56 minute read
Chapter 1 The geography toolkit
The geography toolkit Geography is the study of the places that make up the world around us. Geographers are interested in how human activities and natural processes change the Earth’s places, and in the links between these places. More than ever before, geographers help other people understand how change affects people and places, and how this change can be managed. Geographers have a sense of wonder and curiosity about the world, and this leads them to ask questions about what they see and experience. Geographers use a range of key concepts and skills to answer such questions. Each of these concepts and skills is a tool that you can use to better understand your world. As you master each of these concepts and skills you will gradually fill your toolkit with a range of useful geographical tools. These will help you better understand this amazing planet. 1CHAPTER DRAFT ONLY - NOT FOR SALE
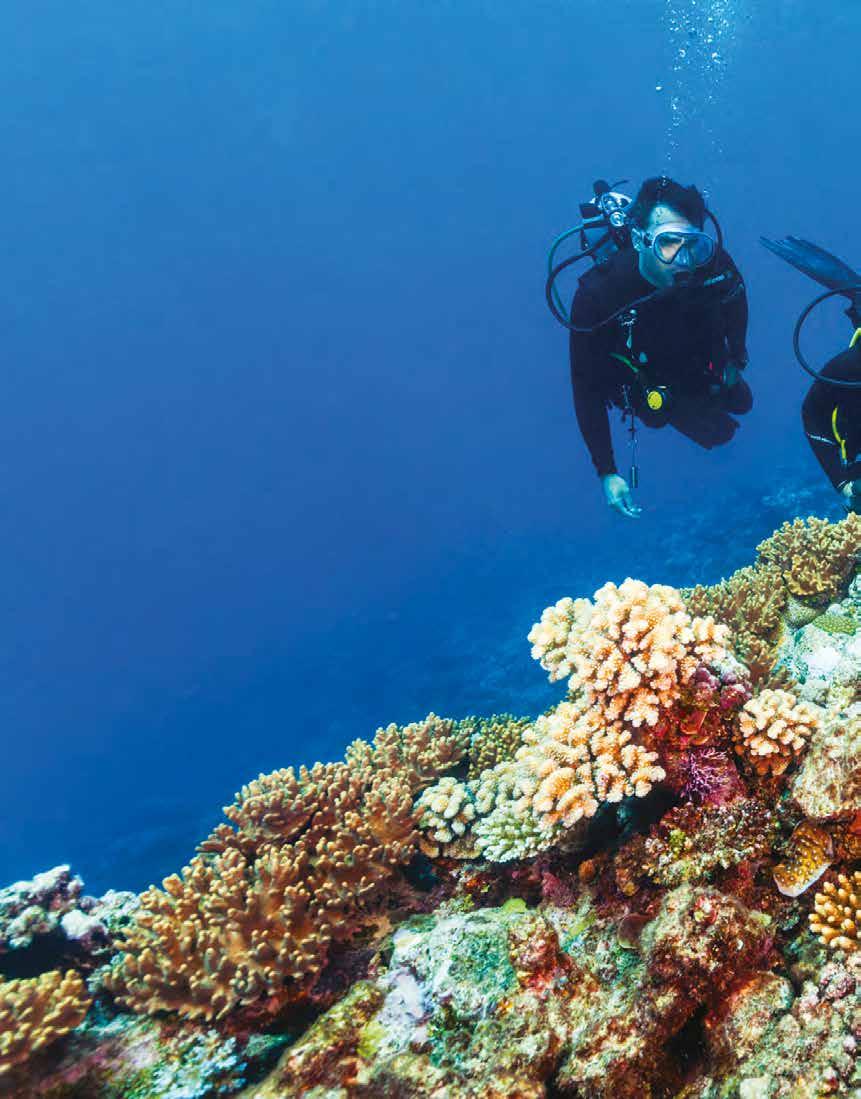
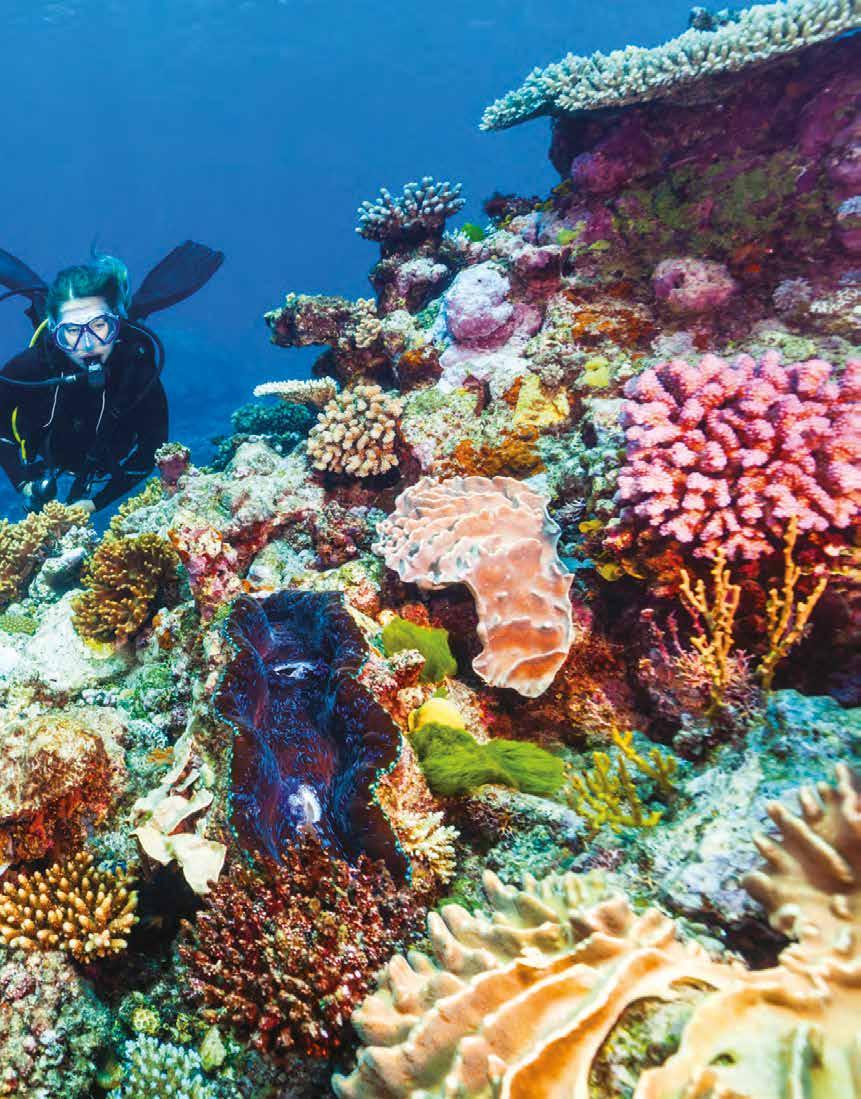
Source 1 Divers examine a giant clam and coral formation at St Crispin Reef in the Great Barrier Reef Marine Park off Port Douglas in Queensland. This year, you will learn about coastal change and management.
1A What are the geographical concepts? 1B DRAFT ONLY - NOT FOR SALE What are the geographical skills?
1.1
Geographical concepts
Geographers use seven key concepts to help investigate and understand the world. These concepts provide a framework to thinking geographically and will help guide you through every geographical inquiry. At times you will use several of these concepts at once, while at other times you may focus on just one.
The seven key concepts in geography are: • place • space • environment • interconnection • sustainability • scale • change.
Place A place is a part of the Earth’s surface that is identified and given meaning by people. Places can be very large, like a whole continent; or they can be small, like a corner of a library. Places can be natural (that is, shaped by the environment and largely unchanged by humans), or built (that is, constructed by humans). Each place is unique, with its own set of characteristics.
Places determine our relationships with one another. Our closest relationships are likely to be with people in places that are physically close. In addition, the environmental and social qualities of a place all influence the way we live. Climate, landscapes, types of
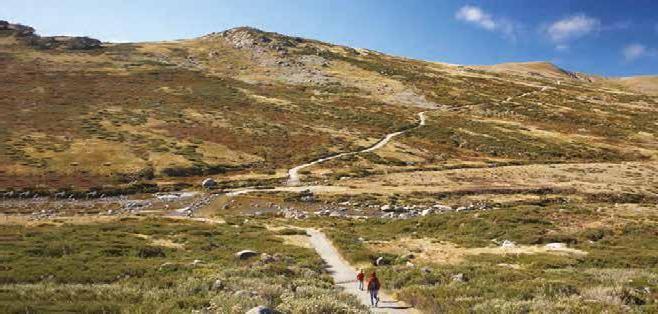
plants and resources, transport networks, entertainment venues and workplaces all have a major impact on our daily lives. Geographers use the concept of place when conducting any geographical inquiry. For example, a geographer visiting Namche Bazaar at the base of Mount Everest would use the concept of place to help understand why people choose to live in this challenging environment and how they overcome these challenges. They would also investigate the ways people have altered this environment, and assess the environmental and social impacts of these changes. DRAFT ONLY - NOT FOR SALE Source 1 A geographer visiting Kosciuszko National Park would be interested in the forces that have shaped these mountains. They would look for clues and begin to ask questions, such as ‘Why are the highest mountain peaks in a line?’ and ‘Why is there snow at the top of the mountain?’
Space
Geographers use the key concept of space when investigating the way that things are arranged on the Earth’s surface. They also investigate the ways people use and change the spaces in which they live. Geographers look for patterns in the way features and structures are arranged, and the concept of space helps them to do this. It has three main elements: • location – where things are located on the Earth’s surface • spatial distribution – the shapes and patterns in which things are arranged on the Earth’s surface • organisation – how and why things are arranged and managed on the Earth’s surface by people.
Understanding the location, patterns and planning
of spaces helps geographers to make sense of our world. Geographers also investigate the ways that people use and change the space in which they live. They recognise that different groups of people use space in different ways and that this changes over time. By examining, researching and describing how spaces are used, geographers can further our understanding of the world and help manage it into the future. It is easy to confuse the concepts of place and space. It may help you to remember that places can be divided and organised into spaces. Spaces also are assigned different purposes. For example, a place like your school is organised into different spaces, each with its own purpose (for learning, for sports, for eating). DRAFT ONLY - NOT FOR SALE Source 2 Geographers might look at this photo of Manhattan, New York, and ask the following questions to investigate the space: • How big is the park located at the centre of the city? • How many buildings are distributed per square metre? • Are the tall buildings in the city organised by residential or business use?

Environment
The key concept of environment relates to the living and non-living elements that make up an area, and the ways they are organised into a system. The world in which we live is made up of many different environments. Some of these – such as deserts, mountains, coral reefs and ice caps – are natural. For an environment to be considered natural, its soils, rocks, climate, plants and animals must remain largely untouched by humans. Natural processes such as tectonic plate movement, erosion and weathering have formed these environments over millions of years.
By contrast, built (or human) environments include large cities, towns, suburbs and areas of farmland. These environments have been so changed by humans – largely for settlement and economic activity – that very few natural features remain.
Geographers are interested in investigating and describing the relationships between people and the environment, including: • the ways in which different groups of people perceive and use the natural environment and why these perceptions differ • the ways in which people change the environment and how these changes can be managed • the impact of environmental hazards on people and how the impacts of these hazards can be reduced. Interconnection All environments and every living and non-living thing are connected. These connections can be on a local level, a national level or a global level. Geographers use this concept of interconnection to better understand the links between places and people, and how these links affect the environment and the way we live. Some examples of interconnection include: • the water cycle – this cycle links the water in the oceans with the land. When it brings rain to inland areas, water flows across the land and into rivers and streams. Farmers rely on this natural link to provide the water they need to grow food.
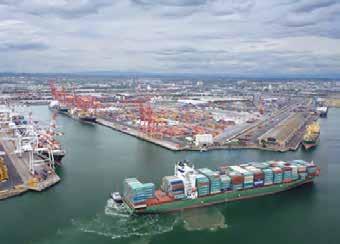
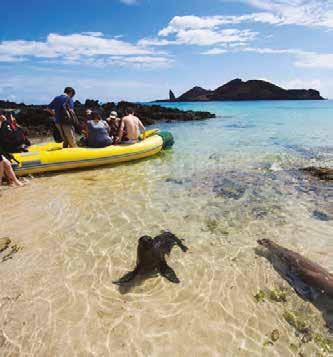
The study of different environments helps geographers analyse the changes that humans make to natural environments and understand their impact, so that they can be managed more wisely. Source 3 The Galapagos Islands in Ecuador are a popular tourist location where tourists interact with the natural environment. DRAFT ONLY - NOT FOR SALE Source 4 A container ship prepares to berth at Port Melbourne.
Sustainability The concept of sustainability relates to the ongoing capacity of the Earth to maintain all life. This means developing ways to ensure that the Earth’s resources be used and managed responsibly, so they can be maintained for future generations.
Sustainability encourages us to think more carefully about these different types of resources, including the ways in which they are formed and the speed at which they are being used. Non-renewable resources (such as oil, coal and natural gas) will one day run out if we continue to use them. Other resources (such as wind, forests, solar and water) are renewable. This means that they replace themselves naturally, or can be replaced to meet the needs of society.
• the internet – with online access available through our mobile phones, tablets, computers and televisions, we are connected to different people all over the world through the content we consume online. • the global marketplace – being consumers in a global marketplace means we are connected to many places via international trade. More than
Sustainable patterns of living meet the needs of the current generations without compromising the ability of future generations to meet their own needs. They also encourage us to look more closely at renewable options and take greater care of the Earth. Actions to improve sustainability can operate at the local, national or international scale.
Geographers use the concept of sustainability to investigate how natural and human systems work, and to understand how resources can be managed in such a way that they will be sustained into the future.
3000 ships carrying 2 million containers pass through the Port of Melbourne (see Source 4) each year. These ships and the goods they carry link dozens of countries around the world. DRAFT ONLY - NOT FOR SALE
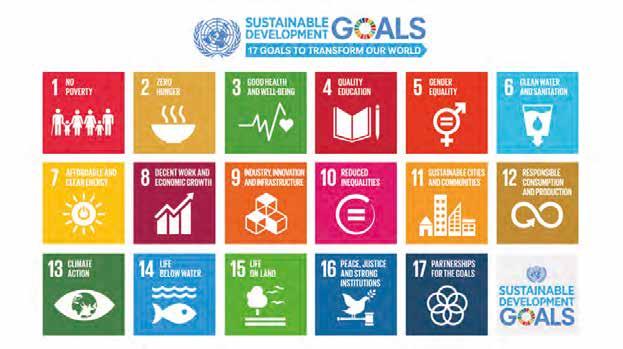
Source 5 In 2015, the United Nations created 17 Sustainable Development Goals for countries to commit to, in order to live more sustainably. You can read more about these on pages 200 to 201.
Scale
Geographers study things that take place on many different spatial levels – from small areas (such as a local park) to very large areas (such as the use of oil and gas all over the world). They use the concept of scale to look for explanations and outcomes at different levels. For example, a geographical inquiry on climate change may be carried out at a range of scales (from smallest to largest): • local – such as an inquiry into increased electricity use for air conditioning in your neighbourhood due to higher-than-average temperatures. Increased energy consumption may result in power outages. • regional – such as an inquiry into coral bleaching on the Great Barrier
Reef. Warming ocean temperatures can trigger coral bleaching, often resulting in coral death.
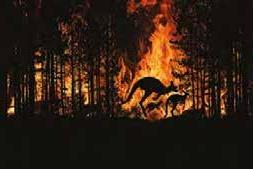
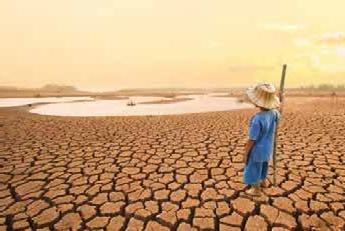
• national – such as an inquiry into changing weather patterns and increased frequency of extreme weather events in Australia, such as bushfires. These affect government allocation of resources, including in relation to water security, agriculture and emergency services. • international – such as an inquiry into drought in Africa. Rains have become less reliable in many places as the climate has changed and many African nations have been hit by a series of devastating droughts that have brought widespread hunger and starvation. • global – such as an inquiry into the reduction in Arctic sea ice due to global warming. This reduction in white ice means that less of the sun’s energy is reflected back into space and more is absorbed into the Earth, resulting in further increases in temperatures globally. climate change a change in global or regional climate patterns; in particular, a change apparent from the mid to late twentieth century onwards and attributed largely to the increased levels of atmospheric carbon dioxide produced by the use of fossil fuelsDRAFT ONLY - NOT FOR SALE
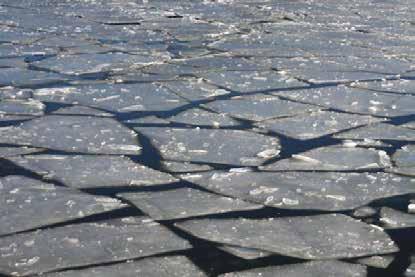
local scale regional scale national scale international scale global scale
Source 6 Geographical inquiries can be carried out on a number of different scale levels.
Change
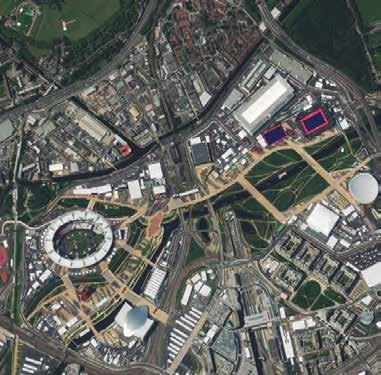
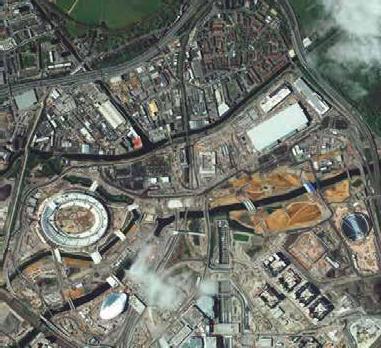
The concept of change helps us to understand what is happening around us and to see the world as a dynamic place. Change in both time and space allows geographers to examine how environments develop, transform or disappear. Change can be the result of natural forces (for example, climate, earthquakes or volcanoes) or the result of human activity (for example, the building of a new bridge or the clearing of forest for farmland). Some changes can be positive (such as the regeneration of vegetation), while other changes can have negative consequences (such as the pollution of waterways from industry). Changes take place on different scales, from local through to global. Local changes that happen quickly, such as storm damage in your street, are easy to observe and explain. Regional or national changes resulting from a bushfire or an earthquake can also happen quickly and their effects can be widespread, with devastating impacts on places and people. Changes that take place on a global scale can take much longer. Global warming, for example, is a long-term change that happens slowly. It has widespread and long-term effects that are not easily explained. Observing and understanding natural or human-made changes is an important part of any geographical inquiry. Geographers need to look at different types of changes, why they have occurred, over what time period they have occurred, and what further changes may take place as a result. Geographers also play an important role in ensuring that change is managed sustainably. Source 7 In preparation for the 2012 Olympic Games, Newham in East London was transformed from a suburb of derelict buildings and polluted rivers (top) into a vast sporting complex (bottom). The project adopted the London 2012: Zero Waste Games Vision, which aimed to make the games truly sustainable. For example, the velodrome shown on the right-hand side of the Check your learning Log onto your obook pro to complete the questions for topic 1.1. DRAFT ONLY - NOT FOR SALE bottom photograph was built using 100 per cent sustainably sourced timber.
1.2
Geographical skills
Geographers are investigators. They explore the world around them by asking questions about what they see. These questions begin an investigation that requires them to collect and analyse information, and to communicate what they have discovered. To complete an investigation they need a set of skills such as drawing maps and cross-sections, surveying, sketching and presenting information. Seven categories of skills are used to complete a full geographical geographical inquiry investigation, known as a geographical inquiry. These are listed in Source 1. a process that To become a better geographer you need to learn new skills as you continue to practise, use geographers use to guide their investigations, and develop the skills you have already learnt. It might help you to think of each of these skills beginning with asking as individual tools in your toolkit. For some geographical inquiries, you may only need to use questions and using one tool; for others, you may need to use many. As you develop each new skill you will have geographical skills gained another important tool in explaining the natural processes and human activities that shape our amazing planet. Source 1 The seven categories of skills used in a geographical inquiry Asking questions and conducting research • Develop geographically significant questions and plan an inquiry that identifies and applies appropriate geographical methodologies and concepts. Conducting fieldwork • Conduct fieldwork, map and interpret data and spatial distributions, and use spatial technologies. Interpreting geographical images • Evaluate multi-variable data and other geographical information using qualitative and quantitative methods, and digital and spatial technologies as appropriate, to make generalisations and inferences, propose Analysing maps explanations for patterns, trends, relationships and anomalies, and predict Identifying patterns and outcomes. relationships • Apply geographical concepts to synthesise information from various sources and draw conclusions based on the analysis of data and information, taking into account alternative points of view. • Identify how geographical information systems (GIS) might be used to analyse geographical data and make predictions. Collecting and representing data • Collect, select, record and organise relevant geographical data and information, using ethical protocols, from a range of appropriate primary and secondary sources. • Evaluate sources for their reliability, bias and usefulness, and represent multi-variable data in a range of appropriate forms, for example, scatter plots, tables, field sketches and annotated diagrams, with and without the use of digital and spatial technologies. • Represent the spatial distribution of geographical phenomena by constructing special-purpose maps that conform to cartographic conventions, using spatial technologies as appropriate. Communicating and reflecting
• Present findings, arguments and explanations in a range of appropriate communication forms, selected for their effectiveness and to suit audience and purpose, using relevant geographical terminology, and digital technologies as appropriate. • Reflect on and evaluate the findings of the inquiry to propose individual and collective action in response to a contemporary geographical DRAFT ONLY - NOT FOR SALE challenge, taking account of environmental, economic and social considerations, and explain the predicted outcomes and consequences of their proposal.
1.3 Asking questions and conducting research
Geographers look at people, land, air, water, plants and animals, and the connections between them to understand what is happening. They also seek to investigate where, why and how natural, managed and constructed environments are formed and changed. These observations often include identifying any problems or issues that need to be investigated and resolved. Developing geographical questions Geographers look at the world around them and ask questions about what they see, experience or have thought about. You may, for example, see a news item about a volcanic eruption. Or you may visit the centre of a large city on a field trip, or a national park on holiday. As you begin to think like a geographer, you will begin to ask questions about these events and places, and these questions may be the starting point for a geographical inquiry.
Developing geographical questions
You can learn to develop geographical questions that will help you begin an inquiry about a particular topic or place. Start your questions with the words ‘what’, ‘where’,
‘how’, ‘why’, ‘what impact’ or ‘what should’. Your questions should examine ideas such as: • Where is it? • How big is it? • How does it interact with other things in this place? • How is it changing? How should people best manage this change? The very best geographical questions open up an exciting area for you to explore.
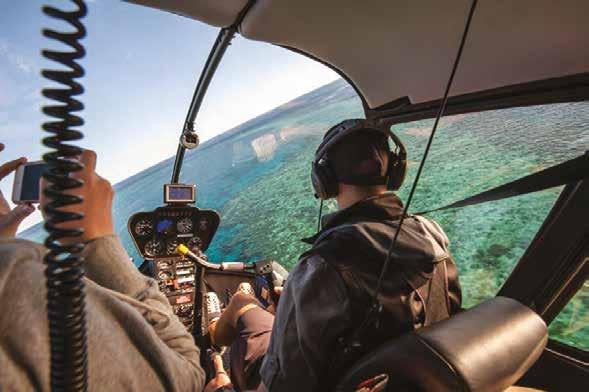
For example, examine Source 2 on the next page. A visitor to the Great Barrier
Reef might ask a simple question, such as:
‘What is the total area of the reef?’ This is a question with a relatively straightforward answer. A better geographical question
would be to ask: ‘How has the total area of the reef changed over time?’ This question opens up a whole new area to explore, because the answer to that question will lead on to further questions and greater depth of understanding. Some other sample questions are: • Why are some patches of the sea dark green and others light green? • How does marine life use the reef? • Where is the reef located and how does this impact it? Practise the skill 1 Explain why ‘How has the total area of the reef changed over time?’ a better geographical question than ‘What is the total area of the reef?’ 2 Examine Source 3 on page 8, which shows tourists on the Galapagos Islands. Work with a partner to develop a set of geographical questions about this place. Where could you begin to find the answers to your questions? KEY SKILL Asking questions & conducting researchDRAFT ONLY - NOT FOR SALE
How is the Great Barrier Reef impacted by the climate?
How do people use the Great Barrier Reef? Are there other coastal areas like the Great Barrier Reef in the world?
Planning a geographical inquiry Asking geographical questions is a good way to develop a range of possibilities for further research and investigation. It is usually best to narrow your investigation by selecting one question. You should select a question in which you are interested and that helps you to better understand the environment you are investigating. Planning an inquiry about the Great Barrier Reef Let us assume you have chosen to investigate the key geographical question: ‘How is the Great Barrier Reef impacted by the climate?’ Consider what information you need to answer this question and where you are going to locate this information. A good way to do this is to use a planning table, like the one in Source 3. Source 3 Planning is a key stage in conducting a geographical inquiry.
Key inquiry question: How is the Great Barrier Reef impacted by the climate?
Information needed Possible sources of this information
Climate data, particularly temperature and rainfall for places at various distances from the Great Barrier Reef • Atlas map to locate towns and cities at various distances from the Great Barrier Reef • Encyclopaedia entry for the climate of Queensland • Online search for climate data for selected towns and cities
Observation of photographs and satellite images of the region • Photographs and satellite images of the Great Barrier Reef from this chapter • Satellite images from Google Earth, including historic imagery
An understanding of the impact of landforms on temperature and rainfall
Check your learning Log onto your obook pro to complete the questions for topic 1.3. • • Printed resources such as geography textbooks, encyclopaedias and Bureau of Meteorology (BOM) books and leaflets BOM website
Source 2 Asking questions is an important skill for geographers. This geographer is examining the Great Barrier Reef from above in a helicopter. DRAFT ONLY - NOT FOR SALE
1.4 Conducting fieldwork
For geographers, the field is an essential primary source of data. Books, websites and maps can give you some information about a particular place, but they are usually secondary sources of information. To really understand a landscape or issue, you need to go and see it for yourself. The skills associated with fieldwork The aim of all fieldwork is to enable you to develop the skills of observation, information gathering, analysis and interpretation of different forms of data, and communication of your results. The types of fieldwork you conduct will differ according to your chosen topic and the fieldwork site. You will be: • identifying different types of environments and the features within them • recording data from different sources • sampling things such as water quality or wind speed
Source 4 You never know where fieldwork • comparing different features to see if there is a pattern will take you! • calculating amounts, such as water flow, numbers of different species of plants and animals, or visitor numbers • communicating your findings. Fieldwork locations and inquiry questions Fieldwork can take place in many locations and for a wide variety of purposes. Rivers and coasts are popular fieldwork locations because the constant movement of water in these places changes the natural environment. Shopping centres, parks and city streets are also popular because the constant movement of people creates patterns, flows and changes. Source 5 provides some examples of fieldwork locations, as well as inquiry questions that can be the beginning of an investigation there. Source 5 Examples of fieldwork locations and inquiry questions for different units of study in Year 10 geography
Unit of study Fieldwork location Inquiry questions
Environmental change and management River or stream • What natural processes are shaping this riverine or coastal environment? Coast • • How do these natural processes impact on human activities? What human activities have changed the natural processes and environment in this place? • How have these environmental changes been managed? • How effective has this management been? • What further management strategies could be used to better manage change in this place?
Geographies of human wellbeing Two contrasting suburbs
• What are living conditions like in these two suburbs? • What are the similarities and differences? • How can these differences be mapped? • Why do these differences occur? • How can wellbeing be improved in these suburbs? Check your learning Log onto your obook pro to complete the questions for topic 1.4. DRAFT ONLY - NOT FOR SALE Program to improve wellbeing • What are the aims of this program? • Why does it exist? • How successful is it in reducing inequalities in wellbeing? • How could it become more successful? • How could it be applied in other regions and places?
1.5
Interpreting geographical images
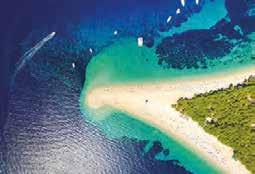
Geographical images are taken to depict and present a place or particular feature of the landscape for the purpose of demonstrating an aspect that is being studied. This is quite different from taking photos of you and your friends for fun, or even from taking an attractive picture of a landscape. Whether you take a geographical image during a fieldwork study, or collect them from researching online, you need to develop the skill of interpreting them.
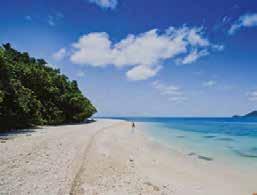
Landscapes can be photographed from several different angles, depending on the position of the camera at the time the photograph was taken. Each angle makes some features of the landscape easier to see and interpret than other features, so you need to carefully consider the angle at which the photograph has been taken (see Source 6).
Check your learning Log onto your obook pro to complete the questions for topic 1.5. Source 6 Different types of geographical images
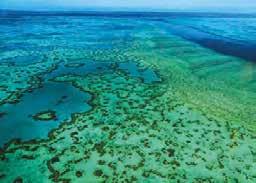
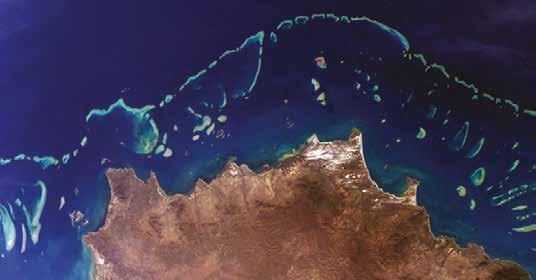
GROUND LEVEL The camera is held by someone at the same level as the landscape being photographed. This angle allows you to clearly see the height of any object and the detail in vertical surfaces. However, objects in the picture can hide the landscape behind them. Ground level is not the most effective method when investigating something like the Great Barrier Reef, as it is underwater. OBLIQUE AERIAL The camera is positioned above the landscape and angled towards the scene being photographed. This angle allows you to see both the foreground and the background of the scene. You can also see both the height of an object and its width or area. However, objects in the background seem much smaller than those in the foreground. VERTICAL AERIAL The camera is positioned directly above the landscape. This vertical (or plan) view allows you to see the extent of any feature. However, it is difficult to judge the height of DRAFT ONLY - NOT FOR SALE a landscape. In this image, for example, it is difficult to judge the depth of the water.
Analysing satellite images
A satellite image is taken from space. It allows us to see large areas of the Earth’s surface. These images are often used to investigate patterns, such as the shape of the reef, its position relative to land, and the distribution of small reef shapes. It is difficult, however, to see smaller features of the environment.
satellite image an image of a place taken from satellites orbiting above the Earth’s surface
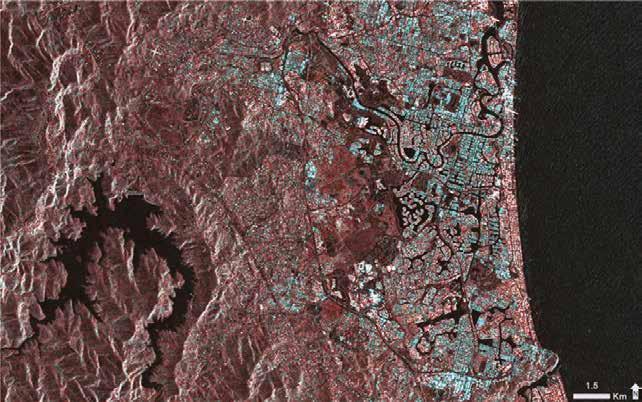
Source 7 This satellite image of the Great Barrier Reef was captured by NASA. Analysing false colour images You may have heard the terms ‘false colour image’ or ‘false colour map’ before. The term ‘false colour’ does not mean the colours used are incorrect; rather, it means that different colours have been used to make the image or map easier to interpret.
The colours used in a false colour image can look quite unnatural (see Source 8). This is because the colours of the natural features are too similar to demonstrate a particular point or aspect. If, for example, you are trying to show where a muddy brown river meets a brown-coloured riverbank – which has brown rocks and some brownish shrubs – you might decide to use false colour to clearly show where the different elements are. You may make the shrub areas bright green, the river neon yellow and the rocks bright red, leaving just the riverbank brown.
If you are looking at a false colour map, you should examine the accompanying legend to interpret the colours used.
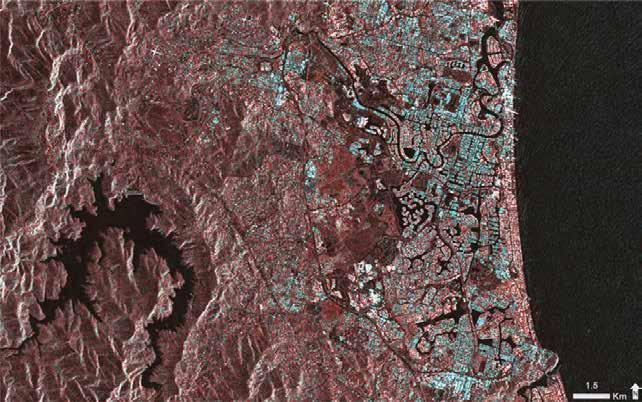
false colour image an image that depicts an object or area in colours that differ from those seen in nature; false colour images use colours that are different or more exaggerated than those shown in standard photographs, in order to make the thing being shown easier to interpret land surface LEGEND water bodies 0 1.5 km DRAFT ONLY - NOT FOR SALE Source 8 This false colour image was captured by a satellite. It uses blue and red to show the contrast between water bodies and the land surface in the Gold Coast, south-east Queensland.
1.6
Analysing maps
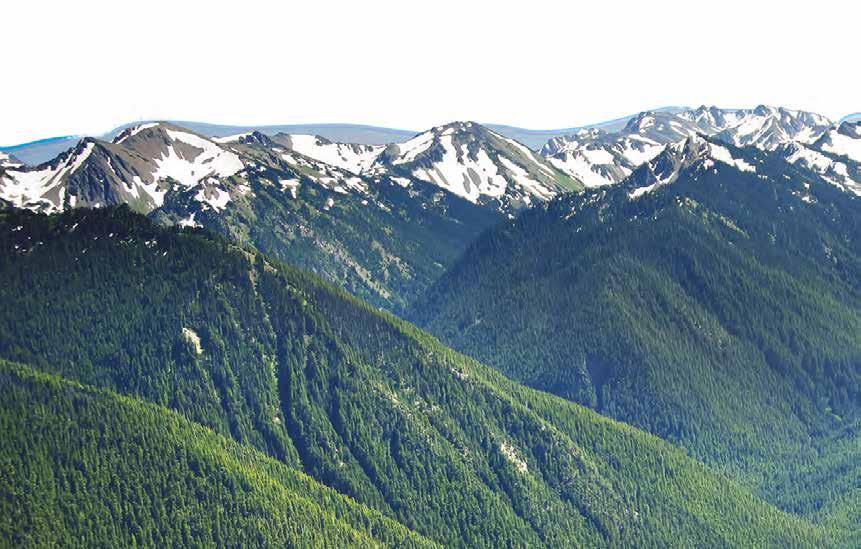
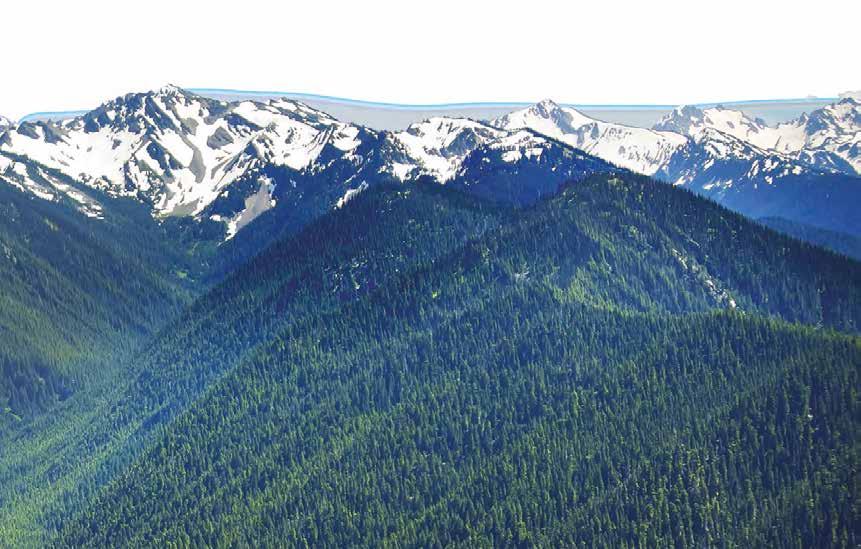
One of the most useful tools that geographers use to process information is a map. Maps are map a simplified plan of an area drawn in the plan view because this ensures the scale will be the same across the entire area. shown from directly above If maps were drawn from an angle, some parts of the mapped area would look distorted and so plan view it would not be an accurate representation of the area. When properly used, maps can reveal a a way of showing great deal about our planet and the ways in which we use it. something as if the viewer is looking down on it from A piece of paper only shows two dimensions: width and length. The Earth’s surface, above; a bird’s-eye view however, has a third dimension: height. Cartographers (map makers) use a variety of methods to show this third dimension, including topographic maps, cross-sections and digital maps. There are a range of different maps and graphic representations you will analyse and create throughout the study of geography. A short explanation of some complex maps and graphic representations is provided in this topic. topographic map a type of map that shows the shape of the land, its relief and landforms contour lines lines drawn on a map that connect points of the same height to show the height and steepness of land Topographic maps Topographic maps are one of a geographer’s most useful tools. They show the shape of the land (such as the shapes formed by hills, valleys and ridges) through the use of contour lines, which join together all places of an equal height above sea level. By learning to interpret
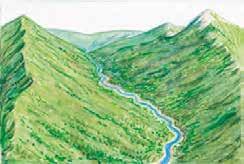
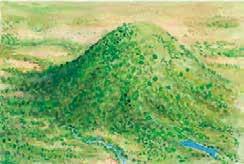
the contour patterns made by these lines, you can work out the shape and height of the land that has been mapped (see Source 9). Also, because most topographic maps are drawn of a small region, they can show that region in great detail – right down to individual buildings and rocks. Source 9 Common contour patterns RoUND hill oR VolCaNo Valley DRAFT ONLY - NOT FOR SALE
RiDGe SPUR
Cross-sections Unlike a map, which shows a landscape in plan view, a cross-section provides a profile (side) view of a landscape. This allows geographers to see the relief of the land from side-on. Interpreting cross-sections can help further our understanding of how
the relief of the land influences the way in which it is used (for example, where people choose to live or where food is grown). Cross-sections are made using contour lines. (see the key skill box on the next page). Source 10 This cross-section of Antarctica helps geographers understand the size of the ice sheets and the size of the bedrock underneath them, and also to see the different areas where ice is thinning.
relief the variations in elevation (height) of areas on the Earth’s surface CliFF PlaTeaU Kilometres –2000 –1000 Sea level 0 1000 2000 3000 4000 5000 Casey (Australia) Scott Base (New Zealand)ice sheet bedrock Height (metres) Greater (Eastern) Antarctica Ross Ice Shelf TRANSANTARCTIC MOUNTAINS 0 500 1000 1500 2000 2500 3000 BA DRAFT ONLY - NOT FOR SALE
KEY SKILL
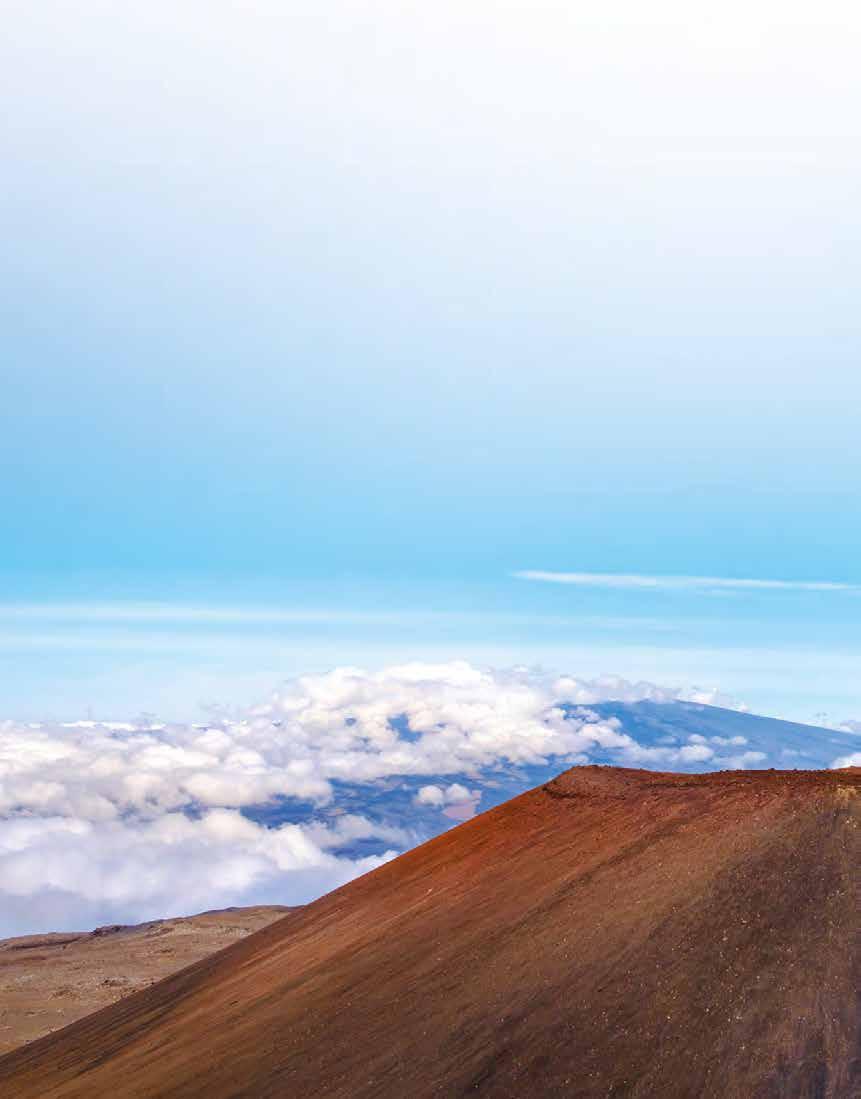
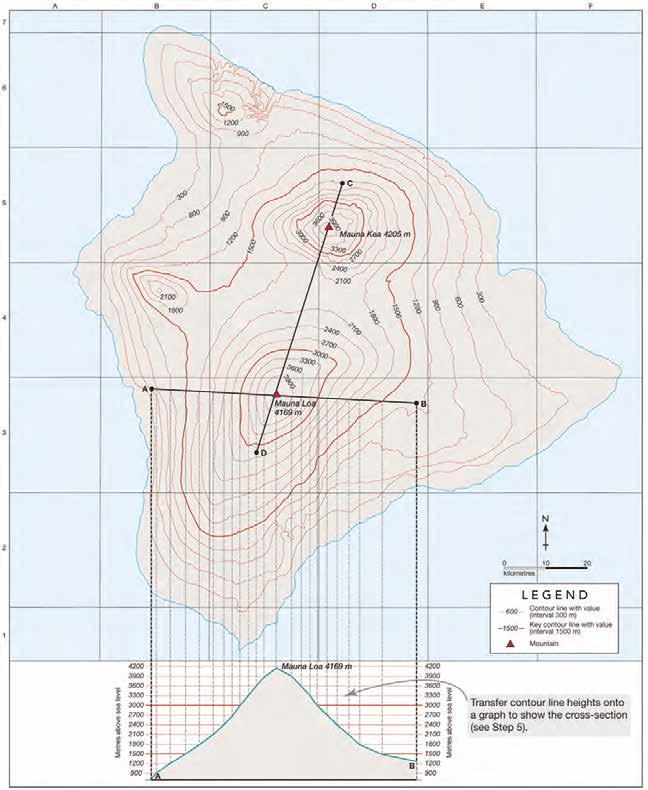
To create a cross-section from a topographic map, follow these steps: Step 1 Identify the cross-section by finding two points on the map to form the outer edges. Step 2 Line up the straight edge of a plain piece of paper across the map so that it covers the two points you identified in step 1. Mark these two points as A and B. Step 3 Make small marks on your paper where each contour line meets it and write the height of the contour. Step 4 On another piece of paper, draw a set of axes for your cross-section. The horizontal axis should be the same width as the distance between points A and B on the map. The vertical scale should begin below the lowest point on your cross-section and extend above the highest point. Step 5 Lie the edge of your first piece of paper along the newly created horizontal axis. For each contour height shown, add a dot onto your cross-section at the correct height according to the vertical scale. Join these dots in a smooth line. Step 6 Lightly shade the area below the line to show that it is solid land. Label both axes and give your cross-section a title.
To practise this skill, log onto your obook pro and complete the key skill worksheet: Drawing a cross-section using contour lines. Key skill worksheet Collecting & representing data: Drawing a crosssection using contour lines
C A B
D
0 10 20 kilometres Contour line (interval 300 m) Key contour line (interval 1500 m)
A B C D E F 7 6 5
Mauna Kea 4205m 2400 4 2400 2100 1800 1500 1200 900 600 300 3000 Mauna Loa 4169m 3 2 Mauna Loa 4169m
300 600 900 1200 1500 3000 2100
1800 900
2100 1500 1200 2700 2700
3300 3300
3600 3600
3900
3900 60090012001500 900 3300 3900 3300 3600 3900 4200 1 DRAFT ONLY - NOT FOR SALE 3000 2700 2400 2100 1800 1500 1200 900
A B
DRAFT ONLY - NOT FOR SALE
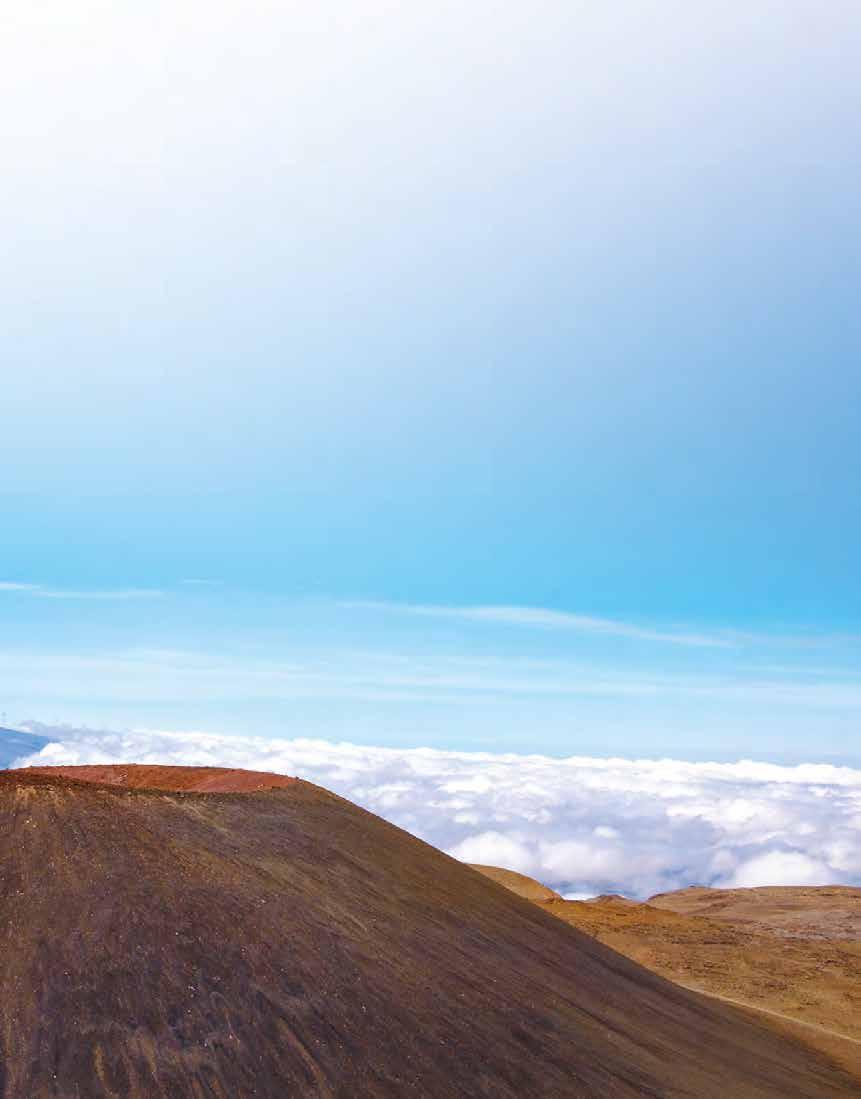
Source 11 Creating a cross-section from a topographic map of Hawaii
Digital maps and elevation models
Check your learning Log onto your obook pro to complete the questions for topic 1.6. There are about 6000 human-made satellites orbiting the Earth. Many of these collect digital data about the shape and height of the land and transmit it back to computers on the ground. This data is then interpreted, and can be used to draw maps.
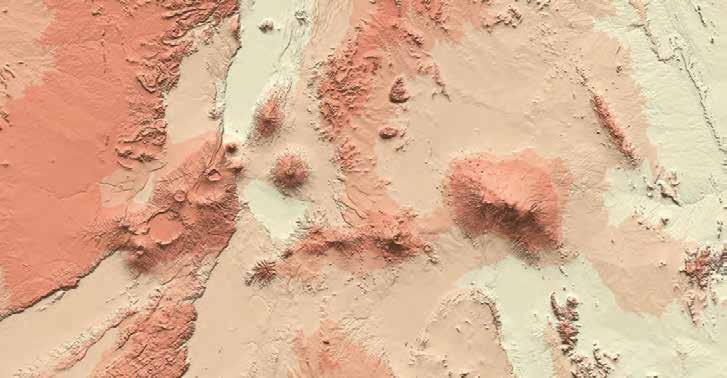
Cartographers can use computer programs to add colours to these digital maps, to highlight certain aspects of the environment. In Source 12, for example, the land has been shaded according to its height. The data can also be manipulated in other ways. In Source 13 it has been used to create a side view of the landform being mapped. This type of illustration is known digital elevation model as a digital elevation model (DEM). (DEM) a topographic illustration (or digital model) that uses a range of data to generate a 3D representation of the Earth’s surface 0 15 30 km cartogram a type of map that is distorted to show a representation of statistical Source 13 This is a digital elevation model of Mount Kilimanjaro and the surrounding area. The data data (e.g. access to water, rates of obesity, etc.), was collected by a NASA space shuttle and an orbiting satellite. rather than land area
Cartograms
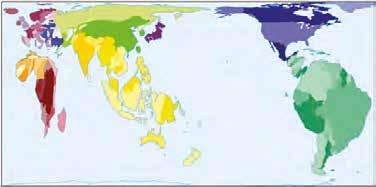
You will have already seen cartograms in the course of your geography studies. These maps look distorted and have areas that appear thinner or more enlarged than they would normally be, depending on what they are showing. Cartograms are sometimes called ‘value by area’ maps, which means the spaces on the maps are altered to show a representation of a value rather than land area. Source 14 This cartogram shows the Earth’s fresh water resources. The There are various software programs distortion shows that South America has large supplies of fresh water, while available that can generate cartograms. Africa has very little.

Source 12 In this digital map of the Mount Kilimanjaro region, land has been shaded according to its height above sea level. Shadows have also been added to help map users understand the shape and height of the land. DRAFT ONLY - NOT FOR SALE
1.7 Identifying patterns and relationships

An important skill that you need to develop in the study of geography is that of identifying patterns and relationships in data. Geographers look for order, diversity, trends, patterns, anomalies and relationships in their information. It often helps to classify information by sorting it into groups. Using methods and models to identify trends, patterns and relationships There are a number of methods and models that geographers use to help identify trends, patterns and relationships in data. These include: • the SHEEPT method • the PQE method. The SHEEPT method SHEEPT is a tool used by geographers to help them consider six factors that may contribute to the patterns identified in their data (see Source 15). When you are examining issues related to your inquiry, it is useful to think about them in terms of these factors and rank them in order of importance. This will help you reach your conclusions. Social – factors relating to culture and people Historical – factors relating to past eventsH Environmental – factors relating to the natural environment (including climate, landforms and vegetation) E Economic – factors relating to the earning or spending of money (including income earned from industry and tourism and the cost of building a dam or highway) E Political – factors relating to governments (including laws, regulations and policies) P Technological – factors relating to the availability and use of different types of technology (including the development of greener technologies, alternative energy sources and GIS) T Source 15 The SHEEPT method S DRAFT ONLY - NOT FOR SALE

The PQE method
aUSTRalia: CliMaTe ZoNeS Tropic of Capricorn
Northern Territory Queensland
Western Australia
South Kati Thanda (Lake Eyre)
Australia New South Wales ACT
Victoria Tasmania
Darwin
PACIFIC INDIAN
OCEAN OCEAN
River Darling Perth
Murray River 0 250 500 750 km Melbourne Sydney
Coober Pedy Lismore
Mildura Cairns
Charters Towers
Tropical wet:
hot and wet all year
Tropical wet or dry:
hot with wet and dry seasons Sub-tropical wet: hot or warm, wet summers; mild winters Sub-tropical dry winter: hot or warm, wet summers; dry winters PQE is a tool used by geographers to describe the data they have gathered (particularly on maps) and to look for patterns in this data. The letters ‘PQE’ stand for ‘pattern’, ‘quantify’ and ‘exceptions’. Source 17 on the next page is a sample of writing that uses the PQE method to describe the
LEGEN D Tropical Semi-desert: hot all year; 250–500 mm rain Desert: hot all year; less than 250 mm rain Dry Maritime hot summer: hot summers, cool winters; wet all year Maritime warm summer: warm summers, cool winters; wet all year Mediterranean: hot and warm, dry summers; mild, wet winters Temperate distribution of climate zones in Australia (as shown below in Source 16). Read the highlighted sections closely. These are sentence starters that can be used to structure your response whenever you are using the PQE method. DRAFT ONLY - NOT FOR SALE
Source 16
Source: Oxford University Press
If you can identify the type of map that you are looking at, make sure you name it.
The uneven pattern of this choropleth map shows that Australia is dominated by a dry climate in the central area, with desert and semi-desert climate zones.
The evidence that quanti es this pattern is the far-reaching location of semi-desert and desert climate zones, which spans most of the central continent and impacts on Western Australia, the Northern Territory, South Australia, Queensland, New South Wales and northern Victoria. In other words, this pattern impacts on every state and territory in Australia except Tasmania and the Australian Capital Territory.
The exception to this pattern is the diverse climate zones around Australia’s coast. For example, the south-eastern areas of Tasmania, Victoria and New South Wales experience maritime climates, whereas parts of the Western Australian coast experience a Mediterranean climate. Far-north Western Australia and Northern Territory are different again, with tropical wet and dry climates. Queensland, where the Great Barrier Reef is located, experiences its own range of climates in just one state.
Pattern – in this step, you need to give a general overview of any patterns you may identify.
Distinguishing between qualitative and quantitative data Primary and secondary data provide either qualitative data or quantitative data (see Source 18). Good geographical inquiries will always be based on a combination of primary and secondary data that is both quantitative and qualitative. Even though qualitative data is an important part of any geographical inquiry, quantitative data is considered to be more valuable because it is less open to personal interpretations and can be more accurately represented in graphs and charts.
Source 18
The PQE method uses mainly qualitative data. Examples of qualitative data The SHEEPT method uses mainly quantitative data. Examples of quantitative data • climate and temperature statistics • tourist numbers • population figures • types and amounts of food grown • forest clearance rates • numbers of people killed in natural disasters • opinions • points of view • personal stories • likes and dislikes • feelings
quantitative data any information that can be recorded as numbers (e.g. ‘the literacy rate is India is 74 per cent’) qualitative data information that focuses on quality rather than quantity; as such, it is usually someone’s opinion and may differ from person to person Check your learning Log onto your obook pro to complete the questions for topic 1.7. Quantify – in this step, you need to add specific and accurate information to define and explain the patterns. Exception – in this step, you need to identify anything that does not fit your patterns. Source 17 PQE example DRAFT ONLY - NOT FOR SALE
1.8
Collecting and representing data
Geographers find answers to their questions in many places. They may collect information themselves by interviewing people, taking photographs, making sketches out in the field, or conducting surveys and questionnaires. This kind of information will generally only be relevant to a particular inquiry and is called primary data. Often, a geographer collects information that supports their inquiry but has not been specifically collected or designed by the geographer for that inquiry. This type of information is called secondary data. Secondary data sources include maps, graphs, statistics and websites that someone else has developed. Some of the best secondary sources of information may be photographs from newspapers and magazines, or satellite images from Google Earth. Regardless of whether you are using primary or secondary data, your investigation or inquiry into any geographical topic should follow these steps: 1 Collect and record the information you think you will need to answer your key inquiry question. 2 Evaluate this information and data to determine that they are accurate and relevant. 3 Represent your findings in an interesting and appropriate way, such as tables, graphs, maps and sketches (see page 18 for more information on these). Reliability and bias Geographers need to evaluate the sources they use for reliability and potential bias, as well as usefulness. In the case of collecting data from primary sources – such as interviewing subjects directly on a topic – the information gathered will be reliable because it is gathered firsthand; but the geographer should keep in mind any potential bias that may be influencing an interview subject’s response. An interview that a geographer is conducting on the potential effects of turning local parkland into an industrial park, for instance, would have very different responses from a representative of the industrial developer than from a member of a local wildlife conservation group. It is important for a geographer to evaluate this kind of bias, and remember to ask questions about the motivation behind it. It is important to evaluate any secondary data for reliability, as well as bias. This is particularly true for information obtained through the internet. Unlike a printed source, such as a book or atlas, it can be very difficult to establish who has written and published information online. Ask yourself: • Is the secondary data from a recognised source; for example, a government body, such as the Bureau of Meteorology, or a research agency, such as CSIRO? • Is the data provided without bias? Or is it presented on a website for a company that might have a vested interest in influencing public opinion? primary data data for a geographical inquiry that was collected in the field by the geographer conducting the inquiry (e.g. survey data, hand-drawn maps or photographs) secondary data data used for a geographical inquiry that was not collected by the geographer conducting the inquiry (e.g. textbooks, atlases or websites)DRAFT ONLY - NOT FOR SALE Before you move to the next stage of your inquiry, it is important to check that you have recorded all your data without errors, and that it is balanced, fair and does not reflect your personal opinions.
Evaluating the reliability of websites
KEY SKILL
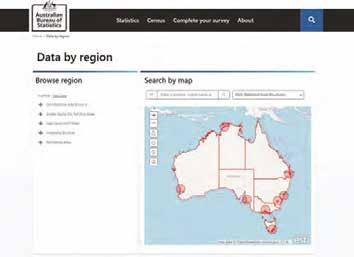
Collecting & representing There is an enormous amount of material data available online, but it is important to keep in mind that not all websites provide reliable information. You must be careful to not automatically accept that all information published online is from a reliable source. Websites should be critically evaluated for reliability by following these steps: Step 1 Find out how old the information is. When was it first published? This will help you decide whether it is useful for your inquiry or not. Step 2 Find out who published the information. Is it possible they have a bias? You can often find out more about the organisation publishing information by going to their ‘home page’ or reading the ‘about us’ section. Step 3 Look at the domain suffix at the end of the URL, as this will give you an important clue about the origin of the information. For example: • ‘.com’ is used by commercial organisations, such as online stores • ‘.org’ is used by non-commercial organisations, such as nongovernment organisations and welfare groups • ‘.gov’ is used by government departments • ‘.edu’ is used by schools and universities • ‘.net’ is used by commercial organisations • ‘.mil’ is used by military groups. Step 4 If you cannot find out when the information was published or who published it, it is probably too unreliable to use in a geographical inquiry. Look for a more reliable source of information. Practise the skill 1 Common websites used for reference information include the CIA World Factbook, the Australian Bureau of Statistics, National Geographic and the United Nations Development Programme. Using the steps listed above, assess the reliability of the data found on these websites. Oxford University Press www.oup.com Search
83% iPad 09:14 AM DRAFT ONLY - NOT FOR SALE

2
Source 19 This webpage offers a range of statistical data about Australia. How can you determine if it contains reliable information?
Being an ethical geographer
When conducting research and obtaining data for an inquiry, it is important for a geographer to be mindful of issues that are likely to raise ethical concerns. This may include being aware of privacy concerns, ensuring anonymity if required, and obtaining informed consent from research participants. Geographers may also need to outline where and how the information obtained will be used or published; and to give special attention to relational data, where geographical references or coordinates might disclose a participant’s location or identity. If a geographer undertakes an inquiry that involves consulting with Aboriginal and Torres Strait Islander communities, they should be aware that there are guidelines and protocols that should be followed. While these are not necessarily rules, it is important to know that Aboriginal and Torres Strait Islander peoples have distinctive regional and cultural identities that require respectful consideration for meaningful consultation. This may involve preferred terminology, cues for cultural communication, and other means for making consultation harmonious and productive. If you are conducting such an inquiry, it is advisable to read some relevant material first, such as the Aboriginal and Torres Strait Islander Peoples Engagement Toolkit, which you can find via your obook pro. Using graphs to record data In Years 7 and 8 you will have learnt how to create and interpret simple graphs, such as line graphs, bar graphs, column graphs and pie charts. In Years 9 and 10 you will be working with more complex graphs. Sometimes you will create such graphs yourself, and sometimes you will interpret them to make sense of the information they provide. Regardless, understanding how information is represented in graphs is an important skill to add to your toolkit. Some of these styles of complex graphs are described below. Climate graphs climate graph Climate graphs show the general climate of a combination bar a place – what the weather is like overall in a and line graph that shows the rainfall and certain location – graphing the average monthly temperature of a given temperature and rainfall over the course of place; also known as a year or other set period of time (see Source 20). climograph Climate graphs combine line and column graphs. Temperature is recorded as a line graph and rainfall is recorded as a bar graph.
400 500 300 200 100 Average rainfall (mm)Average temperature (°C) 40 50 30 20 10 0 Month Perth mm°C JF MAM JJASOND Source 20 A climate graph showing the average monthly temperature and rainfall in Perth Weblink Aboriginal and Torres Strait Islander Peoples Engagement Toolkit 0 DRAFT ONLY - NOT FOR SALE
Compound column graphs
A compound column graph, sometimes called a stacked column graph or stacked bar graph, is used by geographers to compare parts of something to the whole. They are a more complex type of column graph in which each column is split into sections. The results are then stacked on top of each other, in different colours or different shades of a colour, so that they can be easily compared (see Source 21).
Each column in a compound column graph represents a total, and each different-coloured segment represents a part that makes up that total. The graph in Source 21, for example, shows the total increase in world population – from 1950, projected up to 2050. Of the total increase in population, it is immediately clear that Asia, coloured green, has experienced and will continue to experience the greatest growth. It is also immediately clear that Oceania, coloured dark pink, has experienced very small population growth in comparison. Presenting the information in this way means we can quickly see and compare a number of figures that contribute to a total.
10 000 8000 Population (millions) 2000 4000 6000 Europe Asia Africa
KEY Oceania North America South America and Caribbean
20502040203020202010200019901980197019601950 Year Source 21 A compound column graph showing the increase in world population by region, from 1950, projected up to 2050 Population pyramids compound column graph Population pyramids are horizontal bar a type of column graph graphs that show the proportion of males that features two or more sets of related data at the and females in different age groups in a same time so that they can population. Most commonly, they are be compared; information used to compare the population structures provided in each column and growth rates of different countries. A is subdivided for further comparison pyramid-shaped graph shows a population with a high birth rate – that is, the population in that country is growing – while a graph that tapers off (is narrower) at the younger ages indicates a population that is contracting or declining (see Source 22).
Population pyramids can also help geographers to identify the ways in which the population in a single country is changing over time.
population pyramid a type of graph that displays the percentage 2 of males and females in a region or population grouped by age Source 22 3 Population pyramids showing growing (top) and contracting (bottom) populations
Male Age (years) Female 80+ 75–79 70–74 65–69 60–64 55–59 50–54 45–49 40–44 35–39 30–34 25–29 20–24 15–19 10–14 5–9 0–4 10 9 8 7 6 5 4 3 2 1 0 0 1 2 3 4 5 6 7 8 9 10 7 6 5 4 3 1 0 0 1 2 6543 7 Percentage of the total population Percentage of the total population
Male Age (years) Female 80+ 75–79 70–74 65–69 60–64 55–59 50–54 45–49 40–44 35–39 30–34 25–29 20–24 15–19 10–14 5–9 0–4 Male Age (years) Female 80+ 75–79 70–74 65–69 60–64 55–59 50–54 45–49 40–44 35–39 30–34 25–29 20–24 15–19 10–14 5–9 0–4 10 9 8 7 6 5 4 3 2 1 0 0 1 2 4 5 6 7 8 9 10 7 6 5 4 3 2 1 0 0 1 2 76543 Percentage of the total population Percentage of the total population
Male Age (years) Female 80+ 75–79 70–74 65–69 60–64 55–59 50–54 45–49 40–44 35–39 30–34 25–29 20–24 15–19 10–14 5–9 0–4
0 DRAFT ONLY - NOT FOR SALE
Scatterplots
The percentage of original rainforest and population growth rate for selected Asia–Pacific countries Papua New Guinea
Maps can be useful for showing a pattern, but they do not really explain that pattern. A special type of graph, called a scatterplot is a better way of doing this. A scatterplot compares two sets of data in a visual way so that connections between them can be easily seen.
The scatterplot in Source 23 compares the amount of original rainforest remaining in selected Asia–Pacific countries with their population growth rates. It is essentially testing the theory that rainforests are less endangered in countries where the population is growing rapidly.
In this graph, because most of the countries lie close to the trend line, it is possible to say that there is a relationship between the amount of rainforest in a country and the rate at which its population is growing. Countries with the fastest growing populations have the most rainforest remaining. Those countries that lie apart from the general trend, such as Bangladesh, are called outliers. A geographer studying this graph might use it as the beginning of a geographical inquiry into deforestation in Bangladesh.
scatterplot a type of graph that uses two sets of data by plotting points along two axes, the pattern of which shows their correlation; also called a scattergraph or scattergram
70 60 Original rainforest remaining (%) 50 40 30 20 Trend line 10 0.5 1.5 2.0 2.5 Population growth rate (%) Source 23 A scatterplot comparing the amount of original rainforest remaining in selected Asia–Pacific countries with their population growth rates
Indonesia
Myanmar Malaysia Laos Cambodia
Vietnam Sri Lanka Thailand India Philippines Bangladesh
Other graphic representations In addition to maps and graphs, geographers use a range of other visual representations to communicate information they have collected. These include geographical diagrams, sketches, tables, geographical images and geographical information systems. These ways of presenting information allow geographers to communicate their findings in the most clear and appropriate manner.
Tables Tables allow geographers to present and compare data by organising it under different headings. Tables can be useful for presenting information over a range of time periods or locations.
Year
Area (’000 square metres) Glacier A Glacier B Glacier C Glacier D Glacier E Glacier F Glacier G Total 1912 5 676 3 27 5 011 811 372 158 12 058 1953 3 829 0 16 2 156 493 181 0 6 675 1976 2 440 0 0 1 409 209 113 0 4 171 1 DRAFT ONLY - NOT FOR SALE
1989 1 900 0 0 1 168 147 90 0 3 305
2003 1 304 0 0 1 025 132 49 0 2 510
Source 24 This table, based on data gathered by geographers in 2006, shows the change in area of seven glaciers (A–G) on Mount Kilimanjaro, 1912–2003 (in thousands of square metres).
Geographical diagrams
Geographical diagrams are simplified drawings of the real world. They allow geographers to show the features or characteristics of places or things much more directly than describing them in words. Certain interesting or complex processes can also be easily explained and demonstrated in a diagram, and communicated quickly and effectively by simple visual representation. Source 25 This geographical diagram and graph show the dramatic rate at which snow has melted on Mount Kilimanjaro. 1912 Rate of snow melts 1900–2020 2002
14 12 10 2 Area km 2 8 6 4 2 0 1900 1920 1940 1960 1980 2000 2020 Year Glaciers Estimated line Ice 1912
Rate of snow melts 1900–2020 2002
14 12 10 Area km 2 8 6 4 2 0 1900 1920 1940 1960 1980 2000 2020 Year Glaciers Estimated line Ice 1912
Rate of snow melts 1900–2020 2002
14 12 10 2 Area km 8 6 4 2 0 1900 1920 1940 1960 1980 2000 2020 Year Glaciers Estimated line Ice 1912
Rate of snow melts 1900–2020 2002
14 12 Year 10 8 6 4 2 0 1900 1920 1940 1960 1980 2000 2020 Area km Glaciers Ice Estimated line DRAFT ONLY - NOT FOR SALE
Geographical sketches
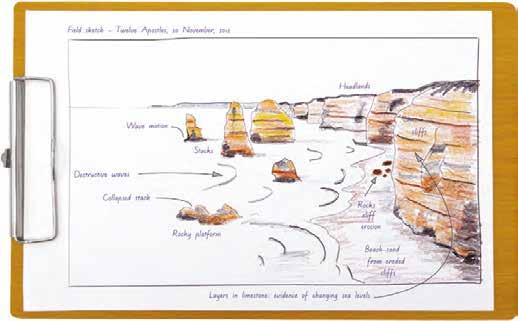
A geographical sketch can be an extremely useful way of collecting information and presenting it in a straightforward and immediate way. Such sketches are often completed in the field (where they are known as field sketches), but may also be created from photographs. A geographer studying the role of waves in the erosion

geographical sketch of a coastline would sketch the rocks a sketch focusing on those parts of the environment and landforms at a beach, while another relevant to the current geographer studying tourism at the same beach would sketch the buildings and roads. Sketches allow the geographer to simplify information to make it easier to understand. Source 26 Field sketches are useful for capturing information quickly and directly. geographical inquiry geographical information systems A geographical information system (GIS) encompasses collecting geospatial data – such as the real-world distance between landmarks, water depth, the height and width of buildings, and the layout of streets and suburbs – and presenting it through digital means. Smartphone apps such as Google Maps and Google Earth allow geographers to navigate through the geographical information system (GIS) a software application designed to capture, store, manipulate, analyse, manage and present all kinds of geographical informationDRAFT ONLY - NOT FOR SALE real world, using GIS data. GISs have many Source 27 GISs gather and present real-world Check your learning different applications, and are used for geographical data using computer technology. Log onto your obook pro to complete the questions for topic 1.8. planning, telecommunications, transport and logistics, to name just a few. Today, a GIS can be found on almost every smartphone, in the form of apps such as Google Maps and Google Earth.
1.9
Communicating and reflecting
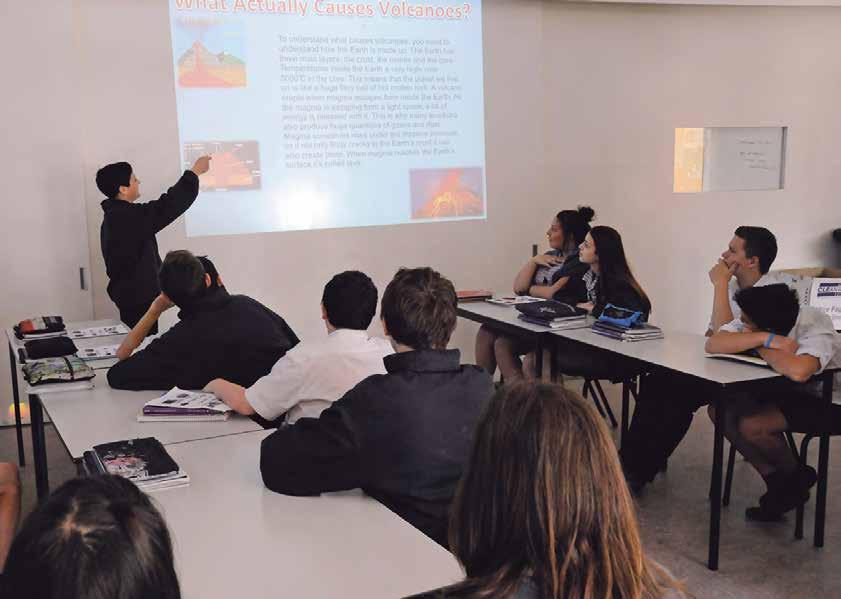
A key skill in the study of geography is the ability to communicate your findings clearly and effectively. There are several ways of doing this, and you should select the method that best suits your audience and purpose: • written methods, such as essays, reports or other text-based presentations • oral methods, such as oral reports, presentations, discussions and debates • graphic methods, such as maps, graphs, and diagrams • visual methods, such as annotated visual displays (AVDs), photographs, sketches and posters • digital methods, such as Wikis, GISs, databases, 3D models and simulations, and multimedia presentations. Source 28 Using PowerPoint is a good way of organising and presenting your findings.DRAFT ONLY - NOT FOR SALE
KEY SKILL
Communicating & reflecting Planning, creating and delivering a PowerPoint presentation
Using PowerPoint is a good way of organising and presenting your findings. You may have found doing oral presentations a little daunting in the past, but following these steps will prepare you to give a PowerPoint presentation with confidence.
PowerPoint allows you to embed images, and provides a structure for outlining your key points in a clear and concise way. You can then talk through your presentation using the slides to both prompt and support you. Using visual aids captures your audience’s attention and makes your presentation a lot more informative, too.
Follow these simple steps and tips when planning, creating and delivering the findings of a geographical inquiry. Plan your presentation Step 1 Gather the findings of the research you have carried out as part of your geographical inquiry, including the sources you have used, the results of any surveys or interviews, and any relevant images, graphs, maps or photographs. Step 2 Plan your presentation carefully so it has a clear beginning, middle and end. Step 3 Know the requirements of your presentation. Your teacher will tell you how long your presentation is expected to be and what key points need to be covered. It is important that you plan your presentation in line with these requirements. For example, if you are required to talk for 10 minutes, you might like to present 10 PowerPoint slides and talk about each one for around a minute. Create your presentation
Deliver your presentation Step 7 Prior to class, check that everything is working as it should and that the screen you are projecting onto is ready and clearly visible to the audience. If you are using any videos, check that the speakers are working. Step 8 Deliver your presentation by speaking clearly and making eye contact with your audience. Step 9 Invite the audience to ask questions. If you do not know the answer, or you are unsure, do not just make something up on the spot. You are better off being honest and offering to answer the question at a later stage, once you have researched the answer. Practise the skill 1 Plan, create and deliver a PowerPoint presentation on a geographical issue that you find interesting. Ensure that you include some interesting visual elements, such as photographs or graphs, as well as your key points. DRAFT ONLY - NOT FOR SALE
Check your learning Log onto your obook pro to complete the questions for topic 1.9. Step 4 It is time to create your slides. Here are some tips to help you create a clear and visually engaging PowerPoint presentation: • Present the content in clear, concise bullet-point form, not huge slabs of information in paragraph form. You do not need to put all your findings up on the screen. • Only include visuals that relate to the content on that particular slide. • Use a design that ensures your audience can clearly see and read the slides. Think about colours, font size and readability. Step 5 Carefully plan what you are going to talk about during each slide, and then record this plan on cue cards that you can refer to throughout your presentation. Step 6 Practise your presentation. You can do this on your own, or in front of a friend or family member.
Reflecting
The title of my geographical inquiry is:
The geographical inquiry I set out to investigate: GENERAL POINTS My rating AREAS OF STRENGTH Comments Comments Comments Comments Comments I was able to complete all stages of my geographical inquiry. I was able to answer all my key inquiry questions. I was able to plan my inquiry effectively. My maps, graphs, tables and diagrams were clear and accurate. I was able to analyse my data and reach a conclusion. I was able to communicate my findings in an interesting and appropriate way. My areas of strength are: I'm getting much better at: AREAS NEEDING IMPROVEMENT The part I found most difficult was: I need the most help with: IMPORTANT ISSUES HIGHLIGHTED BY MY INQUIRY The most important thing I learnt from my inquiry was: This issue is important to me because: This issue is important to my community/ country/world because:
Reflecting involves looking at what you have learnt, thinking about how it was learnt, and asking critical questions about the way 1 2 3 4 5
your geographical inquiry was conducted. Reflecting is an essential skill, as it allows you to learn important lessons from any mistakes that you have made, and apply these lessons in your next geographical inquiry.
There are several ways to reflect on your work. One of the best methods to help you reflect is to complete a self-evaluation checklist (see Source 29). You will find a printable copy of this on your obook pro as well. Responding As well as reflecting on the ways in which you conducted your inquiry, you also need to respond to what you found out. You may even decide that you need to recommend some action based on what you found.
Geographers often use the information gathered and analysed in their inquiry for a specific purpose. This could be to report on an issue and educate people, to raise awareness of a potential problem, or to lobby local, state or federal government Source 29 A self-evaluation checklist is a very about a particular concern. This can be done useful way of reflecting on the findings of your in various ways – from presenting official geographical inquiry. reports or studies, to using social media and starting an online petition. The work you do as a geographer can contribute to your environment, and responding and acting is an important part of this work.
If the results of your investigation lead you to recommend a plan of action, be sure to evaluate your own work. Ask the tough questions that another person might ask when looking at your plan. For example: • Is the plan of action environmentally sustainable? Does it impact in a negative way on the natural environment and natural processes? • Does the plan bring more economic benefits than it costs? Is it affordable in both the short term and the long term? • Does everyone affected by the plan benefit from its outcomes, or just a few people? Source 30 Remember to evaluate any strategy you recommend by weighing up its strengths and weaknesses.

Document Self-evaluation checklist DRAFT ONLY - NOT FOR SALE


