Volume 24 Number 6 - June 2024


Volume 24 Number 6 - June 2024
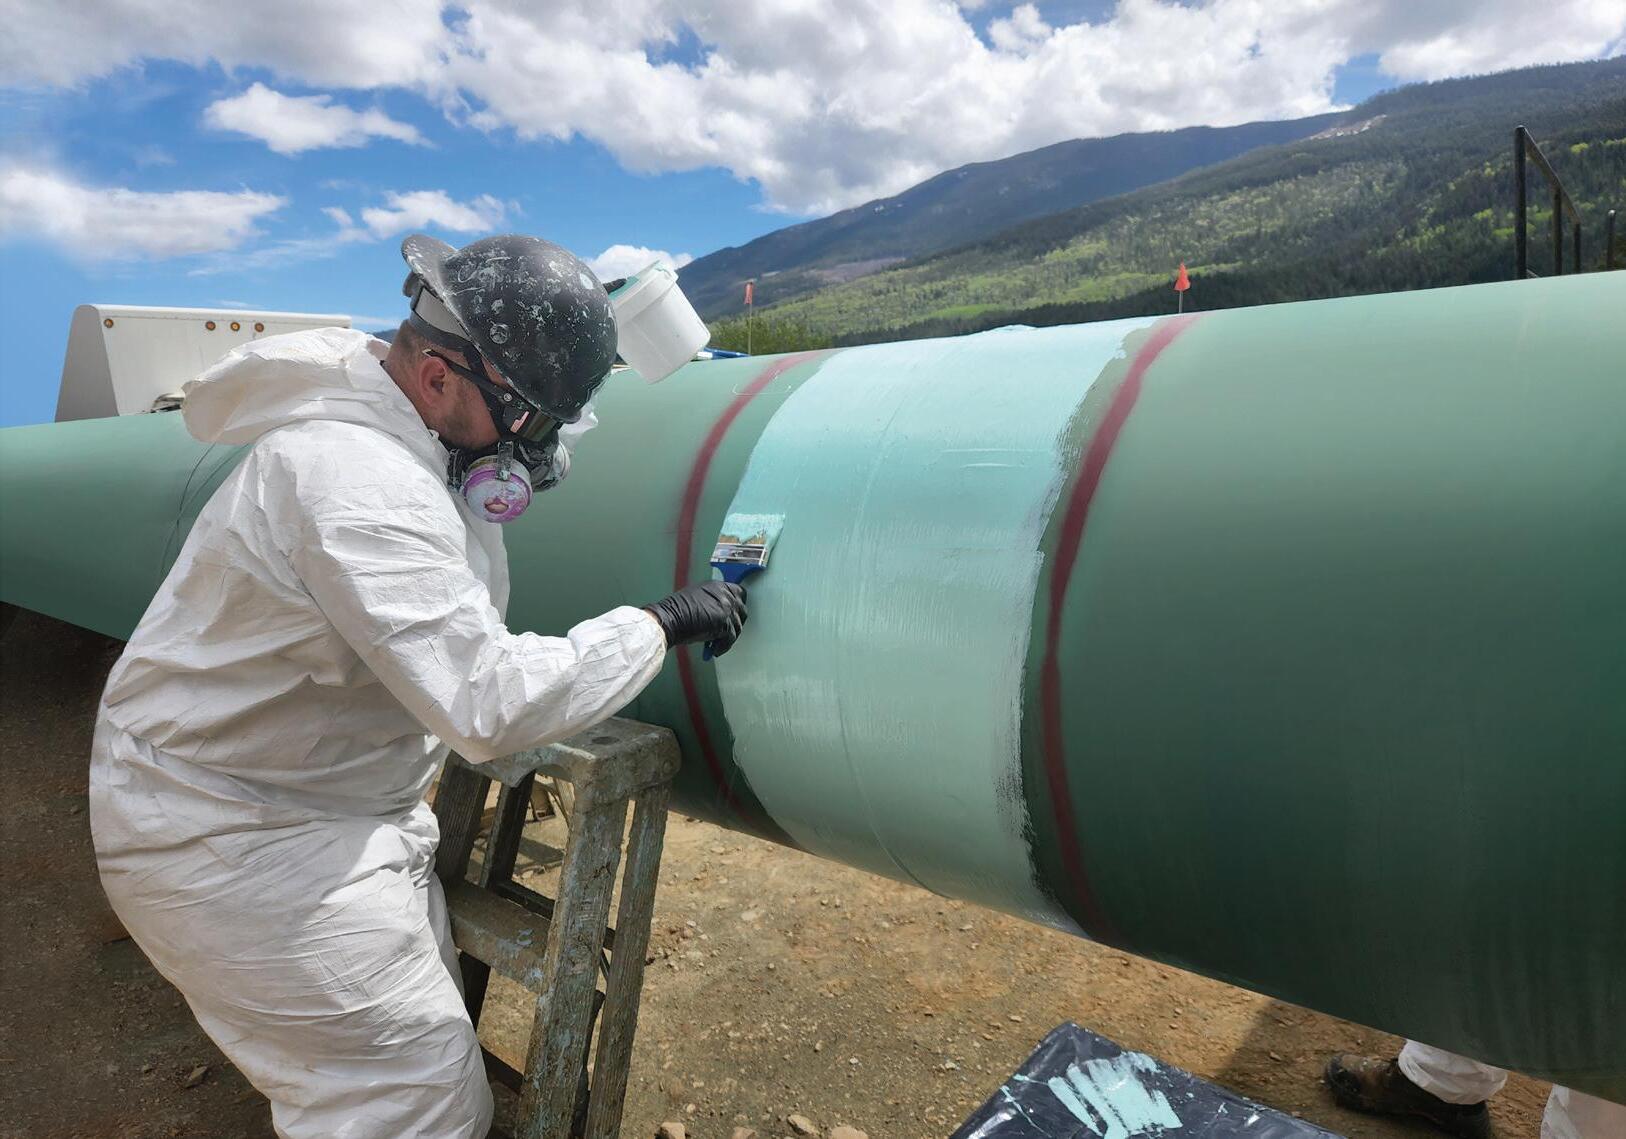
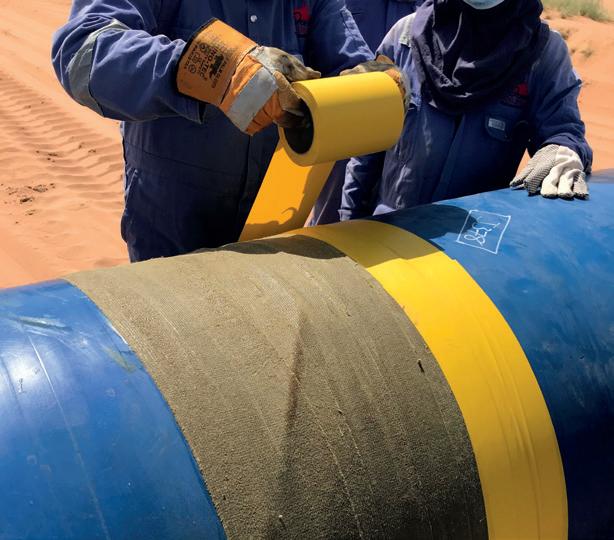
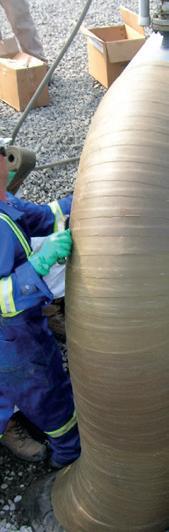
Combining industry-leading abrasion resistance with unmatched flexibility, our range of epoxy solutions are built tough, easy to apply and designed to last.
Whether its HDD or field joint coatings, we’ve got the solution.

03. Editor's comment
05. Pipeline news
Contract news and updates on the Trans Mountain pipeline start date and ONEOK's acquisition of Gulf Coast pipelines.
KEYNOTE: HYDROGEN PIPELINE TRANSPORT
08. Is it all green lights for hydrogen?
Contributing Editor, Gordon Cope, considers the rollout of the hydrogen economy and asks, what will it take to embed an entirely new source of energy throughout the global economy?

15. Hydrogen's pure potential
Garry Hanmer, Senior Simulation Consultant, Atmos International, UK, evaluates how to accurately model pure hydrogen pipelines, using a case study to demonstrate the model tuning process and the selection of appropriate equations of state.
EPC
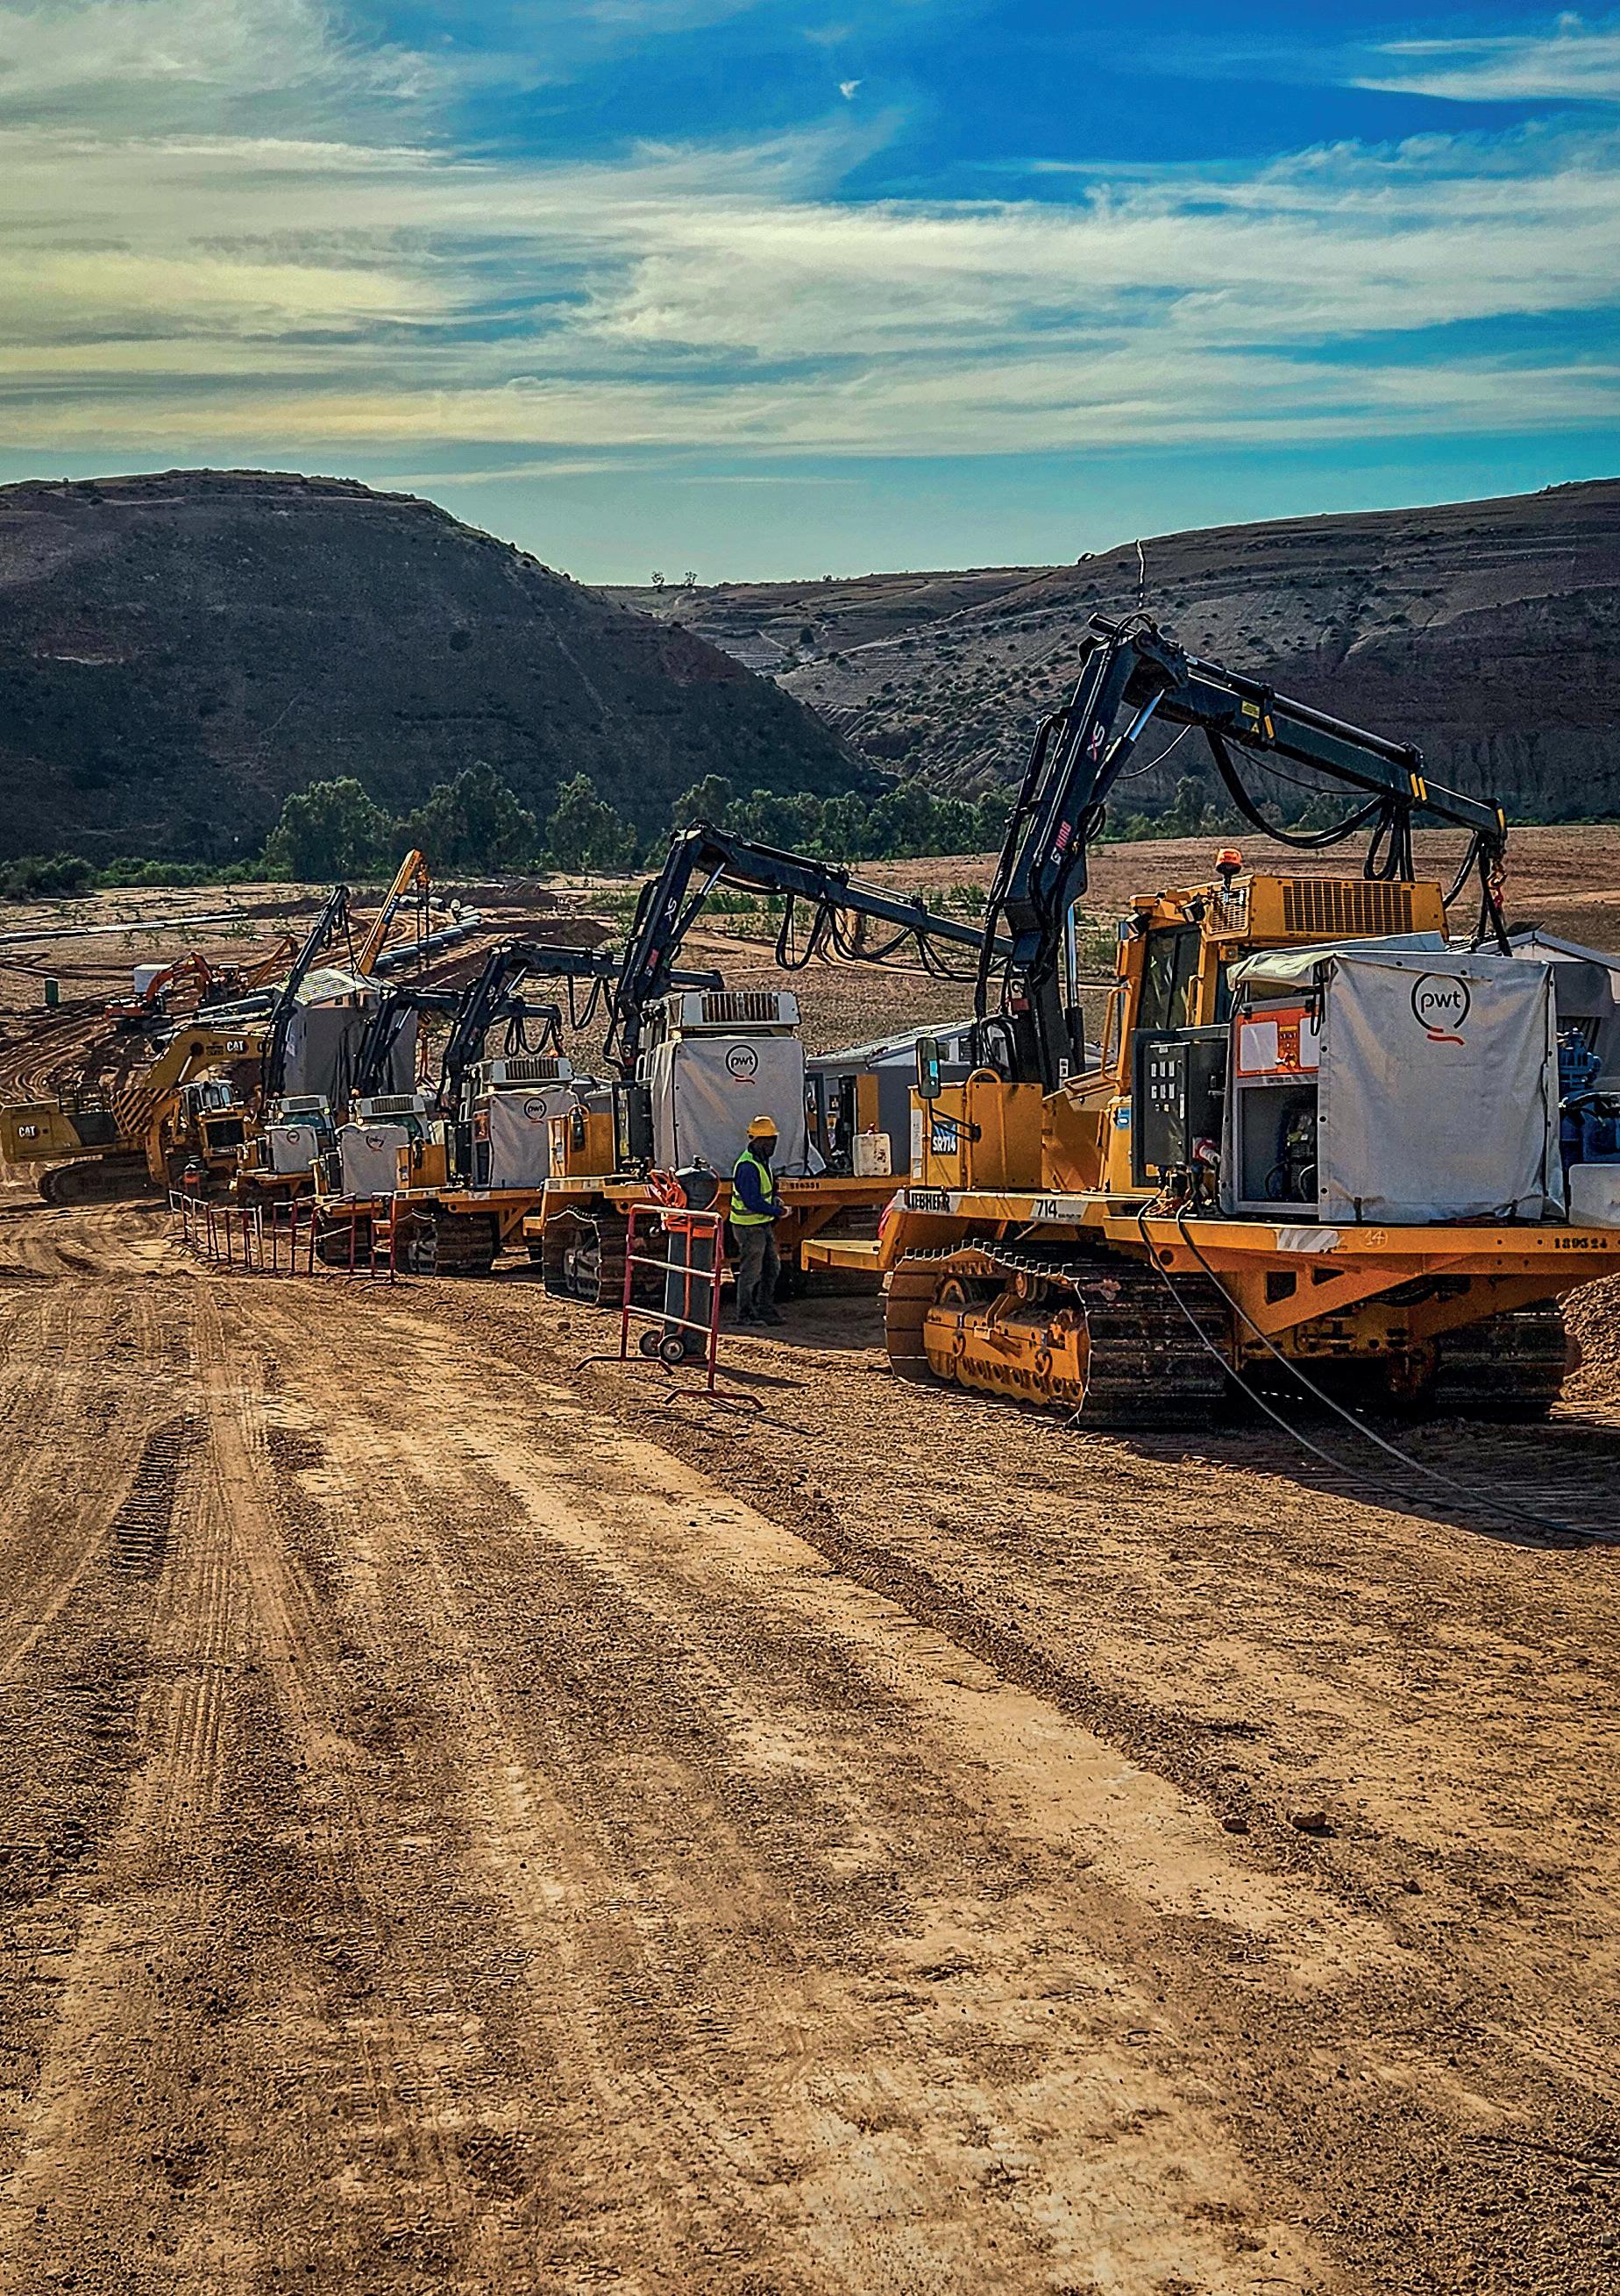
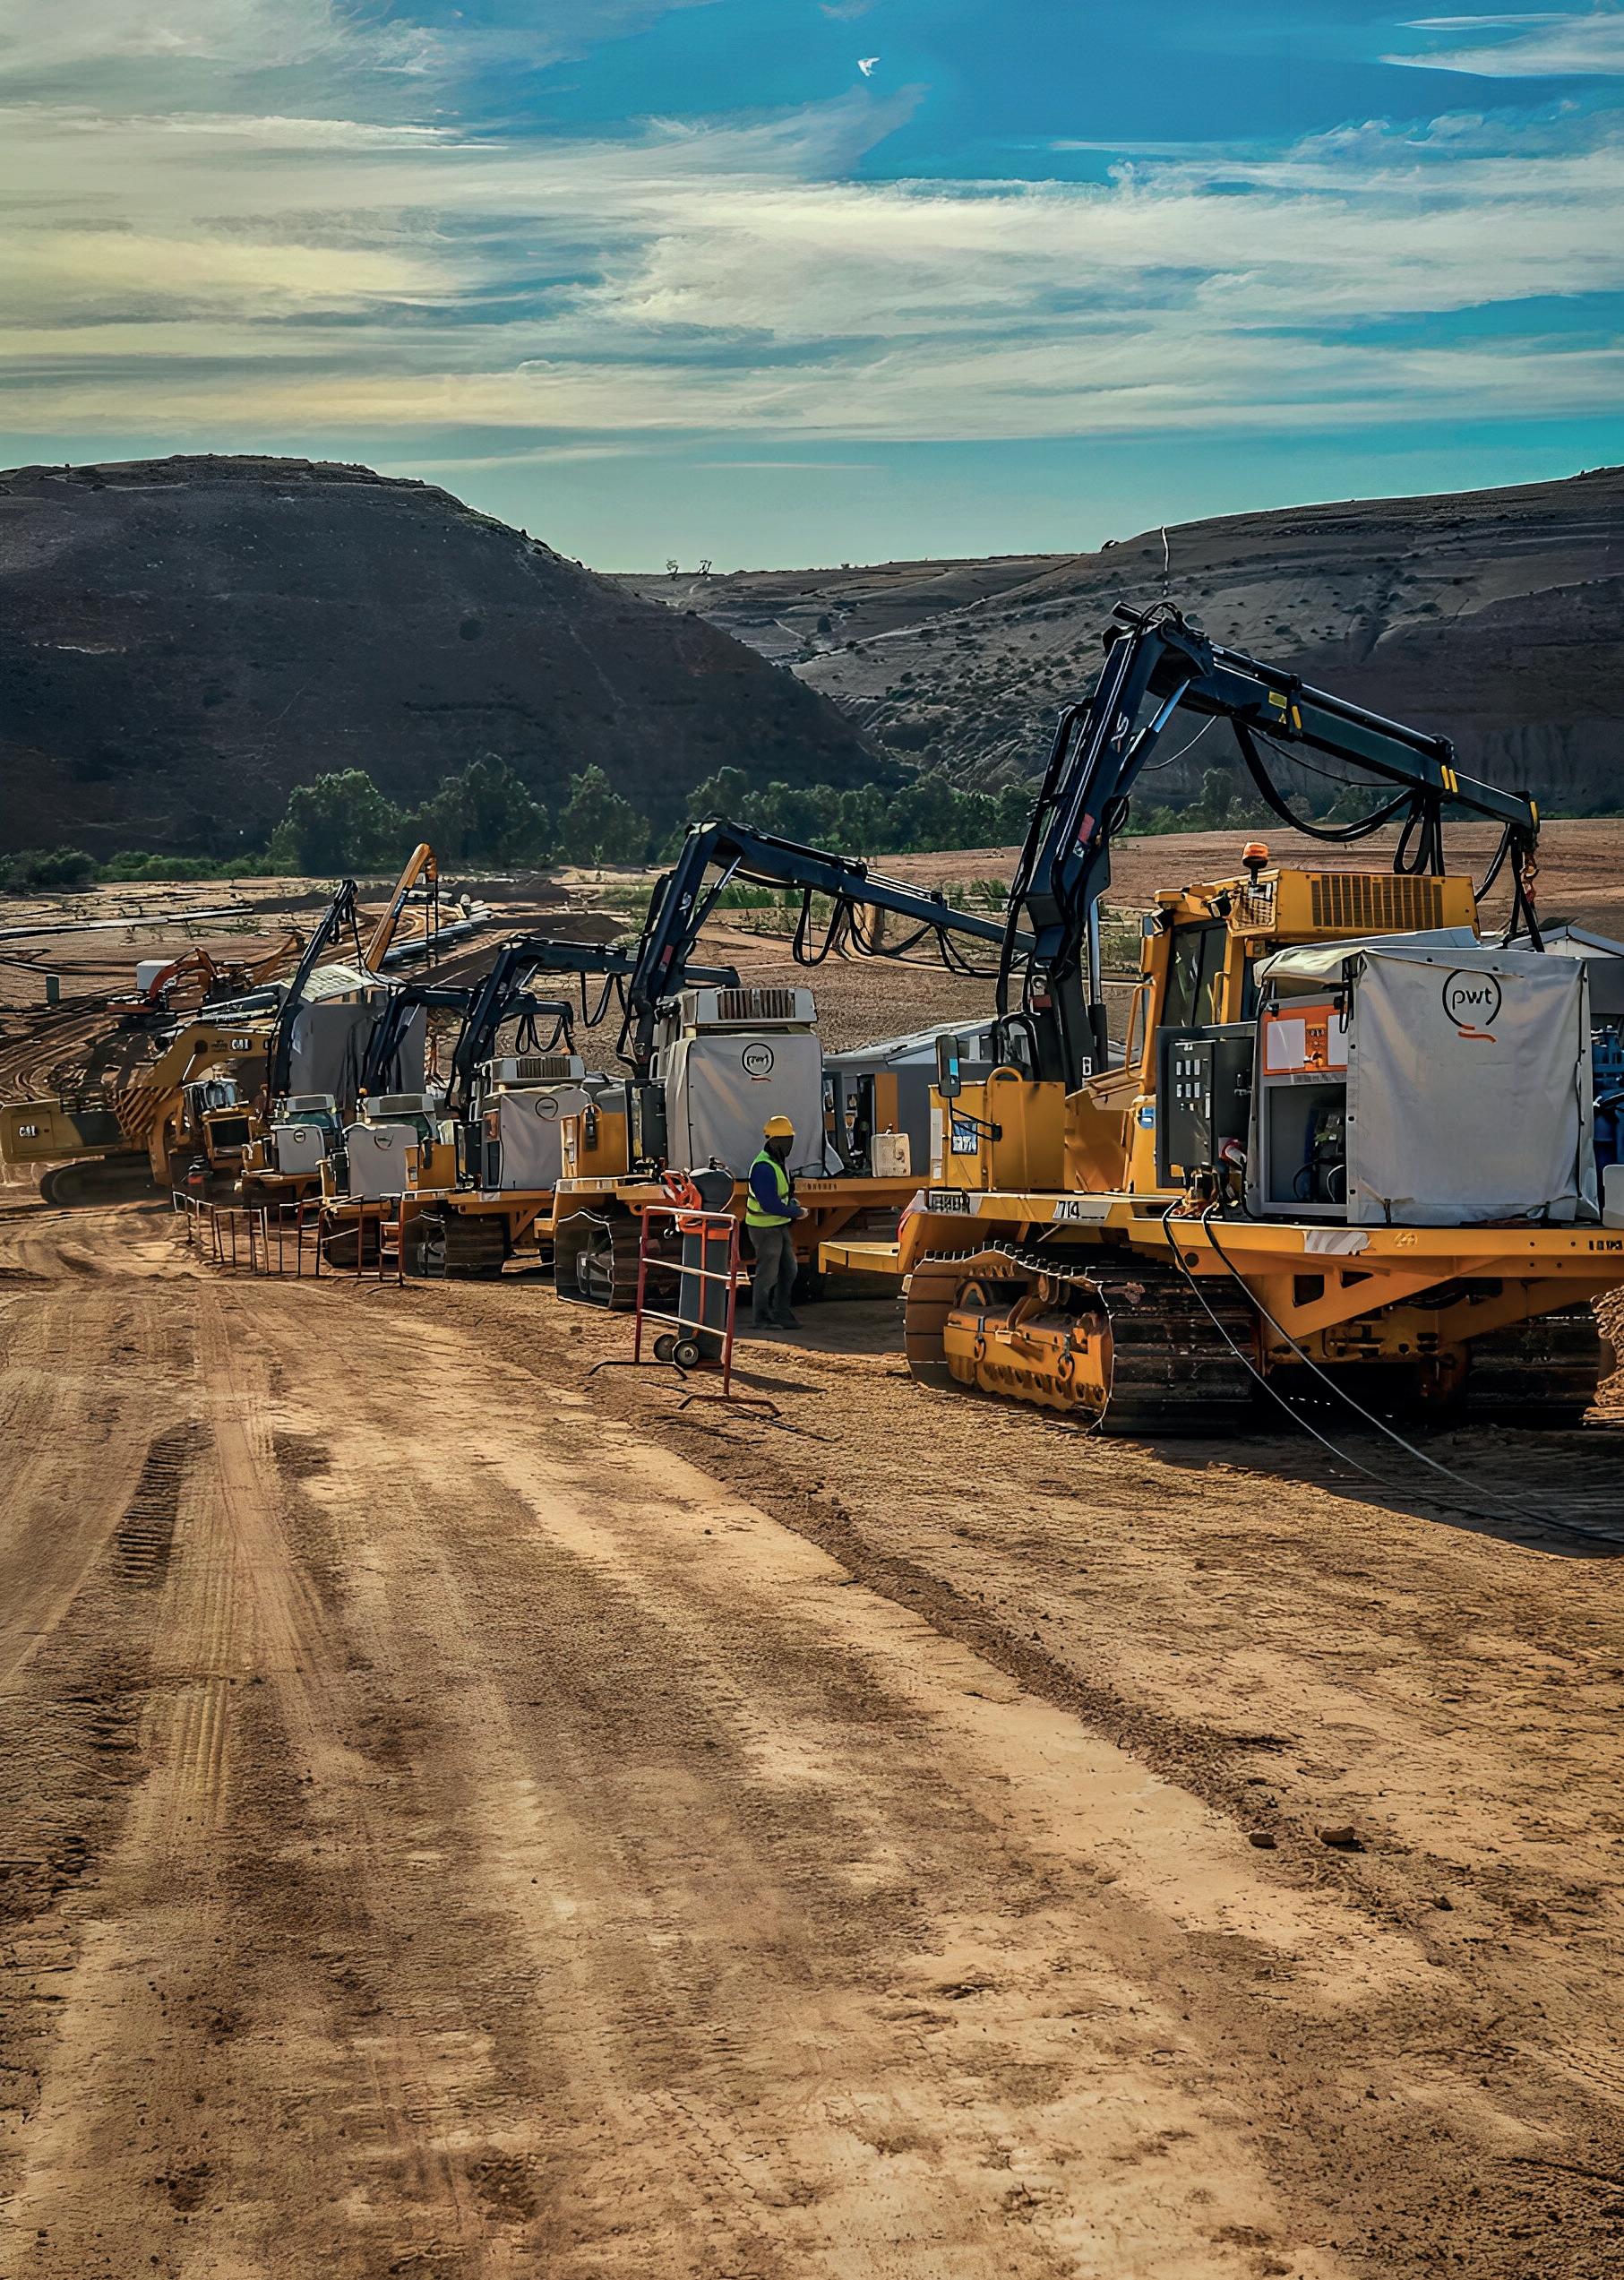
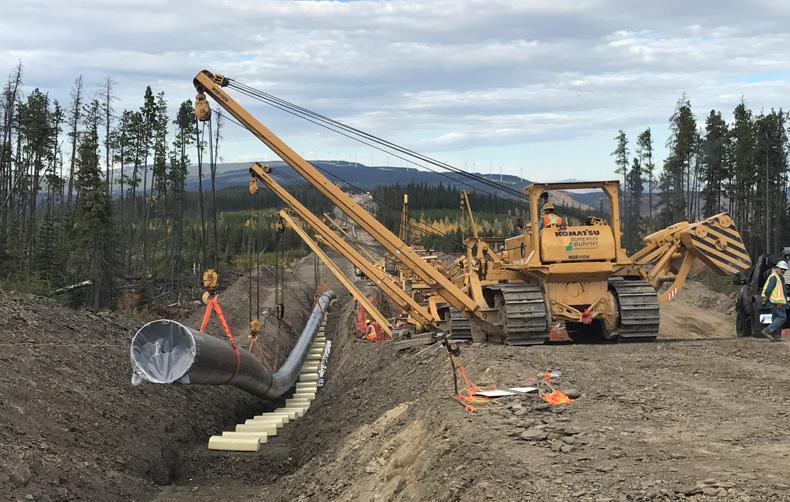
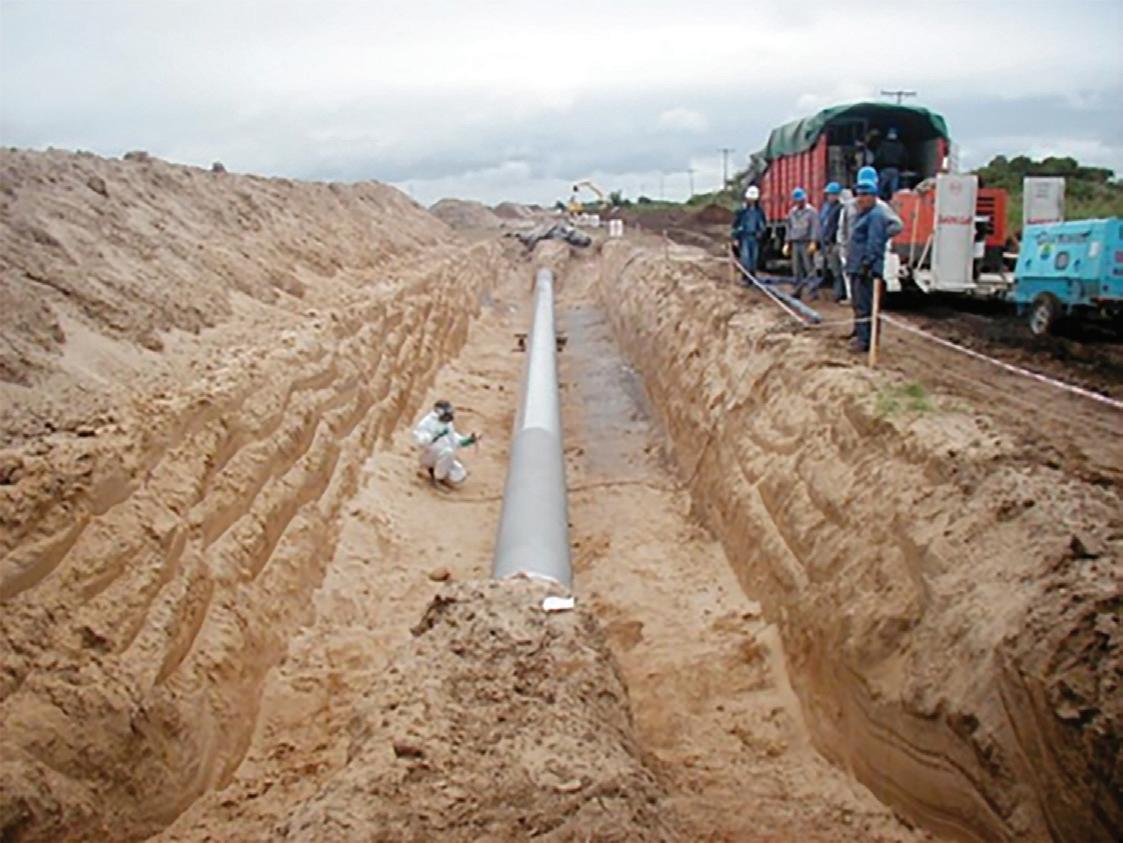
21. A challenging pullback operation
Giacomo Marinelli and Pier Maria Bruzzo, Bonatti, Italy.
SUBSEA PIPELINES
26. The future of subsea surveying unlocked Russell Small, Principal Surveyor, DeepOcean.

COATINGS AND CORROSION
31. Corrosion mapping in action
Angélique Raude, Evident.
INTEGRITY AND INSPECTION
37. The end of radiographic film for pipe inspection?
Norman Stapelberg, Silveray.
PIGGING TOOL PERFORMANCE
43. Debris or corrosion?
Johannes Keuter, 3P Services GmbH & Co. KG, Germany.
49. Managing metal loss
Seamus Jacobs, Dexon Technology, Thailand.
54. No need to chase the pigs
Jim Hunter, Technical Specialist, Pig Tracking, Xylem.
METERING AND MONITORING
58. Putting pressure on fugitive emissions
Mary Loftus, Senior Research and Development Engineer and Valve Doctor, IMI Critical Engineering.
SYSTEMS AND SOFTWARE
62. Reaching the apex with digitisation
Peter Wilson, Executive Industry Consultant, Hexagon Asset Lifecyle Intelligence.


MANAGING EDITOR
James Little james.little@palladianpublications.com
EDITORIAL ASSISTANT
Isabel Stagg isabel.stagg@palladianpublications.com
SALES DIRECTOR
Rod Hardy rod.hardy@palladianpublications.com
SALES MANAGER
Chris Lethbridge chris.lethbridge@palladianpublications.com
SALES EXECUTIVE
Daniel Farr
daniel.farr@palladianpublications.com
PRODUCTION DESIGNER
Kate Wilkerson kate.wilkerson@palladianpublications.com
EVENTS MANAGER
Louise Cameron louise.cameron@palladianpublications.com
DIGITAL EVENTS COORDINATOR
Merili Jurivete merili.jurivete@palladianpublications.com
DIGITAL CONTENT ASSISTANT
Kristian Ilasko kristian.ilasko@palladianpublications.com
DIGITAL ADMINISTRATOR
Nicole Harman-Smith nicole.harman-smith@palladianpublications.com
ADMINISTRATION MANAGER
Laura White laura.white@palladianpublications.com
Palladian Publications Ltd, 15 South Street, Farnham, Surrey, GU9 7QU, UK
Tel: +44 (0) 1252 718 999 Website: www.worldpipelines.com Email: enquiries@worldpipelines.com
Annual subscription £60 UK including postage/£75 overseas (postage airmail). Special two year discounted rate: £96 UK including postage/£120 overseas (postage airmail). Claims for non receipt of issues must be made within three months of publication of the issue or they will not be honoured without charge.
Applicable only to USA & Canada: World Pipelines (ISSN No: 1472-7390, USPS No: 020-988) is published monthly by Palladian Publications Ltd, GBR and distributed in the USA by Asendia USA, 701C Ashland Avenue, Folcroft, PA 19032. Periodicals postage paid at Philadelphia, PA & additional mailing offices. POSTMASTER: send address changes to World Pipelines, 701C Ashland Avenue, Folcroft, PA 19032

In this issue of World Pipelines, we publish articles on: the realities of hydrogen pipeline transport; advances in imaging to detect pipeline corrosion; the performance of inline inspection tools; AI and machine learning for subsea pipeline survey; and monitoring of fugitive emissions from pipelines. One common thread among the articles is that they all look towards a future where the energy transition materialises. Each new piece of technology, or modelling, works to support and sustain the pipeline industry as it evolves.
‘Evolves into what?’, I hear you ask. The energy transition as a phrase is generally taken to mean the elimination of fossil fuels. At this year’s ptc Conference in Berlin, keynote speaker Brigham McCown, from the Hudson Institute (USA), asked “Are we in the midst of an ‘energy transition’, an ‘energy expansion’, or both?” Delegates raised hands according to which term appealed to them, and most people thought that ‘both’ was probably fitting. I got the sense that the term ‘expansion’ felt more comfortable for many of the delegates, since it reflected a broadening of the energy sector to encompass new energy sources, rather than a linear trajectory in which oil and gas are completely replaced by renewable sources.
In research published by Rystad Energy in May, Claudio Galimberti, Global Market Analysis Director, reports: “As oil demand is likely to stay on an upward trajectory in the medium term, the probability of a fast transition away from oil decreases unless we witness breakthroughs in those low-carbon energy carriers that can technically and economically substitute oil. Our updated mid-term forecast should bring a dose of realism to the oil transition narrative, alongside a renewed sense of urgency to explore and invest even more – wherever it makes economic sense – in clean tech and renewables, to achieve those breakthroughs”. 1
The pace of the energy transition, or the energy expansion, is something that has to be judged and recalibrated all the time. We see the pipeline sector reaching to tackle the new challenges that will come with new types of transport such as CO 2 and hydrogen, but we also see it putting much effort into the sustained, safe operation of traditional oil and gas transport.
In what I consider to be a ‘must read’ article on the mining industry (a sector that we cover in our sister magazine Global Mining Review), Nick Bowlin ( The Drift magazine, July 2023), explains how the world’s governments are scrambling to secure mineral and metal supplies, for a future in which decarbonisation relies on EVs and renewable energies. 2
To quote the article: “As the economic historian Adam Tooze argued in March, [the] suggestion of a smooth shift from one mode to another fails to adequately capture the radical nature of the challenge ahead – the total transformation of global energy production required to address the climate crisis. Coal, gas, and oil still account for more than 60% of humanity’s total electricity generation. These need to be phased out immediately; extant and planned fossil fuel projects are almost certain to push the globe past two degrees Celsius of warming. And new energy sources will need to meet surging global electricity demand, which is expected to double, at minimum, in the coming decades. ‘The wholesale displacement of fossil fuels across global electricity generation, with overall capacity expanded to twice its current size, in the space of a single generation, will be a truly staggering undertaking,’ Tooze writes.” 2
I’ll take ‘expansion’ over ‘displacement’ to meet this lofty goal.
1. https://www.rystadenergy.com/news/stronger-for-longer-oil-demand-to-grow-in-the-mid-term-future 2. https://www.thedriftmag.com/a-good-prospect
SENIOR EDITOR Elizabeth Corner elizabeth.corner@palladianpublications.com
Founded in 1933, we cut our teeth in onshore and offshore pipeline construction. Now we are evolving our leading welding and coating solutions for today’s global energy and wider infrastructure sectors.
New GlobalData insight says gas pipelines will underpin global transmission projects growth by 2028. A total of 508 new-build trunk/transmission pipeline projects will start operations from 2024 to 2028. Of these, 368 represent gas pipeline projects, 67 constitute oil pipelines, 60 projects belong to product pipelines, and 13 account for NGL pipelines respectively.
According to the new report, Asia is set to dominate both in terms of pipeline project count and length, globally, by 2028.
Further details from the report include:
) Globally, 508 newbuild trunk/transmission pipeline projects are likely to commence operations during the 2024 - 2028 period.
) About 45% of the upcoming pipeline projects are in the construction stage with expected operational commencement by 2028.
) More than 90 000 km of pipeline length is presently under construction and is likely to become operational by 2028.
) Gas pipelines lead both in terms of project count and pipeline length globally by 2028, as countries continue to grapple with the dual challenges of energy security and environmental sustainability.
Canada’s
) Gas pipelines lead the region in terms of both project count and pipeline length, followed by product pipelines.
) Natural gas and product pipelines account for the bulk of the pipeline length additions in the region due to ever-growing demand from the industrial, domestic, and transportation sectors.
) Among countries, the US leads with the highest number of pipeline projects that are expected to start operations by 2028.
) Gas pipelines constitute the highest number of projects in the country, mainly to supply natural gas for liquefaction terminals.
) In terms of pipeline length, India leads with a proposed 29 800 km by 2028, with gas pipelines contributing the major chunk.
Further analysis on pipeline projects can be found in GlobalData’s new report, ‘New Build Trunk-Transmission Pipelines Projects by Development Stage, Regions, Countries, Project Type and Forecast to 2028’.
After 12 years and CAN$34 billion (US$25 billion), Canada’s Trans Mountain pipeline expansion project (TMX) began commercial operations on Wednesday 1 May, a major milestone expected to transform access to global markets for the country’s producers.
Pipeline constraints have forced Canadian oil producers to sell oil at a discount for many years, but TMX will nearly triple the flow of crude from landlocked Alberta to Canada’s Pacific coast to 890 000 bpd.
Trans Mountain said in a statement: “1 May 2024 signifies the commercial commencement date for the Expanded System. As of today, all deliveries for shippers will be subject to the Expanded System tariff and tolls, and tankers will be able to receive oil from Line 2 by mid-May.
“Line fill on the Expanded System continues, and is expected to be completed within the next few weeks. Both the
existing and expanded pipelines are now able to transport crude oil and Trans Mountain has the ability to load cargoes from all three berths. As of April 30, 2024, the expanded pipeline is 70% full by volume, and 69% complete by distance”.
“Trans Mountain has demonstrated that challenging, long linear infrastructure can be built in Canada,” said Dawn Farrell, President and CEO, Trans Mountain Corporation. “With our project management team and contractors, we were able to build 988 km of new pipeline, 193 km of reactivated pipeline, 12 new pump stations, 19 new storage tanks, and three new berths at Westridge Marine Terminal in Burnaby. We did this while adhering to the highest environmental, safety and social standards including respecting and working with local First Nations and Métis communities throughout the entire process.”
ONEOK, Inc. has announced that it has agreed to acquire a system of natural gas liquids (NGL) pipelines from Easton Energy, a Houston-based midstream company, for approximately US$280 million, subject to customary purchase price adjustments.
The transaction includes approximately 450 miles of NGL pipelines located in the strategic Gulf Coast market centres for NGLs, refined products and crude oil. These pipelines transport a wide range of liquids products through a portion of its capacity to existing customers.
ONEOK plans to connect the pipelines to ONEOK’s Mont Belvieu, Texas, NGL infrastructure and ONEOK’s Houston refined products and crude oil infrastructure, accelerating
commercial synergies.
“This strategic acquisition provides the quickest pipeline connectivity to and within the critical supply and demand centres for our NGLs, refined products and crude oil assets in the Gulf Coast,” said Pierce H. Norton II, ONEOK President and Chief Executive Officer. “We expect that this acquisition will accelerate the ability to capture commercial synergies related to our recent Magellan acquisition and future earnings growth.”
ONEOK expects to close the transaction mid-year 2024. Closing is subject to customary conditions including termination or expiration of the waiting periods under the Hart-Scott-Rodino Antitrust Improvements Act.
Sapura Energy secures US$1.8 billion contracts from Petrobras
11 - 13 June 2024
Global Energy Show 2024 Calgary, Canada
www.globalenergyshow.com
26 - 27 June 2024
Hydrogen Technology Conference & Expo 2024 Houston, USA www.hydrogen-expo.com
26 - 29 August 2024 ONS 2024
Stavanger, Norway www.ons.no
9 - 13 September 2024
IPLOCA convention
Sorrento, Italy
www.iploca.com/events/annual-convention
17 - 20 September 2024
Gastech 2024
Houston, USA
www.gastechevent.com
24 - 26 September 2024
International Pipeline Conference & Expo (IPE) 2024 Calgary, Canada
www.internationalpipelineexposition.com
23 - 24 October 2024
Hydrogen Technology Expo Europe 2024 Hamburg, Germany
www.hydrogen-worldexpo.com
23 - 24 October 2024
Subsea Pipeline Technology (SPT) 2024 London, UK
https://sptcongress.com
4 - 7 November 2024
ADIPEC 2024
Abu Dhabi, UAE
https://www.adipec.com/visit/registration
Sapura Energy has secured contracts valued at US$1.8 billion (9.13 billion reais) from Brazil’s state-owned company Petrobras for the provision of subsea services and six pipelaying support vessels (PLSVs), according to GlobalData.
The Malaysia-based offshore services company said that the contracts were obtained through its joint venture (JV) companies, owned by Seabras Sapura Holding and Seabras Sapura Participações, in collaboration with Paratus Energy Services.
The JVs, in which Sapura Offshore, a wholly owned subsidiary of Sapura Energy, holds a 50% equity interest, won the contracts as part of a competitive tender process.
The deal includes the full fleet of six
Kent secures FEED contract for INEOS Hejre Project
Kent, a global leader in engineering, has been awarded a key Front-End Engineering Design (FEED) contract for the INEOS Hejre project.
The Hejre project, an offshore High Pressure High Temperature (HPHT) development, is located in the Danish sector of the North Sea. It is planned as a tie-back to the South Arne field, utilising the existing Hejre jacket structure.
Kent’s responsibilities under this contract include the complete FEED design for the pipeline, tie-in spools, retrofit risers, and subsea power and fibre optics cable.
Usman Darr, Engineering and Consulting Managing Director for the UK at Kent, expressed his enthusiasm about the project, stating, “We are thrilled to continue our partnership with INEOS Energy Denmark on the Hejre project. Having successfully completed the pre-FEED for the full project scope, this new phase allows us to further demonstrate our robust FEED capabilities and deep understanding of the unique challenges in subsea and offshore engineering, particularly in the challenging conditions of the North Sea.”
Rasmus Enemark-Rasmussen, Project Manager at INEOS, added, “We are delighted to deepen our collaboration with Kent. Their performance in the Hejre pre-FEED phase, coupled with their pivotal role in vital energy transition projects like Greensand, underscores the strength and importance of our ongoing partnership.”
multi-purpose PLSVs, namely Sapura Diamante, Sapura Topázio, Sapura Esmeralda, Sapura Onix, Sapura Jade and Sapura Rubi.
Spanning a period of three years, the contracts have varying mobilisation dates for each vessel, involving the provision of subsea engineering, installation and other related services in Brazilian waters.
The scope of work encompasses operations for the installation of flexible pipes, electric-hydraulic umbilical and power cables, and tasks such as loading, laying and connecting spans at a maximum water depth of 3000 m.
The contracts follow Sapura Energy’s agreement with French oil and gas company TotalEnergies to sell its stake in gas producer SapuraOMV.
• DORIS, ROSEN and SPIECAPAG announce the Pipeline Transition Alliance
• CER orders TC Energy gas pipeline to further reduce pressure
• “Clear and present threat”: three years on from Colonial Pipeline attack
• ATCO Ltd to build 200 km Yellowhead gas pipeline
• Colombia Trasandino oil pipeline likely to stay offline through 2024
Follow us on LinkedIn to read more about the articles linkedin.com/showcase/worldpipelines


Gordon Cope, considers the rollout of the hydrogen economy and asks, what will it take to embed an entirely new source of energy throughout the global economy?
Nations around the world are jumping on the hydrogen bandwagon. From Asia to Europe, governments are opening the fiscal vaults to promote the adoption of this ubiquitous, low-carbon fuel. Already, however, the wheels on the bandwagon are starting to wobble, and for all the predictable reasons.
Why do it in the first place?
Low-carbon proponents have been advocating hydrogen fuels for several decades. The invisible, odorless gas can be produced using electricity from solar and wind farms to break down water into hydrogen and oxygen atoms using electrolysis. The energy-dense gas can be compressed and loaded into special tanks and then burned directly in an internal combustion engine or converted into electricity through the use of a fuel cell. The only emission after combustion is water.
The fuel got a big boost in popularity with the advent of the Ukraine war, which saw Russia use its deliveries of natural gas to Europe as an economic weapon. Energy security quickly became the trump card; hydrogen can be made virtually anywhere, eliminating vulnerability to hostile suppliers.
Production of low-carbon hydrogen falls into two categories: blue hydrogen, where carbon produced during the traditional Haber-Bosch method is captured and sequestered; and green hydrogen, where wind and solar farms produce electricity which is then used to separate hydrogen from oxygen in water molecules through electrolysis.
The EU has gone into overdrive in its desire to achieve a hydrogen economy. Over €13 billion has been earmarked for improving hydrogen technology, production and demand. While onshore sites for wind power in northern Europe are few and far between, offshore sites are abundant. DNV, a consultancy, estimated that a ‘North Sea hydrogen backbone’ consisting of 4200 km of pipelines could be built using existing technology at a cost of between US$15.9 - 23.3 billion. Offshore wind farms could generate an estimated 300 terawatt hours (TWh) of power, enough to create up to 15% of the estimated hydrogen consumption in 2050.
In March 2023, the Dutch government officially designated a site for the world’s largest offshore hydrogen production project: the Ten noorden van de Waddeneilanden (the North of the Wadden Islands). The site, which has the potential for 700 MW of generation, will be connected to Gasunie’s 1200 km hydrogen pipeline network. In late 2023, Gasunie began construction of the first, 30 km stretch to industrial facilities in the port of Rotterdam; plans are being explored that would see the network extend to other hubs, and eventually into Germany and Belgium. Onshore, Germany has been aggressively pursuing a nationwide grid to deliver hydrogen to regional industrial centres. In April 2024, the federal government laid out a financing mechanism to ensure the country’s hydrogen network would be ramped up by 2037. The core network has been estimated to cost US$21.6 billion and extend for 9700 km, and would to be built by private investors, and financed by user fees.
China is the world’s largest producer of hydrogen, with approximately 33 million tpy made from coal and natural gas. There are also several hundred kilometres of existing dedicated pipelines that primarily supply refineries and petrochemical plants.
In 2022, China’s government announced a multi-decade national plan to develop a hydrogen energy sector. The plan, which runs to 2035, seeks to coordinate a complete hydrogen value chain to support a green energy transition, including regulatory framework, production, distribution, fuel cells and vehicles; an initial goal of 100 000 tpy has been set for 2025. Sinopec subsequently announced several green hydrogen projects around the country. In August 2023, it completed construction on the Kuqa facility in Xinjiang province. The plant, which produces 20 000 tpy of green hydrogen from solar farms, is connected to refineries and refueling stations by a 28 000 m3/hr pipeline network.
Japan announced plans in April 2023 to boost hydrogen supplies from 4 million tpy to 12 million tpy by 2040, and up to 20 million tpy by 2050. The plan will involve spending US$113 billion of private and public money over the next 15 years. In February 2024, refiner Idemitsu Kosan announced it would build a 10 000 tpy green hydrogen plant in partnership with Hokuden, a utility located on Japan’s northernmost island of Hokkaido. The island is renowned for some of the highest offshore wind capacity in the world; the plant will be built in the port of Tomakomai and connected to the refinery via pipeline. The JV expects first hydrogen by 2030.
North America is blessed with a secure supply of natural gas, so the geopolitical risk factor is not as severe. Both Ottawa and Washington have imposed net-zero goals by 2050 on wide swathes of their economies, however, and have followed up with multi-billion-dollar subsidies, such as the US Inflation Reduction Act, to get the job done.
A commercial hydrogen infrastructure already exists in the US Gulf Coast (USGC). Over 1600 miles of dedicated pipelines move several million tpy of hydrogen from its sources of manufacture to consumers, primarily refineries and petrochemical plants. The multi-billion dollar system grew organically over the span of nearly a century to meet long-term supply contracts.
In order to convert to low-carbon, hydrogen manufacturers need to either build solar/wind farms and electrolysis plants, or carbon capture and sequestration (CCS) systems. Air Liquide, which specialises in producing industrial gases, makes over 400 million ft3/d of hydrogen at several plants in the USGC and operates over 500 km of the USGC hydrogen pipeline network. The company recently received a grant from the DOE to study the viability of retrofitting carbon-capture to its steam methane reformer in its La Porte plant near Houston, Texas. Air Liquide already uses a proprietary carbon-capture system in France, which allows it to capture up to 95% of produced CO2
Air Products is building a revolutionary hydrogen energy complex in the Fort Saskatchewan industrial region near Edmonton, Alberta. The CAN$1.6 billion facility will create 2200 tpy of blue hydrogen using auto-thermal reforming (ATR), which enables the company to capture 95% of CO2 emissions for sequestration. The power plant is also fueled by hydrogen, avoiding indirect emissions from the grid. The facility will use a 55 km pipeline to deliver blue hydrogen to Shell’s diesel refinery, as well as to third parties and commercial fuel stations.
In October 2023, the US Department of Energy (DOE) awarded California up to US$1.2 billion for a regional clean hydrogen hub. As part of the initiative to promote the hub, Southern California Gas (SoCalGas) is developing Angeles Link, a dedicated, green hydrogen pipeline system that could deliver enough hydrogen to displace the equivalent of 3 million gal./d of diesel fuel. The pipeline would likely originate in the wind and solar-rich desert east of Los Angeles and terminate within the Los Angeles basin near current utility plants or the port of Los Angeles.
To embed an entirely new source of energy throughout the world economy is a staggering undertaking, one that has three main implementation facets; production, consumption and midstream transportation between the two. Each has the same immense challenge, what comes first, the chicken or the egg?
According to Bloomberg, a consultancy, plans for producing clean hydrogen capacity are approaching 50 million tpy, but only about 1 million tpy is so far covered by binding off-take contracts.1 Of these, most is for traditional hydrogen users, including OCI, which will use low-carbon hydrogen to make chemicals and fertilizers, or Shell, which will purchase its own production for use in refineries.


Many more projects have memorandums of understanding (MoUs), but banks are reluctant to lend unless projects can demonstrate guaranteed cash flow, so until good intentions are converted into binding long-term contracts, this financing bottleneck will hamper the construction of production facilities. Analysts also note that major production projects are relying on hydrogen tax credits of up to US$3/kg, but overseers of the US Inflation Reduction Act and the European Hydrogen Bank have been slow to release funds.
Financial wrangling is already having a negative effect. France-based Engie is slow-walking its plans to build 4 GW of green hydrogen, pushing back its 2030 target to 2035. The announcement was made in February, 2024, but signs had already emerged that major projects were being reconsidered. In late 2023, Engie and partners scrapped the Power 2 Methanol project in Belgium. Initially destined to begin producing 8000 tpy of green methanol in the port of Antwerp, it was cancelled due to the fact that no off-takers would commit to long-term contracts at the high prices.
Shell and utility partners have shelved plans to build Project Cavendish, a 700 MW blue hydrogen project in the Isle of Grain in the Thames Estuary. The isle is the site of several power plants and an LNG regasification plant. The plan called for LNG to be converted into hydrogen and the offset CO2 captured and sequestered in Scotland. The blue hydrogen would then be mixed with natural gas and delivered in the London area for home heating. But the consortium became concerned about costs and unproven technologies combined with uncertainty regarding the UK government’s subsidies for mixing hydrogen in home distribution networks. The latter, especially in the face of massive public opposition, eventually derailed the project.
The MidCat pipeline, a 227 km line transgressing the Pyrenees between Spain and France, was conceived over 20 years ago as a way to move Spanish LNG imports to the rest of Europe. In 2019, however, a French independent report concluded that the project would be unprofitable and environmentally harmful. After the start of the Ukraine war, however, France, Spain, Germany and Portugal announced a new project, dubbed BarMar, which would follow an underwater route between Barcelona and Marseille. The line would be developed so that, by 2030, it would be able to move up to 2 million tpy of green hydrogen. Since then, no budget, ROW or customers have been identified. Current production commitments on the Iberian Peninsula are in the order of 50 000 tpy, well shy of economies of scale needed to make the project viable.
A proposed 400 MW green hydrogen project that sought to ship liquid hydrogen from the Portuguese port of Siam to Rotterdam in the Netherlands has been shelved. H2Sines.Rdam, being developed by a consortium of Engie, Shell, Vopak and shipper Anthony Veder, was originally planned to be in operation by 2028, but Shell and other partners found it to be economically unviable. One of the major stumbling blocks was the lack of ships capable of carrying liquid hydrogen at -253˚C, with only one ship with a capacity of 100 t currently under sail; converting the hydrogen to green ammonia would have been a far more viable alternative.
Demand is also in flux. Traditional Haber-Bosch processes produce the stuff for around US$1/kg; green hydrogen is more
than five times as expensive. While breakthroughs in catalysts and such are bound to reduce the price, most advances in technology are unhelpfully slated for the next decade. While much has been made of multi-billions in subsidies to produce green hydrogen, relatively little funding has emerged to incentivise users to buy the expensive stuff. In addition, industrial users are faced with massive bills to convert boilers and production facilities to the gas.
As for transportation, pipeline companies face significant challenges. In addition to weighing out ultimate capacities, midstream firms have to consider their return on investment to shareholders versus their ESG commitments to net-zero targets. When Germany announced financing for the hydrogen network, it included a government guarantee of 6.7% return on equity, as well as a special amortisation vehicle to extend capital expenditure paybacks out to 2055.
Many of the various forecasts for the roll-out of major plants, pipelines and consumption networks are based upon best-case scenarios in which environmental evaluations, public consultations and regulatory licensing all get the green-light. One merely has to recall the Trans Mountain Expansion (TMX) saga to see the pitfalls; the plan to expand an existing export crude pipeline running from Edmonton to tidewater in British Columbia by 680 000 bpd was expected to cost CAN$5.4 billion and take five years to build. In the end, it took over a decade to complete due to First Nation and environmental resistance (as well as COVID, torrential flooding and other factors); the price tag ballooned to over CAN$30 billion.
A final caveat: investors in the production of green hydrogen face the very real prospect of having their assets stranded by white, or natural hydrogen. Scientists know that the gas forms spontaneously during the breakdown of certain igneous minerals; wherever ancient bedrock meets water, hydrogen forms. Most leaks harmlessly into the atmosphere over time, but billions of tonnes accumulate in economic reserves beneath the surface. Already, geologists have discovered 77 million t trapped in the Alsace region of France; all it would take is a conventional drill rig to unlock and produce it at low prices similar to natural gas. Scientists at the USGS speculate that there could be up to 5 trillion t of natural hydrogen underground around the world. Even at 500 million tpy, a figure that would encompass all industrial, commercial and transportation use, the deposits would last for hundreds of years.
The rollout of the hydrogen economy will likely be conducted in fits and starts as governments cajole the energy, transportation, industrial and utility sectors to build electrolysis plants, establish bespoke ROWs, and convert plants and electricity generators into hydrogen-friendly mode. Some jurisdictions, such as the EU, will achieve better results because security trumps cost. Others, faced with the prospects of multi-billion-dollar white elephants, could find their hydrogen schemes curtailed by an unwilling electorate. Regardless, pipeline companies will play an integral part in those projects that succeed, facing significant risks as well as substantial rewards.
References
1. https://about.bnef.com/blog/hydrogen-offtake-is-tiny-but-growing/


Combining industry-leading abrasion resistance with unmatched flexibility, our range of epoxy solutions are built tough, easy to apply and designed to last. Whether its HDD or field joint coatings, we’ve got the solution.
Garry Hanmer, Senior Simulation Consultant, Atmos International, UK, evaluates how to accurately model pure hydrogen pipelines, using a case study to demonstrate the model tuning process and the selection of appropriate equations of state.
The need for a shift in energy generation, transportation and usage to fulfil climate change objectives is acknowledged worldwide, with parties at COP28 agreeing to accelerate decarbonisation efforts. 1 While several competing technologies are vying for a role in this energy transformation, this article concentrates on the potential of hydrogen. Hydrogen provides an opportunity to leverage the existing extensive infrastructure of the fossil fuel industry and hydrogen blends, but there are risks involved.
High pressure steel transmission pipelines face a significant threat from hydrogen embrittlement, which can lead to cracking, blistering and weakness. This occurs when
hydrogen infiltrates the pipeline material, causing corrosion of the steel pipe, valves, and fittings.
Using a case study that examines the implementation of a real-time system for simulating hydrogen pipelines, this article will evaluate the precision of various equations of state by utilising an operational pure hydrogen pipeline.
Transporting hydrogen in large commercial quantities is challenging due to its unique properties. The smaller size of the hydrogen molecules compared to natural gas allows it to diffuse with the pipeline material, leading to hydrogen embrittlement and the deterioration of the steel pipes.
Hydrogen also has a lower energy density than natural gas, requiring larger diameter pipelines to transport
the same amount of energy. This makes long-distance transportation more expensive and less efficient.
While repurposing natural gas pipelines for hydrogen transportation can be beneficial it does require an analysis of operating procedures. Pipeline simulation can assist by modelling the changes in pipeline capacity with the change in fluid.
Hydrogen embrittlement is a process that occurs when hydrogen atoms are absorbed into a metal, causing it to become brittle and susceptible to cracking and fracture. This occurs when hydrogen atoms diffuse into the metal lattice, causing lattice distortion and weakening the metal’s ability to withstand stress.

Hydrogen embrittlement can occur in a variety of ways, but in the pipeline industry it’s commonly associated with when metals are exposed to hydrogen gas or other hydrogen-containing compounds, such as water vapour or hydrogen sulfide.
Preventing hydrogen embrittlement requires a combination of measures, including proper material selection, design and maintenance. In many cases, it’s essential to use materials that are resistant to hydrogen embrittlement, such as high-strength alloys, that have been specifically designed to resist hydrogen embrittlement.
Ensuring the safety of the public in industries such as hydrogen energy, chemical and oil refineries requires careful consideration of hydrogen embrittlement. The selection of a suitable pipeline material is critical in reducing the risk of this phenomenon. An alternative approach to reducing the risk of hydrogen embrittlement is the reduction of the concentration of hydrogen. This can be achieved by blending hydrogen with compounds such as natural gas to dilute the concentration.
The following case study demonstrates how an accurate hydrogen model can be achieved by the model tuning process and the selection of appropriate equations of state so that it can provide a more accurate prediction of the pipeline areas subject to hydrogen embrittlement.
Spanning 160 km from west to east, this pipeline has a mainline section divided into two branches with the southernmost branch splitting into two parallel pipes.
To achieve the required accuracy and reliability of the online model, it is essential to tune the configuration parameters to match actual operational data from the physical pipeline. Operational data was collected for a 27 day
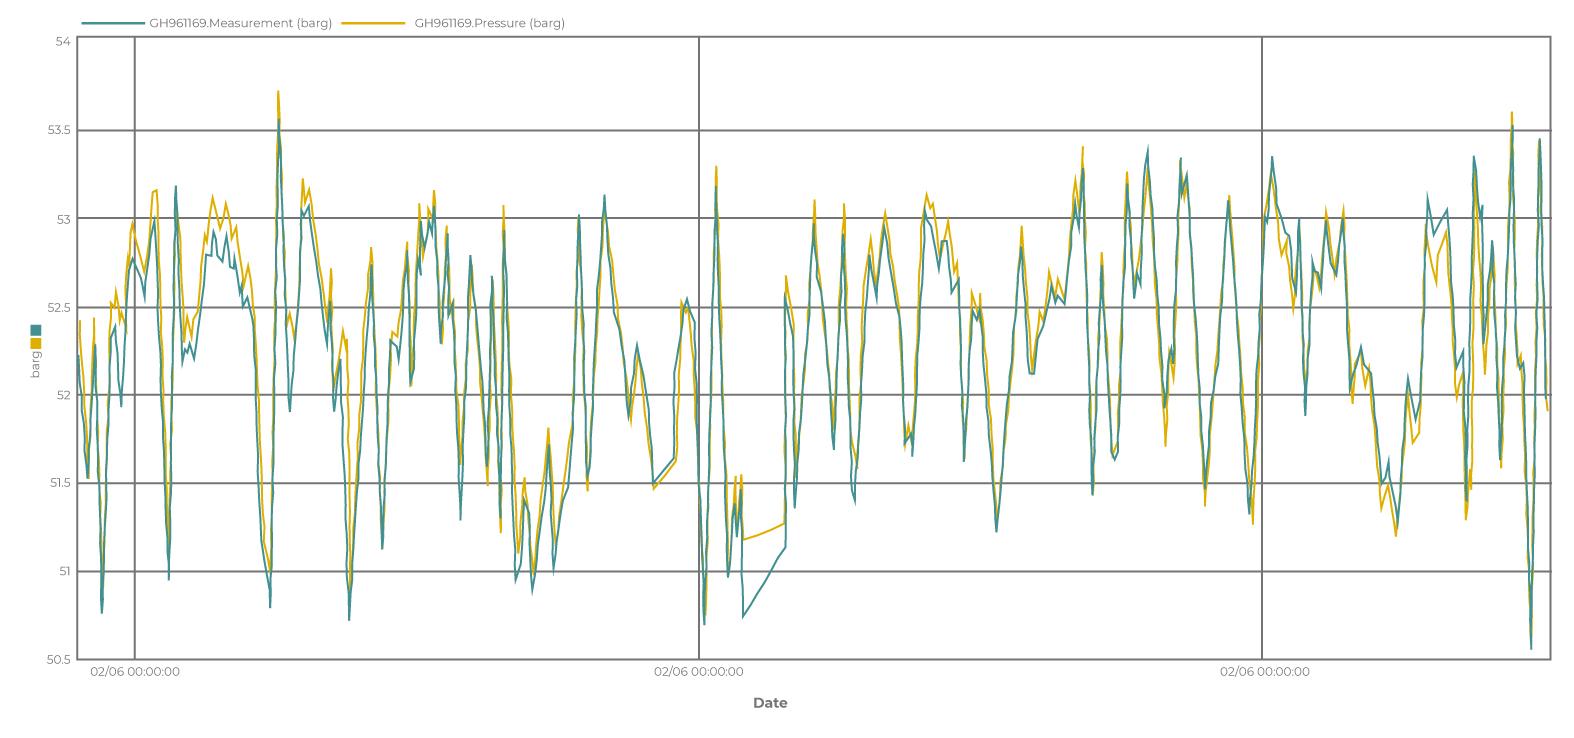
Figure 1. Differences between calculated and measured pressure over 27 days. Figure 2. Measured pressure (in green) versus calculated pressure (in yellow) over 27 days.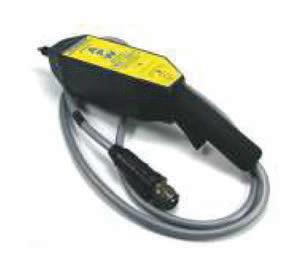

period and a shorter dataset was extracted for seasonal comparison purposes. By minimising deviations between the model’s calculated values and the physical pipeline’s data, the model can be tuned.
The aim of the tuning exercise is to ensure the network line pack, pressure, flow and temperature calculations are accurate. To achieve this, the pipeline roughness property is adjusted for tuning the network line pack and the heat transfer property is tuned for the temperature profile. By adjusting these two properties, an accurate pipeline pressure drop for a specific flowrate can be achieved.
A controlled reference case is selected from the datasets for tuning the pipeline roughness and heat transfer properties. This reference case involves analysing stable periods where the flowrates are at or near the pipeline’s capacity flowrates. It is then imported into an offline simulation for tuning purposes.
The tuning of the network line pack and pipeline temperature profile directly affect each other so an iterative
approach is necessary for tuning these properties. By tuning these properties, an alignment can be achieved between the physical pipeline and the simulated pipeline for network line pack and flow, pressure and temperature.
The process for tuning of the temperature profile should follow the tuning of the pipeline capacity, forming the following steps: 2
1. Offline roughness tuning to the controlled reference case.
2. Online analysis of the temperature metre deviations between measurement and calculated values.
3. Offline heat transfer tuning. a. Tune the soil conductivity of buried and partly buried sections to achieve an accurate temperature profile.
4. Offline roughness tuning re-adjust (point 1).
5. Deploy tuned configuration online.
6. Online analysis of the temperature metre deviations (point 2).
a. Repeat the above steps until the target discrepancy in the temperature profile is achieved.
After the initial tuning is completed, a second sample period is used to validate the tuning. The simulation is run against the entire sample period to confirm the accuracy of the model. The differences between the calculated and measured pressure over the 27 day sample period can be observed (Figure 1).
Figure 1 illustrates the difference between all the calculated and measured pressure from the network and a high level of consistency with an error of less than 0.2 bar throughout the sample period, equivalent to over 99.7% accuracy.
Looking closer at the accuracy of the modelled pressures, we can examine the measured and calculated values of a particular pressure metre. Figure 2 displays the measured pressure (in green) and calculated pressure (in yellow) for the 27 day sample period, demonstrating the automatic tuning of the online model.
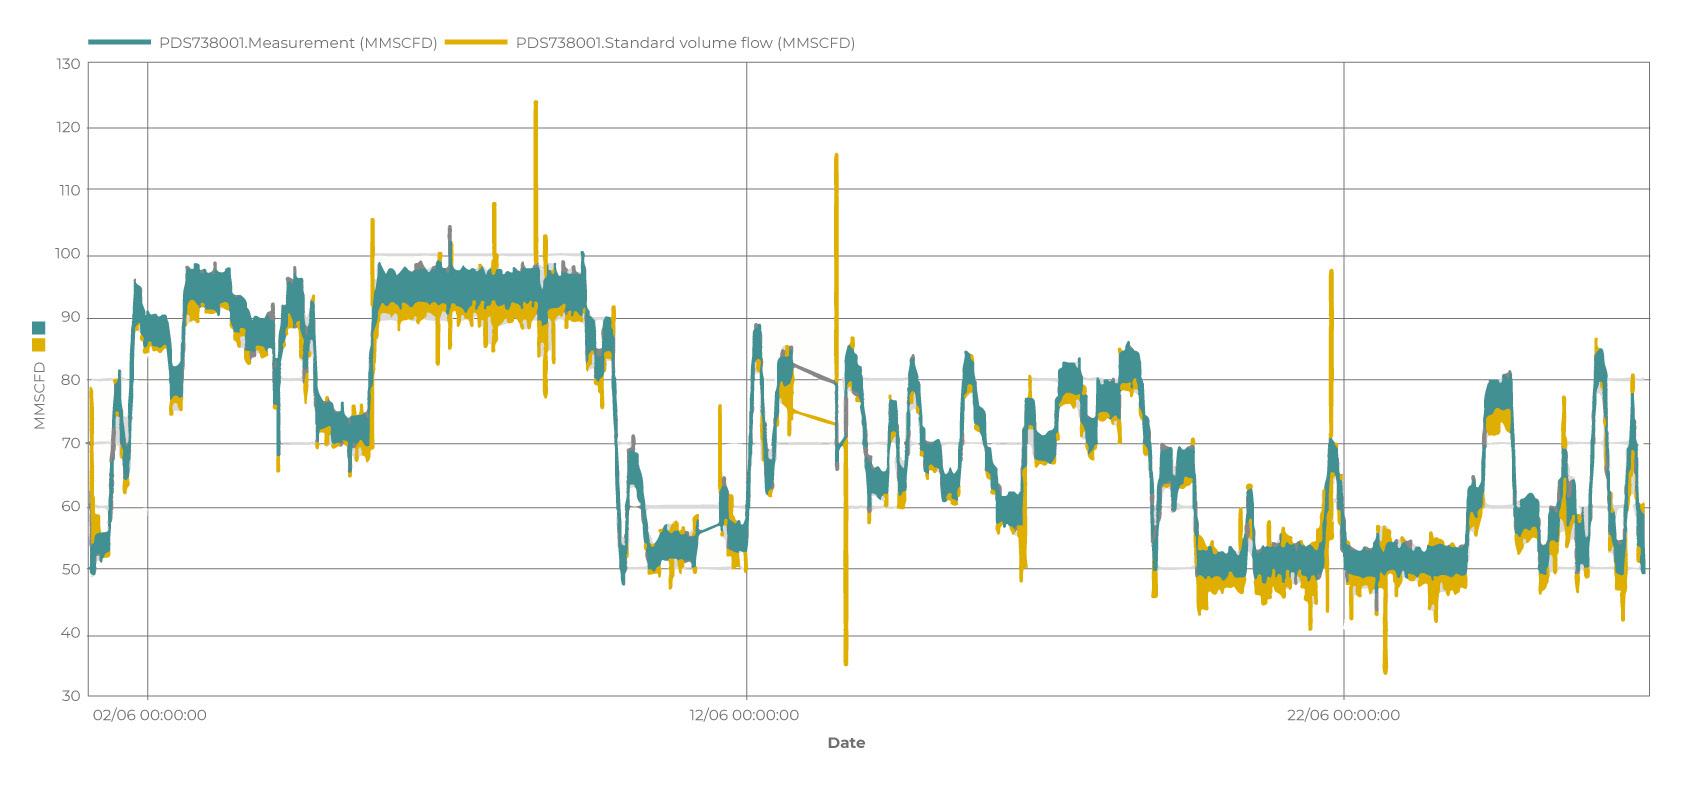
The precision of the calculated flows can also be evaluated by examining the measured and calculated values of one of the pipeline flowmeters. Figure 3 illustrates the
Figure 4. EOS comparisons for pure hydrogen.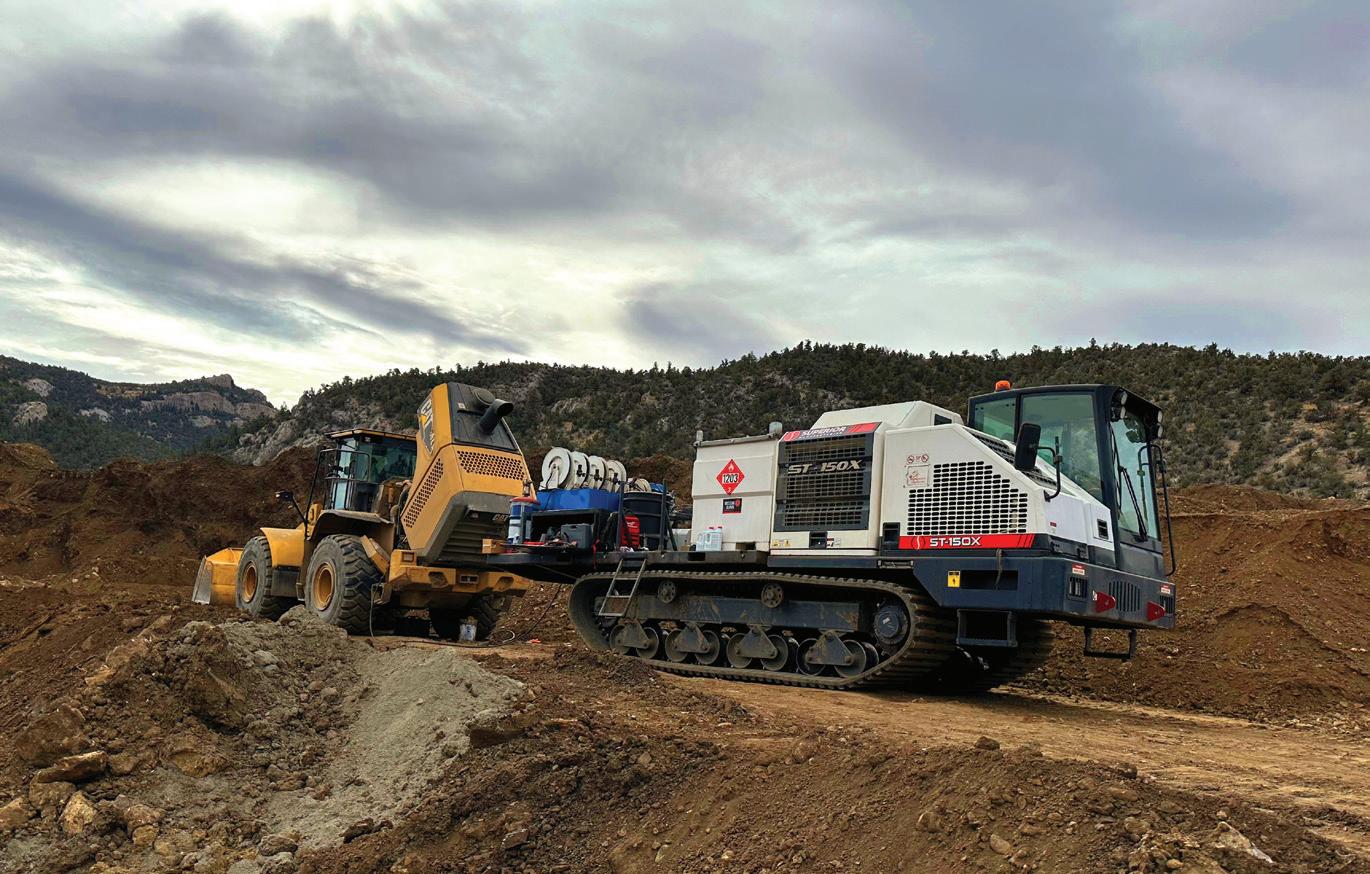
measured flow (in green) and calculated flow (in yellow) during the 27 day sampling period.
The most appropriate equation of state for modelling pure hydrogen
A suitable equation of state (EOS) for the modelling of pure hydrogen is required to be applicable for compositional fluids and to be accurate for the operational range of pressures and temperatures observed within the extracted data. While there are other considerations for the choice of equation (ie. performance and accuracy) these would be evaluated as part of the analysis.
The below equations of state were chosen for this case study.
The GERG EOS is a cubic equation that relies on the composition of gas mixtures and a thermodynamic model to describe their properties. It’s based on the principle of corresponding states, which suggests that gases with similar reduced properties exhibit similar thermodynamic properties. This equation is particularly useful for modelling natural gas mixtures but can also be used for hydrogen blends.
Numerous validations have confirmed GERG’s ability to accurately predict the thermodynamic properties of natural gas mixtures. When applied to hydrogen blends, this equation can forecast properties like density, viscosity, and compressibility factor. However, it assumes that the gases in the mixture do not interact, which may result in inaccuracies in the predicted thermodynamic properties.
AGA8 is a cubic EOS that uses composition-based methodology to determine the thermodynamic characteristics of natural gas and gas blends. This equation of state has undergone extensive verification and is grounded in empirical data. AGA8 is based on a broad set of experimental data on natural gas and gas blends, which is frequently updated to ensure that it remains precise and relevant. However, AGA8 assumes ideal gas behaviour, which may not be valid for hydrogen blends under certain circumstances. At high pressures and low temperatures, hydrogen’s behaviour can diverge from ideal gas behaviour, resulting in inaccuracies in simulation outcomes.
Peng Robinson is a thermodynamic model that utilises a composition-based cubic EOS to calculate fluid properties. It follows the theory of corresponding states, which asserts that fluids at the same reduced temperature and pressure display similar characteristics. This equation is commonly used in the oil and gas industry to simulate the behaviour of natural gas and hydrogen blends. The Peng Robinson EOS has been extensively tested and validated across a broad spectrum of fluids and is simpler than other equations of state while still being capable of modelling mixtures with intricate compositions.
A limitation of using Peng Robinson to simulate hydrogen blends is its failure to account for any chemical reactions that might occur in the blend. Such reactions, such as the interaction between hydrogen and other gases in the blend, can alter the properties of the mixture.
Benedict Webb Rubin Starling (BWRS)
BWRS employs a non-cubic composition-based approach to relate a fluid’s pressure, temperature, and volume to its molecular properties, using a thermodynamic model. While typically used for modelling hydrocarbon mixtures such as natural gas, it is also applicable to hydrogen blends. This equation is rooted in statistical mechanics.
BWRS can predict the thermodynamic properties of hydrogen blends and provides an accurate understanding of the behaviour of the fluid as it moves through the pipeline, as well as for designing pipeline systems that can handle different concentrations of hydrogen.
Equations of state in the context of a real pure hydrogen pipeline
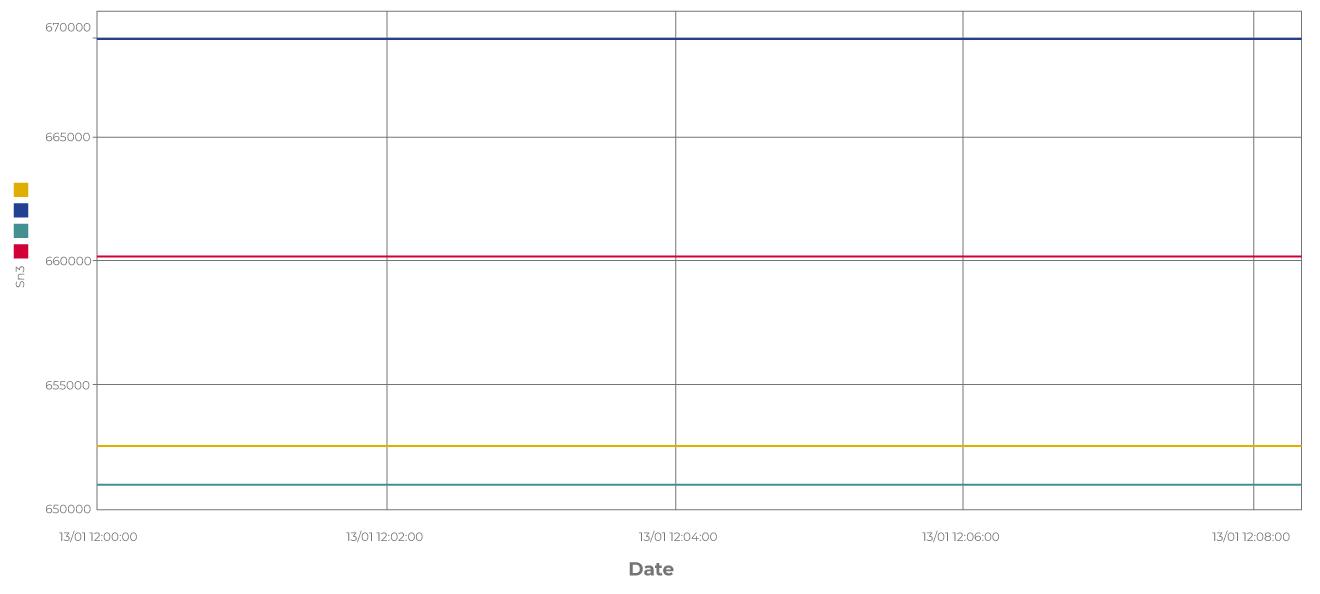
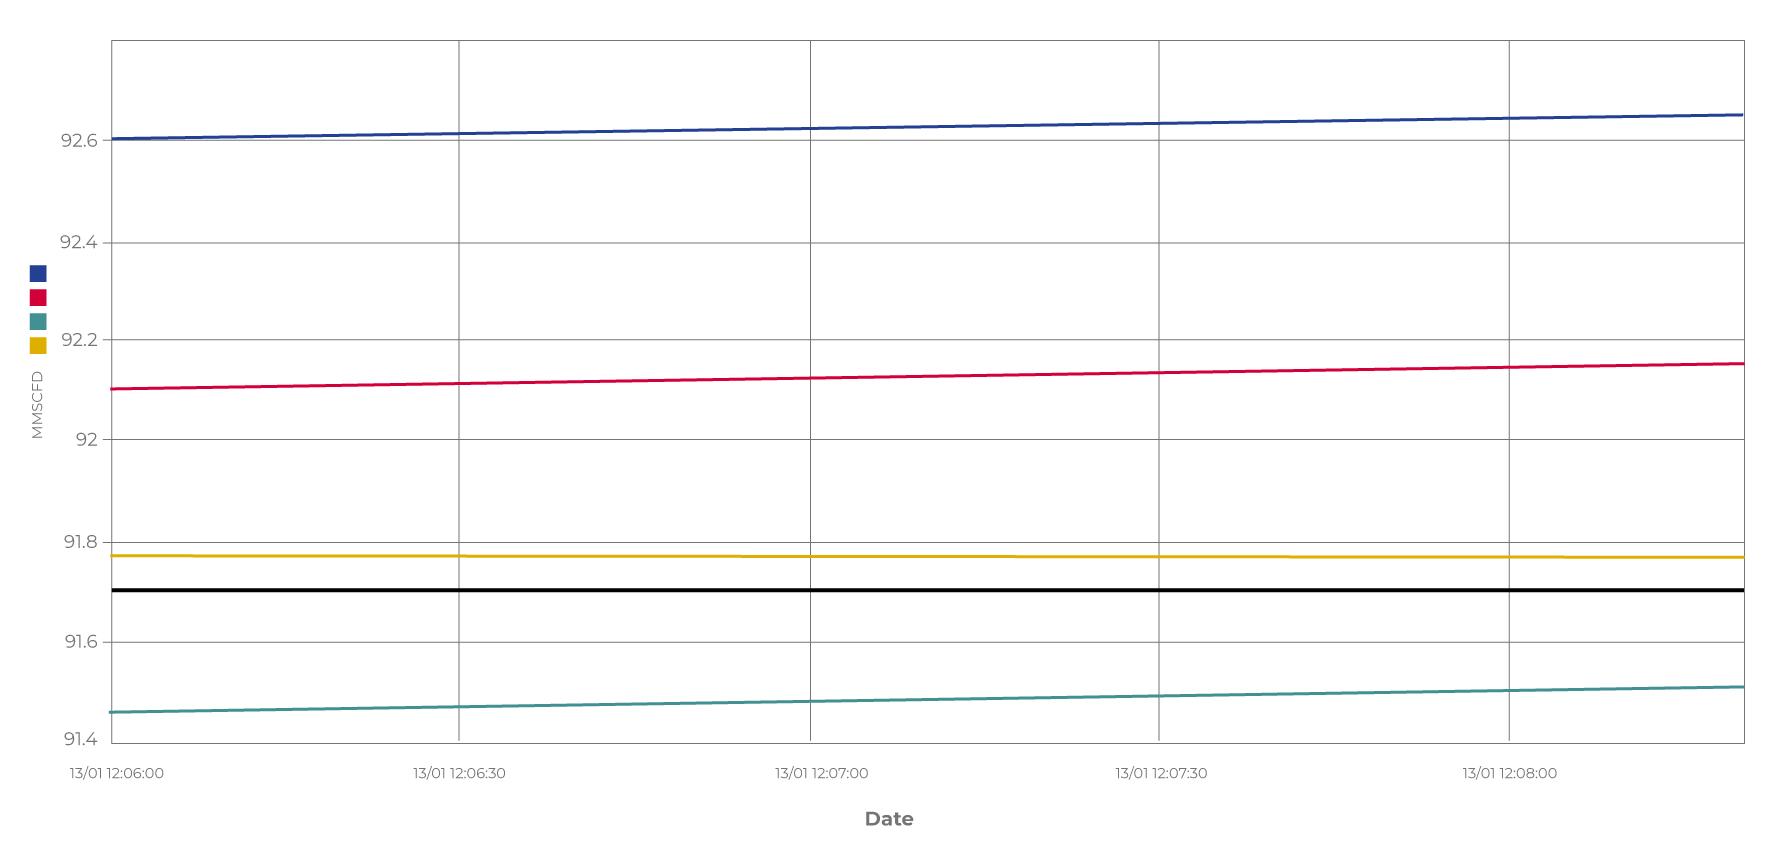
The pipeline capacities for the case study pipeline using pure hydrogen are displayed in Figure 4. The GERG 2004 capacity is shown in orange, BWRS in blue, AGA8 in green and Peng Robinson capacity in red.
We can evaluate the EOS by comparing their flowrate calculations with the measurements obtained from the dataset.
Figure 5 illustrates these comparisons, where the flowrates obtained from the GERG 2004 equation are depicted in orange, BWRS in blue, AGA8 in green, Peng Robinson in red, and the actual measured flowrate in black.
Compared to the measured values, the Peng Robinson EOS exhibited an error of 0.97%, while the AGA 8 and BWRS equations of state exhibited deviations of 0.27% and 0.43% respectively. In contrast, the GERG 2004 equation of state exhibited deviations of only 0.05%.
To conduct this analysis, an offline simulation was performed for each equation of state, with pressure set as the boundary conditions. These pressure setpoints were a part of the controlled reference case that was discussed in the model tuning section above. The simulation then calculated the flowrates for each equation of state, which were subsequently compared against the measured flows observed in the controlled reference case.
Hydrogen plays a crucial role in the future of global energy and the increasing demand for renewable energy sources requires pipelines to be an integral part of the infrastructure. Accurately modelling hydrogen pipelines is essential to mitigating as much risk as possible.
References
1. https://unfccc.int/sites/default/files/resource/Summary_GCA_COP28. pdf 2. https://www.atmosi.com/en/resources/technical-papers/tuning-ofsubsea-pipeline-models-to-optimize-simulation-accuracy/

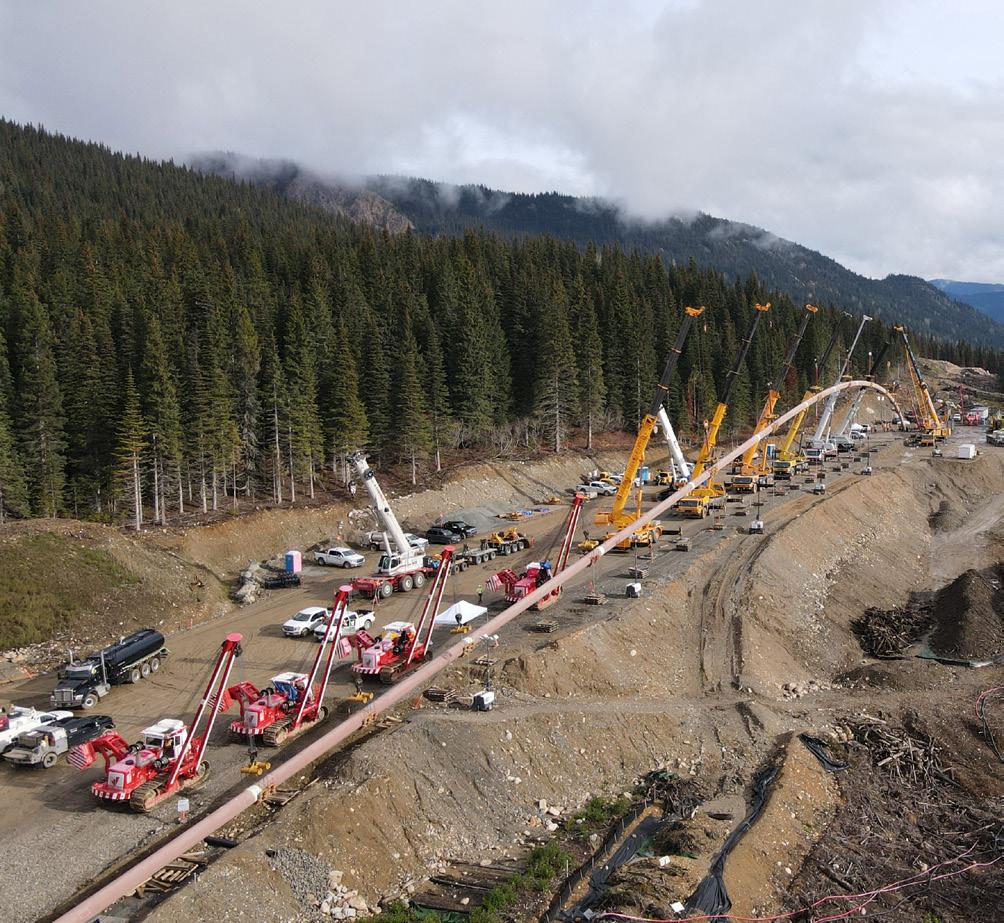
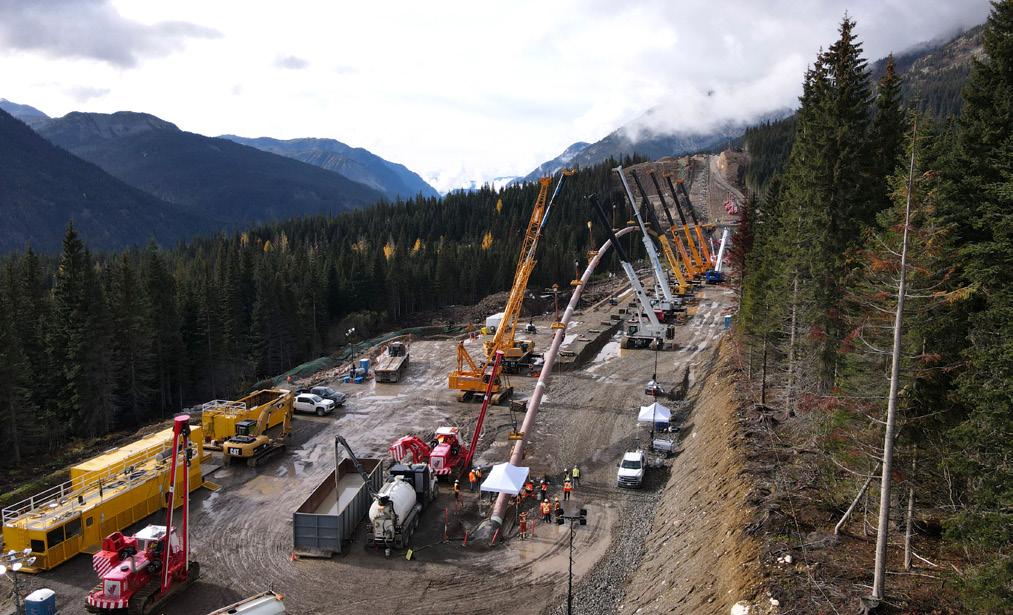
The distance between the top of the northeast wall and the top of the southwest wall is approximately 225 m. The invert of the gulch is at an elevation of 1101.3 m above sea level on the pipeline alignment.
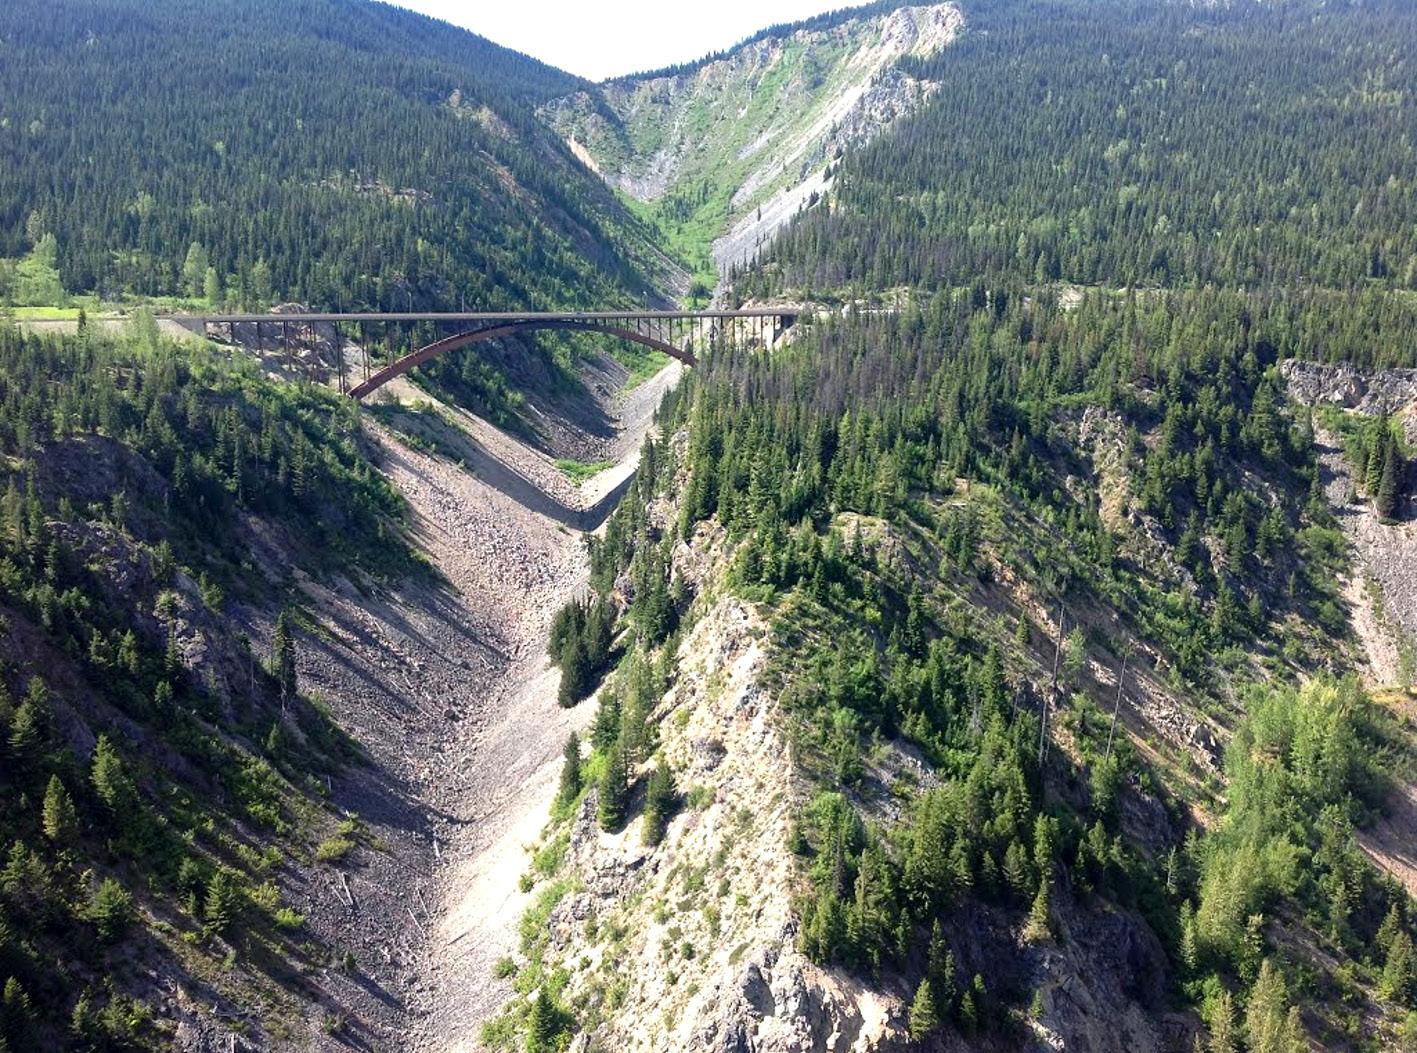
The northeast wall of Dry Gulch is about 94 m high, with the upper portion featuring a rock outcrop with a slope angle of about 57˚ (locally as steep as 78˚) and extending for about 45 m. Further below, there is a blocky rock colluvium lower slope with a slope angle of about 37˚ extending for about 94 m to the bottom of the gulch.
The southwest wall of the gulch is 97 m high, mostly featuring a rock outcrop with a slope angle of about 42˚ (locally as steep as 58˚) and extending about 121 m downwards. This is followed by a rock block colluvium lower slope with a slope angle of about 29˚ and about 32 m long up to the bottom of the gulch.
Dry Gulch is frequently affected by snow avalanches, making the bottom inaccessible for most of the year. Geologically and geotechnically, Dry Gulch is unique due to the contact between two stratigraphic units (Eagle Gneiss to the northeast and Falls Lake Suite granitic rocks to the southwest), resulting in brittle faulting and fracturing of the rock mass.
Another important aspect is the unknown thickness of accumulated talus and depth to the groundwater table at the bottom of the gulch. There is unconfirmed moderate metal leaching and acid rock potential associated with the stratigraphic unit to the southwest of Dry Gulch. Depending on the chosen crossing method, management of rockfall hazard and snow avalanches prior to and during construction could have required extensive temporary and/or permanent retention measures.
One of the key considerations for the construction of the crossing was the schedule for completion of the works and the available time window. The completion of the project had been forecasted for the end of 2023, necessitating the completion of the Dry Gulch crossing by summer 2023. Additionally, work conditions in this area were very challenging during the winter season due to low temperatures, snow precipitation, and high avalanche risk.
Considering the complex geomorphological, geological, and geotechnical settings and the schedule restrictions, the feasibility of the crossing, related to the construction methodology, was carefully assessed. Initially, ‘open cut’ was considered as the default option; however, after a detailed study, it was deemed too complex in terms of safety, environmental impact, durability, and schedule. After a wide comparison of various technologies (HDD, Direct Pipe, microtunnel, raise boring), the TMEP project management team identified the HDD methodology as the most sustainable option for the crossing execution.
The selected HDD profile had a total length of 1842 m, with a horizontal distance of 1794.4 m. The feasibility of the HDD was confirmed in August 2021 when a 1622 m exploration borehole had been successfully drilled along the actual pilot hole alignment from the South pad to about 200 m from the North Pad exit point.
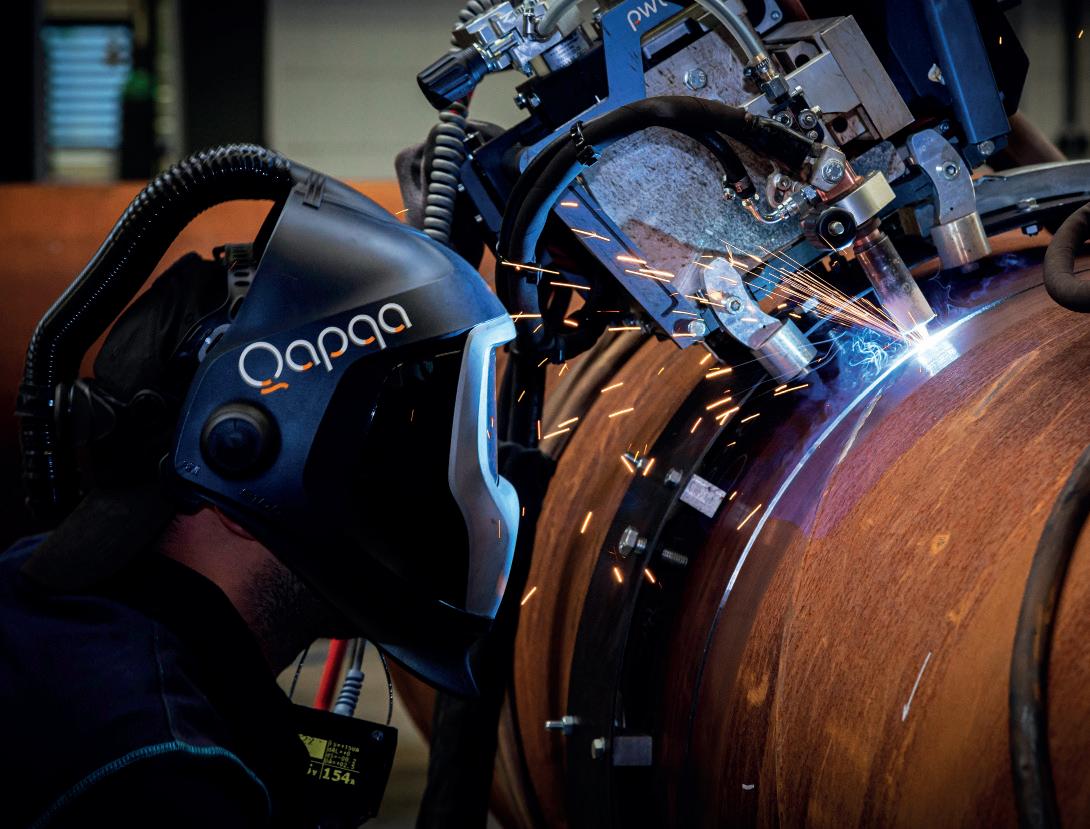
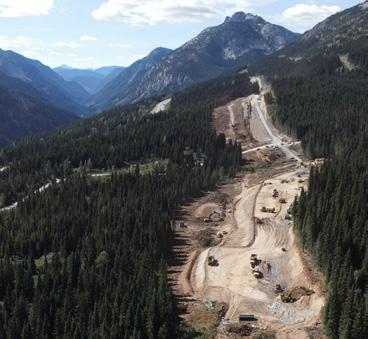
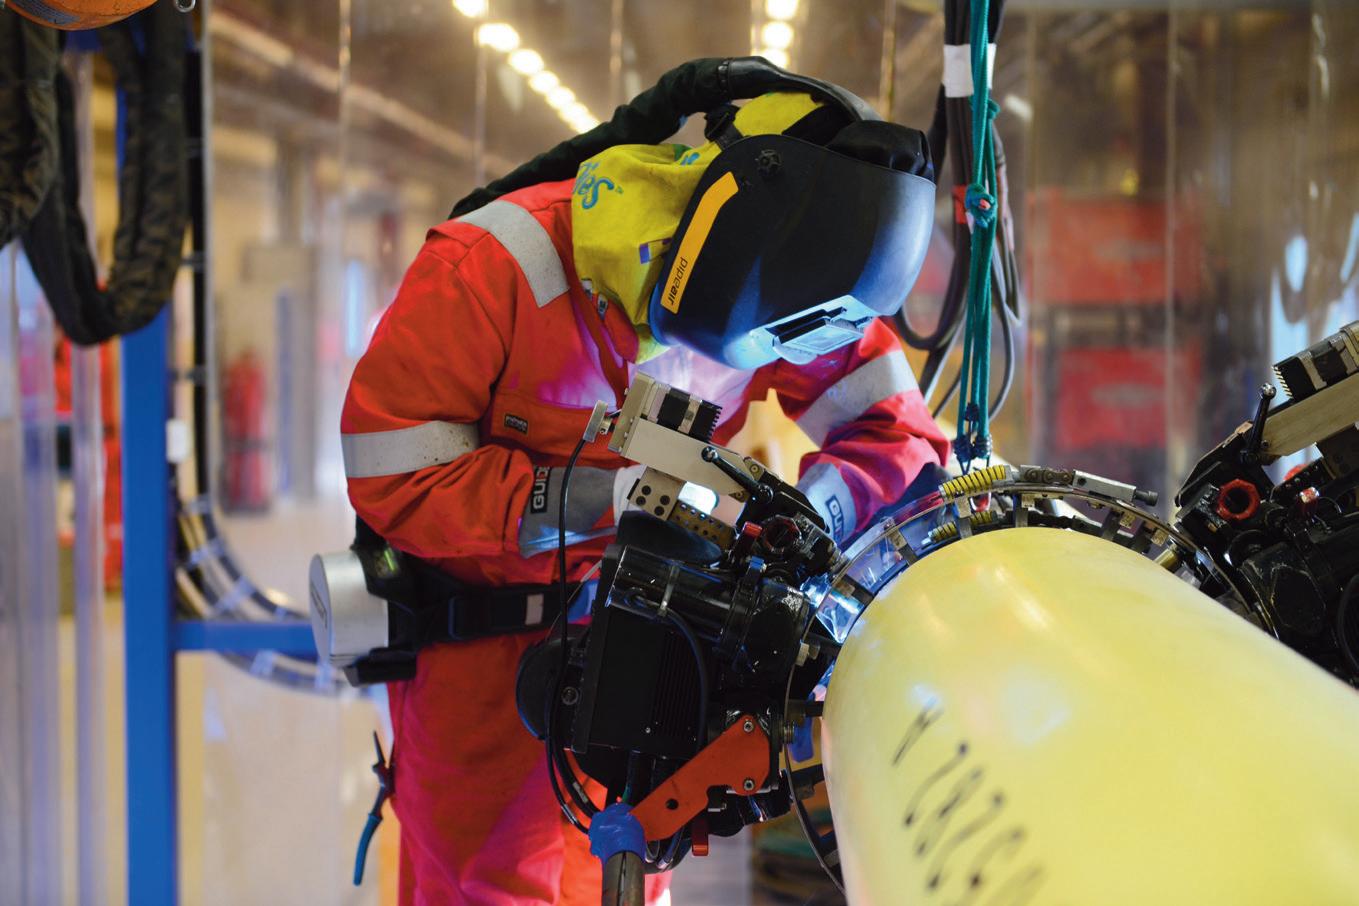
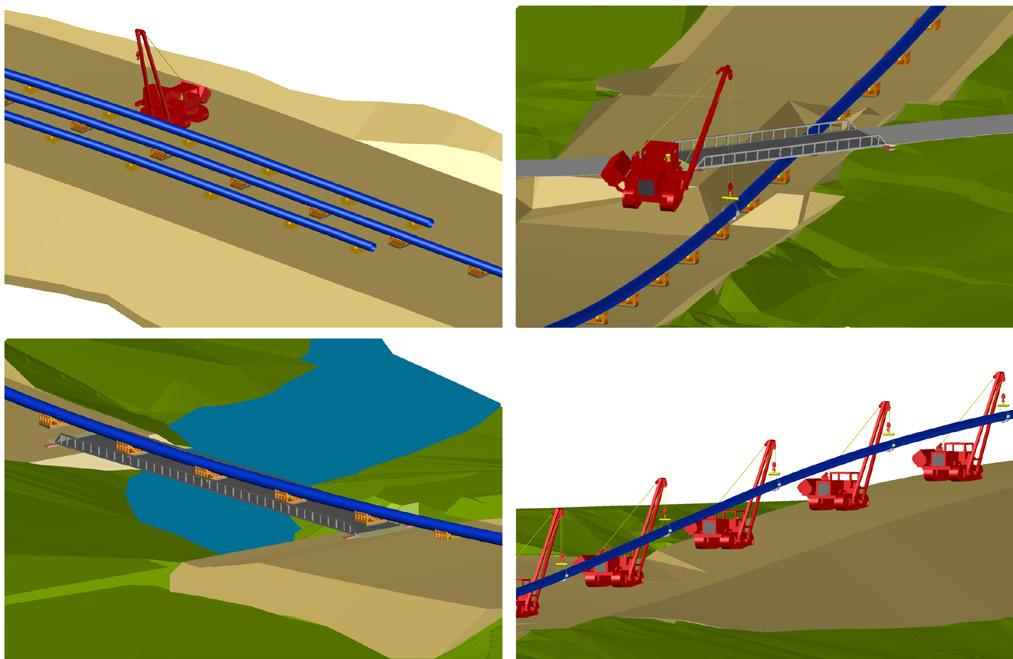
Figure 2. Dry Gulch view. Figure 3. 3D model for pipeline string preparation works.For over three decades, we’ve successfully delivered welding services for heavy sour service projects with stringent technical demands in line with H2 requirements. With our expertise, we’re driving innovation in the energy transition, enhancing your welding operations for unparalleled excellence.
Material Selection: Choosing and using materials that meet strict quality and safety standards. With our extensive track record we can help select the best jointing/material combination.
Weldability Testing: Testing at our Welding Technology Centre provides project pipe weldability testing using operational welding procedures to ensure required performance.
Welding Processes: Selecting the right welding process for your chosen pipe material and applicable specifications for the best performance in H2 environments.
Mechanised Welding: Welding with our easy-to-use machines ensure robust, repeatable welds, to achieve full pipeline integrity.
Internal Inspection: Inspecting and measuring the internal weld and fit-up alignment is key to managing the Hi-Lo and internal weld profile; promoting firing line efficiency.
Data Monitoring: Documenting all welding data during, and after the project; CleverWeld, our data tracking solution is your ally to ensure long term integrity.

The exploration borehole confirmed a low risk of frack out and bore hole collapse within the rock strata, increasing to moderate risk in the surficial layers (up to 10 - 14 m depth from the drilling surface at both north and south pads). To manage this risk, installation of 60 - 70 m casing pipe was the selected mitigation measure.
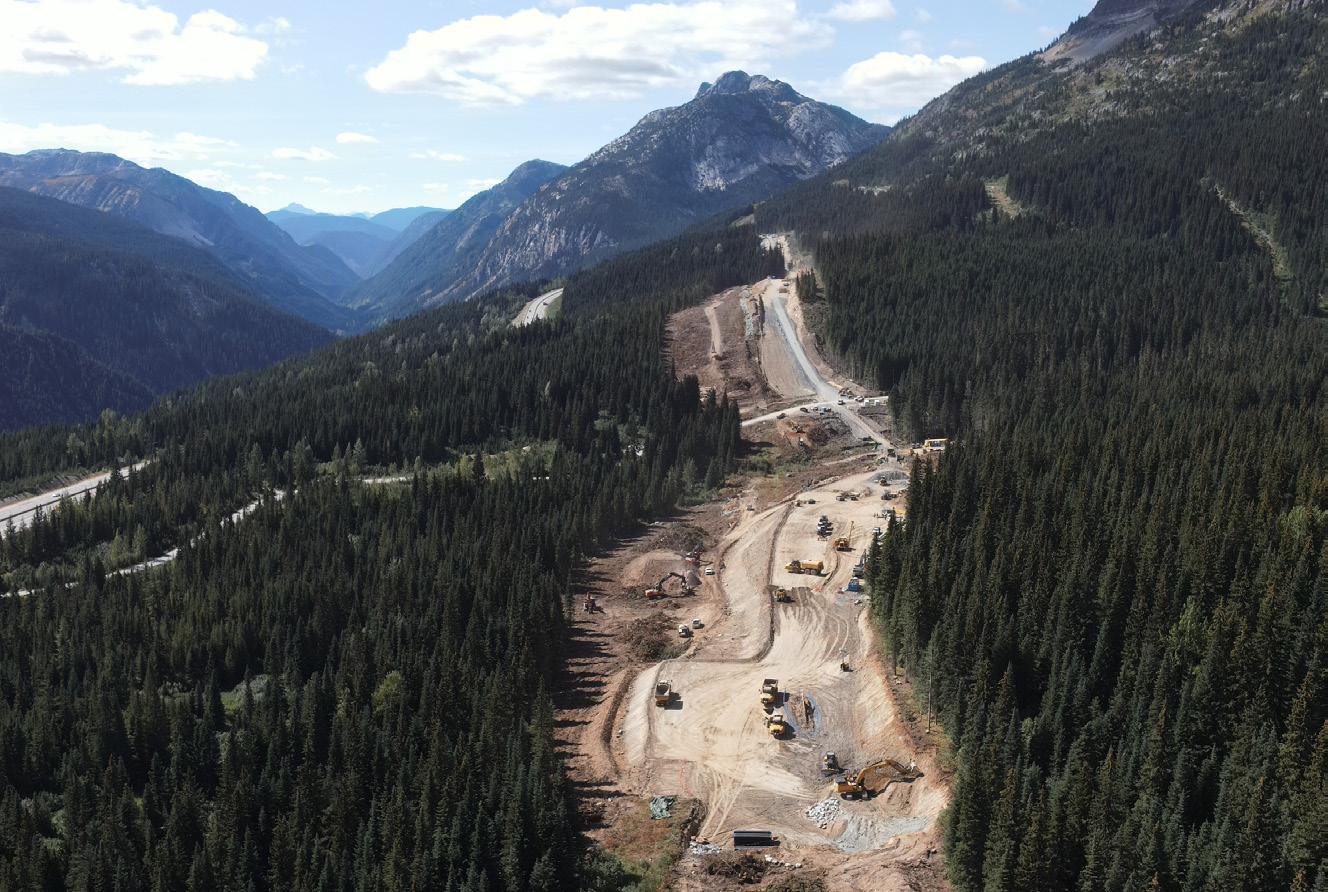
Particular attention was given to the design of the pullback section and the fabrication of the pipeline string, as the area surrounding Dry Gulch featured uneven terrain, steep slopes, several creeks, and a winding right-of-way, due to environmental constraints.
By the end of 2021, a detailed pullback study analysed several options, including single or multiple strings from both the northern and southern sides of the gulch. The final selected option was to pull three pipeline strings (the longest of about 1100 m) from the southern side. This was primarily driven by the limitation of earthworks and environmental impact and supported by the low risk of bore collapsing, as it required two tie-in welds during the pullback.
The selected pullback ROW was challenging, featuring hilly and rocky terrain with horizontal and vertical deviations, a 17˚ slope 220 m long, the crossing of two watercourses and one road. The
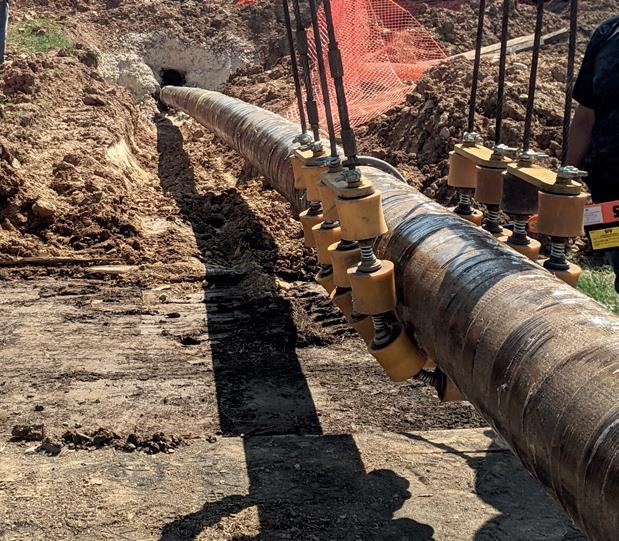
overbreak section, spanning 280 m with a maximum height of 15 m to allow the pipeline string to pass through the contingency thruster and meet the 11˚ entry angle, was supported by seven cranes (six 120 t cranes and one 160 t crane) as well as four side booms. The remaining 820 m of the drag section had been placed on 100 roller supports designed for the pullback and hydrotest loads (40 t).
To ensure a successful pullback, a comprehensive study for the string preparation was performed, including an integrated 3D model/finite element analysis (FEM) analysis.
Additionally, a FEM analysis was conducted to analyse both the static and dynamic behaviour of the pipe string during the pullback phase. In particular, FEM simulation produced the following results:
) Verification that the maximum stress induced in the string during lifting and pulling operations was within acceptable limits, guaranteeing the integrity of the pipe string.
) Definition of the distribution of the equipment and the vertical and lateral loads required for equipment sizing and design additional anchoring systems.
) Definition of the optimal distribution of roller supports and the vertical and lateral loads required for designing their foundations, under pullback and hydrotest conditions.
) Identification of the optimum positioning of the station for the tie-in of two strings, guaranteeing minimal longitudinal stress and bending moment.
) Calculation of any possible longitudinal or vertical uplift displacement, possibly requiring additional restraints or anchors.
Given the project timeline, Bonatti/Kiewit developed a suitable schedule to accommodate the required deadlines, using different teams working in parallel.
Regarding the works of the HDD execution, the pilot hole was executed from August to October 2022 from the north pad to the south pad, confirming the findings of the exploration borehole executed in 2021 and the low risk of bore collapse along the majority of the HDD alignment. Subsequently, the reaming phase started in late October 2022 and progressed through the winter.
In parallel, works for the preparation of the prefabricated string and its associated working ROW were carried out: initially grading and blasting of the section upslope near Falls Lake Road starting June 2022. Later, the section between Falls Lake Road and the drilling pad required significant earthworks to build a 10 m high launching pad for the overbreak section. The preparation of the pullback ROW required about 91 000 m3 of earthworks overall and 16 000 m3 of imported material from adjacent areas.
By autumn 2022, the preparation of foundations and installation of bridges on Falls Lake Road and Falls Lake Creek was completed, and further grading of the drag section was completed in late 2022.
Afterward, stringing and welding of the first two strings (each 378 m) was completed by the end of January 2023, while
fabrication of the main string (1100 m) was completed in March 2023.
A preliminary hydrotest of the strings had been planned for April 2023 – one month before the planned pullback –allowing the completion of support installation and equipment mobilisation.
The final pullback preparation activities started in September 2023, with the mobilisation on-site of the eight cranes and the 17 side booms required for pipeline string management during pullback and the installation of the HDPE buoyancy control pipe inside the NPS 36 in. pipeline strings.
The pullback had eventually started on 18 October 2023, and was smoothly and safely completed in about 52 hours, 30 of which had been required for the two tie-ins and with an average pulling rate ranging from 80 m/hr to 120 m/hr, exceeding the best estimate scenario. The maximum pulling force was within the expected range, and also the continuous monitoring of the vertical and lateral loads on the cranes and side booms confirmed the loads being consistently within the
Considering the exceptional length and project available work space, the engineering, planning, and setting up of the Dry Gulch HDD pullback required extraordinary effort and multidisciplinary coordination from late-2021 to mid-2023 to match high safety and quality standards, minimise environmental impact, and optimise the execution schedule. In particular, feasibility studies, detailed design, and construction engineering was developed from 4Q21 to 1Q23, including different stages of stress analysis, in static and dynamic conditions, and 3D modelling of the rollers to size the equipment required for string management and pipeline anchoring.
The engineered pullback required three pipeline strings (1100 m, 380 m, and 380 m in length), to traverse across 900 m of rollers across rocky terrain with significant horizontal direction and vertical elevation changes, while crossing two watercourses and one road and being lifted at about 15 m elevation for the 200 m long over-break section. Meanwhile, other civil works required to prepare the rollers were completed in the second half of 2022, and the pipeline strings had been welded, hydrotested, and positioned on the rollers from 1Q23 to 3Q23.


Russell Small, Principal Surveyor, DeepOcean, examines the role of AI and machine learning tools in developing subsea pipeline inspection and maintenance, highlighting the opportunities of this technology in a recent project aimed at improving inspection efficiency.
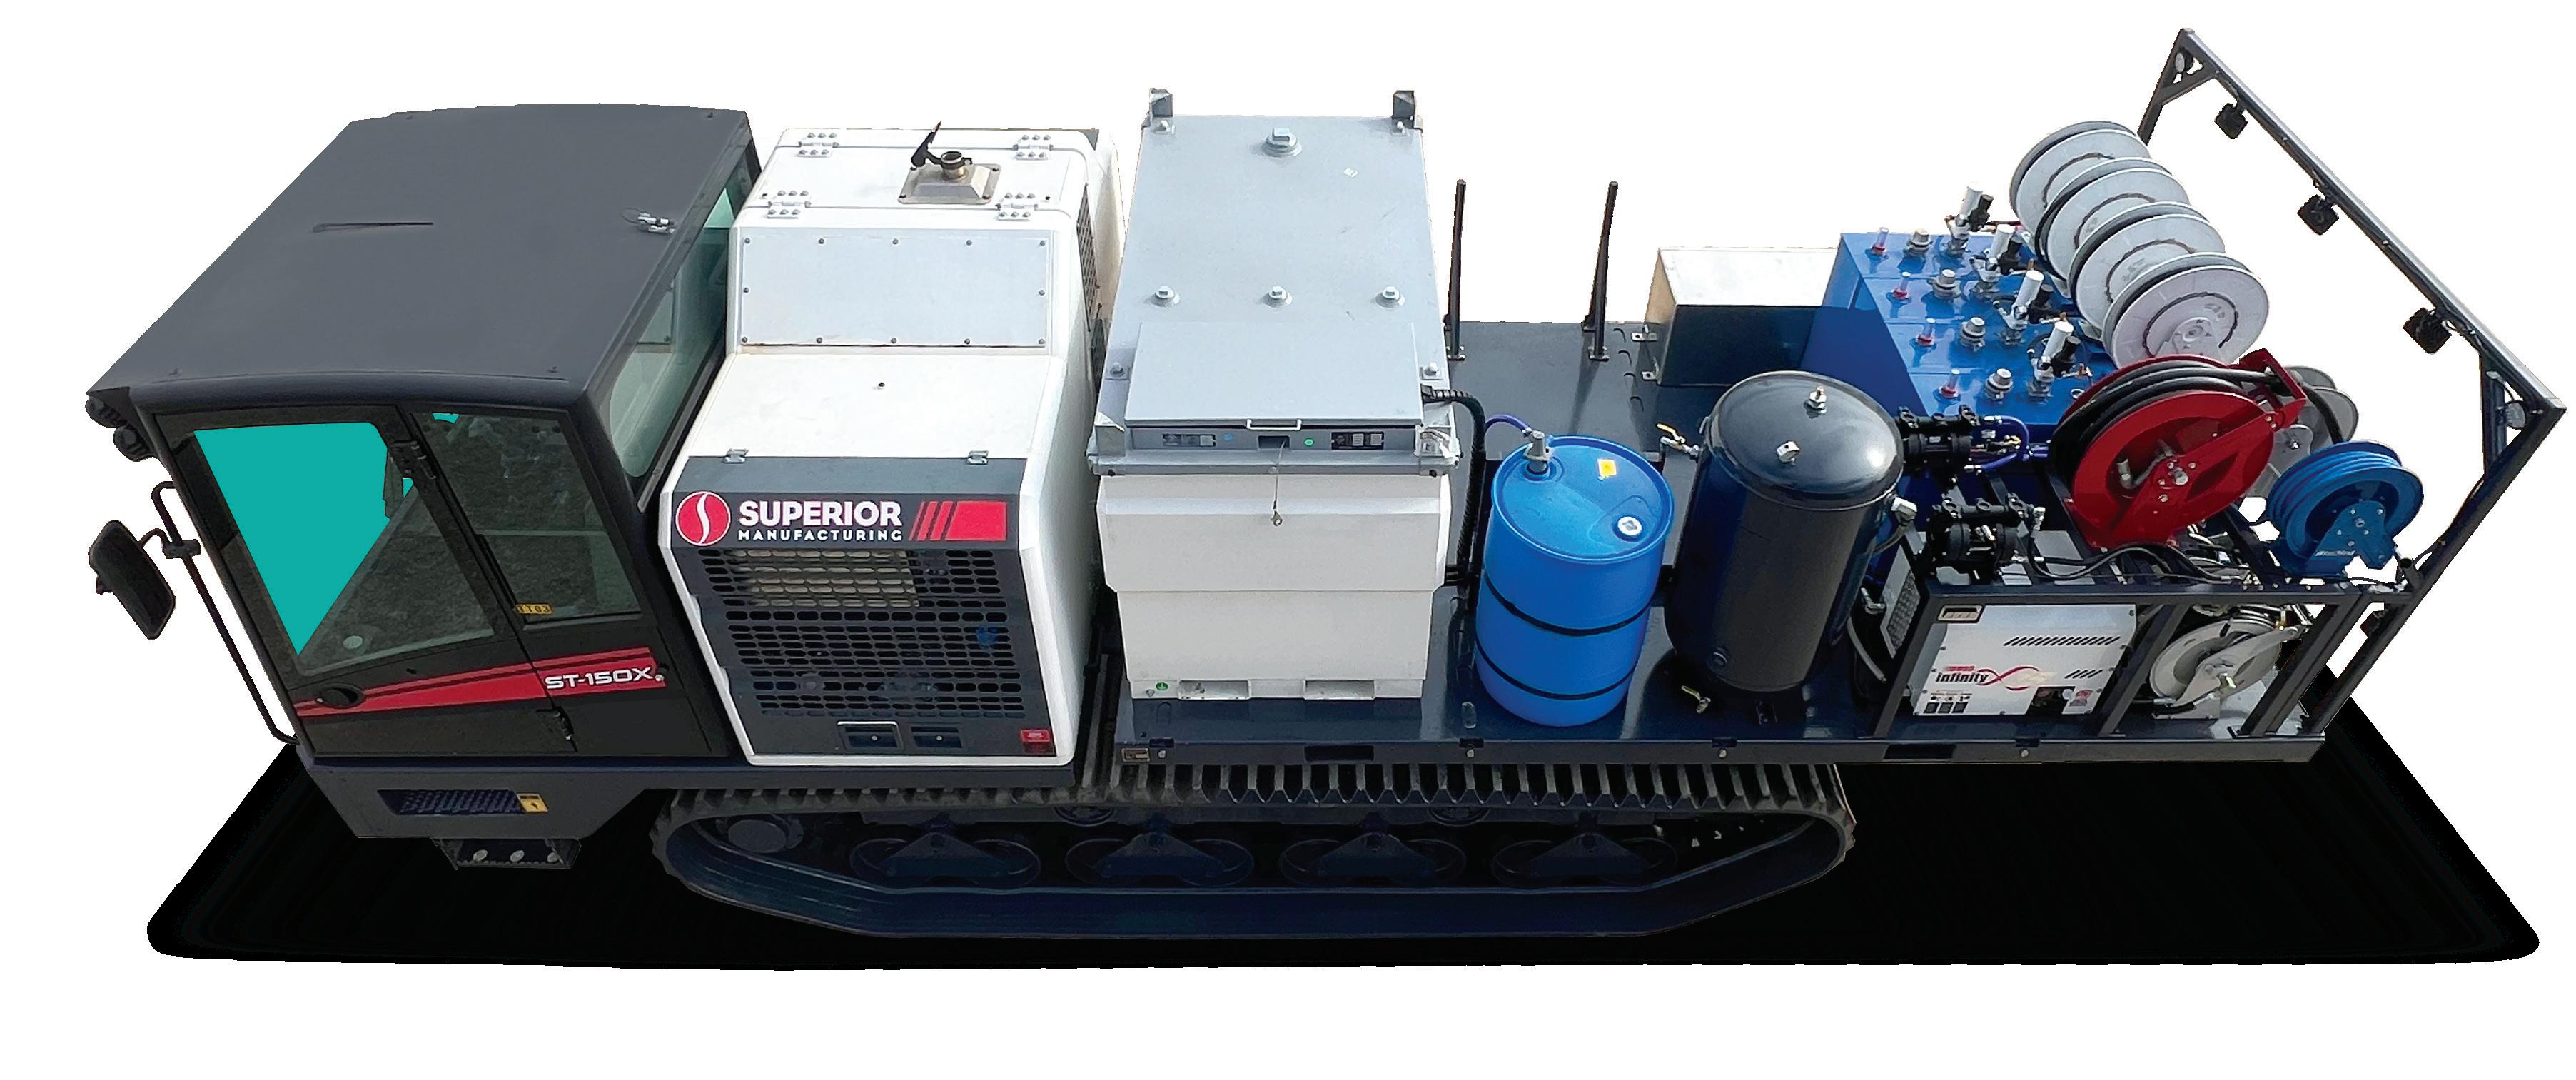
In the last 10 years, the offshore survey industry has seen the evolution of a new breed of fast remotely operated vehicles (ROVs) specifically designed for high-speed surveys and pipeline inspections. The Survey ROV, or SROV as it is commonly referred to, was in 2020 formally adopted by the rigorous standards of the Norwegian petroleum authorities (NORSOK), thereby defining the specific requirements of this new type of ROV. DeepOcean, headquartered in Haugesund, Norway, was an early pioneer of the SROV concept, taking delivery in 2015 of the very first
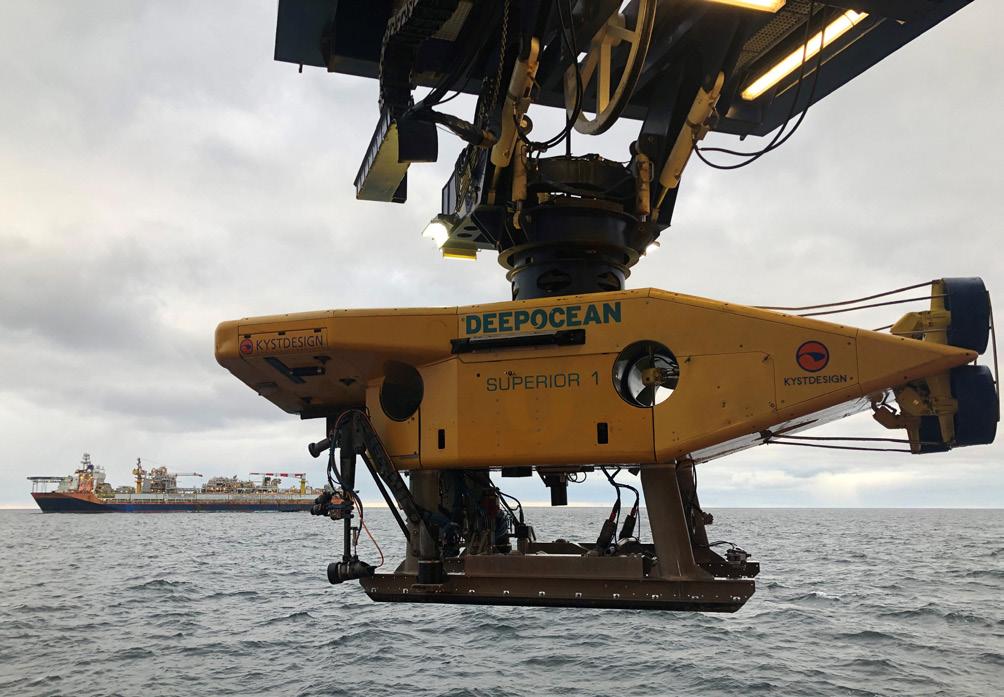

Superior SROV from local ROV innovator Kystdesign. In the intervening years, Superior SROV has surveyed thousands of kilometres of subsea pipelines annually and in all likelihood has the largest single-track record in pipeline inspection of any ROV globally.
The benefits of a modern SROV
Operators on the geographically extensive Norwegian Continental Shelf were quick to understand the economic advantages that a modern SROV can bring to their subsea pipeline inspection programmes. They operate a vast network of oil and gas pipelines extending the length of the North Sea from the shores of France and Belgium to the arctic Barents Sea, all of which requires regular external integrity assessment. Employing DeepOcean’s Superior SROV, mobilised onboard DeepOcean’s flagship survey vessel the Edda Flora, pipeline operators have realised substantial cost savings when compared with the alternative of using slow workclass ROVs configured with a survey sensor payload. Not restricted to only the local Norwegian market, Edda Flora has taken Superior to the Mediterranean Sea and Black Sea for trunk line inspections to depths of 2200 m.
Superior SROV can perform pipeline inspections at up to 4 knots as a result of its array of powerful aft thrusters. To ensure highest data quality during these high-speed inspections, Superior SROV has been designed for maximum stability – its sheer size coupled with its hydrodynamic formfactor ensure that it is a superbly stable sensor platform. The SROV can carry an impressive 700 kg payload of dedicated sensors for pipeline inspection, primarily comprising dualhead multibeam echosounders (MBES), HD video cameras, side-scan sonar (SSS), INS/DVL navigation sensors, still imaging system, dissolved methane detector (for gas leak detection) and other sensors as required by the project needs.
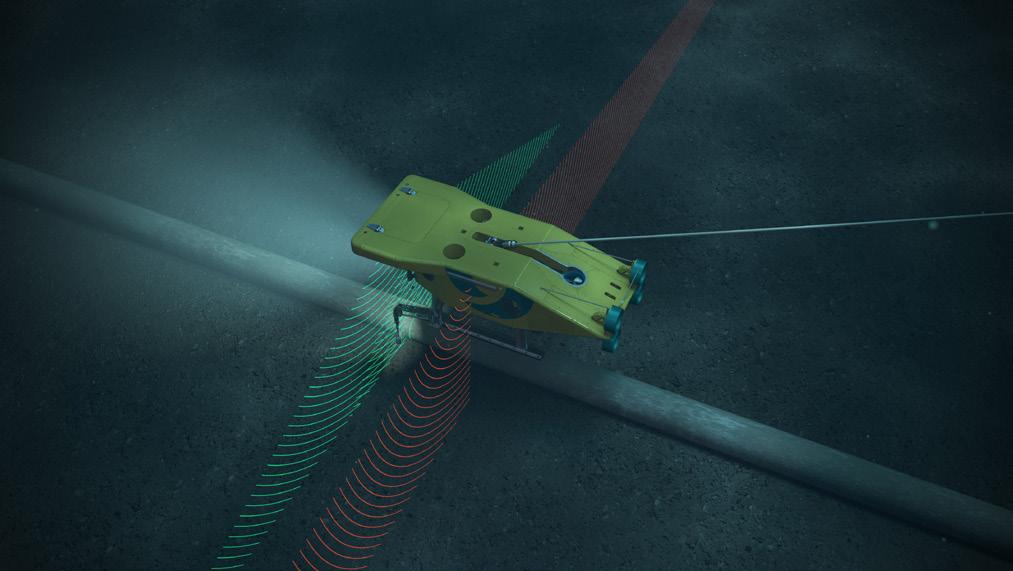
Three main modes of pipeline inspection are employed using Superior SROV depending on the client requirements. Where the largest integrity risk to the pipeline is deemed to be from third party threats such as dragged anchors, trawls and such like, an operator may elect to forego collecting full visual coverage of the pipeline and instead perform a high-fly hybrid acoustic/visual inspection. Flown at about 4 m altitude, what this high-fly mode compromises in visual assessment it gains in efficiency, as there is effectively no sensor-imposed speed limit and therefore, weather depending, acquisition speed can be up to the maximum speed of the ROV which is around 4 knots. The echosounders data allows the freespan condition of the pipeline to be assessed without the traditional requirement of boom mounted video cameras imaging the pipeline/ seabed interface. Additionally, the terrain model generated from the echosounders system is reviewed offline in parallel with the side-scan sonar data for evidence of seabed scars crossing the pipeline that might indicate possible impact and damage to the pipeline. This hybrid method includes a visual component by way of vertically mounted still imaging cameras to photograph the pipeline from above. Depending
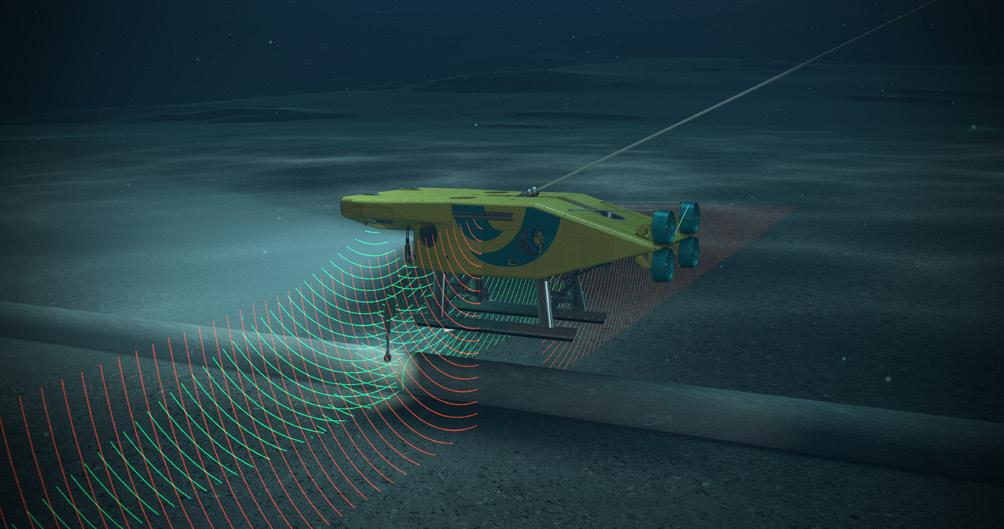
Figure 1. DeepOcean’s Superior Remote Operated Vehicle (SROV). Figure 2. Assessing subsea pipelines for critical anomalies. Figure 3. Three HD video cameras to capture full visual coverage.on the specific client requirements, these images can be reviewed in full to assess the visual integrity of the pipeline, or a more basic and cost effective review can be performed only visually confirming the identity of any debris items observed beside the pipeline within the acoustic multibeam echosounder data.
The inclusion of still photographs in Superior’s armoury can generate innovative digital products, giving integrity engineers even more value from the survey. The photographs are rendered into georeferenced mosaic strips of about 50 m in length which can be useful to visualise the pipeline in a wider context. If required, the images can also be processed using photogrammetric techniques into 3D models, which can be invaluable in assessing critical anomalies.
Superior SROV can of course perform a more traditional visual pipeline inspection, only much faster. Three HD video cameras are arranged to capture full visual coverage of the pipeline. As with the high-fly mode, echosounder- and side-scan sonar data are also acquired to image scars, debris, boulders and such like outside the visual field of view of the cameras. Acquisition speed with the video cameras in close proximity to the pipeline like this tends to be capped at about 2.5 knots – it’s worth observing that this is still twice the speed of a typical WROV carrying a full survey sensor package. The limiting factors are two-fold: principally the video playback during the offline review process becomes uncomfortable for the video reviewers to watch due to the speed that the pipeline features pass through the frame, with increased risk that reportable events are missed. Secondly, at higher speeds it can become challenging to maintain the optimal lighting that’s required to eliminate motion blur in the video footage.
In response to the aforementioned limitation of motion blur in fast video inspections, DeepOcean has further developed the already impressive flexibility of Superior with the addition of boom mounted still imaging cameras. Strobe lighting and the fast shutter speed of these cameras eliminate the potential for motion blur thereby allowing faster acquisition of full visual data. Speeds of nearly 3 knots have been achieved and as more experience
is gained it is hoped that suitable trunk lines can be surveyed at 3.5 knots.
However, these faster visual inspection speeds exacerbate the issue of reviewing the visual images. The offline playback can be performed using the raw stills, typically overlain one another to improve contextual visualisation, or alternatively the stills are converted into so-called pseudo video which can then be treated in the same manner as video playback solutions. Both of these review methods are manually laborious and are unable to keep up with the rate at which the SROV is acquiring more footage. To cope with this challenge, DeepOcean is developing Artificial Intelligence (AI) and machine learning tools.
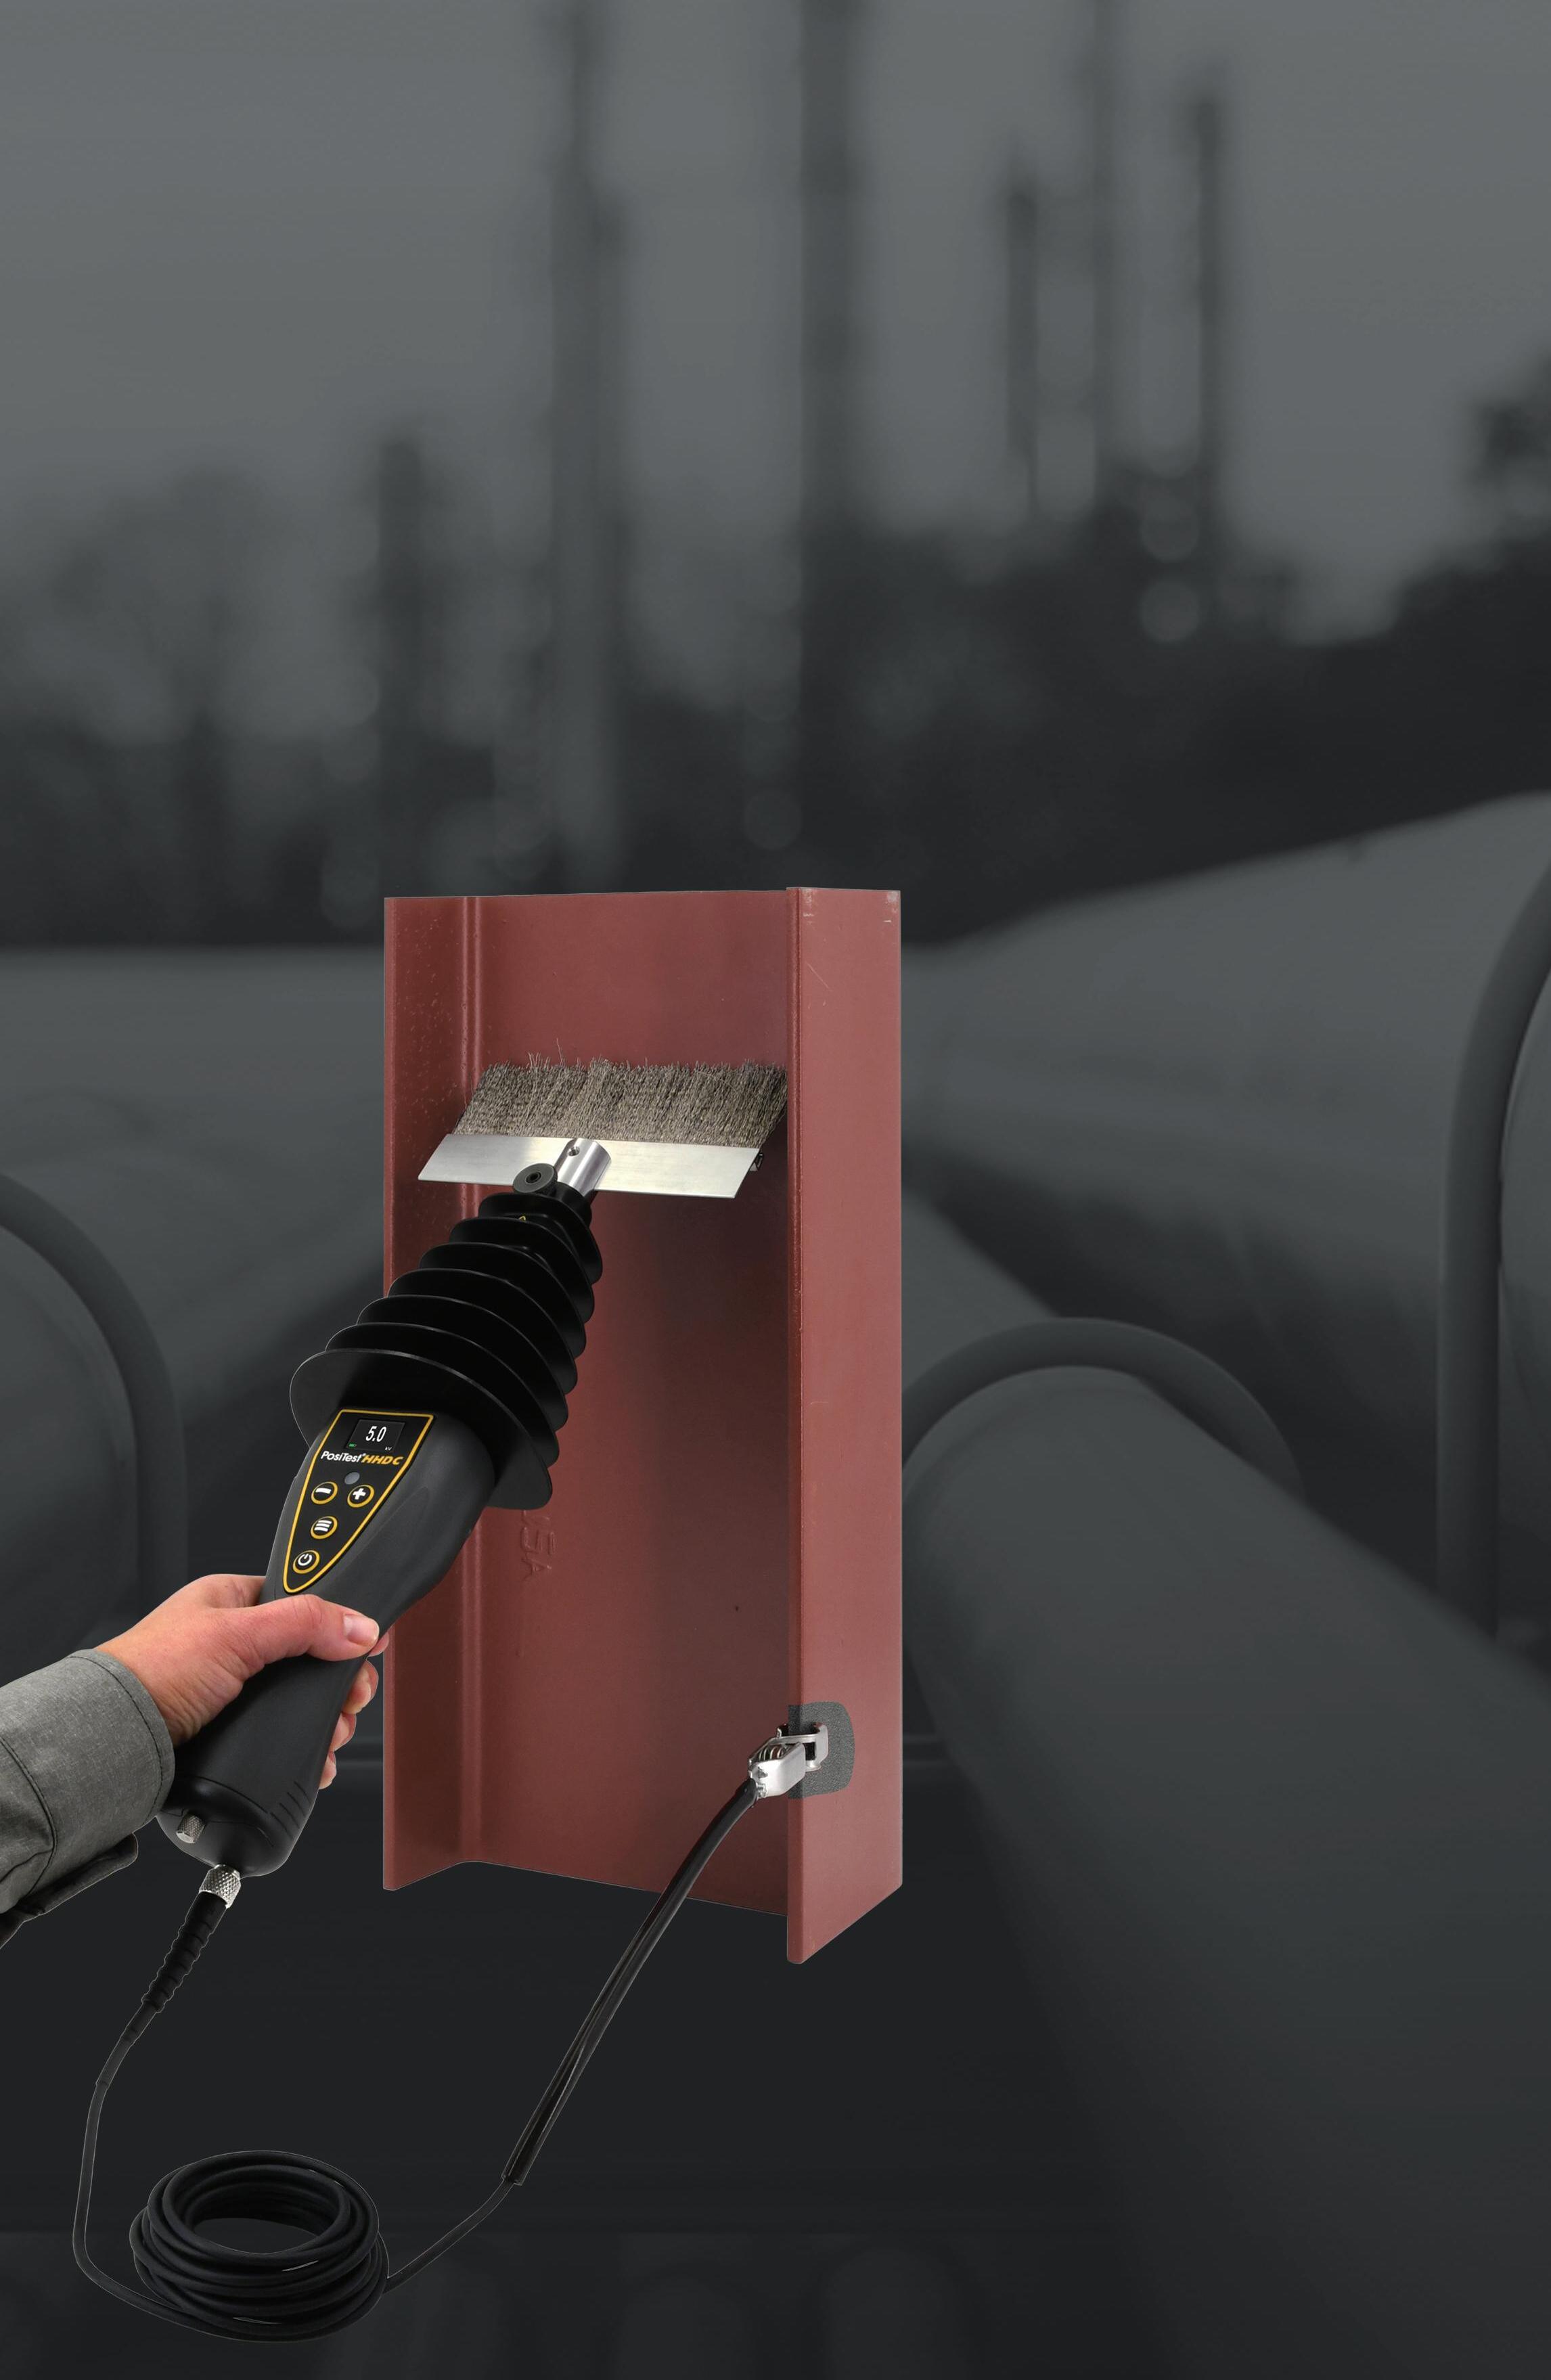
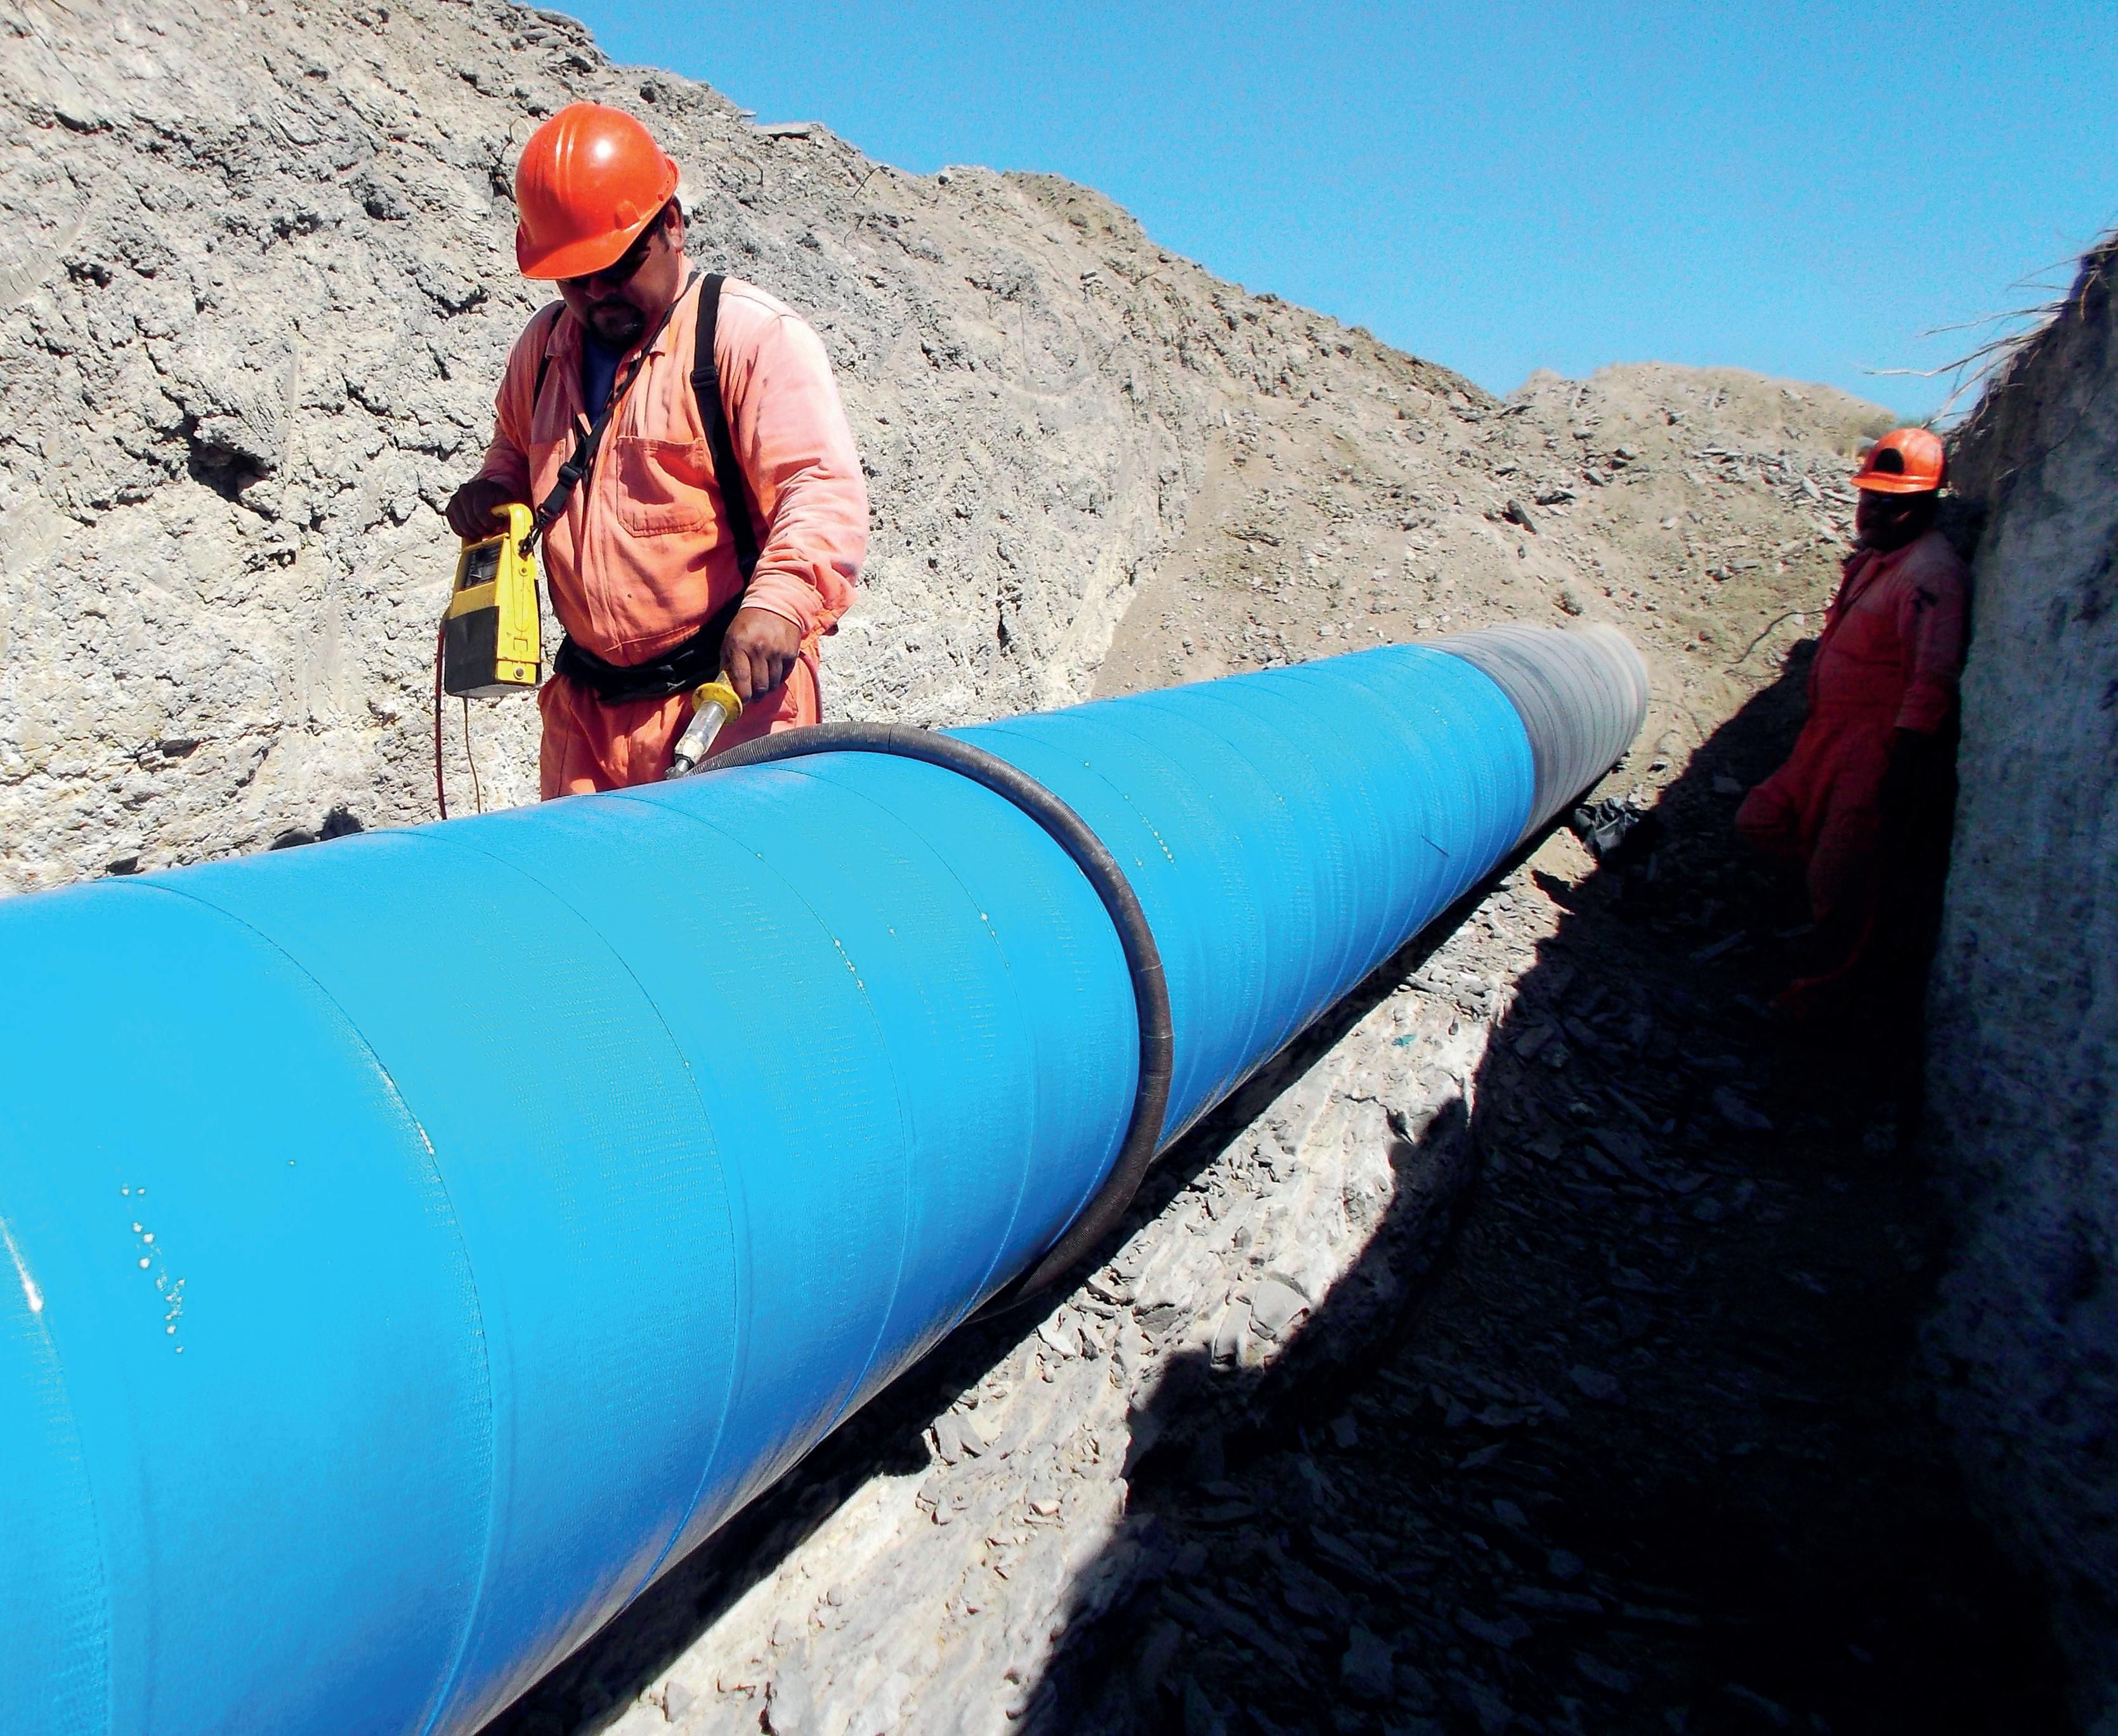
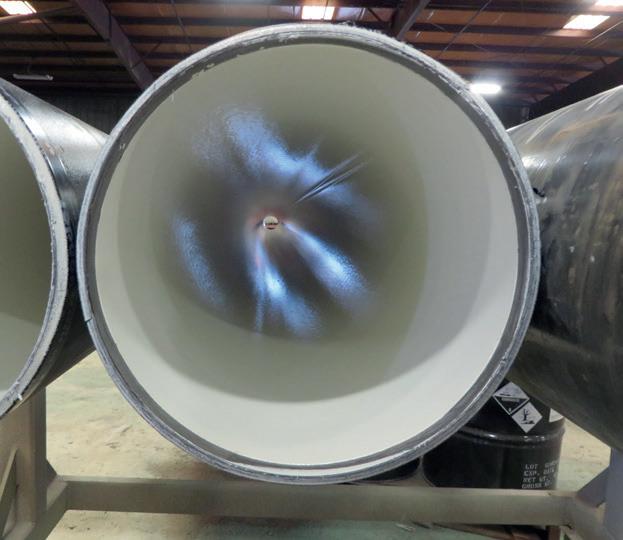
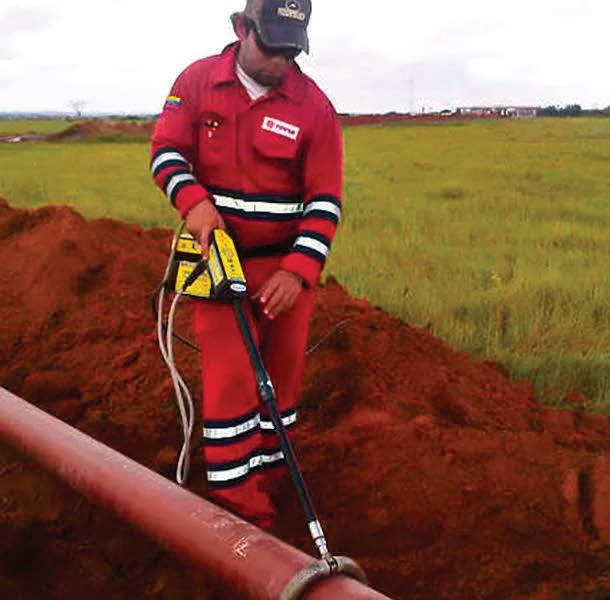
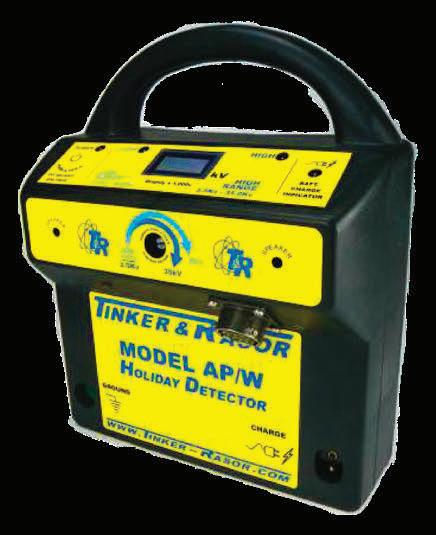
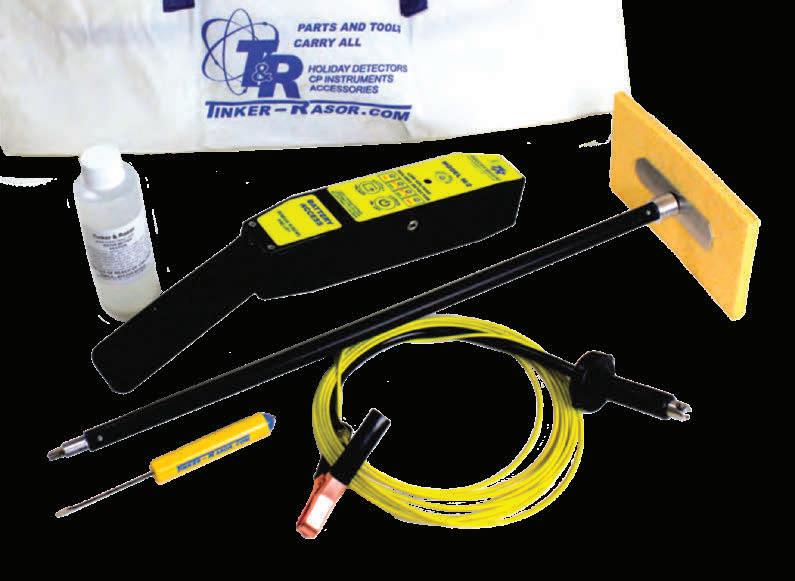
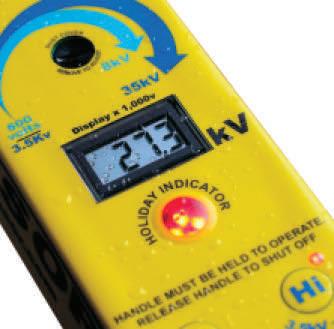
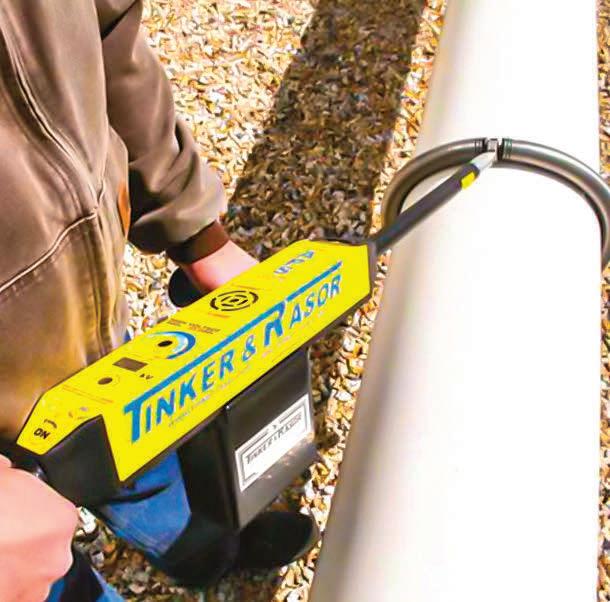
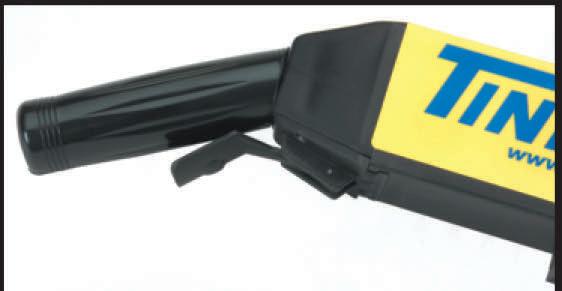
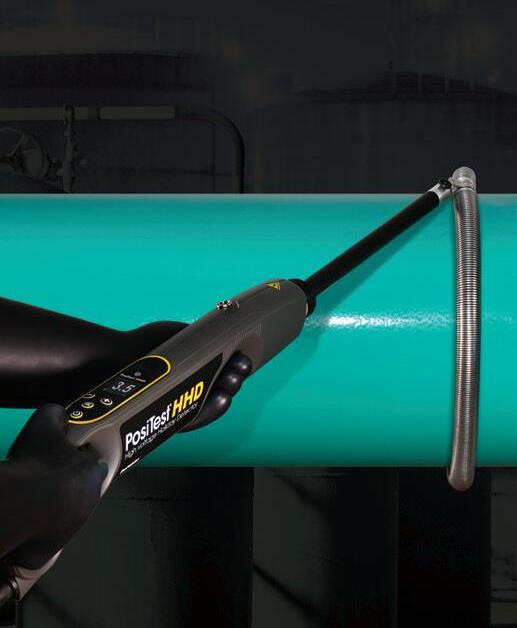
Detects holidays, pinholes, and other discontinuities using continuous
AI and machine learning are transforming the way subsea pipelines are inspected and maintained. DeepOcean explores the opportunities of this technology in an internal project aimed at enhancing the efficiency of subsea pipeline inspection. Traditionally, the inspection of subsea pipelines has been a process requiring highly trained experts to manually review images and videos. This method is time-consuming, with skilled personnel spending hours analysing footage where their expertise is required for only a fraction of the images reviewed.
DeepOcean’s Project Hawkeye addresses these challenges head-on by employing machine learning algorithms capable of scanning through thousands of hours of visual data, identifying potential issues such as corrosion, structural deformities, or marine growth that could signal a need for maintenance. By training the computer as the DeepOcean team would train its employees, the project encapsulates AI’s potential to store and replicate expert-level experience. This approach not only enhances the speed of analysis but also ensures that human experts are engaged in the process where their skills are most needed.
The project outlines a phased approach to implementing this technology. The initial phase focuses on developing and integrating the AI model within an onshore IT environment, allowing for refinement and learning in a controlled setting. The next phase envisions the deployment of this model onto vessel IT systems, enabling real-time insights during inspection operations. Continuous improvement is a cornerstone of this strategy, with a feedback loop where human oversight
contributes to the model’s learning, ensuring it adapts and evolves to the intricacies of the job.
Immediate impacts of this technological shift are tangible. Less man-hours for review processes with its associated cost-savings are just the beginning. Future-proofing the process through continuous improvement ensures that as the AI model becomes more sophisticated, it will increase its capacity to handle complex decision-making, with human experts stepping in only when necessary.
The future of managing critical infrastructure
The vision for the project is ambitious yet practical: to synergise the best of machine learning with the seasoned expertise of DeepOcean’s personnel. The aim is to delegate repetitive, high-volume analysis to machines, freeing up human experts to focus on critical assessments and decision-making, particularly when the AI’s conclusions are inconclusive. This hybrid model promises not just to maintain but to elevate the standard of pipeline inspections.
For the industry stakeholders managing critical infrastructure, such as pipelines for factories and oil and gas exports, DeepOcean’s project offers a glimpse into the future where efficiency, safety, and precision in asset management are enhanced through the strategic application of AI. This project serves as a benchmark, propelling the industry towards a smarter, more sustainable operational paradigm, ensuring the longevity and reliability of essential subsea infrastructure.

Angélique Raude, Evident, describes streamlining the corrosion inspection process, providing a complete solution for corrosion imaging in industrial pipelines.
Carbon steel is the most widely used material for piping systems and components across diverse manufacturing and industrial settings such as power plants, oil refineries, and petrochemical plants. However, carbon steel pipes are susceptible to corrosion and other damage, such as metal loss, cracking, and welding defects. These issues pose a grave risk to pipeline integrity and cause serious safety issues. Consequently, it’s essential to perform
routine inspections to assess and monitor potential damage, helping prevent unexpected breakdowns, environmental harm, and serious accidents.
Pipeline inspection technology is a growing field, with new technology being used all the time. A critical feature of pipeline inspection is nondestructive testing (NDT), which enables inspectors to examine pipelines for corrosion and mechanical damage without permanently altering

the original equipment or structure. Phased array ultrasonic testing (PAUT) is an advanced NDT method that is widely used in pipeline inspections. Phased array technology involves the use of multielement transducers that are electronically controlled to emit ultrasonic waves at precise angles and timings. By manipulating these parameters, phased array testing can create focused beams of ultrasound that can be steered, scanned, and controlled to effectively examine
complex geometries and detect defects such as cracks, corrosion, and weld flaws. This technology offers greater flexibility, accuracy, and efficiency compared to traditional UT methods, making it widely used in the oil and gas industry for quality assurance and asset integrity assessment.
Using PAUT, the Evident HydroFORMTM corrosion scanner provides inspectors with a reliable technique to inspect pipelines quickly and efficiently. Using the next-generation HydroFORM corrosion scanner with the OmniScanTM X3 flaw detector provides a complete solution for corrosion mapping. This pairing facilitates precise measurement of material thickness, simultaneous mapping of internal and external corrosion, and the detection of midwall damage, significantly streamlining the corrosion inspection process.
Building on the field-validated design of its predecessor, the semi-automated HydroFORM scanner now integrates dual-axis encoders, delivering a complete 2-axis corrosion mapping solution without the need for an auxiliary scanner. This advancement facilitates the capture of high-resolution data of large surfaces in minimal time, providing more reliable data and deeper insights for repair and longevity assessment.

The HydroFORM scanner is a proven solution for inspecting internal corrosion in pipes. Its distinctive low-flow water-column design, coupled with foam gaskets, conforms seamlessly to surfaces, eliminating the need for a wedge. The reduced water requirement in the new probe streamlines efficiency, particularly during operations where continuous water feed might not be available. This accelerates the entire process, which can be particularly important when working in more dangerous or physically demanding environments.
Providing excellent surface conformance and coupling conditions, even on rough surfaces, the HydroFORM scanner easily facilitates phased array pipeline inspections. When used with a multigroup instrument, inspectors can map external corrosion simultaneously with internal corrosion in a single scan. This approach provides C-scan mapping that can be analysed directly on the OmniScan X3 flaw detector, streamlining the inspection process and enhancing efficiency.
The HydroFORM scanner’s versatility extends to vertical and inverted scanning tasks, such as monitoring tank walls for corrosion, thanks to its smooth-indexing magnetic wheels and enhanced bubble management. Moreover, the inclusion of gasket protectors significantly enhances the longevity of the foam gaskets, providing crucial protection when navigating rough profiles, welds, and surfaces reaching temperatures of 90°C (194°F).
Equipped with the ScanDeckTM module, the HydroFORM scanner is optimised for easy deployment and one-person operation, helping
Figure 1. First generation Hydroform scanner deployed in field conditions. Figure 2. The HydroFORMTM scanner simplifies corrosion monitoring on pipeline with its smooth-indexing magnetic wheels and advanced bubble management system.

ensure rapid and reliable PA scanning. When used with an OmniScan X3 series flaw detector, the ScanDeck module provides important feedback and remote functionalities, minimising the need for direct operator interaction with the instrument.
Directly in the operator’s eyeline while scanning, status lights indicate which encoder is active, when the optimum index position has been reached, whether the coupling is sufficient, and if the maximum scan speed is exceeded. It also enables the HydroFORM operator to remotely start/ stop and erase the data acquisition on the OmniScan unit. This information and remote-control capability not only reduce time-consuming tasks, but also improve the quality and reliability of the acquired PA data.
Highly adaptable, the HydroFORM scanner accommodates various inspection styles, serving as a manual scanner, a guided 2-axis encoding scanner, or compatible with semi-automated and automated auxiliary scanners for complex, large-area, and remote inspections.
When paired with the OmniScan X3 flaw detector, the HydroFORM scanner delivers exceptional near-surface resolution, accurately identifying the wall thickness in areas as small as 1 mm 2 with precision. By combining a water column system with easy gate synchronisation, the HydroFORM scanner and the OmniScan X3 detector make a complete PA solution for streamlined material inspection. This solution not only addresses present inspection needs but also anticipates and fulfills the evolving requirements of industries reliant on thorough corrosion mapping.
Ever-increasing demand for safe and reliable sources of energy has resulted in the growth of offshore oil and gas production, and the construction of pipelines to support these operations. However, along with this growth comes a heightened need for thorough inspection and maintenance of offshore infrastructure to maintain operational safety and environmental protection.
Based in the UK, a leading engineering and maintenance provider for the onshore and offshore energy sector uses state-of-the-art technology to ensure the integrity and longevity of critical infrastructure within the oil, gas, and wind industries. As part of their routine services, their team of inspection technicians regularly uses the HydroFORM scanner coupled with the OmniScan X3 flaw detector to acquire PAUT data.
This company offers a range of inspection services including phased array corrosion mapping, time-of-flight diffraction (TOFD) for weld root corrosion, and specialised applications, such as identifying touch point corrosion damage at pipe supports. These services are crucial for mitigating the risk of incidents such as oil spills or structural failures, and ensuring the longevity and safety of industrial infrastructure.
Offshore inspections present unique challenges, particularly the safety of personnel due to the remote and often hazardous working environments. Additionally, accessibility to assets can be hindered by factors such as
geographical isolation and adverse weather conditions. To address these challenges, they employ a combination of NDT methods and rope access techniques.
Given the harsh environmental conditions and lack of access to replacements, offshore inspection equipment must be durable, waterproof, and shockproof. It’s also essential that the inspection can be performed quickly, since working on ropes can be difficult and physically demanding. Most importantly, inspectors need to know that their equipment is accurate and reliable as inspection decisions are significantly influenced by the data produced by these tools.
The next-generation HydroFORM scanner sets a new standard for durability, reliability, and efficiency, providing pipeline inspectors with a highly dependable tool for challenging inspections. The system’s 2-axis encoding capability allows for the recording of both the scan and index axes, providing accurate alignment during scanning and resulting in more reliable data capture. This feature is particularly beneficial for assessing the internal condition of piping. By accurately capturing corrosion shapes, the integrity team can then make precise fitness-for-service calculations, determining the longevity of asset operation.
Additionally, the reduced water consumption of the low-flow coupling system for the probe streamlines operations, especially when working in conjunction with rope access where continuous water feed is often unfeasible. Since the probe coupling requires less water, the work can be conducted more quickly and with fewer impediments, which are important advantages considering the challenging and physically demanding nature of working on ropes. This innovation not only enhances efficiency but also improves safety by minimising the need for manual water supply, allowing inspectors to focus more on the task at hand.
Furthermore, the ability to remotely control the OmniScan X3 unit’s data acquisition directly from the scanner enhances operational efficiency, and receiving real-time feedback from the instrument during scanning can improve your data quality. This two-way communication between the instrument and HydroFORM scanner enables inspectors to work more autonomously and efficiently, swiftly responding to changing inspection conditions and troubleshooting any issues that may arise during the scanning process. This seamless integration of control functionalities not only streamlines operations but also helps ensure that scans are conducted with precision and accuracy, ultimately enhancing the reliability of inspection results.
The enhanced efficiency and reliability provided by the new HydroFORM scanner significantly optimise inspection workflows and increase confidence in assessment outcomes. Improved data accuracy and scan quality, coupled with real-time feedback mechanisms, empower inspection teams to make informed decisions swiftly and accurately. Ultimately, these advancements will not only enhance the integrity of inspection outcomes but also contribute to the overall safety and reliability of onshore and offshore assets, benefiting both clients and the broader community.
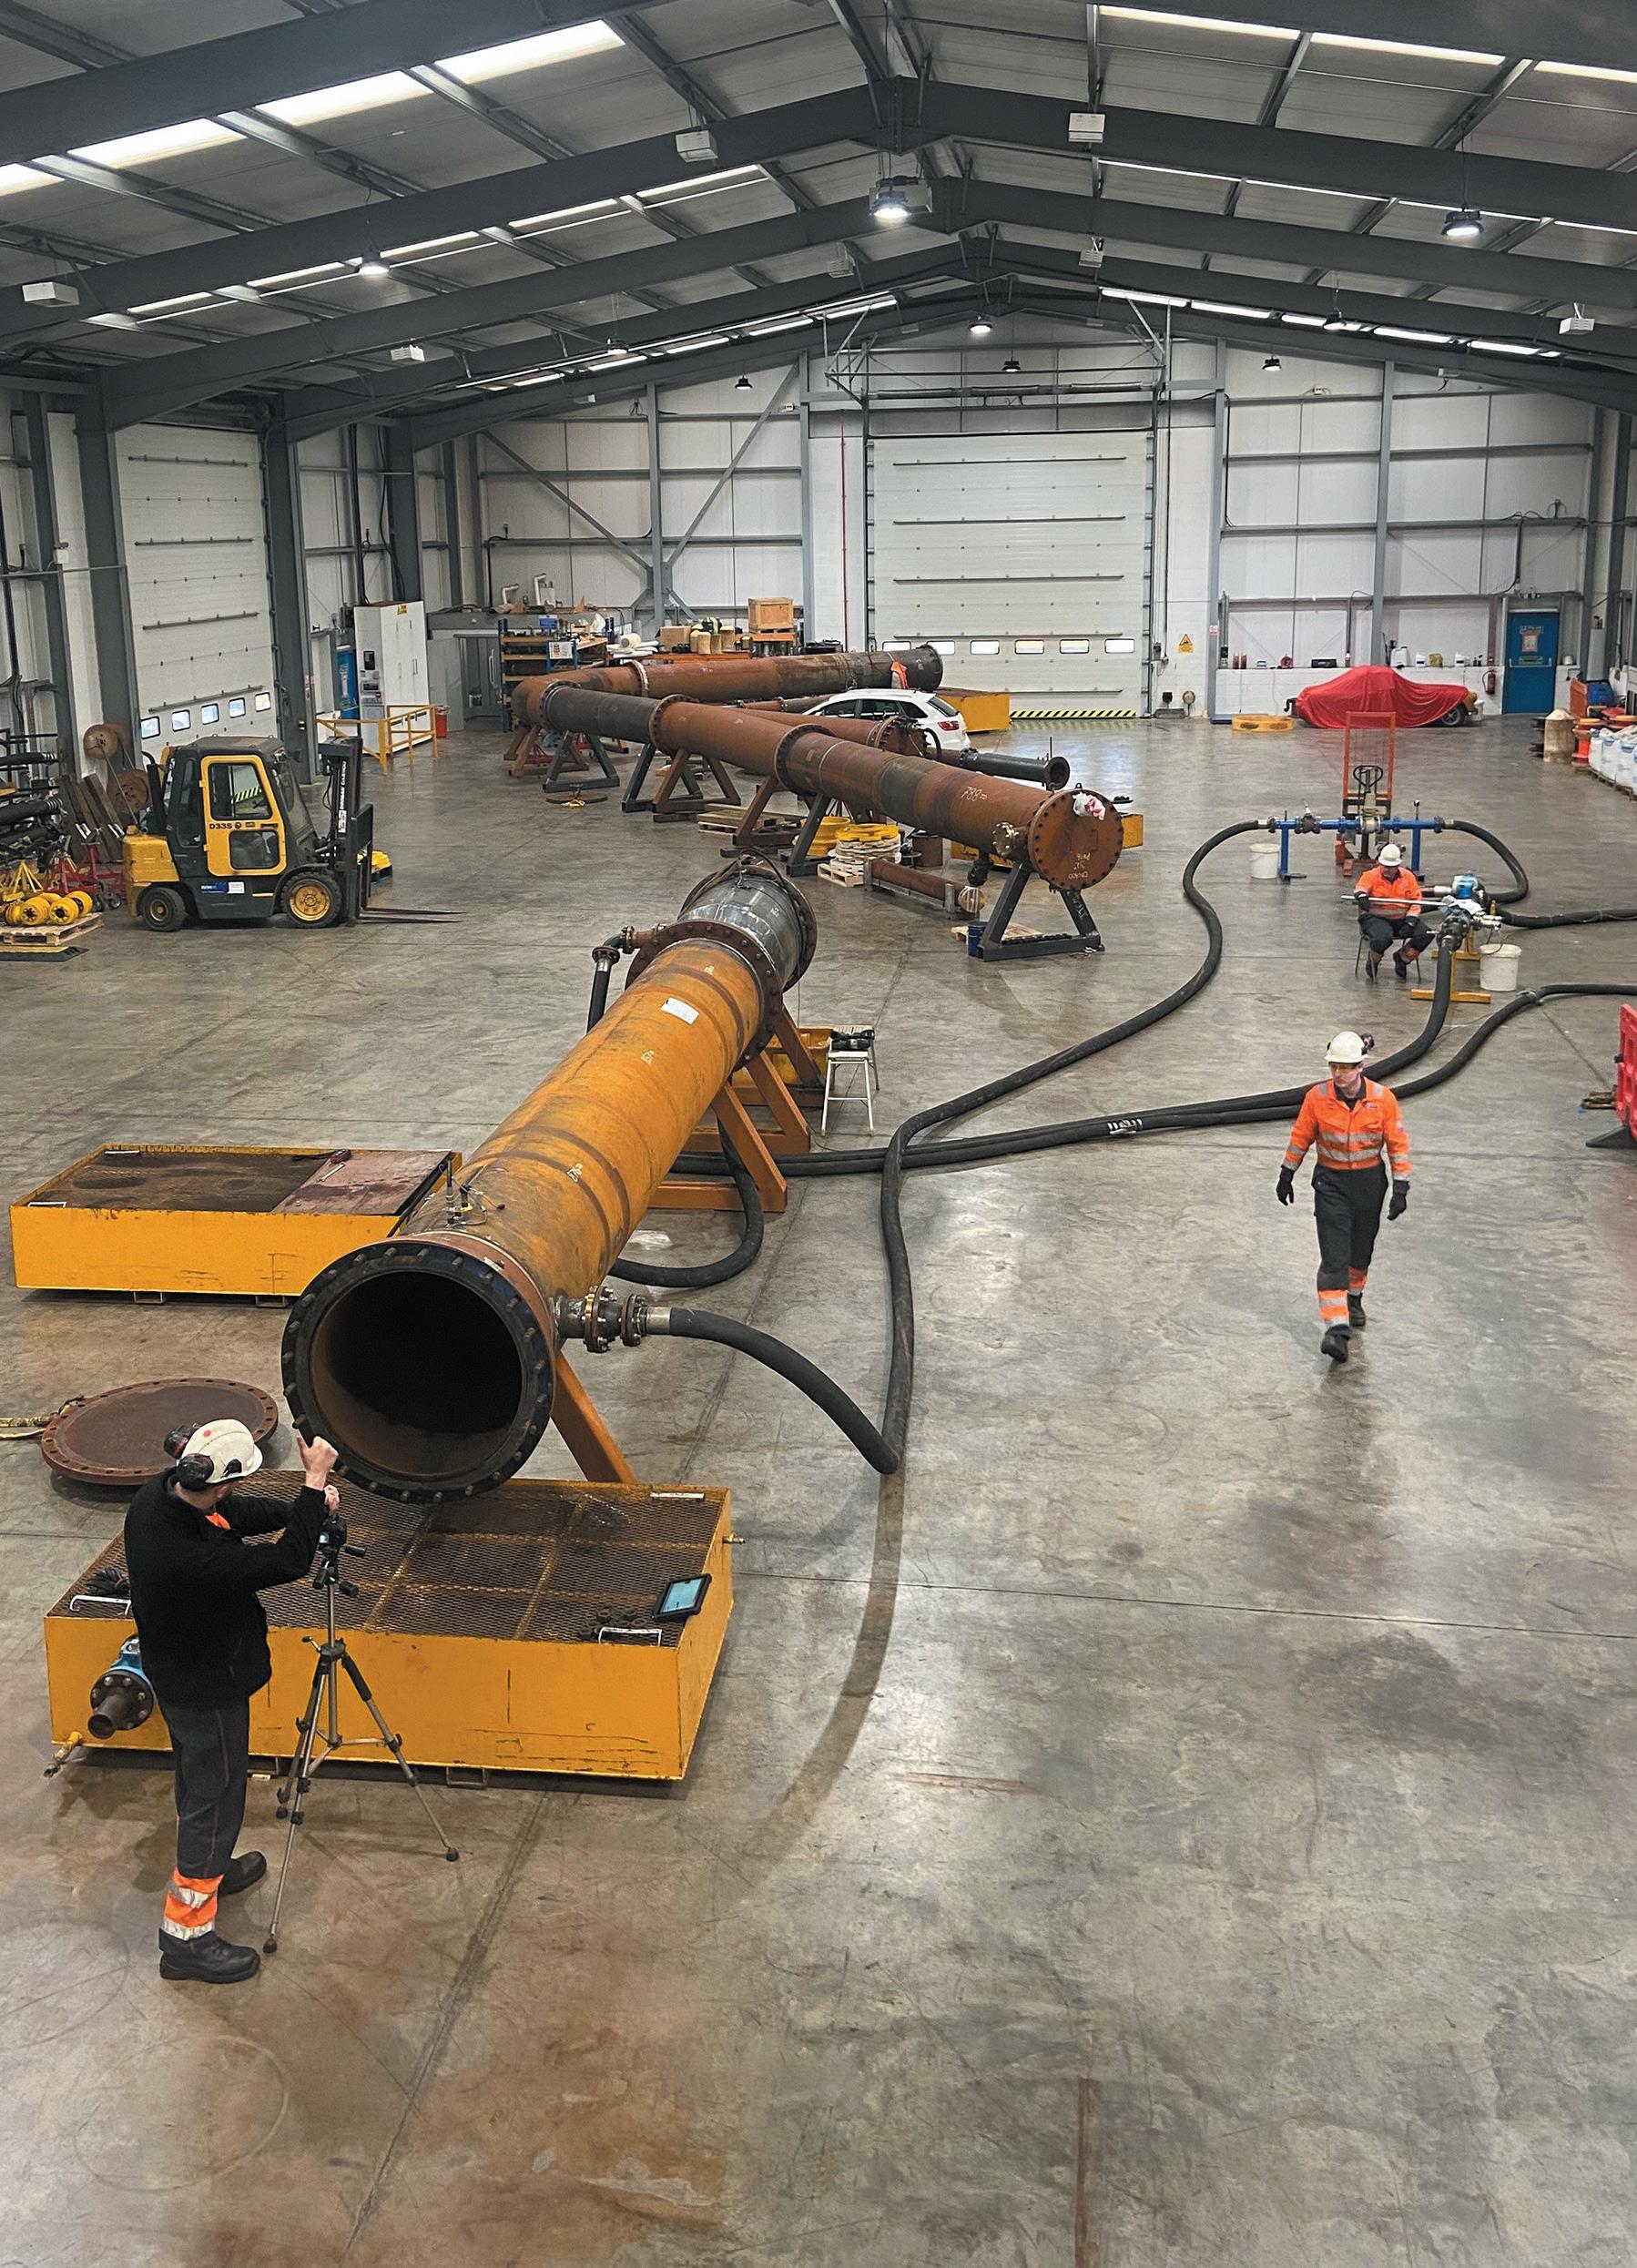
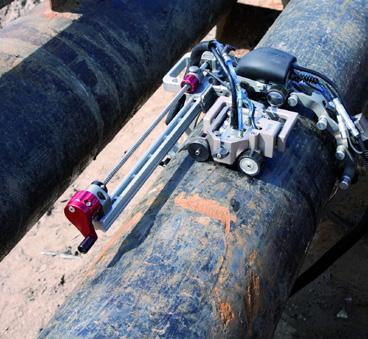
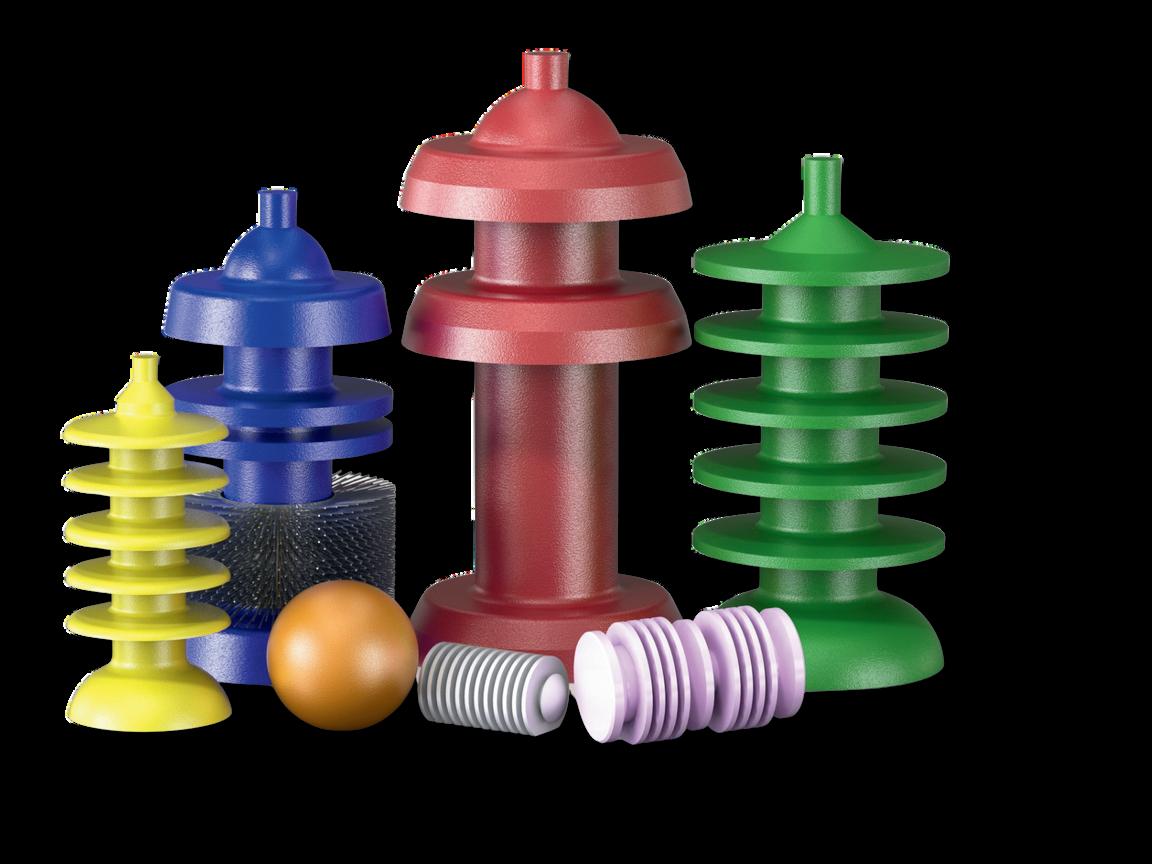
Propipe has been using test loops since 2000 to verify pig performance prior to deployment.
Test rigs allow us to develop Propipe pig designs and also to help ILI vendors verify their ILI tool performance.
Having the ability to run pigs with water or air and to construct custom test rigs that accurately mimic project layouts, allows clients to perform their work knowing that Propipe pig designs have been validated under like conditions.

ABC. See it. Believe it. Trust it. To advertise email Chris Lethbridge at chris.lethbridge@worldpipelines.com or Daniel Farr at daniel.farr@worldpipelines.com
Norman Stapelberg, Silveray, makes the case for how flexible digital X-ray technology is set to transform pipeline inspection.
Radiography is the most common way of inspecting pipes for corrosion and weld defects – usually using traditional X-ray film. So why is it taking so long for the industry to migrate to a faster and more costeffective digital approach?
Digital X-ray film (DFX) takes a different approach to the challenge of inspecting pipe welds, with flexible digital X-ray technology designed to be used just like radiographic film – but with a digital output. This approach allows
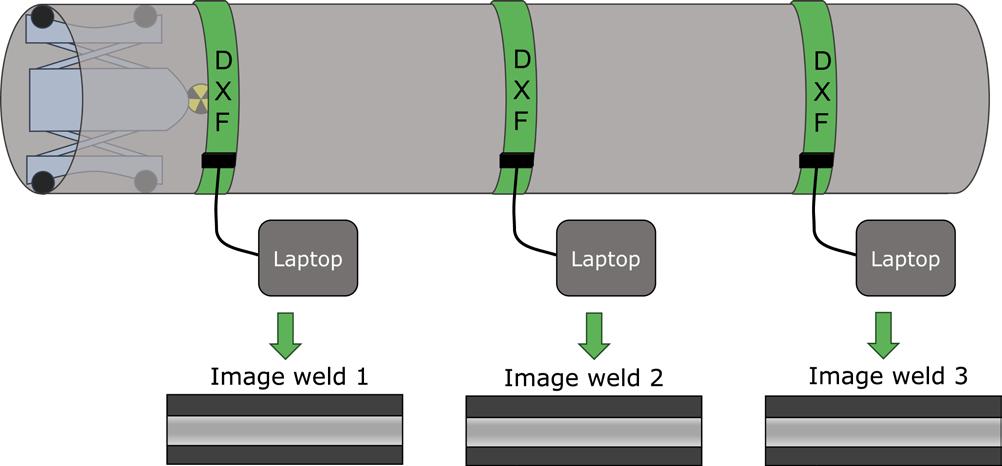
multiple pipeline welds to be prepared for X-ray inspection in advance, before the crawler is inserted – increasing X-ray inspection efficiency and reducing down time significantly compared with traditional film (Figure 1). So, will 2024 be the year that we see the first truly flexible digital replacements for traditional radiographic film?
Radiographic film for pipeline inspection
The main advantage of radiographic film is the fact that it is thin and flexible, enabling it to be wrapped around a pipe while the image is taken. And the film is available on rolls that can be cut to length to match almost any pipe size.
Image intensifier screens – in the form of thin layers of lead – are usually required in front and/or behind the X-ray film. These have to be loaded into light-blocking envelopes in a dark room, to prevent light affecting the film and the subsequent image quality. But modern roll packs are provided with the image intensifier screens already attached to the film and pre-loaded into a light-blocking sleeve, so that loading doesn’t have to be done on site.
After exposure, the film is removed from the sleeve in a dark room and developed manually or automatically to produce the final X-ray film/image. For traceability reasons, these films have to be digitised and electronically stored – or physically stored for up to 60 years in environmental chambers.
Where access allows, pipeline inspection can be done using an X-ray or gamma-ray source mounted on a crawler that travels down the pipe to the weld under inspection. With the film wrapped around the pipe, it is then possible to do a panoramic exposure of the whole weld on a single film –a method called single wall single image (SWSI) (Figure 2).
This is a very efficient method for capturing the image – but has some drawbacks. Firstly, the pipeline has to be taken out of commission to allow access for the crawler. The second drawback is the size of the film to be developed. Depending on the diameter of the pipe, the film could be over 1 m long – making developing it more complicated.
When access to the pipe is not possible, a double wall single image (DWSI) approach is used (Figure 3), where the X-ray or gamma-ray source is on the outside of the pipe, with individual strips of radiographic film on the opposite side of the pipe. This method is much slower than the SWSI approach due to the number of images that have to be captured per weld joint. It also requires a lot more film and the associated chemicals to develop the final images.
So, although X-ray film itself is low cost, thin and flexible, it involves a lot of preparation, consumables (chemicals, image intensifiers and light-blocking sleeves) and storage costs –making its total cost of ownership relatively high. Which brings us back to the question of why the industry has not switched to digital detectors.
Digital flat-panel (DFP) detectors – also sometimes called digital radiography (DR) – have their origins in the medical industry. They are typically square, flat, rigid, heavy and expensive. More modern DFP detectors are more robust, with
Figure 1. SWSI with X-ray or gamma ray source on the crawler using multiple DXF detectors. Figure 2. SWSI with X-ray or gamma ray source on the crawler using radiographic film. Figure 3. DWSI with X-ray or gamma ray source and radiographic film on the outside of the pipe.We are running out of space...

Our inventory in sales & rental in pipeline equipment is out of this world. We have a huge amount of machines from all the big brands that are ready for worldwide delivery, or even further if you want...
You can build on BAUMA!
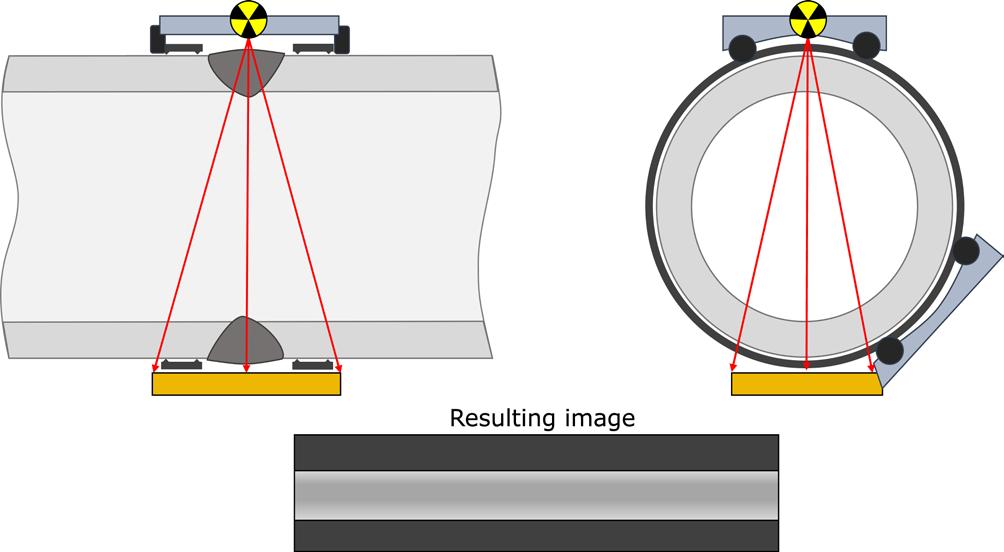
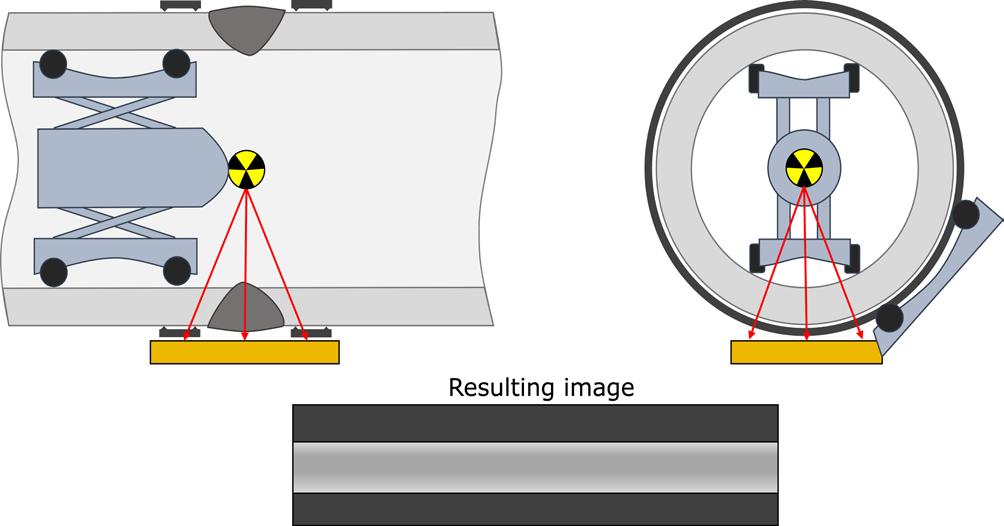
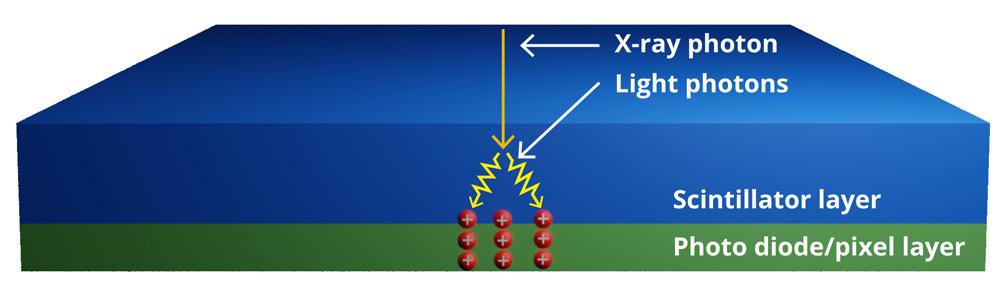

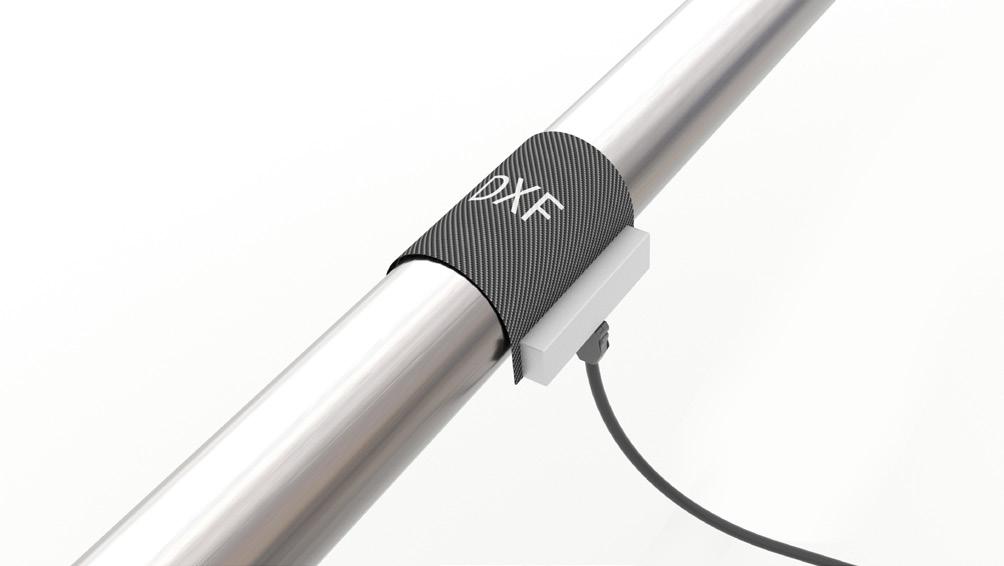
protective housings – but that adds more weight and cost to the panels.
The biggest issue with DFP detectors for the pipeline industry is the fact that they are not flexible – which means they can’t be wrapped around a pipe. For larger diameter pipes, this doesn’t lead to any significant distortion of the images – but it does mean the weld joint being inspected has to be inspected slowly, with many images captured to cover the full pipe circumference.
These images can be captured with the source (gamma or X-ray) mounted on a crawler inside the pipe, as described above, using the SWSI approach (Figure 4). In this case, however, the DFP detector has to be moved several times around the pipe to capture the full image of the weld. These digital images are later stitched together digitally to form a complete weld image. The same issue arises if the DWSI method is used.
There are more automated alternatives for digital radiography of large-bore pipes. One option involves attaching welding bands or similar support rails on either or both sides of the weld under inspection. An X-ray source mounted on a motorised stage is attached to the welding band on one side of the pipe, with a DFP detector on a similar stage on the opposite side of the pipe. When the set-up is complete, the source and detector are rotated around the pipe to capture a continuous image of the weld (Figure 5). The same method can also be deployed with the source mounted on a crawler inside the pipe (Figure 6). The main disadvantage of this method is the set-up time to mount the rails, the X-ray source and the detector.
Another alternative is to use a DFP, with a motorised stage, held to the pipe with permanent magnets. The DFP on the motorised stage is then rotated around the pipe with the source on a crawler inside the pipe. This method has the advantage that it doesn’t require the installation of welding bands or rails on the outside of the pipe on which to mount the source and detector. The use of magnets to keep the motorised stage and DFP in contact with the pipe, however, limits its use to ferrous metal pipes only.
Wherever DFP detectors can be used, there is no denying they generate great images very fast. The software that comes with many of these solutions also makes it very easy to analyse the images. This is likely to improve further with the onset of artificial intelligence software that can do the analysis almost as well as an experienced radiographer.
DFP detectors are typically indirect conversion X-ray detectors. Indirect conversion X-ray detectors use a scintillator material that converts X-rays or gamma rays into visible light. The higher the X-ray or gamma-ray energy, the thicker the scintillator has to be. It then has a pixelated backplane, usually made from amorphous silicon (A-Si) or, more recently, indium gallium zinc oxide (IGZO). This pixelated backplane has a photo diode per pixel which converts the visible light into an electrical signal. These electrical signals are then analysed partly in the hardware world and partly in software, to produce a digital image. Indirect conversion detectors are
Figure 5. DWSI with X-ray or gamma ray source and DFP rotating around the outside of the pipe. Figure 6. SWSI with X-ray or gamma ray source on the crawler and DFP rotating around the outside of the pipe. Figure 7. Indirect conversion X-ray detector explanation. Figure 8. NPX direct conversion X-ray and gamma ray detector explanation.
Dairyland’s PCRX is a solid-state, maintenance-free device designed to simultaneously provide DC decoupling and AC continuity/grounding when used with cathodically protected structures. Unlike traditional decouplers, PCRX’s camouflage technology renders it virtually invisible to interrupted survey testing, making it easier than ever for you to protect and maintain your CP system. Commonly used to decouple electrical equipment from grounding systems, for AC mitigation projects, or other isolation and grounding applications, the PCRX is the most sophisticated decoupler in the world.


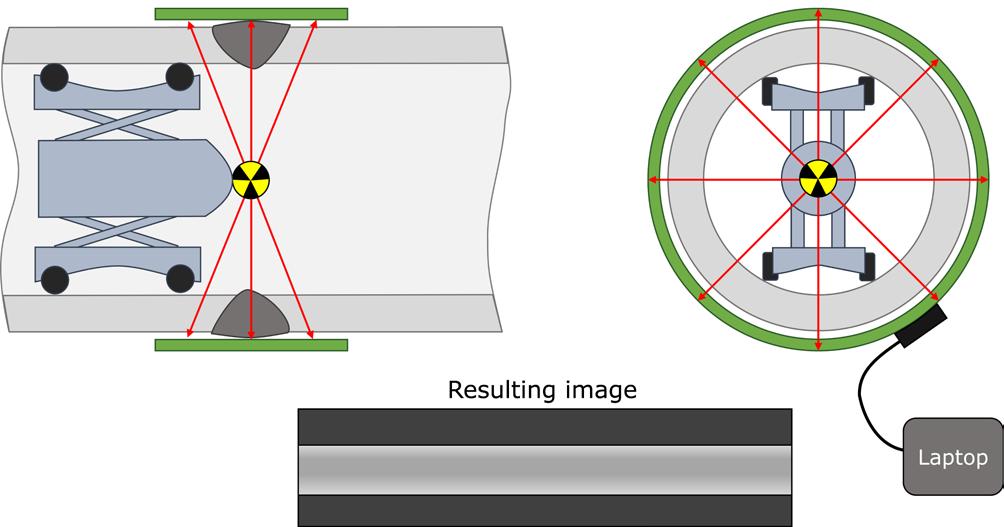
a tried and tested DR detector technology and the most common technology used in medical X-ray imaging (Figure 7).
There are, however, some drawbacks to indirect conversion X-ray detectors:
) There are conversion losses in converting X-rays to visible light and then again to an electrical signal – limiting its sensitivity.
) As soon as the X-rays are converted to visible light, the light scatters from one pixel to the next. In the case of detectors with thick scintillators, the light can scatter across multiple pixels, causing blurring of the image.
A more recent novel introduction to the market is direct conversion detectors based on cadmium telluride (CdTe) and amorphous selenium (A-Se). The CdTe is used instead of a scintillator and converts the X-ray photons directly into an electrical signal, which is then captured by the pixelated backplane. The pixelated backplane in this case doesn’t contain a photodiode. From here, the image processing can be done in the same way as for indirect detectors. Direct conversion detectors typically use more expensive highresolution complementary metal-oxide semiconductor (CMOS) backplanes. The major advantages of direct conversion detectors include:
) Very good spatial resolution and sensitivity – there is no blurring across pixels.
) Very fast and so sensitive that they can be used as photon counting detectors.
Unfortunately, these advantages also come with disadvantages. CdTe is a single-crystal structure that is grown very slowly over weeks. It is therefore limited in size, very expensive and rigid. CdTe direct conversion detectors are thus limited to applications where very high resolution is needed in a small form factor detector. It is typically not used for weld inspection in pipes, due to its cost and size limitations.
Some ‘flexible’ DR detectors are starting to appear on the market. These are still indirect conversion detectors, but they either use flexible scintillators on top of flexible A-Si pixelated backplanes or they use segments of rigid X-ray detectors connected to each other through flexible circuits
to form a panel. In either case, these detectors have only limited flexibility and they are still heavy, relatively thick and expensive. This means they are unlikely to replace X-ray film in the majority of large-bore pipe inspection applications.
The next generation of digital X-ray detectors
In the last decade, meanwhile, there have been huge improvements in the flexible semiconductor industry which could open the door to a new approach for the pipeline industry. TV screens and computer monitors traditionally use A-Si thin-film transistor (TFT) backplanes to produce an image. These can be made flexible but are limited in how small one can make the pixels. With advancements in IGZO and low-temperature polysilicon (LTPS) TFT panels, computer monitors, TVs and mobile phones can now offer much higher resolutions (smaller pixels) than previously possible.
These flexible pixelated backplanes are already being used to enable the ‘flexible’ detectors on the market today. There are, however, further enhancements coming from the solar photovoltaic (PV) market, where flexible organic semiconductor materials are being developed as an alternative to A-Si for solar panels. When these materials are combined with high attenuation nano particles, it is possible to create an X-ray sensitive semiconductor ink called NPX. When NPX is coated onto an A-Si, IGZO or LTPS pixelated backplane, it can be used as a direct conversion X-ray detector (Figure 8). Since both technologies can be made flexible, the end result is a truly flexible digital X-ray detector as a direct alternative to traditional X-ray film – in other words, digital X-ray film (Figures 9 and 10).
A flexible pixelated backplane, coated with direct conversion semiconductor ink and sandwiched between two layers of carbon fibre, is likely to be less than 1 mm thick –and therefore has the potential to be a true replacement for radiographic film. Protecting the digital X-ray film with a layer of carbon fibre offers significantly more scratch resistance than would be the case with radiographic film or CR plates. The risk, however, does exist and therefore these detectors would need to be cost effective enough to be at least semidisposable – so that if they need to be replaced after 100 welds, for example, the total cost of ownership is similar to or lower than radiographic film.
DXF would be used on pipeline applications in exactly the same way as traditional radiographic film. The DXF is wrapped around the pipe in the same way as roll packs, with the source mounted on a crawler in the pipe. With this configuration, a single panoramic image can be generated digitally and instantly – resulting in a significant saving in time and material costs. It also allows DXF to be wrapped around several joints in the pipeline at the same time, so the crawler can move from one to the next consecutively, significantly reducing the time to inspect the whole pipeline and reducing the time that the pipeline is out of commission (Figure 1).
Digital X-ray film is not yet commercially available – but the development of this technology is promising and no longer just a long-term vision.
Johannes Keuter, 3P Services GmbH & Co. KG, Germany, describes the specifics of solving an ILI challenge on two 18 in. gas pipelines.
The integrity plan of any asset is an integral part of a safe hydrocarbon producing facility and pipelines are no exception. 3P Services has been contracted to perform the inline inspection (ILI) of two 18 in. gas import pipelines. The pipelines in question were built post 2010 and had been MFL inspected in 2020 by another ILI company, but their interpretations were compromised by sensor lift-off believed to be caused by pipeline debris.
The scope included several cleaning tool runs and an ILI tool run. To counter the known probability of identification (POI) challenge, an ILI tool was developed with four different sensor types to accurately analyse these known
problematic areas. The specially designed ILI tool was equipped with magnetic flux leakage (MFL) and geometry (GEO) sensors as well as wallguided and stand-off magnetic sensors to inspect the pipeline for internal and external metal loss, geometric discontinuities, and other features. Cleaning runs were performed with export gas as the propelling medium.
The pipeline design, layout, and condition combine several factors which made a successful ILI challenging, such as the pipeline length, wear on tool components, battery life and the cleanliness, causing vibration and stand-off problems
degrading data quality. In addition, the wall thickness, beyond the magnetisation of most MFL tools in the market and the schedule, was very challenging.
The 300 km length of the pipeline requires a low-wear ILI tool design to avoid significant wear of the cups, sensor arms and magnetiser. The run time was anticipated to be three days. The number of batteries required to provide sufficient battery lifetime needed more space and hence, additional tool segments were required. The additional segments complicated the tool transportation and handling. Detailed planning of the transportation and onsite tool handling, in close cooperation between the 3P Services and the client, was necessary.
The pipelines also had several cleanliness challenges. The probability of identification (POI) was limited and no clear differentiation between corrosion and debris was possible. Hence, the previous third party inspections were not fully successful, and the data couldn’t be used for a full evaluation of the client’s problems.
Moreover, the pipelines are classified as ‘heavy wall’. The nominal wall thicknesses of 25.4 mm and 27.3 mm are a measurement challenge for MFL, especially in an 18 in. pipeline, since a proper magnetisation level must be achieved for a good measurement performance. Due to previous unsuccessful third party ILI runs, 3P Services was challenged to develop a heavy wall MFL magnetiser that could magnetise the wall thicknesses, cope with additional debris, and associated vibration and ensure correct reporting specifications would be met.
In addition to technical challenges, the project also had schedule challenges. The schedule challenges refer to the lead time between contract award and onsite activities to build a unique inspection tool, as well as the accelerated time for analysing four data sets to produce the final report. Accelerated reporting times posed a double challenge, because the pipeline length is above that of a normal inspection and there were four data sets to be evaluated. Due to the high-profile nature of this inspection, the client required weekly data analysis updates. For this reason, the 3P Services project team worked on project preparation, tool design, assembly, testing, shipment, project execution and reporting under elevated levels of time pressure.
In order to tackle this very challenging inspection 3P Services had to include several solutions in its overall inspection concept, including a low friction and extended run components design with extended run time, multiple sensors allowing discrimination of pipe wall from debris and a detailed testing and factory acceptance as well as a custom-made cleaning programme.
First, the weights of each segment were estimated, and optimum polyurethane cups were designed. The number of cups, the position and the dimension, were all defined. Furthermore, the geometry measurement segment which carries the wall-guided magnetic sensor was redesigned. The sensor arms were equipped with wheels which guided the arms. This design allows rolling friction instead of sliding friction. This reduced the abrasion significantly.
Unlike most ILI service companies, 3P Services uses wheels to support its MFL magnetiser as standard. It was a clear choice to use this successful wheel design for this extremely long gas pipeline. As an added benefit the wheel design will not compromise any internal coatings adversely. Nevertheless, there was the need to strengthen the magnetisation capabilities of the yokes to magnetise up to 27.3 mm nominal wall thickness. A combination of bespoke yoke design and exceptionally strong magnets solved this challenge. 3P Services has a long history of heavy wall MFL inspection in the past, these experiences were used to find the ideal balance between wear limitation, yoke volume, magnetic strength, and pipeline magnetisation.
A circa 300 km long pipeline with a run time of three days using multi-sensor-technology combo-ILI tool will require enormous energy consumption. Three additional battery segments were needed to carry sufficient battery power to ensure a successful inspection. The battery segments were used as pulling segments to limit the tool lengths and combine two functions.
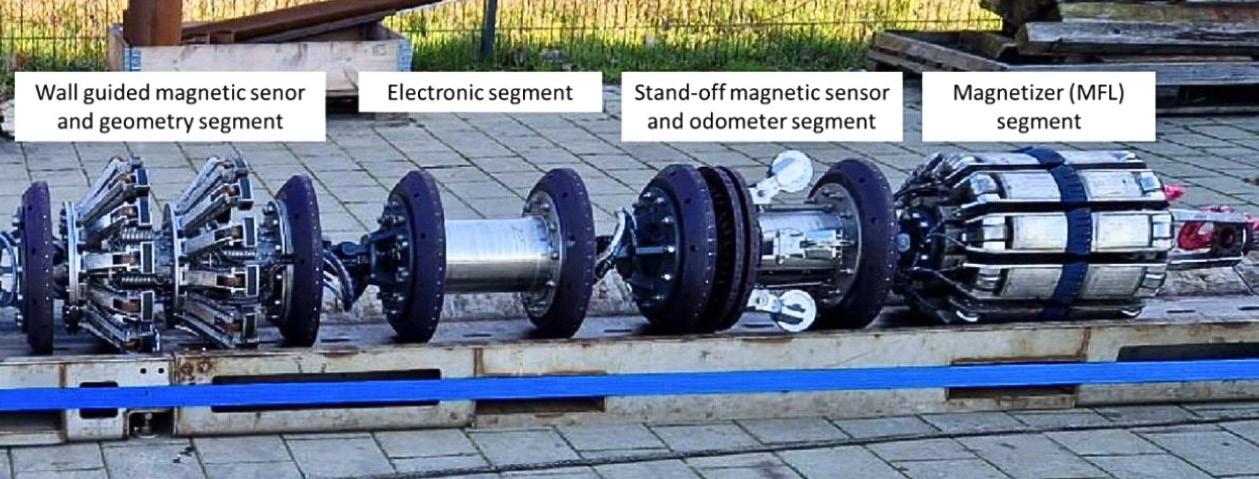
An important part of the preparation of the pipeline inspection is the pre-ILI cleaning of the pipeline. Considering the history of the pipelines previous inspections, special attention was given to the cleaning programme. 3P Services assessed the cleaning programme and the focus remained on

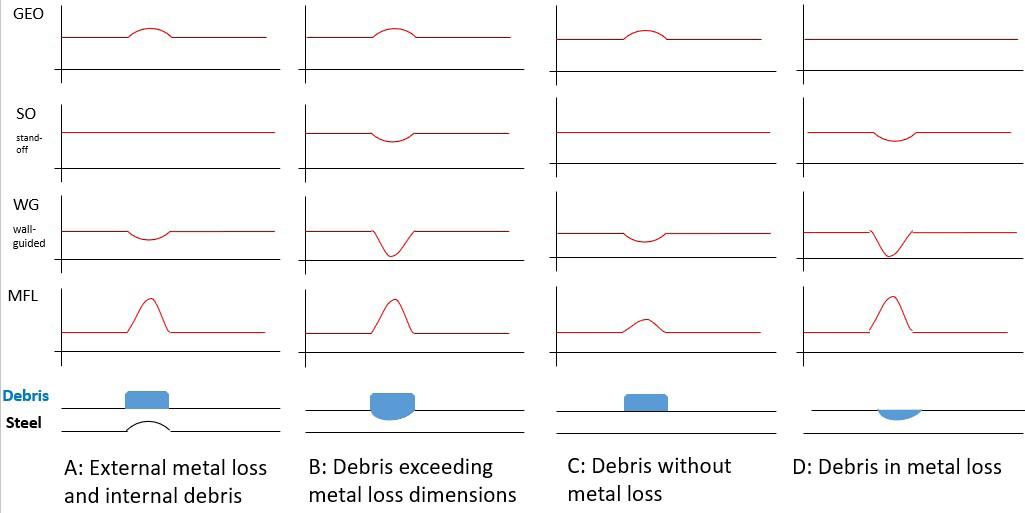
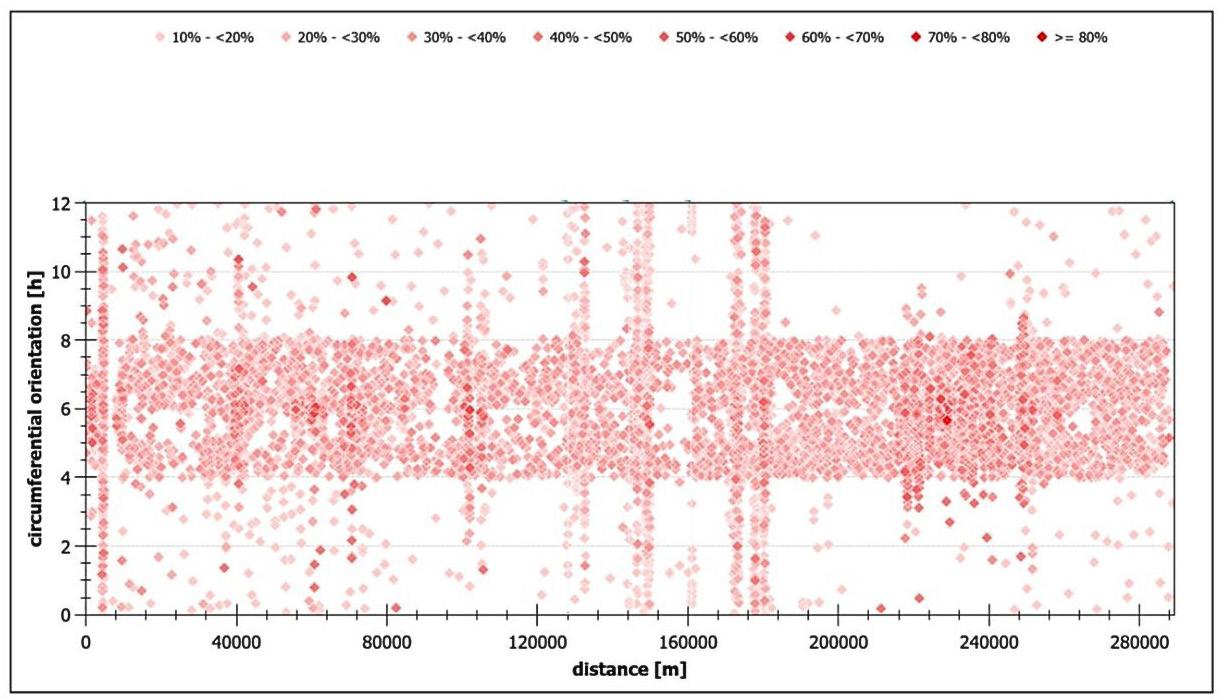
inspecting and collecting complete, good, and unequivocal data from the intelligent tool to avoid a limited probability of identification (POI) and to avoid issues with the clear differentiation between corrosion and debris.
3P Services developed an advanced approach of combining several measurement technologies on one combo-ILI tool, including MFL, GEO, wall guided magnetic sensors and standoff magnetic sensors.
The combination of four different measurement technologies or sensor arrays, respectively, allowed a differentiation of various debris/metal loss situations based on the collected ILI data. The geometric sensors (GEO) measure the internal diameter (ID) and any internal deformations. The wall-guided magnetic sensors were used to measure the distance between each sensor and the next ferritic surface, typically the inner pipe wall. The wall-guided magnetic sensors (WG) move with the movement of the geometric sensor arms. In contrast to that, the stand-off magnetic sensors (SO) don’t move with the movement of the geometric sensor arms. But they also measure the distance between each sensor and the next ferritic surface. Finally, the MFL sensors were used to
measure the magnetic field in the pipe wall and detect internal as well as external metal loss.
Figure 2 shows four different situations (A-D) and the effect of those onto the four different sensor measurements. From top to bottom the effects on each technique can be seen.
Situation ‘A’ shows external metal loss and internal debris. The geometry sensors (GEO) show a corresponding ID reduction. The stand-off magnetic sensors are not in touch with the debris and consequently don’t show any change in signal. Whereas the wall-guided magnetic-sensors show a weak signal caused by the increased distance of themselves to the inner pipe wall due to the arm movement. The MFL sensors show a strong signal caused by the external metal loss.
Situation ‘B’ shows internal metal loss with internal debris thicker than the internal metal loss depth. Consequently, the geometry sensors (GEO) show an ID reduction. In contrast to situation ‘A’, the stand-off magnetic sensors are still not in touch with the debris but show a signal change due to the internal metal loss. The wall-guided magnetic-sensors show a strong signal caused by internal metal loss and the MFL sensors show also a strong signal caused by the internal metal loss.
In situation ‘C’ there is no metal loss but internal debris. Hence, the geometry sensors (GEO) show an ID reduction. The stand-off magnetic sensors are not in touch with the debris and there is no internal metal loss and consequently they don’t show any change in signal. Whereas the wall-guided magneticsensors show a weak signal caused by the increased distance of themselves to the inner pipe wall due to the arm movement. The MFL sensors show a weak signal caused by the minor sensor movement which is possible in case of hard scale debris. There is a risk of misinterpreting this weak signal as metal loss, which probably caused compromised data interpretations in the 2020 third party MFL inspection.
A similar situation is visualised in situation ‘D’, in which internal metal loss is filled with debris. In this case the geometry sensors (GEO) show no ID reduction. The standoff magnetic sensors are again not in touch with the debris but show a signal change due to the internal metal loss. The wall-guided magnetic-sensors show a strong signal caused by internal metal loss and the MFL sensors show also a strong signal caused by the internal metal loss.
In conclusion, the combination of the four different measurement technologies or sensor arrays, respectively, allowed a differentiation of various debris/metal loss situations. Because each situation causes different reactions of each technology. The combination of the data set of each
Figure 2. Effect of different situations (A - D) on multiple measurement technologies.
technology shows a unique picture and allows a significantly improved identification of debris and metal loss or debris with metal loss. This leads to a clear improvement of the probability of identification (POI).
It was decided between the client and 3P Services to test the above-described system and to include a challenging spool piece with internal metal loss and debris into the standard pull-test programme. The characteristics of this spool piece were used to reflect situation ‘D’ as part of the large-scale tool testing. The client did witness the factory acceptance tests (FAT) and the test results were documented with a FAT report
and approved from the operator prior to ship the tools and equipment onsite.
Prior to the start of the cleaning campaign, 3P Services and the client discussed the types and sequence of the cleaning tool runs. Current schedules and operational circumstances were taken into consideration to choose the ideal cleaning tools and cleaning tools sequence. After several cleaning tool runs the client and 3P Services made the joint decision to run the ILI tool.
The intelligent combo tool was installed into the launcher trap and launched with gas according to plan. The overall travel time was 62 hours with an average tool speed of 1.3 m/sec. After receipt, the tool was removed from the receiver trap. Firstly, onsite field technicians checked the completeness of the data of the four sensor sets. The entire pipeline length was recorded. A special analysis of potential debris influence was made, and it was confirmed that there were no indications of debris influence in the data. The upload of the data to 3P Services’ server was completed on the next day. An operations report according to pipeline operator forum (POF) was issued 48 hours after data receipt and the data analysis department started work.

The operator required weekly updates about the data analysis progress, which 3P Services delivered accordingly. A weekly update was shared with the client between the preliminary report and the final report. Eight weeks after the receipt of the data, 3P Services submitted the final report. The final report contains the list of all reported findings, the pipe book and 3P Services’ software to visualise the inspection data. The distribution of metal loss over the pipeline length and circumference was visualised with the following graph.
A typical 6 o’clock pattern of internal metal loss anomalies over the pipeline length and circumference can be seen (Figure 3). 3P Services additionally performed an estimated repair factor (ERF) calculation according to ASME B31.G to provide the operator further data for their integrity assessment.
The execution of the inline inspection with 3P Services’ ILI tool allowed the operator to perform a full integrity management of the asset and take measures to operate the pipeline safely.

Seamus Jacobs, Dexon Technology, Thailand, discusses the importance of inline inspection system performance specifications, inspection data verification, and rigorous testing for the accurate detection of metal loss in oil and gas pipelines.
Oil and gas pipelines play a crucial role in the efficient and reliable transportation of hydrocarbons over large distances. However, like all infrastructure, pipelines are susceptible to a wide range of damage mechanisms threatening safe and reliable operation. Early detection and accurate assessment of damage is crucial to maintaining asset integrity and meeting the worlds energy needs.
Damage mechanisms
Metal loss in oil and gas pipelines can be attributed to erosion or corrosion, both of which can significantly
impact pipeline integrity. Corrosion is caused by a chemical reaction between the pipeline material and the environment, while erosion results from physical abrasion
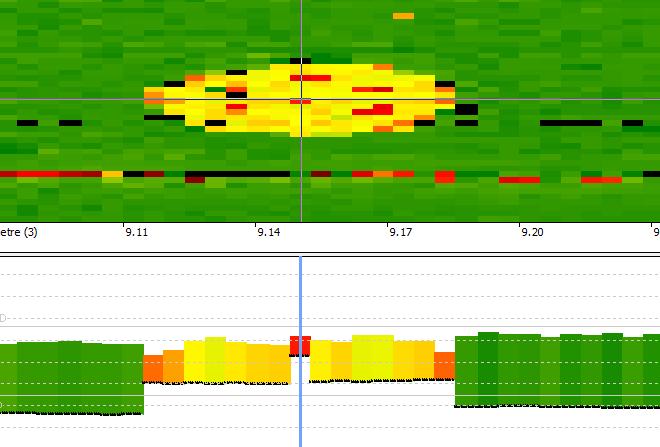
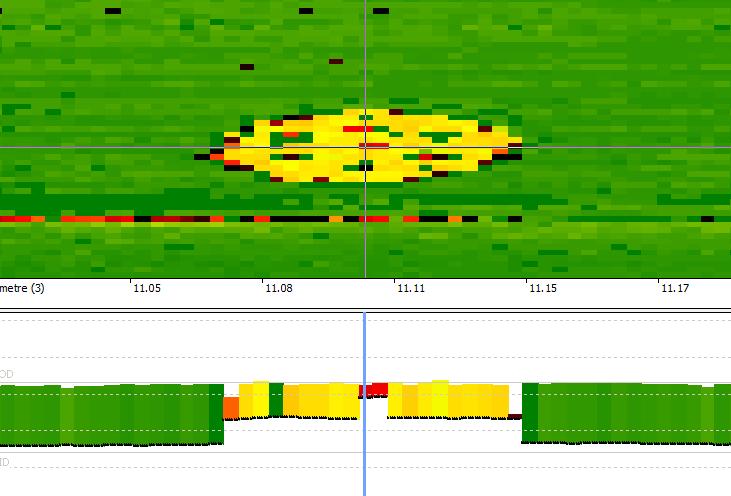
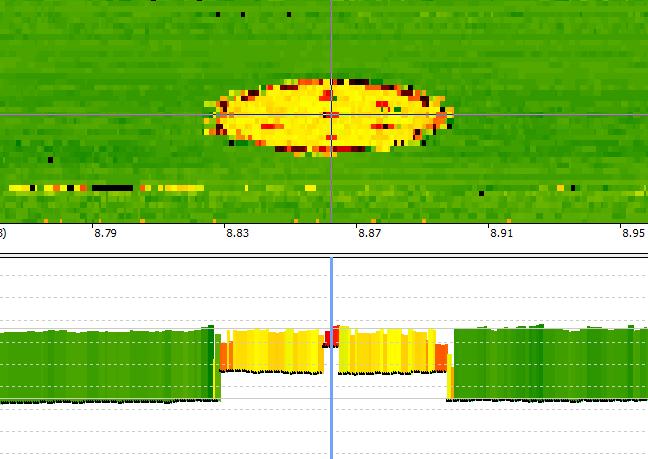
between the pipe’s surface and either transported particles or external environmental mechanisms. While erosion is dependent on physical parameters corrosion growth rates vary widely depending on environmental conditions and specific damage mechanisms.
Corrosion growth rates refer to how quickly corrosion progresses on the surface of a pipe over time. This rate can vary significantly depending on corrosion type, environmental conditions, product being transported, and pipeline properties. General corrosion and other forms of relatively slow forming corrosion typically progress at a rate of hundredths or tenths of a mm/y, while other forms of more rapid and severe material degradation such as microbiologically influenced corrosion (MIC) can progress at a rate of over 8 mm/y.
The American Petroleum Institute (API) and the Pipeline Operators Forum (POF) provide recommendations and guidelines for the inspection and assessment of oil and gas pipeline integrity. POF 100 serves as a critical resource for pipeline operators, offering standardised recommendations for defect assessment. Including base guidelines on anomaly parameters and classification, tool specifications and detection capabilities and inspection reporting.
Pipeline inline inspection (ILI) or as it also known ‘smart pigging’ plays a crucial role in the detection and sizing of metal loss defects in oil and gas pipelines. Ultrasonic (UT) Non-Destructive Testing is a key inspection technique utilised for pipeline integrity assessment. Ultrasonic inspection provides direct measurement and assessment of a pipelines wall thickness. During UT metal loss inspections high-frequency sound waves are transmitted through the pipeline and into the pipe wall. Reflected UT sound waves or ‘echoes’ are received by the ILI system and analysed to detect and characterise internal and external defects.
A pipeline inspection system’s performance specification (its ability to accurately detect, identify and measure defects in a pipeline) are classified as its probability of detection, probability of identification, and sizing accuracy.
Ultrasonic sampling resolution directly impacts an ILI systems performance specification and refers to the number of samples collected over a given area of pipe wall. Similar to the resolution of a television, the higher the number of samples collected, the greater the inspection resolution. In data analysis terms this increase in resolution translates to a more accurate assessment of defects in a pipeline. A metal loss ILI’s sampling resolution is expressed in terms of axial and circumferential spacing between measurements and is reported both axially along the pipe length, and circumferentially around the pipe’s circumference. Sensor spacing, transducer firing rate and
Figure 1. Low resolution ILI data of the same artifical defect collected using the same ILI over multiple runs at varying tool speeds. Figure 2. Medium resolution ILI data of the same artifical defect collected using the same ILI over multiple runs at varying tool speeds.tool run speed are all factors that affect sampling density. The selection of the appropriate ILI system and desired detection capabilities are agreed upon by the client and contractor prior to the inspection, based on inspection requirements and anticipated defects. Axial sampling rate is directly influenced by altering an ILI system’s run speed. Decreasing inspection speeds reduces the space in-between samples, increasing axial sampling density. Circumferential resolution can be affected by the number of ultrasonic transducers in the tool or the pulse rate (Hz) employed.
Figures 1, 2 and 3 illustrate how the axial sampling rate of an ILI system is affected by tool run speed, with sampling resolution increasing from top to bottom. Each of the three images has been taken from ultrasonic ILI test yard inspection data, using the same ILI over three runs at varying speeds with the same artificial defect. Using a colour gradient to represent changes in wall thickness, with dark green representing nominal wall thickness and dark red representing critically thin wall thickness. The top section of each image shows C-Scan inspection data, a graphic representation of wall thickness along the axis and circumference of the pipe. The bottom section of each image shows axial B-Scan inspection data, a cross section representation along the axis of the pipe showing changes in wall thickness as well as ID and OD discrimination. The number of axial samples drastically increases over a given distance as the tool speed is reduced while maintaining the same transducer pulse rate (Hz), reducing the amount of space between samples and increasing POD, POI, and POS.
) Probability of detection (POD): An ILI system’s POD refers to the likelihood of detecting defects of a certain size (typically 90%). This indicates that if such defects are present, the respective inspection system has a 90% chance of recording them. To express the reliability of this 90% POD, a confidence level is defined (typically 95%). This means that if the inspection is repeated, one can expect that 95% of the time, the POD estimate would correctly reflect the true detection capability of the system. Generally, an increase in sampling resolution provides a higher certainty, also applicable to more complex defects.
The example in Figure 6, taken from POF 100 guidelines of a POD graph, shows the relationship between defect size and detection rate percentage.
) Probability of identification (POI): A system’s POI refers to its ability to accurately identify a particular pipeline feature or anomaly type. While a single measurement may indicate that there is a reduction in wall thickness, multiple measurements showing a reduced wall thickness over a particular area may indicate a certain metal loss anomaly class. POI is an important metric in ensuring the reliability and accuracy of Non-Destructive Testing (NDT) and ILI. Accurate identification is crucial for dig verification, maintenance, and repair following pipeline inspection runs.
) Sizing accuracy or ‘probability of sizing (POS)’: Refers to an ILI systems ability to accurately size metal loss defects including defect length, width, and depth. While metal loss area is imperative in identifying the damage mechanism or corrosion type, depth sizing accuracy or wall thickness accuracy is critical in assessing safe pipeline operating parameters and the severity of the anomaly. Depth sizing accuracy refers to the precision with which an ILI tool can accurately measure and report wall thickness and in turn metal loss. Depth sizing accuracy is expressed as a reporting range above and below actual wall thickness. For example, POF recommends a minimum depth sizing accuracy of ± 0.3 – 0.5 mm, with a length and width accuracy of 10 mm, typically at 90% certainty. High sampling resolution ensures that defect dimensions can be measured accurately, which is imperative for assessing the severity and impact on the pipeline’s integrity.
OUR BALL VALVES GO BEYOND THIS DISPLAY AND YOUR EXPECTATIONS!

1/8’’ - 56 ‘‘ CLASS 2500 AND HIGHER


OIL, GAS, HYDROGEN, DISTRICT ENERGY & VARIOUS APPLICATIONS


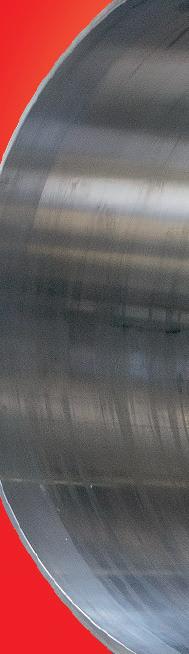

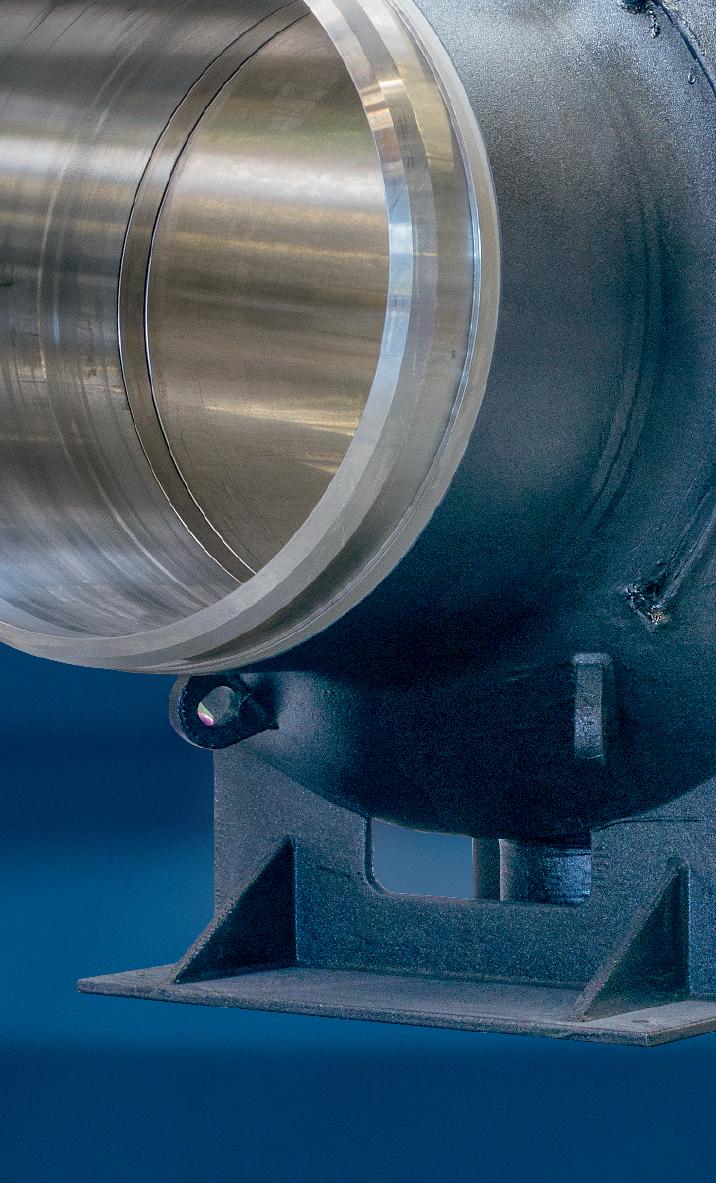

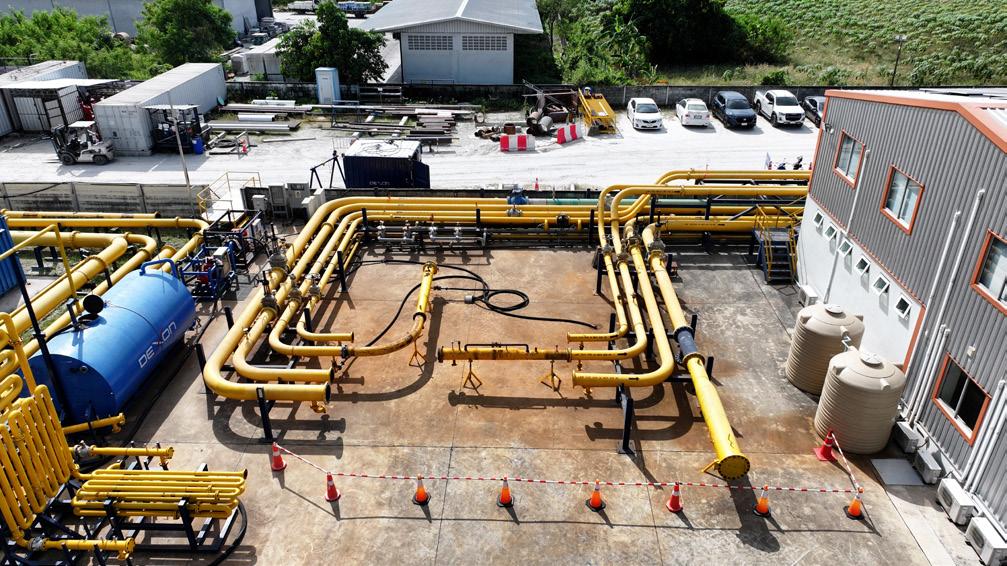
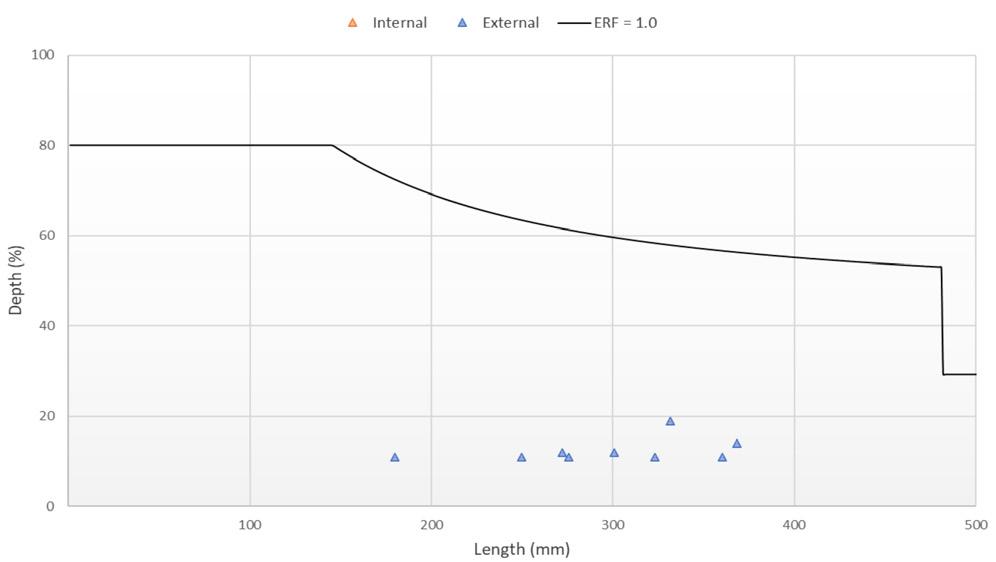
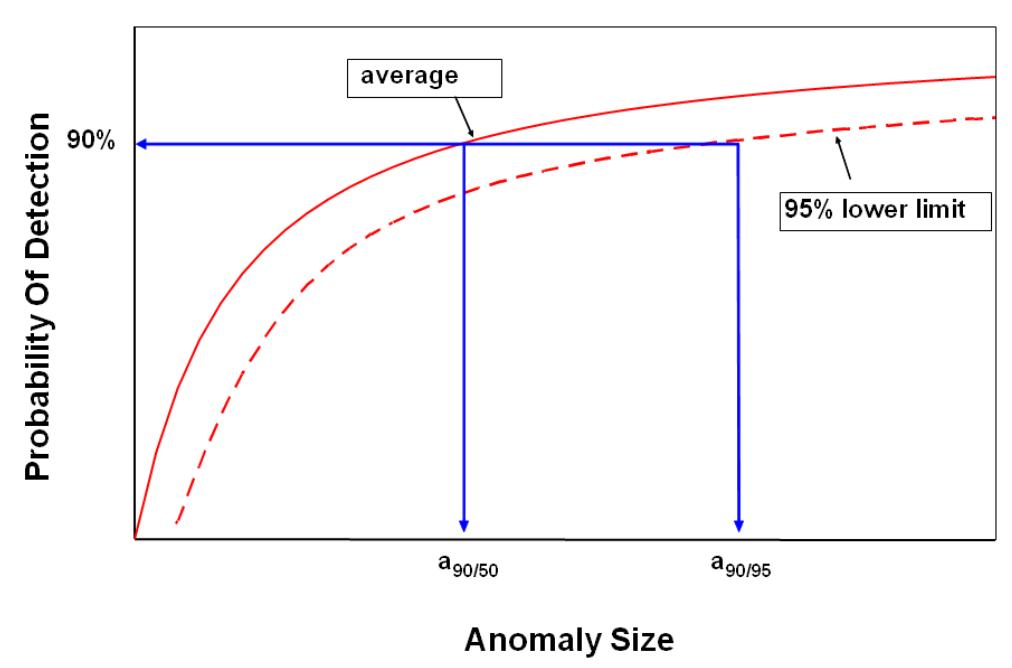
of oil and gas pipelines are fabricated using carbon steel due to its durability and relatively low cost, alternative materials include stainless steel and plastics due to their distinct material properties, which make them suitable for unique applications and operating environments. High-density polyethylene (HDPE) is extensively used throughout the mining industry for the construction of tailing lines. Tailing lines are used to transport large volumes of rock and other debris generated during the mining process for disposal. These pipelines are highly susceptible to extreme erosion at the 6 o’clock position due to abrasion. HDPE lines pose several difficulties to inspection including loss of ultrasonic signal by attenuation, requiring proprietary transducer design and fabrication. Dexon holds over 20 years of HDPE pipeline inspection experience.
A comprehensive assessment of the ILI system’s detection capabilities is essential before conducting in-field inspection runs, ensuring an extensive comparison between actual in-field performance and design specifications. Dexon’s headquarters features a combined seven acre ILI test yard facility allowing for inspection data verification, client pipeline replication for ‘unpiggable’ or challenging pipeline inspection verification, factory acceptance testing and hands-on inspection engineer training for remote inspections. The facility allows for full-scale mock-up testing and is completely self-sufficient, featuring underground storage and collection tanks, aboveground water storage tanks and pumping stations. The yard is split into three sections and includes a range of ILI test loops and lines in a range of sizes for specific testing applications.
) Infinity test loops: Dexon’s ILI infinity loops consist of a series of valves that automatically open and close allowing the tool to be run through a continuous closed loop. The system includes over eight bends in a 160 m loop covering a range of diameters. Infinity test loops allow for tool endurance testing and data collection and verification over long distances, testing the tool components for mechanical ware.
Probability of detection, identification, and sizing accuracy are essential components of pipeline inspection ensuring accurate and reliable assessment of defects. By understanding the likelihood of accurately detecting, categorising, and precisely measuring anomalies, pipeline operators can effectively manage their infrastructure and prioritise maintenance and repair activities.
One of the key advantages of ultrasonic ILI is the ability to inspect a wide range of pipe materials. While the majority
) U bend pump through lines: U-loop pump through lines are fitted with launchers and receivers allowing for the testing of tools requiring gas and liquid propulsion at pressure. U loops include a minimum of two bends per line allowing operators to test a tool’s ability to pass and negotiate bends of differing radii as well as data collection and verification.
) Pull through lines: Pull-through lines are open-ended pipe spools used for the testing of calliper and magnetic flux leakage ILIs. As these tools do not require a liquid couplant unlike ultrasonic tools the launching and receiving portion of the testing can be eliminated, and instead, the tools are pulled through the line using a
winch. Figure 6. Typical example of the average and lower limit POD curve as function of anomaly size with indication of the definitions of a 90/50 (a90) and a 90/95. 1 Figure 5. B31G example graph showing 9 external metal loss defects within acceptable limits. An ERF value plotted above the acceptance line is deemed repairable under B31G guidelines.Dexon’s onsite test yards allow for a range of testing applications prior to in field pipeline inspection to ensure tool performance.
) Inspection data verification: Data verification allows for the detection and sizing of artificial and natural defects for the precise calculation of probability of detection (POD), probability of identification (POI), and sizing accuracy or ‘probability of sizing (POS)’ figures.
) Client pipeline replication: Replication of client pipeline configurations allows inspection teams to assess an ILI systems ability to ensure adequate data collection under challenging inspection conditions or pipeline configurations. Allowing for extensive testing following tool modification and fabrication.
) Factory acceptance testing (FAT): Factory acceptance testing allows for full transparency of ILI system detection capabilities. Comparing tool design detection capabilities, test yard inspection data, and flawed specimen fabrication drawings. Providing actual POD, POI, and POS specifications. Third-party validation of inspection data and tool performance is also available upon request. In person FAT is available at Dexon’s headquarters or remotely via live video link. Blind FAT can also be performed using client supplied flawed specimen pipe spools with either manufactured or natural defects. Alternatively Dexon provides an extensive flawed specimen library for ILI testing.
Engineering assessment calculations are essential for evaluating safe operating parameters and the remaining life of industrial equipment following integrity assessment. Key assessments include Fitness-for-Service (FFS) assessments as outlined in API 579-1 and ASME FFS1, B31G, and Remaining Life Assessment (RLA).
The Pipeline Operators Forum POF 100 recommends the use of B31G and the estimated repair factor (ERF) to assess defect severity and safe operating parameters. The ERF is a ratio of a pipelines maximum allowable operating pressure (MAOP) and safe working pressure (P safe).
ERF = MAOP/P safe
The B31G example graph (Figure 5) shows nine external metal loss defects within acceptable limits. An ERF value plotted above the acceptance line is deemed repairable under B31G guidelines.
Section 7 of API 570, pipeline inspection code provides comprehensive evaluation to determine the remaining
useful life of equipment, considering all relevant factors such as current condition, operational history, and future operating conditions. RLA is calculated as follows:
tactual – trequired
Remaining life (years) = corrosion rate [inches (mm) per year]
t actual: The actual thickness, in inches (millimetres), measured at the time of inspection for a given location or component as specified in 5.7.
t required: The required thickness, in inches (millimetres), at the same location or component as the actual measurement computed by the design formulas (e.g. pressure and structural) before corrosion allowance and manufacturer's tolerance are added. 2
Fitness for service is an engineering assessment methodology used to determine whether damaged or degraded equipment can continue to be safely operated for a specified period. The American Petroleum Institute’s API 579 provides comprehensive guidelines for evaluating the fitness-for-service of piping equipment with 3 levels of intensity.
• Level 1: Quick, conservative screening with minimal data.
• Level 2: Intermediate analysis with more specific data and less conservative assumptions.
• Level 3 or Finite Element Assessment: Provides a highly detailed assessment of the asset using large amounts of data assisted by FEA computer algorithms.
Pipeline maintenance is essential for ensuring the safe and efficient operation of pipelines over time. Regular maintenance activities include inspections, corrosion control, cleaning, and monitoring of pipeline conditions. These tasks help identify any potential issues early on, preventing costly repairs or asset failures.
When it comes to repair methods, pipelines may require different approaches depending on the damage mechanism present and extent of damage. Common repair techniques include sleeve and wrap repairs and cutting and replacing entire sections. Some maintenance can be performed while the line is in use while other repairs may require that line to be taken out of service.
It is essential for pipeline operators to have a robust maintenance and repair plan in place to address issues promptly and ensure the continued integrity of the pipeline system. Compliance with industry standards and regulations is vital to maintain safety and environmental protection.
References
1. POF 100 Specifications and requirements for ILI - Nov 2021.
2. API 570, Piping Inspection Code: In-service Inspection, Rating, Repair, and Alteration of Piping Systems, FOURTH EDITION, FEBRUARY 2016.
Azero-tolerance attitude to any failure of gas or other hazardous liquid-carrying pipelines is driving ever more stringent regulation of the sector. As pipelines age, with many at least 60 years old, the onus is on inspectors to find cracks and corrosion quickly to mitigate risk to the local community and environment.
Since the Pipeline and Hazardous Materials Safety Administration’s (PHMSA) third and final part of its ‘Mega Rule’ – which relates to gas pipelines – came into effect in May 2023, the wider hazardous liquids industry has been keeping a watchful eye on implications of this rule and how it will affect the wider sector. In response, the pipeline management and inspection sector is developing data-driven
tools that are crucial to efficient resource management and safety.
Since coming on the market in the 1960s, inline inspection (ILI) pigs have performed vital tasks such as cleaning pipelines and locating deterioration without stopping the flow. Knowing a pig’s location, speed, and estimated arrival time is crucial to limit the consequences of lost or stuck tools that can obstruct product flow and lead to service disruptions. Advanced inspection technologies help operators track multiple pigs over long distances and remote terrain. For instance, Xylem’s PureHM Armadillo Tracks offers a flexible solution for remote, permanent, and conventional tracking. It works with above-ground markers (AGM) deployed before a tool run, so they are in place and ready to track when
needed. Armadillo Tracks AGMs communicate with a remote tracker that can update their location on LiveMap, giving technicians the ability to track pigs from any location.
But why opt for a tracking device when a technician can do the same job without investing in such advanced technology?
Conventional tracking methods require field technicians to move from site to site to track multiple pigs, sometimes over
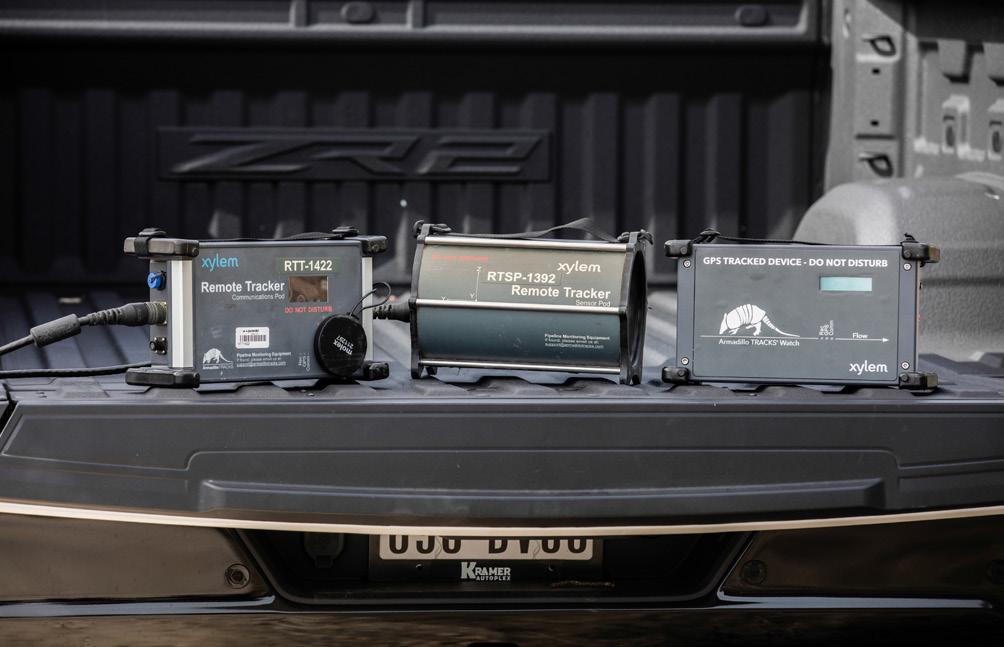
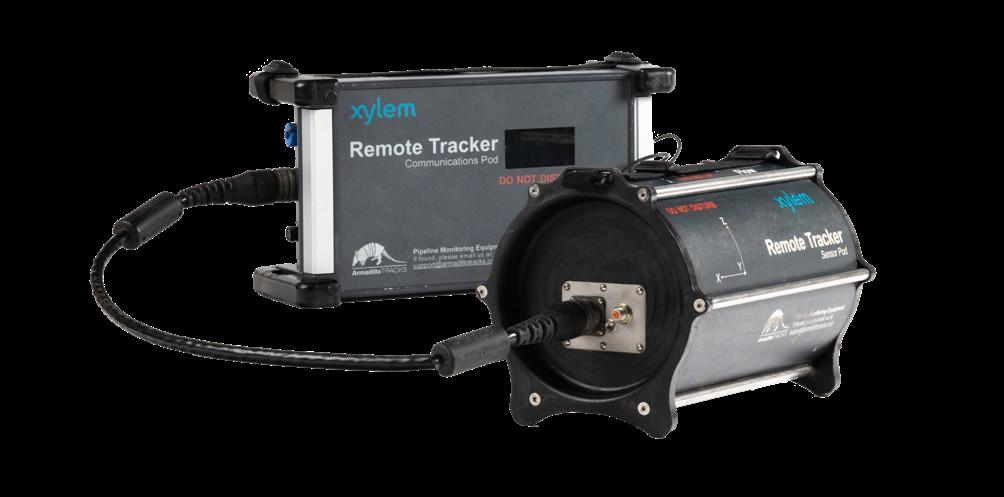
numerous runs, requiring a lot of driving and roadside parking, which both carry risks.
Remote tracking can increase efficiency by allowing operators to monitor pigs from the office, which lowers the risk associated with having trackers in the field and reduces the carbon footprint associated with travel.
When using remote tracking, technicians can temporarily deploy, and test Armadillo Tracks AGMs before a pig run begins. As pigs pass the AGMs, progress is updated on LiveMap, which provides a live view of the pigs’ position, velocity, and estimated time of arrival.
Remote tracking also mitigates risks associated with tracking speeding pigs due to rising differential pressure – a challenge for technicians as they rush from site to site. Speed increases make tracking even more challenging in urban areas or bad weather as travel becomes more difficult.
If there is a reasonable chance that the pig’s speed could increase, it is often safer to remotely track pigs than to chase them. As the AGMs are pre-deployed, changes in pig speed do not affect the ability to track the pig safely. A remote tracker can be at several sites simultaneously when needed.
Depending on the specifics of the run, remote tracking can save operators more than 50% compared to a conventional approach.
Take a typical example of a gas pipeline in an urban environment that requires multiple runs over several days. Conventional tracking would require a minimum of three technicians per day, per shift, and additional trucks, mileage, equipment, and hotel bookings for personnel. If an operational delay occurs, standby charges can be considerable. No auditable data is captured, and human error may come into play.
In contrast, remote tracking requires a single technician for set up and take down. As Armadillo Tracks LiveMap software allows for a real-time view of a pig’s progress and each tool is tracked with multiple sensors, fewer field resources are needed throughout the inspection project.
The estimated cost for a remote tracking job such as this would be US$12 000, 47% less when compared to US$22 500 for the same project tracked using conventional methods.
Or take another typical scenario involving a liquid pipeline that is difficult to access requiring multiple technicians and specialised equipment operating in an elevated risk environment made even riskier after dark. Remote tracking would require two technicians over four helicopter days to deploy and retrieve AGMs.
A real-time view of the pig’s position saves on travel and removes the need for any ‘right of way’ access, reducing risk. Conventional tracking of the same project would require two technicians and 10 helicopter days.
Remote tracking is estimated to deliver savings of up to 47% versus conventional tracking approaches.
Every inspection carries risks and challenges, but all can benefit from remote tracking by increasing safety for inspectors, the local community, and the environment while providing more visibility at reduced cost.
Figure 1. Xylem’s PureHM Armadillo Tracks is a flexible solution for remote, permanent, and conventional tracking, which allows operators to track multiple pigs over long distances and remote terrain. Figure 2. A remote tracker can be at several sites simultaneously when needed. Armadillo Tracks above-ground markers (AGMs) communicate with a remote tracker that can update their location on a Live Map, giving technicians the ability to track pigs from any location.

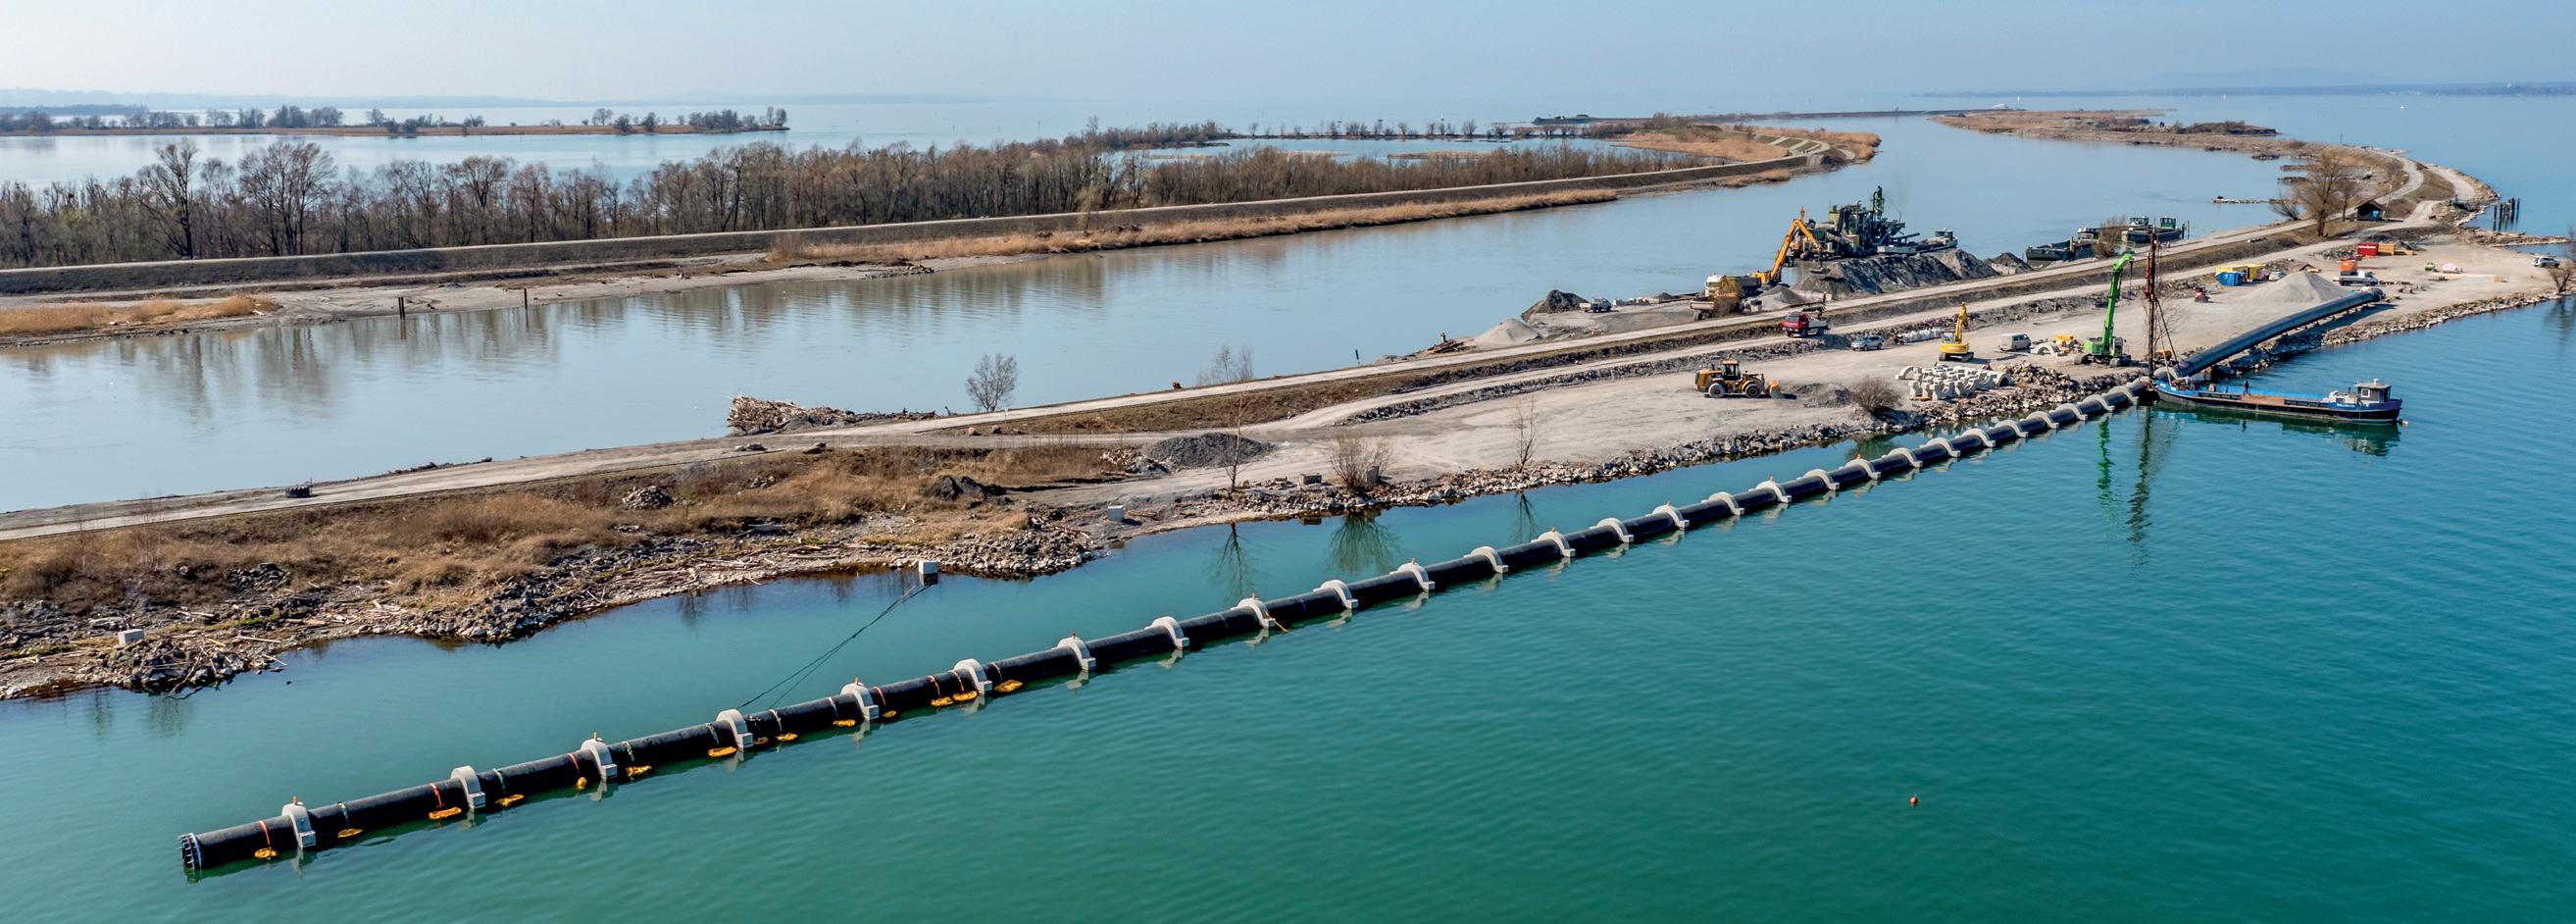
• OUTSTANDING LIFE SPAN
• FAST AND EASY INSTALLATION
• FOR HIGH-VOLUME FLOWS
• HIGH-QUALITY MATERIALS
• EXPERTISE IN PLASTICS PROCESSING

Mary Loftus, Senior Research and Development Engineer and Valve Doctor, IMI Critical Engineering, explores the problem of fugitive emissions and the promise of new packing sets to help overcome what is a significant environmental and health challenge.

Heavy industry has a long-standing fugitive emissions problem. It is unintentionally releasing volatile organic compounds (VOCs) into the atmosphere through the widespread leakage of gases and vapours, as well as flaring at oil and gas refineries.
Climate impacts
This is a significant problem; the unintentional release of VOCs from pressurised equipment accounts for around 5%
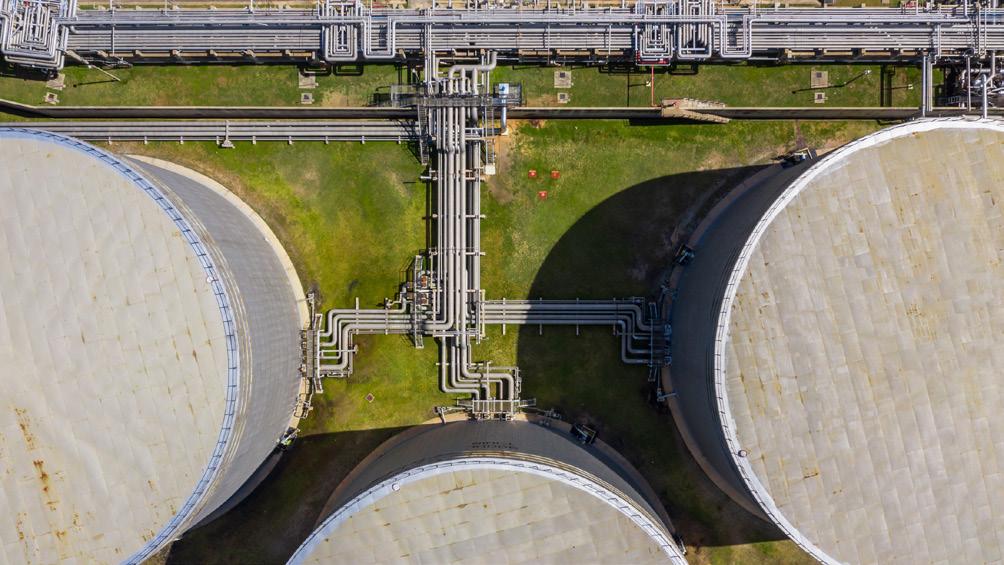
of global greenhouse gas emissions, but likely more because of conservative estimates made during product design and monitoring. Fugitive emissions are thought to account for 20% of global methane emissions from the petrochemicals sector, among the most potent contributors to the greenhouse effect.1
Fugitive emissions are a significant environmental problem, but they are also a long-standing issue that has been overlooked, having been largely untracked since the 1950s. Yet this situation is beginning to change. COP26’s Global Methane Pledge is now dominant in industry thinking, aiming to reduce global methane emissions by at least 30% from 2020 levels by 2030. It is hoped this could curb 0.2°C of global warming by 2050.
The impact of fugitive emissions, however, is not limited to climate change. They are also a significant cause of air pollution, causing ground-level ozone when NOx and VOCs react with each other in sunlight and hot temperatures. This increases health risks to the surrounding environment. Hundreds of thousands of deaths annually are driven caused by smog accelerated by ozone – a key factor in the establishment of testing standards.2 As well as the long-term issues associated with the leakage of VOCs, there is the more immediate hazard of fire and explosion, with many VOCs being highly flammable. Beyond this, hydrogen sulphide can be deadly if it leaks in significant quantities.
While identification and measurement are important first steps in tackling the problem of fugitive emissions, they do not deal with the issue of the sub-standard maintenance of valve packing that is the root cause of most leaks. Control valves drive around 60% of a plant’s emissions, a figure which rises to 70% in refineries. This is despite only representing around 1% of a facility’s total installed assets.3 Control valves generally, and rising stem control valves in particular, are especially susceptible to leakage due to constant modulation. In contrast, standard on/off valves generally suffer fewer leaks because they are not used all the time.
Various standards have been introduced because of increased awareness of the dangers of fugitive emissions in industrial applications. Recent years have seen the industry begin to align
towards recognising ISO 15848-1 as the leading guideline to qualify valve fugitive emissions packing designs.
A significant challenge for the design and operation of valves in heavy industry is the traditional need for force to be applied externally to be effective, for example through the tightening of packing bolts. This results in a significant maintenance burden given the significant number of valves in a typical plant or refinery. Until now, maintenance teams have had to manually tighten hundreds of bolts across plants and refineries, some of which are in difficult to access locations. Ultimately, solutions to fugitive emissions that rely on extensive and frequent manual maintenance are likely to prove unsatisfactory and to be limited in their efficacy in addressing the fundamental climate and health impacts of gas and vapour leakage.
Focusing on applications in plants and oil and gas refineries, IMI set out to address this challenge, which led to the development of a new valve packing solution in the form of EEEasy-Seal™. The solution comprises a proprietary combination of seals, which are both spring and pressure energised and installed in fixed packing cavity. This means the valve packing does not need to have external force applied through the tightening of bolts, for example. The result is that the EEEasy-Seal packing set is virtually maintenance-free.
This effective and efficient valve packing system overcomes the fundamental maintenance and reliability issues associated with standard valve packing systems. EEEasy-Seal has been shown to have reduced friction compared to traditional Teflon V-ring packing sets and since it is installed in a fixed cavity, virtually no maintenance is required, even under the severe operating conditions found in oil and gas facilities.
EEEasy-Seal ensures minimal leakage for extended periods and is certified according to ISO 15848-1 tightness class AM and BH for endurance classes CC1 (20 000 cycles) and CC2 (60 000 cycles).
As a result, it is a much more sustainable proposition for plant and refinery managers, who are no longer faced with the costs and logistical challenges associated with deploying maintenance teams to tighten many hundreds of bolts across facilities.
Novel packing systems such as EEEasy-Seal have helped to drive progress in addressing fugitive emissions. Indeed, IMI has more than 1500 valves fitted in applications up to API 10K pressure class, without reported leaks.
While fugitive emissions may never be eliminated completely, the ongoing development of technologies in this area is helping turn what was once an industry blind spot into a considerably more manageable issue, especially because of the considerably lower maintenance burden.
References
1. https://commission.europa.eu/system/files/2020-06/speaker_intervention_-_ european_university_institute.pdf
2. 1990 Clean Air Act.
3. ESA European sealing assoc. Pub. No. 014/05.
Peter Wilson, Executive Industry Consultant, Hexagon Asset Lifecyle Intelligence, discusses five ways technology is transforming pipeline maintenance and regulatory compliance.
In the past decades, pipeline operators have done an excellent job of executing inspections, maintaining pipelines, and managing leaks. If a few high-profile incidents, from Ghislenghien to Allentown, have made headlines, they are few and far between – and the industry has an exceptional track record of safe, reliable service delivery and infrastructure management.
However, inspections and maintenance activities tend to rely heavily on the knowledge and dedication of field personnel. Today, a variety of external factors challenge such practices, from skill shortages to increasingly systemic compliance requirements.

Several modern technologies – from asset management to better procedure management and AI – can help resolve this tension, providing a solid foundation for system-wide compliance while benefiting efficiency… and financial performance.
Robust asset management practices are central to high-quality integrity management
When trying to implement high-quality integrity management (IM) programmes, many operators encounter the weight of traditions, in the form of localised practices and structures, uncaptured tribal knowledge, or pen-and-paper processes.
In today’s regulatory environment, such features are not only inefficient and unsustainable, but they also make it difficult to address the scope, precision, and system-wide nature of recent compliance requirements.
Programmes like the Transmission Integrity Management Programme (TIMP) and the Distribution Integrity Management Programme (DIMP), for example, require operators to know the entire transmission and distribution system, which often means looking at several thousand miles of pipe. Utilities that still rely on paper cards, distributed databases and unlinked spreadsheets can find it particularly difficult to perform integrity analysis or comply with maximum allowable operating pressure (MAOP) regulations for various pipeline segments.
Secondly, the low-tech, labour-intensive approach has proven increasingly difficult to maintain in recent years, amid shortages of skilled workers and large cohorts of retiring workers. According to the 2022 Global Energy Talent Index, as many as 20% of oil and gas workers are eligible to retire in the next decade.1 This generational shift makes modernisation imperative.
The journey to optimum management capabilities begins with digitising common procedures, such as recording line locators, pig management, fault reporting, public event reporting and communication failures.
True mobility is a crucial second step. To ensure information is captured, structured, and managed for easy access, analysis, and reporting, field workers must have access to mobile capabilities that are easy to use and work in every environment. This constitutes a crucial difference between achieving true digitisation and just storing information in a digital format, such as a spreadsheet, which can add complexity and errors.
Fortunately, out-of-the-box solutions exist: a j5 Pipeline Management IndustraForm Template, for example, can define the information to be recorded, the procedures that must be carried out and the key parameters that must be
reported. Information can come from and be triggered by the distributed control system or data historian. Using such predefined templates ensures that events are correctly categorised and avoids mistakes or invalid values.
A second, critical area of digitisation is control of work. In the past, inadequate permit-to-work (PTW) processes have contributed to devastating industrial accidents such as the 1981 Pacific Gas and Electric Company Natural Gas Pipeline Puncture, leading control authorities such as the HSE in the UK to recognise PTW systems as “a vital part of the effective management of hazards”.2
Digitisation is key to achieving consistent permit-to-work data and ensuring safe processing and real-time monitoring. It can also offer some ‘nice-to-haves’, such as customised workflows or rapid filtering and visualisation of permits in operation in a given geographic area.
Third, and perhaps most important, is the digitisation of shift handover – an area where bad communication and poor procedures have led to several industrial incidents, such as the 2005 Buncefield fire. The objectives to pursue in digitising shift handover are similar: full visibility over information, on-site and off-site, the ability to locate important information rapidly for all authorised users, procedural compliance and auditability across the full pipeline network and the capacity to be interfaced with third-party systems, such as data historians, DCS or SCADA systems.
These three components – digitising operations, control of work and shift handovers – should not be seen as separate efforts but as three areas of attention within the digitisation of operations management, supported by a single solution.
Centralising records related to inspection results, maintenance activities, and new construction in a single platform creates a strong foundation for moving up the hierarchy of pipeline integrity maturity toward operational excellence.
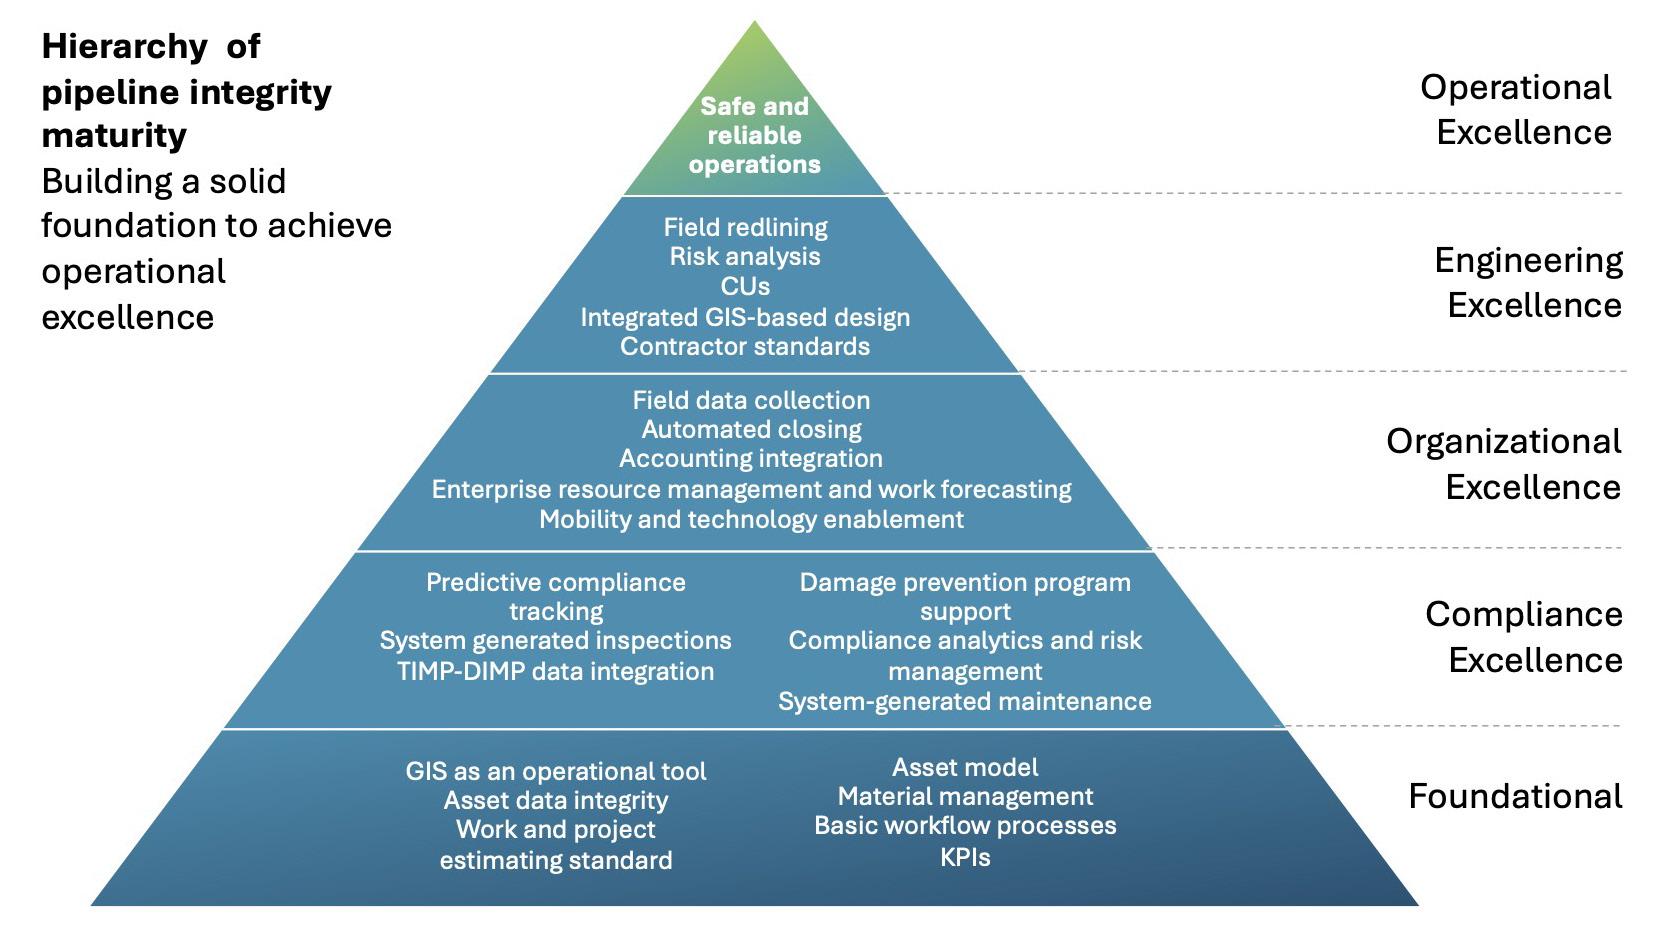
Moving up this pyramid is essential to squaring the compliance circle and creating an approach to compliance that directly benefits the company’s bottom line.
Take the example of Southern Star Central Gas Pipeline, a major player in the natural gas industry that oversees 5800 miles of pipeline, 43 compressor stations and eight gas porosity storage fields.
After adopting an enterprise asset management solution to support operations over this vast and varied territory, the company witnessed a 25% increase in efficiency that translated into an ability to free up resources and improve its safety record. As Stuart Johnson, Manager


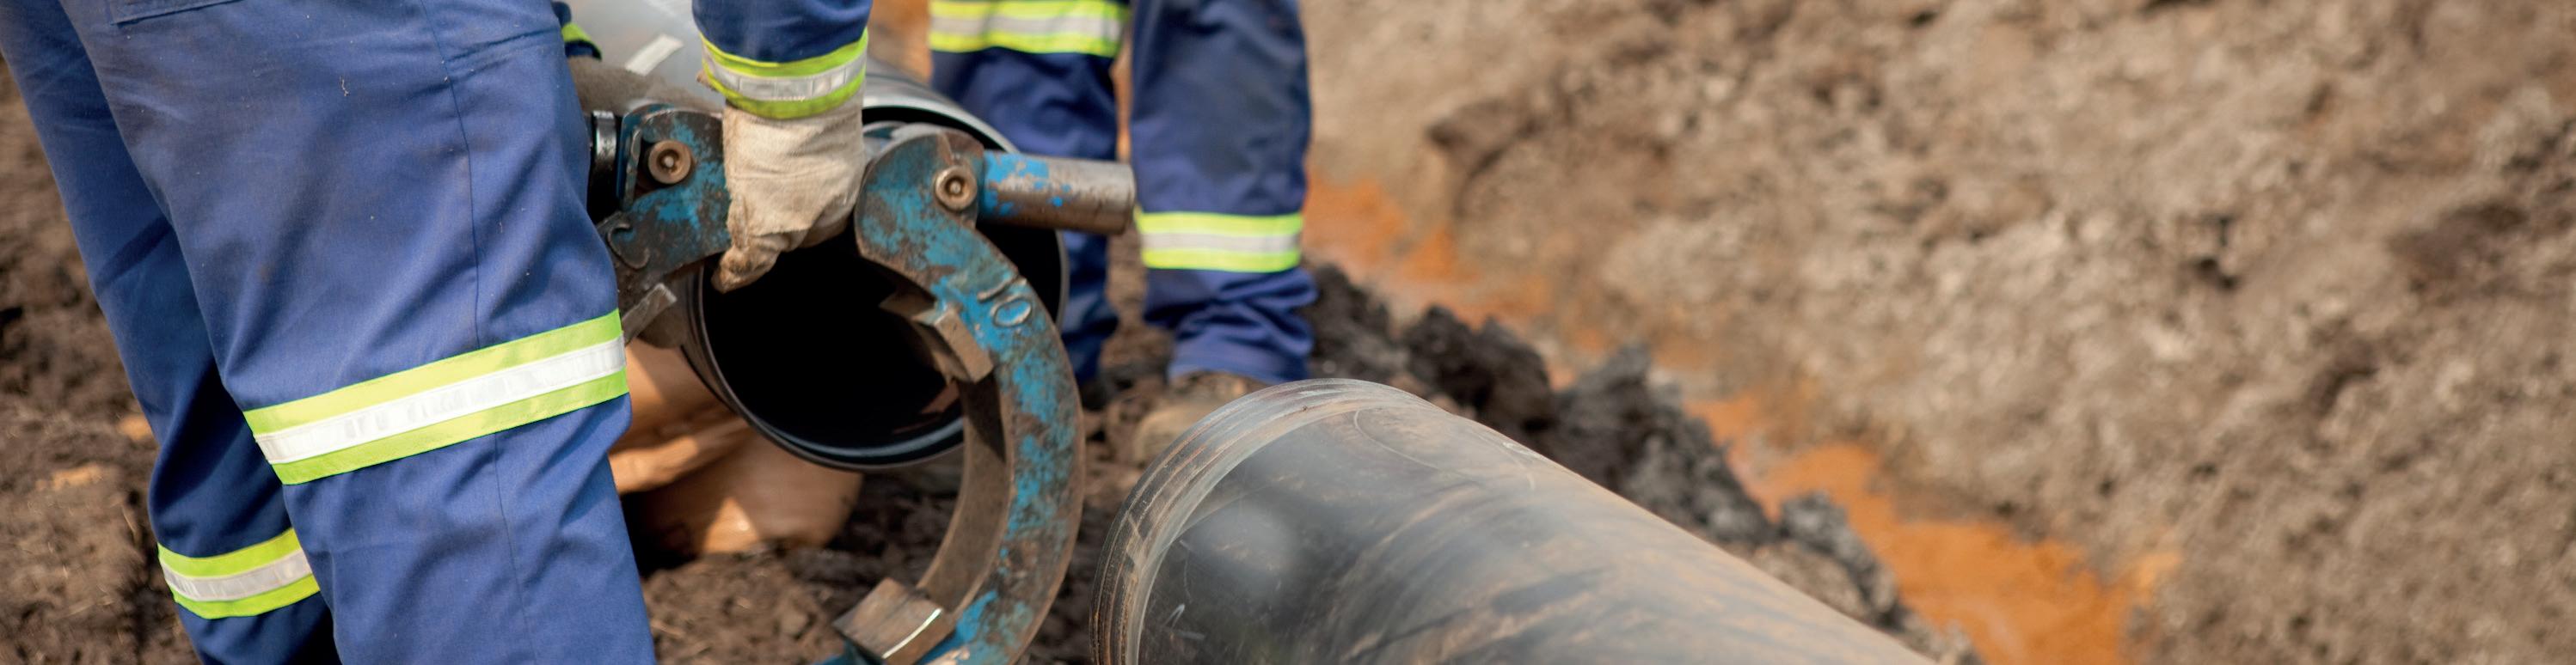
of planning and scheduling, notes: “Being able to reinvest that time back into work that was out there that needed to be done and that we could never get to has really helped increase reliability and safety. It has given us the time to make sure we’re doing the job the right way every time.”
The safety benefits of access to the right information and procedures can rapidly help companies recoup their investment. In recent years, pipeline operators have been fined millions of Euros for near-misses, missed inspections or improper record-keeping of known issues, even in the absence of environmental damage or human injuries.
To avoid such a fate, another crucial area of focus is standard operating procedures (SOPs) and the overall question of procedure and knowledge management.
This topic is paramount for pipeline operators and has a strong impact on their bottom line. Any lapses or errors in procedural execution could contribute to penalties, unscheduled downtimes, and avoidable losses. The ARC Advisory Group estimates that human error is responsible for 42% of unscheduled downtimes, with a significant 16% directly linked to procedural issues.
But, all too often, procedures are inconsistent, incomplete or difficult to access for field operators. As an example, a few years ago, our AcceleratorKMS team was performing an audit at a Fortune 500 pipeline company that grappled with information silos and procedure and training deficiencies. During the discovery process, it emerged that procedures were stored in a Word document of more than 350 pages, hosted on a legacy application that was difficult for operators to navigate, especially from remote locations. Such bottlenecks often led to a delay of up to 10 minutes in accessing the needed information, including safety-critical procedures.
This example outlines the difference between having procedures in a digital format and having achieved digitalisation. Digitalisation is also a matter of information architecture, with the need to set organisational structures, standardised roles that allow for controlled interactions and permissions, and responsibilities such as signoffs and the ability to review and use procedures.
But tackling this problem can have transformative results. By adopting industry-leading practices, the company was able to fix its audit gaps, reduce the need for corrective actions and negotiate the lifting of previously imposed pipeline capacity caps. The move also helped change behaviours and bring a culture of procedure use across the organisation – an outcome in which training and immediate mobile access to procedures were instrumental.
Today’s technology can also help. Artificial Intelligence, for example, assists in authoring and lets workers create procedures and content faster while ensuring that they follow best practices – thus contributing to eliminating inaccuracies, gaps, surprises, and incidents in the field.
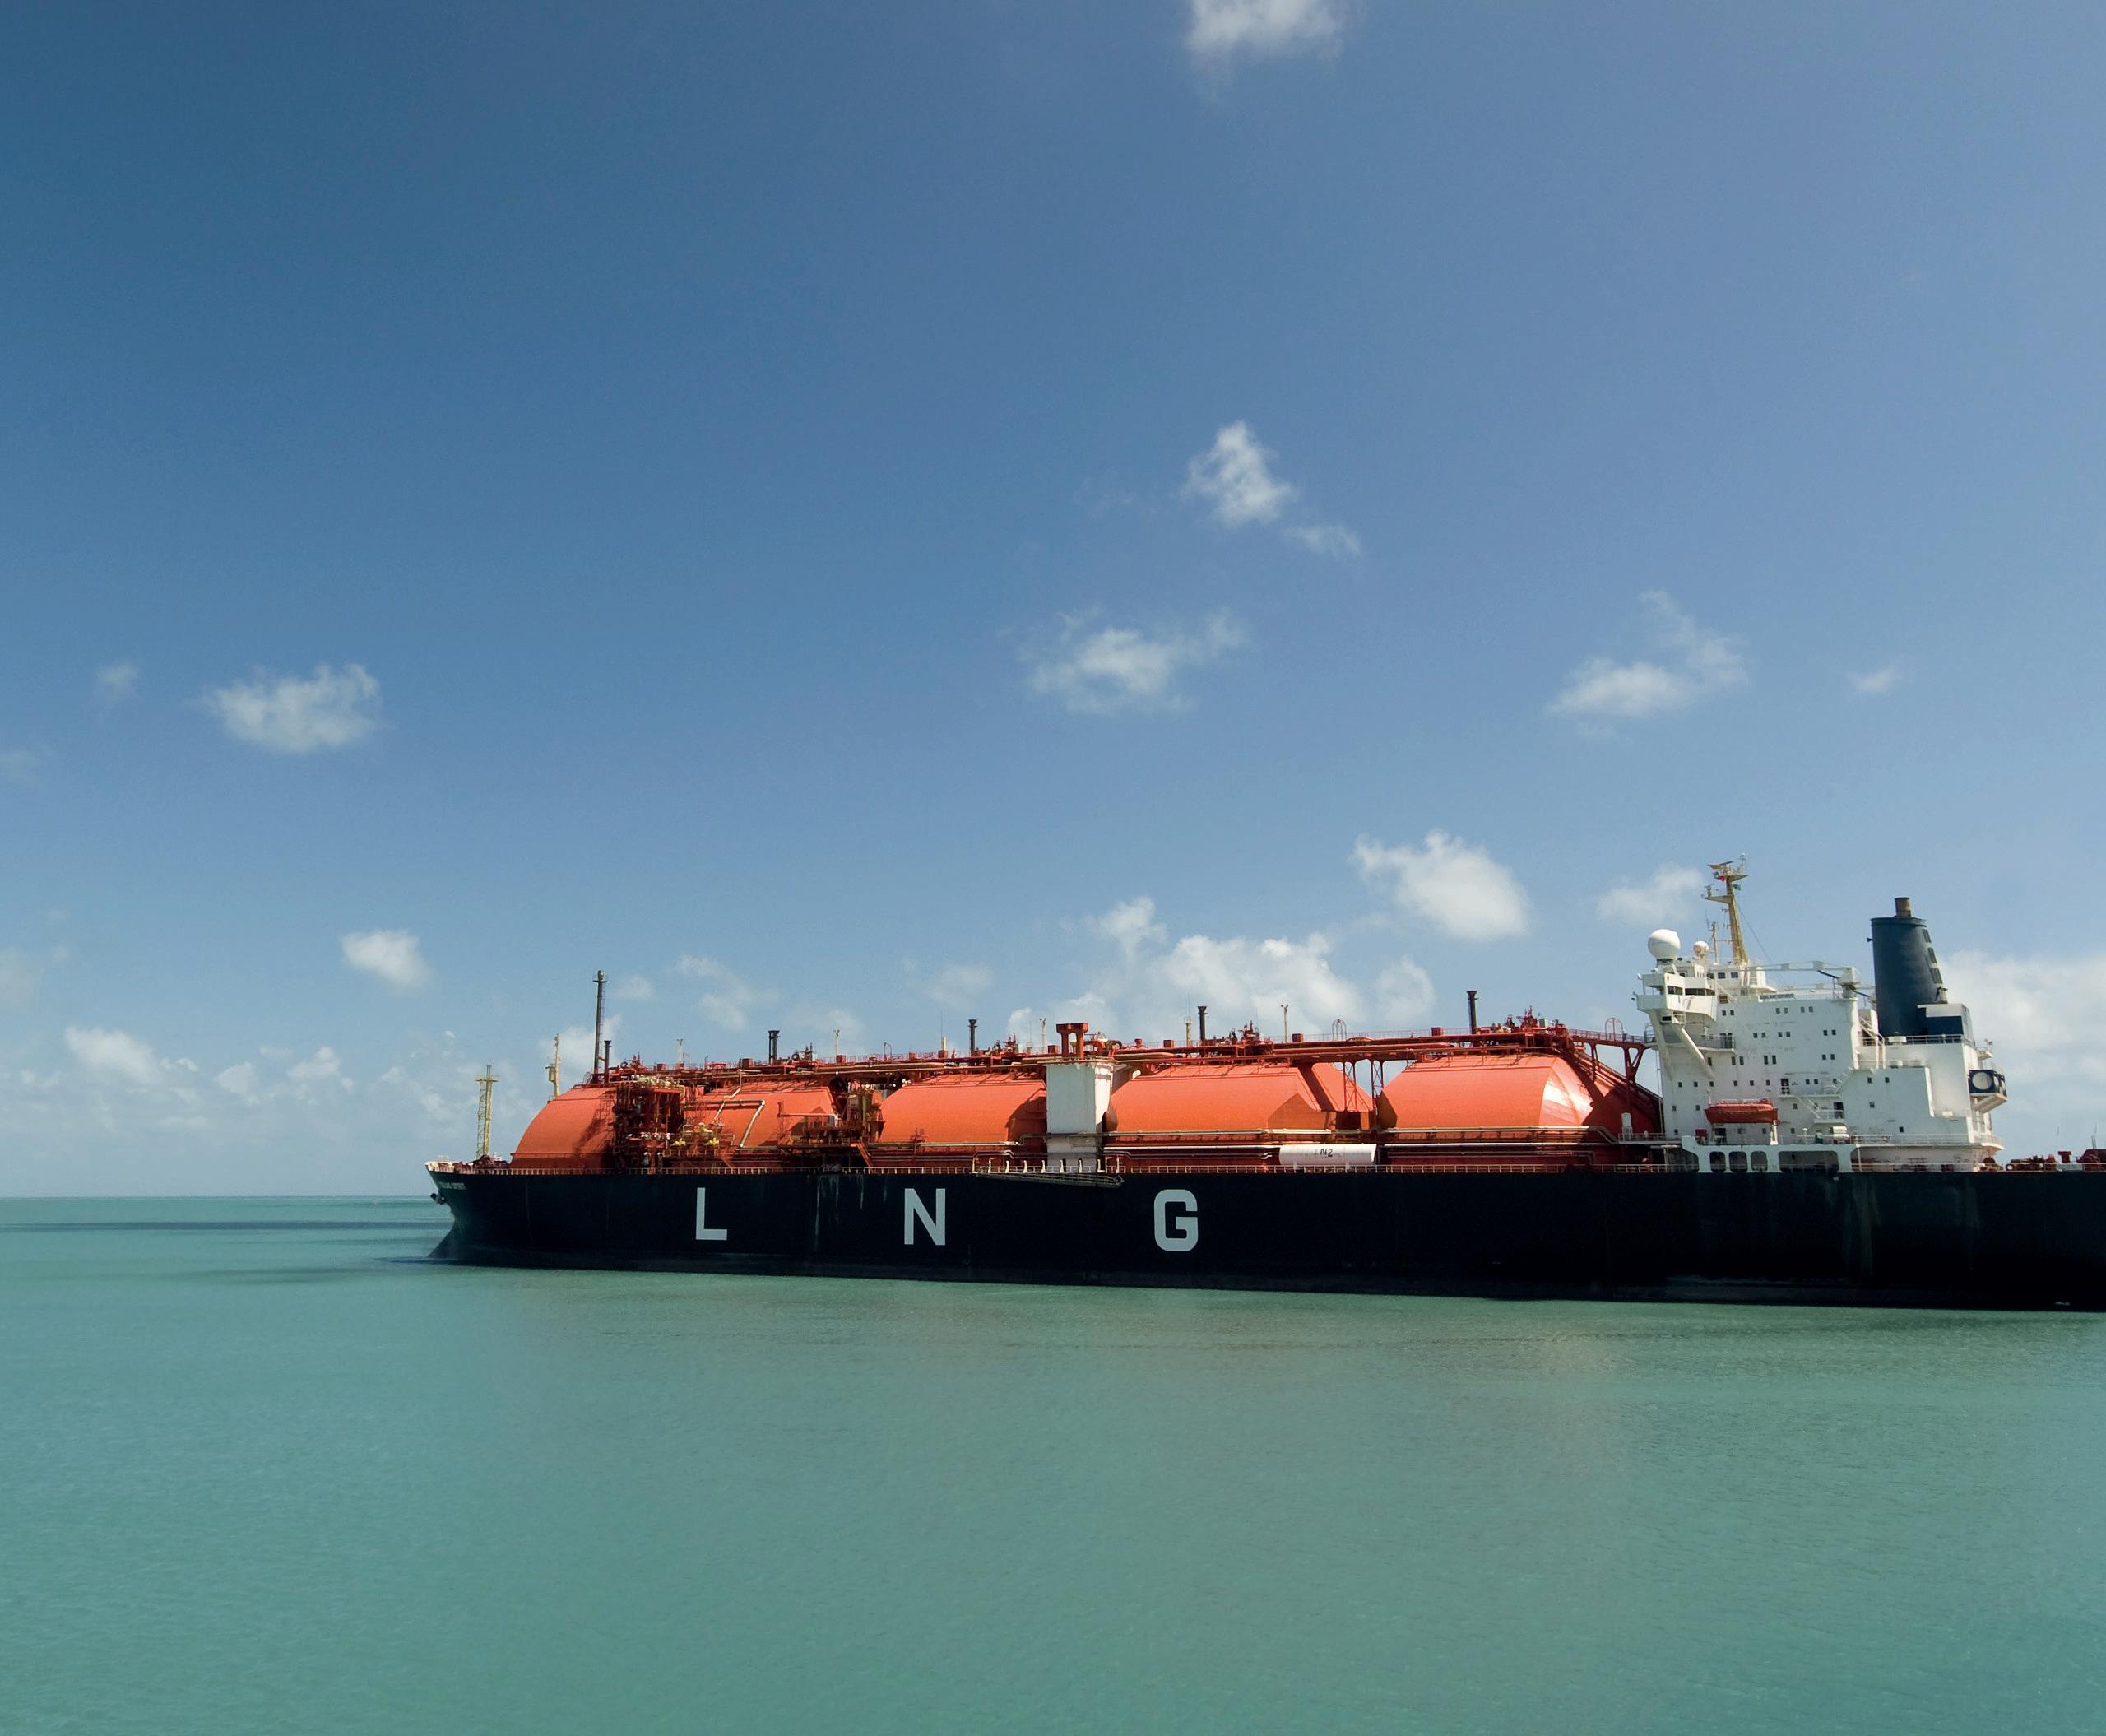
Subscribe online at: www.lngindustry.com/subscribe
www.qapqa.com
Together, we create the most distinctive and integrated welding solutions for the construction of reliable and sustainable pipelines.
In everything we do, we maintain the highest standards. Or as we call it: The Qapqa promise.
• Increase productivity
• Increase quality
• Lower repair rates
• High level of support