BIM:WHEREIMAGINATIONMEETSPRECISIONINCONSTRUCTION

C O N T A C T
+514-967-8378
preetamola ola@gmail com
1980 Rue Sainte-Catherine E Montréal, QC H2K 2H7
E D U C A T I O N
Concordia university
M. Eng in Construction Engineering and Management

BIM:WHEREIMAGINATIONMEETSPRECISIONINCONSTRUCTION
+514-967-8378
preetamola ola@gmail com
1980 Rue Sainte-Catherine E Montréal, QC H2K 2H7
Concordia university
M. Eng in Construction Engineering and Management
I experienced construction management student with 3 years in India, specializing in VDC/BIM Proficient in Navisworks, Revit, and AutoCAD Skilled in clash detection, 4D simulation, and model-based quantity takeoffs. Seeking a full-time VDC/BIM coordination role.
Project Coordinator
2020 – 2022
Lovely Professional university
Bachelor in Civil Engineering
2022 - 2024 2015 - 2019
Assisted in field operations, reviewed blueprints, and managed scheduling with Primavera P6 Used Bluebeam for takeoffs, coordinated subcontractors, prepared RFIs, tracked progress, and ensured timely execution of Kishan Mandi storage and road upgrades
Project Lead
• Revit
• Navisworks
• Autodesk Construction Cloud
• Primavera P6
• Bluebeam
• Power BI
• ProjectWise
2019 - 2020
I led the renovation of approximately 800 rooms in the Jaipur Hub, enhancing workflow efficiency by 20% and minimizing branding costs by 25% Through effective vendor negotiations, I reduced stakeholder issue resolution time and oversaw logistics, ensuring quality and timely material orders
Project coordinator intern
2018- 2018
Assisted in site surveys, soil testing, and foundation assessments for PM Awas Yojana. Monitored construction progress, coordinated material procurement, and tracked daily progress, ensuring compliance, quality, and timely project completion
LinkedIn: Advanced Revit and Dynamo for Interior Design
LinkedIn: Revit Essential Training for Architecture (Imperial and Metric)
Coursera: Construction cost estimating and cost control
Procore Technology-Student Certificate
Project Overview,Scope of Work,Tools & Methods,Estimation Methodology,Quantity Take-off Methodology,Price & Quantity Take-off,Cost Analysis,Results,Design State & Errors,LevelofDevelopment(LOD)UsedandLearnings&Conclusions
Introduction,Overviewof4DBIMProcess,ScheduleDevelopment–Assumptions& Justifications,Result,Conclusion
Introduction,AnalysisoftheidentifiedTP&FPClashes ,ClashGroupingStrategiesandReasoningandConclusion
4
As-design model, As-built model , comparative analysis of four columns and dimension sculpture withqualitativeandquantitativeresults
In this comm was provided Construction based costs.
My responsib the Level of various eleme slabs, walls, accuracy in th
I also exam Take-Off (QT at different d versus 80% co I identified an the model, su and incorrect QTO and predictions.


Commercial Project
Total Area: 16,126 sq ft
Ground Floor: 8,189.69 sq. ft.
First Floor: 7,936.32 sq. ft.
Rooms: 12 on Ground Floor, 14 on First Floor
LOCATION -Montreal, Quebec

3.
Tools & Methods
Quantity Takeoff: Autodesk
Construction Cloud
Costing: RS Means
Model: 3D Model of Commercial Building

Includes concrete foundations with specified footings and walls, steel columns (W10 x 49), structural framing with beams, 4" floor slabs, EPS roof insulation, brick walls on metal studs, and various window sizes and quantities


Quantified elements with Autodesk Construction Cloud, validated against 2D plans, exported to Excel, used RS Means, and applied a 1.3% inflation adjustment

Studied model, isolated elements, applied UniFormat codes, used RS Means for accurate costing and resource allocation, ensuring budget compliance and project efficiency


Priced with RS Means 2011, referenced formats, and multiplied unit costs by quantities to estimate project costs, ensuring accurate budgeting, cost control, and resource allocation for efficient project delivery Detailed quantity takeoffs were also performed to refine the estimates.


Analyzed QTO and RS Means data for Montreal, added 10% provisional sum for design changes, and calculated total cost with overhead and profit.
At 30-40% design, models are basic with ±20-25% QTO accuracy. At 80-90%, models are detailed with ±5% accuracy Contingencies are added without altering BOQ items
Errors such as column repetition, overlapping beams, unconnected beams, and window dimension variance led to inaccuracies in the Quantity Takeoff (QTO), which affected the overall project estimations These issues resulted in miscalculations of material quantities, structural inconsistencies, and potential scheduling delays
To rectify these problems, the team conducted a thorough review of the design model, identifying and correcting misaligned elements, eliminating overlapping beams, and ensuring that all structural components were properly connected Window dimensions were adjusted to match the project’s specifications, and regular quality assurance checks were put in place to prevent future errors. These corrective measures improved the accuracy of the QTO, enhancing the reliability of cost estimation and facilitating smoother construction planning.


-Width of Window – Elevation & 3D
- Height of Window – Elevation & 3D


Columns: LOD 300 Model has specific sizes, location and orientation, but does not have modelled gusset plates, anchor rods etc. to classify as LOD 350.


12: Column LOD 300
(Source: Level of Development Specification Version: 2020)
Beams: LOD 300. Main horizontal beams have specific sizes, slope, elevation and orientation, but does not have modelled cap plates, coping of members, bolts, nuts etc to classify as LOD 350

13: Beam LOD 300
(Source: Level of Development Specification Version: 2020)

Slabs: LOD 300. Formwork materials are defined inclusive of its properties, but does not have hardware or fastener specifications, shoring connections etc. to classify as LOD 350

14: Slab LOD 300
(Source: Level of Development Specification Version: 2020)

Walls: LOD 300 Modelled to specific dimensions and includes major openings for windows and doors, but does not have modelled support framing around openings or cladding etc to classify as LOD 350


Image 14: Wall LOD 300
(Source: Level of Development Specification Version: 2020)
Windows: LOD 300 Modelled to specific location, thickness, size and orientation, but does not have defined mullion shapes or anchorage layouts to classify as LOD 350.

Image 14: Window LOD 300
(Source: Level of Development Specification Version: 2020)
3D model-based QTO boosts accuracy and efficiency but requires detailed models and cost databases. Autodesk Construction Cloud improves speed but needs integration


The 4D BIM process integrates 3D modeling with time-based scheduling to simulate construction sequences, identify potential issues, and enhance project delivery
First Schedule: Standard Construction Timeline- no major time constraints
Second Schedule: Fast-Track Construction Timeline- overlapping tasks and optimizing resource allocation

Task Setup: Autoscheduled tasks; project name entered in task column.
Start Date: Set project start date and calendar, noting holidays
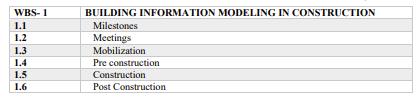
WBS Basis: Summary tasks follow initial Work Breakdown Structure (WBS)

The 4D BIM process integrates 3D modeling with time-based scheduling to simulate construction sequences, identify potential issues, and enhance project delivery
First Schedule: Standard Construction Timeline- no major time constraints
Second Schedule: Fast-Track Construction Timeline- overlapping tasks and optimizing resource allocation
Task Setup: Autoscheduled tasks; project name entered in task column.
Start Date: Set project start date and calendar, noting holidays
WBS Basis: Summary tasks follow initial Work Breakdown Structure (WBS)
A Level-04 Work Breakdown Structure (WBS) was created using cost estimates, including specific interior finishes (C20) Resource assumptions like 1 CRAP and SSWK were based on limited data The WBS has six categories organized by project lifecycle and RS-means Master Format, incorporating tasks from construction drawings and 3D models
Task durations were calculated with RS-means data but adjusted for practicality, such as extending cast-in-place concrete (CIPC) from 0.83 days to 2 days.
Floor & Roof Construction: Activities linked for simultaneous execution, reducing significant days for foundations
Exterior Enclosures: Insulation and metal studs overlapped, speeding up envelope work.
Windows Installation: Frames installed concurrently, reducing installation time from 33 days to 24 days

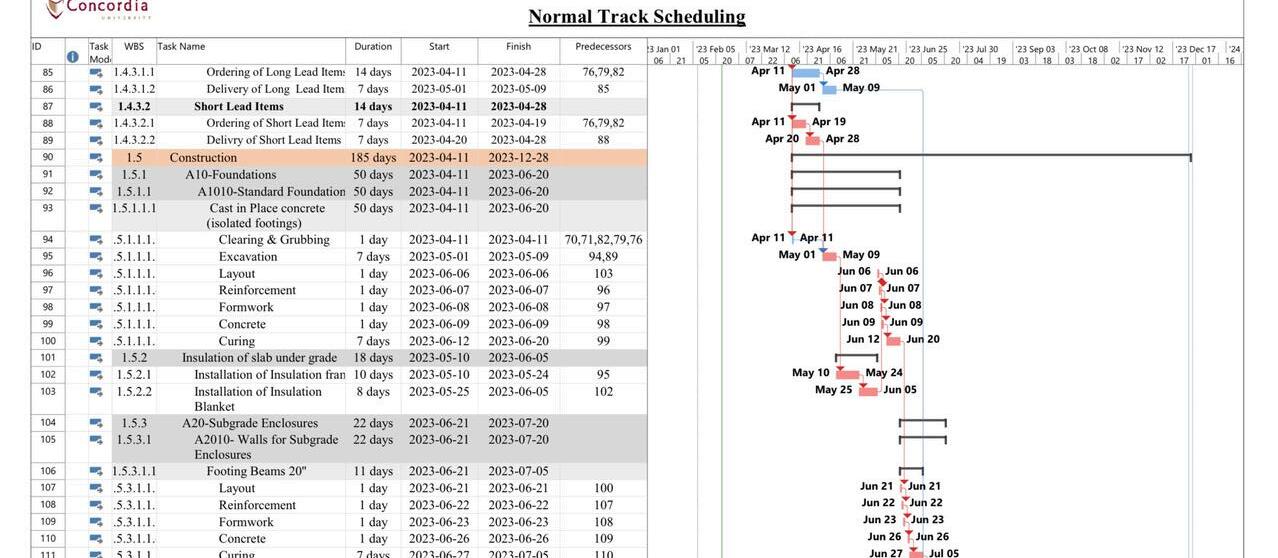
The above images depict the differences in work progress due to change in sequencing from normal schedule to fast-track It is evident in week 23 that, in normal track only sub-structure work is completed However, in fast-track, super-structure (decking slabs, columns and beams) is nearly completed
Once, all activities are added with durations. Then predecessors and successors were added as per field construction sequence. For normal paced project, most of the activities are linked as Finish to Start (FS), with no parallel activities After defining the total duration and task relations the critical path of the project can be indicated. It can be shown in the Gantt chart by using the format and choosing Critical tasks .

In this fast-tracked construction project, key modifications were made to sequencing and task relationships to accelerate the timeline without compromising engineering principles

Foundation Sequencing: Reinforcement and layout tasks performed concurrently, reducing the timeline from 33 days to 24 days.
Subgrade Walls: Formwork and reinforcement done in parallel using SS relations, reducing days Superstructure: Column erection done simultaneously with slab curing, reducing timeline from 21 days to 16 days


4D simulation is a powerful tool for managing projects during both the design and construction phases. By providing valuable insights into the coordination of construction activities, it helps teams understand the potential impact of delays or changes on the overall project timeline. The simulation’s timebased visualization allows project managers to see how construction evolves over time, offering a clearer picture of how tasks should be sequenced. The two schedules in this project highlight the benefits of logical sequencing, where using leads and lags can significantly reduce overall project duration, as shown in the reduced timeline for WBS Level 02 elements in Table 4
The pictorial representation of the project timeline in the results section offers a comprehensive visual overview, helping to improve decision-making and schedule updates This platform also provides a unique opportunity to plan for temporary structures and equipment maneuvering, resolving many constructability issues The ability to visualize the construction process at any given time is invaluable for stakeholders, aiding in more informed decisions. While 4D simulation is increasingly adopted, there are still gaps in its full implementation across a project's lifecycle that need to be addressed to realize its full potential.
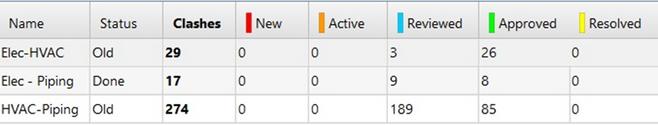
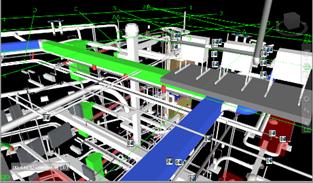
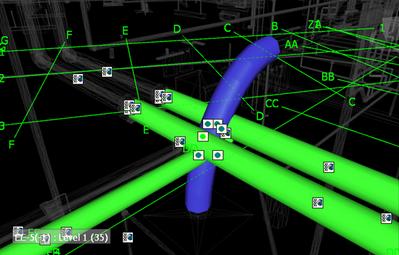
In this project, Autodesk Navisworks Manage was utilized to detect clashes between electrical, HVAC, and piping systems using a federated model. The model was exported as IFC files into Navisworks Manage, allowing for the differentiation and segregation of systems, enhancing effective clash detection.
Clashes were classified into True Positives (approved) and False Positives (reviewed), streamlining the resolution process. A detailed analysis of clash trends by floor, location, and material informed the conclusions drawn for effective design coordination.
Manual identification of clashes was conducted using Navisworks Manage's Hard clash type with zero clearance. This process involved visual analysis across disciplines, including architectural/structural elements, HVAC ducts, gravity lines, fire protection, lighting fixtures, and smalldiameter pipes and valves.

In this project, I developed a comprehensive Clash Detection Workflow diagram, outlining the following key steps:
Step 1: Run clash detection tests between electrical, HVAC, and piping disciplines.
Step 2: Analyze and categorize clashes into True Positives and False Positives
Step 3: Group clashes strategically for streamlined resolution
Step 4: Generate detailed reports to support data analysis and improve design coordination.


Clashes were divided into True Positives (TP) and False Positives (FP), followed by a thorough segregation and analysis based on the hierarchy of system elements, ensuring effective conflict resolution and design coordination.

For HVAC vs Electrical, clashes were sorted by floor levels and resolved through hierarchical analysis. Clashes like Clash-18, Clash-19, and Clash-20 were classified as True Positives, as relocating the rectangular duct connected to mechanical equipment and air handling units was deemed impractical

Clash Number 26 and 29, involving lighting fixtures and air terminals, increased design effort and overall project cost. These clashes necessitated adjustments to the design layout, leading to additional time spent on coordination Consequently, the cost of materials and labor rose, impacting the overall project budget.


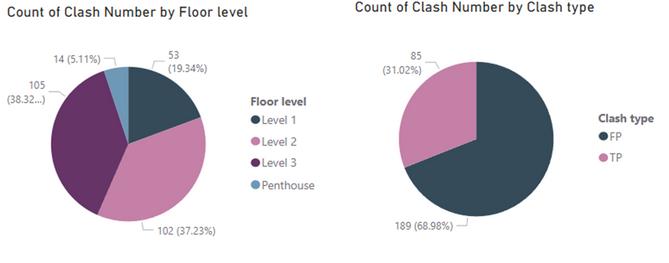
In the Piping vs HVAC clash analysis, Navisworks detected a total of 274 clashes, with 85 classified as True Positives (TP) and 189 as False Positives (FP) Upon examining the hierarchy of disciplines, it became evident that relocating the pipe would resolve all identified clashes. Consequently, Clash66 was categorized as a TP, while the remaining clashes were classified as FP
Total Clashes: 274
Groups: 57
TP: 85
FP: 189


Clash Number - 134, 138, 189, 198, 213, 228
Round Flex Duct vs Victaulic IPS Pipe
TP: 228
FP: 134, 138, 189, 198, 213


14 Clashes
Domestic Water Pipe penetrating Rectangular Duct and 2 Round Ducts
2 Groups with 1 TP each


Level-2


Level-3

Total Clashes: 17
False Positives (FP): 9
True Positives (TP): 8
Groups: 4
Each clash was investigated separately to ensure accurate identification of TP clashes

For instance, Clash-11 and Clash-12 were identical. By removing the pipe, both clashes could be resolved simultaneously Since lighting takes priority over small diameter pipes, the pipe was relocated, classifying Clash-11 as a TP and Clash-12 as an FP
Clash Number - 7,8,9,10, 13,14
Lighting Fixture vs Pipe
Design Effort
Cost of Project


Changing the pipe elevation was not possible due to the presence of an overhead duct, which restricted the available space for rerouting. This limitation complicated the design process and made it challenging to resolve the clash without significant modifications to other systems.


L
S H D E T E C T I O N S W I T H A N A L Y S I S
Clashes were grouped by Composite Object Clash after identifying true positives (TP) and false positives (FP) to minimize clashes and improve resolution efficiency. Multiple clashes often arose from a single entity, allowing resolution through relocating one element.
Each group contained at least one TP, with others as FP. For example, the Victaulic IPS TAP pipe caused multiple clashes (46, 79, 81, etc ), and relocating it would resolve all.
Clash 46 was marked as TP, while the others were FP, and this strategy was applied to other clashes to enhance coordination.


Two additional grouping strategies were used: by Clash Locality and Level Grouping by Level helped prioritize clashes per floor, while Locality unified clashes by grid location for efficient resolution.


8.

9. 10. 11.
Mechanical Equ. By moving Mechanical equipment 56% of TP would be solved in HVAC-Piping.
Pipe By moving Pipes 52% of TP would be solved in HVAC-Piping.
Cable Tray By moving Cable trays 38% of TP would be solved in Elec-Piping.
Pipe By moving Pipes 75% of TP would be solved in Elec-Piping.
Lighting Fixture By moving Lighting fixtures 73% of TP would be solved in Elec-HVAC .
Air Terminals By moving Air terminals 42% of TP would be solved in Elec-HVAC .
Constructability analysis improves project feasibility and safety, enhances cost and time control, reduces change orders, boosts productivity, and decreases coordination errors, resulting in smoother construction processes and better overall outcomes
Limitations
Challenges include accuracy issues with 3D models, high false positives in clash detection, restricted scope of analysis, limited interoperability among software, manual and time-consuming processes, and a steep learning curve for new users.


In this project, it was found that Autodesk's Navisworks is a crucial tool for construction professionals, enabling the identification and resolution of potential conflicts before the construction phase begins. The software effectively integrates design and construction data, enhancing coordination and collaboration among multiple disciplines. Analysis revealed that in the ELEC-HVAC clashes, 90% were classified as True Positives (TP), demonstrating high accuracy in detecting conflicts that need resolution. In contrast, only 47% of clashes in ELEC-Piping and 31% in HVAC-Piping were TP, highlighting the varying effectiveness across different systems.
However, it is important to recognize that while Navisworks is a powerful tool, it should not be relied upon exclusively for clash detection. Engineers must carefully examine the 3D model and apply their expertise to identify real clashes that may go unnoticed by the software This combination of technological support and professional insight is vital for reducing the overall number of clashes, ultimately leading to more efficient project execution and improved outcomes in construction management.
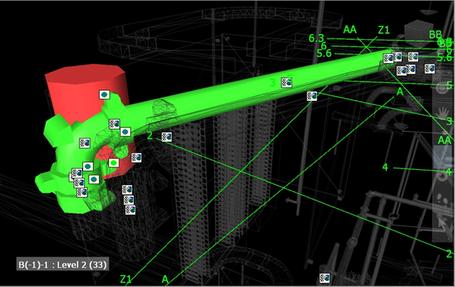
In this project, I worked on a universitywide digital twinning initiative for Concordia University, focusing on modeling the as-built data of the existing sculpture and column structure in the EV building We used tools like Matterport and Autodesk Recap Photo, which employ photogrammetry algorithms to convert 2D images into highly accurate 3D models.
Digital twin technology allows us to simulate and analyze building behavior throughout the design, construction, and operational phases By creating precise digital models, we can identify critical issues related to the structure, mechanical, electrical, and plumbing (MEP) systems before they arise. This proactive approach minimizes the risk of operational problems and enhances overall facility management and efficiency for future university projects.


The table presents a quantitative analysis of the “C” sculpture outside the EV building. Using Autodesk ReCap Photo, the final model was created from 135 images captured at various distances, heights, and angles Initially, four models were generated with 35-40 images each.


To improve the development of as-built models using photogrammetry, it's essential to capture images from diverse angles, ensure accurate alignment between as-built and baseline models, and make precise scaling selections.


The process can be lengthy and time-consuming, especially for large datasets, as ReCap Photo is mainly designed for smaller projects. Additionally, environmental factors such as lighting, weather conditions, and moving objects can negatively impact the quality and accuracy of the final digital model
The table uses data from the Matterport scanner. The team captured images as per the app instructions, creating a 360degree model. After uploading to the Matterport cloud, a 3D model was processed, and distances between columns were measured for accuracy. The model was then edited with annotations and labels for clarity.
Scanning and processing can take hours or days based on space size
Limited range makes it unsuitable for large outdoor areas or multi-story buildings
Accuracy is affected by lighting, scanner quality, and measurement discrepancies.


Limited customization and interactivity within the software.
Not ideal for large-scale projects like factories.
Compatibility issues restrict flexibility
User experience is controlled by the platform, limiting customization
For instance, in below image two different dimensions are shown by the software, even though it was measured from the same point as the software was taking object snaps.
