Department of Building, Civil, and Environmental Engineering
Construction Planning and Control
Course Number BLDG 6801
Professor: Dr. Po-Han Chen
Group 1
Final Report
Participants:
Preetam Ola (40233353)
Winter 2023
List of Tables
List of Figures
1. Introduction
In this project, a variety of techniques will be used to plan and execute the project, starting with identifying the sequence of tasks required to complete the project successfully. This part will be significant for creating the Activity on Node (AON) diagram and the Critical Path Method (CPM) in order to find the project's critical path and estimate its duration and completion date.
Resource management is another technique that will be adopted in this project so that no team member is overworked or underutilized. As a result, the workforce shall be distributed across the project as equitably as feasible. The project must be finished on time and under budget, and this strategy made the most use of the available resources.
Financial planning for each period will be implemented, as well, to closely monitor the project's financial aspects. Our team is set to analyze the costs related to each activity and established the budget necessary for each project phase. We would be able to prioritize and allocate resources effectively since we would be aware of the financial ramifications of each activity.
Furthermore, cost-time planning will be utilized to optimize the project schedule and complete the project earlier than anticipated. This will involve analyzing the trade-offs between the cost and timeline of the project and finding the optimal balance between the two.
By managing the project proactively and using the abovementioned techniques, we will be able to deliver the project on time and within budget, meeting the expectations of the stakeholders.
2. Project Description
The BEUMER Group intends to build an extension to the current Joliette warehouse to house the self-supporting miniload racking structures in order to house the new ASRS.
For the enclosed solution, BEUMER Group proposes a powerful distribution and ASRS solution, where 4 or 5 tires of same SKU are stacked and stored in a flexible miniload storage and all tire distribution and sequencing of tires are performed using a LS-4000CB cross-belt sorter, similar to the BEUMER equipment at from the Bridgestone Aiken plant.
BEUMER's powerful and proven solution provides Bridgestone with higher levels of flexibility than what can be achieved using a conventional high-bay pallet storage. By utilizing a flexible miniload storage concept, Bridgestone will experience a lean handling system where current heavy standard pallet is no longer needed and which can better adapt to future unknown demands that will always occur in the changing supply chains of the automotive and tire industry.
The handling backbone of the tire distribution is based on the LS-4000CB cross-belt sorting technology already running for years at Aiken plant. BEUMER Group's well-known cross-belt loop sorters will integrate perfectly with all inbound and outbound tire flow between process equipment. The backbone in the sortation system is the loop sorter itself, which consists of a system of interconnected carts equipped with electrically driven cross-belts units. This enables tires to be distributed from induction units to predefined destinations such as tire stackers, telescopic truck loading conveyors, sequence buffers and all other equipment needed to be integrated in the project, both now and into the future.
To house the new ASRS, BEUMER Group proposes to construct in continuation of the current Joliette warehouse a free-standing additional building to house the self-supporting miniload racking structures.
In the following pages, BEUMER will walk through the proposed technical solution and thereby define a firm basis for the future discussions with Bridgestone.
3. Methodology
We planned and scheduled a sequence of activities to construct a new warehouse. The whole project consists of 5 Phases, each of which shares the same activities. (except for Tunnel Pile Driving which only appears in phase 1). Each Phase comprises Pile driving, the foundation works, Rebar tying, Formworks, and Concreting slabs. We first dedicated some time to pre-construction activities, namely, the engineering team's design of the piles and the foundation and the Construction Permits procedures, which we estimated would take 20 days, 45 days, and 15 days, respectively. Additionally, since the Line of Balance (LOB) technique is being utilized, as will be explained later on, we reckoned that the best scheduling would be if the mutual activities of each phase were to be completed after one another. For instance, the predecessor for Pile Driving in Phase 2 is the same activity in Phase 1 (with a Finish to Start relationship).
This project's schedule was created via the Critical Path Technique. All of the actions are included, along with their durations and dependencies. With the help of this method, we can estimate the whole project duration and identify
the critical tasks. The project may be delayed if critical tasks are not performed on time. We used the free online tool on RSMeansonline.com to estimate the duration of each activity.
Table 1: Activities and their dependencies
3.1 Project Scheduling Techniques with the use of the Gantt Chart
The project schedule is shown on a Gantt chart. A bar is used to symbolize each activity, and the position and size of the bar correspond to the activity's beginning, duration, and finish dates. During the building phase, the project manager can monitor the project's progress using this chart. Red bars represent the Crucial Path. This project has 11 crucial tasks, and Phase 5 accounts for the majority of them.
Figure 1: Gantt Chart
3.2 Project Scheduling Techniques with the use of Precedence Diagram (AON)
The diagram illustrates how each activity is related to and connected to others. Every activity's information box is configured as shown below.
Early Start Duration Early Finish
Name of the Activity
Late Start Total slack Late Finish
The dependencies for each activity are specified in accordance with the logical sequence and the accessibility of resources and equipment. In the diagram, the activities that are colored red are our critical activities, and the blue ones are the non-critical activities. Also, the shapes of the Parallelogram, the hexagon, and the rectangle represent the major elements, milestones, and individual elements, respectively.
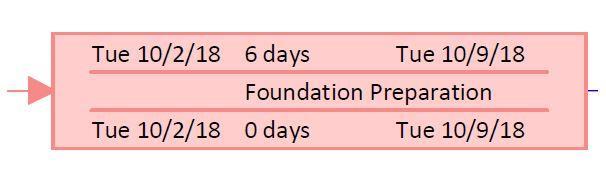
As shown above, the Foundation Preparation is a critical activity (Total Slack = 0 days) with the duration of 6 days, starting from Oct 2 and ending in Oct 9.
Project Commencement is indicated with a hexogon which represent it being a milestone. Also, due to it being the start of the project, it is also a critical activity.
Figure 2: Activity On Node (AON)
We divided the AON diagram into 3 sections and magnified the pictures for better readability.
3.3 Project Cost Estimation
The cost estimators of the Joilette warehouse expansion project agreed to give out the generic cost estimation of the project for privacy reasons as shown in Figure 3. Accordingly, some assumptions were made in order to calculate the direct cost of each of the chosen activities. For example, as shown in Figure 3, the direct cost for piling was $1,735,800 and thus we divided this number by 5 since we have five phases to get the direct cost for the pilling activity for each phase to be $347,160. The same procedure was done to formwork, rebar, and concrete. Some direct costs were given to us, and we did not alter them such as civil design for piles and foundation. Lastly, the tunnel pile driving direct cost was assumed to $256,000. A sample of the direct costs are summarized in Table 2.
On the other hand, the indirect cost was extracted from the project documents to be $2,061,525 however since our project duration is 130 days, we divided that value by 130 days to get the indirect cost to be $15,858 per day.
Table 2 Project costs
3.4 Line of Balance (LOB)
The primary purpose of the LOB technique is to maintain the "balance" of project activities. In other words, operations are produced at a rate that enables each action to be carried out continuously and the accomplishment of project objectives. This helps to keep the project on schedule and prevent delays. The LOB schedule offers details on activity rates and durations and may be easily placed on a graph to follow the project's development. LOB requires less time and effort to prepare than network schedule and, in comparison to other scheduling methods, allows for better management of repetitive projects, adjustment of activity rates, and a smoother flow of resources.
Assumptions
In order to construct the Line of Balance (LOB) diagram for phases 1 to 5 of the project, we have taken into account the critical activities necessary to produce a single unit of product in the repetitive project. Based on the project assumptions, we require the production of 5 units of product (n=5) within a 50-day timeframe (TL=50), which includes a 3-day buffer to enhance project efficiency.
• Number of unit n = 5
• Total duration TL=50
• Buffer = 3 Days
The table presented below outlines the defined activity duration (D) and total float (TF). We have initially calculated the required rate for each activity to achieve project completion within the desired timeframe. Next, we have determined the number of crews required for each activity by multiplying its duration by the corresponding desired rate. As this number can only be an integer, we have rounded it up to determine the actual number of crews needed. Finally, we have calculated the actual rate by dividing the actual number of crews required by the duration of each activity.
Figure 3 Original Project Direct Costs
+ Anchor
Table 3: LOB Calculations Table
The duration for each activity has been extracted from “Table 1: Activities and their dependencies”. The calculations for pile driving, as an example, will be explained below:
TL = Project Deadline Duration = 50 days
T1 = 10 + 6 + 10 + 11 = 37
Desired Rate = (n - 1) / (TL - T1 + TF) = (5 - 1) / (50 - 37 + 0) = 0.307692308
Required Crews (C) =D × Desired Rate = 10 × 0.307692308 = 3.07692308
Actual Crews (Ca) = Round up [Required Crews] = 4
The above Figure indicates 4 critical activities to complete each unit of the project we assume should be done backto-back.
Based on our analysis, we have identified four critical activities that must be completed consecutively to produce a single unit of the project. It is assumed that these activities will be executed in a back-to-back manner to ensure the timely completion of the project.
Activity A (Pile Driving): Total units: n = 5
Figure 4: LOB Schedule for the Critical Path
Activity B (Foundation Preparation):
Total units: n = 5
Actual Rate: RB= 0.33333333 units/ day
R= �� 1 ���� ��1
������ ��1 = �� 1 �� = 4 033333333 =12 days
Activity C (Formwork):
Total units: n = 5
Actual Rate: RC= 0.4 units/ day
R= �� 1
�� ��1
��1 =
1
= 4 04 =10 days
Activity D (Rebar + Anchor):
Total units: n = 5
Actual Rate: RD= 0.3636363636 units/ day
R= �� 1 ���� ��1 ������ ��1 = �� 1 �� = 4 0.3636363636 =11 days
In this phase of the project, we have created a Line of Balance (LOB) diagram to visualize the sequence of activities required to complete each unit of the project. The diagram is depicted below, and it illustrates that Activity A, which involves Pile Driving, takes a total of 20 days to complete in order to produce five units of the project.
Following Activity A, we move on to Activity B, which involves Foundation Preparation. With a lower slope rate of 0.4 compared to its predecessor, we must begin its first point on the 13th day, taking into account the 3-day buffer period that has been incorporated into the project timeline. The activity requires a total of 6 days to complete, meaning that Unit 1 will be finished on day 19, while all five units will be completed by day 31.
Activity C named as Formwork, which has a steeper slope rate of 0.4, follows Activity B. Starting from the upper level and end point of Activity B, we draw Activity C. The subsequent activity, Activity D, has a lower rate of 0.36 compared to Activity C's rate of 0.4. As a result, the buffer should be considered from day 34 onwards.
Despite our initial expectation that the project would be completed in 50 days, the LOB diagram reveals that the project will take an additional nine days to complete. This is due to the nature of the LOB method, as well as the incorporation of three buffers each with a duration of three days. Nonetheless, by implementing the LOB method, we can gain insights into the project's critical path, and allocate resources and time more effectively to ensure that it is completed in a timely and efficient manner.
Conclusion
The Line of Balance (LOB) approach is a useful strategy for scheduling and planning recurring tasks, in conclusion. It helps to highlight crucial tasks that must be regularly monitored to guarantee the project is finished on schedule and offers a clear visualization of the project timetable. The LOB technique enables a more effective and economical use of resources by breaking the project down into repeatable parts. The LOB technique, it should be noted, necessitates precise and thorough knowledge of the project's activities and their interdependencies, as well as a clear comprehension of its goals and limitations. The LOB technique, when applied correctly, may assist project managers in raising the efficiency and effectiveness of their projects.
Figure 5: LOB Schedule for the Critical Path
The management of resources to accomplish project objectives involves several key concepts in project management, including resource planning, resource leveling, resource smoothing, resource allocation, and resource scheduling. Despite these similarities, each notion speaks to a unique facet of resource management. Because of these similarities resource leveling, and resource smoothing are considered the same in this report.
3.5.1 Resource Allocation
The process of allocating resources to specified tasks in the project plan is known as resource allocation. This entails determining which resources will be used for each activity and ensuring that those resources are readily available when required. After resource planning, resource allocation entails identifying the precise resources required to execute each activity.
Assumptions: According to CPC_Complex Scheduling_LOB_Students Lecture: “The goal of LOB is to produce a resource-balanced schedule by identifying the appropriate crew size and number of workers to utilize in each task.” (Dr. Po-Han Chen)
Thus, According to LOB diagram assumption which is completed before the number of crews for each activity is shown in table NO.1.
Also, in our scheduling system, the maximum number of crews assigned per day is 9. Therefore, any days that require more than 9 crews are indicated with a red icon for easy identification.
Figure 6: Gantt Chart for Resource Allocation
This section of the table only considers the number of laborers present on site and does not include information about the quantity of engineers or other personnel.
The table contains important details such as the Early Start, Early Finish, Late Start, and Late Finish, which are necessary for performing resource allocation tasks.
Figure 7: Resource Allocation
The table commences on Monday, 9th October 2018, which is not the same as the project start date, Monday, 7th September 2018. This is because the table only considers the labor workforce, while the earlier dates may have involved activities related to designing and obtaining necessary permissions for the project
Table 4: Total Float
Figure 8: Resource Allocation Chart
Figure 9: Resource Allocation Graph
Resource levelling is a project management strategy that involves adjusting the schedule of project activities to ensure efficient and effective resource utilization. The primary objective of resource levelling is to balance the workload of project resources, ensuring that no resource is overburdened or underutilized. This often involves reassigning resources among activities and delaying or accelerating some processes to optimize resource utilization. In our project, resource levelling resulted in a delay of 10 days, extending the project duration from 130 days to 140 days.
The first step in our resource levelling approach involves identifying the tasks that are currently overloaded. In this project, the following tasks have been identified as overloaded: 1.5.1.4, 1.5.1.5, 1.5.1.6, 1.5.2.3, 1.5.2.4, 1.5.2.5, 1.5.3.1, 1.5.3.2, 1.5.3.3, 1.5.3.4, 1.5.3.5, 1.5.4.1, 1.5.4.2, 1.5.4.3, 1.5.5.1, and 1.5.5.2.
The next step is to identify the non-critical tasks that can be delayed within their float or slack period up to their Late Finish (LF). The following tasks have been identified as non-critical and can be delayed: 1.5.1.6, 1.5.2.3, 1.5.2.5, 1.5.3.1, 1.5.3.2, 1.5.3.3, 1.5.3.5, 1.5.4.1, 1.5.4.2, 1.5.4.3, 1.5.5.1, and 1.5.5.2. These tasks can be rescheduled within their available slack period without affecting the overall project schedule.
Once we have identified the non-critical tasks that can be delayed, the next step is to reschedule them to the end of their slack period. This will help balance the workload and reduce the overall resource demand during peak periods. Therefore, it is recommended to reschedule the identified non-critical tasks to the end of their slack period as part of the resource levelling strategy. These changes are shown in the following chart:
Figure 10: First Step of Resource Leveling Chart
After rescheduling the non-critical tasks to the end of their slack period, we still observe overloading of resources during the final stages of the project, so it is necessary to further adjust the schedule. However, making additional schedule adjustments resulted in a delay to the project completion date. In this project we had a delay of 10 working days that are illustrated in the following chart.
1.5.1.3
1.5.5.1
Figure 11: Second Step of Resource Leveling Chart
In addition to the manual resource leveling process, resource leveling can also be done using project management software such as MS Project and we have also done that with MS Project which can be more accurate than the manual process. This approach involves inputting the project tasks, their duration, and resource requirements into the software, which then automatically generates a resource-loaded schedule.
The resource leveling feature in MS Project can automatically adjust the start and end dates of tasks based on resource availability, to ensure that no resources are overallocated. It can also take into account task dependencies and adjust the schedule accordingly.
This report presents the results of the resource leveling process performed using MS Project software. Three types of visualizations are used to present the results: Table, Gantt charts and resource usage graphs.
Figure 12: Resource Leveling Gantt Chart
Table 5: Resource Leveling
In our case, the resource leveling process has resulted in a delay of 7 days in the project timeline, with the project now expected to be completed on Tue 1/15/2019 instead of the originally planned date of Fri 1/4/2019.
It's important to note that the new timeline takes into account any holidays and weekends that may impact the project schedule. This is important to ensure that the project timeline is realistic and achievable given any potential constraints.
While a delay in the project timeline may not be ideal, it's important to focus on the benefits of resource leveling, which include optimizing resource utilization and increasing the likelihood of project success. It may also be possible to identify opportunities to further optimize the project schedule and minimize any impact of the delay.
In conclusion, resource leveling is the process of adjusting the start and/or end dates of project activities to ensure that the resources required for those activities are available when needed. When resources are over-allocated or under-allocated, resource leveling may result in changes to the duration of the project.
In our project, since resources are over-allocated, because our maximum manpower available is 9 but we have activities with 13 manpower) meaning that more resources (Crew or Manpower) are assigned to a particular activity than are available. Thus, resource leveling results in a delay in that activity. This delay has a ripple effect throughout the project, pushing back the start and/or end dates of subsequent activities and potentially extending up to 10 days the overall duration of the project.
In either case, the impact of resource leveling on the duration of the project will depend on a variety of factors, including the number and nature of the affected activities, the availability and allocation of resources, and the overall complexity of the project.
Figure 13: Resource Leveling Graph
Before deciding on taking the Joilette Bridgestone Warehouse expansion, a financial feasibility study was performed to determine whether the company has enough funds to carry out this project. A financial feasibility report includes a cost/benefit analysis of the project. It also forecasts an expected return on investment, as well as outlines any financial risks. The components that were included in the feasibility study were:
1. The income that is expected to be secured from the warehouse expansion project
2. The warehouse expansion project total cost estimation.
3. The overhead costs estimate of the company.
4. The working capital that is required to finance the construction operations.
Before starting our calculations, the project activities’ durations were changed from days, which were given in the original project documents, to weeks. As shown in Figure 14, the project’s total cost incorporated the direct and indirect costs. The activities’ direct cost is the summation of material, labor, and equipment costs. While the indirect cost consisted of the mobilization, demobilization, temporary site office, and site supervision costs. On the other hand, the company’s overheads cost included the salaries of the head office staff and planning and estimation costs. Accordingly, a markup value of 20% was assumed to cover the company’s overheads and profit. The monthly project total cost and the activities’ start, and end times are demonstrated in Figure 14. It can be seen in the figure that the total cost of the project peaks between weeks 16 and 20 where most of the non-critical activities were happening at that time along with the costliest critical activity which is the slab’s rebar and anchor work.

Figure 14 Activity Monthly Total Cost
Before starting our calculations, some assumptions were made as follows:
1) Progress measurements are made every month with payments due one month later.
2) Cash outflows are incurred at the end of each month.
3) All activities begin at early start times.
4) A retention percentage from the work value was assumed to be 10% which secures the owner against any construction issues and would be paid along with the last monthly claim of the project.
5) A markup value of 20% was assumed to cover the company’s overheads and profit.
The work value is based on the monthly progress measurements and calculated by multiplying the project’s monthly total cost by the markup value. Accordingly, the claim was derived from the work value after subtracting the retention value. The results of the computations of cumulative value, claim, and cost are shown in Table 6. As well as their curves were constructed to better envision these values throughout the project as shown in Figure 15.
3.6.1 Cash Flow and Capital Forecasting
Cash flow in project management refers to the movement of money in and out of a project over a specific period. It is a critical aspect of project management as it enables project managers to monitor the availability of funds and allocate resources effectively. Cash flow is typically tracked through a cash flow statement, which outlines the amount of cash inflows and outflows for a particular project. A positive cash flow means that more money is coming into the project than going out, while a negative cash flow indicates the opposite. Managing cash flow in projects requires careful planning and monitoring to ensure that there is enough cash available to fund ongoing activities and to respond to unexpected events or changes in project scope which are called working capital. Based on the calculations of cumulative total cost and claim, the cumulative cash outflow, inflow, and net were obtained as shown in Table 7. Accordingly, cash flow graphs were structured as shown in figures 16, and 17 to visualize the positive, negative, and net cash flows throughout the project lifecycle. The expected profit from this project is expected to be around $1,870,000.
On the other hand, the working capital was calculated based on the cumulative net cash flow by multiplying it by -1 while the minimum capital value is zero as shown in Table 7. Lastly, the working capital values were graphed against the time in weeks as shown in Figure 18. The maximum required capital that we should make sure that it is available is around $4,937,000 in week 24 of the project.
Figure 15 Cumulative Values Curves
Figure 16 Cumulative Cash Flow Curves
Project management techniques like "crashing" are frequently used to shorten the time it takes to complete a project by moving some duties up in priority. Crashing can be accomplished by increasing the project's resources, such as labor, tools, or working hours. This technique helps shorten the time needed to complete a task, which in turn, diminishes the project's overall timeframe.
The chief reason for using the crashing technique is to meet deadlines or complete a project ahead of schedule. This technique is oftentimes required when a project is time-sensitive or when there are stringent deadlines, which must be met, the project managers can guarantee that the project is finished within the allocated time range through the use of the "crashing" strategy.
It's crucial to keep in mind that applying the crashing strategy can make the project more expensive overall. This is due to the possibility of increased material, labor, and equipment costs if the project is given more resources. Additionally, improper application of the crashing technique may result in extra faults and mistakes that raise the project's cost.
Project managers must carefully evaluate the tasks that can be crashed without affecting the project's quality if the crashing technique is to be effective. They must also take the expense of applying the strategy into account as well as the availability of resources. Project managers can successfully use the crashing technique and guarantee that the project is finished on schedule and within budget by taking these considerations into mind.
The first step we used for our project in crashing is to identify the critical path of the project that are Civil Design (Foundation), Tunnel Pile Driving, Phase#1- Pile Driving, Phase#1- Foundation Preparation, Phase#1- Formwork, Phase#1- Rebar & Anchor, Phase#2- Rebar & Anchor, Phase#3- Rebar & Anchor and Phase#4- Rebar & Anchor which is the sequence of activities that determine the shortest possible duration for the project. Once we identified the critical path, the next step we did is to identify the critical path activities that can be shortened by adding more resources. We have done this by calculating the cost and duration of each critical activity and determining the cost and time required to complete the activity faster.
After identifying the critical activities that can be crashed, the next we did is to determine the additional resources required to complete the activity faster. The additional resources we included is more workers, overtime, material or additional equipment. The cost of the additional resources must be weighed against the cost of the delay to determine the most cost-effective option.
The impact of the crashing we did on direct and indirect costs can be significant. Talking about direct costs it includes the cost of additional resources required to complete the activity faster. The cost of additional resources is likely to increase the project budget, and it is essential to ensure that the increased cost is within the project budget and on the other hand the Indirect costs include overhead costs such as supervision, administration, and project management. Indirect costs may increase if the project duration is reduced, as there may be more pressure on resources and additional costs may be incurred.
The project consists of several critical activities that need to be completed within the scheduled timeframe. The first activity, Civil Design (Foundation), is an essential part of the project and cannot be shortened by adding extra resources, hence its duration remains at 45 days before and after crashing. The activity has a direct cost of $165,000 and a crash direct cost of $165,000, with zero range and zero cost slope. The second activity, Tunnel Pile Driving, can be reduced from its original duration of 6 days to 5 days with the implementation of crashing technique, resulting in a direct cost of $256,000 and a crash direct cost of $262,000. The cost slope for this activity is $6,000, which means it can be shortened by one day with additional resources.
Phase#1- Pile Driving is a critical activity that can be shortened by two days with additional resources. Its original duration is 10 days, which can be reduced to 8 days by implementing the crashing technique. The activity has a direct cost of $347,160 and a crash direct cost of $360,000, with a cost slope of $6,420. Phase#1- Foundation
Preparation has a fixed duration of 6 days and cannot be shortened by adding extra resources. It has a direct cost of $150,000 and a crash direct cost of $150,000, with zero cost slope. Phase#1- Formwork is a critical activity that needs to be completed within the scheduled timeframe, and its duration remains the same before and after crashing. Without crashing, it takes 10 days to complete, with a direct cost of $160,000 and a crash direct cost of $160,000, and a zero-cost slope.
Phase #1 - Rebar & Anchor is another critical activity that can be shortened by one day with additional resources. Without crashing, it takes 11 days to complete, with a direct cost of $380,600 and a crash direct cost of $400,000. This activity is repeated in Phase#2, Phase#3, Phase#4, and Phase#5, with the same direct cost but can be shortened by one day each with additional resources. The cost slope for all these activities is $9,700. The indirect cost for all the activities, including Civil Design (Foundation), Tunnel Pile Driving, Phase#1- Pile Driving, Phase#1- Foundation Preparation, Phase#1- Formwork, Phase#1- Rebar & Anchor, Phase#2- Rebar & Anchor, Phase#3- Rebar & Anchor, and Phase#4- Rebar & Anchor, is $15,858.
Moreover, crashing can also affect the morale and productivity of the project team. Adding more resources may put more pressure on the project team, leading to increased stress, decreased morale, and reduced productivity. Therefore, it is essential to communicate the reasons and benefits of crashing to the project team and provide the necessary support to ensure their productivity and motivation.
In conclusion, crashing is an effective technique for shortening the project duration, but it can have a significant impact on the project's direct and indirect costs. Therefore, it is essential to weigh the cost of crashing against the benefits to determine the most cost-effective option.
3.7.1. Calculations
We calculated the total duration and the critical path based on the AOA diagram. The direct costs for each critical activity were exported from rsmeansonline.com. Then, their crashing duration and direct cost for were assumed. The range of crashing and the cost slope were calculated using the following formulas:
✓ Range of crashing = All-normal duration – Crash duration
✓ Cost slope of crashing = (Crash direct cost – All-normal direct cost) / Range
✓ Total project cost = Total Direct cost + Total Indirect cost
The calculations for Pile Driving activity in Phase 1, for instance, are as follows:
✓ Range of crashing = All-normal duration – Crash duration
Range of crashing = 10 – 8 = 2
✓ Cost slope of crashing = (Crash direct cost – All-normal direct cost) / Range
Cost slope of crashing = (360,000 – 37,160)/2 = 6420
As shown in table 8, Tunnel Pile Driving and the Pile Driving that are devoted to phase 1, have the cheapest cost slope. Thus, said activities are chosen to be crashed.
8: Crashing Calculations Table
First Compression:
Based on the AON diagram, we fathomed that 13 days could be crashed. Hence, the total duration of 3 was considered for compression.
Figure 19: AON after Crashing
15,858 × 3 = 47,574 > (6000 × 1) + (6420 × 2) = 18,840 It is Feasible OK
Optimum Solution
New duration: 127 days
Optimum Cost= 1 × 6000 + 2 × 6420 = 18,840
New Indirect Cost: 127 × 15,858 = 2,013,966
New Project Total Cost = New Project Direct cost + New Project Indirect cost = 7,127,777+ 18,840 + 2,013,966 = 9,160,583
New Project Total Cost = 9,160,583 < Original Project Total Cost = 9,189,317
$ 9,189,317
Table 9 One Time Crash Results
9,160,583
4. Conclusion
The Joilette Bridgestone Warehouse was chosen as a case study for this project. First, the provided project documents were studied intensively, and the required project elements were identified. Accordingly, some project activities were chosen for simplicity reasons in order to apply the learned techniques in the course of Construction Planning and Control. In order to determine the project duration, the critical path method was chosen and therefore the critical activities were identified. Secondly, the project activities were represented using the Activity on Node and the Chant Chart. In addition, the activities’ direct costs were estimated from the given project documents as the given values were generic by taking in consideration the number of phases.
Since most of the chosen activities were repetitive in their nature, we decided to apply the Line of Balance method in order to improve productivity by reducing the amount of idle time and improving the flow of work, as well as to improve the scheduling accuracy by accurately estimating the time and resources required for each activity. For the Line of Balance calculations, the project deadline duration and buffer were assumed to be 50 days and 3 days respectively.
Moreover, resources were allocated to the project activities while assuming that the maximum number of crews available each day is 9 crews. Besides, resource leveling was executed to have a smother level of the required resources throughout the project lifecycle in order to avoid overallocation that can overstress the project resources and minimize the process of hiring and firing. As a result of the resource leveling and allocation processes, the project resources utilization rate was well adjusted compared to its previous state, and the project is expected to be delayed by 7 days.
Additionally, financial planning was performed to ensure that the project is financially sustainable and that the necessary funds are available to complete it. For the cash flow and inflow calculations, markup and retention values were assumed to be 20% and 10% respectively. It was found that the project is economically attractive since it would result in a profit of $4,937,000 and that the company should secure a maximum capital value of $1,870,000 in week 24 of the project.
Finally, project compression was implemented in order to identify the critical activities that could be supplemented with extra resources and thus reduced in duration. For that reason, the cost slopes were calculated, and the optimal critical activities were crashed which resulted in a project duration of 3 days and $28,734 less than the All-normal solutions