10 minute read
Decarbonisation: Celsian


Assessing new raw materials for carbon-lean batches

With decarbonisation at the forefront of the glass industry, Corinne Claireaux1, Mathi Rongen2, Luuk Thielen3 and Johan van der Dennen4 discuss how using alternative raw materials in batches could reduce direct CO emissions. 2


Like every other energy-intensive industry, decarbonisation is the major challenge facing glass. It’s everywhere - on the news and on the desks of many technical, marketing, legal, and fi nancial teams. Consequently, great initiatives all are pulling the industry towards the use of less carbonised energy sources and raw materials, such as GlassTrend projects, Glass Futures, furnace for the future and the Dutch-funded TKI project for hydrogen combustion piloting. Using hydrogen combustion and melters with a higher share of electrical energy is no longer a distant dream. Fossil fuel combustion is the fi rst source of direct (Scope 1) CO2 emission, followed by the decarbonisation of the batch. Additionally, the CO2 footprint of the raw materials constituting the batch contributes to indirect (Scope 3) emissions. A step-by-step approach is proposed to help the glass industry progress towards a carbon-lean batch and glass production.
Batch-to-melt kinetics
Finding undissolved particles in a fi nal product is rather seldom. This high quality is achieved by careful optimisation of the residence time and the temperatures in the melter. Increasing the residence time or the temperature of the melt would degrade the overall energy performance of the melter, which is an absolute no-go. Therefore, any new raw material should not worsen the melting kinetics of the batch. Lab-scale evaluations consist in interrupting the melting of the batch at different times before completion of the conversion. The residual crystalline part of the batch is quantifi ed by X-ray powder diffraction (XRD). This experiment allows the melting rate comparison and the identifi cation of the nature of the residual defects. The effect of raw materials’ nature, particle size, cullet size and quality can be assessed in view of melting rate.
Fining and foaming
foaming, as this will have a negative impact on the process effi ciency or alter the fi ning of the melt - leading to seeds, bubbles and other quality issues. In the High-Temperature Melting Observation System (HTMOS), coupled to the Evolved Gas Analysis (EGA) set-up, the entire melting process is fi lmed and gases arising from the gas-forming reactions are analysed. The atmosphere above the batch in the set-up is tuned to match the combustion atmosphere in the furnace. Undesired phenomena such as foaming, delayed or incomplete fi ning are directly observed while the gas analysis enables monitoring of the fi ning process and quantifi cation of the batch emissions. This information is crucial to ensure that raw materials contribute to the attainment of a homogeneous, bubblefree melt.
Energy demand
The purpose of a glass furnace is to provide the energy required to convert


� Using burnt lime can decrease CO2 emissions from a batch and save on energy costs.

the batch into a bubble-free melt. Part of the quantity of energy required is the sum of the energy needed for heating the raw materials to the reaction temperature, sustaining the endothermic reactions leading to the formation of a melt, and further heating up of the melt to their respective exit temperature. For an industrial glass-melting furnace, the total energy required for batch melting is between 25 and 50% of the total required energy.
Commercial thermal analysis equipment (DTA / DSC) is available to measure the energy required. Such machines use extremely small quantities of raw materials, which may cause representativity issues in batches containing multiple raw materials. These machines also do not allow the use of real-size cullet due to this limited sample size.
These issues are overcome in a new experimental set-up, developed and built at CelSian, which measures the overall energy demand of industrial glass batches. The energy demand set-up is based on the principle of a drop calorimeter. Validation measurements have been performed on silica sand, sapphire and glasses; the results have been compared with thermodynamic data. The set-up has 5% accuracy and 3% reproducibility. It operates between 1000 and 1400°C. This temperature is high enough to fully convert most batches into a melt. Depending on its foaming behaviour, the maximum batch sample size ranges between 200g and 600g. Therefore, it is very easy to test representative industrial batches including cullet pieces as big as 40mm.
Lab to plant
Lab assessment allows the observation, quantifi cation and understanding of the behaviour of the batch raw materials. Information such as the presence of foam (both primary and secondary), the temperature at which a fi rst liquid phase is formed, the redox of the fi nal glass and the energy requirement of the batch are easily obtained. This data can be used in computer models of the full-scale furnace to calculate the coverage of the batch blanket, the energy transfer, the quality of the glass and the energy consumption of the furnace. Calculation of the energy consumption of the furnace does not require advanced CFD modelling and can be obtained by simpler, faster models such as CelSian’s Energy Balance Model. This model simulates the energy consumption and CO2 emissions of a furnace as a function of its design, process input and settings. Therefore, it can be used to evaluate the energy and CO2 savings, which could be generated at the plant scale by the substitution of one or more raw materials.
Application
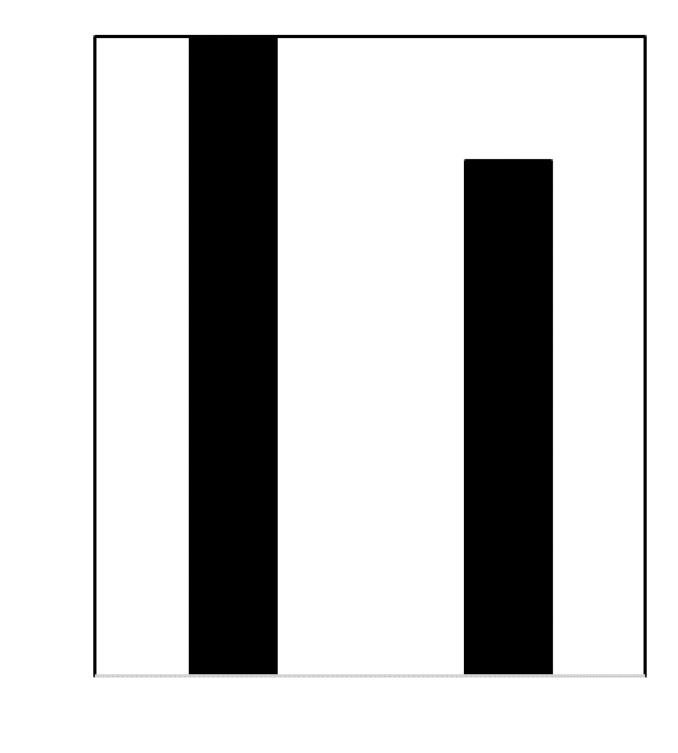
The use of burnt lime CaO instead of limestone CaCO3 is a well-known way to decrease the CO2 emissions from the batch and to save on energy costs. CaO is a reactive raw material that allows for quicker batch-to-melt conversion. Since it is a decarbonised raw material, the foaming behaviour of the batch is reduced, illustrated in Fig 1. Results of an energy demand test on a simple ternary soda-lime silicate glass containing 10% of calcium oxide are shown in Fig 2. Two batches are heated up to 1200°C, one with classic limestone and the other with freshly burnt lime. The use of a decarbonised calcium carrier led to a decrease in energy demand of 20%.
Since the batch recipe is known its heat capacity can be calculated, as well as the quantity of emitted gases, the composition of the obtained glass and the heat capacity of the glass. The energy demand for the heating of the batch, gas and melt can be calculated. The batchto-melt conversion reactions require a signifi cant amount of energy that must be considered in the calculation. The chemical energy demand coeffi cients of the raw materials are used to calculate this. These coeffi cients are obtained or derived from the literature [1, 2] and use detailed thermodynamic data.
Results of the measurement and calculation are presented in Table 1. The glass obtained from both batches has the same composition, so the energy demand for heating the glass is the same. The batch with burnt lime emits less CO2, so the energy demand to heat the gases is lower. The batch-over-melt ratio is higher, so less batch is required to produce the same amount of melt and the energy required to heat the batch is lower. The total result of experiments and calculations agree within 5%, demonstrating the accuracy of the measurement set-up.
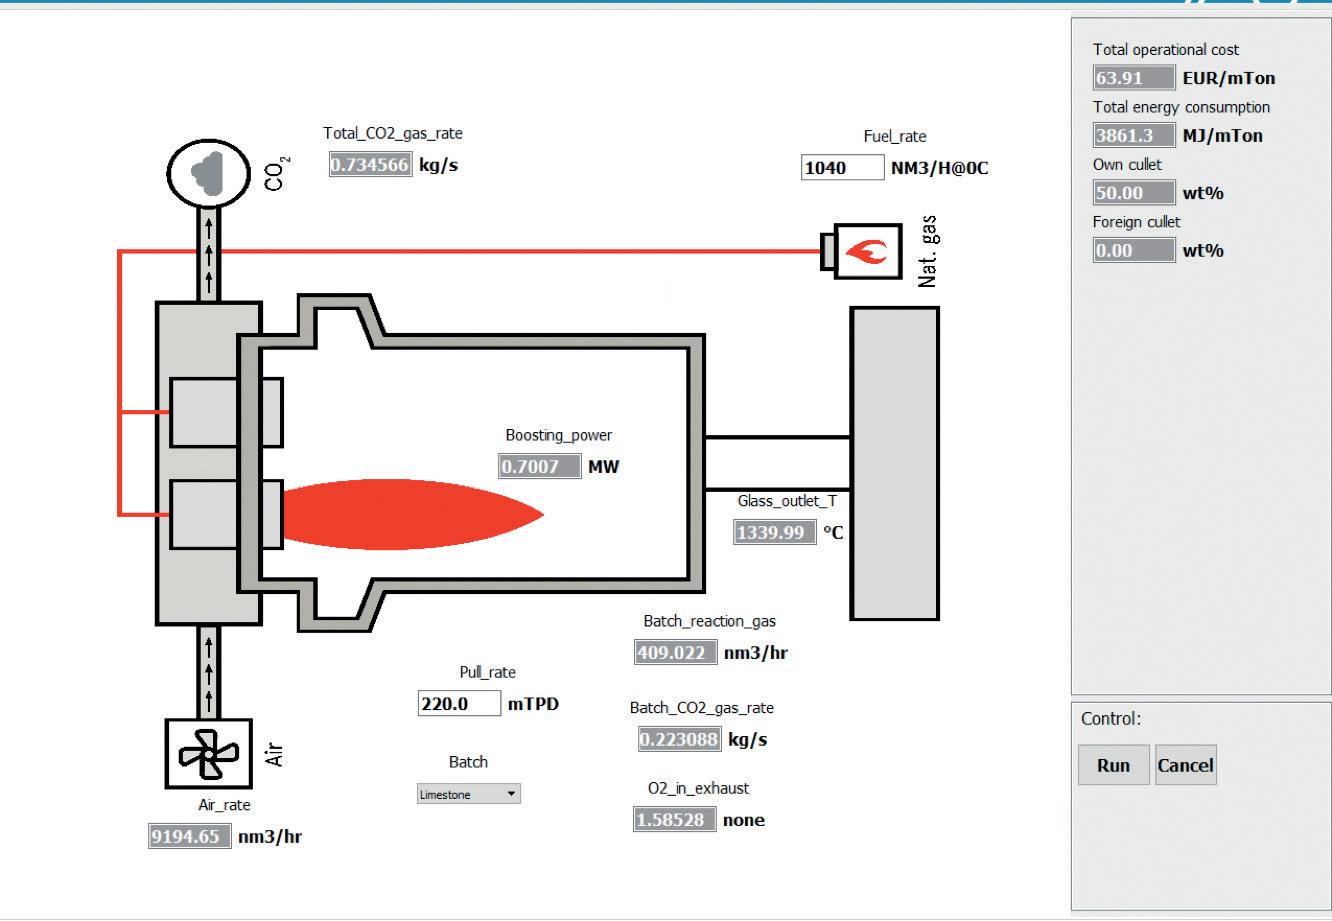
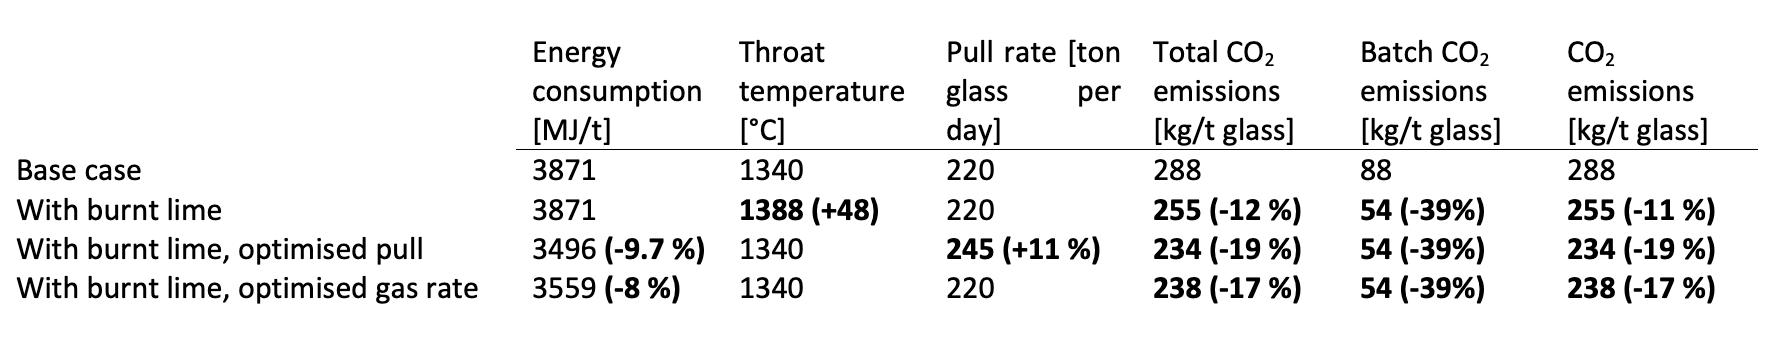
The positive impact of burnt lime is well documented in the literature based on lab-scale trials but there is a lack of information at full scale. Lab-scale results such as the energy demand data presented in Table 1 and information about the foaming behaviour of the melt can be used in the Energy Balance Model (EBM) to model a full-scale furnace. An example of a U-fl ame, air-gas furnace with 0.7 MW of electrical boosting, running with 50% cullet, is presented in Fig 3. In this base case, the furnace produces 220 tons of glass per day. To achieve a throat temperature of 1340°C, 1040m3 of gas are burned with 9195m3 of air, leading to the total production of 288kg of Scope 1 CO2 per ton of produced glass. A few selected data are presented in Table 2. When the limestone is changed for burnt lime, the CO2 emission of the batch decreases by 40%, and the total CO2 emission of the furnace decreases by 12%. Then, several parameters can be modifi ed: � Due to the decarbonised limestone, if the energy input and the glass output remain the same, the energy consumption of the furnace stays the same, but the throat temperature increases by 48°C.
� The pull rate is increased to 245 tons of glass per day to bring the throat temperature back down to its initial value. This 11% increase in glass production leads to a 10% decrease in energy consumption and a 19% decrease in CO2 emissions from the furnace. � An alternative way to reduce the throat temperature down to its initial value, consist in decreasing the energy input without modifying the pull rate. This 8% decrease in energy consumption reduces CO2 emissions by 17%.
Conclusion
In a context where the glass industry is progressing towards decarbonisation, the use of well-assessed, alternative, decarbonised raw materials is a concrete way to reduce direct CO2 emissions. By combining an experimental and modelling approach, CelSian offers a unique procedure to assess raw materials. The batch-to-melt conversion behaviour, kinetics and energy can be observed and quantified on a laboratory scale. This data can then be used in the EBM tool to calculate the full-scale potential CO2, energy and financial savings. These savings can be weighed against the differences in the batch price to obtain a complete economic picture of the changes in raw materials and to guide the glass industry towards more sustainable production. �
References
[1] R. Conradt and P. Pimkhaokham. An easy-to-apply method to estimate the heat demand for melting technical silicate glasses. Glastech. Ber., 63K:134–143, 1990. [2] R. Conradt, Fiberglass Batch-to-Melt Process in H. Li (ed.), Fiberglass Science and Technology, 323-381, 2021.
Writers
1. Glass Scientist and Academy Manager 2. R&D Project Manager and Consultant 3. Consultant and CFD Specialist 4.Operations and Software Developer
CelSian, Eindhoven, Netherlands, https://www.celsian.nl/
� Fig 3. EBM user interface showing the base case parameters. � Table 1. Components of an energy demand calculation. All values are expressed in kJ/kg glass. Calculation and measurement agree within 5%.
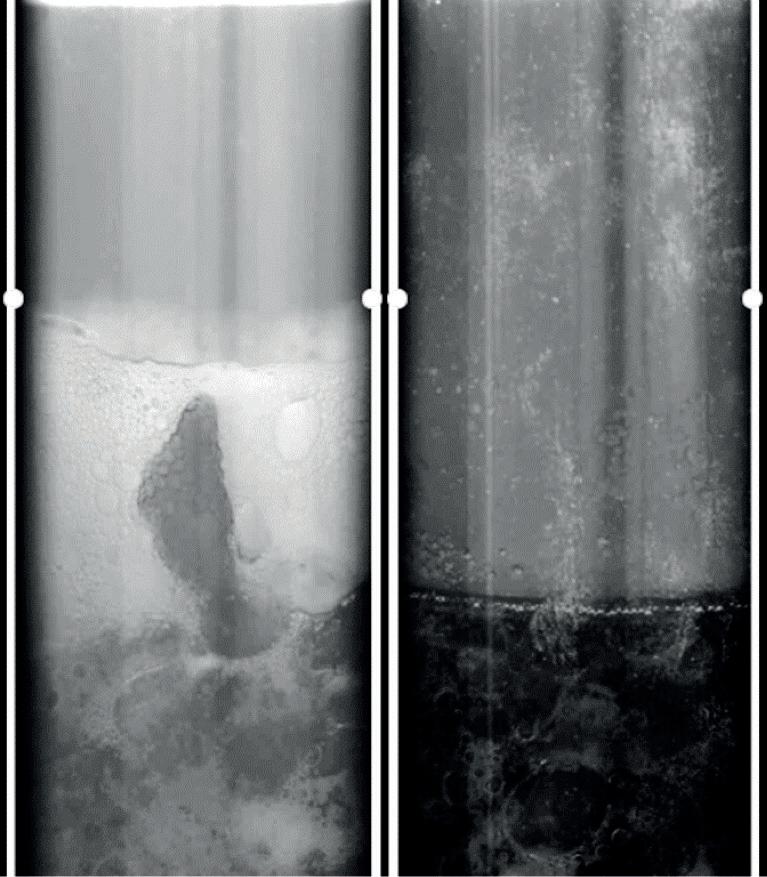
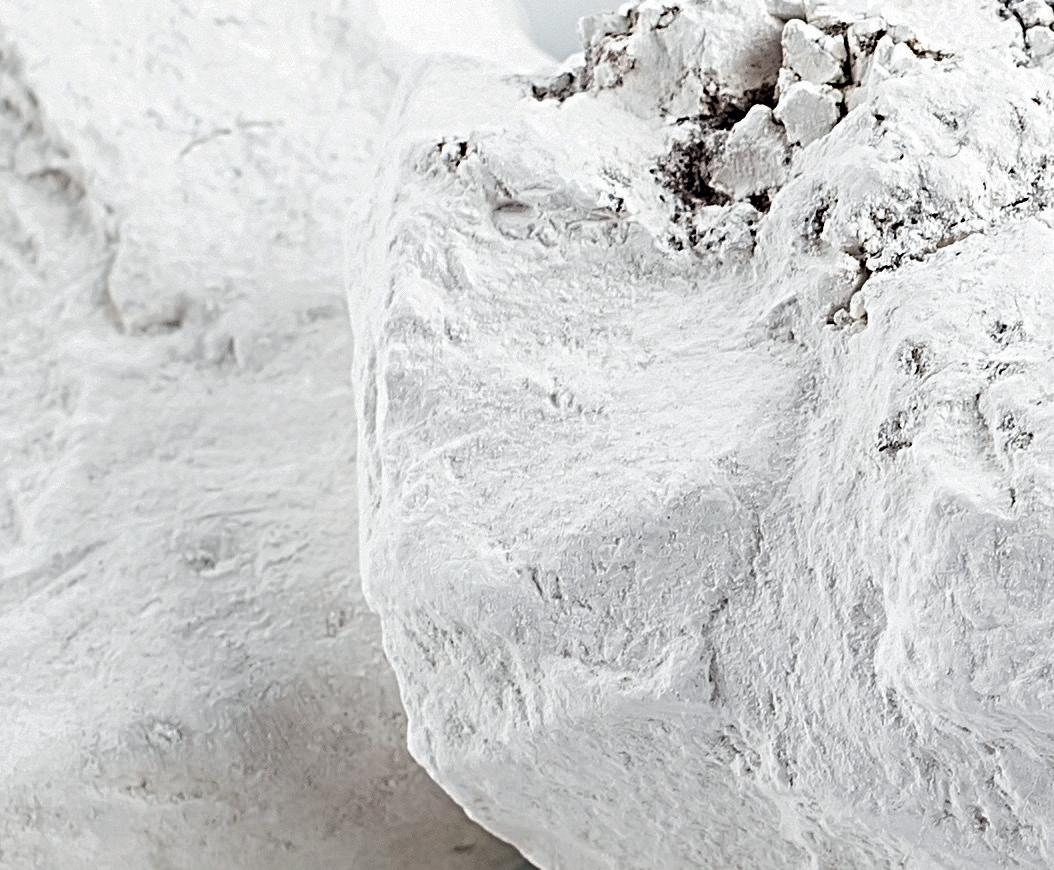
� Fig 1.Extract from an HTMOS video of a glass wool batch at 900°C. On the right side, standard raw materials are used. On the left side, burnt dolomite was used. The height of the camera vision is approximately 10 cm.
100
Relative energy demand (%) 80
60
40
20
0
Lime stone Burnt lime
� Fig 2. Relative energy demand of a ternary soda-lime-silicate batch heated up to 1200°C. The use of burnt lime instead of limestone as a calcium carrier reduced the energy demand by 20%.

� Table 2. Results of an EBM simulation for a U-flame container furnace running with 50% cullet.