8 minute read
Digital glassmaking: Joon X How AI makes furnaces more energy effi cient using data analysis


How AI makes furnaces energy efficient through data analysis
Sylvain Leroy* discusses how the glass sector is already taking advantage of digital technologies and which can lead to up to 3% savings on furnace energy consumption.
As the Fourth Industrial Revolution gains momentum, the glass sector is taking advantage of modern technologies. One of the most promising use cases of digital services today is the energy savings from furnaces.
Industry 4.0 has succeeded by creating new operating systems designed to manage and optimise businesses. Like previous industrial revolutions, this one is transforming the way people work and use technology. Ultimately, this will lead to the modernisation of entire companies.
However, there is still a discrepancy in the pace of adoption between different manufacturers and different industries. While some are well advanced in digital transformation, many are not aware of the full potential of such technologies. Some factories argue that they are not ready because they perceive that they have a lack of resources and a limited understanding of the impact on various stakeholders.
However, for all levels of on-site digitisation maturity and progress, there is a solution available to meet the needs. An important aspect of Industry 4.0 is that it is not about replacing machines and equipment, but about leveraging software and exploiting captured data to make industries more efficient. Delaying the Fourth Industrial Revolution transformation will no longer be a viable option in the glass industry. If you wish to remain competitive, you must embark on this journey.
Energy efficiency starts by leveraging the underlying data inside the plant
The new centrepiece is your data. Data is the asset that in many cases is the most unknown and yet most promising one. Data inside companies can be described as an iceberg floating on water: only a small portion can be seen. And of the seen portion, only a fraction is used. The water around the iceberg is the potential of data that can be created.
Data strategy is the process of using and producing more relevant and useful data, aggregating them, increasing your assets, and thus opening more opportunities. A significant amount of data comes from various glass processes, furnaces, IS machines, lehrs, etc. Smart management of such data could make machines and processes more efficient. To successfully implement these new technologies, several obstacles must be overcome: the lack of time, digital strategy, resources, and domain knowledge. Companies like JoonX can help define and implement this strategy. Digital service suppliers should be independent actors who are
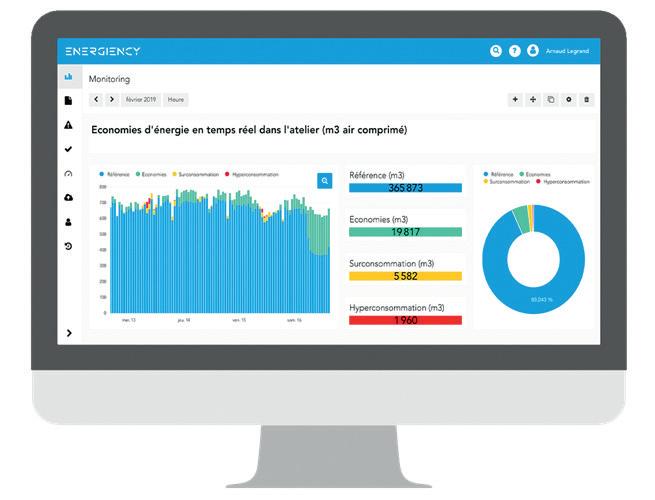
� Fig 1. Typical energy management platform interface (copyright Energiency)
also experts in data science. The aim of a digital strategy is first to collect, organise, and centralise data and second, to connect and make them available to the appropriate services in order to improve specific metrics of glass processes.
Digital services are aimed to improve production, value, and supply chains to increase business revenues. These services enable the integration of previously disparate systems and processes through interconnected computer systems of organisations. The methods used vary from monitoring to constraint solving to deep learning.
How to reduce energy consumption and footprint thanks to an energy management platform?
Data science and A.I. companies, such as JoonX partner Energiency, have decided to develop specific programmes and knowledge in the field of energy. Therefore, instead of focusing on a specific sector, they aim to be the leader of energy savings for all industries. It focuses purely on energy allows the creation and operation of optimal energy management platforms that work across all industries. The objective of such digital platforms is to control and optimise the energy consumption of processes and to exploit the data to identify new energy savings (Fig 1).
Case study: regenerative furnace
This example concerns a typical side-port regenerative float glass furnace of 600t/d which used to produce architectural glass with an air-gas combustion system. This type of furnace requires reversing the combustion approximately every 20 minutes, from right to left and vice versa, to pre-heat the opposite regenerators with the exhaust fumes. This furnace was at the end of its lifetime and its consumption exceeded 400GWh per year. The main objective of this project was to save 1% on the energy bill by digitising the furnace’s energy flows. Note, this plant also had a relatively low level of digitalisation, which proved not to be an obstacle to the project execution.
Taking a closer look at the plant context at the time of the digital project execution, many similarities can be found with most glassmaker operations nowadays. The plant had a strong focus on energy consumption, as it was the main on-site OpEx. The KPIs were defined by the group or the upper management and were tracked by an Operational Excellence Manager. Additionally, the customer had a manual, monthly reporting process on energy consumption which was time consuming and subject to human errors. With the furnace being at the end of its lifetime, one of the objectives was to understand and model the degradation of the regenerators. Indeed, one of the model’s goals was to distinguish in realtime two aspects: the natural reduction in efficiency due to ageing of the regenerators and the variation in energy performance due to operational, process and production parameters that could be optimised.
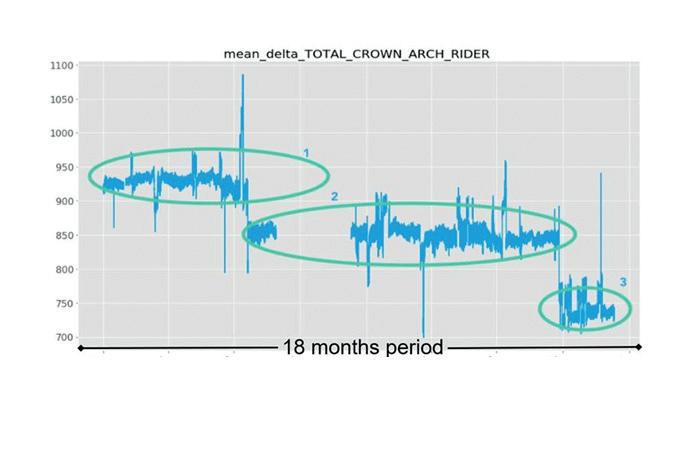
� Fig 2. Degradation of regenerator’s efficiency over an 18-month period
Phase 1: collection and analysis of existing data
The implementation started with a data science phase based on historical data provided by the customer. This step used 18 months of available data organised in 700 different dataflows with a 30s timestep (over a billion data points in total). All the parameters were taken, and the influencing ones were identified to create the model of the system. Most of influencing parameters were related to temperatures and production. In general, and if necessary, the number of dataflows used by the model for the calculation of KPIs can be adapted. Data transfer and storage are flexible, either in the cloud
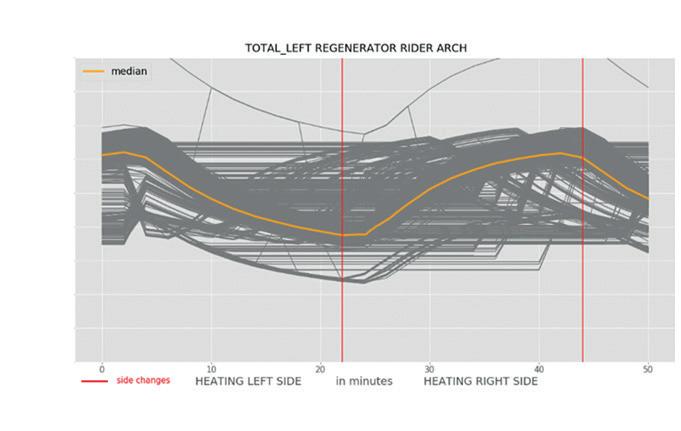
� Fig 3. Left regenerator rider arch temperature
or on-premises (i.e. hosted inside the plant). Different types of connection are available to provide flexibility in adapting to the plant’s IT architecture and to ensure data protection. Data control and security are indeed essential. For this specific project, the data was sent to a cloud via an SFTP server. The customer had an automated exportation of the dataflows in .csv format. The data science allowed a deep analysis of the furnace consumption and of the different flows with their distribution throughout the system. As previously requested by the customer, this phase made it possible to focus on the regenerative system.
The study of the average delta of temperature between the crown (top) and the arch (bottom) of one of the regenerator stacks during the 18-months period was essential in the analysis of the furnace’s regenerators behaviour – see Fig 2. This temperature difference represented the efficiency of the regenerative system, the higher the temperature delta, the more efficient the system (i.e. the combustive air pre-heating temperature). Due to the degradation of the regenerators’ refractories, the pre-heating temperature decreases with the ageing of the furnace.
Phase 2: implementation of the model in the digital platform and observation of energy consumption in real-time
This deterioration of the regenerators was modelled, so that real-time variations in energy performance could be differentiated, and the digital twin of the furnace could be created. This allowed the creation of the baseline of energy consumption considering the deterioration of the regenerators. The baseline is the point of reference on how the energy consumption should be, depending on the context. The model used machine learning technology to give
the values of energies and consumptions in real-time.
The exploratory analysis made it possible to look closely at the average temperature inside one of the left regenerator rider arch (bottom) being pre-heated and at times of combustion reversal. We could identify that the temperature of the stack pre-heated by the exhaust fumes decreased before the combustion was reversed (Fig 3).
This detected a non-optimisation of the combustion. Indeed, the change of combustion side must occur at the peak of the regenerator temperature. Otherwise, the pre-heating of opposite stacks will be reduced. This identification was made through the combination of data science and energy knowledge.
Energy management platform are great tools for closely monitoring consumptions and for precisely identifying the impact of improvement measures. With this in mind, suggestions were made in conjunction with the customer, and results exceeding expectations were achieved. (In general, recommendations of specific explorations and implementations are made according to the furnace and its operational context).
The results
The main recommendation allowed a saving of 2 to 3% (or up to 12 GWh) of energy consumption on the whole furnace gas consumption thanks to the optimisation of the firing time between two combustion inversions. The savings were achieved in a three-month period following the data analysis. This sole result made the implementation of the platform economically viable. In addition, thanks to a better knowledge of the energy temperatures, the customer was able to make optimised planning of the regenerators’ maintenance by acting first on the less efficient ones. The customer was also able to better adjust the combustion to the required thermal profile of the different types of glass produced. The impact of raw materials and gas quality on consumption was understood in real-time thanks to the definition of a new KPI. The platform also gave the value of emissions in real time and could trigger alarms. Finally, automated reports have saved the customer mandays each month and reports became automated, more accurate, and adjusted to different users.
Conclusion
You now have a new dimension to consider, the digital transformation of your businesses. This will support your projects focused on energy savings, process efficiency, predictive maintenance, product quality, pricing, and so on. Digital services are already a reality for glass makers in order to remain competitive. And remember that your teams can implement these solutions with reasonable resources. It is also totally independent of equipment technology, lifetime, and maintenance schedule.
Digital services are the ultimate optimisation. They are safe, with a short ROI, and the best way to improve unoptimised systems and to bring new savings opportunities you might not have identified yet. �
*Founder, JoonX, Mexico City, Mexico www.joonx.org