
BENV0040 VXGC7 INDOOR AIR QUALITY IN BUILDINGS EVALUATING INDOOR AIR QUALITY IN BUILDINGS
i C O N T E N T S 1 . 0 I N T R O D U C T I O N Air Quality, Comfort, Health & Wellbeing.................................................................................................01
Contributing to
Air Quality........................................................................04
is Healthy?........................................................................................................................................06 Aims........................................................................................................................... ..................................08 2 . 0 M E T H O D O L O G Y 1.1 1.2 1.3 1.4
2.1 2.2 2.3 3 . 0 R E S U L T S 5 . 0 C O N C L U S I O N S 6 . 0 R E F E R E N C E S 7 . 0 A P P E N D I X Shared durations of present data......................................................................................................................29 1
26
27
29
4 . 0 R E C O M M E N D E D I N T E R V E N T I O N S
Improving Indoor Air Quality......................................................................................................................20 Baseline Model................................................................................................................. ...........................21 Investigating the Recommended
Iteration No. 1............................................................................................................................................23 Iteration No. 2............................................................................................................................................24 Iteration No.3.............................................................................................................................................25 4.1 4.2 4.3 4.4 4.5 4.6 Study Discussion............................................................................................................... ..........................26 Recommendations for Further Research...................................................................................................26 Conclusion..................................................................................................................... .............................26 5.1 5.2 5.3
Sources of Pollution
Indoor
What
Overall Approach of Study..........................................................................................................................09 Approach in the Evaluation of Monitoring Data......................................................................................12 Approach in the Investigation of Interventions via Simulation Modelling..............................................12
p. 14 p.
p.
p.
p. 09 p. 01
p. 20
Interventions.........................................................................................22
1.1 2.1 2.2 2.3 3.1 3.2 3.3 4.1 4.2 4.3 4.4
F I G U R E S
Wellbeing and Buildings: Conceptual themes and subthemes - adopted from Hanc, McAndrew and Ucci (2018).................................................................................................................... .............................02
Location of Bloomsbury & Euston monitoring stations, London wind rose, placement of rooms and the orientation of their windows...............................................................................................................10
Daily mean readings of NO 2 for the year 2017 from Bloomsbury & Euston monitoring sites............11 Daily mean readings of PM 2.5 for the year 2017 from Bloomsbury & Euston monitoring sites............11
Average concentrations of environmental variables in site & rooms 413, 416 & 418 during the 33 day s.............................................................................................................................. .....................................14
Thermal performance of rooms 413, 416 & 418 during the 33 days within the thermal comfort range proposed within BS EN 15251:2007.........................................................................................................16 Concentrations of PM 2.5 in Euston site, rooms 413, 416 & 418 during assessed period of 33 days....18
Performance of baseline model..................................................................................................................21 Performance of iteration 1 against baseline model..................................................................................23 Performance of iteration 2 against iteration 1.........................................................................................24 Performance of iteration 3 against iteration 2.........................................................................................25
T A B L E S
1.1 1.2 1.3 2.1 3.1 3.2 3.3 3.4 3.5 3.6 3.7
Review on the impacts of indoor air quality, along with interrelated environmental factors, on occupant comfort, health, and wellbeing...........................................................................................................03 Summary of air pollutants and their common sources, both indoor and outdoor - adopted from RCPCH (2020)................................................................................................................... .........................05
Guideline/standard recommendations on indoor air pollutant concentrations, CO 2 , ventilation rates, humidity & thermal comfort.......................................................................................................................07
Design Builder input variables & output assessment for demand control ventilation balancing CO 2 against PM 2.5 external pollution..................................................................................................................13
Room 413 specifications & 33-day average performance conditions......................................................15 Room 416 specifications & 33-day average performance conditions......................................................15
Room 418 specifications & 33-day average performance conditions......................................................15
External conditions 33-day average performance.....................................................................................15
Correlation assessment of environmental conditions within room 413 to other variables.................19
Correlation assessment of environmental conditions within room 416 to other variables.................19
Correlation assessment of environmental conditions within room 418 to other variables.................19
ii L I S T O F F I G U R E S & T A B L E S
1.1 AIR QUALITY, COMFORT, HEALTH & WELLBEING
Buildings that induce adequate environmental qualities within their interior spheres, bestow occupants the opportunity to benefit on multiple fronts. While this is often a result of proper collaboration between various environmental facets - the condition of air quality indoors, in particular - underpins numerous contributions towards conducive comfort, health, and wellbeing. It is nevertheless important to highlight that the extent to which comfort, health and wellbeing of an individual is affected, depends more broadly on the individual’s physiological, psychological, and psychosocial condition and potential, their life’s demands, and their inclusive exposure to environmental conditions (Bircher and Kuruvilla, 2014; Bircher and Hahn, 2016; Sorensen et al., 2021). To put better frame this in context of the built environment, Hanc, McAndrew and Ucci (2018) present conceptual themes and subthemes informed from the definition(s) of wellbeing in the context of buildings (figure 1.1) – while this conceptualisation places wellbeing in the centre, as the product of multiple contributing factors, it more importantly emphasizes the heterogeneity of it as a construct.
01
1.0 INTRODUCTION
Similarly, the interplay between indoor air quality and other environmental factors, governs the quality and performance of the indoor environment and the impact this has on individuals. Table 1.1 expands on key findings regarding how indoor air quality, along with interrelated environmental factors, impact occupant comfort, health, and wellbeing.

02
Indoor Air Quality
Poor air quality can contibute to the transmission of infectious disease and cases of respiratory illness, allergies, asthma and increase the likelihood of sick building syndrome.
Regarding adults, exposure to air pollution can lead to asthma, coronary heart disease, stroke, lung cancer, chronic obstructive pulmonary disease, and diabetes.
High levels of CO2 have negative effects on memory performance, subjective workload, perceived fatigue and motivation.
High levels of CO2 have a negative effect on decision making performance.
CO2 levels at 1000ppm compared to 600ppm had a detrimental impact of 1123% (worse) on decision making.
(Fisk, 2000) (RCP, 2016) (Maula et al., 2017) (Satish et al., 2012)
5 out of 10 of the studies reviewed by the source took place in atypical settings - bias estimates of potential respiratory illness.
Depends on extent of exposure and the individual.
Experiment focused on tasks with high concentration and eliminated noise. Results cannot be generalised in cases of teamwork.
Questions the extent to which outdoor air supply can be reduced.
Ventilation
Extreme levels of CO2 result in symptoms of hyper-ventilation, rapid heart rate, clumsiness, emotional upset and drowsiness.
Exposure to a pollutant source (old used carpet) and a fresh air supply of 10 l/s per person, caused subjects to type 6.5% more slowly, make 18% more typing errors, and experience more headaches.
15 reviewed studies linked improved ventilation with up to 11% gains in productivity, due to a higher delivery of fresh air and reduced levels of pollutants.
With the presence of airborne VOCs, increasing ventilation from 5 l/s to 20 l/s per person improved performance by up to 8%.
Increasing the outdoor air supply rate is more prone to improve occupant performance.
(Alker et al., 2014) (Oseland, 2022)
Lab-based study using simulated decision making tasks - may differentiate from real world scenarios.
CO2 is a proxy measure of poor air quality.
(Wargocki and Wyon, 2017)
(Alker et al., 2014) (Alker et al., 2014)
70% of the subjects were quality when the used carpet was present - questions the role of dissatisfaction on task performance.
Increased productivity may be heavily dependant on reduced levels of pollutants.
Conducted in a lab testmay differentiate from real world scenarios.
Performance improves in tasks requiring cognitive activity when ventilation rates is increased.
(Wargocki and Wyon, 2017) (Seppanen and Fisk, 2006)
Varying level of results for each context analysedin the ventilation systems played a role.
Results begin to plateau at around 40 l/s of outdoor air supply per person.
03
Environmental Factor Impact on Comfort, Health & Wellbeing
Supporting Reference Limitation / Bias / Argument
Environmental Factors
Impact on Comfort, Health & Wellbeing
and behaviour, where lower temperature can lead to aggression, while higher temperature can lead to both apathy and aggression.
Motivation and performance improve when occupants are thermally comfortable. Warm discomfort has more negative effects on both attributes than cold discomfort.
(Cao and Wei, 2005)
Study suggests that temperature is only one of three weather variables affecting people’s mood, daylight and length of nightime also play a role.
Thermal Comfort
Subjects’ heart rate, respiratory ventilation, end-tidal partial pressure of CO2
oxygen saturation decreases in a room temperature of 30°C vs. 22°C, implying negative affects on health and work effort.
Individuals are remarkably adaptable to temperature in a way that they are not, to air quality.
(Cui et al., 2013) (Lan et al., 2011)
The change of human performance could also be explained by change of motivation rather than the change of temperature.
Small sample size (N=12).
Noise
25% of noise perception is attributed to sound level while 75% are from personal and psychological factors, with 65% of variance in work performance, concentration and speech interference, being personal.
Performance drops 66% for ‘memory for prose’ tasks when individuals are exposed to varying types of background noise.
(Alker et al., 2014)
The perception of thermal comfort still has avidual satisfaction.
(Oseland and Hodsman, 2018) (Banbury and Berry, 1998)
Prompts the questiondoes the extent of noise depend more on individual perception or the existing environment.
Small sample size (N=12).
1.2
SOURCES OF POLLUTION CONTRIBUTING TO INDOOR AIR QUALITY
It is predominant to underline that indoor air quality of an environment is affected from contributions of both outdoor air sources of pollution and indoor sources of pollution, and consists of varying emission rates, and therefore it can be complex to determine where a specific pollutant is coming from. Table 1.2 presents a summary of air pollutants and their common sources, both indoor and outdoor. The highlighted sources are those that might be present within the building context yet to be explored in this report.
04
Supporting Reference Limitation / Bias / Argument
Category Pollutant
Particulate matter (PM) of different sizes
Particulate Matter
Environmental Tobacco Smoke (ETS)
Asbestos
Nitrogen Dioxide (NO2)
Nitrogen Oxides (NOx)
Carbon Monoxide (CO)
Indoor Source
• Combustion activities
• Vacuuming & cleaning activities
• Smoking indoors
• Components absorbed by indoor surfaces and later released
• Building materials prior to the year 2000 (now heavily regulated)
• Combustion activities
• N/A
• (Incomplete) combustion of fossil fuels
Outdoor Source
• Air & road transport, combustion activities for industrial purposes; construction sites
• Natural sources
• N/A
• Natural deposits of asbestos minerals
• Burning of fossil fuels
• Motor vehicles, energy production, & industry
• (Incomplete) combustion of fossil fuels
Inorganic Air Pollutants
Carbon Dioxide (CO2)
Ozone (O3)
Volatile Organic Compounds (VOCs)
• Human respiration
• Burning wood, coal or gas
• Sunlight reacting with pollutants in the air
• By some devices such as laser printers, photocopiers & air cleaning appliances.
• Construction & building products
•
Chemical
(Organic Air Pollutants)
Semi-Volatile Organic Compounds (SVOC)
Formaldehyde
Polycyclic Aromatic Hydrocarbons (PAHs)
• Furniture
• Household consumer products
• Plasticisers (phthalates)
• Flame retardants (PCBs, PBB)
• Building materials
• chemical reactions
• Smoking, heating and cooking, burning of coal, oil, gas, rubbish, wood and other organic substances.
• Burning of fossil fuels & industrial processes
• Natural sources
• Sunlight reacting with pollutants in the air
• Combustion activities such as -
• Pesticides
• N/A
• Incomplete combustion, waste incineration, industrial power generation, & vehicular and air
• Natural sources
Airborne Radiation
Radon
• Through the ground, and cracks and fractures.
• Water supplies can contribute to indoor levels.
House dust mites
Moulds/fungi
• Bedding, carpets, mattresses, clothing, and soft furnishings
• Damp/moist surfaces/areas
• Naturally occurring in certain regions in soil, rocks and water.
• N/A
• Growing on food, plants and soil
Biological Pollutants
Endotoxin
Pollen
Pet hair and dander
• N/A
• Plants
• Wherever the animal (household pets or pests) may have been
• Natural environment
• Plants
• N/A
05
1.3 WHAT IS HEALTHY?
From what has been reviewed above, it is evident that in order for occupants to feel comfortable indoors and that their health and wellbeing is not compromised; a building needs fresh air at which it supplies adequate temperature, contains the right amount of moisture, and is free from unhealthy levels of various pollutants whilst resisting decay or infestation. While there are several performance criteria presented in guidelines, regulations, and voluntary schemes, they often vary from one another for several reasons. They all nevertheless present guidelines that balance between what is safe and what is considered achievable in a particular setting, consequently - recommended concentrations of selected pollutants and environmental measures, relevant to this report, are explored in table 1.3.
06
Standard
Supporting Guideline / Standard Pollutant / Variable Annual Average 24-Hour Average

• 5 µg/m3 AQG level
• 35 µg/m3 interim target 1
• 25 µg/m3 interim target 2
• 15 µg/m3 interim target 3
PM2.5
• 10 µg/m3 interim target 4
• 25 µg/m3
• 15 µg/m3 AQG level
• 75 µg/m3 interim target 1
• 50 µg/m3 interim target 2
• 37.5 µg/m3 interim target 3
• 25 µg/m3 interim target 4
(WHO, 2021)
• N/A (DEFRA, 2010)
• (WELL, 2022)
• 10 µg/m3 AQG level

• 40 µg/m3 interim target 1
• 30 µg/m3 interim target 2
NO2
• 20 µg/m3 interim target 3
• 40 µg/m3
CO2
Ventilation Rate
Humidity
Thermal Comfort
• 25 µg/m3 AQG level
• 120 µg/m3 interim target 1
• 50 µg/m3 interim target 2
(WHO, 2021)
• N/A (DEFRA, 2010)
• 400 ppm (REHVA, 2020)
• Average CO2 during occupied day <1500 ppm
• CO2 can’t be greater than: Natural - 2000ppm / Mechanical1500ppm. For 20 consecutive minutes or more
• during occupied day.
BB 101 (ESFA, 2018)
• < 900 ppm (WELL, 2022)
• 8 l/s per person air supply rate
• Minimum 3 l/s per person
• Average 5 l/s per person
• Maximum 8 l/s per person
CIBSE Guide A (CIBSE, 2015)
BB 101 (ESFA, 2018)
• Standard 62.1 (ASHRAE, 2010)
• 4.3 l/s per person (lecture classroom)
• 40 - 70 %
• Summer dry resultant temperature range: 21 - 23 °C
• Winter dry resultant temperature range: 19 - 21 °C
• < 120 hours above 28°C
• Avg. internal vs. external temp. no more than 5°C
• Max 32°C
CIBSE Guide A (CIBSE, 2015)
BS EN 15251:2007 (BSI, 2007)
2
CIBSE Guide A (CIBSE, 2015)
BB 101 (ESFA, 2018)
07
1.4 AIMS
This report is an attempt to build a deeper understanding towards the different dimensions and parameters governing indoor air quality in buildings. More precisely, the aim is to evaluate the indoor air quality of three different rooms within a case study building – rooms 413, 416 and 418 on the fourth floor of UCL’s Central House - via the use of indoor and outdoor monitoring data obtained from 2017. In doing so, this will inform what the drivers of the room performance are.
This will further identify the existing relationship between the internal environment and the external environment in the specified context - as well as what this means for, other environmental factors when there are varying parameters in each setting, and the indoor air quality when it is compared to relevant guidelines. Subsequently, key strategies and interventions which could be utilised to improve the building’s air quality are to be explored via simulation modelling – through this, better clarity will fall onto how adequate conditions can be provided indoors, and hence inform a deeper knowledge of indoor air quality, comfort, health, and wellbeing.
08
2.1 OVERALL APPROACH OF STUDY
As previously outlined in the aims of this report, in order to gain a deeper understanding into how indoor air quality can be controlled and directed to host a fruitful interior environment, it is wise to investigate its governing parameters. Ultimately, an Excel data set has been provided to aid this –UCL’s Central House rooms 413, 416, and 418 have been monitored via an internal IBEM sensor for the duration of the year 2017. Alongside this, are external weather conditions conducted from Central House’s weather station – providing an annual reading of wind direction and speed, rainfall, external temperature, and humidity, as well as barometric pressure and solar radiation. While it is not guaranteed that any of these factors are causal to the indoor air quality, they provide insight into how occupants might have behaved within the interior sphere, and consequently inform if actions such as the opening of windows or the use of indoor heating might have been a driver on the subject matter.
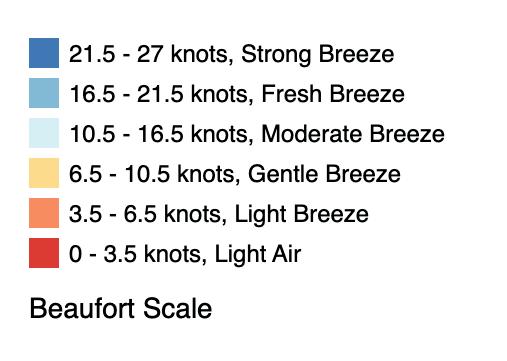
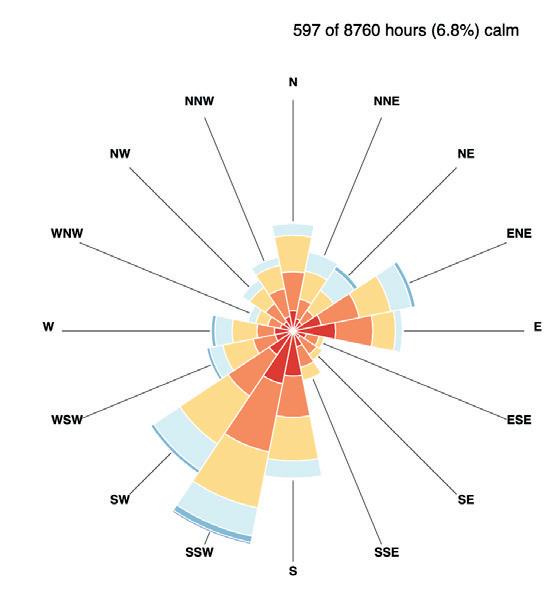
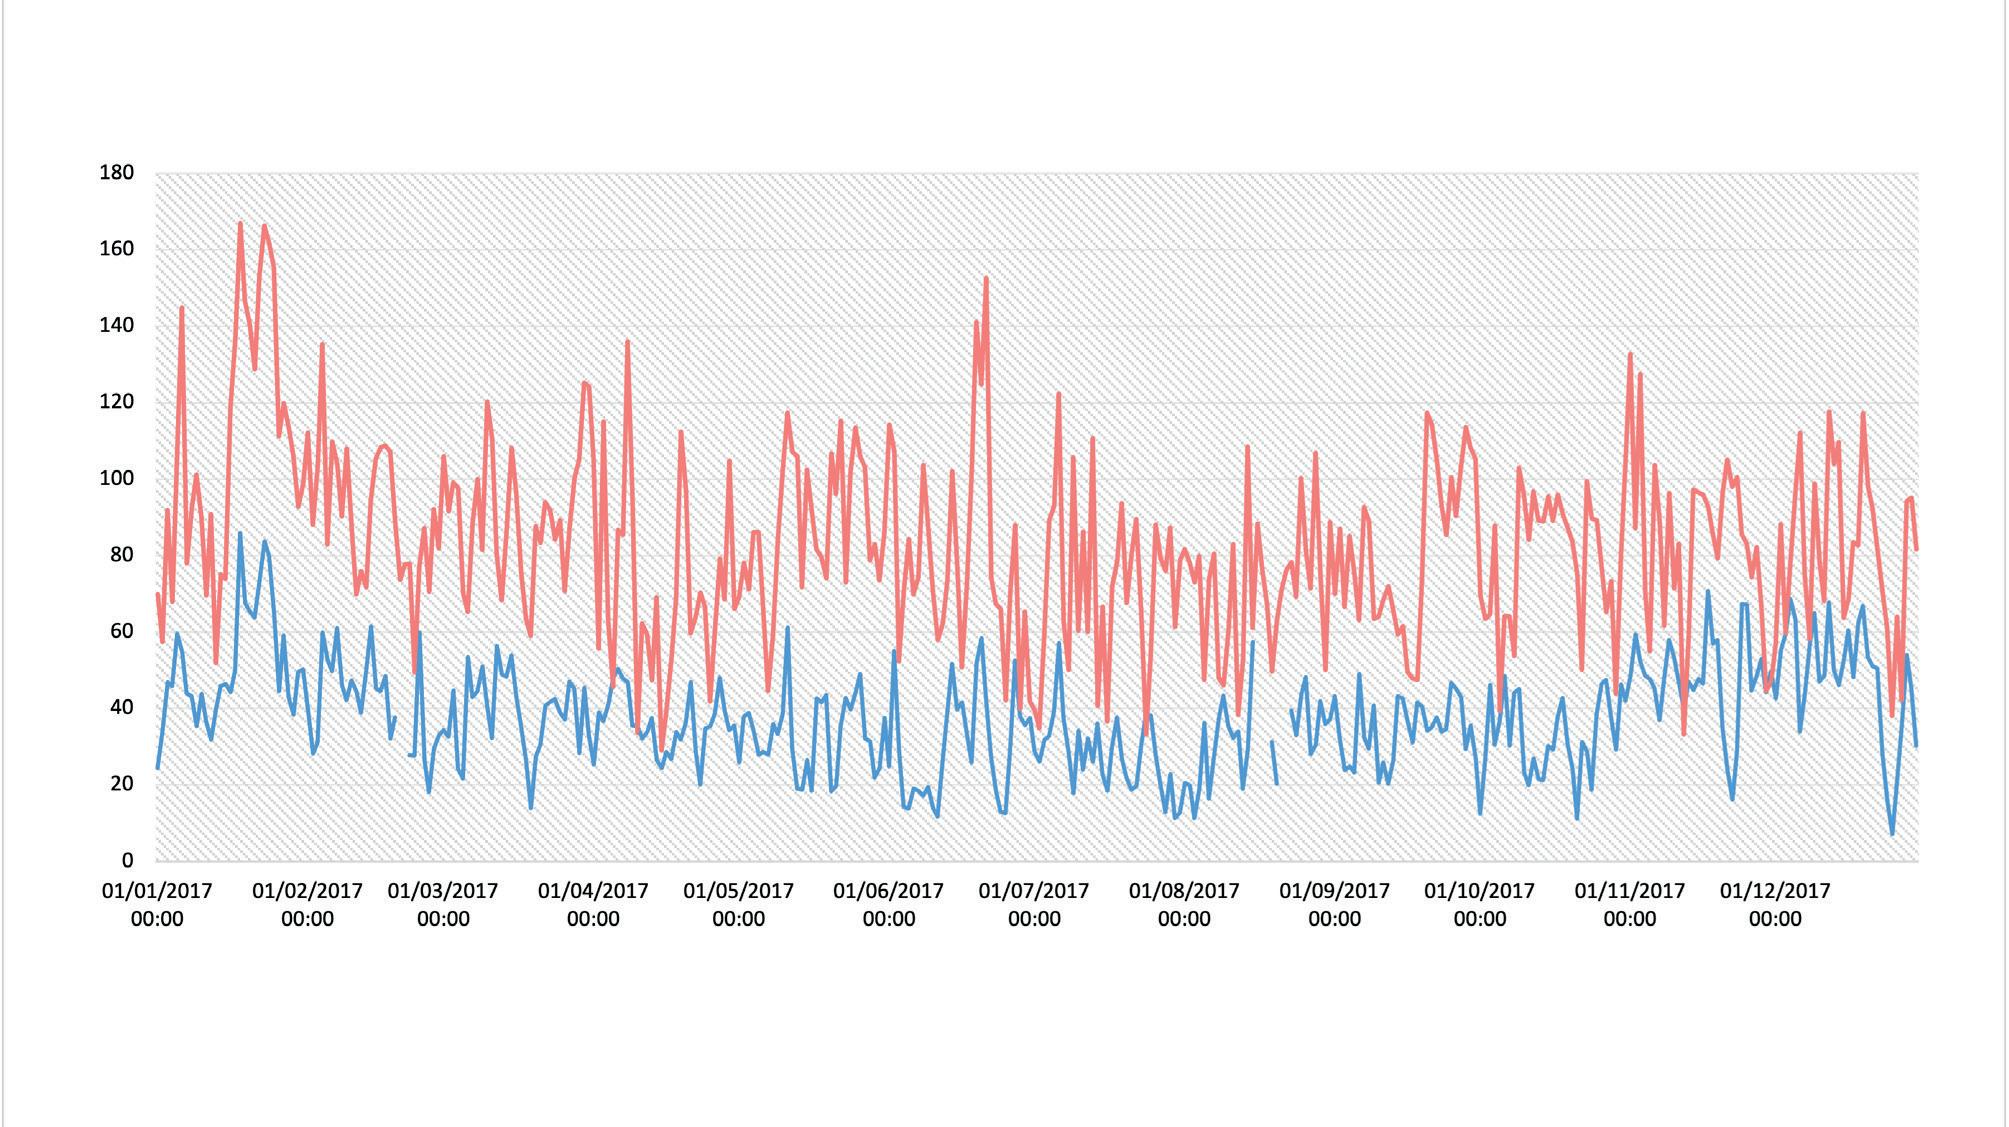
As to assess the air quality conditions of the rooms regarding pollution concentrations, two monitoring stations from the London Air Quality Network hold plausible accountability in terms of the rooms’ indoor air quality. These are the Bloomsbury and Euston monitoring stations, both located in Camden (figure 2.1 presents their exact placement regarding rooms 413, 416 and 418 as well as an according wind rose). Evidently, the Euston monitoring site has closer proximity to Central House and is classified as ‘Roadside’ monitoring with a sampling height of 2.5 metres from the ground. Alternatively, the Bloomsbury monitoring site has a sampling height of 4 metres from the ground and is classified as ‘Urban Background’ where it is more broadly representative of London’s background concentrations. From further comparing the daily mean concentrations of NO2 and PM2.5 during 2017, as seen in figures 2.2 and 2.3, the PM2.5 concentrations of both sites are relatively similar whereas the Euston site presents much higher concentrations of NO2 – which is expected as the burning of fossil fuels from vehicular traffic is a primary source of NO2. Additionally, assessing both stations in terms of wind direction and intensity, it is seen that the direction from which wind in London prevails, potentially leads the monitored pollutants to be re-directed elsewhere than to the location of Central House. Noting that Central House is situated between two roads and due to the conducted analysis, this study will proceed to use the Euston monitoring data as indoor concentrations are highly likely to be correlated with traffic density and distance from roadways.
09 2.0 METHODOLOGY
LOCATION OF CENTRAL HOUSE


EUSTON MONITORING SITE
‘Roadside’, meaning: Site with sample inlets between 1m and 5m of the kerbside. Sampling heights are within 2-3m of the ground.
BLOOMSBURY MONITORING SITE
‘
Urban background’, meaning: Urban location away from major sources and broadly representative of town/city-wide background concentrations.
ROOMS 413, 416 & 418

ROOM WINDOW ORIENTATION 413 418 416
10
VALUE
VALUE
DAILY MEAN READINGS OF NO 2 FOR THE YEAR 2017 FROM BLOOMSBURY & EUSTON MONITORING SITES 2
DATE
EUSTON SITE BLOOMSBURY SITE DATE
DAILY MEAN READINGS OF PM 2.5 FOR THE YEAR 2017 FROM BLOOMSBURY & EUSTON MONITORING SITES
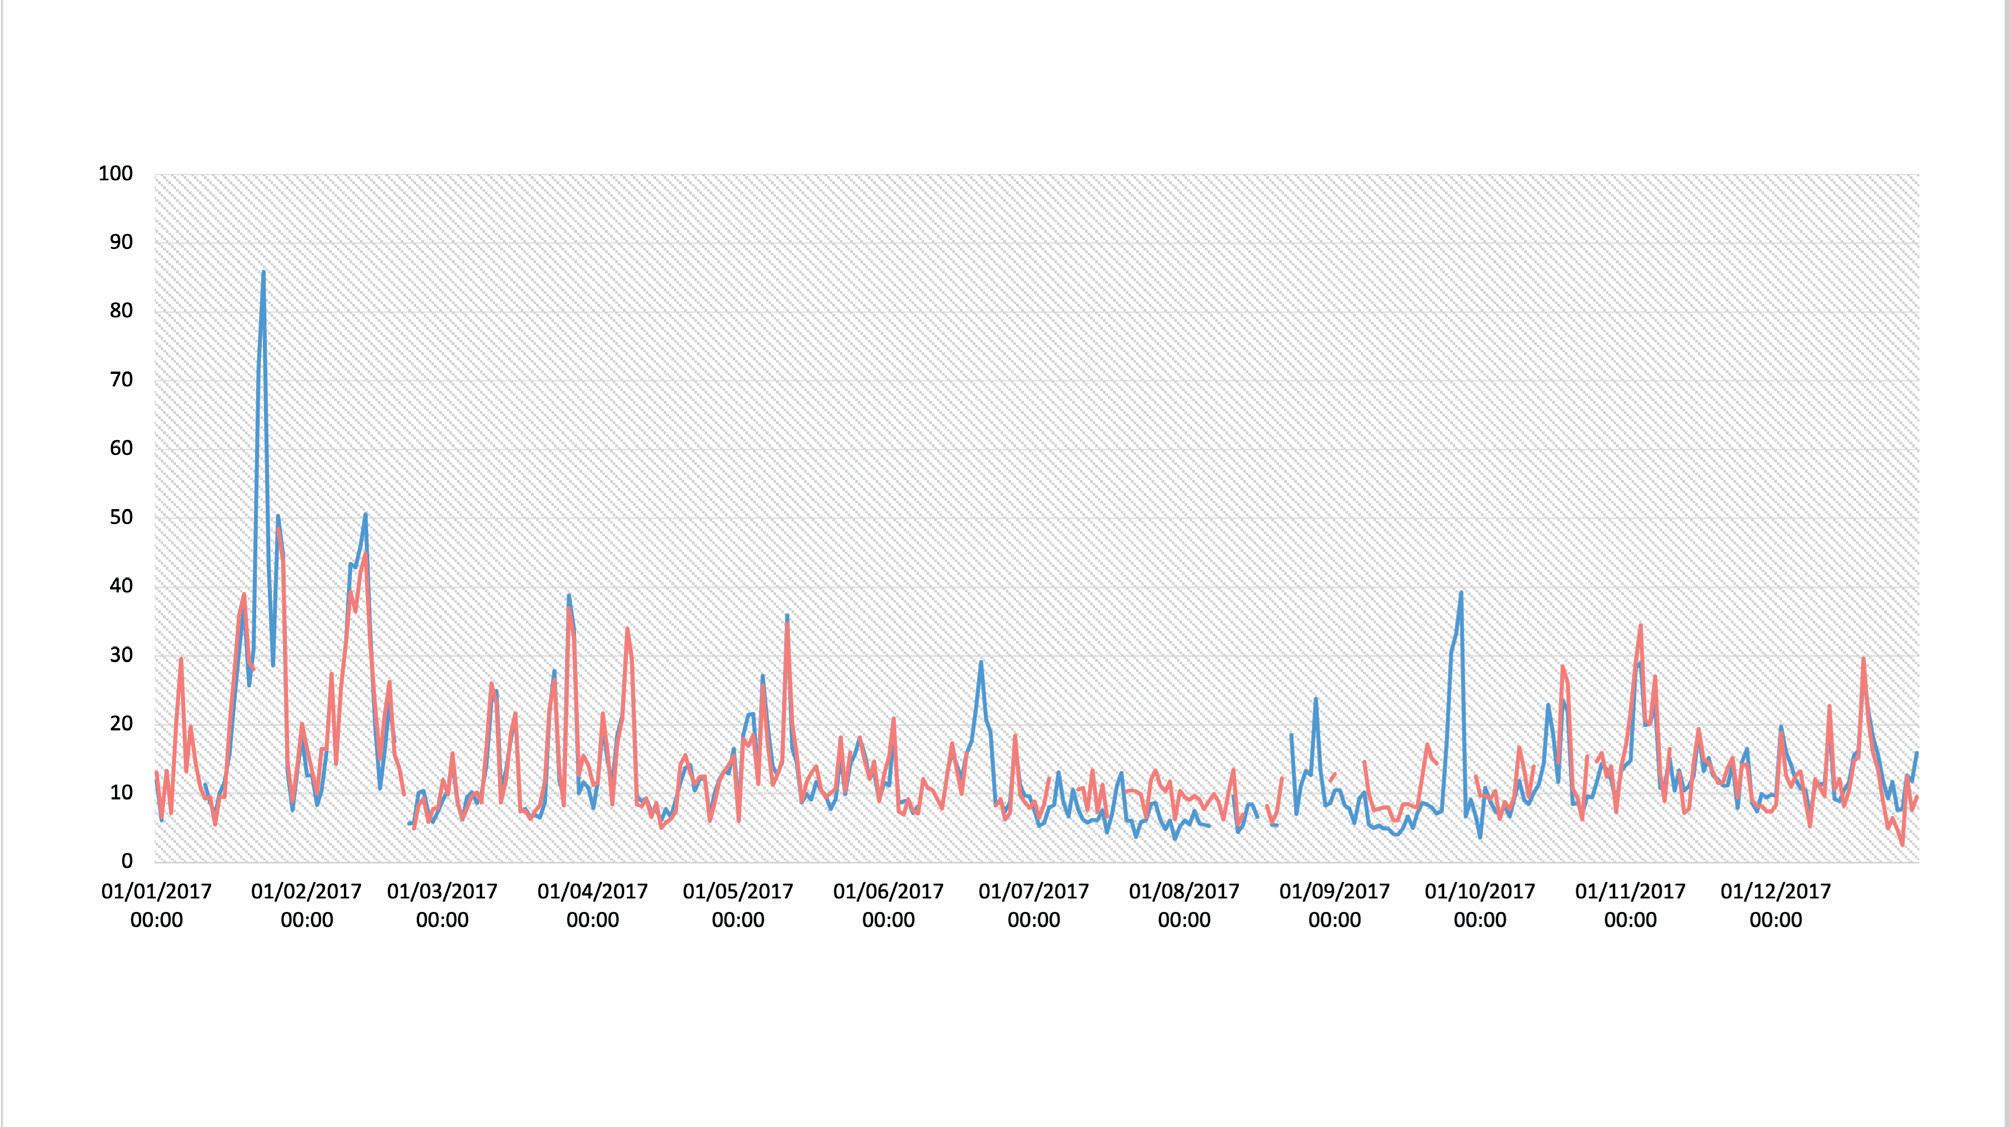
EUSTON SITE BLOOMSBURY SITE
Following this, possible interventions will be tested in Design Builder to help improve the indoor air quality in room 418, as the exact occupancy in room 413 is undefined (10+) and room 416 presents similarity of that to 418 –where a pre-built model has been provided by an authoritative body, design parameters within the model will be explored.
11
2.2 APPROACH IN THE EVALUATION OF MONITORING DATA
Essentially, the data set obtained from the internal IBEM sensors in the rooms, the Central House Weather station, and the Euston monitoring site, present a series of missing data that prevent an appropriate annual analysis to rightfully be carried out. There are only four periods where all the data has been obtained and presented in the data set, the longest duration of those being 33 days starting from 12/07/2017 to 10/08/2017 (see appendix 1 for shared durations of present data). Additionally, the monitoring instruments captured data every 15 minutes – providing an extensive list of outputs. For those reasons, this study will proceed with its aims by analysing monitored data from 12/07/2017 to 10/08/2017.
Where the FDMS instrument used for monitoring in the Euston site presented negative values of pollutant concentration, these are considered as values of 0, as this might be from a very low concentration reading. Ideally, it would be best to assume those values are equal to the detection limit of the measuring method, but in this case - where specifications on the FDMS instrument used by the London Air Quality Network are unknown, this is a carried limitation. Alternatively, where the data presented unrealistically high concentration readings, these have been neglected as they are likely to be due to a malfunction in the instrument.
2.3 APPROACH IN THE INVESTIGATION OF INTERVENTIONS VIA SIMULATION MODELLING
While the external pollutant concentrations from the Euston site are not applicable to the design builder software for similar analysis of room 418, it is yet important to consider the high concentrations of NO2 that were presented prior from the monitoring site. Carrying this through, the approach of the recommended intervention will not expand on varying the window opening area or merely demand control ventilation based on indoor CO2 concentrations, but rather on advanced demand control ventilation balancing CO2 against external pollution of PM2.5. The varying data inputs, outputs and assessment criteria for the simulation are outlined in table 2.1.
12
Variable Set-point
Occupancy (Number of people) 2 0.700
Crack Template Medium
Natural Ventilation Calculated
Operation Schedule
Glazing Area Opens 30%
Mechanical Ventilation On
Min fresh air (sum per person + per area)
Outdoor Air CO2 & Contaminants
Simulating CO2 Concentration Schedule
Simulation Period 13 Jan - 20 Jan
Time Steps per Hour 6
EMS Script (EMS Pollutant Control) Enabled
Output Assessment
Zone Operative Temperature
Zone Air CO2 Concentration
Zone Mechanical Ventilation Air Changes per Hour
Zone Ideal Loads Supply Air Total Heating Rate
Zone Air Generic Air Contaminant Concentration
External CO2 Measured
External Generic Contaminant Measured
1 15 µg/m3 - (WELL, 2022 guideline) 900 ppm - (WELL, 2022 guideline)
2 10 µg/m3 - intermediate assessment 650 ppm - intermediate assessment
3 15 µg/m3 - (WHO, 2021 interim 3 guideline) 400 ppm - (REHVA, 2020 guideline)
13
Iteration No. PM2.5 Control Assessment CO2 Control Assessment
RESULTS
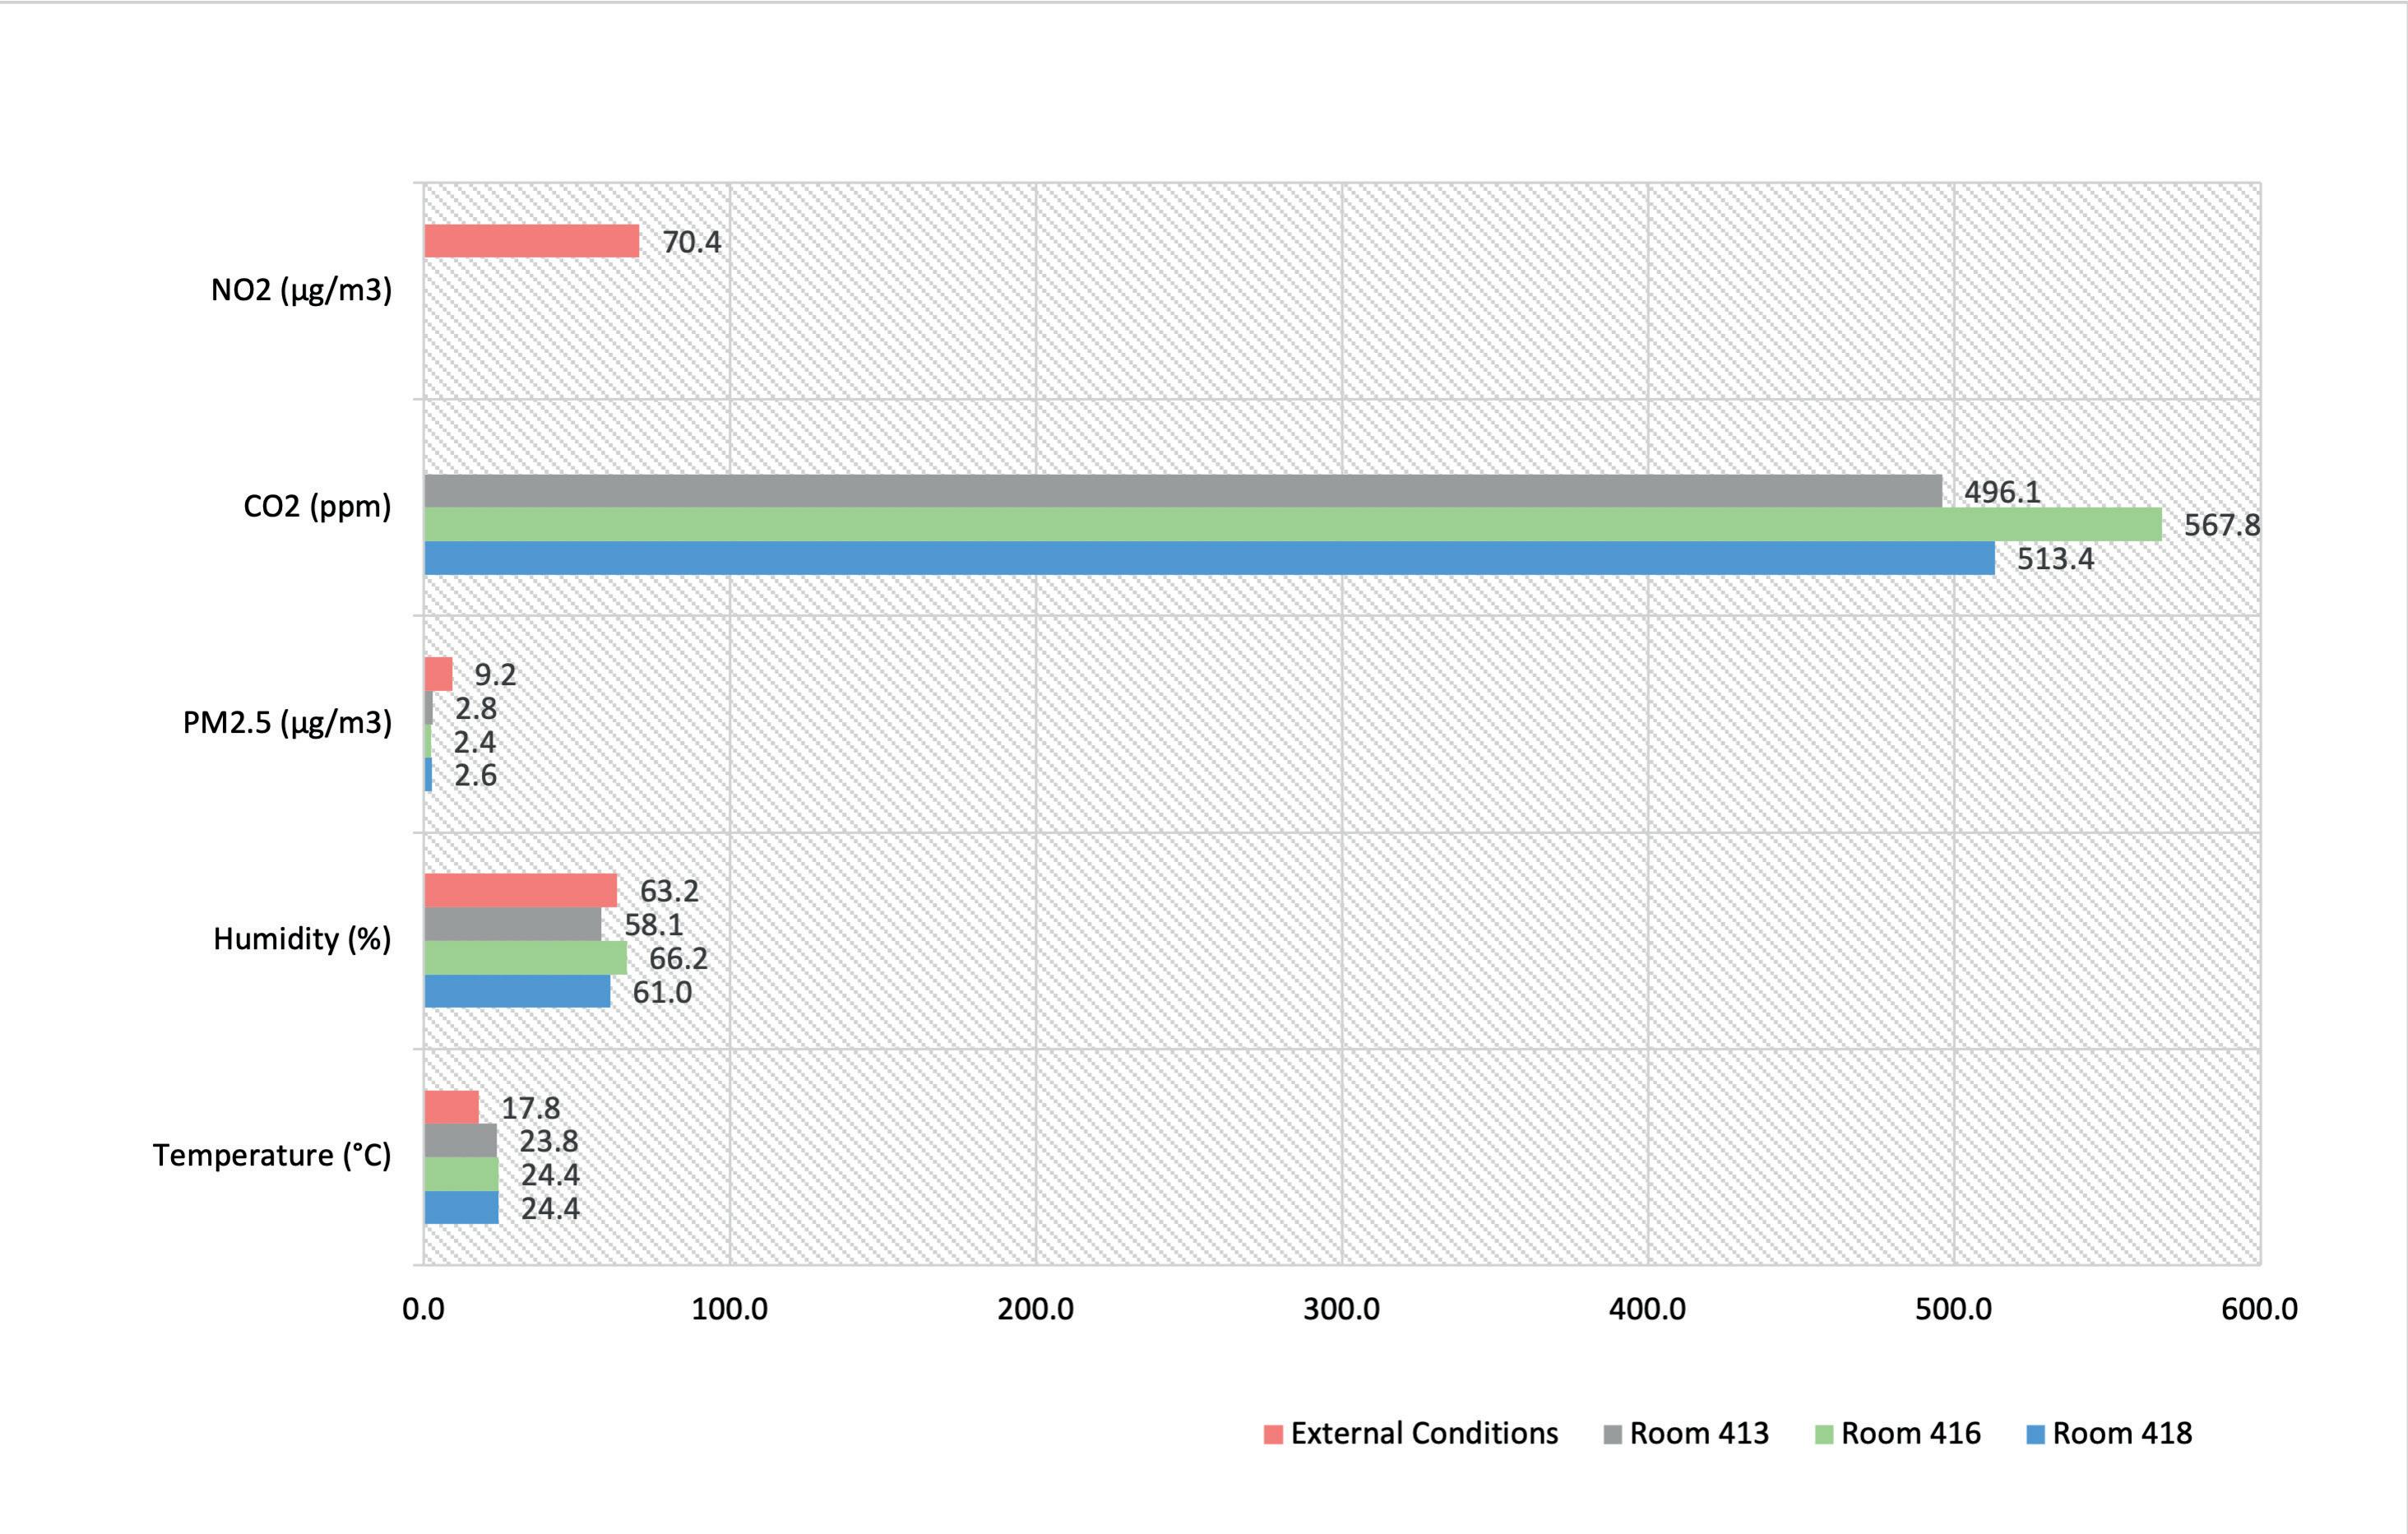
As mentioned prior, the factors affecting poor indoor air quality in buildings, include indoor and outdoor sources, ventilation, occupant behaviour and any integrated filtration strategies. Aspects such as definite indoor sources of pollution and their emission rate, room volume and building characteristics, objects that absorb and re-emit pollutants, occupant behaviour and the location or distribution of ventilation extracts or heat sources, are unknown in this case. In its efforts to inform these aspects, a comparison on the environmental factors between the external environment and all three rooms is presented in figure 3.1, with specifications on each setting outlined in tables 3.1, 3.2, 3.3 and 3.4 respectively.
14 3.0
VALUE VARIABLE
AVERAGE CONCENTRATIONS OF ENVIRONMENTAL VARIABLES IN SITE & ROOMS 413, 416, 418 FROM 12/07/2017 TO 10/08/2017 (33 DAYS)
Factor Measure
Description Room 413, Open Plan
No. of Windows 7
Occupancy 10 + people
PM2.5 33-Day Average 2.8 µg/m3
CO2 33-Day Average 496.1 ppm Humidity 33-Day Average 58.1 % Temperature 33-Day Average 23.8 °C
Factor Measure
Description
No. of Windows 3
Occupancy 4 - 5 people
PM2.5 33-Day Average 2.4 µg/m3 CO2 33-Day Average 567.8 ppm Humidity 33-Day Average 66.2 % Temperature 33-Day Average 24.4 °C
Factor Measure
Description
No. of Windows 2
Occupancy 2 - 3 people
PM2.5 33-Day Average 2.6 µg/m3 CO2 33-Day Average 513.4 ppm Humidity 33-Day Average 61.0 % Temperature 33-Day Average 24.4 °C
Factor Measure
Description External Conditions
PM2.5 33-Day Average 9.2 µg/m3
NO2 33-Day Average 70.4 µg/m3 Humidity 33-Day Average 63.2 % Temperature 33-Day Average 17.8 °C
15
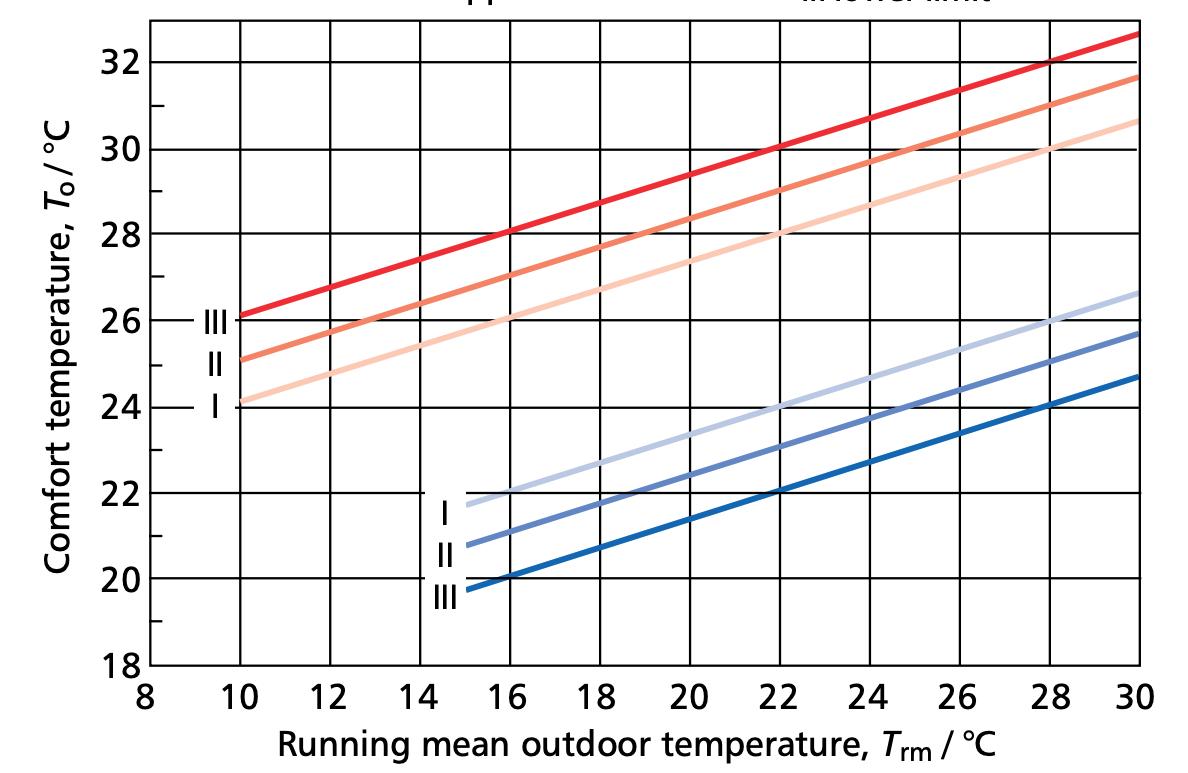
The indoor air quality conditions within all three rooms do not present intensely alarming pollutant concentrations – indicating that there might not be many sources of pollution indoors. Measurements of elevated CO2 levels indoor air are an effective method of identifying poor ventilation in indoor spaces, however all rooms present an average that falls below WELL and Buildings Bulletin 101 guidelines except REHVA’s < 400 ppm target. In a low occupancy or large volume space, a low level of CO2 cannot necessarily be used as an indicator that ventilation is sufficient to mitigate transmissions risks – it is not a good proxy for transmission risk when there is air cleaning as these strategies remove pollutants alone but not CO2.

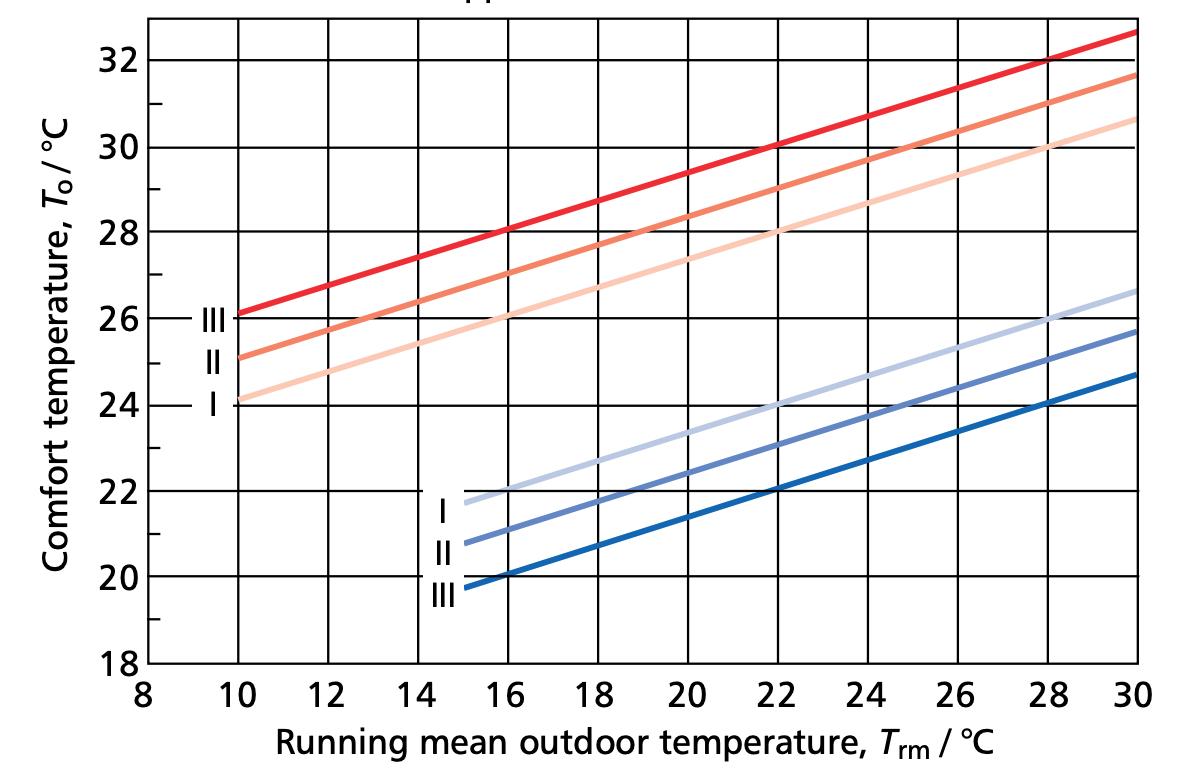
Alternatively, in room 413 which is an open plan with a potential occupancy of 10+ people, CO2 levels are much lower than the other two rooms, this may indicate that ventilation or an opened window area during the investigated time is more than that of the other rooms – this can also be supported by the indoor temperature compared to the external, where room 413 presents an indoor temperature of 23.8 °C which is closer to the outside value of 17.8 °C unlike what is presented in rooms 416 and 418 of 24.4 °C. It is assumed that indoor heating was not turned on during the assessed period, as this was during the summer month of July, but the building design and materials lead to solar penetration and gain despite the slightly cooler weather outside. Nevertheless, all rooms presented an internal vs. external temperature of more than 5 °C – not applying to the thermal comfort guidelines of Buildings Bulletin 101 but conforming to the thermal comfort range of BS EN 1525:2007 (see figure 3.2).

16
ROOM 413 ROOM 416 & 418
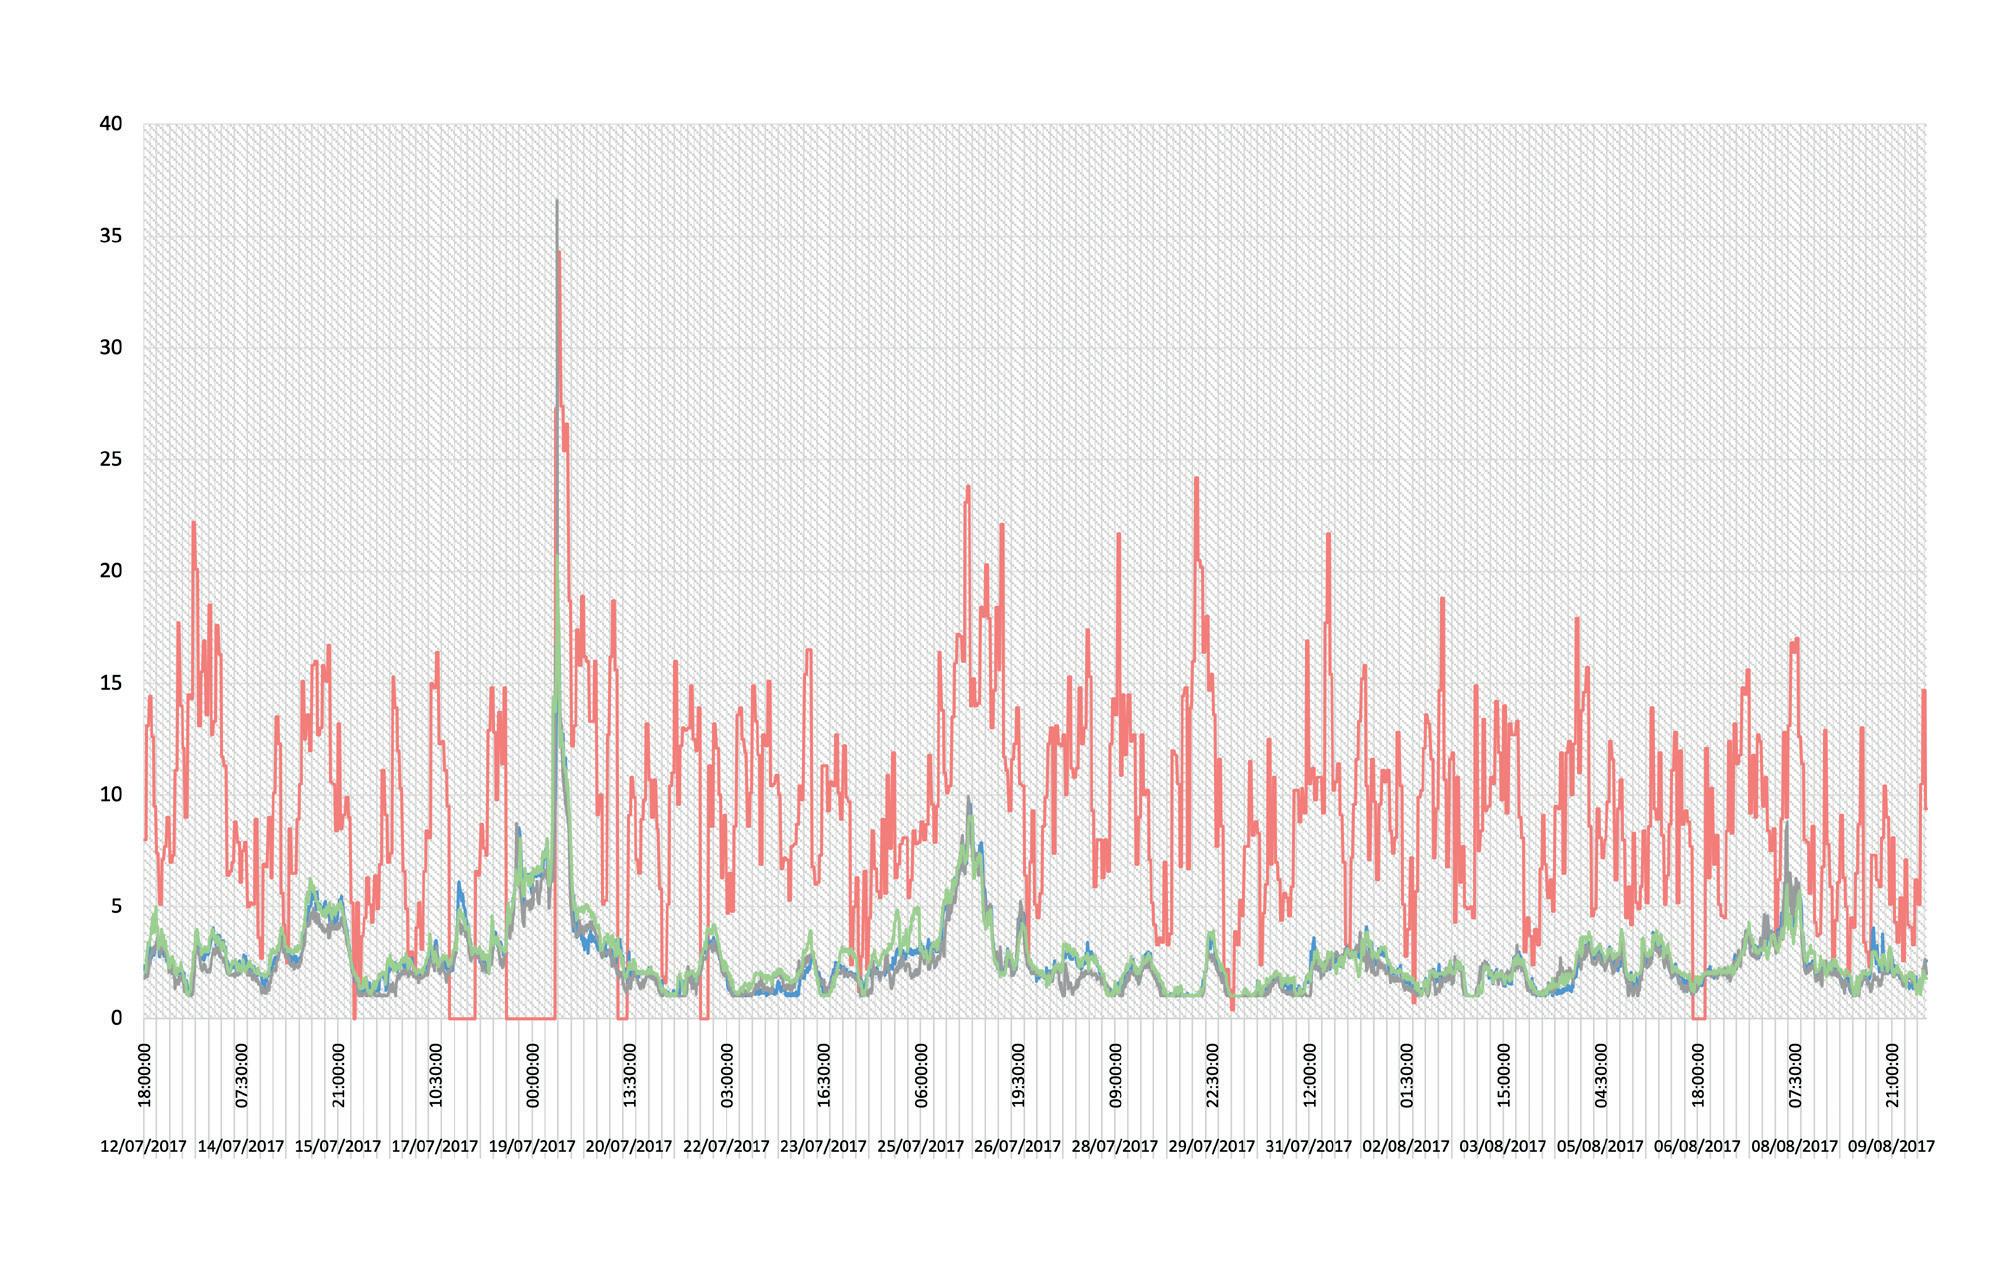
PM2.5 concentrations in the indoor environment vary by season, location, and emission sources, and like other outdoor air pollutants, PM2.5 can enter buildings. Assessing this in terms of the available data, it is seen that PM2.5 concentrations in the room are mainly affected by outdoor concentrations rather by indoor sources as none of the rooms exceed the exterior values and seem to follow the pattern of Euston’s PM2.5 records (see figure 3.3). Where the PM2.5 values recorded from the Euston site fall to 0, this is because they were inputted as earlier mentioned to highlight instrumental malfunction. With respect to the reviewed guidance, the PM2.5 concentrations in the rooms all conform to the targets of WHO, DEFRA and WELL – falling below the lowest limit of 5 μg/m3. While the assessment margin of this slightly differs as the guidelines present annual and 24-hour averages and the results show an approximate monthly average, the guideline criteria is still valid as a monthly duration would reside between both. It is however important to note that there might still be possibility of PM2.5 contributions from an indoor source – this might be related to occupant activities, hence the pollutant presents distinct design challenges.
17
CONCENTRATIONS OF PM 2.5 IN EUSTON SITE, ROOMS 413, 416 & 418 FROM 12/07/2017 TO 10/08/2017 (33 DAYS)
VALUE
CONCENTRATIONS OF PM 2.5 IN EUSTON SITE, ROOMS 413, 416 & 418 FROM 14/07/2017 TO 17/07/2017
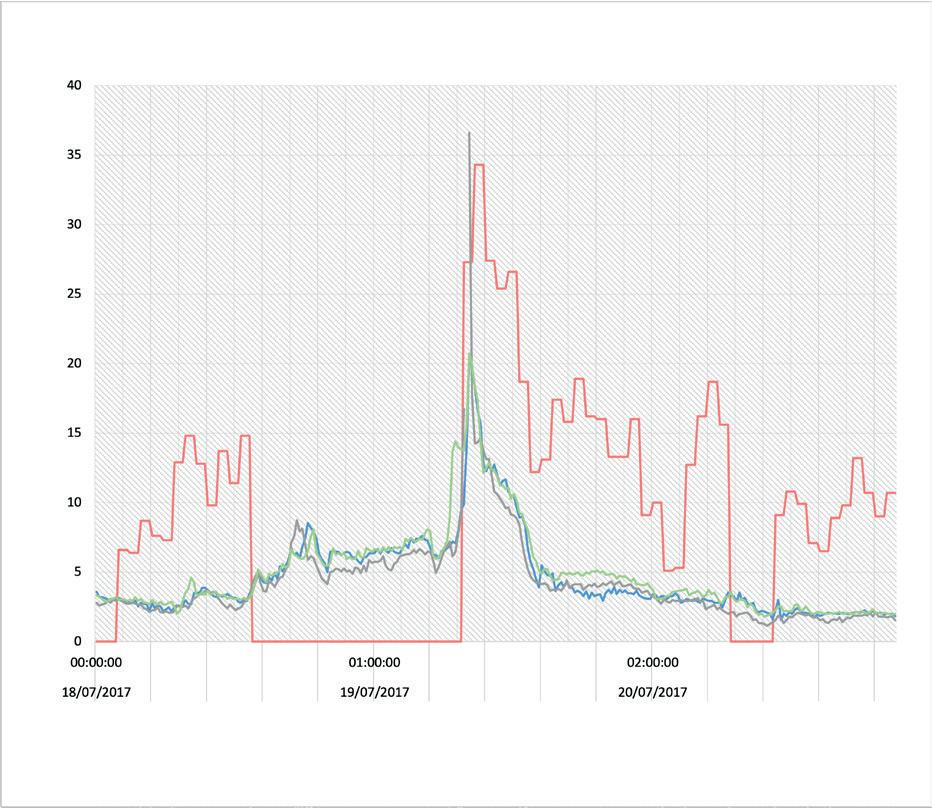
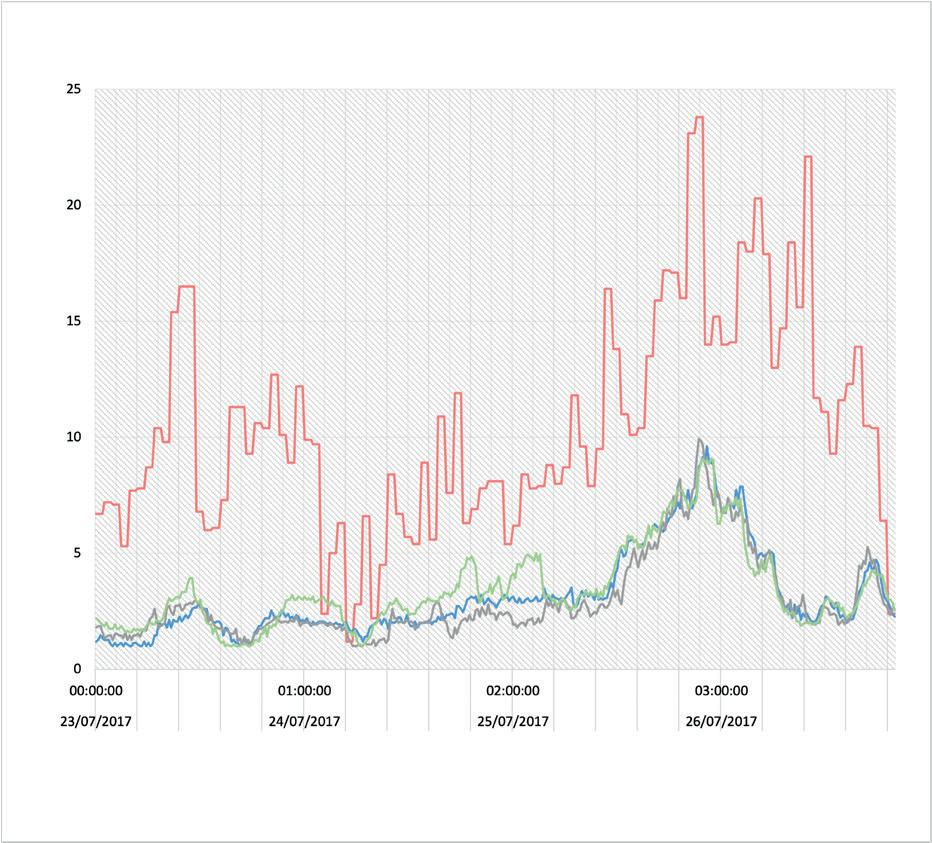
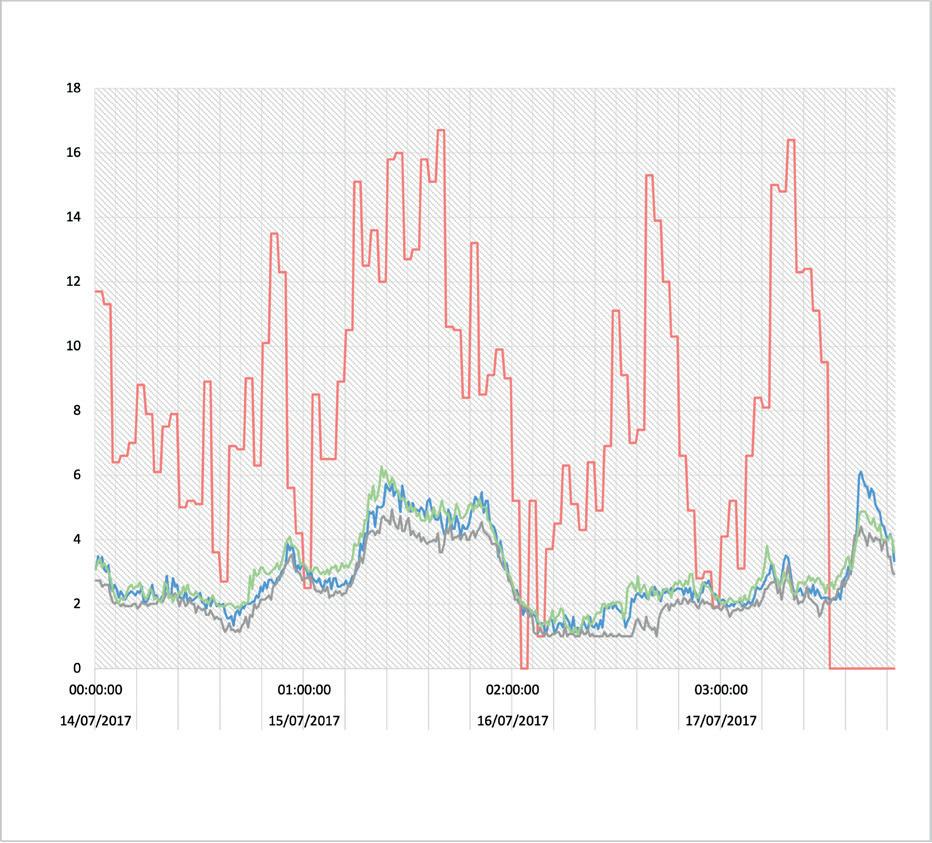
CONCENTRATIONS OF PM 2.5 IN EUSTON SITE, ROOMS 413, 416 & 418 FROM 18/07/2017 TO 20/07/2017
EUSTON SITE
ROOM 413
ROOM 416
ROOM 418
CONCENTRATIONS OF PM 2.5 IN EUSTON SITE, ROOMS 413, 416 & 418 FROM 23/07/2017 TO 26/07/2017 DATE
18
DATE
VALUE DATE DATE VALUE VALUE
As for the relationship between the parameters of the indoor environment and other external environmental variables, this is investigated in tables 3.5, 3.6 and 3.7. By identifying positive/negative correlations and their strength, the relationship of interconnected facets to one another is outlined. It is however important to note that this does not mean causality. From observing these results and comparing each room against the other, the data can conclude what the state of one variable is when the other increases – where values are presented in negative form, variables pose a negative relationship to one another.
19
4.1 IMPROVING INDOOR AIR QUALITY
There are 3 fundamental strategies for improving indoor quality in buildings and retrospectively, enhancing the overall quality of a room, and these are: source control, ventilation for the dilution of pollutants and pollutant distribution and potential strategies of integrated or stand-alone filtration. In this case, as outlined prior, the explored intervention will be advanced demand control ventilation balancing CO2 against PM2.5 external pollution for room 418. As for Design builder, it is important to understand that any model will have uncertainty – and this will be driven by inherent calculations that are behind input parameters.
20 4.0
RECOMMENDED INTERVENTIONS
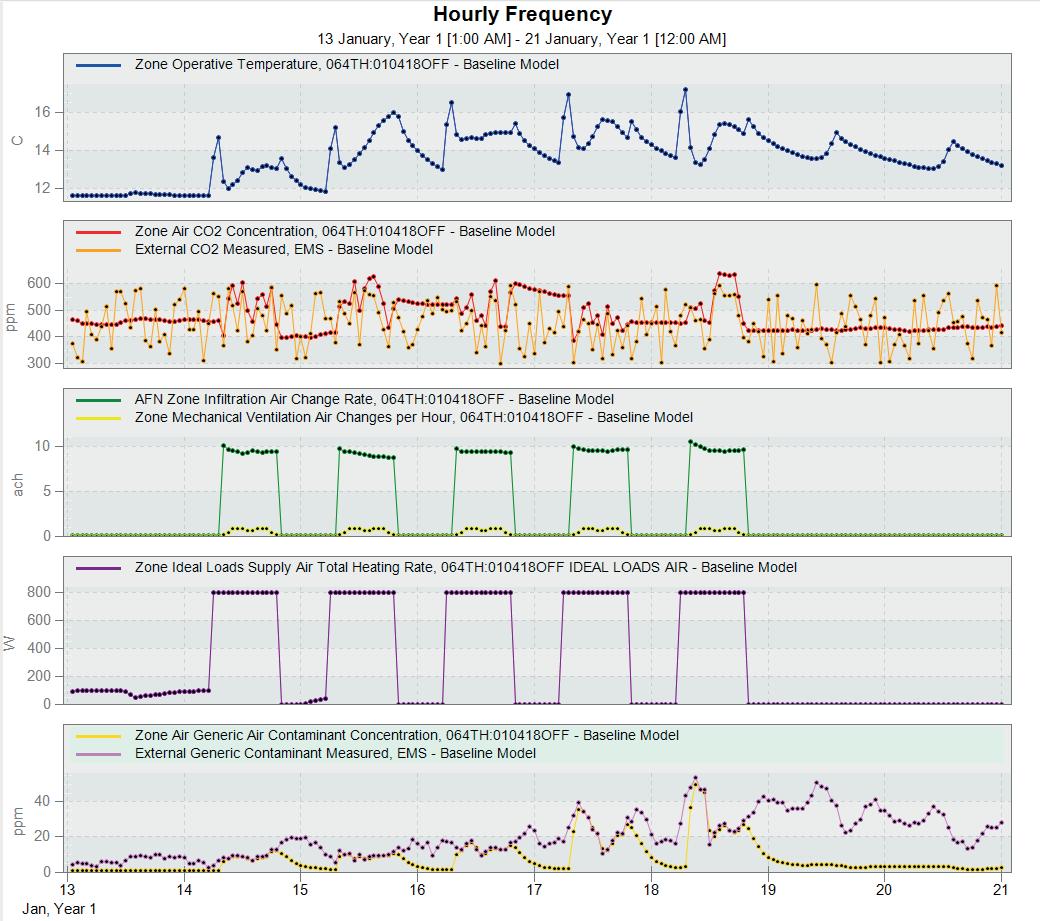
4.2 BASELINE MODEL
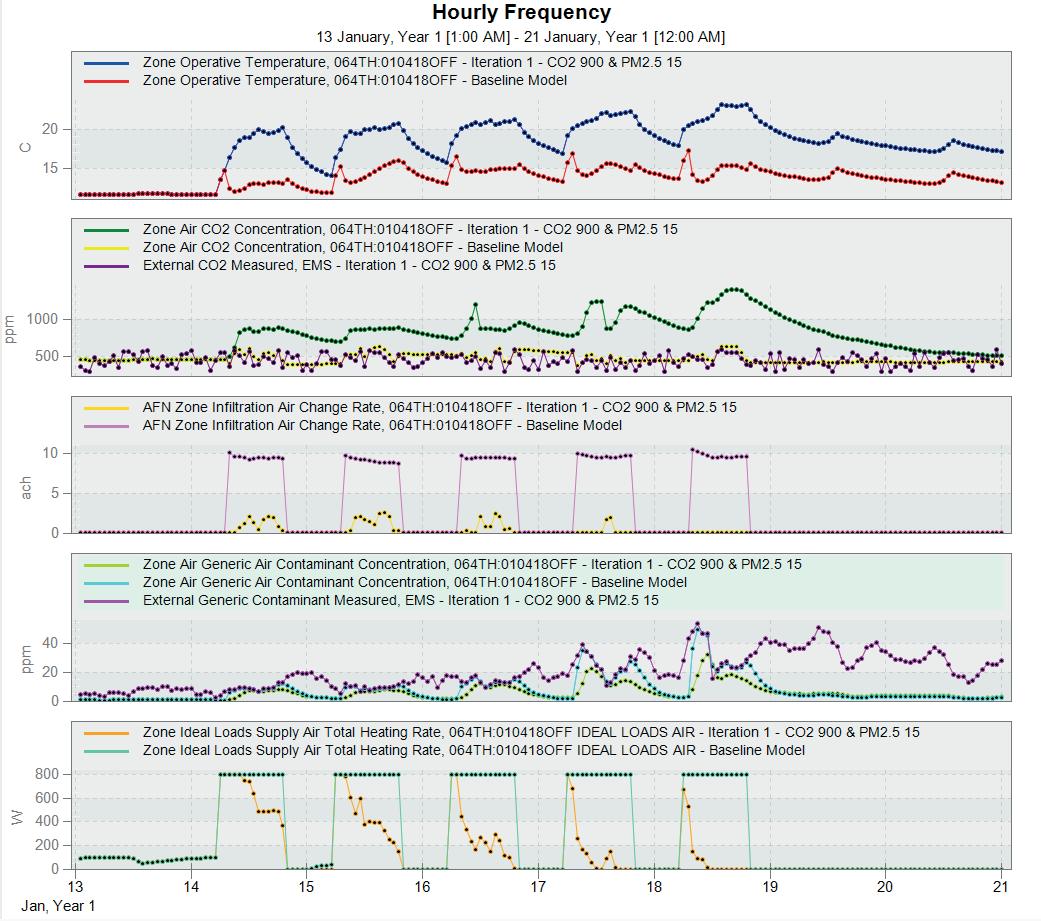
Essentially, the weather file for external pollutant concentrations differs in the model to that of the Euston monitoring station, and so concentrations of PM2.5 and other pollutants will differ. This also applies to the interior concentrations of CO2 – where the model will represent values different than that conducted from the internal IBEM sensors in the rooms, this is because a different file of external contaminants has been loaded into the model. The results for the baseline configurations for Central House outlined in table 2.1 are presented in figure 4.1. This is also assuming that there are no indoor sources of PM2.5 – the results presented account external levels from ventilation.
21
µg/m 3
4.3 INVESTIGATING THE RECOMMENDED INTERVENTIONS
Based on the EMS script coding integrated in the model, the demand control ventilation of the room will run first by assessing the CO2 concentration indoors against the outdoor concentrations of PM2.5, meaning if the CO2 concentrations indoors are high whilst the external concentrations of PM2.5 are low (both based on the set criteria), then the ventilation will run accordingly – if the CO2 concentrations indoors are high whilst the external concentrations of PM2.5 are high as well, meaning there is high outdoor pollution, ventilation will not be operated. Likewise, if CO2 concentrations fall below the set criteria, ventilation will not operate.
22
4.4 ITERATION NO. 1
Here the threshold for CO2 is 900 ppm, while the threshold for PM2.5 is 15 μg/m3. The results are presented in figure 4.2 and compared to the baseline model. It is evident that in this simulation, setting a threshold for CO2 of 900 ppm does not allow for an optimal indoor environment. While heating loads and PM2.5 concentrations have decreased, indoor CO2 concentrations have increased, and air filtration seems insufficient.
µg/m 3
23
Here the threshold for CO2 is 650 ppm, while the threshold for PM2.5 is 10 μg/m3. The results are presented in figure 4.3 and compared to iteration 1. In this simulation, indoor CO2 concentrations are higher than what was presented in iteration 1, and PM2.5 presents similar concentrations – this is assumed to be because external PM2.5 concentrations are rarely below 10 μg/ m3, and hence as setup by the EMS script, ventilation is not set up to operate in this scenario.
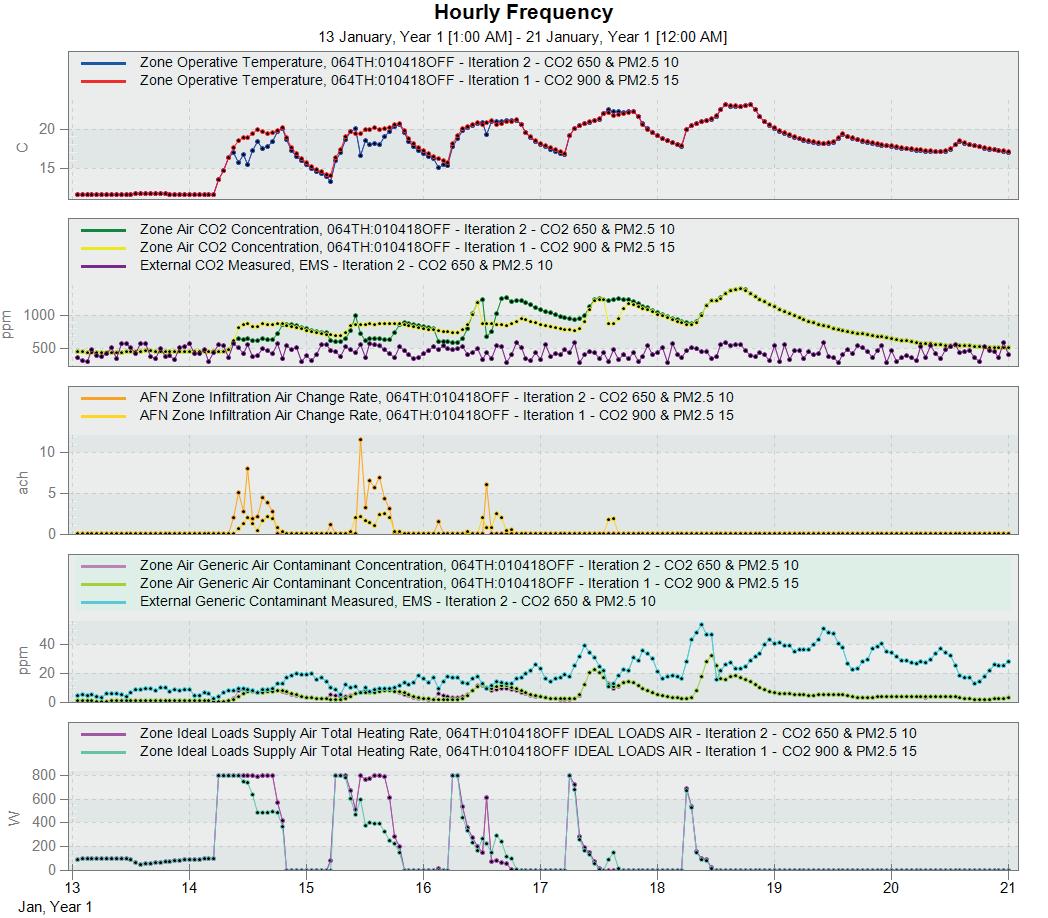
24 4.5 ITERATION
2
NO.
µg/m
3
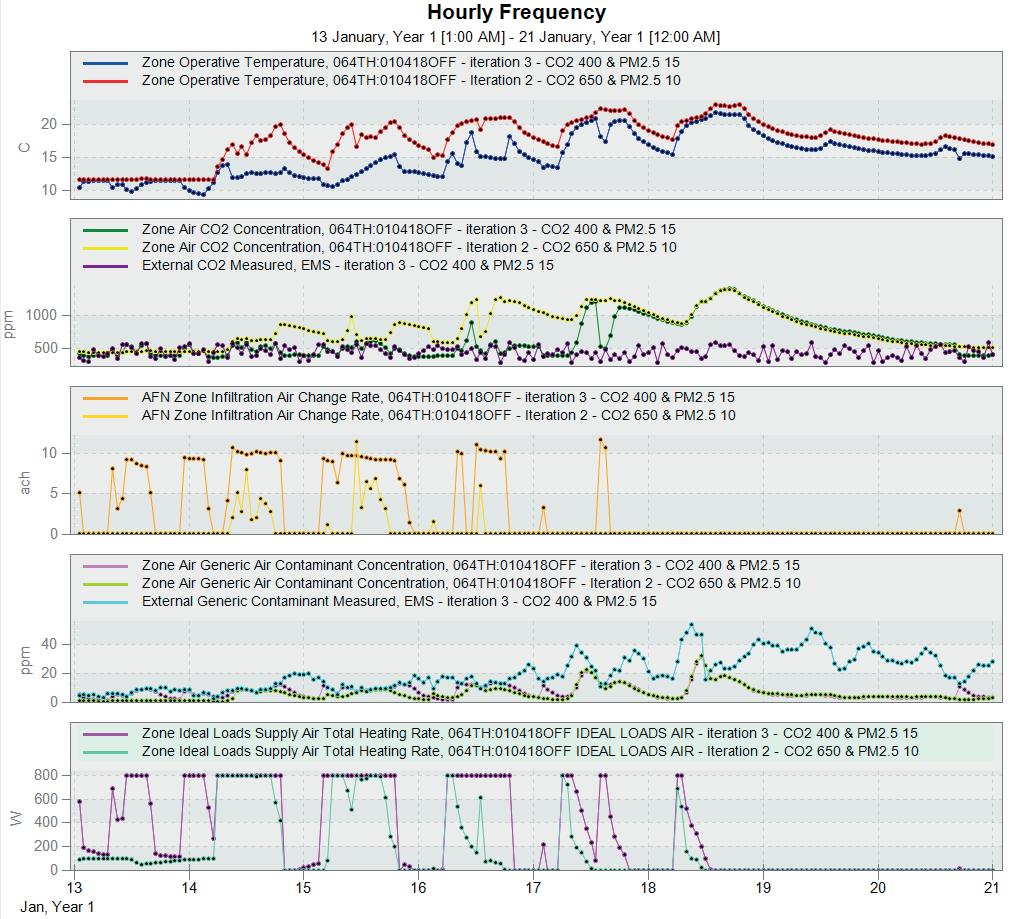
Here the threshold for CO2 is 400 ppm, while the threshold for PM2.5 is 15 μg/m3. The results are presented in figure 4.4 and compared to iteration 2. As seen from the figure, indoor CO2 concentrations in this scenario are much lower than that presented in iteration 2. The air infiltration is much more sufficient, and PM2.5 is contained below the threshold. Heating loads however have increased – but as the indoor air quality performance of the room is much more adequate, this an appropriate trade-off.
25
4.6 ITERATION NO. 3
µg/m 3
5.0 CONCLUSIONS
5.1 STUDY DISCUSSION
It would be unwise to suggest that the results of individual studies, even meta-analyses, are automatically replicable for any organisation. Throughout the process of conducting this study and analysing the given data, it became evident that there remains a limitation within the applicability of guidelines to a specified context when other parameters are ungoverned. For the delivery of environments that host adequate indoor air quality, a study on the specifications of the case study in question cannot go neglected. Elsewise, studies such as this one, merely provide an abstract proposition of indoor air quality control, drivers, and recommended interventions; in a manner that is much like simulation modelling.
5.2 RECOMMENDATIONS FOR FURTHER RESEARCH
To further ground the approach of this study and further research, the process of monitoring should present a wider series of available and accurate data. While this comes with its challenges, being able to obtain a record closest and as accurate as possible to the real world will give a deeper insight into the parameters and variables that govern adequate indoor air quality. Additionally, this would allow a fair investigation into how pollutant concentrations vary during different seasons and consequently provide valuable insight into how indoor air quality is impacted by occupant behaviour during those periods.
5.3 CONCLUSION
This is a developing field in knowledge, with various design approaches and monitoring solutions. The challenges of understanding other emissions, other exposure pathways, and other product types is still a module of investigation. For existing builds, such as Central House, it is imperative that operation and maintenance continue to be recognised and adequately carried out – the environment is ever-changing but the control in which occupants and management possess within the subject matter continues to exist. The responsibility lies within bringing key findings to light and raising awareness. It is recommended that buildings begin and continue to monitor the changing levels of pollutants indoors and the external environment – to further understand the impact this has on a specified context and the comfort, health and wellbeing of the people that occupy them.
26
REFERENCES
Alker, J., Malanca, M., Pottage, C. and O’Brien, R., 2014.
27
6.0
28
Appendix 1 - Shared durations of present data
01/01/2017 03/01/2017 17/02/2017 22/02/2017 15/03/2017 16/03/2017 17/03/2017 20/03/2017 06/04/2017 07/04/2017 08/05/2017 11/05/2017 14/06/2017 29/06/2017 08/07/2017 09/07/2017 11/07/2017 12/07/2017 10/08/2017 14/08/2017 15/08/2017 16/08/2017 23/08/2017 06/09/2017 07/09/2017 21/09/2017 25/09/2017 13/11/2017 17/11/2017 24/11/2017 03/12/2017 05/12/2017 07/12/2017 08/12/2017 11/12/2017 13/12/2017 15/12/2017 30/12/2017 31/12/2017
7.0
APPENDIX
ROOM 418 MONITOR READINGS
EUSTON NO2 & PM2.5
CENTRAL HOUSE WEATHER STATION
LONGEST DURATION OF AVAILABLE DATA IN ALL MEASURES
ROOM 416 MONITOR READINGS ROOM 413 MONITOR READINGS
29
VXGC7 BENV0040 INDOOR AIR QUALITY IN BUILDINGS EVALUATING INDOOR AIR QUALITY IN BUILDINGS 25 APRIL 2022

