


VOLUME 123 NO. 3 MARCH 2023
Putting our Members First SAIMM

Receiving a monthly Journal with a balanced content and of a high standard which serves as a communication medium to keep members informed on matters relating to their professional interests.
The opportunity to attend congresses, symposia, colloquia, schools and discussion groups at competitive prices. Members attend such events at a discount.


Participation in technical excursions and social events which creates further opportunities for inter-active professional association and fellowship.


To make a contribution to the minerals industry in South Africa.


The opportunity to network with a wide crosssection of professional people in the minerals industry.
Official recognition of achievements.
Honorary President
Nolitha Fakude
President, Minerals Council South Africa
Honorary Vice Presidents
Gwede Mantashe
Minister of Mineral Resources and Energy, South Africa
Ebrahim Patel
Minister of Trade, Industry and Competition, South Africa
Blade Nzimande
Minister of Higher Education, Science and Technology, South Africa
President
Z. Botha
President Elect
W.C. Joughin
Senior Vice President
E. Matinde
Junior Vice President
G.R. Lane
Incoming Junior Vice President
T.M. Mmola
Immediate Past President
I.J. Geldenhuys
Honorary Treasurer
W.C. Joughin
Ordinary Members on Council
W. Broodryk G. Njowa
Z. Fakhraei S.J. Ntsoelengoe
R.M.S. Falcon (by invitation) S.M. Rupprecht
B. Genc M.H. Solomon
K.M. Letsoalo A.J.S. Spearing
S.B. Madolo A.T. van Zyl
F.T. Manyanga E.J. Walls
M.C. Munroe
Co-opted to Members
K. Mosebi
A.S. Nhleko
Past Presidents Serving on Council
N.A. Barcza C. Musingwini
R.D. Beck S. Ndlovu
J.R. Dixon J.L. Porter
V.G. Duke M.H. Rogers
R.T. Jones D.A.J. Ross-Watt
A.S. Macfarlane G.L. Smith
M.I. Mthenjane W.H. van Niekerk
G.R. Lane–TPC Mining Chairperson
Z. Botha–TPC Metallurgy Chairperson
M.A. Mello–YPC Chairperson
K.W. Banda–YPC Vice Chairperson
Branch Chairpersons
Botswana Being established
DRC Not active
Johannesburg N. Rampersad
Namibia Vacant
Northern Cape I. Tlhapi
North West I. Tshabalala
Pretoria Vacant
Western Cape A.B. Nesbitt
Zambia J.P.C. Mutambo (Interim Chairperson)
Zimbabwe A.T. Chinhava
Zululand C.W. Mienie
* W. Bettel (1894–1895)
* A.F. Crosse (1895–1896)
* W.R. Feldtmann (1896–1897)
* C. Butters (1897–1898)
* J. Loevy (1898–1899)
* J.R. Williams (1899–1903)
* S.H. Pearce (1903–1904)
* W.A. Caldecott (1904–1905)
* W. Cullen (1905–1906)
* E.H. Johnson (1906–1907)
* J. Yates (1907–1908)
* R.G. Bevington (1908–1909)
* A. McA. Johnston (1909–1910)
* J. Moir (1910–1911)
* C.B. Saner (1911–1912)
* W.R. Dowling (1912–1913)
* A. Richardson (1913–1914)
* G.H. Stanley (1914–1915)
* J.E. Thomas (1915–1916)
* J.A. Wilkinson (1916–1917)
* G. Hildick-Smith (1917–1918)
* H.S. Meyer (1918–1919)
* J. Gray (1919–1920)
* J. Chilton (1920–1921)
* F. Wartenweiler (1921–1922)
* G.A. Watermeyer (1922–1923)
* F.W. Watson (1923–1924)
* C.J. Gray (1924–1925)
* H.A. White (1925–1926)
* H.R. Adam (1926–1927)
* Sir Robert Kotze (1927–1928)
* J.A. Woodburn (1928–1929)
* H. Pirow (1929–1930)
* J. Henderson (1930–1931)
* A. King (1931–1932)
* V. Nimmo-Dewar (1932–1933)
* P.N. Lategan (1933–1934)
* E.C. Ranson (1934–1935)
* R.A. Flugge-De-Smidt (1935–1936)
* T.K. Prentice (1936–1937)
* R.S.G. Stokes (1937–1938)
* P.E. Hall (1938–1939)
* E.H.A. Joseph (1939–1940)
* J.H. Dobson (1940–1941)
* Theo Meyer (1941–1942)
* John V. Muller (1942–1943)
* C. Biccard Jeppe (1943–1944)
* P.J. Louis Bok (1944–1945)
* J.T. McIntyre (1945–1946)
* M. Falcon (1946–1947)
* A. Clemens (1947–1948)
* F.G. Hill (1948–1949)
* O.A.E. Jackson (1949–1950)
* W.E. Gooday (1950–1951)
* C.J. Irving (1951–1952)
* D.D. Stitt (1952–1953)
* M.C.G. Meyer (1953–1954)
* L.A. Bushell (1954–1955)
* H. Britten (1955–1956)
* Wm. Bleloch (1956–1957)
* H. Simon (1957–1958)
* M. Barcza (1958–1959)
* R.J. Adamson (1959–1960)
* W.S. Findlay (1960–1961)
* D.G. Maxwell (1961–1962)
* J. de V. Lambrechts (1962–1963)
* J.F. Reid (1963–1964)
* D.M. Jamieson (1964–1965)
* H.E. Cross (1965–1966)
* D. Gordon Jones (1966–1967)
* P. Lambooy (1967–1968)
* R.C.J. Goode (1968–1969)
* J.K.E. Douglas (1969–1970)
* V.C. Robinson (1970–1971)
* D.D. Howat (1971–1972)
* J.P. Hugo (1972–1973)
* P.W.J. van Rensburg (1973–1974)
* R.P. Plewman (1974–1975)
* R.E. Robinson (1975–1976)
* M.D.G. Salamon (1976–1977)
* P.A. Von Wielligh (1977–1978)
* M.G. Atmore (1978–1979)
* D.A. Viljoen (1979–1980)
* P.R. Jochens (1980–1981)
* G.Y. Nisbet (1981–1982)
A.N. Brown (1982–1983)
* R.P. King (1983–1984)
J.D. Austin (1984–1985)
* H.E. James (1985–1986)
H. Wagner (1986–1987)
* B.C. Alberts (1987–1988)
* C.E. Fivaz (1988–1989)
* O.K.H. Steffen (1989–1990)
* H.G. Mosenthal (1990–1991)
R.D. Beck (1991–1992)
* J.P. Hoffman (1992–1993)
* H. Scott-Russell (1993–1994)
J.A. Cruise (1994–1995)
D.A.J. Ross-Watt (1995–1996)
N.A. Barcza (1996–1997)
* R.P. Mohring (1997–1998)
J.R. Dixon (1998–1999)
M.H. Rogers (1999–2000)
L.A. Cramer (2000–2001)
* A.A.B. Douglas (2001–2002)
S.J. Ramokgopa (2002-2003)
T.R. Stacey (2003–2004)
F.M.G. Egerton (2004–2005)
W.H. van Niekerk (2005–2006)
R.P.H. Willis (2006–2007)
R.G.B. Pickering (2007–2008)
A.M. Garbers-Craig (2008–2009)
J.C. Ngoma (2009–2010)
G.V.R. Landman (2010–2011)
J.N. van der Merwe (2011–2012)
G.L. Smith (2012–2013)
M. Dworzanowski (2013–2014)
J.L. Porter (2014–2015)
R.T. Jones (2015–2016)
C. Musingwini (2016–2017)
S. Ndlovu (2017–2018)
A.S. Macfarlane (2018–2019)
M.I. Mthenjane (2019–2020)
V.G. Duke (2020–2021)
I.J. Geldenhuys (2021–2022)
Editorial Board
S.O. Bada
R.D. Beck
P. den Hoed
I.M. Dikgwatlhe
R. Dimitrakopolous*
L. Falcon
B. Genc
R.T. Jones
W.C. Joughin
A.J. Kinghorn
D.E.P. Klenam
H.M. Lodewijks
D.F. Malan
R. Mitra*
H. Möller
C. Musingwini
S. Ndlovu
P.N. Neingo
M. Nicol*
S.S. Nyoni
M. Phasha
P. Pistorius
P. Radcliffe
N. Rampersad
Q.G. Reynolds
I. Robinson
S.M. Rupprecht
K.C. Sole
A.J.S. Spearing*
T.R. Stacey
E. Topal*
D. Tudor*
F.D.L. Uahengo
D. Vogt*
*International Advisory Board members
Editor /Chairman of the Editorial Board
R.M.S. Falcon
Typeset and Published by
The Southern African Institute of Mining and Metallurgy


PostNet Suite #212
Private Bag X31
Saxonwold, 2132
E-mail: journal@saimm.co.za
Printed by Camera Press, Johannesburg
Advertising Representative
Barbara Spence
Avenue Advertising
Telephone (011) 463-7940
E-mail: barbara@avenue.co.za

ISSN 2225-6253 (print)
ISSN 2411-9717 (online)
Directory of Open Access Journals

Journal Comment: Mining projects in the UK and the community? by D. Tudor .................................................................... iv President’s Corner: To empower or not to empower – That is the Question by Z. Botha ....................................................................
A finite element model of a 5 m radius DC arc ilmenite furnace in idling mode was used to test the notion that slag solidifies when it comes in to contact with colder pig iron. It was found that a slag that is 150°C hotter than the pig iron does not solidify at the interface. The 150°C temperature difference between the slag and pig iron is a result of solid slag at the slag-pig iron interface, not the other way around as suggested in the literature. It is proposed that slag solidification begins with the slow co-current flow of molten slag and pig iron in the outer parts of the furnace. This provides enough time for molten slag to interact with molten pig iron without solidifying. As the reduction products form, the slag solidifies. This approach negates the need for the slag to solidify by merely meeting an inherently colder pig iron.
THE INSTITUTE, AS A BODY, IS NOT RESPONSIBLE FOR THE STATEMENTS AND OPINIONS ADVANCED IN ANY OF ITS PUBLICATIONS.
Copyright© 2023 by The Southern African Institute of Mining and Metallurgy. All rights reserved. Multiple copying of the contents of this publication or parts thereof without permission is in breach of copyright, but permission is hereby given for the copying of titles and abstracts of papers and names of authors. Permission to copy illustrations and short extracts from the text of individual contributions is usually given upon written application to the Institute, provided that the source (and where appropriate, the copyright) is acknowledged. Apart from any fair dealing for the purposes of review or criticism under The Copyright Act no. 98, 1978, Section 12, of the Republic of South Africa, a single copy of an article may be supplied by a library for the purposes of research or private study. No part of this publication may be reproduced, stored in a retrieval system, or transmitted in any form or by any means without the prior permission of the publishers. Multiple copying of the contents of the publication without permission is always illegal.
U.S. Copyright Law applicable to users In the U.S.A. The appearance of the statement of copyright at the bottom of the first page of an article appearing in this journal indicates that the copyright holder consents to the making of copies of the article for personal or internal use. This consent is given on condition that the copier pays the stated fee for each copy of a paper beyond that permitted by Section 107 or 108 of the U.S. Copyright Law. The fee is to be paid through the Copyright Clearance Center, Inc., Operations Center, P.O. Box 765, Schenectady, New York 12301, U.S.A. This consent does not extend to other kinds of copying, such as copying for general distribution, for advertising or promotional purposes, for creating new collective works, or for resale.
N. Dzimunya, B. Besa, and R. Nyirenda ..............................................................
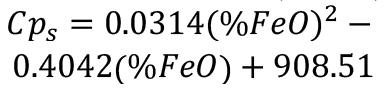
The accurate estimation of peak particle velocity (PPV) is crucial during the design of bench blasting operations in open pit mines since the vibrations caused by blasting can significantly affect the integrity of nearby buildings and other structures. In this paper, we use the random forest (RF) algorithm to develop a model to predict blastinduced ground vibrations from bench blasting using data records. The correlation coefficient of the actual data and RF model-predicted data was 0.95, and the weighted average of the relative absolute error (RAE) was 10.9%.
The RF model can effectively be used to predict PPV. The study also demonstrates that the equivalent-pathbased (EPB) equation is a suitable empirical method for predicting PPV.
The effect of mineralogy on the grindability was investigated using three copper ores – two sulphide and one oxide. The brittleness indices of the ores were calculated using the chemical composition of the gangue, and a good correlation between brittleness indices and Bond work indices was observed, which highlights the importance of the gangue composition in determining the fracture behaviour of the ores
Production of sodium-based zeolites and a potassium-containing leach liquor by alkaline leaching of South African coal fines ash
South African coal fines and a coal fines/K2 CO 3 blend were combusted at 700°C in a laboratory rotary kiln to produce ashes containing metakaolinite and illite/muscovite/orthoclase amorphous materials. The ashes were leached with water and with 1 M and 8 M NaOH at 80°C for 4 hours using a solid to liquid ratio of 1:5. The 8 M NaOH leach yielded 17% sodalite formation through SiO3 2-, Al(OH)4-, and Na+ precipitation in the leached ashes. The 1 M NaOH leach yieldsd no sodalite. Sequential NaOH leaching resulted in the highest potassium dissolution efficiency of 89% for the fines/K2 CO 3 blend and 59% for the fines. It may be possible to increase the ash-derived zeolite concentration by using even higher NaOH concentrations. Sodalite derived from coal ash could possibly be utilized for water purification in industrial applications, or as molecule separators. The potassium-containing liquid could be used in fertilizer manufacture.
123
145

The three major mining projects currently under way in the UK involve rail, coal, and fertilizer. They are all at various stages of the project cycle.
HS2, the controversial high-speed rail project, was originally envisaged to connect London to Manchester and Leeds via Birmingham by 2033. Economics and politics have had a major impact on the final cost – up from an initial £35 billion to over £100 billion, and on the final route – the Birmingham Leeds link has been scrapped. However, work goes on and HS2 has once again begun tunnelling under London after launching its third giant tunnel boring machine (TBM) near Euston station. Following a longstanding tradition of naming TBMs after women, members of the local community have selected the name ‘Lydia’ for the TBM. Lydia Gandaa is a former teacher at the nearby Old Oak Common Primary School and a founding member of the Bubble & Squeak social enterprise in the area. She is an active member of the local community, running after-school and holiday clubs at the Old Oak Community Centre.
The new coal mine in Cumbria is a project near Whitehaven that will produce 2.8 million tons of coking coal a year for steelmaking and create 500 new jobs. It was approved by the UK government in January 2023, despite objections from local, national, and global groups over its climate impact. The mine will emit about 9 million tons of greenhouse gases a year, equivalent to putting 200 000 cars on the road. Most of the coal mined will be exported. The UK Climate Change Committee condemned the decision and said it contradicted the global effort towards net zero. Climate campaigners have been denied the opportunity to institute a legal challenge against the government over its decision to grant planning permission for a new coal mine in Cumbria. The project was initially approved by Cumbria County Council in October 2020. West Cumbria Mining, the firm behind the project, promised to create 500 direct jobs and 1500 in the wider community.
The Woodsmith project is Anglo American’s new polyhalite fertilizer mine that is being developed in the northeast of England near Whitby. Polyhalite is a naturally occurring mineral that contains potassium, sulphur, magnesium, and calcium plus numerous micronutrients, making it an ideal natural fertilizer. The project is currently sinking two mine shafts over a mile deep near Sneaton, south of Whitby and a 37 km long tunnel to a processing area at Wilton on Teesside.
After an investment of £400 million in 2022, Anglo announced that the capital expenditure for this year will be £650 million and approximately £800 million per year for the following three years – a significant investment for the local area.

The project currently employs over 1650 people at its sites in Whitby, Teesside, and Scarborough, with the majority being from the local communities.
The Woodsmith Foundation is an independent charity funded by Anglo American and has recently awarded grants totalling almost £250 000 towards initiatives that will support local communities from Teesside to Scarborough.
Seventy organizations received grants from the Foundation to help them deliver a range of programmes. For example, Scarborough Pride will use their grant to offer meaningful support and activities for the LGBT+ community in the Scarborough Borough. The Loftus Town Council will use their grant to start a gardening club for residents.
So, mining and the community are inseparable. What happens when lithium mining starts in Cornwall will be another story!
Iwant to take a moment and talk about the concepts of empowerment, growth, agency, and actualization. I strongly believe that anyone can be a leader, anywhere, at any given time. Martin Luther King Jr said: ‘a leader is an individual who has the ability to influence a group of individuals in achieving a common goal.’ I also believe that if any member of a team wants to achieve a common goal, they want to do value-adding work, they want to see how they effect change and how their ideas bear fruit.
My question is, how do you, as a leader, step back and allow your team members to not only identify the problem on their own, but also solve that specific problem? How do you, as a leader, work with failure and rising strong?

Leadership and how we work with power go hand in hand. The absolute worst experiences in my life and my career were when I felt powerless. When I believed I had absolutely no resources and no tools to overcome hardship or address challenges. Again, looking towards Martin Luther King Jr, he defined power as the ability to achieve purpose and effect change.
When you’re a leader you have a responsibility to bring out the best in your employees, not to control their outputs. Controlling your team members will only encourage the fear of missing targets or losing that bonus, or worst of all, the fear of failure. I believe the key to successful leadership, as Peter Drucker so elegantly put it, is for leaders to sometimes get out of the way. ‘90% of what we call management,‘ Drucker said, ‘consists of making it difficult for people to get things done.’ This prompts the question, what do leaders need to do? Paint a picture of a better future; help determine the path to achieving that future and then create a safe space and an open environment that will empower your team members to grow, innovate, and win.

I believe this will require you to give your power away.
Power itself is neither good nor bad. It’s all about how you, as a leader, work with power. In the words of Brene Brown: ‘Power over is driven by fear. Daring and transformative leaders share power with, empower people to, and inspire people to develop power within.’ Brown explains it in this way. When you want power over, when you want to control, you will believe that power is finite and use fear to protect your own power. You will leverage fear to divide and devalue basic decency. You will give people experiencing fear and uncertainty a false sense of conviction of your control over them. Being right will be more important to you than getting it right. You will encourage a blame culture.
When you want to give power to and instill power within, you will believe that the team becomes more powerful when power is shared. You will leverage the power of relationships and connection. You will create a culture of learning. You will move away from blame to a culture of ownership. You will think of leadership as serving others.
In the book Alive at Work D.M.Cable1 explains that one of the ways to achieve empowerment is to adopt the humble mindset of a servant-leader. Servant-leaders view their key role as serving employees as they explore and grow, providing tangible and emotional support as they do so. I think
1Cable, D.M. 2018. Alive at Work: The Neuroscience of Helping Your People Love What They Do. Harvard Business Review Press.
To
the most important definition, in this book, of a servant-leader was that this type of leader has the humility, courage, and insight to admit that they can benefit from the expertise of others who have less power than them. It was encouraging to read the theory that servantleadership acknowledges the responsibility of a leader to increase the ownership, autonomy, and responsibility of all team members.
In an article about the book, Alive at Work, the author refers to two case studies.
Case study 1
A study of a UK food delivery service found that the engagement of its drivers was dipping while management was becoming increasingly metric-driven in an effort to reduce costs and improve delivery times. Managers held weekly performance debriefs with drivers and went through a list of problems, complaints, and errors with a clipboard and pen. Eventually, the drivers, many of whom had worked for the company for decades, became resentful. However, this traditional model was disrupted by newer delivery companies and the management team of the case study company decided that things needed to change. The company needed to compete on great customer service, but needed the support of its employees who provided the service. And management needed ideas that could make the company more competitive. The new approach? Instead of nit-picking problems, each manager was trained to simply ask their drivers, ‘How can I help you deliver excellent service?’ Some drivers started to offer suggestions. For example, one driver suggested new products like yogurt and fun string cheese that parents could get delivered early and pop into their kids’ lunches before school. Another driver thought of a way to report stock shortages more quickly so that customers were not left without the groceries they ordered. Small changes created a virtuous cycle. As the drivers got credit for their ideas and saw them put into place, they grew more willing to offer more ideas, which made the depot managers more impressed and more respectful, which increased the delivery people’s willingness to give ideas, and so on. These innovations helped the company deliver better customer service.
When Jungkiu Choi moved from Singapore to China to start as head of Consumer Banking at Standard Chartered, he learned that one of the cultural expectations that his new job entailed was to visit the branches and put pressure on branch managers to cut costs. Jungkiu changed the nature of these visits. Instead of emphasizing his formal power, he started showing up at branches unannounced, and starting his visit by serving breakfast to the branch employees. Then, Jungkiu would hold ‘huddles’ and ask how he could help employees improve their branches. Jungkiu’s approach reduced employees’ anxiety and encouraged ideation and innovative ideas. Over the course of one year, Jungkiu visited over eighty branches in twentyfive cities. The huddles exposed many simple ‘pain points’ that he could easily help remediate. These experiments paid off in terms of company performance. Customer satisfaction increased by 54% during the two-year period of Jungkiu’s humble leadership. Complaints from customers were reduced by 29% during the same period. The employee attrition ratio, which had been the highest among all of the foreign banks in China, was reduced to the lowest.
My question to you is; do you empower your team members? Are you creating a culture of learning and growth? Do your team members have agency and actualization? As our own leader, Nelson Mandela, explained: ‘A leader is like a shepherd. He stays behind the flock, letting the most nimble go out ahead, whereupon the others follow, not realizing that all along they are being directed from behind.’
Z. Botha President, SAIMMAffiliation:
1University of Botswana, Gaborone, Botswana.

2Department of Chemical Engineering, University of Cape Town, South Africa.
Correspondence to: A. Mabentsela
Email: arthurmabentsele@gmail.com
Dates:
Received: 9 Jun. 2020
Revised: 28 Sept. 2020
Accepted: 20 Oct. 2020
Published: March 2023
How to cite: Mabentsele, A. and Mainza, A. 2023
Numercial investigation into slag solidification inside and ilmenite DC arc furnace using a finite element method approach.
Journal of the Southern African Institute of Mining and Metallurgy, vol. 123, no. 3, pp. 113–122
DOI ID: http://dx.doi.org/10.17159/24119717/1247/2023
ORCID: A. Mabentsele http://orcid.org/0000-0003-2976-1201
Synopsis
A finite element model of a 5 m radius DC arc ilmenite furnace in idling mode was used to test the notion that the slag solidifies when it comes in to contact with colder pig iron, thus constituting the initial step in the formation of solid slag at the slag-pig iron interface. It was found that a slag that is 150°C hotter than the pig iron does not solidify at the interface. The 150°C temperature difference between the slag and pig iron is a result of solid slag at the slag-pig iron interface, not the other way around as suggested in the literature. Calculations show that the thickness of the frozen slag at the slag-pig iron interface is 1.7 cm for the furnace used. It is proposed that slag solidification begins with the slow co-current flow of molten slag and pig iron in the outer parts of the furnace. This provides enough time for molten slag to interact with molten pig iron without solidifying. As the reduction products form due to reduction of the slag by carbon in the pig iron, the slag solidifies. This approach negates the need for the slag to solidify by merely coming into contact with an inherently colder pig iron.
Making use of a low thermal contact conductance between the slag and pig iron was found to be sufficient to numerically capture the presence of solid slag at the slag-pig iron interface and to preserve the 150°C difference between the slag and pig iron phase.

Keywords
ilmenite smelting, slag-pig iron interface, effective thermal conductivity.
Introduction
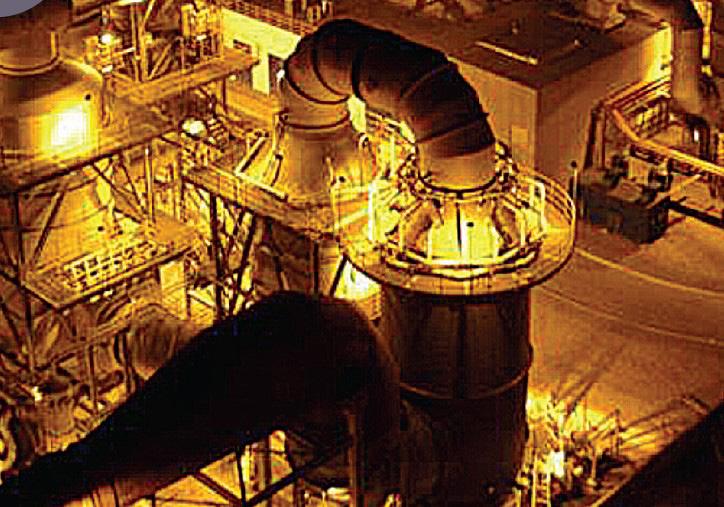
Ilmenite smelting is aimed at producing a TiO2-rich slag, which is used for pigment production, together with molten pig iron for steelmaking. Typical ilmenite feedstock contain 36–50% TiO2, the balance consisting mainly of FeO with minor impurities. Through smelting, the TiO2 content is upgraded to a target of >85%. This upgrade takes place by reduction of the iron in ilmenite from Fe2+ to metallic iron via Equation [1]. The reducing agent used is anthracite (Bessinger, 2000; Gous, 2006).
The reaction takes place in the liquid state at slag temperatures of 1650–1700°C (Pistorius, 2008). Electric furnaces are used to generate the required temperatures. Due to the high electrical conductivity of the ilmenite feed and slag, such furnaces use an open arc configuration where the electrode is not in contact with the molten bath (Bessinger, 2000).
Figure 1 shows a generic schematic of a DC arc furnace with a single hollow electrode. The furnace is circular and consists of four distinct parts: a fixed furnace roof, detachable furnace roof dome, sidewalls, and furnace hearth. Figure 1 does not show the tap-holes.
The fixed roof segments are made from steel and are refractory lined. The steel panels are water-cooled to avoid them melting. An off-gas duct extracts the furnace gas product and maintains a slightly positive pressure inside the furnace to avoid the presence of oxygen in the furnace freeboard space.
The sidewall is lined with a 98 mass % high-fired dense magnesium oxide refractory. The refractory is chosen to have some degree of thermal conductivity to allow for thermal energy transfer for freeze lining formation (Duncanson and Toth, 2004). A steel plate known as the inner shell surrounds the furnace. Between the inner shell and refractory brick, ramming material is placed to ensure sufficient contact between the refractory cold face and inner shell. Water is passed against the inner shell to remove thermal energy from the furnace. This cooling of the inner shell and consequent cooling of the refractory sidewall causes the molten slag in contact with the refractory hot face to solidify, thus forming the freeze lining.
Pistorius (2008) described two thermal non-equilibrium conditions inside the furnace. These arise due to the formation of the freeze lining and the temperature difference between the slag and metal.
Feed (ilmenite + reductant) through hollow electrode Graphite
operation. It is also easy to test numerically whether heating a furnace from bath temperatures below solidus temperatures will lead to a temperature difference of 150°C between the slag and pig iron. Thirdly, it is possible to calculate, using a heat transport model, the thickness of the frozen slag at the slag-pig iron interface.
slag)
Formation of the freeze lining
Ilmenite smelters operate with stringent limitations on the amount of impurities in the titania-rich slag product. Such limitations include less than 1.5 mass % Al2O3 and less than 1.2 mass % MgO in the slag (Pistorius, 2008). These requirements cause challenges for the integrity of the refractory lining and therefore the furnace structure. Owing to the low alumina and magnesia concentrations, the activities of these two species in the slag are low, thus making magnesia and high-alumina refractory bricks highly soluble in molten ilmenite slags. As a result, ilmenite slags are corrosive towards most known refractories (Zietsman, 2004). Ilmenite furnaces must therefore operate with a layer of frozen slag on the refractory hot face to protect the refractory.
The molten pig iron is 150°C colder than the slag phase. Pistorius (2008) postulated that partial solidification of the slag is expected at the slag-metal interface since the furnace slag operates at a low degree of superheat (<50°C) and thus slag should solidify when in contract with the colder pig iron. The effect of this departure from thermal equilibrium on furnace operation was further considered by Pistorius (2008). Pistorius et al. (2011) postulated that the slag in contact with the pig iron partially solidifies; first due to contact with the lower temperature pig iron, then by partial reduction of FeO in the slag immediately in contact with the pig iron bath by dissolved carbon in the pig iron bath via Equation [2], and finally by partial reduction of TiO2 in the slag to Ti2O3
Since FeO fluxes the slag, the above reaction causes an increase in the liquidus temperature of the slag immediately in contact with the pig iron, causing the slag to solidify.

While there is no denying the evidence provided by Pistorius et al. (2011) of solidification of slag at the slag-metal interface through reduction of FeO in the slag by dissolved carbon in the pig iron, the primary solidification of the slag by purely coming into contact with a colder pig iron is a contentious issue. By this notion the pig-iron is always inherently at a lower temperature than the slag. The main cause of this temperature difference is an issue that has not been sufficiently explored. Lastly, the treatment of the ilmenite slag-pig iron interface is rarely considered in the open literature.
It is easy to test numerically whether a slag that is 150°C hotter than the pig iron will solidify at the slag-pig iron interface during
The objectives of this paper are thus to investigate, using a finite element method (FEM) approach, a possible cause for the temperature difference between the slag and pig iron phase. Secondly to test perceived notions about the slag-pig iron interaction, and further to provide a methodology to numerically treat the slag-pig iron interaction. Such a method must yield a value for the thickness of the frozen slag at the interface. The model is applied to an idling furnace where the aim is to maintain the slag and pig iron at fixed temperatures, which in this study are taken to be 1578°C (slag with 15% FeO content) and 1428°C respectively. The operating temperature of the slag was chosen to be 30°C higher than its liquidus temperature, while the pig iron temperature was taken to be 150°C lower than the operating temperature of the slag.


Finite element model derivation
Due to lack of angular heat flow and symmetry along the central axial line in the furnace, the full 3D furnace structure will be modelled as a 2D structure as shown in Figure 2.

Numercial investigation into slag solidification inside an ilmenite DC arc furnace using a finite element method
More detailed information about the dimensions of the furnace sidewall assembly is shown in Table I. Figure 3 shows zones of the furnace to be modelled. The major heat transport mechanisms that will be taken into account include (refer to Figure 3):
➤ Axial radiative and convective heat losses to the furnace freeboard space from the surface of the slag bath BC
➤ Radial sidewall heat losses to the sidewall cooling water on surface DJ
➤ Radial sidewall heat losses to sidewall cooling water on surface JK
➤ Axial heat losses from the slag bath to the pig iron via surface EF
➤ Axial hearth heat losses from surface IL
➤ Thermal energy from the electrode through surface AB (300 mm)
➤ Symmetry conditions are applied on AI.
Major heat sources and sinks that are taken into account include the crust formation on top of the slag bath due to radiation heat loss, solidification of slag in contact with the refractory sidewall to form the freeze lining, water cooling of the furnace sidewall, and losses through the hearth. The reduction reaction (Equation [1]) will not be taken into account because only idling furnace conditions (where feeding stops) are modelled. The chemical properties of the bath will be constant throughout the modelling period except for the slag and pig iron directly in contact with each other, where reduction of the slag by dissolved carbon in the pig iron takes place.
Axial radiative and convective heat losses
Axial radiative and convective heat losses on top of the slag bath (BC, Figure 3) will be accounted for by making use of an effective heat transfer coefficient (heff) on surface BC. The sink temperature for this radiative and convective heat loss is specified to be 25°C.
During furnace idle, feeding stops, resulting in no cloud of feed dust in the furnace freeboard zone. During operation this thick feed dust cloud helps to slow down radiative heat loss from the bath top (BC) to the furnace roof. When feeding stops the freeboard dust settles and thus increases the exposure of the roof refractory to radiative heat losses from the top of the slag bath. Added to the radiation heat loss are natural convective heat losses from the hot slag bath top to the cooler furnace roof panels (Reynolds, 2002).
Reynolds (2002) developed and applied a numerical model for radiative heat transport from the slag bath top to the freeboard space for three different open-bath systems – cobalt removal slags, ferronickel slags of lateritic origins, and zinc slag systems. According to this model, the slag radiates heat to the steel roof panels and upper furnace sidewalls. A portion of this radiation incident wave is reflected by the upper sidewall refractory and roof panel refractory back to the slag bath. The portion of this radiation heat loss that actually leaves the furnace freeboard space is controlled by the thermal resistance of the refractory wall that makes up the upper sidewall refractory and roof panels. Thus the effective heat transfer coefficient for the energy leaving the furnace via the furnace freeboard space is best approximated by making use of the thermal conductivity of the refractory lining the roof panels and its thickness:
convective heat losses), and kref (W.m-1.K-1) and xref (W.m-1.K-1) are the thermal conductivity and thickness of the refractory lining the steel roof panels.
This effective heat transfer coefficient is applied on the slag bath surface. However, the furnace freeboard space is larger than the slag bath top cross-sectional area (area AC), thus a correction has to be made to Equation [3] to account for the difference in area of the slag bath and freeboard space by multiplying the effective heat transfer coefficient by the ratio of furnace freeboard space area and slag bath area, given as 2 for industrial furnaces by Jones and Reynolds (2015). Jones and Reynolds (2015) reported that for a typical industrial furnace the value of the effective heat transfer coefficient is 12 W.m-2.K-1. Jones and Reynolds (2015) used freeboard refractory brick with a thermal conductivity of 1.5 W.m-1.K-1 and thickness of 0.25 m. For the current study, an effective heat transfer coefficient of 10 W.m-2).K^-1 is used. This corresponds to the lowest effective heat transfer coefficient found by Reynolds (2002). The sink temperature for this energy loss is taken to be that of process cooling water (25°C) running through the roof panels (Jones and Reynolds, 2015; Zietsman and Pistorius, 2005a, Reynolds 2002).

Thus the heat loss on surface AC is given by
where QFB is freeboard heat losses (W), Ab is the area of AC (61.51 m2),θbath is the temperature of the slag bath (1578°C), and θsink is the sink temperature (25°C).
Axial heat loss on surface CD are considered to be negligible and thus will not be taken into account. Surfaces CD will modelled as perfectly insulated surfaces (Zietsman and Pistorius 2005a).
Radial ‘upper sidewall’ heat losses will be accounted for by specifying a constant temperature of 50°C on the inner shell surface DJ (Figure 3).
Cooling water is passed against the inner shell (DJ), which is significantly colder then the slag bath. This causes heat to flow by convection from the slag bath (area ACFE) to the freeze lining. Heat then flows from the freeze lining by conduction to the refractory (area CDJF) and ramming, then through the inner shell, where it flows via convection to the cooling water. It has been argued by Zietsman (2004) that water cooling is not a rate-limiting factor in the sidewall heat loss process, thus the modelling of the convective heat loss to the water can be eliminated by specifying a boundary condition for the inner steel shell of 50°C on surface DJ.
The upper sidewall heat losses are thus given by (assuming no contact resistance between ramming and shell as well as ramming and refractory wall)
where heff (W.m-2.K-1) is the effective heat transfer coefficient (which includes radiative heat losses from the slag bath as well as

where QUS is the upper sidewall heat losses (W), L is the height of the slag bath (1 m), θfl is the interface temperature between the freeze lining and slag bath, taken to be the liquidus temperature of the slag (1548°C). θC is the temperature of the cooling water against the inner shell plate ( 50°C). r2 is the outer radial position of the freeze lining (4.43 m), r1 is the inner radial position of the freeze lining (4.32 m), kfl is the freeze lining thermal conductivity (1 W.m-1.K-1), r3 is the outer radial position of the refractory (4.93 m), and kref is the thermal conductivity of the refractory (5.2 W.m-1).K-1).

Numercial investigation into slag solidification inside an ilmenite DC arc furnace using a finite element method
Radial lower sidewall losses
Radial lower sidewall heat losses will be accounted for by specifying a constant temperature of 50°C on the inner shell surface JK (Figure 3). The lower sidewall heat losses are given by
where QLS is the lower sidewall heat losses (W), θpig is the operating temperature of the pig iron (1428°C). L is the height of the lower side wall (0.52 m), and r3 and r2 are the same as in Equation [6].

Hearth heat losses
Axial hearth heat losses will be accounted for by specifying a constant temperature of 50°C on surface IL.
The furnace shell in contact with the hearth bricks is air-cooled (Zietsman, 2004). Heat flows from the hot slag bath (area ACFE) via convection and conduction to the pig iron bath, from the pig iron bath (EFGH) via convection into the lower sidewall bricks and hearth bricks and then through the lower sidewall bricks and hearth bricks to the steel plate via conduction, followed by convection to the cooling media. Zietsman (2004) argued that the largest resistance to hearth heat losses is conduction through the refractory brick layer. As such, the dynamics of hearth heat losses can be fully captured even if the heat transfer to the cooling air is not captured in detail. Following this approach, a simple boundary of a constant temperature of 50°C on the hearth steel plate is used in this study. The heat loss to the hearth is given by
where QH is the hearth heat losses (W), Ah is the area of the hearth (64.43m2), and xref is the average thickness of the hearth brick (1.41 m).
Energy from the arc
Energy from the arc is accounted for by specifying a heat flux on surface AB (Figure 3). Thermal energy reaches the slag bath via four methods: (i) convection from the plasma as it passes over the slag surface, (ii) energy transport by electrons via the Thomson effect, (iii) condensation of electrons as they enter the slag surface, and (iv) radiation heat from the plasma (Qian Farouk, snf Mutharasan, 1995). All four methods are dominant directly underneath the electrode (at the centre of the furnace) and quickly become less effective within the radius of the electrode. However, radiation and convective heat transport continue to be effective at greater distances from the radius of the electrode. In the numerical model the surface of all heat transfer from the electrode is assumed to be equivalent to the electrode radius.
The heat flux (qEL) on surface AB can be calculated by summing the freeboard heat losses (Equation [4]), upper sidewall heat losses (Equation [5]), lower sidewall heat losses (Equation [6]), and hearth heat losses (Equation [7]) and dividing by the cross sectional area of the electrode:
is strongly influence by forced convection when the furnace is on, due to strong electromagnetic stirring of the bath caused by current flow through a self-induced magnetic flux in the slag and pig iron (Alexis et al., 2000). A further stirring of the slag bath is experienced due to momentum transfer from the arc jet as it impinges on the slag bath surface, causing shearing that opposes the electromagnetic stirring (Alexis et al., 2000).
To model convective heat movement in both the slag and pig iron bath Equation [9] has to be solved. This requires that the velocity vector at each location and time step is known. This is found by coupling the energy balance with turbulent Navier-Stokes equations to calculate the velocity field at each time step. This adds five partial differential equations (PDEs) to the list of equations to be solved, in the case of 2D fluid flow where the standard k-e model is used. Furthermore, sources of momentum change have to be modelled by solving Maxwell’s equations in the arc region and bath region. This enables the calculation of electromagnetic forces on each fluid element and thrust of the arc on the slag bath. This adds a further four PDEs to be solved. This can be computationally expensive in terms of both processing time and resources.


where ρ is the density of the phase considered, H is enthalpy, r is the radial dimension, k is the thermal conductivity of the phase being considered, which can take the value of turbulent thermal conductivity in turbulent regime, Cp is heat capacity, θ is temperature, vr is the radial velocity component, vz the axial velocity component, and t is time.
To overcome the need to couple the temperature field with the velocity flow field, an effective thermal conductivity can be used to account for natural and forced convection in the slag and pig iron bath at temperatures above their liquidus (Vanaparthy and Srinivasan, 1998). In this approach, an inflated thermal conductivity of the liquid phase – known as effective thermal conductivity – is used in a conductive energy balance equation at temperatures above the liquidus of the material being modelled. At temperatures below the liquidus, the molecular thermal conductivity of the slag and pig iron is used. By taking this approach, Equation [9], in the case of a molten bath, is transformed to [10]
where Keff is the effective thermal conductivity, which takes the value of [11]

The inflation of the molecular thermal conductivity of the molten phases takes the form (Oksman et al., 2014):
where qEL is the heat flux on surface AB and r is the radius of the electrode (0.3 m).
Heat movement within the slag bath and pig iron bath
Heat movement within the molten slag bath and pig iron bath
where Keff is the effective thermal conductivity of either the motlen slag or pig iron, k is the molecular thermal conductivity of slag or pig iron, fs is the solid fraction of either slag or pig iron, and A is the multiplier used to inflate the molecular thermal conductivity of a molten phase.
In this form, it is assumed that the molecular thermal conductivity of the solid phase is the same as that of the molten
Numercial investigation into slag solidification inside an ilmenite DC arc furnace using a finite element method
phase. This approach can be taken since the value of A can change to accommodate any value assumed for the thermal conductivity of the molten phase.
The multiplier A has been assigned rather arbitrarily; Zietsman (2004) used a value of 5 for his work in modelling ilmenite freeze lining growth and depletion for the same furnace size as used in this study. Whether this value is valid for representing convective heat transfer of the furnace could not be said due to nondisclosure agreements between Zietsman (2004) and the corporate collaborator.
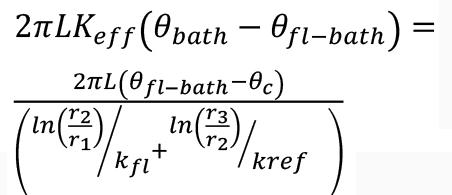
One method to compute the effective thermal conductivity is to set the energy lost by the bath to be equal to the energy gained by the sidewall assembly. Assuming thermal contact resistance is negligible and that the thermal resistance of the ramming phase, steel, and cooling medium is negligible, Equation [13] is derived.
where Keff is the effective thermal conductivity of the bath, θbath is the bath temperature, θfl-bath is the temperature of the bath-freeze lining interface, r1 is the radial position of the bath-freeze lining interface, r2 is the radial position of the inner refractory face, kfl is the freeze lining thermal conductivity, and r3 is the radial position of the outer face of the refractory wall.
In Equation [13], the ratio may be taken as the average heat transfer coefficient of the furnace (Harrison, 1981). Thus it can be compared to reported values for industrial DC arc furnaces. Solving for Keff yields


Using data from Zietsman (2004) for a slag bath with a composition of 15% FeO, 55% TiO2, and 30% Ti2O3 at a bath temperature of 30°C above its liquidus temperature with the operating parameters shown in Table II, the average heat transfer coefficient, , can be calculated to be 263 W.m-2.K-1. This value is in agreement with the heat transfer coefficient for industrial slags reported by Jones and Reynolds (2015) of 200 WW.m-2.K-1 keff was computed to be 1138 W.m-1.K-1
Properties of slag bath for a slag consistting of 15% FeO,55% TiO2, and 30% Ti2O3
θbath
θfl (°C) (liquidus) 1548 (Kotzé and Pistorius, 2010)
θc (°C) 50 (Zietsman, 2004)
kfl (W.m-1.K-1) 1 (Zietsman, 2004)
kslag (W.m-1.K-1) 1 (Zietsman, 2004)
kref (W.m-1.K-1) at 500°CC 5.2
r1 (m)
r2 (m)
4.323 (Zietsman and Pistorius, 2005a)
4.425 (Zietsman and Pistorius, 2005a)
r3 (m) 4.925 (Zietsman and Pistorius, 2005a)
Lslag (m) 1 (Zietsman and Pistorius, 2005a)
Table III
Properties of pig iron bath (Valencia and Quested, 2008)
When the furnace is off, the average heat flux, , is expected to be much less than 263 W.m-2.K-1)as natural convection will dominate, not forced convection.
The same calculation can be done for the pig iron bath by equating the bath heat losses to the sidewall heat losses to find keff when the furnace is on, using data in Table III. For this calculation it can be assumed that the pig iron ‘freeze lining’ does not add resistance to lower sidewall heat losses.
Using the above method it was found that the effective thermal conductivity of the molten pig iron is 223 W.m-1.K-1 when the furnace is on. Since the effective thermal conductivity is a representation of both molecular conduction and convective heat flow, it can be said the slag is more stirred that the pig ion bath.
With the above taken into account, the energy balance to be solved over the furnace body, area ADLI, is of the conductive heat model type (Equation [15].
where k is the thermal conductivity of the material in the region of calculation, which takes the value of effective thermal conductivity in the case of molten slag and pig iron. H is the specific enthalpy of the region of calculation given by:
where Cp(θ) is the heat capacity of the region of calculation. In particular for the slag and pig iron, an adjusted heat capacity will be used to account for latent heat of fusion:

where Cps is the heat capacity of solid slag or pig iron, CpL is the heat capacity of liquid slag or pig iron, depending on the region of calculation,θs is the solidus temperature, θL the liquidus temperature, ΔHf is the latent heat of fusion, and fL is the liquid fraction.
Abaqus 2017 was used as a modelling tool to resolve Equation [16] over the domain of the furnace inclusive of freeze lining, furnace sidewall, ramming, hearth, and steel shell. To accomplish this, boundary conditions have to be prescribed:
investigation into slag solidification inside an ilmenite DC arc furnace using a finite element method
where q is the heat flux (W.m-2), heff is the effective heat transfer coefficient (W.m-2.K-1), and θ is temperature (K).
Temperatures defined by Equations [23-25] are used only at the beginning of the simulation. Equation [23] specifies a slag operating 30°C above its liquidus temperature, while Equation [24] specifies a pig iron bath that is at 150°C lower that the slag phase. Equation [25] specifies the temperature of the refractory brick at the beginning of the calculation step.

Equation [15] can be written in matrix form as follows:


The weak form of Equation [26] combined with the boundary conditions (Equations [18–15] is:


The slag has been shown to penetrate the magnesia bricka up to 15 mm behind the slag-refractory interface (Garbers-Craig and Pistorius, 2006). Due to this intimate interaction between the refractory and the slag, little thermal contact resistance is expected between the two phases. An estimate of 2 ×10⁴ W.m-2.K-1 was used for the thermal contact conductance between the slag and refractory.
Graphite ramming is installed between the outer refractory wall and the steel shell. Ramming material ensures that no air gaps form between the steel shell and the furnace refractory so as to ensure sufficient thermal contact between these two materials (Zietsman and Pistorius 2005a). Given this, it is expected that the thermal contact resistance will be small between the refractory wall and the ramming and between the ramming and steel shell. An estimate of 2 ×10⁴ W.K-1 was used for the thermal contact conductance between refractory-ramming and ramming-steel contact pairs. The same thermal contact conductance was used for the pig iron-refractory interaction.
The slag-pig iron interaction is the focus of the study. Initially a value of 2 ×10⁴ W.m-2).K-1 is used for the slag-pig iron contact pair.
Slag
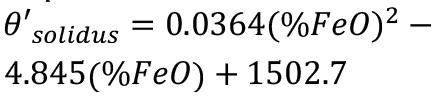
Typical ilmenite slag consists of 54% TiO2, 34% Ti2O3, and 10% FeO, the balance being minor impurities (Garbers-Craig and Pistorius, 2006). The solidus and liquidus temperatures as well as the heat of fusion of the slag depend on the slag chemistry, as shown by Kotzé and Pistorius (2010). Linear approximations of the liquidus temperature, solidus temperature, slag heat capacity, and heat of fusion were determined by Kotzé and Pistorius (2010) based on FactSage-predicted thermodynamic data for a range of slags containing from 6.8% to 17.98% FeO (Equations [30-34]). From this data Kotzé and Pistorius (2010) were able to determine the thermodynamic properties of ilmenite slags as a function of iron oxide content. The following expressions were calculated for the slag compositions used:
where Nθ is the global shape function matrix containing the interpolation functions of temperature, ρ is density, Ω is the domain of the furnace as shown in Figure 3, θ is the column matrix containing the global nodal values of temperature. Bθ contains derivatives of the shape function, and fextθ is a column matrix containing normal components of the heat flux vector on the boundaries of the furnace, given by:
where qn is the normal component of the heat flux vector on natural boundaries.
The slag used in this study contains 15% FeO. The thermal conductivity of the slag bath was specified as follows when the furnace was on:
The density of the slag was 3.800×10³ kg.m-3 (Zietsman, 2004). The heat capacity was specified according to Equation [17].
Numercial investigation into slag solidification inside an ilmenite DC arc furnace using a finite element method
For this study a pre-compacted high-graphite (80% w/w) in a coal tar binder (20% w/w) rammable was used. Its heat capacity is 700 J.kg-1).K-1, thermal conductivity 25 W.m-1 K-1, and density 1.33 kg.m-3 (Brulin et al., 2011).
Refractory
The furnace has a range of zone-specific refractories. For most part the furnace is lined with high-fired dense magnesium brick, which has a specific heat capacity of 800 J.kg-1.K-1 and a thermal conductivity of
Pig iron
The pig iron phase is rich in iron and contains 2% carbon with small amounts of silicon, manganese, and phosphorus (Zietsman, 2004). A higher carbon content of 2.5% has been reported by Gous (2006) and an even higher value of 3% by Mgenge and Steenkamp (2014). A nominal grade of pig iron is given by Mgenge and Steenkamp (2014) and is reported in Table IV:
In this study, properties of grey cast iron were used to model the pig iron phase. In other studies the properties of molten iron have been quoted for the thermal properties of pig iron. The thermal conductivity of the pig iron was adjusted similar to the slag bath.
(Valencia and Quested, 2008). The bulk density of the refractory is 2.787×10³ kg.m-3
Steel shell
The furnace structure is held intact by a steel shell that surrounds the refractory and hearth. A lot of mention is made of this shell (Pistorius, 2008; Zietsman, 2004; Coetzee et al., 2007); however, very little is said about the type of steel that is used. Zietsman (2004) quotes a carbon content of 1.2 wt%, and a manganese content of 0.3%, which suggests that the shell is of ultra-highcarbon steel.
The heat capacity of steel was taken as 461 J.kg-1.K-1. The thermal conductivity is taken as 51.9 W.m-1.K-1, and density 7870 kg.m-3
Results
The heat capacity of pig iron was specified as follows (Valencia and Quested, 2008):
Contacting a hot slag with a colder pig iron
The heat of fusion was specified as 240×103 J.kg-1 (Valencia and Quested, 2008). The bulk density was specified as 7.2×10³ kg.m-3 (Zietsman and Pistorius, 2005b).

In this scenario a slag at 1578°C is contacted with a pig iron at 1428°C. The slag temperature is chosen to be 30°C above the liquidus (1548°C for a slag with 15% FeO) (Equation [30]) while the pig iron temperature is chosen to be 150°C lower than the slag. The furnace is kept in idling mode by only supplying the power needed to sustain the slag and pig iron temperatures (1.7 MW) given the heat losses (Equations [3-6]). The interface between the slag and pig iron is modelled as perfectly permeable to heat transfer by specifying a thermal contact conductance of


2 ×10⁴ W.m-2.K-1. The objective of this test is to observe whether the slag at the slag-pig iron interface will solidify by just coming into contact with a colder pig iron, as stated by Pistorius et al (2011), and also to observe whether the slag-pig iron temperature difference will be maintained throughout the calculation time.
Figure 4 shows the volume-weighted average temperature of the slag bath and pig iron bath after they have been brought into contact inside the furnace. Evidently, the temperature difference of 150°C is not sustained after contact; instead, the slag loses its thermal energy to the pig iron bath and the temperatures converge. This is evidence of the strong agitation of the slag bath and pig iron bath inside the furnace, captured here by the use of effective thermal conductivity of the slag and pig iron at temperatures above their respective liquidus temperatures. The reason the slag bath temperature is lower than that of the pig iron is because of the low temperature of the slag behind the freeze lining, which lowers the volume average temperature. Discarding the freeze lining from the slag average temperature gives a slag temperature of 1584°C, which compares much better to the 1579°C average temperature of the pig iron. Thus there is a 5°C temperature difference between the slag bath and pig iron bath when the two are brought together, not 150°C as quoted in the literature. Thus heat transport alone cannot explain the 150°C temperature difference between the slag bath and pig iron bath quoted for industrial furnaces.
Figure 5 shows the temperature profile inside the furnace after 20 days of cantact between hot slag and colder pig iron. A 20-day period was chosen to ensure thermal equilibrium was reached. Elements with temperatures higher than 1543°C are coloured grey while those lower than 1543°C are colour-coded as per the legend. A constant power supply of 1.7 MW was maintained throughout to compensate for heat losses.

From Figure 5 it can be seen that at the slag-metal interface (indicated by the arrow) there is no sheet of elements with a temperature lower than 1548°C, the liquidus temperature of 15% FeO slag (see Equation [30]), as predicted by Pistorius et al. (2011). The 150°C difference between the slag bath and pig iron bath simply dissipates to the pig iron bath and energy from the electrode passes unhindered through the slag phase to the pig iron phase. This provides proof that solidification of slag at the slag-pig iron interface does not begin at the interface since purely from a thermal point of view any temperature difference between the slag and pig iron bath is dissipated between the two phases.
Also, the freeze lining in Figure 5 is much thicker than the 0.1 m in accordance with Equation [40]; this is because of the nearunhindered heat flow from the slag bath to the pig iron bath, which allows a thicker freeze lining to grow.
To maintain the 150°C difference between the slag and the pig iron it would seem that a ‘barrier’ to heat movement from the slag phase to the pig iron is needed. An ideal candidate for this barrier is solid slag at the interface, since solid slag has a low thermal conductivity of 1 W.m-1.K-1. This barrier is postulated to initially be in the form of co-current laminar flow of slag with the pig iron phase close to the furnace walls. This slag is only transformed to solid slag through reduction reactions close to the furnace walls.
Electromagnetically induced flow causes thorough countercurrent flow in both the slag bath and pig iron bath directly under the electrode. Away from the electrode, the slag and pig iron may flow in a laminar co-current pattern, giving enough time for the slag and pig iron to exchange thermal energy; without, however, the slag solidifying (as seen in Figures 4 and 5). During this interaction carbon in the pig iron reduces the slag, forming solid slag at the interface. In this scenario a slag fluid element remains in close contact with the pig iron due to a slow co-current flow near the outer wall of the furnace. The assumption that the slag solidifies at the slag-pig iron interface purely by coming into contact with a colder pig iron is nullified; furthermore, a method by which an intimate contact between the slag and pig iron can arise is provided, which is slow co-current flow close to the furnace walls.
Proof of concept is seen in results by Pistorius et al. (2011), which show that the reduction product concentration increases towards the furnace wall and decreases directly under the electrode. This constitutes evidence of reduced contact time between the slag and pig iron in this high-mobility zone. Further proof can be seen in flow patterns within a DC arc furnace (Harada et al., 2018).
From Figure 5 it can be seen that just contacting a hot slag with a colder pig iron does not result in a 150°C temperature difference between the slag and pig iron bath. The question is; how does one numerically account for the heat transport barrier posed by the solid slag at the slag-pig iron interface?
One way to do this is by interposing a low thermal contact conductance between the slag bath and the pig iron bath. All the
Numercial investigation into slag solidification inside an ilmenite DC arc furnace using a finite element methodFigure 5—Temperature profile of the furnace after 20 days. Grey colour indicates elements above 1543°C. Mesh size 0.1 m throughout with 0.01 m mesh refinement on slag side of slag-refractory interface. Arrow points to the level of slag-pig iron interface. Tliquidus of slag is 1548°C
heat lost through the pig iron via the lower sidewall (QLS) and hearth heat losses (QH) is derived from the slag, such that the heat lost by the slag to the pig iron is given by
where Abath is the cross-sectional area of the bath (61.5 m2), h is the thermal contact conductance between the slag and pig iron, θslag is the slag bath temperature (1578°C), and θpig is the pig iron bath temperature (1428°C). From Equation [39] the thermal contact conductance needed to maintain a slag that is 150°C hotter than the pig iron can be calculated to be 59.3 W.m-2.K-1. If this thermal contact conductance is taken to be a representation of solid slag at the interface, then its value is given by
The same test of contacting a slag at 1578°C with a pig iron at 1428°C can be done to see if the temperature difference between the slag and pig iron will be maintained throughout the calculation time-frame when a thermal barrier in the form of a low thermal contact conductance is used (59.3 W.m-2.K-1) between the slag and pig iron. The low thermal contact conductance is applied throughout the slag-pig iron interface to resemble a solid slag layer throughout the bath in accordance with sounding observations.
Figure 6 shows the volume-weighted average temperature of the slag and pig iron bath from the time of contact to 20 days after contact. It is clear that the temperature difference of 150°C is maintained. This validates the use of a decreased thermal contact conductance to model the presence of solid slag at the slag-pig iron interface.

where kslag is the thermal conductivity of the slag (1 W.m-1 K-1) and xslag is the thickness of the solid slag. Since xslag is the only unknown, its value can be calculated to give 1.7 cm, thus yielding a value for the thickness of the solid slag. If higher values of the solid slag’s molecular thermal conductivity, such as 3 W.m-1 K-1, are used, a thicker solid slag layer of 5 cm results. At this stage it is not clear what governs this thickness, since this solid layer does not form by heat transport alone.


Figure 7 shows the temperature profile of the furnace after 20 days. Cells with temperatures above 1543°C are coloured grey, while those lower are colour-coded as per the legend. Evidently there is a temperature difference between the slag and pig iron after a thermal barrier is interposed. Furthermore, there is a 11 cm (minimum) thick freeze lining in accordance with Equation [40]. This adds evidence to the conjecture that the temperature difference between the slag and pig iron is due to the solid slag at the interface, and not the other way around. That is, the solid slag must exist first before the pig iron temperature can be lower than the slag temperature. If the solid slag was not present there would not be a temperature difference between the slag bath and pig iron bath.

investigation into slag solidification inside an ilmenite DC arc furnace using a finite element method
A finite element method (FEM) model was developed making use of an effective thermal conductivity to model convective heat flow in the slag and pig iron baths in an ilmenite smelting furnace. The model was used to test the notion that the slag solidifies at the slag-pig iron interface because of the slag coming to contact with a colder pig iron. The model was used to establish and quantify the cause for the temperature difference between the slag and pig iron. A methodology to treat the slag-pig iron interface when using a FEM model was developed and a new slag solidification mechanism at the slag-pig iron interface is suggested.
It was found that contacting a hot slag with a colder pig iron while the furnace is running does not lead to slag solidification at the slag-pig iron interface. Furthermore, the temperature difference between the slag and pig iron is not maintained unless there is a thermal barrier between the slag and pig iron. The thermal barrier must exist first in order for the slag and pig iron temperatures to differ. This thermal barrier is postulated to initially be in the form of a slow co-current flow of slag and pig iron in the outer parts of the furnace. This flow provides enough time for the carbon in the pig iron to reduce the slag immediately in contact with it. Directly under the electrode, the fast-moving countercurrent flow of the slag and pig iron does not allow enough time for the reduction reaction to take place, hence the decrease in reduction products in that region and possibly no solid slag forms. This approach negates the need to have the pig iron bath inherently colder than the slag bath as previously thought, and thus the need for the slag to first solidify at the interface by purely coming into contact with an inherently cold pig iron. The thickness of the solid slag at the interface was calculated to be 1.7 cm for the conditions and furnace dimensions investigated.
The method of using a low thermal contact conductance for the slag-pig iron pair was found to sufficiently account for the presence of solid slag at the slag-pig iron interface, leading to a temperature difference between the slag and pig iron bath and consequently the correct freeze lining thickness.
Alexis, J., Ramirez, M., Trapaga, G,. and Jonsson, P. 2000. Modelling of a DC electric arc furnace - Heat transfer from the arc. ISIJ International, vol. 40, no. 11. pp. 1089–1097.
Bessinger, D. 2000. Cooling characteristics of high titania slags. MSc dissertation, University of Pretoria.
Brulin, J, Rekik, A., Josserand, I., Blond, E., Gasser, A., and Roulet, F. 2011. Characterization and modelling of a carbon ramming mix used in high–temperature industry. International Journal of Solids and Structures, vol. 48, no. 5. pp. 854–864.
Coetzee, C., Lamont, P.H., Bessinger, D., Rabe, J., Zietsman, J.H., and Muller, J. 2007. Application of UCAR® Chill KoteTM lining to ilmenite smelting. Proceedings of the 11th International Ferroalloys Congress, New Delhi, 17–21 February 2007. Indian Ferro Alloy Producers Association. pp. 837–846. https:// www.pyrometallurgy.co.za/InfaconXI/837–Coetzee.pdf
Duncanson, P.L. and Toth, J.D. 2004. The truth and myths of freeze lining technology for submerged arc furnaces. Proceedings of the Tenth International Ferroalloy Congress, Cape Town, 1–4 February 2004. Southern African Institute of Mining and Metallurgy, Johannesburg. pp. 488–499.
Garbers–Craig, A.M. and Pistorius, P.C. 2006. Slag–refractory Interactions during the smelting of Ilmenite. South African Journal of Science, vol. 102. pp. 575–580.
Gous, M. 2006. An overview of the Namakwa Sands ilmenite smelting operations. Journal of the Southern African Institute of Mining and Metallurgy, vol. 106. pp. 379–383.
Harada, T., Hirata, T., Toh, T., and Yamada, T. 2018. Characteristics of closed type DC arc furnace for molten slag reduction (Development of moltern slag reduction process –1). ISIJ International, vol. 58. pp. 1–9.
Harrison, C.E. 1981. Heat transfer and convection in liquid metals. MSc thesis, University of British Columbia.
Jones, R.T. and Reynolds, Q.C. 2015. Design methods for DC arc furnace to enhance furnace integrity. Proceedings of the 54th Conference of Metallurgist, Toronto, 23–26 August 2015. Canadian Institute of Mining, Metallurgy and Petroleum, Montreal. 10 pp. https://www.pyrometallurgy.co.za/Mintek/ Files/2015Jones–Intensity.pdf
Kotzé, H. and Pistorius, P.C. 2010. A heat transfer model for high titania slag blocks. Journal of the Southern African Institute of Mining and Metallurgy, vol. 110. pp. 57–66.
Mgenge, S.G. and Steenkamp, J.D. 2014. Furnace tapping practice at Tronox Namakwa Sands. Proceedings of the Furnace Tapping Conference 2014, 27–29 May 2014. Hundermark, R. and Steenkamp, R. (eds). Symposium Series S80. Southern African Institute of Mining and Metallurgy, Johannesburg. pp. 137–146.
Oksman, P., YU, S., KytÖnen, H., and Louhenkilpi, S. 2014. The effective thermal conductivity method in continuous casting of steel. Acta Polytechnica Hungarica, vol. 11, no. 9. pp. 5–22.
Pistorius, P.C. 2008. Ilmenite smelting: The basics. Journal of the Southern African Institute of Mining and Metallurgy, vol. 108.– pp. 35–43.
Pistorius, P.C., DeVilliers, J.P.R., Gräser, P., and Venter, A. 2011. Partial slag solidification within an ilmenite smelter. Mineral Processing and Extractive Metallurgy, vol. 120, no. 4. pp. 211–217.
Qian, F., Farouk, B., and Mutharasan, R. 1995. Modelling of fluid flow and heat transfer in the plasma region of the DC electric arc furnace. Metallurgical and Materials Transactions B, vol. 26(B). pp. 1057–1067.
Reynolds, Q.C. 2002. Thermal radiation modelling of DC smelting furnace freeboards. Mineral Engineering, vol. 15. pp. 993–1000.
Valencia, J.J. and Quested, P.N. 2008. Thermophysical Properties. Handbook 22B. Furrer, D.U. and Semiatin, S,L, (eds). American Society for Metals. pp. 468–481. https://doi.org/10.31399/asm.hb.v22b.a0005523
Vanaparthy, N.M. and Srinivasan, M.N., 1998. Modelling of solidification structure of continuous cast steel. Modelling and Simulation in Material Science and Engineering, vol. 1, no. 6. pp. 237–249.
Zietsman, J.H. 2004. Interaction between freeze lining and slag bath in ilmenite smelting. PhD thesis, University of Pretoria.
Zietsman, J.H. and Pistorius, P.C. 2005a. Modelling of an ilmenite–smelting DC arc furnace process. Mineral Engineering, vol. 19, pp. 1–18.
Zietsman, J.H. and Pistorius, P.C. 2005b. Ilmenite smelter freeze lining monitoring by thermocouple measurements: Model results. Proceedings of Heavy Minerals 2005, Ponte Vedra, FL,16–19 October 2005. Society for Mining, Metallurgy & Exploration, Englewood, CO. pp. 221–228. u
Numercial investigation into slag solidification inside an ilmenite DC arc furnace using a finite element method
Affiliation:
1University of Zimbabwe, Harare, Zimbabwe.
2University of Zambia, Lusaka, Zambia.
Correspondence to: N. Dzimunya
Email: nevaiddzimunya@gmail.com
Dates:
Received: 19 Sept. 2019
Revised: 24 Oct. 2022
Accepted: 2 Mar. 2023
Published: March 2023
How to cite:
Dzimunya, N., Besa, B., and Nyirenda, R. 2023
Prediction of ground vibrations induced by bench blasting using the random forest algorithm.
Journal of the Southern African Institute of Mining and Metallurgy, vol. 123, no. 3, pp. 123–132
DOI ID: http://dx.doi.org/10.17159/24119717/936/2023
ORCID:
N. Dzimunya http://orcid.org/0000-0002-4616-5818
Synopsis
The accurate estimation of peak particle velocity (PPV) is crucial during the design of bench blasting operations in open pit mines, since the vibrations caused by blasting can significantly affect the integrity of nearby buildings and other structures. Conventional models used to predict blast-induced vibrations are not capable of capturing nonlinear relationships between the different blasting-related parameters. Soft computing techniques, i.e., techniques that are founded on the principles of artificial intelligence, effectively model these complexities. In this paper, we use the random forest (RF) algorithm to develop a model to predict blast-induced ground vibrations from bench blasting using 48 data records. The model was trained and tested using WEKA datamining software. To build this model, a feature selection process using several combinations of Attribute Evaluators and Search Methods under the WEKA Select Attributes tab was performed. The correlation coefficient of the actual data and RF model-predicted data was 0.95, and the weighted average of the relative absolute error (RAE) was 10.9%. The RF model performance was also compared to the equivalent-path-based (EPB) equation on the testing data-set, and it was seen that the RF model can effectively be used to predict PPV. The study also demonstrates that the EPB equation is a suitable empirical method for predicting PPV.
Keywords
Blast-induced ground vibrations, peak particle velocity, random forest algorithm, EPB equation.
Introduction
Blasting is the most common means of fragmenting rock in mining and construction projects. In some cases, blasting is performed in close proximity to buildings and other structures, where the vibrations caused can significantly affect the integrity of these structures. The peak particle velocity (PPV) is the most important parameter generally used to evaluate ground vibrations in blasting sites (Jiang et al., 2019). Accurately evaluating and predicting the PPV, and then optimizing the blast design, helps to minimize the damage caused by blasting vibrations (Longjun et al., 2011).
The intensity of blast-induced ground vibrations is commonly evaluated by regression analysis using the Sadaovsk (Li, Ling, and Zhang, 2009), US Bureau of Mines (Duval and Fogelson, 1962), LangeforsKihlstrom (Langefors and Kihlstrom, 1963), and the Indian Standard (Bureau of Indian Standards, 1973) formulae. The general form of all these conventional methods is presented in Equation [1]:
where
PPV is peak particle velocity (cm/s)
Q is maximum explosive charge (kg)
R is the distance between the explosion source and the measuring point (m)
K, β, and α are site-specific constants that are related to the blasting conditions and rock characteristics.
There are many factors that influence blast vibrations, and mathematical techniques do not accurately model all these factors. As a result, several other techniques have been developed to find a more efficient method for predicting blast-induced ground vibrations. Many researchers have employed soft computing for this purpose. Soft computing refers to a group of computational techniques that are founded on the principles of artificial intelligence. These methods can effectively handle the complexities that arise from the nonlinear relationships between the variables that influence blasting. Methods that have been explored to improve the study of PPV include:

➤ Artificial neural networks (ANNs) (Amnieh, Mozdianfard, and Siamaki, 2010; Amnieh, Siamaki, and Soltani, 2012; Azimi, Khoshrou, and Osanloo, 2019; Das, Sinha, and Ganguly, 2019; Jiang et al., 2019; Kamali and Ataei, 2010; Kosti et al., 2013; Ragam and Nimaje, 2019; Sayadi et al., 2013)
➤ Other machine-learning studies (Lawal, Olajuyi, and Kwon, 2021; Longjun et al., 2011)
➤ Numerical methods (Ducarne et al., 2018; Kumar et al., 2020; Nguyen and Gatmiri, 2007)
➤ Multivariate analysis (Hudaverdi, 2012)
➤ Empirical analysis (Hu and Qu, 2018)
➤ Bayesian approach (Aladejare, Lawal, and Onifade, 2022).
Diverse parameters are used differently in building soft computing methods. Das, Sinha, and Ganguly (2019) developed an ANN model utilizing the following parameters: rock density, number of holes, hole diameter, hole depth, burden, spacing, charge length, stemming length, maximum explosive charge per delay, charge, distance of monitoring point from face, Young’s modulus, Poisson’s ratio, P-wave velocity, and density of explosive. Longjun et al. (2011) compared the performance of support vector machines and the random forest (RF) algorithm utilizing the following: maximum amount of charge at one time, total amount of charge, horizontal distance, elevation difference, front row resistance line, presplit penetration ratio, integrity coefficient, angle of minimum resistance line to measured point, and detonation velocity.
Mostly ANNs have been utilized in blast-induced vibration predictions, and it is critical to explore the performance of other machine-learning algorithms. This should be extended by investigating the performance of these algorithms using different blasting and rock mass parameters to effectively model blastinduced ground vibrations. In this paper, the parameters modified by Hu and Qu (2018) in developing their equivalent-path-based (EPB) equation have been used to build a PPV prediction model using the RF algorithm. This method was chosen because Hu and Qu implemented a unique way of interpreting the distance between the blasting and vibration measurement points, along with the inclusion of pertinent properties such as those concerning explosive energy release and rock mass properties. To optimize the performance of the model, a feature selection procedure is also utilized to develop the best feature subset. The RF model performance is then compared to the results from the EPB equation.
A brief description of the EPB equation and RF is presented in this section. The underlying rationale of choosing to compare these two methods for predicting PPV was that unique parameters were introduced in deriving the EPB equation and thus it is fundamental to use these parameters in developing machine-learning models. This may improve the accuracy of PPV prediction. RF was chosen because it is a widely used algorithm, and the same data-set that was used to test the EPB equation was used to develop the RF model,
later.


The general form of the blast-induced ground vibration formula is illustrated in Equation [1]. To modify and improve the predictive power of this equation, Hu and Qu (2018) developed the EPB equation. Blast-induced ground vibrations arise from the energy released by the detonating explosives. Since the energy is related to the type of explosive, Hu and Qu concluded that the energy release properties of the explosive should be included in the
final formula. The explosion heat of the explosive (Qv) was the parameter suggested to represent this relationship. Hu and Qu also proposed the use of an equivalent propagation path (i.e. a series of straight-line segments P0P1, P1P2, P2P3, ..,PxPx+1 as indicated in Figure 1) of the seismic wave, as opposed to the horizontal distance previously used.
The concept of equivalent path seems reasonable as opposed to taking the distance travelled by the seismic wave as a straight line (as assumed in previous studies). If the measurements are taken on a flat surface, the idea of representing the path travelled by the seismic wave as a straight line is valid (Figure 2).
However, the topography on an open pit mine (Figure 1) is more complex and it is very unlikely that the vibration waves will travel along a straight line to the geophones positioned on the slopes or anywhere outside the pit. The seismic wave will travel, within the ground, to the measuring points and it will never be propagated through the void above the pit floor and sides. Hu and Qu therefore assumed that the shortest possible path that the seismic wave travels beneath the ground can be utilized as the distance from detonation to measuring point. This shortest distance was then used to represent R in Equation [1]. This was termed the 'equivalent distance', and the procedures for determining this distance are given in Hu and Qu (2018). However, the interactions between blast-holes and their influence on the equivalent path was not considered.

Impedance of the rock mass was also included in formulating the EPB equation. The impedance was defined by Hu and Qu (2018) as [2]
where
z is the impedance
ρ is the rock density (g/cm3)
cm is the longitudinal wave propagation velocity of the rock mass (m/s)
η is the integrity factor of the rock mass [η=(cm⁄cr)2 and cr is the longitudinal wave propagation of the rock (m/s)].
The PPV and impedance were said to be negatively correlated. Since impedance is the effective resistance of the rock mass to propagation of the waves, it follows that the higher the impedance of the rock mass the lower the PPV. Following this parametric analysis, the EPB equation (Equation [3]) was proposed (Hu and Qu, 2018) as:
where
i = 0, 1, 2, 3…
PPV is peak particle velocity (cm/s)
Q is the maximum explosive charge fired per delay (kg)
Qv is the explosion heat of the explosive at constant volume (kJ/kg)
Ri is the equivalent distance (m)
θi is the intersection angle of the wave propagation direction to the ground surface at Pi (degrees)
ρi is the density of the rock on the equivalent path (g/cm3)
ηi is the integrity coefficient of the rock mass.
The general structure of the EPB equation is very similar to that of Equation [1]. However, the parameters in the EPB equation have been improved and modified to closely represent the phenomena. Of much importance is the representation of R in Equation [1] as the equivalent distance, Ri. The explosion heat of the explosive (Qv) has also been accommodated in the EPB equation. Site-specific rock mass chartacteristics that influence how seismic waves travel in rocks have also been included in the equation. These rock mass characteristics were chosen by Hu and Qu as the impedance and the density of the rock. A detailed analysis of the development of the EPB equation and how θi can be incorporated into the equation is presented in Hu and Qu (2018).

To easily comprehend the brief description of the RF algorithm, definitions of a few machine-learning technical terms that will feature in the narrative are presented here.
➤ Attributes/features/predictors – These are basically the columns of a data-set, and they represent a separate measurable characteristic of the parameter being investigated. In other words, these are a characteristic of an instance (individual rows in the data-set).
➤ Base learners – Individual models that constitute an ensemble.
➤ Bootstrap sampling – A statistical technique that involves random subsampling with replacements.
➤ Class – The parameter that is being predicted (in this case the PPV).
➤ Classifier – An algorithm that learns from the data and then makes predictions.
➤ Decision tree (DT) – A flow chart-like tree that displays the several outcomes from a sequence of decisions. It is used as a decision-making tool from given data. DTs have three main parts: a root node, internal nodes, and leaf nodes. The root node is the starting point of the tree, and it contains all the input data. An internal node can comprise two or more branches (arrows connecting nodes) and is related with a decision function. A leaf node represents the target/output of a given input vector and denotes a class label. Figure 3 is a simple example of a DT showing when it is possible to blast in an open pit (Yes) and when it is not possible to blast (No) given various weather combinations.


➤ Ensemble – A group of different base models whose individual predictions are combined to produce one optimal predictive model.
➤ Entropy – A technique used in machine-learning to determine how a DT chooses to split data at nodes.
➤ Gini impurity – Another technique which performs similar functions as entropy to build DTs.
➤ Overfitting – This is a challenge in machine-learning where an algorithm can fit the training data very well but fails to generalize to make predictions on new data. In DTs it is caused by developing too deep trees (trees with many internal nodes). Thus, RF is a machine-learning algorithm that consists of growing an ensemble of DTs for accomplishing classification/ regression on a given data-set. Ensemble learning defines all the techniques that use numerous base learners (DT1, DT2, ..., DTk in Figure 4), then combines their individual outputs to produce a single classifier. The base learners combine their outputs by a majority vote technique in classification or through averaging in regression. The RF algorithm is described as an variation of bagging which creates a forest of de-correlated trees and averages their predictions (Breiman, 2001). DT models commonly suffer from overfitting (high variance) and thus averaging out predictions from multiple DTs leads to a decrease in overall variance. The practise of growing these DTs is centred on bagging (bootstrap aggregation), which is a procedure for decreasing the variance of an estimated prediction function. Here, bagging principally encompasses generating several data subsets from the training data by bootstrap sampling (random subsampling with replacement) and selecting random subsets of predictor variables. Each of these data subsets, of similar distribution, is then utilized to independently train a DT. Additionally, for each tree, only a random subset of predictors/ features is used for developing the decision model. For each tree thus created, a predictor is selected to accomplish a decision-split at a particular node. This is generally performed based on either the information gain/entropy or the Gini impurity that selects the best predictor for that node. This procedure is iterated at each node in a DT and consequently several trees are trained. Ultimate prediction decisions are reached based on averaging (for regression) or majority voting (for classification) of individual tree predictions. Since data subsampling and predictor subsampling for each tree is
carried out randomly on a forest of trees, this algorithm is termed RF. Figure 4 is an example of the structure of an RF algorithm for regression.
The data-set utilized to evaluate the usefulness of the RF algorithm in predicting blast-induced ground vibrations was developed from the seismic monitoring measurements carried out by Hu and Qu (2018) at Si-Jia-Ying iron ore mine in China. This mine is a large-scale open pit operation which uses multi-hole millisecond delay bench blasting. The features of the data-set and their corresponding notations are listed in Table I. In this case the PPV is the class attribute. This data-set was chosen for the current study because it is the same as that used to develop and test the EPB equation. This consistency will ensure that the comparisons undertaken between the EPB equation and the RF model will be reasonable and reliable.
A total of 48 instances/data-points forms the data-set, as indicated in Table ll.
Features comprising the data-set
The PPV prediction model was developed using Waikato Environment for Knowledge Analysis (WEKA) software (Hall et al., 2009). WEKA is a handy and powerful machine-learning and data-mining software application that can assist users to understand acquired data better. The software incorporates powerful data analysis tools that can be used to extract useful information from large sums of data and develop machinelearning models.

Raw machine-learning data-sets consist of a mixture of features/ attributes, some of which are irrelevant to making accurate
predictions. Thus, one of the most important exercises in building machine-learning models is to identify the most influential attributes to include in the model. The process of selecting relevant features from the data is called feature selection. In the WEKA software platform this procedure is performed under the Select Attribute tab in WEKA Explorer. Figure 5 is a screenshot of the WEKA home screen with the Explorer tab marked in red. When the Explorer tab is selected the dialog indicated in Figure 6 is displayed. The Preprocess tab is used to load the data-set into the software, the Classify tab is available to the user to enable the construction of different machine-learning models for prediction and classification tasks and the Select Attributes tab is used for feature selection. The Select Attributes tab hosts all the techniques
necessary to accomplish feature selection. Figure 7 shows the dialog that's displayed to the user when the Select Attributes tab is selected. The Choose tabs (circled in red) enable the user to select different combinations of Attribute Evaluators and Search Methods and with the data-set preloaded into the software, the best feature subset is displayed in the Attribute Selection Output window.


In WEKA, feature selection is basically divided into two parts (Attribute Evaluator and Search Method). Each of these two sections presents several techniques for accomplishing the feature selection process. Attribute Evaluator is the technique by which each attribute (also called a column or feature) in a data-set is weighed in the context of the output variable (also known as the class). Search Method, on the other hand, navigates several combinations of features in the data-set to arrive at a short list of selected features. Each Attribute Evaluator technique should be used together with a Search Method, and some Attribute Evaluator techniques require the use of specific Search Methods
The techniques used to perform feature selection in this study are described in Tables lll and IV.
Table V indicates the combination of techniques used to select the best features for the RF model.
Based on the outcomes in Table V and from analysis of variables as they are used in empirical formulae, the RF model was trained and tested using the following features: Ri, Q_Em, Q_ANFO, Qv ANFO, Qv_Em and cm. Explosives properties, distance to measuring point, and rock mass characteristics influence PPV. From Table V, ρ, Qv_Em and cr have been rendered redundant. Therefore, the feature to represent rock mass characteristics was concluded to be cm. This is because η, though present in Table V, was not included because it is dependent on cm (already included) and cr (redundant feature). Thus, the inclusion of η into the feature set will not add any value to the model performance. Qv_Em was included mainly because Qv_ANFO is present in Table V and thus a balanced representation of all the explosive types used was assumed reasonable.
In supervised learning, the performance of a classifier needs to be measured on a given data-set before using it to predict the class of a new project (Zhou, Xibing, and Hani, 2015). To satisfy this criterion, the original data-set is randomly split into two subsets: a training set and a testing set. The training set is used to construct the model and to set the model parameters, while the testing
Search method
Description
GeneticSearch Performs a search using the simple genetic algorithm. Genetic algorithm is a search-based optimization method that is based on the principles of genetics and natural selection.
BestFirst Searches the space of attribute subsets using a method called greedy hill climbing. Hill climbing involves either adding or removing of a feature from the data-set at a time. BestFirst may start with the empty set of attributes and add attributes (forward search) or start with the full set of attributes and remove attributes (backward search). If the addition or deletion of a feature does not change the predictive performance of the model, that feature is assumed redundant.
ExhaustiveSearch Achieves a comprehensive search through the space of attribute subsets, beginning with an empty set of attributes. It registers the best subset found.
GreedyStepwise Executes a greedy forward or backward search through the space of attribute subsets. May start with no/all features or from an arbitrary point in the attribute space. Breaks when the addition/deletion of any remaining features results in a decrease in evaluation.
Ranker Ranks features according to their individual assessments.
Attribute evaluator
Description
WrapperSubsetEval Assesses sets of attributes by utilizing a learning scheme. Cross-validation is exploited to approximate the accuracy of the learning scheme for a set of attributes.
CorrelationAttributeEval Evaluates the worth of a feature by determining its correlation with the class variable.
set is used as an independent validation set for assessing the performance and predictive power of the model. In this study, the data-set was split into 70% training set and the remaining 30% was used as the testing set.
In WEKA, hyperparameter tuning is very important when building a model. Hyperparameters, in machine-learning, are a set of parameters that control the behaviour of a model, and these parameters are set/tuned before the training of a model starts. The tuning of these parameters is important because it determines how well a model is going to learn from the training data, thus enabling best performances to be achieved. The key hyperparameter for RF is the number of attributes to consider at each split point. In WEKA this parameter is controlled by the numFeatures attribute. In the
Table V
Feature selection combinations and feature subsets
Attribute evaluator Search method Set of attributes
GeneticSearch Ri, Q_Em
BestFirst Ri
WrapperSubsetEval
ExhaustiveSearch Q_ANFO, Ri, cm, η
GreedyStepwise Ri
CorrelationAttributeEval Ranker Ri, Q_Em, Qv_ANFO, Q_ANFO, η, cm
previous feature selection exercise, six features were selected and thus the best model involved using all these parameters. Therefore, numFeatures hyperparameter was set to 6 as it yielded the highest correlation coefficient. The other hyperparameters were left on default settings.
The RF model performance was then compared to the EPB equation to evaluate its predictive power and possibility of future use when employing the parameters from the EPB equation as dataset features.
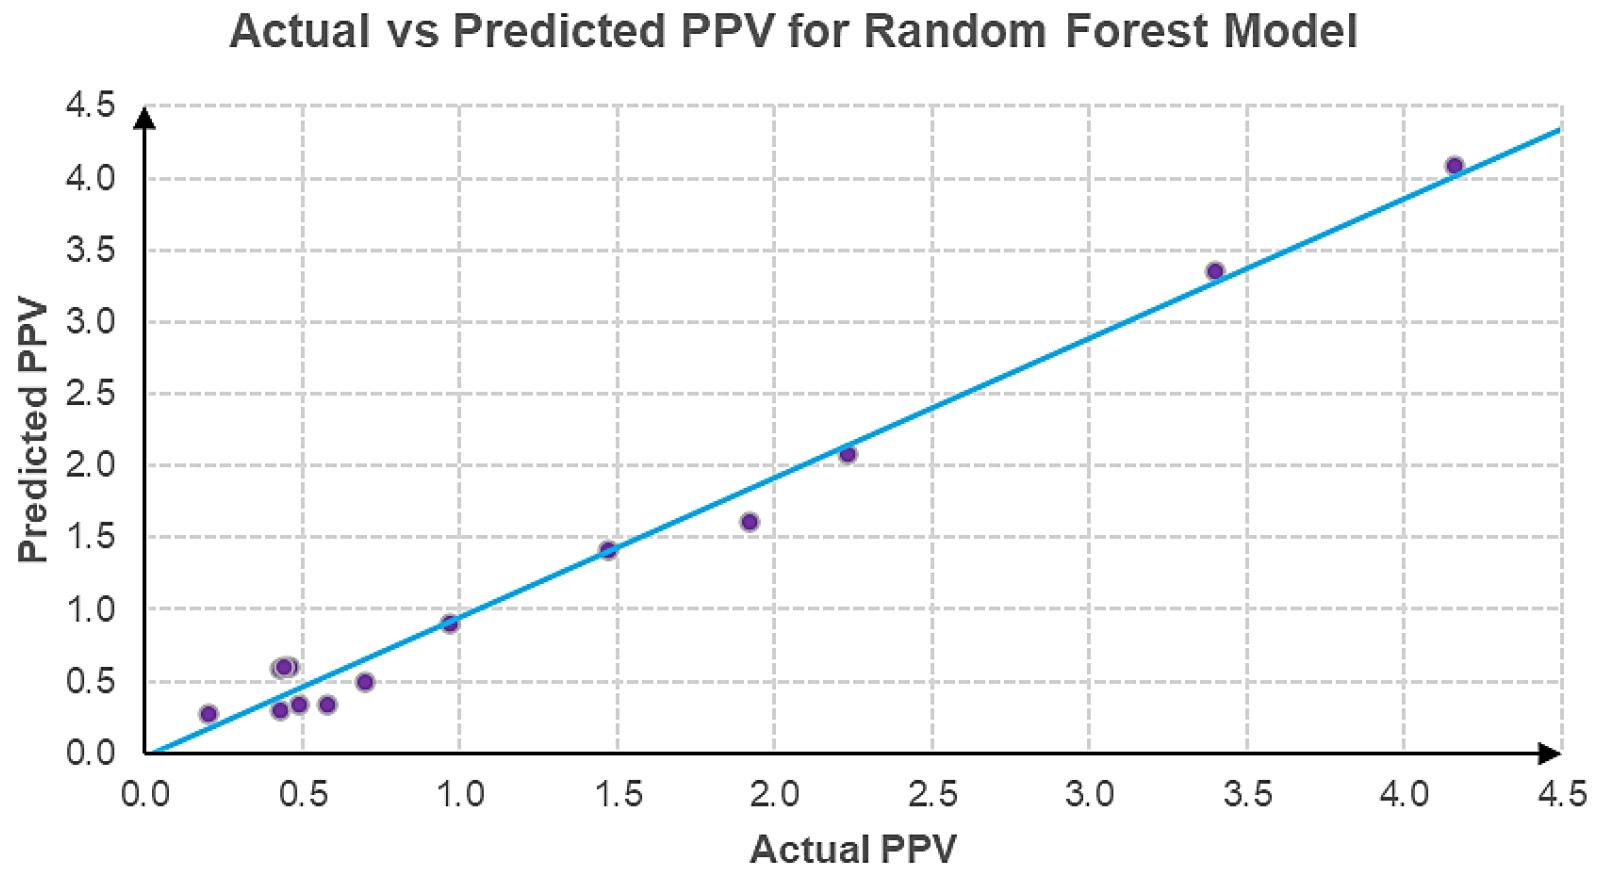
The aim of this investigation was to utilize the parameters that constitute the EPB equation and develop and evaluate the
performance of the RF algorithm from a data-set formulated from these parameters. These parameters are equivalent distance (Ri), maximum explosive charge per delay (Q), explosion heat of the explosive (Q v), and longitudinal wave velocity of the rock mass (cm).
The correlation coefficient of the RF model was 0.95, indicating that this model is suitable for predicting blast-induced ground vibrations using equivalent distance (Ri), maximum explosive charge per delay (Q), explosion heat of the explosive (Qv), and longitudinal wave velocity of the rock mass (cm) as model parameters. The model-predicted PPVs are plotted against the actual values in Figure 8. The agreement is excellent, demonstrating that the RF model is fitted well on the training data-set. As previously highlighted, the model was built by splitting the data into 70% training set and the remaining 30% as the testing set. Thus, 14 data-points were available to test the model.
WEKA also gives a summary of the predictive errors of the model, including mean absolute error (MAE), root mean squared error (RMSE), and relative absolute error (RAE). If the RMSE and MAE are zero, then the model will be perfect, i.e., both values should be minimized. The RF model and the EPB equation results were compared on the test set as indicated in Table VI. Instead of the arithmetic mean, the overall RAE for each set of predictions was computed using the weighted average (Equation [4]) because this approach is reasonably appropriate for regression problems where statistical dispersion is expected between data-points.
that the model is sufficiently capable of predicting blast-induced vibrations within a reasonable range of errors.
The RF model has better prediction capabilities than the EPB equation. This is indicated by an overall RAE of 10.9% for the RF model against 14.8% for the EPB equation. The RF model performs better because it is a soft computing technique and can capture nonlinear relationships between the various blasting-related parameters. The slightly lower prediction performance of the EPB equation can be attributed to the inability of mathematical methods to capture the nonlinear relationships between multiple influencing parameters.
The EPB equation has demonstrated that it can produce results that are not far out of range. Good corelation, in general, is indicated by errors of 10% or lower. The 10.9% RAE achieved by the RF model is reasonably close to 10% and the slightly higher margin could be attributed to the relatively small data-set used to train and test the model. It would be of great value to combine the data-set used here with similar data from Zimbabwe and neighbouring regions in order to undertake further studies. This would have the potential to improve the prediction of PPV using the RF algorithm.
To visualize the comparison more clearly, values of PPV for both models were plotted as shown in Figure 9. The result proves that the established RF model is reasonable and reliable in predicting PPV for bench blasting using equivalent distance (Ri), maximum explosive charge per delay (Q), explosion heat of the explosive (Qv), and longitudinal wave velocity of the rock mass (cm) as predictor variables. Figure 9 shows that the RF model gives a better prediction of the PPV on the test data-set.
It can be seen from Table VI that the predicted values and actual values obtained from RF model are of relatively low comparative error. The overall RAE for the RF model was 10.9%, indicating
The relationships of the four parameters selected for the model with PPV are briefly described as follows.
➤ The prime factor is the equivalent distance (Ri). There is a direct relationship between equivalent distance and the PPV

as it appeared in all the methods used for feature selection. However, this parameter had an individual correlation coefficient of -0.66 with PPV. Logically, this is because the magnitude of the vibration naturally decreases away from the detonation point.
➤ The second factor is maximum explosive charge per delay (Q). The magnitude of PPV is directly proportional to Q. An increase in the quantity of explosives used during blasting results in stronger ground vibrations being caused.
➤ The vibrations also depend on the energy properties of the individual explosives used, expressed as the explosion heat of the explosive (Qv). The greater the energy contained in an explosive, the more likely it is to cause stronger ground vibrations.
➤ Finally, the site-specific characteristics of the rock mass play a key role. This is represented by the longitudinal wave velocity of the rock mass (cm). This parameter, plus the density of the rock (ρ), influences the impedance of the rock mass and the PPV is inversely proportional to ground impedance.
A complex relationship among predictor variables can complicate the prediction of PPV in blasting activities. Therefore, selecting a robust method to develop a PPV prediction model that can cover all the inherent complexity of the problem is very important. RF for regression, in most cases, shows lower average errors and superior predictive performance compared to the other advanced regression algorithms. In this study, RF has proved to be an accurate predictor of PPV in bench blasting scenarios, based on the features chosen for evaluation. However, this should be further verified by integrating other local data-sets with the one used in this study.

Very accurate estimation of PPV is crucial for the design of appropriate bench blasting practices in open pit mining projects, since the vibrations caused by blasting can significantly affect the integrity of nearby buildings and other structures. Conventional methods have been used to predict these blast-induced vibrations. Artificial neural networks (ANNs) have also been developed, resulting in more accurate predictions. To fully understand this phenomenon, it is critical to explore different machine-learning
algorithms and evaluate their performances using different sets of predictors (model input parameters). A random forest (RF) model was developed using equivalent distance (Ri), maximum explosive charge per delay (Q), explosion heat of the explosive (Q v), and longitudinal wave velocity of the rock mass (cm) as predictor variables. The RF model was found to consistently predict PPV to within a reliable range of accuracies. The model displayed a correlation coefficient, between actual and predicted PPV values, on the test set of 0.95 and an overall relative absolute error (RAE) of 10.9%. The performance of the RF model was compared to that of the equivalent-path-based (EPB) equation. The EPB equation yielded an overall RAE of 14.8%, and thus RF model displayed better prediction capabilities. This study also confirms the usefulness of the EPB equation, as well as the effectiveness of the parameters used in the EPB equation, in formulating more comprehensive data-sets for future use with various algorithms. The outcomes of this study can be applicable to open pit mines in Zimbabwe and the neighbouring regions. This can be done by integrating local databases into the data-set and using a similar approach as described in this study. This may improve the performance of the RF model. Further studies are necessary to confirm this proposition.
The authors would like to acknowledge the thoughtful and valuable comments of the anonymous reviewers, which have improved the quality of this paper.
Author contributions
DN: conceptualization, methodology, software, writing - original draft preparation; BB: writing - reviewing and editing; NR: software, writing - reviewing and editing.
References
Aladejare, A., Lawal, A., and Onifade, M. 2022. Predicting the peak particle velocity from rock blasting using Bayesian approach. Acta Geophysica, vol. 70. pp. 581–591. https://doi.org/10.1007/s11600-022-00727-5
Amnieh, H.B., Mozdianfard, M.R., and Siamaki, A. 2010. Predicting of blasting vibrations in Sarcheshmeh copper mine by neural network. Safety Science, vol. 48. pp. 319–325.
Amnieh, H.B., Siamaki, A., and Soltani, S. 2012. Design of blasting pattern in proportion to the peak particle velocity (PPV): artificial neural networks approach. Safety Science, vol. 50. pp. 1913–1916.
Azimi, Y., Khoshrou, S.H., and Osanloo, M. 2019. Prediction of blast induced ground vibration (BIGV) of quarry mining using hybrid genetic algorithm optimised artificial neural network. Measurement, vol. 147. https://doi. org/10.1016/j.measurement.2019.106874
Breiman, I. 2001. Random forest. Machine Learning, vol. 45, no. 1. pp. 5–32. Bureau of Indian Standards. 1973. IS-6922. Criteria for safety and design of structures subjected to underground blast.: ISI Bulletin. https://civilplanets. com/wp-content/uploads/2020/04/6922.pdf
Das, A., Sinha, S., and Ganguly, S. 2019. Development of a blast-induced vibration prediction model using an artificial neural network. Journal of the Southern African Institute of Mining and Metallurgy, vol. 119, no. 2. pp. 187–200.
Ducarne, L., Ainalis, D., Kaufmann, O., Tshibangu, J-P., Verlinden, O., and Kouroussis, G. 2018. Numerical modelling of blast-induced ground vibrations. Proceedings of the 25th International Congress on Sound and Vibration, Hiroshima, Japan 8-12 July 2018. International Institute of Acoustics & Vibration. https://www.researchgate.net/profile/Georges-Kouroussis/ publication/326601233_Numerical_modelling_of_blast-induced_ground_ vibrations/links/5b586eb8458515c4b243ecd5/Numerical-modelling-of-blastinduced-ground-vibrations.pdf
Duval, W.I. and Fogelson, D.E. 1962. Review of criteria for estimating damage to residences from blasting vibrations. Report of Investigations 5868: US Bureau of Mines.
Hall, M., Frank, E., Holmes, G., Pfahringer, B., Reutemann, P., and Witten, I.H. 2009. The WEKA data mining software: An update. ACM SIGKDD Explorations Newsletter, vol. 11, no. 1. pp. 10–18.
Hudaverdi, T. 2012. Application of multivariate analysis for prediction of blastinduced ground vibrations. Soil Dynamics and Earthquake Engineering, vol. 43. pp. 300–308.
Hu, X. and Qu, S. 2018. A new approach for predicting bench blasting-induced ground vibrations: A case study. Journal of the Southern African Institute of Mining and Metallurgy, vol. 118, no. 5. pp. 531–538.
Jiang, W., Arslan, C.A., Tehrani, M.S., Khorami., and Hasanipanah, M. 2019. Simulating the peak particle velocity in rock blasting projects using a neurofuzzy inference system. Engineering with Computers, vol. 35. pp. 1203–1211. https://doi.org/10.1007/s00366-018-0659-6
Kamali, M. and Ataei, M. 2010. Prediction of blast induced ground vibrations in Karoun III power plant and dam: A neural network. Journal of the Southern African Institute of Mining and Metallurgy, vol. 110, no. 8. pp. 481–490.
Kosti, S., Perc, M., Vasovi, N., and Trajkovi, S. 2013. Predictions of experimentally observed stochastic ground vibrations induced by blasting. PLoS ONE, vol. 8. https://doi.org/10.1371/journal.pone.0082056
Kumar, S., Mishra, A.K., Choudhary, B.S., Sinha, R.K., Deepak, D., and Agrawal, H. 2020. Prediction of ground vibration induced due to single hole blast using explicit dynamics. Mining, Metallurgy and Exploration, vol. 37. pp. 733–741.
Langefors, U. and Kihlstrom, B. 1963. The Modern Techniques of Rock Blasting, Wiley, New York.
Lawal, A., Olajuyi, S., and Kwon, S. 2021. Prediction of blast-induced ground vibration using GPR and blast-design parameter optimisation based on novel grey-wolf optimisation. Acta Geophysica, vol. 69. pp. 1313–1324. https://doi. org/10.1007/s11600-021-00607-4
Li, X.B., Ling, T.H., and Zhang, Y.P. 2009. Analysis of Blast Vibration SignalsTheories and Methods. Science Press, Beijing.
Longjun, D., Xibing, L., Ming, X., and Qiyue, L. 2011. Comparisons of random forest and support vector machine for predicting blasting vibration characteristic parameters. Procedia Engineering, vol. 26. pp. 1772–1781.
Nguyen, K.V. and Gatmiri, B. 2007. Evaluation of seismic ground motion induced by topographic irregularity. Soil Dynamics and Earthquake Engineering, vol. 27. pp. 183–188.
Ragam, P. and Nimaje, D.S. 2019. Evaluation and prediction of blast induced peak particle velocity using artificial neural network: Case study. Noise & Vibration Worldwide, vol. 49, no. 3. pp. 111–119.
Sayadi, A., Monjezi, M., Talebi, N., and Khandelwall, M. 2013. A comparative study on the application of various artificial neural networks to simultaneous prediction of rock fragmentation and back break. Journal of Rock Mechanics and Geotechnical Engineering, vol. 5. pp. 318–324.
Zhou, J., Xibing, L, and Hani, S.M. 2015. Comparative performance of six supervised learning methods for the development of models of hard rock pillar stability prediction. Natural Hazards, vol. 79, no. 1. pp. 291–316. u
Job Description:
The Department of Mining Engineering at the Colorado School of Mines (Mines) is seeking a visionary and inspirational leader to be the first-ever J. Steven Whisler Chair for the Head of Mining Engineering. This endowed position was recently established as part of a $7.5M gift from Steve and Ardy Whisler that also established the J. Steven Whisler Professor of Practice and the J. Steven Whisler Scholars Program. We seek a non-conventional leader who can develop and advance a vision that positions our #1 world-ranked Mining Engineering program to be the exemplar for all other mining engineering programs in the future.
The J. Steven Whisler Chair for the Head of Mining Engineering will have both academic and industry experience with a clear vision for training the next generation of engineers in sustainable mining, entrepreneurship, and systems-level thinking. Successful candidates will have demonstrated high ethical standards, are expected to operate in a transparent and collegial way and have a strong commitment to building a program that attracts faculty and students from a wide range of backgrounds. The J. Steven Whisler Chair for the Head of Mining Engineering will have access to endowed resources that can be used to support the teaching and research mission of the Department but will be expected to be used to rally industry enthusiasm, engagement, and additional support for the program.
Click here to apply: https://jobs.mines.edu/en-us/job/495880/j-steven-whisler-chair-for-the-head-of-miningengineering
OPEN UNTIL FILLED
Affiliation:
Department of Mining and Process Engineering, Namibia University of Science and Technology, Windhoek, Namibia.
Correspondence to:
T.E. Moongo
Email: tmoongo@gmail.com
Dates:
Received: 24 Aug. 2021
Revised: 12 Sept. 2022
Accepted: 7 Mar. 2023
Published: March 2023
How to cite: Nghipulile, T., Moongo, T.E., Dzinomwa, G., Maweja, K., Mapani, B., Kurasha, J., and Amwaama, M. 2023

Effect of mineralogy on grindability –A case study of copper ores. Journal of the Southern African Institute of Mining and Metallurgy, vol. 123, no. 3, pp. 133–144
DOI ID: http://dx.doi.org/10.17159/24119717/1714/2023
ORCID: T. Nghipulile http://orcid.org/0000-0003-4399-2620
T.E. Moongo http://orcid.org/0000-0002-2465-0409
G. Dzinomwa http://orcid.org/0000-0001-8763-699X
K. Maweja http://orcid.org/0000-0003-0989-2132
B. Mapani http://orcid.org/0000-0002-5354-3397
J. Kurasha http://orcid.org/0000-0002-7213-7669
M. Amwaama http://orcid.org/0000-0003-1937-585X
Synopsis
The effect of mineralogy on the grindability was investigated using three copper ores – two sulphides and one oxide. The dominant copper minerals were identified by optical microscopy and mineral chemistry derived from SEM-EDS analysis. The sample designated sulphide 1 was borniterich, sulphide 2 ore was mainly chalcopyrite, and the oxide ore was predominantly malachite and minor azurite. The gangue minerals were identified using semi-qualitative XRD analysis. Sulphide 1 contained more than 80% (w/w) of quartz compared to about 70% in the other two ores. The Bond work indices were 13.8, 21.6, and 17.3 kWh/t for sulphide 1, sulphide 2, and oxide ore respectively. This suggested that the chalcopyrite-rich ore is the hardest, while the malachite-rich ore has intermediate hardness, and the bornite-rich ore is the softest. The brittleness indices of the ores were calculated using the chemical composition of the gangue, and a good correlation between brittleness indices and Bond work indices was observed, which highlights the importance of the gangue composition in determining the fracture behaviour of the ores. There is scope for further investigation into the relationship between ore mineralogy and comminution behaviour using other breakage characterization techniques.
Keywords
mineralogy, grindability, work index, relative work index, brittleness index, relative toughness index.
Introduction
Process mineralogy is concerned with the practical application of mineralogical knowledge of ores to guide the development and/or optimization of process flow sheets (Baum, 2014; Bradshaw, 2014; Henley, 1983; Lotter et al., 2018; Whiteman, Lotter, and Amos, 2016). Ores are characterized by inhomogeneities such as flaws, joints, voids`, and a variety of minerals dispersed as grains of various sizes with differing interrelationships with one another, i.e. texture (Chen, Xu, and Li, 2018; Estay and Chiang, 2013; Fan et al., 2018; Hamdi, Stread, and Elmo, 2015; King, 2012; Zhao and Zhang, 2020; Zhou et al., 2015). These discontinuities influence the hardness and fracture toughness of rocks and, in turn, their fracture behaviour (Gutierrez and Youn, 2015), serving as stress risers where both crack initiation and propagation begin (Chen, Xu, and Li, 2018; Griffith, 1920; Zhao et al., 2016).
Mineralogical information is obtained from optical microscopy (mineral texture, mineral identification), scanning electron microscopy (SEM) (morphological characteristics), quantitative evaluation of materials by scanning electron microscopy (QEMSCAN) (degree of liberation of valuable minerals), mineral liberation analyser (MLA) (liberation data), and X-ray diffraction (XRD) (phase identification) (Anticoi et al., 2018; Baum, 2014; Masindi, Foteinis, and Chatzisymeon, 2022; Shi and Zuo, 2014; Sipunga, 2015; Ye, Tang, and Xi, 2020; Liu et al., 2017; Mariano, 2016; Palm et al., 2010; Reichert et al., 2015; Solomon et al., 2011; Xiao et al., 2012). In comminution, the mineralogical data can be related to the grindability parameters (e.g., Bond work index) in order to develop the relationship between the ore mineralogy and grindability. The Bond work index (Wi) is the ore hardness parameter which represents the resistance to crushing or milling (Wills and Finch, 2016) and it is used to design comminution machines such as crushers and mills (Ipek and Goktepe, 2011; Jauregui, 1982; Todorovic et al., 2017). Equation [1] denotes the energy required to reduce the parent particle size to the target progeny size. Additionally, Wi can serve as an input parameter for a geometallurgical model which predicts the grinding efficiency in the milling circuits (Mine, 2017; Mwanga, 2016).
where Wi is the Bond work index in kWh/t, and F80 and P80 are the 80% passing sizes (in µm) for the feed and product respectively.

The influence of ore texture has long been recognized as a critical factor in mineral processing (Bradshaw, 2014; Ghanei, 2020; Mine, 2017; Mwanga et al., 2014; Schouwstra and Smit, 2011). For example, Mine (2017) developed the relationship between grindability and mineralogical data for the Aitik copper mine in Sweden. Ghanei (2020) investigated the relationship between ore texture and grindability in a variety of iron ores. Their work ignited the interest of the authors of this study to advance the understanding of the relationship between ore mineralogy and grindability using a copper deposit that contains multiple mineralized zones as a case study.
The deposit studied is located in the Pan African Damara Orogen, on the Northern Carbonate Platform section within the Mulden Group in the Otavi Mountainland, northern Namibia. The mineralization is hosted by arkosic sandstone with minor calcite (CaCO3) and dolomite (CaMg(CO3)2). The deposit contains three mineralized zones (Kamona and Günzel, 2007). The uppermost zone consists of copper oxides, hydroxides, and carbonates. This is followed by a transition (mixed) zone and then the lowermost sulphide zone as shown in Figure 1. Copper mineralization in the oxide zone, from near the surface to about 70 m depth, is mainly composed of malachite (Cu2CO3(OH)2), azurite (Cu3(CO3)2(OH)2), and cuprite (Cu2O), with minor chalcocite (Cu2S), digenite (Cu1-sS), and covellite (CuS). The transition zone contains a combination of oxides (predominantly malachite) and sulphides (predominantly chalcocite, and bornite, with covellite (CuS) in minor quantities). The sulphide zone contains very fine intergranular disseminated grains of primary copper sulphide minerals (chalcopyrite (CuFeS2) and bornite (Cu5FeS4)) and secondary copper sulphides such as chalcocite (Cu2S), covellite (CuS), and digenite (Cu1-sS).
Three copper ore samples, designated sulphide 1, sulphide 2, and oxide, were obtained from the mine. About 200 kg of each ore type was homogenized using the coning and quartering method to obtain a representative sample weighing approximately 50 kg. The 50 kg samples were stage crushed to 100% passing 3350 µm (a suitable feed size for the laboratory ball mill) using a laboratory jaw crusher. The crushed 50 kg samples were rotary split to prepare 1 kg aliquots for the grindability experiments.
Elemental compositions of representative samples of the crushed feeds were determined using a bench-top X-ray fluorescence (XRF) instrument, model NEX CG supplied by Applied Rigaku Technologies from Austin, Texas, USA. This instrument uses
a built-in calibration procedure referred to as the multi-channel analyser (MCA) calibration software. A representative sample was dry screened over 2360, 1700, 1180, 850, 600, 425, 300, 212, 150, 106,- and 75 µm aperture sieves to obtain the size distribution. After sieving, the size-by-size samples (–75, –300+75 and +300 µm) were prepared for chemical analysis by XRF, as well as for mineralogical examination with optical microscopy, X-ray diffractometry (XRD), and scanning electron microscopy (SEM). The samples for optical microscopy and SEM analysis were mounted in hot resin and then polished on Kemet waterproof silicon carbide grit papers using a 1 µm Kemet diamond slurry to obtain a reflecting surface. In preparation for SEM analysis, the samples were lightly carboncoated using the Quorum Q150T sputter coater (Advancedlab, Switzerland). SEM analysis was conducted using a JEOL JSM-IT300 scanning electron microscope coupled with the Thermo Scientific NS7 EDS software (Advancedlab, Switzerland). Analyses were done in high vacuum in the backscattered mode at an acceleration voltage of 15 kV, a probe current of 50 nA, and a working distance of 15 mm. The size-by-size samples were observed in both reflection and transmission modes for phase identification using an Olympus BX51 optical microscope. Sub-samples of the size-by-size samples were pulverized for semi-quantitative analysis of the gangue phases using a Bruker D8 Advance XRD instrument. The instrument uses the Diffracplus package with XRD Wizard version 2.9.0.22 for sample information entry, XDR Commander version 2.6.1.0 to run the samples, and EVA version 16.0.0.0 for data evaluation. The samples were run with a step size of 0.02 degrees 2Θ with a counting time of 1 second per step.
The Bond work indices (Wi) were experimentally determined following the Bond ball mill standard procedures outlined in Gupta and Yan (2006, pp. 73-75). For each sample type, size analysis was performed on the mill feed (100% passing 3.35 mm material) to determine the 80% passing size and percent passing the test sieve (106 µm). Following the iterative process of screening the mill discharge over the test sieve until three consecutive consistent readings for the undersize weight per revolution are obtained, the work index (in kWh/t) was then calculated using Equation [2]).
where D is the test sieve aperture 106 µm), and Gbp is the constant representing the net mass (in grams) of undersize product per revolution.
Milling experiments were conducted with 1 kg samples which were milled for 5, 10, 15, and 20 minutes using a laboratory ball mill with both the internal diameter and length equal to 305 mm. The milling conditions are listed in Table I. The slurry density was kept constant at 65% solids in all tests. The mill products were wetscreened using a root two series of sieves between 300 and 75 µm, dried at 105°C for 4 hours, and the size distributions generated for all three copper ores.
The powder filling (fc), ball filling (J), and fraction of space (voids) between the balls, denoted as U, were calculated, and kept constant during the experiments as indicated in Table I. The powder filling (fc) is the volume of the charged material expressed as a fraction of the mill volume and is calculated using Equation [3]. The porosity of the bed (ϕ) is theoretically equal to 40% with a bulk density of 4.65 g/cm3 for steel balls (Austin, Klimpel, and Luckie, 1984).

The ball filling (J), which defines the volume of balls at rest expressed as a fraction of the mill volume, is calculated using Equation [4].


The fraction of voids between the balls at rest is calculated using Equation [5], which relates fc and J. An interstitial void volume (U) closer or equal to 100% is desired in the mill as it ensures efficient ball loading (Kiangi, 2011; Mulenga and Moys, 2014).
Test conditions for milling experiments
The XRF elemental compositions for the bulk homogenized samples of the three copper ores are shown in Table II. As a way of validating the XRF assays, SEM-EDS was used to confirm the mineral phases and results are listed in Table A1 in Appendix A. The major difference for the metal values contained in the ores arises from the S and Ca contents. In general, the elemental compositions show that the two sulphide ores have a lower Ca grade and a higher S grade compared to the oxide ore. As already mentioned, the Ca and Mg are contained in the calcite (CaCO3) and dolomite (CaMg(CO3)2) which are minor gangue minerals. Si, K, and Al are contained in the abundant gangue minerals, i.e. quartz (SiO2), K-feldspar (KAlSi3O8), and muscovite (KAl2(AlSi3O11)(OH)2), which were identified using XRD (see Table III).
Table II
Elemental compositions for the feed size-by-size samples of the three copper ores, as determined by XRF
*Oxygen content can be observed in Table A1 in Appendix A from SEM-EDS
Table IV
Physical properties of the copper and main gangue minerals in the ores
Semi-qualitative analysis of the main gangue minerals
Table III shows the semi-quantitative XRD results for the gangue minerals. The contents of copper minerals as well as iron sulphide minerals such as pyrite were below the detection limit for XRD, although they were detected by optical microscopy (see the following section). Considering the average composition, sulphide 1 contains 85% (w/w) quartz and 8% K-feldspars. Sulphide 2 constitutes 70% quartz, 8% K-feldspars, and 8% muscovite. The oxide ore contains 70% quartz (disregarding the –300+75µm fraction) and 7% K-feldspar minerals. Analysis of gangue minerals is essential because, as discussed later, the grindability of the ore is mainly dependent on gangue composition, gangue being the main constituent of the ore.
The ore samples were not collected in situ but were received after having been pre-crushed. As such, their original textures were not easy to reconstruct. This section details the mineralogical assemblages in the crushed ores. Bornite particles (Figure 2a) exhibit deformational twinning; pyrite is elongated and fractured.
These features are associated with the comminution process. Pyrrhotite, a rare phase in these ores, occurs as small 0.05 mm grains (Figure 2a). Bornite, unlike chalcopyrite, exhibits the additional feature of grain-boundary sliding (Figure 2b). The association bornite+chalcopyrite+pyrite is the most common assemblage. Individual grains of chalcopyrite (cpy) and bornite are also present. In Figures 2d, 2e, and 2f a close association of chalcopyrite and pyrite with oxide phases, mainly malachite and minor azurite, can be observed. Based on the optical microscopy results, sulphide 1 has bornite as the dominant copper mineral, sulphide 2 is predominately chalcopyrite, and the oxide ore is mainly made up of malachite.
The physical properties of the main copper and gangue minerals in the ores are listed in Table IV. As regards the copper minerals, bornite is softer than chalcopyrite and malachite. Among the gangue minerals, quartz (the dominant phase, see Table III) is harder than the K-feldspar minerals (microcline and orthoclase). The phyllosilicate mineral muscovite is the softest of the main gangue minerals in the ores. The grindability of the ore is mainly affected by their main constituent (gangue minerals), as shown by the relationship between the gangue mineral composition and Bond work indices, which is discussed later.
Elemental analysis of the valuable and gangue mineral phases in the ore samples for the particle size fraction –3350+300 µm


SEM-EDS analysis was done on the three size fractions (–3350+300, –300+75, and –75 µm) to confirm the mineral phases in the ores. Due to similar observations for the three size fractions, only the backscattered electron (BSE) micrographs of the coarser (–3350+300 µm) and fine (–75 µm) size fractions are shown in Figure 3. Micrographs of the mid-size fraction are included in Appendix A, which also lists the SEM-EDS analyses of all the selected phases. In Figure 3, various phases can be seen. The heavy minerals appear as bright grains and the light (gangue) minerals dark. Table V lists the SEM-EDS analyses of some of the phases. The dominant elements in the heavy mineral phases are Cu, Fe, and S, which suggests sulphide minerals such as bornite, chalcopyrite, and pyrite. Cu and O are the dominant elements for the heavy mineral phase in the oxide ore, which indicates minerals such as malachite and azurite. The grey (abundant) phase is mainly composed of Si, Al, and K, which confirms the XRD results which indicated that quartz and feldspar are the dominant gangue minerals in the ores.
The size distributions for the jaw crusher products are shown in Figure 4. These samples were the feeds for the Bond ball mill work index tests which require the feed to be –3.35 mm. While the oxide (malachite) and sulphide 2 (chalcopyrite) ores had comparable size distributions, the sulphide 1 ore (bornite) was coarser. The effect of the discrepancies in the size distributions of the three ores on the analysis of results was eliminated through normalization of the experimental results (see Figures 5 and 6). The size analysis was done in duplicate for each ore.
The Bond work indices (Wi) for the three ores are listed in Table VI. Based on the standard classification of ore hardness in Table VII, sulphide 1 is of ‘medium’ hardness, the oxide ore is ‘hard’, and sulphide 2 is ‘very hard’. The relative work indices (Wr) were also calculated with respect to to the ore with the
lowest work index (i.e., work index of the ore divided by the work index of sulphide 1). The distribution of the copper mineral grains (bornite, chalcopyrite, malachite, and azurite) within the host rocks introduces structural defects which serve as sites for crack initiation and propagation upon the application of an external load on the particles during comminution (Charikinya, Bradshaw, and Becker, 2015; Chen, Xu, and Li, 2018; Fan et al., 2018; Germanovich et al., 1994; Ghorbani et al., 2013; Griffith, 1920; Shi, Zuo, and Manlapig, 2013; Viljoen et al., 2015; Zhao et al., 2016). The difference in the Wi values for the three copper ores can thus be attributed to mineral texture. However, the elemental compositions (Table II) indicate that the contents of copper minerals such as bornite, chalcopyrite and malachite in the three ores are below 7% (w/w) and their volume fractions are lower than 4% (v/v). Therefore, the Bond work indices of the ores are mainly dependent on the fracturing behaviour of the gangue (abundant) minerals (Buntoro et al., 2018). The lowest Wi, for sulphide 1, could be attributed to the conchoidal fracturing of quartz (see Table IV), since this ore has the highest quartz content Table III). Based on Mohs scale of hardness, quartz is the hardest of all the minerals identified in the ores. Kim et al. (2022) reported that hardness and brittleness are positively correlated with quartz content. The XRD results in Table III, considering the –75 and –3350+300 µm size fractions (the results for the –300+75 µm fraction were disregarded because of the anomaly observed in the quartz content for the oxide ore) showed that sulphide 1, sulphide 2, and oxide contained 85%, 66%, and 70% (w/w) quartz respectively. It can be inferred that the brittleness is highest in sulphide 1, intermediate in the oxide ore, and lowest in sulphide 2. The trend agrees with the Wi values, suggesting that sulphide 2 requires more energy to grind (highest Wi, lowest brittleness), followed by the oxide ore (intermediate Wi and intermediate brittleness), and finally sulphide 1 requires less comminution energy (lowest Wi and highest brittleness).
In the effort to establish the relationship between the chemical composition and Wi, the brittleness indices for the ores were determined. The brittleness index (βi), which is used in fracture mechanics, is dependent on various factors such as composition, texture, porosity, and the applied external load to effect
Table VI
Bond work indices, brittleness indices, and relative toughness values of copper ores
fragmentation (Ye, Tang, and Xi, 2020). Various methods (Fatah et al., 2016; Ye, Tang, and Xi, 2020) are currently applied to calculate the brittleness index, and these can be grouped into two categories: (i) brittleness indices based on rock mechanical properties using parameters such as stress, strain, Poisson’s ratio, and Young’s modulus (Guo, Chapman, and Li, 2012; Jiang et al., 2020; Li et al., 2020; Meng, Wong, and Zhou, 2021; Mews, Alhubail, and Barati, 2019; Ozkahraman, 2010; Swain and Rao, 2009), and (ii) brittleness indices derived from mineral content (Buntoro et al., 2018; Fatah et al., 2016; Ye, Tang, and Xi, 2020). Based on the mechanical properties, βi is obtained by dividing the compressive strength by tensile strength (Meng, Wong, and Zhou, 2021). In the later method the brittleness index is the weight ratio of the brittle minerals, such as quartz and feldspar, to the total mineral content (Fatah et al., 2016; Kang et al., 2020; Ye, Tang, and Xi, 2020). While the βi values from the two methods are not numerically equal, they give a relative indication of the brittleness of rocks.
The later method of calculating the brittleness index, but based on the chemical (elemental) composition rather than the mineral composition, was considered in this study. βi was defined using Equation [6] as the ratio of the acidic elements Si and Al, which contribute to the brittleness of the ore (Buntoro et al., 2018) to the basic elements (K, Ca, and Mg). This is a reciprocal of the basicity modulus in chemistry (Humad, Habermehl-Cwirzen, and Cwirzen, 2019). Pyrite is reported to contribute to the brittleness (Kang et al., 2020), but since it is a minor gangue mineral relative to the silicates, it was not considered for brittleness indexation. The calculated brittleness indices for the three copper ores are listed in Table VI. In agreement with the Wi values in reverse proportionality, it is observed that sulphide 1 (with the smallest Wi) has the highest βi, sulphide 2 (with the highest Wi) the smallest βi, and the oxide ore (intermediate Wi) the intermediate βi. The trend of the calculated βi agrees with the results reported by Kim et al. (2022).
The similarity of the relative toughness values(κr) and the corresponding relative Bond work indices(Wr) in Table VI shows the importance of the chemical composition of the gangue minerals in characterization of the fracture behaviour of ores during comminution.
The three copper ores were mined from different mineralization zones within the same ore deposit and thus the experimental Wi values of the distinct ores could be useful for the development of the geometallurgical model for that deposit (Mine, 2017; Mwanga et al., 2014). However, to account for the inherent variations in the orebody, many samples are needed to develop a reliable geometallurgical model. The procedure used here to determine Wi is time-consuming and thus alternative comminution tests that provide information on the hardness of the ores are used to generate data for geometallurgical modelling. These tests include, among many others, the uniaxial compressive strength (UCS) test, which gives the strength of the rock under compressive stress (Akinbinu, 2017; Ozkahraman, 2010), and the drop weight tests using single particles of narrow size fractions to determine the 10% passing sizes (commonly referred to as parameter t10,which allows the determination of the parameters (denoted as A and b, in the model shown in Equation [8]), the product of which (A × b) indicates the ore’s resistance to impact breakage (Ballantyne, Bonfils, and Powell, 2017; Genç, Ergün, and Benzer, 2004; Nghipulile et al., 2021; Nghipulile, 2019; Tavares, 2007).
where A and b are material-specific impact breakage parameters.
The particle size distributions for the feed and mill products after grinding the 1 kg samples for 5, 10, 15, and 20 minutes were fitted to the Weibull distribution, which is described by the following equation:


The relative toughness (κr) of the ores were then calculated relative to the most brittle (sulphide 1 with bornite as a dominant copper mineral) as follows:
where P(x) is the cumulative percentage passing (%) corresponding to the fragment size (1–1 e); the term xc, called the modular particle size, is the particle size corresponding to

cumulative percentage passing (1–1 e), and m is a fitting parameter, which indicates the width of the distribution.
The cumulative mass distributions, both for the experimental data (shown as points) and the modelled Weibull distributions are presented in Appendix B. The fitting parameters in Equation [8] were determined through iteration by finding the minimum root mean square error (RMSE) between the experimental and modelled data. The Weibull distribution fits well to the experimental data, as shown in the plots in Appendix B. The widths of the distributions (parameter m) for the three ores are shown in Table VIII. It can be seen that the widths of distribution for the sulphide ores are greater (averaging 1.4) that for the oxide ore (1.1). The relationship between the m values and mineral composition has not yet been investigated. A meaningful relationship will only be established as more data become available.
As shown in Figure 5, the xc values were normalized to the feed modular particle sizes to allow better comparison of the three ores through elimination of the variation in the feed size distributions. The normalized modular particle size is a dimensionless quantity which is denoted x'c. To understand the modular size, say after 5 minutes of grinding, the normalized xc values are 0.41, 0.30. and 0.21 for sulphide 2, oxide, and sulphide 1 respectively. The modular particle size (xc) represents the particle size corresponding to 63% (w/w) passing. It is observed that the sulphide 2 ore (chalcopyrite) has the highest 63% passing sizes for any milling time ranging between 0 and 20 minutes. This suggests a low size reduction ratio (lowest βi) for this ore, i.e. more energy is required to effect the required size reduction, as already indicated by the highest Wi. In line with the trend for the relative work indices (Wr) and relative

toughness index (κr), the oxide ore has intermediate modular particle size, and sulphide 1 the smallest, suggesting a high size reduction ratio is achievable among the three ores assuming the same input energy.
The Bond ball mill work indices suggest that the chalcopyrite ore (Wi of 22 kWh/t) is the hardest and bornite ore (Wi of 14 kWh/t) the softest, while the malachite ore (Wi of 17 kWh/t) has an intermediate resistance to breakage. The Wi values were inversely proportional to the quartz content (which increases with the brittleness) in the –3350+300 µm and –75 µm size fractions. Sulphide 1 had an average quartz content of 85% (w/w), sulphide 2 had 66%, and the oxide ore had 70%.
Brittleness and relative toughness indices, based on the chemical composition of the gangue minerals in the ores, were calculated. A good correlation between the relative toughness and the corresponding relative Bond work indices highlighted the importance of the chemical composition of the gangue, the dominant component of the ore, when characterizing the comminution behaviour.
The information from this study, especially the work indices, can be useful when designing a milling circuit to process the ores, as the specific comminution energy required to reduce the parent feed size to the target product size can be estimated using Wi. It is recommended that the relationship between the mineralogy and comminution behaviour should also be investigated using other breakage characterization methods, such as the uniaxial compressive strength test, Brazilian tensile strength test, and drop weight test.
References
Akinbinu, V.A. 2017. Relationship of brittleness and fragmentation in brittle compression. Engineering Geology, vol. 221. pp. 82–90. https://doi.org/10.1016/j. enggeo.2017.02.029
Anticoi, H., Guasch, E., Hamid, S., Oliva, J., Alfonso, P., Garcia-Valles, M., Bascompta, M., Sanmiquel, L., Escobet, T., Argelaguet, R., Escobet, A., de Felipe, J. J., Parcerisa, D., and Peña-Pitarch, E. 2018. Breakage function for HPGR: Mineral and mechanical characterization of tantalum and tungsten ores. Minerals, vol. 8, no. 4. p. 170. https://doi.org/10.3390/min8040170
Austin, L.G., Klimpel, R.R., and Luckie, P.T. 1984. Process Engineering of Size Reduction: Ball Milling. Society of Mining Engineers of AIME, Englewood, CO. Ballantyne, G.R., Bonfils, B., and Powell, M.S. 2017. Evolution of impact breakage characterisation: Re-defining t-family relationship. International Journal of Mineral Processing, vol. 168. pp. 126–135. https://doi.org/10.1016/j. minpro.2017.10.001
Baum, W. 2014. Ore characterization, process mineralogy and lab automation a roadmap for future mining. Minerals Engineering, vol. 60. pp. 69–73. https://doi.org/10.1016/j.mineng.2013.11.008
Bradshaw, D. 2014. The role of “process mineralogy” in improving the process performance of complex sulphide ores. IMPC 2014 - Proceedings of the XVII International Mineral Processing Congress, Santiago, Chile, 20-24 October, 2014.
Buntoro, A., Prasetyadi, C., Wibowo, R.A., Suranto, and Lukmana, A.H. 2018. Validation of shale brittleness index calculation from wireline log of well BETRO-001 by using XRD test results and uniaxial test as parameters for determining potential of shale hydrocarbon - Brown shale of Pematang Group Formation, Central Sumatra Basin. IOP Conference Series: Earth and Environmental Science, vol. 212, no. 1. https://doi.org/10.1088/17551315/212/1/012069
Charikinya, E., Bradshaw, S., and Becker, M. 2015. Characterising and quantifying microwave induced damage in coarse sphalerite ore particles. Minerals Engineering, vol. 82. pp. 14–24. https://doi.org/10.1016/j. mineng.2015.07.020
Chen, C.-F., Xu, T., and Li, S.-H. 2018. Microcrack evolution and associated deformation and strength properties of sandstone samples subjected to various strain rates. Minerals, vol. 8, no. 6. p. 231. https://doi.org/10.3390/min8060231
Estay, D.A. and Chiang, L.E. 2013. Discrete crack model for simulating rock comminution processes with the Discrete Element Method. International Journal of Rock Mechanics and Mining Sciences, vol, 60. pp. 125–133. https://doi.org/10.1016/j.ijrmms.2012.12.041
Fan, X., Chen, R., Lin, H., Lai, H., Zhang, C., and Zhao, Q. 2018. Cracking and failure in rock specimen containing combined flaw and hole under uniaxial compression. Advances in Civil Engineering, vol. 2018. https://doi.org/10.1155/2018/9818250
Fatah, T., Rabe, C., Salazar, J.P., and Filho, R.C.R. 2016. Estimating brittleness index using mineralogy and TOC in the Whangai Formation, New Zealand. Proceedings of the Rio Oil and Gas Expo and Conference 2016, Rio de Janeiro, 26-29 September 2016.
Genç, Ö., Ergün, L., and Benzer, H. 2004. Single particle impact breakage characterization of materials by drop weight testing. Physicochemical Problems of Minereral Processsing, vol. 38. pp. 241–255. http://www.minproc.pwr.wroc.pl/ journal/pdf/2004/241-255.pdf
Germanovich, L.N., Salganik, R.L., Dyskin, A.V., and Lee, K.K. 1994. Mechanisms of brittle fracture of rock with pre-existing cracks in compression. Pure and Applied Geophysics, vol. 143, no. 1. pp. 117–149.
Ghanei, J. 2020. Evaluation of the relation between ore texture and grindability. Master's thesis, Luleå University of Technology.
Ghorbani, Y., Becker, M., Petersen, J., Morar, S.H., Mainza, A., and Franzidis, J.P. (2011). Use of X-ray computed tomography to investigate crack distribution and mineral dissemination in sphalerite ore particles. Minerals Engineering, vol 24, no. 12. pp. 1249–1257. https://doi.org/10.1016/j. mineng.2011.04.008
Ghorbani, Y., Mainza, A.N., Petersen, J., Becker, M., Franzidis, J.P., and Kalala, J.T. 2013. Investigation of particles with high crack density produced by HPGR and its effect on the redistribution of the particle size fraction in heaps. Minerals Engineering, vol. 43–44. pp. 44–51. https://doi.org/10.1016/j. mineng.2012.08.010
Griffith, A.A. 1920. The Phenomena of Rupture and Flow in Solids. https://royalsocietypublishing.org/doi/pdf/10.1098/rsta.1921.0006
Guo, Z., Chapman, M., and Li, X. 2012. A shale rock physics model and its application in the prediction of brittleness index, mineralogy, and porosity of the Barnett Shale. Proceedings of the Society of Exploration Geophysicists International Exposition and 82nd Annual Meeting 2012. SEG 2012, 2406–2410. https://doi.org/10.1190/segam2012-0777.1
Gutierrez, M. and Youn, D.J. 2015. Effects of fracture distribution and length scale on the equivalent continuum elastic compliance of fractured rock masses. Journal of Rock Mechanics and Geotechnical Engineering, vol. 7, no. 6. pp. 626–637. https://doi.org/10.1016/j.jrmge.2015.07.006
Hamdi, P., Stead, D., and Elmo, D. 2015. Characterizing the influence of stressinduced microcracks on the laboratory strength and fracture development in brittle rocks using a finite-discrete element method-micro discrete fracture network FDEM-μDFN approach. Journal of Rock Mechanics and Geotechnical Engineering, vol. 7, no. 6. pp. 609–625. https://doi.org/10.1016/j. jrmge.2015.07.005
Henley, K.J. 1983. Ore dressing mineralogy – A review of techniques, applications and recent developments. Proceedings of the First International Congress on Applied Mineralogy. The Geological Society, London. pp. 175–200.
Humad, A.M., Habermehl-Cwirzen, K., and Cwirzen, A. 2019. Effects of fineness and chemical composition of blast furnace slag on properties of alkaliactivated binder. Materials, vol. 12, no. 20. pp. 1–16. https://doi.org/10.3390/ ma12203447
Ipek, H. and Goktepe, F. 2011. Determination of grindability characteristics of zeolite. Physicochemical Problems of Mineral Processing, vol. 47. pp. 183–192.
Jauregui, R. 1982. Simplified Bond Work Index determination. Encontro Nacional de Tratamento de Minérios, vol 2. pp. 358–367.
Jiang, J., Wang, D., Han, X., and Di, S. 2020. Relationship between brittleness index and crack initiation stress ratio for different rock types. Advances in Civil Engineering, vol. 2020. https://doi.org/10.1155/2020/8091895
Kamona, A.F. and Günzel, A. 2007. Stratigraphy and base metal mineralization in the Otavi Mountain Land, Northern Namibia – A review and regional interpretation. Gondwana Research, vol. 11, no, 3. pp. 396–413. https://doi. org/10.1016/j.gr.2006.04.014
Kang, Y., Shang, C., Zhou, H., Huang, Y., Zhao, Q., Deng, Z., Wang, H., and Ma, Y.Z. 2020. Mineralogical brittleness index as a function of weighting brittle minerals—From laboratory tests to case study. Journal of Natural Gas Science and Engineering, vol. 77, no. 18. 103278. https://doi.org/10.1016/j. jngse.2020.103278
Kiangi, K.K. 2011. Effect of particle filling and size on the behaviour of the ball load and power in a dry mill. PhD thesis, University of the Witwatersrand. 241 pp. https://core.ac.uk/download/pdf/39670024.pdf
Kim, Y., Lee, H.S., Choi, J., Kim, K.H., and Ozyer, C. 2022. Comparison among brittleness, hardness and mineral composition of the Besa River Formation in the Liard Basin, Canada. Journal of Natural Gas Science and Engineering, vol. 103, May. 104632. https://doi.org/10.1016/j.jngse.2022.104632
King, R.P. 2012. Modeling and Simulation of Mineral Processing Systems (1st edn). Butterworth-Heinemann. https://books.google.com/ books?hl=es&lr=&id=ztiwywayyH4C&pgis=1
Li, Y., Li, Y., Zhou, L., Li, D., Zhang, S., Tian, F., Xie, Z., and Liu, B. 2020. Shale brittleness index based on the energy evolution theory and evaluation with logging data: A case study of the Guandong Block. ACS Omega, vol. 5, no. 22. pp. 13164–13175. https://doi.org/10.1021/acsomega.0c01140
Liu, L., Tan, Q., Liu, L., Li, W., and Lv, L. 2017. Comparison of grinding characteristics in high-pressure grinding roller (HPGR) and cone crusher (CC). Physicochemical Problems of Mineral Processing, vol. 53, no. 2. pp. 1009–1022. https://doi.org/10.5277/ppmp170226
Lotter, N.O., Baum, W., Reeves, S., Arrué, C., and Bradshaw, D.J. 2018. The business value of best practice process mineralogy. Minerals Engineering, vol. 116, May. pp. 226–238. https://doi.org/10.1016/j.mineng.2017.05.008
Mariano, R. 2016. Measurement and modelling of the liberation and distribution of minerals in comminuted ores. PhD thesis, University of Queensland. https://doi.org/10.14264/uql.2016.1081
Masindi, V., Foteinis, S., and Chatzisymeon, E. 2022. Co-treatment of acid mine drainage and municipal wastewater effluents: Emphasis on the fate and partitioning of chemical contaminants. Journal of Hazardous Materials, vol. 421, January 2022. 126677. https://doi.org/10.1016/j.jhazmat.2021.126677
Meng, F., Wong, L.N.Y., and Zhou, H. 2021. Rock brittleness indices and their applications to different fields of rock engineering: A review. Journal of Rock Mechanics and Geotechnical Engineering, vol. 13, no. 1. pp. 221–247. https://doi.org/10.1016/j.jrmge.2020.06.008
Mews, K.S., Alhubail, M.M., and Barati, R.G. 2019. A review of brittleness index correlations for unconventional tight and ultra-tight reservoirs. Geosciences, Switzerland, vol. 9, no, 7. https://doi.org/10.3390/geosciences9070319
Mine, A. 2017. Geometallurgical estimation of comminution indices for porphyry copper deposit applying mineralogical approach. Master’s thesis, Luleå University of Technology.
Mulenga, F.K. and Moys, M.H. 2014. Effects of slurry filling and mill speed on the net power draw of a tumbling ball mill. Minerals Engineering, vol. 56. pp. 45–56. https://doi.org/10.1016/j.mineng.2013.10.028
Mwanga, A. 2016. Development of a geometallurgical testing framework for ore grinding and liberation properties. Doctoral thesis, Luleå University of Technology.
Mwanga, A. 2014. Test methods for characterising ore comminution behavior in geometallurgy. Licentiate thesis, Luleå University of Technology. https://doi. org/10.3390/min5020276
Napier-Munn, T.J., Morrell, S., Morrison, R.D., and Kojovic, T. 2005. Mineral Comminution Circuits: Their Operation and Optimisation (3rd edn). Julius Kruttschnitt Mineral Reseach Centre, University of Queensland.
Nghipulile, T. 2019. Modelling studies of a rotary offfset crusher. University of the Witwatersrand.
Nghipulile, T., Bwalya, M., Moys, M., and Simonsen, H. 2021. Exploratory development of a rotary offset crusher. Journal of the Southern African Institute of Mining and Metallurgy, vol. 121, no. 1. pp. 29–38. https://doi. org/10.17159/2411-9717/1325/2021
Ozkahraman, H.T. 2010. Breakage mechanisms and an encouraging correlation between the Bond parameters and the friability value. Journal of the Southern African Institute of Mining and Metallurgy, vol. 110, no. 3. pp. 153–159.
Palm, N.A., Shackleton, N.J., Malysiak, V., and O’Connor, C.T. 2010. The effect of using different comminution procedures on the flotation of sphalerite. Minerals Engineering, vol. 23, no. 11–13. pp. 1053–1057. https://doi. org/10.1016/j.mineng.2010.08.001
Reichert, M., Gerold, C., Fredriksson, A., Adolfsson, G., and Lieberwirth, H. 2015. Research of iron ore grinding in a vertical-roller-mill. Minerals Engineering, vol. 73. pp. 109–115. https://doi.org/10.1016/j.mineng.2014.07.021
Schouwstra, R.P. and Smit, A.J. 2011. Developments in mineralogical techniquesWhat about mineralogists? Minerals Engineering, vol. 24, no. 12. pp. 1224–1228. https://doi.org/10.1016/j.mineng.2011.02.002
Shi, F. and Zuo, W. 2014. Coal breakage characterisation - Part 1: Breakage testing with the JKFBC. Fuel, vol. 117 (part B). pp. 1148–1155. https://doi. org/10.1016/j.fuel.2013.07.042
Shi, F., Zuo, W., and Manlapig, E. 2013. Characterisation of pre-weakening effect on ores by high voltage electrical pulses based on single-particle tests. Minerals Engineering, vol. 50–51, no. 69–76. https://doi.org/10.1016/j. mineng.2013.06.017
Sipunga, E. 2015. Optimization of the flotation of copper smelter slags from Namibia Custom Smelters’ slag mill plant. MSc thesis, University of the Witwatersrand.
Solomon, N., Becker, M., Mainza, A., Petersen, J., and Franzidis, J.P. 2011. Understanding the influence of HPGR on PGM flotation behavior using mineralogy. Minerals Engineering, vol. 24. pp. 12. pp. 1370–1377. https://doi.org/10.1016/j.mineng.2011.07.015
Swain, R. and Rao, R.B. 2009. Alternative approaches for determination of bond work index on soft and friable partially laterised khondalite rocks of bauxite mine waste materials. Journal of Minerals and Materials Characterization and Engineering, vol. 08, no. 09. pp. 729–743. https://doi.org/10.4236/ jmmce.2009.89063
Tavares, L.M. 2007. Breakage of single particles: Quasi-static. Handbook of Powder Technology, vol. 12. Elsevier. pp. 3–68. https://doi.org/10.1016/S01673785(07)12004-2
Todorovic, D., Trumic, M., Andric, L., Milosevic, V., and Trumic, M. 2017. A quick method for Bond work index approximate value determination. Physicochemical Problems of Mineral Processing, vol. 53, no. 1. pp. 321–332. https://doi.org/10.5277/ppmp170126
Viljoen, J., Campbell, Q.P., le Roux, M., and Hoffman, J. 2015. The qualification of coal degradation with the aid of micro-focus computed tomography. South African Journal of Science, vol. 111, no. 9–10. pp. 1–10. https://doi.org/10.17159/ sajs.2015/20140025
Whiteman, E., Lotter, N.O., and Amos, S.R. 2016. Process mineralogy as a predictive tool for flowsheet design to advance the Kamoa project. Minerals Engineering, vol. 96–97. pp. 185–193. https://doi.org/10.1016/j. mineng.2016.05.004
Wills, B.A. and Finch, J. 2016. Wills’ Mineral Processing Technology: An Introudtcion to Practical Aspects of Ore Treatment and Mineral Recovery (8th edn). Elsverier Butterworth-Heinemann.
Xiao, X., Zhang, G., Feng, Q., Xiao, S., Huang, L., Zhao, X., and Li, Z. 2012. The liberation effect of magnetite fine ground by vertical stirred mill and ball mill. Minerals Engineering, vol. 34. pp. 63–69. https://doi.org/10.1016/j. mineng.2012.04.004
Ye, Y., Tang, S., and Xi, Z. 2020. Brittleness evaluation in shale gas reservoirs and its influence on fracability. Energies, vol. 13, no. 2. https://doi.org/10.3390/ en13020388
Zhao, J. and Zhang, D. 2020. Dynamic microscale crack propagation in shale. Engineering Fracture Mechanics, vol. 228, February. 106906. https://doi.org/10.1016/j.engfracmech.2020.106906
Zhao, Y., Zhang, L., Wang, W., Pu, C., Wan, W., and Tang, J. 2016. Cracking and stress–strain behavior of rock-like material containing two flaws under uniaxial compression. Rock Mechanics and Rock Engineering, vol. 49, no. 7. pp. 2665–2687. https://doi.org/10.1007/s00603-016-0932-1
Zhou, X., Gu, X., and Wang, Y. 2015. Numerical simulations of propagation , bifurcation and coalescence of cracks in rocks. International Journal of Rock Mechanics and Mining Sciences, vol. 80. pp. 241–254. https://doi.org/10.1016/j. ijrmms.2015.09.006 u
Elemental compositions for the feed size-by-size samples of the three copper ores, as determined by SEM
Ore
Elemental analysis of the valuable and gangue mineral phases in the ore samples for the particle range –3350+300 µm
Elemental analysis of the valuable and gangue mineral phases in the ore samples for the –300+75 µm fraction

1
SEM EDS analysis (%)
2
Table A4
Elemental analysis of the valuable and gangue mineral phases in the ore samples for the –75 µm fraction

Affiliation:
1 Chemical Resource Beneficiation, North-West University, Potchefstroom Campus, Potchefstroom.
2 Centre of Excellence in Carbon-based Fuels, School of Physical and Chemical Sciences, North-West University, Potchefstroom Campus, Potchefstroom.
3 Centre of Excellence in Carbon-based Fuels, School of Chemical and Mineral Engineering, North-West University, Potchefstroom Campus, Potchefstroom.
4 African Carbon Energy, South Africa.
Correspondence to: R.H. Matjie
Email: matjie4@gmail.com
Dates:
Received: 2 Apr. 2020
Revised: 8 Mar. 2023
Accepted: 8 Mar. 2023
Published: March 2023
How to cite:
Collins, AC., Strydom, C.A., Matjie, R.H., Bunt, J.R., and van Dyk, J.C. 2023
Production of sodium-based zeolites and a potassium-containing leach liquor by alkaline leaching of South African coal fines ash.
Journal of the Southern African Institute of Mining and Metallurgy, vol. 123, no. 3, pp. 145–156
DOI ID: http://dx.doi.org/10.17159/24119717/1167/2023
ORCID: R.H. Matjie http://orcid.org/0000-0002-2839-3729
C.A. Strydom http://orcid.org/0000-0001-5295-2095
J.R. Bunt http://orcid.org/0000-0003-3051-2528
A.C. Collins http://orcid.org/0000-0002-5134-9638
Synopsis
South African coal discards derived from feed coal for thermoprocesses pose human health and environmental problems and incur high disposal costs. These issues need to be resolved. Coal fines and a coal fines/ K2CO3 blend were combusted at 700°C in a laboratory rotary kiln to produce ashes containing metakaolinite (Al2O3.2SiO2) and illite/muscovite/orthoclase amorphous materials. The blend ash and coal fines ash, containing 18% K2O and <1% K2O respectively, were leached with water and with 1 M and 8 M NaOH at 80°C for 4 hours using a solid to liquid ratio of 1:5. The 8 M NaOH leach yielded 17% sodalite (Na8Si6Al6O24(OH)2) formation through SiO32-, Al(OH)4-, and Na+ precipitation in the leached ashes. The 1 M NaOH leach yielded no sodalite. X-ray fluorescence analysis of the original ashes and leached ashes showed low Al and Si dissolution efficiencies due to the sodalite formation. Sequential NaOH leaching resulted in the highest potassium dissolution efficiency of 89% for the ashes of fines/K2CO3 blend and 59% for the fines. It may be possible to increase the ash-derived zeolite concentration by using even higher NaOH concentrations (12–20 M NaOH) during leaching. Sodalite derived from coal ash could possibly be utilized for water purification in industrial applications, or as molecule separators. The potassium-containing liquid could be used in fertilizer manufacture.
Keywords
low-temperature combustion coal ash, alkaline leaching, sodalite, potassium leach liquor.
Introduction
Commercial power stations in many countries around the world utilize pulverized run-of-mine (ROM) feed coal (<75 µm) to produce electricity (Bukhari et al., 2015). Due to population growth and industrialization the demand for power is increasing (Izquierdo and Querol, 2012). During coal mining and feed preparation in South Africa, approximately 60 Mt of coal fines (byproduct) are generated and discarded per annum (Reddick, von Blottnitz, and Kothuis, 2007; Bunt et al., 2015). These coal discards have similar chemical and mineralogical properties to South African gasification and combustion ROM feed coals; however, they are characterized by a higher mineral matter (48% versus 29–32%) and highervitrinite (26% versus 24%) content (Matjie et al., 2015; Bunt et al., 2015; Rautenbach et al., 2019; 2020). Globally, colliery and thermochemical plant activities generate 30 Gt of coal fine discards annually. High costs are associated with the treatment and disposal of these wastes. They contribute significantly to dust generation and acid mine drainage, and are prone to spontaneous combustion (Reddick, von Blottnitz, and Kothuis, 2007). These negative environmental impacts need to be addressed.
Combustion of pulverized fuel (PF) in coal-fired power plants generates a number of byproducts (Nayak and Panda, 2010). Coal ash, comprising coal fly ash (CFA) and coal bottom ash (CBA) (the main constituent) produced during coal combustion, is one of these byproducts (Bukhari et al., 2015). The scope for utilizing these byproducts in other industrial applications is limited (Nayak and Panda, 2010), and the bulk of the ash is discarded into landfills (Murayama, Yamamoto, and Shibata, 2002). The CBA and CFA, which contain zero or trace amounts of mullite (Al6O13Si2) and anorthite (CaAl2Si2O8), have the potential to serve as starting materials in the production of gibbsite (Al(OH)3), due to their high aluminium content (Su et al., 2011; Yang, Zheng, and Zhang, 2014).
The recovery of aluminium from CBA and CFA containing higher proportions of mullite and anorthite has been the focus of many investigations (King et al., 2018; Li et al., 2014; Bunt et al., 1998; Yang, Zheng, and Zhang, 2014). Recovery methods include acid leaching of CBA and CFA (Bunt et al., 1998; Sangita, Nayak, and Panda, 2017), alkaline leaching of CBA and CFA (Li et al., 2014; Su et al., 2011), ammonium sulphate (NH4)2(SO4)) roasting of CFA (van der Merwe et al., 2017), and in some investigations a
combination of these methods. Investigations of alkaline leaching of ash or solid waste materials have shown that the concentration and type of alkaline lixiviant influence the dissolution of the inorganic components. Alumina (Al2O3), silica (SiO2), and aluminium silicate precursors, which are the starting point for a variety of compounds, are mostly obtained by mixing of the CBA/CFA with an alkaline solution (Comrie and Kriven, 2004). Adrian and McCulloch (1966) found that 90% recovery of Al from South African CBA/CFA with low or zero mullite content could be achieved at high leaching temperatures and sodium hydroxide (NaOH) concentrations. However, even with high dissolution the process was not considered economically viable.
Yang, Zheng, and Zhang (2014) reported that an alumina extraction efficiency of 92% was attained by NaOH leaching of a desilicated product containing zero mullite/anorthite from Chinese CFA with a molar ratio of CaO to SiO2 of 1:1 at elevated temperatures and pressures. Furthermore, the formation of NaCaHSiO4 captures the silica and inhibits zeolite formation. Su et al. (2011) stated that a two-step NaOH leach of CFA achieved 89% aluminium dissolution efficiency and that the formation of sodalite (Na8Si6Al6O24(OH)2)) occurred during the first step. Aside from being used to recover inorganic elements, this method has also been used for synthesizing zeolite crystals (Fukasawa et al., 2017). The alkaline solution dissolves aluminium silicates and silica from heated CFA to form silicate and aluminate ions during the NaOH leaching step (Jiang et al., 2015). These ions precipitate and subsequently crystallize on the surface of the CFA particles. Leaching conditions such as the reaction temperature, lixiviant concentration, and leaching time influence the dissolution efficiencies of aluminium and silicon, as well as zeolite formation. In this investigation, the lixiviants referred to are liquid media used in the hydrometallurgical processes to selectively dissolve high-value inorganic elements associated with minerals contained in either CFA/CBA or ores. Fukasawa et al. (2017) found that pulverization of the ash prior to the hydrothermal treatment, increased the surface area, which in turn increased the dissolution of alumina and silica species; if these species do not form part of the inert mullite and feldspars, a high proportion of zeolite is formed.
South African commercial power stations combust PF at elevated temperature (approximately 1600°C), producing CBA and CFA (Rautenbach et al., 2021; van Alphen, 2005). These ashes comprise mainly mullite and quartz (SiO2) with small amounts of anorthite and cristobalite (SiO2) (Rautenbach et al., 2021), which are insoluble in NaOH solution at a leaching temperature of 80°C. These conditions were not used in this study as they are not suitable to produce low-temperature combustion ashes (containing soluble Al, Si, K, and Ti species) from coal fines and coal fines and K2CO3 blends for NaOH leaching.
The aim of this novel investigation was to use alkaline solutions in an attempt to dissolve Al, K, Si, and Ti from illite ((K, H3O)(Al,Mg,Fe)2(Si,Al)), orthoclase (KAlSi3O8), muscovite (KAl2(AlSi3O10(FOH)2), and metakaolinite (Al2O3.2SiO2) amorphous materials contained in the low-temperature combustion ashes. These ashes, with unique chemical and mineralogical properties, were prepared in a laboratory rotary kiln by combusting discarded coal fines (designated SA1) and a blend of ROM feed coal and K2CO3 (designated SA2 blend) at 700°C. The influence of K2CO3 addition on the dissolution efficiency of Al, K, Si, and Ti from illite, muscovite, and orthoclase amorphous phases, metakaolinite, and K species in these low-temperature combustion ashes was investigated. Additionally, the catalytic effect of the heated K2CO3 on zeolite formation from these ashes was investigated.
Neither the effect of K2CO3 addition nor NaOH concentration on the dissolution efficiency of high-value inorganic elements and zeolite formation from low-temperature combustion ashes have been investigated previously. The potassium species and OH– in this ash could also promote precipitation of the zeolite gel precursor and the subsequent crystallization of sodalite in the leached ash.
The original ash and leached ash samples were submitted for X-ray fluorescence (XRF) and the X-ray diffraction (XRD) analyses. The XRF results were used in the calculations of the dissolution efficiencies of the selected inorganic elements (Al, K, Si and Ti) after leaching of the ash samples with deionized water and sodium hydroxide solutions.
The sodium-based zeolite (sodalite) derived from lowtemperature combustion ash has potential for industrial applications such as water and gas purification. Furthermore, the leach liquor containing potassium species could possibly be used as liquid fertilizer.
and methods
Coals sampling, preparation, reagents, and coal composition
The coal fines discards (SA1 and SA2) were derived from two ROM medium-volatile bituminous South African coals from the Highveld Coalfield. The samples were air-dried for 2 days to reduce excess moisture not associated with the coal structure. After drying, each sample was further pulverized in a ball mill to obtain a particle size of <1 mm using standardized methods (ISO 18283 and ISO 13909-4). Because of the similarities in the qualitative XRF and qualitative XRD results for ashes derived from SA1 and SA2, with the exception of the inorganic elements and mineral contents (Collins, 2019), the SA2 sample was blended with 10% K2CO3 (7% K2O) to prepare the SA2 blend. The K2CO3 was added during the ball milling step to ensure thorough mixing and to produce a homogeneous sample.
The SA2 blend ash sample was produced by thermal processing of the SA2 blend sample at 700°C. K2O could increase the dissolution efficiency of K during alkaline leaching. Also, this potassium species in the SA2 blend ash may promote the formation of zeolite (sodalite) during NaOH leaching. The K2CO3 and NaOH, each of 99.5% purity, were provided by Ace Chemicals, South Africa. The NaOH was used to prepare 1 M (4%) and 8 M (32%) NaOH solutions for the leaching experiments. Proximate, ultimate, XRF, and XRD analyses were used to determine the chemical and mineralogical compositions of SA1 and SA2, as described in Collins (2019).
Each coal sample was split into four 5 kg sub-samples. The subsamples were placed on fired clay trays and placed in the hot zone of a laboratory rotary kiln. The temperature of the kiln was increased to 700°C at a heating rate of 10°C/min. A residence time of 3 hours at 700°C was set for all the sub-samples. This step was conducted under an air flow rate of 80 ml/min to facilitate combustion of the organic components. Kaolinite, illite, muscovite, orthoclase, dolomite, calcite, pyrite, and added K2CO3 (in the SA2 blend) transformed at 700°C to form metakaolinite, heated K2CO3, and illite/orthoclase/muscovite amorphous materials. After 3 hours the laboratory rotary kiln was switched off and allowed to cool naturally to ambient temperature. The ash sub-samples were then removed from the kiln and blended to form one homogenous low-temperature combustion ash sample. These ash samples of SA1 and the SA2 blend were submitted for XRD and XRF analyses prior to the NaOH leaching experiments.
XRF (Norrish and Hutton, 1969; ASTM D4326-13) and XRD analyses (Rietveld, 1969; Speukman, 2012) were employed to characterize the SA1 and SA2 blend ash samples and ashes produced from the H2O and NaOH leaching procedures.
A schematic diagram showing the experimental procedure and analytical methods for coal and low-temperature combustion ash samples is presented in Figure 1.
Deionized water was used to dissolve Al, K, Si, and Ti containing compounds from the low-temperature combustion ash samples. Deionized water (100 ml) and 20 g of either SA1 ash or SA2 and K2CO3 blend ash were added to the leaching vessel for the water leaching experiments. The slurry was stirred at 200 r/min and a temperature of 80°C for 4 hours. The hot slurry was then filtered to produce a leached ash residue and leach liquor (filtrate). Sufficient deionized water (about 100 ml) was used to recover all dissolved species from the wet ash residue. The leach liquor was combined with the wash solution to produce the final leach liquor sample. The washed ash residue samples were dried at 60°C in a vacuum furnace and prepared to produce homogeneous solid samples for XRD and XRF analyses.
The same leaching conditions and procedure that were used for the deionized water leaches were utilized in the alkaline leaching tests with either 1 M or 8 M NaOH as lixiviant. The washed and dried washed leached ash residues were submitted for XRD and XRF analyses.

In the first sequential leaching procedure the washed ash residue from the deionized water leaches was returned to the leaching vessel and leached with 100 ml of 8 M NaOH solution using the deionized water leaching conditions to produce the final wet ash residue. The dried leached ash residue was prepared to yield homogeneous leached ash residue samples for XRD and XRF analyses.
For the second sequential leaching tests, the ash samples that were leached with 1 M NaOH were leached again with 8 M NaOH using the same conditions as for the deionized water leaching procedure. The final leached ash samples were washed with water to recover the dissolved inorganic species. Following the water washing step, the washed leached ash residues were dried and prepared to produce representative leached residue ash samples for XRD and XRF analyses.
The dissolution efficiencies of Al, K, Si and Ti into deionized water and alkaline solution were calculated using the XRF results for the original ash samples and the corresponding water-washed leached ash samples using Equation [1].
Where:
h(MO) is the dissolution efficiency for the specific inorganic element (Al, K, Si and Ti);

m(MO)CA and m(MO)RES are the masses of inorganic elements in the coal ash and leached coal ash residue respectively (Jiang et al., 2015).
Proximate and ultimate analyses of the SA1 and SA2 blend samples, together with XRD results for these coals, are presented and discussed in Collins (2019).
XRF and XRD results for the SA1 and SA2 blend ash samples are presented in Table I. XRF analysis indicates that the SA1 ash contains high proportions of SiO2 and Al2O3, with lesser proportions of the other oxides. The XRD results show that this material consists mainly of quartz and amorphous phases with smaller percentages (<2%) of other crystalline phases (Table I). The amorphous material consists primarily of metakaolinite (a transformed product of kaolinite), and lower proportions of illite/ muscovite/orthoclase amorphous phases. This is supported by the XRF and XRD results obtained by Bunt et al. (1998), where
Production of sodium-based zeolites and a potassium-containing leach liqour by alkaline leaching
Chemical and mineralogical compositions for the coal ash samples prepared at 700°C (wt. %)
the ash produced after subjecting coal fines to thermal processing in a rotary kiln at 600°C consisted of metakaolinite and other crystalline phases. The XRF results for the SA2 blend ash sample show that this sample is composed of higher proportions of SiO2, Al2O3, K2O, and CaO with minor proportions of SO3, Fe2O3,TiO2, MgO, P2O5, BaO, Na2O, and SrO. The higher K percentage (18% K2O compared to 1% K2O (Collins, 2019)) in the SA2 blend ash is due to the addition of K2CO3 to the SA2 coal. The SA2 blend ash
sample has a higher amorphous content with smaller percentages of quartz and anorthite than the SA1 ash sample. Calcium oxide can react with metakaolinite at elevated temperatures to form anorthite (Hlatshwayo et al., 2009; Rautenbach et al., 2020).
Diopside is formed from reactive silica reacting with hightemperature carbonate products (CaO or mixture of CaO and MgO

XRF and XRD results for the water-leached ash samples are presented in Table II and Figure 2 respectively. It is clear from a comparison of Tables I and II that the water-leached ash samples yielded similar qualitative XRF, but different qualitative XRD, results compared to those of the original ash samples before leaching, with the exception of chemical and mineralogical compositions. The proportion of K2O in the SA2 blend ash sample decreased during water leaching. This can be attributed to the dissolution of the added K2CO3 in water:
This could imply that almost all the inorganic compounds in the SA1 and SA2 blend ash samples are insoluble in water. The crystalline mineral contents of the leached ash samples decreased slightly compared to the original ash samples due to the slight increase in the amorphous and sodalite contents in the water-leached SA2 blend ash samples (Tables I and II; Figure 2). Available Na2O from the ash samples could react with water, and the subsequently formed KOH can react with metakaolinite to form a small proportion of sodalite in the water-leached SA2 blend ash sample. The potassium hydroxide may promote the formation of zeolite (Murayama, Yamamoto, and Shibata, 2002).
XRF results for the ash samples leached with 1 M NaOH and 8 M NaOH are presented in Table III. Leaching of SA1 ash with 1 M NaOH resulted in a slight decrease in the SiO2 and Al2O3 concentrations, possibly due to the dissolution of metakaolinite and quartz in the sodium hydroxide lixiviant. The solubility of silica in NaOH is well known (Rattanasak and Chindaprasirt, 2009) (Equation [3]). After leaching of the SA1 ash samples with either 1 M or 8 M NaOH, the XRF analysis shows a decrease in SiO2 and Al2O3 concentrations, as expected, compared to the original ash samples and water-leached ashes (Tables I and III). The increase in the CaO concentration in the SA2 blend ash sample leached with 8 M NaOH may be due to the dissolution of K2O and insolubility of CaO in this lixiviant. Also, leaching of the SA2 blend ash with 8 M NaOH dissolved a significant amount of K2O, with the K2O concentration decreasing from 18.3% (Table
I) to 5.1% (Table III). The XRF results for SA1 and SA2 blend leached with 1 M NaOH show only minor changes in the elemental compositions compared to those of the original ash samples (Tables I and III).
XRD analysis
XRD results for the ash samples leached with 1 M and 8 M NaOH are presented in Table IV and Figures 3 and 4. The results indicate a decrease in the quartz content, which can be attributed to the dissolution of quartz in the sodium hydroxide solution (Rahman, Pudasainee, and Gupta, 2017; Su et al.,(2011):
This decrease is partially due to dissolution of the metakaolinite and quartz in sodium hydroxide solution to form an amorphous precipitate (sodalite gel precursor) (Na8Al6Si6O24. (OH)2.2H2O) and sodalite, which subsequently crystallizes from this amorphous material (Equation [4]). The sodium hydroxide leached ash samples contained 11% to 18% sodalite (Tables II, IV and VI; Figures 2-6, 9). The possible reaction of hydrated metakaolinite or kaolinite and sodium hydroxide to form sodalite during the NaOH leaching is as follows (Rahman, Pudasainee, and Gupta, 2017; Yang, Zheng, and Zhang, 2014; Su et al., 2011).
The increase in the amorphous material could be attributed to the formation of sodium alumino-silicate gel in the leached ash samples and subsequent crystallization of sodalite from this phase. XRD analysis of the ash samples shows a slight decrease in calcite concentration from 8.3% to 5.3% as the concentration of Ca/K/Na–feldspars increases from 0.8% to 7.4%. Other changes observed in the mineral composition include a decrease in diopside concentration from 4.4% to zero and an increase in illite from zero to 4.6%. Matjie et al. (2021), Rautenbach et al. (2020) and Rautenbach et al. (2021) state that Al2O3·2SiO2 reacts with K+ from the added potassium species to form K-feldspar in the chars and coal ashes upon pyrolysis and combustion of South African feed-coals. A lower pseudomullite proportion was also noted in the SA2 blend ash sample. These minerals present in the leached SA2 blend ash residue are insoluble in alkaline solution. The amorphous material and quartz concentrations show only minor changes compared to the original SA2 blend ash (Tables I and IV).
The increased sodium concentration was supported by the presence of sodalite (11%) in the leached ash residues (Table IV, Equation [4]). The calcite concentration decreased from 8% to 0.3% as the Ca/K/Na–feldspars concentration increased from 1.7% to 6%. Mineralogical changes were seen in the XRD results due to the dissolution of alkaline-soluble compounds and formation of sodalite and amorphous materials in the ash leached with sodium hydroxide solution.
Minimal changes to the mineralogical composition of the leached ash residue samples were noted (Tables I and II). Leaching of the SA1 and SA2 blend ash samples with 8 M NaOH not only removed alkaline-soluble compounds, but also transformed the metakaolinite in the ash samples to sodalite (Hassan and Crundy,1983).

XRF results for the leached ash samples produced by the two sequential leaching procedures are presented in Table V. XRF analysis of the leached SA1 ash residue indicates that the concentrations of SiO2, Al2O3, and K2O decreased during leaching with H2O and 8 M NaOH, while the proportion of Na2O increased,
Table III
Chemical composition for the coal ash residues after leaching with 1 M and 8 M NaOH solutions (wt. %)
as expected. This implies that metakaolinite and quartz dissolved in the sodium hydroxide solution. XRF analysis of the waterleached SA1 ash residue and the SA1 ash shows that SiO2 and Al2O3 in the SA1 ash decreased during H2O and 8 M NaOH leaching. As expected, the proportion of Na2O increased in the leached SA1 ash residue after H2O and NaOH leaching. This implies that Al2O3 and SiO2,which are associated with metakaolinite in the SA1 ash, were dissolved in the sodium hydroxide solution to form sodalite precipitate gel, significantly reducing the quartz content and increasing the total amorphous content (Table VI, Figures 5 and 6). XRD analysis detected sodalite, calcite, and Ca/K/Na–feldspars in the leached SA1 ash residue (Figures 5 and 6). These minerals do not occur in the original SA1 ash sample (Tables I and VI).
Mineralogical composition for the coal ash residue after leaching with 1 M and 8 M NaOH solutions

XRF results for the SA2 blend ash sample show a significant decrease in the K2O concentration, from 18% to 2% (Table V), after leaching with either H2O and 8 M NaOH, or 1 M NaOH and 8 M NaOH solutions. This can be ascribed to the high solubility of potassium species in water and sodium hydroxide solution (Equation [5]). The SiO2 and Al2O3 contents decreased and the Na2O content increased from 0.1% to 15.3% during the sequential H2O/I M NaOH and 8 M NaOH leaching tests (Tables I and V). The higher proportion of Na2O in the leached SA2 blend ash residue is due to the formation of zeolite phases in this sample (Equation [4]). Finally, the reaction between potassium carbonate and sodium hydroxide to form sodium carbonate and potassium hydroxide in the leach liquors can catalyze the reaction of sodalite during NaOH leaching of the SA2 blend ash (Murayama, Yamamoto, and Shibata, 2002; Equation [4]). The possible chemical reaction between potassium carbonate and sodium hydroxide is as follows:
Table V
Chemical composition of the ash residues after sequential leaching (H2O and 8 M NaOH and 1 M and 8 M NaOH solutions) (wt. %)
On cooling this amorphous material to room temperature, sodalite crystallized (Equation [4]; Figures 5 and 6). The final ash residues produced after the sequential leaching of the original ash are characterized by high proportions of sodalite, Na2O, and amorphous materials, and low proportions of quartz and K2O compared to those of the original ash samples (Tables I – VI).
Mineralogical composition for the ash residues after sequential leaching (H2O and 8 M NaOH and 1 M and 8 M NaOH solutions) (wt. %)
Dissolution efficiencies of inorganic elements (Al, K and Ti)
The dissolution efficiencies for Al, K, and Ti, calculated from the XRF results for the SA1 and SA2 blend ash samples and the corresponding leached ash residues, are presented in Figure 7. Water leaching resulted in low dissolution efficiencies of Al, K, and Ti. The highest K dissolution efficiency (33.4%) for the SA2 blend ash is due to the dissolution of K2CO3 in water (Equation [1]).
Leaching of the SA1 ash sample in 1 M NaOH yielded low dissolution efficiencies of Al, K, and Ti. With 8 M NaOH leaching the dissolution efficiency of K increased to 57.6%, while the values for Al and Ti were relatively unchanged. This was as expected, owing to to the reaction between NaOH and K2CO3. Leaching the SA2 blend ash sample with 1 M NaOH yielded only low dissolution efficiencies of Al, K, and Ti. With 8 M NaOH leaching the dissolutions of Al and Ti were zero or negative, and for K the highest dissolution efficiency (70.5%). The negative or low calculated dissolution values indicate that the dissolved Al and Si in the lixiviants co-precipitated with Na+ ions into the leached ash to form sodalite gel precursor (Tables IV and VI, Figure 7). Sodalite subsequently crystallized at lower temperatures from this amorphous precipitate. Both sodalite and amorphous phases (Na-KTi-Ca-aluminosilicates) in the leached ash residues are accountable for the negative or low dissolution efficiencies of inorganic elements. The sequential leaching tests of the SA1 ash sample with either H2O or 1 M NaOH followed by 8 M NaOH achieved low dissolution

efficiencies of Al and Ti, and a high K dissolution efficiency (57–60%). This suggests either that the lixiviant concentrations were too low for dissolution of soluble minerals and metakaolinite, or that dissolved metakaolinite/quartz ions precipitated with Na+ ions to form sodalite. Sequential leaching of the SA2 blend ash sample with H2O followed by 8 M NaOH yielded dissolution efficiencies of 0% Al, 88% K, and 0% Ti; and 8.7% Al, 89.6% K, and 0% Ti when leaching with 1 M NaOH followed by 8 M NaOH. The high potassium dissolution efficiency values can be ascribed to the solubility of the potassium species from the heated SA2 blend ash during NaOH leaching (Equation [5]). Some potassium ions did not react with metakaolinite or crystallize together with the sodalite after leaching with sodium hydroxide solutions. Other K+ ions could have reacted with OH- ions from the sodium hydroxide solution to form potassium hydroxide (Equation [5]). Other Na+ ions could react with CO32- ions from K2CO3 to form sodium carbonate. This reaction between potassium carbonate and sodium hydroxide may adversely affect sodalite formation. The low dissolution efficiency values of Al and Si during sequential leaching are associated with sodalite and aluminosilicate formation. Sakthivel et al. (2013) heated a mixture of alkali compound and CFA to form zeolite in the ash. Fukasawa et al. (2017) thermally treated a mixture of CFA and NaOH in a microwave oven at 85°C to form aluminosilicate-gel precipitate from which hydrosodalite crystallized. Jiang et al. (2015) heated a blend of fly ash derived from the incineration of municipal

Production of sodium-based zeolites and a potassium-containing leach liqour by alkaline leachingFigure 5—Diffractograms of sodalite-containing SA1 ash leached with water followed by 8 M NaOH, and with 1M NaOH followed by 8M NaOH Figure 6—Diffractograms of sodalite-containing SA2 blend ash leached with water followed by 8 M NaOH, and with 1 M NaOH followed by 8 M NaOH
solid waste and Na2HPO4 at 200°C for 30 minutes to produce zeolite in the ash. All zeolite formation in the ash or solid samples resulted in the negative, low or zero dissolution efficiencies for Al and Si from the coal ash sample during alkaline leaching (Figures 7 and 8).

The dissolution efficiency values of Si are depicted in Figure 8. Leaching of the SA1 and SA2 blend ash samples with H2O showed low dissolution efficiencies for Si due to the negligible solubility of Si in water. Low Si dissolution efficiencies were also achieved in 1 M and 8 M NaOH. This can be attributed to the precipitation of either dissolved metakaolinite (SiO32-, Al(OH)4-), or quartz, and Na+ to form sodalite gel precursor in the leached ash residues. The low Si dissolution efficiency values resulted due to precipitation of these ions from the sodium hydroxide leach liquors and are consistent with results reported by Su et al. (2011); Fukasawa et al (2017); Jiang et al. (2015); Rahman, Pudasainee, and Gupta (2017), and Yang, Zheng, and Zhang (2014).
The percentages of sodium oxide (XRF results) and sodalite (XRD results) in the original ash and ash residue samples are depicted in Figure 9. The SA1 and SA2 blend ash samples, before water leaching, contained no sodium or sodalite (zeolite phase); this phase only appeared after leaching with H2O. As expected, a small increase in the sodium concentration was seen after leaching the SA1 and SA2 blend ash samples with 1 M NaOH. Leaching of the SA1 ash sample with 8 M NaOH solution led to the formation of 14.7% of Na2O and 16.5% sodalite in the ash residue. This same trend was seen after NaOH leaching of the SA2 blend ash sample, which resulted in a 15.7% Na2O and 11% sodalite content in the residues. Murayama, Yamamoto, and Shibata (2002) found that zeolite crystallization decreases in the presence of high potassium (K+) concentrations. Based on the XRD results for the leached SA1 and SA2 blend ash residues in Table IV, the addition of K2CO3 to

the SA2 sample inhibited sodalite crystallization. Other sodium ions can react with carbonate ions from potassium carbonate to form sodium carbonate in the leach liquor. This reaction may subsequently reduce the formation of a high proportion of sodalite in the ash residues during sodium hydroxide leaching (Equation [5]).
As expected, the residues from sequential water leaching (zero Na2O) or 1 M NaOH leaching (a low proportion of Na2O) of the SA1 ash samples contained lower proportions of sodium oxide and sodalite compared to the samples leached with 1 M NaOH and 8 M NaOH. Sequential leaching of the SA2 blend ash sample with 8 M NaOH leads to an increase in sodalite concentration (>15%) in the ash residue. Murayama, Yamamoto, and Shibata (2002) stated that OH– from either KOH or NaOH promotes the reactions for zeolite formation (Equations [2 and 4]). Jiang et al. (2015) explained that, after the initial dissolution of aluminosilicate and zeolite crystal, equilibrium is reached between the zeolite and soluble SiO32- and Al(OH)4- anions. Changing the leaching conditions will disrupt the equilibrium and formation of zeolite will again be initiated.
South African low-temperature combustion ash produced at 700°C was leached in alkaline media in an attempt to solubilize SiO32- and Al(OH)4– ions from metakaolinite in the ash and form synthetic sodium zeolite for possible use in the water purification industries or as molecule separators. The recovery of potassium species for utilization in the fertilizer industry was also investigated. The leaching of the SA1 ash sample with H2O and 1 M and 8 M NaOH solutions yielded only low dissolution efficiencies of Si, Al, Ti, and K compared to the SA2 blend samples (with added K2CO3) leached with 1 M and 8 M NaOH. A high dissolution efficiency of 89% K was achieved by sequential leaching of the SA2 blend ashes using 1 M and 8 NaOH. Small percentages of Al and Si dissolution resulted due to the formation of sodalite precursor gel in the leached ashes after sequential leaching with 1 M and 8 M NaOH. Crystallization of sodalite from the sodalite precursor gel
(amorphous material) resulted in the formation of aluminosilicate glasses. The increase in NaOH concentration from 1 M to 8 M NaOH resulted in a higher proportion of sodalite (16.5%) forming in the SA1 ash residue. A lower proportion of sodalite (11%) was formed in the SA2 blend ash residue due to the reaction between potassium carbonate and sodium hydroxide.

The formation of higher proportions of sodalite and amorphous materials in the leached ash residues resulted in different mineralogical and chemical properties of ash residues during the sequential NaOH leaching of the SA1 and SA2 blend ashes.
To improve the proportion of sodalite in the leached ash, the mixture of the spent potassium carbonate (waste) from the thermo-chemical plants and coal fine discards (waste), as well as coal fines, could be combusted at 700°C to produce potassium- and metakaolinite-containing ash and low-temperature combustion ash for the proposed alkaline leaching process using 12-20 M NaOH. Furthermore, ash-derived zeolites, as well as the low-temperature combustion ashes, should be submitted for morphological characterization, XRD, and particle size distribution analyses using high-resolution transmission electron microscopy (HRTEM) or scanning electron microscopyusing energy dispersive X-ray spectroscopy (SEM-EDS) and Raman techniques.
The information presented in this paper is based on research financially supported by the South African Research Chairs Initiative (SARChI) of the Department of Science and Technology and National Research Foundation of South Africa (Coal Research Chair Grant No. 86880). Any opinion, finding, or conclusion or recommendation expressed in this material is that of the authors and the NRF does not accept any liability in this regard. The authors would like to thank Mrs B. Venter for the X-ray diffraction and X-ray fluorescence analyses of the coal, ash, and ash residue samples; and the Katlego Mphahlele Centre of Excellence in Carbon based Fuels, School of Chemical and Minerals Engineering, North-West University for improving the quality of figures that are reported in this manuscript.
Production of sodium-based zeolites and a potassium-containing leach liqour by alkaline leachingFigure 9—Na2O in ash/ash residue (by XRF, %) versus lixiviant concentration – molar (M) versus sodalite in ash/ash residue by XRD, %)
References
Adrian, A. and Mcculloch, H. 1966. Pressure leaching of ores with particular reference to the upgrading of aluminate solutions. II. Alkaline pressure leaching of Sasol fly ash. Government Metallurgical Laboratory. (Repub. SA), no. C 13/65. 13 pp.
Bukhari, S.S., Behin, J., Kazemian, H., and Rohani, S. 2015. Conversion of coal fly ash to zeolite utilizing microwave and ultrasound energies: a review. Fuel, vol. 140. pp. 250–266.
Bunt, J.R., Van Nierop, P., Matjie, R.H., Ritter, B., Steynberg, E.C., and Katabua, M.J. 1998. South Africa patent no. 98/583.
Bunt, J.R., Neomagus, H.W.J.P., Botha, A.A., and Waanders, F.B. 2015. Reactivity study of fine discard coal agglomerates. Journal of Analytical and Applied Pyrolysis, vol. 113. pp. 723–728. https://doi.org/10.1016/j.jaap.2015.03.001
Collins, A.C. 2019. Extraction of K, AI and Ti containing compounds from ash produced by low temperature combustion. PhD thesis, North-West University. Chapter 4, Section 4.2.2.
Comrie, D.C. and Kriven, W.M. 2004. Composite cold ceramic geopolymer in a refractory application. Proceedings of Advances in Ceramic Matrix Composites IX, Nashville, TN. Wiley. pp. 211–225.
Fukasawa, T., Karisma, A.D., Shibata, D., Huang, A.-N., and Fukui, K. 2017. Synthesis of zeolite from coal fly ash by microwave hydrothermal treatment with pulverization process. Advanced Powder Technology, vol. 28, no. 3. pp. 798–804.
Hassan, I. and Crundy, H.D. 1983. Structure of basic sodalite, Na8Al6Si6O24 (OH)2 2H2O. Acta Crystallographica, vol. C39. pp. 3–5.
Hlatshwayo, T.B., Matjie, R.H., LI, Z., and Ward, C.R. 2009. Mineralogical characterisation of Sasol feed coals and corresponding gasification ash constituents. Energy and Fuels, vol. 23. pp. 2867–2873.
Izquierdo, M. and Querol, X. 2012. Leaching behaviour of elements from coal combustion fly ash: An overview. International Journal of Coal Geology, vol. 94. pp. 54–66.
Jiang, Z., Yang, J., Ma, H., Wang, L., and Ma, X. 2015. Reaction behaviour of Al2O3 and SiO2 in high alumina coal fly ash during alkali hydrothermal process. Transactions of Nonferrous Metals Society of China, vol. 25. pp. 2065–2072.
King, J.F., Taggart, R.K., Smith, R.C., Hower, J.C., and Hsu-Kim, H. 2018. Aqueous acid and alkaline extraction of rare earth elements from coal combustion ash. International Journal of Coal Geology, vol. 195. pp. 75–83.
Li, H., Junbo, H., Wang, C., Bao, W., and Sun, Z. 2014. Extraction of alumina from coal fly ash by mixed-alkaline hydrothermal method. Hydrometallurgy, vol. 147-148. pp. 183–187.
Matjie, R.H., LI, Z., Ward, C.R., and French, D. 2008. Chemical composition of glass and crystalline phases in coarse coal gasification ash. Fuel, vol. 87. pp. 857–869.
Matjie, R.H., LI, Z., Ward, C.R., Kosasi, J., Bunt, J.R., and Strydom, C.A. 2015. Mineralogy of furnace deposits produced by South African coals during pulverized-fuel combustion tests. Energy and Fuels, vol. 29. pp. 8226–8238.
Matjie, R., Bunt, J., Stokes, W., Bijzet, H., Mphahlele, K., Uwaoma, R., and Strydom, C. 2021. Interactions between kaolinite, organic matter, and potassium compounds at elevated temperatures during pyrolysis of caking coal and its density-separated fractions. 2021. Energy and Fuels, vol. 35. pp. 13268–13280.
Murayama, N., Yamamoto, H., and Shibata, J. 2002. Mechanism of zeolite synthesis from coal fly ash by alkali hydrothermal reaction. International Journal of Mineral Processing, vol. 64, no. 1. pp. 1–17.
Nayak, N. and Panda, C.R. 2010. Aluminium extraction and leaching characteristics of Talcher Thermal Power Station fly ash with sulphuric acid. Fuel, vol. 89. pp. 53–58.
Norrish, K., and Hutton, J.T. 1969. An accurate X-ray spectrographic method for the analysis of a wide range of geological samples. Geochimica et Cosmochimica Acta, vol. 33, no. 4. pp. 431–453.
Rahman, M., Pudasainee, D., and Gupta, R. 2017. Review on chemical upgrading of coal: Production processes, potential applications and recent developments. Fuel Processing Technology, vol. 158. pp. 35–56.
Rattanasak, U. and Chindaprasirt, P. 2009. Influence of NaOH solution on the synthesis of fly ash geopolymer. Minerals Engineering, vol. 22, no. 12. pp. 1073–1078.
Rautenbach, R., Strydom, C.A., Bunt, J.R., Matjie, R.H., Campbell, Q.P., and Van Alphen, C. 2019. Mineralogical, chemical, and petrographic properties of selected South African power stations’ feed coals and their corresponding density separated fractions using float-sink and reflux classification methods. International Journal of Coal Preparation and Utilization, vol. 39. pp. 421–446.
Rautenbach, R., Matjie, R.H., Strydom, C.A., and Bunt, J.R. 2021. Transformation of inherent and extraneous minerals in feed coals of commercial power stations and their density-separated fractions. Energy Geoscience, vol. 2. pp. 136–147. https://doi.org/10.1016/j.engeos.2020.09.002
Rautenbach, R., Matjie, R.H., Strydom, C.A., Bunt, J.R., Ward, C.R., French, D., and Van Alphen, C. 2020. Evaluation of mineral matter transformations in low-temperature ashes of South African coal feedstock samples and their density separated cuts using high-temperature X-ray diffraction. International. Journal of Coal Preparation and Utilization, vol. 40, no. 4-5. pp. 320–347. doi: 10.1080/19392699.2019.1677629
Reddick, J.F., Von Blottnitz, H., and Kothuis, B. 2007. A cleaner production assessment of the ultra-fine coal waste generated in South Africa. Journal of the Southern African Institute of Mining and Metallurgy, vol. 107. pp. 55–60.
Rietveld, H.M. 1969. A profile refinement method for nuclear and magnetic structures. Journal of Applied Crystallography, vol. 2. pp. 65–71.
Sakthivel, T., Reid, D.L., Goldstein, I., Hench, L., and Seal, S. 2013. Hydrophobic high surface area zeolites derived from fly ash for oil spill remediation. Environmental Science and Technology, vol. 47, no. 11. pp. 5843–5850.
Sangita, S., Nayak, N., and Panda, C.R. 2017. Extraction of aluminium as aluminium sulphate from thermal power plant ashes. Transactions of Nonferrous Metals Society of China, vol. 27. pp. 2082–2089.
Speakman, S.A. 2012. Basics of X-ray powder diffraction. http://prism.mit.edu/xray [accessed 14 February 2019].
Su, S.Q., Yang, J., Ma, H.W., Jiang, F., Liu, Y.Q., and Li, G. 2011. Preparation of ultrafine aluminum hydroxide from coal fly ash by alkali dissolution process. Integrated Ferroelectrics, vol. 128, no. 1. pp. 155–162.
Van Alphen, C. 2005. Factors influencing fly ash formation and slag deposit formation (slagging) on combusting a South African pulverised fuel in a 200MWe boiler. PhD thesis, University of the Witwatersrand.
Van der Merwe, E.M., Gray, C.L., Castleman, B.A., Mohamed, S., Kruger, R.A., and Doucet, F.J. 2017. Ammonium sulphate and/or ammonium bisulphate as extracting agents for the recovery of aluminium from ultrafine coal fly ash. Hydrometallurgy, vol. 171. pp. 185–190.
Yang, Q.-C., Zheng, S.-I., and Zhang, R. 2014. Recovery of alumina from circulating fluidized bed combustion Al-rich fly ash using mild hydrochemical process. Transactions of Nonferrous Metals Society of China, vol. 24, no. 4. pp.1187–1195. u
The Southern African Institute of Mining and Metallurgy (SAIMM) is seeking an Assistant Proofreader to help with the preparation of papers for publication in the Institute‘s monthly Journal. This is a part-time, work-from-home appointment that would suit an independent freelancer. Applicants should have several years’ proofreading and copy-editing experience, preferably in a scientific or technical sphere, and an excellent command of English language. A degree in a scientific field would be an advantage.

Job description:
Proofreading is the correcting of surface errors such as grammar, spelling, and punctuation, whereas editing seeks to improve the overall quality of writing by enhancing flow, readability, and structure. The two tasks are often undertaken separately, with editing being the first stage, although they may be combined.
In the context of SAIMM publications, the following aspects are considered, with reference to the appropriate SAMM style guide (the Journal, conference papers and books).
Check general layout, ordering of sections, heading styles.
Text in UK English, spelling as per the Oxford English Dictionary. Correctness of grammar, punctuation.
Equations numbered consecutively in order of mention in the text. Use of SI units throughout.
Figures and tables as per guidelines, numbered consecutively in order of mention in the text.
Use of active voice rather than passive.
Ensure all references cited in the text are in the List of References, and vice versa. Check references for style and completeness, fill in missing information via an Internet search where possible.
May involve major changes to content, structure, and language in order to improve clarity, readability, and flow of the text.
Simplify where necessary to avoid verbosity, circumlocution, repetition.
Check for ambiguity. Where the meaning is not clear, query the author by means of an inline comment.
Synopsis should be concise and adequately cover the main points of the paper. The Conclusions section should not be a repeat the Synopsis, nor just a summary of the paper.
Is the flow of the argument logical and clear?
All proofreading changes are made on the document using the ‘Track Changes’ option, adding comments where an explanation or query is necessary. The typeset version for final checking can be converted from PDF to Word (preserving the formatting) using the online utility at pdf2doc.com.
To apply, please send a brief resumé to Tarryn Jensol, Publications Co-ordinator at tarryn@saimm.co.za
To find out more about the SAIMM click here: https://www.saimm.co.za/
13 April 2023 — Cape Mining Club 2023 Cabo Bar, Cape Town
Contact: candice@capeminingclub.com
Website: https://capeminingclub.com/index.php/events/
24-25 April 2023 — Southern African Hydrogen and Fuel Cell Conference 2023
From fundamentals to accelerated integration Hazendal Wine Estate, Stellenbosch, Cape Town
Contact: Camielah Jardine
Tel: 011 538-0237
E-mail: camielah@saimm.co.za
Website: http://www.saimm.co.za
1-5 May 2023 — ALTA 2023 Perth, Australis
Contact: alta@encanta.com.au
Website: https://www.altamet.com.au/conferences/alta-2022/ alta-2023/
11-14 June 2023 — European Metallurgical Conference 2023
Abstracts are to be completed online on https://bit.ly/ Enter2021YPLCfinals
12-16 June 2023 — Copper Cobalt Africa in association with the 10TH Southern African Base Metals Conference 2023
Avani Victoria Falls Resort, Livingstone, Zambia
Contact: Camielah Jardine
Tel: 011 538-0237
E-mail: camielah@saimm.co.za
Website: http://www.saimm.co.za
19-22 June 2023 — Introduction to Multiple-Point Statistics Online Course
Contact: Gugu Charlie
Tel: 011 538-0238
E-mail: gugu@saimm.co.za
Website: http://www.saimm.co.za
25-28 June 2023 — SME APCOM 2023
Intelligent Mining: Innovation, Vision, and Value Rapid City, South Dakota, USA
E-mail: Andrea.Brickey@sdsmt.edu
Website: https://www.smenet.org/Conferences/SME-APCOM
26-29 June 2023 — 26TH World Mining Congress 2023 Brisbane Australia
Website: https://www.wmc2023.org/
28-29 June 2023 — Digital Transformation in Mining 2023
Putting digital technologies to work
The Canvas, Riversands, Fourways
Contact: Gugu Charlie
Tel: 011 538-0238
E-mail: gugu@saimm.co.za
Website: http://www.saimm.co.za
25-26 July 2023 — Diamonds Source to Use 2023 Conference
New Beginnings A brave new (diamond) world Emperors Palace Conference Centre, Kempton Park, Johannesburg
Contact: Camielah Jardine
Tel: 011 538-0237
E-mail: camielah@saimm.co.za
Website: http://www.saimm.co.za
21-22 August 2023 — HMC 2023 Twelth International Heavy Minerals Conference 2023
The Capital Zimbali, Ballito, KwaZulu-Natal
Contact: Gugu Charlie
Tel: 011 538-0238
E-mail: gugu@saimm.co.za
Website: http://www.saimm.co.za
23-24 August 2023 — Amira Global Exploration Manager’s Conference 2023
London, United Kingdom
E-mail: owena.duckworth@amira.global
Website: https://mininginnovationnetwork.swoogo.com/ DMA22
4-7 September 2023 — Geometallurgy Conference 2023
Geomet meets Big Data
Hazendal Wine Estate, Stellenbosch, Western Cape
Contact: Gugu Charlie
Tel: 011 538-0238
E-mail: gugu@saimm.co.za
Website: http://www.saimm.co.za
4-7 September 2023 — 10TH World Gold Conference
Promote high-quality development with green technology innovation
Shenyang New World EXPO, China
E-mail: world@china-gold.org
Website: http://world.china-gold.org/en/
12-14 September 2023 — 10TH International Conference on Ground Support in Mining and Underground Construction
Perth, Western Australia
Website: https://www.acggroundsupport.com/
26-27 September 2023 — DIMI SAIMM Diversity and Inclusion Dialogue 2023
Intersectionality in the Minerals Industry From Awareness to Action
Avianto, Muldersdrift Johannesburg
Contact: Camielah Jardine
Tel: 011 538-0237
E-mail: camielah@saimm.co.za
Website: http://www.saimm.co.za
11-13 October 2023 — 11TH International Ground Freezing Symposium
London
E-mail: events@iom3.org
Website: https://www.iom3.org/events-awards/11thinternational-symposium-on-ground-freezing.html
24-26 October 2023 — Next generation tailingsopportunities or risk? Conference 2023
Emperors Palace, Johannesburg
Contact: Camielah Jardine
Tel: 011 538-0237
E-mail: camielah@saimm.co.za
Website: http://www.saimm.co.za
The following organizations have been admitted to the Institute as Company Affiliates
3M South Africa (Pty) Limited
acQuire Technology Solutions
AECOM SA (Pty) Ltd
AEL Mining Services Limited
African Pegmatite (Pty) Ltd
Air Liquide (Pty) Ltd
Alexander Proudfoot Africa (Pty) Ltd
Allied Furnace Consultants
AMEC Foster Wheeler
AMIRA International Africa (Pty) Ltd
ANDRITZ Delkowr(Pty) Ltd
ANGLO Operations Proprietary Limited
Anglogold Ashanti Ltd
Arcus Gibb (Pty) Ltd
ASPASA
Aurecon South Africa (Pty) Ltd
Aveng Engineering
Aveng Mining Shafts and Underground
Axiom Chemlab Supplies (Pty) Ltd
Axis House Pty Ltd
Bafokeng Rasimone Platinum Mine
Barloworld Equipment -Mining
BASF Holdings SA (Pty) Ltd
BCL Limited
Becker Mining (Pty) Ltd
BedRock Mining Support Pty Ltd
BHP Billiton Energy Coal SA Ltd
Blue Cube Systems (Pty) Ltd
Bluhm Burton Engineering Pty Ltd
Bond Equipment (Pty) Ltd
Bouygues Travaux Publics
Caledonia Mining South Africa Plc
Castle Lead Works
CDM Group
CGG Services SA
Coalmin Process Technologies CC
Concor Opencast Mining
Concor Technicrete
Council for Geoscience Library
CRONIMET Mining Processing
SA Pty Ltd
CSIR Natural Resources and the Environment (NRE)
Data Mine SA
DDP Specialty Products South Africa (Pty) Ltd
Digby Wells and Associates
DRA Mineral Projects (Pty) Ltd
DTP Mining - Bouygues Construction
Duraset
EHL Consulting Engineers (Pty) Ltd
Elbroc Mining Products (Pty) Ltd
eThekwini Municipality
Ex Mente Technologies (Pty) Ltd
Expectra 2004 (Pty) Ltd
Exxaro Coal (Pty) Ltd
Exxaro Resources Limited
Filtaquip (Pty) Ltd
FLSmidth Minerals (Pty) Ltd
Fluor Daniel SA ( Pty) Ltd
Franki Africa (Pty) Ltd-JHB
Fraser Alexander (Pty) Ltd
G H H Mining Machines (Pty) Ltd
Geobrugg Southern Africa (Pty) Ltd
Glencore
Gravitas Minerals (Pty) Ltd
Hall Core Drilling (Pty) Ltd
Hatch (Pty) Ltd
Herrenknecht AG
HPE Hydro Power Equipment (Pty) Ltd
Huawei Technologies Africa (Pty) Ltd
Immersive Technologies
IMS Engineering (Pty) Ltd
Ingwenya Mineral Processing (Pty) Ltd
Ivanhoe Mines SA
Kudumane Manganese Resources
Leica Geosystems (Pty) Ltd
Loesche South Africa (Pty) Ltd
Longyear South Africa (Pty) Ltd
Lull Storm Trading (Pty) Ltd
Maccaferri SA (Pty) Ltd
Magnetech (Pty) Ltd
Magotteaux (Pty) Ltd
Malvern Panalytical (Pty) Ltd
Maptek (Pty) Ltd
Maxam Dantex (Pty) Ltd
MBE Minerals SA Pty Ltd
MCC Contracts (Pty) Ltd
MD Mineral Technologies SA (Pty) Ltd
MDM Technical Africa (Pty) Ltd
Metalock Engineering RSA (Pty)Ltd
Metorex Limited
Metso Minerals (South Africa) Pty Ltd
Micromine Africa (Pty) Ltd
MineARC South Africa (Pty) Ltd
Minerals Council of South Africa
Minerals Operations Executive (Pty) Ltd
MineRP Holding (Pty) Ltd
Mining Projections Concepts
Mintek
MIP Process Technologies (Pty) Limited
MLB Investment CC
Modular Mining Systems Africa (Pty) Ltd
MSA Group (Pty) Ltd
Multotec (Pty) Ltd
Murray and Roberts Cementation
Nalco Africa (Pty) Ltd
Namakwa Sands(Pty) Ltd
Ncamiso Trading (Pty) Ltd
Northam Platinum Ltd - Zondereinde
Opermin Operational Excellence
OPTRON (Pty) Ltd
Paterson & Cooke Consulting Engineers (Pty) Ltd
Perkinelmer
Polysius A Division Of Thyssenkrupp
Industrial Sol
Precious Metals Refiners
Rams Mining Technologies
Rand Refinery Limited
Redpath Mining (South Africa) (Pty) Ltd
Rocbolt Technologies
Rosond (Pty) Ltd
Royal Bafokeng Platinum
Roytec Global (Pty) Ltd
RungePincockMinarco Limited
Rustenburg Platinum Mines Limited
Salene Mining (Pty) Ltd
Sandvik Mining and Construction
Delmas (Pty) Ltd
Sandvik Mining and Construction
RSA(Pty) Ltd
SANIRE
Schauenburg (Pty) Ltd
Sebilo Resources (Pty) Ltd
SENET (Pty) Ltd
Senmin International (Pty) Ltd
SISA Inspection (Pty) Ltd
Smec South Africa
Sound Mining Solution (Pty) Ltd
SRK Consulting SA (Pty) Ltd
Time Mining and Processing (Pty) Ltd
Timrite Pty Ltd
Tomra (Pty) Ltd
Traka Africa (Pty) Ltd
Trans-Caledon Tunnel Authority
Administarator
Trace Element Analysis Laboratory
Ukwazi Mining Solutions (Pty) Ltd
Umgeni Water
Webber Wentzel
Weir Minerals Africa
Welding Alloys South Africa
Worley

Date: 26-27 September 2023
Venue: Avianto, Muldersdrift
Johannesburg
The SAIMM through its committee for Diversity and Inclusion in the Minerals Industry (DIMI) and in collaboration with Women in Mining South Africa (WiMSA) is excited to announce its DIMI Dialogue 2023 focusing on the issues of diversity and inclusion in the mining and minerals industry.


The Southern African minerals industry, just like the global minerals industry, still faces challenges when it comes to diversity and inclusivity in the workplace. While landscape might be changing due to various of companies embracing the need for a more representative and diverse workforce, there is still a lot to be done. Beside issues of gender disparity in the industry, safe spaces in the workplace, protective equipment, sanitation facilities,
pregnancy and childcare facilities are some of the challenges that continue to plague the sector. The industry also needs to go beyond workforce diversity to inclusion, by identifying individuals from different geographic, gender, economic and cultural groups, creating safe spaces for them, providing support for them to grow into their roles. Creating conditions that promote inclusion on a daily basis can go a long way in retaining and advancing the careers of workforce and hence contribute to the long term growth of the minerals industry. DIMI provides a platform for discussion that can lead to the development of strategies for advancing and encouraging decisions that are in the best interest of a diverse workforce.
FOR FURTHER INFORMATION, CONTACT:
Camielah Jardine
E-mail: camielah@saimm.co.za
Head of Conferencing Tel: +27 11 538-0238
SAIMM Web: www.saimm.co.za


The theme of this second geometallurgy conference ‘Geomet meets Big Data’ is inspired by the growing interest and focus on big datasets, machine learning, novel sensors, digital twins and 4IR in the mining industry. The concept of Geometallurgy goes back to some of the earliest mining activities when mineral recognition, mining, separation, and concentration were undertaken simultaneously. Over time, changes in operational structures, product expansion and specialisation ultimately led to the diminishment and breakdown of this holistic approach. In the last two decades, Geometallurgy has become a sophisticated yet entirely logical return to this integrated approach to mine planning. In a world of exponentially increasing ore heterogeneity and metallurgical complexity coupled with a demand for improved sustainability, Geometallurgy is effectively a highly structured, integrated multi-disciplinary collaboration for optimizing the value of an ore deposit. This conference provides a platform for the discussion of some of the newest developments in the field of geometallurgy and a celebration of the success of Geometallurgy integration and value-add.

4 September 2023 Technical Workshop
5-6 September 2023 Conference
7 September 2023 Technical Visit

Hazendal Wine Estate, Stellenbosch, Western Cape
FOR FURTHER INFORMATION CONTACT:
Gugu Charlie, Conference Co-ordinator
E-mail: gugu@saimm.co.za
Tel: +27 11 538-0238, Web: www.saimm.co.za
 SUPPORTED BY
WORKSHOP SPONSORED BY: RESOURCE MODELING SOLUTIONS
SUPPORTED BY
WORKSHOP SPONSORED BY: RESOURCE MODELING SOLUTIONS