
SAIMM Seismic Activity - Themed Edition


Throughout its legacy spanning over a century, the Southern African Institute of Mining and Metallurgy (SAIMM) has played a pivotal role in the dissemination of knowledge and expertise across Africa’s minerals sector, providing its members with local and international access to the latest technological developments in mining, metallurgical and related fields.

SAIMM aims to:
CONVENE, we provide a sound platform for collaborative networking.
ENGAGE, we broaden our members’ networks through engagement forums with technical peers
INFORM, we keep our members informed of technological and sustainability issues and developments by making relevant information available.
EDUCATE, we offer accredited continuous professional development (CPD) and education programmes targeted at our members’ commodity and geographic contexts.


Membership to SAIMM gives you access to:
• Professional affiliation
• Personal development
• Events and networking
• Technical resources
• Special interest groups
For more information visit Membership on www.saimm.co.za

Images: Courtesy of IMS (Institute of Mine Seismology).
The Southern African Institute of Mining and Metallurgy
OFFICE BEARERS AND COUNCIL FOR THE 2024/2025 SESSION
President E. Matinde
President Elect
G.R. Lane
Senior Vice President
T.M. Mmola
Junior Vice President
M.H. Solomon
Incoming Junior Vice President
S.J. Ntsoelengoe
Immediate Past President
W.C. Joughin
Honorary Treasurer
W.C. Joughin
Ordinary Members on Council
W. Broodryk M.C. Munroe
Z. Fakhraei S.M. Naik
B. Genc G. Njowa
K.M. Letsoalo S.M. Rupprecht
S.B. Madolo A.T. van Zyl
M.A. Mello E.J. Walls
K. Mosebi
Co-opted Council Members
A.D. Coetzee
L.T. Masutha
Past Presidents Serving on Council
N.A. Barcza C. Musingwini
R.D. Beck S. Ndlovu
Z. Botha J.L. Porter
V.G. Duke M.H. Rogers
I.J. Geldenhuys G.L. Smith
R.T. Jones
G.R. Lane – TP Mining Chairperson
Z. Botha – TP Metallurgy Chairperson
K.W. Banda – YPC Chairperson
C.T. Chijara – YPC Vice Chairperson
Branch Chairpersons
Botswana K. Mosebi
DRC K.T. Kekana (Interim Chairperson)
Johannesburg N. Rampersad
Limpopo M.S. Zulu
Namibia T. Aipanda
Northern Cape Vacant
North West Vacant
Pretoria P.G.H. Pistorius
Western Cape Vacant
Zambia N.M. Kazembe
Zimbabwe L. Shamu
Zululand Vacant
PAST PRESIDENTS
*Deceased
* W. Bettel (1894–1895)
* A.F. Crosse (1895–1896)
* W.R. Feldtmann (1896–1897)
* C. Butters (1897–1898)
* J. Loevy (1898–1899)
* J.R. Williams (1899–1903)
* S.H. Pearce (1903–1904)
* W.A. Caldecott (1904–1905)
* W. Cullen (1905–1906)
* E.H. Johnson (1906–1907)
* J. Yates (1907–1908)
* R.G. Bevington (1908–1909)
* A. McA. Johnston (1909–1910)
* J. Moir (1910–1911)
* C.B. Saner (1911–1912)
* W.R. Dowling (1912–1913)
* A. Richardson (1913–1914)
* G.H. Stanley (1914–1915)
* J.E. Thomas (1915–1916)
* J.A. Wilkinson (1916–1917)
* G. Hildick-Smith (1917–1918)
* H.S. Meyer (1918–1919)
* J. Gray (1919–1920)
* J. Chilton (1920–1921)
* F. Wartenweiler (1921–1922)
* G.A. Watermeyer (1922–1923)
* F.W. Watson (1923–1924)
* C.J. Gray (1924–1925)
* H.A. White (1925–1926)
* H.R. Adam (1926–1927)
* Sir Robert Kotze (1927–1928)
* J.A. Woodburn (1928–1929)
* H. Pirow (1929–1930)
* J. Henderson (1930–1931)
* A. King (1931–1932)
* V. Nimmo-Dewar (1932–1933)
* P.N. Lategan (1933–1934)
* E.C. Ranson (1934–1935)
* R.A. Flugge-De-Smidt (1935–1936)
* T.K. Prentice (1936–1937)
* R.S.G. Stokes (1937–1938)
* P.E. Hall (1938–1939)
* E.H.A. Joseph (1939–1940)
* J.H. Dobson (1940–1941)
* Theo Meyer (1941–1942)
* John V. Muller (1942–1943)
* C. Biccard Jeppe (1943–1944)
* P.J. Louis Bok (1944–1945)
* J.T. McIntyre (1945–1946)
* M. Falcon (1946–1947)
* A. Clemens (1947–1948)
* F.G. Hill (1948–1949)
* O.A.E. Jackson (1949–1950)
* W.E. Gooday (1950–1951)
* C.J. Irving (1951–1952)
* D.D. Stitt (1952–1953)
* M.C.G. Meyer (1953–1954)
* L.A. Bushell (1954–1955)
* H. Britten (1955–1956)
* Wm. Bleloch (1956–1957)
* H. Simon (1957–1958)
* M. Barcza (1958–1959)
* R.J. Adamson (1959–1960)
* W.S. Findlay (1960–1961)
* D.G. Maxwell (1961–1962)
* J. de V. Lambrechts (1962–1963)
* J.F. Reid (1963–1964)
* D.M. Jamieson (1964–1965)
* H.E. Cross (1965–1966)
* D. Gordon Jones (1966–1967)
* P. Lambooy (1967–1968)
* R.C.J. Goode (1968–1969)
* J.K.E. Douglas (1969–1970)
* V.C. Robinson (1970–1971)
* D.D. Howat (1971–1972)
* J.P. Hugo (1972–1973)
* P.W.J. van Rensburg (1973–1974)
* R.P. Plewman (1974–1975)
* R.E. Robinson (1975–1976)
* M.D.G. Salamon (1976–1977)
* P.A. Von Wielligh (1977–1978)
* M.G. Atmore (1978–1979)
* D.A. Viljoen (1979–1980)
* P.R. Jochens (1980–1981)
* G.Y. Nisbet (1981–1982)
A.N. Brown (1982–1983)
* R.P. King (1983–1984)
J.D. Austin (1984–1985)
* H.E. James (1985–1986)
H. Wagner (1986–1987)
* B.C. Alberts (1987–1988)
* C.E. Fivaz (1988–1989)
* O.K.H. Steffen (1989–1990)
* H.G. Mosenthal (1990–1991)
R.D. Beck (1991–1992)
* J.P. Hoffman (1992–1993)
* H. Scott-Russell (1993–1994)
J.A. Cruise (1994–1995)
D.A.J. Ross-Watt (1995–1996)
N.A. Barcza (1996–1997)
* R.P. Mohring (1997–1998)
J.R. Dixon (1998–1999)
M.H. Rogers (1999–2000)
L.A. Cramer (2000–2001)
* A.A.B. Douglas (2001–2002)
* S.J. Ramokgopa (2002-2003)
T.R. Stacey (2003–2004)
F.M.G. Egerton (2004–2005)
W.H. van Niekerk (2005–2006)
R.P.H. Willis (2006–2007)
R.G.B. Pickering (2007–2008)
A.M. Garbers-Craig (2008–2009)
J.C. Ngoma (2009–2010)
G.V.R. Landman (2010–2011)
J.N. van der Merwe (2011–2012)
G.L. Smith (2012–2013)
M. Dworzanowski (2013–2014)
J.L. Porter (2014–2015)
R.T. Jones (2015–2016)
C. Musingwini (2016–2017)
S. Ndlovu (2017–2018)
A.S. Macfarlane (2018–2019)
M.I. Mthenjane (2019–2020)
V.G. Duke (2020–2021)
I.J. Geldenhuys (2021–2022)
Z. Botha (2022-2023)
W.C. Joughin (2023-2024)
Editorial Board
S.O. Bada
R.D. Beck
P. den Hoed
I.M. Dikgwatlhe
M. Erwee
B. Genc
R.T. Jones
W.C. Joughin
A.J. Kinghorn
D.E.P. Klenam
D.F. Malan
D. Morris
C. Musingwini
P.N. Neingo
A. Nengovhela
S.S. Nyoni
M. Phasha
P. Pistorius
P. Radcliffe
N. Rampersad
Q.G. Reynolds
I. Robinson
S.M. Rupprecht
K.C. Sole
T.R. Stacey
International Advisory Board members
R. Dimitrakopolous
R. Mitra
S. Ndlovu
A.J.S. Spearing
E. Topal
D. Tudor
F. Uahengo
D. Vogt
Editor /Chairperson of the Editorial Board
R.M.S. Falcon
Typeset and Published by
The Southern African Institute of Mining and Metallurgy
PostNet Suite #212 Private Bag X31 Saxonwold, 2132
E-mail: journal@saimm.co.za
Printed by Camera Press, Johannesburg
Advertising Representative
Barbara Spence
Avenue Advertising


Contents
Journal Comment: Seismic activity related to mining by R.J. Durrheim
President’s Corner: Reigniting the research collaborations in the mining industry: too little, too late? by E.
Matinde
..................................................................
THE INSTITUTE, AS A BODY, IS NOT RESPONSIBLE FOR THE STATEMENTS AND OPINIONS ADVANCED IN ANY OF ITS PUBLICATIONS.
Copyright© 2025 by The Southern African Institute of Mining and Metallurgy. All rights reserved. Multiple copying of the contents of this publication or parts thereof without permission is in breach of copyright, but permission is hereby given for the copying of titles and abstracts of papers and names of authors. Permission to copy illustrations and short extracts from the text of individual contributions is usually given upon written application to the Institute, provided that the source (and where appropriate, the copyright) is acknowledged. Apart from any fair dealing for the purposes of review or criticism under The Copyright Act no. 98, 1978, Section 12, of the Republic of South Africa, a single copy of an article may be supplied by a library for the purposes of research or private study. No part of this publication may be reproduced, stored in a retrieval system, or transmitted in any form or by any means without the prior permission of the publishers. Multiple copying of the contents of the publication without permission is always illegal. U.S. Copyright Law applicable to users In the U.S.A. The appearance of the statement of copyright at the bottom of the first page of an article appearing in this journal indicates that the copyright holder consents to the making of copies of the article for personal or internal use. This consent is given on condition that the copier pays the stated fee for each copy of a paper beyond that permitted by Section 107 or 108 of the U.S. Copyright Law. The fee is to be paid through the Copyright Clearance Center, Inc., Operations Center, P.O. Box 765, Schenectady, New York 12301, U.S.A. This consent does not extend to other kinds of copying, such as copying for general distribution, for advertising or promotional purposes, for creating new collective works, or for resale.
Honorary Legal Advisers
M H Attorneys
Auditors
Genesis Chartered Accountants
Secretaries
The Southern African Institute of Mining and Metallurgy 7th Floor, Rosebank Towers, 19 Biermann Avenue, Rosebank, 2196
PostNet Suite #212, Private Bag X31, Saxonwold, 2132 E-mail: journal@saimm.co.za
Telephone (011) 463-7940 . E-mail: barbara@avenue.co.za
ISSN 2225-6253 (print) . ISSN 2411-9717 (online)


SEISMIC ACTIVITY PAPERS
Influence of ground motion model selection on seismic hazard for Johannesburg by B. Manzunzu, R.J. Durrheim, V. Midzi 1
This study investigates the influence of ground motion model (GMM) selection on seismic hazard assessment in the most seismically active regions in South Africa. Mining activities were found to be a major factor contributing to those seismic events. Ten ground motion prediction equations were selected and assessed. The results indicate that the choice of GMPM significantly affects the estimation of seismic hazard levels. GMMs need to be tailored to specific geological and tectonic characteristics.
Automatic data selection, worker exclusion zones and an attempt to identify precursory activity in real time:
Routine and research activities in seismology at Sibanye-Stillwater Ltd by R.I.L. Ferreira, P. Lenegan, R. Masethe ......................................................................... 11
Underground mining in high rock-stress environments can induce unanticipated dynamic rockmass deformation. Data collected by seismic networks are imperative for the design-as-you-mine process. By using the spatial event clusters associated with active workplaces, a problematic subjective component can be eliminated. The application of peak particle velocities (PPV) of past seismicity may prevent production stoppages. A mine-wide array of geophones may not be able to detect higher frequency emissions. However, inexpensive but fit-for-purpose accelerometers are shown to record ‘rock-talk’, leading up to an imminent damaging seismic event.
Macroseismic survey of the ML 4.4, 11 June 2023 Boksburg earthquake by B.S. Zulu, T. Mulabisana, V. Midzi, S. Myendeki, T. Matlou, T. Makhateng, L. Hlatshwayo, H. Mabotja, T. Zulu
The Council for Geoscience (CGS) performed a macroseismic investigation following the occurrence of an earthquake in the Boksburg area on 11 June 2023. The event had a magnitude of ML4.4 and followed strike-slip motion along a northwest-southeast oriented fault. The cluster of past events in that area suggests that there is an active fault. A macroseismic survey was conducted to determine its impact on the community in the region. 153 intensity data points showed high intensity values close to the earthquake source area.
Advanced seismic acquisition techniques in South African mines: Insights from the FUTURE project by M.K Rapetsoa, M.S.D Manzi, M. Sihoyiya, A. Malehmir, I. James, L.V. Socco, J. Lepine, C. Colombero, O. Valeshin, R.J. Durrheim .................................................................................................
In this paper, the FUTURE project undertook detailed surface and underground seismic surveys at the South Deep Gold Mine. Results show the efficacy of these techniques in acquiring high-resolution seismic data. Detailed subsurface geological structures and mineralisation down to 3500 m below ground surface were revealed, while surface data revealed clear seismic reflections corresponding to the Black Reef and Ventersdorp Contact Reef. This study sets a benchmark for future reflection seismic surveys, paving the way for safer, more efficient, deep mineral exploration and extraction practices.
Identification of structures capable of hosting the ML 5.5 Orkney South Africa earthquake and factors controlling the physics and mechanics of dynamic rupture by S.B. Mngadi, M.S.D. Manzi, N.Z. Nkosi, R.J. Durrheim, Jr.H. Ogasawara, Y. Yabe, DSeis team
The largest mining related ML 5.5 earthquake with unusual strike-slip mechanism occurred in the Klerksdorp goldfields at 4.78 km below the surface in 2014. The integration of the legacy 2D reflection seismic data and mine seismicity data indicated a near-vertical structure, striking northnorthwest- southsoutheast (NNW-SSE). It is proposed that the Moab Khotsong M5.5 seismogenic zone is complex and could be controlled by three main processes: a) the complex structural architecture of the seismogenic zone; b) the mechanical process induced by tectonic and/or mining related stresses; and c) the mechanical and chemical processes caused by water and rock interaction.
Using 3D numerical simulations to model active in-mine seismic surveys at South Deep Gold Mine, South Africa by S. Plaatjie, M.S.D. Manzi, L. Linzer, M. Sihoyiya
This study presents results from numerical simulations conducted at South Deep Gold Mine. Active in-mine seismic surveys were used to provide geological structures ahead of the mine face. A finite differencing code known as WAVE3D was applied to model a material’s response to seismic wave propagation The objective was to investigate the wavefield propagation through the rock mass between the mine tunnel and surface. The results were used to constrain the design, and for the acquisition and processing of the real surface and in-mine seismic surveys acquired under the FUTURE project.
Seismicity evolution and rockburst control in the Merensky Reef and UG2 orebody: An intermediate depth platinum mine case study by R.T Masethe, S. Durapraj, U. Maqina, A.C. Adoko
Seismicity and rockburst control within the Merensky Reef and UG2 orebody of an intermediate-depth platinum mine in South Africa’s Bushveld Complex were investigated. Over 1,900 seismic events were recorded revealing complex seismic patterns driven by mining-induced stress changes. The study emphasizes advanced support system redesign and rockburst risk assessment, and highlights the importance of monitoring, geotechnical compliance, and adaptive designs in enhancing safety and reducing seismic hazards in underground mining operations.
19
25
33
43
51

Journal Comment Seismic activity related to mining

This issue focuses on mine seismology, a discipline that has its roots in the South African mining industry. Gold was discovered near present-day Johannesburg in 1886. Mining related seismicity was first encountered in the early 1900s, when extensive stopes, supported solely by small reef pillars, reached depths of several hundred metres. In 1908, -the Government Mining Engineer appointed a committee to “inquire into and report on the origin and effect of the earth tremors experienced in the village of Ophirton” (Report of the 1908 Ophirton Earth Tremors Committee, Witwatersrand Earth Tremors Committee, 1915). The committee concluded that “… under the great weight of the superincumbent mass of rock [...] the pillars are severely strained; that ultimately they partly give way suddenly, and that this relief of strain produces a vibration in the rock which is transmitted to the surface in the form of a more or less severe tremor or shock.” Since then, strenuous efforts have been made to understand the phenomenon of mining induced seismicity, and to mitigate the harm that it causes through damage to mine workings and surface infrastructure, loss of production, and injury to mine workers and the public.
In recent decades, the South African mining industry has made great strides in improving safety. Every death is a tragedy. Nevertheless, we are encouraged that 2022 is the safest year on record, with 49 deaths, compared to a toll of 484 in 1994, with a similar workforce of about 500,000. Provisional figures published by the Ministry of Mineral and Petroleum Resources suggest that 2024 might be even safer. Up until 9 December 2024, 41 lives had been lost and 1746 reportable injuries had occurred, of which 12 of the deaths (29%) and 253 of the injuries (15%) were ‘rock-related’ (i.e. attributed to falls of ground and rockbursts). The rockburst risk has been reduced but not eliminated, requiring further research and better implementation of knowledge and technology. As shallow ore bodies are depleted, the depth of mining is likely to increase and it will become even more important to reduce the risk of rockbursting by managing mining-induced stresses, reinforcing excavations with robust energy-absorbing support elements and systems, and reducing the exposure of mineworkers to hazardous conditions through mechanization and automation.
Not all seismicity related to mining is bad. For example, there are techniques to destress the rock mass and reduce the likelihood of damaging events by releasing stored seismic energy at times and in places where it does not pose a risk. Furthermore, there are mining methods that depend on stress-induced fracturing to break the rock. Here it is important to monitor the progression of the cave front. Seismic energy can also be used to image the rock mass and detect new ore bodies, map extensions to existing ore bodies, and detect structures that might be seismogenic and pose risks, such as faults and dykes. Lastly, deep South African gold mines have provided the stage for pioneering scientific investigations of the physics of earthquakes, the nature of neutrinos, the characteristics of ‘extremophile’ organisms (which could be prototypes of extraterrestrial life), and even the origin of the magnetic field of the Earth and Sun.
The development of knowledge and skill in the field of mine seismology is vital for the wellbeing of the South African mining industry. The papers in this special issue record current efforts by industry practitioners and researchers to ensure that our mines remain efficient while we strive for zero harm.
R.J. Durrheim
President’s Corner

TReigniting the research collaborations in the mining industry: too little, too late?
he global mining industry has experienced unprecedented challenges within the last few years. Some, if not most of the challenges affecting the industry are not new, however, the complexity of the prevailing global economic and geopolitical environments makes their navigation more challenging. Global disruptions such as capital scarcity, volatile commodity prices, climate change, resource and reserve depletion, cybersecurity and technological disruptions, and increasing exploration and operating costs, among others, will continue to significantly impact the profitability and sustainability of mining operations in many jurisdictions. Rapid technological changes will not only require deeper understanding of technological cycles but will also dictate agile adoption and implementation of state-ofthe art technological solutions so as to minimise disruption. The emergence of new value chains driven by the clean energy transition, although presenting a net positive impact to the industry, will continue to create new operational requirements that require a deeper understanding of processes and technologies in order to build economically viable, safe, and socially responsible business models.
Obviously, the Southern African mining industry is not immune to these global challenges and dynamics. However, behind every obstacle lies an opportunity for growth. For example, the mining industry can leverage on the rapid advancements in technology to boost productivity and safety. Collaboration among the key stakeholders in the mining industry, such as leveraging on relationships involving industry, academia, and state-owned research institutions, can also unlock solutions to collective challenges that no one entity in the industry can solve on its own. Although this collaboration can take many forms, the implementation of multidisciplinary strategic research projects and programmes designed to strengthen capacity through postgraduate training and collaborative research programmes can significantly assist the industry to navigate operational challenges and uncertainty. If designed and managed properly, such collaborative platforms can lead to the successful development of new technologies and adoption of agile solutions and postgraduate training programmes that are accessible to all stakeholders in the industry.
Postgraduate training can involve many shapes and forms. Of particular interest, and perhaps the most relevant to the Southern African context, is the implementation of industry-based doctoral training and research programmes. Although the impact of doctoral recipients in most developing economies is a subject of intense debate, there is no doubt that doctoral training programmes create an ecosystem that enhances the capacity to adopt foreign technologies and develop own or endogenous innovations. Industry-focused doctoral training programmes (simply referred to as industry PhDs) are increasingly becoming popular globally. Such training programmes tend to be more practice oriented and are structured to allow the generation and application of advanced knowledge and skills directly in professional settings. In this case, the training programmes are designed to solve real-world problems faced by the mining industry and are carried out in close collaboration involving industry partners as the potential end-users of the solutions. The conception and development of research solutions in situ naturally increase the chances of developing new technologies, products, and processes that are relevant to the market.
Industry PhD training programmes can have a long-term net positive impact on the competitiveness of the mining industry by providing the flexibility to solve common challenges that no single entity has the capacity to solve on their own. Mining companies and/or service providers can have access to fresh
President’s Corner (continued)
perspectives from other research partners and gain timely access to cutting edge research results, thereby reducing the risks and time to implementation. The ability to share resources, infrastructure, and access to intra- and multi-disciplinary expertise increases the ability to develop robust solutions to the challenges faced by industry. The training programmes also present unparalleled benefits to researchers and doctoral students alike. In addition to providing access to shared research facilities and industry expertise, industry PhD training programmes provide the researchers with the opportunity to conduct relevant research that solves industry problems through an authentic community of practice. The ability to obtain hands-on research experience in an industry setting, including opportunities for secondment, also broadens career and employment opportunities for the doctoral recipients.
Although the benefits of proposed collaborative research programmes are obvious, the implementation can be challenging due to the need to address the myriad funding and legal issues. One typical approach to navigate the legal complexities, such as those of IP ownership, is to focus on non-IP specific research projects and topics designed to generate and disseminate knowledge in open access platforms. The implementation can be achieved by establishing a research advisory committee representing the various stakeholders, networks, and/or segments to identify the key industry challenges, conceptualize common and cross-cutting research topics, and to align and drive common purpose and strategic objectives. The role of the advisory committee also includes defining and establishing a clear and robust legal and governance framework to manage complex Research and Development contracts, including implementing a robust and yet flexible IP governance structure through collaborative research agreements. In addition to a well-structured legal framework to guide the strategic partnerships arising therefrom, it is also crucial to develop and sustain trust and interpersonal relationships among the key stakeholders. For state-owned research and academic institutions, developing and implementing the right policy levers are also critical success variables.
In conclusion, as the mining industry continues to face existential challenges, it is futile to assume that there can be a single entity that can solve such challenges on its own. Although there is no quintessential solution to the quantum and complex nature of some of the challenges, collaboration through industrybased doctoral training programmes can have sustained impact on the sector and broader economy. Research collaboration is a complex endeavour and, for this reason, the implementation thereof requires a collective approach by all the stakeholders.
E. Matinde President, SAIMM

Affiliation:
1National University of Science and Technology, Zimbabwe
2School of Geosciences, University of the Witwatersrand, South Africa
3Council for Geosciences, South Africa
Correspondence to:
B. Manzunzu
Email: brassnavy.manzunzu@nust.ac.zw
Dates:
Received: 13 May 2024
Revised: 30 Nov. 2024
Accepted: 9 Dec. 2024
Published: January 2025
How to cite:
Manzunzu, B., Durrheim, R.J., Midzi, V. 2025. Influence of ground motion model selection on seismic hazard for Johannesburg. Journal of the Southern African Institute of Mining and Metallurgy, vol. 125, no. 1, pp. 1–10
DOI ID:
http://dx.doi.org/10.17159/24119717/3430/2025
ORCiD:
B. Manzunzu
http://orcid.org/0000-0003-1903-4190
R.J. Durrheim
http://orcid.org/0000-0003-3832-0600
V. Midzi
http://orcid.org/0000-0003-4351-2797
Influence of ground motion model selection on seismic hazard for Johannesburg
by B. Manzunzu1,2, R.J. Durrheim2, V. Midzi3
Abstract
Selecting ground motion prediction models (GMPM) is crucial in assessing seismic hazard levels in a specific region. This study investigates the influence of ground motion model (GMM) selection on seismic hazard assessment in Johannesburg, South Africa. Most seismic events affecting Johannesburg are related to mining activities and water ingress into the underground mine voids. The most seismically active regions in South Africa include areas around Klerksdorp, Welkom, and Carletonville. These regions experience a significant number of earthquakes, with mining activities being a major factor contributing to seismic events. Ten ground motion prediction equations were selected from regions of similar tectonics setting and were assessed to see if they correspond to the available local data. Six of these were also compared to the ground motions produced by the earthquake of 14 August 2014, which occurred in the Orkney area, one of the mining areas in South Africa. Sensitivity analyses were also carried out to assess the influence of ground motion prediction equations (GMPE) on the seismic hazard of Johannesburg. The results indicate that the choice of GMPM significantly affects the estimation of seismic hazard levels in Johannesburg. Different GMM can lead to varying ground shaking intensity predictions, impacting risk assessments and engineering design considerations. The findings highlight the importance of carefully selecting appropriate GMM tailored to Johannesburg’s specific geological and tectonic characteristics. Understanding how different models perform in this region is essential for accurate seismic risk mitigation strategies.
Keywords
seismic hazard assessment, ground motion prediction equations, sensitivity analysis, Johannesburg
Introduction
The ground motion model predicts the distribution of expected ground motions conditional on the occurrence of a given earthquake scenario. Selecting an appropriate ground motion model is a critical aspect of seismic hazard analysis (SHA). Ground motion prediction equations (GMPE) establish a relationship between a ground motion parameter, such as peak ground acceleration (PGA), peak ground velocity (PGV), peak spectral acceleration (PSA), and a series of explanatory variables that describe the earthquake source, wave propagation path, and local soil conditions (Douglas, 2003; Stewart et al., 2015; Akkar et al., 2014). The importance of PGA and various PSA lies in their significance as critical parameters for assessing seismic risk and designing earthquake-resistant structures. PGA measures the maximum acceleration of ground motion during an earthquake, while PSA indicates the maximum acceleration at specific frequencies. These parameters are essential for evaluating how structures respond to seismic events, as different structures have distinct natural frequencies. Every SHA analysis must include a GMPE that accurately models the transmission of ground motion from the earthquake source to the site.
Ideally, it is preferable to use a GMPE derived from local data, but this is only possible in regions of dense station coverage and high seismicity, such as Japan or California (Douglas et al., 2011; Bommer et al., 2015a). In South Africa, the only accelerometric stations installed are in the cluster networks in the mining regions. These stations have been in operation since 2012, and the existing ground motion record dataset does not enable users to derive such a model due to the lack of strong motion earthquakes (Grobbelaar et al., 2017). Although several moderate seismic events (e.g., the December 1976 M5.2 Welkom event, the April 1977 M5.2 Klerksdorp, and the 2005 M5.3 Stilfontein event) have been recorded in South Africa, these were not captured by the accelerometers for them to be used in developing GMPE (Fernandez and Van der Heever, 1985; Durrheim et al., 2006). Although the 1976 event was recorded on accelerometers,
Influence of ground motion model selection on seismic hazard for Johannesburg
we only had access to the recorded data, apart from that quoted in Fernandez and Van der Heever (1985). In this regard, models from other regions are carefully selected and tested to determine if they fit appropriately with the local data. In actual use in hazard analysis, a ground motion model will be called upon to predict accelerations from the complete range of magnitude and distance scenarios (Shoja-Taheri et al., 2010; Stewart et al., 2015; Midzi et al., 2020). A model that is derived from a dataset that only covers part of this range may not be reliable. This is mainly a problem because the datasets frequently tend to be biased towards small earthquakes at short distances and large earthquakes at long distances (Musson and Sargeant, 2007). This can result in scaling issues when ground motions need to be calculated for parts of the dataset's magnitudedistance domain that require more accurate representation. Otherwise, one must adopt either a relationship in which local data is augmented with data from a broader region or a relationship from anywhere in the world that is considered to be tectonically similar (Cotton et al., 2006; Bommer et al., 2015a; Midzi et al., 2020).
The procedure for selecting the appropriate GMPE for use in the seismic hazard assessment has been well-documented by several authors (Cotton et al., 2006; Scherbaum et al., 2009; Bommer et al., 2010). This process should result in the miniature set of independent models that capture the expected range of possible ground motions in the target region (Cotton et al., 2006). This most miniature set of GMPE will be compared with local data to verify if it capture the local data’s uncertainty. Many studies have been devoted in recent years to evaluating the performance and reliability of the GMPE (Cotton et al., 2006; 2008; Shoja-Taheri et al., 2010; Bommer et al., 2003; 2011). Among those, Cotton et al. (2008) investigated the consequences of using them outside their range of validity. It is often the case when predicting spectral ordinates from earthquakes of small-to-moderate magnitude, for which the observed spectral values are systematically smaller. The problem arises because of the scarcity of strong motion data that are necessary to definitively resolve the shape of the attenuation curve. The uncertainty in the selection process is represented in the branches of the logic tree and weighted according to the analyst’s relative confidence (Bommer et al., 2005) or degree of belief using available information.
Identification and testing of suitable ground motion prediction equations for Johannesburg
Given its position relative to plate boundaries, relatively low earthquake activity, and the slow rate of crustal deformation, South Africa is generally considered a stable continental region (SCR). According to Malservisi et al. (2013) and Stamps et al. (2018), South Africa’s deformation rates are less than 1mm yearly. Therefore, an analogy for this region would be an SCR such as Eastern North America (ENA) and Australia, for which several ground motion models are available. Unlike ENA, however, the current tectonic regime of the southern African region (mainly along the eastern parts) shows evidence of extensional tectonic stresses with dominant normal faulting (Hartnady, 2002; Stamps et al., 2018; Manzunzu et al., 2019; Midzi et al., 2020). Studies by Johnston et al. (1994) show that extensional tectonic stresses are uncommon within SCR, so alternative GMPE from active shallow crust can be selected. Ninety percent of seismicity in South Africa comes from the mining regions, thus motivating for us to identify and select suitable GMPE, preferably derived from induced seismicity. Ground motions from induced seismicity are characterised by high frequencies, which tend to attenuate faster than natural tectonic events (McGarr and Fletcher, 2005; Manzunzu et al., 2017; Zulu, 2018).
Ten pre-selected GMPE from the three tectonic regions mentioned, i.e., SCR, shallow active crusts (SAC), and induced seismicity regions (ISR), were tested on how well they predict ground motion in South Africa using local data for different spectral periods. The information for each GMPE is presented in Table 1. The method of Scherbaum et al. (2004) was applied in order to rank these 10 GMPE. This method is based on a transparent and data-driven process that quantifies the model fit and measures how well the underlying model assumptions are met. Several GMPE in literature were derived from induced seismic events. However, only one, i.e., the relation by McGarr and Fletcher, (2005) is derived explicitly from mining-related events. Most of the other GMPE were derived from geothermal or fracking events. However, the McGarr and Fletcher (2005) relation has been observed to grossly underpredict ground motion for events of MW > 5.0 and distances larger than 10 km (Zulu, 2018). Most GMPE derived from induced seismicity were derived for only one spectral period, i.e., peak ground acceleration (PGA). At the same time, in this study, we needed GMPE that catered for other spectral periods. Hence, they were not tested in this study. The only GMPE from induced seismicity applied in this study was developed by Atkinson (2015) for geothermal sources for spectral periods up to 2 seconds.
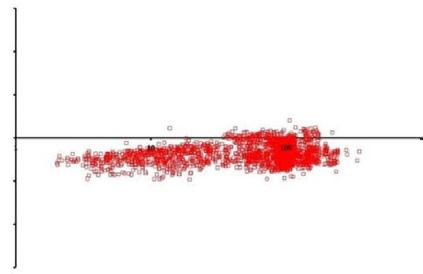
A database of 61 seismic events (Figure 1) was compiled from the South African mining Cluster Networks for use in the testing of the GMPE. Our dataset is mainly composed of mining-related events. However, according to Douglas et al. (2013) and Atkinson (2015), ground motion from natural and induced sources are indistinguishable. Therefore, we also included GMPE derived from natural earthquake sources in this study.
Only events with good waveform data regarding signal-to-noise ratio and recorded by at least five stations were included. These contributed 2 018 two-component horizontal acceleration time series within a hypocentral distance range of 0.8 km to 350 km. The magnitude of the events ranged from 3.0 to 5.5. The various magnitude ranges of the events and the number of records associated with each listed magnitude value are presented in Table 2. Hypocentral distance was taken as the distance metric for all comparisons in place of rupture distance. Due to the moderate magnitudes of all earthquakes and shallow depth, the assumption of equality between hypocentral and rupture distance is inferred (Gupta, 2006).
No field investigations were carried out to determine the site conditions at all the seismic stations. Instead, we estimated values based on the surface geology where the stations are located. Given the need for more detailed geological information at all the seismic stations, five site classes based on the National Earthquake Hazards Reduction Program (NEHRP) (FEMA, 2003) site classification were used. The NEHRP site classification forms one of the standard site classifications used in GMPEs (Table 3). The NEHRP site classes are used to categorise sites based on their seismic amplification potential. Vs30, representing the average shear-wave velocity to a depth of 30 meters, is a crucial parameter in determining these classes. The Vs30 values indicate how the ground will respond to seismic waves, with lower Vs30 values typically associated with higher shaking amplification during earthquakes.
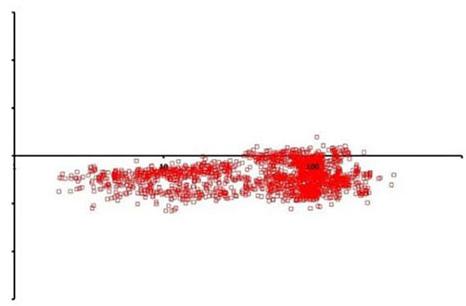
Most of the stations are located on soft rock (Site Class B), followed by stiff rock (Site Class C). This is illustrated clearly in Figure 2, which demonstrates the distribution of earthquake magnitude with hypocentral distance, where each record is linked to the appropriate site conditions.
Influence of ground motion model selection on seismic hazard for Johannesburg
Table 1
GMPE preselected from different tectonic settings to be used in this study, including the regions (SCR, SAC, and ISR) for which they were developed
1 Boore and Atkinson (2008) as modified by Atkinson and Boore (2011)
2 Atkinson and Boore (2006) as modified by Atkinson and Boore (2011)
3 Campbell (2003)
4 Rietbrock et al., (2013) Stochastic model for United Kingdom (SCR)
5 Frankel et al. (1996) as parameterised by EPRI (2004)
6 Akkar et al., (2014) Europe and Middle East (SAC)
7 Silva et al. (2002) Stochastic model for Eastern North America (SCR)
8 Pezeshk et al. (2011) Hybrid model for Eastern North America (SCR)
9 Toro et al. (1997) modified by Toro (2002) Stochastic model for Eastern North America (SCR)
10 Atkinson (2015) Small to medium events at short distance (ISR)
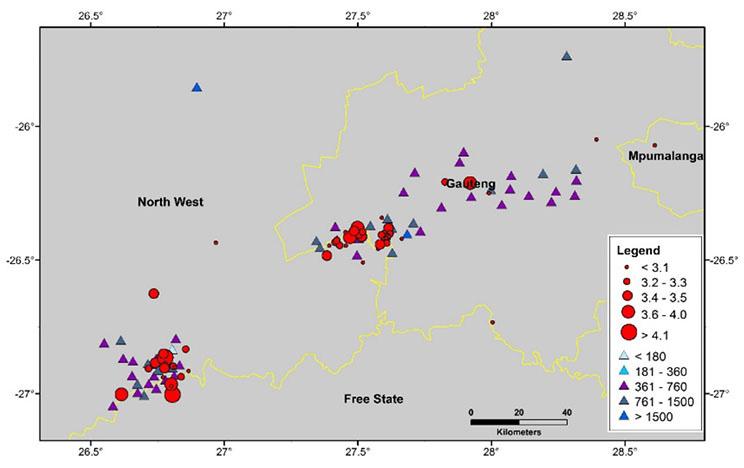
Figure 1—Location of earthquakes used in the testing of GMPE. The figure demonstrates the spatial distribution of the seismic events and the stations. Triangles represent the stations recording the events with each station having a Vs30 value indicated with the colour; circles are the seismic events
The comparison of observed and calculated ground motion is carried out by calculating residuals. Residuals are generally defined as the difference between the natural logarithm of the observed parameter (Yij) and the mean calculated parameters (Ŷ) for a given GMPE, as given by Equation 1 (Shoja-Taheri et al., 2010; Skarlatoudis, 2017). For each observed waveform, the ground motion parameters are extracted at different spectral periods. Each ground motion parameter is compared with predicted ground motion by each individual GMPE at different spectral periods to compute the required residuals.
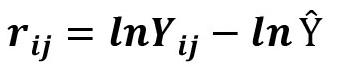
[1]
where lnYij is the value of the jth record of the ith event and lnŶ is the mean value of lnY computed using a particular GMPE. The results of the comparison were presented by considering intraevent and inter-event residuals, which are all usually close to zero and represent the residuals related to each individual source and to combined sources, respectively. The intra-event terms presented here were obtained using the whole database of events for all available hypocentral distances in a similar way as reported by Graves et al. (2008). The two residuals are given by Equations, 2 and 3.
Influence of ground motion model selection on seismic hazard for Johannesburg
Table 2
Number of events and recordings in different magnitude range showing the distance range of the recording stations
Table 3
NEHRP site classification scheme (FEMA, 2003). Vs30 is the shear-wave velocity averaged over the uppermost 30 m Site Class Geologic description Vs30 (m/s)
A Hard rock Vs30 > 1500
B Soft rock 760 < Vs30 ≤ 1500
C Stiff soil 360 < Vs30 ≤ 760
D Soft soil
E Very soft soil Vs30 ≤ 180
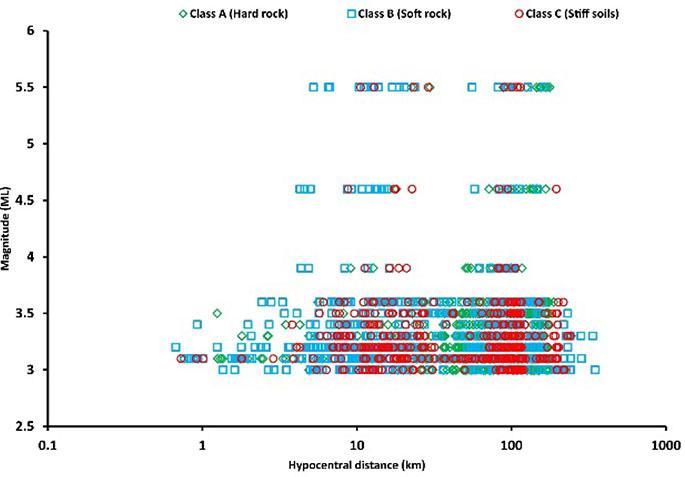
Figure 2—Illustration of site classification of the seismic station records representing different site classes based on NEHRP site classification
[3]
where Ne is the total number of events. The mean of the residuals for the ith event with Ni records is defined as presented in Equation 4:
[4]
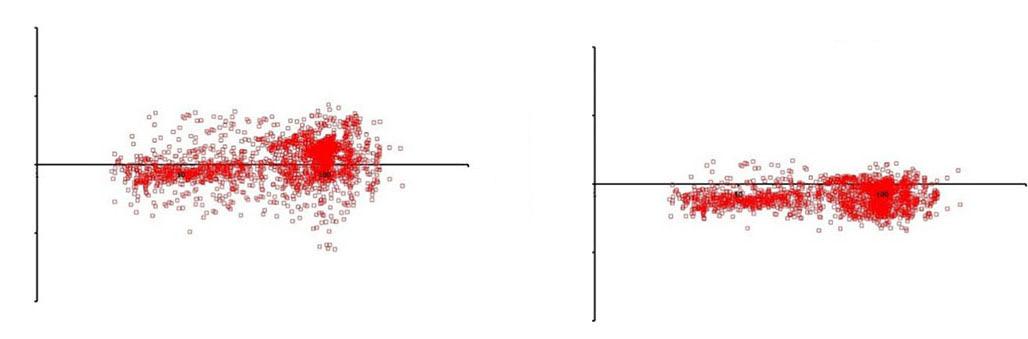
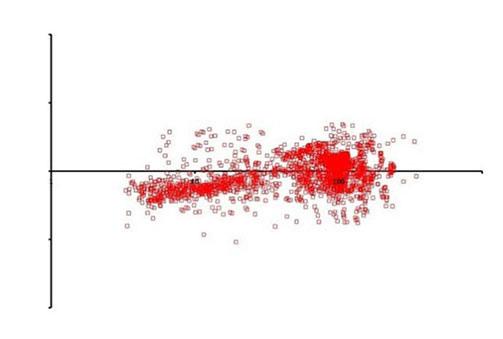
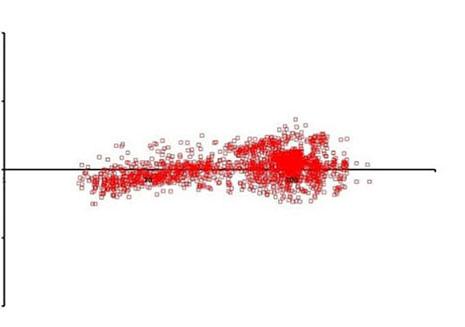
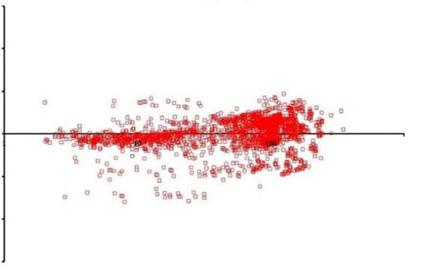
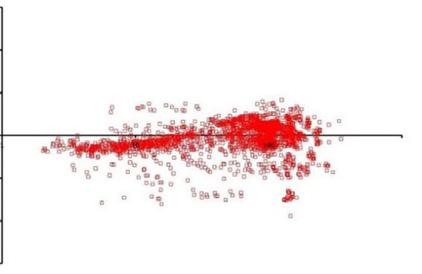
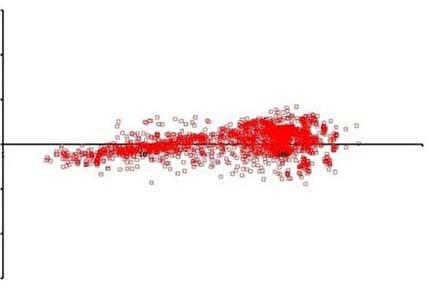
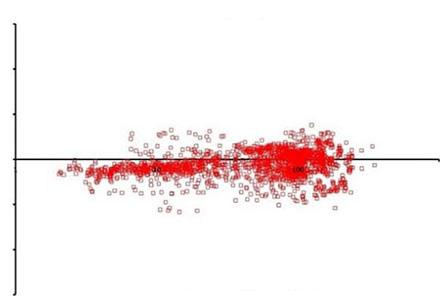
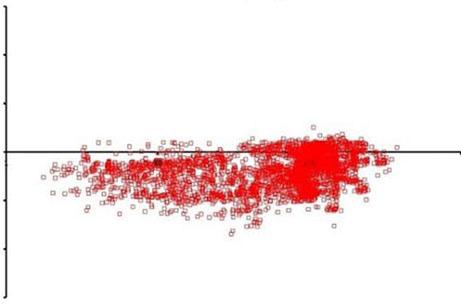
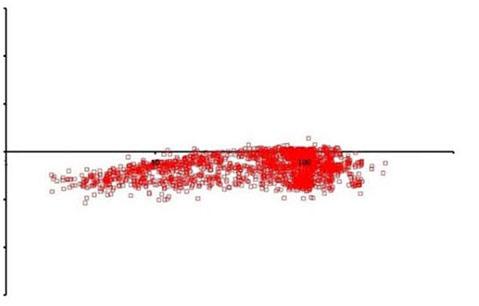
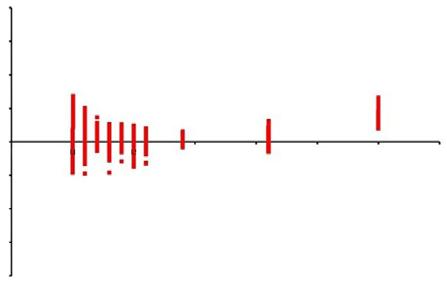
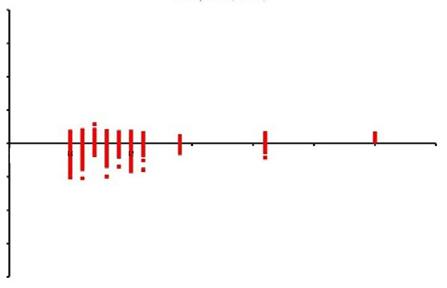
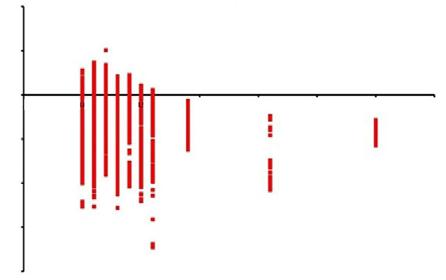
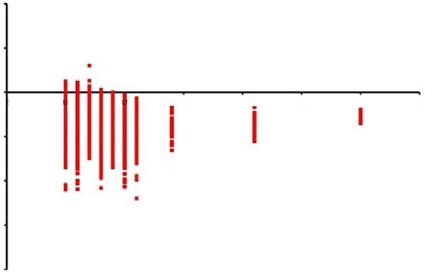
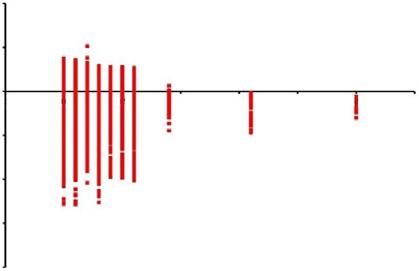
For each GMPE, the residuals were calculated for 5% damped pseudo spectral acceleration for periods 0.0s (PGA), 0.1s, and 2.0s. In the following section, the results are presented by considering the figures related to the residuals (Equations 2 and 3). Figure 3, Figure 4, and Figure 5 show inter-event residuals for the preselected GMPE (Table 1) and tested with observed data in this investigation for the three spectral periods (PGA, PSA = 0.15s, and PSA = 2.0s).
The inter-event terms show similar variation with distance for most of the equations. For most GMPE, the residuals are negative, with the lowest at about -0.01 and smaller at long periods, where residuals are less than -0.005 (and 0.005 where positive) for periods
Rietbrock et al. (2013)
and Boore (2006)
distance (km)
j. Toro et al. (2002)
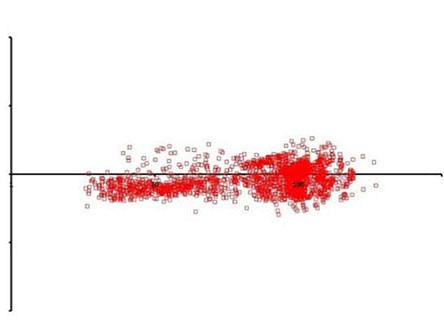
Figure 3—The inter-event residuals of all GMPE for PGA (T = 0.01s) spectral acceleration versus hypocentral distance
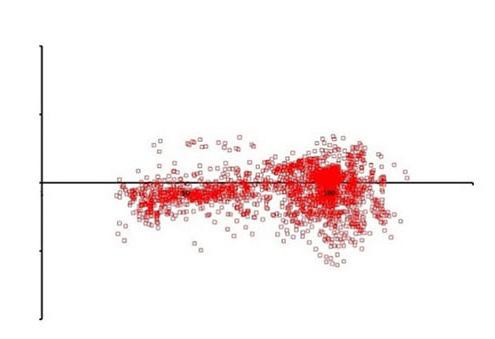
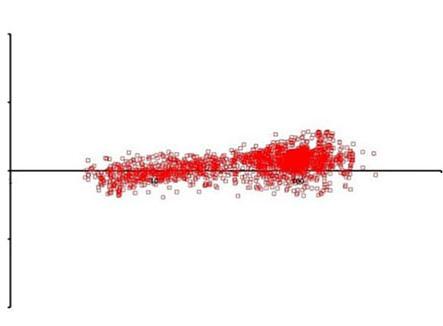
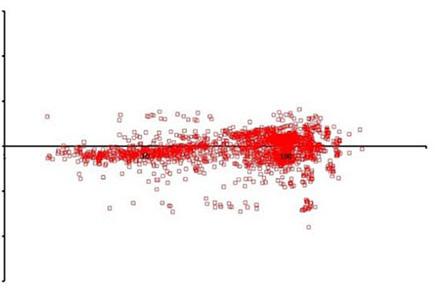
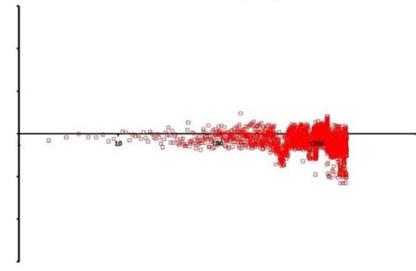
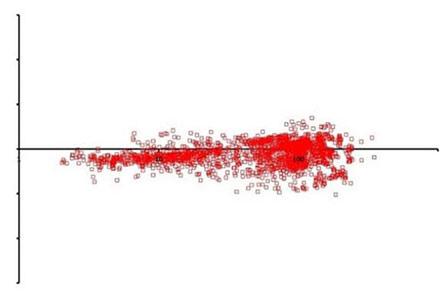
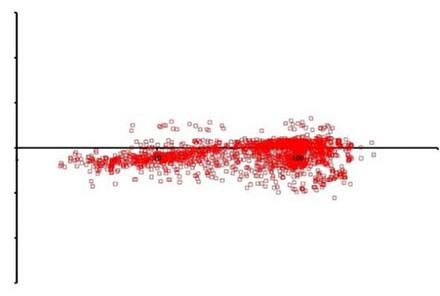
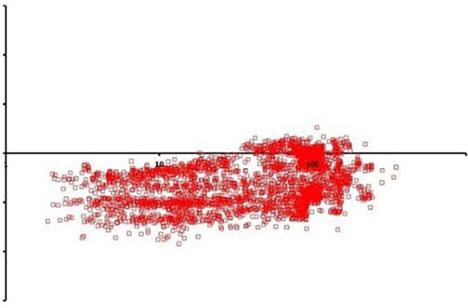
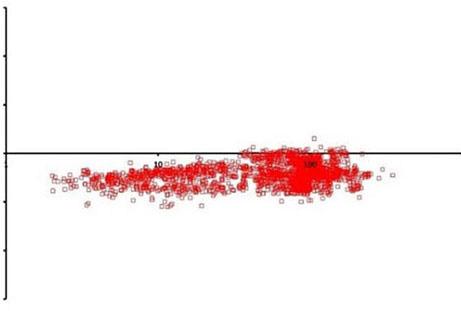
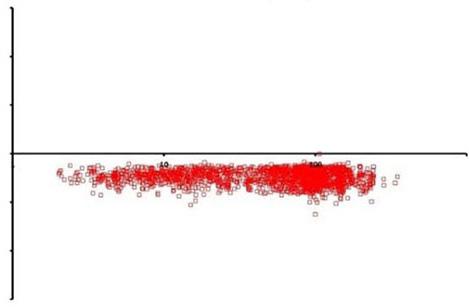
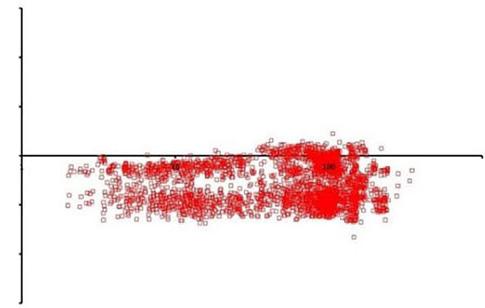
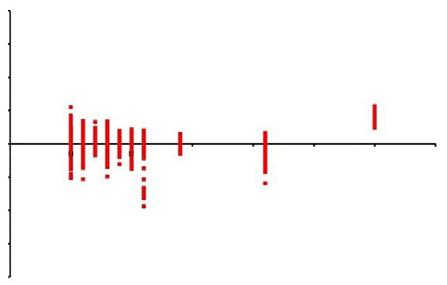
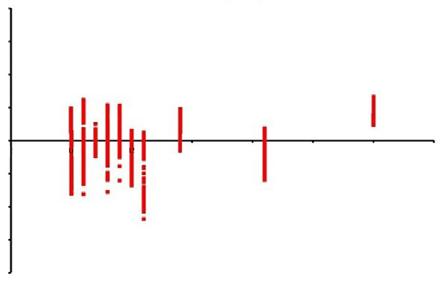
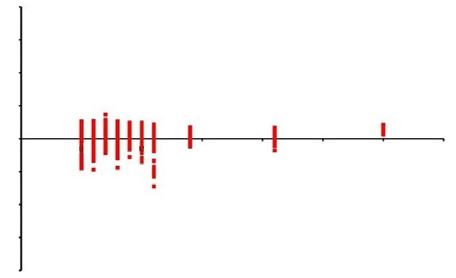
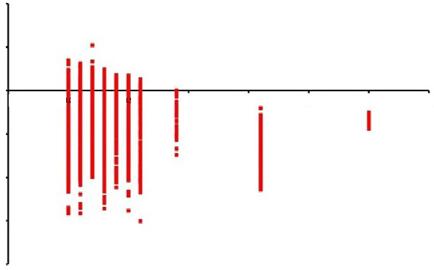
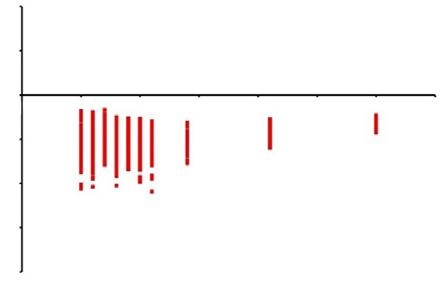
greater than 1.0 seconds. The inter-event residual distribution implies that most of the models, in particular Rietbrock et al. (2013), Campbell (2003), Atkinson (2015), and Toro (2002), overestimate the observed ground motion. The residuals for PGA are large for Silva et al. (2003), Pezeshk et al. (2011), Frankel et al. (1994), and Atkinson and Boore (2006) GMPE (Figure 3). For spectral period T = 0.15s, Atkinson (2015), Akkar et al. (2014), Campbell (2003), Rietbrock et al. (2013 and Pezeshk et al. (2011) GMPE have negative residual values, while Boore and Atkinson (2008) and Atkinson and Boore (2006) have positive values (Figure 4). All GMPE slightly overestimate with distribution very close to the zero-residual line (Figure 5).
Influence of ground motion model selection on seismic hazard for Johannesburg
a. Silva et al. (2003)
c. Pezeshk et al. (2011)
e. Atkinson (2015)
b. Rietbrock et al. (2013)
Boore and
(2008)
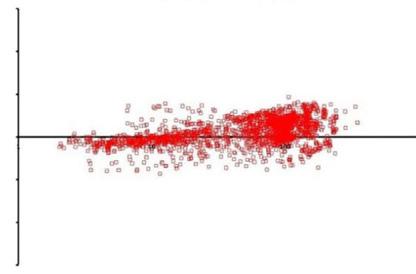
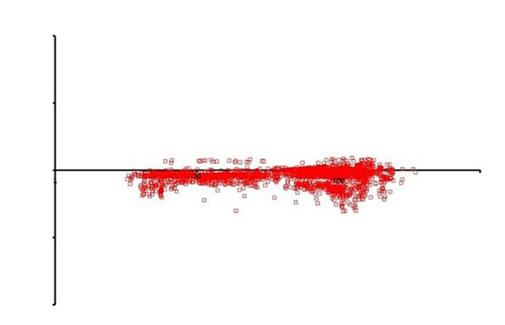
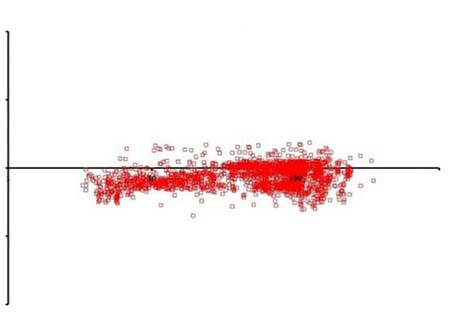
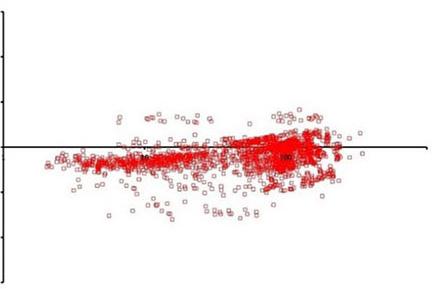
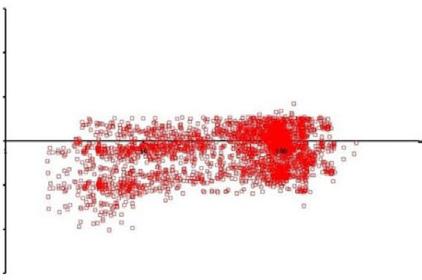
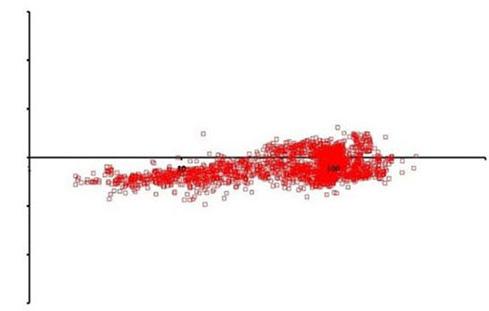
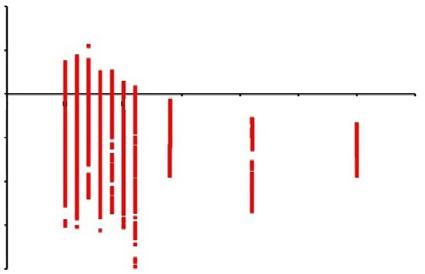
Analysis of intra-event residuals shows larger residuals (between -0.2 to 0.2) compared to inter-event residuals (Figure 6, Figure 7, and Figure 8). High scattering at low magnitudes is consistently observed for all the spectral periods. The scattering improves at high magnitudes but changes from positive to negative residuals with increasing periods. Large residual values seen in Figure 6 and Figure 7 might be due to the use of GMPE outside their range of applicability. Silva et al. (2003), Rietbrock et al. (2013), Frankel et al. (1994), and Atkinson (2015) have large scatter for PGA compared to other GMPE. The scatter is more significant for small-magnitude events than for moderate ones. For the spectral period T = 0.15s, all the GMPE had residuals of less than 0.1, although they seemed to follow the trend of PGA. At spectral period 2.0s, the residuals are lower than ± 0.05, although they seem more negative.
Negative residuals are obtained where the GMPE overestimate the ground motion and underestimate where they are positive. In general, all the GMPE overestimate the ground motion parameters. Using these GMPE will result in hazard values that are slightly higher than observed values. Much of the observed scatter is at lower magnitudes and larger distances, meaning small events recorded at longer hypocentral distances resulted in large errors. Mining-related seismicity attenuates fast, and with increasing
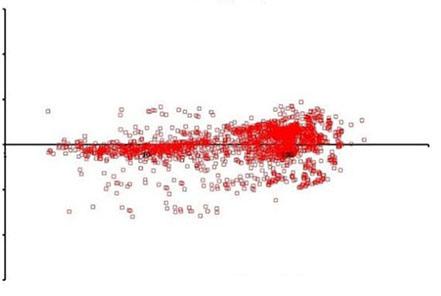
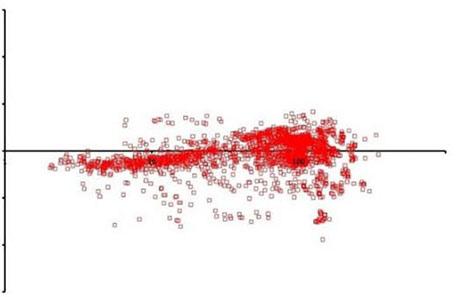
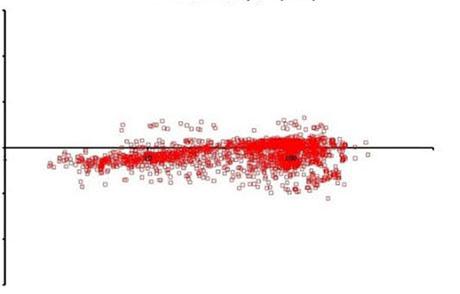
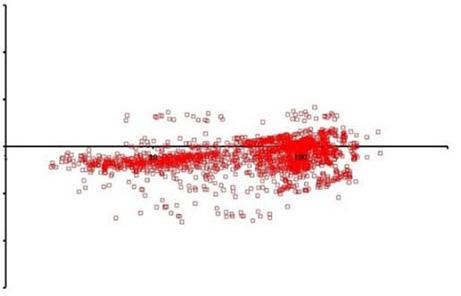

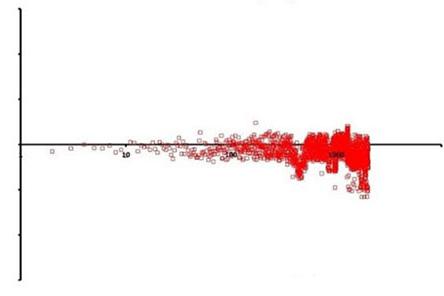
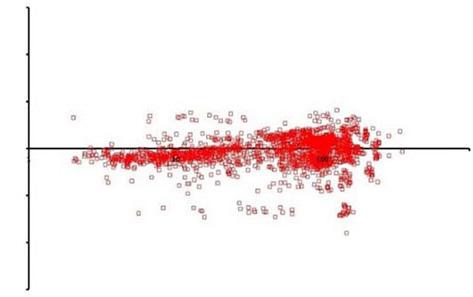
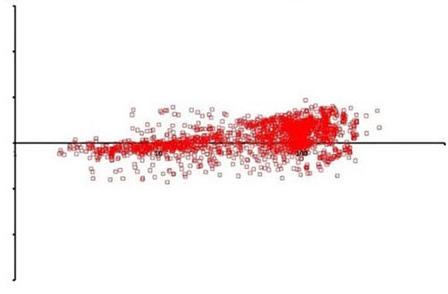
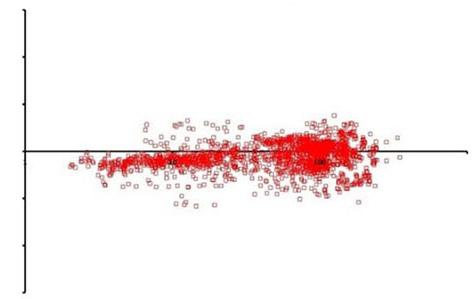
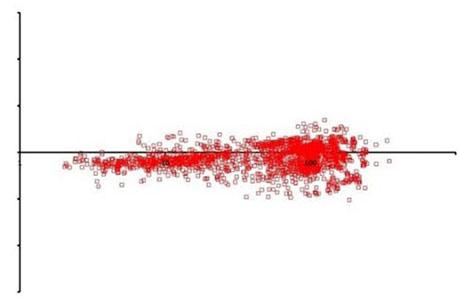
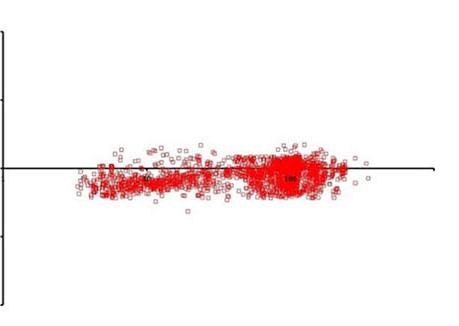
Figure 5—The inter-event residuals of all GMPE for PGA (T = 2.0s) versus hypocentral distance
hypocentral distance can also contributed to this. The selected GMPE cover a large spectrum and will represent the uncertainty in GMPE for our region.
Large variations of the residuals are observed for the Atkinson and Boore (2006) model, which appears to underestimate ground motion at short periods but overestimates at long periods at all distances. Considering the trends observed, the models by Campbell (2003), Toro et al. (2002), Boore and Atkinson (2008), Akkar et al. (2014), Rietbrock et al. (2013), and Atkinson and Boore (2006) consistently appear to match observed data better than the other GMPE. Akkar et al. (2014) over predicts for all spectral periods. Pezeshk et al. (2011), tend to over predict for short periods and under predict for longer periods. Variations in residuals might be because the GMPE were used outside their derived magnitude range since most of the events used in this study fall outside the applicability range of most GMPE. Only the Atkinson (2015) model for induced seismicity was derived for short distances (less than 40 km) and can only be used for induced seismic sources.
Comparison of the Orkney earthquake strong-motion data with preselected GMPE
The strike-slip MW 5.5 Orkney earthquake of 5 August 2014,
Figure 4—The inter-event residuals of all GMPE for PSA (T = 0.15s) versus hypocentral distance
Influence of ground motion model selection on seismic hazard for Johannesburg
a. Silva et al. (2002)
c. Pezeshk et al. (2011)
Rietbrock et al. (2013)
which occurred in the North West province, South Africa, at approximately 10:22 GMT, was recorded by the SANSN and the cluster network in the mining regions. This earthquake falls within the range of magnitude values used in deriving most of the preselected GMPE. Thus, we separately compared its observed ground motion parameters, as recorded by the cluster network of stations, to the predicted values. In Figure 9 we compare the predictions of the ten GMPE preselected for this study to the observations. Rietbrock et al. (2013) and Akkar et al. (2014) predictions fit the data on all the spectral periods analysed, while Atkinson (2015) overpredicts all the spectral periods. Due to its short distance of applicability, the Atkinson (2015) model was not used for further analysis. Toro et al. (2002) and Campbell (2003) mainly overestimate most spectral periods whilst fitting well on others. Silva et al. (2002) and Pezeshk et al. (2011) mainly underestimate ground motion although they sometimes overestimate it. Atkinson and Boore (2006) sometimes overestimate (lower spectral periods <0.1 sec) and sometimes fit the observations well (high spectral periods > 0.1 sec). Boore and Atkinson (2008) fit well up to spectral periods of 0.5 seconds, then it overestimates. For PGA, most of the GMPE overestimate the observed ground motion, except for Rietbrock et al. (2013) and Akkar et al. (2014), which fit well with the data, while Pezeshk et al. (2011) predict lower values. For 0.05
Pezeshk et al. (2011)
Rietbrock et al. (2013)
(1997)
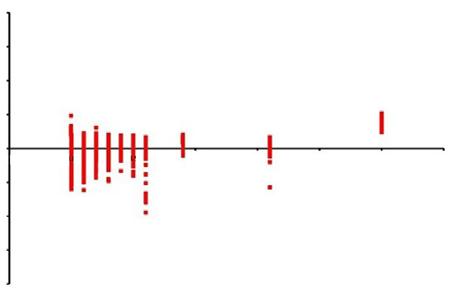
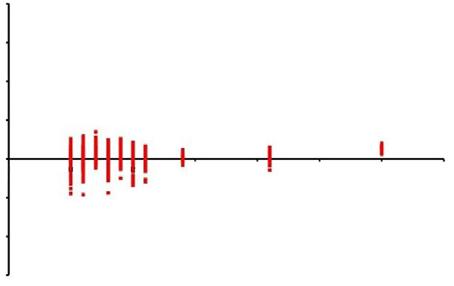
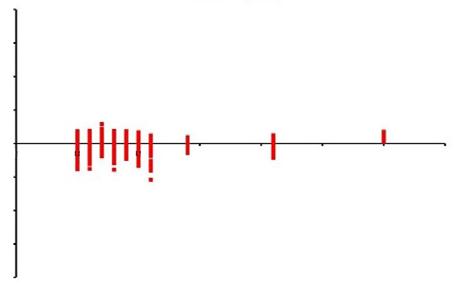
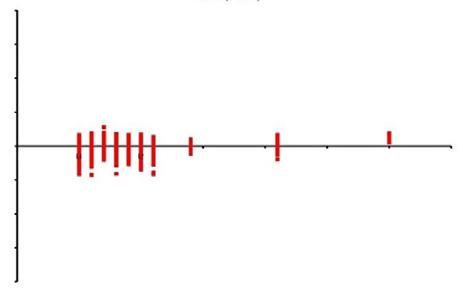
Figure 7—Inter-event terms, also referred to as the mean residual, for the 10 GMPE T = 0.15s spectral period
seconds, Rietbrock et al. (2013), Akkar et al. (2013), and Boore and Atkinson (2008) fit the data while the rest of the GMPE overpredict. It is apparent from these results that the shape of attenuation curves of only one model cannot capture the real behaviour of the data. Therefore, six GMPE were selected to cover the lower (Toro et al., 2002; Boore and Atkinson, 2008), median (Akkar et al., 2014; Rietbrock et al., 2013), and upper range (Campbell, 2003; Atkinson and Boore, 2006) of the ground motion in order to capture the uncertainty associated with GMPE selection. These six GMPE were then used for sensitivity analysis.
Uncertainty analysis related to ground motion prediction equations
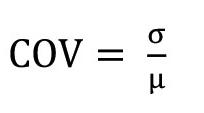
The six GMPE (AB06, BA08, AKETAL14, TO02, RIETAL13, and CAM03) selected by comparing with local data were used in this study to demonstrate the effect of choice of the model on the hazard results. The analyses are conducted for six cases, each corresponding to a different GMPE, to illustrate the effect of the chosen GMPE. The sensitivity of the output to variations in the input parameters is quantified using the coefficient of variation (COV), where COV is a measure of relative variability and is related to both the standard deviation (σ) and the mean (μ) through the equation by Cramer (2001a; 2001b; 2002).
Figure 6—Inter-event terms, also referred to as the mean residual, for the 10 GMPE for PGA
Influence of ground motion model selection on seismic hazard for Johannesburg
Silva et al. (2002)
Pezeshk et al. (2011)
Rietbrock et al. (2013)
Frankel et al (1996)
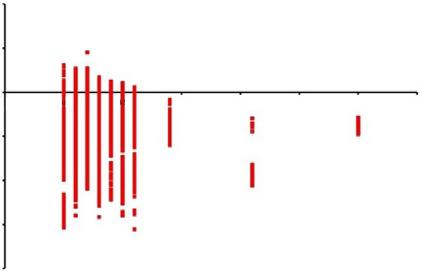
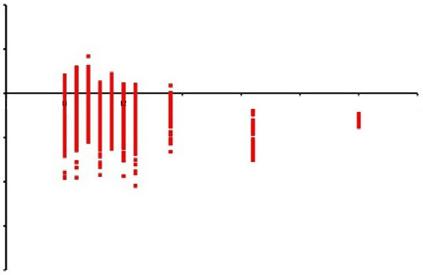
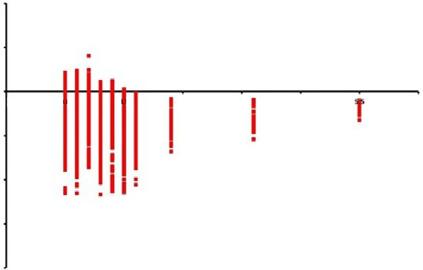
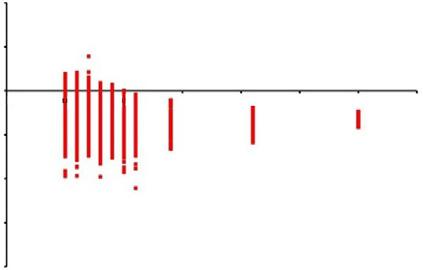
Figure 8—Inter-event terms, also referred to as the mean residual, for the 10 GMPE for T = 2.0s spectral period
COV is a standardised, unitless measure that compares variability between dissimilar groups and characteristics. A small COV value indicates that the variation in the related parameter does not show large variation in output, while a large COV indicates that the output is susceptible to variations in the parameter under investigation (Gomez and Gomez, 1984; Cramer, 2002; Campbell et al., 2010).
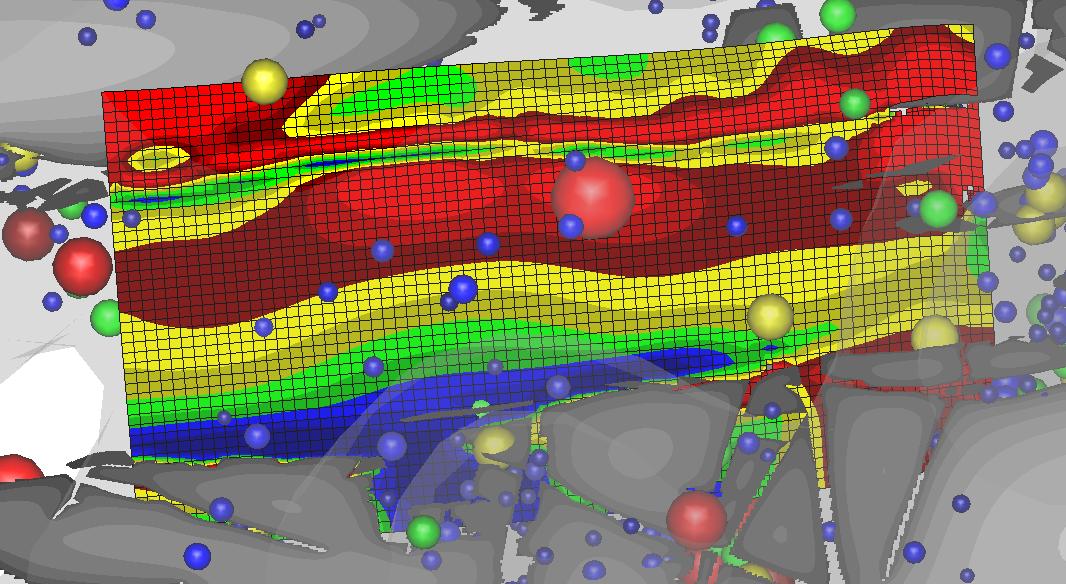
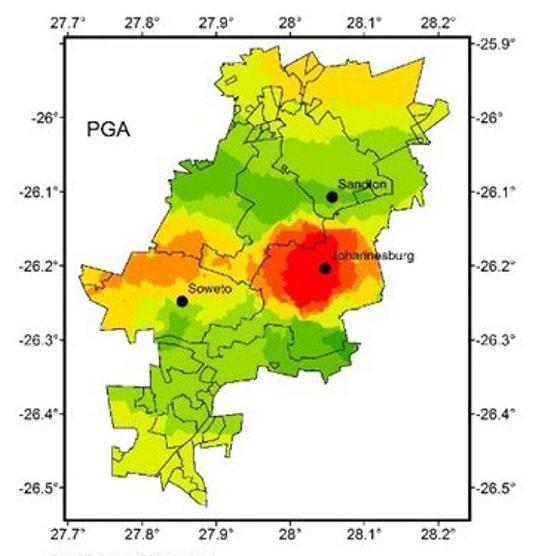
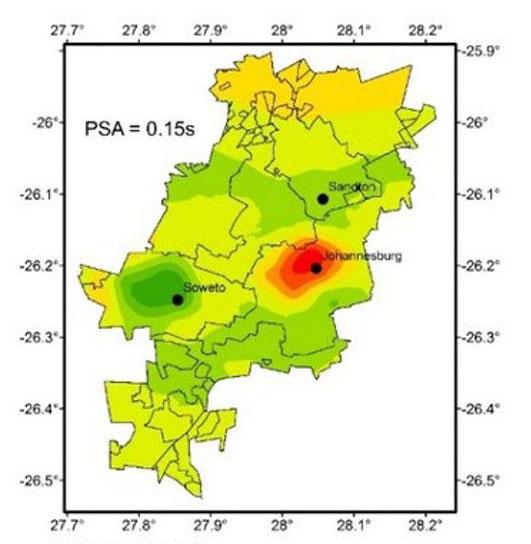
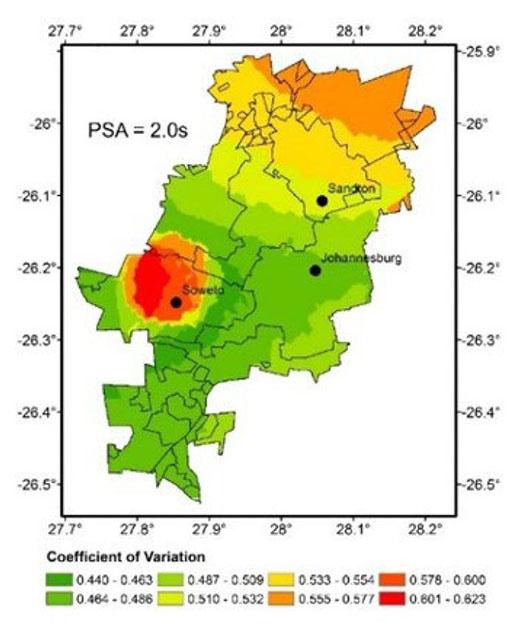
COV results show high values (> 0.3) that indicate large variability in the results (Figure 10). Spatial distribution of the COV values is significantly different for the three spectral periods. High COV values were observed in the central areas for PGA, which decreases north and southwards. For PSA = 0.15s, high COV values are found in the eastern side around Johannesburg CBD while for PSA = 2.0s they are on the west in Soweto. These high COV values for GMPE show that this is an important parameter of which its selection has significant influence on the hazard. Given the uncertainty in the hazard linked to the GMPE, it is necessary that a range of models that cover the epistemic uncertainty associated with the models be selected.
Conclusions
Selecting appropriate GMPE requires a thorough evaluation of local model quality, compatibility with observed data, and consideration of epistemic uncertainties in ground motion prediction. Given the complexity of the seismotectonic setting in the study area, GMPE from various tectonic regimes were chosen for the seismic hazard analysis. To minimise uncertainty in the selection process, ten GMPE were identified and compared with local ground motion data, from which a set of GMPE was selected that best fits the data for the region. Six of these GMPE (Boore and Atkinson, 2008; Campbell, 2003; Akkar et al., 2014; Toro et al., 2002; Rietbrock et al., 2013; and Atkinson and Boore, 2006) were chosen to represent epistemic uncertainty. A sensitivity analysis was conducted to evaluate the impact of GMPE selection on the final hazard estimate.
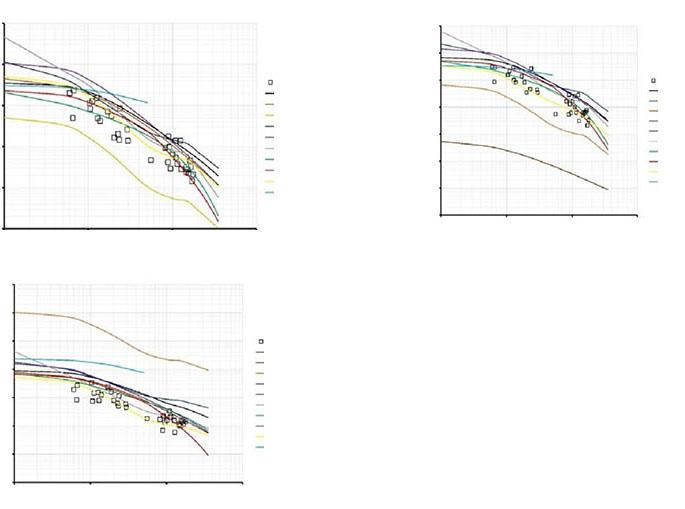
Figure 9—Comparison between the spectral accelerations at three spectral periods recorded during the 2014 Orkney earthquake of magnitude
and the predictions obtained with ten preselected GMPE
Influence of ground motion model selection on seismic hazard for Johannesburg
GMPE based on induced seismicity were excluded, as they did not meet the selection criteria outlined by Bommer et al. (2010), being limited to PGA predictions and not considering other spectral periods. The Atkinson (2015) equation was also excluded because it is applicable only to small magnitudes, whereas seismic hazard analysis focuses on events of moderate to large magnitude that generate ground motions capable of affecting buildings. Comparisons show that when attenuation models are based on a well-assembled database and used within their validity range, they can accurately predict ground motion parameters, especially for short and intermediate structural periods. The methodology adopted in this study aligns with current best practices. Future efforts will be necessary to assess or develop GMPE for this region as suitable strong-motion data from moderate to large earthquakes are recorded.
Acknowledgements
The authors wish to acknowledge the Council for Geosciences for the time provided to carry out the work.
Funding
This work was performed under the PhD funding bursary sponsored by the CGS.
Credit
BM: Conceptualisation, methodology, software, investigation, validation, writing, formal analysis, visualisation. VM: conceptualisation, supervision, software, project management, writing. RJD: supervision, writing.
References
Akkar, S., Sandıkkaya, M.A., Bommer, J.J. 2014. Empirical ground-motion models for point-and extended-source crustal earthquake scenarios in Europe and the Middle East. Bulletin of earthquake engineering, vol. 12, no. 1, pp. 359−387.
Atkinson, G.M. 2015. Ground‐motion prediction equation for small‐to‐moderate events at short hypocentral distances, with application to induced‐seismicity hazards. Bulletin of the Seismological Society of America, vol. 105, no. 2A, pp. 981−992.
Atkinson, G.M., Boore, D.M. 2006. Earthquake ground-motion prediction equations for eastern North America. Bulletin of the Seismological Society of America, vol. 96, no. 6, pp. 2181–2205, doi: 10.1785/0120050245
Atkinson, G.M. 2008. Ground-motion prediction equations for eastern North America from a referenced empirical approach: Implications for epistemic uncertainty. Bulletin of the Seismological Society of America, vol. 98, no. 3, pp.1304–1318, doi: 10.1785/0120070199
Atkinson, G.M., Boore, D.M. 2011. Modifications to existing ground-motion prediction equations in light of new data. Bulletin of the Seismological Society of America, vol. 101, no. 3, pp. 1121−1135, doi: 10.1785/0120100270
Bommer, J.J., Coppersmith, K.J., Coppersmith, R.T., Hanson, K.L., Mangongolo, A., Neveling, J., Rathje, E.M., Rodriguez-Marek, A., Scherbaum, F., Shelembe, R., Stafford, P.J., Strasser, F.O.
Figure 10—COV results for GMPE seismic hazard sensitivity analysis (a) PGA, (b) PSA = 0.15 s, and (c) PSA = 2.0 s
Influence of ground motion model selection on seismic hazard for Johannesburg
2015. A SSHAC Level 3 Probabilistic Seismic Hazard Analysis for a New-Build Nuclear Site in South Africa. Earthquake Spectra, vol. 31, no. 2, pp. 661–698.
Bommer, J.J., Akkar, S., Kale, Ö. 2011. A model for vertical-tohorizontal response spectral ratios for Europe and the Middle East. Bulletin of the Seismological Society of America, vol. 101, no. 4, pp.1783−1806.
Bommer, J.J., Douglas, J., Strasser, F.O. 2003. Style-of-faulting in ground motion prediction equations. Bulletin of Earthquake Engineering vol. 1, no. 2, pp. 171−203.
Bommer, J.J., Strasser, F.O., Pagani, M., Monelli, D. 2013. Quality assurance for logic-tree implementation in probabilistic seismic hazard analysis for nuclear aplications: A practical example. Seismological Research Letters, vol. 84, pp. 938–945.
Bommer J.J., Scherbaum F., Bungum H., Cotton F., Sabetta F., Abrahamson N.A. 2005. On the use of logic trees for ground motion prediction equations. Bulletin of the Seismological Society of America, vol. 95, pp. 377−389. doi: 10.1785/0120040073
Bommer, J.J., Douglas, J., Scherbaum, F., Cotton, F., Bungum, H., Fäh, D. 2010. On the selection of ground-motion prediction equations for seismic hazard analysis. Seismological Research Letters, vol. 81, no. 5, pp. 783−793.
Boore D.M., Stewart J.P., Seyhan E., Atkinson G.M. 2014. NGA‐West2 Equations for Predicting PGA, PGV, and 5% Damped PSA for Shallow Crustal Earthquakes. Earthquake Spectra, vol. 30, no. 3, pp. 1057−1085.
Boore, D.M., Atkinson, G.M. 2008. Ground-motion prediction equations for the average horizontal component of PGA, PGV, and 5%-damped PSA at spectral periods between 0.01 s and 10.0 s. Earthquake Spectra, vol. 24, no. 1, pp. 99−138.
Campbell, K.W. 2003. Prediction of strong ground motion using the hybrid empirical method and its use in the development of ground motion (attenuation) relations in eastern North America. Bulletin of the Seismological Society of America, vol. 93, pp. 1012–1033.
Cotton, F., Pousse, G., Bonilla, F., Scherbaum, F. 2008. On the discrepancy of recent European ground-motion observations and predictions from empirical models: Analysis of KiK-net accelerometric data and point-sources stochastic simulations, Bull. Seismological Society of America, vol. 98, no. 5. pp. 2244–2261.
Cotton, F., Scherbaum, F., Bommer, J.J., Bungum, H. 2006. Criteria for selecting and adjusting ground-motion models for specific target regions: Application to central Europe and rock sites. Journal of Seismology, vol. 10, no. 2, pp. 137.
Douglas, J. 2016. Ground motion prediction equations 1964-2018, http://www.gmpe.org.uk
Douglas, J., Bungum, H., Scherbaum, F. 2006. Ground-motion prediction equations for southern Spain and southern Norway obtained using the composite model perspective. Journal of Earthquake Engineering, vol. 10, no. 1, pp.33–72.
Douglas, J., 2003. Earthquake ground motion estimation using strong-motion records: a review of equations for the estimation of peak ground acceleration and response spectral ordinates. Earth-Science Reviews, vol. 61 nos. 1−2, pp. 43−104.
Douglas, J., Cotton, F., Abrahamson, N., Akkar, S., Boore, D.M., Di Alessandro, C. 2011. Pre-selection of ground-motion prediction equations (Task 2), PEER GEM – Global GMPEs Task 2 WG, www.nexus.globalquakemodel.org/gem-gmpes/posts/
Douglas, J., Edwards, B., Convertito, V., Sharma, N., Tramelli, A., Kraaijpoel, D.,Cabrera, B., Maercklin, N., Troise, C. 2013. Predicting ground motion from induced earthquakes in geothermal areas. Bulletin of the Seismological Society of America, vol. 103, pp. 1875–1897.
Durrheim, R.J., Anderson, R.L., Cichowicz, A., Ebrahim-Trolloped, R., Hubert, G., Kijko, A., McGarr, A., Ortlepp, W.D., Van der Merwe, N. 2006. The risks to miners, mines, and the public posed by large seismic events in the gold mining districts of South Africa, J Hadjigeorgiou and M Grenon (Editors). Proceedings of the Third International Seminar on Deep and High Stress Mining, 2−4 October 2006, Quebec City, CANADA, Universite Laval.
Fernandez, L.M., Van der Heever, P.K. 1985. December. Ground movement and damage accompanying a large seismic event in the Klerksdorp district. Proc 1st International Congress on Rockbursts and Seismicity in Mines, Johannesburg, Sept 1982, pp. 193–198. Publ Johannesburg: SIAMM, 1984.
Frankel, A., Mueller, C., Barnhard, T., Perkins, D., Leyendecker, E.V., Dickman, N., Hanson, S., Hopper, M. 2004. National SeismicHazard Maps: Documentation June 1996, Open-File Report 96−532, U.S. Department of the Interior, U.S. Geological Survey.
Graves, R., Aagaard, B., Hudnut, K., Star, L., Stewart J., Jordan, T. 2008. Broadband simulation for Mw 7.8 southern San Andreas earthquakes: ground motion sensitivity to rupture speed. Geophysical Research Letters, vol. 35, L22302, doi:10.1029/2008GL035750
Grobbelaar, M.R.G., Birch, D., Cichowicz, A. 2017. Comparison of data from complementary seismograph networks in a mining district. Proceedings of the Eighth International Conference on Deep and High Stress Mining, pp. 117−124. Australian Centre for Geomechanics.
Gupta, I.D. 2006. December. Defining source-to-site distances for evaluation of design earthquake ground motion. Proceedings of the 13th Symposium on Earthquake Engineering, Roorkee, 1, pp. 295−306.
Hartnady C.J.H. 2002. Earthquake hazard in Africa: perspectives on the Nubia–Somalia boundary. South African Journal of Science, vol. 98, pp. 425−428.
Johnston, A.C. 1994. The stable continental region earthquake database. The Earthquakes of Stable Continental Regions: Assessment ox Large Earthquake Potential, EPRI Rpt. TR, 102261, pp. 3−1.
Influence of ground motion model selection on seismic hazard for Johannesburg
Manzunzu, B., Midzi, V., Mulabisana, T.F., Zulu, B., Pule, T., Myendeki, S., Rathod, G.W. 2019. Seismotectonics of South Africa. Journal of African Earth Sciences, vol. 149, pp. 271−279.
Manzunzu, B., Midzi, V., Mangongolo, A., Essrich, F. 2017. The aftershock sequence of the 5 August 2014 Orkney earthquake (M L 5.5), South Africa. Journal of Seismology, vol. 21, no. 6, pp. 1323−1334.
Midzi, V., Manzunzu, B., Mulabisana, T., Zulu, B.S., Pule, T., Myendeki, S. 2020. Probabilistic seismic hazard maps for South Africa. Journal of African Earth Sciences, vol. 162, pp. 103689. https://doi.org/10.1016/j.jafrearsci.2019.103689
Musson, R.M.W., Sargeant, S.L. 2007. Eurocode 8 seismic hazard zoning maps for the UK. British Geological Survey Technical Report, CR/07/125, pp. 70.
Malservisi, R., Hugentobler, U., Wonnacott, R., Hackl, M. 2003. How rigid is a rigid plate? Geodetic constraint from the TrigNet CGPS network, South Africa. Geophysical Journal International vol. 192, no. 3, pp. 918–28.
McGarr, A., Fletcher, J.B. 2005. Development of ground–motion prediction equations relevant to shallow mining–induced seismicity in the Trail Mountain area, Emery County, Utah. Bulletin of the Seismological Society of America, vol. 95, pp. 31−47.
Pezeshk, S., Zandieh, A., Tavakoli, B. 2011. Hybrid Empirical Ground-Motion Prediction Equations for Eastern North America Using NGA Models and Updated Seismological Parameters. Bulletin of the Seismological Society of America, vol. 101, no. 4, pp.1859−1870.
Rietbrock, A., Strasser, F., Edwards, B. 2013. A stochastic earthquake ground-motion prediction model for the United Kingdom. Bulletin of the Seismological Society of America, vol. 103, pp. 57−77.
Scherbaum, F., Delavaud, E., Riggelsen, C. 2009. Model selection in seismic hazard analysis: an information-theory perspective.
Bulletin of the Seismological Society of America, vol. 99, pp. 3234−3247.
Scherbaum, F., Schmedes, J., Cotton, F. 2004. On the conversion of source-to-site distance measures for extended earthquake source models. Bulletin of the Seismological Society of America, vol. 94, no. 3, pp. 1053−1069.
Shoja-Taheri, J., Naserieh, S., Hadi, G. 2010. A test of the applicability of NGA models to the strong ground-motion data in the Iranian plateau. Journal of Earthquake Engineering, vol. 14, pp. 278–292.
Silva, W., Gregor, N., Darragh, R. 2002. Development of regional hard rock attenuation relations for central and eastern North America, Technical Report, Pacific Engineering and Analysis.
Stamps, D.S., Saria, E., Kreemer, C. 2018. A geodetic strain rate model for the East African Rift system. Scientific reports, vol. 8, no. 1, pp.1−8.
Skarlatoudis, A.A. 2017. Applicability of ground-motion prediction equations to a Greek within-slab earthquake dataset. Bulletin of Earthquake Engineering, vol. 15, pp. 3987−4008.
Stewart, J.P., Douglas, J., Javanbarg, M., Bozorgnia, Y., Abrahamson, N.A., Boore, D.M., Campbell, K.W., Delavaud, E., Erdik, M., Stafford, P.J. 2015. Selection of ground motion prediction equations for the Global Earthquake Model. Earthquake Spectra, vol. 31, no. 1, pp.19−45.
Toro, G.R., Abrahamson, N.A., Schneider, J.F. 1997. Model of strong ground motions from earthquake in central and eastern North America: Best estimates and uncertainties. Seismological Research Letters, vol. 68, no. 1, pp. 41−57.
Toro, G.R. 2002. Modification of the Toro et al. (1997) attenuation equations for large magnitudes and short distances, Technical Report, Risk Engineering.
Zulu, 2018. Time-dependent seismic hazard assessment in the mining regions of the Gauteng province, South Africa, unpublished MSc thesis. University of Witwatersrand. u
Affiliation:
1Rock Engineering Department, Sibanye-Stillwater Limited, Westonaria, South Africa
2College of Agriculture, Engineering and Science, University of KwaZuluNatal, South Africa
Correspondence to:
R.I.L. Ferreira
Email: Ricardo.Ferreira@sibanyestillwater. com
Dates:
Received: 19 Jun. 2024
Revised: 15 Dec. 2024
Accepted: 9 Jan. 2025
Published: January 2025
How to cite:
Ferreira, R.I.L., Lenegan, P., Masethe, R. 2025. Automatic data selection, worker exclusion zones and an attempt to identify precursory activity in real time: Routine and research activities in seismology at Sibanye-Stillwater Ltd. Journal of the Southern African Institute of Mining and Metallurgy, vol. 125, no. 1, pp. 11–18
DOI ID:
http://dx.doi.org/10.17159/24119717/3465/2025
ORCiD:
R. Masethe
http://orcid.org/0000-0002-4420-7885
Automatic data selection, worker exclusion zones and an attempt to identify precursory activity in real time: Routine and research activities in seismology at Sibanye-Stillwater Ltd
by R.I.L. Ferreira1, P. Lenegan1, R. Masethe2
Abstract
Underground mining in high rock-stress environments can induce unanticipated dynamic rockmass deformation, posing a serious risk to the workforce. Data collected by seismic networks are imperative for the design-as-you-mine process. Often an inappropriate assessment of the seismic hazard is done when unnecessary data are included in analytical techniques, particularly short-term time frames. Depending on the methodology or application of data analysis and interpretation, some of the information may not be relevant and even detract from the objective. By using the spatial event clusters associated with active workplaces to define the shape and size of the polygons for data selection for subsequent analysis, a problematic subjective component can be eliminated.
The mining of tabular reefs in South Africa, be they gold- or platinum group metals, is very extensive, and underground workplaces are often widespread. Production stoppages are very costly, especially for marginal mines, so there is just cause not to evacuate an entire operation’s workforce following the occurrence of a large mining-induced seismic event. A rationale based on the damaging peak particle velocities (PPV) of the past seismicity can exclude the unaffected underground personnel and allow a quick orderly withdrawal where required. Micro-deformation may precede rockbursting, which can occur on-shift close to the workface. A mine-wide array of geophones suitable for the accurate location and analysis of seismicity may not be able to detect these higher-frequency emissions. Inexpensive but fit-for-purpose accelerometers, providing real-time, continuous measurement of acoustic rockmass deformation near the workplace, integrated through underground and surface communications networks, are shown to record ‘rock-talk’, clearly distinguishable from the instrument background noise, which can be in the order of hours leading up to an imminent damaging seismic event.
Keywords
seismicity, risk, workforce, evacuation, safety, warning, short-term, precursory
Introduction
Mining in deep and high-stress environments is often accompanied by dynamic rockmass deformation, the consequences of which can be severe to underground workers and infrastructure. In trying to understand and limit these negative factors, the selection of recorded seismic data in space and time for subsequent analysis and interpretation should be as relevant, accurate and objective as possible. User-defined polygons (i.e., enclosed three-dimensional volumes in space) for the selection of a statistically significant number of seismic events associated with individual workplaces have sometimes included irrelevant seismicity that clouded the desired interpretation results or failed to include some that were relevant. Very often, a lack of regular verification of acceptable polygon geometries causes a mixture of these two problems. In short-term analysis we aim to eliminate this very subjective component and allow the spatial event clusters associated with active workplaces to define the shape and size of the polygons used for data selection. Distant, but also possibly relevant large seismic events are included in these ‘automatic’ polygons.
Sibanye Stillwater’s Driefontein, Beatrix, and Kloof gold mines have been in operation for many decades, employing a non-mechanised method of reef extraction, requiring a large workforce. Such mature gold mines, exploiting the tabular reefs along the rim of the rich Witwatersrand Basin, may have widespread active stopes kilometers distant from each other. Following the occurrence of mining-induced seismicity on-shift or when the elevated seismic risk demands it, the size of a worker impact zone requires quick definition for workforce evacuation. The threshold distance of observable damage due to past seismicity
Automatic data selection, worker exclusion zones and an attempt to identify precursory activity
can be ascertained from mine records, if available. Having the magnitudes of causative events coupled to the calculated ground motions experienced at these distances, the baseline peak particle velocity (PPV) associated with damage can be determined. This knowledge can be extended to calculating the radius around the focus of all future events of ML1.0 and greater (established locally as damaging events), where the baseline PPV is reached. Personnel whose workplaces are located within the volume defined by this radius will receive notification to move to a safe place and then return to the surface in an orderly fashion, or until such time as safe re-entry, post-inspection, is declared.
Analogous to a rock specimen in a laboratory stress test, the rockmass around mining excavations may experience an increased rate of deformation with respect to load just before the onset of catastrophic rock failure, and release energy in the process. This release can manifest as an increase in acoustic micro-seismic deformation, recordable with a nearby instrument having the required sensitivity. We used accelerometers to detect and record the activity preceding seismicity near the reef and close to the immediate face, which could be characterised, principally, as ‘rockbursts’ (i.e., crush-type events), posing a serious hazard onshift. The aim is to understand immediate seismic risk better and eventually warn the workforce timeously.
Seismological setting
Sibanye-Stillwater’s Driefontein gold mine in South Africa, amongst others, exploits narrow tabular reefs and often operates in a deep and high-stress environment. It performs mining at shallow-tointermediate depth but, by virtue of the multi-reef environment, the presence of geological discontinuities and the legacy of long spans of mining, the seismic hazard is ever-present, and the occurrence of large dynamic ground motions is frequent.
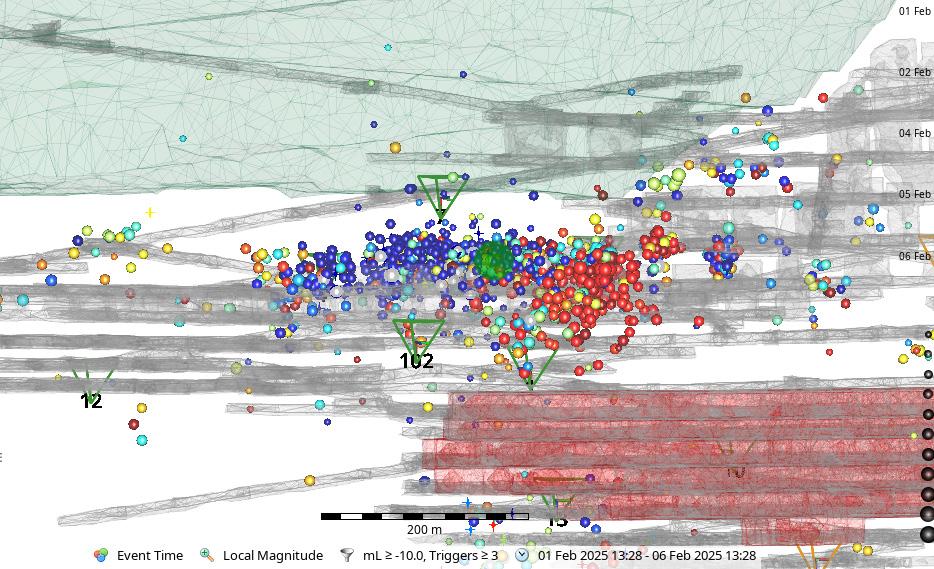
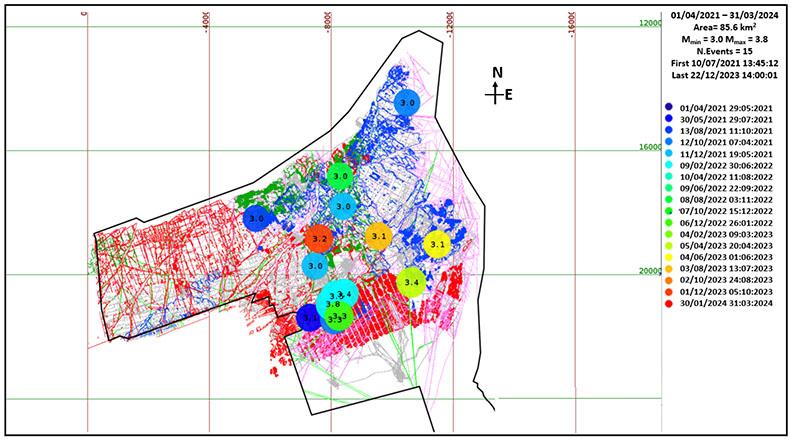
Figure 1 indicates the mining plan of Driefontein operations, bound by the mine lease area (each square represents 16 km2, oriented to local mine coordinates), and locations of 15 seismic events of local magnitude ML3.0 and larger over the three-year period from 1 April 2021 to 31 March 2024 (the largest event
was ML3.8). A period of protracted industrial action, workplace lockdown, and production disruptions occurred between April and June 2022.
A minimum of three tri-axial geophone sites provides the time of occurrence and location of the seismic events in space and ascribe another two independent seismic parameters to the seismic source: seismic potency (P) and radiated seismic energy (E), from which several derivatives quantify the seismicity and provide insight into the changing conditions of the rockmass. The calculation of ML, P, peak particle velocity (PPV), and other seismological parameters relevant to the topics at hand are fully described by Mendecki (2013, 2016) and covered in Ferreira et al. (2023a), which will not be repeated here.
A workshop held by the International Society of Rock Mechanics (ISRM, 2024) aptly redefined a rockburst as “a sudden failure of rock mass surrounding the excavations caused by the rapid release of stored energy when induced stresses exceed the rock strength." In a practical sense underscored by experience, events with local magnitudes of up to ML2.0 coupled with violent ejection of rock from the face may constitute a rockburst. Such event magnitudes usually fall within the expected normal range of energy dissipation around the stope with mining, often triggered by, and ordinarily occurring shortly after blasting. The geomechanical engineering design and support of excavations strive to contain the seismic hazard, but unanticipated rockbursting can still occur on-shift. The geometry of mining layout and geological complexity exerts great influence on the seismic response, and much consideration and due diligence need to be expended to contend with this.
Although an ML3.0 event can have devastating shake-down effects and the ground motions are felt over a large distance from the source, it is well understood that its source mechanism is usually associated with sudden relative dislocation of the rockmass along a geological feature on a large scale, possibly along bedding planes, or shearing of intact rock, typically at highly stressed abutments. They normally occur in back areas, fortunately distant from working places, but are more random in time than rockbursts.
an inclination of approximately
Mine. The middling between the reefs is around 60 m. Depth
mining approaches 3400 m. Major geological features are delineated. The location and magnitude of events ML3.0 and greater (15 in total) are shown by discs, warmer colours indicating the latest, in the time period 1 April 2021 to 31 March 2024. Frequency-magnitude distributions reveal the sensitivity of the seismic network to events as small as Mmin-2.0 (or better) near current working places. Maximum magnitudes (Mmax) in excess of ML3.8 can be expected
Figure 1— Mining plan of the three tabular reefs (red, green, and blue) extracted at Driefontein Gold
of mining increases towards the South with
260; deepest
Automatic data selection, worker exclusion zones and an attempt to identify precursory activity
The seismic coverage and sensitivity to ground motions are in accordance with the density of the geophone array used for event locations and are generally good. Driefontein mine benefits from 42 4.5 Hz ground motion sensors (tri-axial geophones, orthogonally oriented, in a sealed unit), all strategically located for optimum seismic coverage of workplaces. New sensors are installed when the extended mining face necessitates it. The seismic system is given high importance and is efficiently maintained. Location accuracy (usually better than 50 m), frequency-magnitude and temporal distributions attest to this.
Automatic short-term data selection
The size of the seismological database is voluminous, stretching back from the current seismic system in use to 1996 (and to 1983 with older technology), and is augmented with processed waveforms daily. Proper data selection in space and time for interpretation (long- or short-term, very much depending on analytical methodology) is not straightforward, and some past efforts to automatically generate seismicity polygons have endeavored to minimise user influence. The method of Wesseloo et al. (2014), for example, although only partially automated, is still affected by the chosen analysis parameters and not free of user subjectivity. In a more recent development, instead of having a subjective user-delineated polygon for the selection of relevant short-term historical seismicity for each working area, a novel procedure saw a polygon automatically constructed as an envelope, starting with a specified radius, around the active panels (Ferreira et al., 2023a).
Polygon size and geometry
The initial radius is user-specified, usually starting from 50 m (according to location accuracy), and automatically increasing in increments until a statistically significant number of seismic events are included in the search, or until a maximum radius (also
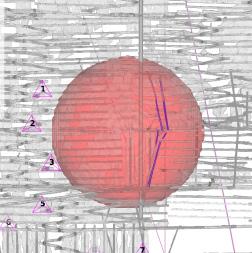
predefined) is attained. The polygons around panels merge until the entire workplace is incorporated into a single polygon. A ‘cluster’ is defined as several events occurring in some finite space and time. Cluster recognition involves a user-defined near-history of events (usually hours), a size of search (a radius of 50 m) and a minimum number of events in the cluster (usually at least ten). If a cluster of events occurs and part of it lies in a working area polygon, then all events from this cluster will be included, and the polygon volume or shape self-adjusts accordingly. Figure 2 illustrates the concept.
Possible influence of nearby large events
If one or more events of sufficiently large magnitude occurred nearby, they can be included into the set of events contained by the geometry of the polygon. These events are classified as ‘damaging’ events, usually ML1.0 or greater. When such events occur, a radius of possibly damaging ground motions is calculated, centered on the focus of the event, and used to assist with the notification of the workforce and workplace evacuation efforts when the seismic risk is elevated. Such an event will be included if the distance from the working area is contained within the volume affected by damagecausing ground motions, previously established as at least 0.08 m/s through in situ inspection. For wider application across the mine, we employ a factor of safety and reduce the threshold of damaging ground motions to 0.06 m/s.
Seismic damage and threshold of observable damage
An increase in event magnitude is linked to an increase in the dimensions of the source. Even though not all seismic events result in damage, as the magnitude of seismic events increases, there is a corresponding and exponential increase in reportable damage (Jager and Ryder, 1999). A larger volume of the mining excavations is affected by higher ground motions and velocities, and a greater likelihood of damage and worker exposure. Accordingly, a worker withdrawal zone scales according to the magnitude.
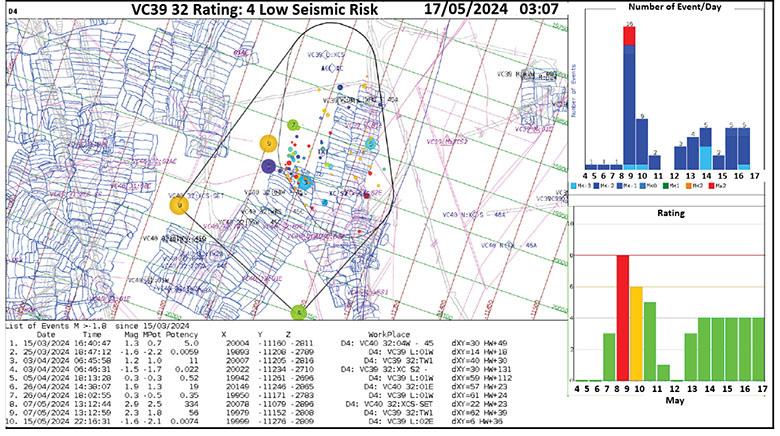
Figure 2— The delineation of a ‘polygon’ for the exclusive selection of events in the direct vicinity of nearby working places is exemplified in this diagram. The polygons are determined automatically to include clusters of seismic events and incorporate sufficiently close large events, which may not necessarily form part of the clusters. The report format includes a plan diagram of the working place, spatial cluster and listing of selected seismicity, and graphical time-history of seismicity and ratings for the past week. This encompasses a daily workplace seismic hazard assessment
Automatic data selection, worker exclusion zones and an attempt to identify precursory activity
The relevant mines’ Codes of Practice (e.g., Code of Practice, 2021) and internal records reveal ML2.0 and greater events are more often associated with damage further afield than the immediate stope face. It further points out that smaller-sized events normally cluster close to the active workings, while a different subset of larger events, with different source mechanisms, are usually associated with more distant geological features or the shearing of intact rock. A typical microseismic network, as used at Driefontein, can provide information on likely modes of deformation and seismic risk. Many factors contribute to rockmass damage, for example, the formation of cracks and fractures as mining disrupts the balance of stress, the ejection of rock from the face, severe excavation deformation, and shakedown when support systems fail. Most seismic activity tends to be centered around the stope face directly after blasting. In these cases, damage, when it happens, is very localised. Midrange to large damaging events (conservatively ML1.0 and larger) with possible aftershock occurrence can occur on-shift, and pose a greater potential risk, particularly to the workforce in adjacent areas or further afield.
Ferreira et al. (2023b) reported on the extent of damage produced by 27 events from one of Driefontein’s deeper shafts, spread over a period of 20 months (demonstrated in Figure 3). The occurrences ranged in magnitude from ML0.9 to ML3.4. The information was recognised as being limited, but established the distances from event sources to the point where no more damage is apparent to an observer during subsequent in situ investigation. The corresponding PPV was then calculated at those distances.
Worker exclusion zones
When and where possible, a record of damage due to seismicity is usually kept for later rockmass re-support or rehabilitation efforts. This information is regularly updated in the mines’ Codes of Practice. The records are expected to be incomplete since access to older accessways and workings is restricted, and often impossible due to personnel barricades and ventilation seals. Given a significant number of large-event occurrences, the threshold
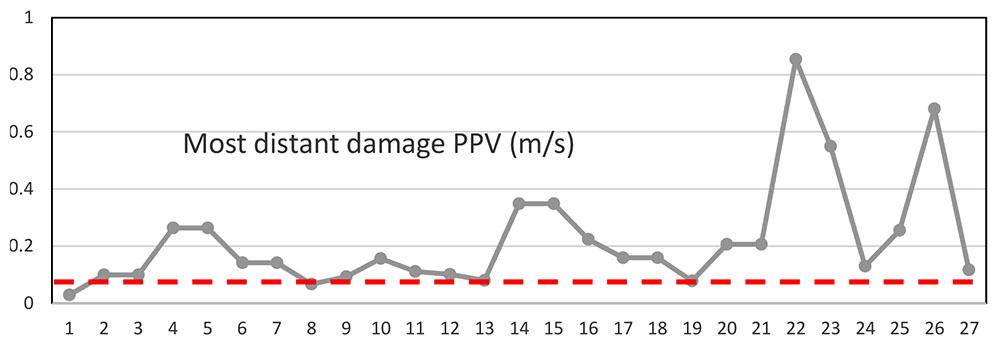
Figure 3—The information provided by in situ inspection of 27 events at Driefontein mine reveals a threshold of ground motion of approximately 0.08 m/s (dashed line) below which damage in stopes, tunnels and ancillary excavations is not visually apparent anymore. This value is further reduced to 0.06 m/s with a factor of safety of 1.5, to account for various unknowns and wider application across the operations. These quantities should be reviewed whenever the ground motion equations are revised
distance of observable damage can nonetheless be ascertained. The magnitudes of causative events coupled with the calculated ground motions experienced at these distances provide the baseline PPV associated with damage. The radius around the focus of all future events of ML1.0 and greater, where the baseline PPV is reached underground, can then be calculated. Personnel working within the volume defined by this radius will receive notification to move to a safe place. Workplace evacuation can be accomplished in an orderly fashion and a safe re-entry is declared after an in situ inspection is done.
Radii of influence and communication with the workforce
Visual displays on screens at various points at the mines provide a list of all active workplaces located within the volume defined by the PPV of at least 0.06 m/s following an event of ML1.0 or greater. Work crews are notified telephonically to withdraw if they are located within the zone of potential damage. The displayed list of affected workplaces may be overwritten in quick succession by subsequent large aftershocks or large tremors elsewhere; to ensure the list is maintained for record-keeping, this information is also relayed by electronic mail. Figure 4 shows an actual example of a seismic event (ML1.5 in this case; picture cropped to fit) as it
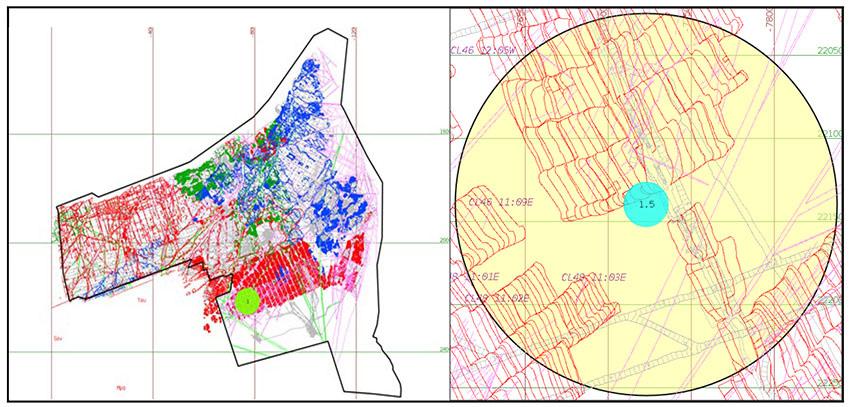
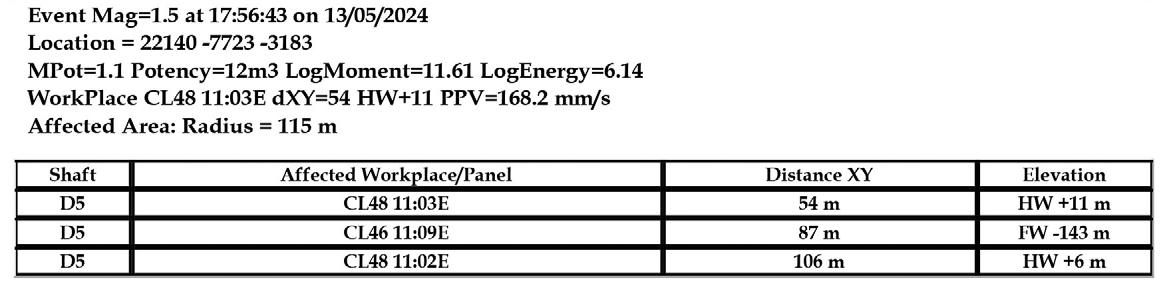
Figure 4—An example of the information communicated via email after a possibly damaging seismic event, showing some event details, its location, and a listing of affected workplaces. A similar display appears at remote terminals in multiple office locations and control rooms across the mines, providing information that may be required for rescue or workplace evacuation efforts
Automatic data selection, worker exclusion zones and an attempt to identify precursory activity
would be displayed on remote screens, its location in relation to the entire mine, and a zoomed-in view of the affected areas with a listing thereof. A control facility, manned around the clock, would also sense the shaking by the tremor on surface, verify the location by the seismic network, and relay the information to the relevant decisionmakers for immediate action.
Microseismicity preceding a possibly damaging seismic event
The onset of production blasting disrupts the state of stress at the mining face and often precipitates seismicity, which can be detected and recorded by an adequate regional seismic system. The failure behaviour of rockmass is complex and strongly influenced by various mining elements, including geological structures, on a micro to macro scale. A thorough understanding of the failure mechanism around an underground excavation needs to include an investigation of the cracking processes of the rockmass and how micro-cracking around the excavation progresses to macrocracking of the rock fabric, leading to failure (Cai et al., 2004). Prior efforts to investigate reliable precursors of large (damaging) seismic events have failed to produce convincing results (Durrheim and Ogasawara, 2012), although there was postulation that physical changes to the rockmass under load could be measured. Spottiswoode (2010) investigated foreshock activity using data collected by mine-wide seismic networks from five mines, representing a range of deep mining methods, and attempted to establish whether any change in seismic character or event rate preceding large events could be inferred. A statistically significant difference in foreshock statistics could not be found, with the conclusion that short-term prediction was not feasible based on seismicity rate alone. Many short-term seismic hazard assessment schemes (SHA) have been derived for rockburst risk management in South African mines (e.g., Durrheim and Ogasawara, 2012; Ferreira et al., 2023a) but reliable and accurate rockburst prediction remains a difficult and elusive goal.
Any large-scale effort to analyse high frequency micro-cracking processes with exceptionally sensitive state-of-the-art sensors quickly runs into cost barriers. A networked array of mine-wide geophones, as normally employed in deep mines to locate and quantify seismicity according to some desired level of sensitivity and accuracy of locations, may not register many micro events located between the sensors, due to rapid high frequency signal attenuation with increasing distance, as opposed to accelerometers installed close to working areas of the mine. We used two inexpensive and relatively insensitive accelerometers, covering three workplaces and separated by 167 m, each with an effective range less than 150 m, installed within 50 m of the active stopes to monitor the cracking process around the excavation in real-time and to explore the rock mass behaviour more deeply. The response limit of the accelerometers is 1 kHz, and sampling frequency is 4 kHz, with 8G full scale range. This differs from previous attempts in that only nearby microseismicity is recorded.
Distance between a ground motion sensor and the seismic source
Given P-wave (VP) and S-wave (VS) velocities of 6200 m/s and 3650 m/s, respectively, as used by Driefontein mine’s geophone array to determine the location of seismic events, it is easily shown that the distance (D) between a recording sensor and the seismic source can be approximated (with some subjective P- and S-wave first arrival picks) by
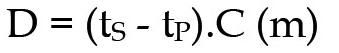
where (tS - tP) is the time difference between the P- and S-wave picks (s) and C is 8875 m/s.
Microseismicity selection criteria
The initial focus is on unanticipated rockbursting, which can occur on-shift (the effects are – for all intents and purposes of the exercise – inconsequential during off-shift times) and any possible precursory activity that may be recorded in the direct vicinity. We considered events in the magnitude range 0.0 < ML < 2.0 (i.e., rockburst-type likely to affect the stope face), restricted to the location of the immediate reef plane (and from the two possible locations, the one closest to the subsequent ‘large’ event) and sought the prior micro-events preferably within 50 m of the main event using Equation 1. Most seismicity occurs concurrent with or soon after blasting (as expected, nucleation processes may have been in formation, and the blast may have introduced further instability into the rockmass). At this stage the two accelerometers work independently with common time only. The locations of main events were established with the regional geophone array. It was hypothesised that any preceding micro-events were closely clustered and associated in some way to the main event. This proved not to be to be entirely correct, as some of the micro-events located by the regional network were shown to be scattered (see Figure 5), which reinforces the need to obtain locations from the accelerometers to define clustering, not yet possible without further software development and installation of additional accelerometers. Not all recorded micro-seismicity by the accelerometers is accepted. A discernible signal-to-noise ratio with clear P- and S-wave arrivals (see Figure 6) allows accurate selection of first motions and distances to the seismic sources to be calculated. Faraway sources are discarded.
In the three-month period of 2 February to 2 May 2024 we identified 15 occurrences (magnitude ranging from ML0.2 to ML2.6), which could potentially be considered ‘damaging’ events. Clear precedence of nearby ‘rock-talk’ was not always found: one (ML2.0 on 20 April at 11:07:42) practically displayed no measurable precursory activity at all, although other instances produced encouraging results. Some events were discarded because of distance (sensor limits). Most of the events almost immediately followed the blasting; one other, an ML1.6, occurred an hour after the blast (which likely precipitated an ML0.5), but showed prior activity throughout the day (see Figures 7 and 8). The ML2.6 event was followed by several smaller aftershocks (ML2.1, ML0.3 in quick succession, and an ML2.1 an hour later). It was interpreted to be the result of shear driven failure on an existing fault some 120 m away. In this instance one accelerometer was closer than the second one (approximately 100 m, as opposed to 170 m) and registered a much greater incidence of preceding micro-events.
The study is ongoing. Preliminary results indicate a newly established viability of the recording of possible precursory activity in the near field, which the regional geophone array does not correspondingly register. Also, microseismic patterns before an imminent large event differ in the continuous record in the absence of a sizeable event. Insomuch that the results obtained thus far hold scintillating promise of proactive warning and orderly evacuation of affected workplaces, the concept needs to be investigated in greater detail.
Challenges
The accelerometers need to be close to the working environment,
Automatic data selection, worker exclusion zones and an attempt to identify precursory activity
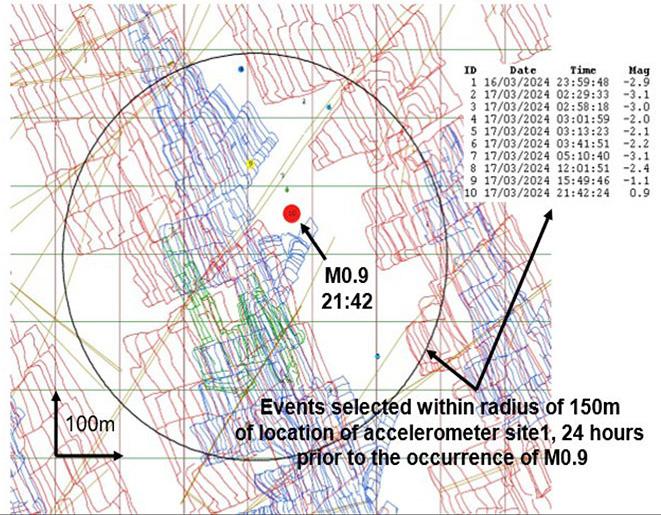
Figure 5—An ML0.9 rockburst-type event occurred very close to active stope faces on a Sunday evening (off-shift). It is represented here by the filled circle in relation to stope plans in a sequential dip-pillar mining configuration. Although some micr-seismicity was detected in the direct environs of the main event, some were scattered further afield. A list of these is provided (1−9, preceding the ML0.9 event). They were selected within 150 m of one of the accelerometer sites. Interestingly, events as small as ML-3.1 could be located with several triggered geophones in this region of the mine, attesting to network sensitivity
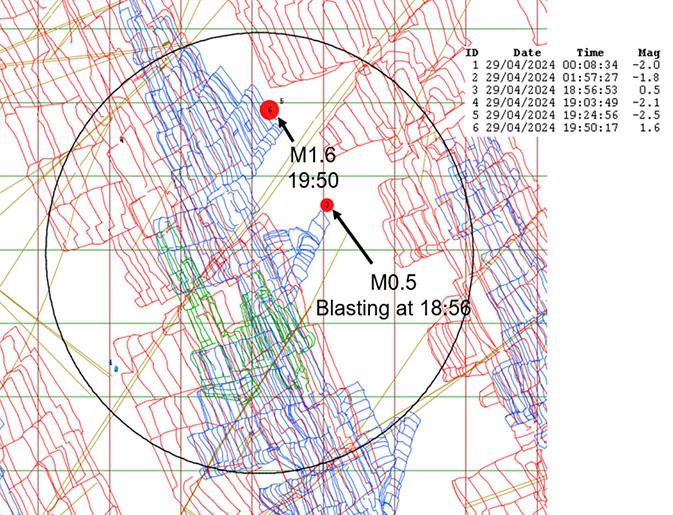
Figure 6—A 24-hour trace of continuous accelerometer data, with the ML0.9 event on Sunday 17 March 2024 (off-shift) at 21:42, preceded by numerous micro-events (inverted top arrows) and some corresponding activity recorded by the regional geophone network (indicated by bottom arrows). An example of a typical micro-event as recorded by the accelerometer and decomposed into three components is shown. Clear P- and S-wave arrivals can be identified
with regular replacements as stoping advances, requiring a dedicated installation and maintenance crew to oversee the logistics. Large numbers of instruments produce vast amounts of data (transfer, storage, and quick access), requiring secondary management systems. Software development to recognise and flag pertinent microseismic events, and associating these with increased seismic risk to the workforce, needs to be done. The delivery of accurate danger signals to the relevant workplace(s) with few
false alarms, needs to be established. Possible integration of data with the recordings of the mine-wide geophone network may be advantageous. These, and other practical considerations, require further investigation.
In closing
Production stoppages are very costly, especially for marginal mines. The management of seismic risk should encompass those
Automatic data selection, worker exclusion zones and an attempt to identify precursory activity
Figure 7—Similar to Figure 5 but showing the locations of an ML0.5 associated with blasting and an ML1.6 almost an hour later. The latter event was shown by the regional network to be preceded by only one micro-event (ML-2.5)
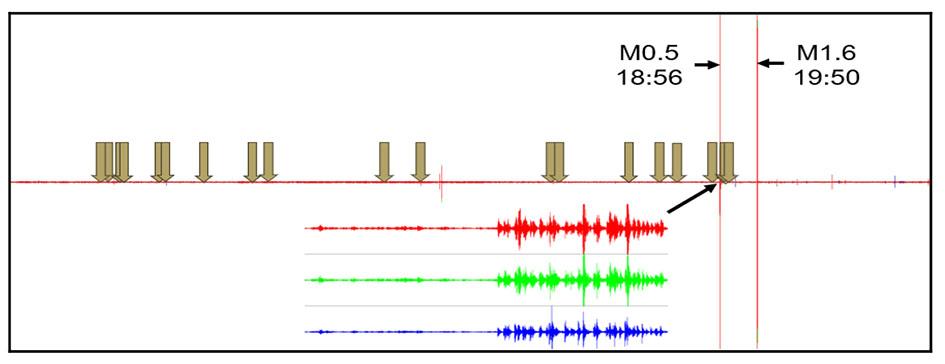
8—A 24-hour continuous accelerometer trace of ground motions, with reference to Figure 7. An ML1.6 seismic event occurred almost an hour after blasting; inverted arrows point to prior nearby micro-events throughout the day, as recorded by one of the accelerometers, unlike the regional geophone array. A decomposition of waveforms (separate X, Y, and Z components) of the blasting is shown just before the ML0.5 event
workplaces affected when seismicity occurs, quickly and effectively. A rock engineering solution needs to define the extent of damage associated with strong dynamic ground motions and evacuate the affected workforce from the zones prone to damage and possible aftershocks. A practical but robust methodology that considers the historical behaviour of the rockmass and establishes a minimum damaging PPV, is then translated into an exclusion zone following the occurrence of events with ML ≥ 1.0. This information is readily and widely communicated across the operations, both electronically and telephonically.
The problematic selection of seismicity for short-term analysis, which has been rather subjective in the past, can be automated for objective, less error-prone assessments. A better approach has produced a very autonomous workplace seismic hazard assessment procedure, defined according to clusters of seismic events in space-time, where the polygons are created with each run of
dedicated software at predetermined times of the day. The possible effects of larger events further afield, likely to cause damage, are incorporated in the seismic trend analysis. Abnormal conditions draw the attention of geotechnical engineers and mine seismologists for closer scrutiny. The workforce is assured of a fresh overview of seismic behaviour just before entering the workplace and on-shift if seismicity occurs.
The continuous measurement of rockmass deformation very close to the workplace can be done with inexpensive sensitivitylimited accelerometers, purposely disregarding microseismicity further afield. The instruments are initially installed as close as possible to the progressing faces of workplaces and replaced as required. The communication networks are integrated through existing underground and surface infrastructure, providing realtime oversight of changing seismological patterns. This research, though at an early stage, shows that it is viable to identify precursory
Figure
Automatic data selection, worker exclusion zones and an attempt to identify precursory activity
activity in the environs of an imminent rockburst-type event and that this activity differs from earlier or subsequent patterns in the absence of a sizeable event. This opens the door to the exciting possibility of detection, early warning, and evacuation of affected workplaces proactively.
An extension of this work will consider the continuous record of individual geophones from the mine-wide array, close to accelerometers, and compare the response. We anticipate a good correlation of signals, but the geophones are likely to introduce undesired triggers from further afield. Farther geophones in the array (separated by hundreds of metres) are expected to show insensitivity to the high frequency acoustic emissions. Dense, sensitive, and expensive geophone arrays have enabled the location of very small events, which in hindsight have added little to the reported low success rate or accuracy of short-term warnings (with advocated network sensitivity of Mmin-2.0 or better, as an objective of monitoring). It should be explored whether a wide spread of tri-axial low-cost accelerometers integrated with a sparser regional seismic network might enhance the monitoring objectives. Future work will shed more light on these and other questions.
Acknowledgements
The authors gratefully acknowledge the support of Sibanye Stillwater for this innovative work. We also recognise the ready support of Dr Ted Stankiewicz. The enabling software and hardware were developed in collaboration with Hamerkop Scientific Services, the Institute of Mine Seismology (IMS), and Hoogenboezem Industries.
References
Cai, M.K.P.K., Kaiser, P.K., Tasaka, Y., Maejima, T., Morioka, H., Minami, M. 2004. Generalized crack initiation and crack damage stress thresholds of brittle rock masses near underground excavations. International Journal of Rock Mechanics and Mining Sciences, vol. 41, no. 5, pp.833–847.
Code of Practice, 2021. A Guide to Reduce Rockfall and Rockburst Accidents, Kloof Gold Mine, Sibanye Stillwater Ltd., South Africa.
Durrheim, R.J., Ogasawara, H. 2012. Can mine tremors be predicted? Observational studies of earthquake nucleation, triggering and rupture in South African mines. Proceedings of the Second Southern Hemisphere International Rock Mechanics
Symposium 14 17 May 2012. South African Institute of Mining and Metallurgy. pp. 327–343.
Ferreira, R.I.L., Masethe, R., Ndaba, P. 2023a. The implementation of ‘automatic’ polygons for relevant data selection in short-term seismic analysis. Proceedings of the ISRM 15th International Congress on Rock Mechanics and Rock Engineering & 72nd Geomechanics Colloquium – Challenges in Rock Mechanics and Rock Engineering, Schubert, W. & Kluckner, A. (eds), Salzburg, Austria, October 9 14, 2023. Austrian Society for Geomechanics: Salzburg. pp. 439–444.
Ferreira, R.I.L., Masethe, R., Ndaba, P. 2023b. Rationale for the quick withdrawal of the underground workforce following (large) dynamic ground motions – how extensive should the exclusion zone be? Proceedings of the ISRM 15th International Congress on Rock Mechanics and Rock Engineering & 72nd Geomechanics Colloquium – Challenges in Rock Mechanics and Rock Engineering, Schubert, W. & Kluckner, A. (eds), Salzburg, Austria, October 9 14, 2023. Austrian Society for Geomechanics: Salzburg. pp. 445–450.
ISRM 2024. International Society of Rock Mechanics Commission on Rockbursts, https://isrm.net/newsletter/ show/248#:~:text=From%20February%201st%20to%20 4th,by%20Professor%20Manchao%20He%2C%20the
Jager, A.J., Ryder J.A. 1999. A Handbook on Rock Engineering Practice for Tabular Hard Rock Mines. The Safety in Mines Research Advisory Committee (SIMRAC), Johannesburg.
Mendecki, A. J. 2016. Mine Seismology Reference Book: Seismic Hazard. Institute of Mine Seismology, ISBN 978-0-9942943-0-2, www.imseismology.org/msrb/, 1 edition
Mendecki, A.J. 2013. Mine Seismology: Glossary of Selected Terms, The 8th Rockburst and Seismicity in Mines Symposium, Russia.
Spottiswoode, S.M. 2010. Mine seismicity prediction or forecasting? Journal of the Southern African Institute of Mining and Metallurgy, vol. 110, pp.11–20.
Wesseloo, J., Woodward, K., Pereira, J. 2014. Grid-based analysis of seismic data. Journal of the Southern African Institute of Mining and Metallurgy, vol. 114, no. 10, pp.815–822.
Affiliation:
Council for Geoscience, South Africa
*Deceased
Correspondence to:
V. Midzi
Email: vmidzi@geoscience.org.za
Dates:
Received: 15 May 2024
Revised: 21 Oct. 2024
Accepted: 9 Jan. 2025
Published: January 2025
How to cite:
Zulu, B.S., Mulabisana, T., Midzi, V., Myendeki, S., Matlou, T., Makhateng, T., Hlatshwayo, L., Mabotja, H., Zulu, T. 2025. Macroseismic survey of the ML 4.4, 11 June 2023 Boksburg earthquake. Journal of the Southern African Institute of Mining and Metallurgy, vol. 125, no. 1, pp. 19–24
DOI ID:
http://dx.doi.org/10.17159/24119717/3409/2025
ORCiD:
T. Mulabisana
http://orcid.org/0000-0002-8459-4058
V. Midzi
http://orcid.org/0000-0003-4351-2797
S. Myendeki
http://orcid.org/0009-0001-3076-4728
T. Matlou
http://orcid.org/0009-0005-4093-7361
T. Makhateng
http://orcid.org/0000-0001-6395-9567
L. Hlatshwayo
http://orcid.org/0000-0003-0550-100X
T. Zulu
http://orcid.org/0009-0004-4935-7796
Macroseismic survey of the ML 4.4, 11 June 2023 Boksburg earthquake
by B.S. Zulu*, T. Mulabisana, V. Midzi, S. Myendeki, T. Matlou, T. Makhateng, L. Hlatshwayo, H. Mabotja, T. Zulu
Abstract
The Council for Geoscience (CGS) performed a macroseismic investigation following the occurrence of an earthquake in the Boksburg area on 11 June 2023. The event had a magnitude of ML 4.4 and a focal mechanism that showed the event as having strike-slip motion along a northwest-southeast oriented fault. The event resulted in aftershocks, some of which occurred away from the causative fault in the east in an area without a mapped fault. However, the cluster of past events in that area suggests that there is an active fault. Due to the size of the main earthquake, a macroseismic survey was conducted to determine its impact on the community in the region. Analysis of observed data obtained from questionnaires resulted in the creation of 153 intensity data points. Their distribution showed high intensity values close to the earthquake source area. However, the investigation highlighted a number of anomalies, such as the higher than expected intensity values observed far from the event epicentre. It could be that these anomalies are caused by site conditions, for example, amplification of ground motion due to thick soil layers.
Keywords Boksburg, earthquake, aftershocks, questionnaire, intensity
Introduction
An earthquake of local magnitude, ML 4.4 occurred in the Boksburg area in Gauteng Province, South Africa, in the early hours (02:38 hours local time) of 11 June 2023. Using the national network as well as the cluster network of stations that are in and around the Klerksdorp–Carletonville–Johannesburg area (Figure 1), the Council for Geoscience (CGS) recorded the event and reported its epicentre at the coordinates 26.2462°S and 28.2061°E with a depth of 1.2km. Eighteen aftershocks scattered in the area were recorded during the first day after the main event (Figure 2). Thereafter, about 50 events were located in the area within six months. The largest recorded aftershock had a magnitude of ML 3.5. The event and its aftershocks are located in the East Rand, an area with many historical gold mines, though the mines in the area are now closed. Following the closure of the mines, seismicity has continued in the area, though with a lower activity rate. It is likely that events are triggered along prestressed faults that pass through the area.
The location of the main Boksburg event and its aftershocks are shown in Figure 2 as well as the longterm seismicity of the region (black open circles). The location indicates that the event occurred along an active northwest-southeast oriented fault located in the East Rand in an area with closed and sometimes flooding mines. The fault is a branch of the Rietfontein fault. The focal mechanism of the event indicates strike slip faulting (Figure 2). The north-south oriented nodal plane is similar (though not the same) in orientation to the northwest-southeast fault branch (Figure 2). It is not clear whether events in this area are natural or triggered. The triggering of events along the fault can be caused by an increase in pore pressure due to flooding of mines, which would result in a decrease of the clamping force. A combination of this phenomenon and the lubrication of the faults could certainly result in the triggering of earthquakes along this and other faults in the area. The long-term seismicity and location of some of the aftershocks imply that there is an unmapped north-northeast-south-southwest oriented fault east of the Boksburg event causative fault, which also appears to be active. Stress transfer from the Boksburg event probably caused aftershocks to be triggered along this possible secondary fault.
The shaking from the earthquake of 11 June 2023 was widely felt, with reports from as far afield as Klerksdorp, Pretoria, and parts of Mpumalanga. Some houses and offices in the Boksburg area were
Macroseismic survey of the ML 4.4, 11 June 2023 Boksburg earthquake
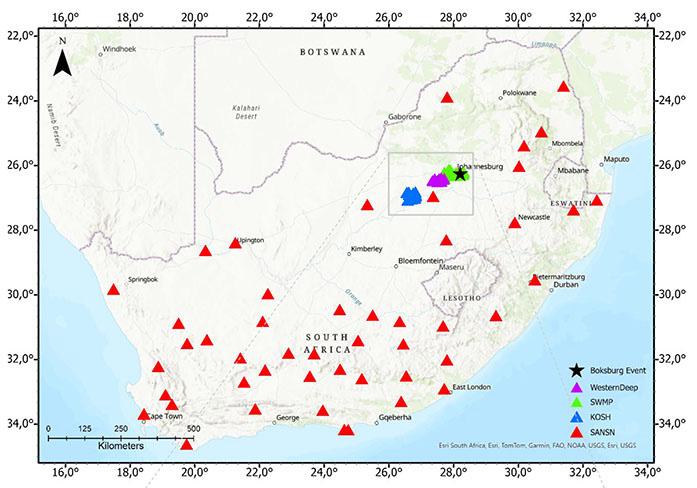
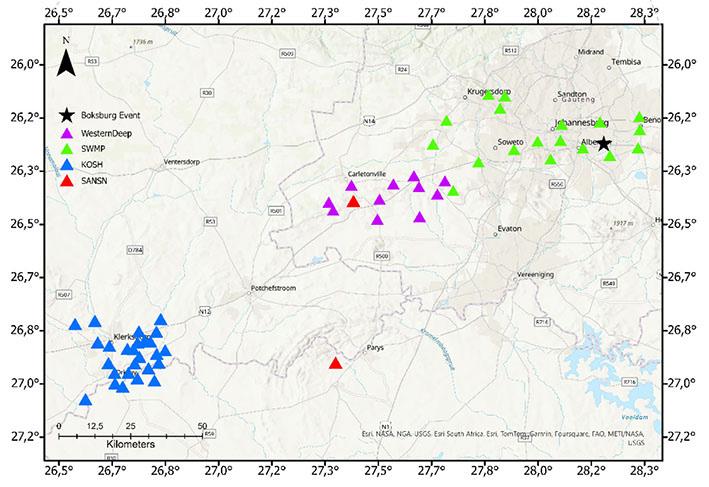
Figure 1—The South African National Seismic Station Network with the zoomed in figure at the bottom showing the cluster networks (KOSH, Western Deep and SWMP) of seismic stations that recorded the earthquake on 11 June 2023
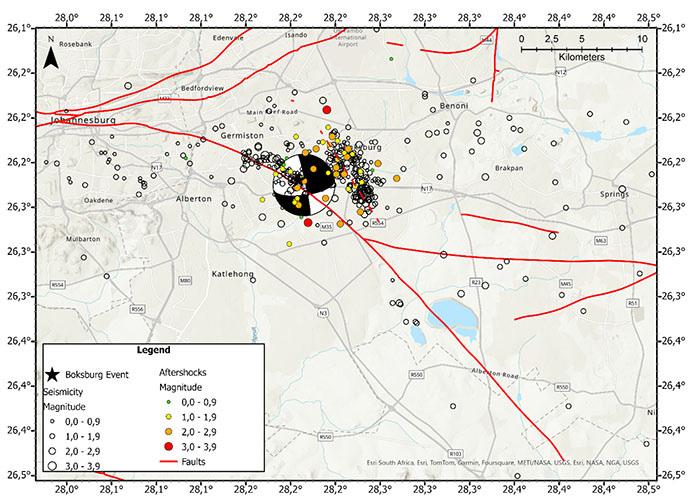
Figure 2—Location of the 11 June 2023 Boksburg event (black star) with its aftershocks (coloured circles). The empty black circles are the long-term seismicity recorded in the region (2016 to 2021). The focal mechanism of the event is represented by the beach ball shown by the circle with two black and two white quadrants. The red dashed line is the possible location of an unmapped active fault
Macroseismic survey of the ML 4.4, 11 June 2023 Boksburg earthquake
damaged (Figure 3). The main results reported in this article are linked to the macroseismic survey that was conducted by the CGS to determine the extent of the impact of this earthquake.
Macroseismic survey and data analysis
Macroseismic intensity data play an important role in the seismological, engineering and loss modelling communities (Midzi et al., 2013). They provide the much needed, and often previously unavailable information for constraining the location and magnitude determination of historical events and for the reconstruction of shaking distributions. The data can also be useful in the selection of appropriate ground motion prediction equations, which can be done either by comparing intensity values with those of other regions of similar tectonics (e.g., Bakun and McGarr, 2002; Allen and Wald, 2009) or by direct comparisons of intensity values with ground motion predictions of peak ground acceleration and response spectral ordinates (e.g., Scherbaum et al., 2009; Delavaud et al., 2009). In South Africa, macroseismic surveys are carried out for all earthquakes of magnitude greater than or equal to 4 that occur in South Africa (e.g., Midzi et al., 2013; Midzi et al., 2015; Pule et al., 2018; Manzunzu et al., 2023) In their publication, Midzi et al. (2013) compiled an intensity database containing 57 earthquakes, using the Modified Mercalli intensity scale, MMI-56 (Richter, 1958).
Thus, following the 11 June 2023 Boksburg earthquake (ML 4.4), the CGS conducted a macroseismic survey to investigate the effects of the event in the region. The macroseismic observations were compiled from online and in-person/face-to-face interview questionnaires.
Observations and intensity data points (IDP)
A total of 511 observations were collected from online sources (280 questionnaires) and also from the survey carried out by the CGS (231 questionnaires). Their spatial distribution is shown in Figure 4.
The methodology followed to translate the information in the collected questionnaires into intensity data points (IDP) is essentially that recommended by Musson and Cecić (2002) and implemented by Midzi et al. (2013). The first step in the analysis of the observations was to sort them according to places, where the places were defined as suburbs or districts in the region. The locations of the places were obtained using a combination of the following sources:
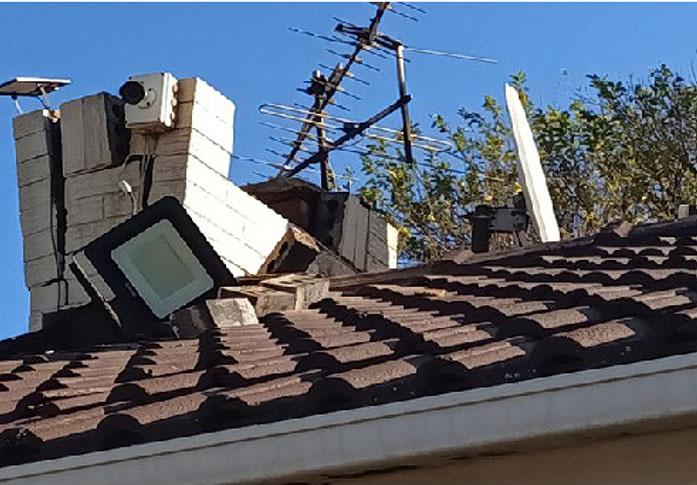

➤ Google Earth
➤ The CGS GIS databases
➤ The Geonames online database of the US National GeospatialIntelligence (GEOINT)) Agency (http://geonames.nga.mil/ ggmagaz/).
All the individual intensity indicators per question in the questionnaires for each place were then summarised. Intensity values were assigned to the sorted and grouped observations by comparing the summary of the observations for each place with the descriptions given for the intensity degrees in the Modified Mercalli
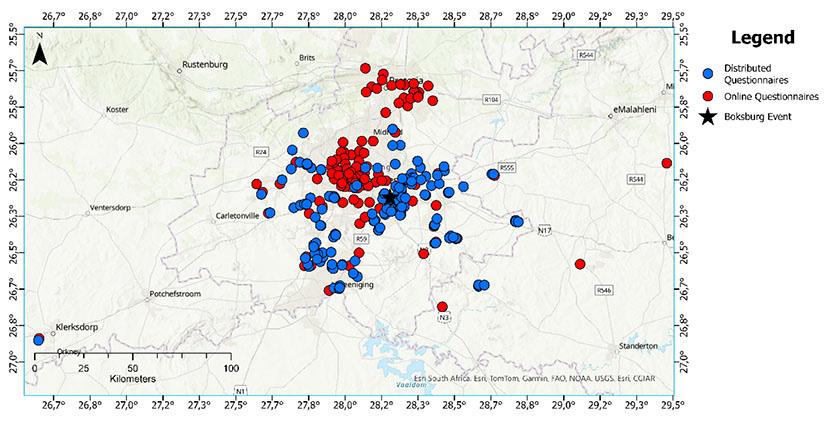
Figure 3—Examples of observed damage to houses and offices in the Boksburg area
Figure 4—Spatial distribution of the observations analysed for the earthquake of 11 June 2023
Macroseismic survey of the ML 4.4, 11 June 2023 Boksburg earthquake
intensity scale (MMI-56 scale). This was done by identifying which of the descriptions for the various intensity degrees best fit the sum of the data collected for the place under consideration. As stated by Musson and Cecić (2002), it is important in this process not to lose focus in pursuit of details of individual diagnostics. The correct assignment is the one that best expresses the generality of the observations. The process followed is described in detail by Midzi et al. (2013). A total of 153 IDP were created using information obtained from the observations (Figure 5).
On analysing the created IDP, it was observed that many (93) had been created using two or more observations (e.g., questionnaires) with 60 IDP created using only one observation
each (Figure 6). Of the 93 IDP, 36 were created using at least five observations. The use of observations from several questionnaires at each place increases the reliability of the results and reduces possible bias. Thus, IDP such as that for Benoni are the most reliable, having been created using observations from 24 questionnaires (Figure 6).
The highest intensity value obtained was of level V−VI, which was experienced at five places, namely Elspark, Elsburg, Palm Ridge, Benoni, and New Redruth. All these places are located close to the epicentre. Some buildings and houses in these areas suffered damage as shown in Figure 3. The distribution of intensity levels showing the number of IDP for each intensity level is shown in Figure 7. It shows that most of the IDP obtained had an intensity level of IV.
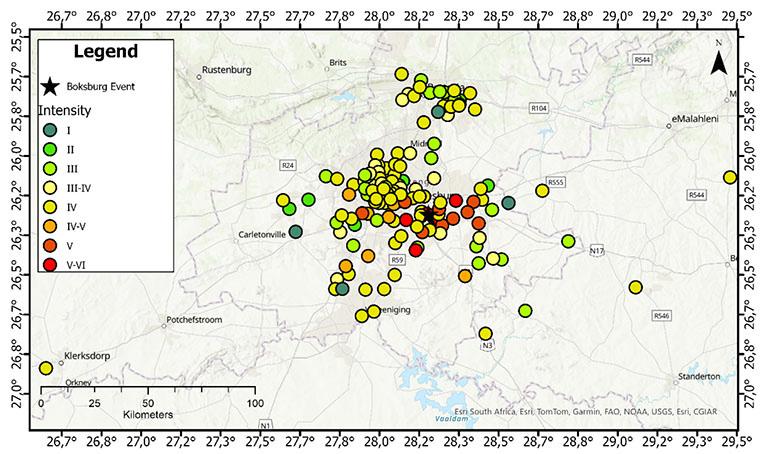
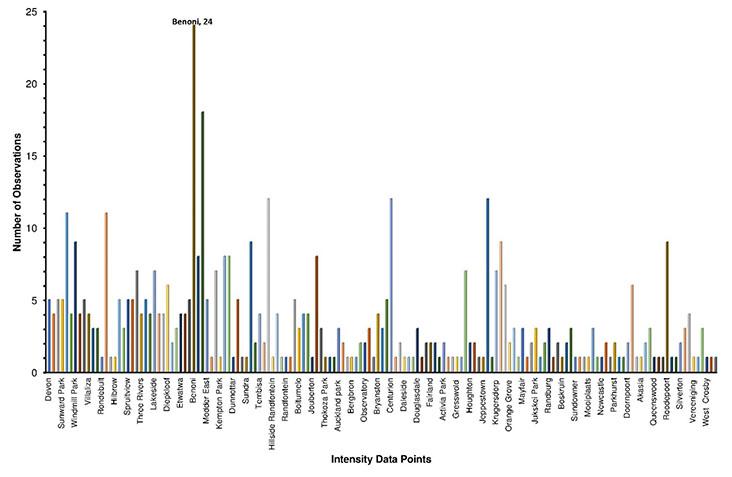
Figure 5—The spatial distribution of the IDP for the 11 June 2023 Boksburg earthquake. The black star indicates the location of the earthquake
Figure 6—Number of observations used to create each IDP
Macroseismic survey of the ML 4.4, 11 June 2023 Boksburg earthquake
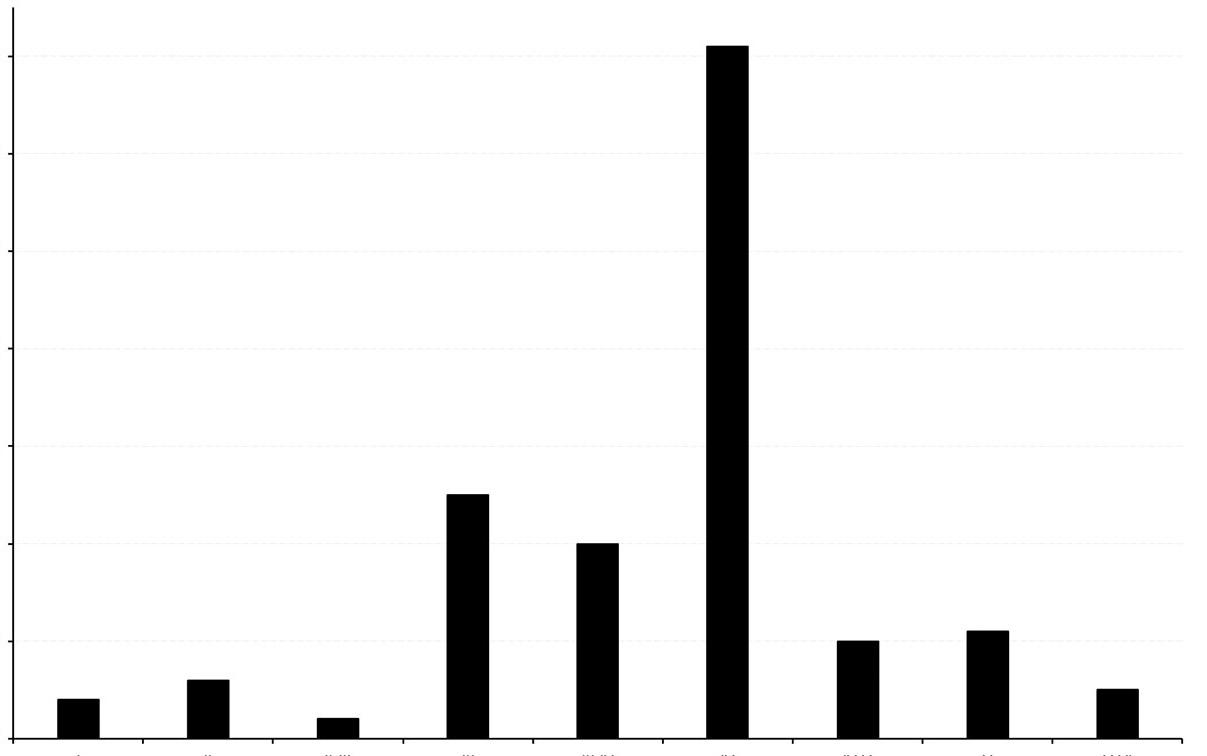
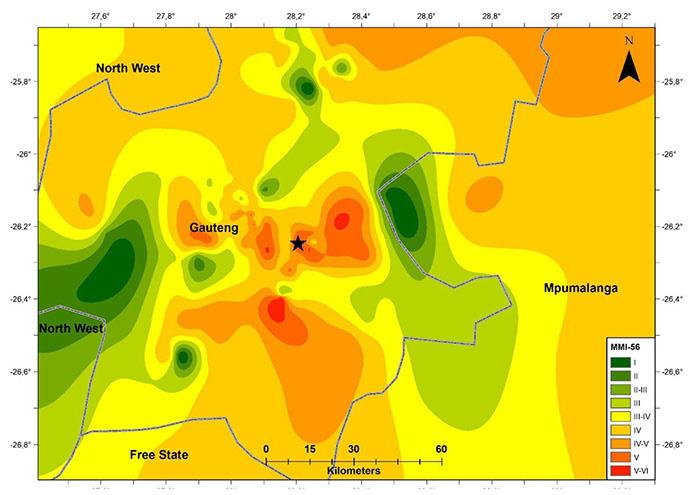
Discussion
An isoseismal map was created using the intensity values obtained from the IDP that are shown in Figure 5. The values were gridded using the Spline with Barriers technique in ArcMap to create the map in Figure 8. The red colours indicate higher intensities up to V−VI and the lower intensities are indicated by the green colours (Figure 8). Thus, areas are shaded using the same colour to indicate that they experienced shaking of equal intensity. As expected, the epicentre is located within areas that experienced the strongest shaking. However, unexpectedly high intensity levels (Level IV)
were observed in Mpumalanga at an epicentral distance of 200 km and Newcastle, approximately 250 km away. An explanation for this could be that the high intensity values at long distances are caused by the amplification of the ground motion by local geology and/or topography. Also, some observations may have been provided by observers located on the upper floors of tall buildings, which are more sensitive to earthquake shaking.
Low intensity values are also observed about 30 km from the epicentre, mixed with IDP of higher intensity that would be expected at such epicentral distance. It is difficult to explain why
Figure 7—Number of IDP for each intensity level
Figure 8—An isoseismal map of the earthquake of 11th June 2023, which shows bands of colours of equal intensity, gridded using the Spline with Barrier technique in ArcMap. The black star is the location of the main Boksburg event
Macroseismic survey of the ML 4.4, 11 June 2023 Boksburg earthquake
there was low intensity so close to the epicentre. This could be due to site conditions, where buildings in the area are built on rock, or just subjective views of observers that, because they were sleeping at the time, might not have experienced the shaking from the earthquake. High intensity values seen near the boundaries of the area are an artifact of the gridding process. The values are influenced by the nearest IDP. Comparison between the distribution of IDP shown in Figure 5 and the isoseismal map (Figure 8) can show the influence of the IDP values on the isoseismal map.
Conclusion
Intensity values were assigned to create IDP for the 11 June 2023 Boksburg earthquake by using observation data from information provided in questionnaires submitted online to the CGS and others filled in during interviews conducted by CGS personnel. A total of 153 IDP were created, with the highest intensity level of V−VI experienced in several places located near the epicentre. There were also observations that indicate that the shaking from the earthquake was felt over 200 km from the epicentre. Higher than expected intensity values were also experienced in Johannesburg central and the northern suburbs, as well as in Pretoria to the north. Intensity has been proven to be highest at the epicentre and locations mostly nearby. Normally, the shaking from the earthquake is highest close to the epicentre and decreases with an increase in epicentral distance. However, it is clear that site geology also contributes much to the distribution of observed intensities.
Recommendations
The following actions are recommended to help in the explanation of observed outlying intensity values, which appear higher than may have been expected when considering their distances from the epicentre of the earthquake:
➤ Investigate the influence on the intensity distribution of observations reported by people on upper floors of multistorey buildings.
➤ Investigate the influence of site geology and topography on intensity distribution.
➤ Investigate the link between intensity distribution, building damage and building type.
➤ Investigate in detail the ground motion inferred by observed variations of intensity in the epicentral region by carrying out a microzonation study of the Ekurhuleni municipality to expand the microzonation of Johannesburg results (Rathod, 2018). This should be done by carrying out a detailed seismic hazard analysis incorporating the site response analysis. The response of soil layers under earthquake excitations should be assessed to provide an indication of the variations of ground motion amplitudes/shaking level on the ground surface. This process is essential for identifying potential seismic “hotspots”, which could have varying effects on structures within the same area. Such information is essential for disaster management and city planning.
➤ In-depth geophysical surveys to understand the fault structures which may be the causative faults of earthquakes in the region.
References
Allen, T.I., Wald, D.J. 2009. Evaluation of ground-motion modelling techniques for use in Global ShakeMap: a critique of instrumental ground-motion prediction equations, peak ground motion to macroseismic intensity conversions, and macroseismic intensity predictions in different tectonic settings. US Geological Survey Open-File Report 2009-1047.
Bakun, W.H., McGarr, A. 2002. Differences in attenuation among the stable continental regions. Geophysical Research Letters, vol. 29, no. 23. doi:10.1029/2002GL015457
Delavaud, E., Scherbaum, F., Kuehn, N., Riggelsen, C. 2009. Information-theoretic selection of ground-motion prediction equations for seismic hazard analysis: an applicability study using Californian data. Bulletin of the Seismological Society of America, vol. 99, no. 6, pp. 3248–3263.
Manzunzu, B. Midzi, V., Zulu, T., Mphahlele, K. 2023. Macroseismic analysis and the determination of a focal mechanism of the 31 October 2019, KwaZulu-Natal earthquake in South Africa. South African Journal of Geology, vol. 126, no. 1, pp. 113–126, doi: https://doi.org/10.25131/sajg.126.0002
Midzi, V., Bommer, J.J., Strasser, F.O., Albini, P., Zulu, B.S., Prasad, K., Flint, N.S. 2013. An intensity database for earthquakes in South Africa from 1912 to 2011. Journal of Seismology, vol. 17, pp. 1183–1205.
Midzi, V., Zulu, B., Manzunzu, B., Mulabisana, T., Pule, T., Myendeki, S., Gubela, W. 2015. Macroseismic survey of the ML 5.5, 2014 Orkney earthquake. Journal of Seismology, vol. 19, no. 3, pp. 741–751, DOI 10.1007/s10950-015-9491-2
Musson, R.M.W., Cecić, I. 2002. Macroseismology. International handbook of earthquake and engineering seismology, W.H.K. Lee, H. Kanamori, P.C. Jennings and C. Kisslinger (ed), International Geophysics, vol. 81(A), pp. 807–822.
Pule T., Midzi, V., Manzunzu, B., Zulu, B., Mulabisana, T., Rathod, G., Mphahlele, K. 2018. The macroseismic survey of the M4.6, 2017 Stilfontein earthquake. Proceedings of 16th European Conference on Earthquake Engineering, 18−21 June 2018.
Rathod G. W. 2018. Seismic Ground Response Analysis and Analysis of Seismic Wave Amplification for Johannesburg Region. Council for Geoscience Report 2018-0232.
Richter, C.F. 1958. Elementary Seismology. W.H. Freeman, San Francisco, 768.
Scherbaum, F., Delavaud, E., Riggelsen, C. 2009. Model selection in seismic hazard analysis: an information-theoretic perspective. Bulletin of the Seismological Society of America, vol. 99, no. 6, pp. 3234–3247. u
Affiliation:
1School of Geosciences, University of the Witwatersrand, Johannesburg, South Africa
2Uppsala University, Uppsala, Sweden
3Politecnico do Torino,Turin, Italy
4Sercel, Nantes, France
Correspondence to:
M.K. Rapetsoa
Email: moyagabo.rapetsoa@wits.ac.za
Dates:
Received: 30 Jun. 2024
Revised: 5 Dec. 2024
Accepted: 16 Jan. 2025
Published: January 2025
How to cite:
Rapetsoa, M.K., Manzi, M.S.D., Sihoyiya, M., Malehmir, A., James, I., Socco, L.V., Lepine, J., Colombero, C., Valeshin, O., Durrheim, R.J. 2025. Advanced seismic acquisition techniques in South African mines: Insights from the FUTURE project.
Journal of the Southern African Institute of Mining and Metallurgy, vol. 125, no. 1, pp. 25–32
DOI ID:
http://dx.doi.org/10.17159/24119717/3432/2025
ORCiD:
M.K Rapetsoa
http://orcid.org/0000-0003-3275-8994
M.S.D Manzi
http://orcid.org/0000-0002-1654-5211
M. Sihoyiya
http://orcid.org/0000-0003-1956-5223
A. Malehmir
http://orcid.org/0000-0003-1241-2988
I. James
http://orcid.org/0000-0002-1655-3529
L.V. Socco
http://orcid.org/0000-0001-8830-9050
C. Colombero
http://orcid.org/0000-0001-9818-7464
R.J. Durrheim
http://orcid.org/0000-0003-3832-0600
Advanced seismic acquisition techniques in South African mines: Insights from the FUTURE project
by M.K. Rapetsoa1, M.S.D. Manzi1, M. Sihoyiya1, A. Malehmir2, I. James1, L.V. Socco3, J. Lepine4, C. Colombero3, O. Valeshin4, R.J. Durrheim1
Abstract
The FUTURE project aims to enhance seismic surveying in South African mining by integrating advanced acquisition technologies. In this paper, we detail surface and underground seismic surveys at the South Deep gold mine as part of the project. Surface seismic acquisition used co-located broadband micro-electromechanical sensors, one and three component recorders connected to geophones, distributed acoustic sensing using a straight fibre optic cable, along with a 6 ton broadband seismic vibrator operating with 4–180 Hz linear sweeps. In addition, underground surveys employed a combination of straight, and helically wound fibre optic cables, cabled-based and nodal sensors, along with a 500 kg drophammer mounted on a skid steer bobcat. The surface and underground seismic arrays were time synchronised using a GPS-time transmitter to allow for accurate seismic data recording in a GPS-denied environment. Results show the efficacy of these techniques in acquiring high-resolution seismic data, revealing detailed subsurface geological structures and mineralisation down to 3500 m below ground surface. Surface data revealed clear seismic reflections corresponding to the Black Reef and Ventersdorp Contact Reef. An underground P-wave velocity model exhibits low velocity anomalies that are associated with fracturing, while a P-wave reflection stack section shows significant reflections and a degree of faulting below the tunnel floor that was not observed on the surface reflection seismic data. We highlight the potential of these technologies to enhance safety, efficiency, and sustainability in mining. This study sets a benchmark for future reflection seismic surveys, paving the way for safer, more efficient, deep mineral exploration and extraction practices.
Keywords seismics, mining, mine design, exploration, DAS
Introduction
The South African mining industry is a critical component of the national economy, contributing significantly to employment and export revenues. However, the industry faces numerous challenges, including the need for improved safety, efficient resource extraction, and accurate subsurface imaging (Manzi et al., 2012a, 2012b; Pretorius et al., 2000; Rapetsoa et al., 2024). Geophysical methods play a crucial role in mineral exploration, mine planning and safety. In particular, the seismic methods have been pivotal in deep gold exploration and mine development in the Witwatersrand goldfields by offering high-resolution imaging of gold-bearing horizons (pebble conglomerates known as reefs) and complex geological structures (faults, dykes, and sills) that have a direct impact on ore extraction (Malehmir et al., 2014; Nkosi et al., 2018; Mutshafa et al., 2023). However, seismic surveys in a structurally complex, metamorphosed, and deformed mining environment, such as the Witwatersrand Basin, yields specific complications, such as low signal-to-noise ratio and strongly scattered seismic energy (Salisbury et al., 2003). In terms of resolution, mine tunnels provide the opportunity to bring seismic instruments closer to the target, thus providing higher resolution and better depth of penetration. Like surface-based surveys, in-mine surveys pose several challenges that need to be addressed such as: (1) lack of GPS signal inside the mines, (2) high level of noise from mine operations and infrastructure, and (3) limited space inside the mine for proper survey designs.
Recent technological advancements in seismic acquisition are transforming the field of geophysics, particularly for mining applications (Malehmir et al., 2012). Distributed acoustic sensing (DAS) technology, which leverages straight and helically wound fibre optic cables to measure seismic wave propagation, offers improved data resolution due to their broadband nature, deployment efficiency, and cost-effectiveness (Douglass et al., 2023; Rafi et al., 2024). Similarly, P-wave broadband sources and nodal sensors (single and three-component) provide flexibility and enhanced data quality for both surface and underground seismic
Advanced seismic acquisition techniques in South African mines
surveys (Stotter and Angerer, 2011; Tellier et al., 2021). These innovations present an opportunity to address the shortcomings of traditional methods, enabling more accurate imaging and safer mining operations.
The FUTURE (Fibre-Optic Sensing and UAV-Platform Techniques for Innovative Mineral Exploration) project represents a pioneering effort to address mining challenges through the integration of advanced seismic acquisition technologies. The project builds upon previous studies, such as those conducted at Maseve mine (Rapetsoa et al., 2022). In this study, we aim to enhance the imaging capabilities and operational safety mines by leveraging state-of-the-art equipment, such as nodal systems (1C and 3C), and distributed acoustic sensing (DAS) technologies.
In this paper, we provide a detailed account of the surface and underground seismic surveys conducted at the South Deep gold mine as part of the FUTURE project. The South Deep mine, one of the world's largest gold deposits, presents a challenging environment due to its extreme depth of ~3700 m, significant environmental noise from ongoing mining operations, and geological complexity introduced by features such as dykes and faults (e.g., the Wrench Fault), making it an ideal site for testing and advancing innovative seismic technologies. By deploying both traditional and cuttingedge methods, the project seeks to establish a comprehensive understanding of subsurface structures and improve the detection of ore bodies and potential hazards.
The technical objectives of this study are to document the seismic acquisition parameters and methodologies employed during surface and underground surveys, compare the effectiveness of traditional seismic methods with advanced techniques like distributed acoustic sensing (DAS), wireless recorders connected to geophones, and micro-electromechanical systems (MEMS) accelerometers in challenging mine environments, establish a benchmark for future seismic surveys in the mining industry, and contribute to the development of safer and more efficient seismic survey techniques that will ultimately improve operational safety and resource extraction in the mining sector. The paper also addresses some challenges that are related to in-mine seismic surveys in active deep mines and provide guidelines that may be useful when designing similar surveys in other deep mines in the world.
The geological objectives of the surveys are to image the gold deposits and delineate geological structures, such as faults and dykes ahead of the mine face that may: (1) affect mine planning and development, (2) act as conduits for water and flammable gas ingress into mining levels, and (3) be re-activated and result in seismicity.
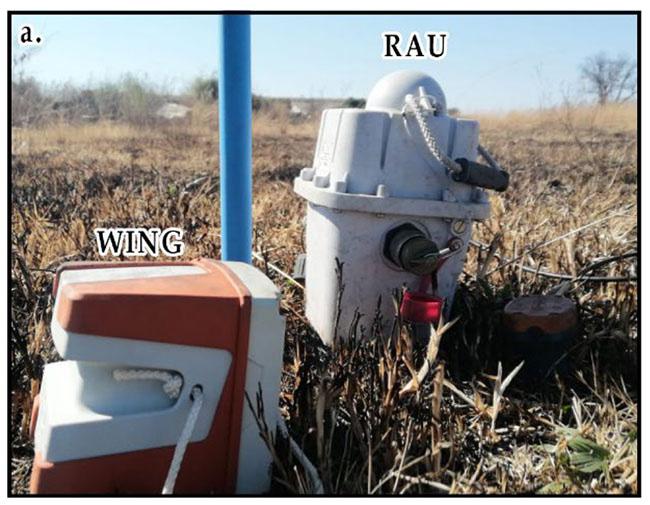
Acquisition
Surface Acquisition
The surface seismic acquisition involved deploying two distinct nodal systems: the WING node or digital field unit (DFU) and the remote acquisition unit (RAU), as illustrated in Figure 1(a). These systems were utilised to compare their performance and data quality. A total of 485 broadband MEMS sensors (WING) and 485 one-component RAUs (5 Hz) were co-located along the seismic profiles to ensure consistency in data comparison. Additionally, 91 three-component RAUs were deployed along Profile 1 (P1a) with a spacing of 20 m to provide more detailed imaging of specific targets. Both the Wings and RAU were spaced at 10 m. A 6 ton mini-vib (Figure 1b) was used as the seismic source, providing a controlled and repeatable signal with a sweep length of 48 s sweep frequencies ranging from 4 to 180 Hz. The Sercel Lite system was employed for data acquisition, ensuring high fidelity and reliability in recording the seismic signals. Differential Global Positioning System (DGPS) was used for precise geodetic surveying, ensuring accurate positioning of the sensors and source points.
Profile 1 (P1) targeted the Wrench Fault (WF) trending southwest-northeast, aiming to capture detailed seismic reflections and structural information related to the WF system. Profile 2 (P2), positioned above active mine tunnels, aimed to complement
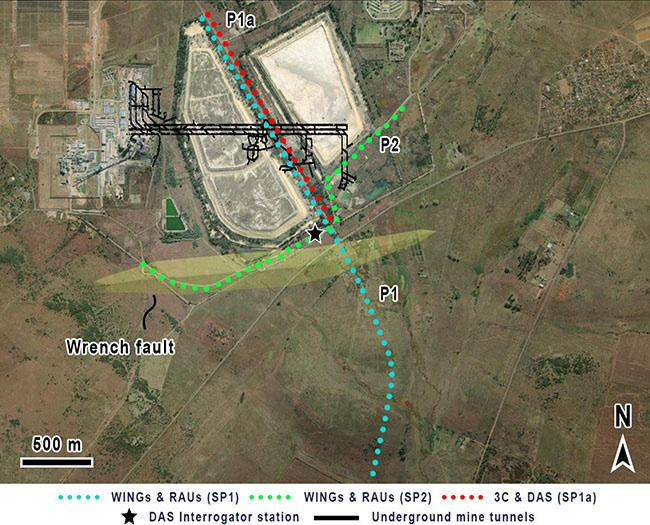
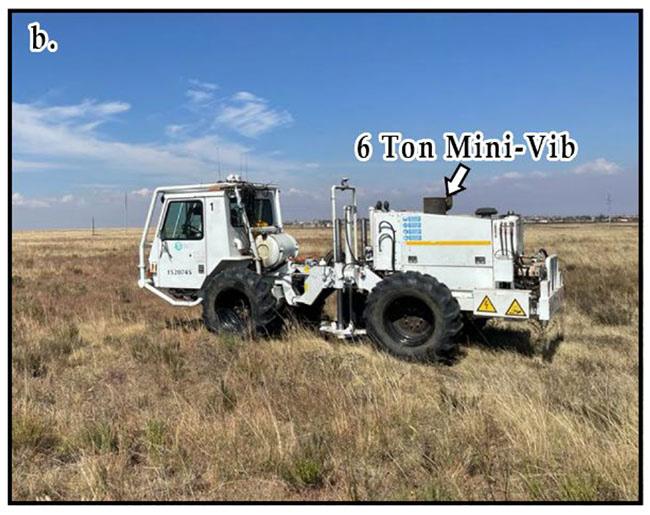
Figure 1—(a) Nodal systems used in the 2023 South Deep surface acquisition (WING and RAU) and (b) Mini-vib used as a seismic source across the profiles
Figure 2—Overview map showing the location of the seismic profiles in relation to the underground tunnel and major geological (Wrench Fault) structures
Advanced seismic acquisition techniques in South African mines
the underground seismic surveys by improving the imaging of structures above the mine tunnels.
Distributed Acoustic Sensing (DAS)
To enhance data quality and capture additional seismic information, distributed acoustic sensing (DAS) technology was integrated alongside the nodal systems. The fibre optic cable used in DAS was strategically deployed alongside the nodal systems for comparison purposes. The fibre optic cable had a total length of 1820 m, with a gauge length set at 10 m and a spatial sampling interval of 5 m, resulting in a high-density channel configuration along the fibre length. To improve the coupling and signal quality, the fibre optic cable was covered with sand (Figure 3a), which significantly reduced noise levels compared to the uncovered fibre cable (Figure 3b). The DAS interrogator was fixed at a single location for three days, capturing both passive and active seismic data.
Tunnel Acquisition
The underground seismic survey at South Deep gold mine involved a combination of cabled systems, nodal sensors, and fibre optic cables. These experiments aimed to assess the feasibility of using
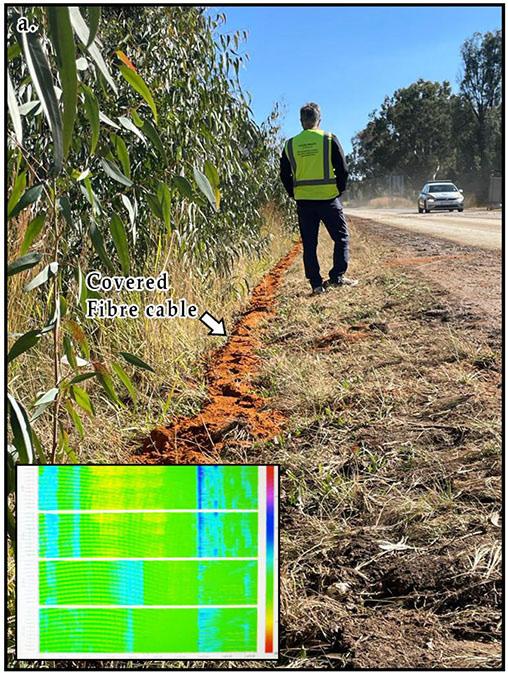
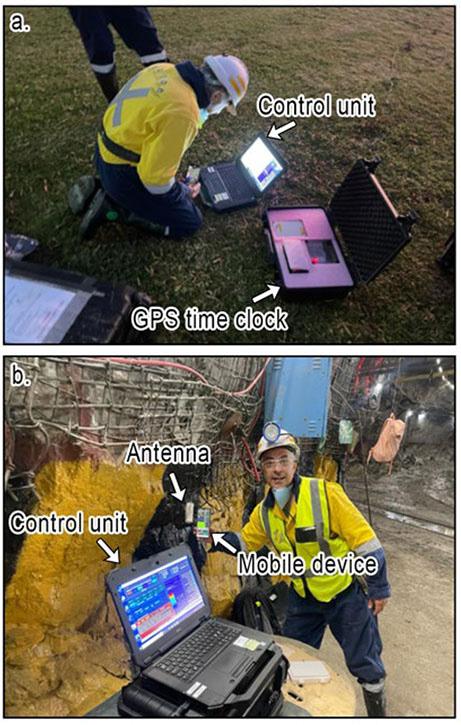
seismic surveys in GPS-denied environments and to compare various acquisition technologies. Before deployment underground, the GPS time system developed under the Smart Exploration Project (Malehmir et al., 2019) was synchronised with satellites on the surface (Figure 4a). Upon reaching 3000 m below the surface, the GPS system was connected to a mobile device to ensure functionality (Figure 4b). The system was then integrated with the nodal sensors and tested using the harvester (Figure 4c).
Two types of fibre optic cables were used: a straight single-mode fibre optic cable (Figure 5a:~727 m along the tunnel floor) and a multimode helical wound fibre optic cable (Figure 5b: 67 m inserted into a near-horizontal borehole). The cables were spliced together, extending the total fibre length to approximately 763 m. The straight fibre was covered with gravel to enhance coupling with the tunnel floor. A 500 kg drophammer mounted on a skid steer bobcat was used as the seismic source (Figure 5c). Shot spacing was set at 10 m, with each location receiving a minimum of four shots. Onecomponent 5 Hz spiked geophones were drilled into the ground every 5 m for optimal coupling (Figure 5d). These geophones were connected in a series using the Geode system powered by 12 V lithium batteries.
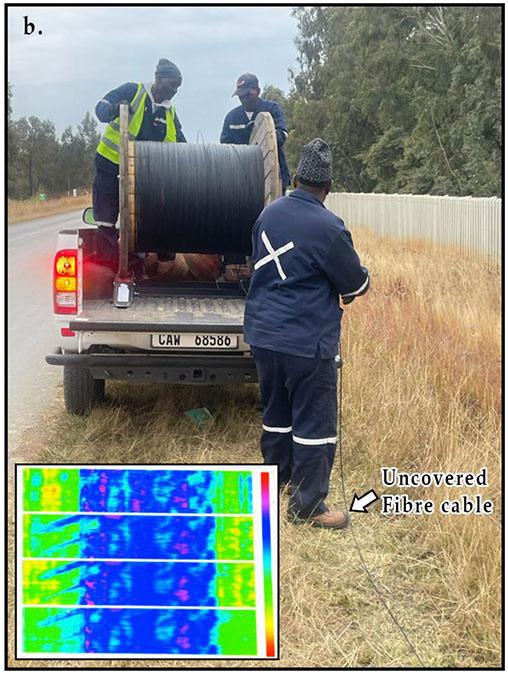
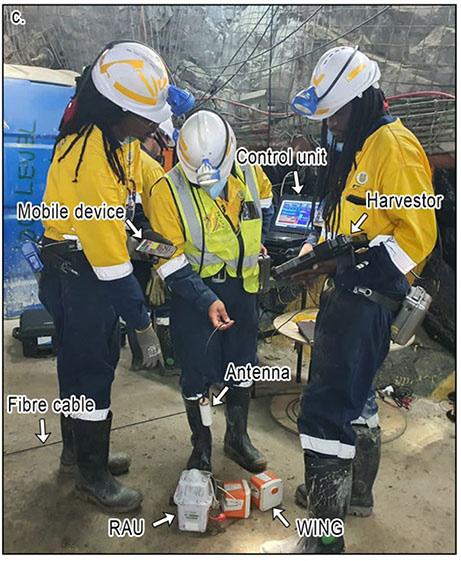
Figure 3—Deployment of distributed acoustic sensing (DAS) fibre optic cable along the nodal system profiles. (a) Insert shows the recorded signal from the covered fibre optic cable with soil and the signal is less noisy (b) Shows the uncovered fibre optic cable
Figure 4— (a) The GPS time system is synchronised with satellites for underground tunnel use, providing signals to (b) Mobile devices at 3000 m below the surface, and (c) Fed to nodal systems
Advanced seismic acquisition techniques in South African mines
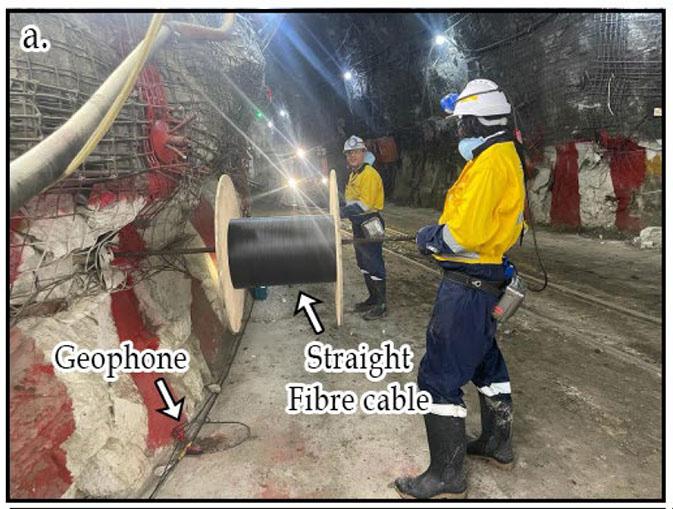
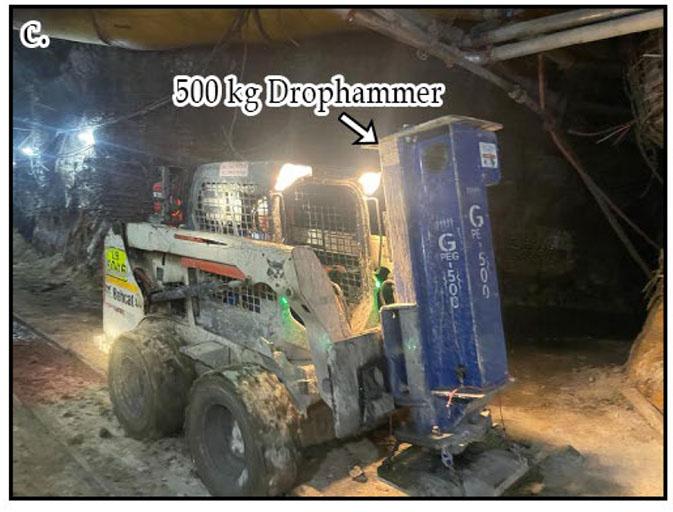
The DAS interrogator was set up near the refuge bay at level 100, working in conjunction with the GPS-time system for precise time tagging. The GPS-time (micro-second accuracy) system can transmit a simulated real or false GPS-time signal without cabling from the surface. Prior to data acquisition, a tap test was conducted along the fibre optic cable to map its response and correlate it with geophone locations. The DAS system operated simultaneously with the cabled seismic system, capturing both passive and active seismic signals. A GPS-time tagging system was used to synchronise the tunnel DAS and surface nodal array to capture the seismic wavefield between the tunnels and the surface. Integrating the GPS-time system with the fibre optic cable through the DAS interrogator’s GPS antenna reduces the attenuation of the GPS-time signal along the length of the fibre cable. Despite the challenges encountered while conducting a survey in an active and operating deep mine, we managed to acquire more than 240 shot records for both surface and underground surveys, with the GPS-time transmitter also used for the continuous recording of passive seismic data (e.g., ambient noise). The time-synchronised surface and tunnel array enable the scanning of the rock mass between the surface and the tunnels like a magnetic resonance imaging (MRI) scanning device.
In selecting the equipment for the FUTURE project, we focused on systems that met the specific needs of the study, such as highresolution imaging and depth of penetration, ensuring optimal data acquisition for subsurface imaging in the challenging South Deep mine environment.
These needs were addressed later in the study, as we successfully achieved the required resolution and depth of penetration. While a comprehensive comparison with other available systems was not conducted, the chosen equipment, including the WING, RAU, and
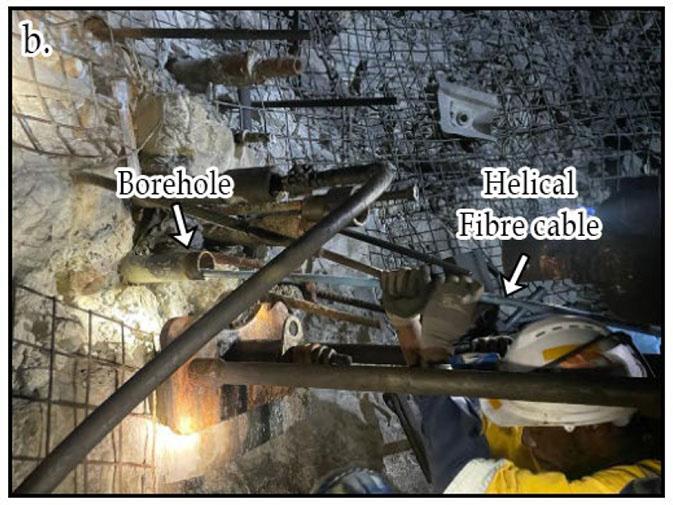
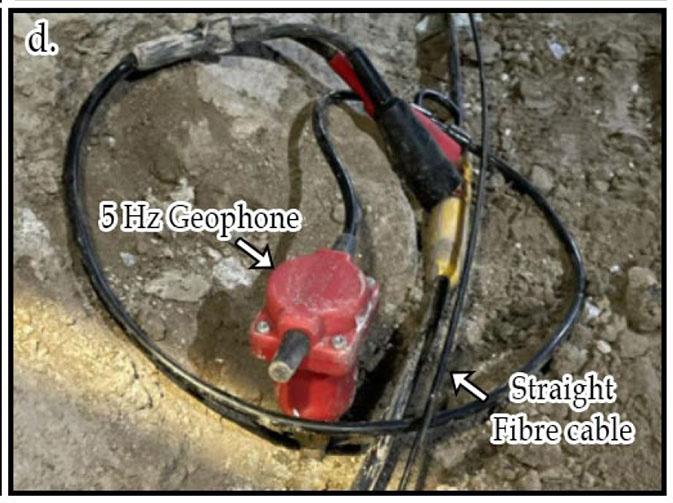
DAS, were selected based on their ability to meet key parameters such as high resolution, flexibility, and reliability. These systems were ideal for complex geological conditions at these mining depths and the operational demands of the mine. For example, to increase the resolution and depth of penetration compared to the previous studies, a combination of a broadband source with broadband nodal receivers was used. DAS systems are also broadband continuous array of sensors (Willis, 2022). The benefits of generating and recording a broadband signal include the reduction of seismic wavelet side lobes by low frequencies and sharpening of the seismic wavelet by higher frequencies (Manzi et al., 2018). The previous surveys in the same area were acquired using a conventional (bandwidth limited) seismic source (10-96 Hz sweep frequency) and 10 Hz cabled geophones (Manzi et al., 2012a, b; Manzi et al., 2013). MEMS sensors (accelerometers) were also chosen because they are insensitive to electromagnetic noise, which is dominant in an operating mine like South Deep mine. Furthermore, sources and sensors used in this project are smaller and lighter than conventional systems making them easier to handle in the field. The MEMS sensors, in particular, are more stable with respect to temperature and ageing of their components, providing more reliable seismic amplitudes and wavelet phase at low frequencies.
This survey set-up surpasses the capability of any synchronised active and passive seismic survey in the world, thanks to the GPStime transmitter, broadband wireless nodes, and DAS technology, opening new possibilities for more innovative survey designs and in-mine seismic studies (Brodic et al., 2021; Rapetsoa et al., 2024).
Seismic resolution
The resolution of the acquired seismic data is influenced by various
Figure 5—(a) Deployment of straight fibre along the tunnel floor at South Deep mine level 100, (b) Helical fibre cable inserted into the borehole for a length of 67 m. (c) A 500 kg drophammer used as a seismic source in underground tunnels mounted on a skid steer 530 bobcat and (d) Drilled 5 Hz one component geophones placed along the straight single mode fibre optic cable
Advanced seismic acquisition techniques in South African mines
factors, including sensor type, spacing, and frequency range of the seismic wavefield. For surface seismic surveys with a dominant frequency of 65 Hz and an average velocity of 6000 m/s, the vertical seismic resolution limit is 23.08 m. Similarly, for underground surveys with a dominant frequency of 60 Hz, the vertical resolution limit is 25 m, according to the ¼ wavelength criterion (Widess, 1973; Yilmaz, 2001). This suggests that the top and bottom of any reef with a thickness smaller than the resolution limit may not be fully resolved. The lateral resolution is governed by sensor spacing and the dominant wavelength. The spatial resolutions provided by the nodal systems (10 m spacing for WINGS and 1C RAU, 20 m spacing for 3C RAU) and DAS (5 m sampling interval) offered a multi-scale approach to seismic imaging. While nodal systems provided uniform and robust coverage, DAS contributed highdensity data critical for capturing fine-scale subsurface features. This synergy enhanced the overall resolution and interpretability of the seismic dataset.
Results and interpretation
The surface seismic data collected from the WING and the RAU demonstrated clear first arrivals and discernible reflections (Figure 6). The raw shot gathers from both systems showed excellent data quality, with notable reflections and possible guided waves. The green arrows in the shot gathers indicate the P-wave first breaks,
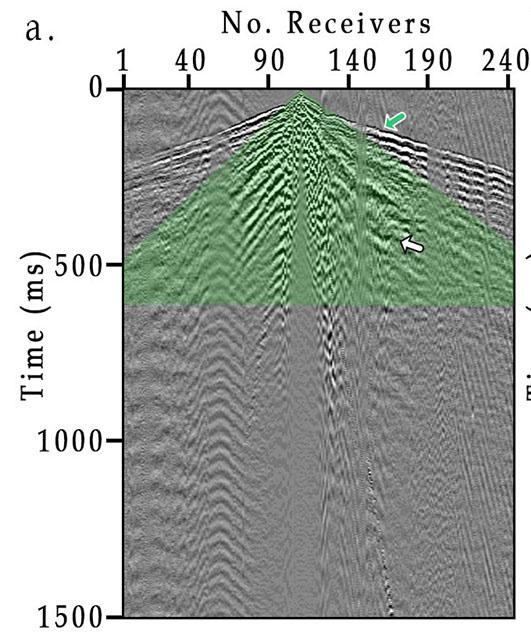
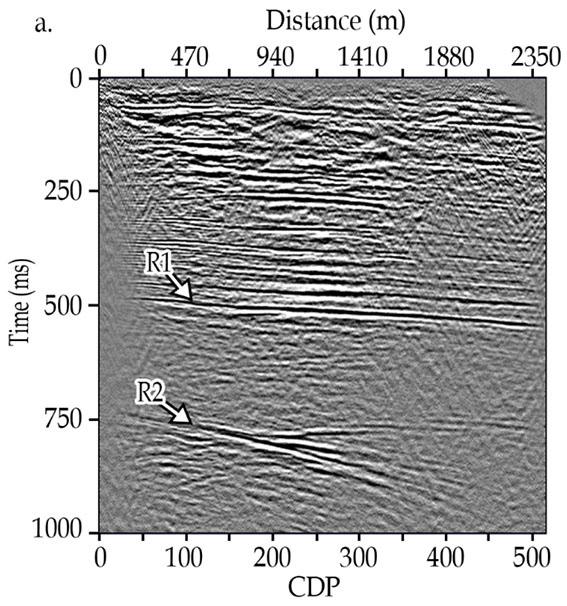
while the white arrows highlight some of the P-wave reflections. The comparison between the RAU (Figure 6a) and WING (Figure 6b) systems revealed minimal differences in data quality, confirming the efficacy of both systems in capturing high-resolution seismic data. The consistent receiver spacing and sweep parameters across profiles ensured reliable data for subsequent processing and interpretation.
Figures 7a and 7b show the unmigrated and the migrated stacked sections, respectively, of the surface seismic profile (P1). The limited length of the profile restricts imaging to about 1000 ms (~3.2 km depth, using interval P-wave velocities of 6500 m/s). The seismic profiles show well-developed Black Reef (R1: BLR) and Ventersdorp Contact Reef (R2: VCR) reflectors, which have been extensively studied in the study area. Additionally, near-surface reflections are well imaged, providing clear detail of the upper subsurface layers. The characterisation of the BLR and VCR reflectors is detailed in Manzi et al. (2012b) using 3D seismic data, and their depths in this study corresponds to those reported in the literature.
The underground seismic acquisition yielded high-quality data, despite the challenging environment. The P-wave seismic tomography results from profile SDT1 revealed three distinct P-wave velocity zones, providing valuable insights into the geological conditions of the area. The near-tunnel zone,
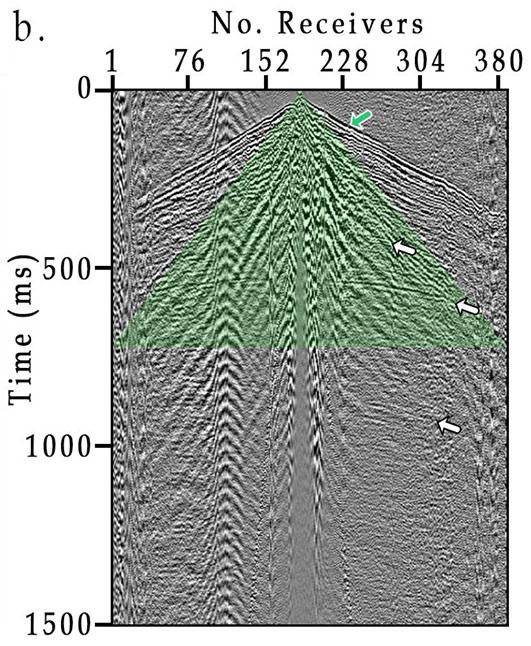
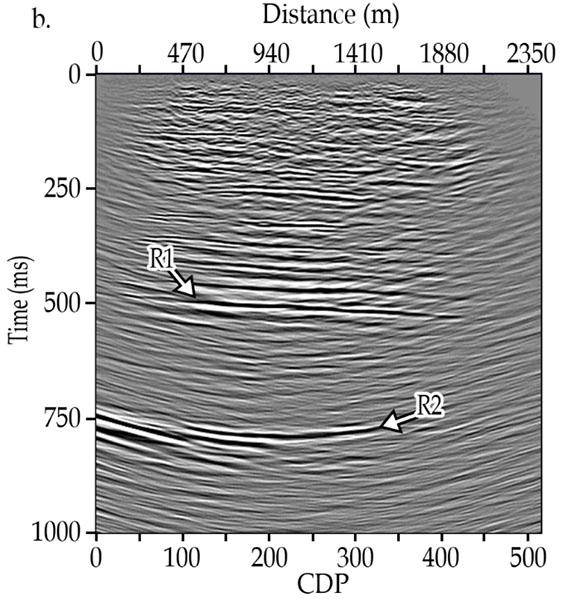
Figure 6—Examples of raw shot gathers from the two seismic profiles (a) P1_RAU and (b) P1_WING, showing the quality of the data on surface, with clear first breaks (green arrow) on. The white arrows show some reflections recorded in the shot gather, while the green shading indicates an area of the surface and guided waves
Figure 7—(a) Unmigrated stacked section from seismic profile P1 showing sub-horizontal (R1: Black Reef) and steeply dipping (R2: Ventersdorp Contact Reef) reflections, and (b) Migrated stacked section. Although the data are imaged to the target depth, the short line length and dipping reflectors limit the ability of the migrated data to fully resolve horizons at 800 ms
Advanced seismic acquisition techniques in South African mines
characterised by velocities between 2000 and 3000 m/s, is indicative of fractured rock, which could correspond to zones of reduced mechanical strength and potential stability risks for mine planning. The intermediate zone, with P-wave velocities ranging from 3100 to 4400 m/s, represents more competent geological units, likely indicating less fractured and more consolidated formations. The deeper high-velocity zone (4500–5800 m/s) suggests the presence of dense, highly competent rock, which provides structural support to the mining environment (Figure 8a). The ray path coverage (Figure 8b) indicated reliable penetration to depths of 14 to 20 m, offering a robust model of the near-tunnel velocity structure. These velocity variations underscore lithological and structural heterogeneities that are critical for evaluating geotechnical conditions and ensuring the safety and efficiency of mining operations.
The depth-converted seismic section of SDT1 displayed significant reflections within the first 200 m below the tunnel, particularly in the central part of the section where the data fold was highest (Figure 9). These reflections likely correspond to lithological boundaries and geological structures, delineating fault zones and compartmentalised geological units. Such insights are critical for understanding stress distributions and planning mining activities to avoid hazardous areas. The complex geological setting and existing infrastructure, such as side tunnels and mine workings, influenced the recorded seismic wave-field, adding complexity to the interpretation. Integrating seismic tomography with reflection imaging and detailed geological mapping ensures comprehensive structural interpretations, enhancing safety and efficiency in mining operations. Despite these challenges, the seismic data acquired underground allowed for a meaningful structural interpretation, highlighting fault compartmentalisation and the presence of distinct geological units.
Discussion
The successful deployment of advanced seismic acquisition technologies at South Deep gold mine demonstrates the feasibility of high-resolution seismic surveys in both surface and underground
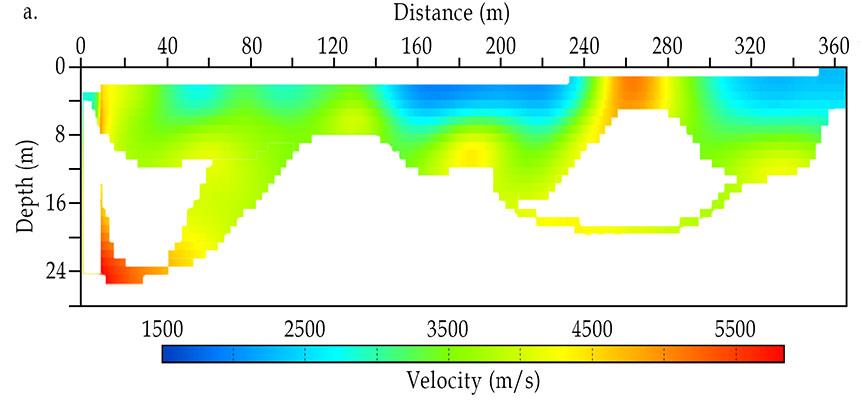
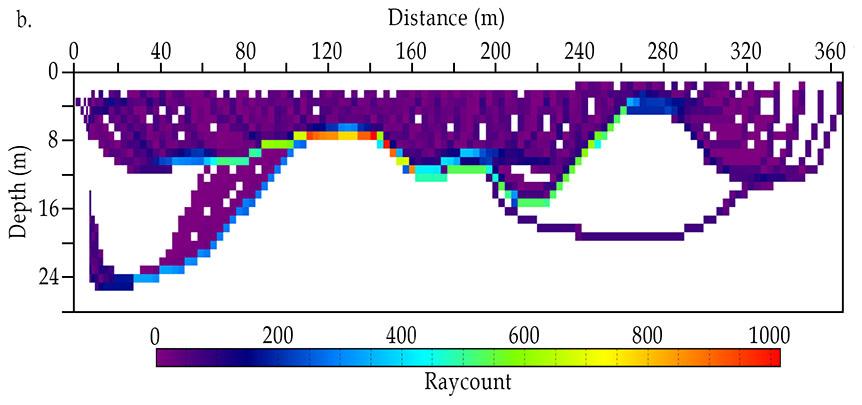
insufficient ray penetration have been excluded to ensure the integrity and reliability of the velocity model interpretation
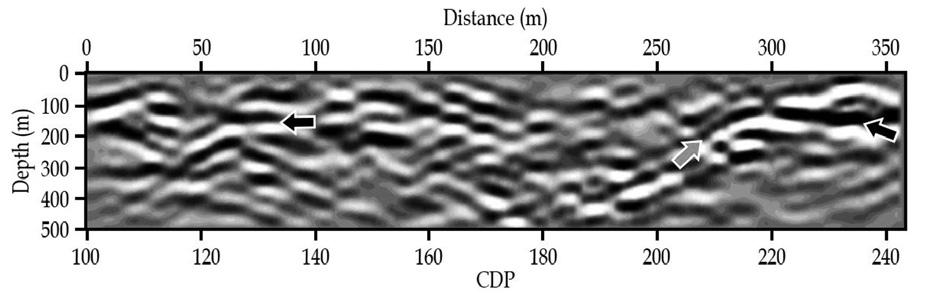
Figure 9—Depth-converted reflection seismic section of SDT1, showing reflections to a depth of 300 m from the tunnel floor. Black arrows indicate reflections approximately 100 m below the tunnel floor, while dipping reflections are highlighted by green arrows
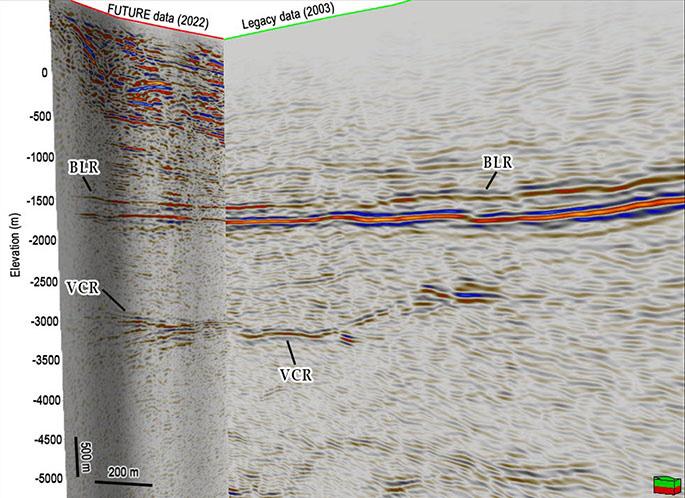
Figure 10—Comparison of legacy seismic data from 2003 (green) and FUTURE project data from 2022 (red). The broadband and dense acquisition (2022) successfully imaged both shallow and deep subsurface targets, whereas the conventional sparse acquisition (2003) was limited to imaging deeper structures. BLR: Black Reef, VCR: Ventersdorp Contact Reef
environments. The comparison of nodal systems, DAS, and conventional cabled geophones provided a comprehensive dataset for analysing subsurface structures. The integration of GPS-time synchronisation and innovative data acquisition techniques ensured high accuracy and reliability, even in GPS-denied underground settings.
Seismic data acquisition for both surface and underground surveys faced several challenges from potential sources of error, primarily noise and coupling issues. For surface acquisition, nodal equipment was affected by noise from moving machinery and traffic along the survey routes. Coupling issues with the nodal receivers were mitigated by burying some sensors or ensuring that they were securely planted into the ground. DAS cables, however, faced significant coupling challenges, which were improved by covering the fibre optic cables with sand. This solution enhanced coupling but added to the deployment time. For underground acquisition, both DAS and traditional wired geophones encountered noise from mining activities, including drilling and machinery operations, and coupling issues due to the hard rock environment. Mitigation efforts, such as drilling geophones into the rock and scheduling surveys during periods of minimal traffic and halted drilling activities, significantly improved data quality and reliability.
The results underscore the potential for using seismic surveys to enhance our understanding of subsurface geology, to monitor mining-induced changes, and improve safety in mining operations.
Figure 8—(a) 2D travel-time tomography results from seismic profile SDT1 (South Deep Tunnel 1), acquired within mine tunnels at a depth of approximately 3000 m. (b) The ray coverage exhibits variability along the profile, with a maximum coverage depth of 25 m. Regions with
Advanced seismic acquisition techniques in South African mines
The data quality and detailed imaging achieved in this study highlight the importance of meticulous planning and execution in seismic surveys. A comparison of surface legacy seismic data collected in 2003 using traditional methods with the 2022 surface FUTURE dataset (Figure 10) underscores the advancements achieved in this study. The 2022 surface FUTURE data exhibited both near-surface and deep seismic signatures, while the legacy data primarily recovered information at larger depths. This improvement is attributed to the broadband nature of the seismic sensors and source used in the FUTURE project. The distinct P-wave velocity zones identified in the tomography provide valuable insights into the subsurface structure, that is, the stratification aids in understanding lithological variations, which are crucial for mine planning and stability assessments. The depth-converted seismic section further reveals significant reflections, indicative of lithological boundaries and fault structures. These reflections suggest the presence of fault compartmentalisation, which are critical for understanding fluid flow, ore distribution, and stress concentrations within the mining environment. The influence of existing mine infrastructure on the seismic wave-field highlights the complexity of data acquisition and interpretation in active mining operations. Overall, the velocity model and reflection seismic data contribute to a comprehensive understanding of the subsurface geology, directly informing safety measures, optimizing resource extraction, and mitigating potential geohazards. Despite the challenges posed by the underground setting, the robust structural interpretation achieved in this study demonstrates the value of integrating seismic methods into mining practices. Although a direct comparison of the underground P-wave velocities between traditional seismic methods and the methods presented in this study is not provided, the P-wave velocity model demonstrates that valuable insights can still be obtained from traditional seismic methods. The limited frequency range and sparse sensor spacing of traditional methods resulted in lower resolution. However, modern techniques, such as those used in the surface data, would have provided higher resolution imaging. The broadband and dense acquisition (FUTURE data) successfully imaged both shallow and deeper targets, addressing the limitations of conventional surveys (legacy data), which primarily focused on deeper targets while neglecting near-surface structures. Future research can build on these findings, utilizing the acquired data and methodologies to further refine seismic imaging techniques and enhance their application in the mining industry.
The use of broadband seismic sensors and a broadband source in the surface acquisition phase of the FUTURE project at South Deep gold mine significantly enhanced data quality and imaging capability. Broadband sensors, such as MEMS, capture a wide range of frequencies (4 Hz to 180 Hz), enabling detailed subsurface characterisation by resolving both deep structures with low frequencies and small-scale features with high frequencies. These sensors offer high sensitivity, low noise levels, and adaptability to various geological conditions, resulting in superior signal-to-noise ratios and clearer seismic images. The broadband mini-vibe source, with its adjustable sweep length and frequency, generated rich seismic signals, improving the resolution and penetration depth of the survey. This comprehensive frequency range facilitated better imaging of complex geological structures, essential for effective mineral exploration and accurate geological modelling. Overall, the deployment of advanced broadband technology proved invaluable for detailed and integrated subsurface investigation.
The use of DAS within the FUTURE project at the South
Deep mine opened many possibilities for its application. Through permanent installation in the mine's tunnel floors and boreholes, DAS will enable continuous monitoring of seismic activity, machinery movements, and drilling operations in real-time. This proactive monitoring strategy will bolster safety measures, significantly reducing the likelihood of accidents, and fostering a secure work environment for mine workers. Additionally, DAS will play a pivotal role in optimizing operational efficiency by providing invaluable insights into machinery performance and underground conditions, ultimately leading to heightened productivity and substantial cost savings. Furthermore, the high-resolution data acquired by DAS can be used to identify potential mineral deposits with greater accuracy, guiding exploration activities within the underground tunnels. This not only benefits the mine's bottom line but also contributes to the long-term sustainability of the operation.
Conclusion
The successful implementation of advanced seismic acquisition technologies at the South Deep gold mine through the FUTURE project marks a significant milestone in the evolution of mining exploration and safety practices. By integrating state-of-the-art equipment such as nodal systems and distributed acoustic sensing (DAS) technologies, this study has demonstrated the feasibility and effectiveness of high-resolution seismic surveys in both surface and underground environments. The comparison of different acquisition methods has provided valuable insights into their respective strengths and limitations, paving the way for optimised surveying strategies in future mining efforts. The results obtained from surface and underground seismic surveys have yielded detailed imaging of subsurface geological structures and mineralisation, enhancing our understanding of the geological complexities inherent in mining operations. Moreover, the deployment of advanced broadband sensors and sources has significantly improved data quality and imaging capability, enabling better characterisation of mineral deposits and geological hazards. The implications of this research extend beyond academic research, with practical implications for enhancing operational safety, efficiency, and sustainability in the mining industry. By leveraging the insights gained from this study, mining companies can optimise exploration efforts, mitigate geological risks, and minimise environmental impacts. Furthermore, the adoption of continuous monitoring technologies like DAS promises to revolutionise safety practices by providing real-time insights into seismic activity and underground conditions. The FUTURE project represents a pioneering effort to advance seismic survey techniques, setting a benchmark for future endeavours in the mining industry. By embracing innovation and collaboration, we can chart a course towards safer, more efficient, and economically sustainable mining operations for generations to come.
Acknowledgements
This research is funded by the FUTURE project of ERA-NET Cofund on Raw Materials (ERA-MIN3), Advanced Orebody Knowledge (AOK), and DSI-NRF Centre of Excellence (CoE) for Integrated Mineral and Energy Resource Analysis (CIMERA). The Department of Science and Innovation (DSI) is greatly appreciated for funding the South African partners in the FUTURE project. We would also like to extend our gratitude to South Deep mine of Gold Fields Ltd. for granting us permission to work at their mine and present these datasets. We also thank researchers and
Advanced seismic acquisition techniques in South African mines
postgraduate students from Wits University, Uppsala University, Politecnico di Torino, and Venda University for their participation on the acquisition of the seismic data as part of the ERA-MIN3Future Project.
We would like to thank the Council for Geoscience (CGS) for allowing us to their seismic equipment in an underground experiment.
References
Brodic, B., Malehmir, A., Pacheco, N., Juhlin, C., Carvalho, J., Dynesius, L., Van Den Berg, J., De Kunder, R., Donoso, G., Sjölund, T., Araujo, V., 2021. Innovative seismic imaging of volcanogenic massive sulfide deposits, Neves-Corvo, Portugal— Part 1: In-mine array. Geophysics, vol. 86, no. 3, pp. B165–B179. https://doi.org/10.1190/geo2020-0565.1
Douglass, A.S., Ragland, J., Abadi, S. 2023. Overview of distributed acoustic sensing technology and recently acquired data sets. The Journal of the Acoustical Society of America, vol. 153 no. 3, pp. A64–A64. https://doi.org/10.1121/10.0018174
Malehmir, A., Donoso, G., Markovic, M., Maries, G., Dynesius, L., Brodic, B., Pecheco, N., Marsden, P., Bäckström, E., Penney, M., Araujo, V. 2019. Smart Exploration: from legacy data to state-ofthe-art data acquisition and imaging. First Break, vol. 37, no. 8, pp. 71–74. https://doi.org/10.3997/1365-2397.n0049
Malehmir, A., Durrheim, R.J, Bellefleur, G., Urosevic, M., Juhlin, C., White, D. J., Milkereit, B., Campbell, G. 2012. Seismic methods in mineral exploration and mine planning: A general overview of past and present case histories and a look into the future. Geophysics, vol. 77, no. 5, pp. WC173–WC190. https://doi.org/10.1190/2012-0724-spsein.1
Malehmir, A., Koivisto, E., Manzi, M., Cheraghi, S., Durrheim, R.J., Bellefleur, G., Wijns, C., Hein, K.A., King, N. 2014. A review of reflection seismic investigations in three major metallogenic regions: The Kevitsa Ni–Cu–PGE district (Finland), Witwatersrand goldfields (South Africa), and the Bathurst Mining Camp (Canada). Ore Geology Reviews, vol. 56, pp. 423–441. https://doi.org/10.1016/j.oregeorev.2013.01.003
Manzi, M.S.D., Durrheim, R.J., Hein, K.A.A., King, N. 2012a. 3D edge detection seismic attributes used to map potential conduits for water and methane in deep gold mines in the Witwatersrand basin, South Africa. Geophysics, vol. 77, pp. WC133–WC147. https://doi.org/10.1190/geo2012-0135.1
Manzi, M.S.D., Gibson, M.A.S., Hein, K.A.A., King, N., Durrheim, R.J. 2012b. Application of 3D seismic techniques to evaluate ore resources in the West Wits Line goldfield and portions of the West Rand goldfield, South Africa. Geophysics, vol. 77, no. 5, pp. WC163–WC171. https://doi.org/10.1190/geo2012-0133.1
Mutshafa, N., Manzi, M.S.D., Westgate, M., James, I., Brodic, B., Bourdeau, J.E., Durrheim, R.J., Linzer, L. 2023. Seismic
imaging of the gold deposit and geological structures through reprocessing of legacy seismic profiles near Kloof–Driefontein Complex East Mine, South Africa. Geophysical Prospecting, vol. 71, pp. 1181–1196. https://doi.org/10.1111/1365-2478.13283
Pretorius, C., Trewick, W., Fourie, A., Irons, C. 2000. Application of 3-D seismics to mine planning at Vaal Reefs gold mine, number 10 shaft, Republic of South Africa. Geophysics, 65, pp. 1862–1870. https://doi.org/10.1190/1.1444870
Rafi, M., Mohd Noh, K. A., Abdul Latiff, A. H., Otchere, D. A., Tackie-Otoo, B. N., Putra, A. D., Riyadi, Z. A., Asfha, D. T. 2024. Application of distributed acoustic sensing in geophysics exploration: Comparative review of single-mode and multimode fiber optic cables. Applied Sciences, vol. 14, no. 13, p. 5560. https://doi.org/10.3390/app14135560
Rapetsoa, M., Manzi, M., James, I., Sihoyiya, M., Durrheim, R.J., Pienaar, M. 2024. Innovative seismic imaging of the platinum deposits, Maseve Mine: Surface and in-mine. Minerals, vol. 14, no. 9, p. 913. https://doi.org/10.3390/min14090913
Rapetsoa, M.K., Manzi, M.S., Westgate, M., Sihoyiya, M., James, I., Onyebueke, E., Kubeka, P., Durrheim, R.J., Kgarume, T. 2022. Cost‐effective in‐mine seismic experiments to image platinum deposits and associated geological structures at Maseve platinum mine, South Africa. Near Surface Geophysics, vol. 20, no. 6, pp. 572–589. https://doi.org/10.1002/nsg.12216
Salisbury, M.H., Harvey, C.W., Matthews, L. 2003. 1. The Acoustic Properties of Ores and Host Rocks in Hardrock Terranes, in: Hardrock Seismic Exploration, Geophysical Developments Series. Society of Exploration Geophysicists, pp. 9–19. https://doi.org/10.1190/1.9781560802396.ch1
Stotter, C., Angerer, E. 2011. Evaluation of 3C microelectromechanical system data on a 2D line: Direct comparison with conventional vertical-component geophone arrays and PS-wave analysis. Geophysics, vol. 76, no. 3, pp. B79–B87. https://doi.org/10.1190/1.3561769
Tellier, N., Laroche, S., Wang, H., Herrmann, P. 2021. Single-sensor acquisition without data jitter: A comparative sensor study. First Break, 39, pp. 91–99. https://doi.org/10.3997/1365-2397.fb2021007
Widess, M.B. 1973. How thin is a thin bed? Geophysics, vol. 38, no. 6, pp. 1176–1180. https://doi.org/10.1190/1.1440403
Willis, M.E. 2022. Distributed Acoustic Sensing for Seismic Measurements – What Geophysicists and Engineers Need to Know. Society of Exploration Geophysicists. https://doi.org/10.1190/1.9781560803850
Yilmaz, Ö. 2001. Seismic Data Analysis: Processing, Inversion, and Interpretation of Seismic Data. Society of Exploration Geophysicists https://books.google.co.za/ books?id=ceu1x3JqYGUC u
Affiliation:
1School of Geosciences, University of the Witwatersrand, South Africa
2College of Science and Engineering, Ritsumeikan University, Japan
3Graduate School of Engineering, Tohoku University, Japan
4The International Continental Scientific Drilling Program (ICDP) Dseis team
Correspondence to: S.B. Mngadi
Email: siyanda.b.m@gmail.com
Dates:
Received: 5 Jun. 2024
Revised: 22 Dec. 2024
Accepted: 21 Jan. 2024
Published: January 2025
How to cite:
Mngadi, S.B., Manzi, M.S.D., Nkosi, N.Z., Durrheim, R.J., Ogasawara, Jr.H., Yabe, Y., DSeis team. 2025. Identification of structures capable of hosting the ML 5.5 Orkney South Africa earthquake and factors controlling the physics and mechanics of dynamic rupture. Journal of the Southern African Institute of Mining and Metallurgy, vol. 125, no. 1, pp. 33–42
DOI ID:
http://dx.doi.org/10.17159/24119717/3445/2025
ORCiD:
S.B. Mngadi
http://orcid.org/0000-0001-6611-4690
M.S.D. Manzi
http://orcid.org/0000-0002-1654-5211
M.S.D. Nkosi
http://orcid.org/0009-0007-0285-8480
R.J. Durrheim
http://orcid.org/0000-0003-3832-0600
Y. Yabe
http://orcid.org/0000-0003-0256-1904
Identification of structures capable of hosting the ML 5.5 Orkney South Africa earthquake and factors controlling the physics and mechanics of dynamic rupture
by S.B. Mngadi1,4, M.S.D. Manzi1,4, N.Z. Nkosi1,4, R.J. Durrheim1,4, Jr.H. Ogasawara2,4, Y. Yabe3,4, DSeis team4
Abstract
On 5 August 2014, the Orkney M5.5 earthquake, the largest in South African gold mining districts, occurred with an unusual strike-slip mechanism at great depth of 4.78 km below the surface. In a rare case, the ML 5.5 earthquake occurred within the area covered by the legacy 2D and 3D reflection seismic data acquired in the 1990s and 2000s for gold exploration and mine development. In addition, the earthquake ML 5.5 rupture plane was recorded and accurately delineated by the underground in-mine seismic network near the source region. The integration of the legacy 2D reflection seismic data and mine seismicity data allowed us to identify a near-vertical structure, striking northnorthwest-south southeast (NNW-SSE). The ICDP-DSeis team drilled three holes (Hole A, Hole B, and Hole C), and two holes (Hole B and Hole C), intersected the upper edges of the ML 5.5 rupture. These holes recovered metasediments, metabasalts, intrusive rocks including dolerite sills and lamprophyre dykes adjacent to the fault zone, and the fault gouge. Late Prof. Tullis Onstott and geomicrobiologists installed a packer in Hole A and successfully recovered saline water and detected gas (~10 MPa). Slip weakening and rupture propagation are significantly influenced by the existence of fault gouges and the production of wear material between two sliding rock surfaces. Using the fault gouge material recovered from Hole C, we conducted friction experiments under dry and room temperature conditions at high slip velocity of ~100 mm/s and normal stress of 2 MPa. The resulting steady-state frictional strength was ~0.66 over a slip weakening distance of ~9.1 m. The steady-state frictional strength was high, which may be caused by large gouge thickness, and the rate of wear generation. As a result, it is proposed that the Moab Khotsong ML 5.5 seismogenic zone is complex and could be controlled by three main processes: a) the complex structural architecture of the seismogenic zone (e.g., intersection of fault, lamprophyre dykes, and dolerite sills); b) the mechanical process induced by tectonic and/or mining related stresses; and c) the mechanical and chemical processes caused by the water and rock interaction.
Keywords
seismicity, seismics, mining, friction experiments, fault gouge, structures
Introduction
Mining at deep levels in highly stressed rock mass may induce earthquakes and pose risk to the life of workers, mine infrastructure, and the public. The study area is located under the Moab Khotsong mine at a depth of 4.78 km below surface (Figure 1), where the largest earthquake recorded in the Witwatersrand Basin, South Africa, occurred in 2014 with a local magnitude of ML 5.5. The vibrations caused by this seismic event were ‘felt’ across South Africa and some neighbouring countries, e.g., Mozambique, with one recorded death (Midzi et al., 2015). The assessed damage was valued at ~R130 million (USD 8.6 million) (Midzi et al., 2015). Though these large seismic events may result in damage and loss of life, they also provide a rare opportunity to study the physics and mechanisms of earthquakes near source regions, which may enhance our understanding of seismic hazard and mitigation strategies (Durrheim, 2012).
This ML 5.5 earthquake prompted seismologists, in particular the ICDP - DSeis team of the International Continental Scientific Drilling Programme, who are drilling into seismogenic zones of ML 2.0 – 5.5 earthquakes in deep South African gold mines, to pose a few fundamental research questions relevant to this study: (1) what is the nature of fault rock that hosted the ML 5.5 earthquake? (2) what is the role of geology? and (3) what is the geological structure (fault, dyke, or sill) related to this earthquake? (Ogasawara et al., 2019). The ICDP - DSeis team drilled into a number of active faults. These seismogenic
Identification of structures capable of hosting the ML 5.5 Orkney South Africa earthquake
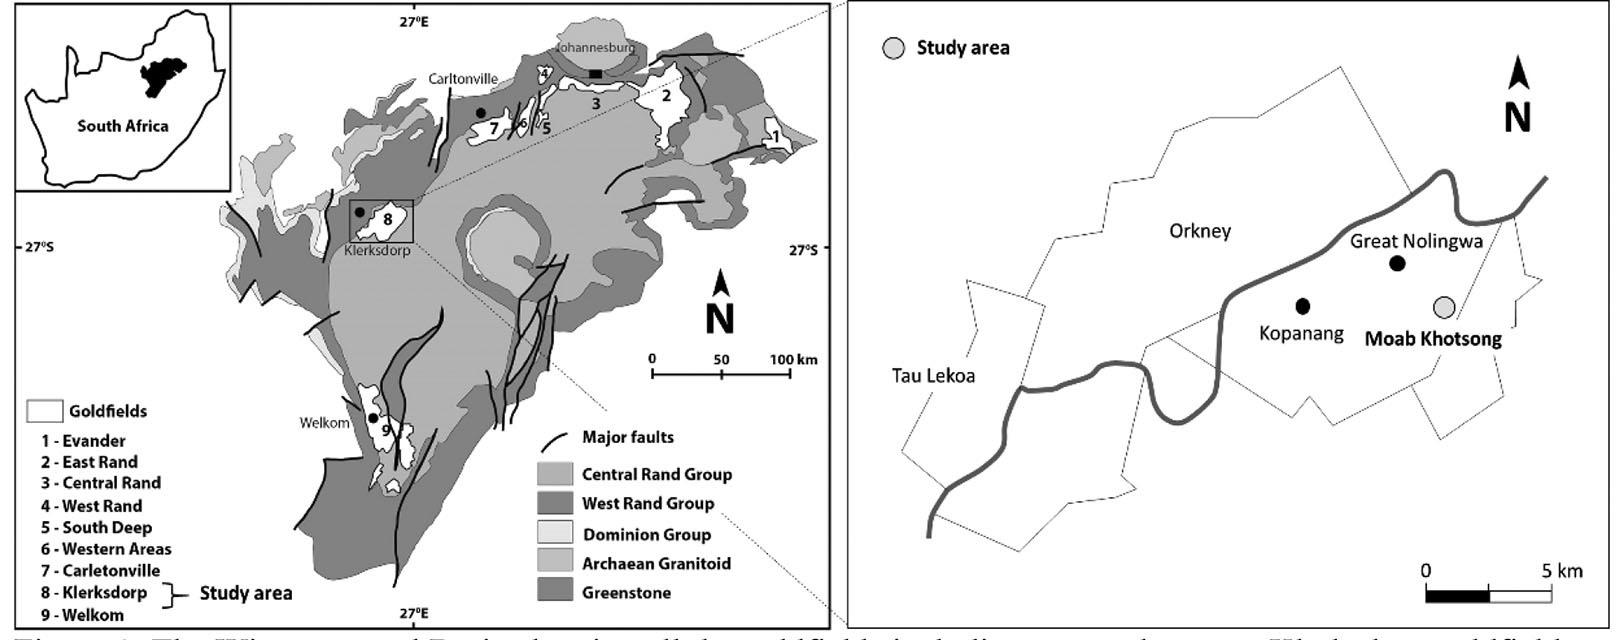
zones are situated at deep level and highly stressed rock mass in South African gold mines, including the Moab Khotsong ML 5.5 earthquake rupture. The Moab Khotsong ML 5.5 seismic event occurred at 4.78 km, which is 1.78 to 2.78 km below the mining levels situated between 2.0 and 3.0 km depth. The faulting mechanism was characterised as strike-slip (Ogasawara et al., 2017). This was distinct from the common ‘normal faulting' mechanism associated with mining-induced activities in this region. This study forms a portion of a greater ICDP-DSeis project. The broader aims of the ICDP-DSeis project include the investigation of the extent of damage, the stress state around the fringes of the earthquake, and the potential existence of living organisms associated with deeplevel earthquakes. The ICDP-DSeis team comprises international researchers from South Africa, Japan, Germany, Switzerland, the USA, Israel, and India. The DSeis team completed drilling at Moab Khotsong to intersect the ML 5.5 rupture and recovered fragile fault rocks (Ogasawara et al., 2017). In this study, we focus on the identification of structures capable of hosting the ML 5.5 Orkney, South Africa, earthquake, and investigating the fault rock composition, frictional properties, and the architecture of the ‘unusual’ strike-slip fault in deep mines.
Mine seismicity
Unique to this study, is that the ML 5.5 earthquake was recorded with a dense and high resolution in-mine seismic network. The in-mine seismic network consisted of 46 triaxial geophones with a frequency of 4.5 Hz and a sampling rate of 6 kHz. The geophones were located near the ML 5.5 earthquake at mining levels between depths of 2.0 km and 3.5 km (Imanishi et al., 2017). Using this dense in-mine seismic network, which is located near the source region, more than 2000 foreshocks and aftershocks were recorded from 4 August 2014 to 31 October 2014, which included the mainshock (ML 5.5 earthquake) (Figure 2). The velocity field used to process and locate these seismic events, also routinely used at Moab Khotsong mine, is the P-wave velocity of ~5960 m/s and the S-wave velocity of ~3610 m/s. The depth of the mainshock was located at ~ 4.78 km below surface. The delineated aftershock distribution spanned ~ 8 km in strike length and ~3 km in dip length. The distribution of these aftershocks revealed that the ML 5.5 rupture plane dips near vertical and strike in a northnorthwestsouthsoutheast (NNW‐SSE) direction, with strike-slip fault mechanism (Imanishi et al., 2017; Ogasawara et al., 2018).
Imanishi et al. (2017) reported that the ML 5.5 earthquake triggered seismicity at the mining levels. However, to the authors’ knowledge, no seismic rupture was observed or mapped in the mining levels. This could mean that the main rupture did not propagate to the mining levels. Therefore, the geological structure responsible for ML 5.5 earthquake remains elusive and not clearly understood. In addition, the aftershock plane, when projected to the mining levels, did not match any known fault or geological structures that could have hosted the ML 5.5 earthquake (Ogasawara et al., 2018).
Legacy reflection seismic data
Coincidentally, the ML 5.5 seismic event occurred in the mining region that is well covered by the several 3D and 2D seismic reflection data originally acquired for mineral exploration (Figure 2a and Figure 3). The shot gathers of legacy 2D reflection seismic profiles were analysed, and only profile AV01 was selected for reprocessing and interpretation due to its ideal perpendicular position to aftershocks (Figure 3). This profile (AV01) was acquired by Anglo Gold Ashanti in 1992, using the vibroseis trucks as energy sources at linear sweep frequency of 10 Hz – 90 Hz with sweep length of 16 s, sampling rate of 2 ms, and recording length of 6 s. The source and receiver (10 Hz) intervals were 50 m and 25 m, respectively. These 2D seismic reflection data were reprocessed using a post-stack migration standard workflow (Manzi et al., 2012a), mainly focusing on improving the velocity analysis guided by the laboratory ultrasonic measurements. Nkosi et al. (2022) conducted physical property measurements of cylindrical core specimens that were retrieved from the ICDP-DSeis project (Hole A, Hole B, and Hole C). The results were compared with downhole physical property data (e.g., sonic and density). The measured rock specimens included intrusives, metasediments, and metabasalts. Subsequently, the data were interpreted to examine and characterise the geological structure that hosted the Orkney earthquake ML 5.5.
Geology of Moab Khotsong mine
Witwatersrand Supergroup
The geology of the Archaean Witwatersrand Basin has been described in detail by several researchers since the gold rush in 1886 (Robb and Meyer, 1995; McCarthy and Rubidge, 2005; Dankert and Hein, 2010). The Witwatersrand Supergroup comprises two groups,
Figure 1—The Witwatersrand Basin showing all the goldfields including our study area – Klerksdorp goldfields, Moab Khotsong mine (modified from Dankert and Hein, 2010)
Identification of structures capable of hosting the ML 5.5 Orkney South Africa earthquake
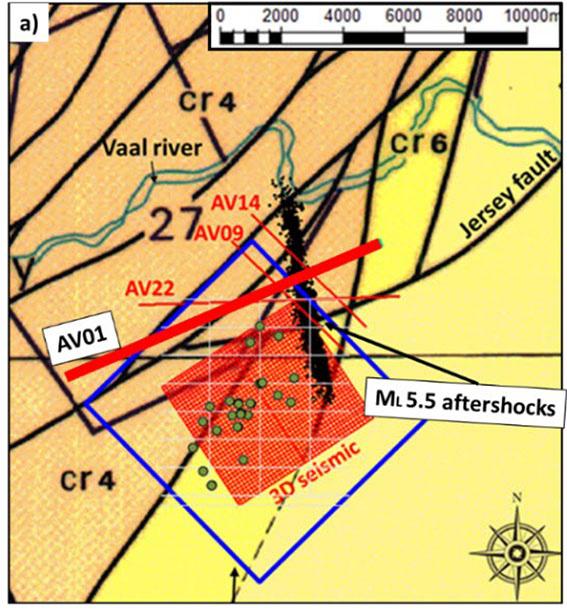
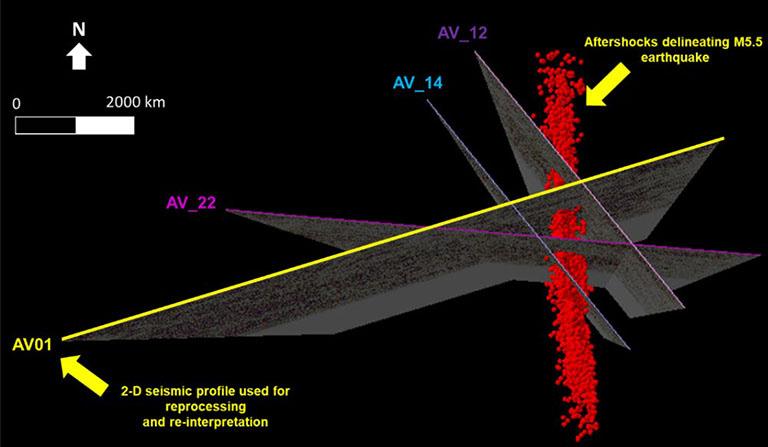
namely the West Rand Group and the Central Rand Group (Myers et al., 1989; Robb and Meyer, 1995; Dankert and Hein, 2010). The West Rand and Central Rand groups tend to decrease in thickness towards the south-eastern edges of the basin. The average thickness of the basin is ~ 4.6 km. The West Rand Group is dominated by clastic sedimentary rocks, such as quartzites and shales with a ratio of about 1:1, and conglomerate ‘primarily mined for gold’. The Central Rand Group hosts more than 70% of the gold-bearing conglomerate horizons and lies on top of the West Rand Group. The Central Rand Group also consists of quartzite and conglomerate packages, and minor bands of shale and lavas (SACS, 1990). The Vaal Reef is the major gold-bearing conglomerate exploited at Moab Khotsong mine and neighbouring mines, such as Kopanong and Great Nolingwa.
Faults, dykes, and sills
The Witwatersrand Basin is structurally complex and has undergone several episodes of deformations. The basin generally exhibits major listric normal faults and their related drag folds that are ascribed to the extensional tectonic regime during the deposition of the Ventersdorp Supergroup (Vermaakt and Chunnet, 1994; Coward et al., 1995). Watts (2005) conducted a detailed mapping of faults with vertical displacements in excess of 10 m at the neighbouring Kopanong mine. They can be grouped into two main categories (1) Zuiping-type faults, and (2) Jersey-type faults. Watts (2005) concluded that most of these faults are Platberg age. The Platberg volcanism occurred at 2754-2709 Ma (Gumsley et al., 2020). Our study area is characterised by numerous sills and dykes that intruded at different geological ages and have been subjected to
2D Seismic profile 2012 3D seismic survey 1996 3D seismic survey
Figure 2—Shows legacy reflection seismic surveys including 1996 3-D survey (blue), 2012 3-D survey (red), and selected 2-D seismic reflection profile (AV01) in relation to aftershocks (black), structures (black) (Modified from Ogasawara Jr. et al., 2018)
Figure 3—Several 2D legacy seismic profiles are shown (AV01, AV_12, AV_14 and AV_22). After short gather analysis, only seismic profile AV01 was reprocessed and reinterpreted. This reflection seismic profile is almost perpendicular to the aftershock plane
Identification of structures capable of hosting the ML 5.5 Orkney South Africa earthquake
several damaging brittle seismic events (Yabe et al., 2019). The sills and dykes are of different ages, such as known post-Karoo dykes of pre-Cretaceous and Cretaceous age (145 - 66 Ma), Karoo dykes (150 Ma), Pilanesberg (1.30 Ga), Transvaal (2.20 Ga), and Ventersdorp (2.60 Ga). These intrusive rocks often host large damaging seismic events (M3.0-3.9) (Van der Heever, 1982) and therefore, are important to understand for mine design and during mining operations (Ogasawara et al., 2019; Yabe et al., 2019).
Moab Khotsong mine drilling: Hole A, B, and branch Hole C
The ICDP-DSeis team drilled three holes, labelled as Hole A, Hole B and Hole C, into the ML 5.5 earthquake rupture delineated by the aftershocks recorded by the in-mine seismic network (Figure 4a). The drilling was, in part, conducted to recover fault rocks and gouge material. Before drilling could take place, the ICDP-DSeis team excavated the chamber by enlarging a portion of a tunnel located at a depth of 2.9km. The dimensions of the drilling chamber are 6m x 6m x 6m. The mine safety regulations did not allow for larger excavation dimensions. The ICDP-DSeis team successfully drilled and recovered fragile ruptured core and fault gouge material. The drilling plunged at 35º−45º downward from the excavated drilling site.
Hole A deflected too much, hence, it could not intersect the ML 5.5 rupture plane, and it was terminated at 817 m. However, Hole A provided a stable hole with good core recovery, allowing the ICDP-DSeis team to measure rock physical properties, conduct borehole geophysical logging, and measure stress variations near the aftershock region. Additionally, Onstott and other geomicrobiologists investigated gas, water, and biomass by installing the automated system for sampling water and gas. The group successfully collected saline water by installing a packer (~10 MPa at the packer) in Hole A at a depth near 420 m, and detected gas (Ogasawara et al., 2020).
The deflection of Hole A led to the drilling of Hole B with a modified by 15º angle (Figure 4b) (Ogasawara et al., 2020). Hole B intersected the uppermost part of the ML 5.5 rupture zone, experiencing a 3 m core-loss zone using a ‘double tube’ core barrel. The drilling was terminated at 700 m from the collar after intersecting the rupture zone, encountering core-loss and instability. Because the important part of the core was lost, i.e., fault gouge material and core samples, the team drilled a branch hole (Hole C)
using a 1.5 m ‘triple tube’ core barrel. Hole C started at 544 m of Hole B and completed at 640 m. The 1.5 m triple tube core barrel drilling technique successfully recovered core samples and fragile fault gouge material.
Hole B and Hole C intersected an altered lamprophyre dyke and the subsequent core-loss zone (Figure 5). The location of the dyke and core-loss zone in the drill core corresponds to the location of the aftershock plane, which was delineated from ML 5.5 earthquake. This suggests that the dyke might be the geological structure that hosted the ML 5.5 rupture. The drilling programme was immediately followed by detailed core logging and downhole geophysical borehole logging of Hole A. The geophysical borehole logging included density and seismic velocity measurements, which showed high seismic velocities coinciding with intrusive rocks compared to other rocks (Figure 6). This suggests that intrusive rocks should have higher acoustic impendence contrast relative to the country rocks (Nkosi et al., 2022). For recovered core from Hole A, Yabe et al. (2019) performed non-destructive stress measurements and an analysis on the core and revealed that stress concentration coincided with the intrusive rock at ~440 m from the borehole collar (Figure 6). A different zone of stress concentration was observed at the depth or location of the upper part of the aftershock plane. The core was sampled at selected lithological units for X-ray diffraction (XRD) analysis.
Minerals and friction experiments
The mineral composition of the fragile core material recovered from Hole B and Hole C was examined. This is because the mineralogy of the fault material has an impact on the mechanical behaviour, the frictional strength, and dynamic rupture propagation. An XRD analysis was conducted on the lamprophyre dykes and fault gouge material, and the results are presented in the following.
XRD analysis
Lamprophyre
dykes
The dominant minerals found in the intrusive rock (lamprophyre dykes), which is thought to host the ML 5.5 earthquake, are biotite (25.06–29.62 wt%), talc (22.60–37.05 wt%), actinolite (16.79–23.11wt%), diopside (4.04–14.43 wt%), chlorite (5.00–7.46 wt%), kaolinite (3.40–4.77 wt%), calcite (1.02–4.30 wt%), and quartz (0.37–0.83 wt%).
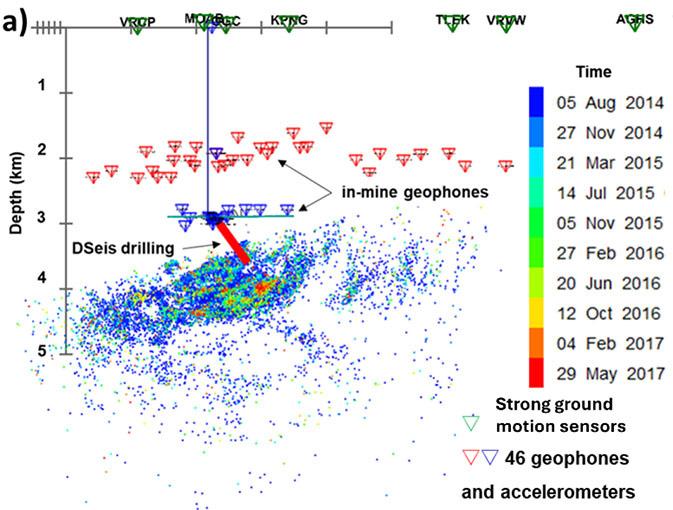
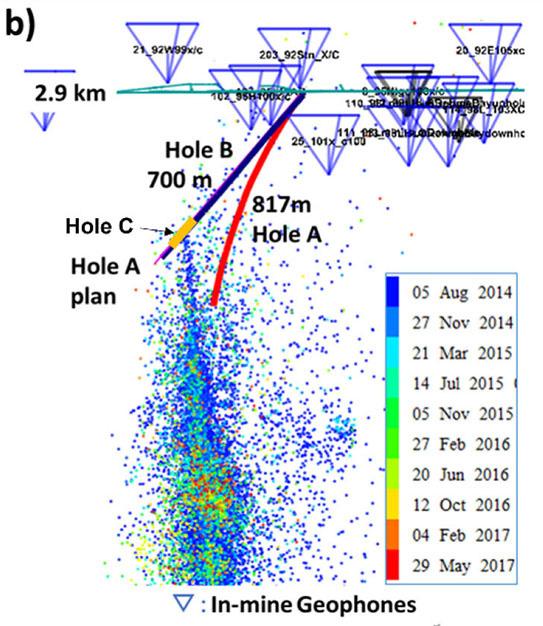
Figure 4—(a) Location of aftershocks generated by ML 5.5 earthquake delineating the rupture plane. (b) Location of Hole A, Hole B and Hole C, where Hole B and Hole C intersected the rupture and intrusive rock potentially responsible for the ML 5.5 event (Ogasawara et al., 2019)
Identification of structures capable of hosting the ML 5.5 Orkney South Africa earthquake
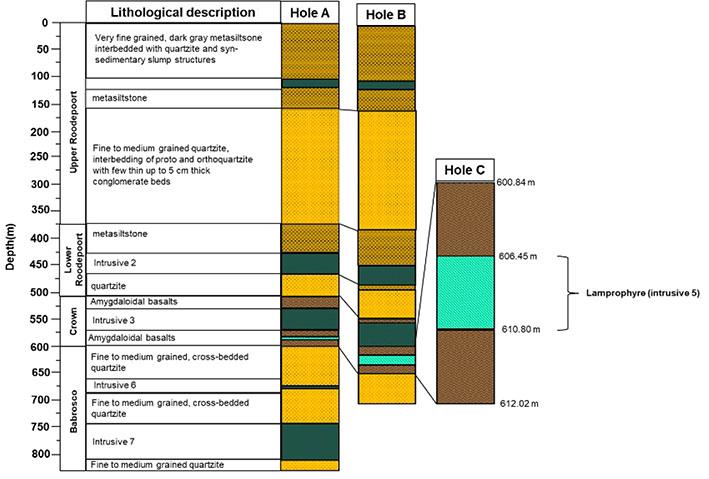
Figure 5—The core logging descriptions of Hole A and B were first conducted by Rickenbacher (2018). In this study we largely focused on the branch Hole C (not illustrateded to scale)
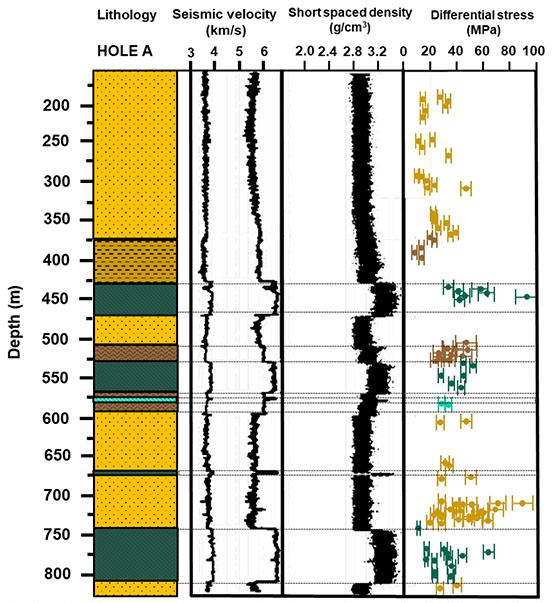
6—The lithological units described from core logging and geophysical borehole logging (Rickenbacher, 2018). Yabe et al. (2019) used diametrical core deformation analysis (DCDA) to measure insitu rock differential stress. The description of the lithology is provided in Figure 5 (Ishida et al., 2018)
Fault gouge
The gouge material was sampled at 63 m (branch Hole C), i.e., equivalent to 608 m distance from the borehole collar of Hole B (see Figure 5), around the core loss zone. Approximately, 3 – 4 g of the
Table 1
gouge material was sampled for XRD analysis. The XRD results of the gouge material are shown in Table 1.
Friction experiments
In earthquake physics, friction is crucial because it affects the propagation of ruptures and the weakening of faults. Frictional resistance weakens exponentially with increasing slip displacement during rupture propagation, namely slip weakening behaviour. The slip weakening behaviour is described by the exponential decay equation (Mizoguchi et al., 2007):
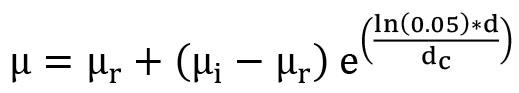
where, µ is the frictional coefficient, μi is the peak friction coefficient (frictional resistance), μr is the steady-state friction coefficient, and d is displacement. The exponential decay equation decreases friction to a constant value, as displacement approaches infinity, thus, one defines dc as a displacement, where (μi-μr) decreases to ~5% of (μi-μr), and lets dc represent Dc. This means dc represents a critical slip displacement (Dc), which is defined as the weakening of the frictional resistance over slip weakening displacement during rupture propagation (Mizoguchi et al., 2007).
The fault gouge material was collected from the ML 5.5 rupture at Moab Khotsong mine and used to perform high slip velocity (100 mm/s) friction experiments. The fault gouge material was sheared at an applied normal stress of ~2 MPa. The fault gouge
XRD analysis of recovered Moab fault gouge from the Orkney M5.5 event (Hole C at depth of ~608 m)
Figure
Identification of structures capable of hosting the ML 5.5 Orkney South Africa earthquake
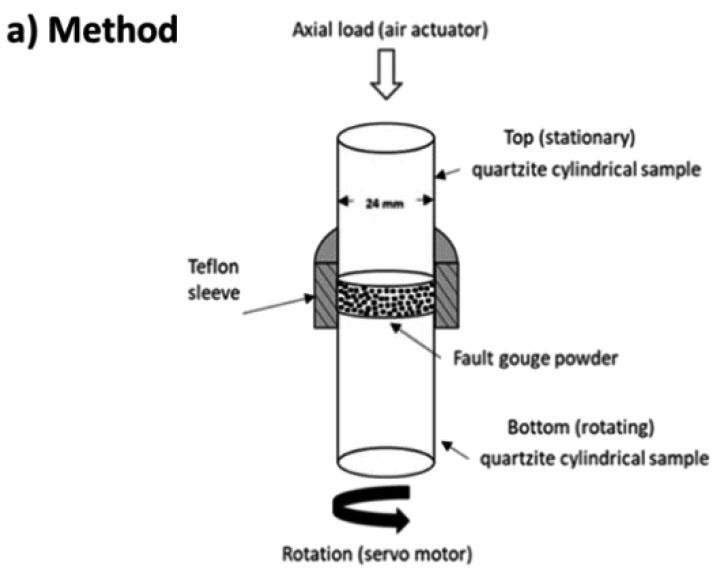
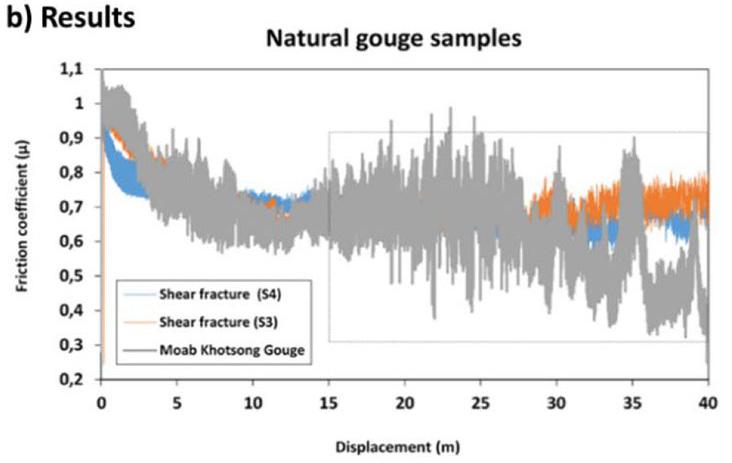
Figure 7—(a) A graphic illustration of the sample assembly for high-velocity friction experiments conducted with an intervening gouge material recovered from the ML 5.5 earthquake (modified from Mngadi et al., 2021). (b) The friction weakening behaviour of the Moab Khotsong mine strike slip fault gouge (grey), in comparison with the fault gouge samples recovered from the normal faults (M1-4) occurring ahead of the stope at Cooke 4 mine
Table 2
The peak (μp) and steady (μs) state friction coefficient of the Orkney M5.5 earthquake compared to Ortlepp shear fractures at 100 mm/s slip velocities (Veq) and 2 MPa normal stress over defined slip weakening distance Dc
sample (weight of ~1 g, equivalent to ~1 mm gouge thickness) was used as an intervening layer between two sliding rock surfaces (Figure 7a). The sliding rock quartzite cylinders and a Teflon sleeve were used to prevent the fault gouge from leaking during shearing. The friction experiments were conducted under room-dry conditions. The fault gouge reached a peak friction coefficient of ~1.0 that decreased to steady-state friction of ~0.66 at ~ 100 mm/s slip velocities. This weakening occurred over a slip weakening distance of ~9.1 m.
Furthermore, Mngadi et al. (2021) used gouge material (S(3) and S(4)) recovered from Cooke 4 mine brittle shear fractures (also known as Ortlepp shear) occurring at the mining levels (M1-4) to make a comparison between these results and similar work on friction experiments in South African deep mines. These shear fractures have normal faults mechanism. The experiments were conducted under similar conditions at slip velocity of 100 mm/s and normal stress of 2 MPa, but different gouge material thicknesses of ~0.5 mm. Sample S(3) revealed peak friction of ~0.98, which weakened to steady-state friction of ~0.67 over a slip weakening displacement of ~12.8 m (Mngadi et al., 2021). Sample S(4) revealed peak friction of 0.92, which weakened to steady-state friction of 0.71, over a slip weakening displacement of ~6.1 m (Mngadi et al., 2021) (Figure 6b) (Table 2).
Integration of reflection seismic data and seismicity
A carefully selected 2D seismic reflection profile (AV01) was reprocessed and reinterpreted (Figure 8). The reason behind the selection of this 2D seismic profile, in particular, is that it crosscuts the aftershock plane in a perpendicular direction, which delineates the ML 5.5 rupture plane. Here, the 2D seismic data was interpreted with the main focus on regional structural geology and the structure
that hosts the ML 5.5 earthquake. In addition, we used the geological core logging and geophysical borehole logging data from the Moab Khotsong mine drilled by the ICDP-DSeis team (specifically drilled to intersect the ML 5.5 rupture). These data were integrated and used to constrain the reflection seismic data interpretation.
Imperative to the study, critical stratigraphic markers, such as the base of the Transvaal Supergroup (2.6 Ga) were identified. This boundary was previously resolved through borehole observations and 3D reflection seismic data interpretation by Watts (2005). We could also detect the Ventersdorp Supergroup-Witwatersrand Supergroup boundary due to the acoustic impendence contrast between the overlying basalts and underlying quartzites of the upper Witwatersrand Supergroup Figure 8).
Structurally, the area is disturbed with multiple sub-vertical faults that tend to branch (Figure 8). Most importantly, the seismic section shows the delineation of the fault (yellow arrows in Figure 9) that correlates well with the seismogenic zone as defined by the aftershocks. The seismic section also exhibits strong and laterally continuous seismic reflections across the fold of seismic data, especially above the seismogenic zone at the cut-off of the aftershock plane (Figure 8 and Figure 9). These may be attributed to the presence of sills as described by Nkosi et al. (2022). These sills may be responsible for the sharp termination of the aftershocks. Furthermore, the section is characterised by low amplitude attenuated near-vertical structures, which may be interpreted as dykes (Figure 8 and Figure 9). The faulting (yellow arrows in Figure 9) shows vertical displacement – predominately reverse faulting (thrusting), which is also widely reported in the Witwatersrand Basin literature (Manzi et al., 2012a) (Figure 9).
Analysis and discussion
Dykes often intrude fault planes over lengths of up to several
Identification of structures capable of hosting the ML 5.5 Orkney South Africa earthquake
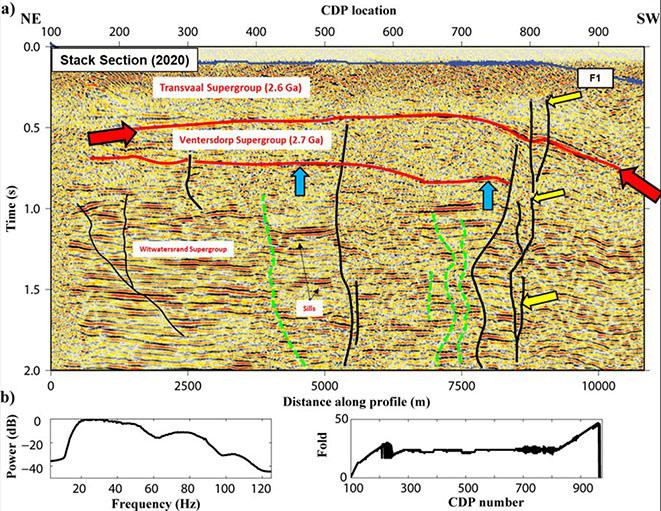
Figure 8—(a) The reprocessed legacy 2-D reflection seismic data (AV01) showing stratigraphic markers such as the Transvaal Supergroup and Ventersdorp Supergroup, e.g., red arrows show the stratigraphic marker; and Ventersdorp Supergroup and Witwatersrand Supergroup, e.g., blue arrows show the stratigraphic marker. The structures are marked clearly, and faults are shown in black, e.g., yellow arrows, while dykes are shown in green. The fault hosting the ML 5.5 earthquake is indicated by F1. (b) The power spectrum of the processed seismic data (left) showing the dominant frequency of the data and the seismic fold of coverage (right)
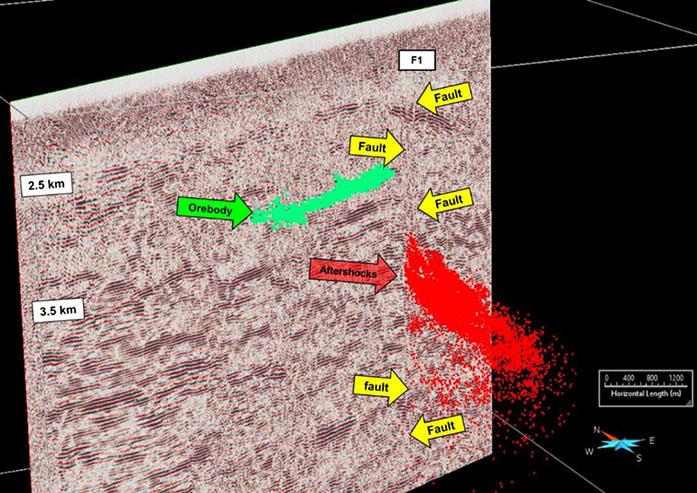
Figure 9—The seismic section extracted from the legacy 3-D reflection seismic data shows the mining stopes (green), fault structure (namely F1) that hosted the ML 5.5 earthquake and seismicity data (red) (aftershocks)
kilometres, e.g., 15-16 km (Van der Heever, 1982). Watts (2005) and Van der Heever (1982) observed that the lamprophyre dykes are the youngest generation of igneous intrusive rocks in the Klerksdorp goldfields (Watts, 2005; Van der Heever, 1982). These dykes are often water- and methane-bearing and are associated with seismicity, which poses a risk to workers, mining operation, and infrastructure (Van der Heever, 1982). Van der Heever (1982) further observed that these dykes are soft, incoherent, and do not form strong, rigid transgressive bodies (Van der Heever, 1982). In general, the conditions in the research area are analogous to those reported by Van der Heever (1982). The ICDP-DSeis team drilled three holes (Holes A, B, and C) into the ML 5.5 earthquake
rupture delineated by the in-mine seismic network. Hole B and Hole C intersected dolerite sills and altered lamprophyre dykes (Rickenbacher, 2018), whereas Hole A intersected saline water (~10 MPa at the packer) that Onstott and the geomicrobiologist team were able to collect (Ogasawara et al., 2020).
As reported by Van der Heever (1982), Hole B demonstrates that the dyke is associated with the fault rupture zone and may be the source of weakness because it intersected the uppermost portion of the ML 5.5 rupture zone, lamprophyre dyke, and experienced a 3 m core-loss zone. These events also coincided with the location of the aftershock for the ML 5.5 rupture plane. These dykes are described by Van der Heever (1982) as having varying thicknesses
Identification of structures capable of hosting the ML 5.5 Orkney South Africa earthquake
ranging from around 1 m to over 3 m, striking northerly, and dipping almost vertically. Importantly, these geometric features match those seen in the reprocessed 2D reflection seismic section data as well as aftershock data. The ML 5.5 earthquake fault mechanism is strike-slip and strikes in a NNW-SSE direction, as shown by Imanishi et al. (2017), who were able to observe the sharp termination of aftershocks right below the mining levels.
The Dseis core that was retrieved from drill holes contained dolerite sills and lamprophyre dykes. Near-vertical low amplitude structures and high amplitude horizontal reflectors were visible in the 2D reflection seismic section. Following an in-depth analysis of the drill core and 2D seismic section, it was determined that the horizontal high amplitude reflectors were dolerite sills intersecting the near vertical structure, and the near-vertical low amplitude structures were lamprophyre dykes associated with the fault hosting ML 5.5. These structural elements may be responsible for the termination of the aftershocks below mining levels associated with the ML 5.5 rupture. Yabe et al. (2019) measured the stress variations in the drill core successfully using the diametrical core deformation analysis (DCDA) stress-measurement method (Funato and Ito, 2017). The measurements revealed the localisation of stress in specific locations adjacent to: (1) the ML 5.5 rupture in Hole B (intrusive rocks); (2) the upper edge of the aftershock region; and (3) the hypersaline brine fissure in Hole A (Yabe et al., 2019). It has been reported in the Bushveld Complex that these lamprophyre dykes are associated with rock failure through decomposing and gas outbursts (Daya, 2019). Large damaging seismic events tend to occur where sills and dykes intersect (Van der Heerver, 1982). Since dykes naturally intrude on mechanically weak areas, like faults, they are frequently linked to stress concentration over time that exceeds fault strength and trigger fault reactivation. This may describe the ML 5.5 earthquake.
Fault gouges, their mineralogy, and the generation of wear material between two sliding rock surfaces have a major impact on slip weakening and rupture propagation (Zoback et al., 2011). Using gouge material collected from the ML 5.5 rupture, we conducted friction experiments at slip velocity of 100 mm/s and a normal stress of 2 MPa. The Moab Khotsong gouge sample showed the peak friction coefficient of ~1.0, which decreased to steady-state friction of ~0.66 over a slip weakening distance of ~9.1 m. These friction coefficient values and weakening behaviour are similar to those found in Ortlepp shear fractures (Cooke 4 mine) at sub-seismic slip velocities (~100 mm/s) (Mngadi et al, 2021; Miyamoto et al., 2022).
The seismogenic zone at Cooke 4 mine is largely controlled by mechanical damage induced by mining-related stresses, while at Moab Khotsong mine, the study revealed that there may be three factors controlling the ML 5.5 earthquake seismogenic zone: (a) intersection between lamprophyre dyke and dolerite sills, which creates a mechanical zone of weakness; (b) tectonic and/or miningrelated stresses; and (c) chemical processes resulting from water and rock interaction.
Conclusion
Three holes, Hole A, Hole B, and Hole C (Figure 4), were drilled by the ICDP-DSeis team into the upper boundaries of the ML 5.5 earthquake rupture. The team was able to develop the drilling chamber by excavating a section of a tunnel that was 2.9 km deep. Hole B intersected an altered lamprophyre dyke and encountered a core-loss zone using "double tube" core barrel. Due to the loss of the crucial core and fault gouge material, the team used a 1.5 m improved "triple tube" core barrel to drill a branch hole ( Hole
C). Fragile fault gouge material and core samples were successfully recovered. The aftershocks recorded by the in-mine seismic network delineated the ML 5.5 rupture plane, and that corresponded with the location as the lamprophyre dyke and core-loss zone in the drill core. This means the altered lamprophyre dyke is the geological structure that hosted the ML 5.5 rupture. Immediately after the drilling of Hole A, thorough core logging, downhole geophysics, physical property measurements, and non-destructive stress measurements were carried out. Furthermore, Onstott and the team of geomicrobiologists examined biomass, water, and gas, Nisson et al. (2023). The team detected and collected saline water successfully. Yabe et al. (2019) conducted non-destructive stress measurements and analysis on the recovered core from Hole A and found that the intrusive rocks, the top portion of the aftershock plane, and saline water were all associated with high stress concentration. Seismic velocity and density measurements, as well as geophysical borehole logging, revealed that intrusive rocks have high seismic velocities and density. Accordingly, intrusive rocks are expected to have a higher acoustic impendence contrast to country rocks. This is specific to dolerite sills, not highly altered lamprophyre dykes. The 2D legacy seismic data acquired in 1992 for gold exploration was reprocessed and reinterpreted. The reprocessing mapped high amplitude horizontal reflectors and a low amplitude near-vertical structure. The horizontal high amplitude reflectors were interpreted as dolerite sills that intersected the near vertical structure. When integrating the aftershock data from the in-mine seismic network, it was evident that the ML 5.5 rupture plane was delineated by these aftershocks. This agreed with the near-vertical fault imaged by the 2D seismic reflection data, which showed a low-amplitude nearvertical structure. This was interpreted to be an altered lamprophyre dyke hosting the ML 5.5 rupture. Furthermore, a strike-slip faulting mechanism that strikes NNW-SSE was revealed by the aftershock data.
Slip weakening and rupture propagation are significantly impacted by fault gouges, their mineralogy, and the production of wear material between two sliding rock surfaces. We performed friction experiments using gouge material extracted from the ML 5.5 rupture at a normal stress of 2 MPa and a sub-seismic slip velocity of 100 mm/s. Over a slip weakening distance of approximately 9.1 meters, the Moab Khotsong gouge sample's peak friction coefficient of ~1.0 decreased to a steady-state friction of approximately 0.66. According to Mngadi et al. (2021), these friction coefficient values and weakening behaviour are comparable to those observed in Ortlepp shear fractures at sub-seismic slip velocities. This research study concludes that the ML 5.5 earthquake rupture is complex, and that three or more factors control the seismogenic zone: (1) the intersection of dolerite sills and a lamprophyre dyke; (2) stresses related to tectonics and/or mining; and (3) chemical processes triggered by the interaction of water and rock formations.
Acknowledgments
Harmony Gold Mining Company Limited and Sibanye Gold Limited are acknowledged for providing permission to publish the results. The authors thank the School of Geosciences and the School of Mining Engineering at the University of the Witwatersrand, Wits Seismic Research Centre, Council for Geosciences, CIMERA, Ritsumeikan University, the CSIR Centre for Mining Innovation, JST-JICA, SATREPS team, ICDP DSeis team for the use of their resources and facilities. This project was also funded by JSPS KAKENHI grants 21224012, 21246134, 26249137, the MEXT’s Earthquake and Volcano Hazards Observation and Research
Identification of structures capable of hosting the ML 5.5 Orkney South Africa earthquake
Program, and the Earthquake Research Institute, the University of Tokyo cooperative research program. RJD acknowledges the support of the South African Research Chairs Initiative of the Department of Science and Technology and National Research Foundation. HO jr thanks UN University GLTP program.
References
Akimasa, I. 2018. Stress measurements with the Diametrical Core Deformation Analysis in the seismogenic zones of M2-5.5 earthquakes. method. Master Thesis, Ritsumeikan University. pp. 67–20
Coward, M.P., Spencer, R.M., Spencer, C.E. 1995. Development of the Witwatersrand Basin, South Africa. In: Coward, M.P., Ries, A.C. (Eds.). Early Precambrian Processes. Geological Society, London, Special Publications, vol. 95, pp. 243–269.
Dankert, B.T., Hein, K.A.A. 2010. Evaluating the structural character and tectonic history of the Witwatersrand Basin. Precambrian Research, vol. 177, pp. 1–22.
Daya, P. 2019. The petrology and petrogenisis of lamprophyric dykes in the Bushveld Complex, and their possible role in causing gas outbursts. University of the Witwatersrand. https://hdl.handle. net/10539/29293
Durrheim, R.J., Ogasawara, H., Nakatani, M., Yabe, Y., Kawakata, H., Naoi, M., Ward, A.K., Murphy, S., Wienand, J., Lenegan, P., Milev, A.M., Murakami, O., Yoshimitsu, N., Kgarume, T., Cichowicz, A., JST-JICA SA research group. 2012. Establishment of SATREPS experimental sites in South African gold mines to monitor phenomena associated with earthquake nucleation and rupture. Proceedings of the 6th International Congress on Deep and High Stress Mining. Perth, pp.173–187.
Funato, A., Ito, T. 2017. A new method of diametrical core deformation analysis for in-situ stress measurements. International Journal of Rock Mechanics and Mining Sciences, vol. 91, pp. 112–118. https://doi.org/10.1016/J. IJRMMS.2016.11.002
Gumsley, A., Stamsnijder, J., Larsson, E., Söderlund, U., Naeraa, T., de Kock, M., Sałacińska, A., Gawęda, A., Fabien Humbert, F., Ernst, R. 2020. Neoarchean large igneous provinces on the Kaapvaal Craton in southern Africa re-define the formation of the Ventersdorp Supergroup and its temporal equivalents. Geological Society of America Bulletin, vol. 132, pp. 9–10. https://doi: 10.1130/B35237.1
Hirono, T., Asayama, S., Kaneki, S., Ito, A. 2016. Preservation of amorphous ultrafine material: A proposed proxy for slip during recent earthquakes on active faults. Scientific Reports, 6, 36536.
Imanishi, K., Ogasawara, H., Yabe, Y., Horiuchi, S., Okubo, M., Murakami, O. 2017. Source parameters of the 2014 ML 5.5 Orkney earthquake sequence, South Africa, estimated by using near-field underground seismic arrays in gold mines. IAGIASPEI 2017. S02. Anthropogenic seismicity. 31 July 31, 2017.
Ishida, A., Sugimura, K., Liebenberg, B., Rickenbacher, M., Mngadi, S.B., Kato, H., Abe, S., Yabe, Y., Noda, T., Funato, A., Ito, T., Nakatani, M., Ward, A.K., Durrheim, R.J., Ogasawara, H. 2018. Stress measurement using cores of drilling into seismogenic zone of M2.0−M5.5 earthquakes in South African gold mines
(ICDP DSeis project). Japan Geosciences Union Meeting, 20−24 May 2018, Chiba, Japan.
Kaneki, S., Yokoyama, Y., Hirono, T., Yabe, Y., Ogasawara, H. 2018. Mineralogical characteristics of fault rocks recovered from aftershock zone of the ML 5.5 Orkney earthquake in South Africa (ICDP DSeis project). Seismological Society of Japan Fall Meeting, Abstracts.
Manzi, M.S.D., Gibson, M.A.S., Hein, K.A.A., King, N., Durrheim, R.J. 2012a. Application of 3D seismic techniques to evaluate ore resources in the West Wits line Goldfield and portions of the West Rand Goldfield, South Africa. Geophysics, vol. 77, WC163WC171. https://doi:10.1190/GEO2012-0133.1
McCarthy, T.S., Rubidge, B. 2005. The Story of Earth and Life. Cape Town: Struik Publishers.
Midzi, V., Zulu, B.S., Manzunzu, B., Mulabisana, T., Pule, T., Myendeki, S., Gubela, W. 2015. Macroseismic survey of the ML 5.5, 2014 Orkney earthquake. Journal of Seismology, vol. 19, no. 3. https://doi:10.1007/s10950-015-9491-2
Miyamoto, T., Hirono, T., Yokoyama, Y., Kaneki, S., Yamamoto, Y., Ishikawa, T., Tsuchiyama, A., Katayama, I., Yabe, Y., Ziegler, M., Durrheim, R.J., Ogasawara. H. 2022. Characteristics of Fault Rocks Within the Aftershock Cloud of the 2014 Orkney Earthquake (ML 5.5) Beneath the Moab Khotsong Gold Mine, South Africa. Geophysical Research Letters, vol. 49, no. 14. https://doi:10.1029/2022GL098745
Mizoguchi, K., Hirose, T., Shimamot, T., Fukuyama, E. 2007. Reconstruction of seismic faulting by high-velocity friction experiments: An example of the 1995 Kobe earthquake. Geophysical Research Letters, vol. 34, L01308. https://doi:10.1029/2006gl027931
Mngadi, S.B., Durrheim, R.J., Manzi, M.S.D., Ogasawara, H., Yabe, Y., Yilmaz, H., Wechsler, N., Van Aswegen, G., Roberts, D., Ward, A.K., Naoi, M., Moriya, H., Ishida, A., SATREPS team and ICDP DSeis team. 2019. Integration of underground mapping, petrology, and high-resolution microseismicity analysis to characterise weak geotechnical zones in deep South African gold mines. International Journal of Rock Mechanics and Mining Sciences. vol. 114, pp. 79–91. https://doi.org/10.1016/j. ijrmms.2018.10.003
Mngadi, S.B., Tsutsumi, A., Onoe, Y., Manzi, M.S.D., Durrheim, R.J., Yabe, Y., Ogasawara, H., Kaneki, S., Wechsler, N., Ward, A.K., Naoi, M., Moriya, H., Nakatani, M. 2021. The effect of a gouge layer on rupture propagation along brittle shear fractures in deep and high-stress mines. International Journal of Rock Mechanics and Mining Sciences, vol. 137, pp. 1365–1609. https://doi.org/10.1016/j.ijrmms.2020.104454
Myers, R.E., McCarthy, T.S., Stanistreet, I.G. 1989. A tectonosedimentary reconstruction of the development of the Witwatersrand Basin, with particular emphasis on the Central Rand Group. Economic Geology Research Unit, vol. 216, pp. 497–540.
Nisson, D.M., Kieft, T.L., Drake, H., Warr, O., Sherwood Lollar, B., Ogasawara, H., Perl, S.M., Friefeld, B.M., Castillo,
Identification of structures capable of hosting the ML 5.5 Orkney South Africa earthquake
J., Whitehouse, M.J., Kooijman, E., Onstott, T.C. 2023.
Hydrogeochemical and isotopic signatures elucidate deep subsurface hypersaline brine formation through radiolysis driven water-rock interaction. Geochimica et Cosmochimica Acta, vol. 340, pp. 65–84.
Nkosi, N.Z., Manzi, M.S.D., Westgate, M., Roberts, D., Durrheim, R.J., Ogasawara, H., Ziegler, M., Rickenbacher, M., Liebenberg, B., Onstott, T.C., DSeis Team. 2022. Physical property studies to elucidate the source of seismic reflectivity within the ICDP DSeis seismogenic zone: Klerksdorp goldfield, South Africa. International Journal of Rock Mechanics and Mining Sciences, vol. 155, 105082. https://doi.org/10.1016/j.ijrmms.2022.105082
Ogasawara, H., Durrheim, R.J., Yabe, Y., Ito, T., Van Aswegen, G., Grobbelaar, M., Funato, A., Ishida, A., Ogasawara, Jr. H., Mngadi, S.B., Manzi, M.S.D., Ziegler, M., Ward, A.K., Hofmann, G., Moyer, P., Boettcher, M., Dight, P., Ellsworth, W., Liebenberg, B., Wechsler, N., Onstott, T., Berset, N., DSeis Team. 2017. Drilling into Seismogenic Zones of M2.0 – ML 5.5 Earthquakes from Deep South African Gold Mines (DSeis): Establishment of Research Sites. Proceedings of the AfriRock International Symposium. 30 September 2017 – 6 October 2017, Cape Town, South Africa.
Ogasawara, H Jr. 2018. Calibration of seismic velocity structure and structural-geological interpretation in the seismogenic zone of the Orkney M5.5 earthquake of 5 August 2014. Master Thesis, Ritsumeikan University. pp. 53.
Ogasawara, H., B. Liebenberg, M. Rickenbacher, M. Ziegler, V.H. Esterhuizen, T.C. Onstott, R.J. Durrheim, M.S.D. Manzi, S. Mngadi, Y. Yabe, H.Y. Ogasawara, S. Kaneki, E. Cason, J.G. Vermeulen, E. an Heerden, T. Wiersberg, M. Zimmer, C. Kujawa, R. Conze, G. van Aswegen, N. Wechsler, A.K. Ward, S. Enslin, S. Tau, M.S. Bucibo, and the DSeis Team. 2019. 2019 status report: Drilling into seismogenic zones of M2.0–M5.5 earthquakes in South African gold mines (DSeis project). Proceedings of the 9th International Congress on Deep and High Stress Mining, Symposium Series S98, Southern African. Institute of Mining and Metallurgy, pp. 375–384.
https://doi:10.36487/ACG_rep/1952_28_Ogasawara
Rickenbacher, M. 2018. Geological and Geotechnical Rock Mass Model from two deep DSEIS boreholes drilled at Moab Khotsong. Swiss Federal Institute of Technology Zurich, MSc Thesis.
Robb, L.J., Meyer, F.M. 1995. The Witwatersrand Basin, South Africa: Geological framework and mineralization processes. Ore Geology Reviews, vol. 10, pp. 67–94.
SACS (South African Committee for Stratigraphy). 1990. South African Stratigraphy. (Kent, comp.). Lithostratigraphy of the Republic of South Africa, South West Africa/Namibia, and the Republics of Bophuthatswana, Transkei and Venda. Handbook, Geology of South Africa, p. 690.
Sammis, C., Osborne, R., Anderson, J., Banerdt, M., White, P. 1987. Self-similar cataclasis in the formation of fault gouge. Pure and Applied Geophysics, vol. 124, nos. 1−2, pp. 53–78.
Van Aswegen, G. 2007. Ortlepp Shears – dynamic brittle shears of South African gold mines. Potvin, Y (Ed.) 1st Southern Hemisphere International Rock Mechanics Symposium, 16−19 September, Perth, Western Australia. pp. 111–120.
Van der Heever, P. 1982. The Influence of Geological Structures on Seismicity and Rockburst in the Klerksdorp goldfields. MSc (Geology). University of Johannesburg. Retrieved from: https://ujdigispace.uj.ac.za/ (Access date: 19 July 2020).
Vermaakt, D.T., Chunnet, I.E. 1994. Tectono-sedimentary processes which controlled the deposition of the Ventersdorp Contact Reef within the West Wits Line. In: Anhaeusser, C.R. (Eds.). Proceedings of the 15th Congress of the Council for Mining and Metallurgical Institutions, vol. 3, pp. 117–130.
Yabe, Y., Abe, S., Ito, T., Ishida, A., Sugimura, K., Kanematsu, M., Higashi, M., Tadokoro, R., Ogasawara, H., Funato, A., Kato, H., Watson, B., Mngadi, S.B., Durrheim, R.J., Hofmann, G., Scheepers, L. 2019. In-situ stress around source faults of seismic events in and beneath South African deep gold mines', in W Joughin (ed.). Proceedings of the Ninth International Conference on Deep and High Stress Mining. The Southern African Institute of Mining and Metallurgy, Johannesburg, pp. 399–411.
Watts, M. 2005. Mark Watts Project. Anglo Gold Ashanti, pp. 104. Zoback, M., Hickman, S., Ellsworth, W., SAFOD Science Team. 2011. Scientific Drilling Into the San Andreas Fault Zone – An Overview of SAFOD's First Five Years. Scientific Drilling, 11, pp. 14–28 u
Affiliation:
University of the Witwatersrand, Johannesburg, South Africa
Correspondence to: S. Plaatjie
Email: 810385@students.wits.ac.za
Dates:
Received: 20 Jun. 2024
Revised: 31 Dec. 2024
Accepted: 22 Jan. 2025
Published: January 2025
How to cite: Plaatjie, S., Manzi, M.S.D., Linzer, L., Sihoyiya, M. 2025. Using 3D numerical simulations to model active in-mine seismic surveys at South Deep Gold Mine, South Africa. Journal of the Southern African Institute of Mining and Metallurgy, vol. 125, no. 1, pp. 43–50
DOI ID:
http://dx.doi.org/10.17159/24119717/3473/2025
ORCiD:
S. Plaatjie
http://orcid.org/0000-0002-7161-8129
M.S.D.Manzi
http://orcid.org/0000-0002-1654-5211
L. Linzer
http://orcid.org/0000-0003-1581-0420
M. Sihoyiya
http://orcid.org/0000-0003-1956-5223
Using 3D numerical simulations to model active in-mine seismic surveys at South Deep Gold Mine, South Africa
by S. Plaatjie, M.S.D. Manzi, L. Linzer, M. Sihoyiya
Abstract
Fiber-Optic Sensing and UAV-Platform Techniques for Innovative Mineral Exploration (FUTURE) is a joint European Union and South African consortium project funded under ERA-NET Cofund ERA-MIN3. The project aims to develop cost-effective and novel seismic methods to image geological structures ahead of the mine face, ultimately leading to improved decision-making and safer mining practices. In this study we present results from numerical simulations conducted at South Deep Gold Mine for active in-mine seismic surveys. The study uses a finite differencing code known as WAVE3D, which models models the propagation of a seismic wave generated by stress pertubations that are applied to a defined grid. The numerical simulation model included two major ore bodies (Black Reef and Ventersdorp Contact Reef) and mine tunnels. The model was constrained using laboratory physical property measurements from underground borehole samples such as seismic velocities (e.g., compressional and shear waves) and bulk densities. Two case studies were created, one modelled the active shots and receivers on surface, and the other modelled the shots at depth (in a mine tunnel at ~4000 m depth) with receivers on surface. In both cases, the objective was to investigate the wavefield propagation through the rockmass between the mine tunnel and surface. The simulated wavefield produced by the source located along the mine tunnel was successfully recorded on surface. The surface-recorded wavefield exhibits clear one-way P-wave arrival times at approximately 450 ms to 500 ms, which can be used to calculate the surface-tunnel P-wave refraction tomogram. The numerical simulation results from the study were used to optimise the acquisition parameters of the in-mine seismic surveys conducted under the FUTURE project.
Keywords mining, mine design, layouts, numerical simulation, seismic surveys
Introduction
South Africa hosts some of the world’s deepest gold mines, with some mines operating at depths close to 4000 m below ground surface. Due to these great depths and high stresses, mine personnel are exposed to risks such as rockbursts, falls of ground and other hazardous conditions linked to the presence of geological structures (e.g., faults and dykes). Furthermore, mining-related accidents affect mining operations and slow productivity. Hence, understanding rock mass behaviour at these depths is a priority for the gold mining industry.
One of the techniques used to map the subsurface gold-bearing horizons in the Witwatersrand Basin is the seismic reflection method (e.g., Durrheim et al., 1991; Gibson et al., 2000; Manzi et al., 2013). However, conducting seismic surveys can be very costly and time consuming and may, in the case of brownfield exploration projects, interfere with the mining operations. Consequently, it has become increasingly useful to optimise the design of seismic surveys by prior numerical simulation. The simulations may be used to study and predict the behaviour of the seismic waves as they propagate through the rock mass. In particular, this computational approach aids the planning of in-mine seismic surveys where there are limited opportunites to place source and sensors. In this study we show how numerical simulations can be used to plan and aid the design of surface and tunnel reflection seismic surveys based on the site geology, infrastructure (i.e., mine tunnel) and laboratory physical property measurements.
This study is part of the Fiber-Optic Sensing and UAV-Platform Techniques for Innovative Mineral Exploration (FUTURE) project, which is an international consortium project funded by the European Union (EU) and South Africa (SA), aimed at developing cost-effective and novel seismic methods for deep mineral exploration, mine planning and development.
Using 3D numerical simulations to model active in-mine seismic surveys at South Deep Gold Mine
One of the challenges of conducting in-mine seismic surveys are mining activities that may limit access to regions of interest and also introduce noise to the data. This noise can be introduced by moving vehicles, machinery, blasting, and other mining-related operations. The simulation of seismic surveys can avoid these challenges since we only work with the elements we compute in our model. Not only does this approach ensure that we simulate the processes that we are interested in, but it is cost-effective and efficient. Thus, using these ‘idealistic’ mine conditions, we are able to extract useful information from numerical simulations to constrain the design, acquisition and processing of the in-mine seismic data.
The study aims to answer the following key questions:
➤ Is it possible to detect on surface the seismic wave field originating from deep underground mine tunnel (~4000 m) to characterise gold-bearing horizons, geological structures (faults, sills, and dykes) and rockmass between surface and tunnel floor?
➤ How do the downward and upward going seismic wavefields interact with the subsurface lithologies, mine infrastructure, and complex geological structures with significantly different physical properties?
➤ Is it possible to conduct time sychronised surface-tunnel seismic surveys for mineral exploration, mine planning, and development?
Geological background
The study area is located 45 km southwest of Johannesburg in South Deep Gold Mine, which is situated on the northwestern rim of the Witwatersrand Basin (Figure 1). The mine is an intermediate to ultradeep level operation with two shaft systems (Figure 2). It operates between 2000 m and 4000 m below the surface, exploiting the Ventersdorp Contact Reef (VCR) and Upper Elsburg Reefs.
Karoo Supergroup sandstones and shales crop out in the mining right area. The Transvaal Supergroup, comprising the Pretoria and Chuniespoort groups, underlie the Karoo Supergroup rocks. The Chuniespoort Group consists of dolostones, quartzites, and shales (Gibson et al., 2000; McCarthy, 2006). The basal layer of the Tranvaal Supergroup is the relatively thin Black Reef Formation (BLR) (ca. 2588±6 Ma, Krapež, 1985; Vos, 1975; Jolly et al., 2004).
The Ventersdorp Supergroup (ca. 2.72−2.63 Ga) lies beneath the BLR. It includes the amygdaloidal basaltic lava’s Pniel sequence (Van der Westhuizen et al., 1991), metasedimentary rocks and bimodal volcanics of the Platberg Group, as well as ultramafic and mafic rocks from the Klipriviersberg Group (Van der Westhuizen et al., 199 1; Manzi et al., 2012). The Ventersdorp Contact Reef (VCR) (ca. 2729±19 Ma, Kositcin and Krapez, 2004; U–Pb detrital zircon SHRIMP) is one of the orebodies mined at South Deep Gold Mine and represents a significant geological marker in the Witwatersrand Basin. It is part of the Ventersdorp Supergroup and comprises a thin fluvial auriferous conglomerate (Gibson, 2004, 2005; McCarthy, 2006).
The VCR is underlain by the Witwatersrand Supergroup, which comprises coarse clastic rocks and bimodal volcanic rocks. The Witwatersrand Supergroup is divided into two main groups: the Central Rand Group and the West Rand Group. The Central Rand Group (ca. 2902 – 2849 Ma, Kositcin and Krapez, 2004; U–Pb detrital zircon SHR-IMP), consists of sandstone, conglomerate, and shale units and unconformably overlies the West Rand Group. The Central Rand Group is divided into two subgroups, namely the upper Johannesburg Subgroup and the lower Turffontein Subgroup. It is significant because it hosts the majority of the auriferous reefs mined in South Deep Gold Mine and across the basin (De Kock, 1964; Manzi et al., 2013).
The West Rand Group (ca. 2984 – 2902 Ma; Kositcin and Krapez, 2004, U–Pb detrital zircon SHRIMP), which is composed
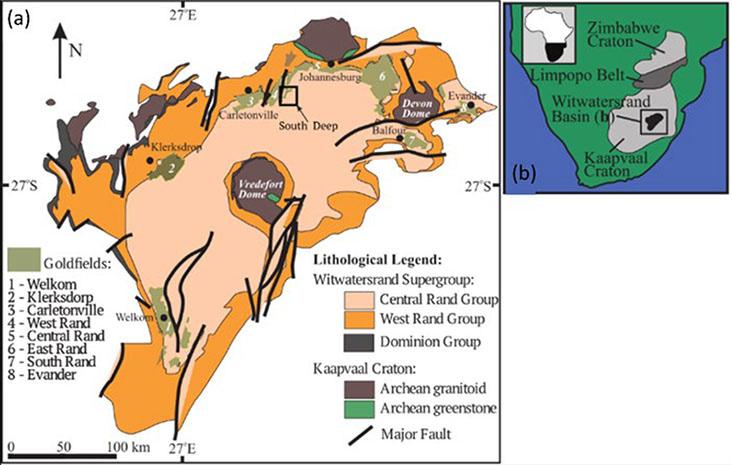
Figure 1—A geological map of the Witwatersrand Basin showing the location of the (a) South Deep Gold Mine and (b) the map of Southern Africa showing the Cratons (Nwaila, 2021 )
Using 3D numerical simulations to model active in-mine seismic surveys at South Deep Gold Mine
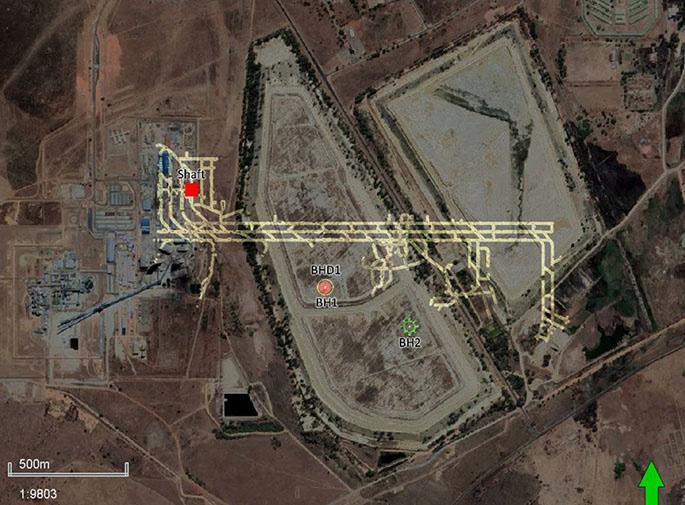
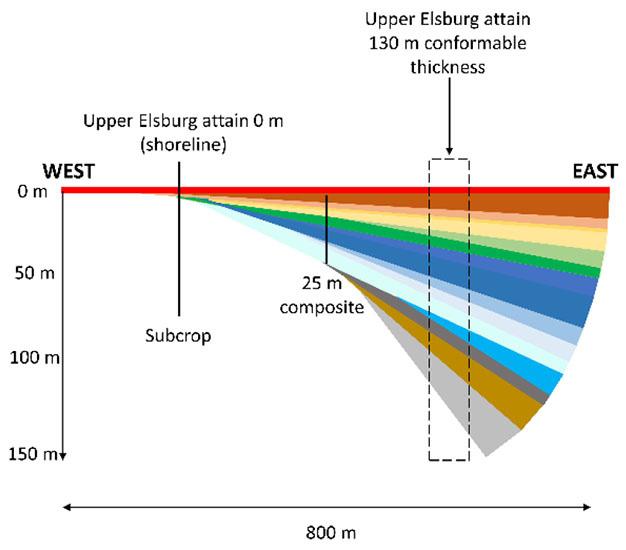
of clastic and predominantly marine metasedimentary rocks, unconformably overlies the Dominion Group (ca. 3074 ± 6 Ma), (Myers et al., 1989). The West Rand Group is further subdivided into three formations: the Jeppestown, Government and Hospital Hill Subgroups (Manzi et al., 2013). The region is also dominated by multiple fault systems such as the north-south trending Panvlakte, West Rand and Wrench Fault systems.
The base of the Ventersdorp Supergroup, the Ventersdorp Contact Reef (VCR), is a strong seismic marker across the basin and it is used as a proxy seismic reflection to constrain the depth and location of the seismically transparent Upper Elsburg Reef (UER) at South Deep Gold Mine (Manzi et al., 2013). The Upper Elsburg reefs are made up of the Upper Elsburg Individuals (Waterpan Member) and the Upper Elsburg Massives (Modderfontein Member). The borehole data reveal that the members attain a maximum combined thickness of 130 m towards the east of the site (see Figure 3).
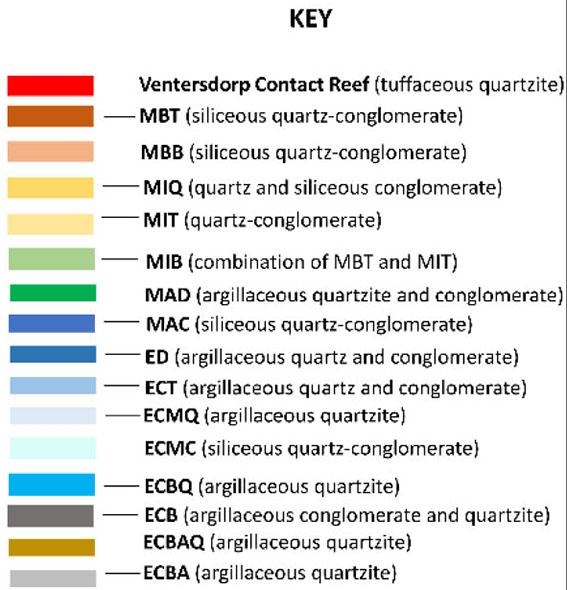
Methodology and results
Physical properties
In order to understand how seismic waves propagate in the study area, an analysis of the laboratory ultrasonic velocities and bulk densities of our samples was conducted. Other physical property measurements used in the study were obtained from the previous studies (e.g., Manzi et al. 2013). The information obtained from the analysis was used in conjuction with mine geometry and geological information to conduct numerical simulations. The 24 samples were collected from three lithologically diverse boreholes spanning the study area (Figure 2). All the boreholes (BH1, BHD1, and BH2) are drilled from the underground workings and intersect the reefs of interest. The borehole BH1 intersects the Modderfontein members (MBT, MBB, MIT, MIQ, MIT, MAD, MAC) and the overlying VCR for 26.6 m and intersects the Waterpan Members (ED, ECT, ECMQ, ECBQ, ECB, ECBAQ, ECBA) for 227.5 m. The borehole BHD1
Figure 2—A satellite map showing the South Deep Gold Mine, the shaft used to access the mining levels and the location of the boreholes BH1, BHD1 (deviation of BH1), and BH2, which produced the 24 samples taken from our study area
Figure 3—Illustration of the clastic wedge model from the Upper Elsburg model of the South Deep Gold Mine
Using 3D numerical simulations to model active in-mine seismic surveys at South Deep Gold Mine
intersects the Modderfontein Members, including the overlying VCR, for 77.69 m and intersects the Waterpan Members for 291.96 m. The most easterly borehole, BH2, intersects the Modderfontein Member including the VCR for 33.67 m and Waterpan Member for 156.33 m.
Elastodynamic modelling
We used a three dimensional finite differencing code known as WAVE3D (Hildyard et al., 1995) which models the propagation of a seismic wave generated by a stress pertubation that is applied to a defined grid. The code does this by solving the elastodynamic wave equation and then calculating the displacements, velocities and stresses at all points in the staggered grid that are induced by the wave field as it propagates. The mesh equations are solved with fourth order accuracy in space, although this reduces to second order at boundaries and discontinuities. The fourth order system provides comparable accuracy to the second order method with a finer mesh (Linzer et al., 2021).
Source models in WAVE3D
Active sources are predefined stress distributions in space and time (dilatational or shear) that are enforced either internally at mesh points or on discontinuity surfaces (Linzer et al., 2021). Choosing an appropriate representation of the source, which introduces frequencies of disturbance into the mesh, has implications for the size and number of grid components. The finite difference scheme suffers from the dispersion of higher frequencies. When defining the source, three factors must be considered: its shape, pulse duration, and region of coverage. These are chosen so that the frequencies in the mesh meet a criterion, ensuring that frequencies below this criterion don't exhibit considerable dispersion within the propagation distances under consideration. The grid element size and source frequency are coupled parameters, meaning the choice of one constrains the other.
We use the following criterion: Dx ≤ 1 5 (vmin f ) (Linzer et al., 2021). Where ∆x is the grid size, vmin is the minimum shear velocity and f is the frequency of the source. Given that the slowest shear velocity (Quartzite, vmin = 3200 m/s), period is 0.015 s (f = 1 0 015 = 66 Hz), which just meets the criterion since ∆x = 10~ 1 5 ( 66 )
Physical properties and numerical modelling parameters
2D waveform processing
3-component recievers are placed according to different configurations (described in the case studies) which can be viewed on the mXrap version 6 platform (Harris and Wesseloo, 2024). The z-component (vertical) of the waveforms was recorded and stored on each reciever (history). Recording channels on each receiver were assigned individual travel-times and consequently converted to seismic traces using ObsPy (a Python framework dedicated to processing seismological data). The sesimic traces were finally converted to SEG-Y format which was used to produce one-way traveltime shotgathers.
The model is constrained in a bounding box with dimensions 2000 m x 2200 m x 3950 m and has a grid size of 10 m. One of the main aims of the survey is to determine whether one can detect and characterise the seismic wavefield reflected by the BLR, VCR, and mine tunnels from the receivers on surface. In order to do this, a simulated source is placed in the tunnel at a depth of 3800 m and the 3-component receivers are ‘buried’ at ~10 m below surface (next to the tailing storage facilities). The source and receiver parameters can be found in Table 1. The result of this model set-up is a 3D cube, which is divided into three lithologies, i.e., dolostone, Ventersdorp andesitic basalts, and quartzites as illustrated in Figure 5. Each lithology is assigned its own seismic velocities and densities.
Following, is an investigation of two case studies where we explore two experimental configurations. The first case study (Figure 6) explores the conventional seismic reflection survey set-up whereby the source and receivers are located on surface and the wavefield is propagated from the surface through the interfaces below surface. In the second case study (Figure 8), the source is placed at a depth of 3800 m below surface and the receivers on surface, and the wavefield is propagated from underground to surface. The parameters used in the case studies are listed in Table 1 and 2.
Case study 1: Source and receivers located on surface
The conventional set-up shows well defined BLR and VCR interfaces (Figure 6a). The source produced clear P- and S-wave first arrivals and the subsequent waves can be seen interfering with each other and producing multiple secondary waves as the
Table 1
used in the study
Using 3D numerical simulations to model active in-mine seismic surveys at South Deep Gold Mine
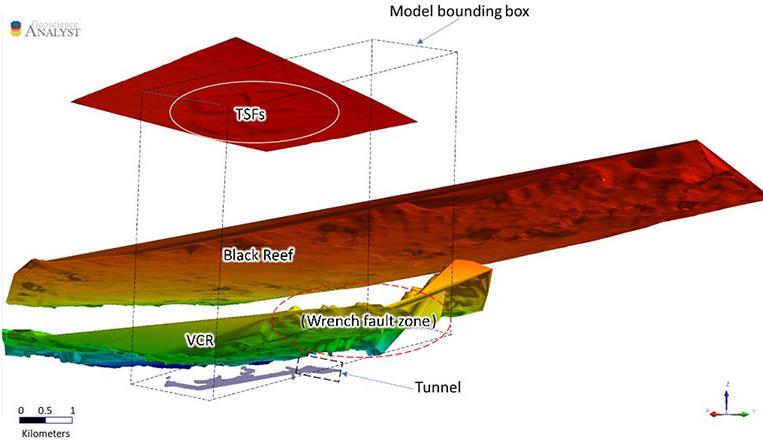
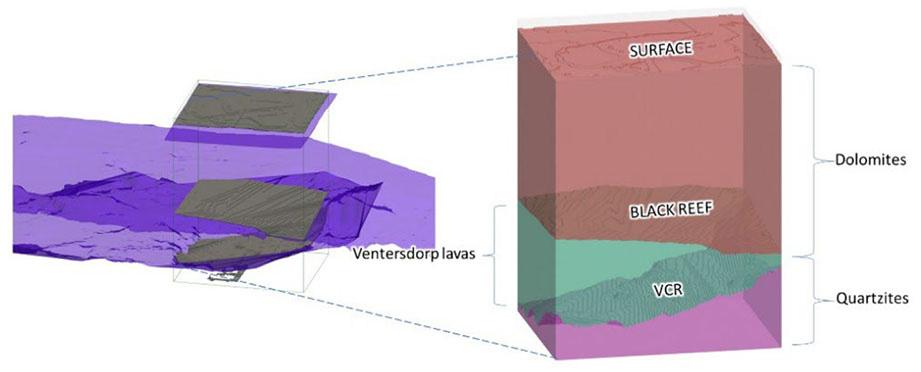
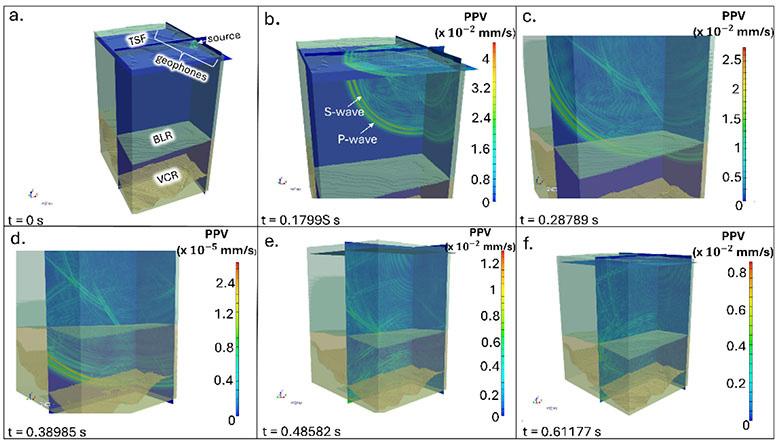
Figure 6—A snapshot sequence showing the propagation and peak particle velocity (PPV) of the wavefield at different times. (a – f) wavefield snapshot at t = 0 s to t = 0.61177 s, showing the P- and S-wave as well as possible reflections from the dolostone – andesitic basalt, andesitic basalt – quartzite interfaces
wavefield propagates through the dolostone (Figure 6b). When the wavefront interferes with the dolostone – andesitic basalt (BLR) interface (Figure 6c), it is mostly refracted but one can also observe few reflections. The dilatational source (amplitude of 106Pa) used
in the model resulted in consistent ground motion throughout the volume of the model. This is indicated by the peak particle velocity (PPV) which varies between 0.0015 – 0.002 mm/s after ~0.29 s of the source’s initiation. In Figure 6d, the wavefield interacts with the
Figure 4—A 3D model illustrating the relative locations of the tailing storage facilities (TSF), Black Reef, Ventersdorp Contact Reef (VCR), and the mine tunnels
Model bounding box
Figure 5—A 3D cube showing the simplified model, which was extracted from a larger, complex model
Using 3D numerical simulations to model active in-mine seismic surveys at South Deep Gold Mine
Table 2
Calculated parameters used in the study
Material
2P-wave modulus is defined as the ratio of axial stress to axial strain in uniaxial strain state, which is equivalent to stating that M = ρVp2, where Vp is the velocity of the P-wave and ρ is the density of the medium in which the wave is propagating through
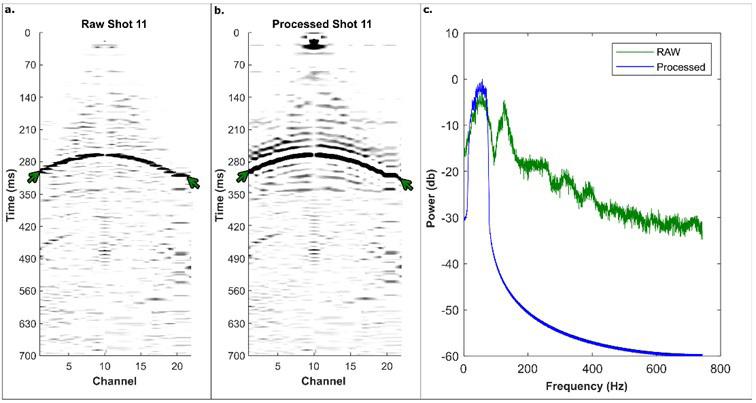
shot gather showing the different arrivals times from the simulation in 700 ms timeframe. The green arrows showing possible reflections. (c) Frequency-power spectrum showing the effect of ACG and bandpass filtering
andesitic basalt - quartzite (VCR) interface and we observe much stronger P-wave reflections. After passing through the interface, we observe a significant decrease in ground motion due to the seismic wave’s propagation and this is indicated by PPV decreasing almost a thousand times from the previous snapshot (i.e. Figure 6c). Near the vicinity of the tunnel (Figure 6e and 6f), the wavefield continues to interact with both of the interfaces and the ground motion velocity averages ~0.06 mm/s in the period 0.49 – 0.61 s after the initiation of the source.
The shotgather (central shot 11) from case study 1 show multiple travel times . An amplitude gain control (AGC) filter is applied to enhance the faint arrivals from the raw shotgather (Figure 7a and 7b). Multiple first arrivals between 220 ms and 280 ms are observed, which are intepreted to represent P-and S-waves first arrivals. These arrivals are followed by P-wave and S-wave reflection events between 280 ms and 350 ms. The strong P-wave reflection observed between 280 ms and 350 ms, represented by the green arrow in Figure 7b, is interpreted to originate from the VCR horizon. One can also observe consistent artificial arrivals, which are a result of boundary conditions of the computational setup. A bandpass filter [0 10 140 160] Hz is applied in Figure 7c.
Case study 2: Source inside the tunnel and receivers on surface
This unique set-up illustrates how the seismic wavefield behaves as it travels from its source located in a tunnel, through the BLR and VCR interfaces and as it reaches the receivers on surface. From its
inception, the wavefield shows well defined P- and S-wave arrivals (Figure 8a). One observes reflections coming off the quartzite –andesitic basalt (VCR) interface. These reflections result in ground motion with PPVs between 0.12 mm/s and 0.06 mm/s. Along the outer edges of the tunnel, we observe significantly higher PPVs (<0.12 mm/s). This range of observed PPV values is influenced, amongst other factors, by the amplitude (106 Pa) of the dilatational source. In Figure 8b, we observe that the wavefield undergoes much less interference as it passes through the lava-dolostone (BLR) boundary. The direction of the wavefront and the PPV remain fairly constant. One can still observe the multiple reflections coming off the geological layers, including the VCR and Black Reef surfaces , but at lower PPVs (> 0.06 mm/s).
Figure 9a shows a time delay (~ 400 ms) of P-wave first arrivals due to the distance (~ 3000 m) between the underground source and the receivers on surface. We apply an amplitude gain control (AGC) filter to enhance the faint arrivals from the raw shotgather (Figure 9a and 9b). A bandpass filter [0 10 140 160] Hz is applied in Figure 9c. A series of high amplitude reflection events can also be seen between 350 ms and 700 ms (indicated by green arrows in Figure in 9b) after bandpass filtering. At this stage it is not clear what these reflections represent, however these could represent the P-wave and S-wave reflections from the Black Reef and VCR horizons.
Conclusion
The use of finite difference modelling to simulate surface and
Figure 7—(a) A raw shot gather (shot 11) showing the different arrivals times from the simulation in 700 ms timeframe. (b) Processed
Using 3D numerical simulations to model active in-mine seismic surveys at South Deep Gold Mine
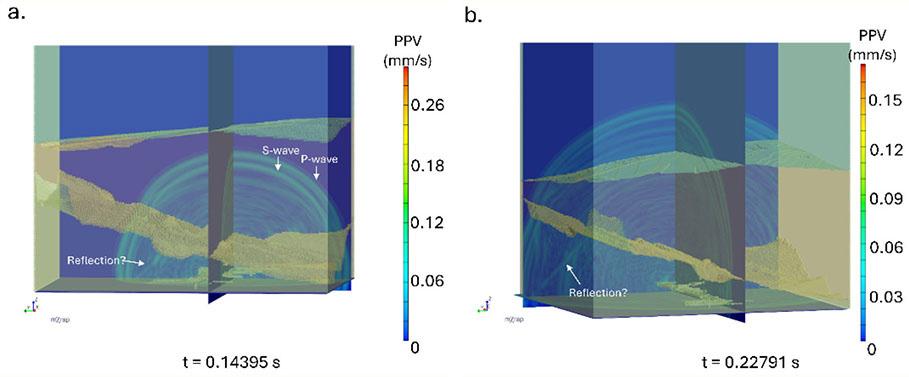
8—A snapshot sequence showing the propagation and peak particle velocity (PPV) of the wavefield at different times. (a) Wavefield snapshot at t = 0.14395 s, showing the P- and S-wave as well as possible reflections from the quartzite - andesitic basalt interface. (b) wavefield snapshot at t = 0.22791 s
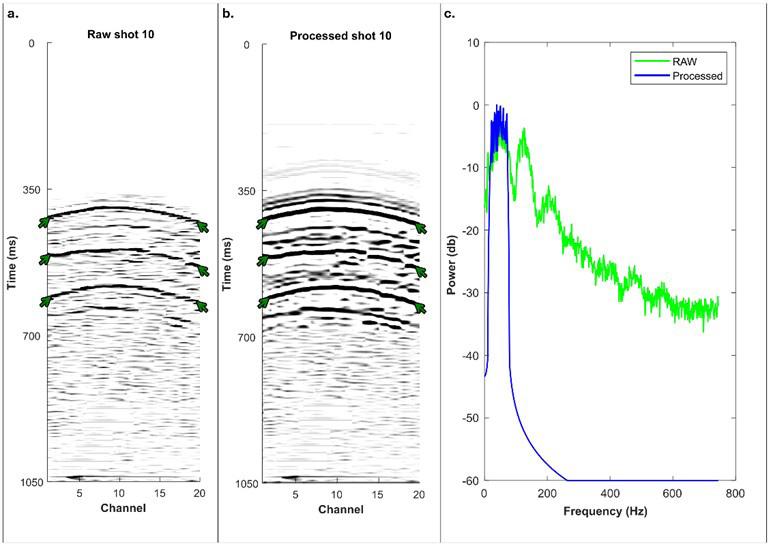
Figure 9—(a) A raw shot gather (shot 10) showing the different arrival times from the simulation in 1050 ms timeframe. The green arrows showing possible reflections from the Ventersdorp Contact Reef and Black Reef. (b) Processed shot gather showing the different arrivals times from the simulation in 1050 ms timeframe. (c) Frequency-power spectrum showing the effect of ACG and bandpass filtering
in-mine reflection seismic surveys revealed useful information about the subsurface geology at South Deep Gold Mine. When we compare both case studies, we note the following:
➤ The configuration of sensors and sources used in the simulations reveal that the seismic wavefield can be recorded from depths close to 4 km below surface. Moreso, both case studies show that the wavefield produced by our source can be used to successfully image the Black Reef (BLR) and Ventersdorp Contact Reef (VCR).
➤ In both case studies, the secondary wavelets undergo mutiple mode conversions even before interacting with the BLR and VCR. These conversions occur much more rapidly when the wavefield interacts with the outer edges of the tunnel.
➤ P- and S-waves tend to interact with the tunnel walls, potentially reflecting, refracting, or converting into other wave modes. When surface waves propagate on the tunnel edge, although they are much slower than the body waves, they carry a significant amount of energy along the surface.
➤ We also note that the wavefield’s behaviour in our simulation is influenced by several factors which include material properties (e.g. reflection and transmission coeffecients due to contrast between the tunnel and the country rock surrounding
it) and frequency content i.e lower frequencies interact with the bulk structure of the tunnel and higher frequencies are sensitives to small-scale features in the geometry.
➤ In the first case, a clear P-wave arrival is recorded at ~290 ms. The velocity of the dolostone layer is 6700 m/s, consequently this corresponds to a depth of 1943 m below surface. These results were used to constrain the design and acquisition of the seismic surveys conducted inside the mine tunnels at South Deep Gold Mine. For example, when conducting an actual reflection seismic survey, we can anticipate that the edges of the underground tunnel will be the main cause of the wavefield’s PPV changes followed by the BLR and VCR interfaces. As such, this would influence the choice of source and receiver parameters utilised in the survey as well as the configuration of sensors used in both case studies. In doing so, one can optimise the design parameters for future surface and in-mine seismic surveys for deep orebody imaging, mine planning, and development .
Acknowledgement
This research is funded by the FUTURE project of ERA-NET Cofund on Raw Materials (ERA-MIN3), Advanced Orebody Knowledge (AOK), and DSI-NRF Centre of Excellence (COE)
Figure
Using 3D numerical simulations to model active in-mine seismic surveys at South Deep Gold Mine
for Integrated Mineral and Energy Resource Analysis (CIMERA). Computational resources were provided by SRK Consulting (South Africa) (Pty) Ltd for WAVE3D. Further acknowledgement goes to the Australian Centre for Geomechanics (ACG) and Mira Geoscience for providing the software mXrap and Geoscience ANALYST, respectively.
We thank South Deep Gold Mine for providing us with mine data as well as granting us the permission to publish this research.
References
De Kock, W.P. 1964. The geology and economic significance of the West Wits Line. Haughton, S.H. (Ed.). The Geology of Some Ore Deposits of Southern Africa, 1. Geological Society of South Africa, Johannesburg, pp. 323–386.
Durrheim, R.J., Nicolaysen, L.O., Corner, B. 1991. A deep seismic reflection profile across the Archean‐Proterozoic Witwatersrand Basin, South Africa. Continental lithosphere: Deep seismic reflections, vol. 22, pp. 213–224.
Gibson, M.A.S., Jolley, S.J., Barnicoat, A.C. 2000. Interpretation of the Western Ultra Deep Levels 3D seismic survey. The Leading Edge, vol. 19, pp. 730–735.
Gibson, M.A.S. 2004. Goldfields KEA 3D Seismic Project: Final Report. Unpublished report to Gold Fields Mining, pp. 52.
Gibson, M.A.S. 2005. Interpretation of the 2003 South Deep 3D Seismic Survey. Unpublished report to Gold Fields Mining, pp. 62.
Harris P.C, Wesseloo J. mXrap software., (2015). Perth, Western Australia, Australian Centre for Geomechanics, The University of Western Australia, version 5. http://mxrap.com/
Hildyard, M.W., Daehnke, A. Cundall, P.A. 1995. WAVE: A computer program for investigating elastodynamic issues in mining. Proceedings of the 35th US Symposium on Rock Mechanics. Balkema, Rotterdam. pp. 519–524.
Jolley, S.J., Freeman, S.R., Barnicoat, A.C., Phillips, G.M., Knipe, R.J., Pather, A . 2004. Structural controls on Witwatersrand gold mineraliation. Journal of Structural Geology, vol. 26, nos. 6–7, pp. 1067–1086.
Kositcin, N., Krapež, B. 2004. Relationship between detrital zircon age-spectra and the tectonic evolution of the Late Archaean Witwatersrand Basin, South Africa. Precambrian Research, vol. 129, nos. 1−2, pp. 141–168.
Krapež, B. 1985. The Ventersdorp Contact Placer: a gold/pyrite placer of stream and debris-flow origin from the Archaean Witwatersrand Basin of South Africa. J. Sediment., vol. 32. pp. 223–234.
Linzer, L., Hildyard, M., Wesseloo, J. 2021. Complexities of underground mining seismic sources. Philosophical Transactions of the Royal Society A: Mathematical, Physical and Engineering Sciences. 379. 20200134. 10.1098/rsta.2020.0134.
Manzi, M.S., Gibson, M.A., Hein, K.A., King, N., Durrheim, R.J. 2012. Application of 3D seismic techniques to evaluate ore resources in the West Wits Line goldfield and portions of the West Rand goldfield, South Africa. Geophysics, vol. 77, no. 5, pp. 163–171.
Manzi, M.S.D., Hein, K.A.A., Durrheim, R., King, N. 2013. Seismic attribute analysis to enhance detection of thin gold-bearing reefs: South Deep gold mine, Witwatersrand basin, South Africa. Journal of Applied Geophysics, vol. 98, pp. 212–228.
McCarthy, T.S. 2006. The Witwatersrand Supergroup. Johnson, M.R., Anhaeusser, C.R., Thomas, R.J. (Eds.), The Geology of South Africa. Geological Society of South Africa, Johannesburg. Council for Geosciences, Pretoria, pp. 155–186.
Myers, R.E., McCarthy, T.S., Stanistreet, I.G. 1989. A tectonosedimentary reconstruction of the development of the Witwatersrand Basin, with particular emphasis on the Central Rand Group. Economic Geology Research Unit Information Circular, 216, pp. 497–540.
Nwaila G.T., Bourdeau, J.E., Jinnah, Z., Frimmel H.E, Bybee G.M, Zhang SE, Manzi M.S.D, Minter W.E.L., Mashaba D. 2021. The Significance of Erosion Channels on Gold Metallogeny in the Witwatersrand Basin (South Africa): Evidence from the Carbon Leader Reef in the Carletonville Gold Field. Economic Geology, 116, pp. 265–284.
Van der Westhuizen, W.A., De Bruiyn, H., Meintjes, P.G. 1991. The Ventersdorp Supergroup: an overview. Journal of African Earth Sciences, vol. 13, pp. 83–105.
Vos, R.G. 1975. An alluvial plain and lacustrine model for the Precambrian Witwatersrand deposits of South Africa. Journal of Sedimentary Petrology vol. 45, pp. 480–493. u
Affiliation:
1College of Agriculture, Engineering and Science, University of KwaZuluNatal, Westville, Durban, South Africa.
2Rock Engineering Department, Sibanye Stillwater PGM, Rustenburg, South Africa.
3School of Mining and Geoscience, Nazarbayev University, Astana, Kazakhstan
Correspondence to: R. Masethe
Email: masetheR@ukzn.ac.za
Dates:
Received: 14 Jun. 2024
Revised: 2 Dec. 2024
Accepted: 22 Jan. 2025
Published: January 2025
How to cite:
Masethe, R.T., Durapraj, S., Maqina, U., Adoko, A.C. 2025. Seismicity evolution and rockburst control in the Merensky Reef and UG2 orebody: An intermediate depth platinum mine case study. Journal of the Southern African Institute of Mining and Metallurgy, vol. 125, no. 1, pp. 51–60
DOI ID:
http://dx.doi.org/10.17159/24119717/3460/2025
ORCiD:
R.T Masethe
http://orcid.org/0000-0002-4420-7885
A.C. Adoko
http://orcid.org/0000-0003-1396-7811
Seismicity evolution and rockburst control in the Merensky Reef and UG2 orebody: An intermediate depth platinum mine case study
by R.T. Masethe1, S. Durapraj2, U. Maqina2, A.C. Adoko3
Abstract
This study investigates seismicity and rockburst control within the Merensky Reef and UG2 orebody of an intermediate-depth platinum mine located in South Africa's Bushveld Complex. Utilising a mine-wide seismic monitoring system, over 1,900 seismic events were recorded between April 2023 and May 2024, revealing complex seismic patterns driven by mining-induced stress changes. The largest event, with a magnitude of ML 2.0, underscores the seismic risks associated with mining at increasing depths. Key findings include the spatial and temporal variability of seismic events, with high seismic activity observed near pillars and geological structures. A significant portion of events correlated with pillar and foundation failures. Moment tensor analysis identified dominant failure modes, such as stress-driven fracture closures and dynamic pillar failures. To mitigate risks, the study emphasises advanced support system redesign and rockburst risk assessment using the rockburst damage potential (RDP) method. The research highlights the importance of monitoring, geotechnical compliance, and adaptive designs in enhancing safety and reducing seismic hazards in underground mining operations. The study applied the RDP framework, classifying damage across R1 to R5 scales, where most instances fell into low-risk categories (R1 and R3), indicating minor to moderate damage. However, data limitations and the tabular stoping method's complexity led to inconclusive results, highlighting the need for more robust data and customised risk assessment tools. Despite these challenges, the RDP approach provided valuable insights into rockburst mechanisms and the effectiveness of existing support systems.
Keywords rockburst, forecast, hazard, risk, monitoring, seismic event
Introduction
Rock mass instabilities represent the single most significant cause of injuries and fatalities suffered by the workforce in South African gold and platinum mines. The severity of rockbursts in platinum mines has increased as excavations have deepened. We present a case study of a mine located on the western limb of the Bushveld Complex in the Northwest province of South Africa, near the town of Rustenburg and about 80 km from Pretoria (Figure 1). The mine produces platinum group minerals (PGM) and covers an area of 33 km2. Two reefs are exploited, namely the Merensky Reef (pegmatoidal pyroxenite) and the UG2 (chromitite). Both reef horizons occur stratigraphically in the Upper Critical Zone of the Rustenburg Layered Suite (Kruger, 2005).
The study is motivated by the increasing seismic risks associated with mining at intermediate depths, particularly in platinum mines within the Bushveld Complex. These operations face challenges similar to those of deep-level gold mines, including seismicity and rockburst hazards. The purpose of the study is to:
➤ Understand the evolution of seismicity in the Merensky Reef and UG2 orebody.
➤ Enhance safety through improved support designs and seismic monitoring.
➤ Develop predictive tools for assessing and mitigating rockburst risks, ensuring operational efficiency and personnel safety.
The methodology combined seismic monitoring using a network of nine tri-axial geophones to record over 1,900 events with advanced analyses, including moment tensor inversion for failure mechanisms and the rockburst damage potential (RDP) method to assess rockburst risks. Additionally, the study evaluated and redesigned rock support systems to enhance resilience under both quasi-static and dynamic seismic conditions. A support system evaluation analysed existing and redesigned rock support systems for quasistatic and dynamic conditions to improve resilience against seismic events.
Seismicity evolution and rockburst control in the Merensky Reef and UG2 orebody
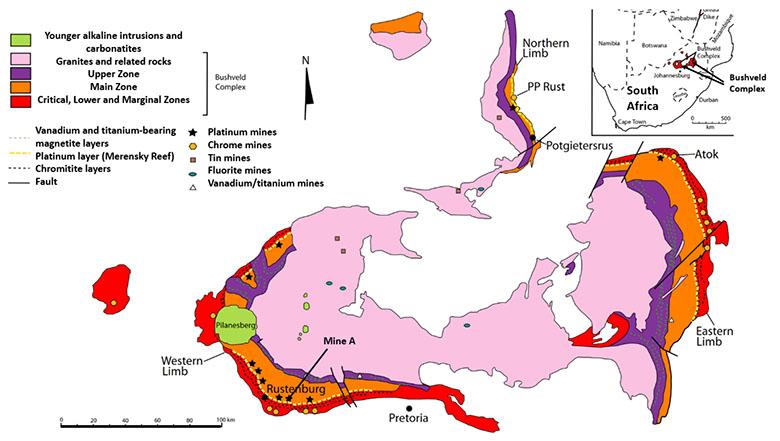
Geology and geotechnical setting
The strata and reefs strike ~east-west and generally dip between 8°N in the west, progressively increasing to 13°N in the far east. The planar continuity of the orebody is impeded by geological structures, such as faults, dykes, potholes, rolling reefs, secondary geologic structures (jointing, layer-parallel, and ramp structures), and iron-rich ultramafic pegmatites.
The UG2 chromitite reef occurs as a narrow tabular layer approximately one meter thick that dips towards the north at an average of 9° in the intermediate-depth platinum mine. The UG2 is mined between 837 m and 1287 m below the surface, displaying minor lateral thickness variation. Stress measurements on 31 level (1200 m) indicated that the horizontal stress (86.8 MPa) magnitude was more than the vertical stress (51.3 MPa), i.e., a high k-ratio = 1.7. The hangingwall pyroxenite unit contains chromitite markers, known as the UG2 markers, forming a plane of low cohesion 0.1 m to 2.4 m above the UG2 Reef (Figure 2). The base of the UG2 Reef is represented by a coarse feldspathic pegmatoidal pyroxenite, which varies in thickness from 0.1 m up to 1 m and forms cusps in contact with the overlying chromitite.
The Merensky Reef (MER) is a regular, persistent tabular orebody with various layers: pegmatoid, chromitite, and pyroxenite (Lougher and Mellowship, 1991). It is generally composed of an upper feldspathic pyroxenite assemblage near the top of the Upper Group of the Upper Critical Zone of the Bushveld Complex. It overlies a thin basal chromitite stringer, followed by an anorthosite to norite footwall and a thin anorthosite layer (0.1 m to 0.2 m thick), which is underlain by norite (Figure 2). Locally, this is termed a ‘pyroxenite reef.’ The Merensky pyroxenite is mined between 787 m and 1267 m below the surface.
The geological features within the mine include a significant density of minor throw faults with near vertical dip angles and a low density of large throw structures. Seismic activity is variable, but information is currently inadequate to distinguish between the influence of fault density and extraction rates. One cannot infer that the absence of major regional faults leads to lower seismic activity and associated risk.
Rock mass instability is driven by extraction rate, rock mass properties, depth (stress), and geological structures. Furthermore,
occasional noritic lenses within the pyroxenite of the Merensky Reef, locally termed ‘brown sugar norite’, (BSN) also pose a risk (Figure 3). The BSN is a fine-grained mela-gabbronorite and only occurs where the upper chromite stringer of the Merensky Reef unit is present (Beukes, 2014). The BSN is not laterally consistent and might be overlooked due to its similarities to Merensky Reef pyroxenite (Beukes, 2014). Figure 3 shows a typical section of the mine where BSN lenses, potholes, and faults pose mining challenges.
According to the classification of Jager and Ryder (1999), it is an intermediate-depth mine. It is associated with a virgin stress state of 25–60 MPa, moderate stope closure of approximately 10–30 mm/m face advance (Figure 4a), and a moderate to severe rockburst hazard. Elastic modeling indicates face stresses up to 90 MPa.
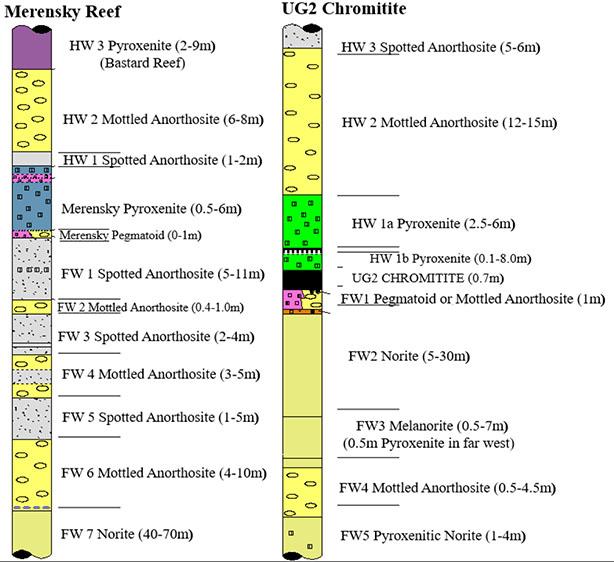
Figure 1—Geological map of the Bushveld Igneous Complex (BIC) indicating the location of the mine (after Taylor et al., 2005)
Figure 2—Schematic stratigraphic column of the Critical Zone indicating the location of the UG2 chromitite and the Merensky Reef
Seismicity evolution and rockburst control in the Merensky Reef and UG2 orebody
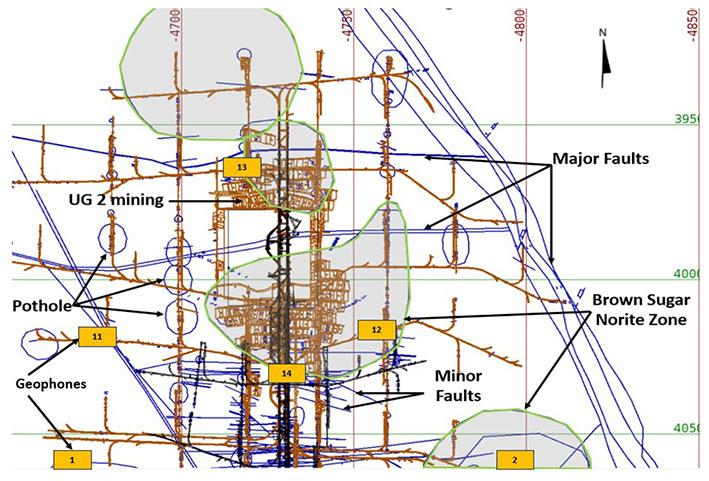
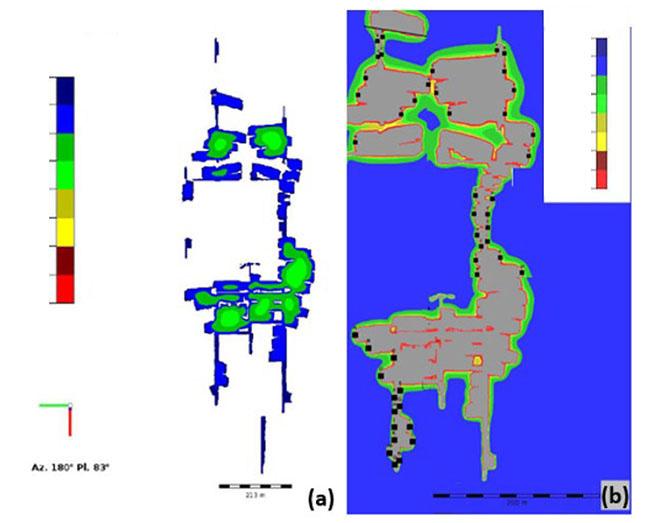
Seismicity and the analysis at the intermediate depth platinum mine
The mine-wide seismic system captured the seismic data. This system comprises 9 4.5 Hz tri-axial geophones sampling at 6 kHz installed at locations surrounding the Merensky and UG2 reef planes (Figure 3). The seismograms determine P- and S-wave arrival times and calculate the relevant source parameters: origin time, location, energy, moment, magnitude, and stress drop. From 18 April 2023 to 20 May 2024, the system recorded 1993 miningrelated seismic events (−3 ≤ ML ≤ 2), which are located with an accuracy of 30 m at best (Figure 5a). The largest seismic event recorded is M2.0, located on a solid containing a very small fault. The depth of these seismic events ranges from 450 m to 1451 m. These seismic events occurred near the MER stopes (Figure 5b).
Since the establishment of the seismic system, the mine has been able to capture seismic data to such an extent that an increase in seismicity is noted. This presents the potential for an increased risk to the safety of mine personnel and a higher probability that mine infrastructure may be damaged. The number and magnitude of seismic events will likely increase with the extraction of the Merensky Reef at increasing mining depths (Gay et al., 1995).
Though the shaft mining MER and UG2 chromitite is relatively new, it is already experiencing challenges similar to deep-level gold mines in the Witwatersrand basin. Aref et al. (1994) concluded that the relationship between seismicity and mining activity varies from area to area. Different areas of this shaft are experiencing different levels of seismicity (Figure 5b). More large seismic events are observed in the BSN zone than in other areas within the mine, though face stresses are moderate (Figure 3).
Diurnal distributions
The diurnal distribution indicates the pattern of seismicity and is an additional method of assessing the workforce's exposure to seismic activity. Seismic events in the lower magnitude range (less than approximately ML1.5) are generally accepted to be
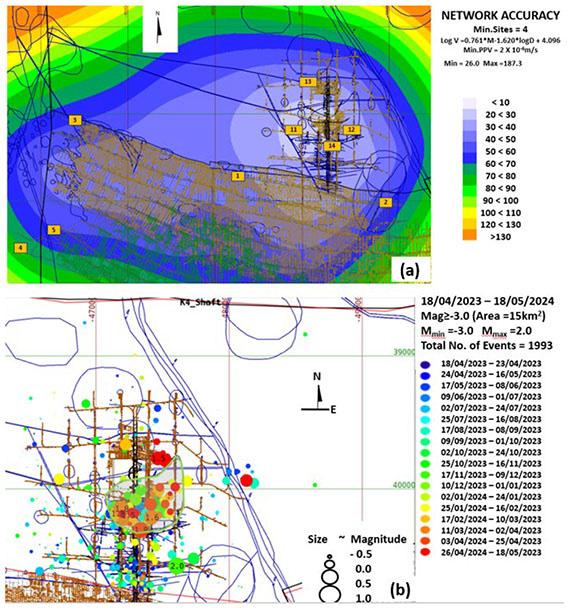
Figure 3—The mine plan indicating geological features, current mining, location of closer geophones (orange rectangles), and the region of brown sugar norite (BSN) in green
Figure 5—(a) Modelled seismic location accuracy (if all geophones in orange rectangles are operational), which is deemed adequate for location and longterm strategic planning. (b) Spatial distribution of seismicity and geological structures
Figure 4—Vantage elastic numerical modelling indicating (a) closure and (b) face stresses
Seismicity evolution and rockburst control in the Merensky Reef and UG2 orebody
associated with stress changes near an active working panel and tend to occur very soon after blasting. Exposure of the workforce to such events is limited by concentrating blasting in a short time window, i.e., by centralised blasting. As previously observed by Haile and Jager (1995), we found that most near-face events occur during blasting time and that seismic activity quickly decreases to background levels (Figure 6). However, larger events are driven by regional stress redistribution and may occur at any time of the day. Larger-magnitude events, which tend to occur outside the blasting time, were associated with observed pillar failures (due to pillar dimensions) and pillar foundation failures (due to a softer hangingwall or footwall). Durrheim et al. (1997) concluded that the level of seismic activity in the Bushveld Complex is a function of many factors, including the regional support system, size and spacing of pillars, geotechnical conditions, depth of mining, and stress regime.
Spatial distribution of seismicity
The mine seismic system recorded 1,993 ML ≥ -3.0 seismic events between April 18, 2023, and May 18, 2024:
➤ The biggest seismic event was ML ≥2.0, located on or very close to the reef plane and associated geological structures.
➤ Ninety percent (90%) of the ML ≥ 0.0 seismic events are located within the brown sugar norite zone.
➤ Of the 27 seismic events with 1.0 ≤ ML < 2.0 located in, or very close to, the reef plane, 70% correlate with pillar foundation failure and bursts, and 30% are associated with other mining elements.
➤ Of the 431 seismic events that have 0.0 ≤ ML < 1.0, 75% are associated with pillar bursts and the remaining 25% are a mix of events associated with geological features, pillar failures, and/or pillar foundation failures.
➤ 1,535 seismic events have −3.0 ≤ ML< 0.0. They are primarily located within active stopes faces. These small events also pose a risk to workers, since preconditioning has not yet been implemented.
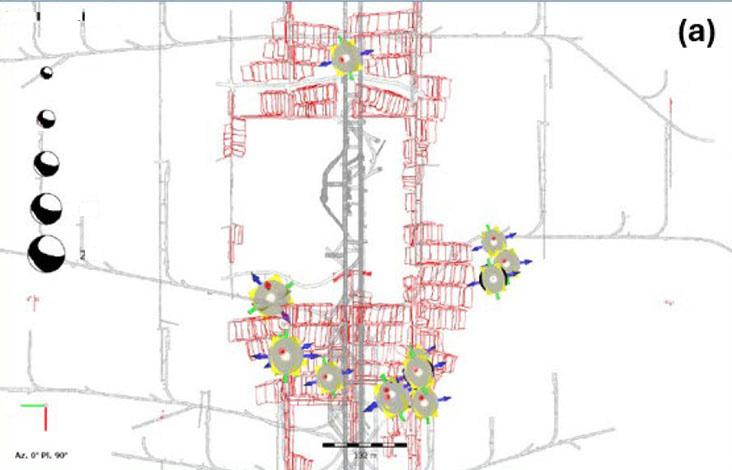
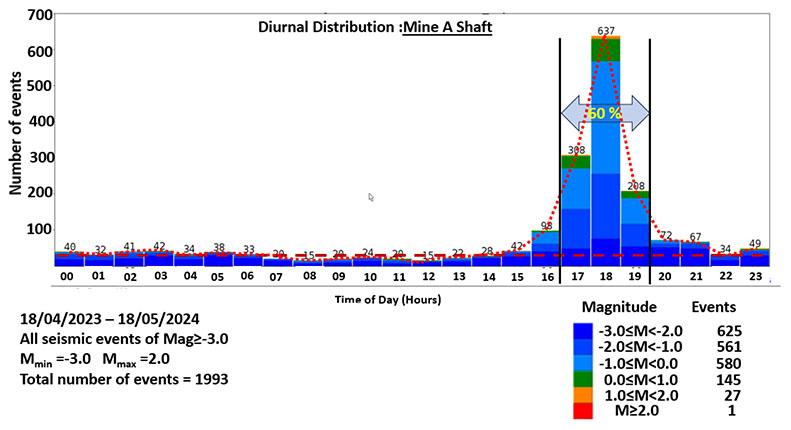
Moment tensor analysis
Different authors have routinely performed the moment tensor inversion, (e.g., Aki and Richards, 2002; Ben-Menahem and Singh, 1981; Jost and Herrmann, 1989; McGarr, 1992; Andersen, 2001). It is the best approach when studying mining-induced seismic event modes of failure (Gibowicz, 1993). Understanding the many failure modes in the UG2 chromitite mining environment requires exploring the source mechanism of mining-induced seismic activity (Figure 7a and b). This is to enhance the design of rock engineers to reduce or eliminate potential hazards and enable efficient mine planning.
Large seismic events of concern were reprocessed, and their waveforms inverted for moment tensors (Figure 7 a and b) and plotted on a Hudson source-type diagram (Figure 7c) that is used to identify source mechanism types such as pure implosion and explosion, crack dilation and closure, ± linear dipoles, and ± compensated linear vector dipoles (CLVD). Most mechanisms are isotropic compensated linear vector dipoles plotting in the Hudson diagram’s implosive zone (Figure 7c). This indicates that the predominant failure mode in the area of interest was the closure of apertures, which includes millimeter-wide mining-induced
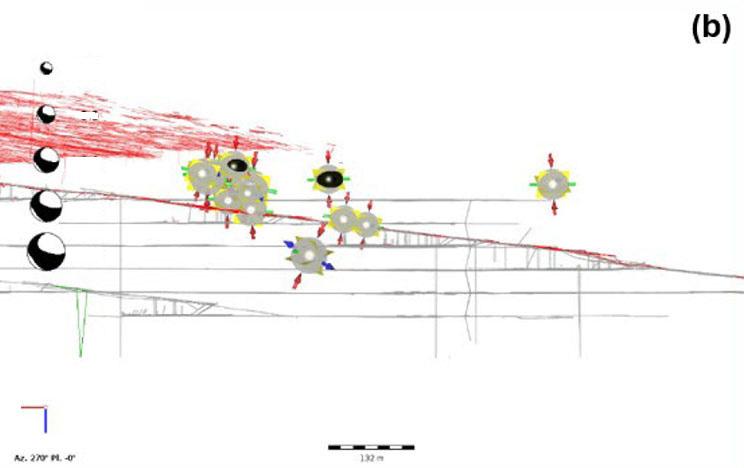
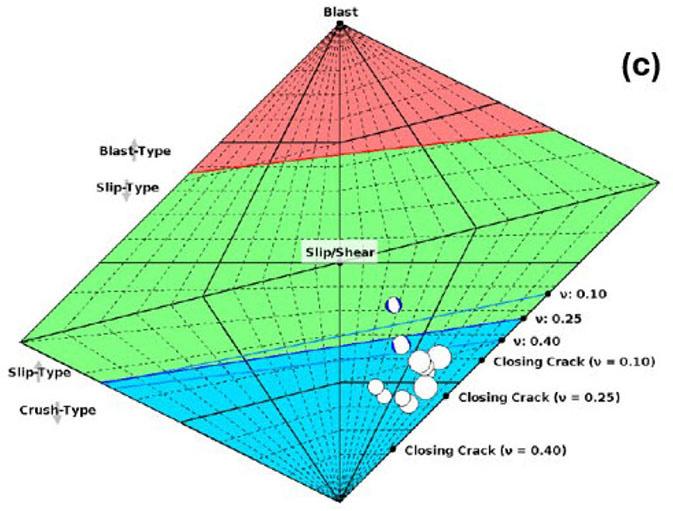
Figure 6—Diurnal distribution of all seismic events indicating the time of blast and the decay to the background level
Figure 7—(a-b) Mechanism classification according to the (c)Hudson diagram
Seismicity evolution and rockburst control in the Merensky Reef and UG2 orebody
fractures and meter-wide stopes. This suggests that while stope closure might have played a significant role, the seismic source mechanisms were more obviously of stress-driven fracture closure. A prominent isotropic component (ISO) and compensated linear vector dipole (CLVD) of more than 60% were present in more than 95% of the entire moment tensor solutions overall (Figure 7 a and b), with the double couple (DC) accounting for 5% of the selected occurrences. The moderate CLVD component indicates that uniaxial deformation formed part of the event mechanisms. These mechanisms are typically associated with dynamic pillar failure and stope closure. These are consistent with the underground observation of dynamic closure on support units.
The findings were that most source mechanisms have dominant crush-type components with smaller shear-type components plotted in the implosive region. About 93% showed negative ISO and CLVD, representing tensile crack closure (‘implosions’). The interpretations of the explosive or implosive point source model (isotropic component) link to the volume change process within the rock mass affected (Figure 7c). These results correspond to previous studies showing that many large mining events have significant implosive volumetric components (McGarr, 1992). The nodal planes of some mechanisms tend to align with stope faces at the mine. The fault plane solution of the moment tensor analysis results does not show any structure related source mechanisms.
Seismic response to production analysis
The seismic response to production analysis is an assessment to distinguish between typical and more hazardous seismic behaviour.
Seismic potency versus production at the mine
Seismic potency (P) is a reliable and handy parameter for this purpose and was calculated and defined by Mendecki et al. (2005) [1]
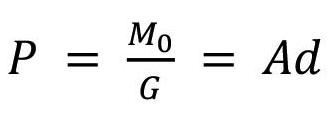
where M0= seismic moment, G = modulus of rigidity (30 GPa), A = area of slip (m2) and d = slip displacement (m). Seismic potency is measured in meters cubed (m3) and can be considered the volume of shear displacement associated with a seismic event. Period 1 (1 March 2023 to 31 October 2023) and Period 2 (1 November 2023 to 31 March 2024) were found to have different seismic responses, indicated by the slope of the best-fit lines (Figure 8); the steeper the slope, the more hazardous the seismic response was deemed to be. The slope of Period 2 (gold line in Figure 8) is steeper (0.0083) than that of Period 1 (blue line in Figure 8, i.e., 0.0016).
The production (Vm) and seismic potency (P) during Period 1 (P1) and Period 2 (P2) are summarised in Table 1. The seismic hazard is estimated by finding the ratio between Vm and P. Interestingly, the average monthly production in P2 is higher than in P1, and the ratio of potency to production is higher in P2 than in P1. However, the period in months is shorter in P2. In addition, P2 stands out as having a higher seismic hazard than P1. The high level of seismicity within the intermediate depth platinum mine in P2 is alarming; the reason for this has yet to be definitively determined but might be due to factors such oversized pillars, production rates, the mechanical properties of the rockmass in the MER mining, or a combination of these factors.
During the first period (P1), there was a large degree of scattering in the locations of the seismic events, while during the
Period 1: This period spans 248 days and contains 4 ML ≥ 1.0 seismic events, 69 ML ≥ 0.0 seismic events, and 580 ML ≥ 3.0 events. The volume-mined is 50.8 x 10³ m3 and the cumulative seismic potency is 69.5 m3; the ratio of volume-mined to seismic potency is thus ∑P/Vm = 0.001. The largest seismic event occurred on 17 May 2023 with ML = 1.1.
Period 2: This period has spans of 150 days and contains 1 ML ≥ 2.0 seismic events, 17 ML ≥ 1.0 events, 82 ML ≥ 0.0 events, and 935 M ≥ 3.0 events. The volume-mined is 101.6 x 10³ m3 and the cumulative seismic potency is 340.8 m3. The ratio of cumulative seismic potency to volume-mined for Period 2 is ∑P/Vm = 0.003, almost three times the ratio in Period 1, indicating an increased seismic hazard in this intermediate depth platinum mine. The largest seismic event occurred on 19 November 2023 with ML = 2.0.
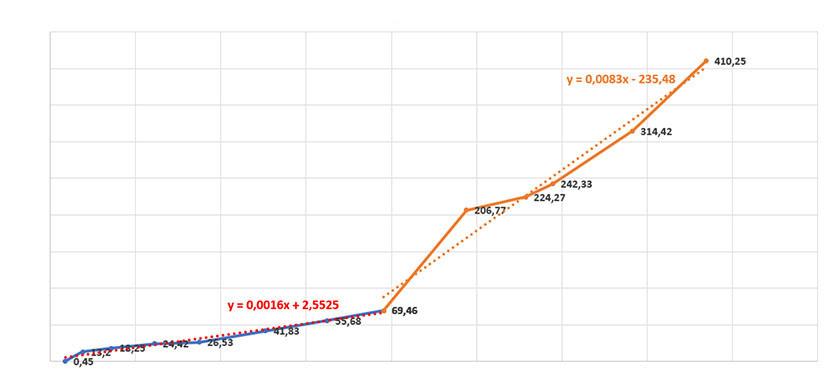
Figure 8—Seismic potency versus production at the mine indicating the change
Table 1
Seismicity evolution and rockburst control in the Merensky Reef and UG2 orebody
second period (P2), the seismicity was concentrated in the brown sugar norite environment in the intermediate depth platinum mine, where the mining was taking place. In both periods, the largest seismic events were located on the pillars and BSN (Figure 5).
Review and upgrade of seismic resistant support
Effectiveness of existing and redesigning of support
The support system needs to support the rockmass under normal gravity loading conditions. Secondly, the same support system must safely support the rockmass under dynamic loading conditions experienced during a seismic event. In the case of seismic loading conditions, the excavation will undergo permanent inelastic deformation, but the emphasis is on providing for the safety of personnel working in these excavations. The mechanics of rock support are complex, and no models exist that can fully explain the interaction of various support components in a rock support system. Nevertheless, Kaiser et al. (1996) summarised three key support functions as: (1) reinforce the rock mass to strengthen it and control bulking; (2) retain broken rock to prevent fractured block failure and unraveling; and (3) hold fractured blocks and securely tie back the retaining element(s) to stable ground. The demand/capacity rationale for support system design in a seismic loading environment is to achieve a support design capacity greater than the load or energy demand supplied to the rockmass by ground vibrations, e.g., a seismic event. Research into developing support units and testing such support in controlled conditions have come a long way and have been documented by many authors (Kaiser et al., 1996, 2012; Cai et al., 2004). The existing support in this area generally performed well, significantly reduced damage, and prevented loss of life and injury under quasi-static conditions. The existing support for quasi-static conditions in the areas of interest is comprised of:
➤ Grout Pack on 3.0 m x 3.0 m pattern.
➤ 1.6 m long resin bolt on a 1.5 m x 1.5 m pattern.
➤ 1.5 m long full column grouted tendon on a 1.5 m x 1.2 m pattern (gully support).
➤ Temporary mechanical prop on a 1.5 m - 2.0 m pattern.
➤ 2.0 m wide safety net on the hangingwall in the stope face area.
In redesigning the local support for these areas, emphasis is placed on improving the strength and yielding capability of the support system. The demand for the support system required a selection of support units that would work with the regional stability pillars and crush pillars to provide the required quasi-static and dynamic (yielding) abilities. The goal of reinforcing the rock mass using rock bolts is not only to strengthen the rock mass, thus enabling it to support itself (Hoek and Brown, 1980), but also to control the bulking process, as rock bolts prevent fractures from
Table 2
Rockburst damage scale (after Heal et. al., 2006)
Rockburst damage scale
R1
R2 Minor damage, less than 1 tonne displaced
propagating and opening when correctly installed. The redesigned support system in this area to mitigate the risk of rockburst now comprises:
➤ Grout Pack on 8.0 m (strike) x 4.0 m (dip) pattern (centre to centre).
➤ 1.6 m long resin bolt on a 1.5 m x 1.5 m pattern (in the stope hangingwall in the face area).
➤ 1.5 m long full column grouted tendon on a 1.5 m x 1.2 m pattern (gully support).
➤ 1.5 m long yielding prestressed elongate (timber and steel elongate) on a 1.5 m (dip) x 2.0 m (strike) spacing (centre to centre).
➤ Temporary mechanical prop on a 1.5 m x 2.0 m pattern.
➤ 2.0 m wide safety net on the stope face.
Rockburst risk analysis using the rockburst damage potential (RDP) approach
Rockburst risk analyses were carried out on stoping excavations of interest. The RDP method is first described and then applied. A system for quantifying the seismic risk is being developed that considers the seismic hazard and the excavation vulnerability (stress damage, support capacity, span, and geological disturbances). This is then used to estimate the expected frequency and extent of seismic damage. The method for assessing excavation vulnerability and rockburst damage potential, developed by Heal et al. (2006), has been adapted and applied. This method is based on 83 case histories with 254 damage locations from 13 Australian and Canadian mines. Heal et al. (2006) proposed the rock damage scale (RDS) (see Table 2). RDP is a function of the excavation vulnerability potential (EVP) and peak particle velocity (PPV) that can be represented by an empirical chart in a probabilistic sense, as shown in Figure 9.
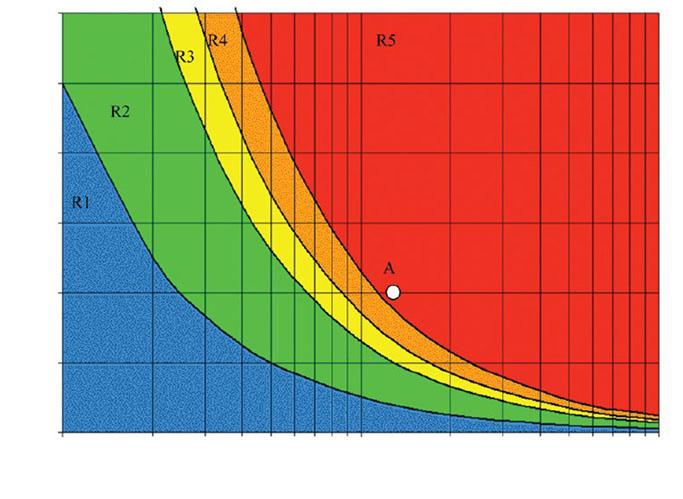
system is loaded, loose in mesh, plates deformed
R3 1 – 10 tonnes displaced Some broken bolts
R4 10 – 100 tonnes displaced
R5 100+ tonnes displaced
Major damage to support system
Complete failure of support system
Figure 9—Empirical chart relating the PPV to the EVP to assess the RDP (R1 to R5) (After Heal et al. 2006)
Seismicity evolution and rockburst control in the Merensky Reef and UG2 orebody
Heal et al. (2006) suggest that the EVP can be determined as follows:
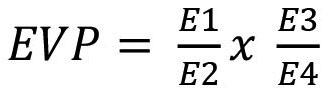
Where E1 represents a stress-to-strength ratio, E2 a support capability, E3 the excavation span and E4 the geological factor. Heal et. al. (2006) defined the E1 parameter as follows:
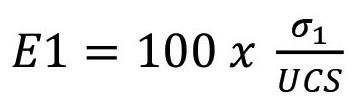
where σ1 = the major principal stress and UCS is the uniaxial compressive strength (UCS).
➤ E2 provides an empirical ranking of support capability in rockburst situations, which is described in Table 3. This is based on analyses of actual and simulated rockbursts (blasting) and installed support systems (Heal and Potvin, 2007).
➤ The E3 parameter represents an excavation span measured in metres (m), and
➤ E4 is the geological factor. Heal et al. (2006) suggest using the following geological factors: 0.5 for a seismically active major structure, 1.0 for no geological structure and or an unfavorable rock mass, and 1.5 for a massive rock mass.
➤ The peak particle elocity (PPV) in metres can be estimated using the following equation (Kaiser et al. 1996):
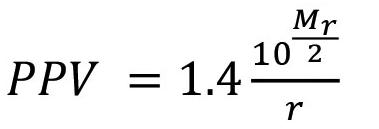
where Mr represents a seismic event magnitude and r the distance in metres between the hypocentre and the experienced damage. The equation considered the magnitude and distance of the seismic event. Heal et al. (2006) do not use PPV as an accurate measure of the PPV generated by a seismic event (particularly in the near field) but present a scaled-distance relationship that can be correlated with rockburst damage.
Results
Following here is a comprehensive evaluation of the feasibility of employing RDP method as a reliable tool for assessing rockburst
Table 3
Support capability in rockburst situations (after Heal et al., 2006)
damage. This involves analysing its effectiveness in predicting the risk and severity of rockbursts in various geological conditions and its applicability in guiding preventive measures and optimising safety protocols in underground mining and tunneling operations.
A dataset was compiled for the purpose and provided in Table 4. The parameters E1, E2, E3, E4, and PPV were determined according to the RDP method. The EVP was calculated for each rockburst instance. Then, each data point (EPV, PPV) was superimposed on Figure 9 to produce the graph in Figure 10, which shows the predicted RDS for the data. It indicates the probability of rockburst damage scale (R1 to R5) for a given EVP and PPV. It can be seen that Figure 10 does not show any clear separation of the data according to each zone (R1 to R5), and most of the data points, including those corresponding to R3, fall within the R1 rockburst damage scale. This might be due to insufficient data points or bias in the data selected. In conclusion, the RDP may not be suitable for these mine conditions. While the RDP has shown to be directly applicable to tunnels and shafts, it might not be directly applicable to intermediate or deep tabular stoping methods. However, it provides a valuable tool for comparative purposes. In the long term, a similar research programme should be implemented to develop a more rigorous risk assessment system directly applicable to deep tabular stoping. Implementing the current system is the onset of this process.
In addition to the seismic assessments, a number of learnings emanated from the seismic ‘storm’ of the period under review. These were that the shaft-based geotechnical department had to institute additional measures to:
➤ Avoid mining irregular or oversized pillars, as these pillars are a source of seismic activity.
➤ Ensure compliance to pillar-cutting standards, as these were perceived to be the source of a significant number of the 1,993 events; compliance is crucial for managing mine-induced seismicity.
➤ Include a number of yielding support elements to assist with the yield required in the system.
➤ Sequence the extraction in such a manner that will reduce the potential seismicity from poor configurations.
➤ Provide systems to adequately assess seismic incidents, generate trend analyses in real-time, and provide recommendations to underground personnel prior to them starting their shifts.
Classification Surface support Reinforcement E2 Rating Example
Low None Spot bolting (spacing > 5 m) 2 Spot bolting with split sets or solid bar bolts, minimal surface support.
Moderate Mesh or fibrecrete Pattern bolting 5 Pattern bolting with split sets or solid bar reinforcement, (spacing 1 m – 1.5 m) with mesh or 50 mm fibrecrete.
Extra bolting Mesh or fibrecrete Pattern bolting with a 8
Pattern bolting with split sets with mesh or 50 mm fibrecrete. second pass of Pattern Bolting Plus, and additional pass of pattern reinforcement, such (overall spacing < 1 m) as solid bar bolts.
High static Mesh or fibrecrete Pattern bolting and pattern 10
Pattern bolting with splits sets or solid bar reinforcement, strength cablebolts with mesh or 50 mm fibrecrete. Plus, pattern cable bolting.
Very high Dynamic surface Pattern dynamic support 25
Pattern bolting with dynamic ground reinforcement, such as dynamic support conebolts, with a dynamic resistant surface support system capacity
Seismicity evolution and rockburst control in the Merensky Reef and UG2 orebody
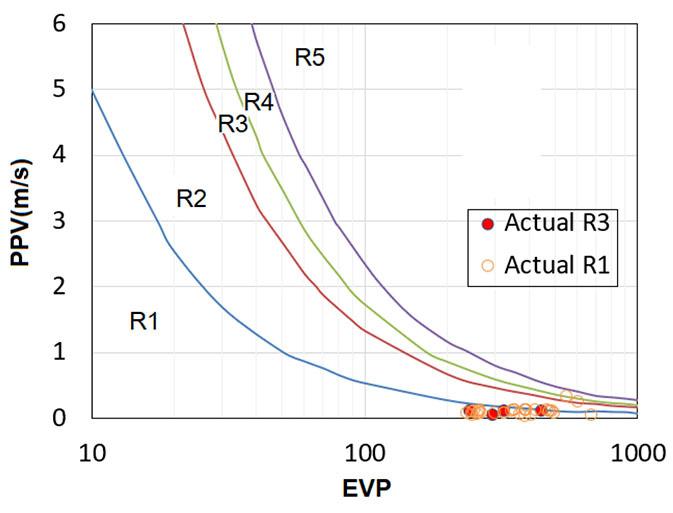
Seismicity evolution and rockburst control in the Merensky Reef and UG2 orebody
➤ Launch an intensive monitoring and numerical modelling programme to quantify geotechnical and geomechanics aspects of the mining.
Conclusions
The seismic database collected for 13 months has proved invaluable in understanding the seismic response to mining within this mine. The evaluation of this seismic response was carried out using seismic statistical hazard parameters and production. The shaft regularly reviews risk mitigation measures. The study indicates that the seismic hazard (slope of cumulative seismic potency versus cumulative production) has increased during period P2 (1/11/2023 – 31/3/2024). An increase in the gradient of the slope indicates an increase in hazards.
Peak particle velocity and excavation vulnerability potential index were correlated. A method to assess rockburst risk, namely rockburst damage potential (RDP) indicates that the damage falls within the R1 and R3 rockburst damage scales. The Mmax value of 2.0 is higher for Period 2 than the Mmax of 1.1 during Period 1. Regarding seismic event statistics, 100 events of M ≥ 0.0 indicated more instability for Period 2. However, the underlying causes of these alterations during the extraction process may stem from various factors, such as the pillar size and the geomechanical properties of the rock mass, especially the unknown rock characteristics of the brown sugar norite (BSN). These factors necessitate thorough investigation and will be incorporated into future research endeavours.
It is important to note that, at this point in the investigation, the increase in stress generation and strain build-up has been primarily attributed to the poor execution of the geotechnical design, with reference, particularly to the local “crush” stability pillars. Therefore, the shaft-based geotechnical discipline must establish and maintain systems and processes to reduce noncompliance, reducing the likelihood of damaging seismicity. This investigation will allow the rock engineering practitioner to have sight of the influence of production data and production rate increases on seismic potency and, in addition to that, infer the potential for rockburst hazards, develop a rockburst hazard forecast, and use rockburst control techniques to reduce the risk.
References
Aki, K.U., Richards, P.G. 2002. Quantitative Seismology 2nd.edn. Sansalito, CA: University Science Books, pp.218-235.
Andersen, L.M. 2001. A relative moment tensor inversion technique applied to seismicity induced by mining. PhD Thesis. University of the Witwatersrand, Johannesburg.
Aref, K., Jager, A.J., Spottiswoode, S.M. 1994. ‘A comparison of seismicity from two mines in the Bushveld Igneous Complex using different pillar systems’. The 1994 ISRM International Symposium and VIth South American Congress on Rock Mechanics, Santiago, Chile.
Ben-Menahem, A., Singh, S.J. 1981. Seismic waves and sources. Springer Science and Business Media.
Beukes, J.J. 2014. Geochemical and mineralogical investigation of the Merensky Reef and its noritic hangingwall at Two Rivers Platinum Mine and Eerste Geluk, Eastern Bushveld, with special reference to the PGE distribution and cryptic variation of the mineral chemistry. MSc Thesis, University of the Free State, South Africa.
Cai, M.K., Kaiser, P.K., Tasaka, Y., Maejima, T., Morioka, H., Minami, M. 2004. ‘Generalized crack initiation and
crack damage stress thresholds of brittle rock masses near underground excavations’. International Journal of Rock Mechanics and Mining Sciences, vol. 41, no. 5, pp.833–847.
Durrheim, R.J., Spottiswoode, S.M., Roberts, M.K.C., Brink, A.V.Z. 2005. ‘Comparative seismology of the Witwatersrand Basin and Bushveld Complex and emerging technologies to manage the risk of rockbursting’. Journal of the Southern African Institute of Mining and Metallurgy, vol. 105, no. 6, pp.409–416.
Gay, N.C, Durrheim, R.J., Spottiswoode, S.M., Van der Merwe, A.J. 1995. ‘Effect of geology, in-situ stress, and mining methods on seismicity in Southern African gold and platinum mines’ in Fuji T. (ed.). Proceeding of the 8th International Congress on Rock Mechanics, ISRM, vol. 8, pp.1321–1325.
Gibowicz, S.J. 1993. ‘Keynote address: Seismic moment tensor and the mechanism of seismic events in mines’. Proceedings of Rockbursts and Seismicity in Mines, Kingston, August, pp.149–155.
Haile, A.T., Jager, A.J. 1995. Rock mass condition, behaviour and seismicity in mines of the Bushveld igneous complex. Safety in Mines Research Advisory Committee, GAP 027, pp.1–207.
Heal, D., Potvin, Y., Hudyma, M. 2006. ‘Evaluating rockburst damage potential in underground mining’ Golden Rocks: The 41st US Symposium on Rock Mechanics (USRMS). Colorado.
Heal, D., Potvin, Y. 2007. ‘In-situ dynamic testing of ground support using simulated rockbursts’, Deep Mining 2007 Y. Potvin ed. Australian Centre for Geomechanics, Australia.
Hoek, E., Brown, E.T. 1980. ‘Empirical strength criterion for rock masses’. Journal of the geotechnical engineering division, vol. 106, no. 9, pp.1013–1035.
Jager, A.J., Ryder J.A. 1999. A Handbook on Rock Engineering Practice for Tabular Hard Rock Mines, SIMRAC.
Jost, M.U., Herrmann, R.B. 1989. ‘A student’s guide to and review of moment tensors’. Seismological Research Letters, vol. 60, no. 2, pp.37–57.
Kaiser, P.K., Cai, M. 2012. ‘Design of rock support system under rockburst condition’. Journal of Rock Mechanics and Geotechnical Engineering, vol. 4, no. 3, pp. 215–227.
Kaiser, P.K., McCreath, D.R., Tannant, D.D. 1995. Rockburst Support Handbook, Geomechanics Research Centre, Laurentian University, Canada.
Kruger, F.J. 2005. ‘Filling the Bushveld Complex magma chamber: lateral expansion, roof and floor interaction, magmatic unconformities, and the formation of giant chromitite, PGE and Ti-V magnetite deposits’. Mineralium Deposita, vol. 40, pp. 451–472.
Lougher, D.R., Mellowship, P. 1991. Strata control problems associated with geological structures on Impala platinum Mines Internal Report.
McGarr, A. 1992. ‘Moment tensors of ten Witwatersrand mine tremors’. Pure and Applied Geophysics, vol. 139, nos. 3−4, pp. 781–800.
Mendecki, A.J. 2005. ‘Persistence of seismic rock mass response to mining’, in Y Potvin and M Hudyma (eds). RaSiM6: Proceedings of the sixth International Symposium on Rockburst and Seismicity in Mines, Australian Centre for Geomechanics, Perth, 97, pp. 97–105.
Taylor, C.D., Schulz, K.J., Doebrich, J.L., Orris, G.J., Denning, P.D., Kirschbaum, M.J. 2005. Geology and nonfuel mineral deposits of Africa and the Middle East. US Geological Survey. u
SAIMM Hybrid Conference
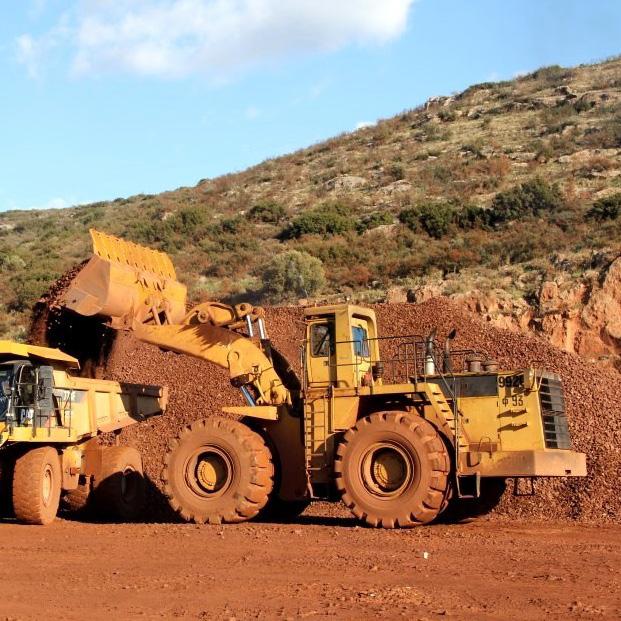
Seismicity evolution and rockburst control in the Merensky Reef and UG2 orebody


International Mineral Asset Valuation Hybrid Conference 2025
Navigating Mineral Asset Valuations in an Uncertain Future
1 October 2025 – Masterclass | 2-3 October 2025 – Conference
The Maslow Hotel, Sandton
BACKGROUND
The purpose of this Mineral Asset Valuation Conference is to bring together professionals from the international mining and finance sectors to discuss and debate mineral asset valuation methodologies and best practices in the context of an uncertain and rapidly changing landscape.
In a time of global transformation, the mineral resources sector faces unprecedented challenges and opportunities. From the increasing influence of Environmental and Social Governance (ESG) considerations to the shifting dynamics of the global economy and geopolitics, the valuation of mineral assets must adapt to navigate an uncertain future.
The International Mineral Asset Valuation Conference 2025 serves as a cornerstone for thought leadership, collaboration, and innovation in this evolving field globally. This event will bring together a diverse group of experts, practitioners, and decision-makers to explore solutions and strategies that ensure mineral asset valuations remain relevant, reliable, and responsive to the world’s rapidly changing landscape.
The conference will delve into key aspects shaping the valuation process, offering attendees valuable insights into how the industry can tackle current and emerging challenges.
Join us as we engage in meaningful dialogue, share innovative practices, and build a path toward a sustainable and resilient future for the mineral valuation profession.
The conference in 2025 will be structured around the following Core Themes:
u The application of Best Practice when uncertain
u Value in the context of increasing ESG requirements
u ‘Rules of the Game’ in today’s evolving world order
u The West/East Principles Divide
u The enhancement and destruction of value from technologies and valuation
u IMVAL as the driver for international alignment
TARGET AUDIENCE
u Mining Industry Professionals
u Valuation Experts and Consultants
u Investors and Financial Analysts
u Legal and Compliance Experts
u Academics and Researchers
u Environmental and ESG Professionals
u Technology Providers
u Consultants.
CALL FOR PAPERS
Prospective authors may choose to submit papers or presentations only.
In person presentations will be preferred, although virtual presentations may be streamed live or prerecorded.
Prospective authors are invited to submit titles and abstracts of their papers and/or presentations in English.
Authors must note whether they wish to submit a peer reviewed paper or a standalone presentation. Authors must note whether they plan to attend in person or whether they would deliver a live-streamed or recorded virtual presentation.
Abstracts should be no longer than 500 words and should be submitted to: Gugu Charlie, Conferences and Events Coordinator, E-mail: gugu@saimm.co.za Tel: 011 538 0238
The complete Proceedings volume will be made available on the internet for public access after the conference.
Acceptance of papers for publication in the SAIMM Journal will be subject to peer review by the Conference Committee and SAIMM Publications Committee post-conference
OF TECHNICAL EXCELLENCE
THE SOUTHERN AFRICAN INSTITUTE OF MINING AND METALLURGY
NATIONAL & INTERNATIONAL ACTIVITIES
21-23 January 2025 — 14TH South African Conference on Computational and Applied Mechanics
Wits Science Stadium, South Africa
Website: https://sacam.co.za/
19-20 February 2025 — Mine Closure Conference 2025
The Maslow Hotel, Sandton
Contact: Gugu Charlie Tel: 011 538-0238
E-mail: gugu@saimm.co.za
Website: http://www.saimm.co.za
12-13 March 2025 — GMG-SAIMM In-Person Forum
Exploring the future of mining through innovation and sustainability
54 on Bath, Rosebank, Johannesburg
Contact: Gugu Charlie
Tel: 011 538-0238
E-mail: gugu@saimm.co.za
Website: http://www.saimm.co.za
7-8 April 2025 — 2ND Southern African Hydrogen and Fuel Cell Conference 2025
Southern Sun Rosebank, Johannesburg
Contact: Gugu Charlie Tel: 011 538-0238
E-mail: gugu@saimm.co.za
Website: http://www.saimm.co.za
8-10 April 2025 — 27TH International Conference on Paste, Thickened and Filtered Tailings
Swakopmund, Namibia
Website: https://acgpaste.com/2025/
26-29 May 2025 — 9TH Sulphur and Sulphuric Acid Conference 2025
Protea Hotel Stellenbosch and Conference Centre, Stellenbosch
Contact: Gugu Charlie
Tel: 011 538-0238
E-mail: gugu@saimm.co.za
Website: http://www.saimm.co.za
3-5 June 2025 — Introduction to Mining Hydrology and Mine Dewatering Design Workshop
Indaba Hotel, Spa and Conference Centre, Fourways
Contact: Gugu Charlie Tel: 011 538-0238
E-mail: gugu@saimm.co.za
Website: http://www.saimm.co.za
25-26 June 2025 — 4TH Digital Transformation in Mining Conference 2025
Glenburn Lodge and Spa, Muldersdrift
Contact: Gugu Charlie Tel: 011 538-0238
E-mail: gugu@saimm.co.za
Website: http://www.saimm.co.za
21-25 July 2025 — AfriRock 2025
Pioneering Progress: The Future of Rock Engineering
Sun City, South Africa
Contact: Camielah Jardine
Tel: 011 538-0237
E-mail: camielah@saimm.co.za
Website: http://www.saimm.co.za
18-19 August 2025 — 13TH International Heavy Minerals Conference 2025
Sun City Resort, Rustenburg, South Africa
Contact: Gugu Charlie
Tel: 011 538-0238
E-mail: gugu@saimm.co.za
Website: http://www.saimm.co.za
1-3 October 2025 — International Mineral Asset Valuation Hybrid Conference 2025
Navigating Mineral Asset Valuations in an Uncertain Future
The Maslow Hotel, Sandton
Contact: Gugu Charlie Tel: 011 538-0238
E-mail: gugu@saimm.co.za
Website: http://www.saimm.co.za
27-29 October 2025 — 9TH International PGM
Conference 2025
PGM - Enabling a cleaner world
Sun City, Rustenburg, South Africa
Contact: Gugu Charlie Tel: 011 538-0238
E-mail: gugu@saimm.co.za
Website: http://www.saimm.co.za
16-22 November 2025 — The 12TH International Copper Conference (Copper 2025)
Phoenix, Arizona, USA
Website: https://www.extractionmeeting.org/ Extraction2025/Extraction2025/Copper2025/default.aspx
Company affiliates
The following organizations have been admitted to the Institute as Company Affiliates
acQuire Technology Solutions
AECI Mining Chemicals, a division of AECI Mining Ltd
African Pegmatite
Allied Furnace Consultants
AMIRA International Africa (Pty) Ltd
Anglogold Ashanti Ltd
Anton Paar Southern Africa
Arcus Gibb (Pty) Ltd
Becker Mining (Pty) Ltd
Bluhm Burton Engineering Pty Ltd
Caledonia Mining South Africa
Castle Lead Works
DDP Specialty Products South Africa (Pty) Ltd
De-Tect Unit Inspection (Pty) Ltd
Digby Wells and Associates
EHL Consulting Engineers (Pty) Ltd
Elbroc Mining Products (Pty) Ltd
Epiroc South Africa (Pty) Ltd
Ex Mente Technologies (Pty) Ltd
Exxaro Resources Limited
FLSmidth Minerals (Pty) Ltd
G H H Mining Machines (Pty) Ltd
Geobrugg Southern Africa (Pty) Ltd
Glencore
Gravitas Minerals (Pty) Ltd
Hatch (Pty) Ltd
Herrenknecht AG
Impala Platinum Holdings Limited
IMS Engineering (Pty) Ltd
Ingwenya Mineral Processing
Ivanhoe Mines SA
Longyear South Africa (Pty) Ltd
Malvern Panalytical (Pty) Ltd
Maptek (Pty) Ltd
Mech-Industries
Micromine Africa (Pty) Ltd
Minearc South Africa (Pty) Ltd
Minerals Council of South Africa
MineRP Holding (Pty) Ltd
Mining Projection Concepts (Pty) Ltd
Mintek
MLB Investments CC
Modular Mining Systems Africa (Pty) Ltd
Murray & Roberts Cementation (Pty) Ltd
Paterson & Cooke Consulting Engineers (Pty) Ltd
Redpath Mining (South Africa) (Pty) Ltd
Rosond (Pty) Ltd
Roytec Global (Pty) Ltd
Rustenburg Platinum Mines Limited - Union
Schauenburg (Pty) Ltd
SENET (Pty) Ltd
Sibanye Gold Limited
Sound Mining Solution (Pty) Ltd
SRK Consulting SA (Pty) Ltd
Tomra (Pty) Ltd
Trans-Caledon Tunnel Authority
Ukwazi Mining Solutions (Pty) Ltd
VBKOM Consulting Engineers
Weir Minerals Africa
Zutari (Pty) Ltd
9th INTERNATIONAL CONFERENCE
27 - 28 OCTOBER 2025 - CONFERENCE
29 OCTOBER 2025 - TECHNICAL VISIT
VENUE - SUN CITY, RUSTENBURG, SOUTH AFRICA

Building on the success of previous events since its inception in 2004, the Platinum Conference Series continues to address the opportunities and challenges facing the global platinum group metals (PGM) industry. As the sector faces increasing demand, from technological innovation and decarbonisation to cost management and market volatility, the 9th International PGM Conference offers a critical platform for addressing these challenges head-on.
Guided by an expert Organising Committee and informed by insights from the industry, this year’s conference will delve into various themes designed to spark meaningful dialogue to drive innovation at every level of the PGM value chain and maintain competitiveness in a rapidly changing global landscape. Attendees can expect high-quality technical papers and presentations, robust networking opportunities, and strategic insights that help shape the future of the industry.
Now more than ever, the platinum industry needs fresh ideas, collaborative partnerships, and forward-thinking strategies to remain relevant. Whether you’re an academic, industry professional, sponsor, or policy leader, your participation will contribute to a dynamic exchange of expertise and solutions that can safeguard the sector’s long-term success. Join us as we explore cutting-edge developments, address the industry’s most pressing issues, and shape a sustainable, competitive future for the PGM industry.
WHO SHOULD ATTEND
• Academics and Researchers
• Business Development Managers
• Concentrator Managers
• Consultants
• Engineers (Mining, Mechanical, Process, Ventilation)
• Exploration and Geology Professionals
• Fund and Investment Managers
• Innovation and Technology Managers
• Market Researchers and Strategy Analysts
• Metallurgists and Pyrometallurgists
• Planning Managers
• Production Managers (Mining and Metallurgy)
• Project Managers
• Scientists
• And anyone interested in shaping the future of the PGM industry
KEY CONFERENCE THEMES
• Technology for Efficient Production
• Decarbonization and Sustainability
• Safety and Cost Management
KEY DATES
27 June 2025 - Submission of abstracts
1 August 2025- Submission of papers
27-28 October 2025 - Conference
29 October 2025 - Technical Visit
• Market Outlook and Strategic Positioning
• Driving Competitiveness, Relevance, and Self-determination
Be part of this dynamic event and help shape the future of the platinum and PGM sector. We invite you to submit your abstracts, register as a delegate, or explore sponsorship opportunities to ensure that this conference continues to be the premier platform for exchanging knowledge, ideas, and best practices.
FOR FURTHER INFORMATION, CONTACT:
Gugu Charlie, Conferences and Events Coordinator
E-mail: gugu@saimm.co.za
Tel: +27 011 538 0238 Web: www.saimm.co.za

ECSA Validated CPD Activity, Credits = 0.1 points per hour attended.
The Value Chain of Heavy Minerals for the Future – From Mine to Market

CONFERENCE THEME
The HMC series of conferences is traditionally focused on mining and processing of heavy minerals. Whilst this conference will still focus on these important aspects, new challenges and opportunities calls for the evolution of the industry.There is a shift in focus to move closer to some of the strategic downstream industries with a focus on improved integration and value chain optimisation. This conference will aim at involving these key downstream industry players to facilitate dialog and knowledge sharing around technical areas where these value chain improvements can be explored. Further to optimizing current value chains, with the recent changes in the global geopolitical landscape, a strong interest for strategic minerals including rare earth elements provide new opportunities for the industry. Development in these provide additional value from the current resources mined. It however requires evolution in how industry approaches geological characterization through to mining and processing to incorporate the rare earth element bearing mineral extraction alongside current value chain. To support the themes already highlighted for the conference, generational knowledge transfer needs to be effectively addressed to ensure the workforce of the future is enabled to lead the industry evolution. The development of technical professionals entering the industry workforce ranging from traditional training and exposure pathways to new approaches including Artificial Intelligence is seen as a key enabler for the future of the heavy minerals industry.
CONFERENCE OBJECTIVE
This series of conferences was started in 1997 and has run since that date. It provides a forum for an exchange of knowledge in all aspects of heavy minerals, from exploration through processing and product applications. This is a strictly technical conference, and efforts by the Organizing Committee are aimed at preserving its technical nature. The benefit of this focus is that it allows the operators of businesses within this sector to discuss topics not normally covered in such forums. The focus on heavy minerals includes the more obvious minerals such as ilmenite, rutile and zircon; and also other heavy minerals such as garnet, and alusite, and sillimanite.
FOR FURTHER INFORMATION, CONTACT:
Gugu Charlie, Conferences and events co-ordinator
ECSA Validated CPD Activity, Credits = 0.1 points per hour attended
ABOUT THE VENUE
Nestled in the rolling hills of the Pilanesberg, one of South Africa’s most scenic locations, Sun City is a world unto itself and has earned its reputation as Africa’s Kingdom of Pleasure. You will find whatever you want at Sun City, from sizzling entertainment, world class casinos and restaurants to cater for all tastes, to the more relaxed poolside venue, quiet places, lush gardens, and extensive sporting facilities including two world-class golf courses. These are just some of the elements that make Sun City unique among the world’s entertainment resorts. Finally re-discovered and now part of Sun City, the Lost City and the Valley of Waves, fabled to be the Ruins of a glorious ancient civilisation, celebrate and bring to life the legends of this mystical city. The Lost City is internationally applauded for its wonderfully imaginative theme and exquisite landscaping whilst the fantastic Valley of Waves is one of the world’s most exciting waterparks.
Professionals specialising or working in the areas of:
• Renewable energy
• Water purification
• Infrastructure
• Desalination plants
As well as the following industry professionals are invited to participate:
• Academics
• Business development managers
• Concentrator managers
• Consultants
• Engineers
CALL FOR PAPERS AND KEY DATES
Prospective authors are invited to submit abstracts of not more 500 words, in English. Please email abstracts and requests to be added to the conference mailing list to Gugu Charlie: Conferences and Events Co-ordinator, SAIMM at gugu@saimm.co.za
25 February 2025 – Abstract submissions
4 April 2025 - Paper submission
18-19 August 2025 – Conference 20 August 2025 – Technical Visit
E-mail: gugu@saimm.co.za Tel: +27 11 538-0238, Web: www.saimm.co.za