
October 2024 Outlook

How Low Will They Go?
- Interest rate cuts are underway, but caution is required
- More room to frontload cuts in New Zealand
- China gets aggressive on monetary policy, but fiscal stimulus is needed
- US election a close-run thing
BEVAN GRAHAM
Implications For Investors
- Lower interest rates, and strong US growth have generated robust returns
- International share markets now face some year-end challenges and risks
- NZ assets should navigate out of the doldrums if the RBNZ is agile enough
GREG FLEMING
How low will they go?
The major theme since our last report has been the ongoing transition to easier monetary conditions amongst the developed economy central banks we monitor most closely. The exceptions to this remain Australia where the central bank is stuck between the rock of not having tightened enough and the hard place of an only very gradual reduction in inflation pressures, and Japan where their central bank is has been raising interest rates in the midst the first signs of sustained inflation in decades.
In most cases the central banks that have eased have taken a cautious approach to easing, citing ongoing concerns about wage growth and service sector inflation, compounded by poor productivity growth. The exception, at least in terms of the initial easing step, has been the US Federal Reserve which started the US easing cycle off with a 50-basis point bang in September. Latest labour market data has since questioned the wisdom of that move.

Having started the easing process, the market focus is now on how far central banks will be able to cut interest rates this cycle to achieve a sustained return to target inflation. There are a couple of key considerations in this regard. The first is the most idiosyncratic to each economy - potential growth. Where is post-pandemic potential growth in each economy? This will largely be determined by the future path of productivity growth. The second consideration, and not completely independent of the first, is the post-pandemic level on neutral interest rates. The answer to that question in the United States is most key to global markets.
The complication for central banks is that neither potential growth nor the level of the neutral interest rate is observable in real time, or even able to be guessed with any degree of robustness. That leaves the labour market as providing the key set of indicators to help form insights into the ultimate destination for interest rates this cycle.
Ready, steady…CUT!!
The pause in the disinflation process in the early months of this year meant the US Federal Reserve (the Fed) was the last of the major central banks to start the easing process. But by the time we got to the September meeting of the Federal Open Market Committee (FOMC), a cut had been well telegraphed by various FOMC speakers and Chair Powell himself in his August speech at the Jackson Hole Monetary Policy Symposium.
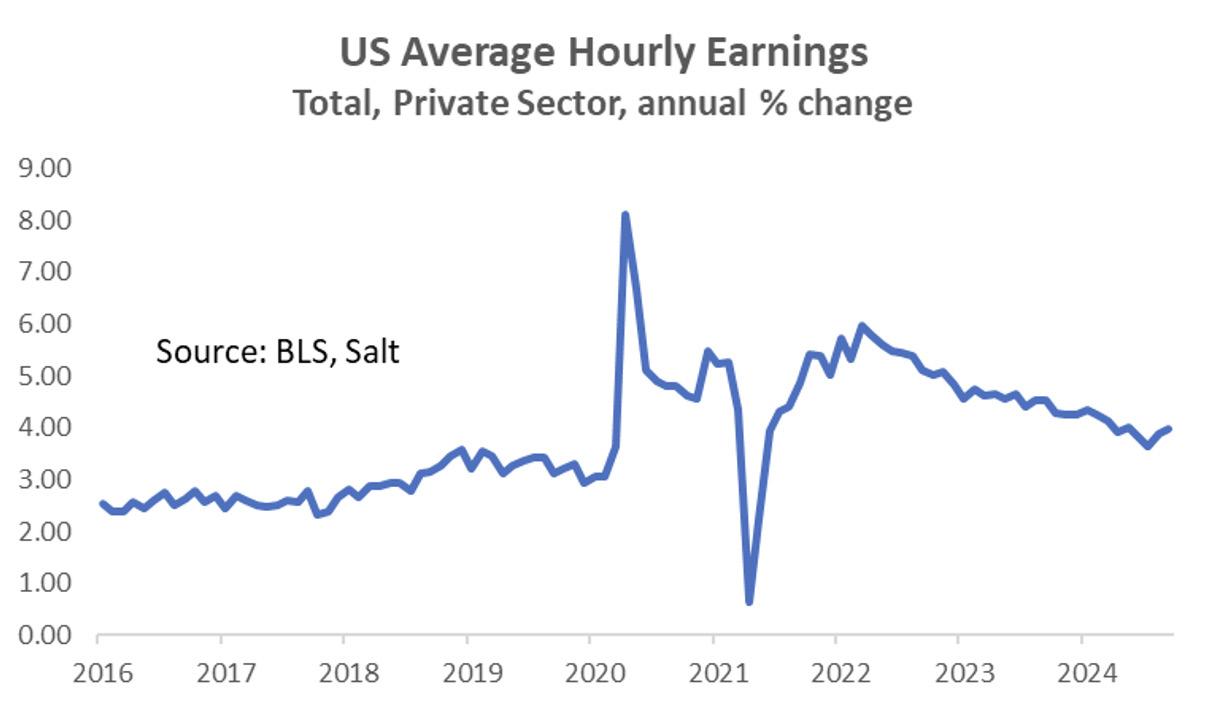
All that was left to debate was the size of the cut. While FOMC member comments had increasingly focussed on the softening labour market, we weren’t of the opinion that the deterioration had been sufficiently significant to warrant a super-sized cut. That’s especially the case with respect to annual wage growth, which at 3.8% at the time of the cut and 4.0% in the latest data, is still significantly higher than the 3% we believe is consistent with 2% inflation. Even a stalling of wage growth at these levels risks reigniting problematic service sector inflation. Furthermore, the economy is still growing at a solid 2.5% pace and is still, at least in our view, headed for a soft landing.
History will show that regardless of the risk, the FOMC opted for a surprise 50bp cut taking the Fed funds rate to 5.0%. Forward guidance and the famous “dot plot” didn’t signal any particular forward path for interest rates. Why 50bp amidst all the signs of economic resilience? We think the first reduction was more about indicating to the market that if the urgency to cut increased, they wouldn’t hesitate to act aggressively.
Both the European Central Bank (ECB) and the Bank of England (BoE) began more cautiously. Both started the process with 25bp cuts in June and July respectively. For its part, the ECB emphasised caution and data dependency when considering future policy adjustments. Even with sluggish growth, the central bank highlighted persistent above target core inflation and, as we expected has thus far taken an every-other-meeting
approach to easing, skipping July but cutting by a further 25bp in September. The BoE’s first cut in July was a close-run thing. The vote to cut was 5-4 in favour. This was followed by a near-unanimous (8-1) decision to leave rates unchanged in September.

We don’t anticipate any policy easing in Australia any time soon. We have previously argued that the Reserve Bank of Australia (RBA) didn’t tighten enough, choosing to allow for a disinflation process that was less damaging on output and the labour market. That strategy always carried the risk that they hadn’t done enough and that hikes would have to resume. While we don’t expect that to be the case, the disinflation process is slow and proving hard work. Indeed, the RBA is repeatedly stating that they “can’t rule anything in or out” with respect to interest rates. The labour market is the biggest headache for them. Employment growth has now surprised to the upside in the last five months and the rise in the unemployment rate has stalled at 4.2%. Wage growth currently sits at 4.1%, still too high in the context of a 2% inflation target. We don’t expect any interest rate declines there until May next year.

Here at home the Reserve Bank of New Zealand (RBNZ) demonstrated a quite remarkable change of tone between Monetary Policy Statements (MPS). Having considered tightening at the May MPS, the central bank cut the Official Cash Rate (OCR) by 25bp to 5.25% at the August MPS. The change in sentiment had been forewarned in the July Monetary Policy Review. We put the change in sentiment down to the RBNZ conceding, with some help from some very soft partial activity data,
that the market consensus was “more right” with respect to the growth and inflation outlook than its own last set of forecasts. The RBNZ then followed up with a 50bp cut to 4.75% in October.
Productivity matters
The persistent part of the post-pandemic inflation resurgence emanated from the labour market, where unsustainably high wage increases saw service sector inflation surge. This was always going to be the hardest part of the disinflation process – getting wage growth back to a level that was consistent with target inflation. It therefore follows that in the near term it is the labour market that holds the key to the level of confidence central banks will have in inflation’s sustained return to target, and with that, the pace and extent of interest rate cuts.
But not all wage increases are created equal. Those that are borne of reward for higher productivity aren’t a problem for central banks as the cost increase is offset by higher production. But those wage increase borne of an imbalance between supply and demand in the labour market and not met by equally large productivity gains will increase business costs and cause central bankers’ a few sleepless nights.
Markets tend to focus on nominal wage growth, largely because of its higher frequency. The more important metric is unit labour costs (ULC). ULCs are just that –the cost of labour required to produce a unit of output. Problem is the data is generally available only quarterly and is quite dated by the time we get it.
The chart below shows recent trends in ULCs across key economies. Data is from the OECD in order to achieve some data consistency. Ignoring Japan for now, the chart helps explain the relative persistence in underlying domestically generated inflation pressures and with that, the relative central bank comfort in easing.

Perhaps not surprisingly given the recent upturn in labour productivity in the US, ULC’s there are least
problematic. Perhaps the better productivity data is a key consideration for the Fed in allowing monetary policy to ease while the economy is still growing strongly and wage growth, while slowing, remains elevated.
ULCs are more problematic in New Zealand, largely on the back of our poor productivity track record. This is not new news for the RBNZ. New Zealand’s inflation track record has long been one of higher than desirable domestic (non-tradeable) inflation, offset by persistently low imported (tradeable inflation). This is a key reason why disinflation processes always seem to need to hurt more here in New Zealand. Greater caution in easing will be required here, especially as we are not convinced that we will get the same assistance from low imported inflation we have had in the past in helping achieve and then maintain target inflation.

Something else for central banks to consider with respect to productivity, especially where there has been a recent improvement, is whether that improvement is structural or cyclical. A cyclical improvement could be driven by the failure of weak firms’ during tough recessionary times that then frees up resources to shift into more productive enterprises. This is unlikely to be sustained. By comparison, an improvement in productivity driven by say, AI technologies, could prove to be more longlasting and beneficial in achieving a higher sustainable (non-inflationary) rate of growth.
Neutral is higher
At the same time central banks are contemplating the inflationary implications of productivity and broader labour market developments, they are also revising up estimated levels of the nominal neutral interest rate. The neutral interest rate is the rate at which monetary policy is neither restrictive nor accommodative for an economy growing near trend.
Think of the nominal neutral rate as having two components, the real (inflation adjusted) component, commonly referred to as r* (r star) in the economic literature, and the level of long-term inflation
expectations. In the United States, r* was generally thought to be around 0.5% prior to the pandemic. Assuming well-anchored inflation expectations of 2%, that gives a nominal neutral rate of 2.5%.
We have written on the factors we believe are now pointing to a higher neutral rate in recent Insights papers over the past few months and don’t intend to repeat the arguments here in full. Suffice to say the combination of de-globalisation, rising geo-political tensions, climate change, ageing populations, easier fiscal policy and rising public debt all suggest to us that r*, and with that the nominal neutral rate assuming inflation expectations remain anchored at 2%, is now higher than it was prepandemic.
But while the direction of travel appears clear to us, pinning down an actual level is more challenging, even for the learned members of the FOMC. The latest “dot plot” from the September Summary of Economic Projections shows that while the median estimate of the long run (i.e. neutral) Fed Funds rate rose to 2.9%, there was a wide dispersion of estimates. Of the 19 dots, there were no more than three opting for any one level, and the implied estimate of r* ranged from 0.375%, so lower than pre-pandemic, to as high as 1.75%.

How low will they go?
As central banks start the easing part of the interest rate cycle, they are cutting into the unknown. In terms of a sustained return to target inflation hard to observe variables such as productivity and the level of neutral interest rates will matter. Central banks that tightened the most and where economic conditions are weakest (read: New Zealand) have scope for some front loading of cuts, but caution will soon be required as interest rates start to close in on “new neutral”. At that point policy setting will need to become more considered and nuanced. So, what does that mean from here for the central banks that have already started the easing process:
• In the United States, the first 50bp is starting to
look a little ill-advised as September labour market data came in stronger than expected. Markets have been framing the FOMC’s next decision in November as a 25 vs 50bp cut, but 50 now looks highly unlikely and doing nothing will likely be an option that is at least discussed. The Committee will likely cut by 25bp in November but expect a pause before too long and a low of around 3.03.5%, data permitting.
• Faster disinflation and a deteriorating growth environment (the Euro area composite PMI printed at 48.9 in September, down from 51.0 in August and below expectations) could see the ECB stepping up the pace of rate cuts to every meeting starting this month, with a pause from March at 2.5%. Expect a terminal rate in the 2.0 to 2.5% range.
• In the UK the Governor of the BoE has recently hinted at a more “activist approach” to policy should inflation stay well-behaved. This sets up a likely period of successive cuts from November, to 3.25% in August next year. But it’s not a done deal. In a more recent speech the central bank’s Chief Economist, Hugh Pill, argued for a more gradualist approach to rate cutting, arguing that postpandemic structural changes need a greater degree of caution.
• Australia: nothing to see here until next year.
• In New Zealand the RBNZ has now cut the OCR 75bp to 4.75%. In deciding to cut by 50bp in October they have opted to use the ability to frontload cuts afforded by weak activity and the still-deteriorating labour market that means target inflation is in sight and likely to be sustained. This sets up a likely further 50bp cut in November. That meeting is the last one before the summer break – they don’t meet again until February - at which point we would expect them to drop back to 25bp cuts. We expect a terminal rate of around 3.5%, our current estimate of neutral.
Japan: a bit more time on the BoJ’s side?
In Japan a rate hike by the BoJ in August along with hawkish guidance from Governor Ueda led to a sharp appreciation in the Yen and a sudden unwinding of “carry trades” that rely on cheap Japanese borrowing costs. That was followed by a less hawkish statement in September where the central bank left interest rates unchanged, believing it has “enough time” to carefully assess factors such as developments in financial and capital markets at home and abroad.
Our base scenario is for a further and likely final 25bp hike to 0.5% in January. That said, we think the BoJ will want to see more solid service inflation in the October and November CPI data before taking any action. The reality is that recent solid growth in wages and unit labour costs has not yet translated to more persistent
service sector prices and the next few months of data will be critical.
Not that we think a return to deflation is likely. Two things are critical here. We don’t expect the 2% inflation target to be changed nor Japan’s broad macroeconomic direction to change under the new Prime Minister, Shigeru Ishiba, and inflation expectations are trending higher amongst both corporations and households, a significant structural change from the previous norm in Japan of zero inflation and zero interest rates. Furthermore, wages should remain under upward pressure amid the continued structural labour shortage stemming from Japan’s aging demographics.

Stepping up the stimulus in China
In September, the Chinese authorities found a new sense of urgency in stepping up their monetary stimulus measures amongst ongoing signs of economic weakness. At the same time, they signalled that further fiscal support was on the way.
There were three main parts to the package. Firstly, the People’s Bank of China (PBoC) announced a cut to the reserve requirement ratios (RRR) of 0.5 percentage points and the main policy interest rate by 0.2 percentage points. Both reductions were larger than usual and the PBoC Governor indicated further cuts were possible by year-end. Secondly, mortgage rates for existing home loans were cut by 0.5 percentage points while the nationwide minimum downpayment for second homes was reduced from 25% to 15%. There was also some funding support made available to speed up the conversion of excess housing inventory into affordable housing. Thirdly, there were some specific measures announced to support the share market.

While these measures were a welcome sign of urgency, we remain sceptical of the ability of lower interest rates by themselves to generate any meaningful uplift in activity, including in the housing market. Credit demand remains weak and housing market sentiment is low. Lower interest rates will likely be ineffective in turning that around. Furthermore, measures to support the share market in the absence of necessary structural change risks creating a bubble.
We still see fiscal policy as the most effective means of stimulating demand, particularly if targeted at consumption. However, we see limited chance of meaningful demand stimulus near term, specifically one that is geared towards consumers. We therefore still need to take a “wait and see” approach to Beijing’s commitment to reflation.
New Zealand
There was good news and bad news in the latest GDP data for New Zealand. The good news is it remained consistent with our characterisation of the economy as bouncing along the bottom of the cycle rather than getting any worse. The bad news is that at -0.2% for the quarter and -0.5% for the year data is still indicating trading conditions for firms remain tough going.

Early signs are that the tax cuts haven’t had much, if any, impact on economic activity. Job security concerns are keeping wallets firmly shut. And while the RBNZ has started to cut interest rates, it will take time for this to manifest as stronger activity.
Business confidence has recovered strongly according to the ANZ’s Business Outlook Survey. Great to see businesses optimistic about the future, but we think doing business is going to prove tough going for a while yet. Our read of the improved confidence is there is an element of wishful thinking in firms “own activity” net positive reading of +45.3%. Same goes with the recovery in pricing intentions to +42.8%. Experienced own activity (this month versus the same month last year) improved but is still sharply negative at -18.5%, though up from -23.1% last month, emphasising how tough it is to do business right now.
The deterioration in the labour market is well entrenched and has further to go. From a low of 3.2% in September 2022, the unemployment rate has risen to 4.6% as at June 2024. We expect it to peak at around 5.5% later this year or early in 2025. While this is extremely painful for many households, it’s this adjustment that will give the RBNZ confidence of a sustained return to target inflation.

Latest inflation data still has headline inflation at 3.3% in the year to June. September data is expected at about the time you read this report and is universally expected to show the annual rate back inside the RBNZ’s 1-3% target band.
It is this development alongside the weakness in economic activity and the labour market that has prompted the RBNZ to cut interest rates by 75bps to 4.75% so far. As mentioned above we expect a further 50bp in November and a terminal rate of around 3.5%.
US Election
The shape of the US election has changed dramatically since our last report. What was at that point a likely (going by polls at the time, especially after the June debate) Donald Trump victory over incumbent Joe Biden is now a likely to be a close-run race between Trump and Kamala Harris.
We wrote on former President Trump’s economic plan
last time, the hallmarks of which are increased tariffs, particularly on imports of goods from China, reduced regulation, getting tough on immigration and the likely extension and possible expansion of the tax cuts delivered in his Tax Cuts and Jobs Act during his first term.
Current Vice-President Harris is campaigning on the “Opportunity Economy”, the centrepiece of which is lower taxes for individuals making less than $400,000 per annum, new subsidies for first home buyers and tax credits for new small businesses. These measures will be paid for by higher taxes on large corporations and wealthy individuals.
Perhaps unsurprisingly in an election campaign, neither candidate has addressed our primary US concern of unsustainable fiscal policy. Both, but particularly Mr Trump, appear to be offering up expansionary fiscal agendas that will have implications for US growth, inflation, debt issuance and the level of neutral interest rates.
Finally, the policy agenda post-election isn’t just about who wins the White House. The shape of congress and which party holds the majority in the House of Representatives and the Senate will also have a bearing on the whether the President can implement their program.
Bevan Graham

Implications for Investors
As the Fourth Quarter of 2024 gets underway, investors who maintained a positive bias through the year are enjoying strong portfolio results, as both equities and bonds have delivered significantly elevated returns compared with their long-run averages. Much of the optimism in markets is founded in the slowing inflation patterns observed in major economies and even in NZ, allowing central banks to initiate monetary easings. After a period of bullish returns, the key question looking ahead is whether markets are now a touch too optimistic on the “goldilocks redux” scenario, given still-present risks from unresolved macroeconomic and political factors before year-end. Policy interest rates, though generally declining, remain restrictive. Forwardlooking markets have been keen to price in a rapid shift to policy dovishness.
Our view is that for multi-sector funds, the prudent course into year-end is to trim back some portfolio risk. Investors have been well-rewarded this year for maintaining a growth bias in the face of volatile data. Future easings by central banks are well-priced in interest rate markets. Until fresh catalysts emerge for an additional, sustained upward move in global shares, we are trimming our global exposure while reducing the size of our underweighting to NZ shares, in our Sustainable Growth Fund. In our Sustainable Income Fund, we continue to diversify via superior yield sources into the global bond markets and are in the process of moving from neutral, to a small overweight position in global fixed income securities.
2024: So far…so Goldilocks
The traditionally-problematic September month (historically prone to negative returns from equities) this year provided a better set of asset returns than the historical average. The average US S&P 500 September index return since 1926 is -1.2%, but this year, optimism was underpinned by a nuanced message from the US Federal Reserve meeting on 18 September, which (while cutting the policy interest rate by a chunky -0.5%) reassured investors that this move was not made in
response to a weak economy, so much as being a suitable step to take, given the declines seen in inflationary pressures and a gently easing labour market.
Growth-sensitive assets rallied on the back of the Fed decision, with the S&P 500 (+2.0%), MSCI AC World (+2.2%) and MSCI Emerging Markets Index (+6.4%) posting positive month-on-month returns. Hong Kong equities responded quickly, jumping 19% after their own half-percent interest rate cut (triggered by Fed’s cut, due to the HK dollar’s exchange rate peg) as well as to the announcement of a major new Chinese economic stimulus package late in the month. New Zealand equities, by contrast, were flat, after the phase of strong returns logged in the first six weeks of the Third Quarter ran out of momentum.
Bond yields continued to fall across the US Treasury curve, and in credit, US dollar and Euro bond spreads tightened, reflecting greater confidence in a nonrecessionary soft landing- though Germany remains vulnerable within the EU context. Global bonds (NZDhedged Aggregate Index) gained 1.1% for the month of September, which was around 0.5% stronger than the performance of the domestic Government and Investment Grade bond markets. For the third quarter, domestic bonds’ 4% gain saw Cash underperform.
Interest rate sensitive assets like Global Listed Infrastructure and Property benefited from the lower rate outlook coupled with diminishing fears of recession, gaining between +2.5% and +3% for the September month, and a remarkable +12% for infrastructure and +13.7% for Property in the Third Quarter. Real assets have, as we anticipated, responded very strongly to the better macro path and have rallied from quite advantageous valuation levels to log one-year gains around +30% - with our Infrastructure Fund gaining +32% (gross) in the year to 30th September and our Global Property Fund up by +29% (gross.) By contrast, the MSCI World Equity Index (in NZD) returned a robust +25% over the same period.
The NZ dollar and the Australian dollar strengthened against the US dollar, by +1.6% and +2.2%, respectively. This lowered the month’s return from unhedged International Equities to +0.3% for the September month (vs. +0.1% for the benchmark) but nevertheless, prudent security selection delivered a healthy +4.9% Third Quarter gross return from our Sustainable Global Shares Fund (well ahead of the +1.9% Quarterly benchmark index return for Q3 2024.)
Oil weakened on supply surpluses, and crude oil sold off by over -6%. A gentle decline in oil prices does underscore the narrative of retreating inflationary pressure in consumers’ minds, as it eventually makes its way through to pump prices for petrol, as well as lowering industrial input costs. However, as early October has shown, Middle Eastern flare-ups can at times trigger sharp up-moves in oil, as secure transportation routes come into doubt.
Natural Gas, by contrast with oil, surged by almost 30% for the September month on strong demand forecasts, but remains down by -32% Year-to-Date. Industrial and Precious metals and Agricultural commodities also gained in September.
As at 30 September, asset markets have consolidated their strengthening trends, which were previously erratic. The S&P 500 Year-to-Date performance was the best first nine months of a year recorded in more than 20 years. Coupled with relief on corporate earnings, central bank monetary policy and overall economic growth, most key investment markets have achieved strong real returns in 2024, whilst Cash returns in all key markets have lagged.

Source: Morgan Stanley Investment Management, Bloomberg
Is a Geopolitical Grinch lurking before Christmas?
Investors have been increasingly willing to “look through” any ambiguous economic data, central bank statements, political upsets and surprises, and so market outcomes have so far remained positive. The outlook for US earnings growth, in particular, remains decent, albeit dominated by the technology sector.
Currently, analysts expect 2024 calendar year US S&P
500 Earnings growth of +10% and project +15% EPS growth for calendar 2025. While this looks rosy, it has been accompanied by a slight deterioration in market valuation, with the S&P 500 moving back up to a 12-month forward P/E ratio of 21.4x at the start of October - well above the 10-year average (18x) and the 5- year average (19.5x). Meantime, bottom-up expectations for the S&P companies imply another +9% price upside over the next 12 months, which would take that Index to 6, 300. If that eventuates, the S&P would have doubled in value in five years and have gained +175% from its March 2020 Covid low of 2,304. Heady performance, as the US economy has so far defied predictions of imminent recession on several occasions since the rebound after Covid faded.

Source: Bloomberg, as at 30 September.
Nevertheless, these gains leave global equity markets at (or near) a new peak, and the durability of such outsized gains depends on the “best future case scenario” being realised in practice, which should become clear in the next six months. We believe there will likely be some bumps in the road ahead, even as the US economy lands softly.
“Vulnerable” is a strong word, so we would say instead that market participants are appearing increasingly complacent. Economic growth and the US labour market have recently shown robustness and if anything, that re-enforces the scenario of a gradual monetary policy easing track from the Federal Reserve. There is no evidence that key conditions for a US recession are building up, and the Fed has time on its side.
We are still of the view that a secular bull market regime remains underway, but we allow that it may be entering a mature phase, and we believe that 6-month risks to returns are more elevated now (through into early 2025) than has been our judgment in the recent past.
The catalyst for any corrective phase in global shares could stem from any one (or a mix) of plausible potential disappointments:
• An indication that the US economy is re-accelerating and removing the need for larger rate cuts.
• The Third Quarter US Earnings season revealing corporate margin problems or negative guidance.
• A failure to secure stabilisation in the Middle East, and an exacerbation of energy price pressure.
• Uncertainty surrounding the tight US Election race and the control of Congress and the White House from 2025 will have impact on a range of investment asset types, with markets so far reflecting easier monetary policy, but so far disregarding the substantial fiscal headwinds that may blow across the Atlantic (in both directions) next year.
Those risks are not regime-shifting shocks of the type that historically would be needed to end a Bull market period (although any major Persian Gulf conflict could fit the bill, as occurred in 2001.) However, these catalysts can easily bring about a shift in the risk tolerance of those investors uncomfortable with elevated uncertainty, and they could thus lead to profit-taking in successful positions, which would work to repress returns into the closing months of 2024. The customary NovemberDecember “Santa Claus Rally” is not an inevitability and given that the S&P 500 has built up a remarkable 34% 12-month return to 30th September, defying economic doomsayers along the way, an upward acceleration in returns seems too optimistic now.
To take the most glaring example, Artificial Intelligence (AI)-themed equity investments, which drove virtually all the US market strength in H1 2024, now have a high bar to attain if some of the capital directed toward advanced chip-related companies is not to be redirected by investors grown impatient for evidence of tangible bottom-line benefits. Given the high market capitalisation key of AI players, any failures to deliver on the anticipated high contribution to annual earnings could interrupt tech-led gains.

Refinitiv Datastream, Bloomberg, UBS
Time to take a few chips off the table
We acknowledge that this more cautious interpretation
of the risk-reward equation is not the consensus view. Much financial media focus at present is on the beneficial effects of the monetary policy easing cycle now underway, and the associated US “soft landing” scenario. We are not disagreeing with that; however, we would stress that we think market pricing already largely reflects the most benign near-term economic and political scenarios. Other possibilities exist, and a potentially-contested US Presidential election next month, fought against the backdrop of a deteriorating international security situation, means that we are comfortable with moving our broad International Equities positioning in the Growth fund for the first time into a small Underweight tilt. This remains counterbalanced by overweight positions in interest rate-sensitive and generally cashflow-predictable infrastructure and listed property holdings in that Fund.
Prioritise protecting existing gains
Whilst corporate earnings have been undeniably persistently strong in the US, and have thus justified the optimistic prior pricing assumptions in the markets, there now seems to be a degree of euphoria entering the market’s valuation psychology. We have retained and overweight exposure to international equities in our Sustainable Growth Fund since April 2023 but lowered the size of the overweighting in mid-June.
The step to move to a modest underweighting in international equities in Q4 2024 is motivated by our priority of protecting the portfolio gains that have accrued to date; and which have been contributed recently by international equities, global listed real assets and the global fixed income opportunities fund components. As at 30th September, the Salt Sustainable Growth Fund’s 12-month gross return rose above +20% and, in the context of the investment objectives of this fund, we no longer consider the risk-reward characteristics of broad global equity markets compelling enough to expose investors to correction risks.
In consequence, we are lowering our target asset allocation to International Equities in the Fund to 34% (from 36%) whilst preserving our more defensive and interest-rate sensitive Fund overweighting to global listed infrastructure and property. Because the listed Real Asset classes do not suffer from the over-valuation concerns affecting the broad US equity market, we expect that they will be much better-placed to weather a period of slowing earnings momentum. As a general rule, diminishing upward earnings momentum expectations (as shown below for the S&P 500) combined with widespread high equity valuations and narrow credit spreads can portend a choppy period, as prior optimism is tempered.
We now consider it a prudent time to lower the size of the active global shares tilt, initially from +1% overweight to a -1% underweight allocation. We believe that relief on the earnings and interest rate front is already rather fully reflected in market pricing, whereas the material risks of pre-election jitters or any profits disappointments are not sufficiently reflected. At the same time, prospective indicators of a definitive end to the current secular bull market are not yet present, which argues against any substantial shift to greater defensiveness, at least until the Fourth Quarter global uncertainties have begun to resolve.
Profit
growth predictions less upbeat and less broad
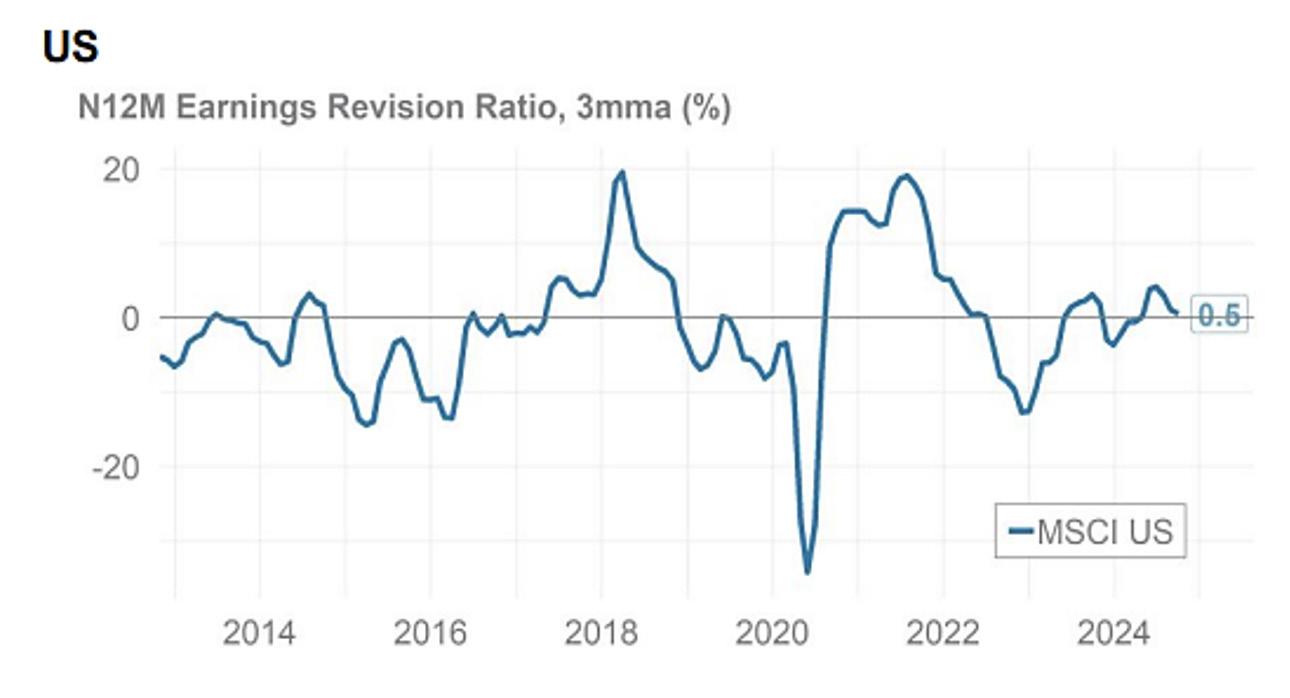
Source: MSCI, IBES data to 30 September 2024
During the third quarter, analysts lowered US S&P 500 Earnings per Share (EPS) estimates in aggregate by a slightly larger margin. While analysts habitually lower their forward earnings estimates as a given quarter / year progresses, the last three months saw a noticeable downshift in the median bottom-up EPS estimate, which was lowered by -3.9% when compared to the median end-June estimate.
This quarterly adjustment has contributed to a downshift in the expected annual earnings growth rate for the S&P 500 companies. At the end of June, annual earnings growth for Q3 was forecast at +7.8% YoY, but this expectation at the time of writing is now for +4.2% overall.

Source: Refinitiv, Datastream, UBS Oct.2024
The upcoming Third Quarter US reporting season will be crucial in testing optimism, and therefore represents a period of elevated risk. Globally, as shown below, earnings momentum has rolled over, and looks to have made a peak, which is typically associated with weakerthan-average market returns, in the subsequent 6-month period.
Monetary policy easings and equities
The binary paths of how equities have historically reacted to an easing cycle varies greatly, as is well known, depending on the economic environment that ensues. The complication in analysing the present instance is that the US Fed Funds Rate sat at its cyclical peak of 5.5% for a full year, until the -0.5% target rate cut on September 18th. So, whilst the historical “track” for soft-landing easing cycles shown below is superficially comforting, this year’s US equity market performance has already exceeded the normal “pay-off” under such a benevolent soft-landing scenario. That raises questions about the scope for major additional gains in the nearterm and allows time for a careful consideration of the forces that could impact the US and the developed world during 2025.

Source: Robert Shiller, WSJ, data set 1926-2024
Additionally, narrow market breadth in a rising overall market indicates lower future returns. Research over the last twenty years shows that if market breadth is narrow in a falling market (e.g. 2008-09) the subsequent quarter-ahead expected return tends to be positive. However, when breadth is narrow within a rising market (e.g. mid-2011, mid-2021, and currently) the forward expected return over a tactical timeframe of 3-9 months is less compelling.
That is not an unequivocally “bearish” indicator, but rather it suggests a slowing or potential stalling rate of gains – more of a “plateau” than a plunge. We rather
expect some laggard, defensive sectors and companies in the Real Asset arena to come into greater prominence as interest rates gently decline. Infrastructure and Real Estate now only have small sector weights within the broad share market indices. While these interest ratesensitive assets have performed well in the last 6months, their scope to outperform other much larger market segments like Consumer Discretionary and Financials has not yet been fully demonstrated and would require a genuine economic slow-down to outshine.
Global politics an additional ground for caution
In the US, as the election race enters its final straight, focus is moving onto the concrete differences (from an investors’ standpoint, at least) between the Democratic and Republican candidates. Whilst a gridlocked outcome may ultimately reassure markets if the Presidency and Congress are unable to advance their agendas quickly, there is a lot of water to flow under the bridge between now and then.
As it stands, Kamala Harris’ proposal to lift the corporate tax rate from 21% to 28% would shave 5% off future S&P500 earnings. Higher capital gains taxes would lift the cost of capital, and the expiry of the 2018 income tax cuts for higher incomes would also impact. Conversely, Donald Trump’s policies for tariffs and continued high deficits would see higher inflation and bond yields. A revival of the US/China Trade War seems probable under Trump, and trade issues hurt markets in 2018. Equally, the Harris camp is also developing restrains on traded technology that could aggravate existing hostilities. Bond markets could potentially revive fears of selective divestment by central banks being used as a diplomatic lever.
Despite the backdrop of central banks easing, politicians could still spoil the markets’ sentiment, with any clumsy moves. It would be reasonable to expect some political fumbling in the months ahead, given the partisanship and hyperbole in the US campaign. This is not only a US problem. The key European Union members, France and Germany, have been experiencing policy paralysis in recent months and this has exerted downward pressure on their asset markets, notwithstanding an active ECB easing interest rates.
Not all global equities are expensive
One complicating factor in moving more defensively regarding International Equities arises due to the wide dispersion of valuations prevailing between the key developed world markets. Most global equity indices are indeed fully valued, viewed in the context of their
historical ranges shown below, although Japan’s Topix remains an exception in remaining fairly cheap compared to its history.
Equity overvaluation is a US phenomenon

Source: MSIM, 30 September 2024. Red dot is current 12mPE.
As becomes immediately clear, the global equity index (excluding the United States) shown in green is presently at close to its historical norm for its 12-month forward Price / Earnings ratio. However, as discussed in our July edition of “Global Outlook,” the weight of the US market is now problematically dominant in the international equity market indices. The 65% share of the ACWI and the 72% share of MSCI World index now constituted by US corporations means that to take an asset class view on International Shares is overwhelmingly conditioned by the US equity outlook, where valuations are high.
While the US has attained market capitalisation-driven dominance due in part to achieving greater profitability than other regions’ there is also a degree of investor willingness to “over-pay” for unrealized, future profits in the US than in other markets. This could be prescient, but it could also be a sign of crowding and a herd mentality, which can store up problems for a later stage of the cycle.
US corporate insiders are less confident
Finally, it would be less concerning if US corporate “insiders” – company directors and officers – were demonstrably on board with the market’s benevolent earnings expectations.
However, recent months have seen historically low levels of insider buying. The range of net buying of company stock by such executives and board members since July has sat in a range of 16%-22%, which is considerably below the ten-year average net buying ratio of 26%.

Source: Wall Street Journal, 7 Oct 2024. US companies with a transaction by an officer or director, percentage with net buying.
Insiders’ net interest in their own companies’ equity is a strong predictor of aggregate future stock returns, and also suggests that those executives close to the “coal face” of company US financials are less confident that there is significant unrealised value in the current trading price of their enterprise’s equity. Officers and directors of US. Companies bought $2.3 billion of their companies’ stock this year through to September, the lowest amount over the comparable period since 2014. This year, the largest insider trades, in the billions of USD by value, have been sales by leaders of big tech companies.
New Zealand equities stir after 3-year hibernation
Whilst the New Zealand equity market is still in the throes of the very difficult domestic trading environment, we believe that a progressive easing path recently initiated by the Reserve Bank of New Zealand and the defensive nature of the industries that are heavily represented on the NZ exchange means that we can now scale back our existing underweighting to the NZ equity holdings in the Salt Sustainable Growth Fund. This is not to express a preference for New Zealand shares over International equity just yet. Rather it is a trimming in the size of our Growth Fund’s negative positioning in domestic shares, which will remain underweight as compared to the Strategic Asset Allocation holding of 25%.
There are certainly considerable macroeconomic and industrial uncertainties affecting the domestic share market, which we do not expect to be resolved before 2025. Nevertheless, the investment managers domiciled in New Zealand (particularly KiwiSaver managers) can be substantial marginal buyers of domestic shares, and the commencement of the latest Official Cash Rate easing cycle on August 14th seems to have provided the rationale for tentatively beginning re-building domestic share allocations within multi-sector portfolios. This
has been supported by a sense that the NZ corporate earnings downgrade cycle is at an advanced stage, and that the first half of 2025 could begin to see positive surprises in guidance. Thus, while the economy is not yet out of the woods, the domestic asset markets are experiencing a sentiment shift towards looking for an improving narrative and “getting in ahead of it.”
NZ equities and bonds outperforming Cash

Source: S&P Global Indices, data to 4 October 2024
Diversified Funds’ Equity exposure is defined by Fund objectives
We are not in a great hurry to fully close out an underweighting to NZ equities in the Salt Sustainable Growth Fund, which currently sits at -6.5%, compared to its Strategic Allocation level, but we will trim it to a -5% underweighting this month. Growth in the portfolio is still preferably sourced from international assets, due to their greater diversification benefits and preferable current macroeconomic drivers.
The Growth Fund’s objective is to outperform NZ Consumer Price Index inflation by 5% over a rolling 5year timeframe, and thus it is important to tilt its asset mix fairly aggressively against underperforming asset classes – in which regard, NZ equities had certainly fitted the bill; underperforming both domestic bonds and bank bills (cash) over a three-year annualised period (which is atypical.) Extending out to five-year returns, NZ equities’ annualised total return was very close to that earned by NZ Cash, at 2.8% p.a total return for shares compared with +2.6% p.a. for 90-day bills and a flat over all annual return from NZ bonds (-0.2% p.a. to Oct 2024, according to the latest S&P/ NZX data.)
Nevertheless, as in recent months, NZ equities have gained some upward traction, and as we anticipate diminishing returns from NZ Cash for the eighteen months ahead, we are comfortable with progressively lifting the domestic equity weighting over the coming months, depending on evidence of incremental improvements in New Zealand’s economic growth path.
In the Sustainable Income Fund, the 43% weighting to NZ shares (including listed Property) has been reduced from almost 50% at the beginning of this year, with a progressive reallocation towards global fixed income assets. Whilst the current NZ equity weighting sits above the Strategic Neutral level of 37.5%, this is justified due to the considerable dividend yield advantage achievable within the domestic market from stable and well-established industry operators.
As international bond yields (influenced by corporate debt interest rates) have risen to offer a comparable yield level to domestic dividend-focused shares, the portfolio allocation to global bonds has been brought
up to a Neutral level, at 35% of the Income Fund’s holdings. Our next step will to be to move into an outright overweighting to global bonds within the Fund, and in preparation for doing so we have been further reducing our domestic listed property exposure.
Strategy conclusions
Our current investment market views are:
• Near-term, corporate earnings need to validate the optimistic assumptions reflected in equity prices after the 2024 rally. A correction was due after strong first-half year gains, but although August saw softness, declines were transitory due to resurgent policy easing hopes. Yet, many companies are still finding the higher interest rate-cost environment challenging.
• Even if late-2024 becomes challenging for asset returns, as we suspect it might, the US Presidential Cycle tends to resolve positively in an election year (taken as a whole) and in the quarters immediately following the election. Trump, as ever, presents a wild card here.
• Equities (as a whole) should see average annual returns close to their long-term norms in the next 3-years with interim weaker periods; selected equity sectors and markets still have scope for resilience and desirable investment features. There are all-weather stocks and defensive sectors that have lagged in recent years. Consumer Staples stocks and Health Care stand out.
• Within the broader market sectors, thematic and valuation support in Utilities and Consumer Staples, Healthcare, and Software as a Service (SaaS) Information Technology enjoy pricing power which assists them to ride out sentiment storms and hedge against economic slowdown.
• Listed real assets also have superior, defensible yields, in a fraught macroeconomic and geopolitical phase. Real Asset’s historical sensitivity to bond yields (as they trend downward) can be supplemented by their cashflow surety, inflation-hedging qualities and (for Infrastructure) non-cyclical defensive merit.
• Bond yields have adjusted well, and may now plateau, which is positive for Real Estate looking forward one year, while Infrastructure may need weaker economies to outperform more markedly, having logged extremely strong one-year returns.
• We see better compensation for duration risk in bonds. However, yield levels will remain volatile. Within fixed income, thematic support is ready to be a prime differentiator, as sovereign and corporate bonds face refinancing risks. We acknowledge sustainable or “green” bonds as a valuable theme.
• Default risk and credit quality are now on the radar and are likely to become more of a market focus in 2025-26, and can set off substantial portfolio re-allocations within and beyond bonds.
Greg Fleming.

IMPORTANT INFORMATION
The information in this publication has been prepared from sources believed to be reliable and accurate at the time of preparation but Salt Funds Management Limited, its officers and directors, make no representation or warranty as to the accuracy or completeness of any of the information contained within. All analysis, opinions and views reflect a judgment at the date of publication and are subject to change without notice. This publication is provided for general information purposes only. To the extent that any of the information in this publication does constitute advice, it does not take into account an investor’s financial situation or goals. An investor should, before making any investment decisions, seek professional advice, having regard to the investor’s financial situation and goals. Past performance is not a reliable indicator of future performance and no representation or warranty, express or implied, is made regarding future performance. This presentation is solely for the use of the person or persons to whom it is provided and must not be distributed or copied, in part or in whole, without the permission of Salt Funds Management Limited. Salt Investment Funds Limited is the issuer of units in the funds comprising the Salt Investment Funds Scheme. The Product Disclosure Statement is available from saltfunds.co.nz