Global April 2024 Outlook

The Bumpy Path to 2%
Good progress being made on headline inflation. Core inflation pressures harder to contain. Most central banks preparing for cuts but timing unclear, especially in the US.
BEVAN GRAHAM
Implication for Investors
Markets consolidate after rapid 6-month run-up in Global Equities. Mid-year more challenging with political and energy price risks. Sovereign Bonds still remain vulnerable to sharp sentiment swings.
GREG FLEMING
The Bumpy Path to 2%
Global growth continues to show surprising resilience, especially in the US where the recession vs soft-landing debate has morphed into more of a soft-landing vs nolanding discussion. In Europe and the United Kingdom, where growth has been most challenged by the war on inflation, a gradual recovery appears underway. Even China’s economy appears to be responding to recent stimulus measures with activity indicators coming in stronger than expected at the start of the year, though challenges remain.
Good progress continues to be made in returning inflation to target, especially at the headline level. As we have long argued, core inflation is proving harder to contain. As we suggested in our January report, the last mile to 2% is proving hardest, and the road is bumpy.
Most developed central banks have thus remained on the sidelines so far in 2024. There are two notable exceptions: in March the Swiss National Bank (SNB) was the first developed central bank to cut interest rates this cycle. Context is important here – in Switzerland both headline and core inflation are back under the 2% target.
And in Japan the central bank raised interest rates for the first time in 17 years, ending 7 years of negative interest rates. They also ended their Yield Curve Control policy along with purchases of equity exchange traded funds and real estate investment trusts.
While other developed central banks haven’t moved yet, they are laying the groundwork. The European Central Bank (ECB) appears most likely to be next cab off the rank. Meanwhile, at the Fed, the latest “dot plot” shows 3 cuts this year, though that is being challenged by latest labour market and inflation data.
US interest rate recalibration
The interest rate implications of resilient growth and sticky inflation is most stark in the US. At the end of 2023, following a surprisingly dovish December FOMC Statement which signalled three cuts in 2024, markets had moved to price in no less than seven interest rate cuts over the year.
What soon followed was a strong December quarter GDP result, and a run of stronger than expected monthly payroll gains that began in January and have continued to surprise on the upside since.
Furthermore, a run of lower-than-expected core PCE inflation results that saw the three-month annualised number drop to 1.5% in December has been replaced by a series of results that saw that measure head back to 3.5% as at March.

This run of events saw a significant recalibration of market expectations of rate cuts. By the end of the March quarter, the seven cuts had been pulled back to 2-3 cuts, in line with the FOMC’s “dot plot”.
The biggest issue is the labour market
If the FOMC is to become more confident of a sustained return to target inflation, they must be confident that conditions in the labour market, particularly wage growth, are moving back into line with that inflation aspiration.
Recent labour market outcomes have been somewhat ambiguous. While growth in monthly payrolls in the Establishment survey has reaccelerated recently, employment growth in the Household survey has been weaker. Which one is closest to the truth is not clear, but given the overall strength in the economy, we think the stronger payrolls data is closer to the truth.
That makes some sense if you think about recent strong immigration inflows and the challenges in surveying new households. The Establishment survey is likely to do a better job of counting the jobs than the Household survey is likely to do in counting the people.
Either way, it’s ultimately the amount of slack in the labour market, as measured by the unemployment rate, and wage growth that matters for inflation. The
SALT Funds Management Page 2
unemployment rate has barely budged in the last 6-months and remains under 4%. At the same time, while wage growth is trending lower, it is moving only slowly and at just over 4% in the year to March, remains at a level that still appears inconsistent with 2% inflation.

US rate cuts soon? Perhaps.
The FOMC’s March “dot plot” continued to signal three rate cuts in 2024, but only just. Only one dot saved the Committee pulling back to two cuts in 2024 at their March meeting.
That seemed to make a June cut a line ball call. But the ball was clearly “out” after another stronger-thanexpected CPI print for March. That had markets pricing the probability of a June cut at 10%, with September at 85% as we go to print.
The minutes of the last FOMC meeting were also enlightening. The key line for us was “Participants generally noted their uncertainty about the persistence of high inflation and expressed the view that recent data had not increased their confidence that inflation was moving sustainably down to 2 percent”.

So, absent some exceptionally soft data in the next few weeks, a June cut appears off the table. If the Committee cuts in June it can only be because they believe the labour market is benefitting from strong supply side forces driven by population growth and higher productivity. Furthermore, they must believe that those supply side forces will be maintained. That’s a big call.
Consensus building required in the FOMC
Another issue to think about is the degree of unanimity in the FOMC. FOMC Chair Jay Powell has said not everyone needs to agree for there to be an interest rate cut (or hike for that matter), but we expect a higher degree of consensus than shown by the dot plot will be required to cut.
Part of the consensus building will likely entail an agreement to go slowly and cautiously once they start to cut. Given there is no obvious need to rush anything, we think that limits opportunities to cut interest rates to the meetings at which the Committee receives updated economic projections, that means June, September and December.
With June off the table, that leaves the possibility of two cuts this year, in September and December. However, September could be complicated by its proximity to the election. That’s especially with respect to starting the easing cycle. A cut that close to the election is more acceptable if it is part of an established trend of interest rate reductions.
Are no cuts a possibility? Absolutely.
A recent comment by Neel Kashkari, the Federal Reserve Bank of Minneapolis President, is fresh in our minds. He said interest-rate cuts may not be needed this year if progress on inflation stalls, especially if the economy remains robust.
And as we said in our January Global Outlook Report its pretty easy to construct an extreme case in which the Fed doesn’t cut rates at all this cycle. Perhaps that possibility is now just a tad less extreme.
First DM cut comes in Europe
The first developed market central bank to cut interest rates this cycle was the SNB which surprised markets with a 25bps rate cut to its main policy rate at its March meeting, taking it from 1.75% to 1.5%.
We have expected the first rate cut to come in Europe, given the generally weaker growth environment across the continent and the faster trajectory of inflation back to target. That manifested in revised forecasts from the SNB showing lower growth and sharply lower CPI forecasts. The SNB sees inflation settling a little above 1% over the medium to longer term.
The SNB also said it will adjust monetary policy again if necessary to ensure inflation remains in a range consistent with price stability. SNB forward guidance makes another 25bps rate cut likely at the June meeting, with potential for a cyclical low of 1.0% in the main policy rate by the end of the year.
SALT Funds Management Page 3
Eurozone a fast follower?
In Europe, the economy largely flat-lined over the second half of last year. At the same time, inflation has made solid progress towards the ECB’s 2% target. Most importantly, at least in terms of being confident of a sustained return to target, growth in negotiated wage increases has slowed to 4.5% in the year to December, while labour costs slowed to 3.4% over the same period.
Headline CPI inflation fell to 2.4% in March from 2.6% in February, while the core CPI fell from 3.1% to 2.9% over the same period. Policy makers continue to voice concern over the pace of wage increases and for this to feed through into higher inflation in the period ahead.
The ECB will thus remain cautious in cutting rates. They left rates unchanged in April but continued to pave the way for a cut as early as June. Wage data will be key to the final decision. We expect that once they start cutting, they will be cautious. As in the United States, in the early stages we expect interest rate cuts will only be considered at meetings at which the Governing Council receives updated economic forecasts, in June, September and December.
Bank of Japan delivers historic rate hike
It’s not often I hover over my computer screen, eagerly awaiting an announcement from the Bank of Japan (BoJ). March 19th 2024 was a momentous day as the BoJ delivered its first interest rate hike in 17-years, ending close to 7-years of negative interest rates.
In its decision, the BoJ set the policy rate in the 0% to 0.1% range, up from -0.1%, and scrapped its Yield Curve Control (YCC) policy. In terms of asset purchases, the BoJ announced it would continue to purchase Japanese Government Bond’s in “broadly the same amount as before”, while purchases of Exchange Traded Funds and Japanese Real Estate Investment Trusts were scrapped.
For such a momentous occasion, market reaction was somewhat limited as the move had been well-flagged and YCC had been gradually relaxed over several months.
Wage growth has been critical
Underlying the BoJ’s decision to end its ultra-easy and unconventional monetary policy stance, the central bank said “a virtuous cycle between wages and prices” was developing, and that the achievement of the 2% price stability target was looking more achievable on a sustainable basis.
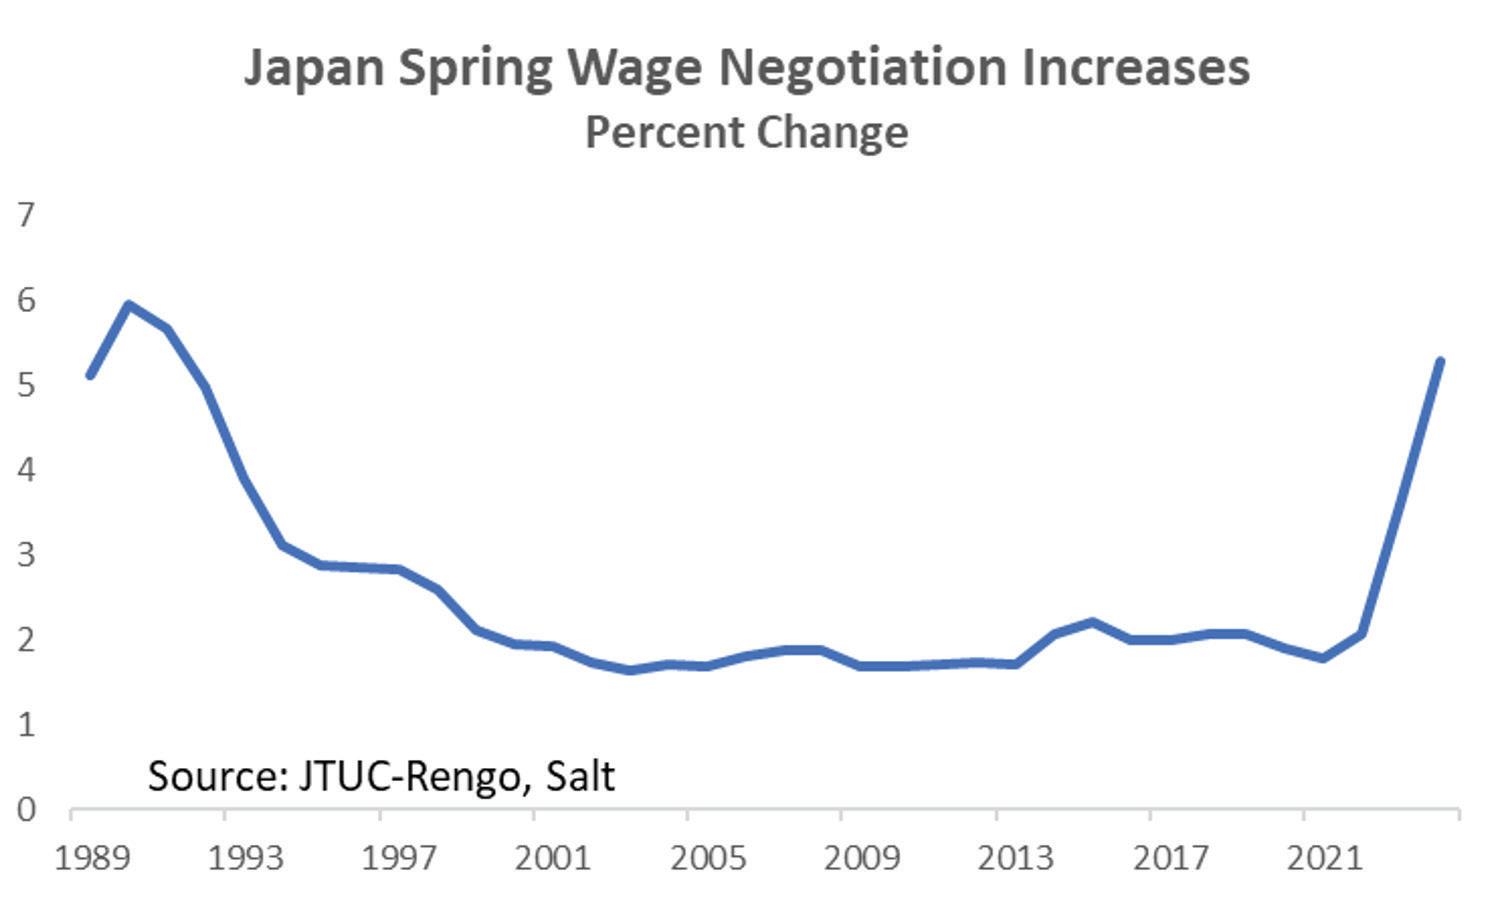
Stronger wage growth has been most critical. Japan’s long-term battle against deflation has often been attributed mostly to challenging demographics, particularly the ageing population. Regular readers of our research will know we attribute the decades-long
problem predominantly to wage setting behaviour.
Their decision in March will have only been emboldened by news just a few days prior to their meeting of the largest shunto spring wage increase in 33 years.
What happens next?
The BoJ offered little in terms of forward guidance at the March meeting, other than continuing to commit to accommodative policy. That leaves the bigger question of the extent to which current better wage-setting/ inflation dynamics are a blip, or whether something more fundamental has changed.
For it to be fundamental and enduring, these moves in wage and price inflation need to build into households’ medium to long-term inflation expectations. Our partners at Morgan Stanley Investment Management note in recent research that Japanese consumers are increasingly willing to accept price increases. Furthermore, a temporary income tax cut in June is likely to boost consumer spending temporarily.
At the same time, Japan’s financial conditions remain accommodative, and improving profit margins from corporate reforms, pricing power, and ongoing automation and digitalisation should sustain a virtuous cycle.
This will all take time to prove. In the meantime, so long as the data shows continued growth in Japan’s GDP, a firming in labour cash earnings as the wage increases take effect, and CPI inflation remaining above 2%, we expect the BoJ to eventually be comfortable hiking interest rates further.
Better signs in China, but challenges persist
A range of activity indicators in China were stronger than market expectations in the first two months of 2024 – with industrial production, fixed asset investment and retail sales all coming in at least slightly stronger than market expectations. That said, it’s important not to read too much into annual growth rates right now as Covid lockdowns and the abandonment of zeroCOVID policies in late 2022 make annual comparisons
SALT Funds Management Page 4
a tad hazardous. Both the manufacturing and nonmanufacturing Purchasing Manger Indices (PMIs) were over 50 (the benchmark that separates expansion from contraction) in March.

The March National People’s Congress set the 2024 growth target at an unchanged “around 5%”. The lack of more meaningful support for domestic demand along with the low probability of any significant upside potential from exports, at least in the first part of the year, makes the growth target challenging.
Importantly, the real estate sector remains a key constraint on growth. Investment in real estate contracted by 13.4% y/y over the January-February. At the same time, residential construction starts have continued to fall –down 24.2% y/y in February. Total floor space permitted is at its lowest levels in nearly 20-years.
There was some easing in monetary policy in February as the PBoC cut the five-year Loan Prime Rate, a key mortgage bench-mark rate, by 25bps to 3.95%. This was a positive development but given the deep declines in property since the implementation of the Three Red Lines policy, such a modest cut appears unlikely to turn the dial significantly.
Indeed, growth in outstanding bank lending has been on a downward trend since April 2023, pointing to weak loan demand. This is at the same time there has been a number of cuts to the Required Reserve Ratio, proving that more liquidity doesn’t help boost activity if there is no demand appetite.
Subdued growth in Australia
The Australian economy saw a subdued end to 2023. Unsurprisingly the weakness was centred in the interest rate sensitive sectors of consumption and residential dwelling investment. Slowing business investment was also a key factor. This was offset by relative strength in public demand along with a recovery in exports.
Household consumption can be expected to remain subdued in the near term but pick up later in the year, initially supported by strong nominal income growth, tax cuts, and an eventual decline in interest rates. Housing
and business investment will also recover later in the year.
We see the unemployment rate rising to around 4.5% by the end of the year which should start to ease pressure on wage growth. This combined with continued below trend growth and an emerging recovery in the supplyside of the economy should see CPI inflation dropping to around 3% by the end of the year and back to the 2% target by the end of 2025. That should allow scope for the RBA to begin lowering interest rates from late this year or early in 2025.
New Zealand struggling
The New Zealand economy continues to struggle under the weight of high inflation and higher interest rates. The economy has now contracted in four of the last five quarters. Annual growth stands at -0.3% in the year to December.

That’s despite the strongest population growth in decades. Strong net inward migration has been the major force behind population growth of 2.8% in the year to December. Annual growth in the economy drops to -3.1% on a per capita basis over the same period.
We expect the economy to continue to show a further modest contraction in the first half of 2024 with the interest rate sensitive sectors of the economy bearing the brunt. Consumer spending, particularly consumer goods, and residential construction are likely to be the weakest sectors of the economy.
Past the peak in net migrant inflows
Latest migration data continues to suggest we are past the peak in annual net inflows, but revisions are continuing to cloud the waters.
After peaking at a net inflow of 142k in November 2023, February data showed the annual running total down to just under 130k. That still a massive number for a country the size of NZ, with all its associated pressures on housing and broader infrastructure.
SALT Funds Management Page 5

We think the annual total continues to fall over the remainder of the year as Covid-related pent-up inflows (and outflows) continue to run their course, and as the labour market continues to soften, offering less opportunity for work.
The Government’s latest policy announcement will also have a dampening effect on inflows, particularly of low or un-skilled workers. As a small country, we will always be reliant on skilled migrants to fill gaps in our labour force, but large inflows of unskilled migrants is not a recipe for higher productivity and sustainably higher wages.
Labour market pressures easing
One of the most significant impacts of the strong net inward migration has been in the labour market. Since net migration turned positive in the third quarter of 2022, we have seen a 158k increase in our working age population, with the labour force increasing by 115k.
That increase in labour supply has taken some pressure off the labour market. While employment growth came in stronger than expected in the last quarter of 2023, the unemployment rate rose to 4.0% (from 3.9%) and wage growth moderated.
With the economy expected to remain weak, demand for labour will reduce. At the same time growth in the working age population is likely to main strong for a few months yet, leading to a sharper rise in the unemployment rate over the next few months. We expect the unemployment rate will be over 5% by the end of the year, which will further reduce pressure on wage inflation.
Inflation trending lower, but still a way to go
Headline inflation is trending lower. Over the final two quarters of 2023, headline inflation came in lower than expected by the RBNZ. However, the downside surprise was all in imported inflation, with non-tradeable, or domestic inflation, coming in higher than the RBNZ was anticipating. By the end of 2023 headline inflation had fallen to 4.7%, the combination of tradeable inflation at 3.0%, but non-tradeable still running at 5.9%.

It’s the non-tradeable part of the inflation equation that concerns the RBNZ most. Remember the RBNZ is only going to ease monetary conditions once they have confidence in a sustained return to target inflation. We don’t think that means non-tradeable inflation needs to be at 2% for the RBNZ to ease, but it certainly needs to be closer than it is now.
That will require more time with growth below trend, a further rise in the unemployment rate, and a continued decline in wage growth. Despite a brief flurry of market concern about the possibility of higher interest rates prior to the February Monetary Policy Statement, we think the RBNZ has tightened enough, and that conditions will be right for a first cut in the Official Cash Rate in November.
The slow reveal of the new Government’s fiscal strategy
We saw a bit of the new Government’s fiscal intent at the time of the Half-Year Economic and Fiscal Update in the Mini (mini mini) Budget. The next part of the reveal was in the 2024 Budget Policy Statement (BPS).
The BPS is an important part of New Zealand’s fiscal reporting regime as it is in this document that the Government sets out its fiscal strategy and high-level goals. That makes it especially important after a change in government.

This year’s BPS indicated the underlying fiscal situation continues to deteriorate. Since Budget 2023 we have repeatedly warned the fiscal outlook was built on less
SALT Funds Management Page 6

than solid macroeconomic assumptions. We have since seen continued downgrades to the economic and fiscal (revenue) forecasts. An operating balance surplus before FY 2027/28 seems unlikely.
The Government remains committed to income tax relief in Budget 2024. We will have to wait for the Budget for details. Our guess remains that the timing will remain on track, but the quantum remains open for debate (and headroom).
Increased debt issuance in the order of $10-15 billion appears likely to be announced at Budget time, reflecting the ongoing deterioration in the fiscal outlook and new capital spending commitments.
The bottom line is the fiscal situation is tight, especially for a government determined to deliver tax relief against myriad calls for increased spending. Tough choices lie ahead.
Bevan Graham
Implications for Investors
Market returns for the beginning of 2024 have validated the more constructive views of the global growth situation and have therefore favoured equities, more than bonds. The US S&P 500 achieved new all-time highs 22 times during the First Quarter, and closed Q1 out with an extremely robust 10.6% gain (in USD terms.) In New Zealand dollar terms, the -5% decline in the March Quarter of NZD/USD added to the gain, with a fully-unhedged New Zealand investor profiting from a 15.2% three-month rally from global equity markets (measured by the MSCI World Index.)
Returns from global shares continued to leave those from most other assets in the shade. For instance, the Bloomberg Barclays Global Bond Index (NZD hedged) was slightly negative for the quarter, despite a March monthly return just below 1.0%. The NZ equity market posted a rather anaemic 2.8% March quarter gain and is up by just 1.9% for the year to March, compared to the 30.9% surge in unhedged international equities over the same period.
April month has, however, commenced with considerably less indifference to risks, among market participants. Investors have been reminded of the impacts of sticky inflation, the crimping effect of elevated interest rates on earnings, and not least, of geopolitical risks and their ability to rapidly push up energy prices and roil markets. As markets were counting on US rate cuts, it seems that in the near term, ”good news is bad news,” as hope for easings recede given US economic vigour. However, economic resilience in the US and later, globally, should ultimately support profit growth.
Many positive developments reflected in market prices
After such an exceptionally strong 6-month period for global equities, which had risen by 22% in NZD terms since October 2023, it is important to take stock about whether the still-challenging international environment fully warrants such a rapid run-up in share prices. There are undoubtedly many positive influences, including the resilience of US corporate earnings, the quiescence of global bond yield spreads (indicating low future credit risk assessments) and the robustness in developed country labour markets, which supports consumer
spending and debt servicing. Consumers are quite indebted, so this is vital.
Whilst the investment environment has not been placid, with periodic flare-ups of risk aversion, interruptions in the bullish equity market trend have continued to be short-lived. Investors remain willing to look through weaker data at times, in anticipation of a solid profits rebound expected by analysts for 2024. In addition, any softer US data is welcomed as allowing for easier Federal Reserve monetary policy. However, the bulk of recent data has been on the firmer side, so bond rates have risen once again.
First quarter of 2024 saw equities beating bonds
As the chart below shows, selected asset classes continued logging strong returns for the March Quarter, carrying on the better sentiment that has broadly prevailed since October 2023. In the cases of listed Property and Infrastructure, the positive annual returns have really been concentrated in the most recent sixmonth period. This is also true of the broad NZ equity market. The rallies that got underway from late last year in several cases restored a positive rolling returns level, following prior value loss as at the end of Q3 2023. Markets were anticipating a loosening in monetary conditions ahead, somewhat prematurely.
Thus, despite the regular and disorienting shifts in sentiment and confidence characteristic of last year, global equities and property securities remained leading contributors to portfolio returns, whilst global infrastructure performance resumed after an indifferent 2023 calendar year, when interest rates provided very little support until late in Q4. Since economic data now suggests a period of moderating growth accompanied by still fairly-elevated inflation, it does not surprise us that infrastructure has begun to show its cyclical merit. Regardless of nominal bond yields’ direction, that growth / inflation regime is typically a supportive phase for listed infrastructure assets. We will therefore continue their moderate overweight allocations. The erratic returns path in the shorter-term should be disregarded for long-duration assets.
Note that the Index returns shown overleaf for property
SALT Funds Management Page 8
and infrastructure are inferior to the returns achieved by the Salt funds, which have generated substantial asset class alpha since their inception.
Multi-asset returns, sorted by 6-month gain

Source: S&P Global Indices, Salt
Might New Zealand assets stir from hibernation?
After a sluggish year’s returns in 2023, when the uninspiring +2.6% full-year return from the NZX 50 Index proved to be less than half of the 5.7% return for the year available from simply investing in NZ 90-day bills, there were some very early “green shoots” visible in domestic assets in the first quarter. However, overall, these are insufficient to support any expectation of outperformance from NZ shares as yet.
The +3.3% return recorded by the NZX 50 Index for March month, and the +3.1% for the March Quarter (with imputation credits), did not distinguish the domestic market in an international context of stronger performances, although the local share market did manage to outperform NZ Investment Grade bonds, which were flat in the first three months of 2024. That reflects a lack of compelling impetus for better NZ corporate and economic performance, in the nearterm. At some point, investors will return to domestic shares, perhaps drawn to their defensive earnings characteristics, but we strongly suspect this will not occur until later this year or perhaps only in early 2025 after some RBNZ easing.
As we noted in our last edition of “Global Outlook,” with a trough in earnings for New Zealand cyclicals forecast for around mid-2024, followed by a gradual resumption of earnings growth, we expect that markets will continue to price in these downgrades (and eventually, scope for upgrades) ahead of actual consensus revisions. Confidence is not yet sufficient to allow for early positioning, on the whole. We look for pricing power, market share growth, option value and sustainable competitive advantage that will support excess return on capital generation, when setting our
preferred positioning in NZ shares.
Given the current challenging economic backdrop, we continue to favour reasonably-priced defensive and secular growth exposures. However, we also have a preference towards higher-quality cyclical names, where we believe downgrade momentum is beginning to turn, and which offer deep relative value when considered in relation to their mid-cycle earnings forecasts.
International assets still preferred
From the multi-asset or Diversified Funds standpoint, that value factor is not yet a sufficient basis for upgrading domestic shares in either the Salt Growth Fund or the Salt Income Fund. In fact, for the Sustainable Income fund, in late March we took advantage of a post-November rally of +11% in New Zealand Property securities to lower the Income Fund’s allocation to this component, in favour of lifting the Global Fixed Income fund component further toward a neutral weight. The income yield receivable from NZ listed real estate is a valuable dividend stream for the Salt Income Fund’s purposes but given the persistent strains on the domestic economy from restrictive monetary policy and the new government’s tightening of fiscal settings, we prefer sourcing a comparable coupon level from the much more diverse securities set held within the Salt Sustainable Global Fixed Income Opportunities Fund.
NZ Listed Property remains at a discount to physical asset values
Listed real estate assets around the world have had a difficult period since interest rates began rising, as government agencies embarked on removing Covid-19 stimulus from 2021-22. New Zealand is no exception, resulting in a situation where the eight key domestic real estate investment vehicles are trading at a historicallywide discount to their average net tangible asset backing.

Source: UBS Research, FactSet
Whilst industrial vacancy levels have been trending upward in the last eighteen months as the economy has performed increasingly poorly, net effective rents have
SALT Funds Management Page 9
so far held up in both industrial and office properties. This gives some scope for upward revaluation, but a critical precondition for capital performance is that the persistently-elevated bond yield levels of the last year need to soften – and that will depend on the inflation outlook, both domestically and internationally.
For the moment, it is difficult to make a strong case for additional exposure to either the NZ equity or bond market. Both equities and bonds have delivered cumulative negative returns of around -5% over the last three years. While this dismal period will not last forever, there needs to be a strong catalyst to turn around the low willingness of investors in New Zealand assets to take a share of their funds out of the relative security of Cash and Term Deposits and begin re-deploying it in other securities which are lagging.
Non-Cash NZ assets have tended to drag on portfolio returns since 2021

Source: S&P Global Indices, data to 12 April 2024
Leaning to international assets for Growth
Recent quarters’ anemic outcomes for capital gains from NZ shares –despite their dividend-advantaged and defensively-oriented characteristics– have been in line with our expectations. For that reason, our Salt Sustainable Growth Fund has held an underweight strategy in domestic equities. The dynamic positioning in that fund in tilting away from NZ shares and in favour of global equities, global property and infrastructure stocks was crucial in helping the Growth Fund achieve a +12% gross return over the year to 31 March, which means that the fund’s long-term performance objective of protecting investors purchasing power by achieving a 5% return above the CPI inflation rate is again on track –even during a high inflation period.
Conditions still tough for Income assets
In terms of the positioning of the Salt Sustainable Income Fund, the advantages in receiving stable dividend streams from PIE-structured domestic holdings still justify the comparative volatility and cyclical sensitivity of the NZ listed equities with Income and
Dividend Growth features. Capital value volatility is now a “price” paid for an acceptable income level sourced from non-Cash asset classes, and whilst the +4.4% gross one-year return from this fund to 31 March is slightly disappointing (given the prevailing Term Deposit rates in NZ throughout last year) we believe that the coming 18-month period will see banks reducing their offered TD rates, potentially quite markedly.
If our expectation comes to pass, the total return to be expected from the Sustainable Income Fund should again significantly outstrip the Term Deposit alternative. Our analysis still supports expectations that over the medium-term (i.e. 5-8 years) the asset mix in the Sustainable Income Fund should generate a baseline annualised gross return of 7.5% p.a. before allowing for additional portfolio management value addition.
Deposit rates have peaked in New Zealand, and banks will begin trimming rates as this year progresses, whilst our own Sustainable Income Fund should be able to maintain a stable distribution level. The reason for that is that the Income fund holds a diverse international portfolio of yield-bearing securities, and thus is not dominated by the dividend and bond coupon levels prevailing in the comparatively concentrated Australasian markets. There is still a very attractive risk-return value proposition in the international fixed income investment universe. In particular, the non-Sovereign bond markets offer yield-advantaged segments that specialists are able to access. Non-benchmarked allocations which are not hamstrung by the weightings in the Bloomberg Global Aggregate will continue to provide opportunities to add value.
Global Funds Managers abandon recession forecasts
This year has so far seen a continuation of last year’ “tug-of-war” in markets between the more constructive economic news flows that allowed international equities and bonds to both record above-average annual gains in 2023, and the negative ones, which have now led to another upward swing in bond interest rates, valuation losses on bonds, and recently, to more nervous equity market sentiment.

Source: Absolute Strategy Research Survey, LGEG / DataStream
SALT Funds Management Page 10
Asset managers have broadly become comfortable with the much-diminished threat of a Central Bank-induced global recession, mainly because the US economy is behaving with remarkably low sensitivity to the higher interest rate environment (compared to during previous cycles.)
However, caution remains evident. While there is now judged to be a less than 50% recession probability, for the first quarterly survey in the two years since interest rates commenced tightening, a 41% probability of recession is not a state of “blithe optimism.”
The reasons for this are manifold. Geopolitics is playing an ever-increasing role in keeping major asset managers cautious. They no longer fear a snap recession, but nor are they implementing maximum risk-on asset allocations. Key components of the still-present caution are a combination of energy price risks emanating from the Middle East and Russia, escalated open conflicts in those regions that could yet draw in other countries, political tensions from the ever-closer US Presidential Election, and signs of a delay to the assumed dovish turn from the US Federal Reserve. In the meantime, asset allocators have higher-yielding cash, or Certificate of Deposit (CD) options available, and are only selectively acting on any “Fears of Missing Out.” To a degree, this contrasts with the recent behavior of groups of retail investors.
Market sentiment is stuck in Neutral risk appetite this year

Source: Morgan Stanley Investment Management Market Sentiment Indicator
Brave New World?
Another element playing into the odd prevailing ambivalence amongst professional investors (weighing the broadly better corporate influences vs. worse government ones) is an awareness that a significant volume of retail investor cash is being directed once again into difficult-to-value assets, such as meme stocks, cryptocurrencies, underdeveloped AI and “future tech” themed vehicles, and super-volatile derivatives like short-dated call options written on individual stocks. Whereas in past cycles, a period where the pros could
confidently expect the diminishing interest rates that lie ahead to tempt cash holdings “off the sidelines” and into the cheaper or more rate-sensitive parts of the traditional equity markets, there is some concern that this may not occur to the typical extent. Evidence is increasing that rather than shifting liquid funds between cash and robust stocks or bonds, a retail preference for quasi-trading behavior is emerging. Recently, this has extended even to precious metals-linked instruments.
Some commentators hold central banks at least in part responsible for this, and a body of professional investor opinion considers as a serious emerging threat to prudent portfolio management. If the real purchasing power of consumers’ savings is less defensible due to actions of monetary or political authorities, a growing sub-set of computer-equipped retail investors will take wealth preservation “into their own hands” and deploy their cash in a whole new set of “Alternative” exposures, on the assumptions that such will 1) always be liquid and 2) only experience growing demand, as more of the global population adopts them.
Thus, the perennial topic of central bank credibility has taken a new form. Investment houses with quantitative and qualitative tools for assessing the attractiveness of securities can be “blind-sided” by sheer momentum, with some market participants now seeking an expected return based on projections of future co-investor numbers (crowding-in) rather than on projections of sustainable earnings growth.
While the long-term validity of the new asset types remains to be proven, there is a valid concern that if a sufficient proportion of the higher-spending demographic begins relying on capital gains from digital asset speculation, any lasting disruption or downtrend in such asset types could trigger a sharp fall in consumption, which is much less easy to forecast than the lagged impacts of monetary policy cycles. An allied consideration is the fragmentation of assets available for higher risk-tolerant investors. Higher-yielding debt and retail-accessible private equity are attracting more individual investor activity, as new Exchange Traded Funds and structures that attempt to democratise specialised asset types are rolled out and promoted. Professional asset managers are usually well aware of the problems that can be stored up when “flows follow performance” – in other words, when more naïve investors chase returns that have accrued to a particular, often novel, asset type.
Another instance is the Emerging Market (EM) and Frontier Market equity asset class. Despite a continuing need for capital in rapidly-growing developing economies, their volatility has conventionally meant that they were primarily of interest to professional investors with strict risk management disciplines and local knowledge. EMs are presently attracting well
SALT Funds Management Page 11
below-average portfolio inflows and are sitting at a Global Asset Allocation average of close to 5%, as compared to their 20-year average allocation of 8.5% (according to JPMorgan, as at 22 March 2024.) Much of that is due to investor disappointment in China, and its shrinking market capitalisation. In our own portfolios, we have found significantly greater opportunity in Emerging Market bonds than in EM equities, and these have generated significant alpha.
However, there is a point at which assets revalue to compelling levels and imply a too-pessimistic view of their future growth path, which should allow the market to form a base and build toward a multi-year recovery path. The danger at present is that the time duration of cycles of momentum-driven behavior have become too short to be effectively actionable as part of a responsibly-managed portfolio with a multi-year performance horizon.
Don’t become a “wall-flower” market economy
Finally, the “brave new world” investment smorgasbord has real-world consequences for small markets such as New Zealand equities and bond securities. It is conceivable that in a world of multiplying and easilyaccessible digital options, more minor markets could find themselves increasingly overlooked, as both domestic and global trading flows move into perpetually seeking the “next new thing” and may find no particular attraction in some traditionally-defined asset allocations, particularly if such portfolios retain a significant homecountry bias (as many still do.) There is little that a fundamentals and valuation-attuned asset manager can do to discourage such developments, beyond thinking outside the boxes on accessing real asset types and other diversifiers.
However, it adds a further element of caution in timing any increase in a portfolio’s allocation to purely-domestic asset classes. This is likely to exacerbate existing tensions between individuals, advisors, asset managers, investment regulators and politicians – who may form unlikely alliances, as their objectives and constituencies do not always match up well.
New Zealand equities are displaying significantly better valuation levels, especially given the current level on domestic bond yields, but they are not yet “cheap” by historical standards. The median NZ PE multiple of 15-16 times earnings has now closed in toward Fair Value for the first time in several years, in terms of the justification supporting discount factors for long duration assets such as growth equities. Arguably, New Zealand equities could become more attractive, were domestic bond yields to fall, but the drivers at the longer end of the yield curve remain primarily US Treasury-yield determined, and US yields have reversed upwards in 2024 to date. A specific reason to place NZ equities
ahead of other asset allocation options will be needed. In the absence of an interest rate advantage supporting valuations or an advantageous industry-mix premium, only economic recovery (or an improbable boost to corporate net earnings via tax changes) could unlock “animal spirits” in our rather-faded, “aging rock star” capital markets. Asset allocations to NZ are thus largely made on a sustainable yield-seeking basis at present.
Artificial Intelligence (AI) identifies AI as the key investment theme – for now Internationally, promising quantitative research is emerging which highlights the impact of dynamic factors. These can take the form of “widely-believed themes or stories” affecting the performance of different market sectors – sometimes, independent from their financial fundamentals. While the analytics in this area is often carried out by machine learning models, the concept owes much to Professor Robert Shiller’s work on Narrative Economics (2000.) Newly-developed “narrative radars” reveal that an ever-changing set of influences can explain (in machine-learning model terms) the performance of various strategies and investment styles. Prediction, in these models, often takes the form that if a particular investment type has underperformed what the model would have anticipated, there is scope for “catch-up” and if it has outperformed the model’s prediction, estimates there is scope for “correction.”
However, these narratives may prove short-lived, or they may wax and wane over a few months or quarters, at the longest. The Artificial Intelligence-Narrative, for example, has been identified as the dominant determinant of relative industry (sector) returns in global share markets recently, but it has been challenged at times by US Real Bond Yields, Economic Hard Data, and even the Chinasensitivity of the industry under consideration.
Diversification benefits between stocks and bonds remain low
This year has also seen continuation in the positive correlation of shares and bond yields, which has been sapping the utility of growth asset / defensive asset diversification from a risk-adjusted returns standpoint. As has been the case for almost 18 months, equity markets have been reacting to developments in sovereign bond markets, which have themselves been driven by the inflation-central bank pivot narrative.
So, returns from the classic US “60% Equity / 40% Treasury Bond” portfolio have been respectable, at 4.25% 2024 Year-to-Date, although this return is dominated by the strong 2024 return from the Equity component. Bonds and stocks have been positive (or negative) in lock-step, but the equity contribution has been much higher than the bond contribution to returns.
SALT Funds Management Page 12

Source: Morgan Stanley Investment Management, April 2024
Our global equity and fixed income investment partner, Morgan Stanley Investment Management (MSIM) has recently demonstrated that the high present correlation is related to elevated current US inflation levels. They note that “for more than two decades starting in 2000, bonds were often an effective hedge against equityled portfolio losses. However, this dynamic dramatically changed in 2022 when both bonds and stocks suffered negative returns, with the 60/40 portfolio declining 17.7%, its worst performance since 1937. In 2023, stocks then surged, with the S&P gaining 26.3% and U.S. 10year treasuries up 3.6%, driving the 60/40 strategy up 17.2%, far above its historical annual median return of 7.8%.”
So, the portfolio mixture has recently been both an amplified negative returns mechanism, and an amplified positive returns engine, rather than a true diversification strategy. This interesting development owes much to the level of inflation. MSIM work shows that based on almost 100 years if data, positive equity-bonds total returns correlation is common when CPI inflation sits above 2.5% for a significant period. The corollary is, until inflation returns toward the Fed’s 2% target, high correlations can persist. Further, were the Fed to lift its inflation tolerance, a full diversification benefit of government bonds versus equities, where sovereign bonds effectively hedged equity losses, may not be rapidly re-visited.

Source: Morgan Stanley Investment Management. Q1 2024

SALT Funds Management
Strategy conclusions
Our central market views for mid-2024 are:
• Near-term, equities can see more volatility. Corporate earnings need to validate the optimistic assumptions reflected in their prices after the Q1 2024 rally. A minor correction was due. Many companies are still finding the higher interest rate -cost environment challenging.
• However, even if mid-2024 is choppy for asset returns, the US Presidential Cycle tends to resolve positively in the second half of an Election year. Trump, as ever, presents a wild card here.
• Equities (as a whole) should see average annual returns close to their long-term norms in the next 3-years with interim weaker periods; selected equity sectors and markets still have scope for resilience and desirable investment features. There are all-weather stocks and defensive sectors that have lagged in recent years. Consumer Staples stocks and Health Care stand out.
• Within the broader market sectors, thematic and valuation support in Utilities and Consumer Staples, Healthcare, and Software as a Service (SaaS) Information Technology enjoy pricing power which assists them to ride out sentiment storms and hedge against economic slowdown.
• Listed real assets also have superior, defensible yields, in a fraught macroeconomic and geopolitical phase. Real Asset’s historical sensitivity to bond yields (as they ultimately trend downward) can be supplemented by their cashflow surety, inflation-hedging qualities and (for Infrastructure) non-cyclical defensive merit. Bond yields have adjusted well, and may now plateau, which is positive for Real Estate looking forward one year, while Infrastructure may need weaker economies to again outperform more markedly.
• Expect more M&A based on strong USD “war-chests” and some abandoned corporate courtships as conditions shift and credit-distressed firms multiply in 2024-25.
• We see better compensation for duration risk in bonds. However, yield levels will remain volatile. Within fixed income, thematic support is ready to be a prime differentiator, as sovereign and corporate bonds face refinancing risks. We acknowledge sustainable or “green” bonds as a valuable theme.
• Default risk and credit quality are now on the radar and are likely to become a market focus later in 2024 and into 2025, and set off portfolio re-allocations within and beyond bonds.
We are now traversing the global slowdown phase as the lagged impacts of tightening of policy around the world continues to impact the real economy, and asset markets adapt to protect existing capital gains by allocating funds toward “all-weather” securities.
Such desirable investments, which we are actively seeking out across all our asset classes, are resilient to both inflation and to profit challenges in a less stimulus-based, capital spending and productivity-led phase of economic growth. International assets are broadly preferred to New Zealand counterparts, where viable, as the key northern hemisphere trading economies have more diversified defensive industries and often, more adaptive economic regulation (whist allowing that electoral / policy change risk is ever with us and will intensify this year with the US Presidential election in November 2024.)
Greg Fleming.
SALT Funds Management Page 14

IMPORTANT INFORMATION
The information in this publication has been prepared from sources believed to be reliable and accurate at the time of preparation but Salt Funds Management Limited, its officers and directors, make no representation or warranty as to the accuracy or completeness of any of the information contained within. All analysis, opinions and views reflect a judgment at the date of publication and are subject to change without notice. This publication is provided for general information purposes only. To the extent that any of the information in this publication does constitute advice, it does not take into account an investor’s financial situation or goals. An investor should, before making any investment decisions, seek professional advice, having regard to the investor’s financial situation and goals. Past performance is not a reliable indicator of future performance and no representation or warranty, express or implied, is made regarding future performance. This presentation is solely for the use of the person or persons to whom it is provided and must not be distributed or copied, in part or in whole, without the permission of Salt Funds Management Limited. Salt Investment Funds Limited is the issuer of units in the funds comprising the Salt Investment Funds Scheme. The Product Disclosure Statement is available from saltfunds.co.nz
