Global July 2023 Outlook
SALT Global Outlook
Growth in the global economy has thus far in 2023 proven to be surprisingly resilient to aggressive central bank tightening
BEVAN GRAHAM
Outlook for New Zealand Equities
NZ equities lagged strong global equity markets in the June quarter MATTHEW GOODSON

Strategy
Conclusions
We retain our central market views for late-2023 GREG FLEMING
Growth resilience, inflation persistence
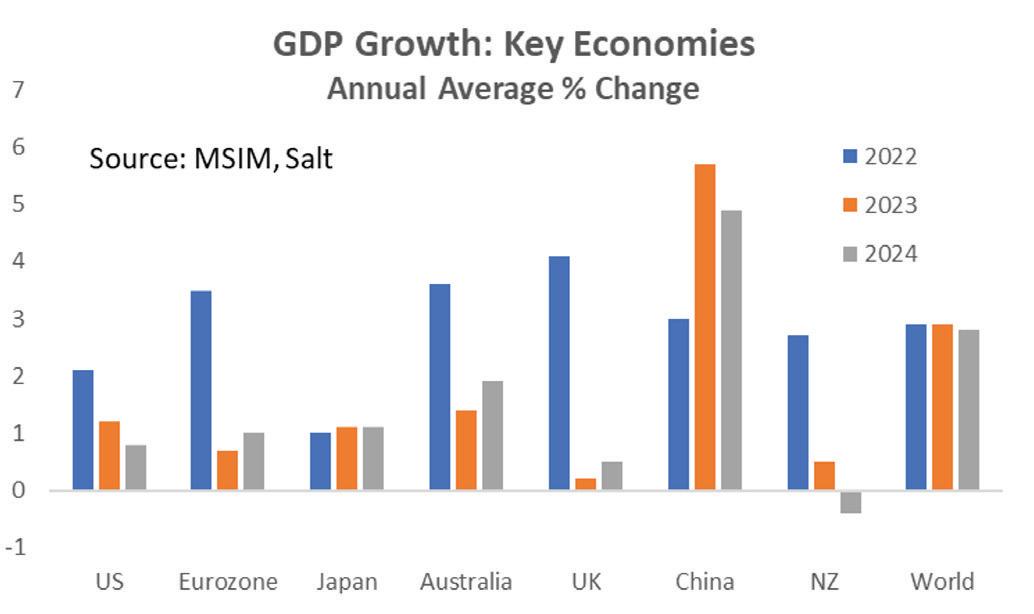
Growth in the global economy has thus far in 2023 proven to be surprisingly resilient to aggressive central bank tightening. At the start of the year, we thought recessions were likely in the United States, the Eurozone, the United Kingdom and here in New Zealand. As 2023 has progressed, activity in most of these jurisdictions has proven more robust than expected.
Inflation persistence
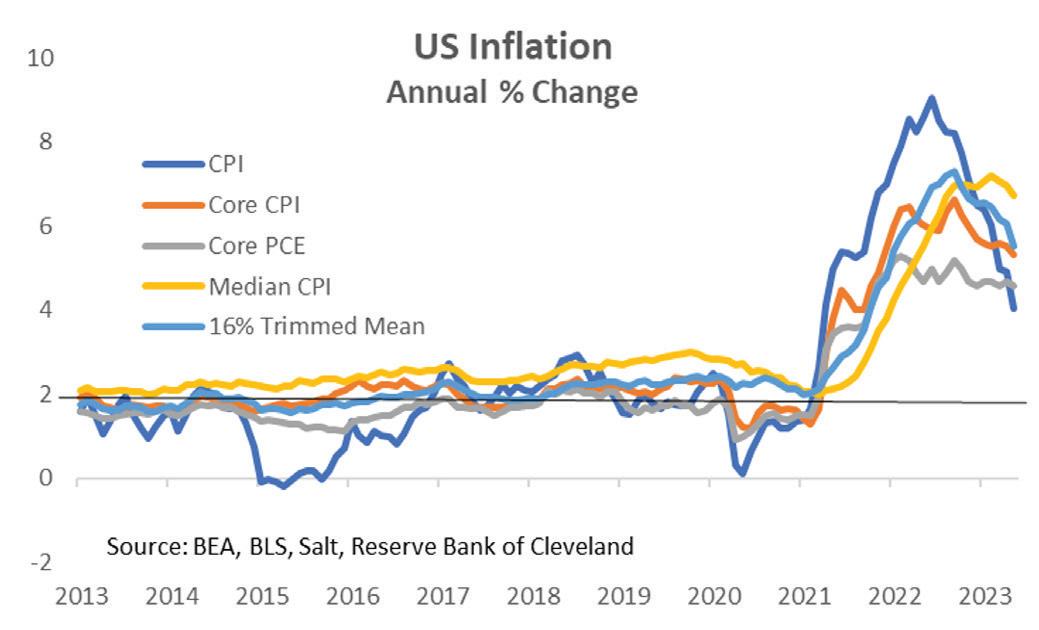
While economic activity has thus far proven more resilient than expected, so too has inflation proven to be more persistent. While headline inflation has slowed noticeably as energy and food prices have fallen, core inflation measures have eased only gradually.
In the United States, resilient consumer spending has helped the economy avoid recession. This has been made possible by the deployment of excess cash, low savings rates and pent-up demand in the labour market that has seen non-farm payrolls expand by an average 278,000 per month over the first 6-months of the year.
The Eurozone experienced a mild recession at the start of the year, though consumer purchasing power has improved through 2023 as energy prices have fallen and inflation has slowed from its highs. But while growth likely resumed in the second quarter of the year, service sector sentiment is deteriorating and manufacturing sector sentiment is already negative, suggesting growth will be only modest at best and a further contraction in activity later this year can’t be ruled out.
Lower commodity prices have also helped the U.K. economy in early 2023, although high inflation and rising interest rates could still see the United Kingdom move into recession by late this year. The Bank of England surprised markets with a 50-basis point increase in the base rate to 5.0% in June.
Across the OECD the core CPI (excluding food and energy) rose an average 7.1% in the year to April, only slightly slower than the peak of 7.8% seen in October last year. We attribute much of this decline to the ongoing normalisation of global supply chains. Over recent months supplier delivery times have shortened, and shipping costs have eased.
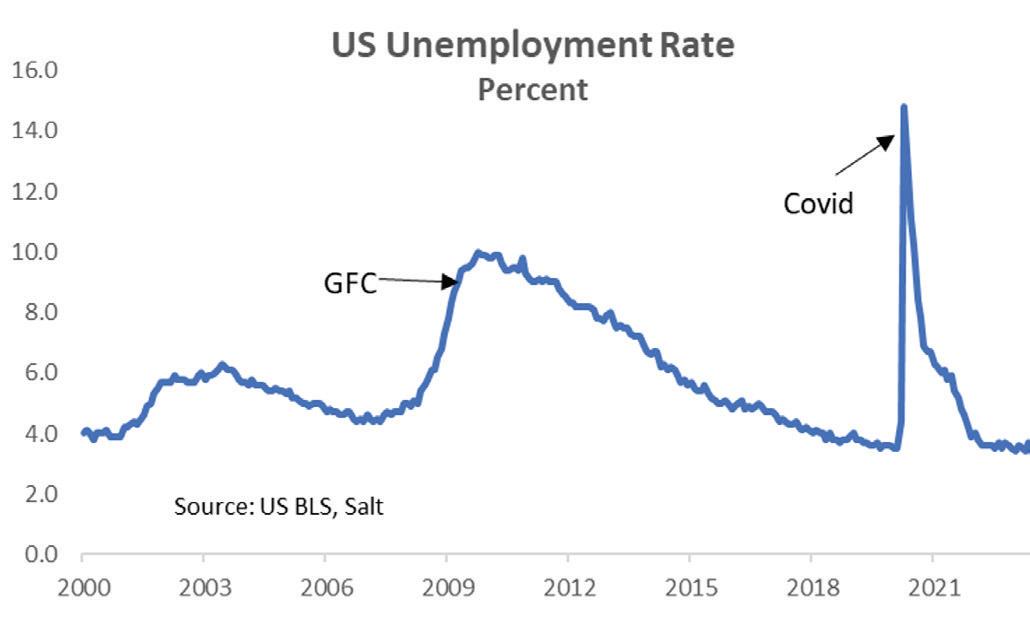
However, as we have discussed many times, the key areas that continue to be the driving force of inflationary pressures are tight labour markets and elevated wage growth. For most countries, unemployment rates remain near record lows. Again, across the OECD, unemployment rates held steady at an average 4.8% in April, matching its record low since 2001.
Given tight labour markets, wage growth continues to accelerate in some countries. For example, in the United Kingdom, average weekly earnings, excluding bonuses, firmed to 7.2% year-over-year in April. Even for some countries and regions where there has been a moderate slowing in wages, such as the United States, Eurozone and here at home in New Zealand, wage growth remains at levels above those historically consistent with CPI inflation returning to central bank targets.
SALT Funds Management Page 2
Resilient growth + persistent inflation = ongoing monetary tightening
Given the overall resilience of activity and persistence of underlying inflation pressures, the first half of 2023, from a policy perspective, has been defined by ongoing monetary tightening by central banks around the world.
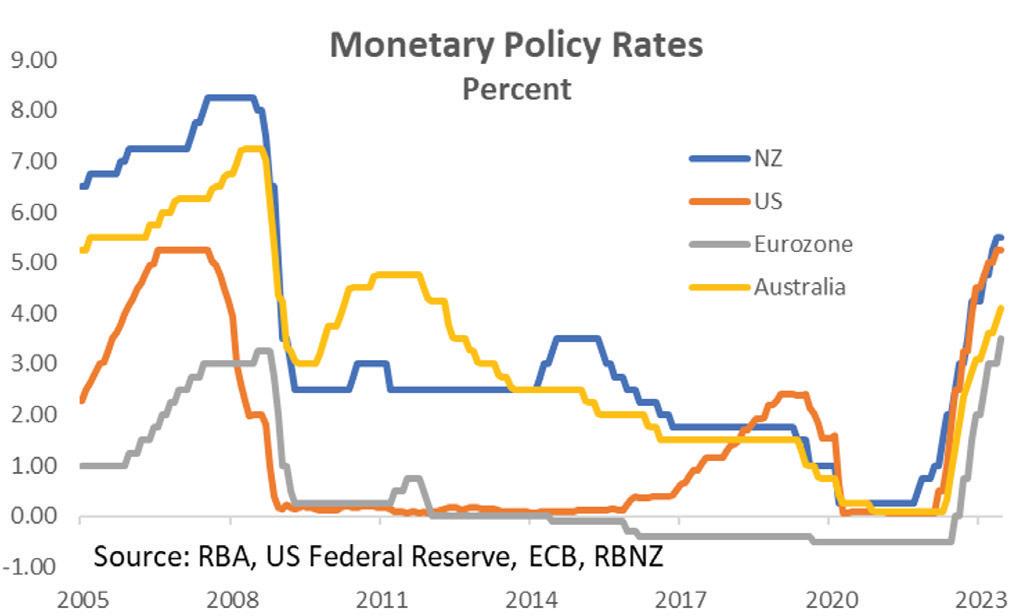
The Federal Reserve has remained active with 75 bps of rate hikes so far in 2023, although the Fed did pause its tightening cycle at its June monetary policy announcement. The European Central Bank has raised its policy rate 150 bps so far this year, while the Bank of England has also raised its policy rate by 150 bps. Reserve Bank of Australia policymakers have raised policy rates 100 bps this year, and the Reserve Bank of New Zealand has hiked rates 125 bps.
To be fair, not all developed economy central banks have been as active. The Bank of Canada has raised rates just 50 bps so far this year, with a January rate hike followed by a pause of several months before a resumption of tightening at the June meeting. The Bank of Japan, meanwhile, has yet to make substantive adjustments to its monetary policy stance in 2023.
If 2023 is the year of peak inflation, then 2024 is the year of disinflation, but within major economies we do not expect a return to target. The dramatic fall from recent inflation peaks should characterise the remainder of 2023, especially for headline inflation as energy prices have fallen notably.
Within core inflation, normalised supply chains and weaker demand should continue to deliver deflation for consumer goods. Services inflation will remain more problematic but should at least stop rising and, at best, moderate slightly.
We are in the hard part of the disinflation process now. The shift from 8% to 4% inflation has been relatively easy. 4% to 2% will be far more challenging.
US at stall speed
In the US, GDP growth is expected to stall across the second and third quarter of this year – the very definition of a soft landing. That reflects the cumulative impact of monetary policy tightening combined with weaker global demand. The extent of the impact of funding pressures in the banking system remains a source of uncertainty and a clear downside risk.
We don’t expect a significant contraction in employment in the period ahead, though we wouldn’t be surprised to see the occasional negative payrolls print. But with jobs growth slowing to below the replacement rate (circa 90,000 per month), the unemployment rate is expected to head to around 4.5% by late 2024, which will be sufficient to take the heat out of wage growth.
Are we approaching a turning point?
As we turn to the second half of 2023, we believe the global economy, interest rates, and currency markets may all be approaching an important turning point. While the global economic outlook has been steadily improving during this year, we see signs that much of that good news is now behind us.
SALT Funds Management Page 3
Growth picks up into 2024 as real wages rise gradually with falling inflation, supporting consumption spending, and on the end of the downturn in residential investment.
Headline inflation is expected to continue to fall through the remainder of 2023 and then more gradually in 2024. Core goods are expected to remain a deflationary force through the rest of the year. Core services inflation remains sticky and only partially normalises over the course of 2024.
Headwinds in the Eurozone
After a resilient first half of the year, there are a number of headwinds for the European economy this year that would limit the acceleration prospects. On the one hand, we expect a positive consumption impulse when falling inflation raises real incomes in the second half of the year on top of continued fiscal support. However, what lower energy prices has given households, monetary policy has had to take away in order to reduce demand.
the housing market stabilises and we see the green shoots of a recovery in credit growth.
Below potential growth in the UK, but above trend growth in Japan
In the UK, we expect below-potential growth in the near term. As in Europe, real wage growth is likely to turn positive by the end of this year as headline inflation retreats on lower energy and food prices, but the cumulative impact of tighter monetary policy, with likely more still to come, will continue to have an impact.
It’s not often that Japan is a star performer in the global growth stakes, but we expect its recent above-trend recovery will continue. Growth will continue to be driven by strong services consumption and inbound consumption by foreign tourists.
Capital spending should be supported by pent-up demand during Covid-related economic restrictions and continued investment in labour-saving investment in software and automation as the country continues to face into its declining working age population.
Increasing signs of slowdown in Australia
There are increasing signs the Australian economy is slowing as the full impact of rate rises continues to flow through. GDP data for the first quarter of the year confirmed consumer spending is slowing while businesses are reporting reduced confidence and forward orders.
The inflation story has shifted from energy and headline inflation to the stickiness of core inflation, especially services. Wage pressures and strong demand have driven core inflation; the persistence of the former is why there is a slower path from here to normalisation.
Higher interest rates begin to impact the economy more explicitly in the second half of the year, with credit demand falling and business investment likely to follow.
After the ECB finishes hiking and begins to cut in next year, we expect a moderate growth impulse as

The labour market continues to be resilient but, as is the case elsewhere, we expect the unemployment rate to rise during the second half of 2023.
Inflationary pressures will continue to ease through the remainder of the year, though the pace will be dependent on the extent of disinflation in goods prices and the extent to which services inflation remains elevated.
SALT Funds Management Page 4
When a pause is just a pause…
As the growth outlook settles, we anticipate an end to the global monetary tightening cycle. As we highlighted above, developed economy central banks have been quite active so far this year. And while some have paused, that does not guarantee they have finished hiking as we have seen in Australia and Canada, and as we expect to see in the US.
• The Federal Reserve held the fed funds rate steady at its June meeting, but its accompanying “dot plot” indicated that policymakers still see a likely two more 25bps rate hikes as possible before the end of this year. That being the case, it seems prudent to expect another rate hike from the Fed in July, followed by another in August. That would take the Fed funds target range to 5.50%-5.75%.
• The European Central Bank raised its Deposit Rate to 3.50% in June and signalled another rate hike was likely in July. We wouldn’t rule out a final 25bp hike in September.
• The Bank of Canada resumed rate hikes with a 25bps increase in June. One more increase seems likely in July.
• The Bank of England probably still has most work to do in terms of monetary tightening. We expect they hike rates 50 bps in August and 25bps in September, reaching a peak policy rate of 5.75%.
• Monetary policy has become something of a stop start affair in Australia, though they have the luxury of more meetings each year than any of the major developed central banks. While they surprised markets by holding rates steady in July, we believe there are still two 25bp hikes in the pipeline for a terminal cash rate of 4.6%.
Looking further ahead, while most developed economy central banks look set raise rates a bit further, signs of softening activity should offer the chance for these central banks to bring their rate hike cycles to an end in the immediate months ahead, especially if that is accompanied by a deceleration of core inflation, some loosening in labour market conditions and slower wage growth.
We need to talk about China
The Chinese economy only ever seems to hit the news feeds when all is not going to plan, or at its worst, in times of high anxiety and extreme risk aversion. Most times those fears prove, if not unfounded, at least overdone. The most recent concern is the obvious deceleration in growth rates of key activity indicators over the second quarter of the year, following the strong bounce as the authorities ended the zero-Covid policy.
Growth has certainly slowed more than we expected following the initial bounce with the industrial sector weighing most heavily on activity levels. We see this slowdown as payback of frontloaded production and policy easing, which are one-off factors and thus do not imply a significant future loss of activity.
We think the recovery is far from over. Indeed, we have seen just this pattern play out over most developed economic as the goods sector weakens in the midst of a strong rebound in social contactbased services post-reopening.
Authorities are taking no chances. Given that the recovery has remained nascent and somewhat fragile, with a still negative output gap (as reflected by disinflationary CPI pressures), we believe the Chinese authorities stand ready to support growth as needed.
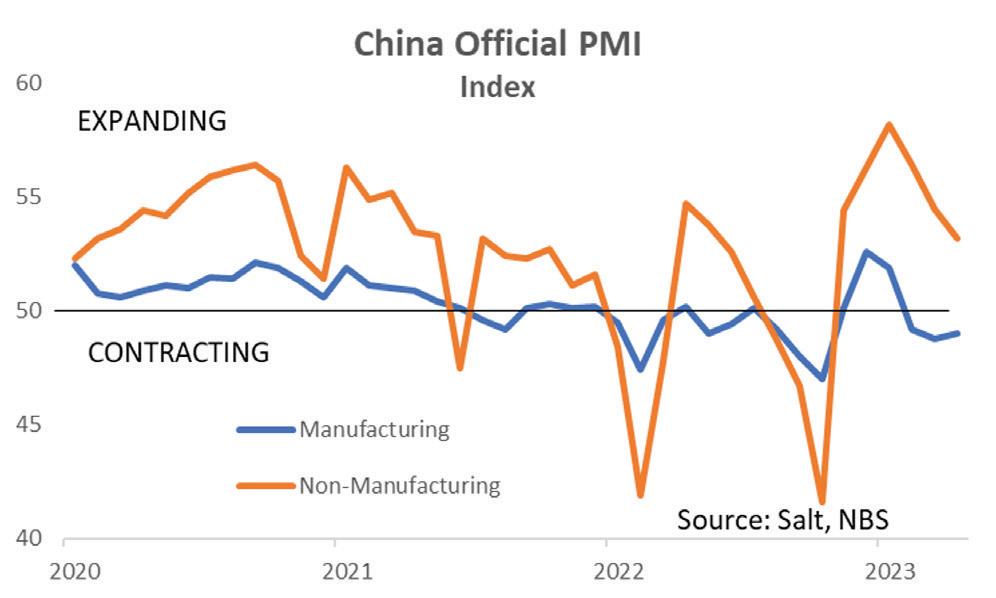
Furthermore, given the pro-business policy stance of the new cabinet, we expect the gradual return of private sector sentiment, which in turn should bring stronger investment from services sector firms and roughly 20 million new jobs over the next 4-5 quarters.
That said, the Chinese economy has faced a number of headwinds recently; the initial shock
SALT Funds Management Page 5
of Covid, 1.5 years of regulatory reset, a slump in the housing market, and Omicron-led lockdowns. We expect there has been some permanent loss of output through these challenges.
And, as we always remind readers, China remains in a long-term transition away from its prior investment-led growth model. A 4-5% annual growth rate over the next 2-3 years, while slower than pre-Covid, would be a solid performance as the economy rebalances towards domestic consumption and resources from the property and infrastructure sectors are reallocated elsewhere.
Weakest point in the cycle still to come in New Zealand
The New Zealand economy is also at a critical turning point. Already stalled in what is at least a technical recession, the economy is yet to experience the weakest point in the cycle. We expect that will be over the September and December quarter of this year as the aggressive tightening in monetary conditions has its most fulsome impact as households on still-low fixed rate mortgages continue to roll over onto significantly higher rates.
Businesses will be under pressure from rising interest rates and weakening demand. We expect that will be felt most acutely in the “goods” sector (as opposed to services) given that many households had their fill of goods during Covid and engaged in a frenzy of online purchases when services were mostly off-limits. Residential construction will be another soft spot in the months ahead which will weigh further on consumer durables.
That said, the growth outlook is not as weak as we assumed earlier this year. The devastating floods of summer and autumn are, and will continue to, lead to higher activity in the quarters and years ahead as communities and the infrastructure that serves and links them are rebuilt.
Another positive growth impulse is coming from higher population growth. Net inward migration has surged over the last few months, with net inflows between June last year and April this year topping 73,000 people. That’s a population gain of 1.4%.
While it appears that total inflow will build further over the next few months (the RBNZ is expecting a peak of 100,000), we believe there is a high degree of pent-up activity in these numbers. Our long-term forecasts assume net inflows of around 30,000 migrants per annum.
Net inward migration a blessing and a curse
Net migration is something of a blessing and a curse for the RBNZ. On the one hand, faster working age population growth adds to the supply of labour. We are not seeing the recent strong employment growth as a sign of resurgent demand for labour, but rather the release of pent-up demand which was unable to be satisfied earlier given the tight labour market and closed borders.
That should, perhaps perversely, take pressure of wage growth. That’s good news for the RBNZ. On the other hand, population growth adds to aggregate demand in the economy, which is not good news for the RBNZ. However, at least for now, we believe the downward pressure on wages is the more important factor.
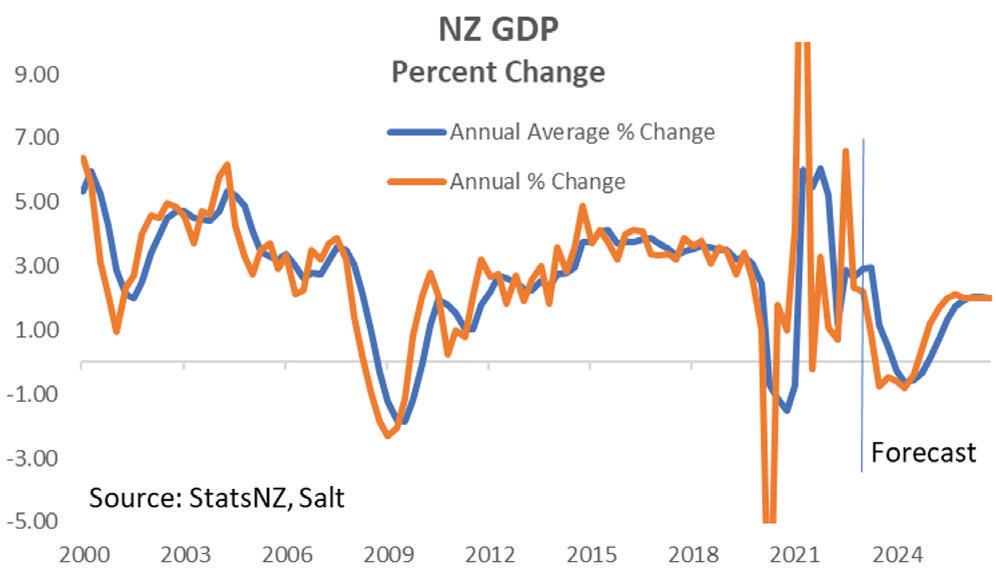
Furthermore, we believe we are close to a turning point in the labour market as the release of that pent-up demand for labour collides with slowing economic activity. As employment growth slows, further growth in the working age population will start to fuel growth in the unemployed statistic, rather than the employed component of the workforce.
Inflation past the peak
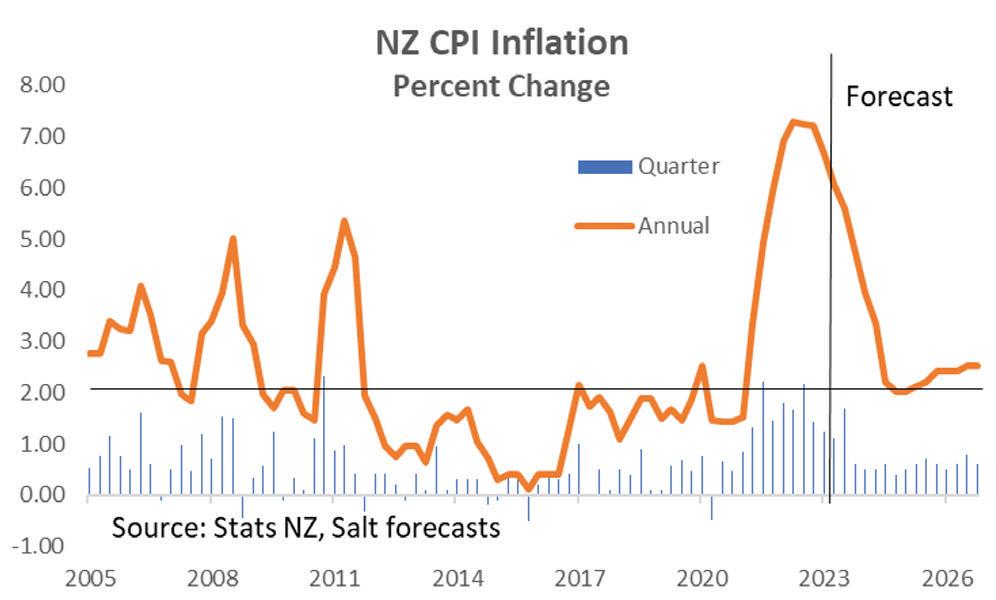
Headline CPI inflation peaked at 7.3% back in June last year and has subsequently fallen to 6.7% as at March this year. We expect headline inflation
SALT Funds Management Page 6
to fall further and to be back inside the top end of thetarget range by late next year or very early in 2025.
The fiscal outlook was built on, in our view, an optimistic assessment of the outlook for the economy. That means it wouldn’t take much of a downside surprise relative to treasury expectations to push what are at best modest fiscal surpluses in 2026 and 2027 into deficit. That also presents upside risk to the debt program.
The critical question for the RBNZ will be whether domestic inflationary pressures, or non-tradeable inflation, is also back to within the target range and whether it is expected to remain there on a sustained basis. That is a more difficult question, but it’s the answer to this question that will determine the outlook for interest rates.
The RBNZ delivered a hawkish 50 basis point hike in the Official Cash Rate in April, which was then followed by a dovish 25 basis point hike in May. The May increase was accompanied by messaging that called time on the hiking cycle. We agree the RBNZ has hiked rate enough.
The key question now is how long the OCR stays at this level, and what scope there is for rate cuts when the time comes. At this stage the most we are prepared to predict is that rates will be at this level until the middle of next year, and that there will be limited scope for rate cuts (relative to where they have come from) when the time comes. At this point we have the OCR falling to our estimate (guess) of the new neutral of 3.0% by early 2026.
Our twin deficits
Budget 2023 was more stimulatory than expected and as was widely expected, pushed the expected return to surplus out to fiscal 2025/26. What was more of a surprise was the increased size of the debt program. Market expectations were for an increase of $10 billion over the next four years, but the program was increased by $20 billion.
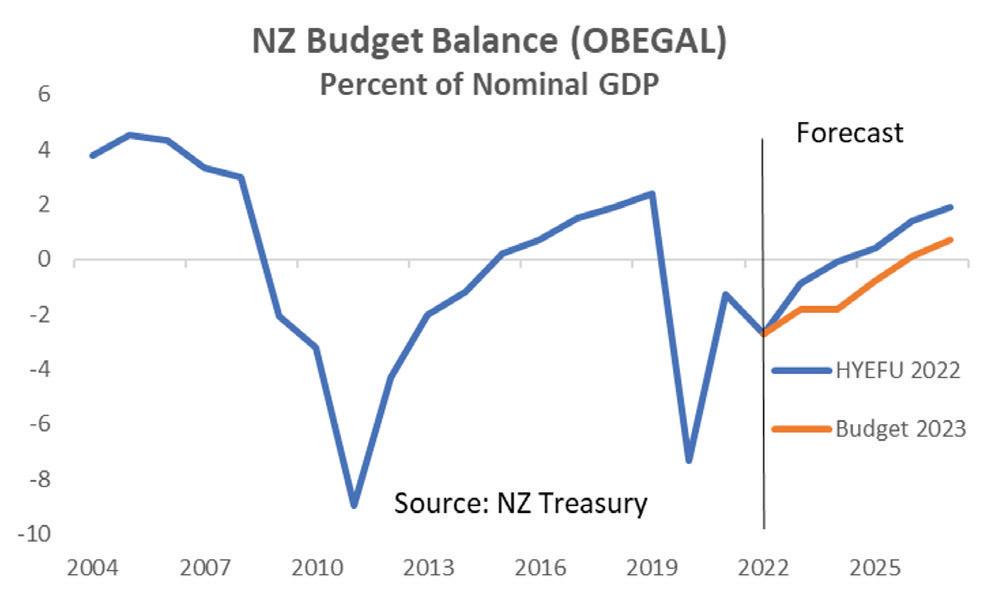
The deterioration in the fiscal outlook comes at the same time as a significant deterioration in our external accounts. Our current account deficit reached 8.9% of GDP in calendar 2022, though had improved to 8.5% of GDP by March 2023.
While there are valid excuses for the deterioration, most notably the absence of income from tourists during the period of Covid-related border closures, there are also reasons to expect the deficit may not improve as fast as some expect. Interest costs are higher, the improvement in tourism flows has stalled, export volumes have been hit by the floods and while import prices have fallen, export prices have fallen further leading to a deterioration in the terms of trade.
The combination of the deteriorating fiscal position alongside the challenging external accounts has not escaped the notice of the rating agencies. After the Budget, Standard and Poor’s was quick to point out that a somewhat expansionary budget could further weaken our external accounts and erode the headroom for our sovereign rating. That’s a reminder that as a small open export-oriented economy, we simply need to be better than everyone else when it comes to fiscal policy.
SALT Funds Management Page 7

Outlook for New Zealand Equities
NZ equities lagged strong global equity markets in the June quarter, being essentially flat at +0.3%. While this was no disaster, it slightly trailed a +1.0% return by the Australian benchmark, a +6.8% return posted by the MSCI World Index and a powerful +13.1% advance by the Nasdaq 100 Index in the USA. Globally, the quarter was notable for large cap technology companies carrying all before them in contrast to fears in the wider market about earnings downgrades and further monetary policy tightening.
Four broad reasons lay behind the relative NZ weakness. Firstly, our market contains no large cap technology stock exposure which led what was a very narrowly based rally in global shares. Secondly, the storm clouds have well and truly gathered for the NZ economy, with the mini-results reason in May being mediocre and the outlook still being to the downside. Thirdly, several negative single stock events occurred in large companies which had an outsized impact on our index. Finally, NZ 10-year bond yields were a moderate headwind, rising from 4.2% to 4.6%, with this movement being larger than most markets, as inflation pressures remain strong.
the previous record GFC weakness of late 2008/ early 2009. It has since bounced somewhat to -24.1 at end-June but this remains very low in historical terms.
That said, the composition of the NZ equity market is far from being identical to that of the NZ economy. It is particularly underweight banks and the rural sector. This means that while listed profit outcomes are clearly correlated to the broader economic malaise, this correlation can often be trumped by sizeable single company events.
The month of May saw a mini-reporting season for companies with March balance dates. The profit results themselves came in broadly in line with expectations but year-ahead forecasts were downgraded at a ratio of roughly three-to-one versus upgrades as the slowing economy and cost pressures impacted expectations. Obvious cyclicals such as retailers, transport companies and building products companies have borne the brunt of the downgrades thus far.
Most property companies reported, and their outcomes were largely as expected on the earnings front, with near term occupancy rates, rent growth and interest expenses being well understood.
NZ business and consumer confidence continues to be shaky, with the chart above looking at firms’ year-ahead profit expectations in the monthly ANZ Business Outlook survey. While the brief historic Covid low of -70.4 has not been revisited, the recent low of -45.1 in late 2022 was weaker than

However, clear risk remains as interest rate hedging rolls off and inflationary rental increases may ebb as the economy slows. Valuations fell to a degree, with expanding cap rates more than offsetting the positive impact of rent growth. That said, markets are forward-looking and the 22% decimation of the sector in 2022 priced in much of these risks and NZ property stocks have actually risen by a respectable +4.8% so far in 2023, albeit most of this came in June as investors may have taken heart at the RBNZ moving to pause mode.
The clear negative outlier among profit reports was NZ’s largest listed company, Fisher & Paykel Healthcare (FPH, -15%), whose result was a touch
SALT Funds Management Page 9
below analyst forecasts. However, FPH saw 15-20% downgrades to Mar24 year forecasts due to a sharp albeit possibly temporary decline in gross profit margins due to a mix of freight cost pressures, input cost inflation and labour cost pressures. We expect FPH’s revenue growth will remain strong and that these themes will dissipate over the next several years but a high-multiple company cannot afford to miss expectations.
The retirement village sector performance had been exceedingly weak in recent quarters but their results in the period were in line with or slightly ahead of expectations. We remain very wary of the quality of most of their results, with “underlying” profits being subject to adjustments that are not externally ascertainable. Our long-held concerns around sizeable debt levels and valuations being divorced from apparent free cash-flow generation also remain firmly in play.
Investors tend to use the sector as a proxy for the NZ housing market. Tentative signs of stabilisation have become apparent since the autumn although house sales numbers remain extremely low and price levels are still falling in inflation-adjusted terms. Nevertheless, this stabilisation sparked a sharp bounce off the lows across the sector in the June quarter, with stand-outs being Arvida Group (ARV, +38%) and Ryman Healthcare (RYM, +25%) although they do remain far below their share price levels of a year ago. From here, the key risks are margin pressures in their care businesses and a potential build-up of unsold inventory if housing market activity remains in the doldrums.
Some of the largest share price movements in the June quarter had little to do with the struggling NZ economy. Pacific Edge Biotechnology (PEB, -80%) slumped on a shock decision by the outsourced decision-making entity, Novitas not to fund their bladder cancer test for Medicare patients. PEB had earlier been granted such funding and they seem to have been caught in both a misunderstanding by Novitas of the efficacy of their test and a general slant against reimbursing diagnostic tests. As July began, a stay of execution after negotiations led to a bounce in PEB, but much remains unclear.
Conversely, the travel technology company Serko (SKO, +57%) bounded ahead on positive early signs
from their company making or breaking deal with booking.com. SKO keeps half the revenues from booking.com “for business” so it is incumbent on them to drive sufficient bookings from businesses to outweigh their sizeable marketing and software development costs.
Amongst larger cap names, the tail-end was brought up by the previously strong performer Ebos (EBO, -21%), who surprisingly lost the Chemist Warehouse contract from 2024 onwards. While being low margin, and having nothing to do with EBO’s performance, it will lead to an operating deleverage across the relatively fixed costs of EBO’s network. There was also a minor negative in Australia, where prescriptions can be doled out for longer periods than previously.
Other stand-out laggards were the infant formula cousins Synlait Milk (SML, -22%) and a2 Milk (ATM, -14%). This came despite the receipt of the longawaited Chinese SAMR registration, which will allow SML to make and ATM to thence sell Chineselabel formula in that market. SML suffered from two earnings downgrades and an over-extended balance sheet, while ATM lowered their revenue guidance to the low-end of previous expectations and the market began to take a less sanguine view of the slumping Chinese birth rate.
Equity markets globally have seen a clear performance distinction open up between large cap technology names and everything else. This is concerning as narrow leadership is a classic sign of a bull market top. In the first half of 2023, the “7 horsemen of the apocalypse” have seen Nvidia +189%, Meta +138%, Tesla +113%, Amazon +55%, Apple +49%, Microsoft +42% and Alphabet a mere +36%. At the same time, the S&P500 is +16.9% (largely due to those 7 names) and the S&P500 High Dividend Index is down -6.4%. A long-term ratio of the Nasdaq Composite to the Russell 2000 Index is back to its early 2000 “neverto-be-repeated” Nasdaq bubble highs. This feels dangerous as the Fed keeps removing liquidity. NZ has thankfully been spared these extreme divergences given our lack of exposure to the outpouring of bubbly hoopla regarding anything to do with generative artificial intelligence. That said, our market remains far from cheap on an overall basis.
SALT Funds Management Page 10
The chart above shows the generally solid relationship between the NZ 10-year bond yield and the one-year forward PE ratio for our “core” market. Visually, one can see that we lie far to the right of the fair value line, with the end-June forward PE of 26.3x being far above the fair value of about 17x. However, we do acknowledge that the composition of our market has changed over time, with our largest companies being stronger growing and therefore higher multiple. The median PE currently sits at circa 15.2x, which is fair value to even a touch cheap at current 4.8% bond yields. Earnings risk is certainly greater but small to midcap companies do currently hold greater valuation appeal.
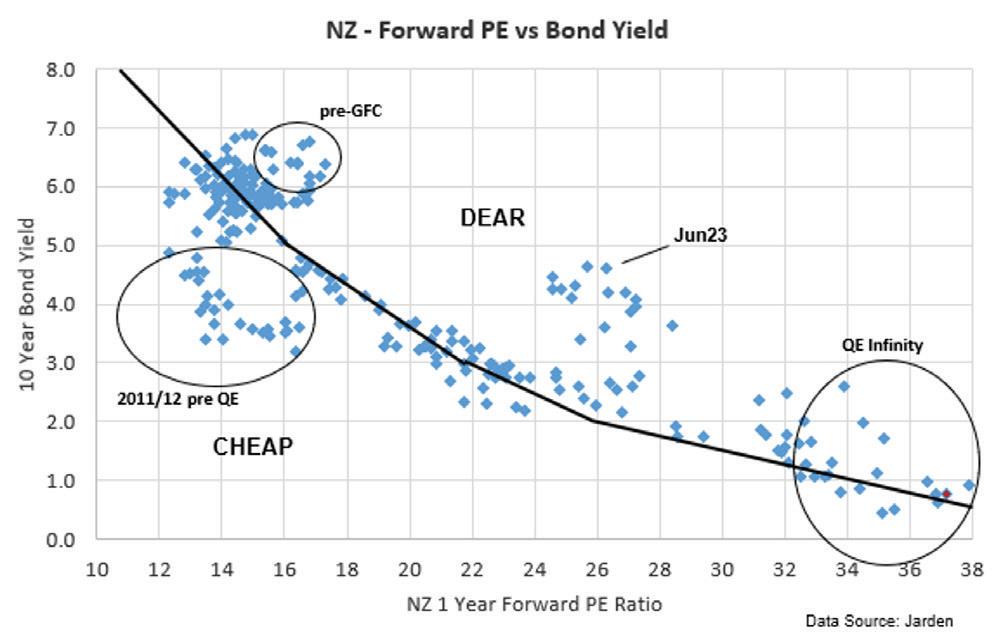
To conclude, NZ equities have lagged those globally as we lack a large cap technology presence and the earnings outlook for many names remains difficult. Further, large names such as Ebos and Fisher & Paykel Healthcare, which have little correlation to the NZ economy, also happened to have experienced earnings downgrades for their own unique reasons. Bond yields rose over the quarter as inflation remained more persistent than some had previously expected.
Small to mid-cap equities are far cheaper than their large-cap peers but the trade-off is that they tend to carry greater exposure to the NZ economy and thus greater earnings risk. Our view is that 2023 will continue to be a tricky year for NZ equity investors and that careful active stock selection is necessary to avoid pot-holes. The economy has stagflationary overtones to it and lessons from past such experiences point towards companies with secular growth drivers and those with positive exposure to rising short term interest rates (such as insurers and to a degree banks). A final layer of complexity is added by the potentially material impact of the election in October, given the substantially differing economic policies of the dominant parties and their likely coalition partners.
SALT Funds Management Page 11
Implications for Investors
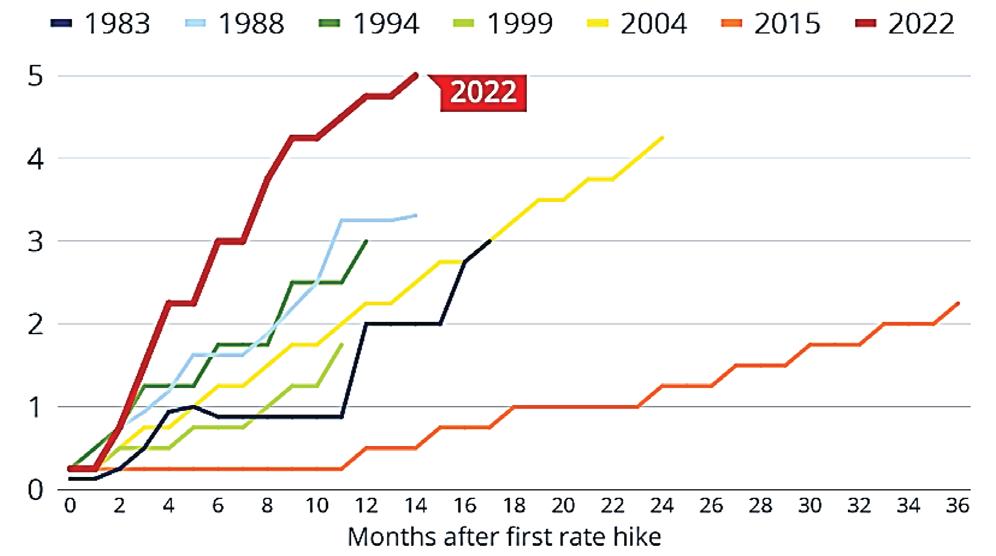
The positive, though volatile, market environment in the first half of this year has now begun to chip away at the most pessimistic sentiment legacies of the last 24 months’ erratic investment returns patterns. This is essentially because the more bearish forecasts prevailing as the year began have so far failed to materialise. The key question now is whether the pessimism about the impact of rapid rises in interest rates on the world economy was overstated, or whether more of a negative impetus is yet to come through. Historically, since 1950, it has taken an average period of between two and three years after rate hike begins, for the US economy to slow to recession. So, given that the US Fed began tightening policy rates as recently as last March, it is plausible that the full impacts will not be felt until 2024.
A fast and furious Fed tightening
positive equity market returns continuing through the second half year, though at a reduced rate of gain, but it implies that agility will be required as 2024 draws closer, as next year’s profit growth track is unlikely to support significant further valuation expansions.
The “wall of worry” has so far supported equities
In our last edition, we posed the question of whether the so-called “wall of worry” confronting investors could see disproportionate positive reactions to fragments of “good news.” This indeed was the general pattern in the second quarter.
The key point to bear in mind is that there is very little surprise element to most of the marketnegative information which dominated early 2023, and therefore investors had the capacity to reward “better-than-expected” news flows. This is consistent with the low prevailing expectations for corporate profit performance, which had led to a long sequence of analyst downgrades to earnings forecasts, across many industries. Investor cash balances remain high, so opportunistic price points for purchasing quality securities which show inflation- and recession-resilient properties can draw funds quickly back into asset markets, at times.
Source: US Federal Reserve
It is now a reasonable assumption that the remainder of 2023 will not see the “rapid-slide recession” news previously priced in by markets, allowing equities to continue a jagged sideways- to -upward path despite many challenges. However, the real slowdown in the US and other Anglophone countries could begin to hit around year-end (at a point when investors may be complacently expecting a continuing “soft landing” at worst.)

That is why late-2023 is likely to see more fixed interest orientation within our diversified funds. Such an economic scenario would translate into
Year-ahead profit growth forecasts are less poor in US, Europe and Japan
Source: MSCI, IBES as at 30 June 2023
SALT Funds Management Page 12

Positive asset returns in first half year…
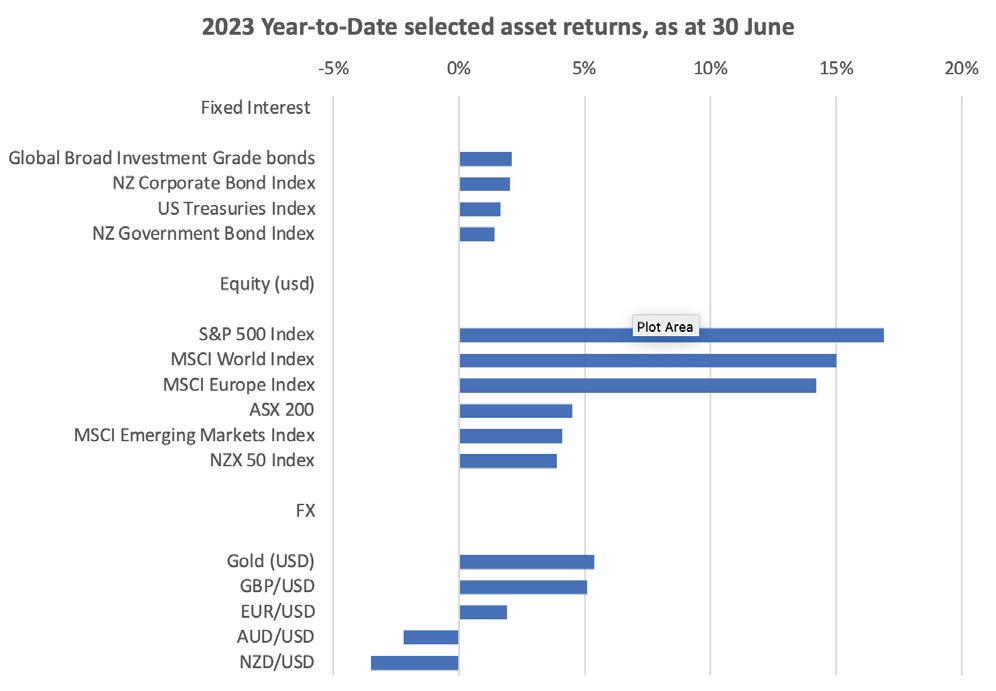
Given the lack of overall clarity presently, it is suggestive that markets have produced generally robust returns in the first six months of this yeara welcome development, though some realism is clearly returning in early July. The stabilisation and uptick in investment returns across a range of major asset types continued from later 2022 well into the June quarter, going against some commentators’ expectations.
Bond markets globally gained between 1-3% and Equities between 3-17% in the six months to the end of June. The first half of July, though, has seen a bullish trend interrupted (if not derailed) by another spike upwards in Sovereign bond yields, reflecting the market’s judgment of tenacious inflationary risks and central bank hawkishness. Equity advances have now paused, as investors once again attempt to digest the significance of these higher interest rate pressures.
A very firm first half year for equities
Thus, investors who prematurely rushed into Sovereign bonds at the beginning of this year, after enjoying a short period of positive returns, have now seen much of those returns evaporate in the latest sell-off.
This does not surprise us, as we have expected range-trading bond yields for this year rather than forecasting a “cycle peak and succeeding rally” in the fixed interest markets. That is why we have chosen a highly-selective global bond portfolio: we do not believe that the years ahead will simply reward bond investors automatically for holding an index-like set of debt instruments through economic slowdowns.
The multi-year credit cycle – which in the mediumterm is as strong an influence on bonds’ total returns as the level of interest rates – is only beginning to turn more problematic for issuers and investors alike. There are still several quarters of choppy market conditions ahead for bonds. Credit rating downgrades, debt deferrals or restructuring risks, set against much less central bank support, are the shoals to be navigated in the fixed income portfolio components, and these treacherous waters for protecting returns lie mostly still ahead of us.
More defensive equity sectors poised for performance
Source: S&P Global Indices, Morgan Stanley
…with bonds increasingly lagging
Since the start of June, the US 10-year bond yield has jumped from 3.60% to 4.07% (as at the time of writing, a 2023 high) and the New Zealand 10year yield, from 4.33% to 4.85%. The deteriorated picture for shorter-term bonds in New Zealand is even more marked, with the 2-year NZ government yield up from 4.80% on 1 June to 5.62% barely six weeks later.
Even if as 2023 progresses, the majority of the value gains from equities prove to be behind us, that does not mean that the equities in our own portfolios have deteriorating expected returns. Quite the contrary. Many of the selections in our funds (both domestic and international) are chosen with particular attention to their capacity to weather economic downturn. Balance sheet strength, pricing power and technical adaptability to new market segments are crucial distinguishing qualities and tend to be common factors among securities that ride out low-growth and borderlinerecessionary periods best.
The global health care sector, for instance, has lagged the broader equity rally in 2023, gaining just 0.8% year-to-date within MSCI World Index ‘s 15% gain in the broad benchmark (in USD terms.) The classically recession-resilient sector has suffered
SALT Funds Management Page 14
comparatively as costs have risen and weighed on profits. Although the sector is not cheap and trades on a 12-month forward P/E ratio of 17.8x, overvaluation has diminished this year. The fairly rich valuations of Health Care stocks in aggregate compare to 26x for Information Technology, 20x for Consumer Discretionary, and 17.7x for Industrials (looking at the MSCI All Country World Aggregate.) In continuing earnings slow-down, the stability in profits earned by well-chosen medical and health-related enterprises are likely to prove more reliable than the vulnerable, economically sensitive cyclical industries which have comparable or higher valuations at present.
So-called “recession stocks” are coming into focus
Unsurprisingly, there is increasing focus in widely followed business publications on ways to align equity portfolios for a potential 2024 US recession. Forbes Magazine in early-July has summarized characteristics to look for in these companies, in the US investment universe:
• Low volatility. Stocks that have not seen a sustained decline of more than 30% in the last 10 years, based on daily closing prices and adjusted for dividends. Only 87 stocks traded on major US exchanges meet this volatility criteria—most US stocks have seen much bigger declines.
• Steady profits. These companies have had positive earnings for at least seven years.
• Earnings growth. Stocks with a minimum of 3% annual EPS growth over the last five years.
• Expected future growth. Stocks which had at least 3% annual EPS growth expectations over the next five years.
• Keep pace with or beat the S&P 500. Stocks that either beat the S&P 500’s total return over the last 10 years or were within 1% of the benchmark index’ return.
These criteria we consider reasonable, and there is significant correspondence between the health care sector selections named by Forbes and those held at elevated weightings within our Sustainable Global Equities portfolio. The key is not to lose focus on the 5-10 year investment time horizon. At present, it is important both to retain the best defensive portfolio elements for near-term
protection, without forgoing the most inflationresilient growth companies which will retain market leadership for years to come, regardless of the “depth” of the economic cooling or recession phase which lies in the immediate future, for many key economies.
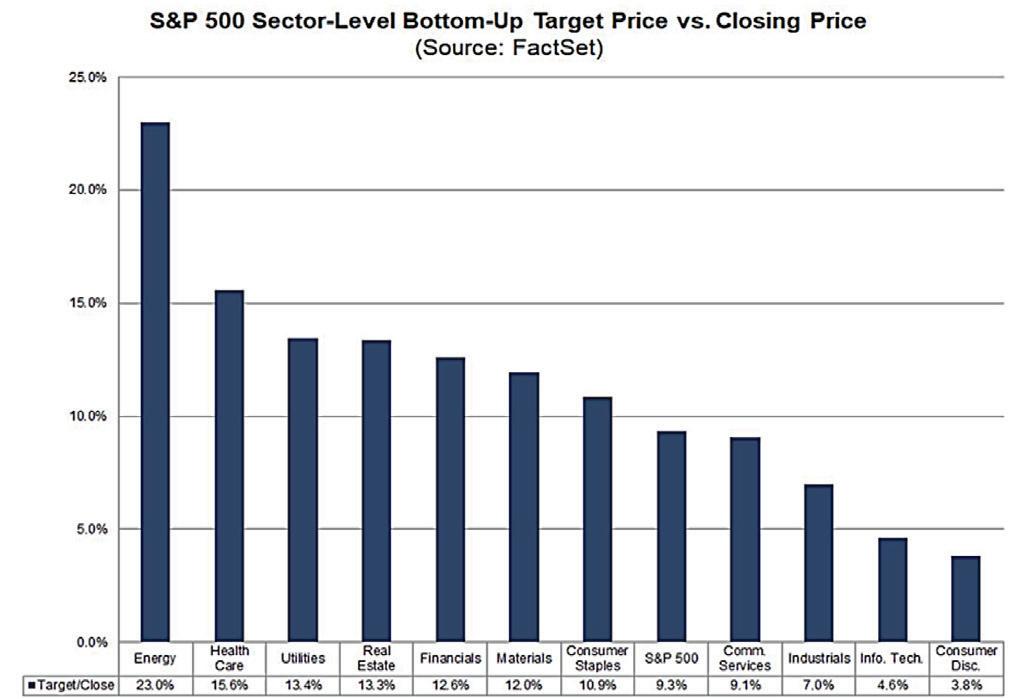
Although it has been slow to develop this year, analysts’ forecasts for which parts of the US equity market will be most rewarded by stock price gains in the year ahead have now begun to show a preference towards firms which (on a bottomup basis) have lagged or been overlooked by the IT-Artificial Intelligence dominated rally in the First Half year.
Forward-looking superior performance from Health Care & Real Assets expected
Source: FactSet Research, data to 7 July 2023
Notable in this chart is the comparative price upside anticipated for stocks within the health care, but also in the utilities and real estate (real asset) industries. It is also interesting that these defensive sectors are forecast to provide better returns as the component companies converge to their target prices, than those classified in the cyclical Communications Services, Industrial, Information Technology, and Consumer Discretionary sectors. That would make sense, given that stocks within the cyclical sectors have already experienced “best case scenario” revaluations upwards in 2023 to date. The phase ahead would reasonably see defensive characteristics better rewarded in relative share price appreciation.
On the latest FactSet data at the sector level, the Energy (+23.0%) and Health Care (+15.6%) sectors are expected to see the largest price
SALT Funds Management Page 15
increases, as these two sectors had the largest upside differences between the bottom-up target price and the closing price on July 7th. On the other hand, the Consumer Discretionary (+3.8%) and Information Technology (+4.6%) sectors are expected to see the smallest price increases over the coming year ahead. While this is only the average of a wide pool of analysts’ views, the fact that the target prices are derived on a companyby-company basis keeps them true to fundamental valuation disciplines.
The other clear message is that US market leadership urgently needs to broaden further from the Mega-Capitalisation technology companies and encompass more reliable, quality companies which are nonetheless better positioned to weather economic storms if the economy fails to convincingly re-accelerate in the latter part of 2023 and weakens into a second dip in the early part of 2024. That scenario is quite plausible, given the lagged effects of high interest rates discussed throughout this report.
“Good news is bad news” – shortterm
As of mid-July, the evident resolve on the part of major global central banks to keep interest rates elevated and not to allow inflation to rebuild any upward momentum is clear. That has in turn revived the old market chestnut that for now, good news is bad news. In other words, strong economic data and reduced geopolitical tension or energy prices – all of which are “good news” in the absolute sense – are nevertheless delivering bad news to markets and specifically, to those investors who are anticipating a relatively short number of months to be spent at “peak monetary tightness.”
Even if an imminent pause in official policy interest rates is on the cards, investors have to adjust their expectations away from the pattern where the last hike of the cycle is rapidly succeeded by the first cut (delivering stimulus and allowing the resumption of strong returns from cyclical equities and from bonds).
Source: ING, Macrobond
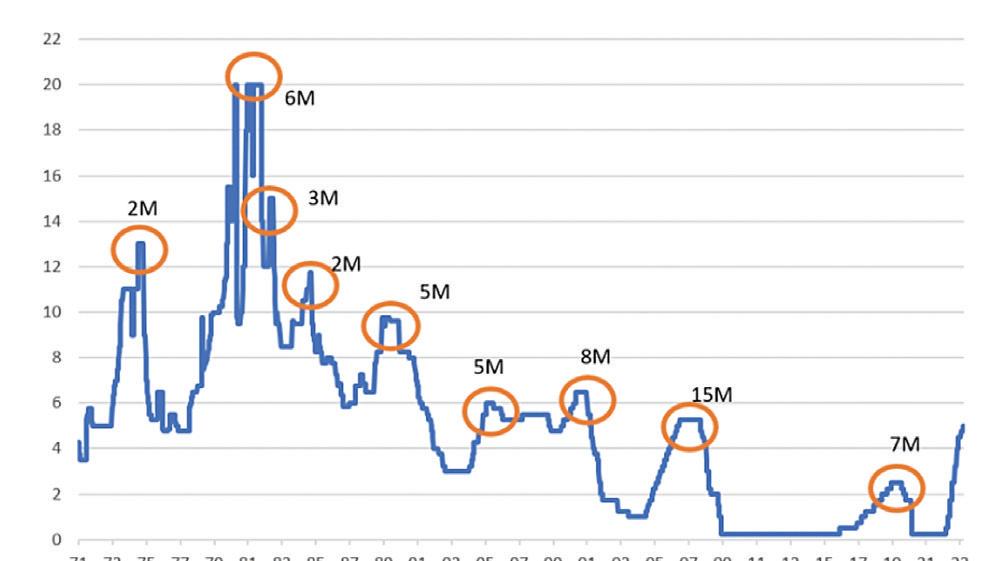
The chart above shows that in over 50 years, there is a wide dispersion of lengths (in months) of time when the US central bank maintained interest rates at their cycle peak, before moving the Fed Funds Rate downward. The median duration of such “holding periods” is 5 months, but the range is from 2 – 15 months. This suggests that while past circumstances have allowed rapid policy pivots from “restrictive” to “stimulatory” monetary conditions, a persistent problem arising from any degree of economic overheating can substantially extend the waiting time before interest rates are reduced.
The balance of US economic indicators currently suggests that forecasters have been too pessimistic, and data are again surprising on the stronger side. Realisation of this has recently pushed bond yields upward.
Economic data in the US is beating expectations, driving interest rates up again

Source: Bloomberg
Markets being largely forward-looking, the implication of these positive surprises has been to weaken the case for any near-term reversal in the direction of the policy interest rate, which has
SALT Funds Management Page 16
Federal Reserve monetary policy cycles 1971-2023
therefore sapped the momentum of the market rally, whilst further evidence comes to light on how permanent price pressure dissipation may prove.
“Good news is good news” –medium-term
However, looking out 2 to 3 years from now, a preferable scenario would be a quieter patch in economic activity that consolidates the recent moderation in inflationary forces, without an accompanying credit crunch or inflationary debt crisis developing in either developed or emerging markets. That may seem a tall order, given the persistence of core inflation and the enormity of the global debt burden, which is rapidly becoming more arduous to service as higher interest rates kick in across loan portfolios.
Nevertheless, the balance of evidence for a lesspainful economic and market adjustment has improved somewhat during the last three months. A variety of indicators we use to estimate the ending of bear equity markets have confirmed that the 2022 episode has indeed concluded, while the indicators needed to signal a new bull equity phase are not yet unanimously upbeat. This leaves asset allocation best positioned in a cautious and provisional overweighting to global equities, funded by a small underweighting to global bonds and cash. Such asset class tilts express the capacity for equities to “look through” short-term negative news, as long as the medium-term picture has not been seriously impaired.
As the first half of 2023 showed, constructively oriented equity investors have been willing to suspend their risk aversity for a period (despite very poor initial market sentiment) whilst those managers convinced of an imminent deepening recession could have exposed their clients to the renewed sell-off in bonds (rather than any safe haven benefit) while forgoing full participation in the rebound rally.
That said, there is no doubt that corporate earnings are presently, and will continue to be, meaningfully challenged at least for the rest of this calendar year. This statement is as apposite for New Zealand as it is for the USA and European equity markets. However, genuinely defensive, and/ or quality companies have scope to ride out the
current mix of high costs alongside diminution in customer spending power and retain their value. Inflation-resilient companies are already passing through cost pressures and at present, many are succeeding in re-contracting at higher prices which their customers have grudgingly accepted. In many cases, enterprises are disinclined to trigger the disruptions of replacing a supplier with another (who may only offer a pricing advantage which cannot be relied upon for multi-year planning) or, of moving premises or facilities when attractive facilities remain in short supply.
Can markets traverse risks of imminent profit plunge?
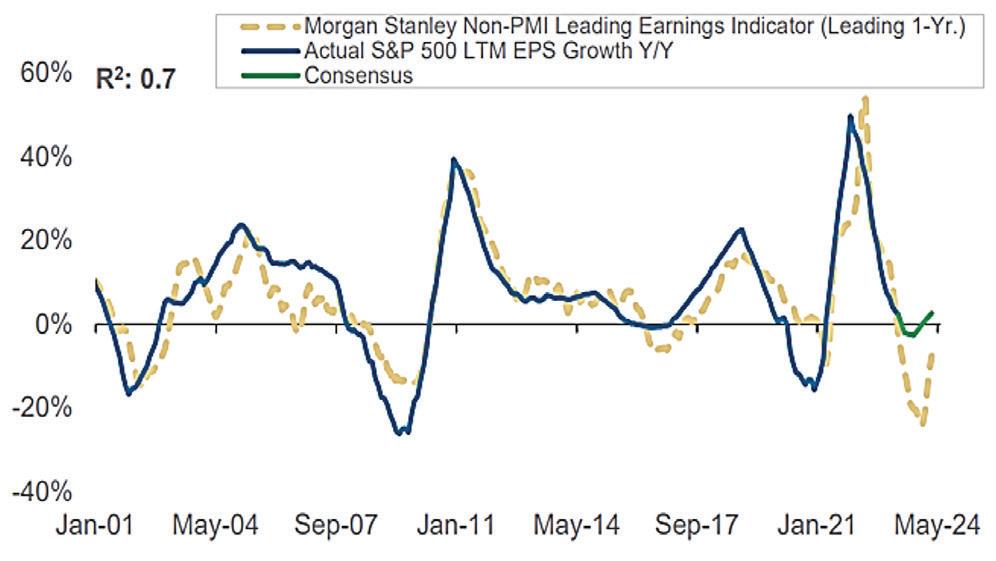
As the US second quarter earnings season gets underway, analysts forecast a -7.2% annual decline in profits – the third consecutive quarterly drop. With analysts predicting corporate profits to grow through the rest of this year, investors will be attuned to whether companies can deliver results in the quarters ahead and if forward earnings expectations can support stock valuations. Our global equities partner Morgan Stanley Investment Management still considers the downside risk to US corporate earnings to be deeper than the market consensus expects, moving into 2024.
Leading indicator for US profits suggests a deeper dip ahead
A transitory dip below “zero profit growth” in the mid-2023 earnings seasons could well be tolerated by equity investors. However, the more substantial drop which the Leading Earnings Indicator suggests is possible would, if realised, almost certainly put paid to a major new equity bull phase for 2024. In summary, the testing period ahead should see more positively differentiated returns performance from the Quality-assessed selections
SALT Funds Management Page 17
Source: Haver Analytics, FactSet, Morgan Stanley Research
in our international portfolios, and a greater investor appetite for the traditionally defensive or recession-resilient types of equity. It is increasingly likely that the performance of the main headline equity indices will be lower than the returns accumulated by these more resilient companies in the next 12-18 months.
A recently-strong economy that is cooling is a time for careful selections
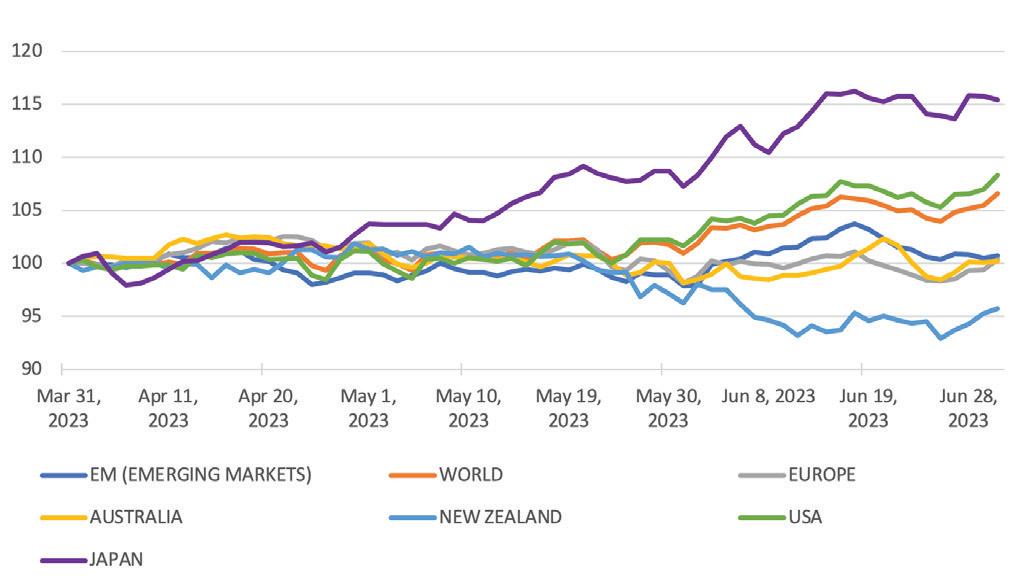
Yield curves, PMIs, leading indicators, and credit conditions all support our view that developed market growth is slowing to stall-speed. The US has to date managed to remain resilient, which has allowed for resumed gains in that country’s equity markets above most others, during the last three months.
2023 Second Quarter equity performance (local currency)
a six-month low of 46.3);
4.) below-average unemployment; and
5.) over 40% of bank senior loan officers tightening lending standards.
That said, the implied below-average returns outlook for equities does not (as we noted in our last edition) argue for a re-allocation away from shares and into bonds. Fixed Interest recorded a positive returns profile earlier this year, in anticipation of earlier monetary policy down the track. Much of those gains have reversed in the mid-year period. Additionally, the magnitude of bond market returns that were experienced during the Quantitative Easing – low inflation epoch are an historical outlier and cannot form a credible expected return from the asset class going forward. Indeed, the old rule of thumb that a bond securities’ current yield is a robust proxy for its expected total return should apply, leading to a 5% per annum best-case nominal returns outlook for broad Fixed Interest indices.
The Equity Risk Premium is obviously very low at present. However, until inflation is running sustainably below 4%-5%, there is an argument to tolerate equity volatility, in the service of purchasing power preservation. Put simply, both shares and bonds real yields may be negative, but shares offer the potential for capital gain over the medium-term (3-4 year) period similar to the duration of a typical bond portfolio.
Source: S&P Broad Market Global Indices (data to 30 June 2023)
Tighter credit conditions are especially germane as a risk, given US mid-cap banking sector stress, and acts as another form of lagged policy tightening on the US economy. Other economies may avoid full recession, but near-zero GDP growth is on the cards and until monetary conditions ease again, few catalysts are visible to recharge activity.
Specifically, we are concerned that five tests for anticipating weakening equity market returns are currently satisfied:
1.) US Forward earnings estimates falling;
2.) a substantial prior US Treasury yield curve inversion;
3.) a sub-50 level on the US Manufacturing Purchasing Managers Index (June’s reading was
Warning on premature NZ government bond investments
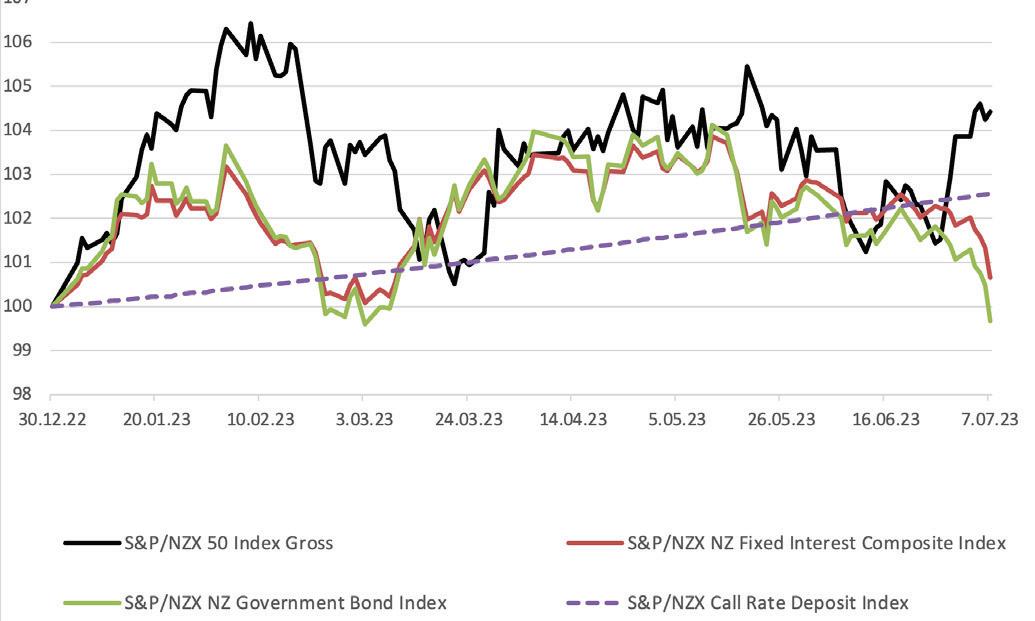
Taken together with the lagged impact of alreadyimplemented monetary tightenings, there seems to be limited scope for capital gains on medium- and longer-term government bonds this year, as much previously-anticipated central bank “dovishness” is now being reconsidered, lowering their mark-tomarket prices.
In New Zealand, whilst NZ government bond securities have offered ever-higher yields, they have not overtaken the total return from domestic equities, nor from cash. We do not anticipate an enduring bond rally in the near future and continue to expect range-trading with a mild upside bias for yields.
SALT Funds Management Page 18
Source: S&P Global Indices
What we expect to see in late 2023-24 is more differentiation between returns from different credit qualities, as borrowers are strained by lowor nil-growth economies and persisting higher costs.
Thus, we are again able to slightly increase our allocations to the fixed interest asset class in July, but with an important caveat. We require our bond holdings to be differentiated by issuer objectives, structures and sustainability-linked outcomes, instead of scaling holdings by the size of an entity’s rolling deficit or re-financing obligations. To this end, we introduced the Salt Sustainable Global Fixed Income Opportunities Fund which is now incorporated in both the Salt Sustainable Income and Salt Sustainable Growth Funds. The Fund is specifically focused on low carbon and climate-friendly bond issuers, as well as those agencies involved with projects aligned with the UN Sustainable Development agenda, in addition to broader acceptable corporate and sovereign issuers.
Diversifying powers of bonds remain very diluted
Finally, in considering the relative merits of bonds and equities within diversified portfolios for the coming period, it is important to take diminishing diversification benefits into account. The positively correlated price movements in equities and bonds in recent months have recently accelerated, and on some measures, the degree of positive correlation is close to a 25-year high.

Source: Morgan Stanley Investment Management to 30.06.2023
Needless to say, the present situation is the inverse of the negative correlation regime that persisted between 2000 and 2020, and which delivered substantial portfolio diversification benefits from a judicious mixture of equity and fixed interest; whereby bonds provided portfolio ballast through the most severe economic weakness phases whilst stocks participated in upside returns capture.
Looking forward, therefore, it may well prove too much to expect any resumption of strong diversification benefits from fixed interest as a broad asset class (distinct from a carefully-selected portfolio of targeted debt securities.) Therefore, while we have lifted our fixed income exposures overall, we do not feel that we should substantially lower our global equity holdings in order to move into a classically defensive posture via aggressive overweighting of the bond asset group for the present. Rather, we focus on the defensive characteristics of the equity components of our portfolios, including particularly our Infrastructure holdings, as well as on the special sustainability aspects and advantageous valuations currently evident in the Global Fixed Income Opportunities Fund.
SALT Funds Management Page 19 NZ Equities vs Bonds and Cash returns in 2023
Strategy conclusions
We retain our central market views for late-2023, reprised below:
• Equities (as a whole) will potentially see average annual returns close to their long-term norms in the next 3 years with interim weaker periods; selected equity sectors and markets still have scope for resilience and desirable investment features. There are all-weather stocks that have lagged in recent years.
• For instance, listed real assets have superior, defensible yields, in a fraught macroeconomic and geopolitical phase. Real Asset’s historical sensitivity to bond yields (as they trend down) may be supplemented by their cashflow surety, inflation-hedging qualities and (for Infrastructure) non-cyclical defensive merit. Bond yields have adjusted well, and may now plateau, which is positive for Real Estate looking forward one year, while Infrastructure has already benefited.
• Within the broader market sectors, thematic and valuation support in Utilities and Consumer Staples, Healthcare, and Software as a Service (SaaS) Information Technology enjoy pricing power which assists them to ride out sentiment storms and hedge against economic slowdown.
• Expect more M&A based on strong USD “war-chests” and also some abandoned corporate courtships as conditions shift and distressed firms multiply into 2024.
• After the global bond sell-off of 2022, we see better compensation for duration risk.
• An additional sell-off in yields in mid-2023 would serve to reinforce this improved situation.
• Within fixed income, thematic support is ready to be a prime differentiator. We acknowledge sustainable or “green” bonds as a valuable emerging theme.
• Default risk and credit quality are now on the radar and are likely to become a market focus later in 2023- mid 2024 and set off portfolio reallocations within and beyond bonds.
We are now entering the expected global slowdown in the later part of 2023 as the lagged impacts of tightening of policy around the world continues to impact the real economy, and asset markets adapt to protect existing capital gains by allocating funds toward “all-weather” securities.
Such desirable investments, which we are actively seeking out across all our asset classes, are resilient to both inflation and to profit challenges in a less stimulus-based, capital spending and productivity-led phase of economic growth. International assets are broadly preferred to New Zealand counterparts, where viable, as the key northern hemisphere trading economies have more diversified defensive industries and often, more adaptive economic regulation (whist allowing that electoral / policy change risk is ever with us and will intensify next year with the US Presidential election in November.
SALT Funds Management Page 20
IMPORTANT INFORMATION
The information in this publication has been prepared from sources believed to be reliable and accurate at the time of preparation but Salt Funds Management Limited, its officers and directors, make no representation or warranty as to the accuracy or completeness of any of the information contained within. All analysis, opinions and views reflect a judgment at the date of publication and are subject to change without notice. This publication is provided for general information purposes only. To the extent that any of the information in this publication does constitute advice, it does not take into account an investor’s financial situation or goals. An investor should, before making any investment decisions, seek professional advice, having regard to the investor’s financial situation and goals. Past performance is not a reliable indicator of future performance and no representation or warranty, express or implied, is made regarding future performance. This presentation is solely for the use of the person or persons to whom it is provided and must not be distributed or copied, in part or in whole, without the permission of Salt Funds Management Limited. Salt Investment Funds Limited is the issuer of units in the funds comprising the Salt Investment Funds Scheme. The Product Disclosure Statement is available from saltfunds.co.nz


