
2024 Outlook
July

Trump 2.0: Are you ready?
Markets appear remarkably sanguine about the prospects of a second Trump presidency
Monetary policy divergence matters, but economic convergence will help
Things are falling into place for the RBNZ
BEVAN GRAHAM
Implications For Investors
Strong global equity returns in First Half Year, with an IT focus
Gentle declines in bond yields to support the lagging assets
Diversification being tested, but still valuable given political risks
GREG FLEMING
Trump 2.0: Are you ready?
2024 is an election-heavy year. An estimated 60% of the world’s population live in counties that will have elections this year, a ratio admittedly assisted by population heavy-weights India, Indonesia and the United States.
None will be more important than the stand-off between Donald Trump and Joe Biden in the United States in November. Trump has been ahead in the polls even before questions were raised about Biden’s capacity, yet markets seem remarkably sanguine about the prospects of Trump 2.0. Maybe that’s because all the focus right now is on the Federal Reserve and interest rates and the political focus will come later.
Or maybe it’s because Trump is now a known quantity. Or is he? Trump was a political novice in 2016. Our concern is that Trump 2.0 is a real possibility, and that this time around he will have a clearer idea of what he needs to do to achieve his objectives. The 2.0 version could be far worse for the US and global economy than 1.0. I dismissed him in 2016 and won’t make that mistake again (I also thought the UK would never be stupid enough to vote for Brexit!)
Trump 2.0 will have profound effects on the globe as he likely doubles down on his anti-trade tirade, and geo-politics will likely become more tense, especially in respect to the US and the west’s relationship with China. Trump also has an unhealthy disrespect for global institutions which does not bode well for multilateral co-operation on trade, climate change or future pandemic preparedness.
At home Trump 2.0 will have fiscal implications as he campaigns on extending his 2017 tax cuts, and immigration which has thus far been a key labour market support in helping firms continue to hire while maintaining downward pressure on wage growth.
Trump and Trade
In 2018, the Trump administration levied tariffs on around 70% of Chinese imports ranging from 7.5% to 25%.
Apart from a few exceptions, the Biden administration has retained these tariff’s and even added a few of their own, most notably on electric vehicles. Being tough on China appears to be a win for both sides of Congress. To be fair, Biden did suspend Trump tariffs on a range of European Union products ranging from agriculture to aviation. For their part, China and Europe retaliated with tariffs of their own on US agriculture, amongst other things.
Trump has been campaigning on an intention to impose
an across the board 10% tariff on all imports from all markets, except for China which will wear a 60% tariff on their exports into the US.
Tariffs, intended by Trump to protect domestic industries and promote re-shoring particularly of manufacturing industries always backfire by increasing consumer prices and limiting choices. They more often than not provoke retaliatory measures, hurting exporters and straining international relations. Moreover, tariffs can stifle innovation and efficiency within protected industries, leading to long-term economic stagnation rather than fostering sustainable growth.
A report* from the Peterson Institute for International Economics (PIIE) found that assuming the tariffs are fully passed on to US buyers, the combination of new Trump tariff proposals will generate consumer costs of at least 1.8 percent of GDP, not considering further damage from foreign retaliation and lost competitiveness. This calculation implies that the costs from Trump’s proposed new tariffs will be nearly five times those caused by the Trump tariff shocks through late 2019, generating additional costs to consumers from this channel alone of about $500 billion per year.
Furthermore, Trump has proposed replacing income tax with the revenue from tariffs. This is populism at its worst. It would hit poorest Americans hardest, the very people he is purporting to help. Also, tariff revenue will likely fall well short of the income tax take and won’t make good fiscal policy either!
Trump and Geo-politics
Trump’s tariff proposals come at a time when geopolitical tensions are already at their highest in decades and are already having a negative impact on trade and investment flows.
Trump’s often unpredictable approach to foreign relations would only serve to create more uncertainties, impacting investment and economic stability around the world. And this is unlikely to be contained to adversaries. Strained relations with traditional allies (e.g. NATO countries) would affect international economic cooperation and geopolitical stability.
Indeed, it is Trump’s unhealthy disregard for global institutions that is the most worrying aspect of Trump 2.0. Withdrawal from international climate agreements could affect global efforts to address climate change, with economic implications for industries related to renewable energy and carbon-intensive sectors.
*Why Trump’s Tariff Proposals Would Harm Working Americans, Kimberly A. Clausing and Mary E. Lovely, PIIE, May 2024
Trump and fiscal sustainability
Perhaps one of the reasons markets appear currently unfazed by the prospect of Trump 2.0 is that while tariffs are a major negative for America’s short-term and longterm economic prospects, that was counterbalanced in his last term with the positive stimulus that came from tax cuts.
But any positive take on tax cuts ignores the longerterm issue of fiscal sustainability. Latest projections for the US budget deficit and federal debt were released by the Congressional Budget Office (CBO) this week. Those forecasts show a marked deterioration from those produced just a few months ago in February.

The deficit is forecast at $1.9 trillion (6.7% of GDP) this fiscal year and to average 6.3% of GDP over the next 10 years. Federal debt is expected to hit $50.7 trillion (122% of GDP) in 2034, revised up from $48.3 trillion (116% of GDP) in the February forecasts. In a longer term set of projections last updated in 2023, the CBO projects US federal debt to reach 192% of GDP by 2053.
If it wasn’t already a problem these latest projections and the scale of the deterioration over just a few months should bring a fresh focus on the financial health of the United States in this year’s Presidential election.
To be fair, the fiscal situation has deteriorated under both Biden (spending) and Trump (spending and tax cuts). Trump’s 2017 tax cuts added nearly $1.9 trillion to the existing debt, according to Committee for a Responsible Federal Budget. Trump has proposed extending those cuts which would add $5 trillion to Federal debt by 2034 according to the CBO. Biden wants to keep the lower tax rates for people who earn less than $400,000, and provide new social spending funded by the portion that is allowed to expire.
Congress suspended the debt ceiling limit in 2023, but that agreement will expire next year, setting up a likely acrimonious confrontation between the two parties over federal spending and tax.
Immigration
and the US labour market
As in New Zealand, the US is going through a period
in which immigration is providing a significant boost to labour market supply. This means that what has been seen as resiliency in the labour market has been able to endure while at the same time, wage growth has been moderating, albeit only gradually.
Our appointed global equity and bonds manager Morgan Stanley Investment Management (MSIM) estimates that immigration has lifted the breakeven rate of monthly payrolls growth from around 70k per month to 265k. The breakeven growth rate is the rate at which payrolls can expand while keeping the unemployment rate stable.
Immigration has thus been a significant benefit to the US economy. Trump’s agenda to significantly restrict immigration and potential deport millions of workers, while no doubt be appealing to some voters, will have serious negative implication for the US labour market and economy.
Monetary policy divergence matters
The European Central Bank became the first of the major central banks to cut interest rates this cycle. This followed earlier cuts from the second-tier Swiss and Swedish central banks.
This move by the ECB was well-flagged and came despite on-going delays in the likely start to interest rate reductions in the United States. While that delay didn’t prevent the ECB cutting, we think it limits how far they can go without the Fed following suit.
The key point is that the ECB has made better progress on meeting its inflation objective than in the US, allowing the central bank to take the first cautious step into less restrictive territory. In so doing they have been careful not to commit to any particular path for monetary policy, indicating this will be a slow and gradual process and will remain highly dependent on how the data plays out.

Key factors the ECB will continue to watch will be wages and the exchange rate, the latter being the constraint on not getting too far ahead of the Fed.
Slow and cautious means we also believe that future cuts
will only at come at meetings at which fresh economic projections are produced. That means no cut at the next meeting in July, with the next one likely to come in September, so long as the data remains supportive.
Economic convergence will help
Resilient economic data and a series of stronger than expected inflation prints through the first quarter of this year has seen the Fed postpone the expected start date of interest rate cuts and reduce the quantum of those cuts in 2024 (though admittedly not as much as the market has had to revise its pricing!).
More recently, US economic data has started to soften. The ISM manufacturing index has been in contraction territory for some time, but the services index is now softening too. Remember this is the sector where the sticky inflation emanates. A slowdown there is welcome. And of course, a slowdown in the services sector is also consistent with the recent softening in the labour market. Payrolls is still printing strongly, but some of the more forward-looking indicators such as job openings and initial jobless claims are on a clear softening trend.

Most importantly, after a period of higher-than-expected inflation through the first quarter of 2024, we are now possibly back to a period of lower-than-expected numbers again with core PCE (the Fed’s preferred inflation gauge) rising just 0.1% (0.08% to 2 decimal places) in May. That brought the annual rate down to 2.57% from 2.78% in April and annualised inflation in the last 3 months to 2.74%, a drop from 3.45% over the same period.
A convergence of US growth and inflation trends towards those in Europe will keep hopes alive of lower US interest rates this year. While the Fed’s dot plot now only shows one cut this year, recent data has brought September, and two cuts, back into play. Such an outcome will allow greater scope for lower interest rates elsewhere.
Data dependency needs to morph to sound judgement
Most central banks continue to emphasise their data dependency in making decisions. A data-dependent
approach to setting monetary policy means that central banks base their decisions on current economic data and trends.
While some data is useful as forward indicators of other data, it is, by definition, historical. In that sense, a datadependent approach can make central banks more reactive than proactive. They may end up constantly adjusting policies in response to economic changes rather than anticipating and preparing for future conditions.
Financial markets closely watch central bank decisions and economic data. A data-dependent approach can lead to increased market volatility as investors try to anticipate central bank moves based on new data releases.
We have seen this play out in New Zealand recently as some analysts and even some market commentators have over-reacted to some new data point – weaker than expected activity data has tended to lead to estimates of the timing of the RBNZ’s first cut being brought forward, only to have it shift out again following the release of higher-than-expected inflation data.
While the data will always be important, judgement eventually plays a crucial role. That’s especially regarding the “sustained” part of central banks inflation mandates.
Elections in France and the UK
As we go to press the early results of the second round of the French legislative elections are coming through and the dust has started to settle on the UK election.
There is a saying in French politics that in the first round of voting you vote with your heart and in the second round you vote with your head. The electorate certainly let President Macron know what they thought of his government, delivering him a third place behind Marine Le Pen’s National Rally (33% of the vote) and the leftwing coalition New Popular Front (29%). President Macron’s centrist alliance came in with around 21%. It’s a tough gig being a centrist politician in Europe these days.
The second round has flipped things on their head. It appears the left has the greatest share of the vote with Macron’s alliance in second and Le Pen in third.
Regardless of the final shape of the legislature, the biggest loser in France is likely to be fiscal sustainability. It’s hard to envisage any outcome that strengthens fiscal discipline. That’s a problem for France and it’s a problem for Europe.
In the UK, the main interest was in how bad the outcome would be for the Conservatives. The answer was really, really bad as Labour won a substantial majority. The

depleted Conservative caucus now faces a challenging time. It must serve its duty as lead opposition party, but also fight a battle on its right flank for the pre-eminent party of the “Right” against Nigel Farage’s Reform UK party.
Australia to hike again?
Regular readers of our research may recall we thought the Reserve Bank of Australia (RBA) would hike interest rates further than they did. We expected a peak of 4.6%, whereas the RBA paused at 4.35%.
In hiking rates less than other central banks (the US and New Zealand), the RBA was implicitly choosing to inflict less harm on the Australian economy, accepting it would require a longer period at “peak rate” and take a longer period for inflation to return to target. Sounds fine, but this approach left a greater chance they might not achieve their goal of returning inflation to target.
As the effects of the tightening in monetary policy has flowed through the economy, growth in activity has slowed and the labour market has started to ease. However, progress on inflation has been less than expected, admittedly as it has in most developed economies. Recent data from the May Monthly CPI indicator (a partial release of some of the data that makes up the full quarterly CPI) is indicating some upside potential to RBA inflation projections that have already been revised up once before.

This has raised the prospect of a further hike in the Australian cash rate, indeed latest market pricing has the prospect of a hike at the August meeting at 50%.
I’m also sitting on the fence. There are strong arguments for both a hike and a hold. The Bank should hold because monetary conditions are already restrictive, and it will just take a bit more time to return inflation to its mandated level. But the RBA should also hike because the achievement of its mandate within a reasonable period of time is under threat and there is no time like the present to pull the trigger.
I don’t profess to have a sufficiently nuanced understanding of the RBA’s reaction function to have a firm view one way of the other. But if push came to shove, I’d pick a hold and no cut until February or May next year.
Things going the RBNZ’s way
The New Zealand economy managed to eke out a 0.2% gain in the March quarter, stronger than our expectation of a small contraction but in line with the RBNZ’s forecast. Neither this result, nor the underlying detail, changes our view of an economy that is essentially flatlining, a situation we expect to prevail all year.
Again, this weakness is despite strong population growth which was reflected in the per-capita growth of -0.3% in the quarter. The per-capita recession is well entrenched.

Partial activity data since March paints a soft picture of June quarter growth which we expect to print negative. Indeed, we see no scope for any pick-up in growth until restrictive monetary conditions start to ease. We do not believe the tax cuts announced in the May Budget and scheduled to kick in from the end of July will shift the dial on activity other, than to offset the deteriorating trends in the labour market and business investment.
That said, the latest ANZ Business Outlook survey showed a degree of consolidation in the June survey after several weaker months. That fits with our characterisation of the economy as flatlining rather than collapsing.
The more significant news in the ANZ survey came in the inflation indicators. While cost expectations fell a bit further, they remain uncomfortably high. However, with the economy struggling, it’s harder to pass those costs
on. Pricing intentions fell to a net +35.3%, its lowest level since 2020. That dynamic is supported by profit expectations, that while improved from last month, are running at -10.9%. But what’s bad for profits right now is good for the Reserve Bank.

The labour market is also supporting the disinflation process. The unemployment rate is on the rise from a low of 3.2% in September 2022 to 4.3% in March of this year. High net inflows of migrants has boosted the supply of labour, which is now colliding with a much weaker employment market. We expect this will lead to reduction in the net inflow of migrants, but we still expect the unemployment rate to be 5.6% by year-end.
We see the unemployment rate rising further and more quickly than the RBNZ, who are forecasting the unemployment rate to peak at 5.1% in the middle of 2025. Our faster rise in the unemployment rate, along with the increasing difficulty in firms’ ability to pass higher costs on, is the key reason we (and it appears everybody else) think the RBNZ will be able to deliver the first cut in the Official Cash Rate earlier then the third quarter of next year as signalled in their hawkish May Monetary Policy Statement.
We have retained our long-held view that the RBNZ will be able to cut interest rates as early as November this year. This is a bold call given the RBNZ’s latest set of projection didn’t have them cutting rates until a year later. But we believe that by November, the RBNZ will have sufficient information to make the judgement that a sustained return to 2% inflation is more likely than not.
Bevan Graham

Implications for Investors
Market returns for the first half of 2024 have validated the more constructive views of the global growth situation, and have therefore continued to favour equities, more than bonds. Indeed, investors have by and large been willing to “look through” challenging data and central bank statements, though at times, negative surprises or hawkish commentaries have caused markets to pause. Market outcomes have so far remained positive, as the outlook for US earnings growth remains strong, albeit dominated by technology.
The US S&P 500 achieved new all-time highs 31 times during the First Half, and closed Q2 out with a robust 3.5% gain (in USD terms.) Although April month had displayed some equity weakness, it was more than offset by rallies in May and June. The influence of US technology stocks drove a significant share of the market’s recent rise. Sentiment was assisted in the last two months of the quarter by a 0.4% decline in the yield in US Treasury bonds, from 4.7% to 4.4%. However, overall global bond markets were largely flat for the second quarter, with the Global Aggregate index (hedged in NZ dollars) rising by just 0.08% over the 3-months to 30 June and by 0.06% year-to-date. Uncertainty on inflation and fiscal risks still hangs over government bonds. Credit spreads also remain very tight, suggesting limited credit risk premia.
In New Zealand dollar terms, the modest recovery of NZD/USD during the June Quarter marginally lowered global shares’ gain, with an unhedged New Zealand investor experiencing a 0.75% three-month return from global equity markets (measured by the MSCI World Index,) bringing their 2024 year-to-date NZD return to 16.1%. However, funds without exposure to the star semi-conductor stock NVIDIA will show a lower return, as the 43% quarterly gain from that one company catapulted it (briefly) into top spot as the world’s most valuable enterprise by market cap. In midJune. Microsoft reclaimed the pole position after a latequarter correction in NVIDIA saw its market capitalisation dip down to “only” USD 3.0 trillion before partially rebounding. Other major semiconductor firms like Broadcom and our own manager’s preferred selection, Taiwan Semiconductor (TSMC) have shown exceptional returns in 2024, gaining in excess of 50% year-to-date, due to AI demand. However, to reap the full benefit,
funds would need to hold a comprehensive clutch of these key players in the dominant AI-transformation market narrative.
10 Most Valuable Companies by Market Capitalisation

Source: BBC,Bloomberg, as at 19 June.
Artificial Intelligence (AI) optimism remains a vital plank for equities
Internationally, promising quantitative research is emerging capable of estimating the impact of dynamic factors. These can take the form of “widely-believed themes or stories” affecting the performance of different market sectors – sometimes, independent from their financial fundamentals. While the analytics in this area is often carried out by machine learning models, the concept owes much to Professor Robert Shiller’s work on Narrative Economics (2000.) Newly-developed “narrative radars” reveal that an ever-changing set of influences can explain (in machine-learning model terms) the performance of various strategies and investment styles. Prediction, in these models, often takes the form that if a particular investment type has underperformed what the model would have anticipated, there is scope for “catch-up” and if it has outperformed the model’s prediction, estimates there is scope for “correction.”
However, these narratives may prove short-lived, or they may wax and wane over a few months or quarters, at the longest. The Artificial Intelligence-Narrative, for example, has been identified as the dominant determinant of relative industry (sector) returns as well as overall returns in global share markets recently, but it
has been challenged at times by US Real Bond Yields, Economic Hard Data, and even the China-sensitivity of the market under consideration.
In the example below, the year-to-date positive performance of the key US equity index can be explained by AI themes, and (to a much lower degree) by Federal Reserve policy expectations and the slope of the US bond yield curve. The Russia/ Ukraine war’s influence has now fallen to zero, on this model, whilst a range of other themes such as China concerns or recently-rising US real yields are exerting a modest negative overall statistical “influence.” These numbers are of course quantitative estimates, but the comparative scale of the influence of Artificial Intelligence-linkages in returns is very apparent.

Source: Bloomberg, FactSet, UBS Narrative Radar 14 June 2024
While that has been a benevolent factor for international equity market returns this year, it does raise some concerns about future risks, if and when investors become more demanding on the evidence and on seeing the actual bottom-line benefits of corporate AI and high-volume data processing adoptions.
So far, this constructive view of the US technology sector has been justified, in terms of the distributions of revenue and profit growth forecast through the year to 30 June, for the impending reporting season.
The US Information Technology sector is expected to report the third-highest annual earnings growth rate of all eleven sectors at 16.4%. Two IT sector subindustries are projected to report double-digit growth: Semiconductors & Semiconductor Equipment (51%) and Technology Hardware, Storage, & Peripherals (10%). Two words suffice to cover the theme at play here: “Big Data.” It is pertinent to note that if NVIDIA were excluded, the annual earnings growth rate for the US IT sector would drop from +16.4% to +6.9%.
The Information Technology sector is also expected to report the highest year-over-year revenue growth rate of all eleven sectors at +9.5%. Almost 4% of that expected revenue gain is attributed to NVIDIA alone.

Source: FactSet, as at 7 July 2024
Market plateau may lie ahead, as uncertainty rises
While we have maintained an overweight bias to International Equites within our Sustainable Growth fund since March 2023, we now consider it a prudent time to lower the size of the tilt from +3% to a more Neutral allocation. We believe that relief on the earnings and interest rate front is already rather fully reflected in market pricing, whereas the material risks of pre-election jitters or any profits disappointments are not sufficiently reflected. At the same time, prospective indicators of equity weakness or any end to the current bull market are not yet present, so a close-to-neutral position is best.
The foregoing comments on an increasingly overconcentrated US equity market is just one factor in this decision. The group of big technology stocks known as the Magnificent Seven— Nvidia, Microsoft, Apple, Amazon, Meta Platforms, Alphabet and Tesla— is responsible for 60% of the S&P 500 index’s total return this year. Prior to its 18% early-July rally, Tesla had not participated, so the H1 2024 market dominance by US tech was confined to the “Big Six.” Nvidia alone has contributed just above 30% of the gains in the S&P 500, year-to-date. In addition, Microsoft, Amazon, and Alphabet have collectively contributed 26% of the gain, and Apple and Meta Platforms together contributed 11%. Weight-loss drug maker Eli Lilly (Zepbound) had also rallied 55% year to date, and it now the tenth largest stock in the S&P 500, just above Tesla by market capitalisation. Excluding Berkshire Hathaway and Lilly, and Amazon -which counts as Consumer Discretionary, despite its heavy internet reliance- the rest of the Top Ten are all Tech. companies, whether classified as pure IT or as Communications Services.
Though six or seven companies drove two-thirds of the rally 15% in the S&P 500 through to end-June, it is important to note that their strong reported earnings and profit margin performance has supported the IT
Megacaps, though their p/e multiples have obviously expanded to demanding levels, and scrutiny will be high. Their earnings may be stable or growing strongly, but changing economic cycles can rapidly impact growth rates in non-discretionary purchasing, whether by individual consumers or by corporates.
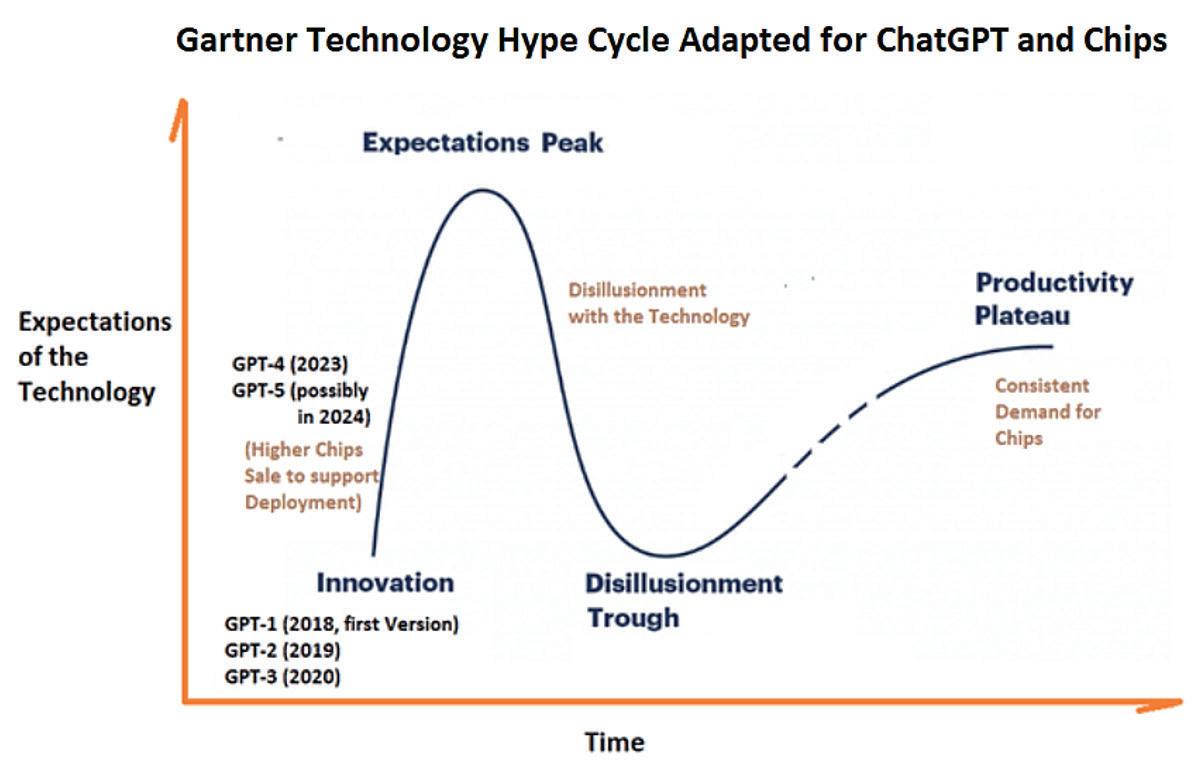
The issue is not so much that such a concentrated situation might precede a broad equity bear market (historically, a causative relationship is not typical, except for the years 2000-01). More importantly, the assumptions underlying the longer-run revenue promise of Artificial Intelligence product enhancements might be currently erring toward the “peak of inflated expectations” phase of the Gartner Hype Curve, and that the following phase of disappointment and excess negative sentiment toward the “trough of disillusionment” can be savage for associated investment securities.
Source: SeekingAlpha
Staying well-diversified is wise, even when it hurts
A “reasonable equilibrium” does eventually emerge, reflected in adjusted market valuations, but that point still seems to be in the future, for high-end microprocessors. The confluence of gaming, virtual reality, generative AI, robotics, digital currencies and data storage is a heady narrative mix, and it currently dominates business media. This has led to resilience in associated market sectors, to periodic negative news, and market participants are still broadly “buying the dips” – which could easily continue until there is a shift in investor psychology. The catalyst for any such shift is unpredictable, as both commercial and political risk factors are present and the US government itself is capable of triggering a shock to the sector.
This political risk dimension is not confined to the Technology sector, though Donald Trump has an uneasy relationship with the Silicon Valley industries during his 2016-20 presidency. Anti-obesity drugs, for instance, are very expensive – particularly for a lifelong treatment course. President Biden’s administration has indicated that the degree of Federal subsidy available to their
health system distributors (which has contributed to sky-rocketing consumer demand and early-life high profitability) cannot last indefinitely.
Political vulnerabilities should not be under-played, given the global complexities in the advanced microchip supply chain and tensions surrounding China and Taiwan. So, the importance of diversification should be remembered particularly in periods when diversification might appear to be diluting portfolio returns. This is because reversals in a dominant market narrative can unfold sharply, and it can be difficult to adjust positions efficiently at times of mass investor and trader exodus from a crowded trade.
US equity gains in 2024 are unevenly spread
As shown below, the acceleration of the Mega-Cap stocks has led to a 10%+ divergence in year-to-date returns between the US S&P 500 (market capitalisation weighted) and an equally-weighted version where each of the 500 constituents is weighted at 0.2%. This scale of divergence is the largest since before 1990.

Source: WSJ, FactSet, Dow Jones
Diversification is usually proven to be the correct method of portfolio management over time. However, the concentration of the global gainers has led to significant difficulties for active managers in the short-term. As at the start of July, the top three S&P stocks constituted 21% of the S&P 500 Index, the top five, 27% and the top 10, 36%. While such concentration is acceptable if there is a good industry mixture represented in a portfolio, that can be increasingly hard to achieve in Index-aware funds. For instance, the Top 10 stocks in the MSCI World Index as at 30 June are identical to the Top 10 S&P 500 stocks, with the exception of just one: the MSCI World Top 10 has JPMorgan as its sole Financials member, whilst S&P 500 has Berkshire Hathaway.
In geographical terms, diversification is similarly tough. The US now constitutes over 72% of the MSCI World
Index, and the next largest country being Japan, at 6%. In the MSCI AC World, which includes nondeveloped markets, the US’ share is above 65%. For a non-US investor in international equities, the overriding longer-term risk must be that something might occur which lastingly, negatively impacts American corporate profitability. There may be a small probability currently assigned to that risk, but it is clearly not negligible.
US companies’ share of MSCI AC World Index has never been so high

Source: Dow Jones
Narrow market breadth in a rising overall market indicates lower future returns
Research over the last twenty years shows that if market breadth is narrow in a falling market (e.g. 2008-09) the subsequent quarter-ahead expected return tends to be positive. However, when breadth is narrow within a rising market (e.g. mid-2011, mid-2021, and currently) the forward expected return over a tactical timeframe of 3-9 months is less compelling.
That is not an unequivocally “bearish” indicator, but rather it suggests a slowing or potential stalling rate of gains – more of a “plateau” than a plunge. We rather expect some laggard, defensive sectors and companies in the Real Asset arena to come into greater prominence as interest rates gently decline. Infrastructure and Real Estate now only have small sector weights within the broad share market indices.

Source: Morgan Stanley, QDS
Taken together, these factors argue for a moderate reduction in portfolio risk from international equities for the second half of 2024, without implementing outright defensiveness just yet. Our positioning has been adjusted accordingly, allowing portfolios to continue to benefit from international asset upside but with more of a proportional alignment toward the credit risk factors in corporate bonds than equities.
NZ
share market reflects current, “crock-star” economy
The NZ equity market posted a soft -3.2% return for the June quarter, erasing its rather anaemic 2.8% March quarter gain and thereby moving into slightly negative returns on both a 2024 year-to-date and one-year basis. This compares poorly to the +16% year-to-date and +21% one-year return from global equity markets (in NZD terms.)
This outcome is as we expected, given the high degree of monetary policy restraint prevailing in New Zealand and the ever-worsening domestic sentiment level. There is simply no real catalyst at present for a recovery in performance by the NZ equity market, and the best approach at home is probably to be incrementally accumulating quality cyclicals, ahead of the inevitable point when the RBNZ eases policy, and investors begin to pre-position for a “green shoots” recovery dynamic which should be visible by mid-2025. Investors would typically wait to see definitive evidence of a shift in policy bias away from tightness and more supportive sentiment readings and could potentially begin allocating more to NZ shares by year- end. However, the proviso is that as international shares have now outperformed domestic equities by so much, for so long, institutional asset allocators probably have a high bar for deploying funds locally.
Diversified Funds’ NZ equity exposure defined by Fund objectives
In the meantime, however, we are not in a hurry to close out a substantial underweighting to NZ equities in the Salt Sustainable Growth Fund, which currently sits at -7%, compared to its Strategic Allocation level.
The Growth Fund’s objective is to outperform NZ Consumer Price Index inflation by 5% over a rolling 5year timeframe, and thus it is important to tilt its asset mix fairly aggressively against underperforming asset classes – in which regard, NZ equities has certainly fitted the bill; underperforming both domestic bonds and bank bills (cash) for the last year, and even over a threeyear annualised period (which is atypical.) Extending out to five-year returns, NZ equities’ annualised index return slightly lags that from Cash, although for that longer period, domestic shares have beaten NZ bond indices by around 2% p.a.

Source: S&P Global Indices, data to 1 July 2024
In the Sustainable Income Fund, the 44% weighting to NZ shares (including listed Property) has been reduced from almost 50% at the beginning of this year, with a progressive reallocation towards global fixed income assets. Whilst the current NZ equity weighting is above the Strategic Neutral level of 37.5%, this is justified due to the considerable dividend yield advantage still achievable within the domestic market from stable and well-established industry operators. As international bond yields (influenced by corporate debt) have risen to a comparable yield level to domestic dividend-focused shares, the portfolio allocation to global bonds has been brought up to a Neutral level, at 35% of the Income Fund’s holdings.
As the table below shows, the expected year-ahead income stream to the Sustainable Income Fund is generated through a diverse set of component asset types and is thus able to target a distribution level which is designed to exceed that available from NZ bank deposits over a three-year average period.
economic upturn in 2025 can unlock the domestic equity total returns driver.
Meanwhile, the Global listed real assets of Property and Infrastructure are delivering a moderate degree of capital growth, with a one-year gross return to 30 June of 7.2% from global property, nearly matched by the 7.0% gross gain from global infrastructure.
As international central banks move ever closer to softening their post-Covid monetary stances (with the US Federal Reserve being key) we believe there is considerable value to be unlocked in global listed real assets, which can be expected to contribute positively to the Income fund through late 2024 into 2025.
Fixed Income: Diversification benefits between stocks and bonds remain low
This year has also seen continuation in the rising positive correlation of shares and bond yields, which has been sapping the utility of growth asset / defensive asset diversification from a risk-adjusted returns standpoint. As has been the case for almost 18-months, equity markets have been reacting to developments in sovereign bond markets, which have themselves been driven by the inflation-central bank pivot narrative.
So, returns from the classic US “60% Equity / 40% Treasury Bond” portfolio have been robust, at 10.3% 2024 Year-to-Date, although this return is dominated by the very strong 2024 return from the Equity component. Bonds and stocks have been positive (or negative) in lock-step, but the equity contribution has been far higher than the bond contribution to returns. Global bonds are essentially flat (or slightly down) in aggregate, in 2024 to date. The correlation shown below has only increased further during the second quarter, from 52% in early April to 65% at the end of June. This means that Bonds may not rally much, even if global equities were to enter a correction phase in the Second Half of 2024.
The corollary is that, due to the anaemic performance of NZ equities and the downward re-pricing of NZ listed property pools, there has not yet been scope for capital value growth from the Income Fund. Nevertheless, we would expect that as many of its domestic equity holdings are at “fair” valuations now and (in the case of property) at a fair degree of discount to fair value, any regime shift from the Reserve Banks and an eventual

Source: Morgan Stanley Investment Management, July 2024
Strategy conclusions
Our central market views are:
• Near-term, equities have achieved extended gains and now, corporate earnings need to validate the optimistic assumptions reflected in their prices after the H1 2024 rally. A minor correction was due, but although April saw softness, declines were transitory due to resurgent Tech euphoria. Rebounds have been narrow in sectoral terms, however, as described earlier. Yet, many companies are still finding the higher interest rate-cost environment challenging.
• Even if mid-2024 becomes more choppy for asset returns, the US Presidential Cycle tends to resolve positively in an Election year and in the quarters immediately following.
• Trump, as ever, presents a wild card here, and growing doubts about Biden’s capacity clearly don’t help. Meanwhile, slowing in the US economy is becoming more apparent.
• Equities (as a whole) should see average annual returns close to their long-term norms in the next 3-years with interim weaker periods; selected equity sectors and markets still have scope for resilience and desirable investment features. There are all-weather stocks and defensive sectors that have lagged in recent years. Consumer Staples stocks and Health Care stand out.
• Within the broader market sectors, thematic and valuation support in Utilities and Consumer Staples, Healthcare, and Software as a Service (SaaS) Information Technology enjoy pricing power which assists them to ride out sentiment storms and hedge against economic slowdown.
• Listed real assets also have superior, defensible yields, in a fraught macroeconomic and geopolitical phase. Real Asset’s historical sensitivity to bond yields (as they trend downward) can be supplemented by their cashflow surety, inflation-hedging qualities and (for Infrastructure) non-cyclical defensive merit. Bond yields have adjusted well, and may now plateau, which is positive for Real Estate looking forward one year, while Infrastructure may need weaker economies to again outperform more markedly.
• Expect more M&A based on strong USD “war-chests” and some abandoned corporate courtships as conditions shift and credit-distressed firms multiply in 2024-25.
• We see better compensation for duration risk in bonds. However, yield levels will remain volatile. Within fixed income, thematic support is ready to be a prime differentiator, as sovereign and corporate bonds face refinancing risks. We acknowledge sustainable or “green” bonds as a valuable theme.
• Default risk and credit quality are now on the radar and are likely to become a market focus into 2025 and set off portfolio re-allocations within and beyond bonds. We are now traversing a slowdown phase as the lagged impacts of tightening of policy around the world continues to impact the real economy, and asset markets should adapt to protect existing capital gains by allocating funds toward “all-weather” securities.
Such desirable investments, which we are actively seeking out across all our asset classes, are resilient to both diminishing growth and to profit challenges in a less stimulus-based, capital spending and productivity-led phase. International assets are still broadly preferred to New Zealand counterparts, where viable, as the key northern hemisphere trading economies have more diversified defensive industries and often, more adaptive economic regulation (whist allowing that electoral / policy change risk is ever with us and will intensify this year with the US Presidential election in November).
Greg Fleming.

IMPORTANT INFORMATION
The information in this publication has been prepared from sources believed to be reliable and accurate at the time of preparation but Salt Funds Management Limited, its officers and directors, make no representation or warranty as to the accuracy or completeness of any of the information contained within. All analysis, opinions and views reflect a judgment at the date of publication and are subject to change without notice. This publication is provided for general information purposes only. To the extent that any of the information in this publication does constitute advice, it does not take into account an investor’s financial situation or goals. An investor should, before making any investment decisions, seek professional advice, having regard to the investor’s financial situation and goals. Past performance is not a reliable indicator of future performance and no representation or warranty, express or implied, is made regarding future performance. This presentation is solely for the use of the person or persons to whom it is provided and must not be distributed or copied, in part or in whole, without the permission of Salt Funds Management Limited. Salt Investment Funds Limited is the issuer of units in the funds comprising the Salt Investment Funds Scheme. The Product Disclosure Statement is available from saltfunds.co.nz