How the delay in passing a farm bill affects local farmers
THE GREAT GATOR:
How XUV is helping farmers with adding a mobile office for boundary mapping
THE COST OF TARIFFS:
How tariffs could impact corn and soybean producers in the U.S.
Advertising
Jamee A. Pierson
Magazine
Jamee A. Pierson
Jamee A. Pierson
‘Dire’ implications of more farm bill delays
By Tom C. Doran Central Iowa Ag Mag
The U.S. agriculture sector is responsible for nearly 6 percent of the nation’s gross national product, and many industries depend on food, feed and fuel production, yet the farm industry is operating on farm bill policy set six years ago.
The implications of delaying passage of a new farm bill were the topic of a Farm Policy Facts’ Groundwork podcast featuring Nate Kauffman, senior vice president and Omaha Branch executive at the Federal Reserve Bank of Kansas City, hosted by Tom Sell.
“During September when Congress was in session, lawmakers heard a consistent theme from the agricultural sector of a financial storm brewing,” Sell said.
“Production costs from land rents to labor costs to machinery costs to even interest rates and the cost of money rose steeply in 2022 and 2023 and have stuck, while commodity prices have plummeted, creating a situation where many farms and many family farms are concerned about having the ability to cash flow and secure operating loans for next year.
“The situation feels dire and it’s not just the farmers. A recent survey of agricultural economists showed that more than 50 percent believe that the agricultural economy is already in a recession.”
The 2018 farm bill that provides an ag safety net among other policies expired on Sept. 30, 2023. It was extended through Sept. 30, 2024.
A second one-year extension of the 2018 farm bill would leave the ag industry working under a seven-year-old plan in the much-changed world of 2025.
Sell: Ag is a significant sector of our economy and an industry that relies on lending. Most farm families take out operating loans and there’s a lot of debt that’s carried on the land interest that are held in private hands throughout the nation. Could you talk about the significance of agriculture?
Kauffman: There’s a couple of places that I would highlight the importance of ag that might be a sometimes a little underappreciated. One is just purely ge -
ography. This country has a large part of its geography that is tied to concerns of what might happen within agriculture or in a rural context just in terms of the area.
When it comes to the direct output that agriculture represents, it’s a relatively small share, but I think where it gets underrepresented is ultimately what that connects to by way of other industries.
When we think through the supply chain in agriculture, you have to start thinking about energy, you have to think about transportation, you have to think about services and segments of the economy that are very tied to ag.
It’s more than just the direct farm output. It’s the other industries that are also reliant on ag, ultimately translating into demand for food and fuel.
Sell: When assessing the state of the agriculture economy and looking at the indicators, what are some of the key things you’re looking at, what are the data points that you focus on?
Kauffman: When we think about agriculture, we do have a very heavy focus on monitoring credit conditions. Because I would argue that what you start to see play out in the way of credit will give you both an early sense the potential economic conditions that you’re going to see later on, but then also the degree to which you would worry about risk that you might see in agriculture.
So, we tend to pay a lot of attention to credit conditions. That’s also because the Federal Reserve is a bank. We have a lot of connections to commercial banks and the financial industry in general, and so we also tend to get a pretty good picture of what’s happening with respect to lending activity and credit by monitoring some of those conditions in agriculture.
Sell: There is a lot of concern about the state of the ag economy right now from the ground up. This was supposed to be a 2023 farm bill. The data shows significant reductions in net farm income and even in gross sales, particularly on the crop side. What’s the data that you’re looking at really showing with respect to the ag economy right now? What are the best hopes or maybe the fears that you have when it relates to
crops and revenues?
Kauffman: 2024 had been a bit of a turning point year. What I mean by that is farm incomes and profits generally speaking for the last three years have been extremely strong.
Some of that early on in the pandemic was supported by government payments, but more than that it was that profit margins were very good as commodity prices were relatively high. We know that input costs were a challenge, but margins were generally pretty good.
This year we’ve seen a pretty sharp decline in crop prices. Cattle markets and other industries have still been relatively strong, but we’ve started to see some pressure coming by way of those lower crop prices.
I describe 2024 as a turning point because you could potentially see some scenarios two, three years out if the current environment persists where some of those challenges could continue to mount.
At the same time, when we look at measures that would suggest whether or not we’re seeing really difficult conditions right now, we’re just not really seeing it.
You’re not seeing a lot of, for example, defaults on loans, or you’re not seeing a lot of financial pressure start to emerge despite the lower commodity prices. I say it’s a turning point because we’re starting to see some of those conditions soften.
You could potentially see some conditions a couple years out, but if it persists there are more of those challenges even if you’re not yet seeing it in the data right now. We tend to look a lot at anything that would suggest some sort of early indication of potential financial stress.
Sell: Agriculture is a longer cycle than a lot of industries. You don’t have daily cash flow. This is the harvest season and I expect the last quarter of the calendar year is when the bulk of farm income comes in. How concerned are you about how this end of the year shapes up?
Kauffman: The fourth quarter tends to be the quarter where a lot of producers are making other decisions about
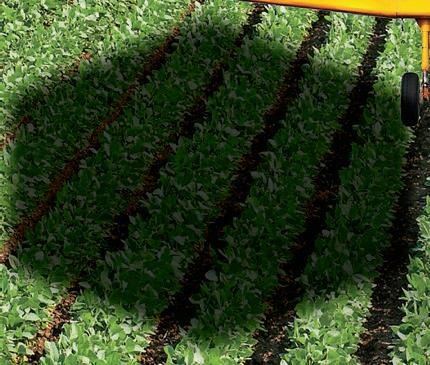
John Deere Gator gives farmers mobile office for boundary mapping
Machines designed with
customer jobs in mind
By Martha Blum Central Iowa Ag Mag
John Deere Gator XUV Crossover Utility Vehicles are built for work.
“We can have fun but our engineers design and test these machines with customer jobs in mind,” said Eric Halfman, John Deere go-to market manager for Gator Utility Vehicles.
The XUV 875 is a diesel machine and the XUV 845 is a gas Gator.
“We have integrated technology built in so the XUV is
GreenStar ready,” Halfman stated. “The Gator can be their mobile office for boundary mapping.”
Instead of using a tractor to boundary map a field, the Gator can be used to do that job. “This machine is lighter and more nimble and able to get closer to things while you’re mapping,” the market manager said. “It is made for going through rough terrain, so you can use a machine that’s made for that and protect the investment of your bigger machine.” Customers don’t have to
order a display or StarFire receiver for the Gator if they already have them on their other equipment. “You can move them from the combine to the Gator,” Halfman said.
A pull-behind sprayer can be used with the Gator. “There is an ISO implement connector so you can do sprayer rate control and section control with this Gator,” Halfman said at the John Deere display area during the Farm Progress Show.
“We have a farmer in northwest Iowa that uses the Gator for wetter spots so he can get in to spray earlier,” he said. “AutoTrac is another option and I don’t know many people
who don’t use GPS technology while spraying.”
Farmers can also use the technology for removing rocks from fields. “You can map where the rocks are in the field,” Halfman noted.
The cargo box is a composite material. “It is class leading from a volume perspective,” he said. “The composite material has allowed our engineers to design some really cool stuff.”
By adding some dimensional lumber, farmers can customize the box to do a job like fencing. “There is a ledge so you can put plywood on there to create a shelf and then you
Corn gets boost from new tech
By Tom C. Doran Central Iowa Ag Mag
A groundbreaking technology has been developed that could boost domestic corn demand by over a billion bushels.
Cameron Rylance, Bluestem Biosciences vice president of government affairs and business development, spoke of how the renewable chemical company can transform the demand market in an interview on Illinois Corn TV.
“Bluestem Biosciences is based in Omaha, Neb. We started with the thesis that you could derive a lot of value from existing ethanol infrastructure in the Midwest utilizing the best feedstock there is — corn — to create chemicals other than ethanol,” Rylance said.
“Through anaerobic fermentation which is currently used to produce ethanol, we can produce chemicals that are currently made using petroleum.”
Bluestem Biosciences developed novel yeast biology for the sustainable anaerobic bio-production of 3-Hydroxypropionic acid, a chemical intermediate for the acrylates chemical family, a $25 billion addressable market.
This strategic platform molecule serves a variety of consumer end markets, like personal care products, paints and coatings.
Bluestem will leverage its novel yeast biology through the retrofit of underutilized existing shuttered ethanol production facilities across the United States.
Bluestem’s anaerobic biology is intended to mimic ethanol production, creating numerous economic benefits while supporting the rural Midwest bioeconomy and agricultural communities.
Additionally, Bluestem’s technology reduces dependence on petroleum for feedstock currently used in chemical production and relies on corn as the primary feedstock, while reshoring supply chains back to the United States.
“Acrylates are a really important chemical for a lot of end markets, but they are all currently made out of oil, and by utilizing the existing ethanol infrastructure across the Midwest, we can address a much higher value end market for corn farmers,” Rylance said.
Acrylates are used in both the public and private sectors, ranging from absorbent polymer inside baby diapers to absorbent sheets at the bottom of a package of meat.
“On the public sector, the Department of Defense is really interested in it for paint, coatings, adhesives, it goes into carbon fiber. It’s about a $25 billion end market. That’s larger than the entire U.S. ethanol market,” Rylance said.
The DOD awarded Bluestem Biosciences a $2.16 million grant last month through its Distributed Bioindustrial Manufacturing Program to plan an anaerobic fermentation facility “for producing an organic acid as a key precursor for the fabrication of defense-related bioplastics/polymers and adhesives.”
The company was founded two years ago and received a pre-seed financing round of $5 million from Zero Infinity Partners, Navigator CO2 Ventures, Invest Nebraska, Bluestem co-founder and CEO Billy Hagstrom and investor Robert Sali.
Rylance reiterated the new process can be incorporated into existing ethanol facilities with only change being the end product.
“The outside of a Bluestem plant looks exactly as an ethanol plant. You have whole kernel corn coming in, you have product coming out along with other co-products. You have distillers dried grain, corn oil and the like. The only difference is the acrylic product being produced as opposed to ethanol,” he said.
“The reason we’ll be able to achieve economic price parity with those existing petroleum-based acrylics is that existing rail loadout, the corn intake and processing equipment, the municipal waste water, that EPA emissions certificate, all of that stuff that sits on a bioethanol facility today, Bluestem will be able to utilize to be commercially successful.”
National Corn Winner
Bluestem was the recipient of one of four Consider Corn Challenge IV winners announced by the National Corn Growers Association at the Advanced Bioeconomy Leadership Conference last year.
The winners each received $62,500 for their unique ways to improve a product or process using feed corn to produce biobased materials.
“We were really excited at Bluestem to be chosen for NCGA’s Consider Corn Challenge IV around this research we’re working on. It’s great not only from a funding standpoint. We’re super excited to receive that funding from NCGA, but more so the connection that we’ve been able to make
with corn farmers on a state and national level,” Rylance said.
“I’m based in Washington, D.C., and that reception has been great. It really put us on the map as somebody that the corn growers look to as a possible new end market and that’s been really exciting for us, as well.”
Corn Advantage
There are many other feedstocks produced by U.S. farmers and Rylance was asked why corn was chosen.
“We’ve chosen corn as a feedstock for a few reasons, but at the end of the day the biggest is that corn producer across the Midwest. We’re confident that by bringing that new source of demand for corn, it’s not going to create scarcity that some people bring up sometimes,” he said.
“Corn growers have always been able to meet that demand through on-farm ingenuity. Also, in D.C. we’ve gotten some push back in terms of climate change and decarbonization, but where we found a lot of good reception is really by highlighting the sustainability of the farmer.
“Corn growers have been sustainably producing corn for over a century and have continued to produce more with less, while reducing that carbon intensity of that corn every year.
“If we’re able to combine that sustainability, on-farm ingenuity, with existing ethanol infrastructure and our new biology, we’re going to unlock some incredible new end markets for corn, while still promoting world agricultural sustainability and U.S.based supply chains.”
Barrel To Bushel
Billy Hagstrom, Bluestem Biosciences co-founder, said, “to get off a barrel of oil, you need to get on to a bushel of corn.”
“That quote has been with us since the beginning of Bluestem. We have seen corn compete with the lowest value portion of a barrel of oil. That’s gasoline. It’s competed with gasoline at the pump for over two decades, and now we’re trying to give it the ability to compete with the highest value fraction of a barrel of oil, those petrochemicals,” Rylance said.
“To put it into perspective, that $25 billion end market of acrylics is equivalent to about 1.8 billion bushels of corn demand per year. That’s a huge amount of corn, a huge amount of chemical market that we need to address, and we’re really excited to be doing it with a sustainable feedstock like corn.”
Farmers pay cost of tariffs
Analysis shows trade war impact
By Tom C. Doran Central Iowa Ag Mag
A new study revealed a tariff-induced trade war would have a serious impact on corn and soybean farmers via lost global market share.
The study was commissioned by the American Soybean Association and the National Corn Growers Association and conducted by the World Agricultural Economic and Environmental Services.
The study specifically investigated the impacts of another potential U.S. and China trade war in which China responds to U.S. punitive tariffs by imposing retaliatory tariffs on corn, soybeans and soybean meal and oil products, as would be expected given the 2018 trade war and overall historical precedent.
Exports of both corn and soybeans are important to U.S. farmers and critical to the bottom lines of farmers.
“Corn and soybeans are prime targets for tariffs as the top two export commodities for the U.S. As the largest exporting state in the country ... farmers can expect to pay an extremely heavy price,” said Jeff Scates, Shawneetown farmer and ICMB chairman.
Corn and soybeans account for about one-fourth of total U.S. agricultural export value. Farmers and rural economies will lose in a reinvigorated trade war with China during a time of extreme financial stress on farm families.
“The study highlights the dangers that come with broad tariffs on imports,” said NCGA Lead Economist Krista Swanson.
“While launching widespread tariffs may seem like an effective tool, they can boomerang and cause unintended consequences. Our first goal should be to avoid unnecessary harm.”
The study found that a new trade war would lead to a steep drop in soy and corn
prices, resulting in a ripple impact across the United States, particularly in rural economies where farmers live, purchase inputs, use farm and personal services, and purchase household goods.
Other recent studies examining the effects of tariffs have arrived at similar conclusions.
Study Findings
If China cancels its waiver and reverts to tariffs already on the books, U.S. soybean exports to China fall between 14 million and 16 million metric tons annually, an average decline of 51.8 percent from baseline levels expected for those years.
U.S. corn exports to China fall about 2.2 million metric tons annually, an average decline of 84.3 percent from the baseline expectation.
Although the export quantity decline is much lower for corn than soybeans, reflecting the smaller quantity of corn exported to China, the relative change from the baseline quantity is significant for corn.
Metro Creative
While it’s possible to divert exports to other nations, there is not enough demand from the rest of the world to offset the major loss of soybean exports to China. At the same time, Brazil and Argentina gain global market share with increased exports.
The United States loses a combined total of 2.3 million to 3.7 million metric tons of soybean plus corn exports annually, while Brazil gains an average of 4.6 million metric tons of soybean plus corn exports annually.
Chinese tariffs on soybeans and corn from the United States, but not Brazil, provide incentive for Brazilian farmers to expand production area even more rapidly than baseline growth.
The expansion is magnified because some land area in Brazil can be used to grow a soybean and corn crop in the same year. Land transitioned into production area in Brazil will remain in production.
The impact on U.S. soybean and corn farmers isn’t limited to a short-term price shock. This is a long-lasting ramification that changes the global supply structure.
A 60 percent retaliatory tariff level intensifies the shock, resulting in a loss of over 25 million metric tons of soybean exports to China and nearly 90 percent of corn exports to China.
In this situation, the United States loses a combined total of 2.9 million to 4.6 million metric tons of soybean plus corn exports annually, while Brazil gains an average of 8.9 million metric tons of annual soybean plus corn exports over the projection timeline.
Price Impacts
A removal of the waiver on existing tariff levels results in a U.S. soybean price that is 60 cents per bushel below the baseline, on average, over the forecast horizon.
The price rises for farmers in Brazil and Argentina, capturing more than 75 cents per bushel over the baseline price on average, according to the study.
In China, the price rises to $1.27 above baseline, on average. The price increases in China make imports more expensive for China, but are beneficial to its farmers.
The result is China buys less foreign soybeans and corn while alternatively expanding its domestic production area
for both crops and retaining the added economic value of the higher price.
The U.S. corn price drops 8 cents per bushel below baseline, on average, while farmers in Argentina and Brazil capture a nearly equivalent increase in their corn price. In China, the price of corn rises 12 cents per bushel, on average.
Under a 60 percent tariff scenario, the price for U.S. soybeans falls nearly $1 per bushel on average, and the price for U.S. corn drops 13 cents per bushel, on average, from already low baseline price levels.
While U.S. soybean and corn farmers are hit harder, farmers in Argentina, Brazil and China see even greater increases in their prices for soybeans and corn.
Comparative prices in Argentina and Brazil rise while farmers in those nations benefit from a combination of higher prices and expanded export opportunity.
Alternatively, U.S. farmers face further price declines at a time when costs remain at record levels and commodity prices are already declining.
Current U.S. Department of Agriculture projections for 2023 and 2024 net cash income would result in the largest two-year decline since the 1970s, leaving U.S. farmers exceptionally vulnerable to the adverse impacts of trade war in 2025.
Depending on the scenario, U.S. soybean farmers lose an average of $3.6 billion to $5.9 billion in annual production value.
U.S. corn farmers lose an average of $900 million to $1.4 billion in annual production value, as the resulting decline in corn prices more than offsets the acreage change.
This burden is not limited to the U.S. soybean and corn farmers who lose market share and production value.
There is a ripple impact across the United States, particularly in rural economies where farmers live, purchase inputs, utilize farm and personal services, and purchase household goods.
Trade War Background
U.S. lawmakers from both parties are increasingly concerned with several Chinese trade practices. While addressing unfair trade practices is warranted, the use of import tariffs as a method to address trade concerns negatively im-
pacts the U.S. farmer and has ramifications for the U.S. economy.
In the 2018 trade war, the United States extended tariffs on steel and aluminum to several major trading partners and separately imposed tariffs on an extensive range of imported products from China.
In response, China and other nations imposed retaliatory tariffs on numerous U.S. products, including many agricultural and food products. This led to significant reduction in U.S. agricultural exports to those nations.
As a result of retaliatory tariffs from the onset in summer 2018 through the end of 2019, U.S. agricultural export losses exceeded $27 billion, with China accounting for about 95 percent of the value lost, according to USDA data.
China and the United States signed a Phase 1 agreement in January 2020, which helped end the trade war. Part of the agreement stipulated China would purchase $80 billion of U.S. agricultural products over 2020 and 2021.
China dramatically increased its purchases of U.S. agriculture products during that time, though final volumes fell short of those obligations, with only $59.2 billion of U.S. agricultural products purchased by China.
Logistics issues stemming from the COVID-19 pandemic and resulting global supply chain crisis further limited China’s purchases, but the revival in trade — which included record volumes of soybeans and corn — helped repair goodwill between China and the United States.
U.S. farmers have worked more than 40 years to establish and nurture their strong trade relationships with China.
During those decades, many farmers visited China as part of trade teams, and Chinese buyers visited the United States.
The 2018 trade war created concerns about the reliability of U.S. supply creating an incentive for China to invest in alternative supply chains. These investments encouraged irreversible production area expansion in U.S. agricultural competitor nations.
While it took decades to fully develop trade with China, the trade war quickly reversed many years of efforts in ways that remain difficult to recover, the report said.
Initiative seeks to double cover crops by 2030
Soil health financial incentives
Farmers for Soil Health empowers farmers to lead the charge in sustainability, putting real money directly into their hands to drive change where it matters most — at the farm level.
With enrollment now open, the program offers an opportunity for farmers to make a meaningful impact on soil health while benefiting financially.
In its first year alone, 238 farmers enrolled, covering more than 78,000 acres, pushing the initiative closer to its goal of doubling cover crop adoption to 30 million acres across the United States by 2030.
This innovative initiative, which is backed by corn, pork and soy commodity groups, in partnership with the National Fish and Wildlife Foundation and the U.S. Department of Agriculture’s Partnerships for Climate-Smart Commodities, provides both financial incentives and technical support to corn and soybean farmers planting cover crops.
The process is designed to be simple, featuring hassle-free enrollment and satellite-based remote monitoring and verification.
“As farmers, protecting the land is personal, and it’s about preserving our family’s legacy,” said Neal Bredehoeft, a soy checkoff farmer-leader from Alma in western Missouri.
“Our farm has been in the family for over a century, and we’ve always prioritized soil and water conservation. My brothers and I have practiced no-till for 30 years and have been using cover crops for near-
ly a decade.
“These conservation practices help keep our soil and nutrients where they belong, and
Farmers for Soil Health provides even more tools to ensure sustainable farming practices for future generations.”
Participating farmers who plant cover crops will receive payments to help transition totaling $50, spanning three years, per new acre of cover crops planted, or a one-time payment of $2 per acre for farmers with existing cover crops.
Eligible farmers will participate in measurement, reporting and verification to highlight progress toward the goal of expanding adoption of cover crops.
“Farmers for Soil Health is
unique in that it provides a couple of key factors that we know will enhance the adoption of cover crops,” said Ben West, FSH executive director.
“Technical assistance provides farmers valuable benefits, and knowing what the science says and how to better implement it on their farms is key. Secondly, putting real money on the table helps farmers mitigate their risks and sustain the willpower and effort to continually adopt these practices in the future.”
Across 20 states, farmers in Delaware, Illinois, Indiana, Iowa, Kansas, Kentucky, Maryland, Michigan, Minnesota, Missouri, Nebraska, New York, North Carolina, North Dakota, Ohio, Pennsylvania, South Dakota, Tennessee, Virginia and
Wisconsin are eligible for enrollment in the cost-share programs through FSH.
“With the support of programs like Farmers for Soil Health, which was built by farmers, for farmers, we can continue improving soil health,” Bredehoeft said.
“This initiative is unique because it not only helps cover the costs of adopting cover crops, but also offers technical support and connects us with supply chain partners. It’s great to see flexibility built into the program whether you’re planting cover crops now or after harvest, FSH meets you where you are.”
Visit farmersforsoilhealth. com for more information and to learn how to enroll online for cover crop payments.
The farmer-led, farmer-driven Farmers for Soil Health initiative offers cost-share programs and technical assistance to farmers in 20 states who plant cover crops for three years.
Central Iowa Ag Mag
demonstrates how a farmer can use the
ping of fields along with many other tasks, such as flagging exact locations of rocks.
have space below for fence posts and tools,” Halfman said.
On the side of the box are four stake pockets. “That allows you to mount tools on the side like a rake or shovel,” Halfman explained. “We also have a chain-saw mount.”
The tailgate is a workstation with pockets for screws, nuts and bolts. “There’s a C chan-
nel for pipes and a bump stop for wood,” the market manager noted. “And there are four spots in the tailgate for clamping.”
The cab has a storage area under the seat. “There is an option for an inverter so you can plug your computer in,” Halfman said. “Then you can pull up the Operations Center and integrate with what’s going on with mapping or you can charge a battery by plugging in
assets. They’re thinking year-end and potential tax implications. So, you’re thinking about possibly a land purchase or sale. You’re thinking about how you might be positioned going into what lenders will often describe as loan renewal season. You’re ending out the year and thinking about what things might look like for the next operating year.
The way I best described that as a potential turning point is because the backward looking data would still suggest that things have been relatively strong, land
a charger for your hand tools.”
The XUV 845 has a new exhaust system. “It is 31 percent quieter,” Halfman said. “There’s a distinct sound to a Gator and some love it, but others say make it quieter.”
For a better, cleaner air draw, Halfman said, the engine air intake location has been changed. “Same for the air intake for the transmission that has so been relocated so we’re
values being a good example.
Land values would still show that things are very, very strong and maybe even continuing to increase, but you’re also hearing some anecdotes of producers pulling back.
One of the measures that we tend to look at quite a bit in surveys that the Fed manages and maintains across the country is a measure of loan repayments, for example.
Most agricultural producers, when times are pretty good, they tend to take a conservative approach. They pay down debt and they tend to repay their loans maybe at even a faster than what you might
drawing better air,” he added.
The Gator has LED lighting and marine-grade vinyl seats. “The Signature addition has leather seats,” Halfman said. “It is a spacious cab and when it’s cold out, we can warm you up and when it’s hot out, we can cool you off.”
For more information about John Deere Gator XUV Crossover Utility Vehicles, go to www.deere.com.
see in the past.
The opposite is true then when things start to turn a little more concerning. They tend to take out financing when it’s needed and repay the loans at a little bit slower pace, and we are in fact seeing some those loan repayment rates start to dip.
We’re paying attention to what this next loan renewal season looks like, in part because the level of interest rates — even though it would come off a little bit from where things were recently, they’re still quite high relative to a few years ago and could factor into some of the challenges that producers would face.
Martha Blum/Central Iowa Ag Mag Eric Halfman
new John Deere XUV 875 with GreenStar technology to complete boundary map-
Cont. 4
Cont. 3
Projected crop prices unchanged
By Tom C. Doran Central Iowa Ag Mag
Lower corn and soybean production estimates resulted in slightly tighter supplies in the U.S. Department of Agriculture’s supply and demand estimates report on Nov. 8.
Here are the details.
Soybeans: USDA kept the U.S. season-average 2024-2025 price forecast the same as last month at $10.80 per bushel.
• U.S. soybean production is forecast at 4.5 billion bushels, down 121 million on reduced yields. The largest production changes are for Iowa, Illinois and Minnesota.
• Exports were lowered 25 million bushels to 1.8 billion on lower supplies and sales to date.
• Crush was reduced by 15 million bushels to 2.4 billion, reflecting lower soybean meal domestic disappearance and exports.
• U.S. soybean ending stocks were lowered 80 million bushels to 470 million bushels.
• Global 2024-2025 soybean production was reduced by 3.5 million tons to 425.4 million, mainly on lower production for the United States and India. Production for India is lowered 0.2 million tons to 12.6 million on information from the Soybean Processors Association of India.
• Global soybean exports were raised on higher shipments for Brazil, Canada and Benin largely offset by lower U.S. shipments. Imports are raised for Pakistan.
• Global soybean ending stocks were reduced 2.9 million tons to 131.7 million mainly on lower stocks for the United States, Brazil and Argentina.
Corn: The new crop season-average received by producers was unchanged at $4.10 per bushel.
• Corn production is forecast at 15.1 billion bushels, down 60 million from last month on a 0.7-bushel reduction in yield to 183.1 bushels per acre.
• Harvested area for grain was unchanged at 82.7 million acres. Total use remained at 15 billion bushels.
• With supply falling and no change to use, corn ending stocks are down to 1.9 billion bushels.
• Foreign corn production is forecast higher as increases for Uganda, Malawi, Belarus, Mozambique, Kenya and Cameroon are partly offset by declines for Mexico, Turkey and the European Union. Mexico production is lowered reflecting lower winter
corn area expectations.
• Major global trade changes include lower corn exports for Brazil and South Africa with increases for Burma and Uganda. Corn imports were lowered for China and Malawi, but raised for Mexico, Vietnam, Turkey and Peru.
• Foreign corn ending stocks are down, mostly reflecting a decline for China that is partly offset by increases for Mexico, Uganda and Canada.
• Global corn ending stocks, at 304.1 million tons, are down 2.4 million.
Wheat: Based on prices reported to date and expectations for futures and cash prices, USDA lowered the season-average price by a dime to $5.60 per bushel.
• Supplies were hiked on higher imports, increased 5 million bushels to 120 million, all on hard red spring.
• Domestic use was raised, all on food use, based mainly on the NASS flour milling products report.
• Exports were unchanged at 825 million bushels, but there are offsetting by-class changes.
• Projected 2024-2025 ending stocks were increased 3 million bushels to 815 million, up 17 percent from last year.
• Global supplies are projected to in-
crease 0.7 million tons to 1.061 billion as higher production for Kazakhstan more than offsets reductions for Argentina, Brazil, Russia and the EU. Kazakhstan’s production is raised 2 million tons to 18 million on harvest results. This is the third-largest crop on record for Kazakhstan.
• Projected 2024-2025 global ending stocks were reduced by 0.1 million tons to 257.6 million as decreases for Argentina, China and Brazil are not completely offset by increases for Kazakhstan and Turkey.