NEW BRUNSWICK'S 2022 CHILD POVERTY REPORT CARD
February 2023


February 2023

Over three decades ago, the Canadian House of Commons unanimously resolved to eliminate child poverty by 2000 That goal remains elusive. There was notable progress in poverty reduction for children aged 0-17 between 2019 and 2020; the New Brunswick child poverty rate decreased from 21.7% in 2019 to 16.6% in 2020. The number of children living in poverty in New Brunswick decreased from over 30,000 to 23,000
“This House seek(s) to achieve the goal of eliminating poverty among Canadian children by the year 2000 ”
- House of Commons, November 24, 1989
Recovery Benefit (CRB), and Canada
Emergency Sickness Benefit (CESB), among others Without these income supports the child poverty rate would have increased from 2019 to 2020; pandemic benefits alone lifted 10,300 New Brunswick children out of poverty. Without pandemic benefits, the child poverty rate would have been 24.0%. With the elimination and clawback of COVID-19 supports, child poverty rates will likely return to pre-pandemic levels.
2020 was a year like no other; the global pandemic had a lasting impact on everyone, especially children and families living on low incomes. Food bank use spiked in March 2020 at the outset of COVID-19 and the implementation of lockdown measures Housing prices escalated in 2020 and 2021 due to a realestate boom tied to the pandemic. Individuals and families are experiencing greater difficulties in meeting basic needs because of inflation and the rising cost of living
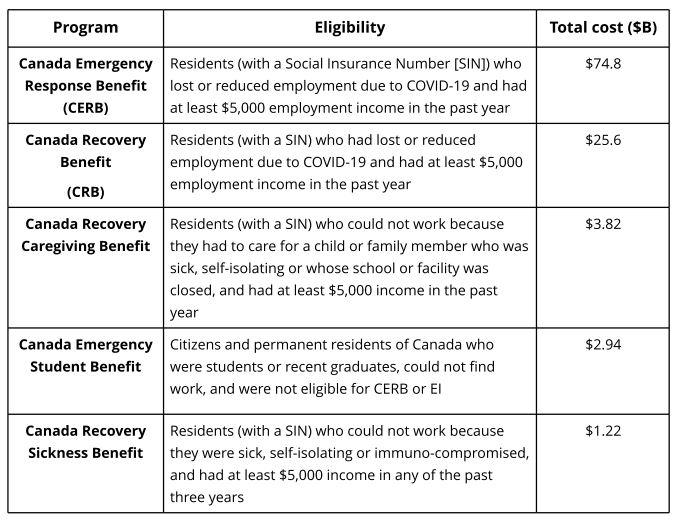
In 2020, many families received unprecedented income support from the federal government through pandemic supports such as the Canada Emergency Response Benefit (CERB), Canada
The Human Development Council releases an annual report card in partnership with Campaign 2000 on the state of child poverty in New Brunswick. Similar provincial and territorial report cards are written by a network of organizations committed to poverty reduction and eradication across the country. These documents are a reminder of a resolution and promise to Canadian children that have not yet been fulfilled.
Poverty is "the condition of a person who lacks the resources, means, opportunities, and power necessary to acquire and maintain economic selfsufficiency or to integrate into and participate in society.”[1]
In 2018, the federal government introduced Opportunity for All: Canada’s First Poverty Reduction Strategy It aims to “reduce poverty by 20 percent by 2020 and 50 percent by 2030 ”[2] The Strategy uses the Market Basket Measure (MBM) as Canada’s official poverty line. The MBM is an absolute measure of poverty. It determines the absolute minimum a family needs to survive. The MBM has limitations (see Appendix A), thus Campaign 2000 and its regional partners use the Low-Income Measure (LIM) in annual child poverty reporting.
The LIM is a relative measure of poverty. It identifies families with incomes below 50% of the median income, adjusted for family size. The LIM uses tax filer data, while MBM data is obtained through the Canadian Income Survey Tax filer data is more reliable than survey data that is derived from a relatively small sample size of the population that may not be representative of all peoples’ realities. This report uses the After-Tax Census Family Low Income Measure (CFLIM-AT) from the T1 Family File (taxfiler data). The most recent data available is from 2020.
In 2020, the CFLIM-AT reported 15,000 more children living in poverty than the MBM (see Figure 1) The gap between the two poverty measures has been widening since 2015.
This report also uses data from the 2021 Census to examine poverty rates for Indigenous and racialized children We report on these populations every five years when new census data is available as statistics for these marginalized children are not available through tax filer data. There are slight differences in the overall poverty rate between these two data sources
Approximately 1 in 8 (13.5%) Canadian children lived in poverty in 2020. Nearly 1 million Canadian children were living in poverty, a reduction of over 300,000 children from the previous year
In New Brunswick, the child poverty rate decreased from 21.7% in 2019 to 16.6% in 2020. The number of children living in poverty in New Brunswick decreased from over 30,000 to 23,000
The highest decile of New Brunswick families with children held 22.1% of total income, compared to just 2.6% in the bottom decile.
The child poverty rates in New Brunswick are unevenly distributed across its eight cities, from a high of over 20% in Campbellton, Bathurst, and Saint John, to a low of 9 5% in Dieppe
Nearly 1 in 5 children under age 6 (18.3%) are living in poverty in New Brunswick.
38% of children in families with one parent are living in poverty in New Brunswick.
1 in 3 racialized children are living in poverty in NB.
Almost 1 in 4 Indigenous children live in poverty in New Brunswick
Government transfers lifted 32,920 New Brunswick children out of poverty in 2020. Without government transfers, the child poverty rate in New Brunswick would be 40 2% - 23 6 percentage points above the official child poverty rate
Pandemic benefits alone lifted 10,300 New Brunswick children out of poverty. Without pandemic benefits, the child poverty rate would have been 24 0%
Without the CCB, an additional 14,020 New Brunswick children would live in poverty. This transfer alone reduced the child poverty rate by 10.0 percentage points.
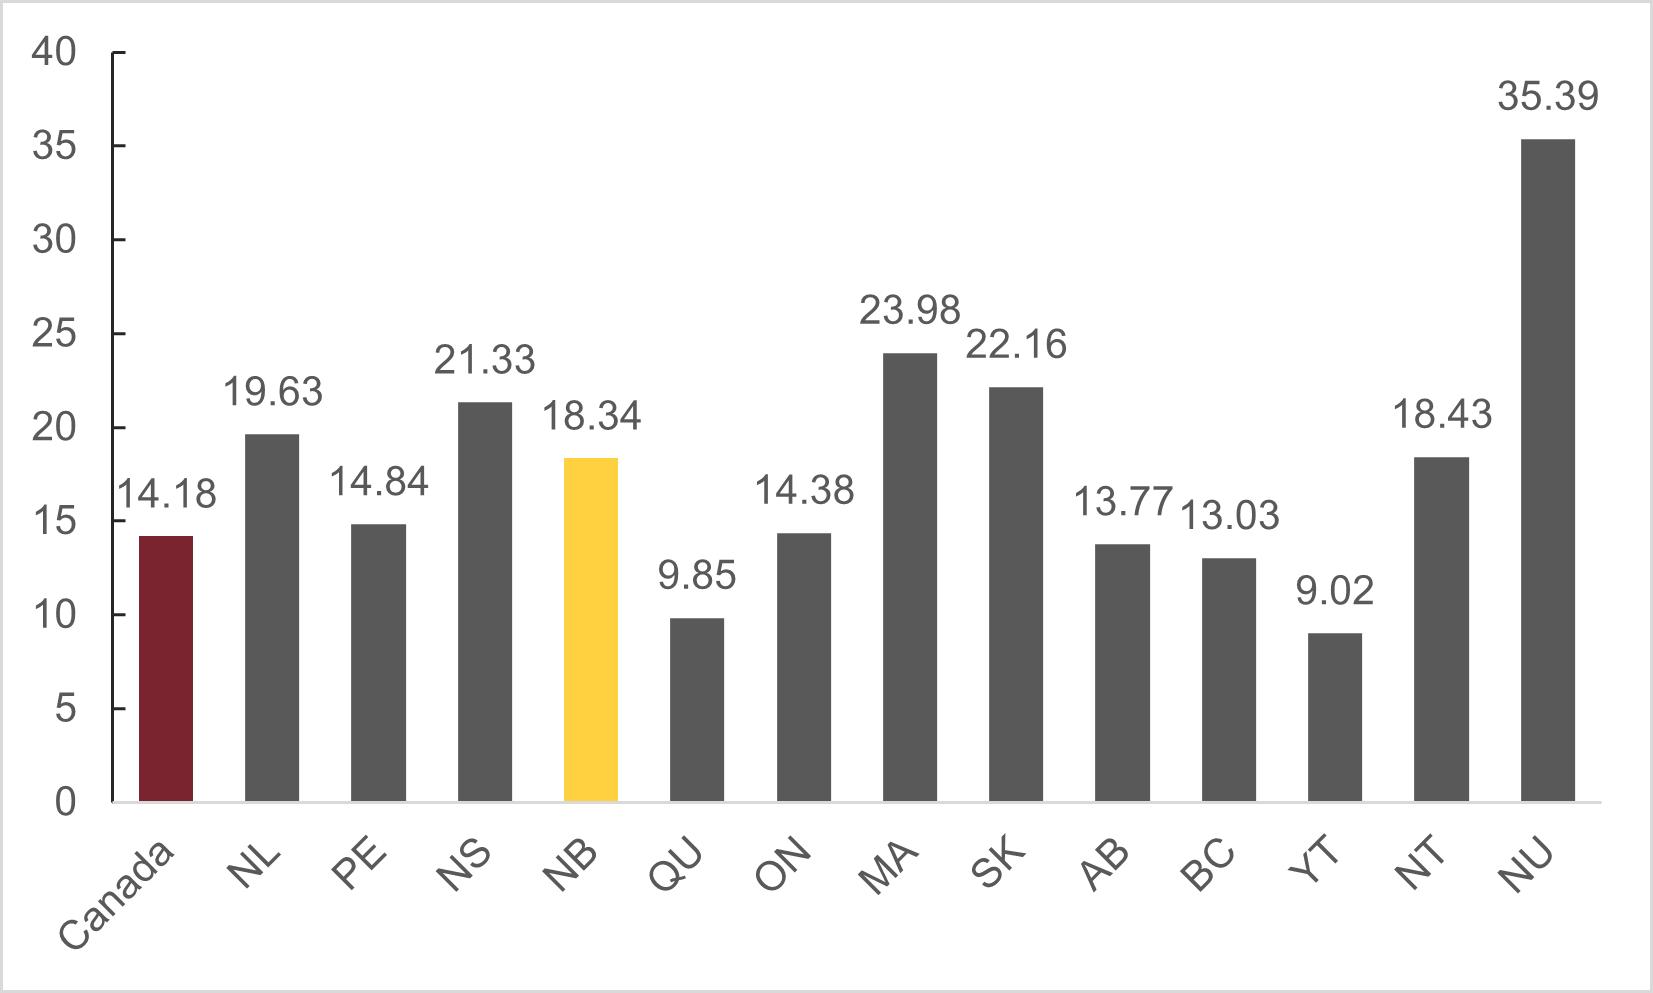
The 2020 tax filer data reveals that approximately 1 in 8 (13 5%) Canadian children lived in poverty in 2020.[3] Nearly 1 million children were living in poverty, a reduction of over 300,000 children from the previous year. In New Brunswick, the child poverty rate decreased from 21.7% in 2019 to 16.6% in 2020. The number of children living in poverty in New Brunswick decreased from over 30,000 to 23,000. Our province had the country's fifth highest child poverty rate (fourth if only considering the provinces and not the territories)
What was the driving force behind the reduction of child poverty in 2020? The implementation of benefits to mitigate the socioeconomic costs of the COVID-19 pandemic! If these benefits had not been introduced, more than 1.5 million children would have been living in poverty in Canada, and over 33,000 would have been children in New Brunswick [4] These numbers are telling. When it comes to poverty reduction, government transfers are highly effective.

The progress in child poverty reduction between 2019 and 2020 is notable but not yet a cause for celebration The child poverty rate would have increased from 2019 to 2020 had it not been for COVID-19 benefits. With the elimination and clawback of COVID-19 supports, child poverty rates will likely return to pre-pandemic levels.[5]
Canada’s 100 highestpaid CEOs took home an average of $10 9 million in 2020. They make 191 times more on average than the standard Canadian worker [6]
Inequality refers to the disproportionate distribution of resources, rights, and opportunities among people in society. The experience of inequality varies from one person to the next, compounded by systems of oppression like racism, sexism, ableism, ageism, and classism that may or may not show up in their lives. The more these systems of oppression intersect or overlap in one’s life, the more likely one is to face relative disadvantage [7]
Inequality establishes a dichotomy between those who have and those who have not It creates conditions for various social, economic, and health problems, with poverty as a prime example. Poverty restricts peoples’ abilities and means to participate fully in their communities. It can negatively affect an individual or family’s sense of belonging and increase feelings of isolation and exclusion.
Income inequality is evident in the distribution of income in the province The highest decile of New Brunswick families with children held 22.1% of total income, compared to just 2.6% in the bottom decile (see Figure 5). This difference is notable - the top decile of families with children held a greater share of income than the bottom four deciles combined.
In dollar amounts, the lowest decile held an average after-tax income of $22,136 compared to $72,813 in the fifth decile and $191,033 in the highest decile (see Figure 6). In 2020, the average income of a family in the highest decile was 8.6 times higher than that of a family in the lowest decile
Policies that seek to redistribute income through taxation and improved social policy are essential to ending poverty and reducing inequality
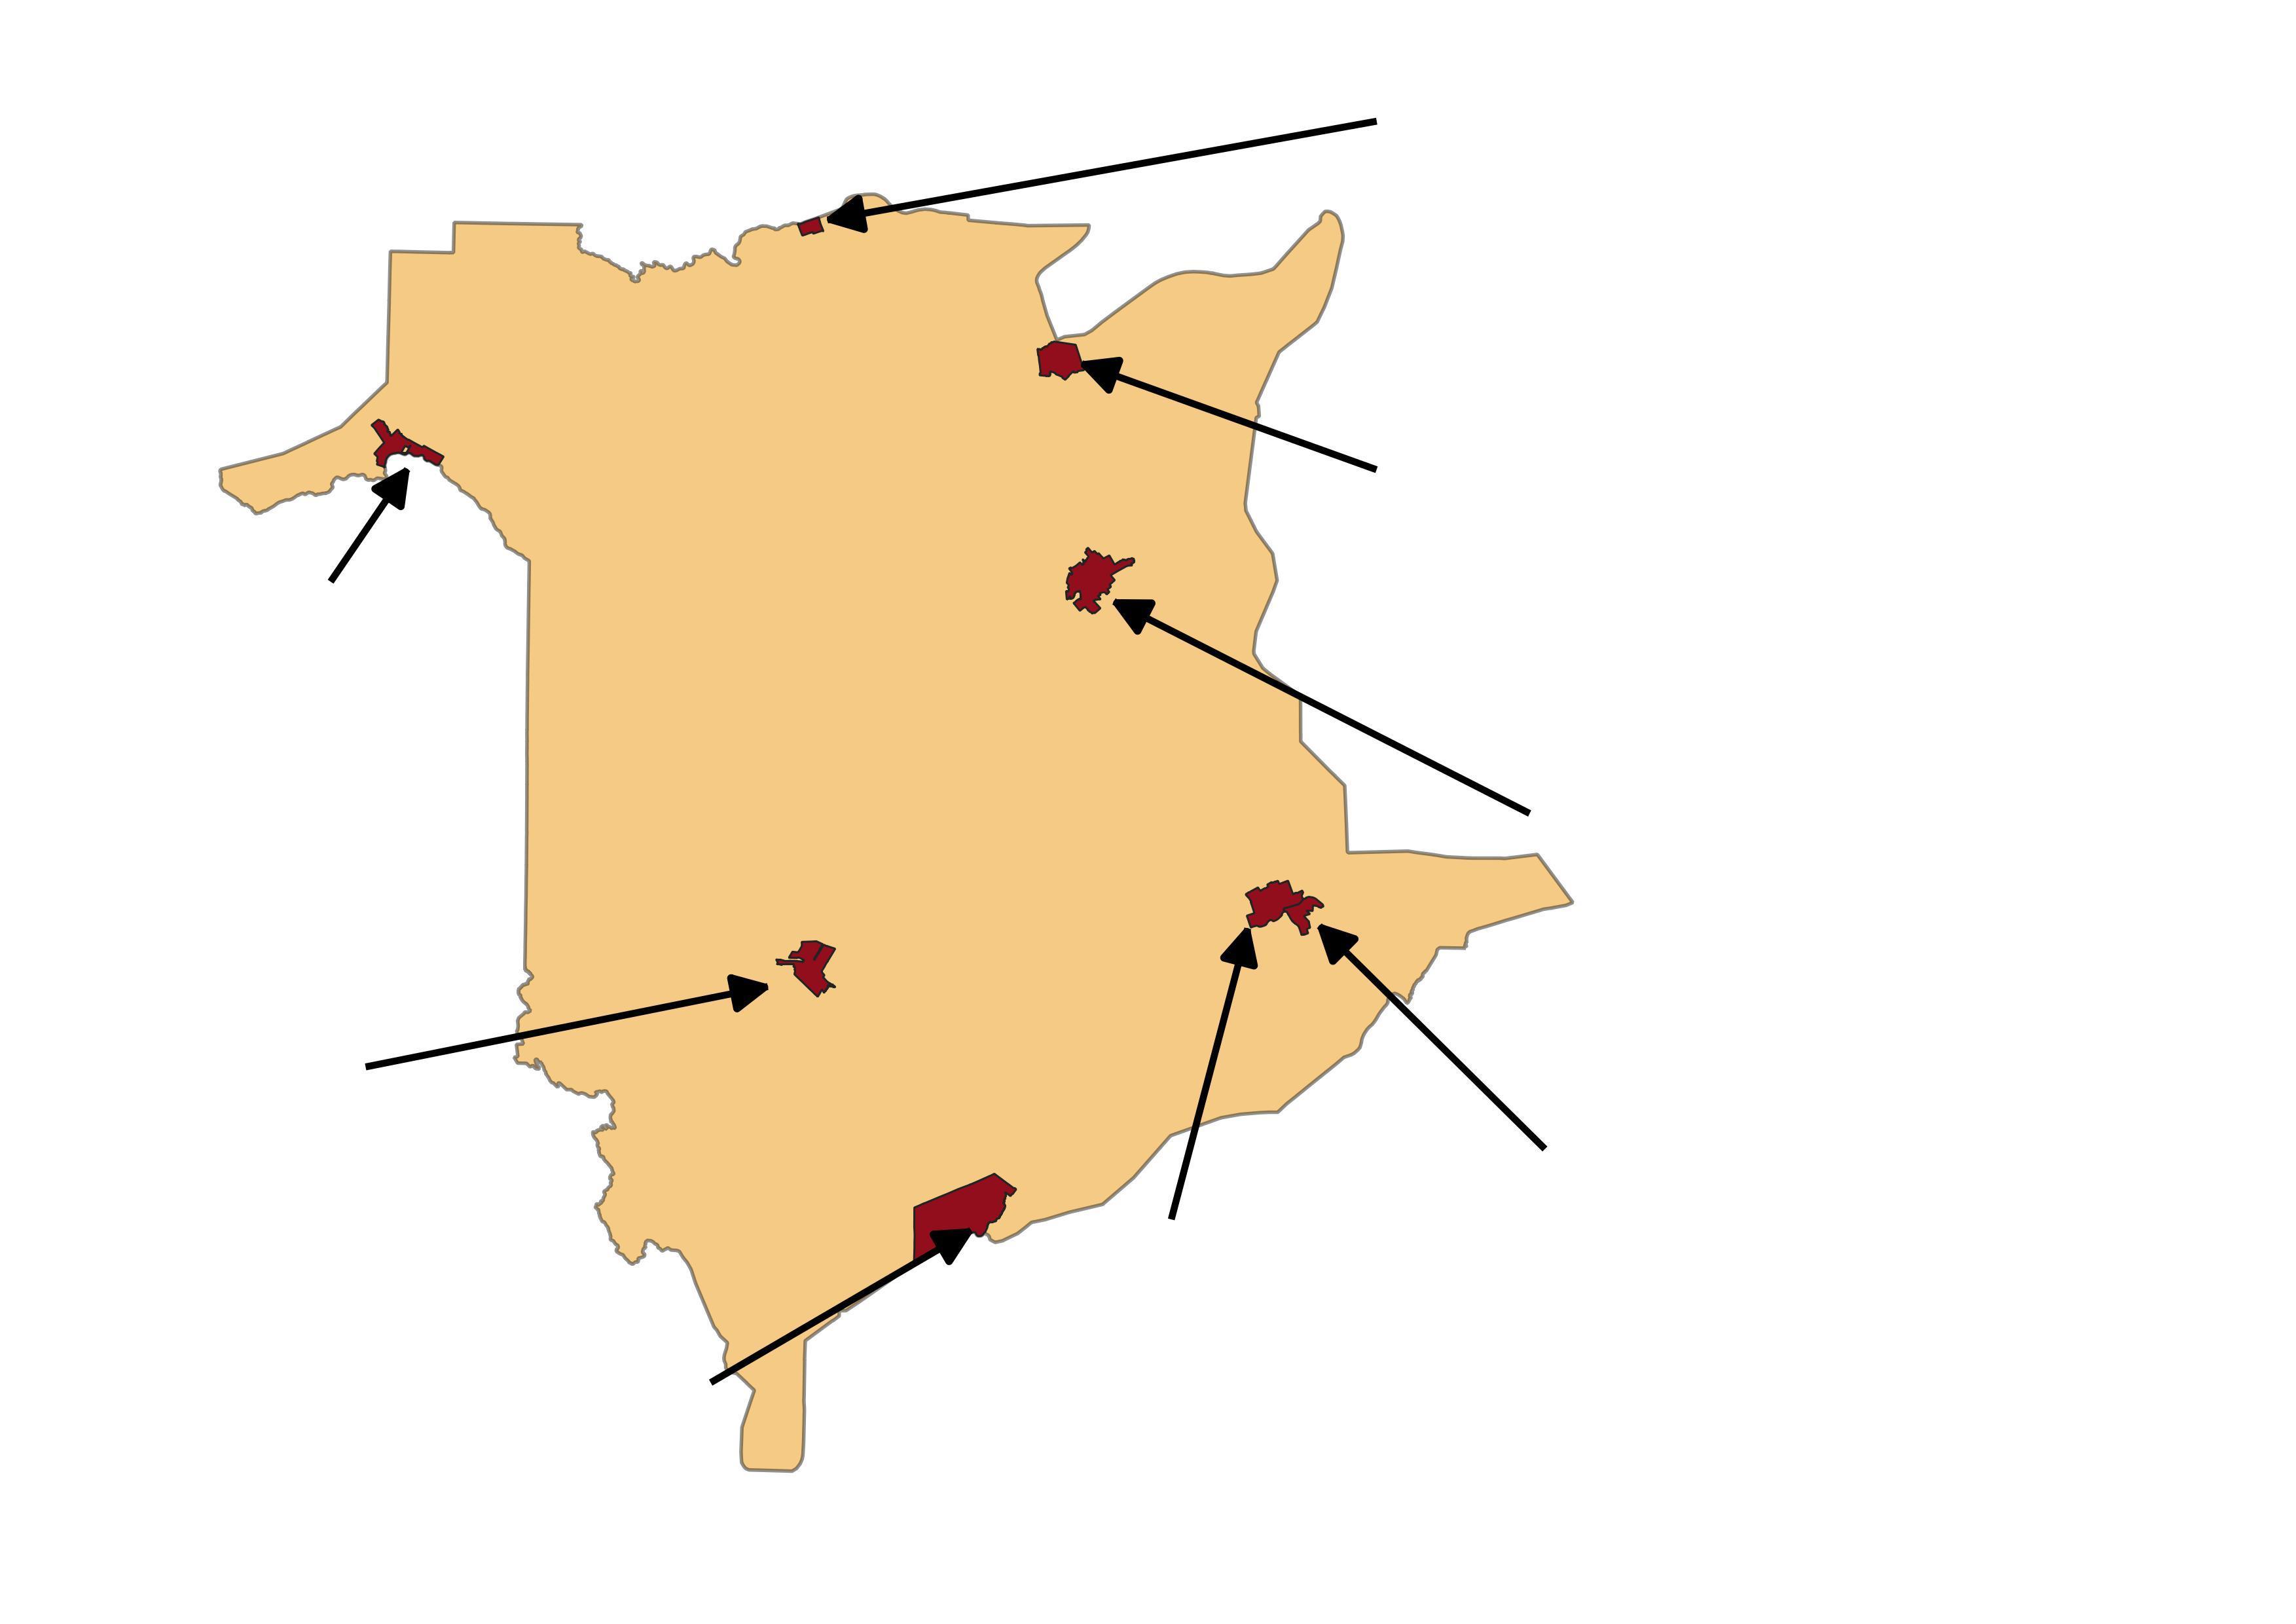
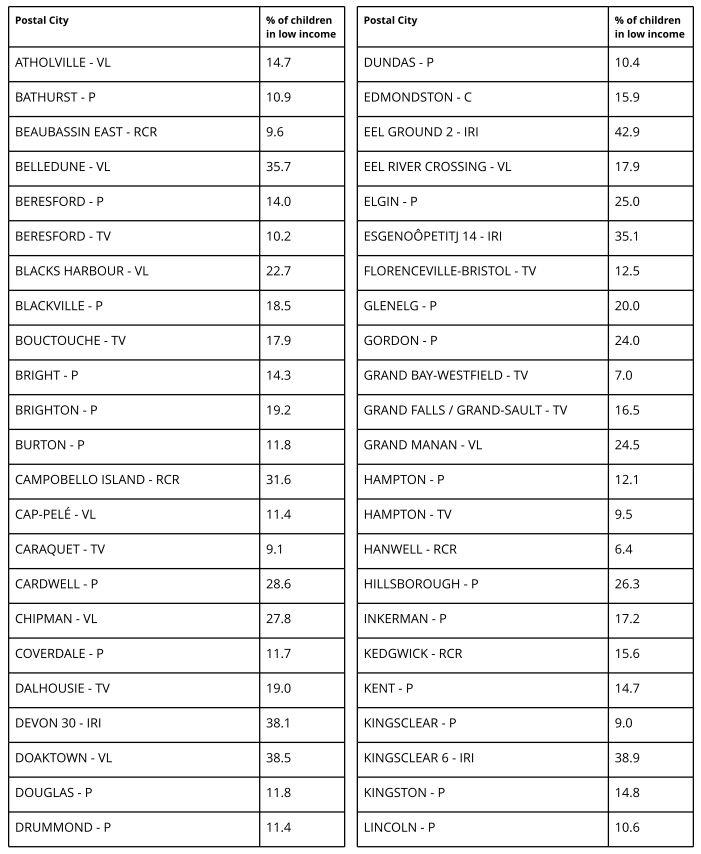
The child poverty rates in New Brunswick are unevenly distributed across its eight cities, from a high of over 20% in Campbellton, Bathurst, and Saint John, to a low of 9 5% in Dieppe The highest child poverty rates are found in the northern part of the province (i.e., Campbellton at 26.1% and Bathurst at 25%) The third highest child poverty rate is in Saint John – New Brunswick’s second largest city – at 23.8%.
Campbellton
Population: 7,047
Child Poverty: 26 1%
Overall Poverty: 22.9%
Senior Poverty: 24 4%
Bathurst
Population: 12,157
Child Poverty: 25 0%
Overall Poverty: 21 4%
Edmundston
Population: 16,437
Child Poverty: 15 9%
Overall Poverty: 15.9%
Senior Poverty: 19 3%
Fredericton
Population: 63,116
Child Poverty: 18.0%
Overall Poverty: 15 2%
Senior Poverty: 11.1%
Moncton
Population: 79,470
Senior Poverty: 25 0%
Miramichi
Population: 17,692
Child Poverty: 17 3%
Overall Poverty: 15.0%
Senior Poverty: 15 6%
Dieppe
Population: 28,114
Child Poverty: 9 5%
Overall Poverty: 9.2%
Saint John
Population: 69,895
Child Poverty: 23 8%
Overall Poverty: 18.5%
Senior Poverty: 17 1%
Child Poverty: 19.3%
Overall Poverty: 16 3%
Senior Poverty: 14.2%
Senior Poverty: 10 9%
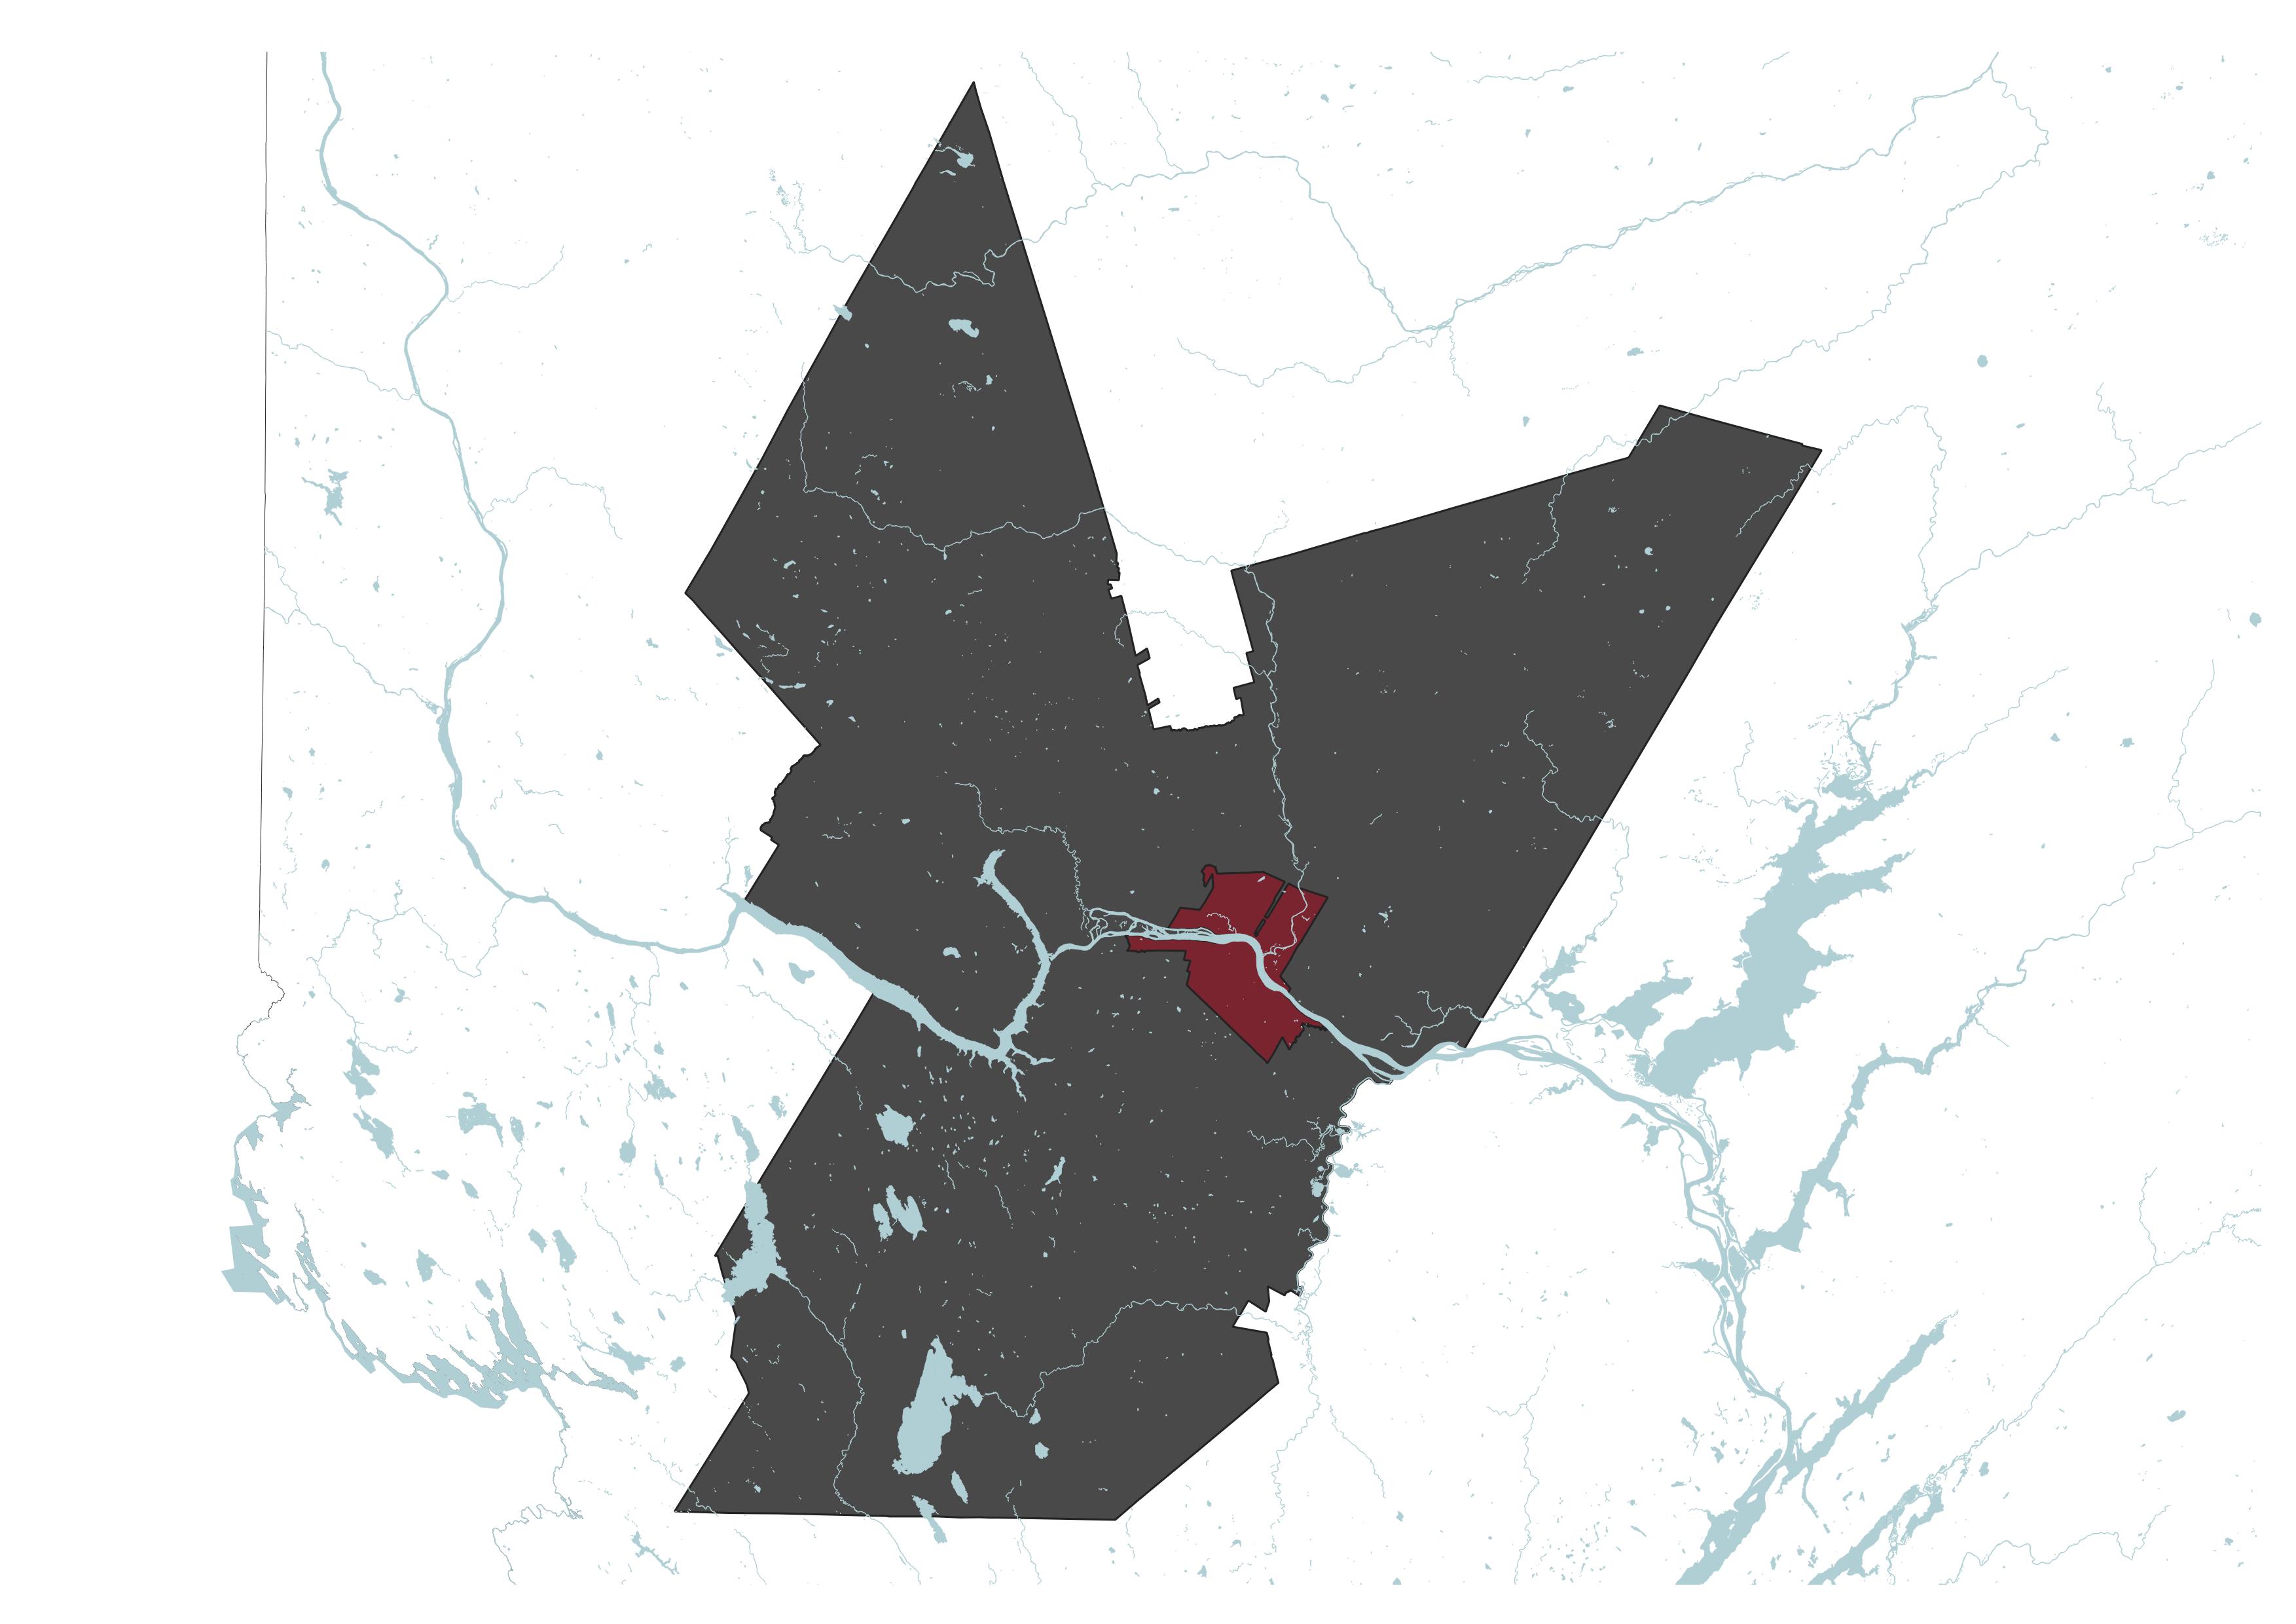
The Census Metropolitan Areas (CMAs) of Moncton and Saint John see large differences in child poverty rates between the central city and neighbouring suburban municipalities. For example, the child poverty rate in Dieppe is approximately half of the rate in the city of Moncton The variance in child poverty rates is even greater between the city of Saint John and its adjoining suburban towns. Saint John’s child poverty rate is over three times higher than the rate in Quispamsis.

Moncton
Child: 19.3%
Overall: 16.3%
Senior: 14 2%
Child: 9 5%
Overall: 9 2%
Senior: 10.9%
Riverview
Child: 11 8%
Overall: 9 3%
Senior: 9.2%
Child: 15 2%
Overall: 13.0%
Senior: 13 0%
Fredericton
Child: 18 0%
Overall: 15 2%
Senior: 11 1%
Child: 15 1%
Overall: 12 8%
Senior: 11 1%
Fredericton CMA Moncton CMA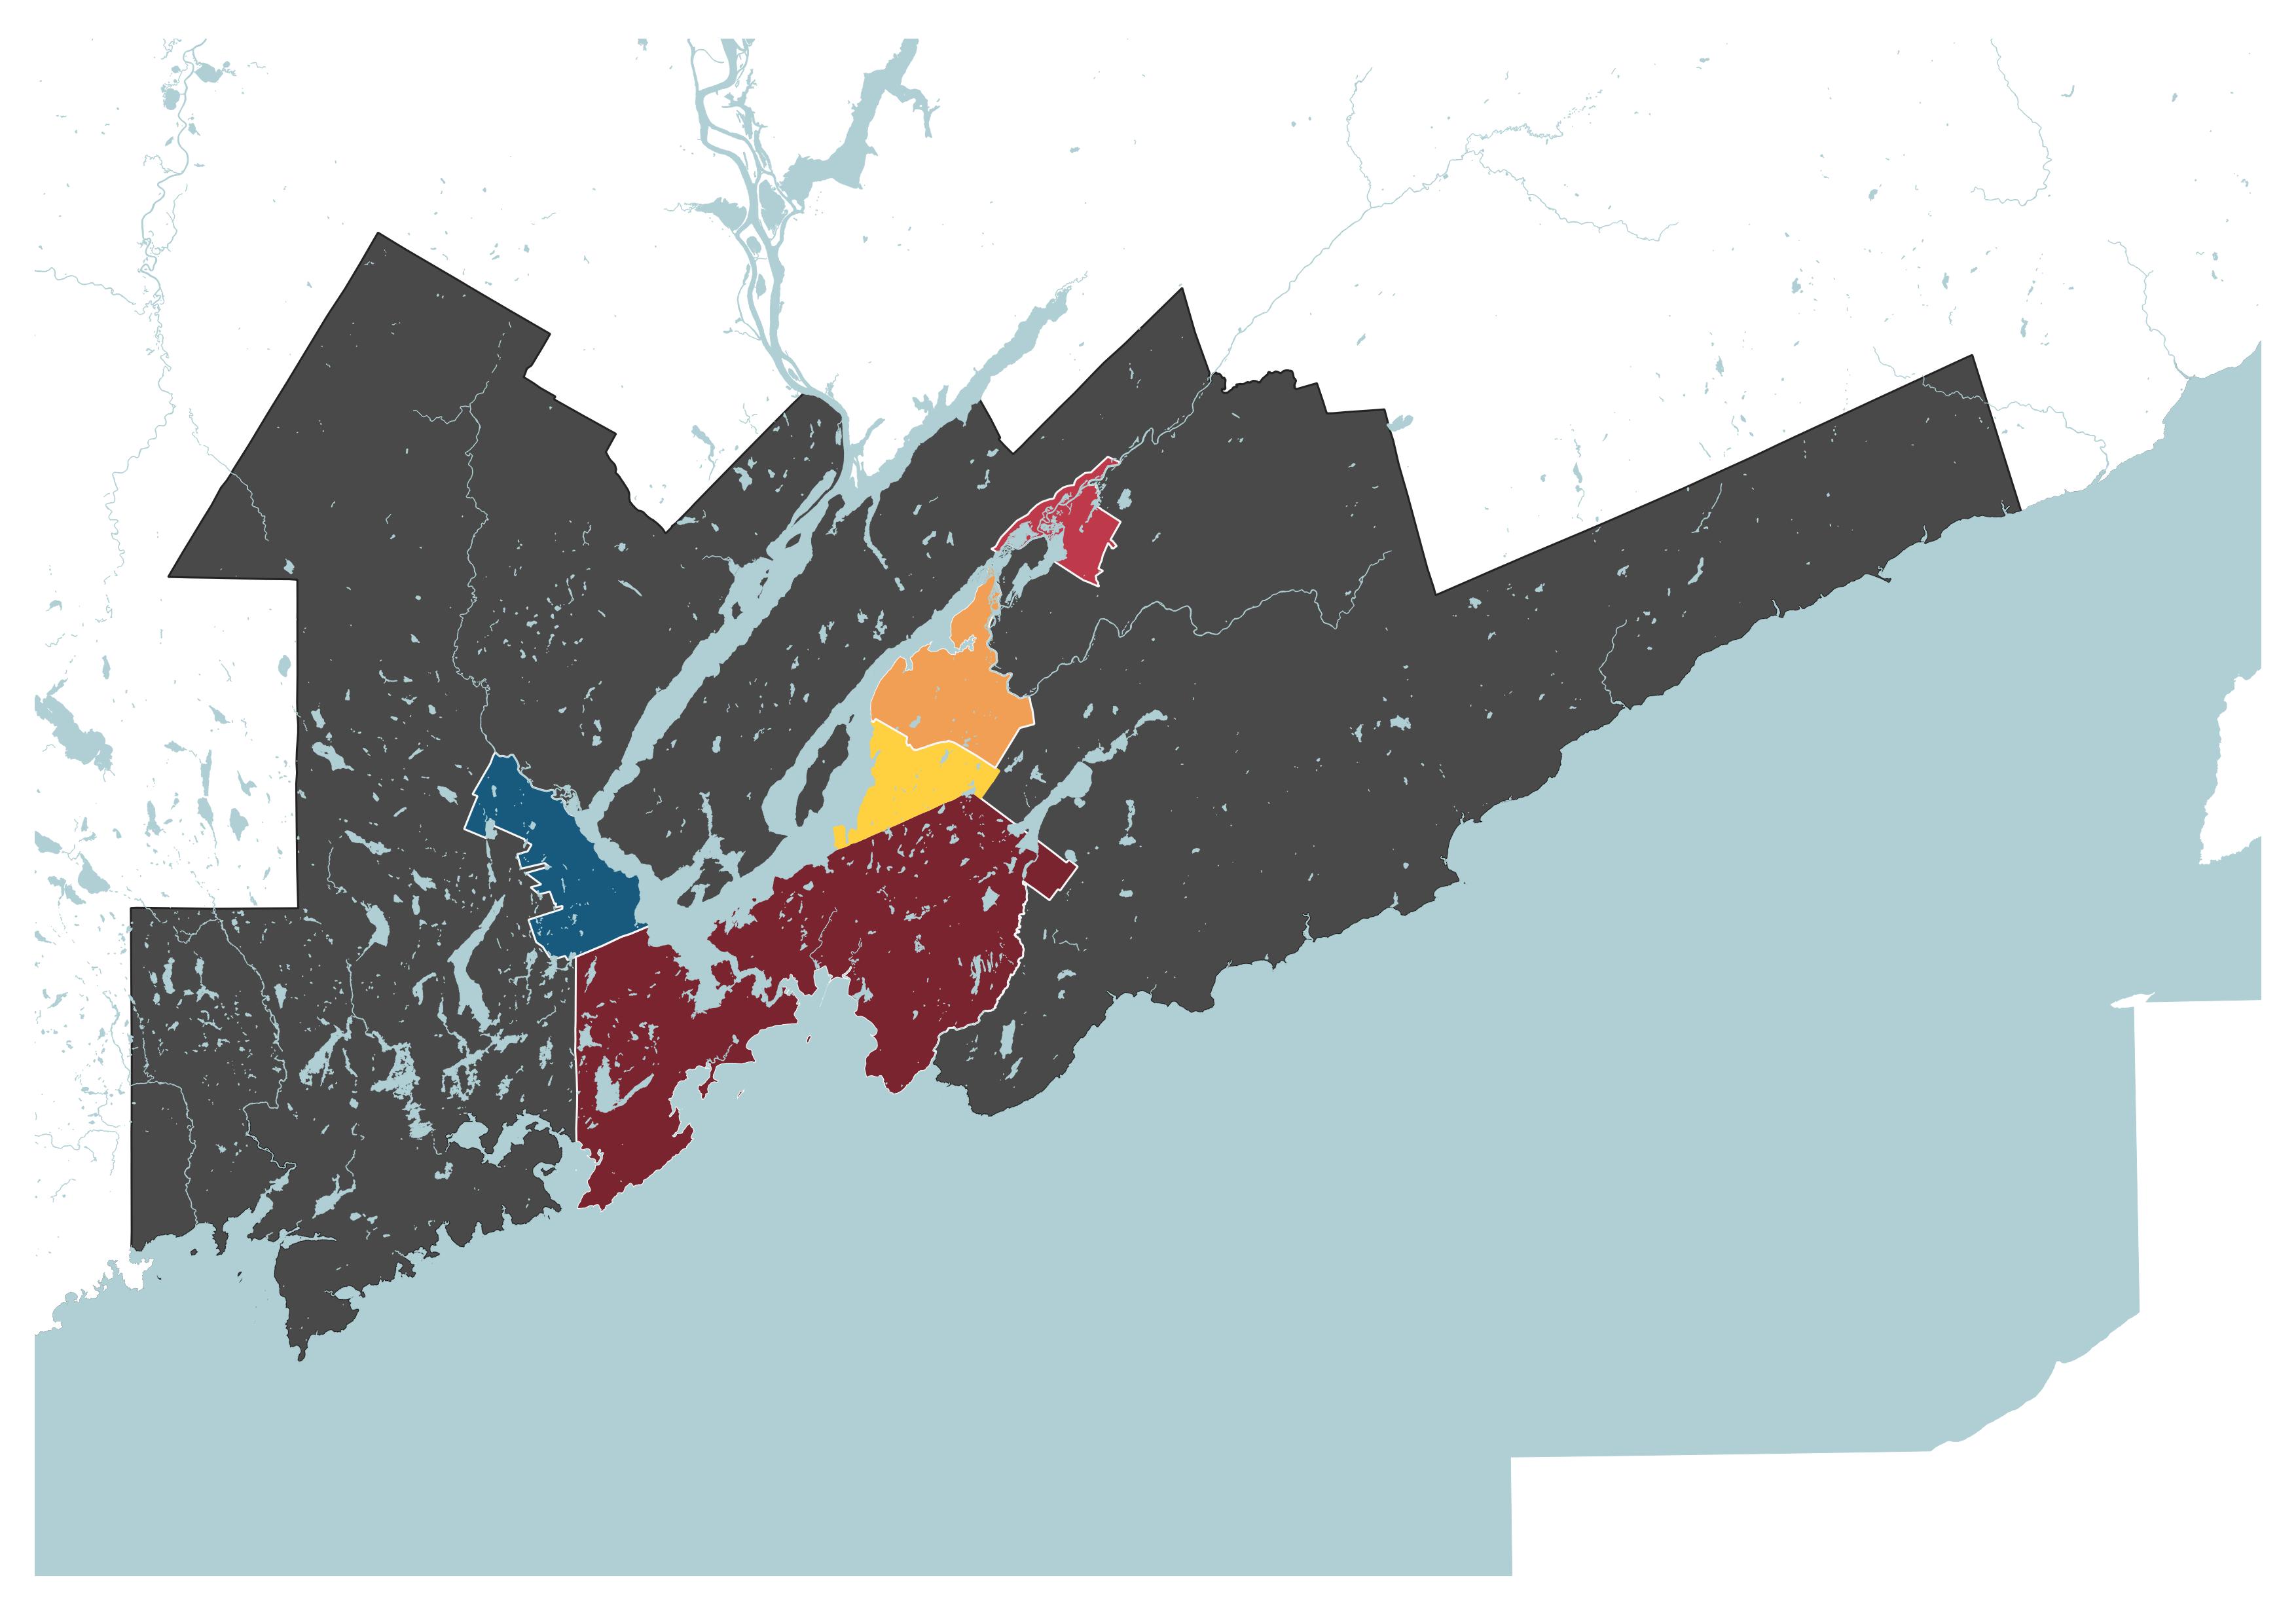
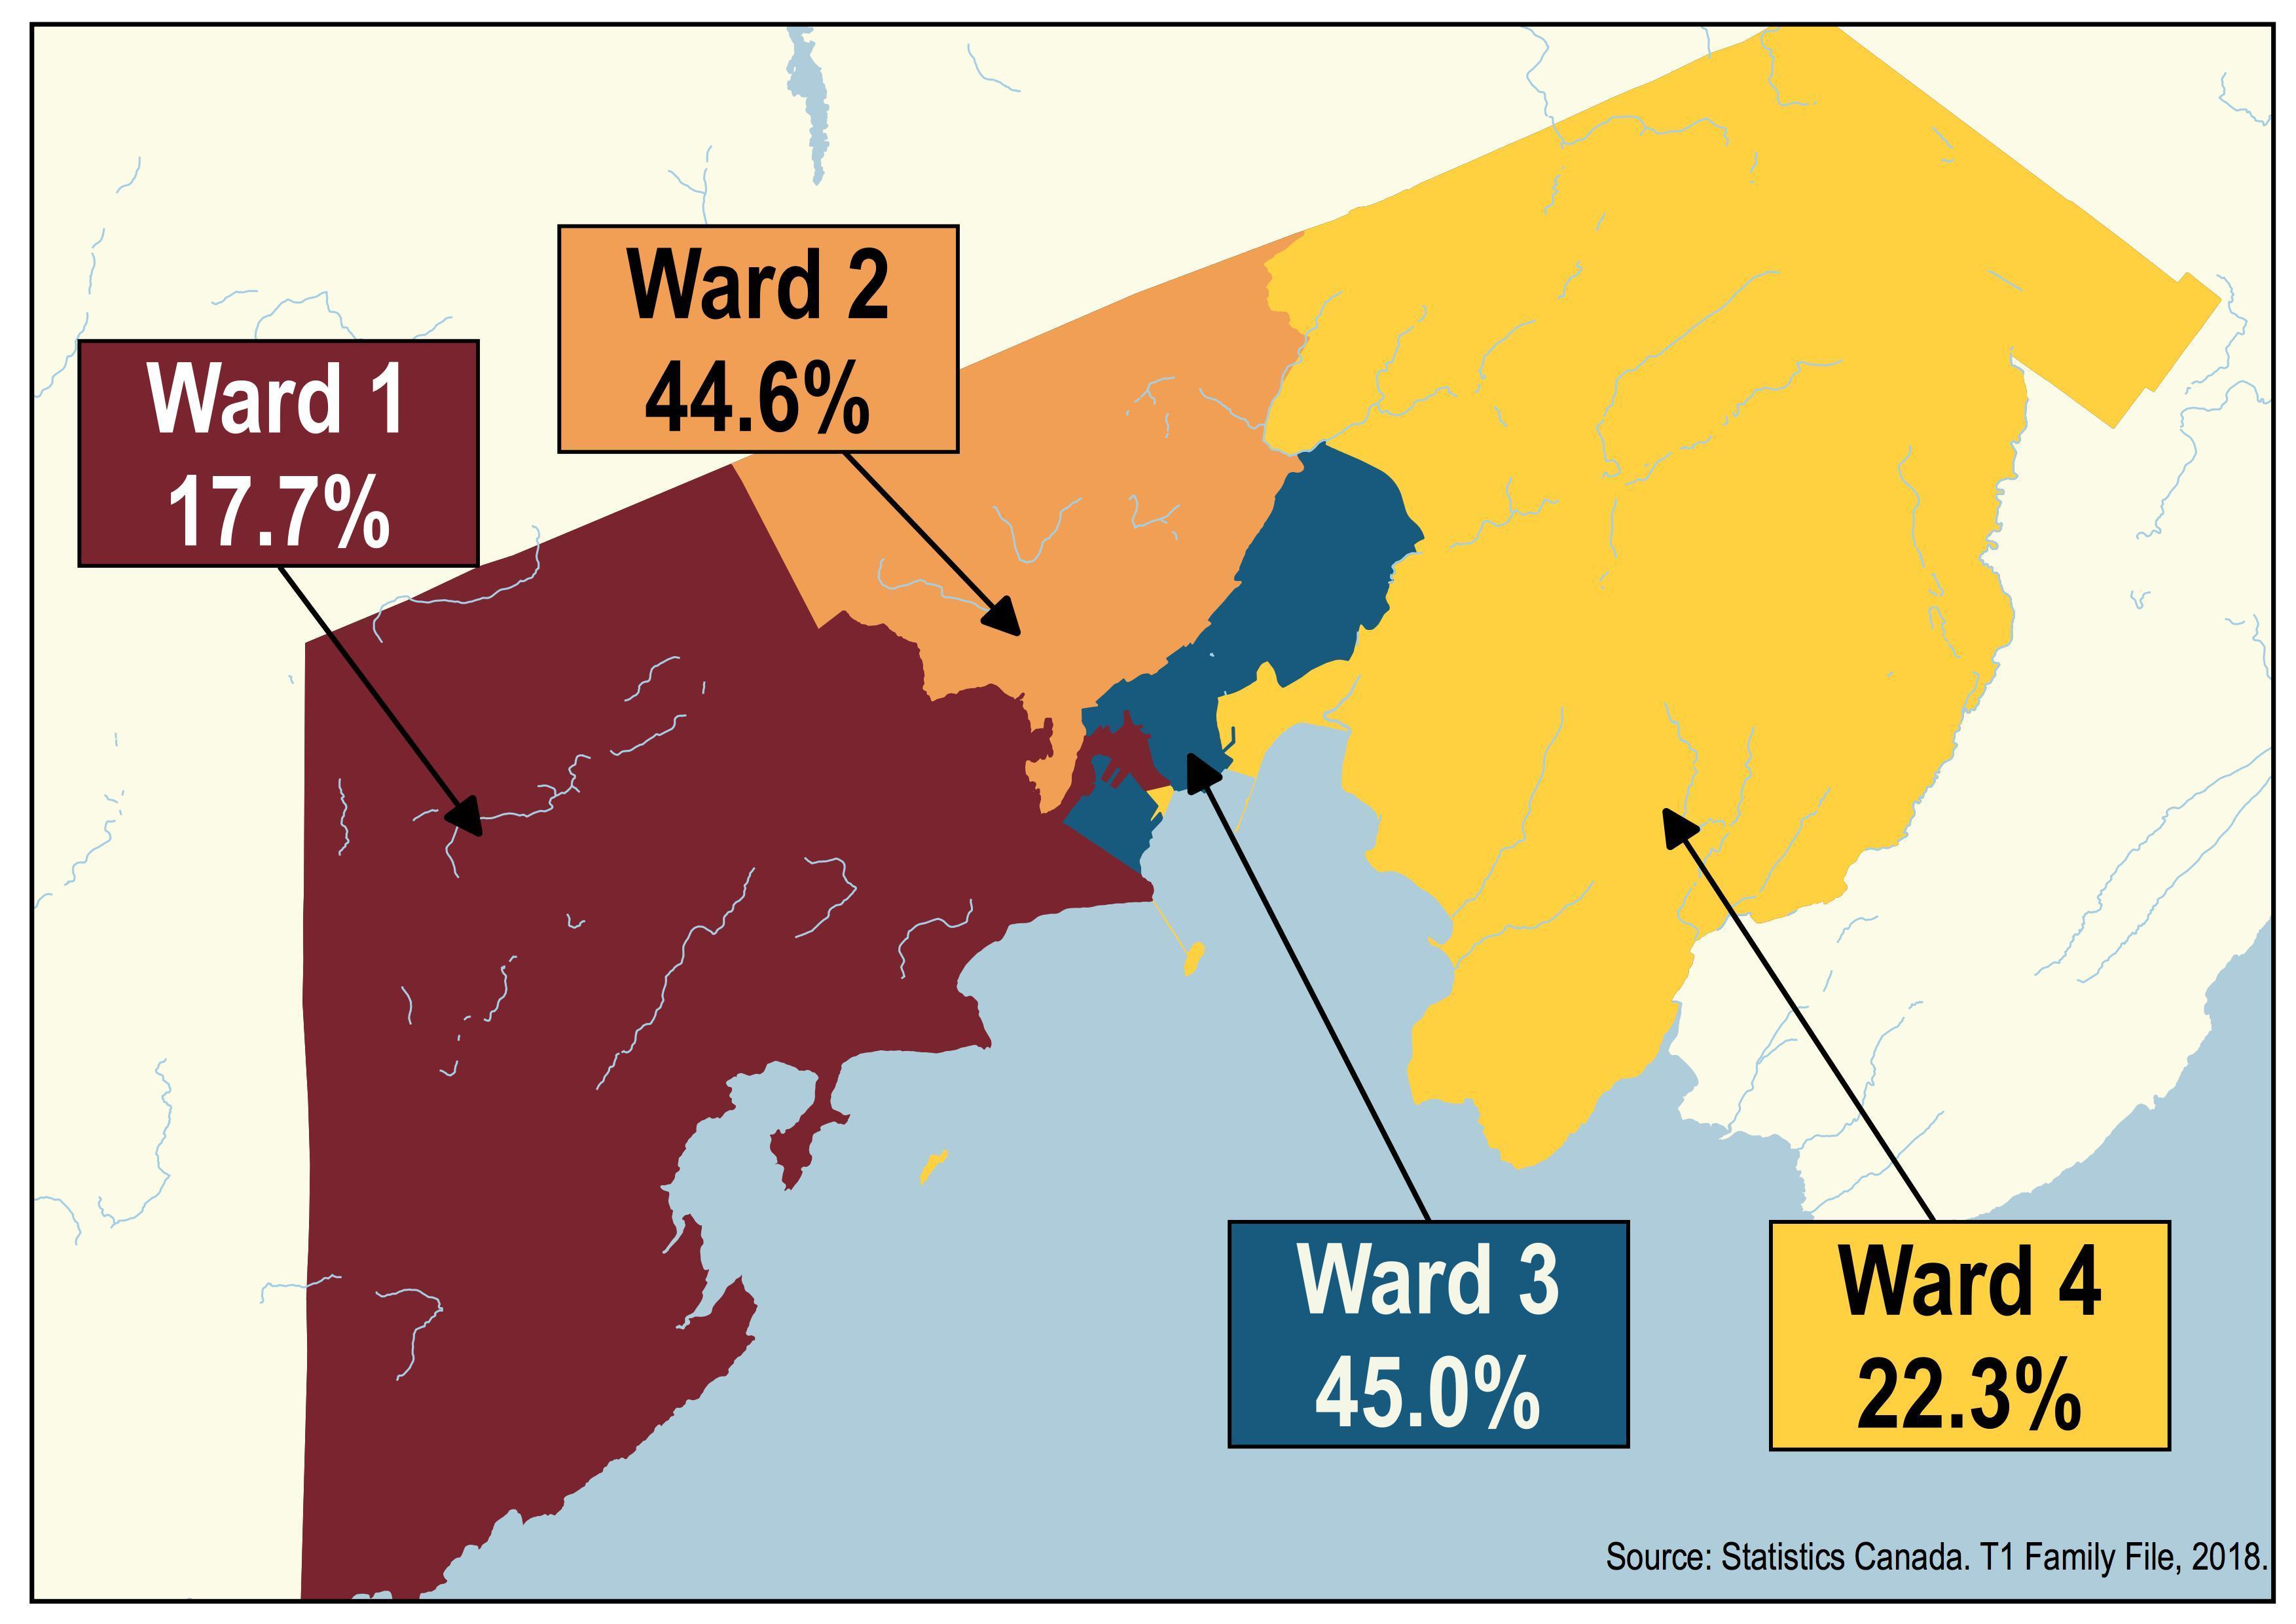
Within Saint John city limits, there are notable differences in the spatial distribution of child poverty. The 2020 child poverty rates in Wards 1 and 4 were below the provincial average, while Wards 2 and 3 had rates that exceeded it The child poverty rates in Wards 2 and 3 were more than double the average child poverty rate in New Brunswick.
Certain child populations are overrepresented among those living in poverty in New Brunswick. These children have disproportionately high poverty rates and encounter greater systemic barriers that can limit their life chances. Some populations include young children under age 6, children in one-parent families, newcomer and immigrant children, racialized children, and Indigenous children.[12] Such populations have greater child poverty rates than the provincial average and experience deeper disadvantages. Children in such marginalized groups were hardest hit by the social, economic, and health consequences of the COVID-19 pandemic.[13]
Raising children is expensive, especially in the early years of a child’s life. The Human Development Council’s report, Living Wages in New Brunswick 2022, reveals that child care is one of the largest expenses for families in Fredericton, Moncton, and Saint John. [14] It is worth noting that full-time child care for a non-school-aged child costs more than after-school care.[15] It can take up a large portion of the household budget Families can face substantial financial stress with the high costs of child care, combined with lost wages from the motherhood pay gap (where mothers suffer interruptions in their earning potential during pregnancy, maternity leave, and transitioning back to work)
Nearly 1 in 5 children under age 6 live in poverty in New Brunswick.Affordable child care is within reach for New Brunswick families In April 2021, the provincial and federal governments promised a 50% fee reduction by the end of 2022, with the goal of $10/day child care by 2026.[17] They delivered on the first promise earlier than anticipated, with a 50% fee reduction beginning on June 1, 2022.
Despite recent progress, some families still face barriers to accessing child care According to the government’s Early Learning and Child Care Action Plan for 2021-2023, there are only enough child care spaces for 47% of New Brunswick’s preschool-aged children.[18] In addition, families may not be able to find a Designated Centre on route to their workplace, they may work outside of typical daycare operating hours, or there may be inclusivity barriers that families with a child with a disability face. In these situations, families may need to seek alternative child care arrangements that are more costly than the new Designated Centre rates.

Households headed by one parent experience higher poverty levels than those headed by couples. In 2020, 38% (14,680) of children in one-parent families lived in poverty, compared to 7% (6,990) of children in couple-headed families. The province’s poverty rate for children in one-parent families is greater than the national average of 36 5%
Income inequality by family type is apparent across the deciles (see Figure 8). Female-led families tend to have the most severe experiences of income poverty. They are disadvantaged by the gender pay gap, and sometimes must work multiple jobs to satisfy basic needs. These positions tend to be lower-wage work in sectors of the labour force like retail, food service, and hospitality. Female lone parents also carry the double burden of providing for the family financially while simultaneously being the sole caregiver at home In 2020, the average income for a female one-parent family in the lowest decile was slightly above $12,000, compared to $40,733 for couple families in the same decile.
38% of children in families with one parent are living in poverty in New Brunswick.
“Racialized” refers to people that are non-Caucasian or non-white. It is used increasingly to replace the term “visible minorities.”[20] Census data from 2021 reveals a high poverty rate for children in racialized populations; 30.7% (3,360) of racialized children (aged 0-14) in New Brunswick are living in poverty. The rate of racialized children in poverty in the province is twice the national rate for racialized children of 15.1%.
Heightened poverty rates for children and families in racialized groups result from systemic and structural racism. These refer to racial discrimination that is pervasive and deeply embedded within systems, laws, policies, and programs They perpetuate the marginalization and oppression of racialized people in society
The overrepresentation of racialized children in poverty is particularly evident among subsets of this population In 2021, Arab children had the highest poverty rates (56.1%), followed by Korean children (43.1%), Latin American children (32%), Black children (31 5%), and Chinese children (31 5%)
1 in 3 racialized children live in poverty in New Brunswick.
Many of New Brunswick’s racialized children are newcomers. According to the 2021 Census, 34.9% (2,175) of immigrant children aged 0-17 years lived in poverty.
Children from Indigenous communities experience high poverty rates The 2021 Census reports that 23.9% (2,040) of Indigenous children lived in poverty in New Brunswick, compared to 15.3% (19,215) of children of nonIndigenous identity. 34% of Inuit children lived in poverty 28 7% of First Nations children on reserve lived in poverty. 23.1% of First Nations children off reserve lived in poverty. 18.6% of Métis children lived in poverty.
The lasting effects of colonialism, racism and intergenerational trauma exacerbate child poverty for Indigenous children. They create additional obstacles for children seeking to reach their potential because they restrict access to resources, opportunities, and power
Nearly 1 in 4 Indigenous children live in poverty in New Brunswick.
Indigenous children are overrepresented in the Canadian child welfare system [21] Many Indigenous children in care are removed from their families and communities, which leads to a loss of culture, language, and identity. This perpetuates harm caused by residential schools and the Sixties Scoop. The latter refers to the large-scale removal of Indigenous children from their birth families and communities from the 1960s to 1980s, which occurred without consent from their families and bands
Children living on First Nation reserves have some of the highest poverty rates in Canada. Their experience of poverty goes well beyond a low family income. They face added challenges like substandard housing, unsafe drinking water, poorer health, and high suicide rates.
For children to be lifted out of poverty, their families need an income that pushes their household income above the poverty line Broadly speaking, household income can be increased in two ways: through employment earnings or through government transfers and benefits. Without an increase to either (or both), the child poverty rate will not decline.
Year over year we see a consistent trend that shows that transfers work! Government support to families through the Canada Child Benefit, Employment Insurance, GST/HST Credits, and Canada Workers’ Benefit lift many children out of poverty. In 2020, government transfers lifted
32,920 New Brunswick children out of poverty. Without government transfers, the child poverty rate in New Brunswick would be 40.2% - 23.6 percentage points above the official child poverty rate.

The remarkable difference that transfers can make became especially evident in 2020. Throughout the year, many families received unprecedented income supports from the federal government.
24.0
Prevalence of low income (LIM-AT) (%)
Prevalence of low income (LIM-AT) (%) without pandemic income supports
Pandemic benefits alone lifted 10,300 New Brunswick children out of poverty. Without pandemic benefits, the child poverty rate would have been 24.0%.
The reduction in child poverty due to pandemic benefits proves that income transfers to families significantly reduces child poverty.
The depth of poverty is the difference between the poverty line and a family’s after-tax median income. It is the amount of money needed to lift a family out of poverty Pandemic supports helped reduce the depth of poverty for families in New Brunswick. In 2020, the after-tax median income for a low-income family of four was $9,642 below the poverty line (see Figure 13). In 2019, this gap was $11,436.

Food security is a growing concern for children and families in New Brunswick. Households are having a harder time making ends meet due to inflation and the rising cost of living It is more expensive now to meet basic needs and raise families, which increases household vulnerability to poverty and hunger The demand for food bank support is higher than ever A total of 23,931 people visited food banks in New Brunswick over the last year, and 7,363 were children.[22]
Figure 13: Depth of Poverty for Low-Income Families in New Brunswick, 2020 (CFLIM-AT)Food bank usage in Canada increased in March 2020 when COVID-19 began and full lockdown measures were introduced From March to May of that year, however, most food banks across the country saw a decrease in demand, which has been attributed to government income support programs like CERB. When these benefits were removed, individuals and families with the lowest incomes, including those receiving social assistance, were most affected Their incomes were drastically reduced while the cost of living climbed. The pandemic taught us an important lesson: income supports are essential to mitigate the effects of a global crisis and its uncertainties.
Despite Canada’s 2019 recognition of housing as a human right,[23] for a growing number of New Brunswickers, access to adequate, affordable housing is increasingly out of reach. Throughout 2020 and 2021 housing prices soared in the province, due in part to a pandemic-related real-estate boom.[24] A corresponding steep increase in rental rates led to calls for government intervention in the form of a rent cap This call was eventually answered, but not until June of 2022, with the cap expiring December 31st. [25] Not surprisingly, these conditions coincided with an overall increase in homelessness in New Brunswick’s urban centres.[26]
As with other social issues, income transfers can be a useful tool for addressing housing precarity. The Canada-New Brunswick Housing Benefit, introduced in 2021, is one such program for low-income working families.[27] While this is a welcome addition to the social safety net for children living in poverty, large gaps persist. Families continue to face the uncertainty presented by a rising cost of living paired with few protections for New Brunswick tenants
The Canada Child Benefit (CCB) makes a big difference for families. Without the CCB, an additional 14,020 New Brunswick children would live in poverty. This transfer alone reduced the child poverty rate by 10.0 percentage points (see Table 4).

Campaign 2000 research has found that the CCB is losing its power to sustain an ongoing reduction in child poverty. While the enhanced CCB reduced child poverty by 8 percentage points in 2020, representing 589,560 fewer children in poverty, this is down from 2019 when the CCB reduced child poverty by 9.3 percentage points, representing 692,060 fewer children in poverty that year [28]
In September 2021, the provincial government introduced a social assistance reform package that addressed some of the issues that had been raised in earlier report cards. The wage exemption - the amount a social assistance recipient can earn before their benefits are clawed back - was raised to $500 per month, with a 50 cent deduction for each additional dollar earned. The government also decided that child support payments, the Canada-New Brunswick Housing Benefit and compensation related to personal injuries will no longer be considered household income. These will no longer be included in calculating how much a family or individual receives in social assistance.
The reform package in 2021 did not include any real increase to the rates They remain some of the lowest in the country and are woefully inadequate in meeting the basic needs of recipients.

As of 2021, social assistance rates are indexed to inflation every April 1st. While this is welcome and needed, this will only preserve the purchasing power of the current rates that are far too low.
Total welfare income for a one-parent family with one child in the province is $21,595, the second lowest in the country, and well below both the MBM and LIM thresholds. Total welfare incomes include basic social assistance payments, plus additional social assistance benefits, federal child benefits, provincial child benefits, GST credit, and provincial tax credits/benefits.
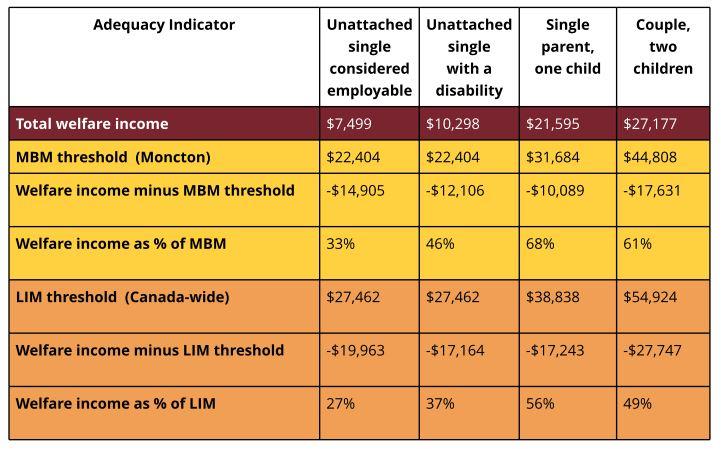 Table 5: Rate Schedule
The federal government has taken strides toward poverty reduction in recent years It also provided Canadians with income supports during the pandemic that improved their standard of living and notably reduced poverty rates. However, the benefits have since been removed. Child poverty rates will likely return to pre-pandemic levels leaving Canadian children and families worse off. Reducing and ending child poverty must remain a priority for both federal and provincial governments in the coming year In keeping with previous report cards, we offer the following recommendations [31]:
Commit to a 50% reduction in poverty between 2015 and 2025 and eliminate poverty by 2030 based on the Census Family Low Income Measure, After Tax (CFLIM-AT) calculated with T1 Family File data
Consider the development of a Strategy for Children and Youth that compliments the Poverty Reduction Strategy and reflects new ambitious targets to end child poverty and advance the right for all children to an adequate standard of living.
Mandate a data-collection strategy that collects data disaggregated by Indigenous identity, impairment, race, gender, migrant status, and 2SLGBTQIA+ identity, among other sociodemographic identities.
Create an Anti-Racism Act for Canada that provides a legislative foundation for the AntiRacism Secretariat and a National Action Plan Against Racism that is well-funded, resultsoriented and produces long-term, sustainable change that address all forms of racism.
Create plans to eliminate poverty for marginalized children and adults who experience higher rates of poverty, including First Nations, Inuit and Métis Peoples, urban and rural Indigenous Peoples, Black and racialized people, people with disabilities, immigrants, newcomers, people with precarious immigration status and female-led lone-parent families along the same timelines – by 50% by 2026 and eliminate poverty by 2030.
Address growing income inequality and generate revenue for poverty reduction programming by eliminating or reducing highly regressive and expensive tax loopholes, closing tax havens, taxing extreme wealth, and implementing excess profit tax focused on corporate pandemic windfalls.
Permanently amend the Canada Labour Code to ensure workers have access to ten permanent paid sick days with an additional fourteen days available during public health emergencies.
Invest $6.4 billion to create a Canada Child Benefit End of Poverty Supplement (CCBEndPov) targeted to families in deep poverty Broaden access to the CCB for families with precarious status by repealing legislation tying eligibility to immigration status. Expand the circle of people able to attest to a child’s residency, ensuring that kinship, customary care and families caring for children outside a formal arrangement have access to the CCB
Reverse CCB reductions due to receiving the Canada Emergency Response Benefit (CERB) for moderate income mothers and protect the CCB from future clawbacks with legislative amendments. Implement CERB Repayment Amnesty for everyone living below or near the CFLIM-AT
Convene a Canada-wide process to develop Early Learning and Child Care (ELCC) workforce strategies that address wages and working conditions, credentials and training, career advancement and professional opportunities.
Enhance the Canadian medicare program to include pharmacare, dentistry, vision and physical rehabilitation services.
Provide sustained funding for poverty reduction programs to achieve the targets set out in the Economic and Social Inclusion Act.
Ensure that the income thresholds for programs available for low income households (for example, New Brunswick Drug Plan and Healthy Smiles, Clear Vision) align with Canada’s Poverty Line, at minimum Thresholds should also account for household size
Approve annual increases to the minimum wage that move it closer to a living wage.[32]
Periodically evaluate the cost of living outside the CPI to ensure that the adjustments to the minimum wage reflect the reality of low-wage workers.
Create more licensed child care spaces and bring the province’s child care coverage rate up to 60%, at minimum, as soon as possible. This would ensure more families have access to affordable, accessible, and inclusive child care.
Update the Employment Standards Act to better protect workers in an economy with more part-time, precarious and gig work, including the provision of ten paid sick days
Build more affordable housing and introduce greater protections for tenants, including the reinstatement of the rent cap
Create a new and distinct disability income support program and update the definition of "disability" to a modern one, in line with the United Nations Convention on the Rights of Persons with a Disability.
Prioritize the support of newcomers through settlement programs, language classes, and workplace attachment initiatives. Where available, support Local Immigration Partnerships.
Work with Indigenous communities to support poverty reduction. Ensure that Indigenous people are represented in poverty reduction and housing strategies
Work with Statistics Canada, the federal government, and Indigenous communities to improve how poverty on reserves is measured.
[1] Government of Canada “Canada’s First Poverty Reduction Strategy”
https://www canada ca/en/employment-social-development/programs/povertyreduction/reports/strategy.html
[2] Employment and Social Development Canada. (2018). Opportunity for All: Canada’s First Poverty Reduction Strategy.
https://www.canada.ca/en/employment-social-development/programs/povertyreduction/reports/strategy html
[3] Statistics Canada, T1 Family File, 2020
[4] Ibid.
[5] Statistics Canada. (2023). Market Basket Measure poverty thresholds and provisional poverty trends for 2021 and 2022.
https://www150.statcan.gc.ca/n1/en/catalogue/75F0002M2022008
[6] Macdonald, D. (2022). Another year in paradise: CEO pay in 2020. (Ottawa: Canadian Centre for Policy Alternatives) https://policyalternatives ca/publications/reports/another-year-paradise
[7] TED. (2016). "The urgency of intersectionality – Kimberlé Crenshaw." https://www.youtube.com/watch? v=akOe5-UsQ2o
[8] Statistics Canada Custom Tabulation, Share of income by decile for families with children, 2020.
[9] Statistics Canada Custom Tabulation, Average income deciles for families with children, 2020.
[10] Statistics Canada, T1 Family File, 2020.
[11] Ibid
[12] This is not an exhaustive list. Children with disabilities are another example of overrepresented young people living in poverty. The most recent data on children living with disabilities is detailed in New Brunswick’s 2019 Child Poverty Report Card, which is available at https://sjhdc.ca/poverty-reduction/.
[13] Statistics Canada (2021) Workers receiving payments from the Canada Emergency Response Benefit program in 2020.
https://www150.statcan.gc.ca/n1/pub/45-28-0001/2021001/article/00021-eng.htm
[14] Atcheson, H., & Driscoll, C. (2022). Living Wages in New Brunswick 2022. https://sjhdc.ca/living-wage/
[15] Atcheson, H , & Driscoll, C (2022) Living Wages in New Brunswick 2022 https://sjhdc ca/living-wage/
[16] Macdonald, D., & Friendly, M. (2022). Game Changer: Will provinces and territories meet the new federal child care fee targets? Canadian child care fees 2021. (Ottawa: Canadian Centre for Policy Alternatives). https://policyalternatives.ca/gamechanger
[17] Employment and Social Development Canada (2022, April 25) “50% child care fee reduction for families in New Brunswick.” https://www.canada.ca/en/employment-socialdevelopment/news/2022/04/50-child-care-fee-reduction-for-families-in-new-brunswick.html
[18] Government of Canada & Government of New Brunswick (2021) Canada-New Brunswick Canada-Wide Early Learning and Child Care Agreement: New Brunswick Action Plan 20212023. https://www2.gnb.ca/content/dam/gnb/Departments/ed/pdf/ELCC/action-plan-2021-2023.pdf
[19] Statistics Canada Custom Tabulation, Average income by decile and family type, 2020.
[20] Homeless Hub, “Racialized Communities,” https://www homelesshub ca/solutions/prioritypopulations/racialized-communities
[21] Macdonald, D., & Wilson, D. (2016). Shameful Neglect: Indigenous Child Poverty in Canada. (Ottawa: Canadian Centre for Policy Alternatives) https://policyalternatives ca/publications/reports/shamefulneglect
[22] Food Banks Canada. (2022). Hunger Count 2022: From a Storm to a Hurricane. (Mississauga: Food Banks Canada). https://hungercount.foodbankscanada.ca/
[23] Canadian Human Rights Commission, "Housing is a human right," https://www chrcccdp gc ca/en/node/717
[24] The Canadian Real Estate Association (CREA), “Residential average price New Brunswick,” https://creastats.crea.ca/board/nbrea
[25] Service New Brunswick (2022, June 10) "Tenants now protected by a temporary rent cap." https://www2.snb.ca/content/snb/en/news/news-release.2022.06.0307.html
[26] Human Development Council, "Urban Homelessness in NB," https://sjhdc.ca/urban-homelessness/
[27] Service New Brunswick (2021, June 21) “Low-income working families can now apply for the CanadaNew Brunswick Housing Benefit.”
https://www2.gnb.ca/content/gnb/en/departments/social development/news/news release.2021.06.0483. html
[28] Campaign 2000. (2023). 2022 Report Card on Child and Family Poverty in Canada. https://campaign2000.ca/report-cards/national/
[29] Government of New Brunswick: Social Development “Social Assistance Rate Schedule A”
https://www2 gnb ca/content/gnb/en/departments/social development/social assistance/social assistance rateschedules html
[30] Laidley, J., & Tabbara, M. (2022). Welfare in Canada, 2021. (Toronto: Maytree). https://maytree.com/wpcontent/uploads/Welfare in Canada 2021 pdf
[31] See Campaign 2000's 2022 Report on Child and Family Poverty in Canada for additional federal recommendations.
[32] For more information on living wages, see the Human Development Council's report on Living Wages In New Brunswick 2022 at https://sjhdc ca/living-wage/
[33] Hunter, G., & Sanchez, M. (2019). A Critical Review of Canada’s Official Poverty Line: The Market Basket Measure.
[34] Ibid
[35] Kneebone, R., & Wilkins, M. (2019). Measuring and Responding to Income Poverty. The School of Public Policy Publications, 12(3).
[36] Djidel, S , Gustajtis, B , Heisz, A , Lam, K , Marchand, I , & McDermott, S (2020) Report on the second comprehensive review of the Market Basket Measure (Ottawa: Statistics Canada). https://www150.statcan.gc.ca/n1/en/catalogue/75F0002M2020002
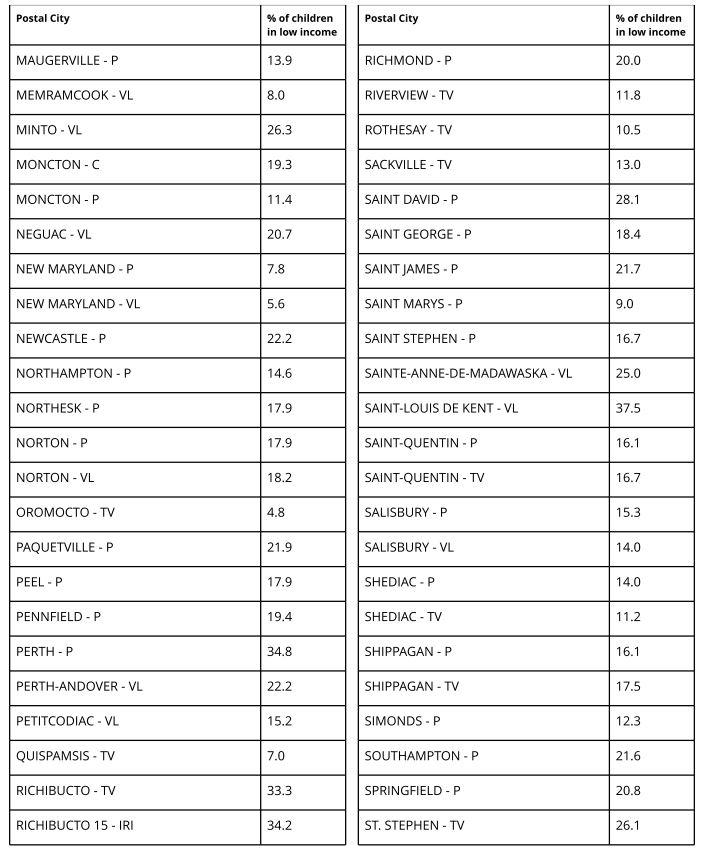
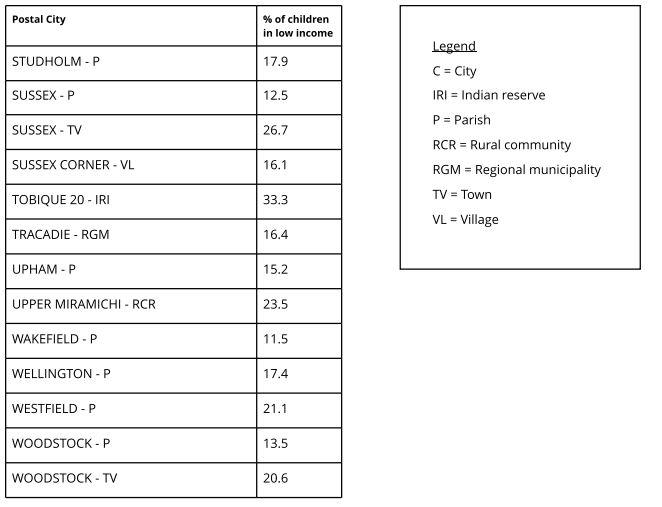
[37] Child poverty rates for postal cities with <50 children below the 2020 CFLIM-AT threshold are not included in the table.
[38] Postal cities are based on the mail delivery system for unique place names within a province or territory.
In November 2018, the federal government adopted the Market Basket Measure (MBM) as Canada’s official poverty line. While we recognize that no measure of poverty is perfect, the MBM has a few shortcomings, which are summarized below. In alignment with Campaign 2000 and its regional partners, we have chosen the Low-Income Measure (LIM) as the poverty measure in this report.

The MBM is an absolute measure of poverty. It is based on the cost of a specific, pre-determined basket of goods and services for a reference family with two adults (one male and one female, aged 25-49) and two children (a girl, aged 9, and a boy aged 13).[33] The MBM includes five expenditure categories: shelter, food, clothing and footwear, transportation, and other household needs.
The MBM is biased towards its developers’ judgments about Canadian family expenses and needs. It has been critiqued for inadequate consideration of different sociocultural norms and needs.[34] Furthermore, the MBM does not include child care, which can be very expensive for families–especially those with non-school-aged children. The MBM does not include non-insured health expenses like dental and vision care, prescription drugs, private health insurance, and assistance for persons with disabilities. The MBM’s basket of goods and services is not automatically adjusted to reflect changes in the cost of living.[35] Instead, it is updated by the government–a process that tends to be costly and time-consuming. The first comprehensive review of the MBM took place between 2008 and 2010. Statistics Canada and Employment and Social Development Canada conducted a second comprehensive review that resulted in the “2018-base MBM”.[36]
The LIM, on the other hand, is a relative measure of poverty. According to the LIM, a household is considered low-income if its total income is less than 50% of median household incomes. The LIM accounts for changes in social norms, as well as income and wealth inequality The LIM rises naturally as societies become wealthier and achieve a higher standard of living. It uses tax filer data from a large sample size, which paints a more accurate picture of people living in poverty. It allows for calculating poverty rates in cities and smaller geographies (see Appendix B) In contrast, the MBM uses Canadian Income Survey data from a relatively small sample size. It cannot provide New Brunswick poverty rate data in geographies outside the major cities of Fredericton, Moncton, and Saint John Finally, using the LIM promotes consistency and comparability to previous Child Poverty Report Cards. The MBM reports lower child poverty rates than the LIM (see Figure 1). A change in methodology to use MBM data would muddle poverty reduction trends in the province. Campaign 2000 and its regional partners prefer the LIM as it accounts for systemic inequality, social exclusion, and environmental stressors that can impact a household’s relative position in the income hierarchy.
Prepared by Heather Atcheson and Chelsea Driscoll with the Human Development Council, a social planning council that coordinates and promotes social development in New Brunswick Copies of the report are available from:
HUMAN DEVELOPMENT COUNCIL
www sjhdc ca 139 Prince Edward St. Saint John, NB Canada
E2E 3S3 506-634-1673