THE SLIFER REPORT



2 0 2 3 MIDYEA R VA IL VA L L EY REA L ESTATE MA RK ET
UP-VALLEY MARKET REVIEWS
2023 NOTABLE SALES
MID-VALLEY MARKET REVIEWS
DOWN-VALLEY MARKET REVIEWS
STAY UP TO DATE ALL YEAR LONG
Our teamof market expertsupdates TheSlifer Report throughout theyear. To seethelatest numbersanddiveeven deeper into thereport, scanthecodeor visit:
VailRealEstate com/Resources/Slifer-Report
SOURCE
Soldresidential propertieswithinEagleCounty,countingboth listingandbuysidefromJanuary1,2023- June30,2023 Sourceof all datainthisreport istheVail Boardof RealtorsMultipleListing Service Informationdeemedreliablebut not guaranteed Consult your Slifer Smith&FramptonBroker for moreinformation

6 | 7 | 9 | 10 | 16 | 18 | 26 | 29 | MARKET SHARE MARKET OVERVIEW LUXURY MARKET OVERVIEW
LAND OVERVIEW CONTENTS
Estate | 2
Slifer Smith & Frampton
Real
A LETTER FROM OUR PRESIDENT
We?re off to an exciting start to 2023 and amid another spectacular summer here in the Vail Valley. With regards to our real estate market robust demand continues to strengthen the value proposition of our real estate despite shifting national fundamentals. For Slifer Smith & Frampton this has been a welcome rebalancing of market fundamentals as we work our way towardsanewand healthier market dynamic,whichprovidesopportunitiesfor astuteBuyersand Sellers
Thekey to thisrebalancing hasbeen arecent risein inventory, asI writethisletter thereare375 active residential listings which is up 25%over the last 30 days, this gain is a welcome sight for Buyers looking to find their homes here in the Vail Valley From a longer-term perspective the current residential inventory isapproximately lessthen 1/3of the available inventory at thistime in 2019 Regardless of shifting for sale inventory, Eagle County has always been a constrained supplymarket dueto all thewonderful openspacethat isthebedrock of our propertyvalues
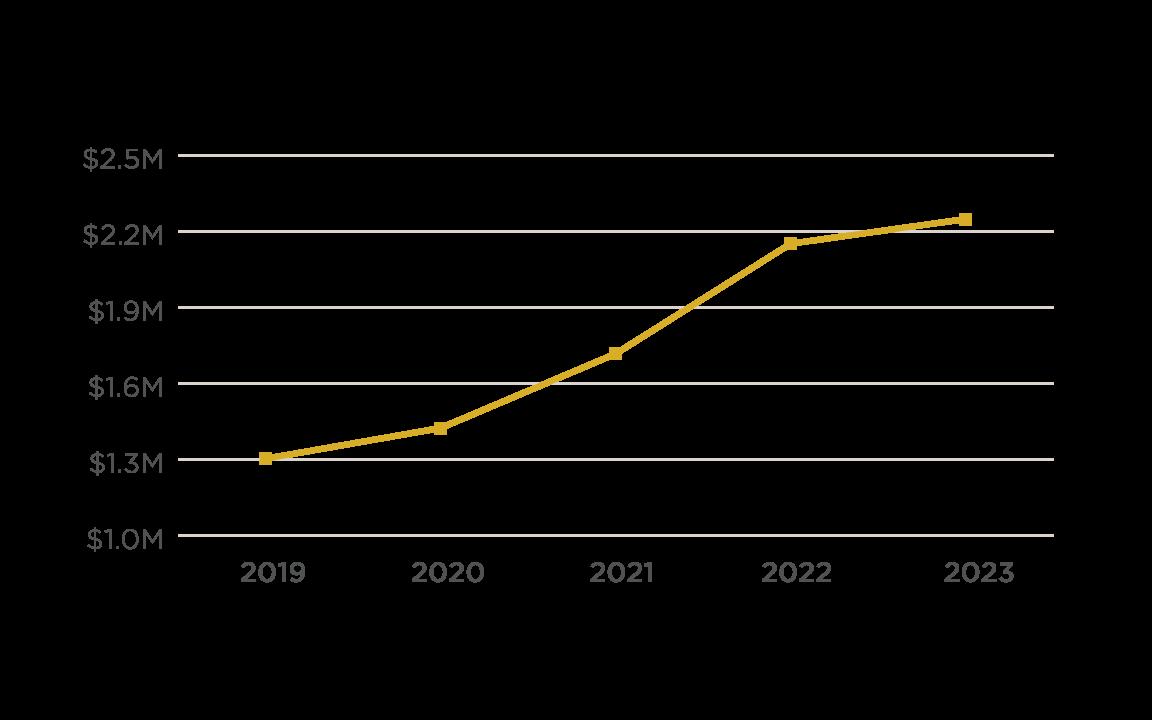
Despite some ominous previous predictions from experts with regards to the rapid rise in interest rates impact on the market, the average residential transaction price is up 4.6% year-to-date as of the end of June from the previous year Alongside that, our sale-to-list price ratio has been normalizing from 100%this time last year to 97%which is more consistent with past markets Theseare still very favorable conditionsfor thosethinking of selling their home in our communities Also, with the previously mentioned increase in inventory and awidening sale to list price ratio spread creates opportunities for Buyers eager to grab their piece of the Vail Valley
For thesecond half of 2023I expect,along with numerousmarket experts,that wewill continue to see prices stabilize here in the Vail Valley and across the nation Limited inventory, and tremendouslifestyledemand in our mountain communitieswill keep our marketsrobust despite prevailingnational headwinds
Asfor Slifer Smith &Frampton weareproud to continueto lead theway on behalf of our clients as the number one brokerage overall and in the luxury market where the team has garnered a 47%market share You may have heard our firm has grown, a large expansion last year into the Front Range market, now connects our city and mountain communities like never before The strength of the Slifer, Smith and Frampton network across Colorado and beyond, as well as our commitment to locally-run, locally focused real estate have helped us maintain our coveted positionasthe#1independent real estatecompanyinColorado
Please take a look through this midyear edition of The Slifer Report to dive deep into the detailsof your specific market area of interest As always, if you have any questions about the data or what it meansfor your real estategoalspleasedo not hesitate to reach out to your Slifer Smith & Frampton broker It is an honor for our team to represent the real estate needs of our incredibleclientsinour amazingcommunity
MATT FITZGERALD
Vail Valley Market President

WE ARE SLIFER SMITH & FRAMPTON
COLORADO'S REAL ESTATE
270+ world-class agents across Colorado
120+ dedicated & local support staff
$10B+ sales volume since 2020
#1
Colorado's leading, independent real estate company
100% Colorado owned & operated
TE COMPANY

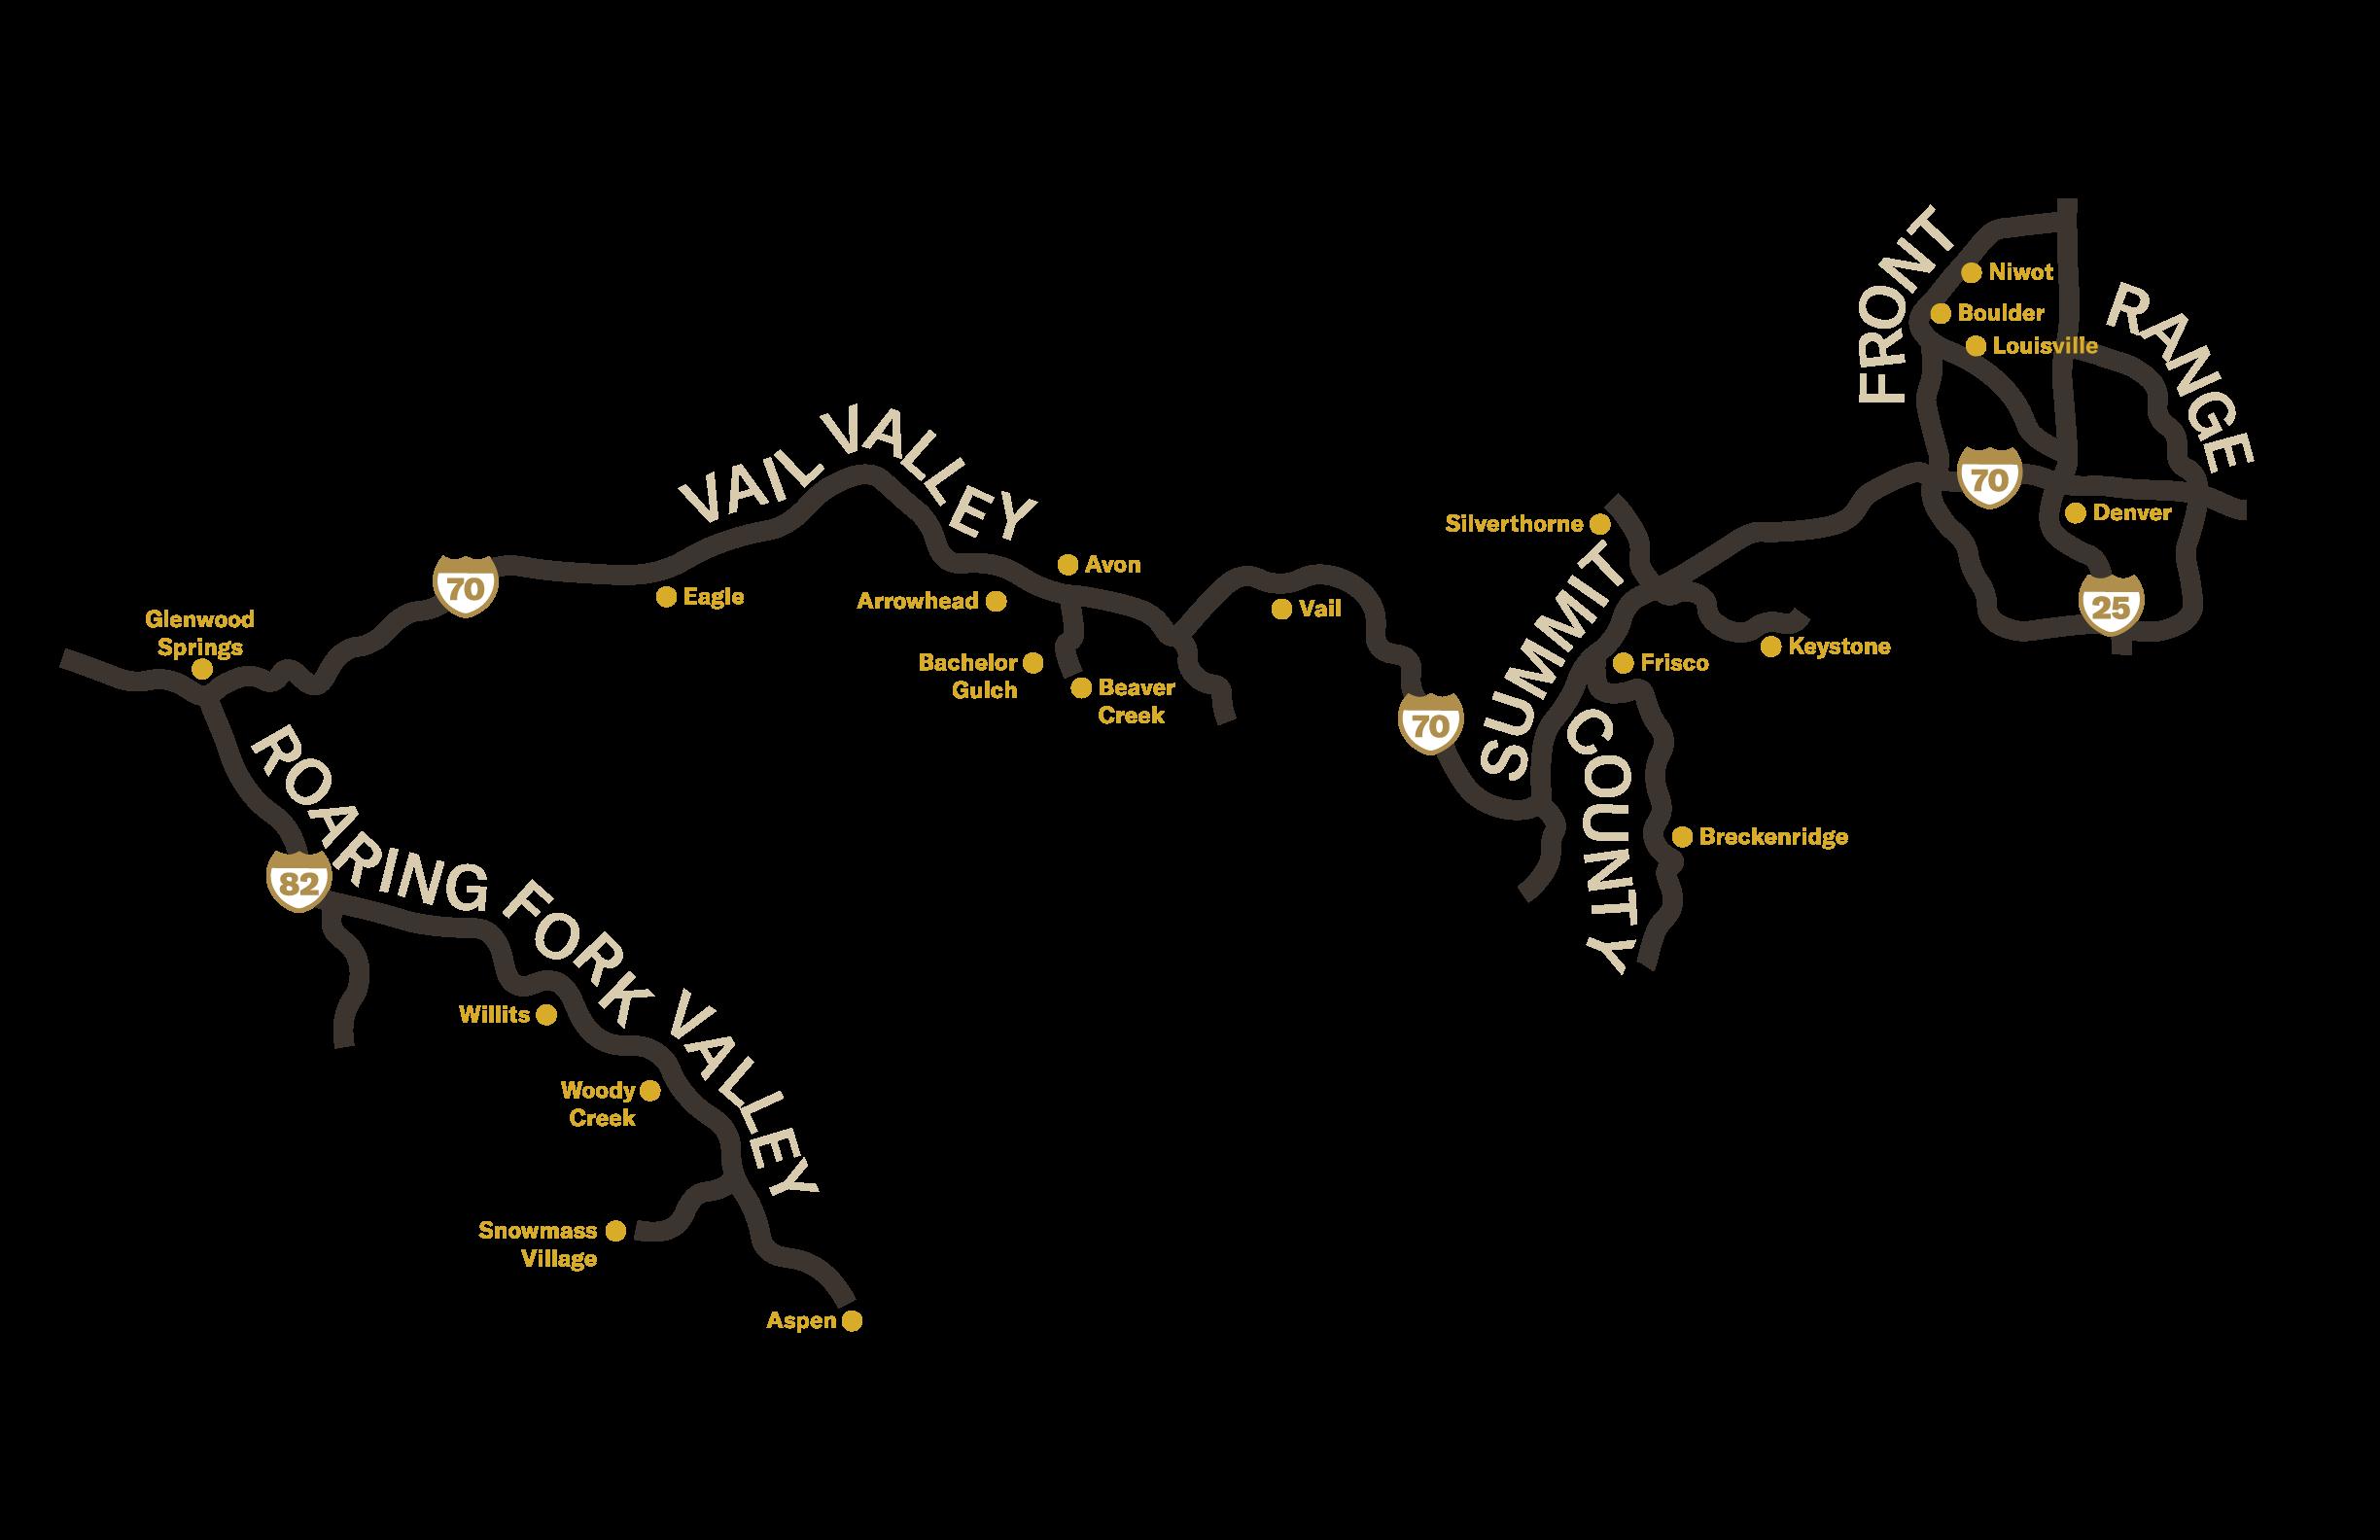
Roaring Fork Valley 6 LOCATIONS Vail Valley 12 LOCATIONS Summit County 5 LOCATIONS Front Range 5 LOCATIONS
OUR MARKET SHARE
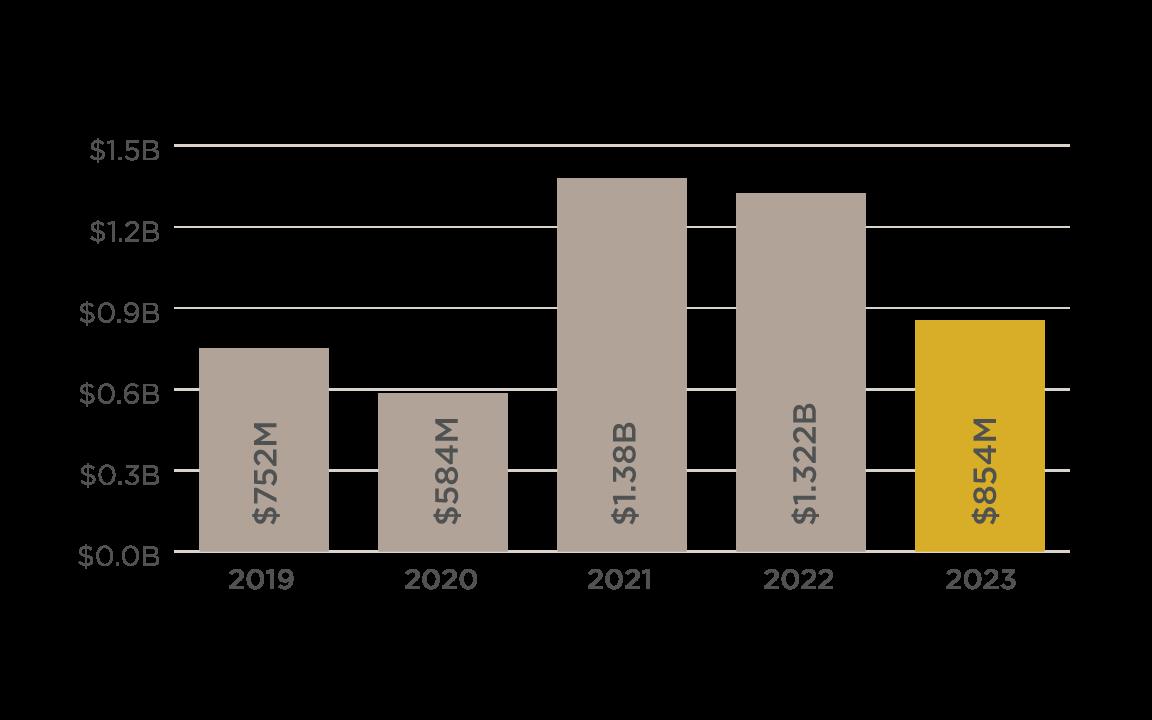
SALES VOLUME COMPARISON | SSF MARKET SHARE
LUXURY SALES VOLUME COMPARISON | SSF MARKET SHARE
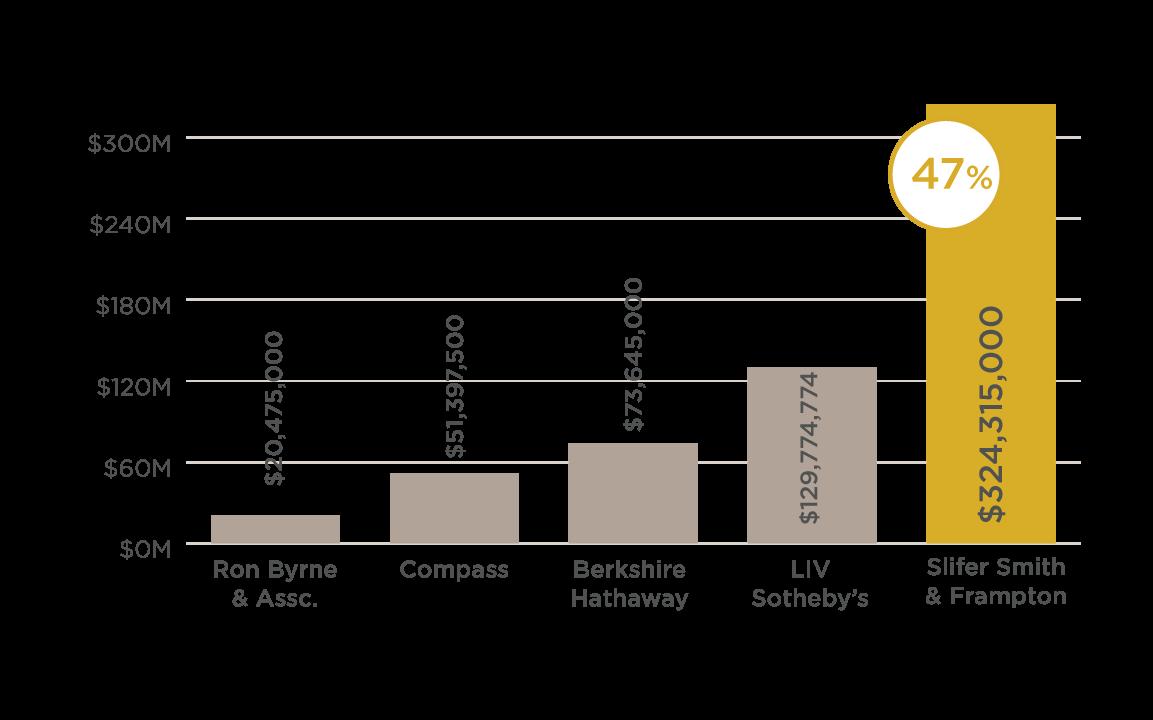
Residential Sales Over $4 Million

Slifer Smith &
Real Estate | 6
Frampton
SALES VOLUME COMPARISON
TRANSACTION COMPARISON

The Slifer Report 2023 | 7
MARKET OVERVIEW
MARKET OVERVIEW
RESIDENTIAL AVERAGE SALES PRICE COMPARISON
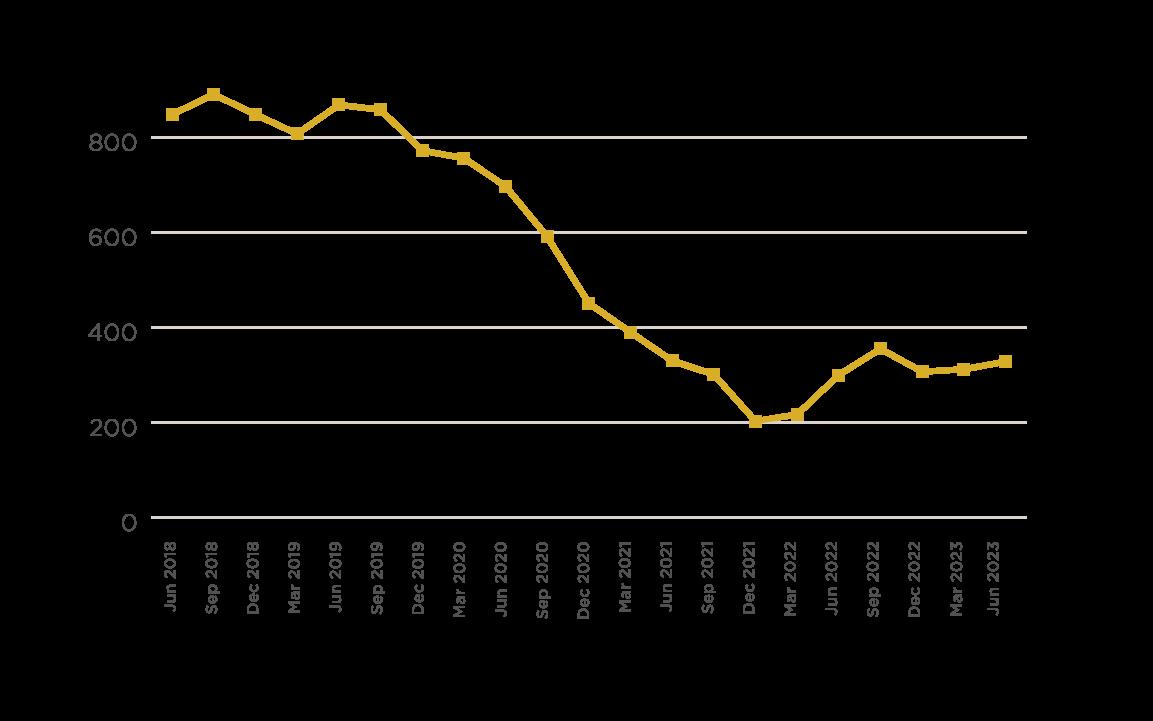
ACTIVE INVENTORY BY MONTH
Slifer Smith & Frampton Real Estate | 8
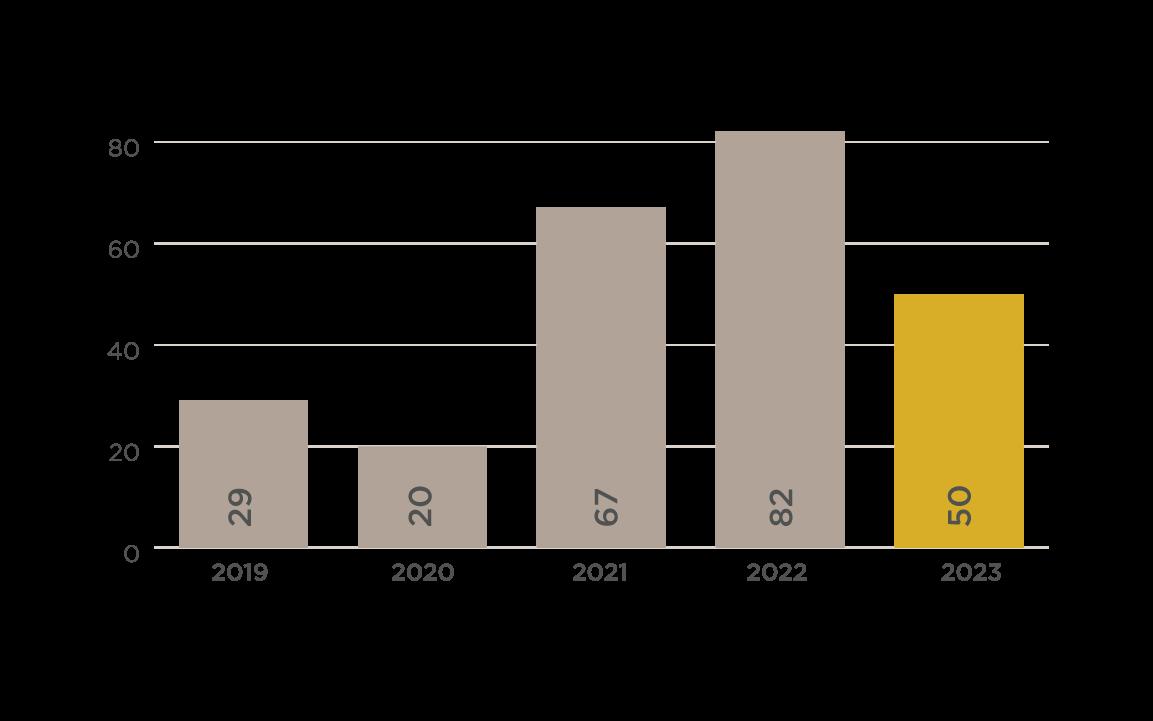
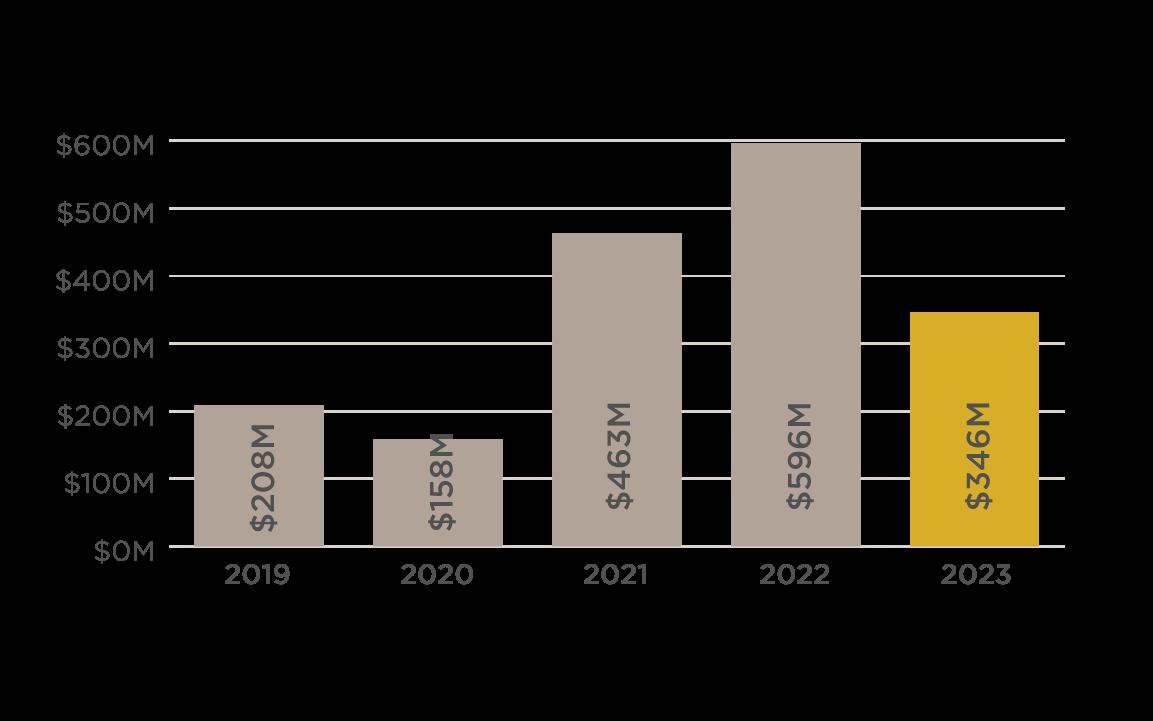
LUXURY OVERVIEW
Residential Sales Over $4 Million
LUXURY SALES VOLUME COMPARISON
LUXURY TRANSACTION COMPARISON
The Slifer Report 2023 | 9
VAIL VILLAGE & LIONSHEAD
$2,570 averagesold price per squarefoot,a 12%increaseover

Slifer
&
Real Estate | 10
Smith
Frampton
SINGLE FAMILY & DUPLEX SALES VOLUME NO OF SALES AVG DAYS ON MARKET AVG SALE MEDIAN SALE 2019 $7,137,500 1 1,414 $7,137,500 $7,137,500 2020 $44,737,500 4 198 $11,184,375 $9,775,000 2021 $89,100,000 6 381 $14,850,000 $12,300,000 2022 $87,835,000 5 227 $17,567,000 $14,985,000 2023 $12,350,000 1 196 $12,350,000 $12,350,000 CONDOMINIUM & TOWNHOME SALES VOLUME NO. OF SALES AVG. DAYS ON MARKET AVG. SALE MEDIAN SALE 2019 $113,625,300 42 349 $2,705,364 $1,912,500 2020 $107,184,500 31 341 $3,457,565 $2,335,000 2021 $235,049,775 91 179 $2,582,965 $2,000,000 2022 $199,365,000 48 79 $4,153,438 $3,237,500 2023 $128,347,750 32 63 $4,010,867 $3,132,500 AREA highlights AVERAGE PRICE PER SQUARE FOOT SALE VS LIST PRICE COMPARISON 2019 2020 2021 2022 2023 Single Family & Duplex $1,798 $2,534 $2,840 $2,838 $3,238 Condominium & Townhome $1,533 $1,653 $1,768 $2,243 $2,549 AVERAGE SALE / LAST LISTED PRICE Single Family & Duplex 100% Condominium & Townhome 96% #1 IN MARKET SHARE SALES
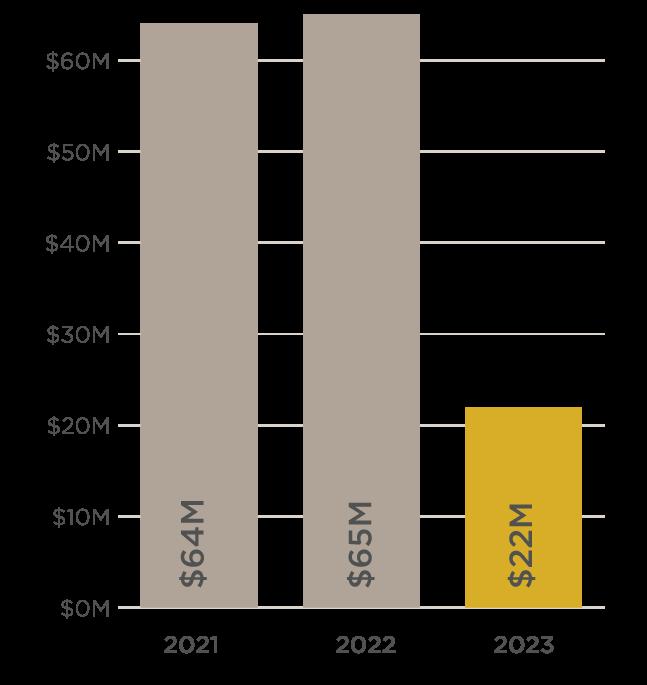
VOLUME COMPARISON
$19.5M highest sale SSFrepresented theseller
2022
VAIL GOLF COURSE, SPRADDLE CREEK & CASCADE VILLAGE
AREA highlights #1 IN
$1,760 averagesold price per squarefoot, an 8%increase over 2022
$8.75M highest sale SSFrepresented thebuyer
SALES VOLUME COMPARISON
The Slifer Report 2023 | 11
SINGLE FAMILY & DUPLEX SALES VOLUME NO OF SALES AVG DAYS ON MARKET AVG SALE MEDIAN SALE 2019 $61,486,000 8 255 $7,685,750 $6,425,000 2020 $5,378,000 1 383 $5,378,000 $5,378,000 2021 $34,800,000 6 340 $5,800,000 $5,775,000 2022 $46,050,000 5 138 $9,210,000 $9,700,000 2023 $15,600,000 2 22 $7,800,000 $7,800,000 CONDOMINIUM & TOWNHOME SALES VOLUME NO. OF SALES AVG. DAYS ON MARKET AVG. SALE MEDIAN SALE 2019 $10,480,000 7 86 $1,497,143 $1,630,000 2020 $10,700,000 7 191 $1,528,571 $1,880,000 2021 $29,789,000 15 143 $1,985,933 $2,100,000 2022 $19,235,000 7 0 $2,747,857 $3,125,000 2023 $6,765,000 3 49 $2,255,000 $2,100,000 AVERAGE PRICE PER SQUARE FOOT SALE VS LIST PRICE COMPARISON 2019 2020 2021 2022 2023 Single Family & Duplex $1,532 $962 $1,355 $1,894 $2,263 Condominium & Townhome $832 $915 $959 $1,440 $1,425 AVERAGE SALE / LAST LISTED PRICE Single Family & Duplex 99% Condominium & Townhome 97%
MARKET SHARE
EAST VAIL & BOOTH CREEK
highlights Slifer Smith & Frampton Real Estate | 12
AREA
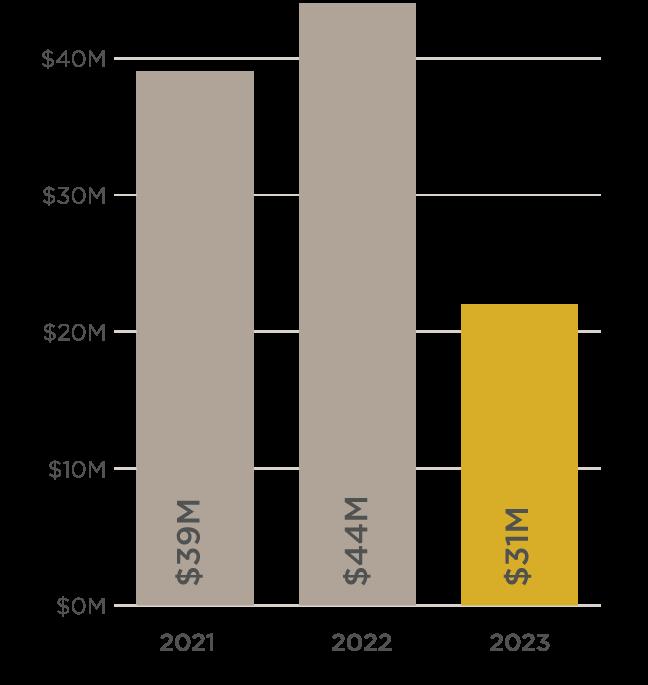
SINGLE FAMILY & DUPLEX SALES VOLUME NO OF SALES AVG DAYS ON MARKET AVG SALE MEDIAN SALE 2019 $16,567,359 11 138 $1,506,124 $1,190,000 2020 $22,133,625 10 284 $2,213,362 $1,486,250 2021 $19,827,000 9 190 $2,203,000 $1,927,000 2022 $24,106,000 8 53 $3,013,250 $2,445,000 2023 $16,903,024 5 255 $3,380,605 $3,400,000 CONDOMINIUM & TOWNHOME SALES VOLUME NO OF SALES AVG DAYS ON MARKET AVG SALE MEDIAN SALE 2019 $14,537,260 23 39 $632,055 $620,000 2020 $8,506,000 14 66 $607,571 $575,000 2021 $18,865,450 27 29 $698,720 $575,000 2022 $20,795,111 20 20 $1,039,756 $1,075,000 2023 $15,495,500 16 38 $968,469 $800,000 AVERAGE PRICE PER SQUARE FOOT SALE VS. LIST PRICE COMPARISON 2019 2020 2021 2022 2023 Single Family & Duplex $567 $632 $902 $1,027 $1,201 Condominium & Townhome $588 $633 $700 $990 $989 AVERAGE SALE / LAST LISTED PRICE Single Family & Duplex 95% Condominium & Townhome 97% SALES VOLUME COMPARISON $1,046 averagesold price per squarefoot,a 4%increaseover 2022 $7.02M highest sale duplexinBooth Creek
WEST VAIL, SANDSTONE & LIONSRIDGE
AREA highlights The Slifer Report 2023 | 13
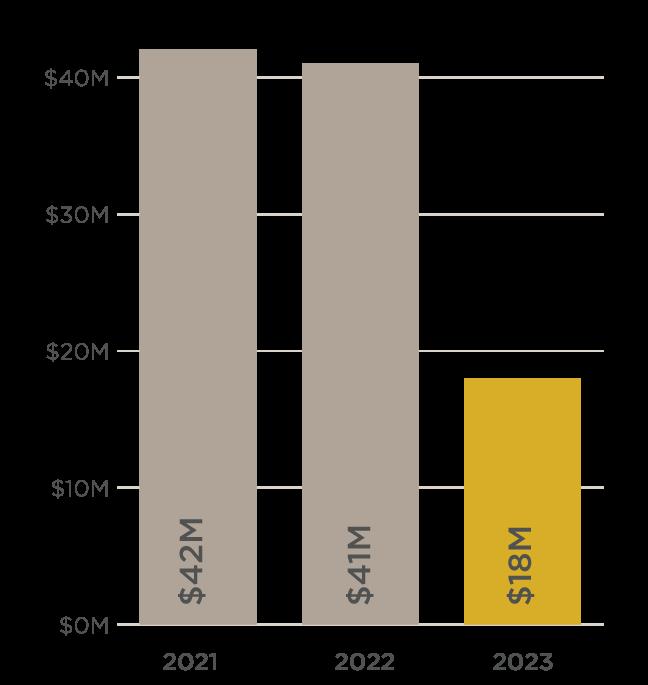
SINGLE FAMILY & DUPLEX SALES VOLUME NO OF SALES AVG DAYS ON MARKET AVG SALE MEDIAN SALE 2019 $14,269,500 7 195 $2,038,500 $2,275,000 2020 $9,494,170 6 104 $1,582,362 $1,167,085 2021 $22,727,082 13 95 $1,748,237 $1,517,000 2022 $17,332,000 5 58 $3,466,400 $3,550,000 2023 $8,635,000 4 26 $2,158,750 $2,255,000 CONDOMINIUM & TOWNHOME SALES VOLUME NO OF SALES AVG DAYS ON MARKET AVG SALE MEDIAN SALE 2019 $15,820,320 24 105 $659,180 $658,750 2020 $14,349,500 22 63 $652,250 $549,500 2021 $19,596,500 26 79 $753,712 $613,000 2022 $23,793,400 24 4 $991,392 $922,500 2023 $9,548,000 9 37 $1,060,889 $830,000 AVERAGE PRICE PER SQUARE FOOT SALE VS. LIST PRICE COMPARISON 2019 2020 2021 2022 2023 Single Family & Duplex $608 $498 $706 $871 $935 Condominium & Townhome $545 $577 $640 $873 $788 AVERAGE SALE / LAST LISTED PRICE Single Family & Duplex 92% Condominium & Townhome 97% SALES VOLUME COMPARISON #1 IN MARKET SHARE
squarefoot
$833 averagesold price per
$2.85M highest sale SSFrepresentedthe buyer&seller
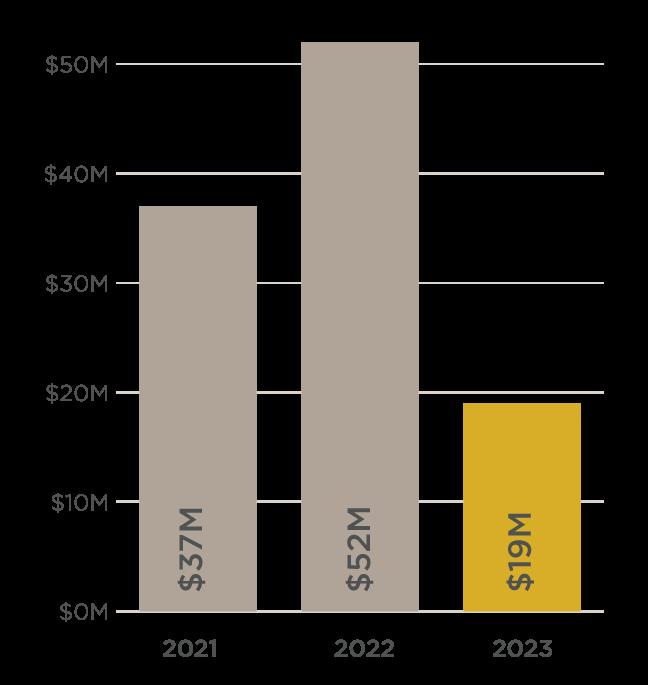
MINTURN & RED CLIFF
637
594
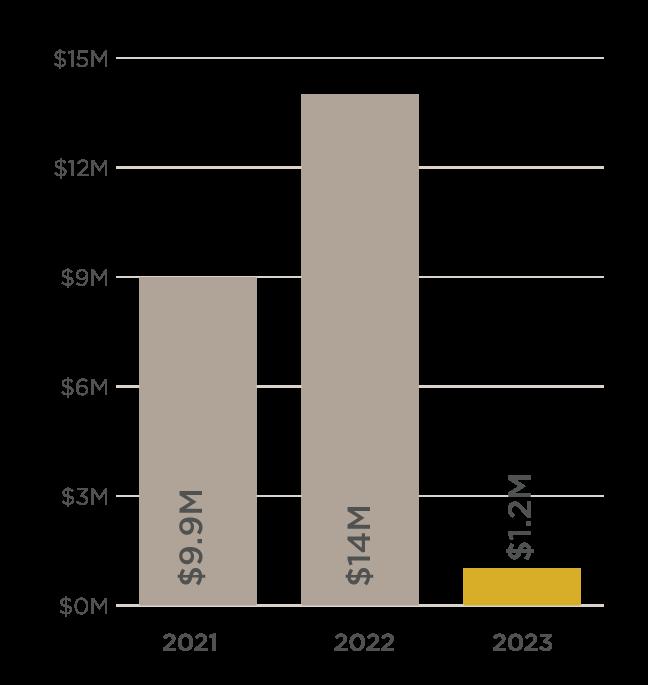
AREA highlights Slifer Smith & Frampton Real Estate | 14
SINGLE FAMILY & DUPLEX SALES VOLUME NO OF SALES AVG DAYS ON MARKET AVG SALE MEDIAN SALE 2019 $2,160,000 2 154 $1,080,000 $1,080,000 2020 $3,885,000 5 226 $777,000 $735,000 2021 $6,619,000 10 167 $661,900 $747,500 2022 10,774,000 9 36 $1,197,111 $1,175,000 2023 $575,000 1 125 $575,000 $575,000
& TOWNHOME SALES VOLUME NO OF SALES AVG DAYS ON MARKET AVG SALE MEDIAN SALE 2019 $1,879,250 3 235 $626,417 $564,250 2020 $5,006,000 7 96 $715,143 $703,000 2021 $3,323,000 6 171 $553,833 $544,000 2022 $3,314,000 4 10 $828,500 $837,000 2023 $700,000 1 187 $700,000 $700,000
LIST
2019 2020 2021 2022 2023 Single Family & Duplex $447 319 $413 $642 $750 Condominium & Townhome $305 $402 $388 $557 $439 AVERAGE SALE / LAST LISTED PRICE Single Family & Duplex 98% Condominium & Townhome 96% SALES VOLUME COMPARISON
CONDOMINIUM
AVERAGE PRICE PER SQUARE FOOT SALE VS.
PRICE COMPARISON
square foot
$
K averagesold price $
averagesold priceper
1.5M averagesold
AREA highlights The Slifer Report 2023 | 15 EAGLE-VAIL SINGLE FAMILY & DUPLEX SALES VOLUME NO OF SALES AVG DAYS ON MARKET AVG SALE MEDIAN SALE 2019 $12,870,000 12 149 $1,072,500 $905,000 2020 $5,769,000 5 29 $1,153,800 $1,015,000 2021 $18,965,437 15 17 $1,264,362 $1,216,750 2022 $30,768,000 14 26 $2,197,714 $1,820,000 2023 $15,760,000 8 40 $1,970,000 $1,602,500 CONDOMINIUM & TOWNHOME SALES VOLUME NO OF SALES AVG DAYS ON MARKET AVG SALE MEDIAN SALE 2019 $7,258,575 13 96 $558,352 $515,000 2020 $7,910,000 14 74 $565,000 $597,000 2021 $18,336,000 27 12 $679,111 $645,000 2022 $21,571,000 25 6 $862,840 $875,000 2023 $4,036,000 5 79 $807,200 $900,000 $
.9M highest sale single-family residence AVERAGE PRICE PER SQUARE FOOT SALE VS. LIST PRICE COMPARISON 2019 2020 2021 2022 2023 Single Family & Duplex $371 $429 $476 $651 $631 Condominium & Townhome $366 $406 $455 $663 $707 AVERAGE SALE / LAST LISTED PRICE Single Family & Duplex 95% Condominium & Townhome 97%
COMPARISON $
price,
#1 IN MARKET SHARE
3
SALES VOLUME
a13.5%increase over 2022
2023 NOTABLE SALES
As a founding member
Slifer Smith & Frampton is proud to fly the Forbes Global Properties flag from Aspen to the Front Range This powerful, global, network of top-tier independent brokerages gives our agents, and our clients, exclusive access to an invaluable network of the world's finest homes and the agents representing them.
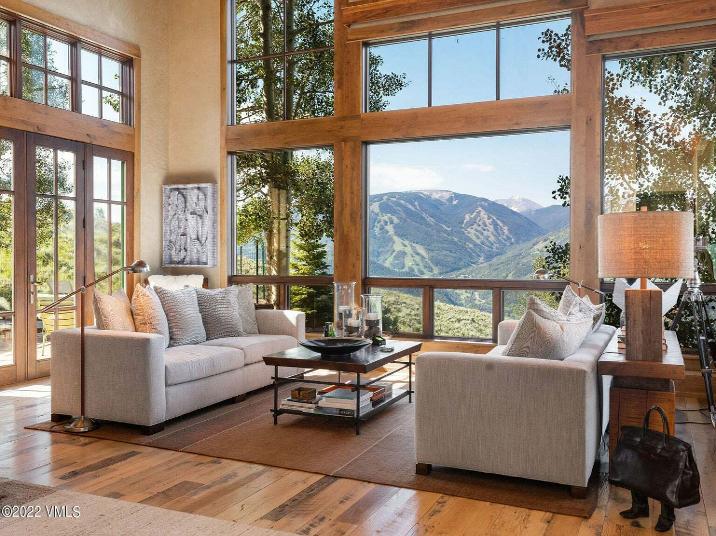
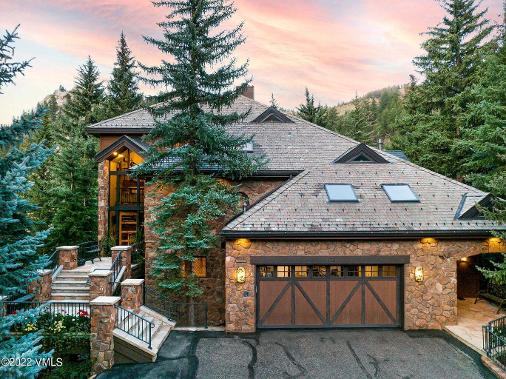
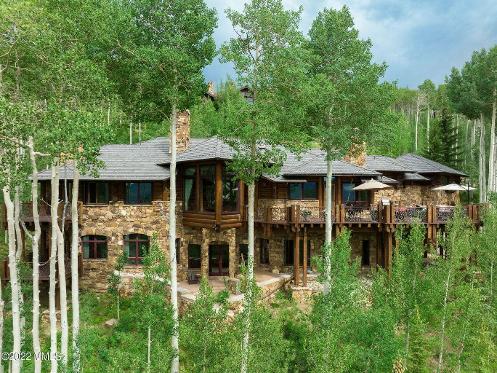
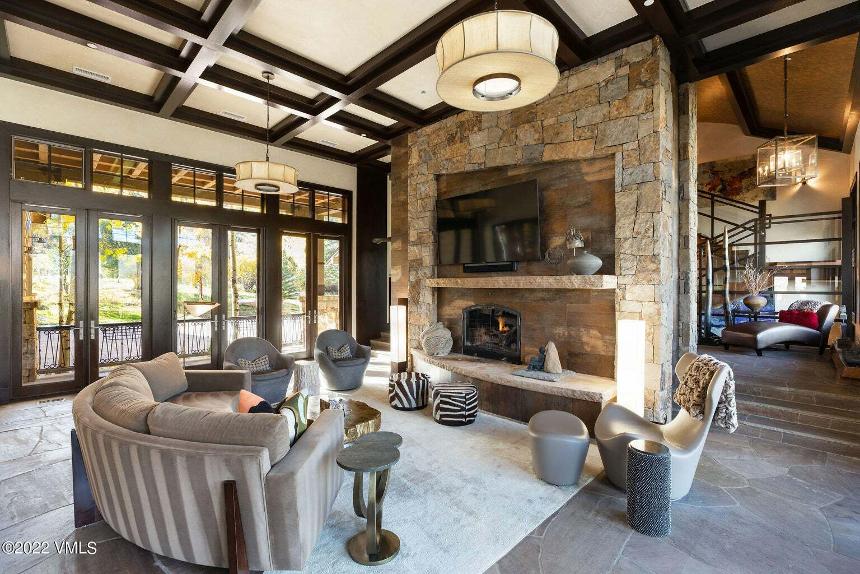
In 2023 our membership with Forbes Global Properties brought some incredible Vail Valley homes to a global audience.

Here are some of our most notable sales of the year so far
ARROWHEAD | $7,495,000
1923 CRESTA ROAD
Represented the Seller
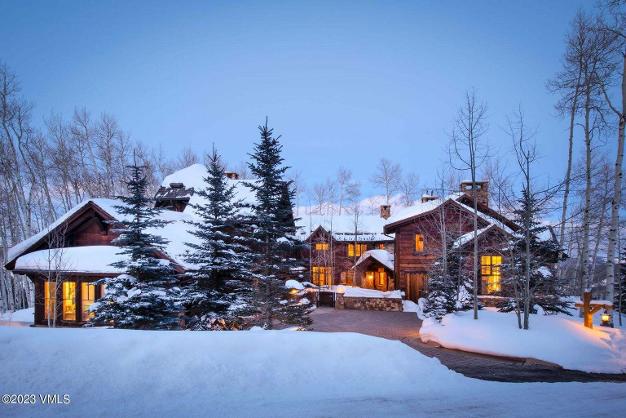
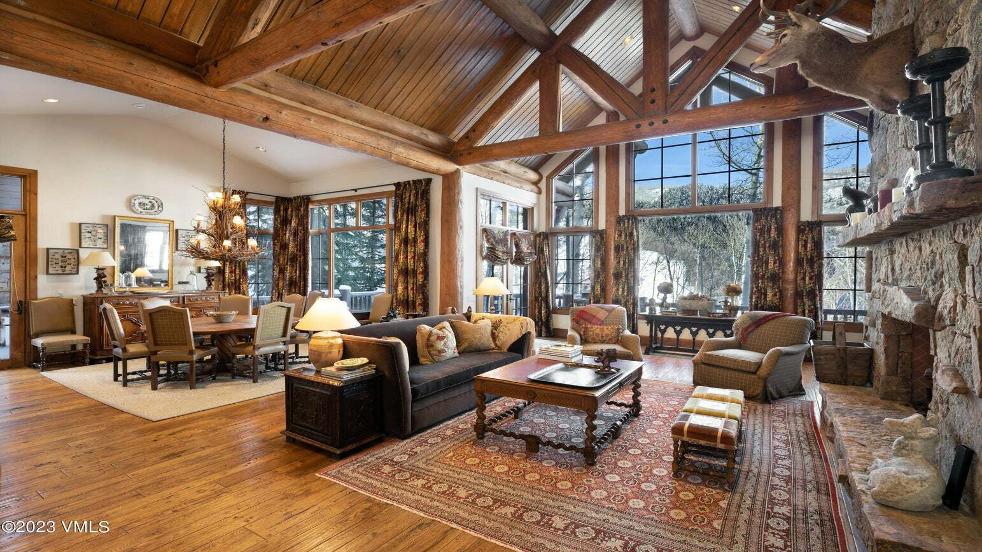
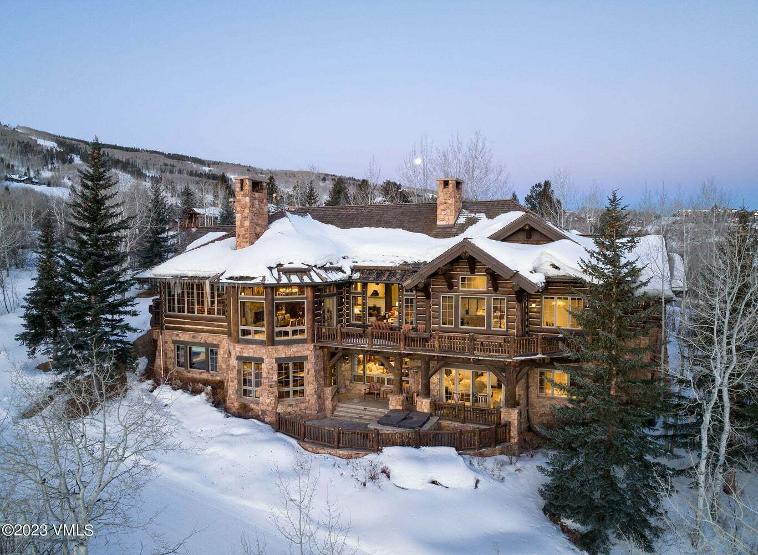
BACHELOR GULCH | $11,550,000
3546 DAYBREAK RIDGE
Represented the Buyer & Seller
BEAVER CREEK | $5,000,000
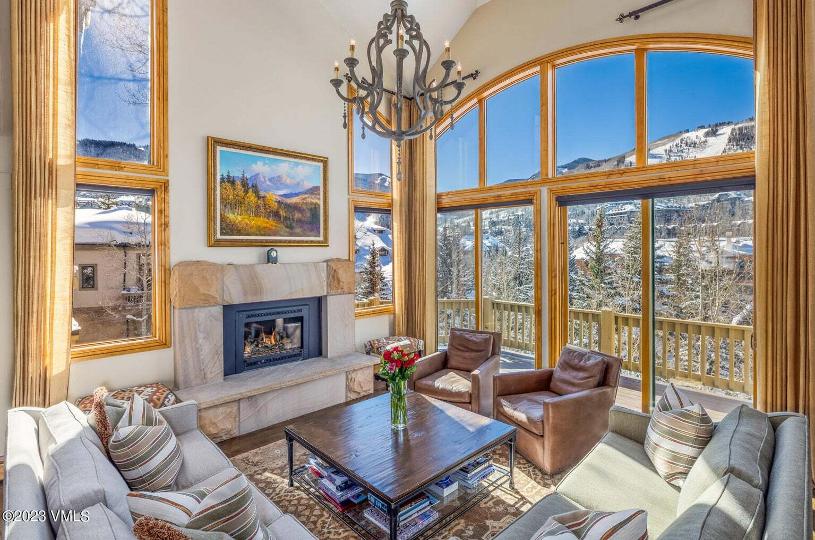
THE ASPENS 12
Represented the Seller
EAGLE | $6,225,000
THE Y KNOT RANCH
Represented the Seller
BACHELOR GULCH | $12,745,000

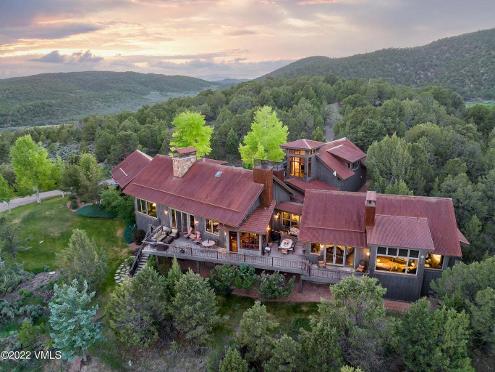
156 ELKHORN ROAD
Represented the Buyer & Seller
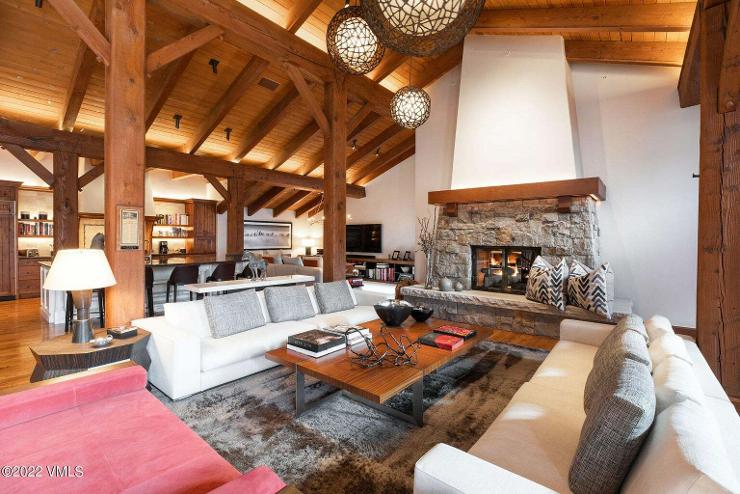
CORDILLERA | $5,000,000
196 SPRING CREEK LANE
Represented the Seller
Real Estate | 16
Slifer Smith & Frampton
The Slifer Report 2023 | 17
VAIL
VILLAGE | $19,500,000 TYROLEAN INN 9 Represented the Seller
MOUNTAIN STAR | $6,750,000 643 PAINTBRUSH Represented the Seller
BEAVER CREEK | $7,800,000 173 SOUTH FAIRWAY DRIVE Represented the Buyer & Seller
BACHELOR
GULCH | $7,750,000 1969 DAYBREAK RIDGE Represented the Buyer & Seller
RED SKY RANCH | $5,655,000 300 ASPEN BLUFF LANE Represented the Seller
incredible properties from around the world anytime at:
BEAVER CREEK | $14,750,000 46 GREYSTONE COURT Represented the Seller View
ForbesGlobalProperties.com
AVON & WILDRIDGE

AREA
Slifer Smith & Frampton Real Estate | 18
SINGLE FAMILY & DUPLEX SALES VOLUME NO OF SALES AVG DAYS ON MARKET AVG SALE MEDIAN SALE 2019 $8,319,500 9 105 $924,389 $905,000 2020 $11,390,000 9 112 $1,265,556 $1,150,000 2021 $13,794,000 9 29 $1,532,667 $1,200,000 2022 $16,222,500 10 36 $1,622,250 $1,322,500 2023 $18,965,000 8 169 $2,370,625 $2,450,000 CONDOMINIUM & TOWNHOME SALES VOLUME NO OF SALES AVG DAYS ON MARKET AVG SALE MEDIAN SALE 2019 $34,448,113 62 95 $555,615 $482,500 2020 $25,364,563 32 95 $792,643 $531,250 2021 $61,380,635 86 47 $713,728 $555,000 2022 $72,338,600 75 13 $964,515 $707,500 2023 $77,445,000 47 70 $1,647,766 $1,175,000 AVERAGE PRICE PER SQUARE FOOT SALE VS. LIST PRICE COMPARISON 2019 2020 2021 2022 2023 Single Family & Duplex $333 $417 $413 $573 $662 Condominium & Townhome $481 $605 $674 $891 $1,106 AVERAGE SALE / LAST LISTED PRICE Single Family & Duplex 95% Condominium & Townhome 97% #1 IN MARKET SHARE SALES VOLUME COMPARISON 68% increaseinaverage sold priceover 2022,to $1.75M $4.8M highest sale SSFrepresented theseller
highlights
$739 averagesold price per squarefoot
$6.75M highest sale SSFrepresented theseller
SALES VOLUME COMPARISON
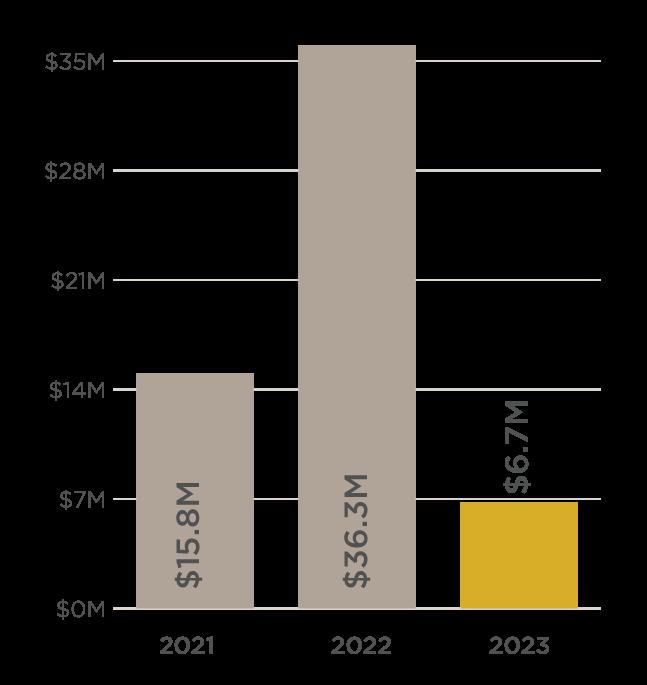
AREA highlights The Slifer Report 2023 | 19 MOUNTAIN STAR SINGLE FAMILY & DUPLEX SALES VOLUME NO OF SALES AVG DAYS ON MARKET AVG SALE MEDIAN SALE 2019 $3,045,000 1 609 $3,045,000 $3,045,000 2020 $0 0 N/A N/A N/A 2021 $15,872,500 3 625 $5,290,833 $5,372,500 2022 $36,300,000 3 203 $12,100,000 $9,050,000 2023 $6,750,000 1 278 $6,750,000 $6,750,000
AVERAGE PRICE PER SQUARE FOOT SALE VS. LIST PRICE COMPARISON 2019 2020 2021 2022 2023 Single Family & Duplex $538 N/A $592 $1,356 $739 AVERAGE SALE / LAST LISTED PRICE Single Family & Duplex 85%
BEAVER CREEK

Slifer
& Frampton Real Estate | 20
AREA highlights
Smith
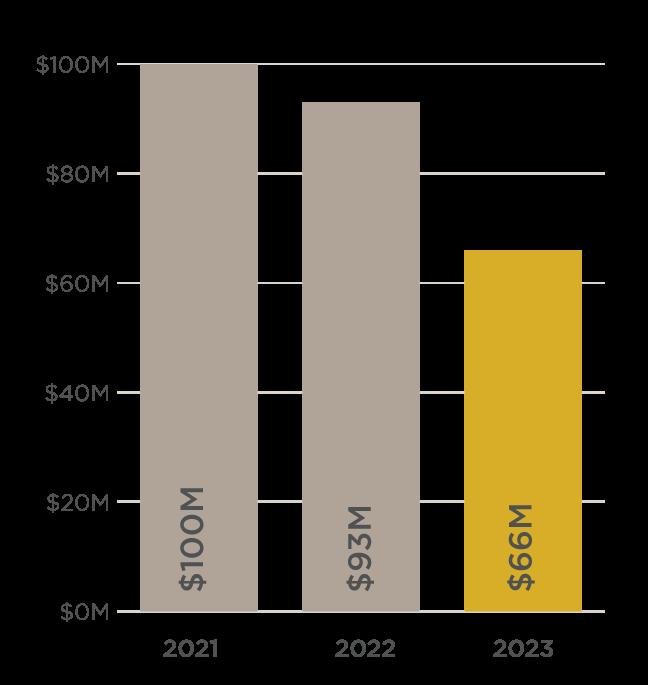
SINGLE FAMILY & DUPLEX SALES VOLUME NO OF SALES AVG DAYS ON MARKET AVG SALE MEDIAN SALE 2019 $36,908,166 10 349 $3,690,817 $3,137,500 2020 $17,500,000 4 322 $4,375,000 $4,400,000 2021 $86,929,000 15 358 $5,795,267 $5,245,000 2022 $23,645,500 4 98 $5,911,375 $4,679,000 2023 $39,229,250 6 250 $6,538,208 $7,012,500 CONDOMINIUM & TOWNHOME SALES VOLUME NO OF SALES AVG DAYS ON MARKET AVG SALE MEDIAN SALE 2019 $56,623,275 43 143 $1,316,820 $1,025,000 2020 $36,617,400 24 163 $1,525,725 $1,135,700 2021 $129,366,700 79 121 $1,637,553 $1,485,000 2022 $125,589,500 53 23 $2,369,613 $2,100,000 2023 $89,145,500 20 55 $4,457,275 $2,381,250 AVERAGE PRICE PER SQUARE FOOT SALE VS. LIST PRICE COMPARISON 2019 2020 2021 2022 2023 Single Family & Duplex $733 $764 $891 $1,069 $990 Condominium & Townhome $757 $784 $929 $1,332 $1,567 AVERAGE SALE / LAST LISTED PRICE Single Family & Duplex 93% Condominium & Townhome 96% #1 IN MARKET SHARE SALES VOLUME COMPARISON 89% increaseof averagesold price over 2022,to $4.93M $1,433 averagepriceper squarefoot,a9% increaseover 2022
$1,440 averagesold price per squarefoot,a 5%increaseover 2022
12.7M highest sale SSFrepresentedthe buyer&seller
AREA highlights The Slifer Report 2023 | 21
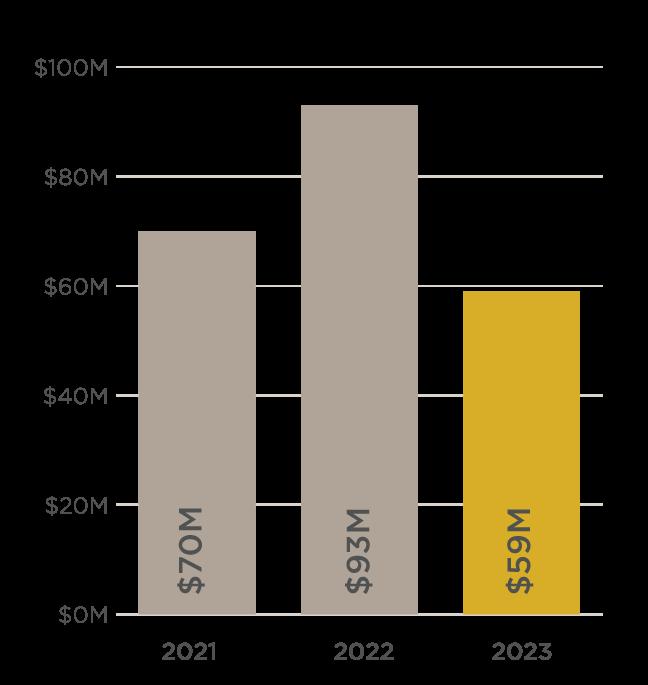
SINGLE FAMILY & DUPLEX SALES VOLUME NO OF SALES AVG DAYS ON MARKET AVG SALE MEDIAN SALE 2019 $22,695,000 3 148 $7,565,000 $7,500,000 2020 $19,300,000 3 420 $6,433,333 $5,000,000 2021 $69,813,750 9 189 $7,757,083 $8,500,000 2022 $55,570,000 6 27 $9,261,667 $8,847,500 2023 $41,145,000 4 68 $10,286,250 $10,325,000 CONDOMINIUM & TOWNHOME SALES VOLUME NO OF SALES AVG DAYS ON MARKET AVG SALE MEDIAN SALE 2019 $17,565,000 10 215 $1,756,500 $1,527,500 2020 $33,415,000 18 154 $1,856,389 $1,867,000 2021 $30,292,000 14 152 $2,163,714 $2,053,500 2022 $37,931,500 10 27 $3,793,150 $3,974,750 2023 $25,671,500 8 0 $3,208,938 $3,400,000 $
AVERAGE PRICE PER SQUARE FOOT SALE VS. LIST PRICE COMPARISON 2019 2020 2021 2022 2023 Single Family & Duplex $955 $798 $1,078 $1,255 $1,220 Condominium & Townhome $918 $927 $996 $1,439 $1,550 AVERAGE SALE / LAST LISTED PRICE Single Family & Duplex 101% Condominium & Townhome 96% SALES VOLUME COMPARISON
IN MARKET SHARE
BACHELOR GULCH
#1
Slifer Smith & Frampton Real Estate | 22
SINGLE FAMILY & DUPLEX SALES VOLUME NO OF SALES AVG DAYS ON MARKET AVG SALE MEDIAN SALE 2019 $41,605,000 14 317 $2,971,786 $2,385,000 2020 $17,240,500 8 198 $2,155,062 $2,060,000 2021 $55,054,950 14 159 $3,932,496 $3,150,000 2022 $67,285,500 14 135 $4,806,107 $4,875,000 2023 $33,130,000 8 131 $4,141,250 $4,025,000 CONDOMINIUM & TOWNHOME SALES VOLUME NO OF SALES AVG DAYS ON MARKET AVG SALE MEDIAN SALE 2019 $13,616,000 12 187 $1,134,667 $1,130,000 2020 $5,776,900 6 113 $962,817 $857,450 2021 $15,512,500 11 56 $1,410,227 $1,125,000 2022 $26,627,500 16 3 $1,664,219 $1,405,000 2023 $26,038,000 10 25 $2,603,800 $2,524,500 AVERAGE PRICE PER SQUARE FOOT SALE VS. LIST PRICE COMPARISON 2019 2020 2021 2022 2023 Single Family & Duplex $569 $529 $662 $908 $1,061 Condominium & Townhome $658 $694 $765 $1,163 $1,262 AVERAGE SALE / LAST LISTED PRICE Single Family & Duplex 96% Condominium & Townhome 97% #1 IN MARKET SHARE SALES VOLUME COMPARISON
averagesold price per squarefoot,a 12%increaseover 2022
highest sale SSFrepresented theseller
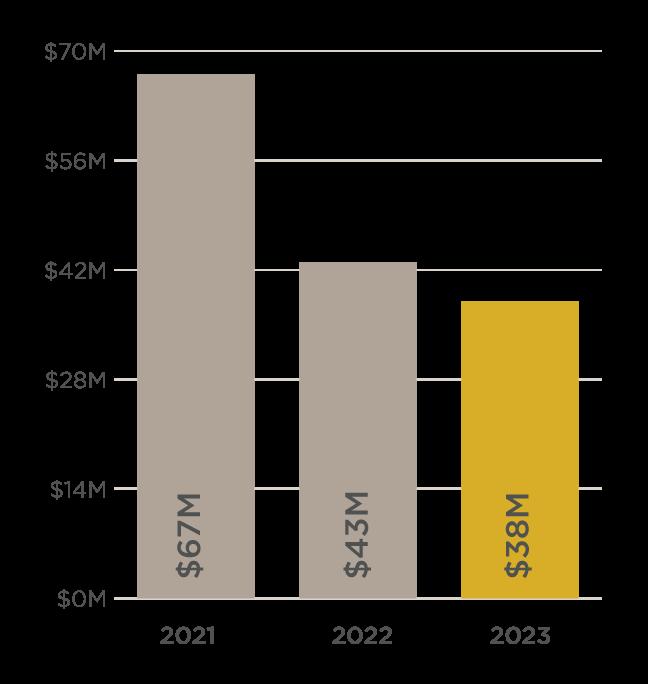
AREA highlights
ARROWHEAD
$1,173
$7.495M
EDWARDS, HOMESTEAD & LAKE CREEK VALLEY
$1.4M averagesold price, a24%increase over 2022 #1
$4.15M highest sale SSFrepresented thebuyer&seller
AREA highlights The Slifer Report 2023 | 23
SINGLE FAMILY & DUPLEX SALES VOLUME NO OF SALES AVG DAYS ON MARKET AVG SALE MEDIAN SALE 2019 $21,298,005 14 182 $1,521,286 $952,500 2020 $13,587,000 9 127 $1,509,667 $1,525,000 2021 $49,360,612 23 51 $2,146,114 $1,395,000 2022 $21,032,600 10 41 $2,103,260 $1,684,800 2023 $25,330,469 11 107 $2,302,770 $1,657,000 CONDOMINIUM & TOWNHOME SALES VOLUME NO OF SALES AVG DAYS ON MARKET AVG SALE MEDIAN SALE 2019 $10,836,075 24 106 $451,503 $426,000 2020 $8,249,885 17 52 $485,287 $496,500 2021 $17,382,000 27 15 $643,778 $597,500 2022 $22,579,300 28 8 $806,404 $782,000 2023 $13,003,000 16 31 $812,688 $848,750
AVERAGE PRICE PER SQUARE FOOT SALE VS. LIST PRICE COMPARISON 2019 2020 2021 2022 2023 Single Family & Duplex $394 $396 $512 $567 $747 Condominium & Townhome $357 $374 $445 $605 $659 AVERAGE SALE / LAST LISTED PRICE Single Family & Duplex 95% Condominium & Townhome 100% SALES VOLUME COMPARISON
IN MARKET SHARE

Slifer Smith & Frampton Real Estate | 24 SINGLETREE SINGLE FAMILY & DUPLEX SALES VOLUME NO OF SALES AVG DAYS ON MARKET AVG SALE MEDIAN SALE 2019 $17,044,000 16 171 $1,065,250 $945,000 2020 $16,048,500 14 127 $1,146,321 $990,000 2021 $26,300,000 17 77 $1,547,059 $1,300,000 2022 $32,981,000 14 8 $2,355,786 $1,997,500 2023 $18,835,000 9 52 $2,092,778 $1,850,000 CONDOMINIUM & TOWNHOME SALES VOLUME NO OF SALES AVG DAYS ON MARKET AVG SALE MEDIAN SALE 2019 $1,505,000 2 21 $752,500 $752,500 2020 $1,190,000 1 137 $1,190,000 $1,190,000 2021 $3,581,500 4 10 $895,375 $787,500 2022 $4,215,000 3 8 $1,405,000 $1,575,000 2023 $2,555,065 2 20 $1,277,532 $1,277,532 AVERAGE PRICE PER SQUARE FOOT SALE VS. LIST PRICE COMPARISON 2019 2020 2021 2022 2023 Single Family & Duplex $352 $331 $487 $626 $732 Condominium & Townhome $456 $446 $563 $696 $734 AVERAGE SALE / LAST LISTED PRICE Single Family & Duplex 94% Condominium & Townhome 99% SALES VOLUME COMPARISON $733 averagesold price per squarefoot,a 13%increaseover 2022 $4.35M highest sale SSFrepresented thebuyer&seller #1 IN MARKET SHARE
AREA highlights
CORDILLERA & TIMBER SPRINGS

AREA highlights The Slifer Report 2023 | 25
SINGLE FAMILY & DUPLEX SALES VOLUME NO OF SALES AVG DAYS ON MARKET AVG SALE MEDIAN SALE 2019 $79,943,183 33 211 $2,422,521 $2,050,000 2020 $46,051,000 21 262 $2,192,905 $1,900,000 2021 $97,056,500 35 76 $2,773,043 $2,650,000 2022 $74,138,471 19 49 $3,902,025 $3,495,000 2023 $64,414,000 17 58 $3,789,059 $3,800,000 $6.1M highest sale single-family residence AVERAGE PRICE PER SQUARE FOOT SALE VS. LIST PRICE COMPARISON 2019 2020 2021 2022 2023 Single Family & Duplex $413 $398 $509 $684 $773 AVERAGE SALE / LAST LISTED PRICE Single Family & Duplex 95% #1 IN MARKET SHARE SALES VOLUME COMPARISON $773
price per squarefoot,a 13%increaseover 2022
averagesold
WOLCOTT, BELLYACHE & RED SKY RANCH
$640 averagesold price per squarefoot,a 7%increaseover 2022
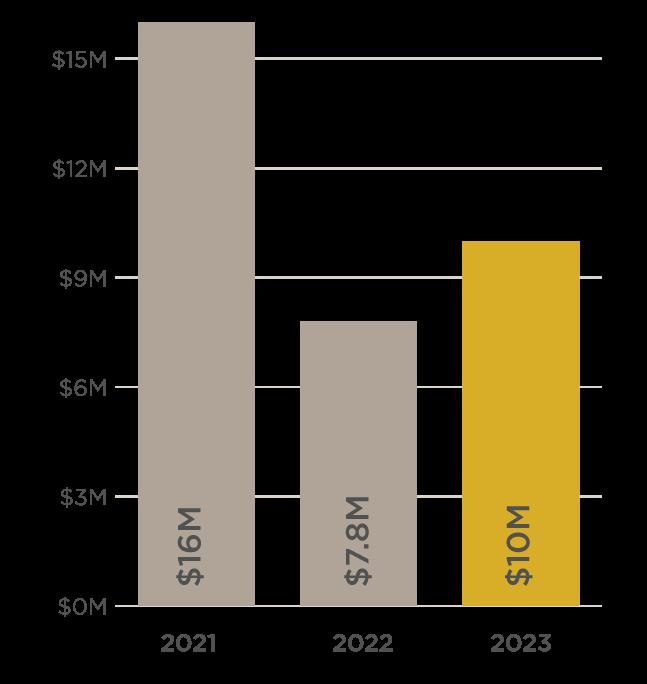
$5.6M highest sale SSFrepresented theseller
VOLUME COMPARISON
AREA highlights Slifer Smith & Frampton Real Estate | 26
SINGLE FAMILY & DUPLEX SALES VOLUME NO OF SALES AVG DAYS ON MARKET AVG SALE MEDIAN SALE 2019 $2,861,650 3 58 $953,883 $755,000 2020 $3,110,000 2 121 $1,555,000 $1,555,000 2021 $16,242,000 6 54 $2,707,000 $2,282,500 2022 $7,875,000 2 52 $3,937,500 $3,937,500 2023 $10,305,000 3 100 $3,435,000 $3,550,000 AVERAGE PRICE PER SQUARE FOOT SALE VS. LIST PRICE COMPARISON 2019 2020 2021 2022 2023 Single Family & Duplex $359 $302 $460 $597 $640 AVERAGE SALE / LAST LISTED PRICE Single Family & Duplex 95% SALES
EAGLE & EAGLE RANCH
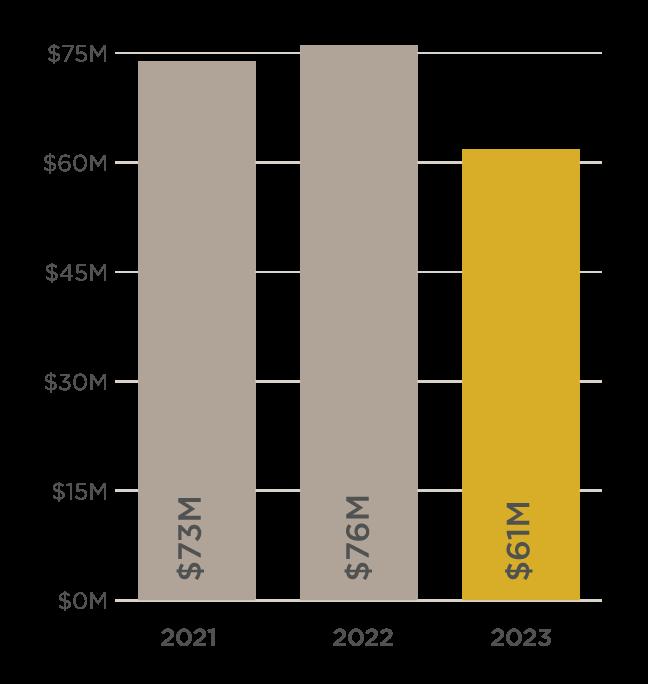
$1.2M averagesold price, a9%increaseover 2022
$6.2M highest sale,a 106 acreranch SSFrepresented theseller
AREA highlights The Slifer Report 2023 | 27
SINGLE FAMILY & DUPLEX SALES VOLUME NO OF SALES AVG DAYS ON MARKET AVG SALE MEDIAN SALE 2019 $27,208,887 38 116 $716,023 $693,575 2020 $25,683,645 30 104 $856,122 $732,500 2021 $57,678,269 47 21 $1,227,197 $1,095,000 2022 $65,962,075 52 17 $1,268,501 $1,215,000 2023 $48,471,125 39 70 $1,242,849 $1,049,000 CONDOMINIUM & TOWNHOME SALES VOLUME NO OF SALES AVG DAYS ON MARKET AVG SALE MEDIAN SALE 2019 $12,722,198 32 79 $397,569 $394,500 2020 $6,254,576 15 90 $416,972 $432,500 2021 $15,479,355 34 8 $455,275 $449,500 2022 $10,638,915 17 2 $625,819 $603,500 2023 $7,161,000 11 16 $651,000 $615,000
AVERAGE PRICE PER SQUARE FOOT SALE VS. LIST PRICE COMPARISON 2019 2020 2021 2022 2023 Single Family & Duplex $235 $304 $327 $415 $414 Condominium & Townhome $277 $287 $355 $428 $479 AVERAGE SALE / LAST LISTED PRICE Single Family & Duplex 95% Condominium & Townhome 99% #1 IN MARKET SHARE SALES VOLUME COMPARISON
GYPSUM & COTTON RANCH
AREA highlights Slifer Smith & Frampton Real Estate | 28
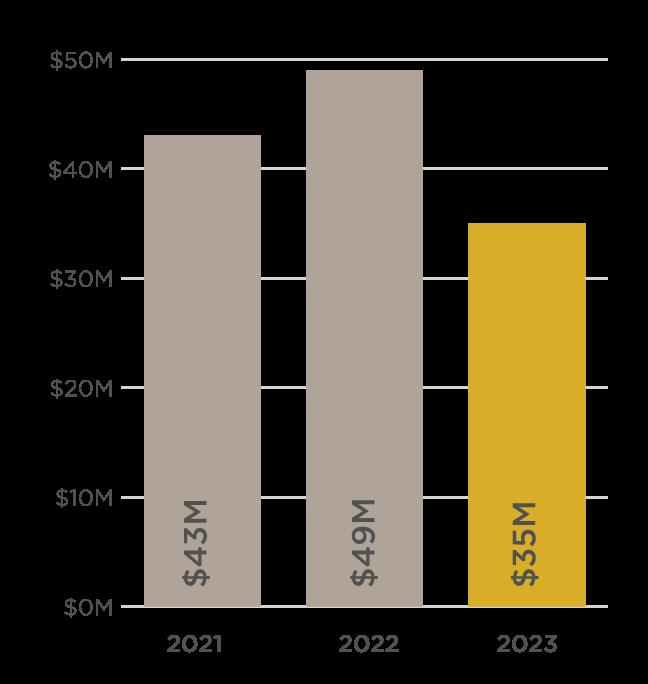
SINGLE FAMILY & DUPLEX SALES VOLUME NO OF SALES AVG DAYS ON MARKET AVG SALE MEDIAN SALE 2019 $20,617,465 40 73 $515,437 $482,250 2020 $17,733,343 31 99 $572,043 $550,000 2021 $28,644,411 46 21 $622,705 $532,896 2022 $35,064,462 47 30 $746,052 $692,620 2023 $32,261,876 42 59 $768,140 $739,500
& TOWNHOME SALES VOLUME NO OF SALES AVG DAYS ON MARKET AVG SALE MEDIAN SALE 2019 $7,929,900 24 209 $329,819 $300,500 2020 $4,557,858 11 29 $414,351 $342,000 2021 $10,912,335 30 46 $363,744 $355,000 2022 $9,564,625 21 3 $455,458 $475,000 2023 $3,430,000 8 2 $428,750 $427,000
PRICE PER SQUARE FOOT SALE VS. LIST PRICE COMPARISON 2019 2020 2021 2022 2023 Single Family & Duplex $216 $249 $261 $365 $389 Condominium & Townhome $312 $243 $308 $356 $492 AVERAGE SALE / LAST LISTED PRICE Single Family & Duplex 98% Condominium & Townhome 100% SALES VOLUME COMPARISON $405 averagesold price per squarefoot,a 7%increaseover 2022 $1.6M highest sale SSFrepresented theseller
CONDOMINIUM
AVERAGE
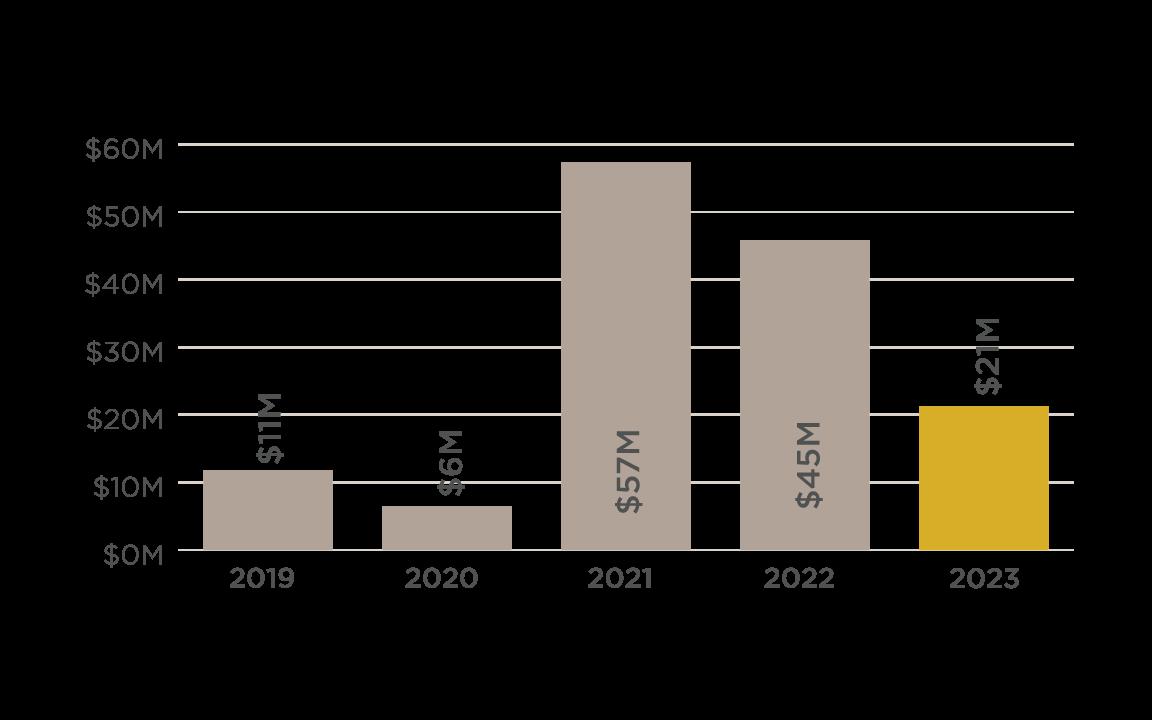
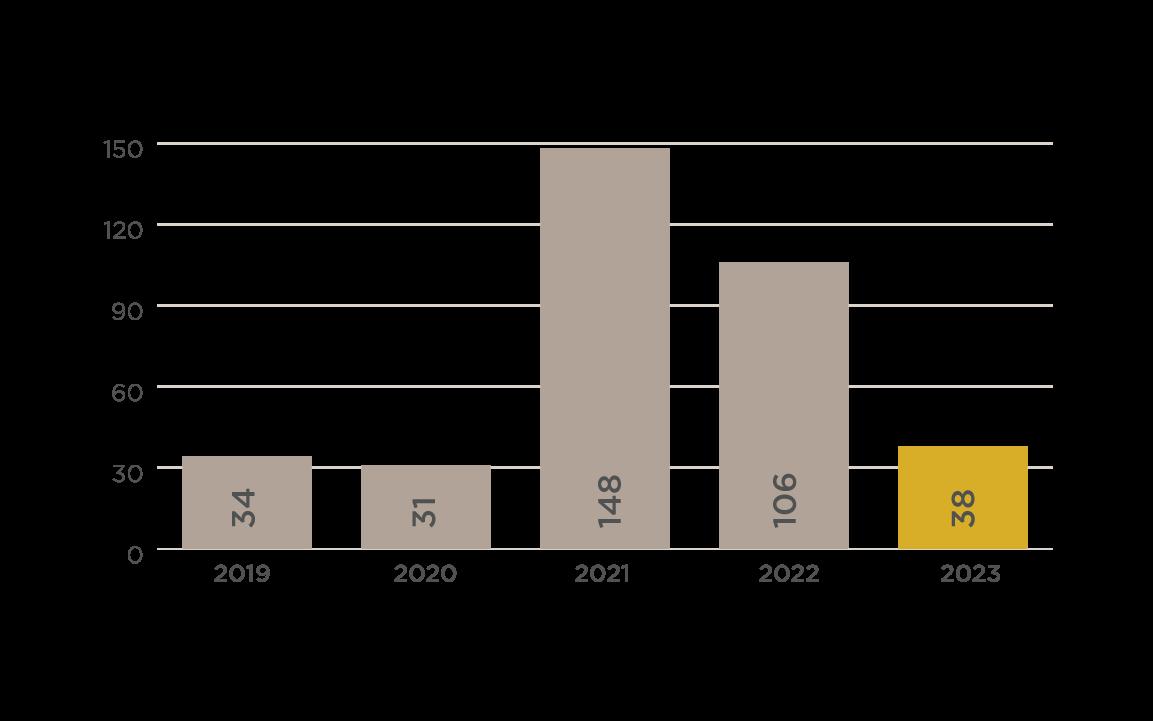
The Slifer Report 2023 | 29 LAND OVERVIEW LAND TRANSACTION VOLUME COMPARISON LAND SALES VOLUME COMPARISON SOURCE SoldlandpropertieswithinEagleCountyJanuary1- June30 of eachyear Sourceof all datainthisreport istheVail Boardof RealtorsMultipleListing Service Informationdeemedreliablebut not guaranteed

S TA Y U P T O D A T E ALL YEAR & V I E W O U R P R O P E R T I E S ANYTIME V A I L R E A L E S TA T E . C O M


