The Value Proposition of All-Electric Student Housing A Case Study
Executive Summary
The case for building electrification is more relevant than ever with an increased focus on renewable energy and sustainability, rising utility and building operations costs, and overall considerations for human health and safety. Utilizing electric-powered, rather than fossil fuel-dependent, building systems and appliances coupled with advancements in energy efficiency sets the stage for a meaningful decrease in both greenhouse gas emissions and operational costs. This case study offers an in-depth exploration of this topic through research and lessons learned from the recently completed Phase One of the North District at the University of California, Riverside (UCR).
Currently the largest planned student life community in the country, UCR’s North District encompasses more than fifty acres and will deliver over 6,000 beds of student housing once completed. Developed through a public-private-partnership between UCR and American Campus Communities (ACC), Phase One of the multi-phased project consists of 545,000 square feet and 1,500 beds in two buildings. It was initially designed with a natural gas infrastructure to power domestic water heating, laundry facilities, and a cafe. However, following an environmental impact report, Phase One was subsequently redesigned to be all-electric at the end of the design development phase. This change makes for an opportune case study of two otherwise identical projects, allowing for an analysis and direct comparison between a mixed fuel-based and all-electric design.
Analysis undertaken for this case study focuses on the potential impact of electrification on square footage and building cost, with the intention of providing insight into both cost-effective and spaceefficient solutions to building electrification in student housing. A comparative analysis of Phase One preand post-electrification was performed to explore this impact at both the building and residential unit scale. The analysis evaluated the all-electric design vs. mixed-fuel design across five key criteria: spatial and structural implications, first costs, life-cycle costs, code challenges, and schedule impacts.
Findings revealed that through thoughtful selection of equipment and minor adjustments to back-ofhouse mechanical spaces, electrification resulted in no material difference in square footage throughout the building, and no change to unit and bed counts. Additionally, the conversion had no impact on the building's structural system. Overall life cycle costs, including costs for electricity, natural gas, and equipment replacement, were found to be ultimately lower than the fossil-fuel alternative, highlighting a longer-term value to building owners. The decision to convert the project to all-electric at the end of the design development phase, did, however, result in an increase in design costs and extend the schedule approximately one to two months to account for unanticipated redesign and documentation. Upon further analysis though, it was determined that these impacts could have been avoided by committing to allelectric early on in the project.
In addition to exploring the impact of electrification on specific project goals, this case study also places the topic of electrification into a broader context by offering research on the larger environmental implications and potential for human harm posed by the continued use of fossil fuels, most notably natural gas. The full case study provides valuable information for university administrators, student housing developers, and designers to make informed decisions regarding building electrification as a means to reducing reliance on fossil fuels, saving on energy costs, and enhancing student health.
General Overview
— Environmental impacts
— Natural gas vs. electric fuel sources
— National and regional trends
— California higher education environmental policies
— Recent all-electric projects

Environmental Impacts
Greenhouse gas emissions resulting from human activity are causing unprecedented increases in global temperature and dramatic shifts in weather patterns worldwide.¹ The scientific community has proven that buildings and the fossil fuel-based energy they consume are a significant contributor to this worsening condition.² According to the U.S. Energy Information Administration, buildings consume forty percent of the total energy produced nationally each year. Moreover, the United Nations Environment Program cites global building operations as contributing a third of energy-related carbon dioxide (CO₂) emissions annually.
The next decade is a critical time to make an impact on the climate crisis and ensure a more livable future. Building owners, developers, and the design industry have an opportunity to make a significant, positive impact on a meaningful scale. It is the challenge of a generation to craft a built environment that conserves and restores resources, protects human health, and diminishes carbon emissions. Across the building industry, moderate sustainability goals are giving way to ambitious new targets.³ Net-zero carbon buildings or portfolios, projects that eliminate the use of fossil fuels, and projects constructed from low-carbon materials are moving steadily into the mainstream.⁴
Just as investors and end users continue to emphasize environmental, social, and governance (ESG) measures in their decision-making, so is the case with students.5,6 For current and incoming students who will face a future heavily impacted by environmental choices made today, a deep interest and demand for university administration to reflect the student population’s values in their decisions is also growing.⁷ Institutions of higher education must therefore carefully consider their decarbonization goals and the types of energy sources used to meet them.
Transportation Other Industry
Other
27% Building Operations
10% Building Materials + Construction (Embodied Carbon)
10% Construction Industry (Other)
Annual Global CO₂ Emissions and the Built Environment
The built environment generates nearly 50% of annual global CO₂ emissions, with building operations responsible for 27% of emissions and building materials and construction (typically referred to as embodied carbon) responsible for an additional 20%.
Data Source: U.S. Energy Information Administration Global Status Report, 2021.Natural Gas vs. Electric Fuel Source
A Changing Tide
The most common approach to minimizing the environmental impact of the built environment, including reducing CO₂ emissions, is to design more efficient buildings that use the least amount of resources and energy in the smallest necessary footprint. However, this approach has its limits: buildings are only as efficient as the technology, building materials, and practices of the time allow.
National investment in natural gas since the 1950’s has led to a massive two million miles of underground infrastructure, which reinforces a continued dependency on this energy source.⁸ Today, most of the nation’s energy grids still rely on fossil fuels, which are not infinite in their availability. Although touted as “cleaner burning fuel,” natural gas, when considering the methane produced in its mining, risk of natural gas leaks, and the hazardous by-products created by burning it, hardly appears cleaner or safer.⁹ Methane has more than 80 times the warming power of carbon dioxide.10 Even though CO₂ has a longer-lasting effect, methane sets the pace for warming in the near term. According to the Environmental Defense Fund, at least 25% of today’s global warming is driven by methane produced from human actions.
The Energy Crisis of the 1970’s and resulting desire to save on fuel costs had a significant impact on the way buildings were designed and constructed.11 Efficiency from both a space and performance perspective emerged as a defining design consideration in any new construction.
Similarly today, we are experiencing another major shift in our approach to building design as renewable energy emerges as a viable, large scale energy source. As energy grids shift to more renewable-dominant sources, moving away from natural gas-dependent energy is becoming more advantageous – and will soon be a financially competitive option.12
U.S. Energy Consumption by Energy Source, 2021
Data Source: U.S. Energy Information Administration, Monthly Energy Review, Table 1.3 and 10.1, April 2022 (preliminary data)
Note: Sum of components may not equal 100% due to independent rounding.
Natural Gas vs. Electric Fuel Source
The Promise of All-Electric
All-electric buildings are not a new concept, but are growing in demand across markets nationwide. In some jurisdictions, such as San Francisco and Berkeley in California, the use of natural gas is now prohibited in new construction.13 By design, these local mandates ultimately lower the incentive for utility providers to continue producing natural gas and, through more sustainable energy choices, reduce the environmental impact of added greenhouse gases as well as associated health and safety risks.
All-electric buildings rely on the premise that the utility provider is either on the path toward nonfossil fuel-based energy generation, or already 100% renewable. Three of the largest challenges of eliminating natural gas from utilities are the limitations of renewables to provide a consistent source of energy (i.e. cloudy days for solar power), lower costs for natural gas in some regions of the country, and the limitations of energy battery storage. Thus, a reliance on natural gas will persist, even as it diminishes.
Until a utility provider’s power plants are completely renewable, an all-electric building will likely continue to consume some fossil fuels for energy, therefore still contributing to an environmental impact. In response to this lag, some institutions purchase carbon credits and/or provide on-site renewables and energy storage facilities to offset any continued necessary fossil fuel usage.14
Recently, a few prominent institutions have made significant commitments to diminish their dependence on fossil fuels. Stanford University has pledged to utilize 100% renewable energy by 2022.15 Even more impactful, the University of California – one of the largest public university systems in the world – expects to be fully carbon neutral by 2025.16 The decisions of both of these institutions will render natural gas obsolete for their campuses while increasing demand for all-electric and renewable energy.
Progress to 100% Clean Energy
Percent renewable and zero-carbon electricity serving California (*Zero carbon in 2045 includes an undefined percentage of large hydro.)
Growth in Building Electrification
• 505 all-electric projects were reported in 2021, an increase of 67.2% from 2020.
• All-electric projects reported in 2021 totaled 76,729,668 gross square feet.
• 1,056 projects were reported with energy modeled by fuel sources in reporting year 2021, an increase of 57.8% from 2020.
• 167,008,729 gross square feet were reported with energy modeling by fuel sources in 2021, (5.3% of all whole building gross square footage) an increase of 80% from 2020.
Source: The American Institute of Architects (AIA), AIA 2030 Commitment by the Numbers: Building Electrification
California State Progress to a 100% Renewable Energy Grid
As California works towards its goal of a 100% renewable energy grid by 2045, the state is gradually eliminating other fossil fuels as a generator of energy, thereby reducing its overall carbon emissions output.
Data Source: 2021 California Clean Energy Almanac
National + Regional Trends
National
The Inflation Reduction Act (IRA) of 2022 makes the single largest investment in climate and energy in American history, enabling the U.S. to respond to the climate crisis, and develop domestic clean energy manufacturing, putting the United States on a pathway to achieving a net-zero economy by 2050.17
However, at 3.8 million square miles, the U.S. spans a broad range of regional climates. Although fossil fuel-free energy sources are becoming more prevalent as an option, especially after the IRA, the choice is more complicated when considering those regions that depend on heating during longer winters.
About 50 million U.S. households – or 40 percent of the population – are located in regions that require intensive heating.18 For New York state residents, nearly 93 percent of heating-related energy consumption utilizes fossil fuels, usually natural gas.19 More than 90 percent of the natural gas consumed for electricity production and heating in the Northeast is derived from shale. 20 During shale gas production, fugitive methane emissions escape, making the gas a contributor to global warming. 21
All-electric facilities are still feasible in regions with harsh winters, but continue to utilize natural gas to support back-up mechanical systems that are guaranteed to operate on the coldest days. 22
State and Local Commitments
The urgency of the latest climate science is inspiring a wave of state and city governments pledging to reach zero emissions, with the built environment as a key piece of these commitments.
New York City 23 and many of California’s24 largest cities are phasing out natural gas in new construction. Washington, D.C. 25 and Denver 26 are putting stringent building performance standards in place. Boston is rolling embodied carbon reduction into building standards. 27 As this continues, many more jurisdictions’ climate ambitions will become codified in policy in the next decade. With early adoption of all-electric facilities, institutions will be well-prepared to meet the requirements of these evolving standards.
California
In California, there is a growing trend to ban natural-gas delivery to new construction, for both environmental and human health and safety reasons. Berkeley 28 was the first city in the country to enact a ban, closely followed by Oakland29 and San Francisco,30 with more cities expected to follow. California’s public, and some private, institutions are also moving away from fossil fuel use in new construction. However, as examined later in this case study, there are still challenges to building for all-electric within current codes.31
California SB100
All electricity to be carbon-free by 2045 (60% by 2030)
Washington Clean Energy Transformation Act
100% clean electricity by 2045
Carbon-neutral energy by 2030
Colorado 2027
Commercial Code
Requires all-electric new construction in 2027.
Chicago Energy Transformation Code Requires electric infrastructure in new construction dwelling units with gas appliances.
New York Climate Leadership & Community Protection Act
100% renewable electricity by 2040 (70% by 2030)
California Higher Education Environmental Policies
Colleges and universities nationwide have steadily been adopting more ambitious environmental targets and policies. In California, individual institutions as well as multicampus systems have set the bar for actionable and measurable environmental impact.
Stanford University
In March 2022, Stanford’s second solar generating station (SSGS2) went online, completing the university’s years-long transition to 100% renewable energy and marking a major milestone in its journey to reach net-zero carbon emissions. The university forecasts approximately $520 million in energy savings, when compared to 2011 campus energy costs.32
California State University (CSU) System
Made up of 23 campuses, the CSU System adopted the goal of carbon neutrality by 2045 in alignment with existing campus plans and statewide goals. To achieve these ambitious targets, the system has adopted a policy to work towards the elimination of new natural gas assets after 2035.33
University of California (UC) System
The UC System’s Sustainable Practices Policy serves as a guide for the 9-campus system to reach carbon neutrality by 2025. Newer buildings have already been constructed without natural gas infrastructure.34
California Carbon-Free Energy Mandates
The percentage of electricity from carbon-free sources of energy is increasing, while at the same time, California is on a solid trajectory with zero-carbon buildings and creating more renewable sources of energy. Data only available through 2017. Projections are shown dashed.
Recent All-Electric Projects*
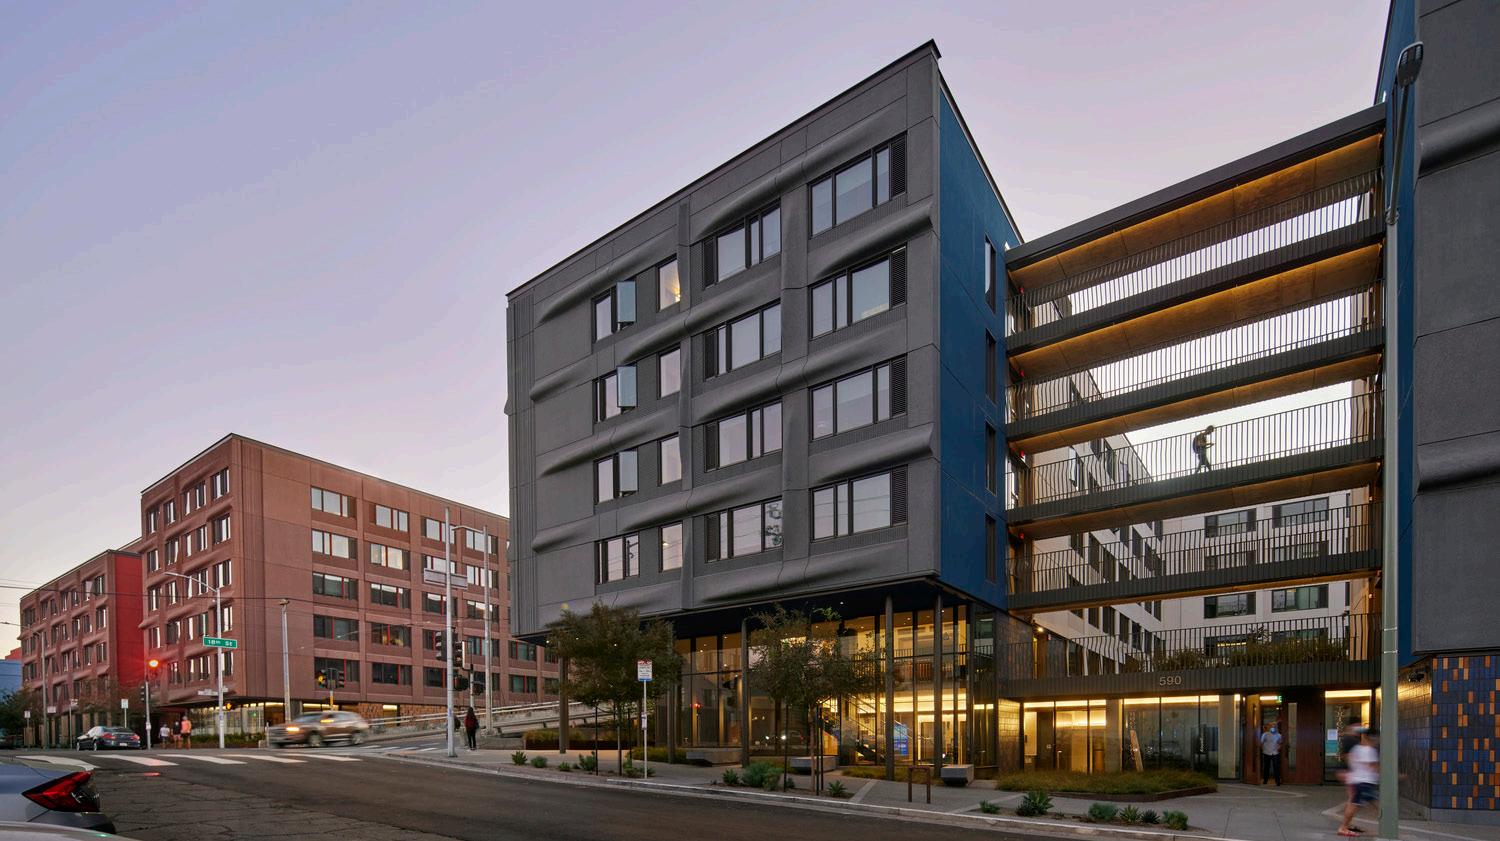
The Green at West Village
University of California, Davis
Energy: All-electric (5.5MW on-site solar array)
Size: 1.3 million square feet
3,300 beds
Summary: Nine four-story apartment buildings along with indoor and outdoor community space and recreational fields. A 10,000-square-foot community building houses a fitness center, multipurpose room, and support services.
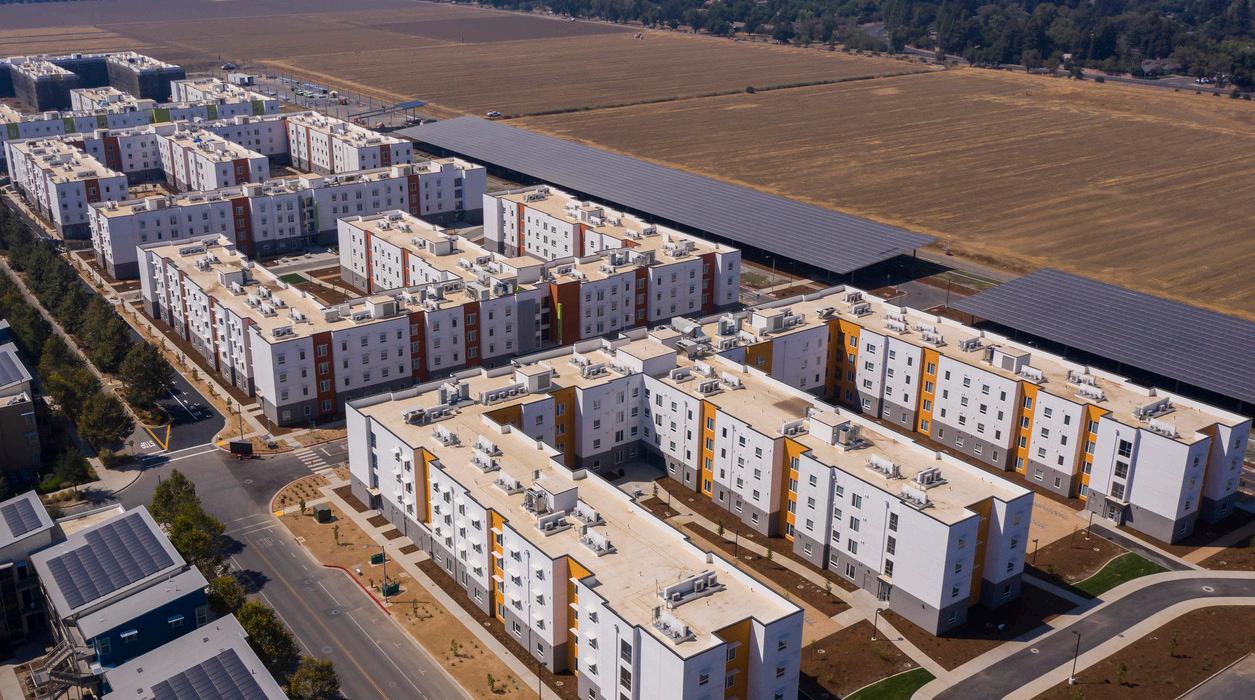
Year Completed: Phase 1 – 2020
Phase 2 – 2021
Certification: LEED Silver
The Tidelands
University of California, San Francisco
Energy: All-electric
Size: 390,000 square feet
700 beds
Summary: Two six-story courtyard buildings with community meeting spaces and retail / grocery
Year Completed: 2020
Certification: LEED Gold
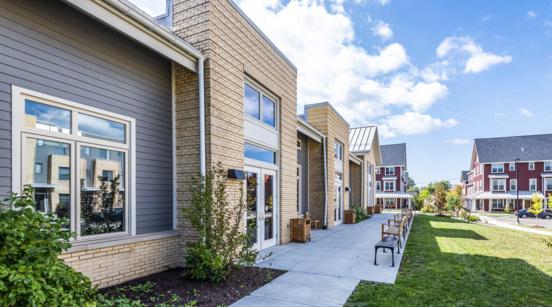
Maplewood Apartments
Cornell University
Energy: All-electric
Size: 17 acres
872 beds
Summary: Graduate apartment complex featuring clubhouse, fitness center, study lounges, and community garden
Year Completed: 2019
Certification: None documented
Credit: CBG Building Company © Bruce DamonteEnergy Delivery & Demand in Student
Central Plant + Public Utility
Similar to a small city, many larger campuses operate their own utility infrastructure. These central plants can deliver chilled water, heating hot water, and steam for the purposes of space conditioning, equipment cooling, and powering research operations. While a central plant offers an institution significant control over efficiency, consistency, and delivery of energy, at the same time, it is burdened with the cost of building, operating, and maintaining the system.
Public utilities generate energy from a variety of sources, including renewables (wind, solar, hydropower), nuclear power, or fossil fuels (coal or natural gas). Utilities are slowly moving toward elimination of fossil fuels from their portfolios due to a nationwide goal to decrease greenhouse gas emissions, as detailed in the IRA . 1
Many universities utilize natural gas-based, co-generation equipment to produce both hot water and electricity for their campuses. Eliminating these systems means that grid-supplied electricity must be procured, which is typically more expensive. 2
Whether a central plant exists for a campus or not, the campus can offset its energy dependence on public utilities through renewable onsite generation such as geothermal systems beneath or proximate to buildings served, or photovoltaic arrays installed on building roofs, across open space, or covering parking lots.3
Public Utility
ELECTRICITY STEAM
NATURAL GAS
CENTRAL PLANT BUILDINGS
ELECTRICITY
ON-SITE RENEWABLES
Overview of Power Distribution from Public Utility to Central Plant to Campus Buildings
Typically, central plants are powered by a combination of electricity and/or natural gas with on-site renewables (if the campus produces its own energy).
Credit: University of California, Berkeley, Co-generation Energy System
Absorption Chillers Electric Chillers Power Process Loads Heating CoolingWater Heating
Domestic water heating is the third largest energy consumer in student residence and apartment buildings – responsible for one-fifth of energy use, following space heating (41%) and lights and appliances (26%). 4 The need for hot water is primarily generated by showers and laundry, with significant spikes in demand occurring in the morning and evening hours, before and after classes. This additional energy need distinguishes campus residential buildings from other campus building typologies, making the delivery method for hot water heating a greater consideration in the design process.
In California, the predominant energy source to heat domestic water is natural gas. 5 Most commonly, these are tank-type water heaters with hot water typically being generated from either centralized boilers or in-unit water heaters. Currently, centralized water heating is only possible when using natural gas-fired boilers or condensing water heaters. With the state’s growing restrictions on the use of natural gas in new construction, alternative methods are needed to remain compliant. Once again, cost and efficiency are the determining factors in considering alternates. Electric resistance water heaters are expensive to own and operate over their lifetimes compared to gas tank-type water heaters.6 Electric tankless water-heaters are not particularly efficient and are primarily intended for point of use applications, rendering them inefficient for the high energy demands of water heating in apartments.7
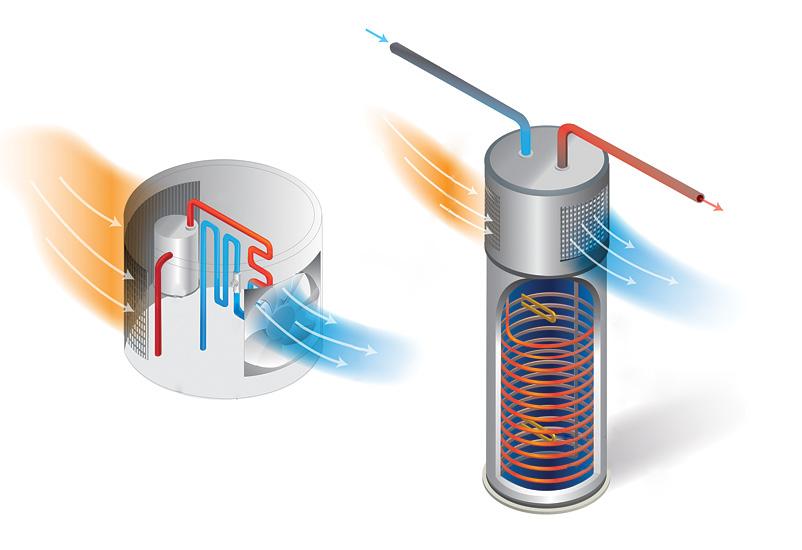
The most efficient method is an electric heat-pump water heater (HPWH). 8 HPWH systems extract energy content from a heat source, usually air, to efficiently heat water. Depending on cold water and ambient air temperatures, as well as patterns of hot water use, HPWHs perform at the same level as standard electric water heaters, while using half the electric energy. However, despite their performance, HPWHs still lag in adoption due to an uninformed design community, historical reliability issues, and high initial costs.
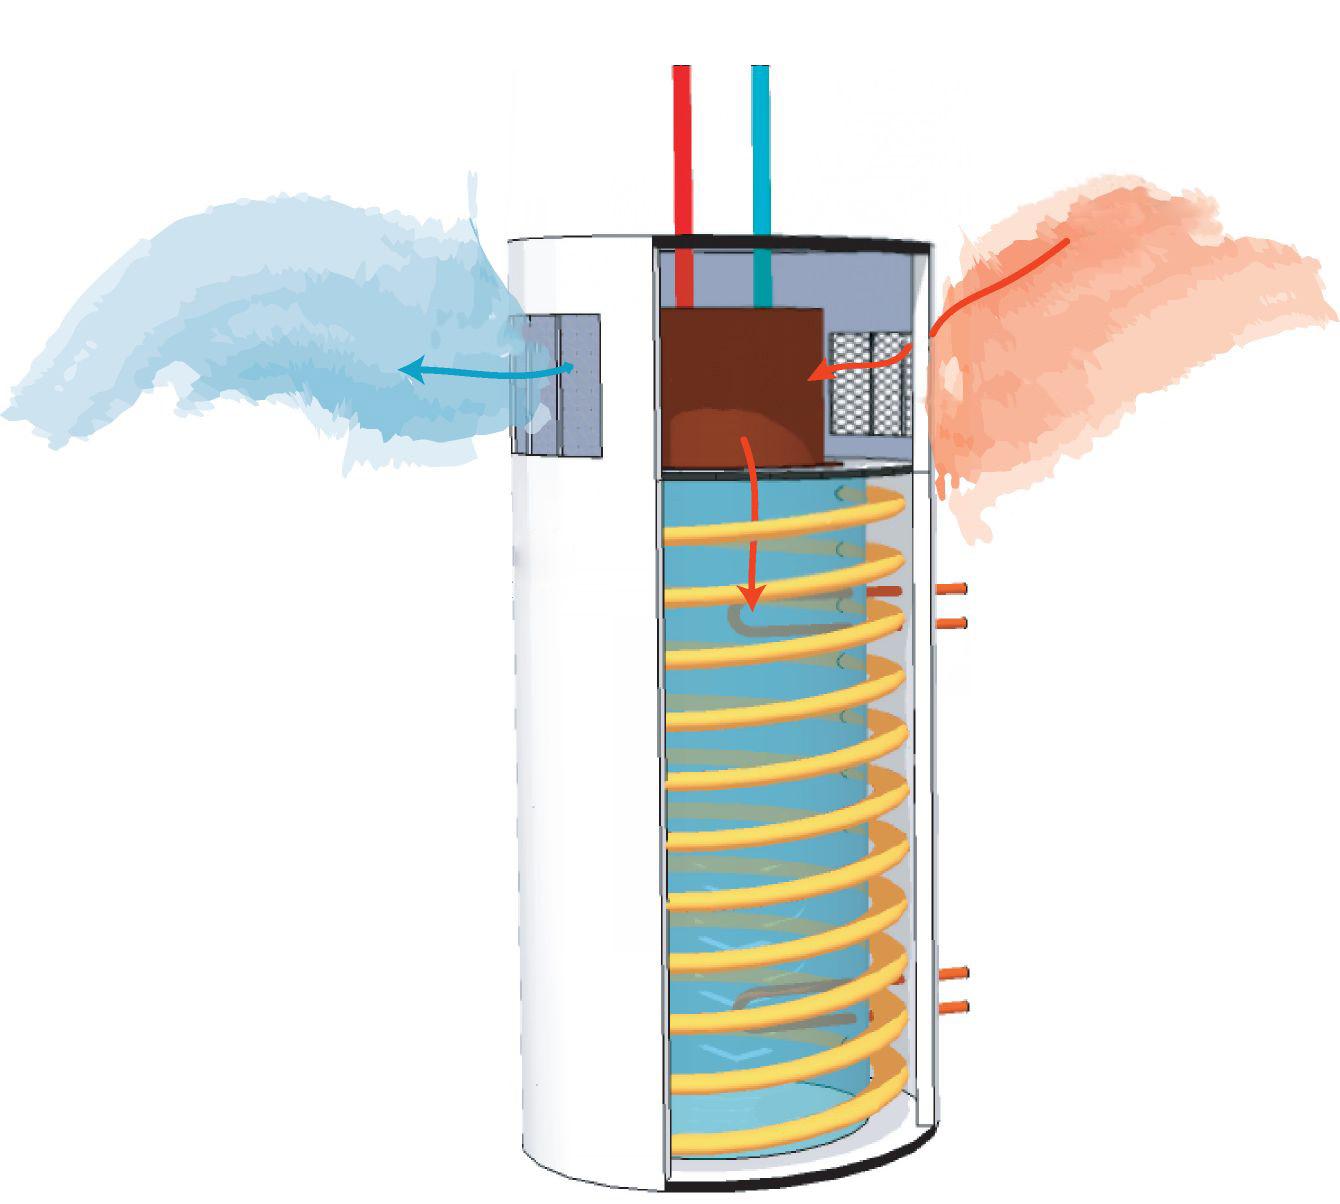
Electric Heat-pump Water Heater (HPWH) System
Currently, HPWHs are the most efficient electric water heating system, not factoring in rooftop solar water heating. This system is utilized in the case study project in lieu of central gas-fired boilers.
Heat pump pushes cold/ dry air out Fan Heat pump pulls hot surrounding air in Heat pump transfers heat from air to water Condenser coil heats water in tank Backup electric heating elements Water tank FilterGeneral Heating / Cooling
Student residence halls and apartments generally employ one of three general mechanical conditioning strategies.
1. 4-pipe fan coils (or radiators/convectors) served by central chiller and boiler plant or central heat pump
— This system is often used when a campus central plant provides hot and chilled water to the building, avoiding the first cost of local equipment.
— 2-pipe systems can be used in heating only or seasonal switch-over applications.
— These systems use water as the heat transfer medium, which is distributed through the building via copper pipe.
Central heat pumps can be used, as an all-electric option, to serve the fan coils hot and cold water. These can be air-source or water-source heat pump systems.
2. Split-system heat pumps with a dedicated fan coil and compressor for each unit
Each unit has an independently system that the occupant has complete control over. This also makes billing the tenant for utilities straightforward.
Each system requires its own compressor unit, leading to many units scattered across the roof.
— Each system requires its own electrical connection and roof penetrations.
These systems are typically the lowest first cost of the options and have minimal installation costs.
Refrigerant is used as the heat transfer medium.
This is system is often used for apartments rather than residence halls but can work in both applications.
3. Variable refrigerant flow (VRF) heat pumps with common compressor bank serving zonal fan coils
These all-electric systems are highly efficient due to sharing compressor capacity between multiple zones.
— Typically, a common bank of compressors is located on the roof or on grade. These compressors provide both heating and cooling via refrigerant to the various fan coils within the building. This allows for a more compact outdoor unit arrangement, as compared to split-systems.
— Utility billing for individual zones can be complex and costly for these systems.
These systems are most often used of residence halls rather than apartments but can work in both applications.
These systems can have more expensive first costs, but can be installed more efficiently that 4-pipe fan coils.
tank
Functionality of HPWH Elements
Electric heating elements and hot refrigerant lines in the heat pump are showcased in the diagram above.
(Left) Interior view of the heat pump itself. (Right) The heat pump is positioned on top of the water tank.
Energy Star
Credit:Laundry
Energy to power laundry facilities, especially dryers, represents a significant portion of the demand in campus apartment buildings. Dryers are the second most energy consuming appliance, behind refrigerators.9
Traditionally, natural gas-heated dryers are more cost efficient than electric dryers, with natural gas rates often less than those for electricity.10 Where electricity must be brought from a public utility, the energy rate costs between electricity and natural gas must be evaluated. If electric capacity is available and is supplied via a central plant on campus, or on-site renewables, such as photovoltaic arrays, the choice to use electricity is a straightforward one.
Electric ventless dryers are also available but are the least efficient type to operate,11 and not suitable for commercial grade applications. They are used mainly for in-unit laundry, when space and cost for venting are not concerns.
Cooking
Most traditional residence halls provide units equipped with an electric-powered microwave/ fridge appliance for making small, light meals. Often, a larger communal kitchen is also provided, either in a centralized location for building-wide use, or on each floor. Most communal kitchens are equipped with an electric-only (not natural gas) range for safety reasons, and require mechanical exhaust fans. However, this energy demand does not significantly impact a building’s total energy use. Of more note are refrigerators, which are 'always on' and thus constantly draw energy to function.12
Student apartments typically include kitchens within the unit, and are equipped with a range, microwave,dishwasher, disposal, and refrigerator. Thus, by the mere increase of the number of appliances in a building, campus apartments use more energy.
Recently, induction stovetops are becoming more ubiquitous in apartment buildings due to their energy efficiency. While the initial cost of the appliance is significant, they offer more cooking control and are significantly more energy efficient than traditional electric resistance cooktops.13 The decision between induction and other cooktop types will vary based on an evaluation of first costs, operational costs, environmental, health and safety concerns.
Credit: Whirlpool
Induction Cooktop
An induction cooktop provides efficient, precision control without the toxic by-products of natural gas emissions.

moist air exits drum
Hot, dry air enters back of drum
Compressor and refrigerant lines
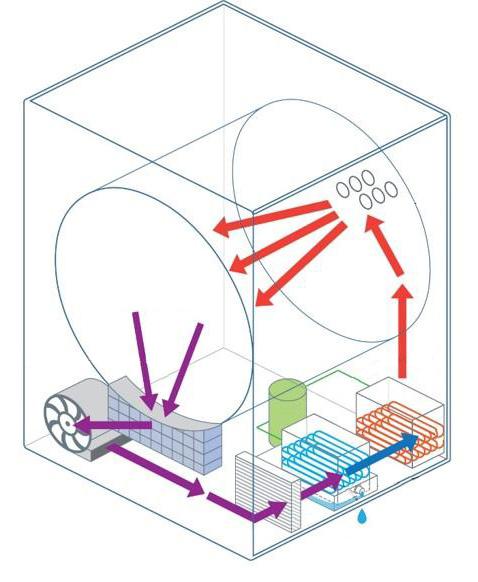
Heat pump condensor coils (hot)
Heat pump evaporator (cold)
Moisture condenses out and is collected or drained away
Secondary filter
Heat Pump Dryer
Compared to standard electric resistance models, heat pump dryers are more efficient and cost-saving for up front and long-term operating costs. (Some ducting omitted for clarity in image above.)
Credit: Center for Energy and Environment
Warm, Lint trap Front BlowerCase Study: UCR North District
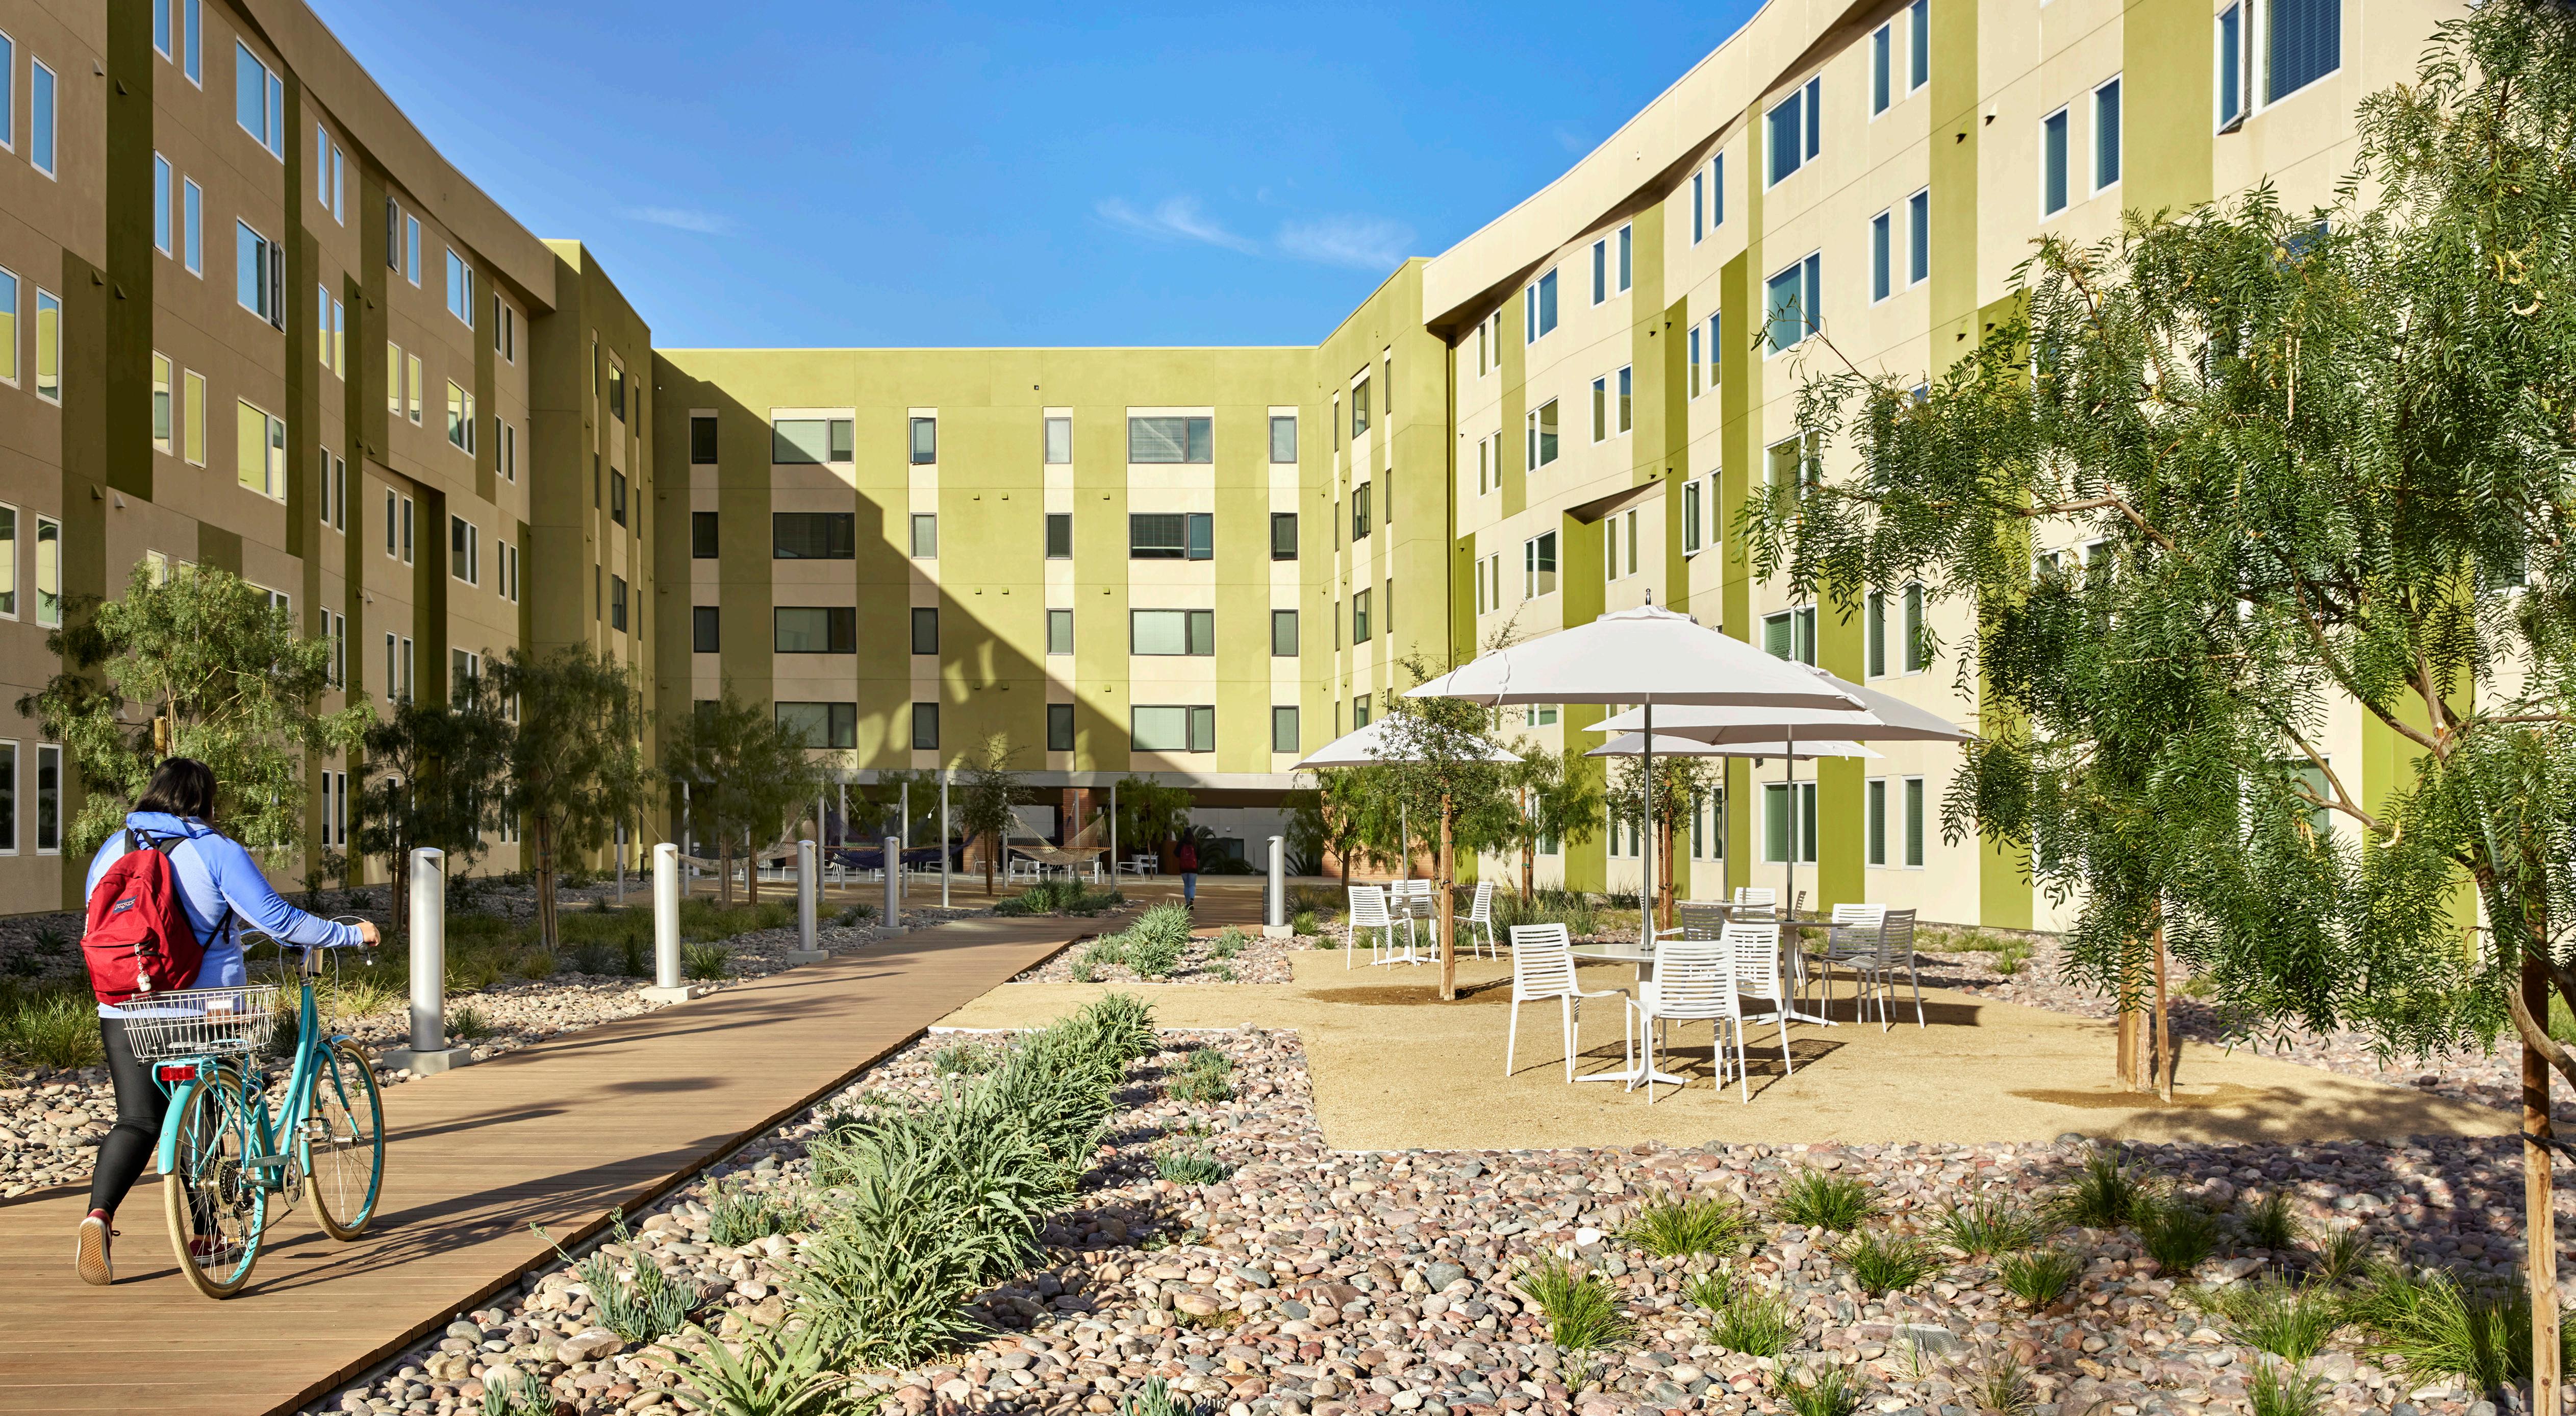
An All-Electric Case Study
University of California, Riverside - North District Phase One
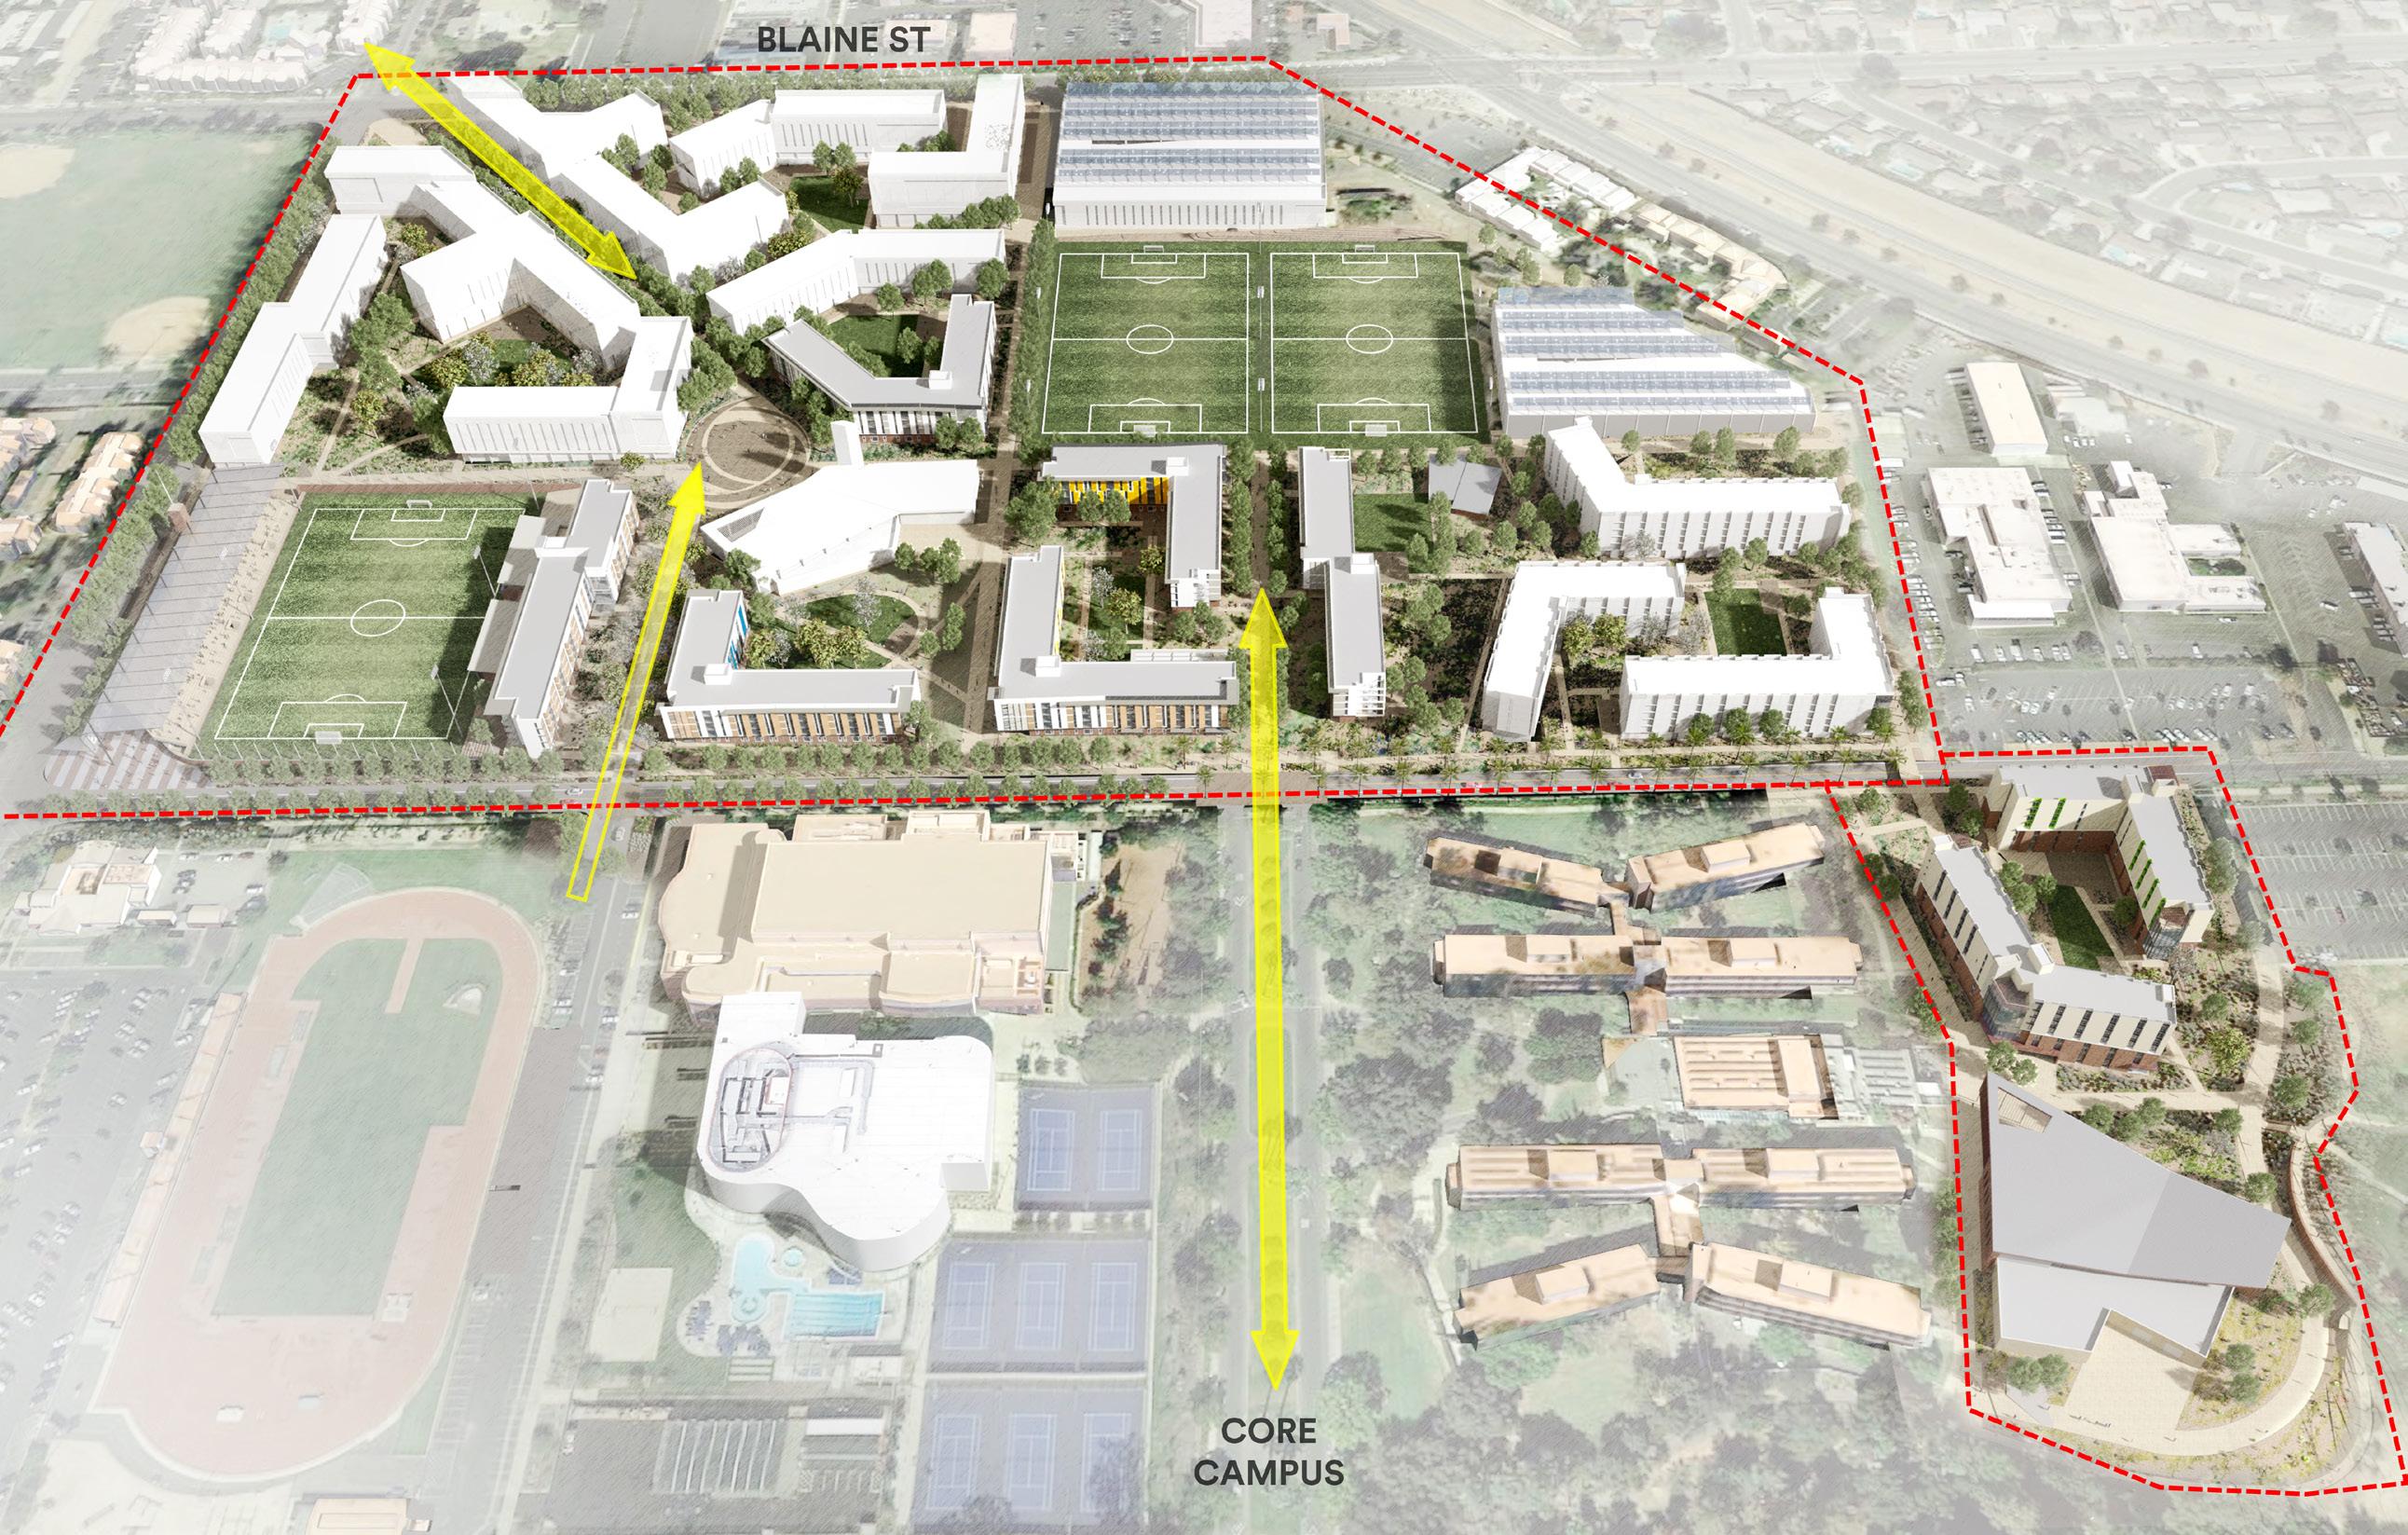
The North District offers a unique opportunity to compare the differences between a mixed fuelbased and all-electric building design. Over the course of the design phases, the project design was documented both ways, offering a unique glimpse at an apples-to-apples comparison of each design.
Conceived in 2017, UCR’s North District is the largest planned student life development in the history of the campus, encompassing more than 50 acres and delivering over 6,000 beds of student housing, along with dining facilities, retail, classrooms, and recreational spaces. The multiphased project’s first phase, which consists of over a half-million square feet and 1,500 beds, was initially designed with a natural gas infrastructure for domestic water heating, laundry facilities, and a community cafe.
By 2018, the project was nearly approved to begin Construction Documentation when the Environmental Impact Report (EIR) was issued and made CEQA approval contingent on the project converting to all-electric. All water heating, clothes dryers, and food service equipment would therefore be electrically powered. Aside from impacts for equipment selection, significant changes to the building’s electrical service and plumbing systems were required.
The changes to design primarily involved:
Eliminating gas service to the building and upgrading electrical service, including step down transformers
Reallocating utility and back-of-house spaces to accommodate larger electrical service and eliminate centralized water heating equipment
Re-specifying gas clothes dryers to be heat pump electric dryers
— Eliminating the centralized gas-powered boiler water heating system and replacing with in unit HPWHs, plus reconfiguring associated plumbing systems
Converting gas-powered cafe equipment (griddle, cooktop, fryers) to be electric equipment
Although the switch from natural gas to allelectric occurred late in the design process, the overall design would not have materially changed had the decision to design an allelectric building been established at the outset of the project. The notable differences are in first cost, life cycle cost, and overall environmental impact, with little impact on unit or building area, as detailed in subsequent sections of this case study.
University of California, Riverside - North District Master Plan, 2017
This master plan diagram illustrates the scale of North District, at over 50 acres, and its relation to UCR’s core campus.
The analysis team compared both energy use options (i.e. all-electric design vs. fossil fuel design) across five key criteria: Spatial and structural implications, first costs, life-cycle costs, code challenges, and schedule impacts.
Spatial Implications
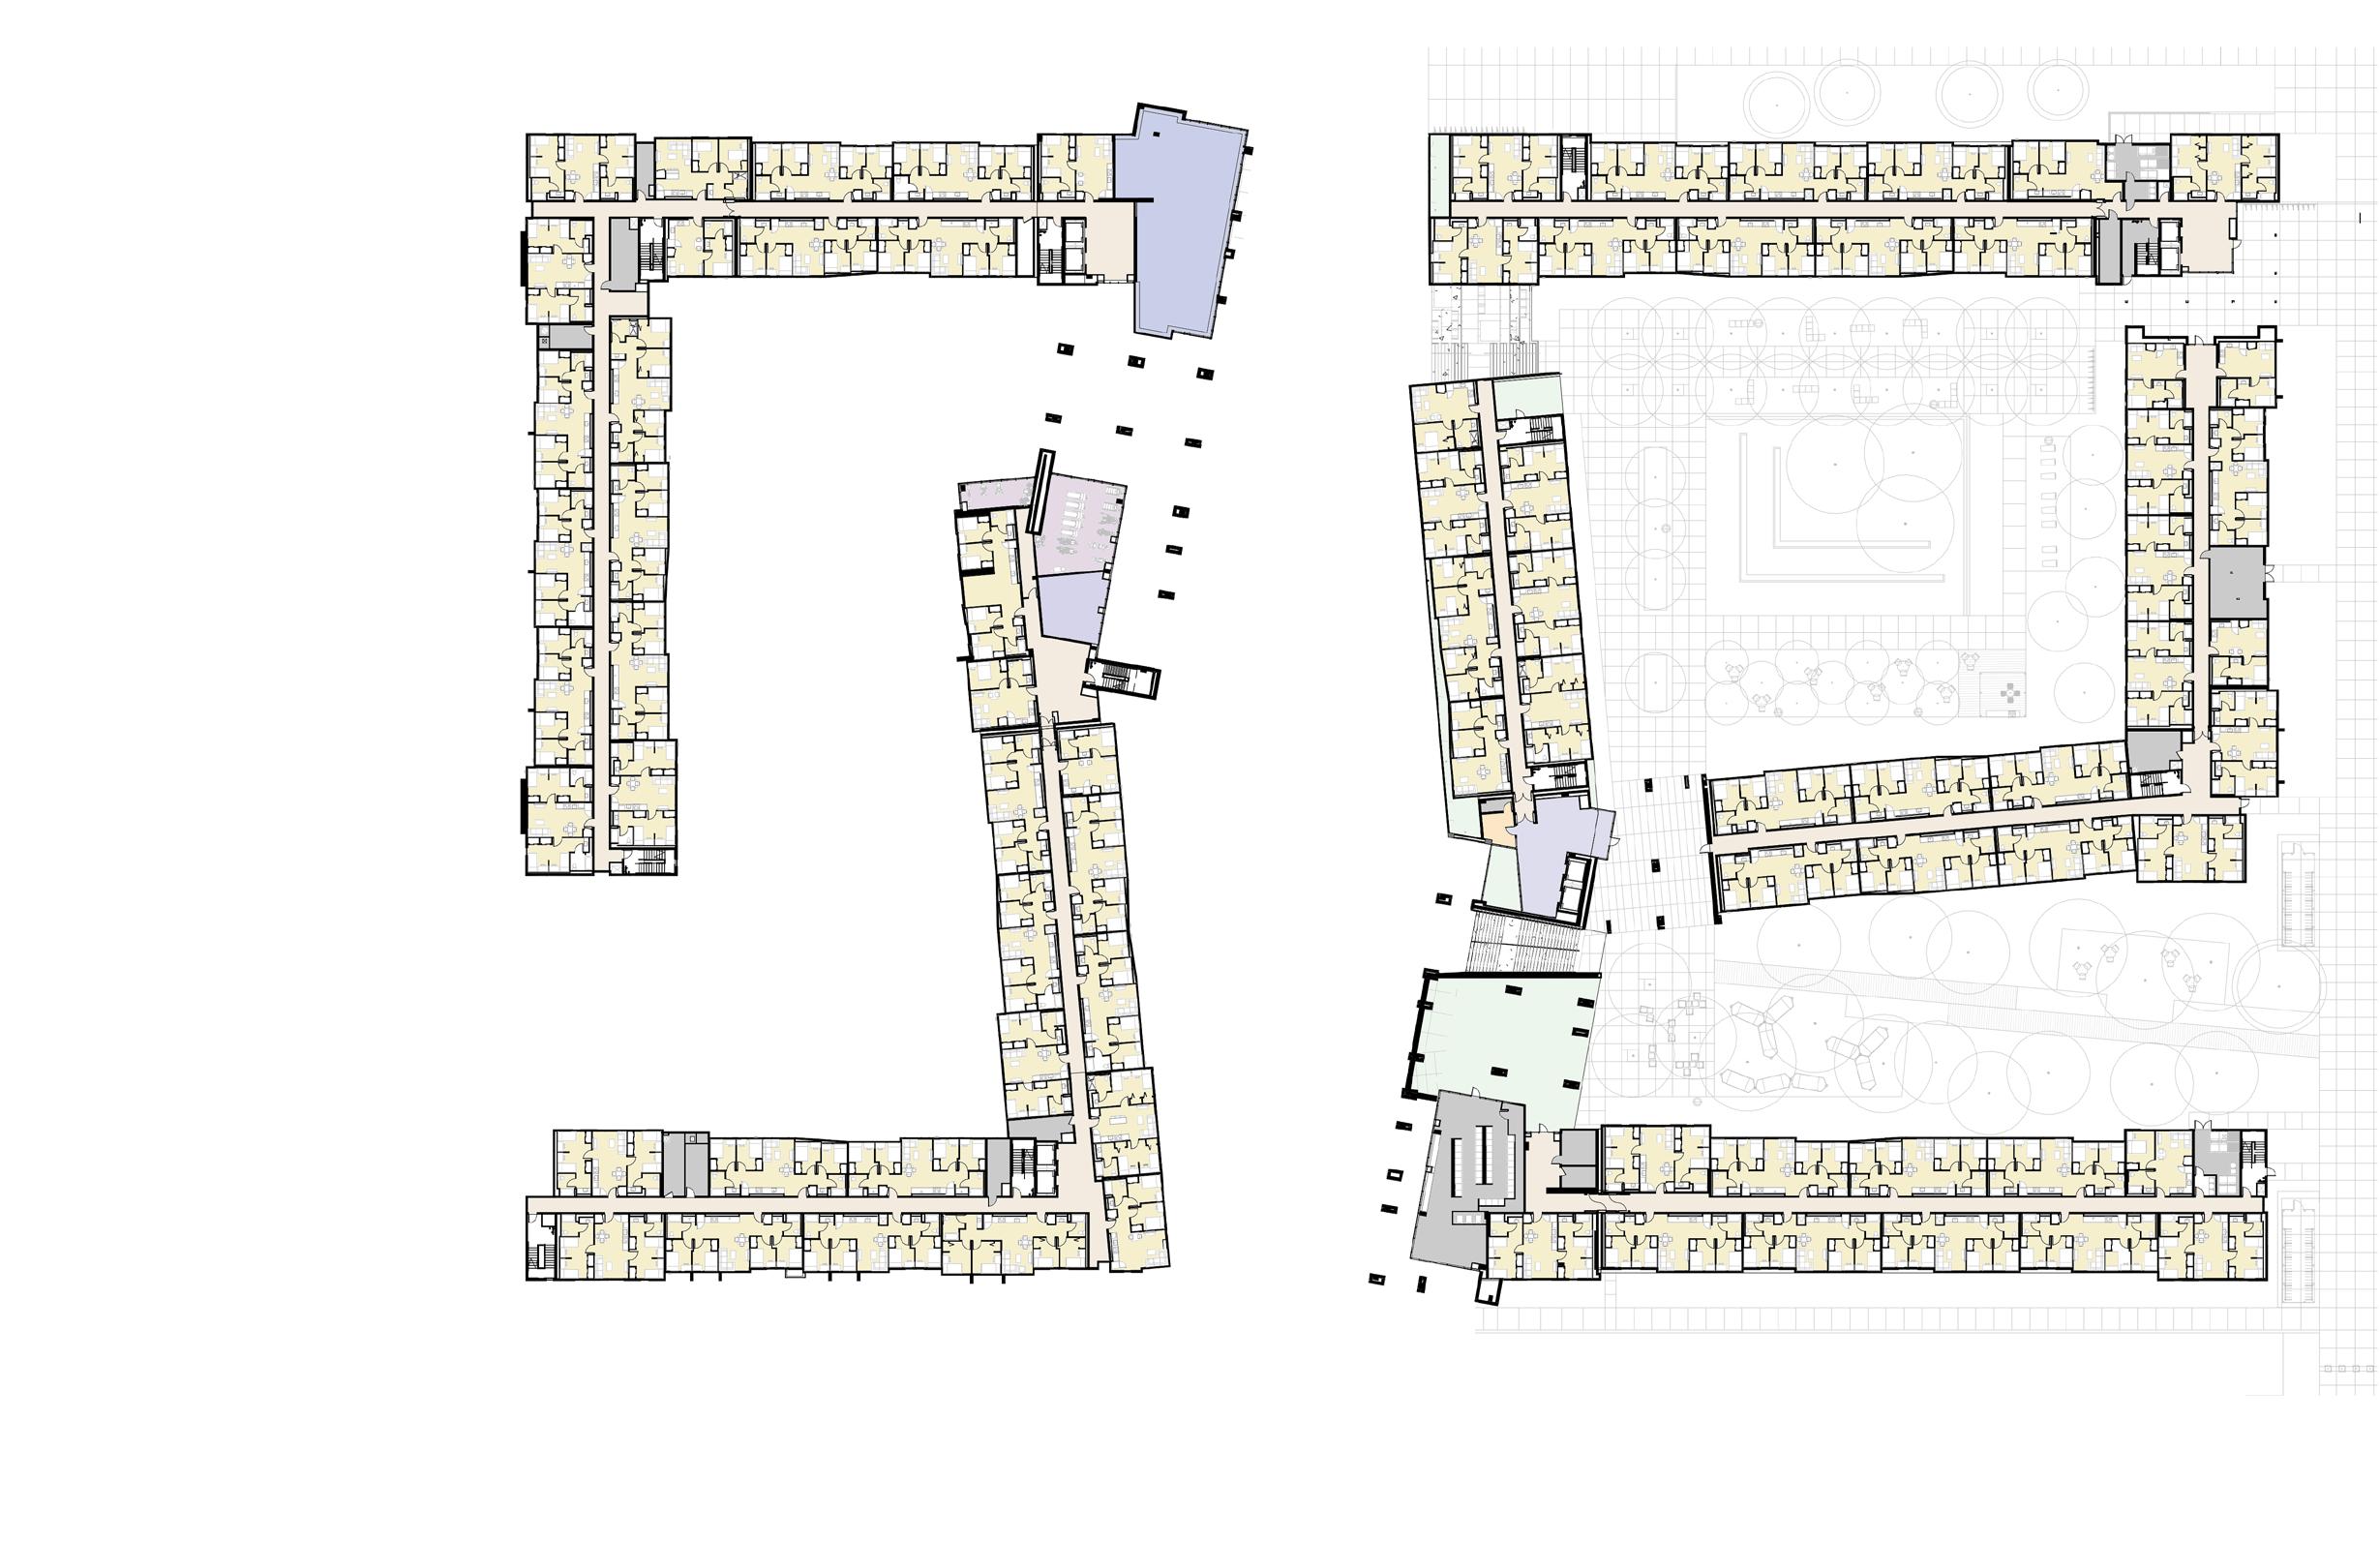
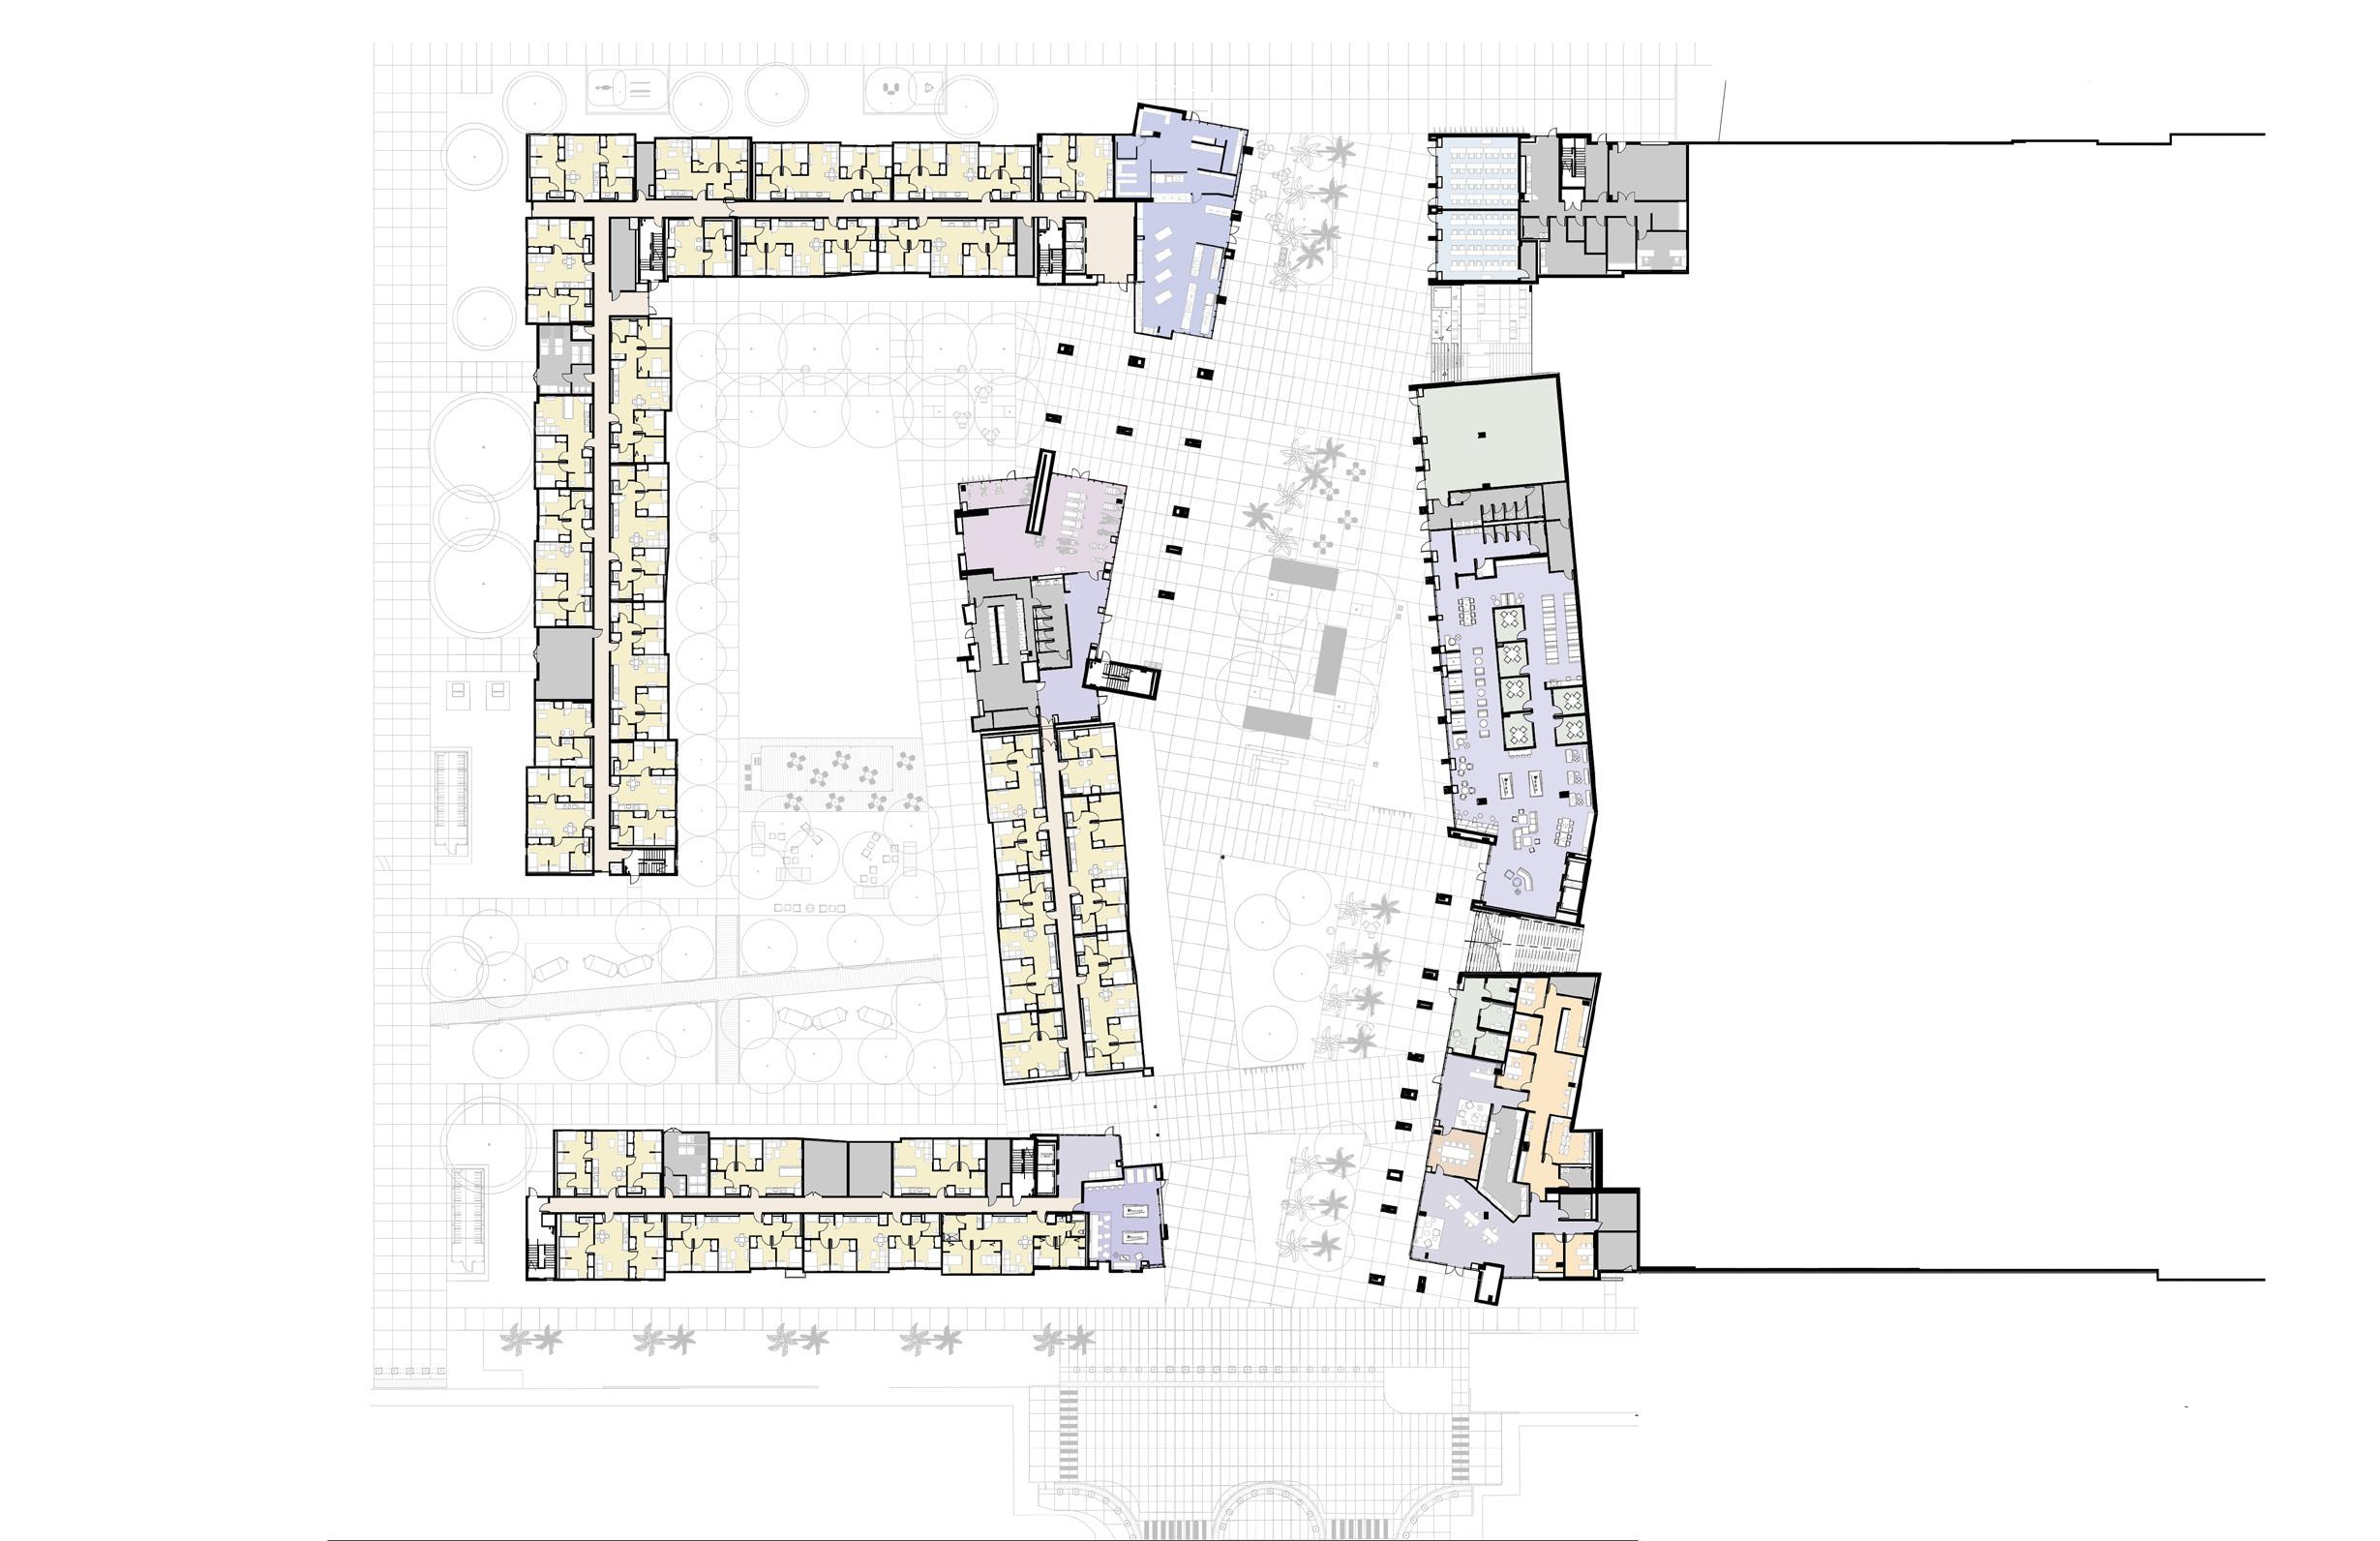
A comparative analysis of the pre- and post-electrification building and unit plans was performed to determine the impact of electrification on square footage, which is a significant driver of building cost. The results revealed that there was no material difference of square footage at either the unit or building level, and that unit and bed quantities were also maintained. These results were achieved through two key strategies: the thoughtful selection of equipment and a simple reconfiguration of the ground floor where incoming power and water heating equipment was located. In addition, the conversion had no impact on the building's structural system (Type 3 wood frame over Type 1 concrete podium); other projects, regardless of the construction type, would also likely be unaffected.
To accommodate the all-electric design, the following adjustments were made:
— Elimination of the large, centralized gas-fired water heating system from the ground floor. The resulting free space was redistributed to increase the size of the electrical rooms in order to support the increased electrical demand and associated equipment.
— In-unit closets initially designed to hold a vertical split system heating and air conditioning unit were re-purposed to house an individual electric HWHP.
— The vertical split system fan coil was respecificed to be a "pancake" fan coil and placed above the bathroom ceiling.
The floor plans on this page introduce the ground floor and typical residential floor plans for the first phase of the North District. The diagrams that follow document the impact of electrification on the design and total square footage of the ground and typical residential floor plans, as well as the three typical unit types. Differentials are provided for reference to demonstrate the negligible differences between the pre- and postelectrification square footage totals.
Spatial Implications
Utility Area Comparative Analysis


Changes made to the areas and quantity of utility spaces in each building in order to accommodate electrification include:
— Modest increase in size of original ground floor electrical rooms.
Booster pump room on ground floor no longer required; converted to electrical room.
— Minimal increase in size of original electrical rooms on typical floors.
Loss of one small study room on each of the residential floors in the West Building to accommodate an additional electrical room.
Dwelling unit mix and positions were rearranged to accommodate increased electrical room size, with no loss to bed count.
Spatial Implications
Unit Area Comparative Analysis
Adjustments within individual apartment units included:
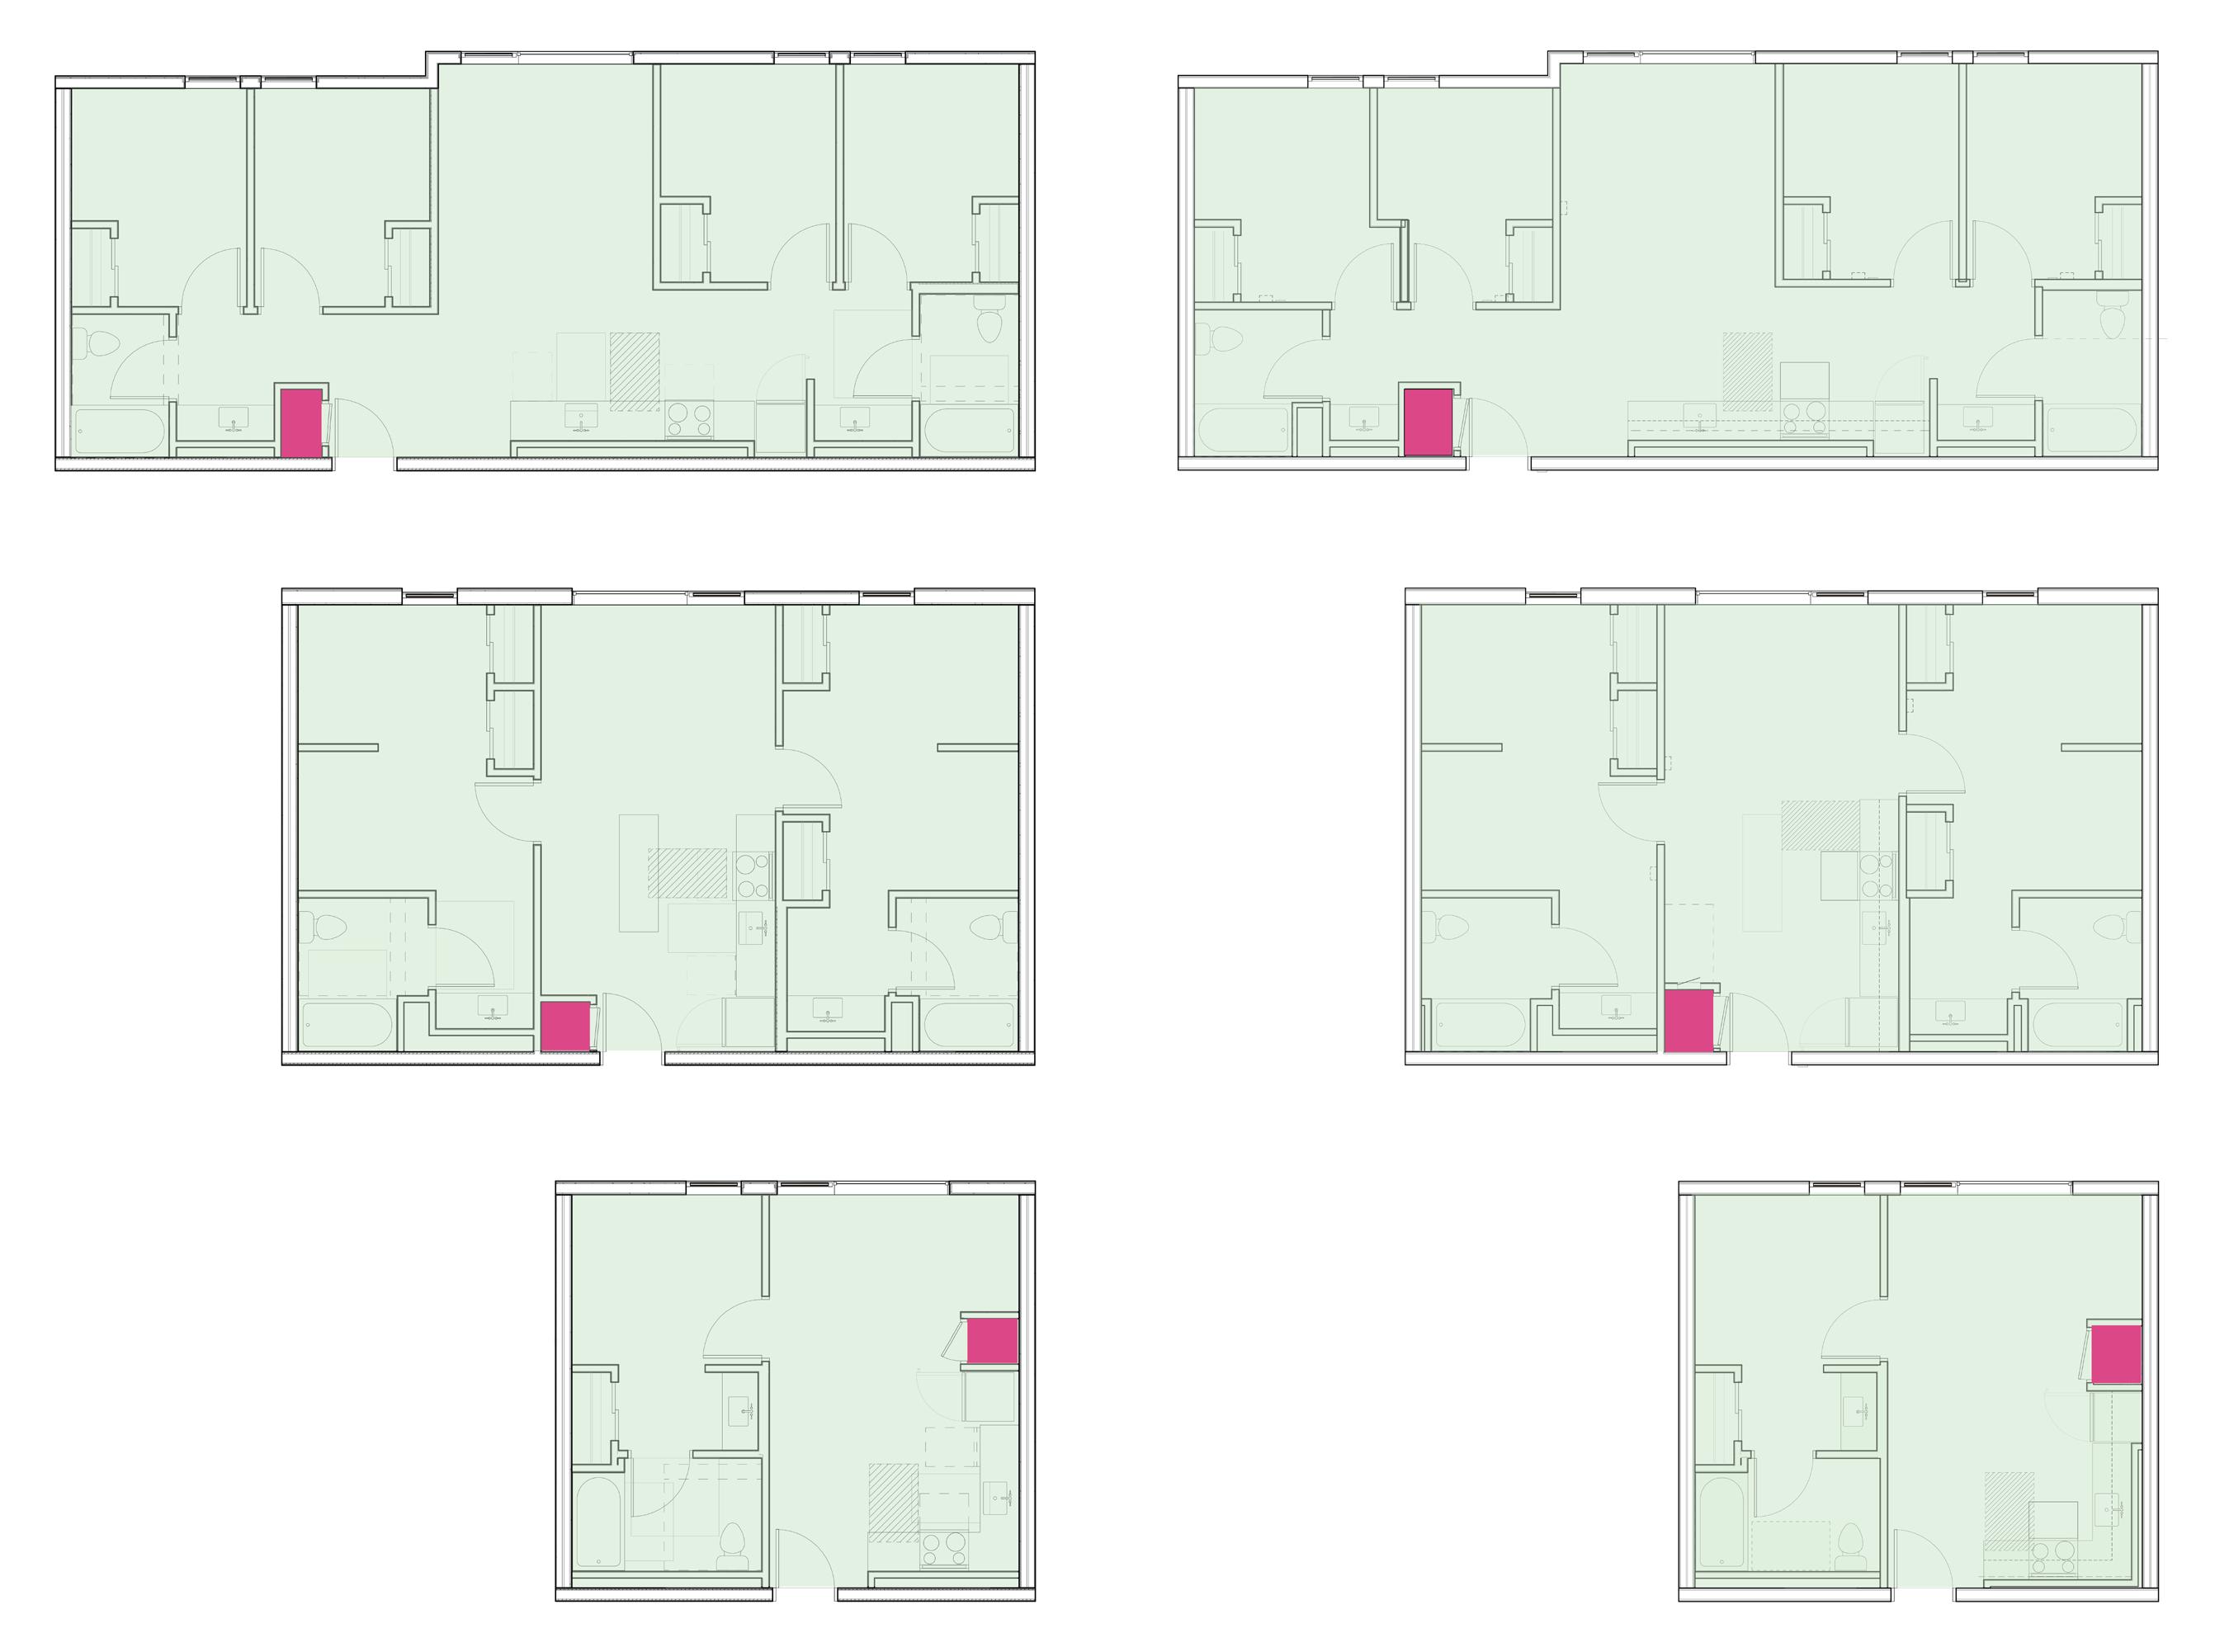
Removal of the vertical fan coil unit from the unit entry utility closet.
Changing to a “pancake” horizontal fan coil unit, installed above the bathroom ceiling.
— Install an electric hot water heat pump in the former fan coil utility closet.
These equipment changes were able to be accommodated without losing rentable area or functionality within the unit. Furthermore, the individual hot water heat pumps connect to the building automation system, now allowing for the potential of individual metering of hot water use.
First Cost and Life Cycle Comparisons
Key to comparing mixed-fuel based design and an all-electric design is understanding how first cost and long-term costs are different. North District already had a general contractor on board performing regular cost estimates at each milestone of the project’s design process. The switch to all-electric design occurred at the end of the Design Development (DD) phase and cost estimates were already available.
After documentation was revised and completed for the all-electric design, the general contractor produced a second cost estimate for comparison to original cost estimate. The first analysis initially demonstrated that changing the design to all-electric for Phase One increased the net cost of construction by approximately $900,000.
A significant portion of this increase was attributed to the expense associated with bringing upgraded power and additional capacity to the site – a cost of approximately $500,000. This included considerable expenses for conduit, trenching, and road cover to reach a power substation located approximately one mile from the project.
However, since Phase One is only about 20% of the overall build-out of the entire North District, the financial burden for increased electric capacity should be distributed among all the remaining phases and buildings. Thus, Phase One should carry $100,000 of this portion of the additional expense,thereby reducing the overall net cost increase to $500,000; down from $900,000.
The $100,000 net increase for electrical costs include larger electrical room equipment, additional NEMA-rated step down transformers and housekeeping pads outside of the building, increased conduit sizes and quantities, and power for 416 individual unit hot water heat pumps. A $400,000 net increase in plumbing costs reflects the need for 416 individual HWHPs and the associated piping, values, and manifolds.
The overall construction cost for the original mixed-fuel powered project was approximately $145.5M. From a total first cost impact, the net increase to convert the project to all-electric was nominal - less than 0.3%. This likely would have been even lower had the project been designed as an all-electric building from the outset, taking advantage of the potential for additional design efficiencies and better sub-contractor pricing.
The costs of electricity, gas, and equipment replacement cycles were evaluated over the long-term life of the building. In brief, the cost to operate the all-electric building will further reduce the impact of first costs. Case study analysis estimates the return-on-investment (ROI) to deliver an all-electric building to be less than ten years, an acceptable and viable financial investment.
First Cost Comparison
1) Mixed-fuel design cost estimate (through DD phase) 2) Final project cost (decision to convert to all-electric at end of DD phase)
3) Estimated cost of project if all-electric from project start
Comparative Life Cycle Cost Analysis
Life cycle costs for both the mixed fuel-based and all-electric design were analyzed, evaluating costs for electricity, natural gas, and equipment replacement over the long-term life of the building. The cost to operate this project as an all-electric building are ultimately lower than the fossil-fuel alternative. From an energy efficiency standpoint, the pEUI between the two designs illustrates that eliminating natural gas for water heating alone has a significant impact to the building’s energy use efficiency, with electric equipment utilizing less energy than natural gas powered counterparts. However, the life cycle cost savings is not actually due to energy cost savings as natural gas rates will remain lower than electricity rates for the foreseeable future.1 The life cycle cost savings is due to the predicted differential in equipment replacement costs, which tend to be lower for electric water heating equipment (the major equipment difference between the two building designs).
In our analysis, the break-even point on the increased first-cost investment is after approximately 20.8 years, which almost correlates with the equipment replacement cycle for natural gas powered building equipment. That said, because the first cost differential is so nominal, one may consider the life cycle cost analysis to be immaterial. However, this is arguable if we were to put value to the more immeasurable benefits gained from an all-electric building, such as the benefits to student health and safety, and the greater environmental benefits gained by eliminating the use of fossil fuel-derived energy from the project.
30-Year Cumulative Cash Flow
Schedule Impacts
Designing an all-electric building does not pose any significant impact to a project schedule. However, in the case of Phase One of the North District, the design team experienced some challenges meeting California’s stringent T24 Energy Code requirements1 , leading to considerable discussion between the project engineers and cost estimator that would have otherwise not been needed with a fossil fuel-based design. The California Building Code cycle at the time (2019) 2 penalized the use of electrical equipment and appliances, which were not able to account for inherent efficiencies. Today, this challenge has been rendered moot with institution of the new 2022 T24 Energy Code3 cycle, which now allows for efficiencies of electrical equipment and appliances to be taken into account without penalty.
The schedule of this project does exemplify the risks of fasttracking the Environmental Impact Report (EIR) and California Environmental Quality Act (CEQA)4 process while design and documentation proceeded. More often than not, student housing projects must be delivered in the late summer in order to meet a university’s Fall move-in date. In order to meet the delivery date for the North District Phase One project, project leadership directed the design team to continue the design phases while the EIR was being drafted. It was not until the end of the Design Development phase that public comment and recommendations were received, including the urging that the project be designed without reliance on fossil fuels, specifically natural gas. The limited redesign necessary for the electrification of the project added approximately six weeks to the overall design schedule in this case.
Through careful schedule management and use of schedule contingencies, the team was able to make up the difference without a detriment to the overall delivery of the project for the planned Fall 2021 opening.

Health + Safety Impacts
There is mounting evidence on the significant impact that natural gas use can have on human health and safety. A recent study found that gas stoves in the United States leak more methane than previously thought, with three-quarters of it being released when stoves are not in use. 5 The high flammability of methane links natural gas to fire and explosion hazards. Moreover, the study found that natural gas used in homes contains volatile organic chemicals besides methane, which contribute to particulate matter pollution and are known to be toxic and, in some cases, carcinogenic, such as benzene. Odorants added to natural gas to detect leaks can cause eye, nose and throat irritation, coughing, nasal congestion, shortness of breath, nausea, stomach discomfort, dizziness, and headaches.6 Considering that roughly 43 million homes cook with natural gas and another 17 million heat with it, to health and safety are immense. In contrast, the use of electricity rather than natural gas not only eliminates the day-to-day health risks associated with air pollutant byproducts, but also avoids potential disaster from leaks and explosions.
In California, two recent disasters, the San Bruno Gas Main Explosion8 and the Aliso Canyon Gas Leak 9 demonstrate the risk for substantial and catastrophic impact to human life and property.
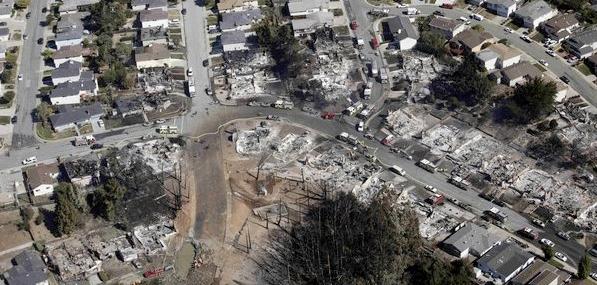
San Bruno Gas Main Explosion, 2010
A 30-inch-diameter segment of an intrastate natural gas transmission pipeline ruptured in the Crestmoor neighborhood, producing a crater about 167 feet long by 26 feet wide and 40 feet deep. An estimated 47.6 million standard cubic feet of natural gas was released and ignited, resulting in a fire that killed eight people and injured many more. 38 homes were completely destroyed and 70 were damaged, resulting in $1.6 billion in damages.
Aliso Canyon Gas Leak, Los Angeles, 2015 - 2016
Between October 2015 and February 2016, the Aliso Canyon Natural Gas Facility leaked an estimated 109,000 metric tons of methane emissions into the surrounding Porter Ranch community. Symptoms including eye, nose, and throat irritation, coughing, severe headaches, shortness of breath, nausea, and dizziness were recorded over a 10-mile radius from the source of the leak. Long-term side effects such as infertility and cancer are still being investigated.

Environmental Impacts
Alternative to Natural Gas Fracking
All-electric projects create a promising alternative to natural gas fracking, which is has multiple negative environmental impacts:10
— Fracking, essential for the production of natural gas and oil from shale formations, is a known contributer to unintentional leaks of one of the most powerful greenhouse gases: methane.
— The process creates vast amounts of wastewater and releases toxic air pollutants. Studies have shown that fracking operations can lead to loss of animal and plant habitats, species decline, migratory disruptions and land degradation.
— Chemicals used in fracking are widely known to seep into and pollute aquifers and drinking water.
Carbon Reduction
While a mixed-fuel project can make some progress in carbon reduction, an all-electric project is able to contribute significantly to decarbonization goals. In analyzing 30-year cumulative carbon emissions, North District Phase One will save roughly 10,000 tons of carbon by 2051, a 56% reduction compared to the carbon emissions of mixed-fuel projects in the same period.
30-Year Cumulative Carbon Emissions
UCR North District Phase One
How much is 10,000 tons of carbon?
By converting to all-electric, phase one of the North District will save approximately 10,000 tons of CO₂ by 2051, the equivalent of annual greenhouse gas emissions from 132 gasoline tanker trucks.
Data Source: U.S. Environmental Protection Agency, Greenhouse Gas Equivalencies Calculator
Operations + Maintenance Impacts
The change from a centralized gas-fired boiler system for hot water to in-unit HWHPs provides both challenges and benefits:
— Individual water heaters provide hot water more efficiently, with water traveling a much shorter distance to its usage fixture compared to the distance from a centralized building system. Loss of heat through piping is greatly reduced.
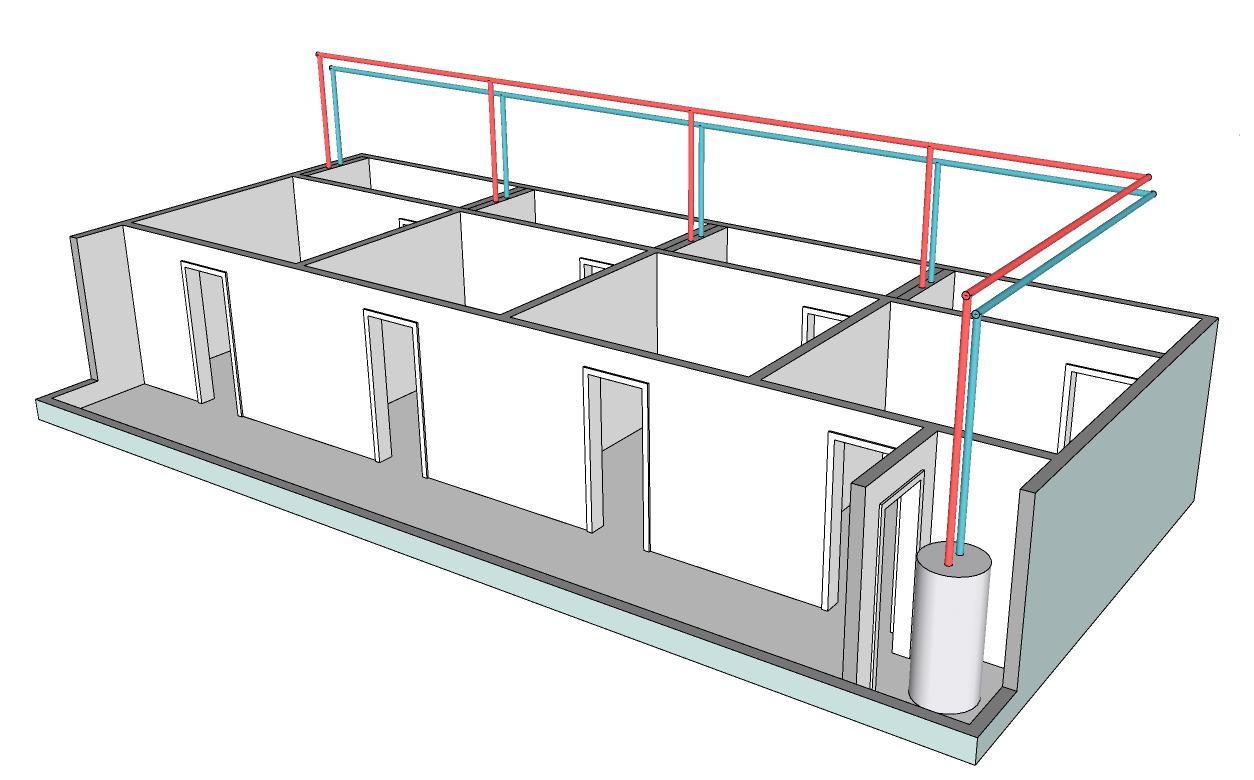
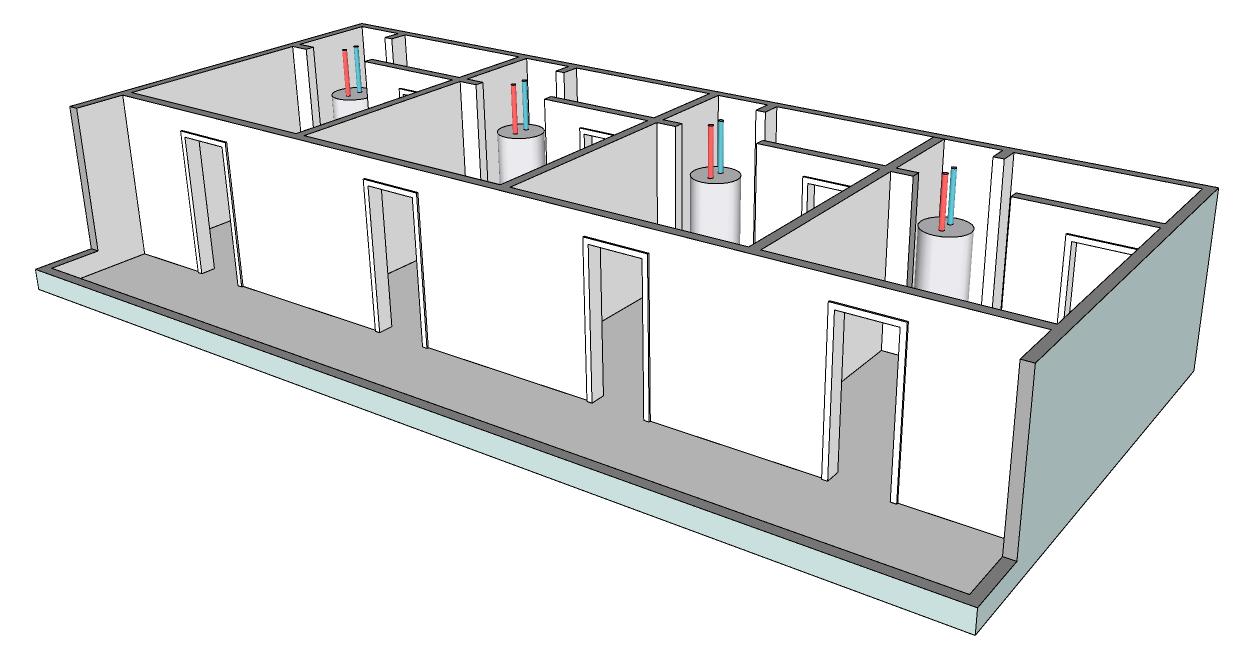
— Under the assumption that more parts equate to more opportunities for failure, maintenance requests and spare parts stored on site are expected to increase.
— Maintenance of in-unit water heaters requires scheduling to allow for staff to enter the unit for repairs, which would not otherwise be required for a centralized system.
— Unlike a centralized gas-fired boiler system in which system failure results in hot water failure across an entire building, in-unit HWHPs limit hot water failure to individual units.
— Carbon emissions and toxic by-products of burning natural gas at the site are eliminated, reducing the impact to health and well-being of student residents.
— Risk of gas leak, building evacuation, and explosion are avoided entirely through the elimination of natural gas usage.
Pre-Electrification
Post-Electrification
Insights
— Key insights — Sources
Key Insights
It is well-documented that the nation’s dependence on fossil fuels must give way to more environmentally responsible and renewable energy sources in order to successfully address climate change. The design industry as a whole has the opportunity to effect meaningful change by working with clients and stakeholders to embrace sustainable solutions in the built environment, particularly the use of cleaner sources of energy. The University of California, Riverside’s decision to convert its newest residential community from mixed-fuel to all-electric energy offers key insights that can be applied to other large-scale student housing projects:
— All-electric projects are not overly complicated to achieve as long as the decision is made early-on during the project concept phase.
— More space in buildings is not required for all-electric modifications.
— Project first costs are not substantial, so the long-term operating cost differential is not notable.
— All-electric projects avoid known health and safety hazards related to natural gas, including toxic emissions and danger of fire and explosion, resulting in buildings that are healthier for occupants and their communities.
— The switch to building electrification is essential to increase overall resiliency and lessen the challenges of climate change.
All told, the case for prioritizing all-electric projects is inevitable as building codes continue to require less usage of fossil fuels and more national, regional, and local incentives for an increase in renewables as the dominant energy source nationwide.
Large-scale, all-electric student housing is not just feasible from a long-term financial standpoint. It is the responsible choice for a future dependent on key decision-makers that commit to the best energy sources today.
Sources
Section One: General Overview
1. United States Energy Information Administration. (n.d.). Energy and the environment explained. www.eia.gov/energyexplained/energy-and-the-environment/
2. Architecture 2030. (n.d.). Why the built environment? architecture2030.org/why-the-building-sector/
3. PricewaterhouseCoopers (PWC). (n.d.). Emerging Trends in Real Estate 2023. www.pwc.com/us/en/industries/financial-services/asset-wealth-management/real-estate/emerging-trends-in-real-estate.html
4. Cutler, Z., Dayton, T., Grant, M., Mahomed, S.; Ojetayo, J. (2022, October 17). Reducing embodied carbon in new construction. McKinsey & Company Global Infrastructure Initiative. www.mckinsey.com/capabilities/operations/our-insights/global-infrastructure-initiative/voices/reducing-embodied-carbon-in-new-construction
5. Diab, A., & Adams, G. (2021, February 23). ESG assets may hit $53 trillion by 2025, a third of global AUM. Bloomberg.
www.bloomberg.com/professional/blog/esg-assets-may-hit-53-trillion-by-2025-a-third-of-global-aum
6. Versace, C., & Abssy, M. (2022, September 23). How Millennials and Gen Z are driving growth behind ESG. Nasdaq.
www.nasdaq.com/articles/how-millennials-and-gen-z-are-driving-growth-behind-esg
7. The Princeton Review. (n.d.). 2022 College Hopes & Worries Survey Report. www.princetonreview.com/college-rankings/college-hopes-worries
8. National Conference of State Legislatures. (2011, Feburary 22). State gas pipelines - breaking it down: understanding the terminology. www.ncsl.org/research/energy/state-gas-pipelines.aspx#F2
9. Energy Justice Network. (n.d.). Natural gas health and environmental hazards. www.energyjustice.net/naturalgas
10. Environmental Defense Fund. (n.d.). Methane: a crucial opportunity in the climate fight. https://www.edf.org/climate/methane-crucial-opportunity-climate-fight
11. We Make Money Not Art. (2009, August 4). Sorry, Out of Gas: Architecture’s Response to the 1973 Oil Crisis. we-make-money-not-art.com/sorry_out_of_gas_architectures/
12. International Renewable Energy Agency (IRENA). (2022, July 13). Renewable power remains cost-competitive amid fossil fuel crisis. [Press release]. www.irena.org/News/pressreleases/2022/Jul/Renewable-Power-Remains-Cost-Competitive-amid-Fossil-Fuel-Crisis
13. Moffit, M. (2020, November 11). San Francisco bans natural gas in new buildings. SFGATE. www.sfgate.com/bayarea/article/San-Francisco-bans-natural-gas-in-new-buildings-15720536.php
14. Logan, K. (2022, November 4). American universities target climate neutrality. Architectural Record. www.architecturalrecord.com/articles/15907-american-universities-target-climate-neutrality
15. Fischer, A. (2022, March 16). Stanford University has pledged to utilize 100% renewable energy by 2022. pv magazine USA. pv-magazine-usa.com/2022/03/16/stanford-university-now-running-on-100-renewables
16. Carbon Neutrality Initiative | University of California, Office of the President (UCOP). (n.d.). ucop.edu/carbon-neutrality-initiative/index.html
17. Inflation Reduction Act of 2022. (n.d.). Energy.gov. www.energy.gov/lpo/inflation-reduction-act-2022
18 - 21. New grad housing is living lab for heat pump study. (n.d.). Cornell Chronicle. news.cornell.edu/stories/2018/02/new-grad-housing-living-lab-heat-pump-study
22. Holladay, M. (2019, April 11). All-Electric Buildings Can Work in Cold Climates. Green Building Advisor. www.greenbuildingadvisor.com/article/electric-buildings-can-work-cold-climates
23. The Official Website of the City of New York. (2021, December 22). Mayor de Blasio Signs Landmark Bill to Ban Combustion of Fossil Fuels in New Buildings. [Press release].
www.nyc.gov/office-of-the-mayor/news/852-21/mayor-de-blasio-signs-landmark-bill-ban-combustion-fossil-fuels-new-buildings
24. Moffit, M. (2020, November 11). San Francisco bans natural gas in new buildings. SFGATE. www.sfgate.com/bayarea/article/San-Francisco-bans-natural-gas-in-new-buildings-15720536.php
25. Building Innovation Hub. (n.d.). DC Building Energy Performance Standards. buildinginnovationhub.org/resource/regulation-basics/dc-building-energy-performance-standards/
26. Hart, Z. (2021, November 23). Denver passes building performance standard. Institute for Market Transformation (IMT).
www.imt.org/news/denver-passes-building-performance-standard/
27. City of Boston. (2021, October 6). Ordinance requiring zero emissions for large buildings by 2050 signed. [Press release].
www.boston.gov/news/ordinance-requiring-zero-emissions-large-buildings-2050-signed
28. Musulin, K. (2019, July 18). Berkeley sets historic law banning natural gas from new buildings. Utility Dive. www.utilitydive.com/news/berkeley-sets-historic-law-banning-natural-gas-from-new-buildings/559026/
29. Ravani, S. (2020, December 2). Oakland bans natural gas in new residential and commercial buildings. San Francisco Chronicle. www.sfchronicle.com/bayarea/article/Oakland-bans-natural-gas-in-new-residential-and-15768549.php
30. Moffit, M. (2020, November 11). San Francisco bans natural gas in new buildings. SFGATE. www.sfgate.com/bayarea/article/San-Francisco-bans-natural-gas-in-new-buildings-15720536.php
31. Lopez, N. (2022, December 15). California approves far-reaching strategy for tackling climate change. So what's next? CalMatters.
calmatters.org/environment/2022/12/california-plan-climate-change/
Sources
32. Fischer, A. (2022, March 16). Stanford University now running on 100% renewables. pv magazine USA. pv-magazine-usa.com/2022/03/16/stanford-university-now-running-on-100-renewables/
33. Energy, Sustainability, & Transportation | The California State University. (n.d.). www.calstate.edu/csu-system/doing-business-with-the-csu/capital-planning-design-construction/operations-center/Pages/energy-sustainability.aspx
34. Carbon Neutrality Initiative | University of California, Office of the President (UCOP). (n.d.). ucop.edu/carbon-neutrality-initiative/index.html
Section Two: Energy Delivery & Demand in Student Life Facilities
1. The White House. (2021, April 22). Fact sheet: President Biden sets 2030 greenhouse gas pollution reduction target aimed at creating good-paying union jobs and securing U.S. leadership on clean energy technologies. [Press release].
www.whitehouse.gov/briefing-room/statements-releases/2021/04/22/fact-sheet-president-biden-sets-2030-greenhouse-gas-pollution-reductiontarget-aimed-at-creating-good-paying-union-jobs-and-securing-u-s-leadership-on-clean-energy-technologies/
2. Sheahan, B. (2022, August 3). Why electricity is more expensive and less reliable. Utility Dive. www.utilitydive.com/news/electricity-restructuring-regulation-sheahan/628748/
3. Special Issue. (2018, December 21). Understanding onsite renewable energy options. Building Operating Management, December 2018 Issue. www.facilitiesnet.com/powercommunication/article/Understanding-Onsite-Renewable-Energy-Options--18161
4. Business Energy Advisor. (2020, April 2). Multifamily residences. esource.bizenergyadvisor.com/article/multifamily-residences
5. Diamond, K., Sanders, M., Hronis, C. (2022, July 12). Today in energy: over one-quarter of U.S. households use electricity as the only source of energy. U.S. Energy Information Administration. www.eia.gov/todayinenergy/detail.php?id=52999
6. Business Energy Advisor. (2018, January 12). Electric resistance tank water heaters. esource.bizenergyadvisor.com/article/electric-resistance-tank-water-heaters
7. Business Energy Advisor. (2018, April 6). Tankless water heaters. esource.bizenergyadvisor.com/article/tankless-water-heaters
8. Hot Water Solutions. (n.d.). Buyer's guide to high-efficiency water heaters. hotwatersolutionsnw.org/buyers-guide
9. Perch Energy. (n.d.). What appliances use the most electricity in your home? www.perchenergy.com/blog/energy/what-appliances-use-most-electricity-home
10. Threewitt, C. (2021, December 20). Gas vs. electric dryers. U.S. News & World Report. www.usnews.com/360-reviews/home-goods/dryers/gas-vs-electric
11. Leverette, M. (2022, October 31). What are ventless dryers, and how do they work? The Spruce. www.thespruce.com/how-ventless-dryers-work-2145837
12. Perch Energy. (n.d.). What appliances use the most electricity in your home? www.perchenergy.com/blog/energy/what-appliances-use-most-electricity-home
13. Matthews, L. (2022, September 9). Which is the most energy efficient stovetop - gas, electric, or induction? LeafScore.
www.leafscore.com/eco-friendly-kitchen-products/which-is-more-energy-efficient-gas-electric-or-induction/
Section Three: Case Study: UCR North District - Phase One
1. Building Energy Efficiency Standards - Title 24. (n.d.). California Energy Commission. www.energy.ca.gov/programs-and-topics/programs/building-energy-efficiency-standards
2. Building Energy Efficiency Standards - Title 24. (n.d.). 2019 Building Energy Efficiency Standards. California Energy Commission.
www.energy.ca.gov/programs-and-topics/programs/building-energy-efficiency-standards/2019-building-energy-efficiency
3. Building Energy Efficiency Standards - Title 24. (n.d.). 2022 Building Energy Efficiency Standards. California Energy Commission.
www.energy.ca.gov/programs-and-topics/programs/building-energy-efficiency-standards/2022-building-energy-efficiency
4. Governor's Office of Planning and Research. (n.d.).
CEQA: The California Environmental Quality Act. opr.ca.gov/ceqa/
5. Iaconangelo, D. (2022, January 27). Gas stoves leak more methane than previously thought. Scientific American.
www.scientificamerican.com/article/gas-stoves-leak-more-methane-than-previously-thought/
6. Arrieta, D., Miller, D., Van Tol, E. (2018, May). Gas odorants - safe handling, health, and environment. asgmt.com/wp-content/uploads/2018/05/002.pdf
7. Iaconangelo, D. (2022, January 27). Gas stoves leak more methane than previously thought. Scientific American.
www.scientificamerican.com/article/gas-stoves-leak-more-methane-than-previously-thought/
8. National Transportation Safety Board (2010, September 9). Pacific Gas and Electric Company Natural Gas Transmission Pipeline Rupture and Fire. www.ntsb.gov/investigations/accidentreports/reports/par1101.pdf
9. Holter, R. (2020, March 17). Incident investigation report regarding the gas leak at the Aliso Canyon Nautral Gas Storage Facility.
www.socalgas.com/sites/default/files/SoCalGas-175.pdf
