1 minute read
How to Read the Shopping Funnel Report


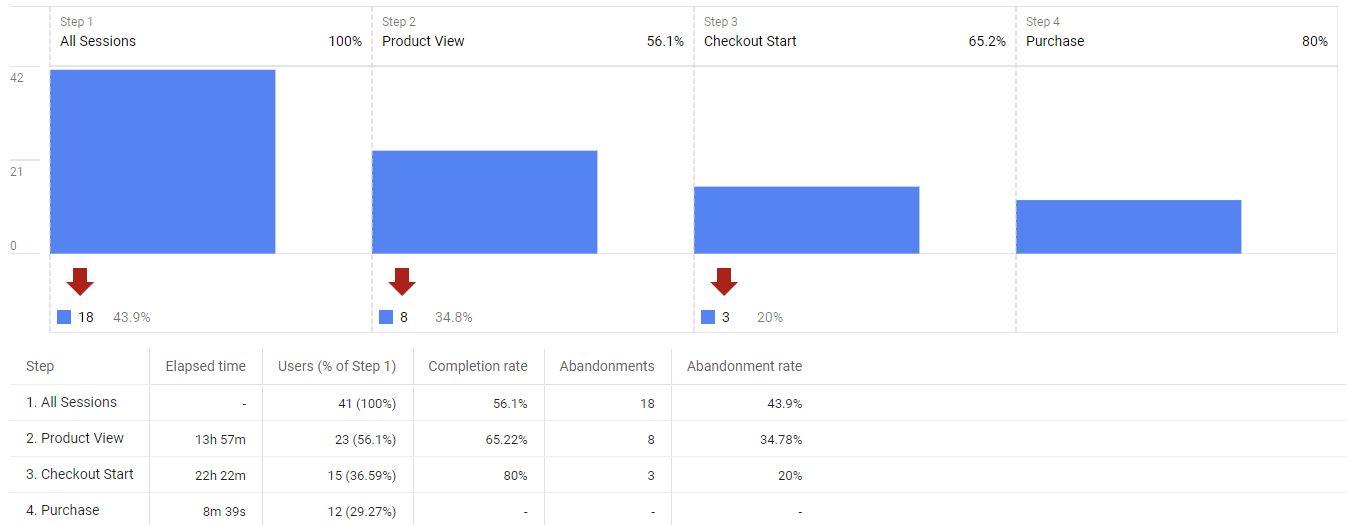
The Shopping Funnel Report is set out with your steps in order from left to right. Your first step is on the far left and your last step is on the far right.
The report has blue bars that represent the number of users at each step. These should go down progressively as you move from left to right (unless your site is doing an exceptional job converting!). Beside each Step name there is a %. This is the percentage of users that progressed from the previous step.

The table below the bars shows you more detail on the Users, Completion rate, abandonments and abandonment rate. You can also add a Breakdown dimension to get more detail about your step data (e.g. adding in Device will breakdown each row in the table into the 3 device types).
Learning places where your users are dropping out of your funnel can help you identify opportunities for refining your site experience.


