STAPLES STEM JOURNAL
SATELLITES NEUROPLASTICITY

F1 AERODYNAMICS
STAPLES HIGH SCHOOL
FEBRUARY 2023
Editor-in-Chief
Lucia Wang ‘23
Assistant Editors
Samuel Zwick-Lavinksy, ’25
Tom Zhang, ’23
Whitman Teplica, ’23
William Boberski, ’25
Layout Editor
Whitman Teplica ‘23
Collaborating Schools
Staples High School, Westport, CT, USA
Global Jaya School, Jakarta, Indonesia
Hwa Chong Institution, Bukit Timah, Singapore
Writers
Aalok Bhattacharya, Staples High School
Mallika Subramanian, Staples High School
Tanvi Gorre, Staples High School
Wan ‘Aliyah, Global Jaya School
Jihyeon Choi, Global Jaya School
Eun Gyul Hwang, Global Jaya School
Haudy Kautsar, Global Jaya School
Kaira Wullu, Global Jaya School
Zhuo Zhuzhen, Hwa Chong Institution
You Xinmei, Hwa Chong Institution
Peng Xinqi, Hwa Chong Institution
We are thankful for the support of our excellent advisor, Ms. Amy Parent.
Cover Image by Vanderlei Longo from Pexels.com
Copyright © 2023 by Staples High School
STEM Journal. All rights reserved.
Published February 2023.
Table of Contents
The Staples STEM Journal provides an outlet for individuals to share their STEM interests with the Staples community and aims to broaden public interest and knowledge in these fields.
Letter from the Editor
Dear Reader,
Happy 2023 from the Staples STEM Journal staff! We can’t wait to share new discoveries and projects with you this year.
After several months of research, writing, editing, and design, I’m so excited to present STEM Journal’s 2023 International Edition our first since our original 2019 collaboration. This issue consists of original research and topic analyses from students at Staples High School in Westport, Connecticut; the Hwa Chong Institution in Bukit Timah, Singapore; and the Global Jaya School in Jakarta, Indonesia. It was a joy to collaborate with other high schoolers from around the globe, all of whom share the same passion for exploring the beauty and complexity of STEMrelated fields. I’m endlessly inspired by the creativity, dedication, and curio sity they exhibited as they sought to answer pressing questions about neuroscience, F1 racing, and everything in between.
I would also like to recognize the teachers who facilitated the success of the International Edition. An enormous thank you to: Ms. Amy Parent, Advisor of Staples STEM Journal; Mr. Cory Carson, Head of the Global Jaya School; Ms. Catherine Norsworthy, Head of Science at the Global Jaya School; and Dr. Tan Chye Liang Joseph, Director of the Hwa Chong Institution Boarding School.
Finally, I want to congratulate the STEM Journal team on receiving First Place in the 2022 American Scholastic Press Association School Magazines Contest! It is our writers’ and editors’ hard work, talent, and inquisitive spirit that make the Journal possible.

I hope you enjoy immersing yourself in these stories as much as I did.
Happy reading!
Lucia Wang ’23 Editor-in-Chief1. Classifying Alzheimer’s Disease with Machine Learning via Wavelet Transform Subband Combinations
Aalok Bhattacharya, Staples High School
Abstract
The 3-D wavelet transform has been used with machine learning techniques to help identify Alzheimer’s Disease (AD) and Mild Cognitive Impairment (MCI) through magnetic resonance imaging (MRI). Although this approach resulted in high accuracy, a large number of subband permutations were obtained due to the usage of the 3-D wavelet transform, which causes redundancy and computational inefficiency during classification. To address this issue, this study discovers the combination with the minimum subbands giving a comparable accuracy with the original approach that used all subbands. The Alzheimer’s Disease Neuroimaging Initiative (ADNI) was used to gain de-identified MRI scans for classification with 75% training and 25% test scans. The scans were standardized by pre-processing through skull stripping, segmentation, and smoothing using the MATLAB toolboxes Statistical Parametric Mapping 12 (SPM 12) and Computation Anatomy Toolbox 12 (CAT 12). Feature extraction was then completed through different 3-D wavelet transform subband combinations. Support vector machine (SVM) classification was used with radial basis function kernels (RBF) to screen patients for AD, MCI, or cognitively normal (CN) status 3 times per subband combination. The mean and standard deviation of the test accuracy for each combination were recorded. Among the tested combinations, the maximum mean test accuracy was 95.3%. To prevent overfitting, fivefold cross-validation was performed on the top 40% subband combinations based on the mean test accuracy. The maximum cross-validation accuracy is 97.3%. Therefore, this study shows the potential of using less 3-D wavelet transform subbands to help screen patients for AD or MCI in the future.

Introduction
Alzheimer’s Disease (AD) is a progressive neurodegenerative condition that leads to brain mass loss and significantly affects the quality of life for patients and their families (National Institute on Aging, 2019). It is
classified as the most common dementia that manifests in humans (National Institute on Aging, 2019), and its prevalence in the United States of America is expected to more than double by 2050 unless any breakthrough regarding prevention or cure happens (Alzheimer’s Association, 2021). Mild Cognitive Impairment (MCI) is a transitional stage in cognitive function from natural cognitive decline to AD (Henderson, n.d.). Patients with MCI are at high risk for conversion to AD and the progression of further cognitive decline (National Institute on Aging, 2019). Diagnosis of MCI and AD has primarily centered on cognitive tests administered by a physician or through brain scans, such as MRI scans (National Institute of Neurological Disorders and Stroke, 2022).
In addition to conventional methods, machine learning techniques including support vector machine (SVM), artificial neural network (ANN), deep learning (DL), and ensemble methods have shown promise identifying AD and MCI (Tanveer et al., 2020). Among them, SVM classification is one of the most excellent methods (Zhang et al., 2015) because it is able to produce high levels of classification accuracy without knowledge about the geometry and distribution of the given dataset (Cortes & Vapnik, 1995). SVM selects and optimizes a hyperplane to separate data (Bhasin & Agrawal, 2020) by maximizing the margin, or the distance from the hyperplane to the closest data points. SVM functions that separate the data (called kernels) can either be linear or non-linear (Cortes & Vapnik, 1995). However, researchers stated that SVM methods that use nonlinear kernels perform well on non-linear data such as MRI scans (Zhang et al., 2015). In SVM and other machine learning classifiers, cross-validation is a procedure used to test the predictive power of a classifier on data that has not been used in the classifier before (Wang et al., 2014). In essence, it tests to make sure a classifier can generalize well and does not overfit a dataset. In k-fold cross-validation, the data set is broken into k folds, with k – 1 folds being used as training data and then iterating the process.
While cross-validation validates SVM results, robust SVM classification itself relies on effective feature extraction. One type of feature extraction that has been used with SVMs in identifying AD and MCI is the wavelet transform, a type of transform that allows for the capture of both frequency and temporal information from a signal (Mallat, 1989). Past studies using the wavelet transform have produced promising results (Bhasin & Agrawal, 2020; Wang et al., 2014; Mishra and Deepthi, 2020; Jha et al., 2017). For example, (Bhasin & Agrawal, 2020) was able to achieve 88.34% classification accuracy for identifying MCI against cognitively normal (CN) scans. However, these studies suffered from only using a few 2-D slices of MRI scans to reduce run time and then applied the 2-D wavelet transform to those slices, which may result in missing foci of AD (Jha et al., 2017). In addition to the 2-D wavelet transform applications, applications of the 3-D wavelet transform have been performed, such as (Mishra & Deepthi, 2020), where they combined several different types of the wavelet transform such as the dual tree M-band wavelet transform or the stationary wavelet transform and then classified the data with an SVM classifier. Researchers also used the wavelet transform on 3D MRI scans followed by principal component analysis and feature fusion before final SVM classification (Ayaz et al., 2017). However, these procedures use all wavelet transform subbands, inevitably adding time to feature extraction. Subbands are created because the wavelet transform applies a low-pass (approximation coefficient creating) and high-pass (detail coefficient creating) filter in each dimension (Kai, n.d.). Figure 1 displays how subbands are created from a 3-D MRI scan. To be more specific, there are two subbands for a 1-D signal, four for a 2-D image, and eight for a 3-D image. These subbands differ in what filters have been applied in each dimension, meaning the data encoded in them is different and each subband will act different in an SVM classifier. Although the studies have demonstrated the potential of using all the subbands in AD and MCI identification, the efficacy of just using some subbands for classification is a question that needs to be answered.

This study presents a machine learning solution based on selecting 3-D wavelet subband combinations of two and using a SVM method for classifying MRI scans as AD, MCI, or CN. By only using two subbands, the run time was significantly reduced while a comparable accuracy was achieved compared to past studies using all the subbands from the 3-D wavelet transform.
Methodology
Data Acquisition
The ADNI database was used in this research, which consists of scans from MRI, positron emission tomography (PET), and other data relating to biomarkers of AD (ADNI, 2009). The objective of the database has been to test the utility of using these biomarkers to characterize the status and progression of MCI and AD (ADNI, 2009). The database has four sections: ADNI-1, ADNI-GO, ADNI-2, and ADNI-3. The ADNI-1 part of the dataset was used because it was the easiest to obtain due to it being well-established, with each 3-D scan from the section falling into three categories: AD, MCI, and CN. Only 50 scans from each category were selected due to computational limitations. As a result, this is a pilot study. The scans were selected by increasing numerical value of the file identification. 75% of these scans were used for training while 25% were used for test classification.
Each of the MRI scans were downloaded in the NIFTI format, which stores them in an accessible manner by the computer. A comma separated values (CSV) spreadsheet provided by ADNI was used to move the images into folders based on their subject condition (AD, MCI, or CN).
Image Pre-processing
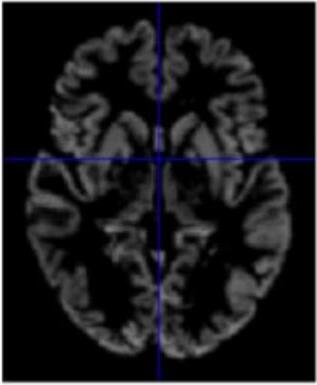
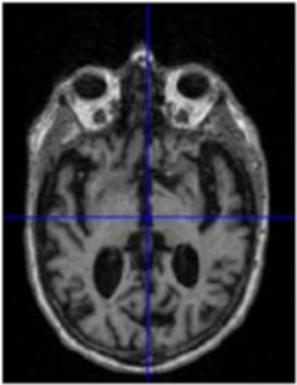
Gray matter atrophy has been found to be responsible for MCI and AD progression (Apostolova et al., 2007). Pre-processing also standardizes the images. (Friston et al., 1994). Thus, pre-processing via segmentation and smoothing to capture just the gray matter of the MRI scans is necessary. The MRI scans were segmented using the Computational Anatomy Toolbox 12 (CAT 12) (Rajapakse et al., 1997) toolbox of MATLAB. These programs segmented the MRI images into grey matter, white matter, and cerebrospinal fluid. Figure 2 shows an unmodified MRI and a segmented MRI, which demonstrates the differences between them. After segmentation, the grey matter from each MRI scan was smoothed using the Statistical Parametric Mapping 12 (SPM12) (Friston et al, 1994) toolbox of MATLAB. These smoothed grey matter images were then sent for feature extraction.
Feature Extraction
The wavelet transform is a process by which both the frequency and time information of a signal can be captured, which applies well for non-stationary signals and images like MRIs (Wang et al., 2014). Types of wavelet transforms can be sectioned into two categories based on the orthogonality of the mother wavelet: continuous wavelet transform (CWT), which uses non-orthogonal mother wavelets, and discrete wavelet transform (DWT), which uses orthogonal mother wavelets. Since MRI scans are discrete, DWT is used in MRI classification (Bhasin & Agrawal, 2020). Equation 1 represents the wavelet expansion of a discrete function !(# )
where ( √* is the normalizing factor, P is the decomposition level, 1&,$ (#) represents the wavelet coefficients, and .",$ (# ) represents scaling coefficients. 1&,$ (#) and .",$ (#) are discrete functions in and where - = {0,1,2, * +! 1}. Equations 2 and 3 show how the wavelet and scaling coefficients are generated (Bhasin & Agrawal, 2020):
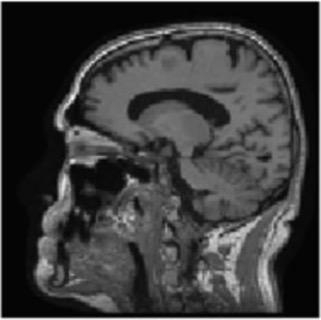
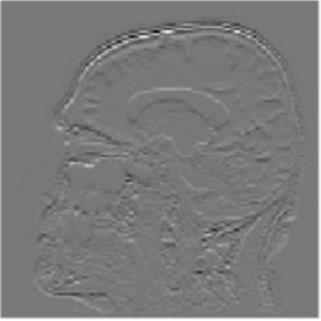
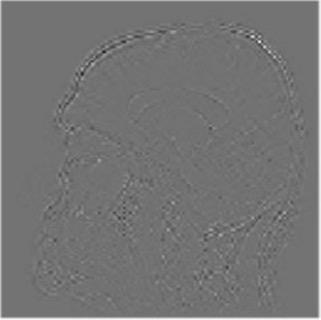
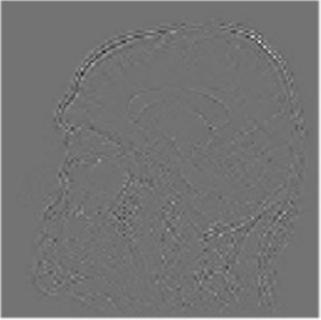
To display how the DWT performs on an MRI scan, the 2-D DWT performed on a 2-D slice of a 3-D MRI scan. Four subbands were generated by a low-pass or high-pass filter being performed on each of the two dimensions in 2-D image. Each subband is represented as a two-letter key, representing what subbands are in which dimension. An “a” represents an approximation subband produced by a low-pass filter and a “d” represents a detail subband produced by a high-pass filter. Figure 2 shows the four resulting subbands after this procedure.
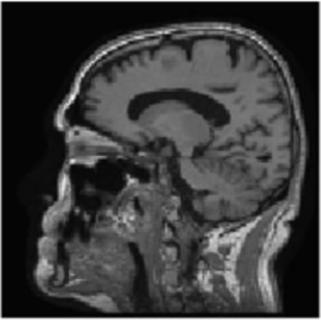
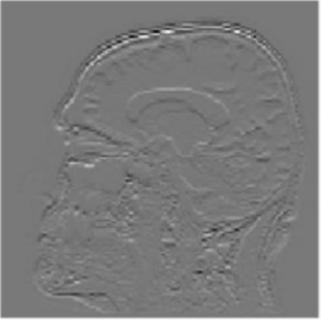
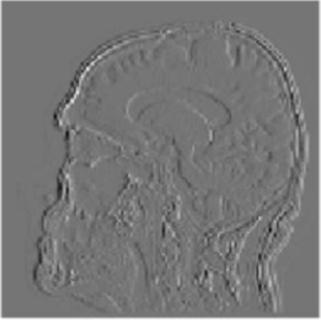
Figure 2. The visualization of the 2-D DWT performed on a model slice with all four subband patterns: 2A: Approximation subbands in both dimensions (aa); 2B: approximation subbands in the horizontal dimension and detail subbands in the vertical dimension (ad); 2C: Detail subbands in the horizontal direction and approximation coefficients in the vertical direction (da); 2D: Detail subbands in both dimensions (dd).
However, the application of the DWT on 2-D slices of MRI scans is prone to missing foci of AD pathology that are necessary for accurate classification (Jha et al., 2017).
The application of the 3-D DWT was the primary focus of this study for its use in feature extraction of the entire 3-D MRI while only using certain subband combinations. After pre-processing, each scan was taken and resized into a standardized size. From there, the 3-D DWT was executed using the biorthogonal 1.3 wavelet with the PyWavelets package (access the PyWavelets documentation at https://pywavelets.readthedocs.io/en/latest/) of Python 3.9.6. Different subband combinations were selected and stored for later classification. To get multiple information points but limit the amount of computational capacity needed to calculate the classification, each subband combination consisted of two of the eight possible subbands at the 3-D level, resulting in a total of 36 subband combinations.
Classification and Cross-Validation
The classification of the final features in this experiment was done by a SVM classifier. Each subband combination was classified three separate times with the SVM. The C value, or regularization parameter, was ten in all trials, and the tolerance was 1 × 10 3. Since linear SVMs do not perform well on non-linear data (Zhang et al., 2015), non-linear radial basis function (RBF) kernels were used. The test classification accuracy was recorded each time the subband combination was run through the SVM. The mean and standard deviation (SD) of the test accuracies for each subband combination were then calculated.
The top 40% of the subband combinations by mean test accuracy were selected for cross-validation. Fivefold cross-validation was used to validate the performance of these combinations.
Results and Discussion
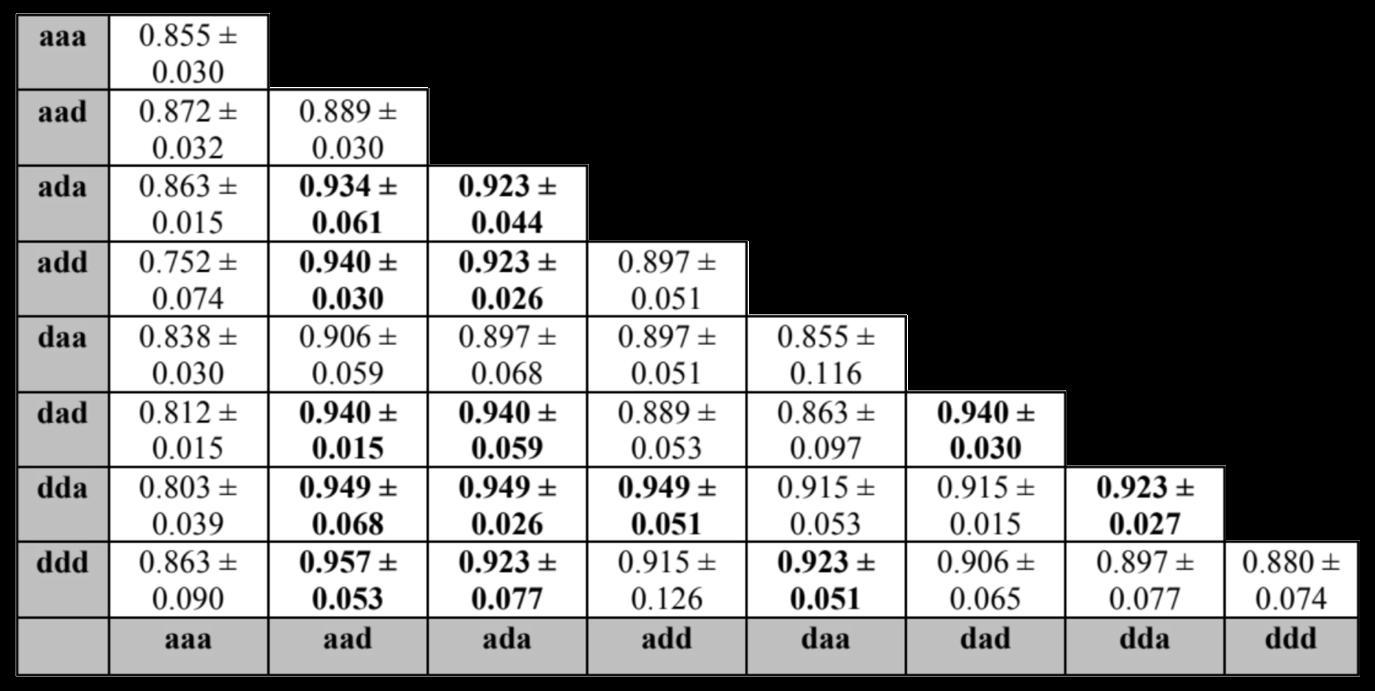
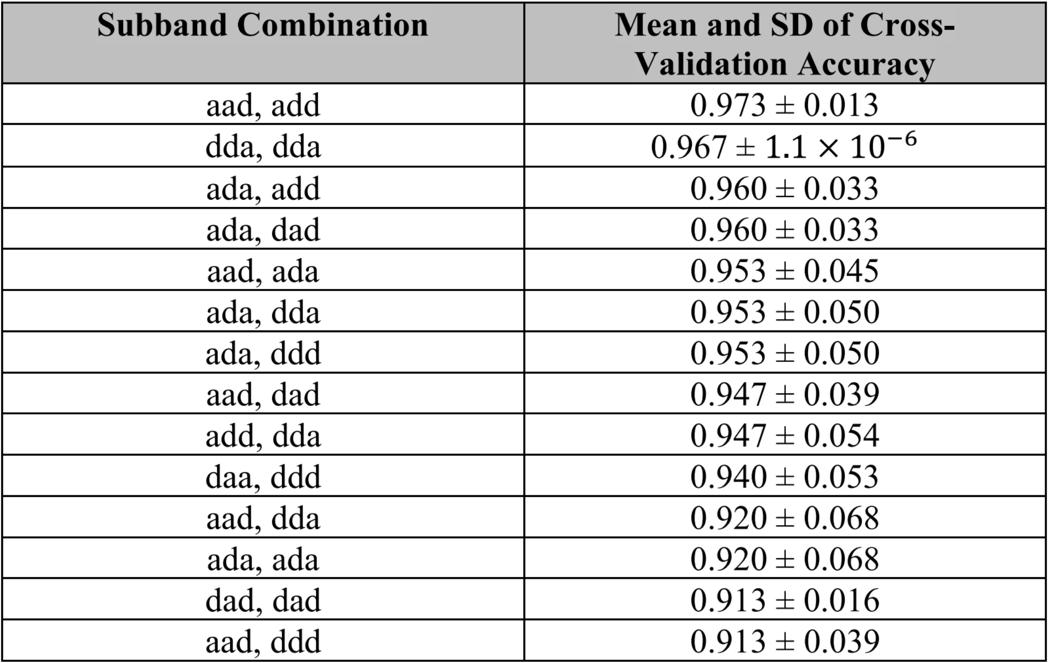
After the 3-D DWT was performed on 150 MRI scans, the feature extracted scans were run through a SVM classifier with RBF kernels and C-value of 10 three times per subband combination. The test classification accuracy was measured for each of the three runs, and then the mean and SD of the test classification accuracies were calculated. Each subband is represented by a three-letter key detailing whether there is an approximation subband (produced by a low-pass filter) or a detail subband (produced by a high-pass filter) in the x, y, and z dimensions. An “a” represents an approximation subband and a “d” represents a detail subband. Table 1 shows the mean and SD of the test accuracy for three runs per subband combination. The minimum mean test accuracy was 75.2% and the maximum mean test accuracy was 95.7%. The top 40% of subband combinations sorted by mean test accuracy were selected for five-fold cross-validation. Table 2 shows the mean and SD of cross-validation accuracy per subband combination, which are sorted by highest mean cross-validation accuracy and lowest SD. Five-fold cross-validation of the selected subband combinations yielded a minimum mean accuracy of 91.3% and a maximum of 97.3%.
This study found that the selection of only two subband patterns can still produce accurate classification. The maximum cross-validation classification accuracy was 97.3%, compared to the 76.0% accuracy found by Ayaz et al. or the 92.8% accuracy found by Sujatha Kumari et al. (Sujatha Kumari et al., 2021). This means that despite using less subbands and needing less computational power, this study’s procedure was able to produce better classification results than previous proposed methods using the 3-D DWT. These results show that the use of only a few subbands in specific subband combinations may be a viable innovation to increase the efficiency of screening patients for AD or MCI via MRI.
Further research is required to see if the method used in this study is applicable to larger data sets. In addition, it is possible the accuracy can be further increased by using a convolutional neural network (CNN) as the classifier.
Conclusion
This study finds that the use of only certain subband combinations may be a viable solution to creating a more efficient method of 3-D DWT on MRI scans to classify patient cognitive status as AD, MCI, or CN. The maximum mean test classification accuracy was 95.7% from the “aad, ddd” subband combination, and the maximum five-fold cross-validation accuracy was 97.3% from the “aad, add” subband combination. Despite requiring less computation capacity and less steps, these results were better than previous proposed procedures to screen patients for AD or MCI based on performing the 3D-DWT on MRI scans. This result shows that using a limited 3D-DWT subband method may be able to increase the efficiency of classifying patients for AD or MCI with MRI. However, this procedure needs to be validated on larger sample sizes of MRI scans.
Acknowledgements
I would like to thank Xiangyi Cheng for her mentorship and guidance of me through this project.
References
ADNI | About. (2009). Usc.edu. http://adni.loni.usc.edu/about/
Ayaz, A., Ahmad, M. Z., Khurshid, K., & Kamboh, A. M. (2017). MRI based automated diagnosis of Alzheimer’s: Fusing 3D wavelet-features with clinical data. 2017 39th Annual International Conference of the IEEE Engineering in Medicine and Biology Society (EMBC). https://doi.org/10.1109/embc.2017.8037048
Apostolova, L. G., Steiner, C. A., Akopyan, G. G., Dutton, R. A., Hayashi, K. M., Toga, A. W., Cummings, J. L., & Thompson, P. M. (2007). Three-Dimensional Gray Matter Atrophy Mapping in Mild Cognitive Impairment and Mild Alzheimer Disease. Archives of Neurology, 64(10), 1489. https://doi.org/10.1001/archneur.64.10.1489
Bhasin, H., & Agrawal, R. K. (2020). A combination of 3-D discrete wavelet transform and 3-D local binary pattern for classification of mild cognitive impairment. BMC Medical Informatics and Decision Making, 20(1). https://doi.org/10.1186/s12911-020-1055-x
Cortes, C., & Vapnik, V. (1995). Support-vector networks. Machine Learning, 20(3), 273–297. https://doi.org/10.1007/bf00994018
Facts and Figures. (2021). Alzheimer’s Disease and Dementia. https://www.alz.org/alzheimers-dementia/facts-figures#prevalence
Friston, K. J., Holmes, A. P., Worsley, K. J., Poline, J.-P. ., Frith, C. D., & Frackowiak, R. S. J. (1994). Statistical parametric maps in functional imaging: A general linear approach. Human Brain Mapping, 2(4), 189–210. https://doi.org/10.1002/hbm.460020402
Henderson, V. (n.d.). Mild Cognitive Impairment. Retrieved February 15, 2022, from https://med.stanford.edu/content/dam/sm/adrc/documents/adrc-information-sheet-mild-cognitive-impairment.pdf
Jha, D., Kim, J.-I., & Kwon, G.-R. (2017). Diagnosis of Alzheimer’s Disease Using Dual-Tree Complex Wavelet Transform, PCA, and FeedForward Neural Network. Journal of Healthcare Engineering, 2017, 1–13. https://doi.org/10.1155/2017/9060124
Kai, S., Li, K., & Selesnick, I. (n.d.). Wavelet Software at Brooklyn Poly. Eeweb.engineering.nyu.edu. Retrieved February 8, 2022, from https://eeweb.engineering.nyu.edu/iselesni/WaveletSoftware/standard3D.html
Leifer, B. P. (2003). Early diagnosis of Alzheimer’s disease: clinical and economic benefits. Journal of the American Geriatrics Society, 51(5 Suppl Dementia), S281-288. https://doi.org/10.1046/j.1532-5415.5153.x
Mallat, S. G. (1989). A theory for multiresolution signal decomposition: the wavelet represe ntation. IEEE Transactions on Pattern Analysis and Machine Intelligence, 11(7), 674–693. https://doi.org/10.1109/34.192463
Mishra, S. K., & Deepthi, V. H. (2020). Brain image classification by the combination of different wavelet transforms and support vector machine classification. Journal of Ambient Intelligence and Humanized Computing, 12(6), 6741–6749.
https://doi.org/10.1007/s12652-020-02299-y
National Institute on Aging. (2019, May 22). Alzheimer’s Disease Fact Sheet. National Institute on Aging.
https://www.nia.nih.gov/health/alzheimers-disease-fact-sheet
Rajapakse, J. C., Giedd, J. N., & Rapoport, J. L. (1997). Statistical approach to segmentation of single-channel cerebral MR images. IEEE Transactions on Medical Imaging, 16(2), 176–186. https://doi.org/10.1109/42.563663
Sujatha Kumari, B. A., Yadiyala, A. G. V., Aruna, B. J., Radha, C., & Shwetha, B. (2021). Early Detection of Mild Cognitive Impairment Using 3D Wavelet Transform. Data Intelligence and Cognitive Informatics, 445–455. https://doi.org/10.1007/978-981-15-8530-2_36
Tanveer, M., Richhariya, B., Khan, R. U., Rashid, A. H., Khanna, P., Prasad, M., & Lin, C. T. (2020). Machine Learning Techniques for the Diagnosis of Alzheimer’s Disease. ACM Transactions on Multimedia Computing, Communications, and Applications, 16(1s), 1–35. https://doi.org/10.1145/3344998
The Dementias: Hope Through Research | National Institute of Neurological Disorders and Stroke. (n.d.). Www.ninds.nih.gov. Retrieved January 29, 2022, from https://www.ninds.nih.gov/Disorders/Patient-Caregiver-Education/Hope-Through-Research/DementiaHope-Through-Research#diagnosis
Wang, X., Nan, B., Zhu, J., & Koeppe, R. (2014). Regularized 3D functional regression for brain image data via Haar wavelets. The Annals of Applied Statistics, 8(2). https://doi.org/10.1214/14-aoas736
Ye, D. H., Pohl, K. M., & Davatzikos, C. (2011). Semi-supervised Pattern Classification: Application to Structural MRI of Alzheimer’s Disease. 2011 International Workshop on Pattern Recognition in NeuroImaging, 1–4. https://doi.org/10.1109/prni.2011.12
Zhang, Y., Dong, Z., Phillips, P., Wang, S., Ji, G., Yang, J., & Yuan, T.-F. (2015). Detection of subjects and brain regions related to Alzheimer’s disease using 3D MRI scans based on eigenbrain and machine learning. Frontiers in Computational Neuroscience, 9. https://doi.org/10.3389/fncom.2015.00066
2. Essential oils from thyme and rosemary in combination as an antibiotic-sparing agent to treat Escherichia coli-caused urinary tract infections
 Mallika Subramanian, Staples High School
Abstract
Antimicrobial resistance (AMR) is one of the largest healthcare emergencies today, with urinary tract infections (UTIs) caused by antibiotic-resistant uropathogenic Escherichia coli (E.coli) (UPEC) as a critical offender. The development of biofilms, matrices of UPEC, further complicate treatment. Antibiotics struggle to pierce the biofilm, leading to longer infections and antibiotic use, increasing AMR. Little has been done to identify efficient UTI treatments which inhibit both bacterial and biofilm growth. Previous research demonstrates that essential oils (EOs), especially T.zygis (thyme) and R.officinalis (rosemary) EOs, can combat bacterial growth as effectively as antibiotics, as well as inhibit biofilm growth. EO combinations have shown enhanced antibacterial and antibiofilm activity over individual EOs, but ratios of EOs in combination have not been optimized. T.zygis and R.officinalis EOs were tested on E.coli in different ratios to establish an optimal EO combination to inhibit bacterial and biofilm activity. Agar disk diffusion evaluated antibacterial activity(n=2) and a colony forming unit/mL assay measured antibiofilm activity(n=30). 100% T.zygis, 0% R.officinalis and 90% T.zygis, 10% R.officinalis had the highest antibacterial activities, with similar activity to ciprofloxacin control. 90% T.zygis, 10% R.officinalis and 60% T.zygis, 40% R.officinalis had the highest antibiofilm activities, with inhibition levels of 80.89% and 80.09%, respectively. 90% T.zygis, 10% R.officinalis was more effective than T.zygis (70.87% inhibition;p=0.03034) or R.officinalis (37.95% inhibition;p=0.0011) alone, and the most effective treatment overall. These results could indicate EO combinations for utilization in alternative antibiotic-sparing treatments for UPEC-caused UTIs.
1. Introduction
Antimicrobial resistance (AMR) is one of the biggest healthcare emergencies today (WHO, 2021), with E. coli resistance against antibiotics being one of the most urgent issues, due to its ability to cause a plethora of diseases (Maduppa, 2019). Urinary tract infections (UTIs) are one of the most prevalent diseases, affecting at least 274 million people annually worldwide (GBD, 2018), and having an incidence of 50-60% in the lifetime of adult women (Medina & Castillo-Pino, 2019). Uropathogenic E. coli (UPEC) causes 75% of uncomplicated UTIs and 65% of complicated UTIs (Flores-Mireles et al., 2015). Due to the abuse of antibiotics for this common
disease, UPEC has become resistant to many kinds of antibiotics (Table 1), specifically fluoroquinolones and β-lactams, such as ciprofloxacin and amoxicillin, respectively (Flores-Mireles et al., 2015; Wu et al., 2021; Smieszek & Pouwels, 2018). Fluoroquinolones and β-lactams are used to treat many other severe infections, and resistance to them can create problems concerning lack of treatment for severe disease (WHO, 2021). The rate of AMR is rising, and because of that, the rate of multi-drug resistant bacteria is also rising (WHO, 2021). This kind of resistant bacteria is a threat to anyone who is susceptible to get a UTI caused by UPEC (MacKinnon et al., 2020).
Table 1. Description of Common Antibiotics that Treat E. coli Infections, their Antibiotic Class, and Percent E. coli Resistance
Antibiotic (Madappa & Stuart, 2019)
Antibiotic Class E. coli
0.8-1.7% (Nitrofurantoin - Side Effects, Uses, Dosage, Overdose, Pregnancy, Alcohol, 2015) (Bryce et al., 2016)
Meropenem Carbapenem 0.2% (Merrem IV (Meropenem): Uses, Dosage, Side Effects, Interactions, Warning) (Nordmann & Poirel, 2019)
Complication of Current Bacterial Infection Treatments by Biofilms
AMR is further complicated by the creation of biofilms by bacteria. Biofilms are the assemblage of microbial cells that are enclosed in a matrix of polysaccharide material, and are responsible for more than 80% of all microbial infections (Römling & Balsalobre, 2012). Biofilm development is crucial for the persistence of UPEC in the urinary tract and its ability to cause UTIs (Sanchez et al., 2013). Bacterial biofilms become resistant to antibiotics because the antibiotics struggle to pierce the polysaccharide matrix (Costerton et al., 1999). This results in recurring biofilm infections, which bring about cycles of antibiotics, and increased resistance to antibiotics (Costerton et al., 1995), effectively rendering antibiotics useless against biofilms.
Essential Oils as an Alternative Therapy
Essential oils offer promising evidence as alternative treatments against both bacterial and biofilm growth. Although there have been many studies proving the effectiveness of EOs in monotherapy against bacterial growth (Lagha et al., 2019; Mahizan et al., 2019; Williams, 2018) and biofilm production of E. coli (Cáceres et al., 2020, Kerekes et al., 2019, Millezi et al., 2019, Neyret et al., 2014), fewer studies have investigated the potential of EOs in combination.
In an experimental procedure on the antibacterial effects of EO monotherapy and combination therapy, Williams, 2018 demonstrated that pine, orange, oregano, and coriander EOs have higher antibacterial effects in combination compared to their individual use. In addition, it showed that specific ratios of the combinations had greater antibacterial efficacy than other ratios. Bassolé & Juliani demonstrated that EOs and EO components can have synergistic, additive, and antagonistic effects on UPEC. The results of this study demonstrated that phenolic and monoterpenoid terpene (EO components) combinations are actively synergistic against E. coli R. officinalis EO was also shown to have synergistic interactions with other EOs.
EOs have also been shown to work against biofilm growth when used in combination with other drugs. Demonstrated in Algburi et al.,, various antibiotics were tested along with natural components to measure the interaction between them when acting against biofilm growth. Thyme oil and Pelargonium graveolens (rose geranium) were tested with ampicillin, penicillin, cloxacillin, cephalothin, methicillin, novobiocin, vancomycin, and norfloxacin, and showed synergistic effects, as well as enhancing effects of the antibiotics. Terpinen-4-ol, an EO component, was also tested with ciprofloxacin and demonstrated synergistic effects. Neyret et al., 2014 reported that thymol and carvacrol (both phenolic components) in combination have higher antibiofilm activity in combination compared to their respective individual antibiofilm activities.
Thymus zygis (T. zygis) and Rosmarinus officinalis (R. officinalis) are both medicinal plants derived from the common name thyme and rosemary, respectively. Their respective essential oils(EOs) have been used for medicinal purposes (Bukovská et al., 2007). Demonstrated in Lagha et al., 2019, both T. zygis EO and R. officinalis EO proved to have antibacterial and antibiofilm capabilities when tested individually on UPEC. However, T. zygis EO had the highest antibacterial activity out of all the EOs, having strong inhibitory action against 90% of the E. coli tested, and R. officinalis EO had the highest antibiofilm activity, inhibiting up to 94.75% of biofilms. Both EOs are also mainly composed of monoterpenoid terpenes, with the main compounds in T. zygis EO being linalool and terpinen-4-ol, and the main compound in R. officinalis EO being 1,8-cineole (Lagha et al., 2019). The terpenes have been attributed to the antibacterial activity of the two EOs (Lagha et al., 2019), and have also been shown in other research to be effective against E. coli (Mahizan et al., 2019).
The benefits of T. zygis and R. officinalis EOs and their components against E. coli have been proven (Lagha et al., 2019) (Bassolé & Juliani, 2012), but the effectiveness of them in combination for optimization of both antibiofilm activity and antibacterial activity remains to be established.
New solutions need to be studied to treat UTIs caused by UPEC in order to decrease AMR levels, which could be done by studying treatments that address both bacterial growth and biofilm production (Høiby et al., 2015). The aim of this study was to investigate and ultimately demonstrate the heightened effectiveness of T. zygis and R. officinalis EOs in combination by effectively optimizing activity against biofilm production and bacterial growth of UPEC. It was hypothesized that the two EOs would work synergistically against UPEC when combined because they are both mainly made of monoterpenoid terpenes. It was also predicted that the EO treatments of 40% T. zygis, 60% R. officinalis, 50% T. zygis, 50% R. officinalis, or 60% T. zygis, 40% R.
officinalis (Groups 7, 8, and 9 in Table 2) would be the most effective due to previous research on specific ratios (Williams, 2018)
2. Materials and Methodology
2.1. Population
The model was a strain of non-pathogenic E. coli called E. coli K-12 that was obtained from Sacred Heart University.
2.2. Materials
Essential Oils
T. zygis and R. officinalis EOs were purchased from Eden Botanicals. Essential oils treatments were created to be 1000 µL total each, and formulated to have different percentages of each essential oil(shown in Table 2) using a calibrated pipette to combine oils in centrifuge tubes. To dilute both essential oils to 2500 mg/mL before creating treatments, 675 µL of T. zygis EO was put in 135 µL of fractionated coconut oil in a centrifuge tube and 675 µL of R. officinalis EO was also put in 135 mL of fractionated coconut oil in a centrifuge tube. These solutions were made as many times as necessary when they were all used up. Both essential oils were stored at approximately 21℃ in the tubes until needed for use (Doterra, n.d.).
Antibiotics
For the antibiotic testing in the agar disk diffusion procedure, ciprofloxacin and penicillin antibiotic disks were purchased and used.
2.3. Study Design
This was an in vitro experimental study consisting of 2 main procedures: the Kirby-Bauer agar disk diffusion method for antimicrobial susceptibility/antibacterial activity and a CFU/mL assay for biofilm inhibition.
2.4. Procedures
2.4.1. Antimicrobial Susceptibility Testing
Antimicrobial susceptibility was examined through the Kirby diffusion method (Balouiri et al., 2016). The entire procedure was carried out on a bench. 24 hrs in MHA broth before being spread on MHA plates. MHA plates were inoculated using a sterile swab to streak the bacteria on. 4 6mm filter paper disks were impreg placed on the surface of the MHA plates. The plates were then incubated at 37 for 24 hours. Antibacterial activity was quantified by measuring the inhibition zone diameters (mm) (Figure 2) around the disks using a ruler.
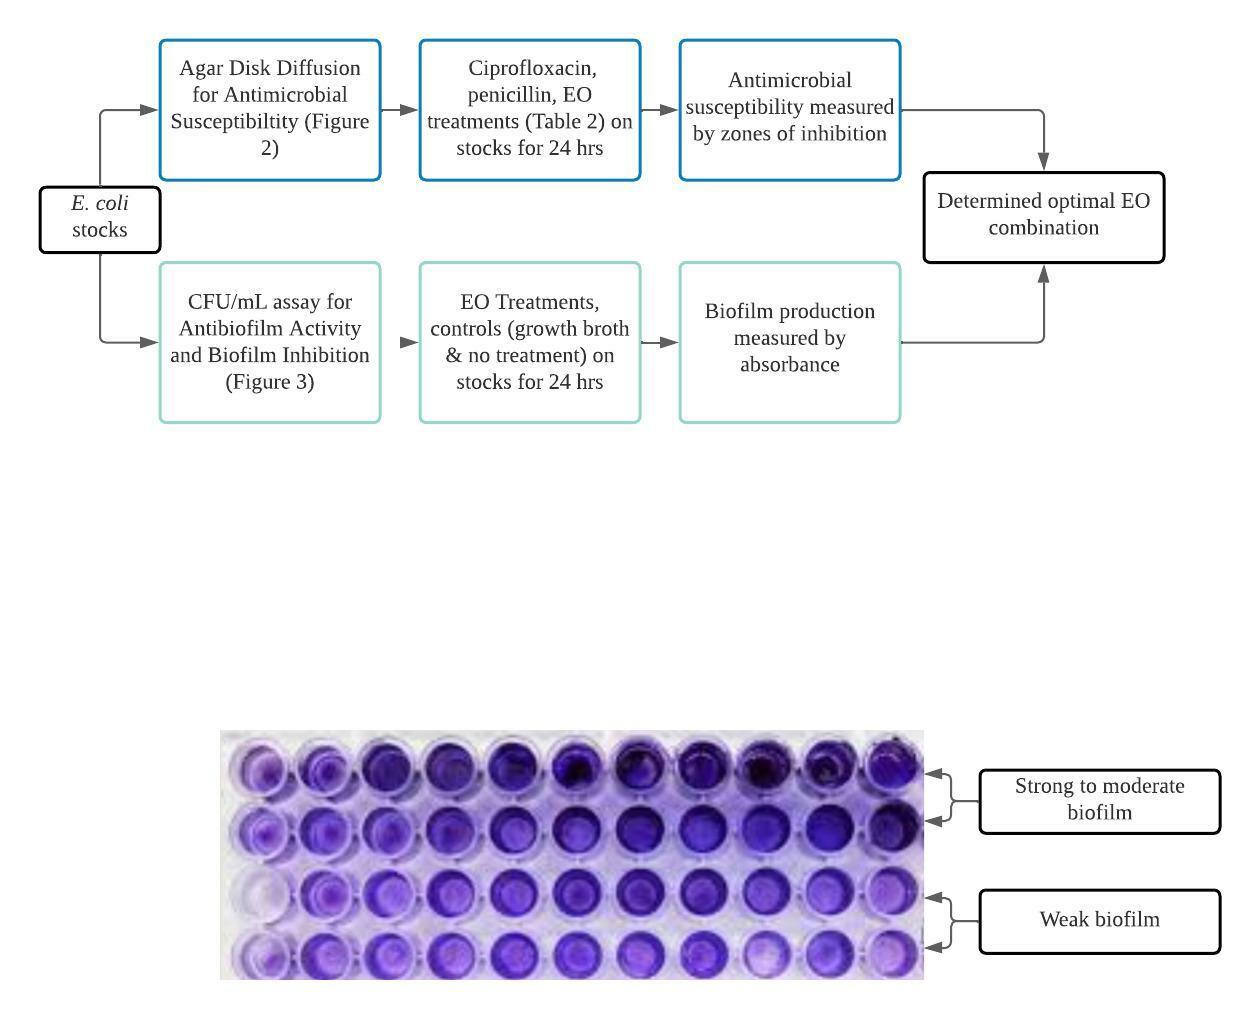
For the cipro and penicillin antibiotic discs, E. coli was spread on the antibiotic plates, and the discs were put directly on the plates. The rest of the procedure carried on as described above.
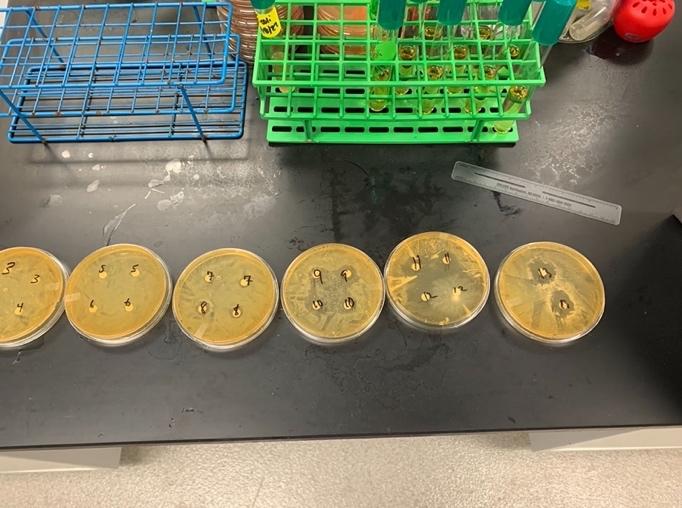
The experiment was duplicated, and the mean zone diameter was recorded for each group (Lagha et al., 2019).
2.4.2. Biofilm Formation and Inhibition
Biofilm formation by E. coli was observed using the crystal violet CFU/mL assay method (see figure 3 for procedure) (Wilson, 2017). This entire procedure was also carried out on a bench. The E. coli cultures were grown at 37℃ for 18-24 hrs in Trypticase Soy broth (TSB). The suspended bacteria was then transferred to a 96-well microtiter plate using a pipette, with 100 μL in each well. 100 μL of EO solutions emulsified in TSB
(see 2.4.2.1.) were then added to their respective wells. The total volume of each well was 200 μL (Lagha et al., 2019). The controls were pure TSB and no treatment (see Figure 3 for well distributions). The plates were incubated at 37°C for 24 hrs, and the crystal violet procedure (described below) was carried out.
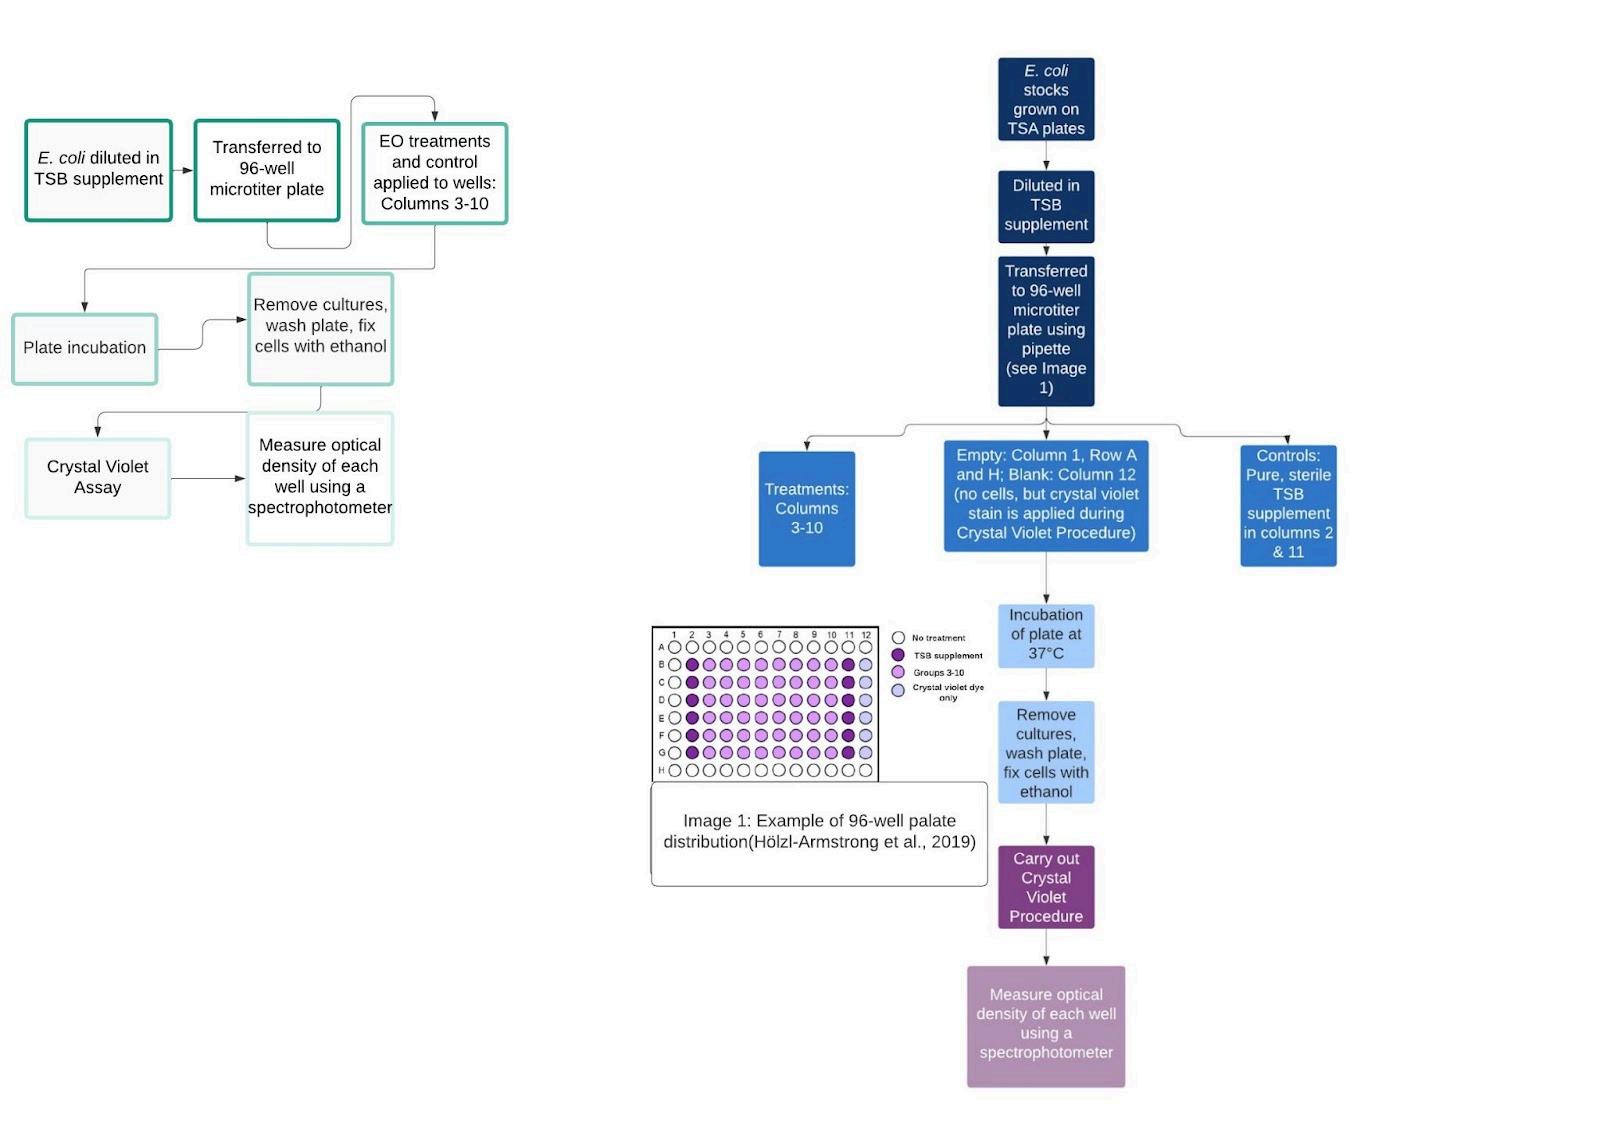
2.4.2.1. Essential Oil Emulsification in TSB Supplement
The EO emulsification in TSB supplement occured in a 1:1 ratio by mixing 10 mL of EO treatment with 10 mL of
2.4.2.1. Crystal Violet Procedure
Culture mediums were carefully removed from the wells of the 96-well microtiter plate using a pipette. 0.2 mL of Phosphate Buffer Solution (PBS) was warmed up to 20℃, and then was used to wash the plate. Each well was washed with 150µL of PBS. The PBS was then removed and 50 µL of crystal violet solution was added to each well. The plate was then incubated at 20℃. After, the plate was immersed in a large beaker filled with tap water in order to wash. This process was repeated in duplicate, with the tap water being changed between washes. The plate was drained upside down on paper towels. 100 µL of 1% sodium dodecyl sulfate (SDS) was applied to each well in order to solubilize the stain. The plate then went into an orbital shaker incubator until the color of the wells was uniform (Crystal Violet Assay, n.d.; Hölzl-Armstrong et al., 2019).
2.4.2.2. Biofilm Production Quantification
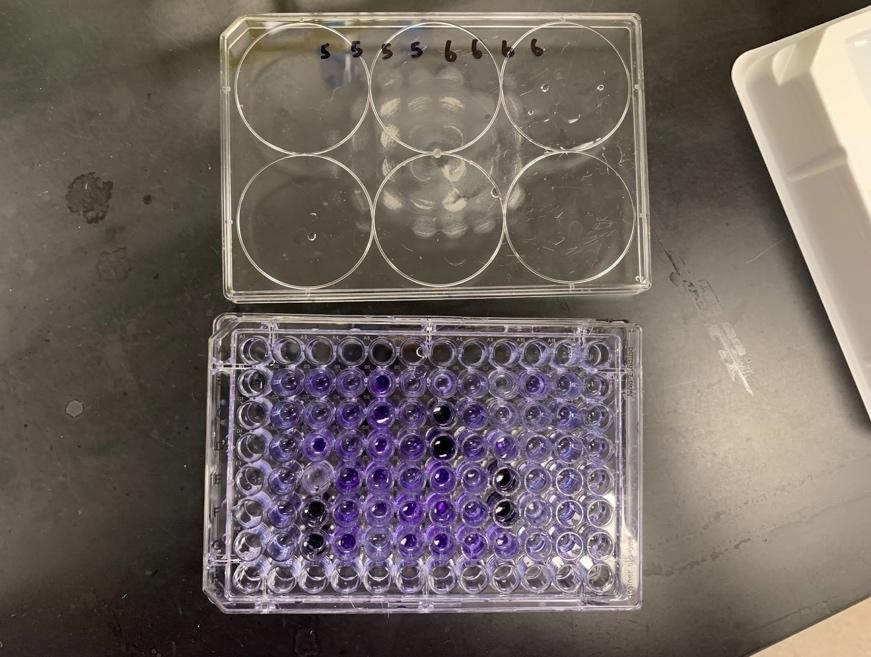
Quantification of biofilm production started with measuring the optical density of each well of the 96-well microtiter plate. After the plate went through the crystal violet procedure, it went into a 96-well spectrophotometer at 570 nm. A darker shade of violet would display a higher absorption, and therefore, more biofilm (Figure 4).
Biofilm inhibition % was calculated using the equation below, as described in Lagha et al.
% Inhibition = 100 - [(absorbance of sample/absorbance of control) * 100]
Statistical Analysis
Statistical analysis was conducted using 2-sample t-tests. Results with p-values < 0.05 were considered to be statistically significant.
For the disk diffusion assay data, the treatments were all compared to the positive control, which was ciprofloxacin.
For the crystal violet CFU/mL assay, the biofilm inhibition % of treatments were all compared to group 13 because that treatment was just the R. officinalis EO, which had been proven to have high biofilm inhibition levels, even higher than T. zygis. By comparing to group 13, it was identified whether or not the combination would be more effective than an individual oil or not.
2.5. Limitations of Study
This experiment was aimed to research alternative medicine for UTIs caused by UPEC, however, due to lab availability and safety protocols, UPEC was not viable to use as an experimental model. However, nonpathogenic E. coli was acceptable to use in place of UPEC. This is because the antibacterial mechanism of action of EOs is to diffuse through the cytoplasmic membrane of the bacteria (Saad et al., 2013), and because non-pathogenic E. coli has a cytoplasmic membrane (Silhayy, 2015). Outer-membrane vesicles (OMVs) are also used by UPEC to cause infection (Terlizzi et al., 2017) which is recognized by the body’s immune responses, and non-pathogenic E. coli also release OMVs that cause immune responses in the body (Behrouzi et al., 2018), so the anatomy of non-pathogenic E. coli is similar to the anatomy of UPEC. This means that the results of this study can be applied to UPEC when discussing alternative medicine for UTIs. In addition, the use of non-pathogenic bacteria removes any ethical or safety concerns associated with using UPEC.
3. Results
3.1. Antibacterial Activity of Essential Oil Combinations
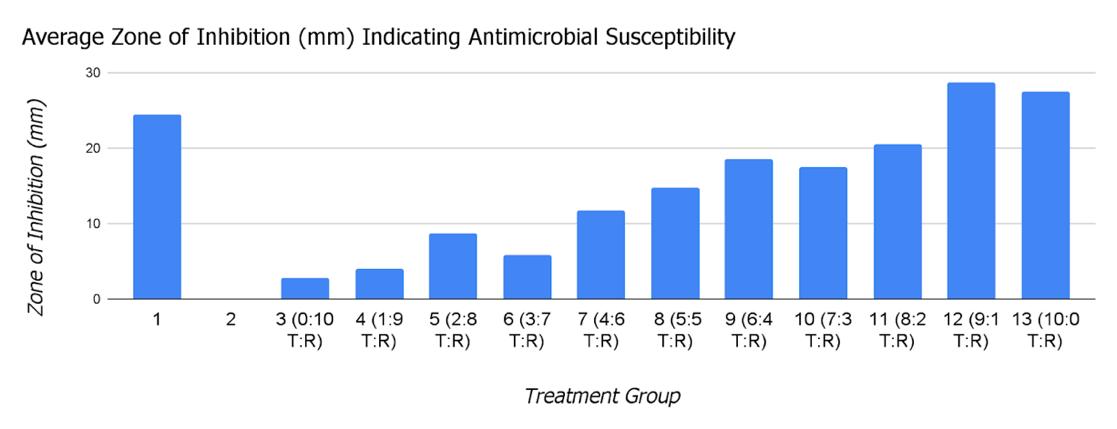
Out of the 11 essential oil combinations, groups 12 (90% T. zygis, 10% R. officinalis) and 13 (100% T. zygis, 0% R. officinalis) had the highest antibacterial activities with average zones of inhibition of 28.67 mm and 27.5 mm, respectively. A 2-sample t-test comparing groups 12 (p=0.0487)and 13 (p=0.304) with group 1 (ciprofloxacin control) demonstrated that they both had similar antibacterial activities to the control. Group 3 (0% T. zygis, 100% R. officinalis) had the lowest antibacterial activity with an average zone of inhibition of 2.75 mm. As the percentage of T. zygis in the treatment increased, the average zone of inhibition trended upwards.
3.2. Biofilm Inhibition by Essential Oil Combinations
Table 4. Effectiveness of inhibiting biofilm formation.
Out of the 11 essential oil combinations, groups 12 (90% T. zygis, 10% R. officinalis) and 9 (60% T. zygis, 40% R. officinalis) had the highest antibiofilm activities with inhibition percentages of 80.89% and 80.09%, respectively. Demonstrated by the p-values comparing the treatments to group 13, the biofilm inhibition of groups 3, 4, 5, and 12 were all statistically different from group 13.
4. Discussion
The overuse of antimicrobials, specifically antibiotics, has led to great levels of resistance, specifically by UPEC (WHO, 2021), with exacerbation of the problem by biofilm development (Sanchez et al., 2013). T. zygis and R. officinalis EOs have been researched as antibacterial and antibiofilm treatments, showing great potential (Lagha et al., 2019). This study looked at the two EOs in combination, and were tested for their antibacterial and antibiofilm activities using disk diffusion and crystal violet CFU/mL assay methods, respectively.
The 90% T. zygis, 10% R. officinalis and 100% T. zygis, 0% R. officinalis combinations had the highest antibacterial activities, and had numerically higher activities compared to the ciprofloxacin control (Table 3, Figure 5). However, due to the small number of trials conducted of the disk diffusion assay because of resource restraint, the argument could not be made that the EO combinations had statistically higher antibacterial activities compared to the ciprofloxacin. These two combinations were made mainly of T. zygis EO, and seeing as T. zygis EO has proven to have greater antibacterial capabilities than R. officinalis (Lagha et al., 2019), this was an expected outcome. It does, however, say that R. officinalis and T.zygis do not have additive or synergistic effects because if they did, then the combinations with the highest antibacterial activities would have had more or any R. officinalis in it, and would most likely have larger zones of inhibition.
The standard deviations of the data were relatively small, however, this can also be attributed to the small sample size.
The 90% T. zygis, 10% R. officinalis and 60% T. zygis, 40% R. officinalis combinations had the highest antibiofilm activities, and did have statistically higher activities compared to the control, which was 100% T. zygis, 0% R. officinalis (Table 4). These two combinations both had a majority of T.zygis compared to R.officinalis, but R. officinalis has been proven to have greater antibiofilm capabilities compared to T. zygis (Lagha et al., 2019), so it can be concluded that there is some sort of enhancing activity occurring between the two essential oils. This enhancing effect would have to be researched further in a more quantifiable manner in order to be categorized, but this study shows promise for the abilities of these two EOs in combination. The standard deviations of the treatments ranged from 8.47 - 79.74, which is a lot of variation. This large range of variation could be attributed to human error, however, if this experiment were to be replicated, the standard deviations should be compared to the results of this study. This variation, however, was accounted for in statistical analysis, so the results of this study are sound.
The intersection between these two assays was the 90% T. zygis, 10% R. officinalis, as it was the only combination that had the highest antibacterial and antibiofilm activities. By being the only intersection between the two experiments, it was the automatic optimized combination. There were no uncontrolled events that impacted either of the experiments, so all results can be taken as valid.This is a different result than hypothesized, and different than the results from Williams, 2018. This signifies that further research into EO ratios when used in combination is necessary. These results confirm that EO combination therapy is more effective than monotherapy against both bacterial and biofilm growth, meaning that combination therapy should be researched further and could have true potential as alternative treatment.
If this experiment were to be done again, the disk diffusion assay should be replicated several more times, so that better and more valid statistical analysis could be conducted on the values. In addition, ciprofloxacin could be used as another control in the CFU/mL assay, to have a standard of comparison against something that is already on the market as a UTI treatment. Since these results prove that these two essential oils in combination are effective enough to be UTI treatments, further research on this topic could venture into using a 90% T. zygis, 10% R. officinalis EO combination on pathogenic E. coli, small test insects with UPEC, such as Drosophila melanogaster, or other types of gram-negative bacteria, such as Pseudomonas aeruginosa (Gram-Negative Bacteria Infections in Healthcare Settings | HAI). Conducting further experiments with other EO combinations that have the same antibacterial and antibiofilm potentials as T.zygis and R. officinalis on UPEC would also be valuable, as it would venture into identifying more possible alternative treatments for UPEC-caused UTIs.
5. Conclusion
Treating UTIs caused by UPEC has become increasingly difficult because of high antibiotic resistance levels and biofilms that further this resistance. This finding demonstrated a 90% T. zygis, 10% R. officinalis EOs as an effective antibacterial and antibiofilm treatment. It also demonstrated that these two EOs enhance each other's effects when used in combination against UPEC. Therefore, it is proposed that this combination be used as an alternative treatment against UTIs in order to spare antibiotic use.
6. Appendix Appendix 1
Synergism is defined as “interaction of discrete agencies (such as industrial firms), agents (such as drugs), or conditions such that the total effect is greater than the sum of the individual effects” (Synergism Definition & Meaning, n.d.). Additive interaction is defined as “a deviation from additivity of the absolute effects of two risk factors” (Ding, 2014). Antagonism is defined as “an interaction between two or more drugs that have opposite effects on the body [...] [that] may block or reduce the effectiveness of one or more of the drugs” (Drug Antagonism | NIH, n.d.).
7. Acknowledgements
I thank Dr. Sankhiros Babapoor from Sacred Heart University for his efforts in aiding me with the resources and space needed to carry out these experiments and his guidance in my experimentation. In addition, I would like to thank Mrs. Amy Parent and Mr. Phil Abraham from Staples High School for their help in confirming my statistical analysis, as well as their guidance throughout this project.
References
Algburi, A., Comito, N., & Kashtanov, D. (2016, 11 18). Control of Biofilm Formation: Antibiotics and Beyond. Applied and Environmental Microbiology. https://journals.asm.org/doi/pdf/10.1128/AEM.02508-16
Aztreonam Injection. (n.d.). MedlinePlus. Retrieved December 8, 2021, from https://medlineplus.gov/druginfo/meds/a687010.html
Balouiri, M., Sadiki, M., & Ibnsouda, S. K. (2016, 04). Methods for in vitro evaluating antimicrobial activity: A review. Journal of Pharmaceutical Analysis, 6. NCBI. 10.1016/j.jpha.2015.11.005
Bassolé, I., & Juliani, H. (2012, 04 2). Essential Oils in Combination and Their Antimic robial Properties. Molecules. NCBI. 10.3390/molecules17043989
Behrouzi, A., Vaziri, F., & Rad, F. R. (2018, 08 01). Comparative study of pathogenic and non -pathogenic Escherichia coli outer membrane vesicles and prediction of host-interactions with TLR signaling pathways. BMC Research Notes. NCBI. 10.1186/s13104-018-3648-3
Bryce, A., Costelloe, C., & Hawcroft, C. (2016, 07 25). Faecal carriage of antibiotic resistant Escherichia coli in asymptoma tic children and associations with primary care antibiotic prescribing: a systematic review and meta-analysis. BMC Infectious Disease PubMed. 10.1186/s12879-016-1697-6
Bryce, A., Hay, A. D., & Lane, I. F. (2016, 03 15). Global prevalence of antibiotic resistance in paediatric urinary tract infections caused by Escherichia coli and association with routine use of antibiotics in primary care: systematic review and meta-analysis. BMJ. https://www.bmj.com/content/352/bmj.i939
Bukovská, A., Cikoš, Š., & Juhás, Š. (2007). Effects of a Combination of Thyme and Oregano Essential Oils on TNBS-Induced Colitis in Mice. Mediators of Inflammation. https://doi.org/10.1155/2007/23296
Cáceres, M., Hidalgo, W., & Stashenko, E. (2020, 03 30). Essential Oils of Aromatic Plants with Antibacterial, Anti-Biofilm and AntiQuorum Sensing Activities against Pathogenic Bacteria. Antibiotics, 9(4). MDPI. https://doi.org/10.3390/antibiotics9040147
Cho, S.-H., Lim, Y.-S., & Park, M.-S. (2011, 06). Prevalence of Antibiotic Resistance in Escherichia coli Fecal Isolates From Healthy Persons and Patients With Diarrhea. Osong Public Health and Research Perspectives, 2(1), 41-45. Science Direct. https://doi.org/10.1016/j.phrp.2011.05.003
Costerton, J. W., Lewandowski, Z., Caldwell, D. E., Korber, D. R., & Lappin-Scott, H. M. (1995). Microbial biofilms. Annual Review Microbiology. PubMed. 10.1146/annurev.mi.49.100195.003431
Costerton, J. W., Stewart, P. S., & Greenberg, E. P. (1999, 05 21). Bacterial biofilms: a common cause of persistent infections. Science PubMed. 10.1126/science.284.5418.1318
Co-trimoxazole. (n.d.). MedlinePlus. Retrieved December 8, 2021, from https://medlineplus.gov/druginfo/meds/a684026.html
Crystal Violet Assay. (n.d.). University of Kansas Medical Center. https://www2.kumc.edu/soalab/lablinks/protocols/cvassay.htm
Dimitrova, L., Kaleva, M., & Zaharieva, M. M. (2021, 08 4). Prevalence of Antibiotic-Resistant Escherichia coli Isolated from Swine Faeces and Lagoons in Bulgaria. Antibiotics, 10(8). MDPI. https://doi.org/10.3390/antibiotics10080940
Ding, B. (2014). Chapter Four - High-Throughput Genetic Interaction Study. Between the Lines of Genetic Code. Science Direct. https://doi.org/10.1016/B978-0-12-397017-6.00004-0
Doterra. (n.d.). Part 5: Packaging and Storage. Doterra. https://www.doterra.com/US/en/essential-oil-production-packaging-andstorage-overview
Doxycycline (Oral Route) Description and Brand Names. (n.d.). Mayo Clinic. Retrieved December 7, 2021, from https://www.mayoclinic.org/drugs-supplements/doxycycline-oral-route/description/drg-20068229
Drug Antagonism | NIH. (n.d.). Clinical Info HIV.gov. Retrieved December 5, 2021, from https://clinicalinfo.hiv.gov/en/glossary/drugantagonism
Flores-Mireles, A., Walker, J., & Caparon, M. (2015, 04 08). Urinary tract infections: epidemiology, mechanisms of infection and treatment options. Nat Rev Microbiol, 13, 269-284. Nature. https://doi.org/10.1038/nrmicro3432
GBD. (2018, 11 10). Global, regional, and national incidence, prevalence, and years lived with disability for 354 diseases and injuries for 195 countries and territories, 1990–2017: a systematic analysis for the Global Burden of Disease Study 2017. The Lancet, 392(10159), 1789-1858. https://doi.org/10.1016/S0140-6736(18)32279-7
High levels of antibiotic resistance found worldwide, new data shows. (2018, January 29). WHO | World Health Organization. Retrieved December 8, 2021, from https://www.who.int/news/item/29-01-2018-high-levels-of-antibiotic-resistance-found-worldwide-newdata-shows
Høiby, N., Bjarnsholt, T., & Moser, C. (2015, 05 1). ESCMID guideline for the diagnosis and treatment of biofilm infections 2014. Clinical Microbiology and Infection. Science Direct. https://doi.org/10.1016/j.cmi.2014.10.024
Hölzl-Armstrong, L., Kucab, J. E., Korenjak, M., Lujiten, M., Phillips, D. H., Zavadil, J., & Arlt, V. M. (2019, 11 13). Characterising Mutational Spectra of Carcinogens in the Tumour Suppressor Gene TP53 Using Human TP53 Knock-in (Hupki) Mouse Embryo Fibroblasts. Methods and Protocols. 10.3390/mps2040085
Kerekes, E. B., Vidács, A., & Takó, M. (2019, 09 12). Anti-Biofilm Effect of Selected Essential Oils and Main Components on Mono- and Polymicrobic Bacterial Cultures. Microorganisms, 7(9). NCBI. 10.3390/microorganisms7090345
Lagha, R., Abdallah, F. B., AL-Sarhan, B. O., & Al-Sodany, Y. (2019, 03 23). Antibacterial and Biofilm Inhibitory Activity of Medicinal Plant Essential Oils Against Escherichia coli Isolated from UTI Patients. NCBI. 10.3390/molecules24061161
Lesovskaya, M. I., & Shaporova, Z. E. (2019). Adaptogenic effects of essential oils: prognosis in vitro and results in vivo. IOP Conference Series: Earth and Environmental Science. https://iopscience.iop.org/article/10.1088/1755-1315/315/4/042001/pdf
MacKinnon, M.C., Sargeant, J.M., Pearl, D.L. et al. Evaluation of the health and healthcare system burden due to antimicrobial-resistant Escherichia coli infections in humans: a systematic review and meta-analysis. Antimicrob Resist Infect Control 9, 200 (2020) https://doi.org/10.1186/s13756-020-00863-x
Madappa, T., & Stuart, M. (2019, 02 11). Which medications in the drug class Antibiotics are used in the treatment of Escherichia coli (E coli) Infections? Medscape. Retrieved December 7, 2021, from https://www.medscape.com/answers/217485-40715/whichmedications-in-the-drug-class-antibiotics-are-used-in-the-treatment-of-escherichia-coli-e-coli-infections
Mahizan, N., Yang, S.-K., Moo, C.-L., Song, A., Chong, C.-M., Chong, C.-W., Abushelaibi, A., Lim, S.-H., & Lai, K.-S. (2019, 06 19). Terpene Derivatives as a Potential Agent against Antimicrobial Resistance (AMR) Pathogens. Molecules. NCBI. 10.3390/molecules24142631
Medina, M., & Castillo-Pino, E. (2019). An introduction to the epidemiology and burden of urinary tract infections. Therapeutic advances in urology, 11, 1756287219832172. https://doi.org/10.1177/1756287219832172
Merrem IV (Meropenem): Uses, Dosage, Side Effects, Interactions, Warning. (n.d.). RxList. Retrieved December 8, 2021, from https://www.rxlist.com/merrem-iv-drug.htm
Millezi, A. F., Costa, K., & Oliveira, J. (2019). Antibacterial and anti-biofilm activity of cinnamon essential oil and eugenol. Clenc. Rural, 49(1). https://doi.org/10.1590/0103-8478cr20180314
Neyret, C., Herry, J.-M., Meylheuc, T., & Dubois-Brissonnet, F. (2014, 01 1). Plant-derived compounds as natural antimicrobials to control paper mill biofilms. Journal of Industrial Microbiology and Biotechnology, 41(1), 87-96. https://doi.org/10.1007/s10295-013-1365-4
Nitrofurantoin - Side Effects, Uses, Dosage, Overdose, Pregnancy, Alcohol. (2015, July 23). RxWiki. Retrieved December 8, 2021, from https://www.rxwiki.com/nitrofurantoin
Nji, E., Kazibwe, J., & Hambridge, T. (2021, 02 09). High prevalence of antibiotic resistance in commensal Escherichia coli from healthy human sources in community settings. Scientific Reports. Nature. https://www.nature.com/articles/s41598-021-82693-4
Nordmann, P., & Poirel, L. (2019, 11 13). Epidemiology and Diagnostics of Carbapenem Resistance in Gram-negative Bacteria. Clinical Infectious Diseases, 69(7). Oxford Academic. https://doi.org/10.1093/cid/ciz824
Römling, U., & Balsalobre, C. (2012, 10 01). Biofilm infections, their resilience to therapy and innovative treatment strategies. Journal of Internal Medicine. Wiley Online Library. https://doi.org/10.1111/joim.12004
Saad, N. Y., Muller, C. D., & Lobstein, A. (2013, 05 09). Major bioactivities and mechanism of action of essential oils and their components. Flavour and Fragrance Journal. Wiley Online Library. https://doi.org/10.1002/ffj.3165
Sanchez, C. J., Mende, K., & Beckius, M. L. (2013, 01 29). Biofilm formation by clinical isolates and the implications in chronic infections. BMS Infect Dis. PubMed. 10.1186/1471-2334-13-47
Silhayy, T. J. (2015, 12 29). Classic Spotlight: Gram-Negative Bacteria Have Two Membranes. Journal of Bacteriology, 198(2). https://doi.org/10.1128/JB.00599-15
Smieszek, T., & Pouwels, K. B. (2018, 02 27). Potential for reducing inappropriate antibiotic prescribing in English primary care. Journal of Antimicrobial Chemotherapy, 73, ii36-ii43. Oxford Academic. https://doi.org/10.1093/jac/dkx500
Synergism Definition & Meaning. (n.d.). Merriam-Webster. Retrieved December 5, 2021, from https://www.merriamwebster.com/dictionary/synergism
Terahara, F., & Nishiura, H. (2019, 04 23). Fluoroquinolone consumption and Escherichia coli resistance in Japan: an ecological study. https://bmcpublichealth.biomedcentral.com/articles/10.1186/s12889-019-6804-3
Terlizzi, M. E., Gribaudo, G., & Maffei, M. E. (2017, 08 15). UroPathogenic Escherichia coli (UPEC) Infections: Virulence Factors, Bladder Responses, Antibiotic, and Non-antibiotic Antimicrobial Strategies. Frontiers in Microbiology. NCBI. 10.3389/fmicb.2017.01566
WHO. (2021). Global Antimicrobial Resistance and Use Surveillance System (GLASS) Report. WHO.
https://www.who.int/publications/i/item/9789240027336
Williams, B. E. (2018, 05). Essential Oils in Combination and Their Effect on E. coli Growth. Ohio University.
https://etd.ohiolink.edu/apexprod/rws_etd/send_file/send?accession=ouashonors1524752078918456&disposition=inline
Wilson, C. (2017, 10 24). Quantitative and Qualitative Assessment Methods for Biofilm Growth: A Mini-review. NCBI.
https://www.ncbi.nlm.nih.gov/pmc/articles/PMC6133255/#R21
Wu, D., Ding, Y., Yao, K., Gao, W., & Wang, Y. (2021, 05 25). https://doi.org/10.3389/fped.2021.670470

 Tanvi Gorre1*, Pabir Patra2,3 , Bhushan Dharmadhikari4,c


