3 minute read
Design Process for Grading a Pedestrian Ramp
cross slope, the water migrates in a direction somewhere between the direction of the main slope and the cross slope, as depicted by the dotted line in Figure 13.2. The dotted line represents water flow diverging to one side of the walkway.
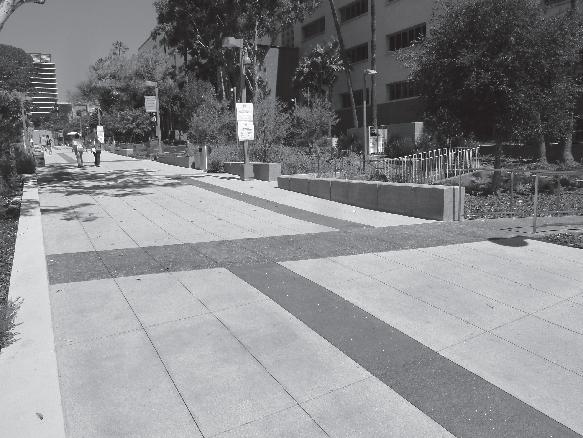
The 4 percent slope of the walk shown in Figure 13.2 is somewhat steeper than is generally found in a high-use public area such as a large urban space. In this situation, the public space lies on an existing sloping site connecting several anchor public buildings; a 4 percent slope made sense because the overall park space slopes close to this percentage already. A 1 or 2 percent slope may be more common in a large urban plaza. What may also be common is to create a slight crown down the center of the walk pitched at a .5 to 1 percent slope to either side of the walk. However, it is often the practice in an urban space to pitch paved surfaces with one cross slope.
Advertisement
106 105
104 Slope of Walk 4% Slope 103
B Cross Slope Path of Water Drop 102 1 % Cross Slope
101 Figure 13.2 Diagram of a sloping walkway at Grand Park in Los Angeles, CA. The walk has a primary 4 percent slope and was designed with a cross slope (B) to ease surface water to the planting area at the left of the walkway. The contours are diagrammatic to help viewers visualize the slope conditions.
The process for setting slopes described in this section is to some extent simplistic, but it should serve as a starting point on how to establish the slope and needed spot elevations for paved or other surfaces. In Figures 13.3-A through 13.3-D, the process for establishing the slope and spot elevations for a pedestrian ramp is broken down into a series of steps.
Step One: Arrows A, B, and C represent the direction of slope for three portions of a pedestrian ramp. Slopes A and C can be as steep as 8 percent, while slope B is for a landing and should not be greater than 1 percent to meet wheelchair accessibility standards. In this example the slopes for A and C are in the range of 2 to 4 percent.
B C
A
Figure 13.3-a Step One showing direction of three sloping sections along the ramp
S2 S1 A
Figure 13.3-B Step Two
Step Two: Assuming ramp slope A is 2 percent and that the designer using the percent of slope calculated the spot elevation S1 located in the center of the ramp and landing, the dashed line that crosses the width of the landing would be the same elevation. Spot elevation S2 would also be the same elevation as S2.
Step Three: The landing would be given a 1 percent slope. Working up-slope from S2 the designer could calculate the spot elevation of S3 using the formula S=V / H. Likewise, the designer could calculate spot elevation S4 with the same formula. Once the elevation of S4 is established, calculations for the next ramp can be made.
Step Four: Assuming ramp slope C is 4 percent, the designer can calculate spot elevation S5 at the end of the ramp. To complete the grading plan for this portion of the ramp, the designer would need to calculate spot elevations at all the corners of the landings. In many instances, the ramp sections and landings would have a cross slope. This would allow the ramps and landings to meet where they join, thus allowing the paved surface for the landing and ramp planes to meet smoothly where they join together. To achieve the smooth transition of the two planes (ramp and landing) would necessitate a certain amount of warping at the time of the construction process and during the pour of the concrete).


