

The Baldwin Review
2023-24
A collection of individual research papers produced by Upper School students of The Baldwin School
Foreword
Eight years ago, Eliza Thaler ’18 established The Baldwin Review with the aim of capturing the intellectual endeavors of Baldwin students beyond the classroom and Baldwin’s gates. Before learning about Eliza’s project, we had the same goal – to provide a platform for our peers to showcase their accomplishments and share their passions with the outside community. So, we reinstated this journal and are honored to be continuing her legacy with the publication of the journal’s fourth edition. This year’s collection includes eight research papers written by members of the Class of 2024 and the Class of 2025, who spent their summers in labs and hospitals in the Greater Philadelphia area, including Temple University, Jefferson University and the University of Pennsylvania. Each paper in this journal is the culmination of months of hard work and dedication. As we delved into each paper, we were struck by the thoroughness and uniqueness of each body of work, epitomizing the curiosity and global impact of Baldwin students. We are grateful to have been a contributing factor to The Baldwin Review this year and to revive its publication. We look forward to watching Baldwin girls continue to lead in countless academic pursuits in the years ahead.
- Megan Chan and Blair Williams, Class of 2024
Special Thanks To
Mrs. Lisa Algeo, Mrs. Christie Reed, Ms. Jessica Tingling and Ms. Heather Wilson for their help with this journal.
Mission
The Baldwin School, an independent college preparatory school, develops talented girls into confident young women with vision, global understanding and the competency to make significant and enduring contributions to the world. The School nurtures our students’ passion for intellectual rigor in academics, creativity in the arts and competition in athletics, forming women capable of leading their generation while living balanced lives.
Table of Contents
MEGAN CHAN ’24
Modeling the Absorption of 4-X Indole to Design More
Efficient Fluorescent Probes
BLAIR WILLIAMS ’24
mRNA Modification and Purification of Norovirus Vaccine
SAMANTHA BRAMEN ’24
Characterizing the Gene Expression of Enl-T1 Mouse
Primary Cells
CLAUDIA KIM ’25
Changes in Saliva pH and Ability to Neutralize When Combined with Different Beverages
NIKOLETTA KUVAEVA ’25
Financial Sentiment Analysis of Investor News Articles
LINDA LIN ’24
Studying the Impact of Interneurons on Early Embryonic Neurogenesis Using Human Cortical Organoids
GURNOOR OTHIE ’25
The Impact of Interferon Gamma Type II on Spiral Artery Remodeling During Pregnancy
TRISHA YUN ’24
NELFE Regulation of MYC Expression in PDAC
MEGAN
CHAN ’24
Megan Chan is a senior from Media, PA, and has attended Baldwin since ninth grade. She is the Co-Editor in Chief of The Baldwin Review, Co-Head of Lamplighters (Baldwin’s student ambassador group), Co-Head of TSA, Co-Head of FBLA and Co-Founder of the Science Research Consortium, which is an organization focused on exposing students to various fields of STEM through discussions, TED talks and participating in the Pennsylvania Junior Academy of Science competition. In addition, she is a member of the Baldwin Orchestra, Philadelphia Youth Orchestra and varsity tennis team and she enjoys learning new dishes and hiking in her free time.

Modeling the Absorption of 4-X Indole to Design More Efficient Fluorescent Probes
Megan Chan ’24, Jordan Howe, Spiridoula Matsika PhD
Matsika Lab at the Temple University Department of Chemistry
ABSTRACT
This paper examines the absorption of 4-X indole in order to determine which functional group placed on position 4 would create brighter and more efficient fluorescent probes. This was completed through an analysis of the bright states, excitation energies, and electrophilicities of both the experimental and computational data.
INTRODUCTION
Computational chemistry involves the use of various software applications to solve chemical problems through simulations, with benefits ranging from its cost-effectiveness to safety and speed. This branch of chemistry has widespread use in numerous applications, including drug discovery and development, predicting reaction mechanisms of experiments, and designing new catalysts. Computational chemistry has numerous real-life applications, such as aiding in drug discovery and development, assisting researchers in predicting drug-target interactions, and facilitating the design of novel chemical substances.
In this project, the examination of the different absorption levels of 4-X indole, depending on its functional group, would help create probes that can then be used in fluorescence-based assays and in biological imaging, allowing for closer examination of protein location, chemical changes, and biological processes in vivo. Different compounds in position 4 have varying effects on the absorption depending on their electronic properties. The organic bicyclic compound, indole, consisting of a six-membered benzene ring fused to a five-membered, N-containing, pyrrole ring. It is a side chain in Tryptophan (Trp), an amino acid used in the synthesis of proteins and biomolecules such as melatonin and serotonin. Trp is often used as a biosensor or fluorophore due to its high fluorescence quantum yield and sensitivity (1). Fluorophores help enhance the specificity and efficiency in tracking the presence, amount, or function activity of a target element (DNA, protein, cell, etc).
The 19 substituent tested were CN, NO2, CHO, CO2H, CO2Me, O-TFA, N-TFA, NH2, NHMe, NMe2, NMe3+, Br, Cl, OH, F, Me, O-Ac, N-Ac, CH3, and -H, or non-substituted indole, was used as a control (2, 3).
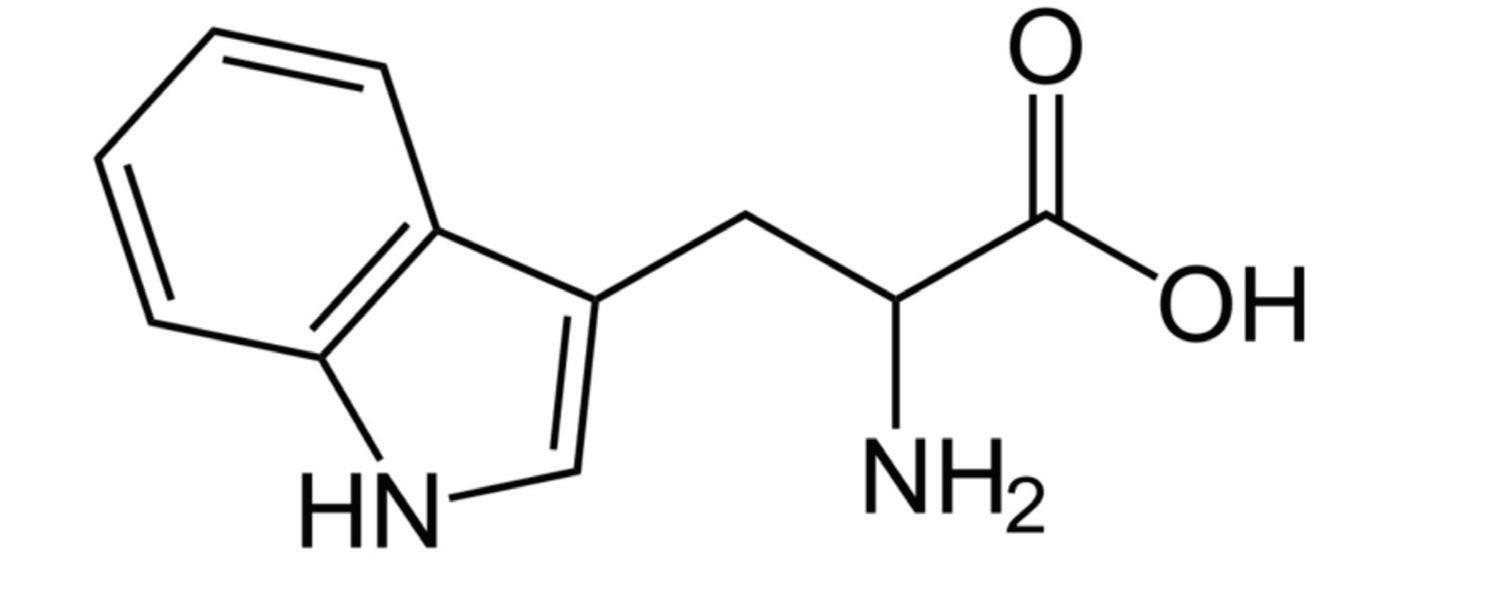
Figure 1. Molecular structure of tryptophan

METHODS
Four methods were used to calculate the energies of the compounds’ excited states. Both the CIS (Configuration Interaction Singles) and TDDFT (Time-Dependent Density Functional Theory) excited state methods were tested in gas phases and with aqueous solvent using PCM (Polarizable Continuum Model), which models the solvent as polarizable and assumes that the solute is nonpolarizable. PCM, theoretically, is an electrostatic field of solvent that surrounds a molecule and affects its interactions. These calculations use water as the solvent. While CIS primarily uses wavefunction to determine calculations, TDDFT relies heavily on electron density.
Before any calculations began, each molecule’s geometry was optimized through changes in its bond length and angles of atoms to obtain the most stable structure with the lowest possible ground state energy. The computational package for all calculations was Gaussian, the basis set 6-31G(d), and the functional B3LYP.
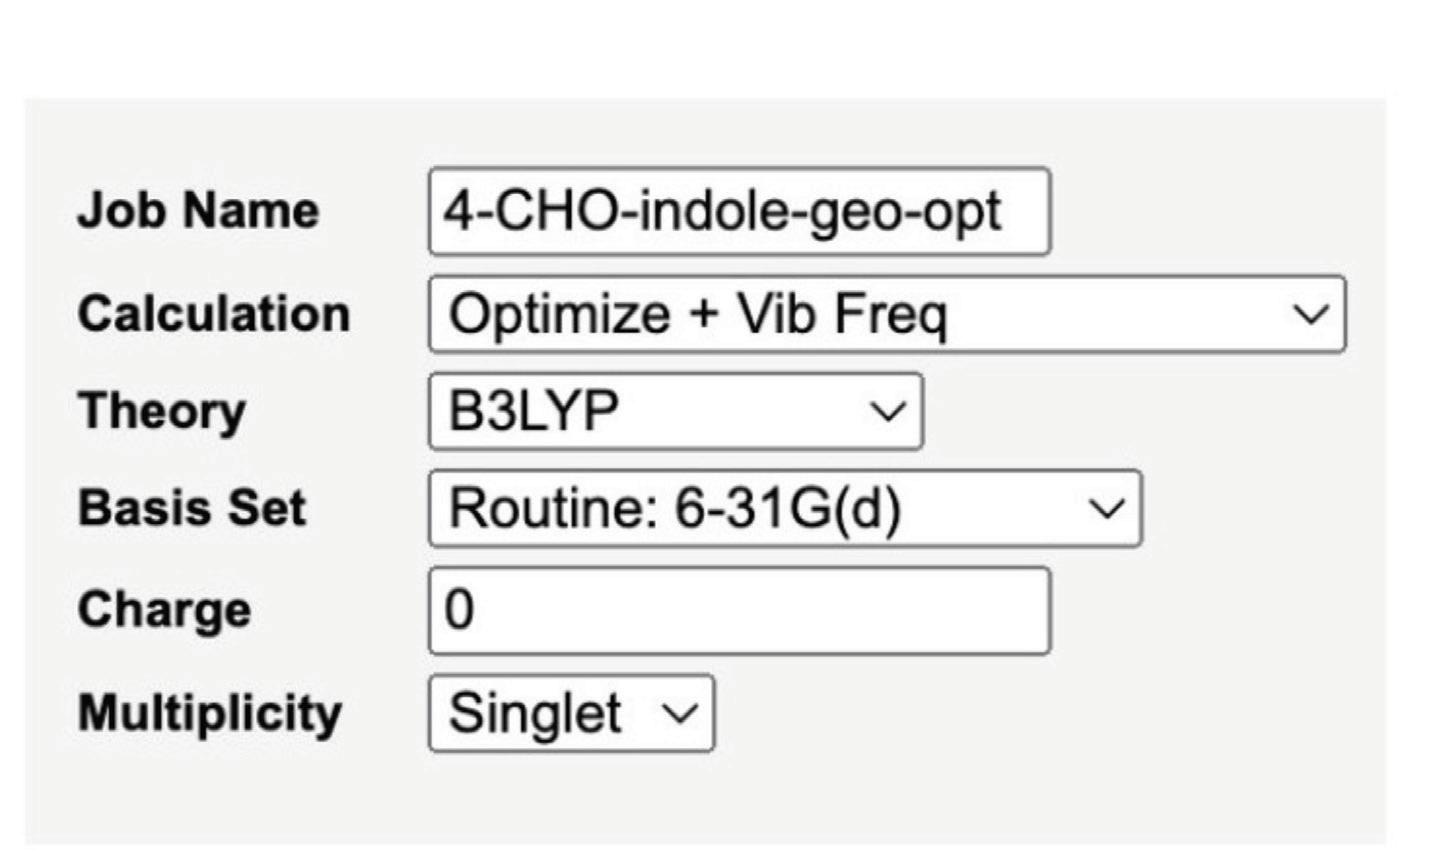
Figure 2. Molecular structure of indole
Figure 3. The Optimize + Vib Freq method was used for each substituent to optimize its geometry before running further calculations.
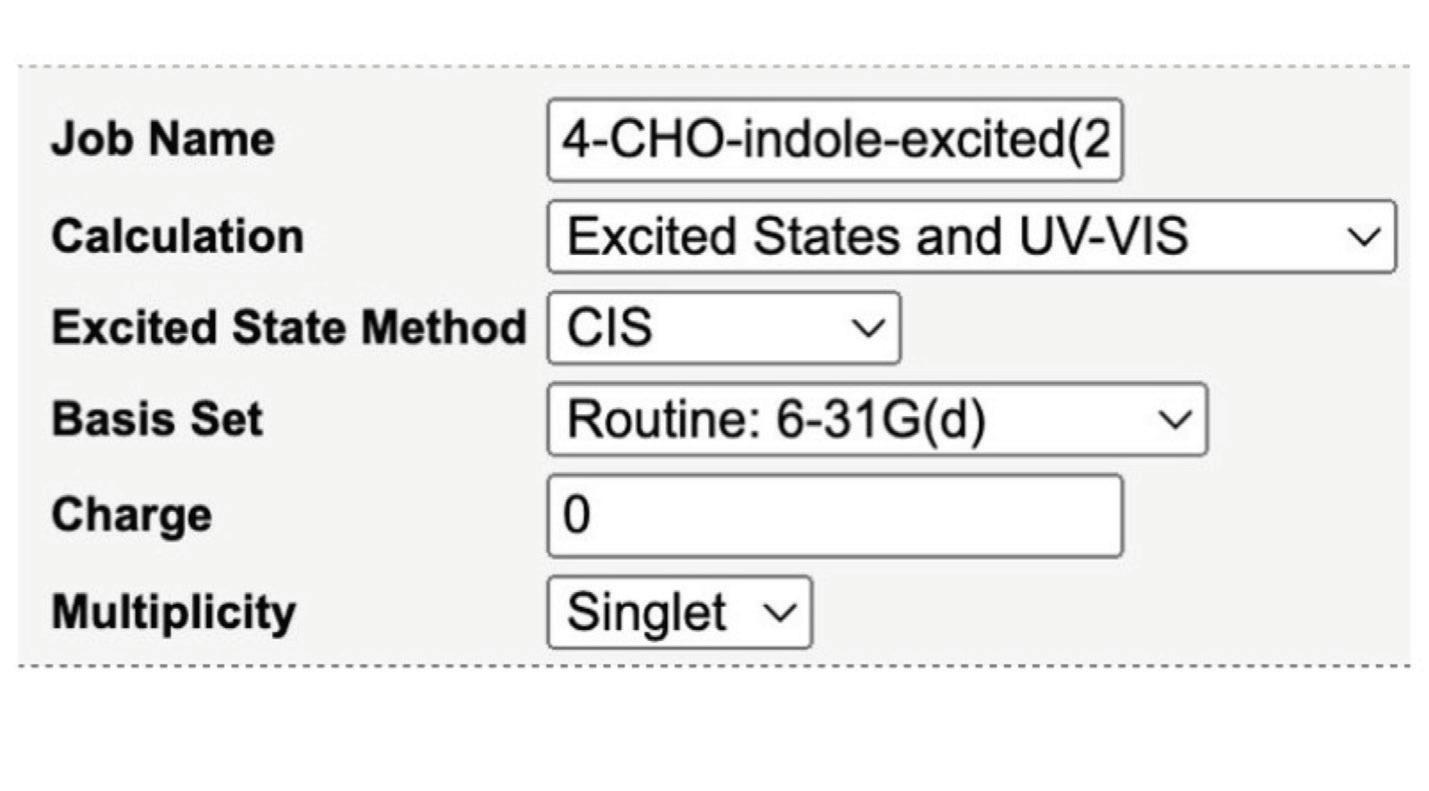
Figure 4. Input for the computational chemistry software WebMO for CIS calculations. The change between whether it was run in the gas phase or PCM occurred in the next step.
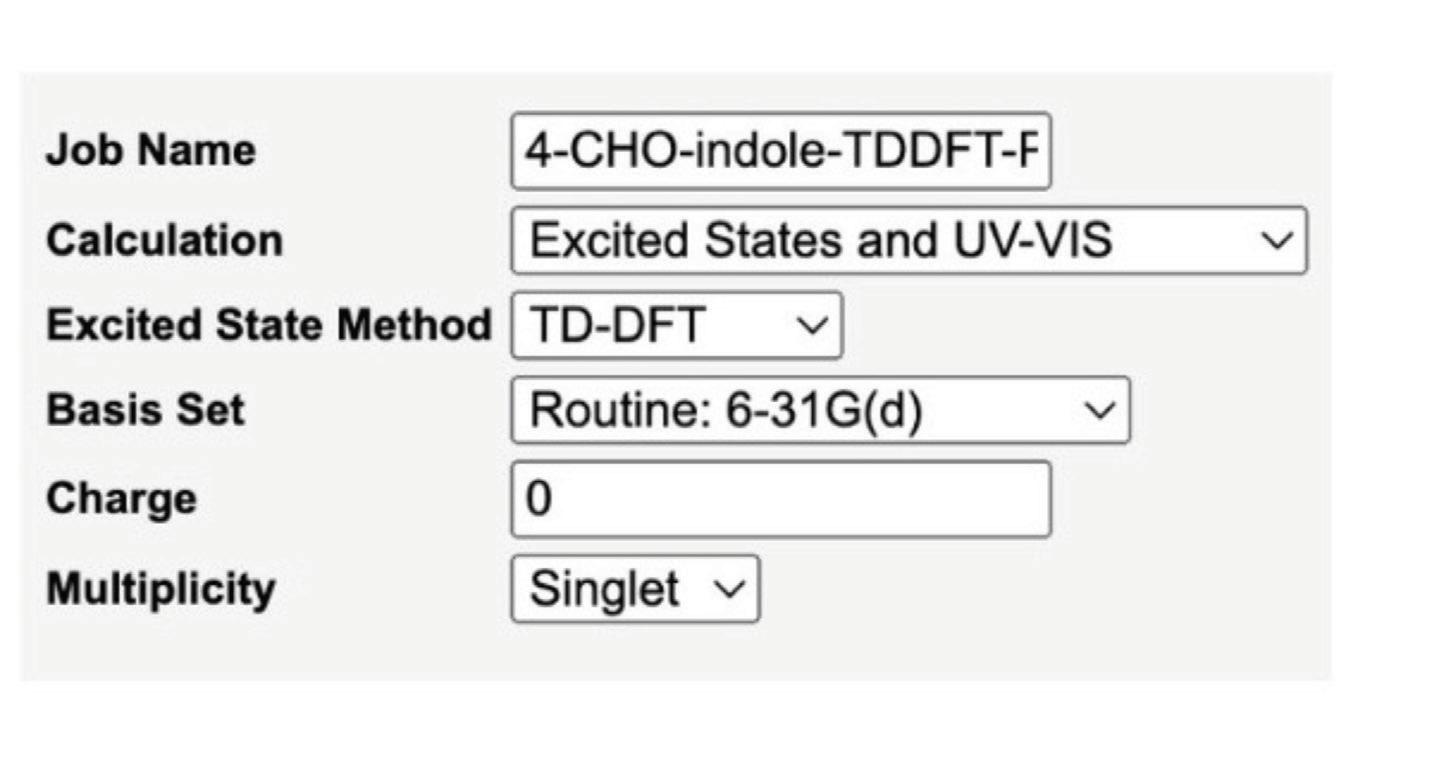
Figure 5. Input for the computational chemistry software WebMO for TDDFT calculations. The change between whether it was run in the gas phase or PCM occurred in the next step.
RESULTS
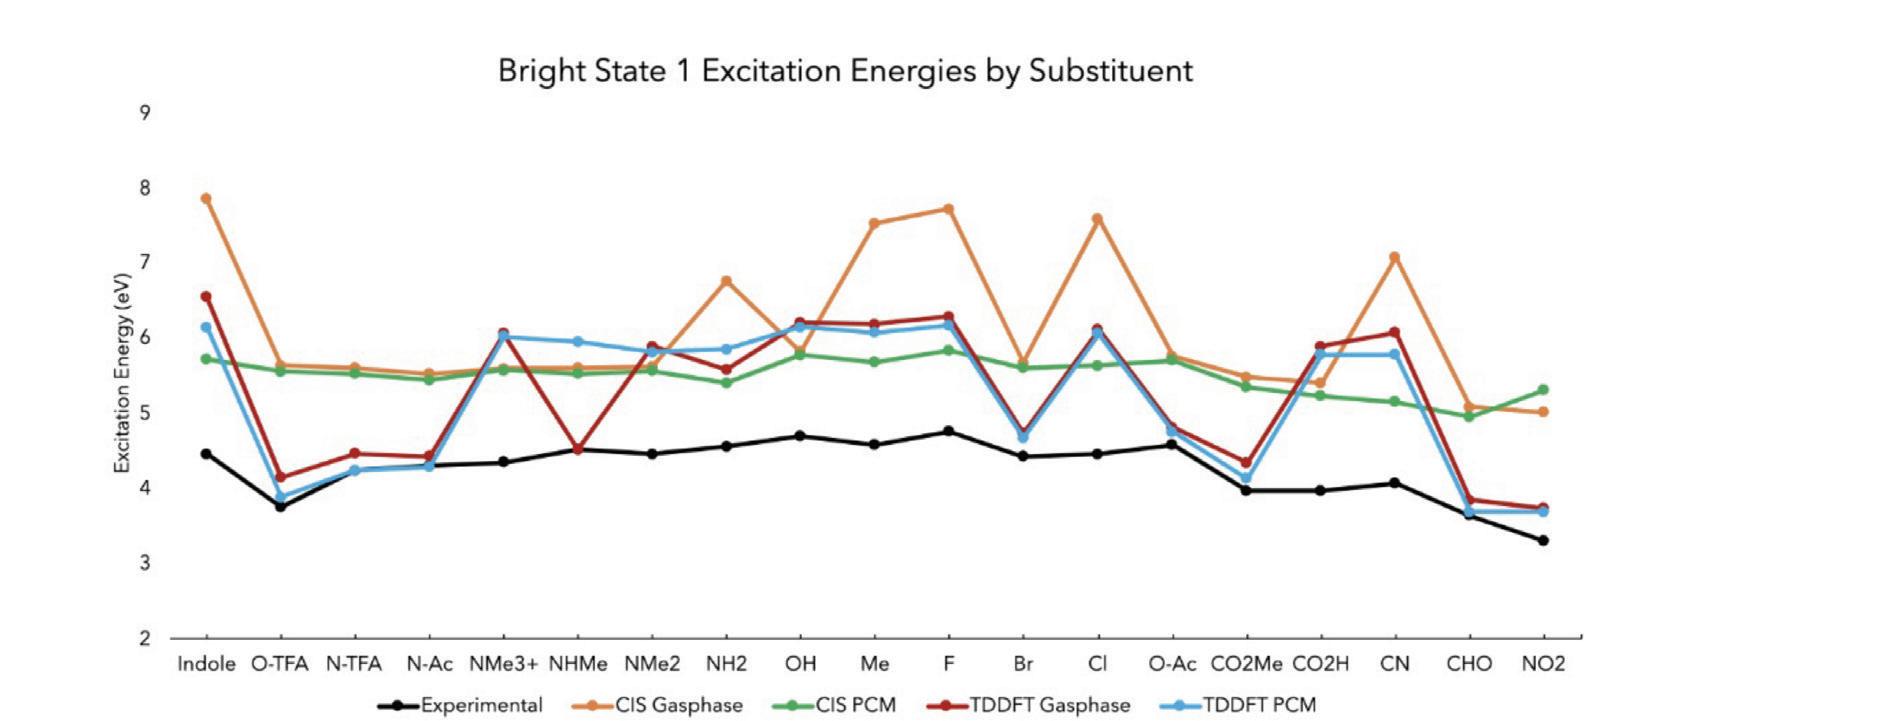
Figure 6. The results of comparing the excitation energies from bright state 1 of the experimental to the four computational methods tested
The black line signifies the experimental data. All of the computational results are compared to the experimental data. CIS PCM (green line) was seen to be the most similar in trend to the experimental. Compared to the other three methods, CIS PCM had the slope most similar to the experimental with a generally flat slope with the same decreasing trend between Fluorine through Cyanide.
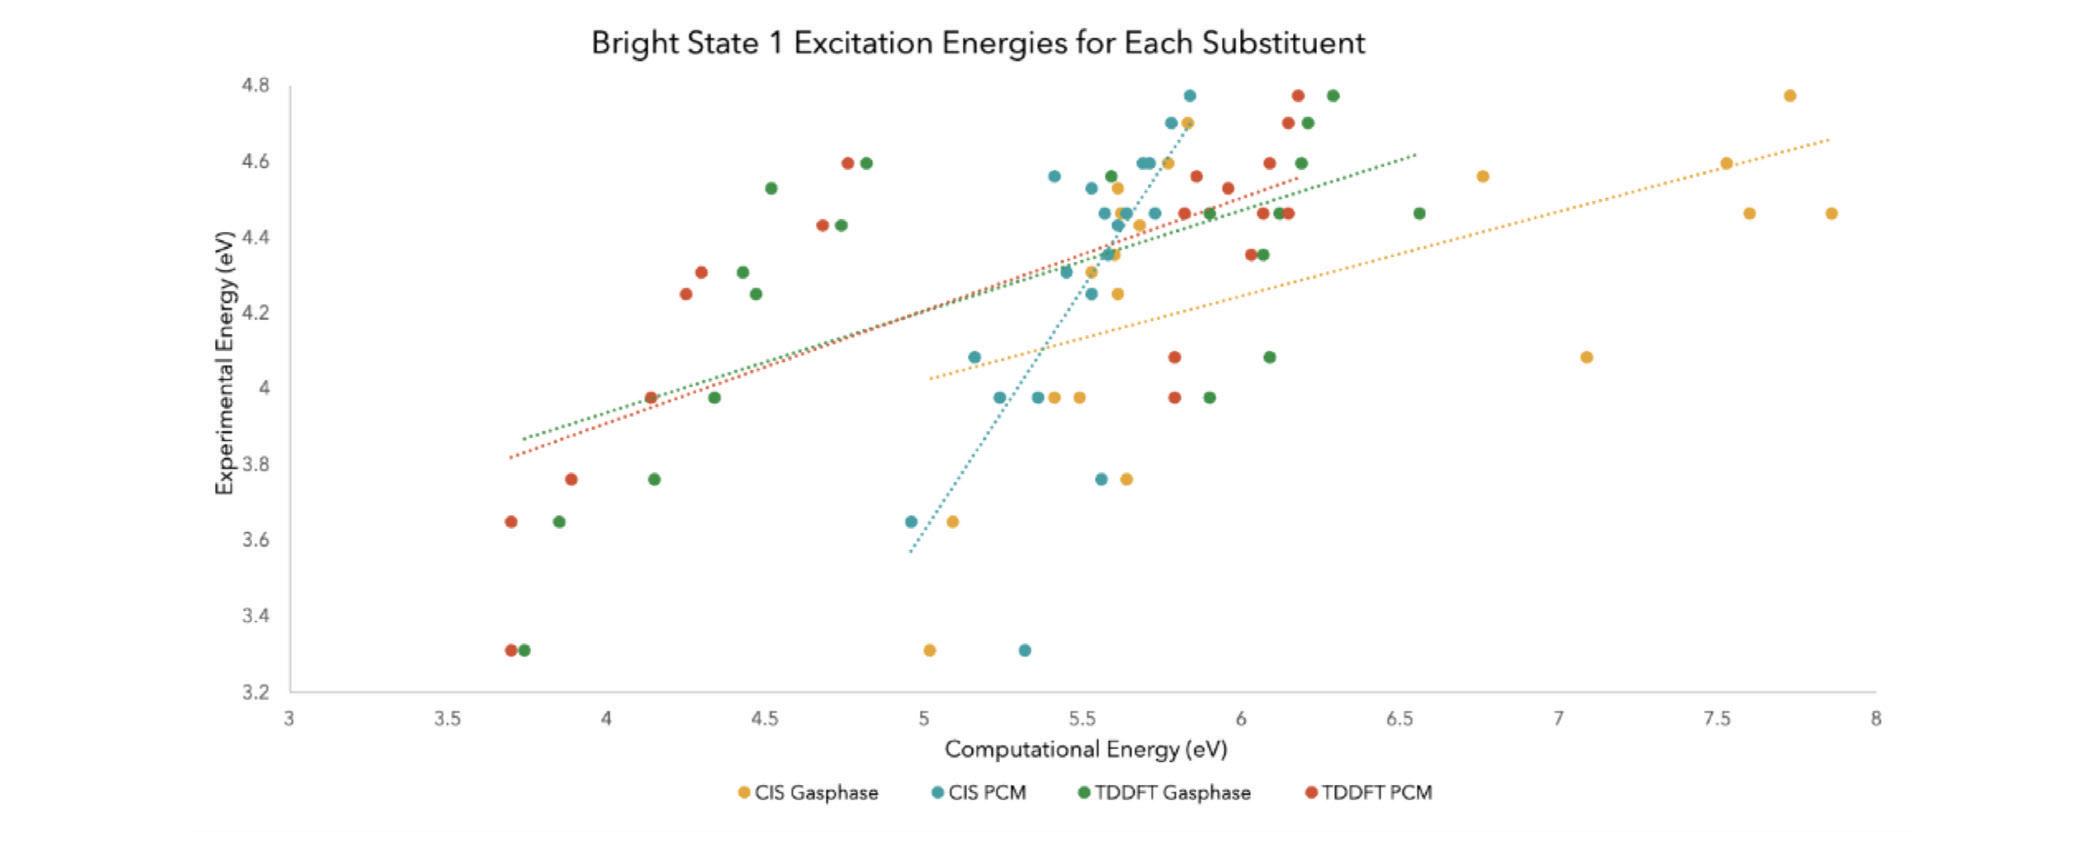
Figure 7. The results of comparing the excitation energies from bright state 1 of the experimental to the four computational methods tested made into a linear and dotted graph
In the order of CIS Gas phase, CIS PCM, TDDFT Gas phase, and TDDFT PCM, the calculated correlation coefficients were 0.2966, 0.5493, 0.4236, and 0.5404. The value of 0.5493 signified that CIS PCM was the most accurate calculation method of the four when considering the linear relationship between the experimental and computational bright state 1 excitation energies.
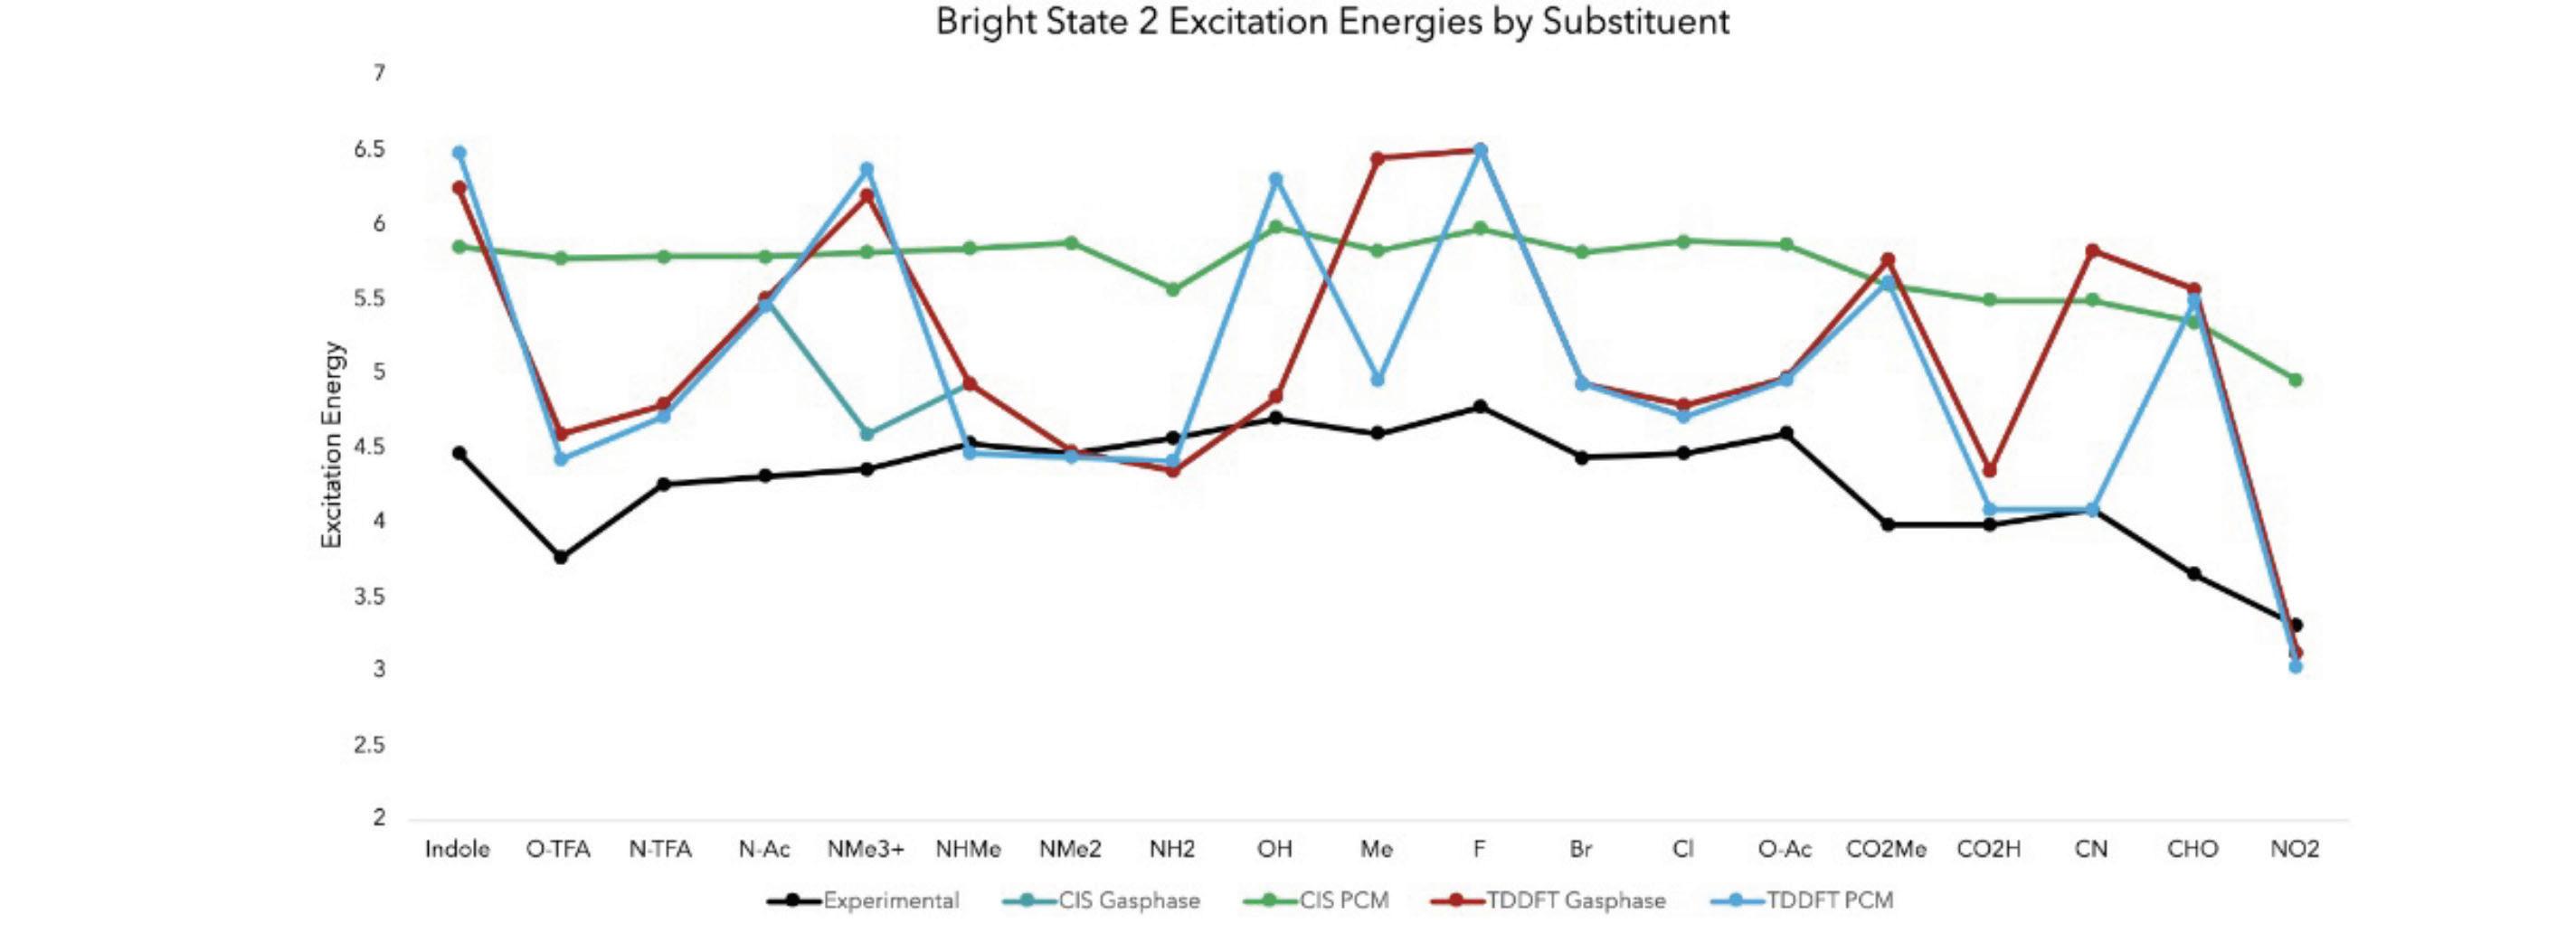
Figure 8. The results of comparing the excitation energies from bright state 2 of the experimental to the four computational methods tested
Similar to the Bright State 1 Excitation Energies by Substituent graph, this figure draws the same conclusion – CIS PCM was the calculation method that produced results most similar to the experimental data. Both the experimental and CIS PCM lines increase and decrease at nearly all the same substituent.
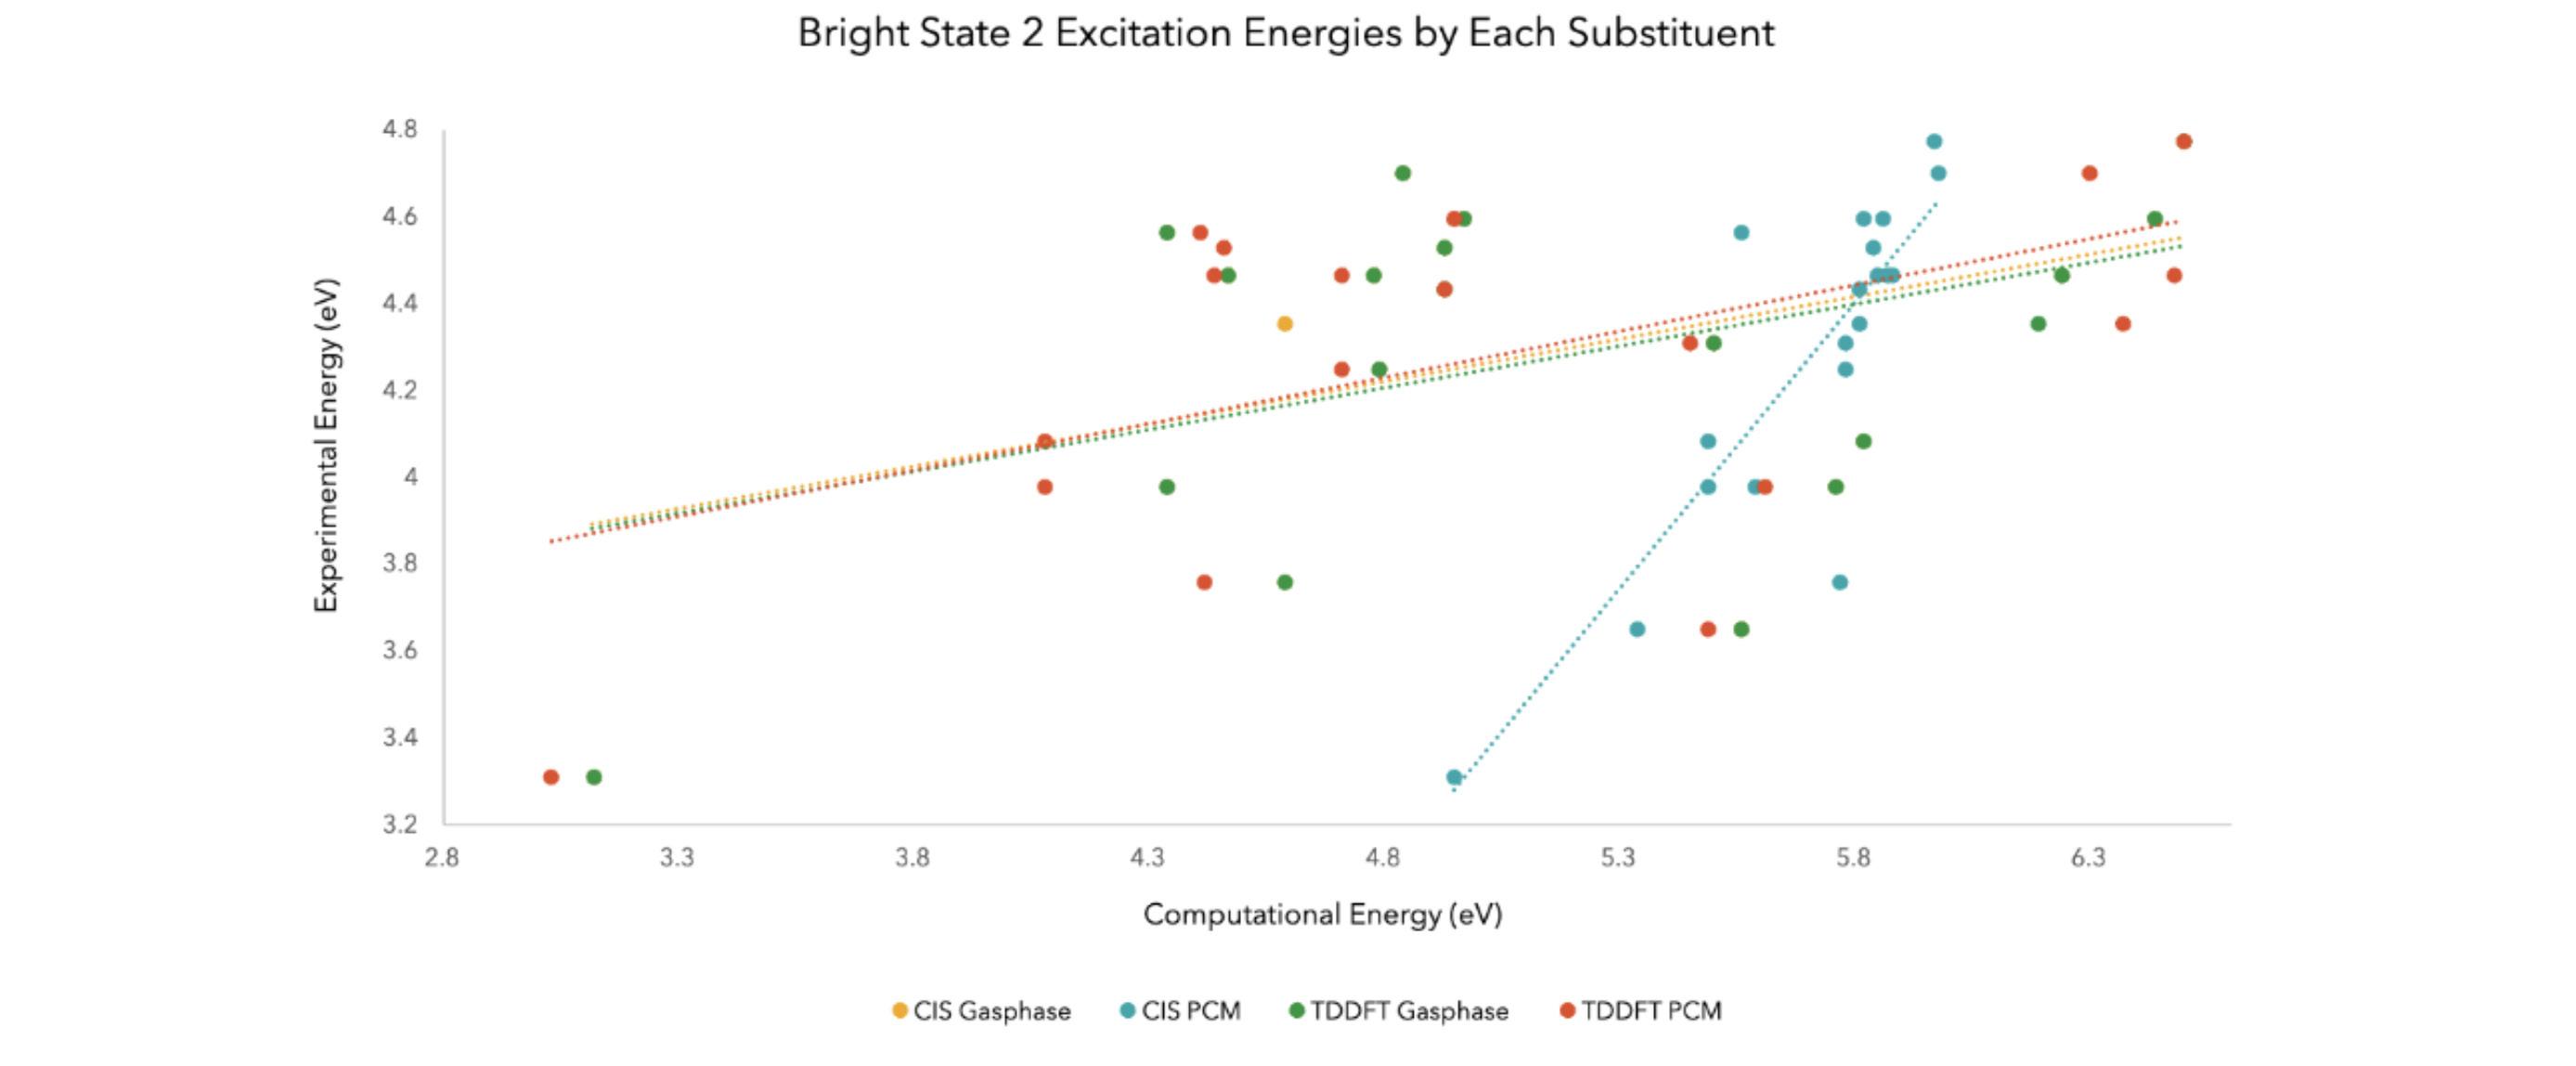
Figure 9. The results of comparing the excitation energies from bright state 2 of the experimental to the four computational methods tested into a linear and dotted graph
The correlation coefficients of the four methods in order of how it is presented on the chart, from left to right, are 0.1779, 0.7281, 0.1838, and 0.262. The value of 0.7281 exemplifies the strength of the linear relationship between the experimental and computational energies of the compounds’ bright state 2 excitation energies, proving that CIS PCM was the most accurate method of calculation.
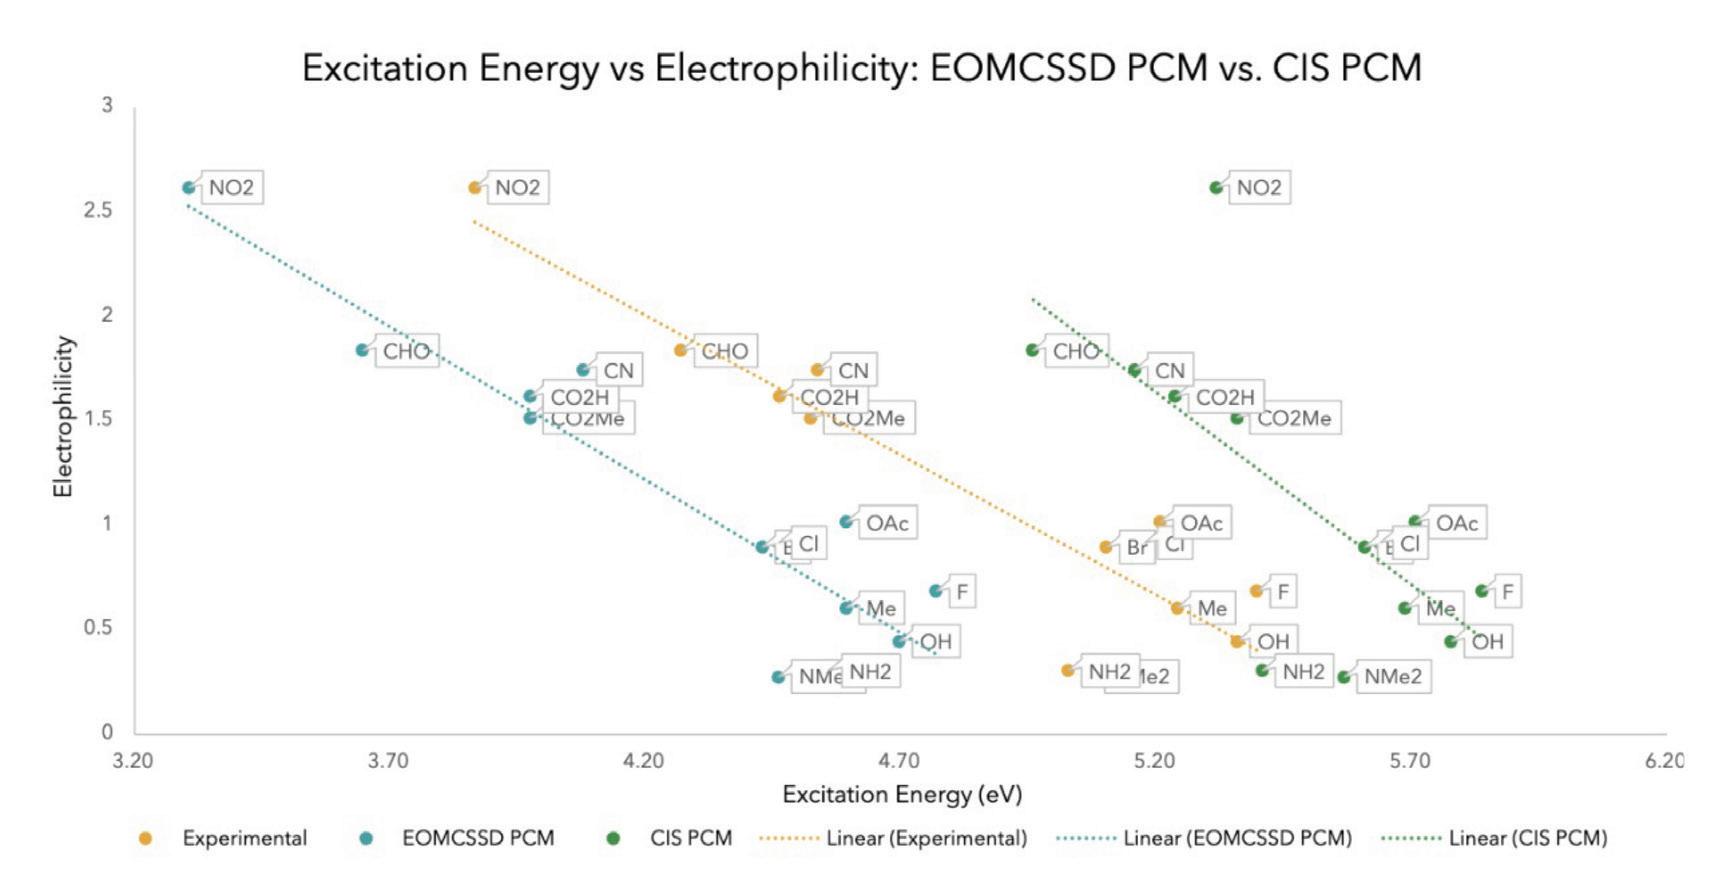
Figure 10. The results of comparing the excitation energies and electrophilicity of CIS PCM to EOMCSSD PCM
After determining that CIS PCM was the method that produced the most accurate results, compared to the other three methods, the substituent excitation energies and electrophilicities were calculated using CIS PCM and EOMCSSD PCM, which is another more complex excited state calculation that is an extension of CCSD (Couple Cluster). The correlation coefficients 0.8305, 0.8295, and 0.4806 for the experimental, EOMCSSD PCM, and CIS PCM, respectively, revealed that EOMCCSD PCM is a more reliable calculation method. It must be noted that the outlier NO2 in the CIS PCM line was likely due to computational error. With the exclusion of this outlier the correlation coefficient increases to ~0.60.
DISCUSSION
The results show that of the four calculation methods tested, CIS PCM best replicates the experimental data (0.5493 and 0.7281). However, when compared to EOMCCSD PCM, a more complicated and expensive method, CIS PCM was not as accurate. Four different computational methods were benchmarked to observe various chemical trends, such as maximum absorption wavelength, energy, dipole moment, and electrophilicity index, and their effects on fluorescence. CHO was found to be the substituent that would likely have the greatest impact in creating a more efficient fluorescent probe.
FUTURE STEPS
The next stages of this research will include digitizing the higher peaks of experimental graphs for comparative analysis with theoretical data pertaining to the third bright state. Further investigation will allow for a deeper understanding of the discrepancies and similarities between experimental observations and theoretical predictions. Additionally, we intend to examine the dipole moment of both the ground and excited states to assess any variations, patterns, or implications on the overall molecular behavior. It will prove beneficial to take into account the molecular orbitals before deciding the genuine bright states, as previous attempts led to the conclusion that the higher energy Rydberg excited states instead. All of these future steps will help to avoid the mischaracterization of energy states, which would, in turn, affect results, analyses, and conclusions.
ACKNOWLEDGEMENTS
I would like to thank Jordan Howe for taking the time and effort to mentor me and introduce me to a new realm of science and technology – computational chemistry. I would also like to thank Dr. Spiridoula Matsika for welcoming me into her lab and for being so patient and encouraging throughout the entire research process. A special thank you to Mrs. Lindsay Davis for providing me with this unique opportunity and for being the one who truly sparked my interest in science, constantly pushing my critical thinking, problem-solving, and analytical skills.
Modeling the Absorption of 4-X Indole to Design More Efficient Fluorescent Probes | Megan Chan ’24
REFERENCES
Abou-Hatab, S., & Matsika, S. (2019). Theoretical investigation of positional substitution and solvent effects on n-cyanoindole fluorescent probes. The Journal of Physical Chemistry B, 123(34), 7424–7435. https://doi.org/10.1021/acs.jpcb.9b05961.
Abou-Hatab, S., Spata, V. A., & Matsika, S. (2017). Substituent effects on the absorption and fluorescence properties of anthracene. The Journal of Physical Chemistry A, 121(6), 1213–1222. https://doi.org/10.1021/acs.jpca.6b12031.
Mickias, R., Ahmed, I., Archaryya, A., Smith III, A., & Gai, F. (2021). Tuning the electronic transition energy of indole via substitution: application to identify tryptophan-based chromophores that absorb and emit visible light. Royal Society of Chemistry (23), 6433–6437. 10.1039/d0cp06710e.
BLAIR WILLIAMS ’24
Blair Williams, a senior from Haverford, PA, has attended Baldwin since the fifth grade. She is the Co-Editor in Chief of The Baldwin Review and Co-head and Co-founder of the Science Research Consortium, a club aimed at providing students with competitive science opportunities. She is also a member of the Baldwin Orchestra and the varsity squash team. During her free time, she enjoys experimenting in her culinary endeavors, traveling and exploring historical archives.

mRNA Modification and Purification of Norovirus Vaccine
Blair Williams ’24, Jessica Vasserman, Elena Vasserman PhD
Weissman Lab at the University of Pennsylvania Department of Medicine
ABSTRACT
This study assesses the production and modification of mRNA in relation to vaccinology. The research in this study is focused on norovirus, a group of viruses causing a widespread contagious infection, resulting in 685 million global cases of norovirus each year and 200,000 deaths concentrated in developing countries (1). mRNA vaccines function by encapsulating mRNA specific to a viral protein in a protective lipid nanoparticle (LNP). The LNP, with the inserted mRNA sequence, is inserted into the body, but it does not enter the nucleus of the cell. Once introduced, the cells use the new mRNA to make a protein which triggers an immune response in the body. The immune response recognizes this foreign viral protein and produces antibodies that protect the body from infection by recognizing and attaching to the specific virus and marking the virus for destruction. Once produced, the body is trained and the antibodies remain in the immune system to protect against future infection (2).
INTRODUCTION
As this study sought to gain an understanding of how to produce and modify mRNA, there was not a scientific question asked. mRNA technology is integral to vaccine development, however the practice of producing and modifying it has already been established. Therefore, this study will document the process of mRNA production, the ways in which it can be degraded and unusable, what scientists are looking for in viable mRNA, and the future steps for how it is then used in epidemiological studies.
MATERIALS and METHODS
Linearization part one: In the first stage of linearization, the necessary components were combined including the DNA luciferase plasmid, the 10x cutsmart buffer, and the restriction enzymes. The specificity of the enzymes to the plasmid is crucial, as it ensures the DNA is cut in the correct locations. It then incubates the mixture overnight.
Linearization part two: This is the process of transforming a circular plasmid of DNA into a linear molecule using restriction enzymes. Once the DNA was thawed and the concentration was measured, phenol chloroform was added. The DNA was centrifuged and the aqueous phase was combined with sodium acetate and isopropanol. After centrifuging the pellet was resuspended with nuclease free water via incubation. After measuring the concentration once again, the gel electrophoresis was run to confirm cutting of the plasmid.
IVT part one: In vitro transcription/translation is the process of transforming DNA to mRNA. In the IVT reaction, the calculated amount of water was added to the thawed DNA. Then, the calculated amounts of 10x buffer, CTP, ATP, m1Y, ccap, and GTP were added to the mixture, vortexing each time. Lastly the T7 enzyme was added. The mixture was incubated for four hours, adding GTP each hour. Then the DNase and LiCl were added and the mixture was stored overnight.
IVT part two: In part two a gel electrophoresis was run to confirm successful transcription and translation. The mixture was centrifuged to reveal the pellet, then washed with ethanol. After
incubating, the concentration could be measured and the gel electrophoresis was run. Once the gel is run, it is also checked to confirm that the rna has not been degraded.
Purification: Cellulose is used to purify the mRNA and remove the double-stranded mRNA contaminants. Cellulose is resuspended, then added to the RNA sample along with STE buffer, ethanol, and nuclease free water. A series of incubation and centrifuge cycles is then performed before measuring the concentration of the mRNA. The double-stranded mRNA is a by-product of the transcription that occurred in IVT and must be removed. Then the gel electrophoresis was run to confirm that again there was no further degradation. Additionally, the gel reveals if the doublestranded RNA by-products have been removed.
RESULTS
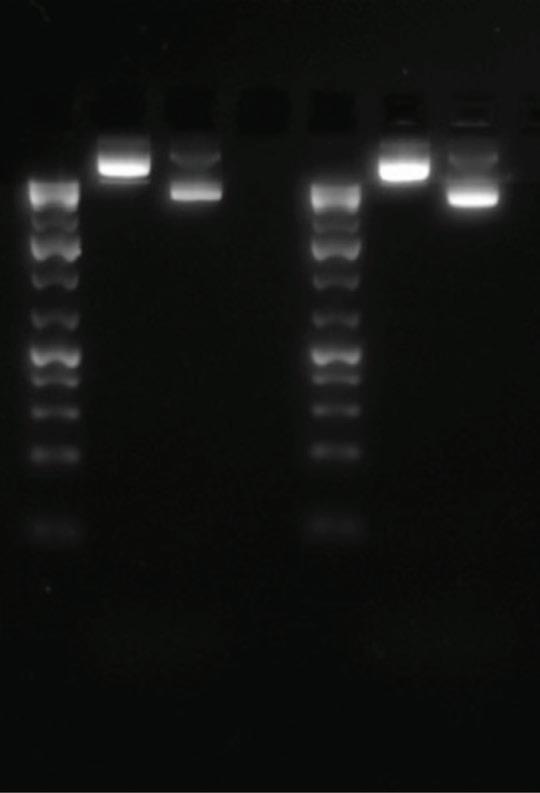

Figure 1: Illustrates the gel electrophoresis of linearization part two of two different plasmids. On the left is the DNA ladder, the middle is the uncut DNA plasmid, and the right is the cut DNA.

Figure 2: Illustrated IVT Part two
Figure 3: Cellulose purification
DISCUSSION
Linearization part two: The plasmid was effectively cut and transformed into a linear molecule, concluded by noting that the bands of the cut DNA are lower than the uncut DNA. The cut DNA, or shorter DNA, will travel farther in less time than the uncut DNA due to its smaller molecular weight.
IVT part two: The gel in part two confirms the full transcription and translation of DNA to RNA by the T7 enzyme. While there is slight streaking below the band, it was concluded that the appearance was due to exposure in the image lab.
Cellulose purification: Similar to the results in IVT, cellulose purification confirmed no degradation. This is seen by the minimal to no amount of exposure and streaking below the band of mRNA. The removal of contaminants during purification allows for the purified mRNA to be acceptable for vivo applications.
FUTURE STEPS
mRNA production and modification is the first of multiple steps in the vaccination testing process. This study solely focuses on mRNA production and modification. Once produced, however, cells are transfected with the mRNA. A BCA is then performed to assess the amount of protein production, which is followed by a Western Blot. During Western Blots, specific antibodies are used to determine if the mRNA produced the correct protein.
ACKNOWLEDGEMENTS
I would like to thank The Weissman Lab for allowing me to work with them and sharing their knowledge and experience with me. I would like to personally thank Jessica Vasserman for mentoring me throughout the mRNA production and modification process and Dr. Elena Vasserman for welcoming me to her team.
REFERENCES
(2023). Norovirus: It isn’t the stomach flu. Cleveland Clinic. https://my.clevelandclinic.org/health/ diseases/17703-norovirus.
Hou, X., Zaks, T., Langer, R., & Dong, Y. (2021, August 10). Lipid nanoparticles for mrna delivery. Nature Reviews Materials 6, 1078-1094. https://www.nature.com/articles/s41578-021-00358-0.
SAMANTHA BRAMEN ’24
Samantha Bramen, a senior from Bryn Mawr, PA, has attended Baldwin since 9th grade. She is a Co-Head of the Science Research Consortium Club, an organization that allows students to competitively explore areas of scientific research, and a member of the varsity squash team. In her free time, Samantha enjoys spending time with her friends, family and pets, as well as experimenting with cooking and baking, traveling and running.

Characterizing
the Gene Expression of Enl-T1 Mouse Primary Cells
Samantha Bramen ’24, Krista Budinich, Yiman Liu, PhD, Liling Wan, PhD
The Wan Lab at the University of Pennsylvania Department of Cancer Biology
ABSTRACT
Enl-T1 mouse primary cells in cell culture may become less reliable for further experimentation over time in vitro due to cell differentiation. By characterizing the gene expression of these cells and imaging the transcriptional condensates at different time periods, the changes in cell type that may occur in the cells can be deduced. After extracting RNA from the cells, and inducing reverse transcription with the RNA to become complementary DNA, the cDNA underwent a quantitative polymerase chain reaction in which certain genes were amplified by primers. The data from the qPCR was analyzed using graphs and compared to the imaging of the cells, with an emphasis on the changes in transcriptional condensates. The relative gene expression of Hoxa6, Hoxa9, Meis1, Enl primers when compared to the Gapdh primer dramatically increased over time, while the number of puncta primers greatly decreased over time. However, the relative gene expression of the Enl primer decreased, correlating directly with the number of puncta over time. It can be concluded that the Enl-T1 Mouse Primary Cells differentiated in vitro to an unknown cell type. This differentiation makes the cells not fit to be used for further experimentation (Song, 2022).
INTRODUCTION
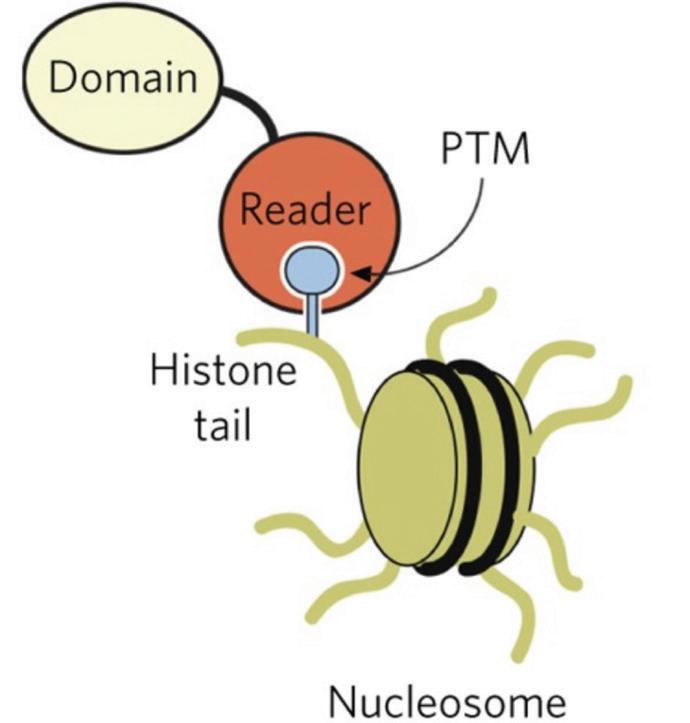
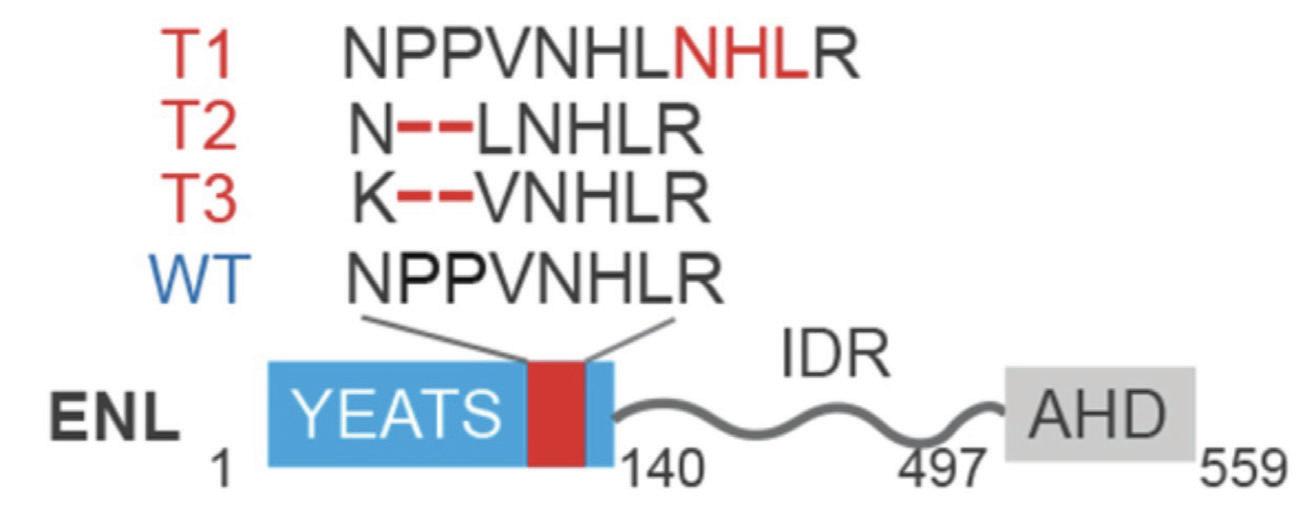
DNA is wrapped around proteins called histones, which can be modified by tags to help the DNA wrap up tightly inside the nucleus. Protein ENL is an acetylation histone reader, meaning it binds to the histone tail and “reads” the tail to signal for other modifications, such as tags, to bind. Hotspot mutations on the ENL YEATS domain can occur that cause Wilms tumor in kidneys (Song, 2022). These mutations are caused by insertions or deletions of base pairs of the DNA sequence. The T1 mutation of Enl is an insertion that causes a gain of function in certain genes that drive cell division. Genes Hoxa6, Hoxa9, Meis 1, and Enl all regulate the division of cells, and when the genes are repeatedly turned on, it can drive leukemia and Wilms tumor to form (Wan, 2020).
Figure 1: Epigenetic reader (Andrews, 2016)
The goal of the experiment was to characterize the gene expression of the Enl-T1 mutation in mouse primary cells over time in vitro. It was expected that if the gene expression of Enl-T1 increases, then the increase in expression of Hoxa6, Hoxa9, and Meis1 because they are regulated by Enl-T1. Therefore, the cells should have more puncta when imaged before and after time in vitro. The Enl-T1 mutation in mice was studied over a twenty-six day period post-extraction from the mice bone marrow. The relative gene expression was found using the four primers in comparison to the Gapdh primer. Additionally, the Enl-T1 cells were imaged for puncta, or transcriptional condensates. These condensates are areas of high concentration in RNA, DNA, and other protein factors that can be viewed through imaging. There is often a direct relationship between the level of gene expression and the number of puncta in the cells. When cells have higher rates of transcription, there will be more transcriptional machinery and there will be more puncta. The purpose of the listed methods was to discover the gene expression of genes Hoxa6, Hoxa9, Meis1, and Enl relative to Gapdh, and compare these results with the quantity of puncta over time after extraction from mouse bone marrow.
METHODS
1. Cells were extracted from mice, and Enl-T1 mutation was implanted in these cells. The cells were put back into the mice. Once the T1 had spread, Whole Bone Marrow Cells were extracted and cultured. Using Whole Bone Marrow Cell Pellets, an RNA extraction was performed in which the cell membrane and nuclear membrane were broken during lysis along with other buffers to ensure the purity of the RNA.
2. Next, the RNA was made into cDNA by placing the RNA with the reverse transcriptase enzyme in incubation so that the single-stranded RNA was made double-stranded and therefore more stable for a qPCR. This occurred as the RNA was read and copied into a complementary double strand of DNA with the enzyme.
3. Finally, a qPCR was performed with Hoxa6, Hoxa9, Meis1, Enl, and Gapdh primers to qualitatively count the specific expression of T1. The quantitative polymerase chain reaction amplified the cDNA strands of genes Hoxa6, Hoxa9, Meis1, Enl, and Gapdh.
Figure 2: ENL Hotspot Mutation on YEATS Domain (Wan, 2020)
RESULTS
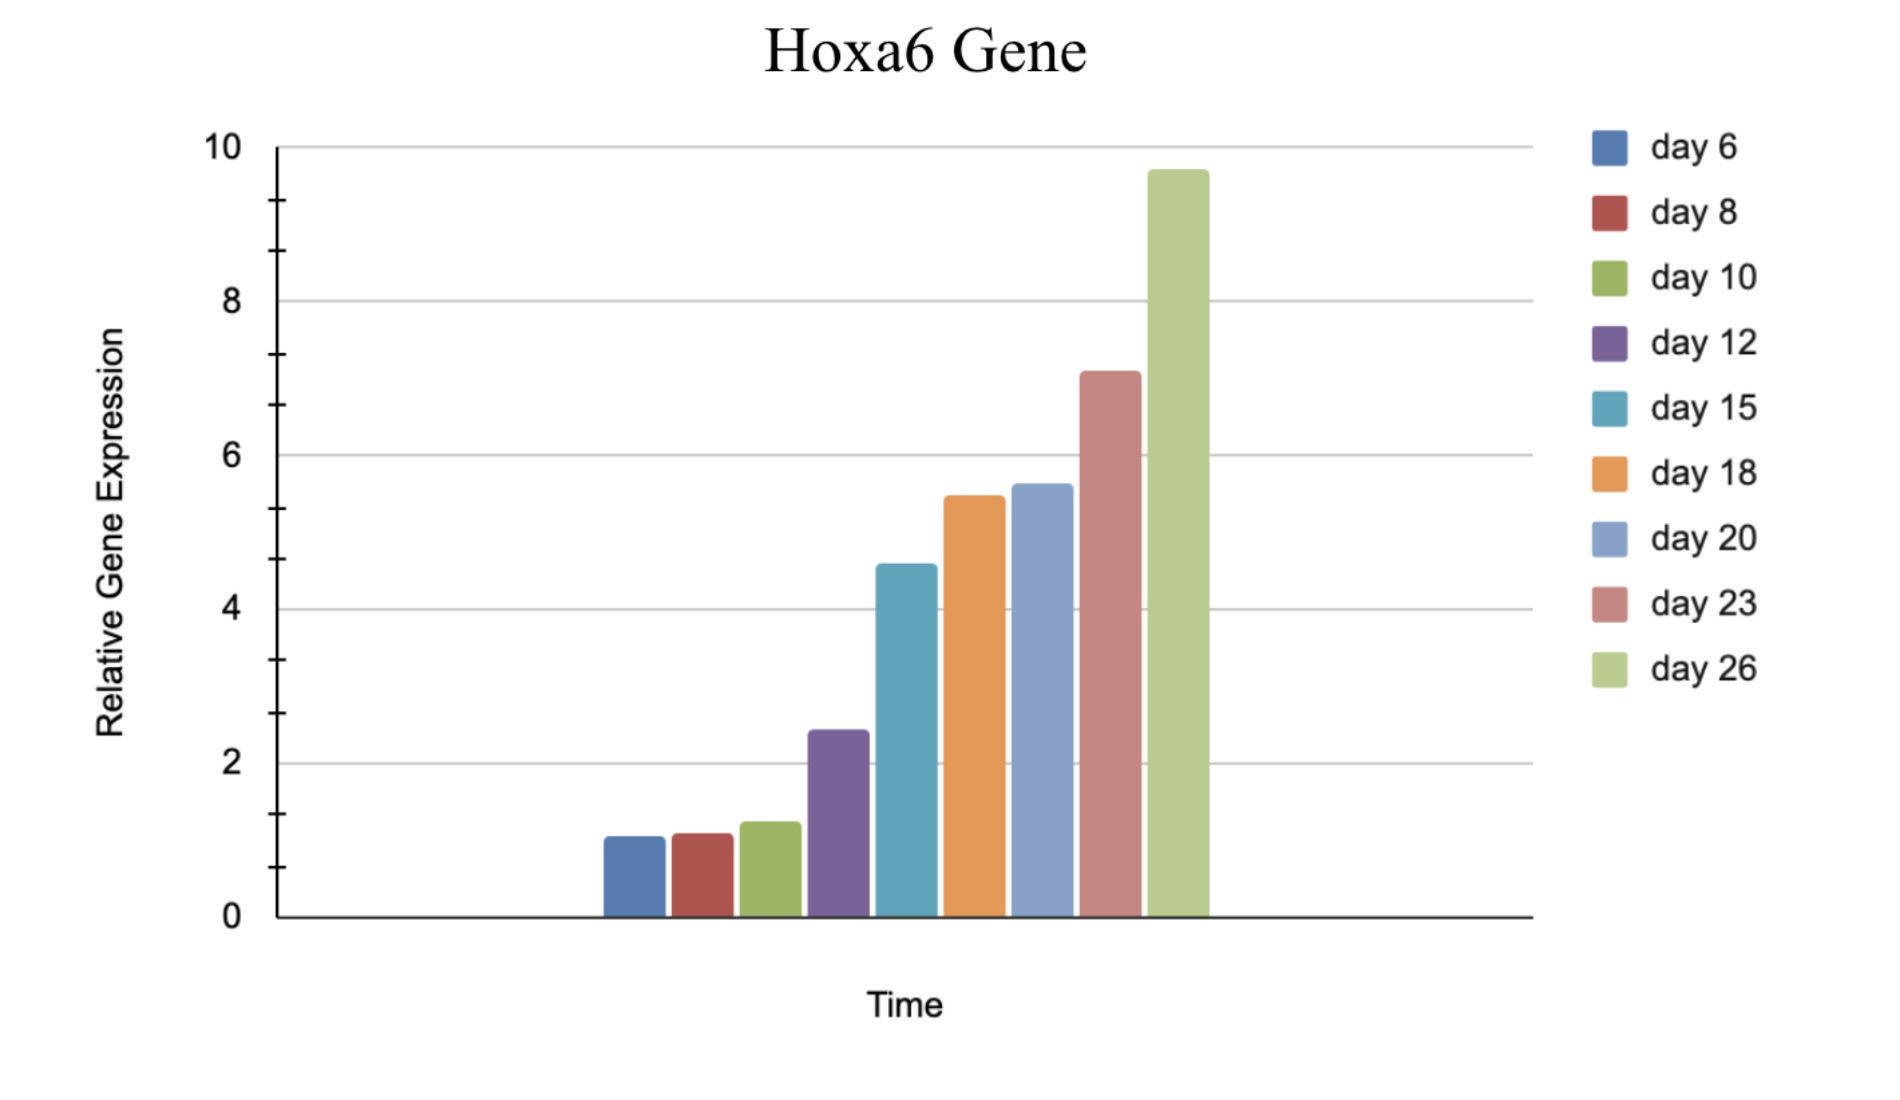
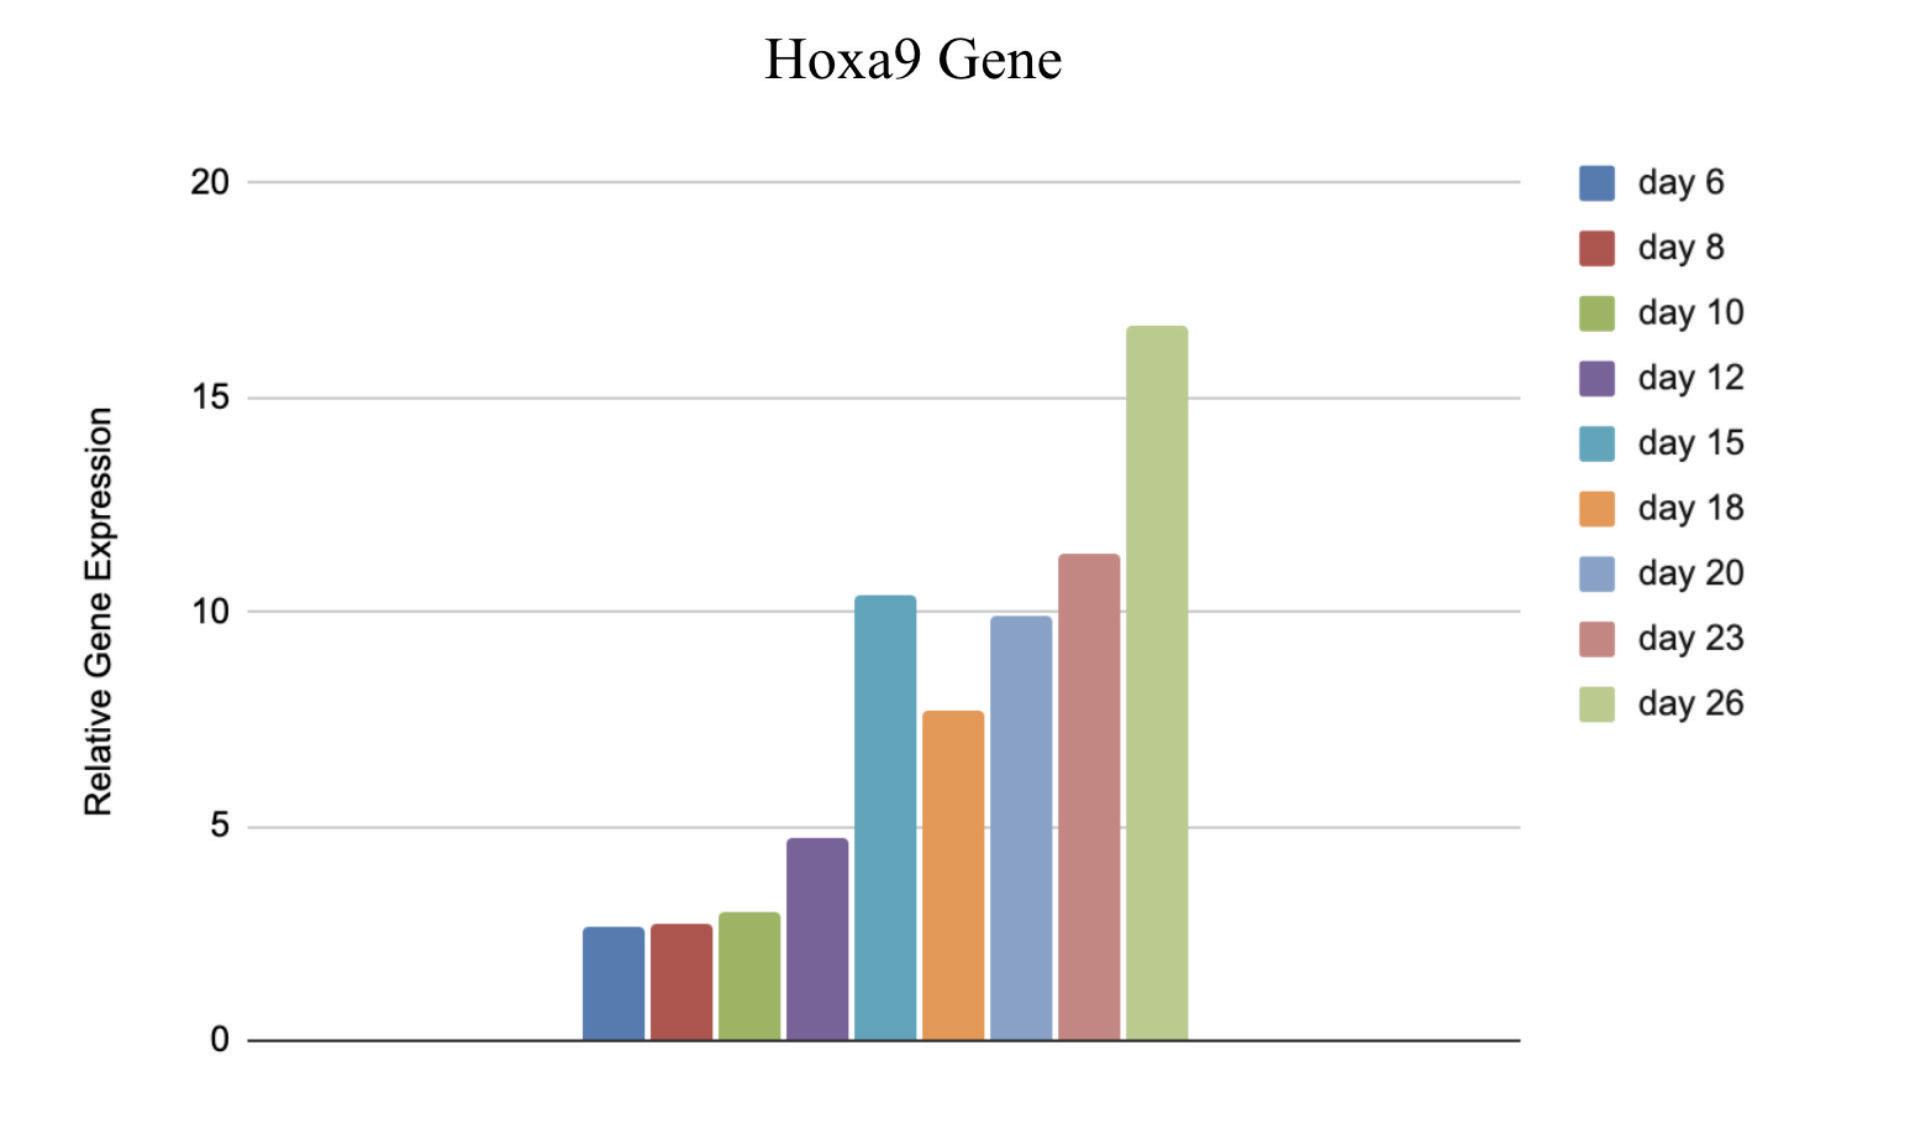
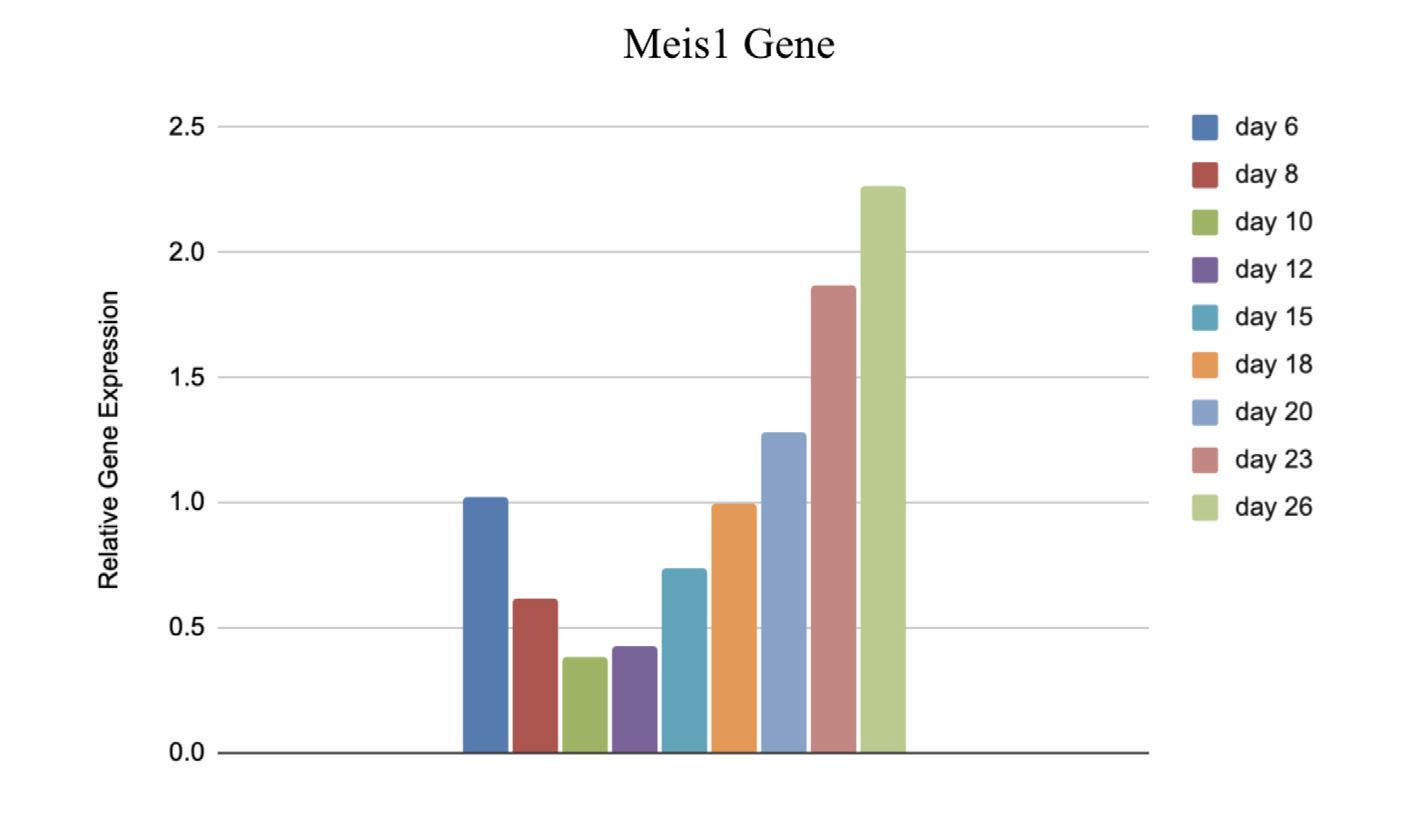
Figure 3: Relative Gene Expression of Hoxa6 from day 6 to day 26 postextraction
Figure 4: Relative Gene Expression of Hoxa9 from day 6 to day 26 postextraction
Figure 5: Relative Gene Expression of Meis1 from day 6 to day 26 post-extraction
Characterizing the Gene Expression of Enl-T1 Mouse Primary Cells | Samantha Bramen ’24
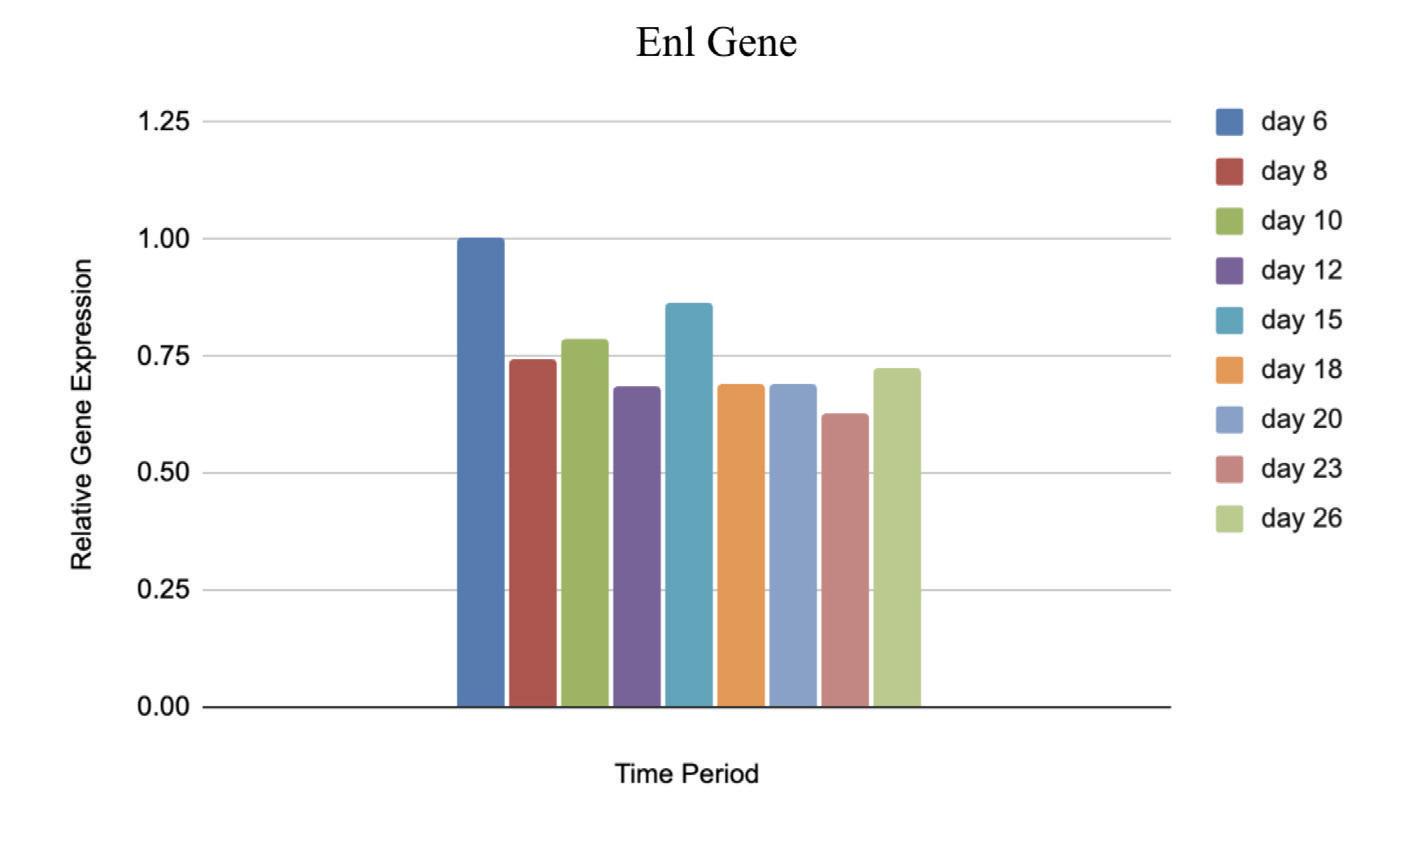
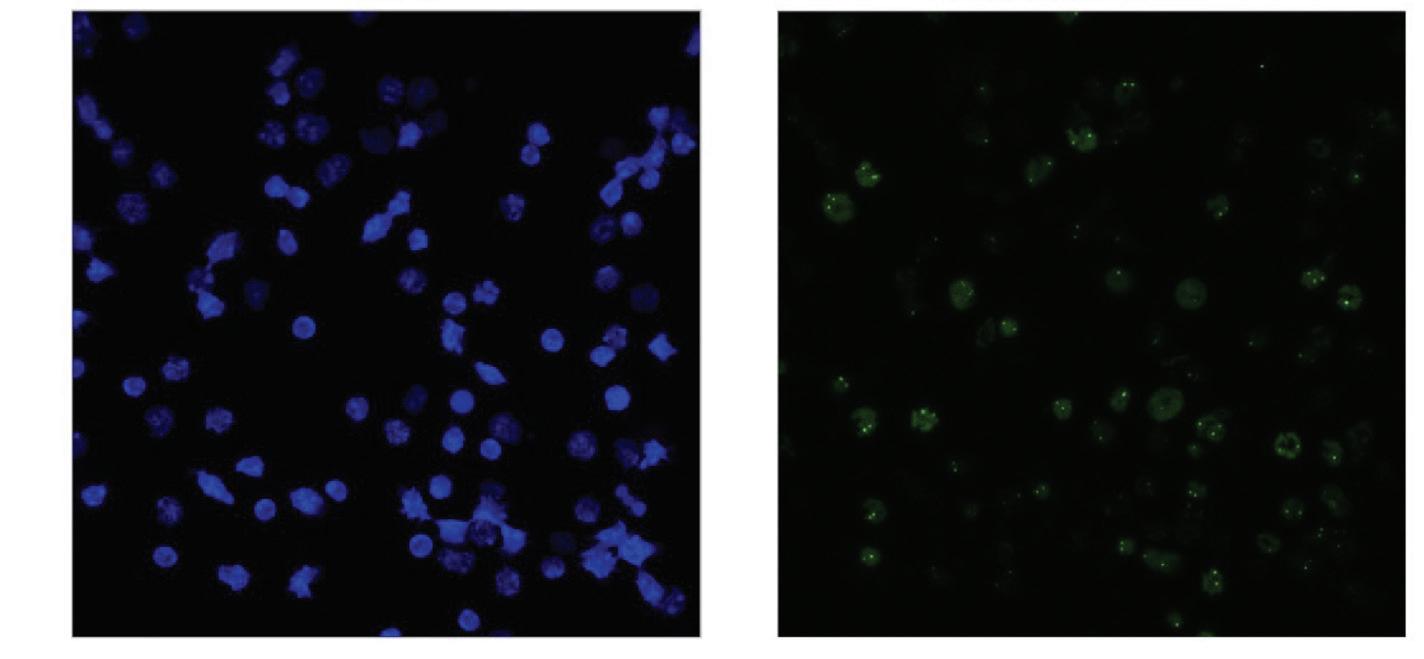
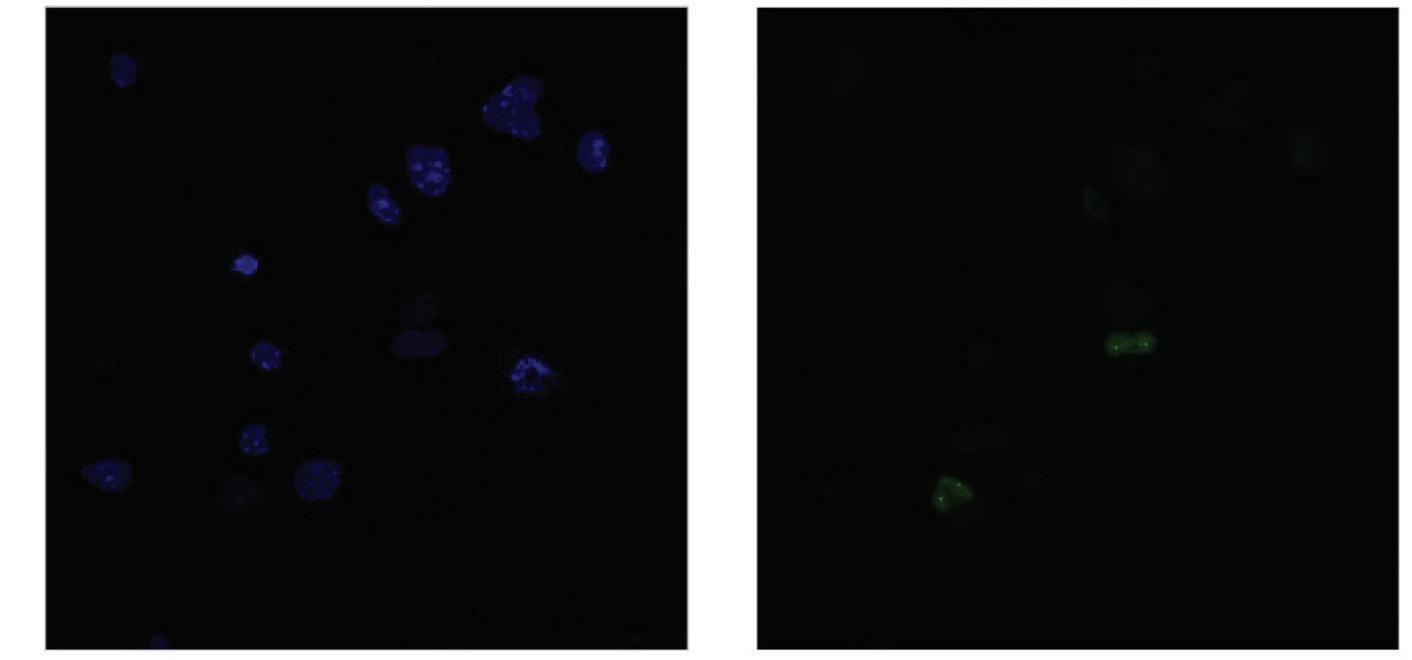
Figure 6: Relative Gene Expression of Enl Primer from day 6 to day 26 postextraction
Figure 7: DAPI stained Whole Bone Marrow cells compared to Halo 200nM 15 stained puncta fresh prepared (day 0)
Figure 8: DAPI stained Whole Bone Marrow cells compared to Halo 200nM 15 stained puncta (day 8 post-extraction)
The relative gene expression of Hoxa6, Hoxa9, and Meis1 relative to Gapdh significantly increased from day 6 to day 26 post extraction, while the gene expression slightly decreased from day 6 to day 26 in the Enl gene. The number of puncta decreased dramatically over an 8 day postextraction period as represented in the comparison of figures 7 and 8.
DISCUSSION
Although it was expected that the gene expression of Hoxa6, Hoxa9, and Meis1 would increase, the small decrease in Enl shows that the cells are not still of the same cell type. If the Enl-T1 mutated cells remained stem cells, then the number of puncta would have also increased along with expression of all four genes. However, the number of puncta was greatly decreased. With these unexpected results, it is plausible that the hematopoietic stem cells have differentiated and therefore the differentiated cells have fewer puncta. This would also explain the slight decrease in Enl as shown in figure 6, consistent with the direct correlation between gene expression and number of puncta. Since the Stem Cells were taken out of the mice and cultured in vitro, it is more likely that differentiation would occur, which is crucial knowledge for further experimentation with these cells.
FUTURE DIRECTIONS
I would like to research methods of preventing cell differentiation in vitro and applying this to the mouse stem cells. Next, I would perform another qPCR and analyze puncta numbers over time with the implemented research of stem cell differentiation prevention.
ACKNOWLEDGEMENTS
I would like to thank Liling Wan, the principal investigator at the Wan Lab, and Krista, my mentor. I would also like to thank Heather Wilson, and the Baldwin Science department for placing me in the Wan Lab and aiding me through the research process.
REFERENCES
Andrews, F., Strahl, B. & Kutateladze, T. (2016). Insights into newly discovered marks and readers of epigenetic information. Nat Chem Biol 12, 662–668. https://doi.org/10.1038/nchembio.2149.
Song, L., Yao, X., Li, H., Peng, B., Boka, A. P., Liu, Y., Chen, G., Liu, Z., Mathias, K. M., Xia, L., Li, Q., Mir, M., Li, Y., Li, H., & Wan, L. (2022). Hotspot mutations in the structured ENL YEATS domain link aberrant transcriptional condensates and cancer. Molecular Cell, 82(21), 4080–4098.e12. https://doi. org/10.1016/j.molcel.2022.09.034.
Wan, L., Chong, S., Xuan, F., Liang, A., Cui, X., Gates, L., Carroll, T. S., Li, Y., Feng, L., Chen, G., Wang, S. P., Ortiz, M. V., Daley, S. K., Wang, X., Xuan, H., Kentsis, A., Muir, T. W., Roeder, R. G., Li, H., Li, W., … Allis, C. D. (2020). Impaired cell fate through gain-of-function mutations in a chromatin reader. Nature, 577(7788), 121–126. https://doi.org/10.1038/s41586-019-1842-7.
CLAUDIA
KIM ‘25
Claudia Kim, a junior from Bryn Mawr, PA, has attended Baldwin since eighth grade. She is the Head of the International Human Rights Club that focuses on spreading awareness and taking action against human rights violations that happen globally. She is a member of the cross-country team in the fall and the track and field team in the spring. During her free time, she enjoys taking walks outside, spending time with friends and family, and reading books.

Changes in Saliva pH and Ability to Neutralize When Combined with Different Beverages
Claudia Kim ‘25, Geelsu Hwang PhD, Bei Bei Gao PhD
Hwang Lab at University of Pennsylvania Department of Preventive & Restorative Sciences
ABSTRACT
Sustaining a healthy environment for oral bacteria is important because if not maintained, it could create imbalance of microbial consortia and lead to dental caries. Factors like low pH and high consumption of dietary sugars can create an environment where tooth-decay-causing bacteria can thrive (1). For this reason, the changes in pH levels of saliva with four different common beverages (orange juice, milk, water, and coffee) were tested and analyzed to determine the speed and efficiency of the saliva’s neutralization and buffering abilities. If the beverage is more acidic, then it would most likely take longer to neutralize and react with the saliva, and if the beverage is more neutral or basic, then it will take a shorter time to neutralize or react with saliva. Through using a benchtop pH meter and timer to record the pH levels at a given time, the effects of saliva buffering were observed in the beverages. The results showed that the efficiency of saliva neutralization depended on how acidic the beverages were initially.
INTRODUCTION
An oval-shaped pathogenic bacteria, Streptococcus mutans, which is typically found in biofilms on the surface of teeth, is a key etiological agent that can cause dental caries or tooth decay. The biofilms that accumulate on the surface of the tooth are also known as dental plaque, which is a highly favorable habitat for S. mutans (1, 2). Biofilms are developed by bacteria adhering to each other and attaching themselves to a surface in a specific structure called an extracellular polymeric matrix. S. mutans is an important bacteria in producing the extracellular polysaccharides that help create this matrix in biofilms (3). This bacteria possesses three qualities that allow them to cause tooth decay: the ability to integrate extracellular glucans from sucrose to assist in the formation of the extracellular matrix, the ability to metabolize carbohydrates into organic acids, and the ability to flourish with stressful environments like low pH (1, 3). Since there are over 800 different oral bacteria species in an average human, the presence of S. mutans is not the only cause of tooth decay (4). However, the stronger the presence of this bacteria, the more it creates a favorable environment for acidogenic and aciduric species (species that thrive in low pH) to grow (1, 4).
Another factor of dental caries is the changes in environments, such as large quantities of sugar or a low pH. Through excessive consumption of dietary sugars, the fermentation of the carbohydrates from the sugar releases organic acids, which aid bacteria like S. mutans in demineralizing the tooth enamel (4, 2). Demineralization is the removal of mineral ions from hydroxyapatite crystals, which can cause high tooth sensitivity and pain (2). Although many beneficial oral bacteria that keep the microbial consortia healthy can survive brief spans of low pH, prolonged exposure to acidic substances can stunt growth. After these periods of an acidic, low pH environment, there are also spans of alkalization to help remineralize the lost minerals in the enamel and neutralize the oral pH. Therefore, the buffering ability of the saliva to sustain a neutral oral pH is a key component to help continue the growth of beneficial oral bacteria (4, 3).
MATERIALS AND METHODS
For this experiment, the following common beverages were used: tap water, Minute Maid orange juice, Lucerne Grade A whole milk, and Starbucks mocha coffee. Before taking samples from the
two subjects, it is imperative to note that the subjects did not have any food or drink before the sample collection to prevent food debris contamination. The method uses a benchtop pH meter to measure the pH of the saliva, beverages, and specific mixtures of the two liquids for each beverage. To achieve this, the following steps were followed:
1) For each subject, 40 mL of saliva was collected in a 50 mL tube and 5 mL of each beverage was poured into 5 smaller test tubes and placed in an ice bucket. The saliva samples were then centrifuged and filtered.
2) Four 15 mL test tubes were prepared with 3 mL of saliva samples in each tube and labeled by solutions.
Ex) Tube 1 is Water + filtered Saliva or W+ F.S.
3) The initial pH of all four beverages was measured and recorded on the data table.
4) Placing the first tube in the pH meter, the initial pH of the saliva sample was recorded.
5) 1 mL of the first beverage was pipetted in the tube, and vortexed before the pH of the new solution was measured again.
6) Right when the pH meter was dropped into the test tube, a timer was immediately started. Once the pH was stabilized, the pH and time were noted. Repeat step 5 two more times with the same beverage (3 mL of beverage in the tube in total).
7) To test the neutralization of the saliva, 1 mL of saliva was pipetted into the solution and vortexed. The pH and the drop times were recorded 2 more times (3 mL more of saliva). This step was similar to step 6, but instead of adding the beverages, saliva was added. In total, by the end of this experiment, there should have been 9 mL of the saliva and beverage solution.
8) Steps 4 - 7 were repeated for the rest of the remaining beverages.
Table 1
RESULTS
Table 1. The initial pH of the beverages
Table 1
Subject 1 Results:
Table 2:
Table 2. The pH of the orange juice and the duration of the orange juice and saliva solution pH were taken to provide a correct reading. The beginning row represents the initial pH of the 3 mL of saliva in the test tube before the addition of the orange juice. OJ 1 represents the first mL of orange juice in the test tube, etc. NS 1 represents 1 mL more of saliva in the test tube to test neutralization of the saliva, etc.
Table 2:
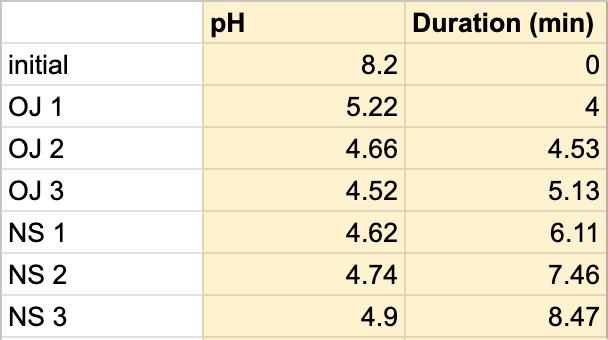
Figure 1.1
Figure 1.1
Table 3. The pH of the milk and the duration of the milk and saliva solution pH were taken to provide a correct reading. The beginning row represents the initial pH of the 3 mL of saliva in the test tube before the addition of the milk. M 1 represents the first mL of milk in the test tube, etc. NS 1 represents 1 mL more of saliva in the test tube to test neutralization of the saliva, etc.
1.2.
1.1
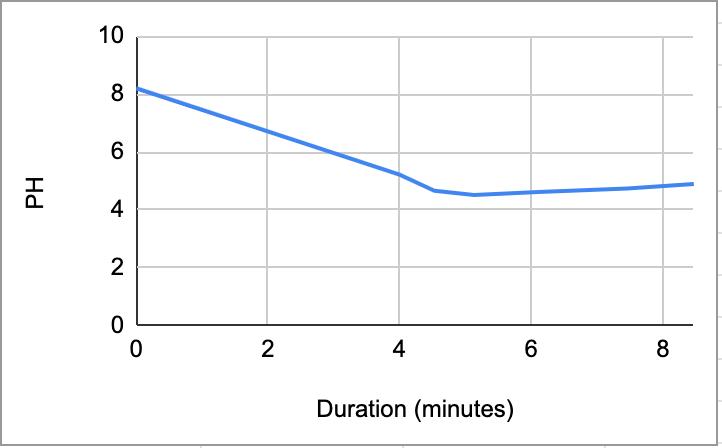

Figure 1.2
Figure 1.2
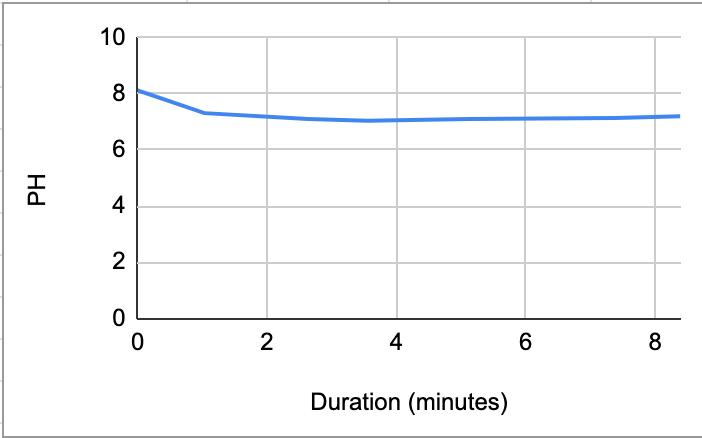
Table 4:
Table 4:
Figure 1.1. The graphical representation of Table 2
Figure
The graphical representation of Table 3
Figure
Table 4. The pH of the water and the duration of how long the water and saliva solution pH were taken to provide a correct reading. The beginning row represents the initial pH of the 3 mL of saliva in the test tube before the addition of the Water. W 1 represents the first mL of water in the test tube, etc. NS 1 represents 1 mL more of saliva in the test tube to test neutralization of the saliva, etc.
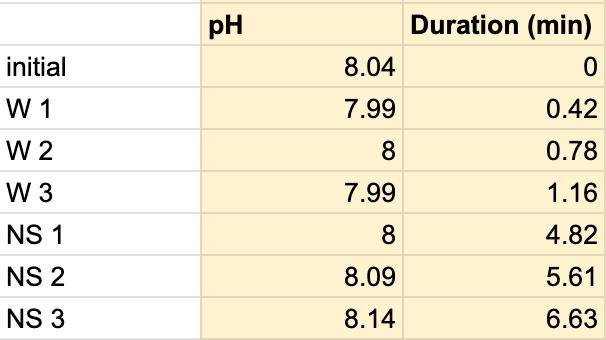
Figure 1.3. The graphical representation of Table 4
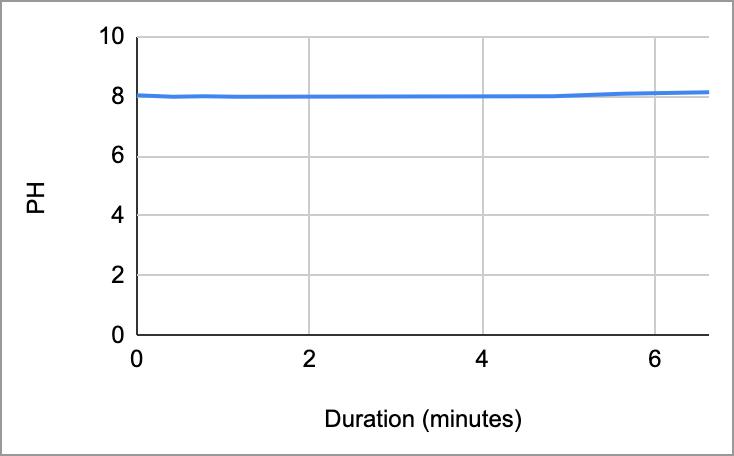
Table 5. The pH of the coffee and the duration of the coffee and saliva solution pH were taken to provide a correct reading. The beginning row represents the initial pH of the 3 mL of saliva in the test tube before the addition of the coffee. C 1 represents the first mL of coffee in the test tube, etc. NS 1 represents 1 mL more of saliva in the test tube to test neutralization of the saliva, etc.
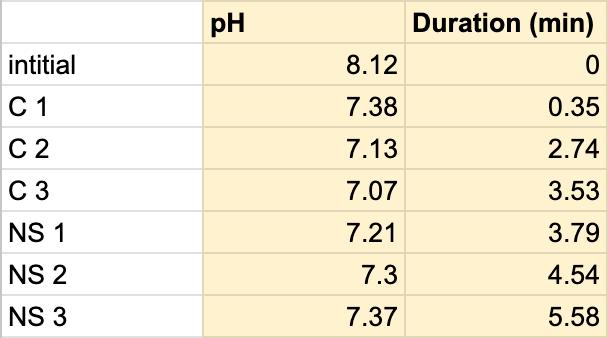
Table 4:
Table 5:
Figure 1.4
Table 5:
Figure 1.4
1.4. The graphical representation of Table 5
Subject 2 Results:
Table 6. The pH of the orange Juice and the duration of the orange juice and saliva solution pH were taken to provide a correct reading. The beginning row represents the initial pH of the 3 mL of saliva in the test tube before the addition of the orange juice. OJ 1 represents the first mL of orange juice in the test tube, etc. NS 1 represents 1 mL more of saliva in the test tube to test neutralization of the saliva, etc.
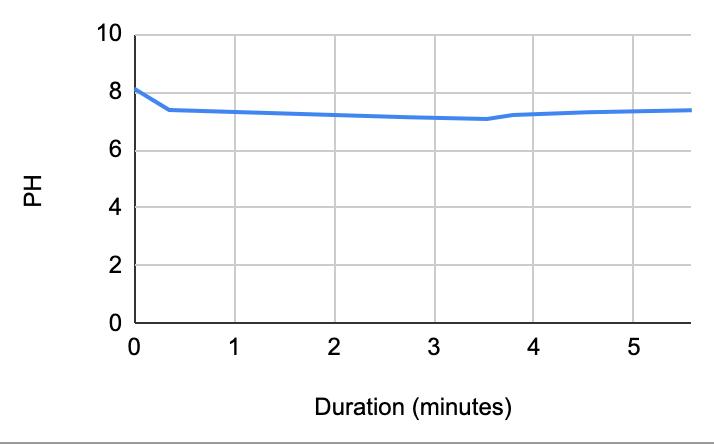
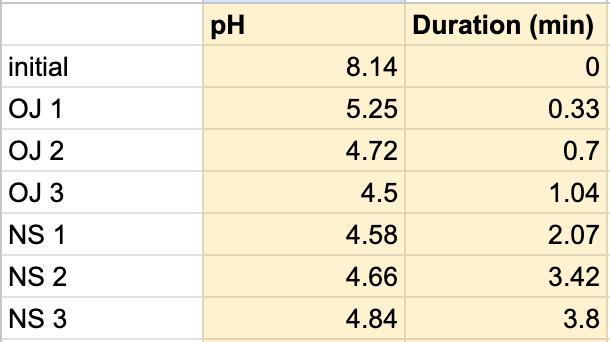
Figure 1.5. The graphical representation of Table 6
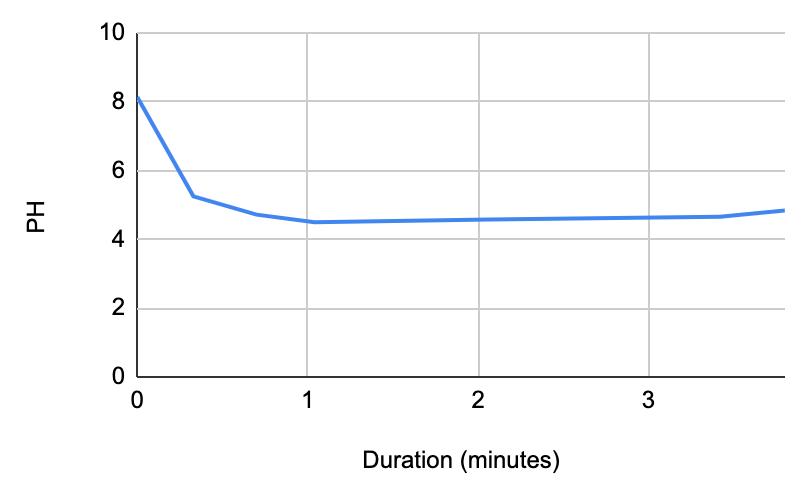
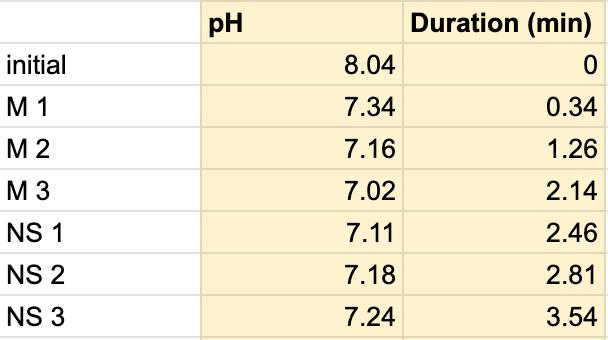
Table 7. The pH of the milk and the duration of the milk and saliva solution pH were taken to provide a correct reading. The beginning row represents the initial pH of the 3 mL of saliva in the test tube before the addition of the milk. M 1 represents the first mL of milk in the test tube, etc. NS 1 represents 1 mL more of saliva in the test tube to test neutralization of the saliva, etc.
Figure
Figure 1.5
Table 7:
Figure 1.4
Table 6: Figure 1.5
Table 7:
1.6. The graphical representation of Table 7
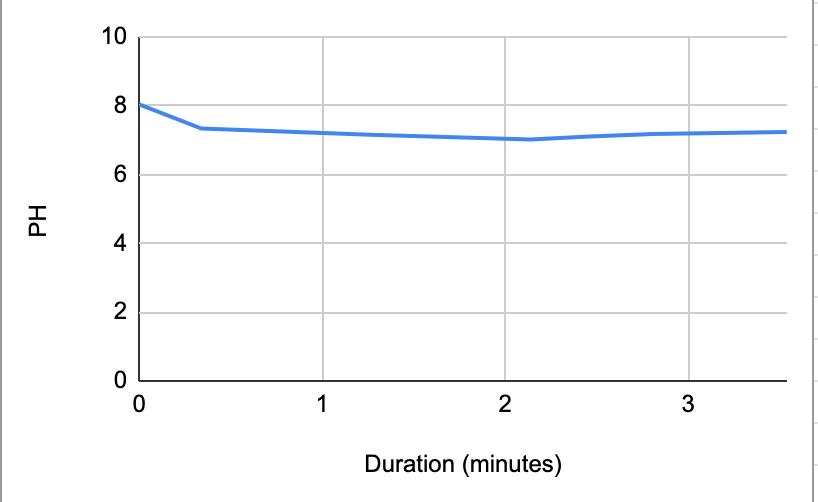
Table 8:
Table 8:
Table 8:
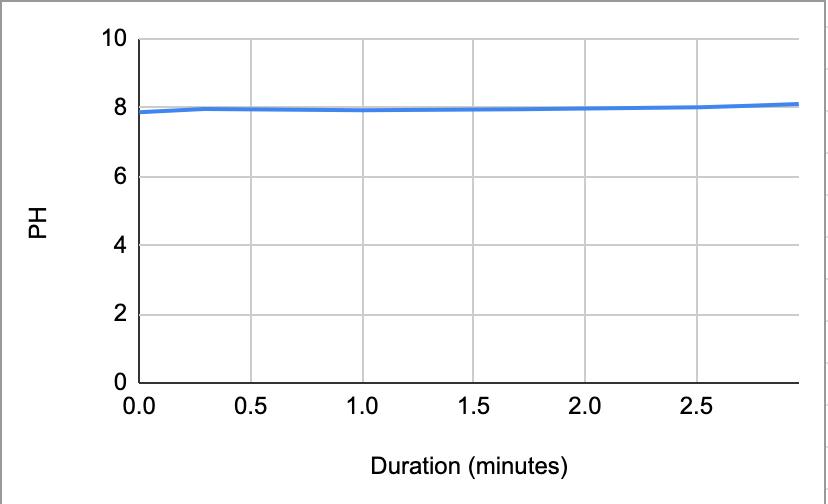
Table 8. The pH of the water and the duration of how long the water and saliva solution pH were taken to provide a correct reading. The beginning row represents the initial pH of the 3 mL of saliva in the test tube before the addition of the water. W 1 represents the first mL of water in the test tube, etc. NS 1 represents 1 mL more of saliva in the test tube to test neutralization of the saliva, etc.

1.7
1.7
1.7
1.7. The graphical representation of Table 8
Figure
Figure
Figure
Figure
Figure
Table 9. The pH of the coffee and the duration of the coffee and saliva solution pH were taken to provide a correct reading. The beginning row represents the initial pH of the 3 mL of saliva in the test tube before the addition of the coffee. C 1 represents the first mL of coffee in the test tube, etc. NS 1 represents 1 mL more of saliva in the test tube to test neutralization of the saliva, etc.
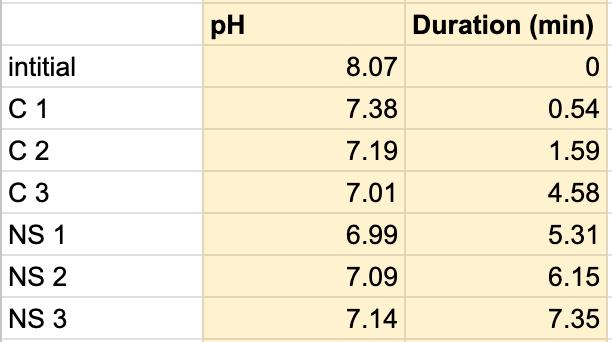
Figure 1.8.
Figure 1.8.
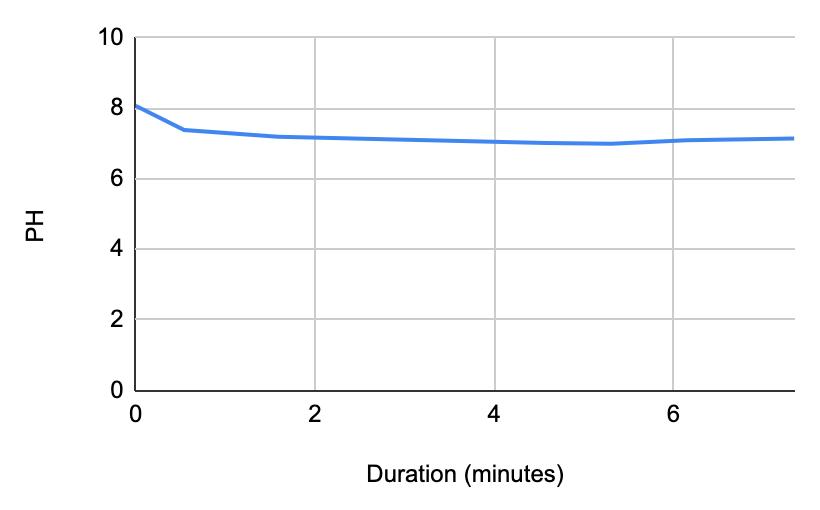
For both subjects 1 and 2, the times the tables listed the first drop of the 1 mL of saliva to test the neutralization of saliva correlated to a very slight rise in the pH. According to the acidity levels of the beverage, the change in the steepness of the graph was different. For example, in Table 1, the water’s pH is 7.52, which is considered neutral. Referring back to graphs for the water, Figure 1.3 (Subject 1) and Figure 1.7 (Subject 2), the initial pH of the saliva relatively remains the same with very few fluctuations hovering around a very similar value. However, in comparison to a highly acidic beverage, orange juice, Table 1 shows that the initial pH of this beverage was 3.97. Figure 1.1 (subject 1) and Figure 1.5 (subject 1) portray a very steep slope in the beginning due to the large pH change from a more basic solution like saliva suddenly mixing with a very acidic drink like orange juice. However, by analyzing Table 2 (subject 1) and Table 6 (subject 2), at the time the 1 mL of saliva to test its neutralization ability was dropped into the tube, the line graphs correlated with the tables by beginning a slight increase in their slope. The data for milk and coffee were similar and portrayed a similar trend, mostly because the coffee used in this experiment already contained some milk. Similar to the previous data with the other beverages, in Table 3 and Figure 1.2 and Table 9 and Figure 1.8, when the neutralization part of the experiment was started, the pH began to increase.
Figure 1.8. The graphical representation of Table 9
DISCUSSION
The data from the results showed that more acidic beverages would take the saliva longer to neutralize and more basic/neutral beverages would take the saliva a much shorter time to neutralize. Table 1 shows the different pH levels of each beverage, showing that the orange juice is highly acidic, the milk and coffee are acidic but nearly neutral, and the water is neutral. Therefore, we hypothesized that orange juice would take the longest for the saliva to neutralize and water would take the shortest to neutralize. Table 2 and Figure 1.1 and Table 6 and Figure 1.5 show the effects that orange juice had on the saliva sample for both subjects. As more orange juice is dropped into the tube, there is a steep decline in the pH until more saliva is added again because the initial pH for the orange juice was 3.97. As the saliva is beginning to neutralize the solution, it is reflected on the graph by a very slow and small incline, which represents how the saliva will take much longer to neutralize the oral pH after highly acidic drinks are consumed. Table 3 and Figure 1.2 and Table 7 and Table 1.6 show the data for the milk. Because milk’s initial pH was 6.71, and close to neutral, the data shows a small and short decline in the pH levels and a small, gradual incline as more saliva is added to the solution again. Table 4 and Figure 1.3 and Table 8 and Figure 1.7 represent the data for water. Since water has a neutral pH (7.52), it was reported on the graph and table that the pH levels of the saliva rarely changed and even increased slightly. The initial pH of saliva for Subject 1 was 8.04 while Subject 2’s was 7.87, and by the end of adding 3 mL of the water and 3 mL more of saliva, the final pH was 8.14 and 8.11, respectively. These results suggest that water is an exceptional beverage to help maintain a healthy oral pH so that the beneficial bacteria can thrive. Lastly, Table 5 and Figure 1.4, and Table 9 and Figure 1.8 showed the data for the coffee. Because the coffee had an initial pH that was similar to the milk, 6.88, the two beverages’ data were similar. For both subjects, right after the beverage was dropped into the tube, there was a quick but short decrease and a plateau until more saliva was inserted into the tube, which started a very slight incline. These results for both subjects with all 4 beverages proved that saliva can neutralize beverages efficiently, but the time in which the pH will return to the initial number will all depend on the acidity of the drink.
However, A discrepancy in this experiment would be the coffee. Instead of using pure black coffee, a latte coffee was used, which could explain why the initial pH for the milk and coffee were similar. Black coffee is a more acidic drink, so for future related experiments, there should be a change in the beverage. Another ambiguity in this experiment was the drastic difference in the time between the two subjects. Although it is clear that orange juice takes the longest time to neutralize and water takes the shortest time, Subject 1’s final times for the four beverages ranged from 5.58 minutes to 8.47 minutes while Subject 2’s final times for the beverages ranged from 2.96 minutes to 7.35 minutes. It is still unclear why there is a large time difference, but it is most likely due to the fact that saliva will be very different between subjects because there are many factors such as diet and environment that can affect the saliva. This experiment also shows the reason why many dentists do not like their patients eating lemons because of their high acidity. Since lemon juice is significantly more acidic than orange juice, the time for the saliva to neutralize the oral pH would take even longer.
FUTURE STEPS
It would be informative to repeat this experiment but with unfiltered saliva to observe whether the presence of bacteria will change the results by speeding up or slowing down the neutralization process. By testing unfiltered saliva, a wider range of the factors in the microbial consortia, such as the correlation between pH and the different types of bacteria, can be tested.
ACKNOWLEDGEMENTS
I would like to thank Dr. Geelsu Hwang, Dr. Bei Bei Gao, and the Hwang Lab staff at Penn Dental Medicine for supporting me throughout this internship and allowing me to spend the summer learning and researching in the lab. Thank you to Anna Ye for working with me over the summer.
REFERENCES
Abranches, J., Brady, L.J., Freires, I.A., Kajfasz, J.K., Lemos, J.A., Palmer, S.R., Wen, Z.T., & Zeng, L. (2019). The Biology of Streptococcus mutans. Microbiology Spectrum 7(1), 1-7. https:// journals.asm.org/doi/10.1128/microbiolspec.gpp3-0051-2018?url_ver=Z39.88-2003&rfr_ id=ori%3Arid%3Acrossref.org&rfr_dat=cr_pub++0pubmed.
Aljabo, A., Bozec, L., Coathup, M., Ibrahim, S., Mudera, V., Neel, E.A.A., Strange, A., & Young, A.M. (2016). Demineralization–remineralization dynamics in teeth and bone. International Journal of Nanomedicine 11, 4743–4763. https://www.ncbi.nlm.nih.gov/pmc/articles/PMC5034904/.
Chu, C.H., Lo, E.C., Mei, M.L., Yu, O.Y., & Zhao, I.S. (2017). Dental Biofilm and Laboratory Microbial Culture Models for Cariology Research. Dentistry Journal (Basel) 5(2), 21. https://www.ncbi.nlm.nih. gov/pmc/articles/PMC5806974/#:~:text=A%20biofilm%20is%20formed%20by,polysaccharide%20 matrix%20in%20dental%20biofilms.
Nascimento, M.M. (2019). Approaches to Modulate Biofilm Ecology. Dental Clinics of North America 63(4), 581-594. https://www.ncbi.nlm.nih.gov/pmc/articles/PMC6980328/.
NIKOLETTA KUVAEVA ’25
Nikoletta Kuvaeva is a junior from Villanova, PA, and has attended Baldwin since 4th grade. She is the head of the BETA Club, the school’s math club, and founded the Graphic Design Committee, a team of people that helps design and market The Baldwin School. She is part of the Baldwin varsity tennis team and spends her time exploring her fascination with AI and volunteering. During her free time, she enjoys traveling, spending time with friends and reading poetry/books.

Financial Sentiment Analysis of Investor News Articles
Nikoletta Kuvaeva ’25 InspiritAI
ABSTRACT
While investors often focus on analysis methodologies that rely solely on the underlying value and pricing of each individual asset, broader market factors, consumer feelings, and news, media reports are also important factors, as they have a significant impact on the immediate and longterm prices of securities. The primary objective of this research is to assist investors in making sound investment decisions in the stock market, by allowing them to classify the sentiment in these news media reports. To do this, this study used a dataset from Malo et al (2014) consisting of 5842 English news sentences on all listed companies in OMX Helsinki, a Finnish stock exchange, labeled as positive, negative, or neutral. We used a logistic regression and a random forest classification model to predict these news sentences’ classifications and our accuracies were 65.53% and 66.65%, respectively. While this does not achieve optimal accuracy, the confusion matrix and error analysis demonstrated that some of these errors were more understandable. Further, this is a step towards converting the incredibly time-consuming job of analyzing sentiment manually, into a quick job that leverages the rapid power of computation.
INTRODUCTION
$7 trillion is produced and lost each year in public financial markets, which include a multitude of securities, including commodities, stocks, and bonds (9). These assets hold 41% of all household wealth and are a major driver of consumer welfare (3). Despite this, the underlying mechanics that cause assets to increase and decrease in value are widely disputed and highly complex (4). As a result, the majority of individuals lack the ability and knowledge to make discretionary investments based on the underlying finances of the stocks they may buy (6). Beyond the underlying financials of a given company, macroeconomic, corporate, and market patterns can shift asset prices alongside a combination of various factors, including world events, history, economic reports, seasonal factors, and human psychology (8). Indeed, human behavior outside of purely financial metrics can have a significant impact on economic, business, and market cycles, as well as the prices of given assets (6). People’s emotions, feelings, and behavioral patterns can be described as sentiments, and their attitudes toward economies or markets can affect markets in magnitudinal ways (5). In this paper, I will introduce the field and applications of sentiment analysis, the study of behavior and attitudes, as a tool in financial decision-making. Moreover, I will demonstrate the opportunity for modern computation tools, including Natural Language processing, to improve the efficacy, speed, and efficiency of sentiment analysis for investors.
BACKGROUND ON SENTIMENTAL ANALYSIS
The fundamental problem of determining when to buy or sell shares, or which stocks to buy, has not been definitively resolved (10). While many investors praise analysis methodologies that rely exclusively on the underlying value and pricing of each individual asset, broader market factors, consumer feelings, and news media reports have a significant impact on the immediate and longterm prices of securities (8). Behavioral economics is a field of study that combines finance and psychology, acknowledging that individuals do not always act rationally when making economic decisions. It recognizes that emotions and impulsivity play a significant role in shaping human behavior. Neoclassical economics, or traditional economics, theories often assume that people
are rational and make decisions based on maximizing their own self-interest. However, behavioral economics takes into account the biases, cognitive limitations, and psychological factors that influence individuals’ choices. By understanding how sentiments and feelings impact decisionmaking, behavioral economics provides valuable insights into how people’s behavior can affect economic outcomes.
The key to successful investing lies in identifying where the pendulum of psychology and the valuation cycle stands in their swing (7). Savvy investors avoid the urge to purchase assets when positive sentiment and a readiness to assign elevated values lead to peak prices (1). In contrast, they know to invest when pessimism and panic selling among investors result in underpriced assets (7). As Sir John Templeton famously remarked, the best strategy is to “buy when others are despondently selling and sell when others are greedily buying,” even though it takes great courage, it often leads to the greatest rewards.
One form of financial analysis involves measuring financial data for individual assets, most notably in performing a fundamental analysis of a company and its stock (7). While this form of analysis is significant in its use throughout the financial world, it is beyond the scope of this research.
A second form of financial analysis is qualitative and relies on information outside of the financials of a given company (12). Rather, it focuses on awareness of the prevailing sentiment among other investors, drawing information from media reports and other verbal measures (7). While everyone may observe daily events reported in the media, not everyone understands the implications of those events on investor sentiment and how to respond accordingly. Despite a general stability in asset pricing that relies on underlying financial fundamentals in the long term, short-term fluctuations are heavily influenced by investor feelings and sentiments that are not purely quantitative (2). Thus, understanding investor sentiment, whether optimistic or pessimistic, and media reports indicating whether the market should be piled into or avoided, is crucial. However, while sentiment analysis remains an invaluable tool in making savvy investment decisions, as a process done by humans, it is laborious and frequently subject to human error.
COSTS AND LABOR OF SENTIMENTAL ANALYSIS
Speaking from personal experience, sentiment analysis is a time-consuming task that can be slow when performed by people. It requires individuals to read through a multitude of different data streams simultaneously, such as social media posts, news articles, and online reviews, to understand public sentiment towards a particular topic or brand (1). Analyzing this large amount of data manually can be extremely laborious, and there is always the potential for human error or bias (2). As a result, people have been trying to look for new ways (7). Many businesses and organizations have turned to automated sentiment analysis tools that use machine learning algorithms (Artificial Intelligence) to analyze and categorize large volumes of data quickly and accurately (6). These tools can provide real-time insights and help businesses make data-driven decisions. AI as well speeds up the process and makes it faster (11). The emergence of artificial intelligence and machine learning tools has revolutionized sentiment analysis, making it faster and
more accurate (11). These tools use natural language processing to analyze text data from a wide range of sources, including social media, news articles, and online reviews, and classify sentiment as positive, negative, or neutral (12). Through this AI the field of finance will be drastically simplified, allowing investors to get quicker and more accurate results rather than relying on impulse. Creating this tool is the main point of this research.
THE STUDY
The primary objective of this model is to assist investors in making sound acquisitions in the stock market by identifying qualitative sentimental trends before they actualize in the market price of the asset. In doing so, this model can help investors buy assets, based on market sentiment, that should appreciate in value.
In this study, we conducted financial sentiment analysis using the Financial PhraseBank dataset created by Malo et al. The dataset consists of 5842 English news sentences on all listed companies in OMX Helsinki, a Finnish stock exchange, randomly selected to cover “small and large companies, different industries, and news sources.” These were then labeled as positive, negative or neutral.
The data set was labeled as positive, negative or neutral based on the sentiment expressed in the news sentence. Positive sentences express a favorable sentiment towards a company or its stock, while negative sentences express an unfavorable sentiment. Neutral sentences do not express any sentiment.
Before analyzing the data, we cleaned the data set by removing any punctuation, special characters, and stop words. We also lowercase all words and lemmatized them to standardize the text data. Additionally, we removed any duplicate sentences and missing values in the data set. After cleaning, the data set consisted of 5812 news sentences, with 1962 labeled as positive, 2019 as negative, and 1831 as neutral.
We analyzed the unique words or the words that weren’t located in the other two lists, in each sentiment class, which provided further insights into the most important words associated with each sentiment category. For example, the unique words in the positive class included terms such as “company,” “opportunities,” and “success.” Words like “opportunities” suggest chances to fix problems and improve the market. Similarly, words like “success” encourage a favorable tone suggesting everything is going well. The unique words in the negative class included terms such as “risk,” “debt,” and “bankruptcy.” Each of these words have a negative tone indicating loss of money and uncomfortable situations. The unique words in the neutral class included terms such as “company,” “share,” and “sale.”
This cleaned data set was then used for further analysis, including exploring the most common words and training binary classification models to predict the sentiment of news sentences. We then used two binary classification models to classify the sentiment of the sentences. The first model was Logistic Regression, we then used two binary classification models to classify
model was Logistic Regression, we then used two binary classification models to classify our sample: logistic regression and random forest. In the logistic regression model, the three sentiment classes (negative, neutral, and positive) were reduced to only three (0, 1, and 2) to simplify the classification task. The second model was a Random Forest classifier. We tuned the hyperparameters of the Random Forest classifier, specifically the maximum depth, using crossvalidation to improve the model's accuracy (see Fig 1). We settled on maximum depth 18, which minimized the depth and maximized (approximately) the model’s accuracy.
our sample: logistic regression and random forest. In the logistic regression model, the three sentiment classes (negative, neutral, and positive) were reduced to only three (0, 1, and 2) to simplify the classification task. The second model was a Random Forest classifier. We tuned the hyperparameters of the Random Forest classifier, specifically the maximum depth, using crossvalidation to improve the model’s accuracy (see Fig 1). We settled on maximum depth 18, which minimized the depth and maximized (approximately) the model’s accuracy.
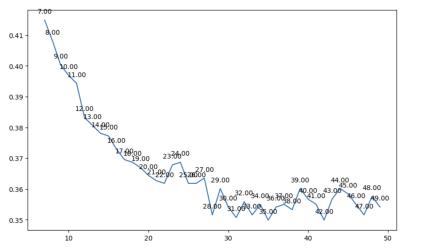
1: Tuning of hyperparameters of the Random Forest classifier, specifically the maximum depth to improve the models accuracy.
RESULTS AND DISCUSSION
RESULTS AND DISCUSSION
Overall, the dataset was well-balanced with approximately one-third of the sentences labeled as positive, negative, and neutral, respectively. The accuracy of the Logistic Regression model was 65.53%, while the Random Forest model achieved an accuracy of 66.65%, indicating that the Random Forest model outperformed the Logistic Regression model in this task. However, further analyses suggested that our model performed better than those accuracy scores indicate.
Overall, the dataset was well-balanced with approximately one-third of the sentences labeled as positive, negative, and neutral, respectively. The accuracy of the Logistic Regression model was 65.53%, while the Random Forest model achieved an accuracy of 66.65%, indicating that the
For example, we analyzed the confusion matrix to gain insights into the model’s classification performance across the three sentiment categories (see fig 2). Our model rarely confused positive and negative sentiment. Rather, it had trouble with distinguishing categories that are more qualitatively similar, like neutral and negative and neutral and positive. The results showed that the models had the most difficulty distinguishing between negative and neutral sentiment, with many instances of misclassification between these two categories. This observation suggests that improving the models’ ability to differentiate between negative and neutral sentiment may be an area for future improvement.
Fig 1: Tuning of hyperparameters of the Random Forest classifier, specifically the maximum depth to improve the models accuracy.
Fig
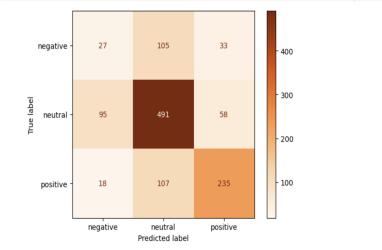
2:
Fig 2:
We also examined the errors made by a sentiment analysis model. This analysis revealed that our model’s mistakes often occurred for sentences where a human might also have trouble. The first error (see Fig. 3: Error #1) was when the model predicted a sentence about a Finnish pharmaceutical company reducing personnel as neutral, but it was actually negative. These errors were understandable as they could also be interpreted differently by a human reader. The second error (see Fig. 3: Error #2) occurred when the model predicted a sentence about a Finnish retailer generating higher revenues as negative, but it was actually positive. This error was less understandable compared to a human but makes sense given the sentence mentions loss.
We also examined the errors made by a sentiment analysis model. This analysis revealed that our model’s mistakes often occurred for sentences where a human might also have trouble. The first error (see Fig. 3: Error #1) was when the model predicted a sentence about a Finnish pharmaceutical company reducing personnel as neutral, but it was actually negative. These errors were understandable as they could also be interpreted differently by a human reader. The second
However, the third error (see Fig. 3: Error #3) was when the model predicted a sentence about a joint venture investing €500,000 in production technology as positive, but it was actually neutral. This error was also understandable as the language used in the sentence could be seen as drastic or high emotion (“straight away”), which could give a more positive connotation.
Error #1 (negative sentence predicted as neutral):
“in Finland Finnish pharmaceutical company Orion Corporation OMX Helsinki : ORNAV said on Wednesday 7 January that it has concluded its personnel negotiations in Finland and will reduce the number of personnel by 205.”
Error #2: (positive sentence predicted as negative):
“Tiimari , the Finnish retailer , reported to have geenrated quarterly revenues totalling EUR 1.3 mn in the 4th quarter 2009 , up from EUR 0.3 mn loss in 2008 .”
Error #3: (neutral sentence predicted as positive):
“The joint venture will invest about EUR 500,000 in production technology straight away.”
Fig
Fig 3:
The analysis revealed that the model’s predictions closely resembled human responses, which was aligned with the research goals. Despite this, it may be useful to investigate and address these errors in future research. Overall, the model had a high level of correct predictions. Furthermore, our model predicted sentiment in a more human-like way, as indicated by the errors made by the model, which were similar to those made by humans. However, further investigation is necessary to address these errors and improve the model’s accuracy.
CONCLUSION
A company cannot control the way its stock market will go. Factors beyond a company’s underlying financials, such as macroeconomic trends, corporate developments, market patterns, world events, historical context, economic reports, and human psychology, all contribute to price shifts. Human behavior, emotions, and behavioral patterns, collectively known as sentiments, can significantly influence economic cycles and the prices of assets. Because of this, sentiment analysis is an extremely valuable tool in the world of business. Even so, sentiment analysis is an incredibly time-consuming and laborious job and very prone to error when done by humans. The introduction of AI changed that. The creation of Financial Sentiment Analysis AI could potentially change the world of business by speeding up the task and providing more accurate answers. Our AI tools leverage natural language processing techniques to analyze vast amounts of text data from sources like social media, news articles, and online reviews, and then categorize the sentiments as positive, negative, or neutral.
The results of sentiment analysis models indicate that they can perform reasonably well in classifying sentiments. While the accuracy of the models may not be perfect, they demonstrate an ability to mimic human responses and provide a more human-like approach to sentiment analysis. The percentage of accuracy is above 50% proving more correct results. The analysis also highlights areas for future improvements, such as distinguishing between closely related sentiment categories and addressing specific errors made by the models. Even so, the model works better and faster than a human. Future improvements for the AI could be categorizing the sentiments into more than 3 categories and being able to predict the future more accurately in terms of graphs.
The use of AI for sentimental analysis is going to change the world of business and help identify where the pendulum of psychology and valuation cycle stand in their swing helping identify successful investments.
ACKNOWLEDGMENTS:
Thank you for InspiritAI’s contributions.
REFERENCES:
Aggarwal, S., Nawn, S., & Dugar, A. (2021). What caused global stock market meltdown during the COVID pandemic–Lockdown stringency or investor panic? Finance Research Letters, 38, 101827. https://doi.org/10.1016/j.frl.2020.101827.
Brown, G. W., & Cliff, M. T. (2003). Investor sentiment and the near-term stock market. ScienceDirect. https://www.sciencedirect.com/science/article/abs/pii/S0927539803000422.
Daniel, W. (2021, May 3). Stocks now represent a record-high percentage of financial assets among US households, reports say. Business Insider. https://markets.businessinsider.com/news/stocks/ stocks-represent-record-percentage-fina ncial-assets-us-households-2021-5-1030380050.
Fernando, J. (2024, April 14). Inflation: What it is, how it can be controlled, and extreme examples (M. J. Boyle, Ed.). Investopedia. https://www.investopedia.com/terms/i/inflation.asp.
Hayes, A. (2024, March 1). Market Psychology: What Is It and Predictions. Investopedia. https:// www.investopedia.com/terms/m/marketpsychology.asp.
Jones, H. (2024, January 29). Is 2024 the year of investor restraint and startup resilience? 8 experts weigh in. Forbes. https://www.forbes.com/sites/hessiejones/2024/01/29/is-2024-the-year-ofinvestor-restraint-and-startup-resilience-eight-experts-weigh-in/?sh=3a0918da678a.
Marks, H. S. (2018). Mastering the Market Cycle: Getting the Odds on Your Side. Harper Business.
Mitchell, C. (2022, March 17). 4 Factors That Shape Market Trends. Investopedia. https://www. investopedia.com/articles/trading/09/what-factors-create-trends.asp.
Nguyen, J. (2022, July 15). Where did the stock market’s $7 trillion loss in value go?. Marketplace. https://www.marketplace.org/2022/07/15/where-did-the-stock-markets-7-trillion-loss-in-v alue-go/.
Sohangir, S., & Wang, D. (2018). Finding Expert Authors in Financial Forum Using Deep Learning Methods. 2018 Second IEEE International Conference on Robotic Computing (IRC), 399-402.
Taherdoost, H., & Madanchian, M. (2023, February 7). Artificial Intelligence and Sentiment Analysis: A Review in Competitive Research. MDPI. https://www.mdpi.com/2073-431X/12/2/37.
Tuovila, A. (2023, December 20). Financial Analysis: Definition, Importance, Types, and Examples. Investopedia. https://www.investopedia.com/terms/f/financial-analysis.asp.
LINDA LIN ’24
Linda Lin, a senior from Philadelphia, PA, has attended Baldwin since eleventh grade. She is an active member of Moot Court, the Asian Student’s Association and Model Congress. Having been a member of state-level debate teams, she works as a student leader with the United Nations and Georgetown University’s Walsh School of Foreign Services to promote youth platforms that drive global cooperation to solving global challenges. During her free time, she enjoys playing the piano, exploring nature and visiting museums and historical sites.

Studying the Impact of Interneurons on Early Embryonic Neurogenesis Using Human Cortical Organoids
Linda Lin ‘24, Qian Yang, PhD, Hongjun Song, MD, PhD
University of Pennsylvania, Perelman School of Medicine - Song Lab
ABSTRACT
Somatostatin has been shown to play a critical role in adult brain functions and intellectual capabilities, but its significance during early human development remains largely undiscovered. This study aimed to use induced pluripotent stem cell (iPSC) technology to provide a cytoarchitecturally accurate modeling of brain organoids and overcome the technical limitations of 2D organoid cultures and animal models. By observing distinctions in stem cell proliferation and differentiation between somatostatin treated cells and medial ganglionic eminence merged cells, it was discovered that the presence of somatostatin (and somatostatin-secreting interneurons) play an important role during early-stage embryonic development by encouraging the proliferation of neurons by triggering the differentiation of unspecialized neural progenitor cells.
INTRODUCTION
Somatostatin (SST) is a neuropeptide secreted by a subset of inhibitory neurons in the hippocampus and neocortex (1). The neuropeptide produces predominantly neuroendocrine inhibitory effects across multiple systems, including GI, endocrine, exocrine, pancreatic, and pituitary secretions (2). It can modify neurotransmission and memory formation in the Central Nervous System (CNS). SST also prevents angiogenesis and has anti-proliferative effects on healthy and cancerous cells in human and animal models. Developmentally, SST-secreting interneurons are primarily generated from medial ganglionic eminence (MGE) (1) (3).
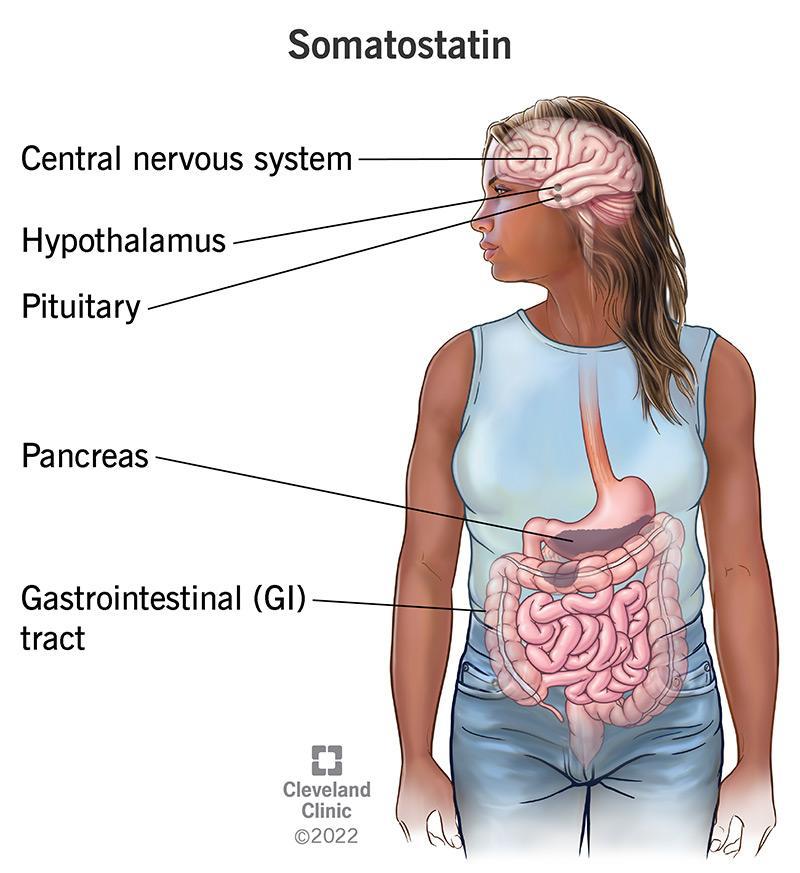
https://my.clevelandclinic.org/health/articles/22856-somatostatin
In adult brains, SST modulates cortical circuits in the neuron and cognitive functions. However, due to a lack of human models, its scientific role in developing brains throughout the embryonic stage remains primarily unknown.
METHODOLOGY
During this study, we generated cortical, hippocampal, and MGE organoids through iPSC (introduction of pluripotent stem cells) derived from skin and blood cells that have been reprogrammed back into an embryonic-like pluripotent state that enables the development of an unlimited source of any type of human cell.
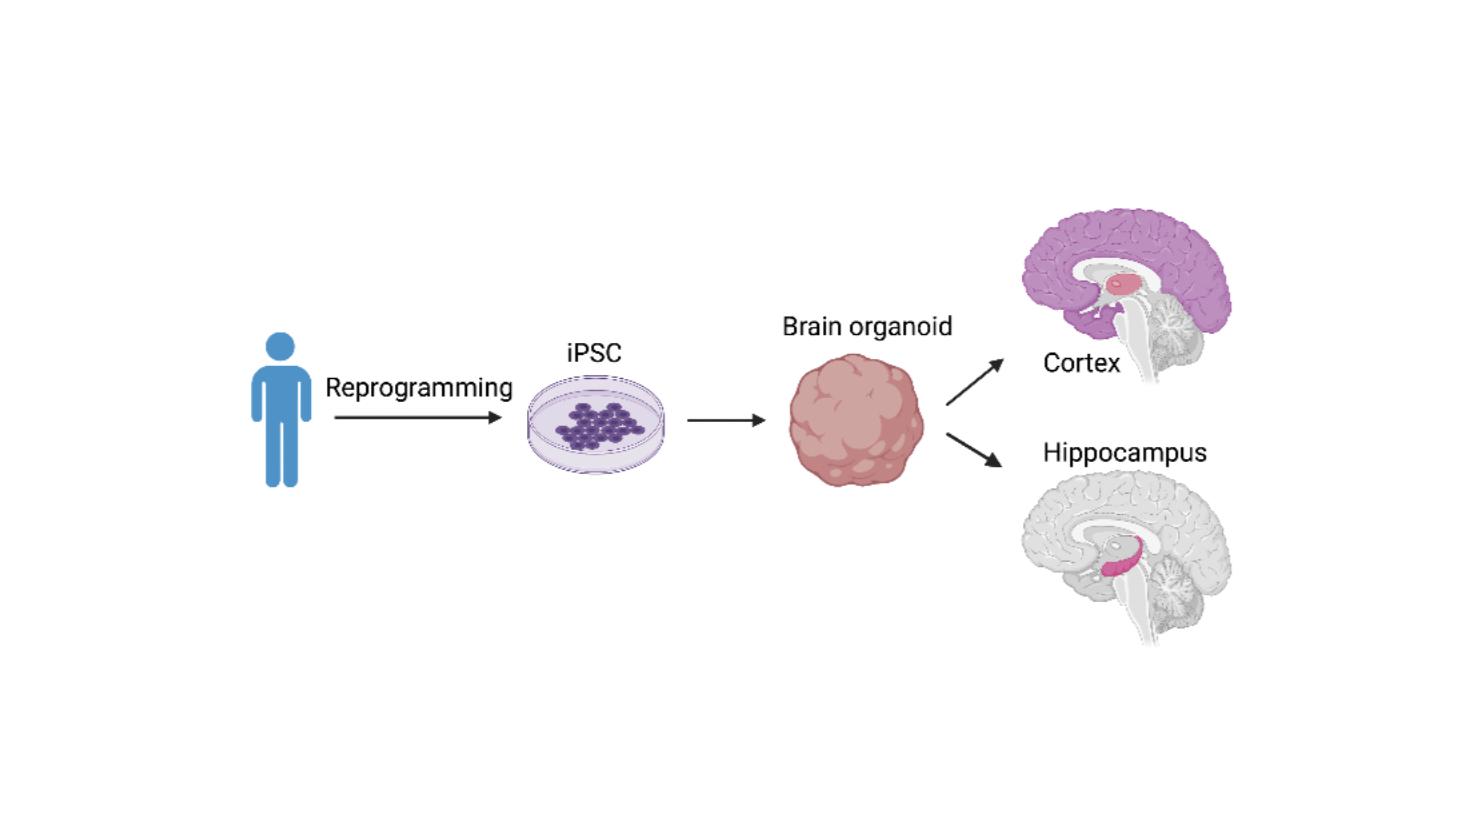
We then preserved organoids as frozen tissue samples and processed by slicing through the cryostat machine. During each trial, we processed two sets of frozen organoids - one processed and merged sample and the other a controlled sample. Each sample was processed continuously from start to finish, and their slices were secured on a microscope slide facilitated by heat adhesion. In total, four slides were used in each trial, and each was labeled. As slices were obtained, they were added onto the slides alternatingly - i.e., as every four were processed, one would be placed on each of the four slides available.
Each slide also contained one sample of sliced organoids from each of the five unique frozen sets used in each trial - also clearly labeled to prevent confusion.
https://www.frontiersin.org/journals/neuroscience/articles/10.3389/fnins.2022.872794/full
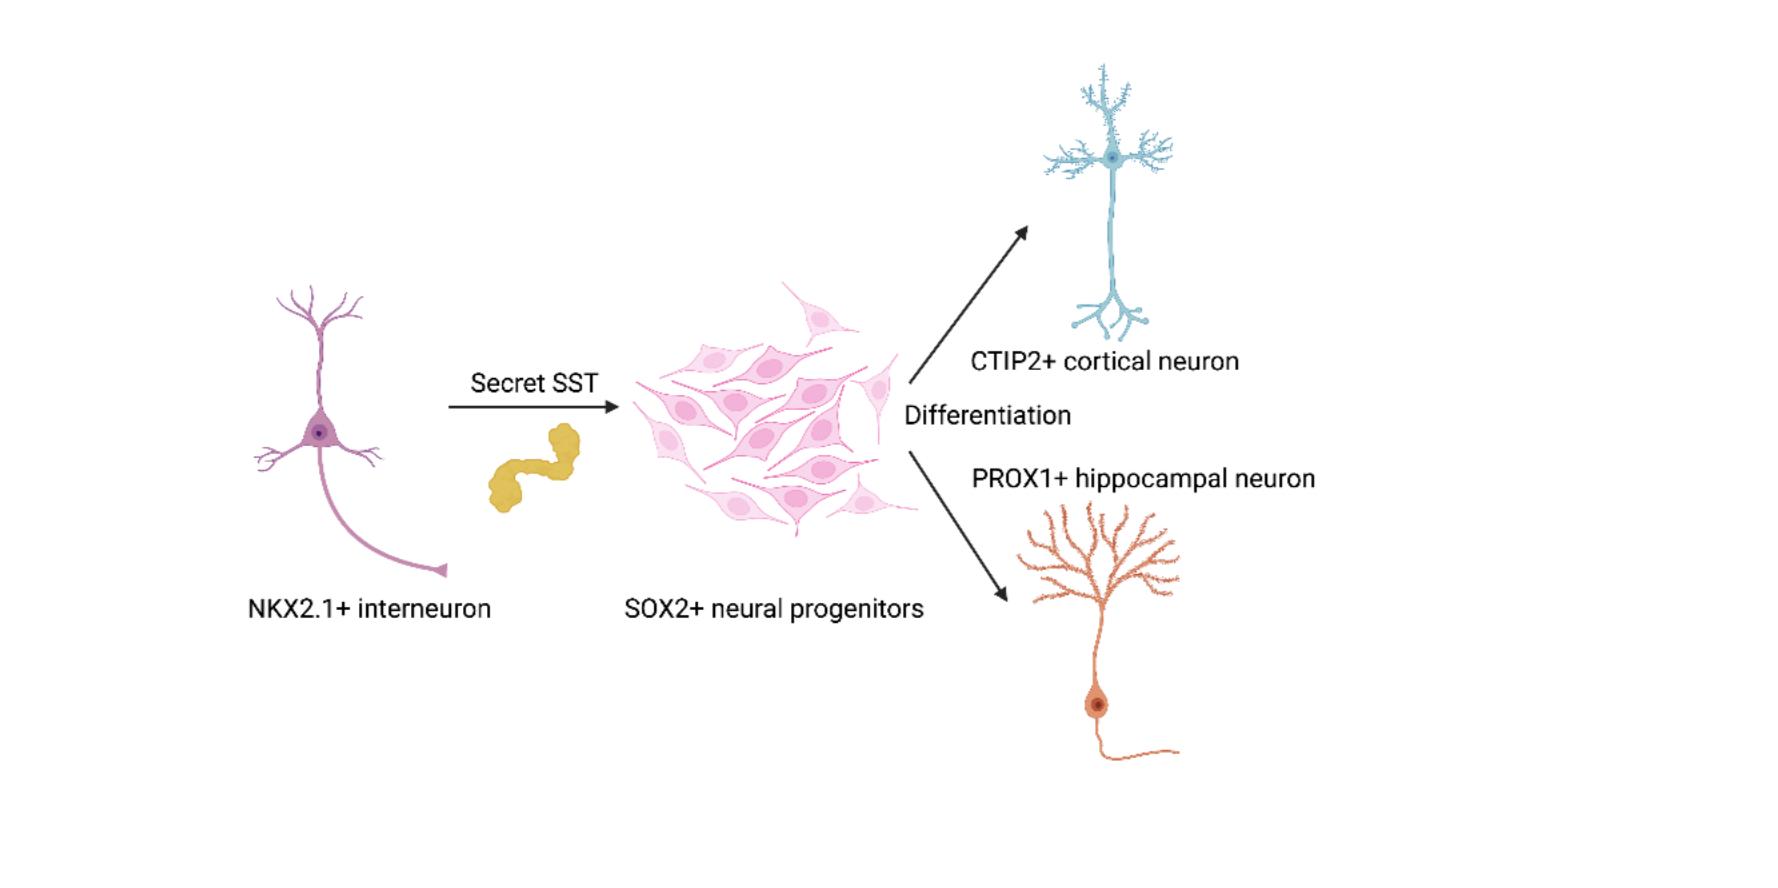
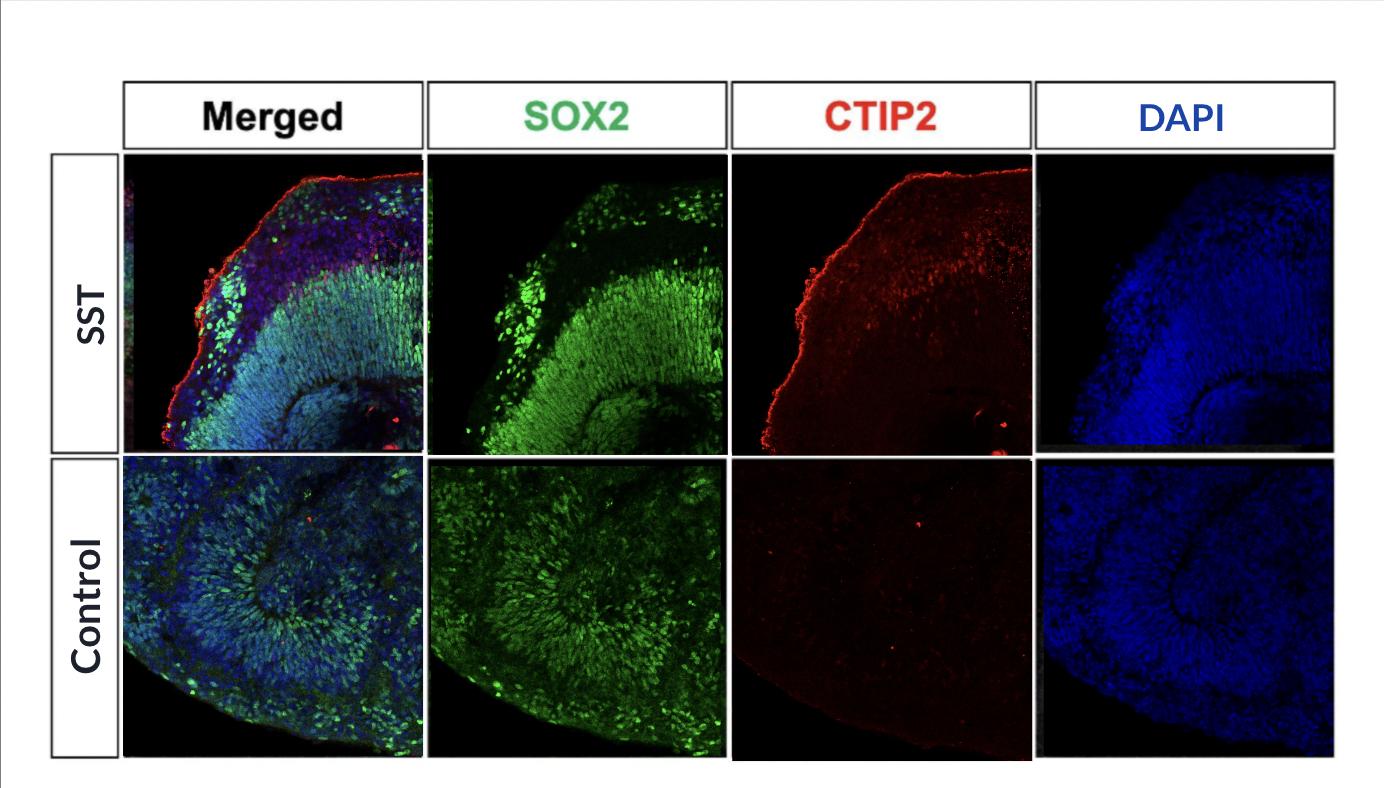
Following this, immunostaining was performed for each slide. Only the samples for one trial were processed at a time. For the primary antibodies used to identify the presence of each specific focus cell group we aimed to analyze, we utilized SOX2 derived from goat to bind to stem cells, CTIP2 derived from rat to bind to deep layer cortical neurons, and PAX6 derived from mouse to bind to cortical neural stem cells. As for the secondary antibodies used to enhance the detection of the target cells listed, we used green to identify goat primary antibodies, red to identify rat primary antibodies, and white to identify mouse primary antibodies. All secondary antibodies used were derived from donkeys.
Once the immunostaining process was completed, the samples were analyzed using confocal microscopy. ZEN, a technical software program, was used to transfer, analyze, and preserve images extracted by the confocal microscope. By alternating channels and matching the colors of specific images to the primary and secondary antibodies used in this experiment, we utilized immunostaining to count cortical, hippocampal, and MGE neurons.
We compared the levels of neurogenesis under different conditions - controlled and experimental. In most cases, the focal point of the lens was set on areas depicting a substantial number of rosettes to increase the efficiency of identification and analyses.
ADVANTAGES OF IPSC ORGANOIDS - RATIONALE BEHIND ITS USE DURING THIS STUDY (4)
• Mouse models commonly used to study human brain development substantially lack humanspecific features critical for enabling human neurogenesis.
• Throughout the processes of biological evolution, the cerebral cortex of the human brain, which heavily contributes to higher-level and complexity cognitive functions and distinguished linguistic abilities, has greatly expanded. This expansion unique to human beings highlights the deficiencies in solely using mouse models to study human neural development.
• Many human-specific genes and cell types are major contributors to the human fetal neurodevelopmental process, and thus cannot be accurately replicated with models that do not contain said genes and cells.
• Due to differences in species-specific genes and gene regulation, mice are also not always a reliable model for human disorders and translational studies.
• Mice are lissencephalic and lack the folded neocortical surface as in primates and humans.
• The SVZ notably expanded in primates and humans with two morphologically distinguished regions–inner and outer SVZ (iSVZ and oSVZ). Outer radial glial (oRG) cells are prevalent progenitor cells in oSVZ and predominantly contribute to the expansion and folding or gyrification of the developing human cortex.
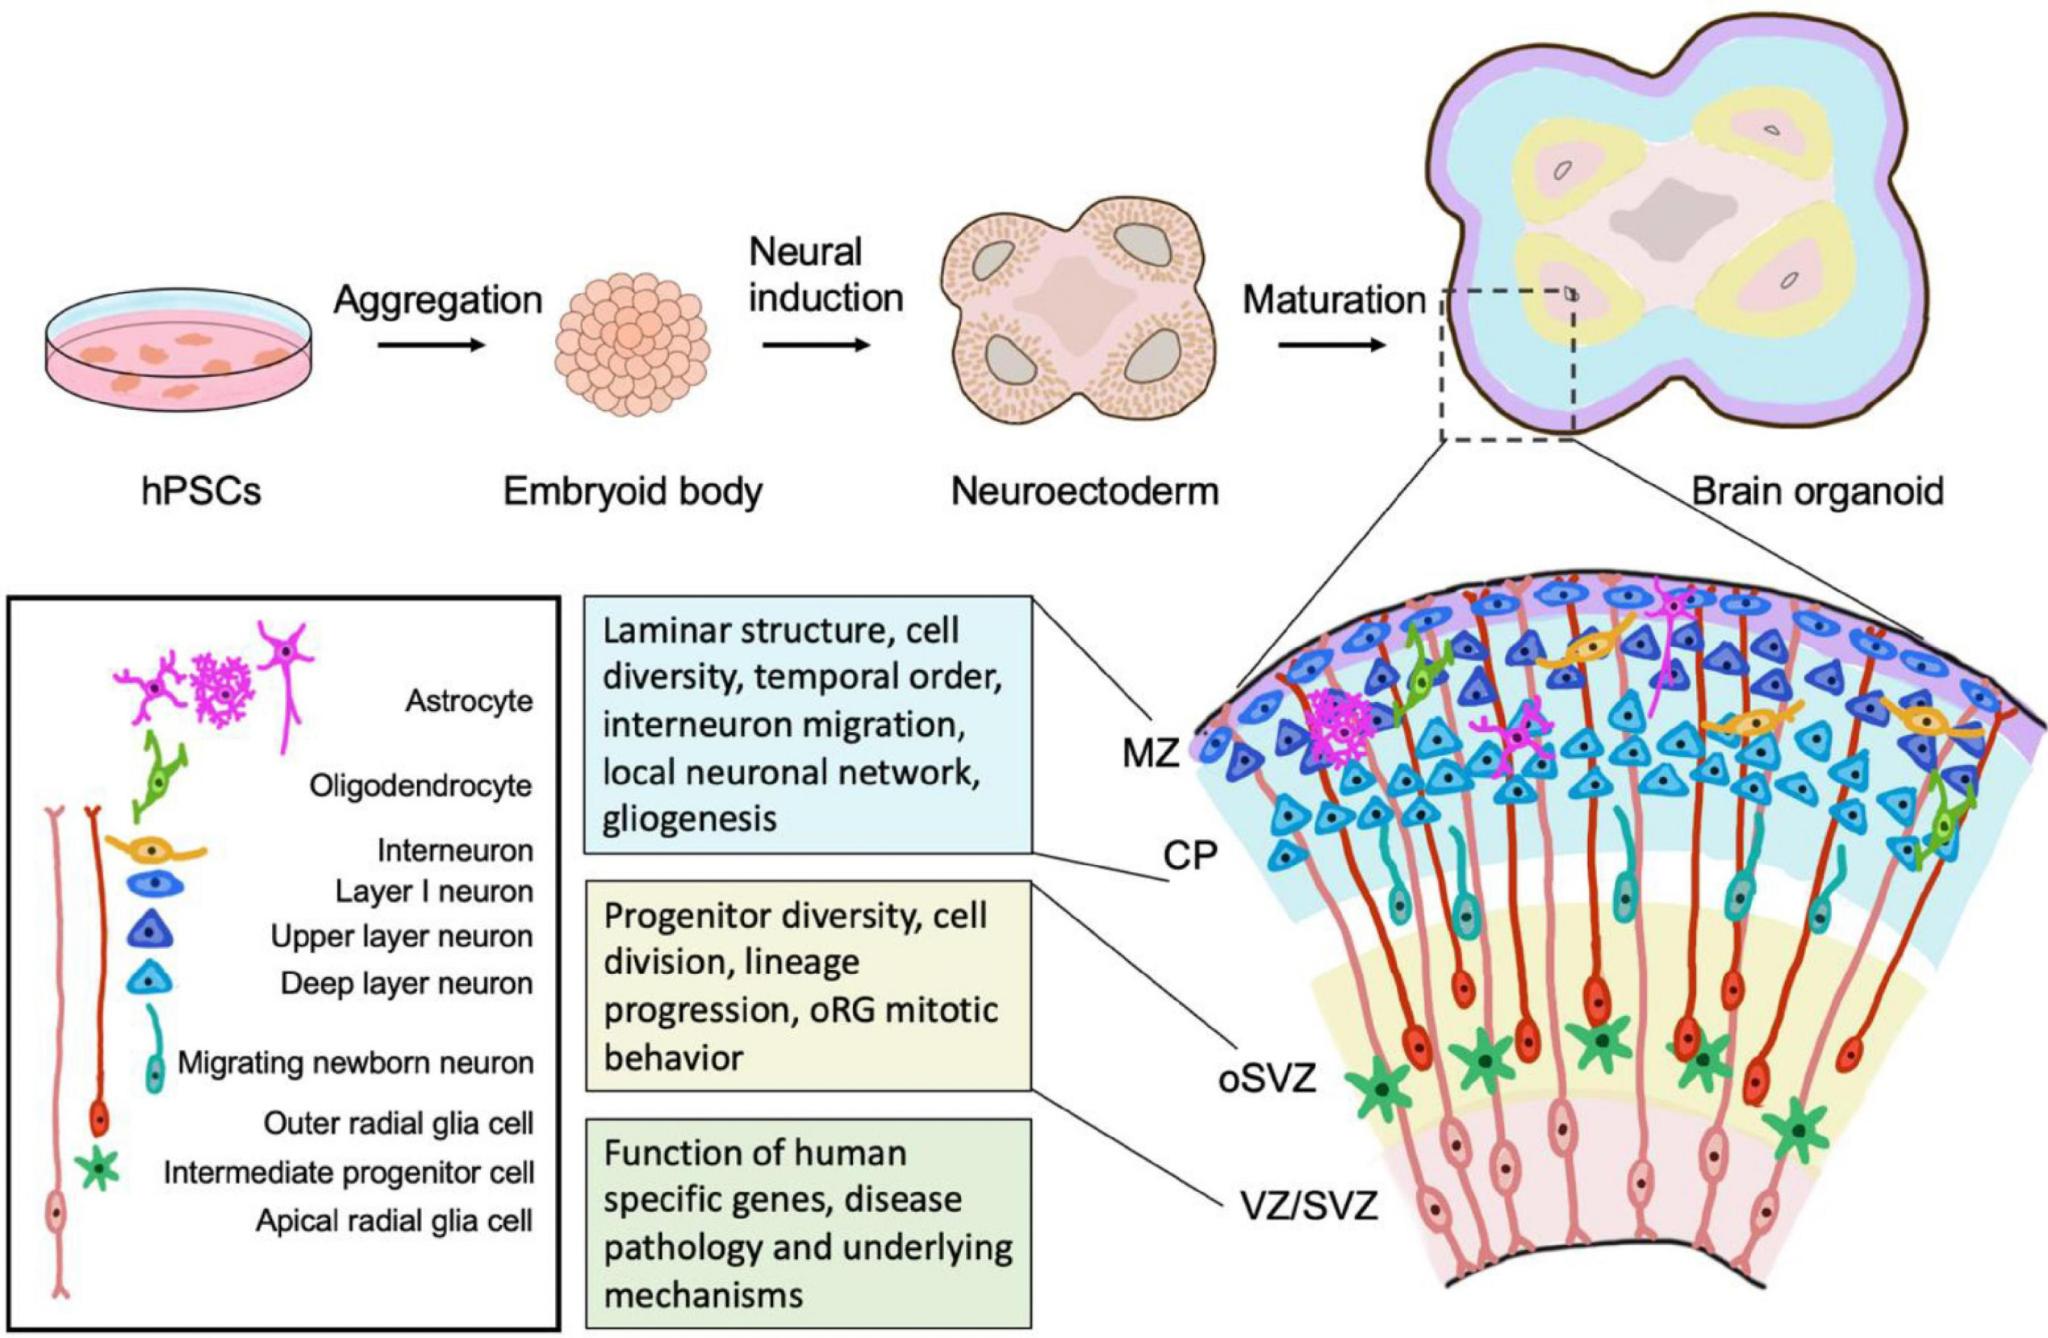
https://www.frontiersin.org/journals/neuroscience/articles/10.3389/fnins.2022.872794/full
RESULTS
We observed active neurogenesis in cortical and SST treated organoids and hippocampal organoids fused with MGE organoids through examinations of the samples. The scientific images extracted from the experimental groups consistently showed increased stem cell growth, as well as deep-layer cortical neuron proliferation in areas surrounding cell rosettes.
DISCUSSION
These results sufficiently suggested the significance of SST-secreting interneurons in promoting neuron differentiation during embryonic development. Consistent results were shown in the results of three repeated trials.
Informed by these findings, SST-secreting interneurons and, consequently, the peptide hormone somatostatin play a critical role in the development of the embryonic nervous system via promotions of neuron differentiation by which neural progenitor cells (unspecialized cells), transform into highly specialized cells with distinct and specific functions within the human body.
FUTURE WORK
Based on the results of this project, future directions could include:
• Studying the signaling pathway activated by SST to mediate neural progenitor differentiation. Investigating mutations in SST production or SST receptor-related brain developmental disorders and the aberrant maturation of neural progenitors.
NOTES AND ACKNOWLEDGEMENTS
This research project was conducted in the Song Lab at the University of Pennsylvania Perelman School of Medicine. I would like to sincerely thank Dr. Qian Yang for patiently guiding me through the basic lab protocols of this project, including but not limited to; understanding and performing the lab procedures, extracting information from scientific literature, citing sources, experimental techniques, curating scientific scale bars and descriptions for data figures, and creating scientific research posters and write-ups. Furthermore, I would like to thank Ms. Heather Wilson for her kind guidance and The Baldwin School for this opportunity. Last but not least, I am beyond appreciative of everyone at the Song Lab for their guidance and support, and Dr. Hongjun Song’s generosity in allowing me to intern in his lab, as well as for his technical expertise and support throughout this process.
REFERENCES
O’Toole, T. J. and Sharma, S. (July 24, 2023). “Physiology, Somatostatin.” Nih.gov. StatPearls Publishing. https://www.ncbi.nlm.nih.gov/books/NBK538327/.
Sharif, S. Belayachi, A & Larrivée, B. (February 5, 2024). “Involvement of Neuronal Factors in Tumor Angiogenesis and the Shaping of the Cancer Microenvironment.” Frontiers in Immunology 15. https://doi.org/10.3389/fimmu.2024.1284629.
Song, You-Hyang. Yoon, J & Lee, S. (March 1, 2021). “The Role of Neuropeptide Somatostatin in the Brain and Its Application in Treating Neurological Disorders.” Experimental and Molecular Medicine/ Experimental and Molecular Medicine 53 (3): 328–38. https://doi.org/10.1038/s12276-021-00580-4.
Yang, Q. Hong, Y. Zhao, T. Song, H. & Ming, G. (April 14, 2022). “What Makes OrganoidsGood Models of Human Neurogenesis?” Frontiers in Neuroscience 16: pp.1, 2, 3, 5. https://doi.org/10.3389/ fnins.2022.872794.
GURNOOR
OTHIE ’25
Gurnoor Othie, a junior from Media, PA, has attended Baldwin since eighth grade. She is Co-Head of the Science Research Consortium, a competitive organization that participates in the Pennsylvania Junior Academy of Science, a member of DECA and a current member of the TRIP Initiative, a research program revolved around conducting a research project on behavioral analysis of fruit flies. Outside of science, she enjoys baking, painting, reading and spending time with her friends and family.

The Impact of Interferon Gamma Type II on Spiral Artery Remodeling During Pregnancy
Gurnoor Othie ‘25, Scott Gordon, Loui Othman
The Gordon Lab at Children’s Hospital of Philadelphia Division of Neonatology
ABSTRACT
Figure 4: Introduction
Figure 5: Materials and Methods
Figure 6: Materials and Methods
Figure 7: Materials and Methods
Figure 8: Materials and Methods
Figure 9: Discussion
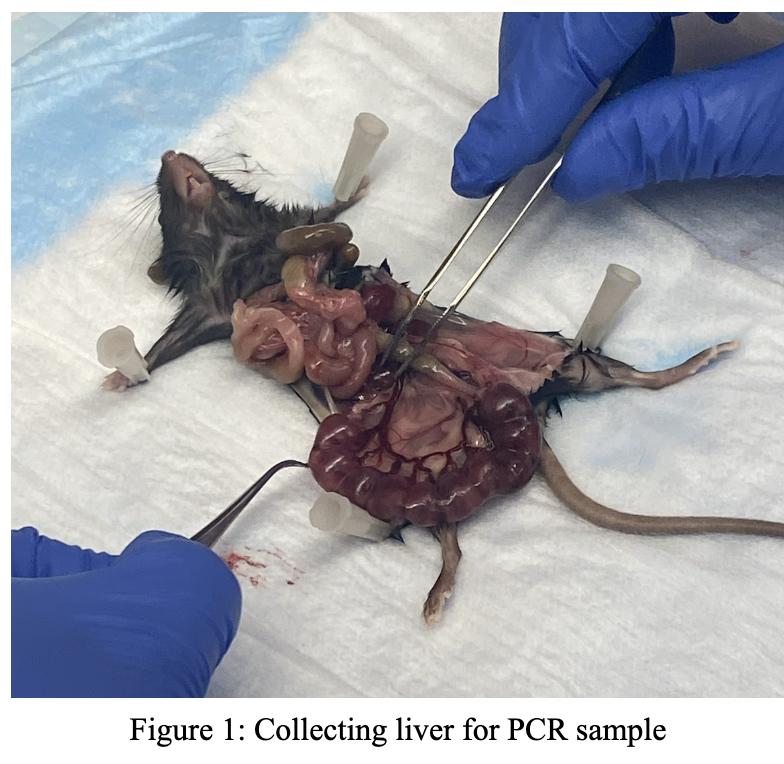
1: Collecting liver for PCR sample
Figure 1: Abstract
Figure 2: Introduction
Figure 3: Introduction
Preeclampsia is a common high blood pressure condition occurring twenty weeks post-conception in 4% of women (1). However, there is a lack of mechanistic understanding of its causes. One potential cause is spiral artery remodeling, and one driver of modeling has been hypothesized to be the Interferon Gamma Type II (INFG) gene (2). The Gordon Lab at the Leonard and Madlyn Abramson Pediatric Research Center of the Children’s Hospital of Philadelphia examines potential causes of preeclampsia by studying how Interferon Gamma Type II affects spiral artery remodeling during placenta and embryo development. To establish the mice’s genotype, amplified DNA from various organs of the mice was used to conduct polymerase chain reaction tests. The spiral artery remodeling was then studied within that genotype group by analyzing the processes’ correlation to the INFG gene and its contribution to pregnancy complications (preeclampsia). Spiral artery remodeling, a potential cause of preeclampsia, was inferred to be caused by the IFNG gene.
Figure 4: Introduction
Figure 5: Materials and Methods
Figure 6: Materials and Methods
INTRODUCTION
Figure 7: Materials and Methods
Figure 8: Materials and Methods
Immunity During Pregnancy and Preeclampsia
Figure 9: Discussion
The immune system prevents the human body from foreign risks; however, why does the maternal immune system not recognize the fetus as a foreign body? This can be attributed to the relationship between the placenta and the immune system. Upon conception, the placenta forms in the mother’s uterus and fixates itself to the uterus for the umbilical cord to develop. The placenta is composed of three layers: the amnion, the chorion, and the decidua (3). The amnion and chorion membranes encompass the amniotic cavity that maintains the embryo and the amniotic liquid surrounding it. The amnion membrane prohibits any loss of the amnion liquid surrounding the embryo inside the amnion cavity (4). The chorion comprises a series of intricate blood vessels, specifically chorionic villi, which aid blood transfer from the maternal system to the fetus through the endometrium, a layer of which is called the decidua (5). The decidua nourishes the embryo with nutrients and works to tolerate trophoblast cells, made of antigens, thus foreign bodies, that infiltrate it, building immune mechanisms (6).
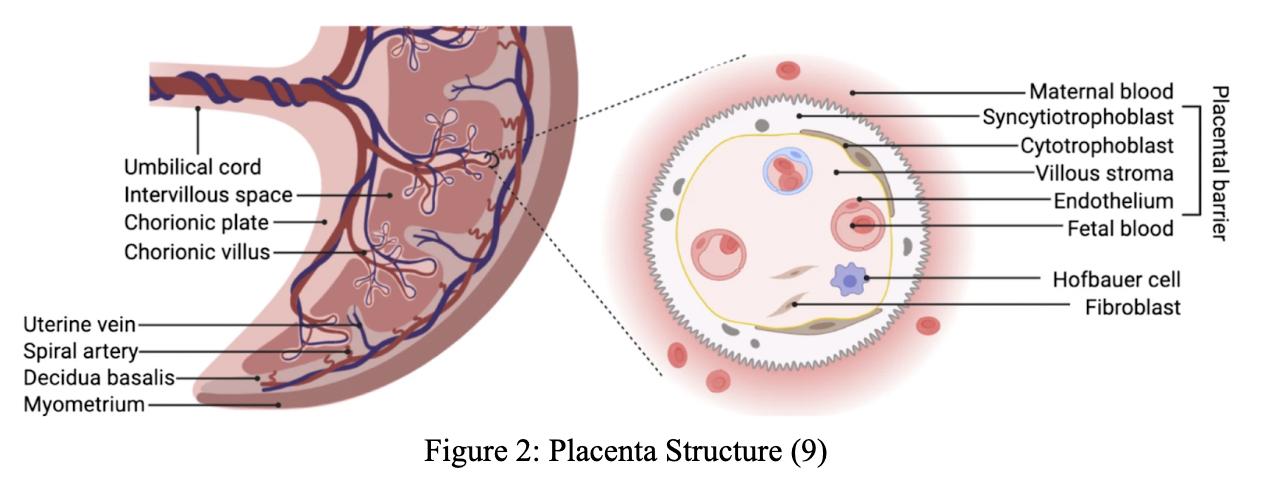
However, what occurs when the mother’s body is not able to adapt to build this tolerance? Preeclampsia is one of the possible complications that may occur, distinguished by the high blood pressure women experience within five months into the pregnancy. Preeclampsia is thought to stem from the underdevelopment of the
Figure
Figure 2: Placenta Structure (9)
placenta, leading to the malnourishment of the fetus. This includes the underdevelopment of the blood vessels within the chorion, thus depleting the embryo of oxygen and nutrients. Additionally, the relationship between the decidua and trophoblasts can impact these blood vessels as trophoblasts, specifically villous trophoblast, infiltrate the decidua in an attempt to initiate blood flow between the fetus and maternal blood. Among these various conjectures, a potential cause of blood flow irregularity is spiral artery remodeling, which may be a consequence of the Interferon Gamma Type II gene (7, 8, 2).
The Interferon Gamma Type II Gene Connection to Immune System
The Interferon Gamma gene (IFNG) is located in chromosomes 10 and 12 and transcripts into the protein Interferon-gamma (IFN-y), a cytokine (signaling) protein that is an integral part of the human body’s immune system. This protein is produced primarily by the natural killer uterine, located in the endometrium of the uterus, cells, and T-cells, upon encountering an external threat such as an anti-viral bacteria or pathogen. When these foreign threats are encountered, including aspects of the placenta, the uterine natural killer is signaled to produce the IFN-y protein through the JAK-STAT pathway, and the T-cells convert into Th1 cells, capable of producing the (IFN-y) protein. These proteins then bind to the receptors of cells that are capable of both receiving and adhering to their signals. This permits them to regulate immune responses to foreign antigens and control the abundance of natural killer cells and T-cells, a crucial necessity, especially during pregnancy, while the embryo and placenta form and develop (2,10).
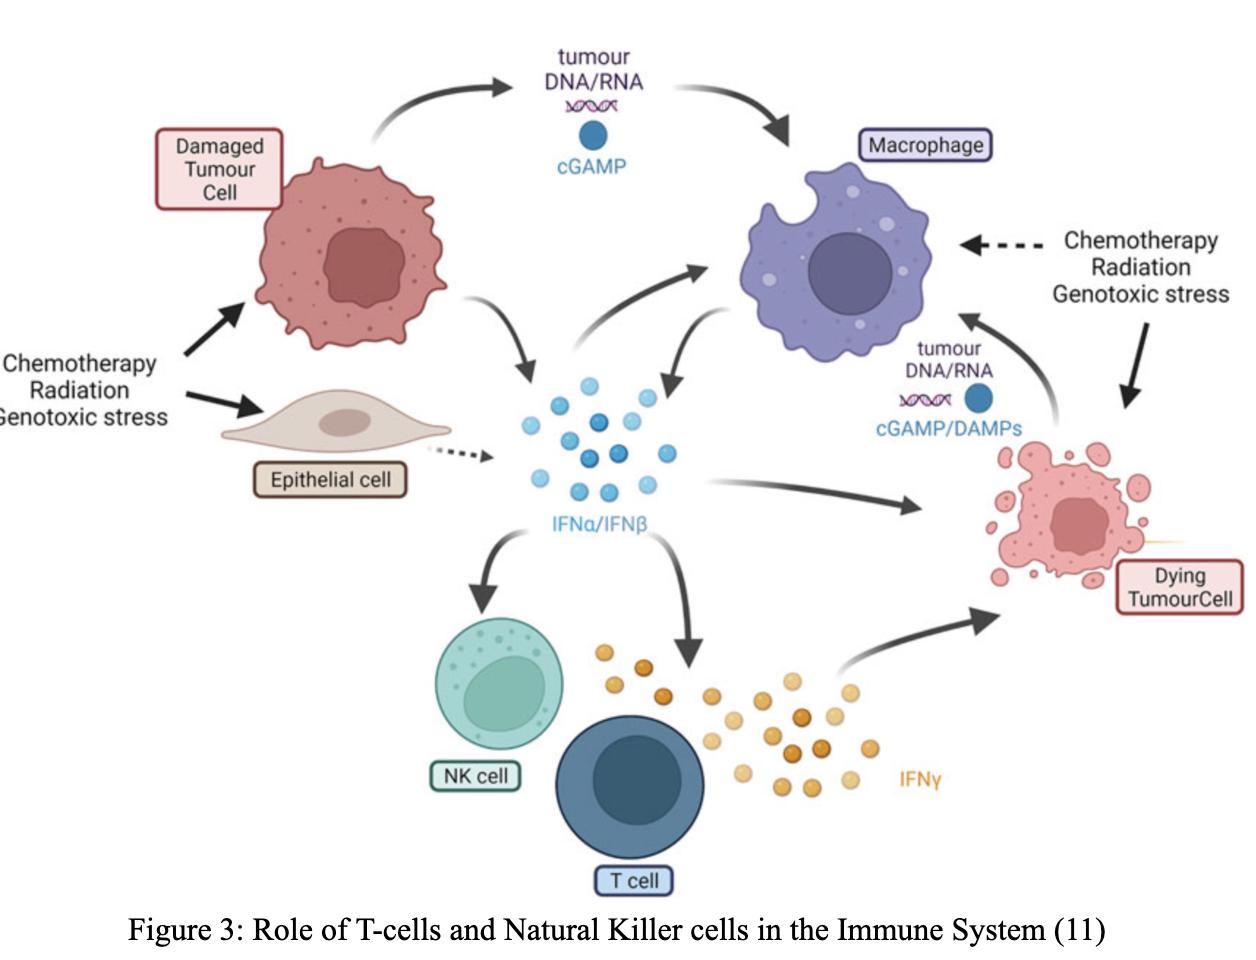
Importance of Spiral Arteries Remodeling
Spiral arteries are essential to the embryo and placenta growth by establishing blood flow and providing critical nutrients. Spiral artery remodeling refers to the rearrangement and reformation of these arteries to vessels within the first five months of pregnancy to accommodate for the increased blood flow as the embryo and placenta develop. This occurs through the infiltration of extravillous trophoblasts (EVT) from the chorionic villi to the endometrium. This leads to the replacement of vascular smooth muscle cells and endothelial cells by EVT cells. This remodeling strengthens the vascular walls as extracellular fibrinoid is discharged, leading to an increase in thickness and allowing the
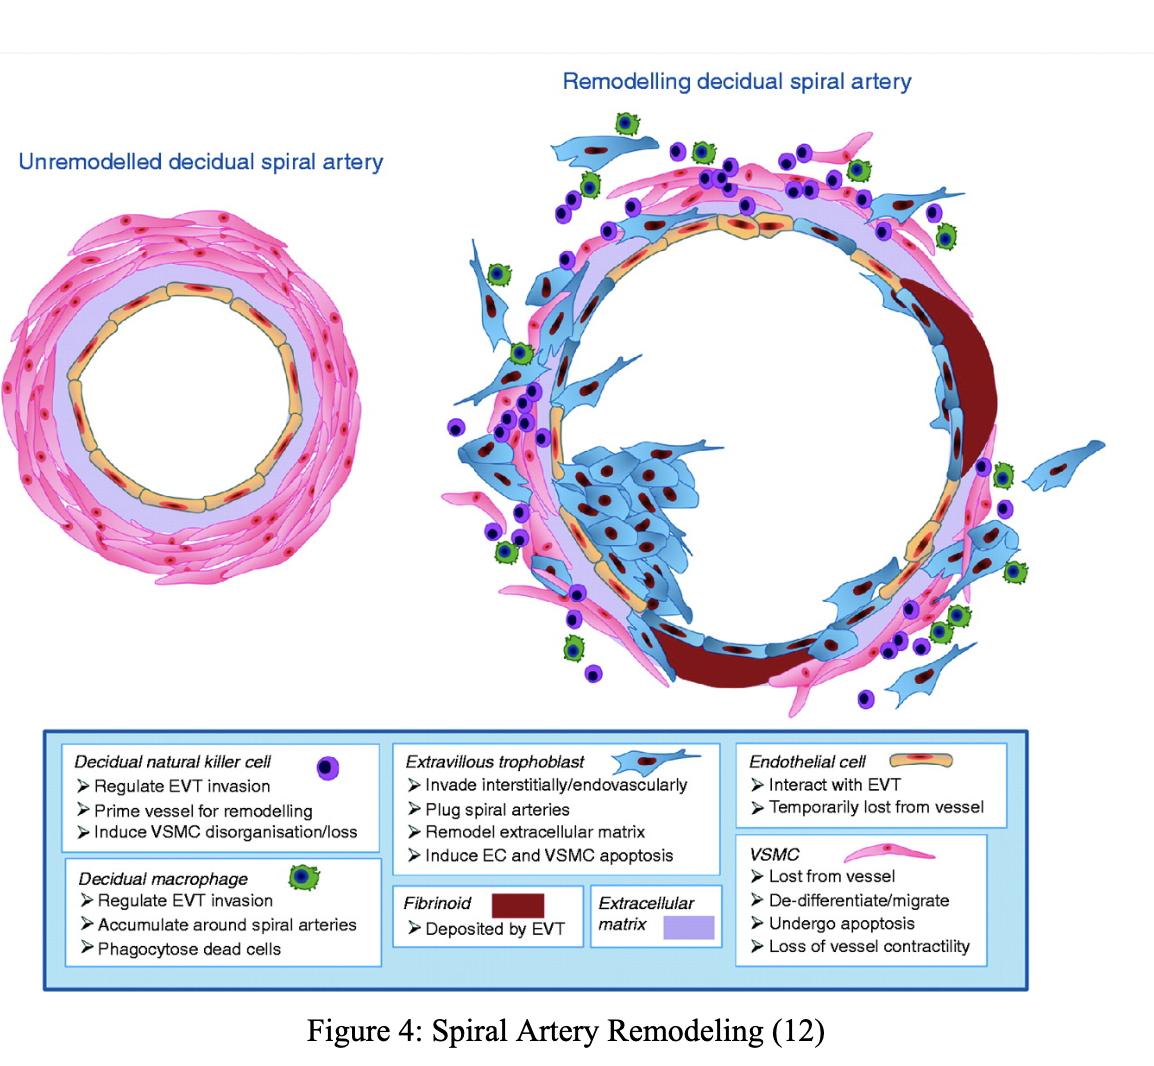
Figure 3: Role of T-cells and Natural Killer cells in the Immune System (11)
Figure 4: Spiral Artery Remodeling (12)
maintenance of a steady blood flow (12). The project studied how the Interferon Gamma Type II impacted the spiral artery remodeling in the uterus during pregnancy and how this influence contributed to preeclampsia.
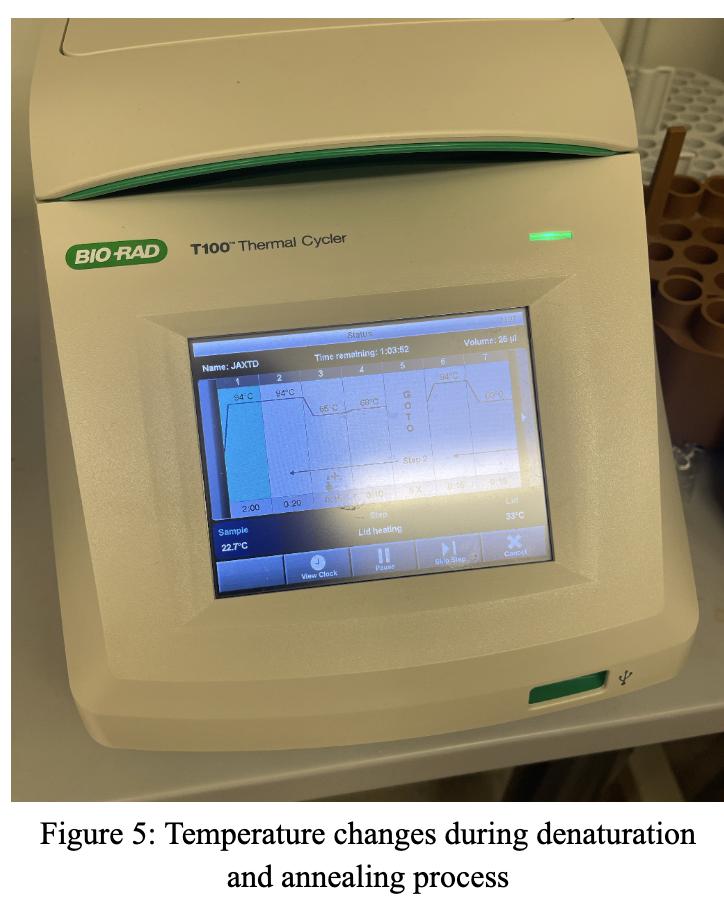
MATERIALS AND METHODS
To conduct polymerase chain reaction and agarose gel electrophoresis, specimens were collected to be used as amplified DNA in order to establish their genotype. The JAX genotyping protocol was used to perform the DNA extraction using ear and liver specimens. Following sample preparation, the samples were put in a heating block that went up to 95°C in order to denature the double helix DNA strand into two single strands by weakening the hydrogen bonds between the complementary base pairs. Following the denaturation process, the temperature was lowered, and the annealing process, during which the primers bonded with the single strands of the sample solution. Tris-borate-EDTA buffer and agarose were stirred and heated in an Erlenmeyer flask. SBYR safe was then added to the cooled agarose solution, poured into the gel tray with two secured combs, and left to dry. After removing the combs, the tray was then loaded with the DNA samples and plugged into a gel power source set to 100V for an hour. Following the hour, the gel was removed and set into a thermal cycler in order to analyze and establish the genotype of the mice (13).
DISCUSSION
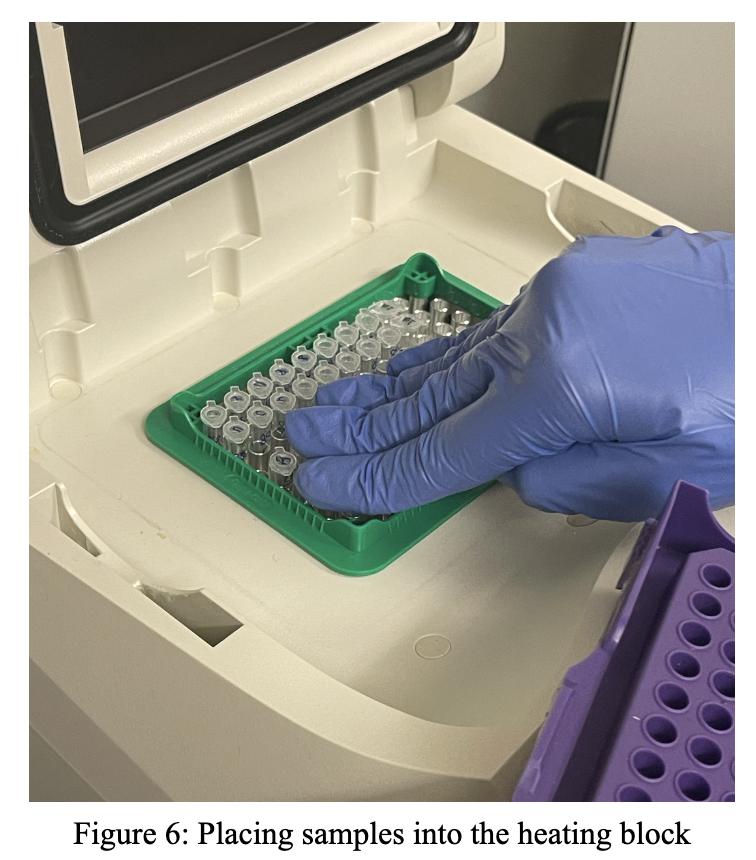
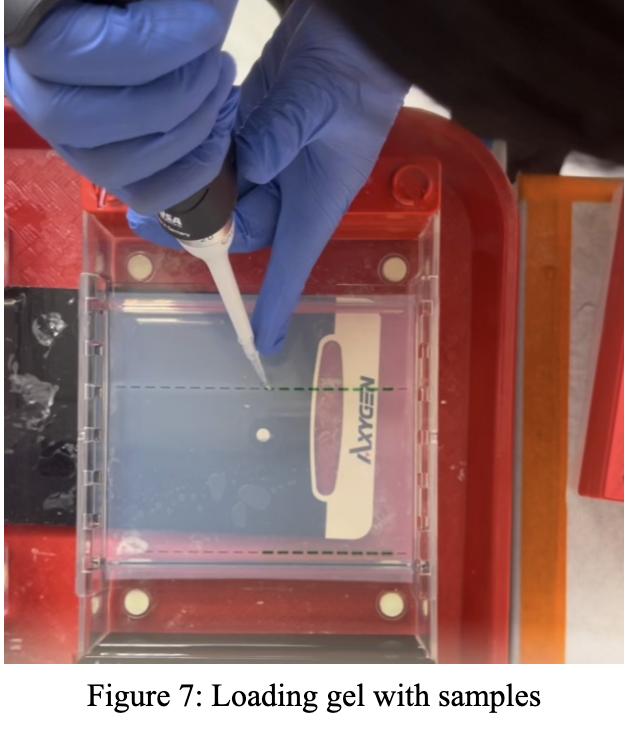
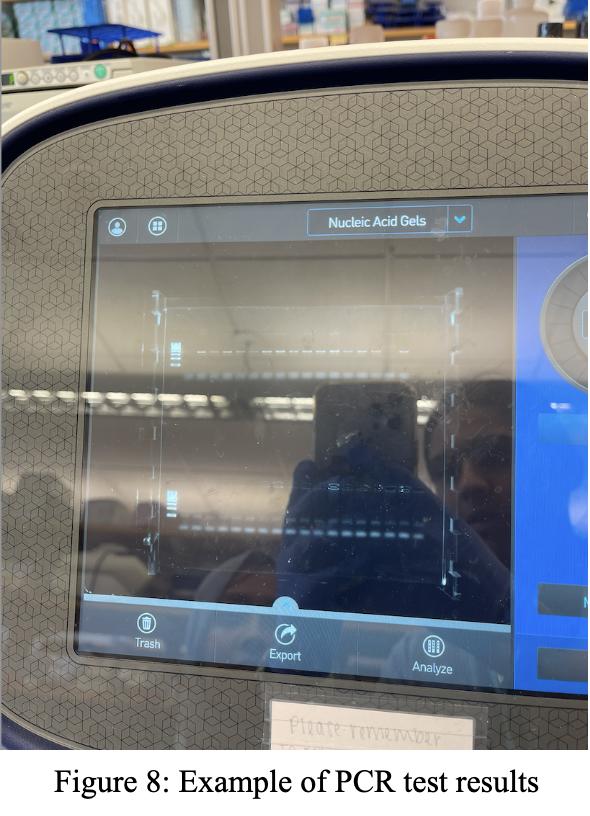
Upon analysis of various polymerase chain reaction tests to study the impact of the IFNG gene on spiral artery remodeling in the uterus, the IFGN gene was believed to play a role in spiral artery remodeling, a potential cause of preeclampsia. Spiral artery remodeling may be a likely cause of preeclampsia occurring through complications due to the (incomplete) execution of the process. For example, a lack of IFN-y protein could lead to the misregulation of natural killer cells and T-cells, thus causing improper immune responses that could potentially harm the fetus. Another potential cause may be the
Figure 5: Temperaturechanges during denaturation and annealing process
Figure 8: Example of PCR test results
role of remodeling in maintaining blood flow to support placenta and embryo growth. Thus, complications in strengthening the vascular walls could lead to organ dysfunction and high blood pressure. It can be inferred that IFN-y protein functional complications could lead to an irregular remodeling process, thus resulting in pregnancy complications and conditions such as preeclampsia (14, 15).
ACKNOWLEDGMENTS
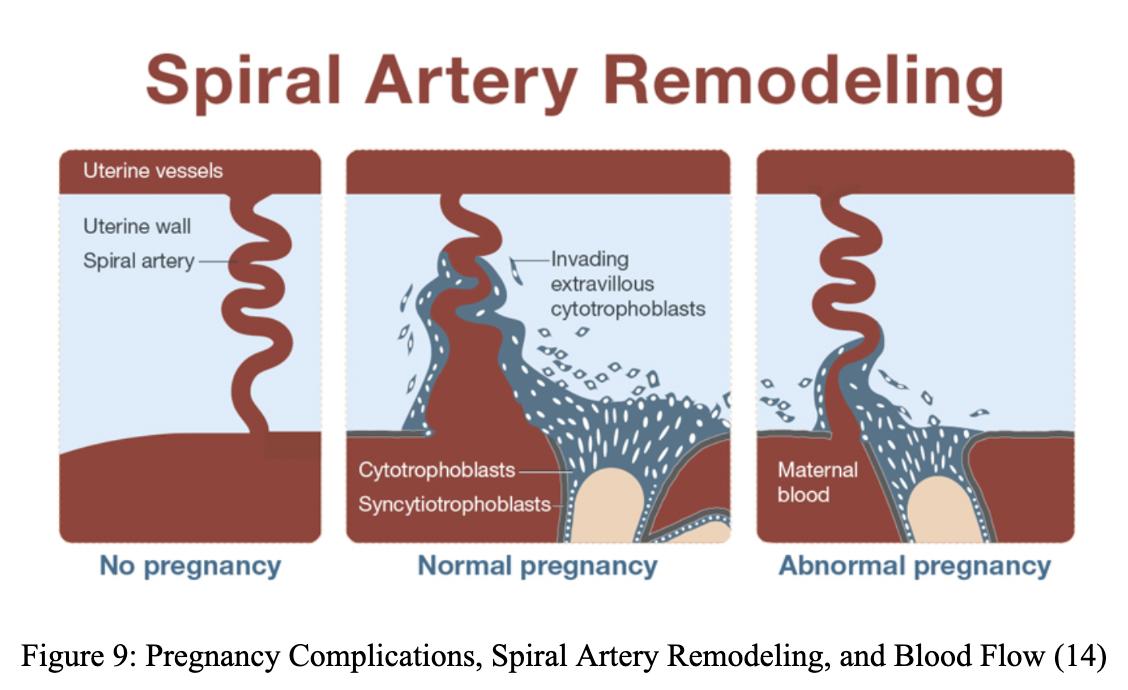
Figure 9: Pregnancy Complications, Spiral Artery Remodeling, and Blood Flow (14)
Thank you to Dr. Scott Gordon and Loui Othman, MD-PhD, and all the lab members of the Gordon Lab at Abramson Research Cancer Center of the Children’s Hospital of Philadelphia for mentoring me in the summer of 2023. By participating and learning from this ongoing study of Dr. Scott Gordon, I learned numerous skills such as lab etiquette, polymerase chain reaction, agarose gel electrophoresis, and mouse organ surgery. Thank you for this opportunity.
REFERENCES
1998, July 20. Ahorion. Encyclopedia Britannica. https://www.britannica.com/science/chorion
Ashkar, A. A., Di Santo, J. P., & Croy, B. A. (July 2000). Interferon-gamma contributes to initiation of uterine vascular modification, decidual integrity, and uterine natural killer cell maturation during normal murine pregnancy. The Journal of Experimental Medicine. 259–270. https://doi.org/10.1084/ jem.192.2.259.
Bailey, P., Barry, S. & Cattolico, C. (2022). Modulation of Type I Interferon Responses to Influence Tumor-Immune Cross Talk in PDAC. Frontiers in Cell and Developmental Biology Vol 10. https://www. frontiersin.org/articles/10.3389/fcell.2022.816517/full
Balasundaram, P. Farhana, A. (August 2023). Immunology at the Maternal-Fetal Interface. National Library of Medicine https://www.ncbi.nlm.nih.gov/books/NBK574542/#:~:text=Decidua%20 contributes%20to%20three%20vital,interfaces%20help%20in%20immune%20tolerance
Bhat, M. Y., Solanki, H. S., Advani, J., Khan, A. A., Keshava Prasad, T. S., Gowda, H., Thiyagarajan, S., & Chatterjee, A. (September 2018). Comprehensive network map of interferon-gamma signaling. National Library of Medicine https://www.ncbi.nlm.nih.gov/pmc/articles/PMC6235777/#:~:text=Gene%20 encoding%20IFN%2D%CE%B3%20protein,5.4%20kb%20(Liu%20et%20al.
Bongaerts, E., Aengenheister, L., & Dugershaw, B.B. (2021). Label-free detection of uptake, accumulation, and translocation of diesel exhaust particles in ex vivo perfused human placenta. J Nanobiotechno. https://doi.org/10.1186/s12951-021-00886-5
Cartwright, J., Fraser, R., Leslie, K., & Wallace, A. (December 2010). Remodelling at the maternal–fetal interface: relevance to human pregnancy disorders. Reproduction. https://rep.bioscientifica.
The Impact of Interferon Gamma Type II on Spiral Artery Remodeling During Pregnancy | Gurnoor Othie ’25
com/view/journals/rep/140/6/803.xml#:~:text=Normal%20remodelling%20of%20the%20 spiral,resistance%20to%20maternal%20blood%20flow.
Evans, B. and Bennett, A. (2020). Formation of the Placenta. University of Cincinnati. https://med.uc.edu/landing-pages/reproductivephysiology/lecture-6/formation-of-theplacenta#:~:text=The%20fully%20developed%20placenta%20consists,the%20decidua%20of%20 the%20maternal.
Fox, R., Kitt, J., Leeson, P., Aye, C. Y. L., & Lewandowski, A. J. (October 2019). Preeclampsia: Risk Factors, Diagnosis, Management, and the Cardiovascular Impact on the Offspring. Journal of Clinical Medicine. https://www.ncbi.nlm.nih.gov/pmc/articles/PMC6832549/.
(2023 June). High Blood Pressure During Pregnancy. National Center for Chronic Disease Prevention and Health Promotion, Division for Heart Disease and Stroke Prevention. https://www. cdc.gov/bloodpressure/pregnancy.htm#print.
(2023, December 9). Placenta. Encyclopedia Britannica. https://www.britannica.com/science/ placenta-human-and-animal.
(2023, December 18). Polymerase Chain Reaction. Encyclopedia Britannica. https://www.britannica. com/science/polymerase-chain-reaction.
(2020, May 2). Preeclampsia and Eclampsia. Encyclopedia Britannica. https://www.britannica.com/ summary/preeclampsia.
Solano, M. (2019). Decidual immune cells: Guardians of human pregnancies. ScienceDirect. https:// www.sciencedirect.com/science/article/abs/pii/S1521693419300549.
Weinberg, D. (May 2023). Human Placenta Project: How Does the Placenta Form? [Internet]. Eunice Kennedy Shiver National Institute of Child Health and Human Development. https://www.nichd.nih. gov/research/supported/human-placenta-project/how-does-placenta-form.
TRISHA YUN ’24
Trisha Yun, a senior from King of Prussia, PA, has attended Baldwin since second grade. She is the Head of the Arts League Organization, which promotes and emphasizes a variety of artwork among a diverse student body in the Upper School, ranging from visual arts to performance art, by coordinating creative events such as the annual Arts Jubilee. Additionally, she is a Creative Director of The Hourglass (the Baldwin newspaper), Co-Head of BETA, Co-Captain of the varsity dance team, Co-Captain of the varsity golf team and a member of Mock Trial. She enjoys designing collages, exploring foreign languages and photography in her leisure time.

NELFE Regulation of MYC Expression in PDAC
Trisha Yun ’24, Hien Dang PhD, Anna Barry MS, Brittany Ruiz PhD Student, Laura Reynolds PhD Student, Meg Grim MS Student
Thomas Jefferson University
Sidney Kimmel Cancer Center, Dang Lab
ABSTRACT
This paper is based on the research from Dr. Hien Dang’s Lab on the role of RNA-binding proteins in pancreatic cancer. PDAC, Pancreatic Ductal Adenocarcinoma, is one of the most lethal diseases and the most common type of pancreatic cancer that occurs due to poor prognosis (1). PDAC has an average five-year survival rate ranging from 4.2~17.4% (2). So far the best treatment provided is surgical resection, but this only applies to patients that have cancer cells that have not yet spread to critical abdominal vessels and adjacent organs. It is best to do the treatment before the cancer metastasizes since once the cancer metastasizes, surgical resection is not an option anymore. However, PDAC is challenging to do so since the symptoms of the cancer appear at the late stage, which means it becomes increasingly difficult to notice and cure PDAC. Some risk factors of PDAC are smoking, diabetes, pancreatitis (chronic inflammation of the pancreas), and a family history of genetic syndromes (3).
INTRODUCTION
One of the main functions of PDAC cases is the Kristen Rat Sarcoma Viral oncogene homolog (KRAS) mutation. KRAS canonically regulates the activation of a variety of signaling functions and is a membrane-bound GTPase. In normal conditions, GDP will be phosphorylated into GTP, allowing KRAS to be activated. However, in PDAC, due to the KRAS mutation, this active GTP state is constantly on. This leads to constant oncogenic signaling, driving the initiation of PDAC. KRAS mutation drives nearly 85% of PDAC cases (4).
Introduction
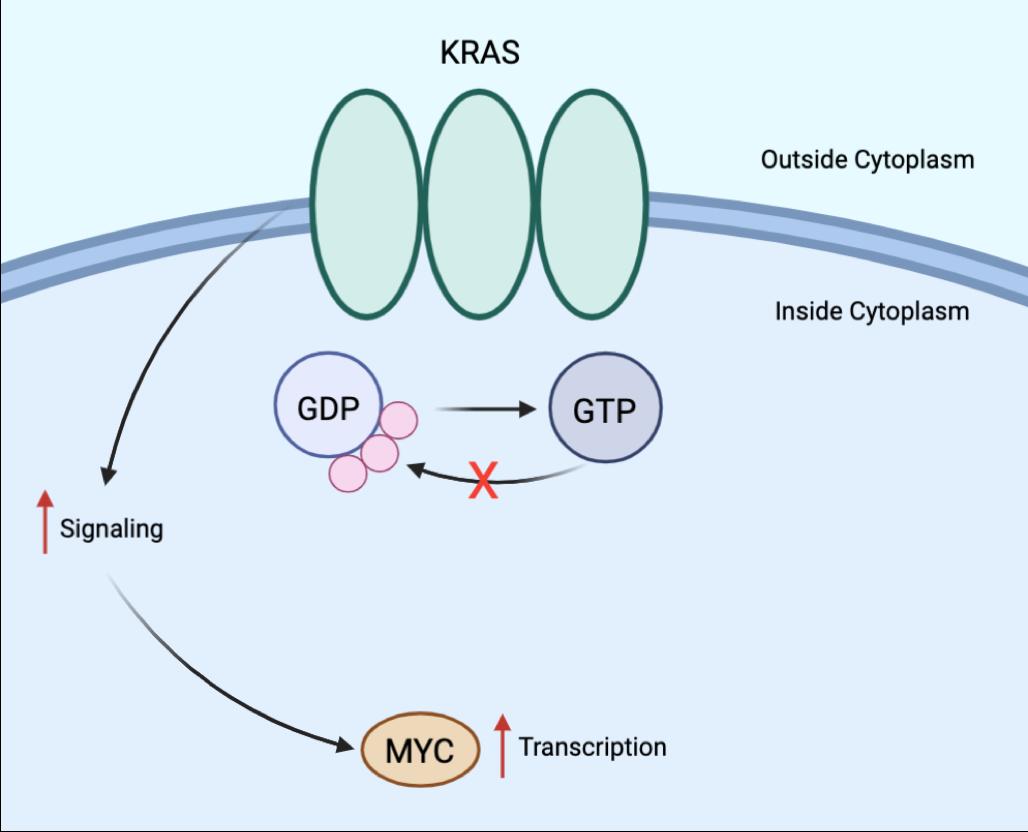
Figure 1: In PDAC, due to KRAS mutation, the active GTP state is constantly on. This leads to constant oncogenic signaling, driving the initiation of PDAC. When the KRAS mutation is present, oncogenic signaling occurs.
One of the proteins that KRAS activates is called myelocytomatosis oncogene, MYC. MYC is highly regulated through KRAS and KRAS is an upstream of MYC. MYC is a basic helix loop helix (bHLH) protein structured transcription factor. It has a central role in almost every aspect of the oncogenic process, especially in cancer development. In normal cells, MYC binds to the myc-associated factor X, the MAX transcription factor, to then bind to DNA to promote transcription. However, MYC gene amplification and increased signaling are commonly found in PDAC patients. Accordingly, MYC expression has been associated with metastatic burden in PDAC patients. Given all this, MYC continues to be an attractive target for PDAC therapies. Unfortunately, MYC is still unable to be pharmaceutically manufactured into a drug due to its multifaceted role in the cell (5). It is of increasing interest to find novel regulators of MYC. One such protein that we are interested in studying is NELFE.
Figure 1: In PDAC, due to KRAS mutation, the active GTP state is constantly on. This leads to constant oncogenic signaling, driving the initiation of PDAC. When the KRAS mutation is present, oncogenic signaling occurs.
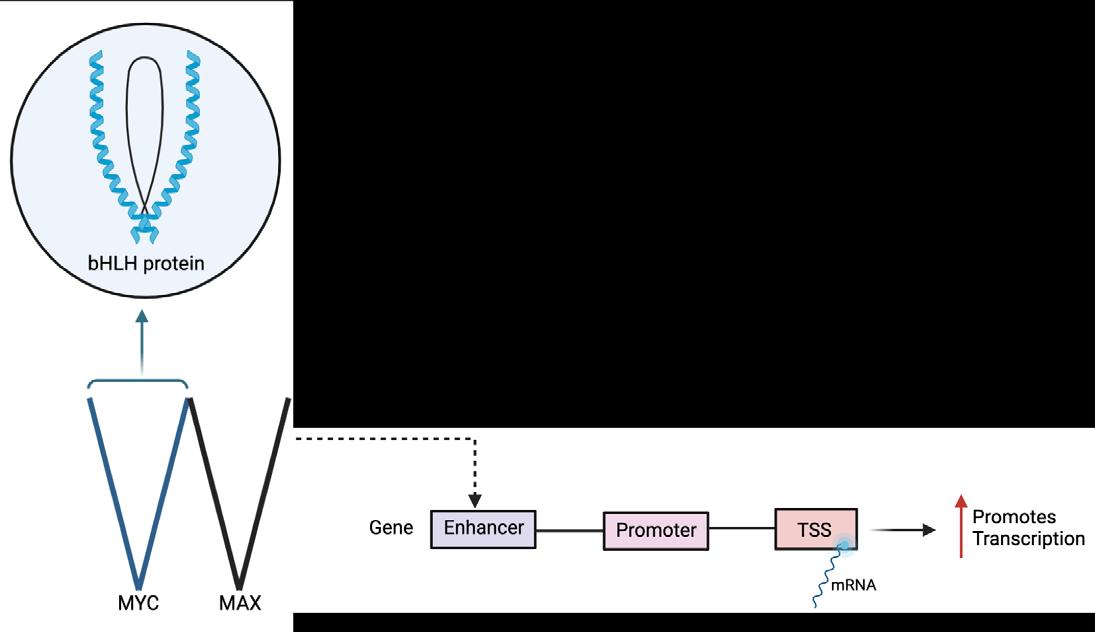
Figure 2: In normal cells, MYC, basic helix loop helix structured (bHLH), binds to MAX, another transcription factor, to then bind to DNA in the E-box to promote transcription. MYC bonded to MAX is binding to the motif in the enhancer to continue promoting transcription (6).
NELF-E (NELFE) is a subunit of the NELF Complex (negative elongation factor), a type of transcription factor. NELFE promotes cancer progression as an RNA-binding protein. NELFE expression was increased in PDAC tissues compared to normal tissues. It has been proven in HCC (Hepatocellular Carcinoma) that NELFE is an oncogenic protein that regulates MYC from binding to DNA by binding to its target, therefore, enhances MYC signaling by modulating MYC’s binding to chromatin and stabilizing MYC target mRNAs. This causes an increase in cancer progression (7) (8). However, it has not yet been proven whether this also occurs in PDAC. It can be hypothesized that NELFE promotes PDAC progression by regulating MYC expression.
Methods:
METHODS
The method uses the mini auxin-inducible degron system, mAID. The general purpose of the mAID system is for rapid degradation of NELFE. More specifically, this system is used in in vivo studies, once tumors have already formed, in order to see if there are changes in the way cancer progresses after NELFE knockdown. Using this system can also control when NELFE will be knocked down. The mAID system was also used to implement in in vivo studies to understand how NELFE influences PDAC progression. NELFE was knocked down by adding an auxin drug once the tumors had formed in order to see if loss of NELFE influences tumor growth or progression. To confirm that the system is working properly, a western blot was run to determine if NELFE was being degraded. The steps of this system are as follows. Using CRISPR/Cas9, the AID sequence was inserted right before the NELFE stop codon, therefore, mAID and NELFE could be transcribed together as one. Once the OsTIR was also constantly expressed in the cell, the auxin could then be added to the system which recruited OsTIR to bind to the mAID and allowed OsTIR to then recruit other proteins to bind to the mAID system, causing ubiquitination and NELFE knockdown. The mAID system used the auxin drug to clearly and precisely target NELFE and rapidly degrade NELFE in the cell.
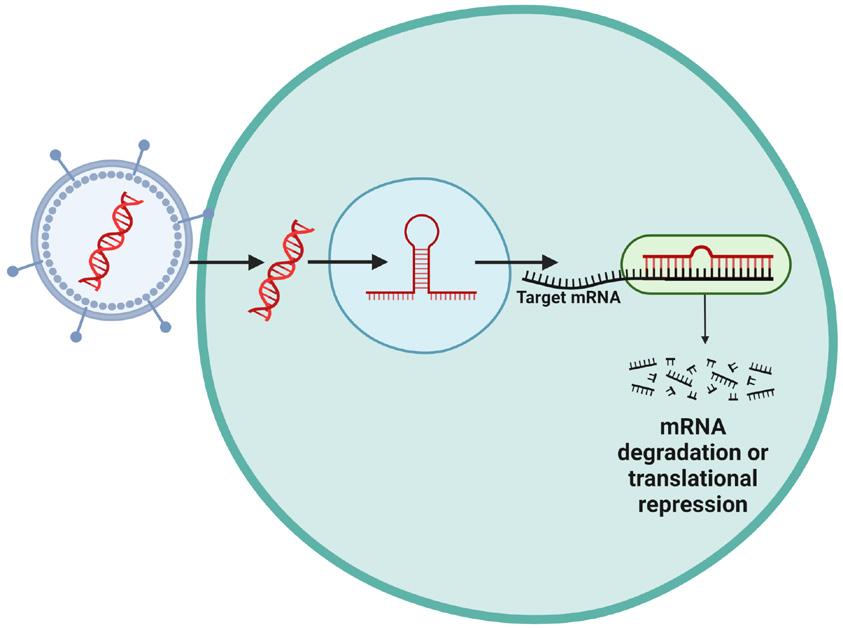
Brittany Ruiz transduced a virus containing the plasmid with shRNA into a cell that would target NELFE's mRNA transcript to decrease NELFE's expression. The shRNA is then integrated into the genome, and after transcription, the shRNA binds to the target mRNA which causes mRNA degradation.
Figure 3: Virus containing the plasmid with shRNA is transduced into the cell, then integrated into the genome. After transcription, the shRNA would bind to the target mRNA which causes mRNA degradation.
Figure 2: In normal cells, MYC, basic helix loop helix structured (bHLH), binds to MAX, another transcription factor, to then bind to DNA in the E-box to promote transcription. MYC bonded to MAX is binding to the motif in the enhancer to continue promoting transcription.6
Figure 3: Virus containing the plasmid with shRNA is transduced into the cell, then integrated into the genome. After transcription, the shRNA would bind to the target mRNA which causes mRNA degradation.
Additionally, an InFusion Snap Assembly Cloning Protocol was used. This method is a fast and directional cloning process of inserting one or more DNA fragments into a vector. The purpose was to clone TagRFP into the OsTIR backbone. TagRFP is a type of Red Fluorescent Protein (RFP), which is a versatile biological marker that is used for visualizing protein localization. First, OsTIR vector was linearized through inverse PCR. Next, another PCR was conducted to amplify the TagRFP segment from its own backbone. Then the Infusion reagent was used to put the RFP inside the OsTIR backbone; the RFP was fused with the OsTIR. The infusion product was then transformed into bacteria. Following the Infusion cloning reaction, clones were picked from the bacteria using the bacterial transformation method to create multiple DNA clones. DNA is introduced into a competent strain of bacteria so that the bacteria can replicate the sequence of interest in amounts
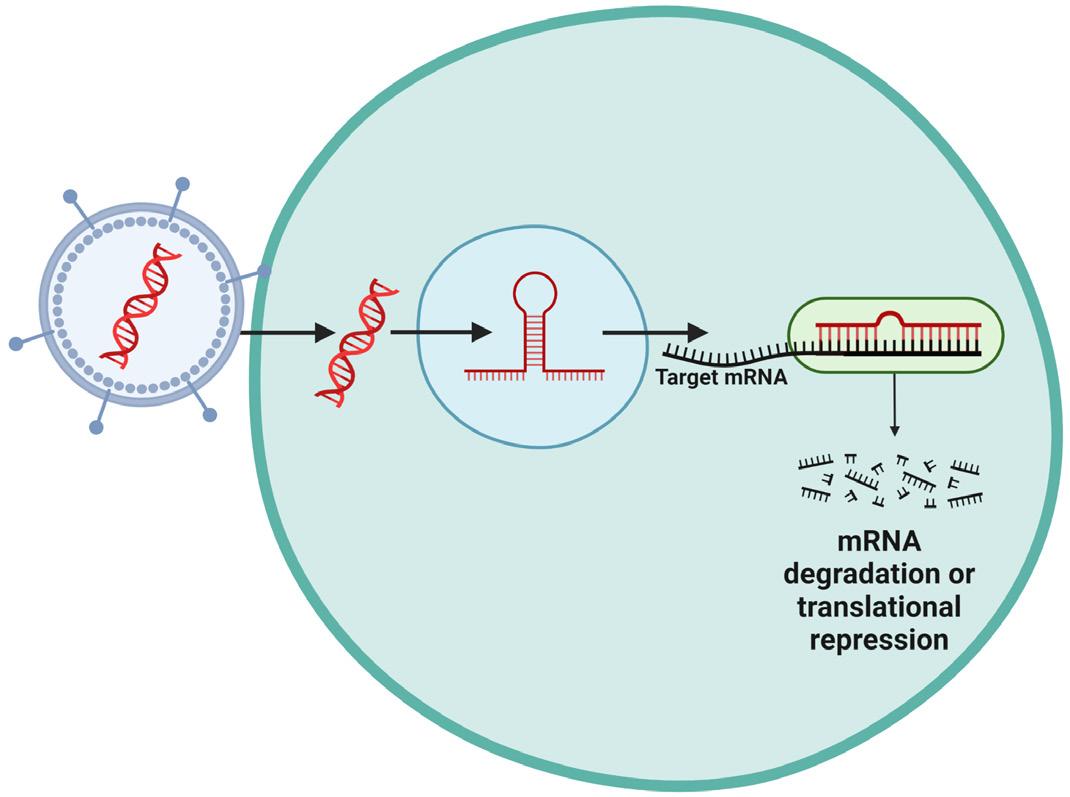
Figure 3: Virus containing the plasmid with shRNA is transduced into the cell, then integrated into the genome. After transcription, the shRNA would bind to the target mRNA which causes mRNA degradation.
Then the pDNA was extracted from the clone that was used in the restriction digest, a method in which the DNA plasmid is cut at specific sites and was used to prepare DNA fragments for subsequent molecular cloning. The size and location of the band shown after running it on the gel, in Figure 4, proved that both TagRFP and OsTIR were in it. The bands are also at the correct size, proving that the experiment was done correctly. During the restriction digest, two different enzymes were used to cut specific spots in the backbone which were run under a gel to confirm that the RFP was put in the right place, in this case, the TagRFP. By using RFP, cells that had the red fluorescent in them were selected, meaning cells that had OsTIR in them were

InFusion Snap Assembly Cloning Protocol product. Both clones (3&4) has 2 bands each at 2 expected same sizes (3752bp & 7451bp respectively), indicating both TagRFP and OsTIR are existing in the pDNA.
Figure 4: InFusion Snap Assembly Cloning Protocol product. Both clones (3&4) has 2 bands each at 2 expected same sizes (3752bp & 7451bp respectively), indicating both TagRFP and OsTIR are existing in the pDNA.
Following the restriction digest, the results were then sent for sequencing.
RESULTS
Figure 3: Virus containing the plasmid with shRNA is transduced into the cell, then integrated into the genome. After transcription, the shRNA would bind to the target mRNA which causes mRNA degradation.
As a result, in PDAC, when NELFE is decreased, MYC also decreases.
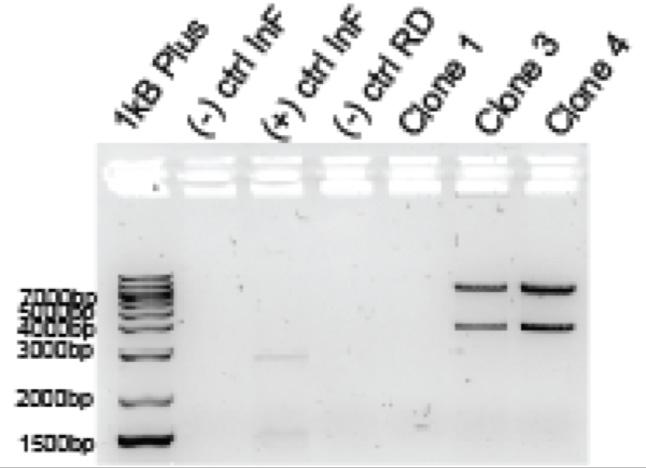
After conducting the western blots, the results in Figure 5 show that when NELFE was knocked down, MYC expression was also lost. The four different types of cells with NELFE, when compared to the controls, show degradation in both MYC and NELFE simultaneously. Ultimately, this suggests that NELFE may regulate MYC expression in PDAC.
Figure 5: Loss of NELFE causes a decrease in MYC protein expression.
Figure 4: InFusion Snap Assembly Cloning Protocol product. Both clones (3&4) has 2 bands each at 2 expected same sizes (3752bp & 7451bp respectively), indicating both TagRFP and OsTIR are existing in the pDNA.
DISCUSSION
Figure 6: Sequencing result; Clean peaks are shown; the result has the same nucleotides as the sequence in the OsTIR backbone, indicating the protocol was conducted and completed properly.
In Figure 6, the data shows clean peaks. The new OsTIR-TagRFP backbone (both clones 3 and 4) had the same nucleotides, matched, and clean.
Figure 6: Sequencing result; Clean peaks are shown; the result has the same nucleotides as the sequence in the OsTIR backbone, indicating the protocol was conducted and completed properly.
It has been observed that knocking down NELFE decreases MYC expression which suggests NELFE regulates MYC in PDAC. RFP was also successfully knocked into the OsTIR backbone during the process. It is important to know which factor helps degrade the MYC expression in order to be a step closer to finding a treatment for a lethal disease like PDAC.
FURTHER WORK
It would be important to further investigate how NELFE decreases MYC expression; What is the mechanism in which NELFE regulates MYC expression in PDAC? Is it through transcriptional or post-transcriptional regulation? Continuing to develop the mAID system cell models by transducing OsTIR1-RFP into cells and fusing mAID to NELFE would be an additional area for further research.
ACKNOWLEDGEMENTS
I would like to acknowledge the Dang Lab for allowing me to join and work with them this summer. It has been a pleasure to learn advanced molecular biology techniques and conduct more hands-on lab experiences. Especially for this poster and presentation, I would like to thank Brittany Ruiz for providing me with data, feedback, and help with the editing process. I was able to further learn about my passion for lab research through this internship.
REFERENCES
Ahmadi, S.E., Rahimi, S., Zarandi, B. Chegeni, R., and Safa, M. (Aug. 9, 2021). MYC: a multipurpose oncogene with prognostic and therapeutic implications in blood malignancies. J Hematol Oncol 14(121). https://doi.org/10.1186/s13045-02101111-4. https://jhoonline.biomedcentral.com/articles/10.1186/s13045-021-01111-4
Chen, H., Liu, H. & Qing, G. (Feb. 23, 2018). Targeting oncogenic Myc as a strategy for cancer treatment. Sig Transduct Target Ther 3(5) https://doi.org/10.1038/s41392-018-0008-7.
Dang, H., Takai, A., Forgues, M., Pomyen, Y., Mou, H., Xue, W., Ray, D., Ha, K.C.H., Morris, Q. D., Hughes, T.R., and Wang, X. W. (Jul. 10, 2017). Oncogenic activation of the RNA binding protein NELFE and MYC signaling in hepatocellular carcinoma. Cancer Cell 32(1), 101–114.e8. doi: 10.1016/j.ccell.2017.06.002. PMID: 28697339; PMCID: PMC5539779; NIHMSID: NIHMS883933. https://www.ncbi.nlm.nih.gov/pmc/articles/PMC5539779/.
Han, L., Zan, Y., Huang, C., and Zhang, S. (Oct. 2, 2019). NELFE promoted pancreatic cancer metastasis and the epithelial-to-mesenchymal transition by decreasing the stabilization of NDRG2 mRNA. Int J Oncol. 55(6), 1313–1323. doi: 10.3892/ijo.2019.4890. PMID: 31638184; PMCID: PMC6831195. https://www.ncbi.nlm.nih.gov/pmc/articles/PMC6831195/
Ji Luo, PhD. (Feb 23, 2021). KRAS mutation in Pancreatic Cancer. Semin Oncol 48(1), 10–18. doi: 10.1053/j.seminoncol.2021.02.003. PMID: 33676749; PMCID: PMC8380752; NIHMSID: NIHMS1672852. https://www.ncbi.nlm.nih.gov/pmc/articles/PMC8380752/.
Moein Ala. (Jan. 3, 2022). Target c-Myc to treat pancreatic cancer. Cancer Biol Ther 23(1), 34–50. doi: 10.1080/15384047.2021.2017223. PMID: 34978469; PMCID: PMC8812741. https://www. ncbi.nlm.nih.gov/pmc/articles/PMC8812741/#:~:text=C%2DMyc%20 overexpression%20is%20 a,proliferative%20pathways%20in%20pancreatic%20cancer
Sarantis, P., Koustas E., Papadimitropoulou, A., Papavassiliou, A.G., and Karamouzis, M.V. (Feb 15, 2020). Pancreatic ductal adenocarcinoma: Treatment hurdles, tumor microenvironment and immunotherapy. World J Gastrointest Oncol 12(2), 173–181. doi: 10.4251/wjgo.v12. i2.173. PMID: 32104548; PMCID: PMC7031151. https://www.ncbi.nlm.nih.gov/pmc/articles/ PMC7031151/#:~:text=Pancreatic%20ductal%20adenocarcinoma%20(PDAC)%20is,rate%20of%20 less%20than%2010%25.

