FIGHTING FLOODS FROM ABOVE

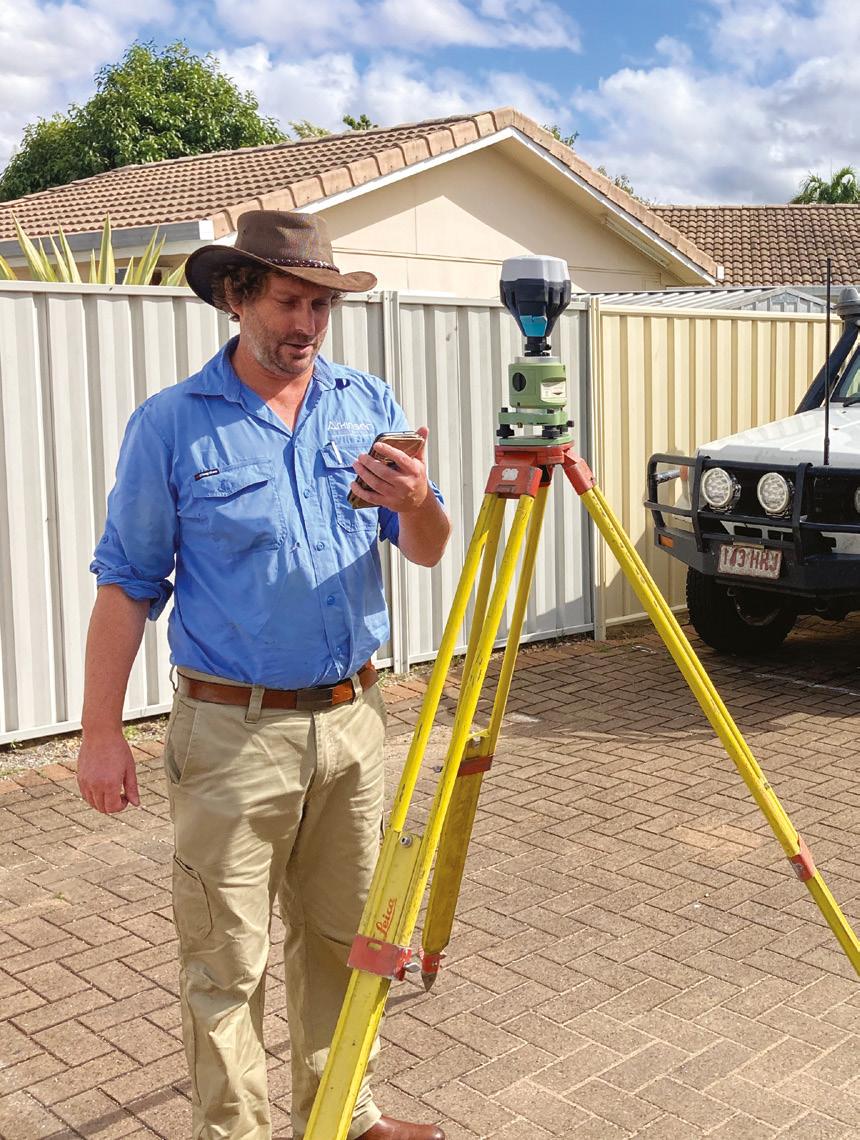


A love for the built environment led to a career in surveying.
14 Digging a job out of a hole
When legacy gear didn’t work, C.R. Kennedy saved the day.
16 Scanning the SS Lake Illawarra
Ultra-high-resolution digital twin of a famous shipwreck.
20 Fighting floods from above
Surveying Byron Bay’s flood aftermath with LiDAR.
Cross River Rail’s 3D digital model continues to transform.

Building a foundation for recovery and resilience.
26 Under the bonnet of AUSPOS
Maintaining and improving the NSW survey control network.
29 Scholarship honours surveyors
UniSQ moves to support worthy surveying students.
30 Geospatial intelligence for grids Imagery and remote sensing for power companies.
32 Putting theory into practice
Gaining practical knowledge on this hydrography course.
33 Unlocking value from with LiDAR

It pays to engage a firm with specialist capabilities.
34 Innovation and climate change Spatial technologies and the vital role they play.
Amplifying the voices of people in the sector.
events
the editor
products

Researchers from Charles Darwin University (CDU) are using 3D-printed models of mine rehabilitation sites to visualise how the Ranger Uranium Mine will be rehabilitated. CDU’s Northern Institute Research Development Officer, Rohan Fisher, is working with the Gundjeihmi Aboriginal Corporation, the Northern Land Council and Energy Resources of Australia to support the Mirarr Traditional Owners as their country that was affected by the Ranger mine is handed back.
“It’s the First Nations people who know this land. It’s their input and guidance that’s vital for the success of our modelling
and, ultimately, rehabilitation projects,” said Fisher. “The first step in success is clear communication, and that’s what this modelling delivers.”
Fisher is using traditional cultural knowledge of the land, water flow modelling and rehabilitation process information, to produce 3D-printed projection augmented models to explore how these decisions interact and affect rehabilitation outcomes.

“It gives the Mirarr people a better understanding of what is being done to rehabilitate the mined area and the longterm impacts,” he said.
The 3D-printed models enable the clear visualisation of complex landscape processes, providing a basis for a betterinformed and more equitable engagement in the mine decommissioning process. “This modelling incorporates places of cultural significance, sophisticated water flow modelling and rehabilitation process information into one dynamic platform,” said Fisher.
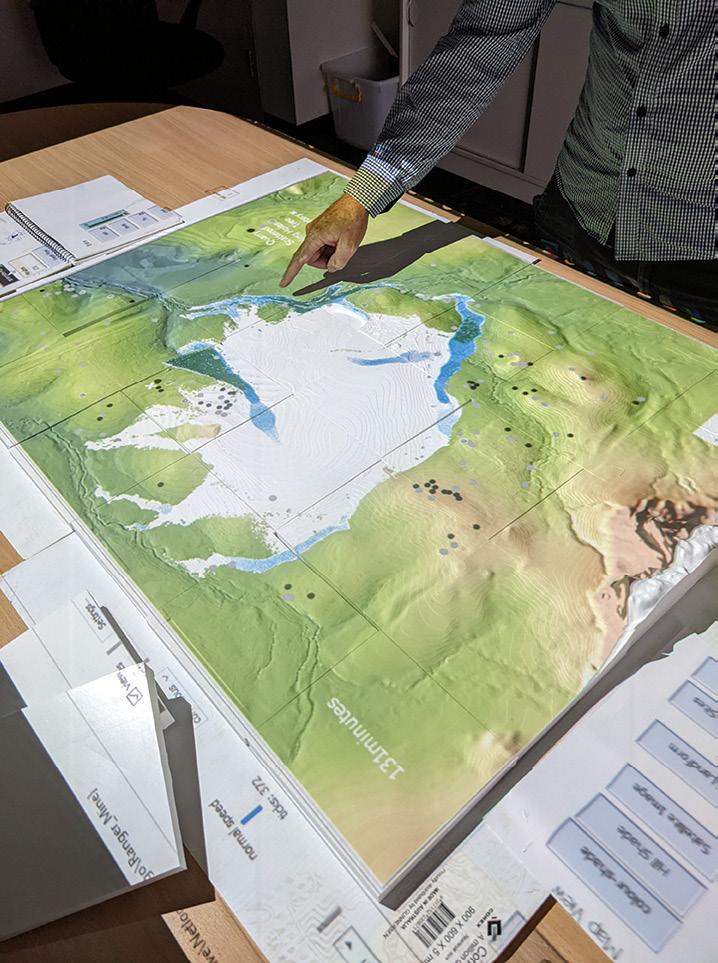
Gundjeihmni Aboriginal Corporation CEO, Justin O’Brien, said cleaning up the Ranger site was the single largest rehabilitation exercise in the history of Australian mining. “This new technology has enabled an unprecedented level of technical engagement on the part of the Mirarr traditional owners and Djurrubu Rangers,” he said. “This modelling is extremely useful in helping Mirarr and their staff to understand the complexities of the work being undertaken to repair country.” n
25 October: 14th Australian Space Forum forum.andythomas.foundation/14thaustralian-space-forum
27 October: Victorian Surveying & Spatial Summit and APSEA-V sssi.org.au/events-awards/regionalconferences
10–11 November: SSSI NSW Regional Conference & APSEANSW/ACT sssi.org.au/events-awards/regionalconferences
14–15 November: World of Drones and Robotics Congress worldofdrones.com.au
22–23 November: Southern Space Symposium
spaceindustry.com.au/events/2022southern-space-symposium
25–26 November: Micromobility Conference 2022 micromobilityconference.com
23–24 February: ISNSW Annual Conference 2023 surveyors.org.au
2 March: WA Digital Twin Summit & APSEA-WA sssi.org.au/events-awards/regionalconferences
15–16 March: Geo Connect Asia 2023 geoconnectasia.com
20–22 March: APAS2023 Conference apas.org.au
21 March: Global Surveyors’ Day 2023 surveyorsday.com
2–5 May: Geospatial World Forum 2023 geospatialworldforum.org
10–11 May: Locate23 locateconference.com
For more events, go to www. spatialsource.com.au/event-listing


 Publisher Simon Cooper

Editor Jonathan Nally
jnally@intermedia.com.au
National Advertising Manager
Anna Muldrock amuldrock@intermedia.com.au
Prepress
Tony Willson Production Manager
Jacqui Cooper
Subscribe
Position is available via subscription only. A 12 month subscription (6 issues) is AUD$76.00. To subscribe visit www.intermedia.com.au, phone: 1800 651 422 or email: subscriptions@intermedia.com.au website: www.spatialsource.com.au
Position is published six times a year, in February, April, June, August, October and December by Interpoint Events Pty Ltd. ABN: 9810 451 2469
Address: 41 Bridge Road, Glebe NSW 2037 Ph: +61 2 9660 2113 Fax: +61 2 9660 4419
Reprints from Position are permitted only with the permission of the publisher. In all cases, reprints must be acknowledged as follows: ‘Reprinted with permission from Position Magazine’, and must include the author’s byline.
The opinions expressed in this publication are those of the authors and do not necessarily represent those of the publisher.
Supported by
The Intermedia Group takes its Corporate and Social Responsibilities seriously and is committed to reducing its impact on the environment. We continuously strive to improve our environmental performance and to initiate additional CSR based projects and activities.
As part of our company policy we ensure that the products and services used in the manufacture of this magazine are sourced from environmentally responsible suppliers.
This magazine has been printed on paper produced from sustainably sourced wood and pulp fibre and is accredited under PEFC chain of custody.
PEFC certified wood and paper products come from environmentally appropriate, socially beneficial and economically viable management of forests.
The wrapping used in the delivery process of this magazine is 100% recyclable.
Thank you to everyone who sent feedback as a result of my editorial in our last issue, where I posed the question of how the industry should describe itself — can we keep on referring to the ‘surveying, space and spatial’ sector, or is there are better descriptor? It turns out this topic was tackled as part of the consultation process for the proposed merger of SSSI and SIBA|GITA, and the view reached was that the word ‘geospatial’ is, globally, the most widely adopted term to describe the sector.
The merger proposal Information Memorandum stated that “Geospatial is an allencompassing term covering the accurate knowing of ‘where,’ which includes surveying; hydrography, cartography, Global Navigation Satellite Systems (GNSS) and Positioning, Navigation and Timing (PNT); spatial analytics; Earth observation from space, airborne and terrestrial platforms; and 3D scanning also from airborne and terrestrial platforms”. These are supported by technologies such as big data, AI, advanced robotics, automation, edge computing and digital twin models. The Memorandum concludes that “It is time we are defined as one. Collectively we are geospatial, but we are comprised of a plethora of disciplines and technologies.”
Still on the topic of the industry, and we have the ongoing problem of finding, training and retaining sufficient professionals who want to make a career in this field. A recent discussion on LinkedIn in August got me thinking about this, particularly as we just happened to be in the midst of National Science Week at the time. “Why aren’t we making use of National Science Week to entice more young people into the sector?” I thought to myself. Perhaps there were individual efforts here and there across the country, but I must say I didn’t get to hear about them. It made me think that if we had a co-ordinated, sectorwide effort to capitalise on National Science Week and the heightened awareness of science it brings, we could use it to highlight how essential the geospatial industry is to Australia and its prosperity.
What do you think? Should we embrace National Science Week in 2023 as an opportunity for all parts of the industry to work together to institute a renewed recruitment drive?
Jonathan Nally EditorGeoscience Australia has awarded the local arm of Lockheed Martin a $1.18 billion, 19-year contract to implement the Southern Positioning Augmentation Network (SouthPAN).
SouthPAN aims to deliver a signal augmenting GPS and Galileo over the Australasian region, improving accuracy from 5 to 10 metres, to within as little as 10 centimetres.
The SouthPAN signal will be of value for a range of sectors, including surveying, civil aviation, vehicle guidance, precision agriculture, maritime navigation, drones and other unmanned vehicles.
“Space is among our fastest growing areas, and our local technical team will play an important role in delivering the benefits of SouthPAN capability to service many sectors including aviation, agriculture, transport, mining and other industries,” said David Ball, Regional Director of Space for Lockheed Martin Australia and New Zealand.
Lockheed Martin Australia will work with the SouthPAN project team to establish a network of GNSS reference stations and satellite uplink facilities that will enable communications with the SouthPAN space infrastructure.

SouthPAN is being implemented as a partnership between Geoscience Australia and Toitū Te Whenua Land Information New Zealand (LINZ) under the Australia New Zealand Science, Research and Innovation Cooperation Agreement.
Australia’s Intergovernmental Committee on Surveying and Mapping’s (ICSM) Geodesy Working Group has released a major new document, the Australian Geospatial Reference System Compendium, which presents a detailed overview of all the foundational elements that make up Australia’s geospatial reference system.
The 148-page document outlines the 10-year effort by the ICSM to upgrade “elements of the Australian Geospatial Reference System (AGRS) to improve the accuracy with which spatial data can be aligned and combined with precise positioning data”.
That upgrade includes:
• Geocentric Datum of Australia 2020 (GDA2020): Australia’s new static datum
• Australian Terrestrial Reference Frame 2014 (ATRF2014): Australia’s first time-dependent coordinate reference frame, which moves with the Australian plate (~7 cm/year).
• DynAdjust: World-first software able to compute a continental scale least squares adjustment of all geodetic data (~2 million measurements) to define GDA2020 and ATRF2014.
• AUSGeoid2020: World-first geoid model which provides location specific uncertainty; thus providing users with a rigorous method of deriving Australian Height Datum heights with uncertainty directly from GNSS.
• Commonwealth Law Changes: The ICSM worked with the National Measurement Institute to update the Recognised Value Standard for Measurement of Position in Australia to legally recognise both static (GDA2020) and time-variable coordinate reference frames (ATRF2014).
• Australian Vertical Working Surface (AVWS): A new vertical datum enabling more accurate conversion of GNSS heights to mean sea level heights.
• GeodesyML: Development and release of the Geodesy Markup Language standard, which aims to make geodetic data more Findable, Accessible, Interoperable and Reusable (FAIR).
“With the growing dependence on position, navigation and timing (PNT) information in a range of industries (e.g. space, intelligent transport, mobile apps etc.) the demand for people with geodesy skills is only going to grow,” said Nicholas Brown, Director of National Geodesy at Geoscience Australia, and one of the authors of the Compendium.
Download the Compendium from https://www.icsm. gov.au/publications/australian-geospatial-reference-systemcompendium.
For the first time in its 160-year history, Victoria’s Land Registry services has processed more than one million transactions in a single financial year.
The agency’s latest Business Activity Report shows that for the 2021–22 financial year, total transactions lodged increased by 14.02% to 1,022,585.
Other statistics from the same year include:
• transactions lodged digitally increased to 993,196, or 97% of total lodgments
• title search volume increased by 6.41%, to 2,977,311
• lodgment revenue increased by 25%, to $492 million
• 7,536 plans of subdivision were lodged, a decrease of 8.3%
• new parcels created from plans of subdivision decreased by 18.2%, to 60,803
The Australian Association for Uncrewed Systems (AAUS) has published the results of its most recent annual remotely piloted aircraft systems (RPAS) industry survey.
The survey, which was open to everyone involved in the Australian RPAS industry, attracted feedback from 145 organisations, including included ReOC holders, excluded category operators, manufacturers and service providers.
Many of the results were consistent with the previous year’s survey, with some of the highlights being:
• While the Australian RPAS industry comprises entities ranging from sole traders to multi-national corporations, a large percentage of survey respondents were from organisations with fewer than 10 staff members.

• There is a growing number of organisations operating in the excluded category.
• Most organisations use multi-rotor drones in the very small and small weight categories, for line-of-sight operations.
• Although most common uses currently are education, sporting events, news and media, and real estate, within the next few years the most common uses are expected to also include defence, research, transport infrastructure, and mining, oil and gas.
• Few organisations are using CASA’s streamlined BVLOS standard scenarios.

• There has been an increased use of fixed-wing drones.
• Regulatory red tape is seen as being the largest risk for industry, followed by the introduction of local government regulations and societal concerns regarding privacy.
The full survey can be found at https://www.aaus.org.au.
The Intergovernmental Committee on Surveying and Mapping (ICSM) Addressing Working Group has released a major new report outlining a strategy to “support all Australian and New Zealand government jurisdictions and the wider stakeholder ecosystem in remediating, and future-proofing, the addressing supply chain”.
Addressing 2035 defines a “vision and roadmap to deliver a dynamic and integrated whole-of-government addressing ecosystem, to enable service delivery and support a 3D and 4D digital economy”.
ICSM and ANZLIC say that the common intent is for jurisdictions and all stakeholders involved in addressing across both countries, to converge on agreed courses of action that will improve addressing capability.
A major element of the strategy is to ensure that “the addressing policy environment supports standards that are fit for the future”.
The report’s research team surveyed 161 stakeholders from within the addressing supply chain to obtain feedback on the positives and negatives of the current addressing environment. Respondents included all levels of government, emergency management authorities, utilities companies and many other service providers.
The report identifies five enabling ‘strategic pillars,’ being:
1. Harmonised addressing policy: Deliver an addressing policy framework that can be harmonised across supply chains to support a standardised addressing model.
2. Future-ready: Review the addressing model against future 3D/4D needs.
3. Jurisdictional flexibility: Enable customised pathways for jurisdictions to adopt a common addressing model and retain their specific data requirements.
4. Interoperability and linkages: Achieve addressing data linkages to other valuable datasets.
5. Education and communication: Drive an increased understanding of the importance of accurate and authoritative addressing.
The authors conclude that “the future of addressing will not just be the modern technical delivery of the information. It will also be unified for discovery, access and use across the whole of government and service providers, for the benefit of citizens.”
You can download the report from https://www.icsm.gov. au/publications/addressing-2035-strategy.
Infrastructure Cook Islands (ICI) has contracted Woolpert to collect topographic and bathymetric LiDAR data and aerial imagery across the islands. The multimillion-dollar contract is funded by the New Zealand Ministry of Foreign Affairs and Trade and the Green Climate Fund.

The data and products developed will help ICI improve and advance sustainable infrastructure development, environmental monitoring and assessment, natural hazard planning and mitigation, disaster and climate resilience, and nautical charting.
“LiDAR data enables us to model the landscape and seascape and understand how they both change over time to identify specific regions most at risk to natural disaster, climate change and other environmental issues,” said ICI Project Manager Jake Langdon.
“We can use this information to focus our resources, reinforce emergency transport routes, protect people and infrastructure in harm’s way, and mitigate the overall impact of natural disasters before they strike.”
The project will cover approximately 229 square kilometres, including terrestrial, lagoon and offshore components, across the 12 inhabited islands of the Cook Islands.
Woolpert will be supported by aerial services provider Kiwi Air of New Zealand, with data collection scheduled for completion in October.
Brett Newman, currently the CEO of the City of Parramatta, will begin his new role as CEO of NSW Land Registry Services (LRS) in November. His appointment follows the announced departure of CEO Adam Bennett, who has been with NSW LRS since 2018.
“We’re delighted to have someone of Brett’s calibre and expertise lead our team at NSW Land Registry Services; his deep understanding of the property sector will continue to deliver strategic benefits for industry in NSW,” said Chairman of the Australian Registry Investments Board, Andrew Dutton.
“We would like to recognise the outstanding contribution our departing CEO, Adam Bennett, has made to the people,

operations and transformation of our organisation since joining in 2018,” Dutton added. “Adam has successfully overseen significant digital transformation initiatives that improve customer and industry experience in NSW.”
Dutton pointed to successful initiatives undertaken during Bennett’s time at the helm of NSW LRS, such as the delivery of 100% eConveyancing, increasing customer satisfaction from 51% to 77%, and ratification of its first Reconciliation Action Plan.
The UK Geospatial Commission has published new guidance to help public sector organisations make more effective cases for investing in location data.
According to the Commission, location data “is a strategic national asset, delivering significant value for people, organisations and wider society. It supports key government priorities such as Net Zero, Levelling Up and had an important role in managing the coronavirus (COVID-19) pandemic.”
The Commission says that public sector bodies “have previously struggled to understand, assess and articulate the economic, social and environmental value of location data coherently, constraining their ability to unlock funding.”
The aim of the new guidance (https:// www.gov.uk/government/publications/ measuring-the-economic-social-and-
environmental-value-of-public-sectorlocation-data) is to provide “a more structured and practical approach to assessing value that is based on bestpractice methods, existing research and the experiences of stakeholders”.
“Linking data to location improves analysis, decisions and outcomes. It is vital that the public sector invests to maintain our strategic national geospatial assets,” said Thalia Baldwin, Commissioner of the Geospatial Commission.

“Our guidance will support organisations to make a coherent and persuasive case for improved geospatial data.”
The guidance sets out a seven-step framework for understanding, assessing and articulating the value of a location data project.
“We all know the practical value of maps and location data in supporting our
everyday life,” said David Henderson, Chief Geospatial Officer at the UK’s Ordnance Survey.
“But expressing that value in a way that supports future investment in geospatial data and services by government and business remains a challenge.
“This work provides a valuable foundation on how to express those benefits and a more consistent approach to making the case for geospatial data.”
The Surveyor-General of Victoria (SGV) Geodesy division has shared the news that Heritage Victoria has recommended the Mount Macedon Survey Cairn be added to the Victorian Heritage Register (VHR).
The 8m-high, mortared stone survey cairn was built in 1860 and is considered to be of state significance as a central component of the original Geodetic Survey of Victoria.

That survey was a major technical achievement, performed from 1858 to 1872 under the direction of Robert J. Ellery, Victorian Government Astronomer.

The Geodetic Survey of Victoria and the network of trigonometrical survey cairns supported coordinated surveying and mapping, enabling rapid allocation of land to new settlers, measurement of the heights of Victoria’s highest peaks and surveying the Black Allan line border between Victoria and NSW.
The Mount Macedon Survey Cairn is one of only two 19th century mortared stone survey cairns built in Victoria, with the other situated at Mount Alexander.
The trigonometrical station was placed at the summit of Mount Macedon to enable clear visibility to and from distant mountain tops and across the surrounding region.
SGV Geodesy says it proudly continues to maintain and enhance the Victorian geodetic survey control network, although its focus has shifted from trigs and cairns on mountain tops to supporting ongoing advancements in GNSS positioning.
The program for Australia’s first national conference and expo dedicated to the micromobility transport sector, has been released.
The Micromobility Conference and associated Micromobility Expo will be held at Royal Randwick Racecourse in Sydney on November 25 and 26, 2022.
Micromobility is the term used to encompass a range of new and emerging transport modalities, such as e-bikes and e-scooters, as well as e-cargo bikes and other lightweight e-power assisted devices used for business and recreational purposes.

Today’s micromobility devices and services are heavily reliant on location-based services, all the way from surveying and planning new bike paths and lanes, to the navigation services employed by users and the tracking systems utilised by service providers.
A recent Australian Cycling Economy Report produced by EY, showed that Australia’s state and local governments spent $428 million on cycling related infrastructure and programs alone in 2020.
The Micromobility Conference will see local and international experts from government, academia and the service provision sector come together under the one roof for the first time, to discuss technologies, trends, policies and service delivery.
The program includes a wide range of feature presentations, with those within the ‘Making it There’ theme (one of the four conference themes) being of particular interest to geospatial professionals.
The ‘Making it There’ sessions will see experts from logistics operators, equipment providers, transport officials and policy makers presenting on and discussing micromobility solutions and networks, as well as environmental considerations and economics.
The co-located Micromobility Expo will give delegates the opportunity to meet with product and service vendors and attend a range of seminars.

As we’re unable to fit every entry into the printed Directory, it’ll have to be on a first-in basis. So don’t delay, do it today! The deadline is 21 October.
https://directory.spatialsource.com.au/sponsors/login.php

Anna Muldrock (amuldrock@intermedia.com.au)
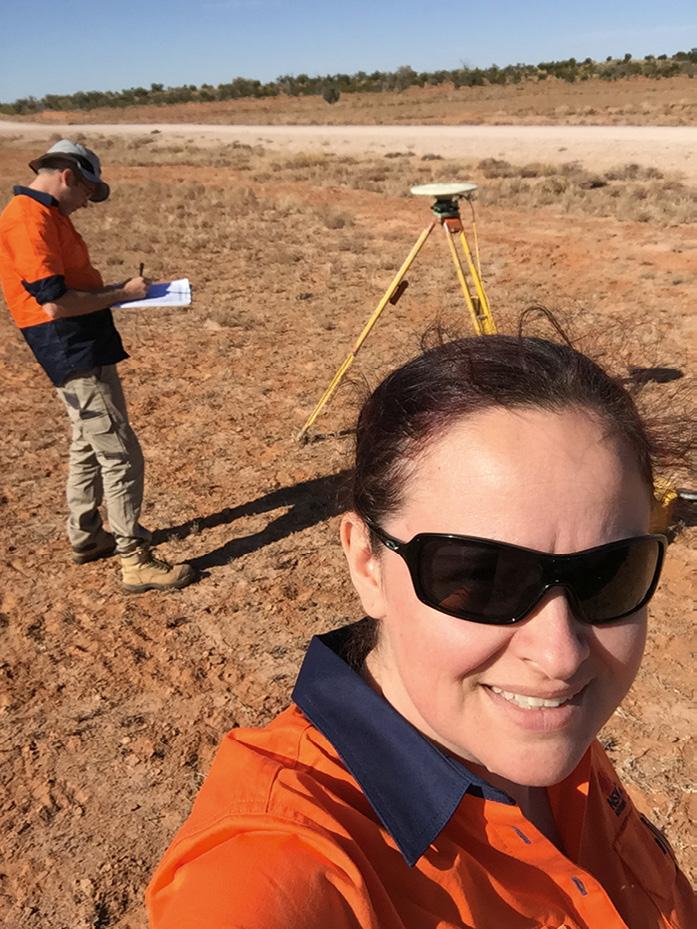
From an early age I decided that I wanted to work in the built environment. Originally I thought about architecture, but in high school I decided on civil engineering. In my second year of university, I got a job with a private surveying firm as a draughtsman and fell in love with the industry, so I decided to change degrees with the intent of becoming a registered land surveyor. I worked throughout my undergraduate degree, gaining a lot of experience in town planning and engineering design, and graduated from UNSW in 2009 with a Bachelor of Engineering in Surveying & Spatial Information Systems.
As Executive Director of NSW DCS Spatial Services, are you still Surveyor General?
As part of the recruitment process I successfully negotiated retaining the Surveyor-General title, so my official title is now Surveyor-General & Executive Director Spatial Services.
Please tell us about your Spatial Services role.
Spatial Services has two main office locations in Bathurst and Sydney and several regional offices in Nowra, Newcastle, Coffs Harbour and Lismore. With our flexible work arrangements, I split my time between working from home and our Sydney and Bathurst offices.

In addition to leading the Spatial Services team, I am part of the Digital. NSW leadership team; I represent NSW on ANZLIC; I am the NSW shareholder proxy for Geoscape Australia; and I
A love for the built environment has resulted in the building of an impressive career in surveying.
Narelle Underwood joined Roads and Maritime Services (RMS, now Transport for NSW) in 2009 as part of its graduate program, completing her registration exams and becoming a Registered Land Surveyor in 2010. During her time with RMS, she worked on a range of road infrastructure projects and held several senior roles, including Southern Region Survey Manager and Principal Surveyor. In October 2016 she left RMS to become Surveyor-General of NSW, and in May 2022 she was appointed Executive Director of NSW DCS Spatial Services.
represent Spatial Services, Digital.NSW and Department of Customer Service on a variety of project, strategy and industry committees — this includes the State Emergency Management Committee and the eConstruction Steering Committee.
What is Spatial Services’ remit? Spatial Services is a division of the Department of Customer Service and provides NSW’s spatial and land information services. Our data products provide the foundation for NSW’s mapping and spatial information systems and are used for building better services across the community, government, industry and the environmental sectors. Our functions include:
• Foundation spatial data products and services (Six Maps, Spatial Collaboration Portal, topographic maps, aerial imagery and LiDAR)
• The Emergency Information Coordination Unit
• Survey operations (CORSnetNSW, Survey Control Information Management System, State control survey, surveying legislation)
• Board of Surveying and Spatial Information
• Geographical Names Board
• Digital Services (printing and graphic design)
We’re undertaking a range of projects based on the Foundation Spatial Data Framework (FSDF) to streamline government processes in terms of planning, design and modelling for NSW’s future needs. Key projects include:
• Live NSW: This incorporates the Spatial Digital Twin (a cross-sector,
collaborative environment which will share and visualise a 4D model) and the Gravity Model (critical geoscience information for infrastructure projects and the management of natural hazards and resources).
• Cadastre NSW: A service for local government authorities to capture and visualise the progress of subdivision developments and increase efficiencies for planning and land development while providing access to intelligent digital property data.
• Digital Survey Plans: Transitioning from ‘paper’ to intelligent digital survey plans to support a more efficient, accurate and accessible land title system.
• Survey Plan Digitisation Project: Digitisation of hard copy survey and strata plans into LandXML and GeoPackage formats.
• Historical Aerial Photography Enhancement Project: Using the state’s 70-year repository of aerial photography to create a 3D digital database to understand how the landscape has altered and to preserve the archival records.
• Whole-of-Government Addressing: The roll out and use of the authoritative NSW Address Database for address verification throughout NSW Government agencies via NSW Point.
You wear a lot of other hats, too, don’t you?
The Surveyor-General is president of the Board of Surveying and Spatial Information (BOSSI), which is the statutory body responsible for the registration of land and mining surveyors in NSW. My key focus areas have included: Improving engagement
The majority of people utilising geospatial information don’t identify themselves as being ‘geospatial’ professionals.
with the profession, industry bodies and allied professions; raising the profile of BOSSI and surveying across government; improving the complaints and disciplinary process; prosecution of unregistered surveyors undertaking land surveys; and supporting candidate surveyors through the registration process.
The Surveyor-General is also the chair of the Geographical Names Board, which is the official body responsible for place naming in NSW. A key focus area for me has been Aboriginal place naming, which encompasses both the use of Aboriginal language in naming and the recognition of traditional Aboriginal place names for geographical features.
I have been involved with the NSW Surveying Taskforce in a few different capacities since it was established 10 years ago. Its prime focus is to raise the profile of the profession, highlighting career opportunities and encouraging more people to join the industry.

What makes you so passionate about this industry?
There are so many reasons. For starters, I cannot think of any other industry that gives you such a wide variety of career options. I recently filmed a masterclass with CSIRO as part of their Generation STEM program and we touched on at least 10 very different specialisations, which is great as we know that the younger generations are not looking for traditional single-job careers and our industry provides an opportunity for a portfolio career without actually changing industries.
I also love that no two days are the same. Each project, policy or strategy means that I am using different skills and learning new things all the time. To be honest, I feel like surveying and geospatial is as much a hobby as it is a job.
For me it has always been about community and place. As I mentioned earlier, I have been fascinated by the built environment since I was young (Lego and SimCity were some of my favourite hobbies growing up). I have enjoyed influencing the
design of the communities that people live in, and while my role in that process has changed, I now get to support decisions that are being made about the built and natural environment through the utilisation of geospatial information.
What do you see as the challenges facing the industry?
Skills shortages in areas of surveying, geospatial and digital, and building capacity and capability in our existing workforce to meet the changing expectations of our customers. And as a result of the combination of increased demand and the skills shortage, I have seen mentoring and training support reduced. If we do not continue to develop and evolve our skills, other industries will step in and start delivering.
Then there’s identity. I would suggest that the majority of people utilising geospatial information don’t identify themselves as being ‘geospatial’ professionals. They likely see geospatial as part of their toolkit, not their profession.
And diversity. There is a lack of diversity in the industry in regard to age, experience, skills, gender and education.
Opportunities include engaging with a broader audience and allied professions to raise the profile and understanding of our industry, and opening up new markets and opportunities. Everything happens somewhere, so the potential for impact is significant… as many people have only just started to realise the real power of using geospatial data to support evidence-based decision making.
And we’re seeing significant investments from governments in data as an asset, as well as opportunities to contribute to the transformation of data systems and processes — further recognition of the value this industry can contribute to the economy.
What are the industry’s strengths? Innovation, resilience and adaptability. While some areas of the industry have
been slow or resistant to change, generally speaking it has embraced technology changes and innovated to provide improved services for our customers.
Project, data and land management. While the democratisation of measurement means that any person can use a device to capture and create a geospatial dataset, increasingly projects are reaching a level of complexity such that good data management is a key for success.
Another strength is understanding metadata… knowing when data is fit for purpose and how to combine data from different sources, taking into account accuracy, currency and projection.
Better collaboration. Despite recent growth we are still a small industry with a fractured voice. There are too many organisations representing surveying and geospatial, competing for membership and attendance at conferences and at continuing professional development events. n
You can connect with Narelle Underwood via linkedin.com/in/narelleunderwood/ and follow DCS Spatial Services at linkedin.com/ company/spatial-services-nsw/.
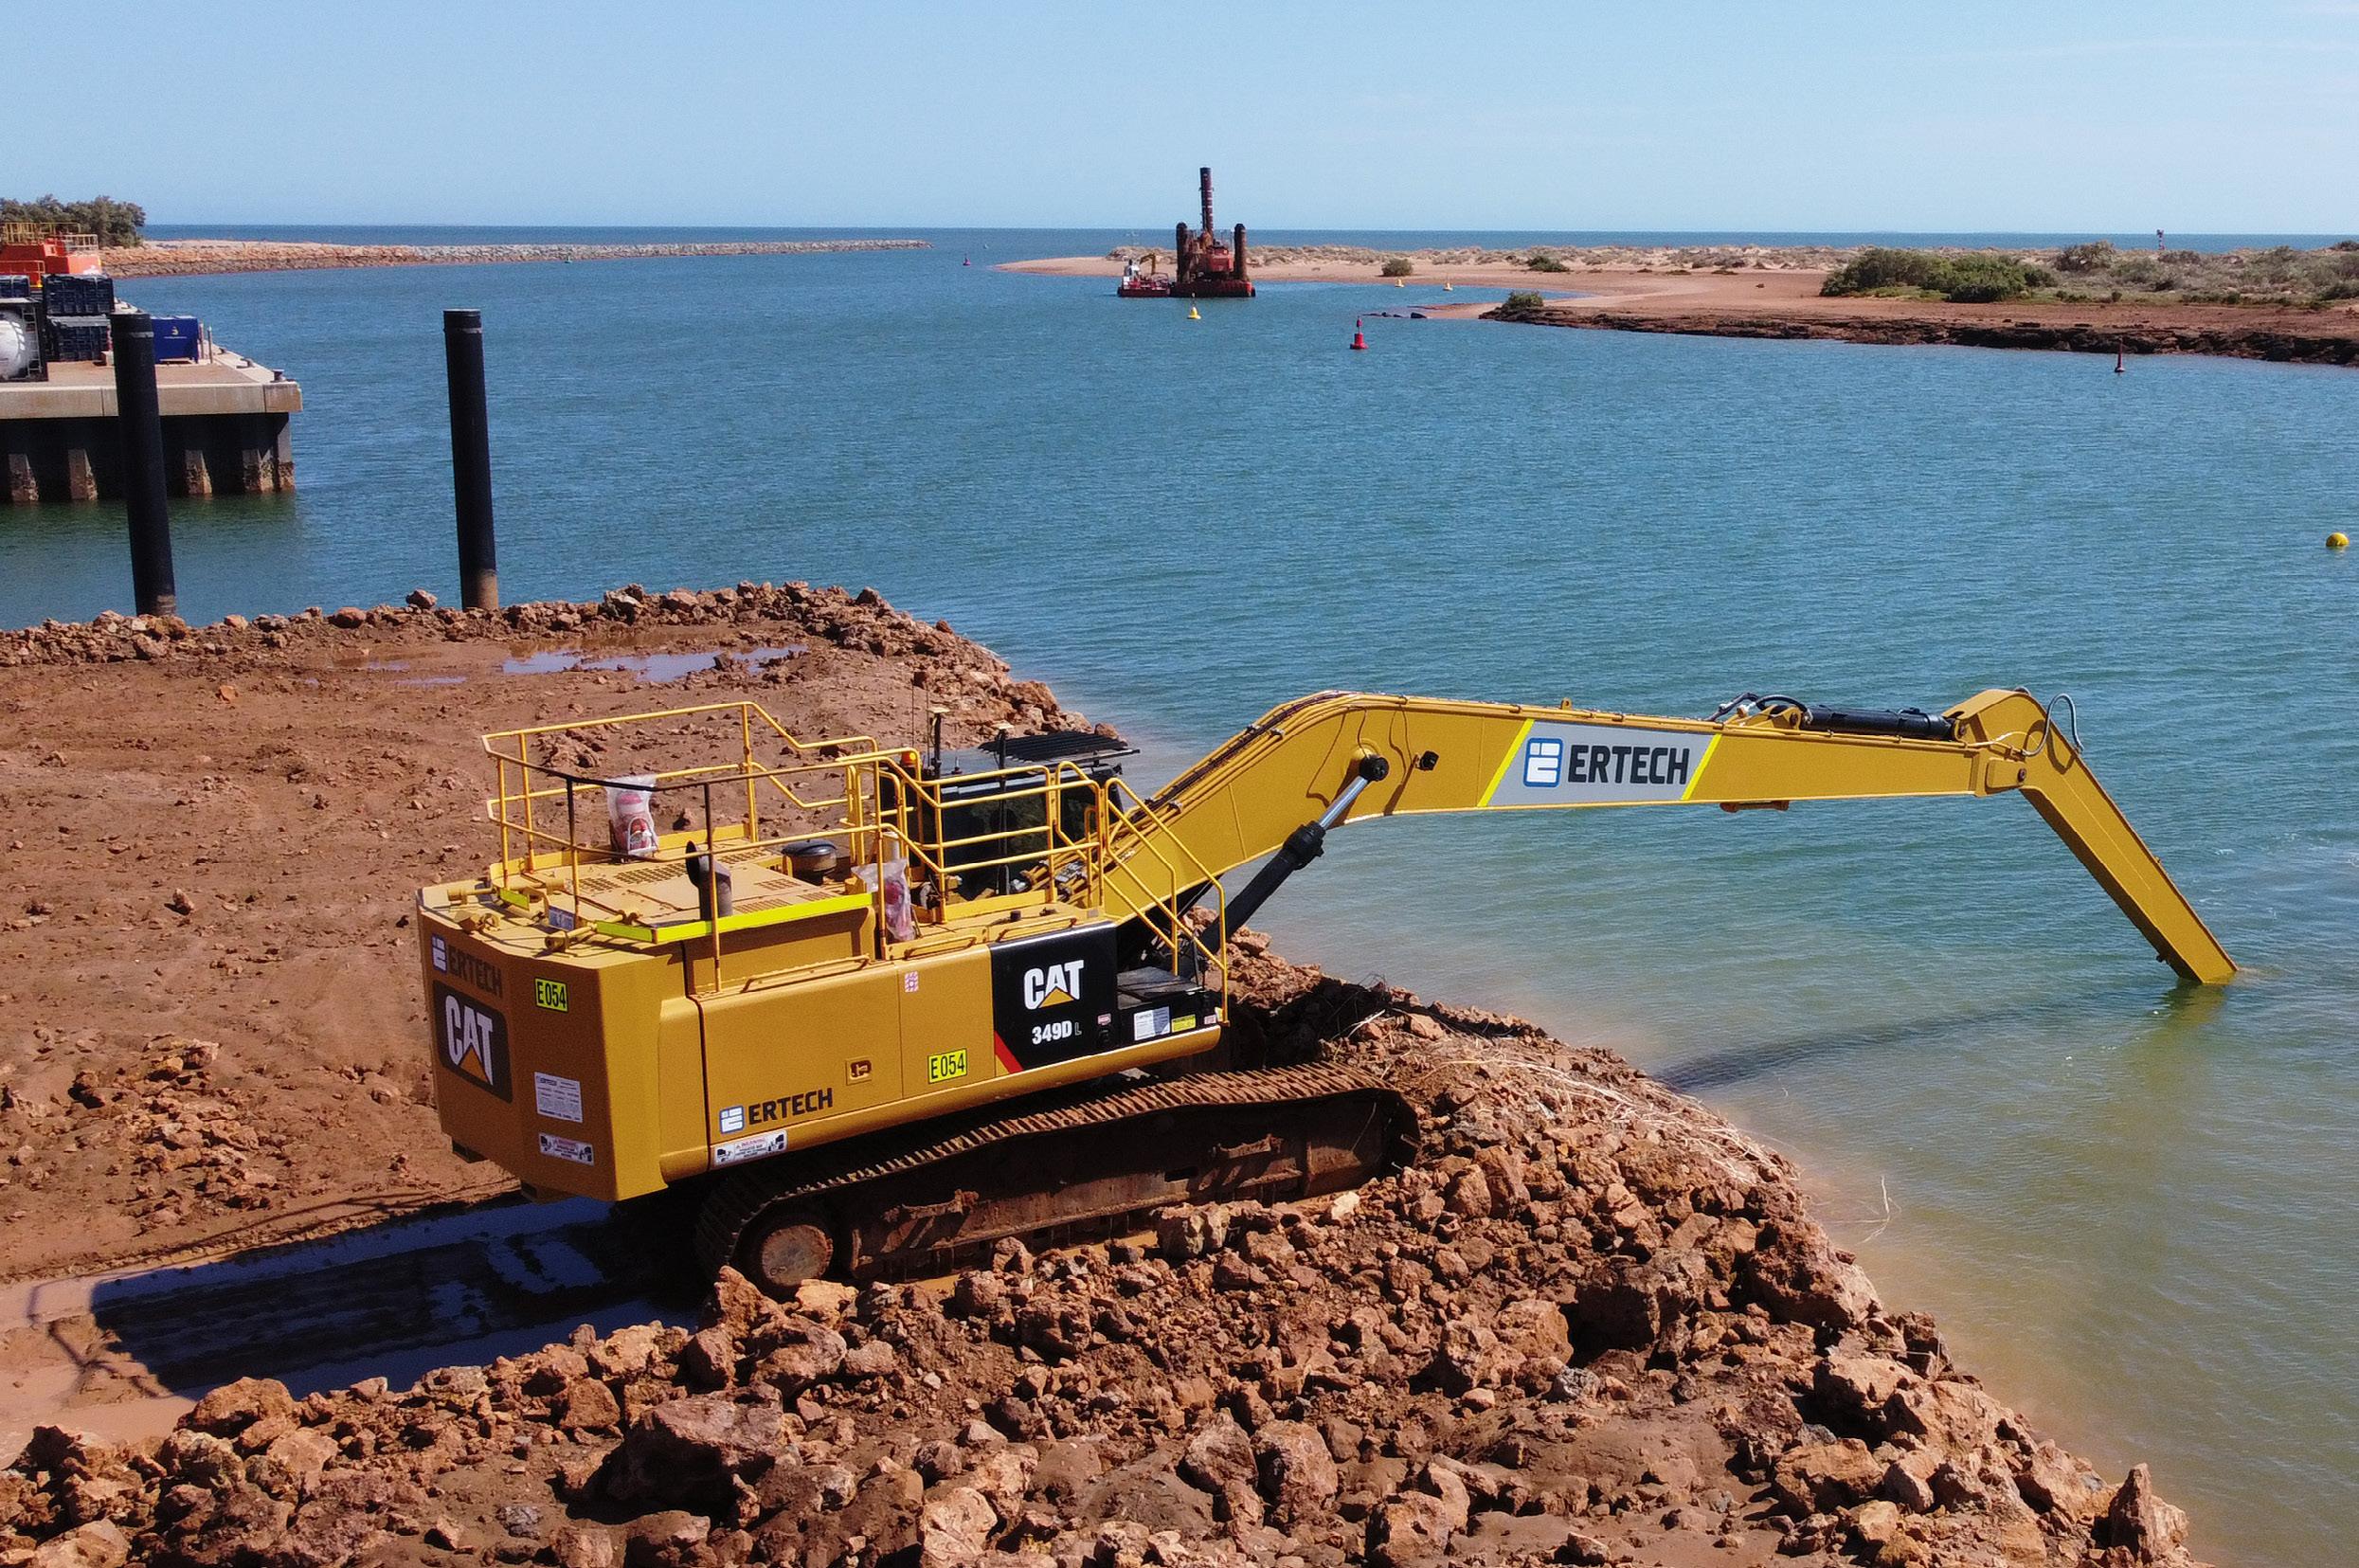
When its legacy machine control equipment could no longer cut it, Ertech turned to a new solution from C.R. Kennedy to save the day.
When WA-based civil engineering company, Ertech, ran into problems during a dredging contract, they turned to a new solution supplied and installed by C.R. Kennedy.
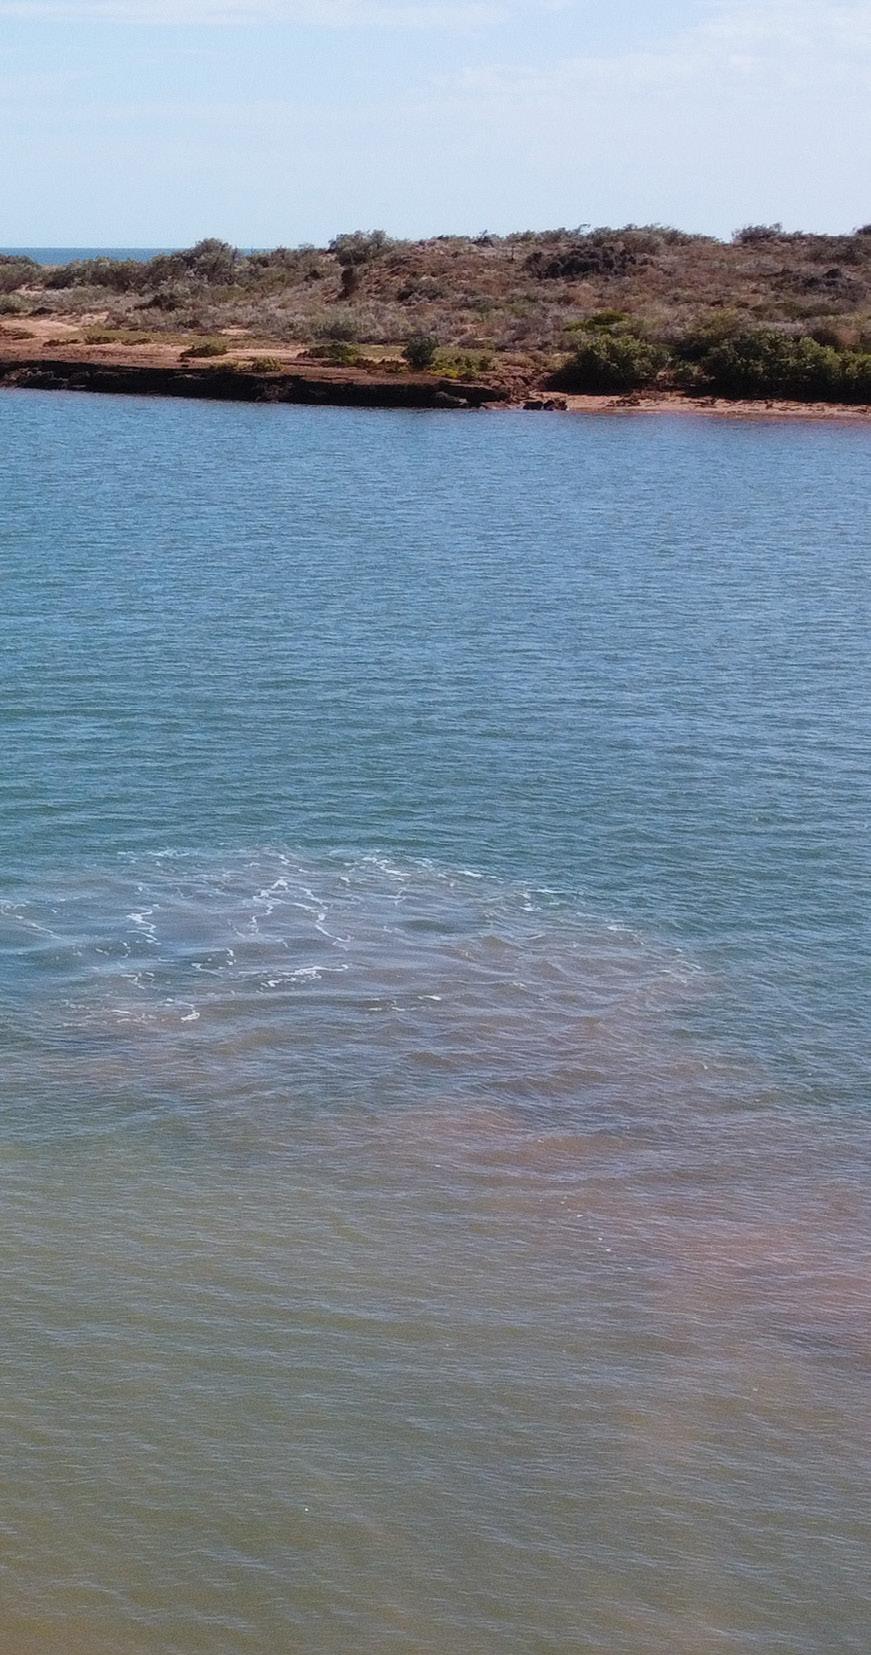
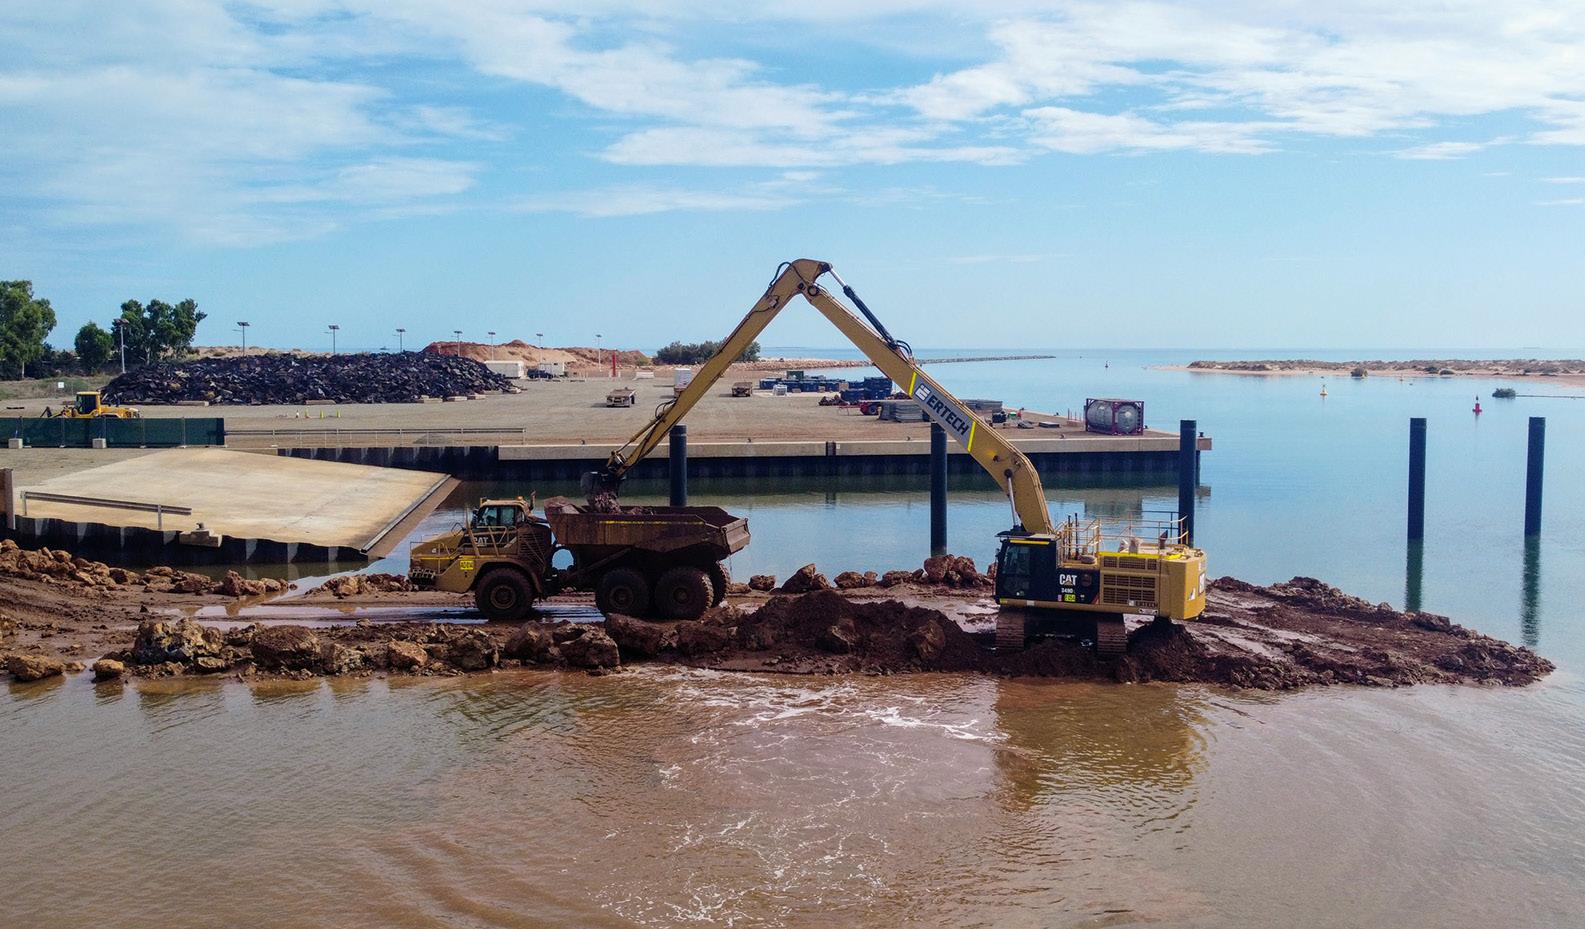
The project in question was the construction of a new boating precinct for the town of Onslow, about 1,300 kilometres north of Perth. An existing boat ramp had become a bit rickety and would go underwater at high tide, so a new ramp was needed. The new facility will also have pens in which people can moor their boats, and from which diving tours and fishing charters can operate.
“For this project we had to dredge about 100,000 tonnes of dirt from the creek, and most of it was done underwater,” said
Bradley Saunders, Ertech’s project manager and engineer for this job.
Ertech began by building a large, temporary bund, dewatered it and then — with a long-reach digger situated on top of the bund — began the process of removing lots of rock.
The rock they had to deal with was calcarenite, a type of limestone that has a very hard capstone but becomes a bit softer toward the bottom. Plus there was a lot of silty, clayey mud underneath and on top of the rock.
“Before we came up here, we had been told there was a 1.5-metre-thick rock shelf where we had to dredge. But once we started dredging, it turned out it was 3 metres thick, almost consistently
across the whole thing,” said Saunders.
“A lot of the dredging was done by operators who couldn’t even see where the bucket was,” added Saunders. “So they might be pulling out material that’s six, seven metres below the tracks, and all they’ve got to go off is the screen and where it’s saying the bucket is.”
At the beginning of the job, Ertech had been using legacy machine control equipment on its digger, but soon found that it was not up to the job. “We’d actually completed a significant part of the dredge when we brought in a subcontractor to do a hydrographic survey. It turned out that quite a significant amount of material was left high of the design levels.”
When Ertech investigated further,
it turned out that the legacy machine control equipment was accurate to ±200 mm, sometimes ±300 mm. But with the job’s design tolerance being +0 mm and –300 mm, Ertech was taking it to the full tolerance and yet the result was still higher than designed.
In addition, Saunders said that when they used the legacy equipment underwater, it would go for a couple of weeks and then just stop working. “The saltwater and all the movement underwater just fried it,” he said.
“So I spoke to our survey manager, who spoke with C.R. Kennedy. They had this brand-new Leica Geosystems MC1 software on a MCP80 machine control system, along with the sensors and all the cabling that goes from the screen down the boom of the digger,” said Saunders. “It’s purposebuilt for dredging, so all the sensors are waterproofed.”
C.R. Kennedy sent two technicians to the site and they installed the equipment in one day. The resulting accuracy improved to ±20mm.
“If you think of an excavator, it’s got a very long boom on it. Our digger is a super-long reach version, so it can boom horizontally out 21 metres,” said Saunders. “When you’re reaching that far, obviously all of the errors multiply significantly if you calibrate it incorrectly or if any of the sensors are off. So to get ±20 mm is exceptional.”
In addition, the legacy machine control equipment was so slow that the digger operators were experiencing a delay of around three seconds between moving the bucket and the control screen updating. That’s the sort of delay you would get if you were communicating with someone on the Moon. Clearly, it wasn’t good enough for a job where the bucket is underwater and the operator can’t see where it is.
“Imagine you’re trying to dig underwater, six metres below your tracks, and you can’t see what you’re doing. You move your bucket and then you have to wait. But this new Leica Geosystems system is almost instantaneous,” said Saunders. The improved performance “gave the operators more confidence with what they were doing, which is half the battle.”
“When we realised the legacy equipment wasn’t working as intended, the operators began to overcompensate, which led to more dredging than was necessary. But
with this more accurate Leica Geosystems equipment, you can bring the tolerances back to what they should be, which saves time, effort, fuel and manpower.”

The MCP80 and MC1 combination’s features include:
• Fully cable free
• Easy removal of panel
• P67 environmental rating
• One common interface across all 3D machine control applications
• Simple and intuitive user interface
• Easy installation and quick setup for operators
• Rugged design of cradle and panel
• Docking station with onboard memory
“We’re actually switching out a lot of our legacy gear now and moving more towards Leica Geosystems,” said Saunders, adding that “C.R. Kennedy were great — they flew the guys up and they installed it in no time at all, and got the job running the way it should be done.” n
“The improved performance gave the operators more confidence with what they were doing, which is half the battle.”
Bradley Saunders, Ertech
 PHIL VANDENBOSSCHE, CHRIS BERRY AND CRAIG DAVEY, CSIRO
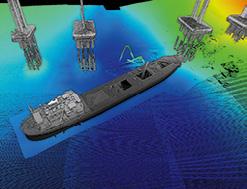
The first-ever ultra-high-resolution spatial digital twin of the SS Lake Illawarra and the Tasman Bridge reveals remarkable detail.
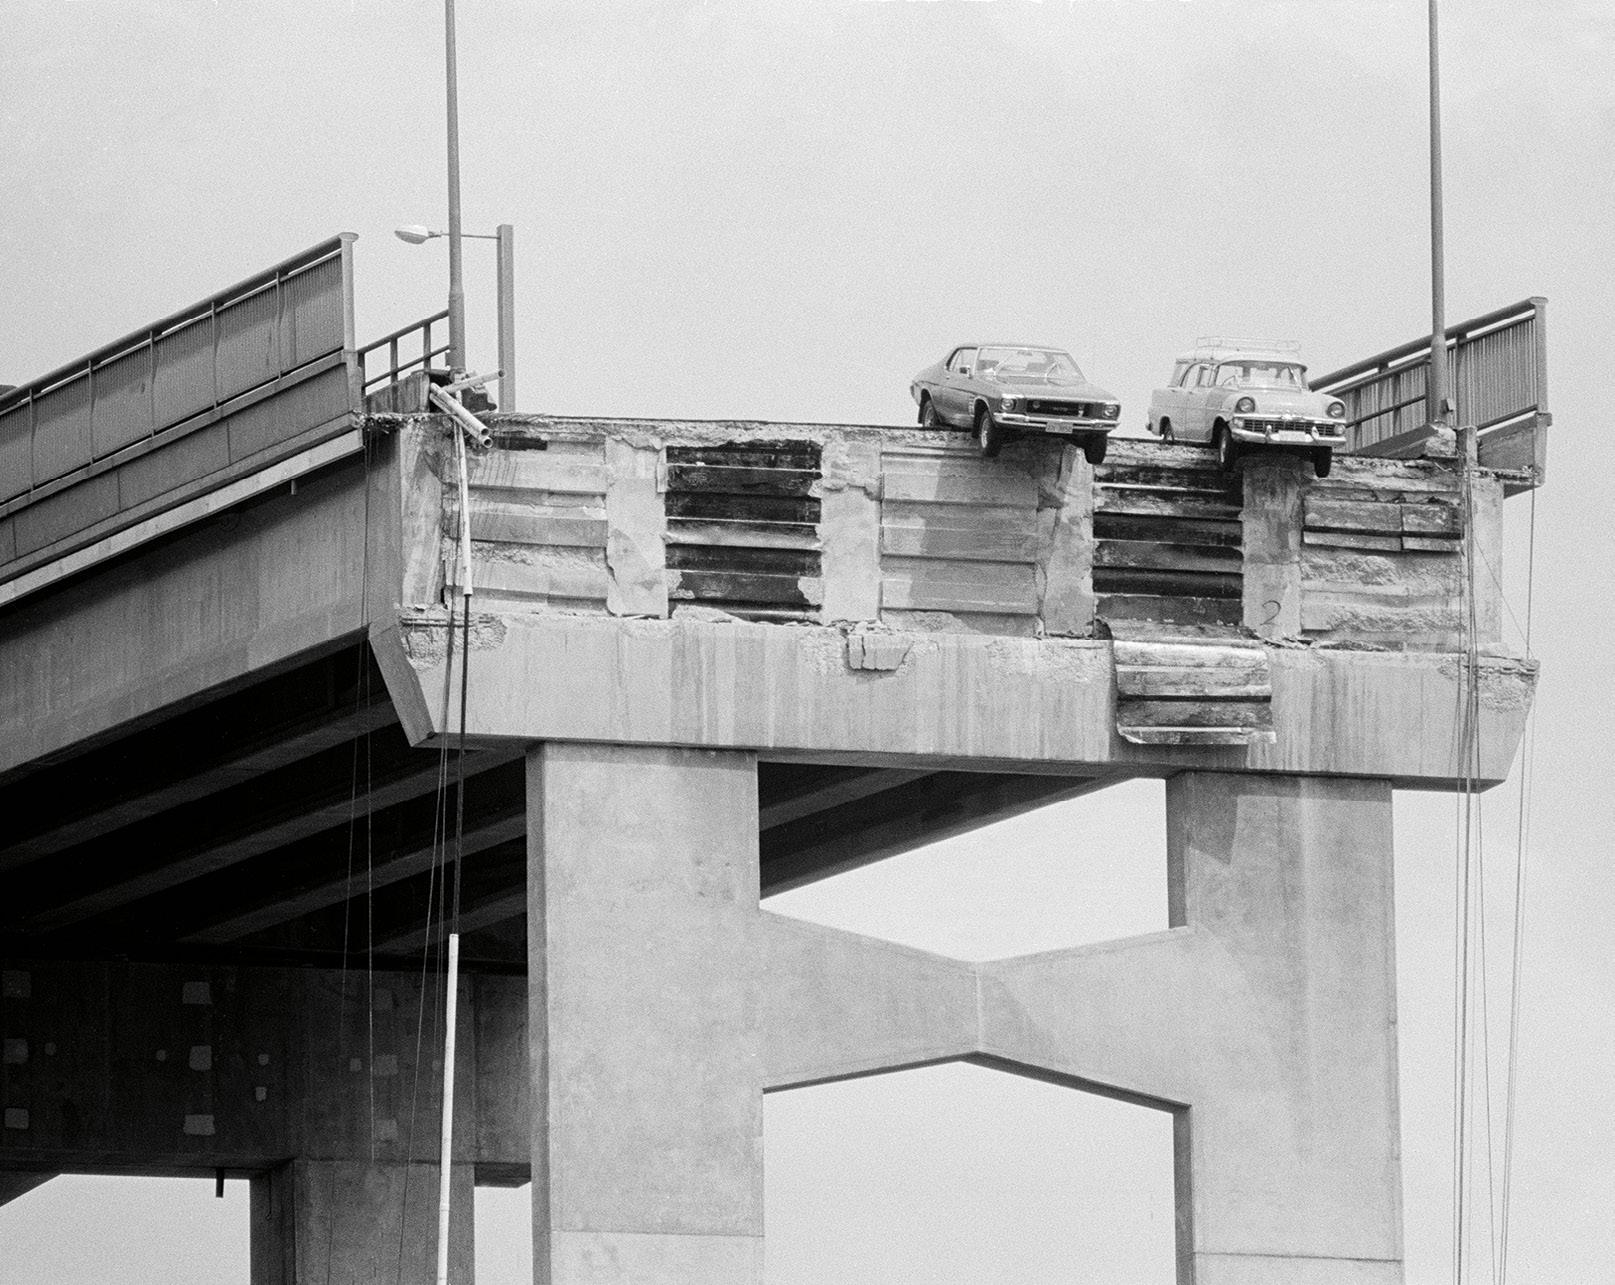
On the night of 5 January 1975, the bulk ore carrier SS Lake Illawarra allided with the Tasman Bridge in Hobart, causing two pylons and a large span of road to collapse into the river. The ship sank with the loss of seven crewmembers, along with five motorists. The occupants of two vehicles had lucky escapes. (SS Lake Illawarra: Tasmanian Archives and Heritage Office/Wikipedia; other images © Commonwealth of Australia, National Archives of Australia, CC BY-NC-ND.)
On the night of 5 January 1975, the 140-metre-long bulk ore carrier SS Lake Illawarra was passing under the Tasman Bridge in Hobart when it struck a bridge pylon near the eastern shore and sank. The impact caused a 127m-long section of the bridge span and two of its supporting pylons to collapse. Twelve lives were lost — seven crewmembers of the vessel and five occupants of cars that went over the edge.


While this tragic event still resonates with many Hobartians, it is often forgotten that the ship remains on the bed of the Derwent River below the bridge at a depth of approximately 35 metres. At that depth and where it lies outside the main channel, it poses no hazard to navigation. However, its presence has attracted interest from divers, boating enthusiasts, historians, research communities and others, including CSIRO.
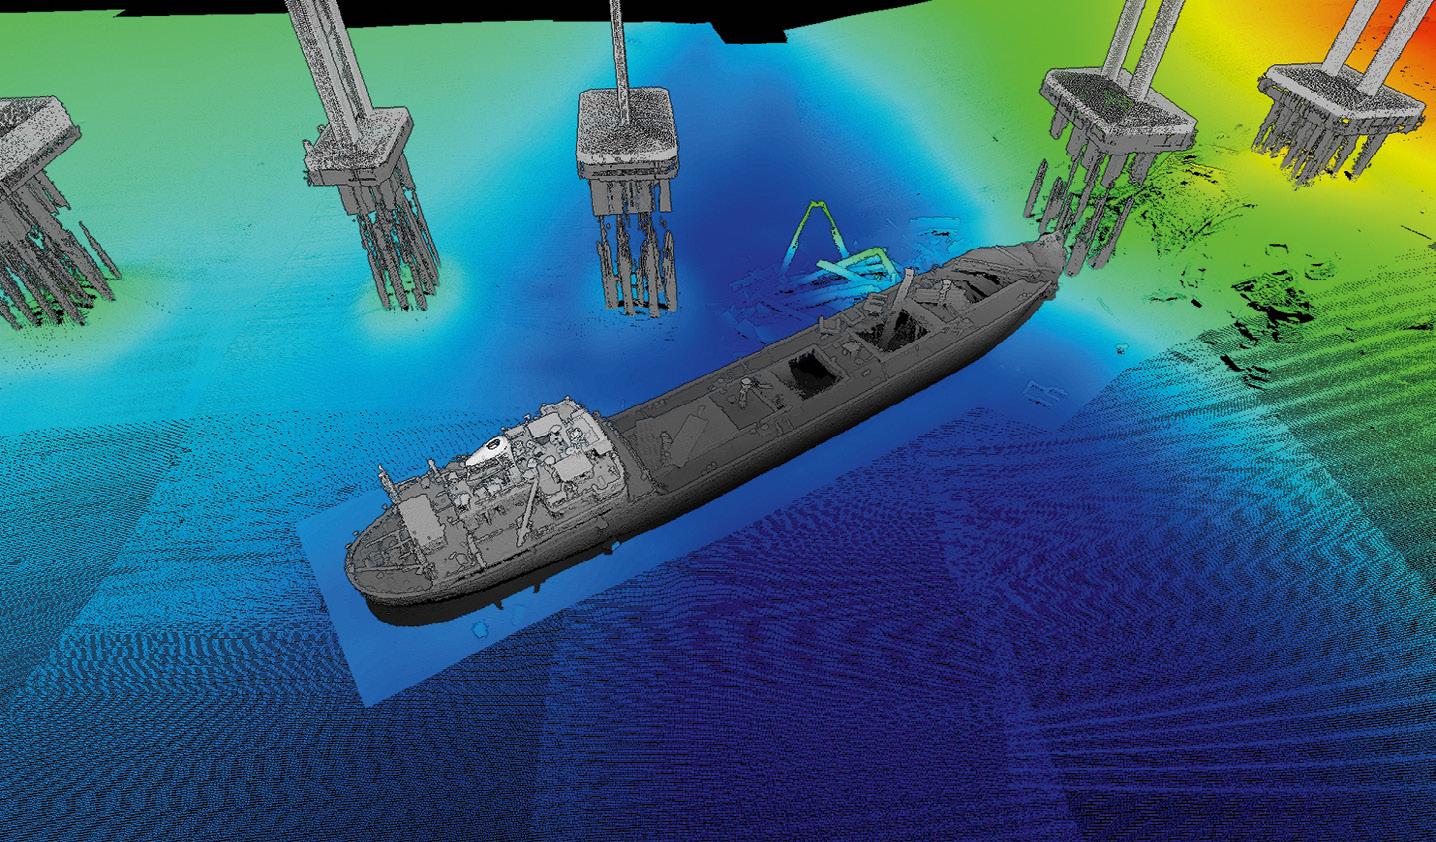
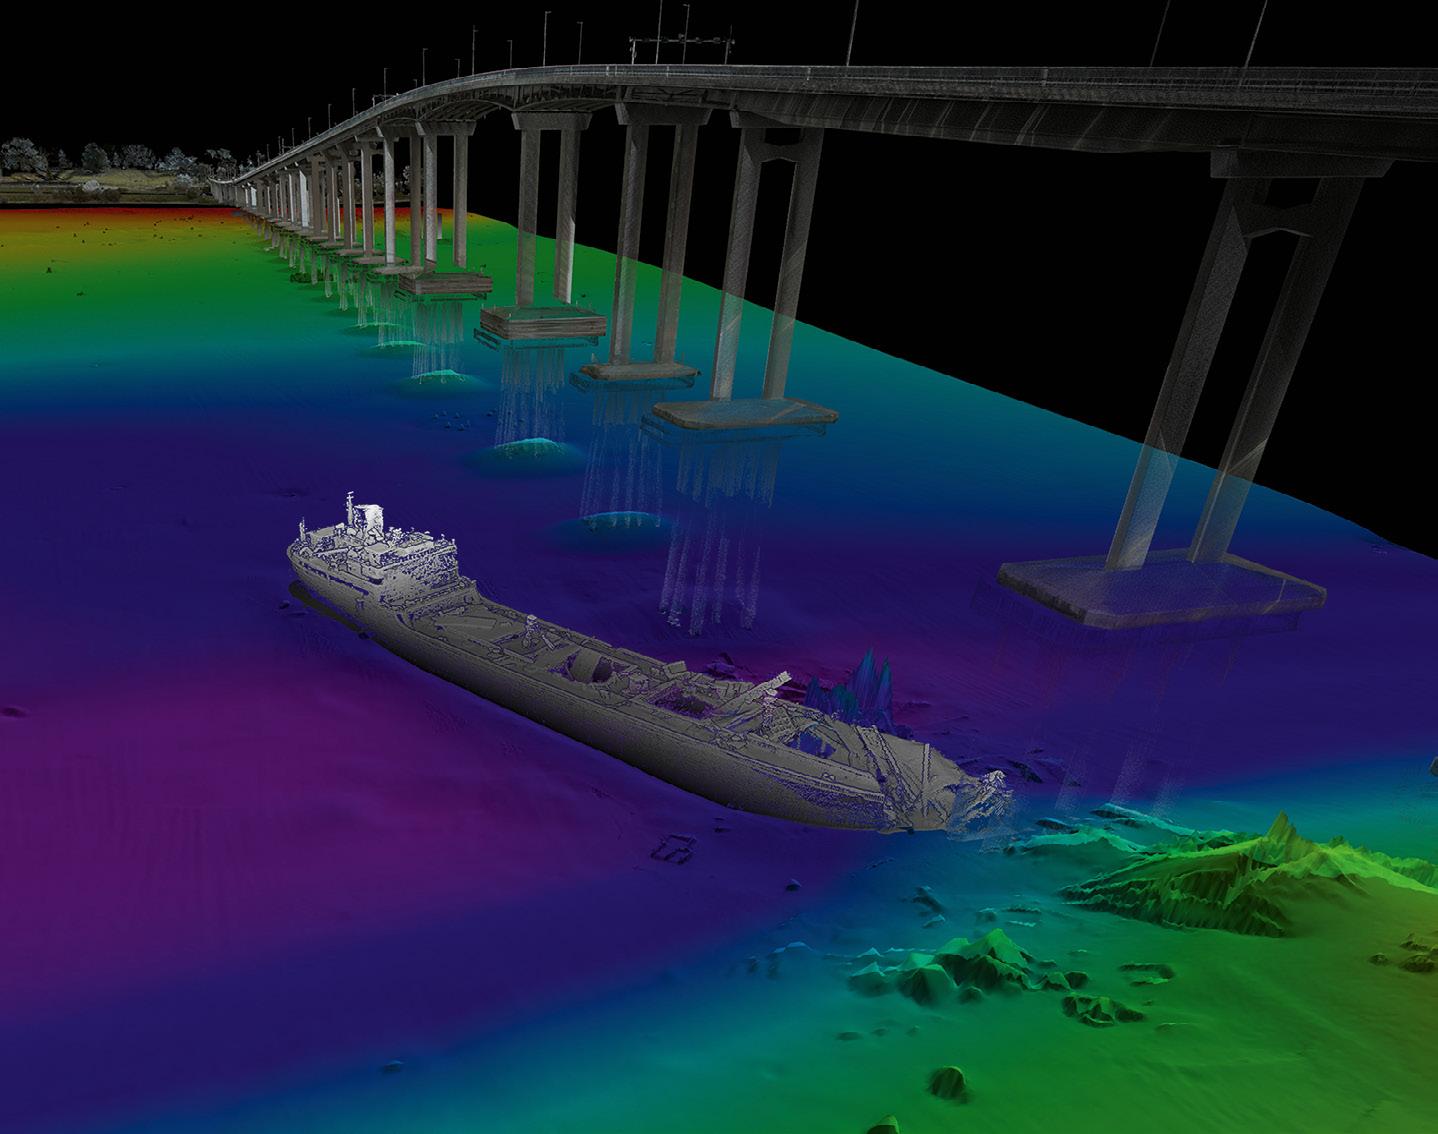
In October 2021, the specialist marine Geophysical Survey and Mapping (GSM) team from CSIRO, in collaboration with industry engineering firm Jacobs, undertook an advanced survey of SS Lake Illawarra and the Tasman Bridge. While the mapping of the wreck was not a novel concept — it was first mapped by CSIRO in 2014 — the 2021 survey differed in that it produced the first ever ultra-highresolution (UHR) spatial digital twin of the wreck, riverbed and bridge infrastructure.
CSIRO initiated the survey project with three objectives: assess the capability of some of the latest sonar technology on the market; enhance skills and capacity in the team; and provide data and visualisations for research and public benefit, including in education and outreach activities.
For this project, Jacobs provided terrestrial survey expertise and the latest laser mapping technology, while CSIRO provided underwater survey expertise, together with some of the latest underwater sonar technology. The CSIRO research vessel RV South Cape was used for the above- and below-water surveys.
The result was the acquisition of more than three times the soundings of 2014, with a total of 4,350,970 data points.
2014 2021
Echosounder device Kongsberg EM2040C NORBIT WINGHEAD i77h

System frequency range 200–400 kHz 200–700 kHz Frequency used 300 kHz 700 kHz
Beam width 1 x 1 degree @ 400 kHz 0.5 x 0.9 degree @ 700 kHz
Max ping rate 50 Hz 60 Hz
Number of soundings per ping 400 single swath, 800 dual swath 1,450
Number of soundings acquired over the wreck 1,407,609 4,350,970 Comparison between the 2014 and the 2021 multibeam echosounder system campaigns.
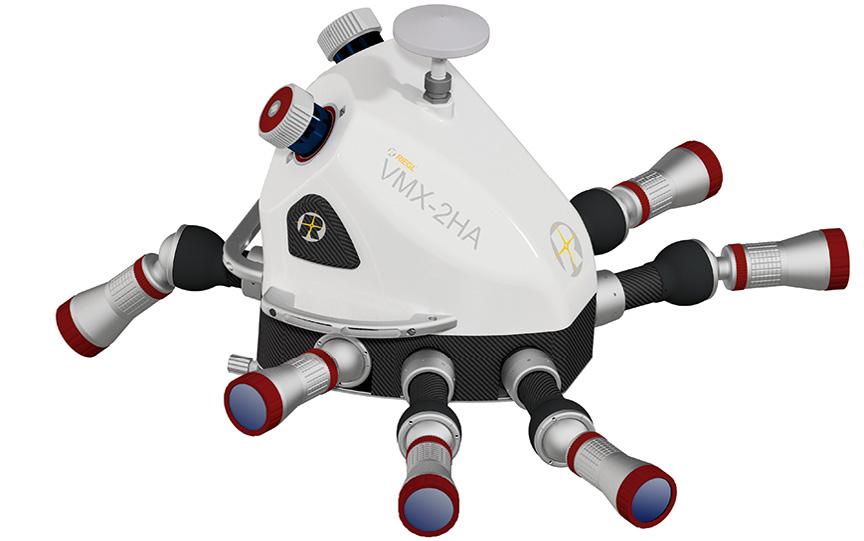
The survey was completed in two phases. First, Jacobs mobilised a RIEGL VMX-2HA high performance, mobile laser scanning (MLS) mapping system on the RV South Cape and conducted a UHR scan of the above-water components, consisting of the bridge, bridge pylons and adjacent shorelines. Next, CSIRO mobilised a hired NORBIT WINGHEAD i77h compact UHR multibeam echosounder and accompanying iLiDAR terrestrial scanner and conducted the underwater survey components. This included the wreck, surrounding riverbed and submerged sections of the supporting bridge pylons.
Prior to each survey, both teams performed rigorous offset measurements and pre-survey calibrations to ensure best survey practice and system performance. A planned survey grid was used to map the riverbed from shore to shore, and on both the southern and northern sides of the bridge. A smaller survey grid was then used to specifically target the detailed mapping of the wreck itself.
In addition to the vessel-based surveys, Jacobs installed the terrestrial MLS system on a vehicle and mapped the entire bridge deck (road) and approaches to the bridge.
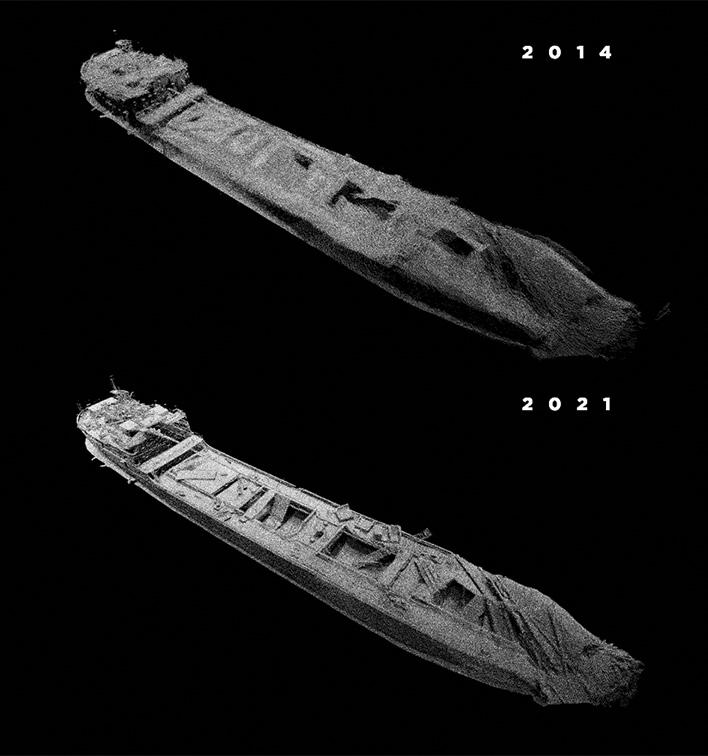
In 2014, CSIRO’s survey of SS Lake Illawarra was undertaken using a Kongsberg EM2040c multibeam echo sounder. At the time, this was one of the latest high-resolution, shallow-water survey sounders available. While this was, and remains, a sophisticated industry standard shallow-water survey system, its highest operating frequency is 400 kHz. However, the 2014 survey was conducted at a nominal
frequency of 300 kHz and in an equipment testing scenario, rather than a detailed planned survey of the wreck. The result of that survey yielded sonar imagery that was impressive at the time and provided the highest-known survey resolution of the wreck, with 1,407,609 soundings. The mapping attracted significant community and media interest.
For the 2021 survey, the NORBIT WINGHEAD i77h was used at a frequency of 700 kHz, more than double that of the 2014 survey, to map the wreck and associated debris in far greater detail — higher frequencies combined with narrow beamwidth results in greater acoustic resolution. The increased resolution of the mapping also benefitted from the detailed, targeted survey plan. The result was the acquisition of more than three times the soundings of 2014, with a total of 4,350,970 data points. Whilst much of the outline and large structures are common to both surveys, the 2021 survey captured the finer detail of the wreckage, including railings, port holes, the mast and numerous other small features. The results almost resemble a photograph.
To understand the advantages of modern underwater sonar technology, if one considers how long it would take for a diver to explore and photograph the wreck — with a narrow field of view and in dark, low-visibility conditions — one can really appreciate the benefits of this technology. The entire wreck can be mapped, in reasonable detail, with a single survey pass at 6 knots in a little under one minute! With multiple carefully planned passes, designed to ensonify all aspects of the feature, the results presented here are possible.
When the terrestrial MLS point cloud data is incorporated with the underwater
The 2021 SS Lake Illawarra survey has almost four times as many soundings as the 2014 survey. NORBIT WINGHEAD i77h (top) and The RIEGL VMX-2HA (bottom). Courtesy RIEGL and NORBIT.soundings, further spatial context is provided, indicating precisely how the shipwreck is orientated and where it rests with respect to the bridge and adjacent eastern shoreline.
At the completion of the survey, Jacobs and CSIRO independently performed various phases of data processing and cleaning to remove unwanted ‘noise’. The dataset was also reduced to a common spatial coordinate system (GDA 2020, MGA55) and vertical datum (AHD: Australian Height Datum). CSIRO performed much of its bathymetry data processing and visualisation using a combination of industry standard software suites including Teledyne CARIS HIPS and SIPS, QPS Qimera and Fledermaus, and Pointerra3D. Once completed, CSIRO combined both the surface and subsurface data to create a combined point cloud dataset. The resulting 3D imagery of the merged digital twin products are featured here.
The digital twin is important in spatially capturing not only the wreck itself, but also the surrounding environment including the Tasman Bridge, the riverbed between the eastern and western shorelines and sections of the shoreline too. While this provides a holistic conceptualisation of the wreck and its setting, each survey point is precisely spatially referenced and therefore can be used for accurate measurements. This opens an avenue for researchers to assess the condition of the wreck, associated features and surrounding riverbed. From an engineering standpoint, the terrestrial laser data of the bridge provides a wealth of data that is fundamental for any future bridge infrastructure planning, upgrades and monitoring purposes.
CSIRO has diverse expertise in its marine GSM team, comprising certified hydrographic surveyors, geophysical surveyors, acousticians, GIS specialists and data management professionals. The team primarily supports the CSIRO Marine National Facility and the advanced ocean research vessel, RV Investigator. However, GSM also undertakes shallow water mapping and survey projects through the Shallow Survey Facility (SSF). The SSF collaborates with researchers and stakeholders nationally on projects of varying scope, from renewable energy developments to habitat mapping projects and everything in-between.
CSIRO would like to thank Paul Digney and Jacobs for partnering on this project. Our thanks also extend to internal collaborators, including Dave Kruse (Master of RV South Cape) and Matt Marrison (CSIRO Corporate Affairs). We also acknowledge the CSIRO Engineering and Technology Strategic Project Program for supporting this project. n
Data collected during the 2021 survey has been used to produce an ultra-high-resolution digital twin of the SS Lake Illawarra wreck, riverbed and the Tasman Bridge.

The summer of 2022 delivered some exceptional rain fall to the Northern Rivers region of NSW, this was due in large part to the La Nina weather cycle which delivered heavy flooding and resulting devastation. Towns such as Lismore were severely impacted by the ensuing floods leaving residents at great risk and suffering considerable loss.
Following repeated flooding combined with summer fires, and the resulting impact to lives, property and
infrastructure, it has become increasingly important to be able to quickly gather data that can provide insight into slope stability, bush fire risks, drainage patterns and other risks such as flooding.
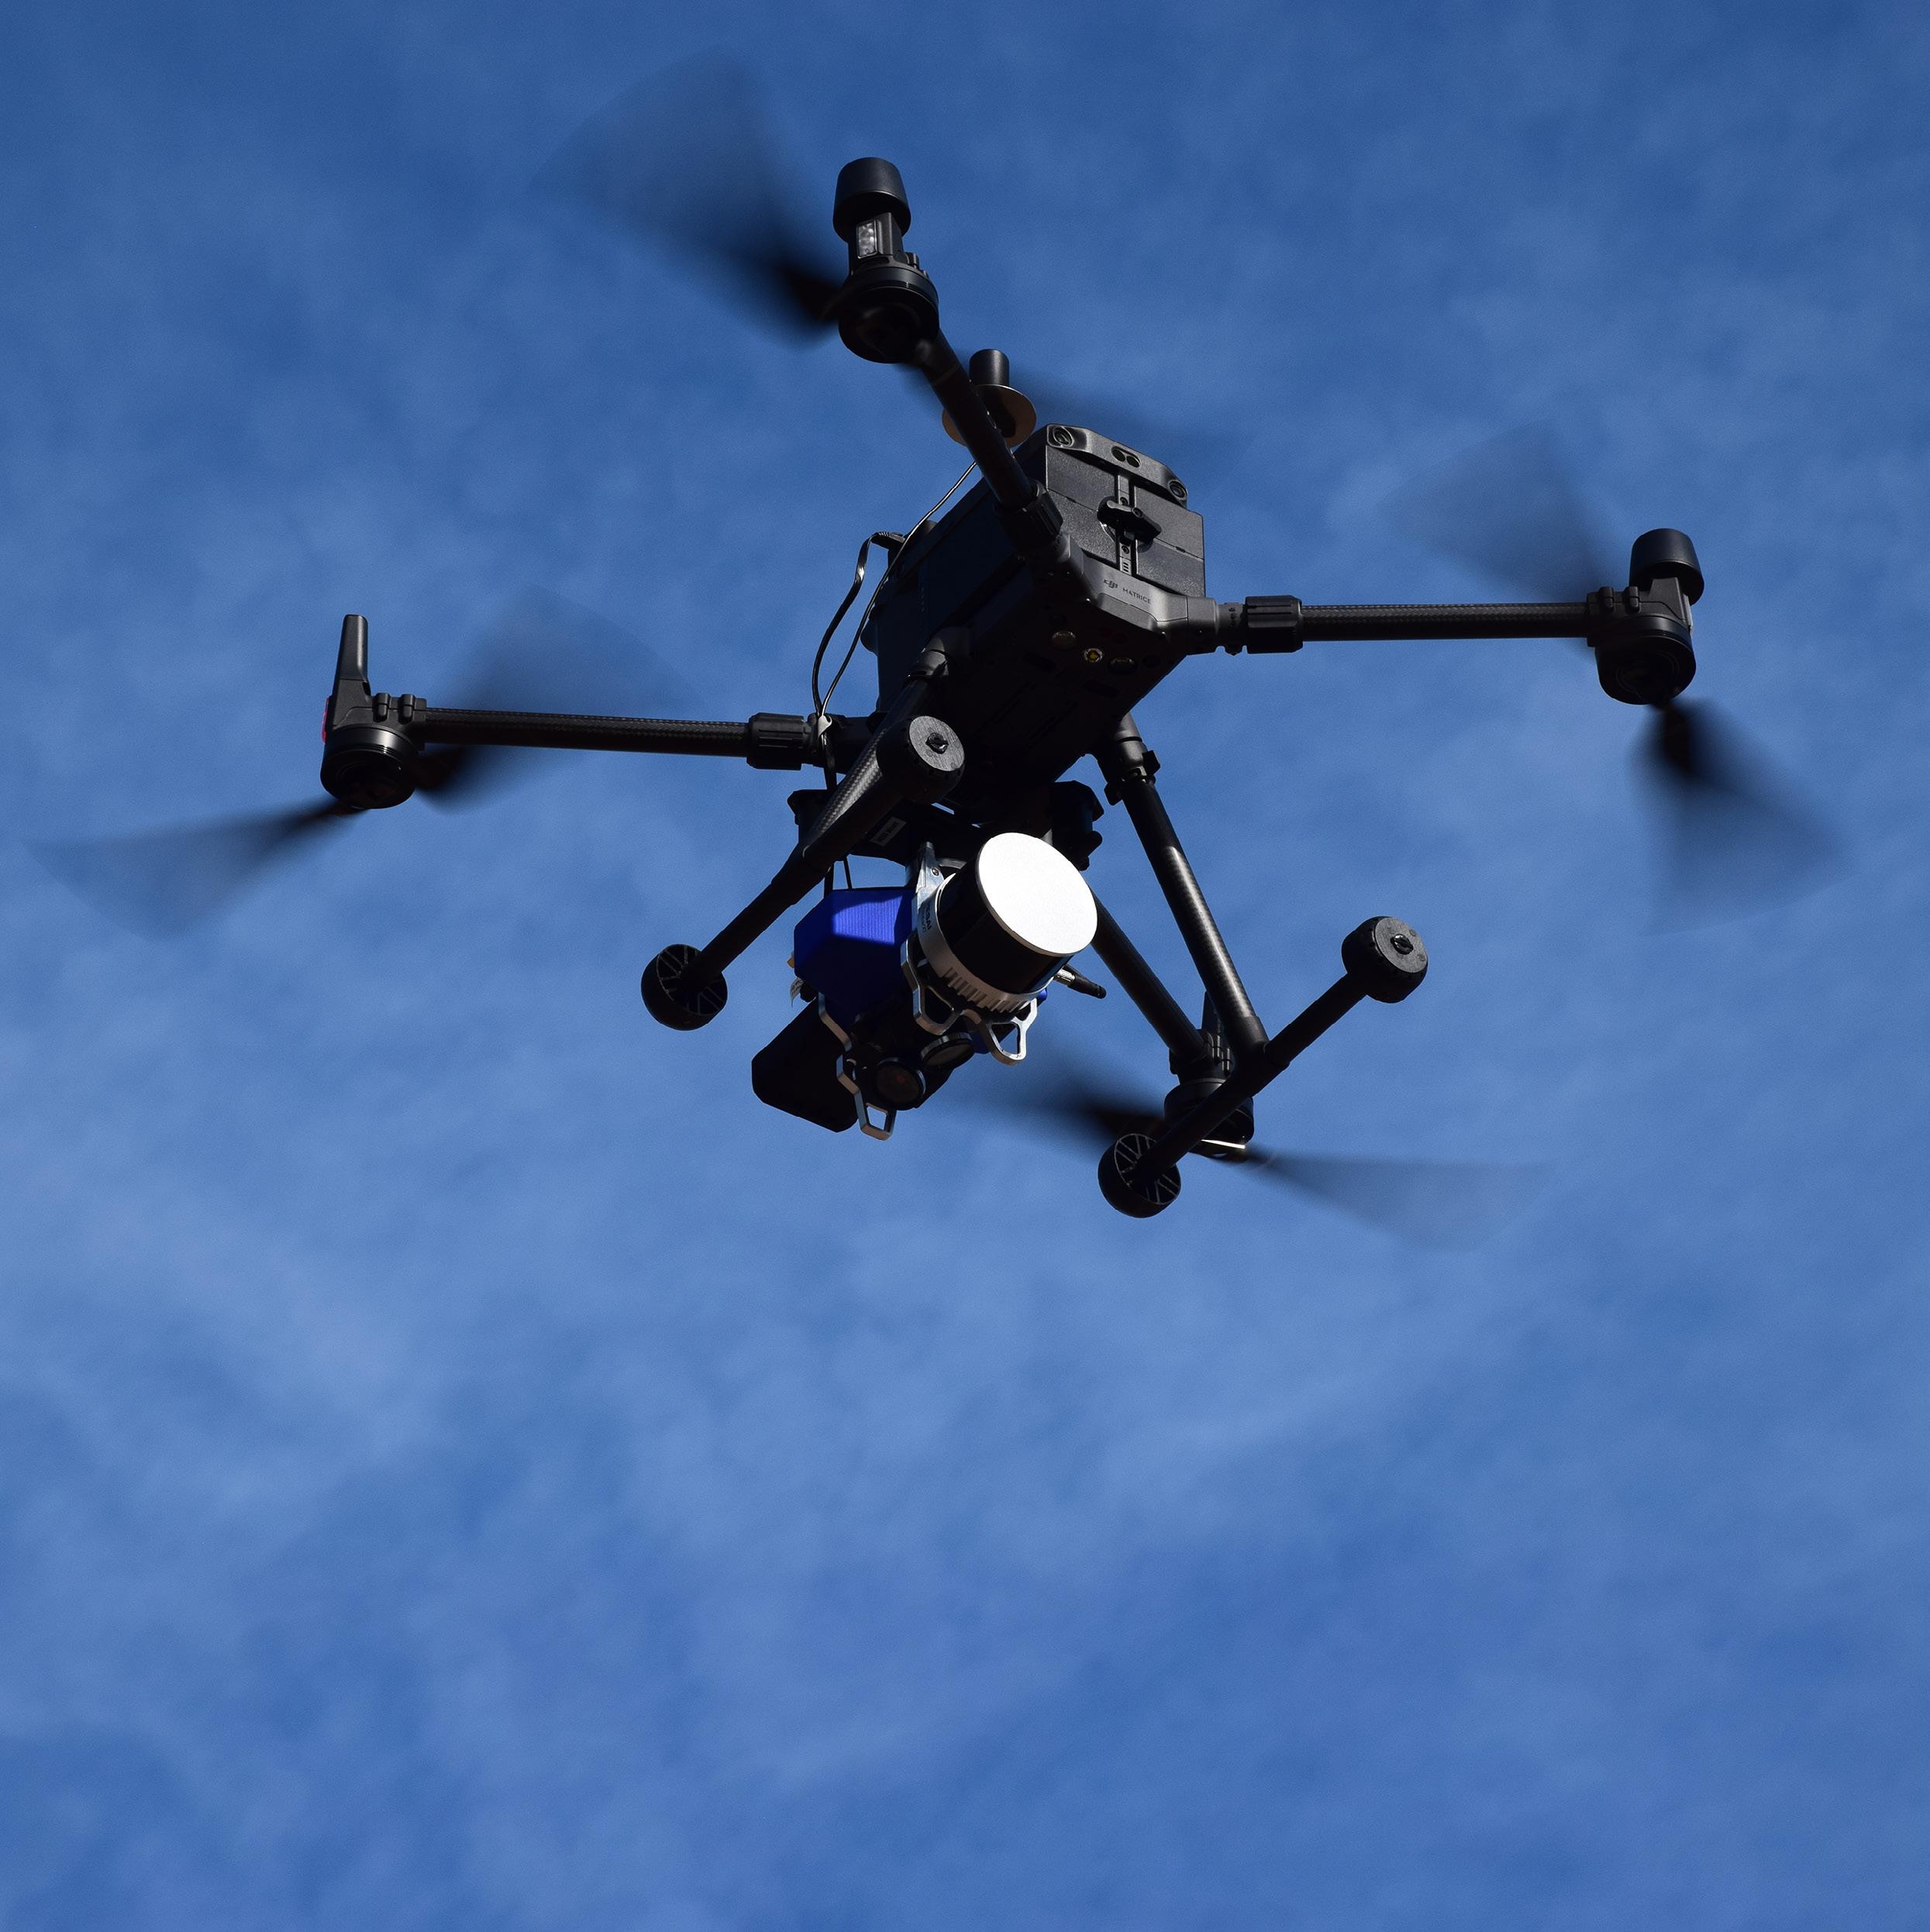
Ensuring that public areas such as roads are safe is a high priority for local councils. Recently Byron Bay Surveying contacted GeoCue Australia for help with their upcoming projects and following this adopted the TrueView 515 drone-based LiDAR system.
In September Byron Bay Surveying Pty Ltd were approached by Richmond Valley Council (RVC) to assist with a major landslide event on Naughtons Gap Road, just north of Casino NSW. We needed a rapid and accurate mapping solution to capture the terrain for geotechnical analysis and planning for remediation design work.
Having worked closely with GeoCue Australia in the past, we felt confident in the technology and support required to get the data we needed in haste. Our meeting with RVC was on a Friday, by Monday morning we had a TrueView 515 and drone in the air scanning the site. By Tuesday morning, we had the colorised point clouds covering an area of 25ha in our hands ready for data extraction and plan production, much of which can be done in the LP360 Drone software. The turnaround given the size of the area was phenomenal.
From the dataset we were able to compare with a baseline survey how the ground had moved and perform catchment and drainage flow analysis, some of the work performed involved capturing data through heavily wooded terrain. The high capture rate of the TrueView 515 made short work of punching through this vegetation. Also, the accuracy provided, quoted at better than +/-50mm, was great for this type of work. We generally saw 30-40mm results.
My thoughts on the technology are this. As surveyors, we are all aware of the rapid rise of “aerial mapping” and the ease of buying an off the shelf package to deliver impressive looking point cloud data and imagery that is entirely devoid of any spatial accuracy or quality.

Flying and mapping is easy, getting quality and efficient data takes time, experience and patience. You can’t get good data without due care and attention but as surveyors that’s our domain and this has been very well addressed with the TrueView 515 and the LP360 Drone software that comes with this system. We used many of the great post processing features including the QA/QC checks.
After meeting with Paul Salmon, the Sales Manager for GeoCue Australia, and running the TrueView LiDAR system over our projects, I have been captured by how far the technology has come and what it offers us for the future. We do very much look forward to seeing how far we can push this technology and which other projects we can take on given our adoption of this fabulous data capture option.
GeoCue are at the forefront of the rise of drone-based LiDAR systems. The lowering cost of entry and easier access to high quality LiDAR data is opening the way for surveyors to access such technology for their projects. These are serious tools built for surveying.
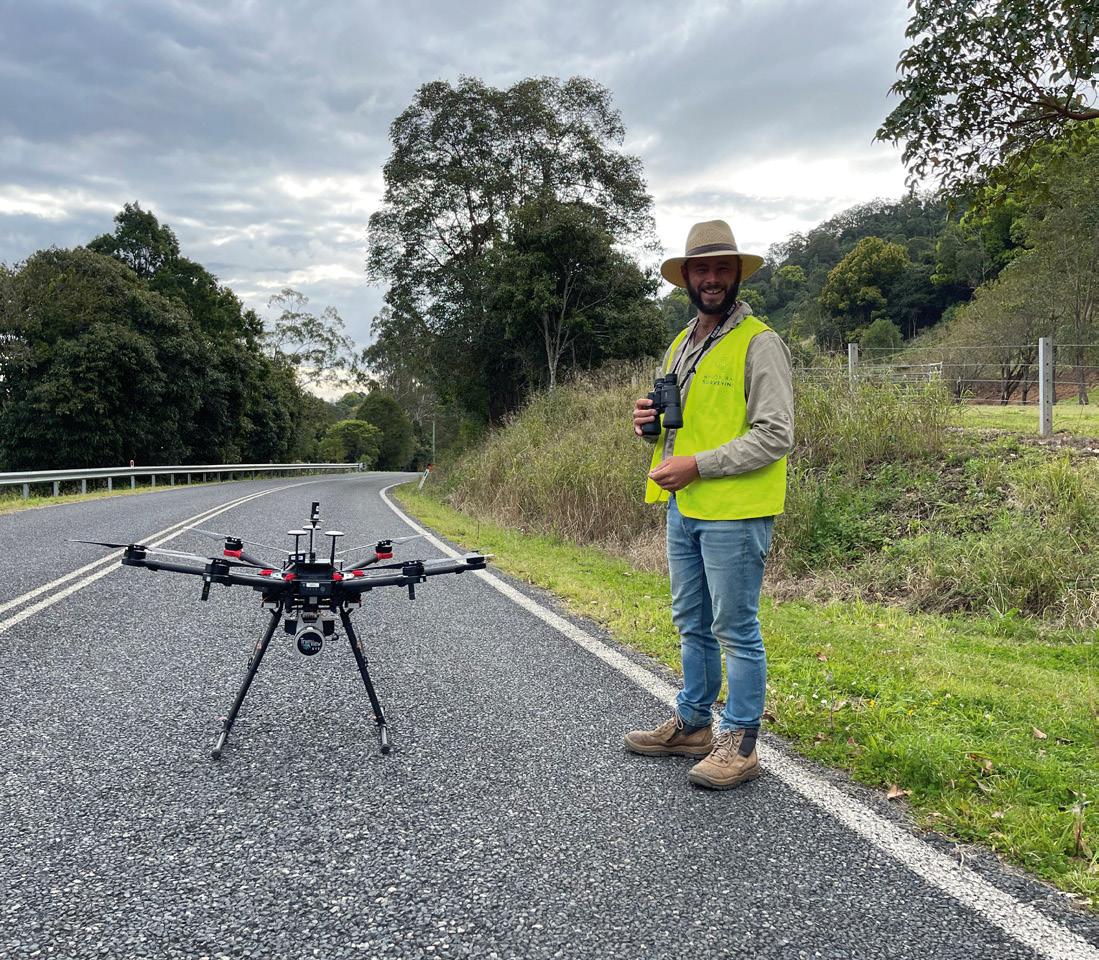
 Lucas Flumm Byron Bay Surveying
GeoCue Australia include extensive support regarding how to get the most from their LiDAR hardware and software and offer 24-hour support. Please contact GeoCue Australia for more information or a trial. www.geocueaustralia.com - sales@geocueaustralia.com
A s Brisbane’s transformational Cross River Rail project enters its fourth year of construction and with the first station buildings beginning to appear out of the ground, new practical uses of the project’s groundbreaking digital model are also revealing themselves on almost a monthly basis.
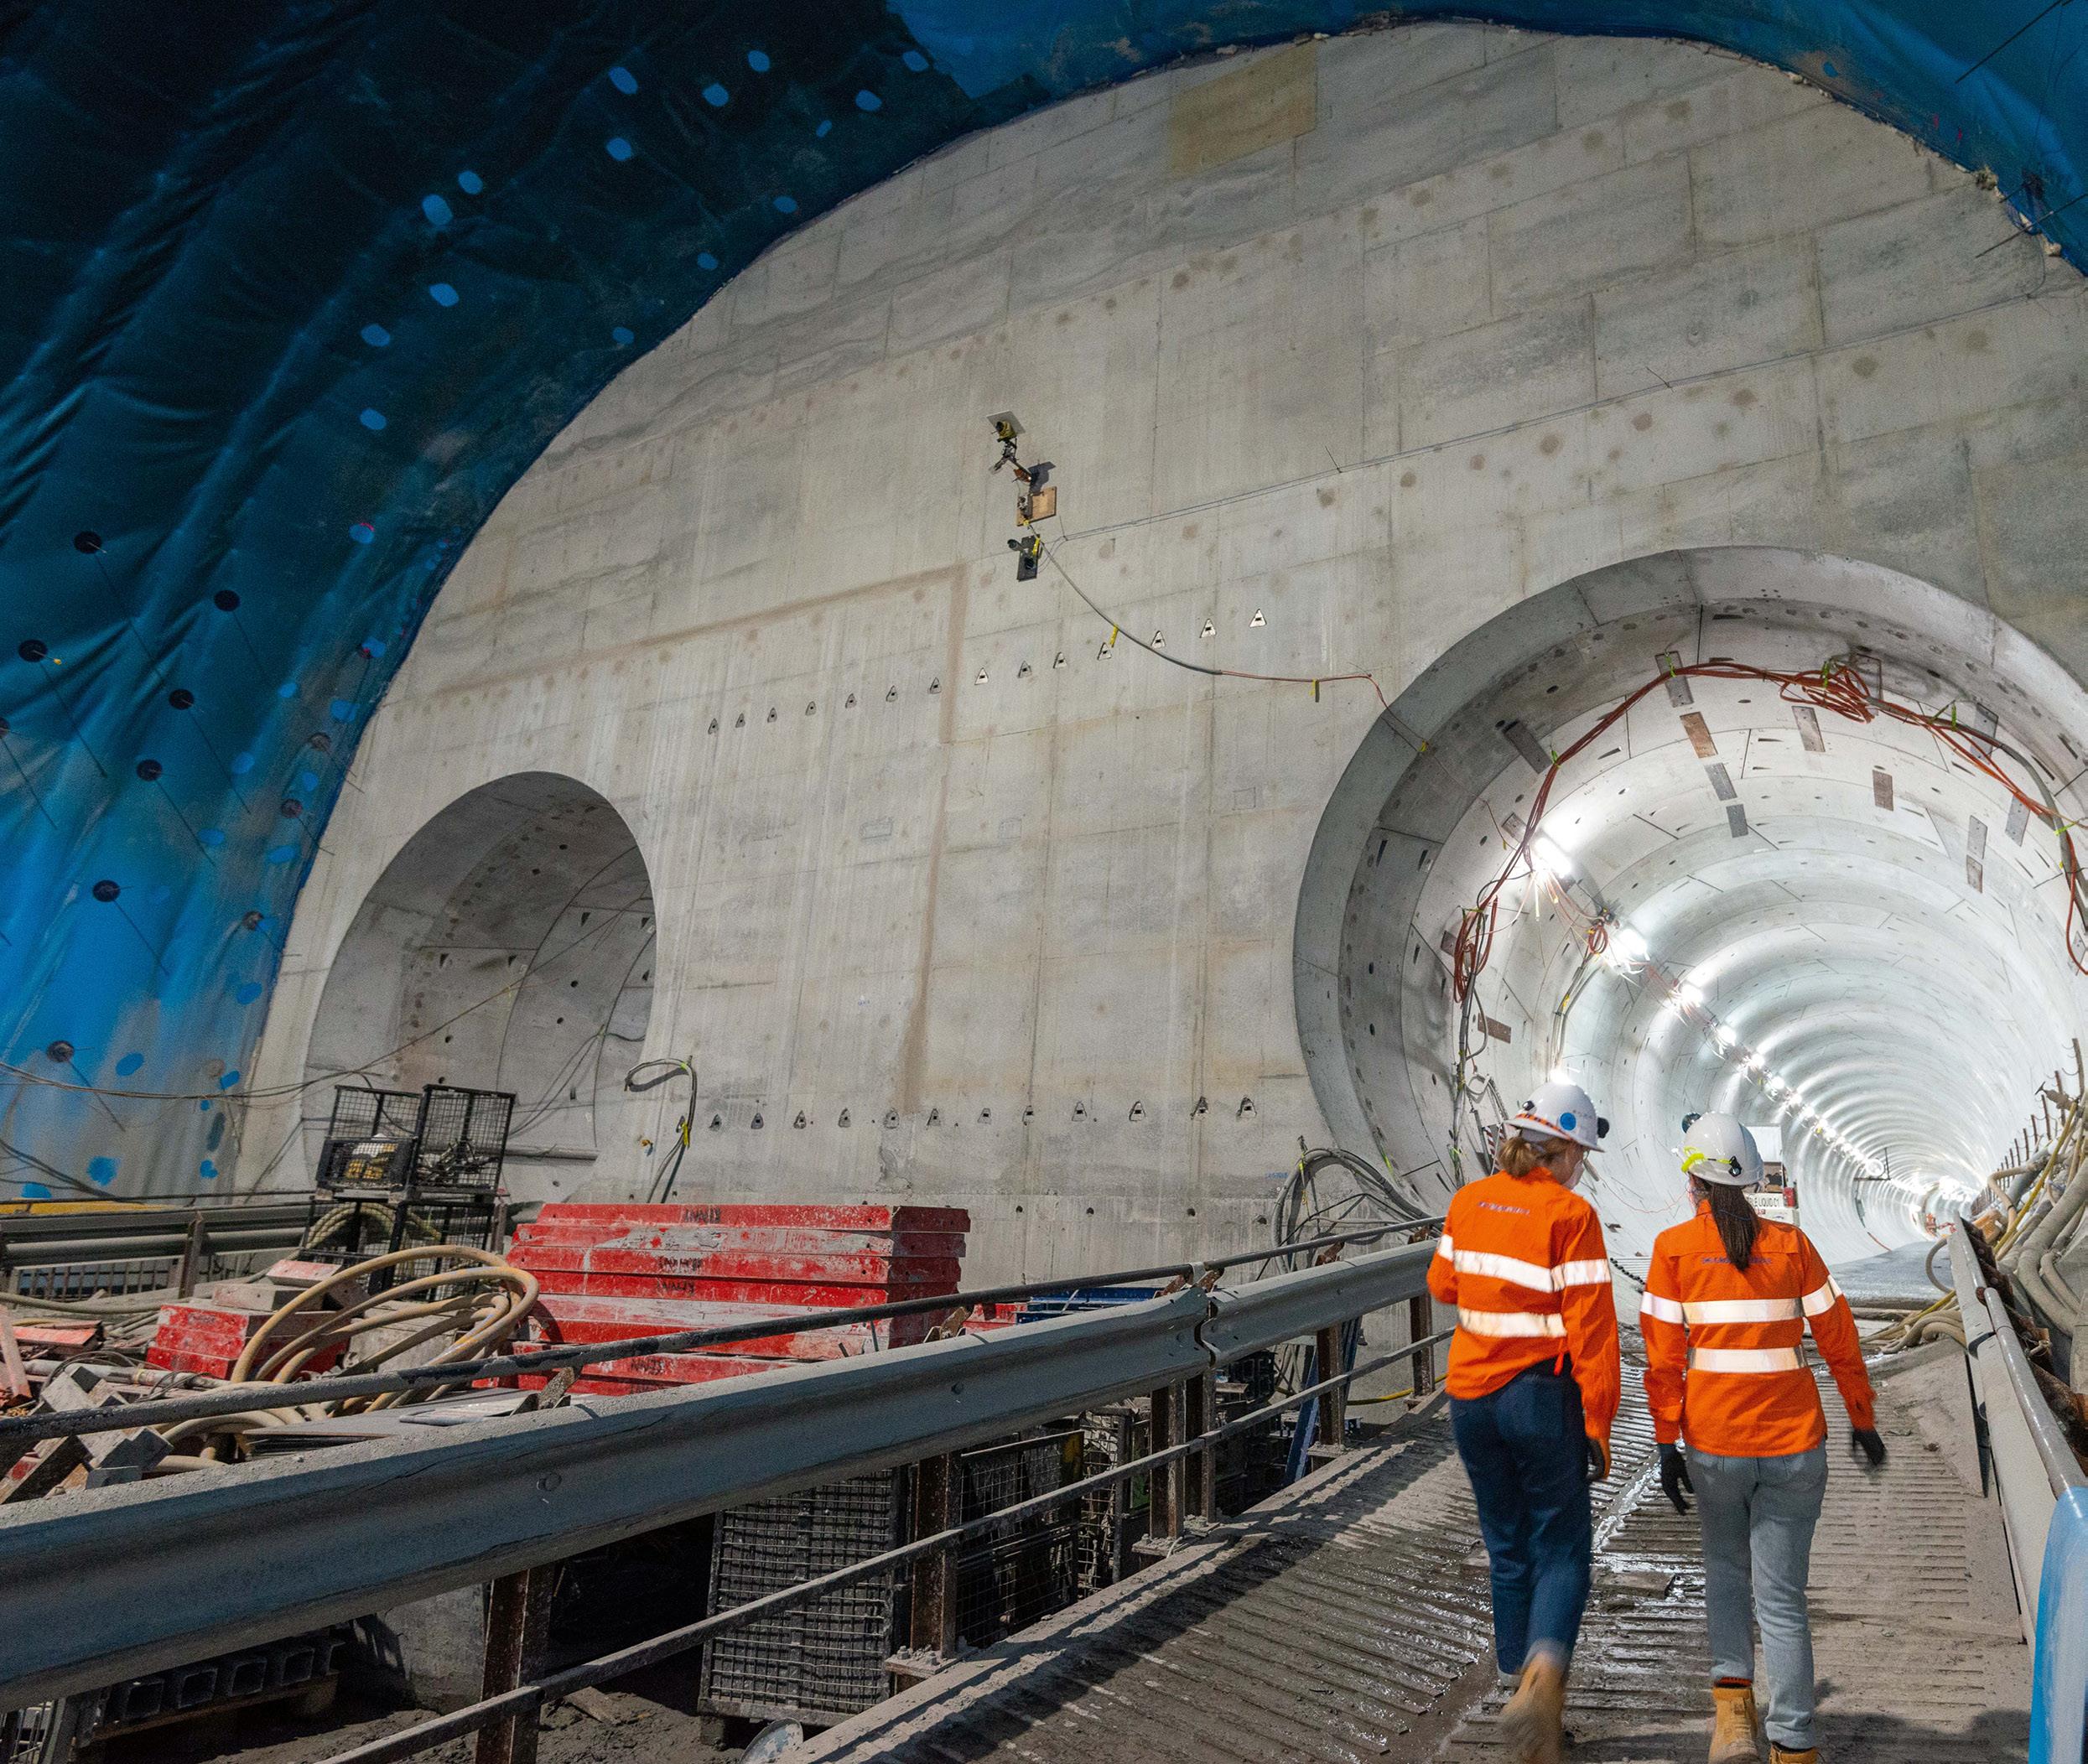
One of Australia’s largest rail infrastructure initiatives, Cross River Rail is 10.2 km of new rail line, including 5.9 km of twin tunnels that run under the Brisbane River and CBD. At its core there will be four new inner-city underground stations at Boggo Road, Woolloongabba, Albert Street and Roma Street (see Position 113, Jun/Jul 2021, p.34: https://bit.ly/3Udhf1g).
The project is also delivering two new above-ground stations
at Exhibition and Dutton Park; six rebuilt stations between Fairfield and Salisbury to the south of the city; three new stations on the Gold Coast; reconfiguration for two new train stabling facilities and installation of a new world-class signalling system.
It is a big project being built by a team determined to transform the way people travel across the whole of South East Queensland, and that same team is equally determined to seize the project as an innovation opportunity across all aspects of construction, including digital modelling.
That is why going back as far as 2018 — before major contractors had even been appointed — the team at Cross River Rail mapped out a strategy for the roles of GIS
land mapping, BIM modelling and the use of virtual reality and gaming engines, to ensure best possible outcomes during construction.
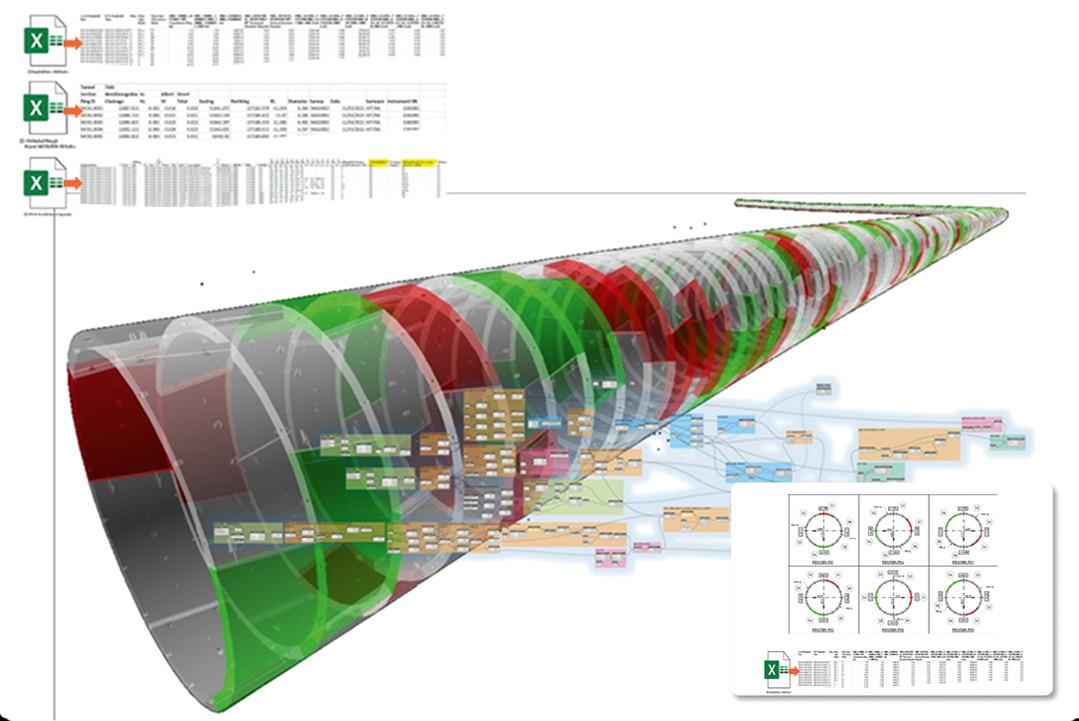
That strategy is referred to as the project’s Digital Network Approach, or ‘Project DNA,’ which to date has included contractual obligations to ensure construction companies feed data to a single federated BIM model, enabling the development of a bespoke GIS web map complete with a capability to shift from 2D to 3D LiDAR/photogrammetry, and the feeding of all digital datasets into a Common Data Environment (CDE).
This CDE has been used to build an interactive, virtual version of Cross River Rail using Unreal Engine, one of the world’s most open and advanced real-
time 3D creation tools, used for development of photoreal visuals and interactive, immersive experiences. The result has been the creation of a navigable digital twin of the Brisbane CBD, complete with new underground stations and twin underground tunnels, enabling users to ‘travel’ anywhere along the new, yet-tobe-completed rail line.
But the team did not stop at the development of a full, interactive virtual Cross River Rail. Fast forward to 2022 — with the project’s twin tunnels now excavated and lined, all four underground station caverns fully excavated and the project moving into new phases of station construction, rail installation and tunnel fit out — and the delivery team’s uses of Project DNA are moving forward also.
RUSSELL VINE The digital model built for Brisbane’s Cross River Rail project is continuing to produce innovative practical applications.With tunnel excavation and lining completed in December 2021, the twin tunnels linking Cross River Rail’s four new underground stations are the first sections of the project’s digital model to become truly ‘as-built’ and reflective of realworld infrastructure.
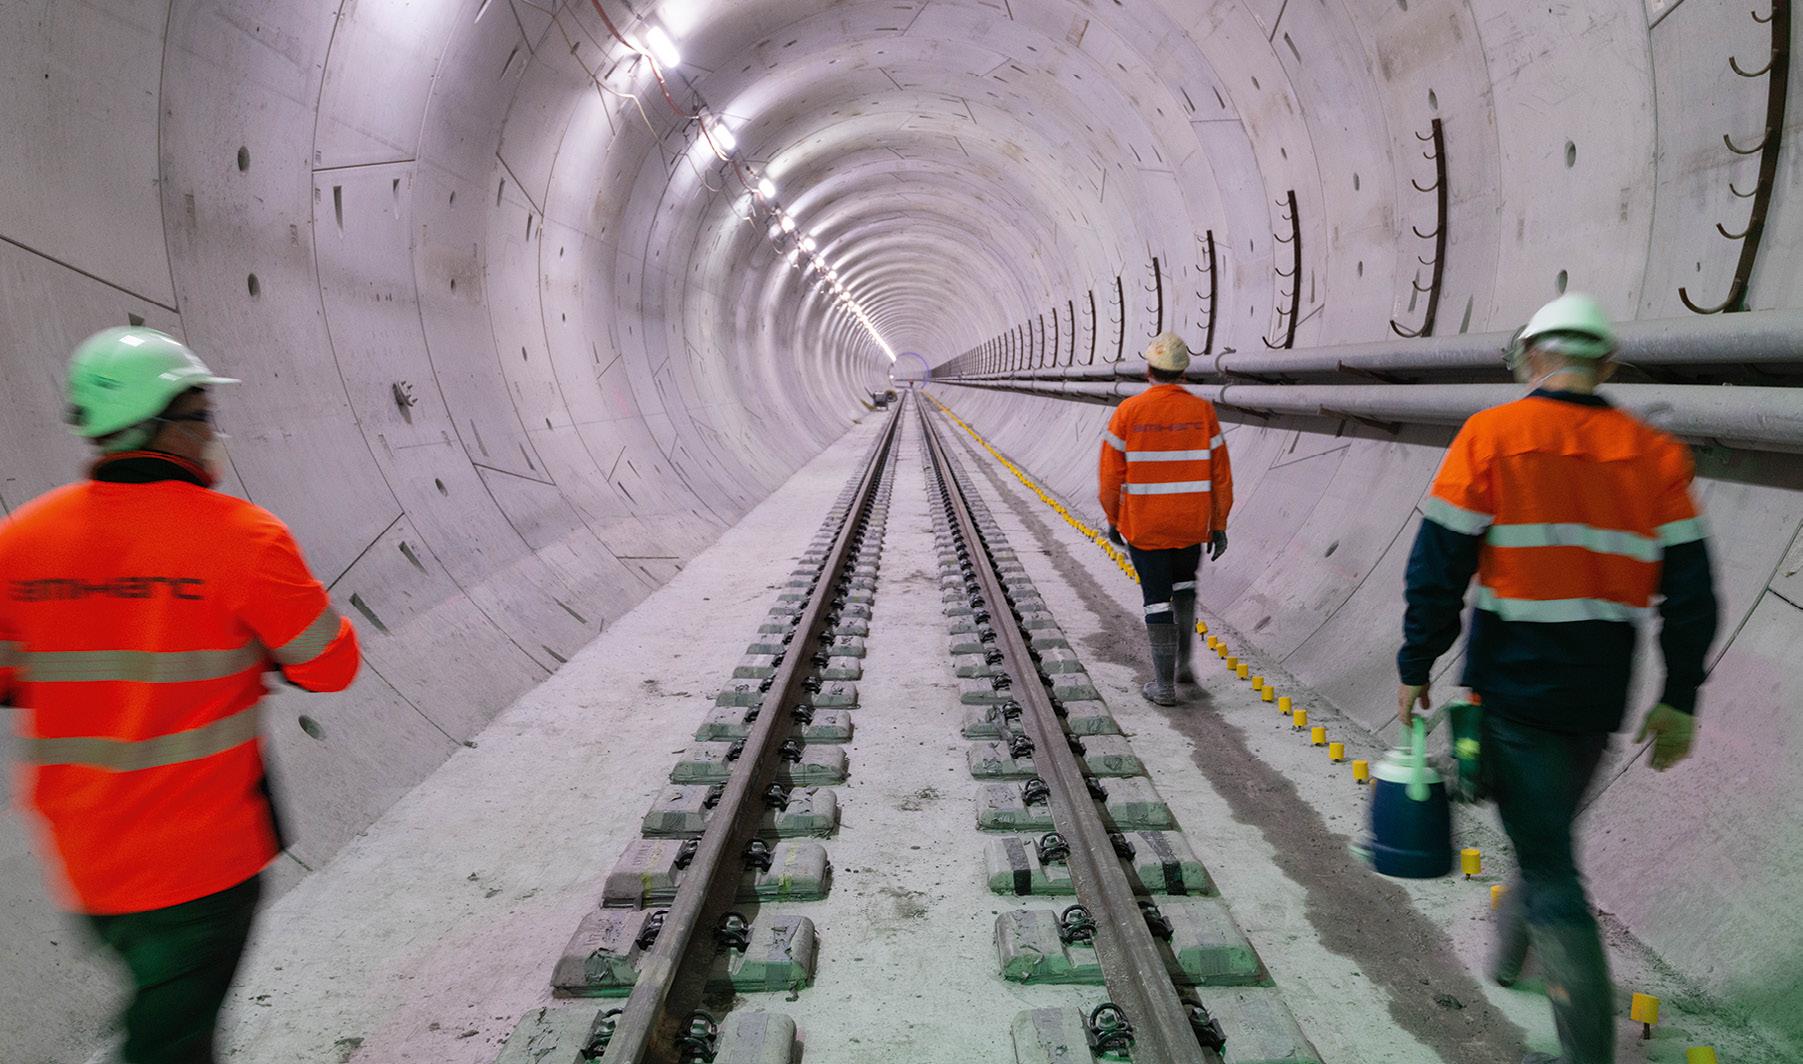
Even more remarkable is that the tunnels in the digital model are not only true to the path of the real tunnels, but were corrected and updated to within 10mm accuracy by using real time telemetry feeds from ‘Merle’ and ‘Else,’ the two giant tunnel boring machines (TBMs) that completed the majority of the excavation.
Equally impressive is the fact that data was also relayed from the TBMs, enabling Cross River Rail to update the digital model with the size and specification, as well as an individual barcode, for each of the 24,000 individual concrete segments used to line twin tunnels.

Not every segment in the tunnels is identical, with different tunnel sections having different complexities when it comes to the lining structure. Having the digital twin tunnels lined with 24,000 digital assets true to the 24,000 segments in the real tunnels has not only reduced risk during installation, but opened the door for the development of an ongoing sophisticated digital asset-based tunnel operation, management and maintenance systems.
With a federated BIM model now made up of over 14 million separate digital assets — and having used Unreal Engine to build a virtual version of the project that allows teams to ‘walk’ first-person through future construction outcomes — exploring uses for augmented reality (AR) has become a new frontier for the delivery team.
In particular, AR is being used during construction of the project’s Exhibition station to the north of Brisbane CBD, as well as at Mayne Yard, where a new stabling yard has been built. In both instances, contractor consortium Unity has developed applications that enable engineers to view BIM model data in real time and as an AR overlay, when looking at worksites using a phone or tablet camera.
Data sets pulled through and viewable also include subsurface utilities such as water, electrical and sewer paths, enabling workers to not only superimpose future structures over existing worksites, but also essentially ‘x-ray’ ground planes before the start of piling or excavation.
One of the greatest benefits of Project DNA has been the ability to tour future underground stations in first-person and within an interactive virtual reality.
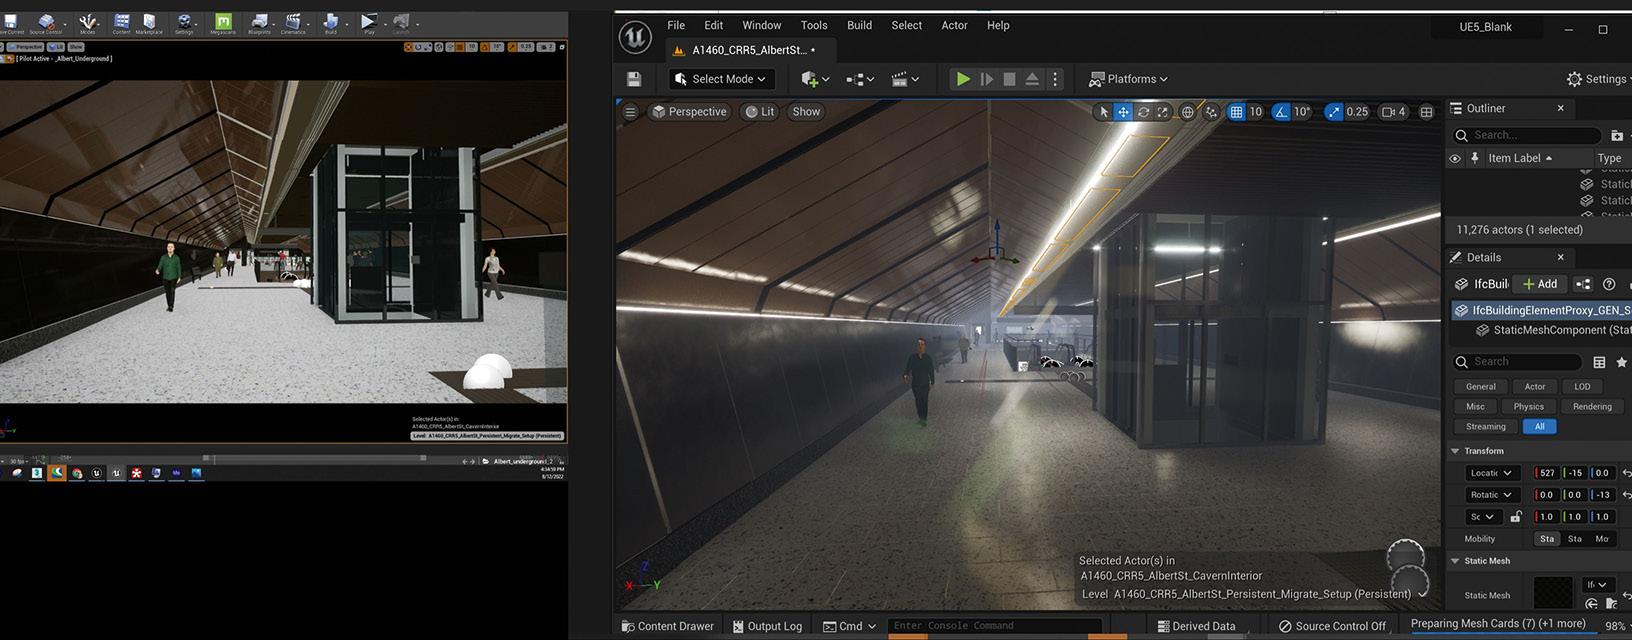
The result has been the creation of a navigable digital twin of the Brisbane CBD, complete with new underground stations.
Not only has this enabled the project team to share with the public what the final stations will look and feel like, it has also provided engineers and designers an opportunity to troubleshoot built environments yet to be constructed, and, in some cases, identify and make critical design refinements that might not otherwise have been picked up.
As the stages of station fit-out draw closer however, Cross River Rail has continued to explore ways of updating the visual fidelity of these VR environments so that finer aspects of finishes, materials and lighting can be examined in much more detail. This also enables the look and feel of future stations to be rigorously tested well in advance of construction.
In these upgraded environments, the level of detail on flooring and wall finishes is accurate down to two millimetres, and all aspects of lighting and shadows become much more photo-realistic.
The station environments can also now be animated to include moving passengers, trains that come and go at platform level and animated content running on areas such as LED advertising screens or dynamic and digital signage boards.
This enables the higherfidelity, increased-level-of-detail visual environment to also be
Brisbane’s Cross River Rail project includes building 5.9 km of twin tunnels plus four huge caverns, such as this one at Roma St. All images courtesy Cross River Rail. Side-by-side comparison showing the boost in visual fidelity of the Project DNA ‘VIS’ model by moving from Unreal Engine version 4 to version 5Above and below: 24,000 individual concrete segments, not all of which are identical, are used to line twin tunnels.
used to review and refine wider aspects of the future stations as a public transport user experience.
In the digital twin of the project’s new Roma Street station ground level, teams are using the model to experiment with the possible installation and addition of a giant art space proposed for the far wall of the concourse.
This huge 40-by-18-metre expanse will be one of the largest public art installations in a train station anywhere in the world, so the ability to contemplate the art as a visual outcome in a fully immersive, first-person virtual reality is of significant benefit to all parties involved.
Similarly, having a detailed digital twin of each station built in a flexible gaming engine is also giving the project’s design teams the opportunity to not only review the location of things such as signage, wayfinding and advertising screens, but to also contemplate how the finer points of the infrastructure will operate, and explore possibilities of them being powered in part by the digital twin of each station, which will of course be on hand on day one of operation.
An example of this, in relation to wayfinding, is the idea of information totems or ‘responsive signage’ points, where train station patrons could use an interactive information point to provide a 3D model of the station and its surrounds (most likely to their phone), to assist with journey planning.
The majority of construction on Cross River Rail is expected to be mostly complete within 2024. It is hoped that despite the hurdles of COVID, global economic pressures and Queensland’s tendency to experience severe weather events, the first services will be successfully tested on the rail line within 2025.
That gives the project two to three more years to not only continue finding practical uses of its digital modelling for the completion of construction, testing and commissioning, but also to consider what the role of a leading-edge digital model will be in the operation and maintenance of the new rail line.

And while what Cross River Rail has built so far in the
digital space can certainly be described as a ‘digital twin,’ the project team is quick to point out that technically, only one of the twins exists so far, as much of the real-world version of the project is yet to move through multiple phases of construction.
So the journey for Cross River Rail from now until the end of 2024 will involve continuing to refine and update the accuracy of a digital model as it moves from being indicative of something that is being built, to being detailed and identical in every way to a piece of rail infrastructure that has been built.
And while the opportunities to plan and execute what the role of the digital model will be in maintaining the infrastructure are very real, it is
the chance to also explore how the digital twin could transform how a rail line operates and be a catalyst for truly futuristic, tech-enabled rail experiences that the project team prizes most highly. Not least of all when you consider that beyond 2025 and the opening of Cross River Rail, Brisbane also has another interesting milestone on its horizon in 2032, when the city will host the Olympic and Paralympic Games. n
Russell Vine is Lead Innovation Officer with the Cross River Rail Delivery Authority and a member of the Delivery Authority’s Executive Leadership Team. This article is an update on progress with the CRR; you can read Russell’s earlier coverage from 2021 at https://bit. ly/3QURgJe
A snapshot of the Project DNA (Digital Network Approach) single federated BIM model, into which construction companies feed data.version 5.Digital twins can help build a foundation on which to consolidate our understanding of the natural environment. However, now more than ever, we need to mobilise new spatial data from the field so that local communities and emergency services can coordinate to undertake risk-prevention activities for community resilience.
As highlighted in recent bushfire and flood enquiries, critical infrastructure facilities need to be mapped and the information shared, so that they can be prioritised for protection. For instance, now is the time to undertake road dilapidation surveys to quantify the damage from floods, recent heavy rainfall and high volumes of traffic. The same data can also address prebushfire road assessments.
With the unprecedented levels of rain in 2022, floodaffected regions could benefit from RapidMap’s evidencebased, spatial capture 360-degree views as a snapshot of the current state of roadsides, properties and asset conditions. LGAs should explore how RapidMap’s 360 Mobile Mapping can help to rapidly quantify and mitigate risks, as a capture-onceand-use-many model.
Asset maintenance and risk mitigation activities can be quickly addressed using the same principals we deliver for biosecurity, weed and vegetation control along roads and across vast landscapes.
RapidMap’s Summit Biosecurity is built to scale, supports nearreal-time collaboration, and is the popular choice to address the New South Wales and Queensland Biosecurity Acts and Biosecurity Data Standards.
Designed to enable users to configure and build reports, the new digital smart forms and automated spatial workflows help non-GIS field officers capture field intelligence and evidence and share it with other users and systems in near real time.
The solution architecture enables configuration for any need, including asset management, disaster recovery, and cultural heritage and compliance across large regions and distributed teams, stakeholders and systems.
Local governments can use mobile mapping interfaces with smart digital forms to quickly undertake field-based observations in the same way that RapidMap helps biosecurity officers undertake property inspections to address defensible spaces around homes.
Similarly, vegetation management customers can be proactive by coordinating inspections from the air and on the ground to prevent
risks from tree encroachment under powerline spans. For this, we can now harness ‘digital inspectors’ in the form of AI. Leveraging LiDAR and remote sensing, AI can identify encroachments and automatically direct work to vegetation management contractors on the ground.
The digital AI approach can remove the expense of field inspection and enable new levels of efficiencies for preventing risks and meeting compliance standards.
At the recent South Australian Spatial Information event in Adelaide, I presented a series of customer case studies that looked at spatial data being created through asset,
Download
LYNNETTE TERRETTemergency and biosecurity management activities, which enhance digital twin data sets and contribute directly to disaster and community resilience.
With new technologies — such as RapidMap’s Summit Biosecurity SaaS, 360 Mobile Mapping for road corridor imagery, LiDAR and AI with RPAS/UAV for broad-acre weed, stormwater, irrigation channel surveillance — the opportunity for improved capture and sharing of geospatial data via digital twin SDIs is clear.
Creating ‘digital inspectors’ from AI will pave the way for faster response times, while ground-truthing using the latest mobile workforce tools such as RapidMap’s Summit SWIFT will give AI developers a faster turnaround for their classifications and corrections.
Using imagery or LiDARbased feature extraction and AI solutions to identify locations for field service and public works teams to collaborate, clearly helps to save time and money. However, every attendance on site also becomes an opportunity for education, improving spatial data and supporting community resilience through upgrades to risk mitigation at the wildlandurban interface.
In summary, we all have the opportunity to direct our efforts towards interoperability, enabling us to capture spatial data once and leverage the content to extract value many times over. n
 Building a foundation for disaster recovery, disease management and community resilience.
The digital AI approach can remove the expense of field inspection and enable new levels of efficiencies.
AUSPOS is Geoscience Australia’s free, cloud-based, online GPS processing service. Its uptake and use worldwide, by new users and dedicated fans, continues to accelerate.
AUSPOS has repeatedly proven its capability and reliability, with more than 270,000 jobs processed in just the first 18 months after the current version 2.4 was released in August 2020 and more than 1 million jobs processed in the decade prior. Following the recent release of ITRF2020, a new AUSPOS version is planned for later this year.
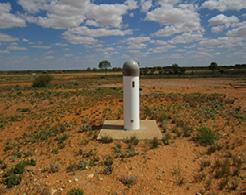
Recognising this tool’s importance, Continuously Operating Reference Station (CORS) networks such as CORSnet-NSW contribute to AUSPOS and more than 12,000 AUSPOS solutions have been used to-date in the NSW survey control network.
This article provides a look under the AUSPOS bonnet and outlines how industry-observed AUSPOS datasets can help maintain and improve the NSW survey control network and the Survey Control Information Management System (SCIMS, the state’s database containing more than 250,000 survey marks on public record).
AUSPOS in brief AUSPOS accepts static, dual-frequency GPS data of at least 1 hour duration (recommended minimum 2 hours, maximum 7 consecutive days) in Receiver Independent Exchange (RINEX) format.
While the submitted RINEX file may contain data from multiple GNSS constellations, only GPS data is used for
processing and thinned to a 30-second epoch interval regardless of the initial sampling rate. The user’s antenna type is selected from a drop-down menu, and the height of instrument (measured vertically from the ground mark to the Antenna Reference Point, ARP) is specified.
AUSPOS uses the International GNSS Service (IGS) core network station data and products (e.g. final, rapid or ultra-rapid orbits depending on availability) together with local CORS to compute precise coordinates based on up to 15 surrounding CORS. These CORS are subject to the Regulation 13 certification process, providing legal traceability with respect to the Recognised-Value Standard (RVS) of measurement of position in Australia.

An automated AUSPOS report (PDF) is then emailed to the user, which includes the computed coordinates (GDA2020 and derived AHD height, GDA94, ITRF2014) and their uncertainties, ambiguity resolution statistics, and an overview of the processing strategy applied. Advanced users can also download Solution Independent Exchange (SINEX) files containing more detailed information.
Positional Uncertainty (PU) is defined as the uncertainty of the coordinates of a point, at the 95% confidence level, with respect to the defined datum. Across NSW, we have found that AUSPOS routinely delivers PU at the 0.02-0.03 m level for the horizontal component and about 0.05-0.06 m for the vertical (ellipsoidal) component. A longer observation span improves PU, particularly in the vertical component.
(See Position 106, Apr/May 2020, p.32, https://bit.ly/3U1CF1b, for details.)
The AUSPOS website contains background information, a submission checklist, a step-by-step submission guide and frequently asked questions to help users submit data, understand the results and aid troubleshooting. Datasets submitted to AUSPOS are neither retained by Geoscience Australia nor passed on to any third party.
The sophisticated, scientific Bernese software is used for data processing. First, the carrier phase data is cleaned in baselineby-baseline mode using triple-differencing (involving two receivers, two satellites and two epochs). In most cases, cycle slips are fixed by the simultaneous analysis of different linear combinations of the L1 and L2 frequencies. If a cycle slip cannot be fixed reliably, bad data points are removed or new ambiguities are introduced.
While data cleaning is performed at a sampling rate of 30 seconds, the basic observable used is the carrier phase with a sampling rate of 3 minutes and an elevation angle cut-off at 7°. Elevation-dependent weighting is applied according to 1/sin(e)2 where e is the satellite elevation. A-priori coordinates for the user data are obtained via Precise Point Positioning (PPP) using zero-difference carrier phase measurements (between L1 and L2 at a single site).
AUSPOS then uses up to 15 surrounding CORS as the reference stations, generally the 7 closest IGS core sites (typically located a few 100 km away) and the 8 closest
VOLKER JANSSEN AND SIMON MCELROY AUSPOS solutions are being used to help maintain and improve the NSW survey control network. The CORSnet-NSW station at Tibooburra. All images courtesy DCS Spatial Services.local sites. This approach provides a relatively dense network for generating a reliable regional ionospheric delay model and tropospheric delay corrections to support ambiguity resolution.
Ambiguities are resolved in baseline-bybaseline mode using the following strategies depending on baseline length (stated in order of increasing accuracy):
• Code-based wide-lane/narrow-lane (L5/ L3) strategy for 200-6,000 km baselines.
• Phase-based wide-lane/narrow-lane (L5/ L3) strategy for 20-200 km baselines.
• Quasi-Ionosphere-Free (QIF) strategy for 20-2,000 km baselines.
• Direct L1/L2 strategy for 0-20 km baselines.
A precise solution for the user data is then computed using double-differencing techniques (involving two receivers and two satellites). The coordinates of the IGS stations (i.e. tier 1 and 2 CORS) are constrained with uncertainties of 1 mm for horizontal position and 2 mm for the vertical component (ellipsoidal height), while lower-tier CORS coordinates are constrained with uncertainties of 3 mm for horizontal position and 6 mm for the vertical (due to the shorter CORS operation time span, lower data quality and/or lowergrade monumentation).
The GPS data is processed in the IGS realisation of the ITRF2014 reference frame and then transformed to GDA2020 via the Australian Plate Motion Model. Derived AHD heights are computed by applying a gravimetric-geometric quasigeoid model (AUSGeoid2020) to the GDA2020 ellipsoidal heights. Legacy GDA94 coordinates are obtained from GDA2020 by coordinate transformation.
Note that AUSGeoid2020 only extends 33 km offshore. Between 33 km and 50 km offshore, the AUSGeoid2020 N-values are linearly blended with the DTU15 Mean Sea Surface (MSS) model produced by the Technical University of Denmark (DTU), i.e. the weighting of AUSGeoid2020 diminishes to zero at 50 km offshore.
Importantly, AUSPOS performs true simultaneous multi-baseline processing, i.e. it combines GPS baseline processing of data collected at several sites in the same time window (which is therefore correlated) with a 3D least squares network adjustment. Commercial off-the-shelf software routinely used by industry and government only mimics this ideal, requiring a 2-step process of single-baseline processing followed by a 3D network adjustment.
Even if you only submit one RINEX file, AUSPOS still performs simultaneous multi-baseline processing because it uses data from up to 15 CORS. This is often overlooked by novice users who focus on AUSPOS delivering 3D coordinates, which may appear like a ‘fancy’ point position to the uninitiated. However, there is a lot going on under the bonnet.
AUSPOS calculates PU based on the East, North and ellipsoidal height coordinate uncertainties according to the Guideline for Adjustment and Evaluation of Survey Control, which is part of ICSM’s Standard for the Australian Survey Control Network (SP1). The coordinate uncertainties of the East, North and ellipsoidal height components are scaled using an empirically derived model, which is a function of duration, data quality and geographical location (latitude and CORS density), and expressed at the 95% confidence level.

Simply put, AUSPOS data can be submitted and processed either individually (mark by mark) or collectively (in sessions, like it was observed in the field). AUSPOS accepts submissions of up to 20 RINEX files in one job, which are then processed together as a cluster, using an observation window between the earliest start time and the latest end time.
Cluster processing considers that the multiple data files were collected during the same time window and are therefore correlated. This means that, rather than individually connecting each user site to the surrounding CORS network, processing includes baselines between the user sites, which provides a stronger local connection.
AUSPOS first detects which rover observed the longest, and this becomes the hub for the user data. Basically, the position of the hub is determined relative to the surrounding CORS, and then all other rovers are processed relative to the hub (provided there is sufficient data overlap of at least 1 hour). Importantly, this places increased emphasis on local relativity between survey marks.
If the survey is planned accordingly, the user site with the longest dataset acts as a hub connecting to all other user sites. If the data overlap of a particular user site with respect to the hub (or another user site) is too short, AUSPOS attempts to compute a baseline to a CORS instead (a strategy based on the maximum number of singledifference observations is used to form the baselines computed in the cluster), thereby losing the desired local connection. If its data quality is insufficient, the user site may be deleted from the cluster.
In theory, and if the survey is planned appropriately, the AUSPOS cluster should therefore provide a stronger connection between the user sites compared to processing each dataset individually. The savvy reader is encouraged to think about the permutations and combinations of network design and potential advantages of clustering.
More than 12,000 AUSPOS solutions have been used to-date in the NSW survey control network.The CORSnet-NSW network reaches across the whole state.
DCS Spatial Services, a unit of the NSW Department of Customer Service (DCS), is responsible for the maintenance of the NSW survey control network. With all CORSnet-NSW stations contributing to the AUSPOS service, it delivers highquality positioning results even for shorter observation sessions of at least 2 hours across NSW, provided sky view conditions are reasonable.
Consequently, in some situations, the use of AUSPOS campaigns has developed into a capable and reliable alternative to conducting traditional static GNSS baseline surveys. AUSPOS also forms a fundamental component of vertical datum modernisation and the propagation of the Australian Vertical Working Surface (AVWS).
While traditional GNSS baseline surveys continue to be performed and adjusted by DCS Spatial Services, it also applies, expands and accelerates the use of AUSPOS. Datasets of at least 6 hours duration propagate the datum in NSW via the National GNSS Campaign Archive (NGCA) hosted by Geoscience Australia, while datasets of less than 6 hours duration strengthen the datum via the state’s Jurisdictional Data Archive (JDA).
To date, more than 12,000 AUSPOS solutions have been used to help maintain and improve the NSW survey control network. These are then expressed as baselines to nearby CORS for inclusion in the GDA2020 national and state adjustments.
To allow NSW users to reap the benefits of AUSPOS processing in a timely manner, DCS Spatial Services has developed and implemented a monthly workflow to automate, as much as possible, the update of survey mark coordinates, heights and their uncertainties in SCIMS based on AUSPOS data. The immediate purpose is to upgrade unestablished marks to established, attach a PU to the coordinates and quicky make them available on public record, until these initial values are updated via the GDA2020 state adjustment (six-monthly).
During the two years since June 2020, more than 3,600 SCIMS updates for more than 1,800 marks have been undertaken via this monthly workflow, providing a quicker way to deliver more accurate information to our customers as we continue to upgrade the state’s survey control network.
Before AUSPOS datasets are individually processed by DCS Spatial Services, they are subject to a quality assurance process, which ensures a minimum observation session length of 2 hours, certainty about antenna type and antenna height, and involves RINEX file screening and editing to ensure correct header information and
The CORSnet-NSW station at Perisher Valley.

sufficient data quality. The AUSPOS results then go through a quality check to assess whether the solution is reliable and suitable for SCIMS update.
Using AUSPOS to support our datum modernisation efforts has several advantages. The field work is quick, logistically simple and very efficient, with reliable solutions achieved even under challenging sky view conditions (particularly for sessions exceeding 6 hours duration).
AUSPOS processing is consistent, of the highest possible standard and very timeefficient, providing a direct connection to the datum (CORS) via a sophisticated, scientific software package using the best products and models available at the time.
The processing results can be ingested by the GDA2020 state adjustment in an automated fashion with minimal effort. Rather than archiving the results, the data is archived and able to be reprocessed at any time to investigate issues or take advantage of improved modelling.
It is recognised that AUSPOS represents an absolute positioning technique because it connects to the surrounding CORS rather than adjacent ground marks. However, the NSW survey control network is becoming so tight that one can anticipate there will soon be little difference between relative and absolute positioning.
The profession is encouraged to contribute to maintaining, expanding and improving the NSW survey control network by submitting suitable, industry-observed AUSPOS datasets and related metadata to DCS Spatial Services.
These AUSPOS data submissions must include:
• RINEX observation file of at least 2 hours duration. Including the raw binary file in the manufacturer’s native format is optional but strongly recommended.
• Completed log sheet or field notes, clearly indicating observation date/time, mark observed, receiver and antenna type and serial number, and antenna height measured vertically to the ARP.
• AUSPOS processing report.
• Locality Sketch Plan for any new mark placed (submitted separately to the AUSPOS data).
• Photographs of the mark, indicating mark type and sky view conditions (optional but recommended).
For clarity and ease of operation, we recommend using the generic DCS Spatial Services GNSS log sheet, available as part of the resource pack for Surveyor-General’s Direction No. 12. The Excel version of the log sheet can easily be modified to accommodate individual needs (e.g. inserting equipment details), which makes it very efficient when printed for use in the field or converted to pdf format.
If the antenna height is routinely measured using a height hook or slant measurement, the relevant antenna diagram and offset calculations to convert this value to the ARP can be included as an image (generally sourced from the equipment manual).
In this regard, a little preparation provides great benefits in the field and further downstream. We found this very valuable when revisiting log sheets from many years ago to mine data for purposes that were not envisaged when the data was originally collected.
The use of AUSPOS campaigns has developed into a capable and reliable alternative or addition to conducting traditional static GNSS baseline surveys in some situations, particularly in NSW with all CORSnet-NSW stations contributing to the AUSPOS service. AUSPOS can deliver high-quality positioning results even for shorter observation sessions of at least 2 hours across the state, provided sky view conditions are reasonable.
This article has looked under the AUSPOS bonnet and explained how AUSPOS solutions are used to help maintain and improve the NSW survey control network. We have also outlined the requirements for industry-observed AUSPOS datasets to be submitted to DCS Spatial Services for potential update of SCIMS and inclusion in the GDA2020 state adjustment. An upcoming article will focus on practical tips and tricks for AUSPOS users. n
Dr Volker Janssen and Simon McElroy work at DCS Spatial Services, a unit of the NSW Department of Customer Service.
The Clem Jones and Geoff Wright Scholarship will support worthy University of Southern Queensland surveying students.
The University of Southern Queensland is honouring past greats of the state’s surveying sector by announcing the opening of the inaugural Clem Jones and Geoff Wright Scholarship for 2023.
The scholarship will be awarded annually to a student commencing their studies in the Bachelor of Spatial Science Technology (Surveying) or Bachelor of Spatial Science (Honours) (Surveying).
Established through founding gifts from the Clem Jones Foundation, the Springfield City Group, and the ISAQ Bicentennial Education Fund, the endowed scholarship is worth up to $12,000 and celebrates the surveying careers of Clem Jones AO and Geoff Wright.
Peter Johnstone, CEO of the Clem Jones Foundation, said honouring the memories of Jones (1918-2007) and Wright (1956-2017) in this way recognised their dedication to surveying and the spatial sciences profession.
“Clem Jones is best known as the longestserving Lord Mayor of Brisbane, but he began his working life as a surveyor and went on to establish his own practice in Brisbane and expanded it to encompass regional offices across Queensland before selling it prior to entering politics,” he said.
“He continued his involvement in surveying and town planning after retiring as Lord Mayor and was a close associate and admirer of Geoff Wright’s professional skills and his commitment to community service and professional development.”

Johnstone said the pair later established a new surveying firm, Clem Jones Wright & Associates, and Wright later served as chair of the Clem Jones Group.
“Geoff demonstrated an early dedication to fostering and supporting others in the profession and was a founding member of the Surveying Graduates Association, an organisation established to give young surveyors assistance and advice in the early stages of their careers,” he said.

“It’s wonderful to honour both the friendship and professional integrity of both men through the University of Southern Queensland’s scholarship.”
Chair of the ISAQ Bicentennial Education Fund, Phillip Pozzi, said it was appropriate to join with the Clem Jones Foundation and Springfield City Group to recognise both men for their contributions to spatial sciences, their
service to the ISAQ and the broader footprint of Southern Queensland.
“We are pleased to have contributed to the establishment of the scholarship which will help more students to study spatial sciences and make a career in an industry that is essential to the development of our nation,” said Pozzi.
University of Southern Queensland Director (Development), Advancement, Mr Stephen Holden, said industry donors have a deep understanding of the need for skilled, qualified surveyors as Australia and southeast Queensland enters a period of intense infrastructure development through to 2032 ahead of the Brisbane Olympics.
“Beyond the Clem Jones and Geoff Wright Scholarship, we have also received scholarship support from a wide range of donors — including foundations, individuals, small surveying firms, industry bodies and businesses large and small,” he said.
“It is uncommon to see such diversity of donors united toward a single purpose, and this singularity of focus speaks to the deep need for support for our student surveyors and the current and future needs of the industry.
“The ongoing support from groups such as the Association of Consulting Surveyors and The Surveyors’ Trust is a priceless asset to not just our University and our students, but the broader community as well.”
Professor Sherif Mohamed, the University’s Head of the School of Surveying and Built Environment said UniSQ is one of a small number of universities offering studies in surveying and the only one in Queensland.
“Springfield, Ipswich and Toowoomba will grow and change to become even better communities through the continued evolution of their built environment over the coming decade and the graduates of our degrees will be the ones leading that evolution,” he said.
“Currently, there is a significant shortage of qualified surveyors, so it’s critical we work hard to deliver high-quality education and undertake high-impact research, to continue to support industry and our collaboration partners.”
Applications for the Clem Jones and Geoff Wright Scholarship close 13 November 2022. For more information visit https://www.unisq. edu.au/scholarships/clem-jones-and-geoffwright-scholarship. n
Geoff Wright Clem Jones AO. Images courtesy Clem Jones Foundation.Innovative use of imagery and remote sensing is leading Horizon Power away from run-to-failure and towards a predictive data-driven model.
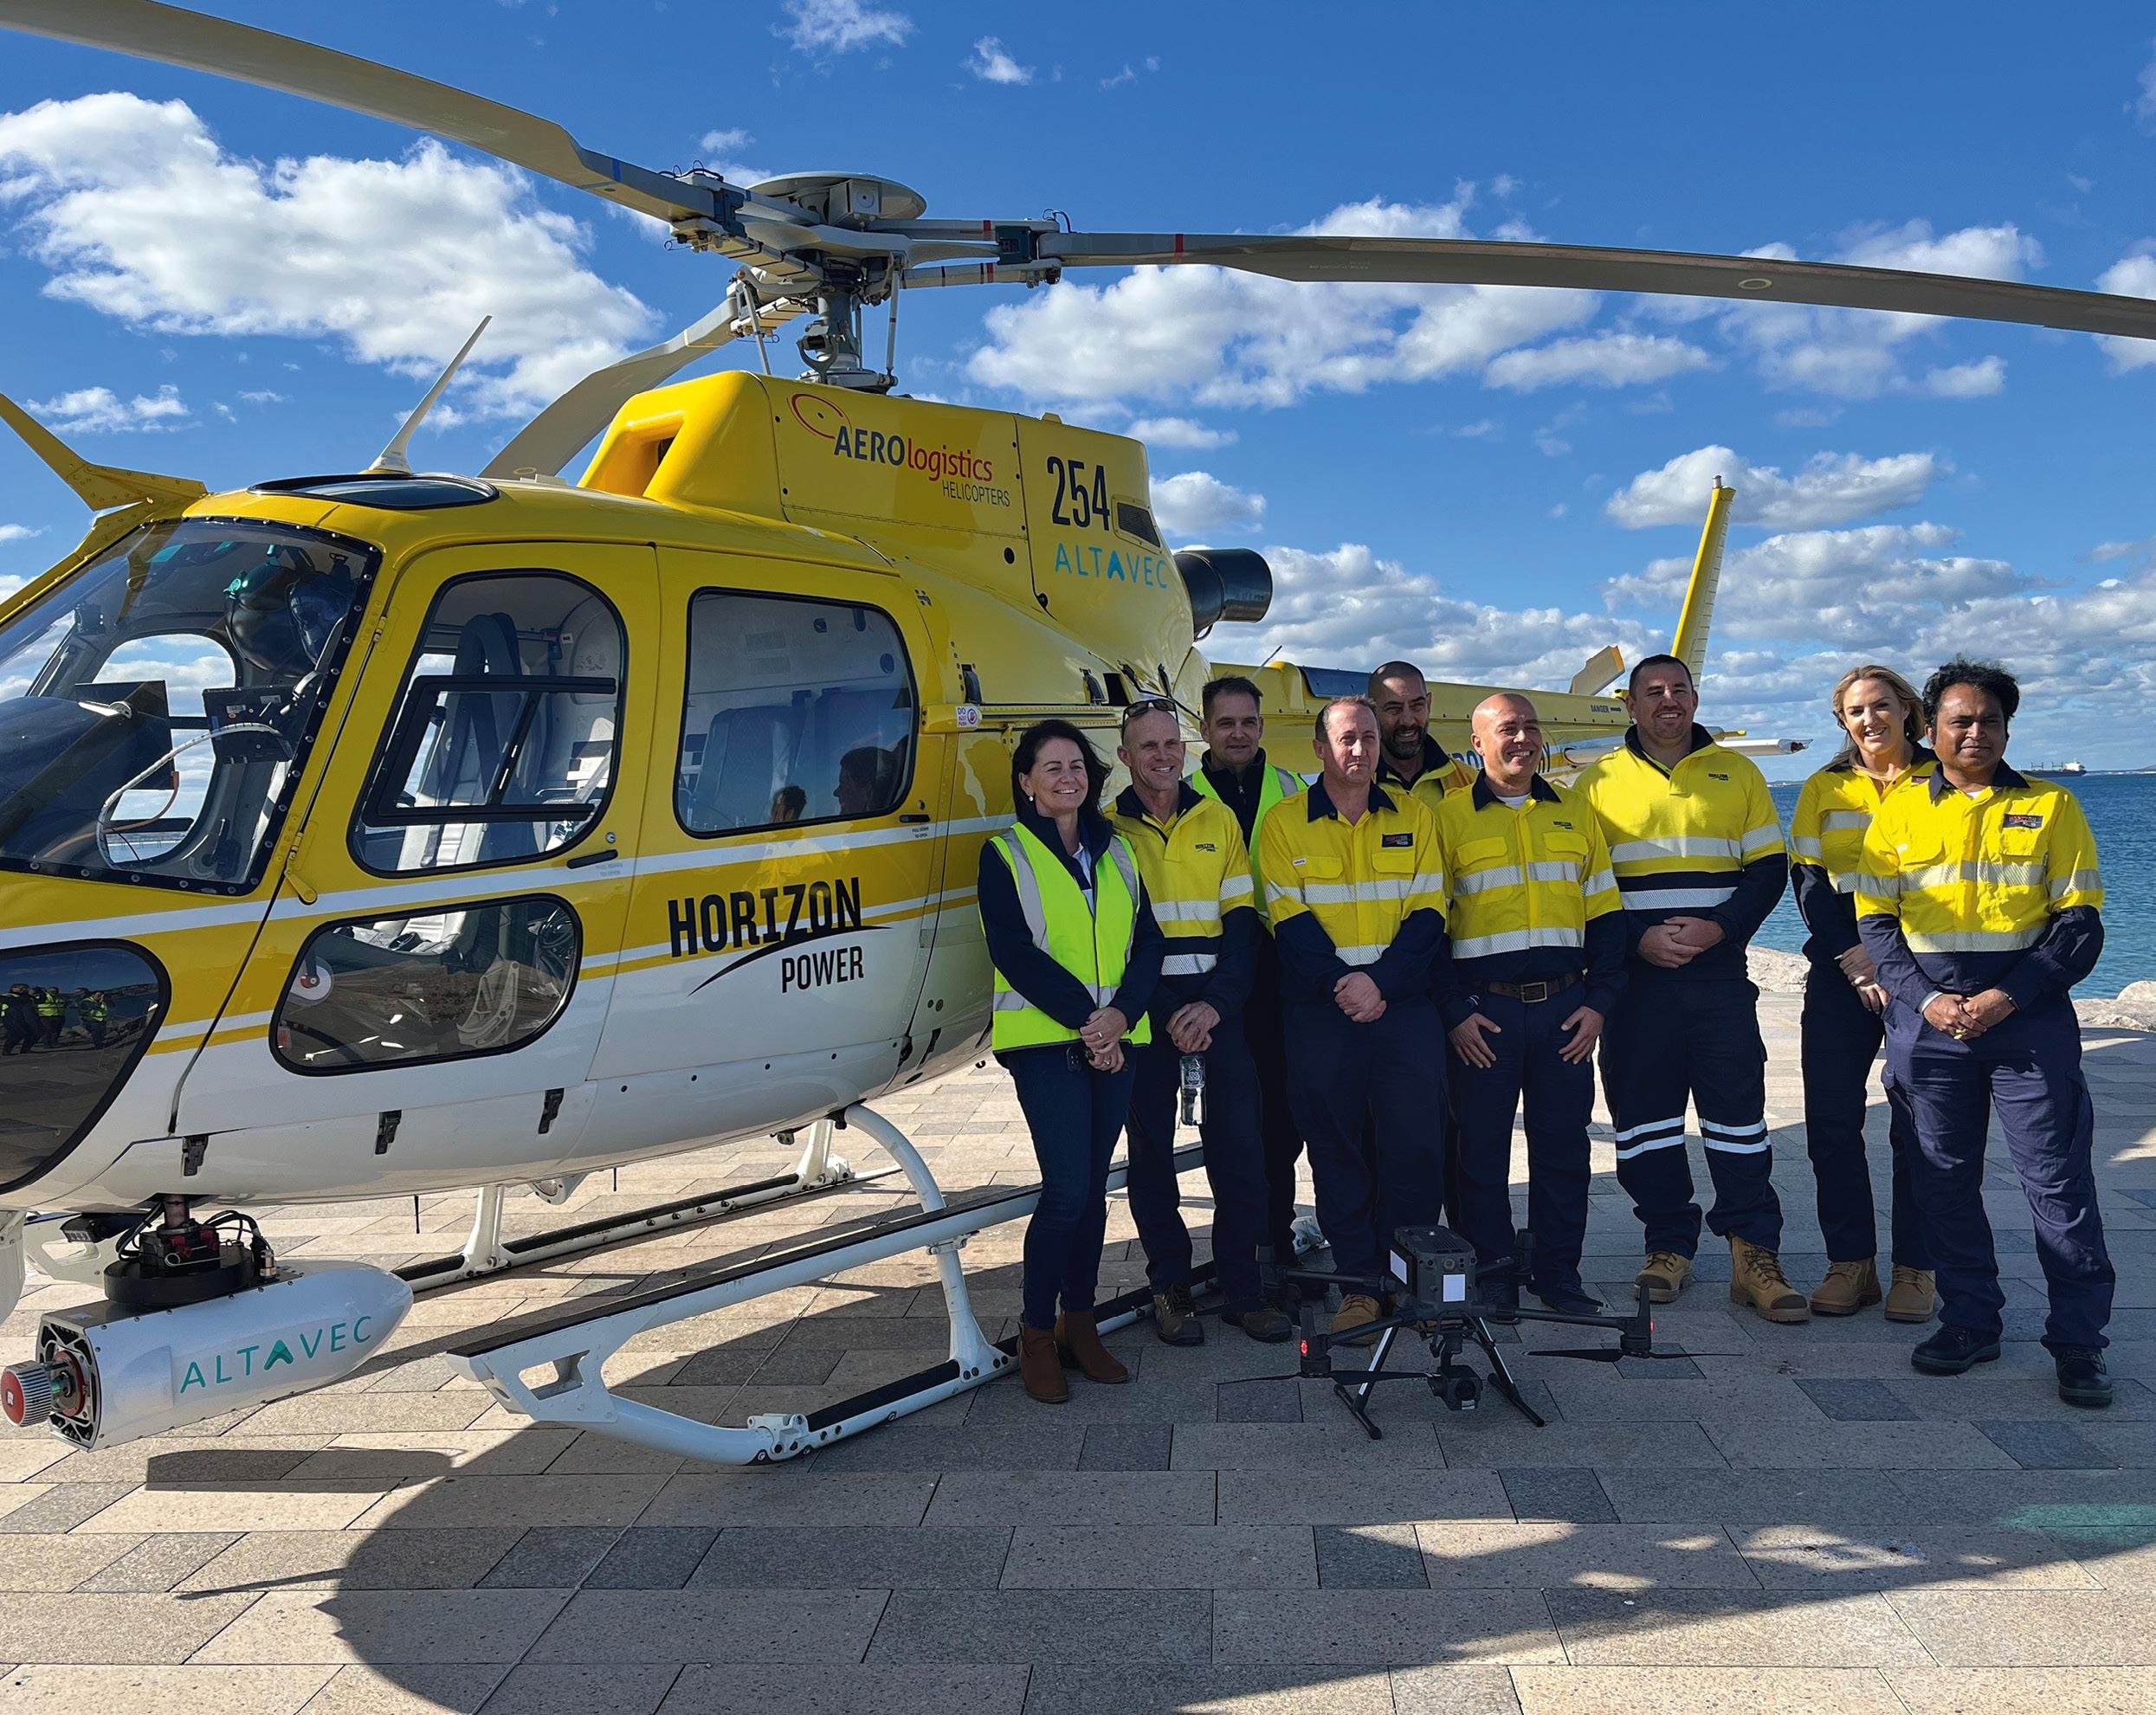
Horizon Power has selected geospatial specialist Altavec to deliver its transformational Geospatial Intelligence Program. Leveraging remoting sensing, imagery and advanced analytic technologies, the program aims to deliver a geospatial intelligence solution that transforms Horizon Power’s ability to quickly understand the state of the network.
With a network spanning thousands of kilometres, the program will optimise asset performance, and keep the network safe and reliable.
In Western Australia, Horizon Power is leading the energy transition with a clear strategy to deliver cleaner and sustainable renewable energy solutions for regional and remote areas of the state. The Geospatial Intelligence Program will create a common operational view of the network and assets that stakeholders can easily explore, analyse and visualise to make informed decisions.
When imagery and operational data is available in one system and integrated with analytics, it will become much easier for stakeholders to understand the state of the network — HV and LV distributions assets, clearances and vegetation.
The Altavec solution will enhance Horizon Power’s ability to resolve core data issues with network alignment as well as implementing predictive maintenance strategies aimed at reducing failures and damages. The centralisation of knowledge, more accurate data and enhanced management visibility will significantly reduce risks and improve network reliability while lowering costs.
The innovative use of imagery and other remote sensing technologies will lead Horizon Power away from the run-to-failure model and towards a predictive datadriven model.
Altavec delivers a worldclass, cloud-based geospatial
intelligence platform. The Altavec AIMS 3D platform is designed to process LiDAR (for network realignment, vegetation analysis and network clearance analysis) and images (for asset condition monitoring) in a highly automated fashion.
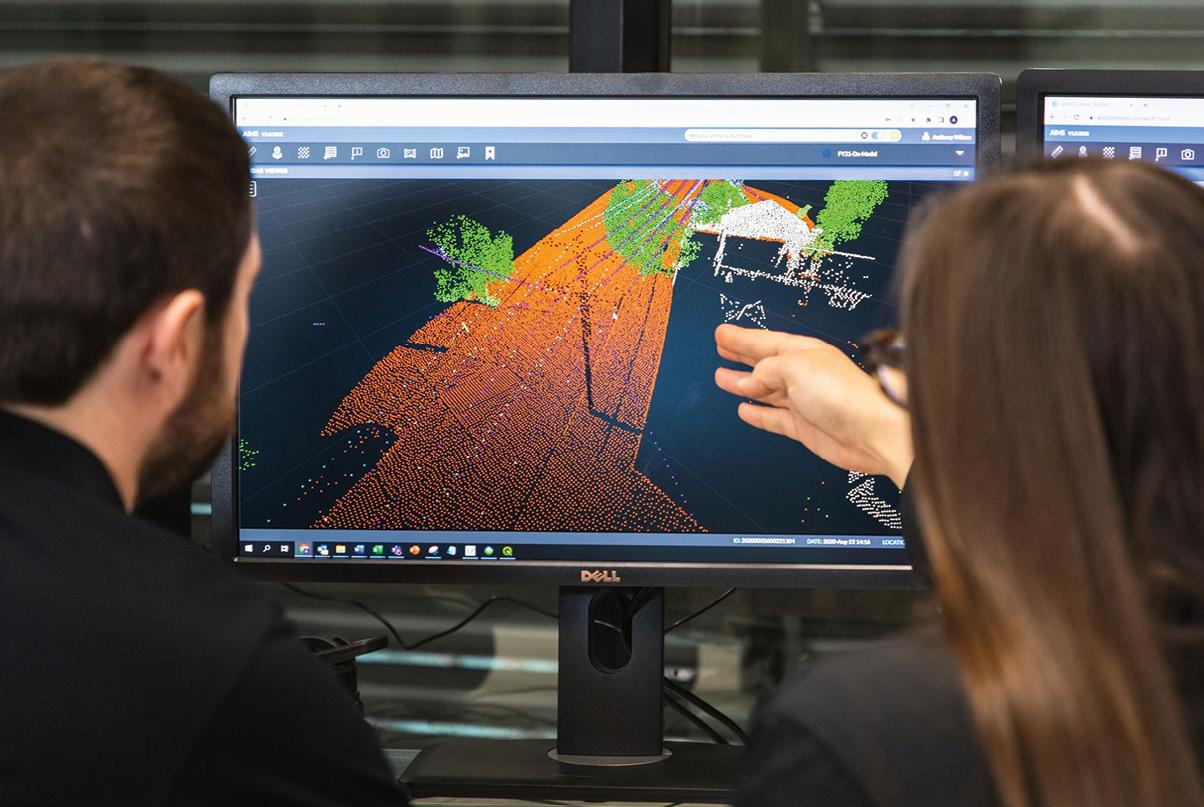
The result is the full network rendered in 2D and 3D, matched to Horizon Power’s assets, and tagged with defects or vegetation encroachments.
With the addition of artificial intelligence (AI) and machine learning (ML) techniques, Altavec scans thousands of images collected across the network in minutes, and guides Horizon Power to areas of concern. Streamlined analytics enable the delivery of actionable insights to decision makers who can then get the right team to the right place at the right time. Altavec is investing heavily to continually improve the accuracy and breadth of the automation.
Business benefits delivered include:
• Virtual inspections will provide the ability to plan beyond the near run-tofailure model and gain visibility into the health of assets and equipment that cannot be seen from the ground.
• Accurate identification and quantification of non-compliant asset conditions, prioritisation of asset maintenance/repairs and targeted preventive maintenance will increase the life of assets and reliability across the network.
• Situational awareness of the network will improve preparedness during emergency events and natural disasters.
• Access to geospatial information will assist in planning and prioritising before crews begin field work, reduce site assessment visits and field travel time. The information will also improve permitting workflows, resulting in better
The result is the full network rendered in 2D and 3D, matched to Horizon Power’s assets.
data and time savings for both office and field crews.
• Reactive maintenance costs will reduce with improved system reliability and fault response efficiency.
Altavec (previously known as Geomatic.ai) is a Tech Mahindra company, specialising in geospatial and network intelligence services for the delivery of digital asset insights. Designed to empower infrastructure businesses to make truly informed decisions about their assets, the team at
Learn more:
Altavec converts LiDAR and imagery into digital network models for compliance, analysis, planning and design purposes.
Having completed more than 300,000 kms of network survey and analysis work across Australia, Altavec has been a trusted partner for Australian utilities for more than 20 years. Ongoing advancements in automated analytics along with developing ML and AI algorithms ensure Altavec delivers the future of network intelligence, now. n
horizonpower.com.au | altavec.com
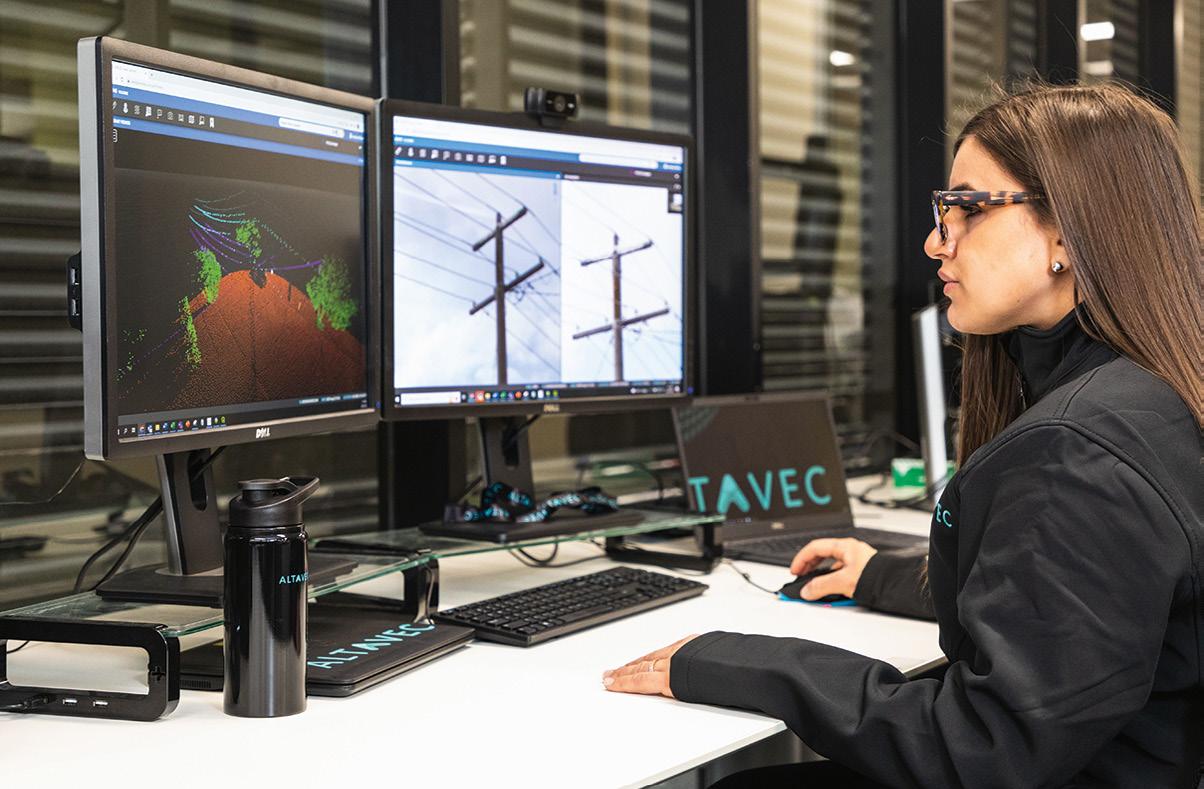
Novices and experienced surveyors gained theoretical and practical knowledge on this intensive hydrography course.
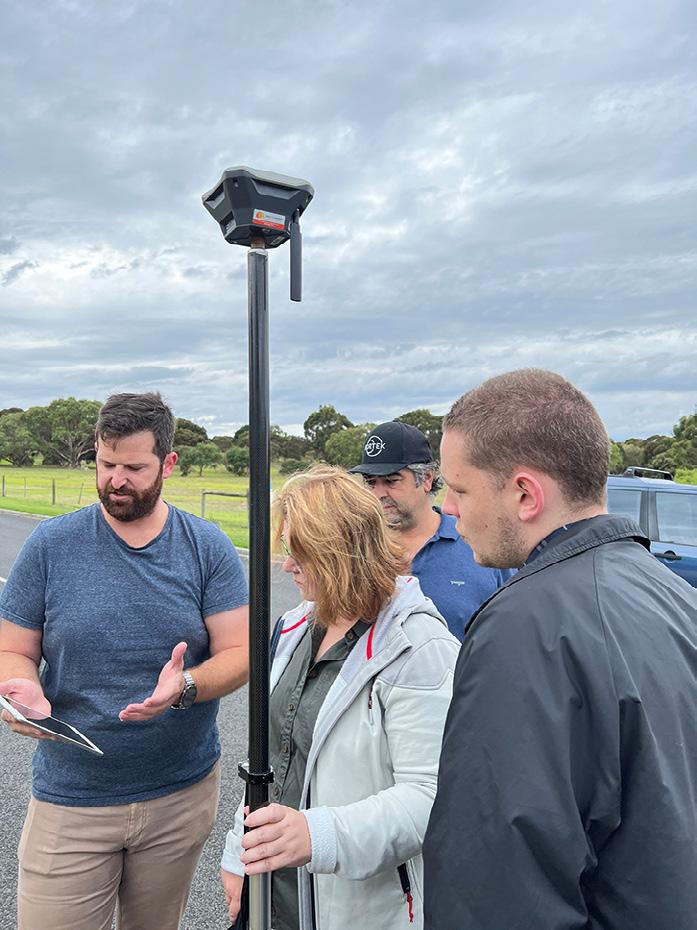 JONATHAN NALLY
Earlier this year, a group of industry members gathered in Victoria to participate in an internationally recognised S-5B hydrographic training program delivered by IIC Academy in partnership with Deakin University. The course attracted a range of participants, from those who knew essentially nothing about hydrography to current surveying business owners and everyone in between. The program comprised 13 weeks of theoretical instruction (delivered online) and 7 weeks of practical assessment, including time spent on the water.
Here, we hear from two of the participants in the program.
Jeremy Monteath: There was a broad range of experience among the students on the course, and I was without doubt the least experienced; in fact, I had never heard of hydrography prior to getting my job at Seismic Asia Pacific in 2020. However, despite this, I was able to fairly easily grapple with the content during the theory stage.
The practical modules have not only given me invaluable hands-on experience but have provided lifelong memories and cherished friendships. Each day we would work on a different task together; sometimes half of us would be out on the boat while the other half were on the computers doing processing. To be honest, I was very apprehensive going into this segment as I knew I had the least knowledge in the whole crew. Thankfully, my concerns were allayed by the staff and the other members of the course, who were very welcoming.
We conducted our final field project in Portland. The students were split into pairs and tasked with surveying a third of the port. My partner and I were allocated the shallow area. We set off in calm winds, weaving our way around the jetties, ‘mowing the lawn’ with our multi-beam and doing multiple SVP casts. It was a highly informative couple of days.
Truly this was a once in a lifetime experience. Not only was I able to learn and develop my hydrographic abilities, but I have formed many long-lasting friendships.
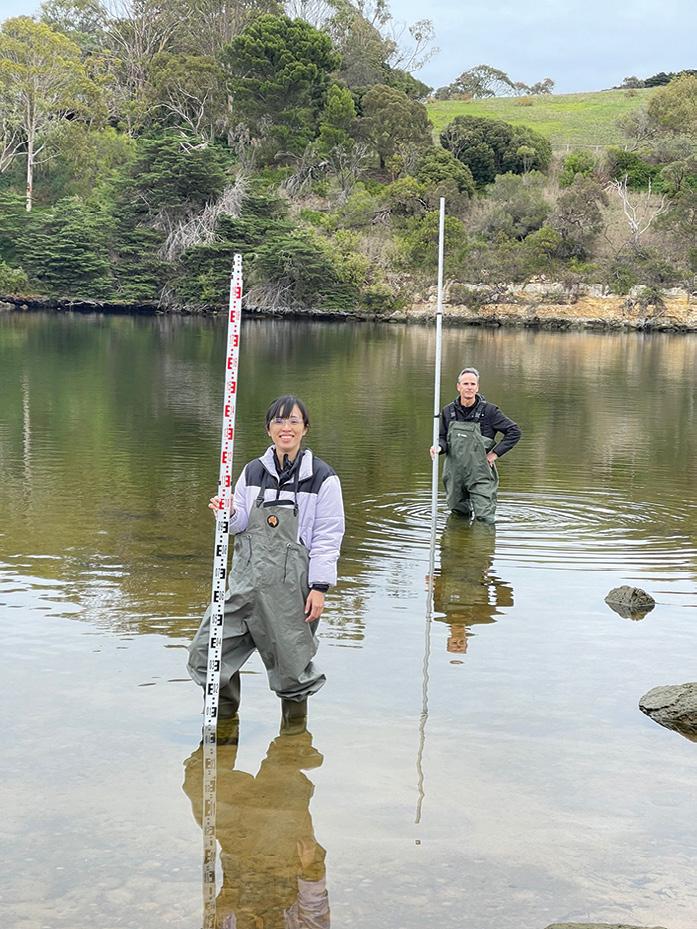
Rod Tansley: I own a hydrographic survey company, Sandmap, based out of Brisbane. I joined the S-5B program as someone who had a fair bit of land survey and GIS experience over 25 years, along with about 3 or 4 years of hydrographic experience with an interferometric system. As a small hydrographic survey company owner, I wanted to fast-track my certification process but also to act as a test case for potentially putting employees through the course.
I found the course to be by far the best I have completed in my career. The theoretical component gave me a solid grounding and background information to reinforce what I already knew, but also supplied me with a lot of new information that has been extremely helpful already.
The practical component held at Deakin University in Warrnambool made it stand out from every other course I have done. The IIC instructors come from a solid hydrographic survey background with years of experience at sea, and I was able to have many technical and practical discussions with them about all things to do with hydrographic survey, which have helped my business immensely. I learned more about hydrographic survey in the 7-week practical component than I did in three years of being on the job and researching through the internet.
Being at Deakin University was an absolute privilege. Their survey boat Yolla was first class, and the first thing I did on arrival back home was to purchase and fit out a 5m version of their 9.2m Stabicraft for our own work.
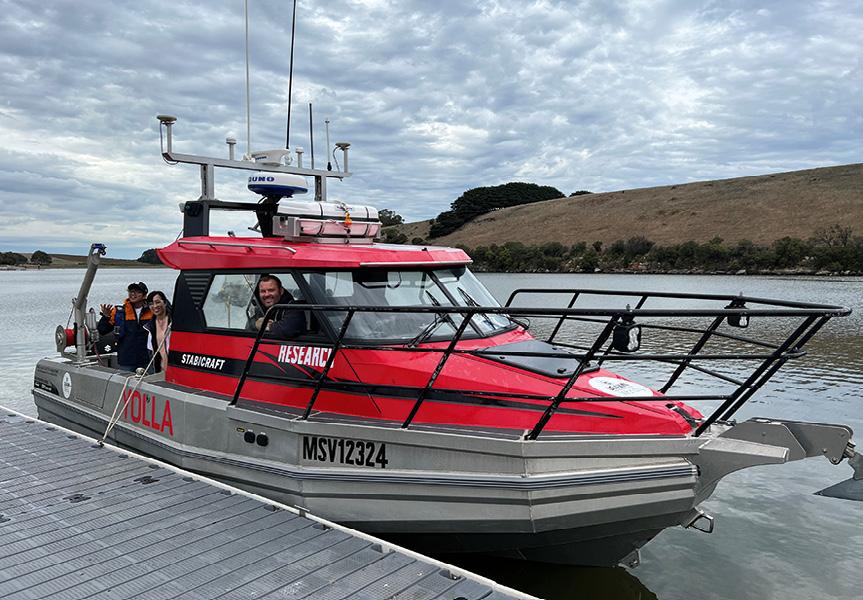
Details of future programs
at http://iicacademy.com or by emailing hydrographicsurveyor@iicacademy.com.
I would say that this course has advanced my knowledge and my business much more than I ever expected it would. I came in with the main purpose to just complete it as another step towards certification, but left with so much more. n
The use of drone-based LiDAR has become progressively more common in land surveying over the past few years. As with all new technologies, there has been (and continues to be) a phased adoption to integrate with existing workflows and develop new workflows to deliver fit for use outputs.
Regional surveyors have an opportunity to leverage the value of drone LiDAR for topographic and land surveys. The benefits are well understood and marketed: increase efficiency, better detail and improve the bottom line. However, with the cost of equipment significant and, often, the cost of training staff in data acquisition and post-processing underestimated, the implementation of drone LiDAR for regional firms and smaller teams has been difficult.
To unlock the value of drone LiDAR, it is worthwhile engaging a specialist spatial firm with established capabilities in data acquisition and post-processing. Diospatial has been at the forefront of bringing this technology to the engineering and surveying sector throughout NSW, Victoria and Queensland, and specialises in providing high accuracy and highresolution LiDAR surveys, to deliver fit for use spatial data products.
Regional surveyors are presented with some unique challenges. Sites are often large parcels of land, across rugged terrain, with hard-to-access features including thick vegetation. Aerial imagery and point cloud or DEM data is usually available through open sources, however this data is often outdated and lacks the resolution and accuracy required.
Drone LiDAR improves access, captures data at a very high resolution, at a fraction of the time and cost. LiDAR can penetrate even dense vegetation, capturing the landform detail in areas otherwise inaccessible or poorly defined by conventional means. High-resolution imagery can be captured simultaneously to produce orthophoto and textured mesh model for visualisation and context.
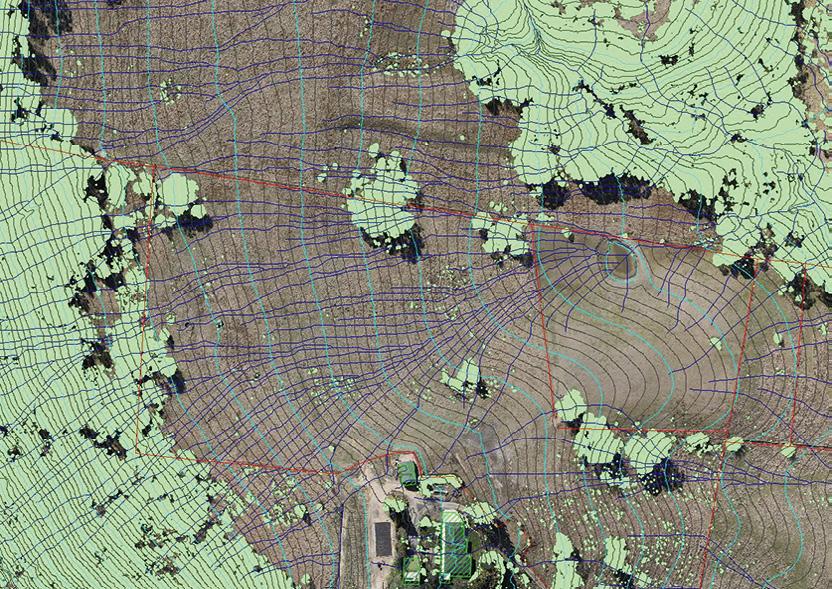
But more detail can often lead to more
confusion and frustration. This is where the post-processing workflows and capabilities of specialist firms like Diospatial provide significant value.
Diospatial classifies the LiDAR data, filters out the noise, parses and subsamples, to produce clean, accurate and fit-foruse spatial data products. Topographic survey data is derived and extracted in post-processing including TINs, DEMs, elevation contours, watersheds, surficial flow paths and site features. Diospatial’s specialist technicians prepare the deliverables in industry standard and preferred file formats, ensuring ready-foruse compatibility with a range of surveying and CAD applications.
On a recent project, Diospatial was engaged by Integrated Consulting to provide drone-LiDAR survey and aerial imagery over a parcel of land in regional NSW.

“The LiDAR and imagery capture service provided by Diospatial was not limited to the accurate capture of the difficult topographic detail required for the design of the development. Prior discussions with all consultants working on the project allowed Diospatial to tailor a data capture to fulfill all the projects spatial data requirements, including for town planning, bushfire planning, traffic engineering, biodiversity and civil design,” said Shannon Dawson, Integrated Consulting.
“The data supplied was based on our site datum, came with an easily understandable metadata and accuracy statement, and was in formats easily imported into our survey computation packages. Diospatial staff worked with our survey team to amalgamate data sets where traditional surveying was undertaken to provide a complete and cost-effective spatial data solution for our client.”
As with all survey and engineering, quality control is critical. LiDAR surveys, unless otherwise required, should be quality controlled in line with the ICSM Guidelines for Digital Elevation Data — an accuracy verification method based on the comparison of LiDAR and derived elevation
data with ground surveyed validation points and details specific wording which should be used in the metadata reporting.
With every survey, Diospatial provides a report that clearly explains the quality control and validation process, achieved accuracy and any limitations. The report can be easily understood by project stakeholders to increase the utilisation of the data and provides a robust record of the acquisition, processing and delivery of the survey.
The accuracy achieved with drone LiDAR is typically 50-100mm at 95% confidence in clear and open terrain — while not impossible, a cautious and sceptical approach should be taken with any LiDAR derived data products claiming better than this. In areas where higher accuracy is required, Diospatial can integrate total station and/or GNSS acquired detail with the LiDAR point cloud to develop a TIN model.
Scan the QR code to check out our sample data set and understand what value you can get from a drone LiDAR survey. For more information, contact Diospatial on info@ diospatial.com n

Spatial technologies play a fundamental role in understanding the challenges of climate change and its impacts.
Acore value of Spatial Vision is a commitment to empower governments and organisations with the tools, technology and expertise to address economic, social and environmental challenges.
While the science and realities of climate change were well established by 1999, many didn’t view it with the urgency it now justifiably receives. Spatial Vision has been assisting in the effort to reduce carbon emissions and prepare for change since this time, commencing with its support of the National Greenhouse Office in monitoring national tree cover change.
Now, increasingly frequent and severe extreme weather events are a daily occurrence globally, and literally playing out in our own backyards with devastating impacts, not to mention exacerbating the economic, social, and environmental challenges.
The escalating cost of natural disasters to Australia

now stands at $38 billion per annum, of which 97% is spent on response and recovery and just 3% on proactive resilience measures (Mindaroo.org). Australia cannot afford to be forever picking up the pieces considering 70% of the world’s natural disasters occur in the Asia-Pacific (eco-business.com).
Spatial technologies continue to play a fundamental role in better understanding the challenges of climate change, and in responding to its impacts, including in emergency service planning, management and response. From their application in climate modelling and macroscale analysis, down to sitespecific evaluations and design, they provide planners and decisional makers with both the insights and information to make better informed plans and decisions. These technologies also provide powerful tools in the evaluation of future climate scenarios, responding in real time to emergencies,
and visualising and communicating information.
Spatial Vision has been applying spatial technologies across a broad range of climate related programs since 1999.
Using spatial data for impact and consequence
Vulnerable local government areas around Australia are seeking urgent assistance in tackling climate change as it relates to their unique circumstances. Spatial technologies are increasing playing a key role in preparing for and efforts to minimise the consequences.
The Victorian Department of Environment, Land, Water and Planning (DELWP) and the Barwon Regional Partnership of councils (BRP) engaged Spatial Vision to help build capacity in the application of spatial technologies to better plan and understand what lies ahead.
A series of spatial case studies were drawn based on the latest CSIRO forecasts within the 2019 Victorian Climate Projections Project. These case studies, which include the impacts of heatwaves, coastal erosion and inundation, overland flooding, wildfire risk and landslips, were undertaken to assist preparing for extreme weather and climate changerelated events. The scenarios ranged from broad strategic evaluations through to local planning-related responses.
Data accessibility and utilisation of spatial data for impact assessment was a key area for improvement.
Hence, the project’s first stage entailed collating suitable spatial datasets, including climate data, community datasets and historical data, and determining additional extreme weather parameters. These included heatwave metrics derived from climate projections to support laterstage asset impact assessments.
Spatial Vision then facilitated several stakeholder workshops to determine extreme weather event scenarios and highpriority council assets to be incorporated in a spatially based impact assessment. Here, designated extreme weather event impacts on these assets were highlighted. Utilising the impact assessment profiles, ‘Consequence of Loss’ case studies were developed for each council, with detailed user stories assisting the councils to better understand the implications to the asset itself, as well as the flow-on effect to the community.
Finally, Spatial Vision trained and mentored the four BRP councils to utilise the datasets and processes for extreme weather planning. A series of map views depicted the impact of climate change projections across the Barwon footprint. Spatial Vision also helped integrate the datasets into councils’ existing GIS environments, also delivering project outputs in a customised QGIS based spatial case study.
“This project exceeded our expectations in providing Councils with very tangible and well-developed case studies demonstrating the
value in using spatial data and technologies to better understand, plan for and mitigate the likely effects of climate change and extreme weather events,” said Bryan Roberts, Project Manager, DELWP (Barwon South West Region). “It also assists in communicating about such events with other stakeholders and the broader community.”
Another council group, the South East Councils Climate Change Alliance (SECCCA), engaged Spatial Vision to undertake an asset vulnerability assessment and financial review to better understand impacts on income and expenditure. The findings informed how at-risk assets were prioritised, costed and managed to be more climate change resilient. The nine member councils were mentored and guided through this process.
To do this, Spatial Vision, with support from Marsden Jacob Associates (MJA), firstly applied a high-level vulnerability assessment on agreed assets (buildings, roads, drainage pits and pipes) for each member council based on the anticipated level of exposure, and sensitivity of the asset to this exposure. Part 2 entailed four representative case studies on an agreed set of climate change or extreme weather scenarios. This included a more detailed financial evaluation and considered possible adaptation options.
Additionally, further skill and capacity building opportunities within member councils were identified. Spatial Vision mentored councils and ran workshops to aid knowledge transfer. These sessions also involved repackaging spatial data to help councils embed the approaches and learnings into their financial planning and decision processes.
“The team at Spatial Vision were extremely flexible and responsive in navigating complex and changing stakeholder requirements,” said Dominique La Fontaine, CEO, SECCCA. “The path forward was made clear with their strong methodology and direct collaboration with Councils to deliver on their needs.”
In recent years, countless Australians have experienced the heartache, havoc and homelessness caused by severe bushfires and flooding. Whilst climate change has become more widely accepted as a major factor, the level of top down and bottomup resistance to bold and immediate environmental reform has seen Australia lag most other developed nations.
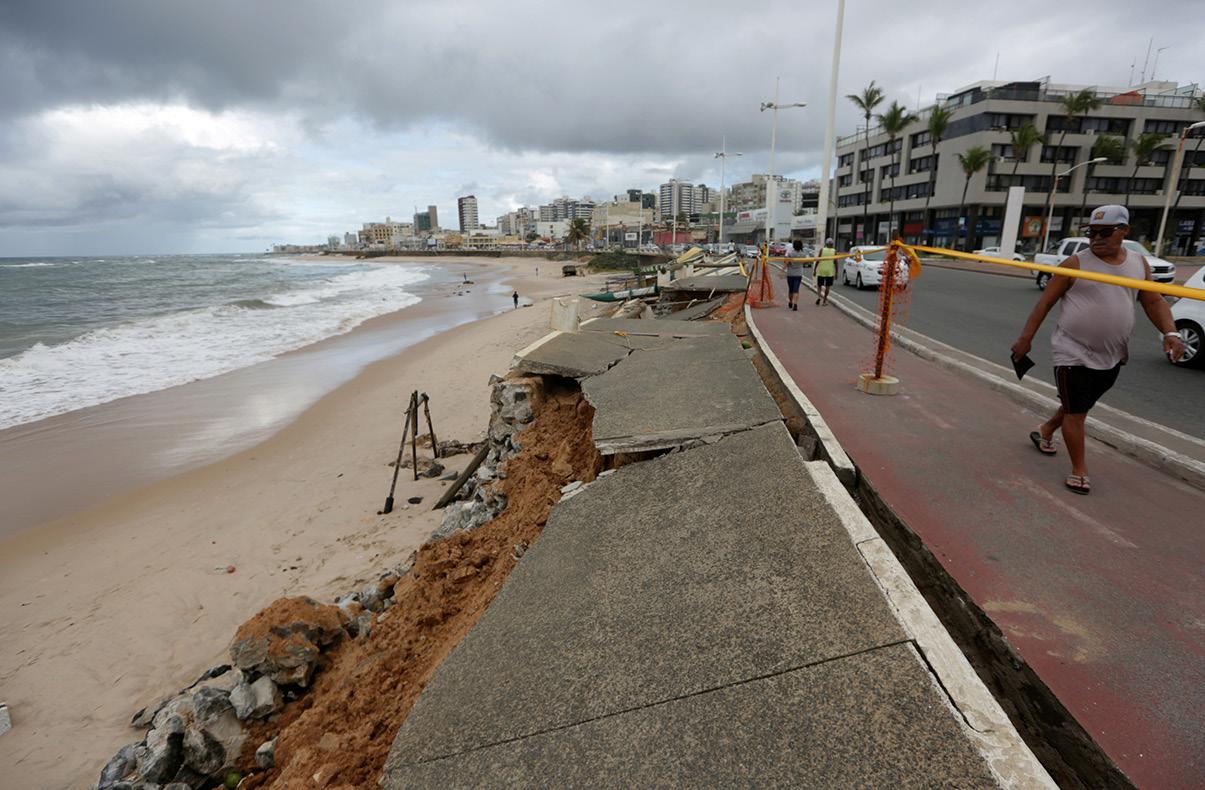
Spatial Vision was engaged by the Climate Council to develop a cutting-edge ‘Climate Risk Map’ to advocate for stronger commitment leading into the 2022 federal election. The strategy behind the Climate Risk Map was to create an interactive modelling tool accessible to every Australian

to determine their home’s risk of fire, flood and extreme wind wherever they live, accounting for the effects of extreme weather over different timeframes (2030, 2050 and 2100) in addition to low-, medium- and high-emission scenarios.
A key plank of the Climate Council’s Uninsurable Nation Report, the user-friendly interface served as a compelling, graphic illustration of the financial and social impact of failing to reduce emissions and achieve net zero, given many parts of Australia may soon be uninhabitable by virtue of home insurance being no longer an affordable or viable option. As an additional feature, users could easily lobby their local MP via an email template.
The Climate Risk Map, which successfully garnered media attention during the election cycle, was built using Mapbox GL JS in conjunction with vector tiles to ensure a highly responsive application.
“We worked with Spatial Vision to bring our Climate Risk Map to life,” said Amanda McKenzie, CEO, Climate Council. “From the outset, we could tell this wasn’t just another project for Tom Hollands and Jarryd Hunter, they shared our vision and understood the why. They delivered a complicated mapping project on time and budget, and with a level of wisdom and acumen rarely encountered.”
Spatial Vision recognises that decisions made today will influence our collective future. Sustainability is more than just our natural environment — it’s also urban environments, social cohesion and justice, economic development and equity.
To increase our overall impact, we are committed to supporting the 17 UN Sustainable Development Goals and are aligning our operations, service delivery and client partnerships with this globally recognised initiative. n
“Spatial Vision delivered a complicated mapping project on time and budget, and with a level of wisdom and acumen rarely encountered.”
Amanda McKenzie, CEO, Climate Council.
Increasing the visibility of diverse identities and amplifying the voices of marginalised people in the sector.
Our industry is beautiful, ubiquitous, powerful, impactful and growing in potential at an accelerating rate. However, for several years now we have been struggling to find creative ways to attract, nurture, grow and retain talent. Our skilled workforce is critical to the industry’s future, as the world becomes increasingly automated and reliant on the datadriven decision-making that we provide foundations for.
As a small but critical industry, we are in the process of realising that diversity, equity and inclusion are not just HR terms — they apply to the very technological core of how we work, what we do and the data we create, use and replicate.
Modern cartography is now digital, and maps are used not only by specialists but also laypeople all around the world. That includes purposes for which they were originally intended, as well as many uses their creators may not have dreamed of.
The data that goes into them is important, because geospatial data and the products that they create are now endlessly replicated and reworked into a wide variety of new products. As this happens, the limitations and weaknesses held within the constructs of these datasets are also amplified.
As spatial and surveying professionals, we are the gatekeepers of local knowledge, because how we create and what we put into a geospatial dataset will inevitably be a reflection of the world as we see it.
And when we do not value diversity, this flows into missing a lot in how we map. We may miss the worldviews of others who exist alongside us or the things that we feel don’t necessarily apply to us, and features in the world that we take for granted or prioritise are magnified. An example is that if we are able-bodied, we may not map wheelchair- or pram-accessible areas.
The Space, Spatial and Surveying Diversity Leadership Network (SSS-DLN) has been contemplating the industry-wide mindsets, values and cultural shifts needed to achieve a sustainable skills base. The good news is, we think it’s within reach, and
we feel that many of us will find achieving it an empowering process. As a first step, we are launching the SSS-DLN Diversity and Inclusion Accord. The Accord is an initiative in which each of us can pledge to increase the visibility of diverse identities and amplify the volume of marginalised voices of people throughout the space, spatial and surveying sector.

The SSS-DLN Accord is based on five key pillars: 1. Be an advocate 2. Be reflective 3. Be active 4. Do not accept excuses 5. Be visible
ROSHNI SHARMA AND MATT DUCKHAMThe Accord is grounded in the foundation of the SSS-DLN’s ‘Thinking differently about difference: An action plan for boosting innovation and collaboration in the Spatial Sectors through diversity and inclusion’ report. This report identified five key barriers inhibiting diversity and inclusion in the sector: low awareness, Anglo-male cultural stereotypes and biases, recruitment bias, limited focus on diversity and inclusion in workplaces and education, and lack of mentoring and sponsorship.
The Accord provides a first step to increasing the visibility of behaviours and actions which are inclusive, working to dismantle stereotypes which are no longer relevant.
If this is something you find thought-provoking or interesting, please visit https://sssdln.org/ the-accord/. You can show your support by signing the Accord, and you’ll also be able to add the SSS-DLN Accord badge to your LinkedIn or social media profile.
Our industry has a rich heritage, and this is something we’re all proud of. The science, technology and solutions we create and facilitate are truly amazing and growing rapidly every day. Can you imagine what we’ll be able to do in two years, five years or ten years, if we are able to nourish the pipeline of talent to bring people into our industry, keep them there and support intergenerational knowledge exchange to strengthen and unite ourselves? n
What we put into a geospatial dataset will inevitably be a reflection of the world as we see it.
The Trimble X12 scanning system integrates Trimble software for precise data capture and infield registration with state-of-the-art 3D laser scanning and imaging hardware technology from Zoller+Fröhlich. It has a range of 0.3m up to 365m and a scan speed of up to 2.187 million points per second. The X12 can be operated by using Trimble Perspective field software installed on a Trimble T10x tablet to enable registration and refinement of scans in the field. Data is exported from the field and processed with Trimble RealWorks or third party software.


The Emlid Reach RX (distributed in A/NZ by Map Gear) is a multi-band RTK rover that fits in a pocket and has a focus on simplicity — a job is started simply by entering the credentials for the corrections network (NTRIP); no more configuration is required. The device makes use of GPS/QZSS, Galileo, Glonass and Beidou to provide cm-accurate positioning. If no network is available, one can be created using the Emlid Reach RS2 or RS2+ as a permanent base and Emlid Caster to send RTK corrections. The Reach RX connects to the ReachView 3 app over Bluetooth Low Energy. The battery provides 16 hours of work on one charge.
Phase One has launched P3 Smart Focus, based on the P3 camera’s 100Mp mediumformat sensor, high-quality AF lens range and integrated laser-based focusing system. Improved performance is delivered by increasing focusing robustness in low-contrast environments and increasing focusing consistency when complex assets with small surface areas. Advanced focus bracketing can be used in situations where re-flying would be very costly. A key feature is advanced focus limit control, which can be used to reduce the chance of images being out of focus even in complex scenarios.

Geoscape has announced the launch of G-NAF Core, a more accessible G-NAF (Geocoded National Address File). G-NAF has more than 50 million contributed addresses distilled into more than 15.2 million G-NAF addresses every quarter; G-NAF Core reduces the complexity of G-NAF by delivering the data in a simplified table model. G-NAF Core features: a single table for all physical addresses in Australia; simple pipe-separated text file format; reduced complexity and faster time to deployment; availability as open data; spatially enabled address data; and references to aid integration with external data.

C.R. Kennedy has been appointed a distributor for the XWatch safety solutions portfolio. The UK-engineered XW product series is aimed at improving safety in the construction, mining and transportation markets, by providing height control, slew control, rated capacity indicator (RCI) and stability features for plant and machinery. The XW series features rugged but easy-to-use TFT operator screens, with software programmed using the CODESYS platform, a manufacturerindependent IEC 61131-3 software standard for engineering control that is used worldwide in automation systems. XWatch products integrate fully with Leica Geosystems’ MC1 machine control software.
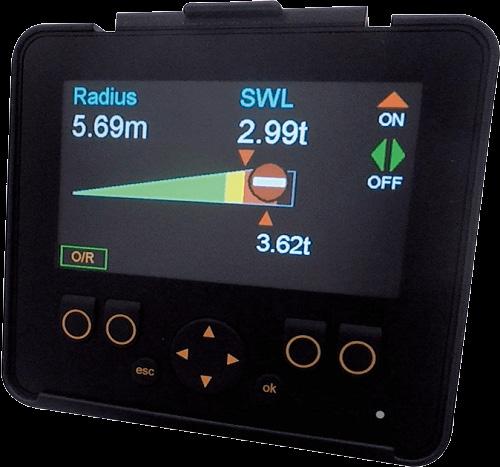


This month sees me writing this column from the other side of the world in Warsaw, Poland. It has been an honour to represent SSSI at the International Federation of Surveyors (FIG) Congress. This was the first time in three years that we were able to come together in person. It is always wonderful to meet surveyors from all over the world as they come together at this premier event of the peak international professional body. It was great to see a number of Australian’s attend the FIG congress, and over the coming weeks we will be sharing with our colleagues our learnings and experiences from this week of activity.
A big congratulations to Dr Diane Dumashie for being elected the FIG President for the term of 2023–26. Dr Dumashie ran a very strong campaign, and we look forward to the coming four years where she will champion climate action, digital transformation, community diversity and inclusion, and ensure continued strong governance within FIG. We wish Dr Dumashie all the best for the upcoming three years and look forward to welcoming her to Australia for the FIG 2025 Working Week in Brisbane.
Commiserations to our Australian presidential nominee, Professor Abbas Rajabifard and Turkish presidential nominee, Dr Orhan Ercan, both of whom were very worthy contenders. I know these gentlemen will remain strong advocates for the surveying and geospatial profession and continue the important work of FIG. We know that Abbas and his team ran an impeccable and thorough campaign and always conducted himself with the utmost professionalism and integrity.
Congratulations must also be extended
to Dr Daniel Steudler from Switzerland and Professor Winnie Shiu from the United States of America for being elected FIG Vice-Presidents.
The FIG Congress has given me renewed energy and enthusiasm for our profession. The theme for this year was ‘Volunteering for the future: Geospatial excellence for a better living’. This was the perfect opportunity to highlight SSSI’s ‘Surveying & Spatial Sciences Volunteer Strategy’ produced by our Disaster Management & Recovery Special Interest Group. The strategy is currently out for review, and we welcome all feedback. When there is a strong call to action and purpose behind volunteering pursuits, our profession will always be first in line to assist where needed.
As I reflect on the five-day event and on all the priorities addressed, it is clear our profession can take a leadership role in reaching the 2030 Sustainable Development Goals, championing digital transformation and supporting diverse and inclusive workforces.
Many conversations during FIG2022 veered towards the reduction in industry capacity. This is an issue affecting the surveying and geospatial profession all over the world.

 The Australian delegation at the FIG2025 Congress in Warsaw, Poland.
Our international colleagues look with interest at the work we are doing in Australia to build industry and capability. It is a timely reminder of the recent report funded by the Surveyor’s Trust and completed by Danika Bakalich — ‘The Australian Surveying and Spatial Workforce – A National Roadmap’ — and the need for us to take action. As you may recall, this report provides a set of clear recommendations to ensure we have a strong pipeline of skilled professionals coming through.
It has been some months since this report has been released. In the next issue of Position, I will endeavour to provide a status update on the recommendations proposed. Attracting new talent to our sector is essential and will not occur without a coordinated approach.
A personal highlight of FIG2022 was providing an update to the Congress about the FIG2025 Working Week which will be held in Brisbane Australia, from 1 to 5 June 2025. I was pleased to announce Steven Jacoby, Executive Director–Spatial Information at Department of Resources (Queensland) as the Convenor, and Peter James, Business Development Manager, Cohga, as Program Chair. Interestingly, Peter is the son of Earl James, the first and so far only Australian FIG President elected.

The theme for FIG2025 is ‘Collaboration, Innovation and Resilience — Championing a Digital Generation’. There are so many

opportunities to explore topics within this theme, and Brisbane will provide the perfect canvas for welcoming the international surveying and geospatial community to Australia.
SSSI continues to progress with the proposed SIBA|GITA merger to form the peak geospatial representative body. We have been pleased with the support from our members and we continue working towards a formal vote at our AGM set for 10 November 2022, which will decide whether we proceed with the merger.
Over the coming weeks, we will be sharing with members the proposed structure and membership model for the new entity in preparation for the pending vote. In the meantime, I am pleased to announce that if members vote in favour of the merger and a geospatial peak body is formed, Dr Peter Woodgate has agreed to be an Independent Director and put himself forward for consideration as the inaugural Chair of the incoming Board (see page 41). The new organisation will benefit significantly from his years of experience in the spatial industry and his business expertise.
It has been a very busy few weeks. I do hope you enjoy these photos on these pages from FIG2022. It was a career highlight being at this event and a great privilege to represent SSSI.
Engineering & Mining Surveying Chair
Andrew Barkham chair.emsc@sssi.org.au
Hydrography Commission Chair
Neil Hewitt chair.hc@sssi.org.au
Land Surveying Commission Chair Lee Hellen chair.lsc@sssi.org.au
Remote Sensing & Photogrammetry Commission Chair
Dr Petra Helmholz chair.rspc@sssi.org.au
Spatial Information & Cartography Commission Chair
Robert Campbell chair.sicc@sssi.org.au

ACT Regional Chair
Noel Ward chair.act@sssi.org.au
NSW Regional Chair Roshni Sharma chair.nsw@sssi.org.au
NT Regional Chair Rob Sarib chair.nt@sssi.org.au
QLD Regional Chair Noel Davidson chair.qld@sssi.org.au
SA Regional Chair Graham Walker chair.sa@sssi.org.au
TAS Regional Chair Inga Playle chair.tas@sssi.org.au
VIC Regional Chair Richard Syme chair.vic@sssi.org.au
WA Regional Chair Darren Mottolini chair.wa@sssi.org.au
SSSI National Office 27-29 Napier Cl, Deakin, ACT 2600 (PO Box 307)
Phone: +61 2 6282 2282 Email: info@sssi.org.au
Above: Paul Digney addresses the FIG2022 Congress. Right: Paul Digney provides an update on FIG2025 Working Week to be held in Brisbane. Paul Digney, SSSI National President, and Professor Abbas Rajibifard, FIG Presidential nominee.This year the University of Tasmania (UTAS) celebrates 50 years of surveying and spatial education. Many UTAS graduates have gone on to become leaders in their respective fields and remain connected with their peers’ years after graduating.
It was in 1972 that with strong support from industry and the surveying profession, the Institution of Surveyors Tasmania and the Tasmanian Board of Surveyors requested the development of a degree program.
As a result, a four-year Bachelor of Applied Science (Surveying) degree was introduced at the recently constructed Mt Nelson campus of the Tasmanian College of Advanced Education (TCAE). The degree was based around three years of course work and one year of professional experience.
The year of professional experience was welcomed by students (as they benefitted greatly from the practical training experience) and by industry (as the students provided great technical assistance).
Today UTAS continues to foster a strong connection to industry and values industry input in developing the next generation of surveying and spatial professionals. Industry members are invited to give guest lectures or asked to assist with field trips or site visits, and their expertise is often called upon to advise on curriculum development. Being a small discipline in a small state means that industry connections are strong and lasting.
Over the years, UTAS academics have been recognised for their important
research work in the areas of monitoring polar ice caps, measuring sea level rise and drone forest mapping, just to name a few.
In 2022 we recognise how far surveying and spatial sciences teaching at UTAS has evolved. The most dramatic change has occurred over the past five years with the introduction of courses being delivered face to face in the classrooms as well as online. The strong emphasis on practical components is still apparent. However, the core focus of courses remains — to prepare students for a career in GIS, remote sensing, surveying and geodesy.
The challenge moving forward is similar to that faced by many universities around Australia — attracting students. With the sector experiencing a severe skills shortages, building sector capability and capacity is a priority for all involved.
To celebrate the 50-year anniversary, UTAS partnered with the Surveying & Spatial Sciences Institute to host a gala dinner. UTAS surveying and spatial graduates from all over Australia came together to reminisce about their UTAS experiences and to share their career journeys.

On the evening, presentations were given by UTAS Vice-Chancellor Professor Rufus Black and Professor Arko Lucieer, Head of School, Geography, Planning, and Spatial Sciences, both of whom highlighted the achievements of the school and graduates.

In addition, the Asia Pacific Spatial Excellence Awards (APSEA) we presented to the Tasmania Region winners. Congratulations to Esk Mapping & GIS for winning the Innovation (Small Business)
Tasmania boasts a vibrant, innovative and supportive surveying and spatial community, with UTAS leading the way in supplying suitably qualified and capable professionals upon graduation. n
Special thanks to Dr Rachael Hurd Senior Lecturer & Surveying and Spatial Sciences Coordinator at UTAS and staff for providing content for this article. For further information about the history of surveying and spatial at UTAS visit: https://www.utas. edu.au/built-digital-natural/geographyand-spatial-sciences/surveying-and-spatialsciences-50th-anniversary.
Award for SPARQS–Next Level Web GIS, and Veris for winning the Technical Excellence Awards for the Paradise Gorge Digital Twin. The gala dinner included presentation of the APSEA-Tas awards. Paul Digney with UTAS Alumni. Professor Arko Lucieer, Head of School, Geography, Planning, and Spatial Sciences, UTAS.An outcome of the proposed merger of the Surveying and Spatial Sciences Institute (SSSI) and Spatial Industries Business Association (SIBA|GITA) is the formation of a new geospatial peak body.
TONY WHEELER, CEO, SSSI2030 Space and Spatial Industries Growth Roadmap, the Australian Urban Research Infrastructure Network, and Canthera Discovery Ltd (a national cancer therapeutics research organisation).
Dr Woodgate has helped create several companies, and managed an industry cluster of over 100 companies translating applied research into commercial outcomes as CEO of the CRC for Spatial Information from 2003 to 2017.
Dr Peter WoodgateThe proposed geospatial peak body will champion the interests of both professionals and businesses working in or allied to the geospatial sector. Its core function will be to build industry capability and capacity, influence policy decisions via proactive advocacy, create consistent and impactful standards and recognise and acknowledge sector achievements. The formation of this new peak body will be determined by member vote at the upcoming SSSI and SIBA|GITA AGMs.
The formation of the proposed geospatial peak body will see the introduction of an Interim Board. Dr Peter Woodgate has agreed to be an Independent Director and has put himself forward for consideration as the inaugural Chair for the incoming Board.
With a space and geospatial career spanning more than three decades, Dr Woodgate is a natural choice as an independent Director and Chair for the proposed new peak body, as he brings a wealth of leadership and best practice governance experience. He is currently Chair of SmartSat CRC, the Steering Committee for the
Dr Woodgate is an Honorary Fellow of the SSSI, a life member of the International Society for Digital Earth and a graduate of the Institute of Company Directors. He is also a member of the Australian Space Agency’s Space Industry Leaders Forum and a Board member of Geoscape Australia. He has a Doctorate of Business Administration (RMIT University) in factors that drive innovation in the spatial industry, a Masters of Applied Science (University of New South Wales) in bushfire mapping using satellite remote sensing, and a Bachelor of Forest Science (University of Melbourne).
The merger of the two organisations will be voted on by members at the SSSI AGM on 10 November 2022 and the SIBA|GITA AGM on 11 November 2022. If the vote is positive, the inaugural Board will consist of representatives from both the current SSSI and SIBA|GITA Boards as well as Independent Directors that will help guide the development of the new organisation. n
SSSI is honoured to host the international geospatial community for the FIG Working Week 2025. This prestigious event will be held from 1 to 5 June in Brisbane and will explore the theme ‘Collaboration, Innovation and Resilience — Championing a Digital Generation’.

The Convenor for FIG Working Week 2025 is Steve Jacoby, Executive Director, Spatial Information at Department of Resources (Queensland), who has 23 years’ experience as a Senior Executive with the Queensland and Victorian Governments, leading their spatial information businesses. Steve has a keen interest in information management and, in particular, seeing the use of spatial information reach its potential within government, business and the public.
The Program Chair is surveyor, Peter James, who is the Business Development Manager for Cohga, an Australian company with a focus on the development of IT products and the provision of associated professional services. Peter is also the son of Earl James, Australia’s first and only FIG president.

Brisbane has a rich history of surveying, dating back to 1839, when the first surveyors arrived in Morton Bay. Their activities have been of critical importance to the planning and development of Queensland.
FIG Working Week 2025 is a great opportunity for Australia’s geospatial community to showcase their technical expertise, strong research capability and warm hospitality. n
As Geoscience Australia’s Director of National Geodesy, Nicholas Brown is responsible for the development and refinement of the Australian Geospatial Reference System; the collection of datums, geoid models, transformation tools and standards required for 4D positioning. Brown holds some other key positions: co-Chair of the UN-GGIM Subcommittee on Geodesy, membership of the Intergovernmental Committee on Surveying and Mapping (ICSM), Chair of the ICSM Geodesy Working Group, membership of FIG Commission 5 and a Director on the SSSI Governing Board.
Brown was the lead author of the recently published 148-page Australian Geospatial Reference System (AGRS) Compendium, which is an outstanding piece of work by ICSM. Even as geospatial professionals, we sometimes forget about the importance of Australia’s Foundation Spatial Data Framework to both our daily roles and to our national economy. The valuable work contained in the AGRS Compendium will underpin so much of what we need to do in the space and geospatial industries in the coming decades in supporting economic growth and security.
SSSI’s CEO, Tony Wheeler, spoke with Brown to find out more about geodesy’s importance for Australia.

TW: What is the primary benefit of going from a static or fixed datum such as GDA2020 to a time-dependent coordinate reference frame such as Australian Terrestrial Reference Frame 2014 (ATRF2014)?
It’s horses for courses. In some cases, such as cadastral surveying or digital twin development, a static datum like GDA2020 is all you need. There is no advantage to adding in the complication of motion of the Australian plate. In emerging use cases such as driverless cars, where the car is receiving information in real-time from GNSS satellites in a time-dependent reference frame (e.g. ITRF2014/ATRF2014), there are advantages leaving positioning coordinates in their native reference frame and then providing additional information the user needs, e.g. maps, roadside infrastructure locations etc, in ITRF2014/ATRF2014.
For this reason, the ICSM Geodesy Working Group developed GDA2020 and ATRF2014 to work well together. The user can choose which datum they want to
operate in, and they can move between them using the Australian Plate Motion Model which accounts for the ~7 centimetre per year movement of the Australian Plate.
TW: How easy is it for the nation to move from a fixed datum to ATRF2014, and do you see a day when all Australian position data is on the current or future versions of ATRF2014? It is more of a communication challenge than and technical challenge. Technically, geodesists have handled the motion of tectonic plates in the backend development of datums for years and shielded the user from the complications. It has been difficult to explain to people that now they have a choice of using GDA2020 or ATRF2014. I see static datums having a role well into the future; both for use cases where time adds unneeded complexity and for providing an efficient and effective way to store data. I do, however, see a significant shift towards real-time applications, including mobile applications operating in ATRF2014.
TW: There have also been upgrades to Australia’s vertical datum with the release of the Australian Vertical Working Surface. What are the improvements and why does it matter? The Australian Vertical Working Surface (AVWS) is a new reference surface for heights in Australia. The Australian Height Datum (AHD) still exists; however, when using GNSS and AUSGeoid2020 to compute AHD heights, biases and distortions in the AHD mean GNSS users are only capable of deriving AHD heights with accuracy of 6–13 centimetres across Australia. Uncertainty in the national height datum of this magnitude makes AHD inappropriate for some applications that require a more accurate reference surface. AVWS heights can be computed directly from GNSS (with a model) without needing to connect to survey mark infrastructure with accuracy of 4–8 centimetres.
Furthermore, in areas where we have airborne gravity data (soon to be large portions of Victoria, all of NSW and parts of SA), the accuracy will be as good as 2 centimetres. This provides an incredible opportunity to combine the benefits of Positioning Australia’s precise positioning services with AVWS for height applications such as large-scale construction, agriculture and environmental modelling.
TW: Over the last decade there have been so many important upgrades to Australia’s Foundation Spatial Data Framework. What are the priorities for the next decade?

We need to make our data FAIRer. That is, it needs to be more Findable, Accessible, Interoperable and Reusable. There is an incredible amount of work which goes into the development and maintenance of FSDF datasets by government and industry. Users rely heavily on the FSDF datasets as trusted information to make decisions that affect people’s safety, prosperity, and environment. The challenge we face is to make this dataset FAIRer so users can maximise the benefits from it. If people are able to Find and Access FSDF data (whether it be open source or not), and it is easily Interoperable and Reusable with other data, the potential applications of foundation level data are almost endless. We are already starting to see this with applications taking advantage of FAIR data from the Positioning layer. Imagine what applications people could develop with access to FAIR data from all layers.
TW: The work of Positioning Australia has been recognised for its importance at the highest levels of government, given it has attracted groundbreaking levels of funding. Tell us why it is so important to our economy going forward?
Geodesy is no longer an esoteric science. Geodesy is relied upon for myriad social, environmental and economic initiatives. In addition to the traditional survey, mapping and navigation fields, geodetic applications are increasingly critical for civil engineering, industrial automation, agriculture, construction, mining, recreation, financial transactions, intelligent transport systems, disaster response and emergency management, environmental studies and scientific research. By next year, location-based services (e.g. augmented reality and emergency services) and intelligent transport services (road, rail, maritime and aviation) are expected to account for 93.5% of Global Navigation Satellite System (GNSS) chipset sales. The reported economic benefits of geodesy technology have the potential to generate upward of $73 billion of value to Australia by 2030. n


