

Awards and scholarships Curtin recognises student and academic success.
Boosting civil construction Better analysis and decisionmaking with Kurloo.
The future of site layout HP SitePrint is improving accuracy and speed. 16 Q&A with Jasbir Randhawa Honouring 30 years of achievement with the AHO.
Leadership in hydrography
How the AHSCP led the way in certification. 20 Cognition in visualisation
Envisioning
27 Supporting the next generation How industry leaders can help tomorrow’s workforce.
28 Maximising surveying efficiency
Trimble’s CenterPoint RTX expands operational reach.
30 Digital Atlas reaches milestone
The Digital Atlas of Australia moves out the beta phase.
31 Re-establishing OGC’s ANZ Forum
Bringing the region’s geospatial community together.
32 AUSPOS cluster processing
Evaluating pros and cons of single and cluster processing.
36 Hidden risks in global geodesy
Vulnerabilities in the world’s geodetic data supply chain.

Council of Australia

The South Australian Government has committed $500,000 via the SmartSat CRC to deliver two new space-based research projects that aim to enhance environmental monitoring. The effort will pilot the use of artificial intelligence along with data captured by the South Australianbuilt satellite, Kanyini, to look at ways to support government agencies and research institutions in their use of thermal sensing and biodiversity mapping.
SmartSat CRC, which is leading the Kanyini mission, will guide the two projects. Kanyini was scheduled for launch onboard SpaceX Transporter 11 in July.
One of the projects will use Kanyini’s thermal imagery and AI-based analytics to provide a more up-to-date picture of surface temperatures across Adelaide and areas of regional South Australia, with the goal of determining how temperature affects the populace. It is hoped that the work, which will be done in conjunction with the Department for Environment and Water, will enable more adaptive planning and responses to the impacts of heatwaves. Another aim is to enable refinement of infrastructure planning and mitigation strategies, boost community resilience during heat events and lead to ‘greening’ investment.
The second project, also in collaboration with the Department for Environment and Water plus the Department of Primary Industries and Regions SA (PIRSA), will test the use of Kanyini’s capabilities to improve understanding of land-use. The enhanced data could be used to help monitor changes in native vegetation cover, crop health and land-use.
Specifically focusing on Kangaroo Island and South Australia’s northern pastoral region, it is hoped the satellite’s hyperspectral imagery and AIbased analytics will deliver improved understanding of native vegetation communities and key species important for carbon sequestration.
“Until now, images of our state have been sourced from foreign satellites, limiting our access to up-to-date, detailed images of areas of interest,” said SmartSat CRC CEO, Professor Andy Koronios. “With the Kanyini mission, we are demonstrating the capability to capture images of specific locations tailored to particular applications.”
“By leveraging advanced data analytics, we have the ability to transform these images into actionable intelligence for state government departments for the benefit of all South Australians.” n
6–8 August: ISPRS TC V Symposium
7–9 August: 14th Session UN-GGIM
9 August: Victoria Geospatial Conference & Excellence Awards
16 August: Spatial Information Day
19 August: AIMS 2024 National Conference
24–30 August: 35th International Geographical Congress
28–30 August: S+SNZ Conference 2024
30 August: NSW Geospatial Excellence Awards
5 September: Queensland Geospatial Conference & Excellence Awards
9–13 September: Advancing Earth Observation Forum
20 September: Tasmanian Geospatial Conference & Excellence Awards
25–27 September: 9th International Colloquium on Scientific and Fundamental Aspects of GNSS
8–10 October: 7th High-level Forum on UN Global Geospatial Information Management
10 October: Intelligent Digital Twins in Natural Resources
11 October: North Queensland Geospatial Conference
22–25 October: ISPRS TC IV 2024 Symposium
23 October: FOSS4G Perth
8 November: Western Australian Geospatial Conference & Excellence Awards
25–29 November: Pacific Islands GIS & Remote Sensing Users Conference
1–8 December: FOSS4G Conference
For more details about these and other events, go to www.spatialsource.com.au/ event-listing
Recognition for outstanding study and work across a range of geospatial disciplines.
Curtin University’s School of Earth and Planetary Sciences recently held its annual awards presentation, at which around 30 worthy students and academics were recognised for their work and personal efforts.
The awards covered many aspects of geological and geospatial sciences; the following is a list of the recipients within the geospatial sphere:
C.R. Kennedy & Co Pty Ltd Surveying Prize for the best first-year Bachelor of Surveying (Honours) student: Blake Botica.
The RM Surveys Award for the best second-year Bachelor of Surveying (Honours) student: James Piesse.
Veris Surveying Student Award for the best third-year Bachelor of Surveying (Honours) student: Jacob Matteo.
C.R. Kennedy & Co Laser Scanning Prize for the best overall student in laser scanning within the integrated surveying area: Joshua Bell.
Geospatial Council of Australia, The D.B. Johnston Award for the best overall doctoral student in the spatial sciences: Dr Roula Zougheibe.
Veris Spatial Information Services Prize for the best student in cartography and mapping: Rughard Steenkamp.
ADAM Technology Pty Ltd Prize: for the best student in digital photogrammetry: Robert Kither.
Fugro Geospatial Award for the mine and engineering surveying student who obtains the highest aggregated marks in the subjects of plane and construction surveying and surveyww computations: Blake Botica.
Fugro Hydrographic Award for the overall best student
undertaking hydrographic surveying: James Mackie.
Fugro Women’s Award for Excellence in the School of Earth & Planetary Sciences for an outstanding graduating female student in spatial sciences: Leidy Luna Cabeza.
Geospatial Council of Australia, The Tony Pivac Prize for the Dux of the Bachelor of Science (Mine and Engineering Surveying) course: Benjamin Dewar.
Woolpert Geospatial Prize for outstanding work in the spatial community: Ainslea Kipling.
The Will Featherstone Memorial Prize for Applied Field Surveying for the best student within the area of applied field surveying: Dominic Abalos.
Hexagon Prize for the student submitting the best final year project in digital image interpretation: Kelzang Dema. Hexagon Digital Award for the student submitting the best innovative project or piece of work in the field of digital realities: Pratchaya Takaew.
Land Surveys Surveying Prize for the student submitting the best final year Bachelor of Surveying (Honours) project or honours dissertation: Andrew Meumann.
The IntelliSpatial Award for the student submitting the best final year project utilising new, high precision geospatial data and capture technologies: Ben Bayley.
Geospatial Council of Australia, The John Forrest Prize for continuous outstanding work within the Bachelor of Surveying (Honours) program: Ella Bougourd.
The Lawry White Medallion awarded to the dux of the Bachelor of Surveying (Honours) program: Dempsey May.
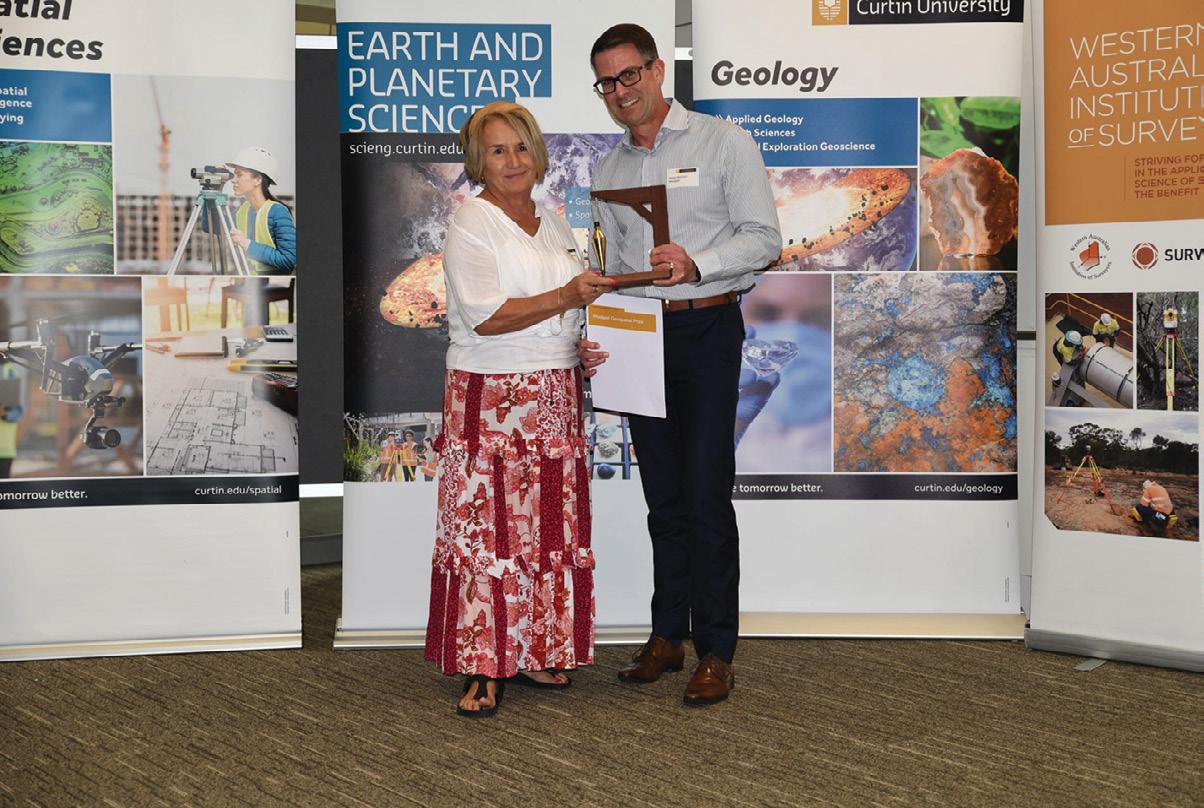
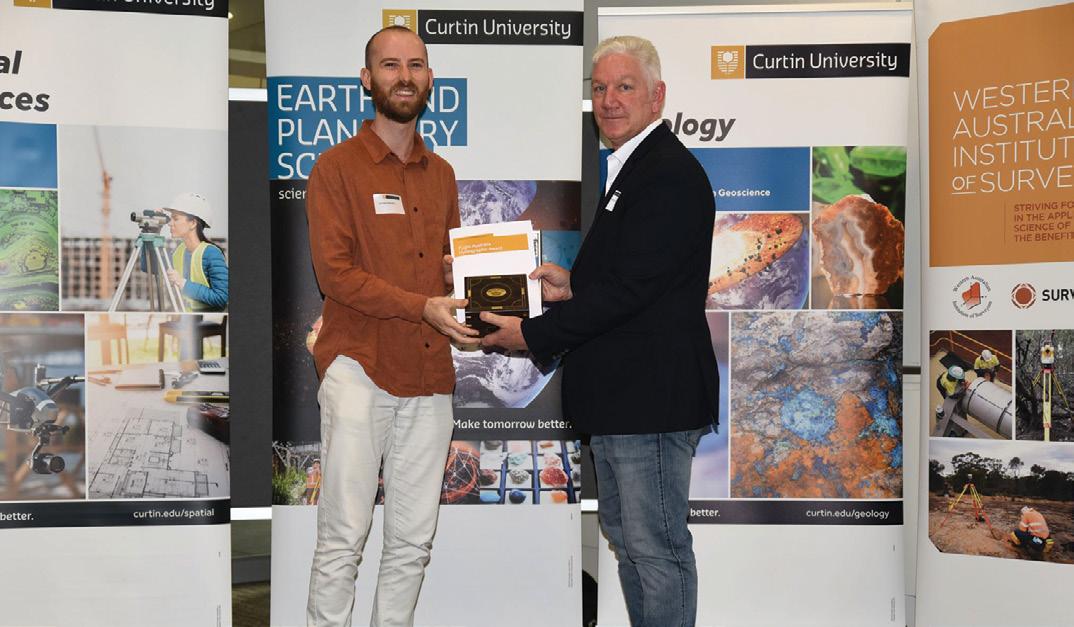
The Western Australian Institution of Surveyors Award for the best student in survey law and project management: Jacob Matteo.
The Western Australian Institution of Surveyors Award for Excellence for the best student in the geospatial intelligence programs: Wai Kit Lau.
The Survey Computations Award for the best overall first year student within the survey computations unit: Blake Botica.
The Ultimate Positioning Group Mine Surveying Award for the student submitting the best mine surveying project: Travis Parkes.
The Ultimate Positioning Group Geospatial Prize for the overall best student performance for calculus units within the Bachelor of Surveying (Honours) program: James Piesse.
The MNG Surveying Scholarship 2024 for the outstanding full-time Bachelor of Surveying (Honours) student with a special interest in digital mapping or cadastral surveying: Rughard Steenkamp.
The MNG Women in Surveying Scholarship 2024 for the outstanding full-time female Bachelor of Surveying (Honours) student with a special interest in an area of digital mapping or cadastral surveying: Greta Lauritsen and Emma Gibson.
The Australian Institute of Mine Surveyors Scholarship 2024 awarded in conjunction with Curtin University to support a student within the Bachelor of Science (Mine and Engineering Surveying) who wishes to pursue a career in mine and engineering surveying: Blake Botica.
MMA Offshore Hydrographic Surveying Scholarship 2024 awarded in conjunction with Curtin University to support a finalyear Bachelor of Surveying (Honours) student who wishes to pursue a career in hydrographic surveying: Merrick Coxall.
Position adds it congratulations to all the recipients. It’s great to see that Australia’s geospatial sector will be in safe and competent hands in the years to come. n

Groundbreaking performance and productivity
• Improve layout productivity up to ten times compared to traditional chalk-line layout.
• Autonomous printing with obstacle avoidance.
• Printed on-slab text helps deliver executions as per plan.
layouts
• Precise printing to complete every project accurately.
• Complex layouts spot-on, laying out intricate arcs and circumferences.
• Raise the bar of predictability, minimizing redos and with great rigour.
One easy solution to do it all
• Simple layout management with cloud-based tools.
• Easily print on most surfaces thanks to HP inks expertise.
• Compact design that fits in a portable case for effortless transport.
Publisher

jnally@intermedia.com.au
National Advertising Manager
amuldrock@intermedia.com.au
Production Manager
is available via subscription. A 12-month subscription (6 issues) is AU$76.00. To subscribe visit spatialsource.com.au/magazine, phone 1800 651 422 or email subscriptions@ intermedia.com.au
Address for mail: 41 Bridge Rd, Glebe NSW 2037. Ph: 02 9660 2113
Position is published six times per year, in February, April, June, August, October and December by The Geospatial Council of Australia. ABN: 22 135 572 815
Position are permitted only with the permission of the publisher. In all cases, reprints must be acknowledged as follows: ‘Reprinted with permission from Magazine’, and must include the
The opinions expressed in this publication are those of the authors and do not necessarily represent those of the publisher.
Official publication of
In June I attended the World Hydrography Day seminar in Wollongong and found it to be absolutely fascinating. The event featured a wide range of very interesting presentations from local and international speakers. I learned about the movement (and dangers) of seafloor dunes in the Torres Strait, how uncrewed semi-autonomous survey vessels are being operated from the other side of the world, why the coming boom in the offshore wind energy sector is great news for Australian hydrography companies, and many more compelling subjects. We’ll be covering a lot of the content from the seminar in our pages over the coming months, but for a start this issue includes two articles that look back at 30 years of hydrographic surveying certification in Australasia. Australia has been a world-leader in this field, so it’s fitting that those involved get the recognition they deserve.

On the topic of conferences, we’re now only nine months away from the Locate25 and FIG Working Week 2025 events, to be held together in Brisbane in April next year. In addition to the 1,000-plus locals who attend Locate, organisers are expecting perhaps twice as many to come from around the world for the FIG event. It’s going to be a great opportunity for Australia to showcase its talents, expertise and accomplishments in front of a global audience. Keep an eye out on SpatialSource.com.au for upcoming announcements of calls for papers, exhibition and sponsorship options, and other details.
At this year’s Locate, the Open Geospatial Consortium (OGC) announced the reestablishment of the OGC regional Australia/New Zealand Forum. As outlined by Chris Body in his article in this issue, the aim of the Forum is to “bring the local geospatial community together to understand, discuss and collaborate on the common drivers of various geospatial programs”. It’s a very welcome development, and all those interested in this field should consider becoming involved.
Jonathan Nally Editor
We take our Corporate and Social Responsibilities seriously and is committed to reducing its impact on the environment. We continuously strive to improve our environmental performance and to initiate additional CSR based projects and activities. As part of our company policy we ensure that the products and services used in the manufacture of this magazine are sourced from environmentally responsible suppliers. This magazine has been printed on paper produced from sustainably sourced wood and pulp fibre and is accredited under PEFC chain of custody.
PEFC certified wood and paper products come from environmentally appropriate, socially beneficial and economically viable management of forests.
Space and spatial — The geospatial intersection of these two sectors
Data deluge — Data analysis, AI, machine learning, augmented reality Technology — Surveying and mapping devices, software and field services
Advertising booking date: 5 September 2024
Advertising material date: 10 September 2024
Publication date: 2 October 2024
For article proposals, contact the Editor: jnally@intermedia.com.au For advertising, contact the Advertising Manager: amuldrock@intermedia.com.au
cultures and to their elders, past, present and emerging.
New Curtin University research could change how space missions are conducted and lead to improvements in industries as diverse as environmental management, agriculture, disaster management and infrastructure inspection.
With funding from the Australian Research Council, the GNSS Satellite Positioning and Navigation Group (GNSSSPAN) team from Curtin’s School of Earth and Planetary Sciences has developed a breakthrough in the operation and monitoring of CubeSats.
The project saw new algorithms developed to use links between satellites to precisely determine a CubeSat’s position, whether flying individually or in formation. The work hinged on developing novel kinematic methods that utilise the new generation of multifrequency and multi-constellation carrier-phase measurements of the GNSS to provide reliable, real-time, precise orbit determination.
Project lead Professor Ahmed ElMowafy said the new approach overcomes
Seven new members have been appointed to the ACT Place Names Advisory Committee and six existing members have been reappointed. ACT Surveyor-General, Greg Ledwidge, said the committee, which helps to name Canberra’s suburbs and public places, represents the ACT’s diverse and inclusive community.
“The new members and reappointed members are from a broad mix of backgrounds… Each member demonstrates a strong understanding of Canberra and our shared history,” he said. “The committee makes a positive impact to our community to help shape a modern and inclusive Canberra by commemorating Australians and Indigenous culture through the naming of suburbs (divisions) and public places, including roads, parks and geographical features.”
The appointments for the next term of the committee include a Ngunnawal Elder and two First Nations people. “Committee members that are Traditional Custodians are vital when considering future names of places as they can share their rich knowledge and connection to Country,” said Ledwidge.
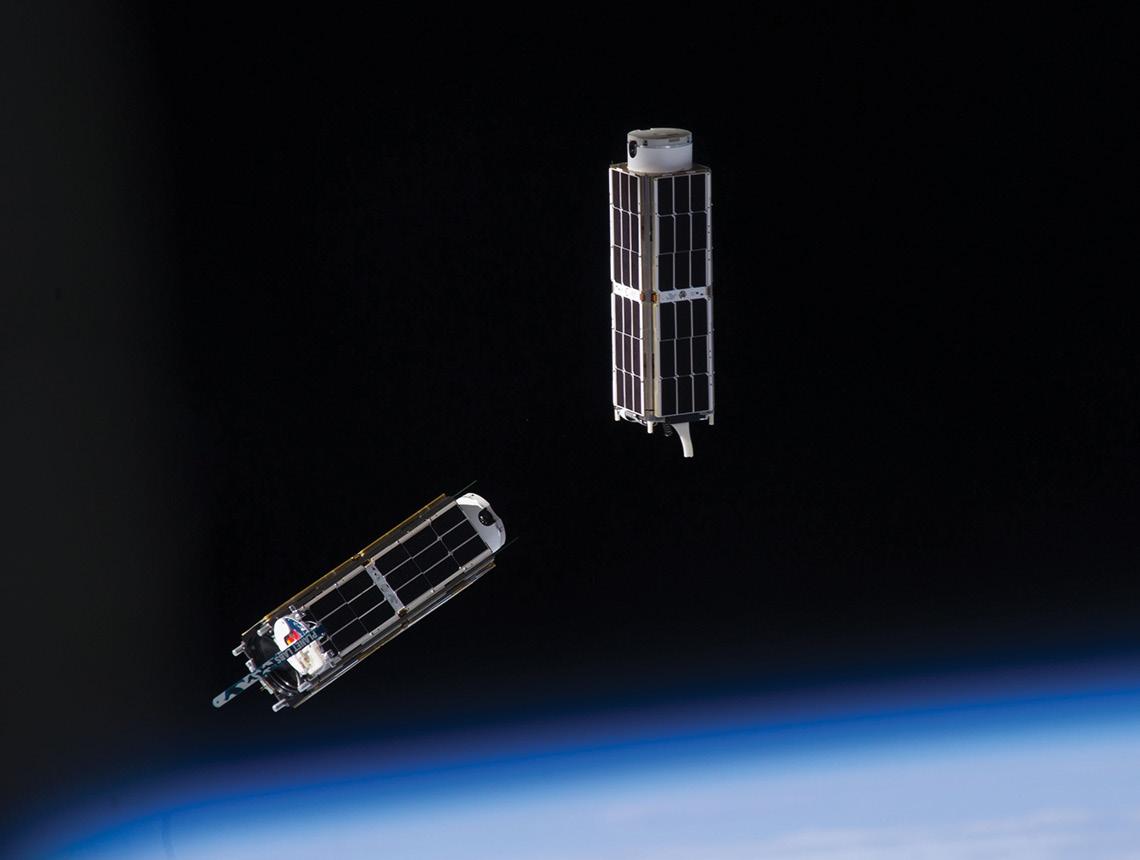
many of the constraints faced when using CubeSats, such as their small size and the aerodynamic forces affecting their orbits.
“These new methods mean CubeSats can now operate more independently, without the need for constant human control,” Professor El-Mowafy said. “When human control is needed, the CubeSats are simpler to manage and can be guided and controlled in real time — making them far more efficient to use in space missions.
“We can now operate them and be precise down to a few centimetres which
is a huge improvement on the previous accuracy level of several metres.”
Professor El-Mowafy said these improvements could help in efforts to manage climate change while also making industry more profitable.
“CubeSats can offer high-definition monitoring of bridges, pipelines and powerlines to improve asset management and prevent accidents, while also supporting responses to incidents and natural disasters with targeted imagery of affected areas,” he said.

The 13 new and reappointed members will serve for a three-year term, from 1 July 2024 to 30 June 2027.
The new appointees are:
• Ms Auriel Bloomfield
• Mr Cornelis Boekel
• Ms Rebekah Davies
• Mr James Glenday
• Ms Paula McGrady
• Ms Philippa Moss
• Ms Violet Sheridan
The reappointed Committee existing members are:
• Mr Greg Ledwidge (Surveyor-General of the ACT)
©stock.adobe.com/au/ink
• Ms Rebecca Sorensen
• Ms Roslyn Dundas
• Mr Mainul Haque, OAM
• Mr Paul Hutchison
• Dr Anne McGrath Ledwidge thanked the committee members who had served in the last term for their dedication, expertise and advice.
“In particular, I’d like to acknowledge Dr Marilyn Truscott and Mr Allen Mawer for their significant contributions to place naming over the past ten years,” he said. “I look forward to working with the new ACT Place Names Advisory Committee to further help shape a modern and inclusive Canberra.”

The Australian Association for Uncrewed Systems (AAUS) has released the results of its latest drone industry survey, and it shows that the surveying sector is one of the largest uses of drones across the country.
The annual survey was open to everyone in the Australian remotely piloted aircraft systems (RPAS) sector, with the 152 respondents encompassing ReOC holders, excluded category operators, manufacturers and service providers.
The survey found that the Australian drone industry is diverse, ranging from sole traders to multinational organisations, but with the largest group of respondents coming from organisations that have 10 or fewer employees.
Drones are currently most commonly used for environment and land management, surveying, and building and construction, although agriculture and farming, emergency services and research use is expected to increase over the next few years.
Compared to the 2022 AAUS survey, there has been an increased usage of RPAS in surveying and a decrease in the use of fixed-wing RPA operations.
Most organisations use multi-rotor drones in the very small and small weight categories under standard operating conditions, but some operators are looking to achieve BVLOS operations, including at night and for close proximity operations, within the next 12 months.
The survey showed that users consider regulatory factors to be the biggest impediment to the drone industry today, with airspace integration issues coming in at number two, followed by the perceived risk of local government regulations negatively affecting the industry.
CASA resourcing is seen as a major problem, with 75% of respondents reporting that their business has been negatively affected by excessive approval processing times.
Geoscience Australia has announced the extension of its National Positioning Infrastructure Capability (NPIC) agreements with the Queensland Department of Transport and Main Roads, RTKNetwest and Aptella. The agreements provide for continued open access to 122 continuously operating reference stations (CORS) across Australia.
The CORS provide corrections that are applied to GNSS signals in order to boost the accuracy and reliability positioning services, and are widely used by the geospatial sector, particularly for surveying.
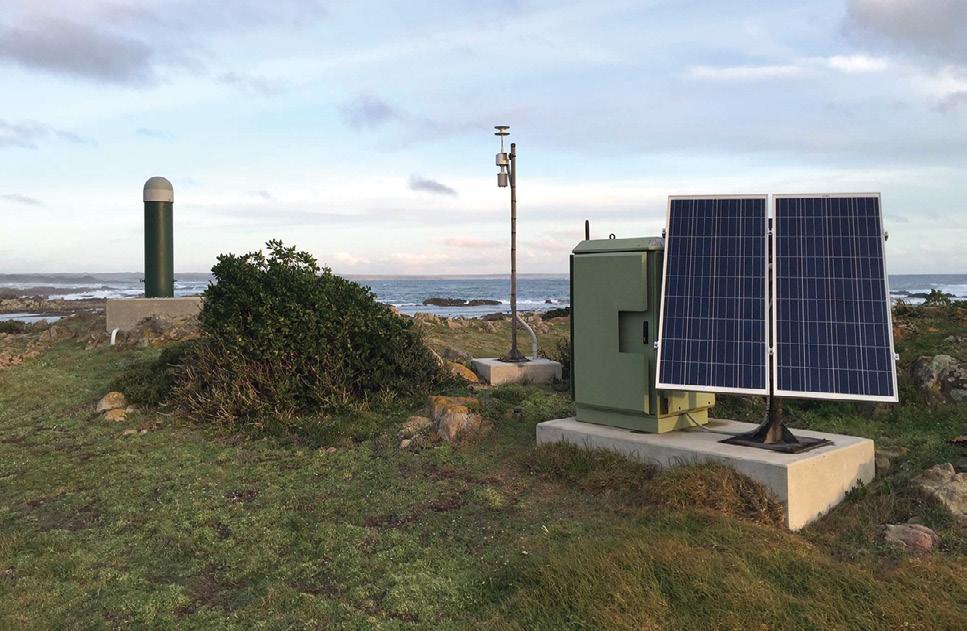
national positioning infrastructure, benefiting industry professionals and wider community”.
In its June industry update, Geoscience Australia says the extended agreements “demonstrate our commitment to maintaining and enhancing
“By ensuring uninterrupted access to these CORS, we aim to foster innovation, improve operational efficiency, and support the growing demands of the user community across Australia.”
Initial datasets from a $4.5 million aerial LiDAR survey of Western Australia’s south coast and Gascoyne regions, is now available to coastal managers.
As part of the Coast Capture WA program, the Department of Transport (DoT) contracted Fugro to map the coast from Esperance to Barrow Island, targeting erosion hotspots. Those hotspots were identified in a report published in 2019 that listed 55 locations where coastal erosion is expected to be a risk to coastal values and assets, as well as 31 ‘watch list’ locations for future investigation.
The new high-resolution data was produced by a LiDAR-equipped aircraft, which commenced work in March to capture topographic and bathymetric data of the foreshore and the seabed out to approximately 20 metres depth.
The locations covered were Bremer Bay, Albany, Peaceful Bay, Augusta and Gnarabup South on the state’s south coast, as well as Coral Bay, Carnarvon, Monkey Mia and Denham in the Gascoyne region.
This and other bathymetry data is available on DoT's WA Bathymetry Portal and can be used by coastal managers to design measures to combat erosion.
The mapping project is part of a $33.5 million, five-year plan to better manage and protect Western Australia's coastline. The $4.5 contract work to date has been funded through the state government’s CoastWA initiative ($3 million) and the Commonwealth ($1.5 million).
“This important work will provide a better understanding of the coastal hazards that have been identified as needing priority and assist the local coastal managers as they respond to the threat,” said WA’s Minister Assisting the Minister of Transport, David Michael.
“The project will provide some key missing pieces to the existing bank of topographic and bathymetric data currently available for the State's coastline and further build the dataset to ensure we implement the most appropriate response measures to erosion,” the Minister added.

"Significant additional funding has been allocated to manage the impacts of coastal erosion and protect WA's coastline through CoastWA and data collection is a key element of the program along with boosted funding for planning and projects, additional technical expertise, community engagement and monitoring of hotspots.”

When Cyclone Gabrielle hit the North Island of New Zealand in February 2023, it resulted in 11 deaths and a total damage bill of at least NZ$13.5 billion, the latter figure making it the costliest Southern Hemisphere cyclone in recorded history.
One of the major risks to life and property was the potential for rainfallinduced landslides. To assess the extent of the risk, an open-source software tool called RiskScape was pressed into service.
RiskScape can be used to gauge the potential for damage and loss from
hazards such as volcanic eruptions, earthquakes, landslides, tsunamis and floods. The software is used across the globe by land-use planners, asset managers, emergency managers and insurers.
With the cyclone approaching in February 2023, New Zealand’s Ministry of Business, Innovation and Employment (MBIE) and the Earthquake Commission EQC Toka Tū Ake, funded a trial development of a risk modelling dashboard to assist response efforts.
Geoscience Australia has appointed Maree Wilson as the new Chief of its Place and Communities Division. Wilson had been the Branch Head of Geoscience Australia’s (GA) Digital Earth Branch and its predecessors since 2020, and has more than 20 years’ experience in the spatial industry, across the public, defence and private sectors.
“Maree brings with her a passion for using spatial data to solve problems and is a recognised leader in her field,” said GA’s CEO, Dr James Johnson. “Her broad networks across the Australian and international spatial, marine, Antarctic and emergency management communities are a strong foundation for her new role as Chief of the Place and Communities Division.”
The Place and Communities Division encompasses a variety of functions, including marine and Antarctic geoscience, spatial and location science and data, and community safety services. The Division is central to Geoscience Australia’s role as the
The team first created a landslide impact model, which enabled estimates to be made of the impact on properties, highways and the rail network. It then produced and issued twice-daily landslide forecasts.
“RiskScape proved accurate, with initial residential claims similar to impact forecast spatial distribution and numbers,” said Dr Nick Horspool, Senior Risk Scientist with GNS Science Te Pū Ao. “RiskScape is ready to provide evidence-based advice and modelling to help New Zealand avoid, mitigate or adapt to these hazards.”

trusted source of information on Australia’s Earth sciences.
Wilson says the Division has a pivotal role to play in driving innovation to shape a location-enabled future for Australia, by facilitating informed decisionmaking by governments, industries and communities alike.
“In today’s dynamic landscape, access to timely and trusted data is critical. From assisting communities in mitigating bushfire risks to informing marine zone planning based on ecological, economic, and social considerations, our Division’s insights enable stakeholders to make smarter placebased decisions,” Ms Wilson said.

Nicholas Cumins has taken the helm at Bentley Systems as its new CEO, having previously served as the company’s COO since January 2022. He replaces Greg Bentley, the eldest of the five brothers who founded Bentley Systems, and becomes the first non-Bentley family member to lead the company.
The 40-year-old business began life as a computer-aided design software firm when it developed the MicroStation engineering application platform. It has since grown to become one of the world’s leading providers of infrastructure engineering software, and during that time has completed more than 120 company acquisitions.
“Infrastructure is at a watershed moment. Despite the massive capital investment in infrastructure projects and jobs post pandemic, so much more remains to be done to make infrastructure more resilient,” said Cumins.
“Our ability to bridge that gap will literally determine the quality of life for generations to come. Fortunately, a paradigm shift in software is reshaping the landscape. AIpowered digital twin solutions are unlocking the value of data across the infrastructure lifecycle.”
The British Antarctic Survey (BAS) has released a new map viewer that brings together all of the Antarctic Digital Database datasets, plus other useful information, and displays them together in an open-access interactive website.
The BAS’ Mapping and Geographic Information Centre (MAGIC) is responsible for keeping the maps and data up to date, with the aim of aiding safe travel and operations on the continent. MAGIC compiles, manages and distributes data that makes up the Antarctic Digital Database, which provides a compilation of topographic data including coastline and contours.
The release of the open-access digital viewer coincides with the latest release of
data updates, which record physical changes in Antarctica. New extents for some ice shelves have been drawn, where icebergs have calved away from the continent or where other ice shelves have grown by flowing away from the land.
The coastline was also updated for the South Orkney Islands, the northernmost group of islands in Antarctica. Ice has been lost in these islands meaning that the glaciers are smaller than previously shown, and new islands have also been identified where glaciers have retreated to reveal islands underneath.
The location of certain offshore rocks and islands has also been improved due to improved imagery, enabling the BAS to locate small islands that previously might have been shown in the wrong location or not at all.

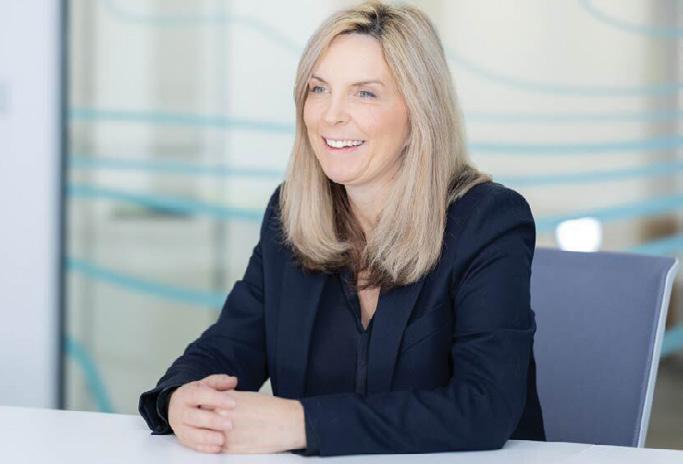
The UK Hydrographic Office (UKHO) has announced the appointment of Vanessa Blake to the position of interim Chief Executive and Accounting Officer.
Blake joined the UKHO in July 2023 Chief Customer Officer and will take up the role of Chief Executive on an interim basis, while a permanent replacement is
sought. She succeeds Peter Sparkes, who has left after nearly four years in the role to become the Chief Executive of the Royal National Lifeboat Institution.
“I am delighted to be taking on the role as Interim Chief Executive at such an important time in the history of the UK Hydrographic Office,” said Blake.
“Significant progress has been made at the UKHO in our digital transformation and adapting to the evolving needs of our customers, while upholding our vital mission of serving defence and supporting safety of life at sea.”
“I look forward to building on these achievements and working with our talented and dedicated people, as well as our distributors and partners around the globe.”
Researchers from New Zealand’s National Institute of Water and Atmospheric Research (NIWA) have mapped the entirety of the country’s famous Lake Wānaka using bathymetry. The work was done to better understand the lake’s underwater structure and potential for earthquakes and tsunamis, after an active fault was discovered there three years ago.
“Lake Wānaka is one of the most photographed locations in the country but until now its depths have remained a mystery. We discovered some really interesting features, including complex channel systems from the rivers that feed into it,” said NIWA marine geology technician, Sam Davidson. “We also saw dramatic steep slopes that plummet to the deepest parts of the lake.”
Using a multibeam echosounder mounted on a small dive vessel, the researchers spent several weeks building up a full 3D model of the entire area.

NIWA is developing computer models of the lake and its catchment, but until now has had to rely on charts created in the 1970s.
“This new depth data that we've captured is more accurate and detailed. This is especially important in shallow parts of the lake like Roys Bay and Stevensons Inlet, but also where rivers flow into the lake, because these areas have seen some of the biggest impacts and changes since the 1970s,” said NIWA hydrodynamics scientist, Dr David Plew.
Challenger 150, which coordinates a global effort to map life in the deep-sea, has signed a memorandum of understanding with The Nippon Foundation-GEBCO Seabed 2030 Project, an initiative dedicated to inspiring and coordinating the global effort to map the entire ocean floor by the end of the decade.
A collaborative project between The Nippon Foundation and the General Bathymetric Chart of the Oceans (GEBCO), Seabed 2030 is officially recognised as a flagship program of the UN Decade of Ocean Science for Sustainable Development (2021–30), with its mission actively supporting UN Sustainable Development Goal 14: to conserve and sustainably use the ocean, seas and marine resources for sustainable development.
Challenger 150 is a global scientific cooperative under the Deep Ocean Stewardship Initiative (DOSI), developed to respond to the needs of the Ocean Decade, building capacity for global deep-sea research, expanding biological observations and the understanding of deep-sea ecosystems, and supporting their sustainable management.
“From mapping unexplored seamounts in the South Atlantic to venturing under
NIWA’s work will also be used to study hazards from future seismic activity.
Lake Wānaka is at risk of experiencing a tsunami-like event due to its location on an active fault and its specific geological features, such as those steep slopes that could create a landslide and pose a risk to lakefront communities.
“Now we have a clear picture of the lake’s structure, we can better inform hazard modellers and councils to better prepare for these events,” said Davidson.

the Arctic ice to study hydrothermal vents, Challenger 150 is rapidly expanding our observational frontiers,” said Professor Kerry Howell, Deep-Sea Ecologist at Plymouth Marine Laboratory (PML) and Co-lead of the Challenger 150 program.
“By combining the high-resolution bathymetric data compiled by initiatives like Seabed 2030 with our own, we can produce unprecedented ecosystem maps and predictive habitat models,” added Dr Ana Hilario, Deep-Sea Ecologist at
University of Aveiro and fellow Co-lead of the Challenger 150 program.
The pairing of the two initiatives evokes the spirit of the historic HMS Challenger mission, which undertook a groundbreaking research voyage between 1872 and 1876 in an attempt to map the ocean floor and the life inhabiting it. The pioneering expedition (after which the space shuttle Challenger and Challenger 150 were both named) mapped the shape of the ocean floor using a lead line lowered from the vessel to the seabed.
Engineering-level accuracy and more frequent data collection is enabling better analysis and faster decision-making.
In an era where technology is rapidly transforming industries, Kurloo is at the forefront of revolutionising mining and civil infrastructure monitoring. A Kurloo trial in Queensland serves as a compelling case study illustrating the significant impact Kurloo can have on managing civil and infrastructure construction projects with higher safety and more efficiency. And in doing so, limiting the risk of expensive time and project cost overruns.
Traditionally, monitoring structural integrity has been a labourintensive process, often requiring surveyors to perform manual checks at regular intervals. This method, while effective, is timeconsuming and takes surveyors away from other tasks. Enter Kurloo, a commercial autonomous monitoring device designed to streamline this process. By automating the collection and analysis of positioning data, Kurloo not only saves time but also enhances the accuracy and reliability of the information collected.
In 2023, the Kurloo was trialled for six months on an existing project, which involved installing Kurloo devices to monitor the displacement of railway embankments and settling plates along a new road alignment.
Kurloo’s installation process was straightforward and efficient. Six monitoring devices and one reference station were set up, covering distances up to 1.2 km from the central reference point. The system’s design ensured that data collection could continue uninterrupted, even during adverse weather conditions, with data stored locally and transmitted via LTE-M mobile or Wi-Fi.
One of the standout benefits of Kurloo’s technology is the substantial time savings it offers. Traditional survey methods would require surveyors to spend approximately one hour per day collecting and publishing monitoring readings. In contrast, once the Kurloo devices were installed and configured, data was automatically collected and made available on the Kurloo Nest dashboard the next business day. This allowed surveyors to focus on more critical on-site tasks, thereby improving overall project efficiency.

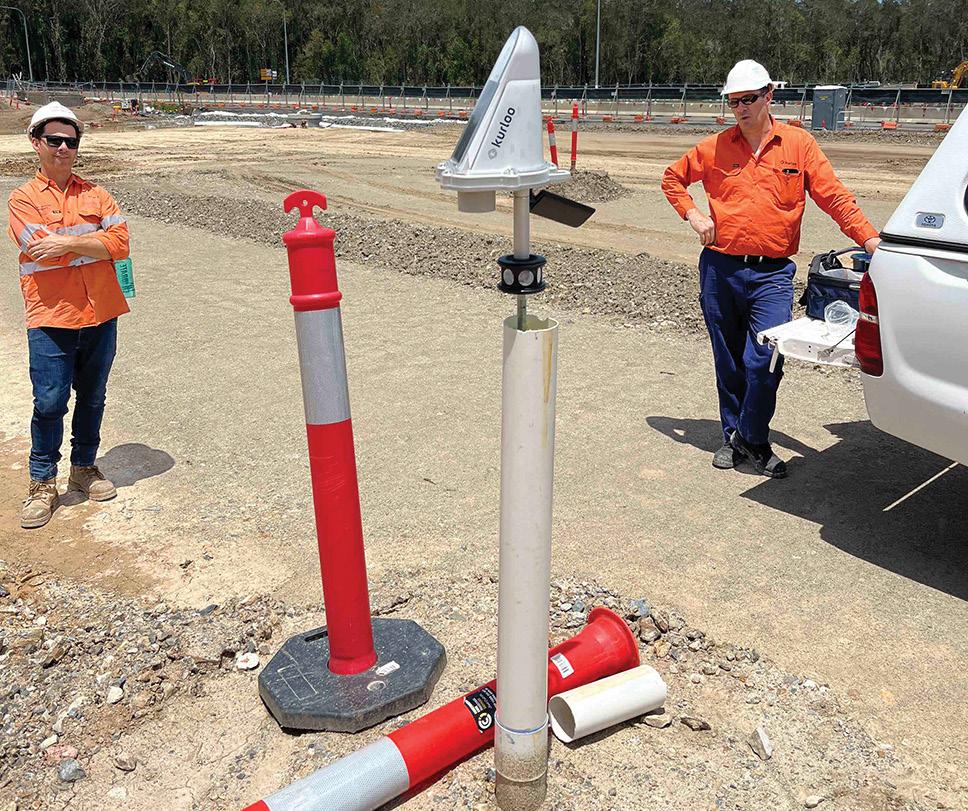
The accuracy of Kurloo’s measurements was another highlight of the trial. The system consistently provided daily measurements with a relative horizontal and vertical accuracy within 5 mm at 95% confidence, matching the precision of traditional techniques. This engineering level of consistent accuracy, combined with more frequent data collection, allows for better analysis and faster decisionmaking, significantly boosting the productivity of the survey teams, contractors and consultants alike and helping to reduce risk.
Feedback from industry professionals involved in the project has been overwhelmingly positive. They appreciated the ease of use, reliability and the significant reduction in manual labour required for monitoring tasks. There is demonstrated potential for a wider application across various civil construction projects.
Looking ahead, the future of autonomous monitoring looks promising with Kurloo. As the technology continues to evolve, we can expect even greater integration with other construction tools and systems. This not only enhances monitoring capabilities but also contributes to more sustainable and efficient construction practices. By providing near real-time, accurate data, Kurloo enables proactive maintenance and early detection of potential issues, ensuring the longevity and safety of infrastructure projects.
In conclusion, Kurloo is demonstrating a quality of outcome not often experienced with remote monitoring, by virtue of its affordability, accuracy and autonomous operation. Kurloo’s highbuild, Australian-made quality is guaranteed to operate continuously for up to five years in the harshest of Australian environments. The Kurloo trial is just one example of how IoT positioning can revolutionise project management, offering significant benefits in terms of time savings, accuracy and overall efficiency. As the industry continues to embrace digital transformation, Kurloo stands out as a key player in driving these advancements forward.
Industry stakeholders should take note of Kurloo’s success and consider the broader adoption of such technologies to stay ahead in an increasingly competitive and technology-driven landscape.
If you’d like to know more about Kurloo, please visit https://www.kurloo.io/contact/. n
HP SitePrint improves accuracy and speed when doing site layouts, and eliminates the chance of manual errors.

Aquiet revolution is taking place in the building construction sector, with new technology offering the opportunity for both construction and surveying companies to boost efficiency and productivity.
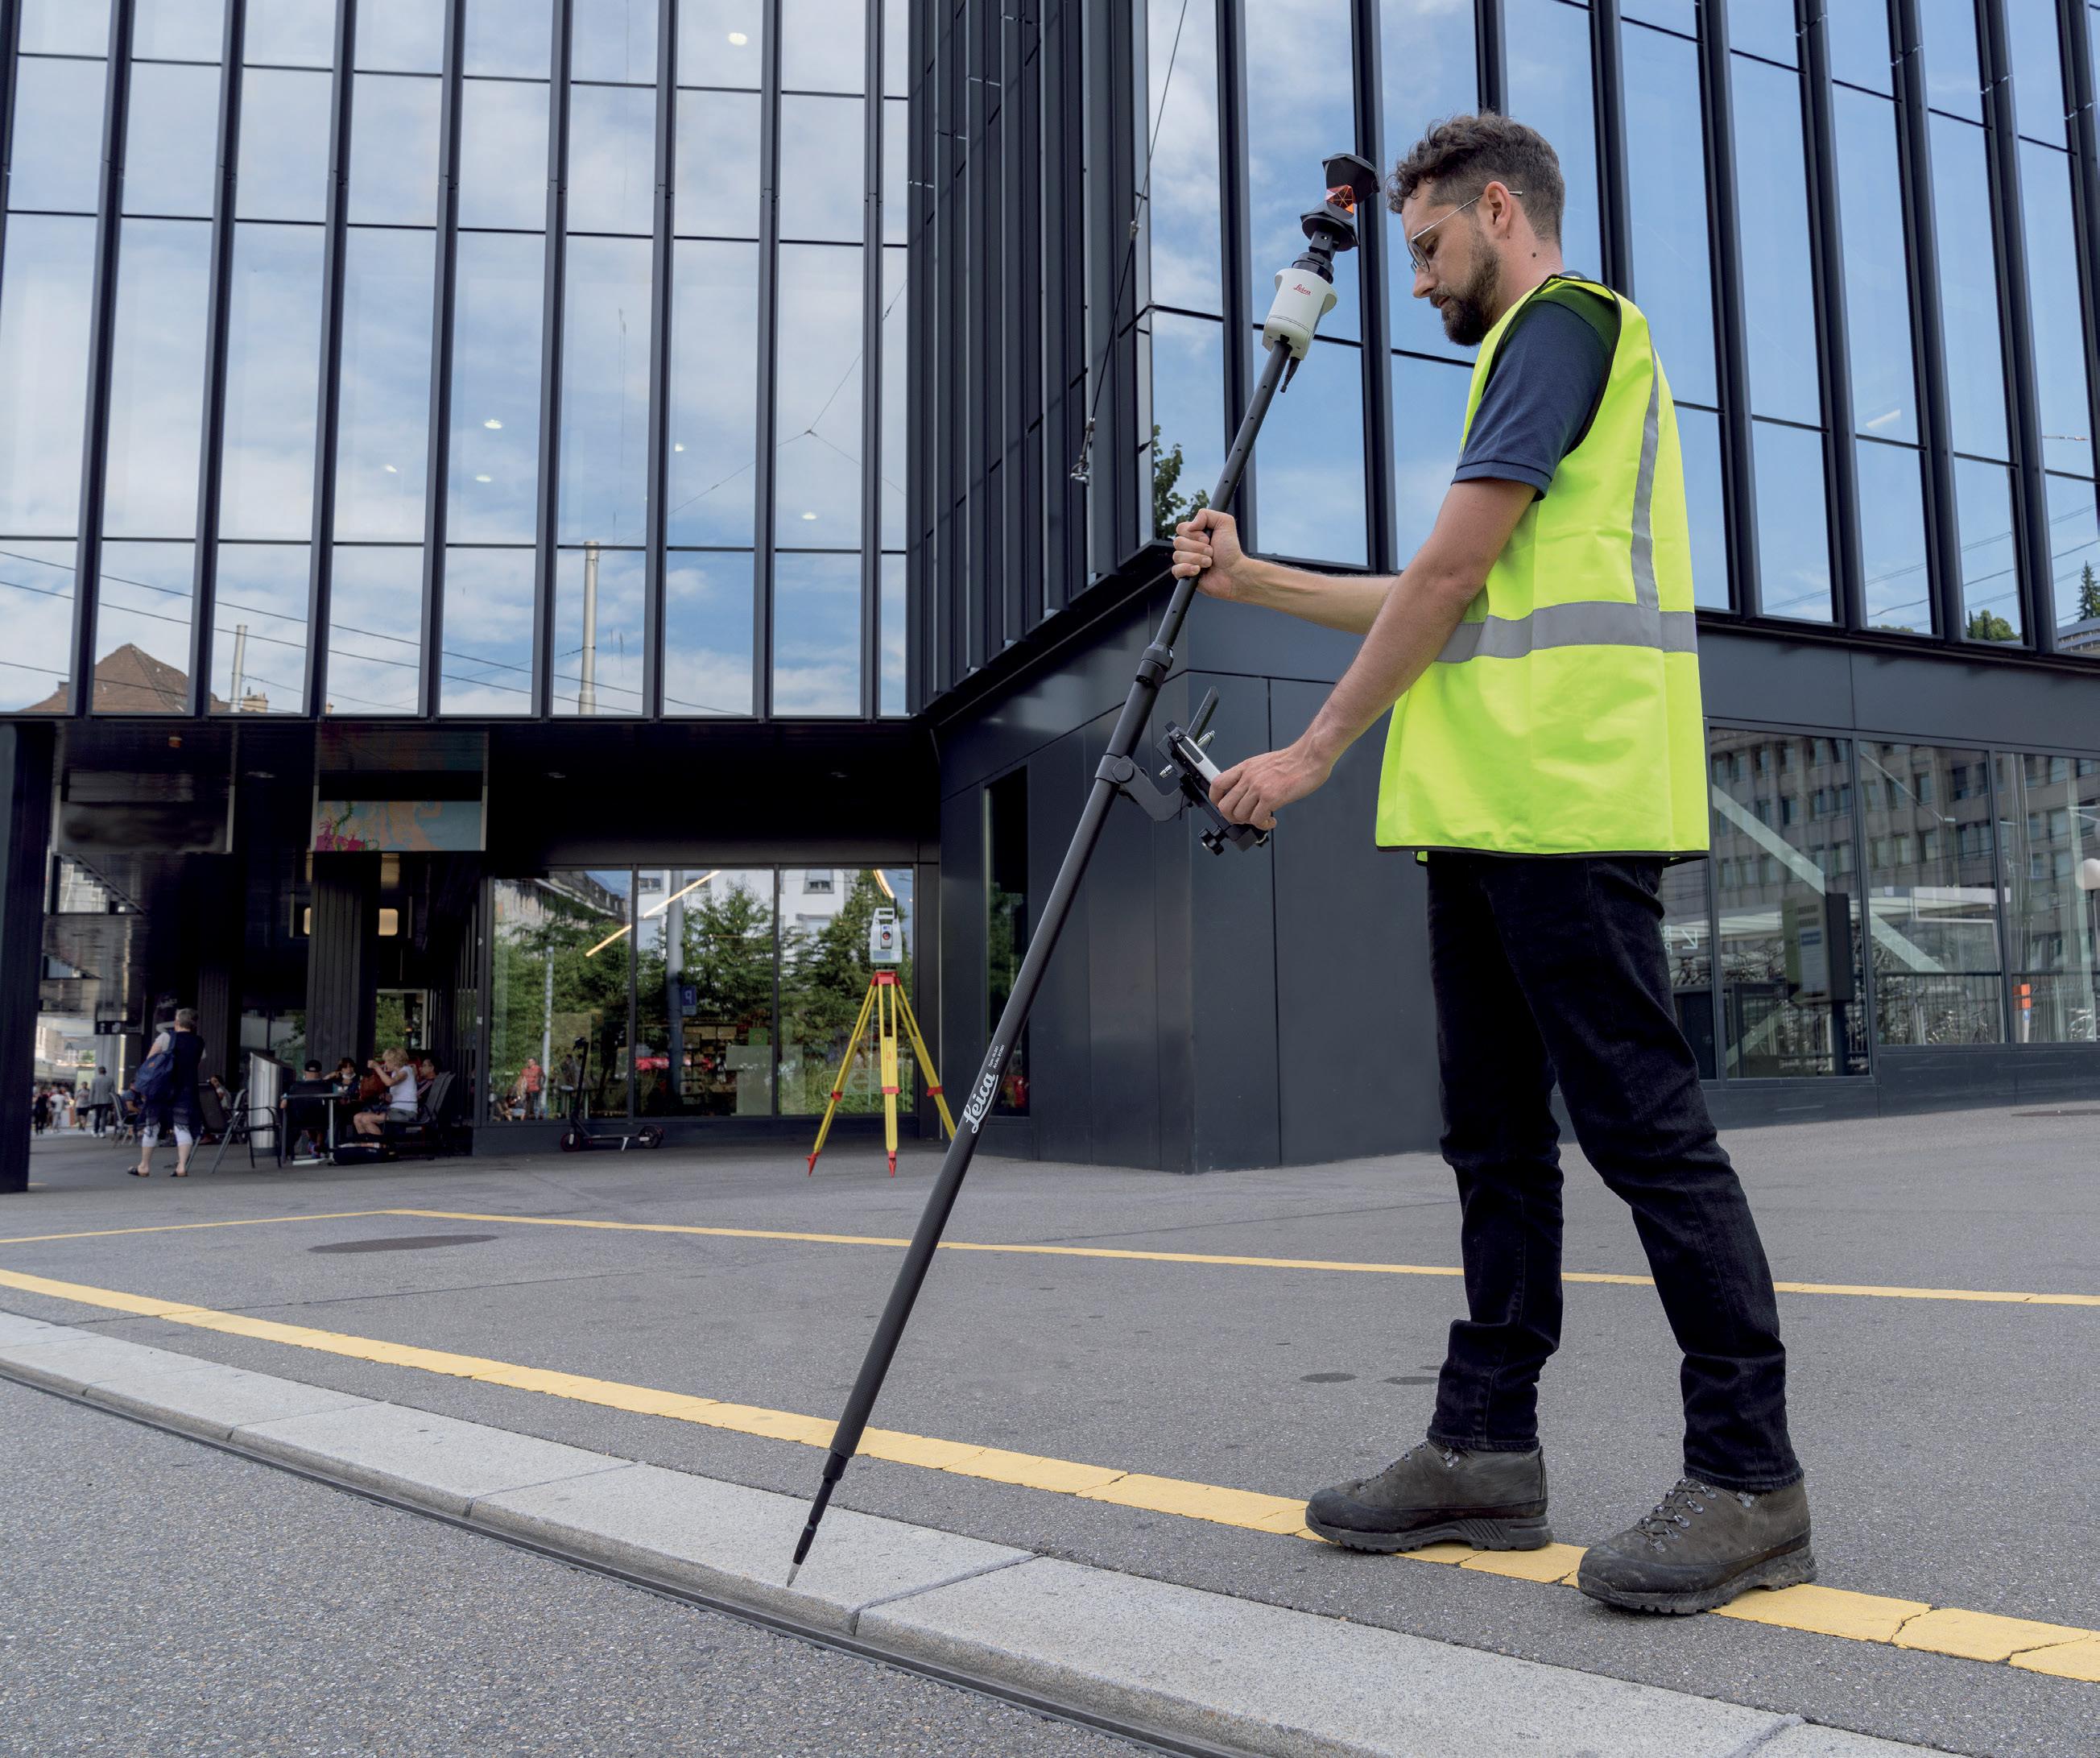
A case in point is the new SitePrint autonomous robot from HP, available in Australia through C.R. Kennedy, which offers a quick, accurate and easy way to accomplish construction site layouts. The days will soon be gone when one or more staff members have to set out layouts manually.
The HP SitePrint’s streamlined workflow and intuitive interface enables construction teams to quickly and accurately print precise
“With HP SitePrint you can help eliminate mistakes and move weeks ahead in your schedule.”
Gerardo Rivera, L5 Drywall
building layouts, which not only saves time but also reduces the chances of errors and rework, resulting in smoother project execution. In fact, a single operator can efficiently complete an entire building layout. And its ability to navigate complex environments and print text directly onto the site surface enhances project efficiency and cost management and minimises delays.
HP SitePrint also offers cost advantages, as you know what you’re getting when you set it to work. Automation of the layout process enables construction companies to gain greater control over their budgeting and cost management, reduce the need for manual intervention and freeing up
time for professionals to tackle other, more valuable tasks.
The HP SitePrint’s userfriendly interface and intuitive controls simplify the adoption of digital tools and processes and enable construction teams to quickly integrate the robot into their workflow. In the words of C.R. Kennedy’s Chief Marketing Officer, Douglas Kennedy, “This product will allow surveyors to no long just be involved with site set out, they will now be able to do site layout.”
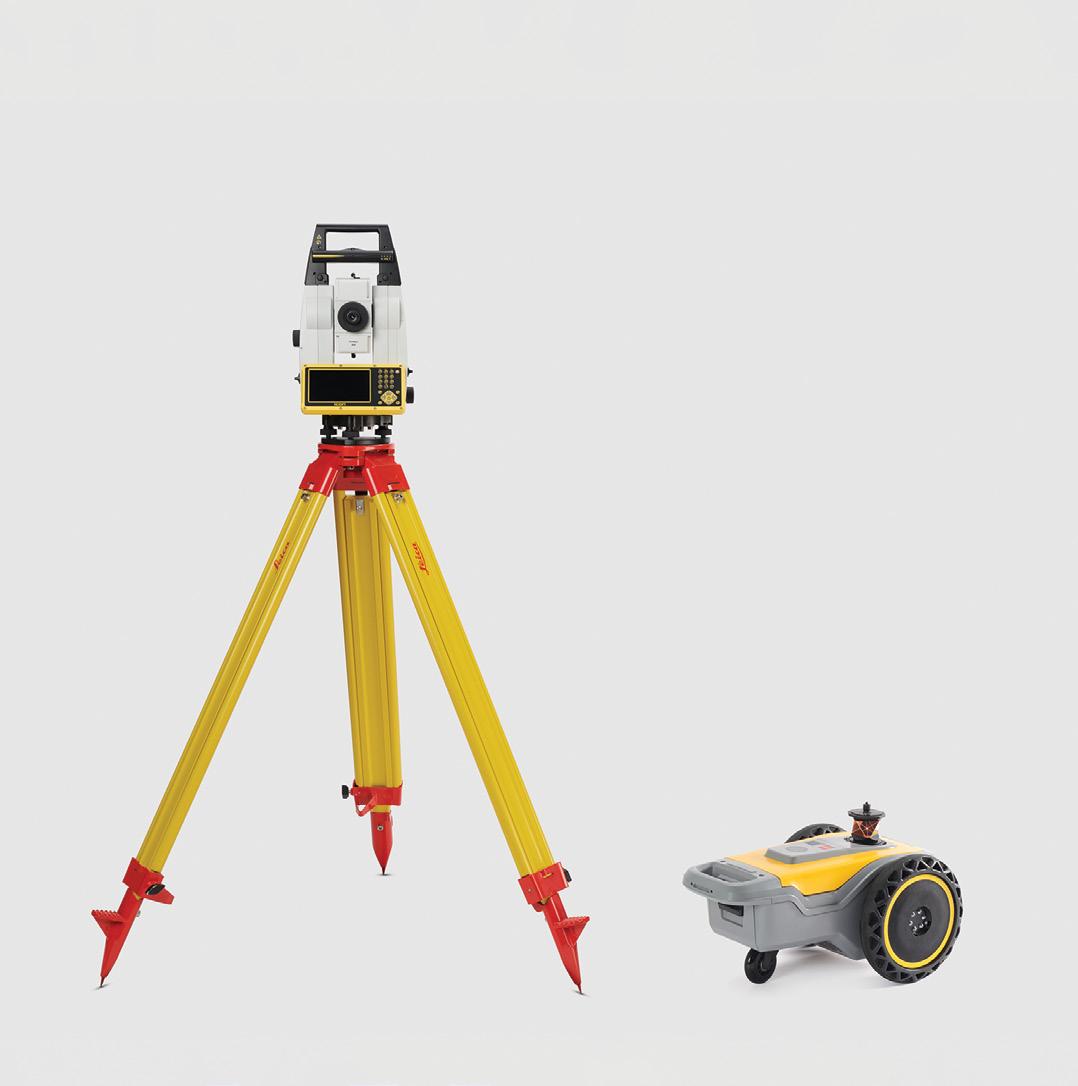
The HP SitePrint is fully integrated into the users’ workflow, using the same software used for other robotic total station tasks on the job site. HP has partnered with the main players of the positioning industry to ensure the HP SitePrint is compatible with their products. For instance, HP and Leica Geosystems, part of Hexagon, have collaborated to integrate HP SitePrint with the Leica TS16, Leica iCON iCR80 and Leica iCON70 robotic total stations. These are extremely high-quality total stations, each with the ability to repeatedly position the HP SitePrint robot comfortably within the 3 mm level of accuracy specified. Leica instruments are famous for their ability to precisely track and lock onto a prism, which is mounted on top of the SitePrint, so the risk of errors is mitigated and rework costs are kept to an absolute minimum.
The HP SitePrint is smart when it comes to safety, too. It incorporates two sets of
that is hardware-activated and prevents accidental falls by continuously monitoring its environment to detect any potential obstacles, cliffs or depressions. And with a printhead positioned 19 mm above the surface, it avoids bumps and scrapes and enables printing in areas that don’t require a broom-swept floor.
Traditionally, “Surveyors often leave marks (grids) on site which other trades use to layout out their work,” said Alex Richardson, Building Construction Consultant with C.R. Kennedy. “The trades often use tape measures and chalk lines, but these are now under scrutiny as chalk lines can disturb potential silica dust on many construction sites… not to mention other health problems such as ongoing knee and back problems.”
The process of using HP SitePrint is easy:
• Prepare your 2D CAD drawing.
• Clean and prepare the site surface.
• Set up your robotic total station and shoot the control points.
• Lock the robotic total station to the HP SitePrint robot’s tracking prism.
• Connect the robotic total station wirelessly to the HP SitePrint robot through the user interface (tablet, phone, laptop, etc).
• Open the CAD file on the control panel, select the print area and submit the job.


• Power: Exchangeable Lithium-Ion battery; runtime of 4 hours per battery
• Surfaces: Porous (polished and rough concrete, tarmac, wood); non-porous (terrazzo, vinyl and epoxy)
• Maximum slope: 2.5°
• Dimensions: 50.5 x 31.7 x 26.1 cm
• Weight: 8.9kg
• Printing speed: Up to 1,260 m/h
• Navigation speed: 1,620 m/h
• Min. print width: 2 mm
• Max. print width: 51 mm
• Printable elements: Lines, text, dashed-lines, curved lines, circumferences.
• Printhead floor clearance: 19 mm
• Connectivity: Bluetooth, 4G, WiFi
• Safety: 4 fall-off sensors; 3 collision-avoidance LiDAR sensors
• Choose between different inks for different types of layouts.
• Set the HP SitePrint to work.
HP claims that layout productivity can be boosted by up to ten times compared to traditional chalk-line layout, with printed on-slab text helping to deliver more accurate executions as per the plan. Complex layouts such as intricate arcs and circumferences are easy, and SitePrint can print on most common surfaces thanks to HP’s expertise with inks.
“On our first day with the device we did a competition between SitePrint and a manual layout team of four people. The HP solution laid out seven or eight rooms in the time it took the manual team to do two or three!” said Gerardo Rivera, COO of L5 Drywall. “Now we can free up resources to start laying out track much earlier, helping move the project forward faster.”
“The accuracy also impressed us,” Rivera added. “Make a couple of errors during the [traditional] layout phase and you end up ripping out walls later in the project — eating away at your margin. With HP SitePrint you can help eliminate mistakes and move weeks ahead in your schedule.”
HP SitePrint promises to transform the construction industry and boost the role of construction-sector surveyors. By enhancing efficiency, maximising resources, accelerating digital adoption and ensuring cost predictability, this innovative tool enables construction companies and surveyors to unlock the full potential of technology in their operations.
For more information about the HP SitePrint, visit C.R. Kennedy at survey.crkennedy.com.au. n
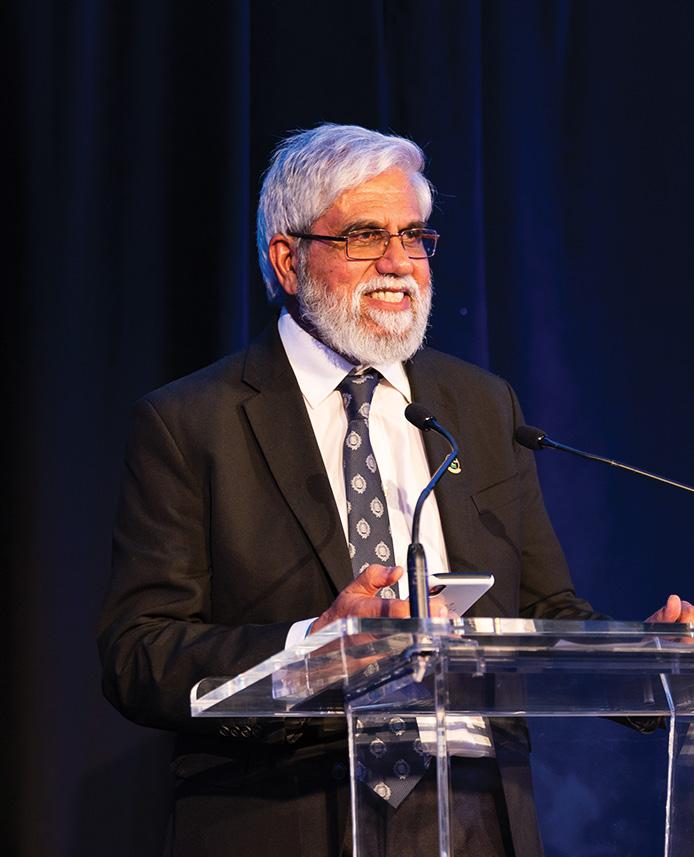
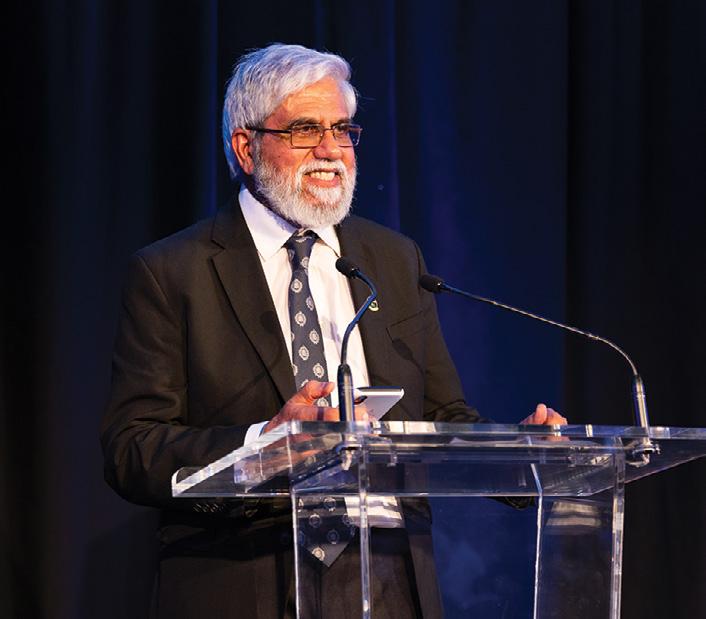
Jasbir Randhawa
BY JONATHAN NALLY
Celebrating 30 years of accomplishments with the Australian Hydrographic Office.
asbir Randhawa is a superstar within the field of hydrography, having spent 30 years with the Australian Hydrographic Office (AHO) and 20 years before that in other endeavours within the disciplines of land and hydrographic surveying.
During the course of his 50-year career, he has been presented with many awards, prizes and commendations, including Fellowship of the Surveying and Spatial Sciences Institute (now GCA), multiple Commendations from the Hydrographer of Australia, a Department of Defence Australia Day Medallion, and this year the GCA Hydrographic Excellence Award (Oceanic). In June this year, he formally retired from his role of Assistant Director of External Relations with the AHO.
How did you get into hydrography?
Upon completing high school in Malaysia, I obtained a scholarship from a British mining company, Osborne & Chappel, to attend a three-year land surveying course at the national Technical College (now the University Technology Malaysia). I graduated with a first-class diploma and proceeded to the UK where I successfully completed The Royal Institution of Chartered Surveyors (RICS) Professional Examinations.
My initial employment was as an Assistant Surveyor with Hunting Surveys in the UK, which was then the largest international survey company carrying out projects in Africa and the Middle East. During my one-year stint there I gained experience in a range of surveying disciplines — land, topographic, engineering and hydrographic — including a hydrographic survey for an oil pipe-line route in the North Sea.
Upon returning to the Far East in 1974, I joined the Hydrographic Department, Port of Singapore Authority (PSA) as an assistant hydrographer. During my career with PSA I was sent overseas to upgrade my skills and qualifications — a Category B course at the Indian Navy Hydrographic School, Cochin in 1975 and a Category A course at the Royal Navy Hydrographic School, HMS Drake, Plymouth, UK in 1983.
In 1989 I migrated to Australia and joined the Australian Hydrographic Office in North Sydney.
Tell us more about your work at the AHO. My role as Assistant Director External Relations in the Australian Hydrographic Office (AHO) involved co-ordinating many of the national and international responsibilities of the Australian Hydrographer. This entailed provision of secretariat support (since early 1990s) to a number of forums chaired by the Australian Hydrographer, one of which is the Australasian Hydrographic Surveyors Certification Panel, or AHSCP (see page 18).
The AHO was instrumental in establishing the AHSCP in 1994 as a regional certification scheme, providing a pathway for certification of professional hydrographic surveyors to international standards. The incumbent Australian Hydrographer is the ex-officio Chair and I was the Secretary for 30 years (1994 to 2023).
Another important body is the Ports Australia Hydrographic Surveyors Working Group (PAHSWG), which provides a forum for the exchange of ideas and information relating to all aspects of hydrographic surveying. The WG meets every six months, with participants from Australian state and local port operators. Reports are presented relating to survey projects carried out as well as current and future development works. It is also a useful forum for an exchange of ideas and advise on standards for hydrographic surveying and provides co-ordination of surveying activity where appropriate. In 2005 the WG prepared the ‘Principles for Gathering and Processing Hydrographic Information in Australian Ports’ document for use in Ports and supplement the International Hydrographic Organization (IHO) Special Publication S-44 (Standards for Hydrographic Surveys). Work is in progress to develop the current version into a ‘Standards’ document.
Hydrographic Seminars organised by GCA and/ or the Australasian Hydrographic Society are held in conjunction with PAHSWG meetings as a means of providing CPD activity to the attendees and regionally based hydrographic surveyors.
A third crucial body is the Tides & Sea Levels Working Group (TSLWG), a working group of the Intergovernmental Committee on Survey and Mapping (ICSM), with representation from national, state, port and scientific agencies engaged in the determination of tides and sea level. Its predecessor, the Permanent Committee on Tides and Mean Sea Level, was established in 1979 by the then National Mapping Council to co-ordinate a national database of tidal records, as well as develop national standards and best practice guidelines for tidal related matters.
The TSLWG has published the Australian Tides Manual, which provides operating procedures for operators of tide gauges on the Australian National Network (first published in 1984 and now revised regularly), and the Tidal Interface Compendium of Australian and New Zealand terms used in the inter-tidal zone.
The TSLWG’s current activities include:
• Developing an Australian Tidal Data exchange format to assist in data exchange between agencies and users.
• Standardising tidal analysis methods to provide for improved tidal predictions for safe navigation of large vessels.
• Investigation of mean sea levels around Australia and their significance for landbased vertical datums.
• Supporting national and global oceanographic community activities with Intergovernmental Oceanographic Commission (IOC) Global Sea Level Observing System (GLOSS) stations, tsunami stations and long-term sea-level monitoring.
How about hydrography in the Pacific?
The South West Pacific Hydrographic Commission (SWPHC), one of the 15 Regional Hydrographic Commissions of the IHO, was established in 1993 to coordinate hydrographic activity and cooperation at the regional level. Currently it comprises of 12 Members (IHO Member States) and six Associate Members. Australia through the AHO is the current Chair — we provide
secretariat support and are an active participant in most of the activities. The current focus of the SWPHC includes:
• S-100 workshops to promote digital innovation and data standards. S-100 is the new Universal Hydrographic Data Model that supports a greater range of hydrographic-related digital data sources, products and customers.
• MSDIWG meetings to promote Marine Spatial Data Infrastructure (MSDI) in the region for the sustainable development and use of the oceans, seas and inland waters in line with the UN Sustainable Development Goals. The focus is on encouraging coastal states to share data and adopt open data policies.
• The SWPHC Hydrographic Leaders Programme aims to build and encourage a network of leaders for the region. The pilot program comprises a cohort of 17 participants from 12 nations, each matched with a mentor.
• The Empowering Women in Hydrography Project aims to build relationships and support career growth through mentoring, opportunity and awareness.
• And the Pacific One Maritime Framework (POMF) is seeing governments across the Pacific realising the importance of hydrography to meet their country goals. SWPHC has been invited by The Pacific Community (SPC) to actively participate in the POMF.
What other work have you been involved in?
During the early years with the AHO I was involved in the analysis of international technical standards and documentation relating to work carried out by the IHO Working Group on Quality of Data. I also contributed to the implementation of AHO’s Hydrographic Information System, relating mainly to technical and professional issues of hydrographic surveying which were important in reshaping the project.

My early years with the PSA provided me the opportunity to participate in several regional projects, such as joint hydrographic surveys and joint tidal and current studies of the Malacca and Singapore Straits, and hydrographic surveys and flood control studies of Muara Port and the Brunei River in Brunei.
What’s something that might surprise people about Australian hydrography? Most people are unaware that hydrography underpins almost every activity associated with the sea. It has a vital role in ensuring safe navigation, protecting the environment, managing resources, maritime boundary delimitation, understanding climate change, etc.
The AHO performs a legislated role under the Australian Navigation Act 2012 which relates to the International Convention for the Safety of Life at Sea (SOLAS) and United Nations Convention on Law of the Sea (UNCLOS). Its remit is to provide hydrographic services in Australian Waters. We have over 60,000 km of coastline and an Exclusive Economic Zone of over 8 million square kilometres, so our maritime estate is bigger than our land estate. Our marine domain covers 10% of the Earth’s surface; interestingly, approximately 70% of Australia’s jurisdiction lies beneath the ocean’s surface.
We chart from northern Australia to Antarctica, and also support Papua New Guinea, the Solomon Islands and Timor Leste to meet their SOLAS requirements. Our charts enable approximately 26,500 ship arrivals in Australian ports each year. We have 70 international trading ports and another 70 to support domestic commercial vessels. Approximately $1.2 billion of trade moves through our ports each day — so hydrography is a true enabler for our Australian economy as we know that 99% of our trade is undertaken via shipping.
What are you most proud of from your career?
I consider it a great privilege to have worked for a world-class national hydrographic office during my lengthy career. As mentioned earlier, my role involved engagement with external forums, national as well as international. It has been an extremely rewarding professional experience working with dedicated and competent personnel carrying out the incredible work we do. Two forums celebrated their 30th Anniversary this year — the AHSCP and the SWPHC. I was actively involved in their initial establishment, have participated in their activities throughout this period, and I am proud of the significant things we have achieved for hydrography in Australia, New Zealand and the South West Pacific. n
The Australasian Hydrographic Surveyors Certification Panel was the first globally recognised certification scheme.
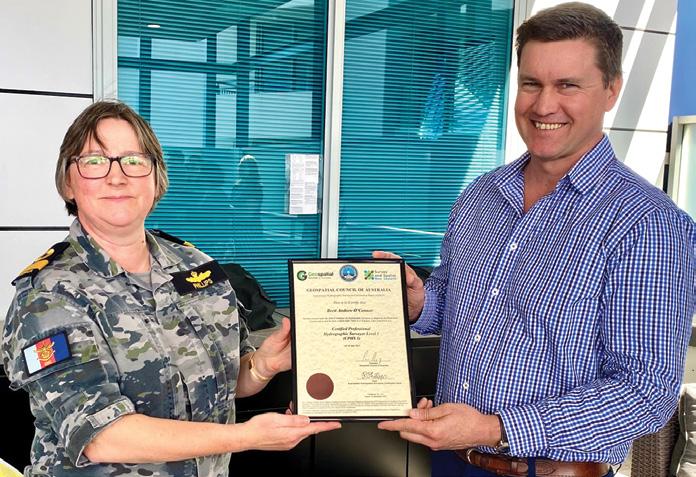
In June 2024, alongside World Hydrography Day celebrations in Wollongong, the Australian Hydrographic Office celebrated the 30th Anniversary of the Australasian Hydrographic Surveyors Certification Panel (AHSCP), the professional certification scheme for hydrographic surveyors in Australia and New Zealand. The AHSCP was the first internationally recognised certification scheme for hydrographic surveyors.
AHSCP background
Specialist certification in hydrographic surveying is the official recognition of competence in that field, signifying that an individual possesses the necessary knowledge to perform hydrographic surveying tasks along with the demonstrated ability to apply that knowledge across various hydrographic disciplines.
The AHSCP is recognised by the International Board on Standards of Competence for Hydrographic Surveyors and Nautical Cartographers (IBSC), and through this recognition is endorsed by the International Federation of Surveyors (FIG), International Hydrographic Organization (IHO) and the International Cartographic Association.
Professional certification as a hydrographic surveyor underpins the quality framework for the conduct of hydrographic survey in Australia’s waters, with AHSCPcertified Level 1 and level 2 surveyors required for the conduct of hydrographic surveys in major ports, some offshore activities as well as being increasingly required for commercial hydrographic survey projects.
As just one example of the importance placed on professional hydrographic certification, all surveying activity undertaken through the HydroScheme Industry Partnership Program (HIPP) — the Australian Government partnership with industry for the conduct of hydrographic surveying in Australia waters — is conducted under the supervision of AHSCP-certified Level 1 hydrographic surveyors, ensuring that the surveys are conducted to the highest professional standards.


According to Declan Stubbing, Chair of S+SNZ Hydrographic Professional Stream, “The AHSCP and hydrographic certification established a benchmark for professional competence, and a pathway for young hydrographic surveyors which the New Zealand industry has benefited greatly from. We face some unique challenges in New Zealand and our association with the AHSCP helps ensure the supply of quality hydrographic data to support safe navigation, environmental management and economic development in New Zealand waters.”
The AHSCP Certification is a rigorous assessment process, combining both academic achievement with practical experience recorded through a logbook, reports of survey and referee reports. All AHSCP-certified hydrographic professionals can be justifiably proud of having met the stringent standards of this panel.
BY REBECCA CUSACK
The incumbent Hydrographer of Australia chairs the AHSCP as an exofficio member, and the expert Panel is composed of five members, each representing a different facet of the discipline. Each Panel member must be a current Level 1-certified hydrographic surveyor, and is elected to this position by their peers — namely, current certified Level 1 or 2 hydrographic surveyors who are members of the Geospatial Council of Australia (GCA) or Survey and Spatial New Zealand (S+SNZ).
The current members are:
• Ex-officio Chair — Robyn Phillips, CDRE RAN
• Representative for Private Practice — Neil Hewitt
• Representative for Hydrography for Coastal Zone Management — Barry Smith
• Representative for Nautical Charting Hydrography — Ian Phillips
• Representative for Education — Dean Battilana
• Representative for Industrial Offshore Surveying — Katherine Butcher Jasbir Randhawa was the AHSCP Secretary throughout its 30-year history until mid-this year and played a key role in the development of the AHSCP Guidelines. The AHSCP Guidelines have been used by other international certification schemes to develop their programs in seeking IBSC recognition, demonstrating the lasting influence that Mr Randhawa has had on hydrographic professionalism worldwide.
“For 30 years the AHSCP has led the world in providing a certification framework for hydrographic surveyors that adds value to both individuals and employers,” said CDRE (Retired) Rod Nairn, former Hydrographer of Australia. “AHSCP certification ensures that professional hydrographic surveyors have appropriate education, practical consolidation and sufficient real world experience to be competent to carry out their roles.”
Four AHSCP meetings are held every year, with the meetings dates and the closing dates for submission of applications advertised on the GCA website.
Certification applications are submitted to the AHSCP Secretariat, where an initial check is undertaken to ensure that all required documentation has been provided and in the correct formats.
Applicant packs are then separately provided to each AHSCP panellist for their independent assessment against the AHSCP Guidelines. Completed assessments are sent back to the AHSCP Secretariat where a combined panel assessment is produced. The AHSCP panellists are not aware of their fellow panellist’s assessments until this point.
The AHSCP meeting is conducted to review the independent assessments and to arrive at a consensus position regarding each candidate. Each of the panellists represents a specific area of hydrographic specialism, which informs the panel determination of the outcome for the candidate.
For candidates who are required to provide additional information, the AHSCP panellists spend considerable time developing a response intended to provide the candidate with as much guidance as possible for their certification journey. Detailed guidance may also be provided to candidates awarded a Certified Professional Hydrographic Surveyor (CPHS) Level 2 to inform their potential journey towards an AHSCP Level 1 certification in the future.
The ex-officio Chair approves the decisions, and the AHSCP Secretariat then completes the administration processes through drafting letters and preparing Certificates and certification pins.
Hydrographic surveyor competency certification has long been an objective of the Australasian hydrographic community. At a Hydrographic Society Symposium held in Sydney in 1991, some 100 hydrographic surveyors voted unanimously to explore a means of industry regulation and accreditation (certification), recognising that certification would lift hydrographic surveying standards, thereby ensuring the delivery of quality surveying services to government and the private sector and providing a career path for aspiring hydrographic surveyors.
In 1992, the then Institution of Surveyors Australia (ISA) established a series of commissions for surveying specialities including hydrography, modelled on the FIG commissions. The 1993 meeting of the Council of Reciprocating Surveyors Boards of Australia and New Zealand (CRSBANZ),

comprising all Surveyors-General of the Australian states and territories and the New Zealand Surveyor-General, was briefed on the accreditation proposal and supported the idea.
The ISA Hydrographic Commission was subsequently formed and charged with the task of establishing a means of accreditation. This resulted in the creation of the Australian Hydrographic Surveyors Accreditation Panel (AHSAP), which held its inaugural meeting on 4 August 1994.
In 2001 the AHSAP became the Australasian Hydrographic Surveyors Accreditation Panel with the ratification of the Trans-Tasman agreement between the ISA and NZIS. The AHSAP had by then accredited a number of applicants from New Zealand and other countries and its work was becoming recognised internationally.
In 2004, the ISA and four related associations founded the Spatial Sciences Institute (SSI). The AHSAP became the AHSCP, in line with SSI conventions that recognised accreditation of courses of study and certification of individuals.
In 2009, members of ISA and SSI voted to dissolve their respective organisations and move the assets and memberships into the Surveying and Spatial Sciences Institute (SSSI), with the AHSCP continuing its work within the SSSI Hydrography Commission.
In 2023, the new peak geospatial body GCA was formed from the merger of the SSSI and the Spatial Industries
Business Association (SIBA|GITA).
All the Commissions within SSSI were disbanded and regrouped to an ‘Area of Practice (AoP)’ structure, i.e. disciplinebased groups based on shared interest and expertise in geospatial related topics. Accordingly, the AHSCP is now under the purview of Hydrography AoP.
By far the greatest challenge facing the AHSCP and the three other internationally recognised hydrographic surveyor certification schemes, is ensuring that the certification continues to meet the needs of the contemporary hydrographic surveyor.
To this end, the International Board on Standards of Competence (IBSC) for Hydrographic Surveyors and Nautical Cartographers has commenced a review of the standards framework for hydrographic surveyors (IHO Standards S5-A and S5-B).
Declan Stubbing, Chair of the S+SNZ Hydrographic Professional Stream, says that “The AHSCP and hydrographic certification established a benchmark for professional competence, and a pathway for young hydrographic surveyors which the New Zealand industry has benefited greatly from. We face some unique challenges in New Zealand and our association with the AHSCP helps ensure the supply of quality hydrographic data to support safe navigation, environmental management and economic development in New Zealand waters.”
The AHSCP is also undertaking a review of the AHSCP Guidelines as the it prepares its six-yearly submission to the IBSC for international recognition. All hydrographic surveyors and other interested professionals are encouraged to contribute to the AHSCP Guidelines review by emailing their thoughts to ahs.cp@defence.gov.au with ‘AHSCP Guidelines Review’ in the subject line.
Rebecca Cusack is Secretary of the Australasian Hydrographic Surveyors Certification Panel. n
Hydrographic surveyors from around the world seek AHSCP certification to professionalise their hydrographic practice. Since the first meeting held on 4 August 1994, the AHSCP has assessed 403 applications, comprising:
• 309 Australians
• 39 New Zealanders
• 51 from 18 other nations
The number of successful applicants is:
• 189 AHSCP Level 1 (professional level)
• 146 AHSCP Level 2 (technical level)
Envisioning human-computer interaction with the latest geoinformatic and cartographic devices.

The explosion of geospatial data the world has experienced since the start of the Internet and the increasing accessibility of high spatial and temporal resolution satellite imagery, means that understanding how humans and computers can cooperate and collaborate in an era of big geospatial data is becoming ever more important.
New and improved technologies such as AI and immersive environments raise new questions about how human cognition informs interaction with computers. Pervasive computing also means that many people have a digital map in their pocket, meaning they are relying on maps more than ever to support many varied kinds of tasks in all sorts of use situations and contexts.
The vision of the International Cartographic Association (ICA)’s Commission on Cognitive Issues in Geographic Information Visualization
(CogVis) is to use what we know about visual perception and cognition to support the design of successful static maps, dynamic and interactive maps, and geovisual analytics displays and systems.
When you were building a map, did you ever struggle to decide how to symbolise your data? Our commission undertakes research that can help you make these decisions and inform how geospatial systems designers build systems that can help the system’s users to make spatiotemporal decisions effectively and efficiently.
We do this through projects that build an evidence base about when, how, why and for whom human inference, analytical reasoning and problem solving, and spatio-temporal decision-making is successful. This fundamental knowledge informs the development of design principles and guidelines that can support a human-centred approach to visualising geospatial information.
BY PYRY KETTUNEN, PETR KUBÍČEK, HUA LIAO, TUMASCH REICHENBACHER
©stock.adobe.com/au/alexdndz
Our commission often collaborates with other groups within the ICA and with our sister societies, such as the International Society for Photogrammetry and Remote Sensing, the Open Geospatial Consortium and national geospatial societies in member countries to investigate topics of mutual interest and to produce research and practical outputs.
Some recent events and workshops have investigated themes such as:
• cognitive issues involved in the use of maps designed for mobile devices;
• how to build an evidence base for deciding how to choose symbols for new types of map displays such as in immersive environments (e.g. augmented or virtual reality);
• which opportunities AI technologies might provide for helping us to understand how people use maps or how to personalise maps by adapting them to a new situation or new user.
“Eye tracking and machine learning might be combined to create gaze-aware interactive maps that use the reader’s eyes to control the map.”
Some of our publications are freely available through links on our website. A recent issue of the International Journal of Cartography that our Commission helped to produce includes some contributions that practitioners might find useful for informing their work. For example, one of the papers summarises the results of many scientific studies that tried to answer the question of how small map symbols can be before they are no longer legible. Another article explored how eye tracking and machine learning might be combined to create gaze-aware interactive maps that use the reader’s eyes to control the map.
Other contributions in the journal explore topics such as levels of detail in augmented reality, how people move in virtual indoor environments, and designing common interactions (e.g., zooming) for multiscale maps. (Note: If any of the articles

Are you staying up to date?
aren’t open access, you can contact the author and ask for a free copy.)
Want to learn more and get involved? Currently, the commission has about 230 members representing 34 countries. You can become a member, receive the topical emails from our mailing list, and see additional details at the commission’s website https:// cogvis.icaci.org/. Our website includes links to recent publications and videos of workshop presentations. For example, you can see the videos from the lightning talks at our recent MapAI workshop, which took place in Stellenbosch South Africa before the most recent International Cartographic Conference.
Another good opportunity to get involved is the participation in the various workshops and events (co)organised by the CogVis commission. These events are held in different regions of the world and are open
to anyone who is interested. You can see the upcoming schedule on the commission website. Moreover, the commission is organising sessions dedicated to cognitive issues in cartography at the bi-annual International Cartographic Conference (ICC). During these conferences the commission also holds meetings to discuss the commission plans and activities.
Dr Pyry Kettunen is Research Manager at the Finnish Geospatial Research Institute FGI, NLS. Dr Petr Kubíček is Professor in the Masaryk University, Brno. Dr Hua Liao is Associate Professor at the School of Geographic Sciences, Hunan Normal University in Changsha, China. Dr Tumasch Reichenbacher is Group Leader at the Department of Geography, University of Zürich. This group of Co-Chairs wants to acknowledge all the previous Chairs and ViceChairs for the work they have done to bring the Commission to the present day. n

Position magazine’s online site is SpatialSource.com.au, where you’ll find daily news, feature articles, interviews, product announcements and more. Please check it regularly, and don’t forget to subscribe to our FREE weekly newsletter at spatialsource.com.au/subscribe.

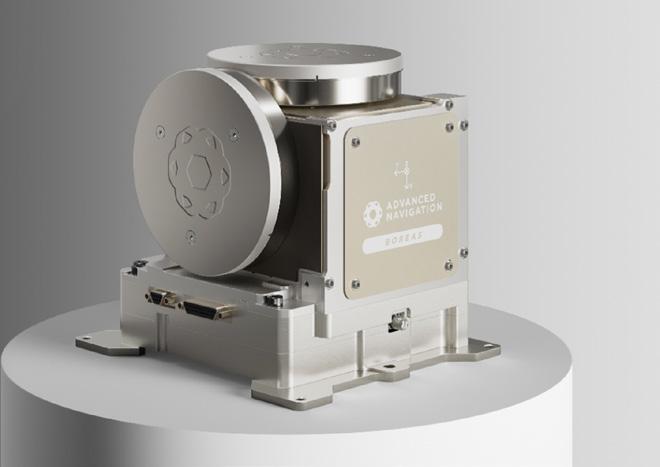
HP SitePrint from Aptella automatically prints plans directly onto the construction surface, removing the need for manual methods and increasing speed and accuracy.

Advancements in robotics and automation are enabling faster, more accurate set-out and as-built verifications for the construction sector. Dubbed ‘digital construction,’ an oxymoron for an industry that is physical in every sense, these new methods could contribute to a shift in labour-productivity growth that for decades has stagnated around 1%1
“Infusing digital technology” and “advanced automation”2 are recommended measures included in seven key areas, that range from reshaping regulation and contractual frameworks to reskilling the workforce. Technology would arguably underpin each of the seven, as it does with most aspects of our lives where modern techniques help us to analyse, streamline and automate information to improve processes and communication.
Every building project begins life in the digital landscape, with computeraided design (CAD) models created by a combination of architects, engineers and surveyors. Once approved and boundary alignments verified, surveyors are engaged to mark out control points, and where
required, perform set-out for key features such as grid lines. With expertise in managing CAD models, surveyors continue to marry the digital with the physical by using optical total stations and field-based CAD software to precisely mark out plans on site.
Outside of surveyor-led set-out, layout of these computer-based plans on the building site is typically where digital technology meets an abrupt end, often with expensive consequences. Most of the set-out falls to the building trades, who calculate offsets and scale measurements based
off printed, paper plans using measuring tapes, stringlines, and various shades of spray paint.
“The potential for human error is unavoidable when you are relying on these manual methods,” says Mitch Laughlin, who specialises in building automation technology at Aptella.
“Even the most experienced, skilled people can make a mistake during the setout process, that may not be picked up until a lot further into the job, such as when a surveyor or engineer comes back to check as-builts. Then you have the cost and time delays to fix it, which leads to budget and program blow-outs,” he added.
Enabling the building trades with the skills and tools to perform set-out tasks and check their work as they go, is ticking several boxes when it comes to transforming productivity and reducing rework, Mitch explains. And far from replacing the work typically done by a surveyor, these methods require the combined expertise of multiple stakeholders who are all working to the same, digital plans.
“It benefits all parties if the work being done can be checked along the way to make sure it’s right, but with the skills shortage of surveyors it’s not possible, affordable, or in most cases desirable, for them to do so,” he says. “A surveyor is of course pivotal for establishing control on site and any boundary verifications, but with these new methods the building trades can then learn how to perform a resection and set-out everything from footings, walls, columns, penetrations and more without reliance on the survey crew.”
Mitch notes that having more eyes looking at the same project data helps identify any errors before they escalate into bigger problems. “We’ve had instances where customers have identified incorrect

“The enriched information provided by the HP SitePrint is unmatched.”
– Mitch Laughlin, Aptella
control points on the job, because when they go to set-out using the digital plan nothing aligns to it. The more different trades get to work with the data and digital layout methods, the better the outcomes for everyone involved.”
A CAD design is extremely complex with many layers of data, so another example Mitch says works well with Aptella’s customers is for surveyors to provide a simplified data file for the contractors for each stage of the build and their specific work on the job.
“The plumber gets the design for drainage, penetrations and services, whereas the builder may get the footings, slab and columns, so both parties can work with the data they need and continually check and verify their work with a digital record of what has been done,” he adds.
Aptella provides comprehensive training and remote technical support for customers in the building trades that are adopting these new methods. “There is a direct correlation between how committed our customers are to upskilling their workers and the speed at which they see productivity gains,” Mitch says. “Ensuring their team is confident in how to use it, with our Tokara remote access platform to guide them over the phone when they get stuck, means they quickly reap the benefits.”
New advancements in robotics promise to offer even greater productivity gains. Robots such as HP SitePrint can automatically print construction plans directly onto the construction surface, removing the need for manual methods and increasing speed and accuracy.
“HP SitePrint sets out a complete design, including lines, arcs, points, text references, and in an array of colours to bring the plan to life on site without any further calculations or measurements needed,” Mitch says.
The fine lines and text references leave no room for misinterpretation by the various contractors working on site, with millimetrelevel accuracy of every point on the plan. Unlike traditional methods that require multiple people and result in set-out with little to no reference information shown, the robot gives a precise mark and legible reference that’s easy for everyone on site to understand and follow. “The enriched information provided by the HP SitePrint is unmatched,” he adds.
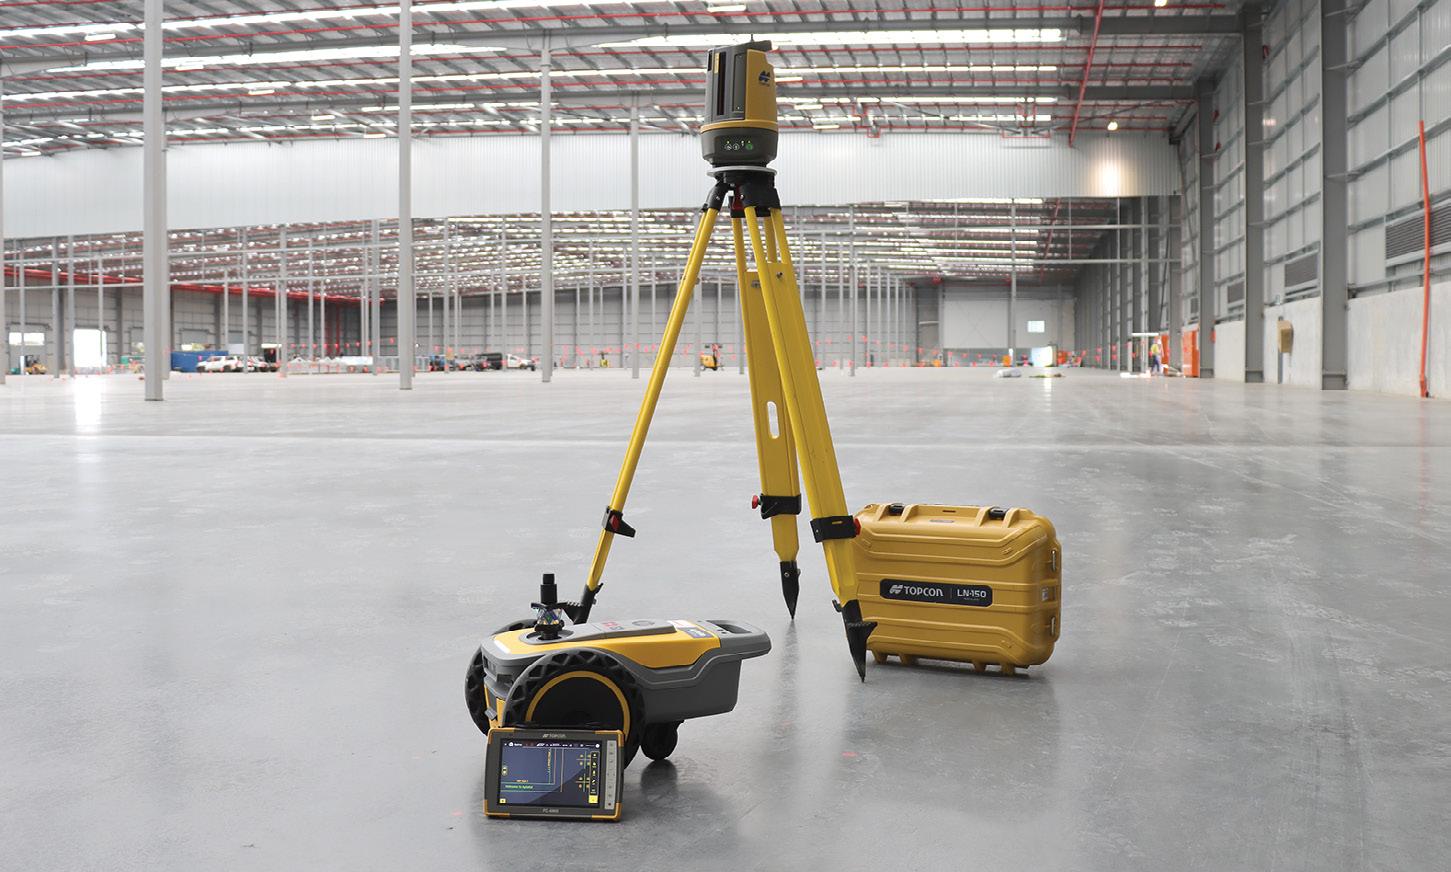
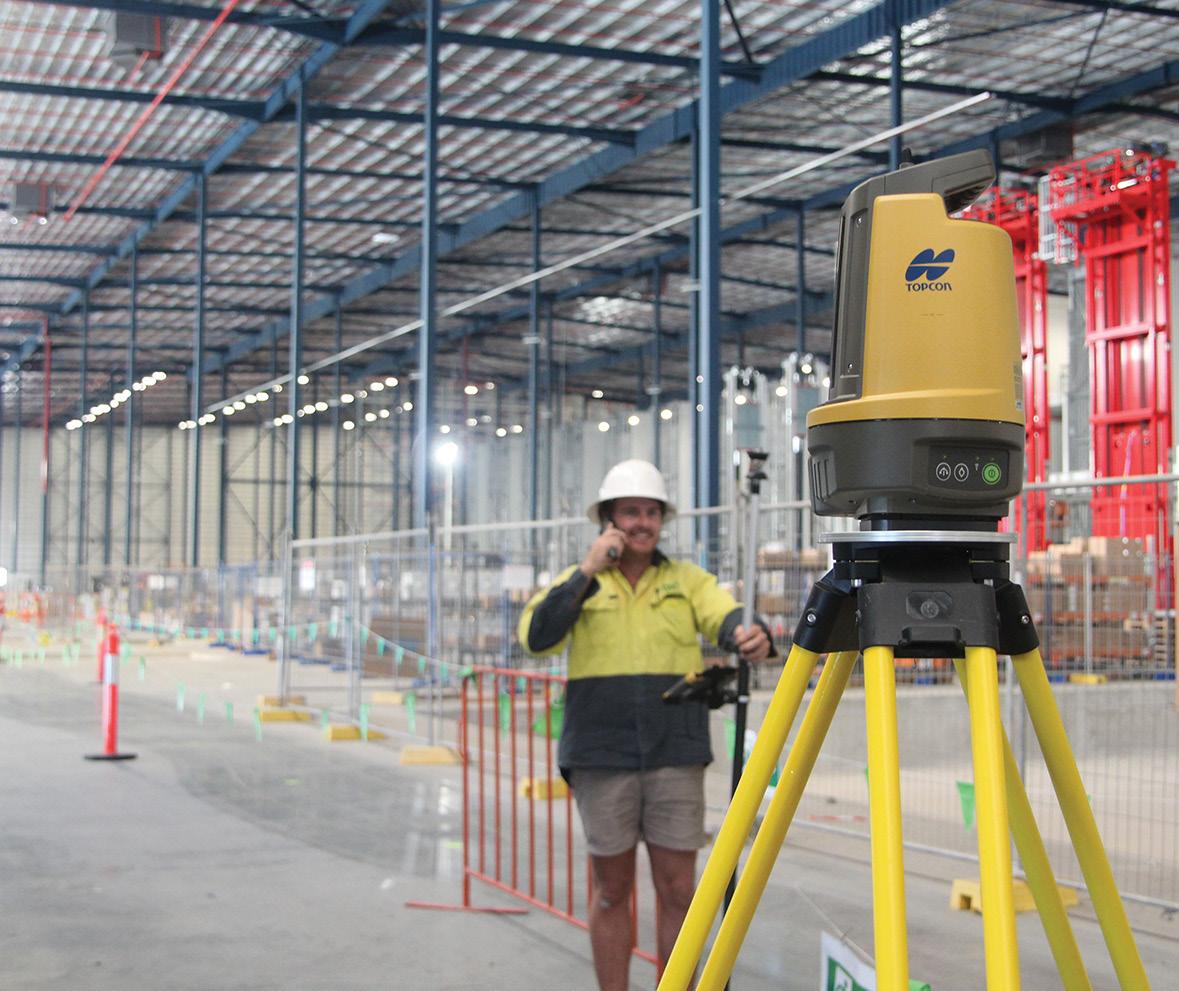
Systems such as Topcon’s LN-150, which is paired with a field controller and software, provides a fully robotic, one-person total station that integrates seamlessly with the HP SitePrint robot.
“The LN-150 is hugely popular for construction set-out because it has the accuracy of a fully robotic total station but without the complexity of a premium optical instrument that is usually over-specified for these applications,” Mitch says.
“Surveyors can use their high-end instruments for cadastral work and run the LN-150 with the HP robot as a robust, accurate solution to set-out construction jobs at scale.”
For a demonstration please visit aptella.com or call 1300 867 266. n
1. ‘Reinventing Construction: A Route to Higher Productivity,’ McKinsey & Company, 2017. p.11
2. https://www.mckinsey.com/capabilities/operations/ourinsights/reinventing-construction-through-a-productivityrevolution

Geospatial research and analysis are critical in providing the evidence base required for policy and planning. BY
SCOTT LIMBRICK

“This is rare data that isn’t available in a lot of places often we’re trying to estimate parameters using satellite data or people going out and doing surveys.”
– Dr Mathew Lipson, ARC Centre of Excellence for Climate Extremes
With Australia facing challenges such as responding to climate change, facilitating energy transitions and delivering adequate housing and infrastructure for cities and regions undergoing demographic shifts, it’s critical that policy and planning decisions are informed by relevant research and analysis.
With the wide variety of factors impacting these environmental, social and economic changes, access to data is vital — though it is not always easy to obtain or use. The cost to researchers, both financial and in terms of time, of obtaining and cleaning geospatial data from different sources can be significant, even as such data is required for detailed analysis. This is why AURIN, the Australian Urban Research Infrastructure Network, seeks to support both researchers and decisionmakers by providing access to spatial tools and hard-toget datasets.
Using these, researchers across Australia have produced work addressing liveability, informing climate change adaption, deepening our understanding of the employment implications of COVID and more.
At AURIN we’re always excited to see the range of research only possible with geospatial data, particularly as these findings provide the foundation for government and industry decisions.
Below are just a few examples of the ways researchers have used this data in their work.
As part of the ‘Map of the Month’ initiative — a science communications project led by the University of Melbourne, in collaboration with AURIN, Melbourne Centre for Cities, Melbourne Data Analytics Platform, and Pursuit — academics, community leaders and government representatives have contributed to the development of data-driven maps intended to spark important policy discussions.
One such map, based on research by Dr Thami Croeser and Dr Michele Acuto and produced by Amanda Belton, Dr Emily Fitzgerald and Dr Stuart Lee, using data provided by AURIN and Geoscape Australia, calculated the extent of asphalt and concrete surrounding each building in metropolitan Melbourne. They found that such buildings are surrounded by a total of 271 square kilometres of asphalt and concrete, with more than 50% of all buildings surrounded by land at least one-third concrete and asphalt — and that there is a large east-west divide, with western suburbs exposed to far more heat than those in the east.
This analysis, made possible only with specific data, highlights the problem of a socioeconomic gap in urban heating effects, and points to the need to address this inequality through de-paving certain regions.
The Map of the Month project has been made possible through the support of the Lord Mayor’s Charitable Foundation and partnerships
with the Victorian Office for Suburban Development and the Municipal Association of Victoria.
Using cycling infrastructure data made available through AURIN, in addition to data sourced from Vicroads, the Victorian Government and their own surveys, researchers at Monash University conducted a study of the role of neighbourhood design in cycling activity.
The resulting paper, The role of neighbourhood design in cycling activity during COVID-19: An exploration of the Melbourne experience, by Mahsa Naseri, Dr Alexa Delbosc and Dr Liton Kamruzzaman, assesses how various populations in Melbourne changed their cycling activity during lockdown conditions.
This work involved calculating built environment indicators including residential density, green space area, landuse mix, street connectivity and cycling infrastructure coverage, in addition to determining the length of cycling infrastructure in each neighbourhood by applying GIS methods to data from Vicroads and AURINS.
Among other observations, the study found that even during lockdown, significant gaps remained in cycling levels — changed conditions and reduced local traffic did not encourage older people or women to take up cycling at higher rates. With cycling an important opportunity to
contribute to health and wellbeing, these findings provide a valuable resource for planners in ensuring built environments respond to the needs of the wider community. That lockdown conditions made little difference to the uptake of cycling for leisure among these groups indicates that such needs require further research and planning.
Of the importance of data for this research, Mahsa Naseri said, “AURIN data played an important role in this research, offering key insights into Melbourne’s cycling infrastructure. It facilitated a comprehensive analysis, connecting neighbourhood design, demographics, and cycling behaviour during Covid-19 lockdowns, providing valuable input for urban planning and policy decisions.”
Using Geoscape Buildings data accessed through AURIN’s Restricted Data program, Dr Mathew Lipson and his UNSW colleagues at the ARC Centre of Excellence for Climate Extremes, Dr Melissa Hart and Dr Negin Nazarian, have worked to create a new set of gridded data that they are able to feed into their models.
Dr Lipson noted the importance of high-resolution, standardised data for their work: “From the data that you’ve provided us, we can calculate parameters describing the city and feed it straight into our climate models. This is rare data that isn’t available in a lot of places – often we’re trying to estimate parameters using satellite data or people going out and doing surveys. So it’s really, really valuable in that sense.”
By better incorporating built characteristics into climate models, it will be possible to understand and simulate climate impacts and mitigation measures — the importance of which has also been highlighted through projects such as the Map of the Month.

A ‘Map of the Month’ showing urban heat scores across the suburbs of Melbourne. Created by the Map of the Month project team and Pursuit, University of Melbourne, with Datawrapper. Developed with AURIN's data catalogue service using ABS data and Trees, Greenspace and Buildings datasets © Geoscape Australia 2023.
In addition to work on building the foundation for Australia’s Urban Digital Twins and ensuring continued access to our existing datasets and tools, AURIN is proud to be facilitating wider access to commercial data through several partnerships. As a result of these collaborations, researchers are able to obtain data at a reduced cost from providers including APM,
Geoscape and Ambient Maps, and enabling research informed by leading property, spatial and noise data.
We’re also looking forward to providing new, hard-to-get data as part of the Australian Urban Health Indicators (AusUrb-HI) project, in collaboration with PHRN, AUO, QUT and ARDC, which is developing a suite of indicator data assets that will improve our ability to understand the
health of Australian urban and regional populations.
Geospatial data and tools continue to support important research and analysis — work which would be incredibly difficult without such resources, but which continues to be critical in providing the evidence base required for effective, responsive policy and planning.
Scott Limbrick is Media Manager at AURIN. n
BY TORI MURRANT
Investing in young professionals fosters a greater sense of community and helps build a stronger, more capable workforce.
In our dynamic industry, young and emerging professionals (YEPs) bring a fresh perspective, innovative ideas, and a force for driving the adoption of new technologies. Supporting this new talent is essential for the continued growth of our workforce. The geospatial industry is set to experience significant growth, as highlighted in the Geospatial Council of Australia’s (GCA) recent report ‘Economic Impact of Geospatial Services in Australia’, so it’s critical that leaders in our industry empower YEPs. By nurturing the development of YEPs, leaders can foster an environment that supports the future of our industry.
While leadership is important for the development of YEPs, it’s important to recognise the value that any experienced professional can offer. Whether or not you identify as a leader, you hold a wealth of knowledge and experience that can benefit YEPs. By sharing your experience, you can contribute to the growth of the next generation.
Helping others grow can be deeply rewarding. When we

speed networking, meet-ups and webinars. Mentoring offers guidance, supports professional development and helps build the confidence of YEPs.
invest our time into developing YEPs, we do more than just shape their future; we foster a greater sense of community within the industry. This helps build a stronger and more capable workforce, while also bringing a sense of personal fulfillment knowing that we have played a part in guiding the next generation.
Engage directly at networking events. Networking events are valuable opportunities for connection, but YEPs sometimes feel intimidated by all the senior people around them at events such as conferences and can be reluctant to speak up. Approach them authentically, ask questions and show genuine interest. Your engagement provides encouragement for YEPs, who may feel nervous in these settings.
Engaging is beneficial for both parties — you can find out how the next generation works and learn some new ideas!
Participate in mentorship programs. Mentorship is important for professional growth. It can be informal or formal, such as the structured mentoring program offered by the GCA, which includes
Be a sponsor. Sponsorship goes beyond mentorship by actively advocating for the mentee in professional settings. Sponsors help identify opportunities and provide platforms for YEPs to showcase their skills and talent. This active support can accelerate the growth of a YEP’s career.
Offer shadowing opportunities. Shadowing senior colleagues is a practical way for YEPs to learn. Whether it’s attending meetings or understanding the scope of why they complete tasks, these experiences are valuable for YEPs. Shadowing facilitates collaboration and learning, and helps strengthen team relationships.
Provide constructive feedback and one-on-one time. Making personal time to share constructive feedback promotes transparency and openness. Regular one-on-one sessions provide YEPs with a platform to share ideas and seek guidance.
According to PwC’s 2023 Workforce Survey, 46% seek feedback and 44% provide it. Having a culture of providing healthy feedback improves engagement and development on both sides.
Share your journey. Sharing your professional journeys helps
unmask senior leadership by showcasing humble beginnings, as well as the different career paths available, such as the transition from technical roles to managerial roles. Transparency helps inspire and guide YEPs’ career development.
Help them discover their purpose. Beyond passion and fulfillment, understanding the broader scope and impact of work tasks is valuable for having a sense of purpose. Leaders can help support this by highlighting YEPs’ strengths and how they align to the organisation’s values, to instil a broader sense of purpose.
According to PwC’s 2023 Workforce Survey, young and emerging professionals value training, career progression and personal fulfillment. By focusing on these values, leaders can create an environment where YEPs feel supported and motivated and drive our industry forward. As experienced professionals, we should commit to uplifting the next generation to help them develop their skills for our industry’s future.
Tori Murrant is an organising member of the Geospatial Council of Australia’s Young and Emerging Professionals committee, winner of the Locate24 Best YEP Presentation, researcher at UNSW and GIS Lead at Monteath & Powys. n
The CenterPoint RTX correction service expands operational reach beyond traditional network footprints.
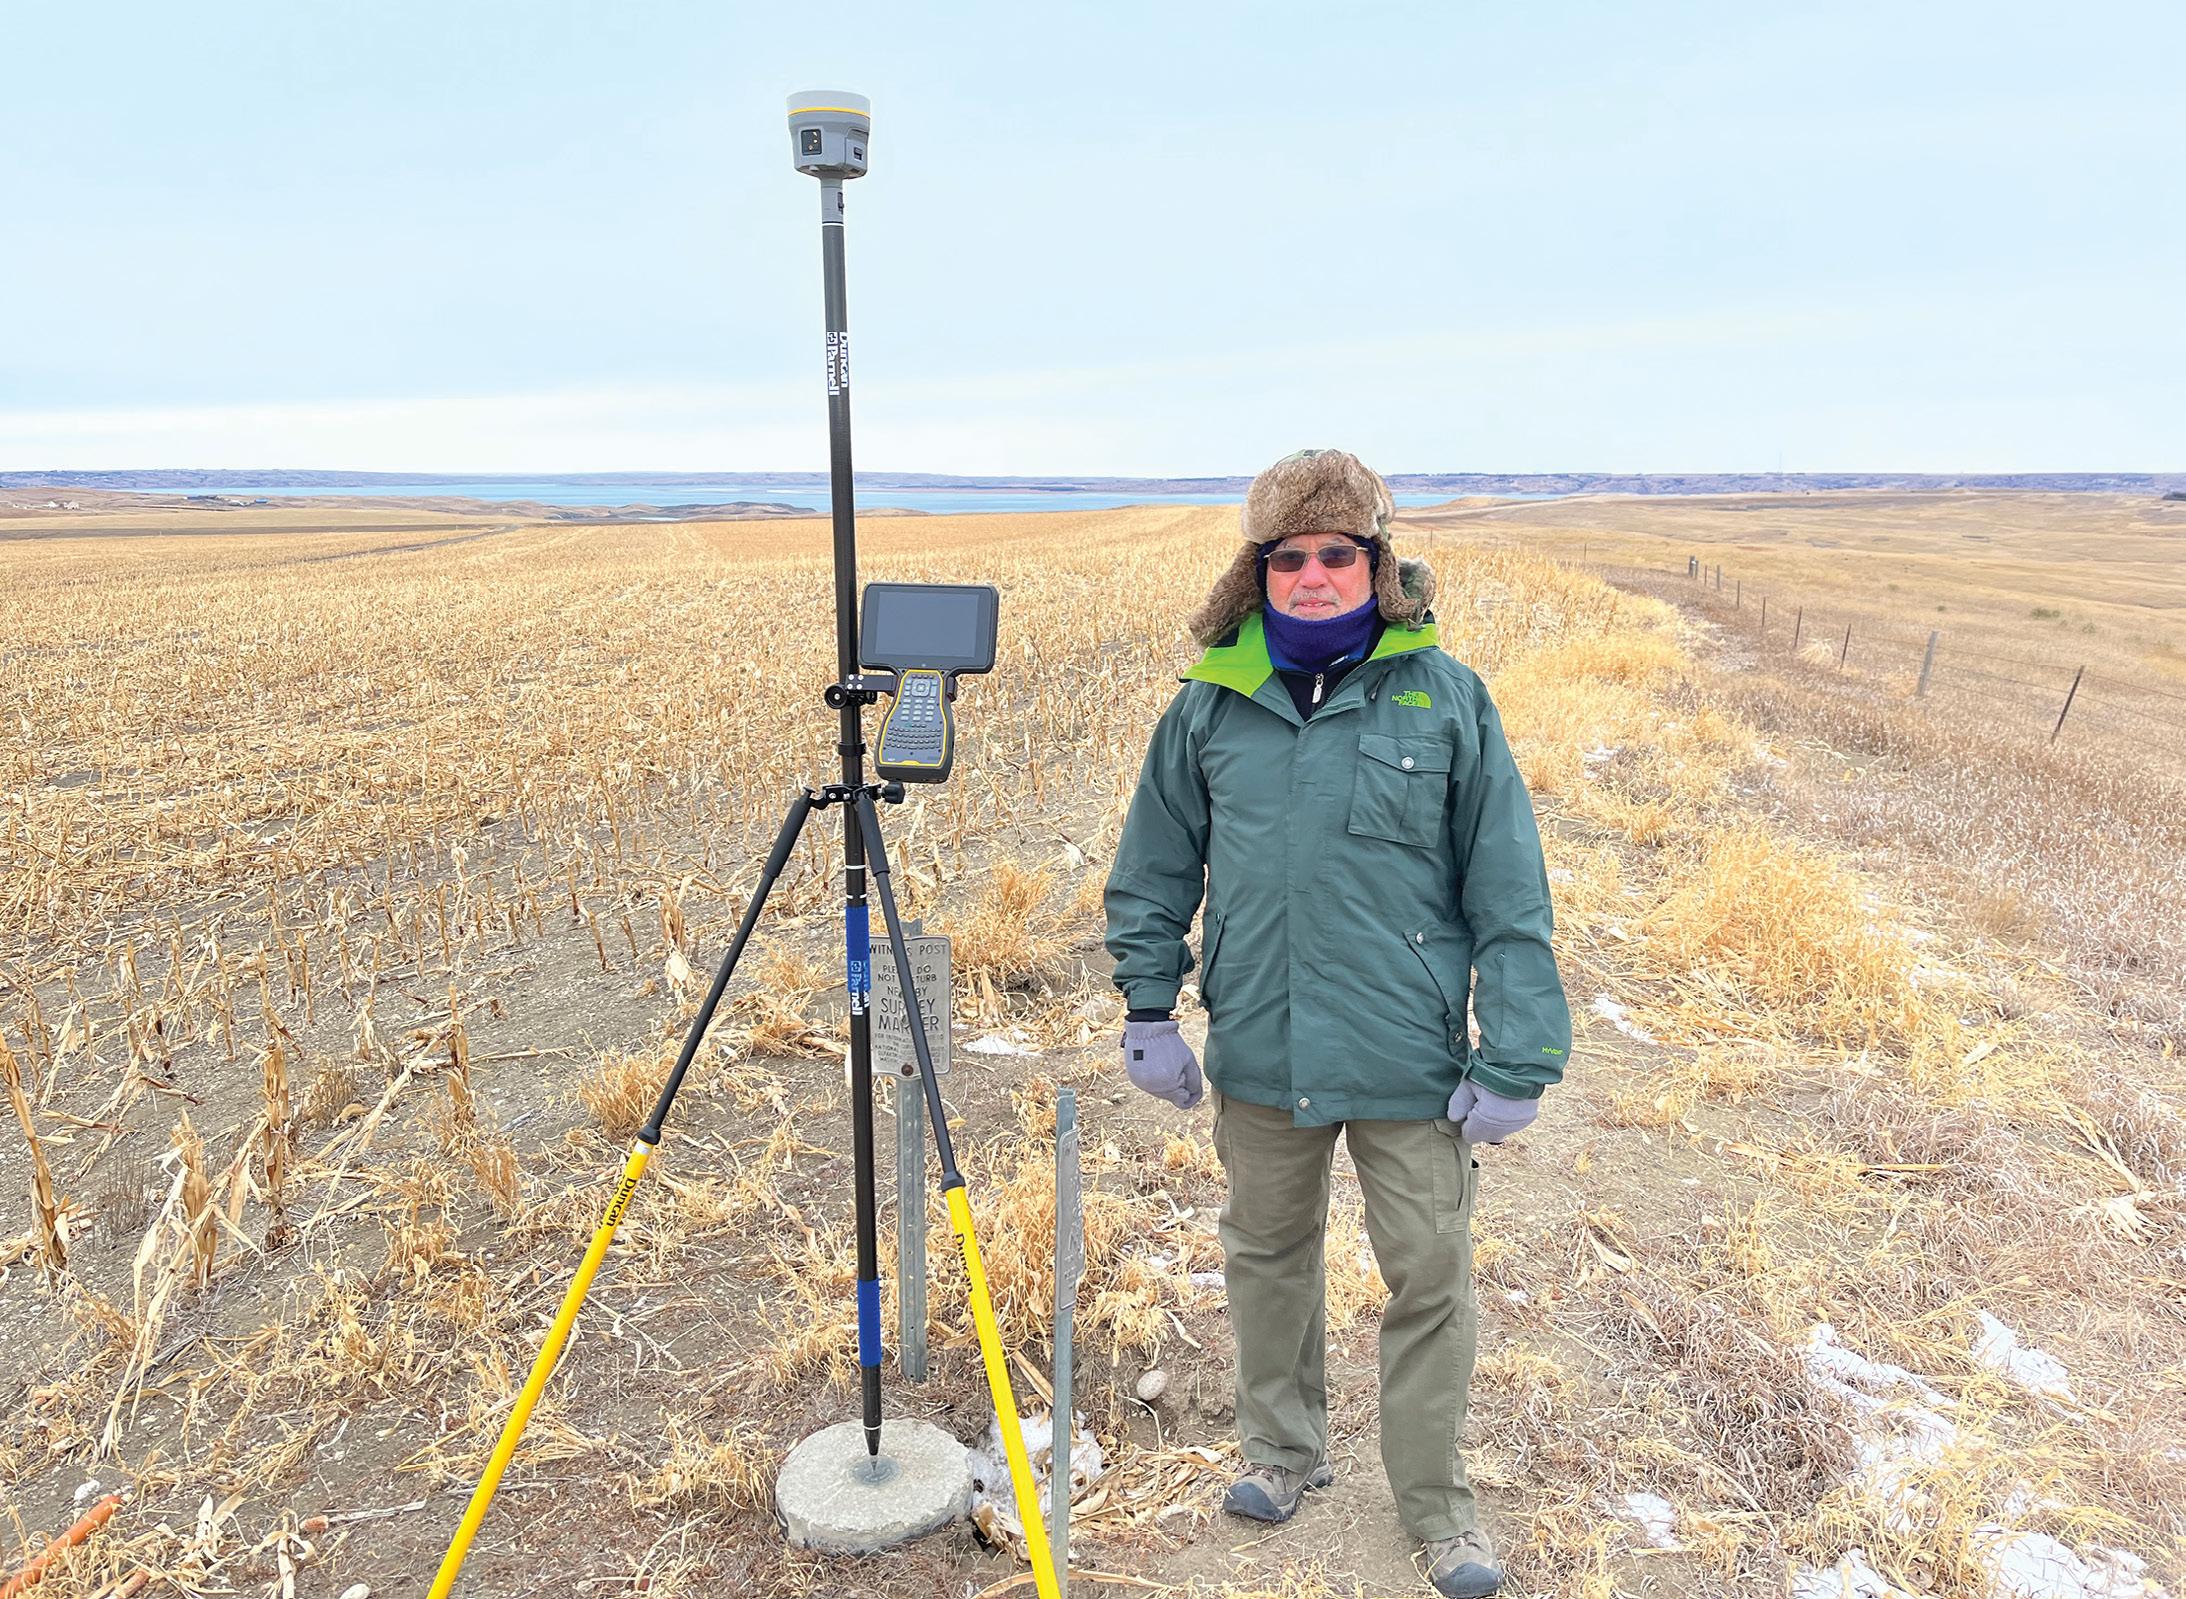
For WGI, a leading engineering and design firm in the US, commitment to delivering precise data and reliable surveying — regardless of location or conditions — is paramount. Such dedication gives WGI the freedom to serve clients across both public and private sectors anywhere, anytime and under any circumstances.
Expecting the unexpected in the field is a key part of a surveyor’s role. Confronting the difficult terrains, facing hardware failures or experiencing connectivity issues on the job site can trigger a cascade of complications, potentially bringing
an entire project to a grinding halt. This imperative — navigating potential obstacles — propelled WGI to equip itself with the appropriate GNSS tools and expertise to handle any task that arises. By ensuring its surveyors are prepared, WGI contributes to its customers’ ability to complete projects safely, efficiently and on budget.
As a leader in providing technology-based solutions for the construction of public infrastructure and real estate development, WGI dispatches its surveyors across the
country on a wide range of projects, including vast geographical expanses, remote job sites or areas that lack basic infrastructure. Surveyors face a wide range of challenges and different environments daily — it’s the job.
Operating in an area with limited-tono mobile coverage often leads to utilising methods of data collection that take significantly more time, such as static GNSS missions or setting up a base station at an NGS control point that is inconveniently far from the site. Likewise, when travelling to locations outside of VRS coverage areas, one has to keep track of a myriad of local
“With
CenterPoint RTX, we were able to streamline our operations and in turn had greater efficiency in completing this particular survey.”
– Roberto Mantecon, WGI
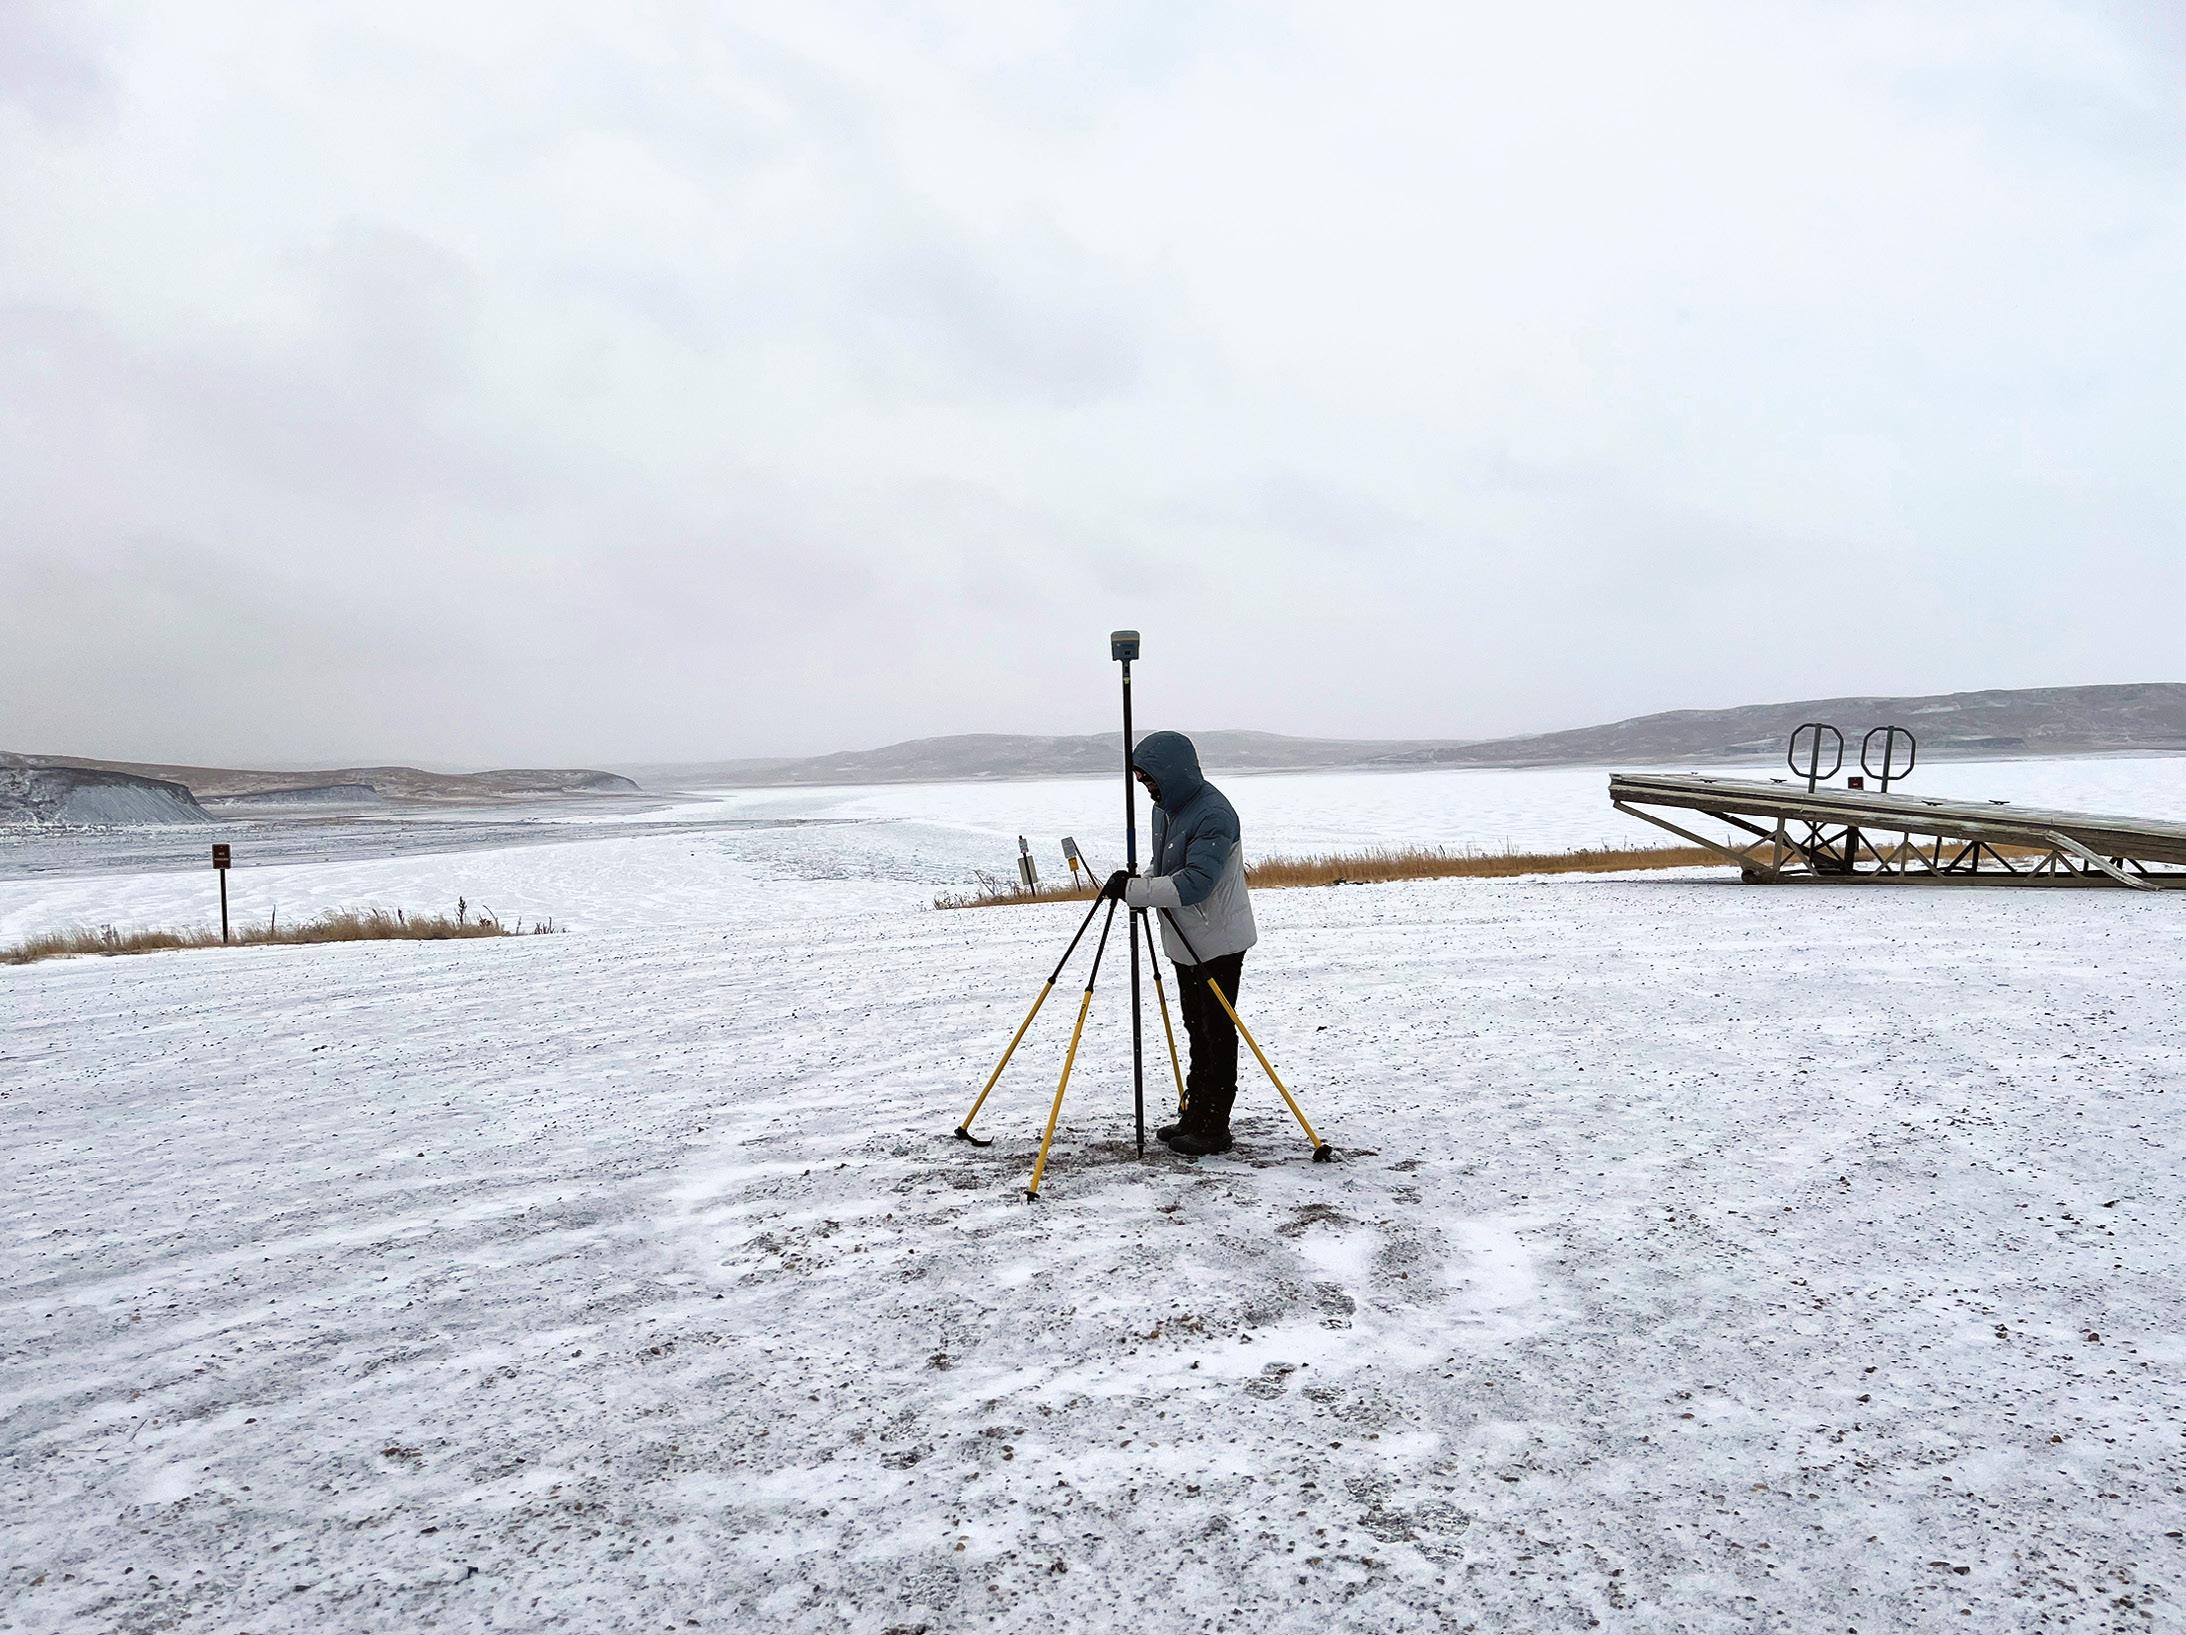
real-time networks. Many third-party RTNs also don’t offer full-constellation support, which impacts satellite availability and makes getting precise measurements more difficult.
Knowing that companies in the public and private sectors responsible for the design and construction of mega-projects — from infrastructure to real estate to industrial developments — rely on solid partners, WGI needs to deliver accurate land surveying data consistently, and on every job. This led WGI to explore the opportunity to integrate Trimble® CenterPoint® RTX® correction service into its arsenal of surveying tools.
While Trimble’s VRS Now™ correction service ensures consistent uptime and accurate measurements, unfortunately, it does not exist everywhere. WGI was exploring its options around how to complement its GNSS workflows and improve its surveying toolkit for greater productivity in the field. Following a recommendation from trusted partner Duncan Parnell and within a day of trialling the product, Roberto Mantecon,
senior operations manager at WGI, realised that Trimble CenterPoint RTX could expand WGI’s operational reach beyond VRS-network footprints and enhance the efficiency of their land surveying capabilities.
“I decided to try CenterPoint RTX and took it to areas without cell coverage. It lit up immediately and exceeded the precision we had been able to obtain previously. We checked 40-50 NGS benchmarks and had consistent 2 cm accuracy on the vertical,” he said.
Because of how quickly CenterPoint RTX converged to a precise position, Mantecon was able to cover 300 to 450 kilometres in one day — a 30% increase in kilometres covered per day.
“With CenterPoint RTX, we were able to streamline our operations and in turn had greater efficiency in completing this particular survey,” he said.
“This Trimble RTX system rocks,” Mantecon added, pointing out that it can address any challenge so his teams in the field don’t have to worry about a local base, local datum or finding a local RTN. “Trimble RTX delivers highly consistent results,” he said.
Mantecon and his team have been leveraging VRS workflows to capture location data using Trimble’s RTK network for 15 years, but the addition of the realtime CenterPoint RTX service allowed WGI to have two corrections work in concert and deliver a true advantage in the field.
“In the remote areas where we are working, it would take significantly longer to get accurate measurements. With CenterPoint RTX we can capture the data within three minutes. Static operations would have taken at least 15 minutes per location.”
The expanded toolkit isn’t just making the customers happy, Mantecon adds. “The field guys love using CenterPoint RTX — it’s very versatile and with one receiver, they can multitask. This was the immediate answer to what they were looking for.”
Not only are customers and field staff impressed, but the reliable accuracy and efficiency gains have paid for the cost of the subscription many times over.
For more information, visit positioningservices.trimble.com. n
The Atlas has moved out of its Beta phase after a period of user testing.
Geoscience Australia’s Digital Atlas of Australia has moved out of the Beta phase following a successful period of user testing, during which there was continued growth in user demand as new data and features were made available.
The fully operational Digital Atlas of Australia was launched on 28 May by the federal Minister for Resources and Northern Australia, Madeleine King, and Geoscience Australia’s CEO, Dr James Johnson.

— making virtual design and planning possible without even having to visit the site.”
The Atlas brings together a range of ‘trusted national datasets’ from across government and presents them on an interactive online platform. It is based upon an ‘Integrated Geospatial Infrastructure,’ and according to GA aims to connect data “across borders to transform and streamline how we connect, manage and use data. This infrastructure will move us from data swamps and silos to a digital ecosystem enabling seamless integration, sharing, and analysis of location data.”
The initiative was introduced as a result of two strategies outlined in the Federal Budget 2021–22 — the Digital Economy Strategy and Australian Data Strategy, which, together, aim to “transform Australia into a modern and leading digital economy by 2023 and focus on improving the accessibility and discoverability of the wealth of data held by Commonwealth organisations”.
In a statement issued in May 2021, Dr James Johnson, CEO of Geoscience Australia, said that the new platform “will embed analysis tools that allow anyone to explore, graph, analyse and compare information that meets their needs in their neighbourhood and across the country”.
“For example, a business will be able to explore and download demographic profiles of towns and regions, along with information on infrastructure, to determine the most commercially-viable places to set up new outlets, anywhere in Australia
The Atlas groups data into a range of different themes:
• Administrative boundaries
• Buildings and settlements
• Land cover and land use
• Physical infrastructure
• Population distribution
• Transport and transport infrastructure
• Water bodies
Data will also be discoverable according to specific ‘initiatives,’ the first of which to be implemented was bushfire intelligence, bringing together a Historical Bushfires dataset and a range of interactive products to support bushfire research, national emergency management and risk management.
Final operating capability for the Atlas is due in mid-2025.
“The Digital Atlas of Australia offers a treasure trove of information, all in one place,” Minister King said. “The Digital Atlas can help identify opportunities for industries such as mining and agriculture by combining analysis of soil and geology, water bodies, and land use data.”
“Using data from across government agencies, the Digital Atlas gives government comprehensive data to better understand and to respond to issues.”
Speaking to Position last year, Lisa Bush, National Location Information Branch Head at Geoscience Australia, said that “what we would really like to do at Geoscience Australia is identify and
fill the gaps in our national foundation data to truly realise the potential of location-enabled decision-making for all Australians”.
“Developing the Digital Atlas came with its fair share of challenges, and among these, three significant hurdles come to mind,” Bush added. “Foremost, finding the right technology that can seamlessly handle interoperability and scalability to ensure the platform can grow and adapt with changing needs is essential.”
Bush went on to say that “Wrangling and harmonising the diverse range of data from a range of sources and critically assessing if they are fit for purpose is a big one. What is currently available in the Digital Atlas is the best available, but we know it could be better. It could have more current and accurate data, and so we are focused on working with data producers and suppliers to get the right data, at the right quality and currency needed to support meaningful outcomes and, ultimately, leave no gaps in our foundation data.”
Bush also said that a major challenge was accommodating the needs of a diverse user base.
“Our aim was to create an accessible platform that caters to users with varying levels of geospatial experience,” Bush said. “Striking a balance between providing information in a straightforward format for novices while also offering detailed metadata for geospatial experts was no small feat. It’s an intricate dance of simplicity and comprehensiveness that we will continue to choreograph.” n

BY CHRIS BODY
The Forum will bring the community together to discuss and collaborate on common drivers of geospatial programs.
The Open Geospatial Consortium (OGC) membership has reestablished many of its Regional Forums after the pandemic, including the Australia/ New Zealand Forum (OGC ANZ Forum)
The Regional Forums are important within OGC as they provide national and regional members the opportunity to highlight their geospatial programs or other local geospatial innovation. In general, the forums focus on:
• helping to identify and discuss common interoperability issues in a local or regional context;
• identify specific interoperability research, development and demonstration activities that can be usefully carried between OGC members within their local/national contexts;
• outreach to raise awareness of the benefits of OGC innovation, standards and their impact;
• provide for coordinated representation in the OGC; and
• provide a platform for growing OGC membership and project participation by organisations not presently represented in OGC membership.
The re-establishment of the ANZ Forum will bring the local geospatial community together to understand, discuss and collaborate on the common drivers of various geospatial programs by:
• developing awareness, acceptance, and implementation of geospatial interoperability best practices based on Australian and New Zealand National policies;
• supporting the promotion and adoption of existing OGC standards appropriate to Australian and New Zealand markets;
• identifying requirements related to Australian and New Zealand needs and introducing them into OGC processes;
• developing supportive and synergistic working relationships with similar national organisations so as to complement their programs and achieve authentic mutual benefit; and
• highlighting the impact and benefits of OGC innovation and standards in Australia and New Zealand, based on specific regional use cases, with a focus on local government, and academic and research organisations.
Anyone interested in supporting the re-establishment of the OGC ANZ Forum, is encouraged to contact Trevor Taylor (ttaylor@ogc.org) or Chris Body (cbody@ogc.org).
OGC members and nonmembers alike are encouraged to join.
In addition to the OGC Regional Forums, OGC holds three Member Meetings each year — one each in Europe, the Americas and the Asia-Pacific — where OGC’s Standards Working Groups, Domain Working Groups, members and other geospatial experts meet. The meetings serve to progress standards, provide feedback on innovative initiatives being run by the OGC Collaborative
Solutions and Innovation (COSI) program, hear about the latest happenings at OGC, network with the leaders of the geospatial community, and see what’s coming next.
The meetings are open to the public, though there are some closed sessions, and provide a great way to start to get to know — and get involved with — the OGC Community.
The next OGC Member Meeting will be held in Seoul, Republic of Korea, from 4 to 8 November 2024. The meeting will focus on such diverse topics as:
• Artificial intelligence for geospatial
• Urban digital twins
• Climate resilience
• Indoor navigation
• Sensor integration
• API development
• Land administration
• Blockchain and DLT
• Geodesy and coordinate referencing systems
• Metadata Registration is opening soon. Visit ogcmeet.org to learn more.
In addition, Standards Australia will host the ISO/TC 211 Geographic Information/ Geomatics Committee meeting in Sydney from 11 to 15 November 2024. n
BY NICHOLAS GOWANS AND VOLKER JANSSEN
Cluster processing is a decision of convenience rather than performance.

AUSPOS is Geoscience Australia’s free online Global Positioning System (GPS) processing service. It takes advantage of the International GNSS Service (IGS) core network station data and products (e.g. final, rapid or ultra-rapid orbits depending on availability) together with Continuously Operating Reference Stations (CORS) in and around Australia.
Processing is based on static dual-frequency GPS carrier phase and code data of at least 1 hour duration (recommended minimum of 2 hours, maximum of 7 consecutive days). When submitting 30-second Receiver Independent Exchange
(RINEX) data, users are required to specify the antenna type and the vertically measured antenna height from the ground mark to the Antenna Reference Point (ARP).
An AUSPOS report (PDF) is then emailed to the user, which includes the computed coordinates and their uncertainties, ambiguity resolution statistics, and an overview of the processing strategy. For advanced users, Solution Independent Exchange (SINEX) files containing more detailed information are also available for download.
AUSPOS datasets can be submitted and processed either individually or collectively in
groups (clusters) of concurrent observations. In this article, we thoroughly test and quantify the effect of AUSPOS cluster processing by leveraging the extensive GNSS observation datasets held by DCS Spatial Services, a unit of the NSW Department of Customer Service (DCS).
AUSPOS data can be submitted and processed either individually (mark by mark) or collectively (in groups of concurrent observations). Individual, singlemark AUSPOS processing refers to the data collected at one survey mark being processed relative to
the surrounding CORS network with no direct relationship to any other rover that was operating at the same time.
AUSPOS cluster processing considers that the multiple data files were collected during the same time window and are therefore correlated. Rather than individually connecting each user site to the surrounding CORS network, processing includes baselines between the user sites. In theory, this provides a stronger relative connection, provided all user sites are observed in a similar time window and the baselines formed between user sites are less than 20 km in length (Figure 1).

AUSPOS first detects which rover observed the longest, and this becomes the hub for the user data (regardless of the relative geometry of all user stations and CORS). In the ideal scenario, baselines are then formed between the hub and the surrounding CORS, while all other rovers are connected to the hub (provided there is sufficient data overlap).
AUSPOS accepts submissions of up to 20 RINEX files in one job, which are then processed together as a cluster, using an observation window that contains the collected data at all sites (between earliest start time and latest end time).
Individual observation sessions should overlap by at least 1 hour with respect to the hub, as this overlap is used to compute the baselines between user sites (and the direct L1/L2 ambiguity resolution strategy applied for short baselines is more reliable for data exceeding 1 hour). The baselines in the cluster are formed based on the maximum available number of single-difference observations (involving one satellite and two receivers).
If the data overlap of a particular user site with respect to the hub is too short, AUSPOS attempts to compute a baseline to another user site instead (Figure 2a). If this is unsuccessful, a baseline to a CORS is formed, thereby losing the desired relative connection (Figure 2b).
Positional Uncertainty (PU) is defined as the uncertainty of the horizontal and/or vertical
coordinates of a point, at the 95% confidence level, with respect to the datum. It can be separated into Horizontal PU (HPU) for horizontal position and Vertical PU (VPU) for ellipsoidal height.
HPU is expressed as the radius of a 95% circle of uncertainty, generally calculated from the standard error ellipse produced by a least squares network adjustment. VPU is a linear quantity and obtained by scaling the standard deviation by 1.96 to convert it to 95% confidence.
AUSPOS calculates PU based on the East, North and ellipsoidal height coordinate uncertainties according to the Guideline for Adjustment and Evaluation of Survey Control, which is part of the Standard for the Australian Survey Control Network (SP1), version 2.2.
As the government agency responsible for the maintenance of the NSW survey control network, DCS Spatial Services maintains an
extensive repository of GNSS observation data.
Using in-house generated Python code, it has been interrogated to automatically form clusters based on the following criteria:
• Each observation must have been processed through AUSPOS version 2.4 in single user station mode.
• Each observation may only be used in a single cluster.
• Each observation within a cluster must have a minimum overlap of at least 2 hours with the longest observation (hub) in the cluster.
• Each station within a cluster must be located no further than 10 km (a distance nominated by the authors) from the nearest usersubmitted station.
• Clusters must not contain more than 20 user-submitted observations. This strategy resulted in the formation of 909 clusters of two or more observations using 3,124 GNSS observation files. While the most prominent cluster sizes included 2 (51%),
3 (19%) and 4 (11%) survey marks, the largest cluster grouped together 17 marks.
Each cluster was processed through AUSPOS, with the resulting AUSPOS report and SINEX results being stored for analysis. Of the 909 clusters identified, five (0.6%) failed to process and 199 observations (6.4%) across 131 clusters processed with warnings of large PU.
Our goal was to evaluate the general performance differences between AUSPOS single and cluster processing, rather than reviewing outlier or worstcase events. Therefore, the failed clusters were discarded without further review, and the observations with large uncertainties were removed from the analysis. This resulted in 2,879 observation files producing results that could be validly compared.
Observations receiving large-uncertainty warnings were tallied according to the processing strategy applied and visualised to illustrate when a station observation received a warning for large PU: in single mode processing, cluster processing, both, or one and not the other (Figure 3).
This simple analysis shows that clustered solutions are more prone to resulting in large-uncertainty warnings, particularly at user stations with less-than-ideal observing conditions (e.g. poor sky view due to tree cover or other obstructions).

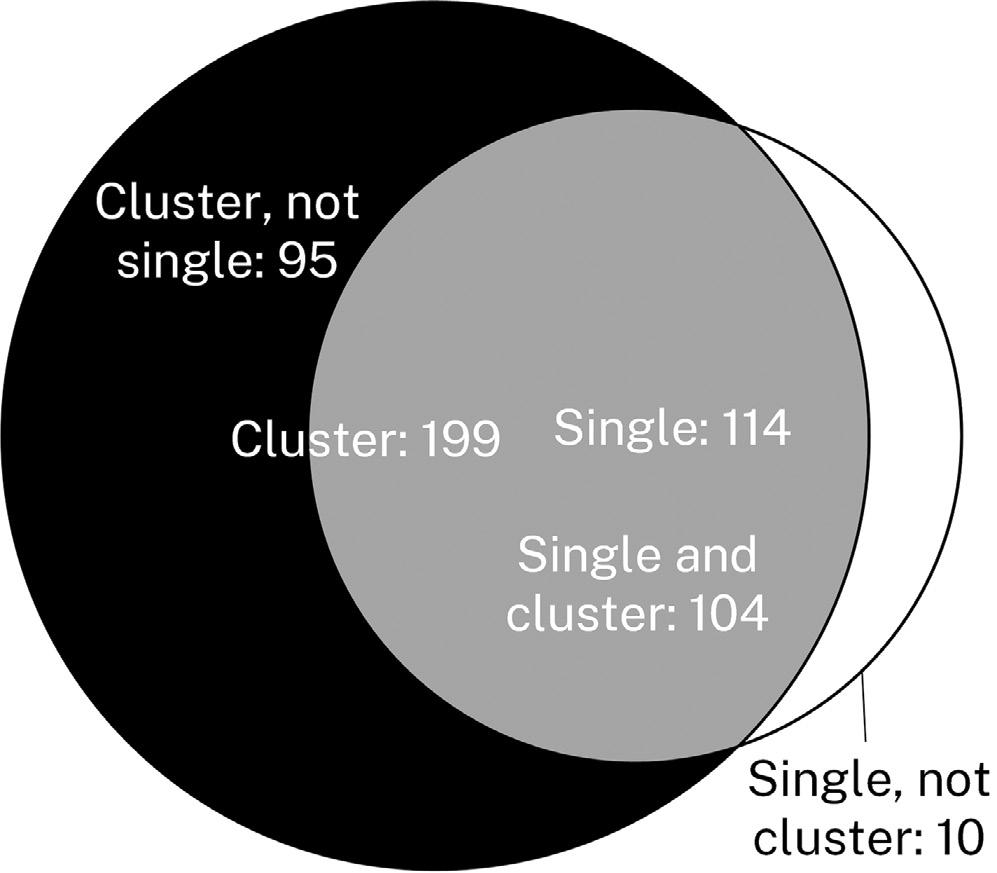
This may be due in part to a different ambiguity resolution strategy adopted by AUSPOS with multiple submitted user stations as the baseline lengths within the cluster are shorter than those to the surrounding CORS. The short-distance, direct L1/L2 strategy applied for 0-20 km baselines may not perform as well in tough observing environments as the long-distance QuasiIonosphere-Free (QIF) strategy applied for 20-2,000 km baselines.
Acknowledging the number of observations containing warnings in the AUSPOS report, it is worth noting that even though these observations do not produce centimetre-level positions, they may still be useful for submetre applications.
Alternatively, the largeuncertainty warning may only be attached to the vertical component of the solution (generally due to a relatively short observation session affected by tree cover), while the horizontal component can still be considered fit-for-purpose. Results of this nature are routinely assessed by DCS Spatial Services on a case-by-case basis. There is further utility in storing such observation data, considering that a result that fails (or produces warnings) today may
PU and covariance) and can be separated into Horizontal RU (HRU) for horizontal position and Vertical RU (VRU) for ellipsoidal height.
All coordinates and quality values analysed were adopted from the GDA2020 SINEX files. Using the GeodePy Python library, PU and RU were computed from the variance-covariance matrix and expressed at the 95% confidence level.
changes for all coordinate components are less than one millimetre and well within the standard deviation of the distributions (Figure 4). This alone is sufficient to demonstrate that no significant difference is detectable between the two processing strategies based on the data available.
become acceptable in the future as processing strategies are refined over time.
The quality of results from AUSPOS single-processing and cluster-processing solutions was examined in terms of coordinate changes, derived baselines between usersubmitted stations, Positional Uncertainty (PU) and Relative Uncertainty (RU).
RU is calculated for a pair of survey marks (based on their
Baselines between user stations were derived through coordinate differences from the SINEX files. Single-solution results were taken from their respective, discrete SINEX files and assumed uncorrelated (i.e. all covariances between stations are zero), while cluster-solution results adopted the relevant inter-station covariances as reported in the SINEX file.
The four primary areas of interest (coordinates, derived baselines, PU and RU) show no significant change or improvement when AUSPOS cluster processing is employed. While there are some changes in the extremities of the distributions, these are not considered further because this study is looking for a clear trend.
The mean and median
Similarly, when baselines are derived between AUSPOS usersubmitted stations, the average changes in baseline components are sub-millimetric. This shows that even if a clustered solution might have a theoretically superior RU, no appreciable difference is evident in the actual relative positions.
The distribution of uncertainty was quantified via histograms of the obtained GDA2020 PU and RU values for single and cluster solutions. Inspection confirmed the high quality of AUSPOS solutions – with median values of about 0.017 m (HPU), 0.045 m (VPU), 0.022 m (HRU) and 0.059 m (VRU) – and that little change is present between the two processing modes.
However, investigating the changes in uncertainty presented more mixed results (Figure 5). Cluster processing, on average, saw a very small degradation in horizontal and vertical PU while small improvements were

4: GDA2020 coordinate changes in (a) Easting, (b) Northing and (c) ellipsoidal height for each observation. Differences are computed as cluster-solution coordinate minus single-solution coordinate (courtesy DCS Spatial Services).
“Our goal was to evaluate the general performance differences between AUSPOS single and cluster processing, rather than reviewing outlier or worst-case events.”
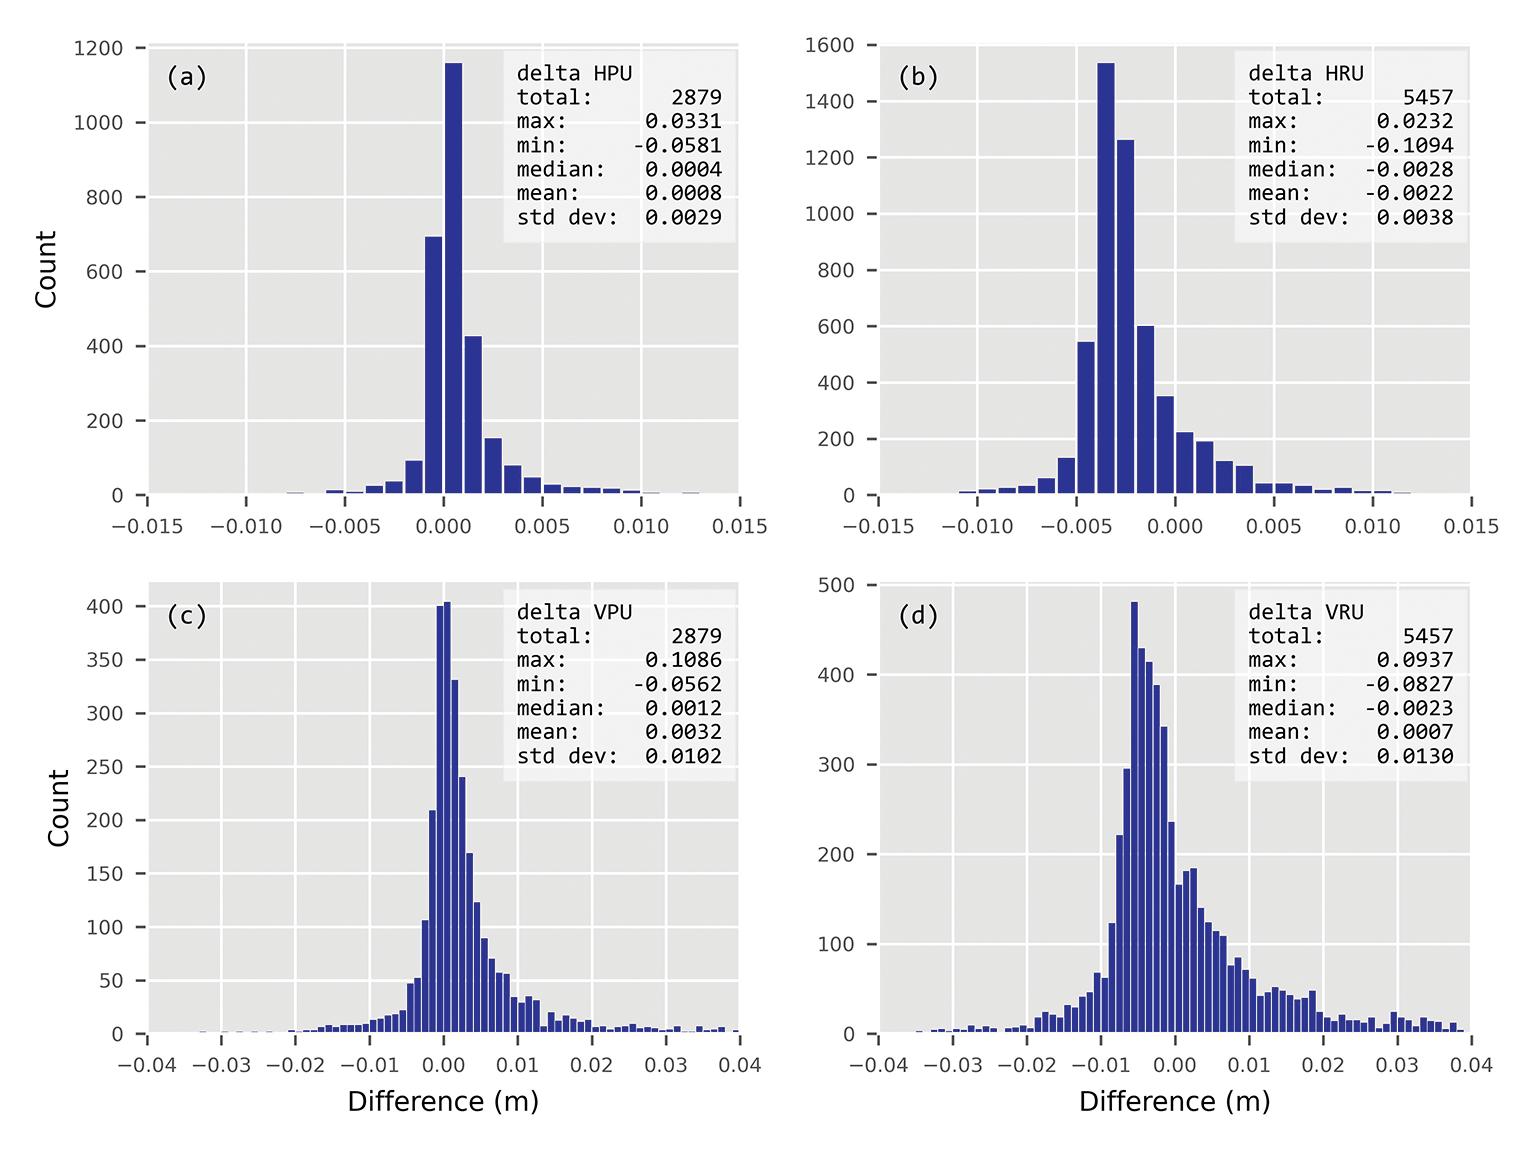
observed in horizontal and vertical RU. Neither of these changes exceeded one-sigma of their distributions and therefore these changes are also considered statistically insignificant.
The most notable uncertainty improvement using cluster processing was a median change of 0.0028 m in HRU, falling comfortably within the one-sigma level of 0.0038 m. However, it should be noted that the improvement to RU is computed from uncertainties expressed at the 95% confidence level. When converted back to the one-sigma level, the difference is closer to 1 mm, which is an improvement of questionable value to any surveyor, for any application.
Such small improvement in RU may come as a surprise. On first consideration, one would expect that stations observed concurrently and processed together should have a more precisely determined relative position, which would yield improved RU.
However, the variancecovariance matrix provided by AUSPOS may not be well suited to RU computations due to the large number of constraints employed by AUSPOS. Surrounding CORS are constrained at 1 mm horizontally and 2 mm vertically (IGS stations) or 3 mm horizontally and 6 mm vertically (other CORS). This likely decorrelates the uncertainty estimates at the user stations, resulting in RU values that are almost indistinguishable from those obtained when the observations are processed as discrete single solutions.
This effect is readily seen in least squares network adjustments with very good connection to datum where the precision of the constraints ‘overpowers’ the measurements between stations. Even if this is the case, the minimal change in coordinates and relative position still supports the conclusion that AUSPOS cluster
This supports our earlier assertion that the large number of CORS constraints can cause a decorrelation of the uncertainty estimates at the user stations. Similarly, no significant correlation was found between the change in RU and the cluster size.
Finally, the experiment was rerun with the RU analysis restricted to only include pairs of stations where AUSPOS reported that a baseline had been formed during processing. This allowed 1,455 pairs of stations to be analysed, producing median changes of -0.0031 m (HRU) and -0.0037 m (VRU) which are not significantly different to the full analysis shown in Figures 5b and 5d.
processing, in its current form, offers no real advantage over single processing.
On the other hand, the high quality of results in single mode across NSW may be in part due to the dense CORS network contributing to AUSPOS. The bar may be set so high that little benefit is gained with the supply of additional observations between user stations.
With no clear trend in RU difference between singlesolution and cluster-solution, the change in RU was examined with respect to the distance between stations. No discernible correlation was evident.
Furthermore, it is noted that the full duration of each observation may not be utilised by AUSPOS depending on the observation overlap between stations forming a baseline. As such, the RU for each pair of stations was examined with respect to the overlapping observation time. Again, no discernible correlation was evident.
We conclude that AUSPOS positioning results do not significantly differ between single and cluster mode. Considering the additional effort required for field work planning and logistics, purpose-designed cluster networks offer little benefit, at least in regions covered by a dense CORS network such as NSW. In some instances, AUSPOS users may encounter more frequent large-uncertainty warnings where cluster processing is employed, especially at sites with challenging sky view conditions. If such problems are encountered, the user is advised to try single mode AUSPOS processing.
However, AUSPOS clustering may be more convenient for some users and applications because concurrently observed RINEX files can be submitted together in one job and the processing results are received in a single AUSPOS report.
This is a decision of convenience rather than performance and will depend on the user’s preferences and the task at hand. In any case, AUSPOS continues to deliver high-quality positioning results via a sophisticated but convenient online service.
Nicholas Gowans and Dr Volker Janssen work at DCS Spatial Services, a unit of the NSW Department of Customer Service. n

BY JONATHAN NALLY
Our societies depend upon geodesy, but the world’s geodetic ecosystem faces significant vulnerabilities.
Weaknesses in the global geodesy supply chain are leaving the world vulnerable to catastrophic failures of critical infrastructure and resultant adverse economic impacts, according to a new report from the United Nations Global Geodetic Centre of Excellence (UN-GGCE).
The vulnerability of the world’s mostly satellite-based positioning, navigation and timing (PNT) ecosystem is well known, but the weakness of the fundamental measurements underpinning it are less well appreciated.
According to the report, PNT, communications and Earth observation satellites require two things: knowledge of the satellites’ exact place in space at every moment, and continually updated knowledge of the Earth’s shape, orientation, gravity field and coordinate reference frame. Collectively, they are known as ‘geodetic products’.
These geodetic products are produced by the global geodesy supply chain, which involves:
• continuous observation of the movement of the Earth and satellites, accomplished by ground-based observatories and the scientists and technicians who operate them;
• data centres and data centre operators who quality check the data from observatories and make it available to the global geodesy analysis community; and,
• analysis centres, correlation centres and analysts who translate the raw data into geodetic products.
This supply chain is becoming more vulnerable as each year passes, due to a number of factors.
The first is that decision makers in government are largely unaware of the world’s heavy reliance on geodesy, due to a lack of readily understandable and accessible information on why geodesy is so important.
Another factor is that around half of all ground observation stations are no longer productive due to age or lack of operational funding. Added to that is the fact that “data collection from ground stations observatories along with quality checking, analysis and development of geodetic products is reliant on in-kind contribution and is done on a best-effort basis,” says the UN-GGCE.
On the topic of funding, the UN-GGCE says that the funding “allocated to the operation of the global geodesy supply chain is estimated to be between €60-90 million per year worldwide, which is less than 0.05% of revenue generated from GNSS and EO services”.
One clear weakness is that the global geodesy sector does not have an international governance body, such as meteorology does with the World Meteorological Organisation. If such a body were to be formed, it would be able to ensure that “the global geodesy supply chain meets Member State requirements, including the provision of accurate and reliable geodetic products critical to people’s lives,” the UN-GGCE says.
Added to that is the decline in the number of geodetic professionals in many
parts of the world, due to fewer geodesy training opportunities within the tertiary sector, and a general lack of awareness of career opportunities.
Finally, the UN-GGCE says that even the sectors that are reliant on geodesy and satellite-based PNT, are unaware of the extent of the global geodesy supply chain and it’s vulnerabilities.
To combat these problems, UN member states and partners are working on a Joint Development Plan, to be released in August 2024, which will show how they might “work together to strengthen the supply chain to enhance the reliability and integrity of the geodetic products”.
Actions that could be taken include:
• establishing a geodesy working group to assess the risks in the supply chain, translate those risks into evidence with which to influence decision makers, and develop mitigation strategies;
• officially recognising the supply chain as ‘critical national infrastructure’ and resourcing it appropriately;
• developing outreach programs to make geodesy more visible and understandable to society;
• sharing data and knowledge, and building capacity;
• developing formal bilateral or multilateral agreements to address gaps in the supply chain; and,
• investigating options for foreign aid investment to support the supply chain in other countries.
The report can be found at ggim.un.org/ UNGGCE/documents/20240620-Hidden_ Risk_Report.pdf. n
Trimble has announced the newest addition to its GNSS receiver portfolio, the R980. The R980 brings together several Trimble technologies to create a tool for land surveying, transportation infrastructure, construction, energy, oil and gas, utilities and mining projects. Features include Trimble’s ProPoint GNSS positioning engine and IMU-based tilt compensation using Trimble TIPTM technology. Communication capabilities include a dual-band UHF radio and an integrated, worldwide LTE modem for receiving corrections. With the R980 able to operate on 450 MHz, 900 MHz or LTE bands, users have flexibility in how they receive and transmit RTK corrections. The R980 also includes Trimble IonoGuard technology, which mitigates ionospheric disturbances for RTK GNSS, and Trimble Everest Plus for advanced multipath mitigation.

IBM has unveiled a new platform, IBM Environmental Intelligence, designed to empower data scientists and application developers with environmental data sets. Currently under public preview, it features curated data from public and commercial data sets, out-of-the box models, and connectors, that align with specific events and generate alerts, supporting data integration into mission-critical software and daily operations. It provides a wide range of geospatial APIs for processing, normalising and organising public data sets into geospatial layers for scientific analysis and visualisation. By leveraging APIs or Python Geospatial SDK, it can work with data sets such as highresolution imagery (ESA Sentinel 2 and NASA Landsat 8), Global weather (ERA5) and JAXA ALOS 3D Global.


Leica Geosystems has announced the launch of the Leica iCON gps 120, a smart antenna designed to empower construction professionals with scalable and flexible machine control solutions. The iCON gps 120 is integrated into the existing Leica MC1 solution platform and extends the solution offering to more applications and machine types. Customers can start with a single GNSS solution using an SBAS or HxGN SmartNet PPP service, or for higher specifications upgrade to an RTK solution with low- or highaccuracy by adding the Leica CR50 communication unit. With a second iCON gps 120, customers get a full, high-accuracy, dual-GNSS solution with heading.

Teledyne Geospatial has announced the availability of CARIS AutoChart, a new nautical chart production solution that automates the generation of paper charts in PDF and/or TIF formats from S-57 ENC files, reducing or eliminating delays between the release of new S-57 ENC datasets and their corresponding paper charts. CARIS AutoChart creates each paper chart from a template file, populating it with relevant features from the matching S-57 ENC data, while handling the addition of borders, grids, marginalia information, depth contour labels, textual annotations and masking as specified in the paper chart template. It also detects labels overlapping key navigation information and includes customisable label placement rules to automatically move labels and avoid conflicts.

Kate Lundy President/Chair
Kate Ramsay Deputy Chair
Alistair Byrom Deputy Chair
Jacinta Burns Director
Paul Digney Director
Stewart Dunne Director
Mary-Ellen Feeney Director
Darren Mottolini Director
Roshni Sharma Director
In the last edition of Position, I touched on the preliminary findings of our ‘Economic impact of geospatial services in Australia’ report, which was produced by ACIL Allen. I am therefore pleased to let you know that after a couple of months of refining the report with the Steering Committee, the full version will be available on our website by mid-August.
As you are likely aware, the purpose of commissioning the report was to assess the current economic impact of geospatial services in Australia today, as well as to predict its expected impact in 10 years’ time. The forward-looking projections for 2033–34 have been revised upwards following further refinement of the economic modelling — the actual projected impact is now an additional $90 billion in GDP and 32,000 FTE jobs, assuming a favourable operating scenario, and in a business-as-usual environment (BAU), the impact would be just over $62 billion in GDP. The current figures for 2023–24 remain unchanged at $39 billion impact on Australia’s economy and 12,000 FTE jobs.
The report contains numerous case studies (split by sector), demonstrating the extent, importance and reach of geospatial information in Australia. There is also a separate accompanying document containing 180 case studies.
There is a significant difference between the two forward-looking scenarios assessed in this study, and a question we have received a number of times: “What
would shift the dial to enable the higher outcome?” These projections represent the best estimates for both a BAU and a favourable operating environment scenario. It is possible that the BAU scenario could be lower, and the favourable operating environment could be higher depending on future conditions. Which path is realised depends on several variables. Achieving a higher outcome will require regaining the momentum of adoption and innovation maintained from 2008 to 2020, but which was lost to some extent during the COVID period.
The things that would maintain the momentum and enable Australia to achieve a higher outcome, include:
• Resolving the workforce shortages in the geospatial field at both professional and technical levels.
• Maintaining an active research and innovation effort to continue to build knowledge and innovation in the Australian sector.
• Ongoing access to space-based systems and services including Earth observations from space, positioning, navigation and timing, and satellite communications.
• Achieving a national approach to sharing geospatial data including ownership, access and security, while progressing the digital transformation agenda.
• Continued investment in geospatial data infrastructure, including Foundation Spatial Data and bathymetry.
• Steady progress on development of spatial digital twins by state/territory and local government, and the private sector.
• Establishing the relationship between geospatial information and critical infrastructure.
• Increased innovation by the private sector that would in turn accelerate the update of geospatial information use across most sectors of the economy. By understanding where we stand today and envisioning our potential influence on the national economy over the next decade, we are aiming use this report to help shape policies that will not only foster further growth of Australia’s economy, but also position the geospatial sector at the heart of Australia’s broader narrative and economic growth. This report will serve as a benchmark for us, and we are committed to developing actionable recommendations for state and federal government to harness the full potential of geospatial technologies. We are extremely grateful to the organisations who have partnered with
GCA and the Chartered Institution of Civil Engineering Surveyors (CICES) have joined forces with a new Memorandum of Understanding (MoU) aimed at enhancing geospatial standards and promoting professional excellence across continents.
At the core of the partnership is a commitment to harmonise certification standards for engineering surveyors, facilitating mutual recognition between the UK and Australia. This collaboration also seeks to promote global best practices in competency standards, ensuring members of both organisations benefit from shared knowledge and experiences. Key aspects of the MoU include identifying and sharing best practices, capturing collective value through standardisation, and supporting joint participation in relevant events. Both organisations will also collaborate on strategic projects and initiatives that add value to their respective memberships, promoting greater awareness of the engineering surveying profession, and fostering professional development opportunities.
“We are excited to partner with CICES in this strategic endeavour to elevate geospatial standards globally,” said Tony Wheeler, CEO of GCA. “This collaboration
us on the report (listed on the report’s acknowledgements page), and who provided funding, advice and guidance via their participation on the project steering committee, without which this work would not have been possible. While the industry still has a long way to go to achieve its full potential, this report sets a strong foundation for future advancements.
The report shall be followed by a detailed document that articulates our recommendations to state and federal governments that lays out a clear set of actions that will provide a favourable environment for geospatial to flourish, and assist the nation in increasing the overall size of the economy, the number of skilled workers and lifting overall productivity.
A discussion paper shall be released later this year inviting comment. We would value input from as wide a as possible an audience to ensure we capture the essential set of recommendations to go forward with. n
Tony Wheeler CEO, Geospatial Council of Australia

underscores our commitment to fostering innovation, sharing knowledge and promoting excellence within the industry.”
“This MoU with GCA represents a genuinely significant moment for our organisations,” added Simon Hamlyn, CEO of CICES. “By aligning our efforts, we can better serve our respective memberships and contribute to advancing geospatial standards worldwide.”
The agreement underscores a shared vision to leverage geospatial information for sustainable development goals, aligning with the United Nations 2030 Agenda. Regular communication at governance and management levels will facilitate ongoing collaboration, ensuring that initiatives are effectively executed, and goals achieved.
Through this strategic partnership, GCA and CICES aim to strengthen the geospatial profession’s global footprint, empower professionals with enhanced capabilities, and foster a community where excellence thrives.
State and Territory Chairs and Co-Chairs
NSW Chair
Brittany Baker
NSW Vice-Chair
Hanno Klahn
ACT Chair
Mike Stapleton
Queensland Chair
Cameron Brittain
Queensland Vice-Chair
Koray Ozdogu
South Australia Chair
Graham Walker
South Australia Vice-Chair
Jennifer Brindle
Tasmania Chair
Anthony O’Flaherty
Victoria Chair
Nicole Kiely
Western Australia Chair
Laren Collen
GDARS Chair
Dr Jagannath Aryal
Surveying Chair
Mike Stapleton
Hydrography Chair
Neil Hewitt
Young and Emerging Professionals Chair
Oscar So
In the ever-evolving field of Earth observation, few individuals stand out as prominently as Lavender (Qingxiang) Liu. Having recently been awarded the GCA Oceanic ‘Future Leader of the Year Award’ at Locate24, Lavender’s contributions to geospatial science and the remote sensing community have been noteworthy. Her journey, marked by significant achievements and a dedication to diversity and inclusion, undoubtedly serves as an inspiration to many in the industry.
Currently working as an Earth observation data scientist at FrontierSI, Lavender’s passion for geomatic engineering and remote sensing came from a desire to harness technology to solve pressing global issues. Her educational background, with a PhD in Geomatic Engineering and a Bachelor’s in Surveying and Mapping Engineering, provided a solid foundation for a career dedicated to innovation and scientific exploration. “I was drawn to Earth Observation because of its ability to generate data-driven insights that can address real-world challenges,” says Lavender. “I was fascinated by the technology involved in this field, which combines remote sensing, data science and artificial intelligence.”
Lavender’s PhD research focused on coastal change monitoring using satellite remote sensing imagery, a project that posed significant challenges and yielded remarkable results. “One of the main challenges in my PhD research was that, as application-driven research, it required not only remote sensing but also some domain knowledge on coastal engineering which I didn’t have at the start,” she explains. However, despite this initial hurdle, Lavender’s perseverance led to significant breakthroughs. “The highlight of my research was evaluating the capability of multi-source time-series satellite data for coastal erosion monitoring,” she says. “Satellite remote sensing was not widely applied in coastal engineering at that time.”
Her work not only demonstrated the potential of satellite remote sensing in coastal engineering but also paved the way for future applications in the field.

“Being curious and openminded towards new technology, ideas and approaches to solutions has helped fuel my inspiration.”
Lavender’s role as an Earth observation data scientist has evolved significantly over the years. Initially focused on delivering projects, she has transitioned to leading and managing complex projects. This shift from execution to leadership has been a defining aspect of her career growth.
“I have been developing my ability to take initiative in guiding project decisions and planning strategically,” Lavender says. “Additionally, my role now involves greater cross-functional collaboration and external engagement, such as working with the business development team and end users to understand their needs.”
This evolution reflects her growing influence and the expanding scope of her responsibilities within the geospatial industry.
Throughout her career, Lavender has been fortunate to have mentors who have significantly influenced her professional development. “Early in my career, my mentors were my PhD supervisors, Prof. John Trinder and Prof. Ian Turner, who are experts in two
different areas,” she says. “The key insights gained from their mentorship were the importance of conducting applicationdriven research and the value of multidisciplinary collaboration.”
Another pivotal mentor in Lavender’s career has been Jasmine Muir. “She has impacted me through her inclusive leadership, encouragement and trust,” Lavender says. “My current manager, Fang, has mentored me on the importance of being proactive and open-minded, and has been instrumental in developing my leadership skills.”
Lavender believes that staying motivated and inspired in a rapidly advancing field like Earth observation requires a unique blend of curiosity and dedication. “Being curious and open-minded towards new technology, ideas and approaches to solutions has helped fuel my inspiration,” Lavender explains. She says it is her interest to gain new knowledge and this has helped her to stay motivated. Working on projects with tangible positive impacts on society also keeps her driven. “Knowing that my work contributes to addressing real-world problems gives me a sense of purpose and satisfaction,” she says. “In addition, being part of a passionate and talented team with diverse skills and perspectives is very motivating.”
Lavender sees a bright future for Earth observation and data analysis in solving global challenges. “The advancements of Earth observation and data analysis are speeding up the process of addressing global challenges,” she believes. “By leveraging advanced technologies and fostering global collaboration, Earth observation is providing critical insights and solutions for real-world problems such as environmental monitoring, disaster management, agriculture, urban planning and climate research.”
Lavender also plays a key role in promoting diversity and inclusion within the geospatial industry. At the end of last year, she was honoured with GCA’s Western Australia Diversity and Inclusion Award at the regional Geospatial Excellence Awards ceremony for her efforts. Her commitment is evident through her active

participation as a member and co-chair of FrontierSI’s D&I Committee, along with her involvement in initiatives like the Launching Leaders Internship Program. This program offers paid internships that enable candidates to develop technical and leadership skills, expand their networks and gain valuable experience in the space and spatial sector.
Additionally, Lavender led the National Land Cover and Crop Mapping project, an international collaboration between FronteriSI, Food and Agriculture Organisation of the United Nations and Digital Earth Africa. This project aimed to build capacity for African nations on improved use of Earth observation data for sustainable urban development and accelerated agricultural innovation. Winning the GCA DEI award has further motivated Lavender to foster a more inclusive geospatial community, ensuring that underrepresented individuals are seen, heard and acknowledged for their contributions.
Looking ahead, Lavender has clear goals and aspirations for her career and contributions to DEI in the geospatial industry. “I aspire to take on more leadership roles, where I can drive innovation and efficiency in geospatial solutions,” she says. “I strive to contribute to fostering a diverse and inclusive culture within FrontierSI by actively implementing FrontierSI D&I committee’s initiatives, and plan to proactively get involved with DEI initiatives within the geospatial community.”
Regarding the future of Earth observation, Lavender believes it will play a pivotal role in addressing global challenges such as climate change, disaster response and sustainable development. “With rapid advancements in remote sensing platforms,
data volume, frequency and resolution, we will be able to monitor changes and emergencies more promptly and conduct more accurate modelling and predictions using advanced data analytics,” she says. “The increased openness of data and tools will allow a broader range of users to access and utilise this data, thereby enhancing the global community’s capacity to address worldwide issues.”
Lavender’s journey in the field of Earth observation is a testament to the power of
dedication, innovation and a commitment to diversity and inclusion. Her work not only advances the geospatial industry but also serves as an inspiration to the next generation of scientists and leaders. As she continues to push boundaries and break new ground, Lavender’s impact on the field and beyond will undoubtedly grow, driving forward the critical work of addressing global challenges through cutting-edge technology and inclusive leadership. n

We are delighted to once again host our annual Regional Conference Series, combined with the Geospatial Excellence Awards dinners, taking place across Australia from August to November.
From GIS specialists to remote sensing experts, the GCA Regional Conference Series is your opportunity to gain invaluable insights, forge strategic partnerships and unlock new avenues for growth and innovation. Whether you're seeking to expand your skill set, explore new technologies, or simply connect with like-minded professionals, our conferences are your gateway to success in the ever-evolving world of geospatial technology.
This is also an exceptional opportunity to showcase your work to an audience of industry experts, academics and professionals in the geospatial field. We welcome submissions on a wide range of topics, including GIS, remote sensing, spatial data analysis and emerging geospatial technologies. Contribute to shaping the future of geospatial science and connect with leading minds in the industry. Keep an eye on geospatialcouncil.org.au for abstract submission dates.
If you’re keen to put your brand at the forefront of the geospatial sector across the country, don’t miss this opportunity, through GCA Event Partnerships, to elevate your brand as a key player in the Australian geospatial sector. The Regional Conference Series provides an opportunity to enhance brand visibility across event marketing channels, and access to these highly sought after face-to-face events.
Please save the dates for our Regional Conference Series. We invite you to participate, whether by submitting an abstract, attending the conferences or partnering with us to enhance your brand's presence. Join us across Australia from August to November and be a part of shaping the future of geospatial technology. Together, we will celebrate excellence and pave the way for new opportunities in this dynamic field.
For more information on our Event Partnerships, please contact Claire Gerber, National Partnerships Manager, at Claire.Gerber@geospatialcouncil.org.au.
The Australian geospatial community is mourning the loss of one of its most illustrious alumni, former surveyor and federal parliamentarian, the Honourable Gary Nairn AO, who passed away on 1 June 2024 at the age of 73.
Gary was known as a great friend of the geospatial sector, having served as a Director and Chair of SIBA, and as chair of the Association of Consulting Surveyors Australia prior to that. He was an Honorary Fellow of SSSI (now the GCA).
Gary attended Sydney Boys High School prior to studying a Bachelor of Surveying at UNSW. After graduating he moved to the Northern Territory where he resided for many years, going on to become a partner in a leading surveying and mapping company, Earl James and Associates, the head office for which was in Darwin.
While in the NT he became the President of the Country Liberal Party and oversaw a period of great success for that party during. At the time of his move back to NSW and into federal politics as the member for Eden Monaro in 1996, he had risen to become the Managing Director of Earl James and Associates.
Gary was a member of the Howard Government and went on to become the Special Minister of State. While in that role and in his previous role of Parliamentary Secretary to the Prime Minister, Gary was a great advocate for the geospatial sector and was instrumental in the establishment of the 2001–02 Spatial Information Industry Action Agenda (SIIAA), a governmentsponsored review into the potential of an emerging industry. The SIIAA also led to the creation of the industry body SIBA in 2003.
The formation of the SIIAA in turn led to the successful bid for the Cooperative Research Centre for Spatial Information (CRCSI), which ran from 2003 until 2018, and has now transitioned into FrontierSI. Gary provided ongoing advice to the CRCSI and contributed greatly to its success.
In 2015, Gary was appointed as an Officer in the Order of Australia for his contribution to spatial sciences, NSW and NT communities, federal parliament and disability support services. In 2018, he was appointed as National Chairman of The Duke of Edinburgh’s International Award-Australia.
Mark your calendars! The International Federation of Surveyors (FIG) and GCA are delighted to be hosting the FIG Working Week 2025 in Brisbane from 6 to 10 April 2025. This exciting event, which will incorporate Locate25, will take place at the Brisbane Convention & Exhibition Centre.
Participating in FIG Working Week offers unparalleled access to the international surveying community, providing a platform to exchange experiences and stay at the forefront of developments across various aspects of surveying practice, including ethics, standards and education. Above all, FIG members are part of the global community of surveyors seeking to extend the usefulness of surveying for the betterment of society, environment and economy.
The overall theme for the Working Week 2025 is ‘Collaboration, Innovation and Resilience: Championing a Digital Generation.’ It will feature an insightful and technical program with local and international practitioners, allied professionals and academics speaking on their fields of expertise.
What to expect:
• 1,200 to 1,800 international and national attendees
• Pre- and post-events
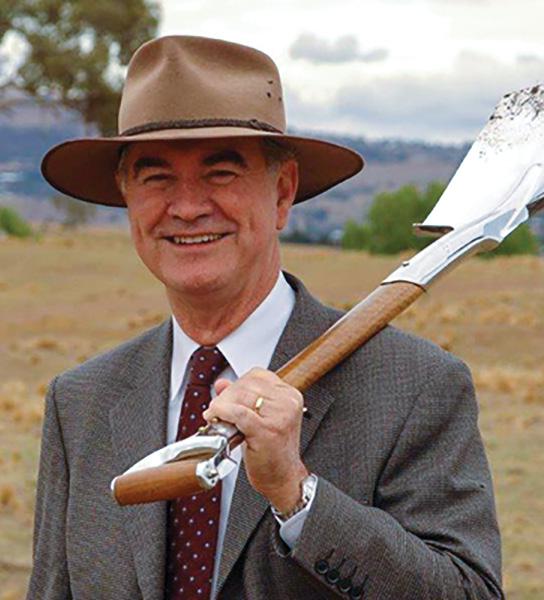
“Gary was someone who was admired by many as a statesman in our industry and the wider community, and renowned for the dignity and composure with which he conducted himself in so many important and influential roles,” said Tony Wheeler, CEO of the GCA.
“Gary spent his later years heavily involved with sustainable farming practices through his role as a Director of the Mulloon Institute,” added Wheeler. “He met his recent health challenges with good humour, strength and dignity, along with the determination that he had demonstrated throughout his life.”
“He is greatly missed by the whole geospatial community and our thoughts go out to his family and closest friends.” n

• 70+ sessions
• 80+ countries represented
• Dedicated networking opportunities
• Extensive exhibition
The call for papers and registration will be opening shortly. Please visit: www.fig.net/fig2025/ for more information.


