THE POHRER REPORT

JANUARY TO JUNE, 2023 Inside South Florida’s most exclusive real estate marke t .
home: 120
Photographed
Via Del Lago. Listed by Gary Pohrer.
Featured Property

CONTENTS Letter from Gary Pohrer Single Family Homes: All Neighborhoods Single Family Homes: North End Single Family Homes: In-Town Single Family Homes: Estate Section Condos & Townhomes: All Neighborhoods In Closing 3 4 8 11 13 15 19
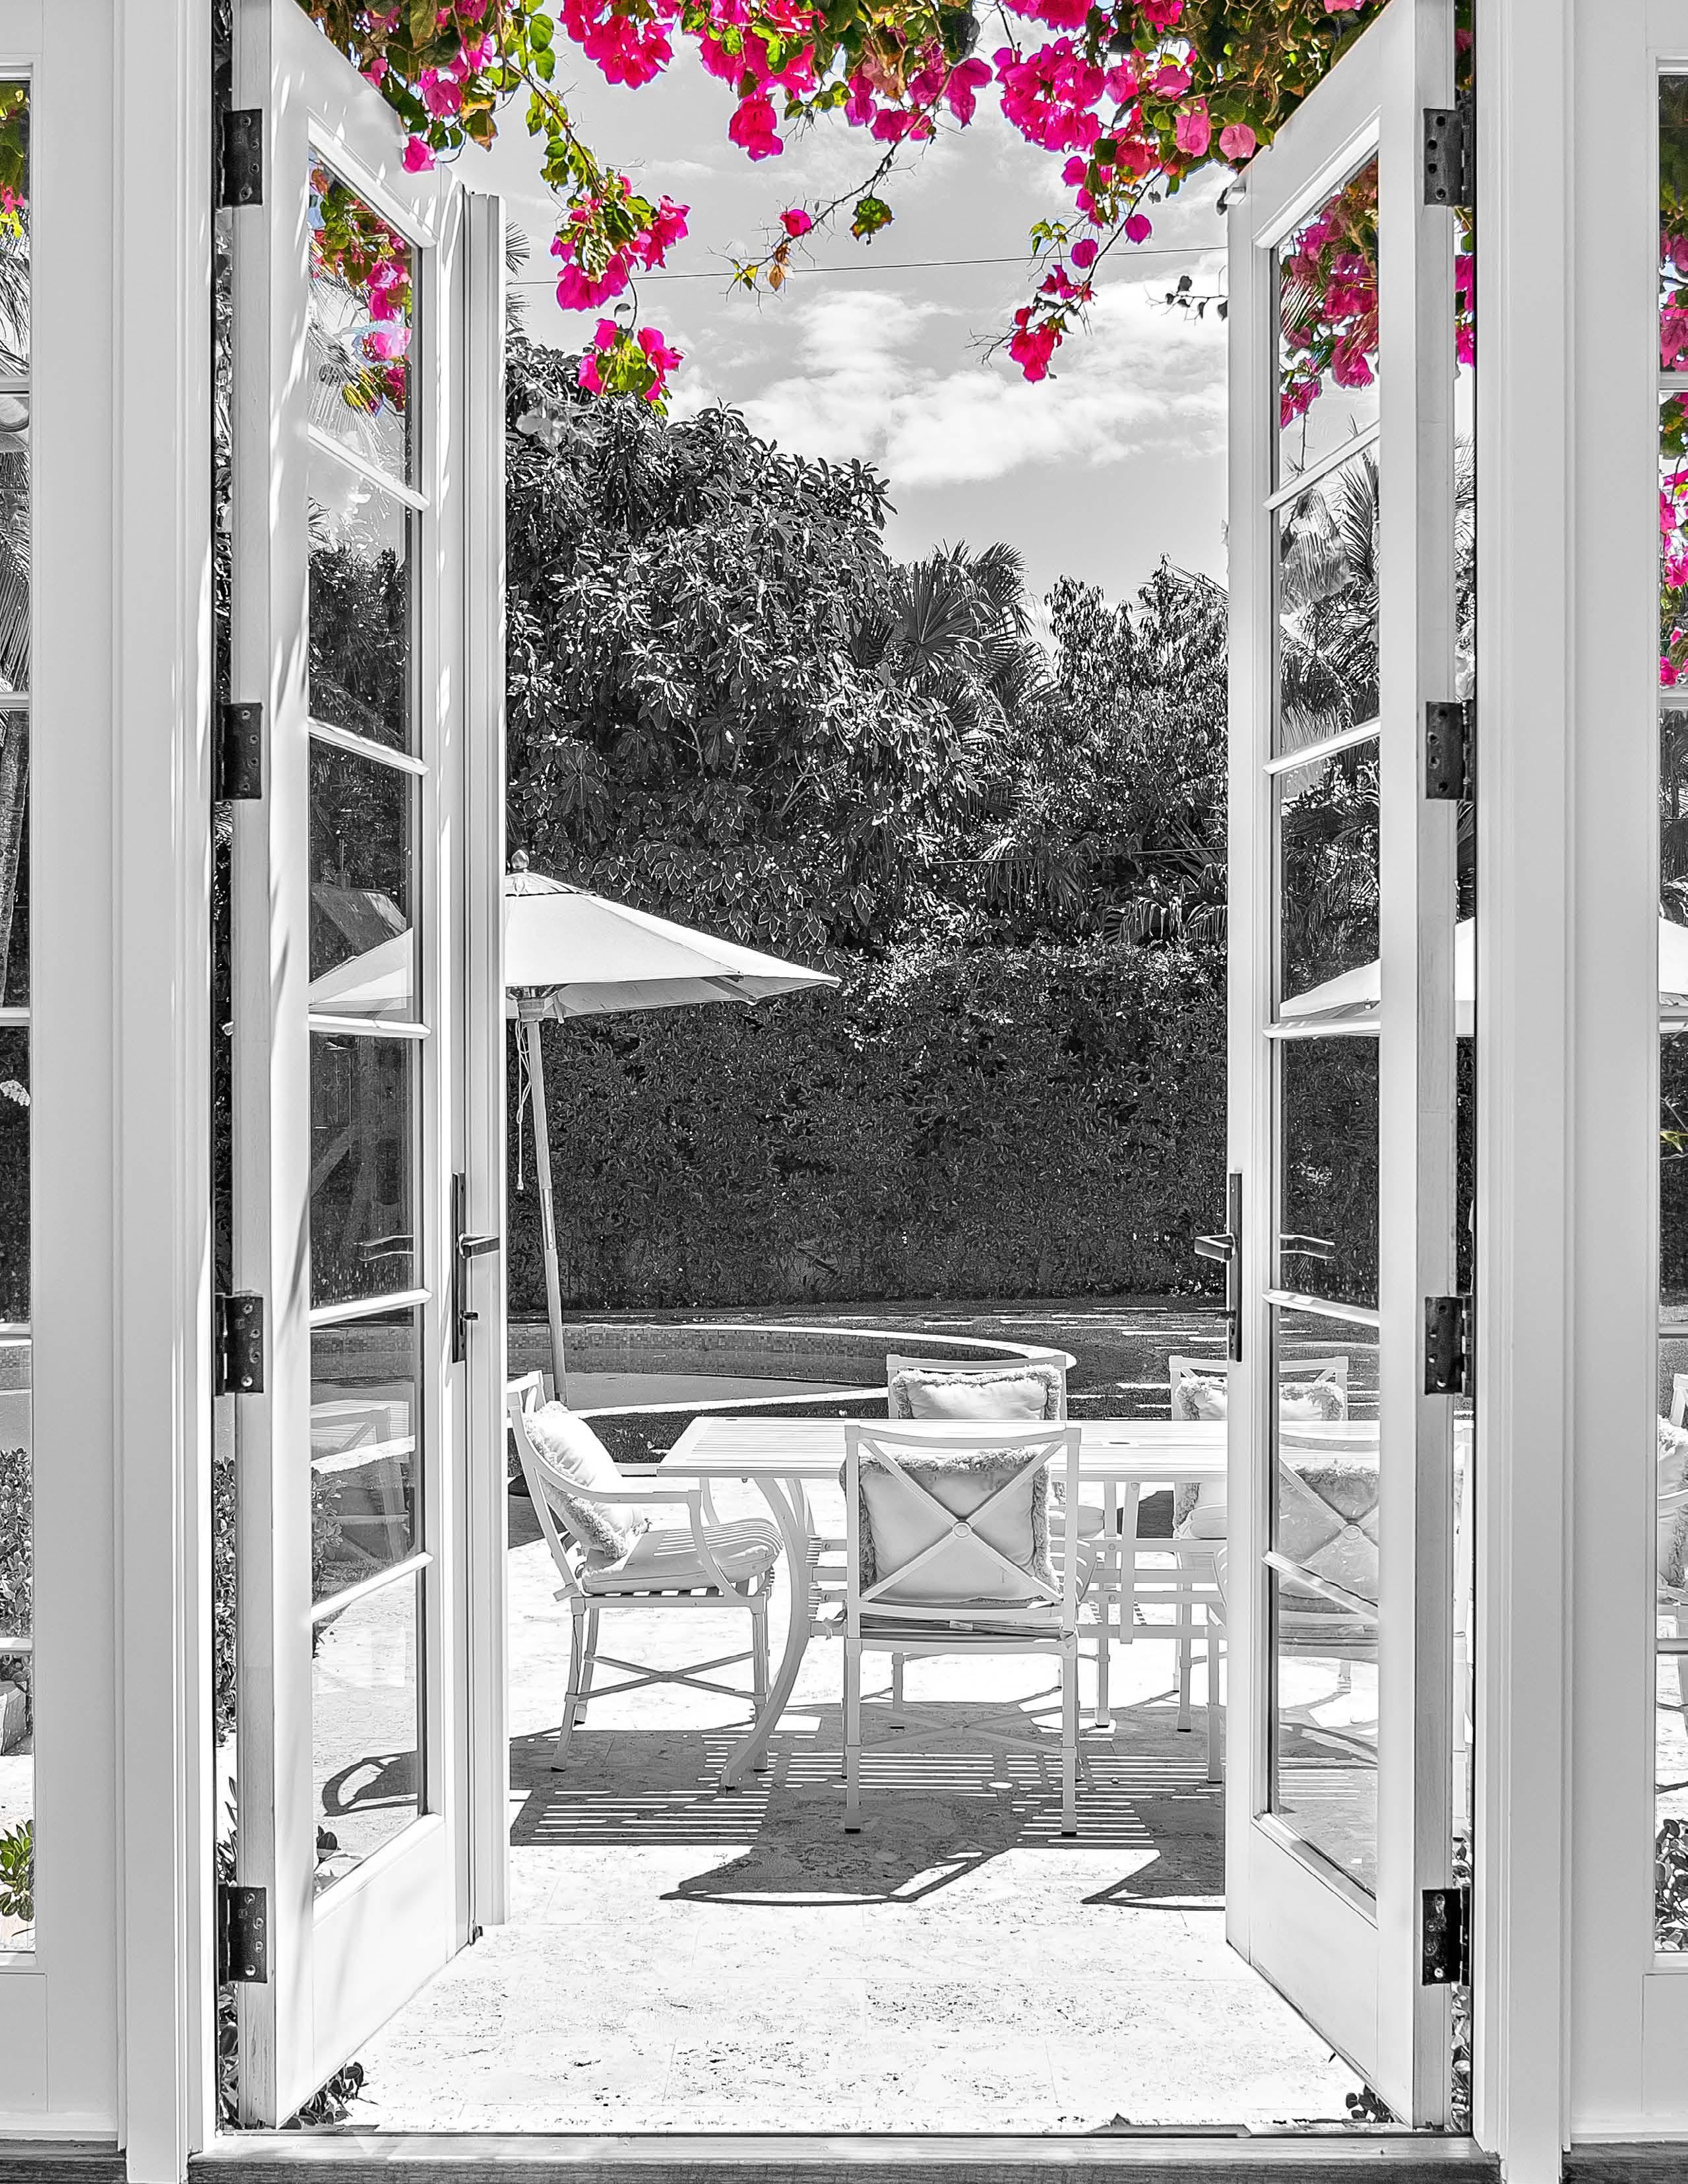
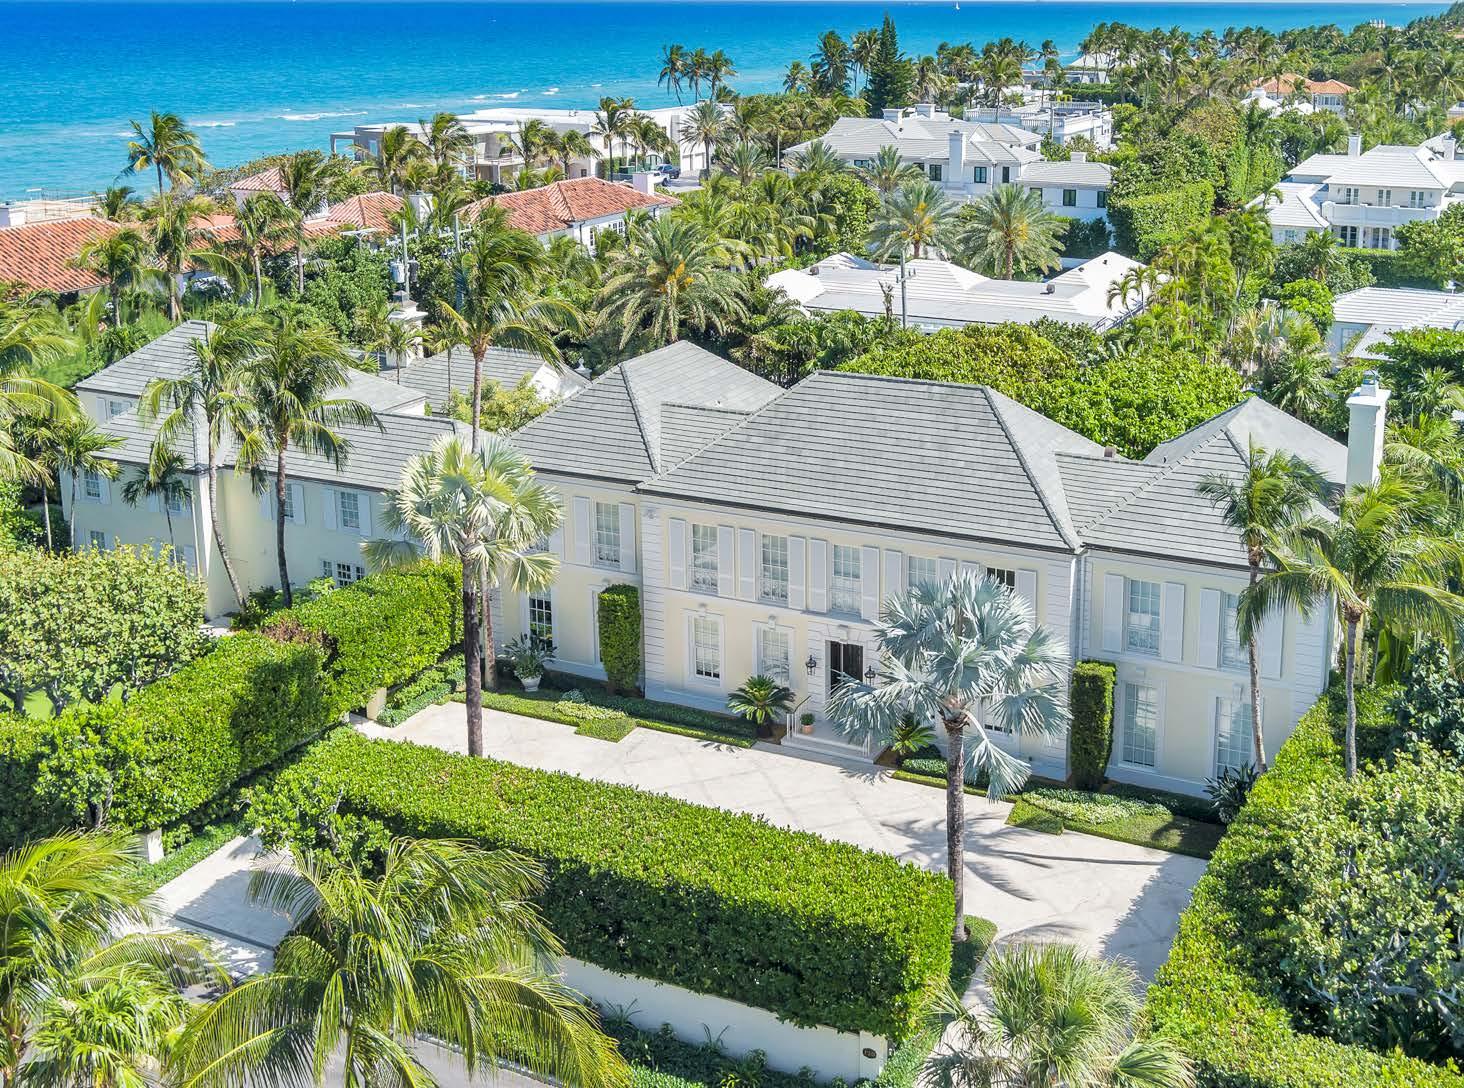
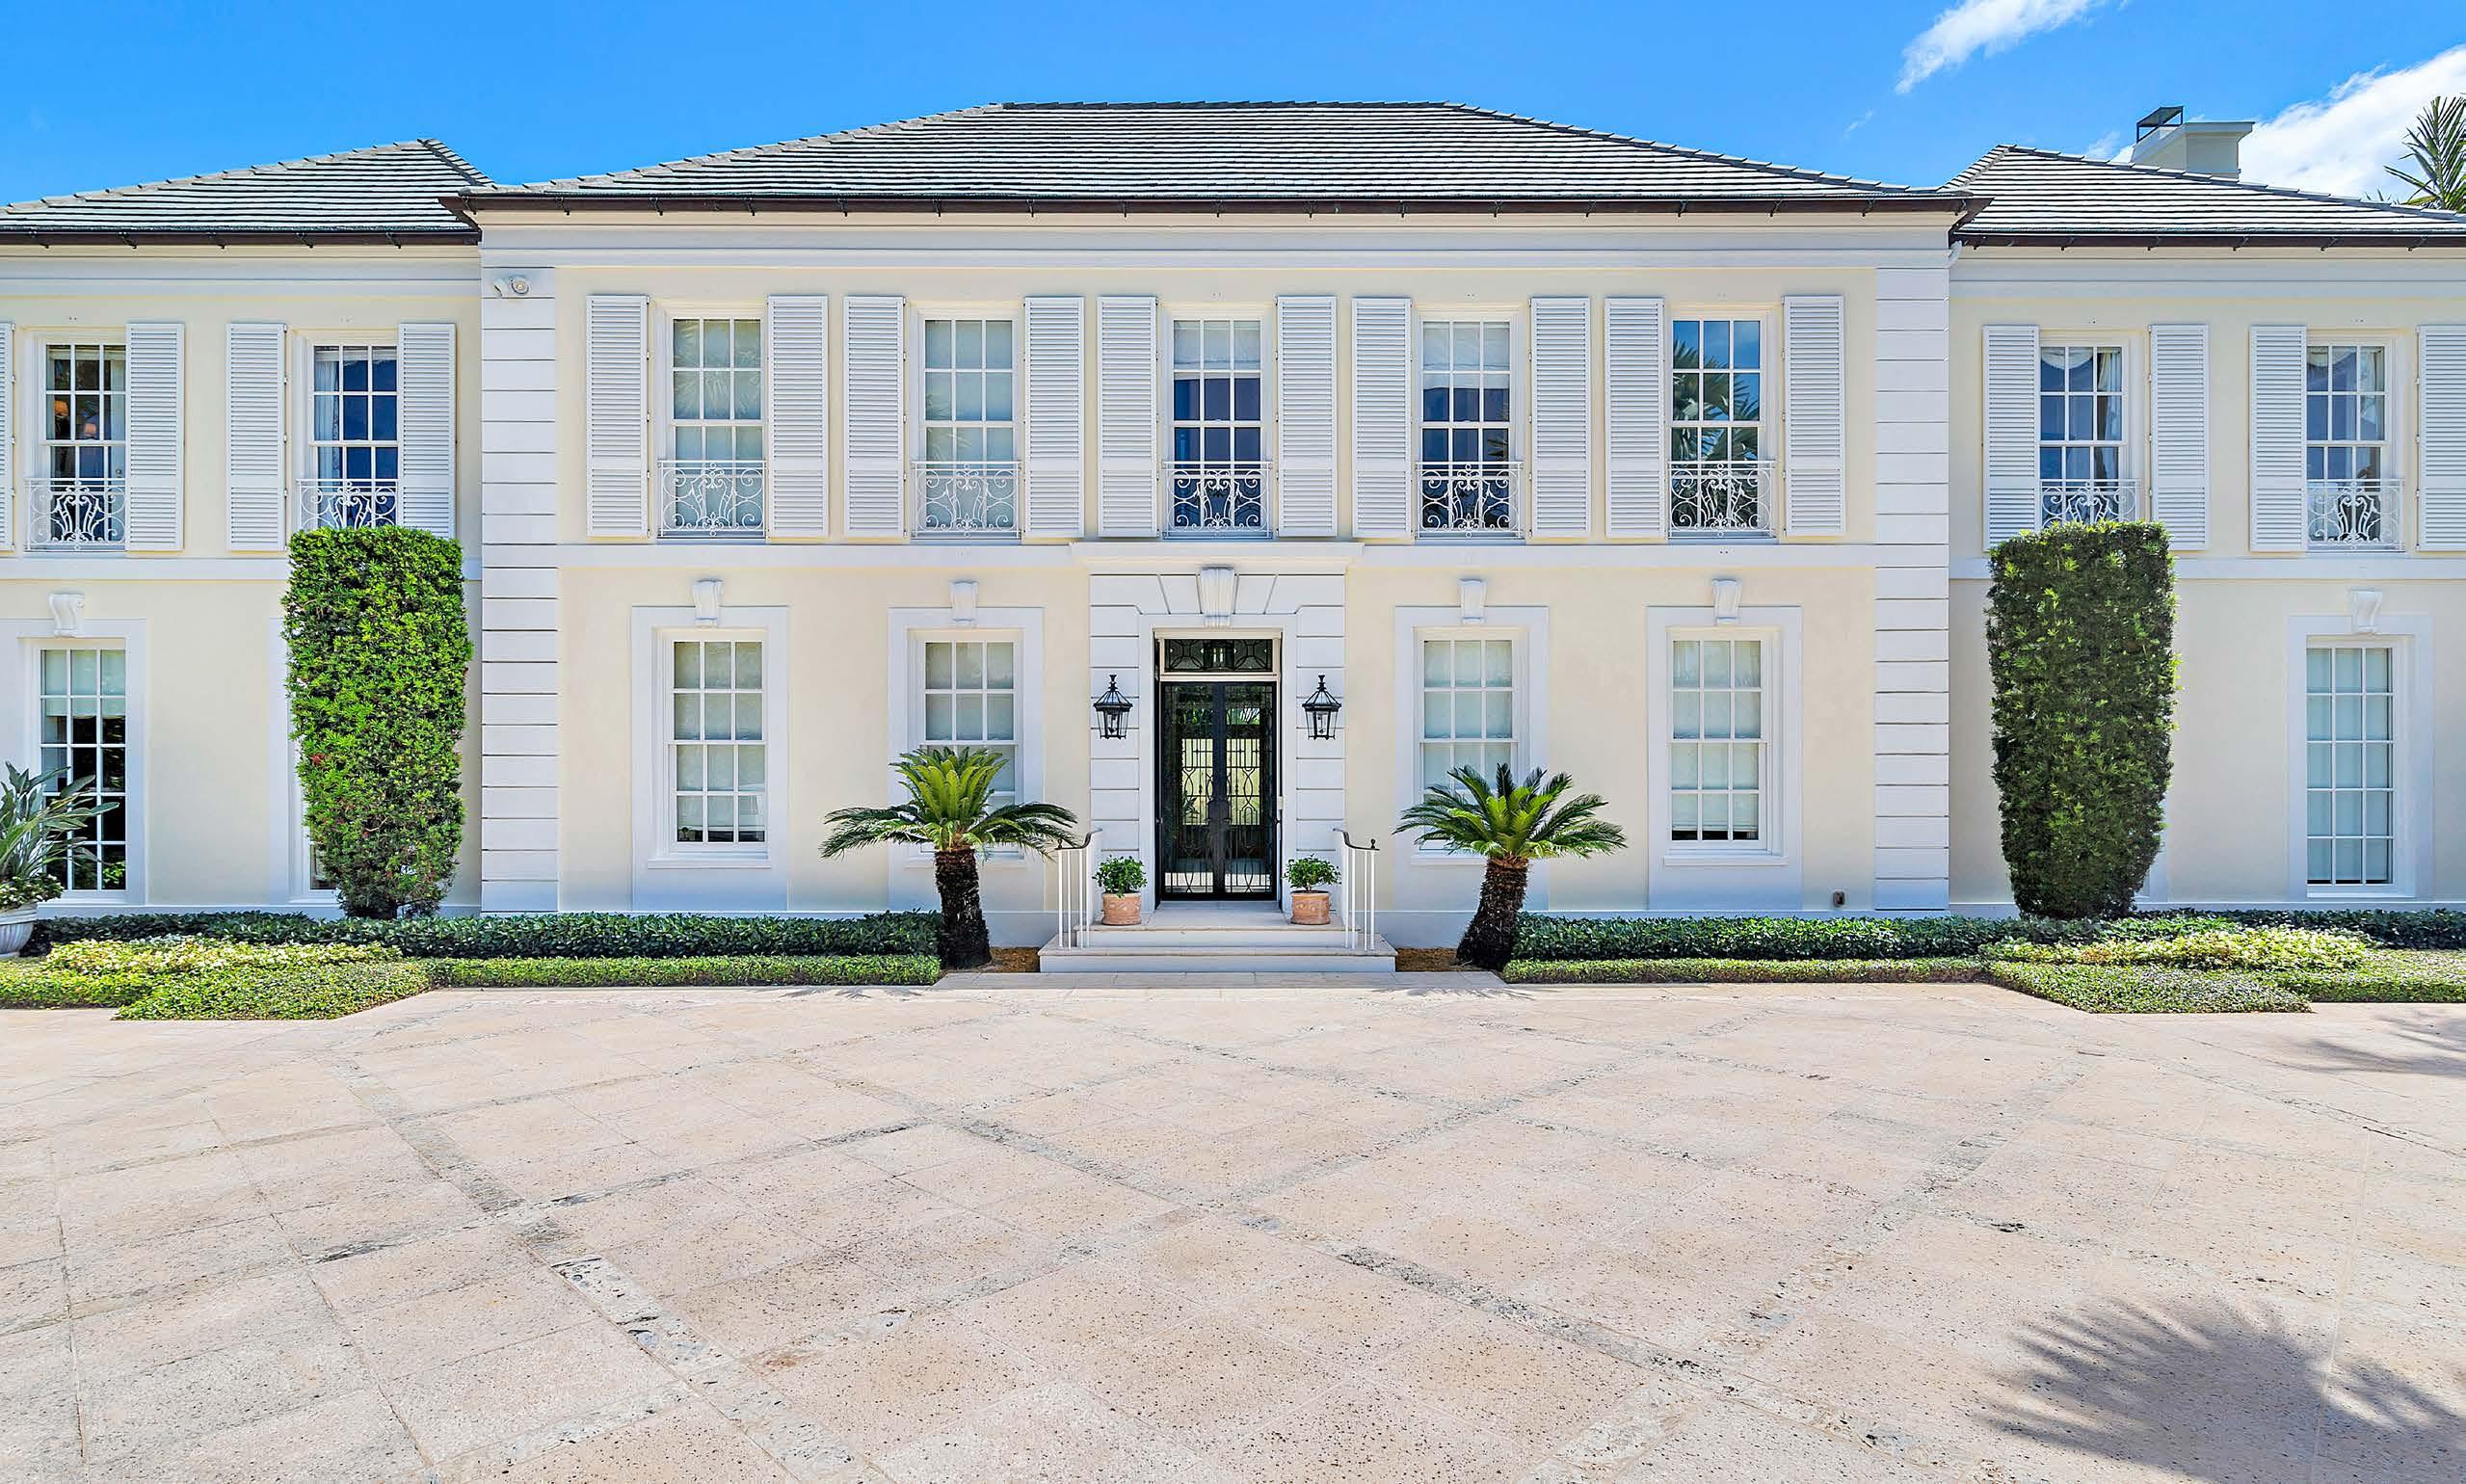
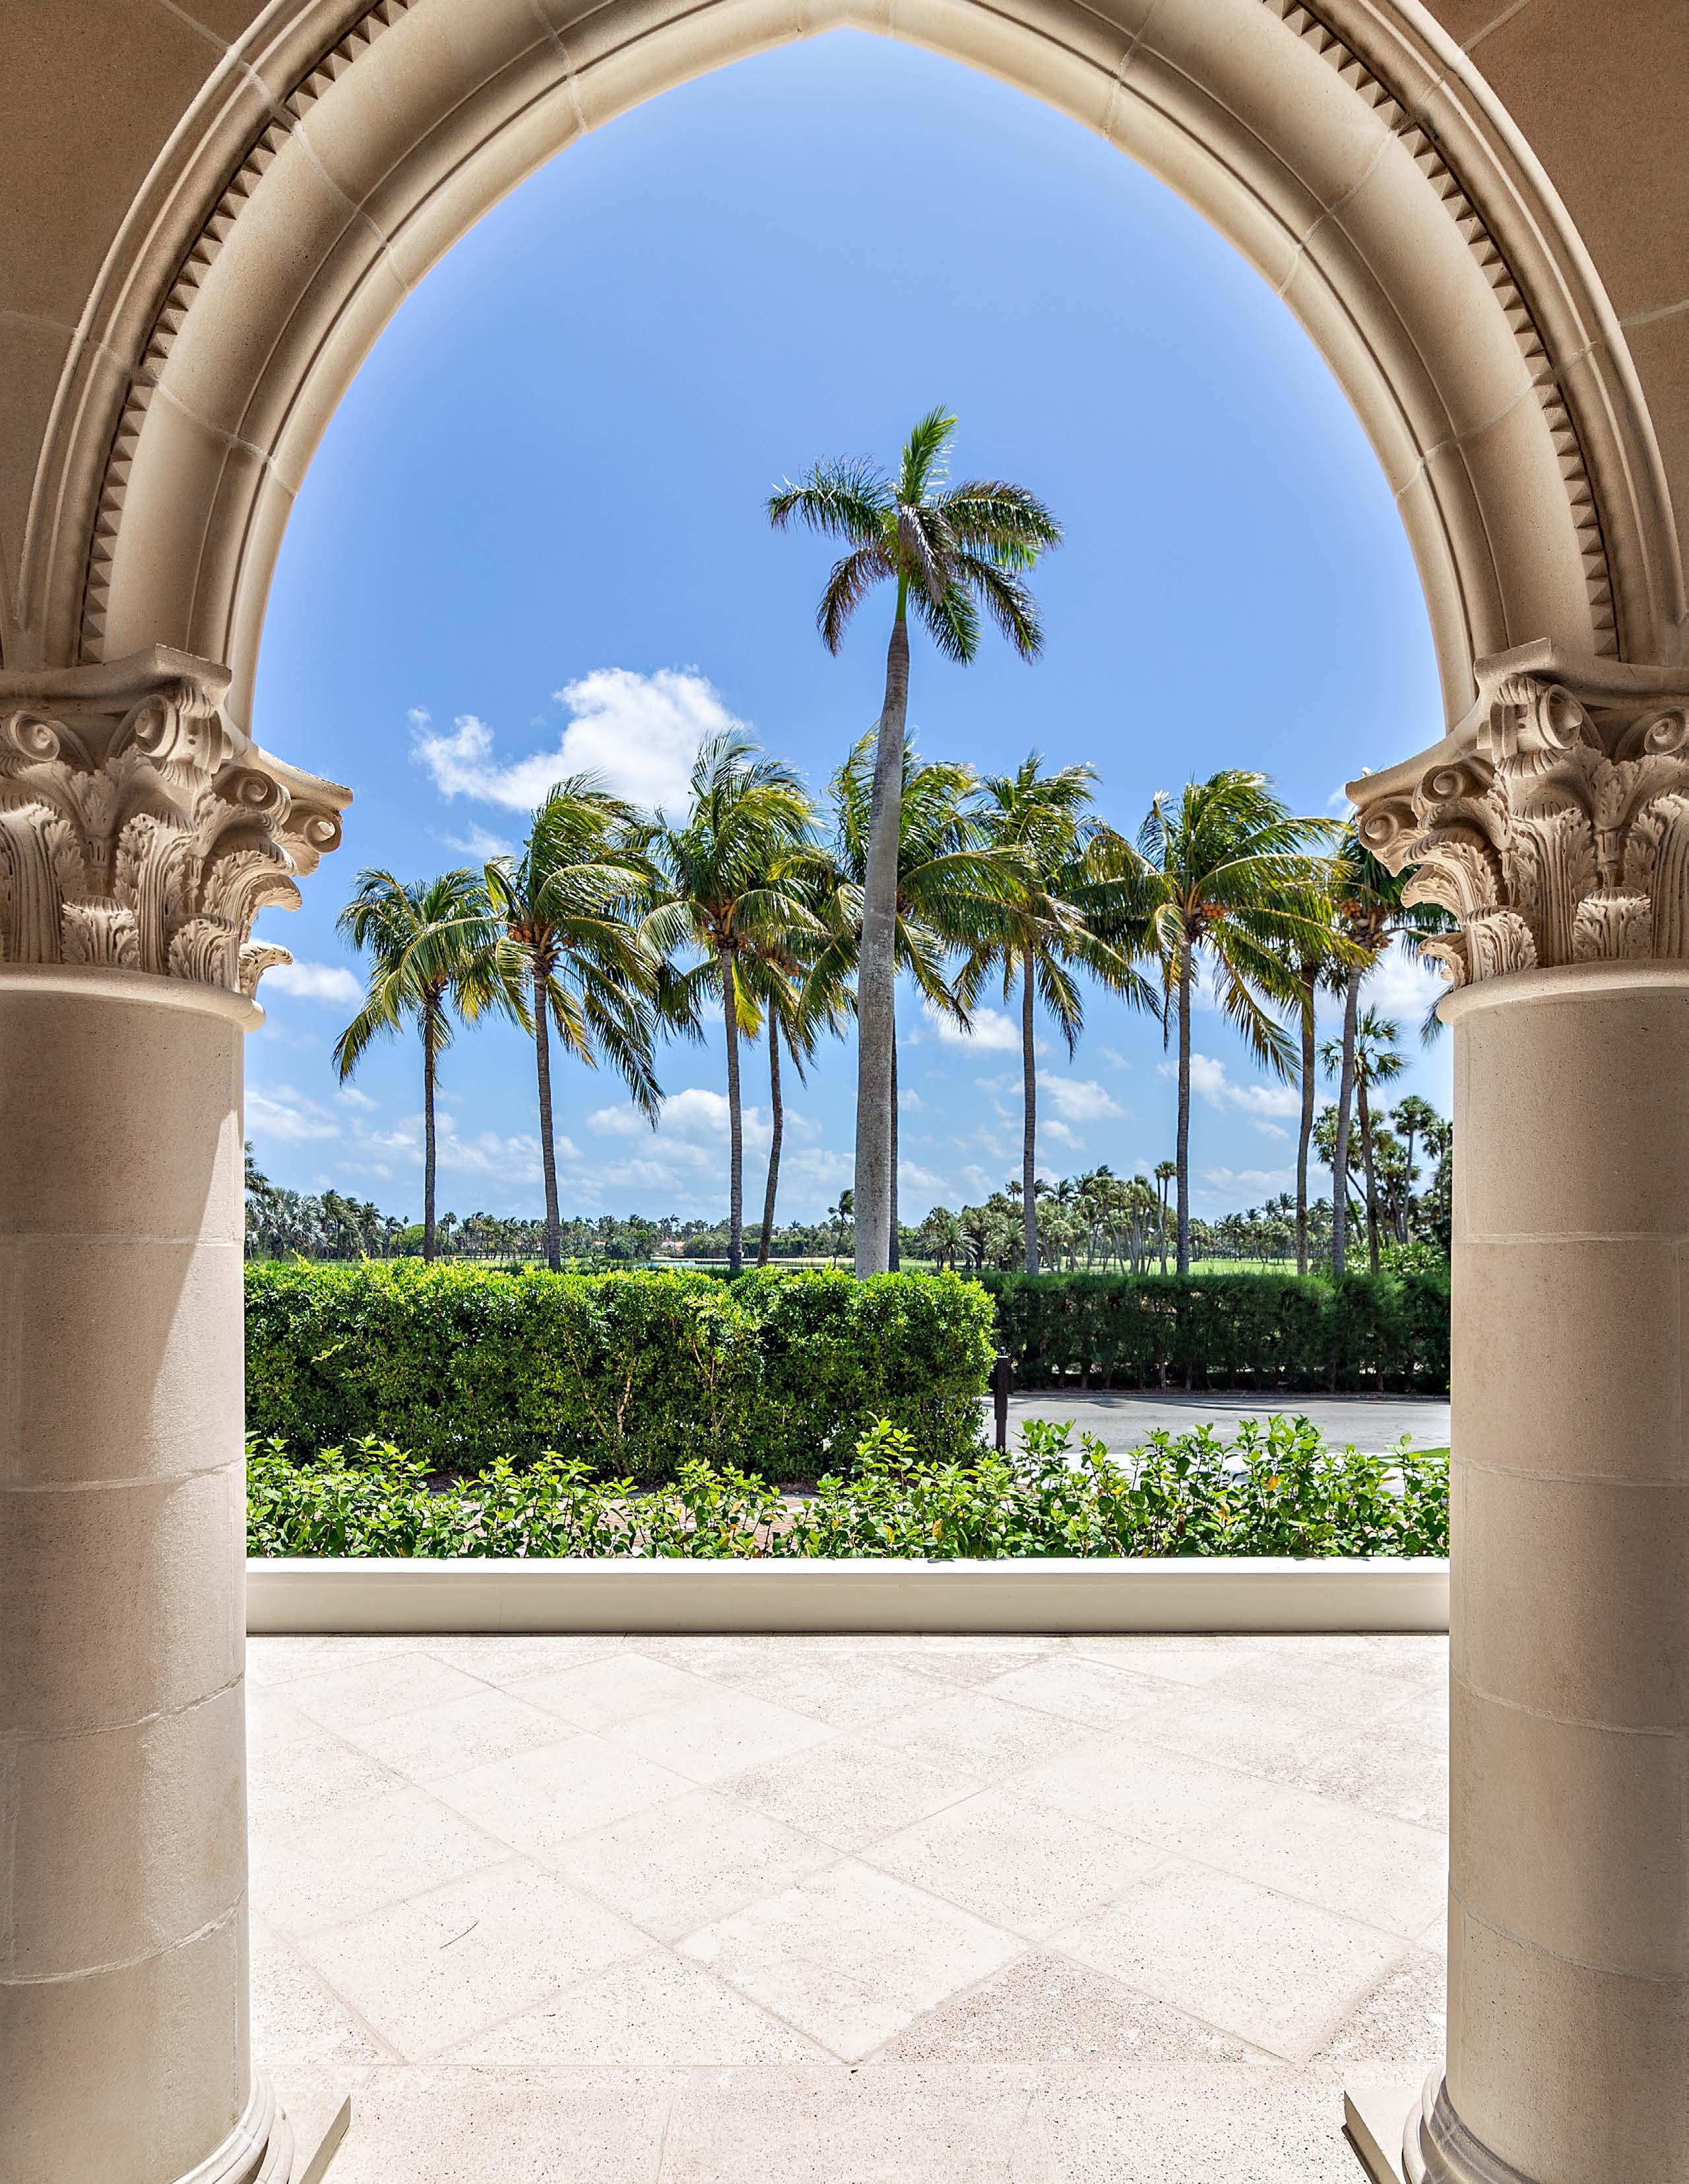
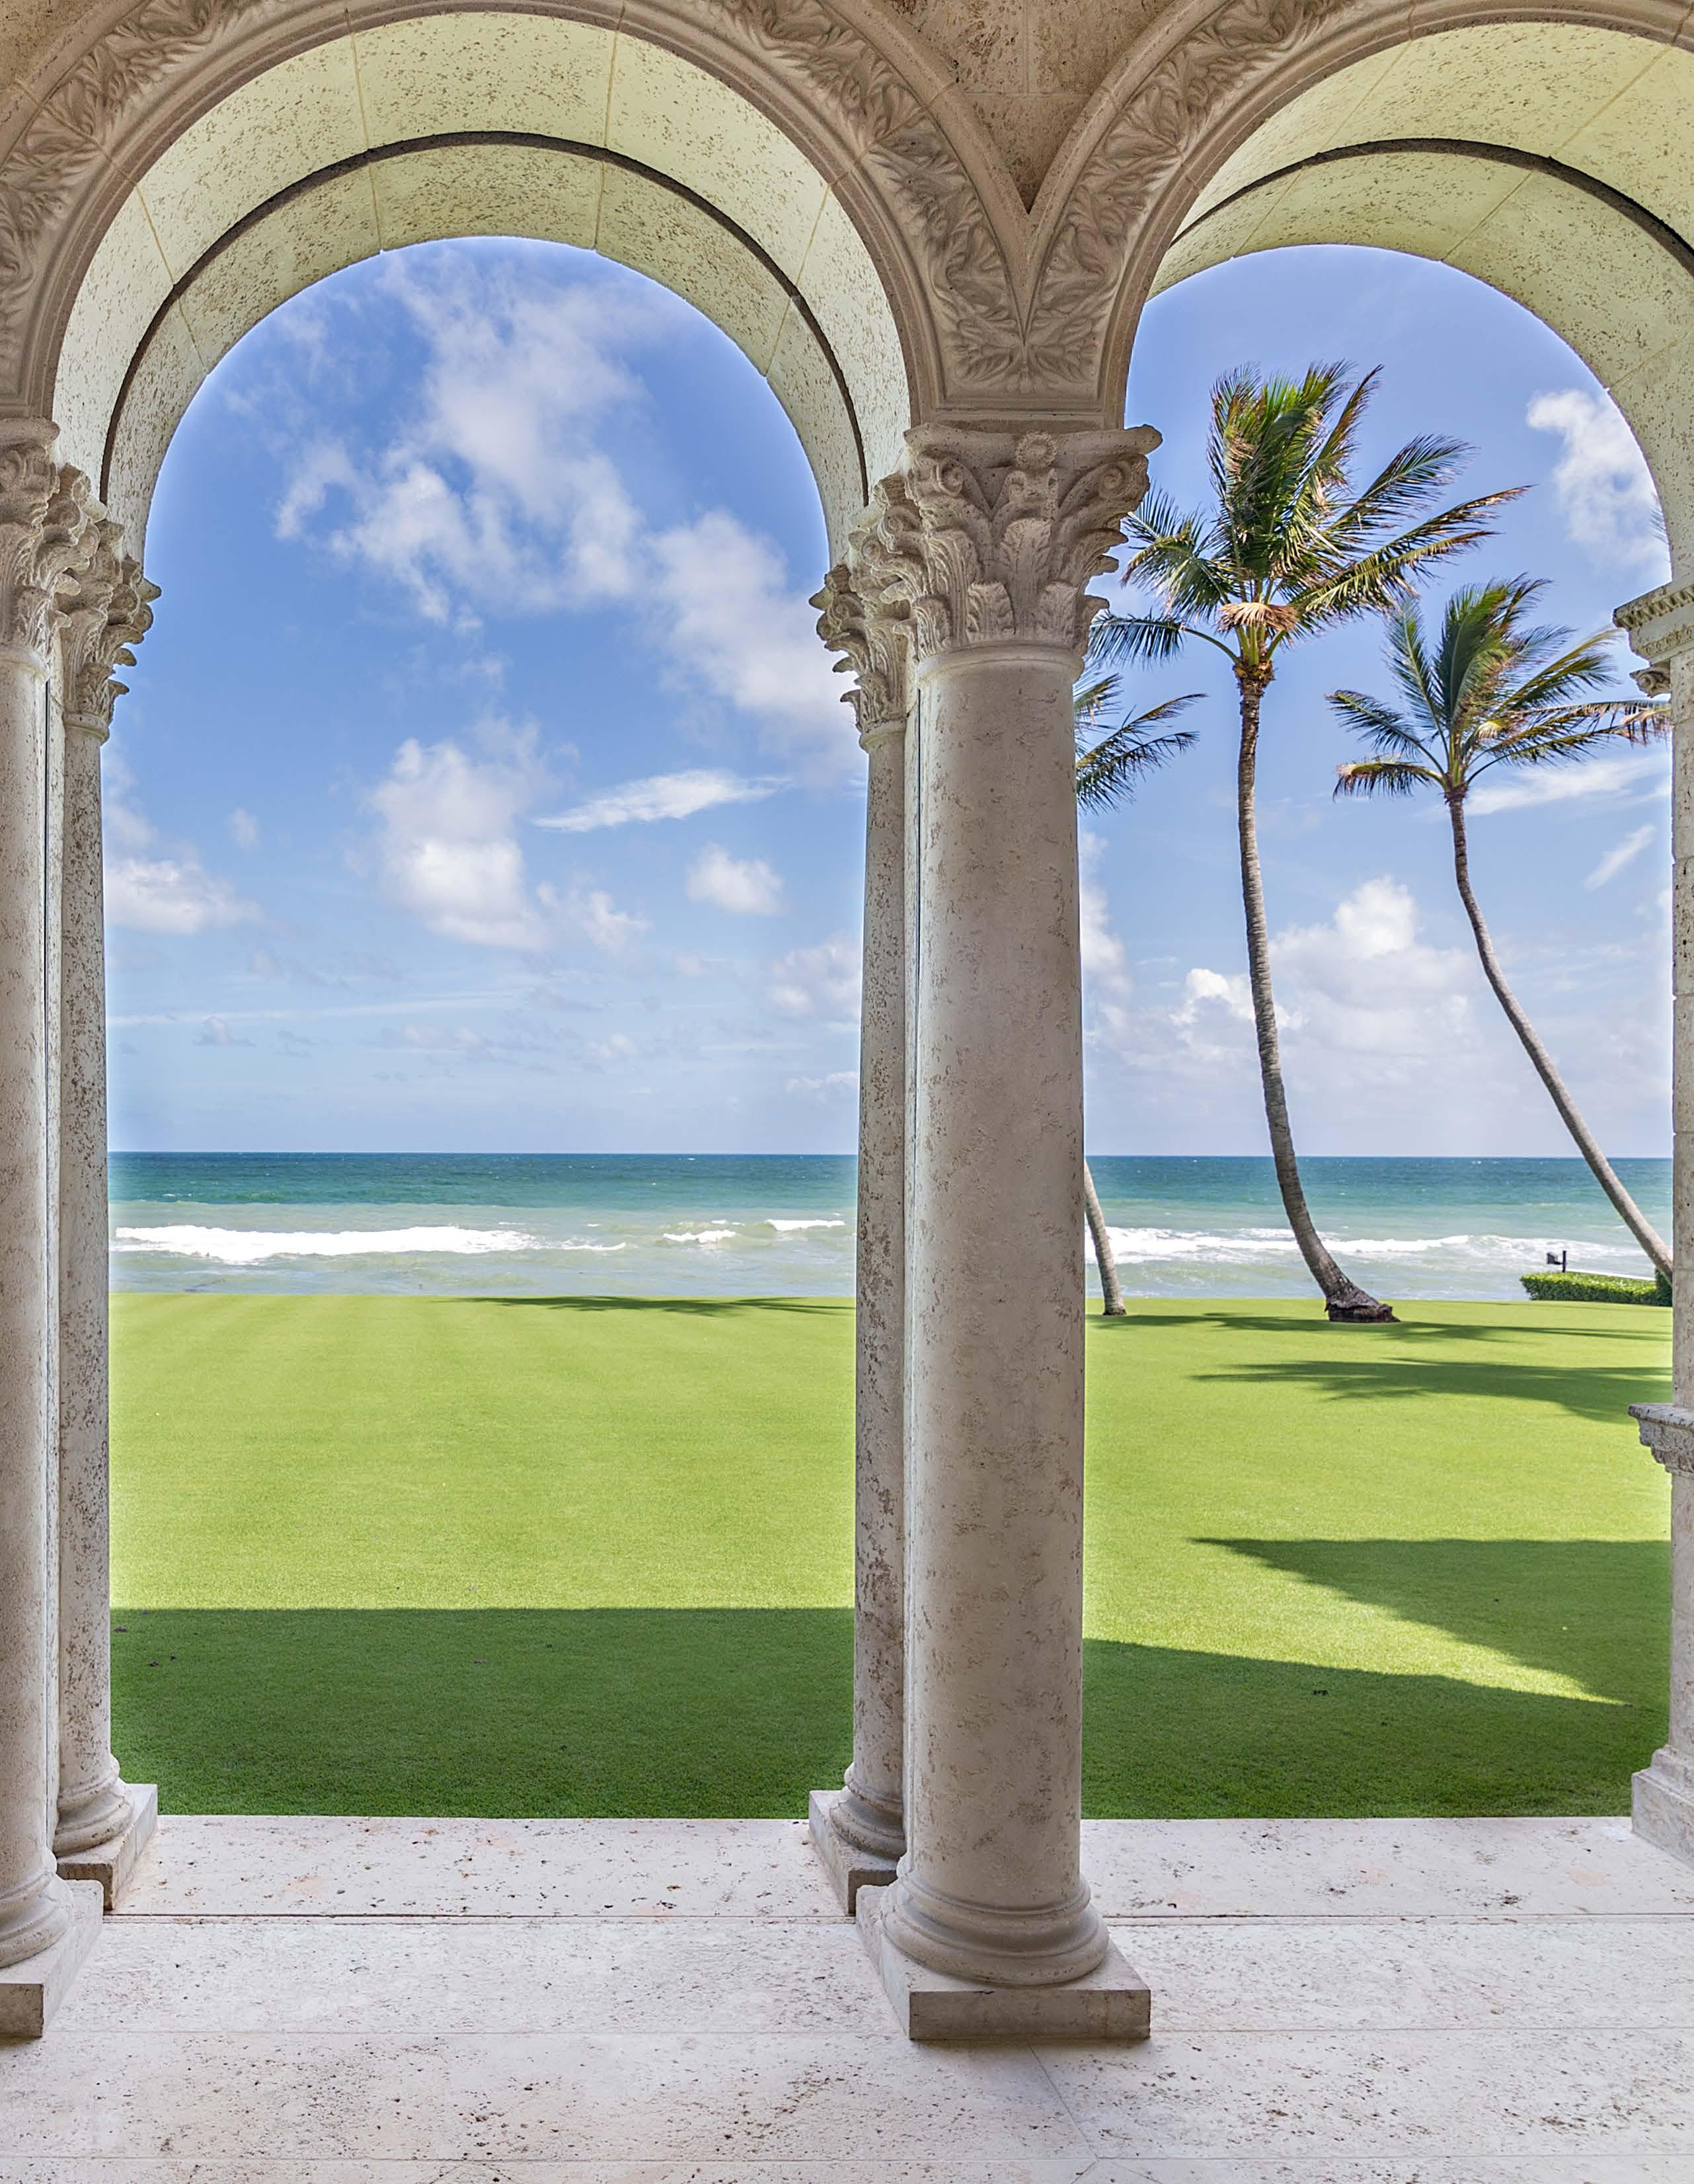
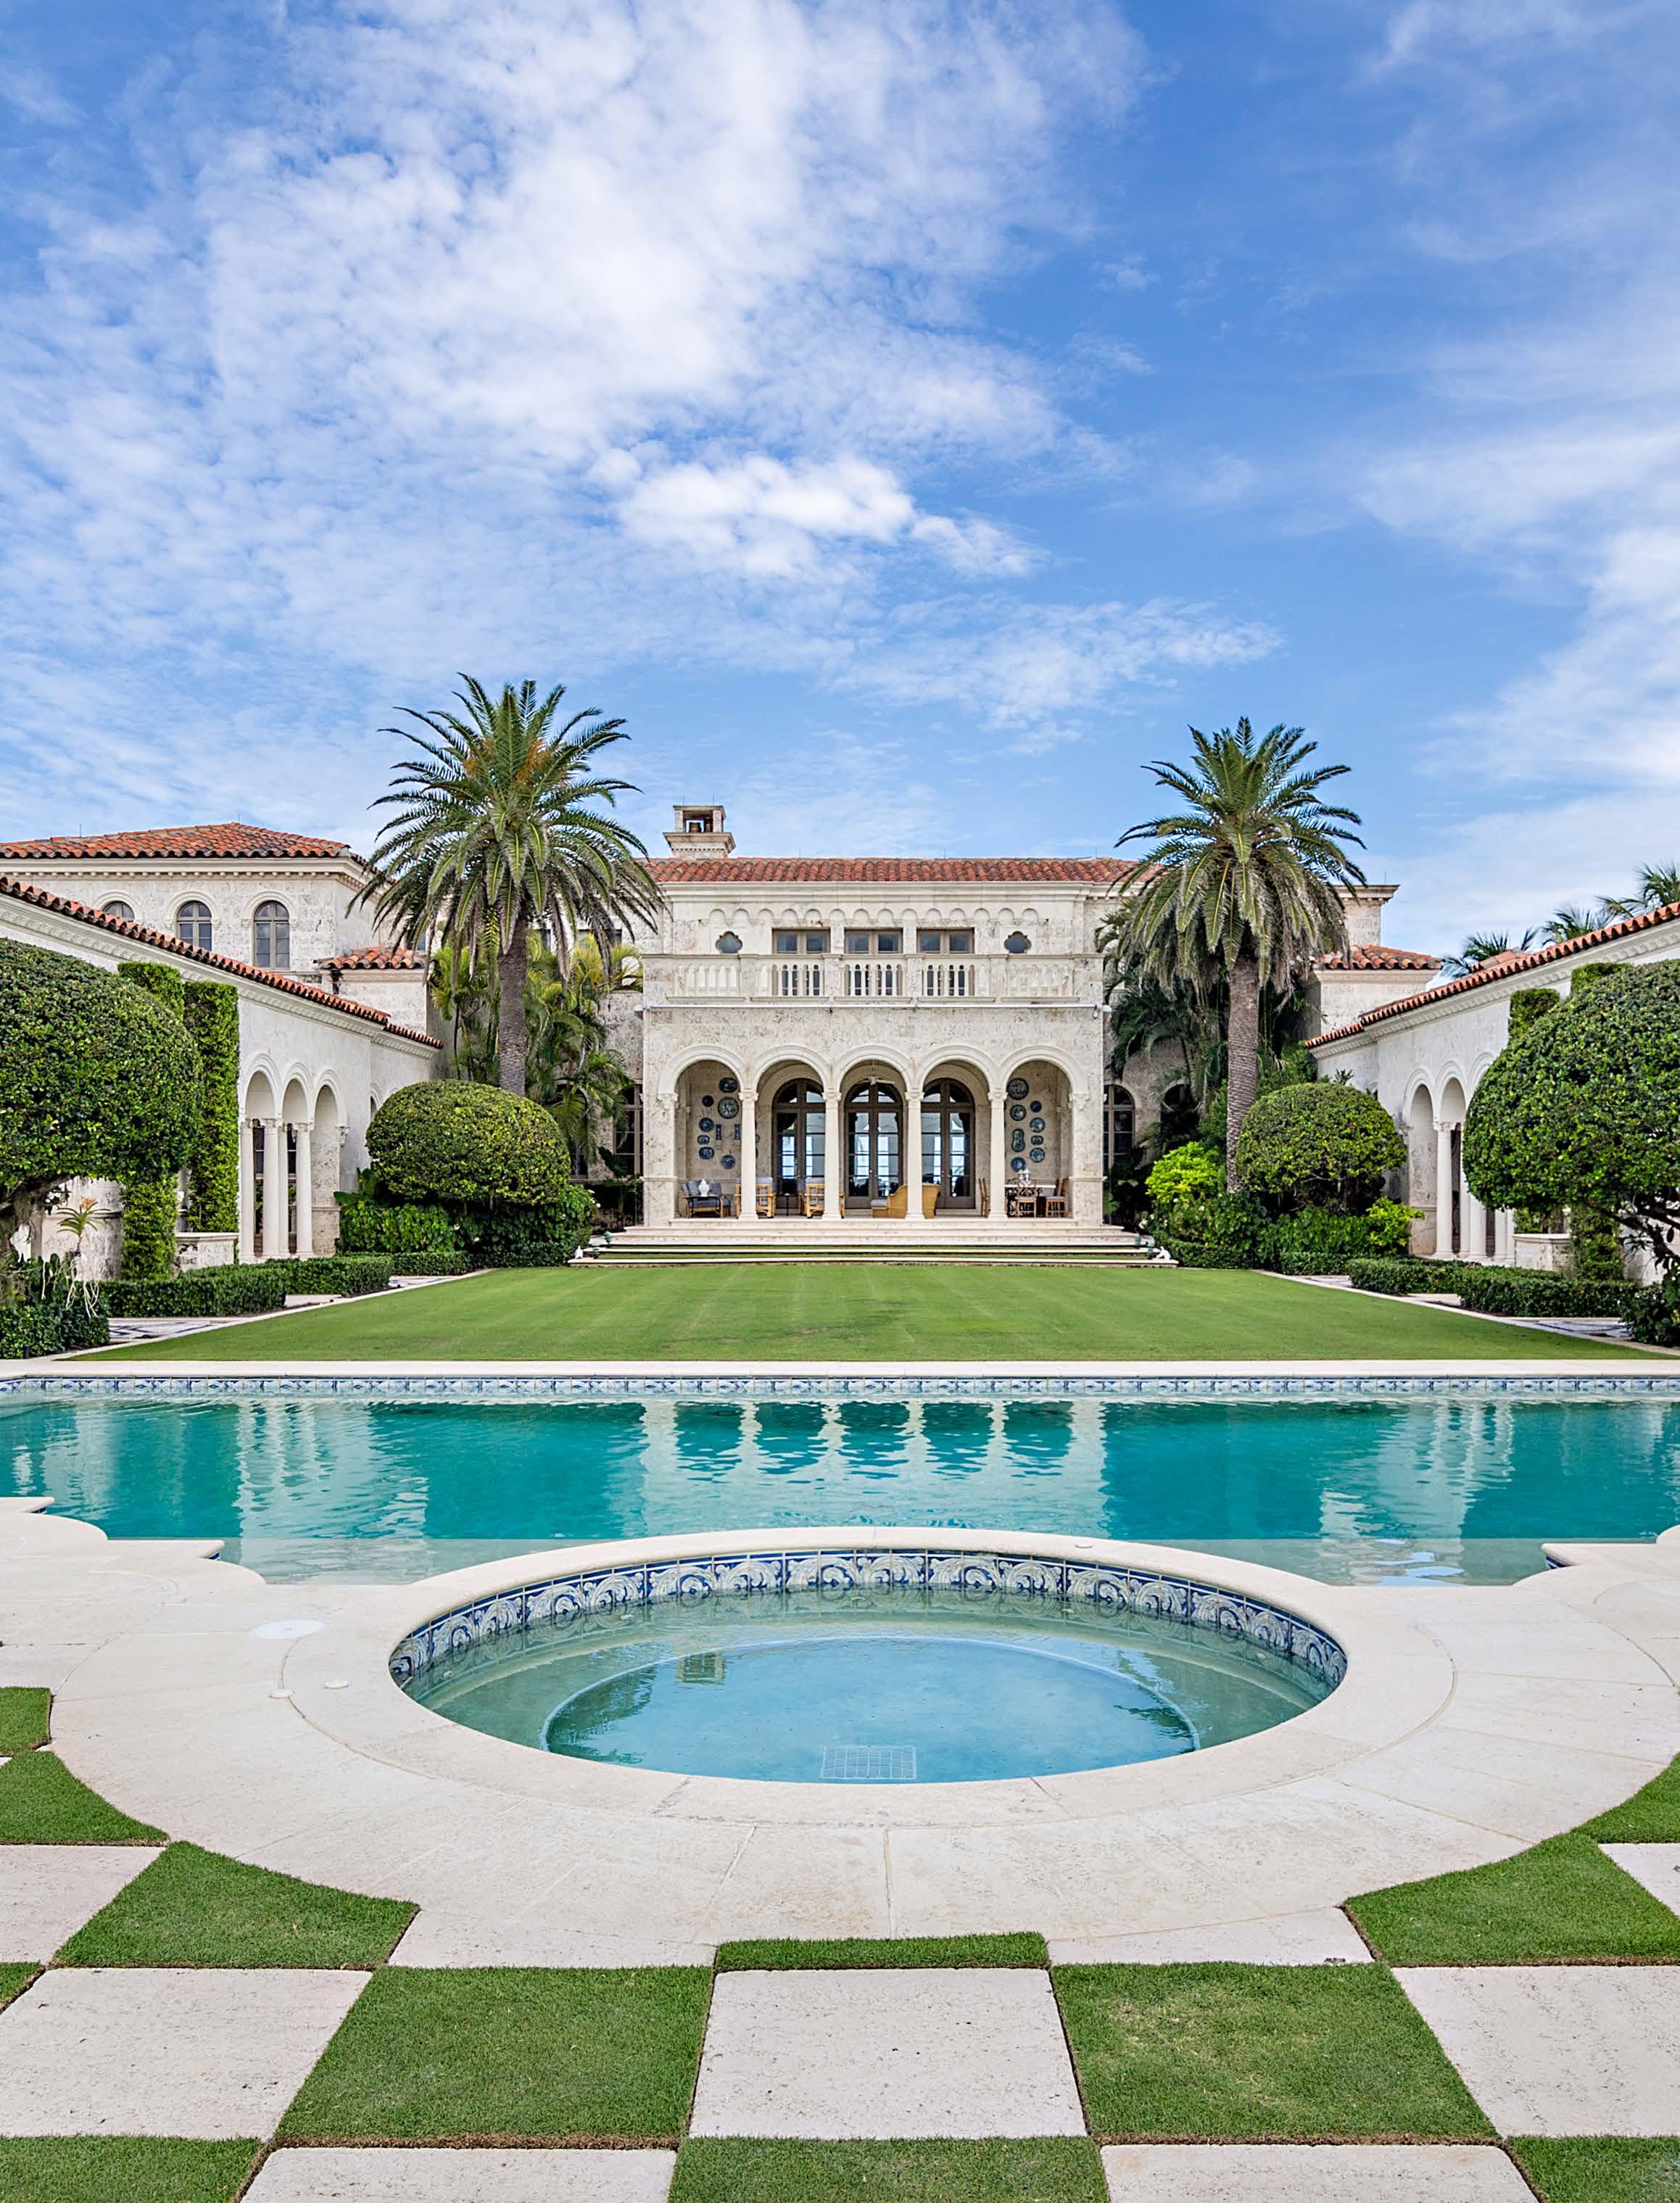
120 Via Del Lago, one of Marion Sims Wyeth’s classic Palm Beach masterpieces. Situated on nearly an acre in the Estate Section of Palm Beach, this approximately 13,000 square foot home exudes true precision in its design. Listed at $37.5M. GARY POHRER | GARYPOHRER.COM | 2
Letter From Gary


The 2023 season is nearing its end and it’s been another lively one at that. Having experienced several quarters in a row of decreasing transaction volume, we wanted to make sure The Pohrer Report delivers plenty of fresh new information and insights. Thus, instead of publishing quarterly reports, we will now deliver twice a year, with our first report showcasing activity from January through June, and our year-end report covering Q3/Q4 activity and a comprehensive overview of the entire year.
As I dove into the key performance metrics from Q1 and Q2 of 2023, some trends emerged from both the data and the activity I’ve seen on the ground.
• Total Sales Value was overall still higher than pre-pandemic levels. Even though transactions are slowing and inventory is building, we still saw tremendous activity, with over $1.6B in sales value transacting in the first half of 2023 across single family homes, condos and townhomes.
• We started to feel the uncertainty people have around the larger macroeconomic climate. Inventory reached the highest levels we’ve seen in quite some time, and there was less urgency around making offers.
• When removing the 3 outlier $100M+ sales from our database we began to see some weakening across PPSF and average sale price year-over-year. Average sale price was down across both waterfront and non-waterfront homes and PPSF was flat on waterfront home sales and down across non-waterfront home sales.
• We continued to see pre-pandemic traffic patterns return to normal, with December to April being a very active time of daily showings. Activity slowed to one or two showings per week during the off season.
I hope you enjoy the read. As always, please don’t hesitate to reach out with any questions or if I can be of assistance to you in any way.
Best regards,
Gary Pohrer
Executive Director of Luxury Sales

 Douglas Elliman


340 Royal Poinciana Way M302
Palm Beach, FL 33480
O: 561.655.8600
M: 561.262.0856
gary.pohrer@elliman.com
garypohrer.com

*PER DOUGLAS ELLIMAN INTERNAL RECORDS. **AS RECOGNIZED BY THE DOUGLAS ELLIMAN ELLIE AWARDS FROM 2017-2021. *** RANKED IN 2023 INDIVIDUAL BY SALES VOLUME 2022 REALTRENDS + TOM FERRY THE THOUSAND.
Tammy Bernstein Sales Associate
REPORT CONTRIBUTORS
Beth Johnson Sales Associate
Elizabeth Tristan Sales Associate Market Insights Advisor
In Sales Since 2020* $1.5B+ Douglas Elliman Palm Beach Realtor for Sales Volume From 2017-2021** #1 Ranked Nationwide 2023 REALTrends + Tom Ferry The Thousand*** #30 Years Selling Real Estate in Florida 20 GARY POHRER | GARYPOHRER.COM | 3
SINGLE FAMILY HOMES
ALL NEIGHBORHOODS

1H Summary: Single Family Homes: All Neighborhoods
Transaction volume was down -43% year-over-year (YOY)* in the first half of 2023, largely driven by decline across both waterfront and non-waterfront properties.
Total sales value* was down -21% YOY, driven by a -49% decrease in non-waterfront sales. Even though waterfront transactions were down, there were several premium sales in the first half of 2023, resulting in flat YOY sales value for waterfront properties.
Price per square foot (PPSF)* across home size* (PPSF: Home Size) grew +1% on waterfront sales and declined -10% on non-waterfront sales.
*Please note that this quarter we removed three outlier sales ($100M+) from our calculations when tabulating the average sale price and PPSF metrics as we felt it did not give an accurate picture of the current state of the market as it relates to pricing.
Year-over-year (YOY): A method of evaluating two or more measured events, comparing the results of one period with those of a comparable period on an annualized basis.
Total sales value: The sum of all sales during a period of time.
Price per square foot (PPSF): A calculation of the value of each square foot of area of a house, condo or any building. It is calculated by dividing the price by the square footage.
PPSF: Home Size: This is based on the current under air square footage.
PPSF: Lot Size: This is based on the PPSF of the total lot.
Sale to List Ratio: The ratio of the final sale price of a home to its list, or asking, price expressed as a percentage. If the sale to list ratio is above 100%, the home sold for more than the list price. If it’s less than 100%, the home sold for less than the list price.
% CHANGE YEAR OVER YEAR 1H 2022 IH 2023 TRANSACTIONS WATERFRONT NON-WATERFRONT TOTAL SALES VALUE WATERFRONT NON-WATERFRONT AVERAGE SALES PRICE* WATERFRONT NON-WATERFRONT AVERAGE PPSF: HOME SIZE* WATERFRONT NON-WATERFRONT AVERAGE PPSF: LOT SIZE* WATERFRONT NON-WATERFRONT 47 15 32 $1,220,208,104 $816,493,725 $403,714,379 $37,807,210 $9,797,238 $5,578 $2,949 $1,288 $911 82 19 63 $1,550,565,935 $759,431,380 $791,134,555 $39,970,073 $12,557,691 $5,507 $3,287 $1,469 $935 -43% -21% -49% -21% 8% -49% -5% -22% 1% -10% -12% -3%
GARY POHRER | GARYPOHRER.COM | 5
Inventory: Active Listings
In the first half of the year, inventory really started to build up in single family homes. Active listings were up +52% YOY, from an average of 50 active listings in 1H 2022 to an average of 75 active listings in 1H 2023.
Days On Market
The rate at which homes sold decreased by -82%. In 1H 2022, homes spent an average of 129 days on the market, whereas in 1H 2023, homes stayed on the market an average of 234 days.
0% 50 100 150 200 190 130 122 194 137 172 105 31 84 60 150 38 39 40 68 MAR -1 7 SEP -1 7 JUN17 DE C17 MAR -1 8 SEP -1 8 JUN18 DE C18 MAR -1 9 SEP -1 9 JUN19 DE C19 MAR -2 0 SE P-2 0 JUN20 JUN21 DE C20 MAR -2 1 MAR -2 2 SE P-2 1 SE P-2 2 DE C21 DE C22 JUN22 JUN23 MAR -2 3 ACTIVE LISTINGS
0 100 200 600 300 400 500 145 571 73 590 357 322 193 215 170 148 335 425 138 120 95 39 108 MAR -1 7 SEP -1 7 JUN17 DE C17 MAR -1 8 SEP -1 8 JUN18 DE C18 MAR -1 9 SEP -1 9 JUN19 DE C19 MAR -2 0 SE P-2 0 JUN20 JUN21 DE C20 MAR -2 1 MAR -2 2 SE P-2 1 SE P-2 2 DE C21 DE C22 JUN22 JUN23 MAR -2 3 DAYS
MARKET
ON
234
GARY POHRER | GARYPOHRER.COM | 6
DAYS
Sale to List Ratio*
It’s fair to say we have entered a period of discovery, in which the assumptions made on a property’s value are not holding at the level they have in recent years. In the first half of 2023, homes no longer sold at 95%+ of list price and the sale to list ratio dropped to 78% of original list price.
Sale to List Ratio: The ratio of the final sale price of a home to its list, or asking, price expressed as a percentage. If the sale to list ratio is above 100%, the home sold for more than the list price. If it’s less than 100%, the home sold for less than the list price.
SALE TO LIST RATIO 70 75 80 100 105 85 90 95 93 105 88 88 86 78 98 87 85 76 74 77 79 96 97 86 91 MAR -1 7 SEP -1 7 JUN17 DE C17 MAR -1 8 SEP -1 8 JUN18 DE C18 MAR -1 9 SEP -1 9 JUN19 DE C19 MAR -2 0 SE P-2 0 JUN20 JUN21 DE C20 MAR -2 1 MAR -2 2 SE P-2 1 SE P-2 2 DE C21 DE C22 JUN22 JUN23 MAR -2 3
GARY POHRER | GARYPOHRER.COM | 7
NORTH END
SINGLE FAMILY HOMES
Palm Beach’s North End, located north of Wells Road, is celebrated for quiet seclusion. Thanks to zoning laws that prohibit condos and commercial properties in this area, many residents enjoy private beachfront views.
1H 2023 Summary: Single Family Homes: North End
Transaction volume was down -62% YOY in the first half of 2023.
Total sales value was down -22%, largely driven by a -74% decline in non-waterfront sales value.
PPSF: Home Size was down -11% on waterfront homes and down -5% on non-waterfront sales.
*Please note that this quarter we removed three outlier sales ($100M+) from our calculations when tabulating the average sale price and PPSF metrics as we felt it did not give an accurate picture of the current state of the market as it relates to pricing.
% CHANGE YEAR OVER YEAR 1H 2022 1H 2023 TRANSACTIONS WATERFRONT NON-WATERFRONT TOTAL SALES VALUE WATERFRONT NON-WATERFRONT AVERAGE SALES PRICE* WATERFRONT NON-WATERFRONT AVERAGE PPSF: HOME SIZE* WATERFRONT NON-WATERFRONT AVERAGE PPSF: LOT SIZE* WATERFRONT NON-WATERFRONT 18 7 11 $639,776,730 $538,670,600 $101,106,130 $42,734,120 $9,191,466 $5,777 $3,146 $1,247 $713 47 9 38 $820,223,780 $350,664,750 $469,559,030 $38,962,750 $12,356,817 $6,527 $3,316 $852 $1,378 -62% -22% -71% -22% 54% -78% 10% -26% -11% -5% 46% -48%
GARY POHRER | GARYPOHRER.COM | 9
Most Recent North End Sales
*These listings were sold/represented by Gary Pohrer of Douglas Elliman Real Estate.
GARY POHRER | GARYPOHRER.COM | 10 $170,000,000 589 N COUNTY ROAD YES 26,115 $6,510 69,099 $2,460 $155,000,000 1495 N OCEAN BOULEVARD YES 21,754 $7,125 115,430 $1,343 $68,145,600 149 E INLET DRIVE YES 11,706 $5,821 62,753 $1,086 $66,000,000 1350 N LAKE WAY YES 13,375 $4,935 35,632 $1,852 $34,900,000 107 DOLPHIN ROAD YES 3,579 $9,751 10,001 $3,490 $23,000,000 1330 N OCEAN BOULEVARD YES 3,676 $6,257 48,391 $475 $21,625,000 1246 N LAKE WAY YES 4,649 $4,652 14,584 $1,483 $14,000,000 515 N LAKE WAY NO 3,023 $4,631 12,092 $1,158 $13,150,000 233 MIRAFLORES DRIVE NO 3,694 $3,560 13,665 $962 $11,350,000 110 MOCKINGBIRD TRAIL NO 2,931 $3,872 21,967 $517 $9,500,000 224 VIA MARILA* NO 3,641 $2,609 16,474 $577 $9,237,430 239 WELLS ROAD NO 3,001 $3,078 14,000 $660 $8,625,000 232 LA PUERTA WAY NO 3,133 $2,753 12,502 $690 $8,300,000 224 BAHAMA LANE NO 2,488 $3,336 10,171 $816 $7,475,000 151 SEAGATE ROAD* NO 3,386 $2,208 11,021 $678 $6,818,700 111 REEF ROAD NO 2,853 $2,390 10,001 $682 $6,550,000 1171 N OCEAN WAY NO Lot Sale Lot Sale 9,727 $673 $6,100,000 209 LIST ROAD* NO 2,618 $2,330 10,132 $602 SALE PRICE ADDRESS WATERFRONT? SF HOME SIZE SF LOT SIZE PPSF ($) PPSF ($) APPROX. APPROX. HOME SIZE LOT SIZE
GARYPOHRER.COM
IN-TOWN
SINGLE FAMILY HOMES
Nestled between Worth Avenue and Wells Road lies the energetic center of Palm Beach Island, In-Town. Packed with shops, secluded beaches, and five-star restaurants, this hub of culture and leisure lures residents with a flair for cosmopolitan life.

\
1H 2023 Summary: Single Family Homes: In-Town
In-Town transaction volume was down -25% YOY in the first half of 2023.
Total sales value was down -42% YOY at $129M in the first half of 2023, compared to $225M in the first half of 2022.
In-Town PPSF: Home Size was down -14% YOY, and PPSF: Lot Size was down -8% YOY in the first half of 2023.
Most Recent In-Town Sales
*These listings were sold/represented by Gary Pohrer of Douglas Elliman Real Estate.
Note: Reporting in this section does not break out waterfront versus non-waterfront properties, as there are limited waterfront sales in this area. In most years, zero waterfront homes sold.
% CHANGE YEAR OVER YEAR 1H 2022 1H 2023 TRANSACTIONS TOTAL SALES VALUE AVERAGE SALES PRICE AVERAGE PPSF: HOME SIZE AVERAGE PPSF: LOT SIZE 15 $129,819,074 $8,654,605 $2,709 $1,161 20 $225,422,775 $11,271,139 $3,162 $1,255 -25% -42% -23% -14% -8%
$16,200,000 130 COCOANUT ROW NO 5,786 $2,800 14,523 $1,115 $14,000,000 315 COCOANUT ROW* NO 4,503 $3,109 10,202 $1,372 $12,005,756 220 BRAZILIAN AVENUE NO 4,010 $2,994 8,560 $1,403 $10,700,000 160 SUNSET AVENUE NO 4,530 $2,362 6,752 $1,585 $8,935,000 163 SEABREEZE AVENUE NO 2,877 $3,106 6,125 $1,459 $8,312,000 218 BRAZILIAN AVENUE NO 4,010 $2,073 8,560 $971 $8,120,000 159 AUSTRALIAN AVENUE NO 3,324 $2,443 10,498 $773 $7,960,818 323 CHILEAN AVENUE NO 2,761 $2,883 9,374 $849 $7,575,500 315 SEASPRAY AVENUE NO 2,574 $2,943 6,125 $1,237 $7,540,000 421 BRAZILIAN AVENUE NO 2,788 $2,704 3,916 $1,925 $7,500,000 140 ATLANTIC AVENUE NO 2,075 $3,614 8,242 $910 $6,200,000 254 N COUNTY ROAD* NO 2,652 $2,338 4,439 $1,397 $5,275,000 265 PARK AVENUE NO 1,764 $2,990 3,498 $1,508 $4,995,000 318 AUSTRALIAN AVENUE NO 1,963 $2,545 5,750 $869 $4,500,000 263 PARK AVENUE NO 2,306 $1,951 5,249 $857 SALE PRICE ADDRESS WATERFRONT? SF HOME SIZE SF LOT SIZE PPSF ($) PPSF ($) APPROX. APPROX. HOME SIZE LOT SIZE
GARY POHRER | GARYPOHRER.COM | 12
ESTATE SECTION
SINGLE FAMILY HOMES
The Estate Section comprises all residences south of Worth Avenue to Sloans Curve. It is renowned for its opulent residencies and exclusive social clubs including The Everglades Club, Bath and Tennis Club, and Mar-a-Lago.
1H 2023 Summary: Single Family Homes: Estate Section
The Estate Section had the strongest YOY performance of all areas on Palm Beach Island. Transactions were flat in the first half of 2023, compared to the first half of 2022.
Total sales value was only down -2% YOY when comparing the first half of 2023 to the first half of 2022. This was driven largely by a $100M sale at 195 Via Del Mar.
PPSF was up +14% YOY across waterfront sales from 1H 2022 to 1H 2023 and was down -8% YOY across non-waterfront sales from 1H 2022 to 1H 2023.
Most Recent Estate Section Sales
% CHANGE YEAR OVER YEAR 1H 2022 1H 2023 TRANSACTIONS WATERFRONT NON-WATERFRONT TOTAL SALES VALUE WATERFRONT NON-WATERFRONT AVERAGE SALES PRICE WATERFRONT NON-WATERFRONT AVERAGE PPSF: HOME SIZE WATERFRONT NON-WATERFRONT AVERAGE PPSF: LOT SIZE WATERFRONT NON-WATERFRONT 14 8 6 $450,612,300 $277,823,125 $172,789,175 $34,727,891 $14,557,835 $5,433 $3,177 $1,321 $911 14 9 5 $458,502,750 $362,350,000 $96,152,750 $40,261,111 $19,230,550 $4,785 $3,457 $1,469 $836 0% -11% 20% -2% -23% 80% -14% -24% 14% -8% -10% 9%
$100,000,000 195 VIA DEL MAR NO 17,424 $5,739 70,741 $1,414 $63,431,750 854 S COUNTY ROAD YES 13,085 $4,848 87,338 $726 $44,975,000 550 S OCEAN BOULEVARD YES 8,146 $5,521 21,161 $2,125 $41,382,500 930 S OCEAN BOULEVARD YES 6,528 $6,339 19,267 $2,148 $36,850,000 930 S OCEAN BOULEVARD YES 6,528 $5,645 19,267 $1,913 $28,694,175 135 GULFSTREAM ROAD NO 5,925 $4,843 17,350 $1,654 $26,663,000 466 S OCEAN BOULEVARD YES 5,954 $4,478 7,714 $3,456 $25,000,000 1741 S OCEAN BOULEVARD YES 5,266 $4,747 24,838 $1,007 $24,520,875 977 S OCEAN BOULEVARD YES 1,677 $14,622 20,077 $1,221 $17,100,000 240 EL VEDADO ROAD NO 7,820 $2,187 28,297 $604 $15,000,000 124 PARC MONCEAU YES 3,950 $3,797 10,677 $1,405 $14,900,000 125 GULFSTREAM ROAD NO 3,504 $4,252 10,476 $1,422 $9,600,000 125 VIA VIZCAYA NO 3,532 $2,718 11,273 $852 $2,495,000 2278 IBIS ISLE ROAD E NO 2,133 $1,170 12,506 $200 SALE PRICE ADDRESS WATERFRONT? SF HOME SIZE SF LOT SIZE PPSF ($) PPSF ($) APPROX. APPROX. HOME SIZE LOT SIZE
GARY POHRER | GARYPOHRER.COM | 14
CONDOS & TOWNHOMES
ALL NEIGHBORHOODS
Whether you seek a large building with resort-style amenities or the boutique elegance of a small, full-service site, Palm Beach Island offers an expansive range of options just steps from shorelines, shops, restaurants and more. Palm Beach townhomes are ideal for those who seek the convenience of a condo but crave the spaciousness of a house.
1H 2023 Summary: Condominiums and Townhomes

Transaction volume in the first half of 2023 was down -42% YOY, due to a -46% decline in In-Town transactions and a -40% decline in South End transactions.
Total sales value was down -32% YOY.
PPSF rebounded after the decline we saw in Q4 of 2022. In the first half of 2023, PPSF was up +8% on In-Town transations and up +5% on South End transactions.
Inventory: Active Listings
In the first half of 2023, inventory was up +128% YOY. The same period in 1H 2022 averaged 59 active listings per month, whereas 1H 2023 averaged 134 active listings per month.

TRANSACTIONS IN-TOWN SOUTH END TOTAL SALES VALUE IN-TOWN SOUTH END AVERAGE SALES PRICE IN-TOWN SOUTH END AVERAGE PPSF: HOME IN-TOWN SOUTH END 218 52 166 $421,988,163 $219,860,550 $202,127,613 $4,228,088 $1,217,636 $2,405 $764 373 96 277 $624,922,124 $302,102,367 $322,819,757 $3,146,900 $1,165,414 $2,224 $726 -42% -46% -40% -32% -27% -37% 34% 4% 8% 5% % CHANGE YEAR OVER YEAR 1H 2022 1H 2023
ACTIVE LISTINGS 350 300 250 200 150 100 50 332 333 323 250 75 64 238 236 276 199 114 119 146 146 75 88 53 MAR -1 7 SEP -1 7 JUN17 DE C17 MAR -1 8 SEP -1 8 JUN18 DE C18 MAR -1 9 SEP -1 9 JUN19 DE C19 MAR -2 0 SE P-2 0 JUN20 JUN21 DE C20 MAR -2 1 MAR -2 2 SE P-2 1 SE P-2 2 DE C21 DE C22 JUN22 JUN23 MAR -2 3
GARY POHRER | GARYPOHRER.COM | 16
Days On Market
The number of days on market was up +24% compared to the same period last year. During 1H 2022, condos and townhomes took an average of 111 days to sell. In 1H 2023, condos and townhomes took an average of 137 days to sell.
Sale to List Ratio*
89%
The sale to list ratio for condos and townhomes hovered right around 89% for the first half of 2023. This was down -7% compared to the same period last year.
SALE TO LIST RATIO
Sale to List Ratio: The ratio of the final sale price of a home to its list, or asking, price expressed as a percentage. If the sale to list ratio is above 100%, the home sold for more than the list price. If it’s less than 100%, the home sold for less than the list price.
350 300 250 200 150 100 50 150 150 152 254 229 305 209 210 325 141 151 142 204 115 82 MAR -1 7 SEP -1 7 JUN17 DE C17 MAR -1 8 SEP -1 8 JUN18 DE C18 MAR -1 9 SEP -1 9 JUN19 DE C19 MAR -2 0 SE P-2 0 JUN20 JUN21 DE C20 MAR -2 1 MAR -2 2 SE P-2 1 SE P-2 2 DE C21 DE C22 JUN22 JUN23 MAR -2 3 DAYS
MARKET
ON
100 90 85 80 75 70 89 88 87 90 91 93 96 96 94 96 87 85 85 84 87 88 92 93 93 90 MAR -1 7 SEP -1 7 JUN17 DE C17 MAR -1 8 SEP -1 8 JUN18 DE C18 MAR -1 9 SEP -1 9 JUN19 DE C19 MAR -2 0 SE P-2 0 JUN20 JUN21 DE C20 MAR -2 1 MAR -2 2 SE P-2 1 SE P-2 2 DE C21 DE C22 JUN22 JUN23 MAR -2 3
136 DAYS
GARY POHRER | GARYPOHRER.COM | 17
Most Recent Condo and Townhome Sales
*These listings were sold/represented by Gary Pohrer of Douglas Elliman Real Estate.
$17,900,000 219 BRAZILIAN AVENUE 6,092 $2,938 $16,500,000 221 ROYAL POINCIANA WAY 6,183 $2,669 $10,400,000 2 N BREAKERS ROW, S 25 3,084 $3,372 $8,500,000 130 SUNRISE AVENUE, PH 8 2,476 $3,433 $8,000,000 315 S LAKE DRIVE, PH C 2,705 $2,957 $7,650,000 360 S OCEAN BOULEVARD, 0043 2,450 $3,122 $7,400,000 100 SUNRISE AVENUE, 611 2,025 $3,654 $6,495,000 300 S OCEAN BOULEVARD, 1B 2,149 $3,022 $6,000,000 150 BRADLEY PLACE, 0616 2,290 $2,620 $5,900,000 100 WORTH AVENUE, 516 1,597 $3,694 $5,537,500 100 WORTH AVENUE, 605 2,022 $2,739 $5,500,000 100 WORTH AVENUE, 713* 3,180 $1,730 $5,500,000 340 S OCEAN BOULEVARD, 0250 1,826 $3,012 $4,982,150 355 COCOANUT ROW 2,730 $1,825 $4,525,400 429 AUSTRALIAN AVENUE, 100 1,989 $2,275 $4,500,000 44 COCOANUT ROW, 111A 1,601 $2,811 $4,500,000 330 S OCEAN BOULEVARD, 0021 2,454 $1,834 $4,459,000 44 COCOANUT ROW, 120B 1,501 $2,971 $4,425,000 130 SUNRISE AVENUE, 2070 1,983 $2,231 $4,300,000 389 S LAKE DRIVE, PHE 2,002 2,148 $4,264,000 100 WORTH AVENUE, 717 1,580 $2,699 $4,200,000 100 WORTH AVENUE, 302 1,588 $2,645 $4,000,000 44 COCOANUT ROW, 216A 1,226 $3,263 $4,000,000 100 SUNRISE AVENUE, 610 1,580 $2,532 $3,965,000 100 WORTH AVENUE, 607 1,539 $2,576 $3,675,000 44 COCOANUT ROW, 512A 1,215 $3,025 $3,575,000 389 S LAKE DRIVE, 1A* 1,541 $2,320 $3,300,000 350 S OCEAN BOULEVARD, 1030 1,186 $2,782 $3,200,000 100 WORTH AVENUE, 507 1,539 $2,079 $3,100,000 429 AUSTRALIAN AVENUE, 30 1,686 $1,839 $3,025,000 315 S LAKE DRIVE, 2A 1,816 $1,666 $2,750,000 44 COCOANUT ROW, 502A 900 $3,056 $2,725,000 250 BRADLEY PLACE, 610 1,220 $2,234 $2,700,000 354 CHILEAN AVENUE, 0066 1,193 $2,263 $2,500,000 130 SUNRISE AVENUE, 2110 1,580 $1,582 $2,500,000 127 PERUVIAN AVENUE, 2040 1,428 $1,751 $2,340,000 100 WORTH AVENUE, 421* 1,580 $1,481 $2,200,000 170 N OCEAN BOULEVARD, 308 1,395 $1,577 $2,100,000 300 S OCEAN BOULEVARD, 4G 1,257 $1,671 $2,000,000 130 SUNRISE AVENUE, 6180 1,097 $1,823 $1,994,000 170 CHILEAN AVENUE, 5A 1,201 $1,660 $1,850,000 389 S LAKE DRIVE, 3E 1,184 $1,563 $1,676,000 139 SUNRISE AVENUE, 2040 990 $1,693 $1,580,000 220 ATLANTIC AVENUE, 0060 646 $2,446 SALE PRICE ADDRESS PPSF ($) SF UNIT SIZE APPROX. UNIT SIZE
GARY POHRER | GARYPOHRER.COM | 18
Most Recent Condo and Townhome Sales
In Closing
We appreciate you taking the time to read our report, and hope you found our insights on the Palm Beach Island market interesting.
Economic uncertainty remains high, given four high profile bank collapses and interest rates hitting a 22 year high. Whispers of recession are influencing purchase and sale behavior. We are just now starting to see the uncertainty manifest in the most recent purchase data, and it’s unclear the full impact it will have on Palm Beach real estate in the coming six months to a year. That said, we remain cautiously optimistic about Palm Beach Island’s unique real estate market, as we’ve consistently seen its resilience when faced with challenging economic times over the last 40 years.
As always, don’t hesitate to reach out if we can assist you with any of your real estate needs.
Warmest wishes,
Gary Pohrer
Sales Associate
Executive Director of Luxury Sales

M: 561.262.0856
gary.pohrer@elliman.com
Source: Above data is pulled from Palm Beach MLS, The Beaches MLS and the Palm Beach Property Appraisers (PAPA). Specifically, we are only looking at transactions located in the 33480 zip code.
$1,525,000 223 ATLANTIC AVENUE, F4 953 $1,600 $1,350,000 139 SUNRISE AVENUE, 3020 990 $1,364 $1,260,000 354 CHILEAN AVENUE, 0052 782 $1,611 $845,000 235 SUNRISE AVENUE, 3107 788 $1,072 $775,000 235 SUNRISE AVENUE, G 1 1,023 $758 $700,000 235 SUNRISE AVENUE, MZ B 1,081 $648 $662,500 223 ATLANTIC AVENUE, E4 804 $824 $550,000 235 SUNRISE AVENUE, 3201 480 $1,146 SALE PRICE ADDRESS PPSF ($) SF UNIT SIZE APPROX. UNIT SIZE
340 ROYAL POINCIANA WAY, M302, PALM BEACH, FL 33480. 561.655.8600 © 2023 DOUGLAS ELLIMAN REAL ESTATE. ALL MATERIAL PRESENTED HEREIN IS INTENDED FOR INFORMATION PURPOSES ONLY. WHILE, THIS INFORMATION IS BELIEVED TO BE CORRECT, IT IS REPRESENTED SUBJECT TO ERRORS, OMISSIONS, CHANGES OR WITHDRAWAL WITHOUT NOTICE. ALL PROPERTY INFORMATION, INCLUDING, BUT NOT LIMITED TO SQUARE FOOTAGE, ROOM COUNT, NUMBER OF BEDROOMS AND THE SCHOOL DISTRICT IN PROPERTY LISTINGS SHOULD BE VERIFIED BY YOUR OWN ATTORNEY, ARCHITECT OR ZONING EXPERT. EQUAL HOUSING OPPORTUNITY.
GARY POHRER | GARYPOHRER.COM | 19 GARYPOHRER.COM