NOVEMBER 2023 — NOVEMBER 2024
Inside South Florida’s most exclusive real estate marke t .


NOVEMBER 2023 — NOVEMBER 2024
Inside South Florida’s most exclusive real estate marke t .
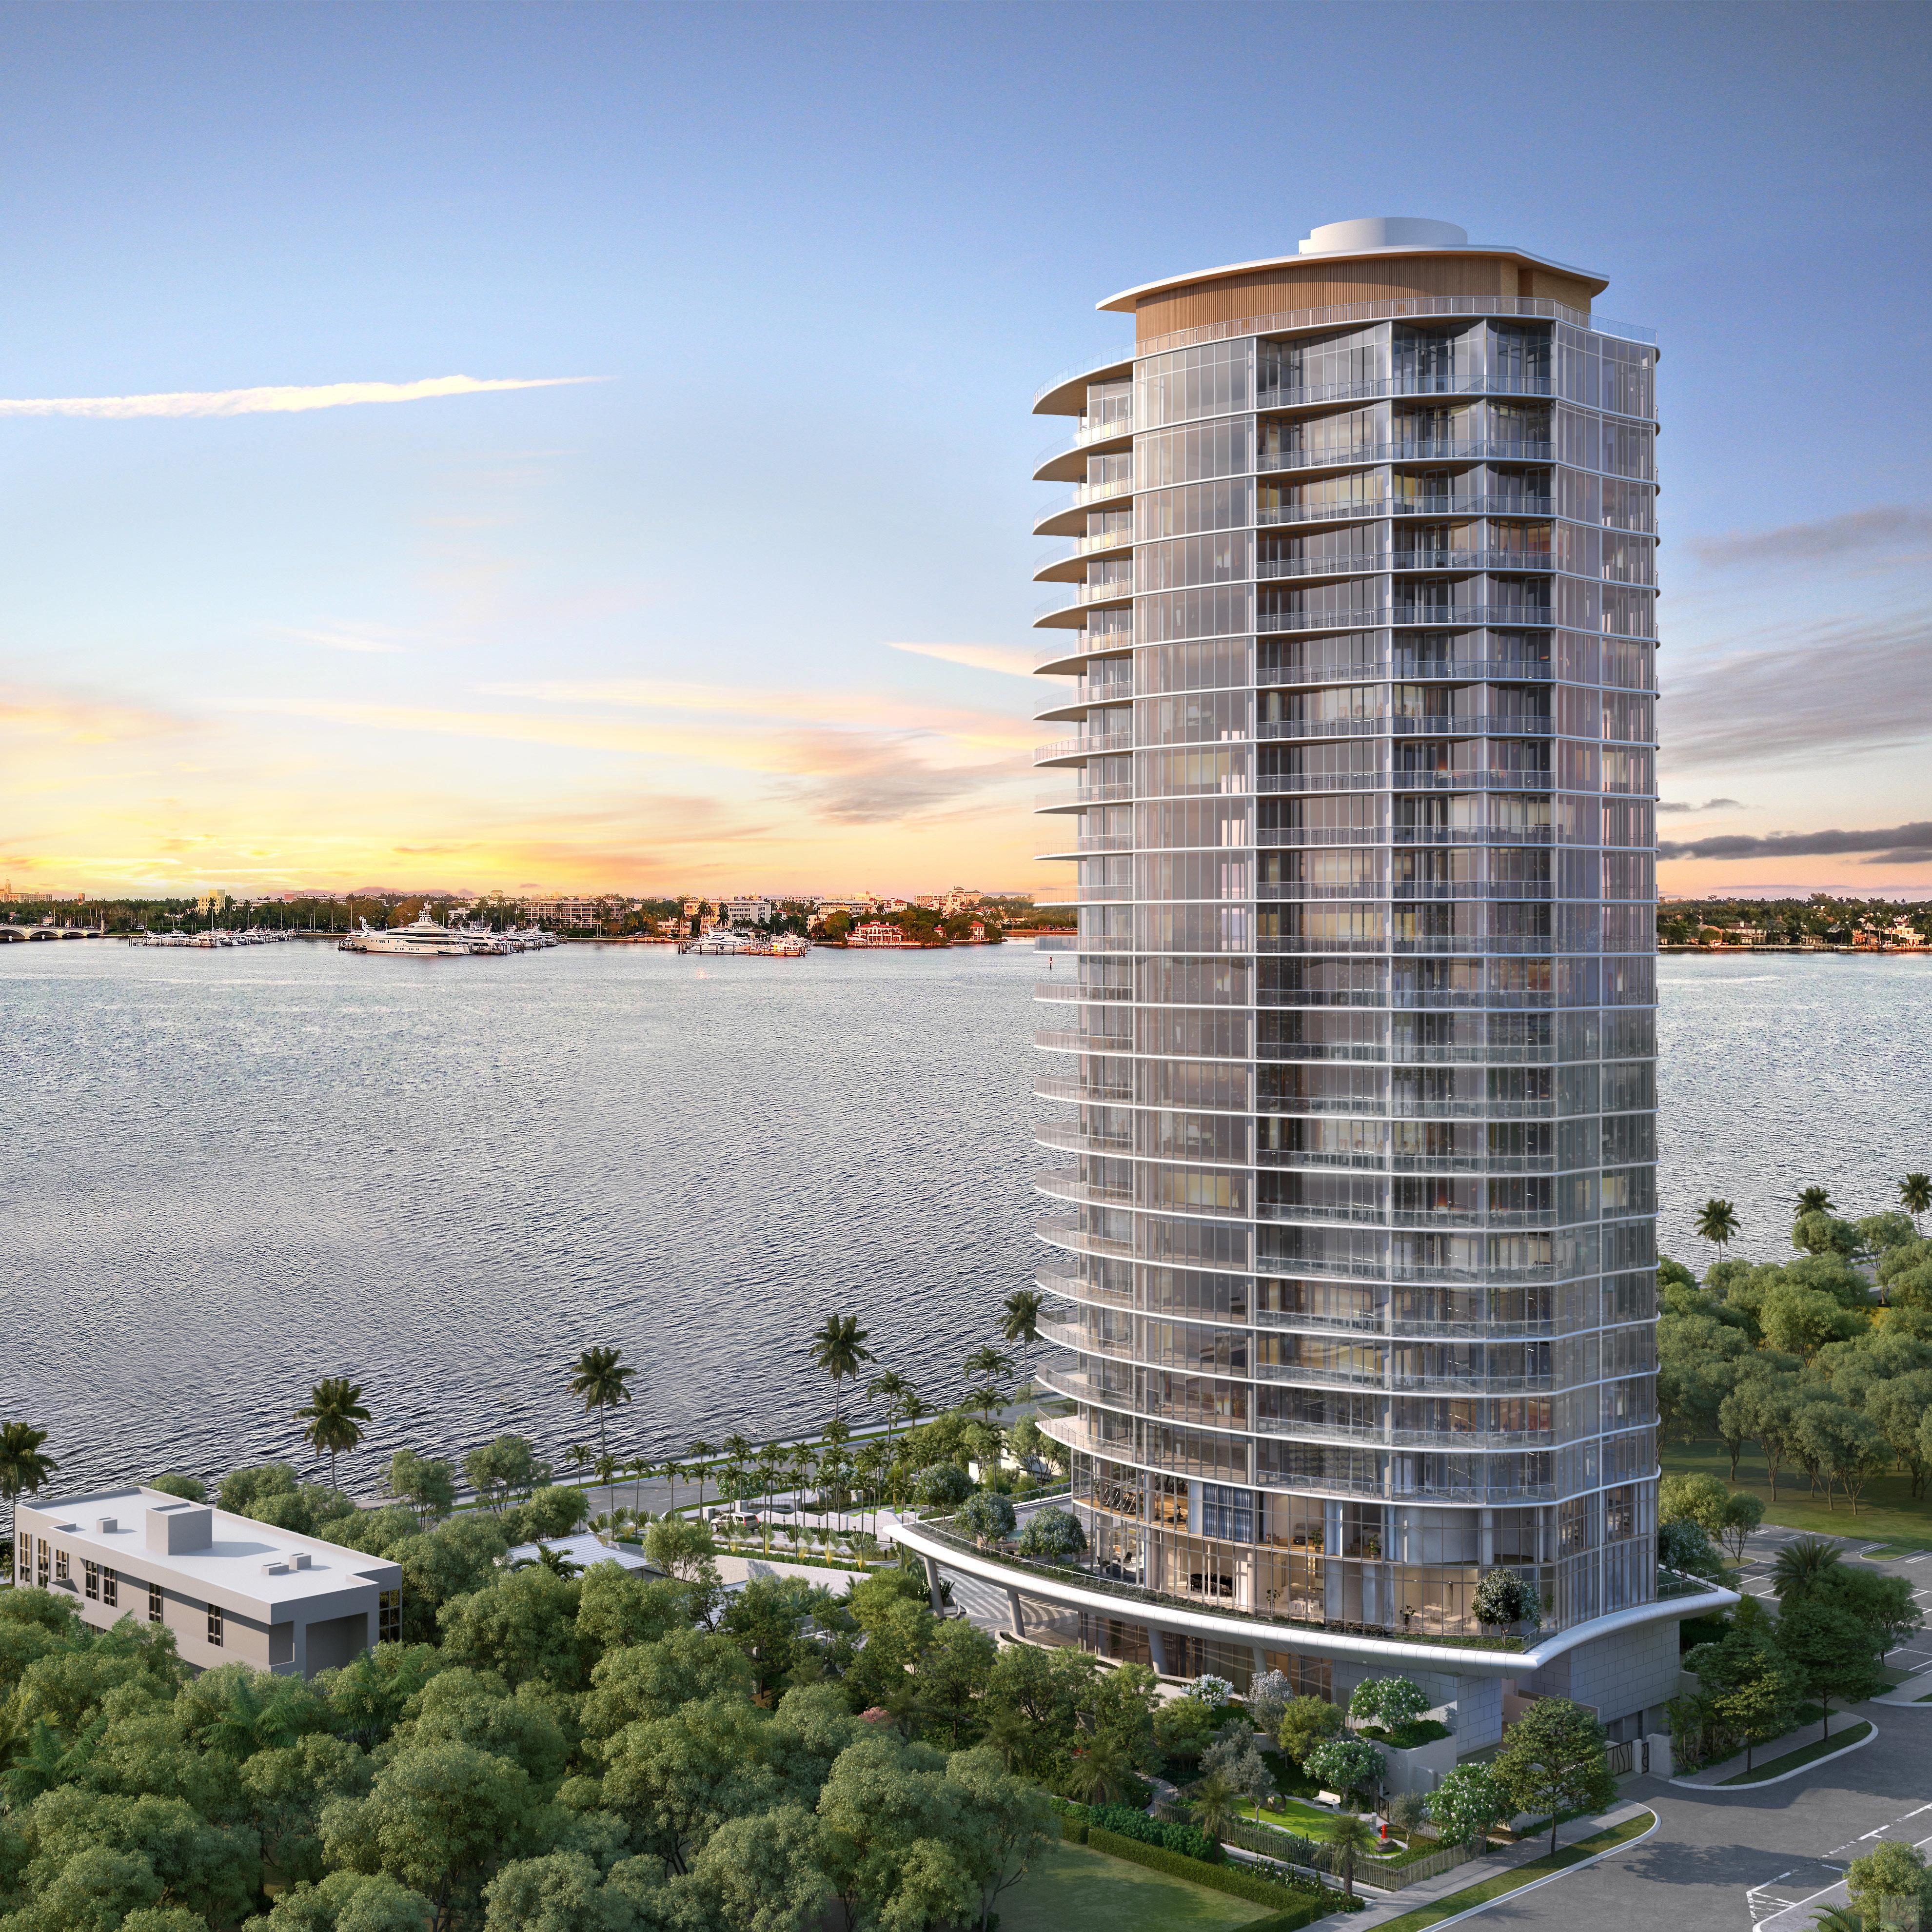
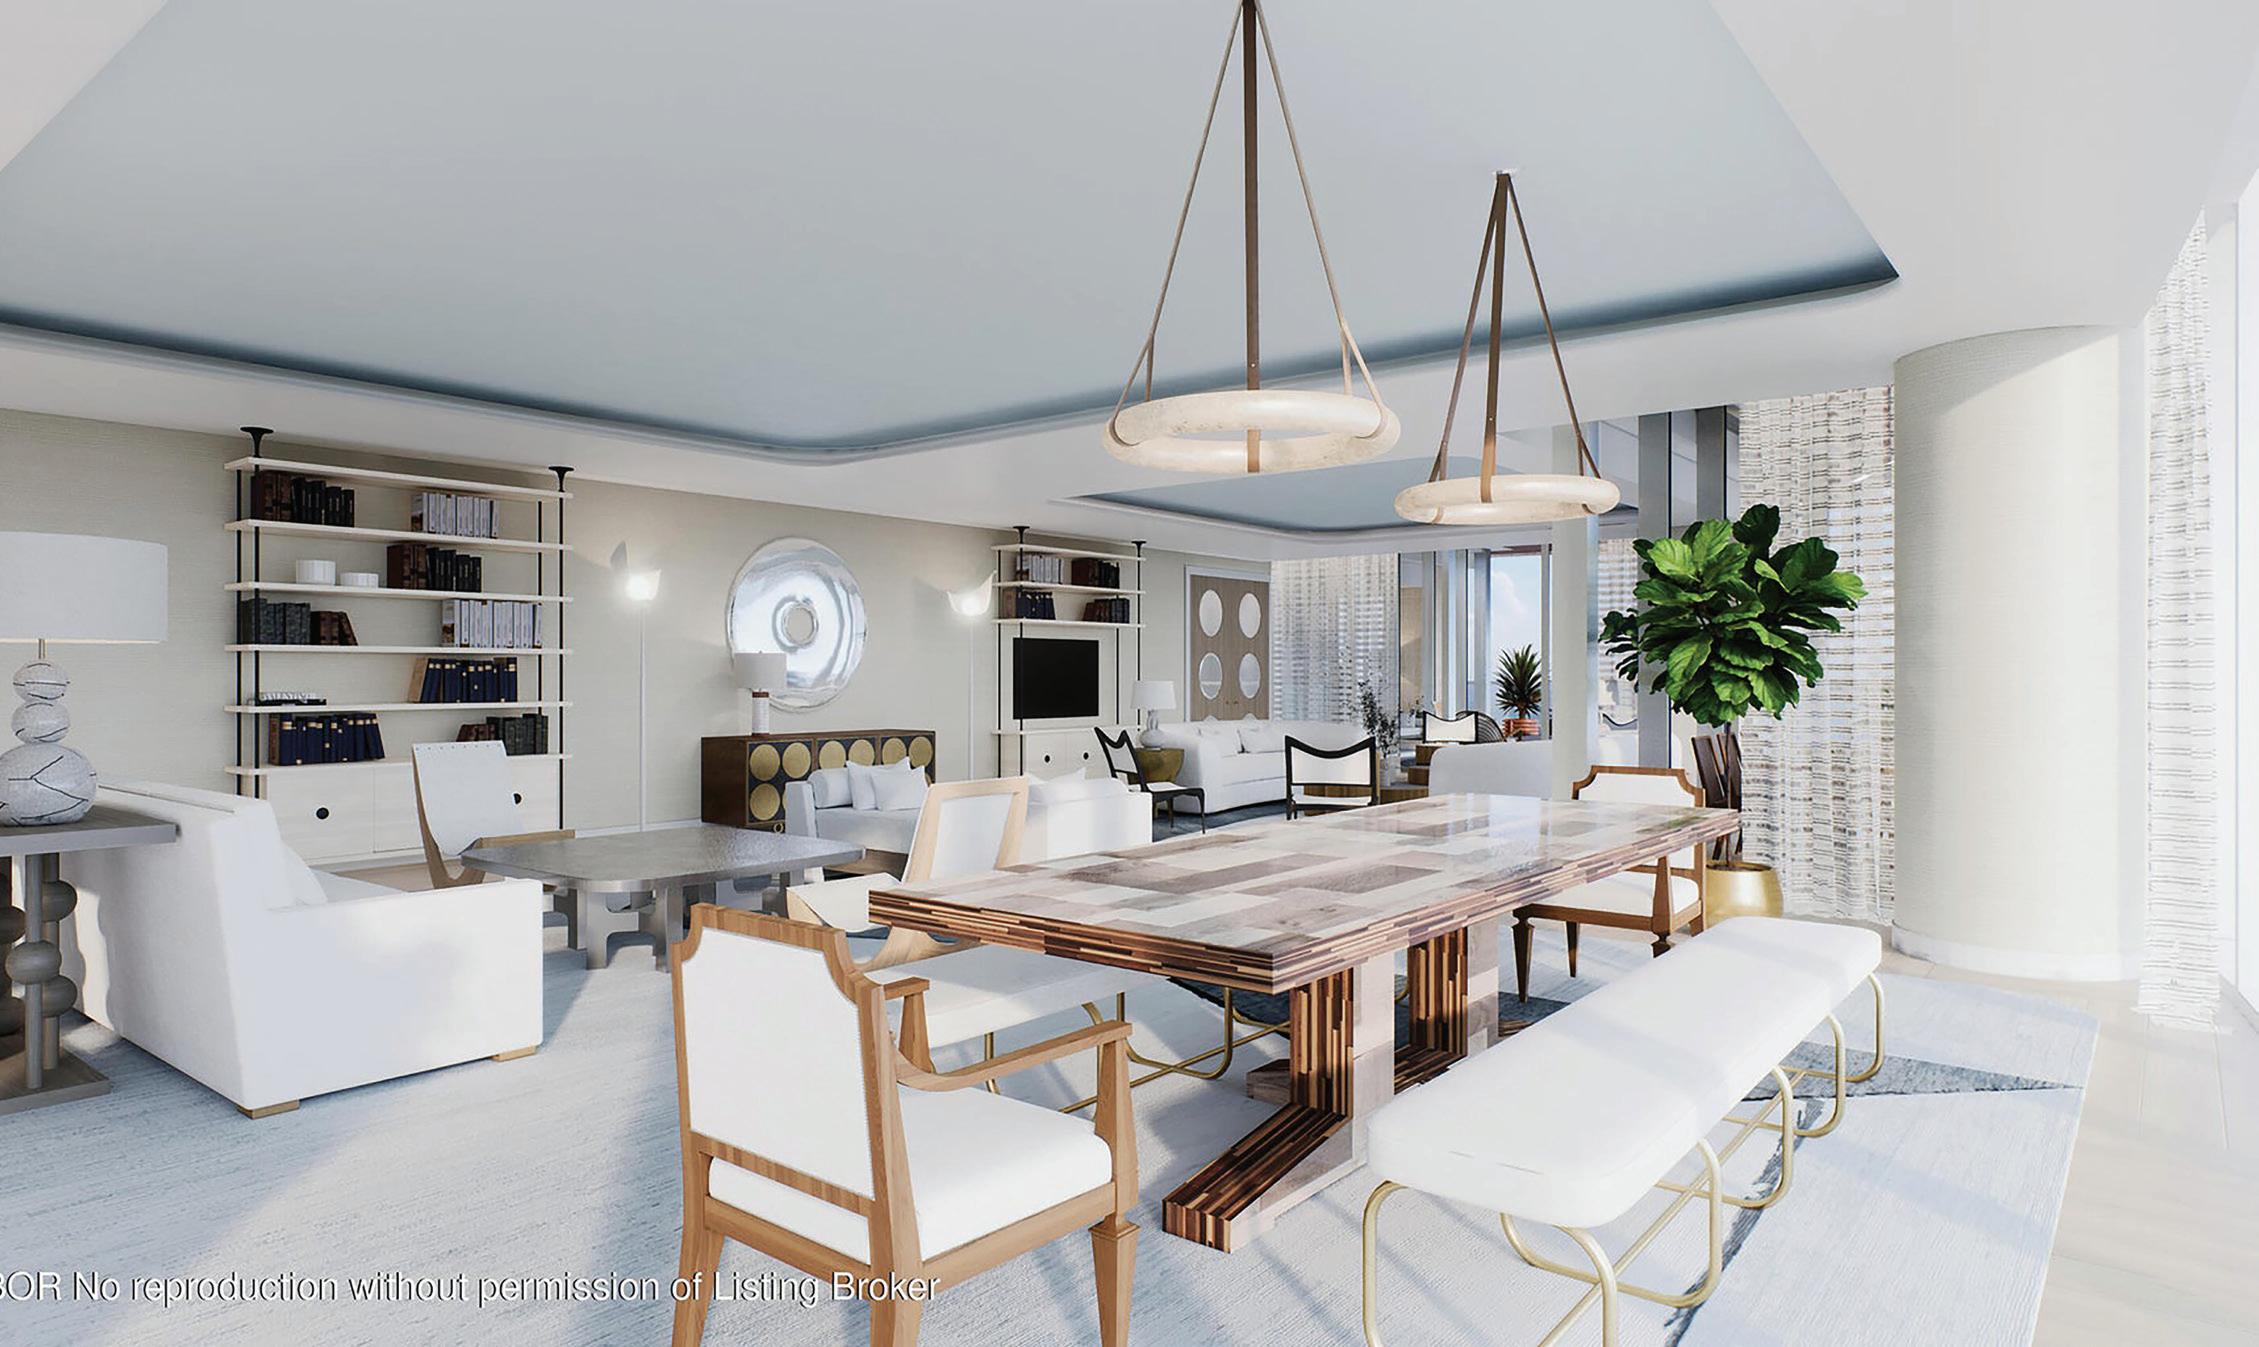
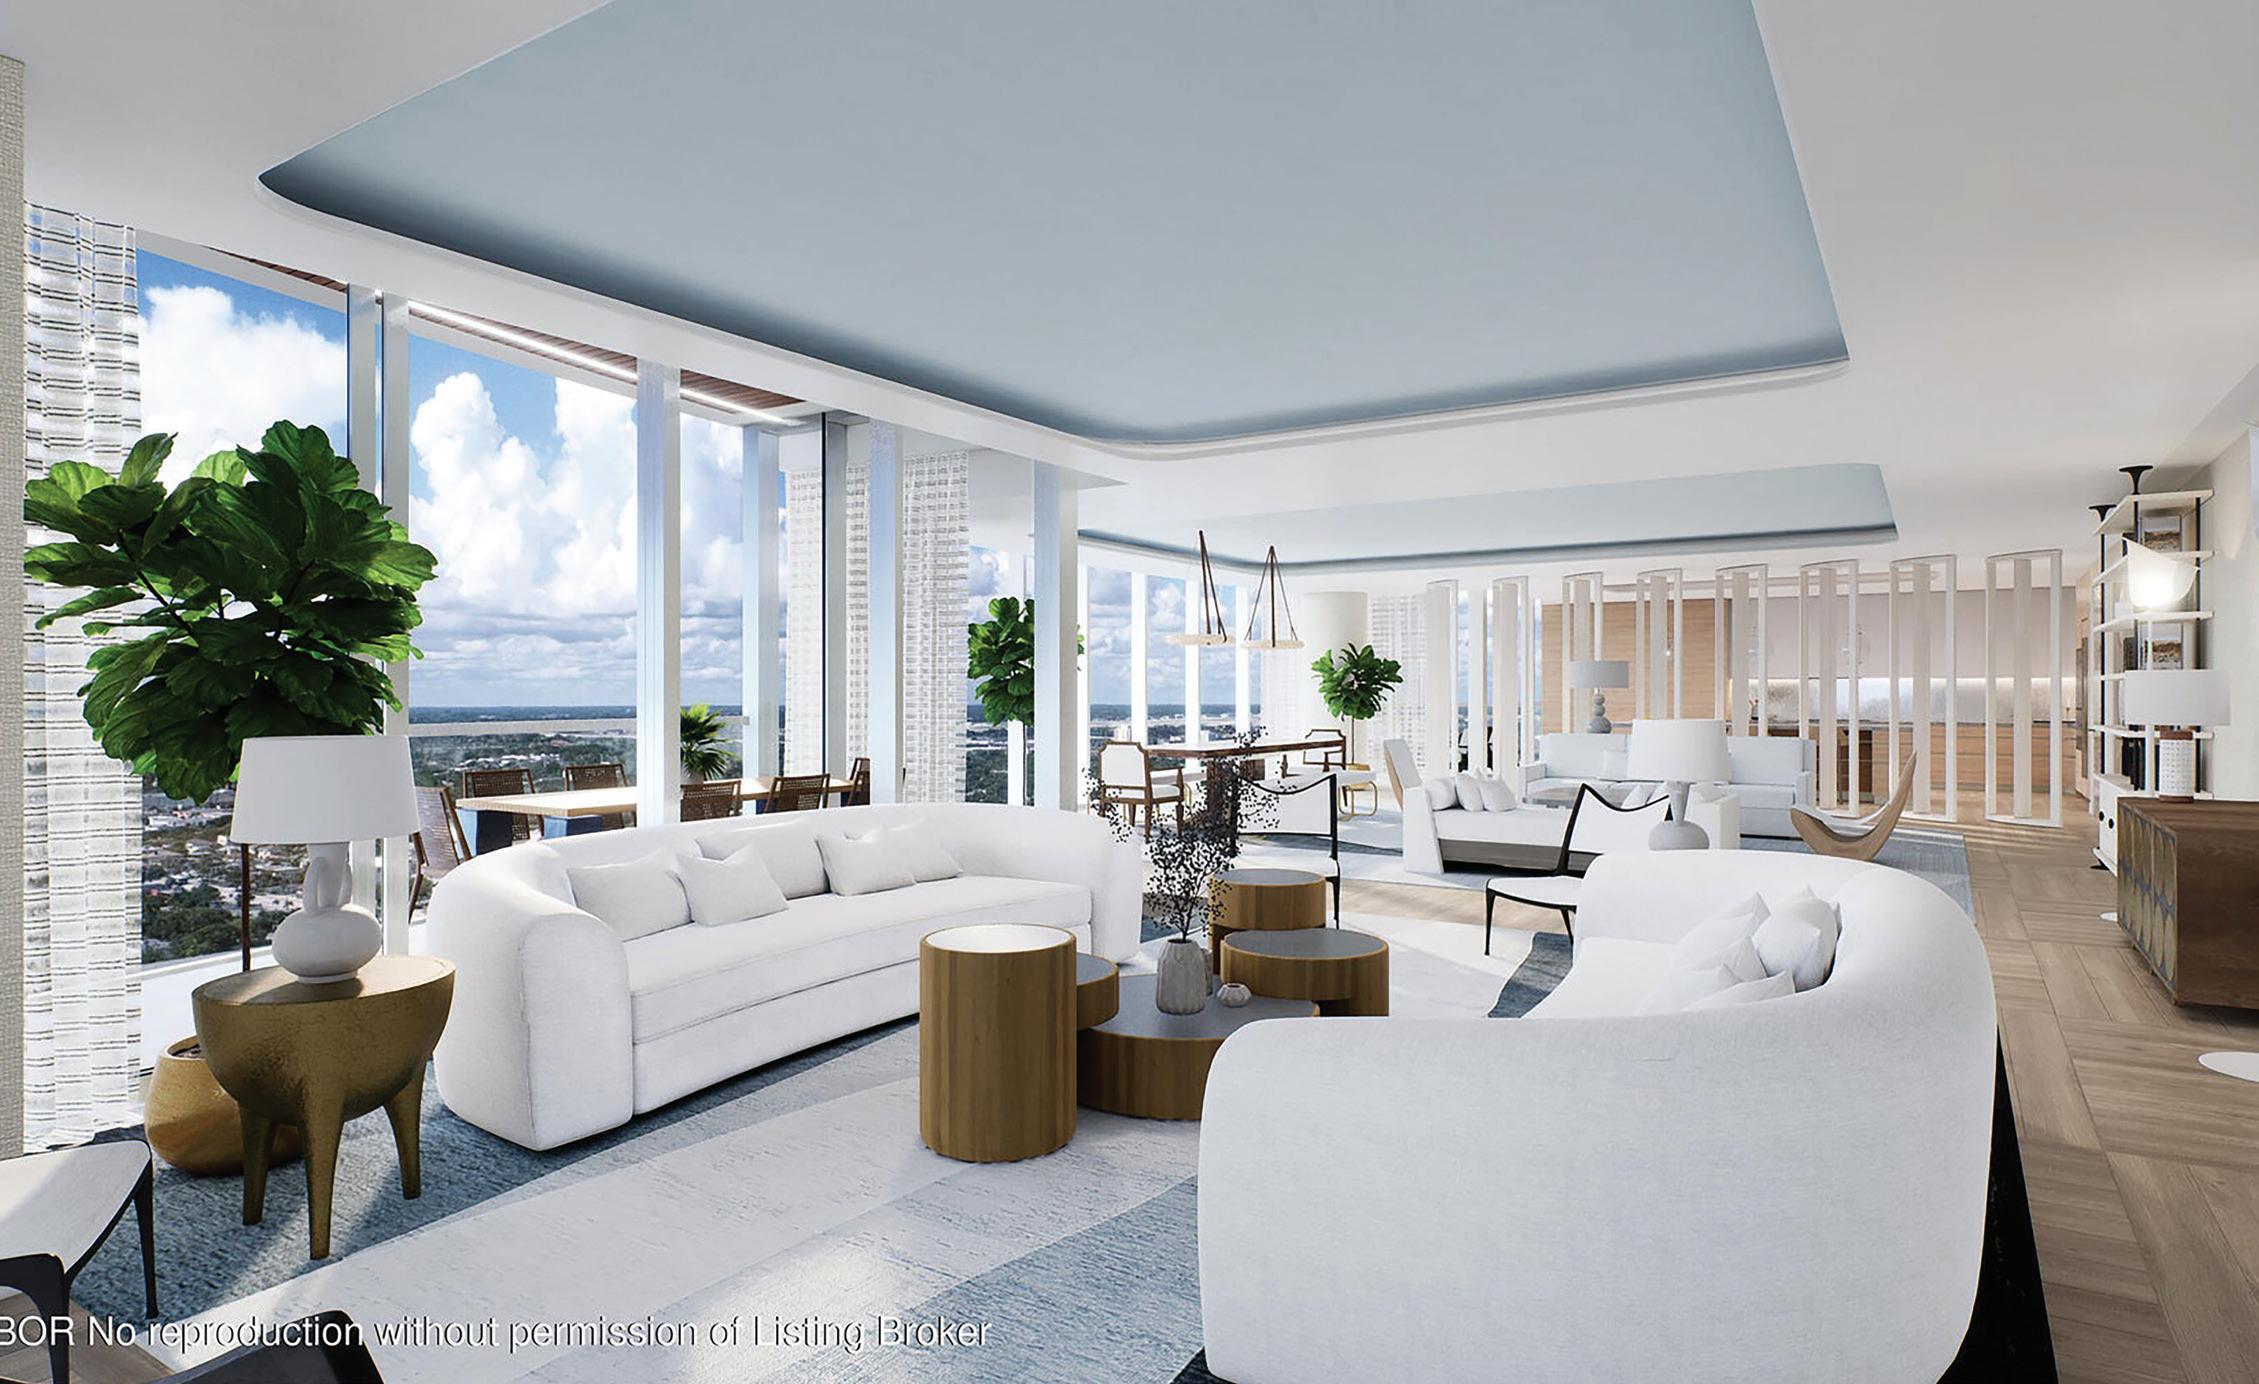
Forte on 1309 S. Flagler Drive, Unit 2302 priced at $15.3M. An unparalleled opportunity to own one of the last three available residences at Forte on Flagler, a newly completed luxury tower on Flagler Drive. This expansive condo offers 4,440 square feet of living space and features 4 bedrooms, 4 full bathrooms, 1 half bathroom, and wraparound terraces with stunning eastern and southern exposures.

Happy New Year from Palm Beach! I hope that you and your loved ones had a wonderful holiday season and look forward to a happy and healthy year ahead.
The 2024 year has officially come to a close, and it was busier than I had anticipated. Given the uncertainty of our economy, the unstable geopolitical climate, and it being an election year, it was a year of many unknowns.
As I dove into the key performance metrics from 2024, some trends emerged from both the data and the activity I’ve seen on the ground.
• It appears that we’re reaching a new normal baseline over the last two years as it relates to transaction volume. After the peak demand of 2020 to 2022, we seem to have leveled out at around 80 transactions for single family homes and 75 for In-Town condo and townhomes across the entire market.
• Palm Beach Island inventory reached new highs during the 2024 season, with anywhere from 90 to 100 active listings across single family home properties. I believe this led to an increase in price discovery, with buyers testing the waters by making offers well below the last asking price, and acceptance rates often coming in -20% to -25% below the original asking price.
• We continue to see weakening in price per square foot (PPSF), specifically on non-waterfront properties. Waterfront trophy properties continue to grow in average sale price and PPSF given the scarce nature of the asset.
I hope you enjoy reading our annual report. As always, please don’t hesitate to reach out with any questions or if I can be of assistance to you in any way.
All the best,

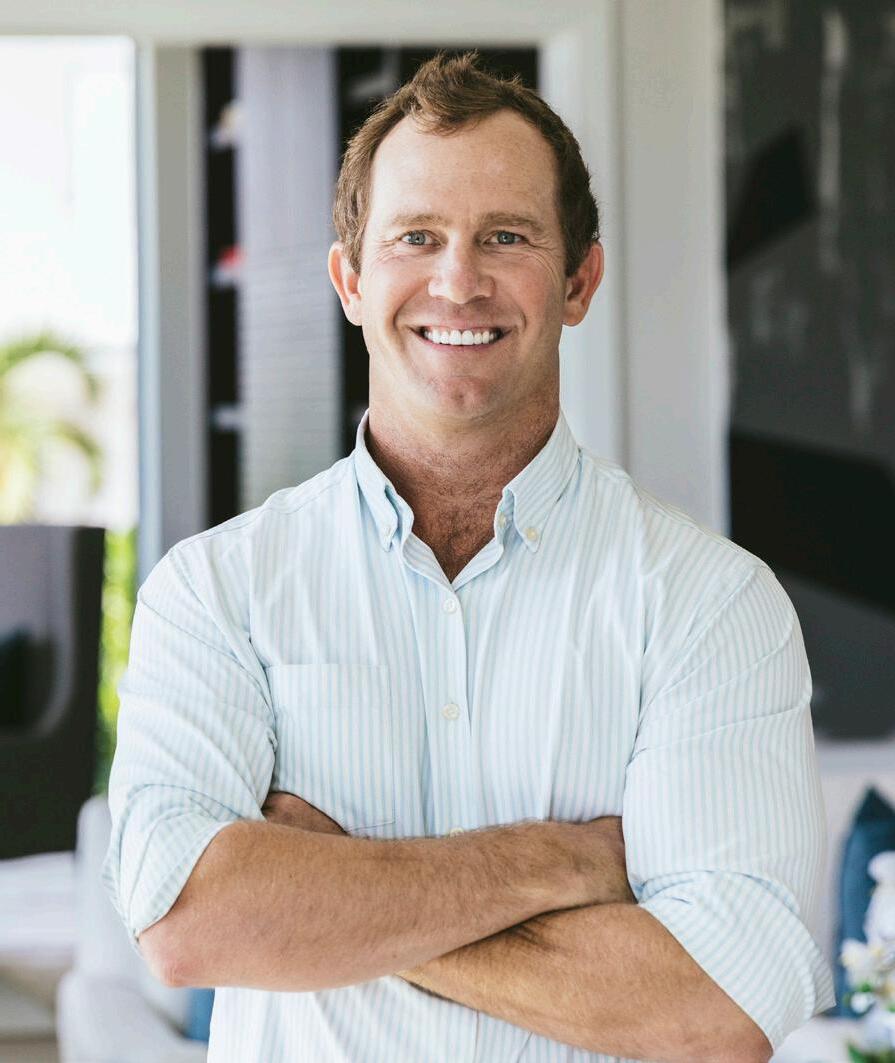
Gary Pohrer
Executive Director of Luxury Sales
Douglas Elliman
340 Royal Poinciana Way M302 Palm Beach, FL 33480
M: 561.262.0856
gary.pohrer@elliman.com garypohrer.com


Transaction volume is up +9% overall, year over year* (YOY). Non-waterfront transaction volume is up +15% YOY, whereas waterfront transactions are down -11%.
Total sales value* was up +5% YOY, driven largely by the +8% increase in non-waterfront sales. Sales activity seems to be leveling out at the volumes we saw in 2023 and 2024, at around $1.6B annually.
Price per square foot (PPSF)* across home size* (PPSF: Home Size) grew +13% on waterfront sales and declined -6.5% on non-waterfront sales.
$940,944,000
$740,037,575
$1,606,679,476
$920,528,725
$686,150,751
$21,685,371 $51,140,485 $12,848,838
**Please note that the transaction numbers and the total sales value represents January to November of the respective years. Data for December 2024 was not complete at the time of writing this report, and will be reflected in the next report.
The inventory trend is mirroring what we saw in 2023. During the summer months of 2024, inventory bottomed out at around 65 listings and then bounced back to roughly 90 to 100 listings during the peak season. This is a +150% increase over the inventory drought we saw during the height of the pandemic, from 2021 to 2022.
The rate at which homes sold was fairly flat YOY with the average days on market (DOM) in 2024 coming in right around 189 days. This was down slightly from 2023’s average DOM of 197.
We continue to operate in a period of price discovery. Sellers’ asking prices suggest a growth in PPSF, but homes closed well below ask, as we’ve seen a decline in sale to list ratio, at numbers anywhere from -20% to -25% below the original list price.
Year-over-year (YOY): A method of evaluating two or more measured events, comparing the results of one period with those of a comparable period on an annualized basis.
Total sales value: The sum of all sales during a period of time.
Price per square foot (PPSF): A calculation of the value of each square foot of area of a house, condo or any building. It is calculated by dividing the price by the square footage.
PPSF: Home Size: This is based on the current under air square footage.
PPSF: Lot Size: This is based on the PPSF of the total lot.
Sale to List Ratio: The ratio of the final sale price of a home to its list, or asking, price expressed as a percentage. If the sale to list ratio is above 100%, the home sold for more than the list price. If it’s less than 100%, the home sold for less than the list price.
Through November 2024 year-to-date, there have been a total of 76 single family home transactions. This was on par with 2023, but well below the record transaction years of 2021 and 2022. Overall, the market is not quite back up to pre-pandemic sales levels yet partly due to the lower inventory levels we’re still experiencing.
Total sales value for single family homes in the Palm Beach market has hovered right around $1.6B for the last two years. Total sales value for single family homes is down -45% from the peak of 2021, down $1B to $1.5B per year.
$3,066,242,429
$527,032,691 $834,011,861 $949,030,144 $928,590,589 $794,286,008 $1,980,266,401 $1,691,458,976 $1,680,981,575
PPSF: Home Size was up +1% YOY overall.
Waterfront PPSF: Home Size was up +13% YOY, however non-waterfront PPSF: Home Size lagged, dipping down -7% YOY.
Price appreciation has slowed over the last two years, compared to the record growth we saw from 2020 to 2022.
Compound annual growth rate* (CAGR) for the Palm Beach single family home asset class has averaged 8.53% growth over the last 42 years.
Compound Annual Growth Rate (CAGR): A performance metric that provides insight into an investment’s growth rate over a specified period of time longer than one year.
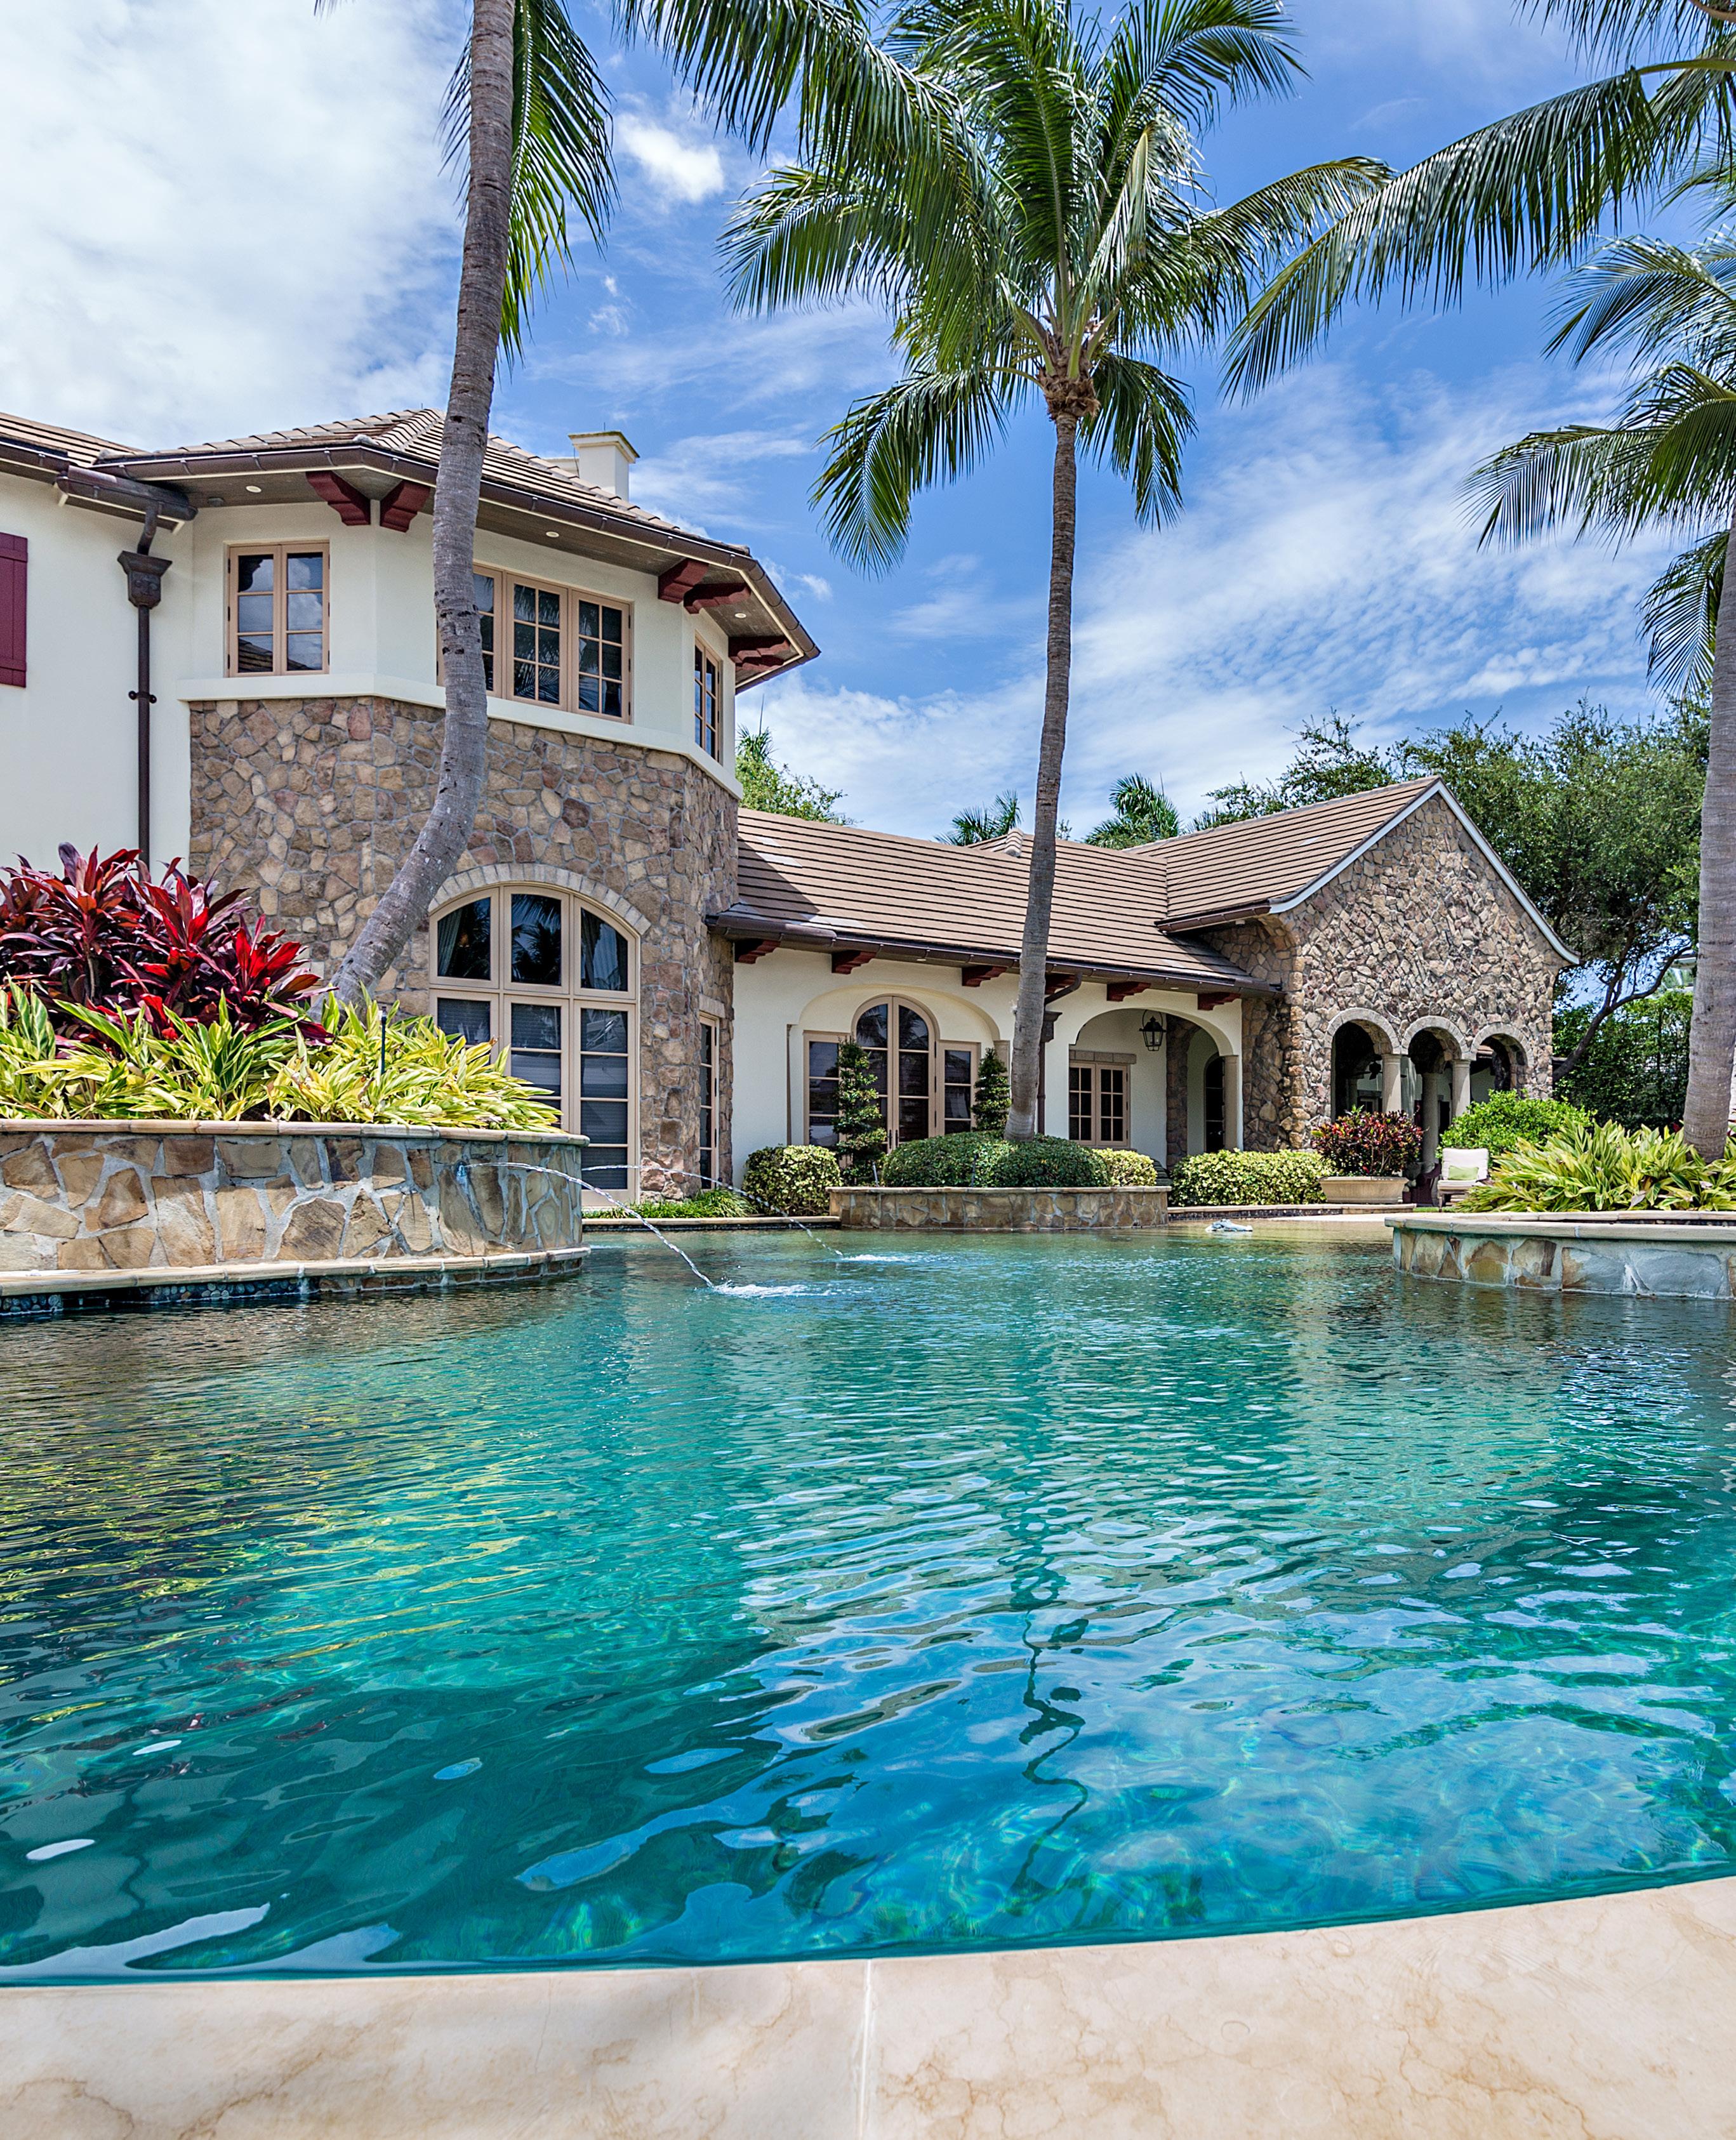
200 West Coconut Palm Road, listed for $32,000,000
This unprecedented 25-room mansion sits on over one acre with 300 feet of water frontage. This property has been said to be one of the most celebrated estates in the Royal Palm Yacht & Country Club. Luxurious living with over 18,000sf of expansive living areas, formal dining room, temperature-controlled wine cellar, movie theater, game rooms, stunning flagstone terraces, a resort-style pool, and grand entertainment loggia. Perfectly situated on a triple lot complete with 6 car garage and dock for over 200’ yacht.


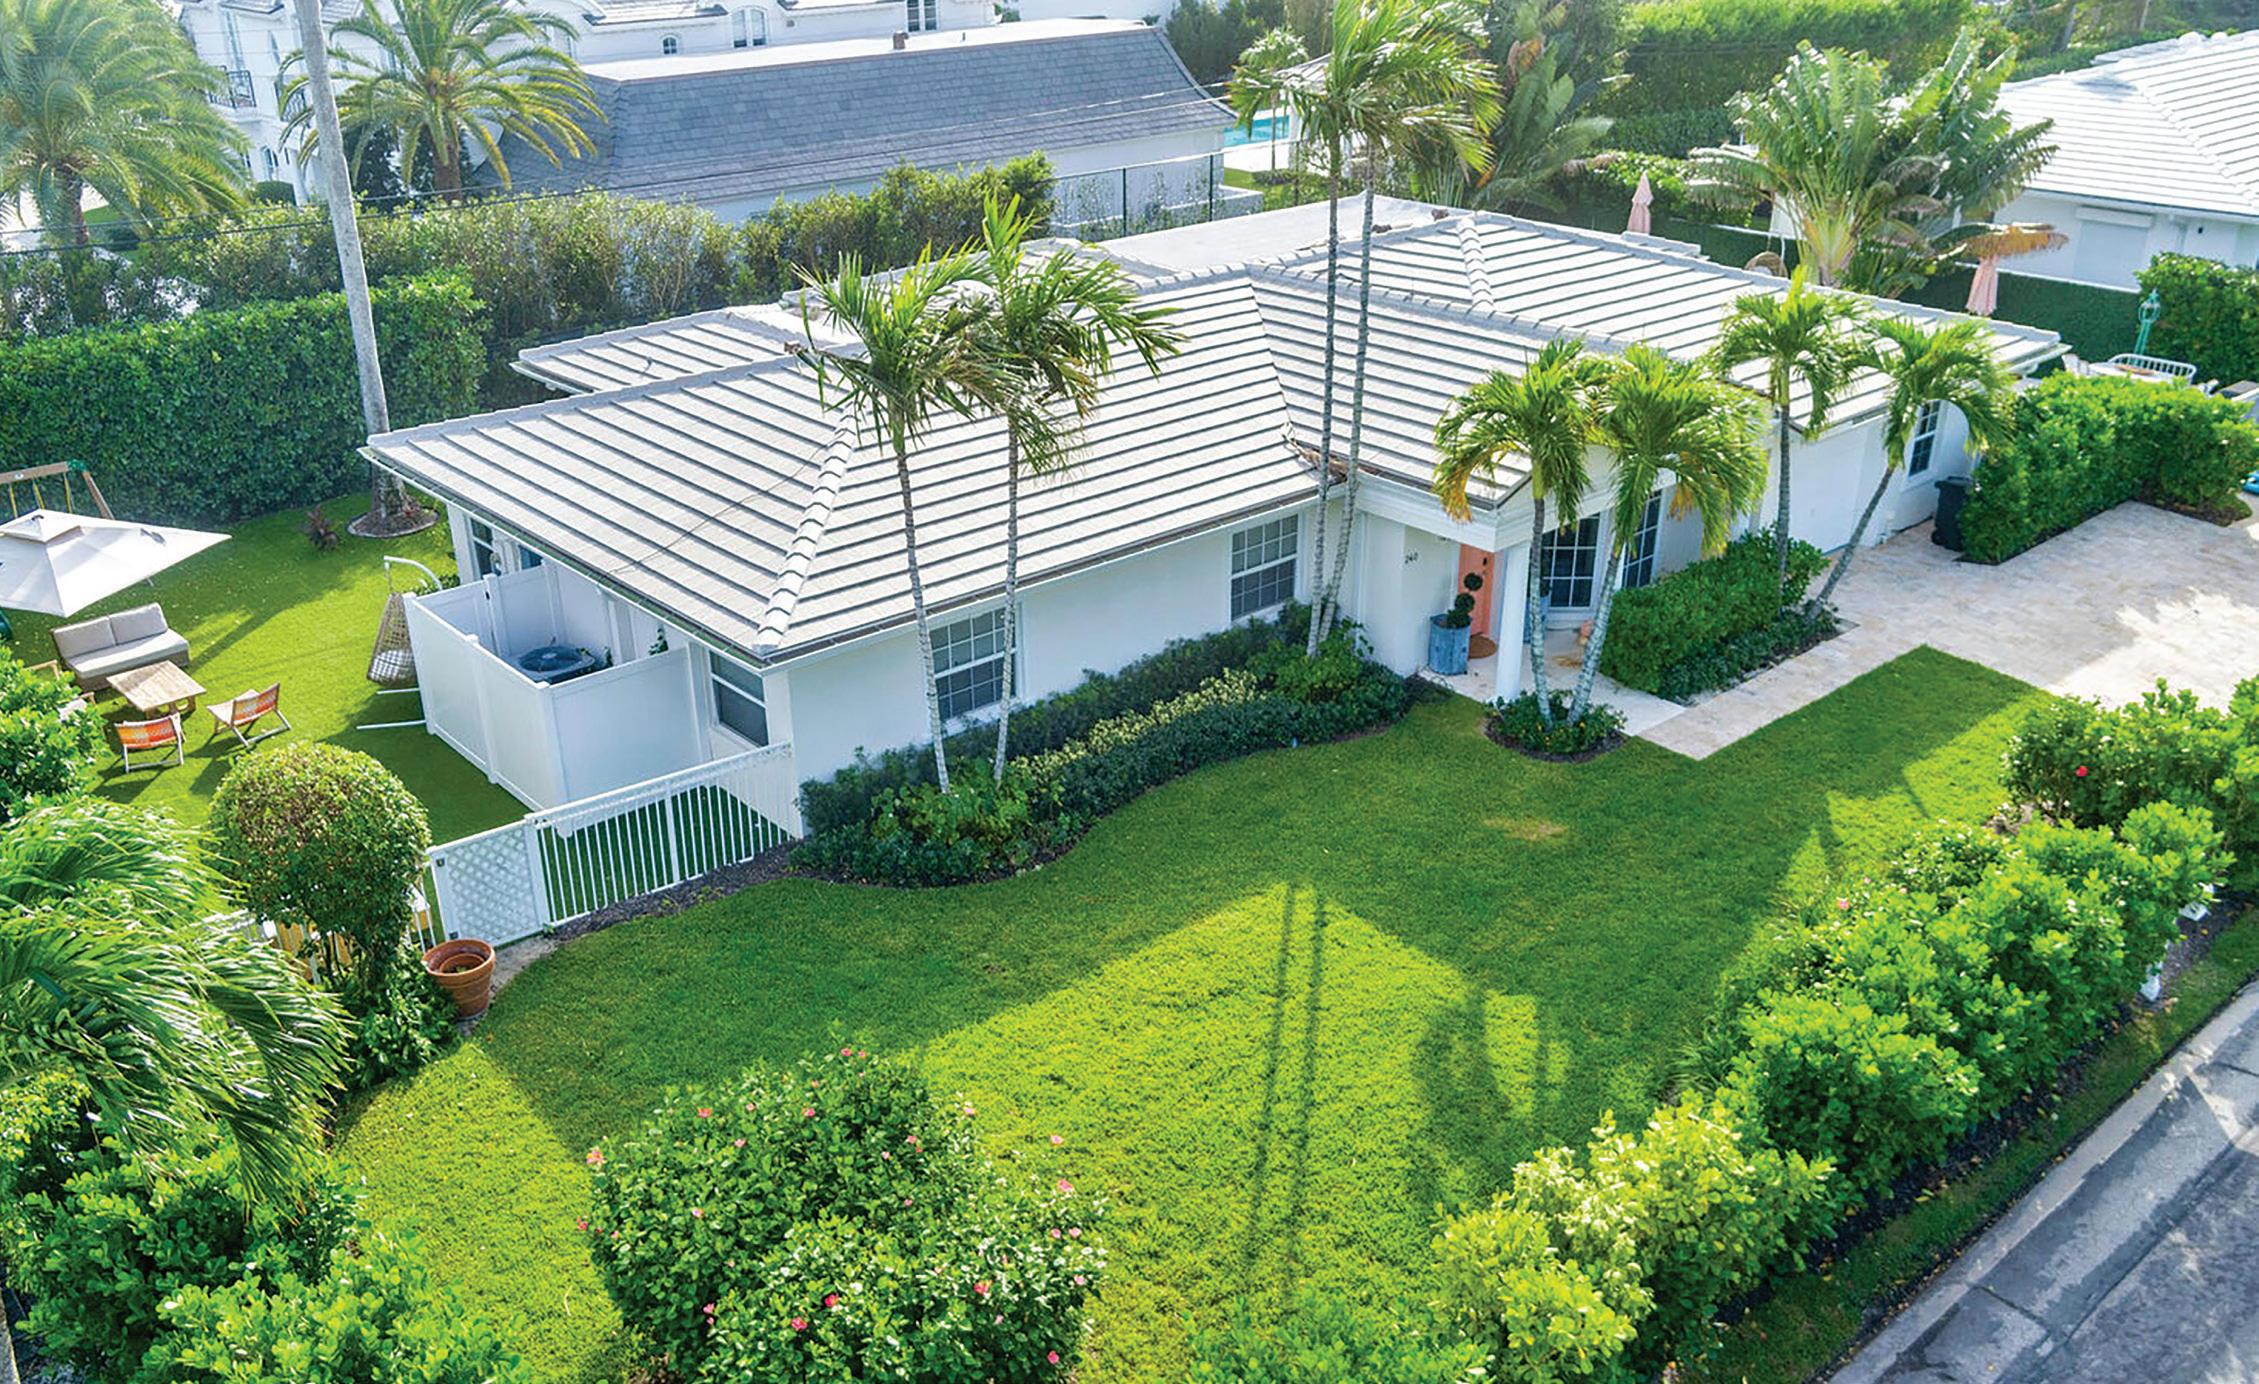
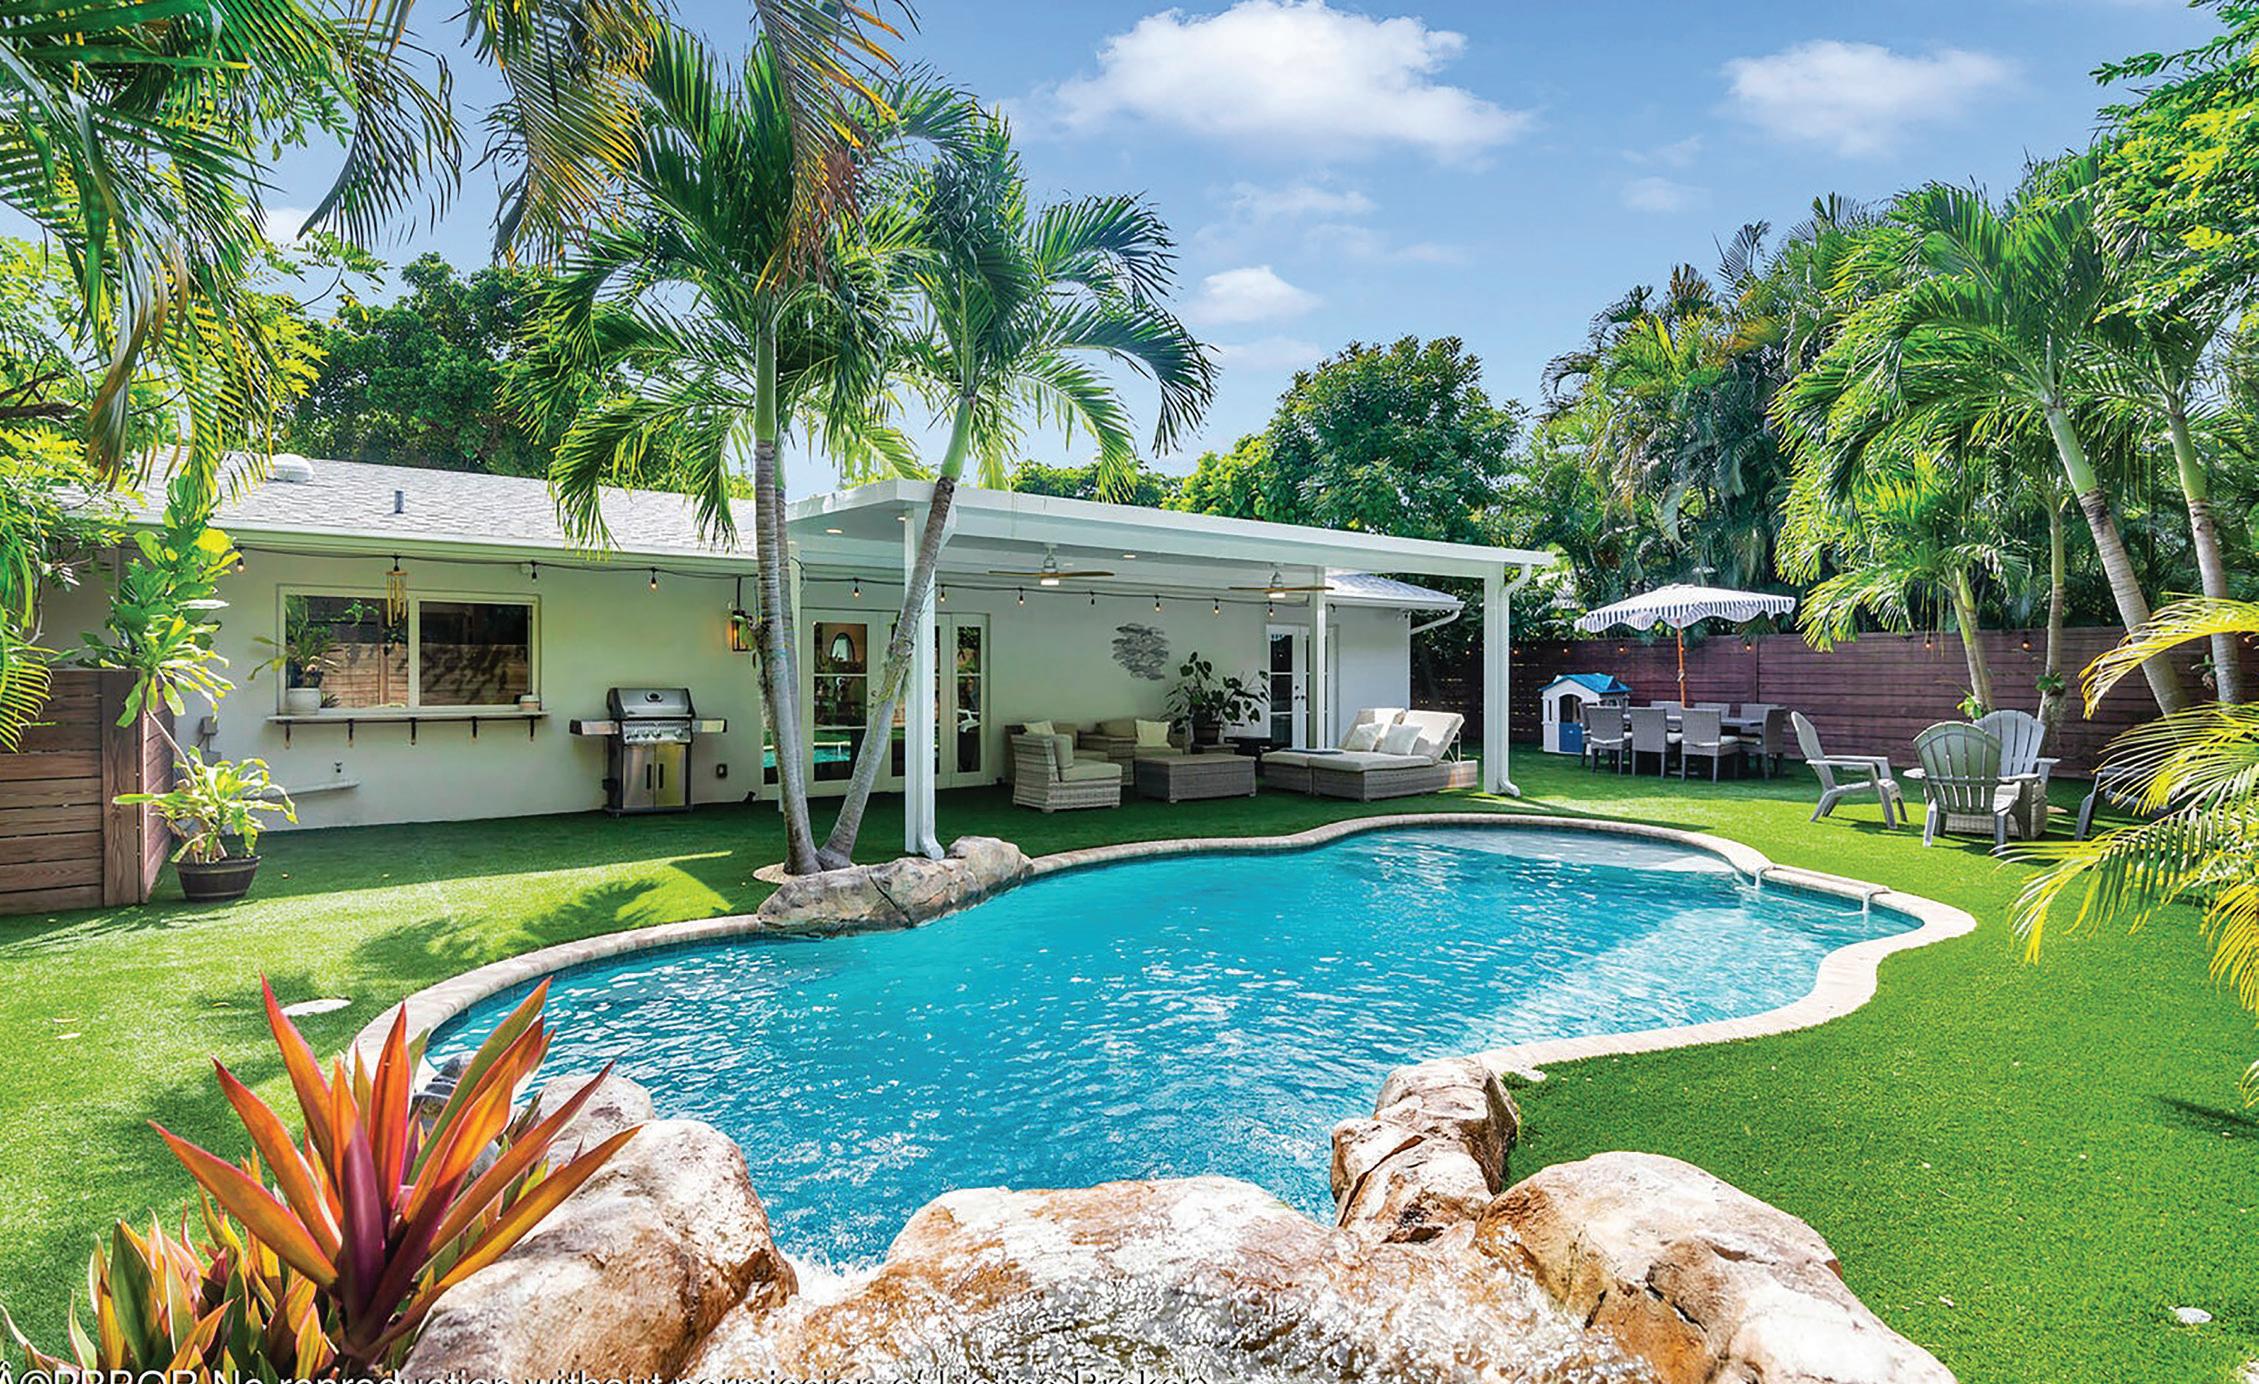
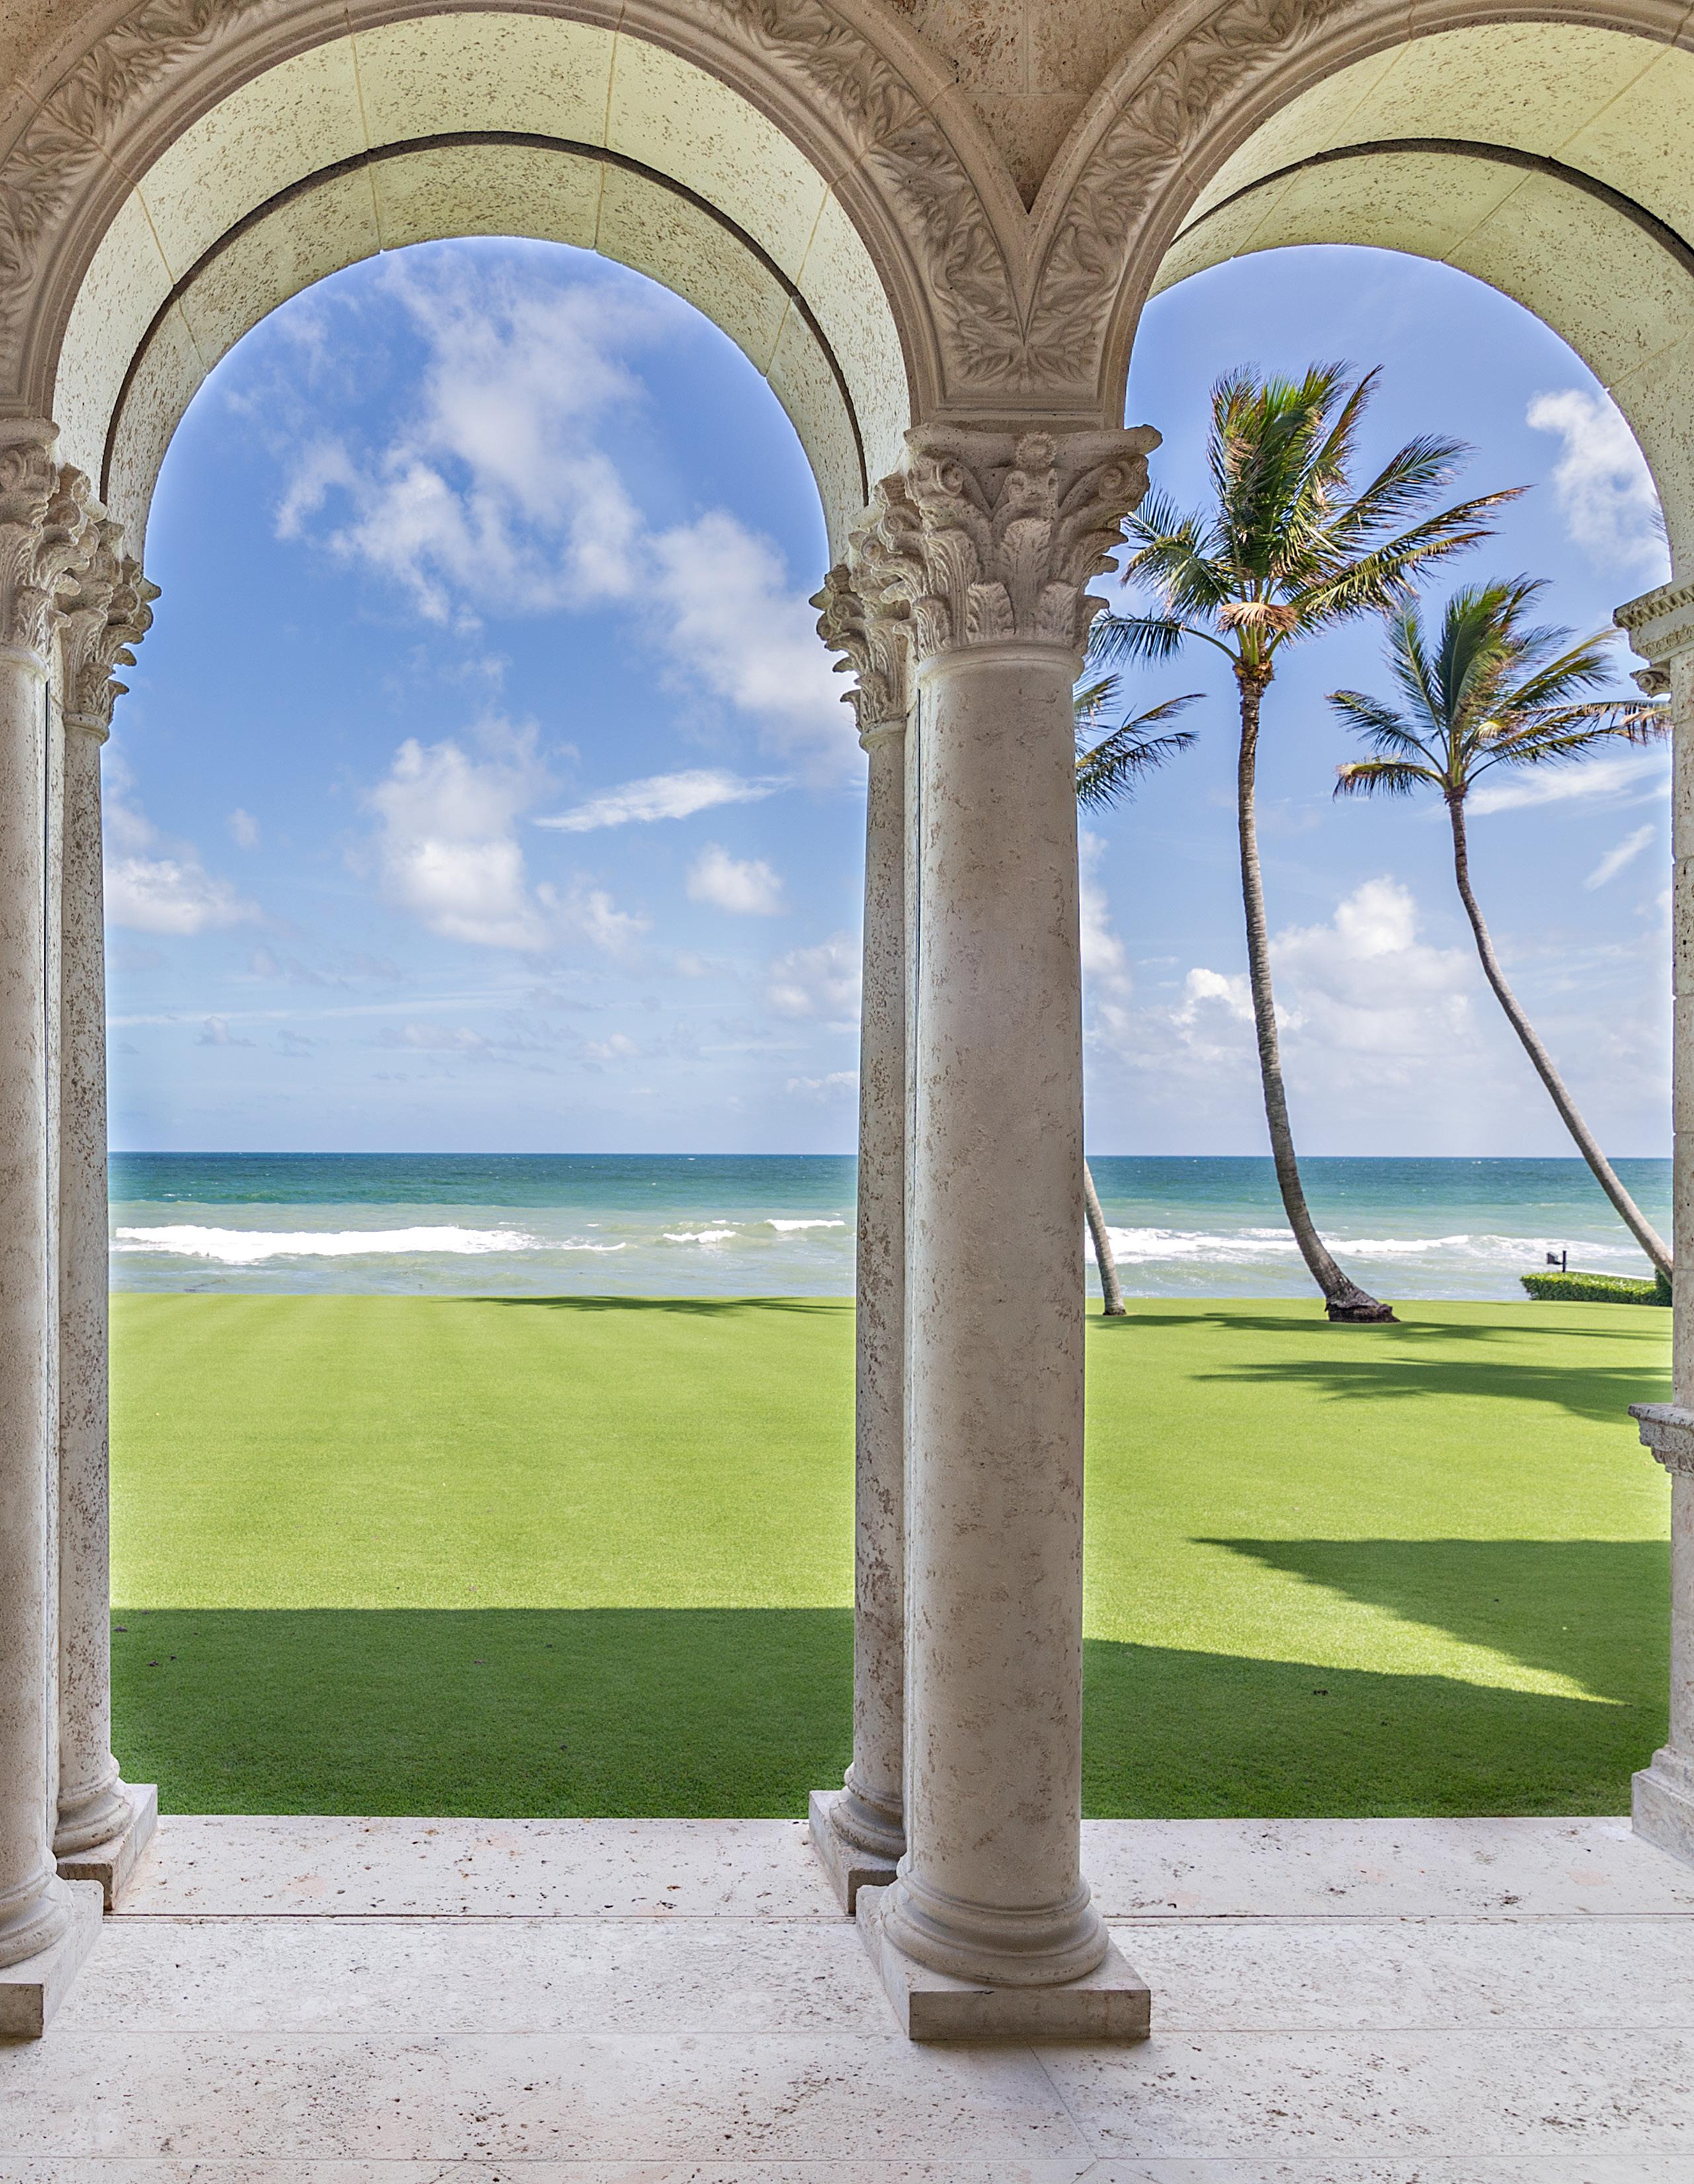
Palm Beach’s North End, located north of Wells Road, is celebrated for quiet seclusion. Thanks to zoning laws that prohibit condos and commercial properties in this area, many residents enjoy private beachfront views.
Transaction volume was up +23% YOY in 2024 compared to 2023.
Total sales value was down -4%, largely driven by a -17% decline in waterfront sales value.
PPSF: Home Size was up +24% on waterfront homes and down -16% on non-waterfront sales.
$74,250,000
$25,000,000
$13,900,000
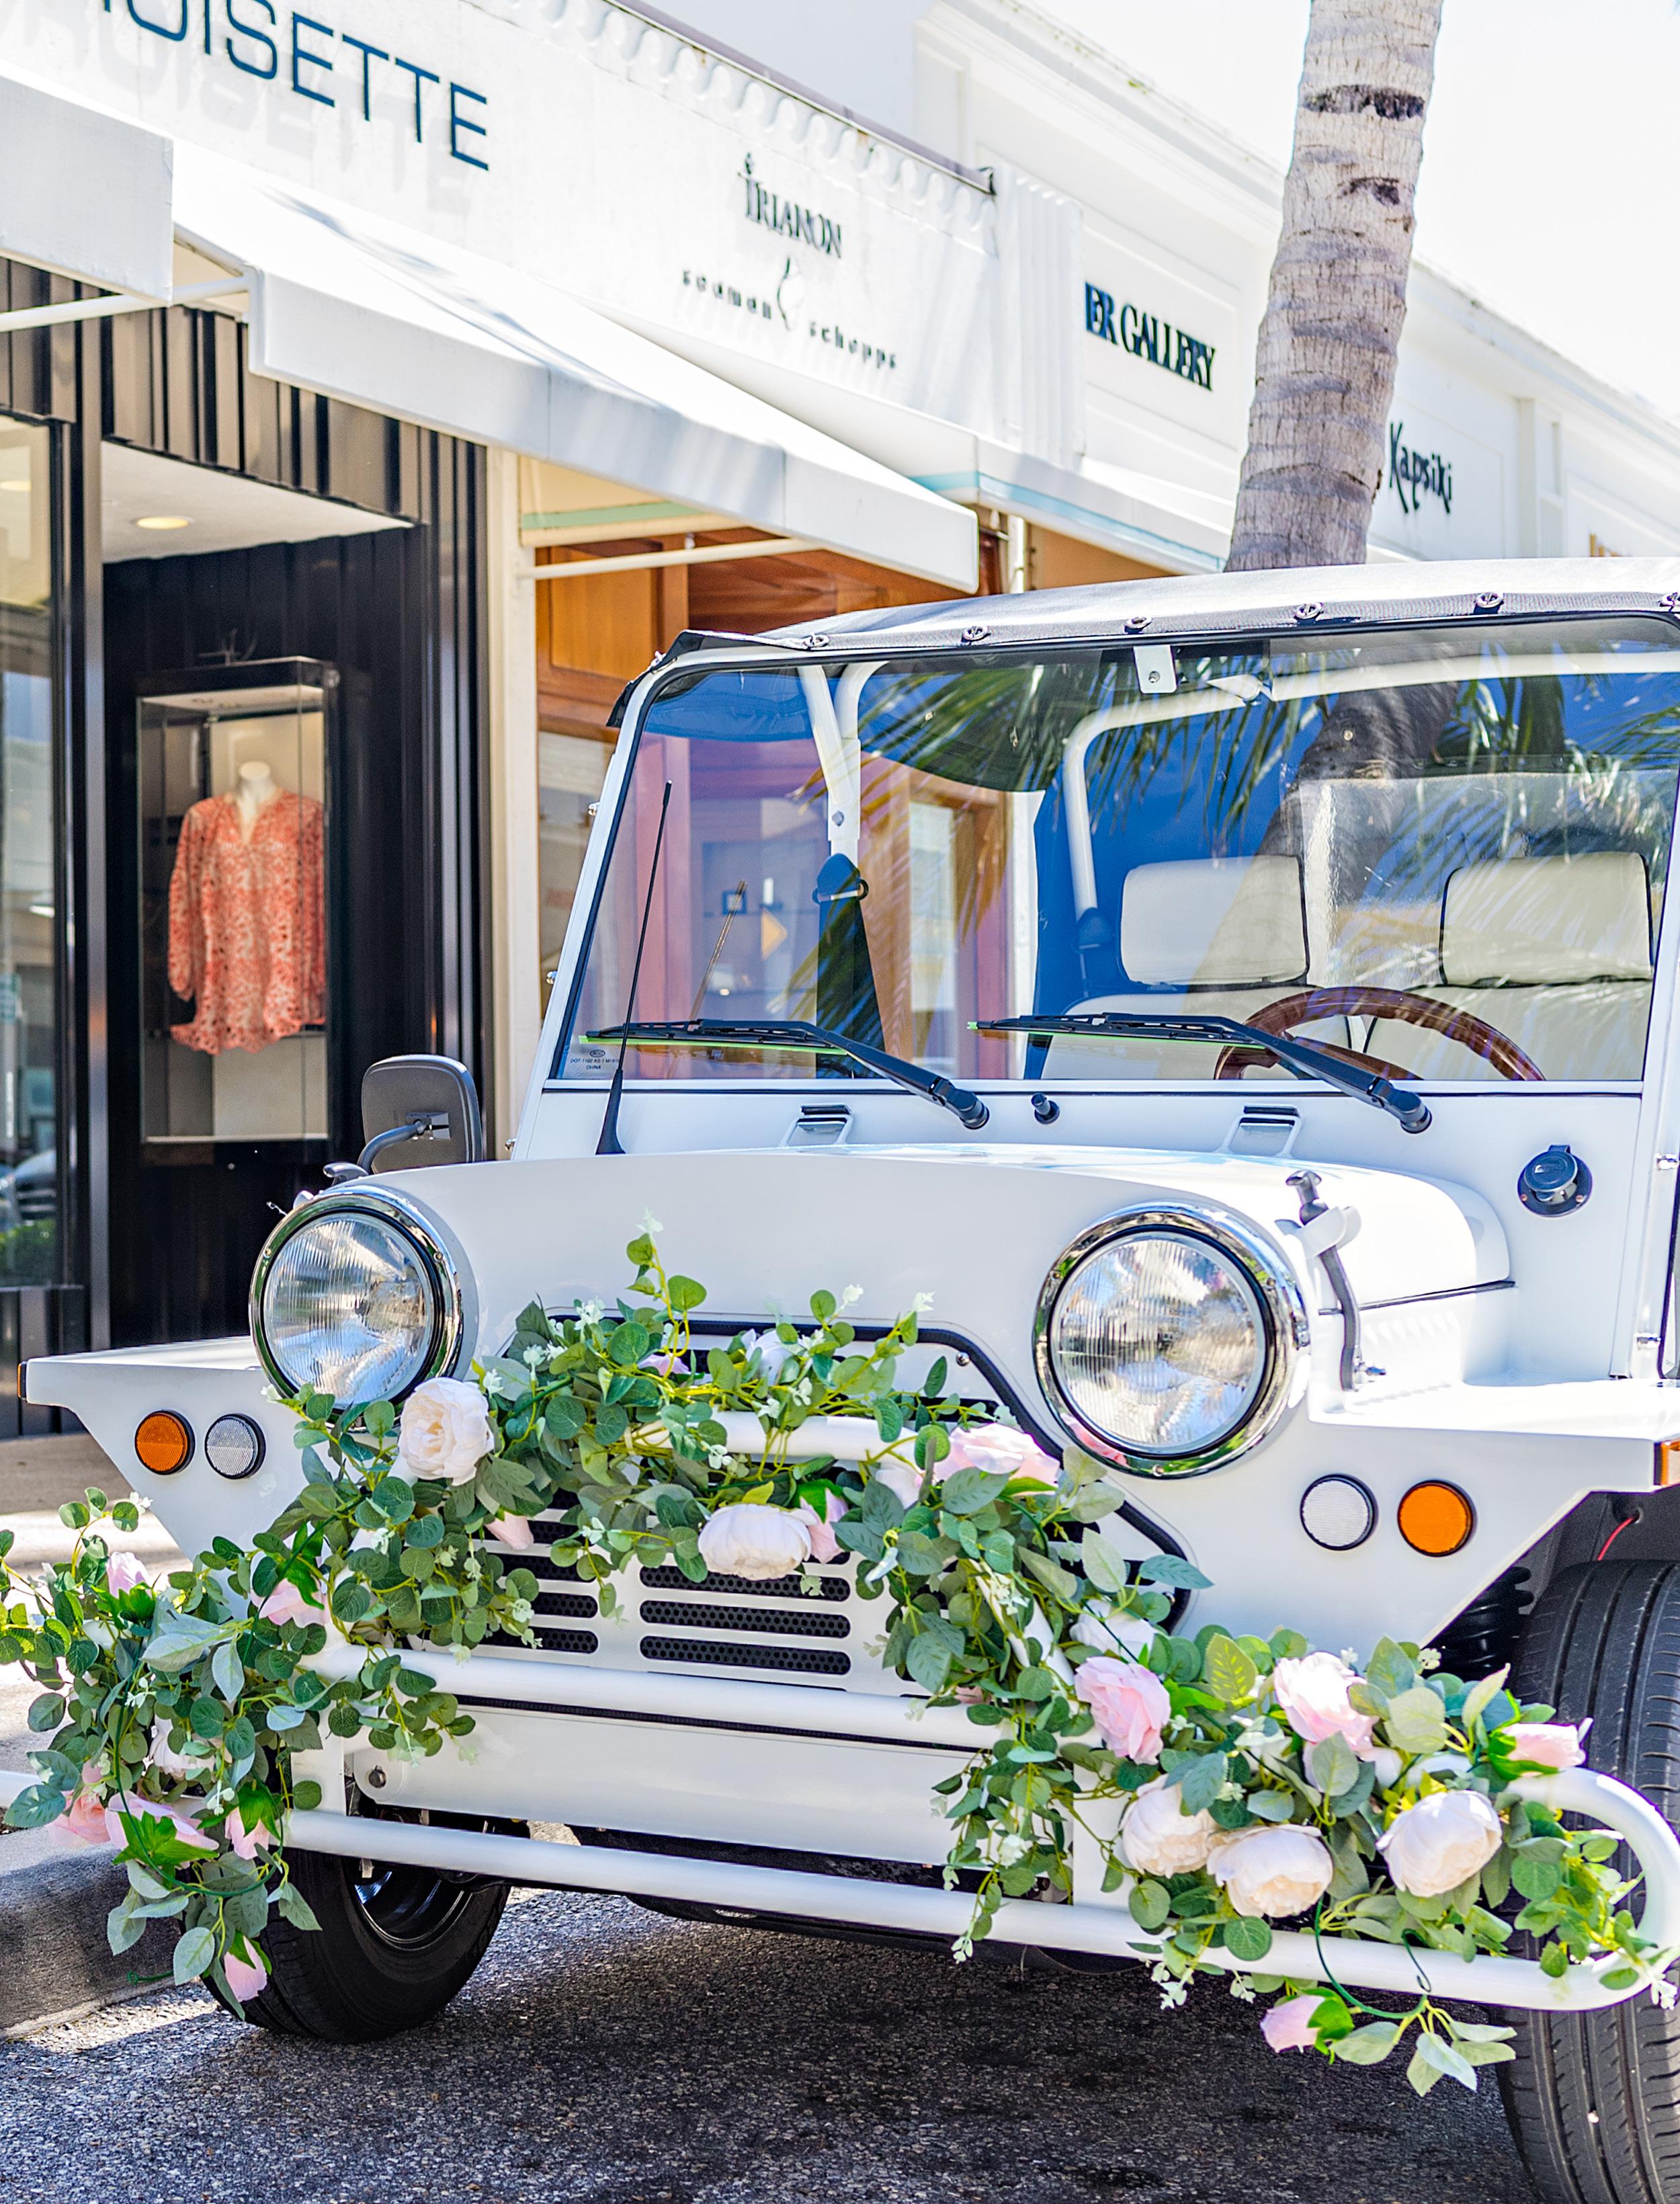
Nestled between Worth Avenue and Wells Road lies the energetic center of Palm Beach Island, In-Town. Packed with shops, secluded beaches, and five-star restaurants, this hub of culture and leisure lures residents with a flair for cosmopolitan life.
In 2024, In-Town showed unchanged performance across single family homes on Palm Beach Island, with small growth across transactions and PPSF.
In-Town transaction volume was up +4% YOY.
Total sales value was down -1% YOY.
In-Town PPSF: Home Size was up +1% YOY.
Note: Reporting in this table reflects only non-waterfront properties, as there are limited waterfront sales in this area. In most years, zero waterfront homes sold. This year featured several waterfront sales that are listed in the recent sales, but not reflected in the table comparing YOY sales data.
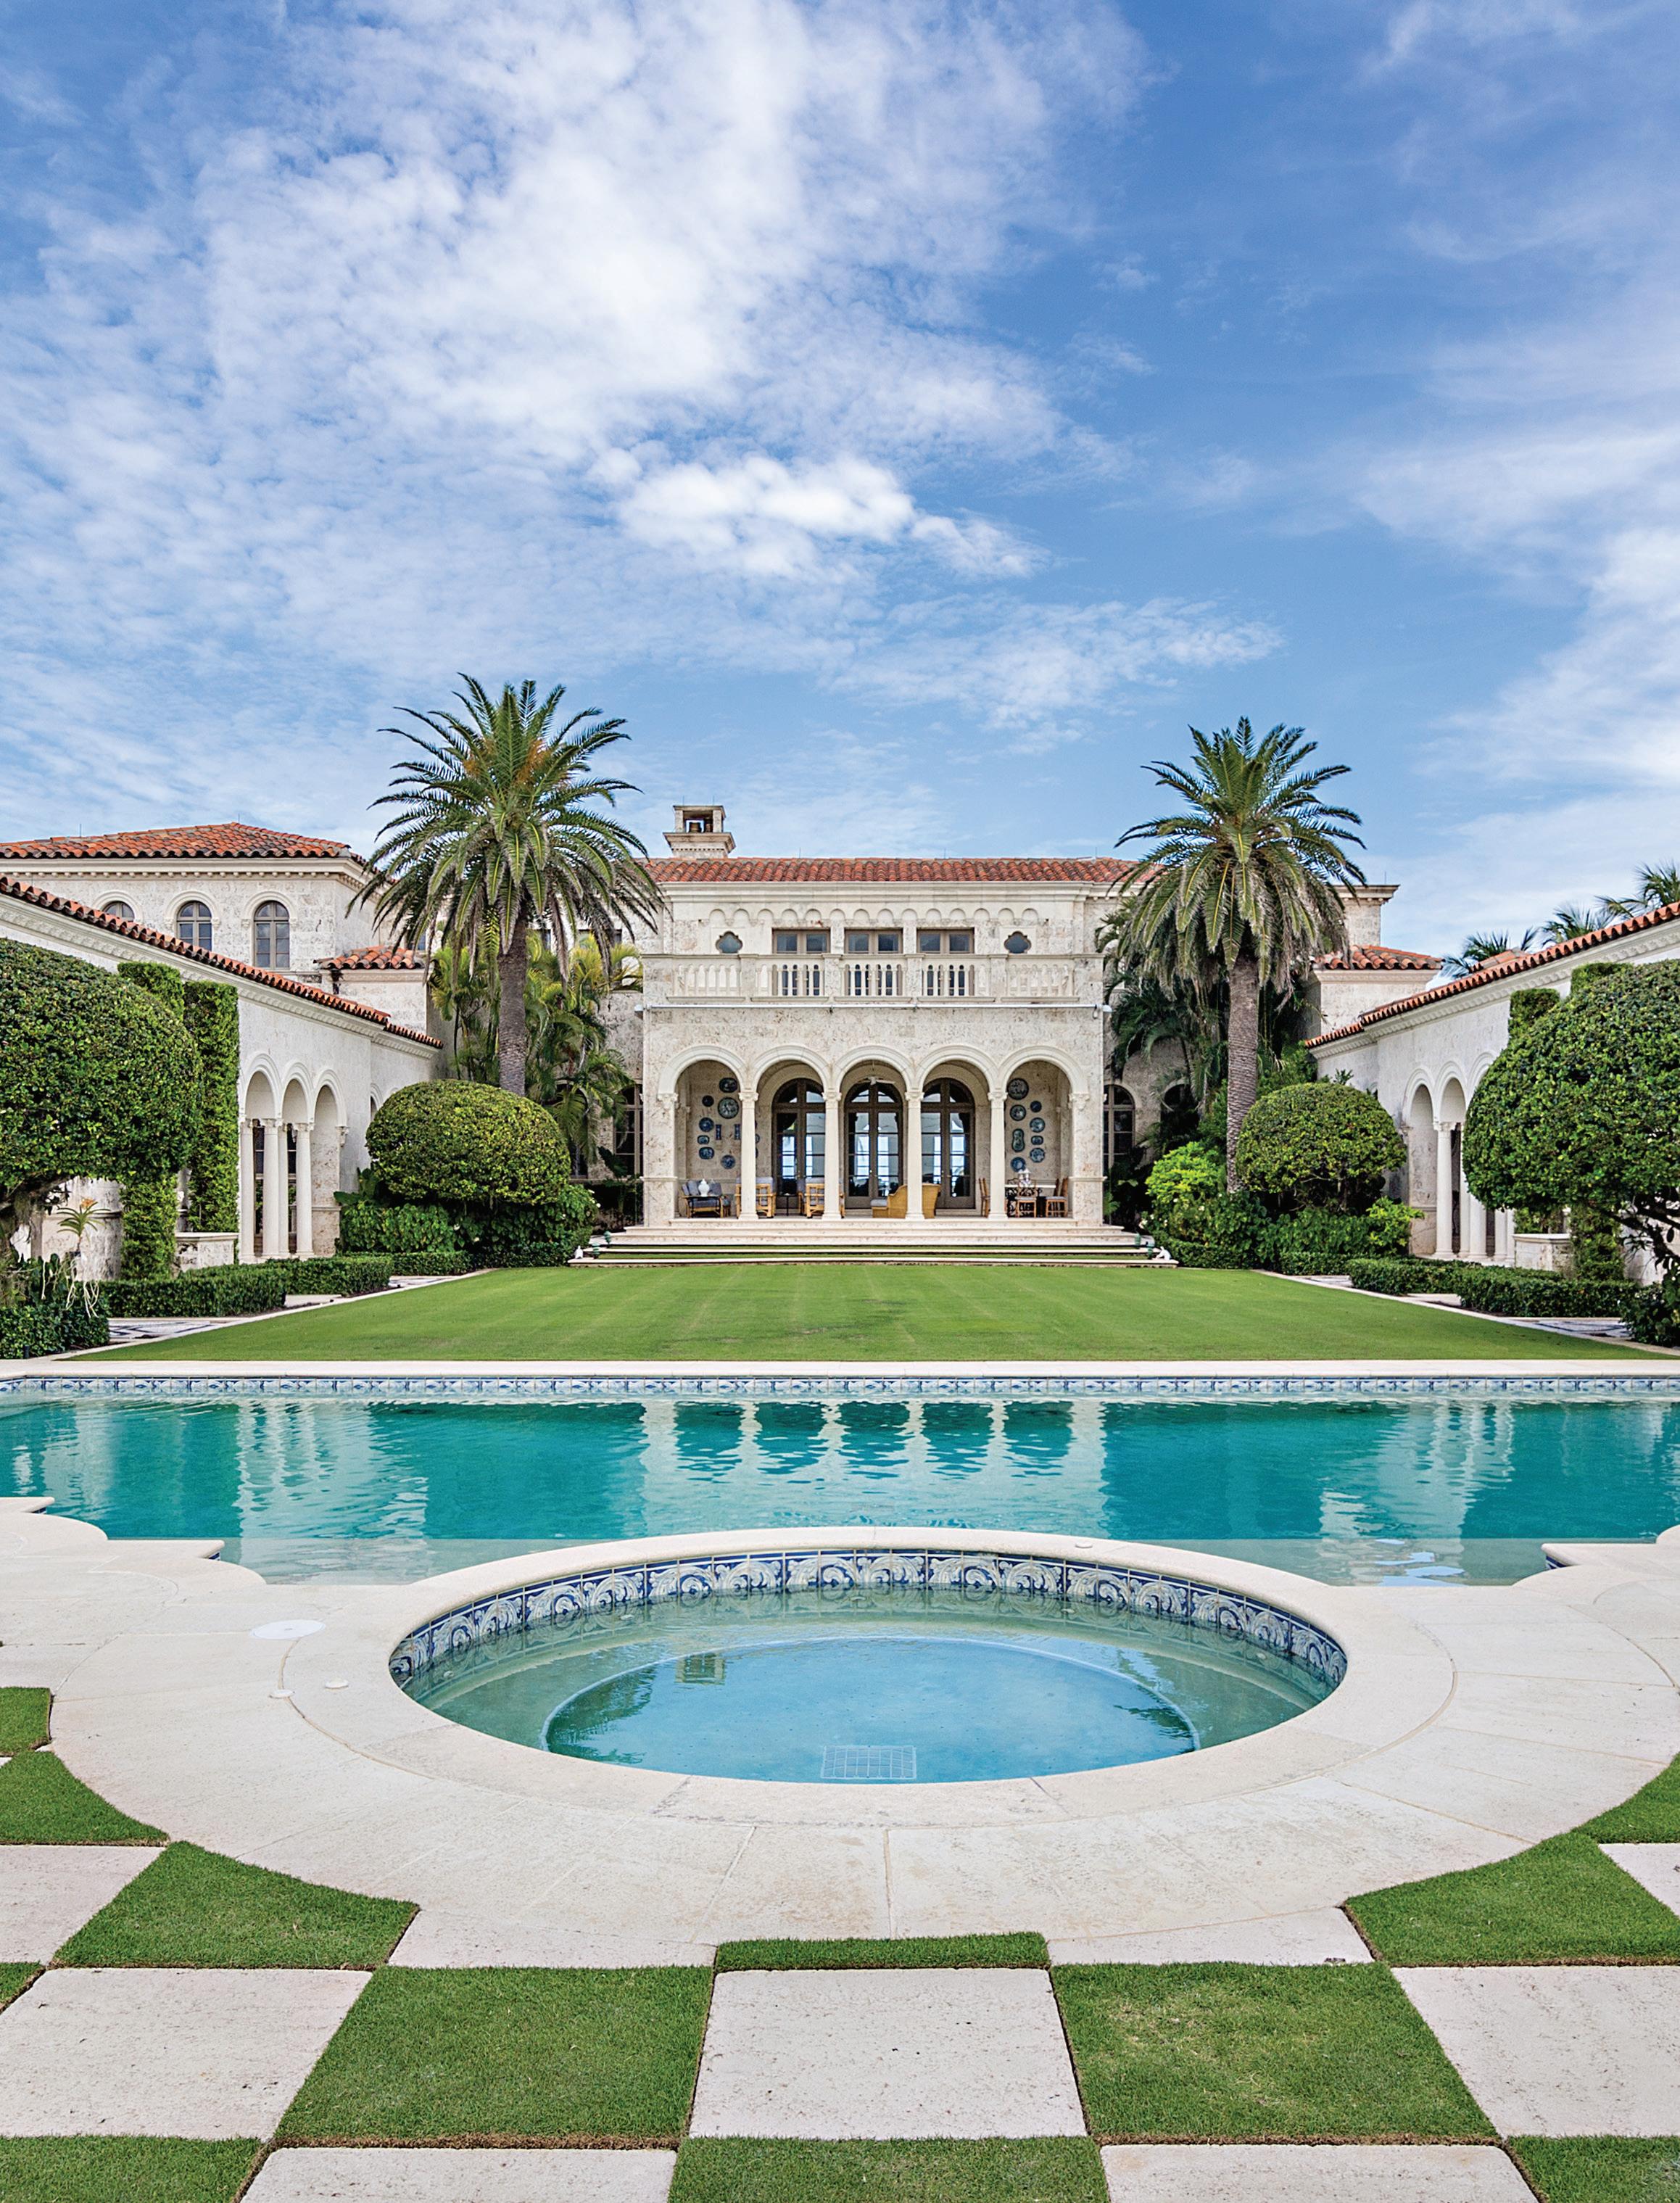
The Estate Section comprises all residences south of Worth Avenue to Sloans Curve. It is renowned for its opulent residencies and exclusive social clubs including The Everglades Club, Bath & Tennis Club, and Mar-a-Lago.
Transactions were down -47% in 2024 compared to 2023. In 2024, total sales value was only down -5% YOY when compared to 2023. This was driven entirely by non-waterfront sales value being down -40% YOY.
PPSF: Home Size was up +4% YOY, with a -1% decline in waterfront PPSF and +3% increase in non-waterfront.
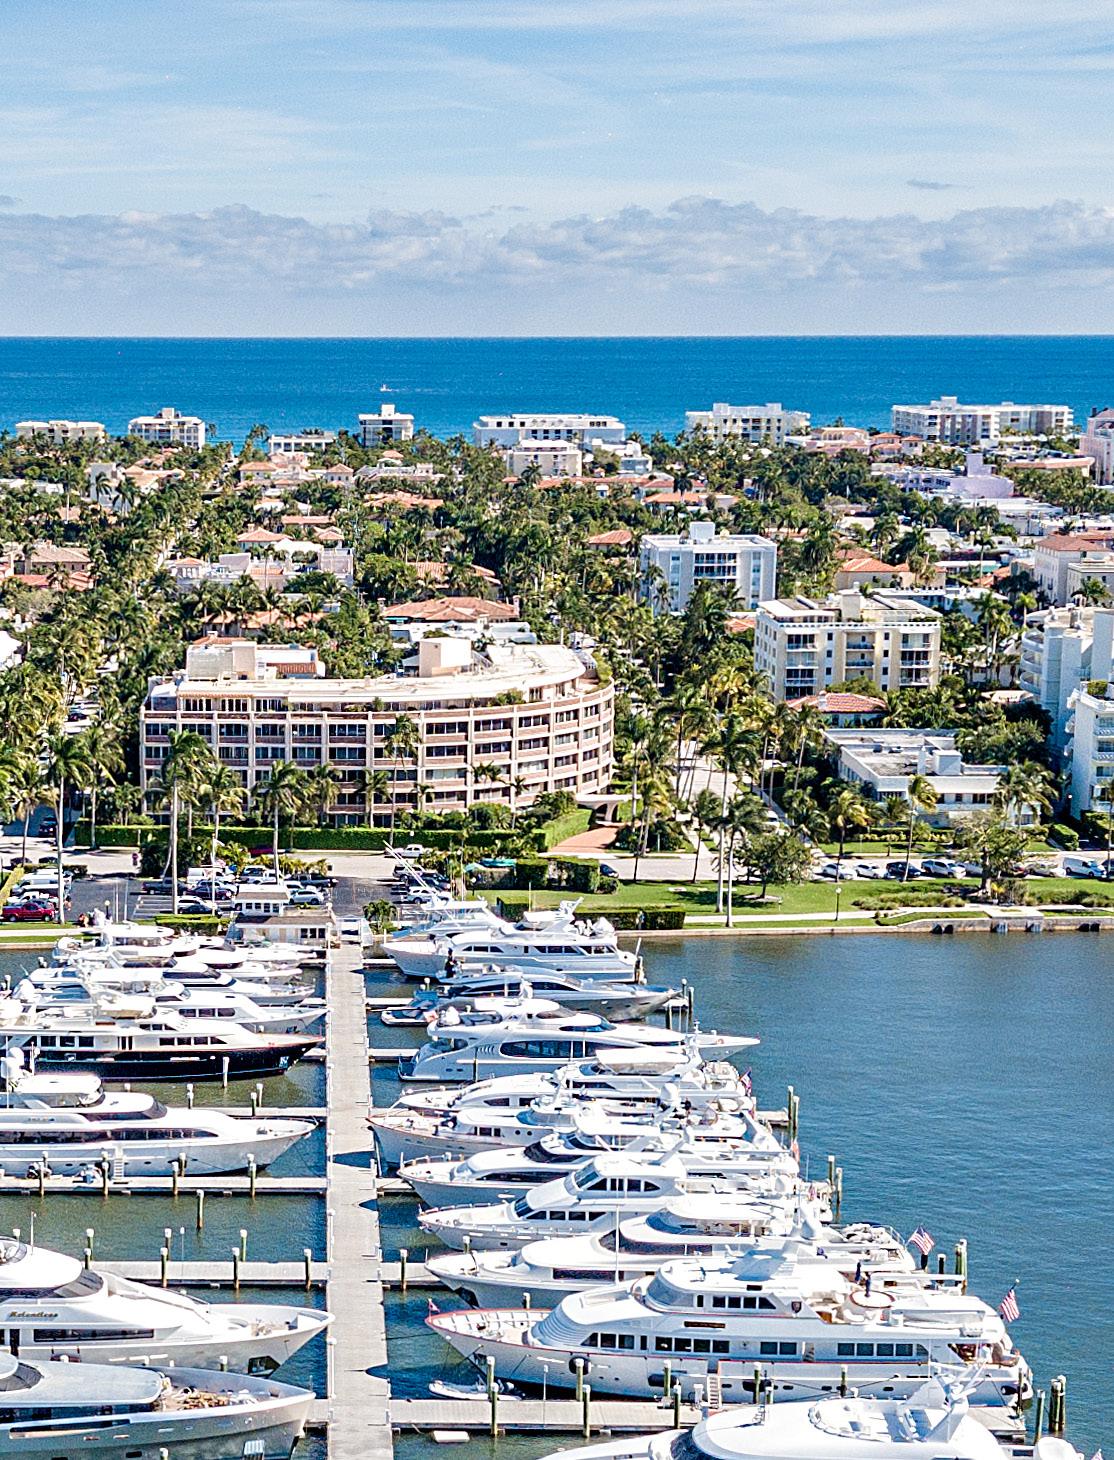
Whether you seek a large building with resort-style amenities or the boutique elegance of a small, full-service site, Palm Beach Island offers an expansive range of options just steps from shorelines, shops, restaurants and more. Palm Beach townhomes are ideal for those who seek the convenience of a condo but crave the spaciousness of a house.
Transaction volume was down -14% YOY, due to a -8% decline in In-Town transactions and a -16% decline in South End transactions. While this is still a decrease YOY, the pace of the decline is slowing when one compares 2022 and 2023 to the present.
Total sales value was down -18% YOY.
PPSF has stabilized over the last two years. We saw a decline of -1% YOY in PPSF for In-Town transactions and a decline of -4% for South End transactions.
Inventory is up +30% YOY. The same period in 2023 averaged 125 active listings per month, whereas 2024 averaged 163 active listings per month. Additionally, in both 2023 and 2024, we saw a return of the pre-pandemic seasonality trend in which inventory decreased during the off-season and increased during the peak season.
The number of days on market was up +11% compared to the same period last year. In 2023, condos and townhomes took an average of 141 days to sell. In 2024, condos and townhomes took an average of 157 days to sell.
The sale to list ratio for condos and townhomes hovered right around 86% in 2024. This was down -2% compared to the same period last year. 86%
$2,350,000
We appreciate you taking the time to read our report, and hope you found our insights on the 2024 Palm Beach Island market interesting.
In summary, we believe we’re reaching a new normal around activity for both single family homes and the condominium and townhome category. We still have an active list of people willing to buy, but buyers seem much less willing to continue to pay initial asking price (and in some cases above asking price) for properties in the same way we saw during the 2020, 2021, and 2022 seasons.
As we kick off 2025, we look forward to another wonderful season on Palm Beach. As always please don’t hesitate to reach out if we can assist you with any of your real estate needs.
Warmest wishes,

Gary Pohrer
Executive Director of Luxury Sales
Douglas Elliman
340 Royal Poinciana Way M302 Palm Beach, FL 33480
M: 561.262.0856
gary.pohrer@elliman.com garypohrer.com
Source: Above data is pulled from Palm Beach MLS, The Beaches MLS and the Palm Beach Property Appraisers (PAPA). Specifically, we are only looking at transactions located in the 33480 zip code.