THE POHRER REPORT

Inside South Florida’s most exclusive real estate marke t .
Q4 2022
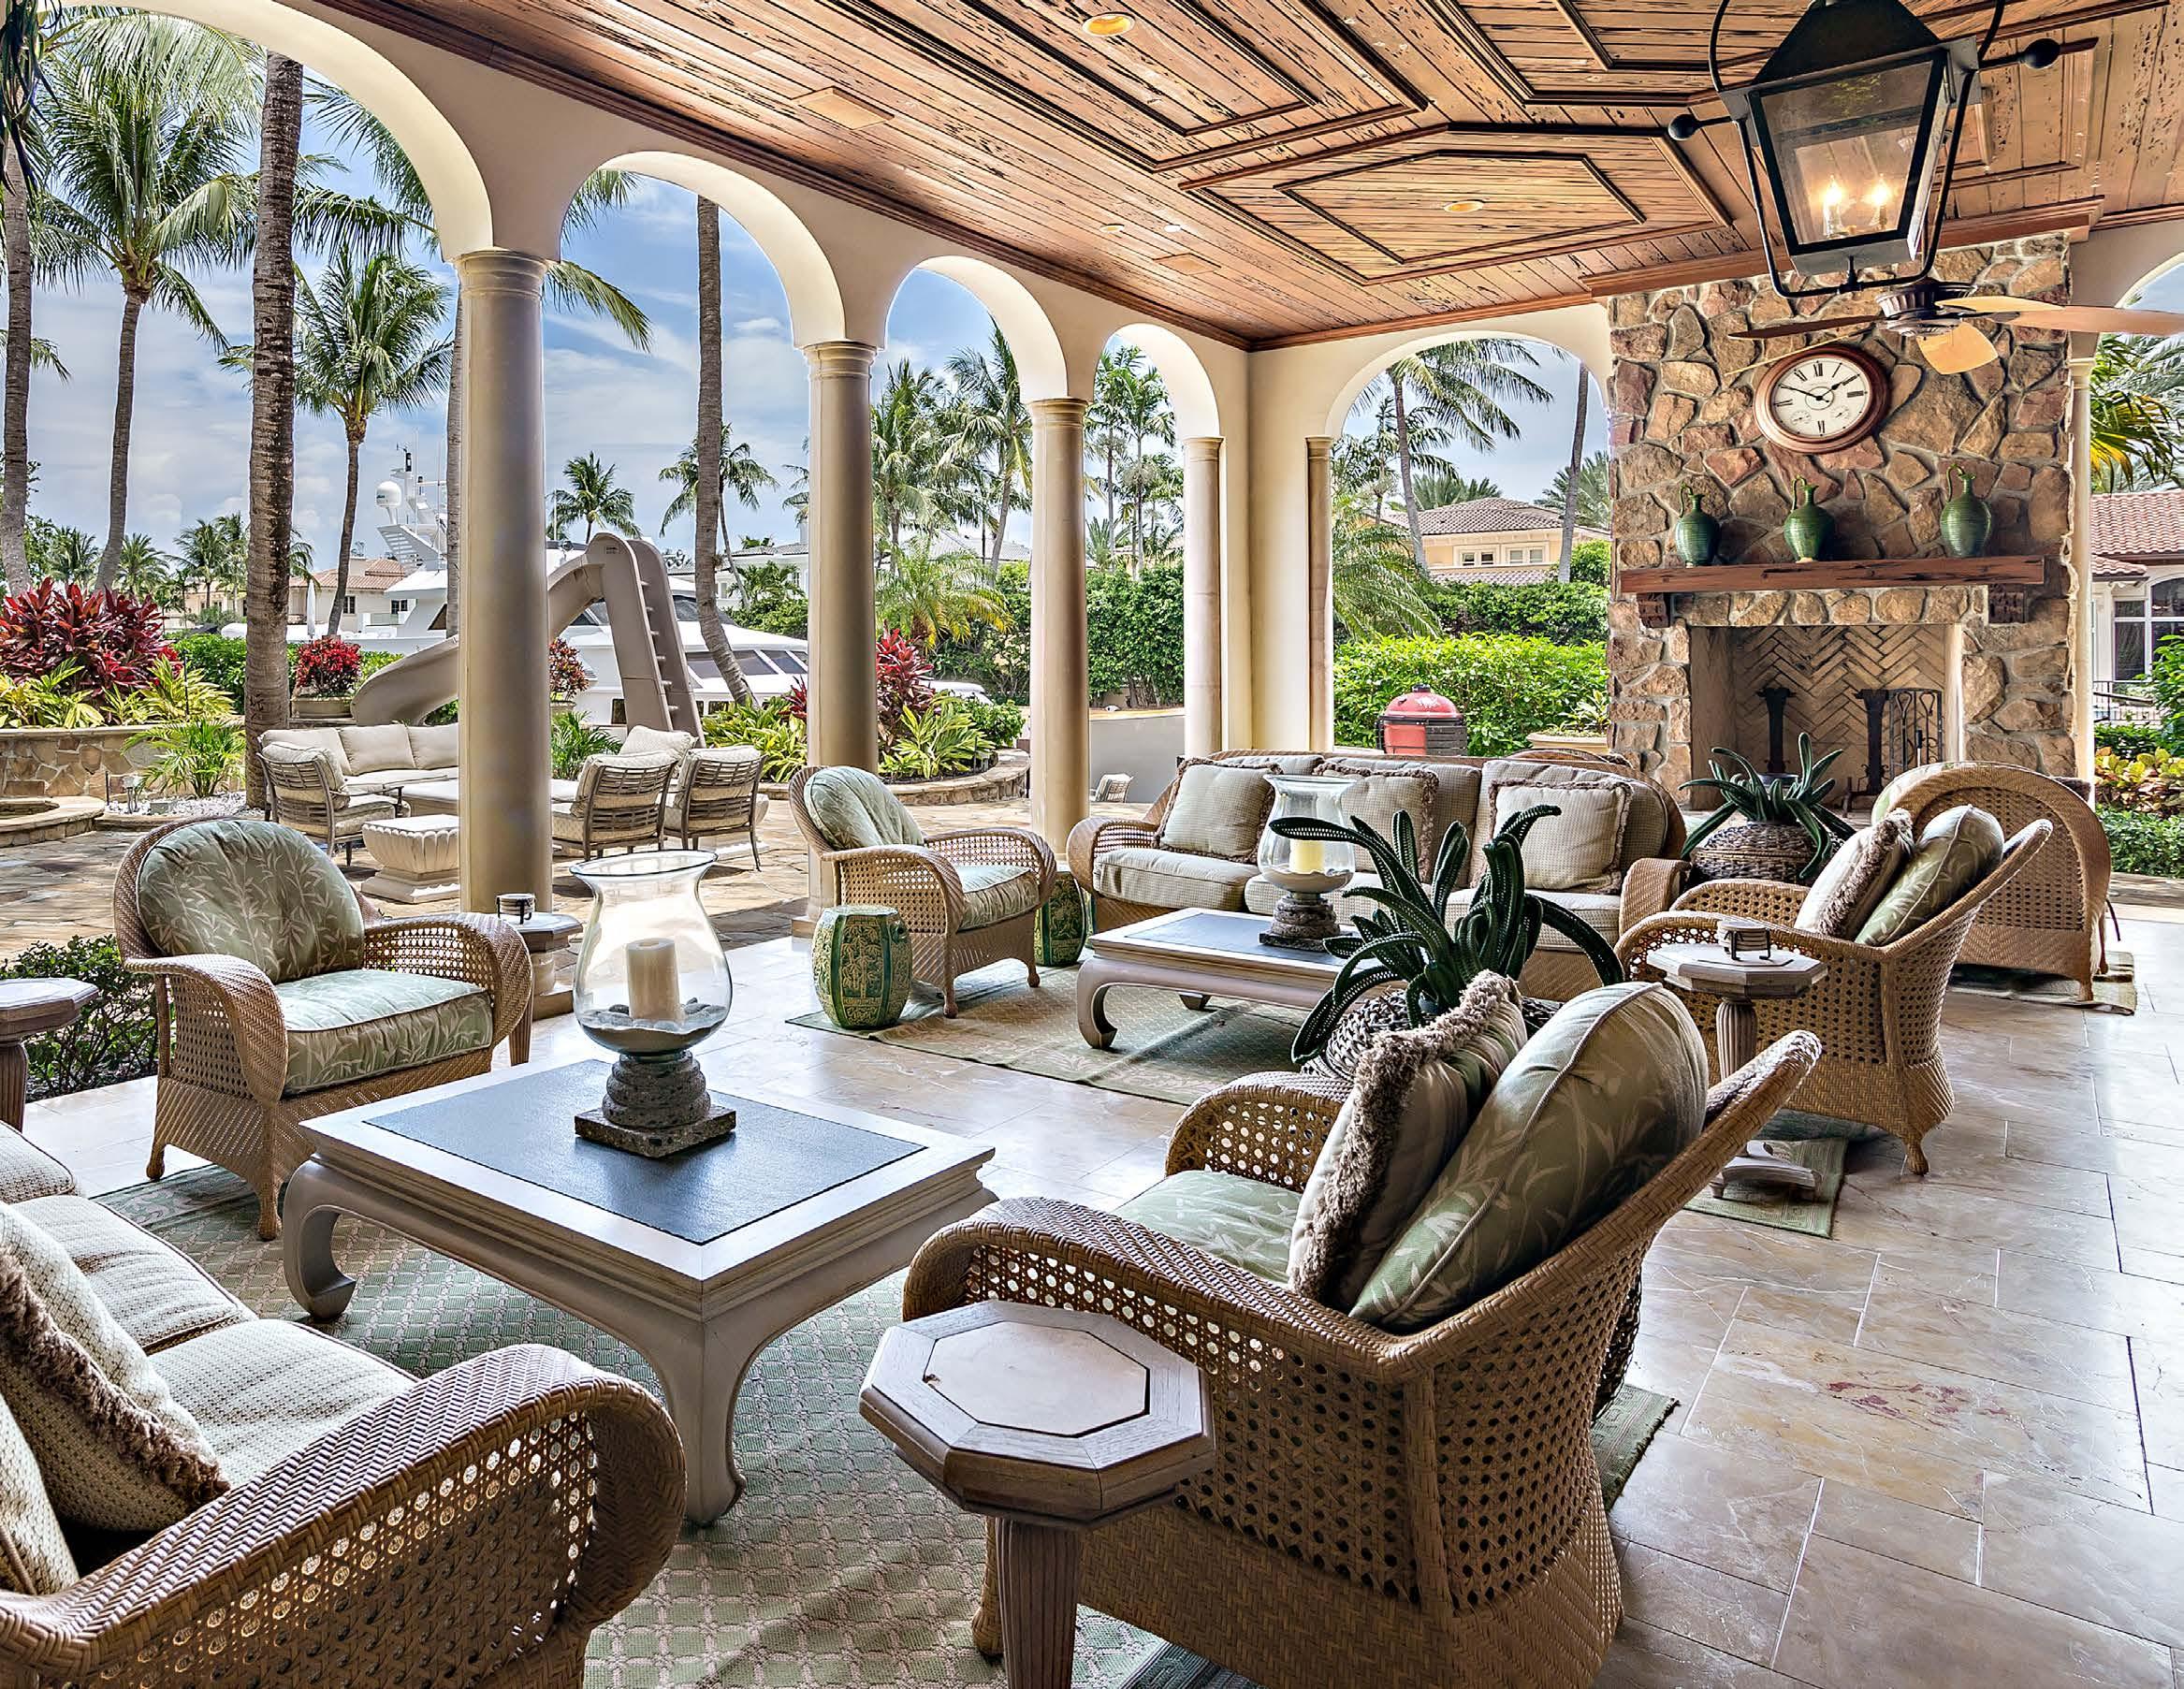
Photographed home: 200 W Coconut Palm Road. Listed by Gary Pohrer of Douglas Elliman Palm Beach.


CONTENTS
from Gary Pohrer Single Family Homes: All Neighborhoods Single Family Homes: North End Single Family Homes: In-Town Single Family Homes: Estate Section Condos & Townhomes: All Neighborhoods In Closing 3 4 12 16 20 24 31
Property 200 W Coconut Palm Road Royal Palm Yacht and Country Club, 25-Room estate on approx. one acre, with approx. 300ft water frontage. GARY POHRER | GARYPOHRER.COM | 2
Letter
Featured
Letter From Gary


It’s crazy to believe that this is our sixth edition of The Pohrer Report. Thank you for taking the time to read our report each quarter and for sharing the thoughtful feedback which helps us make it better each time.
Our Q4 2022 report is more dense than usual, as we have added in-depth, year-end summaries of annual KPIs across both the single family home and condo and townhome asset classes. I found it very interesting to zoom out from the quarterly performance to capture a high level view on how the Palm Beach market performed compared to other years over the last decade. The biggest take away for me was that YES, transactions and activity has slowed down in comparison to 2020 and 2021 BUT, when you compare the core KPIs to pre2020 activities, it appears that 2022 was on par with (and in some cases stronger than) some of the typical years we’ve had in Palm Beach real estate.
As we close out the year, I would like to take a moment to express my gratitude for clients, prospective clients, and the incredible professionals I get to work with. I feel so fortunate to be a leader in this business, collaborating with outstanding colleagues and advising some of the most interesting and influential people with their Palm Beach real estate needs.
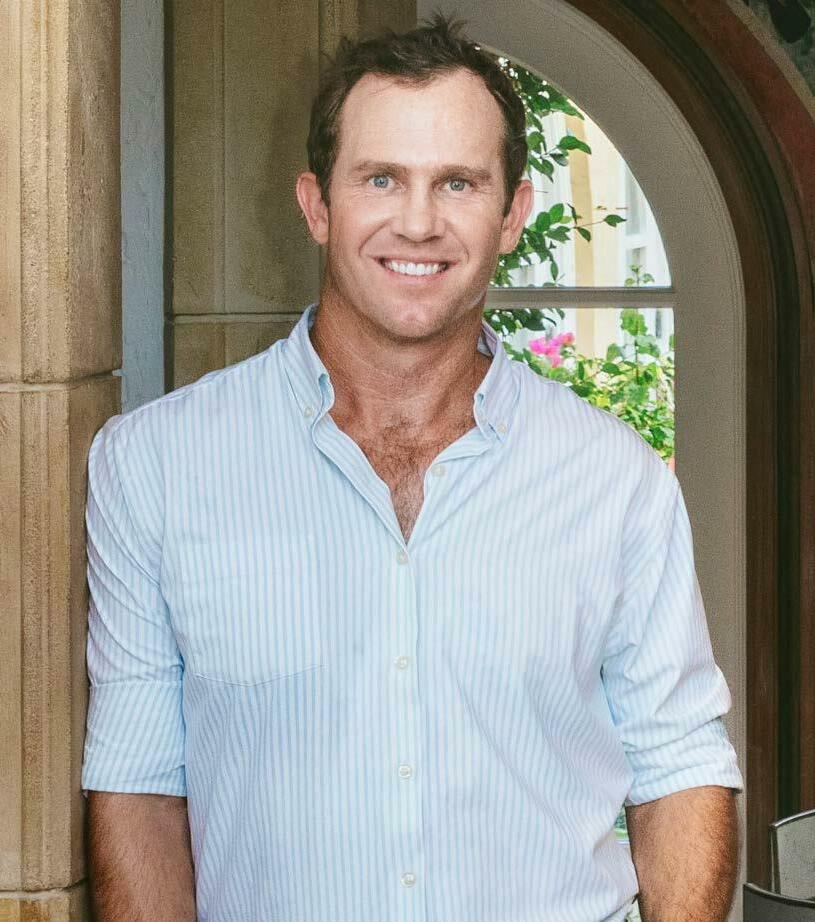
I hope you enjoy the read and as always, please don’t hesitate to reach out with any questions or if I can be of assistance to you in 2023 and beyond.
Best regards,
$1B+
#1
In Sales Since 2020*
Gary Pohrer
Executive Director of Luxury Sales



Douglas
Elliman
340 Royal Poinciana Way M302 Palm Beach, FL 33480
O: 561.655.8600
M: 561.262.0856
gary.pohrer@elliman.com
garypohrer.com

Ranked Nationwide 2022 REALTrends + Tom Ferry The Thousand***
#15 Years Selling Real Estate in Florida
18
GARY POHRER | GARYPOHRER.COM | 3 *PER DOUGLAS ELLIMAN INTERNAL RECORDS. **AS RECOGNIZED BY THE DOUGLAS ELLIMAN ELLIE AWARDS FROM 2017-2021. *** RANKED IN 2022 INDIVIDUAL BY SALES VOLUME 2022 REALTRENDS + TOM FERRY THE THOUSAND.
Tammy Bernstein Sales Associate
REPORT CONTRIBUTORS
Beth Johnson Sales Associate
Elizabeth Tristan Sales Associate Market Insights Advisor
Douglas Elliman Palm Beach Realtor for Sales Volume From 2017-2021**
SINGLE FAMILY HOMES


ALL NEIGHBORHOODS

Q4 Summary: Single Family Homes: All Neighborhoods
Transaction volume was down -67% year-over-year (YOY)* in Q4, largely driven by decline across both waterfront and non-waterfront properties.
Total sales value* was down -56% YOY, driven by a -50% decrease in non-waterfront sales and a -66% decrease in waterfront sales value.
Price per square foot (PPSF)* across home size* (PPSF: Home Size) continued to grow YOY, and was up +34%.
Price per square foot lot size (PPSF: Lot Size) was up similarly, growing YOY at a rate of +35%.
FOOTER: Glossary


Year-over-year (YOY ): A method of evaluating two or more measured events, comparing the results of one period with those of a comparable period on an annualized basis.
Total sales value : The sum of all sales during a period of time.
Price per square foot (PPSF): A calculation of the value of each square foot of area of a house, condo or any building. It is calculated by dividing the price by the square footage.
PPSF: Home Size: Home size is based on the current under air square footage.
PPSF: Lot Size: This is based on the PPSF of the total lot.
% CHANGE YEAR OVER YEAR Q4 2021 Q4 2022 TRANSACTIONS WATERFRONT NON-WATERFRONT TOTAL SALES VALUE WATERFRONT NON-WATERFRONT AVERAGE SALES PRICE WATERFRONT NON-WATERFRONT AVERAGE PPSF: HOME SIZE WATERFRONT NON-WATERFRONT AVERAGE PPSF: LOT SIZE WATERFRONT NON-WATERFRONT 13 1 12 $245,976,256 $66,000,000 $179,976,256 $18,921,250 $66,000,000 $14,998,021 $4,335 $7,752 $3,731 $1,195 $2,407 $1,008 39 7 32 $553,184,409 $194,608,000 $358,576,409 $14,184,216 $27,801,143 $11,205,513 $3,224 $5,212 $2,671 $885 $1,116 $796 -67% -86% -63% -56% -66% -50% 33% 137% 34% 34% 49% 40% 35% 116% 27%
GARY POHRER | GARYPOHRER.COM | 5
Inventory:
Active Listings

Though the number of active listings still sits in the double digits, we have seen an increase of +26% YOY from an average of 41 active listings in Q4 2021 to an average of 52 active listings in Q4 2022.
Days On Market
125 DAYS
Homes continue to sell at an improved rate in Q4 2022. Single family homes stayed on the market for an average of 125 days, which was a YOY improvement of -15% compared to Q4 2021, when homes took an average of 146 days to sell.
GARY POHRER | GARYPOHRER.COM | 6
0% 50 100 150 200 190 130 122 194 137 172 105 31 60 39 40 58 JAN17 JUL Y17 AP R17 OC T17 JAN18 JUL Y18 AP R18 OC T18 JAN19 JUL Y19 AP R19 OC T19 JAN20 JUL Y20 AP R20 AP R21 OC T20 JAN21 JAN22 JUL Y21 JUL Y22 OC T21 APR -2 2 OC T22 ACTIVE LISTINGS 0 100 200 600 300 400 500 145 571 73 590 357 322 193 215 138 120 125 95 39 108 JAN17 JUL Y17 AP R17 OC T17 JAN18 JUL Y18 AP R18 OC T18 JAN19 JUL Y19 AP R19 OC T19 JAN20 JUL Y20 AP R20 AP R21 OC T20 JAN21 JAN22 JUL Y21 JUL Y22 OC T21 APR -2 2 OC T22
DAYS ON MARKET
Sale to List Ratio*
In Q4 2022, single family homes sold on average -7% below the asking price.
SALE TO LIST RATIO
FOOTER: Glossary
Sale to List Ratio: The ratio of the final sale price of a home to its list, or asking, price expressed as a percentage. If the sale to list ratio is above 100%, the home sold for more than the list price. If it’s less than 100%, the home sold for less than the list price.

GARY POHRER | GARYPOHRER.COM | 7
70 75 80 100 105 85 90 95 93 105 86 78 98 87 85 76 79 96 97 91 MAR -1 7 SEP -1 7 JUN17 DE C17 MAR -1 8 SEP -1 8 JUN18 DE C18 MAR -1 9 SEP -1 9 JUN19 DE C19 MAR -2 0 SE P-2 0 JUN20 JUN21 DE C20 MAR -2 1 MAR -2 2 SE P-2 1 SE P-2 2 DE C21 DE C22 JUN22
Single Family Homes Transactions
2022 closed out the year with a total of 106 single family home transactions. This was on par or in some cases above what we’ve seen in the years prior to 2020.
Single Family Homes Total Sales Value
Total sales value for single family homes was just shy of $2B in 2022, closing out the year at $1.98B. The breakdown was split fairly evenly between waterfront ($870M) and non-waterfront ($1.1B) single family home sales.
Total sales value on single family homes was down -58% in 2022 compared to 2021, flat compared to 2020, and up significantly compared to a typical year pre-2020.
$3,0666,242,429
$1,601,984,854

$1,464,257,854 464257 854 $1
Total Sales Value ($) Sales Value ($) Non-Waterfront Sales Sales Value ($) Waterfront Sales
GARY POHRER | GARYPOHRER.COM | 8
TRANSACTIONS 0 50 100 150 200 250 97 118 139 185 162 106 111 95 152 131 120 233 219 2010 2012 2011 2013 2014 2016 2015 2017 2018 2020 2019 2021 2022
$0 $500M $1B $1.5B $2B $2.5B $3B $3.5B 2010 2012 2011 2013 2014 2016 2015 2017 2018 2020 2019 2021 2022
TOTAL SALES VALUE ($)
Single Family Homes Price Per Square Foot (PPSF): Home Size
PPSF: Home Size was up +46% YOY. Waterfront PPSF: Home Size was up +31% YOY compared to non-waterfront, which was up +59% YOY.

Single Family Homes Price Per Square Foot (PPSF): Lot Size
GARY POHRER | GARYPOHRER.COM | 9
PPSF ($) HOME SIZE $1,000 $2,000 $3,000 $4,000 $5,000 $6,000 2010 2012 2011 2013 2014 2016 2015 2017 2018 2020 2019 2021 2022 Average $/SF $/SF Non-Waterfront $/SF Waterfront Sales $4,077 $5,5542 $0 $3,374 PRICE PER SF ($) LOT SIZE $200 $400 $600 $800 $1,000 $1,200 $1,400 $1,600 2018 2020 2019 2021 2022 Average $/SF $/SF Non-Waterfront $/SF Waterfront Sales $1,091 $1,396 $0 1 091 396 $ $931
YOY and non-waterfront
PPSF: Lot Size was up +47% YOY. Waterfront PPSF: Lot Size was up +44%
was up +53% YOY.
Single Family Home Average Sale Price ($)
Average sale price was up +33% YOY. Waterfront average sale price was up +25% YOY compared to non-waterfront average sale price, which saw an increase of +42% YOY.
Compounding Annual Growth Rate (CAGR)/ Price Appreciation

CAGR for the Palm Beach single family home asset class over the last 40 years sits at 8.97%

AVERAGE SALE PRICE ($) $0 $5,000 $10,000 $15,000 $20,000 $30,000 $25,000 $35,000 $45,000 $17,248,726 $12,365,176 $41,666,475 $40,000 Average Sale Price ($) Average Sale Price ($) Non-Waterfront Average Sale Price ($) Waterfront 2010 2012 2011 2013 2014 2016 2015 2017 2018 2020 2019 2021 2022
CAGR 16% 14% 12% 10% 8% 6% 4% 2% 18% 0 ‘82-’91 ‘92-’01 ‘12-’22 ‘82-’21 6.6% ‘02-’11 4.5% 15.6% 10.5% 8.97%
GARY POHRER | GARYPOHRER.COM | 10
Compounding Annual Growth Rate (CAGR)/ Price Appreciation
The 2021 trajectory of record high price appreciation on single family homes continued in 2022. Single family homes appreciated at a rate of +46% YOY.
Price Per Square Foot: Comparing Performance Across Neighborhoods
Historically, the Estate Section traded at a premium compared to other neighborhoods on the island. In 2022, the other neighborhoods caught up and were no longer considered more of a value purchase.
FOOTER: Glossary

Compound Annual Growth Rate (CAGR): A performance metric that provides insight into an investment’s growth rate over a specified period of time longer than one year.

GROWTH YOY GROWTH YOY 2021 2022 2021 2022 WATERFRONT NON-WATERFRONT NORTH END IN-TOWN ESTATE SECTION $5,045 $6,694 33% $2,103 $3,398 62% $4,161 $5,496 32% $1,916 $3,267 71% $3,810 $4,716 24% $2,411 $3,492 45% TOTAL SALES VALUE ($) 60% 50% 40% 30% 20% 10% 0% -10% -20% - 13% - 10% +33% - 18% +21% +46% 1983 2021 1985 1989 1993 1997 2001 2005 2009 2013 2017
GARY POHRER | GARYPOHRER.COM | 11
NORTH END
SINGLE FAMILY HOMES

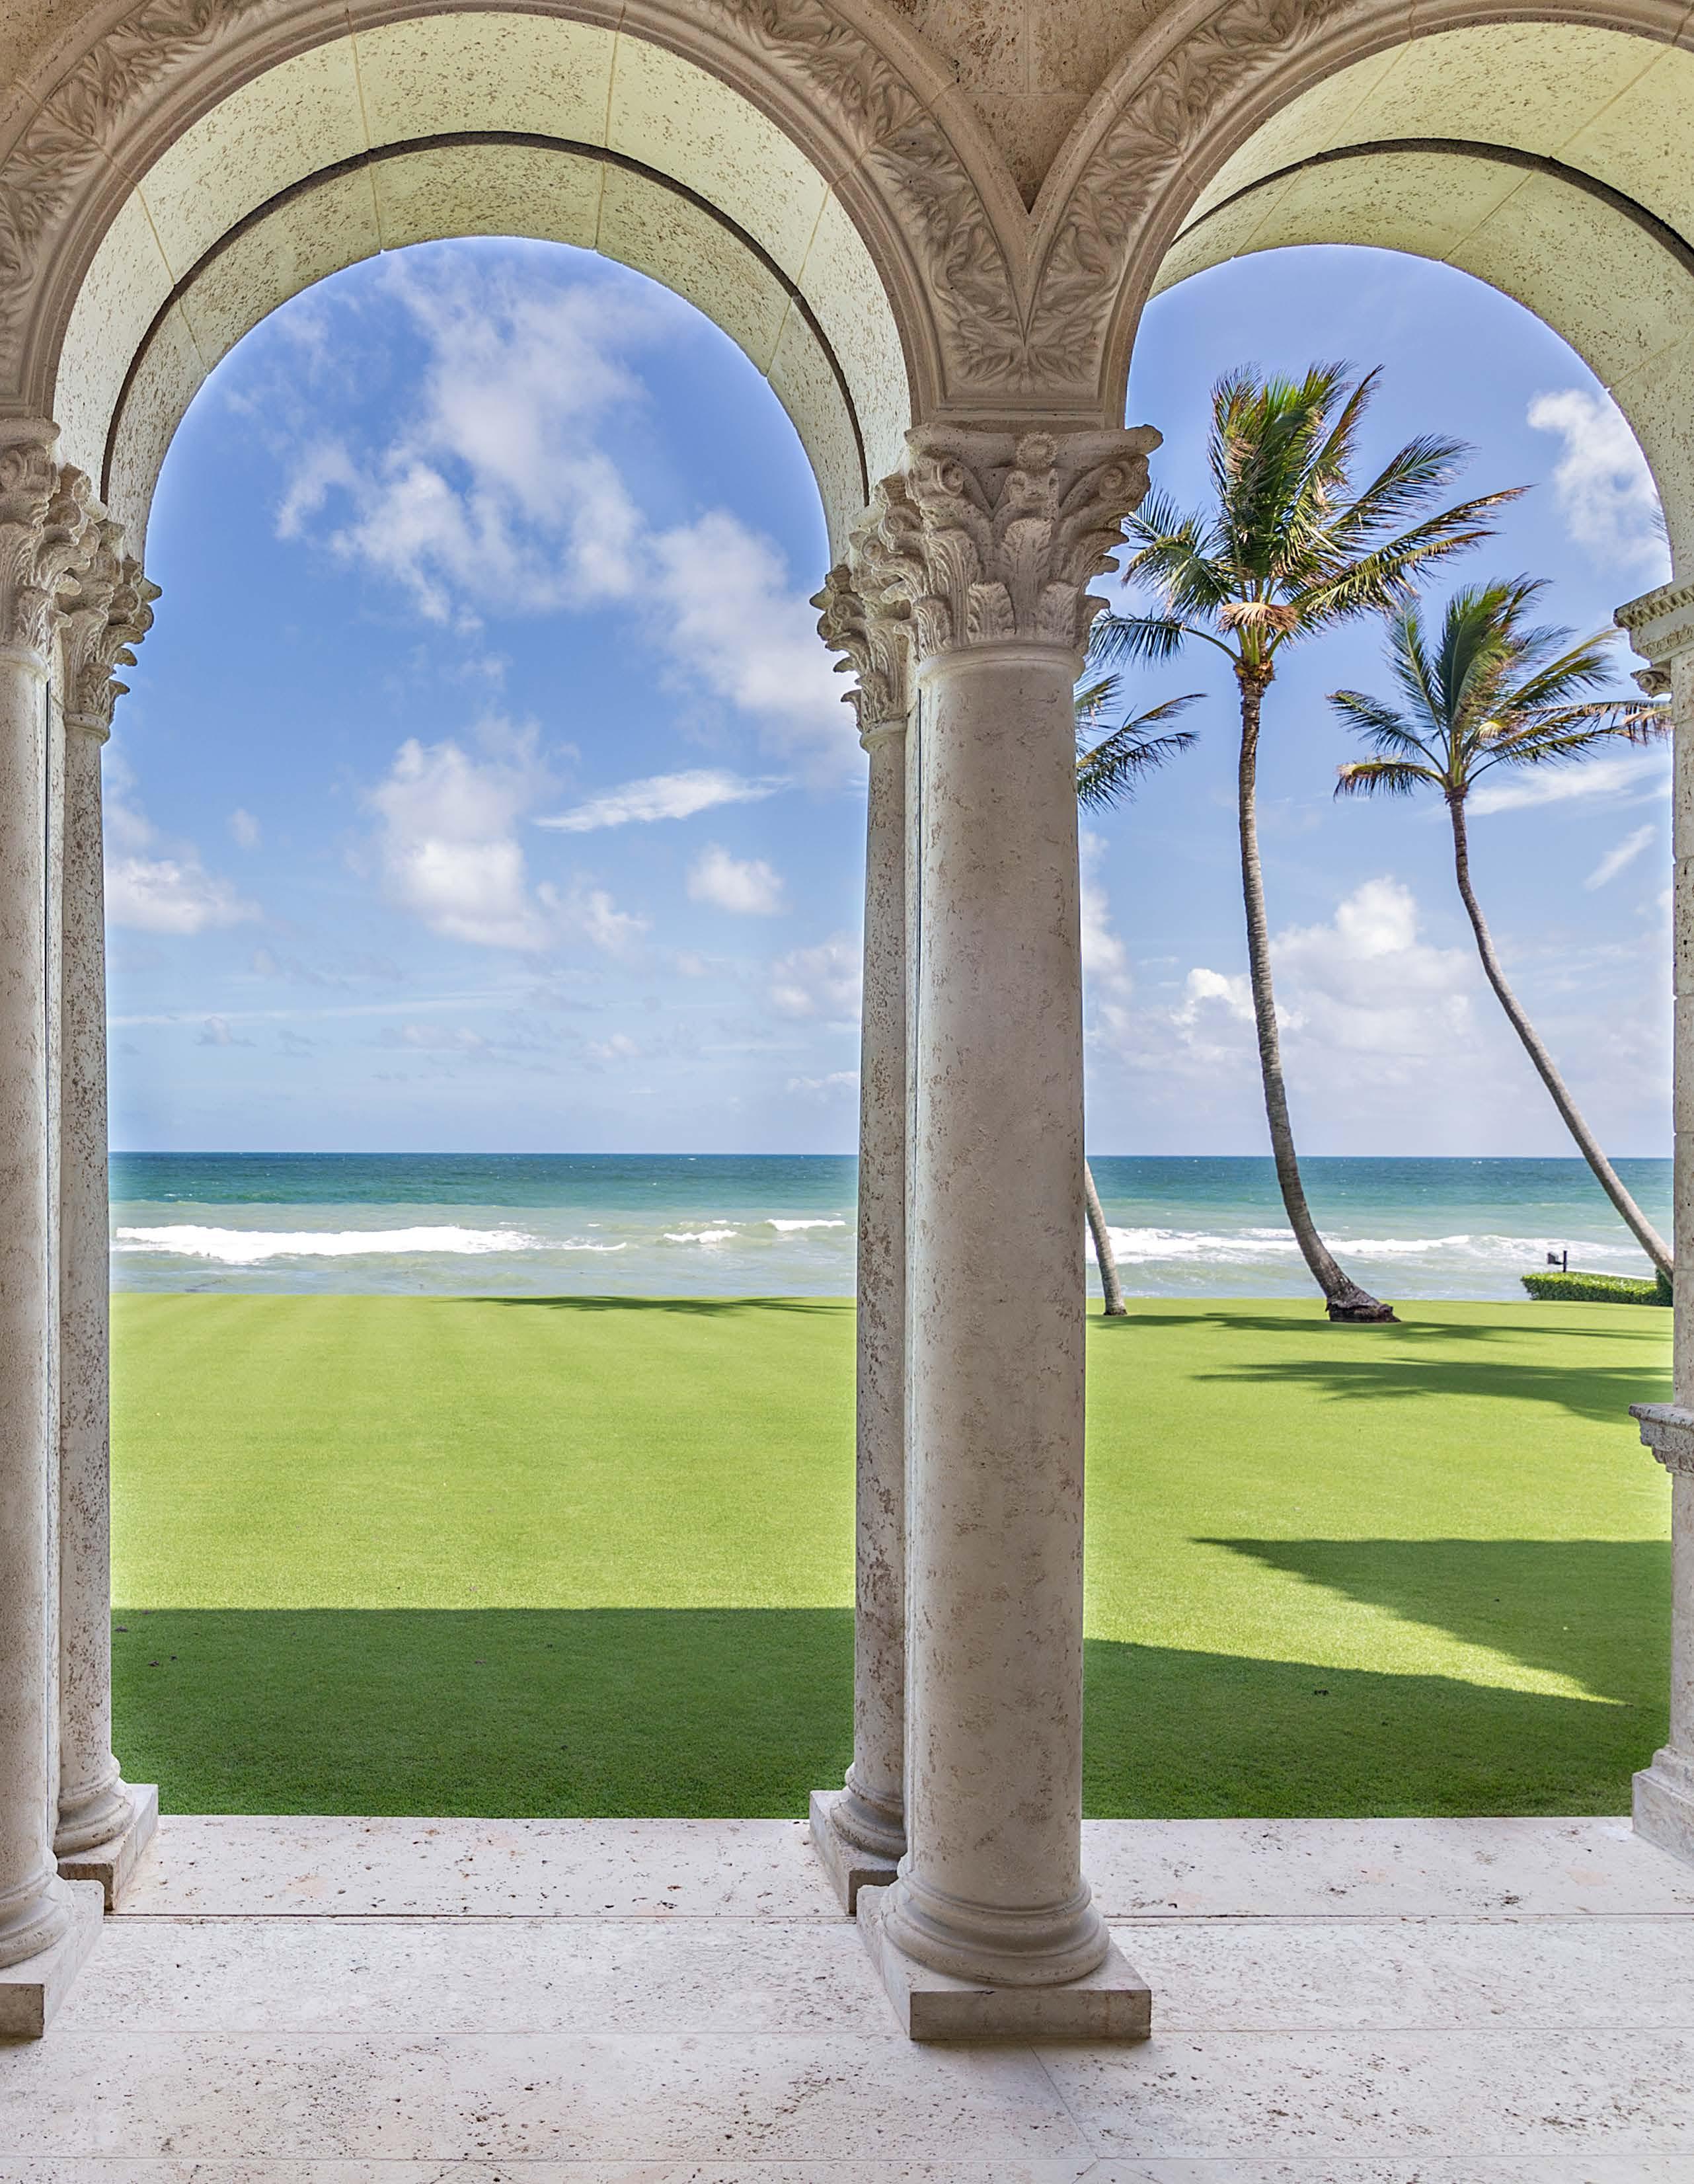
Palm Beach’s North End, located north of Wells Road, is celebrated for quiet seclusion. Thanks to zoning laws that prohibit condos and commercial properties in this area, many residents enjoy private beachfront and lake trail access.
Q4 Summary: Single Family Homes: North End


Transaction volume was down -62% YOY for the fourth quarter of 2022.
Total sales value was down -48%, largely driven by a -61% decline in non-waterfront sales value.
PPSF: Home Size was up +42% in Q4 YOY. Additionally, PPSF: Lot Size increased +40% YOY driven by a single large waterfront transaction on the North End.
Most Recent North End Sales
GARY POHRER | GARYPOHRER.COM | 13 % CHANGE YEAR OVER YEAR Q4 2021 Q4 2022 TRANSACTIONS WATERFRONT NON-WATERFRONT TOTAL SALES VALUE WATERFRONT NON-WATERFRONT AVERAGE SALES PRICE WATERFRONT NON-WATERFRONT AVERAGE PPSF: HOME SIZE WATERFRONT NON-WATERFRONT AVERAGE PPSF: LOT SIZE WATERFRONT NON-WATERFRONT 8 1 7 $142,350,000 $66,000,000 $76,350,000 $17,793,750 $66,000,000 $10,907,143 $4,527 $7,752 $3,330 $1,151 $2,407 $793 21 3 18 $276,049,551 $82,458,000 $193,591,551 $13,145,217 $27,486,000 $10,755,086 $3,198 $5,517 $2,712 $823 $915 $789 -62% -67% -61% -48% -20% -61% 35% 140% 1% 42% 41% 23% 40% 163% 0% $66,000,000 6 Via Los Incas Yes 8,514 $7,752 27,425 $2,407 $16,300,000 225 W Indies Drive No 4,393 $3,710 14,623 $1,115 $15,050,000 245 Ridgeview Drive No 4,250 $3,541 11,500 $1,309 $12,000,000 1150 N Ocean Way No 3,885 $3,089 24,977 $480 $10,250,000 210 Palmo Way No Lot Sale 14,009 $732 $9,550,000 231 El Dorado Lane No 2,794 $3,418 10,481 $911 $6,700,000 286 Orange Grove Road No 2,864 $2,339 8,154 $822 $6,500,000 225 El Pueblo Way No Lot Sale 12,502 $520 SALE PRICE ADDRESS WATERFRONT? SF HOME SIZE SF LOT SIZE PPSF ($) PPSF ($) APPROX. APPROX. HOME SIZE LOT SIZE
Single Family Homes Transactions: North End
2022 closed out the year with a total of 60 single family home transactions. This was -40% to -45% below the transaction volumes from 2020 and 2021, but on par with pre-2020 levels for the North End.
Single Family Homes Total Sales Value
Total sales value on the North End was just above $1B in 2022, with $600M generated from non-waterfront sales, and $400M from waterfront sales.

ANNUAL CLOSED TRANSACTIONS
TOTAL ANNUAL SALES VALUE ($) $200M $400M $600M $800M $1B $1.2B $1.4B $1,262,238,499 $0 $665,073,870 Total Sales Value Sales Value Non-Waterfront Sales Value Waterfront 2010 2012 2011 2013 2014 2016 2015 2017 2018 2020 2019 2021 2022 $416,664,750
20 30 40 50 60 70 80 90 100 110 120 57 70 71 100 60 56 40 68 75 65 109 96 2010 2012 2011 2013 2014 2016 2015 2017 2018 2020 2019 2021 2022 GARY POHRER | GARYPOHRER.COM | 14
Single Family Homes Price Per Square Foot (PPSF)
PPSF: Home Size is up +46% YOY, with waterfront up +33% YOY ($5,045 to $6,694) and non-waterfront up +62% YOY ($2,103 to $3,398).
PPSF ($)
Single Family Home Average Sale Price ($)
AVERAGE SALE PRICE ($)

$0 $5,000,000 $10,000,000 $15,000,000 $20,000,000 $30,000,000 $25,000,000 $35,000,000 $45,000,000 $17,248,726 $12,365,176 $41,666,475 $40,000,000
2010 2012 2011 2013 2014 2016 2015 2017 2018 2020 2019 2021 2022
Average Sale Price ($) Average Sale Price ($) Non-Waterfront Average Sale Price ($) Waterfront
$0 $1,000 $2,000 $3,000 $4,000 $5,000 $6,000 $8,000 $4,239 $3,398 $6,694 $7,000 Average $/SF $/SF Non-Waterfront $/SF Waterfront Sales 2010 2012 2011 2013 2014 2016 2015 2017 2018 2020 2019 2021 2022
Average sale price was up +31% YOY, with waterfront sales increasing +5% YOY, and non-waterfront seeing a big lift, up +51% YOY. GARY POHRER | GARYPOHRER.COM | 15
IN-TOWN
SINGLE FAMILY HOMES


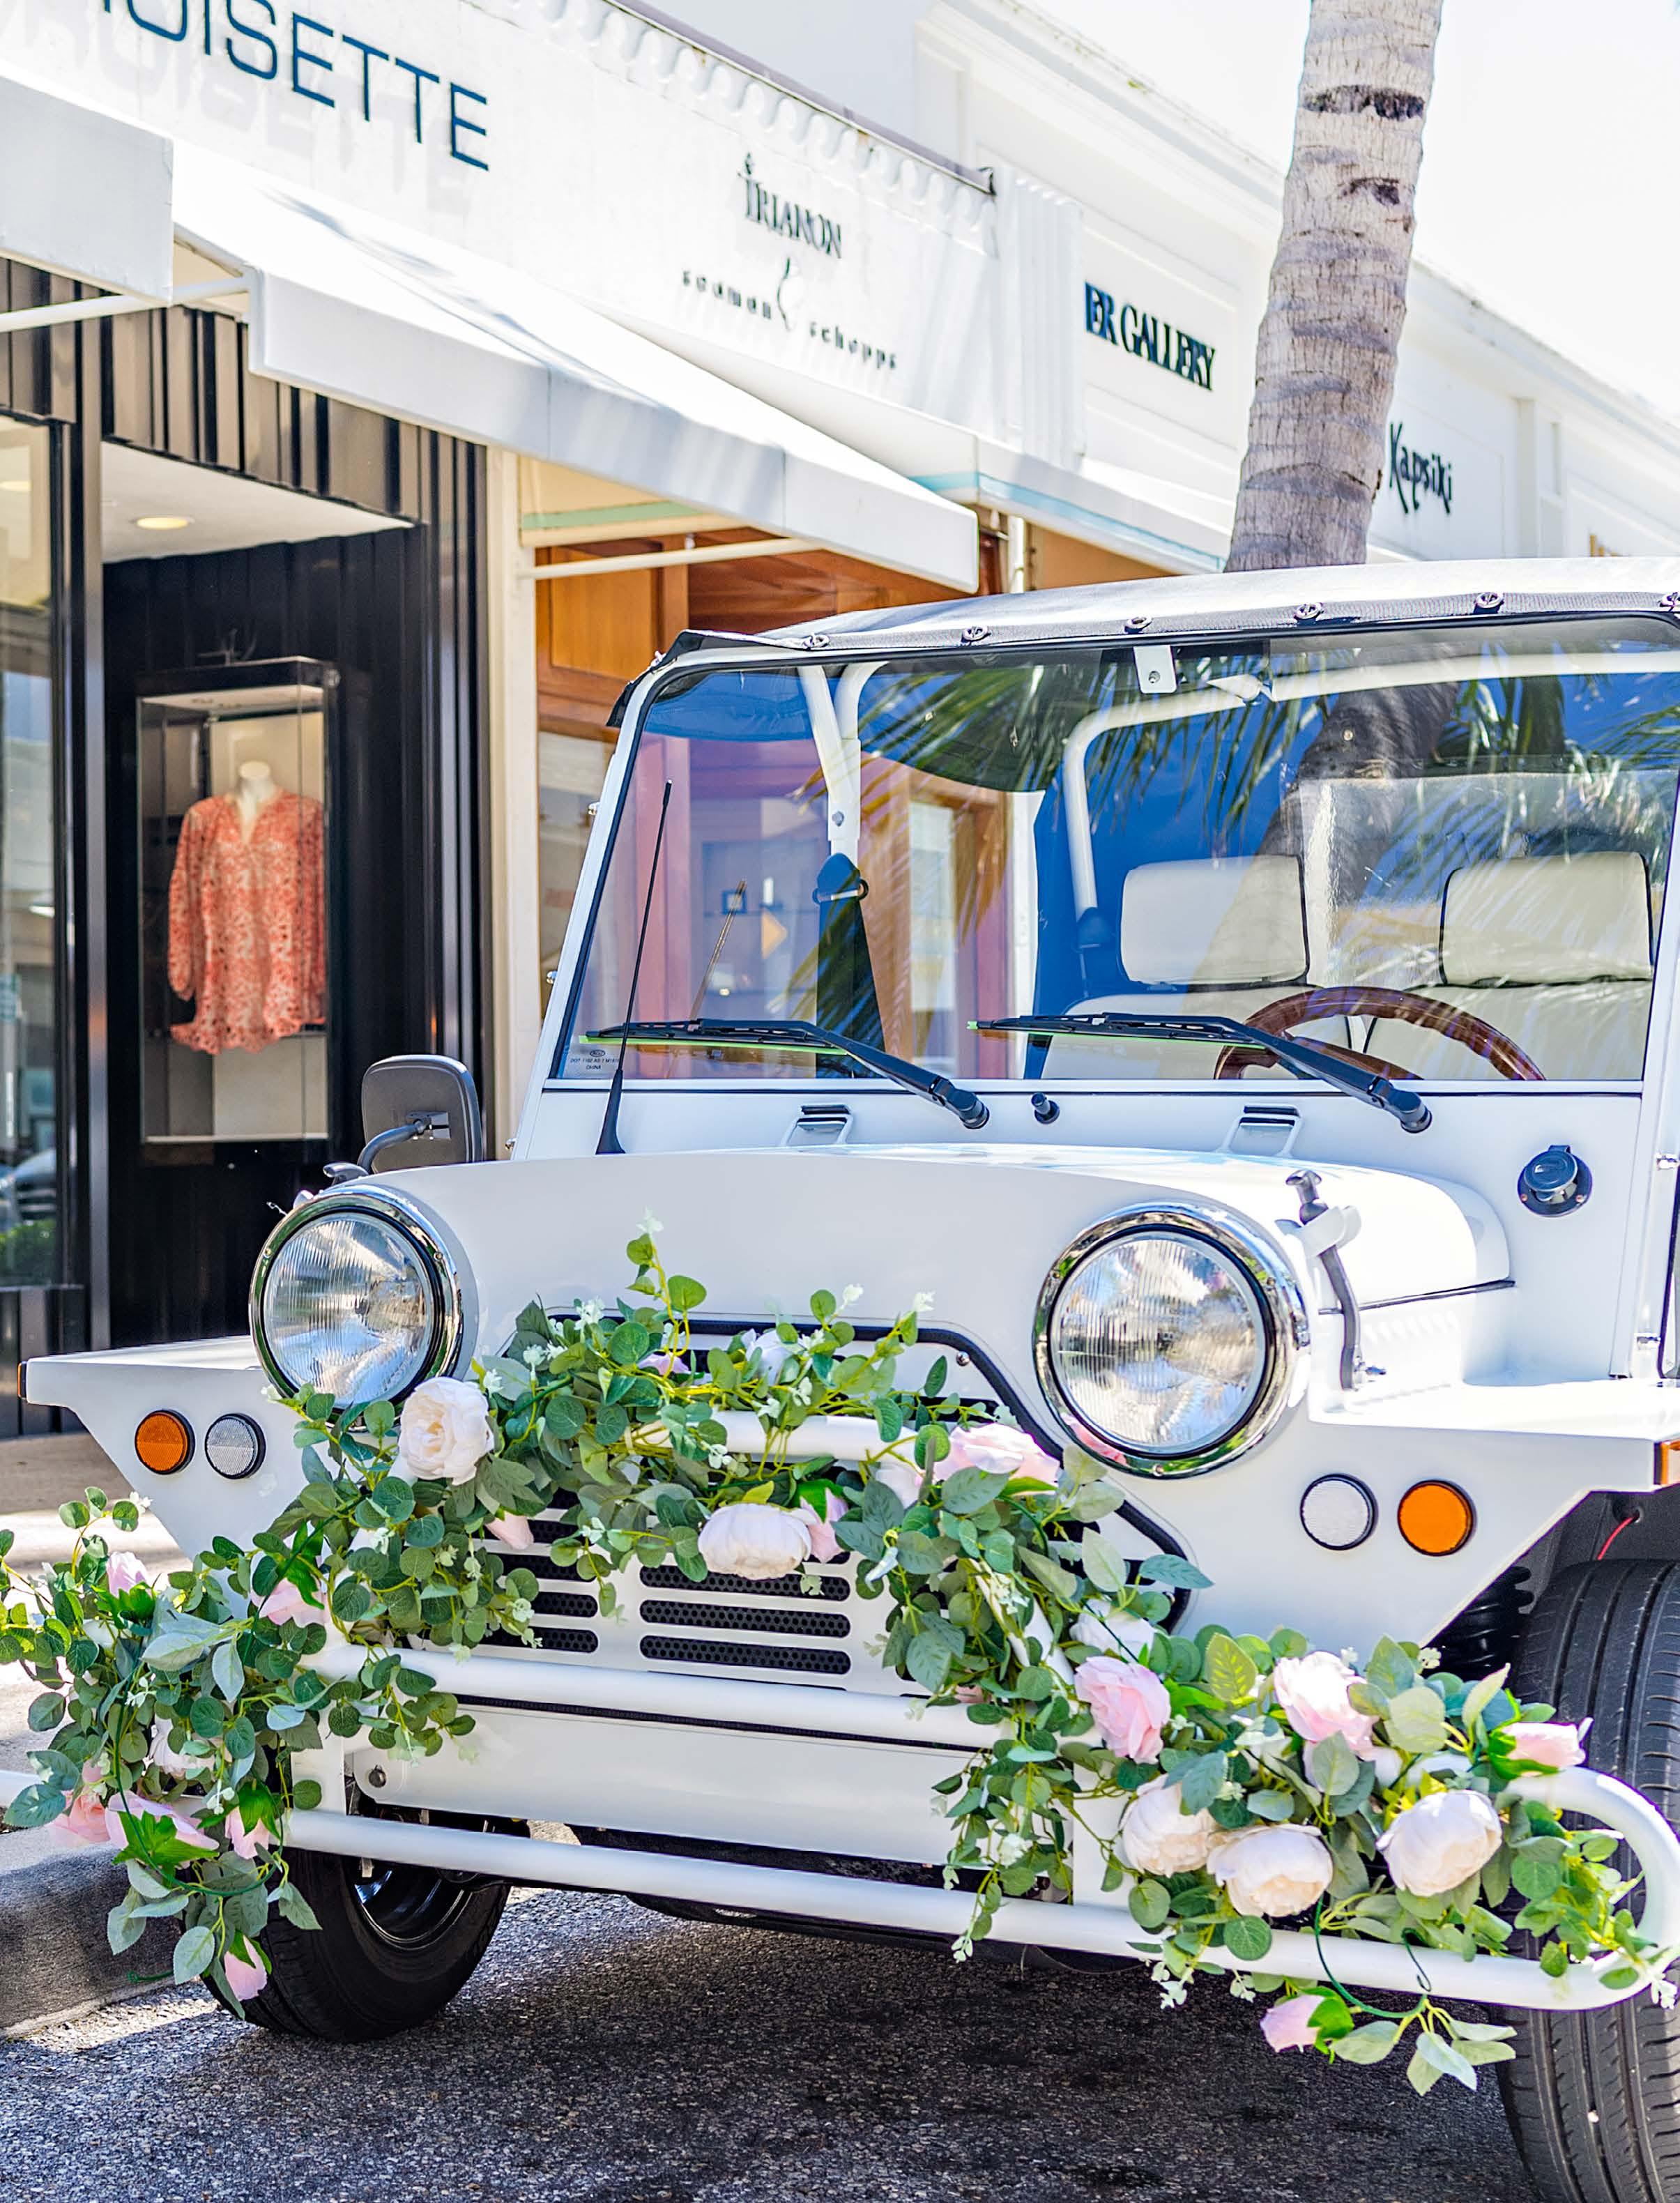
Nestled between Worth Avenue and Wells Road lies the energetic center of Palm Beach Island, In-Town. Packed with shops, secluded beaches, and five-star restaurants, this hub of culture and leisure lures residents with a flair for cosmopolitan life.
\
Q4 Summary: Single Family Homes: In-Town
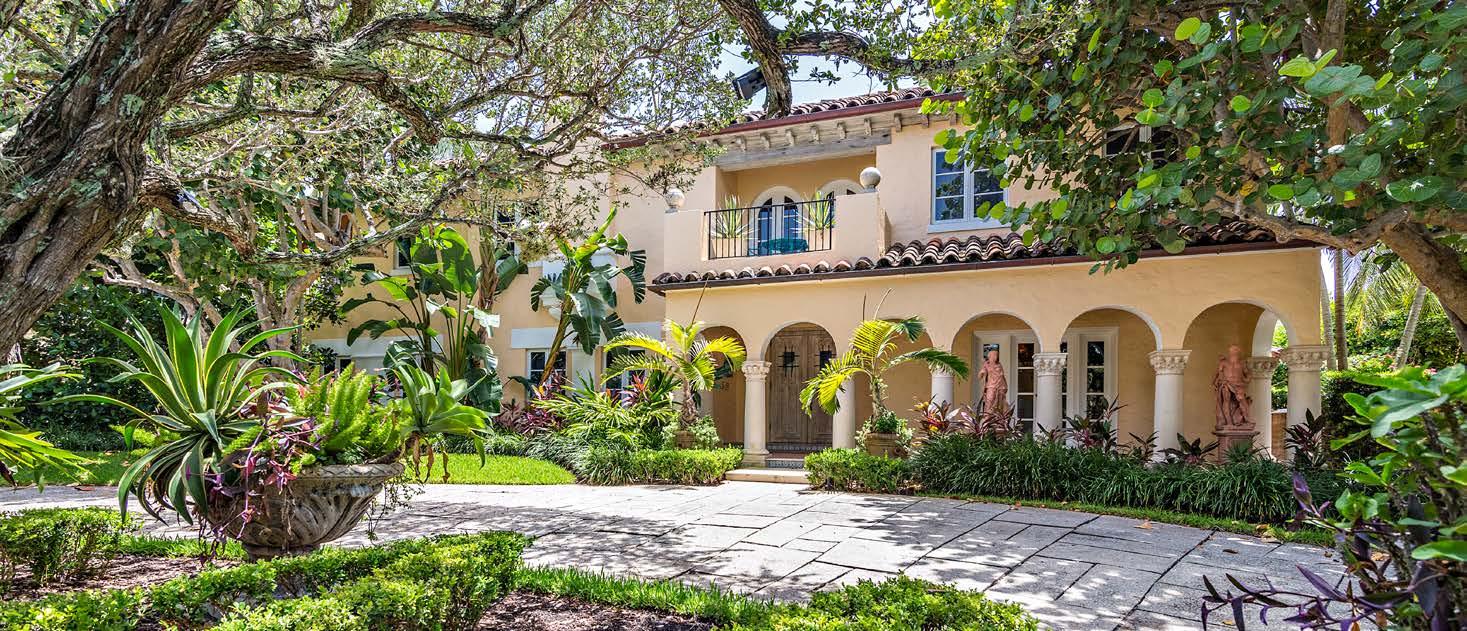
In-Town transaction volume was down -70% YOY in Q4 2022, the sixth consecutive quarter that saw a decline in transaction volume.
Total sales value was also down -44% YOY at $48M in Q4 2022, compared to $87M in Q4 2021. Total sales value was up $10M QOQ from Q3 2022.
In-Town PPSF: Home Size was up +82% YOY, and PPSF: Lot Size was up +51%.
Most Recent In-Town Sales
NOTE:

Reporting in this section does not break out waterfront versus non-waterfront properties, as there are limited waterfront sales in this area. In most years, zero waterfront homes sold.

% CHANGE YEAR OVER YEAR Q4 2021 Q4 2022 TRANSACTIONS TOTAL SALES VALUE AVERAGE SALES PRICE AVERAGE PPSF: HOME SIZE AVERAGE PPSF: LOT SIZE 3 $48,539,137 $16,179,712 $3,913 $1,272 10 $86,866,100 $8,686,610 $2,153 $845 -70% -44% 86% 82% 51%
$24,000,000 124 Brazilian Avenue No 5,682 $4,224 17,119 $1,402 $21,339,137 211 Dunbar Road No 5,962 $3,579 19,502 $1,094 $3,200,000 151 Root Trail No 760 $4,211 1,542 $2,075 SALE PRICE ADDRESS WATERFRONT? SF HOME SIZE SF LOT SIZE PPSF ($) PPSF ($) APPROX. APPROX. HOME SIZE LOT SIZE
Sold | 124 Brazilian Avenue | Palm Beach | $24,000,000 GARY POHRER | GARYPOHRER.COM | 17
Single Family Homes Transactions: In-Town


2022 closed out the year with a total of 28 single family home transactions. This was -55% to -68% below the transaction volume we saw in 2020 and 2021 respectively, but flat-to-below pre-2020 levels of In-Town transactions.
HED: Single Family Homes Total Sales Value
Total sales value on In-Town sales was just above $358M in 2022. This represented a -24% decline from 2021 total sales value.
$0 $500K $300K $100K $200K $400K $600K $558,634,298 $89,497,284 $246,146,613 $167,807,274 $158,463,953 $358,549,842 Total Sales Value ($) 2010 2012 2011 2013 2014 2016 2015 2017 2018 2020 2019 2021 2022
15 95 85 65 45 25 35 55 75 28 62 34 87 26 36 55 55 2010 2012 2011 2013 2014 2016 2015 2017 2018 2020 2019 2021 2022 TOTAL ANNUAL SALES VALUE ($) ANNUAL CLOSED TRANSACTIONS GARY POHRER | GARYPOHRER.COM | 18
Single Family Homes Price Per Square Foot
PPSF: Home Size was up +71% YOY, with waterfront increasing +32% YOY ($4,161 to $5,496), and non-waterfront growing +71% YOY ($1,916 to $3,267).
Single Family Home Average Sale Price ($)
Average sale price was up +68% YOY from $7.6M (2021) to $12.8M (2022).


$11,560,489 $7,388,470 $4,437,351 $4,310,122 $3,091,846 $3,442,203 $2,237,149 $0 $12,000 $8,000 $2,000 $4,000 $10,000 $14,000 2010 2012 2011 2013 2014 2016 2015 2017 2018 2020 2019 2021 2022
$3,267 $1,916 $1,328 $1,118 $788 $644 $0 $3,500 $2,500 328 $ $1,500 $500 $1,000 $2,000 $3,000 2010 2012 2011 2013 2014 2016 2015 2017 2018 2020 2019 2021 2022 AVERAGE
PPSF ($) GARY POHRER | GARYPOHRER.COM | 19
SALE PRICE ($)
ESTATE SECTION


SINGLE FAMILY HOMES
The Estate Section comprises all residences south of Worth Avenue to Sloans Curve. It is renowned for its opulent residencies and exclusive social clubs including The Everglades Club, Bath and Tennis Club, and Mar-a-Lago.

Q4 Summary: Single Family Homes:

Estate Section
The Estate Section had another slow quarter of transactions, selling just two properties in Q4 2022. This was down -75% compared to Q4 of 2021. In Q4 2022, PPSF was up +23% YOY for non-waterfront sales. There were no waterfront sales in the Estate Section during this period.

Most Recent Estate Section Sales
% CHANGE YEAR OVER YEAR Q4 2021 Q4 2022 TRANSACTIONS WATERFRONT NON-WATERFRONT TOTAL SALES VALUE WATERFRONT NON-WATERFRONT AVERAGE SALES PRICE WATERFRONT NON-WATERFRONT AVERAGE PPSF: HOME SIZE WATERFRONT NON-WATERFRONT AVERAGE PPSF: LOT SIZE WATERFRONT NON-WATERFRONT 2 0 2 $55,087,119$55,087,119 $27,543,560$27,543,560 $4,271$4,271 $1,251$1,251 8 4 4 $190,268,758 $112,150,000 $78,118,758 $23,783,595 $28,037,500 $19,529,690 $4,234 $5,008 $3,465 $1,019 $1,331 $763 -75% -100% -50% -71%-29% 16%41% 1%23% 23%64%
$32,087,119 220 Jungle Road No 7,738 $4,147 19,201 $1,671 $23,000,000 150 El Vedado Road No 5,161 $4,457 24,851 $926 SALE PRICE ADDRESS WATERFRONT? SF HOME SIZE SF LOT SIZE PPSF ($) PPSF ($) APPROX. APPROX. HOME SIZE LOT SIZE
GARY POHRER | GARYPOHRER.COM | 21
Single Family Homes Transactions: Estate Section


2022 closed out the year with a total of 18 single family home transactions. This was -50% to -70% below the transaction volume we saw in 2020 and 2021, but on par with pre-2020 levels of Estate Section transaction volume.
Single Family Homes Total Sales Value: Estate Section
Total annual sales value on estate section properties was just above $580M in 2022. This was a -56% decline from 2021 total sales value.
GARY POHRER | GARYPOHRER.COM | 22
0 10 20 30 40 50 60 70 14 25 36 18 21 22 61 2010 2012 2011 2013 2014 2016 2015 2017 2018 2020 2019 2021 2022 ANNUAL CLOSED TRANSACTIONS TOTAL
VALUE ($) $200M $400M $600M $800M $1B $1.2B $1.4B $1,332,307,283 $0 $846,093,225 Total Sales Value Sales Value Non-Waterfront Sales Value Waterfront 2010 2012 2011 2013 2014 2016 2015 2017 2018 2020 2019 2021 2022 $486,214,058
ANNUAL SALES
Single Family Homes Price Per SF: Estate Section
PPSF: Home Size was up +36% YOY. Waterfront PPSF: Home Size was up +24% YOY ($3,810 to $4,716), compared to non-waterfront PPSF: Home Size, which was up +45% YOY ($2,411 to $3,492).
Single Family Home Average Sale Price: Estate Section
Average sale price was up +48% YOY from $21.8M (2021) to $32.3M (2022).

AVERAGE SALE PRICE ($)

$0 $5,000 $10,000 $15,000 $20,000 $30,000 $25,000 $35,000 $45,000 $22,319,747 $21,815,680 $40,723,000 $40,000 Average Sale Price ($) Average Sale Price ($) Non-Waterfront Average Sale Price ($) Waterfront 2010 2012 2011 2013 2014 2016 2015 2017 2018 2020 2019 2021 2022
$0 $500 $1,000 $1,500 $2,000 $2,500 $3,000 $4,000 $4,267 $3,492 $4,716 $3,500 3492 $4,500 $5,000 Average $/SF $/SF Non-Waterfront $/SF Waterfront Sales 2010 2012 2011 2013 2014 2016 2015 2017 2018 2020 2019 2021 2022
PPSF
GARY POHRER | GARYPOHRER.COM | 23
($)
CONDOS & TOWNHOMES
ALL NEIGHBORHOODS


Whether you seek a large building with resort-style amenities or the boutique elegance of a small, full-service site, Palm Beach Island offers an expansive range of options just steps from shorelines, shops, restaurants and more. Palm Beach townhomes are ideal for those who seek the convenience of a condo but crave the spaciousness of a house.
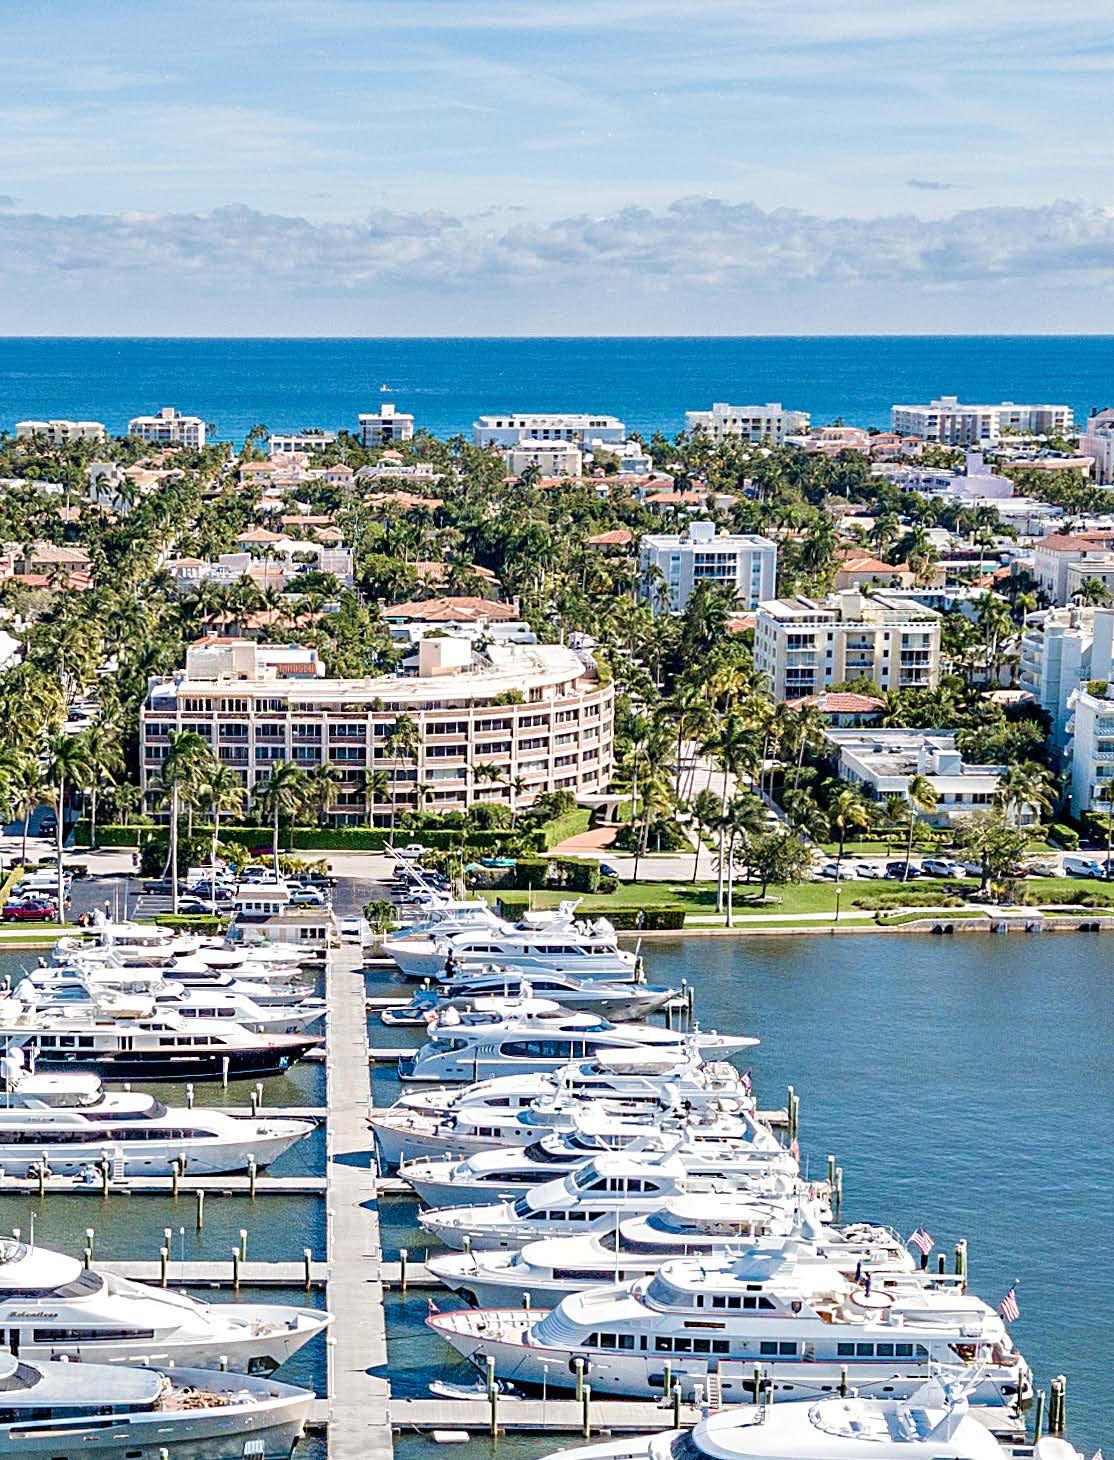
Q4 Summary: Condominiums and Townhomes

Transaction volume in Q4 was down -60% YOY, due to a -53% decline in In-Town transactions and a -65% decline in South End transactions.
Total sales value was down -49% YOY. This was the first quarter where we saw a decline in PPSF, which was down-7% YOY for In-Town condos and townhomes and -3% decline for South End condos and townhomes.
Most

Recent
Condo and Townhome Sales
$23,750,000 110 Sunset Avenue E, 4b 4,668 $5,088 $4,500,000 100 Sunrise Avenue, 515 1,547 $2,909 $4,150,000 100 Royal Palm Way, G-3 2,535 $1,637 $3,750,000 400 S Ocean Boulevard, 4060 1,716 $2,185 $3,664,000 150 Bradley Place, 0205 1,815 $2,019 $3,604,500 350 S Ocean Boulevard, 2020 1,234 $2,921 $3,400,000 429 Australian Avenue, 80 1,914 $1,776 $3,275,000 100 Sunrise Avenue, 505 1,673 $1,958 $2,925,000 400 S Ocean Boulevard, 2020 1,716 $1,705 $2,200,000 300 S Ocean Boulevard, 3e 1,257 $1,750 $1,950,000 226 Brazilian Avenue, 0080 1,317 $1,481 $1,950,000 44 Cocoanut Row, 321a 1,272 $1,533 $1,750,000 44 Cocoanut Row, 507a 900 $1,944 $1,650,000 315 S Lake Drive,4a 1,816 $909 $1,280,000 389 S Lake Drive, 4f 1,194 $1,072 $1,000,000 44 Cocoanut Row, 306b 900 $1,111 SALE PRICE ADDRESS PPSF ($) SF UNIT SIZE APPROX. UNIT SIZE TRANSACTIONS IN-TOWN SOUTH END TOTAL SALES VALUE IN-TOWN SOUTH END AVERAGE SALES PRICE IN-TOWN SOUTH END AVERAGE PPSF: HOME IN-TOWN SOUTH END 52 18 32 $85,499,157 $38,236,500 $19,012,657 $1,644,215 $2,124,250 $ 594,146 $1,264 $1,711 $487 130 38 92 $168,045,415 $101,183,225 $66,862,190 $1,292,657 $2,662,716 $726,763 $889 $1,834 $499 -60% -53% -65% -49% -62% -72% 27% -20% -18% 42% -7% -3% % CHANGE YEAR OVER YEAR Q4 2021 Q4 2022
GARY POHRER | GARYPOHRER.COM | 25
Inventory: Active Listings

In Q4 2022, inventory was up +37% YOY. The same period in 2021 averaged 73 active listings per month, whereas Q4 2022 averaged 100 active listings per month.
Days on Market
The number of days on market was up +14% compared to the same period last year. During Q4 2022, condos and townhomes took an average of 136 days to sell. 136 DAYS
GARY POHRER | GARYPOHRER.COM | 26
350 300 250 200 150 100 50 0 82 106 91 151 185 300 246 150 176 325 232 228 193 305 229 175 148 147 199 151 JAN17 OC T17 JUL Y17 AP R17 OC T17 JAN18 JUL Y18 AP R18 OC T18 JAN19 JUL Y19 AP R19 OC T19 JAN20 JUL Y20 AP R20 AP R21 OC T20 JAN21 JAN22 JUL Y21 JUL Y22 OC T22 OC T21 APR -2 2
MARKET ACTIVE LISTINGS 350 114 300 250 200 150 100 50 0 240 276 236 265 75 74 53 250 332 322 323 JAN17 OC T17 JUL Y17 AP R17 OC T17 JAN18 JUL Y18 AP R18 OC T18 JAN19 JUL Y19 AP R19 OC T19 JAN20 JUL Y20 AP R20 AP R21 OC T20 JAN21 JAN22 JUL Y21 JUL Y22 OC T22 OC T21 APR -2 2
DAYS ON
Sale to List Ratio

The sale to list ratio for condos and townhomes hovered right around 90% for Q4 2022. This was down -5% compared to last quarter and the previous three quarters. 90%
Condominiums & Townhomes Transactions
2022 closed out the year with a total of 513 condo and townhome transactions. This represented a -38% decline, compared to 2021. As we saw with the single family home asset class, the downward trend with condos and townhomes was only in comparison to 2021 behavior; it was still above or of similar volume to pre-2020 levels.
0 100 200 300 400 500 600 800 900 829 243 700 All Transactions Transactions (#) South End Transactions (#) In-Town 2010 2012 2011 2013 2014 2016 2015 2017 2018 2020 2019 2021 2022 586
100 95 90 85 80 75 70 87 85 83 93 87 90 96 88 85 88 89 93.1 96 95 94 97 93 93 89 98 85 JAN17 OC T17 JUL Y17 AP R17 OC T17 JAN18 JUL Y18 AP R18 OC T18 JAN19 JUL Y19 AP R19 OC T19 JAN20 JUL Y20 AP R20 AP R21 OC T20 JAN21 JAN22 JUL Y21 JUL Y22 OC T22 OC T21 APR -2 2 ANNUAL CLOSED TRANSACTIONS SALES TO LIST RATIO
GARY POHRER | GARYPOHRER.COM | 27
Condominiums & Townhomes Total Sales Value


Total sales value in 2022 for condos and townhomes was down -14%, closing out the year at $831M. The breakdown was split fairly evenly between In-Town ($395M) and South End sales ($408M).
Condominiums & Townhomes Price Per SF
PPSF grew YOY across both In-Town and South End condos. In-Town grew +59% YOY to $2,169 PPSF and South End grew +30% to $698 PPSF. Note, Q4 was the first quarter we saw a decrease in PPSF across both In-Towns and South End condos, which is something to watch as we enter 2023.
$0 $500 $1,000 $1,500 $2,000 $2,500 $2,169 $698
2010 2012 2011 2013 2014 2016 2015 2017 2018 2020 2019 2021 2022
$/SF South End $/SF In-Town
PPSF ($) TOTAL ANNUAL SALES VALUE ($) $0 $200,000,000 $400,000,000 $600,000,000 $800,000,000 $1,000,000,000 $1,200,000,000 $967,663,135 $456,287,625 $407,801,437
2010 2012 2011 2013 2014 2016 2015 2017 2018 2020 2019 2021 2022 GARY POHRER | GARYPOHRER.COM | 28
All Transactions Transactions (#) South End Transactions (#) In-Town
Condominiums & Townhomes Average Sale Price ($)
Average sale price was up +39% YOY, with In-Town average sale price was up +58% YOY and South End average sale price up +24% YOY.
Compounding Annual Growth Rate (CAGR)/ Price Appreciation

CAGR for the Palm Beach In-Town condo and townhome asset class over the last 40 years sits at 6.5%, largely impacted by stellar growth in the last several years.

‘82-’91 ‘92-’01 ‘12-’22 ‘82-’21 3.5% 2% 0 4% 6% 10% 8% 12% ‘02-’11 1.3% 10% 7.7% 6.5%
$0 $500,000 $1,000,000 $1,500,000 $2,000,000 $2,500,000 $3,000,000 $1,619,876 $1,078,840 $3,500,000 840 781,0 Average Sale Price Average Sale Price In-Town Average Sale Price South End 2010 2012 2011 2013 2014 2016 2015 2017 2018 2020 2019 2021 2022 $2,969,510 CAGR AVERAGE SALE PRICE ($) GARY POHRER | GARYPOHRER.COM | 29
Compounding Annual Growth Rate (CAGR)/ Price Appreciation

2022 continued on the 2021 trajectory of record high price appreciation on In-Town condos and townhomes. Price appreciation for In-Town condos and townhomes grew +59% YOY.

30% 5% -5% 25% 35% 15% -15% -25% 45% 55% 0% 60% +21. 1% +31. 1% +8.4% +22.7% + 15.7% 17.7% 14.6% -6.4% - 11.9% -1 % - 13.3% - 12.5% 1983 2021 1985 1987 1989 1993 1991 1997 1999 1995 2001 2003 2005 2007 2009 2019 2017 2015 2013 2011 ANNUAL % RETURN
(+/-)
GARY POHRER | GARYPOHRER.COM | 30
In Closing
We appreciate you taking the time to read our report, and hope you found our insights on the Palm Beach Island market interesting.
I would like to again express my gratitude to my clients, colleagues and prospective clients for taking the time to read our report each quarter and for entrusting us with your business over the years. 2022 was another very busy year for us, culminating in over $350M in total sales value. We look forward to another busy year, and please do not hesitate to reach out if we can be of assistance to you in 2023 and beyond.
Warmest wishes,
Gary Pohrer
 Sales Associate
 Executive Director of Luxury Sales
M: 561.262.0856
gary.pohrer@elliman.com

Source: Above data is pulled from Palm Beach MLS, The Beaches MLS and the Palm Beach Property Appraisers (PAPA). Specifically, we are only looking at transactions located in the 33480 zip code.
340 ROYAL POINCIANA WAY, M302, PALM BEACH, FL 33480. 561.655.8600 © 2023 DOUGLAS ELLIMAN REAL ESTATE. ALL MATERIAL PRESENTED HEREIN IS INTENDED FOR INFORMATION PURPOSES ONLY. WHILE, THIS INFORMATION IS BELIEVED TO BE CORRECT, IT IS REPRESENTED SUBJECT TO ERRORS, OMISSIONS, CHANGES OR WITHDRAWAL WITHOUT NOTICE. ALL PROPERTY INFORMATION, INCLUDING, BUT NOT LIMITED TO SQUARE FOOTAGE, ROOM COUNT, NUMBER OF BEDROOMS AND THE SCHOOL DISTRICT IN PROPERTY LISTINGS SHOULD BE VERIFIED BY YOUR OWN ATTORNEY, ARCHITECT OR ZONING EXPERT. EQUAL HOUSING OPPORTUNITY.
GARY POHRER | GARYPOHRER.COM | 31


 Sales Associate
 Executive Director of Luxury Sales

