
Q3 2022
Inside South Florida’s most exclusive real estate market.
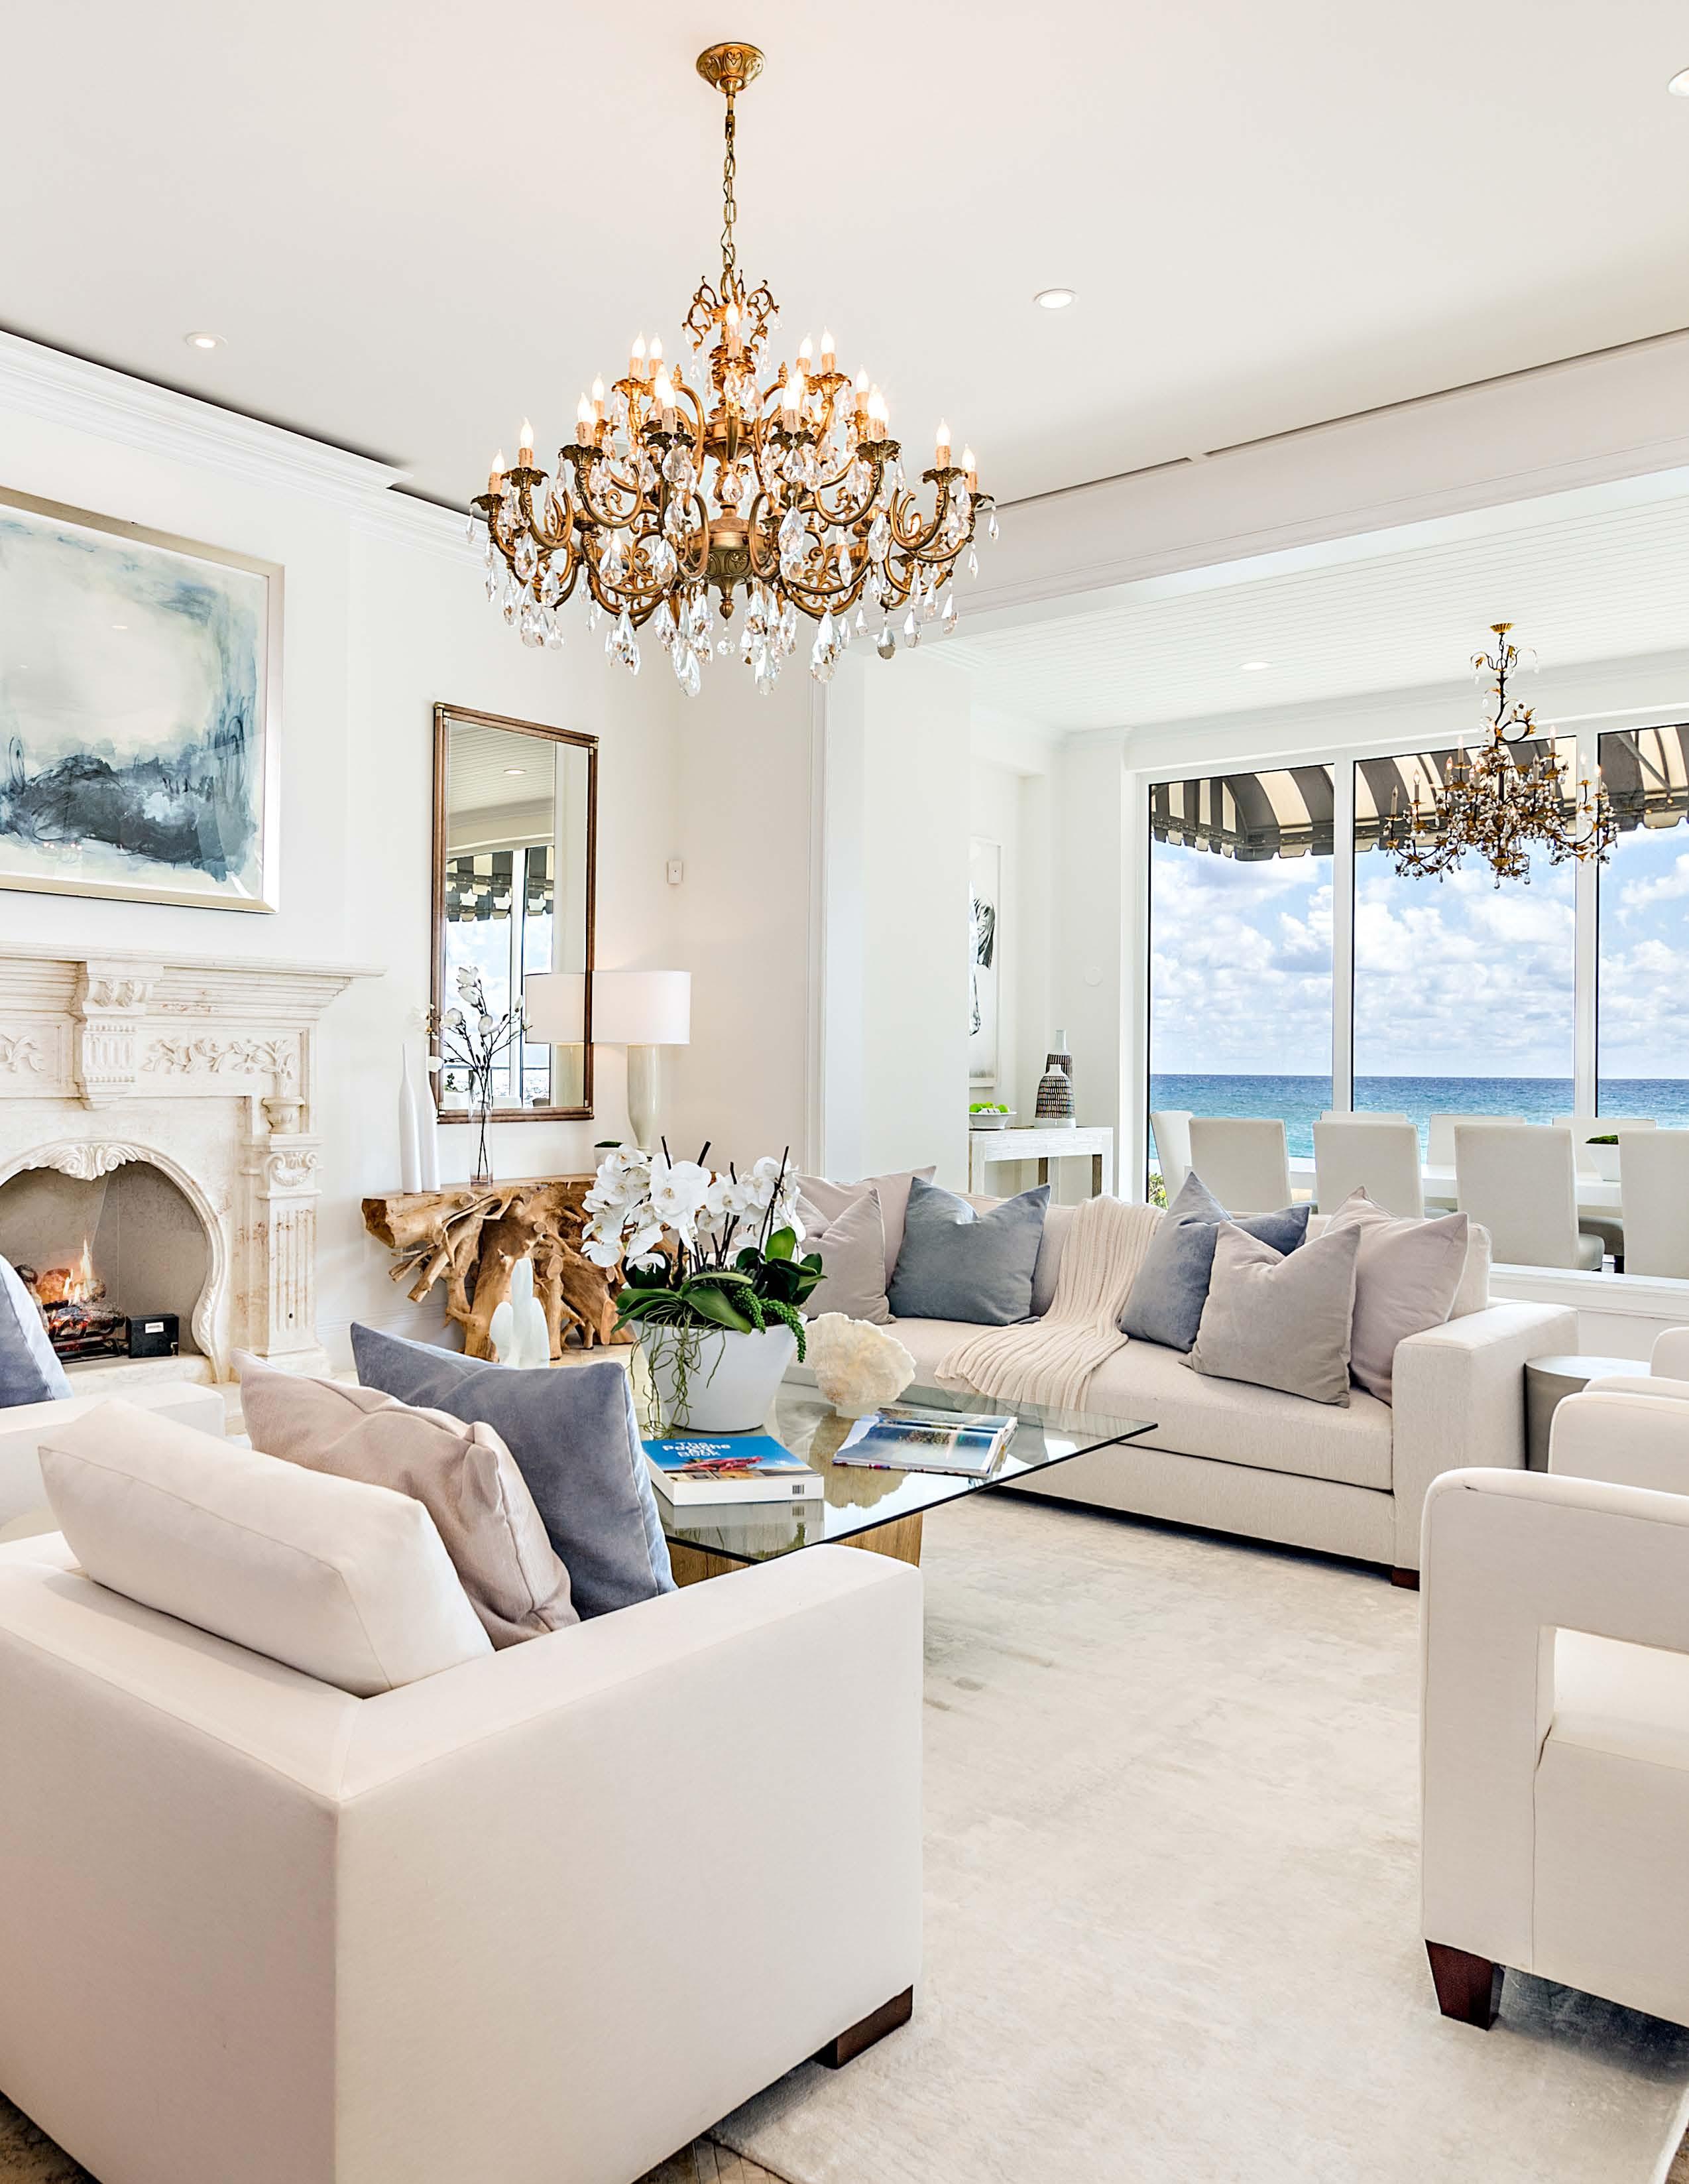
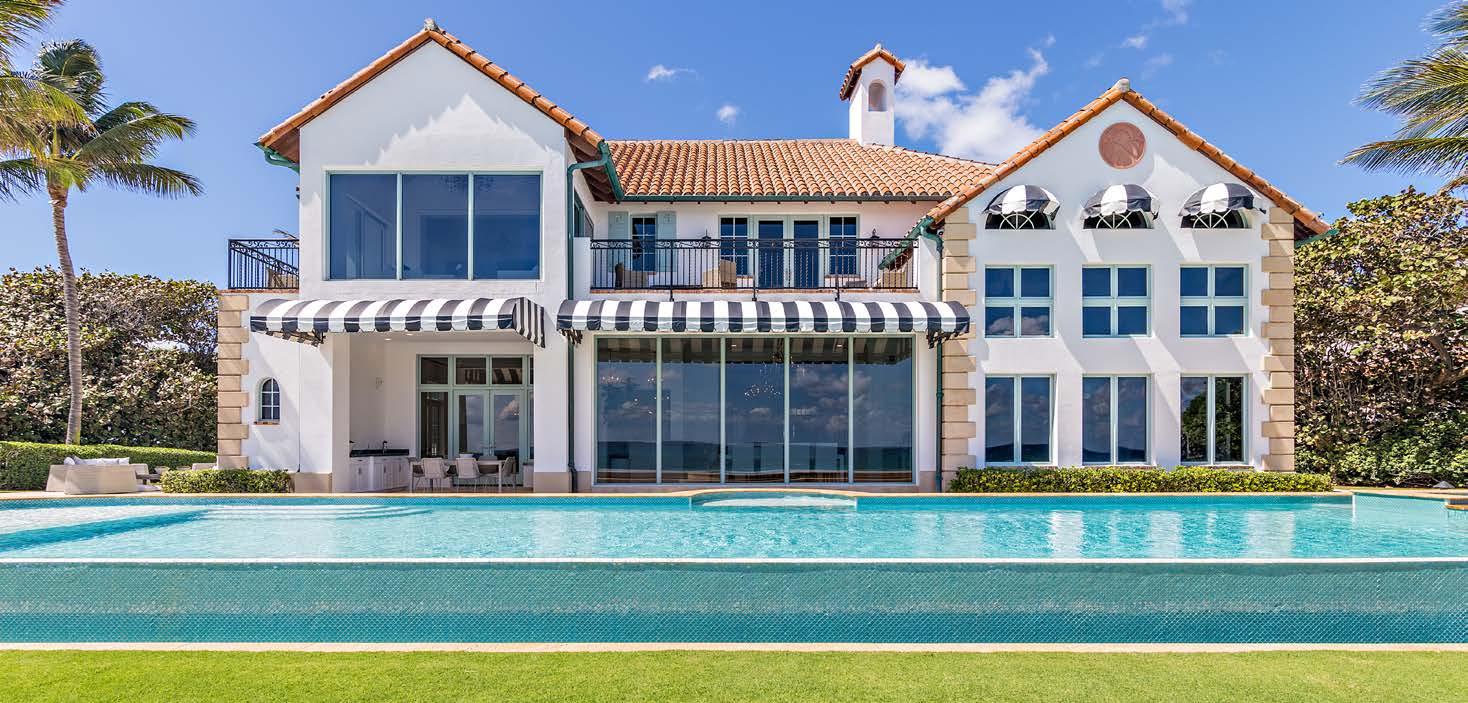
Photographed home: 860 S
Boulevard.
Ocean Listed by Gary Pohrer of Douglas Elliman Palm Beach.
Single
Single
Single


GARY POHRER | GARYPOHRER.COM | 3 CONTENTS
from Gary Pohrer
Family Homes: All Neighborhoods
Letter
Single
Family Homes: North End
Family Homes: In-Town
Family Homes: Estate Section
& Townhomes: All Neighborhoods Featured Insights: Additional Data to Track All Things Real Estate In Closing 3 6 10 12 14 16 20 26 Featured Property 860 S Ocean Boulevard Direct ocean and intracoastal estate with an approximately 150ft of sprawling beach frontage, guest house and tennis court. www.860soceanblvdmanalapan.com
Condos
Over the past 19 years, Gary Pohrer’s record-breaking sales and unwavering work ethic have earned him impressive accolades. Over the past two years Gary has risen to one of the top two agents in Douglas Elliman Agents Nationwide, making him one of the most successful agents in Palm Beach. Palm Beach may be Gary’s niche, but he continues to prove his top-tier experience with record sales throughout Palm Beach County. Including oceanfront residences from Manalapan to Jupiter Island, exclusive homes in top Golf Club communities like Old Palm Golf Club, and oceanfront properties in Seminole Landing. Gary Pohrer has proven his ranking as one of the top agents in the area with sales totaling over $1 Billion since 2020. **
Originally from St. Louis, Missouri, Gary relocated to John’s Island in Vero Beach, Florida, to pursue a career as a professional golfer. When he moved to Jupiter two years later, he found his passion shifting from golf to real estate. An avid player since the age of three, he enjoys getting to know his clients over a round of golf in the area.
In addition to golf, Gary, his wife Kelly, and their two children love biking on the lake trail, tennis at their local club, boating, and paddle boarding. They are also involved in fund-raising for Adopt-A- Family of the Palm Beaches, a charitable organization dedicated to helping homeless families.


Gary and his family have been residents of the Town of Palm Beach since 2008. Because of his personal and professional understanding of the Town, he is keenly aware of the small island’s intricacies, along with the highlights that differentiate one neighborhood from another. Residents often see him jogging through the area as he explores each street. He finds “on the ground” insight to be the most effective research of properties. Multiple times in his career he has found an off-market property for a client while doing his daily routines in Palm Beach and delivered a contract to their door unsolicited.
Many new clients are unaware that Palm Beach is divided into three distinct areas: North End, Midtown, and Estate Section. Some boast larger lots, many enjoy access to the beach, and others include private cabanas. Gary’s approach when working with a client for the first time is to start with a private tour of the island as opposed to just viewing properties.
“I don’t only sell my clients a home, I sell them the Palm Beach lifestyle. I introduce them to their new neighbors, and the local clubs, and make them feel right at home from the start.”


GARY POHRER | GARYPOHRER.COM | 4 *PER DOUGLAS ELLIMAN INTERNAL RECORDS. **AS RECOGNIZED BY THE DOUGLAS ELLIMAN ELLIE AWARDS FROM 2017-2021. *** RANKED IN 2022 INDIVIDUAL BY SALES VOLUME 2022 REALTRENDS + TOM FERRY THE THOUSAND. In Sales Since 2020* $1B+ Douglas Elliman Palm Beach Realtor for Sales Volume From 2017-2021** #1 Ranked Nationwide 2022 REALTrends + Tom Ferry The Thousand*** #15 Years Selling Real Estate in Florida 18
Gary Pohrer Sales Associate Executive Director of Luxury Sales M 561.262.0856 gary.pohrer@elliman.com garypohrer.com
Letter From Gary


If you happened to find yourself on Palm Beach Island this summer, it felt very reminiscent of Palm Beach pre-2020. You could walk in to your favorite restaurant without a reservation, traffic was minimal (with the exception of construction vehicles coming and going), and most of the private clubs returned to their off-season schedules. Local real estate returned to pre-2020 velocity as well. I’m hesitant to use the adjective ‘slow,’ because it was by no means a slow summer with nearly $300M in real estate transactions during Q3. But what we’re seeing is a major slowdown in sheer volume of transactions. In Q3 2022, only 11 single family homes sold on the island — which is even slow for a Q3 in a pre-2020 climate, when there was an average 30 transactions (see chart on page 21).
This represents a very interesting market dynamic where inventory has dried up, yet demand is still extremely high. We continue to see price per square foot (PPSF) creep up on the limited inventory, but there simply are not a lot of quality homes on the market right now. I share this because if you are preparing to sell your home or have considered selling but are getting cold feet due to the uncertain economic climate, it is actually a VERY good time to sell — even given the macro headwinds.
I hope you enjoy the read and as always, please don’t hesitate to reach out with any questions.
Best regards,
Gary Pohrer
Executive Director of Luxury Sales
Douglas Elliman 340 Royal Poinciana Way M302 Palm Beach, FL 33480 O: 561.655.8600 M: 561.262.0856 gary.pohrer@elliman.com garypohrer.com
REPORT CONTRIBUTORS
Elizabeth Vollman Tristan Sales Associate Market Insights Advisor

 Tammy Bernstein Sales Associate
Beth Johnson Sales Associate
Tammy Bernstein Sales Associate
Beth Johnson Sales Associate
SINGLE
HOMES


ALL NEIGHBORHOODS
FAMILY
Q3 Summary: Single Family Homes: All Neighborhoods
Transaction volume was down -66% year-over-year (YOY)* in Q3, largely driven by decline across both waterfront and non-waterfront properties.
Total sales value* was down -71% YOY, driven by a -45% decrease in non-waterfront sales and a -88% decrease in waterfront sales value. Price per square foot (PPSF)* across home size* continued to grow YOY, and was up slightly from the same period last year: +10% PPSF: Home Size. Price per square foot lot size (PPSF: Lot Size) declined YOY for waterfront properties, driven mostly by a single waterfront sale. However, it increased YOY by +11% in the non-waterfront category.
GARY POHRER | GARYPOHRER.COM | 7
YEAR OVER YEAR
% CHANGE
Q3 2021 Q3 2022 TRANSACTIONS WATERFRONT NON-WATERFRONT TOTAL SALES VALUE WATERFRONT NON-WATERFRONT AVERAGE SALES PRICE WATERFRONT NON-WATERFRONT AVERAGE PPSF HOME WATERFRONT NON-WATERFRONT AVERAGE PPSF LOT WATERFRONT NON-WATERFRONT 11 1 10 $178,686,623 $44,880,000 $133,806,623 $16,244,238 $44,880,000 $13,380,662 $3,638 $4,225 $3,476 $738 $567 $821 32 11 21 $614,969,798 $373,430,675 $241,539,123 $19,217,806 $33,948,243 $11,501,863 $3,309 $4,029 $2,593 $808 $861 $737 -66% -91% -52% -71% -88% -45% -15% 32% 16% 10% 5% 34% -9% -34% 11%
family homes stayed on the market for an average of 127 days during Q3 2022. This a YOY improvement of -16% compared to Q3 2021, when homes took an average of 153 days to
GARY POHRER | GARYPOHRER.COM | 8
Active Listings Days
Market Though still below the levels of 2017 to 2019, inventory of single family homes are
up,
average of 32 active listings in Q3 2021 to an average of 41 active listings
Q3 2022. 0% 50 100 150 200 190 130 122 194 137 172 105 31 58 39 40 JAN17 JUL Y17 AP R17 OC T17 JAN18 JUL Y18 AP R18 OC T18 JAN19 JUL Y19 AP R19 OC T19 JAN20 JUL Y20 AP R20 AP R21 OC T20 JAN21 JAN22 JUL Y21 JUL Y22 OC T21 APR -2 2 ACTIVE LISTINGS 0 100 200 600 300 400 500 145 571 73 590 357 322 193 215 138 120 95 108 3 JAN17 JUL Y17 AP R17 OC T17 JAN18 JUL Y18 AP R18 OC T18 JAN19 JUL Y19 AP R19 OC T19 JAN20 JUL Y20 AP R20 AP R21 OC T20 JAN21 JAN22 JUL Y21 JUL Y22 OC T21 APR -2 2 DAYS ON MARKET Single
127 DAYS
Inventory:
On
slowly building
+29% YOY from an
in
sell.
Sale to List Ratio
In Q3 2022, single family homes sold on average -15% below the asking price. This was a large jump down compared to the 90% to 95% sale to list ratio that had been consistent over the last several quarters.
SALE TO LIST RATIO
100
95 93
90
105 85
80
75
70
105 86 78
98 87 76
96 91 MAR -1 7 SEP -1 7 JUN17 DE C17 MAR -1 8 SEP -1 8 JUN18 DE C18 MAR -1 9 SEP -1 9 JUN19 DE C19 MAR -2 0 SE P-2 0 JUN20 JUN21 DE C20 MAR -2 1 MAR -2 2 SE P-2 1 SE P-2 2 DE C21 JUN22
FOOTER: Glossary
79
Year-over-year (YOY ): A method of evaluating two or more measured events, comparing the results of one period with those of a comparable period on an annualized basis.
Total sales value : The sum of all sales during a period of time.
Price per square foot (PPSF): A calculation of the value of each square foot of area of a house, condo or any building. It is calculated by dividing the price by the square footage.
PPSF: Home Size: Home size is based on the current under air square footage.
PPSF: Lot Size: This is based on the PPSF of the total lot.
Sale to List Ratio: The ratio of the final sale price of a home to its list, or asking, price expressed as a percentage. If the sale to list ratio is above 100%, the home sold for more than the list price. If it’s less than 100%, the home sold for less than the list price.
GARY POHRER | GARYPOHRER.COM | 9
*
NORTH END
SINGLE FAMILY HOMES
Palm Beach’s North End, located north of Wells Road, is celebrated for quiet seclusion. Thanks to zoning laws that prohibit condos and commercial properties in this area, many residents enjoy private beachfront views.

Q3
GARY POHRER | GARYPOHRER.COM | 11
Summary: Single Family
$16,225,000 301 Polmer Park 6,365 $2,549 22,939 $707 $16,000,000 261 Nightingale Trail 4,673 $3,424 12,650 $1,265 $14,349,750 152 Dolphin Road 3,846 $3,731 11,025 $1,302 $9,400,000 170 Seagate Road 2,675 $3,514 11,365 $827 $8,375,000 171 El Pueblo Way 2,632 $3,545 9,962 $841 $8,000,000 301 Polmer Park Land Land 14,945 $535 SALE PRICE ADDRESS WATERFRONT? SF HOME SIZE SF LOT SIZE PPSF ($) PPSF ($) APPROX. APPROX. HOME SIZE LOT SIZE Most Recent North End Sales FOOTER: Glossary Quarter-over-quarter (QOQ) : The measure of an investment or a company’s growth from one quarter to the next. % CHANGE YEAR OVER YEAR Q3 2021 Q3 2022 TRANSACTIONS WATERFRONT NON-WATERFRONT TOTAL SALES VALUE WATERFRONT NON-WATERFRONT AVERAGE SALES PRICE WATERFRONT NON-WATERFRONT AVERAGE PPSF HOME WATERFRONT NON-WATERFRONT AVERAGE PPSF LOT WATERFRONT NON-WATERFRONT 5 0 5 $72,349,750 $72,349,750 $14,469,950 $14,469,950 $3,632 $3,632 $873 $873 12 3 9 $201,225,798 $132,510,675 $68,715,123
$3,416 $4,680 $2,246 $898 $1,282 $569 -58% -100% -44% -64% -100% 5% -14% 90% 6% 62% -3% 53%
Homes: North End Transaction volume was down -58% YOY for the third quarter of 2022. This was the first quarter in the last 14 quarters that did not see a waterfront sale on the North End. Total sales value was down -64%, as there were no waterfront transactions. Total sales value was up +5% YOY on non-waterfront properties. PPSF: Home was up +62% in Q3 YOY. Additionally, PPSF: lot increased quarter-over-quarter (QOQ)* +53%.
$16,768,817 $44,170,225 $7,635,014
IN-TOWN
SINGLE FAMILY HOMES
Nestled between Worth Avenue and Wells Road lies the energetic center of Palm Beach Island, In-Town. Packed with shops, secluded beaches, and five-star restaurants, this hub of culture and leisure lures residents with a flair for cosmopolitan life.

\
In-Town transaction volume was down -56% YOY in Q3 2022, the fifth consecutive quarter that saw a decline in transaction volume.
Total sales value was also down -64% YOY at $38M in Q3 2022, compared to $105M in Q3 2021.
In-Town PPSF: Home was up +26% YOY, and PPSF: Lot was up +23%. The area rebounded this quarter QOQ, and we saw a slight uptick of +4% PPSF since Q2 2022. The downward trend we saw for In-Town in Q2 did not hold.
Most

Q3 Summary: Single Family Homes: In-Town
Recent In-Town Sales 62
FOOTER:
Quarter-over-quarter (QOQ) The measure of an investment or a company’s growth from one quarter to the next. NOTE: Reporting in this section does not break out waterfront versus non-waterfront properties, as there are limited waterfront sales in this area. In most years, zero waterfront homes sold. GARY
| GARYPOHRER.COM | 13 $16,000,000 130 Brazilian Avenue 4,955 $3,229 12,841 $1,246 $9,271,300 135 Chilean Avenue 2,611 $3,550 7,100 $1,306 $7,300,000 153 Australian Avenue 2,504 $2,915 10,502 $695 $5,600,000 422 Australian Avenue 1,772 $3,160 6,251 $896 SALE PRICE ADDRESS WATERFRONT? SF HOME SIZE SF LOT SIZE PPSF ($) PPSF ($) APPROX. APPROX. HOME SIZE LOT SIZE TRANSACTIONS TOTAL SALES VALUE AVERAGE SALES PRICE AVERAGE PPSF HOME AVERAGE PPSF LOT 4 $38,171,300 $9,542,825 $3,223 $1,040 9 $104,851,000 $11,650,111 $2,560 $849 -56% -64% -18% 26% 23% % CHANGE YEAR OVER YEAR Q3 2021 Q3 2022
Glossary
POHRER
ESTATE SECTION
SINGLE FAMILY HOMES
The Estate Section comprises all residences south of Worth Avenue to Sloans Curve. It is renowned for its opulent residencies and exclusive social clubs including The Everglades Club, Bath and Tennis Club, and Mar-a-Lago.

Activity in the Estate Section continued to trend downwards significantly, YOY. In Q3 of 2022, transaction volume was down -82% and total sales value was down -78%. This is the third consecutive quarter we saw YOY decline in total sales value.
Q3 saw a weakening PPSF in the Estate section. That being said, we don’t think it’s indicative of a real trend as it only reflects a total of two sales. PPSF: Home was down -5% and PPSF: Lot was down -21% respectively, YOY. PPSF: Home for waterfront sales was up +13% YOY, thus the overall decline was really driven by a single non-waterfront home.
Summary: Single Family Homes: Estate Section Most Recent Estate Section Sales
Q3
GARY POHRER | GARYPOHRER.COM | 15 $44,880,000 2315 S Ocean Boulevard Yes 10,663 $4,224 79,140 $567 $23,285,573 125 Via Del Lago 9,271 $2,511 36,246 $642 SALE PRICE ADDRESS WATERFRONT? SF HOME SIZE SF LOT SIZE PPSF ($) PPSF ($) APPROX. APPROX. HOME SIZE LOT SIZE % CHANGE YEAR OVER YEAR Q3 2021 Q3 2022 TRANSACTIONS WATERFRONT NON-WATERFRONT TOTAL SALES VALUE WATERFRONT NON-WATERFRONT AVERAGE SALES PRICE WATERFRONT NON-WATERFRONT AVERAGE PPSF HOME WATERFRONT NON-WATERFRONT AVERAGE PPSF LOT WATERFRONT NON-WATERFRONT 2 1 1 $68,165,573 $44,880,000 $23,285,573 $34,082,787 $44,880,000 $23,285,573 $3,426 $4,225 $2,512 $591 $567 $642 11 8 3 $308,893,000
$3,146 $747 $729 $816 -82% -88% -67% -78% -81% -66% 21% 49% 3% -5% 13% -20% -21% -22% -21%
$240,920,000 $67,973,000 $28,081,182 $30,115,000 $22,657,667 $3,593 $3,743
CONDOS & TOWN HOMES
ALL NEIGHBORHOODS
Whether you seek a large building with resort-style amenities or the boutique elegance of a small, full-service site, Palm Beach Island offers an expansive range of options just steps from shorelines, shops, restaurants and more. Palm Beach townhomes are ideal for those who seek the convenience of a condo but crave the spaciousness of a house.

Q3 Summary: Condominiums and Townhomes
Transaction volume in Q3 was down -43% YOY, due to a -50% decline in In-Town transactions and a -41% decline in South End transactions.
Total sales value was down -12% YOY. As with single family homes, PPSF for In-Town condos and townhomes continued to rise with +63% YOY growth, coming in at $2,308 PPSF. This was a -6% decline from Q2 2022, which saw a PPSF of $2,445.
In Q3 2022, inventory was up +11% YOY. The same period in 2021 averaged 66 active listings per month, whereas Q3 2022 averaged 73 active listings per month.
GARY POHRER | GARYPOHRER.COM | 17
250
350
250 200 150 100 50 238 236
146 75 80 53 339 JAN17 JUL Y17 AP R17 OC T17 JAN18 JUL Y18 AP R18 OC T18 JAN19 JUL Y19 AP R19 OC T19 JAN20 JUL Y20 AP R20 AP R21 OC T20 JAN21 JAN22 JUL Y21 JUL Y22 OC T21 APR -2 2
Inventory: Active Listings 400
332 333 323 250 74 64
300
276 199
ACTIVE LISTINGS
TRANSACTIONS IN-TOWN SOUTH END TOTAL SALES VALUE IN-TOWN SOUTH END AVERAGE SALES PRICE IN-TOWN SOUTH END AVERAGE PPSF HOME IN-TOWN SOUTH END 86 18 68 $115,475,023 $52,256,000 $63,219,023 $1,342,733 $2,903,111 $929,692 $961 $2,308 $649 152 36 116 $131,109,007 $58,022,060 $73,086,947 $862,559 $1,611,724 $630,060 $632 $1,415 $439 -43% -50% -41% -12% -10% -14% 56% 80% 48% 52% 63% 48% % CHANGE YEAR OVER YEAR Q3 2021 Q3 2022
number of days on market continued to decline in
2022, reaching an average of 114 days. This was a -27% decrease from the same period last year, when properties stayed on the market for an average of 156 days. This was a slight uptick from Q2 2022, when properties averaged 107 days on market.
GARY POHRER | GARYPOHRER.COM | 18 Days on Market 400 173 219 325 232 254 115 84 350 300 250 200 150 100 50 204 175 142 147 148 176 151 365 228 204 209 229 245 305 300 201 185 80 150 91 JUL Y17 AP R17 OC T17 JAN18 JUL Y18 AP R18 OC T18 JAN19 JUL Y19 AP R19 OC T19 JAN20 JUL Y20 AP R20 OC T20 JAN21 JAN22 JUL Y21 JUL Y22 OC T21 AP R21 APR -2 2 DAYS ON MARKET The
114 DAYS Sale to List Ratio* 88 89 85 84 100 95 90 85 80 75 70 90 90 90 91 93 96 97 97 94 96 98 83 87 83 87 88 92 93 93 JUL Y17 AP R17 OC T17 JAN18 JUL Y18 AP R18 OC T18 JAN19 JUL Y19 AP R19 OC T19 JAN20 JUL Y20 AP R20 OC T20 JAN21 JAN22 JUL Y21 JUL Y22 OC T21 AP R21 APR -2 2 SALE TO LIST RATIO The
list
condos
94%
Q3
sale to
ratio for
and townhomes hovered right around 94% for Q3 2022. This has been consistent the past few quarters
Most Recent Condo & Townhome Sales
$15,000,000 100 Royal Palm Way, PH 1 2,870 $5,226 $3,895,000 400 S Ocean Boulevard, 4190 1,716 $2,270 $3,500,000 100 Sunrise Avenue, 424 1,623 $2,157 $3,200,000 44 Cocoanut Row, 308A 1,497 $2,138 $3,150,000 100 Sunrise Avenue, 605 1,673 $1,883 $3,000,000 227 Australian Avenue, 0051 1,287 $2,331 $2,895,000 130 Sunrise Avenue, 6100 1,673 $1,730 $2,825,000 130 Sunrise Avenue, 2150 1,673 $1,689 $2,536,000 225 Everglade Avenue, 0020 1,218 $2,082 $2,500,000 240 S Country Road, 0160 968 $2,583 $2,450,000 455 Australian Avenue, 2B 1,188 $2,062 $1,875,000 325 S Lake Drive, 6 738 $2,541 $1,650,000 44 Cocoanut Row, 207A 900 $1,833 $1,500,000 220 Atlantic Avenue, 0040 646 $2,322 $650,000 455 Worth Avenue, 301 949 $685 $620,000 235 Sunrise Avenue, 1013 557 $1,113 $550,000 235 Sunrise Avenue, MZ B 1,081 $509 $460,000 235 Sunrise Avenue, 2224 389 $1,183
GARY POHRER | GARYPOHRER.COM | 19
SALE PRICE ADDRESS PPSF ($) SF UNIT SIZE APPROX. UNIT SIZE
FEATURED INSIGHTS HOMES
ADDITIONAL DATA TO TRACK ALL THINGS REAL ESTATE
The following is an analysis of supplemental data we evaluate at to keep a pulse on all aspects of the real estate market.

Average 30-Year Fixed Mortgage Rate
Q3 10-Year Transaction Volume Trend
The average 30-year fixed mortgage rate increased in Q3 over Q2 as the Fed continued to raise interest rates. The most recent 30-year fixed mortgage rate sits right at 7%. Source: https://fred.stlouisfed.org/series/MORTGAGE30US
Transaction volume has been trending down YOY for the last several quarters, and became especially dramatic in Q3 of 2022 when we saw a dip of -66% from the previous year. For the first time transaction volume this quarter has gone below what we typically would expect in a third quarter, this quarter averaged 11 transactions, whereas in the decade preceding Covid, a typical Q3 averaged ~30 transactions. The Palm Beach market is in a very unique position where it is still a great time to sell because the continued increase in PPSF (+22% in Q3 2022) reflects high demand.
GARY POHRER | GARYPOHRER.COM | 21
06/1971 06/1974 06/1977 06/1980 06/1983 06/1986 06/1989 06/1992 06/1995 06/1998 06/2001 06/2004 06/2007 06/2010 06/2013 06/2016 06/2019 06/2022 16.00 18.00 14.00 12.00 10.00 8.00 6.00 4.00 2.00 0.00 20.00
INTEREST RATE (%)
20 30 40 50 60 10 0 2013 2014 2021 2015 2016 2017 2018 2019 2022 2020 47 53 33 32 39 21 25 25 18 11 9 10-YEAR TRANSACTION VOLUME TREND
share of listings with a price cut refers to the number of unique properties with a list price at the end of the month that’s less than the list price at the beginning of the month, divided by the number of unique properties with an active listing at some point during the month.
Share of listings with a price cut continued to increase with each passing month in Q3. South Florida share of listings with a price cut hit 23% in October, and the national rate sat right at 28%. Both are record highs.
GARY POHRER | GARYPOHRER.COM | 22
Listings
01/2018 03/2018 03/2018 07/201801/2019 03/201905/2019 07/2019 01/202003/202005/202007/202001/2021
10% 15% 20% 25% 5% 0% US
% OF LISTINGS WITH A PRICE DECREASE
Source: Zillow Data Center. 860 S Ocean Boulevard | Manalapan | $45,000,000 | 860soceanblvdmanalapan.com
Share of
with a Price Cut 100 DAYS
03/202105/202107/202101/202203/202205/202207/202209/2022
South Florida
The
United States New Home Sales
A sale of a new house occurs with the signing of a sales contract or the acceptance of a deposit. The house can be in any stage of construction: not yet started, under construction, or already completed. New home sales account for about 10 percent of the U.S. housing market. 201 Sunset Road | West Palm Beach | $11,000,000 | www.201sunsetroad.com

POHRER Virtually Rendered
700 800 900 1000 1100 600 500 2018 2019 2020 2021 2022 NEW HOME SALES Source: US Census Data. GARY
New home sales in the United States fell -10.9% to a seasonally adjusted annualized rate of 603K in September of 2022. Housing demand in the U.S. has fallen sharply as the Federal Reserve aggressively raises interest rates to combat the surge in inflation. Sales fell in the South (-20.2% to 356K) and the West (-0.7% to 135K) but rose in the Northeast (+56% to 39K) and the Midwest (+4.3% to 73K). | GARYPOHRER.COM | 23
Construction spending refers to monthly estimates of the total dollar value of construction work done on new structures or improvements to existing structures for private and public sectors in the United States.

Construction spending in the U.S. unexpectedly increased +0.2% month-over-month in September of 2022, rebounding from a downwardly revised 0.6% fall in August and beating market forecasts of a -0.5% drop. Spending on private construction went up +0.4%, led by a +1% surge in investment in nonresidential structures, namely for manufacturing (+7.6%) and office (+0.1%) sites. Investment in residential construction was unchanged, with spending on single-family projects dropping -2.6% while outlays on multi-family housing projects increased +0.3%.
NO V 2021 DE C 2021 JAN 2022 FEB 2022 MAR 2022 AP R 2022 MA Y 2022 JUN 2022 JUL 2022 A UG 202 2 SEP 202 2 .5 1 2 3 2.5 1.5 -.5 -1 0 1.3 1.5 -0.6 0.9 1 2.7 0.7 0.7 0.6 0.8 0.2 US CONSTRUCTION SPENDING +/-
United States New Construction Spending
GARY POHRER | GARYPOHRER.COM | 24 254 N County Road | Palm Beach | $7,950,000 | 254ncountyroad.com
Source: US Census Data.
Housing Starts
Housing starts refer to the number of new residential construction projects that begin during any particular month. Estimates of housing starts include units in structures being totally rebuilt on an existing foundation. Source: US Census Data.

Housing starts in the U.S. declined -4.2% month-over-month to a seasonally adjusted annualized rate of 1.425M in October of 2022. Single-family housing starts dropped -6.1% to a rate of 855K while the rate for units in buildings with five units or more decreased -0.5% to 556K. Starts were down in the Northeast (-34.7% to 96K), the Midwest (-11.1% to 185K); and the West (-10.6% to 336K) while starts went up in the South (+6.7% to 808K). Compared to October 2021, housing starts fell -8.8%. The U.S. housing market has been hit by soaring materials costs and rising mortgage rates, which recently reached their highest level since 2001.
| 25
GARY
POHRER | GARYPOHRER.COM
US NEW HOME STATS 1200 1400 1600 1800 2000 1000 800 2014 2016 2018 2020 2022
| 25 209 List Road | Palm Beach | $6,950,000 | www.209listroad.com
GARY
POHRER | GARYPOHRER.COM
In Closing
We appreciate you taking the time to read our report, and hope you found our insights on the Palm Beach Island market interesting.
The biggest takeaway for me this quarter is that PPSF continues to grow YOY, and is inching up QOQ. This shows that buyers still see the value of owning real estate on Palm Beach Island even amid the uncertainty around the global economy. Additionally, transaction volume is lower than it’s ever been due to limited supply — therefore, it continues to be a sellers market right now on Palm Beach. If you are considering selling your property, don’t hesitate to reach out as I’d welcome the opportunity to help you achieve your real estate goals.
Thank you again for reading our report. If you have any feedback for us, we’d love to have it, as we are always looking for new ways to break down the data in more interesting or accessible ways.
Warmest wishes,
Gary Pohrer
Executive Director of Luxury Sales
Douglas Elliman
340 Royal Poinciana Way M302 Palm Beach, FL 33480 O: 561.655.8600 M: 561.262.0856 gary.pohrer@elliman.com garypohrer.com
Source: Above data is pulled from Palm Beach MLS, The Beaches MLS and the Palm Beach Property Appraisers (PAPA). Specifically, we are only looking at transactions located in the 33480 zip code.
340 ROYAL POINCIANA WAY, M302, PALM BEACH, FL 33480. 561.655.8600 © 2022 DOUGLAS ELLIMAN REAL ESTATE. ALL MATERIAL PRESENTED HEREIN IS INTENDED FOR INFORMATION PURPOSES ONLY. WHILE, THIS INFORMATION IS BELIEVED TO BE CORRECT, IT IS REPRESENTED SUBJECT TO ERRORS, OMISSIONS, CHANGES OR WITHDRAWAL WITHOUT NOTICE. ALL PROPERTY INFORMATION, INCLUDING, BUT NOT LIMITED TO SQUARE FOOTAGE, ROOM COUNT, NUMBER OF BEDROOMS AND THE SCHOOL DISTRICT IN PROPERTY LISTINGS SHOULD BE VERIFIED BY YOUR OWN ATTORNEY, ARCHITECT OR ZONING EXPERT. EQUAL HOUSING OPPORTUNITY.
GARY POHRER | GARYPOHRER.COM | 26

