
11 minute read
Jacksonville............................................................................................55


Short Term Outlook for Jacksonville, FL December 2021 Forecast
2021:Q4 2022:Q1 2022:Q2 2022:Q3 2022:Q4 2023:Q1 2023:Q2 2023:Q3 2023:Q4 2024:Q1 2024:Q2 2024:Q1 2024:Q2
Personal Income (Billions $)
Total Personal Income 92.8 93.5 94.6 95.7 96.6 97.5 98.5 99.8 101.0 102.4 103.7 105.0 106.3
Pct Chg Year Ago Wages and Salaries
5.2 -5.0 1.7 3.2 4.1 4.3 4.2 4.2 4.6 5.1 5.3 5.3 5.2 49.4 50.4 51.1 51.7 52.1 52.6 53.1 53.6 54.2 54.9 55.6 56.3 57.0 Nonwage Income 43.4 43.1 43.5 44.1 44.5 44.9 45.4 46.1 46.8 47.5 48.1 48.7 49.3 Real Personal Income (12$) 83.8 84.1 84.7 85.3 85.7 86.1 86.7 87.4 88.0 88.8 89.5 90.1 90.7 Pct Chg Year Ago 0.5 -8.7 -1.3 0.9 2.2 2.4 2.3 2.4 2.7 3.1 3.2 3.1 3.1 Per Capita Income (Ths) 56.2 56.4 56.8 57.2 57.3 57.6 58.0 58.5 59.0 59.6 60.2 60.7 61.3 Real Per Capita Income (12$) 50.8 50.7 50.9 50.9 50.9 50.9 51.0 51.2 51.4 51.7 51.9 52.1 52.3 Average Annual Wage (Ths) 65.0 65.6 66.0 66.3 66.6 67.0 67.3 67.7 68.2 68.8 69.4 70.0 70.7 Pct Chg Year Ago 3.2 3.1 2.5 2.5 2.5 2.1 2.0 2.1 2.4 2.7 3.0 3.4 3.6
Establishment Employment (Place of Work, Thousands, SA)
Total Employment 743.6 751.2 757.3 761.9 765.4 768.8 772.5 775.6 779.1 782.7 786.0 788.6 790.7 Pct Chg Year Ago 4.1 5.1 4.9 4.0 2.9 2.3 2.0 1.8 1.8 1.8 1.8 1.7 1.5 Manufacturing 33.0 32.9 32.9 32.7 32.8 32.8 32.8 32.7 32.6 32.5 32.4 32.3 32.2 Pct Chg Year Ago 1.3 1.7 3.0 0.1 -0.6 -0.5 -0.5 -0.1 -0.6 -0.8 -1.0 -1.0 -1.1 Nonmanufacturing 710.6 718.3 724.3 729.2 732.6 736.1 739.7 743.0 746.5 750.2 753.6 756.3 758.5 Pct Chg Year Ago 4.2 5.2 5.0 4.2 3.1 2.5 2.1 1.9 1.9 1.9 1.9 1.8 1.6 Construction & Mining 48.7 48.3 47.8 47.6 47.3 47.0 46.9 46.8 46.7 46.6 46.6 46.6 46.7 Pct Chg Year Ago 1.9 4.1 0.5 -3.0 -2.8 -2.7 -2.0 -1.6 -1.4 -0.8 -0.5 -0.3 0.0 Trade, Trans, & Utilities 162.7 162.8 163.1 164.7 163.6 163.8 166.0 165.8 166.4 166.0 164.6 164.4 164.2 Pct Chg Year Ago 4.6 4.1 4.1 3.3 0.6 0.6 1.7 0.7 1.7 1.4 -0.9 -0.9 -1.3 Wholesale Trade 27.8 28.2 28.7 29.8 30.1 30.5 30.6 30.8 31.0 31.4 31.9 32.2 32.5 Retail Trade 81.2 79.8 78.7 77.4 75.6 74.9 77.0 76.7 76.7 75.4 72.7 72.0 71.2 Trans, Wrhsng, & Util 53.6 54.8 55.8 57.5 57.9 58.5 58.4 58.3 58.6 59.2 59.9 60.2 60.5 Information 9.2 9.2 9.4 9.5 9.4 9.4 9.5 9.5 9.6 9.8 9.9 9.9 9.9 Pct Chg Year Ago 2.5 4.0 7.0 3.3 1.5 1.6 1.4 0.6 3.0 3.9 3.8 3.7 2.3 Financial Activities 72.7 74.1 75.8 77.3 77.2 77.2 76.5 76.2 76.4 77.0 77.7 78.2 78.6 Pct Chg Year Ago 3.9 5.1 7.7 7.2 6.2 4.1 0.8 -1.4 -1.1 -0.2 1.6 2.6 2.9 Prof & Business Services 110.6 116.6 118.0 117.6 118.6 119.9 119.9 120.6 121.8 123.6 125.6 126.7 127.7 Pct Chg Year Ago -0.6 5.6 6.9 6.5 7.1 2.8 1.6 2.5 2.8 3.1 4.7 5.1 4.8 Educ & Health Services 116.8 117.1 120.5 121.0 120.2 120.6 120.1 120.3 120.5 121.4 122.1 122.7 122.9 Pct Chg Year Ago 4.9 4.3 6.8 4.8 2.9 2.9 -0.3 -0.6 0.3 0.7 1.7 2.0 2.0 Leisure & Hospitality 85.1 84.3 82.5 83.2 87.6 89.2 91.6 94.4 95.3 95.6 96.4 96.8 97.2 Pct Chg Year Ago 16.2 11.9 0.9 2.9 2.9 5.8 10.9 13.5 8.8 7.2 5.3 2.5 2.0 Other Services 26.1 26.6 27.6 28.4 28.6 28.9 28.8 29.0 29.1 29.4 29.8 30.1 30.4 Pct Chg Year Ago 4.7 6.2 7.5 10.1 9.5 8.4 4.6 2.0 1.8 2.0 3.2 3.9 4.2 Federal Government 18.6 18.6 18.7 18.7 18.8 18.8 18.8 18.8 18.8 18.9 18.9 18.9 18.9 Pct Chg Year Ago -4.5 -1.1 1.7 1.4 1.2 0.8 0.5 0.2 0.1 0.5 0.7 0.7 0.6 State & Local Government 60.2 60.5 60.9 61.2 61.4 61.5 61.7 61.7 61.9 62.0 62.1 62.1 62.1 Pct Chg Year Ago 1.8 3.5 6.2 3.7 2.1 1.6 1.3 0.8 0.7 0.8 0.6 0.6 0.3
Other Economic Indicators
Population (Ths) 1650.1 1657.8 1666.0 1675.1 1684.4 1692.3 1699.8 1706.6 1712.9 1718.7 1724.2 1729.7 1735.3 Pct Chg Year Ago 1.6 1.7 1.8 2.0 2.1 2.1 2.0 1.9 1.7 1.6 1.4 1.4 1.3 Labor Force (Ths) 835.0 843.0 849.5 853.5 858.2 863.3 868.5 872.6 875.3 877.0 878.8 880.3 882.3 Pct Chg Year Ago 6.8 5.5 4.2 3.5 2.8 2.4 2.2 2.2 2.0 1.6 1.2 0.9 0.8 Unemployment Rate (%) 5.0 4.7 4.3 4.1 3.9 3.8 3.8 3.8 3.8 3.7 3.7 3.7 3.7 Total Housing Starts 20886.219708.618511.617726.117230.916887.516596.516508.116489.916248.315953.815832.515617.7 Single-Family 16338.615532.714876.814240.513837.313466.813116.212997.512934.012696.512515.812492.012379.3 Multifamily 4547.6 4175.8 3634.9 3485.7 3393.6 3420.7 3480.3 3510.6 3555.9 3551.8 3438.1 3340.5 3238.3
PROFILES
The Lakeland–Winter Haven MSA is comprised only of Polk County. It is located in the westerncenter of the state and is heavily agriculturally based, especially in citrus. Lakeland is the home to Legoland Florida and is also the location of Publix Supermarket headquarters. Each year the Detroit Tigers host spring training at Joker Marchant Stadium. Lakeland is also home to Florida Polytechnic University, the newest member of the State University System.
QUICK FACTS
• Metro population estimate of 724,777 as of 2019 (5-Year Estimate) (U.S. Census Bureau). • Polk County population estimate of 724,777 as of 2019 (5-Year Estimate) (U.S. Census Bureau). • Civilian labor force of 330,412 in August 2021 (Florida Research and Economic Database). • An unemployment rate of 5.6% as of August 2021, not seasonally adjusted. This amounts to 18,659 unemployed people (Florida Research and
Economic Database).
OUTLOOK SUMMARIES
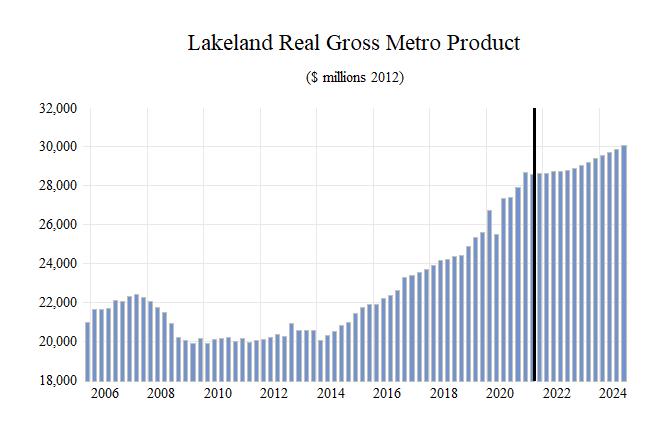
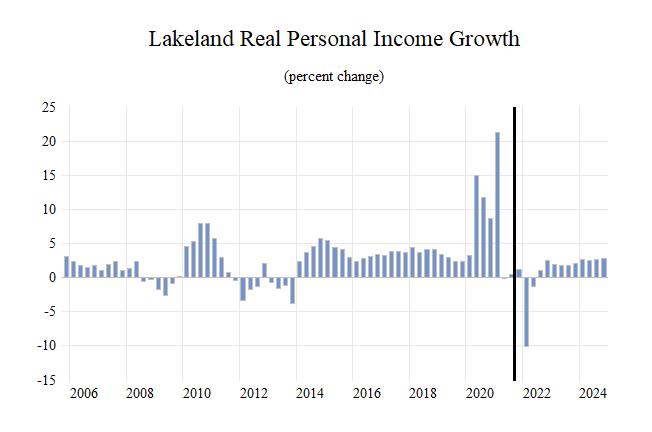
The studied economic indicators are predicted to show mixed levels of growth in the Lakeland Metropolitan Statistical Area (MSA). Gross Metro Product for the MSA will come in at $29,024.79 million. The MSA will experience average personal income growth of 3.8 percent, but per capita income will be the lowest in the state at $38,500. The average annual wage will grow at an annual rate of 3.4 percent to $57,000. Lakeland’s population will grow at an annual rate of 2.0 percent.
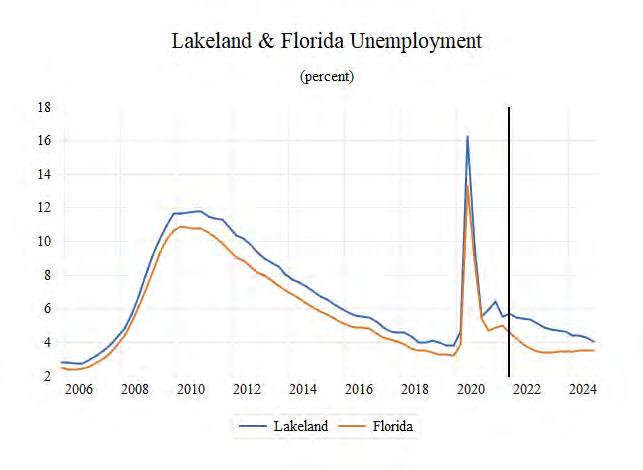
Employment growth is expected to average 2.1 percent, but Lakeland will experience a slightly high unemployment rate at 5.1 percent, compared to the other MSA’s.
Leisure sector will lead the MSA in average annual growth at 7.2 percent. Other Services sector will follow at 5.8 percent. The Information sector will see growth at 4.8% and the Federal Government sector, and the Construction & Mining sector will see respective contractions in growth of -1.4 percent, and -0.8 percent.
METRO NEWS SUMMARIES
765 renters in Polk County could lose homes as federal eviction moratorium ends
• It is anticipated that when the federal moratorium on evictions comes to an end this week, 765 renters in Polk County could lose their homes. • However, Polk County has $22 million in federal funding that could assist these people, but they have to apply for it. • Out of the 765 eviction cases, 334 of the tenants mentioned that COVId-19 is why they are behind on their rental payments. Source: The Ledger, July 2, 2021
Lakeland City Commission to consider issuing $60M bonds for capital projects
• The Lakeland City Commission is set to vote on whether or not they should issue $60 million in bonds that will help cover the costs of debt while also having funds for new capital improvement. • About $13 million of the money acquired through bonds would be used to finance capital improvement projects for Lakeland. • This includes $3.5 million, which would be used to purchase a vacant 106-acre plot of land that would be used as a recreational field and park. Source: The Ledger, July 28, 2021
‘A little too hot’? Lakeland, most overpriced Florida market, has one of the worst housing shortages
• According to a study by professors from the Florida Atlantic University and Florida
International University found that the most overpriced housing market in Florida is in
Lakeland. • A press release for the study said, “As of July 31, homes in Lakeland were selling for 31.39 percent above their long-term pricing trend.” • This is compared to the least overpriced markets of the nine analyzed, which was Miami-Fort
Lauderdale, which had a premium of 12.91%. Source: The Ledger, August 17, 2021
Lakeland Linder International Airport seeks to serve up new restaurant
• Even though it has been over two years since the
Lakeland airport had a restaurant, that is about to change. • While it has not been revealed which restaurants are interested, the airport director, Gene Conrad, said that two companies have expressed interest in having a full-service restaurant in the airport.
• Conrad also mentioned that the restaurant will probably have its rent waived for the first year to help it get established and be successful in the future. Source: The Ledger, August 30, 2021
Lakeland auto dealership acquired by West Palm Beach group
• Myers Auto Group, LLC acquired Cannon
Automotive Group, which will be renamed as
Subaru Lakeland. • While the cost of the acquisition has not been disclosed, the principal dealer Stephen Myers Jr. said that “the transition has gone very smoothly.” • Danny Cannon one of the previous owners of
Cannon Automotive Group said, “The years leading up to Covid were out best years,” which was one of the reasons for selling the business alongside with nearing retirement age. Source: The Ledger, September 3, 2021
Construction set to start on new Culver’s in north Lakeland
• Construction on the soon to be 4,600-squarefoot Culver’s is planning to start next week after approval of a building permit. • Culver’s will feature dual-lanes at the drive-thru, which is something not many other stores have in
Florida. • This will constitute the third Culver’s in Polk
County. Source: The Ledger, September 9, 2021
Lakeland -Winter Haven MSA Industry Loca�on Quo�ents
Total Nonagricultural Employment
Total Private
Goods Producing
Service Producing
Private Service Providing
Mining, Logging, and Construc�on
Manufacturing
Trade, Transporta�on, and U�li�es
Wholesale Trade
Retail Trade
Transporta�on, Warehousing and U�li�es
Informa�on
Financial Ac�vi�es
Professional and Business Services
Educa�onal and Health Services
Leisure and Hospitality
Other Services
Government
0 0.5 1 1.5 2 2.5 3
Long Term Outlook for Lakeland-Winter Haven, FL December 2021 Forecast
2016 2017 2018 2019 2020 2021 2022 2023 2024
Personal Income (Billions $)
Total Personal Income Pct Chg Year Ago Wages and Salaries Nonwage Income Real Personal Income (12$) Pct Chg Year Ago Per Capita Income (Ths) Real Per Capita Income (12$) Average Annual Wage (Ths) Pct Chg Year Ago 22.5 24.2 25.5 27.0 29.6 32.1 31.8 32.9 34.4 2.6 7.4 5.5 5.8 9.8 8.3 -0.8 3.6 4.3 9.6 10.2 10.8 11.5 12.4 13.6 14.3 14.8 15.3 12.9 14.0 14.7 15.5 17.2 18.4 17.5 18.2 19.0 23.3 24.7 25.5 26.5 28.8 30.1 29.0 29.5 30.2 1.5 5.8 3.3 3.8 8.6 4.6 -3.5 1.8 2.2 34.2 35.8 36.7 37.9 40.4 42.8 41.6 42.3 43.3 35.5 36.6 36.7 37.2 39.3 40.1 37.9 37.9 38.1 44.4 45.9 47.1 48.5 51.8 55.1 56.4 57.4 59.2 1.5 3.2 2.6 3.1 6.8 6.4 2.3 1.9 3.1
Establishment Employment (Place of Work, Thousands, SA)
Total Employment 215.6 221.0 227.9 235.7 237.5 245.7 251.8 256.2 257.8 Pct Chg Year Ago 3.6 2.5 3.1 3.4 0.8 3.5 2.5 1.7 0.7
Manufacturing Pct Chg Year Ago Nonmanufacturing Pct Chg Year Ago Construction & Mining Pct Chg Year Ago Trade, Trans, & Utilities Pct Chg Year Ago
17.1 17.1 17.6 18.0 17.9 18.0 18.3 18.4 18.3 2.8 0.4 3.0 2.0 -0.8 0.8 1.7 0.4 -0.7 198.5 203.9 210.3 217.7 219.6 227.7 233.5 237.8 239.6 3.7 2.7 3.1 3.5 0.9 3.7 2.5 1.8 0.8 12.7 13.1 13.7 14.3 15.0 15.6 15.4 15.0 14.5 4.6 3.2 4.6 4.6 4.6 4.0 -0.8 -3.1 -3.1 54.6 56.8 58.2 61.3 65.4 68.8 68.8 69.0 67.8 5.1 4.0 2.4 5.3 6.8 5.1 0.0 0.4 -1.8
Wholesale Trade Retail Trade Trans, Wrhsng, & Util Information Pct Chg Year Ago 10.1 10.4 10.6 11.2 11.2 11.3 11.9 12.4 13.3 27.1 28.0 28.6 29.3 31.0 32.8 30.8 29.9 27.4 17.4 18.5 19.0 20.8 23.2 24.6 26.1 26.7 27.1 1.8 1.9 1.9 1.9 1.8 1.9 2.0 2.1 2.2 6.5 9.0 1.8 -0.4 -6.5 5.5 4.5 4.1 4.9
Financial Activities Pct Chg Year Ago Prof & Business Services Pct Chg Year Ago Educ & Health Services Pct Chg Year Ago Leisure & Hospitality Pct Chg Year Ago Other Services Pct Chg Year Ago Federal Government Pct Chg Year Ago State & Local Government Pct Chg Year Ago 12.4 12.2 12.5 13.3 14.1 14.3 15.0 15.5 15.8 1.7 -1.3 2.8 5.8 6.4 1.3 4.8 3.2 2.0 28.6 29.9 31.3 32.5 32.6 34.1 35.7 35.9 36.6 4.0 4.6 4.5 3.8 0.5 4.6 4.7 0.6 1.9 31.5 32.4 33.7 34.5 34.7 35.8 36.5 36.3 37.3 1.4 2.8 4.1 2.4 0.4 3.2 2.0 -0.7 2.6 23.0 23.6 24.1 24.6 21.1 22.7 23.9 26.8 27.8 4.3 2.3 2.4 2.1 -14.5 7.5 5.5 12.3 3.5 5.8 5.9 6.3 6.6 6.2 6.5 7.3 7.6 7.8 2.6 1.0 6.5 5.4 -5.8 4.3 11.5 4.1 3.4 1.1 1.1 1.2 1.2 1.4 1.2 1.3 1.3 1.3 2.3 0.8 8.4 2.1 13.7 -11.0 3.5 2.6 -0.6 27.0 27.0 27.3 27.4 27.3 26.8 27.6 28.3 28.6 3.2 0.0 1.3 0.3 -0.2 -1.7 3.0 2.3 1.0
Other Economic Indicators
Population (Ths) Pct Chg Year Ago Labor Force (Ths) Pct Chg Year Ago Unemployment Rate (%) Total Housing Starts Single-Family Multifamily
657.9 675.8 694.6 711.9 732.1 749.4 764.4 779.3 792.6 2.5 2.7 2.8 2.5 2.8 2.4 2.0 2.0 1.7 287.9 293.1 298.6 306.6 316.5 326.2 335.2 334.5 330.4 2.4 1.8 1.9 2.7 3.2 3.1 2.8 -0.2 -1.2 5.6 4.8 4.2 3.9 9.1 5.9 5.4 4.7 4.3 4354.1 4581.4 5061.7 8067.7 9404.9 11201.4 7971.6 6272.6 5892.2 3514.9 4536.7 5061.7 6542.6 7154.7 9128.8 6727.9 5286.4 4886.0 839.1 44.8 0.0 1525.0 2250.2 2072.5 1243.7 986.2 1006.2


