Florida & Metro FORECAST


2022-2025 SUMMER 2022
About University of Central Florida (UCF)
The University of Central Florida is a public, multi-campus, metropolitan research university, dedicated to serving its surrounding communities with their diverse and expanding populations, technological corridors, and international partners. The mission of the university is to offer highquality undergraduate and graduate education, student development, and continuing education; to conduct research and creative activities; to provide services that enhance the intellectual, cultural, environmental, and economic development of the metropolitan region; to address national and international issues in key areas; to establish UCF as a major presence; and to contribute to the global community.
About the College of Business
The College of Business advances the university’s mission and goal in providing intellectual leadership through research, teaching, and service. The college is striving to enhance graduate programs, while maintaining the strong undergraduate base. The college delivers research and quality business education programs at the undergraduate, masters, doctoral, and executive levels to citizens of the state of Florida and to select clientele nationally and internationally.
We would like to recognize the following organizations for their support of the Institute for Economic Forecasting:

FLORIDA & METRO FORECAST 2022 - 2025
Published quarterly by the Institute for Economic Forecasting, College of Business, University of Central Florida
Copyright © 2022 Institute for Economic Forecasting. All rights reserved.
Publications of the Institute for Economic Forecasting are made possible by the following staff:
Dr. Sean Snaith, Director
Evan Aldrich, Researcher
Nefertari Elshiekh, Researcher
Al-Sadh Imadh, Researcher
Jacob Nair, Researcher
Benjamin Snider, Researcher
Andrew Tritch, Researcher
Jennifer Wharry, Researcher
This forecast was prepared based upon assumptions reflecting the Institute for Economic Forecasting judgments as of the date it bears. Actual results could vary materially from the forecast. Neither the Institute for Economic Forecasting nor the University of Central Florida shall be held responsible as a consequence of any such variance. Unless approved by the Institute for Economic Forecasting, the publication or distribution of this forecast and the preparation, publication or distribution of any excerpts from this forecast are prohibited.
4 Florida & Metro Forecast / Summer 2022
TABLE OF CONTENTS
Florida Highlights and Summary
Florida Forecast Tables
Florida Forecast Charts
Florida News
Cape Coral–Fort Myers 29 – 33
Crestview–Ft. Walton Beach–Destin
Deltona–Daytona Beach–Ormond Beach
Fort Lauderdale-Pompano Beach-Sunrise
Gainesville
Homosassa Springs
Jacksonville
Lakeland–Winter Haven
Miami–Fort Lauderdale–West Palm Beach
– 38
– 43
– 48
– 53
58
63
– 68
– 73
Miami-Miami Beach-Kendall 74 – 78
Naples–Immokalee–Marco Island 79 – 83
North Port–Sarasota–Bradenton 84 – 88 Ocala 89 – 93
Orlando–Kissimmee–Sanford 94 – 98 Palm Bay–Melbourne–Titusville
Panama City
Pensacola–Ferry Pass–Brent
99 – 103
– 108
– 113
Port St. Lucie 114 – 118
Punta Gorda 119 – 123
Sebastian–Vero Beach
Sebring
– 128
– 133
Tallahassee 134 – 138
Tampa–St. Petersburg–Clearwater
The Villages
West Palm Beach-Boca Raton-Boynton Beach
Industry Location Quotient
143
Institute for Economic Forecasting 5
5 – 17
..................................................................... 18 – 23
................................................................... 24 – 27
Summaries................................................................. 27 – 28
34
39
44
49
............................................................................ 54 –
............................................................................................ 59 –
.................................................................. 64
69
..................................................
...................................................................................... 104
109
124
129
.......................................... 139 –
........................................................................................ 144 – 148
149 – 153
154
•
HIGHLIGHTS OF THE SUMMER 2022 FLORIDA FORECAST
The impact of the Pasta Bowl Recession in Florida will continue to slowly manifest as 2022 gives way to 2023. There will not be large payroll job losses or very high unemployment rates, but this mild recession will impact the labor market.
• Hurricane Ian will not have an outsized impact on the state economy, but the local impacts are substantial. This forecast was produced prior to the hurricane and does not reflect the impact of Ian; however, we have reprinted our analysis of Hurricane Irma from 2017. The magnitudes may differ, but the pattern of that hurricane’s economic impact and recovery will be like those of Irma.
• From 2022-2025, Florida’s economy, as measured by Real Gross State Product, will expand at an average annual rate of just 1.0%. Real Gross State Product will mildly contract during the recession as growth will slow to -0.2% in 2023, turn positive in 2024, and growth begins to accelerate in 2025 to 1.7%.
• Payroll job growth in Florida will begin to falter during the recession but not in every sector. After year-over-year growth of -4.9% in 2020, the labor market rebounded to 4.6% in 2021. With job growth expected to be 4.3% in 2022, payroll employment will contract by 0.6% in 2023 and again by 1.5% in 2024 before expanding by 0.6% in 2025.
• Labor force growth in Florida will average 1.6% from 2022-2025. After growing 2.7% in 2022, Florida’s labor force growth will decelerate because of the recession over 20232025.
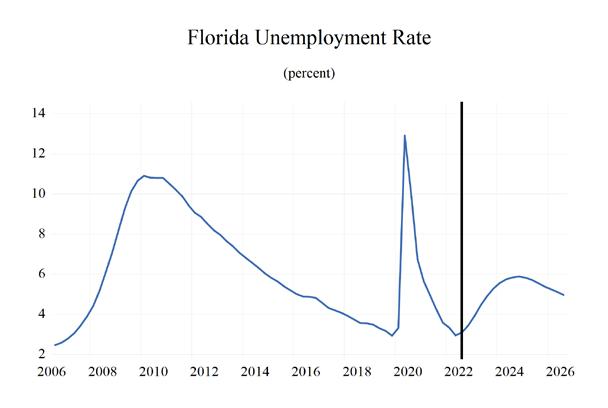
• The unemployment rate jumped from 3.3% in 2019 to 7.9% in 2020, fell to 4.8% in 2021, and will fall to 3.6% in 2022. The recession will push up the rate to 4.7% in 2023 and to 5.8%, before easing slightly to 5.6% in 2025.
•
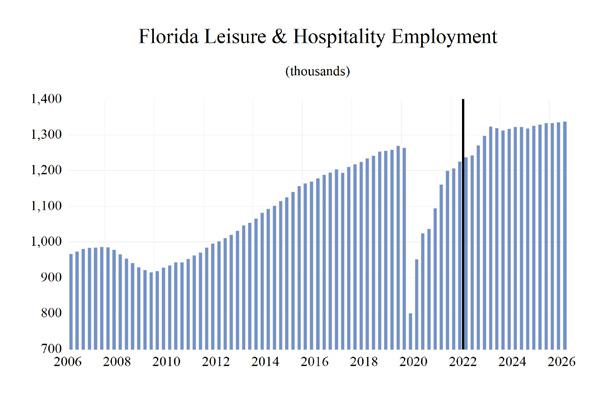
The sectors expected to have the strongest average job growth during 2022-2025 are Leisure & Hospitality (7.0%), Financial Services (3.0%), Education & Health Services (2.5%), Information (1.6%), and Trade, Transportation & Utilities (1.5%).
• Housing starts will be suppressed by the Pasta Bowl Recession and higher mortgage rates. The total starts of 156,561 in 2020 jumped to 190,167 in 2021 and will rise to 195,417 in 2022 before the recession leads to a deceleration in starts to 154,459 in 2023 and 150,974 in 2024 before ticking up to 154,790 in 2025. Rapid house price appreciation will vanish over this period as supply catches up with demand dampened by rising mortgage rates, decreasing affordability, and the recession.
• Real personal income growth will average 1.0% during 2022-2025. Following a pullback in 2022, growth will average 2.0% through the end of 2025 hitting 3.2% that year. Florida’s average growth will be 0.1 percentage points higher than the national rate over that four-year span.
6 Florida & Metro Forecast / Summer 2022
This Florida & Metro Forecast was prepared prior to the impact of Hurricane Ian. Thus, the outlook does not reflect the impacts of the storm, which at a state level may not turn out to be as significant as they will be, at least in the near term, for the metropolitan areas that bore the brunt of the storm’s impact.
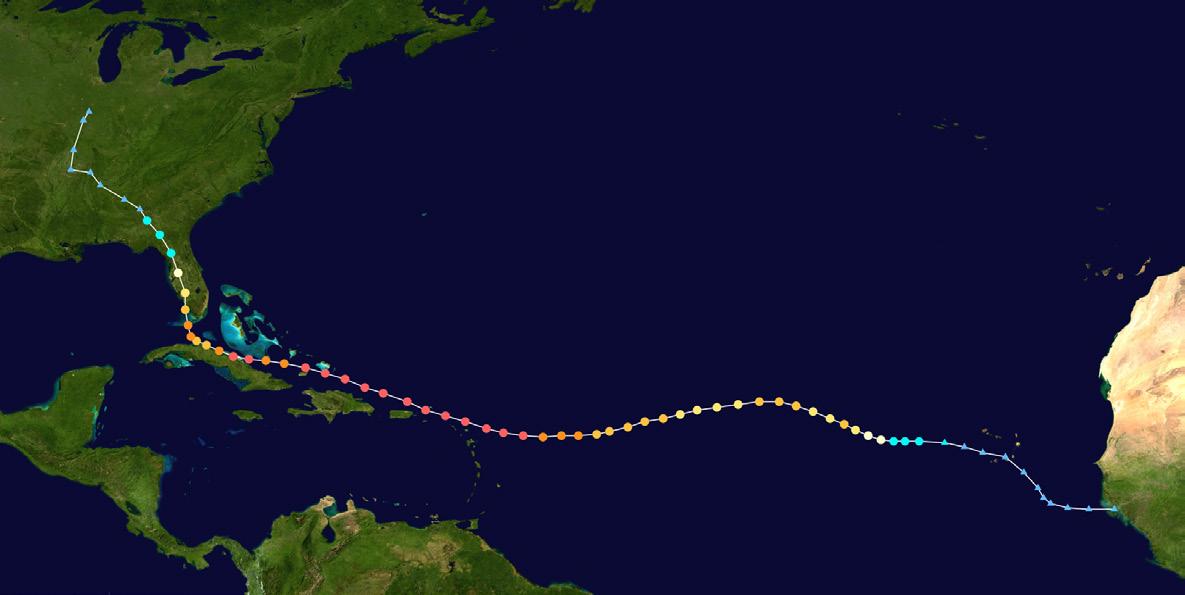
This is of course not the first time a hurricane has impacted the state, nor will it be the last time. In the Fall of 2017, Hurricane Irma traveled the entire length of the state and in the wake of its landfall, we discussed the impact of that hurricane and looked at the historical impacts of hurricanes on the state in the October 2017 release of the Florida & Metro Forecast. 3
An excerpt from that forecast is reprinted below:
HURRICANE IRMA
Hurricane Irma hit the Florida Keys on September 10 th as a Category 4 storm. Its impact on the archipelago was devastating. The storm continued north, making a second landfall near Marco Island, where it continued a northward path along the length of western Florida. Every part of the state was impacted by the storm, with nearly all counties experiencing at least tropical storm strength winds and power outages that were widespread and, in many areas, lasted for up to a week.
Irma was different than previous hurricanes that have impacted the state, as virtually no county went unscathed by this storm. There have been stronger storms that have hit the state, but they generally traversed across a section of the state, rather than traveling the entire length.
On September 11th , I was picking up shingles that had blown off my roof the night before and scattered across my and my neighbors lawns and trees. They were heavy and dirty, and as I picked up the pieces of my roof, I realized that I would have to go back and reopen the Florida & Metro Forecast this quarter: Irma
F LORIDA S UMMAR y Institute for Economic Forecasting 7
3 https://issuu.com/ucfbusiness/docs/fl_metro_forecast_october_2017_irma_66c50b23752de3
changed the economic data, if only in the short run. Forecasting is a dirty business, too.
Natural disasters are a regular occurrence, and the economic impact of these events has been frequently analyzed in the academic literature.4 The extent and length of the impact, as you might expect, is in part a function of the magnitude and scope of the disaster. It also depends on the level of economic development in the impacted area. Developing countries can see economic growth permanently lowered as a result of natural disasters, owing to a heavier dependence on agriculture which can be devastated by natural disasters. Also, the lack of capital required to rebuild infrastructure and other production capacity makes the recovery in such economies a more difficult task.
When natural disasters strike the U.S. economy, the impacts are often difficult to discern in data at the national level, though Irma’s impact on payroll employment was evident and third quarter GDP may also show some effects. These disasters impact just a small portion of the total economy and resources are readily available to help in relief and recovery efforts. The same cannot be said for the small Caribbean nation of Antigua and Barbuda, whose economies may never completely recover from the storm’s wrath.
The literature suggests that, for developed nations, the events can actually raise economic growth over time. The mechanism by which this operates is a function of the capital that is being replaced is newer and thus more productive than the capital that was destroyed. The new air conditioning unit is more efficient, the computers are faster, the windows more energy efficient, and so on.
WHAT DOES HURRICANE IRMA MEAN FOR FLORIDA’S ECONOM y ?
Irma certainly isn’t the first hurricane to have hit the state. Since 1990, there have been 13 hurricanes with paths that significantly impacted the state. They are as follows:
ANDREW DATE: 08/24/1992 Path: Hit South Florida traveling west, hit as Category 5 (this was the strongest hurricane to hit the state during this time period).
ERIN DATE: 08/02/1995-08/03/1995 Path: Hit East-Central Florida traveling west as a Category 1, which lost strength around Polk County, then re-strengthened to a Category 2 in the Gulf before hitting Pensacola.
OPAL DATE: 10/6/1995 Path: Hit Gulf, Florida Panhandle (Pensacola), hit as Category 4.
EARL DATE: 09/1/1998 Path: Hit Florida Panhandle as a Category 2.
GEORGES DATE: 09/25/1998 Path: Hit Key West, then moved eastward over the Panhandle.
IRENE DATE: 10/15/1999 Path: Hit Key West and then mainland Monroe County as a Category 1, crossed state and entered Atlantic in Palm Beach County.
CHARLE y DATE: 08/13/2004
Path: Hit the Keys and Cayo Costa as a Category 4, then passed up through Port Charlotte and moved across the state, hitting Orlando and entering the Atlantic at New Smyrna Beach as a Category 1.
F LORIDA S UMMAR y 8 Florida & Metro Forecast / Summer 2022
4 http://www.sciencedirect.com/science/article/pii/ S0959378014000351?via%3Dihub
FRANCES DATE: 09/5/2004
Path: Hit St. Martin and St. Lucie Counties as a Category 2, crossed the state and entered the Gulf near Tampa.
JEANNE DATE: 09/26/2004
Path: Hit Hutchinson Island, moved west to Pasco County and then swung north toward Georgia.
DENNIS DATE: 07/10/2005
Path: Hit the Florida Keys.
WILMA DATE: 10/24/2005
Path: After intensifying in the Gulf of Mexico, Wilma hit Cape Romano in Florida. Wilma crossed the state and entered the Atlantic near Jupiter.
HERMINE DATE: 09/01/2016
Path: Turned in the Gulf, then passed upwards through the Panhandle. Cut through the Southeast U.S., entering the Atlantic near Virginia.
MATTHEW DATE: 10/7/2016
Path: Moved up parallel to the coast of Florida, fading from a Category 4 to a Category 2. Eventually dissipated on October 9th off the coast of North Carolina.
IRMA DATE: 09/10/2017
Path: Initial landfall at Cudjoe Key as a Category 4. Then made second landfall as Category 3 on Marco Island. Eventually moved up, dissipating off the coast of New England.
Do any of these storms give us an insight into what Irma may have done to Florida’s economy? In some ways they all do, but as far as being directly comparable to the impact of Irma, there are just a few that bear mentioning.
Andrew was the most powerful hurricane to have hit the state and its path took it across the southernmost portion of the peninsula. While Miami is the largest metro area in the state and because such a small fraction of the state was impacted by Andrew, it is probably not the best comparison for what the impacts of Irma might be.
Probably the closest comparable event to Irma over this time period occurred in 2004. That year, a trio of hurricanes—Charley, Frances, and Jeanne—impacted Florida in a period of about six weeks and the cumulative impact on the state’s economy was more discernable than any single hurricane prior to Irma.
In quarterly data, it difficult to separate the effects of the hurricanes from other factors impacting the economy, but if we examine monthly payroll employment data, then the consequences of the hurricanes become more evident. Figure 1 below plots the path of overall payroll employment as well as employment in three sectors most impacted by hurricanes.
The employment data in this chart normalizes employment for all four sectors to one for July 2004, the month prior to the first hurricane hitting the state. Thus subsequent months display the level of employment relative to what it was before the impact of the hurricanes.
Hurricane Charley hit Florida in August of 2004 followed by Frances and Jeanne in September. In September, employment declined in each of these sectors. The largest overall decline occurred in the Leisure & Hospitality sector, where the declines were significant enough to pull it and overall payroll employment below their July levels. After September, the recovery of jobs ramped up and construction job growth accelerated as the process of repairing and rebuilding got underway. Recovery in tourism was slower than in these other sectors, but by October, employment had surpassed pre-hurricane levels.
Other measures of economic activity in the wake of
F LORIDA S UMMAR y Institute for Economic Forecasting 9
Figure 1. The Payroll Employment Impact of the 2004 Hurricanes.
Hurricanes Charley/Frances/Jeanne
Employment Levels Normalized to 1 in the Month Prior to the Hurricanes
Jul-04 Aug-04 Sep-04 Oct-04 Nov-04 Dec-04 Jan-05
these three hurricanes showed less distinct impacts. The unemployment rate fell from 4.6% in July to 4.5% in October and further to 4.2% by January 2005. The number of people who were unemployed in the state fell from 391,000 in July to 364,000 by January 2005. There were certainly individuals who became unemployed as a direct result of the storms, but the overall effects were not discernable.
The growth rate of Real Gross State Product, or Real State GDP, for Florida slowed from 3.9% in the 2nd quarter of 2004 to 2.7% in the 3rd quarter but subsequently accelerated to 9.0% in the final quarter of that year.
Since Irma impacted so much of the state, it is reasonable to assume that the impacts of the storm on
the state’s economy will be larger than the combined effects of 2004’s three hurricanes. The path to recovery will likely look the same, perhaps extended by a month or two as a result of the widespread geographical area touched by the storm.
Add hurricanes to death and (federal) taxes on the list of things you can’t avoid in Florida. As certain as all these things are, so too is the state’s economic recovery from Hurricane Irma. The greatest risk to our economic outlook may be from the tempest that continues to rage in Washington, D.C.
F LORIDA S UMMAR y 10 Florida & Metro Forecast / Summer 2022
0.98 0.99 1 1.01 1.02 1.03 1.04 1.05 1.06
Total Nonfarm Real Estate, Rental, and Leasing
Leisure and Hospitality Construction
FLORIDA’S HOUSING MARKET
Inventories are depleted but rising, sales dropping, and price appreciation rapidly decelerating.
The August 2022 single-family home report released by Florida Realtors shows a market for existing housing that remains historically depleted of inventory that is responsible for fueling a continuation of rapid price appreciation year over year. The median price has pushed $149,200 above the peak price of the housing bubble in June 2006.
The median sales price for single-family homes increased by $53,000 in August 2022, year-overyear, and now stands at $407,000—a year-over-year price appreciation of 15.0%. Price appreciation in the townhome/condominium market continues as well, with an increase in the median sales price of $52,500 year-over-year, registering at $305,000 in August of this year. This price increase represents a 20.8% increase in median prices year-over-year.
Inventories of single-family homes in August are up from 1.3 months of supply a year ago to 2.4 months of supply this year. This indicates an inventory balance that is still skewed heavily in favor of sellers in the single-family market, according to the Florida Realtors report. 3 From August 2021 to this August, inventories of condominiums rose from 1.7 months to 2.2 months, indicating that the condo market is still tilted in the seller’s favor. Put another way, there are still severe shortages in both the existing singlefamily home and condo markets.
Distressed sales of single-family homes in the
3 According to the Florida Realtors, the benchmark for a balanced market (favoring neither buyer nor seller) is 5.5 months of inventory. Numbers above that indicate a buyers’ market, numbers below a sellers’ market. Other real estate economists suggest a 6-to-9-month inventory as being a balanced market.
form of short sales remain at very low levels despite the impact of the recession. They have decreased from 80 in August of 2021 to 40 in August of 2022, a decrease of 50.0%. Foreclosure/REO sales also continued to decline year-over-year by 32.8% versus August 2021. Traditional sales are down 15.7% year-over-year versus August 2021 as rapid price appreciation exacerbates affordability problems amid depleted inventories that are worsened by rising mortgage rates. Distressed sales of condos in the form of short sales are still at very low levels in August 2022 (6). Foreclosure/ REO sales are down from August 2021 (-24.0%). Traditional sales of condos are down 20.3% in August 2022 when compared to August 2021.
In August 2022, the percentage of closed sales of single-family homes that were cash transactions stood at 30.1%. For condos, that figure is much higher, as 50.0% of all closings were cash transactions. The condo market’s share of cash transactions has increased slightly year-overyear, but the single-family home market share of cash transactions has declined slightly which may indicate a decreasing role of cash investors in Florida’s single-family housing market. This is occurring amidst a sharp decline in mortgage availability.4
Figure 2 depicts the monthly realtor sales of existing single-family homes, as well as the 12-month moving average of these sales. The smoother moving average line evens out the seasonality and other statistical noise in monthly housing market data. Sales have been on a strong
4 The Mortgage Credit Availability Index (MCAI), put out by the Mortgage Bankers Association, fell by 0.5% to 108.3 In August from July 2022. The decrease in the index from July to August indicates that mortgage lending standards continue to tighten. The index is benchmarked to 100 in March 2012. Relative to that month, mort gages in August 2022 were only 8.3% more available. In 2006, the value of this same index approached 900 and at the start of 2020, the index was near 185. Despite rising mortgage rates, financing is not available to all comers.
F LORIDA S UMMAR y Institute for Economic Forecasting 11
0
upward path the past few years, and the 12-month moving average and monthly sales have greatly exceeded their peak value during the housing bubble. Sales growth coming out of the bottom has been on a stronger trend than the prebubble housing market, but over the past year, the 12-month moving average has flattened out and now is beginning to decline. This reflects decreasing affordability in the face of the rapid price appreciation over the past several years, the depleted inventory of houses for sale and tighter mortgage credit markets. The COVID-19 plunge in sales during April and May pulled down the moving average in 2020, but the immediate post-shutdown rebound was strong, fueled by pent-up demand and record-low mortgage rates at the time.
The housing market in Florida is weakening under the burden of high prices and rising mortgage rates. Economic and job growth in Florida is forecasted to slow as the economy enters the Pasta Bowl Recession. More baby boomers will reach the end of their working lives, and this bodes well for continued population growth via the in-migration of retirees and job seekers to Florida. We expect this upward trend in sales to resume as increases in the supply of new housing coupled with the recession will reverse price appreciation in an environment with continuing strength in the demographic drivers housing demand, and despite rising mortgage rates.
Figure 3 displays median sales prices for existing single-family homes. Median sales prices continue to climb since bottoming out in 2011. The double-
Figure 2. Single-Family Existing-Home Sales
Florida
digit pace of price increases in 2016 and 2017, which eased in 2018 and 2019, has resumed in 2020. Over the past year, the 12-month moving average of median sales prices has risen by more than $63,988.
Extremely low inventories of existing homes for sale and lagging housing starts growth have contributed to an environment where home prices continue to rise. The shortage in the single-family market will be partially ameliorated as the pace of single-family housing starts ramped up in 2021 and 2022, but high prices due to the rapid appreciation of the past several years have prompted sellers to get off the sidelines.
This period of unsustainable multi-year pace of price appreciation is rapidly ending. The recession, coupled with rising mortgage rates and a lastminute rush of sellers trying to get in before the market cools down, will bring an end to the spike in prices and will likely lead to some price depreciation.
Single-family housing starts in 2025 are expected to increase by nearly 33% from 2017 levels.
FLORIDA SUMMAR y 12 Florida & Metro Forecast / Summer 2022
5,000 10,000 15,000 20,000 25,000 30,000 35,000 40,000
Single Family, Exis�ng Homes
Realtor Sales Moving Average
Source: Florida Realtors
GROSS STATE PRODUCT
Public health lockdowns caused a plunge in real Gross State Product (GSP) in 2020 of 2.8% year-over-year. This decline was smaller than both of the annual declines that occurred during the Great Recession (-3.9% in 2008 and -5.5% in 2009.) However, the second quarter’s yearover-year decline in 2020 was steeper than any quarter during the Great Recession. Fortunately, the COVID-19 recession, while steeper than the previous recessions, was also very short-lived at just two months. The Pasta Bowl Recession will be significantly longer.
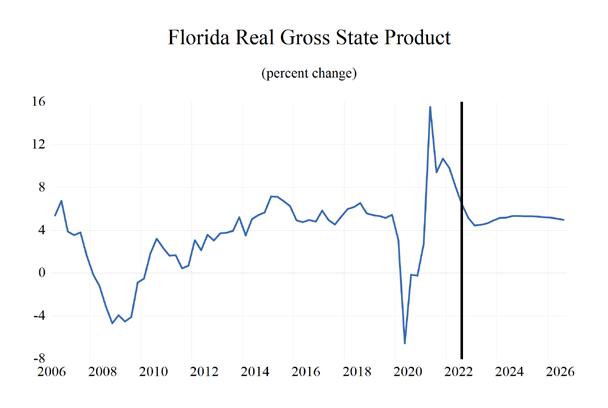
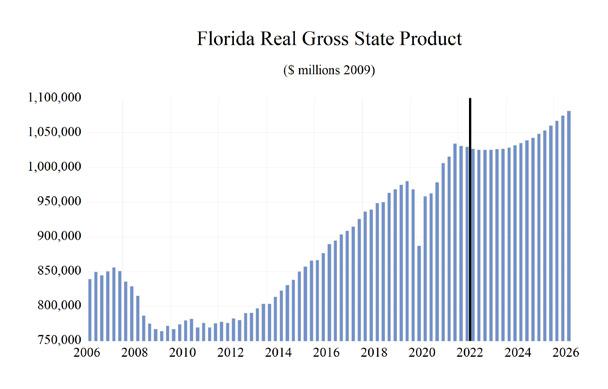
During 2022-2025, Florida’s real GSP is expected to grow an average of just 1.0% annually. This growth followed a sharp contraction in 2020 of 2.8%. This contraction was followed by an even sharper acceleration of growth in 2021 to 6.9%. The 1.0% growth from 2022 through 2025 will be a slower pace for growth compared to the prior four years (when growth averaged 2.5%) thanks to the recession slowing growth to -0.2% in 2023
and 0.7% in 2024. This projected average rate of growth for Florida’s economy over the next four years is on par with the average of our forecasted real GDP growth for the U.S. economy (1.1%) over the same time frame.
Housing prices have made extensive progress from the bottom of the housing crisis. During the crisis, median existing-home prices fell to a low of $122,200 but now stand at $407,000. This price appreciation has improved household balance sheets in Florida. With the price appreciation to date, Florida has more than recovered the aggregate housing value lost during the housing market collapse, but rougher waters and a likely decline in prices loom ahead for this market.
In 2017, Florida’s economy broke the $1 trillion threshold with a nominal Gross State Product (GSP) of $1.002 trillion which increased to $1.226 trillion in 2021. Looking forward, GSP will reach $1.335 trillion in 2022, $1.390 trillion in 2023, $1.433 in 2024, and then reach $1.489 trillion in 2025.
Real GSP (adjusted for inflation) exceeded $1 trillion in 2021 and will climb to $1.05 trillion in 2025.
PERSONAL INCOME, RETAIL SALES, AND AUTO SALES
Personal income growth surged to 6.2% (thanks to stimulus and unemployment payments offsetting the recession’s impact) in 2020 and 9.6% in 2021, amid additional federal stimulus spending and
FLORIDA SUMMAR y Institute for Economic Forecasting 13
$0 $50,000 $100,000 $150,000 $200,000 $250,000 $300,000 $350,000 $400,000 $450,000 Florida Single Family, Exis�ng Homes Median Sales Price Moving Average Source: Florida Realtors Figure 3. Median Sales Price,
Single-Family
Existing Homes
tax credits. Real personal income will contract by 1.9% in 2022, then rise by 0.5% in 2023 and 2.2% in 2024 before rising to 3.2% in 2025 as the Pasta Bowl Recession gets further in the rear-view mirror. Real personal income growth during 20222025 will average just 1.0% in Florida, weighed down by the recession.
Nominal personal income will be slightly below $1.57 trillion in 2025, marking an increase in personal income of nearly $843 billion from its Great Recession nadir in 2009. In 2018, real disposable income growth averaged 6.2%, up from the previous year’s 3.6% growth rate. Average growth in Florida during 2022-2025 will be 1.3% with the tax credits, faster wage, and salary growth, and stimulus payments that fueled a climb through 2021 before contracting by 4.1% in 2022 as those stimulus-related boosts faded, and inflation accelerated.
Financial markets experienced a strong rebound since the low point of the COVID-19 financial crisis, thanks in large part to the Federal Reserve Bank’s resumption of zero-interest-rate policy, quantitative easing, and other stimulus programs. The Dow Jones Industrial Average fell to 18,214 in March 2020 but then surged to a new record high of 36,953 in January 2022. The Pasta Bowl Recession and additional headwinds - as the Fed continues to pursue a tightening phase for monetary policy - have financial markets falling significantly from those highs, with the likelihood of more room to fall as the Fed and the economy continue down this path.
Home equity in Florida did not recover as rapidly as financial asset wealth during the 2007-2009 recession, but housing prices have been climbing over the past five years and median prices have significantly exceeded the highs of the housing
bubble. The housing market did not suffer the pandemic pain that financial markets experienced during the COVID-19 recession nor will it during this recession.
Unlike the recovery that followed the Great Recession, the housing market has not been an albatross around the neck of Florida’s economy during that recovery. On the contrary, housing will still be an important economic driver as the recovery from the COVID-19 recession gives way to the Pasta Bowl Recession, as builders work to replenish severely depleted inventories.
Retail spending was hurt by the public health shutdowns and the effective collapse of the tourism industry in Florida. Retail spending in the second quarter of 2020 contracted by 10.3% versus the same quarter in 2019. Spending levels began recovering after the short but deep recession and economic lockdowns, to fully counter the plunge and drive full-year growth. In 2021, retail sales grew robustly versus 2020 rising nearly 16.0% year over year. Sales are coming back down to earth, and after weak growth during the recession, growth will average 2.4% during 2022-2025.
Consumers began to purchase light vehicles at a faster pace after the Great Recession ended, releasing several years of pent-up demand, and continued to do so through 2016, though the pace slowed considerably by 2016. The 2020 recession once again caused a contraction of new passenger car and truck registrations of 9.6% for 2020 versus 2019. This contraction was not as pronounced nor as long-lasting as the one that took place during the Great Recession.
Some pent-up demand and the economic recovery boosted registrations coming out of the recession. Vehicle registration growth in Florida surged in 2021 with growth rising to
F LORIDA S UMMAR y 14 Florida & Metro Forecast / Summer 2022
9.3%. Registration growth in Florida during 2022-2025 will average -5.3%. Over this period, depleted inventories and very high prices will lead to registrations contracting 17.2% in 2022, then contracting by 2.7% in 2023, falling by 0.5% in 2024 before contracting further by 0.8% in 2025. In 2025, Florida’s new passenger car and truck registrations will be 1.05 million.
EMPLOYMENT
Business payrolls were decimated by COVID-19 lockdowns as layoffs happened in mass. However, Florida’s total business payrolls surpassed their prepandemic levels late in 2021. The pace of Florida’s labor market recovery has exceeded the recovery of the national job market since the end of the lockdowns. The recession will change that.
Payroll job growth decelerated in 2017 to 2.2%, before it rose to 2.5% in 2018. Job growth eased to 2.1% in 2019 as Florida’s economy closed in on full employment.
Then came COVID-19 and the lockdowns, closures, and travel restrictions which were followed by federal spending policies to try and counter the disastrous effects of shutting down the economy.
Job growth plummeted in March and April, contributing to a 4.9% year-over-year contraction in 2020. However, Florida’s decision to open the economy up and eschew further lockdowns caused job growth to roar back to 4.6% in 2021 but it will ease slightly to 4.3% in 2022.
In 2023 the effects of the recession will turn job growth negative. Total payroll jobs will contract 0.6% in 2023, and again by 1.5% in 2024. Job growth will resume in the second half of 2024 and in 2025 job growth will be 0.6% in Florida.
Florida’s labor market will slightly underperform the national economy until 2025.
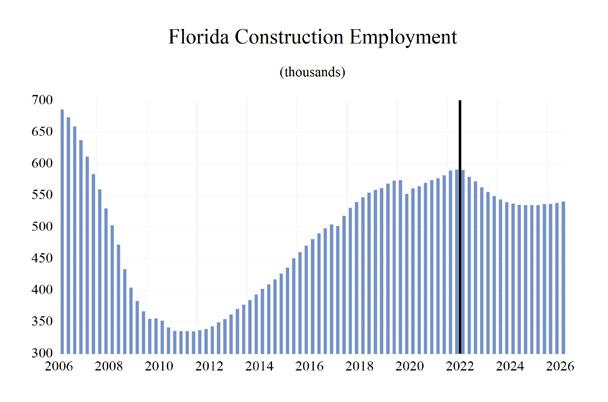
Construction job growth turned negative in 2020 but accelerated in 2021 with housing starts rising amid depleted inventories and as large-scale public works projects carried on uninterrupted by the pandemic. Despite the episodic plateauing in new home construction growth and the COVID-19 shakeup, growth rates in housing starts over the forecast horizon supported construction job growth of 4.2% in 2019, before falling to -0.4% in 2020 and then recovering to 2.2% in 2021. Job growth should rise to 2.0% in 2022, before the effect of the recession kicks in causing construction jobs to contract by 4.7% in 2023 and again by 3.8% in 2024, before job losses slow to 0.7% in 2025. The average annual job growth during 2022-2025 will be -1.8%. Construction employment will average 534,980 in 2025—a level that is nearly 145,000 fewer jobs than the 2006 peak employment in the Construction sector.
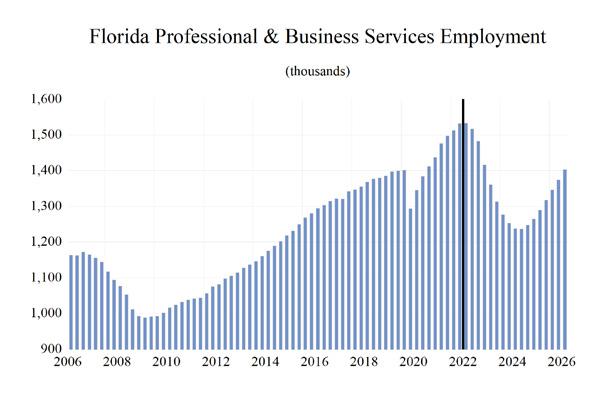
The Professional and Business Services sector, one of the fastest-growing sectors coming out of the 2020 recession, is in for a slowdown as the Pasta Bowl Recession looms. Job losses in this sector are expected to average 3.0% during 2022-2025. Job growth in this sector eased in 2017 and 2018 to 3.0% and 2.8%. Growth in this sector decelerated further to 2.1% in 2019 and then fell to -2.5% in 2020 because of the pandemic and lockdowns. Growth accelerated to 7.4% in 2021, and then will slow to 4.7% in 2022, plunge to -8.6% in 2023 and to -10.2% in 2024 before rebounding to 2.3% in 2025. The Professional and Business Services sector is comprised principally of white-collar, service-providing businesses. The sector includes accounting firms, financial management companies, advertising agencies, computer systems design
F LORIDA S UMMAR y Institute for Economic Forecasting 15
firms, law firms, architectural and engineering companies, and temporary employment agencies. Job losses during the COVID-19 recession were heavily concentrated in employment services and other business support services as many businesses were forcibly closed and these will also be the areas hit hard by the Pasta Bowl Recession.
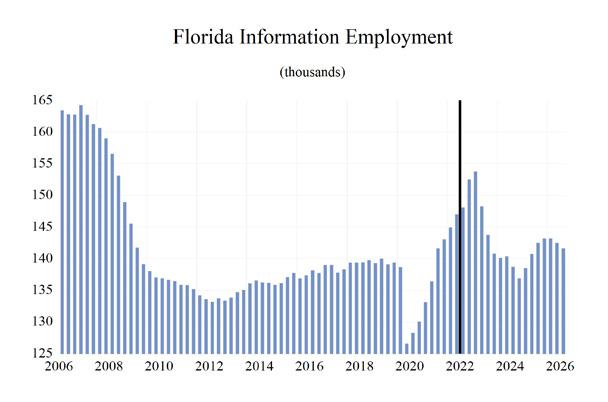
The Information sector is a mix of high-tech ventures, including computer programming and software development. However, job growth in this sector has long been weighed down, primarily by the people who pay for it along with traditional media, which has struggled with structural and technological changes in the gathering and dissemination of information. Sources of growth within this sector in Florida, such as software development, data processing and hosting, wireless telecommunications, and content creation have offset the lingering loss of jobs in traditional media and publishing. Job growth was flat in 2019, -6.1% in 2020, but recovered to 5.9% in 2021 and will hit 6.9% in 2022, boosted by the continued roll-out of 5G wireless services. Job growth will turn negative to -1.0% in 2023 then further to -5.2% in 2024 before rebounding to 1.6% in 2025. The projected growth path implies an average growth rate of 0.6% during 2022-2025.
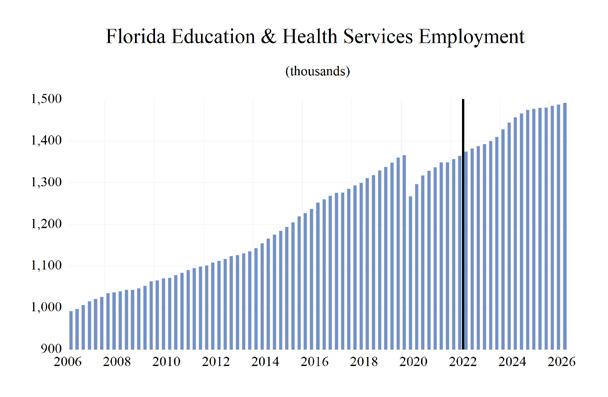
The Education and Health Services sector in Florida grew consistently even during the worst part of the 2007-2009 Great Recession. However, the pandemic hit the sector hard, as most elective procedures, screenings, and early interventions were postponed, schools closed, and employment contracted by 2.4% in 2020. The state’s growing population with a larger share of older residents, who have a higher demand for health services, has and will continue to support growth in this sector. There are continuing clouds of policy uncertainty over the health sector, but despite this uncertainty,
job growth will continue through the recession. During 2022-2025, employment in this sector is expected to continue to expand at an average rate of 2.5%.
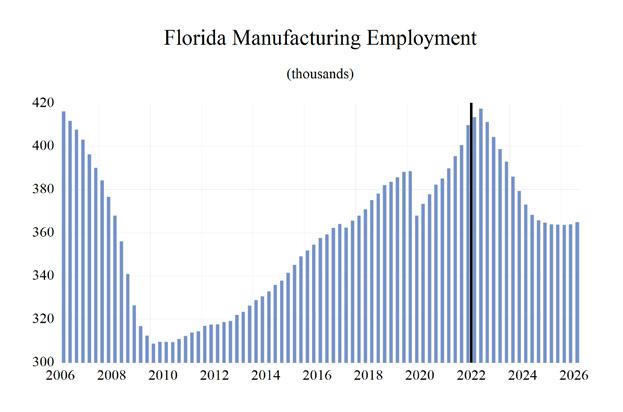
Manufacturing employment expanded in Florida at an average rate of 3.2% in 2019, one of the best growth rates in the past 18 years. During 20162019 job growth averaged 2.9% in Florida as the Trump administration pushed policies that helped level the playing field for U.S. manufacturers. The economic environment for the manufacturing sector is increasingly uncertain as recessions loom over the US and other world economies. After job losses of 2.1% in manufacturing in 2020, job growth accelerated to 3.0% in 2021 and will rise by 5.7% in 2022. After which job growth will decelerate and the sector will once again lose jobs from 2023 through 2025. Average job growth during 2022-2025 will come in at -1.5%.
The State and Local Government sector in Florida is enjoying increasing property values even as COVID-19 took only a brief chunk out of sales tax revenues, albeit much smaller than was being predicted in Tallahassee as revenue has greatly exceeded forecasts. As housing prices continue to climb, property tax revenue rose as well. Government budget shortfalls led to job losses in this sector that persisted for six years from 2009 through 2014. Despite growing tax revenues, the shadow of that prolonged budgetary crisis has kept spending growth modest and employment growth restrained. As Florida’s population and economy continue to grow, the demand for state and local government services continues to grow as well. To meet this demand, growth in state and local government employment will be necessary but will not rise to the levels seen during the housing boom. Average job growth in State and Local Government during 2022-2025 will be
F LORIDA S UMMAR y 16 Florida & Metro Forecast / Summer 2022
1.5%, with annual growth rising to 2.2% in 2023 and decelerating thereafter. The recession will put some pressure on both sales tax and property tax revenues, but this should not result in any severe budgetary issues.
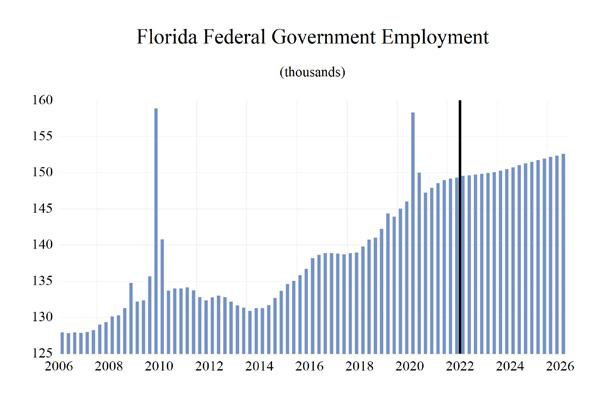
Federal Government employment growth in Florida strengthened over 2020 because of the Decennial Census, but historic deficits and a national debt of over $31 trillion will become a factor going forward. Average job growth in the Federal Government sector in Florida will average just 0.6% during 2022-2025, with growth having turned negative during 2021 after the temporary hiring surge during the 2020 census year.
UNEMPLOYMENT
The unemployment rate in Florida has fallen from its May 2020 peak of 14.2% and stands at 2.7% as of August 2022. When unemployment spiked to 14.2% in May of 2020, it was 2.9 percentage points higher than the peak level of unemployment from the Great Recession. This unprecedented surge in unemployment occurred over just three months, while it took two-and-a-half years for the unemployment rate to reach its peak in the Great Recession.
Nationally, and in Florida, the level of workers who are working part-time but not by choice, and workers marginally attached to the labor force— defined as workers who are neither working nor currently looking for work but indicate that they want and are available for a job and have looked for work in the past 12 months—also spiked during the public health shutdowns. When adding these workers and discouraged workers—defined as workers who are currently not working and did not look for a job in the four weeks preceding the Bureau of Labor Statistics’ monthly survey of
households—to the headline unemployment figure, U-3, we get the broadest measure of unemployment estimated by the BLS, known as U-6.
Looking at U-6, we see a labor market that is still impacted by the trauma of public health measures. U-6 in Florida averaged 6.7% during the 3rd quarter of 2021 through the 3rd quarter of 2022. Meanwhile, the national rate of U-6 averaged 7.6% during the same period. U-6 unemployment in Florida during the 3rd quarter of 2021 through the 3rd quarter of 2022 was 6.1 percentage points below the rate in 2014, 9.3 points lower than the 16% rate in 2012, and down 12.6 percentage points from its peak average rate of 19.3% in 2010 (the nation’s U-6 averaged 16.7% in 2010). As the economy continues to recover and the COVID-19 pandemic abates, these numbers will stabilize in Florida but before the end of 2022, they will begin climbing again during the recession.
Analysis of how U-6 behaves relative to the headline unemployment rate (U-3) continues to provide important information necessary to fully understand the health of the labor market. The gap between these two measures continues to narrow. The average spread between U-6 and U-3 over the past year was hovering at 3.4 percentage points at the national level, that gap was the same at 3.4 percentage points in Florida.
F LORIDA S UMMAR y Institute for Economic Forecasting 17
Table 1. Annual Summary of the University of Central Florida's Forecast for Florida
Personal Income and GSP
Personal Income (Bil. $) 1023.1 1087.2 1139.8 1210.0 1325.8 1382.0 1434.6 1491.0 1566.9
Florida.(%Ch Year ago) 7.2 6.3 4.8 6.2 9.6 4.2 3.8 3.9 5.1 U.S.(%Ch Year ago) 4.7 5.1 4.1 6.5 7.5 3.2 5.0 4.3 4.4
Personal Income (Bil. 2012$) 952.4 996.8 1037.5 1080.3 1136.7 1115.2 1120.8 1145.3 1182.1 Florida.(%Ch Year ago) 5.5 4.7 4.1 4.1 5.2 -1.9 0.5 2.2 3.2
U.S.(%Ch Year ago) 2.8 2.9 2.5 5.3 3.5 -2.9 1.5 2.5 2.6
Disp. Income (Bil. 2012$) 839.9 892.4 928.1 973.9 1014.8 973.5 994.4 1032.5 1065.6 Florida.(%Ch Year ago) 3.6 6.2 4.0 4.9 4.2 -4.1 2.1 3.8 3.2 U.S.(%Ch Year ago) 2.8 3.4 2.3 6.2 2.3 -5.3 3.2 4.1 2.6
GSP (Bil. $) 1002.6 1057.9 1116.4 1106.0 1226.3 1335.2 1390.4 1433.5 1488.8 (%Ch Year ago) 5.2 5.5 5.5 -0.9 10.9 8.9 4.1 3.1 3.9
GSP (Bil. 2012$) 913.0 943.5 971.6 944.0 1008.7 1028.3 1026.1 1033.6 1051.2 (%Ch Year ago) 3.6 3.3 3.0 -2.8 6.9 1.9 -0.2 0.7 1.7
Employment and Labor Force (Household Survey % Change Year Ago)
Employment 2.2 2.5 2.1 -4.9 4.6 4.3 -0.6 -1.5 0.6 Labor Force 1.7 1.3 1.5 -1.7 2.2 2.7 2.0 0.8 0.7 FL Unemployment Rate (%) 4.3 3.7 3.2 8.3 4.6 3.2 4.7 5.8 5.6 U.S. Unemployment Rate (%) 4.4 3.9 3.7 8.1 5.4 3.6 4.2 4.7 4.8
Nonfarm Employment (Payroll Survey % Change Year Ago)
Total Nonfarm U.S. 1.6 1.6 1.3 -5.8 2.8 4.0 1.1 0.0 0.2 Florida 2.2 2.5 2.1 -4.9 4.6 4.3 -0.6 -1.5 0.6 Mining -1.3 2.2 -1.6 -4.0 -1.2 -1.9 1.8 0.9 -0.4 Construction 6.3 7.4 4.2 -0.4 2.2 2.0 -4.7 -3.8 -0.7 Manufacturing 2.2 2.6 3.2 -2.1 3.0 5.7 -2.1 -6.3 -3.2
Nondurable Goods 1.9 1.2 2.8 -2.9 3.3 6.0 -0.9 -3.9 -2.5
Durable Goods 2.3 3.2 3.4 -1.7 2.9 5.6 -2.6 -7.4 -3.6
Trans. Warehs. & Utility 1.5 2.4 1.5 -3.1 5.2 4.4 -1.0 -2.7 -1.8
Wholesale Trade 1.5 2.5 2.0 -2.6 3.4 7.2 1.2 1.1 1.4 Retail Trade 0.7 1.0 -0.5 -4.7 3.9 2.9 -2.6 -5.6 -4.4
Financial Activities 2.6 2.3 2.9 0.2 4.7 4.9 0.4 1.8 1.7 Prof. and Business Services 3.0 2.8 2.1 -2.5 7.4 4.7 -8.6 -10.2 2.3
Edu & Health Services 2.6 2.3 2.9 -2.4 2.2 2.1 2.0 3.7 2.0
Leisure & Hospitality 2.2 2.4 2.4 -19.8 11.2 9.4 6.1 1.2 0.6
Information 0.7 0.7 0.0 -6.1 5.9 6.9 -1.0 -5.2 1.6
Federal Gov't. 1.1 0.6 2.4 4.9 -1.1 0.8 0.3 0.5 0.6 State & Local Gov't. 0.7 0.9 0.7 -2.8 -1.0 0.7 2.2 1.9 1.2
Population and Migration
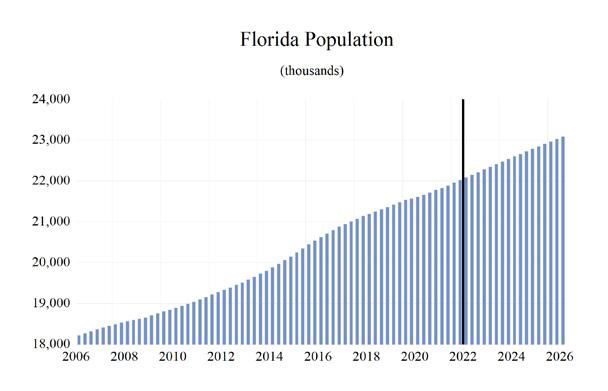
Population (ths) 20904.8 21164.1 21390.9 21595.0 21803.1 22054.5 22314.8 22569.8 22817.3
(%Ch Year ago) 1.6 1.2 1.1 1.0 1.0 1.2 1.2 1.1 1.1
Net Migration (ths) 69.6 57.2 55.3 56.6 68.1 67.5 65.1 63.6 61.8
(%Ch Year ago) -16.9 -17.9 -3.4 2.3 20.4 -1.0 -3.5 -2.3 -2.9
Housing
Housing Starts Tot. Private (ths) 116.7 130.6 146.2 156.6 190.2 195.4 154.5 151.0 154.8
Housing Starts Single Family (ths) 85.1 93.7 101.8 112.0 143.9 133.8 104.0 103.1 105.8
Housing Starts Multi-Family (ths) 31.6 36.9 44.4 44.6 46.3 61.6 50.4 47.9 49.0
Consumer Prices
(%Ch Year ago) 2.5 2.5 1.8 0.9 5.5 9.3 5.0 1.8 1.5
FLORIDA TABLES 18 Florida & Metro Forecast / Summer 2022
2017 2018 2019 2020 2021 2022 2023 2024 2025
Table 2. Quarterly Summary of the University of Central Florida's Forecast for Florida*
2022Q2
Personal Income and GSP
Personal Income (Bil. $) 1374.4 1389.7 1413.8 1421.8 1429.0 1438.1 1449.6 1466.6 1481.6 1498.9 1516.9 1537.1 1556.7 Florida.(%Ch Year ago) 1.8 1.1 1.7 0.6 0.5 0.6 0.8 1.2 1.0 1.2 1.2 1.3 1.3 U.S.(%Ch Year ago) 1.7 1.5 1.6 0.9 1.0 1.1 1.0 1.1 1.0 1.0 1.1 1.2 1.1
Personal Income (Bil. 2012$) 1114.2 1112.4 1121.2 1119.1 1119.1 1120.6 1124.3 1132.8 1140.5 1149.5 1158.5 1168.3 1177.4 Florida.(%Ch Year ago) 0.1 -0.2 0.8 -0.2 0.0 0.1 0.3 0.8 0.7 0.8 0.8 0.8 0.8 U.S.(%Ch Year ago) -0.1 0.2 0.7 0.1 0.5 0.6 0.6 0.7 0.6 0.6 0.7 0.7 0.6 Disp. Income (Bil. 2012$) 971.7 971.4 980.5 981.5 989.2 998.4 1008.7 1019.1 1028.0 1037.1 1045.8 1054.1 1062.0
Florida.(%Ch Year ago) 0.1 0.0 0.9 0.1 0.8 0.9 1.0 1.0 0.9 0.9 0.8 0.8 0.8 U.S.(%Ch Year ago) -0.1 0.2 0.8 0.5 1.3 1.3 1.3 0.9 0.8 0.7 0.7 0.7 0.6
GSP (Bil. $) 1328.9 1345.8 1362.1 1375.0 1385.2 1396.0 1405.6 1415.4 1426.9 1439.1 1452.5 1465.0 1480.6 (%Ch Year ago) 1.9 1.3 1.2 0.9 0.7 0.8 0.7 0.7 0.8 0.9 0.9 0.9 1.1 GSP (Bil. 2012$) 1029.6 1027.0 1025.4 1025.3 1025.5 1026.5 1027.0 1028.7 1031.7 1035.0 1039.1 1042.7 1048.3 (%Ch Year ago) -0.1 -0.3 -0.2 0.0 0.0 0.1 0.0 0.2 0.3 0.3 0.4 0.3 0.5
Employment and Labor Force (Household Survey % Change Year Ago)
Employment 1.1 0.3 0.0 -0.2 -0.6 -0.6 -0.5 -0.4 -0.3 0.0 0.0 0.1 0.3 Labor Force 1.1 0.3 0.6 0.6 0.4 0.3 0.2 0.2 0.1 0.1 0.2 0.2 0.2 FL Unemployment Rate (%) 2.9 3.1 3.4 3.9 4.5 4.9 5.3 5.6 5.7 5.8 5.9 5.8 5.7 U.S. Unemployment Rate (%) 3.6 3.5 3.6 3.9 4.1 4.3 4.5 4.6 4.7 4.8 4.8 4.8 4.8
Nonfarm Employment (Payroll Survey % Change Year Ago)
Total Nonfarm
U.S. 0.8 0.7 0.4 0.2 0.1 0.0 0.0 0.0 0.0 0.0 0.0 0.1 0.1 Florida 1.1 0.3 0.0 -0.2 -0.6 -0.6 -0.5 -0.4 -0.3 0.0 0.0 0.1 0.3 Mining -0.4 0.4 -0.3 1.0 0.7 0.4 0.6 0.1 0.0 0.0 0.0 -0.1 -0.1 Construction 0.3 -0.1 -1.9 -1.2 -1.6 -1.3 -1.2 -0.9 -0.8 -0.5 -0.4 -0.1 0.0 Manufacturing 2.3 0.9 0.9 -1.5 -1.7 -1.4 -1.4 -1.8 -1.7 -1.7 -1.2 -0.7 -0.3
Nondurable Goods 2.0 0.7 0.0 -0.5 -0.8 -0.9 -0.9 -1.1 -1.1 -1.0 -0.8 -0.6 -0.4
Durable Goods 2.5 1.0 1.3 -1.9 -2.1 -1.6 -1.7 -2.1 -2.1 -2.0 -1.4 -0.8 -0.3 Trans. Warehs. & Utility 1.1 -0.8 -0.2 -0.6 0.4 -0.8 -0.1 -0.9 -1.3 -0.5 -0.6 -0.7 -0.3 Wholesale Trade 3.0 0.7 -0.2 0.8 -0.5 -0.4 0.1 0.5 0.7 0.5 0.5 0.3 0.3 Retail Trade 0.4 -1.7 -0.3 -1.6 0.9 -1.2 -0.4 -2.0 -2.8 -1.3 -1.4 -1.6 -0.8 Financial Activities 1.5 0.6 -0.1 0.6 -0.9 -0.2 0.2 0.7 1.1 0.7 0.5 0.5 0.2 Prof. and Business Services 1.3 0.1 -1.0 -2.3 -4.5 -3.9 -3.5 -2.7 -1.9 -1.3 0.0 0.8 1.4 Edu & Health Services 0.6 0.7 0.6 0.4 0.3 0.5 0.7 1.3 1.1 0.9 0.6 0.6 0.2 Leisure & Hospitality 1.6 1.0 0.4 2.3 2.1 1.9 -0.3 -0.5 0.3 0.4 0.0 -0.3 0.5 Information 1.4 0.7 3.0 0.8 -3.6 -3.1 -2.0 -0.5 0.2 -1.2 -1.3 1.2 1.7 Federal Gov't. 0.1 0.2 0.0 0.1 0.1 0.1 0.1 0.1 0.1 0.2 0.2 0.2 0.1 State & Local Gov't. 0.3 0.5 0.6 0.6 0.5 0.6 0.5 0.5 0.4 0.3 0.2 0.3 0.3
Population and Migration
Population (ths) 22,022.3 22,087.8 22,152.4 22,217.5 22,282.4 22,347.3 22,411.9 22,475.6 22,538.7 22,601.4 22,663.7 22,725.5 22,787.1 (%Ch Year ago) 0.3 0.3 0.3 0.3 0.3 0.3 0.3 0.3 0.3 0.3 0.3 0.3 0.3
Net Migration (ths) 68.4 66.8
63.8 63.4 63.1 62.5 62.3 (%Ch Year ago) -1.2 -2.4 -2.2 -0.3 0.0 0.1 -0.4 -1.1 -0.6 -0.7 -0.5 -0.9 -0.3
Housing Starts Tot. Private (ths)
Housing Starts Single Family (ths) 143.9
Housing Starts Multi-Family (ths)
(%Ch
Housing Consumer Prices
148.5 150.0 151.8 153.5 154.7 155.3
101.2 102.5 103.7 104.8 106.0 106.2
F LORIDA T ABLES Institute for Economic Forecasting 19
2022Q3 2022Q4 2023Q1 2023Q2 2023Q3 2023Q4 2024Q1 2024Q2 2024Q3 2024Q4 2025Q1 2025Q2
65.3 65.1 65.1 65.2 64.9 64.2
211.9 183.4 177.5 160.6 155.0 151.9 150.4
123.6 117.3 107.4 103.8 102.8 102.1
68.0 59.8 60.2 53.2 51.2 49.1 48.3 47.3 47.5 48.1 48.7 48.7 49.1
Year ago) 2.4 1.6 1.5 1.3 0.8 0.8 0.6 0.4 0.3 0.2 0.3 0.4 0.4 *Quarterly at an annual rate
Employment Quarterly*
Florida Payroll Employment (Thousands)
Total Nonfarm 9,315.4 9,341.0 9,339.2 9,324.9 9,272.2 9,220.0 9,169.8 9,130.5 9,107.2 9,102.8 9,101.9 9,113.1 9,143.1 Manufacturing 409.8 413.5 417.3 411.1 404.3 398.6 392.9 386.0 379.2 372.9 368.3 365.7 364.5
Durable Goods 280.2 282.9 286.7 281.2 275.3 270.9 266.2 260.7 255.4 250.3 246.7 244.8 244.2
Wood Products 14.8 15.1 15.5 13.8 12.3 11.3 10.9 10.4 10.0 9.7 9.7 9.9 10.0
Computer & Electronics 45.3 45.7 45.6 45.8 46.0 46.1 46.1 46.1 46.2 46.3 46.5 46.7 46.9 Transportation Equipment 54.2 53.9 53.9 53.3 52.9 52.3 51.0 49.4 47.5 45.6 43.9 42.5 41.7
Nondurables 129.7 130.6 130.6 129.9 128.9 127.8 126.6 125.2 123.8 122.6 121.6 120.9 120.4 Foods 36.5 36.7 36.9 36.8 36.9 36.9 37.0 36.8 36.5 36.3 36.1 36.0 36.0
Non-Manufacturing 8,905.6 8,927.6 8,921.8 8,913.8 8,867.9 8,821.3 8,777.0 8,744.5 8,728.0 8,730.0 8,733.6 8,747.4 8,778.5
Mining 5.2 5.3 5.2 5.3 5.3 5.4 5.4 5.4 5.4 5.4 5.4 5.4 5.4
Construction 590.6 590.3 579.1 572.1 562.7 555.4 548.5 543.4 539.3 536.8 534.9 534.6 534.8 Trans. Warehs. & Utility 1,935.2 1,920.3 1,917.1 1,905.2 1,911.9 1,896.0 1,893.8 1,876.8 1,852.6 1,842.6 1,831.2 1,819.0 1,814.1 Wholesale Trade 382.7 385.3 384.5 387.7 385.9 384.5 384.8 386.6 389.3 391.4 393.2 394.4 395.5
Retail Trade 1,141.2 1,121.7 1,118.0 1,099.8 1,109.8 1,096.6 1,092.7 1,071.2 1,040.8 1,027.5 1,012.7 996.6 988.7
Information 147.0 148.1 152.5 153.8 148.3 143.7 140.8 140.1 140.4 138.7 136.9 138.5 140.8 Prof. & Bus. Services 1,532.2 1,532.9 1,517.4 1,482.8 1,416.3 1,360.9 1,312.7 1,277.0 1,252.7 1,237.0 1,236.8 1,247.1 1,264.4 Admin. & Support 696.4 705.8 709.5 716.2 709.0 704.5 697.2 686.5 674.1 660.4 653.8 651.4 650.3 Prof. Sci & Tech 120.7 122.1 123.2 124.1 124.2 124.5 125.2 126.4 127.7 128.0 128.3 128.6 128.5 Mgmt. of Co. 715.1 705.1 684.7 642.5 583.1 531.8 490.2 464.0 451.0 448.6 454.6 467.1 485.7 Financial Activities 652.9 657.0 656.2 660.2 654.2 652.6 654.0 658.3 665.3 670.3 673.9 677.1 678.6 Real Estate & Rent 445.8 449.9 450.3 453.5 449.8 449.1 450.6 454.1 459.4 463.1 466.0 468.6 470.1 Fin. & Insurance 207.2 207.1 206.0 206.6 204.4 203.5 203.4 204.2 205.9 207.2 208.0 208.4 208.5 Edu. & Health Service 1,364.3 1,374.0 1,382.1 1,387.4 1,392.1 1,399.2 1,409.5 1,427.8 1,443.6 1,456.9 1,465.7 1,473.9 1,476.8 Education Services 180.0 183.1 186.1 185.3 183.9 184.6 186.7 190.0 193.4 196.2 198.2 199.3 199.6 Health Services 1,184.3 1,190.8 1,196.0 1,202.1 1,208.1 1,214.6 1,222.8 1,237.9 1,250.1 1,260.7 1,267.4 1,274.6 1,277.3 Leisure & Hospitality 1,225.1 1,237.3 1,242.7 1,270.7 1,297.4 1,322.7 1,318.7 1,312.6 1,316.9 1,322.3 1,322.4 1,318.2 1,325.3 Other Services 355.2 359.6 361.0 361.7 359.7 359.9 362.8 366.9 371.5 376.0 379.8 383.4 385.3 Government 1,097.9 1,102.8 1,108.5 1,114.7 1,120.0 1,125.6 1,130.9 1,136.1 1,140.4 1,144.1 1,146.7 1,150.2 1,153.0 Federal Gov't. 149.3 149.6 149.6 149.7 149.8 150.0 150.1 150.3 150.5 150.8 151.0 151.3 151.5 State & Local Gov't 948.6 953.3 958.8 964.9 970.2 975.6 980.8 985.8 989.9 993.3 995.6 998.9 1,001.5
*Quarterly at an annual rate
F LORIDA T ABLES 20 Florida & Metro Forecast / Summer 2022 Table 3.
2022Q2 2022Q3 2022Q4 2023Q1 2023Q2 2023Q3 2023Q4 2024Q1 2024Q2 2024Q3 2024Q4 2025Q1 2025Q2
Employment Annual
Florida Payroll Employment (Thousands)
Total Nonfarm 8,569.6 8,781.0 8,964.7 8523.66 8,915.4 9,301.6 9,246.7 9,110.6 9,165.4 Manufacturing 363.5 372.9 384.8 376.8 388.1 410.3 401.7 376.6 364.5
Durable Goods 246.5 254.5 263.0 258.5 265.9 280.8 273.4 253.3 244.2
Wood Products 14.0 14.4 14.0 13.9 14.2 15.0 12.1 9.9 10.1
Computer & Electronics 41.3 41.9 44.0 44.3 44.4 45.3 46.0 46.3 46.9
Transportation Equipment 42.0 44.9 47.8 48.3 50.4 53.4 52.4 46.6 41.4
Nondurables 117.0 118.4 121.8 118.3 122.2 129.5 128.3 123.3 120.2 Foods 32.2 32.8 34.2 33.4 34.2 36.4 36.9 36.4 36.0
Non-Manufacturing 8,206.2 8,408.0 8,579.8 8,146.8 8,527.3 8,891.3 8,845.0 8,734.0 8,800.9
Mining 5.6 5.7 5.6 5.4 5.4 5.3 5.4 5.4 5.4
Construction 505.3 542.8 565.4 563.1 575.6 587.2 559.7 538.6 535.0
Trans. Warehs. & Utility 1,738.9 1,779.9 1,805.7 1,750.1 1,840.3 1,921.7 1,901.7 1,850.8 1,818.0
Wholesale Trade 337.1 345.7 352.7 343.6 355.3 381.0 385.7 390.1 395.7 Retail Trade 1,103.5 1,114.0 1,108.4 1,055.8 1,096.9 1,129.3 1,099.7 1,038.0 992.3
Information 138.5 139.5 139.4 130.9 138.6 148.1 146.6 139.0 141.2 Prof. & Bus. Services 1,324.6 1,361.8 1,390.6 1,356.0 1,455.7 1,523.7 1,393.2 1,250.9 1,279.4 Admin. & Support 551.0 570.4 594.7 602.0 655.3 699.6 706.7 668.7 651.7 Prof. Sci & Tech 103.3 108.7 115.0 110.6 115.0 121.5 124.5 127.6 128.3 Mgmt. of Co. 670.2 682.6 680.9 643.3 685.4 702.6 561.9 454.6 499.4 Financial Activities 563.1 575.8 592.6 593.8 621.8 652.3 655.2 666.9 678.3 Real Estate & Rent 379.8 387.3 396.4 406.6 425.5 446.1 450.7 460.6 470.1 Fin. & Insurance 183.3 188.5 196.2 187.2 196.3 206.2 204.5 206.3 208.2 Edu. & Health Service 1,276.0 1,305.1 1,343.3 1,311.2 1,340.3 1,369.1 1,397.0 1,448.5 1,477.5 Education Services 163.3 168.1 173.0 164.5 173.0 182.3 185.1 194.5 199.4 Health Services 1,112.7 1,136.9 1,170.3 1,146.7 1,167.2 1,186.8 1,211.9 1,254.0 1,278.1 Leisure & Hospitality 1,200.6 1,229.4 1,259.0 1,009.9 1,122.7 1,227.7 1,302.4 1,318.5 1,326.3 Other Services 348.0 353.1 353.3 322.6 334.0 355.2 361.0 373.5 385.5
Government 1,105.6 1,115.0 1,124.9 1,104.0 1,093.1 1,100.9 1,122.8 1,141.8 1,154.2 Federal Gov't. 138.8 139.6 142.9 149.9 148.2 149.4 149.9 150.7 151.6 State & Local Gov't 966.8 975.4 982.0 954.1 944.9 951.5 972.9 991.1 1,002.6
F LORIDA T ABLES Institute for Economic Forecasting 21 Table 4.
2017 2018 2019 2020 2021 2022 2023 2024 2025
Table
Personal Income-Quarterly*
2022Q2
Billions Current Dollars
Personal Income 1374.4 1389.7 1413.8 1421.8 1429.0 1438.1 1449.6 1466.6 1481.6 1498.9 1516.9 1537.1 1556.7
Wages & Salaries 645.4 653.3 657.2 660.6 661.1 662.3 664.8 667.5 671.7 677.0 682.3 688.6 696.2
Other Labor Income 122.4 123.1 123.7 124.4 124.5 124.7 124.9 125.4 125.9 126.6 127.4 128.7 129.9
Nonfarm 74.3 76.8 78.7 78.8 78.7 79.1 79.3 80.0 80.9 82.3 83.8 85.3 87.0
Farm 4.1 4.3 4.2 3.8 3.4 3.0 2.7 2.5 2.3 2.2 2.2 2.1 2.2
Property Income 348.1 353.3 365.5 372.2 377.4 381.5 386.9 393.5 400.3 407.3 414.6 422.1 428.0
Transfer Payments 278.2 277.7 284.1 282.0 283.8 287.2 290.7 297.8 300.7 303.8 307.5 312.3 316.2
Social Insurance 102.0 102.7 103.6 104.2 103.9 103.7 103.8 104.2 104.3 104.6 105.1 106.2 107.0
Billions 2012 $
Personal Income 1114.2 1112.4 1121.2 1119.1 1119.1 1120.6 1124.3 1132.8 1140.5 1149.5 1158.5 1168.3 1177.4 Wages & Salaries 523.2 522.9 521.2 520.0 517.7 516.0 515.6 515.6 517.1 519.2 521.1 523.4 526.5
Other Labor Income 99.2 98.5 98.1 97.9 97.5 97.2 96.9 96.9 96.9 97.1 97.3 97.8 98.2
Nonfarm 60.3 61.4 62.4 62.0 61.6 61.6 61.5 61.8 62.3 63.1 64.0 64.8 65.8
Farm 3.3 3.5 3.3 3.0 2.7 2.3 2.1 1.9 1.8 1.7 1.7 1.6 1.6
Property Income 282.2 282.8 289.9 293.0 295.5 297.2 300.1 303.9 308.1 312.4 316.7 320.8 323.7
Transfer Payments 225.6 222.3 225.3 222.0 222.3 223.8 225.4 230.0 231.5 233.0 234.8 237.3 239.2 Social Insurance 82.7 82.2 82.2 82.0 81.4 80.8 80.5 80.5 80.3 80.2 80.2 80.7 80.9
New Passenger Car & Truck Registrations 1094.3 1090.1 1055.6 1051.3 1069.0 1072.8 1077.1 1076.0 1068.5 1055.1 1049.6 1050.3 1054.1 Retail Sales (Billions $) 477.5 477.5 478.4 479.3 479.2 480.3 480.5 481.5 482.1 482.8 483.9 486.0 488.4 Real Retail Sales (Billions 2012$) 387.1 382.2 379.4 377.3 375.3 374.2 372.7 371.9 371.1 370.3 369.5 369.4 369.4
*Quarterly at an annual rate
F LORIDA T ABLES 22 Florida & Metro Forecast / Summer 2022
5.
2022Q3 2022Q4 2023Q1 2023Q2 2023Q3 2023Q4 2024Q1 2024Q2 2024Q3 2024Q4 2025Q1 2025Q2
Personal Income-Annual
Billions Current Dollars
Personal Income 1023.1 1087.2 1139.8 1210.0 1325.8 1382.0 1434.6 1491.0 1566.9
Wages & Salaries 447.2 473.3 499.7 510.6 579.3 647.6 662.2 674.6 700.3
Other Labor Income 94.8 101.6 106.1 105.2 114.5 122.6 124.6 126.3 130.7
Nonfarm 59.7 63.8 64.7 71.2 75.8 75.7 79.0 81.8 88.0 Farm 1.9 1.0 1.1 1.8 1.3 3.5 3.2 2.3 2.2
Property Income 289.4 312.4 325.3 324.7 330.1 351.7 379.5 403.9 430.7
Transfer Payments 195.8 205.5 217.8 275.0 314.0 279.2 285.9 302.4 318.2
Social Insurance 69.2 73.8 78.4 82.0 92.9 102.3 103.9 104.5 107.4
Billions 2012 $
Personal Income 952.4 996.8 1037.5 1080.3 1136.7 1115.2 1120.8 1145.3 1182.1 Wages & Salaries 416.3 433.9 454.8 455.8 496.2 522.6 517.3 518.2 528.4
Other Labor Income 88.3 93.1 96.6 93.9 98.1 99.0 97.4 97.0 98.6
Nonfarm 55.6 58.5 58.9 63.5 65.0 61.1 61.7 62.8 66.4
Farm 1.8 0.9 1.0 1.6 1.1 2.8 2.5 1.8 1.6
Property Income 269.4 286.4 296.1 289.9 282.9 283.8 296.5 310.3 324.9
Transfer Payments 182.3 188.4 198.2 245.6 269.8 225.4 223.4 232.3 240.0
Social Insurance 64.4 67.7 71.3 73.2 79.5 82.6 81.2 80.3 81.1
New Passenger Car & Truck Registrations 1319.6 1339.1 1340.7 1212.5 1325.9 1097.5 1067.6 1062.3 1053.9 Retail Sales (Billions $) 340.0 358.7 368.1 375.7 446.4 475.8 479.8 482.6 490.3
Real Retail Sales (Billions 2012$) 316.5 328.9 335.0 335.3 382.5 384.0 374.9 370.7 369.9
F LORIDA T ABLES Institute for Economic Forecasting 23 Table 6.
2017 2018 2019 2020 2021 2022 2023 2024 2025


F LORIDA C HARTS 24 Florida & Metro Forecast / Summer 2022


F LORIDA C HARTS



F LORIDA C HARTS 26 Florida & Metro Forecast / Summer 2022
Governor Ron DeSantis awards more than $28.4 million in funding for economic growth to 23 Florida communities
•
On June 21, 2022, Governor Ron DeSantis awarded more than $28.4 million in funding for economic growth and community resiliency to 23 Florida communities through the Community Development Block Grant – CV (CDBG-CV) program, and the Community Development Block Grant – Disaster Recovery (CDBG-DR) Hazard Mitigation Grant Match Program.
•
“Investments made today will provide 23 communities with access to the resources they need to diversify their economies, increase public safety, and mitigate future risks,” said the Governor.
•
The CDBG-CV program, administered by DEO, primarily benefits low- and moderate-income residents. Activities include workforce housing, training, and sustainability, as well as broadband infrastructure and planning.
Source: flgov, June 21, 2022

 FLORIDA NEWS SUMMARIES
The Florida Department of Economic Opportunity announces nearly $48 million available for Florida’s small cities to further community development projects
• The Florida Department of Economic Opportunity (DEO) announced nearly $48 million available in grant funding for Florida’s small cities to further community development projects through the Florida Small Cities Community Development Block Grant (CDBG).
•
The funding can be used for economic development, commercial and neighborhood revitalization, housing rehabilitation, and other infrastructure improvements, which can include planning for broadband deployment and expansion.
•
Non-entitlement units of local government that have an open grant through the Neighborhood Revitalization, Housing Rehabilitation, and Commercial Revitalization program areas are also eligible to apply for funding in the Economic Development program area for job creation and/or retention activities.
Source: DEO Press Releases, June 27, 2022
F LORIDA C HARTS
Florida’s national parks bring in $855 million in visitor spending
• Florida’s 11 national parks generated roughly $1.3 billion in economic contributions last year, according to a new report from the National Parks Service. This ranks Florida as the eighth highest state in park-related visitor spending.
• Last year, some 13.4 million visitors to national parks in Florida spent $855 million in the regions near the parks, known as gateway regions.
• That spending — on things like lodging, outfitters, and gas — supported 11,900 jobs, $441 million in labor income and $753 million in value added in the Florida economy.
Source: AXIOS Tampa Bay, July 6, 2022
Florida sending ‘inflation relief’ stimulus checks to families: What to know
• Gov. Ron DeSantis announced Thursday that his administration is sending checks worth up to $450 per child to lower-income families in the state. An estimated 59,000 families will qualify for the money.
• Florida is paying for the initiative by reallocating $35.5 million that it received from President Biden’s signature COVID-19 relief package, the American Rescue Plan.
• Officials expect the money to arrive between July 25 and Aug. 7, which is before Florida’s “back-to-school” sales-tax holiday.
Source: Fox Business, July 22, 2022
July consumer sentiment continues to rise despite high inflation
•
Consumer confidence among Floridians increased in July four-tenths of a point to 61.4 from June’s revised figure of 61. Similarly, consumer sentiment at the national level increased in July.
•
Floridians’ opinions about current economic conditions were mixed, with views of personal financial situations down, while favorability toward buying a major household item rose. Florida’s expectations about future economic conditions remained mostly unchanged.
• “Floridians are slightly more optimistic in July, but
despite this positive change, confidence remains low at levels that are comparable to those observed during the Great Recession,” said Hector H. Sandoval, director of the Economic Analysis Program at UF’s Bureau of Economic and Business Research.
Source: University of Florida News, August 2, 2022
Governor Ron DeSantis awards $276,000 to foster economic development through the Competitive Florida Partnership Program
• Through the Competitive Florida Partnership Program, Governor DeSantis awarded $46,000 to six Florida communities: the cities of Archer, Gretna, Keystone Heights, and North Miami, as well as Glades County and the town of Welaka.
• The program, administered by the Florida Department of Economic Opportunity (DEO), supports communities in developing plans to attract new business and create workforce opportunities, improve resiliency to disasters, and connect with various state and federal resources to diversify and expand their economies.
• According to Governor DeSantis, “These investments will support meaningful projects that help small and rural communities strengthen their local economies and create opportunities for their residents.”
Source: FLGOV News Releases, August 12, 2022
Florida unemployment rate down to 2.7 percent
• Florida’s unemployment rate dipped to 2.7 percent in July, matching the level before the COVID-19 pandemic slammed into the economy in early 2020, state officials announced Friday.
• Adrienne Johnston, the chief economist for the Florida Department of Economic Opportunity, said the state has hit or exceeded 70,000 jobs added in the private sector (which occurred in July) only seven times since 1990.
• Johnston also noted that with a rebound from COVID came a shift in job types: “…we’re seeing strong growth in financial activities and professional and business services. You can see here that we’ve outpaced the nation in terms of manufacturing.”
Source: CBS News, August 19, 2022
F LORIDA N EWS S UMMARIES 28 Florida & Metro Forecast / Summer 2022
PROFILES
The Cape Coral MSA is comprised of Lee County. It is in the southwest coast. It is known for its many canals having over 400 miles of canals. Cape Coral has the most extensive canal system of any city in the world and is the largest master-planned community in the U.S.
QUICK FACTS
• Metro population estimate of 737,468 as of 2019 (5-Year Estimate) (U.S. Census Bureau).
• Lee County population estimate of 737,468 as of 2019 (5-Year Estimate) (U.S. Census Bureau).
• Civilian labor force of 369,929 in July 2022 (Florida Research and Economic Database).
• An unemployment rate of 2.8% as of July 2022, not seasonally adjusted. This amounts to 10,333 unemployed people (Florida Research and Economic Database).
OUTLOOK SUMMARIES
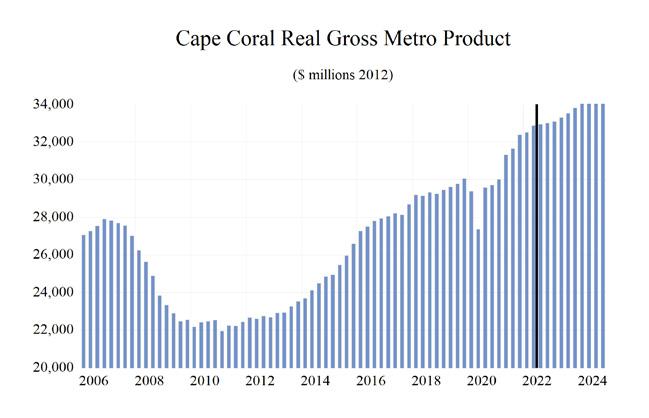
The studied economic indicators are predicted to show mixed levels of growth in the Cape Coral Metropolitan Statistical Area (MSA). Gross Metro Product for the MSA will come in at $33,857.17 million. The MSA will rank 9th in both personal income growth at 5.4 percent, as well as in per capita income at $51,500. The average annual wage will grow at an annual rate of 4.4 percent to $67,200. Cape Coral’s population grow at the third highest rate, at an annual rate of 2.3 percent.
Employment growth is expected to average 1.5 percent, the fifth highest, and Cape Coral will experience one of the lowest unemployment rates in the state at 4.3 percent.
The Other Services sector will lead the MSA in average annual growth at 6.0 percent. The Leisure and Hospitality sector will follow at 5.7 percent. Its two lowest sectors in average annual growth, Construction and Mining and Professional and Business Services, will see growth rates of -2.2% and -2.0%, respectively.
METRO NEWS SUMMARIES
Geis Companies builds apartments, industrial near Alico Road
•
The Centro Apartments, near Three Oaks Parkway and north of Alico Road, is the most visible of the projects, with thousands of cars driving by the site every day off I-75. The company paid $4.5 million in October for the land.
• There will be 264 units, which are expected to be completed by June 2023, with one to three bedrooms and private balconies. Other planned amenities include a clubhouse, event center, theater, two-story fitness room, indoor and outdoor yoga studio, a salon and a courtyard with a pavilion, outdoor kitchen, pool, fire pit, walking path, a Koi Pond, a community fresh garden and games.
• It is building Legacy 500K, the current name for two 250,000-square-foot distribution centers and warehouse storage facilities off Oriole Road, which runs just north of Alico Road. The buildings will be configured to house tenants in spaces as small as 37,000 square feet, or tenants can lease the entire building.
Source: Gulfshore Business, June 14, 2022
Cape Coral moving closer to all-ages affordable housing development
• The 96-unit Civitas community to be built off Pine Island Road would be open to families of all ages. Typically, such developments are aimed at seniors, but this one will have no age restrictions. Cape Coral officials say they are trying to create more affordable all-ages housing for city residents because they know it’s tough for people to keep up with the cost of living.
• The rental housing will be for people at or below 80% of the area’s median income, meaning a family of four would have to make less than $64,000 to live in these units. The funding for this project comes from the city, the state, and the Florida Housing Finance Corporation.
CAPE CORAL - FORT M y ERS Institute for Economic Forecasting 29
• Amy Yearsley, Cape Coral housing coordinator, says residents are struggling more than ever to find affordable housing and rates just continue to go up, partly due to migration from other states.
Source: WINK, June 15, 2022
Lee County gets more than $7M to build, repair affordable housing developments
• Amid rising rental rates, the Lee Board of County Commissioners voted Tuesday to allocate $7.5 million from the federal American Rescue Plan Act Recovery & Resilience Program to two affordable housing developments. Southward Village is a low-income housing development in Fort Myers that will be one of the properties receiving a makeover.
• Southwest Florida Affordable Housing Foundation will put 185 new units in Southward Village. The commissioners also gave Habitat for Humanity the green light to build 36 homes in North Fort Myers. That development will be called McNeill Village.
• Lee county expects the projects will be completed and able to serve residents by 2024
Source: WINK, July 13, 2022
Climate change prompts Cape Coral’s Mercola to stress biodynamic farming
• While Florida is best known for growing oranges and strawberries, farming’s future may be in Cape Coral.
• Mercola market in Cape Coral is a 10,000-square-foot market at 125 SW Third Place where it showcases 1,400 different kinds of health foods, supplements and other products that are mostly bought online from customers across the country. About 75 of those products resulted from biodynamic farming.
• Chief Business Officer, Ryan Boland, explained how he believes this will impact the future of farming. Boland has traveled throughout the
upper Midwest with a message. He was trying to convince people the new way of farming is an older way of farming.
Source: Wink News, July 21, 2022
Economic development projects pending in South Cape
•
Booming business is always in-season in Cape Coral, and while some wait for the permit backlog to shake free, other projects in the city are taking a step forward, or even changing hands. A pair in the city’s South Cape are now at the forefront of what’s pending.
• The Cove at 47th — a luxury mixed-use development at 870 Southeast 47th Terrace — is set to break ground on Aug. 24 at 10 a.m.
• Another massive project just about ready to break ground in Cape Coral is Bimini Square. Biondi said it is her understanding that project will break ground in the fall.
Source: Cape Coral Breeze, August 11, 2022
$120 million apartment project coming to Cape Coral
•
A West Palm Beach real estate investment and development firm has bought 26 acres at Tierra De Paz Loop and plans to build a $120 million apartment complex, Siesta Lake, on the site.
•
The plan for the low-rise community near Pine Island Road currently calls for one-, two- and three-bedroom units. Amenities will be standard for a modern complex with a gym, pool, and business center. But Siesta Lake’s owners are also jumping on the bandwagon and plan to build a pickleball court on the property.
•
Shoreham Capital, which is partnering with Bridge Investment Group from Utah and Wynkoop Financial from Colorado on the development, paid $11.5 million for the property
Source: Business Observer, August 16, 2022
CAPE CORAL - FORT M y ERS 30 Florida & Metro Forecast / Summer 2022
Total Nonagricultural Employment

Cape Coral-Ft. Myers MSA Industry Loca

on
CAPE CORAL - FORT M y ERS Institute for Economic Forecasting 31 0 0.2 0.4 0.6 0.8 1 1.2 1.4 1.6 1.8 2
Total Private Goods Producing Service Producing Private Service Providing Mining, Logging, and Construc�on Manufacturing Trade, Transporta�on, and U�li�es Wholesale Trade Retail Trade Transporta�on, Warehousing and U�li�es Informa�on Financial Ac�vi�es Professional and Business Services Educa�onal and Health Services Leisure and Hospitality Other Services Government
�
Quo�ents
Long Term Outlook for Cape Coral-Fort Myers, FL August 2022 Forecast
Personal Income (Billions $)
Total Personal Income 37.4 39.3 40.8 43.3 47.9 50.3 53.1 55.8 59.2
Pct Chg Year Ago 5.7 5.0 3.9 6.0 10.7 5.1 5.6 5.1 6.0
Wages and Salaries 12.6 13.3 14.1 14.6 16.9 19.5 20.1 20.6 21.3
Nonwage Income 24.9 26.0 26.7 28.7 31.0 30.9 33.0 35.3 37.9
Real Personal Income (12$) 34.9 36.1 37.6 39.3 41.8 41.3 42.2 43.6 45.4 Pct Chg Year Ago 4.9 3.4 4.2 4.6 6.3 -1.1 2.2 3.3 4.2
Per Capita Income (Ths) 51.8 53.5 54.4 56.3 60.6 62.0 64.0 65.8 68.5
Real Per Capita Income (12$) 48.2 49.1 50.1 51.2 52.9 50.9 50.9 51.4 52.6
Average Annual Wage (Ths) 47.4 48.8 50.4 54.2 59.4 64.5 65.8 68.2 70.4 Pct Chg Year Ago 3.5 3.0 3.3 7.5 9.6 8.6 2.1 3.5 3.2
Establishment Employment (Place of Work, Thousands, SA)
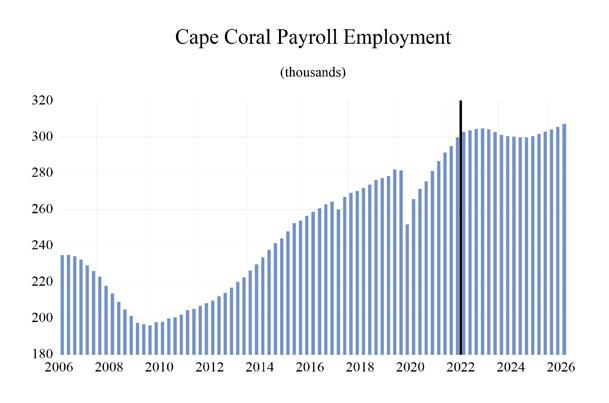
Total Employment 263.5 271.2 278.5 267.6 283.7 300.3 304.0 300.4 301.2 Pct Chg Year Ago 2.4 2.9 2.7 -3.9 6.0 5.9 1.2 -1.2 0.3
Manufacturing 6.0 6.3 6.5 6.4 7.1 7.6 7.6 7.0 6.8 Pct Chg Year Ago 3.0 6.1 2.8 -1.4 10.0 7.6 -0.2 -7.1 -3.6
Nonmanufacturing 257.5 264.9 272.0 261.1 276.6 292.7 296.4 293.3 294.4 Pct Chg Year Ago 2.3 2.9 2.7 -4.0 5.9 5.8 1.3 -1.0 0.4
Construction & Mining 27.5 30.7 32.6 32.7 34.2 35.2 33.8 31.9 31.2 Pct Chg Year Ago 5.7 11.6 6.2 0.2 4.5 2.9 -3.8 -5.6 -2.2
Trade, Trans, & Utilities 53.7 54.1 54.8 53.5 56.1 59.6 60.1 58.3 56.9 Pct Chg Year Ago 0.5 0.8 1.2 -2.4 5.0 6.2 0.9 -3.1 -2.4
Wholesale Trade 7.5 7.5 7.7 7.9 8.3 9.0 9.5 9.7 9.9
Retail Trade 41.2 41.4 41.3 39.5 41.6 43.8 43.5 41.1 39.4 Trans, Wrhsng, & Util 4.9 5.3 5.8 6.1 6.2 6.8 7.1 7.4 7.6
Information 2.8 2.8 2.8 2.9 3.1 3.3 3.2 3.0 3.0 Pct Chg Year Ago -4.0 -1.1 1.8 0.8 7.7 6.7 -2.2 -7.8 1.0
Financial Activities 13.3 13.6 14.0 13.5 14.2 15.7 16.6 16.8 16.7 Pct Chg Year Ago 2.4 1.7 3.3 -3.3 5.2 9.8 6.3 0.8 -0.3
Prof & Business Services 35.6 37.2 37.6 36.6 40.6 42.7 40.2 36.5 37.1 Pct Chg Year Ago 3.0 4.6 1.2 -2.7 10.8 5.1 -5.8 -9.2 1.7
Educ & Health Services 29.2 30.1 31.4 30.7 31.7 33.1 34.3 35.4 36.0 Pct Chg Year Ago 2.7 3.2 4.2 -2.4 3.6 4.4 3.6 3.2 1.5
Leisure & Hospitality 41.1 41.9 43.6 37.1 41.7 46.4 49.0 51.0 51.9 Pct Chg Year Ago 0.9 1.9 4.1 -14.9 12.5 11.2 5.7 3.9 1.8
Other Services 11.7 11.6 11.7 10.8 11.4 12.4 12.9 13.7 14.4 Pct Chg Year Ago 2.6 -0.8 0.7 -7.2 5.6 8.6 4.2 5.9 5.3
Federal Government 2.4 2.4 2.4 2.6 2.4 2.3 2.4 2.4 2.4 Pct Chg Year Ago -3.0 -2.4 1.1 7.9 -8.2 -0.9 3.7 -0.8 -0.1
State & Local Government 40.2 40.5 41.1 40.8 41.2 42.1 43.7 44.4 44.8 Pct Chg Year Ago 3.9 0.7 1.4 -0.7 0.9 2.2 3.9 1.7 0.9
Other Economic Indicators
Population (Ths)
848.2
Pct Chg Year Ago 2.1 1.7 2.0 2.5 2.9 2.7 2.3 2.2 1.9
Labor Force (Ths) 332.7
Total Housing Starts
2.8 4.1 5.2 5.1
371.7 382.4 385.7 388.6 Percent Change, Year Ago 1.1 1.8 2.2 -0.3 3.5 4.1 2.9 0.9 0.7 Unemployment Rate (%) 4.2
Single-Family
1429.2 3524.7 3807.4 3683.1 3820.4
5964.2 5507.5 5739.3 Multifamily
CAPE CORAL - FORT M y ERS 32 Florida & Metro Forecast / Summer 2022
2017 2018 2019 2020 2021 2022 2023 2024 2025
722.6 734.6 749.5 767.8 790.4 811.7 830.3
864.5
338.7 346.0 345.1 357.1
3.6 3.2 8.0 4.2
6609.6 7973.1 8102.3 10732.6 12385.2 13290.5 9771.6 9190.7 9559.7
4784.2 5574.8 5786.9 6641.6 10956.0 9765.8
1825.4 2398.3 2315.4 4091.0
Short Term Outlook for Cape Coral-Fort Myers, FL August 2022 Forecast
2022:2 2022:3 2022:4 2023:1 2023:2 2023:3 2023:4 2024:1 2024:2 2024:3 2024:4 2025:1 2025:2
Personal Income (Billions $)
Total Personal Income 50.0 50.8 51.9 52.4 52.9 53.3 53.9 54.7 55.4 56.2 57.1 58.0 58.8
Pct Chg Year Ago 7.2 7.5 7.8 7.7 5.7 5.0 3.9 4.3 4.7 5.4 5.8 6.0 6.1
Wages and Salaries 19.4 19.7 19.9 20.0 20.1 20.1 20.2 20.3 20.5 20.7 20.8 21.0 21.2
Nonwage Income 30.6 31.0 32.1 32.5 32.8 33.2 33.7 34.3 34.9 35.6 36.3 37.0 37.6
Real Personal Income (12$) 41.2 41.4 41.9 42.0 42.1 42.3 42.6 43.0 43.4 43.9 44.3 44.8 45.2
Pct Chg Year Ago 0.7 1.1 1.9 2.9 2.1 2.3 1.6 2.3 3.0 3.7 4.2 4.3 4.3
Per Capita Income (Ths) 61.8 62.4 63.4 63.7 63.8 64.1 64.4 65.0 65.4 66.1 66.8 67.5 68.1
Real Per Capita Income (12$) 51.0 50.8 51.2 51.0 50.9 50.8 50.8 51.1 51.2 51.6 51.9 52.2 52.4
Average Annual Wage (Ths) 64.4 64.9 65.1 65.3 65.5 65.8 66.6 67.2 67.9 68.5 69.1 69.6 70.1 Pct Chg Year Ago 10.1 7.7 3.9 2.9 1.7 1.5 2.3 2.9 3.6 4.0 3.7 3.6 3.3
Establishment Employment (Place of Work, Thousands, SA)
Total Employment 299.9 302.8 303.6 304.5 304.8 304.1 302.7 301.2 300.4 300.1 299.8 299.8 300.5
Pct Chg Year Ago 6.7 5.6 4.2 3.2 1.6 0.4 -0.3 -1.1 -1.4 -1.3 -1.0 -0.5 0.0
Manufacturing 7.5 7.7 7.8 7.7 7.7 7.5 7.4 7.2 7.1 7.0 6.9 6.8 6.8
Pct Chg Year Ago 7.6 7.2 6.8 4.2 1.6 -1.5 -4.8 -6.4 -7.4 -7.6 -7.2 -6.0 -4.3
Nonmanufacturing 292.3 295.1 295.8 296.8 297.1 296.6 295.3 294.0 293.3 293.1 292.9 293.0 293.8
Pct Chg Year Ago 6.6 5.6 4.1 3.2 1.6 0.5 -0.2 -0.9 -1.3 -1.2 -0.8 -0.3 0.1 Construction & Mining 35.2 35.5 35.0 34.7 34.2 33.5 33.0 32.5 32.0 31.8 31.5 31.4 31.3 Pct Chg Year Ago 3.3 3.5 1.2 -1.0 -2.9 -5.5 -5.9 -6.5 -6.2 -5.3 -4.4 -3.4 -2.4
Trade, Trans, & Utilities 59.9 59.8 60.0 59.8 60.4 60.2 60.1 59.4 58.4 57.9 57.4 56.9 56.7 Pct Chg Year Ago 7.8 6.2 4.8 1.9 0.9 0.7 0.1 -0.7 -3.5 -3.7 -4.4 -4.1 -2.8
Wholesale Trade 8.9 9.1 9.2 9.4 9.5 9.5 9.5 9.6 9.7 9.7 9.8 9.9 9.9 Retail Trade 44.2 43.8 43.9 43.3 43.9 43.5 43.4 42.4 41.2 40.7 40.1 39.5 39.2 Trans, Wrhsng, & Util 6.8 6.9 6.9 7.0 7.1 7.1 7.2 7.3 7.5 7.5 7.5 7.5 7.6 Information 3.3 3.2 3.4 3.4 3.3 3.1 3.0 3.0 3.0 3.0 2.9 2.9 3.0 Pct Chg Year Ago 8.2 3.7 4.5 4.5 0.6 -3.8 -9.8 -11.8 -8.9 -5.6 -4.6 -3.1 -0.7
Financial Activities 15.7 15.9 16.1 16.6 16.7 16.6 16.6 16.6 16.8 16.8 16.8 16.8 16.8 Pct Chg Year Ago 11.3 9.5 10.0 11.8 6.7 4.3 2.9 0.1 0.4 1.2 1.4 1.1 -0.1 Prof & Business Services 42.3 42.8 42.8 42.3 40.8 39.5 38.2 37.2 36.6 36.1 36.0 36.3 36.7 Pct Chg Year Ago 6.3 3.4 1.0 -1.3 -3.3 -7.8 -10.7 -12.0 -10.4 -8.6 -5.6 -2.4 0.4
Educ & Health Services 33.0 33.6 33.9 34.1 34.3 34.4 34.6 35.0 35.3 35.6 35.8 35.9 36.0 Pct Chg Year Ago 4.2 5.3 6.3 6.3 3.7 2.6 2.1 2.8 3.1 3.4 3.4 2.7 1.9
Leisure & Hospitality 46.9 47.3 46.9 47.4 48.5 50.0 50.2 50.3 50.9 51.3 51.4 51.3 51.8 Pct Chg Year Ago 12.2 11.5 6.2 6.8 3.5 5.6 7.1 6.1 4.9 2.6 2.3 2.0 1.7
Other Services 12.3 12.6 12.7 12.8 12.8 12.9 13.1 13.3 13.6 13.8 14.0 14.2 14.4 Pct Chg Year Ago 9.0 8.8 7.8 7.2 4.0 2.8 3.0 3.8 6.0 6.9 7.1 6.7 5.8
Federal Government 2.3 2.3 2.4 2.4 2.4 2.4 2.4 2.4 2.4 2.4 2.4 2.4 2.4
Pct Chg Year Ago -5.0 -0.1 1.2 2.3 6.5 4.2 1.8 0.0 -1.4 -1.0 -0.6 -0.3 0.1 State & Local Government 41.5 42.1 42.6 43.2 43.6 43.9 44.1 44.2 44.4 44.5 44.6 44.7 44.8
Pct Chg Year Ago 2.5 1.0 1.7 2.9 5.1 4.3 3.4 2.5 1.7 1.5 1.2 1.1 1.0
Other Economic Indicators
Population (Ths)
Pct Chg Year Ago 2.7 2.7 2.6 2.4
2.2 2.2 2.2 2.1 2.1 2.0 1.9 Labor Force (Ths) 370.1
Pct Chg Year Ago 4.1 3.3
Unemployment Rate (%) 2.5
Total Housing Starts
Single-Family
Multifamily
386.7 387.3
0.9 0.7 0.6 0.7 0.7
5.4 5.3
3697.1 3753.2 3769.9
CAPE CORAL - FORT M y ERS Institute for Economic Forecasting 33
809.3 814.2 819.2 823.5 828.0 832.6 837.1 841.6 846.2 850.4 854.6 858.5 862.5
2.3 2.3
373.2 377.1 380.0 382.1 383.3 384.2 384.8 385.4 386.0
388.1
4.0 3.6 3.2 2.7 1.9 1.3
2.7 3.1 3.5 3.9 4.4 4.8 5.1 5.2 5.3
5.2
14661.9 12362.1 11768.4 10448.2 9876.8 9429.4 9332.0 9079.6 9118.5 9213.4 9351.2 9470.6 9570.9
11031.1 8755.4 7741.6 6631.4 6026.8 5670.9 5527.6 5456.2 5459.8 5516.2 5598.0 5700.7 5746.0
3630.8 3606.7 4026.8 3816.8 3849.9 3758.5 3804.4 3623.4 3658.7
3824.9
PROFILES
The Crestview MSA is comprised of Okaloosa and Walton counties and is located in the northwest corner of the state. Crestview is known as the “Hub City” because of the convergence of interstate 1, State Road 85, U.S. Highway 90, the Florida Gulf & Atlantic Railroad and the Yellow River and Shoal River in or near the city.
QUICK FACTS
• Metro population estimate of 272,056 as of 2019 (5-Year Estimate) (U.S. Census Bureau).
•
Okaloosa County population estimate of 203,794 as of 2019 (5-Year Estimate) (U.S. Census Bureau).
• Walton County population estimate of 68,262 as of 2019 (5-Year Estimate) (U.S. Census Bureau).
• Civilian labor force of 140,167 in July 2022 (Florida Research and Economic Database).
• An unemployment rate of 2.4% as of July 2022, not seasonally adjusted. This amounts to 3,310 unemployed people (Florida Research and Economic Database).
OUTLOOK SUMMARIES
The studied economic indicators are predicted to show relatively high levels of growth in the Crestview Metropolitan Statistical Area (MSA). Gross Metro Product for the MSA will come in at $15,845.64 million. The MSA will experience above-average personal income growth of 5.5 percent, and real per capita income will be relatively high in the state at $55,700. The average annual wage will grow at an annual rate of 5.9 percent (the third highest) to $67,500. Crestview’s population will grow at an annual rate of 1.3 percent.
Employment growth is expected to average 1.5 percent, and Crestview will experience the lowest Unemployment rate in the state at 3.5 percent.
The Leisure & Hospitality sector will lead the MSA in average annual growth at 4.2 percent. The Financial sector will follow at 3.1 percent. The Construction and Mining, and Manufacturing sectors will see respective contractions in growth of -1.8 percent and -1.7 percent, respectively.
METRO NEWS SUMMARIES
Miramar Beach property sells for $25M, setting record for most expensive home in Panhandle
• The Premier Property Group announced the $25 million record-breaking sale of a 10.78-acre, compound-style Gulf-front estate in Miramar Beach.
•
This is the second time this property broke the record for the most expensive home in the panhandle; it originally sold for $16.1 million in 2020.
• Jason White, chief operating officer of The Premier Property Group has stated that the sale is “indicative of the strength of our market and its continued growth.”
Source: NWFdailynews, June 29, 2022
Last three parcels at Mossy Head Industrial Park purchased by real estate development group
• Onicx Group obtained the last available 34 acres of Mossy Head Industrial Park for $1.3 million.
• The company plans to construct several buildings in which it will conduct light manufacturing work.
• The arrival of Onicx Group will bring the number of businesses to 15 and county officials could conceivably expand the park’s borders in the future.
Source: NWFdailynews, June 29, 2022
LiveOak Fiber to Invest $100M in Okaloosa County Fiber Network While Pledging to Create 50 New Jobs
•
LiveOak Fiber expects to begin connecting their first customers of their not yet constructed $100 million fiber optic network as early as February 2023.
• Residents and businesses within LiveOak Fiber’s network can expect a robust internet service with 10G per second - the fastest speeds in the U.S.
CRESTVIEW - FT. WALTON BEACH - DESTIN 34 Florida & Metro Forecast / Summer 2022
•
To construct and operate the network, LiveOak expects to create 50 new jobs in Okaloosa County over the next three years.
Source: Business Wire, July 11, 2022
Construction on final Silver Shells tower to begin this summer in Destin.
• St. Kitts, a 13-story condominium developed by Sandestin Development LLC, will be the sixth and final tower at Silver Shells Beach Resort.
• St. Kitts will offer 70 units with prices ranging from $1.4 million to $3.5 million. About 30% of the units have been reserved.
• The tower will feature three and four-bedroom units ranging from 2,380 square feet to 4,540 square feet.
Source: NWFdailynews, July 15, 2022
JPMorgan Chase Simplifies Affordable Housing Financing
• JPMorgan is developing a 72-unit affordable housing development in Fort Walton Beach called Shoreline Villas.
• The bank is providing $10.8 million in equity alongside a $11.9 million construction loan that will convert into a $5.2 million permanent loan to develop the project.
• JPMorgan Chase is also developing several other affordable housing projects across the country strengthening the relationship between their commercial banking and investment banking teams.
Source: Commercial Observer, August 1, 2022
Destin, Okaloosa Co. spending $16M for public beach property
•
Okaloosa County Commissioners approved the funds along with the city of Destin to buy 336 feet of gulf-front property known as Tarpon Beach to be used as public access.
•
$10 million is coming from the Tourism Development Council tax funds in which the City of Destin will receive $1.6 million each year from its 12.5% share of County funds.
•
Currently, the county and Destin are also buying shore at Crystal Beach. The total for both projects is $32,500,000 gaining nearly 600 feet of public access.
Source: WKRG, August 18, 2022
CRESTVIEW - FT. WALTON BEACH - DESTIN Institute for Economic Forecasting 35
Beach-Des


Total Nonagricultural Employment
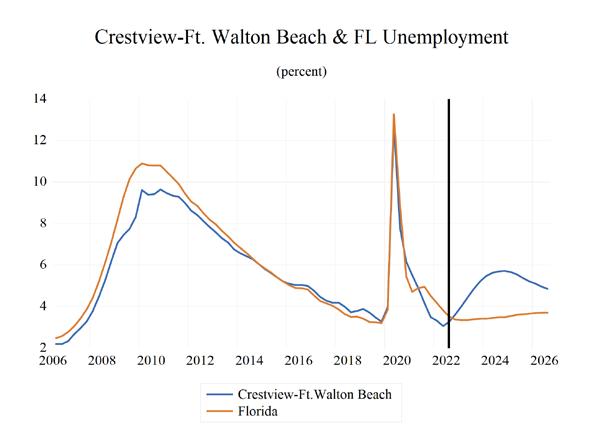
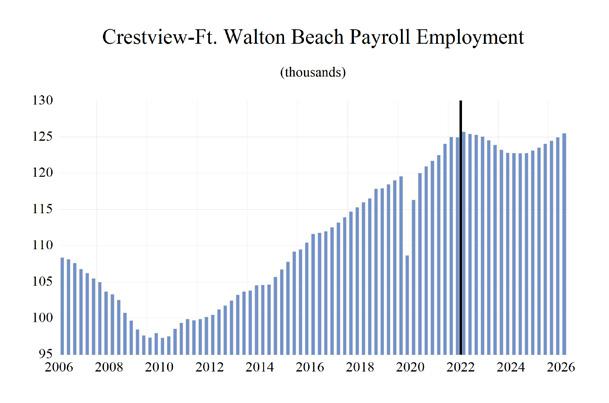
CRESTVIEW - FT. WALTON BEACH - DESTIN 36 Florida & Metro Forecast / Summer 2022 0 0.2 0.4 0.6 0.8 1 1.2 1.4 1.6
Total Private Goods Producing Service Producing Private Service Providing Mining, Logging, and Construc�on Manufacturing Trade, Transporta�on, and U�li�es Wholesale Trade Retail Trade Transporta�on, Warehousing and U�li�es Informa�on Financial Ac�vi�es Professional and Business Services Educa�onal and Health Services Leisure and Hospitality Other Services Government Crestview-Ft. Walton
�n MSA Industry Loca�on Quo�ents
Long Term Outlook for Crestview-Fort Walton Beach-Destin, FL August 2022 Forecast
Personal Income (Billions $)
Total Personal Income 13.7 14.7 15.7 17.0 18.7 19.5 20.2 21.0 22.1
Pct Chg Year Ago 6.9 7.1 7.0 7.8 10.3 3.9 3.5 4.3 5.1
Wages and Salaries 6.4 6.7 7.3 7.7 8.8 9.7 9.9 10.2 10.5
Nonwage Income 7.4 8.0 8.5 9.3 10.0 9.8 10.3 10.9 11.6
Real Personal Income (12$) 13.4 14.1 14.9 15.9 16.8 16.5 16.5 16.9 17.5 Pct Chg Year Ago 6.4 4.7 6.1 6.5 5.9 -2.2 0.2 2.5 3.2
Per Capita Income (Ths) 50.5 52.9 55.4 58.9 63.8 65.5 66.9 68.7 71.5
Real Per Capita Income (12$) 49.4 50.6 52.5 55.1 57.3 55.4 54.8 55.3 56.6
Average Annual Wage (Ths) 49.4 50.4 53.1 57.2 61.9 67.0 69.0 71.9 74.1
Pct Chg Year Ago 2.1 2.0 5.5 7.7 8.2 8.2 3.0 4.1 3.1
Establishment Employment (Place of Work, Thousands, SA)
Total Employment 112.9 115.6 118.3 116.1 122.3 125.3 124.7 122.9 123.4
Pct Chg Year Ago 1.9 2.4 2.3 -1.8 5.3 2.4 -0.5 -1.4 0.4
Manufacturing 3.3 3.0 3.2 3.4 3.4 3.5 3.4 3.2 3.1
Pct Chg Year Ago -6.9 -7.4 4.4 8.7 -0.9 1.7 -2.3 -5.5 -2.6
Nonmanufacturing 109.6 112.6 115.2 112.7 118.9 121.8 121.3 119.7 120.3
Pct Chg Year Ago 2.2 2.7 2.3 -2.1 5.5 2.5 -0.4 -1.3 0.5 Construction & Mining 6.6 6.9 6.9 7.0 7.3 7.4 6.9 6.5 6.3
Pct Chg Year Ago 2.4 4.7 -0.2 1.3 4.4 1.9 -6.6 -6.7 -2.9 Trade, Trans, & Utilities 20.5 21.1 21.2 20.5 21.4 22.2 21.8 21.0 20.3
Pct Chg Year Ago 2.3 2.8 0.5 -3.3 4.8 3.4 -1.5 -3.9 -3.0
Wholesale Trade 1.6 1.7 1.8 1.7 1.8 2.0 2.1 2.1 2.1
Retail Trade 16.9 17.2 17.1 16.5 17.1 17.6 17.2 16.3 15.6 Trans, Wrhsng, & Util 2.0 2.1 2.3 2.3 2.5 2.5 2.5 2.6 2.6 Information 1.1 1.2 1.3 1.3 1.3 1.5 1.4 1.3 1.3
Pct Chg Year Ago 14.9 6.5 4.8 -1.3 3.7 10.5 -0.9 -6.9 -0.2
Financial Activities 6.7 7.0 7.1 7.0 7.5 7.6 7.7 7.8 8.0
Pct Chg Year Ago 7.4 4.5 2.3 -2.3 7.6 1.2 2.2 1.3 1.9
Prof & Business Services 15.7 17.0 17.9 18.5 20.4 20.7 19.3 17.6 17.8 Pct Chg Year Ago 1.5 8.3 5.4 3.0 10.5 1.3 -6.5 -8.9 1.0
Educ & Health Services 11.9 11.9 12.5 12.3 12.4 12.8 13.1 13.6 13.8
Pct Chg Year Ago 1.0 -0.3 4.8 -1.6 1.4 3.1 2.3 3.8 1.4
Leisure & Hospitality 21.8 22.3 22.6 20.7 22.5 23.2 23.7 24.4 25.0 Pct Chg Year Ago 3.7 2.2 1.5 -8.6 8.9 3.1 2.0 2.9 2.6
Other Services 4.9 4.8 4.9 4.8 5.0 5.2 5.2 5.4 5.6
Pct Chg Year Ago -4.6 -1.7 2.3 -1.5 4.1 3.6 -0.1 3.8 5.1
Federal Government 8.7 8.7 8.9 9.2 9.3 9.5 9.9 9.8 9.7
Pct Chg Year Ago 0.0 0.6 2.1 3.5 1.3 1.8 4.2 -0.7 -1.1
State & Local Government 11.8 11.8 11.9 11.6 11.7 11.8 12.2 12.3 12.3
Pct Chg Year Ago 1.9 -0.1 1.3 -2.3 0.4 1.1 3.2 0.9 0.2
Other Economic Indicators
Population (Ths) 271.9 278.0 284.2 288.5 293.7 297.2 301.2 305.9 308.9
Pct Chg Year Ago 2.2 2.3 2.2 1.5 1.8 1.2 1.4 1.5 1.0
Labor Force (Ths) 123.4 125.3 127.7 127.6 132.8 134.9 137.4 137.3 137.3
Percent Change, Year Ago 1.1 1.6 1.9 -0.1 4.1 1.6 1.8 0.0 0.0
Unemployment Rate (%) 3.6 3.1 2.8 6.1 3.4 2.5 3.4 4.1 4.0
Total Housing Starts 2400.2
Single-Family 2083.7 2064.2
Multifamily 316.5
3762.9 3051.8 2125.8 2124.8 2198.9
2419.0 3353.2 2579.1 1690.3 1680.4 1744.9
409.7 472.7 435.6 444.5 453.9
CRESTVIEW - FT. WALTON BEACH - DESTIN Institute for Economic Forecasting 37
2017 2018 2019 2020 2021 2022 2023 2024 2025
2194.0 3170.9 2949.8
2364.5
129.8 806.5 530.8
Short Term Outlook for Crestview-Fort Walton Beach-Destin, FL August 2022 Forecast
2022:2 2022:3 2022:4 2023:1 2023:2 2023:3 2023:4 2024:1 2024:2 2024:3 2024:4 2025:1 2025:2
Personal Income (Billions $)
Total Personal Income 19.4 19.6 19.9 20.0 20.1 20.2 20.4 20.7 20.9 21.1 21.4 21.7 21.9
Pct Chg Year Ago 5.9 6.5 5.6 5.1 3.5 3.0 2.6 3.4 4.0 4.7 4.9 5.0 5.1
Wages and Salaries 9.6 9.8 9.8 9.9 9.9 9.9 10.0 10.0 10.1 10.2 10.3 10.4 10.4
Nonwage Income 9.7 9.8 10.1 10.1 10.2 10.3 10.4 10.6 10.8 10.9 11.1 11.3 11.5
Real Personal Income (12$) 16.5 16.5 16.5 16.5 16.5 16.5 16.6 16.7 16.8 17.0 17.1 17.3 17.4
Pct Chg Year Ago -0.5 0.1 -0.1 0.4 0.0 0.3 0.3 1.4 2.2 3.0 3.3 3.3 3.3
Per Capita Income (Ths) 65.3 65.9 66.6 66.7 66.8 66.9 67.3 67.9 68.3 69.0 69.7 70.4 71.1
Real Per Capita Income (12$) 55.5 55.3 55.4 55.1 54.8 54.7 54.7 55.0 55.1 55.5 55.8 56.1 56.4
Average Annual Wage (Ths) 67.0 67.6 68.0 68.4 68.6 69.1 70.0 70.9 71.6 72.2 72.8 73.4 73.8
Pct Chg Year Ago 9.4 8.0 4.8 4.2 2.5 2.3 3.0 3.7 4.3 4.5 3.9 3.5 3.1
Establishment Employment (Place of Work, Thousands, SA)
Total Employment 125.0 125.7 125.4 125.3 125.0 124.5 123.9 123.2 122.8 122.8 122.7 122.8 123.1
Pct Chg Year Ago 2.7 2.6 1.1 0.2 0.1 -0.9 -1.2 -1.6 -1.8 -1.4 -0.9 -0.4 0.2
Manufacturing 3.4 3.5 3.5 3.4 3.4 3.4 3.3 3.3 3.2 3.2 3.1 3.1 3.1
Pct Chg Year Ago 2.2 1.0 0.3 -1.6 -0.7 -2.5 -4.4 -4.8 -5.9 -5.9 -5.2 -4.1 -2.8
Nonmanufacturing 121.5 122.3 121.9 121.9 121.6 121.2 120.6 120.0 119.6 119.6 119.6 119.6 120.0
Pct Chg Year Ago 2.7 2.7 1.1 0.3 0.1 -0.9 -1.1 -1.6 -1.7 -1.3 -0.8 -0.3 0.3 Construction & Mining 7.5 7.5 7.3 7.2 7.0 6.8 6.7 6.6 6.5 6.4 6.4 6.3 6.3 Pct Chg Year Ago 2.5 2.3 -0.8 -3.7 -6.4 -8.3 -8.1 -8.2 -7.4 -6.2 -5.0 -3.9 -2.9
Trade, Trans, & Utilities 22.3 22.2 22.1 21.8 22.0 21.7 21.7 21.5 21.0 20.8 20.6 20.4 20.3 Pct Chg Year Ago 5.0 3.3 1.8 -1.0 -1.2 -2.2 -1.8 -1.8 -4.5 -4.3 -5.2 -5.0 -3.4
Wholesale Trade 2.0 2.1 2.1 2.1 2.1 2.1 2.1 2.1 2.1 2.1 2.1 2.1 2.1 Retail Trade 17.7 17.7 17.5 17.2 17.4 17.1 17.1 16.8 16.3 16.1 15.9 15.6 15.5 Trans, Wrhsng, & Util 2.5 2.5 2.5 2.5 2.5 2.5 2.5 2.5 2.6 2.6 2.6 2.6 2.6
Information 1.4 1.4 1.5 1.5 1.5 1.4 1.4 1.4 1.4 1.3 1.3 1.3 1.3
Pct Chg Year Ago 12.0 5.6 7.5 6.7 1.2 -2.5 -8.5 -10.0 -6.9 -5.4 -4.8 -3.5 -1.9
Financial Activities 7.5 7.5 7.6 7.8 7.8 7.7 7.7 7.8 7.8 7.9 7.9 8.0 8.0 Pct Chg Year Ago 0.3 -1.1 -1.2 -0.3 4.4 2.9 1.8 -0.1 0.5 1.9 2.8 2.8 2.2 Prof & Business Services 20.6 20.8 20.6 20.3 19.6 19.0 18.4 17.9 17.6 17.4 17.4 17.5 17.7 Pct Chg Year Ago 0.5 1.6 0.3 -1.7 -4.7 -8.6 -10.9 -11.8 -10.1 -8.1 -5.2 -2.3 0.3
Educ & Health Services 12.8 12.9 13.0 13.0 13.1 13.2 13.3 13.4 13.6 13.7 13.8 13.8 13.8 Pct Chg Year Ago 3.3 3.7 4.0 3.7 1.9 1.7 2.0 3.3 4.1 4.2 3.8 2.8 1.7
Leisure & Hospitality 23.3 23.3 22.9 23.1 23.5 24.0 24.1 24.1 24.3 24.5 24.6 24.6 24.9 Pct Chg Year Ago 3.7 4.5 -1.2 -1.2 0.8 3.3 5.1 4.3 3.5 1.8 2.2 2.5 2.6
Other Services 5.1 5.2 5.2 5.2 5.1 5.1 5.2 5.2 5.3 5.4 5.5 5.6 5.6
Pct Chg Year Ago 5.6 2.6 1.3 0.8 0.1 -1.0 -0.3 0.9 3.4 5.1 5.8 6.0 5.7
Federal Government 9.4 9.5 9.7 9.8 9.9 9.9 9.9 9.9 9.8 9.8 9.8 9.8 9.7 Pct Chg Year Ago 1.0 2.3 3.7 5.0 6.1 3.8 1.8 0.1 -0.9 -1.0 -1.0 -1.0 -1.1
State & Local Government 11.7 11.9 12.0 12.1 12.2 12.2 12.2 12.3 12.3 12.3 12.3 12.3 12.3 Pct Chg Year Ago 0.6 1.3 2.5 3.6 4.0 3.0 2.2 1.4 0.9 0.8 0.6 0.4 0.3
Other Economic Indicators
Population (Ths) 296.7 297.5 298.4 299.4 300.5 301.8 303.1 304.3 305.5 306.4 307.2 307.9 308.5
Pct Chg Year Ago 1.2 1.0 1.1 1.1 1.3 1.4 1.6 1.6 1.6 1.5 1.3 1.2 1.0 Labor Force (Ths) 134.3 135.1 136.2 136.9 137.4 137.5 137.5 137.5 137.4 137.3 137.3 137.2 137.3
Pct Chg Year Ago 1.4 1.7 2.3 2.1 2.3 1.8 1.0 0.4 -0.1 -0.2 -0.2 -0.2 -0.1
Unemployment Rate (%)
Total Housing Starts
Single-Family
Multifamily
CRESTVIEW - FT. WALTON BEACH - DESTIN 38 Florida & Metro Forecast / Summer 2022
2.3 2.4 2.7 2.9 3.2 3.5 3.8 4.0 4.1 4.1 4.2 4.1 4.0
3106.8 2670.3 2526.9 2199.0 2146.8 2123.6 2033.8 2055.2 2129.1 2143.6 2171.5 2196.6 2204.7
2703.2 2238.6 2037.8 1763.3 1679.9 1668.9 1649.0 1635.1 1678.1 1693.7 1714.6 1739.6 1749.1
403.7 431.7 489.1 435.7 466.9 454.8 384.9 420.0 450.9 449.9 456.9 456.9 455.6
PROFILES
The Deltona–Daytona–Ormond Beach MSA is comprised of Volusia and Flagler Counties. It is located on the east coast of Florida and is notable for special events that occur throughout the year such as Bike Week. It is home to NASCAR headquarters and the Daytona International Speedway, which hosts popular races such as the Daytona 500.
QUICK FACTS
• Metro population estimate of 646,288 as of 2019 (5-Year Estimate) (U.S. Census Bureau).
• Volusia County population estimate of 553,284 as of 2019 (5-Year Estimate) (U.S. Census Bureau).
•
Civilian labor force of 316,095 in July 2022 (Florida Research and Economic Database).
• An unemployment rate of 3.1% as of July 2022, not seasonally adjusted. This amounts to 9,733 unemployed people (Florida Research and Economic Database).
OUTLOOK SUMMARIES
Growth in the economic indicators studied in this forecast is expected to be mixed for the Deltona –Daytona – Ormond Beach Metropolitan Statistical Area (MSA). Gross Metro Product in the Deltona MSA will be $21,345.97 million, placing it 12th in the state for metro output. Personal income levels will grow by an average annual rate of 5.5 percent, driven by a 5.9 percent increase in the average annual wage to $56,800. Interestingly, though Deltona ranks second in average annual wage increase, it ranks second to last in average annual wage. Per capita income levels will come in at $44,300, placing it 19th out of the studied MSAs. We expect population growth of 1.6 percent per year.
The Deltona – Daytona – Ormond Beach MSA labor market will experience an average level of annual employment growth at 2.2 percent, the highest of the studied MSAs, leading to an unemployment rate of 4.9 percent.
The Leisure & Hospitality sector will experience the fastest growth rate in this MSA with an annual growth
rate of 6.3 percent. The Financial sector will follow at 4.1 percent. Deltona will see the largest contraction in growth in the Professional and Business Services sector, at -2.2%.
METRO NEWS SUMMARIES
Deltona may add fire fee to tax bills
• Deltona leaders are talking about requiring all property owners in Deltona — including churches and other tax-exempt organizations — to pay a yearly charge for fire protection.
• After expressions of angst, including a call to postpone the discussion, the City Commission on June 6 passed a resolution to take the first steps toward adding the fire fee.
• The fee, if ultimately adopted, would be placed on property-tax bills mailed in the fall to each property owner in Deltona. While single-family homes would likely pay a flat fee, the fees for businesses would probably be based on their square footage.
Source: The West Volusia Beacon, June 14, 2022
Revenue attracts capital in lodging industry
• The latest hospitality industry report is a repeat of last month with a sharp increase in bed tax collections showing lodging revenue continuing to grow in Volusia County.
• Bed tax collections were up 13.5% from a year ago as Volusia County set a record high for April. While much of it is still caused by inflation, it also is continuing to inflate the prices for lodging properties and sales.
• With the recently reported Ocean Court Motel sale in Daytona Beach Shores, Ely Silverstein of March & Millichap stated in a news release, “This is another example of out-of-area capital migrating into the Daytona Beach area. This deal is one of four beachfront Volusia County hotels we have scheduled to close within the next 60 days.”
Source: Hometown News Volusia, June 16, 2022
D ELTONA – D A y TONA B EACH – O RMOND B EACH Institute for Economic Forecasting 39
Volusia County back to OK, economically speaking
•
The jobs sector of the Volusia County economy has fully recovered from the hit it took with the Covid-19 pandemic, and even showed some improvement.
•
The average total employment in Volusia in 2001 was 174,997, up from 167,084 in 2020 and 174,185 in 2019, according to the just-released Annual Census of Employment and Wages. Average occupational wages never slowed down. They were at $47,395 in 2021, $44,395 in 2020 and $41,675 in 2019.
•
The biggest recovery in jobs, as one might expect, was in leisure and hospitality, with 26,637 in 2021, up from 23,770 in 2020. Of course, that’s also the lowest-paying job sector. More encouraging was the recovery in manufacturing jobs to 10,756 in 2021 from 9,930 in 2020.
Source: Hometown News Volusia, July 14, 2022
Tractor Supply eyes Ormond Beach for store
• Nationwide retailer Tractor Supply has confirmed plans to build a store in Ormond Beach.
• Tractor Supply also is working on a store in Daytona Beach on LPGA Boulevard in Timber Creek Village. Tractor Supply stores already are in DeLand, Deltona, and New Smyrna Beach.
• The Brentwood, a Tennessee-based company with 2,003 stores in 49 states, has discussed building a store in the 2000 block of West Granada Boulevard with the Ormond Beach Site Plan Review Committee.
Source: Hometown News Volusia, July 21, 2022
Ormond commissioner’s OK new car wash design
•
Pleased with the proposed changes to the exterior of the building, the Ormond Beach City Commission unanimously approved on Wednesday, Aug. 3, a rezoning and development order for a new full-service car wash.
•
The new “Splash Car Wash” will be built at 55 N. Nova Road, at the site of a former church.
• The property was rezoned from B-8 Commercial to a Planned Business Development. The current vacant church structure will be demolished.
Source: Ormond Beach Observer, August 3, 2022
Deltona State College holds groundbreaking ceremony for new classroom/ lab building on Deltona Campus
• Daytona State College kicked off the construction of a new multi-disciplinary classroom and laboratory building with a groundbreaking ceremony on its Deltona Campus.
• The facility, scheduled to open in Spring 2024, will be home to the college’s nursing, sonography, and high-tech CNC Machining programs, supporting up to 120 nursing students, up to 40 CNC training students, and up to 100 students in a new sonography program.
• The two-story, 30,000-square-foot building will include classrooms, medical simulation labs, offices, and space for CNC machining equipment.
Source: Deltona State College, August 17, 2022
D ELTONA – D A y TONA B EACH – O RMOND B EACH 40 Florida & Metro Forecast / Summer 2022
Deltona Daytona Beach Ormond Beach MSA Industry Location Quotients
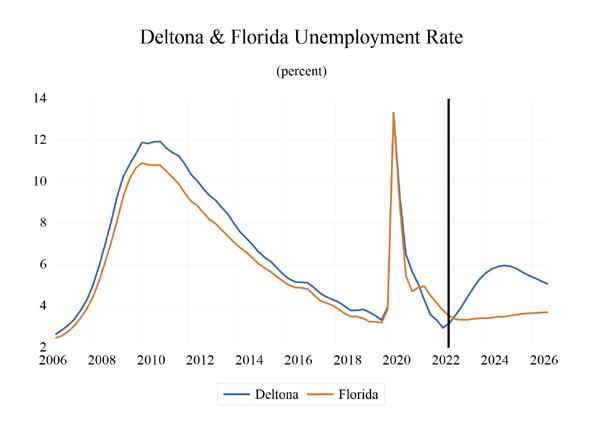
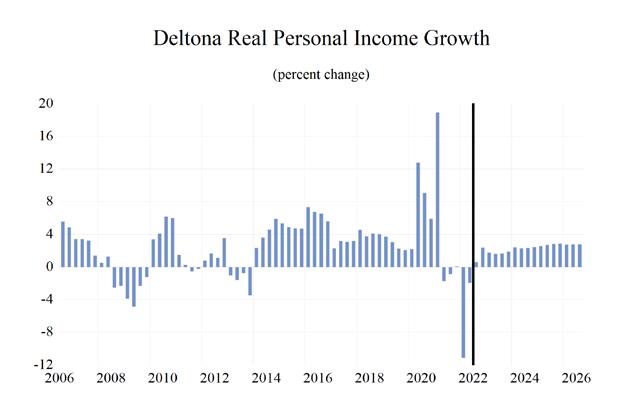
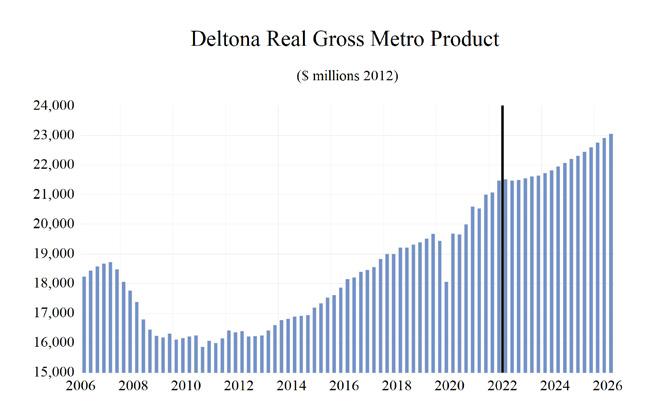
Total Nonagricultural Employment
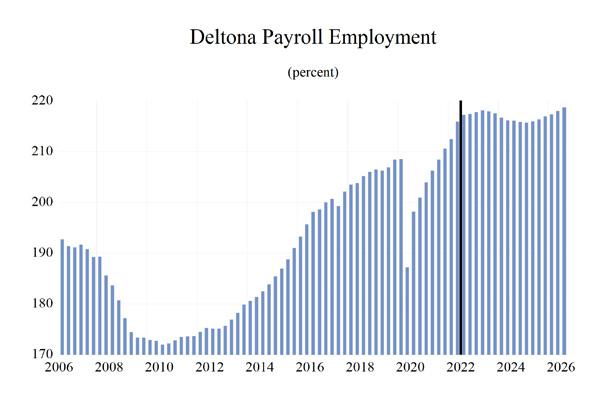
D ELTONA – D A y TONA B EACH – O RMOND B EACH Institute for Economic Forecasting 41 0.0 0.2 0.4 0.6 0.8 1.0 1.2 1.4
Total Private Goods Producing Service Producing Private Service Providing Mining, Logging, and Construction Manufacturing Trade, Transportation, and Utilities Wholesale Trade Retail Trade Transportation, Warehousing and Utilities Information Financial Activities Professional and Business Services Educational and Health Services Leisure and Hospitality Other Services Government
Long Term Outlook for Deltona-Daytona Beach-Ormond Beach, FL August 2022 Forecast
Personal Income (Billions $)
Total Personal Income 27.2 28.7 30.2 32.1 34.9 36.1 37.9 39.7 41.7
Pct Chg Year Ago 6.5 5.8 5.2 6.1 8.7 3.5 4.9 4.7 5.2
Wages and Salaries 8.4 8.9 9.3 9.5 10.9 12.3 12.7 13.1 13.6
Nonwage Income 18.7 19.9 21.0 22.6 24.0 23.8 25.2 26.5 28.1
Real Personal Income (12$) 25.9 27.2 28.7 30.1 31.4 30.6 31.1 32.0 33.0 Pct Chg Year Ago 4.8 5.0 5.4 4.8 4.4 -2.6 1.6 3.0 3.3
Per Capita Income (Ths) 42.2 44.0 45.7 47.7 50.8 51.6 53.2 54.8 57.0
Real Per Capita Income (12$) 40.3 41.7 43.3 44.7 45.7 43.7 43.6 44.2 45.2
Average Annual Wage (Ths) 41.7 43.1 44.5 47.5 52.2 56.5 58.1 60.4 62.7 Pct Chg Year Ago 2.7 3.2 3.4 6.7 9.8 8.4 2.8 3.9 3.8
Establishment Employment (Place of Work, Thousands, SA)
Total Employment 200.5 204.6 207.0 198.7 207.3 215.7 217.8 216.2 216.2
Pct Chg Year Ago 2.1 2.0 1.2 -4.0 4.3 4.1 1.0 -0.7 0.0
Manufacturing 11.6 11.8 11.4 10.7 11.4 12.4 12.4 11.6 11.2
Pct Chg Year Ago 0.9 1.2 -3.4 -6.2 7.0 8.7 -0.3 -6.6 -3.4
Nonmanufacturing 188.8 192.8 195.6 188.0 195.9 203.3 205.4 204.6 205.0
Pct Chg Year Ago 2.2 2.1 1.4 -3.9 4.2 3.8 1.0 -0.4 0.2 Construction & Mining 12.9 13.8 14.2 14.0 14.2 14.4 13.7 13.0 12.7
Pct Chg Year Ago 6.6 6.9 2.7 -1.4 1.3 1.4 -5.0 -4.8 -2.1 Trade, Trans, & Utilities 38.4 39.1 39.5 38.9 42.2 43.6 43.1 41.4 40.2
Pct Chg Year Ago 3.4 1.8 1.0 -1.5 8.6 3.4 -1.3 -4.0 -2.9
Wholesale Trade 5.1 5.2 5.2 4.9 5.1 5.3 5.5 5.6 5.8 Retail Trade 30.6 30.9 31.0 30.2 31.6 32.3 31.5 29.6 28.4 Trans, Wrhsng, & Util 2.7 3.0 3.3 3.7 5.5 6.1 6.1 6.1 6.0
Information 2.4 2.4 2.4 2.0 1.8 2.0 2.0 2.1 2.2
Pct Chg Year Ago -3.3 0.1 -0.7 -16.7 -8.7 7.2 3.4 1.6 4.0
Financial Activities 8.4 8.5 8.7 9.0 9.6 9.9 10.5 10.6 10.7
Pct Chg Year Ago -1.9 0.9 2.2 4.2 5.9 3.9 5.3 1.1 0.7
Prof & Business Services 23.7 23.2 23.4 23.0 23.2 24.2 23.0 20.9 20.9
Pct Chg Year Ago 1.3 -2.4 1.1 -1.7 0.8 4.1 -4.9 -8.9 0.0
Educ & Health Services 38.8 39.8 40.7 39.8 40.3 41.4 43.1 45.1 46.1
Pct Chg Year Ago 2.2 2.5 2.2 -2.3 1.4 2.5 4.3 4.5 2.3
Leisure & Hospitality 31.4 33.0 32.9 27.8 30.9 33.2 34.5 35.5 35.9
Pct Chg Year Ago 1.5 5.0 -0.3 -15.4 11.0 7.6 3.8 2.9 1.3
Other Services 9.0 9.0 8.9 8.2 8.3 8.5 8.9 9.4 9.8
Pct Chg Year Ago 2.0 0.1 -0.8 -7.9 0.9 3.1 3.9 5.5 4.7
Federal Government 1.4 1.4 1.5 1.6 1.5 1.5 1.5 1.5 1.5
Pct Chg Year Ago 5.0 0.7 5.3 5.3 -6.0 -1.9 4.1 -1.0 -0.7
State & Local Government 22.3 22.6 23.4 23.6 23.8 24.6 25.2 25.2 25.1
Pct Chg Year Ago 1.4 1.4 3.7 1.0 0.8 3.2 2.3 0.3 -0.6
Other Economic Indicators
Population (Ths) 643.5
686.7 700.2 712.4 723.3 731.5
Pct Chg Year Ago 1.8 1.5 1.4 1.6 2.1 2.0 1.7 1.5 1.1
Labor Force (Ths) 293.7 297.0 299.3
Percent Change, Year Ago
Unemployment Rate (%)
Total Housing Starts
Single-Family
Multifamily
D ELTONA – D A y TONA B EACH – O RMOND B EACH 42 Florida & Metro Forecast / Summer 2022
2017 2018 2019 2020 2021 2022 2023 2024 2025
653.0 662.4 672.9
295.8 302.7 310.4 316.7 317.0 316.9
1.1 1.1 0.8 -1.2 2.3 2.5 2.0 0.1 0.0
4.6 3.9 3.6 8.3 4.7 3.2 4.6 5.8 5.7
3078.4 3563.6 4516.9 5812.9 5590.7 7740.9 5740.4 4884.1 4989.1
2856.9 3270.8 3871.8 4650.6 5369.0 5522.6 3975.9 3632.2 3727.2
221.5 292.9 645.2 1162.3 221.6 2218.3 1764.5 1251.9 1261.9
Short Term Outlook for Deltona-Daytona Beach-Ormond Beach, FL August 2022 Forecast 2022:2 2022:3
Personal Income (Billions $)
Total Personal Income 35.9 36.4 37.0 37.3 37.7 38.0 38.5 39.0 39.4 39.9 40.4 41.0 41.5
Pct Chg Year Ago 5.4 6.0 6.1 6.3 4.8 4.6 4.0 4.3 4.5 4.9 5.0 5.2 5.3
Wages and Salaries 12.3 12.4 12.5 12.6 12.7 12.8 12.9 13.0 13.1 13.2 13.3 13.4 13.5
Nonwage Income 23.7 23.9 24.5 24.7 25.0 25.3 25.6 26.0 26.3 26.7 27.1 27.5 27.9
Real Personal Income (12$) 30.6 30.5 30.8 30.8 31.0 31.1 31.3 31.6 31.8 32.1 32.4 32.7 32.9
Pct Chg Year Ago -1.0 -0.4 0.3 1.5 1.2 1.9 1.7 2.4 2.7 3.2 3.4 3.5 3.5
Per Capita Income (Ths) 51.4 51.8 52.5 52.7 53.0 53.3 53.7 54.1 54.5 55.1 55.6 56.2 56.8
Real Per Capita Income (12$) 43.8 43.5 43.7 43.6 43.6 43.6 43.7 43.9 44.0 44.3 44.6 44.9 45.1
Average Annual Wage (Ths) 56.5 57.0 57.2 57.6 57.8 58.2 58.9 59.5 60.1 60.7 61.3 61.9 62.4 Pct Chg Year Ago 9.7 7.6 4.0 3.7 2.4 2.2 3.1 3.3 3.9 4.3 4.0 4.1 3.8
Establishment Employment (Place of Work, Thousands, SA)
Total Employment 215.9 217.2 217.4 217.7 218.1 217.9 217.5 216.7 216.2 216.1 215.8 215.7 215.9
Pct Chg Year Ago 4.7 4.2 3.2 2.5 1.0 0.3 0.0 -0.5 -0.9 -0.8 -0.8 -0.5 -0.1
Manufacturing 12.3 12.5 12.7 12.6 12.5 12.3 12.1 11.9 11.7 11.4 11.3 11.2 11.2
Pct Chg Year Ago 10.5 8.2 7.6 4.9 1.3 -1.8 -5.2 -6.2 -6.6 -6.9 -6.6 -5.5 -4.2
Nonmanufacturing 203.5 204.7 204.6 205.1 205.6 205.6 205.4 204.8 204.5 204.7 204.5 204.4 204.7
Pct Chg Year Ago 4.3 4.0 3.0 2.4 1.0 0.5 0.4 -0.1 -0.5 -0.5 -0.4 -0.2 0.1
Construction & Mining 14.4 14.5 14.2 14.0 13.8 13.6 13.4 13.2 13.0 13.0 12.9 12.8 12.8
Pct Chg Year Ago 2.2 1.7 -0.8 -3.6 -4.3 -6.2 -5.8 -5.9 -5.4 -4.4 -3.7 -2.8 -2.1
Trade, Trans, & Utilities 44.0 43.6 43.4 43.0 43.4 43.1 43.0 42.3 41.4 41.1 40.7 40.3 40.1
Pct Chg Year Ago 4.8 3.1 1.3 -1.5 -1.4 -1.2 -0.9 -1.5 -4.5 -4.6 -5.3 -4.8 -3.2
Wholesale Trade 5.3 5.3 5.4 5.5 5.5 5.5 5.6 5.6 5.6 5.7 5.7 5.7 5.8 Retail Trade 32.6 32.1 31.9 31.3 31.7 31.4 31.3 30.6 29.7 29.3 28.9 28.5 28.3 Trans, Wrhsng, & Util 6.2 6.1 6.1 6.1 6.1 6.1 6.1 6.1 6.1 6.1 6.0 6.0 6.0
Information 2.0 2.0 2.0 2.1 2.0 2.0 2.0 2.1 2.1 2.1 2.1 2.1 2.1
Pct Chg Year Ago 8.8 3.7 6.0 6.4 4.3 3.3 -0.3 -0.6 2.3 2.7 2.2 2.5 2.9
Financial Activities 9.8 10.0 10.1 10.4 10.5 10.5 10.5 10.5 10.6 10.6 10.7 10.7 10.7 Pct Chg Year Ago 2.4 3.9 4.7 6.5 7.2 4.5 3.1 0.5 0.6 1.6 1.9 1.8 1.0
Prof & Business Services 24.2 24.5 24.4 24.1 23.3 22.6 21.9 21.4 21.0 20.7 20.6 20.7 20.8 Pct Chg Year Ago 4.9 5.5 4.3 2.3 -3.9 -7.7 -10.2 -11.3 -9.8 -8.3 -6.1 -3.5 -1.0
Educ & Health Services 41.1 41.6 42.2 42.6 43.0 43.3 43.7 44.4 44.9 45.4 45.7 45.9 46.1 Pct Chg Year Ago 1.9 3.1 4.8 5.1 4.5 4.0 3.6 4.2 4.5 4.8 4.4 3.6 2.6
Leisure & Hospitality 33.7 33.8 33.1 33.5 34.2 35.1 35.2 35.1 35.5 35.7 35.7 35.7 35.9 Pct Chg Year Ago 8.5 8.4 3.0 3.9 1.5 3.8 6.1 4.8 3.8 1.7 1.6 1.5 1.2
Other Services 8.5 8.6 8.7 8.8 8.8 8.9 9.0 9.2 9.3 9.4 9.6 9.7 9.8 Pct Chg Year Ago 1.6 4.3 4.7 5.5 4.2 2.9 3.0 3.7 5.5 6.4 6.3 5.8 5.1
Federal Government 1.4 1.5 1.5 1.5 1.5 1.5 1.5 1.5 1.5 1.5 1.5 1.5 1.5 Pct Chg Year Ago -5.2 0.2 1.5 3.2 6.7 4.5 2.0 -0.1 -1.5 -1.3 -1.0 -0.8 -0.6
State & Local Government 24.5 24.7 24.8 25.0 25.2 25.2 25.2 25.2 25.2 25.2 25.2 25.1 25.1
Pct Chg Year Ago 5.0 1.5 2.3 3.1 2.6 2.0 1.5 0.8 0.2 0.2 -0.1 -0.3 -0.5
Other Economic Indicators
Population (Ths) 698.7 701.8
716.7 719.6 722.2 724.7 726.9 728.7 730.6
Pct Chg Year Ago 1.9 2.0 1.9 1.8 1.8 1.7 1.7 1.6 1.6 1.5 1.4 1.3 1.2 Labor Force (Ths) 309.0 310.9 313.7 315.5 316.8 317.2 317.4 317.3 317.1 316.9 316.9 316.8 316.8 Pct Chg Year Ago 2.5 2.1 2.7 2.5 2.5 2.0 1.2 0.5 0.1 -0.1 -0.2 -0.2 -0.1
Unemployment Rate (%)
Total Housing Starts
Single-Family
Multifamily
1236.1 1249.8 1243.3
D ELTONA – D A y TONA B EACH – O RMOND B EACH Institute for Economic Forecasting 43
2022:4 2023:1 2023:2 2023:3 2023:4 2024:1 2024:2 2024:3 2024:4 2025:1 2025:2
704.9 708.0 710.9 713.9
3.0 3.2 3.5 3.9 4.4 4.9 5.3 5.6 5.8 5.9 6.0 5.9 5.8
9115.9 7858.2 7389.3 6284.7 5788.0 5612.8 5275.9 4921.4 4827.3 4865.1 4922.6 4968.9 5005.0
6294.5 5189.5 4818.2 4261.5 3986.5 3873.0 3782.5 3627.8 3599.2 3629.0 3672.9 3725.6 3739.9
2821.4 2668.6 2571.1 2023.1 1801.5 1739.9 1493.4 1293.6 1228.1
1265.1
PROFILES
The Broward County MSA Is located in Southeastern Florida. It is estimated to be the second-most populous county in the State of Florida and the 17th Most populous county in the United States.
QUICK FACTS
• Metro population estimate of 1,952,778 as of 2019 (5-Year Estimate) (U.S. Census Bureau).
•
Broward County population estimate of 1,952,778 as of 2019 (5-Year Estimate) (U.S. Census Bureau).
•
Civilian labor force of 1,071,543 in July 2022 (Florida Research and Economic Database).
•
An unemployment rate of 2.9% as of July 2022, not seasonally adjusted. This amounts to 30,619 unemployed people (Florida Research and Economic Database).
OUTLOOK SUMMARIES
The Fort Lauderdale–Pompano Beach area is expected to show low levels of growth in the economic indicators. Personal income is expected to grow an average of 3.7 percent annually, the second lowest of the MSAs. It will experience an average real per capita income level of $47,600. Average annual wage growth will be 4.0 percent. The annual wage level is expected to be $77,400, the second highest of the studied areas. Fort Lauderdale is expected to average a population growth of 0.7 percent each year. The area has the fifth highest Gross Metro Product of the MSAs studied at an average level of $103,183.63 million.
Employment is expected to grow at an average rate of 0.6 percent each year, while Unemployment is expected to be 4.9 percent.
Fort Lauderdale’s fastest growing sector is expected to be the Leisure sector, which will experience 4.9 percent average annual growth, followed by the Other Services sector which will grow at an average of 4.0 percent annually.
METRO NEWS SUMMARIES
Fort Lauderdale Commission votes to move forward with Boring Co. Proposal
• In June, the Fort Lauderdale commission agreed to pay Texas-based Boring Co. $375,000 to map out the route of the proposed Las Olas Loop and determine what the final cost would be to taxpayers.
•
According to the proposal, the Las Olas Loop would consist of a 2.4-2.7 mile underground tunnel with up to three stations that would connect Fort Lauderdale with Fort Lauderdale Beach. Compared to surface transportation, the tunnel “offers reduced costs, less surface disruption during construction and operations, fewer right-of-way acquisitions and faster construction time,” the proposal states.
• According to the proposal, the Boring tunnel can be expanded to connect with other destinations and transit systems in Fort Lauderdale.. This could include extending the tunnel to provide service to Fort Lauderdale International Airport, Port Everglades and the Fort Lauderdale Tri-Rail station.
Source: South Florida Business Journal, June 13, 2022
30-story apartment tower proposed in Flagler Village
• The 30-story Flagler Sky View apartments have been proposed in the Flagler Village neighborhood in Fort Lauderdale.
• Totaling 441,654 square feet, Flagler Sky View would have 270 apartments, 2,680 square feet of commercial space and 322 parking spaces. There would be coworking space on the first floors and an amenity deck with a pool on the seventh floor.
• There’s been a boom of multifamily development in Flagler Village as people aim to live near downtown Fort Lauderdale. With rents rising at record levels, developers are eager to move forward with apartment projects.
Source: South Florida Business Journal, June 13, 2022
F ORT L AUDERDALE - P OMPANO B EACH - S UNRISE 44 Florida & Metro Forecast / Summer 2022
BHG Financial Expands Headquarters in Fort Lauderdale.
•
Fintech firm BHG Financial is in the process of increasing its floor plan on the 11th floor at 201 E. Las Olas Blvd. to 10,000 square feet from 3,000 square feet, said Jasmine Heard, communications coordinator for the company. The firm plans on adding an additional 100 jobs at the office.
• BHG Financial, originally known as Bankers Healthcare Group, was founded in Davie 21 years ago. BHG arranges loans for healthcare professionals and companies via a state-of-the-art loan delivery platform.
• Completed last year, the office space at The Main Las Olas is among the newest in the city of Fort Lauderdale. As such, the building has attracted several companies and firms, and is at least 93% leased, according to Blanca Commercial Real Estate, the commercial brokerage that represents landlords Stiles Corp. and San Francisco-based real estate company Shorenstein.
Source: South Florida Business Journal, July 22, 2022
Kushner/Aimco proposes tallest tower in Fort Lauderdale for the second time
• Kushner Cos. and Aimco revealed plans for the tallest tower in Fort Lauderdale as the second phase of their project on West Broward Boulevard. The multifamily project is part of a push to expand the downtown density west of the Florida East Coast Railway. Their first phase in the project would break the height record for the city, and this second phase would exceed it again.
• In January, the partners paid a combined $49 million for 4.2 acres on West Broward Boulevard. They recently obtained approval to develop the site at 300 W. Broward Blvd. with the city’s tallest building, rising 48 stories, or nearly 546 feet. That would top the 100 Las Olas condo, which measures 499 feet in 46 stories.
•
Totaling 618,084 square feet, the tower at 200 W. Broward Blvd. would have 381 apartments, 7,527 square feet of commercial space and 434 parking spaces. Apartments would range from 630 to 1,870 square feet. There would be 36 studio apartments, 96 one-bedroom units, 44 one-bedroom units with dens, 117 two-bedroom units, 44 two-bedroom units with dens, eight
three-bedroom units, and 36 three-bedroom units with dens.
Source: South Florida Business Journal, July 25, 2022
HTG proposes affordable housing deal with Fort Lauderdale
• The city’s Community Redevelopment Agency on Aug. 16 will consider a $5 million Development Incentive Program (DIP) loan for Sistrunk View LLC. The LLC is a partnership between Miamibased HTG, Elite Equity Development, and Greg Brewton and Associates.
• “The city of Fort Lauderdale is rapidly becoming less affordable for its residents, with new luxury and market rate developments slowly displacing local residents,” the developers said in a statement. “Sistrunk View’s proposal focuses on utilizing this CRA asset to maximize the number of much-needed affordable housing stock to this prime downtown location.”
• All of the apartments would be affordable housing for at least 50 years. There would be 16 units for households making up to 30% of area median income, 42 units for households making up to 60% of area median income, and 48 units for households making up to 80% of area median income.
Source: South Florida Business Journal, August 15, 2022
JetBlue cutting 12 routes from Fort Lauderdale airport
• New York-based JetBlue, which in late July agreed to buy South Florida’s Spirit Airlines for $3.8 billion in cash, confirmed it will be cutting 37 routes from its airline service network, including 12 from Fort Lauderdale-Hollywood International Airport.
• Some of the destinations affected by the route cancellations are Chicago, Philadelphia, Seattle, and Aruba.
• Before announcing the route cuts, JetBlue was the second-largest airline at Fort Lauderdale airport based on market share. Discount airline Spirit, which on July 28 agreed to be sold to JetBlue ending a monthslong bidding war between Frontier Airlines and JetBlue, is the leading carrier there.
Source: Miami Herald, August 18, 2022
F ORT L AUDERDALE - P OMPANO B EACH - S UNRISE Institute for Economic Forecasting 45
Broward County MSA Industry Loca�on Quo�ents

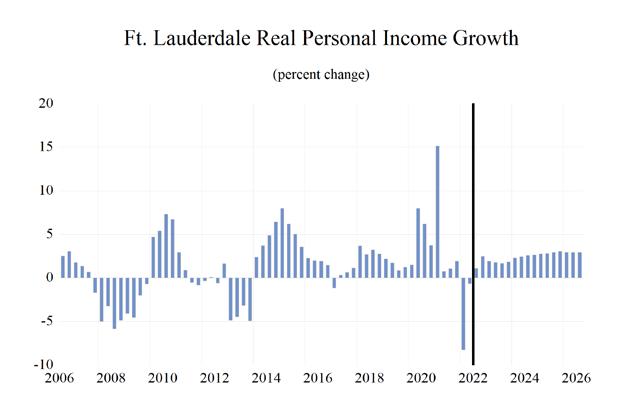

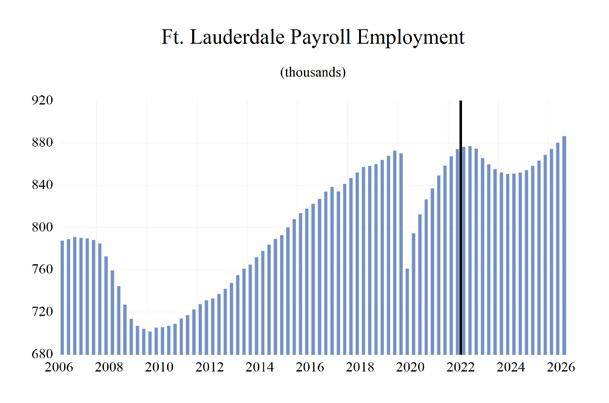
F ORT L AUDERDALE - P OMPANO B EACH - S UNRISE 46 Florida & Metro Forecast / Summer 2022 0 0.2 0.4 0.6 0.8 1 1.2 1.4 1.6 Total Nonagricultural Employment Total Private Goods Producing Service Producing Private Service Providing Mining, Logging, and Construc�on Manufacturing Trade, Transporta�on, and U�li�es Wholesale Trade Retail Trade Transporta�on, Warehousing and U�li�es Informa�on Financial Ac�vi�es Professional and Business Services Educa�onal and Health Services Leisure and Hospitality Other Services Government
Long Term Outlook for Fort Lauderdale-Pompano Beach-Deerfield Beach, FL (Division of Miami MSA) August 2022 Forecast
Personal Income (Billions $)
Total Personal Income 93.7 98.3 103.4 109.5 119.6 124.7 128.2 131.9 138.5
Pct Chg Year Ago 5.0 4.9 5.2 5.9 9.3 4.3 2.8 2.9 5.0
Wages and Salaries 46.4 49.1 51.5 51.9 58.5 65.0 66.0 67.0 70.0
Nonwage Income 47.3 49.2 51.8 57.6 61.1 59.7 62.2 64.9 68.5
Real Personal Income (12$) 81.4 82.5 86.3 89.5 93.9 92.2 91.7 92.8 95.7 Pct Chg Year Ago 2.4 1.4 4.6 3.7 4.9 -1.8 -0.5 1.2 3.1
Per Capita Income (Ths) 48.6 50.6 53.1 56.4 62.0 64.6 66.0 67.2 69.9
Real Per Capita Income (12$) 42.1 42.5 44.3 46.1 48.7 47.7 47.2 47.3 48.3
Average Annual Wage (Ths) 55.2 57.2 59.3 63.9 69.1 74.1 76.1 78.4 80.9 Pct Chg Year Ago 3.4 3.7 3.5 7.8 8.2 7.2 2.8 3.0 3.2
Establishment Employment (Place of Work, Thousands, SA)
Total Employment 837.1 853.6 866.2 809.6 842.9 873.7 863.8 851.5 861.2
Pct Chg Year Ago 2.1 2.0 1.5 -6.5 4.1 3.7 -1.1 -1.4 1.1
Manufacturing 27.5 28.1 29.0 27.5 28.1 29.4 28.8 27.3 26.6
Pct Chg Year Ago -0.3 2.1 3.2 -5.1 2.3 4.7 -2.0 -5.3 -2.5
Nonmanufacturing 809.6 825.5 837.2 782.1 814.8 844.3 835.0 824.2 834.6 Pct Chg Year Ago 2.1 2.0 1.4 -6.6 4.2 3.6 -1.1 -1.3 1.3 Construction & Mining 46.7 48.6 50.0 48.9 48.6 48.4 45.9 44.7 45.1
Pct Chg Year Ago 5.5 4.2 2.8 -2.1 -0.7 -0.4 -5.2 -2.4 0.9 Trade, Trans, & Utilities 187.4 192.6 195.4 185.9 193.2 201.0 199.3 195.9 194.5
Pct Chg Year Ago 1.0 2.8 1.4 -4.9 3.9 4.1 -0.9 -1.7 -0.7
Wholesale Trade 48.5 49.8 51.1 49.7 50.6 53.3 54.0 55.6 57.4 Retail Trade 110.3 111.8 111.2 103.1 106.4 108.6 105.9 100.5 96.5 Trans, Wrhsng, & Util 28.5 31.0 33.1 33.1 36.2 39.1 39.3 39.9 40.5
Information 20.1 20.1 19.8 18.8 20.4 21.7 21.6 21.1 21.6 Pct Chg Year Ago 4.1 -0.3 -1.4 -5.2 8.9 6.3 -0.3 -2.6 2.6
Financial Activities 60.2 61.7 64.8 63.7 65.1 66.3 65.6 67.4 69.2 Pct Chg Year Ago 1.9 2.6 4.9 -1.6 2.1 2.0 -1.0 2.6 2.7
Prof & Business Services 148.5 151.8 153.5 146.7 157.2 164.2 148.3 132.0 135.2 Pct Chg Year Ago 3.3 2.2 1.1 -4.4 7.1 4.5 -9.7 -11.0 2.4
Educ & Health Services 110.3 111.2 112.5 108.1 110.3 110.6 112.4 117.5 121.1 Pct Chg Year Ago 4.0 0.9 1.1 -3.9 2.1 0.3 1.6 4.6 3.0
Leisure & Hospitality 94.4 96.0 97.5 75.9 85.8 96.8 105.2 104.7 103.3
Pct Chg Year Ago 0.4 1.7 1.6 -22.2 13.1 12.8 8.6 -0.4 -1.4
Other Services 38.3 38.0 37.4 31.4 32.9 34.9 35.5 37.0 38.4
Pct Chg Year Ago 0.1 -0.7 -1.7 -15.9 4.6 6.1 1.8 4.0 3.9
Federal Government 6.9 7.0 7.0 7.4 7.0 6.8 6.6 6.7 7.0
Pct Chg Year Ago 1.1 0.9 0.5 5.8 -5.1 -4.0 -3.0 2.8 3.3
State & Local Government 96.9 98.5 99.4 95.2 94.3 93.5 94.6 97.2 99.3
Pct Chg Year Ago 1.2 1.6 1.0 -4.2 -1.0 -0.8 1.2 2.7 2.2
Other Economic Indicators
Population (Ths)
1930.4 1941.3 1946.0 1939.7 1929.9 1931.1 1943.0 1961.9 1982.8
Pct Chg Year Ago 1.0 0.6 0.2 -0.3 -0.5 0.1 0.6 1.0 1.1
Labor Force (Ths) 1014.2 1024.0 1032.5 1021.2 1028.0 1045.8 1058.0 1071.3 1084.9
Percent Change, Year Ago 1.2 1.0 0.8 -1.1 0.7 1.7 1.2 1.3 1.3
Unemployment Rate (%) 4.0 3.5 3.1 9.6 4.9 3.3 4.7 5.8 5.6
Total Housing Starts
Single-Family 1778.8
Multifamily
2982.2
4589.1 3451.6 4567.7 3817.1 4766.2 5223.6
1425.4 1667.0 1546.1 1423.6 1583.2 1715.9
3163.7 1784.6 3021.6 2393.5 3183.0 3507.7
F ORT L AUDERDALE - P OMPANO B EACH - S UNRISE Institute for Economic Forecasting 47
2017 2018 2019 2020 2021 2022 2023 2024 2025
4332.5
4346.6
1498.3 1656.4
2553.7 1483.9 2690.2
Short Term Outlook for Fort Lauderdale-Pompano Beach-Deerfield Beach, FL (Division of Miami MSA) August 2022 Forecast 2022:2 2022:3 2022:4 2023:1 2023:2 2023:3 2023:4 2024:1 2024:2 2024:3 2024:4 2025:1 2025:2
Personal Income (Billions $)
Total Personal Income 123.9 125.4 127.5 127.9 127.8 128.2 128.9 130.0 131.2 132.5 134.0 135.9 137.6 Pct Chg Year Ago 5.8 6.5 5.8 4.8 3.2 2.2 1.0 1.7 2.6 3.3 4.0 4.5 4.9
Wages and Salaries 64.7 65.5 66.0 66.2 65.9 65.9 66.1 66.3 66.7 67.3 67.9 68.7 69.5
Nonwage Income 59.2 59.9 61.6 61.7 61.9 62.3 62.8 63.7 64.4 65.2 66.1 67.2 68.1
Real Personal Income (12$) 92.0 91.9 92.6 92.2 91.7 91.5 91.5 92.0 92.5 93.1 93.7 94.6 95.3
Pct Chg Year Ago -0.6 0.1 0.0 0.0 -0.3 -0.5 -1.2 -0.2 0.9 1.7 2.4 2.8 3.1
Per Capita Income (Ths) 64.2 64.9 66.0 66.0 65.9 65.9 66.1 66.5 66.9 67.5 68.1 68.8 69.5
Real Per Capita Income (12$) 47.6 47.6 47.9 47.6 47.2 47.0 46.9 47.1 47.2 47.4 47.6 47.9 48.1
Average Annual Wage (Ths) 73.7 74.4 74.9 75.4 75.9 76.4 76.9 77.5 78.1 78.7 79.4 80.0 80.7
Pct Chg Year Ago 8.0 6.7 3.4 2.8 2.9 2.6 2.7 2.8 3.0 3.0 3.1 3.3 3.3
Establishment Employment (Place of Work, Thousands, SA)
Total Employment 874.2 876.3 877.0 874.7 865.7 859.7 855.3 852.2 850.7 851.1 852.1 854.4 858.4
Pct Chg Year Ago 4.4 3.2 2.1 0.8 -1.0 -1.9 -2.5 -2.6 -1.7 -1.0 -0.4 0.3 0.9
Manufacturing 29.3 29.5 29.7 29.4 29.0 28.7 28.3 27.9 27.5 27.1 26.8 26.6 26.6
Pct Chg Year Ago 5.3 4.4 3.6 0.6 -1.1 -2.9 -4.7 -5.0 -5.1 -5.6 -5.5 -4.6 -3.3
Nonmanufacturing 844.9 846.8 847.3 845.3 836.7 831.0 826.9 824.3 823.2 824.0 825.4 827.8 831.8
Pct Chg Year Ago 4.4 3.1 2.1 0.8 -1.0 -1.9 -2.4 -2.5 -1.6 -0.8 -0.2 0.4 1.0 Construction & Mining 48.6 48.4 47.4 46.8 46.0 45.5 45.1 44.9 44.7 44.7 44.7 44.8 45.0
Pct Chg Year Ago 0.1 0.2 -2.5 -4.9 -5.3 -6.0 -4.7 -4.0 -2.8 -1.9 -1.0 -0.1 0.7
Trade, Trans, & Utilities 201.8 200.5 201.2 200.0 199.9 198.5 198.7 197.7 195.8 195.3 194.7 194.0 193.9 Pct Chg Year Ago 5.7 3.1 2.1 -0.3 -1.0 -1.0 -1.2 -1.2 -2.0 -1.6 -2.0 -1.8 -1.0
Wholesale Trade 53.3 53.7 53.7 54.0 53.9 53.9 54.2 54.7 55.3 55.9 56.4 56.8 57.3 Retail Trade 109.4 107.5 108.1 106.3 106.7 105.5 105.3 103.4 100.7 99.5 98.2 96.8 96.1 Trans, Wrhsng, & Util 39.1 39.3 39.5 39.7 39.3 39.1 39.3 39.5 39.9 40.0 40.1 40.4 40.5
Information 21.5 21.8 22.2 22.3 21.8 21.4 21.0 21.0 21.2 21.1 21.0 21.3 21.6 Pct Chg Year Ago 7.9 3.0 4.3 4.2 1.6 -1.8 -5.2 -5.9 -3.0 -1.1 0.0 1.1 1.8
Financial Activities 65.8 66.3 66.1 66.2 65.4 65.3 65.6 66.2 67.1 67.8 68.3 68.8 69.1 Pct Chg Year Ago 2.4 1.2 0.2 -1.3 -0.7 -1.4 -0.8 0.1 2.6 3.8 4.1 3.9 3.0
Prof & Business Services 166.1 165.5 163.3 159.3 150.8 144.4 138.9 134.9 132.2 130.4 130.4 131.5 133.5 Pct Chg Year Ago 6.8 4.9 1.8 -1.7 -9.2 -12.8 -14.9 -15.3 -12.3 -9.7 -6.1 -2.5 1.0
Educ & Health Services 109.7 110.7 111.1 111.6 111.7 112.5 113.6 115.4 117.0 118.3 119.4 120.3 120.9 Pct Chg Year Ago -0.7 0.3 0.7 0.7 1.9 1.6 2.3 3.4 4.7 5.2 5.0 4.3 3.3
Leisure & Hospitality 97.1 98.4 100.1 103.0 105.2 106.6 105.9 105.0 104.8 104.8 104.3 103.5 103.5 Pct Chg Year Ago 12.8 10.9 10.0 12.3 8.3 8.4 5.8 1.9 -0.3 -1.7 -1.5 -1.4 -1.3
Other Services 34.8 35.3 35.5 35.6 35.4 35.4 35.8 36.2 36.7 37.2 37.7 38.1 38.3 Pct Chg Year Ago 6.3 5.9 4.9 4.7 1.6 0.3 0.6 1.8 3.9 5.2 5.4 5.1 4.4
Federal Government 6.7 6.7 6.6 6.5 6.5 6.6 6.6 6.7 6.7 6.8 6.8 6.9 6.9 Pct Chg Year Ago -4.0 -4.5 -6.2 -7.0 -3.4 -1.7 0.4 1.7 3.0 3.3 3.3 3.3 3.3 State & Local Government 92.8 93.2 93.8 94.0 94.1 94.8 95.6 96.3 97.0 97.5 98.0 98.6 99.1 Pct Chg Year Ago -1.2 -1.2 -0.6 -0.2 1.4 1.8 1.9 2.4 3.0 2.8 2.6 2.4 2.2
Other Economic Indicators
Population (Ths) 1930.3 1931.7 1933.5 1936.6 1940.7 1944.9 1949.7 1954.4 1959.3 1964.3 1969.7 1975.1 1980.3 Pct Chg Year Ago 0.0 0.2 0.3 0.4 0.5 0.7 0.8 0.9 1.0 1.0 1.0 1.1 1.1 Labor Force (Ths) 1047.9 1045.8 1048.5 1053.1 1055.7 1059.5 1063.6 1066.7 1069.7 1072.7 1076.0 1079.2 1082.9 Pct Chg Year Ago
Unemployment Rate (%)
Total Housing Starts
Single-Family
3117.5 3308.8 3425.1 3438.1 3497.7
1610.6 1650.9 1689.6 1713.1 Multifamily
F ORT L AUDERDALE - P OMPANO B EACH - S UNRISE 48 Florida & Metro Forecast / Summer 2022
2.2 1.2 1.4 1.2 0.7 1.3 1.4 1.3 1.3 1.2 1.2 1.2 1.2
3.1 3.2 3.6 4.0 4.5 5.0 5.3 5.6 5.8 5.9 5.9 5.8 5.7
4276.3 3810.8 3878.2 3565.6 3677.3 3856.2 4169.3 4389.4 4680.0 4919.4 5076.0 5127.7 5210.8
1515.8 1425.2 1444.6 1380.5 1394.3 1439.2 1480.3 1508.8 1562.5
2760.5 2385.6 2433.6 2185.1 2282.9 2417.0 2689.0 2880.6
PROFILES
The Gainesville MSA is comprised of Alachua and Gilchrist Counties and is located in the central north portion of the state. This metro is home to the University of Florida and the Florida Museum of Natural History, Florida’s official natural history museum.
QUICK FACTS
• Metro population estimate of 323,799 as of 2019 (5-Year Estimate) (U.S. Census Bureau).
•
Alachua County population estimate of 269,043 as of 2019 (5-Year Estimate) (U.S. Census Bureau).
•
Gilchrist County population estimate of 18,582 as of 2019 (5-Year Estimate) (U.S. Census Bureau).
• Civilian labor force of 148,724 in July 2022 (Florida Research and Economic Database).
• An unemployment rate of 2.8% as of July 2022, not seasonally adjusted. This amounts to 4,231 unemployed people (Florida Research and Economic Database).
OUTLOOK SUMMARIES
The Gainesville Metropolitan Statistical Area (MSA) will show relatively high levels of growth in the studied economic indicators. Gross Metro Product of $14,508.03 million will place the MSA 18th in the state for metro output. Relatively strong average annual wage growth of 5.9 percent will help drive personal income growth up 6.2 percent, the highest of the MSAs studied. The average annual wage will be $64,900, and per capita income will be $47,700, both around the state average level. Population growth will be 0.8 percent, ranking Gainesville among the lowest in population growth.
Gainesville will be the second highest in average annual employment growth, at 1.7 percent, as well as second lowest in unemployment rate, at 3.7 percent.
The Leisure & Hospitality sector will see the largest annual growth at 3.9 percent. The Trade, Transportation and Utilities sector will follow with a growth rate of 3.5 percent. The only sector experiencing a relatively large contraction will be the Construction and Mining sector, at -1.6 percent.
METRO NEWS SUMMARIES
Gainesville residents celebrate the completion of an affordable housing community
• Alachua County has recently completed an affordable housing community after the County partnered with Fairstead. The project saw the renovation of Sweetwater Square, which last saw a renovation all the way back in the 1970’s.
• Residents were thrilled for the project, with Fairstead’s Director of development, Estelle Chan stating, ““New kitchens, new bathroom, flooring, blinds, the works. It was like they were moving into a brand new home.”
• The county provided $26.5 million in the form of a block grant, with their goal to house the homeless and help people get off and stay off the streets. Of the 200 units in the complex, 198 are already occupied as of June 2.
Source: WCJB TV20, June 2, 2022
Gainesville City Commission moves forward with East Gainesville sports complex proposal
• The East Gainesville sports complex is one step closer to potentially being realized as Gainesville City Commission voted unanimously to explore the possibilities of the plan. It is now being analyzed for its profitability and plausibility.
• The plan would repurpose Citizen’s Field and add more space to the MLK Multipurpose Center, expanding it from 19,000 to at least 60,000 square feet. The inside would include 2 basketball courts, a group fitness facility, meeting rooms, and more.
• Public opinion regarding the plan is heavily split. Supporters of the complex believe that it will help stimulate their economy. However, others assert that East Gainesville needs to focus on more pressing issues, such as housing and programs aimed at revitalizing the area’s economy.
Source: Alligator, June 6, 2022
G AINESVILLE Institute for Economic Forecasting 49
Construction Begins on Gainesville, Florida’s Newest Active Adult Community at Celebration Pointe
•
Discovery Senior Living currently operates 111 communities. A large number of their communities are in Florida, accounting for 22 communities. They have begun construction on their newest community in Gainesville at Celebration Pointe.
•
The new community, named The Experiential Living, includes 180 small apartments along with many amenities. These include but are not limited to a bar and entertainment area, a fitness center, and a large 4,000 square foot rooftop lounge.
• Residents will also have access to the Experiential Living app, which will allow them easy access to additional and third-party services. Construction is to be completed within 2 years, projecting to early 2024.
Source: GlobalNewswire, July, 7, 2022
Gainesville plans to use $8 million in ARPA funds to address affordable housing
• Gainesville’s General Policy Committee passed a plan to create more affordable housing. The plan is projected to directly help 203 households and will be funded by allocating $8 million from the American Rescue Plan Act (ARPA).
• The plan will use $6 million to underwrite construction for low-income households in the form of rental units. $1.2 million will similarly be used for low-income single-family homes. The rest of the money will be used in programs to improve stability of low-income homes and assist in down-payments.
• While the plan was unanimously passed, mayor Lauren Poe comments on how more needs to be done to tackle the affordable housing crisis. More plans to tackle the issue are being created, such as the expansion of capacities for nonprofit housing entities along with a redevelopment strategy for city-owned land.
Source: The Gainesville Sun, July 29, 2022
$1.5M NSF grant provides STEM scholarships
• The University of North Georgia (UNG) has received a grant of $1.5 million, allowing the university to distribute $10,000 to roughly 31 students. This funding is a 6-year National Science Foundation (NSF) Scholarship in S-STEM.
•
First and Second year students studying for a Bachelor’s or Associates in biology, chemistry, engineering, mathematics, and physics will be able to acquire 4 year funding through the NSF S-Stem program. Accepted students will have a faculty and peer mentor to guide them towards conducting undergraduate research.
• A previous grant of $615,000 from 2015-2020 helped 14 students enter graduate school right away. This larger grant can be expected to produce even larger numbers, nearly doubling the funding. Throughout the grant’s 6-year duration, UNG will analyze the fund’s usage to ensure it is used effectively.
Source: University of North Georgia, August 29, 2022
Alachua County Commission sends letter opposing Gainesville multi-family zoning plan
• Gainesville’s plan to end single-family zoning has passed 4-3 in their city commission voting. The Comprehensive Plan Amendment would allow duplexes and quadruplexes to be built in the city in place of single-family homes.
• The plan is highly controversial, with worries about historic neighborhoods and the high density of units per acre. A newly formed nonprofit, “Gainesville Voices,” plans to challenge the proposal in court. Alachua County Commissioners are also asking for the proposal to be delayed while a proper analysis of the plan’s impacts could be made.
• The State Department of Economic Opportunity is reviewing the plan to determine if it will be approved. Afterwards, a second meeting and vote regarding the proposal will take place.
Source: WCJB TV20, August 31, 2022
G AINESVILLE 50 Florida & Metro Forecast / Summer 2022
Total Nonagricultural Employment
Gainesville MSA Industry Location Quotients
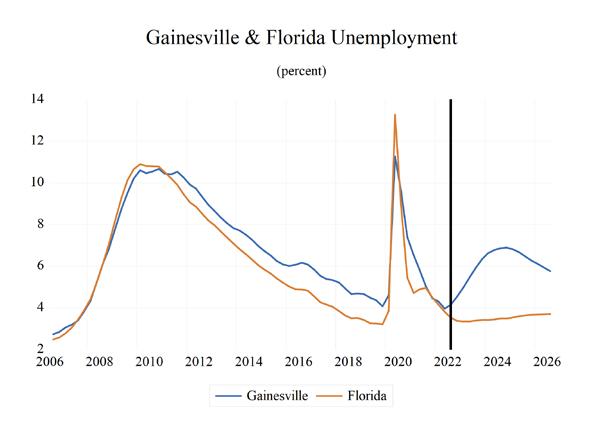
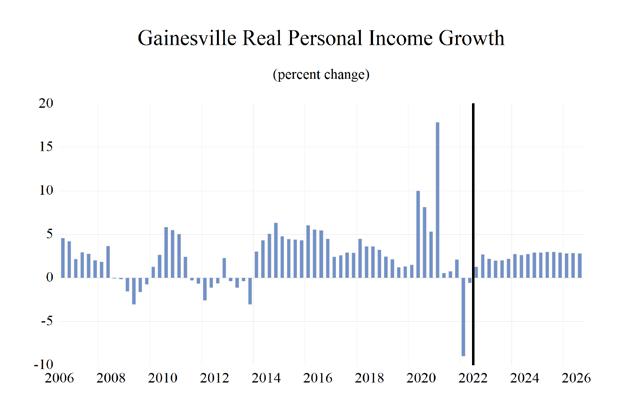
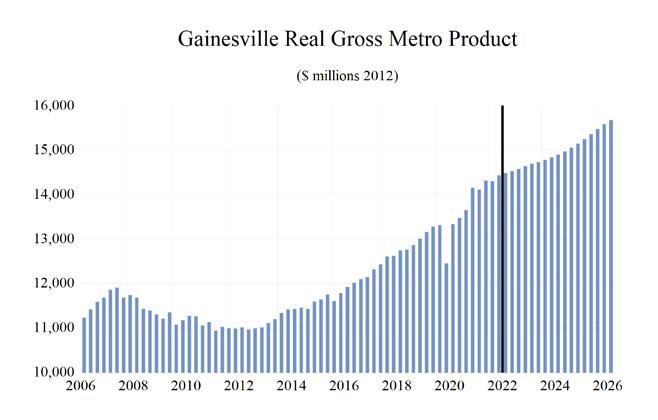
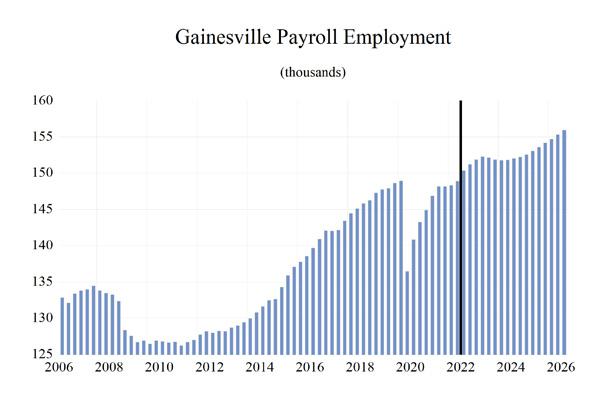
Service Providing
Logging, and Construction
Transportation, and Utilities
Trade
Trade
Warehousing and Utilities
Activities
and Business Services
and Health Services
and Hospitality
Services
G AINESVILLE Institute for Economic Forecasting 51 0 0.5 1 1.5 2 2.5 3
Total Private Goods Producing Service Producing Private
Mining,
Manufacturing Trade,
Wholesale
Retail
Transportation,
Information Financial
Professional
Educational
Leisure
Other
Government
Long Term Outlook for Gainesville, FL August 2022 Forecast
Personal Income (Billions $)
Total Personal Income 11.9 12.6 13.2 14.1 15.7 16.4 17.2 18.0 18.9
Pct Chg Year Ago 6.5 5.9 4.4 7.2 10.9 4.4 4.9 4.7 5.1
Wages and Salaries 6.7 7.2 7.5 7.8 8.9 9.7 10.1 10.5 10.9
Nonwage Income 5.2 5.5 5.7 6.3 6.8 6.7 7.1 7.5 8.0
Real Personal Income (12$) 11.7 12.1 12.7 13.5 14.4 14.1 14.3 14.7 15.2 Pct Chg Year Ago 4.7 3.8 5.0 6.0 6.5 -1.8 1.5 3.0 3.3
Per Capita Income (Ths) 41.2 43.2 44.8 47.7 52.7 54.7 56.8 58.9 61.6
Real Per Capita Income (12$) 40.2 41.3 43.2 45.5 48.2 47.1 47.3 48.3 49.6
Average Annual Wage (Ths) 47.0 49.2 50.6 54.9 60.0 64.5 66.3 68.9 71.0 Pct Chg Year Ago 3.1 4.7 2.9 8.4 9.4 7.4 2.7 3.9 3.1
Establishment Employment (Place of Work, Thousands, SA)
Total Employment 142.4 145.4 147.9 142.4 147.0 149.7 152.1 152.0 153.3 Pct Chg Year Ago 2.3 2.1 1.7 -3.7 3.3 1.8 1.6 -0.1 0.9
Manufacturing 4.6 4.7 4.8 4.5 4.6 5.0 5.0 4.6 4.5 Pct Chg Year Ago 1.4 2.3 2.9 -6.7 3.1 8.1 -0.6 -6.7 -3.8
Nonmanufacturing 137.9 140.7 143.1 137.9 142.4 144.7 147.1 147.3 148.9
Pct Chg Year Ago 2.3 2.1 1.7 -3.6 3.3 1.6 1.7 0.2 1.1
Construction & Mining 5.6 5.9 6.0 6.1 6.2 6.4 6.1 5.7 5.5 Pct Chg Year Ago 6.0 5.0 3.1 0.6 2.6 2.3 -4.9 -6.4 -3.1 Trade, Trans, & Utilities 20.9 21.2 21.0 20.4 21.4 22.6 23.2 23.4 23.9
Pct Chg Year Ago 2.8 1.5 -0.8 -3.2 5.3 5.4 2.8 0.6 2.2
Wholesale Trade 2.8 3.0 3.2 3.1 3.1 3.2 3.3 3.4 3.4
Retail Trade 14.9 14.9 14.5 13.8 14.3 14.6 14.3 13.3 12.5 Trans, Wrhsng, & Util 3.2 3.3 3.3 3.5 4.1 4.8 5.6 6.7 8.0
Information 1.5 1.6 1.7 1.6 1.9 2.0 1.8 1.7 1.7 Pct Chg Year Ago -2.2 8.9 7.1 -8.9 19.5 2.7 -5.6 -5.5 -0.1
Financial Activities 7.0 6.8 6.9 6.6 6.4 6.7 7.2 7.4 7.4 Pct Chg Year Ago 6.3 -2.8 1.4 -4.2 -2.9 4.5 7.3 2.5 0.2
Prof & Business Services 14.2 14.9 15.4 15.6 17.5 17.2 16.6 15.2 15.6 Pct Chg Year Ago 4.1 4.6 3.6 1.5 11.8 -1.8 -3.4 -8.3 2.3
Educ & Health Services 25.5 26.4 27.5 27.1 27.5 28.2 28.9 29.9 30.2 Pct Chg Year Ago 2.8 3.5 4.2 -1.3 1.4 2.3 2.8 3.2 1.3
Leisure & Hospitality 15.4 16.0 16.1 13.2 14.6 14.6 15.0 15.4 15.6 Pct Chg Year Ago 1.5 3.6 1.0 -18.1 10.6 -0.1 3.0 2.2 1.5
Other Services 4.3 4.4 4.3 3.9 4.0 4.2 4.2 4.4 4.5
Pct Chg Year Ago -3.4 1.1 -1.1 -9.7 1.7 6.6 -0.6 3.6 3.5
Federal Government 4.7 4.5 4.6 4.9 4.8 4.8 5.0 4.9 4.8 Pct Chg Year Ago -0.2 -3.2 1.9 6.9 -1.7 -0.4 3.1 -1.3 -1.4
State & Local Government 38.7 39.1 39.4 38.4 37.9 38.0 39.0 39.4 39.6 Pct Chg Year Ago 1.4 0.9 0.8 -2.5 -1.2 0.2 2.5 1.2 0.4
Other Economic Indicators
Population (Ths) 289.7 293.0 294.7 296.6 297.5 299.4 302.5 305.1 307.1 Pct Chg Year Ago 1.2 1.1 0.6 0.7 0.3 0.6 1.0 0.9 0.6 Labor Force (Ths) 141.2 143.2 145.0 141.5 145.6 148.9 152.7 153.5 154.3
Percent Change, Year Ago 1.4 1.4 1.3 -2.4 2.9 2.3 2.5 0.6 0.5 Unemployment Rate (%) 3.9 3.4 3.0 5.8 3.8 2.8 3.7 4.4 4.2
1856.6 1816.2 1921.1 1260.2 1081.1 1119.3 Single-Family 681.4
Total Housing Starts
842.7 921.1 891.7 949.9 589.7 442.8 459.4 Multifamily 1070.8 617.4 1360.4 935.5 924.5 971.2 670.6 638.3 659.9
G AINESVILLE 52 Florida & Metro Forecast / Summer 2022
2017 2018 2019 2020 2021 2022 2023 2024 2025
1752.2 1344.1 2203.0
726.7
Short Term Outlook for Gainesville, FL August 2022 Forecast
2022:2 2022:3 2022:4 2023:1 2023:2 2023:3 2023:4 2024:1 2024:2 2024:3 2024:4 2025:1 2025:2
Personal Income (Billions $)
Total Personal Income 16.3 16.5 16.8 16.9 17.1 17.2 17.4 17.7 17.9 18.1 18.3 18.6 18.8
Pct Chg Year Ago 6.0 5.6 5.4 5.8 5.1 4.7 4.0 4.3 4.5 5.0 5.1 5.1 5.2
Wages and Salaries 9.6 9.8 9.9 10.0 10.1 10.1 10.2 10.4 10.4 10.6 10.7 10.8 10.9
Nonwage Income 6.6 6.7 6.9 6.9 7.0 7.1 7.2 7.3 7.4 7.5 7.7 7.8 7.9
Real Personal Income (12$) 14.1 14.1 14.2 14.2 14.3 14.3 14.4 14.6 14.7 14.8 14.9 15.1 15.2
Pct Chg Year Ago -0.4 -0.7 -0.3 1.0 1.5 1.9 1.7 2.4 2.7 3.4 3.5 3.5 3.4
Per Capita Income (Ths) 54.4 54.9 55.8 56.1 56.5 56.9 57.4 58.1 58.6 59.2 59.9 60.6 61.2
Real Per Capita Income (12$) 47.1 46.9 47.2 47.2 47.3 47.3 47.5 47.9 48.1 48.5 48.8 49.2 49.4
Average Annual Wage (Ths) 64.4 64.7 65.0 65.5 65.9 66.4 67.2 68.0 68.6 69.2 69.7 70.3 70.7
Pct Chg Year Ago 8.9 6.2 2.9 2.6 2.3 2.5 3.4 3.7 4.0 4.3 3.7 3.4 3.2
Establishment Employment (Place of Work, Thousands, SA)
Total Employment 148.9 150.3 151.2 151.9 152.3 152.2 151.9 151.8 151.8 152.0 152.2 152.6 153.1
Pct Chg Year Ago 1.4 1.5 2.1 2.4 2.3 1.2 0.5 -0.1 -0.3 -0.1 0.2 0.5 0.8
Manufacturing 5.0 5.1 5.1 5.1 5.0 4.9 4.9 4.8 4.7 4.6 4.5 4.5 4.5
Pct Chg Year Ago 9.9 8.2 7.6 5.0 0.4 -2.3 -5.2 -6.1 -6.7 -7.1 -6.8 -5.7 -4.4
Nonmanufacturing 143.9 145.3 146.1 146.8 147.3 147.2 147.0 147.0 147.1 147.4 147.7 148.1 148.6
Pct Chg Year Ago 1.1 1.3 1.9 2.3 2.3 1.3 0.7 0.1 -0.1 0.1 0.5 0.7 1.0 Construction & Mining 6.4 6.4 6.3 6.2 6.1 6.0 5.9 5.8 5.7 5.6 5.6 5.6 5.5
Pct Chg Year Ago 4.7 2.6 0.0 -2.1 -4.6 -6.5 -6.6 -7.2 -7.0 -6.2 -5.1 -4.1 -3.2
Trade, Trans, & Utilities 22.6 22.7 22.9 22.9 23.3 23.3 23.4 23.4 23.3 23.3 23.4 23.5 23.7 Pct Chg Year Ago 6.1 5.9 5.3 3.3 2.8 2.5 2.5 2.2 0.0 0.3 -0.1 0.4 1.8
Wholesale Trade 3.2 3.2 3.2 3.3 3.3 3.3 3.3 3.4 3.4 3.4 3.4 3.4 3.4 Retail Trade 14.8 14.6 14.6 14.3 14.5 14.2 14.2 13.8 13.4 13.1 12.9 12.6 12.5 Trans, Wrhsng, & Util 4.7 4.9 5.1 5.3 5.5 5.7 5.9 6.2 6.5 6.8 7.1 7.5 7.8
Information 2.0 1.9 1.9 1.9 1.9 1.8 1.8 1.8 1.8 1.7 1.7 1.7 1.7 Pct Chg Year Ago 2.4 -2.5 -1.5 -3.2 -4.5 -5.3 -9.3 -9.2 -6.0 -4.1 -2.5 -1.3 -0.6
Financial Activities 6.6 6.8 6.9 7.1 7.2 7.2 7.2 7.3 7.4 7.4 7.4 7.4 7.4 Pct Chg Year Ago 5.0 4.0 5.2 7.9 9.1 6.8 5.3 2.5 2.4 2.6 2.4 1.6 0.3 Prof & Business Services 16.8 17.2 17.4 17.4 16.8 16.3 15.8 15.4 15.2 15.1 15.1 15.3 15.4 Pct Chg Year Ago -5.0 -1.8 0.6 0.6 0.0 -5.0 -9.3 -11.2 -9.6 -7.6 -4.4 -1.2 1.3
Educ & Health Services 27.9 28.3 28.6 28.7 28.9 29.0 29.2 29.5 29.8 30.0 30.1 30.2 30.3 Pct Chg Year Ago 2.0 2.4 3.3 3.3 3.3 2.4 2.1 2.8 3.2 3.4 3.3 2.5 1.5
Leisure & Hospitality 14.8 14.9 14.6 14.7 14.9 15.3 15.3 15.2 15.3 15.4 15.5 15.5 15.6 Pct Chg Year Ago -0.8 -1.4 -0.8 4.2 0.6 2.6 4.6 3.7 2.8 1.1 1.4 1.6 1.7
Other Services 4.3 4.3 4.3 4.2 4.2 4.2 4.2 4.3 4.3 4.4 4.5 4.5 4.5 Pct Chg Year Ago 8.5 6.9 3.7 1.8 -1.1 -2.0 -0.9 1.2 3.5 4.8 5.1 4.7 4.1
Federal Government 4.8 4.8 4.9 5.0 5.0 5.0 5.0 4.9 4.9 4.9 4.9 4.9 4.8 Pct Chg Year Ago -0.9 0.2 1.5 2.6 5.2 3.2 1.3 -0.4 -1.7 -1.6 -1.5 -1.4 -1.4
State & Local Government 37.7 38.0 38.3 38.6 39.0 39.1 39.2 39.4 39.4 39.5 39.5 39.6 39.6 Pct Chg Year Ago -0.5 -0.7 0.3 1.2 3.4 3.0 2.5 1.8 1.2 0.9 0.7 0.5 0.4
Other Economic Indicators
Population (Ths) 299.0 299.7 300.6 301.5 302.2 302.8 303.5 304.2 304.8 305.4 305.9 306.4 306.9 Pct Chg Year Ago 0.5 0.7 0.9 1.0 1.1 1.0 1.0 0.9 0.9 0.9 0.8 0.7 0.7
Labor Force (Ths) 148.2 149.4 150.8 151.9 152.6 153.0 153.2 153.4 153.5 153.6 153.8 153.9 154.2 Pct Chg Year Ago 2.0 2.1 3.0 3.0 3.0 2.4 1.6 1.0 0.5 0.4 0.3 0.4 0.5
Unemployment Rate (%) 2.7 2.8 3.0 3.3 3.6 3.9 4.1 4.3 4.4 4.5 4.5 4.4 4.3
Total Housing Starts 2400.1
1087.2 1057.3 1080.9 1098.8 1112.2 1122.0 Single-Family
452.8 426.5 442.0 449.8 460.0 462.3 Multifamily
650.1 634.4 630.8 638.9 649.0 652.2 659.7
G AINESVILLE Institute for Economic Forecasting 53
1743.3 1625.5 1355.4 1278.1 1234.0 1173.4
1219.8 858.6 807.6 656.7 609.6 569.1 523.3
1180.4 884.8 817.8 698.7 668.6 664.8
PROFILES
The Homosassa Springs MSA is located in the central northwest portion of the state. Homosassa Springs is a Census designated place in Citrus county and is known for and named after the warm spring located in Homosassa Springs Wildlife State Park which attracts manatees to the area.
QUICK FACTS
• Metro population estimate of 145,169 as of 2019 (5-Year Estimate) (U.S. Census Bureau).
• Citrus County population estimate of 145,169 as of 2019 (5-Year Estimate) (U.S. Census Bureau).
•
Civilian labor force 46,845 in July 2022 (Florida Research and Economic Database).
• An unemployment rate of 4.2% as of July 2022, not seasonally adjusted. This amounts to 1,989 unemployed people (Florida Research and Economic Database).
OUTLOOK SUMMARIES
The Homosassa Springs Metropolitan Statistical Area (MSA) is expected to see mixed growth in most of the economic indicators, relative to the other MSAs studied. Homosassa’s expected Gross Metro Product of $4,193.43 million will be second to last in the state. Personal income growth of 5.2 percent will put the MSA’s per capita income level at $39,500, the third lowest in the state. Average annual wage growth of 5.8 percent, the fifth highest, will push the average annual wage up to $53,100, the lowest in the state. Population growth will be 1.7 percent, relatively higher than the state average of 1.1 percent.
Employment growth is expected to average 1.5 percent annually. Homosassa’s unemployment rate will come in at 6.0 percent, the second highest in the state.
The fastest growing sector in the Homosassa Springs MSA will be the Leisure sector, which will see an average annual growth rate of 4.9 percent. The Financial sector will come in second at a growth rate of 4.6 percent, followed by the Other Services sector again at 4.6 percent. The Federal Government sector will see the largest contraction in growth, at -5.1 percent.
METRO NEWS SUMMARIES
Residents, business owners feeling pain at the pump
•
With gas prices expected to hit the $5 mark soon, Citrus County residents and business owners are making budget adjustments.
•
The lawn care business is especially feeling the pain. Robert Platz, the owner of Local Boy Lawn and Pest Control in Beverly Hills, said he’s spending an average of $3,000 more a month due to the gas hike. Samantha Jumper, one of the managers at Angelotti’s Pizza in Inverness, said they raised the delivery fee from $2 to $3. Inflation, rising supply costs, and other economic factors forced an across-the-board price hike in food, she says.
• According to AAA - The Auto Club Group, the cost of a barrel of oil is nearing $120, nearly double from last August, as increased oil demand outpaces the tight global supply which is the likely cause of this price jump.
Source: Chronicle Online June 7, 2022
Gas prices finally head back down
• For the first time in nine weeks, the average price declined 7 cents after reaching an all-time high of $4.89 per gallon. And it doesn’t look now like it will reach the dreaded $5 per gallon price point.
• Florida gas prices averaged $4.82 per gallon on June 19th, according to AAA – The Auto Club Group. “I’m hopeful the trend may continue this week, especially as concerns appear to be mounting that we may be on the cusp of an economic slowdown, putting downward pressure on oil,” said Patrick De Haan, head of petroleum analysis at GasBuddy.
• A check with GasBuddy showed some of the lowest gas prices in Citrus County are in the Inverness area. Circle K and Shell along U.S. 41 north were selling unleaded at $4.67.
Source: Chronicle Online June 20, 2022
HOMOSASSA SPRINGS 54 Florida & Metro Forecast / Summer 2022
Home inventory rising but not enough to crush demand
•
The demand for single-family homes in Citrus County remains brisk, despite higher mortgage interest rates and increased inventory. Until demand slows down, the median price of homes will continue to rise. In June, it was $289,050, up 23 percent from last year’s $235,000.
• There were 364 closed sales in June, down 1.4 percent from last year, according to the latest monthly statistics from Florida Realtors. Pending sales were down 17.6 percent.
• The number of new listings is rising along with inventory, which means buyers are starting to have more to pick from. There was a 78.7 percent increase in active listings in June: from 315 to 563
Source: Chronicle Online, Jul 25, 2022
In tough times, Citrus United Way offers help
• United Way of Citrus County still has about $20,000 left of the $450,000 they were awarded from the federal CARES act for COVID-19 relief.
• This money is specifically earmarked to help people suffering financial hardship due to COVID-19.
• People who are homeless as well as the ALICE population (asset-limited, income-constrained and employed) are eligible for funding. ALICE people earn just above the Federal Poverty Level but less than what it costs to make ends meet. The agency’s deadline to use this money is Aug. 31.
Source: Chronicle Online: July 30, 2022
Developer eyes multi-family housing near Meadowcrest
• A well-known local developer is hoping to build 32 multi-family homes, consisting of 10 duplexes and 3 quadplex buildings, on 3.3 acres off County Road 486 in Lecanto.
• The Planning and Development Commission approved the planned unit development (PUD) plan last year and county commissioners officially signed off on it in November 2021. “If the economy and inflation begin to stabilize, I hope to break ground in 2023,” says Terry LaGree, president of Barbaron, Inc. and managing partner in White Stone Landings, LLC.
• LaGree said that as the economy is starting to improve, he’s hopeful he can secure financial backing to move forward with the project. “We went through the approval process; I’ve got my engineering completed and I’m ready to submit the permit.” He said he will decide whether to move forward or not in the next 60 days.
Source: Chronicle Online, August 3, 2022.
Affordable housing project proposed for Homosassa
• A 160-unit apartment complex with reduced rents is being proposed in southwest Citrus County between Homosassa Springs and Sugarmill Woods. The 19.3-acre project is proposed three miles west of the Suncoast Parkway/Cardinal Street interchange.
• Invictus Development, the developer of the proposed project, is attempting to get tax credits to build the $19.4 million project. Despite there being ample need for affordable housing, getting tax credits which pay for about 85 percent of these kinds of projects, is still difficult. Developers typically sell the tax credits for about 90 cents on the dollar for cash to fund their developments according to Rick Cavalieri, executive vice president of Invictus.
• Cavalieri will apply for the tax credits in December and hear in about January if he’s been selected. If he gets the tax credits, Cavalieri said Invictus could begin construction of the first of two phases in June 2023 and finish that first phase in the Fall of 2024.
Source: Chronicle Online, Aug. 27th.
HOMOSASSA SPRINGS Institute for Economic Forecasting 55


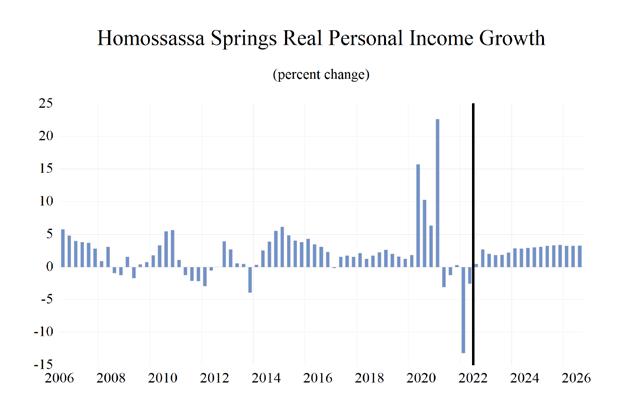
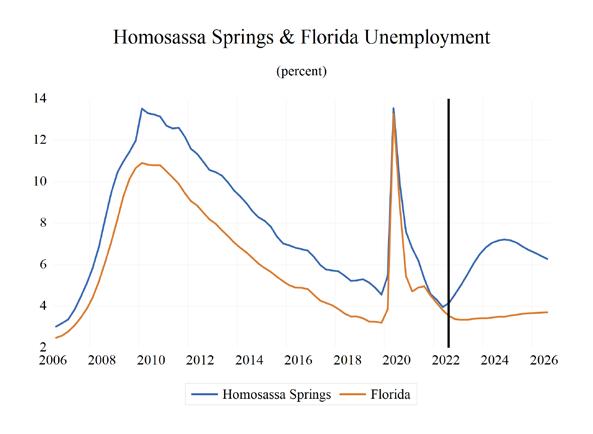
HOMOSASSA SPRINGS 56 Florida & Metro Forecast / Summer 2022 0.9 0.92 0.94 0.96 0.98 1 1.02 1.04 1.06 Total Nonagricultural Employment Total Private Goods Producing Service Producing Private Service Providing Government Homosassa Springs MSA Industry Loca�on Quo�ents
Long Term Outlook for Homosassa Springs, FL August 2022 Forecast
Personal Income (Billions $)
Total Personal Income 5.4 5.7 6.0 6.4 7.0 7.1 7.5 7.9 8.3
Pct Chg Year Ago 3.6 4.6 5.3 7.6 9.0 1.9 4.9 5.1 5.9
Wages and Salaries 1.3 1.4 1.4 1.4 1.6 1.8 1.9 1.9 2.0
Nonwage Income 4.1 4.3 4.5 5.0 5.3 5.3 5.6 5.9 6.3
Real Personal Income (12$) 5.7 5.6 5.9 6.2 6.5 6.3 6.4 6.6 6.8 Pct Chg Year Ago 4.2 -2.3 5.4 6.6 4.7 -4.1 1.5 3.3 4.0
Per Capita Income (Ths) 36.9 37.9 39.3 41.4 44.1 44.0 45.3 46.9 49.2
Real Per Capita Income (12$) 38.8 37.3 38.6 40.3 41.3 38.7 38.6 39.3 40.5
Average Annual Wage (Ths) 40.1 41.2 42.1 44.7 49.1 53.0 54.2 55.9 57.4 Pct Chg Year Ago 3.1 2.7 2.2 6.1 10.0 7.9 2.1 3.3 2.7
Establishment Employment (Place of Work, Thousands, SA)
Total Employment 33.2 33.3 33.3 32.0 33.2 34.1 34.1 34.0 34.2
Pct Chg Year Ago -0.1 0.1 0.2 -3.9 3.7 2.5 0.2 -0.4 0.7
Manufacturing 0.5 0.5 0.5 0.5 0.6 0.6 0.6 0.5 0.5
Pct Chg Year Ago 1.3 1.5 4.6 0.8 8.3 4.6 -2.5 -9.2 -4.1
Nonmanufacturing 32.7 32.8 32.8 31.5 32.7 33.5 33.6 33.5 33.7
Pct Chg Year Ago -0.1 0.1 0.2 -3.9 3.7 2.4 0.3 -0.3 0.8 Construction & Mining 2.9 3.0 3.0 3.0 3.1 3.2 3.1 2.9 2.9
Pct Chg Year Ago -0.3 3.5 1.5 -0.2 3.7 2.2 -3.6 -4.0 -1.2 Trade, Trans, & Utilities 7.5 7.5 7.4 7.2 7.3 7.4 7.3 7.1 6.9
Pct Chg Year Ago -1.6 -0.1 -1.1 -2.7 1.3 1.6 -1.4 -2.7 -2.4
Wholesale Trade 1.0 1.0 1.0 1.0 1.0 1.1 1.1 1.1 1.1
Retail Trade 5.2 5.2 5.1 5.0 5.0 5.1 5.0 4.8 4.6 Trans, Wrhsng, & Util 1.2 1.2 1.2 1.2 1.2 1.2 1.2 1.2 1.2
Information 0.4 0.3 0.3 0.3 0.3 0.3 0.3 0.3 0.3
Pct Chg Year Ago -0.5 -7.5 -6.2 -7.5 -8.0 4.0 -2.7 -4.8 -0.6
Financial Activities 1.2 1.2 1.3 1.3 1.4 1.5 1.5 1.5 1.5
Pct Chg Year Ago -1.1 3.1 4.2 -0.8 10.3 5.4 2.2 0.5 1.2
Prof & Business Services 3.3 3.2 3.2 3.2 3.6 3.8 3.7 3.5 3.6 Pct Chg Year Ago 3.4 -3.6 -0.3 -0.2 11.6 6.2 -3.1 -5.5 2.5
Educ & Health Services 7.5 7.4 7.7 7.3 7.2 7.3 7.5 7.8 7.9
Pct Chg Year Ago -1.9 -1.8 4.3 -6.0 -0.8 1.2 3.0 3.9 1.8
Leisure & Hospitality 4.7 4.8 4.6 4.2 4.7 4.9 5.0 5.1 5.2 Pct Chg Year Ago 2.3 2.4 -3.9 -8.4 10.4 4.8 2.9 1.7 2.6
Other Services 1.0 1.1 0.9 0.9 0.9 1.0 1.0 1.0 1.1
Pct Chg Year Ago 8.9 2.5 -11.7 -9.3 9.8 2.8 0.9 4.9 6.3
Federal Government 0.2 0.2 0.2 0.2 0.2 0.2 0.2 0.2 0.2
Pct Chg Year Ago 3.8 3.6 3.6 -8.2 -14.9 -9.7 3.0 1.3 4.2
State & Local Government 4.1 4.1 4.2 4.1 4.1 4.1 4.1 4.1 4.2
Pct Chg Year Ago -1.3 0.8 1.2 -2.2 1.1 -0.3 0.7 0.2 0.6
Other Economic Indicators
Population (Ths) 146.7 149.2 151.7 154.9 158.4 162.0 165.0 167.4 169.2
Pct Chg Year Ago 1.9 1.7 1.7 2.1 2.3 2.2 1.9 1.4 1.0
Labor Force (Ths) 47.5 47.2 47.0 46.6 47.3 48.1 49.2 49.3 49.3
Percent Change, Year Ago -0.7 -0.8 -0.4 -0.8 1.6 1.7 2.2 0.3 0.0
Unemployment Rate (%)
5.7 4.2 5.8 7.1 7.0
Total Housing Starts
Multifamily
966.0 1235.5 1068.4 924.9 981.2
1018.0 1289.7 1095.5 953.1 1010.5 Single-Family
31.6 52.0 54.2 27.1 28.3 29.4
HOMOSASSA SPRINGS Institute for Economic Forecasting 57
2017 2018 2019 2020 2021 2022 2023 2024 2025
6.0 5.4 5.0 9.1
514.1 845.0 869.7 892.5
431.7 823.8 724.8 860.9
82.4 21.2 144.9
Short Term Outlook for Homosassa Springs, FL August 2022 Forecast
2022:2
Personal Income (Billions $)
Total Personal Income 7.1 7.2 7.3 7.4 7.4 7.5 7.6 7.7 7.8 7.9 8.0 8.2 8.3
Pct Chg Year Ago 3.7 4.7 5.7 6.0 5.0 4.8 3.9 4.4 4.8 5.4 5.8 5.9 6.0
Wages and Salaries 1.8 1.8 1.8 1.8 1.9 1.9 1.9 1.9 1.9 1.9 1.9 2.0 2.0
Nonwage Income 5.3 5.3 5.5 5.5 5.6 5.6 5.7 5.8 5.9 6.0 6.1 6.2 6.3
Real Personal Income (12$) 6.3 6.3 6.3 6.3 6.4 6.4 6.4 6.5 6.5 6.6 6.7 6.8 6.8 Pct Chg Year Ago -2.5 -1.6 -0.1 1.2 1.4 2.0 1.6 2.5 3.0 3.7 4.1 4.2 4.2
Per Capita Income (Ths) 43.8 44.1 44.8 45.0 45.1 45.4 45.7 46.2 46.6 47.2 47.8 48.4 48.9
Real Per Capita Income (12$) 38.8 38.5 38.8 38.6 38.6 38.6 38.7 38.9 39.1 39.5 39.8 40.1 40.4
Average Annual Wage (Ths) 53.0 53.4 53.5 53.7 53.9 54.2 54.8 55.3 55.7 56.2 56.5 56.9 57.2
Pct Chg Year Ago 9.3 6.7 3.6 3.0 1.7 1.6 2.3 2.8 3.4 3.7 3.2 3.0 2.7
Establishment Employment (Place of Work, Thousands, SA)
Total Employment 34.0 34.1 34.1 34.2 34.2 34.2 34.1 34.0 33.9 34.0 34.0 34.1 34.2
Pct Chg Year Ago 2.8 2.5 1.3 0.3 0.7 0.1 -0.2 -0.4 -0.7 -0.4 -0.1 0.2 0.7
Manufacturing 0.6 0.6 0.6 0.6 0.6 0.6 0.6 0.5 0.5 0.5 0.5 0.5 0.5
Pct Chg Year Ago 3.7 6.0 5.4 1.9 -0.3 -3.8 -7.7 -9.1 -9.4 -9.4 -8.9 -7.1 -5.1
Nonmanufacturing 33.4 33.5 33.5 33.6 33.6 33.6 33.5 33.5 33.4 33.5 33.5 33.6 33.7
Pct Chg Year Ago 2.8 2.4 1.2 0.3 0.7 0.1 0.0 -0.3 -0.6 -0.3 0.1 0.4 0.8 Construction & Mining 3.2 3.2 3.1 3.1 3.1 3.0 3.0 3.0 2.9 2.9 2.9 2.9 2.9
Pct Chg Year Ago 2.5 1.5 -0.5 -2.5 -2.4 -4.7 -4.7 -5.0 -4.5 -3.7 -2.9 -2.1 -1.4
Trade, Trans, & Utilities 7.4 7.3 7.3 7.3 7.3 7.3 7.3 7.2 7.1 7.0 7.0 6.9 6.9
Pct Chg Year Ago 2.5 0.6 -0.7 -2.9 -0.9 -1.0 -0.6 -0.6 -3.1 -3.1 -3.9 -4.0 -2.8
Wholesale Trade 1.0 1.1 1.1 1.1 1.1 1.1 1.1 1.1 1.1 1.1 1.1 1.1 1.1 Retail Trade 5.1 5.1 5.1 5.0 5.1 5.0 5.0 4.9 4.8 4.7 4.7 4.6 4.6 Trans, Wrhsng, & Util 1.2 1.2 1.2 1.2 1.2 1.2 1.2 1.2 1.2 1.2 1.2 1.2 1.2
Information 0.3 0.3 0.3 0.3 0.3 0.3 0.3 0.3 0.3 0.3 0.3 0.3 0.3 Pct Chg Year Ago 5.8 1.6 3.6 2.2 -1.5 -3.5 -7.9 -7.9 -4.8 -3.4 -2.7 -1.8 -1.4
Financial Activities 1.5 1.5 1.5 1.5 1.5 1.5 1.5 1.5 1.5 1.5 1.5 1.5 1.5 Pct Chg Year Ago 6.5 3.8 3.4 3.7 3.5 1.3 0.5 -1.0 -0.3 1.4 2.2 2.2 1.6 Prof & Business Services 3.8 3.8 3.8 3.8 3.7 3.6 3.5 3.5 3.5 3.4 3.5 3.5 3.5 Pct Chg Year Ago 8.2 4.9 3.3 1.3 -2.0 -4.7 -7.0 -8.0 -6.4 -4.8 -2.4 -0.2 1.8
Educ & Health Services 7.2 7.3 7.4 7.4 7.5 7.5 7.6 7.7 7.8 7.8 7.9 7.9 7.9 Pct Chg Year Ago 0.5 3.1 3.8 3.6 3.0 2.6 2.8 3.5 4.0 4.2 4.0 3.1 2.1
Leisure & Hospitality 4.9 4.9 4.8 4.9 5.0 5.1 5.1 5.1 5.1 5.1 5.1 5.2 5.2 Pct Chg Year Ago 5.0 6.2 0.5 0.8 2.1 3.8 4.8 3.2 1.9 0.4 1.2 2.0 2.7
Other Services 1.0 1.0 1.0 1.0 1.0 1.0 1.0 1.0 1.0 1.0 1.1 1.1 1.1 Pct Chg Year Ago 1.7 4.7 2.4 1.4 1.3 0.1 0.8 2.1 4.4 6.2 7.0 7.4 7.1
Federal Government 0.2 0.2 0.2 0.2 0.2 0.2 0.2 0.2 0.2 0.2 0.2 0.2 0.2 Pct Chg Year Ago -15.5 -6.0 -4.5 -3.4 8.3 5.1 2.7 1.2 0.1 1.4 2.6 3.4 4.4 State & Local Government 4.1 4.1 4.1 4.1 4.1 4.1 4.1 4.1 4.1 4.1 4.1 4.1 4.1 Pct Chg Year Ago 0.1 -1.8 -0.5 -0.3 1.5 1.1 0.4 0.1 -0.1 0.2 0.4 0.5 0.7
Other Economic Indicators
Population (Ths) 161.6 162.4 163.2 164.0 164.7 165.4 166.1 166.7 167.2 167.7 168.1 168.5 169.0
Pct Chg Year Ago 2.2 2.3 2.1 2.0 1.9 1.8 1.8 1.7 1.5 1.4 1.2 1.1 1.1 Labor Force (Ths) 47.9 48.2 48.6 49.0
49.4 49.4 49.3 49.3 49.3 49.3 Pct Chg Year Ago 1.2 1.8 2.8 2.5 2.6
Unemployment Rate (%) 4.0 4.2
Total Housing Starts
1.5 0.8 0.4 0.1 0.0 -0.1 0.0
6.8 7.0 7.2 7.2 7.2 7.1
973.7
Single-Family
26.7 27.4 28.1 28.6 28.9 29.2 29.4
903.3 921.5 944.8 971.5 973.7 Multifamily
HOMOSASSA SPRINGS 58 Florida & Metro Forecast / Summer 2022
2022:3 2022:4 2023:1 2023:2 2023:3 2023:4 2024:1 2024:2 2024:3 2024:4 2025:1 2025:2
49.2 49.3 49.3
2.3
4.6 5.0 5.5 6.1 6.5
1491.5 1325.0 1271.3 1152.5 1110.5 1089.0 1029.9 957.5 931.3 950.0
1000.7 1003.1
1431.6 1281.1 1233.2 1122.9 1083.9 1063.6 1003.3 930.0
59.9 44.0 38.1 29.6 26.7 25.5
PROFILES
The Jacksonville MSA is comprised of Baker, Clay, Duval, Nassau, and St. Johns counties. It is located on the northeast coast of Florida and is home to several major U.S. military bases, such as the Jacksonville Naval Air Station, as well as shipyards, the University of North Florida, and the Jacksonville International Airport.
QUICK FACTS
• Metro population estimate of 1,503,574 as of 2019 (5-Year Estimate) (U.S. Census Bureau).
• Baker County population estimate of 29,201 as of 2019 (5-Year Estimate) (U.S. Census Bureau).
• Clay County population estimate of 219,252 as of 2019 (5-Year Estimate) (U.S. Census Bureau).
• Duval County population estimate of 957,755 as of 2019 (5-Year Estimate) (U.S. Census Bureau).
• Nassau County population estimate of 88,625 as of 2019 (5-Year Estimate) (U.S. Census Bureau).
• St. John County population estimate of 264,672 as of 2019 (5-Year Estimate) (U.S. Census Bureau).
• Civilian labor force of 838,147 in July 2022 (Florida Research and Economic Database).
• An unemployment rate of 2.8% as of July 2022, not seasonally adjusted. This amounts to 23,718 unemployed people (Florida Research and Economic Database).
OUTLOOK SUMMARIES
The Jacksonville Metropolitan Statistical Area (MSA) is expected to see above-average growth in most of the economic indicators, relative to the other MSAs studied. Jacksonville’s expected Gross Metro Product of $82,016.09 million will be sixth in the state. Personal income growth of 5.9 percent will put the MSA’s per capita income level at $51,200. Average annual wage growth of 5.6 percent will push the average annual wage up to $71,500, the eighth highest in the state. Population growth will be 1.5 percent.
Employment growth is expected to average 1.3 percent annually. Jacksonville’s unemployment rate will come in at 4.2 percent.
The fastest growing sector in the Jacksonville MSA will be the Leisure sector, which will see an average annual growth rate of 7.1 percent. The Other Services sector will come in second at a growth rate of 4.1 percent, followed by the Education-Health Services sector at 2.6 percent. The Professional and Business Services sector, and the Construction & Mining sector will see respective contractions in growth of -2.6 percent, and -2.1 percent.
METRO NEWS SUMMARIES
Lincoln Property Company buys large Jax industrial portfolio
• Lincoln Property purchased a portfolio of industrial properties in Jacksonville.
• The purchase included eight local buildings, totally 933,478 square feet.
• Mike Davis of Cushman & Wakefield and helped broker the deal said, “This is one of the premier industrial portfolios in Jacksonville. It’s proximity to the Jacksonville airport and road systems accessing the metro area makes this the location of choice for image conscious corporate users requiring highly functional distribution space.”
Source: Jacksonville Business Journal, June 6, 2022
J ACKSONVILLE Institute for Economic Forecasting 59
Two Jax multifamily properties sold to L.A.based joint venture
• The Landings at Southpoint and The Landings at Parkview in Jacksonville were both purchased in an off-market sale.
• The properties were purchased by a Los Angeles-based joint venture between Westmount Square Capital and Miramar Capital Advisors.
• Mark McGregor, principal at Westmount Square Capital, said, “We are thrilled to have sourced this off-market opportunity in a submarket with great employment drivers.”
Source: Jacksonville Business Journal, June 27, 2022
Report: Jacksonville’s industrial real estate sector continues sustained growth
• As vacancy rates drop for Jacksonville’s industrial real estate sector, demand continues to increase.
• The sale of investment-grade properties during the first half of 2022 reached $361.5 million across 3.8 million square feet, up from $239.8 million across 3.6 million at the same time in 2021.
• Construction costs continue to influence rents, causing them to increase. The direct weighted average asking lease rate is up 18.1% compared to last year.
Source: Jacksonville Business Journal, July 28, 2022
Proposed Jacksonville FreezPak project part of billion-dollar expansion plan
• BG Capital, which owns and develops real estate, and FreezPak, a logistics company, are planning to develop a dozen cold storage facilities near ports nationwide.
• The Jacksonville mayor’s office moved along a request for a #3 million property tax rebate related to a cold storage facility in Jacksonville.
• Therefore, it is possible that FreezPak and BG Capital are planning to open one of their facilities in Jacksonville.
Source: Jacksonville Business Journal, July 28, 2022
Rising rents incites online fight as popular Riverside Cafe says it might have to close
• Jacksonville’s Riverside neighborhood has undergone tremendous development over the past decade leading to rising commercial rents.
• Commercial rents across the submarket have risen an average of 28% over the last five years.
• A cafe in Riverside said that the new landlord has proposed a rent increase of nearly 400%.
Source: Jacksonville Business Journal, August 11, 2022
Jacksonville apartment community sold for $13 million
• Stonemont Village apartments in Jacksonville sold for $13 million.
• Stonemont Village is an 89-unit multifamily property.
• NAI Hallmark Vice President Luke McCann who helped broker the transaction said that Stonemont Village “is in a premier location within the San Marco submarket offering tremendous upside as the immediate area continues to be a top destination for renters and investors alike.”
Source: Jacksonville Business Journal, August 19, 2022
J ACKSONVILLE 60 Florida & Metro Forecast / Summer 2022
Total Nonagricultural Employment
Total Private Goods Producing Service Producing
Private Service Providing Mining, Logging, and Construction Manufacturing Trade, Transportation, and Utilities
Wholesale Trade Retail Trade Transportation, Warehousing and Utilities Information Financial Activities
Professional and Business Services
Educational and Health Services
Leisure and Hospitality Other Services Government
Jacksonville MSA Industry Location Quotients
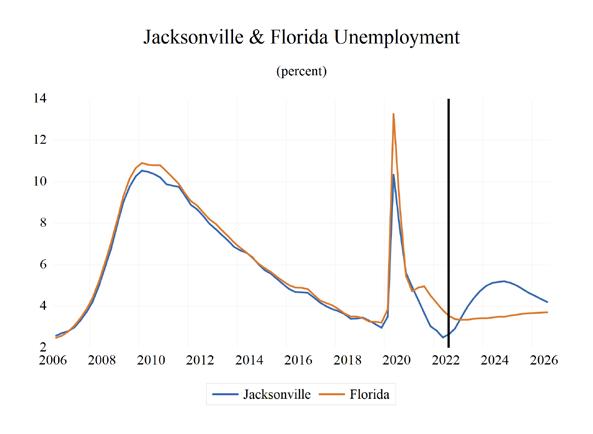
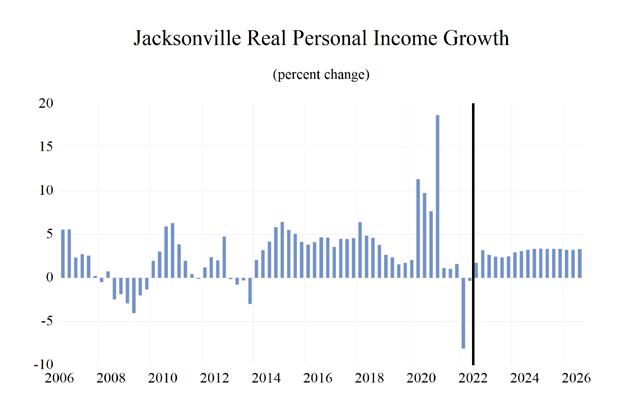
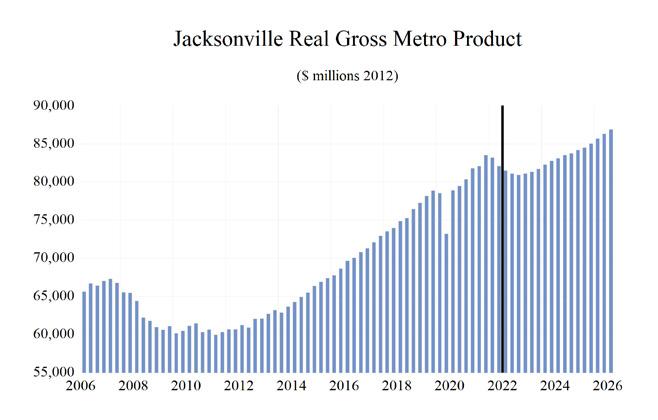
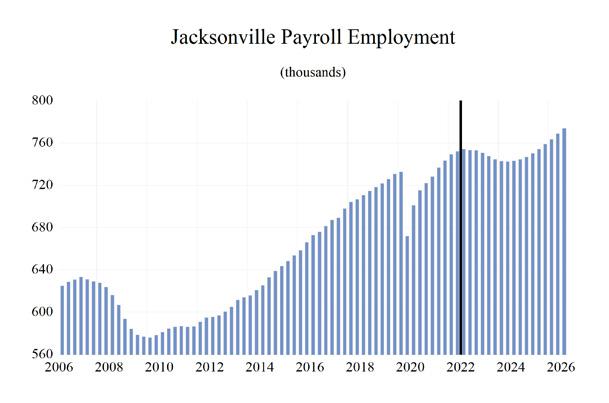
J ACKSONVILLE Institute for Economic Forecasting 61 0 0.2 0.4 0.6 0.8 1 1.2 1.4 1.6
Long Term Outlook for Jacksonville, FL August 2022 Forecast
Personal Income (Billions $)
Total Personal Income 73.4 77.4 81.5 87.5 96.3 100.2 104.7 109.8 115.6
Pct Chg Year Ago 7.5 5.4 5.3 7.4 10.0 4.1 4.5 4.9 5.3
Wages and Salaries 38.1 40.2 42.1 43.9 49.5 54.5 56.0 57.4 59.9
Nonwage Income 35.3 37.2 39.4 43.6 46.8 45.7 48.7 52.4 55.7
Real Personal Income (12$) 69.8 73.4 77.0 81.7 86.3 84.6 85.5 88.2 91.2 Pct Chg Year Ago 6.4 5.1 5.0 6.1 5.7 -2.1 1.2 3.1 3.4
Per Capita Income (Ths) 48.1 49.7 51.4 54.2 58.7 60.0 61.7 63.8 66.3
Real Per Capita Income (12$) 45.8 47.2 48.6 50.6 52.6 50.6 50.4 51.3 52.3
Average Annual Wage (Ths) 53.7 55.4 56.9 60.8 66.1 70.9 73.2 75.7 78.1 Pct Chg Year Ago 3.5 3.2 2.7 6.9 8.6 7.4 3.2 3.4 3.1
Establishment Employment (Place of Work, Thousands, SA)
Total Employment 688.9 709.0 724.1 705.1 732.4 752.3 749.0 743.2 752.5
Pct Chg Year Ago 3.1 2.9 2.1 -2.6 3.9 2.7 -0.4 -0.8 1.2
Manufacturing 31.0 31.4 32.6 32.5 32.4 33.3 32.6 31.4 31.0
Pct Chg Year Ago 4.6 1.4 3.6 -0.2 -0.2 2.6 -2.1 -3.7 -1.3
Nonmanufacturing 657.9 677.6 691.6 672.6 700.0 719.0 716.4 711.9 721.6
Pct Chg Year Ago 3.0 3.0 2.1 -2.7 4.1 2.7 -0.4 -0.6 1.4 Construction & Mining 42.3 45.1 46.5 46.1 47.9 47.5 44.0 42.2 41.8
Pct Chg Year Ago 8.0 6.6 3.1 -0.8 3.9 -0.8 -7.5 -4.0 -1.0 Trade, Trans, & Utilities 142.2 152.3 157.9 155.6 160.2 164.7 165.6 164.8 165.0
Pct Chg Year Ago 2.9 7.1 3.7 -1.5 3.0 2.8 0.5 -0.4 0.1
Wholesale Trade 25.0 25.8 27.3 26.5 27.4 29.5 29.9 30.4 30.9 Retail Trade 79.6 82.2 81.7 78.2 81.0 81.9 80.4 77.0 74.3
Trans, Wrhsng, & Util 37.6 44.3 48.9 50.8 51.8 53.3 55.2 57.4 59.8 Information 9.3 9.3 9.0 8.7 8.8 9.4 9.3 9.1 9.3
Pct Chg Year Ago -1.3 -0.8 -3.3 -2.8 1.0 6.3 -0.4 -2.3 2.5
Financial Activities 67.1 67.1 67.1 68.0 70.4 70.1 70.3 72.8 75.1
Pct Chg Year Ago 4.4 0.1 -0.1 1.3 3.6 -0.4 0.3 3.6 3.2
Prof & Business Services 105.3 107.3 109.2 107.7 114.5 119.7 107.9 95.7 98.4
Pct Chg Year Ago 3.2 1.9 1.7 -1.3 6.3 4.5 -9.8 -11.4 2.9
Educ & Health Services 105.4 107.5 110.3 110.0 112.7 114.2 116.7 121.6 124.5
Pct Chg Year Ago 2.8 1.9 2.7 -0.4 2.4 1.3 2.2 4.2 2.4
Leisure & Hospitality 84.7 85.6 86.9 73.6 81.3 89.4 96.7 96.5 95.4 Pct Chg Year Ago 2.6 1.2 1.4 -15.2 10.4 10.0 8.2 -0.2 -1.2
Other Services 25.3 26.4 27.0 25.7 27.1 28.1 28.8 30.2 31.6
Pct Chg Year Ago 1.2 4.4 2.1 -4.8 5.4 3.9 2.3 5.0 4.6
Federal Government 17.8 18.0 18.6 19.2 19.0 18.3 18.1 18.5 18.8
Pct Chg Year Ago 1.2 1.3 3.5 2.9 -1.1 -3.5 -0.8 1.9 1.9
State & Local Government 58.5 58.9 59.1 58.1 58.1 57.6 59.0 60.4 61.5
Pct Chg Year Ago 0.9 0.6 0.4 -1.8 0.1 -0.9 2.4 2.5 1.7
Other Economic Indicators
Population (Ths) 1525.7 1555.6 1585.5 1614.4 1640.9 1669.8 1698.1 1720.8 1743.1 Pct Chg Year Ago 2.1 2.0 1.9 1.8 1.6 1.8 1.7 1.3 1.3
Labor Force (Ths) 752.2
Percent Change, Year Ago
Unemployment Rate (%)
Total Housing Starts
Single-Family
Multifamily
775.7
3.0 1.0 0.8
16232.6 16443.7
12108.0 12525.7
J ACKSONVILLE 62 Florida & Metro Forecast / Summer 2022
2017 2018 2019 2020 2021 2022 2023 2024 2025
765.6 778.0
795.3 814.8 838.9 847.2 854.1
2.3 1.8 1.6 -0.3 2.5 2.5
4.1 3.5 3.2 6.8 4.0 2.7 4.1 5.1 4.9
13122.9 14132.8 15453.3 16063.3 21860.9 19682.7 16612.2
9755.6 10454.7 11668.3 12690.5 16748.3 14025.5 11539.8
3367.3 3678.1 3784.9 3372.8 5112.6 5657.2 5072.4 4124.6 3918.0
Short Term Outlook for Jacksonville, FL August 2022 Forecast
2022:2 2022:3 2022:4 2023:1 2023:2 2023:3 2023:4 2024:1 2024:2 2024:3 2024:4 2025:1 2025:2
Personal Income (Billions $)
Total Personal Income 99.6 100.7 102.3 103.2 104.1 105.2 106.3 107.9 109.2 110.5 111.9 113.4 114.9
Pct Chg Year Ago 5.6 5.9 5.1 5.0 4.6 4.4 3.9 4.5 4.8 5.0 5.2 5.1 5.2
Wages and Salaries 54.2 54.9 55.3 55.7 55.9 56.1 56.4 56.7 57.2 57.7 58.2 58.8 59.6
Nonwage Income 45.4 45.7 47.0 47.6 48.2 49.0 50.0 51.2 52.0 52.8 53.6 54.5 55.3
Real Personal Income (12$) 84.4 84.3 84.9 85.0 85.3 85.7 86.2 87.1 87.9 88.6 89.3 90.1 90.8
Pct Chg Year Ago -0.8 -0.5 -0.7 0.3 1.0 1.7 1.6 2.6 3.0 3.4 3.6 3.4 3.4
Per Capita Income (Ths) 59.8 60.2 60.9 61.1 61.4 61.8 62.3 63.0 63.5 64.1 64.7 65.4 66.0
Real Per Capita Income (12$) 50.7 50.3 50.5 50.3 50.3 50.4 50.5 50.9 51.1 51.4 51.7 51.9 52.2
Average Annual Wage (Ths) 70.5 71.3 71.8 72.3 72.9 73.5 74.1 74.8 75.4 76.0 76.6 77.2 77.8
Pct Chg Year Ago 8.1 6.7 3.6 3.1 3.4 3.1 3.3 3.4 3.5 3.4 3.3 3.3 3.2
Establishment Employment (Place of Work, Thousands, SA)
Total Employment 752.2 754.1 753.4 752.9 750.8 747.7 744.6 742.8 742.3 743.2 744.5 746.7 750.2
Pct Chg Year Ago 3.3 2.4 1.4 0.5 -0.2 -0.9 -1.2 -1.3 -1.1 -0.6 0.0 0.5 1.1
Manufacturing 33.0 33.3 33.6 33.0 32.7 32.4 32.2 31.9 31.5 31.2 31.0 30.9 30.9
Pct Chg Year Ago 2.8 2.6 2.3 -0.7 -1.0 -2.5 -4.2 -3.5 -3.6 -4.0 -3.8 -3.1 -1.9
Nonmanufacturing 719.3 720.8 719.8 719.9 718.1 715.2 712.4 710.9 710.9 712.1 713.6 715.8 719.3
Pct Chg Year Ago 3.3 2.4 1.3 0.5 -0.2 -0.8 -1.0 -1.2 -1.0 -0.4 0.2 0.7 1.2
Construction & Mining 47.8 47.3 45.9 45.0 44.2 43.6 43.0 42.6 42.3 42.1 41.9 41.8 41.8
Pct Chg Year Ago 0.4 -1.7 -5.3 -8.4 -7.6 -7.8 -6.3 -5.2 -4.4 -3.5 -2.7 -1.9 -1.1
Trade, Trans, & Utilities 164.8 164.4 164.5 164.4 166.1 165.6 166.2 165.7 164.7 164.6 164.4 164.2 164.5 Pct Chg Year Ago 3.6 2.2 1.1 -0.5 0.8 0.8 1.0 0.8 -0.9 -0.6 -1.1 -0.9 -0.1
Wholesale Trade 29.7 29.8 29.7 29.9 29.9 29.9 29.9 30.1 30.3 30.5 30.6 30.8 30.9 Retail Trade 82.4 81.2 80.9 79.7 81.1 80.5 80.5 79.2 77.1 76.3 75.4 74.4 74.0 Trans, Wrhsng, & Util 52.7 53.3 53.9 54.8 55.1 55.3 55.8 56.5 57.3 57.7 58.3 59.0 59.6
Information 9.2 9.3 9.5 9.6 9.4 9.2 9.1 9.1 9.1 9.1 9.1 9.2 9.3 Pct Chg Year Ago 8.9 3.0 3.7 3.1 1.7 -1.2 -4.9 -5.4 -2.8 -1.0 0.1 1.2 1.9
Financial Activities 69.8 70.1 69.9 70.4 69.9 70.2 70.7 71.4 72.5 73.3 74.0 74.6 75.0 Pct Chg Year Ago -0.1 -1.5 -1.1 -0.3 0.1 0.2 1.1 1.5 3.7 4.4 4.7 4.4 3.5
Prof & Business Services 120.9 120.8 119.3 115.7 110.0 105.1 100.9 97.8 95.8 94.5 94.5 95.4 97.0 Pct Chg Year Ago 5.5 5.4 2.4 -1.8 -9.0 -13.0 -15.4 -15.5 -12.9 -10.1 -6.3 -2.4 1.3
Educ & Health Services 113.6 114.2 114.6 115.4 116.3 117.1 118.1 119.7 121.1 122.4 123.2 124.0 124.4 Pct Chg Year Ago 1.8 0.6 1.0 1.0 2.4 2.5 3.0 3.8 4.1 4.5 4.4 3.6 2.7
Leisure & Hospitality 89.8 90.9 91.7 94.5 96.7 98.2 97.5 96.7 96.6 96.6 96.2 95.5 95.6 Pct Chg Year Ago 11.0 10.0 8.1 10.8 7.7 8.1 6.3 2.3 -0.1 -1.7 -1.4 -1.3 -1.1
Other Services 27.9 28.3 28.4 28.6 28.6 28.7 29.1 29.5 30.0 30.4 30.8 31.2 31.5 Pct Chg Year Ago 4.0 4.2 3.0 3.1 2.4 1.4 2.3 3.1 4.7 5.9 6.1 5.9 5.1
Federal Government 18.1 18.1 18.1 18.0 18.1 18.2 18.3 18.3 18.4 18.5 18.6 18.7 18.8 Pct Chg Year Ago -4.4 -4.0 -4.3 -4.5 -0.2 0.5 1.1 1.7 1.9 1.8 1.9 2.0 2.0 State & Local Government 57.1 57.4 57.8 58.3 58.7 59.2 59.6 60.0 60.3 60.6 60.8 61.1 61.4 Pct Chg Year Ago -1.1 -1.2 -0.3 0.5 2.9 3.1 3.1 3.0 2.7 2.4 2.1 1.9 1.7
Other Economic Indicators
Population (Ths) 1665.7
1712.8 1718.0 1723.4 1729.1 1734.9 1740.5 Pct Chg Year Ago 1.7 1.8
1.3 1.3 1.3 1.3 1.3 Labor Force (Ths)
Pct Chg Year Ago
Unemployment Rate (%)
Total Housing Starts
Single-Family
Multifamily
J ACKSONVILLE Institute for Economic Forecasting 63
1673.7 1681.4 1688.3 1695.2 1701.4 1707.3
1.8 1.8 1.8 1.7 1.5 1.5
815.2 816.5 822.4 831.7 838.4 841.6 843.7 845.2 846.5 847.9 849.5 851.0 852.9
2.9 2.3 2.8 3.3 2.8 3.1 2.6 1.6 1.0 0.7 0.7 0.7 0.8
2.5 2.7 2.9 3.4 4.0 4.4 4.7 5.0 5.1 5.2 5.2 5.1 5.0
20391.1 18297.5 18202.4 16998.5 16701.2 16470.0 16279.3 16071.9 16162.5 16284.4 16411.5 16520.8 16520.8
14124.8 12350.1 12001.5 11435.1 11435.5 11583.9 11704.8 11783.2 12027.4 12232.5 12388.8 12549.3 12567.6
6266.3 5947.4 6200.9 5563.4 5265.7 4886.2 4574.4 4288.7 4135.1 4051.9 4022.7 3971.5 3953.2
PROFILES
The Lakeland–Winter Haven MSA is comprised only of Polk County. It is located in the westerncenter of the state and is heavily agriculturally based, especially in citrus. Lakeland is the home to Legoland Florida and is also the location of Publix Supermarket headquarters. Each year the Detroit Tigers host spring training at Joker Marchant Stadium. Lakeland is also home to Florida Polytechnic University, the newest member of the State University System.
QUICK FACTS
• Metro population estimate of 724,777 as of 2019 (5-Year Estimate) (U.S. Census Bureau).
• Polk County population estimate of 724,777 as of 2019 (5-Year Estimate) (U.S. Census Bureau).
• Civilian labor force of 338,715 in July 2022 (Florida Research and Economic Database).
• An unemployment rate of 3.6% as of July 2022, not seasonally adjusted. This amounts to 12,095 unemployed people (Florida Research and Economic Database).
OUTLOOK SUMMARIES
The studied economic indicators are predicted to show mixed levels of growth in the Lakeland Metropolitan Statistical Area (MSA). Gross Metro Product for the MSA will come in at $27,872.56. The MSA will experience above-average personal income growth of 5.6 percent, but per capita income will be the lowest in the state at $38,200. The average annual wage will grow at an annual rate of 5.6 percent to $60,400. Lakeland’s population will grow at an annual rate of 2.2 percent.
Employment growth is expected to average 1.6 percent, but Lakeland will experience a slightly high unemployment rate at 5.4 percen compared to the other MSA’s.
The Other Services sector will lead the MSA in average annual growth at 5.5 percent. The Leisure sector will follow at 5.5 percent. The Federal
Government sector, and the Construction & Mining sector will see respective contractions in growth of -2.9 percent, and -1.4 percent.
METRO NEWS SUMMARIES
Lakeland Electric to Increase Fuel Charge Next Quarter
•
Lakeland has been seeing higher costs in its energy production, particularly in natural gas. Combined with overall higher temperatures, it was announced in early June that electrical costs would increase by $0.2 per kWh (from $0.4 to $0.6 kWh) starting July 1st.
• To put it into perspective, this is the highest price for electricity in Lakeland since 2009. For the average household, this will increase average home costs from $40 to $60 per month. While this is a significant increase, Lakeland will still have a relatively low electric rate compared to the rest of Florida.
• To help circumvent some of these changes, Lakeland Electric is willing to perform free energy audits by request to help consumers find ways to save energy. They have also provided tips online, including setting thermostats to 78° during this summer and using a hot water timer.
Source: Lakeland Electric, June 7, 2022
Publix bringing tech campus to downtown Lakeland; will demolish old Citrus Mutual building
• Lakeland’s downtown will now be the site of a new technology campus for Publix Super Markets Inc. A former Fed-Ex building on E. Lemon Street will be replaced by the campus, while it is currently being used by Publix for their IT workers.
• Lakeland struck a deal with Publix where they will be paid a total of $500,000 over a 3-year period by the Lakeland city and county under the promise that it will create 100 new full-time jobs.
L AKELAND – W INTER H AVEN 64 Florida & Metro Forecast / Summer 2022
•
The company will also receive a $26 million tax break. The company expects an annual wage of roughly $93,500 for its employees there.
The city is looking forward to the construction of the campus, however there are still minor concerns. A nearby building will be demolished to construct a large parking lot. While officials are displeased with the loss, they are hopeful for what the new technology campus will bring for the downtown.
Source: The Ledger, June 21, 2022
PCPS Employee Salary Agreements and Raises Approved for 2022-23
•
On July 12th, the Polk County School Board held a meeting in which they approved salary agreements with multiple unions. These unions include the Polk Education Association (PEA) and the American Federation of State, County and Municipal Employees.
• The agreement includes increased wages in the form of a new $15 per hour minimum wage for Polk County Public Schools (PCPS) employees, a $16.25 per hour minimum wage for bus drivers, an increase in starting teacher salary by $2,000, with other salaries increasing by at least 2.25%. Degree supplements have also increased to $3,162, $4,517, and $6,776 for master’s, specialist, and doctoral degrees respectively.
• PEA union members received $1000 through Secondary School Emergency Relief Supplements. Paraeducators and clerical personnel also saw their salaries increase, increasing by 3%.
Source: Polk County Public Schools, July 12, 2022
Lake Wire Development Gets Break in Sale Price
From City
•
The area around Bonnet Springs Park is starting to see large changes as a nearby piece of land had its price reduced to the park developers. The developers provided the city with a letter
and presentation, after which a 5-1 ruling by Lakeland City Commission had the land discounted to $25,000 instead of the initial agreement for $424,601.
•
The park developers have already progressed the nearby areas, removing tons of garbage and spending $8 million to remediate a stormwater pollution source. They also contributed to the city’s grant towards cleaning Lake Bonnet and have secured an endowment fund for their project, rather than relying on tax-payer dollars. All of this was presented to the city, leading to the 5-1 ruling.
• After the purchase the land, it will be bundled with additional land and be resold to Carter
Acquisitions LLC of Atlanta, where there are plans to build a complex with 630 apartments along with some commercial add-ons.
Source: LkldNow, July 18, 2022
New Lakeland waterline fails, creating washout at Wabash Avenue and 10th Street
• In the early morning, Northwest Lakeland saw one of its intersections in a sad state of affairs. In the southeast corner of Wabash Avenue and 10th street, a waterline broke and washed away and eroded the corner.
• The waterline was a smaller part of a $5.1 million construction project which also included a roadway, sidewalks, a railroad crossing, and a stormwater drainage system. The intersection in question was improved and also introduced a new traffic light.
• Water was initially shut off to the area, however it has since been maintained. Temporary traffic control measures are also in effect until repairs are made. The cause for failure has not been clear, however the waterline is reportedly still under COBB Construction’s warranty.
Source: The Ledger, August 30, 2022
L AKELAND – W INTER H AVEN Institute for Economic Forecasting 65
Total Nonagricultural Employment
Total Private Goods Producing Service Producing
Private Service Providing Mining, Logging, and Construction Manufacturing Trade, Transportation, and Utilities
Wholesale Trade Retail Trade Transportation, Warehousing and Utilities
Financial Activities
Professional and Business Services
Educational and Health Services
Leisure and Hospitality Other Services Government
Lakeland - Winter Haven MSA Industry Location Quotients
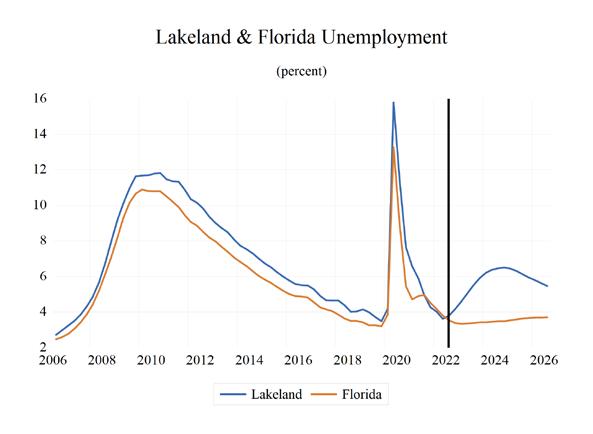
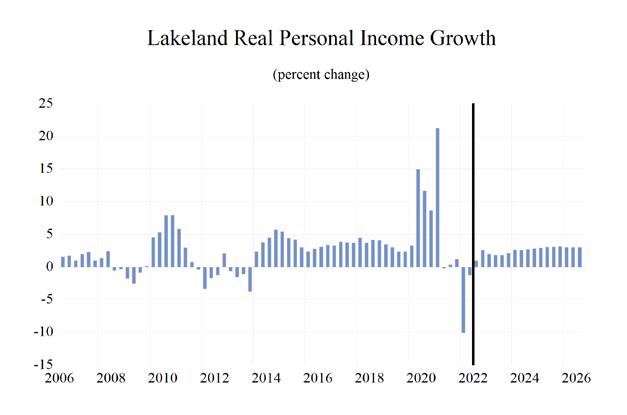
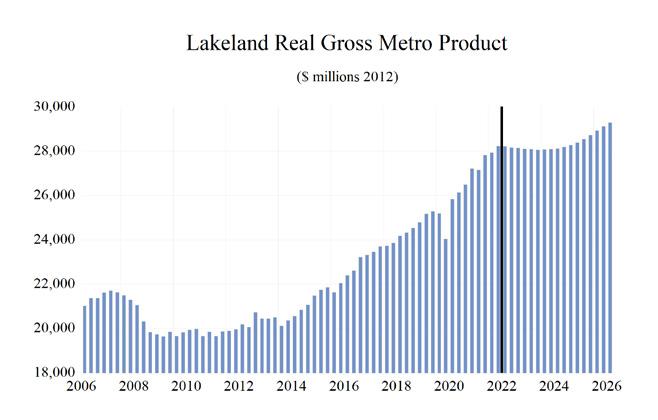
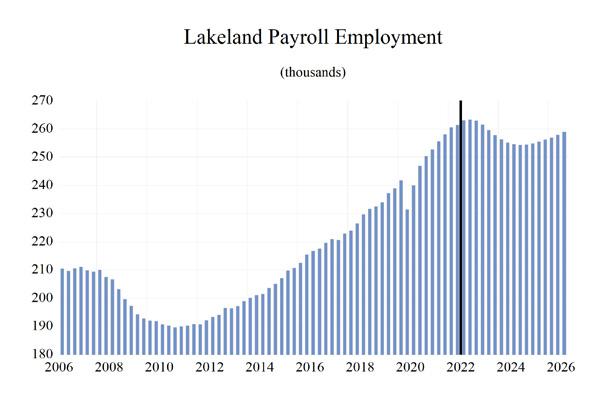
L AKELAND – W INTER H AVEN 66 Florida & Metro Forecast / Summer 2022 0 0.5 1 1.5 2 2.5 3 3.5
Information
Long Term Outlook for Lakeland-Winter Haven, FL August 2022 Forecast
Personal Income (Billions $)
Total Personal Income 24.2 25.5 27.0 29.6 32.9 34.1 35.5 36.7 38.5 Pct Chg Year Ago 7.4 5.5 5.8 9.8 11.0 3.8 4.0 3.5 4.9
Wages and Salaries 10.2 10.8 11.5 12.4 14.3 15.9 16.1 16.3 16.7
Nonwage Income 14.0 14.7 15.5 17.2 18.6 18.2 19.3 20.4 21.8
Real Personal Income (12$) 23.5 24.8 26.1 28.3 30.2 29.5 29.7 30.2 31.1 Pct Chg Year Ago 6.0 5.4 5.2 8.7 6.6 -2.3 0.7 1.8 3.0
Per Capita Income (Ths) 35.8 36.7 37.9 40.4 43.5 43.9 44.6 45.3 46.7
Real Per Capita Income (12$) 34.8 35.7 36.6 38.7 40.0 38.0 37.4 37.3 37.8
Average Annual Wage (Ths) 45.9 47.1 48.5 51.3 56.0 60.4 61.7 63.5 65.1 Pct Chg Year Ago 3.2 2.5 3.1 5.6 9.2 7.9 2.2 3.0 2.5
Establishment Employment (Place of Work, Thousands, SA)
Total Employment 221.0 227.9 235.6 240.0 254.2 262.0 260.5 255.1 255.2
Pct Chg Year Ago 2.5 3.1 3.4 1.9 5.9 3.1 -0.6 -2.1 0.0
Manufacturing 17.1 17.6 18.0 17.9 18.0 18.4 18.3 17.4 16.8 Pct Chg Year Ago 0.4 3.0 2.0 -0.5 0.5 2.4 -0.8 -5.0 -3.1
Nonmanufacturing 203.8 210.3 217.6 222.1 236.2 243.6 242.2 237.7 238.3
Pct Chg Year Ago 2.7 3.2 3.5 2.1 6.3 3.1 -0.6 -1.8 0.3 Construction & Mining 13.1 13.7 14.3 14.9 15.4 15.5 14.9 14.1 13.7 Pct Chg Year Ago 3.2 4.6 4.6 4.3 3.0 1.0 -4.3 -5.3 -2.4 Trade, Trans, & Utilities 56.8 58.2 61.2 67.5 75.2 77.6 76.3 73.6 72.6
Pct Chg Year Ago 4.1 2.4 5.2 10.2 11.4 3.2 -1.6 -3.7 -1.3
Wholesale Trade 10.4 10.6 11.2 11.2 11.3 12.2 12.7 13.2 13.4 Retail Trade 27.4 27.7 28.2 29.3 31.4 32.4 31.7 29.4 27.9 Trans, Wrhsng, & Util 19.0 20.0 21.9 27.0 32.5 33.0 32.0 31.0 31.3
Information 1.9 1.9 1.9 1.8 2.0 2.1 2.1 1.9 1.9 Pct Chg Year Ago 9.0 1.8 -0.4 -6.0 7.1 7.3 -2.1 -5.4 -0.2
Financial Activities 12.2 12.5 13.3 14.1 14.5 14.7 15.4 15.5 15.7 Pct Chg Year Ago -1.3 2.8 5.8 6.0 2.7 1.6 4.7 0.8 1.0
Prof & Business Services 29.9 31.3 32.5 32.9 35.3 37.2 34.7 30.8 30.9 Pct Chg Year Ago 4.5 4.6 3.8 1.3 7.2 5.4 -6.6 -11.3 0.1
Educ & Health Services 32.4 33.7 34.5 34.6 35.2 35.7 36.5 38.0 38.7 Pct Chg Year Ago 2.7 4.1 2.4 0.2 1.6 1.6 2.3 3.9 2.1
Leisure & Hospitality 23.6 24.1 24.6 21.3 24.0 25.6 25.8 26.2 26.7 Pct Chg Year Ago 2.3 2.4 2.1 -13.6 12.8 6.7 0.7 1.7 1.9
Other Services 5.9 6.3 6.6 6.3 6.8 7.2 7.4 7.8 8.1
Pct Chg Year Ago 1.0 6.6 5.4 -5.5 7.8 6.2 3.1 5.1 4.1
Federal Government 1.1 1.2 1.2 1.4 1.2 1.2 1.3 1.2 1.2 Pct Chg Year Ago 0.7 8.4 2.0 13.6 -10.5 -0.9 2.1 -2.3 -1.3
State & Local Government 26.9 27.3 27.4 27.4 26.7 26.7 27.8 28.6 28.8
Pct Chg Year Ago -0.1 1.3 0.3 0.0 -2.3 0.1 3.9 2.9 0.6
Other Economic Indicators
Population (Ths) 675.8
777.5 795.0 810.4 824.2
Pct Chg Year Ago 2.7 2.8 2.5 2.9 3.2 2.8 2.2 1.9 1.7
Labor Force (Ths) 291.1 296.5 304.0 319.6 327.7 334.4 340.3 339.9 338.5
Percent Change, Year Ago 1.6 1.8 2.5 5.1 2.5 2.0 1.8 -0.1 -0.4
Unemployment Rate (%) 4.9 4.3
Total Housing Starts
Single-Family
Multifamily 45.0 0.0
5.4 3.9 5.3 6.4 6.2
11569.5 8521.4 6900.1 6422.6
9506.3 9327.2 6789.2 5630.0 5162.8
2098.1 2242.3 1732.2 1270.2 1259.9
L AKELAND – W INTER H AVEN Institute for Economic Forecasting 67
2017 2018 2019 2020 2021 2022 2023 2024 2025
694.6 711.9 732.5 756.0
3.8 9.7
4576.2 5060.2 8048.2 9380.1 11604.5
4531.2 5060.2 6531.5 7128.9
1516.7 2251.2
Short Term Outlook for Lakeland-Winter Haven, FL August 2022 Forecast
2022:2 2022:3 2022:4 2023:1 2023:2 2023:3 2023:4 2024:1 2024:2 2024:3 2024:4 2025:1 2025:2
Personal Income (Billions $)
Total Personal Income 33.9 34.3 34.9 35.2 35.3 35.5 35.8 36.1 36.5 36.9 37.3 37.8 38.3 Pct Chg Year Ago 5.8 5.8 5.6 5.6 4.1 3.6 2.6 2.8 3.2 3.8 4.3 4.6 4.9
Wages and Salaries 15.9 16.1 16.1 16.2 16.1 16.1 16.1 16.2 16.2 16.3 16.4 16.5 16.6
Nonwage Income 18.1 18.2 18.8 19.0 19.2 19.4 19.7 20.0 20.2 20.6 20.9 21.3 21.6
Real Personal Income (12$) 29.5 29.4 29.7 29.7 29.7 29.7 29.8 29.9 30.1 30.3 30.6 30.8 31.0 Pct Chg Year Ago -0.6 -0.6 -0.1 0.8 0.6 0.9 0.3 0.9 1.4 2.2 2.7 3.0 3.1
Per Capita Income (Ths) 43.8 43.9 44.5 44.6 44.6 44.6 44.7 44.9 45.1 45.4 45.8 46.2 46.5
Real Per Capita Income (12$) 38.1 37.7 37.8 37.6 37.4 37.2 37.2 37.2 37.2 37.4 37.5 37.6 37.7
Average Annual Wage (Ths) 60.4 60.7 60.9 61.3 61.4 61.7 62.3 62.8 63.3 63.8 64.2 64.6 64.9 Pct Chg Year Ago 9.4 6.9 3.6 3.0 1.7 1.6 2.3 2.6 3.1 3.4 3.0 2.9 2.5
Establishment Employment (Place of Work, Thousands, SA)
Total Employment 261.3 263.0 263.3 263.0 261.5 259.5 257.8 256.3 255.1 254.6 254.3 254.3 254.8
Pct Chg Year Ago 3.4 2.9 2.0 1.0 0.1 -1.3 -2.1 -2.5 -2.4 -1.9 -1.4 -0.8 -0.1
Manufacturing 18.3 18.5 18.7 18.5 18.4 18.2 18.0 17.8 17.5 17.2 17.0 16.9 16.9
Pct Chg Year Ago 1.3 2.8 3.3 1.5 0.6 -1.6 -3.7 -4.2 -4.8 -5.4 -5.5 -4.7 -3.6
Nonmanufacturing 243.1 244.5 244.6 244.4 243.1 241.3 239.8 238.5 237.6 237.4 237.3 237.4 237.9
Pct Chg Year Ago 3.6 2.9 1.9 0.9 0.0 -1.3 -2.0 -2.4 -2.3 -1.6 -1.0 -0.5 0.1
Construction & Mining 15.5 15.6 15.4 15.2 15.0 14.7 14.5 14.3 14.1 14.0 13.9 13.8 13.8
Pct Chg Year Ago 1.3 1.9 -0.2 -2.1 -3.5 -5.8 -5.7 -6.0 -5.8 -5.1 -4.2 -3.4 -2.5
Trade, Trans, & Utilities 77.5 77.3 77.3 77.1 76.8 76.0 75.5 74.6 73.5 73.2 72.9 72.6 72.5
Pct Chg Year Ago 4.1 2.1 0.6 -1.4 -0.9 -1.7 -2.4 -3.2 -4.3 -3.6 -3.4 -2.7 -1.4
Wholesale Trade 12.1 12.3 12.4 12.6 12.7 12.8 12.8 13.0 13.2 13.2 13.3 13.3 13.4 Retail Trade 32.6 32.1 32.1 31.8 32.0 31.6 31.3 30.5 29.4 29.0 28.6 28.1 27.8 Trans, Wrhsng, & Util 32.8 33.0 32.9 32.7 32.1 31.7 31.3 31.1 30.9 31.0 31.0 31.2 31.3
Information 2.1 2.1 2.2 2.1 2.1 2.0 2.0 2.0 2.0 1.9 1.9 1.9 1.9
Pct Chg Year Ago 11.1 2.7 6.2 4.4 -1.0 -3.2 -8.4 -8.5 -5.8 -4.1 -3.0 -1.8 -0.8
Financial Activities 14.4 14.7 14.9 15.4 15.5 15.4 15.3 15.4 15.5 15.6 15.6 15.7 15.7 Pct Chg Year Ago 1.0 1.7 2.7 4.7 7.1 4.3 2.7 0.0 0.2 1.3 1.8 1.8 1.3 Prof & Business Services 37.3 37.6 37.6 36.9 35.4 33.9 32.6 31.7 30.9 30.4 30.3 30.4 30.6 Pct Chg Year Ago 7.3 6.1 4.5 1.9 -5.1 -9.8 -13.1 -14.2 -12.6 -10.4 -7.3 -4.2 -1.1 Educ & Health Services 35.5 35.9 36.2 36.3 36.4 36.6 36.9 37.4 37.8 38.2 38.4 38.6 38.7 Pct Chg Year Ago 1.1 2.0 2.8 2.6 2.5 2.0 2.0 3.2 3.8 4.3 4.1 3.3 2.3
Leisure & Hospitality 25.7 25.9 25.4 25.3 25.6 26.2 26.1 26.0 26.2 26.3 26.4 26.4 26.7 Pct Chg Year Ago 7.8 5.0 0.3 -0.3 -0.5 0.8 2.9 2.6 2.3 0.7 1.3 1.9 1.8
Other Services 7.1 7.3 7.3 7.4 7.3 7.4 7.5 7.6 7.7 7.8 7.9 8.0 8.1 Pct Chg Year Ago 5.6 6.2 5.9 6.1 2.9 1.6 1.9 2.9 5.2 6.1 6.0 5.5 4.4
Federal Government 1.2 1.2 1.2 1.3 1.3 1.3 1.2 1.2 1.2 1.2 1.2 1.2 1.2 Pct Chg Year Ago -5.5 0.1 0.4 1.0 4.8 2.6 0.3 -1.5 -2.9 -2.5 -2.1 -1.7 -1.2
State & Local Government 26.5 26.8 27.1 27.4 27.7 27.9 28.1 28.4 28.6 28.7 28.7 28.7 28.8
Pct Chg Year Ago -1.0 1.1 2.0 3.3 4.4 4.0 3.9 3.6 3.3 2.8 2.0 1.2 0.5
Other Economic Indicators
Population (Ths) 775.2
819.0 822.5
Pct Chg Year Ago 2.9 2.8 2.7 2.5
Pct Chg Year Ago 2.1 1.6
Unemployment Rate (%)
Total Housing Starts
Single-Family
Multifamily
340.1 339.7 339.3 338.9 338.7
2.0 2.0 1.9 1.8 1.7 1.7 Labor Force (Ths) 333.0
0.3 -0.1 -0.3 -0.4 -0.5 -0.4
L AKELAND – W INTER H AVEN 68 Florida & Metro Forecast / Summer 2022
780.2 784.9 789.0 793.0 797.0 801.1 805.0 808.7 812.3 815.7
2.3 2.2 2.1
334.8 337.5 339.3 340.5 340.8 340.8 340.5
2.3 2.2 2.2 1.8 1.0
3.6 3.8 4.2 4.6 5.0 5.5 5.9 6.2 6.4 6.5 6.5 6.4 6.3
13440.4 11314.9 10561.6 9422.7 8735.4 8244.5 7683.0 7231.6 6903.8 6789.6 6675.5 6594.0 6487.4
10417.2 8827.7 8237.4 7432.8 6986.0 6571.9 6166.3 5833.6 5692.9 5560.2 5433.1 5352.2 5230.7
3023.2 2487.2 2324.2 1989.9 1749.4 1672.6 1516.8 1398.0 1210.8 1229.4 1242.4 1241.8 1256.7
PROFILES
The area is expected to show mixed levels of growth in the economic indicators. Personal income is expected to grow an average of 5.2 percent annually, a moderate level compared to all MSAs studied. The average real per capita income level of $55,400 is the seventh highest in the areas studied. Average annual wage growth will be 4.9. The average annual wage level is expected to be $75,100, the second highest of the studied areas. Miami is expected to average a population growth of 0.3 percent each year. The area has the highest Gross Metro Product of the MSAs studied at an average level of $348,718.15 million.
Employment is expected to grow at an average rate of 2.4 percent each year, while unemployment is expected to be moderate at an average rate of 4.1 percent.
Miami’s fastest growing sector is expected to be the Leisure & Hospitality sector, which will experience 9.0 percent average annual growth, followed by the Professional and Business Services sector, which will grow at an average of 3.4 percent annually.
QUICK FACTS
• Metro population estimate of 6,090,660 as of 2019 (5-Year Estimate) (U.S. Census Bureau).
• Miami-Dade County population estimate of 2,716,940 as of 2019 (5-Year Estimate) (U.S. Census Bureau).
• Broward County population estimate of 1,952,778 as of 2019 (5-Year Estimate) (U.S. Census Bureau).
• Palm Beach County population estimate of 1,496,770 as of 2019 (5-Year Estimate) (U.S. Census Bureau).
• Civilian labor force of 3,157,574 in July 2022 (Florida Research and Economic Database).
• An unemployment rate of 2.6% as of July 2022, not seasonally adjusted. This amounts to 82,919 unemployed people (Florida Research and Economic Database).
OUTLOOK SUMMARIES
The Miami–Fort Lauderdale–Palm Beach area is expected to show mixed levels of growth in the economic indicators. Personal income is expected to grow an average of 4.9 percent annually, a moderate level compared to all MSAs studied. The average real per capita income level of $54,800 is the sixth highest in the areas studied. Average annual wage growth will be 5.4. The average annual wage level is expected to be $76,000, the third highest of the studied areas. Miami is expected to average a population growth of 0.5 percent each year. The area has the highest Gross Metro Product of the MSAs studied at an average level of $334,898.40 million.
Employment is expected to grow at an average rate of 1.5 percent each year, while unemployment is expected to be moderate at an average rate of 4.9 percent.
Miami’s fastest growing sector is expected to be the Leisure & Hospitality sector, which will experience 9.6 percent average annual growth, followed by the Information and Other Services sectors, which will grow at averages of 2.9 and 2.8 percent, respectively.
METRO NEWS SUMMARIES
Company from New York leases 20,000 square feet at 830 Brickell
• A-Cap, an insurance and financial services company with over $6 billion in assets under management, signed a 20,000 square foot lease in Miami’s financial center.
• Its neighbors at 830 Brickell will include Microsoft and several other big-time financial firms.
• The 55-story building is expected to be completed by the end of this year, and it is already 60% leased.
Source: South Florida Business Journal, June 14, 2022
M IAMI – F ORT L AUDERDALE – W EST P ALM B EACH Institute for Economic Forecasting 69
Billionaire Ken Griffin to relocate Chicago firms to Miami
• Citadel, which is the $51 billion hedge fund founded by Ken Griffin, is moving its global headquarters from Chicago to Miami.
• A spokesman for the firm said the company will hire local investment and tech professionals.
• Citadel will keep an office in Chicago and some employees will remain there.
Source: South Florida Business Journal, June 23, 2022
Starwood cancels purchase of Miami Beach office building
• Starwood Capital Group was set to purchase an office building in Miami Beach, but days before the purchase was supposed to close, the company pulled out of the deal.
• Starwood Capital Group was planning to purchase The Lincoln for $92.5 million.
• Starwood Capital Group will most likely lose the $2.5 million deposit it made when the property went under contract. However, if the company had pulled out of the deal a week earlier, it could have gotten the deposit back.
Source: South Florida Business Journal, July 27, 2022
Logistics company leases 141,000 square feet under construction near MIA
• Industrial space is limited in the Miami-Dade area.
• As a result, tenants are deciding to lease spaces that are not yet built.
• This includes a logistics company, which is leasing a 141,000 square foot property located near Miami International Airport, but that is still under construction.
Source: South Florida Business Journal, July 29, 2022
Estate Cos. wins approval for second tower in North Miami Beach
• The Estate Companies is looking at a multifamily project in the city called Soleste on the Bay, which would include retail and restaurant space.
• For construction to begin, the city has to approve changing the seven-year-old site plan. If the city approves, then construction will start in the fourth quarter.
•
The Estate Companies purchased this development site for $21.3 million.
Source: South Florida Business Journal, August 19, 2022
$195M construction loan goes to apartment project in Miami
• Namdar Group, a New York based real estate investment and development firm, received a $195 million loan, which they will use to buy a development site in downtown Miami.
• They are planning to build a pair of apartment towers, one with 41 floors and one with 43 floors.
• The development site is located just two blocks away from Brightline’s Miami Central station.
Source: South Florida Business Journal, August 26, 2022
M IAMI – F ORT L AUDERDALE – W EST P ALM B EACH 70 Florida & Metro Forecast / Summer 2022
Miami Fort Lauderdale West Palm Beach MSA Industry Location Quotients

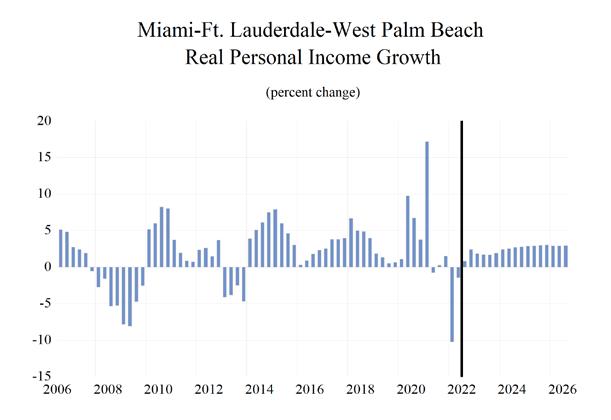
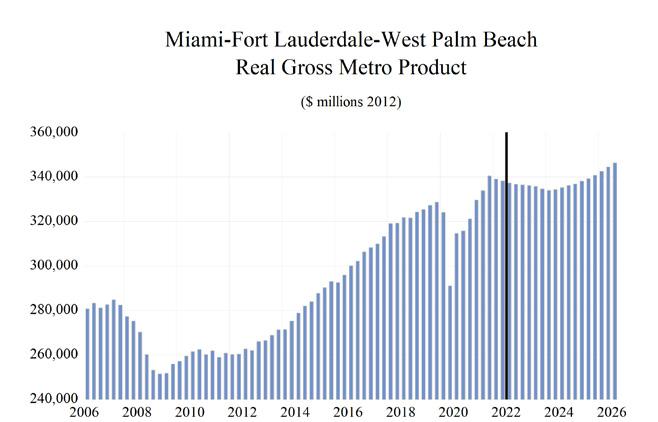
Total Nonagricultural Employment
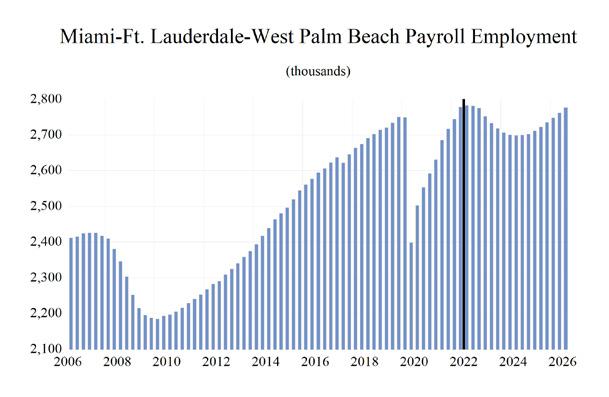
M IAMI – F ORT L AUDERDALE – W EST P ALM B EACH Institute for Economic Forecasting 71 0 0.2 0.4 0.6 0.8 1 1.2 1.4 1.6
Total Private Goods Producing Service Producing Private Service Providing Mining, Logging, and Construction Manufacturing Trade, Transportation, and Utilities Wholesale Trade Retail Trade Transportation, Warehousing and Utilities Information Financial Activities Professional and Business Services Educational and Health Services Leisure and Hospitality Other Services Government
Long Term Outlook for Miami-Fort Lauderdale-Pompano Beach, FL August 2022 Forecast
Personal Income (Billions $)
Total Personal Income 339.9 363.4 378.3 396.2 432.1 449.4 464.1 479.1 502.2
Pct Chg Year Ago 8.6 6.9 4.1 4.7 9.0 4.0 3.2 3.2 4.8
Wages and Salaries 149.7 157.7 165.9 167.0 188.5 210.4 214.5 217.9 226.3
Nonwage Income 190.1 205.7 212.4 229.2 243.6 239.1 249.6 261.2 275.9
Real Personal Income (12$) 294.9 305.1 315.8 323.9 339.2 332.1 332.0 337.0 346.9 Pct Chg Year Ago 5.9 3.5 3.5 2.6 4.7 -2.1 0.0 1.5 3.0
Per Capita Income (Ths) 55.7 59.3 61.6 64.7 71.0 73.8 75.9 77.8 80.9
Real Per Capita Income (12$) 48.3 49.8 51.4 52.9 55.7 54.6 54.3 54.7 55.9
Average Annual Wage (Ths) 56.6 58.5 60.5 65.2 70.6 75.5 77.8 80.3 82.9 Pct Chg Year Ago 3.3 3.3 3.4 7.8 8.2 7.0 3.0 3.2 3.2
Establishment Employment (Place of Work, Thousands, SA)
Total Employment 2631.6 2682.9 2729.5 2550.8 2656.2 2771.4 2744.4 2701.0 2717.9
Pct Chg Year Ago 1.8 1.9 1.7 -6.5 4.1 4.3 -1.0 -1.6 0.6
Manufacturing 88.6 89.8 91.5 87.4 89.1 93.4 91.0 85.0 82.0
Pct Chg Year Ago 0.7 1.4 2.0 -4.5 2.0 4.8 -2.6 -6.6 -3.5
Nonmanufacturing 2543.1 2593.1 2638.0 2463.5 2567.1 2678.0 2653.4 2616.0 2635.9
Pct Chg Year Ago 1.9 2.0 1.7 -6.6 4.2 4.3 -0.9 -1.4 0.8 Construction & Mining 130.4 138.7 143.1 140.0 139.8 141.3 134.9 130.7 130.9
Pct Chg Year Ago 5.6 6.4 3.1 -2.1 -0.2 1.1 -4.6 -3.1 0.1 Trade, Trans, & Utilities 597.9 609.7 619.1 585.7 604.7 631.8 624.8 611.3 603.8
Pct Chg Year Ago 0.9 2.0 1.5 -5.4 3.3 4.5 -1.1 -2.2 -1.2
Wholesale Trade 145.5 148.0 148.8 143.0 146.8 155.6 156.4 158.9 162.4 Retail Trade 337.3 338.4 335.1 310.1 320.0 326.8 317.1 299.5 286.6 Trans, Wrhsng, & Util 115.1 123.4 135.2 132.5 138.0 149.4 151.3 152.9 154.9
Information 51.1 51.0 51.0 47.6 50.8 55.2 55.3 53.1 53.9
Pct Chg Year Ago 2.9 -0.1 -0.1 -6.6 6.8 8.5 0.3 -4.1 1.5
Financial Activities 181.3 184.7 189.8 187.8 195.3 200.9 198.4 202.2 206.1 Pct Chg Year Ago 1.9 1.9 2.7 -1.0 4.0 2.9 -1.3 1.9 2.0
Prof & Business Services 434.9 444.4 452.0 436.2 464.8 480.9 436.3 390.7 399.1 Pct Chg Year Ago 2.9 2.2 1.7 -3.5 6.5 3.5 -9.3 -10.5 2.2
Educ & Health Services 392.7 400.7 411.6 397.8 406.1 413.3 418.7 433.9 442.9 Pct Chg Year Ago 3.0 2.0 2.7 -3.4 2.1 1.8 1.3 3.6 2.1
Leisure & Hospitality 323.2 328.0 334.1 255.5 294.2 339.9 366.9 365.4 361.0
Pct Chg Year Ago 0.9 1.5 1.9 -23.5 15.1 15.5 7.9 -0.4 -1.2
Other Services 122.7 122.4 120.8 107.1 110.4 115.7 116.5 119.7 122.9 Pct Chg Year Ago -0.9 -0.3 -1.3 -11.3 3.1 4.8 0.7 2.7 2.7
Federal Government 33.7 33.9 34.5 36.1 34.9 33.6 32.5 32.9 33.5
Pct Chg Year Ago 0.5 0.6 1.7 4.6 -3.2 -3.7 -3.3 1.3 1.7
State & Local Government 275.3 279.5 282.1 269.6 266.0 265.4 269.0 276.1 281.8 Pct Chg Year Ago 1.4 1.5 0.9 -4.4 -1.3 -0.2 1.4 2.6 2.1
Other Economic Indicators
Population (Ths) 6102.5 6127.2 6142.9 6121.0 6088.1 6086.2 6110.6 6155.1 6207.2 Pct Chg Year Ago 0.9 0.4 0.3 -0.4 -0.5 0.0 0.4 0.7 0.8
Labor Force (Ths)
3068.6 3114.4 3133.0 3159.5 3187.0
Percent Change, Year Ago 2.2 0.6 1.2 -4.2 2.0 1.5 0.6 0.8 0.9
Unemployment Rate (%)
Total Housing Starts
Single-Family
Multifamily
5.0 3.3 4.7 5.9 5.8
M IAMI – F ORT L AUDERDALE – W EST P ALM B EACH 72 Florida & Metro Forecast / Summer 2022
2017 2018 2019 2020 2021 2022 2023 2024 2025
3080.1 3100.1 3138.9 3007.6
4.4 3.7 3.0 8.4
17253.3 17107.4 18892.0 19980.0 21402.5 24652.2 20611.5 21322.2 21962.3
6693.3 6724.7 7351.7 7547.4 9011.0 9017.8 8075.5 8635.4 8883.8
10560.0 10382.8 11540.3 12432.6 12391.5 15634.4 12536.0 12686.8 13078.6
Short Term Outlook for Miami-Fort Lauderdale-Pompano Beach, FL August 2022 Forecast 2022:2 2022:3 2022:4 2023:1 2023:2 2023:3 2023:4 2024:1 2024:2 2024:3 2024:4 2025:1 2025:2
Personal Income (Billions $)
Total Personal Income 447.1 451.8 459.5 461.6 462.9 464.7 467.1 471.9 476.3 481.4 486.7 492.9 499.1 Pct Chg Year Ago 5.9 6.2 5.7 5.1 3.5 2.8 1.7 2.2 2.9 3.6 4.2 4.5 4.8
Wages and Salaries 209.7 212.1 213.4 214.5 214.2 214.4 214.8 215.6 216.9 218.6 220.4 222.5 225.0
Nonwage Income 237.4 239.7 246.1 247.1 248.6 250.3 252.3 256.3 259.4 262.8 266.3 270.4 274.1
Real Personal Income (12$) 331.9 331.1 333.7 332.7 331.9 331.6 331.7 333.8 335.8 338.1 340.4 343.1 345.6 Pct Chg Year Ago -0.5 -0.2 -0.1 0.3 0.0 0.1 -0.6 0.3 1.2 2.0 2.6 2.8 2.9
Per Capita Income (Ths) 73.5 74.2 75.4 75.7 75.8 76.0 76.2 76.9 77.5 78.1 78.8 79.7 80.5
Real Per Capita Income (12$) 54.5 54.4 54.8 54.6 54.4 54.2 54.2 54.4 54.6 54.9 55.1 55.4 55.7
Average Annual Wage (Ths) 75.1 75.9 76.4 76.9 77.5 78.1 78.7 79.3 80.0 80.6 81.3 81.9 82.6
Pct Chg Year Ago 7.8 6.4 3.3 2.9 3.1 2.9 3.0 3.1 3.2 3.3 3.3 3.4 3.3
Establishment Employment (Place of Work, Thousands, SA)
Total Employment 2778.5 2782.0 2781.1 2775.1 2751.8 2733.1 2717.7 2706.5 2700.0 2698.7 2698.9 2702.5 2711.3 Pct Chg Year Ago 5.6 3.6 2.4 1.1 -1.0 -1.8 -2.3 -2.5 -1.9 -1.3 -0.7 -0.1 0.4
Manufacturing 93.3 94.0 94.8 93.3 91.6 90.3 88.9 87.3 85.7 84.2 83.0 82.4 82.0
Pct Chg Year Ago 5.4 5.5 5.1 1.9 -1.9 -4.0 -6.2 -6.4 -6.5 -6.8 -6.6 -5.6 -4.2
Nonmanufacturing 2685.2 2688.0 2686.3 2681.9 2660.2 2642.8 2628.8 2619.2 2614.3 2614.5 2615.8 2620.1 2629.3
Pct Chg Year Ago 5.6 3.6 2.3 1.1 -0.9 -1.7 -2.1 -2.3 -1.7 -1.1 -0.5 0.0 0.6 Construction & Mining 141.9 142.0 139.5 137.8 135.4 133.8 132.5 131.5 130.8 130.4 130.2 130.4 130.7
Pct Chg Year Ago 2.1 1.9 -0.5 -2.9 -4.6 -5.7 -5.0 -4.5 -3.4 -2.6 -1.7 -0.9 0.0
Trade, Trans, & Utilities 637.2 631.9 631.4 627.2 627.6 622.3 622.1 618.0 611.6 609.2 606.6 603.6 602.6 Pct Chg Year Ago 6.5 3.7 2.4 0.1 -1.5 -1.5 -1.5 -1.5 -2.5 -2.1 -2.5 -2.3 -1.5
Wholesale Trade 156.1 157.1 156.6 157.5 156.2 155.7 156.1 157.1 158.4 159.6 160.6 161.4 162.2 Retail Trade 330.7 323.9 323.5 317.6 320.0 316.0 315.0 309.0 300.3 296.5 292.3 287.8 285.5 Trans, Wrhsng, & Util 150.4 150.9 151.3 152.2 151.4 150.6 151.0 151.8 152.9 153.2 153.6 154.4 154.9
Information 54.8 55.5 56.6 57.3 56.1 54.5 53.4 53.2 53.4 53.1 52.6 53.0 53.7 Pct Chg Year Ago 10.9 5.9 6.4 6.4 2.3 -1.7 -5.7 -7.1 -4.7 -2.7 -1.6 -0.4 0.5
Financial Activities 200.2 201.1 200.3 200.4 197.9 197.4 197.9 199.4 201.6 203.2 204.4 205.5 206.1 Pct Chg Year Ago 4.0 1.9 0.6 -0.8 -1.1 -1.9 -1.2 -0.5 1.9 2.9 3.3 3.1 2.2 Prof & Business Services 483.9 483.1 477.0 465.9 443.4 425.6 410.4 399.1 391.4 386.3 386.1 389.2 394.5 Pct Chg Year Ago 5.4 3.0 0.3 -2.8 -8.4 -11.9 -14.0 -14.3 -11.7 -9.2 -5.9 -2.5 0.8
Educ & Health Services 411.5 413.9 416.0 417.1 416.9 418.8 422.1 427.6 432.4 436.4 439.1 441.7 442.6 Pct Chg Year Ago 1.9 1.2 1.6 1.4 1.3 1.2 1.5 2.5 3.7 4.2 4.0 3.3 2.4
Leisure & Hospitality 342.5 345.8 349.7 359.4 366.7 372.1 369.5 366.2 365.8 365.6 364.1 361.3 361.5 Pct Chg Year Ago 17.6 13.0 9.9 11.7 7.1 7.6 5.7 1.9 -0.2 -1.7 -1.5 -1.4 -1.2
Other Services 115.6 116.8 117.2 117.3 116.2 116.0 116.7 117.8 119.1 120.3 121.4 122.4 122.9 Pct Chg Year Ago 4.8 5.0 4.0 3.5 0.5 -0.7 -0.5 0.4 2.5 3.8 4.0 3.9 3.2
Federal Government 33.5 33.2 32.9 32.6 32.4 32.5 32.6 32.7 32.8 33.0 33.1 33.3 33.4 Pct Chg Year Ago -3.4 -4.3 -5.6 -6.5 -3.5 -2.3 -0.9 0.3 1.4 1.6 1.7 1.7 1.7 State & Local Government 264.0 264.6 265.8 266.9 267.8 269.7 271.7 273.7 275.4 277.0 278.3 279.8 281.2 Pct Chg Year Ago 0.0 -1.2 -0.5 -0.1 1.4 1.9 2.2 2.6 2.9 2.7 2.4 2.2 2.1
Other Economic Indicators
Population (Ths)
Pct Chg Year Ago -0.1
Labor Force (Ths)
Pct Chg Year Ago
Unemployment Rate (%)
Total Housing Starts
Single-Family
Multifamily
0.7 0.7 0.8 0.8
0.8
12989.6
M IAMI – F ORT L AUDERDALE – W EST P ALM B EACH Institute for Economic Forecasting 73
6085.1 6087.1 6090.1 6096.5 6104.9 6115.0 6126.2 6137.1 6148.6 6160.7 6173.8 6187.6 6200.7
0.1 0.1 0.2 0.3 0.5 0.6 0.7
0.8
3121.8 3115.2 3118.0 3124.3 3127.4 3135.6 3144.6 3150.7 3156.2 3162.2 3168.8 3175.1 3182.8
1.9 0.8 0.9 0.7 0.2 0.7 0.9 0.8 0.9 0.8
0.8 0.8
3.0 3.1 3.5 4.0 4.6 5.0 5.4 5.7 5.9 6.0 6.0 6.0 5.9
24965.7 22619.7 23175.0 20953.5 20560.2 20354.5 20577.7 20639.7 21141.7 21602.9 21904.6 21906.4 22001.8
9166.2 8379.1 8443.6 7976.3 7939.2 8112.2 8274.1 8361.8 8579.9 8749.2 8850.8 8916.8 8913.2
15799.5 14240.6 14731.4 12977.2 12620.9 12242.2 12303.5 12278.0 12561.7 12853.7 13053.8
13088.5
PROFILES
The Miami-Miami Beach-Kendall MSA is located in the southeastern section of the state. Miami-Dade County is estimated to be the most populous county in Florida and the seventh-most populous county in the United States.
QUICK FACTS
• Metro population estimate of 2,716,940 as of 2019 (5-Year Estimate) (U.S. Census Bureau).
• Miami-Dade County population estimate of 2,716,940 as of 2019 (5-Year Estimate) (U.S. Census Bureau).
•
Civilian labor force of 1,318,427 in July 2022 (Florida Research and Economic Database).
• An unemployment rate of 2.3% as of July 2022, not seasonally adjusted. This amounts to 29,980 unemployed people (Florida Research and Economic Database).
OUTLOOK SUMMARIES
The Miami Dade–Kendall area is expected to show mixed levels of growth in the economic indicators.
Personal income is expected to grow an average of 3.6 percent annually, the lowest of the MSAs studied. The average real per capita income level of $49,900 ranks eleventh in the areas studied. Average annual wage growth will be 6.4 percent, the highest of the MSAs, and the average annual wage level is expected to be $72,400, the seventh highest of the studied areas. Miami is expected to average a population growth of 0.4 percent each year. The area has the fifth highest Gross Metro Product of the MSAs studied at an average level of $106,609.67 million.
Employment is expected to grow at an average rate of 0.2 percent each year, the second lowest in the state, while unemployment is expected to be 5.2 percent.
Miami’s fastest growing sector is expected to be the
Leisure & Hospitality sector, which will experience 3.6 percent average annual growth, followed by the Information sector, which will grow at an average of 1.7 percent annually. We expect most of its sectors to contract in the following year, with State and Local government contracting the most at -1.6 percent.
METRO NEWS SUMMARIES
Company from New York leases 20,000 square feet at 830 Brickell
• A-Cap, an insurance and financial services company with over $6 billion in assets under management, signed a 20,000 square foot lease in Miami’s financial center.
• Its neighbors at 830 Brickell will include Microsoft and several other big-time financial firms.
• The 55-story building is expected to be completed by the end of this year, and it is already 60% leased.
Source: South Florida Business Journal, June 14, 2022
Billionaire Ken Griffin to relocate Chicago firms to Miami
• Citadel, which is the $51 billion hedge fund founded by Ken Griffin, is moving its global headquarters from Chicago to Miami.
• A spokesman for the firm said the company will hire local investment and tech professionals.
• Citadel will keep an office in Chicago and some employees will remain there.
Source: South Florida Business Journal, June 23, 2022
Starwood cancels purchase of Miami Beach office building
• Starwood Capital Group was set to purchase an office building in Miami Beach, but days before the purchase was supposed to close, the company pulled out of the deal.
M IAMI - M IAMI B EACH - K ENDALL 74 Florida & Metro Forecast / Summer 2022
•
Starwood Capital Group was planning to purchase The Lincoln for $92.5 million.
• Starwood Capital Group will most likely lose the $2.5 million deposit it made when the property went under contract. However, if the company had pulled out of the deal a week earlier, it could have gotten the deposit back.
Source: South Florida Business Journal, July 27, 2022
Logistics company leases 141,000 square feet under construction near MIA
• Industrial space is limited in the Miami-Dade area.
•
As a result, tenants are deciding to lease spaces that are not yet built.
•
This includes a logistics company, which is leasing a 141,000 square foot property located near Miami International Airport, but that is still under construction.
Source: South Florida Business Journal, July 29, 2022
Estate Cos. wins approval for second tower in North Miami Beach
•
The Estate Companies is looking at a multifamily project in the city called Soleste on the Bay, which would include retail and restaurant space.
• For construction to begin, the city has to approve changing the seven-year-old site plan. If the city approves, then construction will start in the fourth quarter.
•
The Estate Companies purchased this development site for $21.3 million.
Source: South Florida Business Journal, August 19, 2022
$195M construction loan goes to apartment project in Miami
• Namdar Group, a New York based real estate investment and development firm, received a $195 million loan, which they will use to buy a development site in downtown Miami.
•
They are planning to build a pair of apartment towers, one with 41 floors and one with 43 floors.
• The development site is located just two blocks away from Brightline’s Miami Central station.
Source: South Florida Business Journal, August 26, 2022
M IAMI - M IAMI B EACH - K ENDALL Institute for Economic Forecasting 75
Miami-Miami Beach-Kendall Division MSA Industry Location Quotients
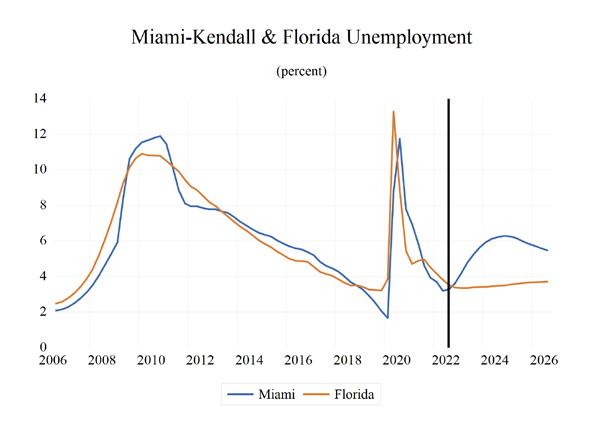
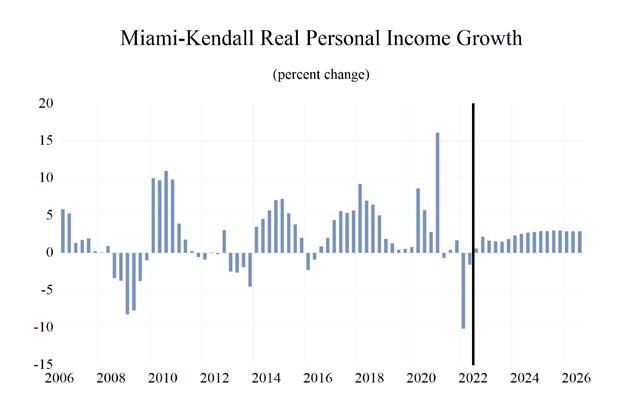
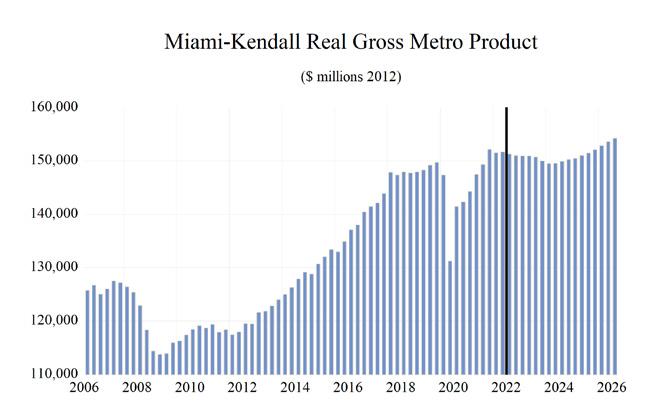
Total Nonagricultural Employment
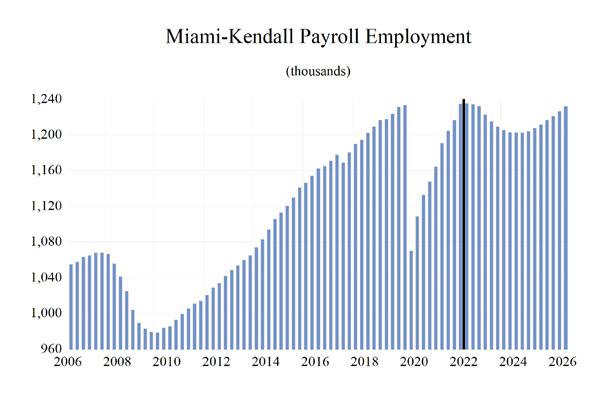
M IAMI - M IAMI B EACH - K ENDALL 76 Florida & Metro Forecast / Summer 2022 0 0.2 0.4 0.6 0.8 1 1.2 1.4 1.6 1.8 2
Total Private Goods Producing Service Producing Private Service Providing Mining, Logging, and Construction Manufacturing Trade, Transportation, and Utilities Wholesale Trade Retail Trade Transportation, Warehousing and Utilities Information Financial Activities Professional and Business Services Educational and Health Services Leisure and Hospitality Other Services Government
Long Term Outlook for Miami-Miami Beach-Kendall, FL (Division of Miami-Fort Lauderdale MSA) August 2022 Forecast
Personal Income (Billions $)
Total Personal Income 132.1 143.4 147.3 154.9 170.1 177.6 182.7 187.9 196.3
Pct Chg Year Ago 10.4 8.6 2.7 5.2 9.8 4.4 2.8 2.9 4.5
Wages and Salaries 67.1 70.9 74.8 74.4 83.7 93.6 95.6 97.4 101.2
Nonwage Income 64.9 72.5 72.5 80.5 86.4 84.0 87.1 90.4 95.1
Real Personal Income (12$) 114.6 120.4 123.0 126.6 133.5 131.2 130.7 132.1 135.6 Pct Chg Year Ago 7.7 5.1 2.1 3.0 5.5 -1.7 -0.4 1.1 2.6
Per Capita Income (Ths) 48.8 52.9 54.4 57.6 63.9 67.0 68.9 70.5 73.1
Real Per Capita Income (12$) 42.3 44.4 45.4 47.1 50.2 49.5 49.3 49.6 50.5
Average Annual Wage (Ths) 56.8 58.8 60.8 65.1 70.7 75.6 77.9 80.5 83.2 Pct Chg Year Ago 3.2 3.5 3.5 7.0 8.5 7.0 3.0 3.3 3.3
Establishment Employment (Place of Work, Thousands, SA)
Total Employment 1174.5 1199.0 1222.3 1136.1 1176.9 1230.1 1219.8 1203.4 1209.8
Pct Chg Year Ago 1.5 2.1 1.9 -7.1 3.6 4.5 -0.8 -1.3 0.5
Manufacturing 41.2 41.5 42.3 40.4 40.5 42.8 41.4 38.0 36.1
Pct Chg Year Ago 0.1 0.6 2.2 -4.6 0.2 5.7 -3.2 -8.3 -5.0
Nonmanufacturing 1133.3 1157.5 1180.0 1095.8 1136.4 1187.4 1178.4 1165.4 1173.8
Pct Chg Year Ago 1.6 2.1 1.9 -7.1 3.7 4.5 -0.8 -1.1 0.7
Construction & Mining 47.7 52.4 54.3 53.3 52.1 53.3 51.5 49.8 49.6
Pct Chg Year Ago 6.2 9.7 3.7 -1.8 -2.2 2.3 -3.3 -3.4 -0.4
Trade, Trans, & Utilities 294.3 300.0 307.0 287.5 294.0 308.2 305.2 299.2 295.9
Pct Chg Year Ago 0.9 1.9 2.3 -6.3 2.2 4.9 -1.0 -2.0 -1.1
Wholesale Trade 73.6 73.9 74.1 70.5 72.7 77.4 77.3 77.8 78.8
Retail Trade 147.0 146.7 144.4 132.4 136.5 138.7 133.9 126.4 121.0 Trans, Wrhsng, & Util 73.8 79.4 88.5 84.6 84.7 92.2 94.0 95.0 96.1
Information 19.4 20.0 20.6 19.0 20.2 21.9 21.9 20.8 21.0
Pct Chg Year Ago 1.0 3.2 3.0 -7.5 6.4 8.0 -0.1 -4.9 1.1
Financial Activities 80.7 81.2 81.9 80.7 84.6 87.5 86.0 86.9 87.9
Pct Chg Year Ago 2.2 0.7 0.9 -1.4 4.8 3.4 -1.6 1.0 1.1
Prof & Business Services 173.2 178.3 182.2 174.8 183.6 189.2 173.5 157.6 161.6 Pct Chg Year Ago 2.7 2.9 2.2 -4.0 5.1 3.0 -8.3 -9.2 2.5
Educ & Health Services 183.4 187.6 193.1 187.4 192.5 197.7 200.1 206.9 210.9 Pct Chg Year Ago 2.7 2.3 3.0 -3.0 2.8 2.7 1.2 3.4 1.9
Leisure & Hospitality 141.4 143.3 146.1 105.8 125.1 146.2 156.3 155.8 154.4
Pct Chg Year Ago 0.4 1.3 1.9 -27.6 18.3 16.9 6.9 -0.3 -0.9
Other Services 51.4 51.3 50.4 45.5 46.6 48.3 48.3 49.2 50.2 Pct Chg Year Ago -2.9 -0.2 -1.7 -9.8 2.5 3.6 -0.1 1.9 2.1
Federal Government 20.0 20.1 20.5 21.5 21.0 20.3 19.6 19.8 20.0
Pct Chg Year Ago 0.7 0.5 1.9 4.6 -2.0 -3.3 -3.6 0.9 1.3
State & Local Government 121.8 123.4 123.9 120.3 116.5 114.8 115.9 119.4 122.2
Pct Chg Year Ago 1.4 1.3 0.4 -2.9 -3.1 -1.5 1.0 3.0 2.4
Other Economic Indicators
Population (Ths) 2708.8 2710.7 2709.5 2688.4 2660.3 2649.8 2652.3 2666.2 2684.4
Pct Chg Year Ago 0.6 0.1 0.0 -0.8 -1.0 -0.4 0.1 0.5 0.7
Labor Force (Ths) 1349.1 1354.9 1377.5 1270.9 1308.0 1319.8 1319.2 1326.2 1334.0
Percent Change, Year Ago 3.4 0.4 1.7 -7.7 2.9 0.9 0.0 0.5 0.6
Unemployment Rate (%) 4.8 3.9 2.7 7.5 5.3 3.4 5.0 6.1 6.1
Total Housing Starts
9587.8
10497.7 12104.6 10042.9 9386.3 9363.0 Single-Family 2319.5
2068.9 2540.1 3079.3 2615.8 2582.7 2575.9 Multifamily
7957.6 9025.4 7427.1 6803.6 6787.1
M IAMI - M IAMI B EACH - K ENDALL Institute for Economic Forecasting 77
2017 2018 2019 2020 2021 2022 2023 2024 2025
8955.1 9590.2
8519.7
2337.8 2404.5
6635.5 7252.4 7183.3 6450.9
Short Term Outlook for Miami-Miami Beach-Kendall, FL (Division of Miami-Fort Lauderdale MSA) August 2022 Forecast 2022:2 2022:3 2022:4 2023:1 2023:2 2023:3 2023:4 2024:1 2024:2 2024:3 2024:4 2025:1 2025:2
Personal Income (Billions $)
Total Personal Income 177.0 178.4 181.1 181.9 182.4 182.9 183.5 185.1 186.9 188.8 190.7 192.9 195.2 Pct Chg Year Ago 6.5 6.2 5.3 4.5 3.1 2.5 1.3 1.8 2.4 3.3 3.9 4.2 4.4
Wages and Salaries 93.4 94.4 95.0 95.5 95.5 95.6 95.9 96.3 97.0 97.8 98.6 99.5 100.6
Nonwage Income 83.6 84.0 86.1 86.4 87.0 87.3 87.6 88.8 89.9 91.0 92.1 93.4 94.5
Real Personal Income (12$) 131.4 130.7 131.5 131.1 130.8 130.5 130.3 130.9 131.7 132.6 133.3 134.3 135.2
Pct Chg Year Ago 0.0 -0.2 -0.5 -0.2 -0.4 -0.2 -0.9 -0.1 0.7 1.6 2.3 2.5 2.6
Per Capita Income (Ths) 66.8 67.3 68.4 68.7 68.8 68.9 69.1 69.6 70.1 70.8 71.3 72.1 72.8
Real Per Capita Income (12$) 49.6 49.3 49.6 49.5 49.4 49.2 49.0 49.2 49.4 49.7 49.9 50.1 50.4
Average Annual Wage (Ths) 75.2 76.0 76.5 77.1 77.6 78.2 78.8 79.5 80.2 80.9 81.5 82.2 82.9
Pct Chg Year Ago 7.7 6.3 3.4 3.0 3.2 2.9 3.0 3.1 3.3 3.4 3.5 3.4 3.4
Establishment Employment (Place of Work, Thousands, SA)
Total Employment 1234.8 1235.1 1234.3 1232.1 1222.6 1215.1 1209.4 1205.2 1203.1 1202.6 1202.6 1204.0 1207.4 Pct Chg Year Ago 6.0 3.7 2.5 1.3 -1.0 -1.6 -2.0 -2.2 -1.6 -1.0 -0.6 -0.1 0.4
Manufacturing 42.9 43.3 43.8 42.8 41.8 40.9 40.2 39.2 38.3 37.5 36.8 36.4 36.2
Pct Chg Year Ago 6.3 7.7 7.6 4.0 -2.7 -5.4 -8.2 -8.4 -8.2 -8.4 -8.2 -7.1 -5.7
Nonmanufacturing 1191.9 1191.8 1190.5 1189.3 1180.8 1174.2 1169.2 1166.0 1164.7 1165.1 1165.7 1167.5 1171.2
Pct Chg Year Ago 6.0 3.6 2.3 1.2 -0.9 -1.5 -1.8 -2.0 -1.4 -0.8 -0.3 0.1 0.6
Construction & Mining 53.6 53.9 53.1 52.6 51.8 51.2 50.6 50.2 49.8 49.6 49.5 49.5 49.5
Pct Chg Year Ago 3.6 4.1 2.0 0.0 -3.4 -5.0 -4.8 -4.7 -3.8 -3.0 -2.2 -1.4 -0.6
Trade, Trans, & Utilities 312.2 309.1 308.2 306.6 306.6 303.9 303.7 301.9 299.4 298.3 297.1 295.9 295.5 Pct Chg Year Ago 7.3 4.5 3.1 1.1 -1.8 -1.7 -1.5 -1.5 -2.3 -1.8 -2.2 -2.0 -1.3
Wholesale Trade 78.0 78.3 78.0 78.3 77.3 76.8 76.9 77.2 77.7 78.0 78.4 78.6 78.8 Retail Trade 141.0 137.3 136.5 134.0 135.1 133.4 133.0 130.4 126.7 125.2 123.4 121.5 120.6
Trans, Wrhsng, & Util 93.2 93.4 93.6 94.3 94.2 93.7 93.9 94.3 95.0 95.1 95.4 95.9 96.2
Information 21.7 22.0 22.4 22.7 22.2 21.5 21.0 20.9 20.9 20.8 20.5 20.6 20.9 Pct Chg Year Ago 10.1 6.1 6.2 6.0 2.1 -2.0 -6.3 -7.9 -5.6 -3.5 -2.4 -1.3 -0.2
Financial Activities 87.4 87.7 87.1 87.0 86.0 85.6 85.6 86.1 86.8 87.3 87.6 87.9 88.0 Pct Chg Year Ago 4.8 2.4 0.8 -0.8 -1.6 -2.4 -1.7 -1.1 1.0 2.0 2.3 2.1 1.3
Prof & Business Services 189.5 189.7 187.7 183.8 176.0 169.8 164.4 160.5 157.8 156.1 156.2 157.6 159.8 Pct Chg Year Ago 4.5 2.1 -0.3 -3.1 -7.1 -10.5 -12.4 -12.7 -10.4 -8.1 -5.0 -1.8 1.3
Educ & Health Services 197.3 198.3 199.3 199.6 199.2 200.0 201.5 204.1 206.2 208.1 209.3 210.4 210.8 Pct Chg Year Ago 3.3 2.0 2.2 1.9 1.0 0.9 1.1 2.2 3.5 4.0 3.9 3.1 2.2
Leisure & Hospitality 147.6 148.4 149.7 153.5 156.0 158.4 157.4 156.0 155.9 156.0 155.4 154.3 154.6 Pct Chg Year Ago 20.1 12.9 9.1 10.5 5.7 6.7 5.1 1.6 -0.1 -1.5 -1.3 -1.1 -0.9
Other Services 48.3 48.6 48.7 48.7 48.2 48.0 48.2 48.6 49.0 49.4 49.8 50.1 50.3
Pct Chg Year Ago 3.4 3.7 3.0 2.4 -0.2 -1.3 -1.1 -0.4 1.8 3.0 3.3 3.2 2.6
Federal Government 20.3 20.1 19.9 19.7 19.5 19.6 19.6 19.7 19.7 19.8 19.9 19.9 20.0
Pct Chg Year Ago -2.6 -3.9 -5.3 -6.3 -3.8 -2.7 -1.4 -0.1 1.0 1.2 1.3 1.3 1.4
State & Local Government 113.9 114.1 114.3 114.9 115.3 116.2 117.2 118.2 119.0 119.8 120.5 121.2 121.9
Pct Chg Year Ago -1.3 -2.6 -1.9 -1.6 1.2 1.9 2.5 2.9 3.2 3.0 2.8 2.6 2.5
Other Economic Indicators
Population (Ths) 2650.4 2649.2 2648.3 2648.8 2650.2 2653.2 2656.9 2660.4 2664.1 2668.1 2672.4 2677.4 2682.0
Pct Chg Year Ago -0.5 -0.3 -0.2 -0.1 0.0 0.2 0.3 0.4 0.5 0.6 0.6 0.6 0.7
Labor Force (Ths) 1323.7 1320.2 1318.2 1318.2 1317.2 1319.3
1325.3 1326.9 1328.7 1330.4 1332.7 Pct Chg Year Ago
Unemployment Rate (%)
Total Housing Starts 12441.3
Single-Family 3278.5
Multifamily 9162.7
0.6 0.5 0.5
9353.9 9391.9 9437.3 9385.6 9394.7
2560.8 2579.5 2592.9 2597.6 2600.9 2588.0
6774.4 6799.1 6839.7 6784.7 6806.7
M IAMI - M IAMI B EACH - K ENDALL 78 Florida & Metro Forecast / Summer 2022
1322.2 1323.9
1.2 0.2 0.2 0.1 -0.5 -0.1 0.3 0.4 0.6
0.6
3.2 3.3 3.6 4.2 4.8 5.2 5.6 5.9 6.1 6.2 6.3 6.3 6.1
11468.3 11786.2 10589.3 10182.8 9807.4 9592.3 9362.0
2960.8 2904.8 2667.8 2602.8 2600.7 2591.9
8507.5 8881.4 7921.4 7580.0 7206.7 7000.4 6801.2
PROFILES
The Naples–Immokalee–Marco Island MSA is comprised of Collier County only. Located on the southwest coast of Florida it is notable for numerous recreation and leisure activities. This region is sometimes referred to as the “Crown Jewel of Southwest Florida.”
QUICK FACTS
• Metro population estimate of 371,453 as of 2019 (5-Year Estimate) (U.S. Census Bureau).
• Collier County population estimate of 384,902 as of 2019 (5-Year Estimate) (U.S. Census Bureau).
•
Civilian labor force of 185,942 in July 2022 (Florida Research and Economic Database).
• An unemployment rate of 2.8% as of July 2022, not seasonally adjusted. This amounts to 5,249 unemployed people (Florida Research and Economic Database).
OUTLOOK SUMMARIES
The Naples—Marco Island Metropolitan Statistical Area (MSA) is expected to show relatively strong performance in most of the economic indicators studied in this forecast. Gross Metro Product will come in at $19,929.11. Average annual wage growth of 4.1 percent will push the average annual wage level to $74,100, the fifth highest in the state. Personal income growth of 6.1 percent will lead to the highest per capita income level in the state at $97,800. The Naples – Marco Island MSA will a population growth of 1.8 percent.
The Naples area will experience an employment growth rate of 1.3 percent. This will lead to an unemployment rate of 4.0 percent.
The Other Services sector will lead Naples with the highest average annual growth rate of 4.5 percent. This is followed by the Leisure & Hospitality and the Education - Health Services sectors at respective rates of 4.3 percent and 3.8 percent.
METRO NEWS SUMMARIES
Encompass Health and NCH Healthcare System announce plan to own and operate inpatient rehabilitation hospital in Naples, Florida
•
Encompass Health and NCH Healthcare System today announced the intention to enter a joint venture to operate a 50-bed, freestanding inpatient rehabilitation hospital in Naples, Florida.
•
Recently, the Board of Directors of NCH Healthcare System approved its investment in this collaboration with Encompass Health. The hospital is currently under construction in Naples at 14305 Collier Boulevard and is scheduled to open in August 2022.
• When the hospital opens, NCH Healthcare System intends to relocate its existing 54-bed rehabilitation unit, The NCH Brookdale Center for Healthy Aging & Rehabilitation, to the new hospital.
Source: Cision PR Newswire, June 15, 2022
Collier County tourism on the rise with an uncertain future
•
As locals of Southwest Florida feel they are enjoying a season of less traffic, emptier restaurants, and quieter beaches, some may be surprised to hear that there has been a more than 5% uptick in tourists so far this year compared to last, with an 8% increase in visitors in May of this year compared to May 2021.
•
In May alone, the county brought in $242 million in revenue from hotels and vacation rentals, an almost 12% increase compared to May 2021.
• Collier County has brought in $1.5 billion altogether in lodging revenue so far this year, a more than 20% increase from this time last year.
Source: Gulfshore Business, June 28, 2022
N APLES – I MMOKALEE – M ARCO I SLAND Institute for Economic Forecasting 79
Great Wolf Lodge breaking ground on East Naples $250 million water park, resort
• Great Wolf Lodge will give Collier County a boost with a destination attraction and a 500-suite hotel, the company’s 21st resort in the country.
• Great Wolf Lodge, billing itself as North America’s largest family indoor water park resort, is known for attracting children and families to venues. The Naples location is slated to open in 2024 and will have 100,000 square feet of indoor water park and 62,000 square feet of attractions.
• Blackstone and Centerbridge Partners are investing more than $250 million into the project. It will bring in 250 to 500 constructionrelated jobs and 600 full- and part-time jobs upon the lodge’s opening, according to company officials.
Source: Gulfshore Business, July 13, 2022
Construction begins on Lamborghini of Naples dealership
• Construction of the 18,000-square-foot dealership for the Italian luxury supercar brand began last month on a 2-acre vacant commercial parcel in the Sabal Bay master planned unit development.
• Estimated to be completed around April 1, 2023, the project has been contracted to Clearwaterbased Park & Eleazer Construction.
• The new Naples dealership is being developed by West Broward Imports LLC, a division of Warren Henry Auto Group, which also owns Lamborghini Broward in Davie as well as about a dozen other auto dealerships in Florida.
Source: Naples Florida Weekly, July 28, 2022
The Tides luxury condominiums under construction at Bayfront Naples
• Bayfront Naples is growing with the addition of 35 luxury condominium units in two buildings under construction on either side of Third Avenue South at Goodlette-Frank Road, the northern entrance into the longtime mixed-use development in Naples.
•
Instead of retail shops on the first floor, as is the case with the existing five-story Bayfront buildings, a parking garage will be on the first floor of The Tides at Bayfront, the new condo complex.
• The Tides’ development plans by Dyehouse Comeriato Architect of Naples were approved by City Council on Dec. 15 and by Naples Design Review Board in late February.
Source: Gulfshore Business, August 1, 2022
Residential units planned at Hammock Cove in East Naples
•
An Iowa-based developer plans to build luxury residential units on the last open lot in the second phase of the Shops at Hammock Cove on U.S. 41 East in East Naples.
• Caliber Florida, a subsidiary of Caliber Iowa, plans a building with about 60 dwelling units on 4.34 acres of vacant commercial property at 4936 Tamiami Trail E., which is east of Thomasson Drive.
• This project would be the first for Caliber Florida, initiated this spring when Caliber Iowa bought the Hammock Cove property, which is part of the Sabal Bay master planned unit development.
Source: Gulfshore Business, August 3, 2022
N APLES – I MMOKALEE – M ARCO I SLAND 80 Florida & Metro Forecast / Summer 2022
Total Nonagricultural Employment
Total Private Goods Producing Service Producing
Private Service Providing Mining, Logging, and Construction Manufacturing Trade, Transportation, and Utilities
Trade Retail Trade
Warehousing and Utilities Information
Activities
and Business Services
and Health Services
Leisure and Hospitality
Services Government
Naples Immokalee Marco Island MSA Industry Location Quotients
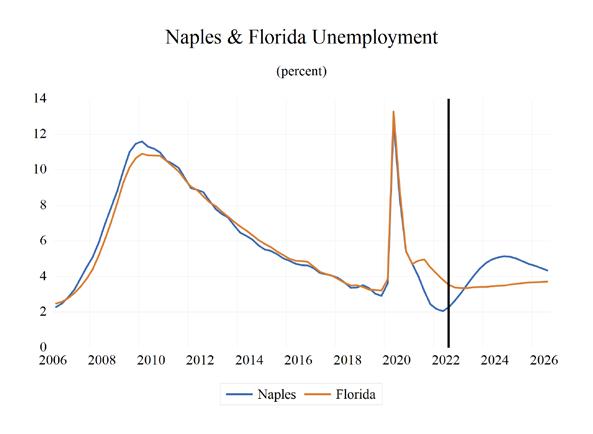

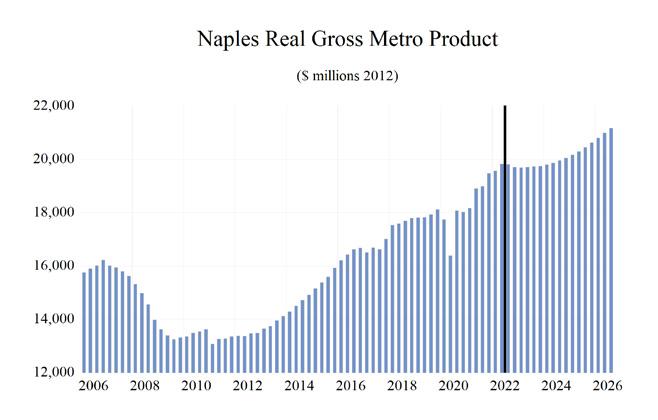
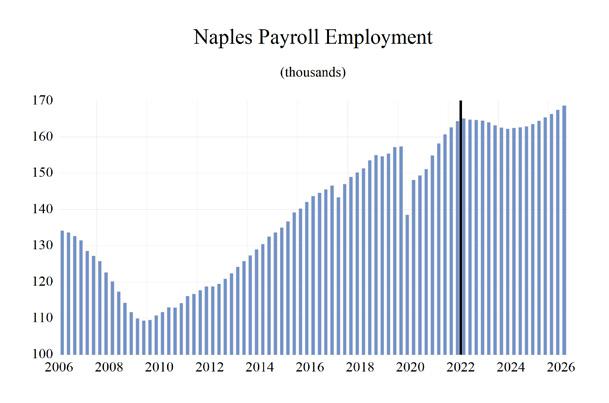
N APLES – I MMOKALEE – M ARCO I SLAND Institute for Economic Forecasting 81 0 0.5 1 1.5 2 2.5
Wholesale
Transportation,
Financial
Professional
Educational
Other
Long Term Outlook for Naples-Immokalee-Marco Island, FL August 2022 Forecast
Personal Income (Billions $)
Total Personal Income 33.9 37.9 39.8 40.8 44.4 46.8 49.7 52.6 56.1
Pct Chg Year Ago 7.6 11.7 5.2 2.5 8.7 5.5 6.2 5.9 6.7
Wages and Salaries 7.5 8.1 8.6 8.9 10.4 11.7 12.0 12.3 12.7
Nonwage Income 26.4 29.7 31.2 31.9 34.0 35.1 37.7 40.3 43.4
Real Personal Income (12$) 30.7 34.0 36.0 36.4 38.0 37.7 38.7 40.3 42.3 Pct Chg Year Ago 7.5 10.5 6.0 1.0 4.4 -0.7 2.8 4.1 4.8
Per Capita Income (Ths) 93.6 103.3 107.1 107.9 114.7 118.2 123.1 128.2 134.9
Real Per Capita Income (12$) 84.9 92.7 96.8 96.2 98.2 95.3 96.0 98.3 101.6
Average Annual Wage (Ths) 51.2 53.7 55.4 60.0 66.0 71.2 72.6 75.3 77.3 Pct Chg Year Ago 1.6 4.8 3.1 8.4 10.0 7.9 2.0 3.7 2.7
Establishment Employment (Place of Work, Thousands, SA)
Total Employment 145.6 151.0 155.5 148.3 156.2 164.2 164.1 162.5 164.1
Pct Chg Year Ago 2.1 3.7 3.0 -4.6 5.3 5.1 -0.1 -1.0 1.0
Manufacturing 4.0 4.3 4.7 4.9 5.0 5.3 5.2 5.0 4.9
Pct Chg Year Ago 5.6 7.8 10.1 5.2 2.3 4.7 -0.8 -5.6 -1.3
Nonmanufacturing 141.6 146.8 150.8 143.4 151.2 158.9 158.9 157.5 159.2
Pct Chg Year Ago 2.0 3.6 2.8 -5.0 5.4 5.1 0.0 -0.8 1.1 Construction & Mining 15.4 17.2 17.7 17.2 18.0 18.8 18.0 16.9 16.5
Pct Chg Year Ago 3.2 11.6 2.6 -2.8 5.0 4.2 -4.4 -5.8 -2.3
Trade, Trans, & Utilities 27.9 28.6 29.2 28.3 29.3 31.2 31.5 30.9 30.2
Pct Chg Year Ago 2.0 2.5 2.1 -3.0 3.5 6.4 1.0 -2.0 -2.2
Wholesale Trade 4.1 4.4 4.8 4.8 5.0 5.5 5.6 5.7 5.9
Retail Trade 21.9 22.1 22.2 21.4 21.9 23.2 23.3 22.5 21.5
Trans, Wrhsng, & Util 1.9 2.1 2.2 2.1 2.4 2.6 2.6 2.7 2.7
Information 1.5 1.4 1.4 1.2 1.2 1.3 1.3 1.3 1.3
Pct Chg Year Ago -8.3 -4.0 0.0 -13.2 1.3 5.9 0.5 -0.6 2.0
Financial Activities 8.3 8.4 8.7 8.7 9.4 9.6 10.0 10.0 10.2
Pct Chg Year Ago 3.2 1.1 4.6 -0.7 7.7 2.3 4.2 0.6 1.3
Prof & Business Services 16.1 16.7 17.3 17.3 18.8 19.5 17.0 14.7 15.1 Pct Chg Year Ago 0.9 3.8 3.7 0.2 8.7 3.4 -12.8 -13.2 2.8
Educ & Health Services 21.6 22.3 23.1 23.0 23.8 24.7 25.6 26.7 27.4
Pct Chg Year Ago 2.5 3.6 3.3 -0.4 3.5 3.9 3.5 4.4 2.8
Leisure & Hospitality 28.3 29.0 30.0 25.5 28.2 30.7 31.7 32.6 33.4 Pct Chg Year Ago 2.9 2.7 3.1 -15.0 10.9 8.9 3.3 2.6 2.5
Other Services 8.9 9.2 9.2 8.7 9.1 9.8 10.0 10.4 10.9
Pct Chg Year Ago -0.9 3.6 0.3 -6.1 5.4 6.7 2.1 4.5 4.9
Federal Government 0.7 0.7 0.7 0.8 0.7 0.7 0.7 0.7 0.7 Pct Chg Year Ago 1.2 0.0 2.3 6.8 -9.7 -5.6 2.6 -0.9 0.6
State & Local Government 13.1 13.2 13.6 12.8 12.5 12.7 13.2 13.4 13.5
Pct Chg Year Ago 1.4 0.9 2.6 -5.8 -1.9 1.5 3.6 1.3 0.9
Other Economic Indicators
Population (Ths) 362.2 366.4 372.0 378.3 386.9 395.7 403.5 410.3 416.1
Pct Chg Year Ago 1.5 1.2 1.5 1.7 2.3 2.3 1.9 1.7 1.4
Labor Force (Ths) 172.0 176.3 179.0 176.3 180.8 188.3 194.0 195.7 197.4
Percent Change, Year Ago 1.6 2.5 1.6 -1.5 2.6 4.1 3.1 0.9 0.9
Unemployment Rate (%) 4.2 3.6 3.2 7.5 3.6 2.3 3.8 5.0 4.9
Total Housing Starts
Single-Family 2907.7 3119.1
4218.9 6040.3 5863.7 5228.9 5822.8 6005.9
3149.6 4280.6 3727.4 3225.7 3443.3 3564.4
Multifamily 786.5 1112.3 631.3 1069.2 1759.7 2136.3 2003.2 2379.6 2441.5
N APLES – I MMOKALEE – M ARCO I SLAND 82 Florida & Metro Forecast / Summer 2022
2017 2018 2019 2020 2021 2022 2023 2024 2025
3694.2 4231.4 4008.5
3377.2
Short Term Outlook for Naples-Immokalee-Marco Island, FL August 2022 Forecast 2022:2 2022:3 2022:4 2023:1 2023:2 2023:3 2023:4 2024:1 2024:2 2024:3 2024:4 2025:1 2025:2
Personal Income (Billions $)
Total Personal Income 46.4 47.1 48.5 48.9 49.4 49.9 50.6 51.4 52.1 53.0 53.9 54.8 55.7 Pct Chg Year Ago 7.6 8.2 9.1 8.3 6.3 5.9 4.3 5.1 5.6 6.2 6.6 6.7 6.8
Wages and Salaries 11.7 11.9 11.9 11.9 11.9 12.0 12.1 12.1 12.2 12.3 12.4 12.5 12.7
Nonwage Income 34.7 35.2 36.6 37.0 37.4 38.0 38.5 39.3 39.9 40.7 41.5 42.3 43.0
Real Personal Income (12$) 37.6 37.7 38.4 38.4 38.6 38.8 39.2 39.6 40.1 40.6 41.1 41.6 42.1 Pct Chg Year Ago 1.1 1.7 3.2 3.4 2.7 3.1 2.0 3.2 3.8 4.5 5.0 5.0 5.0
Per Capita Income (Ths) 117.6 118.8 121.5 121.9 122.6 123.4 124.5 126.0 127.3 128.9 130.7 132.5 134.1
Real Per Capita Income (12$) 95.2 94.9 96.2 95.8 95.9 96.0 96.4 97.2 97.8 98.7 99.6 100.5 101.3
Average Annual Wage (Ths) 71.2 71.7 71.7 72.0 72.2 72.6 73.6 74.3 75.1 75.7 76.1 76.7 77.0 Pct Chg Year Ago 9.4 7.5 3.1 2.7 1.4 1.2 2.6 3.2 4.0 4.2 3.4 3.2 2.6
Establishment Employment (Place of Work, Thousands, SA)
Total Employment 164.3 165.1 164.8 164.7 164.5 164.0 163.2 162.5 162.2 162.5 162.6 162.9 163.6
Pct Chg Year Ago 6.1 4.4 2.5 1.3 0.1 -0.7 -0.9 -1.3 -1.4 -0.9 -0.3 0.2 0.8
Manufacturing 5.2 5.3 5.4 5.3 5.3 5.2 5.1 5.0 5.0 4.9 4.9 4.9 4.9
Pct Chg Year Ago 5.7 4.5 5.6 2.9 1.1 -1.7 -5.2 -5.7 -6.1 -5.7 -4.9 -3.5 -1.7
Nonmanufacturing 159.1 159.8 159.4 159.3 159.2 158.8 158.1 157.5 157.3 157.6 157.8 158.0 158.7
Pct Chg Year Ago 6.1 4.3 2.4 1.2 0.1 -0.6 -0.8 -1.2 -1.2 -0.8 -0.2 0.3 0.9 Construction & Mining 18.8 18.9 18.6 18.5 18.1 17.8 17.5 17.2 17.0 16.8 16.7 16.6 16.6 Pct Chg Year Ago 5.2 4.2 1.3 -1.5 -3.8 -6.0 -6.3 -6.8 -6.3 -5.4 -4.4 -3.4 -2.5 Trade, Trans, & Utilities 31.5 31.2 31.2 31.2 31.6 31.6 31.7 31.4 30.9 30.7 30.5 30.2 30.1 Pct Chg Year Ago 8.6 5.3 3.7 1.0 0.5 1.1 1.4 0.6 -2.2 -2.6 -3.8 -3.9 -2.8
Wholesale Trade 5.5 5.5 5.5 5.6 5.6 5.6 5.6 5.7 5.7 5.8 5.8 5.9 5.9 Retail Trade 23.4 23.1 23.2 23.0 23.4 23.3 23.4 23.1 22.5 22.3 21.9 21.6 21.4 Trans, Wrhsng, & Util 2.6 2.6 2.6 2.6 2.6 2.6 2.6 2.6 2.7 2.7 2.7 2.7 2.7
Information 1.3 1.3 1.3 1.3 1.3 1.3 1.3 1.3 1.3 1.3 1.3 1.3 1.3
Pct Chg Year Ago 8.5 2.8 4.5 4.8 1.7 0.3 -4.6 -3.2 -1.0 0.2 1.7 1.9 1.7
Financial Activities 9.5 9.6 9.7 10.0 10.0 10.0 9.9 9.9 10.0 10.1 10.1 10.2 10.2 Pct Chg Year Ago 1.8 0.3 3.0 4.6 6.1 3.9 2.1 0.0 -0.5 1.0 1.8 2.1 1.8
Prof & Business Services 19.5 19.5 19.2 18.5 17.4 16.4 15.7 15.1 14.8 14.5 14.5 14.7 14.9 Pct Chg Year Ago 5.8 2.0 -1.7 -6.3 -11.1 -15.8 -18.3 -18.3 -15.0 -11.4 -7.1 -2.9 1.1
Educ & Health Services 24.5 24.8 25.1 25.3 25.5 25.7 25.8 26.2 26.6 26.9 27.1 27.3 27.4 Pct Chg Year Ago 4.3 3.0 3.9 3.9 4.0 3.3 3.0 3.7 4.2 4.7 4.8 4.1 3.1
Leisure & Hospitality 31.0 31.1 30.7 30.9 31.5 32.3 32.3 32.2 32.4 32.7 32.9 32.9 33.2 Pct Chg Year Ago 9.4 8.4 2.2 2.4 1.7 3.7 5.3 4.1 3.0 1.4 1.8 2.2 2.5
Other Services 9.8 9.9 9.9 10.0 9.9 9.9 10.0 10.2 10.3 10.5 10.6 10.8 10.9 Pct Chg Year Ago 7.1 7.3 6.0 5.7 1.5 0.4 0.9 1.9 4.2 5.7 6.1 6.1 5.5
Federal Government 0.6 0.6 0.7 0.7 0.7 0.7 0.7 0.7 0.7 0.7 0.7 0.7 0.7 Pct Chg Year Ago -10.3 -2.3 -1.5 -0.7 5.8 3.4 1.9 0.0 -1.8 -1.2 -0.5 0.1 0.8
State & Local Government 12.6 12.8 12.9 13.1 13.2 13.2 13.3 13.3 13.3 13.4 13.4 13.4 13.5
Pct Chg Year Ago 1.2 0.9 2.1 3.3 4.4 3.7 2.8 2.0 1.3 1.1 1.0 1.0 1.0
Other Economic Indicators
Population (Ths) 394.8 396.8 398.9 400.8 402.5 404.4 406.1 407.8 409.6 411.2 412.6 414.0 415.4
Pct Chg Year Ago 2.3 2.3 2.3 2.1 2.0 1.9 1.8 1.8 1.7 1.7 1.6 1.5 1.4 Labor Force (Ths) 187.4 189.1 191.2 192.7 193.9 194.5 194.9 195.2 195.5 195.8 196.2 196.6 197.1 Pct Chg Year Ago 3.9 3.5 4.4 4.0 3.5 2.8 2.0 1.3 0.8 0.7 0.6 0.7 0.8
Unemployment Rate (%) 2.1 2.3 2.6 3.1 3.6 4.0 4.4 4.8 5.0 5.1 5.1 5.1 5.0
Total Housing Starts
5828.1 5857.8 5920.5 5976.9
Single-Family
1842.9 1957.3 2014.0 2198.3 2318.8 2389.0 2391.8 2418.7 2422.4 2440.0
3277.6 3334.4 3366.1 3439.2 3466.0 3501.8 3554.5 3570.9 Multifamily
N APLES – I MMOKALEE – M ARCO I SLAND Institute for Economic Forecasting 83
6002.6 5305.1 5188.4 4978.9 5112.3 5291.6 5532.8 5685.0
6010.9
3816.9 3390.2 3271.2 3136.0 3155.0
2185.7 1914.9 1917.2
PROFILES
The North Port-Sarasota-Bradenton is located in Sarasota County in the southwest segment of the state. North Port Encompasses fourteen miles of interstate 1-75 within its boundaries and it has two international airports within 45 minutes.
QUICK FACTS
• Metro population estimate of 803,709 as of 2019 (5-Year Estimate) (U.S. Census Bureau).
•
Sarasota County population estimate of 384,213 as of 2019 (5-Year Estimate) (U.S. Census Bureau).
•
Manatee County population estimate of 419,496 as of 2019 (5-Year Estimate) (U.S. Census Bureau).
• Civilian labor force of 396,663 in July 2022 (Florida Research and Economic Database).
• An unemployment rate of 2.7% as of July 2022, not seasonally adjusted. This amounts to 10,513 unemployed people (Florida Research and Economic Database).
OUTLOOK SUMMARIES
The North Port area is expected to show relatively strong levels of growth in the economic indicators. Personal income is expected to grow an average of 4.4 percent annually, ranking 16th of the 25 MSA’s studied. The average real per capita income level of $55,400 is the fifth highest in state. Average annual wage growth will be 3.9 percent, the lowest in the state; however, the average annual wage level is expected to be $66,200. North Port is expected to average a population growth of 1.7 percent each year. The area has one of the highest Gross Metro Product of the MSAs studied at an average level of $36,636.17 million.
Employment is expected to grow at an average rate of 1.0 percent each year while unemployment is expected to be moderate at an average rate of 4.4 percent.
North Port’s fastest growing sector is expected to be the Leisure sector, which will experience 5.2 percent
average annual growth, followed by the Other Services sector, which will grow at an average of 3.4 percent annually.
METRO NEWS SUMMARIES
North Port commissioners ask for details on affordable housing options
•
North Port city commissioners are considering allowing for tiny homes and container homes within the limits, establishing inclusionary zoning in the city’s land development code, and a list of incentives to prompt developers to build affordable homes.
•
Allowing accessory dwelling units of about 650-square-feet on a single-family lot garnered considerable support. However, concerns were raised regarding the safety of tiny homes during hurricane season.
• It was stressed that a priority needs to be made for low-income affordable houses, and later added that the commissioners must think about affordable housing as it does roads, bridges and parks.
Source: Sarasota Herald-Tribune, June 9, 2022
A huge new industrial park is headed to Palmetto
• A warehouse development has broken ground in Palmetto and is slated to be ready for tenants next year. Palmetto Industrial Park will span three buildings and 427,000-square-feet. The development will include three rear-load, Class A facilities.
• The project will cater to larger and smaller users, e-commerce providers, and local industry suppliers. For the most part, the tenants will be wholesalers.
• The development will accommodate spaces as small as 40,000-square-feet with a storefront and a drive-in ramp. The goal of the park is to bring in both regional companies and larger national players.
Source: Sarasota Magazine, July 22, 2022
N ORTH P ORT - S ARASOTA - B RADENTON 84 Florida & Metro Forecast / Summer 2022
Bold moves or more of the same? Sarasota-area governments mobilize on affordable housing
•
In addition to North Port, Sarasota County just allotted $25 million in federal dollars to affordable housing, while Venice is conducting a review of its land-use regulations.
•
An additional $137 million from area nonprofits will be used towards the building of almost 700 new units of affordable housing through multiple public and nonprofit regional partners with expertise in the area.
• The county currently supports that mandatory inclusionary zoning would help keep pace with the demand for affordable housing that is created by new growth.
Source: Sarasota Herald-Tribune, July 6, 2022
Mote Science Education Aquarium will be built from the inside out
•
The Mote SEA will begin construction this August with plans to open in 2024.
• Mote has raised $90 million toward its capital campaign goal of $110 million for the $130 million facility. The county had committed the last $20 million — revenue from tourist taxes — toward the development costs.
• Consultants to Mote have estimated the new aquarium will draw 600,000 to 700,000 visitors in its first year of operation, doubling its current turnstile count.
Source: Your Observer, July 21, 2022
Sarasota Memorial is building a new hospital in North Port
• Master planning and preconstruction are underway for the City of North Port’s first hospital operated by Sarasota Memorial Health Care Systems.
• The hospital will open with 100 beds with the capacity to double in size. It will offer medical, surgical, and specialty care, outpatient programs
and diagnostic services, as well as space for educational and support programs.
• If permit proceedings allow, the foundation will take shape by 2025.
Source: Sarasota Magazine, August 10, 2022
Sarasota County’s new headquarters projected to cost $72M-$74M
•
Sarasota County sold its current administration center to Benderson Development Co. for $25 million while the new $72 to $74 million administration center is being constructed.
•
The larger building will be able to accommodate 80% of the county’s office workers as well as provide adequate modern facilities for employees.
• The county believes the move would make the building accessible to more county residents as the population center moves to the southern part of the county.
Source: YourObserver, August 30, 2022
N ORTH P ORT - S ARASOTA - B RADENTON Institute for Economic Forecasting 85
Total Nonagricultural Employment
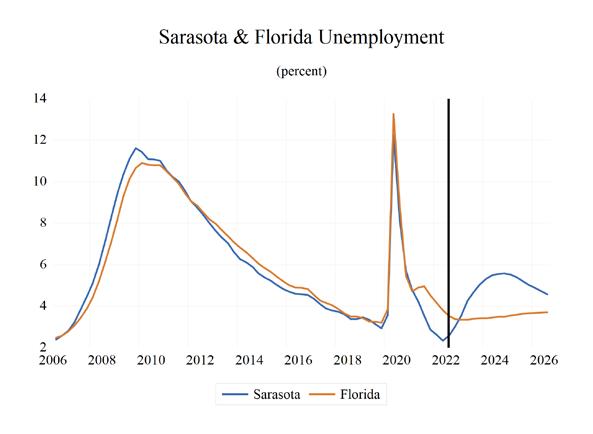
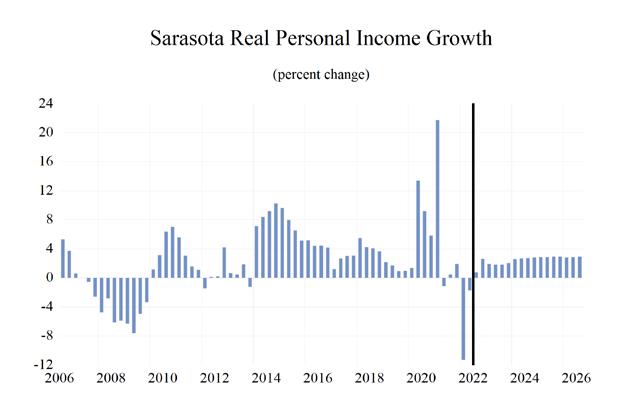
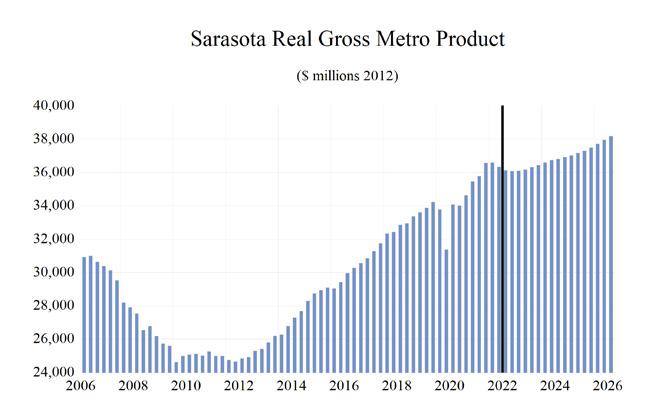
North Port Sarasota Bradenton MSA

N ORTH P ORT - S ARASOTA - B RADENTON 86 Florida & Metro Forecast / Summer 2022 0 0.2 0.4 0.6 0.8 1 1.2 1.4 1.6
Total Private Goods Producing Service Producing Private Service Providing Mining Logging and Construc�on Manufacturing Trade, Transporta�on, and U�li�es Wholesale Trade Retail Trade Transporta�on, Warehousing and U�li�es Informa�on Financial Ac�vi�es Professional and Business Services Educa�onal and Health Services Leisure and Hospitality Other Services Government
Industry Loca�on Quo�ents
Long Term Outlook for North Port-Sarasota-Bradenton, FL August 2022 Forecast
Personal Income (Billions $)
Total Personal Income 44.9 47.7 50.2 53.0 57.9 59.9 62.9 65.6 68.7
Pct Chg Year Ago 7.6 6.1 5.3 5.5 9.3 3.5 4.9 4.3 4.8
Wages and Salaries 14.2 15.3 15.9 16.3 18.9 21.3 22.0 22.2 22.8
Nonwage Income 30.7 32.4 34.3 36.6 39.1 38.6 40.9 43.4 45.9
Real Personal Income (12$) 41.0 43.3 45.7 47.4 49.8 48.5 49.2 50.5 52.0 Pct Chg Year Ago 4.7 5.7 5.4 3.8 5.0 -2.6 1.5 2.6 2.9
Per Capita Income (Ths) 56.6 59.0 61.0 63.1 67.2 68.0 70.0 72.1 74.6
Real Per Capita Income (12$) 51.6 53.6 55.5 56.4 57.7 55.0 54.8 55.5 56.4
Average Annual Wage (Ths) 47.0 49.2 50.4 54.4 59.1 63.5 65.3 67.1 68.9 Pct Chg Year Ago 2.6 4.5 2.6 7.8 8.7 7.5 2.7 2.9 2.6
Establishment Employment (Place of Work, Thousands, SA)
Total Employment 301.1 308.9 314.3 299.2 317.3 334.4 335.6 329.4 329.6
Pct Chg Year Ago 2.4 2.6 1.7 -4.8 6.0 5.4 0.4 -1.9 0.1
Manufacturing 16.6 16.8 17.1 16.3 17.8 19.4 18.6 17.3 16.6
Pct Chg Year Ago -0.1 1.0 2.1 -4.5 8.9 9.0 -3.9 -7.3 -3.7
Nonmanufacturing 284.5 292.1 297.2 282.9 299.5 315.0 317.0 312.1 312.9
Pct Chg Year Ago 2.5 2.7 1.7 -4.8 5.9 5.2 0.6 -1.5 0.3
Construction & Mining 23.5 25.4 26.4 26.4 27.3 28.5 28.1 27.5 27.6
Pct Chg Year Ago 6.6 8.1 4.2 -0.1 3.5 4.4 -1.4 -2.3 0.3
Trade, Trans, & Utilities 57.4 59.5 60.0 58.0 61.3 63.6 63.7 61.8 60.6
Pct Chg Year Ago 0.5 3.6 0.9 -3.4 5.7 3.7 0.2 -2.9 -2.0
Wholesale Trade 8.4 8.7 8.9 8.4 9.1 9.9 10.0 10.3 10.6
Retail Trade 43.6 44.9 44.6 42.7 44.5 45.7 45.3 42.9 41.0
Trans, Wrhsng, & Util 5.4 6.0 6.5 6.8 7.6 8.0 8.4 8.7 9.0 Information 3.5 3.4 3.5 3.3 3.3 3.6 3.7 3.5 3.6
Pct Chg Year Ago -2.1 -1.0 1.7 -5.1 1.5 7.7 1.4 -3.2 2.5
Financial Activities 14.9 14.8 15.4 15.6 16.5 17.1 17.2 17.9 18.6
Pct Chg Year Ago 0.8 -0.5 3.9 1.5 5.7 3.8 0.6 4.0 3.9
Prof & Business Services 47.2 47.4 46.2 42.9 48.4 49.8 45.7 40.8 41.9 Pct Chg Year Ago 4.0 0.3 -2.5 -7.2 13.0 2.8 -8.2 -10.7 2.7
Educ & Health Services 52.9 54.5 56.3 55.2 56.0 58.2 59.4 61.0 61.6
Pct Chg Year Ago 2.8 3.0 3.2 -1.9 1.6 3.9 2.0 2.7 0.9
Leisure & Hospitality 44.4 44.9 46.1 39.0 43.4 49.8 54.2 53.7 52.7 Pct Chg Year Ago 3.4 1.1 2.7 -15.4 11.3 14.7 8.8 -0.9 -1.9
Other Services 13.3 14.2 14.8 14.1 14.6 15.4 15.7 16.2 16.7
Pct Chg Year Ago 1.9 6.9 3.9 -4.8 3.8 5.5 1.9 3.3 3.0
Federal Government 2.0 2.0 2.0 2.1 2.0 1.9 1.9 2.0 2.0
Pct Chg Year Ago 4.3 0.0 0.8 4.4 -5.5 -3.5 0.7 2.1 2.2
State & Local Government 25.4 26.0 26.5 26.4 26.5 27.0 27.3 27.5 27.6
Pct Chg Year Ago 0.2 2.2 1.7 -0.4 0.6 1.6 1.2 1.0 0.2
Other Economic Indicators
Population (Ths) 793.8 807.7 823.1 840.2 861.8 881.5 897.4 909.4 921.3
Pct Chg Year Ago 1.9 1.7 1.9 2.1 2.6 2.3 1.8 1.3 1.3
Labor Force (Ths) 356.8 362.4 366.4 359.8 373.1 387.7 400.4 402.6 403.6
Percent Change, Year Ago 1.6 1.6 1.1 -1.8 3.7 3.9 3.3 0.6 0.2
Unemployment Rate (%) 4.0 3.5 3.2 7.4 3.8 2.6 4.4 5.5 5.3
Total Housing Starts 7222.8 9657.0 9230.9 9689.0 14529.4 15395.5 11104.0 9499.3 9377.5
Single-Family 5920.1 6228.3 6664.6 8109.2 12180.8 11609.2 8501.6 7457.6 7403.7
Multifamily 1302.7 3428.7 2566.3 1579.8 2348.7 3786.3 2602.4 2041.7 1973.8
N ORTH P ORT - S ARASOTA - B RADENTON Institute for Economic Forecasting 87
2017 2018 2019 2020 2021 2022 2023 2024 2025
Short Term Outlook for North Port-Sarasota-Bradenton, FL August 2022 Forecast 2022:2 2022:3 2022:4 2023:1 2023:2 2023:3 2023:4 2024:1 2024:2 2024:3 2024:4 2025:1 2025:2
Personal Income (Billions $)
Total Personal Income 59.5 60.2 61.5 61.9 62.6 63.2 63.7 64.5 65.2 65.9 66.6 67.5 68.3
Pct Chg Year Ago 5.5 6.0 6.2 5.9 5.1 4.9 3.6 4.2 4.2 4.3 4.6 4.6 4.7
Wages and Salaries 21.3 21.5 21.7 21.9 22.0 22.0 22.1 22.1 22.1 22.2 22.4 22.5 22.7
Nonwage Income 38.3 38.7 39.8 40.0 40.6 41.1 41.7 42.4 43.1 43.7 44.3 45.0 45.6
Real Personal Income (12$) 48.4 48.3 48.9 48.8 49.1 49.3 49.5 49.9 50.3 50.6 51.0 51.4 51.8 Pct Chg Year Ago -0.9 -0.4 0.5 1.1 1.6 2.1 1.4 2.3 2.4 2.7 3.0 2.9 2.9
Per Capita Income (Ths) 67.7 68.1 69.3 69.4 69.9 70.2 70.7 71.3 71.8 72.4 72.9 73.6 74.3
Real Per Capita Income (12$) 55.0 54.6 55.0 54.7 54.8 54.8 54.9 55.2 55.4 55.6 55.8 56.1 56.3
Average Annual Wage (Ths) 63.2 63.8 64.2 64.6 65.0 65.5 66.0 66.5 66.9 67.3 67.8 68.3 68.7
Pct Chg Year Ago 8.4 7.0 3.3 2.5 2.8 2.6 2.8 2.9 3.0 2.8 2.8 2.7 2.7
Establishment Employment (Place of Work, Thousands, SA)
Total Employment 334.8 335.8 337.1 337.5 336.8 335.1 332.9 330.9 329.4 328.8 328.3 328.2 328.9
Pct Chg Year Ago 6.6 4.5 3.5 2.3 0.6 -0.2 -1.2 -1.9 -2.2 -1.9 -1.4 -0.8 -0.2
Manufacturing 19.4 19.5 19.6 19.2 18.8 18.4 18.1 17.8 17.4 17.1 16.8 16.7 16.7
Pct Chg Year Ago 11.6 7.2 4.8 0.6 -3.1 -5.4 -7.6 -7.6 -7.2 -7.3 -7.1 -5.9 -4.3
Nonmanufacturing 315.4 316.4 317.5 318.2 318.1 316.7 314.8 313.1 312.0 311.7 311.5 311.5 312.2
Pct Chg Year Ago 6.3 4.3 3.4 2.4 0.8 0.1 -0.9 -1.6 -1.9 -1.6 -1.0 -0.5 0.1
Construction & Mining 28.5 28.8 28.6 28.4 28.3 28.1 27.8 27.6 27.5 27.4 27.4 27.4 27.5
Pct Chg Year Ago 6.1 4.4 2.2 0.3 -0.7 -2.5 -2.7 -2.9 -2.8 -2.2 -1.5 -0.7 0.2
Trade, Trans, & Utilities 63.7 63.3 63.5 63.4 64.0 63.6 63.6 62.9 61.9 61.5 61.0 60.6 60.4 Pct Chg Year Ago 4.5 2.8 1.8 -0.6 0.6 0.5 0.1 -0.7 -3.4 -3.3 -4.0 -3.7 -2.4
Wholesale Trade 9.8 9.9 9.9 10.0 9.9 10.0 10.0 10.1 10.2 10.3 10.4 10.5 10.5 Retail Trade 45.9 45.4 45.5 45.1 45.8 45.3 45.1 44.3 43.0 42.5 41.9 41.2 40.9 Trans, Wrhsng, & Util 7.9 8.0 8.1 8.3 8.3 8.4 8.4 8.5 8.6 8.7 8.8 8.9 9.0
Information 3.6 3.6 3.7 3.8 3.7 3.6 3.5 3.5 3.6 3.5 3.5 3.6 3.6 Pct Chg Year Ago 9.3 3.7 5.8 6.5 4.0 0.0 -4.5 -6.2 -3.7 -1.9 -1.0 0.4 1.5
Financial Activities 17.1 17.2 17.2 17.3 17.1 17.2 17.4 17.6 17.8 18.1 18.3 18.4 18.6 Pct Chg Year Ago 4.5 2.9 1.5 0.6 0.5 0.3 1.0 1.6 4.1 4.9 5.2 5.0 4.2 Prof & Business Services 49.7 49.6 49.4 48.5 46.6 44.7 43.0 41.7 40.8 40.3 40.3 40.7 41.3 Pct Chg Year Ago 3.8 1.4 -0.8 -3.9 -6.2 -9.9 -13.0 -13.9 -12.3 -9.9 -6.2 -2.5 1.1
Educ & Health Services 58.4 58.7 59.0 59.1 59.3 59.5 59.8 60.4 60.9 61.3 61.5 61.7 61.7 Pct Chg Year Ago 5.2 3.8 4.3 3.8 1.6 1.4 1.4 2.2 2.8 3.0 2.9 2.1 1.2
Leisure & Hospitality 50.3 50.9 51.6 53.1 54.2 55.0 54.5 54.0 53.8 53.7 53.4 52.9 52.8 Pct Chg Year Ago 16.4 14.0 12.2 14.2 7.8 8.2 5.6 1.7 -0.7 -2.3 -2.1 -2.0 -1.8
Other Services 15.4 15.6 15.6 15.7 15.6 15.7 15.8 15.9 16.1 16.3 16.5 16.6 16.7 Pct Chg Year Ago 6.1 6.1 4.7 4.4 1.6 0.6 1.0 1.6 3.1 4.1 4.4 4.2 3.5
Federal Government 1.9 1.9 1.9 1.9 1.9 1.9 1.9 2.0 2.0 2.0 2.0 2.0 2.0 Pct Chg Year Ago -5.8 -1.5 -1.8 -2.0 1.4 1.6 1.8 2.1 2.2 2.1 2.2 2.2 2.2 State & Local Government 27.0 26.9 27.0 27.1 27.2 27.3 27.4 27.5 27.5 27.6 27.6 27.6 27.6 Pct Chg Year Ago 2.4 -1.1 0.1 0.4 0.9 1.7 1.7 1.5 1.2 0.8 0.5 0.3 0.2
Other Economic Indicators
Population (Ths) 879.5
910.8 913.8 916.9 919.8 Pct Chg Year Ago 2.3 2.3 2.1 2.0 1.9 1.7 1.6 1.4 1.3 1.3 1.3 1.3 1.3 Labor Force (Ths) 386.7 389.1 393.2 396.8
402.3 402.4 402.5 402.6 402.8 403.0 403.3 Pct Chg Year Ago 4.2 3.2 3.9 3.9 3.6
Unemployment Rate (%)
Total Housing Starts
Single-Family
Multifamily
2.3 1.4 0.5 0.2 0.1 0.1 0.2
2039.3 2013.2 2009.3 1989.4
N ORTH P ORT - S ARASOTA - B RADENTON 88 Florida & Metro Forecast / Summer 2022
884.0 888.1 892.3 895.9 899.2 902.2 905.1 907.9
400.5 401.8
3.2
2.3 2.6 3.0 3.5 4.2 4.7 5.0 5.3 5.5 5.6 5.6 5.5 5.4
17803.1 15241.2 14166.6 12434.0 11367.5 10585.4 10029.3 9595.9 9473.0 9450.0 9478.3 9514.7 9465.3
12961.6 11275.3 10513.1 9424.2 8661.9 8148.1 7772.2 7490.8 7433.7 7436.7 7469.0 7525.3 7477.8
4841.5 3965.9 3653.5 3009.8 2705.5 2437.3 2257.1 2105.1
1987.5
PROFILES
Comprised of Marion County only, the Ocala MSA is located northwest of the Orlando area and is in the center of the state. The second largest national forest in Florida, the Ocala National Forest, and Silver Springs are two main outdoor attractions in the area.
QUICK FACTS
• Metro population estimate of 353,526 as of 2019 (5-Year Estimate) (U.S. Census Bureau).
• Marion County population estimate of 365,579 as of 2019 (5-Year Estimate) (U.S. Census Bureau).
•
Civilian labor force of 145,032 in July 2022 (Florida Research and Economic Database).
• An unemployment rate of 3.5% as of July 2022, not seasonally adjusted. This amounts to 5,050 unemployed people (Florida Research and Economic Database).
OUTLOOK SUMMARIES
The Ocala Metropolitan Statistical Area (MSA) is expected to show weak levels of growth in its economic indicators. Ocala’s Gross Metro Product is $10,801.78.
Average annual wage growth of 4.4 percent will lead to an average annual wage of $58,500, among the lowest in the state. Personal incomes will grow by 6.1 percent, the second highest in the state. This will lead to a per capita income level of $40,000. Population growth will average 1.7 percent.
Employment growth is expected to average a rate of 1.0 percent annually. The unemployment rate is estimated to average 5.2 percent.
The Other Services sector will lead Ocala at an average annual growth rate at 4.6 percent. The Education & Health Services sector and the Financial services sector will expand at rates of 4.0 percent and 3.7 percent respectively.
METRO NEWS SUMMARIES
Marion County Airport T-hangar project nears completion
•
The Marion County Airport (X35) has announced that the addition of 20 T-hangars, measuring approximately 30,000 square feet, is scheduled for completion later this month.
• Grants from the Florida Department of Transportation Aviation provided 80% of the funding necessary to complete the $3 million project, and Marion County funded the remaining 20% of the project.
• These additions will also allow for a 20% increase in permanent occupancy at the airport, which will help reduce the airport’s 142-person waiting list for hangar space. According to Marion County, doing so will add to the $44 million economic impact the airport already provides the local economy.
Source: Ocala-News, July 14, 2022
Marion schools: Tentative budget hits all-time high of $905M thanks to COVID relief funds
• The Marion County School Board on Thursday approved the school district’s tentative 2022-23 budget, a record spending plan of $905 million that is inflated by federal COVID-19 relief dollars
• Employee salaries have increased significantly because of Gov. Ron DeSantis’ mandate to increase teacher salaries. From 2021-22 to 202223, employee salaries increased by $52.8 million, from $297.1 million to $349.9 million.
•
The district budget includes about $85 million more in revenue from federal COVID-19 relief money. In all the district has, or will receive through 2023-24 school year, $197.5 million in relief funds, parts of which must be spent on specific programs like online schooling and afterschool and summer programs to prevent learning loss.
Source: Ocala Star Banner, July 22, 2022
O CALA Institute for Economic Forecasting 89
Marion County workforce: July unemployment rate was 3.5%, down from June’s 3.6%
• Marion County’s unadjusted unemployment rate dropped to 3.5% in July, down from 3.6% in June, according to the state’s latest jobs report, which was released on Friday. The rate is 1.7 percentage points lower than July 2021.
• Summer unemployment rates fluctuate due to seasonal trends like school closures, causing some parents to stay at home to watch children and students to find summer jobs
• In one year, Marion’s labor force grew by 1,166 and the number of people who are employed increased by 4,593. The labor force in Marion County in July was 145,032, up 663 since June. The labor force was 142,866 a year ago.
Source: Ocala Star Banner, August 23, 2022
Two Ocala projects: One is a known entity, the other is a mystery. Both won city approval
• On Aug. 16, the Ocala city council voted 4-1 to allow an existing materials recovery facility to operate as a recycling and trash center in a residential neighborhood.
• The lone dissenter, Ire Bethea, said that the vote sent the wrong message to the city by building homes while allowing the expansion of a waste facility in the community. The ordinance paves the way for Friends Recycling to take garbage into the facility. However, garbage collected would not be allowed to be stored on-site and has to be transported daily.
•
The city council also approved the sale of land near Ocala International Airport for $8.62 million for a mysterious project known only as Project Angus. Airport board officials present at the city council meeting strongly objected to the sale. Although no specifics were released, the CEP reported the project “would result in more than 1,200 new jobs, wages averaging more than $50,000/year and more than $300,000,000 in capital investment.”
Source: Ocala StarBanner, August 26, 2022
MCPS recognizes graduates of inaugural leadership class
• Twenty members of the Marion County community have gained a greater understanding of what it takes to operate Marion County Public Schools after completing the Leadership MCPS program.
•
Graduates participated in eight monthly sessions, with topics such as teaching and learning, funding public education, and supporting a safe and positive learning / working environment
•
The Leadership MCPS program will continue in 2023, and community members are welcome to apply.
Source: Ocala News, October 4, 2022
In 3-1 vote, Ocala City Council agrees to continue funding Ocala Metro CEP
• In a 3-1 vote, the Ocala City Council on Tuesday approved the city’s annual agreement to help fund the Ocala Metro Chamber & Economic Partnership, which receives $190,000 a year from the city.
•
The CEP was formed to help the city and county attract businesses to Ocala/Marion County at a time when the country was in a recession. It has helped bring in big corporate entities including FedEx, Chewy, Auto Zone, Amazon and Dollar Tree, and has helped transform the county into a logistics and warehousing powerhouse.
• The lone dissenter, councilmember Jay Musleh, agreed with other councilmembers that the CEP has helped Ocala, especially in times of need, but stated that the city’s support should not be permanent and should be phased out over time.
Source: Ocala Star Banner, October 5, 2022
O CALA 90 Florida & Metro Forecast / Summer 2022
Total Nonagricultural Employment
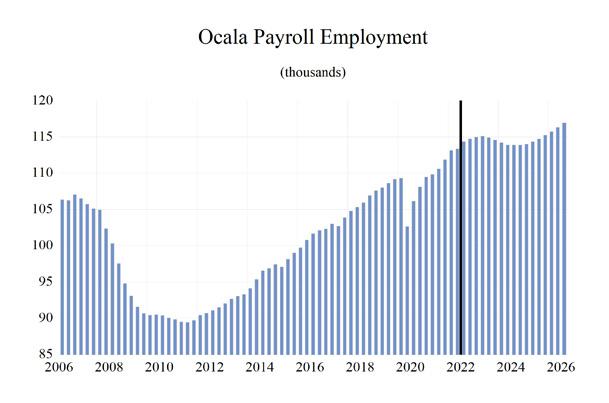
Total Private Goods Producing Service Producing
Service Providing
Logging, and Construction Manufacturing Trade, Transportation, and Utilities Wholesale Trade Retail Trade
Warehousing and Utilities Information Financial Activities
and Business Services
Educational and Health Services
and Hospitality Other Services Government
Ocala MSA Industry Location Quotients

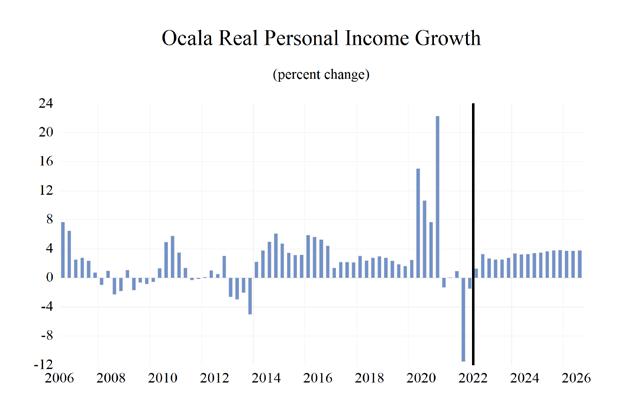
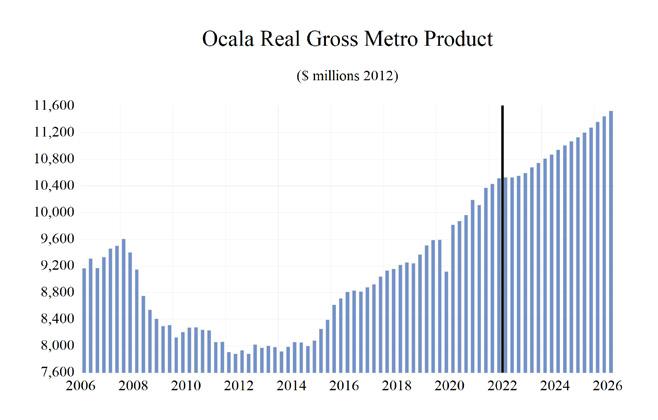
O CALA Institute for Economic Forecasting 91 0 0.5 1 1.5 2 2.5
Private
Mining,
Transportation,
Professional
Leisure
Long Term Outlook for Ocala, FL August 2022 Forecast
Personal Income (Billions $)
Total Personal Income 12.9 13.5 14.2 15.5 17.0 17.7 18.7 19.7 20.8
Pct Chg Year Ago 6.0 4.6 5.2 9.4 9.6 3.9 5.6 5.4 6.0
Wages and Salaries 4.3 4.5 4.8 5.0 5.7 6.4 6.6 6.8 7.1
Nonwage Income 8.6 9.0 9.4 10.5 11.3 11.3 12.0 12.8 13.8
Real Personal Income (12$) 12.8 13.3 13.9 15.0 15.8 15.5 15.8 16.4 17.1 Pct Chg Year Ago 4.0 4.2 4.1 8.5 5.2 -2.2 2.2 3.6 4.1
Per Capita Income (Ths) 36.1 37.1 38.3 41.0 44.0 44.8 46.4 48.1 50.4
Real Per Capita Income (12$) 35.8 36.7 37.5 39.8 40.9 39.2 39.3 40.1 41.3
Average Annual Wage (Ths) 41.1 42.3 43.7 47.1 51.6 55.8 57.4 59.6 61.2 Pct Chg Year Ago -0.1 2.8 3.3 7.9 9.5 8.2 2.8 3.8 2.8
Establishment Employment (Place of Work, Thousands, SA)
Total Employment 103.0 105.8 108.3 106.6 110.4 113.9 114.9 114.0 114.6 Pct Chg Year Ago 1.9 2.7 2.5 -1.7 3.7 3.1 0.9 -0.8 0.6
Manufacturing 8.1 8.6 9.3 9.5 10.0 10.5 10.4 9.6 9.4 Pct Chg Year Ago 3.9 5.4 7.8 2.3 5.3 5.0 -1.0 -7.1 -2.4
Nonmanufacturing 94.8 97.2 99.1 97.1 100.5 103.4 104.5 104.3 105.2
Pct Chg Year Ago 1.7 2.5 2.0 -2.0 3.5 2.9 1.1 -0.2 0.8 Construction & Mining 7.3 7.8 8.5 8.7 8.9 9.1 8.7 8.3 8.1
Pct Chg Year Ago 4.8 8.1 7.9 2.2 3.2 1.8 -4.2 -5.2 -2.2 Trade, Trans, & Utilities 24.7 25.4 26.1 26.2 27.8 28.6 28.4 27.7 27.4
Pct Chg Year Ago 3.9 2.7 2.7 0.8 5.9 3.0 -0.8 -2.3 -1.2
Wholesale Trade 3.6 3.9 4.2 4.1 4.2 4.5 4.8 4.8 4.9 Retail Trade 16.5 16.8 16.7 16.5 17.5 17.8 17.2 16.3 15.6 Trans, Wrhsng, & Util 4.6 4.7 5.2 5.6 6.1 6.3 6.4 6.7 6.9
Information 0.8 0.8 0.6 0.5 0.6 0.6 0.6 0.6 0.6 Pct Chg Year Ago 1.1 -5.2 -17.5 -17.1 5.5 17.4 -1.7 -4.7 0.2
Financial Activities 3.9 3.9 3.9 3.9 4.0 4.2 4.5 4.6 4.6 Pct Chg Year Ago 0.5 0.7 0.6 -1.5 3.9 4.8 6.3 2.0 1.5
Prof & Business Services 9.0 9.5 9.5 9.8 10.6 11.0 10.5 9.6 9.7 Pct Chg Year Ago -2.1 5.3 0.0 3.6 7.7 3.4 -4.4 -8.3 0.7
Educ & Health Services 18.5 18.8 18.8 18.4 18.4 19.1 20.0 21.0 21.5 Pct Chg Year Ago 0.8 1.7 0.1 -2.5 0.1 3.9 4.7 4.9 2.6
Leisure & Hospitality 12.9 13.1 13.5 11.7 12.6 13.4 13.8 14.2 14.5 Pct Chg Year Ago 2.5 2.1 2.6 -13.5 8.1 6.0 3.3 2.4 2.7
Other Services 3.0 2.9 3.0 2.9 2.9 3.0 3.1 3.3 3.5
Pct Chg Year Ago -4.5 -2.5 1.4 -3.1 2.4 1.8 3.4 6.6 6.4
Federal Government 0.7 0.7 0.7 0.9 0.8 0.8 0.8 0.8 0.8
Pct Chg Year Ago 0.0 0.0 3.5 18.3 -6.8 -0.6 1.6 -2.8 -1.5
State & Local Government 14.1 14.2 14.5 14.2 13.9 13.7 14.2 14.4 14.5
Pct Chg Year Ago 1.4 0.7 2.2 -2.2 -2.4 -1.4 3.5 1.5 0.7
Other Economic Indicators
Population (Ths) 357.0 363.1 370.2 378.5 386.7 394.8 402.2 408.3 413.1
Pct Chg Year Ago 1.8 1.7 2.0 2.2 2.2 2.1 1.9 1.5 1.2
Labor Force (Ths) 132.8 134.7 138.0 139.0 141.7 144.0 147.4 147.9 148.2
Percent Change, Year Ago 0.8 1.4 2.4 0.7 2.0 1.6 2.3 0.4 0.2
Unemployment Rate (%) 5.1 4.5 3.9 7.7 4.9 3.4 5.0 6.3 6.2
Total Housing Starts 2070.1
Single-Family 1920.4
3617.1 5686.7 5211.8 3466.9 3192.6 3266.2
3600.8 5605.1 4509.6 3026.2 2960.6 3037.5
Multifamily 149.7 45.3 11.3 16.2 81.7 702.3 440.6 232.0 228.7
O CALA 92 Florida & Metro Forecast / Summer 2022
2017 2018 2019 2020 2021 2022 2023 2024 2025
2643.0 2410.2
2597.7 2398.9
Short Term Outlook for Ocala, FL August 2022 Forecast
2022:2 2022:3
Personal Income (Billions $)
Total Personal Income 17.5 17.8 18.2 18.4 18.5 18.7 19.0 19.2 19.5 19.8 20.1 20.4 20.7
Pct Chg Year Ago 5.7 6.7 7.4 7.0 5.8 5.4 4.2 4.9 5.2 5.6 5.9 5.9 6.1
Wages and Salaries 6.4 6.5 6.5 6.6 6.6 6.6 6.7 6.7 6.8 6.9 6.9 7.0 7.0
Nonwage Income 11.2 11.3 11.7 11.8 11.9 12.1 12.3 12.5 12.7 12.9 13.2 13.4 13.7
Real Personal Income (12$) 15.4 15.5 15.7 15.7 15.8 15.9 16.0 16.1 16.3 16.5 16.7 16.8 17.0
Pct Chg Year Ago -0.7 0.3 1.6 2.1 2.2 2.6 1.9 2.9 3.4 3.9 4.3 4.2 4.2
Per Capita Income (Ths) 44.5 44.9 45.8 46.0 46.2 46.5 46.9 47.4 47.8 48.4 49.0 49.6 50.1
Real Per Capita Income (12$) 39.2 39.0 39.4 39.3 39.3 39.3 39.5 39.7 40.0 40.3 40.6 40.9 41.2
Average Annual Wage (Ths) 55.7 56.2 56.5 56.8 57.1 57.5 58.2 58.8 59.4 59.9 60.3 60.7 61.0 Pct Chg Year Ago 9.5 7.3 4.1 3.4 2.4 2.3 3.0 3.5 4.0 4.2 3.6 3.3 2.8
Establishment Employment (Place of Work, Thousands, SA)
Total Employment 113.3 114.3 114.8 115.0 115.1 114.9 114.6 114.2 113.9 113.9 113.9 114.0 114.3
Pct Chg Year Ago 3.2 3.4 2.6 1.6 1.6 0.5 -0.2 -0.7 -1.1 -0.9 -0.6 -0.2 0.4
Manufacturing 10.3 10.5 10.7 10.6 10.5 10.3 10.1 9.9 9.7 9.5 9.4 9.4 9.4
Pct Chg Year Ago 4.4 5.2 5.3 2.6 1.3 -2.0 -5.6 -6.8 -7.4 -7.3 -6.8 -5.2 -3.0
Nonmanufacturing 103.0 103.8 104.1 104.4 104.7 104.6 104.5 104.3 104.2 104.4 104.5 104.6 105.0
Pct Chg Year Ago 3.1 3.2 2.3 1.5 1.6 0.8 0.4 -0.1 -0.5 -0.2 0.0 0.3 0.7
Construction & Mining 9.1 9.2 9.0 8.9 8.8 8.6 8.5 8.4 8.3 8.2 8.2 8.1 8.1
Pct Chg Year Ago 2.2 2.5 0.2 -1.9 -3.2 -5.7 -5.8 -6.2 -5.7 -4.9 -4.0 -3.1 -2.3
Trade, Trans, & Utilities 28.6 28.4 28.5 28.4 28.6 28.3 28.3 28.1 27.8 27.6 27.5 27.4 27.3
Pct Chg Year Ago 3.8 1.8 0.5 -1.9 -0.2 -0.4 -0.6 -1.0 -2.8 -2.4 -2.9 -2.6 -1.5
Wholesale Trade 4.5 4.6 4.6 4.7 4.8 4.8 4.8 4.8 4.8 4.8 4.9 4.9 4.9 Retail Trade 17.9 17.6 17.6 17.2 17.4 17.2 17.1 16.8 16.3 16.1 15.9 15.7 15.6 Trans, Wrhsng, & Util 6.2 6.3 6.3 6.4 6.4 6.4 6.5 6.6 6.7 6.7 6.7 6.8 6.9 Information 0.7 0.7 0.7 0.7 0.6 0.6 0.6 0.6 0.6 0.6 0.6 0.6 0.6
Pct Chg Year Ago 28.1 7.7 9.2 6.5 -1.2 -3.6 -7.9 -8.0 -4.3 -3.1 -3.0 -2.0 -1.1
Financial Activities 4.1 4.2 4.3 4.5 4.5 4.5 4.5 4.5 4.6 4.6 4.6 4.6 4.6 Pct Chg Year Ago 3.9 4.9 6.0 7.5 8.4 5.5 3.9 1.3 1.5 2.5 2.8 2.6 1.8 Prof & Business Services 11.0 11.1 11.1 11.0 10.6 10.3 10.0 9.8 9.6 9.5 9.5 9.5 9.6 Pct Chg Year Ago 4.9 4.7 3.7 2.1 -3.3 -6.9 -9.5 -10.6 -9.3 -7.9 -5.2 -2.6 -0.1
Educ & Health Services 18.9 19.3 19.5 19.7 19.9 20.1 20.3 20.6 20.9 21.1 21.3 21.4 21.5
Pct Chg Year Ago 3.9 4.5 5.4 5.1 5.2 4.4 4.3 4.8 4.9 5.0 4.8 4.0 2.9
Leisure & Hospitality 13.4 13.6 13.4 13.5 13.7 14.0 14.1 14.0 14.1 14.2 14.3 14.3 14.5
Pct Chg Year Ago 6.1 7.1 2.5 2.8 2.0 3.4 5.2 4.1 2.8 1.2 1.7 2.1 2.8
Other Services 2.9 3.0 3.0 3.1 3.1 3.1 3.1 3.2 3.3 3.3 3.4 3.4 3.5
Pct Chg Year Ago -0.9 3.1 3.3 3.7 3.9 2.6 3.2 4.2 6.5 7.8 8.0 7.8 7.0
Federal Government 0.8 0.8 0.8 0.8 0.8 0.8 0.8 0.8 0.8 0.8 0.8 0.8 0.8
Pct Chg Year Ago -3.8 3.1 1.0 2.1 3.6 1.4 -0.7 -2.3 -3.5 -3.0 -2.4 -1.9 -1.3
State & Local Government 13.5 13.7 13.8 14.0 14.1 14.2 14.3 14.3 14.4 14.4 14.4 14.4 14.5
Pct Chg Year Ago -2.9 -0.6 0.7 1.9 4.8 4.1 3.2 2.3 1.6 1.2 1.0 0.8 0.7
Other Economic Indicators
Population (Ths) 393.8 395.7 397.6 399.4 401.3 403.1 404.7 406.2 407.7 409.1 410.3 411.4 412.5
Pct Chg Year Ago 2.0 2.1 2.0 1.9 1.9 1.9 1.8 1.7 1.6 1.5 1.4 1.3 1.2 Labor Force (Ths) 143.3 144.3 145.7 146.6 147.3 147.6 147.8 147.9 147.9 147.9 148.0 148.0 148.1 Pct Chg Year Ago 1.3 1.8 2.8 2.7 2.8 2.3 1.5 0.8 0.4 0.2 0.1 0.1 0.2
Unemployment Rate (%) 3.1 3.3 3.7 4.2 4.7 5.3 5.7 6.1 6.3 6.4 6.5 6.4 6.3
Total Housing Starts
3234.1 3157.7 3183.1 3198.7 3231.0 3267.7
Single-Family
363.1 309.2 254.1 221.8 224.7 227.4 227.0 228.6
2981.4 2924.9 2903.6 2961.2 2974.0 3003.5 3040.7 3047.3 Multifamily
O CALA Institute for Economic Forecasting 93
2022:4 2023:1 2023:2 2023:3 2023:4 2024:1 2024:2 2024:3 2024:4 2025:1 2025:2
5591.8 4722.9 4329.5 3777.6 3511.3 3344.4
3275.9
4731.8 3858.0 3547.7 3173.6 3025.0
860.0 864.9 781.8 604.0 486.3
PROFILES
The Orlando–Kissimmee–Sanford MSA is comprised of Lake, Orange, Osceola and Seminole Counties. Located in the southern center of the state, this area is home to numerous tourist attractions such as Walt Disney World, Universal Studios and Sea World. It is also home to the Orlando Magic and the Orlando City Soccer Club. Orlando hosts many conventions utilizing some of the biggest hotels in the country and America’s second largest convention center. The University of Central Florida, the nation’s second largest university, and many other places of higher education also reside in the MSA.
QUICK FACTS
• Metro population estimate of 2,508,970 as of 2019 (5-Year Estimate) (U.S. Census Bureau).
• Lake County population estimate of 367,118 as of 2019 (5-Year Estimate) (U.S. Census Bureau).
• Orange County population estimate of 1,393,452 as of 2019 (5-Year Estimate) (U.S. Census Bureau).
• Osceola County population estimate of 375,751 as of 2019 (5-Year Estimate) (U.S. Census Bureau).
• Seminole County population estimate of 471,826 as of 2019 (5-Year Estimate) (U.S. Census Bureau).
• Civilian labor force of 1,404,415 in July 2022 (Florida Research and Economic Database).
• An unemployment rate of 3.0% as of July 2022, not seasonally adjusted. This amounts to 42,570 unemployed people (Florida Research and Economic Database).
OUTLOOK SUMMARIES
The Orlando—Kissimmee Metropolitan Statistical Area (MSA) is expected to show moderate growth in the economic indicators studied in this forecast. The MSA’s Gross Metro Product level will be at $138,176.98, the fourth highest in the state. Average annual wage growth of 4.3 percent will push the average annual wage level to $70,700. The per capita income level of $44,200 will be boosted by personal income growth of 4.2 percent. Population growth will be 1.5 percent.
The Orlando MSA will experience an employment growth rate of 1.4 percent annually. Orlando’s unemployment rate should average 5.0 percent.
Leisure & Hospitality is expected to be the fastest growing sector in the area, averaging 6.8 percent growth annually. The Other Services sector will see the second-highest average annual growth rate at 3.5 percent, followed by the Information Services sector at 2.6 percent.
METRO NEWS SUMMARIES
Dropped COVID-19 travel restrictions could be boon for Florida economy
• 38 Florida mayors sent a letter to President Biden asking to lift international travel restrictions.
Orange County Mayor Demings believes that if the U.S. sees an increase in international travel, much of that would be redirected towards Florida.
• Sr. Director of Public Relations, Denise Spiegel, stated “This news comes right on time for the summer season — one of the most anticipated seasons for travel — and we can expect to welcome an increased number of visitations from global travelers, business to thrive and a positive impact of our economy.”
• On June 12th,President Biden finally lifted the requirement for a negative Covid-19 test to enter the U.S. The decision made during the early summer brings hopes of increased tourism in Florida, with an estimated 20% increase in international travel.
Source: ClickOrlando, June 10, 2022
O RLANDO – K ISSIMMEE – S ANFORD 94 Florida & Metro Forecast / Summer 2022
Orlando homes for sale jump by 44.2%, but median price still rises
• Orlando home prices continue to rise, despite a significant increase in the volume of homes in the market. A report found that in May, Orlando’s metro area saw an increase of 1,200 homes for sale, resulting in the largest monthly increase of 44%.
• Although more homes were for sale, median home prices rose by 2.7% to $379,950. However, Tansey Soderstrom from the Orlando Regional Realtor Association stated, “This new surge in inventory is a sign that the Orlando housing market is beginning to level out, which is good news for both buyers and sellers.”
•
Orlando named most vacant major U.S. city, study says
• Orlando’s housing market faces a negative outlook as a new study reveals how much of the city is filled with vacant homes. The study claims that Orlando has the highest vacancy rate in theUnited States.
•
The study was conducted by Clever Real Estate, who found that 160,952 housing units are left vacant in Orlando, totaling to a 15.3% vacancy rate. Alarmingly, Orlando is reported as the only city to exceed 15% in the entire study.
•
The influx of houses has been attributed to an easing of COVID-19 restrictions and higher interest rates. Interest rates are also expected to continue rising in the near future, which should slowly de-accelerate the number of houses for sale.
•
Source: Orlando Sentinel, June 15, 2022
New businesses get capital investment through Orlando program
• With many of the hurdles that the pandemic caused finally coming to pass, businesses have been looking for relief and assistance. The Business Assistance Program (BAP) aims to do just that for the city of Orlando.
• The BAP helps new and small businesses pay for startup and development costs in the form of matching funds. The program will match funds up to $20,000 per applicant and plans to help expand businesses as well as encourage new businesses to settle in Orlando.
• Their funds can be used for street improvements, sewer developments, landscaping, building permits, along with a plethora of other developmental costs. As of July 21st, 163 businesses have applied and been approved for matching funds, totaling to $1,516,169.
Source: Spectrum News 13, July 21, 2022
The study suspects that this may be due to vacation homes in the area. While the reasoning is not conclusive, the high vacancy rate may be a poor indicator for the housing market in Orlando.
Source: WESH, July 22, 2022
Orlando planning board OKs 1st phase of RoseArts District development
• The Rosemont area has been the site of a back and forth between a newly proposed RoseArts District and the current residents. An estimated billion-dollar project which would build 6,000 new homes in apartments and 150,000 square feet of retail spaces has seen considerable backlash from residents who fear unwanted changes.
•
However, on August 16, the Orlando Municipal Planning Board approved the project with some minor changes. These changes include stormwater management, wastewater policies, and transit.
•
Current residents are still pushing back, with many believing that this development will take away from the greenery of the current landscape. Sentiment is not all negative, as some residents believe that the plan will revitalize the community.
Source: ClickOrlando, August 16, 2022
O RLANDO – K ISSIMMEE – S ANFORD Institute for Economic Forecasting 95
Total Nonagricultural Employment
Private Goods Producing Service Producing
Service
and
Trade, Transportation, and
Warehousing
Orlando Kissimmee Sanford MSA Industry Location Quotients
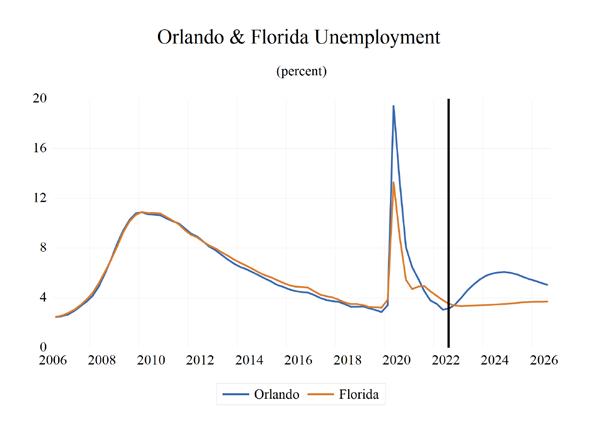
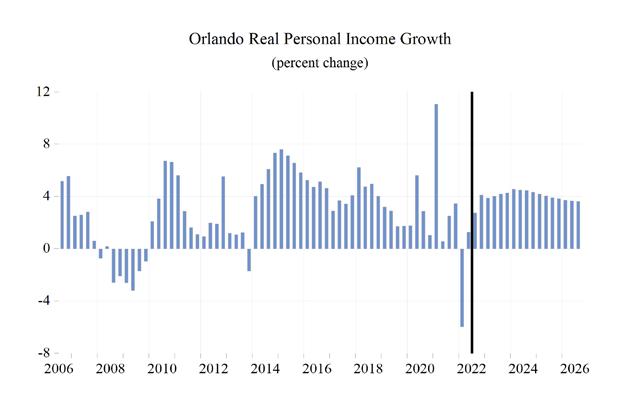
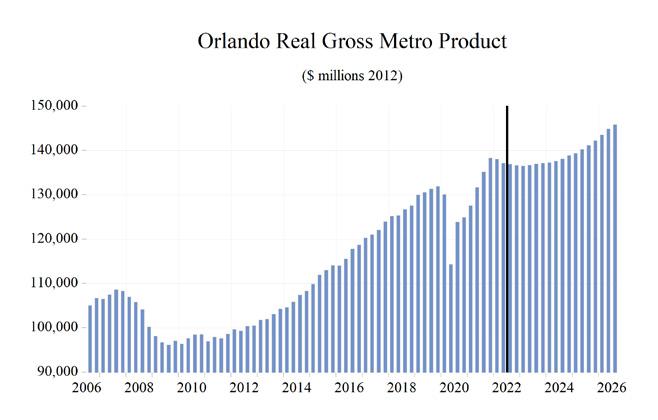
Trade

O RLANDO – K ISSIMMEE – S ANFORD 96 Florida & Metro Forecast / Summer 2022 0 0.2 0.4 0.6 0.8 1 1.2 1.4 1.6
Total
Private
Providing Mining, Logging,
Construction Manufacturing
Utilities Wholesale
Retail Trade Transportation,
and Utilities Information Financial Activities Professional and Business Services Educational and Health Services Leisure and Hospitality Other Services Government
Long Term Outlook for Orlando-Kissimmee-Sanford, FL August 2022 Forecast
Personal Income (Billions $)
Total Personal Income 106.5 113.3 119.3 127.3 140.8 148.1 151.5 157.3 165.9
Pct Chg Year Ago 7.7 6.4 5.3 6.7 10.6 5.2 2.3 3.8 5.5
Wages and Salaries 62.9 67.6 71.6 70.6 80.5 91.0 93.2 95.6 100.3
Nonwage Income 43.6 45.7 47.6 56.6 60.3 57.1 58.3 61.7 65.6
Real Personal Income (12$) 99.3 105.3 110.3 116.0 123.2 122.0 120.8 123.3 127.8 Pct Chg Year Ago 5.8 6.1 4.7 5.2 6.2 -1.0 -0.9 2.1 3.6
Per Capita Income (Ths) 41.7 43.4 45.0 47.5 52.2 54.2 54.7 55.9 58.1
Real Per Capita Income (12$) 38.9 40.3 41.6 43.3 45.7 44.7 43.6 43.9 44.7
Average Annual Wage (Ths) 50.1 52.1 53.7 58.1 62.8 67.3 69.4 71.9 74.1 Pct Chg Year Ago 3.1 3.9 3.1 8.3 7.9 7.2 3.2 3.5 3.2
Establishment Employment (Place of Work, Thousands, SA)
Total Employment 1249.3 1293.4 1329.7 1212.0 1276.5 1348.4 1338.0 1326.4 1348.6
Pct Chg Year Ago 3.4 3.5 2.8 -8.9 5.3 5.6 -0.8 -0.9 1.7
Manufacturing 44.4 46.6 49.3 48.5 49.8 51.6 50.5 48.1 47.2
Pct Chg Year Ago 4.4 5.0 5.9 -1.6 2.7 3.6 -2.2 -4.7 -1.9
Nonmanufacturing 1205.0 1246.9 1280.4 1163.5 1226.7 1296.9 1287.6 1278.3 1301.5
Pct Chg Year Ago 3.3 3.5 2.7 -9.1 5.4 5.7 -0.7 -0.7 1.8 Construction & Mining 74.2 82.2 86.1 83.0 82.9 81.0 77.1 78.0 81.5
Pct Chg Year Ago 8.7 10.8 4.7 -3.6 -0.2 -2.2 -4.8 1.2 4.4 Trade, Trans, & Utilities 233.9 240.5 246.2 235.3 245.3 256.6 251.2 244.4 240.5
Pct Chg Year Ago 2.4 2.8 2.4 -4.4 4.3 4.6 -2.1 -2.7 -1.6
Wholesale Trade 43.8 44.8 45.9 44.8 46.4 50.0 50.5 51.3 52.1 Retail Trade 149.0 150.8 151.0 140.5 145.1 148.0 141.4 133.0 127.3 Trans, Wrhsng, & Util 41.1 44.9 49.3 50.0 53.8 58.6 59.3 60.1 61.0
Information 24.4 25.3 25.6 24.2 25.0 26.6 26.8 26.7 27.6
Pct Chg Year Ago 1.2 3.6 1.1 -5.4 3.5 6.5 0.7 -0.4 3.4
Financial Activities 74.2 76.1 78.3 77.3 82.6 84.8 83.1 84.6 86.3
Pct Chg Year Ago 1.2 2.5 3.0 -1.2 6.8 2.6 -2.0 1.9 1.9
Prof & Business Services 219.8 229.0 235.0 218.0 237.2 252.6 228.6 207.6 217.7
Pct Chg Year Ago 6.3 4.2 2.6 -7.2 8.8 6.5 -9.5 -9.2 4.9
Educ & Health Services 152.2 155.5 160.7 158.2 163.0 164.6 166.7 174.0 178.7
Pct Chg Year Ago 2.6 2.1 3.4 -1.5 3.1 1.0 1.2 4.4 2.7
Leisure & Hospitality 257.2 266.5 276.2 201.9 225.8 265.9 287.9 290.6 291.4
Pct Chg Year Ago 3.1 3.6 3.6 -26.9 11.9 17.7 8.3 0.9 0.3
Other Services 43.8 44.3 44.8 40.0 41.0 43.4 44.1 45.7 47.1
Pct Chg Year Ago -0.6 1.1 1.2 -10.9 2.7 5.7 1.7 3.6 3.1
Federal Government 14.6 14.7 14.7 15.2 15.0 14.3 14.0 14.4 14.9
Pct Chg Year Ago 4.5 0.7 -0.3 3.7 -1.2 -4.9 -2.2 3.1 3.3
State & Local Government 110.6 112.8 112.9 110.4 108.7 106.9 108.0 112.2 115.8
Pct Chg Year Ago 1.1 2.0 0.1 -2.2 -1.5 -1.7 1.0 3.8 3.2
Other Economic Indicators
Population (Ths) 2555.3 2611.4 2649.3 2678.5 2695.2 2729.6 2770.3 2812.2 2857.7
Pct Chg Year Ago 2.6 2.2 1.5 1.1 0.6 1.3 1.5 1.5 1.6
Labor Force (Ths) 1290.4 1322.3 1349.5 1326.2 1326.8 1373.4 1402.2 1428.0 1453.0
Percent Change, Year Ago 2.6 2.5 2.1 -1.7 0.0 3.5 2.1 1.8 1.8
Unemployment Rate (%) 4.0 3.4 3.1 11.0 5.1 3.3 4.8 6.0 5.8
Total Housing Starts 19187.2 24706.9 23762.8 23554.9 27640.0 31295.7 26174.1 26155.3 27168.9
Single-Family 14368.1 15897.2 15339.5 15143.3 17709.0 17400.2 16421.8 17731.4 18614.3
Multifamily 4819.1 8809.7
8411.6 9931.0 13895.5 9752.3 8423.9 8554.6
O RLANDO – K ISSIMMEE – S ANFORD Institute for Economic Forecasting 97
2017 2018 2019 2020 2021 2022 2023 2024 2025
8423.3
Short Term Outlook for Orlando-Kissimmee-Sanford, FL August 2022 Forecast
2022:2 2022:3 2022:4 2023:1 2023:2 2023:3 2023:4 2024:1 2024:2 2024:3 2024:4 2025:1 2025:2
Personal Income (Billions $)
Total Personal Income 147.5 148.7 150.5 150.6 150.9 151.8 152.7 154.6 156.3 158.2 160.1 162.3 164.7 Pct Chg Year Ago 7.6 6.6 4.9 3.4 2.3 2.1 1.5 2.6 3.6 4.2 4.8 5.0 5.4
Wages and Salaries 90.7 91.7 92.2 92.7 92.9 93.5 93.9 94.3 95.1 96.1 97.0 98.0 99.5
Nonwage Income 56.8 57.1 58.3 58.0 58.0 58.3 58.9 60.2 61.2 62.1 63.1 64.2 65.2
Real Personal Income (12$) 122.1 121.5 121.8 121.0 120.6 120.7 120.9 121.9 122.8 123.9 124.8 125.9 127.1 Pct Chg Year Ago 1.1 0.2 -0.8 -1.2 -1.2 -0.6 -0.7 0.7 1.8 2.6 3.2 3.3 3.5
Per Capita Income (Ths) 54.1 54.4 54.8 54.7 54.6 54.7 54.8 55.3 55.7 56.2 56.6 57.1 57.7
Real Per Capita Income (12$) 44.8 44.4 44.4 43.9 43.6 43.5 43.4 43.6 43.7 44.0 44.1 44.3 44.6
Average Annual Wage (Ths) 66.9 67.6 68.1 68.6 69.1 69.7 70.4 71.0 71.6 72.2 72.7 73.2 73.9 Pct Chg Year Ago 7.7 6.8 3.8 3.2 3.3 3.1 3.3 3.5 3.6 3.5 3.3 3.2 3.2
Establishment Employment (Place of Work, Thousands, SA)
Total Employment 1351.0 1351.2 1348.4 1346.7 1340.2 1335.9 1329.3 1324.8 1324.3 1326.8 1329.9 1334.6 1343.2 Pct Chg Year Ago 7.9 3.7 1.6 0.3 -0.8 -1.1 -1.4 -1.6 -1.2 -0.7 0.0 0.7 1.4
Manufacturing 51.3 51.7 52.1 51.4 50.6 50.2 49.7 49.0 48.3 47.7 47.3 47.1 47.1
Pct Chg Year Ago 5.0 3.3 2.8 0.3 -1.3 -3.0 -4.7 -4.6 -4.6 -4.9 -4.7 -3.8 -2.5
Nonmanufacturing 1299.7 1299.5 1296.3 1295.3 1289.6 1285.7 1279.7 1275.9 1275.9 1279.0 1282.5 1287.4 1296.1 Pct Chg Year Ago 8.1 3.7 1.6 0.3 -0.8 -1.1 -1.3 -1.5 -1.1 -0.5 0.2 0.9 1.6
Construction & Mining 80.4 80.2 78.4 77.7 76.9 76.9 77.0 77.2 77.6 78.3 79.0 79.9 80.9
Pct Chg Year Ago -1.6 -3.3 -6.5 -8.6 -4.4 -4.1 -1.9 -0.7 0.9 1.7 2.6 3.5 4.3
Trade, Trans, & Utilities 258.9 256.2 254.4 252.1 252.5 250.3 249.9 247.7 244.7 243.4 242.0 240.5 239.9 Pct Chg Year Ago 7.1 3.8 1.3 -1.9 -2.5 -2.3 -1.8 -1.7 -3.1 -2.7 -3.2 -2.9 -1.9
Wholesale Trade 50.2 50.6 50.4 50.7 50.5 50.4 50.4 50.7 51.1 51.4 51.7 51.9 52.1 Retail Trade 150.0 146.5 144.8 141.7 142.7 140.8 140.2 137.3 133.4 131.7 129.8 127.7 126.8 Trans, Wrhsng, & Util 58.8 59.1 59.2 59.6 59.3 59.1 59.3 59.7 60.1 60.3 60.5 60.8 61.0
Information 26.3 26.7 27.1 27.3 27.0 26.6 26.3 26.4 26.7 26.8 26.9 27.2 27.6 Pct Chg Year Ago 8.7 3.9 3.5 3.4 2.6 -0.3 -2.9 -3.3 -1.0 0.8 2.2 3.0 3.1
Financial Activities 84.4 84.6 84.1 83.9 82.8 82.6 82.8 83.5 84.4 85.1 85.6 86.0 86.3 Pct Chg Year Ago 4.1 0.6 -1.1 -2.5 -1.8 -2.4 -1.4 -0.5 1.9 2.9 3.3 3.1 2.2
Prof & Business Services 254.9 253.6 250.4 243.3 232.2 223.3 215.7 210.5 207.3 205.7 206.8 209.9 214.3 Pct Chg Year Ago 10.6 4.2 0.7 -3.4 -8.9 -12.0 -13.8 -13.5 -10.7 -7.9 -4.1 -0.3 3.3
Educ & Health Services 164.0 164.6 164.6 165.1 165.9 167.0 168.5 171.0 173.2 175.2 176.6 177.9 178.5 Pct Chg Year Ago 1.5 0.4 0.4 -0.1 1.2 1.5 2.4 3.6 4.4 4.9 4.8 4.0 3.0
Leisure & Hospitality 267.0 269.4 273.2 281.2 286.9 292.4 291.3 289.7 290.4 291.3 291.1 290.0 291.3 Pct Chg Year Ago 21.9 12.0 8.6 10.7 7.5 8.5 6.6 3.0 1.2 -0.4 0.0 0.1 0.3
Other Services 43.3 43.8 43.9 43.9 44.1 44.1 44.4 44.9 45.5 46.0 46.5 46.9 47.1 Pct Chg Year Ago 6.6 5.6 3.7 3.1 1.8 0.7 1.3 2.3 3.2 4.4 4.6 4.4 3.6
Federal Government 14.2 14.1 14.0 13.9 13.9 14.0 14.1 14.2 14.4 14.5 14.6 14.7 14.8 Pct Chg Year Ago -5.3 -5.7 -6.6 -7.1 -2.0 -0.5 1.1 2.4 3.3 3.3 3.4 3.4 3.4
State & Local Government 106.2 106.2 106.3 106.8 107.2 108.4 109.6 110.7 111.7 112.7 113.5 114.5 115.4 Pct Chg Year Ago -1.0 -2.4 -2.3 -1.9 0.9 2.1 3.1 3.6 4.2 3.9 3.6 3.4 3.3
Other Economic Indicators
Population (Ths) 2724.2 2734.6 2745.0 2754.7 2765.0 2775.3 2785.9 2796.3 2806.7 2817.3 2828.4 2839.9 2851.7 Pct Chg Year Ago 1.2 1.4 1.5 1.5 1.5 1.5 1.5 1.5 1.5 1.5 1.5 1.6 1.6 Labor Force (Ths) 1372.6 1375.9 1382.2 1390.2 1398.5 1406.5 1413.6 1419.4 1425.0 1430.7 1436.8 1442.7 1449.4 Pct Chg Year Ago
Unemployment Rate (%)
Total Housing Starts 33797.5 29918.3 29319.8
1.9 1.7 1.6 1.6 1.7
25788.8 25622.4 25958.7 26335.0 26705.2 27020.0 27210.6
Single-Family 17934.5 16357.4 16431.2 15914.1 16173.1 16628.3 16971.8 17171.8 17591.8 17938.9 18223.1 18534.4 18640.1 Multifamily 15863.0 13560.9 12888.5 10914.3 10021.4 9256.4 8817.0 8450.5 8366.9 8396.1 8482.1 8485.6 8570.5
O RLANDO – K ISSIMMEE – S ANFORD 98 Florida & Metro Forecast / Summer 2022
4.6 2.2 2.3 2.0 1.9 2.2 2.3 2.1
3.0 3.1 3.5 4.0 4.6 5.1 5.5 5.8 5.9 6.0 6.1 6.0 5.9
26828.4 26194.5 25884.7
PROFILES
The Palm Bay–Melbourne–Titusville MSA is comprised of Brevard County only. Typically known as “Florida’s Space Coast”, this area is home to the Kennedy Space Center. Located in the central part of Florida’s east coast, the region is home to Cape Canaveral Air Force Base, Patrick Air Force Base, and government contractors such as L3 Harris Technologies. Like much of Florida, this area is growing fast; Port Canaveral is now a leading cruise ship port.
QUICK FACTS
• Metro population estimate of 585,507 as of 2019 (5-Year Estimate) (U.S. Census Bureau).
• Brevard County population estimate of 601,942 as of 2019 (5-Year Estimate) (U.S. Census Bureau).
• Civilian labor force of 300,700 in July 2022 (Florida Research and Economic Database).
• An unemployment rate of 2.7% as of July 2022, not seasonally adjusted. This amounts to 8,166 unemployed people (Florida Research and Economic Database).
OUTLOOK SUMMARIES
The Palm Bay—Melbourne—Titusville Metropolitan Statistical Area (MSA) will show moderate growth in the studied economic indicators when compared to other MSAs. The MSA will have the tenth-highest Gross Metro Product at $28,119.71. Average annual wage growth will average 4.1 percent, leading to the sixth-highest average annual wage of $72,700. Personal income growth will average 4.5 percent, leading to a per capita income level of $49,000. Population growth will expand at an average annual rate of 1.0%.
Employment growth will average 0.7 percent. Palm Bay’s unemployment rate will hover around 4.1 percent.
The Other Services sector will lead the way in Palm Bay with an average annual growth rate of 3.6 percent. The Leisure & Hospitality Services sector will follow with a growth rate of 3.3 percent, Education & Health Services will be third at 2.7 percent average annual growth.
METRO NEWS SUMMARIES
Brightline buys $12.5 million property in Cocoa but says nothing about possible station
• Brightline picked up a 33-acre piece of land near the U.S. 1 and State Road 528 interchange which may imply commuter rail is coming to Brevard County.
•
A study conducted in 2016 by the Space Coast Transportation Planning Organization ranked the Clearlake Road land recently purchased by Brightline the highest due to its “strategic location and potential development opportunity.”
• Municipal leaders are hoping a future rail stop will be a major economic boon to the county, with the station itself serving as a hub for spending and commerce.
Source: Florida Today, June 1, 2022
Sierra Space planning astronaut academy on Florida’s Space Coast
• Sierra Space has plans to create the world’s first fully integrated Human Spaceflight Center and Astronaut Training Academy at the Kennedy Space Center.
• The academy is hoping to begin the astronaut selection process in late 2023, with training for the first class to begin in 2024 and to start flying those astronauts by 2026.
• Sierra Space is also developing the world’s first commercial space station in partnership with Blue Origin, known as the Orbital Reef.
Source: FOX 35, June 15, 2022
P ALM B A y – M ELBOURNE – T ITUSVILLE Institute for Economic Forecasting 99
Brevard County commissioners OK $30M marketing grant to Cocoa Beach Westin hotel project
•
A $388 million resort hotel and conference center is replacing an existing resort on State Road A1A.
• The hotel developer, Driftwood Capital, will have $1 million available each year for a grant that extends 30 years generated from the county’s 5% tourist development tax.
•
Driftwood Capital CFO Glenn Wasserman said, within five years after opening, the Westin project would support 1,300 local jobs and would boost tourism tax revenues by $3.1 million a year, as well as increase local sales tax and property tax revenue.
Source: Click Orlando, July 19, 2022
L3Harris, Northrop Grumman awarded $1.3 billion to build missile warning satellites
• The SDA announced that L3Harris Technologies, Inc., and Northrop Grumman Strategic Space Systems have been awarded $1.3 billion to build 14 satellites each as part of the SDA’s Tranche 1 Tracking Layer satellite program.
• The work on the L3Harris-developed satellites would be split between its facilities in Fort Wayne, Indiana, and Palm Bay, Florida.
• The tracking layer satellites are designed to detect threats and then relay that information to the transport layer satellites.
Source: News 13, July 19, 2022
Florida ‘innovation park’ construction planned next to Space Coast airport
•
A new nearly one million-square-foot industrial space is in the works next to Space Coast Regional Airport and Space Coast Air & Spaceport owned by the Titusville-Cocoa Airport Authority.
• The intention of this project is to attract businesses relocating to or expanding in the Space Coast region.
•
The first phase of Space Coast Innovation Park will feature five buildings, each ranging in size from 100,500 to 108,000 square feet. The second phase will consist of four more industrial buildings ranging from 92,500 to 106,200 square feet.
Source: Orlando Inno, July 29, 2022
Brevard County Zoo project adds new designs
•
The Brevard County Zoo has released renderings of a nearly $100 million aquarium and conservation campus to attract thousands of visitors, create hundreds of jobs, and serve as a hub for research efforts.
• “The prediction is that it would end up leading to over 900 jobs, probably $80 [to] $90 million of economic impact,” said Keith Winsten, executive director of Brevard Zoo.
• Fundraising has reached its halfway mark with more than $47 million and the groundbreaking ceremony is set for September 2024.
Source: WFTV, August 28, 2022
P ALM B A y – M ELBOURNE – T ITUSVILLE 100 Florida & Metro Forecast / Summer 2022
Total Nonagricultural Employment
Total Private Goods Producing Service Producing
Private Service Providing Mining, Logging, and Construction Manufacturing Trade, Transportation, and Utilities
Wholesale Trade Retail Trade Transportation, Warehousing and Utilities Information
Activities
Professional and Business Services
Educational and Health Services
and Hospitality
Services Government
Palm Bay - Melbourne - Titusville MSA
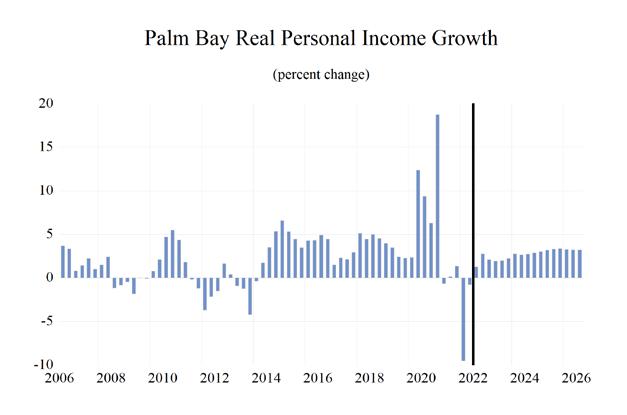
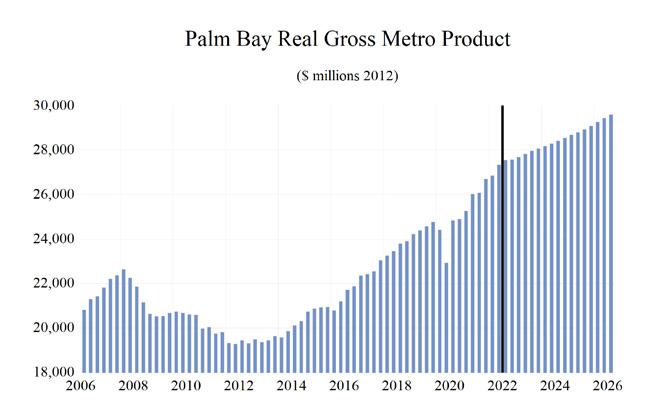
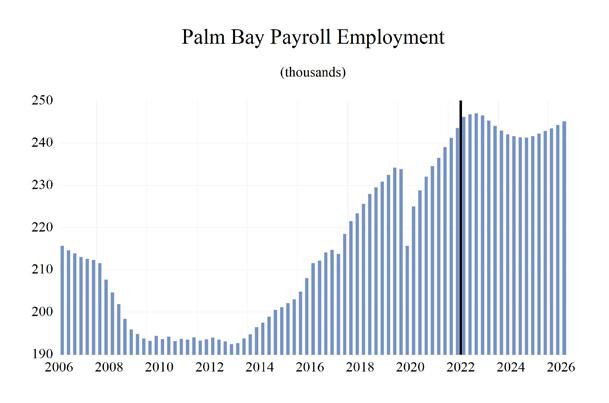
Industry Location Quotients
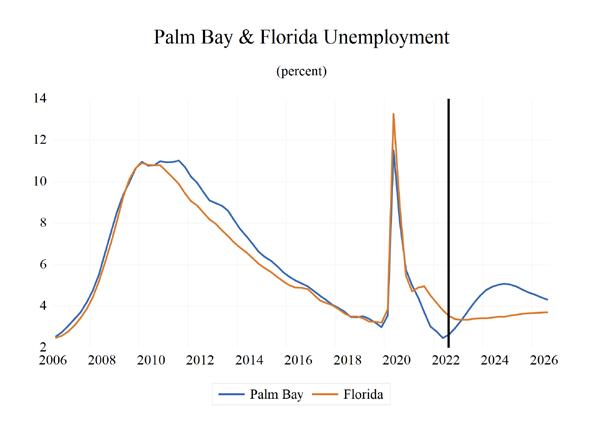
P ALM B A y – M ELBOURNE – T ITUSVILLE Institute for Economic Forecasting 101 0 0.5 1 1.5 2 2.5 3 3.5
Financial
Leisure
Other
Long Term Outlook for Palm Bay-Melbourne-Titusville, FL August 2022 Forecast
Personal Income (Billions $)
Total Personal Income 25.8 27.5 29.2 31.3 34.5 36.0 37.6 39.2 41.1 Pct Chg Year Ago 6.4 6.3 6.3 7.4 10.1 4.4 4.4 4.1 5.0
Wages and Salaries 11.3 12.1 13.0 13.6 15.5 17.2 17.7 18.1 18.6
Nonwage Income 14.5 15.4 16.1 17.8 19.0 18.8 19.9 21.1 22.5
Real Personal Income (12$) 24.5 25.7 27.4 29.1 30.7 30.2 30.5 31.3 32.2 Pct Chg Year Ago 4.4 4.9 6.7 6.1 5.7 -1.8 1.1 2.4 3.1
Per Capita Income (Ths) 43.9 46.1 48.5 51.5 55.9 57.7 59.7 61.5 63.9
Real Per Capita Income (12$) 41.6 43.2 45.6 47.7 49.8 48.4 48.4 49.1 50.1
Average Annual Wage (Ths) 51.9 53.1 55.6 59.4 64.8 69.6 71.3 73.9 76.1 Pct Chg Year Ago 3.7 2.4 4.6 6.9 9.1 7.3 2.5 3.7 2.9
Establishment Employment (Place of Work, Thousands, SA)
Total Employment 215.3 224.6 231.7 225.8 235.5 244.4 245.7 242.0 242.0
Pct Chg Year Ago 2.9 4.3 3.2 -2.6 4.3 3.8 0.5 -1.5 0.0
Manufacturing 23.7 25.8 27.4 28.7 29.6 30.6 30.2 28.9 28.0
Pct Chg Year Ago 6.0 9.0 6.1 4.7 3.3 3.3 -1.3 -4.4 -3.0
Nonmanufacturing 191.6 198.8 204.3 197.1 205.9 213.8 215.5 213.1 214.0
Pct Chg Year Ago 2.6 3.8 2.8 -3.5 4.4 3.8 0.8 -1.1 0.4 Construction & Mining 13.4 14.9 15.4 16.2 17.6 17.6 16.8 15.9 15.5
Pct Chg Year Ago 7.3 11.0 3.7 5.1 8.7 -0.1 -4.3 -5.7 -2.3 Trade, Trans, & Utilities 36.5 37.9 38.2 37.2 39.1 42.5 44.5 44.0 43.0
Pct Chg Year Ago -0.3 3.8 1.0 -2.8 5.1 8.7 4.7 -1.1 -2.2
Wholesale Trade 4.6 5.0 5.3 5.2 5.4 5.7 6.1 6.2 6.4
Retail Trade 28.2 28.6 28.4 27.6 28.5 29.0 28.2 26.5 25.3 Trans, Wrhsng, & Util 3.7 4.2 4.6 4.3 5.2 7.7 10.2 11.3 11.3
Information 2.6 2.6 2.4 1.9 2.0 2.1 2.1 2.1 2.1
Pct Chg Year Ago 10.6 -0.6 -7.1 -19.3 1.4 8.4 -2.2 -1.5 1.1
Financial Activities 8.0 8.6 8.6 8.8 9.1 9.1 9.7 9.9 9.9
Pct Chg Year Ago 5.4 6.5 0.8 1.6 3.3 0.7 6.4 1.6 0.9
Prof & Business Services 31.9 33.1 35.3 36.8 38.5 39.7 37.1 33.6 34.0 Pct Chg Year Ago 6.9 3.5 6.6 4.4 4.5 3.1 -6.4 -9.5 1.1
Educ & Health Services 35.6 36.9 38.3 35.4 35.9 36.5 37.8 39.1 39.8
Pct Chg Year Ago 0.9 3.6 3.8 -7.5 1.3 1.8 3.4 3.6 1.9
Leisure & Hospitality 26.9 27.9 28.6 24.4 27.1 29.0 29.6 30.3 30.9 Pct Chg Year Ago 2.0 3.6 2.6 -14.8 11.3 6.8 2.1 2.2 2.0
Other Services 8.7 8.9 9.0 8.3 8.5 8.9 9.0 9.4 9.8 Pct Chg Year Ago 2.3 2.3 1.6 -8.8 2.9 5.1 1.1 3.7 4.4
Federal Government 6.3 6.3 6.4 6.7 6.8 6.7 6.8 6.7 6.6
Pct Chg Year Ago 0.6 -0.3 1.8 4.7 0.9 -0.4 0.7 -1.2 -1.5
State & Local Government 21.6 21.9 22.0 21.5 21.5 21.7 22.1 22.3 22.4
Pct Chg Year Ago 0.6 1.4 0.7 -2.5 -0.2 1.0 1.9 1.0 0.3
Other Economic Indicators
Population (Ths) 588.5 595.3 601.7 609.1 617.2 623.9 630.3 636.8 642.8
Pct Chg Year Ago 1.7 1.2 1.1 1.2 1.3 1.1 1.0 1.0 0.9
Labor Force (Ths) 266.8 274.5 281.4 281.6 288.9 294.8 302.5 304.7 306.7
Percent Change, Year Ago 1.8 2.9 2.5 0.1 2.6 2.0 2.6 0.7 0.6
Unemployment Rate (%) 4.4 3.6 3.3 7.2 4.0 2.7 3.9 4.9 4.9
Total Housing Starts
Single-Family
Multifamily 628.8
1036.7
4838.1 4378.7 3270.1 3708.9 3864.2
4043.2 3795.8 2799.2 2815.6 2907.4
794.9 582.9 470.9 893.3 956.8
P ALM B A y – M ELBOURNE – T ITUSVILLE 102 Florida & Metro Forecast / Summer 2022
2017 2018 2019 2020 2021 2022 2023 2024 2025
2918.4 2755.6 3549.1 4175.6
2289.6 2309.1 2512.4 3226.5
446.5
949.1
Short Term Outlook for Palm Bay-Melbourne-Titusville, FL August 2022 Forecast
2022:2 2022:3 2022:4 2023:1 2023:2 2023:3 2023:4 2024:1 2024:2 2024:3 2024:4 2025:1 2025:2
Personal Income (Billions $)
Total Personal Income 35.8 36.3 36.9 37.2 37.4 37.7 38.1 38.5 38.9 39.4 39.9 40.4 40.8
Pct Chg Year Ago 6.2 6.6 6.3 6.1 4.6 4.0 3.1 3.5 3.9 4.4 4.7 4.8 5.0
Wages and Salaries 17.1 17.4 17.5 17.7 17.7 17.7 17.8 17.9 18.0 18.2 18.3 18.4 18.5
Nonwage Income 18.7 18.8 19.4 19.5 19.8 20.0 20.3 20.6 20.9 21.2 21.6 22.0 22.3
Real Personal Income (12$) 30.1 30.2 30.4 30.4 30.5 30.5 30.7 30.9 31.1 31.4 31.6 31.9 32.1 Pct Chg Year Ago -0.3 0.2 0.6 1.3 1.1 1.2 0.9 1.6 2.1 2.8 3.1 3.2 3.2
Per Capita Income (Ths) 57.4 58.1 59.0 59.2 59.5 59.7 60.2 60.7 61.2 61.7 62.4 63.0 63.6
Real Per Capita Income (12$) 48.4 48.3 48.6 48.4 48.4 48.4 48.5 48.7 48.9 49.2 49.5 49.8 50.0
Average Annual Wage (Ths) 69.5 70.0 70.3 70.6 71.0 71.4 72.2 72.9 73.6 74.3 74.8 75.4 75.8 Pct Chg Year Ago 8.7 6.5 3.5 2.9 2.1 2.0 2.8 3.3 3.8 4.0 3.6 3.3 2.9
Establishment Employment (Place of Work, Thousands, SA)
Total Employment 243.5 246.2 246.8 247.0 246.5 245.3 244.0 242.9 242.0 241.6 241.4 241.3 241.6
Pct Chg Year Ago 3.8 4.1 3.3 2.4 1.2 -0.4 -1.1 -1.7 -1.8 -1.5 -1.1 -0.7 -0.2
Manufacturing 30.5 30.8 31.0 30.6 30.4 30.1 29.8 29.5 29.0 28.6 28.4 28.2 28.0
Pct Chg Year Ago 4.0 3.8 3.7 1.7 -0.3 -2.4 -4.0 -3.8 -4.4 -4.8 -4.8 -4.4 -3.4
Nonmanufacturing 213.1 215.4 215.8 216.4 216.2 215.2 214.2 213.5 213.0 213.0 213.0 213.1 213.6
Pct Chg Year Ago 3.8 4.1 3.2 2.5 1.5 -0.1 -0.7 -1.4 -1.5 -1.0 -0.6 -0.1 0.3
Construction & Mining 17.5 17.7 17.4 17.3 17.0 16.7 16.4 16.1 15.9 15.8 15.7 15.6 15.5 Pct Chg Year Ago -2.7 0.9 -0.8 -2.8 -2.8 -5.6 -5.9 -6.6 -6.3 -5.4 -4.4 -3.4 -2.5
Trade, Trans, & Utilities 42.3 42.8 43.4 43.8 44.6 44.6 44.8 44.5 44.0 43.8 43.5 43.2 43.0 Pct Chg Year Ago 10.0 9.3 8.2 6.0 5.5 4.3 3.2 1.8 -1.3 -1.8 -2.9 -3.1 -2.4
Wholesale Trade 5.7 5.8 5.9 6.0 6.1 6.1 6.1 6.1 6.2 6.2 6.3 6.4 6.4 Retail Trade 29.2 28.8 28.7 28.2 28.5 28.1 28.0 27.3 26.5 26.2 25.8 25.4 25.2 Trans, Wrhsng, & Util 7.4 8.2 8.9 9.5 10.0 10.4 10.8 11.1 11.3 11.4 11.4 11.4 11.3 Information 2.1 2.1 2.1 2.1 2.1 2.1 2.0 2.0 2.1 2.1 2.1 2.1 2.1 Pct Chg Year Ago 15.1 1.2 2.9 0.8 -2.0 -2.5 -5.0 -4.1 -2.1 -0.6 1.1 1.7 1.2
Financial Activities 9.0 9.2 9.4 9.7 9.7 9.7 9.7 9.8 9.8 9.9 9.9 10.0 10.0 Pct Chg Year Ago -0.5 0.6 3.7 7.5 8.5 5.7 3.9 1.1 1.1 1.9 2.2 2.0 1.2 Prof & Business Services 39.5 40.0 39.8 39.2 37.7 36.4 35.2 34.3 33.6 33.3 33.2 33.4 33.7 Pct Chg Year Ago 3.3 3.1 1.7 -0.4 -4.5 -8.9 -11.6 -12.6 -10.8 -8.6 -5.6 -2.6 0.1 Educ & Health Services 36.2 36.8 37.2 37.4 37.7 37.9 38.1 38.6 39.0 39.3 39.5 39.8 39.8 Pct Chg Year Ago 0.8 3.5 4.2 4.2 4.0 2.9 2.6 3.2 3.5 3.8 3.7 3.0 2.1
Leisure & Hospitality 29.3 29.4 28.9 29.1 29.4 29.9 29.9 30.0 30.2 30.4 30.5 30.5 30.8 Pct Chg Year Ago 6.6 7.4 1.7 2.4 0.5 1.8 3.8 2.8 2.5 1.5 1.9 1.9 2.0
Other Services 8.9 9.0 9.0 9.1 9.0 9.0 9.1 9.2 9.3 9.4 9.5 9.7 9.7 Pct Chg Year Ago 5.5 5.1 4.1 3.8 0.8 -0.4 0.1 1.1 3.5 4.9 5.3 5.4 4.8
Federal Government 6.7 6.7 6.8 6.8 6.8 6.8 6.8 6.7 6.7 6.7 6.7 6.6 6.6 Pct Chg Year Ago -1.0 -0.2 0.3 0.6 1.9 0.6 -0.3 -0.9 -1.5 -1.1 -1.2 -1.4 -1.5 State & Local Government 21.5 21.6 21.7 21.9 22.1 22.1 22.2 22.2 22.3 22.3 22.3 22.4 22.4
Pct Chg Year Ago 2.4 -0.9 0.3 1.0 2.6 2.2 2.0 1.4 1.0 1.0 0.8 0.6 0.3
Other Economic Indicators
Population (Ths) 623.2
Pct Chg Year Ago 1.1 1.1 1.0 1.0 1.0 1.1 1.0 1.0 1.0 1.0 1.0 1.0 0.9 Labor Force (Ths) 293.2 295.5 298.5 300.7 302.3 303.1 303.8 304.2 304.5 304.9 305.4 305.8 306.3 Pct Chg Year Ago 1.7 2.0 2.9 3.0 3.1 2.6 1.8 1.2 0.7 0.6 0.5 0.5 0.6
Unemployment Rate (%)
Total Housing Starts
Single-Family
Multifamily
P ALM B A y – M ELBOURNE – T ITUSVILLE Institute for Economic Forecasting 103
624.6 626.3 627.9 629.5 631.2 632.8 634.4 636.1 637.7 639.2 640.6 642.1
2.5 2.6 2.9 3.3 3.7 4.1 4.5 4.8 4.9 5.0 5.1 5.0 4.9
4398.2 3717.2 3608.5 3304.7 3193.7 3223.2 3358.9 3539.3 3722.0 3763.1 3811.2 3854.2 3874.2
3992.4 3413.5 3261.1 2940.4 2773.8 2743.8 2738.8 2756.5 2806.1 2832.3 2867.5 2908.1 2918.3
405.8 303.7 347.4 364.2 420.0 479.4 620.0 782.7 915.9 930.8 943.7 946.1 955.9
PROFILES
The Panama City MSA, known for its beaches and emerald green water is located in the Northwest portion of the state. Panama City is the largest City between Tallahassee and Pensacola. This area is the more populated of two principal cities of the Panama City-Lynn Haven MSA and it is the county seat of Bay County.
QUICK FACTS
• Metro population estimate of 182,161 as of 2019 (5-Year Estimate) (U.S. Census Bureau).
• Bay County population estimate of 182,161 as of 2019 (5-Year Estimate) (U.S. Census Bureau).
• Civilian labor force of 95,772 in July 2022 (Florida Research and Economic Database).
• An unemployment rate of 2.6% as of July 2022, not seasonally adjusted. This amounts to 2,467 unemployed people (Florida Research and Economic Database).
OUTLOOK SUMMARIES
The Panama City Metropolitan Statistical Area (MSA) will show low levels of growth in the studied economic indicators when compared to other MSAs. The MSA will have Gross Metro Product at $9,081.30. Average annual wage growth will average 4.7 percent, leading to an average annual wage of $62,900. Personal income growth will average 4.1 percent, leading to a per capita income level of $46,000.
Employment growth will average 0.2 percent, ranking second to last of the MSA list. However, its unemployment rate will hover around 4.1 percent, lower than the state average.
The Other Services sector will lead the way in Panama City with an average annual growth rate of 3.1 percent. The Education and Health Services sector will follow with a growth rate of 2.7 percent, and the Leisure and Hospitality sector will be third at 2.9 percent average annual growth.
METRO NEWS SUMMARIES
Plans for Martin Theatre’s rebirth include a restaurant and speakeasy
• Hurricane Michael delivered a devastating blow to the Martin Theatre in downtown Panama City in 2018, but the historic entertainment venue is being primed for a spectacular comeback.
• City officials, engineers and community members met last week to present an updated plan for the theater and discuss the interior renovation. Plans call for adding the Tennessee House restaurant and The Ritz speakeasy bar and lounge and transforming the movie theater into a theater for the arts.
• The Tennessee House will take over the Martin’s former “green room” while The Ritz will occupy the former Downtown Improvement Board building next door to the Martin on the north side.
Panama City News Herald, June 1, 2022
Resia establishing a new manufacturing operation in Florida
• Resia will invest more than $40 million to establish a new manufacturing operation in Bay County, FL. The Miami-based vertically integrated real estate company expects to create 200 new jobs at the 200,000 square-foot, stateof-the-art facility.
• Formerly known as AHS Residential, Resia is in negotiations to build the factory on a site in VentureCrossings Enterprise Centre.
• Resia develops, builds, and manages multifamily communities across the U.S. The company currently has more than 5,000 units under development in fast-growing metros in Florida, Texas, Georgia, and has plans for Colorado, the District of Columbia, and Arizona.
Source: Business Facilities, June 13, 2022
PANAMA CIT y 104 Florida & Metro Forecast / Summer 2022
Cherry Street set for $5.8 million in sewer repairs, widened sidewalks, new lighting, and more
• Residents along busy Cherry Street soon will be seeing upgrades to their growing area. City commissioners on Tuesday approved an almost $5.8 million construction contract to make major improvements along the road.
•
The improvements will include repairs to the sewer and water systems, widened sidewalks, new lighting, and more greenery. Work is expected to start in the next two to three months.
• Commissioner Jenna Flint Haligas said the project will improve the overall quality of life and health of the city, starting with a new multi-use pathway connecting the St. Andrews Marina with the Downtown Marina.
Source: Panama City News Herald, July 1, 2022
Academy Sports + Outdoors opens new store in Panama City, FL
• Academy Sports + Outdoors (“Academy”) (Nasdaq: ASO), a leading full-line sporting goods and outdoor recreation retailer, is excited to announce the opening of its Panama City, Fla. store.
• Located at 820 W. 23rd Street, the 55,000 square-foot store brings approximately 60 new jobs to the community. Academy will host grand opening festivities from Friday, July 29 through Sunday, July 31.
• The new Panama City location marks the second of nine new stores Academy will open this year and one of three stores currently planned for Florida.
Source: Yahoo! Finance, July 26, 2022
Hyatt Hotels opens first location in Panama City Beach
• With tourism booming on the beach, travelers now have another great lodging option to choose from when visiting Bay County.
• According to a Monday press release from OTO Development, a business management consultant based in South Carolina, Hyatt Place Panama City Beach is open, claiming the spot as the first beachfront Hyatt property on the Gulf of Mexico.
• Located at 15727 Front Beach Road within walking distance to Pier Park, the 11-story hotel features 224 rooms, a swimming pool, lazy river, hot tub, and fitness center.
Source: Panama City News Herald, August 2, 2022
Panama City approves next 3 phases of St. Andrews Marina restoration
• Almost four years after the St. Andrews Marina was severely damaged by Hurricane Michael, city officials on Tuesday approved the latest master plan and design work.
• The City Commission approved the middle three phases of the five-phase plan to rebuild the marina, coming in at a combined $984,500. The architectural and engineering services are being done by Moffatt & Nichols.
• While Phase 1 covers ongoing repairs to the bulkhead and utilities, The rest of the phases will continue to restore and revitalize the marina.
Source: Panama City News Herald, August 10, 2022
PANAMA CIT y Institute for Economic Forecasting 105
Total Nonagricultural Employment
Panama City MSA
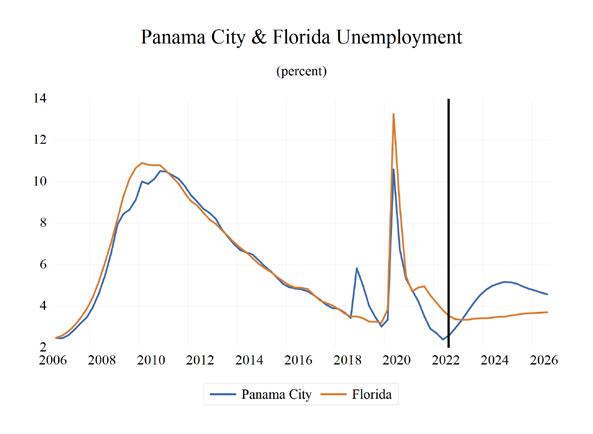
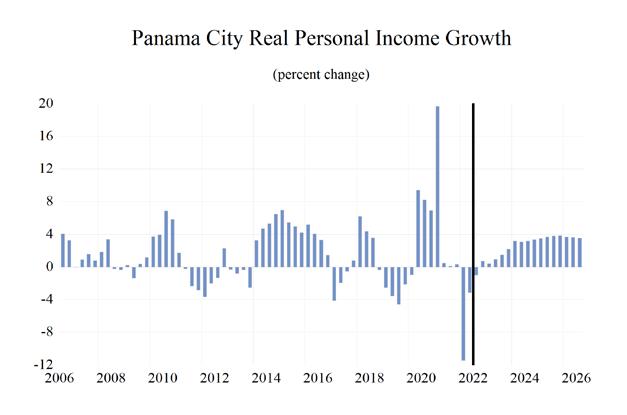
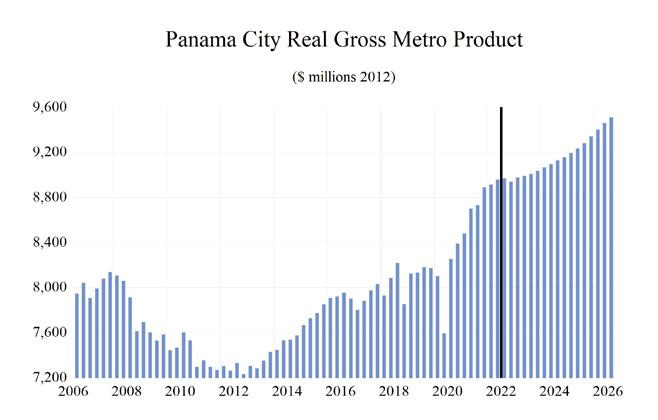
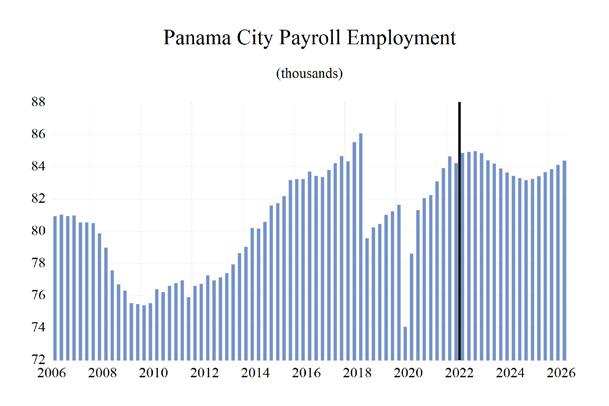
Loca
on
PANAMA CIT y 106 Florida & Metro Forecast / Summer 2022 0 0.2 0.4 0.6 0.8 1 1.2 1.4 1.6
Total Private Goods Producing Service Producing Private Service Providing Mining, Logging, and Construc�on Manufacturing Trade, Transporta�on, and U�li�es Wholesale Trade Retail Trade Transporta�on Warehousing and U�li�es Informa�on Financial Ac�vi�es Professional and Business Services Educa�onal and Health Services Leisure and Hospitality Other Services Government
Industry
�
Quo�ents
Long Term Outlook for Panama City, FL August 2022 Forecast
Personal Income (Billions $)
Total Personal Income 8.3 8.6 8.8 9.4 10.3 10.7 11.0 11.5 12.1
Pct Chg Year Ago 1.8 4.3 1.5 6.9 10.1 3.5 3.6 4.5 4.6
Wages and Salaries 3.8 3.9 4.0 4.1 4.7 5.2 5.4 5.5 5.7
Nonwage Income 4.5 4.7 4.7 5.3 5.6 5.4 5.7 6.0 6.4
Real Personal Income (12$) 8.1 8.4 8.3 8.8 9.3 9.0 9.1 9.3 9.6 Pct Chg Year Ago 1.0 3.5 -1.0 5.6 5.7 -2.6 0.3 2.8 2.7
Per Capita Income (Ths) 40.4 42.3 45.6 49.3 53.1 53.9 55.1 57.1 59.3
Real Per Capita Income (12$) 39.6 41.2 43.2 46.2 47.8 45.7 45.2 46.1 47.0
Average Annual Wage (Ths) 43.0 44.5 48.1 50.2 55.0 59.9 61.6 64.0 66.0 Pct Chg Year Ago 0.4 3.4 8.1 4.6 9.4 8.9 2.8 3.8 3.2
Establishment Employment (Place of Work, Thousands, SA)
Total Employment 84.0 83.9 80.7 78.9 82.8 84.7 84.6 83.6 83.4
Pct Chg Year Ago 0.7 -0.2 -3.8 -2.3 5.0 2.2 -0.1 -1.2 -0.2
Manufacturing 3.2 3.1 3.0 3.2 3.4 3.7 3.7 3.6 3.5
Pct Chg Year Ago -11.6 -4.8 -1.7 4.6 8.2 8.0 0.9 -3.0 -3.0
Nonmanufacturing 80.8 80.8 77.7 75.7 79.4 81.0 80.9 79.9 79.9
Pct Chg Year Ago 1.3 0.0 -3.8 -2.5 4.8 2.0 -0.1 -1.1 -0.1
Construction & Mining 5.1 5.5 6.9 7.0 7.0 7.3 6.8 6.3 6.0
Pct Chg Year Ago 4.1 7.7 24.9 1.1 0.2 4.4 -6.8 -7.6 -5.2 Trade, Trans, & Utilities 16.5 16.1 15.7 15.7 16.2 16.6 16.9 16.2 15.7
Pct Chg Year Ago -0.1 -2.4 -2.0 -0.1 3.0 2.5 2.0 -4.2 -3.4
Wholesale Trade 2.3 2.3 2.3 2.2 2.3 2.5 2.6 2.6 2.6
Retail Trade 12.1 12.0 11.8 11.8 12.1 12.3 12.6 11.9 11.3 Trans, Wrhsng, & Util 2.1 1.8 1.7 1.8 1.9 1.9 1.8 1.8 1.8
Information 0.9 0.9 0.8 0.7 0.7 0.8 0.8 0.7 0.7
Pct Chg Year Ago -8.9 1.2 -10.7 -15.2 7.3 15.0 -6.3 -6.9 -1.4
Financial Activities 4.4 4.6 4.5 4.7 5.3 5.5 5.4 5.3 5.3
Pct Chg Year Ago 2.9 3.0 -1.9 5.5 11.3 3.5 -0.6 -2.5 -0.1
Prof & Business Services 11.0 10.9 11.1 10.2 10.4 10.8 10.5 9.9 10.1 Pct Chg Year Ago 3.4 -1.0 2.1 -8.8 2.7 3.2 -2.5 -5.8 2.1
Educ & Health Services 11.6 11.6 9.6 9.7 10.2 10.5 10.8 11.1 11.3
Pct Chg Year Ago 4.5 -0.1 -17.0 0.7 5.4 2.8 3.0 3.3 1.5
Leisure & Hospitality 14.2 14.2 12.9 12.0 13.3 13.3 13.1 13.6 14.0 Pct Chg Year Ago -0.8 -0.1 -9.0 -7.3 11.3 -0.1 -1.7 4.0 2.7
Other Services 2.8 2.8 2.7 2.6 2.7 2.8 2.8 3.0 3.1
Pct Chg Year Ago 1.5 0.3 -6.2 -1.6 4.4 1.6 0.7 5.3 4.6
Federal Government 3.8 3.9 3.7 3.9 3.9 3.9 4.0 4.0 4.0 Pct Chg Year Ago 0.0 1.6 -4.4 4.9 1.7 -0.7 3.6 -0.4 -0.7
State & Local Government 10.4 10.4 9.8 9.3 9.6 9.5 9.7 9.8 9.8
Pct Chg Year Ago 0.2 -0.7 -5.9 -4.5 2.8 -0.6 2.0 1.0 -0.3
Other Economic Indicators
Population (Ths) 204.8 203.8 192.2 189.7 194.0 197.7 200.2 202.0 203.4
Pct Chg Year Ago 0.9 -0.5 -5.7 -1.3 2.3 1.9 1.3 0.9 0.7
Labor Force (Ths) 93.5 93.3 88.9 87.8 91.1 93.0 94.7 94.6 94.6
Percent Change, Year Ago -0.2 -0.3 -4.6 -1.3 3.8 2.1 1.8 0.0 0.0
Unemployment Rate (%) 4.2 4.2 3.9 6.5 3.9 2.6 3.9 5.0 5.0
Total Housing Starts 1491.0 1500.3 1701.3 1926.9 2092.0 2145.9 1483.4 1382.1 1411.3
Single-Family 951.5 1104.4 1397.0 1524.2 1457.0 1631.8 962.5 723.9 759.1
Multifamily 539.5 395.8 304.3 402.6 635.0 514.1 520.9 658.2 652.2
PANAMA CIT y Institute for Economic Forecasting 107
2017 2018 2019 2020 2021 2022 2023 2024 2025
Short Term Outlook for Panama City, FL August 2022 Forecast
2022:2
Personal Income (Billions $)
Total Personal Income 10.6 10.7 10.9 10.9 11.0 11.1 11.2 11.4 11.5 11.6 11.7 11.9 12.0 Pct Chg Year Ago 5.4 5.5 4.9 4.2 3.6 3.5 3.1 4.0 4.4 4.9 4.8 4.6 4.6
Wages and Salaries 5.2 5.3 5.3 5.4 5.4 5.4 5.4 5.5 5.5 5.5 5.6 5.6 5.6
Nonwage Income 5.4 5.4 5.5 5.6 5.6 5.7 5.8 5.9 6.0 6.1 6.2 6.3 6.3
Real Personal Income (12$) 9.0 9.0 9.0 9.0 9.0 9.1 9.1 9.2 9.3 9.3 9.4 9.5 9.5 Pct Chg Year Ago -0.9 -0.9 -0.8 -0.5 0.1 0.7 0.8 2.1 2.6 3.2 3.2 2.9 2.8
Per Capita Income (Ths) 53.7 54.0 54.7 54.7 54.9 55.2 55.7 56.4 56.8 57.4 58.0 58.5 59.0
Real Per Capita Income (12$) 45.7 45.4 45.5 45.2 45.2 45.2 45.4 45.7 45.9 46.2 46.5 46.7 46.9
Average Annual Wage (Ths) 59.9 60.3 60.7 61.0 61.3 61.7 62.4 63.1 63.7 64.3 64.8 65.3 65.8 Pct Chg Year Ago 10.3 8.1 4.9 4.0 2.4 2.2 2.8 3.3 3.9 4.3 3.8 3.6 3.3
Establishment Employment (Place of Work, Thousands, SA)
Total Employment 84.2 84.9 84.9 85.0 84.8 84.4 84.2 83.9 83.6 83.4 83.3 83.2 83.3
Pct Chg Year Ago 2.4 2.1 1.2 0.4 0.7 -0.5 -0.9 -1.3 -1.4 -1.1 -1.1 -0.9 -0.5
Manufacturing 3.7 3.7 3.8 3.7 3.7 3.7 3.7 3.7 3.6 3.6 3.6 3.5 3.5
Pct Chg Year Ago 9.7 7.2 6.5 3.9 2.2 -0.4 -1.9 -2.0 -2.7 -3.5 -3.7 -3.6 -3.4
Nonmanufacturing 80.6 81.1 81.2 81.2 81.1 80.7 80.5 80.2 80.0 79.8 79.7 79.6 79.7
Pct Chg Year Ago 2.1 1.9 1.0 0.2 0.7 -0.5 -0.8 -1.2 -1.4 -1.0 -1.0 -0.7 -0.3 Construction & Mining 7.4 7.4 7.2 7.1 6.9 6.7 6.6 6.5 6.3 6.2 6.1 6.1 6.0 Pct Chg Year Ago 8.3 3.8 0.3 -2.7 -7.0 -8.9 -8.6 -8.7 -8.0 -7.2 -6.5 -6.0 -5.3
Trade, Trans, & Utilities 16.5 16.6 16.8 16.9 17.1 16.9 16.9 16.5 16.3 16.1 15.9 15.7 15.6 Pct Chg Year Ago 2.5 2.2 2.9 1.6 3.8 2.3 0.1 -1.9 -4.7 -4.9 -5.5 -4.8 -4.0
Wholesale Trade 2.5 2.5 2.5 2.6 2.6 2.6 2.6 2.6 2.6 2.6 2.6 2.6 2.6 Retail Trade 12.1 12.2 12.5 12.5 12.7 12.6 12.6 12.2 12.0 11.8 11.6 11.4 11.3 Trans, Wrhsng, & Util 1.9 1.8 1.8 1.8 1.8 1.8 1.8 1.8 1.8 1.8 1.8 1.8 1.8 Information 0.8 0.8 0.8 0.8 0.8 0.7 0.7 0.7 0.7 0.7 0.7 0.7 0.7
Pct Chg Year Ago 28.5 2.9 3.7 1.0 -6.8 -7.7 -11.4 -10.9 -6.7 -5.2 -4.6 -3.4 -2.6
Financial Activities 5.4 5.4 5.5 5.5 5.5 5.4 5.3 5.3 5.3 5.3 5.3 5.3 5.3 Pct Chg Year Ago 3.7 0.4 0.4 -0.9 1.7 -0.6 -2.7 -4.0 -3.8 -1.8 -0.5 0.3 0.4
Prof & Business Services 10.7 10.9 11.0 10.8 10.6 10.4 10.2 10.0 9.9 9.8 9.8 9.8 10.0 Pct Chg Year Ago 1.9 5.4 4.8 2.6 -0.9 -4.5 -7.1 -7.3 -6.2 -5.6 -4.0 -1.8 0.6
Educ & Health Services 10.4 10.5 10.7 10.7 10.8 10.8 10.9 11.0 11.1 11.2 11.2 11.3 11.3 Pct Chg Year Ago 2.5 3.1 4.4 4.2 3.5 2.4 1.9 2.6 3.2 3.8 3.5 2.8 1.8
Leisure & Hospitality 13.4 13.4 12.9 13.0 13.0 13.1 13.3 13.5 13.6 13.7 13.8 13.8 14.0 Pct Chg Year Ago -0.1 0.9 -5.2 -5.0 -2.8 -2.1 3.2 3.8 4.5 4.3 3.6 2.5 2.8
Other Services 2.8 2.8 2.8 2.8 2.8 2.8 2.8 2.9 2.9 3.0 3.0 3.1 3.1 Pct Chg Year Ago 3.0 1.0 0.8 0.9 0.4 0.3 1.3 2.7 5.6 6.6 6.3 5.9 4.9
Federal Government 3.8 3.9 4.0 4.0 4.1 4.1 4.0 4.0 4.0 4.0 4.0 4.0 4.0 Pct Chg Year Ago -2.4 -1.9 -0.1 1.3 6.4 4.5 2.3 0.6 -0.7 -0.7 -0.6 -0.6 -0.7
State & Local Government 9.5 9.5 9.6 9.6 9.7 9.8 9.8 9.8 9.8 9.8 9.8 9.8 9.8
Pct Chg Year Ago -1.0 -1.1 -0.2 0.5 2.5 2.8 2.2 1.7 1.3 0.6 0.3 0.0 -0.3
Other Economic Indicators
Population (Ths) 197.3 198.1 198.8 199.4 200.0 200.5 201.0 201.4 201.8 202.2 202.6 202.9 203.2
Pct Chg Year Ago 2.0 1.8 1.6 1.5 1.4 1.3 1.1 1.0 0.9 0.8 0.8 0.7 0.7 Labor Force (Ths) 92.6 93.1 93.9 94.4 94.7 94.8 94.8 94.7 94.7 94.6 94.6 94.6 94.6
Pct Chg Year Ago 1.9 2.2 2.6 2.3 2.2 1.7 1.0 0.4 0.0 -0.2 -0.2 -0.2 -0.1
Unemployment Rate (%) 2.4 2.6 2.9 3.3 3.7 4.1 4.5 4.8 5.0 5.1 5.2 5.1 5.1
Total Housing Starts
1419.8 1398.2 1381.6 1369.3 1379.7 1397.8 1407.1 1414.6 Single-Family 2069.7
1006.4 894.0 808.3 733.6 705.5 720.2 736.3 752.5 760.1 Multifamily 526.1
492.0 525.8 589.9 647.9 663.8 659.6 661.5 654.6 654.5
PANAMA CIT y 108 Florida & Metro Forecast / Summer 2022
2022:3 2022:4 2023:1 2023:2 2023:3 2023:4 2024:1 2024:2 2024:3 2024:4 2025:1 2025:2
2595.8 2072.4 1861.6 1617.3 1498.4
1587.4 1358.6 1141.3
485.0 503.0 476.0
PROFILES
The Pensacola–Ferry Pass–Brent MSA is comprised of Escambia County and Santa Rosa County. Located in the northwest corner of Florida bordering Alabama, the region is home to the Pensacola Naval Air Station, Blue Angels, and the National Museum of Naval Aviation. This area has been referred to as the “Cradle of Naval Aviation.”
QUICK FACTS
• Metro population estimate of 488,246 as of 2019 (5-Year Estimate) (U.S. Census Bureau).
• Escambia County population estimate of 318,316 as of 2019 (5-Year Estimate) (U.S. Census Bureau).
• Santa Rosa County population estimate of 184,313 as of 2019 (5-Year Estimate) (U.S. Census Bureau).
• Civilian labor force of 241,376 in July 2022 (Florida Research and Economic Database).
• An unemployment rate of 2.8% as of July 2022, not seasonally adjusted. This amounts to 6,844 unemployed people (Florida Research and Economic Database).
OUTLOOK SUMMARIES
The Pensacola—Ferry Pass—Brent Metropolitan Statistical Area (MSA) will experience below average levels of economic growth in the studied indicators. Gross Metro Product will be $20,491.67. Average annual wage growth will be 4.0 percent, leading to an average annual wage of $65,100. Personal income growth will be 4.0 percent, placing the per capita income level at $46,600. Pensacola’s population will grow by an average rate of 1.0%.
Employment growth in the MSA will rise by 0.5 percent, and the unemployment rate will be 4.3 percent.
The Financial sector will be the fastest growing sector in Pensacola with a 3.6 percent average annual growth rate. The Education and Health Services sector
will grow at the second-fastest rate in the MSA at 2.9 percent. The Other Services sectors will place third at a 2.7 percent average annual growth.
METRO NEWS SUMMARIES
‘Topping ceremony’ held for new hotel at Pensacola Beach
• A “topping out” ceremony was held for The Fairfield by Marriott on Pensacola Beach Friday. The ceremony is a tradition when crews finally reach the top floor of a major structure.
• The previous hotel on the site was heavily damaged by Hurricane Sally and was torn down, leading to this new $75 million development set to open next spring.
• “We’re gonna have an amazing elevated lobby bar that overlooks the gulf, obviously we’re gonna reopen our fish heads restaurant that’s been closed since hurricane sally and we’re gonna have the most amazing lazy river swimming pool behind the hotel as well that is bigger and better than any of the swimming pool complexes we’ve built to date,” said Ted Ent, President and CEO of Innisfree.
Source: WEAR, June 10, 2022
Maker’s Coffee Co. plans to bring creative space — and good coffee — to downtown Pensacola
• Maker’s Coffee Co. owner Caleb Pierce said the goal of Maker’s, located at 422 S. Palafox St. in Downtown Pensacola, is to provide a space for customers to pursue their passions and to develop staff to be leaders for wherever they end up next.
• Pierce and his wife Haley, both photographers and videographers, opened up the shop after having visited cities all over the world and establishing the routine of always visiting a coffee shop first thing in a new city.
• Pierce said part of the goal of Maker’s is to help support and give other small business owners a platform, including Pensacola cottage baker Kaitlynn Knowles, owner of Casita Bread, who
P ENSACOLA – F ERR y P ASS – B RENT Institute for Economic Forecasting 109
will be sharing the kitchen and providing bread for the shop.
Source: Pensacola News Journal, June 24, 2022
Amazon distribution facility is coming to Santa Rosa County.
• Santa Rosa County is welcoming another vendor to its industrial parks, but this time in the form of the globally recognized company Amazon.
• The proposal combines two structures in the Santa Rosa Industrial Park, which are currently being used by Navy Federal Credit Union as a call center. In total, the facility will be around 81,000 square feet.
•
“It’ll show other companies that investing in Santa Rosa County is a good thing. Hopefully other companies and businesses take notice,” said District 4 Commissioner Dave Piech.
Source: Pensacola News Journal, July 1, 2022
$6.3 million new park at Bruce Beach to include central plaza, play structures and more
•
A groundbreaking ceremony was held by city officials and contractors for a new park at historic Bruce Beach.
• The $6.3 million contract was awarded to Biggs Construction Company in May to build the first phase of the project. The first phase of the park will include a central plaza with a walkway surrounded by trees leading to the sandy beach shore, a shade structure, two public lawn areas with seat walls, a learning garden with plants and play structures for children, and a pedestrian bridge over Washerwoman Creek connecting the park to Community Maritime Park.
• Councilwoman Teniadé Broughton noted that Bruce Beach holds a special place in the history of Pensacola. The area was a popular swimming spot for the city’s Black residents during the height of segregation in the south. After several drownings at the location, the city’s Black community advocated for a swimming pool to be built on the property in the 1950s which was built and remained open until the 1970s.
Source: Pensacola News Journal, July 26, 2022
How Weber’s Skate World plans to make Milton a hub for pro roller skaters
• The roller-skating scene in Milton is set to grow as David Weber, current owner of Weber’s Skate World, has plans in the works to expand his operation to include an outdoor track neighboring the indoor facility. The ultimate goal is to host professional skating events that could draw thousands of athletes, families and fans to the area.
• Weber’s outdoor proposal involves the track site, a spectator area and parking spaces. He spoke to the fact that the inside of the track could house additional activities but has not, as of yet, landed on what exactly that will entail.
• Weber said he hopes to have an internationallevel event in Milton through World Skate within the next three years. World Skate is the international governing body for sports performed on skating wheels.
Source: Pensacola News Journal, July 28, 2022
New Pensacola townhomes offer downtown living for non-multi-millionaires
• One Spring, located at the corner of Spring and Intendencia streets, will have 14 townhomes, each with private rooftop terraces that overlook downtown Pensacola. Ron Ladner, who is developing the project with his business partner Rimmer Covington, told the Pensacola News Journal that 11 of the units are already under sales contracts.
• The development will have six three-bedroom units and eight two-bedroom units. Ten of the units have street-facing balconies, and the rooftop terraces will include gardens.
• “You see the guys north of us are starting at $900,000 and everywhere you look it’s $1 million-plus,” Ladner said. “We tried to build a product that’s really cool and you don’t have to be a multi-millionaire to enjoy it.”
Source: Pensacola News Journal, August 2, 2022
P ENSACOLA – F ERR y P ASS – B RENT 110 Florida & Metro Forecast / Summer 2022
Total Nonagricultural Employment
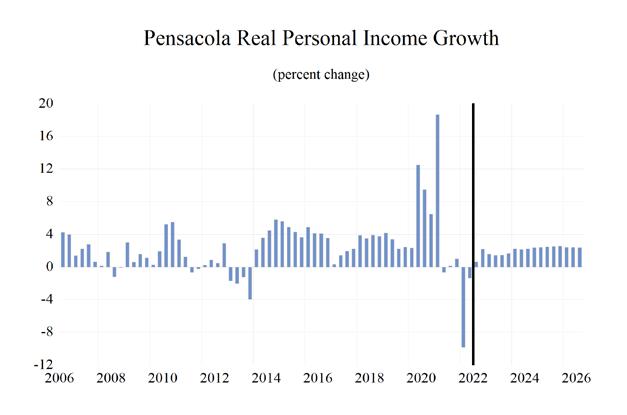
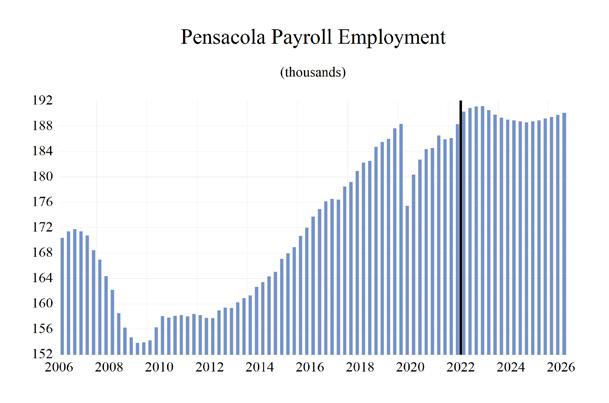
Pensacola Ferry Pass Brent MSA Industry Location Quotients

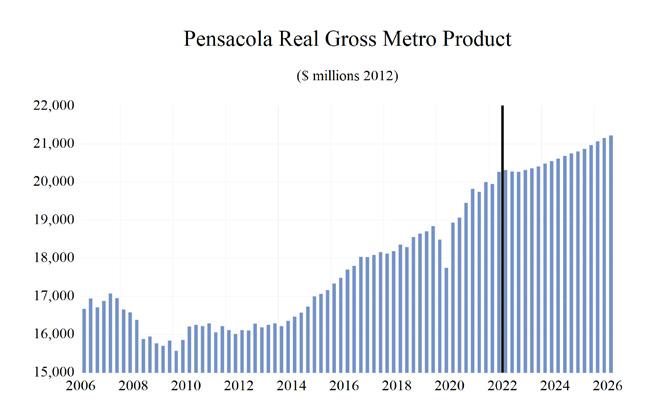
P ENSACOLA – F ERR y P ASS – B RENT Institute for Economic Forecasting 111 0 0.2 0.4 0.6 0.8 1 1.2 1.4
Total Private Goods Producing Service Producing Private Service Providing Mining, Logging, and Construction Manufacturing Trade, Transportation, and Utilities Wholesale Trade Retail Trade Transportation,Warehousing and Utilities Information Financial Activities Professional and Business Services Educational and Health Services Leisure and Hospitality Other Services Government
Long Term Outlook for Pensacola-Ferry Pass-Brent, FL August 2022 Forecast
Personal Income (Billions $)
Total Personal Income 20.9 21.7 22.8 24.6 26.9 27.8 28.9 30.1 31.4
Pct Chg Year Ago 5.7 3.6 5.4 8.0 9.1 3.5 4.1 4.0 4.3
Wages and Salaries 9.1 9.4 10.0 10.4 11.6 12.7 13.1 13.4 13.7
Nonwage Income 11.8 12.3 12.8 14.2 15.3 15.1 15.8 16.7 17.7
Real Personal Income (12$) 20.3 21.0 22.1 23.6 24.8 24.1 24.3 24.9 25.5 Pct Chg Year Ago 3.9 3.5 5.2 6.9 4.8 -2.6 0.8 2.3 2.5
Per Capita Income (Ths) 42.7 43.6 45.2 48.1 52.0 53.4 54.9 56.5 58.4
Real Per Capita Income (12$) 41.5 42.3 43.8 46.2 48.0 46.3 46.1 46.6 47.4
Average Annual Wage (Ths) 47.0 48.0 49.8 53.0 57.9 62.6 64.0 66.1 67.8 Pct Chg Year Ago 3.3 2.2 3.8 6.2 9.4 8.0 2.2 3.3 2.7
Establishment Employment (Place of Work, Thousands, SA)
Total Employment 176.9 181.2 186.0 181.7 185.3 188.9 190.6 189.0 188.8
Pct Chg Year Ago 2.3 2.4 2.6 -2.3 2.0 1.9 0.9 -0.9 -0.1
Manufacturing 6.1 6.5 7.1 6.9 7.2 7.6 7.5 7.0 6.7
Pct Chg Year Ago -2.0 5.2 9.7 -2.3 4.3 5.2 -0.6 -7.3 -4.4
Nonmanufacturing 170.7 174.8 178.9 174.8 178.1 181.3 183.1 182.0 182.2
Pct Chg Year Ago 2.5 2.4 2.4 -2.3 1.9 1.8 1.0 -0.6 0.1 Construction & Mining 11.5 11.7 12.2 12.0 12.7 12.9 12.2 11.4 11.0
Pct Chg Year Ago 6.1 1.7 4.3 -1.3 5.3 1.8 -5.2 -6.3 -3.5 Trade, Trans, & Utilities 33.2 33.6 33.8 33.5 34.6 35.7 35.0 33.9 33.0
Pct Chg Year Ago 2.1 1.4 0.4 -0.8 3.3 3.3 -2.0 -3.3 -2.6
Wholesale Trade 5.6 5.7 5.7 5.7 6.0 6.6 6.6 6.7 6.8 Retail Trade 23.4 23.8 23.8 23.5 24.0 24.4 23.8 22.6 21.6 Trans, Wrhsng, & Util 4.1 4.2 4.3 4.3 4.6 4.7 4.6 4.6 4.6 Information 1.9 1.8 1.7 1.5 1.5 1.6 1.6 1.5 1.5
Pct Chg Year Ago -5.8 -8.1 -4.7 -9.5 0.9 4.7 -3.8 -4.8 0.0
Financial Activities 12.9 14.0 14.9 15.2 15.2 15.5 16.6 17.2 17.5
Pct Chg Year Ago 5.1 8.4 6.3 1.8 0.2 1.6 7.6 3.8 1.6
Prof & Business Services 22.7 24.3 24.4 24.5 25.5 26.8 25.7 23.4 23.2 Pct Chg Year Ago 1.0 6.9 0.5 0.5 3.9 5.4 -4.3 -8.7 -0.9
Educ & Health Services 29.9 30.2 31.0 30.5 30.7 31.4 32.7 33.9 34.3 Pct Chg Year Ago 2.1 0.8 2.8 -1.6 0.5 2.4 4.2 3.8 1.0
Leisure & Hospitality 24.1 24.6 25.8 22.8 23.6 23.2 24.5 25.3 26.0
Pct Chg Year Ago 5.3 1.8 4.9 -11.7 3.8 -1.6 5.5 3.4 2.7
Other Services 6.2 6.3 6.6 6.5 6.9 7.1 7.2 7.4 7.7
Pct Chg Year Ago 3.6 2.2 4.1 -0.5 5.6 3.4 0.6 3.1 3.8
Federal Government 6.6 6.6 6.6 6.8 6.7 6.6 6.8 6.8 6.6
Pct Chg Year Ago -0.7 -0.6 1.1 2.8 -1.8 -0.8 3.3 -1.4 -2.0
State & Local Government 21.7 21.8 22.0 21.5 20.8 20.4 20.7 21.0 21.2
Pct Chg Year Ago 0.5 0.4 0.8 -2.3 -3.1 -2.0 1.7 1.4 0.8
Other Economic Indicators
Population (Ths) 489.0 496.2
516.5 520.4 526.8 533.0 537.7 Pct Chg Year Ago 1.3 1.5 1.7 1.4 0.9 0.8 1.2 1.2 0.9
Labor Force (Ths) 219.5 222.7 226.7 226.6 230.2 235.0 240.1 240.6 240.9
Percent Change, Year Ago 1.2 1.4 1.8 0.0 1.6 2.1 2.2 0.2 0.1 Unemployment Rate (%) 4.2 3.6 3.2 6.7 4.2 3.3 4.2 5.0 4.9
Total Housing Starts
3559.5 3088.6 2269.4 2154.3 2222.3
Single-Family
213.9 223.2 123.6 68.3 181.7 202.5
3336.3 2965.0 2201.2 1972.6 2019.8 Multifamily 31.1 33.0
P ENSACOLA – F ERR y P ASS – B RENT 112 Florida & Metro Forecast / Summer 2022
2017 2018 2019 2020 2021 2022 2023 2024 2025
504.6 511.9
2666.6 2481.7 3309.8 4098.5
2635.6 2448.7 2778.4 3884.6
531.5
Short Term Outlook for Pensacola-Ferry Pass-Brent, FL August 2022 Forecast
2022:2 2022:3 2022:4 2023:1 2023:2 2023:3 2023:4 2024:1 2024:2 2024:3 2024:4 2025:1 2025:2
Personal Income (Billions $)
Total Personal Income 27.7 28.0 28.4 28.6 28.8 29.0 29.3 29.6 29.9 30.3 30.6 30.9 31.2
Pct Chg Year Ago 5.3 5.6 5.6 5.7 4.1 3.6 3.0 3.5 3.8 4.3 4.4 4.4 4.4
Wages and Salaries 12.7 12.9 13.0 13.1 13.1 13.1 13.2 13.3 13.3 13.4 13.5 13.6 13.7
Nonwage Income 15.0 15.1 15.5 15.6 15.7 15.9 16.1 16.4 16.6 16.8 17.1 17.3 17.6
Real Personal Income (12$) 24.1 24.1 24.2 24.2 24.3 24.3 24.4 24.6 24.8 25.0 25.1 25.3 25.4
Pct Chg Year Ago -1.1 -0.8 -0.2 0.9 0.6 0.9 0.8 1.6 2.1 2.6 2.8 2.7 2.6
Per Capita Income (Ths) 53.3 53.8 54.4 54.6 54.8 55.0 55.4 55.8 56.2 56.7 57.2 57.7 58.2
Real Per Capita Income (12$) 46.4 46.3 46.4 46.2 46.1 46.1 46.2 46.3 46.5 46.8 47.0 47.1 47.3
Average Annual Wage (Ths) 62.6 63.0 63.2 63.5 63.7 64.0 64.7 65.3 65.8 66.4 66.8 67.3 67.6 Pct Chg Year Ago 9.5 7.2 3.9 3.2 1.8 1.6 2.3 2.8 3.4 3.7 3.3 3.0 2.7
Establishment Employment (Place of Work, Thousands, SA)
Total Employment 188.3 190.3 190.9 191.1 191.1 190.5 189.8 189.3 189.0 188.9 188.7 188.6 188.7
Pct Chg Year Ago 2.0 2.0 2.7 2.7 1.5 0.1 -0.6 -0.9 -1.1 -0.8 -0.6 -0.4 -0.2
Manufacturing 7.5 7.7 7.8 7.7 7.6 7.5 7.4 7.2 7.1 6.9 6.8 6.7 6.7
Pct Chg Year Ago 5.4 6.4 6.6 4.2 1.0 -1.9 -5.3 -6.5 -7.3 -7.8 -7.6 -6.5 -5.1
Nonmanufacturing 180.8 182.6 183.1 183.4 183.5 183.0 182.4 182.1 182.0 182.0 181.9 181.8 182.0
Pct Chg Year Ago 1.9 1.8 2.5 2.6 1.5 0.2 -0.3 -0.7 -0.9 -0.6 -0.3 -0.2 0.0
Construction & Mining 13.0 13.0 12.7 12.6 12.3 12.1 11.9 11.7 11.5 11.4 11.3 11.2 11.1 Pct Chg Year Ago 2.5 2.7 0.2 -2.0 -4.9 -6.9 -6.8 -7.2 -6.8 -6.0 -5.2 -4.4 -3.6
Trade, Trans, & Utilities 35.8 35.7 35.7 35.1 35.3 34.9 34.8 34.5 34.0 33.7 33.4 33.1 33.0
Pct Chg Year Ago 4.7 2.5 1.4 -2.0 -1.2 -2.3 -2.5 -1.8 -3.9 -3.5 -3.9 -4.0 -2.9
Wholesale Trade 6.6 6.7 6.7 6.7 6.7 6.6 6.6 6.7 6.7 6.8 6.8 6.8 6.8 Retail Trade 24.5 24.4 24.3 23.8 24.1 23.7 23.6 23.2 22.6 22.3 22.0 21.7 21.6 Trans, Wrhsng, & Util 4.7 4.7 4.7 4.6 4.6 4.6 4.6 4.6 4.6 4.6 4.6 4.6 4.6
Information 1.6 1.6 1.6 1.6 1.6 1.5 1.5 1.5 1.5 1.5 1.5 1.5 1.5 Pct Chg Year Ago 8.2 1.3 2.4 0.6 -3.2 -4.6 -8.1 -7.9 -5.3 -3.5 -2.1 -1.0 -0.5
Financial Activities 15.2 15.6 15.8 16.4 16.6 16.7 16.8 17.0 17.2 17.3 17.4 17.5 17.5 Pct Chg Year Ago 0.7 1.0 3.4 7.4 9.3 7.2 6.3 3.7 3.5 4.0 3.8 3.1 1.8
Prof & Business Services 26.9 27.2 27.2 26.9 26.0 25.3 24.5 24.0 23.5 23.2 23.1 23.1 23.1 Pct Chg Year Ago 7.0 6.4 5.4 3.8 -3.4 -7.3 -9.8 -10.9 -9.5 -8.1 -5.9 -3.6 -1.7
Educ & Health Services 31.3 31.6 32.0 32.2 32.6 32.9 33.1 33.6 33.9 34.1 34.2 34.3 34.3 Pct Chg Year Ago 2.0 3.2 4.7 5.0 4.3 4.0 3.6 4.1 3.9 3.8 3.3 2.3 1.3
Leisure & Hospitality 23.2 23.8 23.7 23.9 24.3 24.9 25.0 25.0 25.2 25.5 25.7 25.7 26.0 Pct Chg Year Ago -2.9 -2.5 2.3 7.6 4.5 4.6 5.2 4.4 4.1 2.5 2.9 3.1 3.0
Other Services 7.1 7.2 7.2 7.2 7.2 7.2 7.2 7.3 7.4 7.5 7.5 7.6 7.7 Pct Chg Year Ago 3.0 4.1 3.5 3.3 0.4 -0.8 -0.3 0.6 2.9 4.3 4.7 4.8 4.3
Federal Government 6.5 6.6 6.7 6.8 6.9 6.9 6.8 6.8 6.8 6.7 6.7 6.7 6.6 Pct Chg Year Ago -3.0 0.6 2.0 3.2 5.5 3.4 1.4 -0.3 -1.6 -1.8 -1.8 -1.9 -2.0 State & Local Government 20.1 20.3 20.4 20.6 20.7 20.8 20.8 20.9 21.0 21.1 21.1 21.1 21.2 Pct Chg Year Ago -2.3 -2.2 -1.5 -0.7 3.0 2.4 2.1 1.8 1.3 1.4 1.2 1.0 0.9
Other Economic Indicators
Population (Ths) 519.7
Pct Chg Year Ago 0.6 0.8 0.9 1.1 1.2 1.3 1.3 1.2 1.2 1.1 1.1 1.0 0.9 Labor Force (Ths) 234.0 235.5 237.6
240.7 240.7 240.6 240.6 240.6 240.7 240.8 Pct Chg Year Ago 2.1 1.9 2.7 2.8 2.6 2.1 1.3 0.7 0.2 0.1 0.0 0.0
Unemployment Rate (%)
Total Housing Starts
Single-Family
Multifamily
P ENSACOLA – F ERR y P ASS – B RENT Institute for Economic Forecasting 113
520.9 522.5 524.4 526.0 527.7 529.3 530.9 532.3 533.7 535.0 536.1 537.2
239.1 240.1 240.5
0.1
3.1 3.2 3.4 3.7 4.1 4.4 4.7 4.9 5.0 5.1 5.1 5.0 4.9
3150.0 2675.9 2601.4 2377.5 2297.7 2231.8 2170.7 2099.3 2169.4 2160.2 2188.2 2216.6 2229.1
3221.9 2690.4 2548.1 2334.4 2239.6 2170.7 2060.0 1958.2 1980.6 1964.1 1987.6 2017.5 2026.1
-71.9 -14.5 53.2 43.1 58.1 61.1 110.7 141.1 188.8 196.1 200.6 199.1 203.1
PROFILES
The Port St. Lucie MSA is a city on the Atlantic coast of southern Florida. Located in St. Lucie county, this municipality is the most populous in the county. Known for its Botanical Gardens and the waterways of the North Fork St. Lucie Aquatic Preserve which are home to manatees, river otters, egrets and alligators.
QUICK FACTS
• Metro population estimate of 472,012 as of 2019 (5-Year Estimate) (U.S. Census Bureau).
• Martin County population estimate of 159,065 as of 2019 (5-Year Estimate) (U.S. Census Bureau).
• St. Lucie County population estimate of 312,947 as of 2019 (5-Year Estimate) (U.S. Census Bureau).
• Civilian labor force of 232,029 in July 2022 (Florida Research and Economic Database).
• An unemployment rate of 3.1% as of July 2022, not seasonally adjusted. This amounts to 7,264 unemployed people (Florida Research and Economic Database).
OUTLOOK SUMMARIES
The Port St. Lucie Metropolitan Statistical Area (MSA) is expected to show slightly below average levels of growth in its economic indicators. Port St. Lucie’s Gross Metro Product will be $17,830.80. Average annual wage growth of 4.0 percent will lead to an average annual wage of $61,100, ranking nineteenth in the state. Personal incomes will grow by 4.4 percent. This will lead to a per capita income level of $53,800, the seventh highest in the state. Population growth will average 1.8 percent.
Employment growth is expected to average a rate of 1.2 percent annually. The unemployment rate is estimated to average 4.7 percent.
The Other Services sector will lead Port St. Lucie at an average annual growth rate at 4.1 percent. The Leisure and Hospitality sector and the Financial sector will expand at respective rates of 3.9 percent and 3.5 percent.
METRO NEWS SUMMARIES
Port St. Lucie City Council Approves Installation of “Heart in the Park” in Tradition
• The Port St. Lucie City Council Monday unanimously approved a proposal made by the developer Mattamy Homes to place a public work of art in Tradition.
•
The City’s Public Art Advisory Board has already signed off on the project.
•
This sculpture will be the largest heart sculpture in the world. Mattamy Homes submitted the proposal as required by the City’s public art requirement.
Source: WQCS News, June 16, 2022
Flower distributor plans to build facility in Port St. Lucie, create 210 jobs
• The city plans to sell nearly 5 acres of vacant property for about $1.2 million to Galleria Farms, LLC, a company that imports and distributes fresh-cut flowers. This deal is expected to bring new business to the city and create about 210 new jobs, say officials in Port St. Lucie.
• The city said the purchase price is above the land’s appraised value of $700,000.
• Galleria Farms is expected to build a 70,000-square-foot building with refrigerated space and office space on the property. This sale is expected to be complete by October, according to the city’s news release.
Source: WPTV, June 28, 2022
Tropicana announces 27 layoffs, closure of fruit processing at St. Lucie County plant
• Tropicana told state officials it laid off 27 of its employees at its St. Lucie County plant last week due to declining citrus crops.
• “We will not be processing fruit there for the 2023 season and are consolidating that work to our Bradenton plant, “ says spokeswoman Amanda Donahue.
PORT ST. LUCIE 114 Florida & Metro Forecast / Summer 2022
•
“All employees in fruit processing, citrus operations, feed mill, and fruit maintenance operations will be impacted,” said Jennifer Kane, human resources representative at the plant, in the letter to the state. “Given these unfortunate and unforeseen business circumstances, the future of the fruit processing operations at the Fort Pierce plant is highly uncertain, and this closure is expected to be permanent.”
Source: TC Palm, July 20, 2022
New trash provider outlines plan for Port St. Lucie residents
• For months, Port St. Lucie residents have been complaining about poor trash service. “We have to bring our trash out every day. Because we don’t know what day they’re going to pick it up. So, you have to have it out on the curb,” says city resident Devern Clemon.
• City leaders have heard these complaints and hired a new trash provider, FCC Environmental for the city. They will take over on September 5th. The company is providing three rear-loader trucks to assist the city as they play a neverending game of catch-up.
• FCC said it’s recruiting employees to fill about 100 open positions. FCC will only pick up once a week and limit yard waste collection to once a week. Residential customers will also see a nearly 50% rate hike, paying $138 more annually. The city is confident they’re moving in the right direction.
Source: WPTV, Jul 20, 2022
New program helps Port St. Lucie residents find affordable housing
• A new program has given a handful of residents in Port St. Lucie the chance to become first-time homeowners for a fraction of what the market is asking these days.
• Federal grant money helped fund these homes for low-to-moderate income residents who met minimum credit score levels and attended a seminar on home ownership. “When the home is resold, it’s only sold to another income-eligible buyer for another affordable price,” LacourseBlum said.
•
The Community Land Trust of Palm Beach County and the Treasure Coast is hoping to have another handful of homes available for purchase in the city sometime next year.
Source: WPTV, August 8th, 2022
Guessing game: Large manufacturing facilities to join FedEx, Amazon in PSL, but who is it?
• Two massive new manufacturing facilities, code-named Project Green and Project Apron, are being built in the same industrial park as Amazon, FedEx, and Cheney in Tradition. The two proposed buildings each exceed 1 million square feet.
• Both of the current undisclosed companies also intend to request economic incentives such as temporary tax breaks, impact-fee mitigation, and expedited site-plan review and permitting. To be eligible for these incentives, companies must be a targeted industry in St. Lucie County such as life sciences, information technology, aviation, etc. and also pay employees at least 115% above St. Lucie County’s average wage, $49,504 annually, or $23.80 hourly.
•
Project Apron and Project Green site plans were approved by Port St. Lucie’s Site Plan Review Committee earlier this month. The EDC expects to reveal the company identities when the City Council reviews the projects and proposed incentives next month, according to Pete Tesch, president of the Economic Development Council of St. Lucie County.
Source: TC Palm, August 22, 2022
PORT ST. LUCIE Institute for Economic Forecasting 115
Total Nonagricultural Employment
Port St. Lucie MSA Industry Loca�on Quo�ents
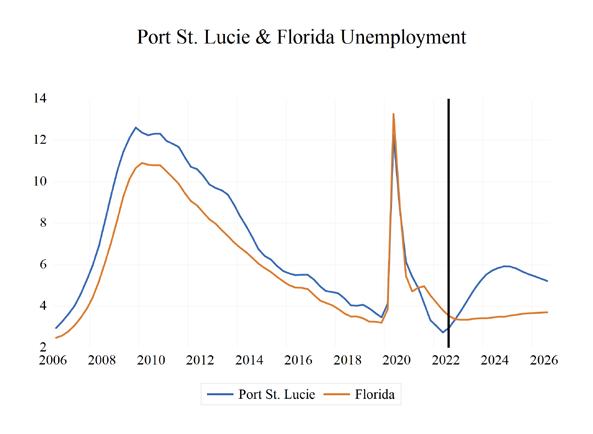
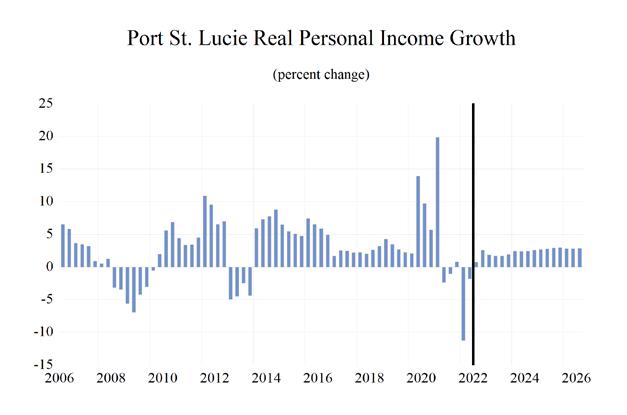

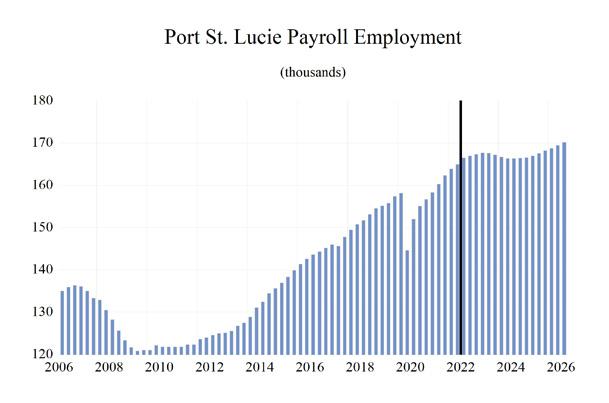
PORT ST. LUCIE 116 Florida & Metro Forecast / Summer 2022 0 0.2 0.4 0.6 0.8 1 1.2 1.4 1.6
Total Private Goods Producing Service Producing Private Service Providing Mining, Logging, and Construc�on Manufacturing Trade, Transporta�on, and U�li�es Wholesale Trade Retail Trade Transporta�on, Warehousing and U�li�es Informa�on Financial Ac�vi�es Professional and Business Services Educa�onal and Health Services Leisure and Hospitality Other Services Government
Long Term Outlook for Port St. Lucie, FL August 2022 Forecast
Personal Income (Billions $)
Total Personal Income 25.2 26.4 27.7 29.3 31.7 32.6 34.2 35.8 37.6
Pct Chg Year Ago 6.3 4.8 4.7 5.7 8.2 3.0 4.8 4.6 5.2
Wages and Salaries 6.5 6.9 7.3 7.6 8.7 9.8 10.1 10.4 10.7
Nonwage Income 18.7 19.5 20.4 21.7 23.0 22.8 24.1 25.4 26.9
Real Personal Income (12$) 23.8 24.5 26.2 27.4 28.5 27.6 28.0 28.8 29.8 Pct Chg Year Ago 5.7 3.1 7.1 4.5 3.9 -3.1 1.5 2.8 3.3
Per Capita Income (Ths) 54.1 55.9 57.5 59.6 62.8 62.9 64.7 66.7 69.4
Real Per Capita Income (12$) 50.9 51.7 54.5 55.8 56.5 53.3 53.0 53.8 54.9
Average Annual Wage (Ths) 44.3 45.4 46.9 49.8 54.5 58.8 60.1 62.0 63.6 Pct Chg Year Ago 2.7 2.3 3.3 6.2 9.5 8.0 2.1 3.2 2.7
Establishment Employment (Place of Work, Thousands, SA)
Total Employment 146.1 151.3 155.7 152.5 159.4 165.6 167.5 166.5 167.3
Pct Chg Year Ago 2.2 3.5 2.9 -2.1 4.5 3.9 1.1 -0.6 0.5
Manufacturing 6.8 7.0 7.5 7.4 7.7 8.2 8.3 7.7 7.5 Pct Chg Year Ago 3.4 2.5 8.3 -1.7 3.9 7.3 0.0 -6.2 -3.6
Nonmanufacturing 139.3 144.3 148.2 145.1 151.7 157.3 159.2 158.7 159.9 Pct Chg Year Ago 2.1 3.6 2.7 -2.1 4.6 3.7 1.2 -0.3 0.7 Construction & Mining 10.2 11.3 12.0 12.3 12.7 12.8 12.4 12.0 11.8
Pct Chg Year Ago 4.1 10.6 5.9 2.3 3.2 0.6 -2.7 -3.3 -1.5 Trade, Trans, & Utilities 31.0 31.2 31.0 31.3 32.8 33.6 33.0 31.9 31.4
Pct Chg Year Ago 0.6 0.7 -0.6 0.8 4.7 2.7 -1.9 -3.4 -1.6
Wholesale Trade 5.3 5.1 5.2 5.0 4.9 5.1 5.3 5.4 5.6 Retail Trade 21.3 21.5 21.2 20.9 21.9 22.4 21.7 20.4 19.6 Trans, Wrhsng, & Util 4.5 4.6 4.6 5.3 5.9 6.2 6.0 6.1 6.1
Information 1.3 1.2 1.2 1.1 1.2 1.2 1.2 1.1 1.2
Pct Chg Year Ago -1.2 -5.2 -1.4 -9.1 6.8 2.8 -2.9 -3.1 2.3
Financial Activities 5.6 5.5 5.9 6.0 6.2 6.6 7.0 7.1 7.1 Pct Chg Year Ago 2.4 -0.6 7.1 1.7 3.3 6.3 5.6 1.3 0.8
Prof & Business Services 17.6 19.2 20.7 22.0 23.1 23.8 23.3 22.2 22.5 Pct Chg Year Ago 3.5 9.0 8.1 5.9 5.3 2.7 -1.7 -4.9 1.5
Educ & Health Services 26.8 27.6 28.6 27.8 28.3 29.1 30.3 31.6 32.2 Pct Chg Year Ago 4.3 2.8 3.7 -2.8 1.8 3.0 4.0 4.2 1.9
Leisure & Hospitality 19.3 20.5 20.9 18.0 20.4 22.5 23.2 23.4 23.7 Pct Chg Year Ago 3.9 6.0 2.3 -14.1 13.6 9.9 3.3 0.9 1.3
Other Services 8.0 8.2 8.0 7.6 8.0 8.4 8.6 9.0 9.4
Pct Chg Year Ago -2.0 2.3 -2.1 -5.6 6.3 4.9 2.3 4.6 4.7
Federal Government 1.0 1.0 1.0 1.1 1.0 1.0 1.0 1.0 1.0
Pct Chg Year Ago 0.1 0.0 2.5 4.8 -7.8 -2.0 2.1 -2.5 -1.1
State & Local Government 18.5 18.6 18.7 18.0 18.0 18.3 19.2 19.5 19.5
Pct Chg Year Ago -0.2 0.7 0.6 -3.8 0.0 1.8 4.5 1.6 0.4
Other Economic Indicators
Population (Ths) 466.4 473.5
505.0 518.5 529.0 536.0 542.1 Pct Chg Year Ago 1.7 1.5 1.6 2.2 2.7 2.7 2.0 1.3 1.1
Labor Force (Ths) 209.7 213.9 218.0 218.3 224.0 230.9 236.8 238.1 238.9
Percent Change, Year Ago 2.0 2.0 1.9 0.1 2.6 3.1 2.6 0.6 0.3
Unemployment Rate (%) 4.9 4.3 3.8 7.8 4.4 3.0 4.5 5.7 5.7
Total Housing Starts
Single-Family 2083.6
Multifamily 72.0
6626.3 6313.2 4358.0 3959.7 4054.4
5608.4 4905.5 3321.7 3041.2 3098.5
1017.9 1407.7 1036.2 918.5 955.9
PORT ST. LUCIE Institute for Economic Forecasting 117
2017 2018 2019 2020 2021 2022 2023 2024 2025
481.3 491.7
2155.6 3576.4 4080.2 4942.1
2791.2 3565.6 4591.8
785.3 514.6 350.2
Short Term Outlook for Port St. Lucie, FL August 2022 Forecast
2022:2 2022:3
Personal Income (Billions $)
Total Personal Income 32.4 32.8 33.5 33.8 34.0 34.3 34.7 35.1 35.5 36.0 36.5 37.0 37.4 Pct Chg Year Ago 4.6 5.4 6.2 6.4 5.0 4.6 3.5 3.9 4.3 4.8 5.2 5.2 5.4
Wages and Salaries 9.8 9.9 10.0 10.0 10.1 10.1 10.2 10.3 10.3 10.4 10.5 10.6 10.6
Nonwage Income 22.7 22.9 23.5 23.7 24.0 24.2 24.5 24.9 25.2 25.6 26.0 26.4 26.7
Real Personal Income (12$) 27.6 27.6 27.9 27.9 28.0 28.1 28.2 28.5 28.7 28.9 29.2 29.5 29.7 Pct Chg Year Ago -1.8 -1.0 0.4 1.5 1.5 1.8 1.2 2.0 2.5 3.2 3.5 3.6 3.5
Per Capita Income (Ths) 62.7 63.1 64.1 64.2 64.4 64.7 65.2 65.8 66.3 67.0 67.7 68.5 69.1
Real Per Capita Income (12$) 53.3 53.0 53.3 53.0 52.9 52.9 53.0 53.3 53.6 53.9 54.3 54.6 54.8
Average Annual Wage (Ths) 58.8 59.2 59.4 59.6 59.8 60.1 60.7 61.3 61.8 62.3 62.7 63.1 63.4 Pct Chg Year Ago 9.4 7.0 3.7 3.0 1.7 1.5 2.2 2.7 3.2 3.6 3.2 3.0 2.7
Establishment Employment (Place of Work, Thousands, SA)
Total Employment 164.9 166.5 167.0 167.4 167.7 167.6 167.2 166.7 166.4 166.4 166.4 166.6 167.0
Pct Chg Year Ago 4.2 3.9 2.9 2.1 1.7 0.7 0.1 -0.4 -0.8 -0.7 -0.4 -0.1 0.4
Manufacturing 8.2 8.3 8.4 8.4 8.3 8.2 8.1 7.9 7.8 7.7 7.6 7.5 7.5
Pct Chg Year Ago 10.2 5.5 5.8 3.8 1.6 -1.1 -4.0 -5.2 -6.2 -6.8 -6.7 -5.6 -4.2
Nonmanufacturing 156.7 158.2 158.5 159.0 159.4 159.4 159.1 158.7 158.6 158.7 158.9 159.1 159.5
Pct Chg Year Ago 3.9 3.8 2.7 2.1 1.7 0.8 0.3 -0.1 -0.5 -0.4 -0.1 0.2 0.6
Construction & Mining 12.7 12.8 12.6 12.6 12.5 12.4 12.2 12.1 12.0 12.0 11.9 11.9 11.8 Pct Chg Year Ago 0.1 1.5 -0.6 -2.3 -2.1 -3.4 -3.1 -3.6 -3.4 -3.2 -2.8 -2.2 -1.7
Trade, Trans, & Utilities 33.7 33.5 33.4 33.1 33.2 32.9 32.8 32.4 31.9 31.7 31.5 31.3 31.3 Pct Chg Year Ago 4.0 1.7 0.1 -2.6 -1.3 -1.7 -1.9 -2.2 -4.1 -3.6 -3.8 -3.3 -1.9
Wholesale Trade 5.0 5.1 5.1 5.3 5.3 5.3 5.3 5.3 5.4 5.4 5.5 5.5 5.6 Retail Trade 22.5 22.2 22.1 21.7 21.9 21.6 21.5 21.0 20.4 20.2 19.9 19.7 19.5 Trans, Wrhsng, & Util 6.2 6.2 6.1 6.1 6.0 6.0 6.0 6.0 6.1 6.1 6.1 6.1 6.1 Information 1.2 1.2 1.2 1.2 1.2 1.1 1.1 1.1 1.1 1.1 1.1 1.1 1.2 Pct Chg Year Ago 0.4 -2.5 0.0 -1.2 -0.9 -2.6 -6.8 -6.6 -3.3 -1.8 -0.5 1.1 1.8
Financial Activities 6.5 6.7 6.8 7.0 7.0 7.0 7.0 7.0 7.1 7.1 7.1 7.2 7.2 Pct Chg Year Ago 7.3 5.8 5.6 6.9 7.7 4.9 3.2 0.6 0.7 1.7 2.0 1.9 1.1 Prof & Business Services 23.6 23.9 23.9 23.9 23.5 23.2 22.8 22.5 22.2 22.0 22.0 22.2 22.4 Pct Chg Year Ago 3.0 3.6 2.6 1.5 -0.3 -3.0 -4.9 -6.0 -5.5 -4.9 -3.2 -1.4 0.6
Educ & Health Services 28.9 29.4 29.8 29.9 30.2 30.4 30.7 31.1 31.5 31.7 31.9 32.1 32.2 Pct Chg Year Ago 2.1 4.1 4.8 4.9 4.5 3.5 3.2 4.1 4.4 4.3 4.0 3.2 2.2
Leisure & Hospitality 22.7 22.9 22.6 22.7 23.1 23.5 23.4 23.3 23.3 23.5 23.5 23.5 23.7 Pct Chg Year Ago 11.1 9.8 4.5 4.7 1.8 2.8 4.0 2.5 1.1 -0.3 0.3 0.9 1.4
Other Services 8.4 8.5 8.6 8.6 8.6 8.6 8.7 8.8 9.0 9.1 9.2 9.3 9.4 Pct Chg Year Ago 4.9 5.3 4.7 4.5 2.4 1.0 1.3 2.2 4.5 5.7 6.0 5.9 5.2
Federal Government 1.0 1.0 1.0 1.0 1.0 1.0 1.0 1.0 1.0 1.0 1.0 1.0 1.0 Pct Chg Year Ago -5.0 1.4 0.7 1.4 4.7 2.3 -0.1 -1.9 -3.4 -2.7 -2.1 -1.5 -0.9
State & Local Government 18.1 18.4 18.7 18.9 19.1 19.2 19.3 19.4 19.5 19.5 19.5 19.5 19.5
Pct Chg Year Ago 1.2 1.4 3.0 4.4 5.5 4.5 3.4 2.4 1.6 1.3 0.9 0.7 0.4
Other Economic Indicators
Population (Ths) 517.1
Pct Chg Year Ago 2.7 2.7 2.6 2.4 2.1 1.9 1.7 1.4 1.3 1.3 1.2 1.2 1.1 Labor Force (Ths) 229.9 231.6 233.9 235.5 236.7 237.3 237.7 237.9 238.1 238.2 238.4 238.5 238.8
Pct Chg Year Ago 2.9 3.0 3.5 3.3 3.0 2.5 1.7 1.0 0.6 0.4 0.3 0.3 0.3
Unemployment Rate (%) 2.7 3.0 3.3 3.8
Total Housing Starts
5.5 5.7 5.8 5.9 5.9 5.8
Single-Family
900.1 909.8 924.9 939.3 943.9 954.6
3048.6 3016.9 3033.5 3065.8 3101.6 3108.3 Multifamily
PORT ST. LUCIE 118 Florida & Metro Forecast / Summer 2022
2022:4 2023:1 2023:2 2023:3 2023:4 2024:1 2024:2 2024:3 2024:4 2025:1 2025:2
520.2 523.2 525.9 528.1 530.2 531.9 533.5 535.2 536.8 538.3 539.7 541.2
4.3 4.7 5.2
7238.3 5881.2 5392.0 4690.4 4383.1 4264.1 4094.3 3948.6 3926.7 3958.4 4005.1 4045.5 4062.9
5584.0 4525.8 4076.1 3560.7 3346.1 3239.6 3140.5
1654.3 1355.4 1315.8 1129.6 1037.0 1024.5 953.9
PROFILES
The Punta Gorda MSA is located in the southwest segment of the state. Punta Gorda is the County seat of Charlotte County and the only incorporated municipality in the country.
QUICK FACTS
• Metro population estimate of 181,067 as of 2019 (5-Year Estimate) (U.S. Census Bureau).
•
Charlotte County population estimate of 181,067 as of 2019 (5-Year Estimate) (U.S. Census Bureau).
• Civilian labor force of 76,157 in July 2022 (Florida Research and Economic Database).
•
An unemployment rate of 3.0% as of July 2022, not seasonally adjusted. This amounts to 2,322 unemployed people (Florida Research and Economic Database).
METRO NEWS SUMMARIES
Miami investor pays nearly $20 million for Charlotte County center
•
A Miami real investment firm has bought a Port Charlotte shopping center for $18.9 million by Murdock Owner, an LLC.
•
The 139,478-square-foot Murdock Carrousel shopping center is on U.S. 41 near Murdock Circle and Murdock Town Center. This area is crowded with retailers and eateries including a Walmart Supercenter, Target, Metro Diner, and Chick-fil-A all within about a mile of one another.
• The shopping center was 83.4% occupied at the time of sale according to Plaza Advisors, which represented the seller.
Source: Business Observer, June 1, 2022
Construction starts on 60,000-square-foot facility for national building supply distributor
OUTLOOK SUMMARIES
The Punta Gorda Metropolitan Statistical Area (MSA) is expected to show mixed levels of growth in its economic indicators. Punta Gorda’s Gross Metro Product will be $5,784.58. Average annual wage growth of 4.5 percent will lead to an average annual wage of $59,400, among the lowest in the state. Personal income will grow by 4.8 percent, which will lead to a per capita income level of $41,500. Population growth will average 2.8 percent, the second highest in the state.
Employment growth is expected to average a rate of 1.2 percent annually. The unemployment rate is estimated to average 4.8 percent.
The Financial sector will lead Punta Gorda at an average annual growth rate of 4.6 percent. The Leisure and Hospitality sector and the Education and Health Services sector will expand at respective rates 4.0 and 3.3 percent.
• Construction has started on a new, nearly 60,000-square-foot facility for ABC Supply in Charlotte County.
• The building, which will include a 53,200-square-foot warehouse and 6,700 square feet of office space, will sit on 6 acres at the Charlotte County Park of Commerce, next to the Punta Gorda Airport.
•
Seagate Development Group, which is building the 59,900-square-foot facility, says crews have begun working and that the building is scheduled to be finished early next year. When done, 2.5 acres will remain for future growth.
Source: Business Observer, June 7th, 2022
A-Gas Expands its Business Operations in Southwest Florida with the Acquisition of Certified Refrigerant Services
• A-Gas, a UK-based supply and lifecycle management company for refrigerants, has
PUNTA GORDA Institute for Economic Forecasting 119
acquired Punta Gorda based company Certified Refrigerant Services Inc. in Punta Gorda, Florida.
• Group Chief Executive Officer of A-Gas, Jack Govers, commented, “We are looking forward to this expansion of our refrigerant business in the USA. This demonstrates our ongoing commitment to safe and efficient recovery and reclamation of refrigerant gases, which is a critical part of the circular economy and a sustainable future.”
• This is A-Gas’ tenth acquisition since the investment by Private Equity firm KKR.
Source: Business Wire, July 14, 2022
D.R. Horton plans 894-lot Coral Creek subdivision off Burnt Store Road in Punta Gorda
• Coral Creek will be a mixture of single-family homes, townhomes, and twin villas, said Justin Robbins, division president of D.R. Horton.
• Randy Thibaut, William Rollins, and Justin Thibaut of LSI Companies brokered the 306.3 acres on July 1 in Punta Gorda for $19.5 million. CC Burnt Store LLC made the purchase.
• Preparing the lots for construction should begin in November, Robbins said, with vertical construction planned for late 2023.
Source: Gulfshore Business, July 28, 2022
Nearly 1 million square feet in industrial space coming to Southwest Florida next year
• A 378,000-square-foot Punta Gorda warehouse logistics center is under construction on the grounds of the Enterprise Charlotte Airport Park.
• Equus Capital Partners, which is building the facility, says the location was chosen so that the center could be between Naples and Tampa Bay, as well as close to Fort Myers. Equus says there are 5.5 million people within two hours of Punta Gorda.
• Equus has begun marketing the property nationally and hopes to have it fully leased by the time construction is done — expected in the 2023 second quarter.
Source: Business Observer, August 4, 2022
South County Regional Park Improvements
• Charlotte County started construction on improvements to the South County regional park located in Punta Gorda on August 22, 2022.
•
The project has a budget of $570,870.00 and will include several improvements to the park, such as 8 new pickleball courts, 2 new tennis courts, site furnishings, and landscaping as well as an upgrade to the existing remote control race car track.
• Construction is currently forecasted to be completed by January of 2023.
Source: Charlotte County Florida, September 08, 2022
PUNTA GORDA 120 Florida & Metro Forecast / Summer 2022
Total Nonagricultural Employment
Punta Gorda MSA Industry Loca�on Quo�ents

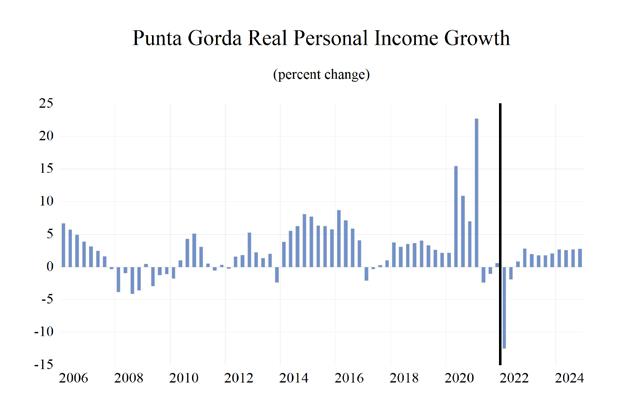
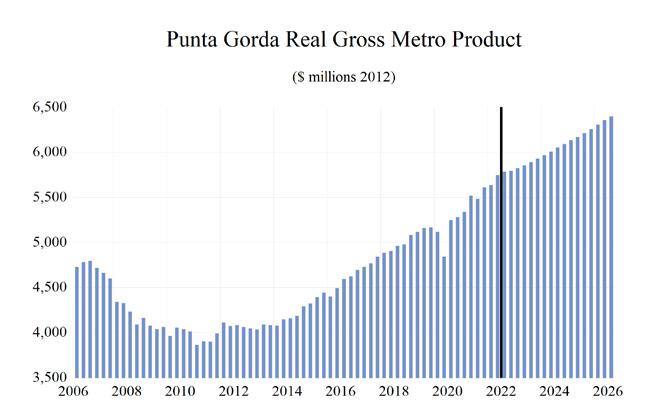
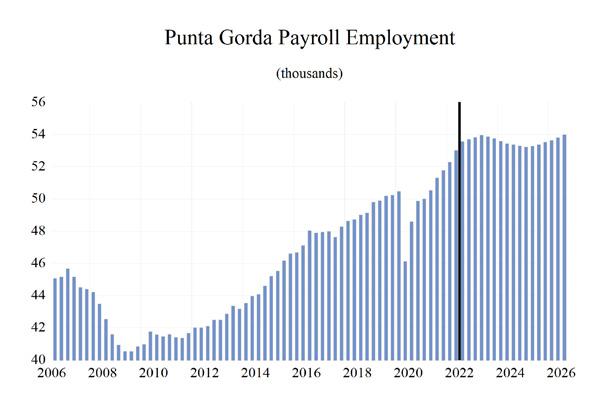
PUNTA GORDA Institute for Economic Forecasting 121 0 0.2 0.4 0.6 0.8 1 1.2 1.4 1.6 1.8
Total Private Goods Producing Service Producing Private Service Providing Mining, Logging, and Construc�on Manufacturing Trade, Transporta�on, and U�li�es Wholesale Trade Retail Trade Transporta�on, Warehousing and U�li�es Informa�on Financial Ac�vi�es Professional and Business Services Educa�onal and Health Services Leisure and Hospitality Other Services Government
Long Term Outlook for Punta Gorda, FL August 2022 Forecast
Personal Income (Billions $)
Total Personal Income 7.4 7.8 8.3 8.9 9.7 10.0 10.5 11.1 11.7
Pct Chg Year Ago 4.9 5.4 5.4 7.5 9.5 3.1 5.2 5.2 5.7
Wages and Salaries 2.0 2.1 2.2 2.3 2.7 3.0 3.1 3.2 3.3
Nonwage Income 5.4 5.7 6.0 6.5 7.0 7.0 7.4 7.8 8.4
Real Personal Income (12$) 7.0 7.4 7.8 8.3 8.7 8.4 8.6 8.9 9.2 Pct Chg Year Ago 1.1 5.1 5.8 6.2 5.2 -3.0 1.8 3.5 3.8
Per Capita Income (Ths) 42.0 43.6 45.0 47.0 49.7 49.4 50.3 51.7 53.6
Real Per Capita Income (12$) 39.5 40.9 42.4 43.7 44.4 41.5 41.0 41.4 42.2
Average Annual Wage (Ths) 41.4 42.8 44.5 47.6 52.3 56.7 58.1 60.3 62.4 Pct Chg Year Ago 3.5 3.4 3.9 7.1 9.9 8.3 2.4 3.9 3.5
Establishment Employment (Place of Work, Thousands, SA)
Total Employment 48.0 48.9 50.0 48.8 50.9 53.1 53.9 53.4 53.4
Pct Chg Year Ago 1.1 1.9 2.4 -2.5 4.4 4.4 1.3 -0.8 -0.1
Manufacturing 0.8 0.8 0.8 0.8 0.9 0.9 0.9 0.9 0.8
Pct Chg Year Ago -0.9 1.1 -1.0 -0.2 13.0 4.8 -2.0 -7.1 -2.3
Nonmanufacturing 47.2 48.1 49.2 48.0 50.0 52.2 52.9 52.6 52.5
Pct Chg Year Ago 1.2 1.9 2.4 -2.6 4.2 4.4 1.4 -0.7 -0.1 Construction & Mining 3.9 4.2 4.3 4.4 4.7 4.8 4.6 4.4 4.3
Pct Chg Year Ago 0.3 8.0 3.2 2.9 5.9 1.2 -3.7 -4.9 -1.9 Trade, Trans, & Utilities 11.2 11.5 11.7 11.6 11.8 12.4 12.4 11.9 11.5
Pct Chg Year Ago 2.2 2.1 2.4 -1.6 2.1 5.3 -0.3 -4.1 -3.6
Wholesale Trade 0.8 0.8 0.8 0.8 0.8 0.8 0.9 0.9 0.9 Retail Trade 9.4 9.6 9.7 9.5 9.7 10.2 10.1 9.5 9.0 Trans, Wrhsng, & Util 1.0 1.0 1.2 1.2 1.3 1.4 1.5 1.5 1.5
Information 0.5 0.4 0.4 0.3 0.4 0.4 0.5 0.5 0.5 Pct Chg Year Ago 0.1 -13.4 -7.5 -12.9 16.2 9.6 2.2 -0.7 0.5
Financial Activities 2.1 2.2 2.3 2.2 2.3 2.5 2.7 2.7 2.7 Pct Chg Year Ago 2.1 4.4 3.4 -3.4 3.9 7.5 8.8 2.3 -0.1
Prof & Business Services 4.4 4.2 4.4 4.5 5.2 5.4 5.2 4.7 4.7 Pct Chg Year Ago -3.1 -3.0 2.8 3.6 16.0 2.9 -4.4 -9.1 0.6
Educ & Health Services 9.4 9.6 10.0 9.6 9.4 9.8 10.2 10.6 10.8 Pct Chg Year Ago 0.9 3.0 3.5 -3.5 -1.9 3.5 3.9 4.0 1.7
Leisure & Hospitality 7.6 7.7 7.8 6.9 7.5 8.2 8.5 8.7 8.8 Pct Chg Year Ago 4.7 1.3 0.3 -11.4 9.8 8.5 4.1 2.1 1.4
Other Services 2.1 2.1 2.2 2.3 2.5 2.6 2.6 2.7 2.8
Pct Chg Year Ago -0.4 2.9 4.7 4.7 6.0 7.2 -0.6 2.5 3.4
Federal Government 0.3 0.3 0.3 0.3 0.3 0.3 0.3 0.3 0.3
Pct Chg Year Ago -7.7 -0.1 5.4 9.9 -14.1 -2.3 5.0 -1.2 -1.1
State & Local Government 5.7 5.7 5.8 5.7 5.8 5.8 6.0 6.2 6.2
Pct Chg Year Ago 0.0 0.3 2.1 -2.2 1.3 0.0 4.2 2.1 0.8
Other Economic Indicators
Population (Ths) 177.1 179.8 183.7 188.9 195.6 202.9 209.4 214.6 218.5
Pct Chg Year Ago 1.8 1.5 2.2 2.8 3.6 3.7 3.2 2.5 1.8
Labor Force (Ths) 69.5 70.2 71.3 71.4 73.2 75.3 77.2 77.5 77.8
Percent Change, Year Ago 0.4 1.0 1.5 0.1 2.5 3.0 2.5 0.4 0.3
Unemployment Rate (%) 4.8 4.2 3.8 7.9 4.4 3.1 4.6 5.8 5.8
Total Housing Starts 1227.5 1880.0
2575.8 3674.0 3930.9 2160.9 1599.3 1614.1
Single-Family 1213.3 1816.2 2077.1 2371.7 3229.2 3039.8 1523.8 1136.2 1136.1
Multifamily 14.2 63.8 99.9 204.2 444.8 891.0 637.1 463.1 478.0
PUNTA GORDA 122 Florida & Metro Forecast / Summer 2022
2017 2018 2019 2020 2021 2022 2023 2024 2025
2177.0
Short Term Outlook for Punta Gorda, FL August 2022 Forecast
2022:2 2022:3 2022:4 2023:1 2023:2 2023:3 2023:4 2024:1 2024:2 2024:3 2024:4 2025:1 2025:2
Personal Income (Billions $)
Total Personal Income 10.0 10.1 10.3 10.4 10.5 10.6 10.7 10.9 11.0 11.2 11.3 11.5 11.6 Pct Chg Year Ago 5.1 5.8 6.4 6.6 5.1 5.0 4.1 4.7 5.0 5.4 5.7 5.7 5.9
Wages and Salaries 3.0 3.1 3.1 3.1 3.1 3.1 3.2 3.2 3.2 3.3 3.3 3.3 3.3
Nonwage Income 6.9 7.0 7.2 7.3 7.3 7.4 7.5 7.7 7.8 7.9 8.0 8.2 8.3
Real Personal Income (12$) 8.4 8.4 8.5 8.5 8.6 8.6 8.7 8.8 8.8 8.9 9.0 9.1 9.2 Pct Chg Year Ago -1.3 -0.6 0.6 1.8 1.5 2.2 1.8 2.8 3.2 3.7 4.1 4.0 4.0
Per Capita Income (Ths) 49.3 49.5 50.0 50.1 50.2 50.4 50.6 51.1 51.4 51.8 52.4 52.9 53.4
Real Per Capita Income (12$) 41.7 41.3 41.3 41.1 41.0 40.9 40.9 41.1 41.2 41.4 41.7 41.9 42.1
Average Annual Wage (Ths) 56.7 57.1 57.3 57.6 57.8 58.1 58.8 59.4 60.0 60.6 61.1 61.7 62.1 Pct Chg Year Ago 9.8 7.6 4.1 3.4 1.9 1.8 2.6 3.2 3.8 4.4 4.0 3.8 3.6
Establishment Employment (Place of Work, Thousands, SA)
Total Employment 53.0 53.6 53.7 53.8 54.0 53.9 53.7 53.6 53.4 53.4 53.3 53.2 53.3
Pct Chg Year Ago 4.9 4.4 3.7 3.0 1.8 0.6 0.1 -0.5 -1.0 -0.9 -0.8 -0.6 -0.3
Manufacturing 0.9 0.9 1.0 1.0 0.9 0.9 0.9 0.9 0.9 0.9 0.8 0.8 0.8
Pct Chg Year Ago 3.8 5.4 4.7 0.9 0.9 -2.8 -6.9 -7.6 -6.9 -7.2 -6.9 -5.1 -3.4
Nonmanufacturing 52.1 52.6 52.7 52.9 53.0 53.0 52.8 52.7 52.6 52.5 52.5 52.4 52.4
Pct Chg Year Ago 4.9 4.4 3.7 3.0 1.8 0.6 0.2 -0.3 -0.9 -0.8 -0.7 -0.6 -0.2 Construction & Mining 4.7 4.8 4.7 4.7 4.6 4.6 4.5 4.4 4.4 4.3 4.3 4.3 4.3
Pct Chg Year Ago 1.5 1.2 -1.0 -3.1 -2.2 -4.7 -5.1 -5.7 -5.4 -4.7 -3.8 -3.0 -2.1
Trade, Trans, & Utilities 12.5 12.5 12.4 12.4 12.5 12.4 12.4 12.2 11.9 11.8 11.6 11.5 11.4 Pct Chg Year Ago 7.3 5.4 3.6 0.8 -0.3 -0.7 -0.7 -1.4 -4.5 -4.7 -5.7 -5.7 -4.2
Wholesale Trade 0.8 0.8 0.8 0.9 0.9 0.9 0.9 0.9 0.9 0.9 0.9 0.9 0.9 Retail Trade 10.3 10.2 10.2 10.0 10.2 10.1 10.0 9.8 9.5 9.4 9.2 9.1 9.0 Trans, Wrhsng, & Util 1.4 1.4 1.4 1.5 1.5 1.5 1.5 1.5 1.5 1.5 1.5 1.5 1.5 Information 0.4 0.5 0.5 0.5 0.5 0.5 0.4 0.4 0.5 0.5 0.4 0.5 0.5 Pct Chg Year Ago 7.6 10.2 12.6 11.7 2.4 -0.2 -4.2 -3.5 0.1 0.3 0.5 0.7 -0.3
Financial Activities 2.4 2.5 2.6 2.7 2.7 2.7 2.7 2.7 2.7 2.8 2.8 2.8 2.7 Pct Chg Year Ago 6.3 8.9 10.5 12.5 10.3 7.2 5.2 2.4 2.2 2.6 2.2 1.4 0.1 Prof & Business Services 5.4 5.4 5.5 5.4 5.2 5.1 4.9 4.8 4.7 4.6 4.6 4.6 4.7 Pct Chg Year Ago -0.2 3.2 3.0 1.6 -2.1 -6.9 -10.0 -11.5 -10.3 -8.5 -5.8 -2.9 -0.4
Educ & Health Services 9.7 9.9 10.0 10.1 10.1 10.2 10.3 10.4 10.5 10.6 10.7 10.7 10.7
Pct Chg Year Ago 4.0 3.7 4.8 5.1 4.2 3.3 3.0 3.7 4.2 4.4 4.0 3.0 1.9
Leisure & Hospitality 8.2 8.3 8.3 8.3 8.5 8.7 8.7 8.6 8.7 8.7 8.8 8.7 8.8 Pct Chg Year Ago 11.0 7.7 4.8 5.4 2.6 3.8 4.9 3.7 2.6 0.9 1.2 1.5 1.6
Other Services 2.7 2.7 2.7 2.7 2.6 2.6 2.6 2.7 2.7 2.7 2.7 2.8 2.8 Pct Chg Year Ago 10.8 6.3 4.3 3.4 -1.4 -2.5 -1.8 -0.5 2.1 3.8 4.5 4.5 3.9
Federal Government 0.3 0.3 0.3 0.3 0.3 0.3 0.3 0.3 0.3 0.3 0.3 0.3 0.3
Pct Chg Year Ago -8.9 4.1 5.3 5.4 8.2 4.7 2.0 0.0 -1.7 -1.6 -1.4 -1.3 -1.0 State & Local Government 5.7 5.8 5.9 6.0 6.0 6.1 6.1 6.1 6.2 6.2 6.2 6.2 6.2
Pct Chg Year Ago -1.1 -0.3 1.2 2.7 5.6 4.6 3.7 2.9 2.3 1.9 1.4 1.1 0.8
Other Economic Indicators
Population (Ths) 202.0 203.9 205.6 207.2 208.7 210.2 211.6 212.9 214.1 215.2 216.3 217.3 218.1 Pct Chg Year Ago 3.7 3.8 3.7 3.5 3.3 3.1 2.9 2.7 2.6 2.4 2.2 2.1 1.9 Labor Force (Ths) 75.1 75.6 76.3 76.8 77.2
77.4 77.5 77.5 77.5 77.6 77.6 77.7 Pct Chg Year Ago 2.9 2.6 3.4 3.3 2.8 2.3 1.5 0.9 0.4 0.3 0.2 0.2 0.3
Unemployment Rate (%) 2.9 3.1 3.5 3.9
Total Housing Starts
5.6 5.8 5.9 6.0 6.0 5.9
1579.0 1596.1 1615.1 1626.9
Single-Family
464.7 454.7 462.8 470.2 472.6 477.5
1142.4 1124.3 1133.4 1144.9 1154.3 1148.0 Multifamily
PUNTA GORDA Institute for Economic Forecasting 123
77.3
4.4 4.8 5.3
4897.6 3754.8 3220.1 2642.6 2299.0 1942.2 1759.9 1607.0
1625.6
3748.4 2813.7 2360.4 1870.3 1585.2 1387.5 1252.3
1149.2 941.1 859.7 772.3 713.7 554.7 507.5
PROFILES
The Sebastian MSA is located in central east Florida and is comprised of the Indian River County. Sebastian is home to Pelican Island, America’s first National Wildlife refuge, and is known for its Atlantic-facing beaches.
QUICK FACTS
• Metro population estimate of 153,989 as of 2019 (5-Year Estimate) (U.S. Census Bureau).
• Indian River County population estimate of 153,989 as of 2019 (5-Year Estimate) (U.S. Census Bureau).
•
Civilian labor force of 67,356 in July 2022 (Florida Research and Economic Database).
• An unemployment rate of 3.5% as of July 2022, not seasonally adjusted. This amounts to 2,342 unemployed people (Florida Research and Economic Database).
OUTLOOK SUMMARIES
The Sebastian Metropolitan Statistical Area (MSA) is expected to show average growth in the economic indicators studied in this forecast. The MSA’s Gross Metro Product level will be at $6,792.15. Average annual wage growth of 4.5 percent will lead the average annual wage level to $65,000. The per capita income level of $79,300 - the second highest in the state MSAs - will be boosted by personal income growth of 4.8 percent. Population growth will be 1.5 percent.
The Sebastian MSA will experience above an average employment growth rate in the state at 1.4 percent annually. Sebastian’s unemployment rate should average 5.0 percent, among the highest in the state.
The Leisure sector is expected to be the fastest growing sector in the area, averaging 5.5 percent growth annually. The Other Services sector will see the second-highest average annual growth rate at 5.2 percent, followed by the Information sector at 3.9 percent.
METRO NEWS SUMMARIES
Three new developments underway along State Road 60 in Vero Beach
•
Three major construction projects – one commercial, two residential – are the most recent along the rapidly developing stretch of State Road 60. The project slated for completion first is a 4,650-square-foot 7-Eleven with a 16-pump gas station with an estimated opening in the winter of 2022
•
The two residential projects known as The Mason and The Griffon are currently under construction. Both projects aim to increase the supply of upscale multi-family residential units in the area.
• New, upscale rental opportunities, Indian River County Community Development Director Phil Matson says, are filling a need for professionals such as traveling nurses, doctors, teachers and other professionals, who stay in an area for months at a time. Additionally, he says, “we strive for mixed uses along Vero’s corridors, punctuating residential corridors with carefully chosen commercial entities.” This, he says, avoids the unattractive “mile-after-mile of gas stations and strip malls that areas to the south now face.
Source: Vero News, June 30, 2022
Sebastian City Council approves new hiring incentives
•
The Sebastian city council unanimously approved hiring incentives and sign-on bonuses for new city workers amid a widespread worker shortage affecting many municipalities and local businesses.
• City Manager Paul Carlisle told the council on Wednesday that “everyone is having difficulty hiring staff.” He said other communities are offering sign-on bonuses and hiring people right out of the police academy, even paying for the academy, to become police officers. Carlisle wants the city to become more competitive by recommending temporary hiring incentives and sign-on bonuses.
SEBASTIAN - VERO BEACH 124 Florida & Metro Forecast / Summer 2022
•
The city wants to pay a sign-on bonus of $2,500 to $3,500 depending on experience for all fulltime vacant positions. In addition, the city would reimburse police recruits for the police academy if they are a Florida resident.
Source: Sebastian Daily, July 16, 2022
Summer slump for Treasure Coast hotel industry comes after strong spring
•
One year after the tourism comeback following the onset of the pandemic, the hotel market on the Treasure Coast began showing the traditional impacts of the summer slump. Occupancy numbers were slightly down in May and June, compared to the same months in 2021.
• We also had a very strong 2021 summer which does skew the numbers a little bit,” said Kirk Funnell, director of tourism and marketing for the Indian River County Chamber of Commerce. “We had a huge American Recovery Grant promotion that we ran last summer that was above our normal advertising budget.”
• Many of them may have stayed away this summer because of gas prices, Funnell said, along with other economic factors plaguing the country.
Source: TC Palm, August 8, 2022
Vero Beach Regional Airport ranked No. 1 general aviation airport in the state by FDOT
•
Vero Beach’s airport was recognized by FDOT as Florida’s general aviation airport of the year during a Florida Airports Council conference in Orlando. The winner is selected based on safety, aesthetics and airport management.
• In March, the airport completed an $8.5 million runway rehabilitation project, which included runway resurfacing and replacing lights and signs. It was mostly funded by the Federal Aviation Administration and FDOT.
•
The airport has a significant impact on the local economy. About 5,500 people are employed on Vero Beach Regional Airport’s property, and it has an economic impact of about $1.3 billion, according to FDOT.
Source: TC Palm, August 9, 2022
SEBASTIAN - VERO BEACH Institute for Economic Forecasting 125
Total Nonagricultural Employment
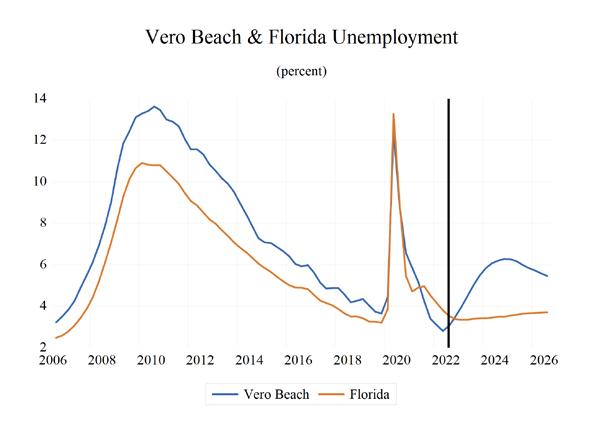
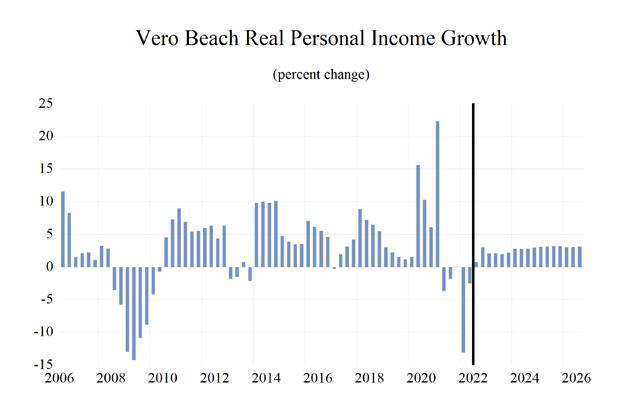

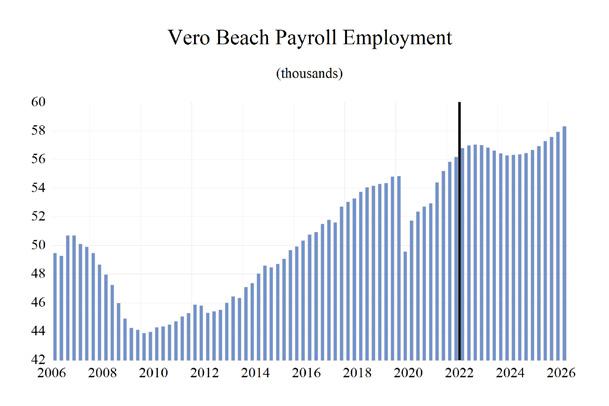
SEBASTIAN - VERO BEACH 126 Florida & Metro Forecast / Summer 2022 0 0.2 0.4 0.6 0.8 1 1.2 1.4 1.6
Total Private Goods Producing Service Producing Private Service Providing Mining, Logging, and Construc�on Manufacturing Trade, Transporta�on, and U�li�es Wholesale Trade Retail Trade Transporta�on,Warehousing and U�li�es Informa�on Financial Ac�vi�es Professional and Business Services Educa�onal and Health Services Leisure and Hospitality Other Services Government Sebas�an Vero Beach MSA Industry Loca�on Quo�ents
Long Term Outlook for Sebastian-Vero Beach, FL August 2022 Forecast
Personal Income (Billions $)
Total Personal Income 11.6 12.6 13.3 13.8 14.8 15.2 16.0 16.9 17.8
Pct Chg Year Ago 6.6 8.4 5.9 3.4 7.5 2.8 5.6 5.2 5.7
Wages and Salaries 2.4 2.6 2.7 2.7 3.1 3.5 3.6 3.7 3.9
Nonwage Income 9.2 10.0 10.6 11.0 11.7 11.7 12.4 13.1 13.9
Real Personal Income (12$) 11.6 12.3 12.7 13.0 13.4 13.0 13.2 13.7 14.2 Pct Chg Year Ago 6.4 6.1 3.4 2.3 3.2 -3.3 2.3 3.4 3.8
Per Capita Income (Ths) 75.7 80.8 84.2 85.5 90.1 90.9 94.6 98.2 102.7
Real Per Capita Income (12$) 75.6 78.9 80.3 80.7 81.7 77.6 78.1 79.7 81.9
Average Annual Wage (Ths) 46.5 47.8 49.2 52.5 57.2 61.9 63.6 66.2 68.1 Pct Chg Year Ago 1.0 2.8 2.9 6.6 9.1 8.1 2.8 4.1 2.8
Establishment Employment (Place of Work, Thousands, SA)
Total Employment 51.9 53.5 54.4 52.1 53.8 56.4 56.9 56.3 56.8
Pct Chg Year Ago 2.8 3.1 1.7 -4.2 3.2 4.9 0.8 -0.9 0.9
Manufacturing 2.0 2.2 2.3 2.2 2.1 2.3 2.3 2.1 2.0 Pct Chg Year Ago 4.4 12.8 4.8 -6.8 -3.0 9.6 1.0 -8.6 -3.8
Nonmanufacturing 49.9 51.3 52.1 50.0 51.7 54.1 54.6 54.2 54.8
Pct Chg Year Ago 2.7 2.8 1.5 -4.1 3.5 4.7 0.8 -0.6 1.0
Construction & Mining 4.0 4.3 4.5 4.4 4.5 4.6 4.4 4.1 4.0 Pct Chg Year Ago 7.6 6.8 3.6 -1.3 1.7 2.0 -4.6 -5.6 -2.2
Trade, Trans, & Utilities 10.4 10.8 10.6 10.5 10.8 11.2 11.2 10.8 10.5
Pct Chg Year Ago 2.0 3.6 -1.9 -0.7 3.3 3.6 -0.2 -3.4 -2.6
Wholesale Trade 0.8 0.9 0.9 1.0 1.1 1.3 1.3 1.3 1.3
Retail Trade 8.8 9.0 8.7 8.6 8.8 9.0 8.9 8.5 8.1 Trans, Wrhsng, & Util 0.8 0.9 0.9 0.9 0.9 1.0 1.0 1.1 1.1 Information 0.6 0.6 0.6 0.5 0.4 0.4 0.4 0.4 0.5 Pct Chg Year Ago 0.0 0.0 -5.7 -14.7 -17.9 -1.5 4.9 4.2 7.9
Financial Activities 2.6 2.7 2.8 2.8 2.9 3.1 3.2 3.3 3.3 Pct Chg Year Ago -1.8 2.2 3.4 0.3 6.2 4.4 5.9 1.5 0.9
Prof & Business Services 5.9 6.2 6.4 6.2 6.6 6.9 6.3 5.6 5.7 Pct Chg Year Ago 4.9 5.1 4.1 -4.0 6.6 5.1 -8.9 -11.8 2.2
Educ & Health Services 10.4 10.5 10.9 10.7 10.7 11.1 11.4 11.9 12.1 Pct Chg Year Ago 2.0 1.1 3.9 -1.8 0.0 3.8 3.0 3.8 2.2
Leisure & Hospitality 8.1 8.1 8.3 7.1 7.7 8.6 9.1 9.3 9.6 Pct Chg Year Ago 3.8 1.0 2.3 -15.0 9.4 11.3 5.2 2.5 2.9
Other Services 2.7 2.9 2.8 2.7 2.9 3.1 3.2 3.4 3.6 Pct Chg Year Ago 0.9 4.0 -3.0 -2.1 7.4 4.5 3.3 6.6 6.2
Federal Government 0.4 0.4 0.4 0.4 0.4 0.4 0.4 0.4 0.4 Pct Chg Year Ago 17.7 -6.8 9.4 4.2 -3.8 2.4 3.9 0.0 -0.2
State & Local Government 4.9 4.9 4.9 4.7 4.7 4.8 4.9 5.0 5.1 Pct Chg Year Ago 0.5 1.8 -0.9 -3.5 -0.3 1.4 3.3 2.1 0.5
Other Economic Indicators
Population (Ths) 152.9 155.4 158.0 160.8 164.0 167.0 169.5 171.8 173.7 Pct Chg Year Ago 1.8 1.7 1.6 1.8 2.0 1.8 1.5 1.4 1.1 Labor Force (Ths) 63.5 64.5 65.1 64.1 65.2 67.1 68.8 69.2 69.5 Percent Change, Year Ago 2.2 1.6 1.0 -1.5 1.6 3.0 2.5 0.6 0.4 Unemployment Rate (%) 5.1 4.5 3.9 8.0 4.7 3.1 4.7 6.1 6.1
Total Housing Starts 1111.1 1292.3 1445.6 1129.2 1394.9 1723.4 1484.7 1459.4 1448.0 Single-Family 1107.6 1254.3 1410.7 1120.9 1353.1 1530.4 1318.6 1217.0 1195.7 Multifamily 3.5 38.0 34.9 8.2 41.8 193.0 166.0 242.3 252.2
SEBASTIAN - VERO BEACH Institute for Economic Forecasting 127
2017 2018 2019 2020 2021 2022 2023 2024 2025
Short Term Outlook for Sebastian-Vero Beach, FL August 2022 Forecast
2022:2 2022:3 2022:4 2023:1 2023:2 2023:3 2023:4 2024:1 2024:2 2024:3 2024:4 2025:1 2025:2
Personal Income (Billions $)
Total Personal Income 15.0 15.3 15.7 15.8 15.9 16.1 16.3 16.5 16.7 17.0 17.2 17.5 17.7
Pct Chg Year Ago 4.4 5.4 6.9 7.2 6.0 5.4 4.0 4.5 4.9 5.4 5.8 5.8 5.9
Wages and Salaries 3.5 3.6 3.6 3.6 3.6 3.6 3.7 3.7 3.7 3.8 3.8 3.8 3.9
Nonwage Income 11.6 11.7 12.1 12.2 12.3 12.5 12.6 12.8 13.0 13.2 13.4 13.7 13.9
Real Personal Income (12$) 12.9 12.9 13.1 13.2 13.2 13.3 13.4 13.5 13.6 13.8 13.9 14.0 14.2 Pct Chg Year Ago -1.9 -1.0 1.1 2.4 2.4 2.6 1.7 2.5 3.1 3.8 4.1 4.1 4.0
Per Capita Income (Ths) 90.2 91.3 93.3 93.9 94.3 94.8 95.6 96.7 97.5 98.6 99.8 101.0 102.1
Real Per Capita Income (12$) 77.3 77.3 78.2 78.1 78.0 78.1 78.4 78.9 79.3 80.0 80.6 81.2 81.6
Average Annual Wage (Ths) 61.8 62.2 62.5 62.9 63.3 63.7 64.6 65.3 66.0 66.6 67.0 67.5 67.9 Pct Chg Year Ago 9.1 7.5 4.2 3.3 2.4 2.4 3.3 3.8 4.3 4.5 3.8 3.3 2.8
Establishment Employment (Place of Work, Thousands, SA)
Total Employment 56.2 56.8 57.0 57.0 57.0 56.8 56.6 56.4 56.3 56.3 56.4 56.4 56.7
Pct Chg Year Ago 6.1 4.4 3.2 2.2 1.5 0.1 -0.6 -1.1 -1.3 -0.9 -0.5 0.0 0.7
Manufacturing 2.2 2.3 2.4 2.4 2.3 2.3 2.2 2.2 2.1 2.1 2.1 2.0 2.0
Pct Chg Year Ago 8.5 8.4 8.4 5.4 4.3 -0.1 -5.1 -7.6 -8.9 -9.3 -8.9 -7.3 -5.0
Nonmanufacturing 53.9 54.5 54.6 54.7 54.7 54.5 54.4 54.2 54.1 54.2 54.3 54.4 54.6
Pct Chg Year Ago 6.0 4.2 3.0 2.0 1.4 0.1 -0.4 -0.8 -1.0 -0.6 -0.1 0.3 0.9 Construction & Mining 4.6 4.6 4.5 4.5 4.4 4.3 4.2 4.2 4.1 4.1 4.1 4.0 4.0 Pct Chg Year Ago 2.4 2.8 0.3 -2.1 -3.9 -6.1 -6.2 -6.6 -6.1 -5.3 -4.3 -3.3 -2.4
Trade, Trans, & Utilities 11.2 11.2 11.2 11.2 11.3 11.2 11.2 11.1 10.8 10.8 10.7 10.6 10.5 Pct Chg Year Ago 4.7 3.8 2.2 -0.8 0.5 -0.3 -0.3 -0.8 -3.8 -3.9 -4.8 -4.7 -3.1
Wholesale Trade 1.3 1.3 1.3 1.3 1.3 1.3 1.3 1.3 1.3 1.3 1.3 1.3 1.3 Retail Trade 9.0 8.9 8.9 8.8 9.0 8.9 8.9 8.7 8.5 8.4 8.3 8.2 8.1 Trans, Wrhsng, & Util 1.0 1.0 1.0 1.0 1.0 1.1 1.1 1.1 1.1 1.1 1.1 1.1 1.1 Information 0.4 0.4 0.4 0.4 0.4 0.4 0.4 0.4 0.4 0.4 0.4 0.4 0.5 Pct Chg Year Ago -3.1 -2.5 1.5 3.0 7.7 6.8 2.4 1.3 5.5 5.7 4.5 5.3 6.1
Financial Activities 3.0 3.1 3.1 3.2 3.3 3.2 3.3 3.3 3.3 3.3 3.3 3.3 3.3 Pct Chg Year Ago 3.4 4.0 5.1 7.0 7.9 5.3 3.7 1.1 0.9 1.8 2.1 1.8 1.2 Prof & Business Services 6.9 7.0 6.9 6.8 6.4 6.2 5.9 5.7 5.6 5.5 5.5 5.5 5.6 Pct Chg Year Ago 7.8 4.0 1.7 -1.7 -6.6 -11.9 -15.1 -15.9 -13.4 -10.5 -6.7 -2.8 0.7
Educ & Health Services 11.0 11.1 11.3 11.3 11.4 11.5 11.5 11.7 11.8 11.9 12.0 12.1 12.1
Pct Chg Year Ago 5.1 2.8 3.2 3.3 3.6 2.9 2.4 3.2 3.8 4.0 4.1 3.3 2.4
Leisure & Hospitality 8.7 8.8 8.7 8.8 9.0 9.2 9.2 9.2 9.2 9.3 9.4 9.4 9.5 Pct Chg Year Ago 15.1 10.1 5.7 6.2 4.0 5.0 5.6 4.2 2.6 1.3 2.0 2.5 3.1
Other Services 3.0 3.1 3.1 3.1 3.1 3.1 3.2 3.3 3.3 3.4 3.5 3.5 3.6 Pct Chg Year Ago 4.5 4.3 3.5 3.6 3.8 2.6 3.1 4.2 6.5 7.7 7.9 7.6 6.8
Federal Government 0.4 0.4 0.4 0.4 0.4 0.4 0.4 0.4 0.4 0.4 0.4 0.4 0.4
Pct Chg Year Ago 2.1 1.2 2.4 3.6 6.1 4.0 2.1 0.6 -0.5 -0.2 -0.1 0.0 0.0
State & Local Government 4.7 4.8 4.9 4.9 4.9 5.0 5.0 5.0 5.0 5.1 5.1 5.1 5.1
Pct Chg Year Ago 1.1 1.5 2.7 3.5
Other Economic Indicators
Population (Ths)
Pct Chg Year Ago
Labor Force (Ths)
Pct Chg Year Ago
Unemployment Rate (%) 2.8
Total Housing Starts
Single-Family
Multifamily
2.0 1.3 0.8
0.3 0.3
248.2
SEBASTIAN - VERO BEACH 128 Florida & Metro Forecast / Summer 2022
3.6 3.1 2.8 2.7 2.5
0.5
166.7 167.4 167.9 168.5 169.2 169.8 170.5 171.0 171.6 172.1 172.6 173.0 173.5
1.9 1.9 1.7 1.5 1.5 1.5 1.5 1.5 1.4 1.3 1.2 1.2 1.1
66.8 67.3 68.0 68.4 68.8 69.0 69.1 69.2 69.2 69.3 69.3 69.4 69.5
3.6 2.2 3.0 3.0 2.9 2.5 1.7 1.1 0.6 0.4
0.4
3.1 3.5 3.9 4.5 5.0 5.5 5.8 6.1 6.2 6.3 6.3 6.2
1926.9 1588.3 1520.3 1433.0 1481.9 1508.2 1515.7 1500.0 1448.1 1442.5 1446.9 1458.3 1454.8
1741.7 1474.1 1409.9 1321.7 1323.4 1319.9 1309.5 1269.3 1203.8 1196.3 1198.6 1208.1 1203.1
185.2 114.2 110.3 111.3 158.4 188.2 206.2 230.7 244.3 246.1
250.1 251.7
PROFILES
The Sebring MSA is comprised of Highlands County and is located in the South central portion of the state. Sebring is nicknamed “The City of the Circle” in reference to Circle Drive, the center of the Sebring Downtown Historic District. Sebring is the home of the Sebring International Raceway, created on a former airbase and it is currently known as the host of the 12 Hours of Sebring, an annual WeatherTech SportsCar Championship Race.
QUICK FACTS
• Metro population estimate of 103,437 as of 2019 (5-Year Estimate) (U.S. Census Bureau).
• Highlands County population estimate of 103,437 as of 2019 (5-Year Estimate) (U.S. Census Bureau).
• Civilian labor force of 34,535 in July 2022 (Florida Research and Economic Database).
• An unemployment rate of 4.4% as of July 2022, not seasonally adjusted. This amounts to 1,526 unemployed people (Florida Research and Economic Database).
OUTLOOK SUMMARIES
The Sebring Metropolitan Statistical Area (MSA) is expected to show relatively low levels of growth in its economic indicators. Sebring’s Gross Metro Product will be the lowest in the state at a level of $2,684.30. Average annual wage growth of 4.5 percent will lead to an average annual wage of $57,300. Personal incomes will grow by 3.9 percent, leading to a per capita income level of $38,300, the third lowest in the state. Population growth will average 1.2 percent.
Employment growth is expected to average a rate of 0.6 percent annually. The unemployment rate is estimated to average 6.2 percent, the highest in the state.
The Leisure and Hospitality sector will lead Sebring at an average annual growth rate of 5.1 percent. The
majority of Sebring’s sectors will see a contraction in annual growth, with the largest contraction in growth in the Manufacturing sector at 5.9 percent.
METRO NEWS SUMMARIES
New Addition to Lake Placid’s Journal Plaza Underway
• Lake Placid Greater Chamber of Commerce’s Executive Director Jennifer Bush and five future tenants just broke ground for an addition to the popular Journal Plaza.
•
Currently, the Journal plaza houses The Blueberry Patch, a clothing and souvenir shop,Morty & Edna’s Craft Food restaurant, and The Wet Dog, a popular craft beer brewery. The site is a popular hangout spot as well on Saturday mornings with many artisan vendors.
• The new tenants will be Wine Down, Puppers & Hairballs (pet supplies and food), Lake Placid Soda & Ice Cream, Local Yocal (general store), and Owl & Otter Expresso Co. (coffee). All the owners and their families were present for last week’s groundbreaking ceremony.
Source: Highland News-Sun, June 8, 2022
Federal relief funds boosts School District budget
• Federal funding of $50 million will boost the School Board of Highlands County’s 2022-23 budget to its highest level ever of $222,068,571 up from $198,404,278.
• Florida’s plan for the Elementary and Secondary School Emergency Relief (EESER) funds include sustaining the safe operation of schools and equitably expanding opportunity for students who need it most, particularly those most impacted by the COVID-19 pandemic.
Source: Highland News-Sun, July 9, 2022
Duke studying site above U.S. 27 for business park
• Lake Placid Vice Mayor Ray Royce said Duke Energy is launching a site readiness study to
SEBRING Institute for Economic Forecasting 129
•
determine whether the site near their field of solar panels could work for drawing new employers to the town.
“This is really a tremendous potential opportunity for our area,” Royce said. “The idea is to bring to fruition the building of a business campus for light industrial, cold storage, or other light manufacturing. The result would be better paying jobs that pay $20 or $30 an hour, not $15 an hour.”
• Though Duke will pay for the study, it will also be involved in the marketing of the property and other aspects of its financial side. Several people who own land nearby – including orange growers – have been in contact with Duke and have expressed interest in including their property.
Source: Highlands News-Sun, June 29, 2022
Visit Sebring awarded nearly $14,000 more in grants for sports tourism events
• The Florida Sports Foundation (FSF) has awarded Visit Sebring/Highlands County Tourist Development Council (TDC) close to $14,000 in grant funds for events occurring July-September 2022.
• The funds will help offset Visit Sebring’s grant funding awarded to three sporting events occurring during this period: Youth Lacrosse Showcase (July 23-24), Motosurf Games (Aug. 20-21), and Fall Prep Lacrosse (Sept. 17-18).
• The Florida Sports Foundation’s grant programs were established in 1996 to assist communities and host organizations in attracting sports events to the state of Florida. The Foundation’s Board of Directors awards grants every quarter and emphasizes out-of-state economic impact, return on investment, community support, and image value to the state.
Source: Highlands News-Sun, July 18, 2022
Lake Wales CRA board invests in small business incubator
• Board members of the Lake Wales Community Redevelopment Agency (CRA) approved funding for a three-year grant agreement worth nearly $1 million for the creation of a small business incubator by the Florida Development Corporation (FDC).
• The 3,570-square-foot business incubator will be located on Lincoln Avenue in the city’s northwest neighborhood. BizLINC staff will provide qualified entrepreneurs a variety of training and business-related services, such as strategic planning, financial reporting, technical assistance, e-commerce, office space, and much more.
• The mission of BizLINC is to help startup companies and entrepreneurs build successful companies, which in turn creates more job opportunities and drives innovation and economic development in Lake Wales and beyond.
Source: Highlands News-Sun, August 7, 2022
Sebring Farmers Market relaunch proposed
• Miguel Araujo and Cinthia Arcos of Mike’s Produce, and Lisa Wingo and Bill Wendel of Totally Baked Cookie Co., want to bring back the Sebring Farmers Market and continue a better sense of community for their customers and all of Highlands County, according to their business plan.
• The business plan from Mike’s Produce and Totally Baked Cookie Co. states their businesses were started and thrived at the Sebring Farmers Market in their first year as vendors under Dan and Jackie Andrews. When the second season came around, it was apparent the market had the potential to grow but lacked some effort and marketing to continue its success.
• Their objective is to provide opportunities for local vendors to showcase their products and provide residents and visitors inexpensive, fresh, and creative options.
Source: Highlands News-Sun, August 15, 2022
SEBRING 130 Florida & Metro Forecast / Summer 2022
MSA
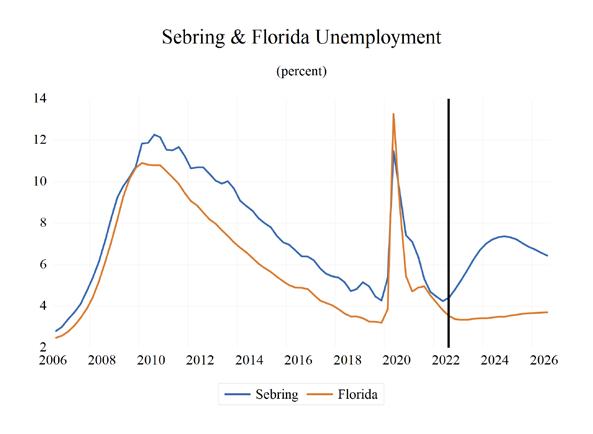
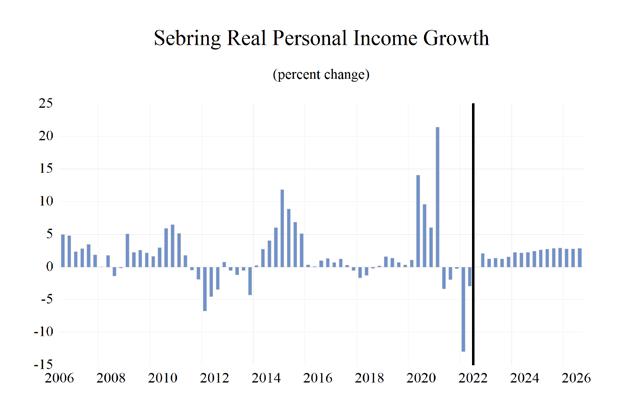
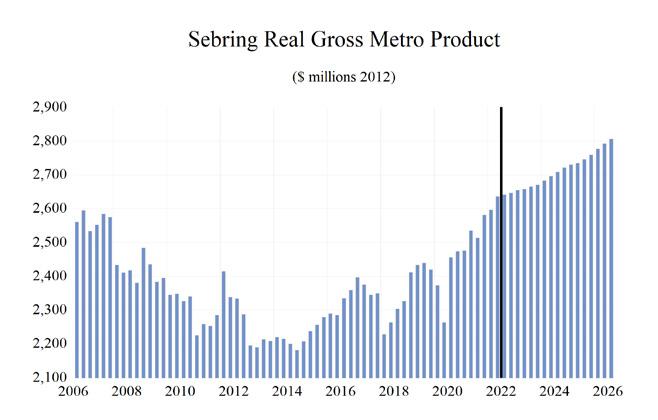

SEBRING Institute for Economic Forecasting 131 0 0.2 0.4 0.6 0.8 1 1.2 1.4 1.6 Total Nonagricultural Employment Total Private Goods Producing Service Producing Private Service Providing Government Sebring
Industry Loca�on Quo�ents
Long Term Outlook for Sebring, FL August 2022 Forecast
Personal Income (Billions $)
Total Personal Income 3.4 3.5 3.6 4.0 4.3 4.4 4.6 4.8 5.1
Pct Chg Year Ago 4.8 0.9 5.6 8.7 9.5 2.5 4.0 4.2 4.8
Wages and Salaries 1.1 1.1 1.1 1.2 1.3 1.5 1.5 1.5 1.6
Nonwage Income 2.4 2.4 2.5 2.8 3.0 3.0 3.1 3.3 3.5
Real Personal Income (12$) 3.7 3.5 3.7 3.9 4.1 4.0 4.0 4.1 4.2 Pct Chg Year Ago 3.8 -3.4 3.5 7.8 5.2 -3.5 0.7 2.5 2.9
Per Capita Income (Ths) 34.2 34.4 36.0 39.0 41.9 42.1 43.3 44.8 46.7
Real Per Capita Income (12$) 36.5 35.2 36.1 38.8 40.1 37.9 37.7 38.3 39.3
Average Annual Wage (Ths) 41.4 41.8 43.4 46.1 50.6 54.7 56.0 58.3 60.3 Pct Chg Year Ago 2.4 0.9 3.9 6.1 9.9 8.1 2.4 4.0 3.5
Establishment Employment (Place of Work, Thousands, SA)
Total Employment 25.7 26.2 26.2 24.9 25.5 26.4 26.5 26.2 26.1
Pct Chg Year Ago 1.3 1.8 0.0 -4.7 2.3 3.4 0.5 -1.2 -0.3
Manufacturing 0.7 0.7 0.6 0.7 0.6 0.6 0.6 0.5 0.5
Pct Chg Year Ago 0.7 -7.5 -5.5 2.3 -11.5 9.4 -5.9 -16.4 -8.5
Nonmanufacturing 25.0 25.5 25.5 24.3 24.9 25.7 25.9 25.7 25.7
Pct Chg Year Ago 1.3 2.1 0.1 -4.9 2.7 3.3 0.7 -0.8 -0.1 Construction & Mining 1.3 1.4 1.5 1.6 1.7 1.7 1.7 1.6 1.6
Pct Chg Year Ago 1.0 8.2 6.9 6.3 6.1 4.5 -2.0 -4.6 -3.8 Trade, Trans, & Utilities 5.6 5.8 5.8 5.5 5.6 5.7 5.7 5.6 5.4
Pct Chg Year Ago 0.2 2.7 -0.6 -3.7 0.2 2.4 0.6 -2.7 -3.6
Wholesale Trade 0.8 0.8 0.8 0.8 0.8 0.8 0.8 0.8 0.9 Retail Trade 3.9 4.0 4.0 3.8 3.8 3.9 3.9 3.7 3.5 Trans, Wrhsng, & Util 0.9 1.0 1.0 0.9 0.9 0.9 0.9 1.0 1.0
Information 0.2 0.2 0.2 0.1 0.2 0.2 0.2 0.2 0.2
Pct Chg Year Ago 4.1 2.7 -11.1 -8.0 34.9 2.2 -5.9 -9.3 -1.5
Financial Activities 0.9 0.9 1.0 0.9 0.9 0.9 1.0 1.0 1.0 Pct Chg Year Ago 2.0 3.9 7.0 -4.7 0.6 2.0 4.1 0.4 2.0
Prof & Business Services 3.0 2.6 2.3 2.1 2.5 2.6 2.3 2.1 2.0 Pct Chg Year Ago 0.6 -13.5 -9.2 -8.0 14.7 4.4 -10.1 -11.3 -0.7
Educ & Health Services 6.1 6.1 6.3 6.1 6.0 6.1 6.2 6.4 6.4 Pct Chg Year Ago 2.0 1.1 2.8 -3.2 -0.9 1.5 1.7 1.9 0.7
Leisure & Hospitality 3.2 3.6 3.6 3.1 3.3 3.5 3.7 3.8 4.0 Pct Chg Year Ago 6.0 9.9 0.1 -12.4 6.8 6.4 3.6 2.8 5.4
Other Services 0.6 0.7 0.7 0.6 0.6 0.6 0.6 0.6 0.7
Pct Chg Year Ago 8.5 6.1 -1.5 -7.3 -4.5 3.7 0.7 2.8 4.2
Federal Government 0.3 0.3 0.3 0.3 0.3 0.3 0.3 0.3 0.3
Pct Chg Year Ago -0.2 -2.5 6.7 9.1 -11.0 -0.1 4.9 1.8 -1.4
State & Local Government 3.9 4.1 4.1 3.8 3.9 4.1 4.2 4.3 4.2
Pct Chg Year Ago -2.6 5.4 -0.2 -5.5 1.8 3.8 3.9 1.3 -1.0
Other Economic Indicators
Population (Ths)
100.2 100.5 101.2 101.6 103.5 105.6 106.9 107.7 108.2
Pct Chg Year Ago 1.0 0.3 0.7 0.4 1.9 2.1 1.2 0.8 0.5
Labor Force (Ths) 36.1 36.2 35.5 34.6 35.1 35.6 36.5 36.8 37.0
Percent Change, Year Ago 0.8 0.1 -1.9 -2.6 1.4 1.4 2.6 0.8 0.5
Unemployment Rate (%) 5.8 5.0 4.7 8.4 5.9 4.5 6.0 7.2 7.1
Total Housing Starts 173.7 224.5 242.9 358.1 499.1 552.1 411.9 398.9 403.3
Single-Family 171.8 202.4 235.5 354.7 484.9 479.4 351.7 337.7 334.2
Multifamily 1.9 22.1 7.4 3.4 14.1 72.7 60.2 61.2 69.1
SEBRING 132 Florida & Metro Forecast / Summer 2022
2017 2018 2019 2020 2021 2022 2023 2024 2025
Short Term Outlook for Sebring, FL August 2022 Forecast
2022:2
Personal Income (Billions $)
Total Personal Income 4.4 4.5 4.6 4.6 4.6 4.6 4.7 4.7 4.8 4.8 4.9 5.0 5.0
Pct Chg Year Ago 4.2 5.1 5.7 5.4 4.3 3.8 2.7 3.5 4.0 4.5 4.8 4.8 4.9
Wages and Salaries 1.5 1.5 1.5 1.5 1.5 1.5 1.5 1.5 1.5 1.5 1.6 1.6 1.6
Nonwage Income 3.0 3.0 3.1 3.1 3.1 3.1 3.2 3.2 3.3 3.3 3.4 3.4 3.4
Real Personal Income (12$) 4.0 4.0 4.0 4.0 4.0 4.0 4.0 4.1 4.1 4.1 4.2 4.2 4.2
Pct Chg Year Ago -2.1 -1.2 0.0 0.6 0.7 1.1 0.4 1.6 2.2 2.9 3.2 3.1 3.1
Per Capita Income (Ths) 41.9 42.2 42.9 43.0 43.1 43.4 43.7 44.1 44.5 45.0 45.5 46.0 46.4
Real Per Capita Income (12$) 37.9 37.6 37.9 37.7 37.7 37.7 37.8 38.0 38.2 38.5 38.7 39.0 39.2
Average Annual Wage (Ths) 54.7 55.1 55.2 55.5 55.7 56.1 56.8 57.4 58.0 58.6 59.1 59.6 60.0 Pct Chg Year Ago 9.6 7.1 3.9 3.2 1.9 1.9 2.8 3.4 4.0 4.4 4.0 3.9 3.5
Establishment Employment (Place of Work, Thousands, SA)
Total Employment 26.3 26.5 26.6 26.6 26.6 26.5 26.4 26.3 26.2 26.2 26.1 26.1 26.1
Pct Chg Year Ago 3.5 3.3 2.7 1.8 1.0 -0.1 -0.7 -1.2 -1.4 -1.1 -1.0 -0.7 -0.4
Manufacturing 0.6 0.6 0.7 0.6 0.6 0.6 0.6 0.5 0.5 0.5 0.5 0.5 0.5
Pct Chg Year Ago 10.9 11.4 9.8 3.8 -3.2 -8.9 -14.7 -17.0 -16.8 -16.3 -15.4 -12.5 -9.5
Nonmanufacturing 25.7 25.8 25.9 26.0 26.0 25.9 25.8 25.8 25.7 25.7 25.6 25.6 25.6
Pct Chg Year Ago 3.3 3.2 2.5 1.8 1.1 0.2 -0.4 -0.8 -1.0 -0.8 -0.6 -0.5 -0.2
Construction & Mining 1.7 1.7 1.7 1.7 1.7 1.7 1.7 1.6 1.6 1.6 1.6 1.6 1.6
Pct Chg Year Ago 4.8 5.5 3.9 2.2 -1.7 -3.9 -4.2 -4.6 -4.7 -4.6 -4.5 -4.4 -4.0 Trade, Trans, & Utilities 5.7 5.7 5.7 5.7 5.7 5.7 5.7 5.7 5.6 5.5 5.5 5.4 5.4
Pct Chg Year Ago 3.2 2.5 1.9 0.0 1.0 1.0 0.3 -0.3 -2.7 -3.4 -4.6 -4.9 -4.1
Wholesale Trade 0.8 0.8 0.8 0.8 0.8 0.8 0.8 0.8 0.8 0.8 0.9 0.9 0.9 Retail Trade 3.9 3.9 3.9 3.9 3.9 3.9 3.9 3.9 3.8 3.7 3.6 3.6 3.5 Trans, Wrhsng, & Util 1.0 1.0 1.0 1.0 0.9 0.9 1.0 1.0 1.0 1.0 1.0 1.0 1.0
Information 0.2 0.2 0.2 0.2 0.2 0.2 0.2 0.2 0.2 0.2 0.2 0.2 0.2 Pct Chg Year Ago 1.6 -0.4 0.3 -1.5 -4.6 -6.5 -11.2 -12.3 -10.4 -8.1 -6.2 -4.2 -2.2
Financial Activities 0.9 0.9 0.9 1.0 1.0 1.0 1.0 1.0 1.0 1.0 1.0 1.0 1.0 Pct Chg Year Ago -0.3 3.7 3.5 4.8 5.9 3.6 2.1 -0.6 -0.6 1.0 1.9 2.6 2.5
Prof & Business Services 2.6 2.6 2.6 2.5 2.4 2.3 2.2 2.1 2.1 2.0 2.0 2.0 2.0 Pct Chg Year Ago 5.3 2.3 0.6 -3.5 -8.3 -13.2 -15.4 -15.3 -12.1 -10.1 -7.2 -4.6 -2.2
Educ & Health Services 6.1 6.2 6.2 6.2 6.2 6.2 6.2 6.3 6.3 6.4 6.4 6.4 6.4 Pct Chg Year Ago 1.1 2.1 2.8 2.4 2.3 1.2 0.7 1.1 1.6 2.3 2.4 1.9 1.0
Leisure & Hospitality 3.5 3.6 3.5 3.6 3.6 3.7 3.7 3.7 3.7 3.8 3.8 3.9 3.9 Pct Chg Year Ago 6.9 4.9 0.4 1.1 3.0 4.6 5.7 3.9 2.5 1.8 3.1 4.5 5.8
Other Services 0.6 0.6 0.6 0.6 0.6 0.6 0.6 0.6 0.6 0.6 0.7 0.7 0.7 Pct Chg Year Ago 3.7 4.0 3.0 2.5 1.1 -0.5 -0.5 0.2 2.2 3.9 4.7 5.0 4.8
Federal Government 0.3 0.3 0.3 0.3 0.3 0.3 0.3 0.3 0.3 0.3 0.3 0.3 0.3 Pct Chg Year Ago -3.1 3.1 3.8 5.4 6.0 4.9 3.5 2.8 2.2 1.4 0.6 -0.6 -1.7 State & Local Government 4.1 4.1 4.1 4.2 4.2 4.2 4.2 4.3 4.3 4.3 4.3 4.3 4.2
Pct Chg Year Ago 3.3 3.7 5.2 6.3 3.7 3.1 2.4 1.9 1.7 1.3 0.5 -0.3 -1.1
Other Economic Indicators
Population (Ths) 105.5 105.9 106.3 106.6 106.8 107.0 107.2 107.4 107.6 107.8 108.0 108.1 108.2
Pct Chg Year Ago 2.1 2.1 1.9 1.6 1.3 1.0 0.8 0.8 0.8 0.8 0.7 0.6 0.5 Labor Force (Ths) 35.3 35.6 36.0 36.3 36.5 36.6 36.7 36.7 36.8 36.8 36.9 36.9 37.0 Pct Chg Year Ago 0.5 1.6 2.4 2.4
Unemployment Rate (%) 4.2
Total Housing Starts
Single-Family
Multifamily
2.8 2.0 1.3 0.9 0.6 0.5 0.5 0.5
7.0 7.2 7.3 7.4 7.3 7.2
336.9 337.8
58.6 60.9 63.6 66.2 68.8
SEBRING Institute for Economic Forecasting 133
2022:3 2022:4 2023:1 2023:2 2023:3 2023:4 2024:1 2024:2 2024:3 2024:4 2025:1 2025:2
3.2
4.4 4.8 5.3 5.7 6.2 6.7
590.5 488.1 459.7 414.0 404.8 414.9 413.9 400.0 396.3 397.9 401.4 405.6 405.7
517.1 441.0 416.7 370.1 346.9 346.4 343.4 338.4 337.7
339.4 336.9
73.5 47.1 43.0 43.8 57.9 68.5 70.5 61.6
PROFILES
The Tallahassee MSA is comprised of Gadsden, Jefferson, Leon, and Wakulla Counties. It is located between Pensacola and Jacksonville. Tallahassee is the capital city of Florida and houses Florida State University and Florida A&M University.
QUICK FACTS
• Metro population estimate of 382,197 as of 2019 (5-Year Estimate) (U.S. Census Bureau).
• Gadsden County population estimate of 45,660 as of 2019 (5-Year Estimate) (U.S. Census Bureau).
• Jefferson County population estimate of 14,246 as of 2019 (5-Year Estimate) (U.S. Census Bureau).
• Leon County population estimate of 293,582 as of 2019 (5-Year Estimate) (U.S. Census Bureau).
• Wakulla County population estimate of 33,739 as of 2019 (5-Year Estimate) (U.S. Census Bureau).
• Civilian labor force of 200,364 in July 2022 (Florida Research and Economic Database).
• An unemployment rate of 3.0% as of July 2022, not seasonally adjusted. This amounts to 6,024 unemployed people (Florida Research and Economic Database).
OUTLOOK SUMMARIES
The Tallahassee MSA is expected to show low levels of growth in this forecast’s studied indicators. Tallahassee’s Gross Metro Product will be $16,992.73. Average annual wage growth of 4.0 percent should put the average annual wage at $62,500. Personal incomes will grow by 4.1 percent annually, placing the per capita income level at $48,500. Population growth will be -0.1 percent, the only contraction in population of the MSAs.
Average annual employment growth of 0.7 percent will lead to an unemployment rate of 4.3 percent for the MSA, lower than the state average of 4.6 percent.
The Leisure & Hospitality sector will see the highest annual growth rate in the MSA at 7.4 percent. The Manufacturing sector will follow with a growth rate of 2.5 percent. The Information sector and Construction and Mining sector will contract at rates of 2.1 and 1.3 percent, respectively.
METRO NEWS SUMMARIES
FSU, Tallahassee Memorial HealthCare team up to construct new academic health center
• Florida State University and Tallahassee Memorial HealthCare announced today a new partnership to build the FSU Health Tallahassee Center, a new facility that will offer advanced medical training and translational research opportunities and explore the academic health center of the future.
• The building, funded by a $125 million appropriation from the Florida Legislature, will be located on the TMH campus and include educational, medical and research laboratory space while drawing on the knowledge and expertise of TMH clinicians and faculty from the FSU College of Medicine and College of Nursing.
• The center will provide about 130,000 gross square feet of medical and research-related space distributed over five floors. It will accommodate an estimated 30 principal investigators, producing an estimated $40 million of additional annual grant funding, focused on clinical trials, data-driven precision health, digital health and clinical informatics, and clinical and translational research.
Source: FSU, June 2, 2022
Airport’s International Processing Facility to bring unseen global access to capital city
• A $28-million capital investment to Tallahassee’s airport is expected to unlock international access for travelers and economic development. In a few years, residents will be able to book non-
T ALLAHASSEE 134 Florida & Metro Forecast / Summer 2022
•
stop flights overseas, including charter, business or general aviation flights. Possible destinations include the Caribbean, Canada, Mexico, and South America.
So far this year, passenger traffic at Tallahassee’s airport has recovered to levels before the COVID-19 pandemic grounded travel two years ago. First quarter 2022 shows 184,927 passengers, a 93.9% increase compared to the same time last year.
•
The International Processing Facility is slated to be complete by 2024. Once it is, officials said the airport’s $599 million economic impact in Tallahassee and the region is projected to reach $1 billion and the project is expected to create 1,600 jobs for the region.
Source: Tallahassee Democrat, June 7, 2022
North American Aerospace Industries eyeing Tallahassee airport
• North American Aerospace Industries, a company that specializes in aircraft teardown and recycling, is the mystery company behind Project Alpha, a new development coming to Tallahassee airport.
•
NAAI company’s website states its processes make North American Aerospace Industries “the only company in the world that can dispose of 100 percent of a commercial jetliner without putting any materials in landfills.”
• If the company makes a deal with Tallahassee’s airport, it’s slated to generate 985 permanent jobs and 1,443 temporary construction jobs. It may spur a $450 million total economic impact, according to a report by Florida State University’s Center for Economic Forecasting and Analysis.
Source: Tallahassee Democrat, July 13, 2022
Avatar Financial Group Provides $1M Bridge Loan for Tallahassee Multifamily
• Avatar Financial Group has closed a $1.4-million bridge loan for a 12-month term at 8.99% on behalf of a low-rise multifamily property located at 103 Cactus Street in Tallahassee, FL.
• Avatar’s loan provided funds for construction completion as well as an interest reserve enabling the property to be stabilized with new tenants. The owners will conventionally refinance the property once renovation is completed.
• The two-story property is situated between Florida State University, Florida A&M University and Tallahassee Community College and is valued at $2.6 million. The complex was constructed in 1994 with 24 one-, two- and fourbedroom units.
Source: Connectre, July 20, 2022
New Tallahassee banking initiative to help lowerincome communities
• When Labarron Smith wanted to start his own business in Tallahassee he worked with the Capital City Chamber of Commerce on financial education and options that allowed him to qualify for things like a low interest rate loan. The Capital City Chamber of Ccommerce is now hoping to provide the same guidance to people across Tallahassee through the Bank On Initiative.
• Katrina Tuggerson, President of the Chamber, said for the past three years she’s been looking at community solutions to help address poverty. After finding the Bank On initiative in 202, she met with their leadership team to bring the project to Tallahassee.
• The Bank on initiative, also in cities nationwide like Chicago, Philadelphia and Savannah, will focus on offering financial education to people who might not otherwise have the knowledge they need to make the best financial decisions.
Source: WTXL Tallahassee, September 19, 2022
T ALLAHASSEE Institute for Economic Forecasting 135
MSA
Total Nonagricultural Employment
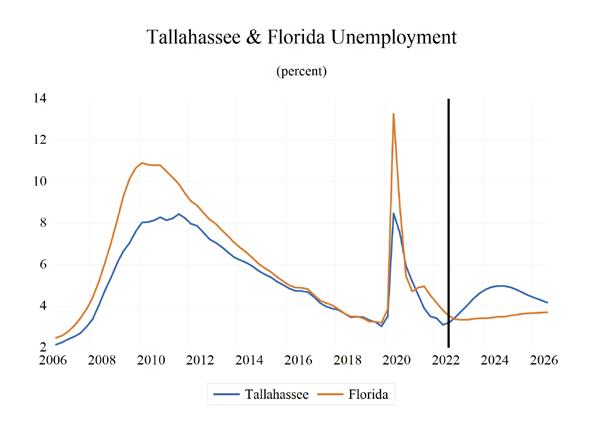

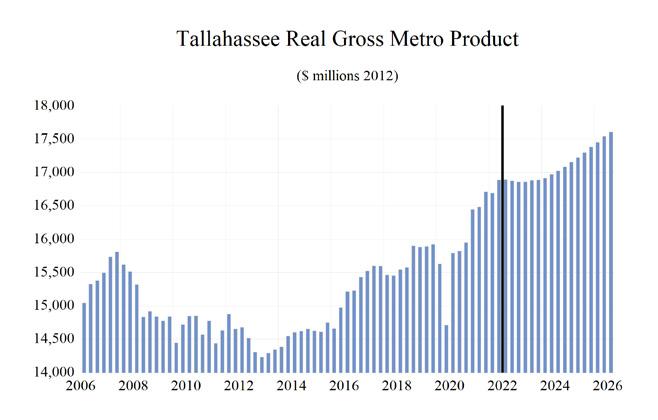

T ALLAHASSEE 136 Florida & Metro Forecast / Summer 2022 0 0.5 1 1.5 2 2.5 3
Total Private Goods Producing Service Producing Private Service Providing Mining Logging and Construc�on Manufacturing Trade, Transporta�on, and U�li�es Wholesale Trade Retail Trade Transporta�on, Warehousing and U�li�es Informa�on Financial Ac�vi�es Professional and Business Services Educa�onal and Health Services Leisure and Hospitality Other Services Government Tallahassee
Industry Loca�on Quo�ents
Long Term Outlook for Tallahassee, FL August 2022 Forecast
Personal Income (Billions $)
Total Personal Income 15.6 16.3 17.0 18.2 20.1 21.0 21.8 22.6 23.6
Pct Chg Year Ago 4.7 4.9 4.3 6.7 10.3 4.8 3.7 3.6 4.4
Wages and Salaries 8.2 8.5 8.9 9.2 10.3 11.4 11.7 12.0 12.4
Nonwage Income 7.4 7.8 8.1 9.0 9.7 9.6 10.1 10.6 11.2
Real Personal Income (12$) 15.1 16.0 16.6 17.5 18.6 18.3 18.4 18.8 19.2 Pct Chg Year Ago 2.3 6.5 3.6 5.6 5.9 -1.4 0.4 1.9 2.5
Per Capita Income (Ths) 41.0 42.9 44.5 47.3 52.0 54.6 56.6 58.6 61.3
Real Per Capita Income (12$) 39.6 42.0 43.3 45.6 48.2 47.6 47.8 48.7 50.0
Average Annual Wage (Ths) 45.2 46.3 47.7 51.0 55.8 60.2 61.3 63.2 65.2 Pct Chg Year Ago 3.4 2.5 3.0 7.0 9.3 7.9 2.0 3.1 3.0
Establishment Employment (Place of Work, Thousands, SA)
Total Employment 179.9 183.7 186.7 179.6 184.8 189.1 190.3 189.3 189.9
Pct Chg Year Ago 1.4 2.1 1.6 -3.8 2.9 2.3 0.6 -0.5 0.3
Manufacturing 3.2 3.2 3.4 3.4 3.8 4.0 3.9 3.6 3.5
Pct Chg Year Ago 1.3 0.3 4.6 1.5 10.7 5.2 -2.4 -6.6 -3.8
Nonmanufacturing 176.7 180.5 183.3 176.2 181.0 185.2 186.4 185.7 186.4
Pct Chg Year Ago 1.4 2.1 1.6 -3.9 2.8 2.3 0.7 -0.4 0.4 Construction & Mining 7.4 8.0 8.7 8.3 8.2 8.0 7.7 7.5 7.4
Pct Chg Year Ago 3.8 8.2 9.4 -4.7 -2.2 -1.6 -3.7 -2.9 -1.2 Trade, Trans, & Utilities 24.3 24.5 24.6 23.6 24.6 25.5 25.5 24.6 23.9
Pct Chg Year Ago -0.6 0.8 0.3 -4.0 4.2 3.8 -0.3 -3.3 -2.9
Wholesale Trade 3.8 3.8 3.9 3.8 3.9 4.1 4.2 4.3 4.4
Retail Trade 18.5 18.5 18.5 17.6 18.3 18.8 18.6 17.5 16.7 Trans, Wrhsng, & Util 2.0 2.1 2.2 2.2 2.4 2.6 2.7 2.8 2.8
Information 3.4 3.1 3.1 3.1 3.4 3.6 3.5 3.2 3.2
Pct Chg Year Ago 6.9 -8.3 0.0 0.8 8.3 6.0 -3.4 -6.4 -0.1
Financial Activities 7.8 7.9 7.8 7.6 7.9 8.1 8.4 8.4 8.3 Pct Chg Year Ago 3.4 2.1 -2.2 -2.3 3.8 2.6 4.0 -0.2 -0.4
Prof & Business Services 20.3 21.6 22.3 22.9 24.9 26.0 24.4 22.3 22.4 Pct Chg Year Ago 0.7 6.5 3.3 2.9 8.7 4.4 -6.1 -8.9 0.8
Educ & Health Services 23.2 24.0 24.8 24.5 24.7 25.4 25.9 26.7 27.1 Pct Chg Year Ago 5.3 3.4 3.2 -1.2 1.0 2.8 1.7 3.3 1.5
Leisure & Hospitality 20.0 20.4 21.0 16.6 18.7 19.4 20.5 21.5 21.9 Pct Chg Year Ago 1.2 1.8 2.8 -20.6 12.1 3.7 5.8 5.1 1.9
Other Services 8.9 9.4 9.0 8.7 8.4 8.8 8.9 9.3 9.9
Pct Chg Year Ago -5.3 6.3 -4.0 -4.0 -2.5 4.1 1.0 5.1 5.5
Federal Government 2.1 2.0 2.1 2.2 2.1 2.1 2.2 2.1 2.1 Pct Chg Year Ago 3.8 -2.8 4.1 3.2 -3.3 -0.2 2.8 -0.9 -1.0
State & Local Government 59.4 59.5 60.0 58.6 58.2 58.3 59.6 60.0 60.1
Pct Chg Year Ago 1.3 0.3 0.7 -2.2 -0.8 0.2 2.3 0.7 0.1
Other Economic Indicators
Population (Ths) 380.2 381.5 383.5 384.6 385.5 385.2 385.3 385.3 384.8
Pct Chg Year Ago 0.8 0.3 0.5 0.3 0.2 -0.1 0.0 0.0 -0.1
Labor Force (Ths) 189.0 191.1 192.8 189.3 194.4 198.7 202.5 202.4 201.9
Percent Change, Year Ago 0.6 1.1 0.9 -1.8 2.7 2.2 1.9 -0.1 -0.2
Unemployment Rate (%) 4.1 3.6 3.3 6.4 4.3 3.3 4.2 4.9 4.7
Total Housing Starts
Single-Family 1814.7 2014.3
Multifamily 888.0 968.5
2346.9 2528.9 2472.7 2002.9 2024.0 2098.8
1292.4 1476.5 1246.1 1012.7 1052.8 1092.4
1054.5 1052.4 1226.6 990.2 971.2 1006.4
T ALLAHASSEE Institute for Economic Forecasting 137
2017 2018 2019 2020 2021 2022 2023 2024 2025
2702.8 2982.8 2320.6
1185.1
1135.6
Short Term Outlook for Tallahassee, FL August 2022 Forecast
2022:2 2022:3 2022:4 2023:1 2023:2
Personal Income (Billions $)
2023:4
2024:2
Total Personal Income 20.9 21.2 21.5 21.6 21.7 21.8 22.0 22.2 22.5 22.7 23.0 23.2 23.5 Pct Chg Year Ago 6.9 6.0 5.9 5.7 3.7 3.1 2.3 2.8 3.4 4.0 4.3 4.4 4.4
Wages and Salaries 11.4 11.5 11.6 11.7 11.7 11.7 11.8 11.9 12.0 12.1 12.2 12.3 12.4
Nonwage Income 9.5 9.6 9.9 10.0 10.0 10.1 10.2 10.4 10.5 10.6 10.8 11.0 11.1
Real Personal Income (12$) 18.3 18.3 18.4 18.4 18.4 18.4 18.4 18.6 18.7 18.8 18.9 19.1 19.2 Pct Chg Year Ago 0.4 -0.4 0.1 0.9 0.2 0.4 0.1 0.9 1.6 2.4 2.7 2.7 2.6
Per Capita Income (Ths) 54.4 55.0 55.8 56.1 56.4 56.7 57.1 57.7 58.3 58.9 59.6 60.3 60.9
Real Per Capita Income (12$) 47.6 47.5 47.8 47.7 47.7 47.7 47.9 48.2 48.5 48.8 49.2 49.5 49.8
Average Annual Wage (Ths) 60.2 60.6 60.8 60.9 61.1 61.4 62.0 62.5 63.0 63.5 64.0 64.5 64.9 Pct Chg Year Ago 9.5 6.7 3.9 3.0 1.5 1.3 2.0 2.5 3.1 3.6 3.3 3.3 3.1
Establishment Employment (Place of Work, Thousands, SA)
Total Employment 188.8 190.1 190.5 190.8 190.7 190.2 189.6 189.3 189.4 189.3 189.3 189.4 189.7 Pct Chg Year Ago 2.7 1.7 1.8 1.9 1.0 0.1 -0.5 -0.8 -0.7 -0.4 -0.2 0.0 0.2 Manufacturing 4.0 4.0 4.0 4.0 3.9 3.9 3.8 3.7 3.6 3.6 3.5 3.5 3.5
Pct Chg Year Ago 5.3 3.6 2.9 0.5 -1.4 -3.2 -5.4 -6.0 -6.6 -7.0 -6.7 -5.6 -4.4
Nonmanufacturing 184.9 186.1 186.4 186.8 186.8 186.3 185.8 185.6 185.7 185.7 185.7 185.9 186.2 Pct Chg Year Ago 2.6 1.6 1.8 1.9 1.1 0.1 -0.4 -0.6 -0.6 -0.3 0.0 0.1 0.3 Construction & Mining 8.0 8.0 7.9 7.8 7.8 7.7 7.6 7.6 7.5 7.5 7.4 7.4 7.4 Pct Chg Year Ago -2.1 -0.4 -2.2 -3.7 -3.0 -4.4 -3.7 -3.6 -3.2 -2.7 -2.2 -1.9 -1.4
Trade, Trans, & Utilities 25.7 25.6 25.5 25.4 25.6 25.4 25.4 25.1 24.7 24.5 24.2 24.0 23.8
Pct Chg Year Ago 4.8 3.6 2.4 0.2 -0.1 -0.5 -0.6 -1.2 -3.8 -3.7 -4.5 -4.4 -3.4
Wholesale Trade 4.0 4.1 4.1 4.2 4.2 4.2 4.2 4.2 4.3 4.3 4.3 4.4 4.4 Retail Trade 19.0 18.8 18.8 18.6 18.8 18.5 18.5 18.1 17.6 17.3 17.1 16.8 16.6 Trans, Wrhsng, & Util 2.7 2.7 2.7 2.7 2.7 2.7 2.7 2.8 2.8 2.8 2.8 2.8 2.8 Information 3.6 3.6 3.7 3.7 3.5 3.4 3.3 3.3 3.3 3.2 3.2 3.2 3.2
Pct Chg Year Ago 8.0 4.1 6.4 4.4 -2.7 -4.9 -10.0 -10.1 -6.9 -4.8 -3.5 -2.0 -0.9
Financial Activities 8.0 8.1 8.3 8.5 8.5 8.4 8.3 8.3 8.4 8.4 8.4 8.4 8.4 Pct Chg Year Ago 3.5 0.2 3.7 7.3 5.4 2.7 0.8 -1.5 -0.8 0.5 0.9 0.8 -0.2
Prof & Business Services 25.9 26.2 26.1 25.8 24.8 24.0 23.2 22.7 22.3 22.0 22.0 22.1 22.3 Pct Chg Year Ago 5.8 3.1 1.8 -0.2 -4.4 -8.5 -11.3 -12.0 -10.0 -8.0 -5.1 -2.4 -0.1
Educ & Health Services 25.4 25.6 25.7 25.7 25.8 25.9 26.0 26.3 26.6 26.9 27.0 27.1 27.1 Pct Chg Year Ago 3.2 2.8 3.1 2.7 1.8 1.2 1.2 2.5 3.2 3.7 3.8 2.9 1.8
Leisure & Hospitality 19.7 19.8 19.5 19.7 20.2 20.9 21.0 21.1 21.5 21.7 21.7 21.7 21.9 Pct Chg Year Ago 4.8 1.6 2.4 7.3 2.4 5.5 7.9 7.2 6.3 3.7 3.3 2.7 1.9
Other Services 8.7 8.9 8.9 8.9 8.8 8.9 9.0 9.1 9.3 9.4 9.6 9.7 9.8 Pct Chg Year Ago 4.2 4.9 3.9 2.8 1.0 -0.1 0.4 2.0 5.0 6.5 7.0 6.9 6.0
Federal Government 2.1 2.1 2.1 2.1 2.2 2.2 2.2 2.1 2.1 2.1 2.1 2.1 2.1 Pct Chg Year Ago -1.8 0.6 1.5 2.4 4.8 3.0 1.2 0.0 -1.2 -1.2 -1.0 -1.0 -1.0
State & Local Government 57.7 58.2 58.7 59.2 59.6 59.7 59.8 59.9 60.0 60.0 60.0 60.1 60.1
Pct Chg Year Ago -0.4 -0.4 0.5 1.3 3.2 2.5 1.9 1.2 0.7 0.5 0.3 0.2 0.1
Other Economic Indicators
Population (Ths) 385.1
385.4 385.3 385.1
Pct Chg Year Ago -0.2 -0.1 0.0 0.1 0.1 0.0 0.0 0.0 0.0 0.0 0.0 -0.1 -0.1 Labor Force (Ths) 198.2 199.2 200.8 201.9 202.6 202.8 202.8 202.6 202.4 202.3 202.1 202.0 201.9 Pct Chg Year Ago 2.2 2.0 2.6
0.4 -0.1 -0.2 -0.3 -0.3 -0.3
4.9 5.0 5.0 4.9 4.8 Total Housing Starts
Unemployment Rate (%) 3.1 3.2
2039.9 2062.5 2088.4
Single-Family 1291.0
961.0 961.7 972.9 989.3 993.3 1006.6
1014.9 1056.2 1067.0 1073.3 1095.1 1095.1 Multifamily
T ALLAHASSEE 138 Florida & Metro Forecast / Summer 2022
2023:3
2024:1
2024:3 2024:4 2025:1 2025:2
385.2 385.4 385.4 385.3 385.3 385.3 385.3 385.4
384.9
2.6 2.2 1.8 1.0
3.5 3.7 4.0 4.4 4.6 4.8
2773.8 2334.9 2259.9 2052.5 1991.0 1986.9 1981.2 1975.9 2017.9
2101.7
1124.0 1095.6 1019.9 1000.0 1015.8 1015.0
1482.9 1211.0 1164.3 1032.6 991.0 971.1 966.2
PROFILES
The Tampa–St. Petersburg–Clearwater MSA is comprised of Hernando, Hillsborough, Pasco, and Pinellas counties. Located centrally on the west coast of Florida, this region includes Tarpon Springs, Sponge Docks, Ybor City, Bush Gardens, the University of South Florida, and the University of Tampa. The Tampa Bay Buccaneers and the Tampa Bay Rays call this region home.
QUICK FACTS
• Metro population estimate of 3,097,859 as of 2019 (5-Year Estimate) (U.S. Census Bureau).
• Hernando County population estimate of 193,920 as of 2019 (5-Year Estimate) (U.S. Census Bureau).
• Hillsborough County population estimate of 1,471,968 as of 2019 (5-Year Estimate) (U.S. Census Bureau).
• Pasco County population estimate of 553,947 as of 2019 (5-Year Estimate) (U.S. Census Bureau).
• Pinellas County population estimate of 974,996 as of 2019 (5-Year Estimate) (U.S. Census Bureau).
• Civilian labor force of 1,646,691 in July 2022 (Florida Research and Economic Database).
• An unemployment rate of 2.7% as of July 2022, not seasonally adjusted. This amounts to 45,286 unemployed people (Florida Research and Economic Database).
OUTLOOK SUMMARIES
The Tampa—St. Petersburg—Clearwater Metropolitan Statistical Area (MSA) is expected to show low levels of growth in the economic indicators relative to the other MSAs studied. The Tampa MSA will contribute the second-highest level of Gross Metro Product in the state at $157,311.80. Average annual wage growth of 4.1 percent will give the MSA the fourth-highest annual wage in the state at $74,600. Personal income growth of 4.0 percent will place the per capita income level at $48,900. Tampa will experience the average population growth of 1.1 percent.
Employment growth is expected to average 1.6 percent annually, the third highest in the state. The MSA’s unemployment rate should average 4.6 percent. The fastest growing sector in the Tampa area will be the Leisure & Hospitality sector with an average annual growth rate of 4.3 percent. This is followed by the Other Services sector with an average annual growth rate of 2.9 percent. The Professional and Business Services sector will see the largest contraction in growth of 4.5 percent.
METRO NEWS SUMMARIES
Tampa’s Westshore Marina District will come alive over summer
• South Tampa’s newest waterfront neighborhood is getting busier. A New business development done by BTI Partners has turned the struggling lot south of the Gandy Bridge into an upscale community.
• More businesses and events will open this summer. The first of three Marina Pointe condominium towers and a private marina is expected to finish construction by the end of the year. Units are sold out and sales for the second tower’s 150 condos will begin Wednesday.
• The Westshore Marina District in total should be completed by 2025, said Dominic Pickering, the West Coast Florida executive director for BTI Partners.
Source: Tampa Bay Times, June 2, 2022
St. Pete mayor reopens talks on the future of Rays stadium site
• The mayor of St. Petersburg is reopening talks about the future of the Tropicana Field site where baseball’s Tampa Bay Rays play their home games.
• Mayor Ken Welch said Wednesday that two previous proposals for the 86-acre downtown location are being scrapped, with a new round of plans to be solicited beginning in mid-August.
T AMPA – S T . P ETERSBURG – C LEARWATER Institute for Economic Forecasting 139
• Welch said the goal is to choose a new redevelopment plan by the end of this year..
The Rays’ Tropicana Field lease is up in 2027 and Welch said the new plan should envision including a stadium at the site.
Source: ESPN, June 29, 2022
Prudential Investment arm signs office lease at Midtown Tampa
• PGIM Inc. will enter the Tampa market next year, bringing 150 jobs to the $1 billion development at N Dale Mabry Highway and Interstate 275.
• The Fortune 500 company will be setting up shop at Midtown Tampa.
• PGIM Inc., the global investment arm of Prudential Financial, announced Wednesday that it’s leasing 22,272 square feet at Midtown West, the first main office building at N Dale Mabry Highway and Interstate 275.
Source: Tampa Bay Times, July 6, 2022
Goodbye, downtown Tampa’s industrial past. Hello, more Walter Street Tampa
• The old Ardent Mills flour mill, once part of a thriving port, will make way for more connectivity at the edge of a fast-growing downtown.
• Friday, a piece of downtown Tampa’s past fell to pave the way for plans for its future. Curious onlookers watched from a balcony atop a new 23-story residential tower in the chic Water Street Tampa district as Mayor Jane Castor operated heavy construction equipment to tear down part of the old Ardent Mills flour mill — a last remnant of Tampa’s industrial warehouseand-wharf past.
• Tearing down just one building of the 3-acre mill that opened in 1938 was the symbolic start to a methodical demolition process expected to last three months.
Source: Tampa Bay Times, July 22, 2022
Downtown Tampa skyscraper sells to New York firm
•
The Wells Fargo Center in Tampa has sold. The well-known rose-colored tower, a feature on Tampa’s downtown skyline since the 1980s, went to an investment group led by New York real estate investment and development company The Feil Organization.
•
The sale price was not initially disclosed, but was later revealed to be $120 million.
•
The 22-story Wells Fargo Center was built in 1985 at 100 South Ashley Drive at a time when downtown Tampa was a far different place than what it is today.
Source: Business Observer, August 11, 2022
•
Darryl Shaw to buy, develop 25 acres between Ybor City, Port Tampa Bay
• For years, one of the most closely watched plots of land between Ybor City and Tampa’s Channel District has been a privately held 25-acre ship repair site at the north end of Port Tampa Bay, directly south of the Lee Roy Selmon Expressway.
•
The site may finally have a buyer — and it’s a familiar one. Darryl Shaw, the veterinary entrepreneur turned Ybor City real estate investor, has a deal in place to purchase the land occupied by International Ship Repair and Marine Services, a spokesperson said Wednesday.
• The three-parcel property would be purchased in two phases over the next five years.
Source: Tampa Bay Times, August 31, 2022
T AMPA – S T . P ETERSBURG – C LEARWATER 140 Florida & Metro Forecast / Summer 2022
Total Nonagricultural Employment
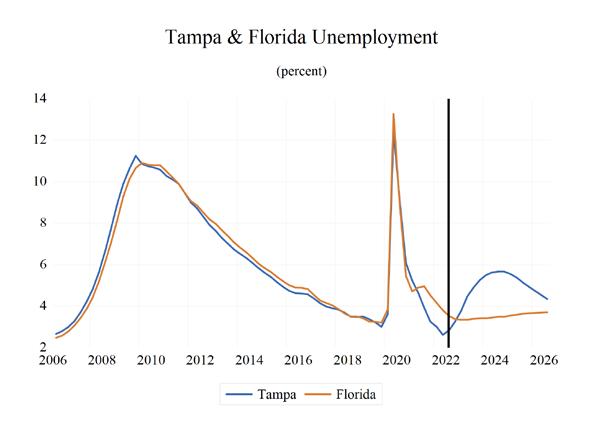


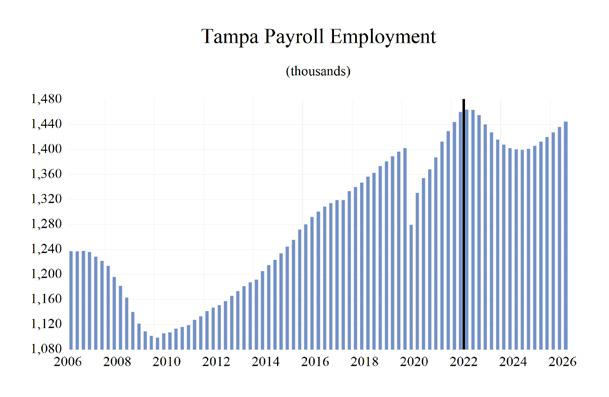
T AMPA – S T . P ETERSBURG – C LEARWATER Institute for Economic Forecasting 141 0 0.2 0.4 0.6 0.8 1 1.2 1.4
Total Private Goods Producing Service Producing Private Service Providing Mining, Logging, and Construc�on Manufacturing Trade, Transporta�on, and U�li�es Wholesale Trade Retail Trade Transporta�on, Warehousing and U�li�es Informa�on Financial Ac�vi�es Professional and Business Services Educa�onal and Health Services Leisure and Hospitality Other Services Government Tampa St. Petersburg Clearwater Industry Loca�on Quo�ents
Long Term Outlook for Tampa-St. Petersburg-Clearwater, FL August 2022 Forecast
Personal Income (Billions $)
Total Personal Income 141.7 149.6 157.4 169.6 186.3 195.0 201.4 208.0 218.1
Pct Chg Year Ago 5.9 5.5 5.2 7.8 9.8 4.7 3.3 3.3 4.8
Wages and Salaries 70.6 74.8 79.5 82.9 93.9 104.7 106.1 107.0 110.9
Nonwage Income 71.1 74.8 77.9 86.7 92.3 90.3 95.4 101.0 107.2
Real Personal Income (12$) 138.2 145.2 148.9 153.9 162.3 159.9 159.9 162.4 167.2 Pct Chg Year Ago 4.6 5.0 2.5 3.4 5.5 -1.4 0.0 1.5 3.0
Per Capita Income (Ths) 46.1 48.0 50.0 53.2 57.8 59.7 60.9 62.3 64.7
Real Per Capita Income (12$) 45.0 46.6 47.3 48.3 50.3 49.0 48.4 48.6 49.6
Average Annual Wage (Ths) 53.0 54.9 56.9 61.3 66.5 71.2 73.3 75.7 78.0 Pct Chg Year Ago 2.4 3.6 3.7 7.7 8.5 7.1 3.0 3.2 3.1
Establishment Employment (Place of Work, Thousands, SA)
Total Employment 1320.9 1351.2 1384.5 1341.1 1398.9 1457.3 1434.2 1401.9 1409.3 Pct Chg Year Ago 2.0 2.3 2.5 -3.1 4.3 4.2 -1.6 -2.3 0.5
Manufacturing 66.4 67.3 69.0 66.9 68.6 72.5 70.9 66.9 65.2
Pct Chg Year Ago 2.4 1.3 2.5 -3.0 2.5 5.7 -2.1 -5.7 -2.6
Nonmanufacturing 1254.4 1283.9 1315.5 1274.2 1330.4 1384.8 1363.3 1335.0 1344.2
Pct Chg Year Ago 2.0 2.3 2.5 -3.1 4.4 4.1 -1.6 -2.1 0.7
Construction & Mining 73.9 78.4 81.9 83.0 86.0 87.4 84.2 81.5 81.2 Pct Chg Year Ago 4.7 6.0 4.6 1.3 3.6 1.6 -3.6 -3.2 -0.3
Trade, Trans, & Utilities 247.2 249.0 252.1 248.9 260.1 269.8 266.8 258.7 253.1
Pct Chg Year Ago 0.0 0.7 1.2 -1.2 4.5 3.7 -1.1 -3.0 -2.2
Wholesale Trade 52.1 53.1 54.3 54.5 56.4 60.0 60.7 61.6 62.6 Retail Trade 160.0 160.4 158.7 153.7 160.3 163.4 158.7 149.6 142.7 Trans, Wrhsng, & Util 35.1 35.5 39.0 40.8 43.5 46.4 47.4 47.6 47.8
Information 25.3 25.8 25.8 24.6 26.7 28.5 27.8 26.3 26.6
Pct Chg Year Ago -1.4 2.0 0.0 -4.4 8.6 6.6 -2.6 -5.3 1.3
Financial Activities 112.6 116.9 121.7 123.9 128.7 132.8 132.7 137.1 141.6
Pct Chg Year Ago 4.6 3.8 4.1 1.8 3.9 3.2 -0.1 3.3 3.3
Prof & Business Services 235.1 241.0 247.8 247.9 264.0 276.1 244.3 212.4 216.9
Pct Chg Year Ago 2.5 2.5 2.8 0.1 6.5 4.6 -11.5 -13.1 2.2
Educ & Health Services 205.2 211.0 218.7 213.9 217.5 221.7 224.8 233.1 238.0
Pct Chg Year Ago 2.8 2.8 3.7 -2.2 1.7 2.0 1.4 3.7 2.1
Leisure & Hospitality 153.2 158.9 162.7 133.8 149.5 167.7 178.4 177.9 175.6
Pct Chg Year Ago 2.7 3.7 2.4 -17.8 11.7 12.2 6.4 -0.3 -1.3
Other Services 45.7 46.8 47.5 43.3 44.9 48.5 49.1 49.8 50.3
Pct Chg Year Ago 1.3 2.5 1.4 -8.8 3.7 7.8 1.4 1.3 1.1
Federal Government 24.8 25.2 26.7 28.4 28.6 28.0 27.7 28.0 28.3
Pct Chg Year Ago 2.0 1.8 5.8 6.3 0.9 -2.0 -1.2 1.0 1.2
State & Local Government 131.5 131.0 130.6 126.5 124.3 124.3 127.4 130.3 132.3
Pct Chg Year Ago 0.2 -0.4 -0.3 -3.2 -1.7 0.0 2.5 2.3 1.5
Other Economic Indicators
Population (Ths) 3072.1 3113.6 3150.2 3187.2 3223.8 3266.7 3305.1 3338.8 3372.8
Pct Chg Year Ago 1.7 1.4 1.2 1.2 1.1 1.3 1.2 1.0 1.0
Labor Force (Ths) 1494.9 1513.9 1541.8 1543.3 1571.9 1606.8 1641.0 1650.6 1656.7
Percent Change, Year Ago 1.4 1.3 1.8 0.1 1.9 2.2 2.1 0.6 0.4
Unemployment Rate (%) 4.1 3.6 3.3 7.8 4.3 2.9 4.6 5.6 5.3
Total Housing Starts 17576.5 16711.6 21449.2 20363.0 24660.3 25055.9 22932.0 24079.5 24715.9
Single-Family 12720.7 13667.0 14869.1 15631.3 19899.3 18068.0 16538.6 17597.7 18152.5
Multifamily 4855.7 3044.6 6580.1 4731.8 4761.0 6987.9 6393.4 6481.8 6563.4
T AMPA – S T . P ETERSBURG – C LEARWATER 142 Florida & Metro Forecast / Summer 2022
2017 2018 2019 2020 2021 2022 2023 2024 2025
Short Term Outlook for Tampa-St. Petersburg-Clearwater, FL August 2022 Forecast
2022:2 2022:3 2022:4 2023:1 2023:2 2023:3 2023:4 2024:1 2024:2 2024:3 2024:4 2025:1 2025:2
Personal Income (Billions $)
Total Personal Income 193.9 196.2 199.4 200.2 200.8 201.7 203.0 205.0 206.9 208.9 211.2 214.0 216.7 Pct Chg Year Ago 6.4 6.7 5.9 5.0 3.6 2.8 1.8 2.4 3.0 3.6 4.1 4.4 4.7
Wages and Salaries 104.3 105.6 106.2 106.3 106.1 105.9 106.0 106.1 106.7 107.3 108.1 109.0 110.2
Nonwage Income 89.6 90.7 93.2 93.9 94.8 95.8 97.0 98.9 100.2 101.6 103.2 105.0 106.5
Real Personal Income (12$) 159.8 159.6 160.7 160.1 159.8 159.7 160.0 160.9 161.9 162.8 163.9 165.3 166.6 Pct Chg Year Ago 0.0 0.3 0.1 0.3 0.0 0.1 -0.4 0.5 1.3 1.9 2.5 2.7 2.9
Per Capita Income (Ths) 59.5 60.0 60.7 60.8 60.8 61.0 61.2 61.7 62.0 62.5 63.0 63.7 64.3
Real Per Capita Income (12$) 49.0 48.8 48.9 48.6 48.4 48.3 48.2 48.4 48.5 48.7 48.9 49.2 49.4
Average Annual Wage (Ths) 70.9 71.5 72.0 72.5 73.0 73.6 74.2 74.8 75.4 76.0 76.6 77.2 77.8 Pct Chg Year Ago 7.8 6.4 3.2 2.8 3.1 2.9 3.1 3.2 3.3 3.3 3.2 3.2 3.1
Establishment Employment (Place of Work, Thousands, SA)
Total Employment 1459.6 1463.3 1462.7 1454.5 1440.0 1426.9 1415.5 1407.1 1401.8 1399.7 1398.9 1400.6 1405.4 Pct Chg Year Ago 5.2 3.6 2.4 0.8 -1.3 -2.5 -3.2 -3.3 -2.6 -1.9 -1.2 -0.5 0.3
Manufacturing 72.1 73.0 73.7 72.6 71.3 70.4 69.5 68.4 67.3 66.3 65.6 65.2 65.1
Pct Chg Year Ago 6.5 5.8 5.3 2.2 -1.2 -3.6 -5.7 -5.8 -5.6 -5.9 -5.7 -4.6 -3.2
Nonmanufacturing 1387.5 1390.3 1389.0 1382.0 1368.7 1356.5 1346.0 1338.7 1334.5 1333.4 1333.3 1335.3 1340.3
Pct Chg Year Ago 5.2 3.5 2.2 0.7 -1.4 -2.4 -3.1 -3.1 -2.5 -1.7 -0.9 -0.3 0.4
Construction & Mining 87.5 87.7 86.4 85.7 84.6 83.6 82.7 82.1 81.6 81.3 81.1 81.1 81.2
Pct Chg Year Ago 2.5 1.6 -0.5 -2.4 -3.3 -4.6 -4.3 -4.2 -3.6 -2.8 -2.0 -1.2 -0.4
Trade, Trans, & Utilities 271.4 269.2 268.9 267.3 268.5 266.1 265.5 262.9 259.1 257.4 255.6 253.6 252.6 Pct Chg Year Ago 5.2 2.9 1.5 -0.8 -1.1 -1.2 -1.3 -1.7 -3.5 -3.2 -3.8 -3.5 -2.5
Wholesale Trade 59.8 60.3 60.4 61.0 60.7 60.5 60.6 60.9 61.4 61.8 62.1 62.3 62.6 Retail Trade 165.0 162.1 161.4 158.6 160.2 158.3 157.7 154.5 150.1 148.1 145.8 143.4 142.2 Trans, Wrhsng, & Util 46.6 46.8 47.1 47.7 47.6 47.2 47.3 47.4 47.6 47.6 47.6 47.8 47.9
Information 28.2 28.4 29.1 29.2 28.0 27.1 26.6 26.5 26.6 26.2 25.8 26.1 26.5 Pct Chg Year Ago 9.0 2.7 4.3 3.5 -0.7 -4.5 -8.6 -9.1 -5.3 -3.4 -3.0 -1.6 -0.1
Financial Activities 132.3 133.3 133.2 133.6 131.9 132.2 133.0 134.5 136.4 138.0 139.3 140.5 141.4 Pct Chg Year Ago 3.4 3.0 2.1 0.8 -0.3 -0.8 -0.1 0.6 3.4 4.4 4.7 4.5 3.6 Prof & Business Services 277.4 277.0 273.1 264.6 249.7 236.8 226.1 218.2 212.9 209.4 208.9 210.6 213.9 Pct Chg Year Ago 6.9 3.4 -0.1 -4.4 -10.0 -14.5 -17.2 -17.5 -14.7 -11.6 -7.6 -3.5 0.5
Educ & Health Services 221.3 222.5 223.3 223.7 223.9 225.0 226.7 229.7 232.3 234.5 235.9 237.3 237.9 Pct Chg Year Ago 2.3 1.8 2.1 1.8 1.2 1.1 1.5 2.7 3.8 4.2 4.1 3.3 2.4
Leisure & Hospitality 169.6 170.8 172.1 174.3 178.4 181.1 179.8 178.2 178.1 178.0 177.2 175.9 176.0 Pct Chg Year Ago 13.6 11.2 9.1 10.0 5.2 6.1 4.5 2.2 -0.2 -1.7 -1.4 -1.3 -1.2
Other Services 48.5 49.3 49.7 49.6 49.0 48.9 49.0 49.3 49.6 50.0 50.2 50.4 50.4
Pct Chg Year Ago 8.5 8.6 7.7 6.9 1.1 -0.9 -1.3 -0.6 1.2 2.3 2.5 2.3 1.6
Federal Government 27.9 27.8 27.8 27.7 27.6 27.7 27.8 27.9 27.9 28.0 28.1 28.2 28.3 Pct Chg Year Ago -2.5 -2.4 -3.0 -3.5 -0.9 -0.4 0.1 0.7 1.1 1.1 1.2 1.2 1.3
State & Local Government 123.4 124.3 125.4 126.2 127.0 127.9 128.6 129.4 130.1 130.6 131.1 131.6 132.1 Pct Chg Year Ago -0.2 0.1 1.1 1.7 2.9 2.9 2.6 2.6 2.4 2.2 1.9 1.7 1.6
Other Economic Indicators
Population (Ths) 3261.7 3272.4 3282.3 3292.3 3301.4 3309.5 3317.4 3325.8 3334.7 3343.0 3351.9 3360.8 3369.3 Pct Chg Year Ago 1.3 1.4 1.3 1.3 1.2 1.1 1.1 1.0 1.0 1.0 1.0 1.1 1.0 Labor Force (Ths) 1605.7 1610.5 1621.2 1631.6 1640.4 1644.5 1647.5 1648.9 1649.9 1651.1 1652.5 1653.8
Pct
Year
Unemployment Rate (%)
Total Housing Starts
Single-Family
Multifamily
T AMPA – S T . P ETERSBURG – C LEARWATER Institute for Economic Forecasting 143
1655.6
Chg
Ago 2.5 1.9 2.4 2.6 2.2 2.1 1.6 1.1 0.6 0.4 0.3 0.3 0.3
2.6 2.8 3.2 3.8 4.5 4.9 5.2 5.5 5.6 5.7 5.7 5.6 5.4
26112.7 23706.5 23758.5 22550.3 22716.1 23047.6 23414.1 23526.2 23944.1 24293.0 24554.6 24717.7 24786.7
18552.4 16934.9 16808.2 16170.0 16302.1 16689.3 16993.1 17153.3 17498.9 17769.9 17968.7 18164.4 18199.8
7560.2 6771.5 6950.3 6380.3 6414.0 6358.3 6421.0 6372.9 6445.2 6523.1 6585.9 6553.3 6586.9
PROFILES
The Villages MSA is located in the north central portion of the state and is comprised of Sumter County. The villages shares its name with a broader masterplanned age-restricted community that spreads into portions of Lake and Marion Counties.
QUICK FACTS
• Metro population estimate of 125,044 as of 2019 (5-Year Estimate) (U.S. Census Bureau).
•
Sumter County population estimate of 125,044 as of 2019 (5-Year Estimate) (U.S. Census Bureau).
•
Civilian labor force of 36,108 in July 2022 (Florida Research and Economic Database).
• An unemployment rate of 3.9% as of July 2022, not seasonally adjusted. This amounts to 1,403 unemployed people (Florida Research and Economic Database).
OUTLOOK SUMMARIES
The Villages Metropolitan Statistical Area (MSA) is expected to show relatively high levels of growth in its economic indicators. The Villages Gross Metro Product will be the third lowest in the state at a level of $4,477.15. Average annual wage growth of 4.5 percent will lead to an average annual wage of $62,900. Personal incomes will grow by 5.6 percent, the fifth highest rate of growth in the state. This will lead to a per capita income level of $52,100. Population growth will average 3.0 percent, the highest in the state.
Employment growth is expected to average a rate of 1.6 percent annually, the third highest of the MSAs, while the unemployment rate is estimated to average 5.8 percent, again the third highest in the state.
The Other Services sector will lead The Villages at an average annual growth rate of 6.5 percent. The Education and Health Services, as well as the Financial sector will expand at respective rates of 4.6 percent and 4.3 percent.
METRO NEWS SUMMARIES
Major chains bring big business to area
• The Villages and its surrounding communities continue to be a hot spot for big chain stores and restaurants.
•
More well-known businesses are coming to the area as the community continues to grow and bring in more residents. McDonald’s, Dairy Queen, Sprouts Farmers Market, Sephora at Kohl’s, and Culver’s are just a few new businesses that have recently opened or are coming soon.
•
“Those that have previously established a presence in the community have a good handle on their performance in our market and can grow with us more easily,” said Scott Renick, The Villages’ vice president of commercial development. “Businesses that are new entrants to The Villages often rely on those competitors’ successes as validation of the opportunity that exists here for them.”
Source: The Villages Daily Sun, June 16, 2022
Workforce housing development will include 1,320 new homes on pastureland
•
A new workforce housing development will include 1,320 new homes on 331 acres of pastureland.
•
The development will include 770 single family units and 550 town home lots at the Hammock Oaks development at County Road 466 and Cherry Lake Road.
•
A community development district will construct and finance stormwater, utilities, roadways, hardscape/landscape/irrigation, and amenities. The maximum number of residential units will be 1,320 with an overall density of four dwelling units per acre.
Source: The Villages News, June 18, 2022
THE VILLAGES 144 Florida & Metro Forecast / Summer 2022
Walton Global buys 171 acres in Sumter County for new development
• Walton Global has purchased 171 acres of land in Sumter County for a new development to be known as Hamilton.
•
The land located off County Road 48 near Webster will be dedicated to up to 800 units of family housing.
• In addition to its proximity to The Villages, the “attractively priced single-family homes” will also be ideal for commuters to Tampa and Orlando, according to Walton Global. The company said the units will be ideal for first-time homeowners.
Source: The Villages News, July 20, 2022
The Villages leads nation in new home sales midyear 2022
• The Villages has sold an “estimated” 1,500 new homes at the halfway point of 2022 according to real estate consulting firm RCLCO. The figure is only an estimate because The Villages does not release official mid-year sales numbers.
• If that figure is accurate, it would mean The Villages is on pace for a 25% drop in new home sales versus last year when they sold 4,004 new homes.
• For reference, over the last 20 years The Villages has averaged about 2,800 new home sales per year.
Source: Florida for Boomers, July 22, 2022
New grocery store in the Villages expected to be open in the height of snowbird season
• Construction of the new Sprouts Farmers Market in The Villages is expected to be finished in the height of snowbird season.
• Brisk work is taking place at the construction site at the corner of County Road 466 and Buena Vista Boulevard. It is anticipated the store could open in January.
• Sprouts Farmers Market is an American specialty grocer offering a health-oriented assortment that focuses on fresh and naturally derived products. Its offerings are especially focused on produce, which constituted around 22 percent of its sales last year.
Source: Village News, August 2, 2022
Hilton opens Home2 Suites in Florida’s The Villages
• Hilton has opened the latest property in its All-Suites portfolio. The Home2 Suites by Hilton Wildwood-The Villages (Fla.) is the first extended-stay all-suite hotel in the area, according to the brand.
• The hotel was developed and is owned by Tampabased commercial real estate firm, Liberty Group.
• The hotel has 96 studio and one-bedroom suites across four floors. Each guest suite has a kitchen with a microwave, coffee maker and full-size refrigerator as well as assorted cookware and dishware.
Source: Hotel Management, August 8, 2022
THE VILLAGES Institute for Economic Forecasting 145
The Villages MSA


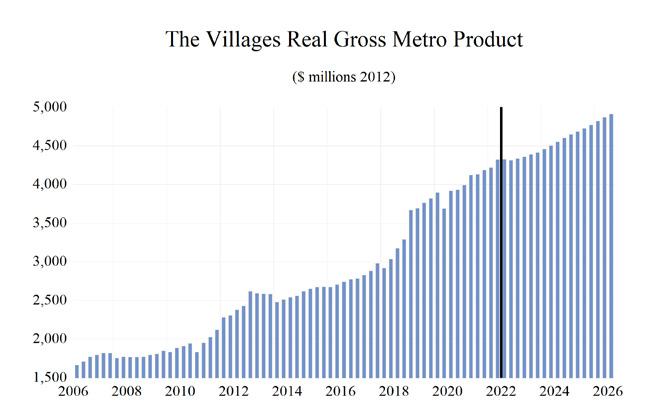
Loca�on
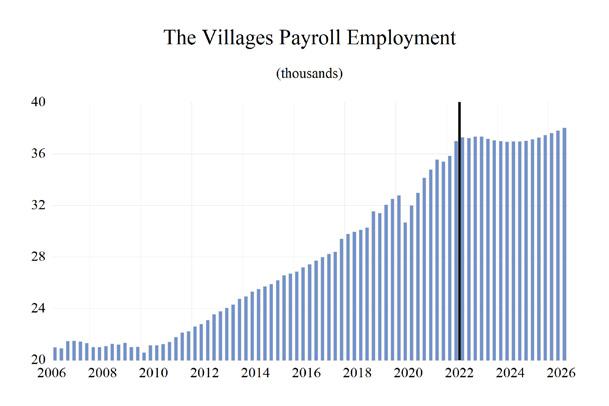
THE VILLAGES 146 Florida & Metro Forecast / Summer 2022 0 0.2 0.4 0.6 0.8 1 1.2 1.4 1.6 Total Nonagricultural Employment Total Private Goods Producing Service Producing Private Service Providing Government
Industry
Quo�ents
Long Term Outlook for The Villages, FL August 2022 Forecast
Personal Income (Billions $)
Total Personal Income 5.8 6.3 7.1 7.6 8.3 8.5 9.1 9.6 10.3
Pct Chg Year Ago 7.8 9.4 12.9 6.1 9.0 3.0 6.5 6.0 6.9
Wages and Salaries 1.3 1.4 1.5 1.6 1.9 2.2 2.3 2.4 2.5
Nonwage Income 4.5 4.9 5.6 6.0 6.3 6.3 6.8 7.2 7.8
Real Personal Income (12$) 6.0 6.1 6.8 7.1 7.5 7.2 7.5 7.8 8.2 Pct Chg Year Ago 9.7 2.6 10.5 4.9 4.7 -3.1 3.1 4.2 5.0
Per Capita Income (Ths) 48.4 51.6 56.5 57.7 60.7 60.5 62.5 64.4 67.1
Real Per Capita Income (12$) 50.2 50.1 53.7 54.2 54.9 51.4 51.4 52.1 53.3
Average Annual Wage (Ths) 44.5 45.9 47.5 50.4 55.2 60.2 61.7 63.8 65.8 Pct Chg Year Ago 4.5 3.1 3.5 6.2 9.6 9.0 2.4 3.4 3.1
Establishment Employment (Place of Work, Thousands, SA)
Total Employment 28.5 30.0 31.9 32.1 35.0 36.8 37.2 37.0 37.2
Pct Chg Year Ago 4.4 5.3 6.2 0.7 8.9 5.3 1.1 -0.7 0.7
Manufacturing 1.1 1.2 1.3 1.3 1.3 1.4 1.4 1.3 1.3
Pct Chg Year Ago 6.2 12.0 8.8 -0.8 5.2 5.9 -0.5 -5.4 -2.9
Nonmanufacturing 27.4 28.8 30.6 30.8 33.6 35.4 35.8 35.6 35.9
Pct Chg Year Ago 4.4 5.0 6.1 0.8 9.1 5.3 1.1 -0.5 0.8 Construction & Mining 3.2 3.4 3.6 3.7 4.1 4.4 4.3 4.1 4.0
Pct Chg Year Ago 12.3 5.7 8.4 1.1 11.9 6.7 -2.7 -4.0 -3.4 Trade, Trans, & Utilities 5.5 6.3 6.4 6.5 6.5 6.8 6.9 6.8 6.6
Pct Chg Year Ago 0.4 12.8 1.5 1.9 0.5 4.8 1.7 -2.3 -2.0
Wholesale Trade 0.8 0.9 0.9 0.9 0.9 1.0 1.0 1.1 1.1 Retail Trade 3.8 4.3 4.4 4.5 4.5 4.7 4.7 4.5 4.3 Trans, Wrhsng, & Util 0.9 1.0 1.1 1.1 1.1 1.1 1.2 1.2 1.2 Information 0.2 0.2 0.2 0.2 0.2 0.2 0.2 0.2 0.2
Pct Chg Year Ago -2.2 5.5 14.0 -13.5 29.5 2.9 -4.7 -8.3 -0.2
Financial Activities 1.2 1.3 1.5 1.6 1.8 2.0 2.1 2.1 2.1 Pct Chg Year Ago 2.5 9.8 15.0 10.6 10.9 10.9 5.8 0.7 -0.3
Prof & Business Services 2.0 2.1 2.3 2.4 2.9 3.0 2.7 2.3 2.4
Pct Chg Year Ago 9.5 8.2 5.9 8.0 17.7 6.2 -10.8 -13.4 3.2
Educ & Health Services 5.5 5.6 6.4 6.7 6.8 7.1 7.5 7.9 8.2
Pct Chg Year Ago 7.0 2.0 13.2 5.9 1.3 4.1 5.3 5.3 3.8
Leisure & Hospitality 4.2 4.4 4.5 3.9 5.6 6.2 6.0 6.0 6.1
Pct Chg Year Ago 2.5 4.7 1.7 -12.9 43.0 9.9 -2.9 0.1 1.9
Other Services 0.5 0.5 0.6 0.5 0.6 0.7 0.7 0.8 0.8
Pct Chg Year Ago 2.1 -10.3 21.2 -6.8 11.8 12.4 5.1 4.8 3.6
Federal Government 1.7 1.6 1.6 1.7 1.7 1.7 1.7 1.7 1.8
Pct Chg Year Ago 3.5 -6.0 0.1 5.7 1.4 -3.8 4.1 0.3 1.6
State & Local Government 3.4 3.5 3.6 3.5 3.3 3.3 3.6 3.7 3.7
Pct Chg Year Ago 1.5 1.5 2.9 -2.0 -5.6 -0.6 9.9 1.9 0.8
Other Economic Indicators
Population (Ths)
119.5 122.6 126.5 131.5 136.2 140.7 145.1 149.3 153.1
Pct Chg Year Ago 2.1 2.6 3.1 3.9 3.6 3.4 3.1 2.9 2.6
Labor Force (Ths) 30.1 31.1 32.3 32.7 34.6 36.1 37.3 37.7 38.0
Percent Change, Year Ago 2.5 3.5 3.9 1.0 6.1 4.3 3.2 1.2 0.8
Unemployment Rate (%) 6.2 5.3 4.8 8.6 5.4 4.2 5.6 6.7 6.5
Total Housing Starts 1770.2
Single-Family 1770.1
4432.8 4899.2 2991.8 2562.5 2649.3
2889.6 3852.4 3560.9 2162.6 1938.7 2026.5
Multifamily 0.1 0.0 160.5 547.7 580.4 1338.3 829.2 623.8 622.8
THE VILLAGES Institute for Economic Forecasting 147
2017 2018 2019 2020 2021 2022 2023 2024 2025
2043.3 2850.7 3437.3
2043.3 2690.2
Short Term Outlook for The Villages, FL August 2022 Forecast
2022:2 2022:3
Personal Income (Billions $)
Total Personal Income 8.4 8.6 8.8 8.9 9.0 9.1 9.2 9.4 9.5 9.7 9.9 10.0 10.2 Pct Chg Year Ago 5.0 6.6 8.4 8.8 6.6 6.0 4.7 5.3 5.7 6.3 6.7 6.8 7.0
Wages and Salaries 2.2 2.3 2.3 2.3 2.3 2.3 2.3 2.3 2.4 2.4 2.4 2.4 2.4
Nonwage Income 6.2 6.3 6.5 6.6 6.7 6.8 6.9 7.0 7.2 7.3 7.5 7.6 7.7
Real Personal Income (12$) 7.2 7.2 7.4 7.4 7.4 7.5 7.5 7.6 7.7 7.8 7.9 8.0 8.1 Pct Chg Year Ago -1.4 0.2 2.6 3.8 3.0 3.2 2.4 3.3 3.9 4.6 5.1 5.1 5.2
Per Capita Income (Ths) 60.3 60.8 61.9 62.1 62.3 62.5 62.9 63.5 64.0 64.7 65.4 66.1 66.7
Real Per Capita Income (12$) 51.4 51.2 51.7 51.5 51.4 51.3 51.4 51.6 51.9 52.2 52.6 52.9 53.2
Average Annual Wage (Ths) 60.2 60.6 60.9 61.2 61.4 61.7 62.4 63.0 63.5 64.1 64.6 65.1 65.5 Pct Chg Year Ago 10.7 8.1 4.4 3.6 2.1 1.7 2.4 2.9 3.4 3.9 3.5 3.4 3.2
Establishment Employment (Place of Work, Thousands, SA)
Total Employment 37.0 37.3 37.2 37.3 37.3 37.2 37.0 37.0 36.9 37.0 37.0 37.0 37.1
Pct Chg Year Ago 6.3 4.9 5.1 4.1 1.0 -0.3 -0.5 -0.9 -1.1 -0.6 -0.2 0.1 0.5
Manufacturing 1.4 1.4 1.5 1.4 1.4 1.4 1.4 1.4 1.4 1.3 1.3 1.3 1.3
Pct Chg Year Ago 7.4 5.6 5.8 3.8 0.4 -1.8 -4.1 -4.7 -5.5 -5.8 -5.5 -4.5 -3.3
Nonmanufacturing 35.6 35.8 35.8 35.9 35.9 35.8 35.6 35.6 35.6 35.6 35.6 35.7 35.8
Pct Chg Year Ago 6.3 4.9 5.1 4.1 1.0 -0.2 -0.3 -0.8 -0.9 -0.4 0.0 0.2 0.7
Construction & Mining 4.5 4.5 4.4 4.4 4.3 4.3 4.2 4.2 4.1 4.1 4.0 4.0 4.0
Pct Chg Year Ago 9.8 7.3 4.7 2.4 -3.4 -4.9 -4.5 -4.5 -3.9 -3.9 -3.8 -3.8 -3.8
Trade, Trans, & Utilities 6.8 6.8 6.9 6.9 7.0 6.9 6.9 6.9 6.8 6.7 6.7 6.6 6.6
Pct Chg Year Ago 5.7 4.9 4.2 1.8 2.2 1.9 0.8 -0.1 -2.5 -2.9 -3.6 -3.6 -2.6
Wholesale Trade 1.0 1.0 1.0 1.0 1.0 1.0 1.1 1.1 1.1 1.1 1.1 1.1 1.1 Retail Trade 4.7 4.7 4.7 4.7 4.8 4.7 4.7 4.6 4.5 4.4 4.4 4.3 4.3 Trans, Wrhsng, & Util 1.1 1.1 1.1 1.2 1.2 1.2 1.2 1.2 1.2 1.2 1.2 1.2 1.2 Information 0.2 0.2 0.2 0.2 0.2 0.2 0.2 0.2 0.2 0.2 0.2 0.2 0.2 Pct Chg Year Ago -0.5 0.9 3.3 1.4 -3.0 -5.7 -11.5 -12.3 -8.0 -6.5 -5.9 -4.0 -1.9
Financial Activities 2.0 2.0 2.1 2.1 2.1 2.1 2.1 2.1 2.1 2.1 2.1 2.1 2.1 Pct Chg Year Ago 12.5 8.6 8.4 8.4 7.3 4.5 3.0 0.2 0.2 1.0 1.3 1.0 0.0 Prof & Business Services 3.0 3.1 3.0 3.0 2.8 2.6 2.5 2.4 2.4 2.3 2.3 2.3 2.4 Pct Chg Year Ago 7.3 5.8 2.6 -1.9 -8.8 -14.5 -17.9 -18.4 -15.2 -11.6 -7.2 -2.8 1.4
Educ & Health Services 7.0 7.2 7.3 7.4 7.5 7.5 7.6 7.7 7.8 7.9 8.0 8.1 8.2
Pct Chg Year Ago 3.7 3.7 5.1 5.5 5.9 5.1 4.6 5.2 4.9 5.5 5.6 4.9 4.3
Leisure & Hospitality 6.3 6.2 6.0 6.0 6.0 6.0 6.0 5.9 6.0 6.0 6.0 6.0 6.1 Pct Chg Year Ago 12.3 8.7 -2.0 -2.6 -4.8 -4.2 0.2 -0.4 -0.3 0.4 0.9 1.2 2.0
Other Services 0.7 0.7 0.7 0.7 0.7 0.7 0.7 0.7 0.7 0.8 0.8 0.8 0.8
Pct Chg Year Ago 14.4 7.8 7.8 7.8 6.1 3.8 3.0 3.5 4.8 5.5 5.3 4.9 4.2
Federal Government 1.6 1.6 1.7 1.7 1.7 1.7 1.7 1.7 1.7 1.7 1.7 1.7 1.7
Pct Chg Year Ago -7.0 -3.3 -0.8 1.0 7.7 5.2 2.8 1.0 -0.4 0.0 0.6 1.1 1.7 State & Local Government 3.4 3.5 3.5 3.6 3.6 3.7 3.7 3.7 3.7 3.7 3.7 3.7 3.7
Pct Chg Year Ago 0.3 -1.0 26.8 28.6 6.0 4.9 3.8 2.8 1.9 1.6 1.2 1.0 0.8
Other Economic Indicators
Population (Ths) 140.2 141.3 142.4 143.5 144.6 145.7 146.7 147.8 148.8 149.8 150.7 151.7 152.6
Pct Chg Year Ago 3.4 3.4 3.3 3.2 3.1 3.1 3.0 3.0 2.9 2.8 2.7 2.6 2.6 Labor Force (Ths) 36.0 36.3 36.7 37.0 37.3 37.4 37.5 37.6 37.7 37.8 37.8 37.9 38.0 Pct Chg Year Ago 4.4 3.7 4.0
Unemployment Rate (%) 3.9 4.1 4.5
2.3 1.6 1.2 1.0 0.8 0.8 0.8
6.5 6.7 6.8 6.8 6.8 6.6
2534.8 2561.3 2596.5 2634.3 2651.4 Single-Family
Total Housing Starts
2071.1 1968.9 1925.5 1914.4 1940.4 1974.7 2011.9 2028.5 Multifamily 1713.2
632.0 620.5 620.9 621.7 622.4 622.8
THE VILLAGES 148 Florida & Metro Forecast / Summer 2022
2022:4 2023:1 2023:2 2023:3 2023:4 2024:1 2024:2 2024:3 2024:4 2025:1 2025:2
3.8 3.6 3.1
4.9 5.3 5.8 6.2
5823.9 4676.8 4116.9 3482.8 3064.6 2789.5 2630.3 2557.4
4110.7 3266.8 2858.6 2421.3 2189.1
1410.1 1258.3 1061.6 875.5 718.4 661.5
PROFILES
The West Palm Beach-Boca Raton-Boyton Beach MSA stretches from the state’s Atlantic coast into the rural center and includes the northern edge of the everglades national park. It is known for its numerous golf courses along the coastline and its sandy beaches.
QUICK FACTS
• Metro population estimate of 1,496,770 as of 2019 (5-Year Estimate) (U.S. Census Bureau).
•
Palm Beach County population estimate of 1,496,770 as of 2019 (5-Year Estimate) (U.S. Census Bureau).
• Civilian labor force of 767,604 in July 2022 (Florida Research and Economic Database).
• An unemployment rate of 2.9% as of July 2022, not seasonally adjusted. This amounts to 22,320 unemployed people (Florida Research and Economic Database).
OUTLOOK SUMMARIES
The West Palm Beach–Boca Raton area is expected to show relatively strong levels of growth in the economic indicators. Personal income is expected to grow an average of 4.1 percent annually. The average real per capita income level of $73,200 is third highest in state. Average annual wage growth will be 4.1 percent; however, the average annual wage level is expected to be $81,000, the highest of the studied metropolitan areas. West Palm Beach is expected to average a population growth of 0.7 percent each year. The area has one of the highest Gross Metro Product of the MSAs studied at an average level of $82,899.07 million.
Employment is expected to grow at an average rate of 0.4 percent each year, while Unemployment is expected to be relatively high at an average rate of 4.6 percent.
West Palm Beach’s fastest growing sector is expected to be the by the Leisure & Hospitality sector, which will experience 5.8 percent average annual growth, followed by the Information sector, which will grow at an average of 2.8 percent.
METRO NEWS SUMMARIES
Analysts: Lack of affordable housing threatens economy
• Palm Beach County’s shortage of affordable housing has started to affect the growth of its economy to the point where its recent expansion is in jeopardy speakers said at a housing summit last week.
• “We offer competitive wages,” said Clinton Forbes, the executive director of Palm Tran, the county’s bus system, “but we are having trouble hiring and retaining employees. People want to live where they work, and it is difficult for our drivers to do that.”
• Thursday’s summit came as commissioners are considering asking voters to approve a $200 million bond referendum in November to build more affordable and workforce housing.
Source: WPTV 5, June 11, 2022
From online banking to art storage: 5 companies expand in or relocate to Palm Beach County
• An online banking platform, an art storage business, and a Top 5 global producer of pharmaceutical softgels are among the latest business relocating to Palm Beach County, according to an announcement by the Business Development Board of Palm Beach.
• Between them, the five companies will create just under 500 new jobs and further diversify the county’s economic base. MyBambu, a financial technology company from Nashville, lists a customer roster that is 90% Hispanic, while the arrival of Renco USA further bolsters the area’s manufacturing base.
• The boom of new office space in West Palm Beach has helped to lure businesses, with COVID-19 changing the game. Firms that would use 75,000 square feet of office space in New York might only need 25,000 square feet in Palm Beach County, Smallridge said, with employees going back to the office less frequently.
Source: Palm Beach Post, June 23, 2022
W EST P ALM B EACH - B OCA R ATON - B O y NTON B EACH Institute for Economic Forecasting 149
West Palm Beach tweaks parking rates in response to anger from residents, business owners
• West Palm Beach changed several metered parking rules and fees after backlash from residents and business owners in the area.
• City Commission members approved adjustments this week that reduces the expired meter fees to $35 from $37.50, scraps the $10 overnight metered parking fee, and ends 24/7 meter enforcement. Meter enforcement will end at midnight in the highest demand areas of downtown, at 9 p.m. in areas just beyond that core, and at 7 p.m. in areas farther out.
•
The changes ease some of the concerns of locals. Downtown residents were especially hit hard by the $10 overnight fee, as some smaller buildings do not offer parking. Though the lower fees decrease city funds for parking infrastructure, they may help to alleviate the economic struggles of residents.
Source: Palm Beach Post, July 15, 2022
Port of Palm Beach proposing tariff increase to keep up with inflation
• To address inflation and the rising cost of labor and materials, the Port of Palm Beach is proposing a 5% tariff increase which would be the largest increase it has ever made.
• The Port of Palm Beach is an economic engine for Palm Beach County and the surrounding areas. It processes more than $14 billion in commodities annually, according to the port.
• Transportation owners are pushing back against the proposal, believing that their clients will move to other ports in response to the tariff hike. The Port of Palm Beach scheduled a public hearing for Tuesday, but the meeting was postponed.
Source: WPTV 5, July 26, 2022
The Press office and retail complex in West Palm Beach slated to open during winter
• The Press, a retail and office complex that houses the Palm Beach Post, Starbucks, and soon, Joseph’s Classic Market, is slated to open this winter.
• Tricera Capital, the developer of the Dixie Highway center, just secured an additional $19 million in financing to complete the project, which is at the southwest corner of Belvedere Road and South Dixie Highway. The money will be used to build out spaces for several newly signed retail and office tenants, said Ben Mandell, Tricera managing partner and chief executive.
• After the departure of a Sprouts Grocery store, the anchor tenant of a planned retail section of the Press, Tricera inked a deal with the established Joseph’s Classic Market to take the grocery space. Joseph’s will occupy 15,000 square feet of a 120,000-squarefoot warehouse space that formerly was home to the Post’s printing press and its distribution center.
Source: The Palm Beach Post, August 3, 2022
New ‘economic engine’: Construction company bringing 200 jobs to Belle Glade starts 1st project
• Construction has started on a parking garage for the Finfrock facility off Orange Avenue Circle, bringing more than 200 jobs to one of the areas in Palm Beach County with the highest unemployment rates.
• Finfrock will hire for a variety of manufacturing and administrative positions that will pay competitive wages above the area’s median household income. The office of the Business Development Board of Palm Beach County projected the facility will have a $242 million economic impact in The Glades, a largely agricultural region along the shores of Lake Okeechobee.
• The coronavirus pandemic affected Belle Glade residents disproportionately since most work in the service and agricultural industries. Belle Glade’s mayor, Steve Wilson, believes the opening of Finfrock’s complex to be a victory for the city’s residents and hopes it will lift and attract more businesses to Belle Glade.
Source: The Palm Beach Post, August 19, 2022
W EST P ALM B EACH - B OCA R ATON - B O y NTON B EACH 150 Florida & Metro Forecast / Summer 2022
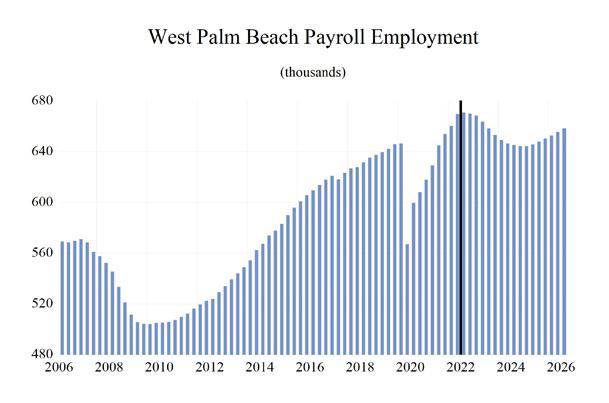
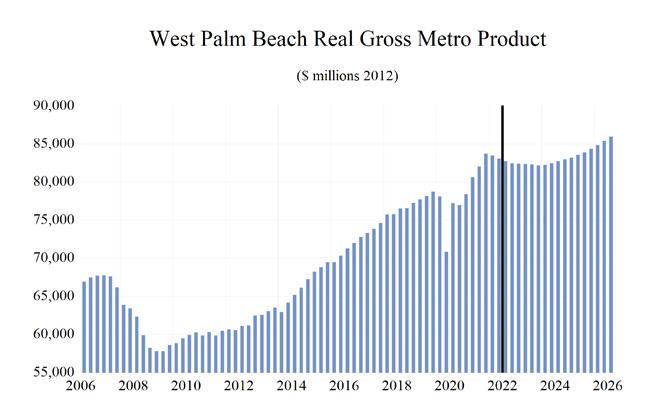
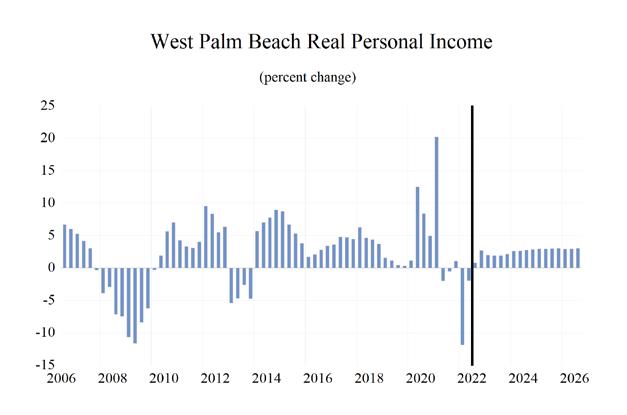
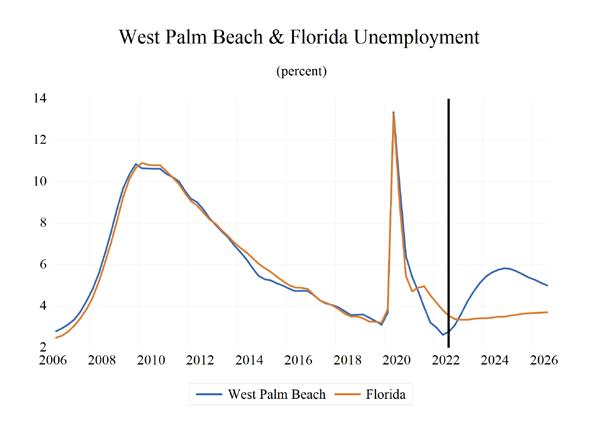
W EST P ALM B EACH - B OCA R ATON - B O y NTON B EACH Institute for Economic Forecasting 151 0 0.2 0.4 0.6 0.8 1 1.2 1.4 1.6 Total Nonagricultural Employment Total Private Goods Producing Service Producing Private Service Providing Mining Logging and Construc�on Manufacturing Trade, Transporta�on, and U�li�es Wholesale Trade Retail Trade Transporta�on Warehousing and U�li�es Informa�on Financial Ac�vi�es Professional and Business Services Educa�onal and Health Services Leisure and Hospitality Other Services Government Palm Beach County MSA Industry Loca�on Quo�ents
Long Term Outlook for West Palm Beach-Boca Raton-Delray Beach, FL (Division of Miami MSA) August 2022 Forecast
Personal Income (Billions $)
Total Personal Income 114.0 121.7 127.6 131.9 142.4 147.1 153.2 159.3 167.3
Pct Chg Year Ago 9.6 6.7 4.9 3.3 8.0 3.3 4.1 4.0 5.1
Wages and Salaries 36.1 37.7 39.5 40.7 46.2 51.8 52.8 53.4 55.1
Nonwage Income 77.9 84.0 88.1 91.1 96.2 95.4 100.4 105.9 112.2
Real Personal Income (12$) 99.0 102.2 106.5 107.8 111.8 108.7 109.6 112.0 115.6 Pct Chg Year Ago 6.9 3.2 4.3 1.2 3.7 -2.8 0.8 2.2 3.2
Per Capita Income (Ths) 77.9 82.5 85.8 88.3 95.1 97.7 101.1 104.3 108.6
Real Per Capita Income (12$) 67.6 69.3 71.6 72.2 74.6 72.2 72.3 73.4 75.1
Average Annual Wage (Ths) 58.1 59.5 61.4 67.1 72.3 77.2 79.6 82.3 84.9 Pct Chg Year Ago 3.2 2.6 3.1 9.3 7.7 6.8 3.1 3.3 3.2
Establishment Employment (Place of Work, Thousands, SA)
Total Employment 620.0 630.3 641.0 605.1 636.4 667.5 660.8 646.1 646.8
Pct Chg Year Ago 2.1 1.7 1.7 -5.6 5.2 4.9 -1.0 -2.2 0.1
Manufacturing 19.9 20.2 20.2 19.5 20.5 21.2 20.7 19.8 19.3
Pct Chg Year Ago 3.5 1.9 0.0 -3.5 5.1 3.4 -2.2 -4.8 -2.1
Nonmanufacturing 600.1 610.0 620.8 585.6 615.8 646.3 640.1 626.4 627.5 Pct Chg Year Ago 2.0 1.7 1.8 -5.7 5.2 4.9 -1.0 -2.1 0.2
Construction & Mining 36.0 37.7 38.8 37.8 39.1 39.6 37.5 36.2 36.2
Pct Chg Year Ago 4.8 4.9 2.8 -2.7 3.4 1.4 -5.4 -3.3 0.0 Trade, Trans, & Utilities 116.2 117.1 116.7 112.3 117.6 122.5 120.4 116.3 113.4
Pct Chg Year Ago 0.7 0.8 -0.3 -3.8 4.7 4.2 -1.8 -3.4 -2.4
Wholesale Trade 23.5 24.2 23.6 22.8 23.5 25.0 25.1 25.6 26.2 Retail Trade 80.0 79.8 79.6 74.7 77.1 79.5 77.3 72.6 69.0 Trans, Wrhsng, & Util 12.8 13.0 13.6 14.8 17.0 18.1 18.0 18.0 18.2 Information 11.6 11.0 10.6 9.8 10.2 11.6 11.8 11.2 11.3
Pct Chg Year Ago 4.3 -5.1 -3.4 -7.5 3.6 14.0 2.1 -5.2 0.2
Financial Activities 40.5 41.8 43.1 43.4 45.6 47.1 46.7 47.9 49.1 Pct Chg Year Ago 1.2 3.3 3.2 0.6 5.1 3.4 -0.8 2.4 2.5
Prof & Business Services 113.1 114.3 116.4 114.7 123.9 127.4 114.4 101.1 102.4 Pct Chg Year Ago 2.6 1.1 1.8 -1.4 8.0 2.9 -10.2 -11.7 1.3
Educ & Health Services 99.1 101.9 106.0 102.4 103.3 105.0 106.3 109.5 110.9
Pct Chg Year Ago 2.5 2.8 4.0 -3.4 0.9 1.6 1.3 3.0 1.3
Leisure & Hospitality 87.4 88.7 90.5 73.8 83.3 96.9 105.4 104.9 103.3
Pct Chg Year Ago 2.3 1.5 2.1 -18.5 12.8 16.4 8.8 -0.5 -1.5
Other Services 33.0 33.1 33.0 30.2 30.9 32.5 32.7 33.5 34.3
Pct Chg Year Ago 1.2 0.1 -0.3 -8.4 2.3 5.2 0.7 2.3 2.3
Federal Government 6.7 6.8 7.0 7.2 6.9 6.5 6.3 6.4 6.5
Pct Chg Year Ago -0.6 0.6 2.6 3.4 -4.7 -4.7 -2.8 0.8 1.1
State & Local Government 56.5 57.7 58.7 54.1 55.3 57.1 58.4 59.5 60.2 Pct Chg Year Ago 1.7 2.1 1.8 -7.9 2.2 3.3 2.4 1.8 1.1
Other Economic Indicators
Population (Ths)
1463.3 1475.2 1487.4 1493.0 1498.0 1505.3 1515.3 1526.9 1540.1 Pct Chg Year Ago 1.2 0.8 0.8 0.4 0.3 0.5 0.7 0.8 0.9
Labor Force (Ths)
Percent Change, Year Ago 1.2 0.6 1.1 -1.8 2.4 2.2 0.9 0.8 0.8
Unemployment Rate (%) 4.2 3.7
Total Housing Starts
Single-Family
Multifamily
2.9 4.4 5.7 5.6
7169.7
2700.2
4592.0
W EST P ALM B EACH - B OCA R ATON - B O y NTON B EACH 152 Florida & Metro Forecast / Summer 2022
2017 2018 2019 2020 2021 2022 2023 2024 2025
716.8 721.2 728.9 715.5 732.6 748.8 755.8 762.0 768.1
3.4 8.3 4.3
3965.7 4535.0 4957.6 6871.2 7453.2 7979.9 6751.5
7375.8
2595.0 2888.6 3290.8 4053.2 4803.9 4392.4 4036.1 4469.5
1370.7 1646.4 1666.8 2818.1 2649.3 3587.4 2715.4
2783.8
Short Term Outlook for West Palm Beach-Boca Raton-Delray Beach, FL (Division of Miami MSA) August 2022 Forecast 2022:2 2022:3
Personal Income (Billions $)
2025:1
Total Personal Income 146.2 148.0 150.9 151.8 152.6 153.6 154.8 156.7 158.3 160.1 162.0 164.2 166.2 Pct Chg Year Ago 5.2 5.9 6.1 5.9 4.4 3.8 2.6 3.2 3.7 4.2 4.7 4.7 5.0
Wages and Salaries 51.6 52.2 52.5 52.8 52.8 52.9 52.9 52.9 53.2 53.5 53.9 54.3 54.8
Nonwage Income 94.6 95.8 98.4 99.1 99.8 100.8 101.9 103.8 105.1 106.6 108.1 109.9 111.4
Real Personal Income (12$) 108.5 108.5 109.6 109.4 109.4 109.6 109.9 110.9 111.6 112.4 113.3 114.3 115.1 Pct Chg Year Ago -1.1 -0.5 0.3 1.1 0.8 1.0 0.3 1.3 2.0 2.6 3.1 3.1 3.2
Per Capita Income (Ths) 97.2 98.3 100.0 100.5 100.8 101.3 101.8 103.0 103.8 104.7 105.7 106.9 108.1
Real Per Capita Income (12$) 72.2 72.0 72.6 72.4 72.3 72.3 72.3 72.8 73.2 73.6 73.9 74.4 74.8
Average Annual Wage (Ths) 76.8 77.5 78.0 78.6 79.3 80.0 80.6 81.3 81.9 82.7 83.3 84.0 84.6
Pct Chg Year Ago 7.6 6.3 3.2 2.8 3.2 3.2 3.4 3.3 3.3 3.4 3.3 3.3 3.2
Establishment Employment (Place of Work, Thousands, SA)
Total Employment 669.5 670.6 669.8 668.3 663.5 658.3 653.1 649.1 646.2 645.0 644.2 644.1 645.5
Pct Chg Year Ago 6.4 4.0 2.4 1.2 -0.9 -1.8 -2.5 -2.9 -2.6 -2.0 -1.4 -0.8 -0.1
Manufacturing 21.1 21.2 21.3 21.1 20.8 20.7 20.4 20.1 19.9 19.6 19.4 19.3 19.3
Pct Chg Year Ago 3.7 3.0 2.1 -0.4 -1.3 -2.7 -4.3 -4.4 -4.7 -5.1 -4.9 -4.0 -2.8
Nonmanufacturing 648.4 649.4 648.5 647.2 642.6 637.7 632.7 628.9 626.4 625.4 624.7 624.8 626.2
Pct Chg Year Ago 6.5 4.0 2.5 1.3 -0.9 -1.8 -2.4 -2.8 -2.5 -1.9 -1.3 -0.7 0.0 Construction & Mining 39.7 39.7 39.0 38.4 37.6 37.2 36.8 36.5 36.2 36.1 36.0 36.1 36.2
Pct Chg Year Ago 2.5 1.2 -1.4 -4.4 -5.4 -6.3 -5.7 -5.0 -3.6 -2.8 -1.9 -1.0 -0.2
Trade, Trans, & Utilities 123.2 122.3 122.0 120.6 121.2 120.0 119.7 118.4 116.4 115.5 114.7 113.7 113.2
Pct Chg Year Ago 6.2 2.9 1.3 -1.5 -1.7 -1.9 -1.9 -1.9 -3.9 -3.7 -4.2 -4.0 -2.8
Wholesale Trade 24.8 25.0 25.0 25.2 25.1 25.0 25.1 25.3 25.5 25.7 25.9 26.0 26.1 Retail Trade 80.3 79.2 78.9 77.3 78.2 77.1 76.7 75.2 72.9 71.8 70.7 69.5 68.8
Trans, Wrhsng, & Util 18.1 18.2 18.2 18.2 17.9 17.8 17.9 17.9 18.1 18.1 18.1 18.2 18.2
Information 11.6 11.8 12.0 12.3 12.0 11.7 11.4 11.3 11.3 11.2 11.1 11.1 11.2 Pct Chg Year Ago 19.0 11.0 10.9 11.3 4.0 -0.7 -5.4 -7.7 -6.0 -4.0 -2.9 -1.8 -0.8
Financial Activities 47.0 47.2 47.0 47.2 46.5 46.5 46.7 47.1 47.7 48.1 48.5 48.8 49.0 Pct Chg Year Ago 4.9 1.9 0.9 -0.2 -1.0 -1.4 -0.8 -0.3 2.5 3.5 3.9 3.7 2.8 Prof & Business Services 128.2 127.8 126.0 122.7 116.6 111.4 107.0 103.7 101.4 99.8 99.5 100.1 101.2 Pct Chg Year Ago 4.9 2.0 -0.6 -3.8 -9.1 -12.8 -15.1 -15.5 -13.0 -10.5 -7.0 -3.5 -0.1
Educ & Health Services 104.5 105.0 105.6 105.8 106.0 106.3 107.0 108.2 109.2 110.0 110.5 110.9 111.0 Pct Chg Year Ago 1.9 0.8 1.4 1.0 1.4 1.3 1.3 2.2 3.0 3.5 3.3 2.6 1.6
Leisure & Hospitality 97.8 99.0 99.8 102.9 105.5 107.1 106.2 105.2 105.0 104.9 104.4 103.5 103.5 Pct Chg Year Ago 18.9 15.4 10.8 13.0 7.9 8.1 6.4 2.2 -0.5 -2.0 -1.8 -1.6 -1.4
Other Services 32.5 32.9 32.9 33.0 32.6 32.6 32.7 33.0 33.3 33.7 33.9 34.2 34.3 Pct Chg Year Ago 5.5 5.8 4.6 3.9 0.4 -0.9 -0.6 0.2 2.1 3.4 3.7 3.5 2.8
Federal Government 6.5 6.4 6.4 6.4 6.3 6.3 6.4 6.4 6.4 6.4 6.4 6.4 6.5 Pct Chg Year Ago -5.4 -5.3 -5.9 -6.4 -2.6 -1.6 -0.6 0.2 1.0 1.0 1.1 1.1 1.1
State & Local Government 57.3 57.3 57.7 58.0 58.3 58.6 58.9 59.2 59.4 59.6 59.8 60.0 60.1
Pct Chg Year Ago 4.9 2.0 2.7 3.2 1.7 2.3 2.2 2.2 2.0 1.7 1.5 1.3 1.1
Other Economic Indicators
Population (Ths) 1504.4
Pct Chg Year Ago
Labor Force (Ths)
Pct Chg Year
Unemployment Rate (%)
Total Housing Starts
Single-Family
Multifamily
W EST P ALM B EACH - B OCA R ATON - B O y NTON B EACH Institute for Economic Forecasting 153
2022:4 2023:1 2023:2 2023:3 2023:4 2024:1 2024:2 2024:3 2024:4
2025:2
1506.2 1508.2 1511.0 1514.0 1516.8 1519.5 1522.2 1525.2 1528.4 1531.7 1535.2 1538.4
0.4 0.6 0.6 0.6 0.6 0.7 0.7 0.7 0.7 0.8 0.8 0.8 0.9
750.2 749.2 751.3 753.0 754.5 756.8 758.8 760.1 761.3 762.6 764.0 765.4 767.2
Ago 2.7 1.3 1.5 1.1 0.6 1.0 1.0 0.9 0.9 0.8 0.7 0.7 0.8
2.6 2.8 3.1 3.6 4.2 4.7 5.1 5.4 5.6 5.7 5.8 5.8 5.7
8248.2 7340.6 7510.6 6798.7 6700.1 6690.9 6816.1 6888.4 7107.8 7291.6 7391.3 7393.2 7396.3
4371.9 3993.1 4094.2 3928.0 3942.1 4072.3 4202.0 4292.1 4438.0 4545.7 4602.3 4626.4 4612.1
3876.3 3347.5 3416.5 2870.8 2758.0 2618.6 2614.1 2596.3 2669.8 2745.8 2789.0 2766.9 2784.2
EXPLANATION AND INTERPRETATION
This technique compares the local economy to a reference economy; in this case, the local economy is the chosen MSA, and the reference economy is the state of Florida. An Industry Location Quotient (LQ) is calculated to determine if the local economy has a greater share of each industry’s employment than the reference economy. The LQ helps to identify specializations that exist in the local economy.
There are only three possible outcomes: 1. An LQ greater than one 2. An LQ equal to one and 3. An LQ less than one. An LQ that is greater than one means that the share of local employment in that particular industry is greater than the reference economy employment share in that same industry. This implies that some of the goods or services produced by that industry are exported for consumption elsewhere. An LQ of one means that local demand is met by the local industry. No goods/services are imported or exported from the local area in that industry. The share of local employment in that industry is equal to the share for that industry in the reference economy. An LQ less than one implies that the industry is not meeting local demand for that good or service, and in order to meet demand, that area must import that good or service. This also means that the share of local employment in that industry is less than the share of employment in that industry for the reference economy.
CALCULATION
An industry location quotient is a calculated ratio of two ratios.
LQ = ((Local employment in industry A in year T / Total local employment in year T) / (Reference economy employment in industry A in year T) / (Total reference employment in year T))
For example:
Orlando MSA employment for Information is 27,400
Total Orlando MSA nonagricultural employment is 1,104,100
Florida employment for Information is 169,800
Total Florida nonagricultural employment is 8,247,000
LQ = ((27,400 / 1,104,100) / (169,800 / 8,247,000)) = 1.2039
Source: Florida Regional Economic Database, Current Employment Statistics, August 2022
INDUSTR y LOCATION QUOTIENT 154 Florida & Metro Forecast / Summer 2022
Sean Snaith, Ph.D., is the director of the University of Central Florida’s Institute for Economic Forecasting and a nationally recognized economist in the field of business and economic forecasting.

Snaith is the recipient of multiple awards for the accuracy of his forecasts, his research and his teaching. He has served as a consultant for local governments and multinational corporations such as Compaq, Dell and IBM. Before joining UCF’s College of Business, he held teaching positions at Pennsylvania State University, American University in Cairo, the University of North Dakota and the University of the Pacific.
Snaith is frequently interviewed in international, national and regional media. He has been quoted in The Wall Street Journal, USA Today, The New York Times, The Economist and The Guardian and has appeared on CNBC, Fox Business Network, The Nightly News with Brian Williams, Al Jazeera, the BBC and CBC, China Central TV, Sky News, Nippon TV and the Business News Network, based in Toronto.
Snaith is a sought-after speaker known for his engaging and humorous presentations. He has built a national reputation for his unique ability to explain complex subject matter in a digestible manner. He earned praise from one business editor for having “an uncanny knack of making economics not only understandable but interesting.”
Snaith is a member of several economic organizations and national economic forecasting panels, including The Wall Street Journal’s Economic Forecasting Survey, the Associated Press’ Economy Survey, CNNMoney.com’s Survey of Leading Economists, USA Today’s Survey of Top Economists, Federal Reserve Bank of Philadelphia’s Survey of Professional Forecasters, Bloomberg and Reuters.
Snaith holds a B.S. in Economics from Allegheny College and an M.A. and Ph.D. in Economics from Pennsylvania State University.
Sean M. Snaith, PhD
Director,
Institute for Economic Forecasting
P 407.823.1451 E ssnaith@ucf.edu ief@ucf.edu ucf_ief
ucf.ief
ucf.ief linkedin.com/company/institutefor-economic-forecasting/

UNIVERSITY OF CENTRAL FLORIDA INSTITUTE FOR ECONOMIC FORECASTING P.O. BOX 161400 ORLANDO, FLORIDA 32816 PH 407.823.1453 • FX 407.823.1454 WWW.IEC.UCF.EDU


 FLORIDA NEWS SUMMARIES


