2 minute read
Table 3: The Output of Duration Calculation
Table 3: The Output of Duration Calculation
Activity Quantity Unit Productivity Rate Total working hrs Crew size Resources no. Activity Duration (days)
Excavation for water truck and so forth (the whole line separate)
2250m3 m3 4 labour hrs/m3 9000 hrs 3 3 excavators 300 days
This activity duration is included in the duration of site preparation extracted from timeline.
This method could provide a preliminary guide for the activity duration but is restricted to the relevant quantity available and reasonable assumptions, which is not suitable for the entire project. Therefore, this report also introduces the three-point estimation.
4.4.2.3 Three-Point Estimation (PERT Analysis)
All the method like Precedence Diagram Method (PDM) or parametric estimation are assumed to be utilised when the duration of construction activities remain the same and are non-variable
along the duration of the entire project from start to finish. This is not realistic and practical. Therefore, the three-point (PERT) estimation applied introduces the uncertainty into the estimation of the construction activity duration in the schedule management.
Uher (2003) states that unlike the PDM or parametric estimation where a single duration is estimated for each activity, PERT considers three duration estimates for each construction activity in this project as following:
--Optimistic () which is the minimum estimated duration that may occur in the best-case scenario on that specific construction activity
--Most likely ( ) which the duration estimated can be achieved in the most likely scenario
--Pessimistic ( ) which is the maximum duration estimated that may occur in the worst-case scenario on the specific construction activity
From these three estimate durations, the expected duration value of the specific activity ( ) can be calculated by:
Expected Duration (Mean Value):
Also, the Standard Deviation:
At this stage, the probability of duration to complete the project (X) is calculated by assuming that the probability distribution of the total project duration is normal distribution (Appendix A for the detailed explanation of Normal Distribution).
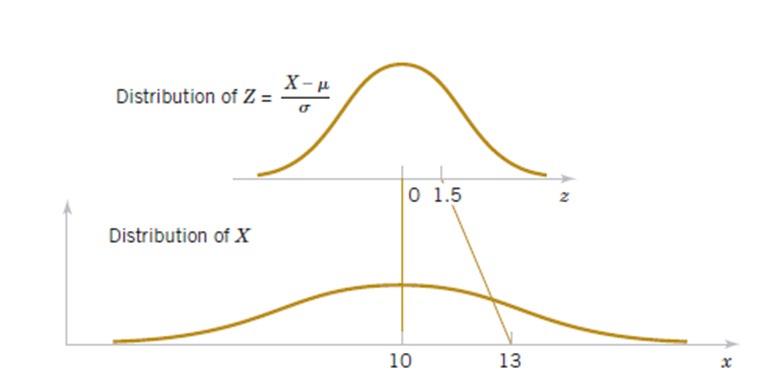
By utilising a simple statistical analysis which converts the normal distribution into standard normal distribution Z-value, we can calculate and find the specific activity duration of critical path with a corresponding probability P-value. (APPENDIX B)
The normal variable (X) can be standardised into Z, which
random variable, and is used to denote the distribution. , a standard


