
apre@pml.ac.uk Catchment to Coast Research Activities at PML
Andy Rees

Socio-economics
River Flow
July 2007
River Flow from EA at Gunnislake
MetOffice “Rainfall was double the monthly average”
Salinity @ L4
Salinity stratification in near surface over ~3 weeks
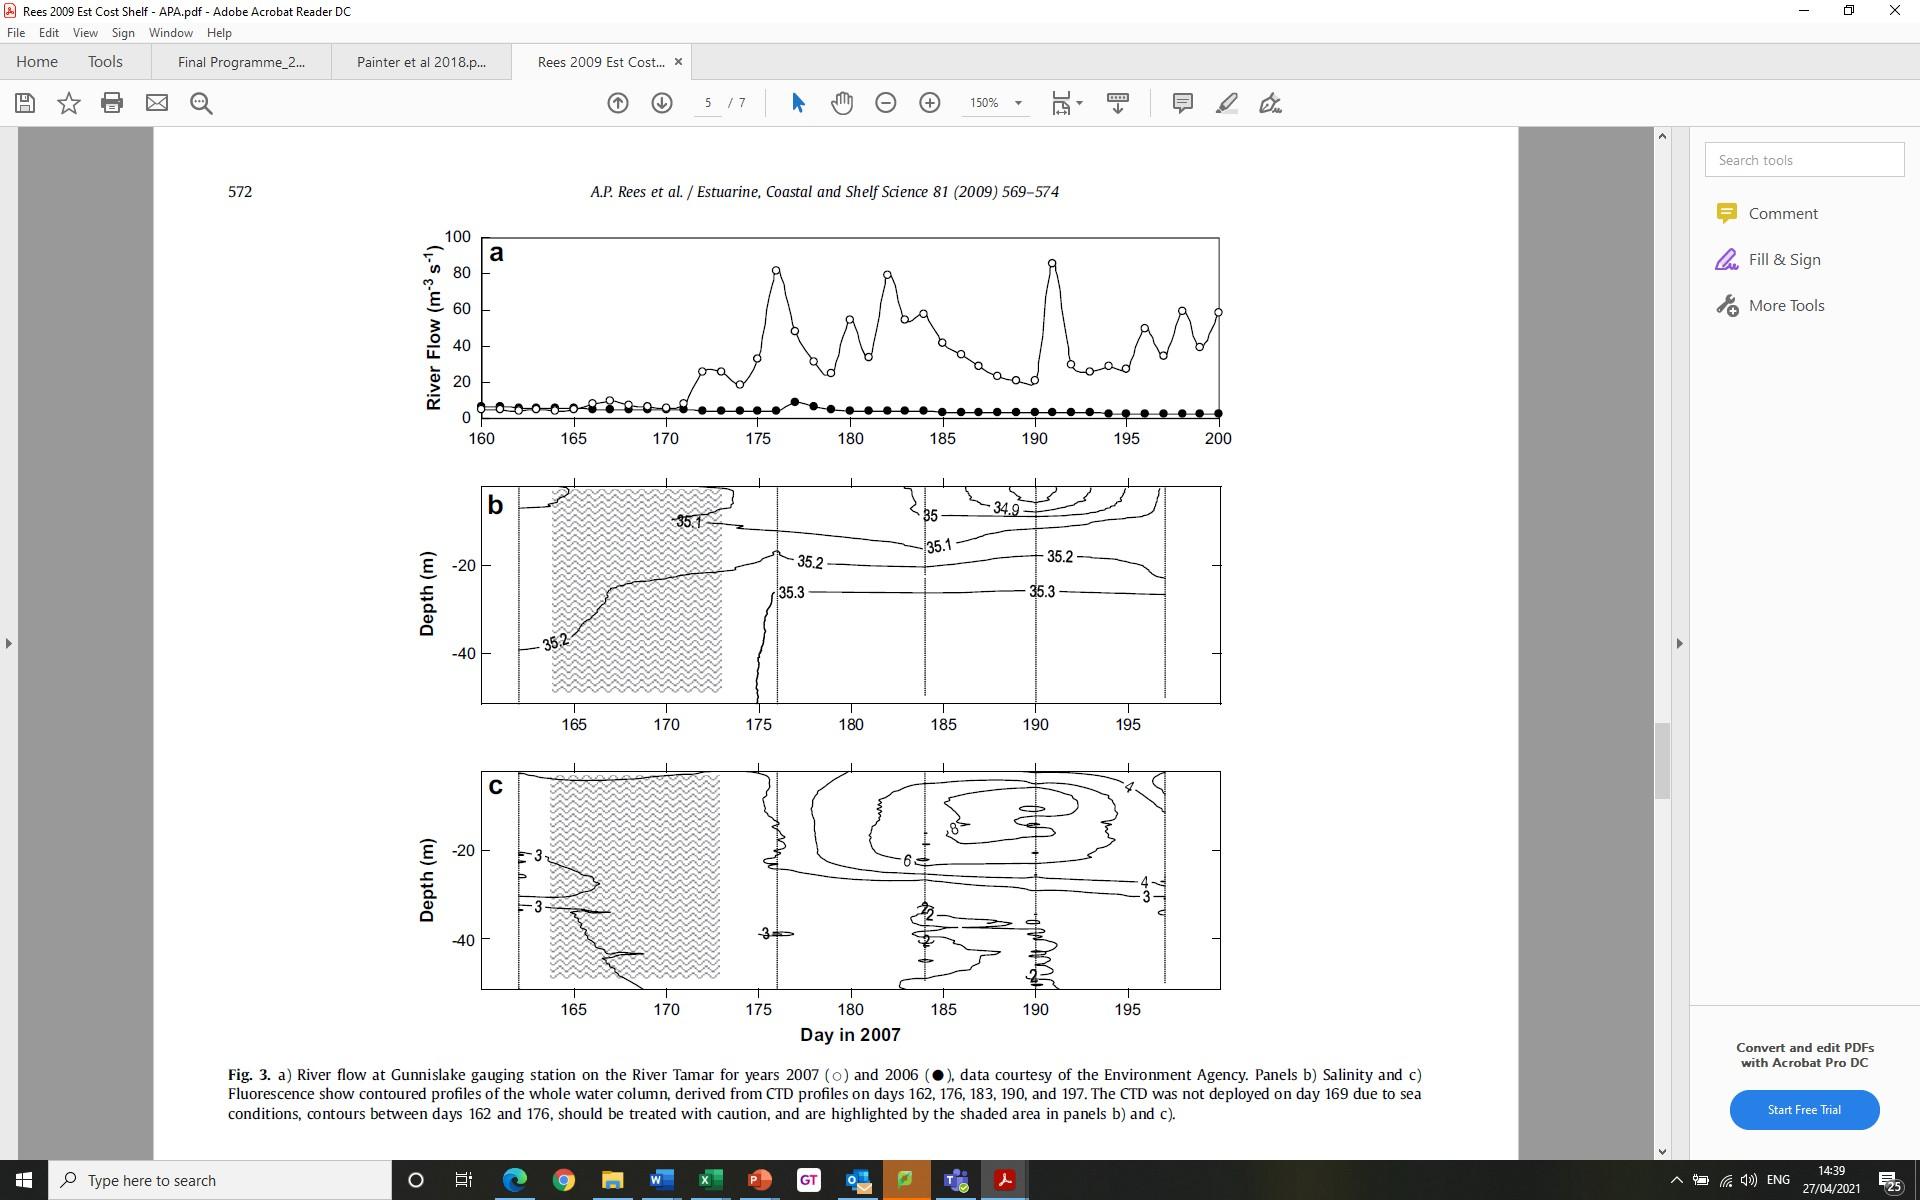
elevated DIN at L4 – 2.2 µM relative to 2007 mean of 0.35 µM
not paralleled with changes in DIP
Chlorophyll
intense bloom of diatom Chaeotoceros
debelis followed by massive dinoflagellate increase
Rees et al., 2009 Est, Coast & Shelf Science 81, (2009), 569-574
Tamar & The Western English Channel
Land-Ocean connectivity – the River Tamar
- Catchment to Coast
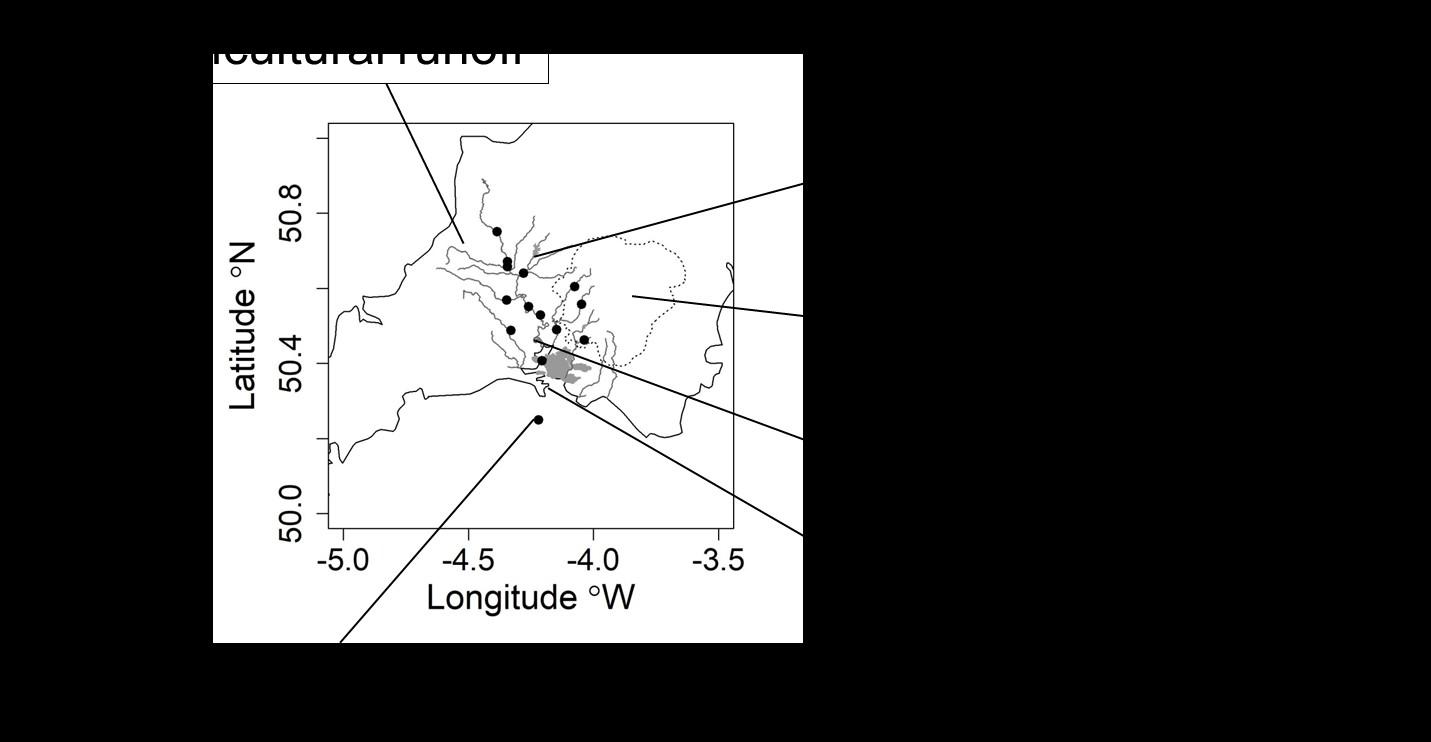 1. Land Ocean Aquatic Continuum (LOAC)
2. The Western Channel Observatory (WCO)
3. Nature Based Solutions – wetland creation
4. Nature Based Solutions – seagrass
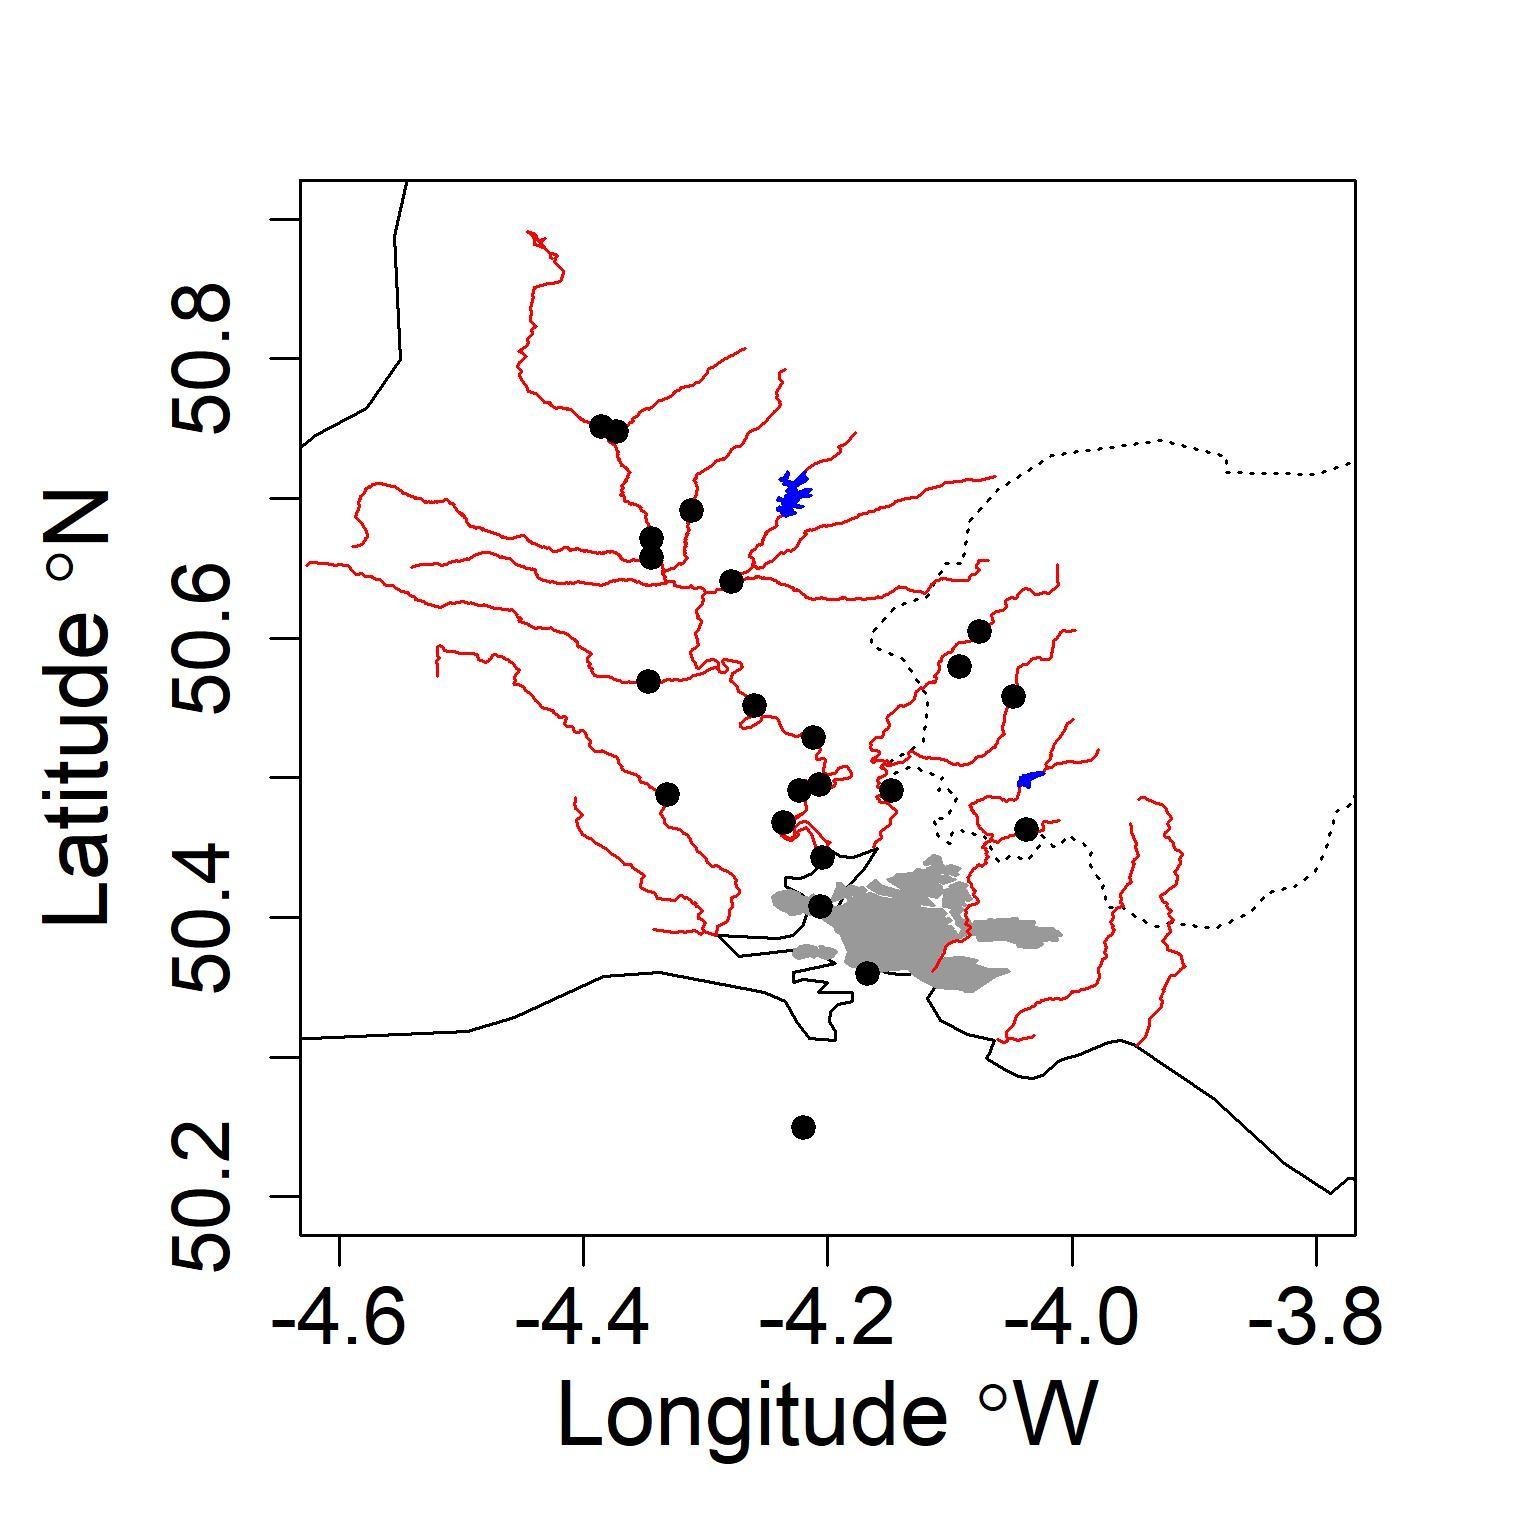
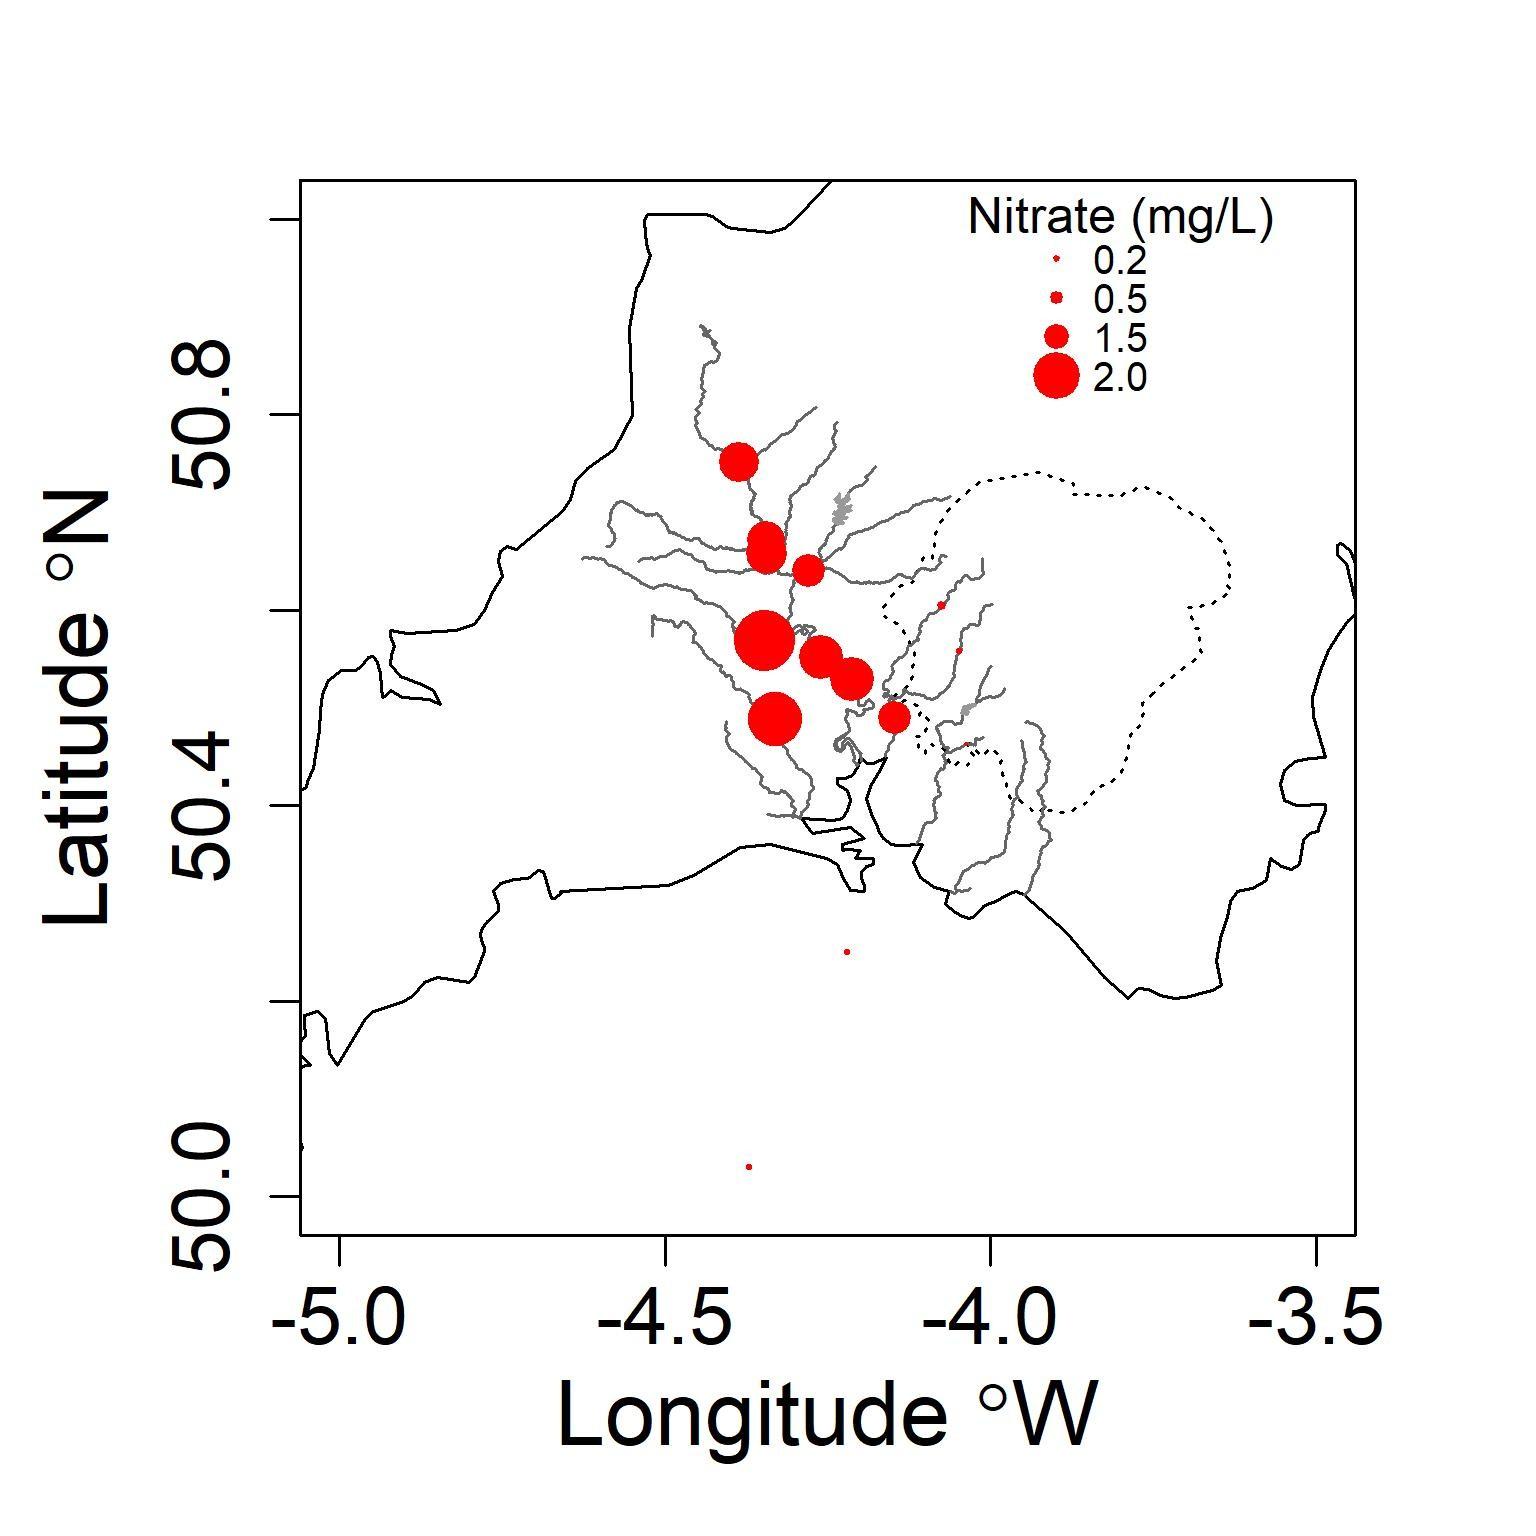
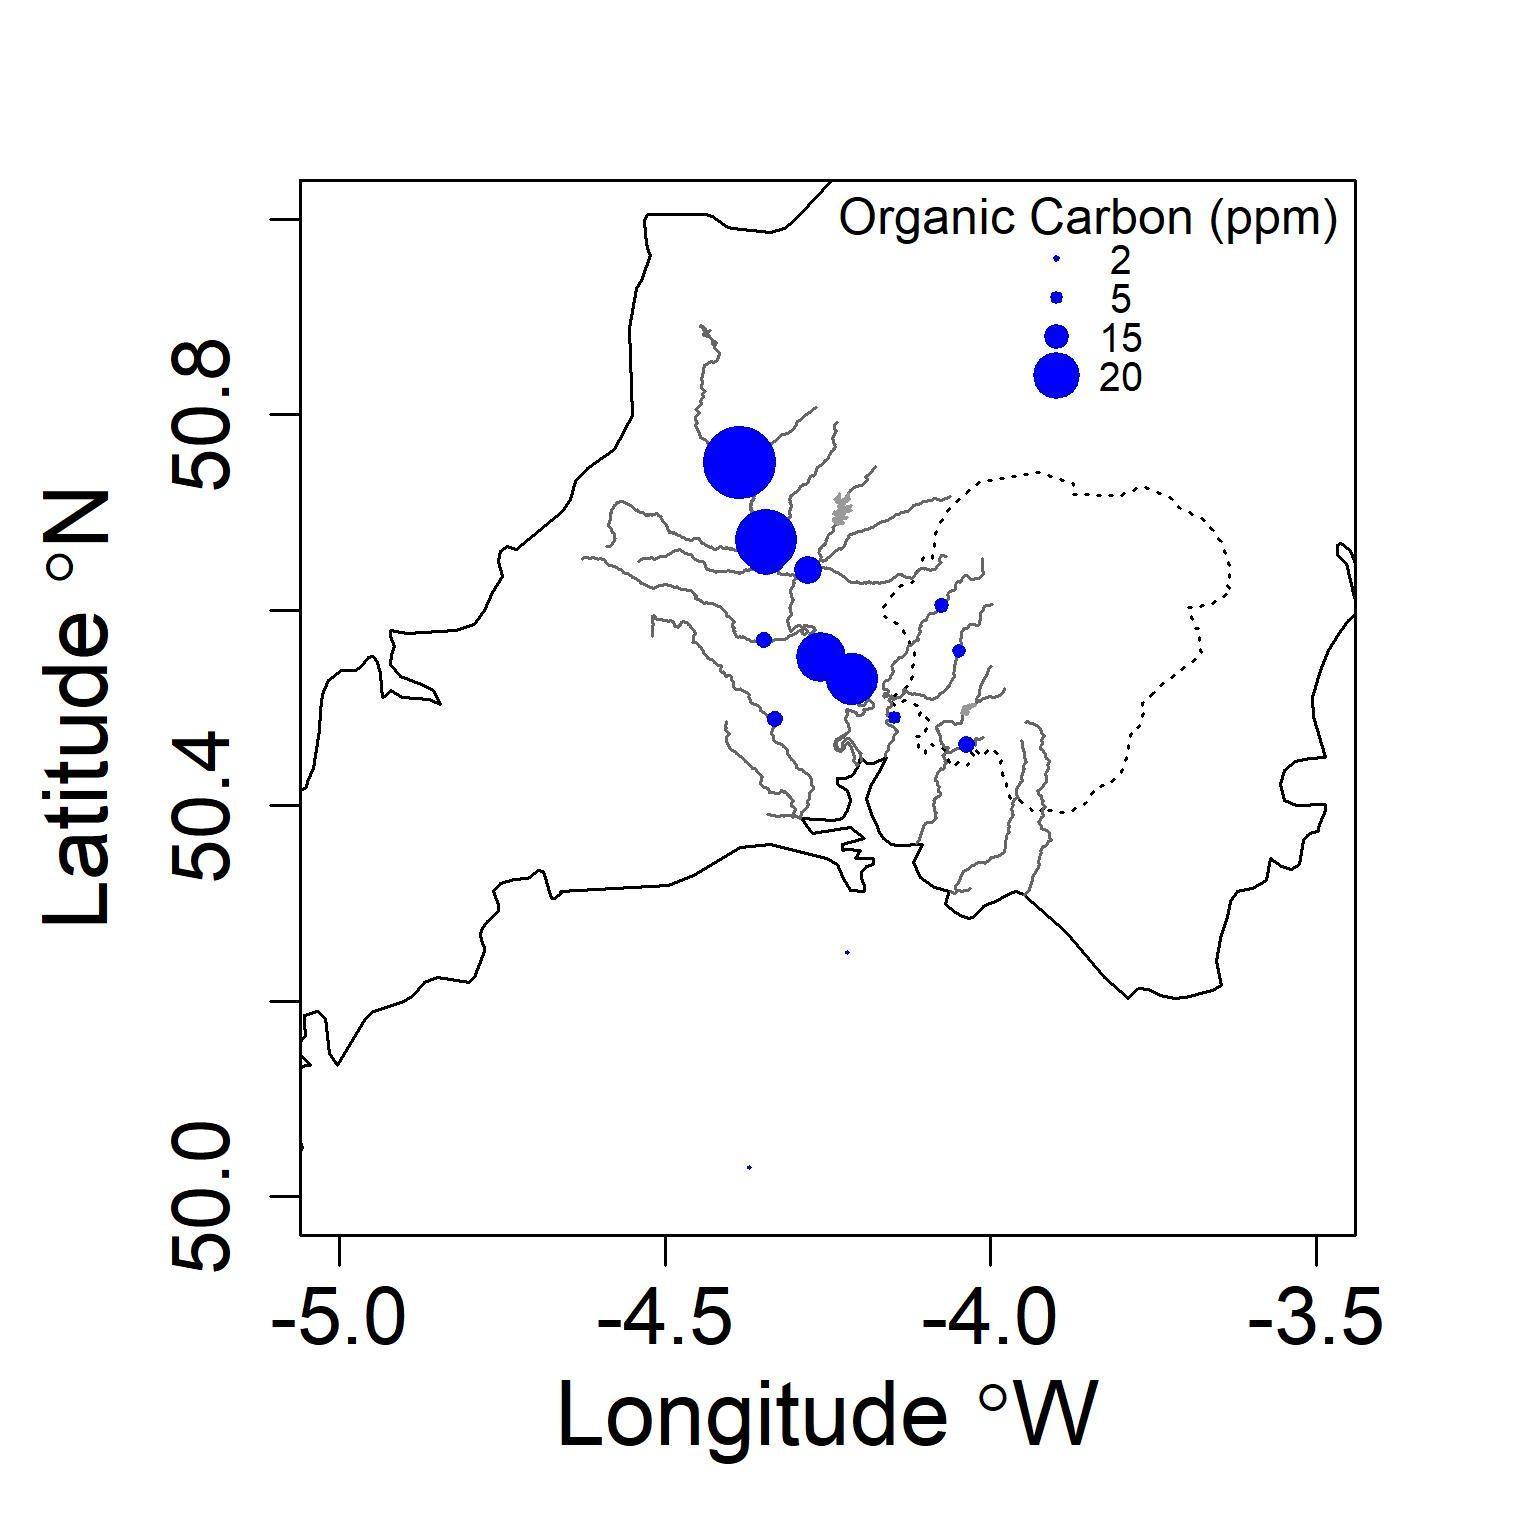
Bi-monthly monitoring of 15 Sites, Top of Tamar to Estuary Mouth (C, N, P, GHGs, microbes)

ParticulateCarbon,
Silicate, CDOM , DOC , DIC , Alkalinity ,
Temperature, Salinity , Conductivity , (Oxygen) , Nitrate,
ParticulateNitrogen,
CarbonDioxide, pH ,
SuspendedSolids,
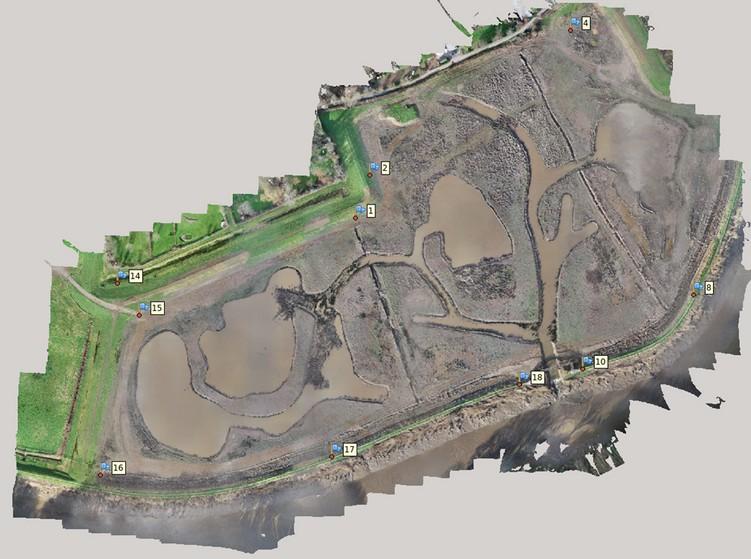
Quarterly sampling of new wetland (C, N, P, GHGs, microbes)
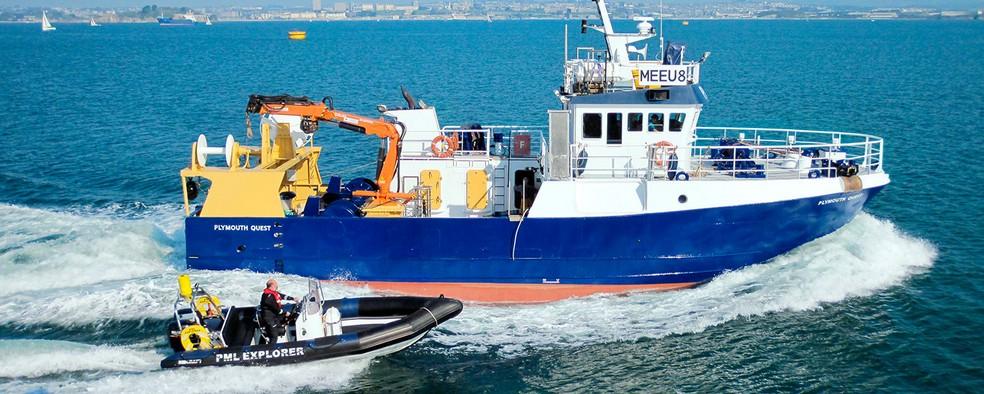
Weekly sampling at Western Channel Observatory
(C, N, P, GHGs, microbes)
Nitrite, Ammonium, Phosphate
NitrousOxide,
Bacteria, Algae, DNA/RNA
Methane,
Continuous atmospheric observations of NH3, NOx and aerosol NO3, NH4 at Penlee Point Observatory
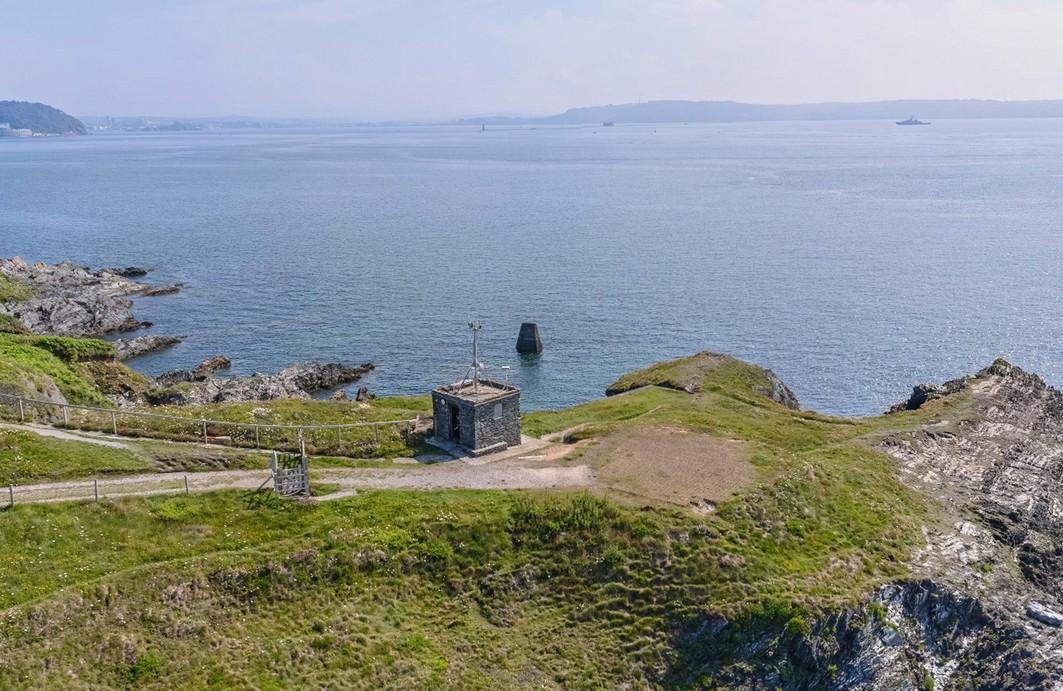
Catchment to Coast – River Tamar
May 2022
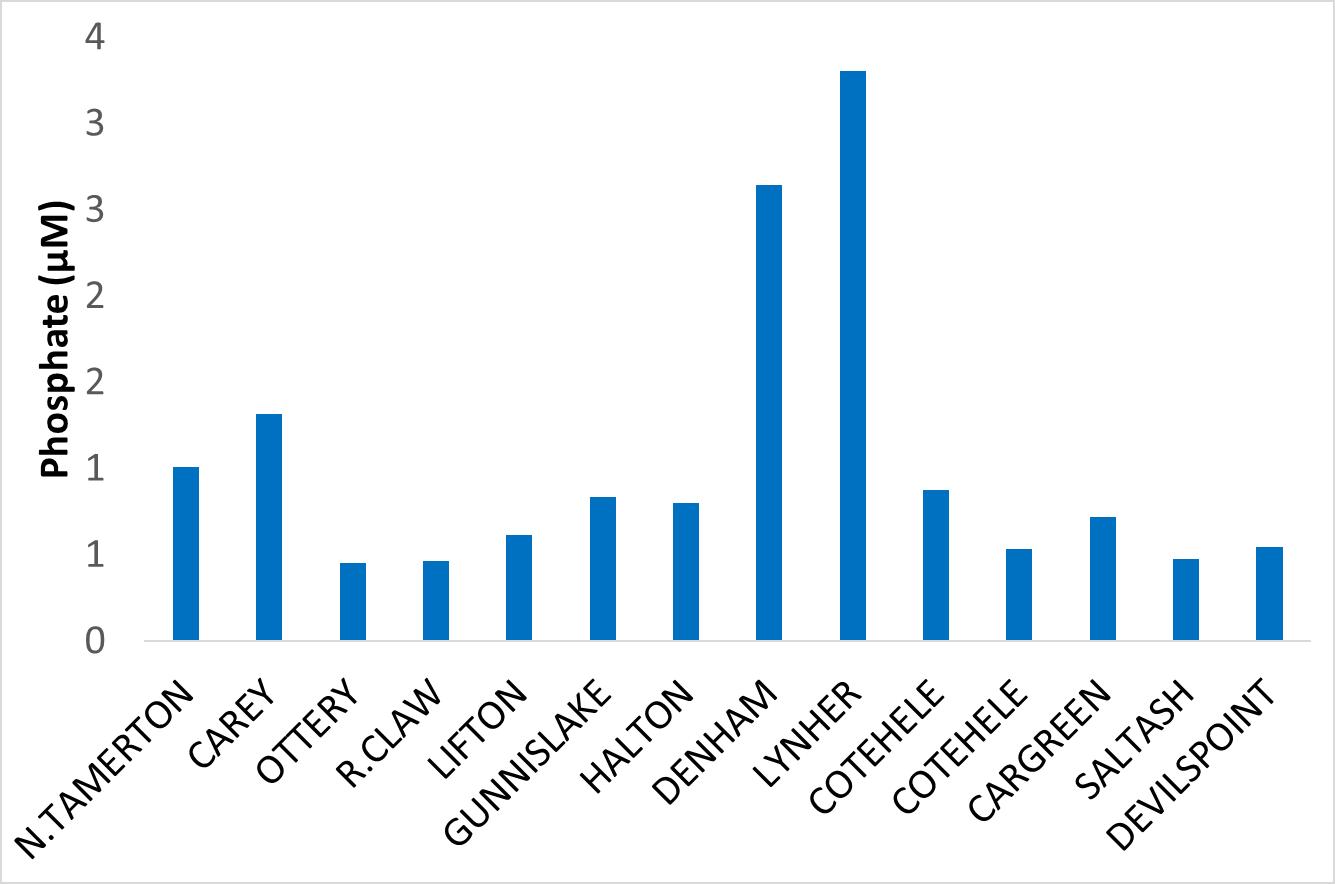
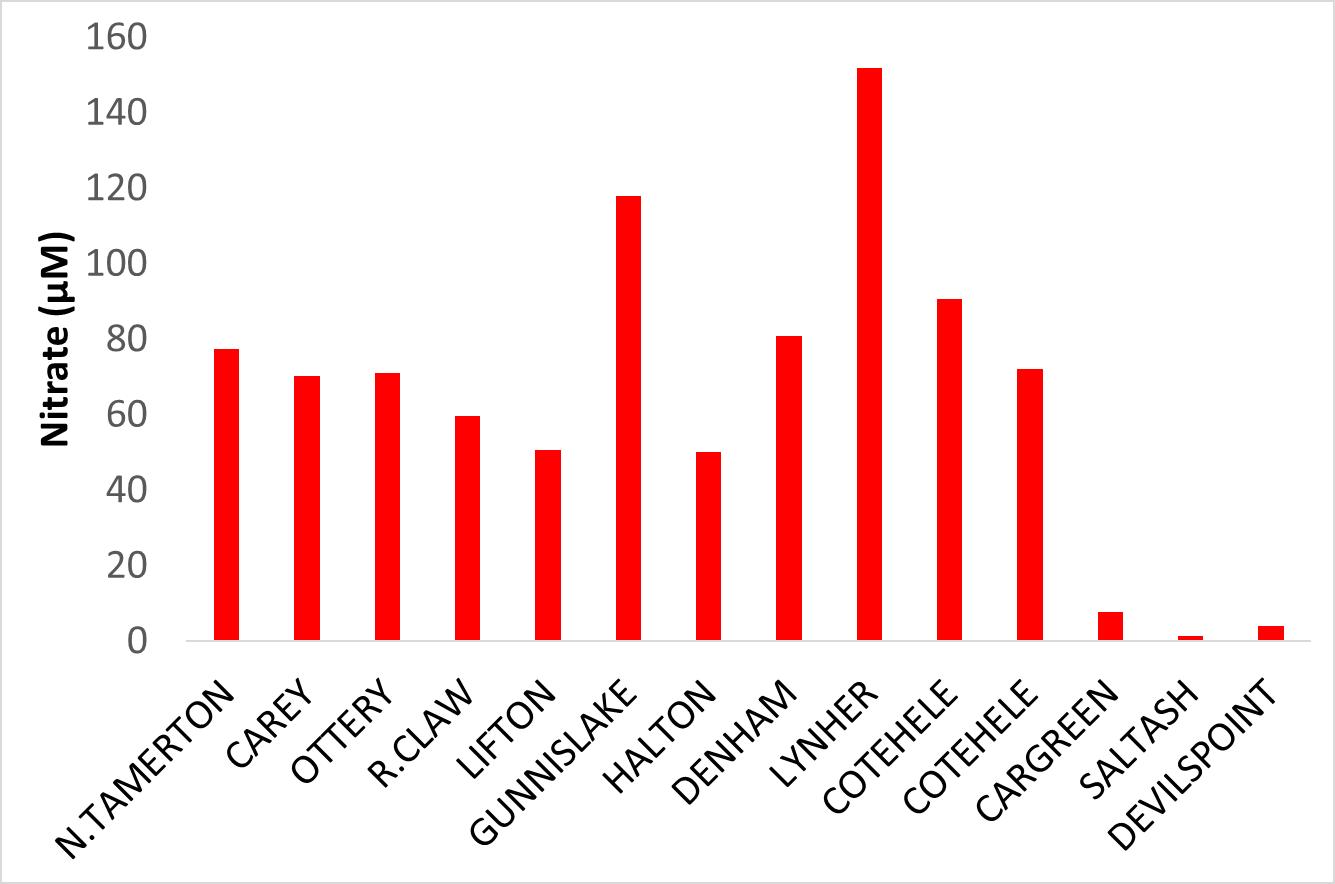
For the marine people!
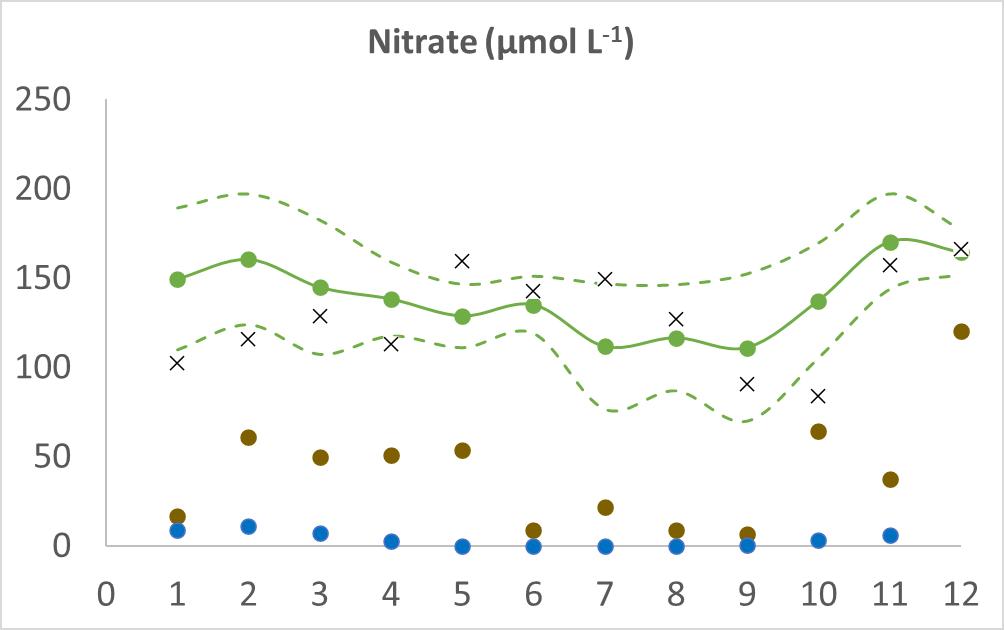
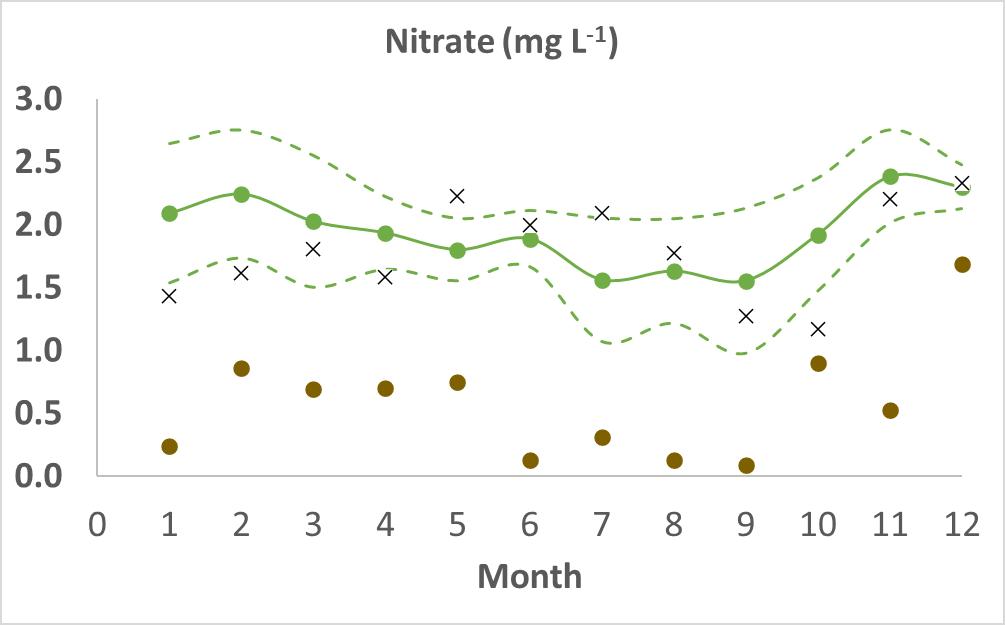
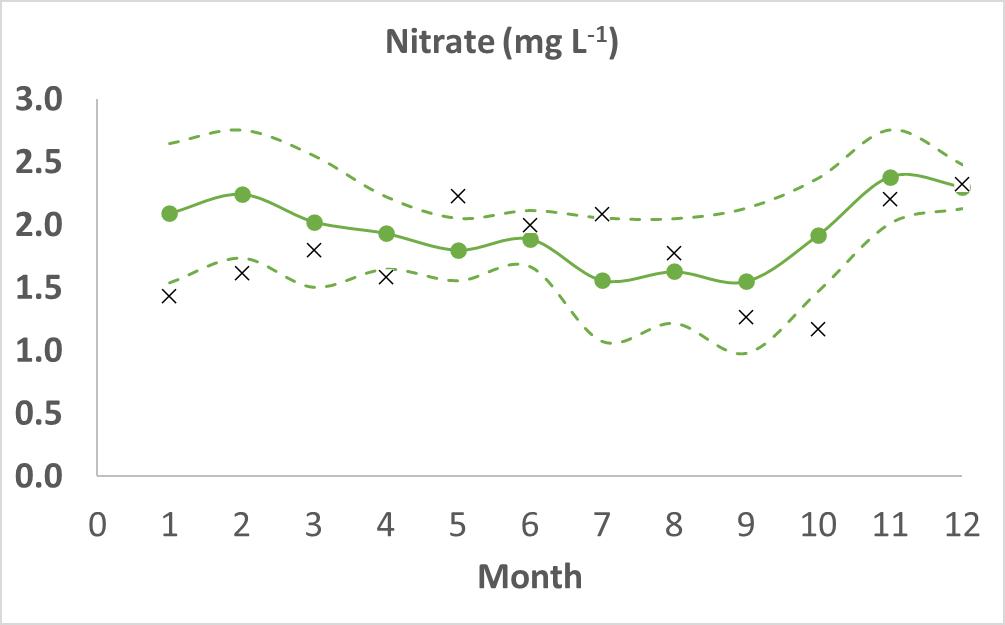
Mean (± 1sd) nitrate at Gunnislake (2017 – 2022)
X nitrate at Gunnislake 2021
nitrate at Saltash 2021
nitrate at L4 2021
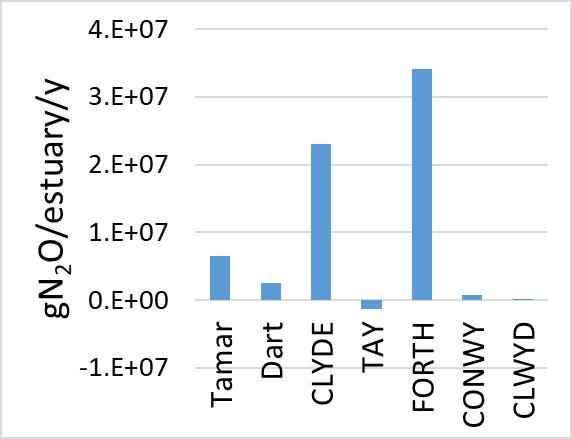
Nitrous oxide is a potent Greenhouse Gas
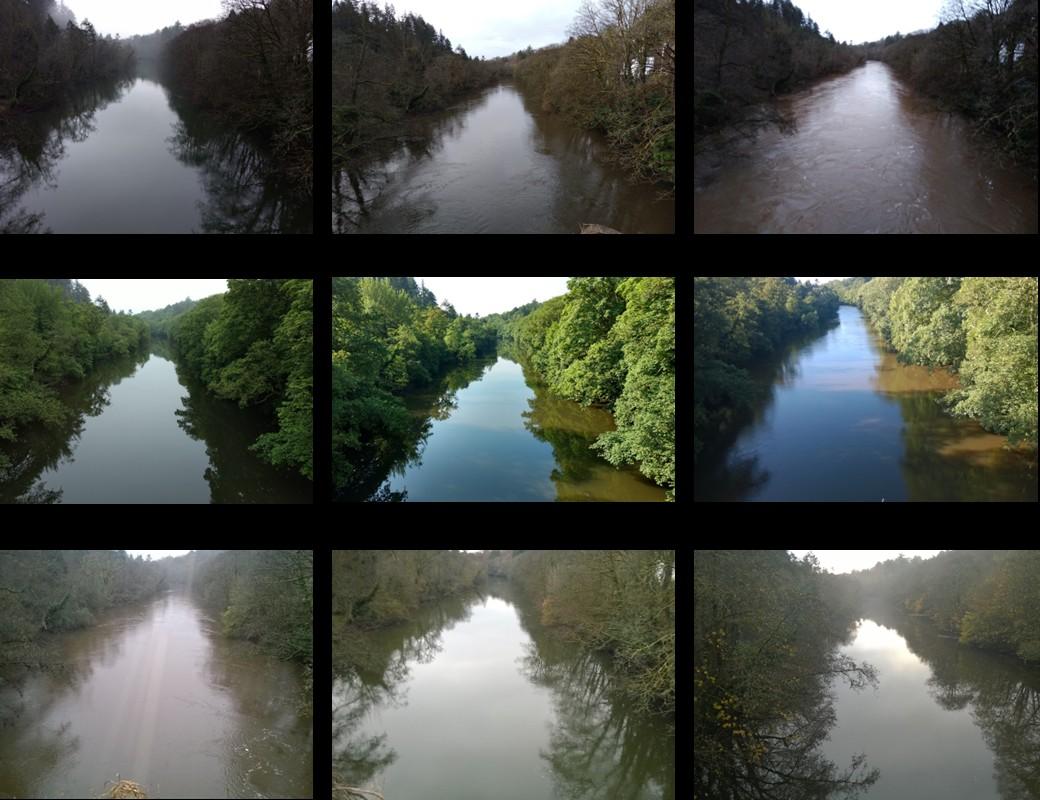
June 2017
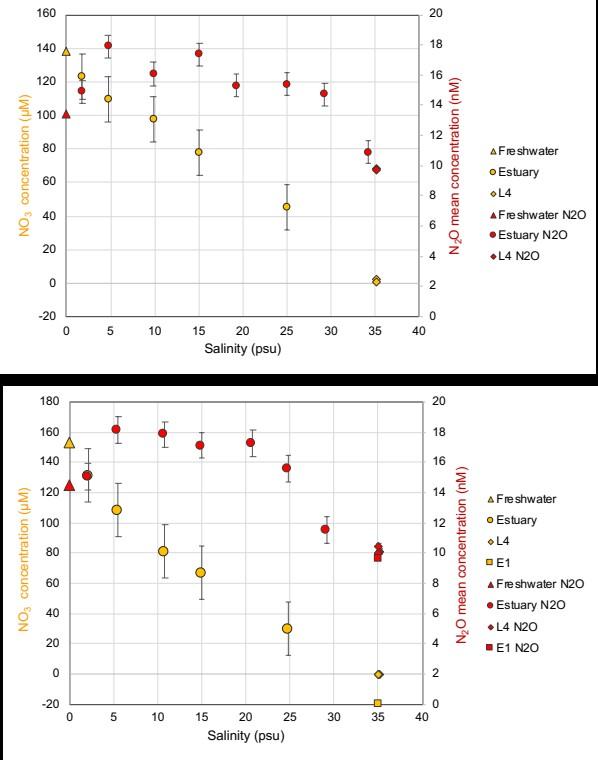
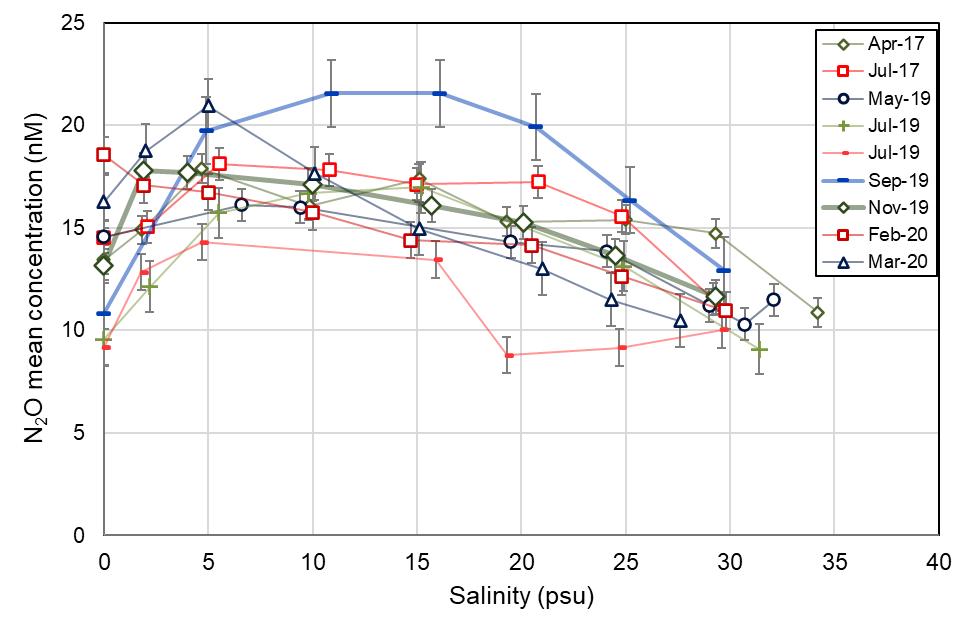
N2O catchment to coast
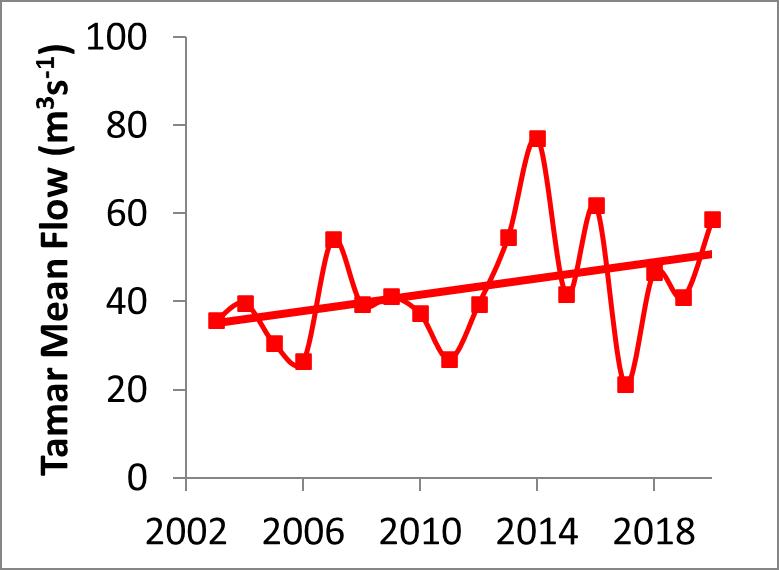
River flow (Water quantity) affects N2O release to the atmosphere
Since 2003:
Mean winter-time flow rate of Tamar increased at ~ 1.0 m3s-1 y-1
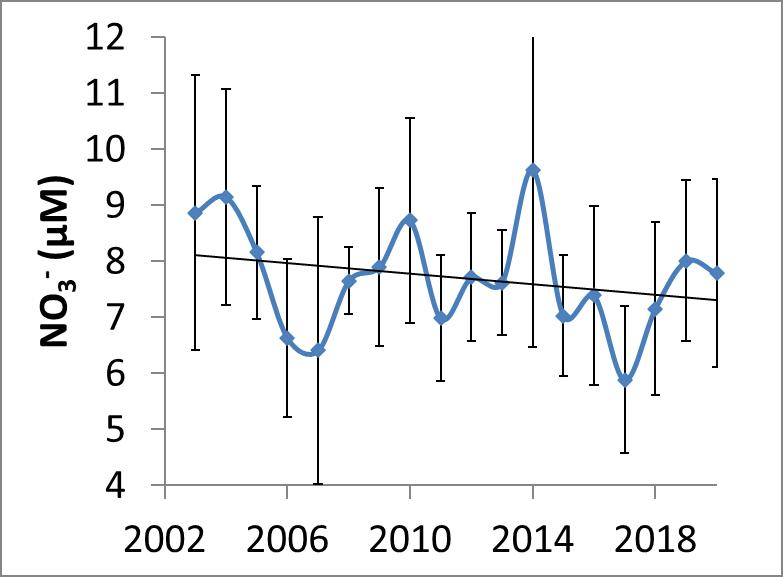
Mean winter-time nitrate at L4 decreased at ~ 48 nmol L-1 y-1
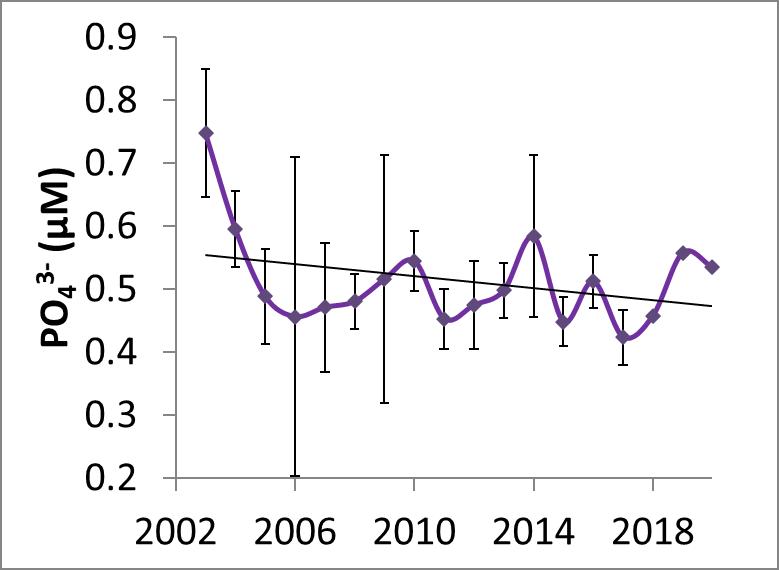
Mean winter-time phosphate at L4 decreased at ~ 5.0 nmol L-1 -1
Western Channel Observatory
Decreasing concentrations of N & P at L4 over the last 20 years.

Nutrients consistently elevated in coastal waters (L4) relative to Atlantic waters (E1).
~40% for N and ~8% for P. BUT
Maximum concentrations of N observed at L4 are strongly correlated to Gunnislake river flow.
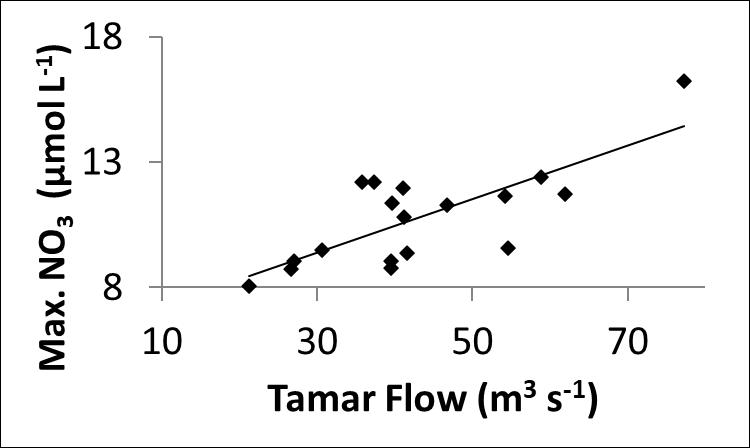
L4 E1
Changing Environment
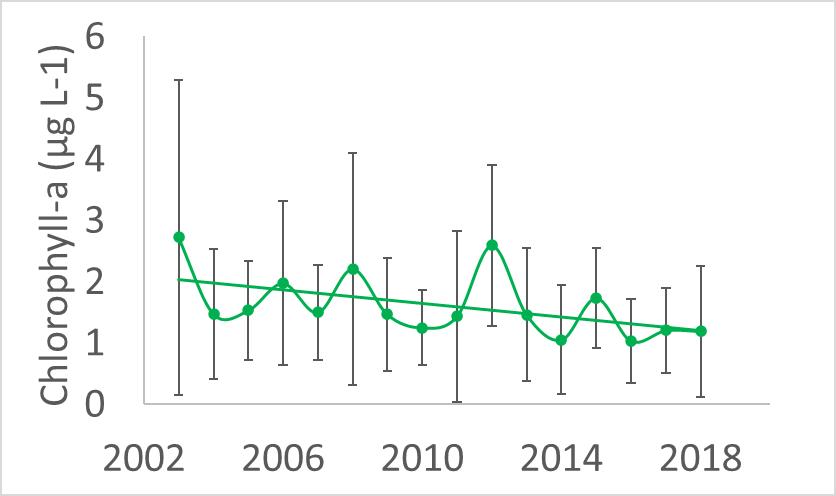
Decrease in mean spring-time Chlorophyll-a of ~0.1µg Chl-a y-1
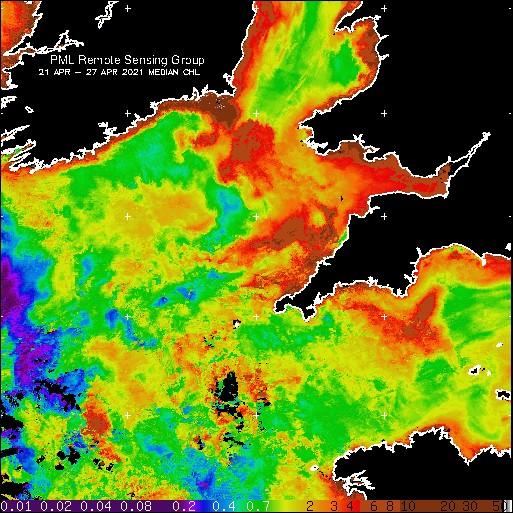
Conditions reports for local marine users
Operational Model: supporting smart monitoring
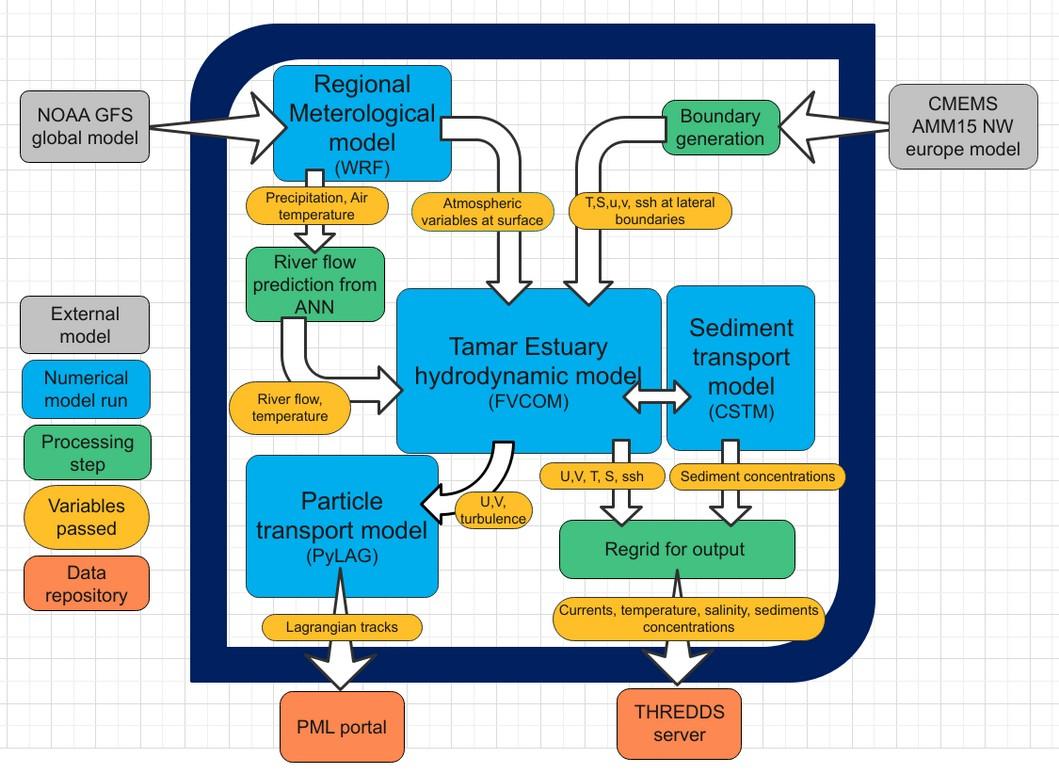
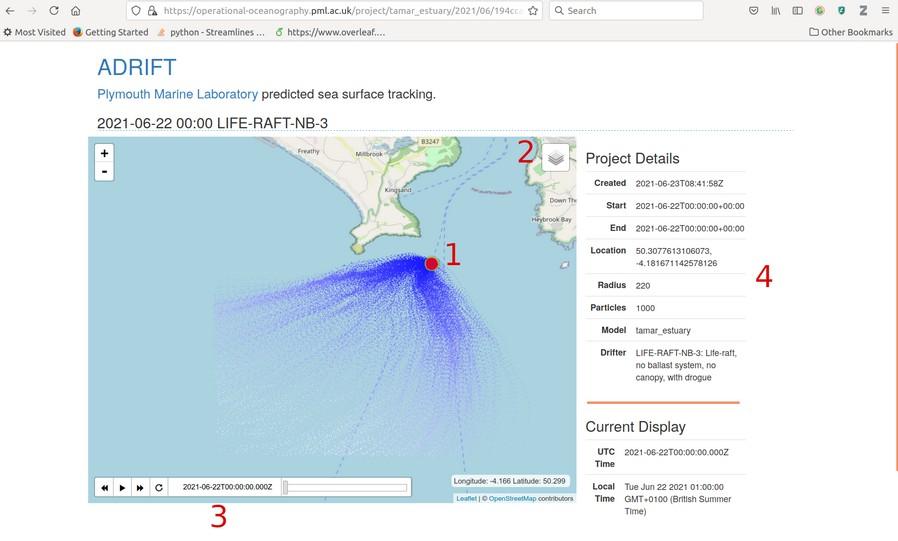
Operational models of Tamar estuary and SW UK shelf now produce a 1 day nowcast, 2 day hydrodynamic forecast
https://plymouthmarineforecasts.org/
These support experimental risk management tools for a variety of end users
Accumulation of pollutants
Search and Rescue support
Harmful algal bloom advection forecast
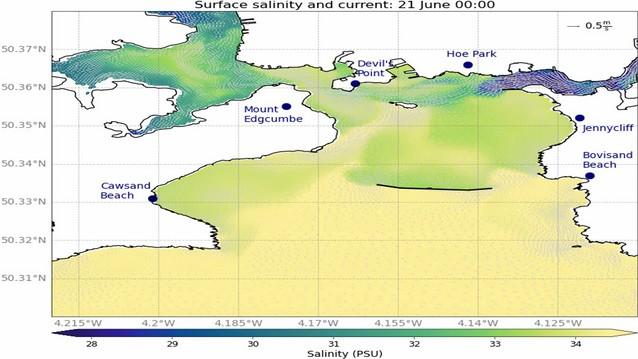
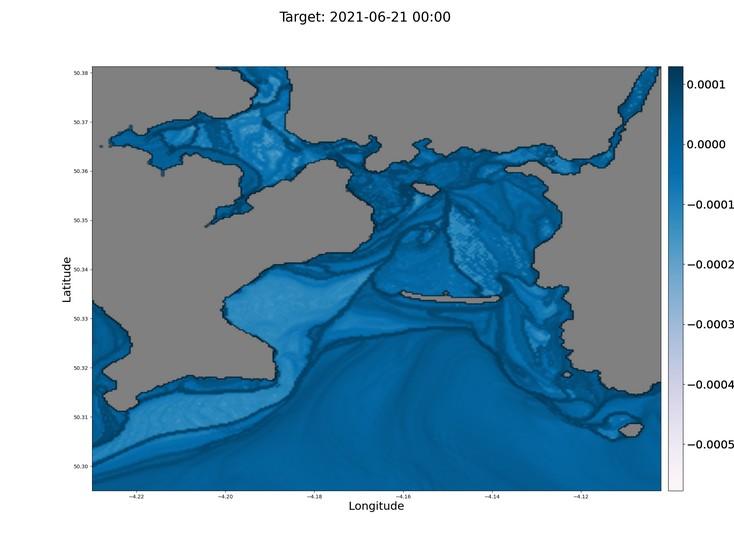
- Integrate WCO/EO observations with model outputs for new operational products (e.g. HAB risk )
- Integrate into smart sound, using machine learning approaches combine with autonomous platforms
- Test new tools for coastal risk and industry needs
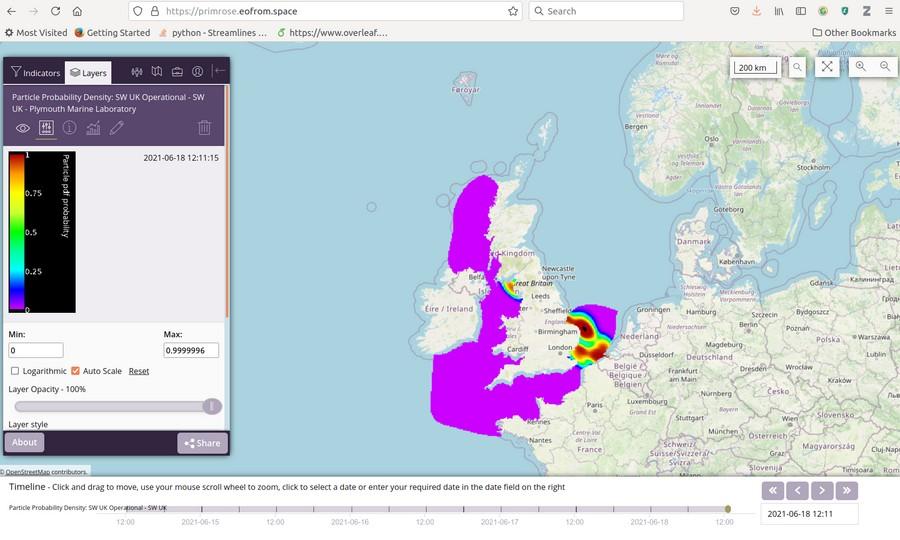
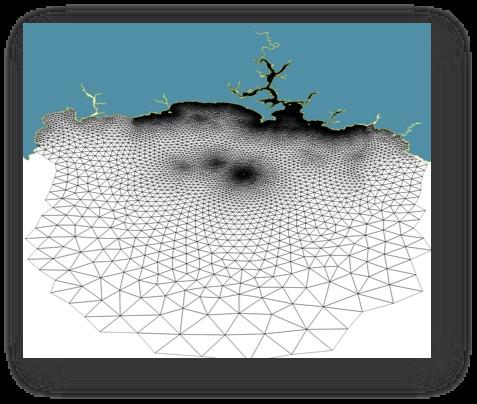
- Use to optimise data collection strategies for other science questions

U s e r s F u t u r e F o r e c a s t s y s t e m
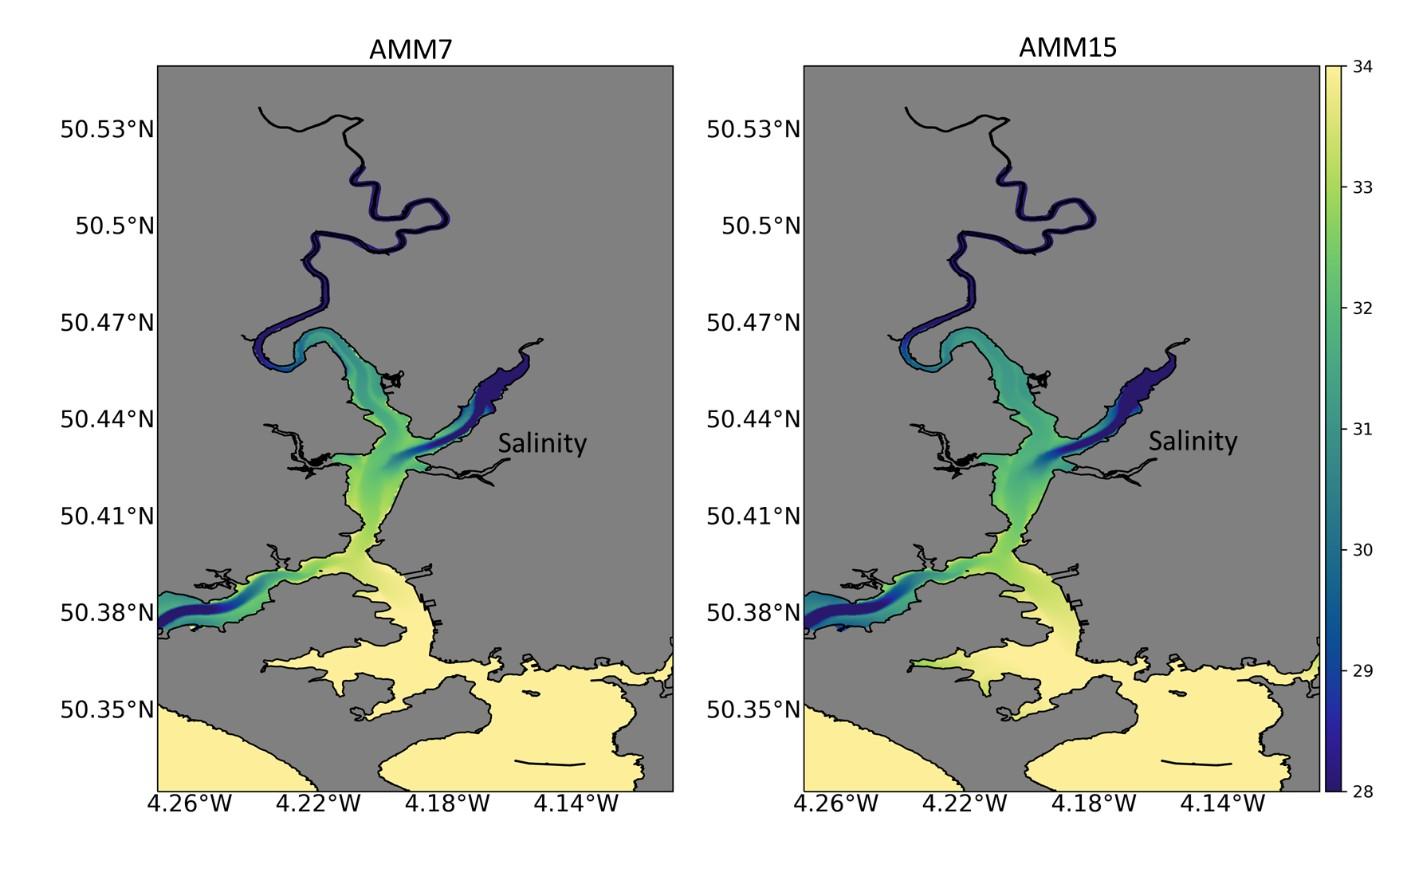
AMM15 (2019)
Results are from 2 different years
AMM7 (2018)
Largest differences in a narrow salinity band that occupies the middle part of the estuary
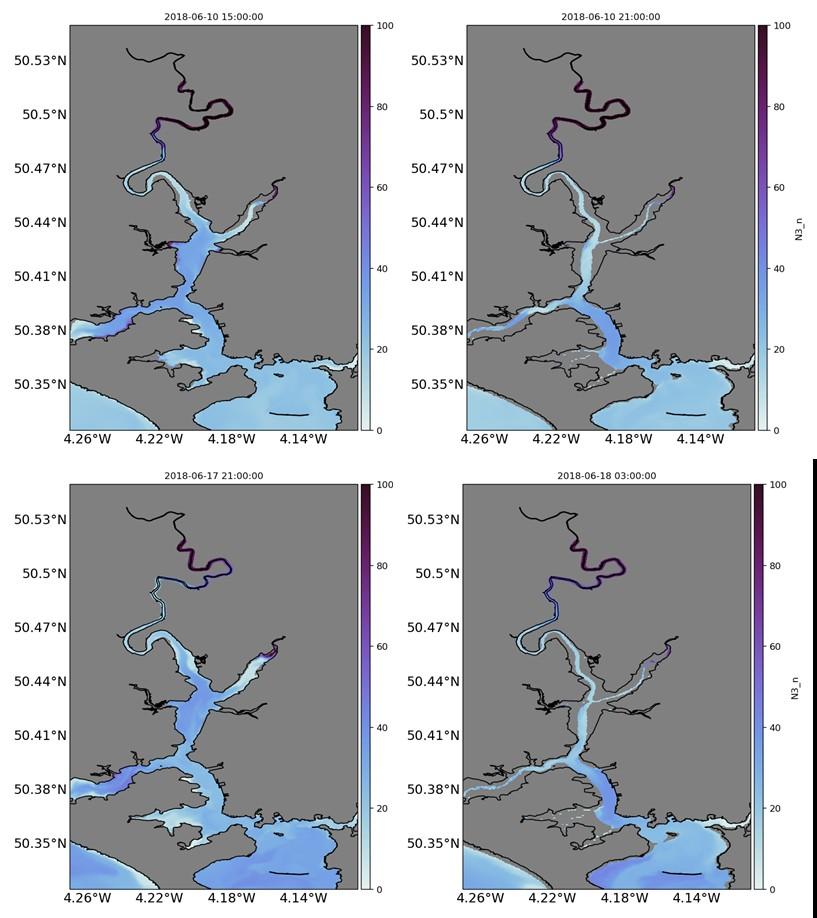
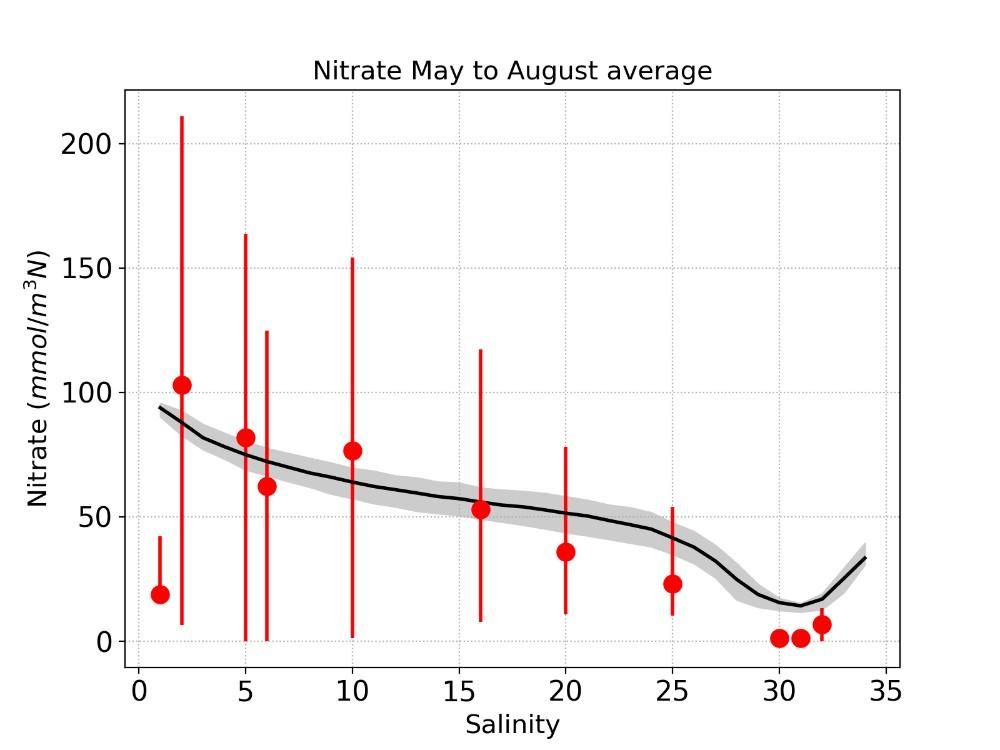
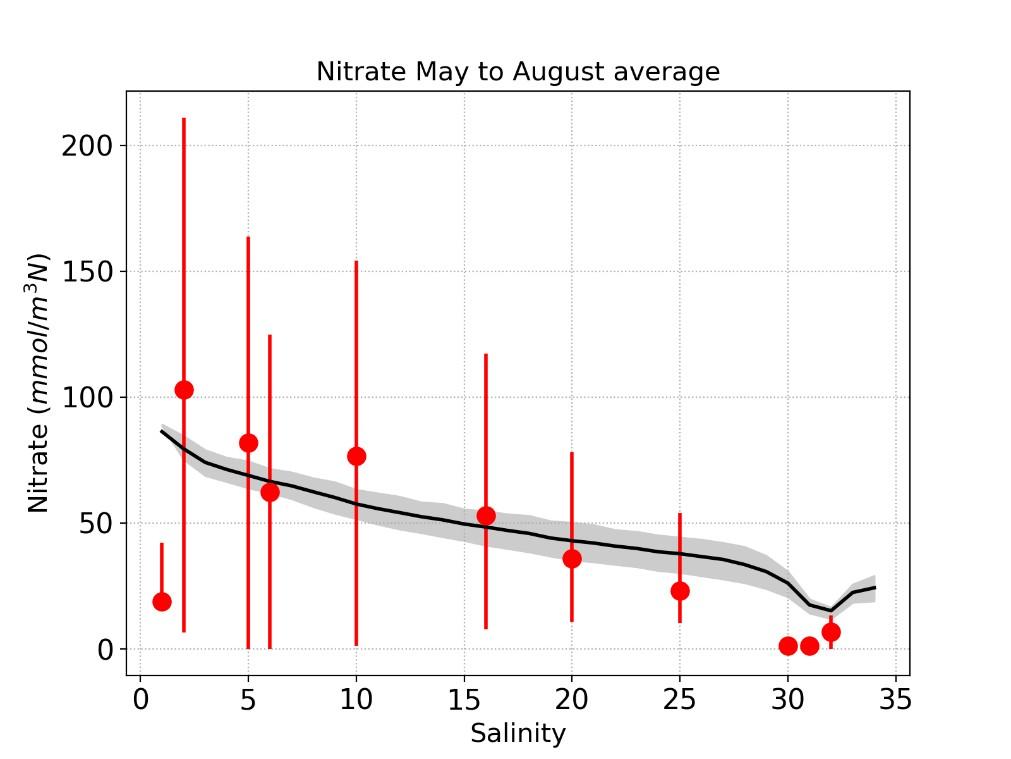
Nitrate
Nitrate
2018-2019: Biogeochemical results
Nature Based Solutions – wetland creation
Gas Exchange


Burial Sediment-C, Denitrification… Exchange w. River Tamar

Digital Elevation
Plant growth
December-August
Sediment Accretion
Socioeconomic Valuation
Photo: Will Jay, Aser Mata
Nature Based Solutions – seagrass
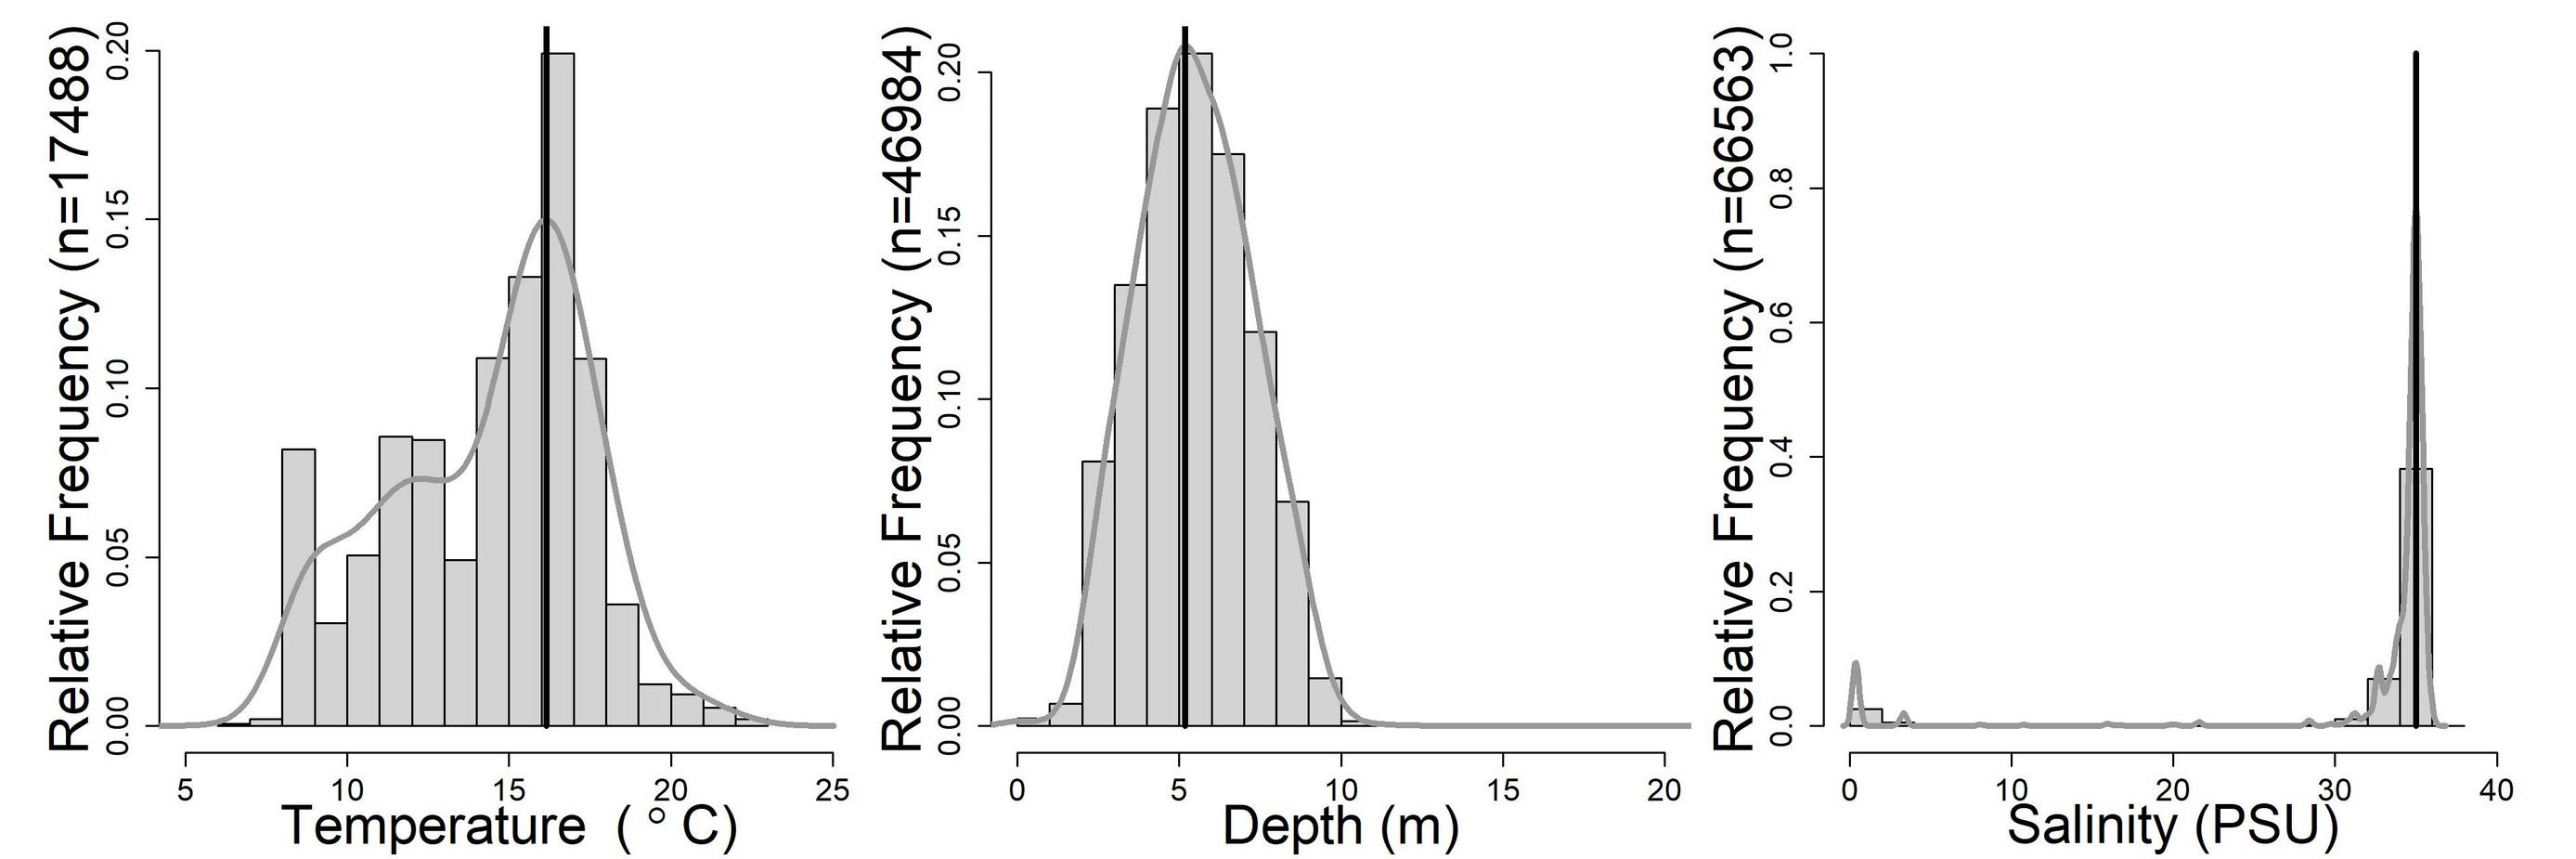
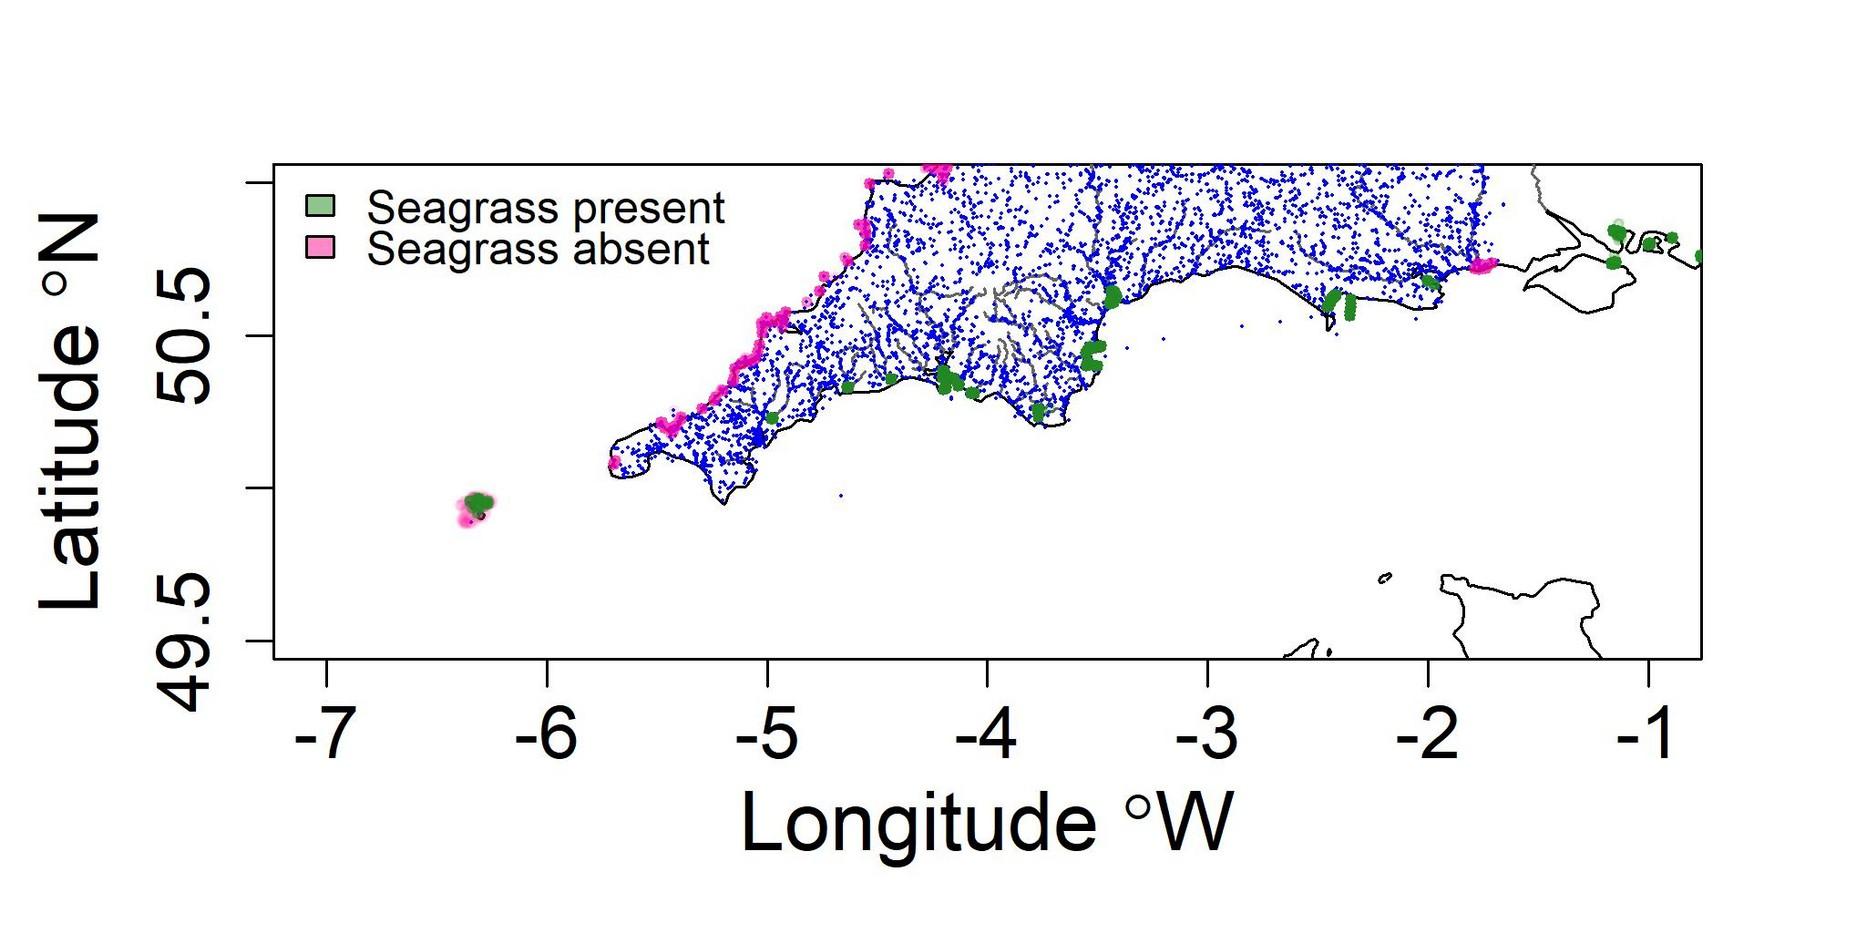
• Seagrasses prefer warm, shallow, saline water with low nutrients
1) What data is available and how do we share it better?
Who can make use of this information and how?
2) What is happening on land that is influencing aquatic systems ?
Who can help us understand how activities on land (in particular agriculture) impact our observations?
3) How do we use the information/data we are collecting to inform management processes. Determine a pipeline for knowledge exchange and impact generation within this group.


 1. Land Ocean Aquatic Continuum (LOAC)
2. The Western Channel Observatory (WCO)
3. Nature Based Solutions – wetland creation
4. Nature Based Solutions – seagrass


