3 minute read
1. Introduction


The Georgian Targeted Social Assistance (TSA), managed and administered by the Ministry of Internally Displaced Persons from the Occupied Territories, Labor, Health, and Social Affairs (MoILHSA), has been a successful program in reaching poor households. The TSA was established in 2005 and it has since provided monthly cash transfers to poor households identified based on a proxy means test (PMT) assessment. 2 In 2015, the government reformed the TSA to implement more stringent and objective eligibility criteria,3 introduce a scheme of differentiated levels of benefits for the TSA, and introduce a Child Benefit Program. As of March 2020, the TSA covered about 129,000 households or 12.3 percent of Georgia’s population4 and provided benefits to approximately 148,000 children, equivalent to almost 21 percent of all children in the country.
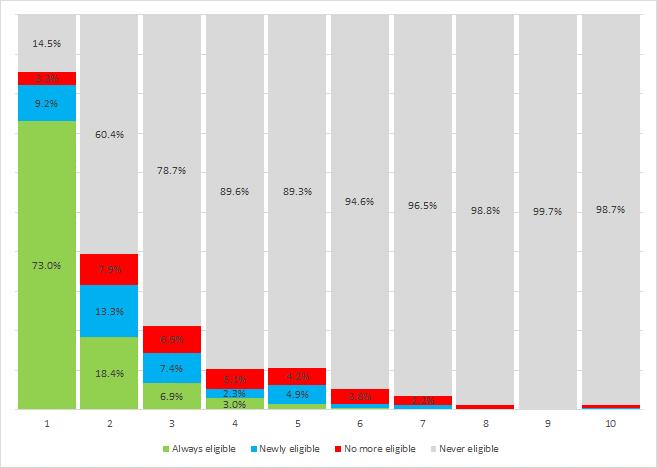
The PMT formula is also used to determine eligibility to local benefits for socially vulnerable households administered by municipalities, such as utilities and transport subsidies, education fee waivers, free meals, and disability- and health-related benefits. An inventory of local benefits based on the TSA formula compiled by the World Bank between April and May 2019 shows that different eligibility thresholds are set to determine such local benefits. 5 Despite the overall good targeting performance of the TSA program, which is among the best in the region, the government has requested the World Bank to update the estimation of the PMT model to minimize the inclusion and exclusion errors associated with the TSA program in light of the changing economy and structural changes in the living conditions since 2013 (year of the data used to estimate the current PMT model)6 . In addition, while there has been some improvement in the last couple of years, the TSA coverage of the poor deteriorated since 2013 due to both design and implementation aspects related to the scoring PMT formula. The actual coverage of the bottom quintile was 46 percent in 2013 and 36 percent in 2018; the benefit incidence in the poorest quintile was 75 percent in 2013 and 70 in 2018. 7 Acknowledging the importance of building a solid and accurate targeting system, the government requested World Bank support to update the estimation of the model and, as a next step, to improve the implementation processes. The COVID pandemic added urgency to the request, as it also
Advertisement
22 The score resulting from the PMT assessment first introduced in 2005 is used to determine eligibility, not only to the TSA but also to child allowances and various programs administered at the local level. The eligibility PMT score threshold is 65,000 for TSA transfers, whereas 100,000 is the eligibility score threshold for child benefits. The TSA benefit amount varies according to the number of household members and the score interval for households with score below 65,000. Since January 1, 2019, the child benefit amount is equal to GEL 50 per child for all households with score less than 100,000 (up from GEL 10 per child, in place until 2018 since 2015, when it was introduced). 3 The TSA uses a PMT to identify beneficiaries. In the 2015 reform, the PMT for the program was revised to capture more objective information to measure income and assets. To do this, most variables provided by households to the Social Services Agency (SSA) are cross-verified against various databases from several sources including the Ministry of the Interior (car registration), gas and electricity companies, revenue service, and customs control. 4 Information on the number of beneficiaries is updated every month on the SSA website: http://ssa.gov.ge/index.php?lang_id=GEO&sec_id=1477. 5 Eligibility thresholds for local benefits range between 70,000 and 200,000 in the Tbilisi municipal area. 6 Baum, Mshvidobadze, and Posadas 2016. The 2013 PMT update was aimed to (a) remove from the PMT formula easily concealable durable goods, as social agents were reporting that households had adopted this practice; (b) include new easily verifiable and potentially income-generating items; (c) reduce the total number of variables used in the PMT formula to simplify it; and (d) remove from the PMT formula the subjective assessment of the social agents. 7 Based on the consumption distribution net of all social assistance transfers, as per the World Bank ASPIRE/SPEED methodology for overtime and cross-country comparisons. It has to be noted that the comparison between 2013 and 2018 accounts for differences in the two different data sources. While the methodology to estimate the two performance indicators is the same, the data source is different: the Welfare Monitoring Survey for 2013 and the Household Income and Expenditure Survey (HIES) for 2018.