5 minute read
2. Review of the current targeting approach


became critical to ensure that the newly adopted emergency benefits are not only well targeted but also administered quickly and efficiently.
The implementation of the PMT in Georgia rests on a dynamic social registry linked with other administrative databases through common identifiers. Different from PMT targeting systems based on census data collection such as in many Latin American countries, the dynamic registry in Georgia allows the computation of the PMT score as frequently as certain households characteristics change such as income, social benefit receipt, and asset ownership. The full recertification of the households is due every four years.
Advertisement
The government is also strongly committed to link TSA beneficiaries with employment activation services as a means of putting TSA beneficiaries on a path to self-sufficiency. Since January 1, 2019, an income disregard was introduced to gradually phase out of the program those TSA beneficiaries who find employment. According to the reform, the labor income from a new job is disregarded when determining eligibility, allowing TSA beneficiaries to remain in the TSA program for up to a year to ensure they have a stable income source.
This paper first reviews the performance of the current targeting system and recommends improvements to the existing PMT formula. One implementation issue we identified is the inconsistency in how monetary and nonmonetary values are treated when calculating the PMT score. The practice has been to calculate the score based on monetary variables (income, social benefits package, and utility expenditures) at current nominal prices, which have inevitably inflated the predicted consumption. As the PMT formula was estimated at 2013 prices, the recommendation to correctly implement the current PMT formula would be to deflate all monetary variables to 2013 prices. Second, to further improve the poverty targeting accuracy, the paper presents the updated PMT model estimation and discusses the benefits and cost of transitioning to the new PMT formula. The empirical analysis is based on the 2018 HIES collected by the National Statistics Office of Georgia (Geostat), the latest available to the team at the time of the analysis. The remainder of this note is organized as follows. Section 2 looks at the performance of the current PMT model to identify key areas of possible improvements. Section 3 develops alternative estimates and proposes a new PMT formula, comparing its theoretical performance with that of the current one. This is followed by a discussion of the implementation of the formula in the following years to avoid problems encountered with the current approach. Section 4 goes further to make a more radical proposal to consider moving to an ‘hybrid’ approach combining an income test with the PMT, highlighting the advantages of the approach and the steps needed for its development and implementation. A final section provides a summary of key recommendations for the immediate, short, and medium term.
As of May 2020, the Socially Vulnerable Household Database (SVHD), the national social registry, contained information about 308,000 households, about 30 percent of the nationwide total. To register and apply to the TSA (and other benefits and services), households need to go to the local office of the Social Service Agency. The initial application is submitted via the social agent at the reception desk of the local SSA office. The application includes basic information on the household, as well as consent information that the applicants sign to acknowledge their rights and responsibilities regarding data use, access, protection, and so forth. Subsequently, the local social agent conducts a home visit to the applicant’s home to gather further information, needed for the complete household declaration that forms the basis of the eligibility to social assistance.
Information collected in the declaration form reflects what is required according to the Government Resolution No. 758 of 2014 to calculate the household PMT score along with information curated from other government administrative systems. The PMT estimation methodology, grounded on 2013 household survey data, identified a relationship between households’ consumption expenditure levels and households’ characteristics, including agricultural property, durable assets and revenues, expenditure for utilities, household demographics, education and employment of household members, geographical characteristics, dwelling characteristics, and other real estate ownership.
The PMT formula generates a household score (welfare index), which represents an estimate of the household’s welfare: the higher the score, the better are the estimated living standards. The welfare index has two elements: (a) the household’s consumption expenditure estimate and (b) the household needs. The score is the transformation of a welfare estimate obtained by dividing the consumption expenditure estimate by the household’s needs. If a household receives TSA, however, the monetary value of received transfers is subtracted from the consumption expenditure estimate. The formula can be written as follows:
������������������������������������������������ = Consumptionestimate−TSA .HouseholdNeeds×SubsistenceMinimum
The monthly Subsistence Minimum (SM) at the time of the formula estimation was GEL 149.6. Annex A details the construction of the score in the current model.
This paper focuses exclusively on reviewing the ‘consumption estimate’ part of the index, holding constant the current rules and formula (established in Government Resolution No. 758 of 2014) for the measurement of needs—essentially an assessment of equivalence scales that allow to evaluate a household’s consumption needs based on the household’s size and composition. Further work will need to be done to update the needs index.8
The use of the SM level in the PMT formula does not affect the ranking of households. However, once thresholds are set, changing the SM level does influence the number of households that fall under a certain threshold: holding other things constant, increasing the SM increases the number of households falling below a fixed threshold. Conversely, decreasing the SM level reduces the number of households falling below a fixed eligibility threshold.
More importantly, the SM influences the needs index by estimating specific equivalence scales. For example, assigning a disproportionate weight to food expenditure reduces the equivalence scale of those groups who have a lower daily calorie intake requirement (children and the elderly). Therefore, it would be important to review the way the needs index is computed to ensure that equivalence scales reflect the current needs and consumption patterns. Nevertheless, for the way the formula is estimated, the needs index revision can be done independently from the consumption model. Hence, the current performance assessment is independent of the way equivalence scales are determined, which are taken as given and applied both to the true and estimated consumption levels.
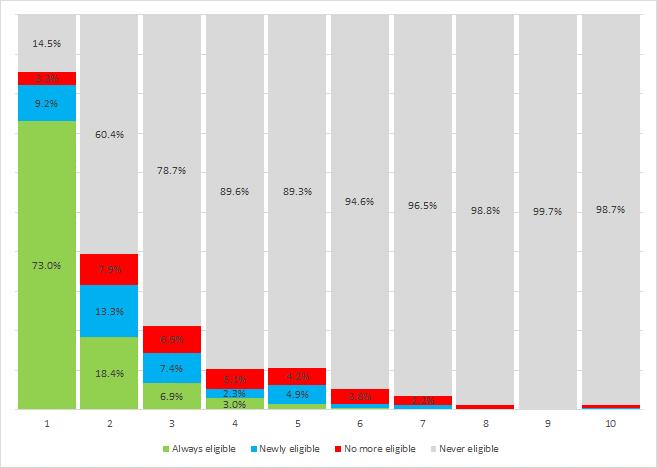
We reviewed both the ‘actual’ performance (based on its implementation) and the ‘theoretical’ performance (based on simulations) of the current targeting PMT formula.
8 The current needs index suffers from some apparent shortcomings when compared to the most recent data. Most importantly, it overstates the share of budget that is spent on food and assumes it to be at 70 percent, far above the value estimated on HIES 2018 data (50 percent on average, no more than 60 percent among the poorest, ECAPOV). The implication of the overestimated food share is in terms of the calculation of equivalence scales. The equivalent scales are different if we consider food compared to other expenses.