DASHBOARD Q4

2022


Welcome to the Q4 2022 Edition of the Aftermarket Dashboard, a quarterly information service for members of the AAAA.
This industry publication captures useful statistical and related data, as indicators of the unfolding trends and health of the automotive aftermarket industry, and has been designed to provide regular insight on our industry. We value your suggestions for improvement or feedback regarding content.

in Review

Consumer confidence continued to fall through the final quarter of 2022.
Despite a small improvement in December, Australian’s consumer confidence remains at the lows seen through the COVID pandemic, and the Global Financial Crisis.
This poor result is largely being driven by the ongoing cost of living crisis and concerns about the overall outlook of the economy. Given further inflationary pressure suggests more rate rises to come, this is likely to get worse before it gets better.
Business confidence fell during the final quarter of 2022, largely due to a poor result in November. Despite this, business confidence rebounded strongly in December, driven by increasing confidence about the performance of the Australian economy over both the short term (throughout 2023) and long term (next 5 years.)

It will be interesting to see how business’s react throughout the first quarter of 2023, with further rate rises likely to impact consumer spending through 2023.
Petrol prices remained at a similar level in Q4, averaging 2c a litre more across the country than in the previous quarter. While this does suggest a level of stability, the reality is harder to predict. The ongoing war in Ukraine will continue to stretch global oil supplies, while in Australia living costs continue to increase, suggesting that further price fluctuations are likely.

Q4 sales were strong despite ongoing vehicle supply shortages, with more than 270,000 vehicles sold. This is up 16% from Q4 in 2021, and just 1,778 less than Q4 2020.

Overall, consistently solid results through 2022 led to a 3% YoY growth in total vehicles sold, with the new vehicle market reaching 1,081,429 units. This outperformed our midyear forecast of 1.05m vehicles, emphasising the level of demand we’re currently seeing in the marketplace. All eyes will be on the Q1 2023 results, as dealerships hope they can continue this trend.
270,299 2022 sales volume in Q4

All Australian states and territories recorded YoY increases in Q4 new vehicle sales, with Queensland and Western Australia both up by almost a quarter on their 2021 results.
Despite the average wait time for vehicles still sitting at ~151 days, the rise indicates a level of recovery across the nation amongst the ongoing supply chain limitations and challenges. All states and territories will be looking to continue this trend heading into the new year.

54,640 vehicles sold
Toyota finished at the top of the leaderboard again this quarter, with an impressive 17% YoY increase. We can however see a level of movement in our top 10 in Q4:

▪ Ford posted strong results to close out 2022, gaining 24% YoY and finishing 3rd for the quarter. Despite the shift away from local manufacturing, the Ford operation keeps going from strength to strength
▪ MG continues its strong year, up 55% YoY to take 6th spot (with 480 more sales than Hyundai)
▪ Fellow Chinese brand GWM broke into the top 10, up 67% YoY.
▪ Hyundai will be disappointed to drop to 7th, with its 2022 results down 19% (as the only top 10 brand to decline YoY).
12,992
EV sales continue to increase, recording a 549% YoY increase as total sales for the year approached 35,000 units. While Tesla continues to drive much of this volume, we are seeing a wide range of new entrants competing with legacy brands in this part of the market.

As highlighted above, Tesla continues to dominate the EV landscape, delivering 42% of total electric vehicles for the quarter. While the Model 3 sedan (2,227 sales) is still performing well, the Model Y is well clear at the top of the list, with its 3,341 sales giving it over a quarter of the EV market.
In 3rd spot we’ve got a new entrant however, with the Chinese-made BYD Atto 3 performing well in its first full quarter. Whilst its sales don’t challenge either of Tesla’s models, it did outperform the Polestar 2, again highlighting the potential for strong sales for more competitively-priced EV models.

(Source: ABS for 2021 Figures, BITRE for 2022 Figures)
Looking at full year data, the 2022 statistics demonstrate the continuing rapid growth in EV sales in Australia. As the fastest growing fuel type, 3.1% of vehicles sold in in 2022 were Electric, with significant further growth expected in the year ahead.
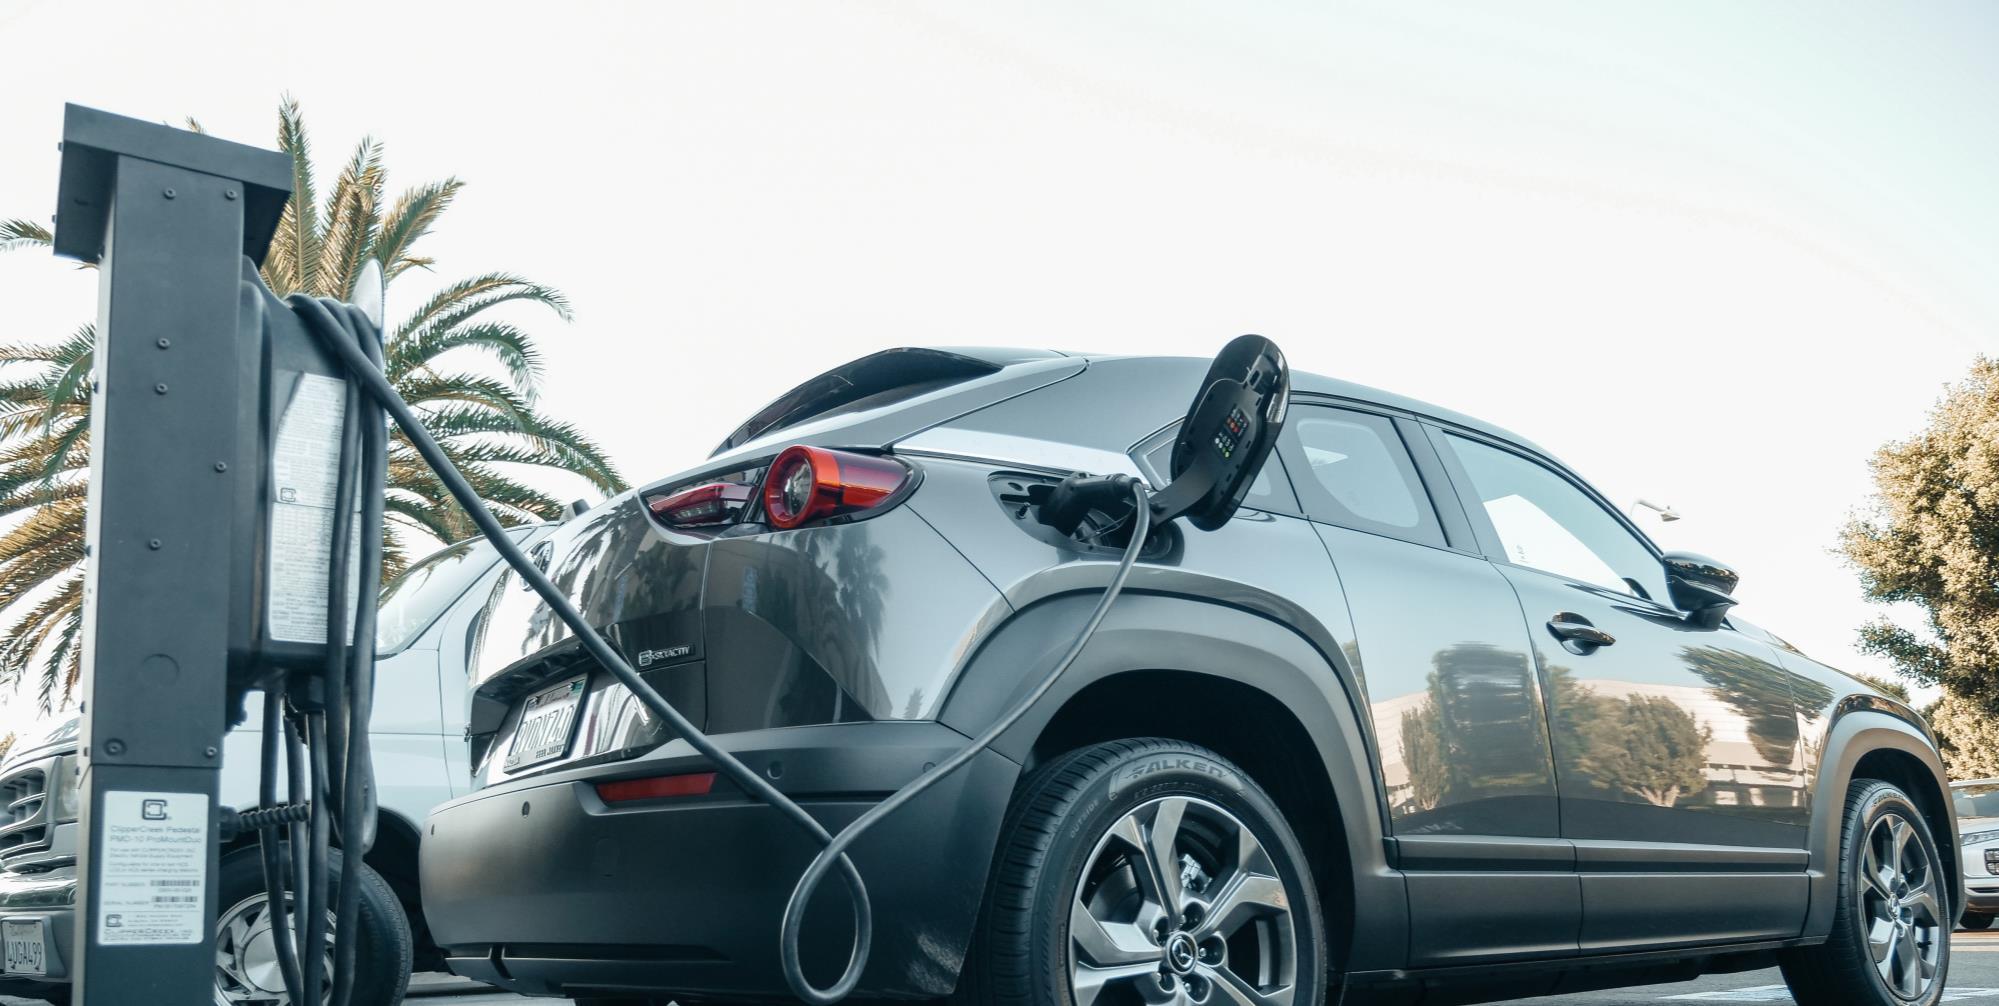
Despite this trajectory, the latest Car Parc data from BITRE shows that EVs still only account for 0.18% of Australia’s Car Parc. They have a long way to go before becoming a mainstream solution.
(Source: BITRE. Note: This is the first edition published by BITRE since taking over from the ABS.)


(Source: VFACTS)
Toyota continued its run of Australian market dominance by recording its best result in 14 years. Despite lengthy waits for some models, customers are not being put off, with many willing to wait for their preferred option.


Despite a slight YoY decline, Mazda is still firmly in second place, with Kia producing its best ever year to close out the podium in 3rd, ahead of Mitsubishi, Hyundai and Ford. Looking ahead to 2023, we could also see MG challenging the established cohort.


(Source: VFACTS)

Private buyers are back in force, posting a 7.7% YoY increase, and making up well over half of 2022 new vehicle sales.
Fleets went in the other direction, with both business and government buyers less likely to record purchases in 2022 (despite the growth in total vehicle sales for the year).
Finally, rental companies continue to rebuild their fleets, posting a moderate 5.8% YoY increase (equating to ~3,500 vehicles).
The 2022 result saw all fuel types except petrol post sales increases. This demonstrates that at this moment in time, EV and Hybrid sales are primarily replacing petrol alternatives. Looking to the future, this will change as more electric Light Commercial options are brought to market, with Diesel then also likely to face declining sales
Looking at EV sales, whilst the fuel category continues to see rapid growth (549% YoY), it sill only accounts for 3.1% of total sales (excluding PHEV). Despite this, factors such as government incentives, charging infrastructure and public awareness will all lead to this figure to grow year on year for the foreseeable future.
With that said, EV sales are expected to lag Hybrid vehicle sales over the short to medium term.
Looking around the country, we can see almost universal YoY increases in new vehicle sales. The sole exception is WA, which fell just 229 sales short of its 2021 result. Victoria saw the largest increase at 5.3%, closely followed by New South Wales at 3%.
Heading into 2023, while new vehicle sales in some markets could be negatively impacted by increasing cost of living pressure, it would be unsurprising to see strong results in WA and QLD off the back of the continuing resources booms.

Toyota Australia has taken the step of transforming its former car-assembly site in Melbourne into a $100 million pre-delivery mega centre that aims to trim delivery times for new vehicles. Preparing a new car ahead of customer handover typically takes dealerships hours, days, or weeks depending on the options fitted to each vehicle. However, with the pre-delivery process now on an industrial scale, Toyota Australia can put the finishing touches on up to 270 vehicles a day – one car every two minutes rolling off robotized inspection lines – before they are sent to showrooms ready for customer handovers.
There is absolutely no doubting Australia’s affection for light utility vehicles, popularly known as Utes. Every month the list of top five new vehicle sales contains at least of couple of Utes, with Toyota Hilux and Ford Ranger generally topping the list.

Now, finally, the first electric Ute is on offer in Australia – with the launch and unveiling of the LDV eT60, with an 88.5kWh battery, a modest 330kms of range – and an eye-watering drive away price of $88,431 for tradies, or $92,000 for other mortals
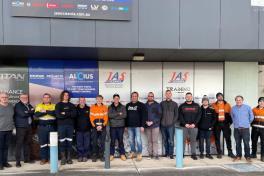
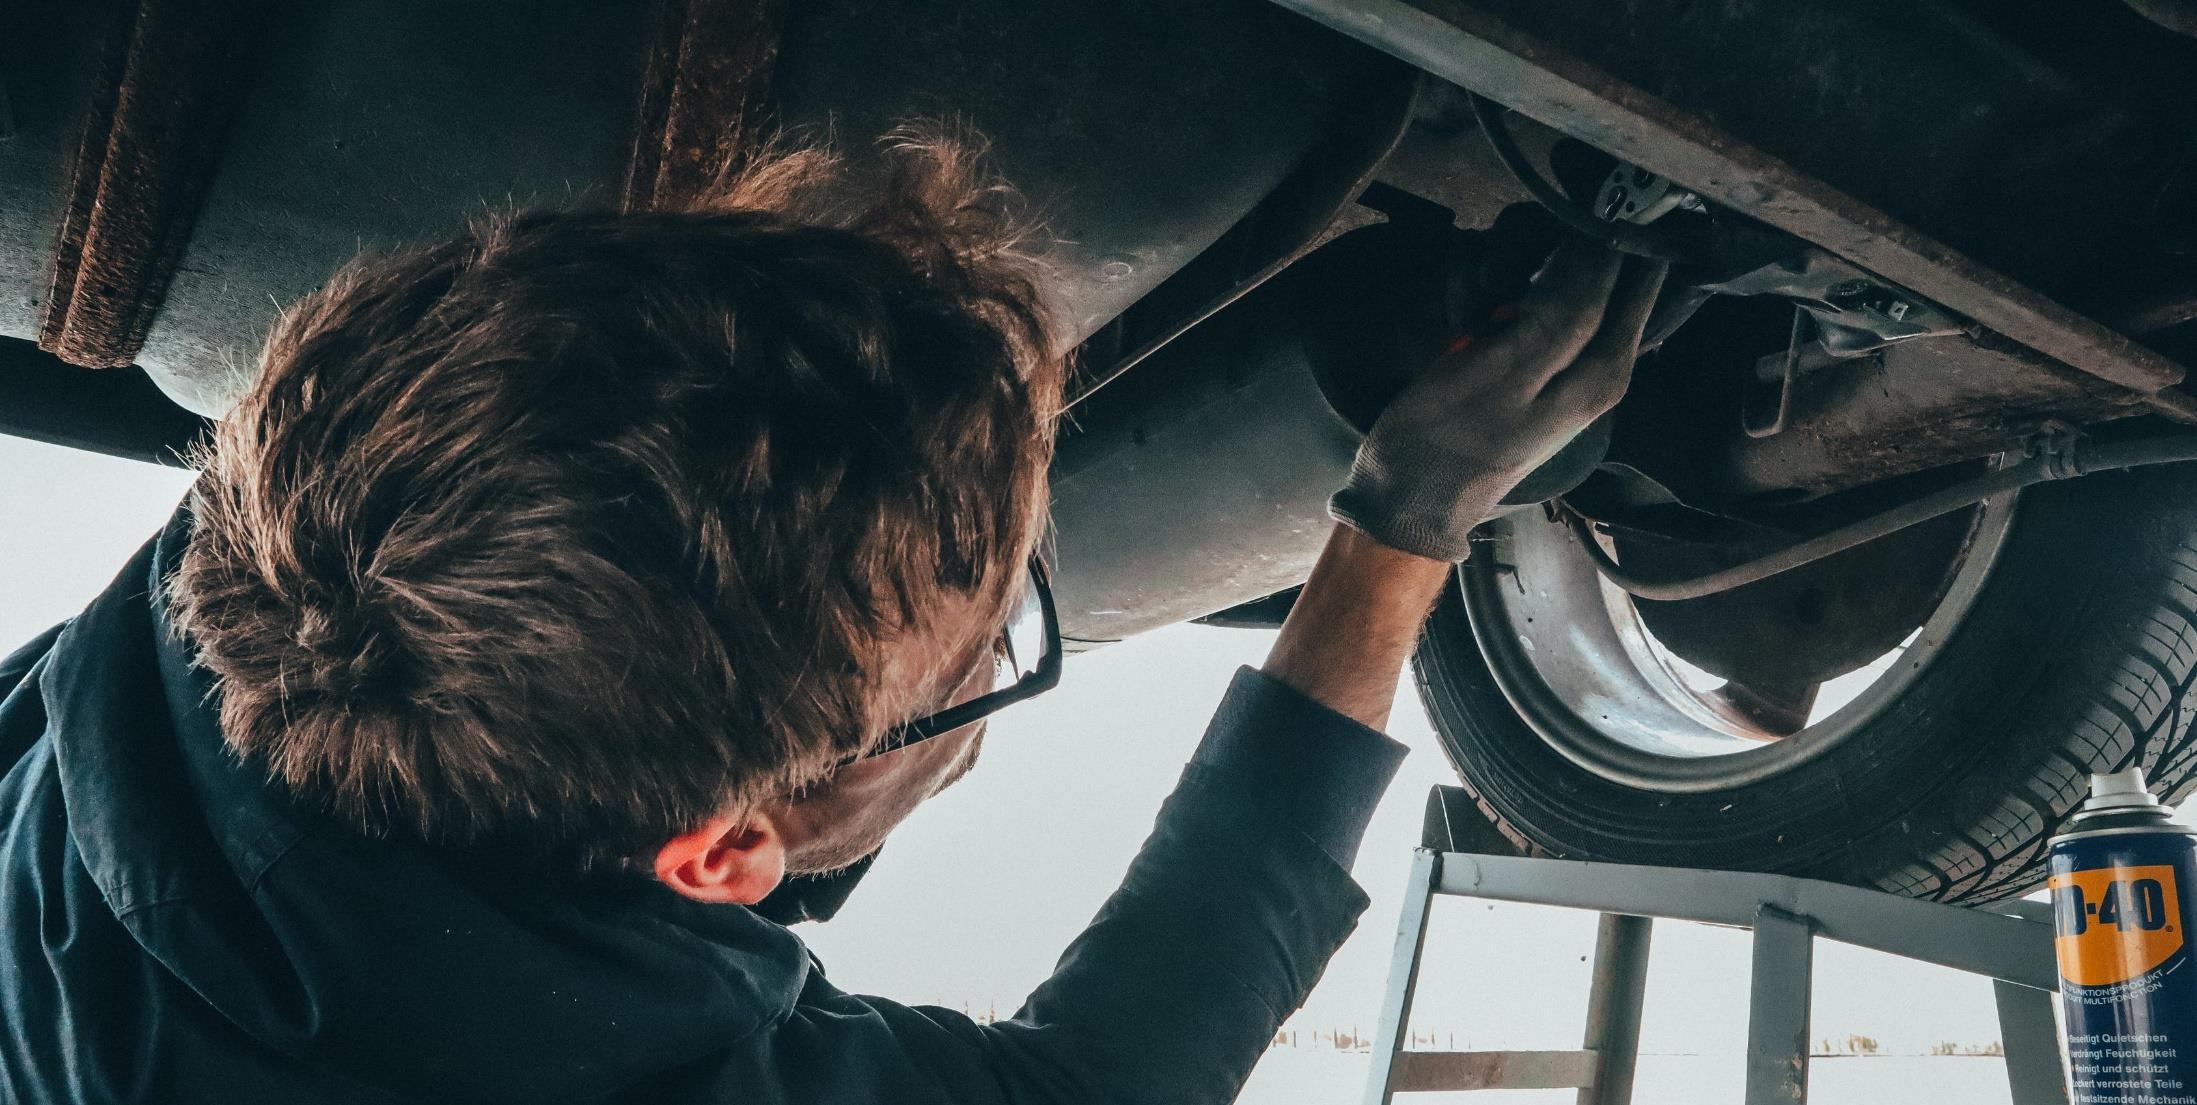
JAS Oceania’s auto electrical diagnostics and parts/equipment training has grown significantly since the program was officially launched at the Australian Automotive Aftermarket Expo in April 2022.
Industry specific training programs have been designed and conducted by JAS Oceania using the experience of one of Australia’s last true auto electrical specialists in the market, taking advantage of the training team’s more than 85 years of auto electrical industry experience.

CMV Truck & Bus has entered an agreement to acquire Warrnambool Truck & Trailer Repairs in Warrnambool, Victoria. arrnambool Truck & Trailer Repairs has been representing CMV Truck & Bus in the region for both parts supply and servicing and repairs of Mack Trucks, UD Trucks and Volvo Trucks and Buses over the past 12 years. CMV Truck & Bus operates dealerships in Clayton, Dandenong, Derrimut, Epping, Shepparton, Traralgon and Wodonga, along with a Training Institute at Derrimut.
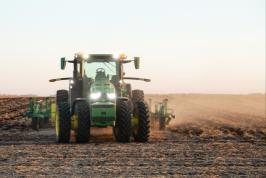
The Australian Automotive Aftermarket Association (AAAA) has reaffirmed its support of the agricultural industry’s right to repair fight
Earlier this month, John Deere announced it had signed Memorandum of Understanding (MoU) with the American Farm Federation acknowledging that farmers should have the ability to take their equipment to a repairer of their choice to fix the problem or repair the machinery themselves.
Australian Automotive Aftermarket Association Dashboard. Presented by ACA Research. Copyright © 2023.
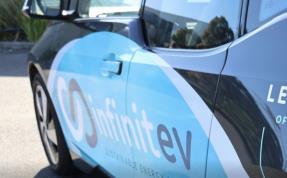
A Melbourne-based startup called Infinitev has embarked on programs to refurbish end-of-life hybrid (HEV) and electric vehicle (EV) batteries for re-use in mobility or static storage. Rather than wasting a battery pack, often it’s possible to replace only the defective cells with an eye to the (slowly) burgeoning circular economy. After all, batteries may be considered faulty with 70-80 per cent of their storage remaining under OEM warranty provisions, usually after six to eight years of service..
The Australian Automotive Aftermarket Association, is the national industry association representing manufacturers, distributors, wholesalers, importers and retailers of automotive parts and accessories, tools and equipment, as well as providers of vehicle service, repair and modification services in Australia.
With over 20 years of automotive experience, ACA Research has developed a detailed understanding of the automotive sector, using this market knowledge, we design and deliver research that helps our clients understand and overcome their business issues, empowering them to move forward with confidence.
For more information, please contact:
Lesley YatesDirector
ofGovernment Relations and Advocacy
Australian Automotive Aftermarket Association (AAAA)
Convenor: Automotive Products Manufacturers & Exporters Council (APMEC)
7-8 Bastow Place
Mulgrave VIC 3170 Australia
+61 (3) 9545 3333 | 0402 005 476 lyates@aaaa.com.au
For more information, please contact:
Ben Selwyn Matthew Beatty Director Account ExecutiveACA Research
ACA Research
0411 132 166 0467 243 525 bselwyn@acaresearch.com.au
mbeatty@acaresearch.com.au
Level 6, 54 Miller St
North Sydney NSW 2060 Australia
+61 (2) 9927 3333
