BIOCLIMATIC DESIGN FOR TOWERS
KUTAY MERT KILCIOĞLU MARITZA REGINA RUBIO MARTIN
ARCHITECTURAL ASSOCIATION SCHOOL OF ARCHITECTURE

MASTER OF ARCHITECTURE
EMERGENT TECHNOLOGIES AND DESIGN 2017-2019
Architectural Association, 2018 36 Bedford Square,London WC1B3ES
Architectural Association [Inc], Registered Charity No. 311083 Company limited by guarantee. Registered in England No. 171402
BIOCLIMATIC DESIGN FOR TOWERS
M.Arch Candidates :
Course Director :
Studio Master :
Studio Tutors :
Kutay Mert Kilcioğlu
Maritza Regina Rubio Martin
Michael Weinstock
Dr.Elif Erdine
Antiopi Koronaki
Alican Süngür
Dr.Lidia Badarnah
Consultants :
Dr.George Jeronimidis
Mohammed Makki
Milad Showkatbakhsh
ARCHITECTURAL ASSOCIATION SCHOOL OF ARCHITECTURE
GRADUATE SCHOOL OF ARCHITECTURE
PROGRAMME : Emergent Technologies and Design [EmTech]
TERM : 2017 - 2019
COURSE TITLE : M.Arch Dissertation
COURSE DIRECTOR : Michael Weinstock
COURSE TUTORS : Dr. Elif Erdine, Dr. George Jeronimidis, Dr.Lidia Badarnah Mohamed Makki, Antiopi Koronaki, Alican Süngür
SUBMISSION DATE : 11st January 2019
SUBMISSION TITLE : Bioclimatic Design for Towers
STUDENT NAMES : Kutay Mert Kilcioğlu, Maritza Regina Rubio Martin
DECLERATION : “We certify that this piece of work is entirely our own and that any quotation or paraphrase from the published or unpublished work of others is duly acknowledged.”
SIGNATURE OF STUDENTS : (Kutay Mert Kilcioğlu) (Maritza Regina Rubio Martin)
DATE : 11st January 2019
16999 words
7 Chapter Main Heading
ACKNOWLEDGEMENTS
We would like to express our sincere gratitude to Michael Weinstock and Elif Erdine for their invaluable support and guidance throughout this Master of Architecture dissertation at the Architectural Association.
Special Thanks to Mohammed Makki, George Jeronimidis, Antiopi Koronaki, Alican Süngür and Lidia Bardanah for so graciously sharing their expertise and insights, during the formation and development of the MArch thesis - Bioclimatic Design for Towers.
We also would like to recognise the support of our family as well as friends at the Emergent Technologies and Design studio, for their consistent encouragement and constructive criticism on the dissertation.
“ASIA.” n.d. Sartorial Trips. http://www.sartorialtrips.com/asia/.
ABSTRACT
Megacities turned out a consumption centre with the rapid growth of population and its demands. However, there is a huge potential for food production capacity in the cities which we can prevent the food shortage that is very possible to happen in the close future. In addition, the usage of that capacity will turn out the consumer population into a part of the production chain.
Unfortunately, cities have only the mechanism of industrial production right now. Food is generally imported from far away distances which results with the extra cost of transportation and other economic casualties.
The aim of the project is to turn our cities into a centre of food production which will result in many new job opportunities in the city. In order to achieve this ambition, a kinetic secondary facade will be designed and agricultural properties will be added. That facade will not only be beneficial for food production but also will be helpful to reduce energy consumption by adapting itself into the changing external conditions. Improvements in comfort zone inside of the buildings will be highly considered during the design phase.
In order to achieve our ambition, we will first focus on implementing designed facade system to existing skyscrapers. Secondly, an algorithm which adapts the system to be applicable for different scales will be generated. Finally, the results will be adapted for new construction high-rise buildings with bioclimatic principles implemented and a proposal design system established.
2.1 Overview
2.2 Food Security
2.2.1 Overview
2.2.2 Population Impact
2.2.3 Climatic Impact
2.2.4 Urbanization
2.3 Shanghai
2.3.1 Culture : City of Towers
2.3.2 Demographic
2.3.3 Subtropical climate
2.3.4 Climate of Shanghai
2.3.5 Pollution rate
2.4 Agricultural Precedents
2.4.1 Vertical Farming
2.4.2 Crop analysis
2.5 Climatic Conditions
2.5.1 Microclimate
2.5.2 Comfort Levels
2.6 Tower Systems
2.6.1 Structure Subsystem
2.6.1.1 Overview
2.6.1.2 Forces acting on high-rise buildings
2.6.1.3 Structural Classification
2.6.2 Circulation Subsystem
2.6.2.1 Core Allocation
2.6.3 Facade Subsystem
2.6.3.1 Double Skin Facade
2.6.3.2 Kinetic Facade
2.7 Architectural Precedents
2.7.1 Bioclimatic Design
2.7.2 Ken Yeang
2.8 Conclusions
2.9 Research Question
3. DESIGN METHODOLOGY
3.1 Methodology Overview
3.1.1 Computational
5.3
5.5 Space
5.7.1 Crop/ Season daylight
12 table
2.
INTRODUCTION DOMAIN TOWER SYSTEM DESIGN & ARCHITECTURAL PROPOSAL
Design Strategy p.156
Tower
p.158
Constructed Ecosystems
of Contents 1.
5.
5.1
5.2 Bioclimatic
Design
5.2.1
Experiment Set-Up I p.160
5.3.1 Form Finding Process
5.3.2 Form Finding Objectives
5.3.3 GA Form Finding Iterations
5.3.4 Observations and Conclusions
Primary
External
Secondary
5.4 Structural Development p.170 5.4.1
Structure 5.4.2
Structure Design Process 5.4.3
Structure Design Process
5.4.3.1 Recursive Subdivision of Surface
5.4.4 Structure Design Details
p.184
Organization
5.5.1 Function Distribution according to Solar Radiation
5.5.2 Connectivity of functions – Metaball Study
5.5.3 Functional Distribution
5.5.4 Floor Plan Organization
5.6 Vertical Circulation System p.192
5.7 Agricultural System p.194
5.7.2 Average Crop Production with aeroponics
5.7.3 Crop Production Amount
p.17 p.19 p.21 p.30 p.42 p.50 p.54 p.74 p.78 p.81 p.83 p.84
Design Strategy 4. FAÇADE SYSTEM DESIGN Design Ambition p.91 4.1 Problems and Solutions p.92 4.2 Research Development p.94 4.2.1 Bernoulli-Venturi 4.2.2 Coanda Effect 4.2.3 Aeroponics System
Development p.100 4.4 Structural Strategy p.102 4.4.1 Standard Tower Experiment Set-Up 4.4.1.1 Wind Behavior 4.4.1.2 Existing Structure Analysis 4.4.1.3 Additional Structure Analysis 4.4.1.4 Façade Pressure Analysis 4.4.1.5 Panelization Criteria 4.4.1.6 Panelization Post Analysis 4.5 Self Shading Experiment p.116 4.5.1 Self Shading Criteria 4.5.2 Self Shading Post Analysis 4.5.3 Crop Selection by panel 4.6 Component Design Process p.122 4.6.1 Form Development 4.6.2 Rotation – Coanda Effect
Extrusion- Panel mechanism 4.7 Ventilation & Actuation p.130 4.7.1 Compartment Workflow: Pressure 4.7.2 Aeroponics Compartment: Temperature 4.7.3 Aeroponics Compartment: Humidity 4.7.4 Harvesting mechanism 4.7.5 Controlling Interior Ventilation 4.7.6 Interior Air Circulation Analysis 4.7.6.1 Panel Sizes 4.7.6.2 Wind Pressure 4.7.6.3 Buffer Zone Depth 4.7.6.4 Openings Direction 4.8 Observations and Conclusions p.152 p.89 p.155
4.3 Component
4.6.3
5.8 Façade System p.202
5.8.1 Panel Classification
5.8.2 Pressure Control Panel
5.8.3 Pressure Panel Workflow
5.8.4 Open- Close Mechanism Panel
5.8.5 Panel Rotation
5.9 Vertical System Proposal p.214
6.1 Interior Air Circulation Analysis p.226
6.1.1 Buffer Zone Depth
6.1.2 Allocation of Open&Close mechanism panels
6.1.3 Wind Direction
6.1.4 Wind Speed Test
6.1.5 Roof Test
Conclusions
13
p.239 BIBLIOGRAPHY p.243 APPENDIX p.253
6. 7. 8. 9. POST EVALUATION FURTHER STUDIES
6.2
p.236
p.225
1. Introduction
©Blackstation
Food security is one of the immediate issues that will impact the densest cities in the world. According to United Nations by 2050 population will increase 9.7 billion, of which one-third will inhabit urban areas. Resources to maintain a sustainable agricultural system throughout the next decades will continue to decrease. Future farming strategies must take direct measures to address the increasing need for faster and more efficient production. If not, the world will face global famine and its catastrophic consequences.
Recently, several international organisations such as the Food and Agricultural Organization (FAO) have developed new techniques to limit the land overexploitation and pollution. Of the studied cases, one yielding possibility is the establishment of agriculture in a dense urban context, in cities, where there are limited arable land and lack of abundant water source.
To respond to the rapid growth of urban population, we are aiming to adapt high-density structures to facilitate self-sustaining agriculture for the urban context, while integrating it into urban ecosystems to address environmental and comfort requirements of its occupants
17 Chapter Main Heading
INTRODUCTION
2. Domain
©Blackstation
OVERVIEW
Overpopulation, one of the looming consequences of better living conditions and economic growth in the cities areas has begun diminishing the resources for food production demands in next generations.
For example, China’s population is projected to increase by 1.38 billion and 293 million of urban dwellers in one of their largest cities: Shanghai. Due to its dense urban morphology and limited land resources, high-rises buildings are the first option to accommodate a continuous expansion of inhabitants in the city. However, high-rise buildings requires a vast amount of energy consumption during their construction and also their cycle life.
Thus, further research about bioclimatic strategies starts emerging to improve construction practices while providing higher and adequate natural resources.
The aim to this project is to better understand sustainable building design principles in high-rise buildings construction and to identify precedents that had successfully adapted better performance over building’s cycle life.
21 Chapter Main Heading
2.2 FOOD SECURITY
2.2.1 OVERVIEW
According to the Food and Agricultural Organization (FAO), there will be millions of people without reliable access to food in the next fifty years. Due to rapid globalisation and urbanisation, agricultural lands are diminishing drastically, and it will become a severe issue to produce enough food for the whole population. Thus, one possibility will be the increase of food output in the cites, specifically in high-rise buildings.
One of the most feasible solution, according to the academia in sustainable solutions, may be vertical farming. It consists of cultivating food crops on vertically stacked levels with no soil needed in between. The main advantage is the productivity and efficiency achieved in a limited timespan while confined to smaller areas. In addition, vertical farming has flexible site management

Food Security Domain
2/3
will live in urban areas
FOOD SECURITY
By 2050 the world population is expected to grow to
Demand for food will grow 9.7 billion 35%
The number of 15-24 years old will increase in Sub-Saharan Africa and South Asia
Sustainably improve agricultural productivity to meet increasing demand
Increasing food demand is worsening competition for natural resources, deforestation and land degradation
Increase in food production by 2030
CLIMATIC IMPACT
SOCIAL IMPACT
million
Climate Change is jeopardizing crop and livestock production people living in rural areas, area still extremely poor today
Ensure a sustainable natural resource base
Increasing fossil energy GHG emissions are exacerbating climate change
people are chronically hungry
~2 billion
people suffer micronutrient deficiencies
Overweight and obesity are increasing worldwide
million ~1/2 billion
people in more than 20 countries are affected by protracted crisis
Outbreak of transboundary pests and diseases of plants and animals is growing alarmingly
1/3


of all food produced is lost or wasted resulting in losses for farmers and unnecesary pressures on natural resources
Food systems will be more efficient, inclusive and resilient
23 Food Security Domain
SOURCE. FOOD & AGRICULTURE ORGANIZATION. FUTURE OF FOOD AND AGRICULTURE 2018: Alternative Pathways to 2050. S.l.: FOOD & AGRICULTURE ORG, 2018.
~700
~800
2.2.2 POPULATION IMPACT
Currently, the world population stands at 7.6 billion, and it is projected to increase to 9.6 billion by 2050.
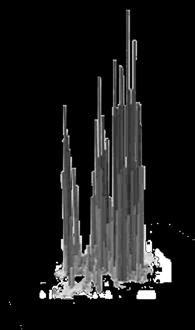
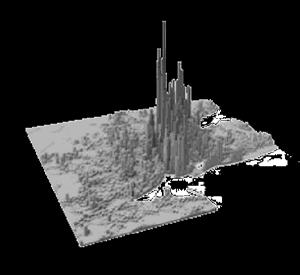
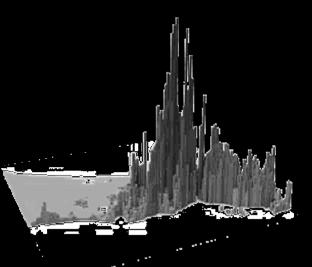
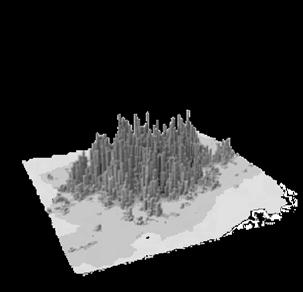
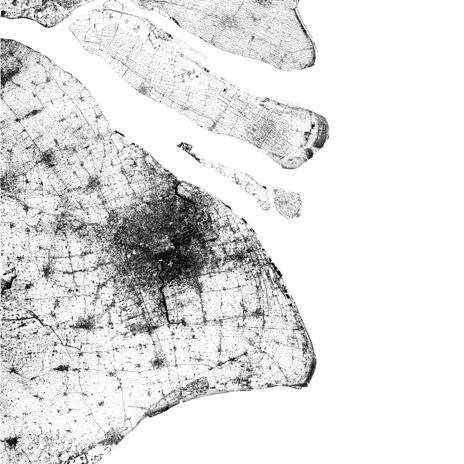
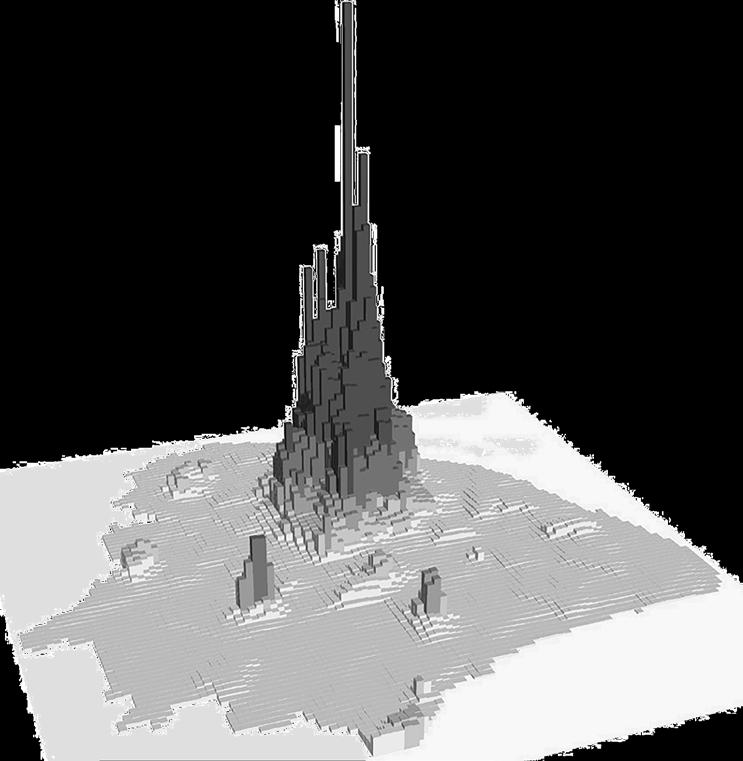
In the following diagram, world population density can be seen with patterns of urbanization of pockets of urbanizing areas. The continual growth verges towards the densification of deep urban areas, that continually provide density growth with the same plot of land area. Shanghai can be taken as an archetypal city of rapid urban growth, with its urban development centered towards vertical growth, a culture of racing skyscrapers. What spurred from the 1990 onwards is the ever increasing pace of high-rise development and technology that propelled a continual increase in height of buildings. By the 21st-century hundreds of buildings over 30 stories are approved for new construction, poised to race each other to the skies.
Throughout history, cities that increase vertically occur in the multinational centre for business and finances. In many cases, foreign investment is one of the main proponent of vertical growth of cities, principally in the global financial centres of each city.
SOURCE. “The Future of Food and Agriculture.” 2017. FAO.
“World Population Projected to Reach 9.7 Billion by 2050 | UN DESA | United Nations Department of Economic and Social Affairs.” n.d. Accessed September 5, 2018. 2015-report.html.
24 Food Security Domain
2018 2050 POPULATION 7.6 Billions POPULATION 9 Billions FOOD DEMAND +50% 2018 POPULATION 7.6 Billions 2050 POPULATION 9 Billions
111.065 pp/km2
49.088
ISTANBUL
77.267 pp/km2
MUMBAI
121.312 pp/km2
JOHANNESBURG
42.398 pp/km2
Density map of largest cities in the world

SOURCE. LSE Cities Density Cities Map: “2011_chw_2050_01.Gif (1092×1221).”. https://files.lsecities.net/files/2011/11/2011_ chw_2050_01.gif.
25 Food Security Domain
HONG KONG peak
MEXICO CITY peak
pp/km2
NEW YORK CITY peak 58.530 pp/km2
SAO PAULO peak 29.704 pp/km2
LONDON peak 17.324 pp/km2
SHANGHAI peak 74.370 pp/km2
peak
peak
peak
2.2.3 URBANIZATION
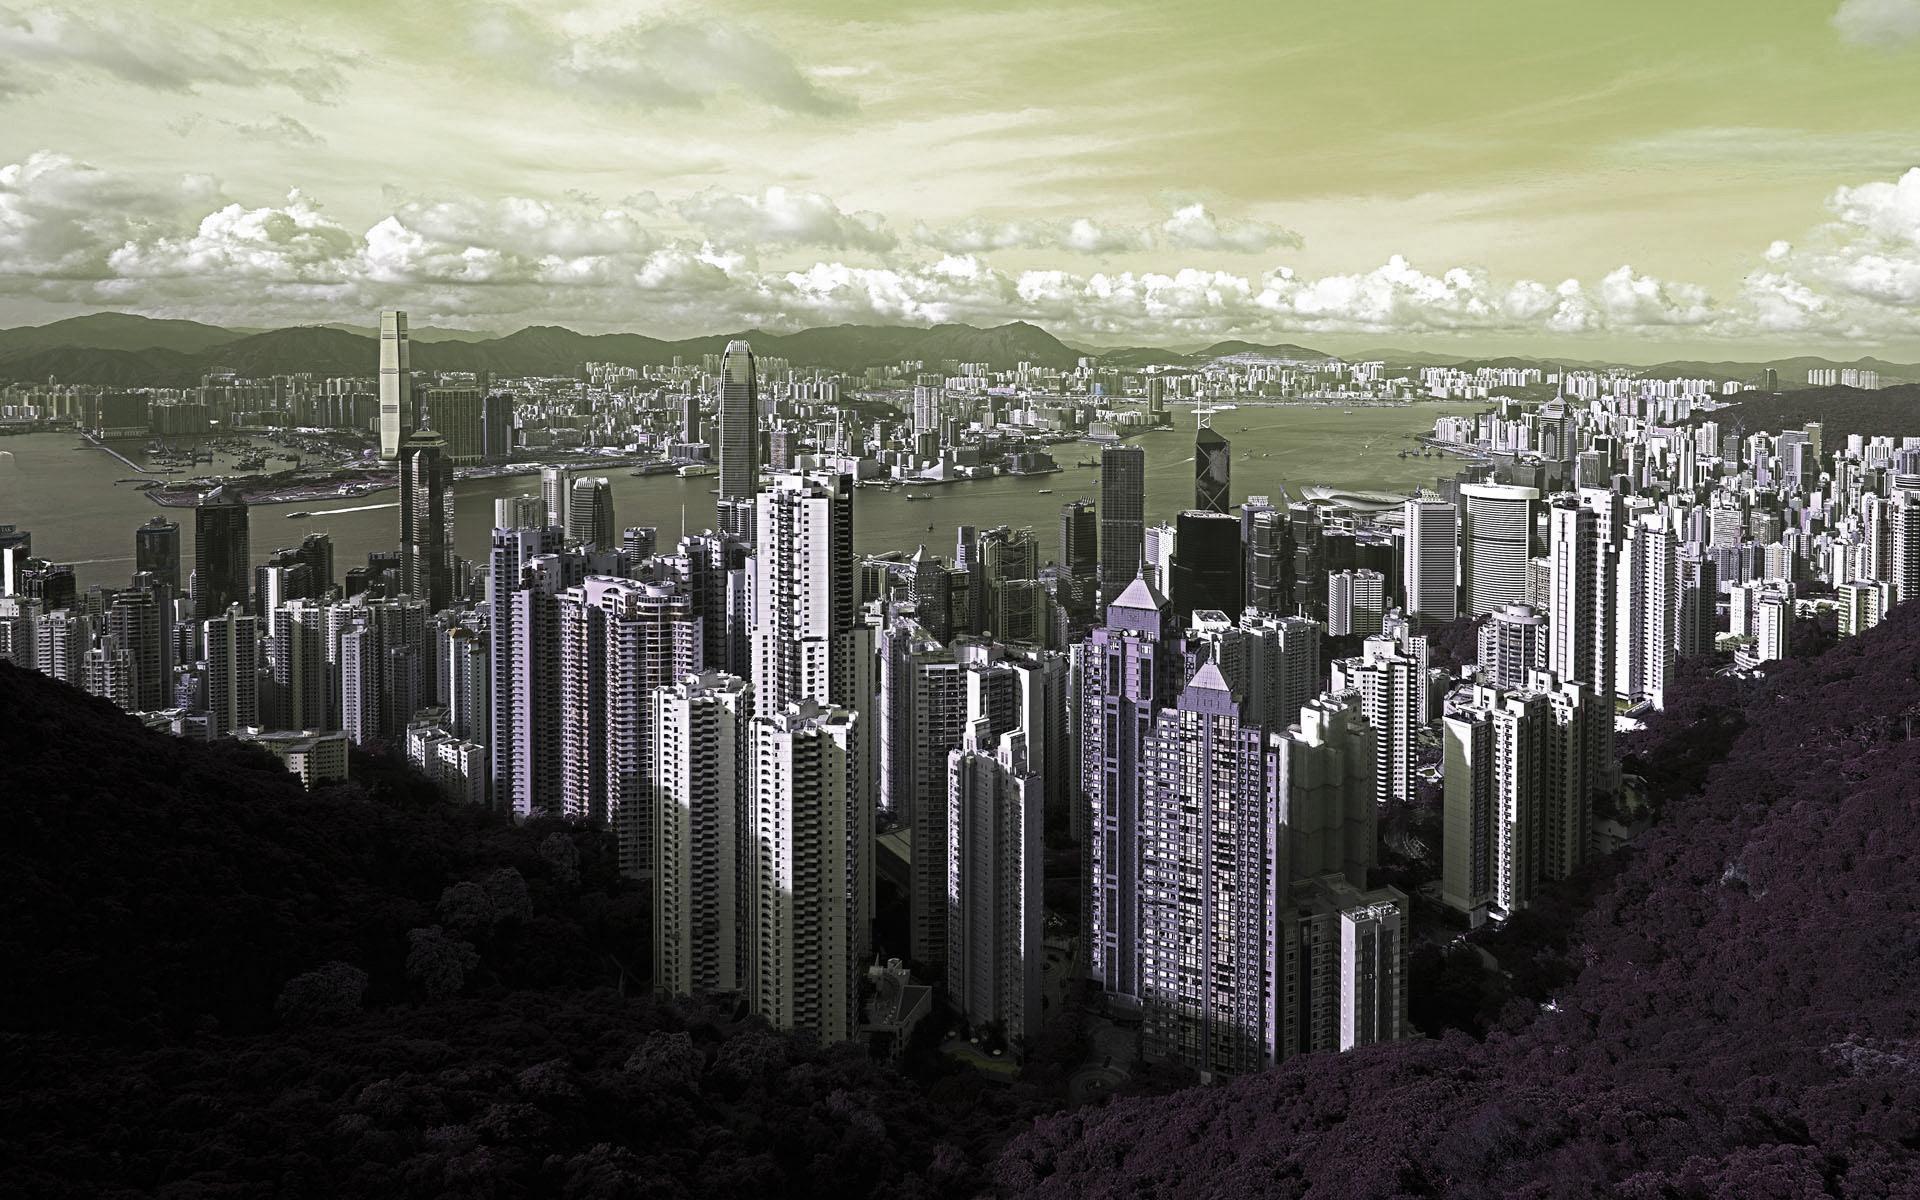
Since the Industrial Revolution, human’s impact have transformed the land of which they live. From increasing agricultural overexploitation and new technologies for farming to a decreasing of traditional farmers needed for food production. As time goes on, rural areas are gradually being replaced by urban centres, where the population occupy any profitable land of the cities. According to the statistics, there are cities such as Gibraltar or Hong Kong that are already occupied at the maximum capacity. In all, population growth and climatic data are taking the more and more part of urbanisation impact with the worse consequences for humanity.
SOURCE http://worldpopulationreview.com/world-cities/shanghai-population/ Seto, Karen C. n.d. “Urban Growth in China: Challenges and Prospects,” 35. “National Bureau of Statistics of China >> Census Data.” http://www.stats.gov.cn/enGliSH/Statisticaldata/CensusData/.
26 Food Security Domain
Rural Urban China Percentage of population in urban and rural areas Year Proportion of total population (%) 2018 2050 2025 2000 1975 1950 0 80 70 60 50 40 30 20 10 90 Proportion of total population (%) Percentage of population in urban and rural areas China Urban Year Rural
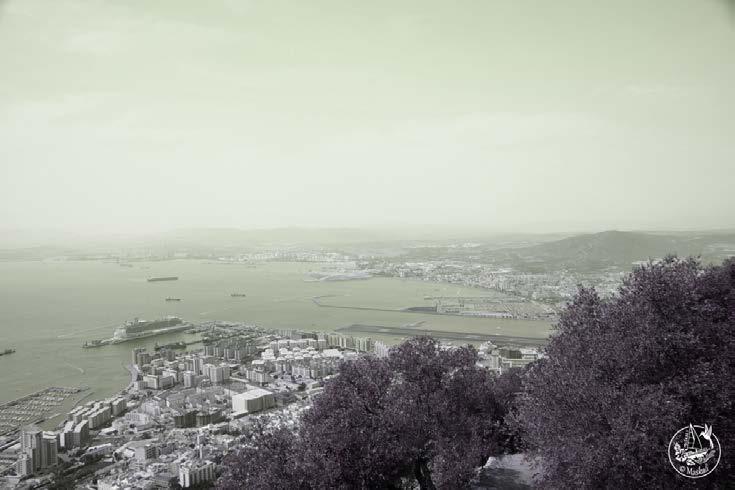


Food Security Domain Gibraltar
Current population in the city [millions] Annual waste production [kg/per capita] 25.5 343 CLIMATIC IMPACT POPULATION IMPACT Current population in metropolitan region [millions] Daily water consumption [litres per capita] 25.5 439 Central area density (people per km2) Annual electricity use [kW/h per capita] 23.227 6.357 Percentage of the country’s population residing in each city Annual CO2 emissions [kg per capita] 1.0 10.680 GDP per capita [USS] 5.0 Average annual growth of GVA 1993-2010 11.8 Life expentancy [years] Projected growth 2010-2025 [people per hour] 81 26
Hong Kong. China
km2 %
SOURCE. C. Nicholas Raphael, Professor, Jinan Li, and Senior Programer. n.d. “POTENTIAL URBAN HAZARD ZONES OF SHANGHAI PRC.Pdf.” Department of Geography and Geology Eastern Michigan University Ypsilanti, MI48197 2389 Timbercrest Ct. Ann Arbor, MI48106.
2.2.4 CLIMATIC IMPACT
The increasing urbanisation and human activity produces harmful substances in the atmosphere. Air pollution has a range of negative impacts in all aspects of society, from damage of human health to damage of ecosystems, food crops and the built environment. Most cases occur in the densest cities in the world. Recently, China has become the world’s leading greenhouse gas emitter due to a high production of consumer goods. Hence the size of the carbon legacy is closely tied to consumption patterns.
By one hand, according to the World Health Organisation (WHO) highlights air pollution as the highest environmental risk to human health and it estimates to be the cause of seven million premature deaths every year.
By the other hand, the World Resources Institute summarise the GHG emissions percentages regarding different causes, and as it is observed, some of the factors can be solved or reduced with different sustainable plans.
28 Food Security Domain
Largest
CHINA U.S INDIA RUSSIA JAPAN GERMANY KOREA IRAN CANADA SAUDI ARABIA 28.21% 15.99% 6.24% 4.53% 3.67% 2.23% 1.75% 1.72% 1.71% 1.58%
SOURCE. “CO2 and Other Greenhouse Gas Emissions.” n.d. Our World in Data. https://ourworldindata.org/co2-and-othergreenhouse-gas-emissions.
producers of CO2 emissions worldwide 2016
World GHG Emissions
SOURCE. “World_ghg_flow_chart_2005.Png (1500×1081).” http://www.wri.org/sites/default/files/world_ghg_flow_chart_2005.png.

29
Transportation Transportation Air Rail, Ship & Other transport Residential Buildings CARBON DIOXIDE CO2 HFCs, PFCs SF2 METHANE NITROUS OXIDE N2O Commercial Buildings Unallocated Fuel Combustion Iron & Steel Oil/Gas Extraction, Refining & Processing 9.9 % 1.6 % 2.3 % 9.9 % 77 % 1 % 14 % 8 % 5.4 % 3.5 % 3.2 % 6.3 % Aluminium / Non ferrous metals Machinery Pulp, paper and printing Food & Tobacco T&D Losses Chemicals Coal Mining Cement Other industry 1.4 % 1.0 % 1.0 % 1.0 % 1.9 % 4.8 % 1.4 % 3.8 % 5.0 % Deforestation Agricultural Energy Use Afforestation Agriculture Soils Reforestation Livestock & Manure Harvest/Management Rice Cultivation Other Other Agriculture Landfills Wastewater, Other waste 18.3 % 1.4 % -1.5 % 6.0 % -0.5% 5.1 % 2.5 % 1.5 % -0.6% 0.9 % 2.0 % 1.6 % Electricity & Heat Other Fuel Combustion Industry Fugitive Emissions Industrial Processes Land Use Change AGRICULTE Waste 13.5 % SECTOR End Use
Activity Gas 24.6 % 9.0 % 10.4% 3.9 % 3.4 % 18.2 % 13.5 % 3.6 %
/
2.3 SHANGHAI
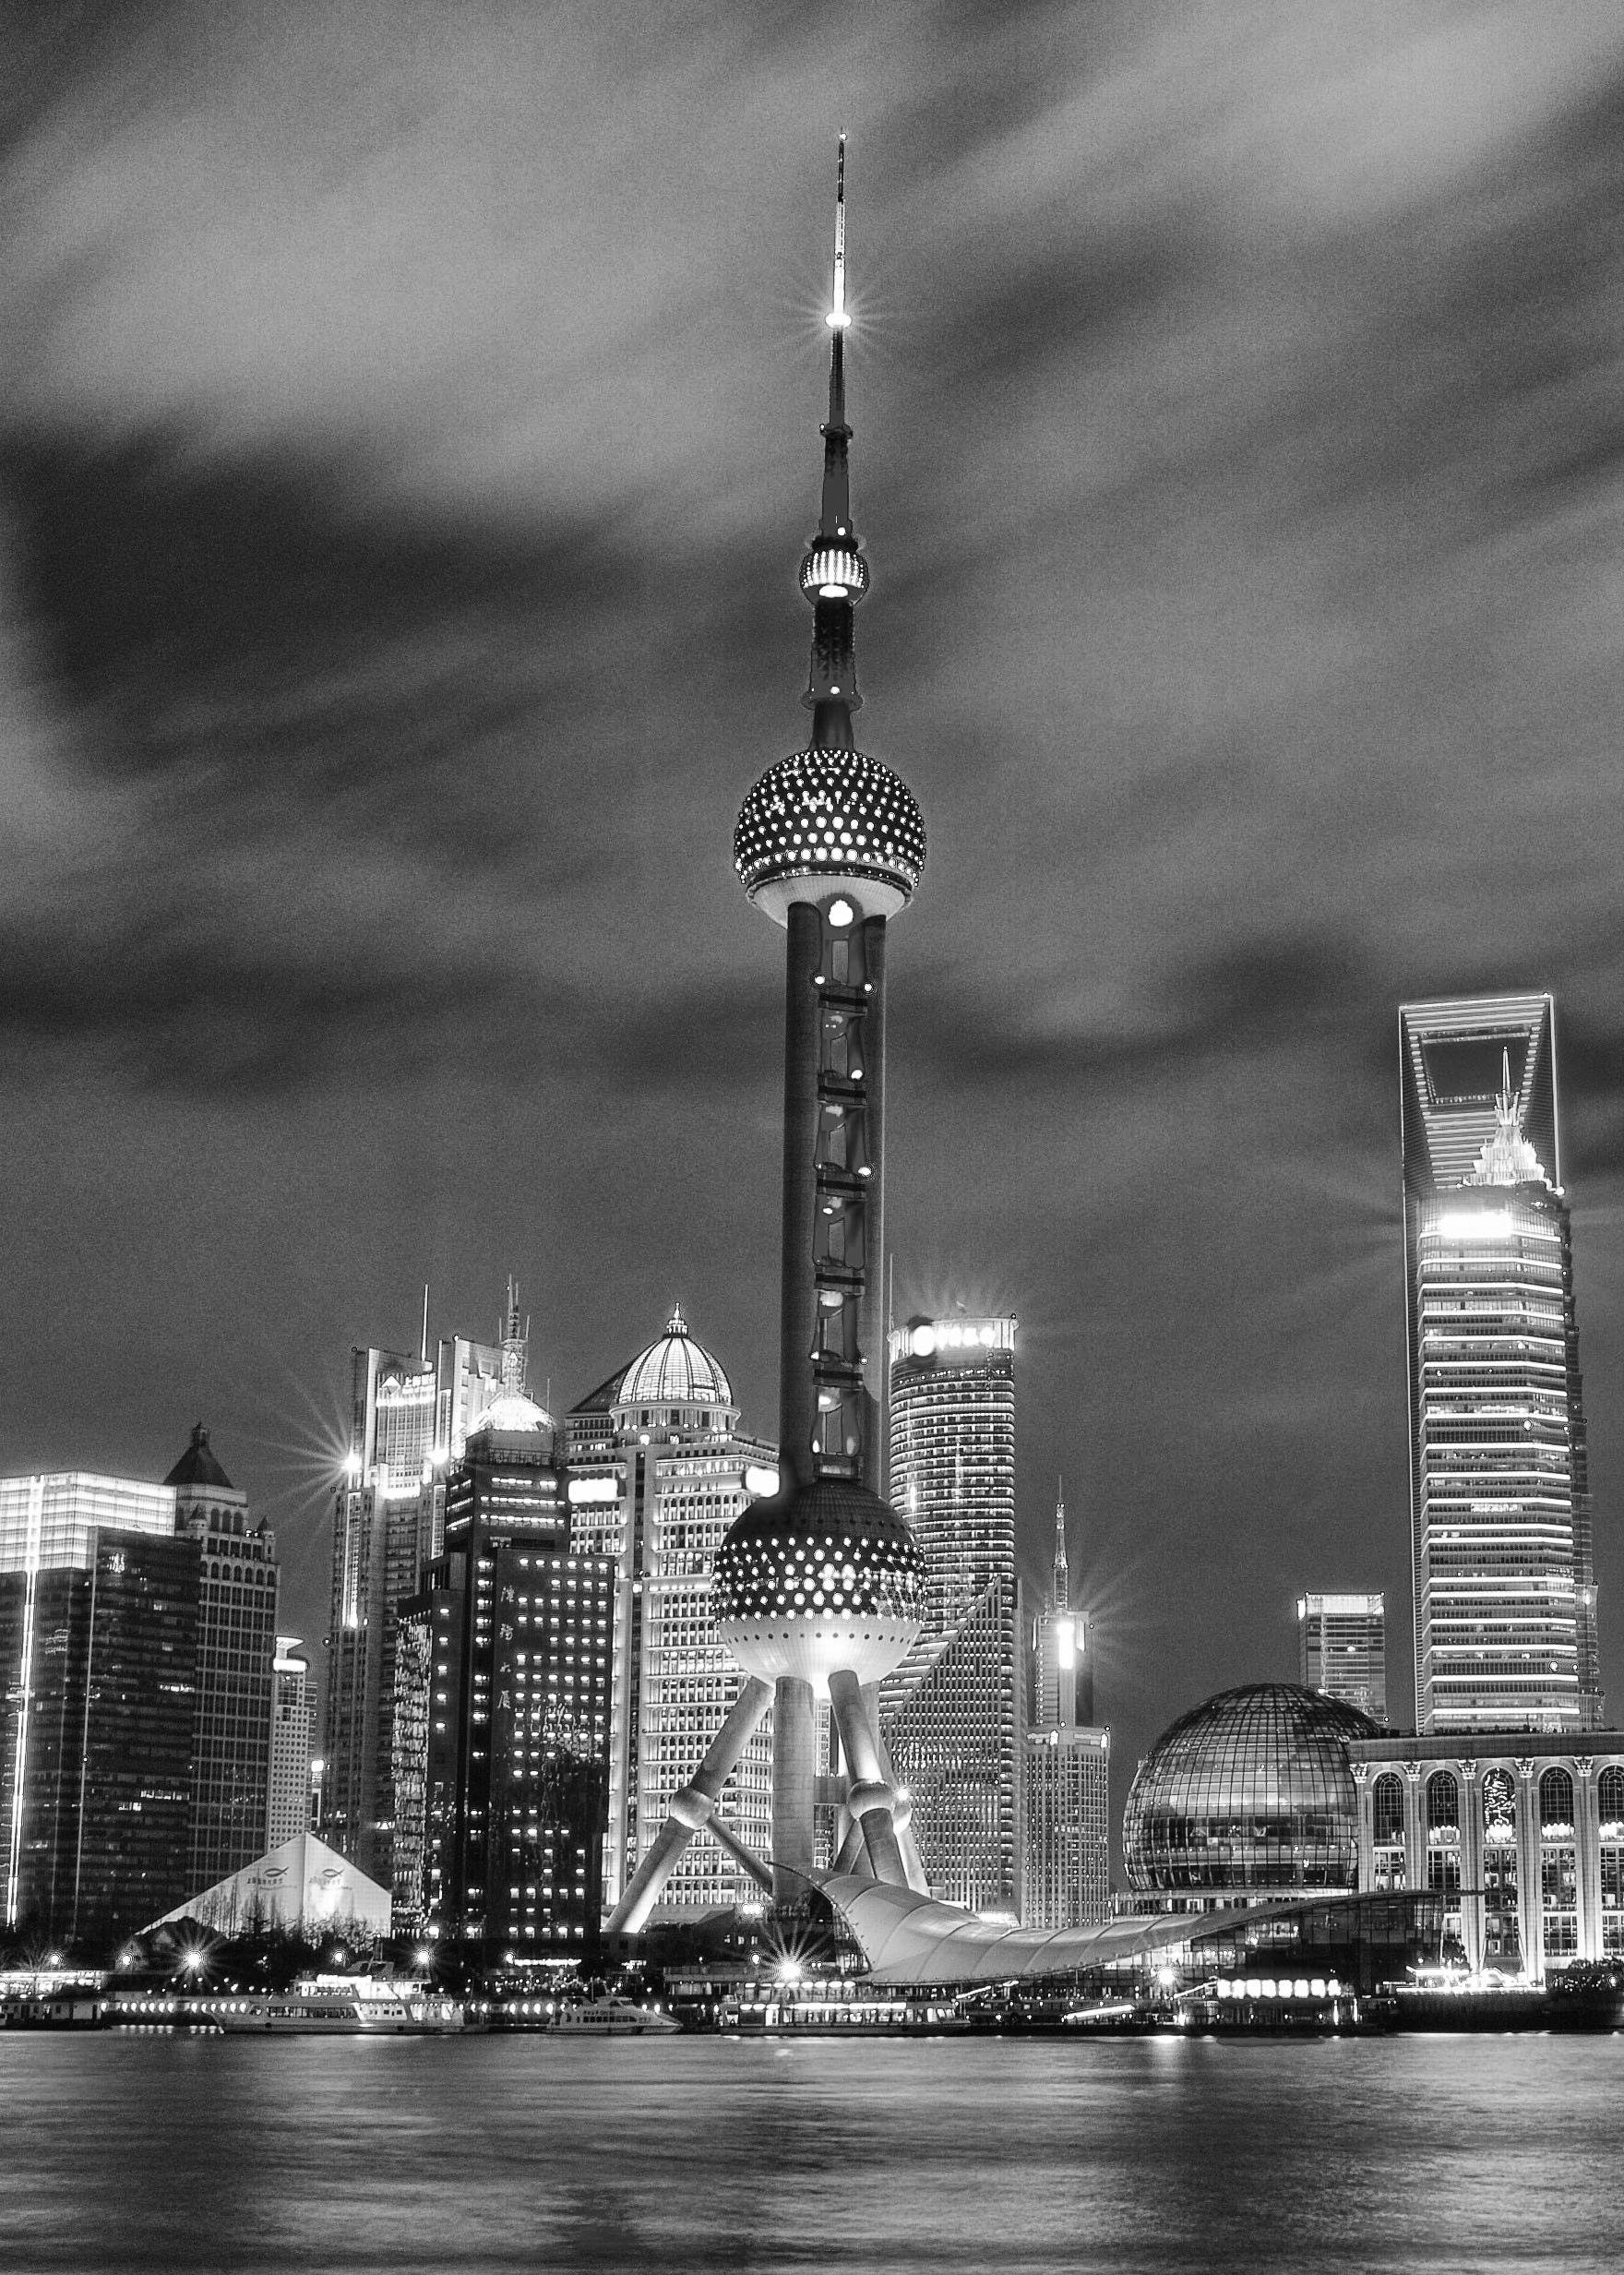
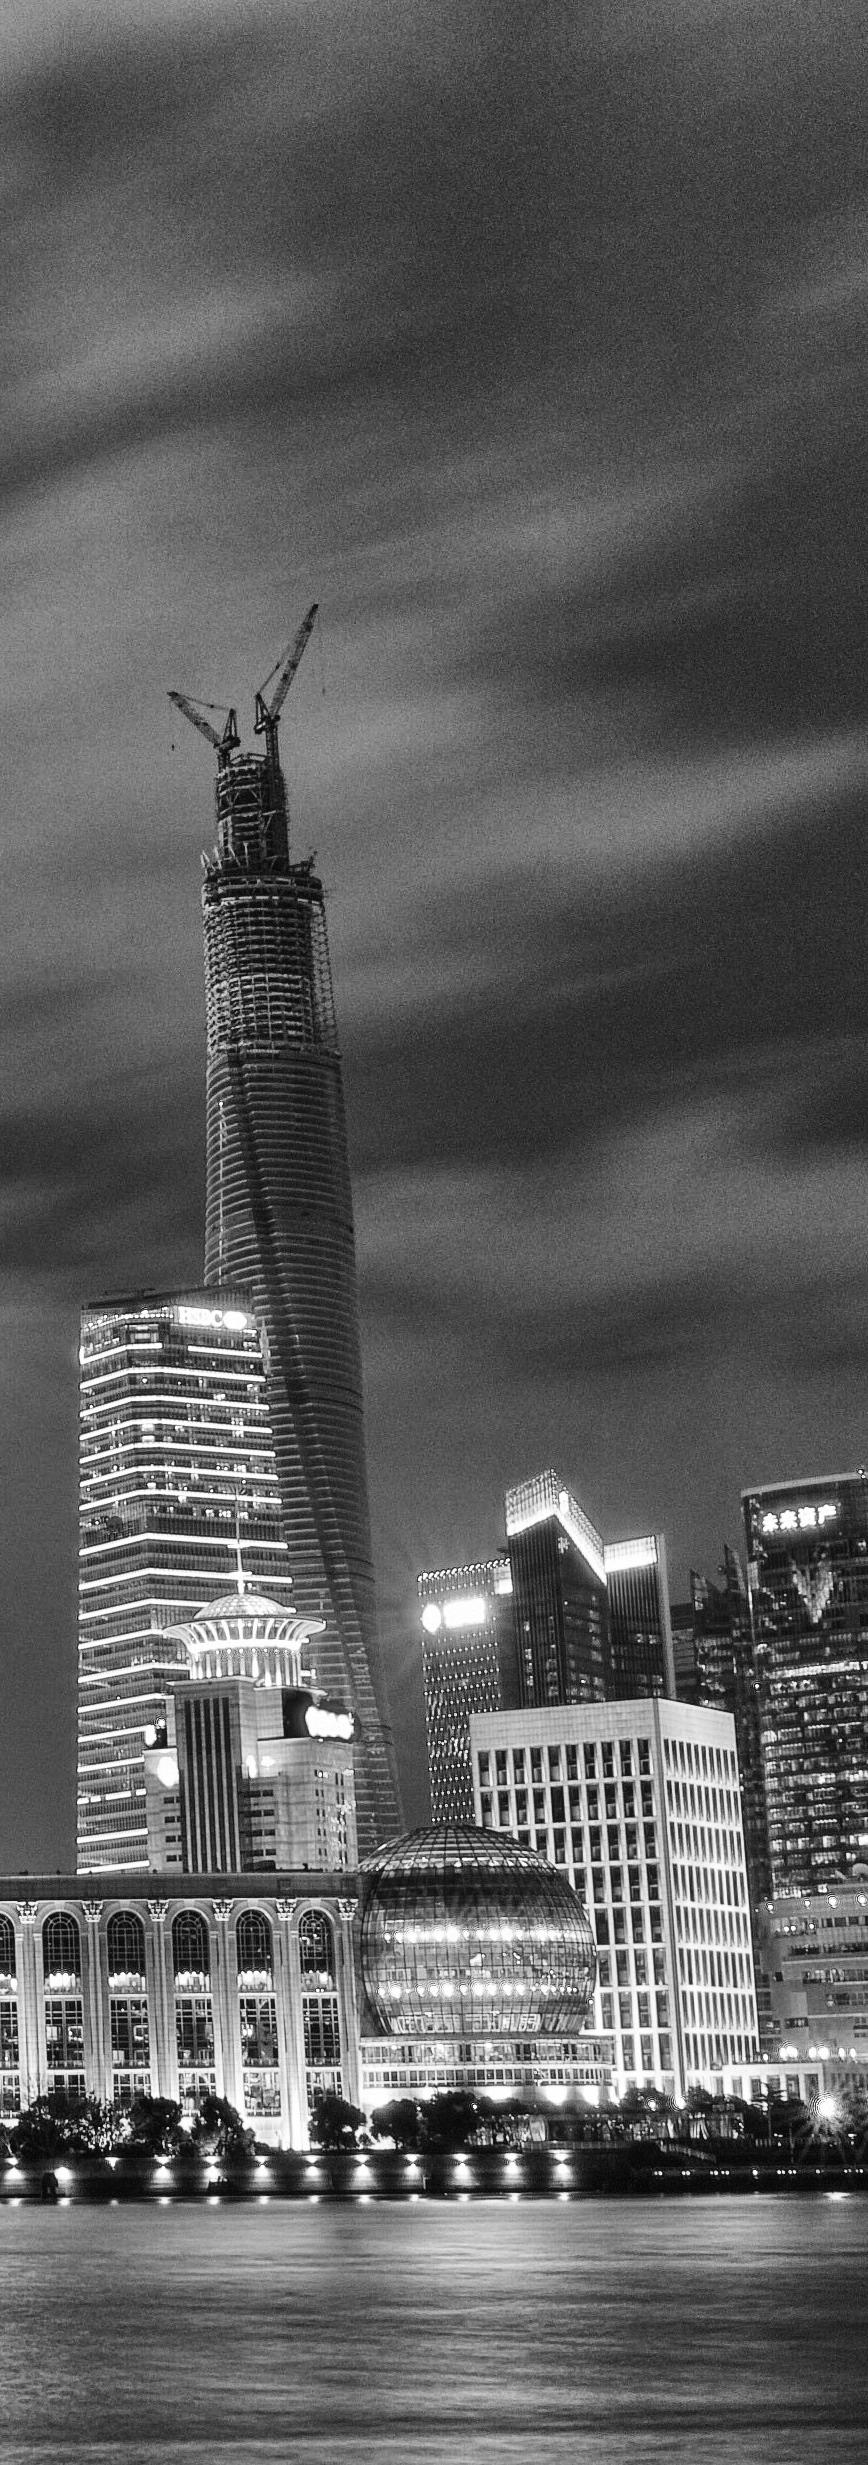
2.3.1 TOWER CULTURE OF SHANGHAI
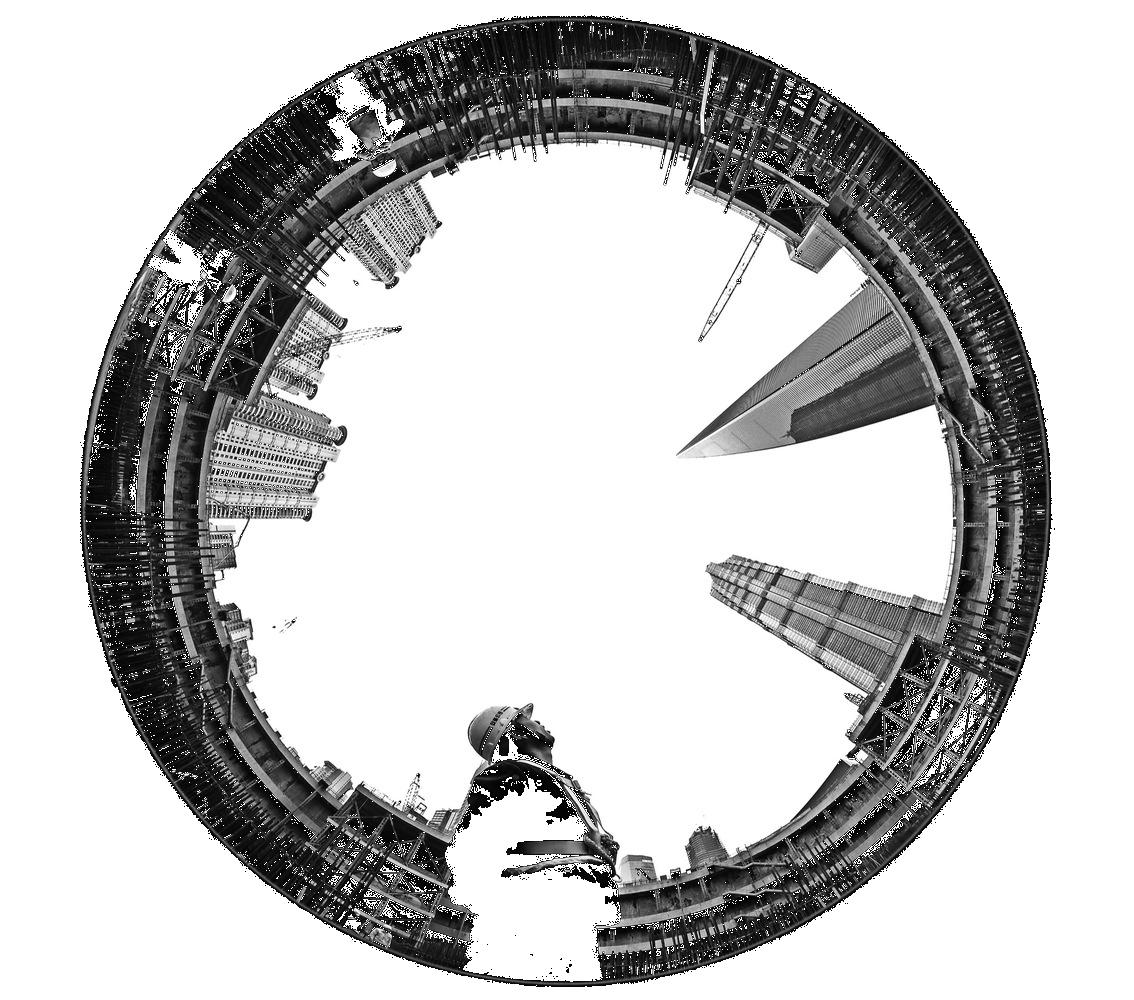
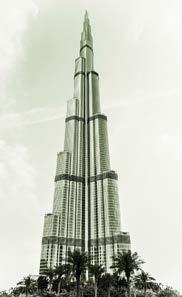
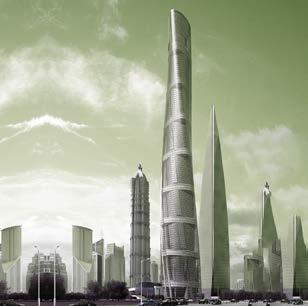
One of the most rapidly densifying city in the world is Shanghai. Being the most populated city in the world, and also as the primary financial hub of the world, Shanghai has adopted one of the most intensive high-rise culture in the world. From the 1990 onwards, the main ambition of further developments in Shanghai has always been to build higher skyscrapers, with better technology. Earlier to that, Shanghai’s first building boom occurred between the 1920s and 1930s when the city was established as a financial center for foreign companies. Thus, over 20,000 buildings 11th stories or higher were constructed, many of which displays distinct colonial architectural influence from the west. Many developments arose from the first boom can be found such as the French Concession and the Bund.
However, the 1980s’ economic reforms brought on a second construction boom, this time towards vertical growth and densification.
Consequently, buildings such as the Tower of Shanghai, the tallest skyscraper in the city, displays a magnificent high that densifies the city while marking the city as an important global financial centre.
SOURCE “List of Tallest Buildings in Shanghai.” 2018. Wikipedia. https://en.wikipedia.org/w/index.php?title=List_of_tallest_ buildings_in_Shanghai&oldid=875474744.
30 Context Domain
SOURCE. “World_ghg_flow_chart_2005.Png (1500×1081).” http://www.wri.org/sites/default/files/world_ghg_flow_chart_2005.png.
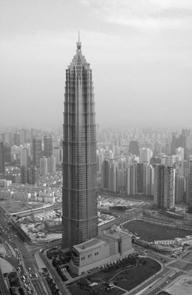

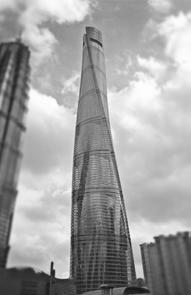
31 Context Domain NAME HEIGHT-FLOOR NUMBER YEAR OF CONSTRUCTION SHANGHAI TOWER Gensler 632m / 128 Floors 2015 SHANGHAI WORLD FINANCIAL CENTER Kohn Pedersen Fox 492m / 101 Floors 2008 JIN MAO TOWER Skidmore, Owings & Merrill LLP 421m / 88 Floors 1999 SHIMAO INTERNATIONAL PLAZA Ingenhoven Overdiek und Partners 333m / 60 Floors 2005 SINAR MAS CENTER Skidmore, Owings & Merrill LLP 320m / 67 Floors 2017
5 Tallest Skyscrapers in Shanghai
2.3.2 DEMOGRAPHICS OF SHANGHAI
In the 1980’s reforms, Shanghai has rapidly transformed from a mostly agrarian city to a financial capital in merely two decades. Shanghai has become the largest and and one of the densest cities in China. By 2050, it will host a population of more than 50 million, which will require new design strategies to address the need for high-density development. Most of China has adopted a strict onechild policy in China to keep the population in check until 2016. But due to Shanghai’s high population, the lifting of the the strict one-child policy is extended five more years, this strategy allows for capping of urban population to 25 million.
Besides, 39% of Shanghai residents are long-term migrants, a number tripled in 10 years, and most population live in urban areas. In the 21st century, Shanghai has grown by an astonished 165.5% and raised its life expectancy to 83 years, which contributes as well to total population growth.
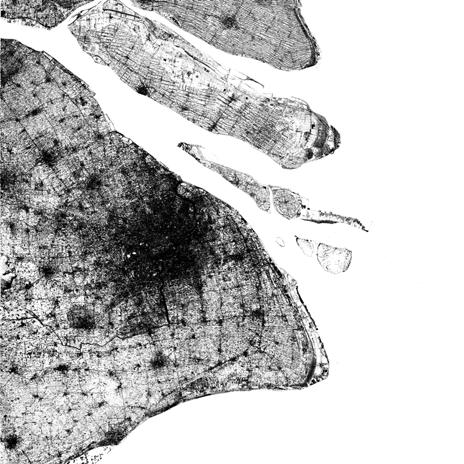
SOURCE. “World of Change: Sprawling Shanghai.” 2017. Text.Article. March 13, 2017. https://earthobservatory.nasa.gov/world-ofchange/Shanghai.
“Shanghai Population 2018 (Demographics, Maps, Graphs).” http://worldpopulationreview.com/world-cities/shanghaipopulation/.
32 Context Domain
1984 Population 6.847.000 Growth Rate 2.79% 1999 Population 10.450.000 Growth Rate 5.96%
SOURCE. LSE Cities Density Cities Map: “2011_chw_2050_01.Gif (1092×1221).” https://files.lsecities.net/files/2011/11/2011_ chw_2050_01.gif.
“World’s Population Increasingly Urban with More than Half Living in Urban Areas | UN DESA | United Nations Department of Economic and Social Affairs. world-urbanization-prospects-2014.html.

33 Context Domain 2004 Population 16.763.000 Growth Rate 3.73% 2016 Population 25.888.000 Growth Rate 2.93%
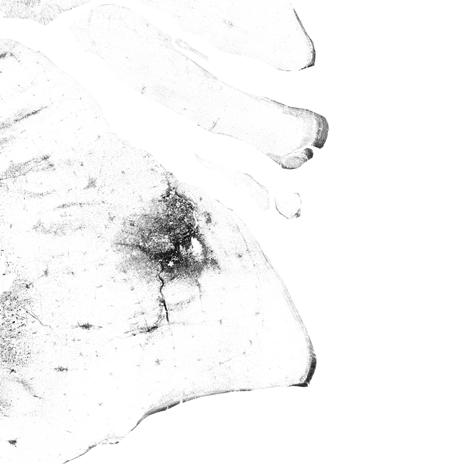
Density Map of Shanghai
2.3.3 SUBTROPICAL HUMID CLIMATE
According to the Köppen classification, there are two subtypes of humid subtropical climate (Cfa and Cwa) which Cfa subtype is the more predominant. This climate is most common on the eastern sides of all continents in coastal regions and between the latitudes of 20o to 35o N and S, but also there are exceptions, such as the inland areas of the US or China.
During summer time, these areas are mainly moist because of the maritime airflow that comes from subtropical anticyclonic where highest temperatures can reach from 30 °C to 38 °C. Furthermore, this period is wetter than in winter and rainfall coming from convectional thunderstorm activity.
The coldest month is quite mild, as it reaches 5-12 oC at the minimum where winter precipitation causes frontal cyclones along the polar front. In addition, net precipitation varied from 75 to 200 cm annually.
Another system it is essential to take into account is the Holdridge life zones(1947-Leslie Holdridge) where it offers a whole picture of a global bioclimatic scheme for the classification of land areas. A notion of soil and climax vegetation which can be mapped once climate is known.
SOURCE. “Humid Subtropical Climate | Climatology.” n.d. Encyclopedia Britannica. https://www.britannica.com/science/humidsubtropical-climate.
34 Context Domain
Holdridge life zone classification scheme
SOURCE. “Humid Subtropical Climate | Climatology.” n.d. Encyclopedia Britannica. https://www.britannica.com/science/humidsubtropical-climate.
“Holdridge Life Zones.” 2018. Wikipedia. https://en.wikipedia.org/w/index.php?title=Holdridge_life_ zones&oldid=847677283.
35 Context Domain
Köppen climate classification - Subtropical humid climate
potential evapotranspirationratio humidity provinces critical temperature line latitudinal regions polar subpolar boreal cool temperate warm temperate subtropical tropical annualprecipitation(mm) 800016000 4000 2000 1000 500 250 125 62.5 0.125 0.25 0.5 1 2 4 8 16 32 1.5 oC 3 oC 6 oC 12 oC 24 oC biotemperature
2.3.4 CLIMATE OF SHANGHAI
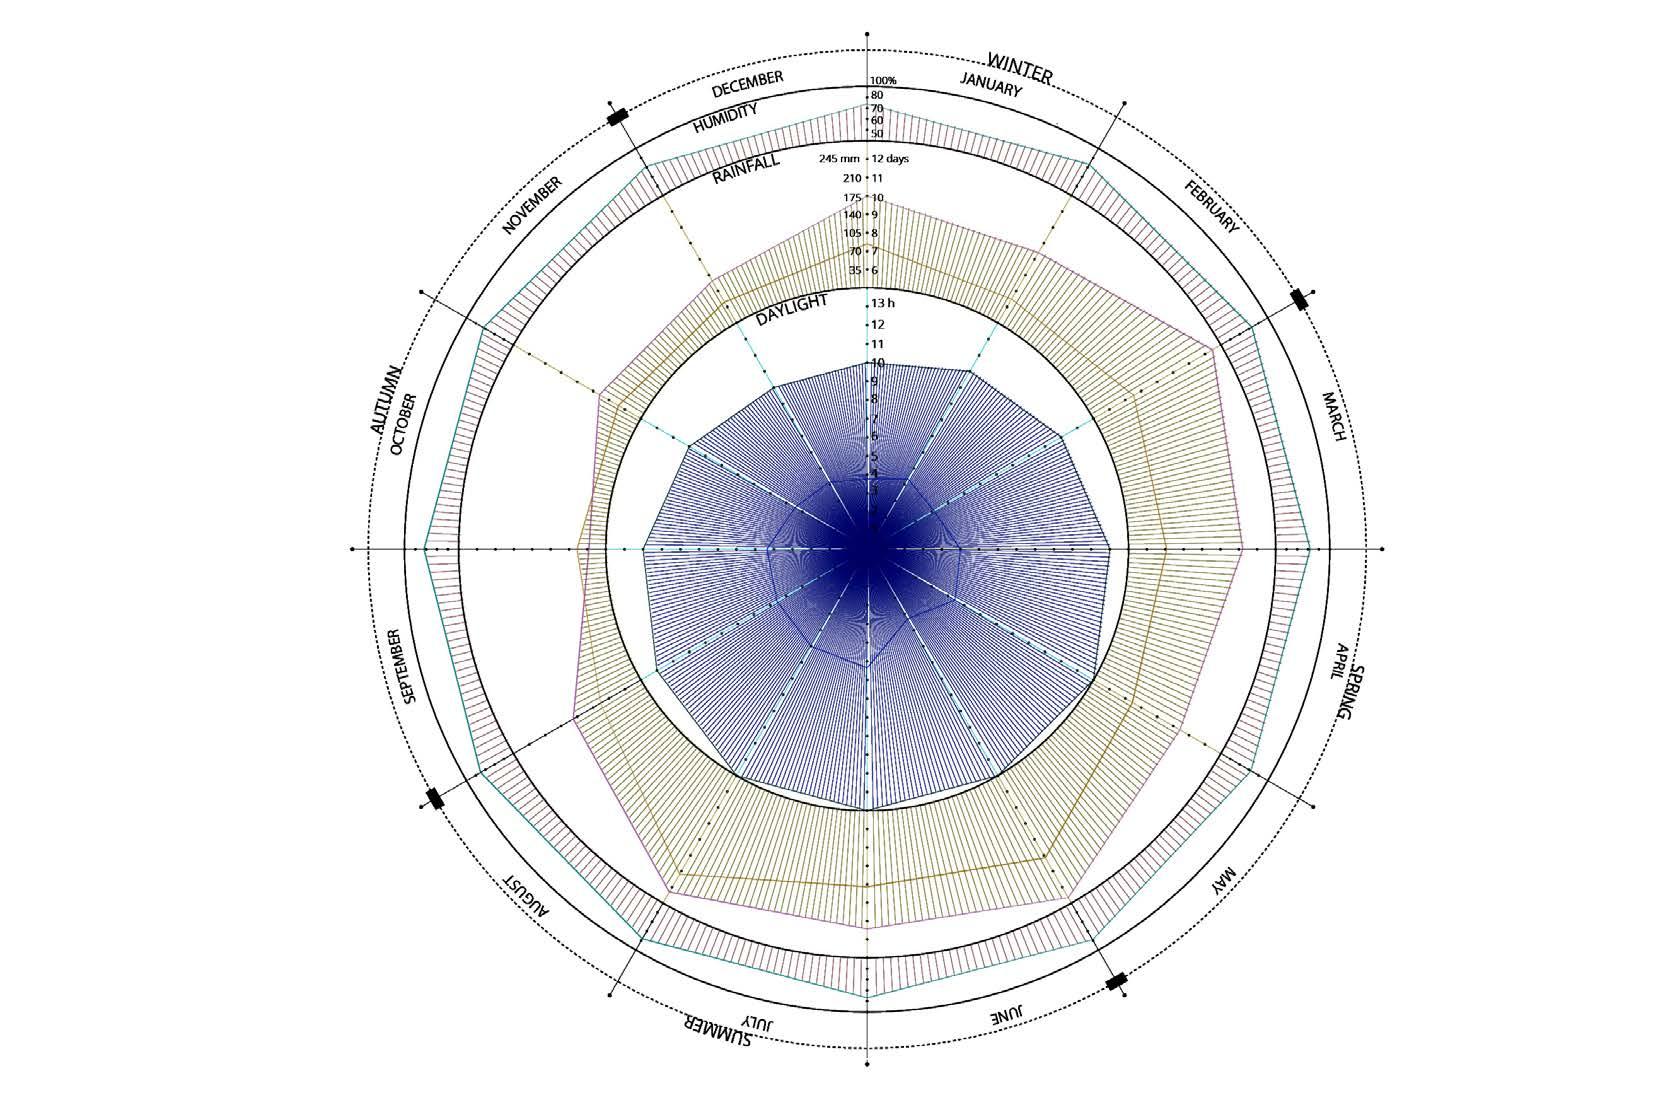
Shanghai is situated in a climate characterized as a humid and subtropical. According to the diagram, relative humidity can reach a high percentage of 70-85%.
The annual precipitation is 245 mm and an average of 12 days monthly of rainfall. The wettest months occur during spring and summer.
Also, there is a peak difference between the warmest month, July at 40oC. In the coldest month of January, temperatures reaches -5oC. In terms of daylight hours and sunshine hours, summer accumulates 13 hours in total during a month.
36 Context Domain
SOURCE.
oC 40 30 20 10 0 -10 January February March April May June July 40 30 20 10 -10 0 C Ladybug Analysis .epw Shanghai “Shanghai Monthly Climate Averages.” n.d. WorldWeatherOnline.Com. https://www.worldweatheronline.com/shanghaiweather/shanghai/cn.aspx.
Sunshine [h]
Daylight [h]
Rainfall [mm]
Rainfall [days]
Humidity [%]
37 Context Domain
July August September October November DecemberT
2.3.5 AIR POLLUTION RATE
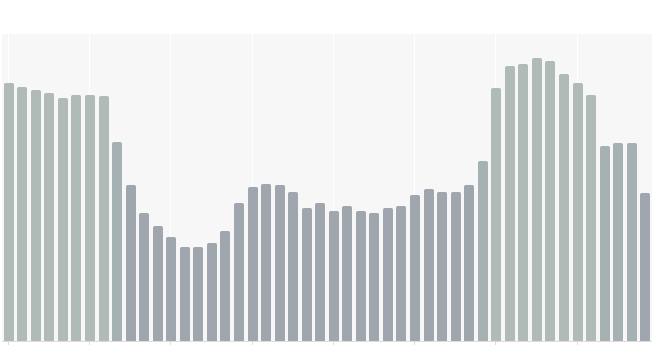
Increasing urbanisation and human activity produce harmful substances to the atmosphere, and air pollution has a range of negative impacts, such as human health, damage to ecosystems, food crops and the built environment. Recently, China has become the world’s leading greenhouse gas emitter on account of high production of consumer goods. Hence the size of the carbon legacy is closely tied to consumption patterns. According to the World Health Organization (WHO), the annual average PM2.5 in Shanghai reach 48ug/m3, thrice the maximum value deemed safe as air quality. Due to that air pollution is considered as the most significant environmental risk to human health and it estimates to be the cause of seven million premature deaths every year.
AQI % Shanghai air pollutant in a day
*AQI: time
38 Context Domain
SOURCE. project, The World Air Quality Index. n.d. “World Health Organization: 2014 Air Pollution Ranking.” Aqicn.Org. http://aqicn.org/search/vn/. project, The World Air Quality Index. n.d. “Shanghai Air Pollution: Real-Time PM2.5 Air Quality Index (AQI).” Aqicn.Org. http://aqicn.org/city/shanghai/. Air Quality Index
SO2 EMISSIONS, BY WORLD REGION (IN MILLION TONNES) Annual sulphur dioxide (SO2) emissions in million tonnes
140 m tonnes
SOURCE. “Air Pollution: Does It Get Worse before It Gets Better?” n.d. Our World in Data. https://ourworldindata.org/airpollution-does-it-get-worse-before-it-gets-better.
39 Context Domain
CO2 NO2
CO2 NO2 $
$
120
100
80 m tonnes 60 m tonnes 40 m tonnes 20 m tonnes 0m tonnes 1850 1880 1900 1920 1940 1960 1980 2020 Africa Asia Europe North America South America
m tonnes
m tonnes
2.3.6 LOSS OF ARABLE LANDS
Due to a significant economic development in Shanghai, building land has increasingly expanded and encroached upon arable land in the last decade. Despite a 70% of greens production in local areas, the population ratio will increase 4.35% with 50 millions of citizens and it will be necessary a prompt solution for establish an agricultural systems capable to produce faster and in large quantities.
Thus, the adaptation of new agricultural systems in urban land will be necessary and it will slightly reduce the transportation of food as well as air pollution rates. Consequently, further studies in new agricultural systems will respond to the food demands in urban areas.
SOURCE. “13 Vertical Farming Innovations That Could Revolutionize Agriculture.” 2018. July 4, 2018. https:// interestingengineering.com/13-vertical-farming-innovations-that-could-revolutionize-agriculture.
Mazzolai, Barbara, Lucia Beccai, and Virgilio Mattoli. 2014. “Plants as Model in Biomimetics and Biorobotics: New Perspectives.” Frontiers in Bioengineering and Biotechnology 2. https://doi.org/10.3389/fbioe.2014.00002.
40 Precedents Domain
GrasslandWaterbodyBuilding Land Forest Land Cultivated Land Land use Change ( 100 sq km ) -16 -8 16 0 8 Land Use Change [100 sqkm] Cultivated Land Forest Land Water-body Grassland Building Land Shanghai Land
IN 10 YEARS
Use Change
SOURCE. “Spatiotemporal Variation of Landscape Patterns and Their Spatial Determinants in Shanghai, China.” n.d. ResearchGate https://www.researchgate.net/publication/321996207_Spatiotemporal_variation_of_landscape_ patterns_and_their_spatial_determinants_in_Shanghai_China.


41
Domain 2016 Population 25.888.000 Growth Rate 2.93% Local Food Production Shanghai Production Ratio 70% Leafy Green Exported Food Estimated Population :2050 Population 50.000.000 Growth Rate 4.35%
Precedents
2.4 AGRICULTURE
2.4.1 VERTICAL FARMING
Vertical Farming is the practice of producing food in vertically stacked layers onto vertically inclined surfaces or integrated in other structures such as skyscrapers...Due to that it is necessary the indoor farming techniques as well as controlled-environment agriculture (CEA) technology, where all environment factors can be controlled. During ten years Shanghai will transform its arable lands to convert them into dwellings for responding to the growth of population. Due to the lack of resources for a traditional agriculture production Vertical farming is seen the more sustainable method of agriculture than its counterparts. Thus, exported food could decrease to enhance the local production in cities, and it will allow being part of a new green design in skyscrapers. Further studies about existing vertical farming sytems considered depending on different cases. As the diagram shows those greenery methods can vary based on five factors such as integration which it could be in an existing building or a new one, placement which plants can be integrated in different architectural elements such as the roof, facade or adequate indoor spaces, exposure which can be direct or indirect natural sources for the plant growth requirements, growing medium which the plant growth depends on watering and nutrients system without soil such as aeroponics where the roots are suspended in the air and they receive all nutrients and water from the mist environment, the hydroponics where the roots receive the mineral nutrients through a water medium and aquaponic, a combination of aquaculture and hydroponic system making it possible in a symbiotic environment. However, the most important is the production purpose and the advantages and disadvantages of those systems. This project aims to create a food production loop that can create new opportunities for social and economical aspects as well as a air and water cleaner system for a high-rise building. Furthermore, this innovative method allows producing a higher amount of food with shorter time demands in different contexts. The disadvantages are the high demand of artificial energy and primary expenses for this application.
42 Chapter Main Heading
Farming: Definition and Background.” https://www.verticalfarming.com/definition-and-background/. “Vertical Farming.” 2018. Wikipedia. https://en.wikipedia.org/w/index.php?title=Vertical_farming&oldid=875658654. SOURCE.
“Vertical
Urban Agriculture Integration Typology VERTICAL FARMING
SOURCE. “Urban Agriculture Integration Typology.” n.d. Association for Vertical Farming (blog). https://vertical-farming.net/ vertical-farming/integration-typology/.


43 Chapter Main Heading
INTEGRATION Holistic Facade Exposed Aeroponic Market production Retrofitted Rooftop Enclosed Aquaponic Community focuse Converted Indoor Closed Hydroponic Cleaner System PLACEMENT EXPOSURE GROWING MEDIUM PRODUCTION PURPOSE . . . . . . . . . . . . . . . . . . . . . . . .
2.4.2 CROP ANALYSIS
The eight most suitable crops for vertical farming system were selected for a further research and analysis, which were analysed in this diagram the different parameters to their adequate growth and subsequently their harvesting for each one of the crops. As it is shown from the diagram each one of the crops has different properties to be consider for a suitable growth, which means they have specific environmental parameters to take into account for a faster production.
44 Chapter Main Heading >12h SUNLIGHT (HOURS) >6h >6h >14h 7.5 PLANTING DEPTH (CM) 3.0 1.5 1.5 50 SPACING IN ROW (CM) 40 60 25 15-21 TIME TO HARVEST (WEEK) 16-20 14-18 5-6 35 MAXIMUM HEIGHT (CM) 180 35 25 0.27 WATER UPTAKE (LCROP/DAY) 0.42 0.11 0.11 5 PLANTING DENSITY (CROP/M2) 10 20 20 11.47 21 70% 2.87 CROP PRODUCTION (CROP/M2DAY) MAXIMUM TEMPERATURE (OC) RELATIVE HUMIDITY TRANSPIRATED WATER UPTAKE (KG/DAY)* 15.77 30 60% 2.79 8.25 15 70% 1.77 13.24 24 70% 1.76 POTATO
0.99 ENERGY DEMAND (KWH/M2DAY) 0.95 0.80 0.80
TOMATO CABBAGE SPINACH
SOURCE.
Institute of Space Systems. 2013. “Feasibility Study VerticalFarm EDEN.Pdf.”
In addition, planting density and crop production per day can be useful for quantifying the production ratio during longer periods according to food demands and climate conditions. Another issue that it is important for the crops is the minimum expense in artificial energy and natural factors such as sun light hours seasonally can be adapted to each crop demand. To conclude, it is also important to consider the high relative humidity ratio that crops can withstand in Shanghai where the humidity ranges over 70-80% overall year.
45 Chapter Main Heading >10h >6h >6h >6h 1.5 2.0 2.0 1.5 25 54 30 45 5-6 17-21 12-15 8-11 25 90 35 60 0.20 0.38 0.24 0.10 20 6 6 6 5.96 15 70% 1.77 20.28 22 50% 2.77 1.10 17 50% 2.45 8.5 20 80% 1.77 Max.Height 90 cm Max.Height 60 cm Max.Height 35 cm Max.Height 25 cm Ground Level 0 cm Max.Height 3-7 cm LETTUCE PEPPER PEAS BOK CHOY 0.80 0.95 0.85 0.80
2.4.2 CROP ANALYSIS
For a further crop knowledge the following diagram also takes into account two main environmental parameters such as radiation and wind force and direction. Radiation provides heat and daylight for the 8 kind of crops based on the energy demand of each of them. Wind also can enhance ventilation for the overheating spaces where plants are growing overall year.
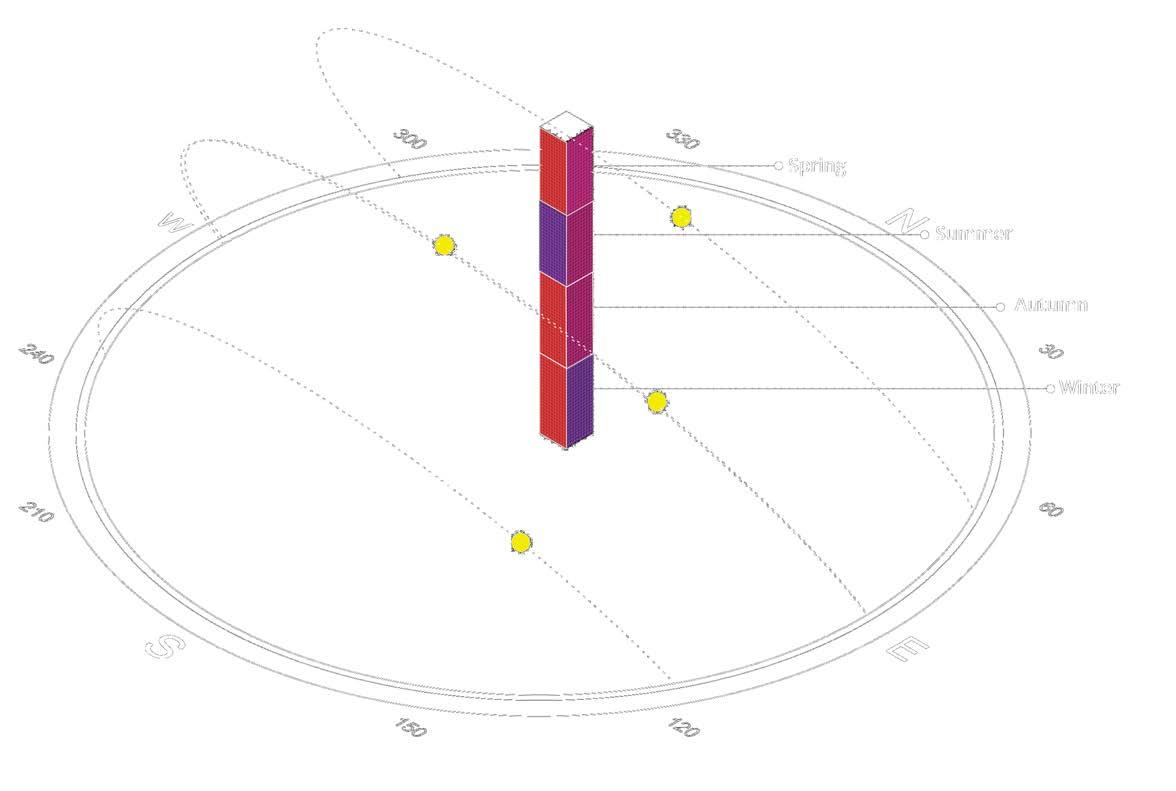
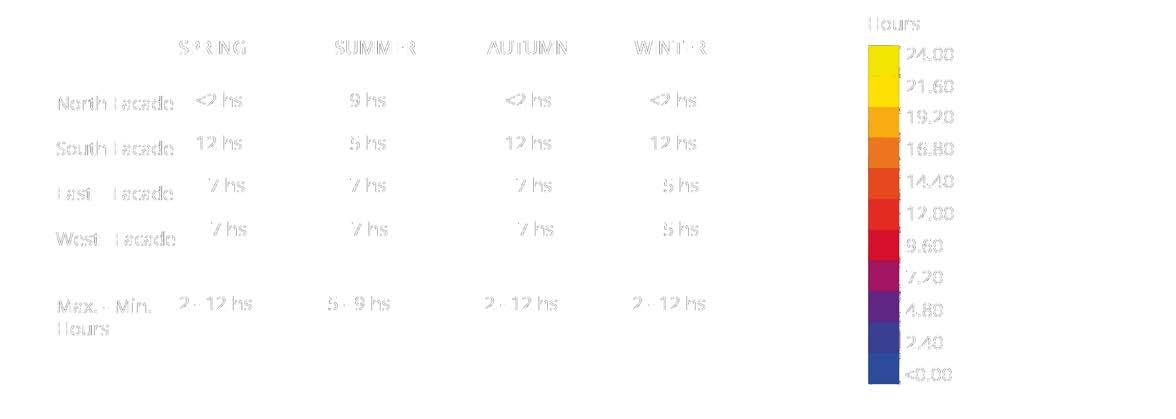
To conclude, it is taken into account the orientation and season each crop is ideally grown. Due to that, it is also analyzed the amount of daylight hours that each facade side receive seasonly.
The least daylight amount is on North Facade in Spring,Autumn and Winter. and also in Summer , south facade side.Thus it is considering the fact of artifical light use (LEDs)
46 Main Heading Chapter
WIND RADIATION reppep p e a s tomatoes ecuttel bokchoy pot at o e s egabbac pshcani NE E SE S SW W NW N NE E S E S S W W N W N NE E SE S SW WNW N NE E SE S SW W NW W E N S S N E W S N E W W E N S N 1 - 24 h 0 - 30 C 0-5 kg/day 0 - 100% 0-1 L/day 0-20crop sunlightenergy demand harvest time crop productionplanting density water uptaketranspirated water relative humidity maximum temperature 0 - 1 kW depth plant max heigthspace in row RETNIW NMUTUA US M M E R SPRING SPRING S UMMER NMUTUA RETNIW 16h 8h 8h 16h CROP PAR AMETERS SEASONS 1-25 w 0-8 cm 10-180cm 10-80cm saeP yohCkoB| ecutteL| saeP|yohCkoB| C|seotatoP|egabbaC|yohCkoBbba a eg P e epp r | T o m a t o e s | Po t a t o e s | To ma toes Tomatoes| Potatoes|Tomatoes mlaPoobmaB|eugnoTwaLnirehtoM hCeseni yenoM waLnirehtoM|tnalP Bamb o o P a m BambooPalm |MotherinLawTongue ORIENTATION AND SEASON LETUCCE TOMATO CABAGGE PEPPER PEAS BOK CHOY SUMMER SPRING SUMMER AUTUMN SPRING AUTUMN WINTER SPRING SUMMER AUTUMN POTATO SPINACH LETUCCE TOMATO CABAGGE PEPPER PEAS BOK CHOY TOMATO CABAGGE PEPPER PEAS BOK CHOY W E N S
SOURCE. Ladybug Analysis in Shanghai Wind and Radiation Overall year Institute of Space Systems. 2013. “Feasibility Study VerticalFarm EDEN.Pdf.”
Precedents Domain
47 Chapter Main Heading South East Isometric View Crop classification according to daylight and orientation Domain Precedents
2.4.3 LOCAL CLEANER PLANTS
SPECIES CLEANERHUMIDIFIER PLANT


BAMBOO PALM (Chrysalidocarpus lutescens)


MOTHER-IN-LAW’S TONGUE (Sansevieria trifasciata)


CHINESE MONEY PLANT (Pilea peperomioides)

The vegetation diversity allows numerous plant species to play different roles to improve environmental conditions such as humidity control or air cleaners. The factors to enhance their growth give a secure system to cultivation and rearrange spaces that can benefit from those plants.
ROLE
48
Domain
Precedents
filtered
Indirect sunlight WATER LIGHT high watering 3-4 times/week low watering regular watering TEMPERATURE 23OC-29OC > 10OC 22OC-30OC
direct sunlight Indirect sunlight
HUMIDIFIERS
AIR CLEANER
FOOD PRODUCERS
PLANTS
“Caring For Bamboo Palms: How To Grow A Bamboo Palm Plant.” n.d. Gardening Know How. https://www.gardeningknowhow.com/houseplants/bamboo-palm/grow-bamboo-palm-indoors.htm. SOURCE.
In the diagram it is gathered all the parameters needed for local plants growth conditions. As it is seem each plant specie can naturally work as a humidifier inside dried spaces or convert CO2 to O2 as well as removing other toxic volatile organic compounds from the indoor air. The aim for this plants integration is the improvement of air quality in different interior spaces without the demand of artificial energy that produce air polluted instead of clean air.

SOURCE. “Plant Care Mother-in-Laws Tongue | House Plants.” /plant_care_mother_in_laws_tongue. InterMari. 2017. “Pilea Peperomioides | Chinese Money Plant Care & Info.” Houseplant Central (blog). February 12, 2017. https://houseplantcentral.com/pilea-peperomioides-chinese-money-plant-care-info/.

49 Precedents Domain RELATIVE HUMIDITY 70-80 % 40-60 % 75-85 % MAX.HEIGHT INCOMES ZONE 5-10 m (outside) 1 m 0.30 m Natural humidifier Convert CO2 into O2 (Night) Removing Formaldehyde and other VOC’s *VOC’s volatile organic compounds PATIOS/ ATRIUMS RESIDENTIAL OFFICE %
2.6 CLIMATIC CONDITIONS
2.5.1 MICROCLIMATE
“Microclimate is the atmospheric conditions affecting an individual or a small group of organisms, esp when they differ from the climate of the rest of the community.”
Human comfort is affected by different factors that can gradually vary the environmental values in an internal space. Thusly, there are various parameters for enhancing and controlling the indoor environmental conditions. There are some observations about human body behaviour from different activities. Thus, space indoor must be adaptable to a different temperature, humidity or daylight needs at different hours of the day. Furthermore, there are physical and personal factors that affect each human such as age or gender. We aim to understand all of these changing parameters to include it in the further design of indoor spaces. In order to follow some studies done about optimum values for an indoor space requirements, the following diagram show several parameters - temperature, humidity, airflow speed and daylight - which vary according to the different uses applied: residential, offices and commerces.
As it is concluded, temperature do not change very much over the uses of spaces while daylight it is mostly necessary for residential and commerces. Regarding to humidiy the value must be 25% and 40% respectively and airflow speed oscillate between 0.10 m/s to 1.60 m/s as maximum.
“Microclimate Definition and Meaning | Collins English Dictionary.” https://www.collinsdictionary.com/dictionary/ english/microclimate.
50 Precedents Domain
SOURCE. Michael Boduch and Warren Fincher. 2009. “Standards of Human Comfort.” UTSoA - Meadows Seminar
Fall 2009. https://soa.utexas.edu/sites/default/disk/preliminary/preliminary/1-Boduch_Fincher-Standards_of_Human_Comfort.pdf.


51 Precedents Domain Functions Residential Office Commerces Temperature 21-26 21-22 21-26 Humidity Airflow speed 25-60% 0.25-0.50m/s 40% 40% 0.10-1.60m/s 0.10-1.60m/s Daylight >12h 6-8h >12h % Microclimate INDOOR SPACE OUTSIDE oC Temperature % Humidity Airflow Daylight CONTEXT R E S I DENTIAL C O M MERCES O F F I CE
2.5.2 COMFORT LEVELS
Through human senses, the degree of comfort levels of indoor spaces can vary depending on physical and personal factors of every person. While discomfort is about approaching extremes, comfort is primarily about determining ranges. Thus, there are different optimal range values for enhancing and controlling the microclimate of the space use. In addition, there are some observations about human body behaviour from various activities that can be considered as an additional factor that also define the indoor spaces. Thus, ideal indoor condition is an optimal combination of different parameters such as temperature, humidity or daylight that can be controlled for different circumstances and distinc occupants needs.
The aim is to understand all of these changing parameters to include it in the further design of indoor spaces. However it is necessary the previous analysis of the environmental factors that occurs outside in order to provide better solutions. Regarding to Shanghai climate, one of the main problems as it was mentioned in previous chapters, it is the high rate of relative humidity that affects the human living comfort. The following psychometric detect the optimum temperature- between 23oC to 26oC and air rate ranges which allow comfort level for indoor spaces.
52 Precedents Domain
SOURCE. Michael Boduch and Warren Fincher. 2009. “Standards of Human Comfort.” UTSoA - Meadows Seminar Fall
2009. https://soa.utexas.edu/sites/default/disk/preliminary/preliminary/1-Boduch_Fincher-Standards_of_Human_Comfort.pdf.
Precedents Domain
SOURCE. Ladybug Analysis_ Comfort Zone range in Shanghai
Psychometric Chart of Shanghai CHINA

53
Resting Light
Heavy work 65 W 100 W 585 W Metabolic Rate Water Vapour/person 40 g/h 50 g/h 200 g/h
work
01 JANUARY
Operative Temperature oC -10 kJ/kg 0 kJ/kg 10 kJ/kg 20 kJ/kg 30 kJ/kg 40 kJ/kg 50 kJ/kg 60 kJ/kg 70 kJ/kg 80 kJ/kg 90 kJ/kg 100 kJ/kg 110 kJ/kg 0.03 0.025 0.02 0.015 0.01 0.005 10% 20% 30% 40% 50% 70% 80% 60% 100% 90% Hours Comfort 194.00< 84.60 75.20 65.80 56.40 47.00 37.60 28.20 18.80 9.40 <0.00 1.00 <0.00 -20 -15 -10 -5 0 5 10 15 20 25 30 35 40 45 50 Specific humidity gram moisture/ kg dry air Humidity Ratio kg water/ kg air Humidity Percentage
Annual analysis
- 31 DECEMBER 24 h
2.6 TOWER SYSTEMS
2.6.1 SUBSYSTEM 01: STRUCTURE SYSTEM
2.6.1.1 OVERVIEW
“The first fundamental of structural art is the discipline of efficiency; a desire for minimum materials, resulting in less weight, less costs and less visual mass”
Billington
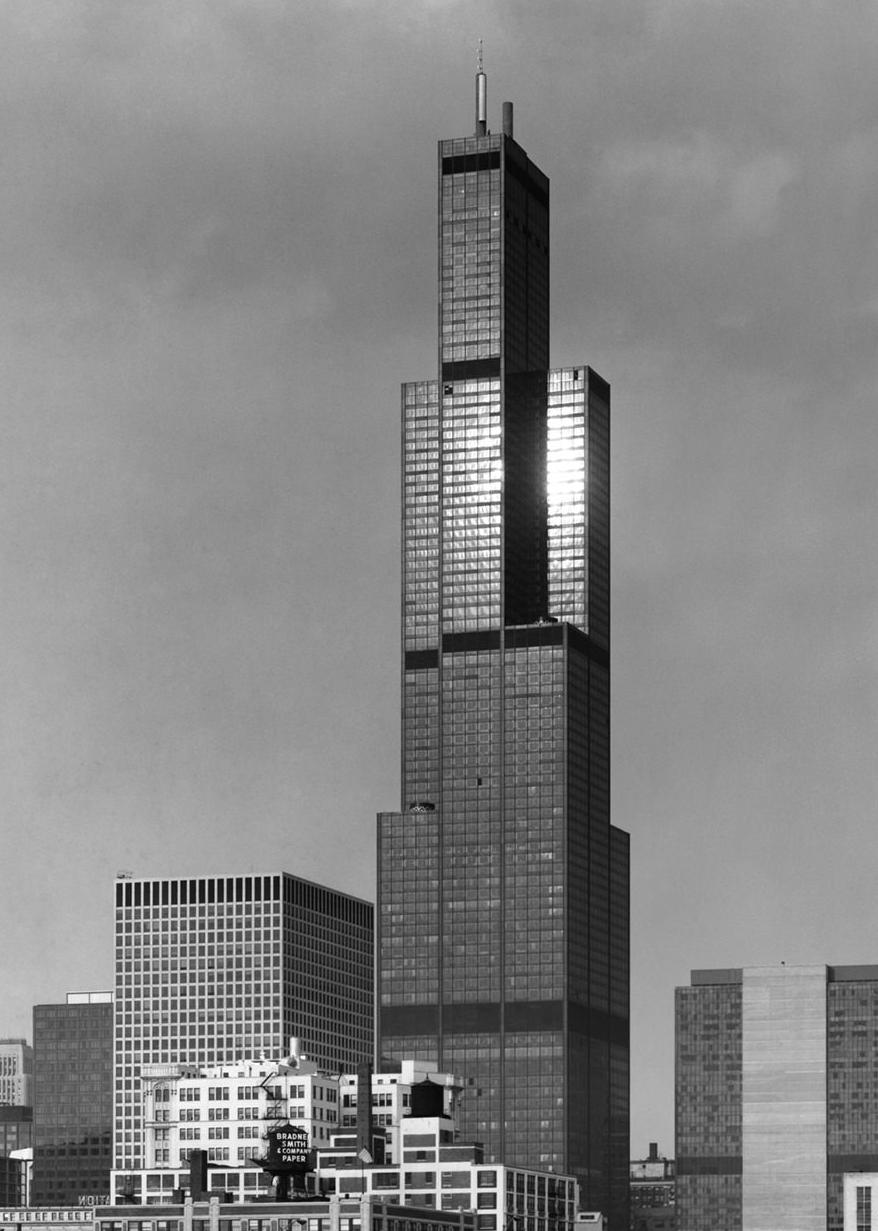
One of the most influential engineer in the structural field of skyscrapers is Fazlur Rahman Khan. His engineer knowledge and design was fundamental to the better understanding of design and its relationship with structure. As the tallest building at the time, Sears Towers (1974) remains as an important reference for the structural design of skyscrapers. His innovation aims challenges the limits of building height, while interrogating the relationship of form-function of structure.
First aim is to research how a skyscraper construction is developable from the beginning, to gather better choices for structural design without functional limitations and efficiency warranty.
SOURCE. “Skyscraper Design and Construction.” 2018. Wikipedia. https://en.wikipedia.org/w/index.php?title=Skyscraper_design_ and_construction&oldid=865315420.
54 Precedents Domain
©SOM ©EzraStoller
2.6.1 SUBSYSTEM 01: STRUCTURE SYSTEM
2.6.1.2 FORCES ACTING ON HIGH-RISE BUILDINGS
Structurally, skyscrapers are able to withstand different loads that directly affect the structure. There are static and dynamic loads, and the results vary in the context, use, and material. One of the most aggravating reactions is caused by lateral loads, which means wind forces and direction.
The understanding of different high-rise buildings structures depends on results and post analysis that affects the whole construction of the building.
The variation of static load results from reactions forces, overturning moments, deflections, critical buckling loads, forces between cores distribution are among the forces to be evaluated.
Firstly, it is crucial to understand how wind pressure affects to the whole body of the building and the different pressure between the bottom and the top zone of the building where pressure increase or decrease gradually. Although, another factor is taken into account: wind direction - windward, direction upwind from the point of reference and leeward, direction downwind from the point of reference - which divide building sides into low and high pressure regions.
Secondly, high-rise buildings deformation change based on the force types:
-Shearing forces are unaligned forces push one part of the body in one direction, and another part of the body in the opposite direction.
-Bending moment is the reaction induced in a structural element, especially beams, when an external force or moment is applied to the element to bend.
-Torsional moment, is the twisting of an object due to an applied torque.
2016. “Structural Design of High-Rise Building.” 2016. http://www.byggmek.lth. se/fileadmin/byggnadsmekanik/publications/tvsm5000/web5213.pdf.
“Windward and Leeward.” 2018. Wikipedia. https://en.wikipedia.org/w/index.php?title=Windward_and_ leeward&oldid=864542505.
“Shear Force.” 2018. Wikipedia. https://en.wikipedia.org/w/index.php?title=Shear_force&oldid=868741106.
“Bending Moment.” 2018. Wikipedia. https://en.wikipedia.org/w/index.php?title=Bending_moment&oldid=874647927.
56 Precedents Domain
SOURCE. Erik Hallebrand and Wilhelm Jakobsson.
57 Chapter Main Heading ©Ezra Stoller F High Pressure Low Pressure LEE WARD F High Pressure Low Pressure LEE WARD BENDING MOMENT TORSIONAL MOMENT
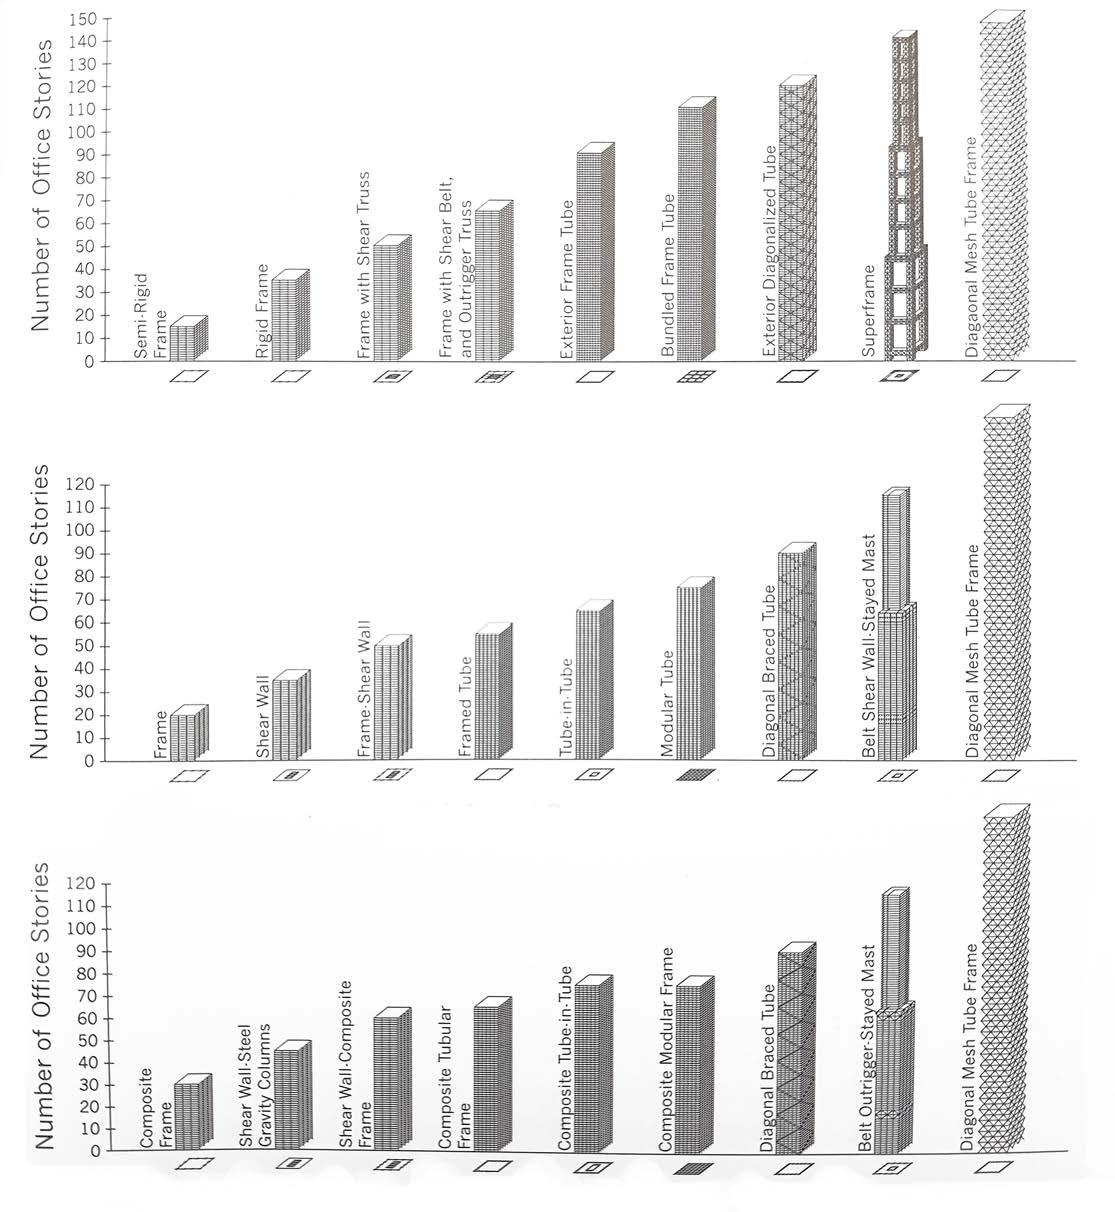
An intensive development period for high-rise buildings occurred in the later half of the 20th century. Due to a strong economy and the development of different construction techniques, new structural systems allowed novel ways to design skyscrapers.
Tubular forms, outriggers, diagrids, and mixed structures have been explored and realized in last decades.
According to Mir ve M.Ali, there are interior and exterior structures. Most structural elements are positioned based on such structural studies, and with the advent of technological computation programs, these forces can be accurately simulated.
However, the new classification by Mir M.Ali is guided by lateral load resisting capabilities, implying a division between primary structure, capable of resisting lateral actions (wind and seismic actions) and minor structure, which withstands minor loads.
In the diagram, it is shown that the limits of a structural system is based on the number of stories, thus their height. Even though it is not accurate, it estimates the most efficient and safe solutions during years of development.
58 Precedents Domain
2018.
САВРЕМЕНА ТЕОРИЈА И ПРАКСА У ГРАДИТЕЉСТВУ 13 (1). https://doi.org/10.7251/STP1813549K.
SOURCE. Kovačević, Ilda.
“MODERN STRUCTURAL CONCEPTS FOR HIGH-RISE BUILDINGS.”
2.6.1.3 STRUCTURAL CLASSIFICATION
2.6.1 SUBSYSTEM 01: STRUCTURE SYSTEM
Precedents Domain
STEEL SYSTEM
REINFORCED CONCRETE SYSTEM
COMPOSITE SYSTEM
Practical Height Limit of Structural Systems [Mir M.
59
SOURCE. Sarkisian, Mark P. 2012. Designing tall buildings: structure as architecture. New York: Routledge.
Ali]
Number
Number Stories Number
Stories
Stories
2.6.1 SUBSYSTEM 01: STRUCTURE SYSTEM
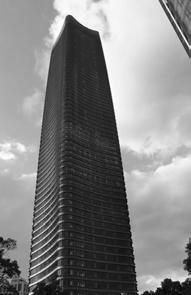
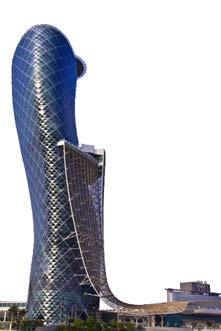
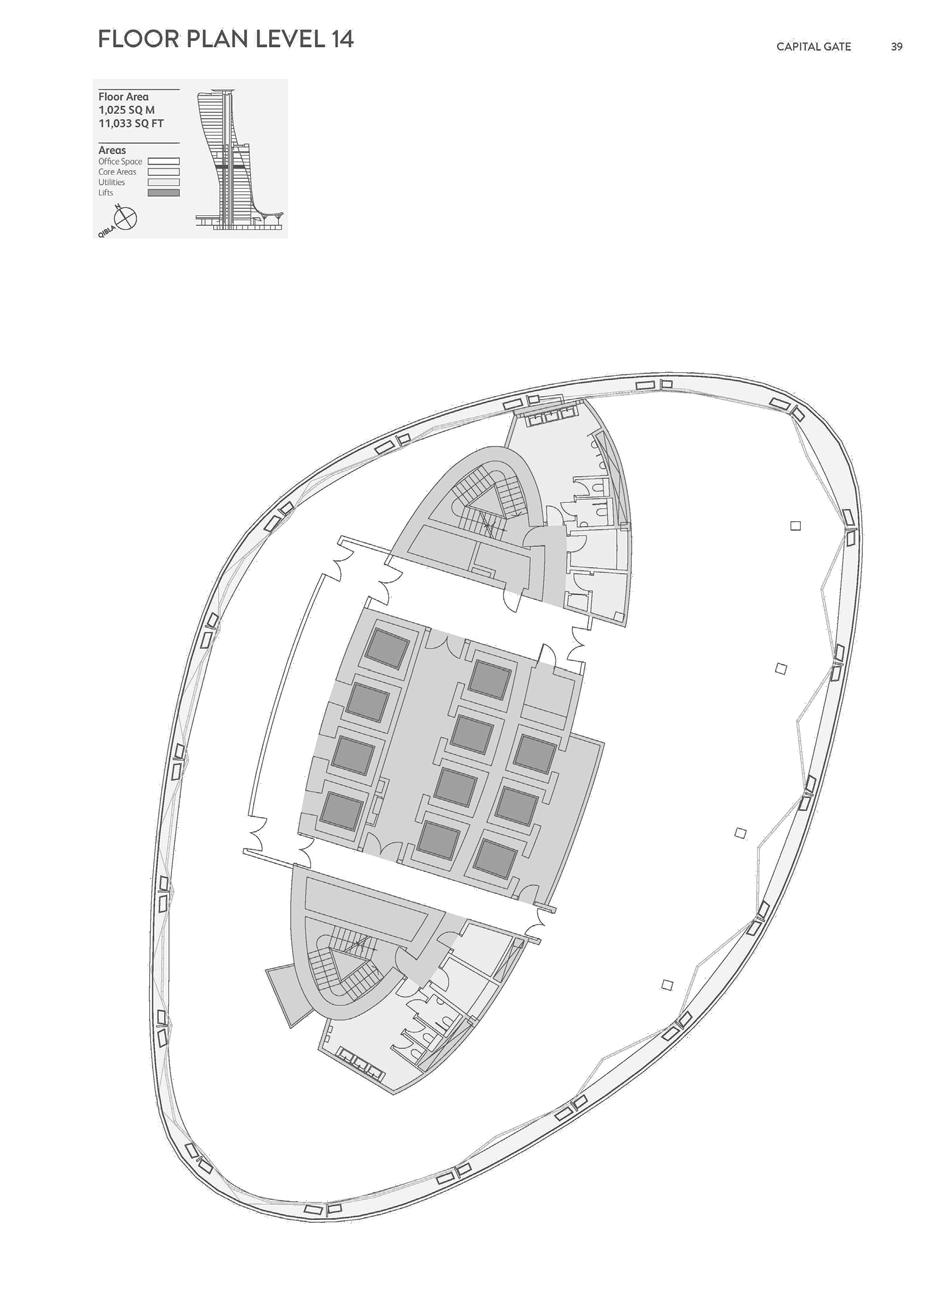
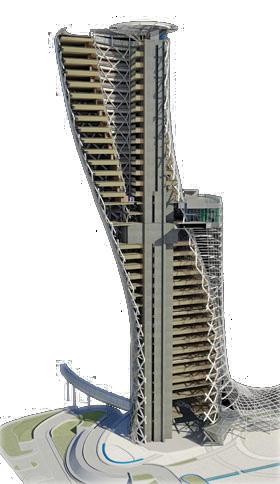
Capital Tower is one of the furthest-leaning towers in the world. It was constructed with 18 degrees westward of inclination which allows creating a curvaceous shape whose floor slabs change the shape orientation and provide flexible programming such as hotel and offices.
The importance of this precedent is to show how the structure system work in a high-rise building. The structural elements are: concrete core surrounded by two steel truss, and its external and internal structure, consisting of a diagrid system which withstands lateral loads. Also, steel beams support concrete floor and connect two diagrid systems to create an atrium in between. However horizontal trusses are also the main elements for resisting wind load. The dense outriggers system was put into use on the 17th floor in the mechanical floor.
SOURCE. Sisson, Patrick. 2016. “Uncommon Core: A Proposed Skyscraper Rethinks Tower Design.” Curbed. February 9, 2016. https://www.curbed.com/2016/2/9/10953352/nexus-skyscraper-design-plp-architecture.
Meer Musabber ali (joyous). 07:24:56 UTC. “High Rise Structure & Core.” Education. https://www.slideshare.net/ joymeer/high-rise-structure-core.
60 Case Study Domain
2.6.1.4 CAPITAL GATE ABU DHABI
PROJECT HEIGHT STRUCTURE CAPITAL GATE RMJM Abu Dhabi 164.7 m / 36 Floors 2011
core: concrete 30 m2
Concrete Core Steel Diagrid
Truss to counteract overbalancing forces
Atrium
Mechanical Shaft
Solar Shading
SOURCE. Bara Al Refai. 15:09:49 UTC. “Capital Gate.” Design. https://www.slideshare.net/BaraAlRefai/capital-gate-72057045.
“Capital Gate Tower, Abu Dhabi.” http://www.ctbuh.org/TallBuildings/FeaturedTallBuildings/CapitalGateTowerAbuDhabi/ tabid/3380/language/en-GB/Default.aspx.
“Capital Gate Floor Plans - Abu Dhabi.” n.d. http://www.worldfloorplans.com/floorplans/Capital-Gate-Level-05.shtml.

Case Study Domain
Section through Capital Gate
2.6.2 SUBSYSTEM 02: CIRCULATION SYSTEM
The relationship between interior spaces and human movement configures the circulation inside a building, and several factors are directly affect normal or emergency conditions. Numerous elements provide different types of circulation and passageways such as ramps, lobbies, stairways, elevator hoistways. Location of such elements also strongly affect the arrangement of the floor plan. Vertical circulation systems are divided into categories depending on their role in the building. Class I include ramps, stair, escalators, and elevators and provide the movements for people and goods while Class II systems that include dumb waiters and vertical conveyors are not used for human circulation.
Most of the towers share a conventional layout design: the core. This element is usually allocated in the centre of the building but also can be placed in the corner of the building or even being split into two cores. The advantages of this system are in term of accessibility and the allowance of daylight inside the spaces, controlling the depth and division of functions. On the other hand, the core location limits the extent of the indoor areas and require elements as corridors to separate functions. But there are also new core typologies which are emerging to replace the central core. The Nexus Building proposal by PLP took a chance on a pivoting point as support and connected with the different floor plates which provide better qualified interior spaces.
In terms of costs, central core carry many advantages with regards to vertical circulation, and structural slabs can be supported at each level by cantilevers from the core.
https://www.sefindia.org/rangarajan/CoreDesign.pdf.
62 Precedents Domain
n.d.
SOURCE. “CoreDesign.Pdf.”
Edgett, Steven D, and Allen M Williams. 2004. “VERTICAL CIRCULATION,” 48.
Single core Central core Double core
2.6.2.1 CORE ALLOCATION
Organic Spaces and Intermixing Functions
Organic Spaces and Intermixing Functions
Organic Spaces and Intermixing Functions
Organic Spaces and Intermixing Functions
Precedents Domain
CIRCULATION SYSTEMS
Circulation Systems
Circulation Systems
Circulation Systems
Circulation Systems
PRIMARY CIRCULATION
Continuous system linking al major zones in building with entrance
High speed Lifts
Circulation Ramp
Rain Water Collection and Waste Recycling
SECONDARY CIRCULATION
Circulation between hyperzones
District Lifts
Rain Water Collection and Waste Recycling
TERCIARY CIRCULATION
Circulation with each zone
Local Lifts
QUARTERNARY CIRCULATION
Systems for interfloor circulation Ramps and travellators
Rain Water Collection and Waste Recycling
Partially Applied Double Facade
Partially Applied Double Facade
Partially Applied Double Facade
Partially Applied Double Facade
Dancing Tower Zaha Hadid
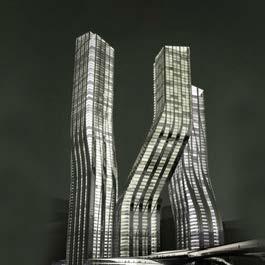
Vertical Landscaping
Vertical Landscaping
Rain Water Collection and Waste Recycling Vertical Landscaping
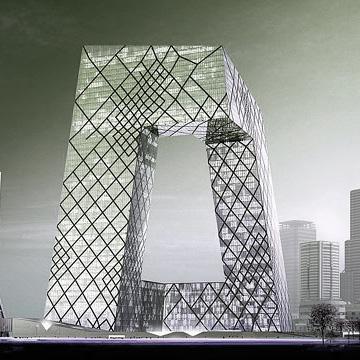
CCTV Tower OMA
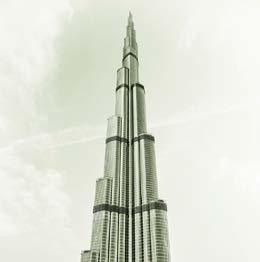
Burj Khalifa SOM
Vertical Landscaping
SOURCE. Yeang, Ken, Ivor Richards, and The Images Publishing Group. 2013. Eco Skyscrapers, Volume 2 / Ken Yeang ; [Edited by Lucy Bullivant]. Mulgrave, Vic. : Images Publishing, 2011. “Dancing Towers by Zaha Hadid | Yanko Design.” n.d. Accessed December 30, 2018. http://www.yankodesign. com/2007/04/19/dancing-towers-by-zaha-hadid/. siteadmin. 2015. “CCTV HEADQUARTERS.” High Quality Customised Private and Small Group Tours | U China Travel (blog). August 6, 2015. https://www.uchinatravel.com/2015/08/06/cctv-headquarters/. “DSC_0105.Jpg (1064×2048).”https://allthingscruise.com/wp-content/uploads/DSC_0105.jpg. Burj Khalifa Tower
63
2.6.2 SUBSYSTEM 02: CIRCULATION SYSTEM
Burj Khalifa is located in front of an artificial lake and surrounded by green areas. The concept of the project takes as a reference to a flower called Hymenocallis, a local flower which harmonious shape establish the structural logic of the building.
The main functions are divided into three Y shaped plan, and it provides the central entrance nodes for distinct uses such as hotel residences and offices.
The structural system is created by a central “buttressed core” that decreases in the higher levels. In addition, the core is tied together to the mechanical floor through outrigger walls to maximise the building stiffness. There is a spiral staircase that surrounds the building to resist the strong sandstorms of Dubai. The tower’s performance is significantly influenced by wind forces and shape, and orientation strategies allow better performance for the building in the worst case scenarios.
The buildings geometry connects the users directly with its natural surroundings, and the interior programming is split into public and private spaces without the need of avoiding flexible circulation and access to the different areas. Thus, Burj Khalifa offers more significant distribution for social spaces.
Due to the height throughout the building and the temperature differences from inside and outside, it is applied passive control systems to enhance natural ventilation based on stack effect principles.
SOURCE. “Burj Khalifa - The Skyscraper Center.” n.d. http://www.skyscrapercenter.com/building/burj-khalifa/3. “Burj Khalifa.” 2018. Wikipedia. https://en.wikipedia.org/w/index.php?title=Burj_Khalifa&oldid=875993083.
64 Case Study Domain
core: concrete 30 m2
PROJECT HEIGHT STRUCTURE BURJ KHALIFA SOM Dubai, UNITED ARAB EMIRATES 828m / 163 Floors 2008
2.6.2.2 BURJ KHALIFA
https://www.slideshare.net/safaamohammed5496/burjkhalifa-48217403.
65 Case Study Domain
SOURCE. Safa Aboelssaad. 08:44:13 UTC. “Burj Khalifa.” Engineering.
PLAN TYPE
CORE DESIGN
Upper Plan Middle Plan wind direction Lower Plan Tail Tail Nose Nose / Cutwater
Residences Offices
Disorganized Vortex Shedding Behaviour Triangular shape deflect wind to different ways and reduce vortex effect
Hotel Service Elevator Service Lifts
2.6.3 SUBSYSTEM 03: FACADE SYSTEM
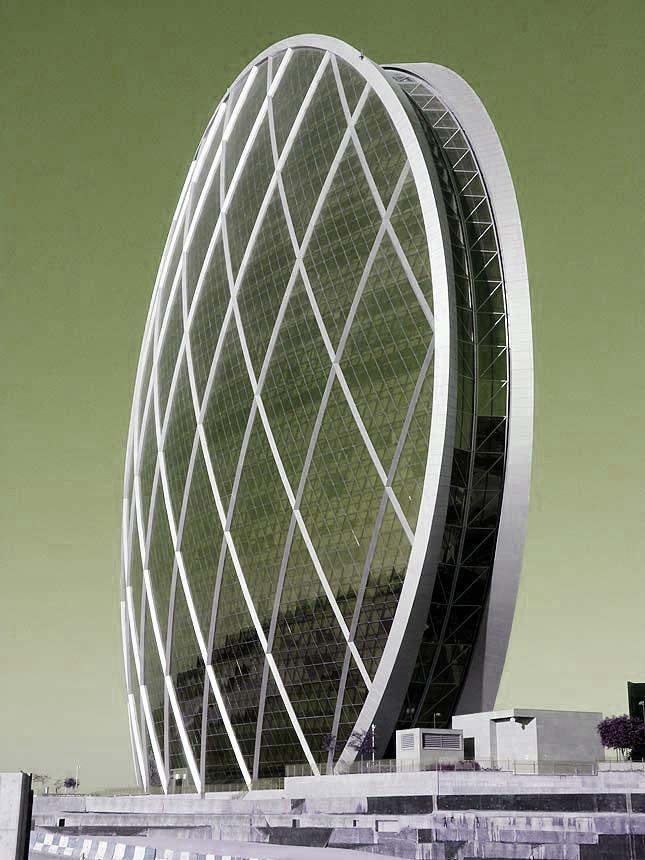
Facades play a vital role in the design and structure of a tower. The facade is a crucial element that affects directly to the indoor spaces while creates a direct impact from the exterior. The design of a facade must address different elements such as ventilation, views, user comfort, and its self-weight to the structure. It is an element with direct relation to develop, use, structure and building services.
First, the facade design requires a process that can be redefined by specific phases like the initial conception, functionality, fabrication, and maintenance. Also, external factors such as wind, light or rainfall are taken into account during the facade construction, and for instance, roof element performance might be included as the same envelope function.
Second, a layered construction method is recommended with targeted drainage edges.
Third, assembly would better be executed from bottom to top to ensure proper sealing.
Finally, the materiality of the facades and classification based on the openings is a fundamental basis for enhancing responsive systems depending on the contexts.
SOURCE. “Burj Khalifa - The Skyscraper Center.” n.d. http://www.skyscrapercenter.com/building/burj-khalifa/3.
“Burj Khalifa.” 2018. Wikipedia. https://en.wikipedia.org/w/index.php?title=Burj_Khalifa&oldid=875993083.
“Aldar Headquarters Round Building - Al Raha Gardens.” n.d. http://www.weltrekordreise.ch/bilder%20 ae/208-P1040511.jpg.
66 Precedents Domain
SUBSYSTEM 03: FACADE SYSTEM
One of the strategies is to integrate bioclimatic principles in the architecture by the use of a double facade system as the envelope for the buildings. The system consists of two layers of enclosure, with an air corridor in between. The aim is to gain the benefit of environmental parameters such as wind or solar radiation to provide natural ventilation or thermal insulation. This passive design strategy uses least extensive mechanical systems while providing higher indoor comfort levels than other facade systems such as single skin facade. Moreover, several types of double skin facade work differently from each other. The factors depend on the local or global performance of the facades and the kind of air circulation interaction from each layer of the skin.
SOURCE. “Double-Skin Façade System: Materials, Advantages & Examples | Study.Com.” https://study.com/academy/lesson/double-skin-fa-ade-system-materials-advantages-examples.html.
68
Cavity Exhaust air Indoor Thermal radiation & convection Absorptive glass Thermal convection Thermal radiation & convection Transmitted solar radiation Clear glass Reflected solar The heat transfer and air movement in DSF
DOUBLE SKIN
Precedents Domain
2.6.3.1
FACADE 2.6.3
Single Skin Facade (Standard Curtain Wall)
Double Skin Facade (Corridor Type)
SOURCE. “Double Skin Façade: The State of Art on Building Energy Efficiency.” 2016. ResearchGate. January 2016. https://www. researchgate.net/publication/274194137_Double_Skin_Facade_The_State_of_Art_on_Building_Energy_Efficiency. http://conniezhou.com/portfolio/2016/shanghaitower
69 Chapter Main Heading
Exhaust air Open system IN OUT Not open Facade types + basic components and airflow patterns Supply air Static air buffer External air curtain External air curtain
Double Skin Facade (Box-WIndow)
Double Skin Facade (Multi-Storey)
2.6.3
SUBSYSTEM 03: FACADE SYSTEM
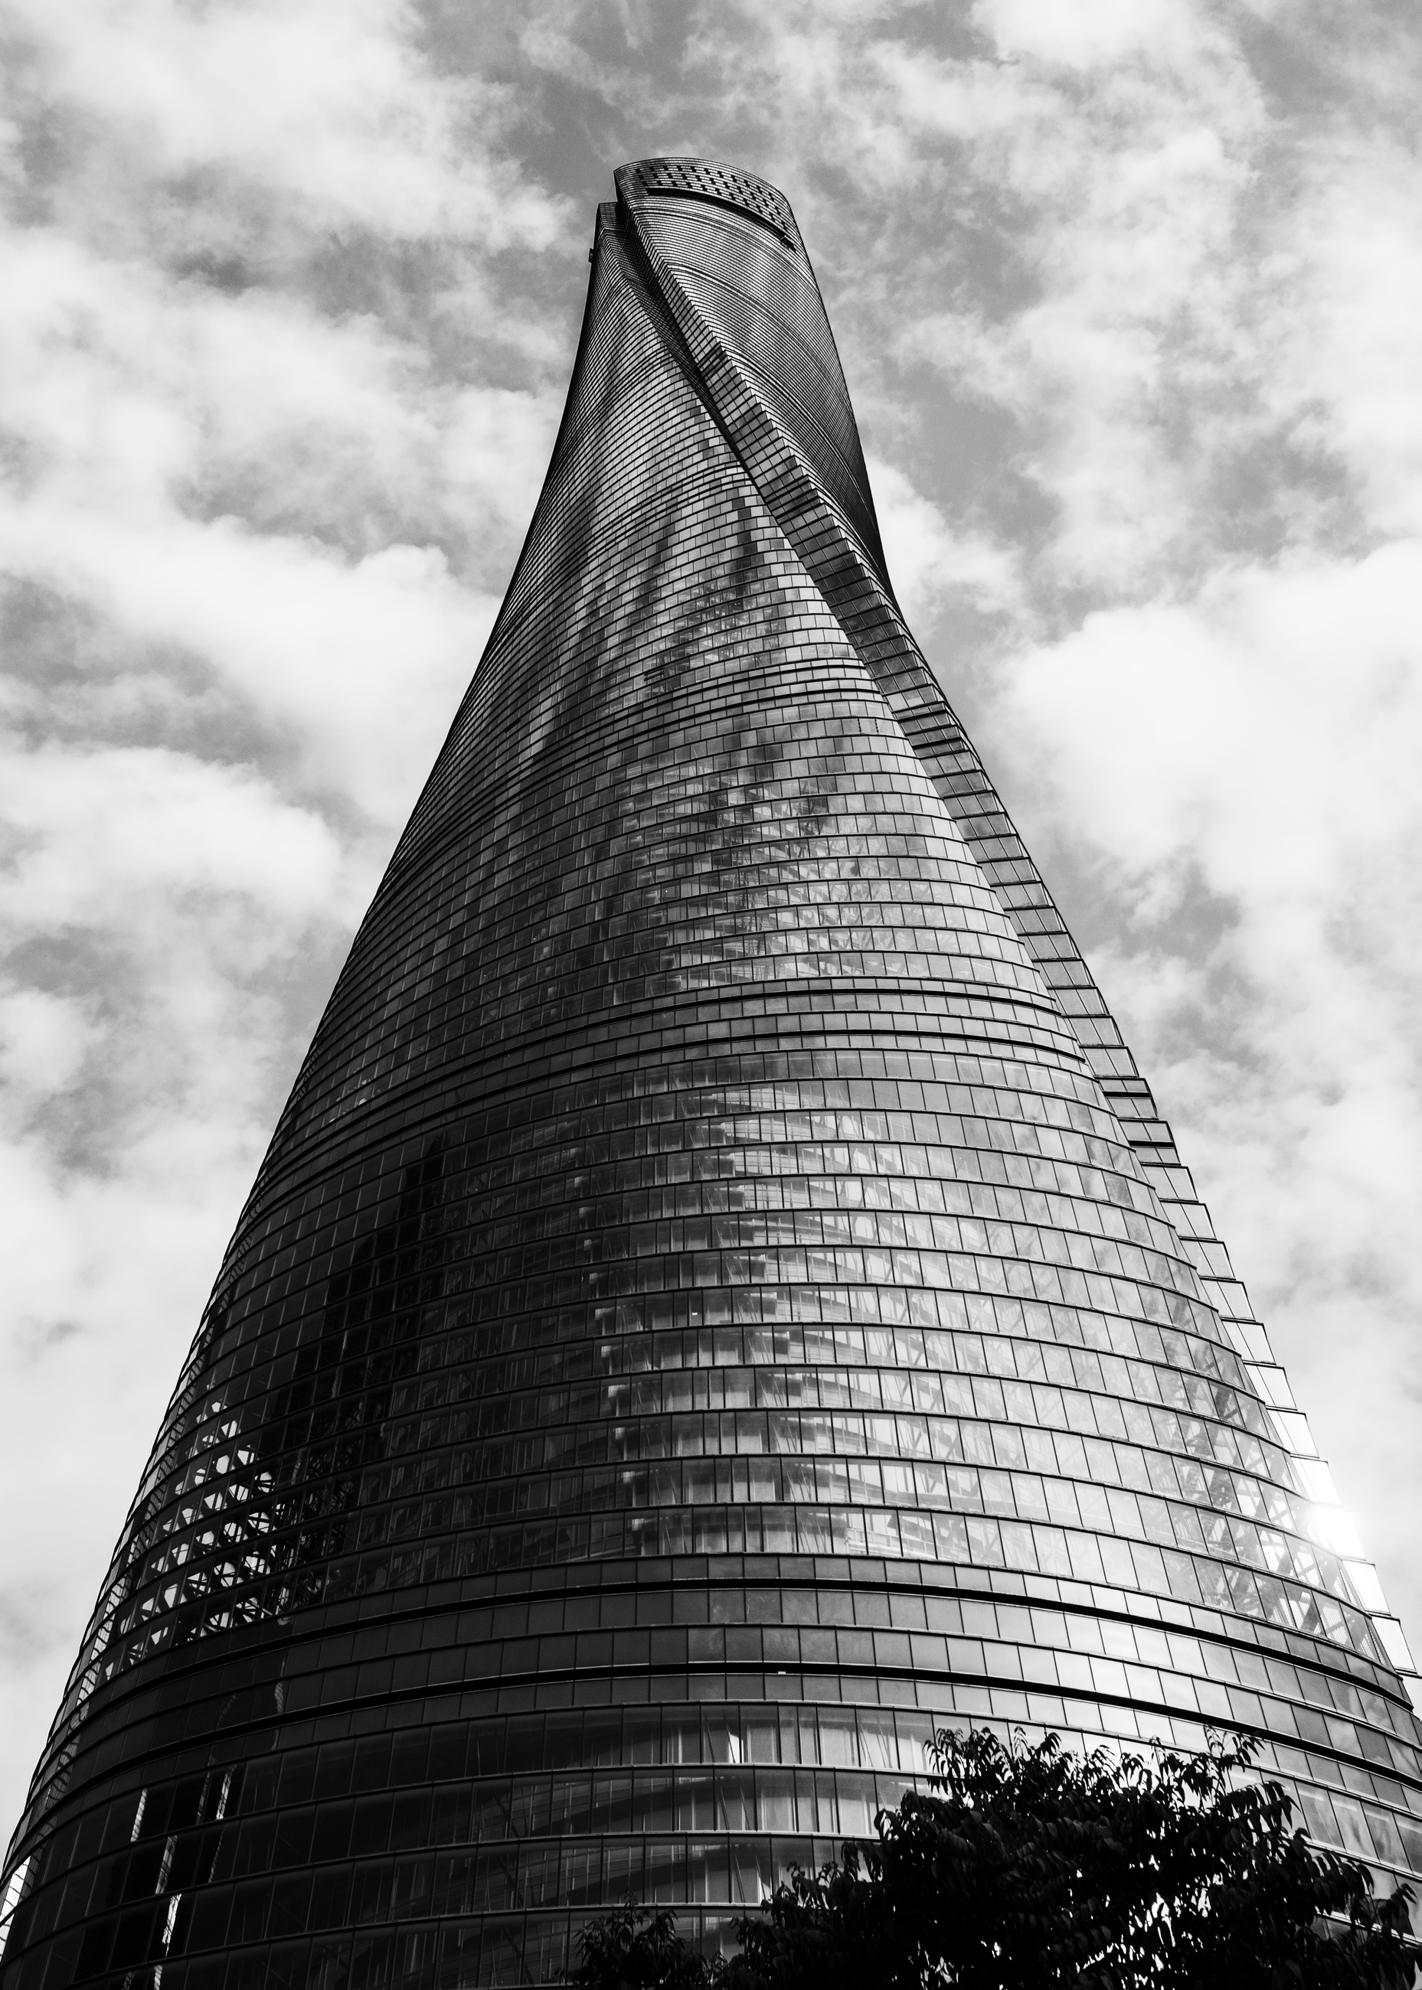
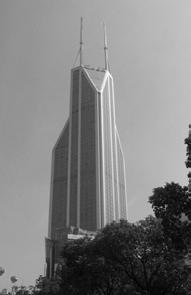
SHANGHAI TOWER GENSLER Shanghai, CHINA
2.6.3.2
Core: Reinforced concrete 30 m2
Columns: Concrete encased steel
Floor spanning: Steel
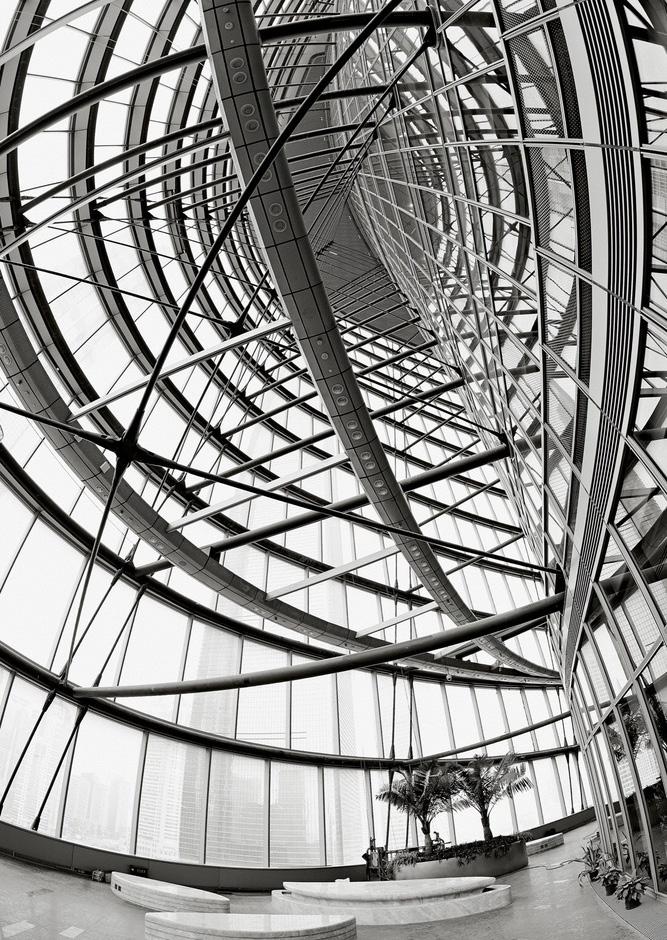
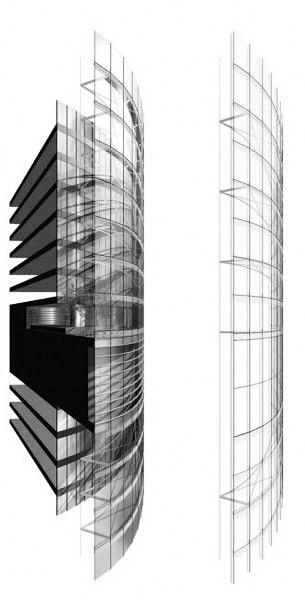
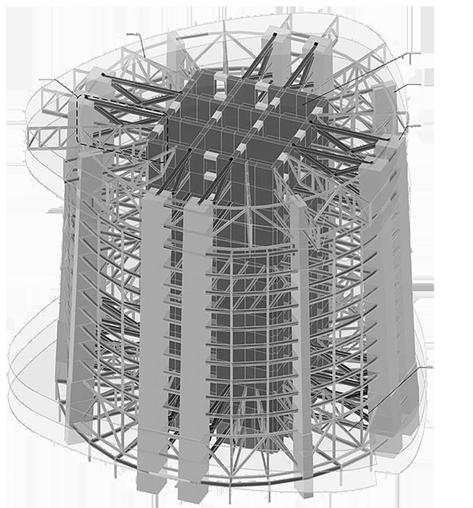
As a bioclimatic project reference, Shanghai Tower embodies numerous green architecture elements and sustainable practices. Firstly, the global morphology features twisting form that is calculated to conserve 24% of structural loadings compared to a rectangular footprint and of the same height. Secondly, the tower’s programme with a central core responds to mixed-use functions enclosing sky lobbies such as light-filled garden atriums in between each zone throughout the building. This kind of distribution provides vertical programming that enhance better social spaces for its users. However this “sky plazas” also play an essential role for allowing natural ventilation and regulate temperature through a double skin facade which actuates between the inside and outside warming up the cold external air in the winter and dissipates heat from the interior during the summer. Thirdly the tower includes ice storage air-conditioning and tri-generation system which consist of a greywater/rainwater collector system to preserve a recycling system as a part of tower’s life cycle.
SOURCE. “Shanghai Tower - The Skyscraper Center.” n.d. http://www.skyscrapercenter.com/building/shanghai-tower/56.
Zhaoa,
14: 1759–67. https://doi.org/10.1016/j.proeng.2011.07.221.
70
SHANGHAI TOWER
X., J.M. Ding, and H.H. Suna. 2011. “Structural Design of Shanghai Tower for Wind Loads.” Procedia Engineering
PROJECT HEIGHT STRUCTURE
632
Floors 2015
m / 128
Case Study Domain
Radical Trusses
SOURCE. “Double Skin Façade: The State of Art on Building Energy Efficiency.” 2016. ResearchGate. January 2016. https://www. researchgate.net/publication/274194137_Double_Skin_Facade_The_State_of_Art_on_Building_Energy_Efficiency. “Shanghai Tower Core.” n.d. https://i.pinimg.com/originals/25/21/69/25216983bc8adca90864578c70081b03.jpg.
71 Case Study Domain
Core-wall Diagonal column
Outrigger Trusses
Belt Trusses Super column
Shanghai Tower panel system
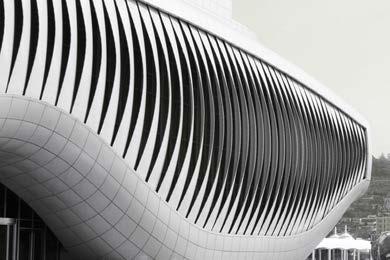
Over the past few decades, Kinetic Facades had emerged in response to the environmental changes in order to meet the needs of buildings. The advantages comes from the dynamic elements that role the performance of the building facades. Most designers and architects aim to incorporate different strategies during manufacturing and assembly to take the natural sources such as daylight or thermal radiation as awareness aspects for enhancing the user comfort, decreasing the energy consumption and cost efficiency. One of the drawbacks of this system is the dependency on the post evaluation of their performance, and nowadays there are techniques to simulate responsiveness of the elements. One case study is Al Bahar tower in Abu Dabhi, with its “Mashrabiya” shading components, responds to the excessive exposure of the incidence sun angles over the year. It is actuated by folding kinetically by the sensor and mechanical actuation systems. However the active system is not a new invention, and it was implemented since the 1920s, but according to the energy conservation community (IEA-ECBCS- Annex 44 - Integrating Environmentally Responsive Elements in Buildings,2011) kinetic facades are put forward as a “necessary step towards further energy efficiency improvements in built environments.”
72
SOURCE. “Responsive Skins.” n.d. Responsive Skins. Accessed December 30, 2018. https://yazdanistudioresearch.wordpress. com/. Kamil Sharaidin. 2014. “Kinetic Facades: Towards Design for Environmental Performance.”
Al Bahar Tower Aedas UK
One Ocean SOMA Institut du Monde Arabe Jean Nouvel
2.6.3
2.6.3.3 KINETIC FACADE
Precedents
Domain SUBSYSTEM 03: FACADE SYSTEM
http://www.ctbuh.org/TallBuildings/FeaturedTallBuildings/ FeaturedTallBuildingArchive2012/AlBaharTowersAbuDhabi/tabid/3845/language/en-GB/Default.aspx.
Karanouh, Abdulmajid, and Ethan Kerber. 2015. “Innovations in Dynamic Architecture.” Journal of Facade Design and Engineering 3 (2): 185–221. https://doi.org/10.3233/FDE-150040.
73
Precedents Domain
SOURCE. Peter Oborn with Edwin Heathcote, Edward Denison and Eric Ormsby. 2013. Al Bahr Towers : The Abu Dhabi Investment Council Headquarters. Chichester : Wiley,. “Al Bahar Towers, Abu Dhabi.”
04 03 02 01 13 10 14 15 12 11 06 01+05 07 08
+ Power & Control Cable Connection
Sleeve; penetrates the Curtain Wall & connect to Main Structure
Cantilever Struts 04 Star Pin-Connection 05 Actuator Casing 06 Y Structure Ring Hub
Structure Sleeves 08 Y Structure Arms 09 Y Node Pin Connection 10 Y Mobile Tripod
Head Pin Connection
Stabiliser
Slider
Mesh Frame & Sub Frame
Mesh
Fig. The Al-Bahr Towers curtain-wall and honeycomb structure were defined by the linking of nodes generated from the intersection of tangential circles and the extrusion of the underlying radial grid.
01 Actuator
02 Strut
03 Supporting
07 Y
11 Actuator
12
13
14 Fabric
15 Fabric
2.7 ARCHITECTURAL PRECEDENTS
2.7.1
BIOCLIMATIC DESIGN
Many examples of traditional architecture use bioclimatic principles as a sustainable design approach that attempts to enhance building comfort while reducing energy consumption and gaining the benefit of local natural resources. Therefore, most new buildings design are aware of climate and environment conditions. Architectural elements take part in this process of design and they are adapted according to the context where responsive control systems aid to enhance natural ventilation and daylight without extra artifial energy demand.
The basis for a sustainable design requires the passive systems application to control indoor microclimate needs and the energy demand.
Some architects take from natural behaviours and patterns that benefits design and adapt the theory into practice. One example occurs in Harare, Zimbabwe where a mid-rise building takes from termite behaviour the capacity of cooling naturally without air conditioning support.
But there are more techniques that for instance in Malaysia also are key elements, such as passive solar heat protection to reduce as the minimum the heat gain or natural daylight system which ensures internal lighting needs with reduced artificial lighting and creates more visual comfort.
Due to a subtropical climate in Shanghai, different strategies have been executed in high rise building to cope with extreme temperatures and also relative humidity. One example occurs in Shanghai Tower which stack effect enhance the movement of air for providing better indoor microclimate.
74
SOURCE. “USGBC+ | Bioclimatic Design.” http://plus.usgbc.org/bioclimatic-design/.
Precedents Domain
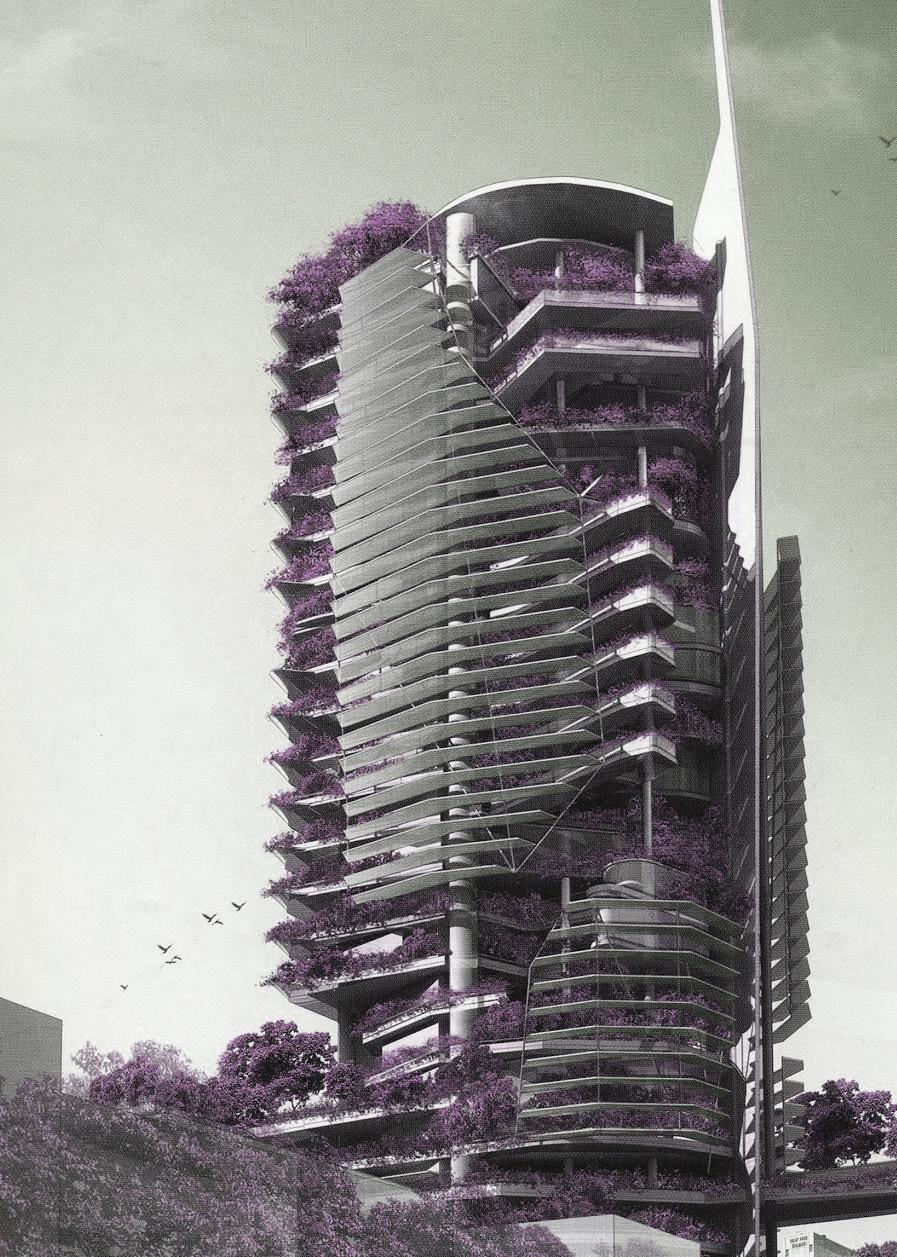
KEN YEANG AND BIOCLIMATIC ARCHITECTURE
Ken Yeang was born in Malaysia and he is an architect and well known for his ecological implication for sustainable architectural design and eco masterplans.

Regarding his theory and practical experience, it is indispensable to understand the formal basis for a biointegration of humanmade with nature, creating hybrid systems named “constructed ecosystems”
Ecosystems balance the energy and material sources without substantial loss of nutrients, and humans are part of that equilibrium.
Furthermore, it is essential for the opportunities to create wider variety of skyscrapers and extract from them responsive systems that interact in the site and enhance better conditions for its inhabitants. Some of the steps for an architectural ecodesign device the integration of eco cells which is translated to incisions to the global form, allowing lowest levels direct connection to the outside. In addition, Ken Yeang implemented a vertical integration of vegetation and natural resources catchments, such as rainwater or daylight control depending on different site demands.
In conclusion, reflection of Ken Yeang’s practices guides the framework of designing a system’s logic with ecological linkages. Human-made decisions provide a balance between biotic and abiotic components during the whole process.
http://www.hamzahyeang.com/
https://www.youtube.com/watch?time_ continue=1&v=H1P1kkcEzWM.
EARLST2007. n.d.
76
2.7.2
SOURCE. “T. R. Hamzah and Yeang Sdn Bhd|Ecoarchitecture| Ecomasterplanners| Green Design|Ecoinfrastructure|Eco Masterplanning and Eco Architecture Malaysia | Eco Architects | Eco Infrastructure.”
echo-architects-malaysia-projects/.
An Interview with Architect Ken Yeang, on CNN’s ’Just Imagin
Hart, Sara, and David Littlefield. 2011. Eco architecture: the work of Ken Yeang. Chichester, West Sussex: Wiley.
Ken Yeang Solaris Science Center, Singapore Roof as a green element
Case Study Domain
“In my heart I believe that biology is the beginning and the end of everything. Its the biggest source of ideas, the biggest source of invention. Nobody can invent better than nature....” K.Y.
©Editt Tower Singapore. Ecoarchitecture
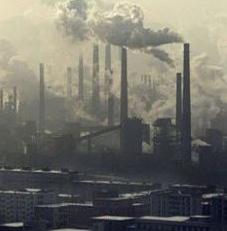
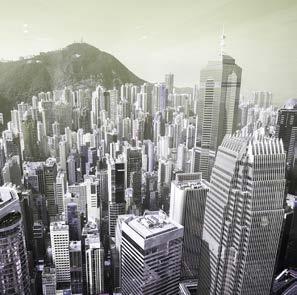
In the coming decades, food security will be a major issue affecting the most populated cities. As resources continue to dwindle, current agricultural techniques will not be sufficient for the growing demand in food production.
Urban tissues are at a constant flux, and towers are compact systems that provide a possible additional area to host vegetation, to enable provision of better living conditions in the densest cities with limited area.
On the other hand, there are two main factors causing environmental impacts. First is the construction pollution due to a rapid urbanization. Second is the high loss of arable land caused by the former. Thus, new developing systems are necessary for decreasing environmental damages and reversing the climate impact, while ensuring methods of preservation of the environment.
As the diagram shows, there are three parts that connect problems and solutions. The second part defines the main problem for a specific location such as Shanghai and the current issues that are involved for food security problem. The aim is to answer how a bioclimatic design can be applied for existing buildings and subsequently for future high-rise building construction systems.
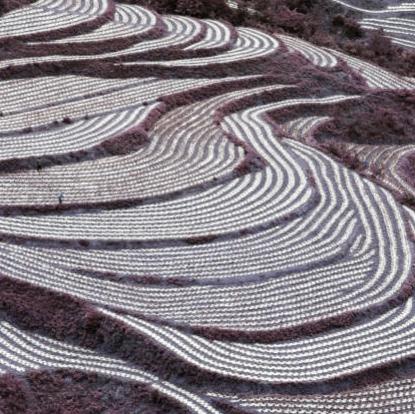
SOURCE. Lin, C. h. 2012. “Est100 一一一一(Some Photos): Tobacco Field , Maze , Wuning County, in Southwest China’s Guizhou Province . 一一一 一一.” Est100 一一一一(Some Photos) (blog). June 1, 2012. https://okok1111111111.blogspot.com/2012/06/ tobacco-field-maze-wuning-county-in.html.
“Polluted-Chinese-City_opt1.Jpg (500×312).” https://www.borgenmagazine.com/wp-content/uploads/2013/11/pollutedchinese-city_opt1.jpg.
“Anyone Got a Light? Incredible Photos Taken from the Air Show China’s Sprawling Maze of Tobacco Fields.” 2001. GhanaNation.Com (blog). November 30, 2001. https://www.ghanagrio.com/articles/uk/19210-anyone-got-a-lightincredible-photos-taken-from-the-air-show-china-s-sprawling-maze-of-tobacco-fields.html.
78 Conclusions Domain
Crop fields , China
Hong Konk City
Polluted Cities
2.8 CONCLUSION
ATTACHABLE FACADE FOR EXISTING TOWERS BIOCLIMATIC
79 Chapter Main Heading
(M.Sc. Ambition) (M.Arch. Ambition) FOOD SECURITY SHANGHAI High Humidity Natural Ventilation Inefficiencies Rapid Urbanization Rapid Population Increase Towers BIOCLIMATIC DESIGN Loss of arable lands Vertical Farming
PROBLEM SOLUTION
TOWER DESIGN LOCATION
RESEARCH QUESTION
Can we devise a bioclimatic tower design which can continuously adapt to its external and internal governing parameters to achieve better living conditions while providing a suitable environment for food production under subtropical climate conditions?
3. design methodology
3.1 METHODOLOGY OVERVIEW
MSc Phase
FACADE SYSTEM DESIGN
Computational
Fluid Dynamic
Multi-Objective Generative Algorithm
-Octopus
MArchPhase
TOWER SYSTEM DESGIN
Finite Element Analysis
Karamba
Environmental Analysis
Ladybug+ Honeybee
MAch Phase
ANALYSIS & EVALUATION
Computational
Fluid Dynamic
Overview Methodology
Finite Element Analysis
Karamba
Multi-Objective Generative Algorithm
-Octopus
FORM FINDING GENETIC ALGORITHM
3.1.1 COMPUTATIONAL DESIGN STRATEGY
Multi-objective Genetic Algorithm is a flexible tool for define the geometry and program form finding while several conflictive design objectives are involved. Iterative performative designs generate numerous solutions in the project that we aim to analyze and evaluate.
COMPUTATIONAL FLUID DYNAMIC
This method formed the system logic of the project. High-rise buildings demands an efficient performance while they withstand lateral loads, mainly the wind forces. In order to have a fluid flow imitation simulated for real cases it was need run different experiments for improve the natural ventilation in indoor spaces and calibrate surface pressures on the leeward and windward sides of the project.
In the facade system design it was set local experiments for panels attached to existing facades and in the tower system design was focus on the relation between panels and indoor distribution.
86 Strategy Methodology
FINITE ELEMENT ANALYSIS
This tool is based on the structural performance constraints for a developing structural system in high-rise buildings. The objective for this tool is the calibration between global and local structural elements of the building through a geometry, environment and aerodynamic restrictions in design experiments.
ENVIRONMENTAL ANALYSIS LADYBUG | HONEYBEE
This method define the program distribution, spaces quality for mixed used and simulate dynamically environmental factor that affect the global and local design system in different contexts.
COMPUTATIONAL CONTROL SYSTEM | ARDUINO
A system based on sensory tools and computational rulemechanism system. The tool involve kinetic control of the material for simultaneous instant needs for indoor spaces qualities to humans and plants.
87 Chapter Main Heading
4. facade system design
DESIGN AMBITION
To respond to the rapid growth of urban population, this research aims to adapt high-density structures to small ecosystems while providing products and comfort level for its users.
Natural Ventilation Inefficiencies Reduce Humidity
VERTICAL FARMING ON TOWERS
Additional exerted load to structure
Climatic Control for Plants
Improve cross ventilation
Larger Pressure Difference on different facades
Control of air velocity
Increasing Structural efficiency
Distributed Wind Load
Variation in crop requirements
Control of air intake volume
Adjustable Buffer Zone Depth
4.1 PROBLEMS & SOLUTIONS PROBLEM SOLUTION
Variation of Panel Sizes
Adjustable Rotation of ventilation gates
92 Chapter Main Heading
Problems&Solutions Façade System
Water Demand Energy Demand for artificial lighting (LED) Harvesting
Control of direct sunlight hours Extract water by condensation Collect solar power
Self shading panels by extrusion Integrated condensation system
BIOCLIMATIC PANEL DESIGN
Photovoltaic materials Integrated conveyor system
93 Chapter Main Heading
Problems&Solutions Façade System
4.2 RESEARCH DEVELOPMENT
4.2.1
BERNOULLI- VENTURI PRINCIPLES
Bernoulli’s principle is closely related to stack effect. Both systems respond to air circulation flow, but Bernoulli’s principle is affected by pressure differences while stack effect uses temperature differences.
Both strategies consist of the cooling air circulation ascends from the low inlet apertures and hotter exhaust air escapes through large outlet cavities. The ventilation percentage is proportional to the area of the gaps and the exit velocity of the atmosphere the interior space.
However, it is a difficult process to incorporate in a humid context, as air density and air pressure factors involved. The more the moisture content is in the air the less dense the air can become. This makes hot air rise because of lower pressure and not temperature. Thus, this condition applies to a high rise building, and the aim should be to implement air circulation from exterior to interior throughout the height of the building.
94 Research Development Façade System
SOURCE. “Density of Moist Humid Air.” n.d. https://www.engineeringtoolbox.com/density-air-d_680.html. “File:Air Density vs Temperature.Svg.” n.d. Wikipedia. https://en.wikipedia.org/wiki/File:Air_density_vs_temperature.svg.
Air density vs. temperature 1.40 -20 -10 Density [kg/m3] 1.35 1.30 1.25 1.20 1.15 0 10 20 30 Temperature [ C ] 0 Moist Air Density Density Ratio 1.2 1 0.8 0.6 0 20 40 60 80 100 Temperature oC 20 0 Relative Humidity % Ref. Density Ratio=1 Temperature=20oC Relative Humidity=0% 80 100 60 40
SOURCE. “How to Heat and Cool a Supertall.” 2015. ÜBERWELL™ (blog). November 11, 2015. http://uber-well.com/how-to-heatand-cool-a-supertall/. “Bernoulli’s Equation.” n.d. https://www.princeton.edu/~asmits/Bicycle_web/Bernoulli.html.


95 Research Development Façade System
ρ1v1
ρ2v2 v1 Δt CV x R x v2 Δt
A1 P1
A2 P2
Stack effect in Shanghai Tower
4.2.2 COANDA EFFECT
This principle of Henri Coanda allows a better understanding between pressure effect its practical application. It is explained in an aerospace engineering as follows: “The tendency of a jet of fluid emerging from an orifice to follow an adjacent flat or curved surface and to entrain fluid from the surrounding so that a region of lower pressure develops.”
Nevertheless, this phenomenon may occur along a curved wall either in a free jet or a wall jet. Experiments show the pressures allocation along with a circular curve wall and the application it is how the velocity gradient in the shear flow in the boundary layer. In the velocity gradient, particles are blown away from the surface, thus lowering the pressure in the bottom surfaces.
96 Research Development Façade System
SOURCE. “Coandă Effect.” 2018. Wikipedia. https://en.wikipedia.org/w/index.php?title=Coand%C4%83_effect&oldid=871955756.
1_ A jet of air entrains air molecules from its immediate surroundings causing a fall in air pressure surrounding the jet.
2_ If a (flat) surface is placed close and parallel to the jet, the molecules of air removed from between the jet and the surface cannot readily be replaced by ambient air molecules. The resultant deficit of air between the jet and the surface results in a greater lowering of air pressure on that side of the ject than on the other.
3_ The difference in air pressure on the two sides of the jet, causes the jet to curve towards the surface, and then to cling to it.
4_ Even if the surface is curved as shown in the diagram, the jet will cling to that surface, because any molecules of ambient air that move into the space between the jet and the surface are swept away by entrainment by the jet..
5_ The jet is particularly likely to be bent towards the surface, and then cling to it, if a step (of the right height) is introduced just below the jet at the beginning of the surface. A low pressure vortex develops behind the step accentuating the initial difference in pressure on either side of the jet.
97 Research Development Façade System Ambient pressure ENTRAINMENT ENTRAINMENT NET FORCE ON JET COANDA EFFECT Ambient pressure Ambient pressure Ambient pressure Ambient pressure Ambient pressure 1 2 3 4 5 LowpressureArea created Low pressure Wide Surface Low pressure Area created Low pressure Vortex
4.2.3 AEROPONICS SYSTEM
Among the variety of agricultural systems, aeroponics is the most efficient way of vertical farming. It was developed in the 1990s by the National Aeronautical and Space Administration (NASA), and it was looking for a suitable technique to grow plants in space. Nowadays commercial leaders try to use this technique that ensures predictable results of harvest with less impact on the environment and a decrease of energy. The advantage of this system is that it doesn’t require soil soil, and the amount of water is minimal, reaching 90% less than conventional watering systems. However, the cost of this system is expensive, and the technology is relative new and successful precedents are limited. The following diagram shows how an aeroponic system works. Plants are suspended in neoprene discs with their roots suspended in the air over a tank filled with a nutrient solution. As a result, plants can absorb better oxygen and nutrients, thus developing quicker. Aerofarm, a precedence in New Jersey produces more than two million pounds of greens annually. Furthermore, it is ideal to accommodate as many plants as possible in smaller areas to enhance the production in a short time.
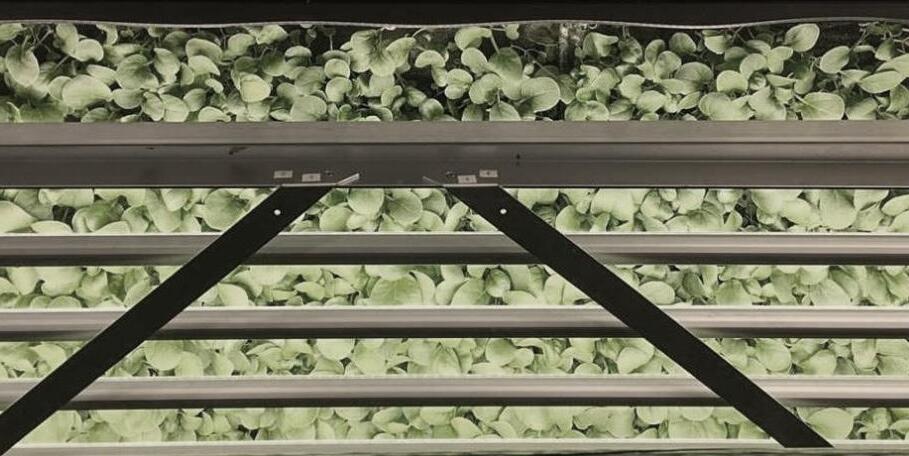
Research Development Façade System
SOURCE. “Aeroponics.” 2018. Wikipedia. https://en.wikipedia.org/w/index.php?title=Aeroponics&oldid=869011534. “AeroFarms Technology.” n.d. AeroFarms (blog). Accessed December 30, 2018. https://aerofarms.com/technology/.
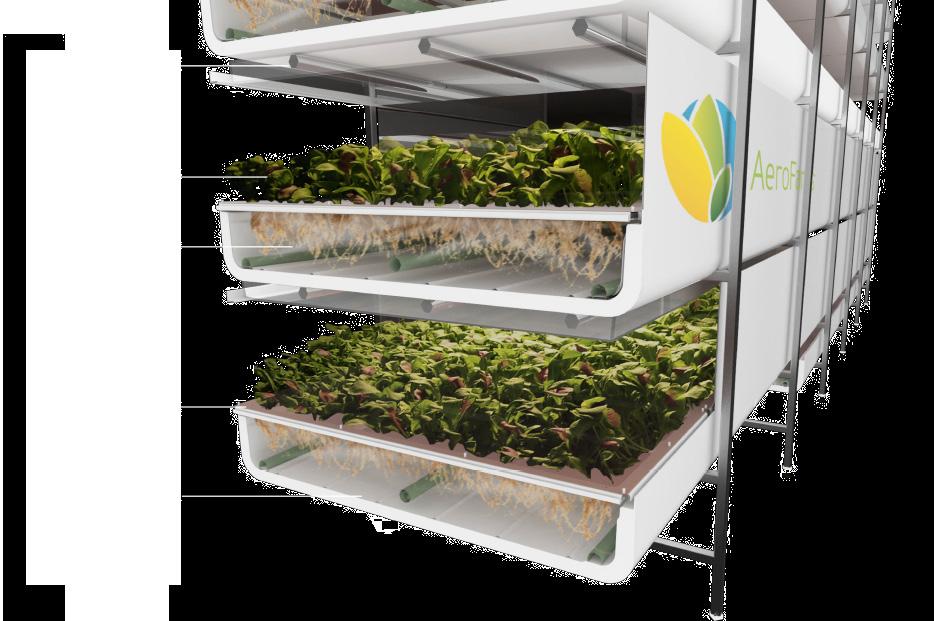
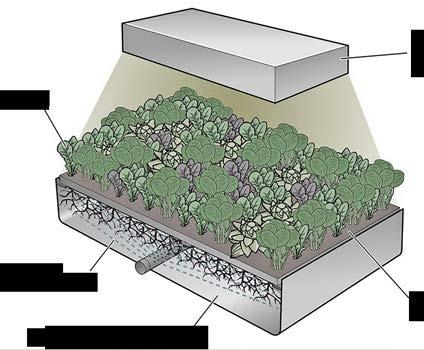
99 LED LIGHTING LEAFY GREENS AEROPONIC MIST CLOTH MEDIUM SOLUTION CHAMBER % OC Pump
reservoir Spray jet mist nozzle Gravity Drain
Nutrient
Research Development Façade System
4.3 COMPONENT DEVELOPMENT
Megacities have become consumption center with the rapid growth of population and its demands. However, there is a huge potential for food production capacity in the cities.
Unfortunately, since cities are mainly focused on industrial production, food is generally imported from a great distance which results in extra cost of transportation and other economic spendings.
The aim of the project is to turn high density cities into a centre of food production. In order to achieve this ambition, a responsive secondary facade which provides suitable environment for plant growth is designed.
That facade will not only provide microclimate for plant growth, but also increase the cross ventilation in order to improve the living conditions inside of the building.
Initially aerodynamic principles ,such as coanda effect ,for air ventilation and structural principles of towers are investigated. Subsequently, acquired information formulates design experiments.
During design phase, various computational techniques and post analysis tools are used, which will be detailed in further chapters.
100
Component Development Façade System
101
4.4 STRUCTURAL STRATEGY
4.4.1 STANDARD TOWER EXPERIMENT SET-UP
H = 450 m
STRUCTURE: EXTERIOR DIAGONALIZED TUBE [STEEL]
FLOOR LEVEL: 4.5 m [100 STORIES]
Initially, a standard tower with a height of 450 meter was proposed with a default gross floor area set as 2500 square meters (50m x 50m).
As the number of floors and structural heights increase, structural solutions must respond to a behaviour typically controlled by lateral wind loads. Due to lateral wind loads increasing with height, diagonalized tube system is selected as the structural system.
The diagonalized tube system is a structural system that is used in high-rise buildings, enabling them to resist lateral loads from wind and seismic pressures. The exterior frame design must be sufficiently strong to resist all lateral loads on the building, thereby allowing the interior of the building to be simply framed for gravity loads which results with a fewer interior columns located at the core.
The tube system can be constructed by using concrete, steel or a composite of both. When Mark Sarkasian’s Tower Structural Classification chart is considered, steel is preferred as a structural material.
102
Component Development Façade System
Structural System - Designing Buildings Wiki.” n.d. Accessed January 7, 2019. https:// www.designingbuildings.co.uk/wiki/Tube_structural_system?fbclid=IwAR2thGf7ptuajgy-cBnz-ika
SOURCE. “Tube
xYmLZ8ZJ99WDgk8Jv33MZCk4nFYPvnUN1ik.
EXTERIOR DIAGONAL TUBE [STEEL]
FLOOR LEVEL: 4.5 m [100 STORIES]
COLUMN SPACING: 4.5 m (wide flanged section)
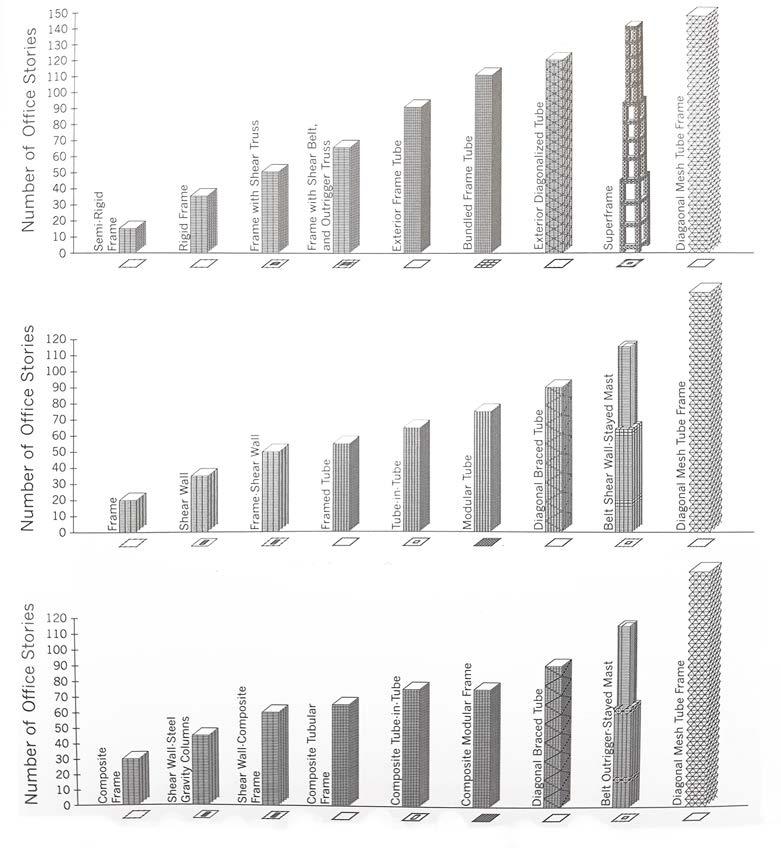
W E N S H = 450 m Number Stories STEEL SYSTEM
50m 50m Diagrid Forces Flow Gravity Load Wind Load Component Development Façade System
4.4.1 STANDARD TOWER EXPERIMENT SET-UP
4.4.1.1 WIND BEHAVIOUR

Wind is a phenomenon of great complexity due to the multiple flow situations arising from its interaction with various structures. Wind pressure on the surface is affected by the characteristics of approaching winds and the geometry of the structure. The pressure is not steady but highly fluctuating, partly as a result of local vortex shedding at the edges of the structure. The pressure is also not distributed over the surface of the structure in a homogeneous manner; they vary with position.
While analyzing the pressure distribution on the selected tower geometry, a CFD simulation has been run in a 3D environment. The maximum wind velocity recorded in Shanghai within the last 100 years was taken into consideration with an increasing wind speed according to wind profile. (The wind speed of 30m/s in 10-meter height)
104 PRESSURE + High Low PRESSURE -
WHIRL WAKE AREA
STANDING
Component Development Façade System
SOURCE. Mendis, P, T Ngo, N Haritos, A Hira, B Samali, and J Cheung. n.d. “Wind Loading on Tall Buildings,” 14.
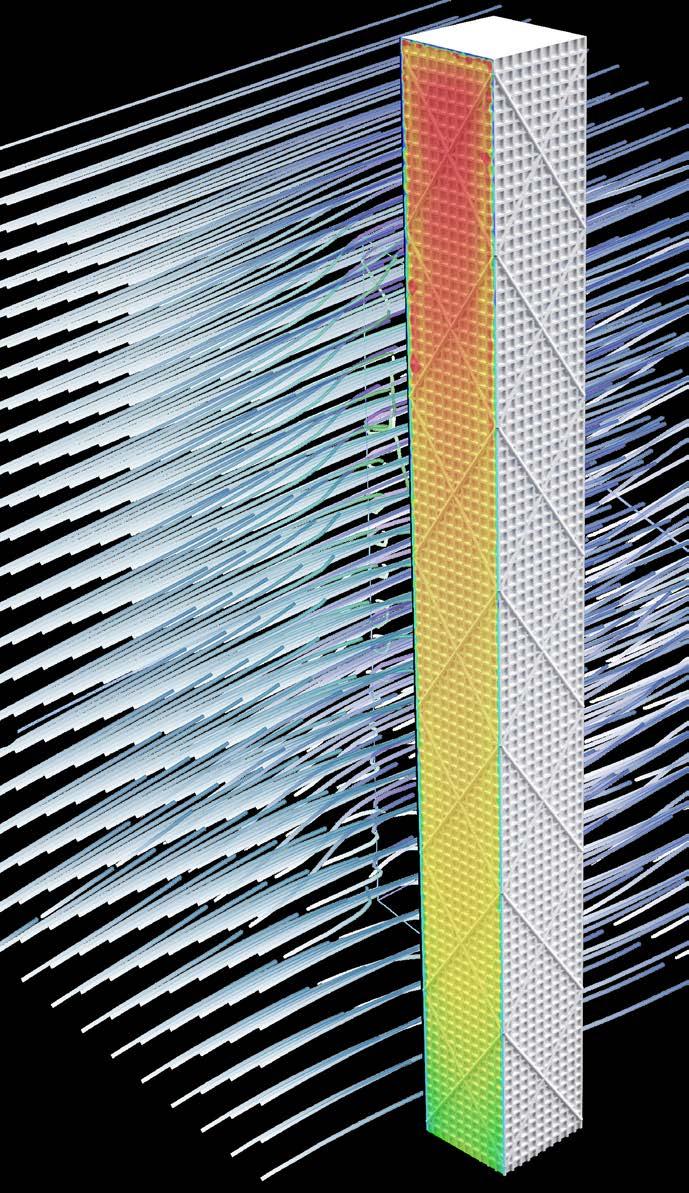


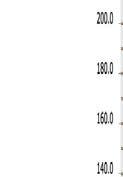
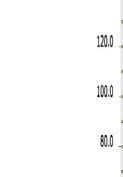

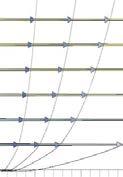
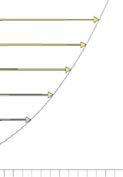

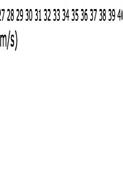


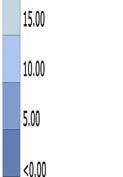

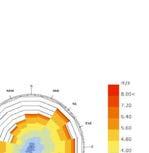
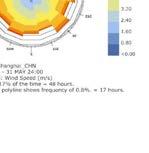
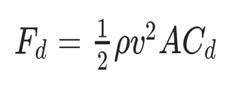
105 Static PressurePa 1217.91 1000 500 0 -500 -817.551 <0.00 5.00 10.00 15.00 20.00 25.00 30.00 35.00 40.00 45.00 50.00< m/s Wind Load Formula m/s 0 5 15 30 50 0 100 200 300 400 500 m Height (m) Speed (m/s) Component Development Façade System
4.4.1 STANDARD TOWER EXPERIMENT SET-UP
4.4.1.2
EXISTING STRUCTURE ANALYSIS
In order to measure the maximum deflection that happens on the structure, Finite Element Analysis has been run on the structure. The applied forces are gravity and wind loads. The wind load is calculated by taking the average wind speed and direction of the last 20 years, taken from Energy Plus Weather Data. Increasing wind speed according to wind profile is applied, as it varies between 30m/s (in 10 meter height above from the ground level) and 50 m/s (in 500 meter above from the ground level).
As previously mentioned, exterior diagonal tube structure combined with a wide flanged sectioned I beams are used. More precisely, as an I beam, HE 1000 x 494 type which has 1036 mm beam height, 309 mm Flange width with a 31 mm Web thickness is tested under the given load cases.
As shown on the diagram, the amount of deflection gradually increases as the height increases. The maximum deflection calculated is 66 centimetres under the given load conditions. Twist behaviour observed due to the unequal wind loads in different directions.
106
Component Development Façade System
EXTERIOR DIAGONAL TUBE [STEEL]

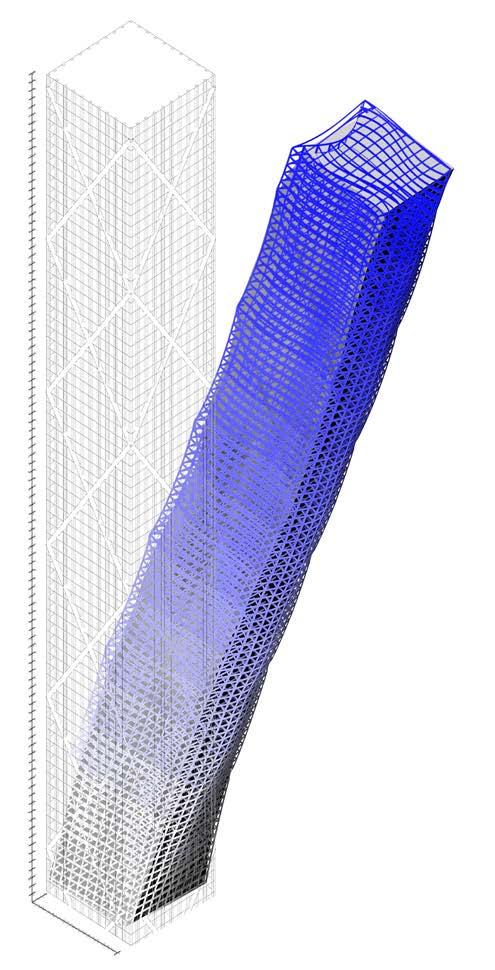
FLOOR LEVEL: 4.5 m [100 STORIES]
COLUMN SPACING: 4.5 m (wide flanged section)


107 Load Profile Increasing Displacement 6.6m m/s 0 0 100 200 300 400 500 30 50 m Existing Structure deformation factor 1:50
50m 50m Component
Development Façade System
4.4.1 STANDARD TOWER EXPERIMENT SET-UP

3.24m 2.63m
Quadrangular Structure

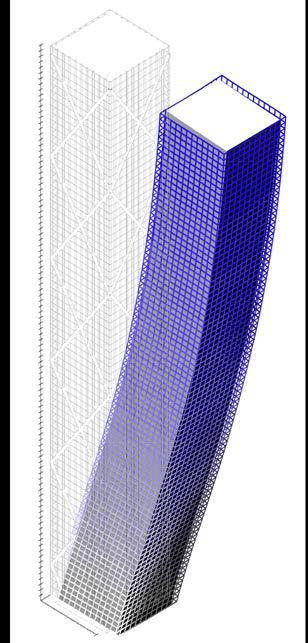
Max Displacement: 3.24 m
Total Length: 73,339 m
Max Displacement: 2.63 m
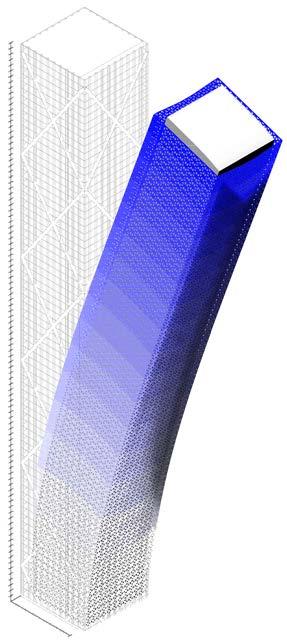
Total Length: 179,045 m
108 m
Hexagonal Structure Component Development Façade System
4.4.1.3
ADDITIONAL STRUCTURE ANALYSIS
2.33m
Triangular Structure
Max Displacement: 2.33 m
Total Length: 170,615 m
Scale deformation ratio 1:50
In order to design a structure for the secondary facade, FEA analysis was run on different structural patterns connected with the existing quadrangular structure combined with diagonal tube structure. For each experiment the same load cases are applied including gravity load and wind load.
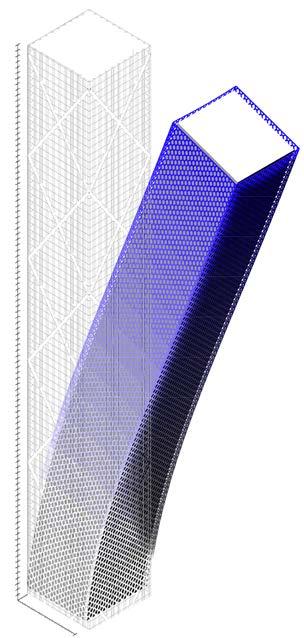
Quadrangular, Hexagonal and Triangular structural patterns are compared according to total material usage and maximum structural deflection.
It is observed that there is an inverse proportion between the material usage and the maximum displacement that occurs on the structure. Hexagonal and Triangular patterns require around 230% more material to be built while providing around 25 % less deflection.
OBSERVATION CONCLUSION
Although it is possible to observe an increase in displacement on the structure due to less material usage requirements, Quadrangular Structure has been selected as an additional structural pattern in existing tower structure in which the diagonal tube structure is combines with a wide flanged sectioned I beams.
109
Component Development Façade System
4.4.1.4 FACADE PRESSURE ANALYSIS
The pressure that occurs on the facade surface is calculated using computational fluid dynamic analysis tools. Wind speed is taken as 30m/s in 10-meter height above from the ground and increases up to 50 m/s as the height increases 500 meter above from ground level.
This experiment is conducted in order to observe how pressure varies according to height, which results in changing panel sizes used to build the secondary facade. It is observed that the absolute value of the minimum negative static pressure ( -817.5 Pa) is less than the maximum static pressure (1217.9 Pa). As a result, the value of static pressure that occurs on the windward facade is taken into account.
Since the wind load is related to the square of the wind velocity, the pressure at the upper portion of the surface is 5 times greater than the pressure on the lower portion of the surface.
Within the height range of 0 to 50-meter, Static Pressure is calculated to be around 200 Pa. From 50 meters up to 500 meters there is a gradual increase on the pressure which rises from 500 Pa to 1217 Pa.
110
Component Development Façade System
4.4.1 STANDARD TOWER EXPERIMENT SET-UP
111 Wind Pressure on Surface INPUTS Structure of Tower
Bracing- Steel Static PressurePa 1217.91 1000 500 0 -500 -817.551 Component Development Façade System
Cross
4.4.1 STANDARD TOWER EXPERIMENT SET-UP
4.4.1.5 PANELIZATION CRITERIA
Based on the information obtained from FEA analysis and CFD experiments, quadrangular structure is utilized as the structural patter, with an introduction of different panel sizes to respond to the varying pressure on the surface is determined by CFD experiments.
Panel sizes are linked with the structural patterns by setting a multi objective optimization which has the conflicting criteria of minimizing panel numbers, minimizing panel areas, minimizing deflection and equalizing distribution of pressure for each panel.
Since the structural pattern determines the panel sizes, decreasing panel number will result in a higher deflection. Experiment yielded gradual decrease in panel sizes as the height from the ground increases. As such, the criteria of minimizing panel areas and equalizing distribution of pressure is added to the optimization algorithm.
112
Component Development Façade System
CONFLICTING CRITERIAS
MINIMIZE PANEL NUMBERS
ITERATIONS
MINIMIZE PANEL AREAS
MINIMIZE DEFLECTION
EQUALIZE DISTRIBUTION OF PRESSURE
Iterations for panels subdivision

113
Component Development Façade System
4.4.1 STANDARD TOWER EXPERIMENT SET-UP
4.4.1.6 PANELIZATION POST ANALYSIS
OBSERVATION
Genetic Algorithm is run for 40 generations with an individual number of 20 in each generation. As a part of the algorithm, Finite Element Analysis is applied to each individual in order to obtain the maximum deflection amount occurred on structure.
In order to do that, existing quadrangular structure is combined with diagonal tube structure to keep fixed and additional facade structures with its connection beams from the structural nodes are tested together.
Within the 800 individuals, the most fit solution is determined by selecting the average fittest solution for all the conflicting criteria. Due to criteria being in conflict, it is important to note that the selected iteration do not necessarily perform best for any individual criterion alone, but the overall rank of the individual is considered.
It is observed that as the generation number increases, the displacement value increases, and the total necessary amount of material decreases, which are linked to other criteria such as minimizing the number of panel numbers and balancing distribution of pressure.
CONCLUSION
A comparison with the existing structure reveals a 66 cm maximum deflection value. Selected individual with a 53.1 centimetre is contributing to the overall stiffness of the structure against the lateral wind load and the gravity load. When compared with the standard quadrangular structural pattern, the distorted pattern uses 21% less material. Even though the maximum displacement value is 20 centimetres higher, the uneven grid provides more heterogeneously distributed static pressure for each panel.
114
Component Development Façade System
Max Displacement: 5.31 m
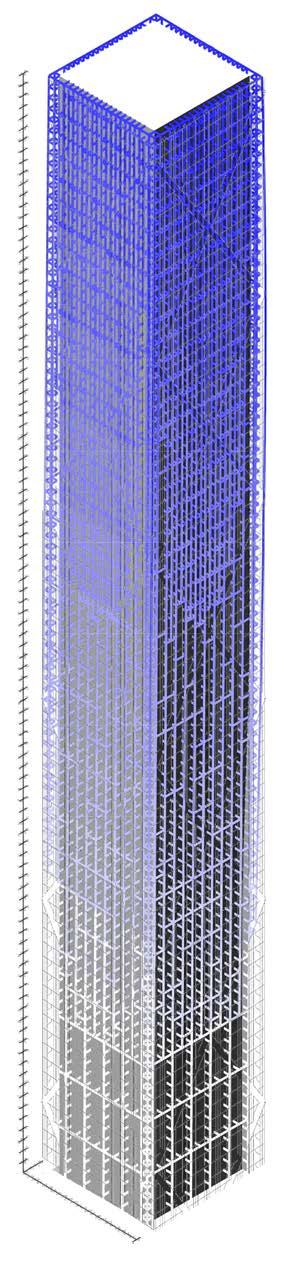
Total Length: 57,760 m
115 POST ANALYSIS
SELECTED
Component Development Façade System
ITERATION
4.5 SELF SHADING EXPERIMENT
4.5.1 SELF SHADING CRITERIA
In order to have an additional layer of control for the direct sunlight hours, relating to the air temperature inside of the panels, a kinetic self-shading mechanism is introduced.
A self-shading mechanism enables panels to increase their depth perpendicular to the façade, which blocks the sunlight for its adjacent panels.
A set of CFD analysis is run. The results reveals the of depth between adjacent panels is necessary. In order to maintain the air ventilation inside the panels and maintain the coanda effect obtained by the curvature of the panel surfaces, the difference of depth in adjacent panels should be at a maximum %40.
Due to such conclusion, 2 conflicting criteria is obtained for the genetic algorithm. The first criterion is to minimize the extrusion difference between adjacent panels and the second one is to maximize self-shading. In order to maximize selfshading, the extrusion difference should be higher, showing that the two determined criteria are conflicting.
As an input, adjacency of panels that are obtained from panelization algorithm determined. The minimum amount of panel depth is set as 2 meters due to the space requirements for aeroponics and the variable buffer zone depth and maximum amount is set as 4 meters. The algorithm ran for 50 generations and 15 individuals in each generation.
116
Component Development Façade System
Maximize self shading for each season
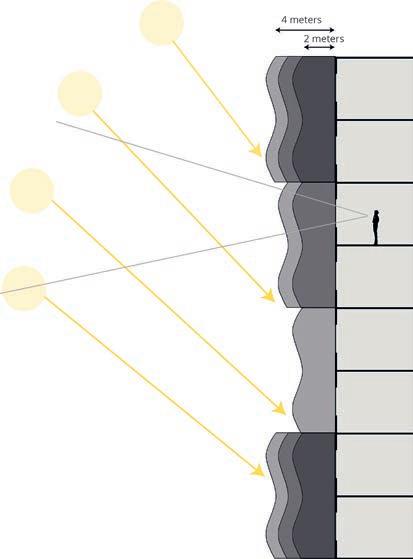
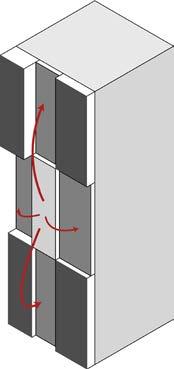
117 Adjacency of panels 4 3 2 1 INPUTS SELECTED ITERATION PANELIZATION 2 to 4 meter Minimize extrusion differences between adjacent panels
CONFLICTING CRITERIAS Component Development Façade System
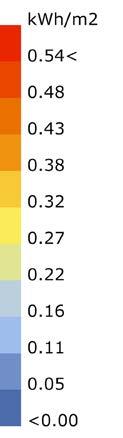
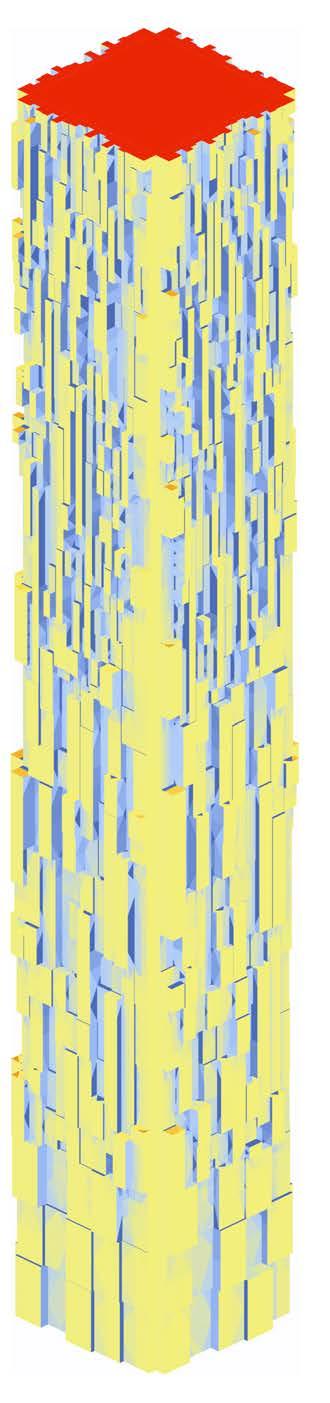
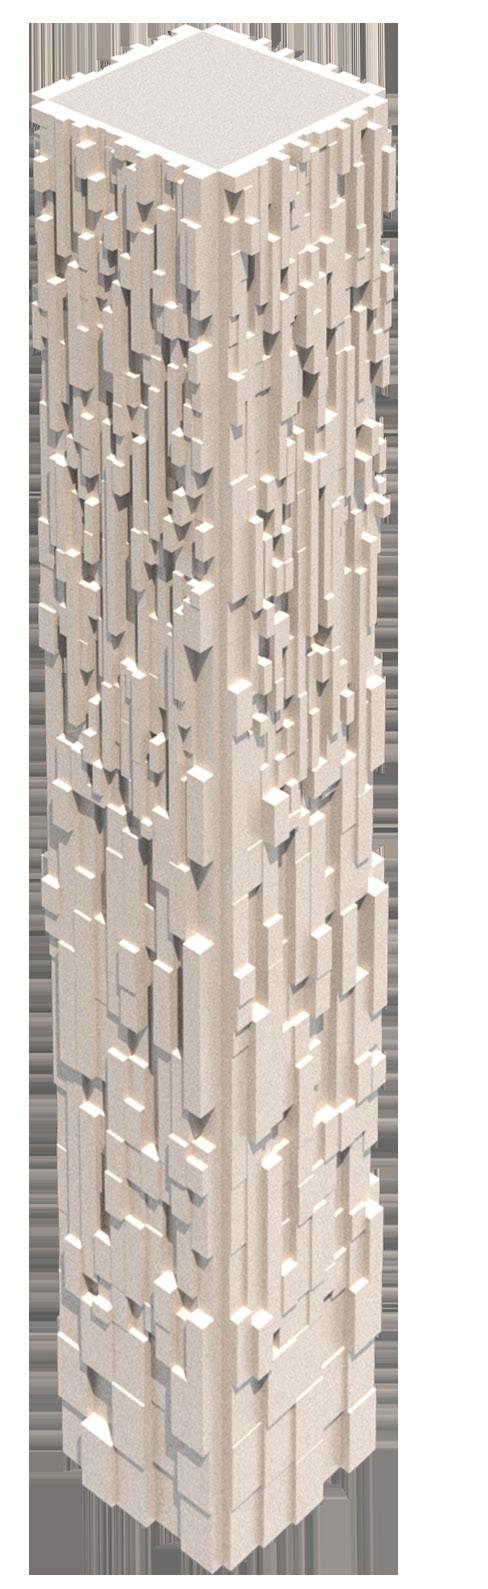
118 POST ANALYSIS SELECTED ITERATION 4.5.2 SELF SHADING POST ANALYSIS Component Development Façade System
Solar Radiation Analysis
Summer
Due to the conflicting criteria, it is observed that as the difference of depth for adjacent panels increases, the amount of total solar radiation decreases on the facade surface. However, in order not to affect the air ventilation in a negative way, the difference in depth of adjacent panels are minimized.
Examining the solar radiation analysis on the selected iteration, the self-shading algorithm creates a variation of solar radiation levels on the facade surface.
OBSERVATION CONCLUSION
During summer, the amount of solar radiation ranges from 0.05 kWh/m2 to 0.37 kWh/m2. Without changing depth for each panel, the facade surface will obtain an average of 0.30 kwh/m2 solar radiation, meaning a 38% reduction of direct sunlight during the summer.
119
Component Development Façade System
The variation obtained from the solar radiation analysis leads to a selection of plants that can be produced in each panel that have a separate micro climate.
Crop parameters were also part of the research. Due to climatic variations of each season, crops are classified according to the amount of direct sunlight hours and required temperature range to maximize production.
For the summer season, the growing conditions of bok choy, pepper, cabbage and peas are found to be suitable vegetation to grow on the facade. Plants are assigned to the panels of varying solar radiation based on their sun requirement.
After the crops are assigned to the specific panels, calculating the production area for each panel, a total production area which leads to total amount of crops that can be produced is calculated for each plant in all seasons.
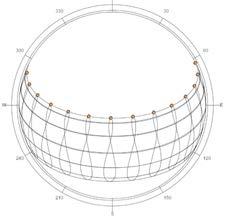
However, the production of crops on the facade can be affected by external factors, such as wind speed, air temperature, and relative humidity. In order to create a more controlled micro climate, the design of the panel requires additional architectural solutions.
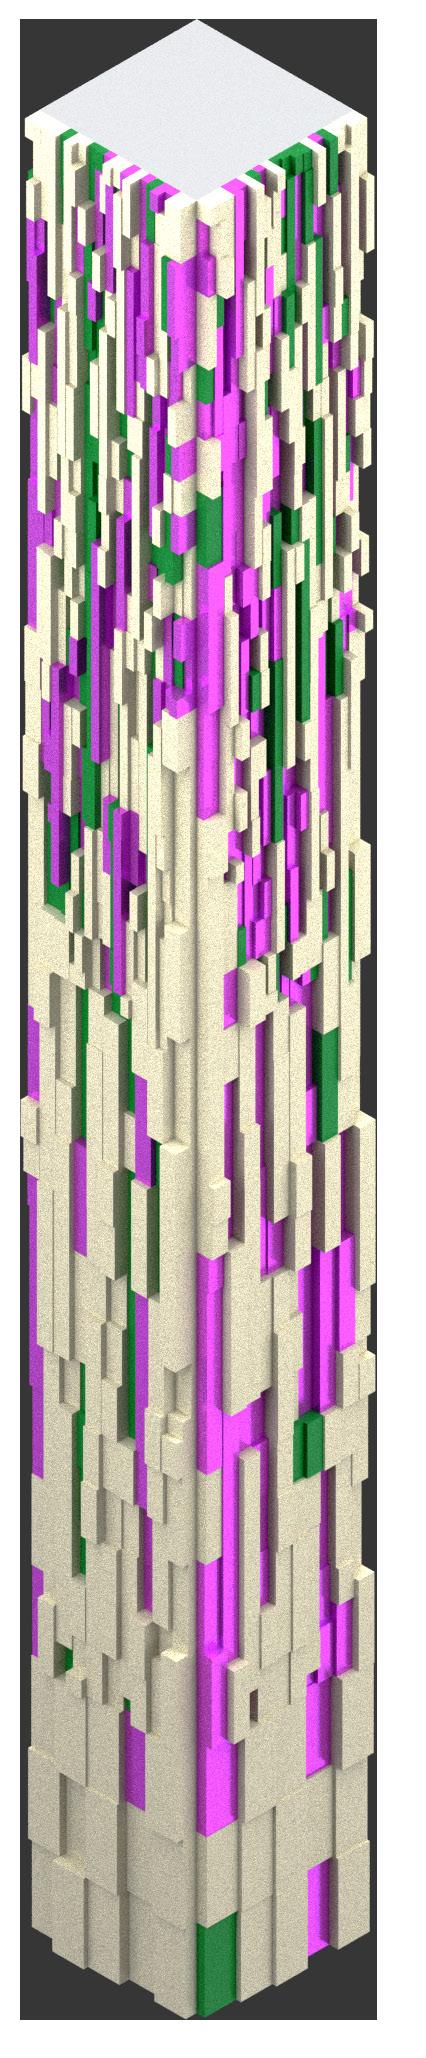
120 N
Development Façade
CROP SELECTION BY PANEL
Component
System
4.5.3
121 Summer Season - East Facade 7 Hours Direct Sun Light / day Cabbage Pepper Peas Bok Choy 6 Hours Direct Sun Light / day 5 Hours Direct Sun Light / day 4.5 Hours Direct Sun Light / day >6h >6h >6h >6h 15 oC 0.80 kWh/m2day 22 oC 0.95 kWh/m2day 17 oC 0.85 kWh/m2day 20 oC 0.80 kWh/m2day PEPPER CABBAGE PEAS BOK CHOY Sunlight (hours) Temperature Energy Demand Component Development Façade System
4.6 COMPONENT DESIGN PROCESS
Due to the high relative humidity in the climate of Shanghai, air ventilation plays a key role in increasing the comfort level in building interior. The challenge of the project is to create a micro climate that sustains plant growth while providing the necessary amount of air supply for the interior space. However due to fact that plants release moisture to the air, keeping the plants in the same space where the air is artificially ventilated will result in an increased relative humidity inside the tower and a decrease in the comfort zone (in terms of what). Therefore, the aeroponics compartment’s air intake and outlet are separated from the air ventilation gates.
In order to increase the effect of air ventilation with the coanda effect, which can be described simply as: leading the air with the curvature of surfaces. Each panel’s face has a specific curvature that leads the air to its adjacent panels, which results in an increase in the total volume of air circulating inside the building.
Due to self-shading requirements, each panel has its own position perpendicular to the normal of the facade in each season. Since the positions are different in each season, a sliding mechanism is introduced.
122
Component Development Façade System
4.7.1
FORM DEVELOPMENT
RELATION BETWEEN AIR FLOW AND FACADE SYSTEM
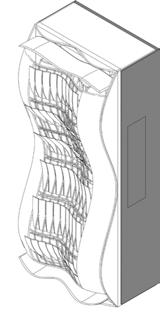
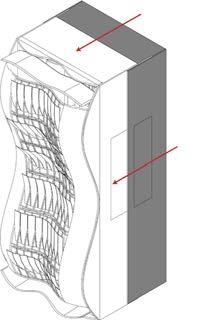
4.7.2
ROTATIONCOANDA EFFECT
CURVATURE AFFECT THE AIR FLOW DIRECTION
4.7.3
EXTRUSION (SLIDING MECHANISM)
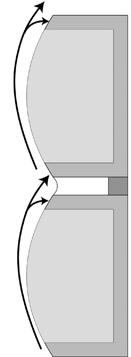
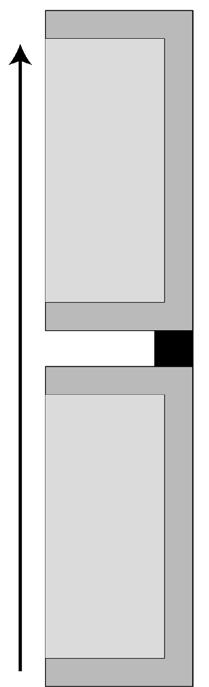
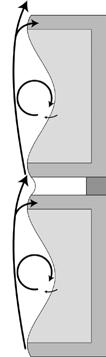

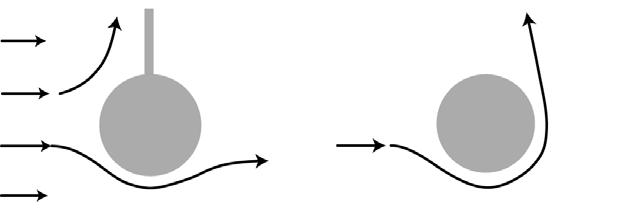
123
Air Flows Along the Convex Surface
Coanda Effect
Component Development Façade System
4.6.1 FORM DEVELOPMENT
The form of the panels needs to respond to two different problems simultaneously. While the aeroponic compartment needs a continuous and slow airflow, the tower ventilation compartment requires a continuous and higher speed airflow.
Airflow has a natural tendency to stick the convex surfaces. As such, the aeroponics compartment, represented as light grey in the diagram, features a concave surface. The tower ventilation air gates are convex surfaces so that the airflow will be attracted by the convex surface that results in a higher volume of air inlet.
Computational Fluid Dynamic analysis is used to investigate the ratio between the degree of curvature of the convex and concave surfaces. Experiments reveal that the best ratio in order to increase the Coanda effect is when the ratio of the convex surface (tower ventilation compartment air gates) is half of the concave surface (aeroponics compartment air gates).
When the ratio of the curvature gets smaller than the double size and surfaces have similar curvatures, the required amount of ventilated airspeed could not be achieved.
When the ratio of the radius gets bigger, flatter surface is obtained and becomes ineffective in protecting against the wind, which results in a higher speed of air inside, affecting the plants in a negative way especially in winter times.
As a result, the selected curvature ratio between the aeroponics compartment and the tower ventilation compartment is 2:1
124
Component Development Façade System
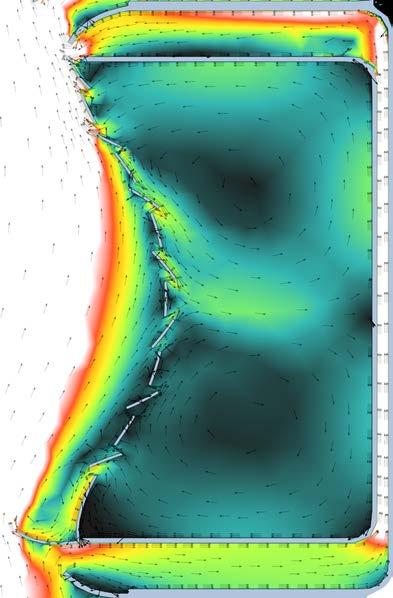


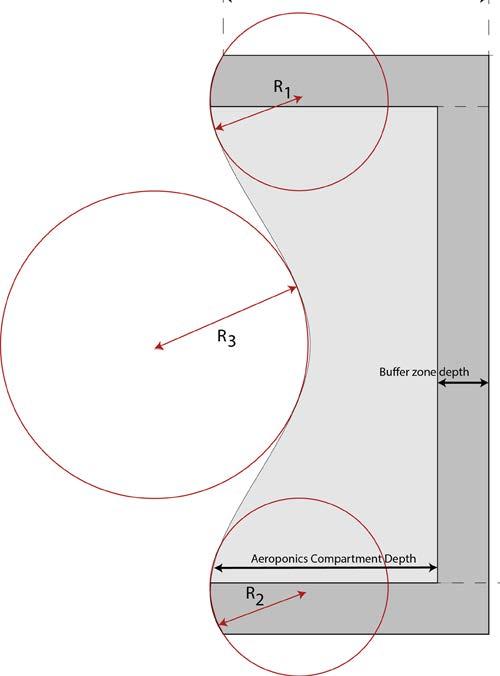
125 Air Circulation inside panel 5m/s Slower air circulation 5 m/s <0.00 0.30 0.60 0.90 1.20 1.50 1.80 2.10 2.40 2.70 3.90 3.00 4.20 3.30 4.50 3.60 5.00 m/s Panel Height Air intake Height R1 = R2 R3= 2R2 Aeroponic Compartment Height Panel Depth Form Curvature Relations Component Development Façade System
4.6.2 ROTATION - COANDA EFFECT
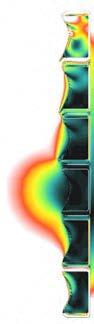
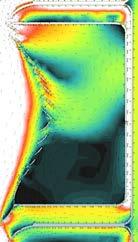
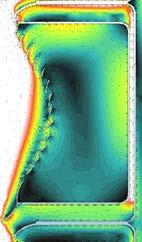
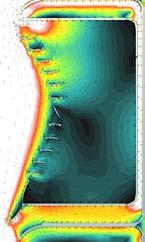

126
1_ α = 135O convex 2_ α = 100O concave 3_ α = 90O convex 1 2 3 1_ α = 90O concave 2_ α = 135O concave 3_ α = 90O convex 1 2 3 1 2 3 1_ α = 80O convex 2_ α = 70O 3_ α = 45O concave 1_ α = 135O concave 2_ α = 135O concave 3_ α = 45O concave 1 2 3 <0.00 0.30 0.60 0.90 1.20 1.50 1.80 2.10 2.40 2.70 3.90 3.00 4.20 3.30 4.50 3.60 5.00 m/s Component
Development Façade System
In order to understand the effect of having different angles between the wind direction and the ventilation of compartment, a series of CFD experiments have been conducted. This series of experiments also test how convexity or concavity affects air flow to stick on air gate surface and lead the air inside the compartment.
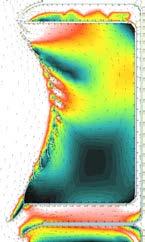
It is observed that the angle between air gates and the wind flow direction can be used to control air flow direction inside the compartment. When the angle between surface normal and the wind direction is more than 90 degrees, air tends to enter from the top and leave from bottom of the compartment. However, that behaviour is counteracting with the natural behaviour of the air movement the hot air rises under normal circumstances. In order to have a continuous air flow inside the compartment, the thermodynamic properties of the air need to be supported. Therefore, the aim is to use the air gates that are located downside of the compartments as an air intake gate.
The speed of air flow is also affected by the angle between the air gates and the wind direction. The maximum ventilation speed obtained when the angle is 45 degrees. The minimum ventilation speed obtained when the angle is 90 degrees.
OBSERVATION CONCLUSION
In order to promote the thermodynamic behaviours of air flow, air flow most enter from the bottom and travel upwards within the compartment. It is observed that in order to achieve this ambition, air gates need to be designed as separate convex surfaces. Air ventilation speed has a key role to create a suitable micro climate which provides suitable growing conditions for the crops. Speed of air ventilation can be controlled by air gate angles towards wind direction. The maximum speed of ventilation obtained when the angle is 45 degrees and minimum speed obtained when the angle is 90 degrees
127 1_ α = 45O convex 2_ α = 45O concave 3_ α = 45O convex 1 2 3
Component Development Façade System
4.6.3 EXTRUSION - PANEL SLIDING MECHANISM
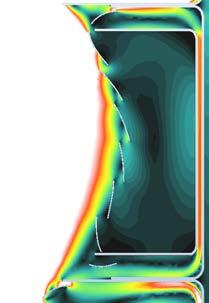
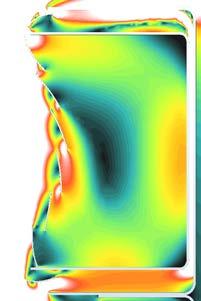
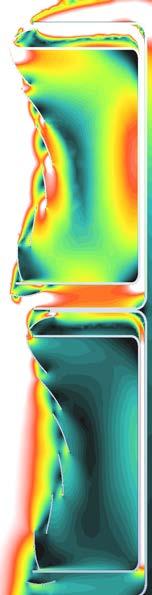
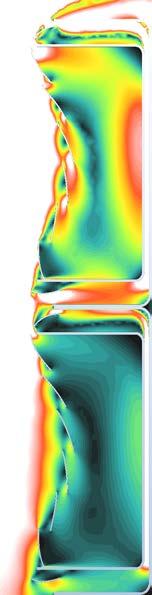
128 5 m/s <0.00 0.30 0.60 0.90 1.20 1.50 1.80 2.10 2.40 2.70 3.90 3.00 4.20 3.30 4.50 3.60 5.00 m/s 0% 20% 40%
Development
Component
Façade System
To have a controlled microclimate inside of the aeroponic compartment, a kinetic mechanism that allows changing the panel depths perpendicular to façade surface is introduced.
This set of CFD experiment tests how air ventilation inside the aeroponics compartment is affected by the difference of depth in adjacent panels. In order to understand the effect, adjacent panels are extruded in different ratios.
It is observed that, as the depth difference increase, air ventilation is affected in a negative way. The reason behind that is the convexity of the panel that has more depth pulls the air flow towards itself and creates a negative pressure for its adjacent panel.
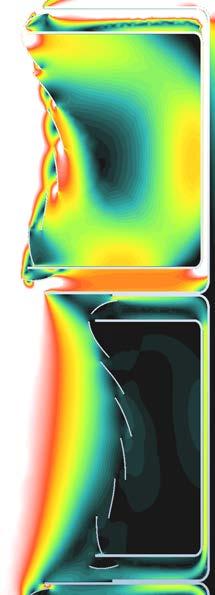
OBSERVATION CONCLUSION
It is observed that when the depth difference of adjacent panels is 60% and the ventilation in the aeroponic compartment of the panel that has less depth, it is not enough to maintain the necessary amount of air circulation to create suitable growth conditions for plants. As a result, a limitation of 40% is implemented.
129 60%
Component Development Façade System
4.7 VENTILATION AND ACTUATION
In this stage of the design, panels are designed in a detailed way according to the parameters obtained from the experiments. The challenge was to integrate adaptive systems to the panel design that can respond to the immediate external changes. Responsive systems are selected according to changing wind direction, changing wind speed, temperature and relative humidity.
Plants are producing moisture and because of that, growing plants on the facade will results in a higher humidity levels inside the tower and decrease the comfort zone of the users. Due to that reason, air intake and outlet of the aeroponic and tower ventilation compartment are separated.
In addition, to be able to optimize the growing conditions, artificial lighting is introduced for aeroponics. Artificial lighting brings an advantage of continuous growth during the night and the days when solar radiation alone is not sufficient. In order to provide energy for artificial lighting, semi-transparent photovoltaic glass is selected as a material.
130
Component Development Façade System
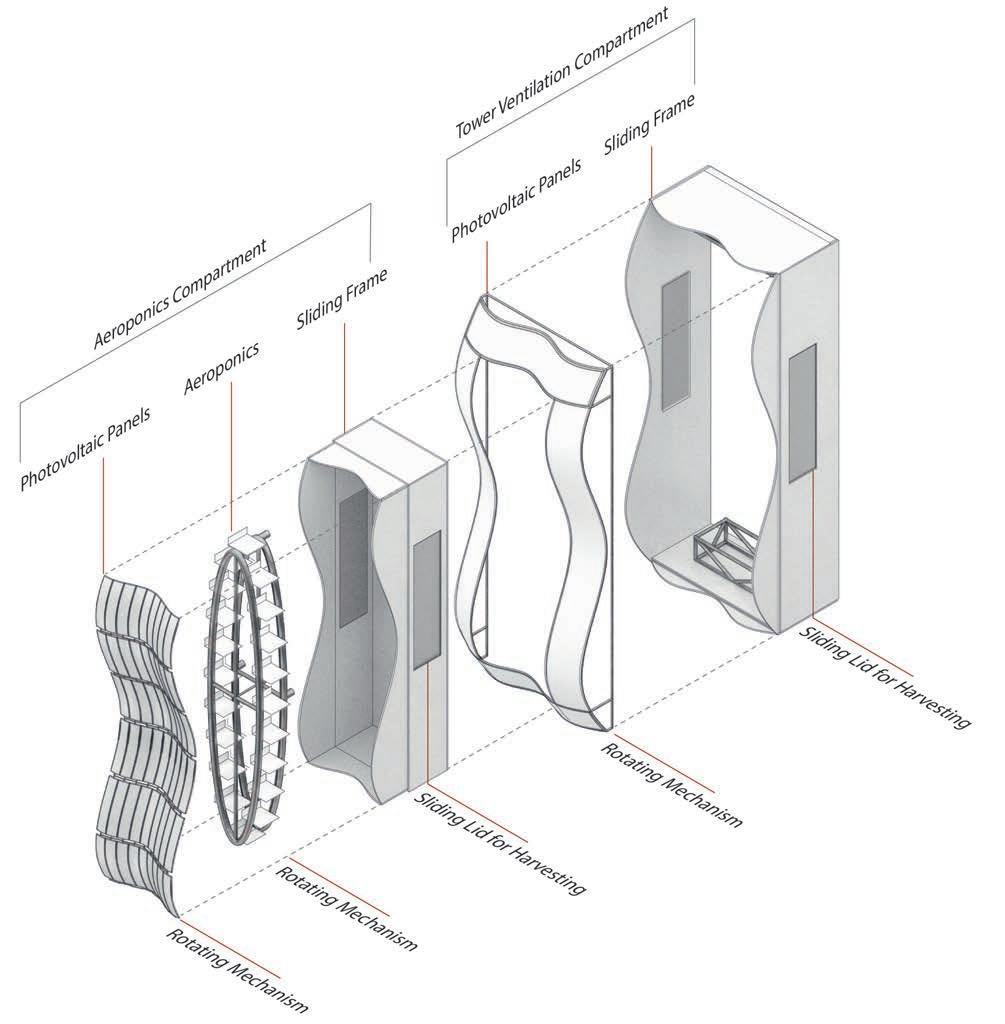
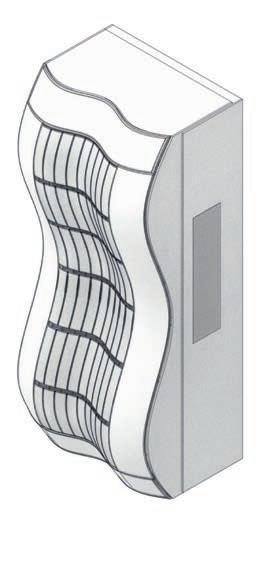
131 Component Development Façade System
4.7.1 COMPARTMENT WORKFLOW: PRESSURE
In order for the design to respond to all wind directions, the panel is designed symmetrically in X and Z axis, which results in a double curved surface. Double curved surface enables to slow down airflow in the aeroponic compartment by creating negative pressure and increased speed of air in tower ventilation compartment which leads to a higher ventilation efficiency in tower ventilation regardless of wind direction.
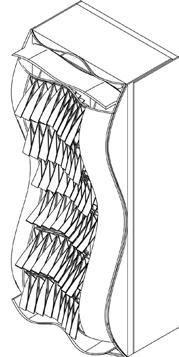
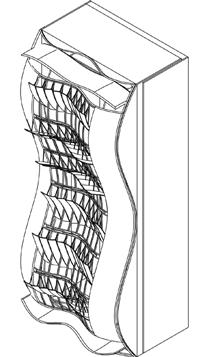
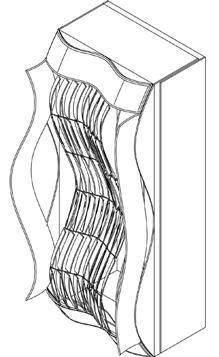
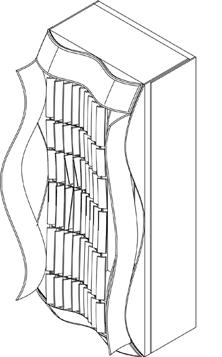
The design of the tower ventilation compartment is based on Bernoulli and Venturi principles. This compartment creates a buffer zone between the aeroponic compartment and the existing facade of the building.
The intention is to create a constant pressure difference between the buffer zone and the interior space of the tower so that a constant air circulation could be achieved. Pressure difference will result in a constant air circulation which will increase comfort zone of the users in subtropical humid climate of Shanghai.
132
Component Development Façade System
Rotation of air gates according to wind direction
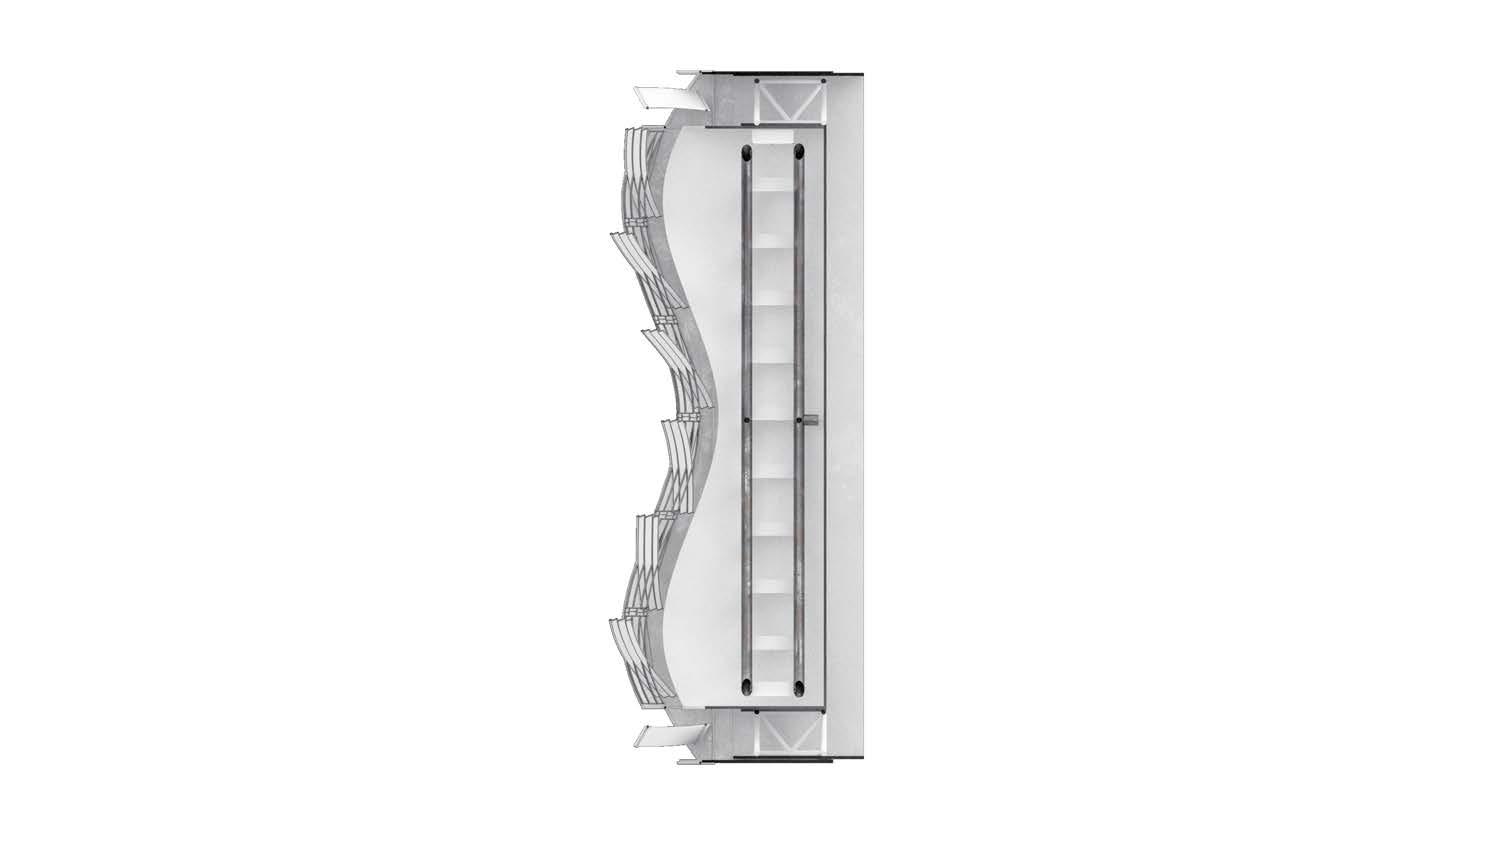
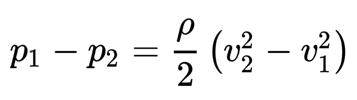
Variable Dimension Target Air Circulation Speed V= 0.8 m/s VOutside Wind OUTSIDE INSIDE +Tower Ventilation Compartment Workflow Component Development Façade System
4.7.1 COMPARTMENT WORKFLOW: PRESSURE
According to Ashrae Standards, a constant air circulation with a speed of 0.8m/s is necessary inside the towers. Ashrae standards also indicate that more than 2 m/s of air circulation can disturb the users. Due to that reason, 0.8m/s is selected as a target air circulation.
Bernoulli’s Principle states that an increase in the speed of fluid occurs simultaneously with a decrease in pressure. In addition, the Venturi effect reveals how the velocity of incompressible fluids must increase as they pass through a constriction, in accordance with the principle of mass continuity, while its static pressure must decrease in accordance with the principle of conservation of mechanical energy.
The work-flow of tower ventilation compartment is based on a changing depth of buffer zone which is directly related with the exterior wind speed. In order to have a constant pressure difference between the buffer zone and inside the tower, air flow speed should be constant in buffer zone. In addition, to have a constant air speed in the buffer zone, the depth of the zone can be reduced or increased.
If the exterior wind speed is 0.8m/s less than internal air circulation, the buffer zone will need to have less volume so that the air inside the buffer zone has to flow faster, which results in a decreasing pressure in the buffer zone.
134
Component Development Façade System
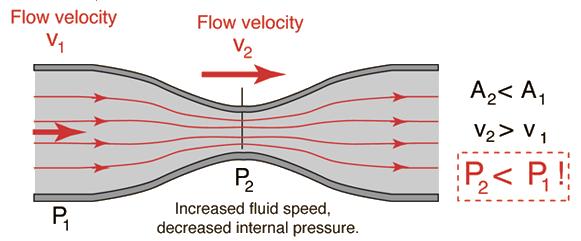
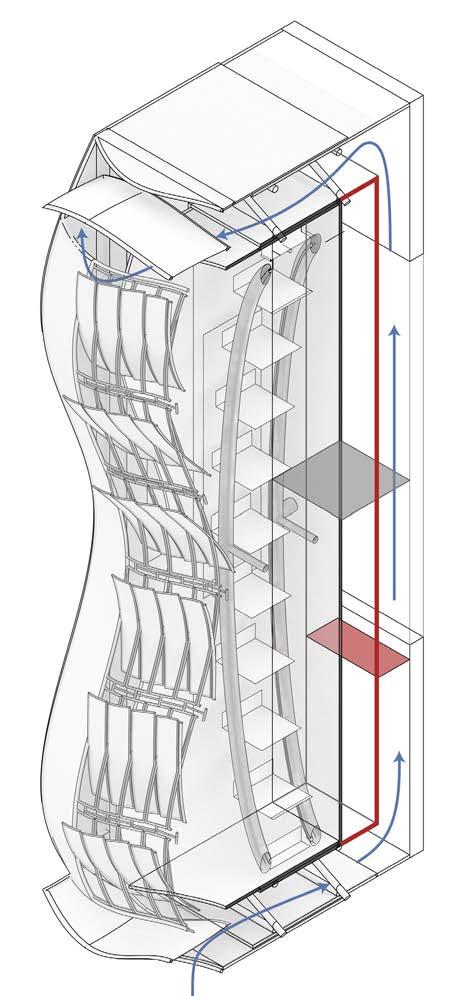
135 A P 2 2 A P 1 1 Component Development Façade System
4.7.2 AEROPONICS COMPARTMENT: TEMPERATURE
Aeroponic system proves to be more effective system compared to other vertical gardening systems. The advantage of not using earth is the reduction in the total amount of weight exerted on the structure.
However, aeroponics systems come with one disadvantage as well. Due the plant roots not situating inside the protective environment of earth, they become more sensitive to external factors.
In order to maintain the suitable growth conditions for aeroponics, temperature of the microclimate inside of the aeroponic compartment has to be carefully controlled.
Rather than introducing a heating system, temperature can also be controlled by the amount of air circulated inside of the compartment. Since the system is directly affected by the exterior air temperature, the volume of air circulating inside needs to be under control. Hence another layer of parameter is added on the rotation of the air gates which is aeroponic compartment’s interior air temperature.
If the temperature is higher than the optimum conditions of specific plants that grow inside of the compartment, more air circulation needs to be provided by rotating the air gates 45 degrees.
If the temperature is below the optimum conditions, air circulation can be decreased by closing the air gates and the temperature in the compartment can be increased with the sunlight.
136
Component Development Façade System
Temperature control with air ventilation
Controlled Parameter : Volume of air circulated per minute
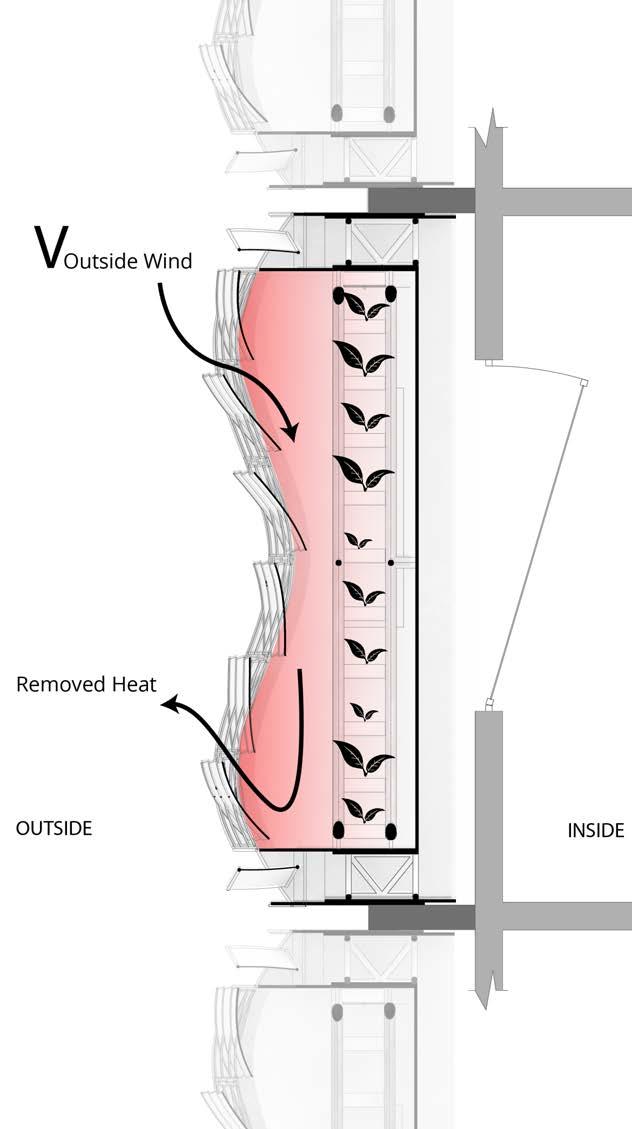
137 Component Development Façade System
4.7.3 AEROPONICS COMPARTMENT: HUMIDITY
Another important parameter to create a suitable environment for plant growth is to keep relative humidity under control. In order to keep the relative humidity in the same range, total amount of plants that can be produced in each panel is calculated. Since each species of plant has a specific amount of moisture that they release to the environment, it becomes possible to calculate how many grams of moisture will be produced per minute in each panel. The psychometric chart sets the relationship between the gram of moisture in the air and the relative humidity in specific temperature ranges.
With the information obtained from the psychometric chart it is understood that, depending on the exterior temperature and relative humidity, the amount of air needs to be circulated inside of the panel can be specifically calculated and the rotation of the air gates can be arranged accordingly.
SOURCE. Team, ME Mechanical. 2016. “Overview of Psychrometric Chart.” ME Mechanical (blog). April 13, 2016. https://me-mechanicalengineering.com/psychrometric-chart/.
138
Component Development Façade System
0 05 0.790.810.830.850.870.90 0.92 5oC 10oC 10% 20% 30% 40% 60% 80% 15oC 20oC 25oC 30oC 1015 Dry bulb temperature oC Relative Humidity [ % ] Specific volume [ m3/kg ] Total pressure = 1 atm PSYCHROMETRIC CHART Specific humidity grams moisture / kilogram dry air 20253035404550 5 10 15 20 25 30
Humidity level control with air ventilation
Controlled Parameter : Volume of air circulated per minute
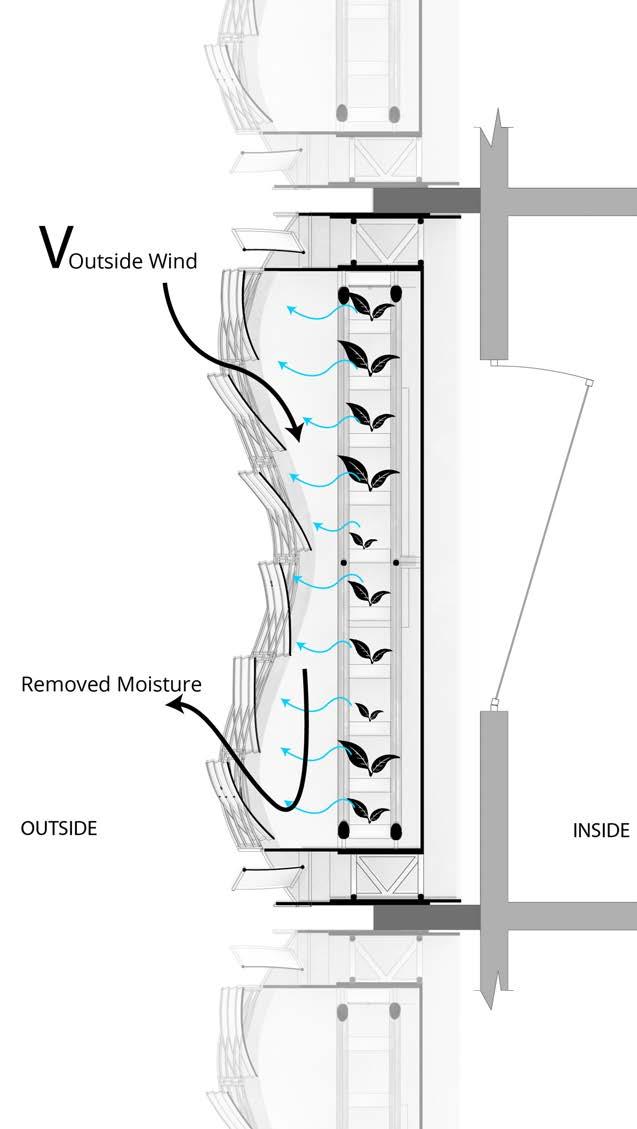
139 Component Development Façade System
4.7.4 HARVESTING MECHANISM
Existing Tower Structure
Elevator Structure
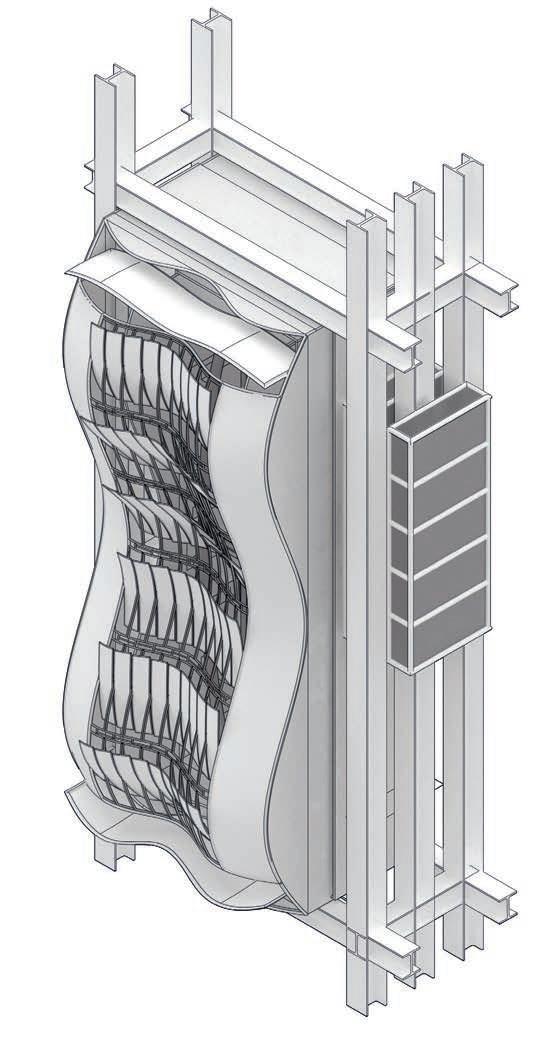
Additional Panel Structure
Elevator System for Harvesting
Elevator System for Harvesting
Exterior elevator system is introduced for harvesting the aeroponic systems. In terms of location, the elevator system is designed between the additional structure of the secondary facade and the existing structure of the tower. A new structure specifically for harvesting mechanism is introduced between the two I beams of existing facade and the secondary facade structure. Due to the fact that connection beams are blocking the elevator’s path, elevator is designed as two separate parts each facing with only one row of panels throughout the tower.
140
Component Development Façade System
Rotating Mechanism

In order to have an automated mechanism for harvesting, aeroponics systems are located on a conveyor system. A sliding lid is designed on the walls of the panels to collect the crops and to replace the new aeroponics systems. An elevator system is responsible for collecting the produced crops and for delivering them to the ground level.
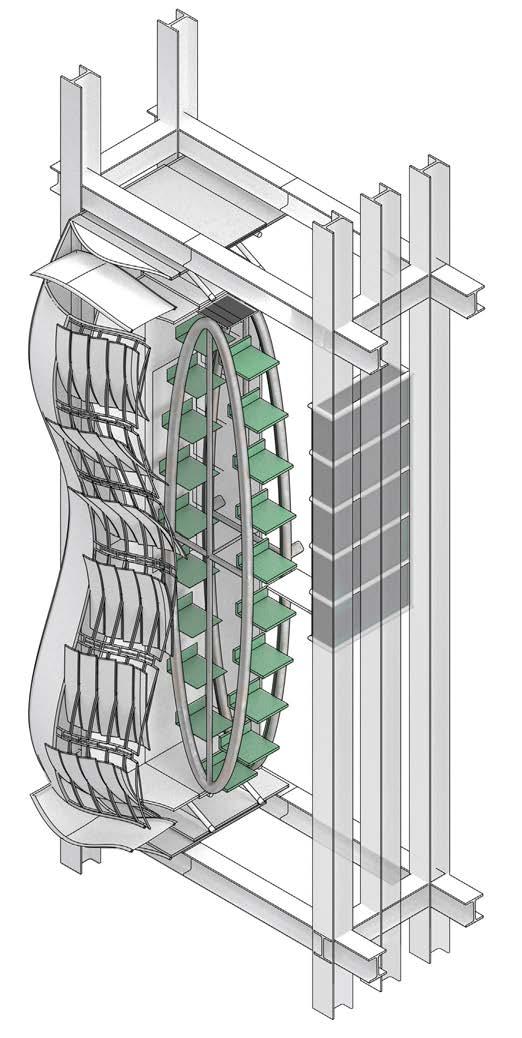
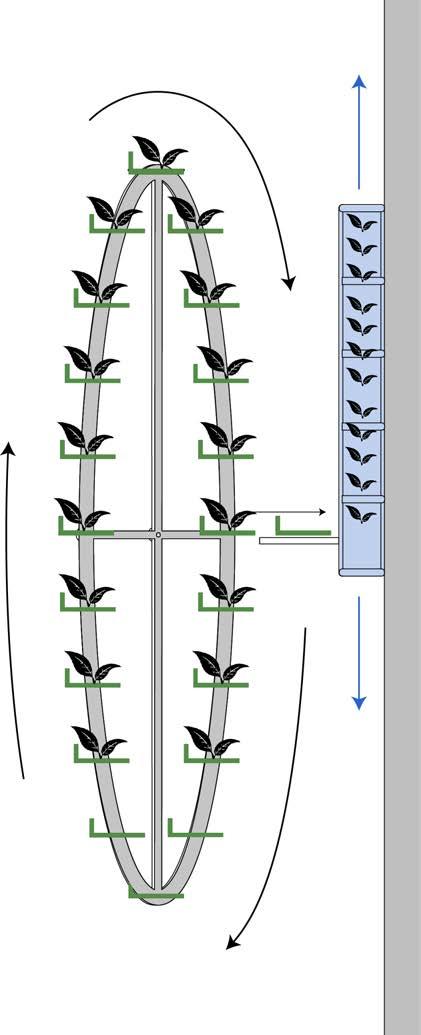
141
Aeroponics Units Component Development Façade System
4.7.5 CONTROLLING INTERIOR VENTILATION
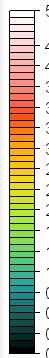
In order to analyse the effects of panels on interior ventilation, a series of CFD tests are ran. Experiments are based on different panel sizes, different wind speeds, different buffer zone depths and different positions of air gates depending on the high and low wind pressure on facades. CFD experiments are based on 2D drawings and the core area is set as a 0 pressure in order to mimic the negative pressure that ventilation cores provide in real world.
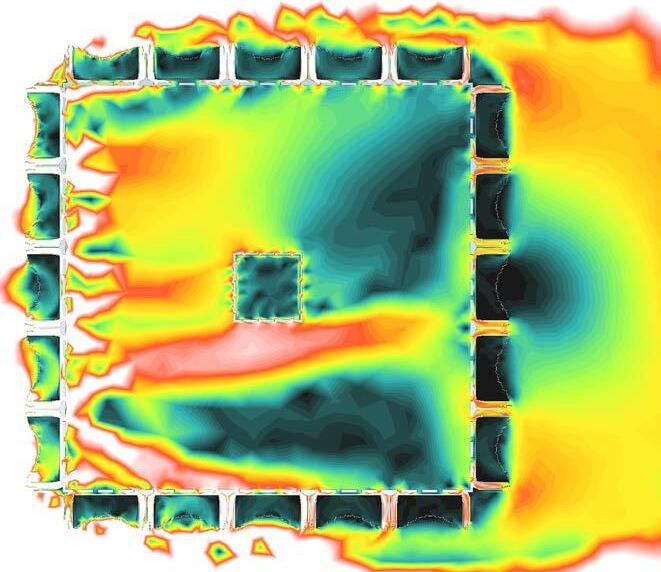
142 Interior Air Circulation test Wind speed : 5m/s <0.00 0.12 0.24 0.36 0.48 0.60 0.72 0.84 0.96 1.08 1.56 1.20 1.68 1.32 1.80 1.44 2.00 m/s V
Component Development Façade System
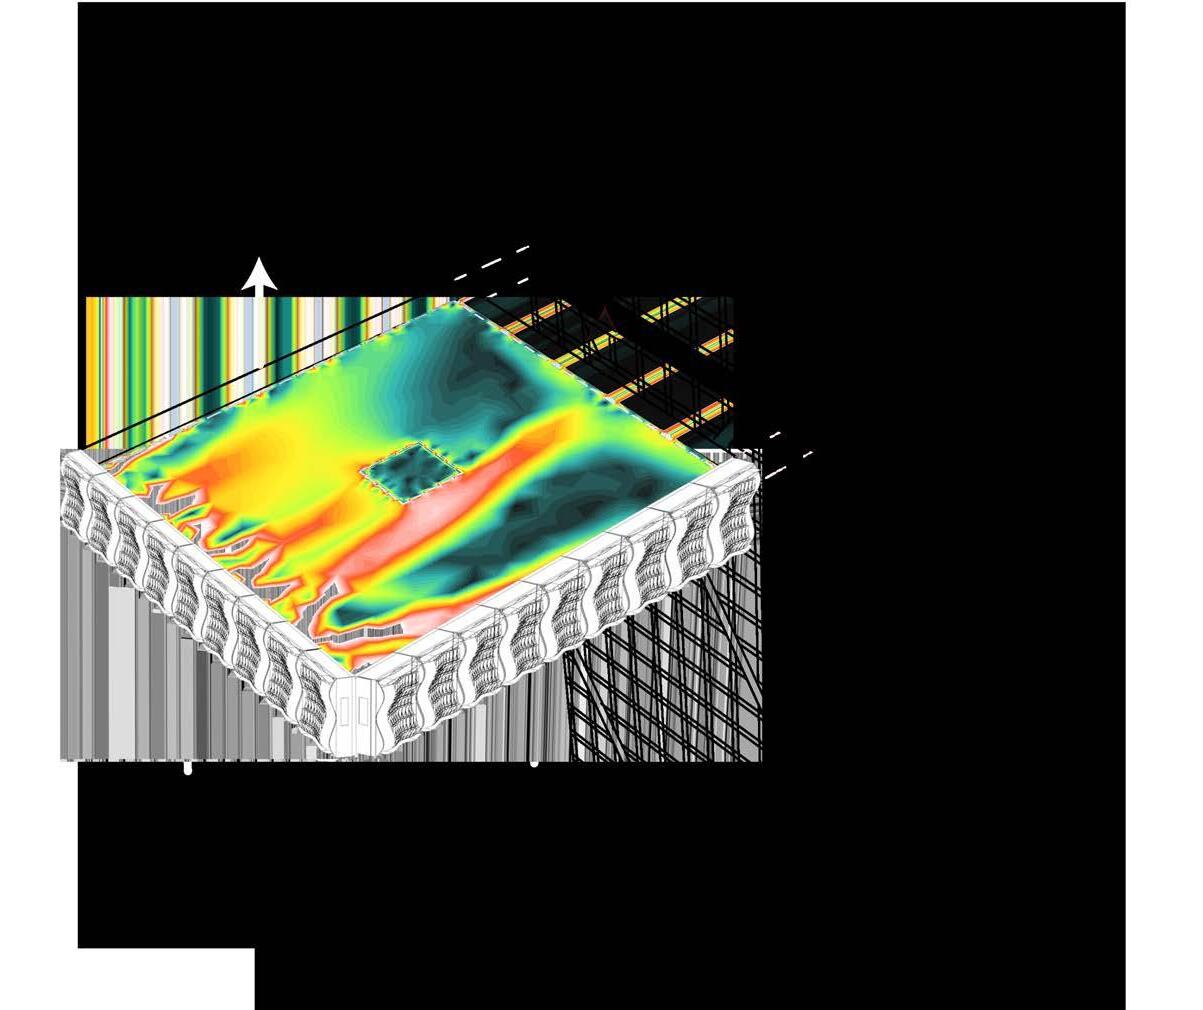
143 V Component Development Façade System
4.7.6 INTERIOR AIR CIRCULATION ANALYSIS
4.7.6.1
PANEL SIZES
OBSERVATION
In this experiment, the effect of different panel sizes on interior ventilation is investigated. It is observed that regardless of the buffer zone depth, interior ventilation is affected in a negative way when the number of panels is increased. The reason is that the smaller panels have also smaller air intake and outlet gates.
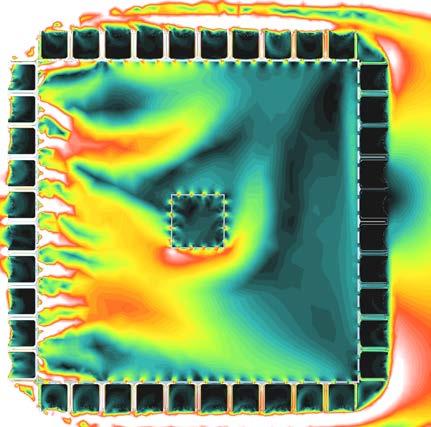
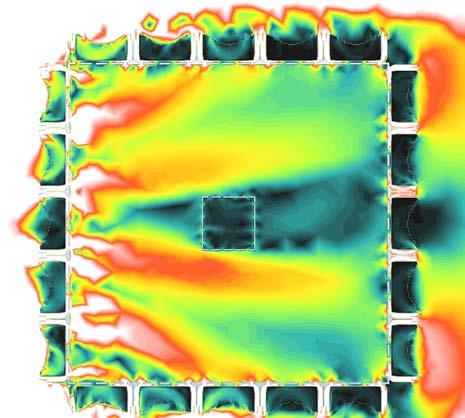
144 Big Panels Size Panel width: 10 meter 1 Floor : 1 to 15 Middle Panels Size Panel width : 5 meter Floor : 15 to 60 2
Component Development Façade System
CONCLUSION
In order for ventilation not to be affected by the panel sizes, air ventilation gate size needs to be kept in the same size which will result in a changing volume ratio of aeroponic compartment on the panel.
145 2 1 w <0.00 0.12 0.24 0.36 0.48 0.60 0.72 0.84 0.96 1.08 1.56 1.20 1.68 1.32 1.80 1.44 2.00 m/s
Component Development Façade System
OBSERVATION
In this CFD experiment the effect of different external wind speeds on interior ventilation is tested. It is observed that, as the external wind speed is increased, it results in a higher-pressure difference on buffer zone. Higher pressure difference on the buffer zones lead to a better air ventilation inside of the tower. When the exterior wind speed reaches to 10m/s, the interior air ventilation speed reaches to 2m/s in most of the areas on the floor. Ventilation speed of 2m/s is categorised as ‘not comfortable’ according to ASHRAE standards.
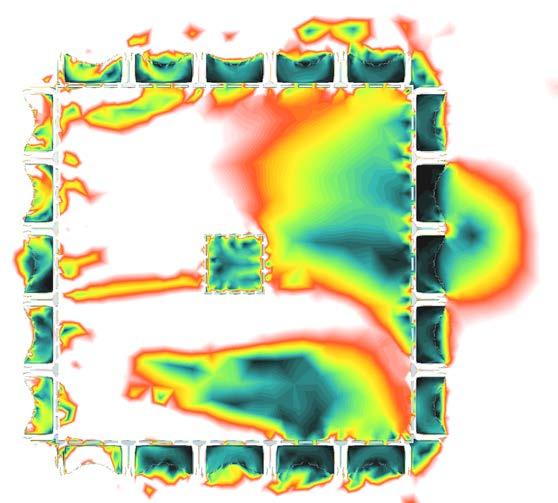
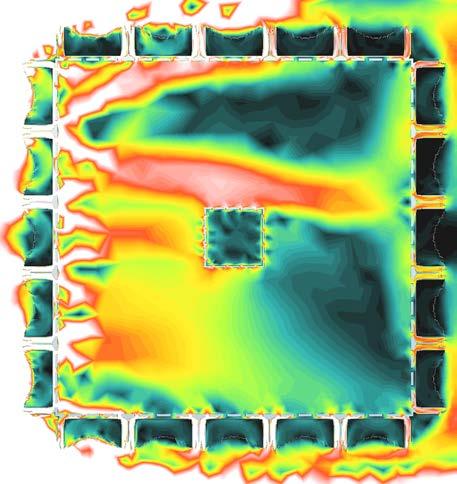
146
INTERIOR AIR CIRCULATION ANALYSIS Component Development Façade System WIND SPEED 4.7.6.2 4.7.6 Wind Speed: 5 m/s Panel size : 5 x 5 m Wind Speed: 10 m/s Panel size : 5 x 5 m
CONCLUSION
Changes in exterior wind speed could be reflected inside the tower directly, which is parallel to the objective. The target air velocity for interior ventilation was set as 0.8 m/s with a reference of ASHRAE standards. In order to have 0.8m/s air ventilation, 7m/s air speed in the buffer zone was necessary. The required amount of air speed could be obtained when the outer air speed is 5m/s.
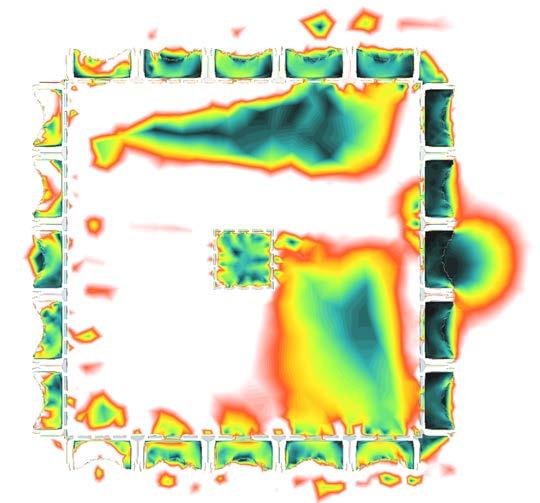
147
Wind Speed: 15 m/s Panel size : 5 x 5 m <0.00 0.12 0.24 0.36 0.48 0.60 0.72 0.84 0.96 1.08 1.56 1.20 1.68 1.32 1.80 1.44 2.00 m/s
Component Development Façade System
OBSERVATION
In order to understand the effect of pressure difference in buffer zone to the air ventilation inside of the tower. Different buffer zone depth of high pressure facade( 100cm, 50cm, 25cm)tested against the same buffer zone depth of low pressure façades (10cm).
It is observed that, the wider the buffer zone is, the slower wind speed obtained in the buffer zone. Since slow air tends to have higher pressure, pressure difference between the façades would increase, which results with a higher interior ventilation.
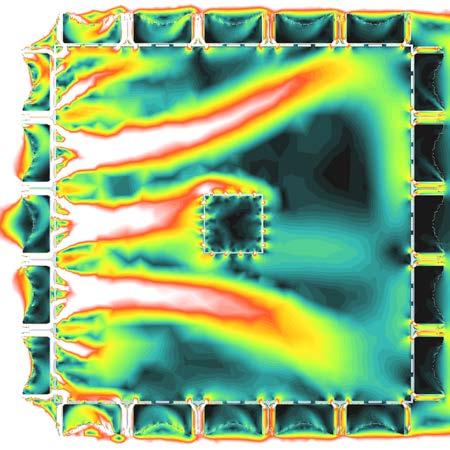
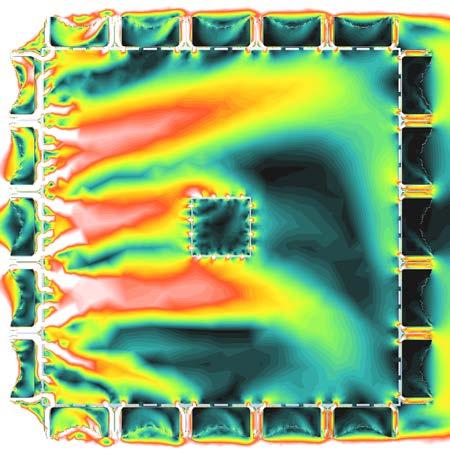
148 High pressure surface buffer zone depth : 100 cm Low pressure facades buffer zone depth : 10 cm HIGH pressure LOW pressure LOW pressure 1 2 High pressure surface buffer zone depth : 50 cm Low pressure facades buffer zone depth : 10 cm
INTERIOR AIR CIRCULATION ANALYSIS Component Development Façade System 4.7.6
BUFFER ZONE DEPTH
4.7.6.3
CONCLUSION
These experiments reveal the importance of pressure difference between buffer zones in high pressure facade and low-pressure façades. In order to increase the interior ventilation speed, the buffer zone depth of higher-pressure facade should be maximized and depth of lower-pressure minimized.
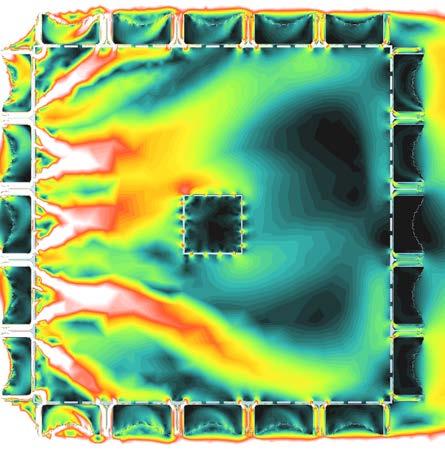
149 3 High pressure surface buffer zone depth : 25 cm Low pressure facades buffer zone depth : 10 cm <0.00 0.12 0.24 0.36 0.48 0.60 0.72 0.84 0.96 1.08 1.56 1.20 1.68 1.32 1.80 1.44 2.00 m/s
Component Development Façade System
OBSERVATION
In this experiment for the redirection of the air inside the tower, the air gates on each facade were opened or closed in order to redirect the airflow, always keeping the air gates open on facade with the highest wind pressure. It is observed that choosing different locations for open-air gates can have vary the efficiency of air ventilation inside.
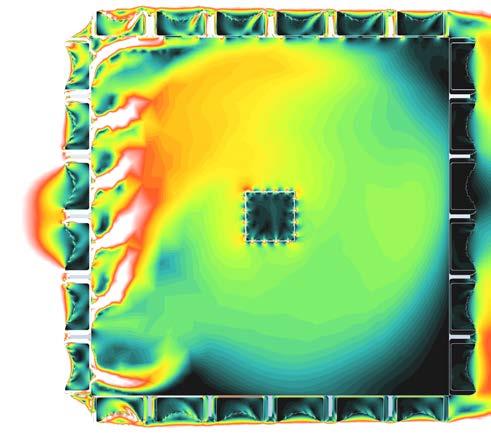
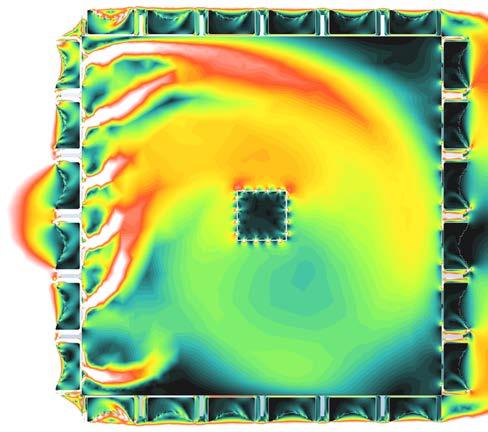
150 1 2
INTERIOR
Component Development Façade System
DIRECTION
AIR CIRCULATION ANALYSIS
OPENING
4.7.6.4
4.7.6
CONCLUSION
As the direction of the air flow is coming from the facade with the highest wind pressure, the airflow inside of the building will always be on direction to the facade with the low wind pressure where the air gates are open.
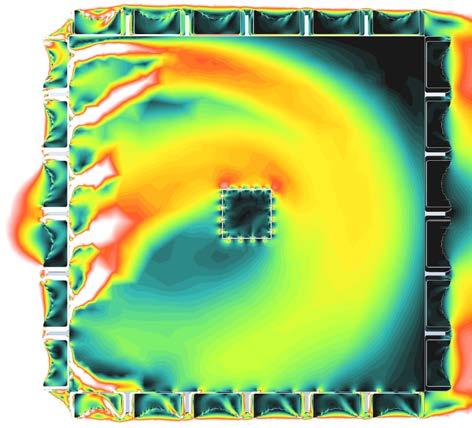
151 3
<0.00 0.12 0.24 0.36 0.48 0.60 0.72 0.84 0.96 1.08 1.56 1.20 1.68 1.32 1.80 1.44 2.00 m/s Component Development Façade System
4.8 OBSERVATIONS AND CONCLUSIONS
The ambition was to create a micro climate on the facade which will provide a suitable environment for plant growth conditions and at the same time will increase the ventilation efficiency inside the tower.
One of the challenges was to reduce the extra load that will be exerted on the existing structure due to the additional loads that plants and earth will add on. Aeroponics system was therefore implemented.
Due to the fact that Shanghai is located on a subtropical humid climate zone, natural ventilation has a key role in improving comfort zone inside of the building. Natural ventilation also plays the key role on controlling the temperature and relative humidity level inside of the aeroponics compartment.
Following this ambition, a facade system that consists of panels is designed based on Bernoulli and Venturi principles, which enables constant airflow regardless of wind direction and wind speed.
However, as a disadvantage of separating the aeroponics compartment from the tower ventilation compartment, the harvesting process had to be due to not having human access to the aeroponics compartment.
Further studies and experiments will focus on architectural solutions on how to integrate people to the production process as well as creating small constructed ecosystems.
152
Component Development Façade System
Initial Component Proposal
PROPOSAL AND
5. tower system design ARCHITECTURAL
5.1 PROBLEMS & SOLUTIONS
Limited Nature and Human Relation
Problems
Limited Nature and Human Relation Integration of live and abiotic environment
Consumer society
Cultivation
Effective System Usage
Solutions
Bioclimatic Panel Design
M.Arch Ambition I Local Scale
156 Chapter Main Heading
Design Strategy Tower System
CONVENTIONAL TOWER DESIGN
High Energy Consumption
Environmental Pollution
Low-Energy structure
Efficient Form Design
Bioclimatic Tower Design
CONSTRUCTED ECOSYSTEM
M.Arch Ambition II
Global Scale
Efficient Material Usage
157 Chapter Main Heading
Design Strategy Tower System
5.2 BIOCLIMATIC TOWER DESIGN
5.2.1 CONSTRUCTED ECOSYSTEMS
Ken Yeang is the pioneer of bioclimatic design in architecture. His bioclimatic design principles can be summarized as follows:
-Providing continuous ventilation in the building by documenting the wind movement of the location and shaping the building form in order to maximize natural ventilation.
-Integration of multi-story atrium into the building in order to channel ventilation.
-Orientation of the building to reduce solar radiation entering through the windows, but allowing for natural lighting.
-Selection of materials that reflect rather than absorb radiation, and which release the absorbed heat as thermal radiation.
-Providing recesses and sky courts to create shade for the interior of the building whilst also encouraging interaction with the external environment.
-Designing vertical landscape to provide shading, minimize heat reflection and glare, and to encourage diversity of plant species that connects with the local ecosystem on the ground level.
According to Yeang, bioclimatic design is an effective way to reduce energy consumption and lowering the overall heat-island effect on the locality, whilst integrating harmoniously into the ecological and geographical context of the region, due to their climatic responsive design.
158
Bioclimatic Principles Tower System
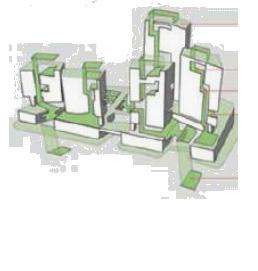
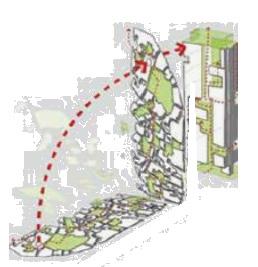
159 Primary Circulation Secondary Circulation Tertiary Circulation Quaternary Circulation Water Purification Diagram Rooftop Zone Water Collector Storage Tank Waste Recycling Diagram Chute Mechanical Waste Seperator Linear Intermixing Intermixing Juxtapositioning Primary Circulation Secondary Circulation Instant CompartimentationOrganic Spaces Tertiary Circulation Quarternary Circulation Continuous system linking al major zones in building with entrance Circulation between hyperzonesCirculation within each zone System for inter-floor circulation High Speed Lifts District lifts Local Lifts Ramps and travellators Circulation Systems Organic Spaces and Intermixing Functions Partially Applied Double Facade Rain Water Collection and Waste Recycling Vertical Landscaping Circulation Ramp Water Purification Diagram Rooftop Zone Water Collector Storage Tank Waste Recycling Diagram Chute Mechanical Waste Seperator Linear Intermixing Intermixing Juxtapositioning Primary Circulation Secondary Circulation Instant CompartimentationOrganic Spaces Tertiary Circulation Quarternary Circulation Continuous system linking al major zones in building with entrance Circulation between hyperzonesCirculation within each zone System for inter-floor circulation High Speed Lifts District lifts Local Lifts Ramps and travellators Natural Ventilation and Daylight Penetration Standart Tower Interior Space & Double skin relationship Circulation Systems Organic Spaces and Intermixing Functions Partially Applied Double Facade Rain Water Collection and Waste Recycling Vertical Landscaping Circulation Ramp Natural Ventilation and Daylight Penetration Interior Space & Double Skin relationship Organic Spaces and Intermixing Functions Circulation Systems Partially Applied Double Facade Vertical Landscaping Rain Water Collection and Waste Recycling Water Purification Diagram Rooftop Zone Water Collector Rain water catchment Scallops Storage Tank Waste Recycling Diagram Mechanical Waste Seperator Linear Intermixing Intermixing Juxtapositioning Primary Circulation Secondary Circulation Instant CompartimentationOrganic Spaces Tertiary Continuous system linking al major zones in building with entrance Circulation between hyperzonesCirculation High Speed Lifts District lifts Local Circulation Systems Organic Spaces and Intermixing Functions Partially Applied Double Facade Rain Water Collection and Waste Recycling Vertical Landscaping Circulation Ramp Water Purification Diagram Rain water catchment Scallops Storage Tank Storage Tank Waste Recycling Diagram Linear Intermixing Intermixing Juxtapositioning Primary Circulation Secondary Circulation Instant Compartimentation Organic Spaces Tertiary Circulation Quarternary Circulation Continuous system linking al major zones in building with entrance Circulation between hyperzonesCirculation within each zone System for inter-floor circulation High Speed Lifts District lifts Local Lifts Ramps and travellators Natural Ventilation and Daylight Penetration Standart Tower Interior Space & Double skin relationship Circulation Systems Organic Spaces and Intermixing Functions Partially Applied Double Facade Rain Water Collection and Waste Recycling Vertical Landscaping Circulation Ramp Water Purification Diagram Rooftop Zone Water Collector Rain water catchment Scallops Storage Tank Storage Tank Waste Recycling Diagram Linear Intermixing Intermixing Juxtapositioning Primary Circulation Secondary Circulation Instant CompartimentationOrganic Spaces Tertiary Circulation Quarternary Circulation Continuous system linking al major zones in building with entrance Circulation between hyperzonesCirculation within each zone System for inter-floor circulation High Speed Lifts District lifts Local Lifts Ramps and travellators Standart Tower Interior Space & Double skin relationship Circulation Systems Organic Spaces and Intermixing Functions Partially Applied Double Facade Rain Water Collection and Waste Recycling Vertical Landscaping Circulation Ramp Water Purification Diagram Rooftop Zone Water Collector Storage Tank Waste Recycling Diagram Linear Intermixing Intermixing Juxtapositioning Primary Circulation Secondary Circulation Instant CompartimentationOrganic Spaces Tertiary Circulation Quarternary Circulation Continuous system linking al major zones in building with entrance Circulation between hyperzonesCirculation within each zone System for inter-floor circulation High Speed Lifts District lifts Local Lifts Ramps and travellators Natural Ventilation and Daylight Penetration Standart Tower Interior Space & Double skin relationship Circulation Systems Organic Spaces and Intermixing Functions Partially Applied Double Facade Rain Water Collection and Waste Recycling Vertical Landscaping Circulation Ramp Purification Diagram Rain water catchment Scallops Tank Waste Recycling Diagram Mechanical Waste Seperator Primary Circulation Secondary Circulation CompartimentationOrganic Spaces Tertiary Circulation Quarternary Circulation Continuous system linking al major zones in building with entrance Circulation between hyperzonesCirculation within each zone System for inter-floor circulation High Speed Lifts District lifts Local Lifts Ramps and travellators Ventilation and Daylight Penetration Space & Double skin relationship Circulation Systems Spaces and Intermixing Functions Applied Double Facade Water Collection and Waste Recycling Landscaping Circulation Ramp Water Purification Diagram Rooftop Zone Water Collector Storage Tank Waste Recycling Diagram Chute Mechanical Waste Seperator Linear Intermixing Intermixing Juxtapositioning Primary Circulation Secondary Circulation Instant CompartimentationOrganic Spaces Tertiary Circulation Quarternary Circulation Continuous system linking al major zones in building with entrance Circulation between hyperzonesCirculation within each zone System for inter-floor circulation High Speed Lifts District lifts Local Lifts Ramps and travellators Natural Ventilation and Daylight Penetration Standart Tower Interior Space & Double skin relationship Circulation Systems Organic Spaces and Intermixing Functions Partially Applied Double Facade Rain Water Collection and Waste Recycling Vertical Landscaping Circulation Ramp Bioclimatic Principles Tower System
5.3 EXPERIMENT SET-UP I
Inspired by Ken Yeang’s principles of constructed ecosystems, this experiment aims to define the relationship between form, microclimate, functional relations and structure. It is done by FEA analysis tools (KARAMBA) and environmental analysis tools (LADYBUG), which are incorporated into a form finding genetic algorithm.
Shanghai’s climatic data files of the past 25 years are used for analysing the effects of its climate on interior spaces. The analysis are aimed to establish the allocation of functions according to their specific needs. The values that are obtained from solar radiation analysis are determined by the functional usage within the building. Afterwards, functional usage map is analysed according to the connectivity of same functions. Functional distribution is also used in order to calculate the number of users and their total distance to the core area within the tower.
In terms of structure, the effect of wind load and gravity load on the generated form is analysed. While analysing the wind load, increasing wind speed and altitudes are also taken into account.
Such strategies are implemented by a feedback loop, which is established in order for design to respond not only one, but multiple criteria at the same time. The output of those experiments creates the base for a bioclimatic tower design. Output of the genetic algorithm is used as a base to develop each criterion.
160 Bioclimatic Principles Tower System
BIOCLIMATIC TOWER DESIGN
MICROCLIMATE
FUNCTIONAL RELATIONS
161 Chapter Main Heading FORM
STRUCTURE
Bioclimatic Principles Tower System
5.3.1 FORM FINDING SYSTEM
A set of basic parameters, including scale, rotation, axial displacement, and anchor point selection are used in the form finding process. Each rule has its own gene pool in the genetic algorithm.
For each iteration obtained by the gene pools, the obtained form is categorised directly correlated with how much wind load is exerted to, considering the increasing wind load as the altitude rises. In addition to that displacement, under wind and gravity loads, occurred on surface is also measured.
Another set of gene pools are used for selection of void and functional spaces, providing a base for assigning different functions by considering solar radiation analysis. Solar radiation analysis is based on the specific weather data file for Shanghai which takes an average of weather data collected over the last 25 years and it is important to note that the analyses are based on yearly input rather than seasonal values.
Assigned functions provide information on the total amount of square meter for each function in each floor which enables to calculate total number of people and their overall distance to the core area, which is used for circulation purposes. The occupancy is calculated by the average user number for one square meter and that amount is multiplied by the total square meter for each function in each floor. Average values are obtained by energy plus data files.
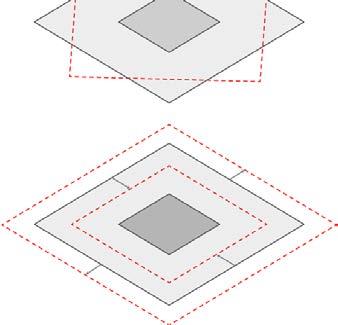
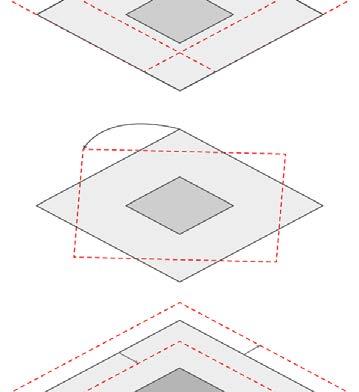
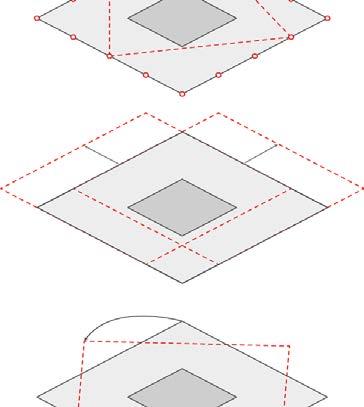
Rotation : 0-90o
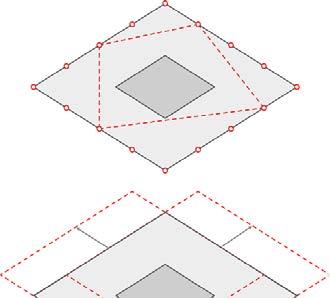
162
point selection
in y direction : 5m
RULES FOR FORM FINDING: Anchor
Move in x direction : 5m Move
Scale : 0.7:1 1.5:1 Form-Finding Tower Design System
Surface Displacement
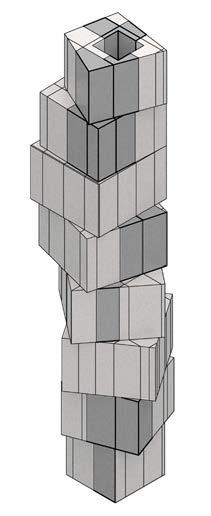
Under Wind Load and Gravity Load
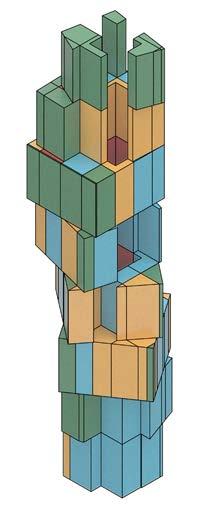
Void Space & Functional Space selection

Radiation Analysis of Functional Spaces Assigned Functions
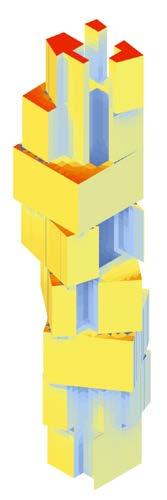
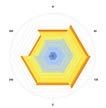
Total Distance of Users to Core Area
Commercial : 0.16 person/m2
Residential : 0.03 person/m2

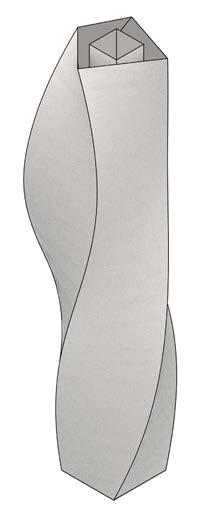
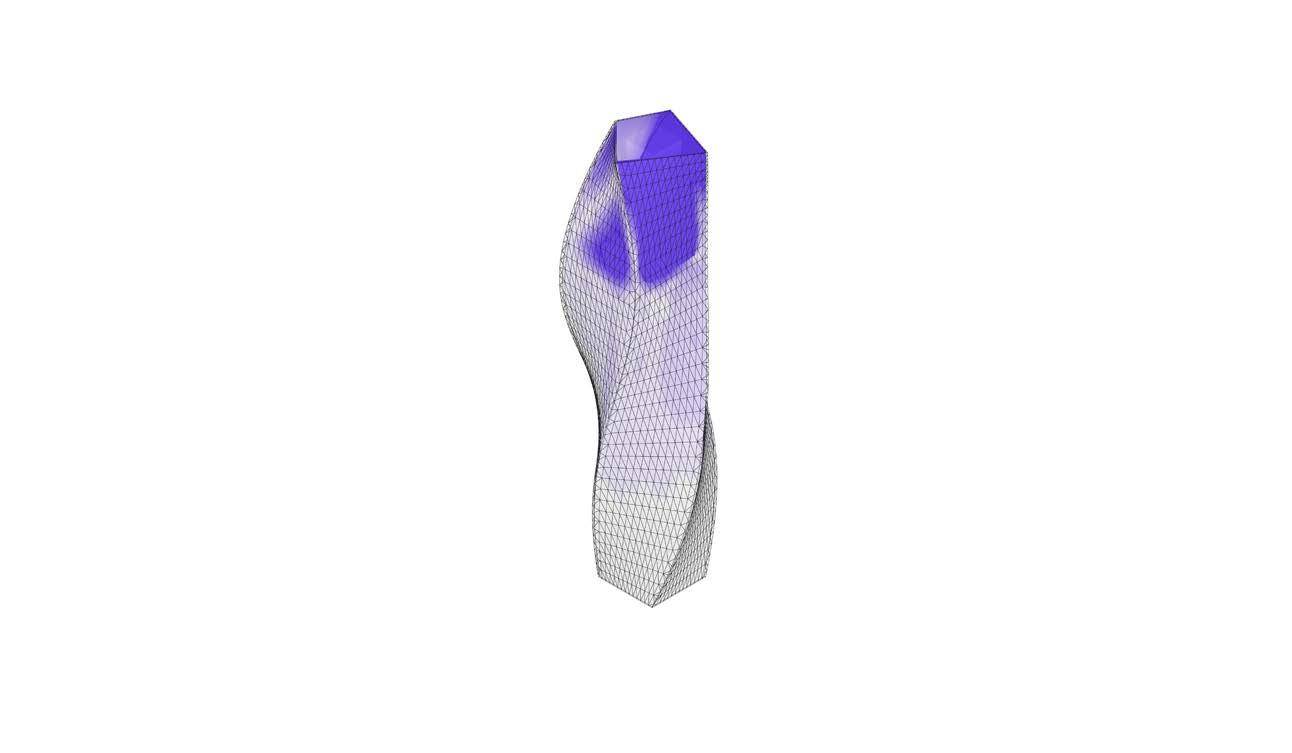
Offices : 0.07 person/m2
Aeroponic Systems : 0.02 person/m2
163
Form-Finding Tower Design System
Objectives for the genetic algorithm can be examined under 3 headings which are structural, circulation, and functional distribution strategy.
In terms of structural strategies, wind pressure on surface is minimized by the increasing wind pressure on the surface as the altitude increases. Another objective is to minimize the surface deflection under wind and gravity loads. With those objectives it is expected to obtain a form in which the slenderness ratio will increase gradually as the altitude increase.
As described before, the assignment of functions are based on solar radiation analysis of interior spaces, which is directly related with the form of the building. From the highest amount of solar radiation to the lowest, the functions are assigned as, green areas, offices, residential and green areas respectively. Green areas are assigned to the lowest and the highest amount of solar radiated spaces according to different growth conditions of plants. While some species require a higher amount of sunlight, other species, such as peas, require less. Assigning green areas into the spaces of the most and least solar radiation provides an opportunity to cultivate a wider variety of plants.
In terms of functional distribution strategies, void spaces are clustered, which will results in an increased connectivity of functional spaces. The form finding strategy manipulates the form and creates a suitable microclimate, aiming to maximize the connectivity of green areas as well as the connectivity of the similar functions, such as residential and office spaces. Another strategy is to increase the total amount of square meter separated for functional areas.
In terms of circulation strategy, functional distributions are used to calculate the occupancy in each floor in order to measure the distance of users to the core area where the circulation systems are located. Total distance of people to circulation systems is aimed to be minimized.
164
Form-Finding Tower Design System
FORM FINDING OBJECTIVES 5.3.2
STRUCTURAL STRATEGY
CIRCULATION STRATEGY
Minimize Wind Pressure
Minimize Structural Deflection
Minimize distance according to number of people from core
F.A.R RATIO
% ACTIVITY LEVEL + HOURS
FUNCTION DISTRIBUTION STRATEGY
Maximize functional areas
Maximize connection between Void spaces
Maximize connection of green areas
Minimize distance between same functions
165
Form-Finding Tower Design System
MINIMUM WIND PRESSURE
GA FORM FINDING ITERATIONS
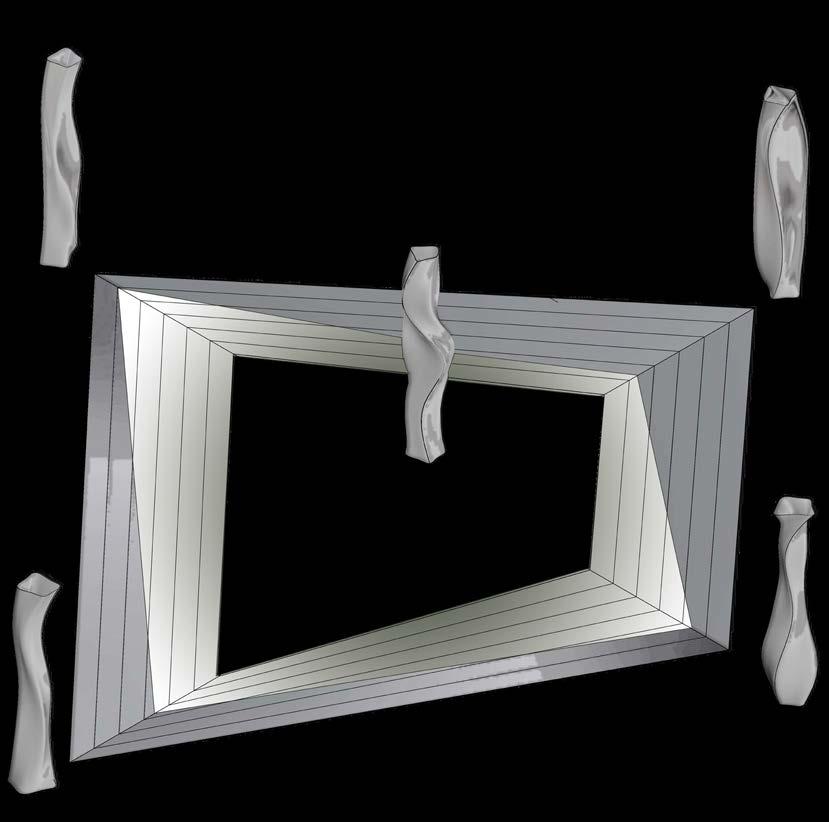
MAXIMUM TOTAL AREA
MINIMUM DEFLECTION
MINIMUM CORE DISTANCE
OBSERVATION
A genetic algorithm is run for 40 generations, with 15 individual in each generation. A total of 600 iterations are ranked in terms of their fitness values. While selecting the iteration that will best suited for all the determined objectives, a global ranking system is implemented to select an individual that responds best to each of the conflicting criteria, rather than for one criterion. It is observed that the best ranked individual obtained one of the last generations is generation 32, individual 13.
166 Chapter Main Heading
Form-Finding Tower Design System
15
5.3.3
40 GENERATIONS
INDIVIDUALS
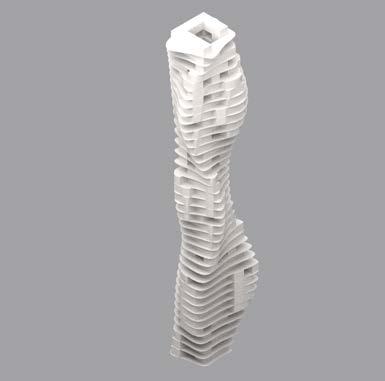
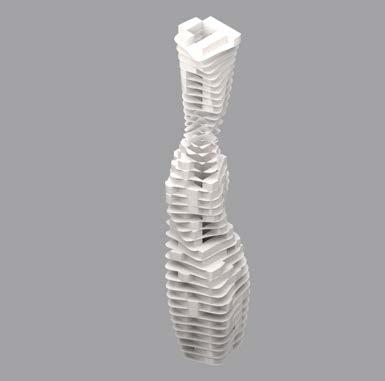
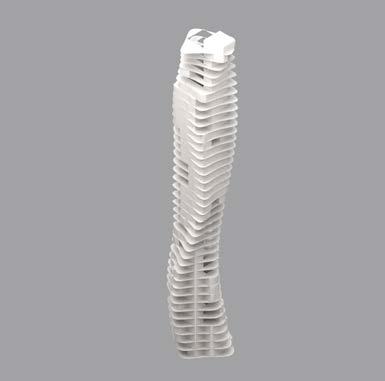
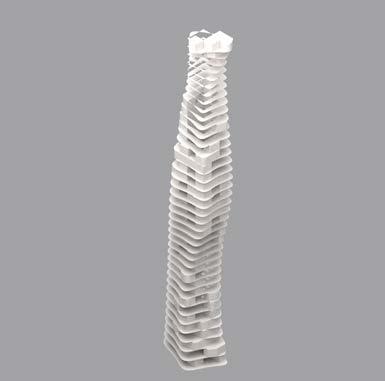
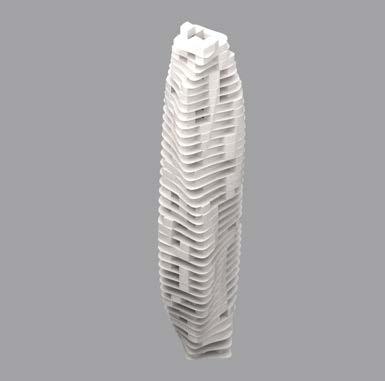
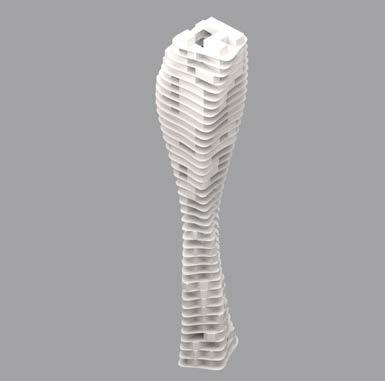
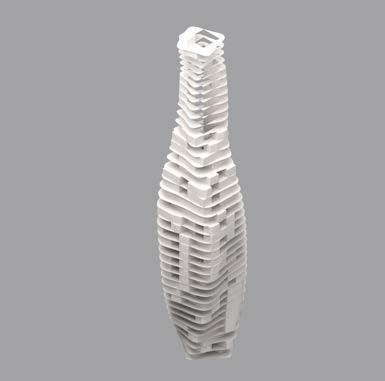
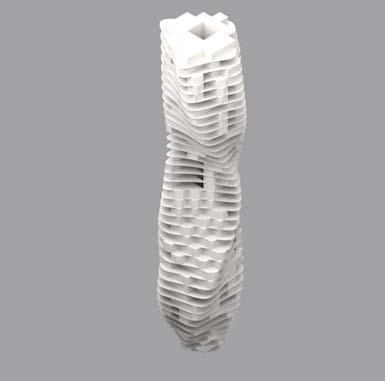
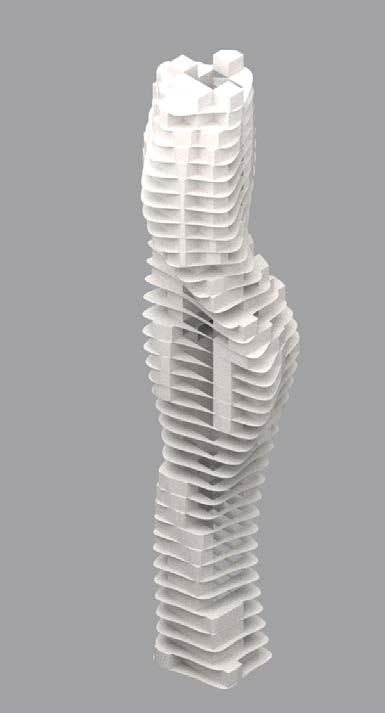
167 Chapter Main Heading GENERATIONS 22 GENERATIONS 2 INDIVIDUALS 7 GENERATIONS 9 INDIVIDUALS 15 GENERATIONS 24 INDIVIDUALS 5 GENERATIONS 5 INDIVIDUALS 12 GENERATIONS 12 GENERATIONS 27 GENERATIONS 32 INDIVIDUALS 13 RULES x 0.7: 1 1.5: 1 0o 90o 5 m 5 m y Form-Finding Tower Design System
OBSERVATIONS & CONCLUSIONS 5.3.4
The form finding genetic algorithm reveals the importance of form on controlling the microclimate inside the tower as well as the overall effect on external factors such as wind load on tower.
Upon studying the results in objective space, it is observed that over the generations, multi-objective genetic algorithm generates individuals that responds better to all the given criteria simultaneously.
Parallel coordinate plot is important to understand the relationship of criteria. Minimum displacement graph has out-ranged values which is caused by 3 iterations of invalid computer graphics. Those iterations are dispatched from the data tree, while determining the fittest iterations.
Standard deviation graphs are provided in order to illustrate the increase of fitness to the given criteria over generations. Within all criteria, maximizing total area of the functional spaces is the only one which fitness value is not increased. The possible reason for that may be, maximizing total area for functions objective is conflicting with the all other objectives at the same time. In order to increase overall fitness value of the generations the total amount of area could not be increased.
However, it is important to mention that the genetic algorithm output is used as a base to develop the design. In that thesis study, the advantage of using genetic algorithm can be interpreted as linking the ideas and creating a system that responds to the given objectives. All of the objectives that are mentioned in previous chapters are analysed individually and developed in further studies.
168
Form-Finding Tower Design System
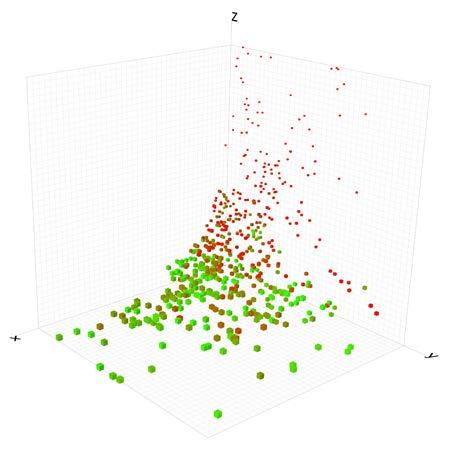
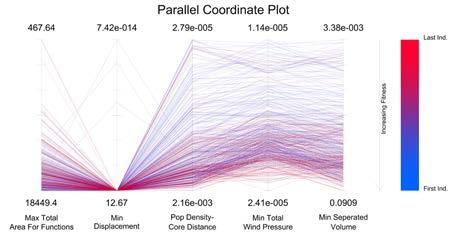
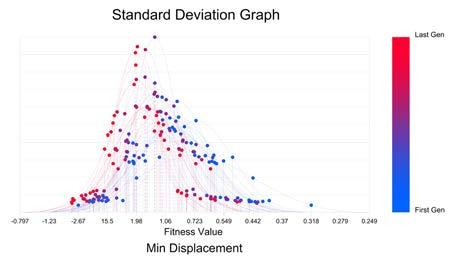
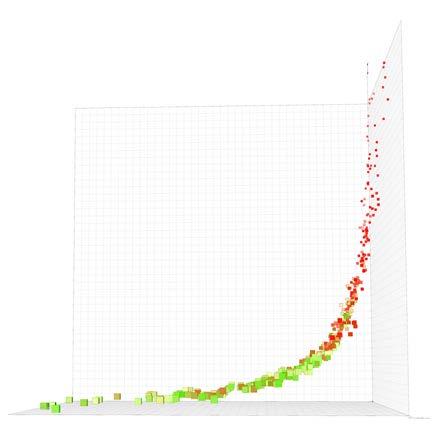
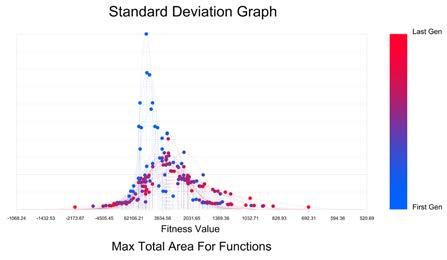
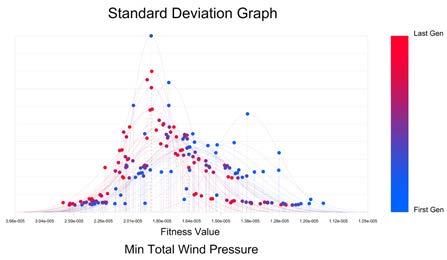
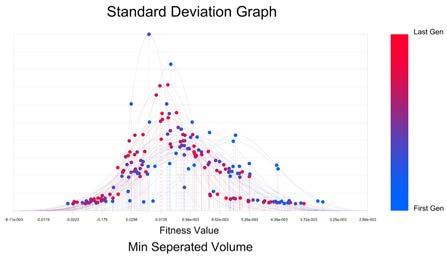
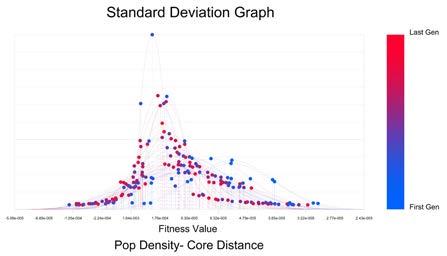
169 Objective Space Form-Finding Tower Design System
5.4 STRUCTURAL DEVELOPMENT
Form and the core area which are obtained as a result of genetic algorithm used as a base while designing the structure of the tower. Structural design of the building consist of primary structure and secondary structure.
Primary structure consist of external structure, radial slab beams and core structure. Secondary structure is responsible for carrying and distributing the lateral loads that are exerted on the facade, and it consist of double diagrid structure. Double layered structural system is selected due to the requirements of double facade.
While designing the structure various of computation techniques used such as Finite Element Analysis and Agent-based design system. These computational techniques are selected according to their potential benefits on the design process. Agent based system is used to create an efficient and lightweight structural design, based on the loads that affect the form.
The loads taken into account are wind load and gravity load. It is important to mention that earthquake loads are not taken into account.
170
Structure Tower Design System
External Structure
Secondary Structure
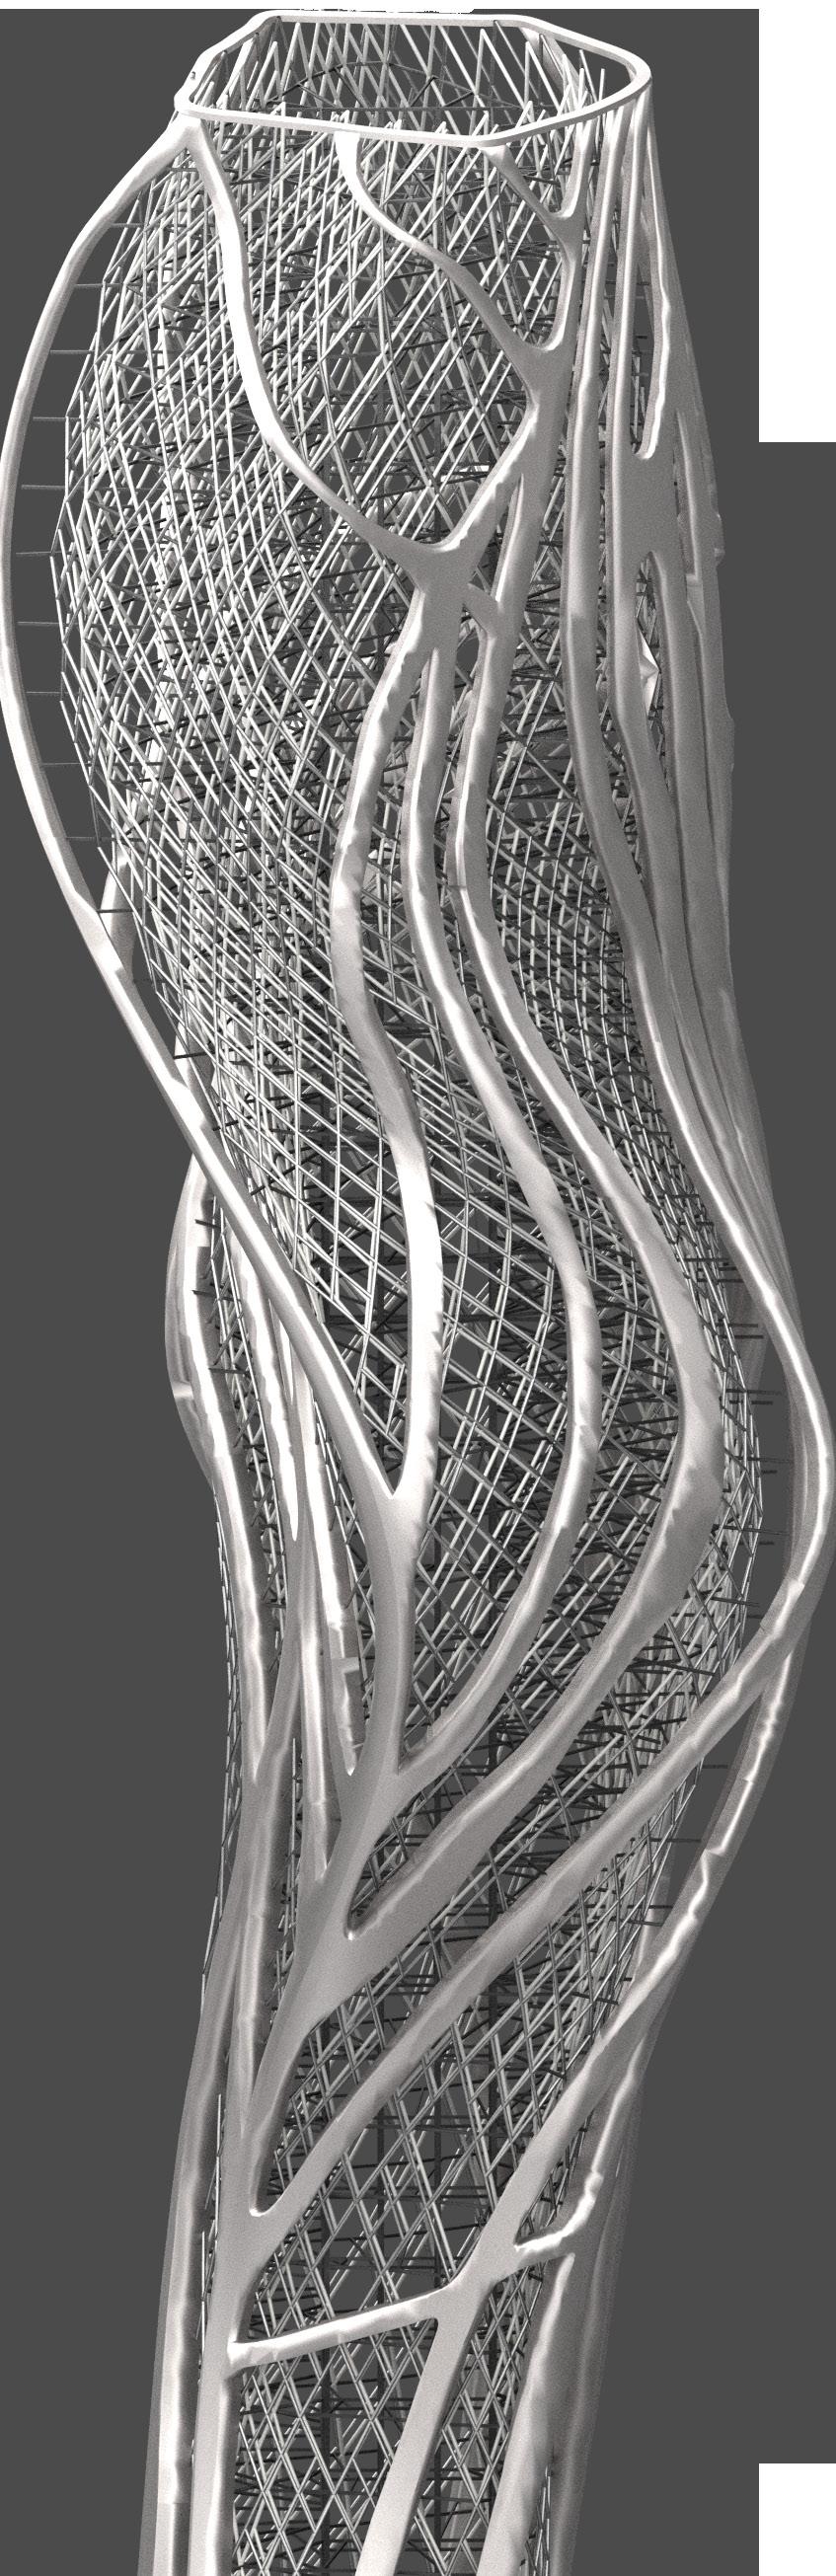
171
Structure Tower Design System
5.4.1 PRIMARY STRUCTURE
Primary structure of the building consists of 3 layers. From inside to outside, primary structure consists of core structure, radial slab beams and external structure respectively. While maintaining the circulation system inside, the core structure is designed as the main load-bearing element that is capable of resisting all the external factors, as well as gravity loads that affects the tower. Diagonalized I beam structure is used as an element to increase the stability of the core systems against lateral loads. Diagonals are designed with a consideration of not blocking the entrances of elevators that are located inside the core structure. Specifically, as an I beam, HE 1000 x 494 type, which has 1036mm beam height, 309mm Flange width, and 31mm web thickness, is tested under the given load cases.
Radial slab beam systems are not only designed to carry the slabs of the tower but also to maintain the connectivity of core structure with external structure. Connectivity is provided by the connection beams that go beyond the slab boundaries and connect the external structure. As an I beam, HE 160 A type beam with 152mm beam height,160 mm flange width and a 6mm web thickness is tested under the given load cases.
172
Structure Tower Design System
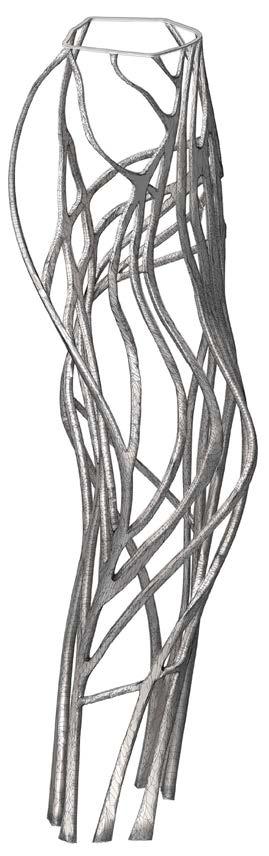
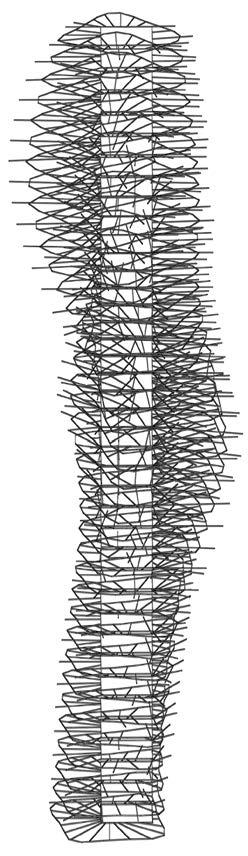
173 Core Structure Slab & Connection Beams External Structure Structure Tower Design System
5.4.2 EXTERNAL STRUCTURE DESIGN PROCESS
Agent based system is selected as a methodology while designing the external structure. The reasoning for selecting the agent based system is to minimize the material usage by presenting an organic structure as an output which is specifically designed under the requirements of the form under the given load conditions.
As a starting point, the form is tested under the wind and gravity loads in order to obtain surface utilization map which calculates the ratio between yield stress and Von Mises yield criterion with the help of finite element analysis tools (KARAMBA). Yield stress can be basically described as the stress point at which material begins to deform plastically.
As a second step, a grid of points on top the surface are assigned as attractor or as a repelling force to create a force field that the agents will act accordingly with the help of surface utilization map. Points that are located in higher stress zones have an attractor force to pull the agents towards themselves and points that are located in lower stress value zones have a repelling force to push the agents from themselves which allows the agents to be concentrated on higher stress zones.
As a last step, in order to create an external structure that supports all the high stress zones of the surface with a least amount of material, the shortest walk algorithm used to simplify the agents paths.
SOURCE. “Yield Stress - an Overview | ScienceDirect Topics.” n.d. Accessed January 6, 2019. https://www.sciencedirect.com/ topics/materials-science/yield-stress.
“What Is the Meaning of the Von Mises Stress and the Yield Criterion?” 2017. SimScale. April 19, 2017. https://www. simscale.com/blog/2017/04/von-mises-stress/.
174
Structure Tower Design System
S urface Utilization Map
Applied loads:
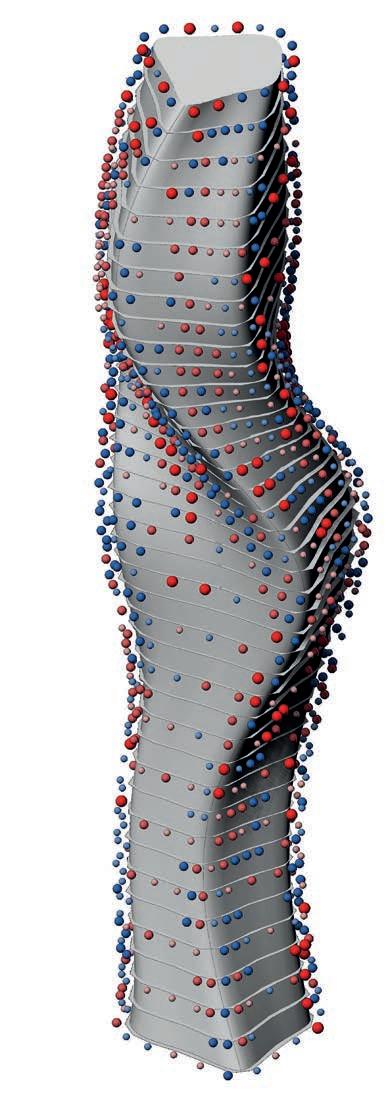
Wind load
Gravity load
Repeller
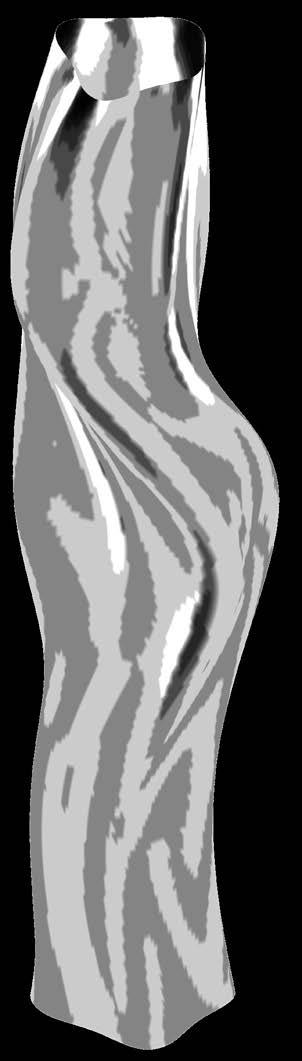
Attractor
S implified agents paths
175 INPUT
Structure Tower Design System
5.4.2 EXTERNAL STRUCTURE DESIGN PROCESS
Selected agent paths are used as an input to create an external structure. In order to decrease the overall external structural dead load, the structure is designed in a way that manipulates the thickness of the form so that the top of the tower is exposed to as little amount of weight as possible.
In order to analyse the maximum displacement on the primary structure that carries the core structure; the radial beam system with connection beam and external structure, a finite element analysis is done on the structure by applying the wind and gravity loads.
Wind loads are calculated based on the increasing wind speed as the altitude increases. A wind speed of 30m/s at 10 meter above from the ground and 50m/s at 200 meter above from the ground is taken into account.
As a result a maximum displacement of 0.207 meters is calculated on the primary structure.


176
Wind Profile Height m 0 50 m/s 220 180 160 140 120 100 80 60 40 20 0 core slabs exoskeleton P rimary Structure S econdary Structure facade structure [secondary structure]
Structure Tower Design System
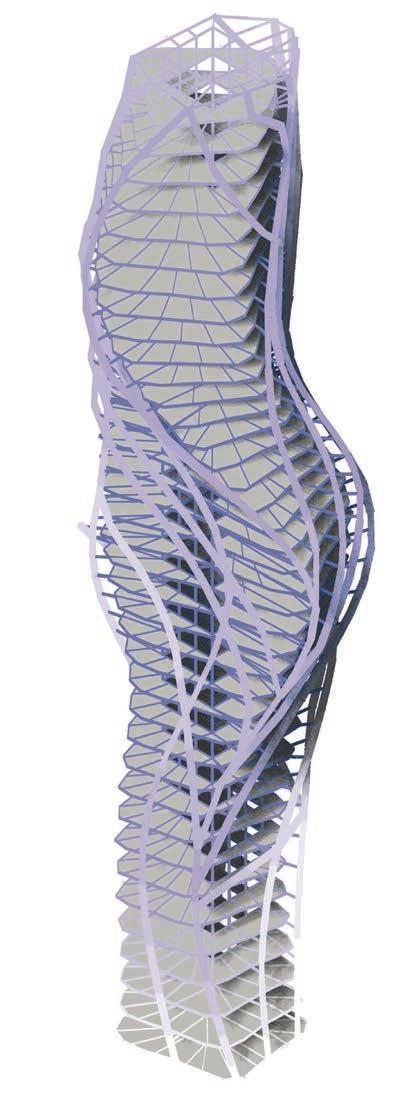
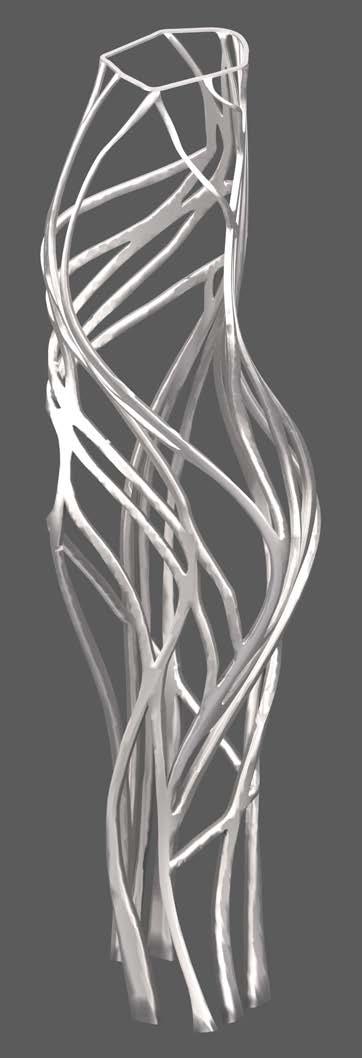
177 Output Structural Analysis
rimary Structure E xternal Structure Structure Tower Design System
Max Displacement: 0.207 m P
5.4.3 SECONDARY STRUCTURE DESIGN PROCESS
In addition to the primary structure, a secondary structure is designed to carry and transfer the additional load of the facade system to the primary structure.
Different patterns applied on surface and according to the absolute value of Gaussian curvature, the number of subdivision is increased for each pattern.
Diagrid, triangular and quadrangular patterns are applied on surface, in order to understand which geometry is more suitable to to add onto the primary structure.
Secondary structures that are based on different geometries are tested with finite element analysis method under the same load conditions and compared according to the maximum displacement occurred on the structure as well as total required amount of material to build the structure.
In terms of the maximum displacement values, from most to least, quadrangular grid structure, triangular structure and diagrid structure has the values of 12 , 9.2 , 8.5 centimetres respectively. Thus, the least amount of structural displacement is obtained on the diagrid structure.
The results also reveal that, within the tested patterns, diagrid structures need the least amount of material to be constructed. Due to those reasons, diagrid structure is selected for secondary structure.
178
Core
Exoskeleton Primary Structure Secondary Structure facade structure [secondary structure] Structure Tower Design System
Slabs
curvature -
Diagrid Structure
Max Displacement: 0.085 m
Total Length: 56684 m
triangular Structure
Max Displacement: 0.092 m
Total Length: 142122 m
Quadrangular Grid Structure
Max Displacement: 0.12 m
Total Length: 82260 m
curvature +
179
Structure Tower Design System
5.4.3 SECONDARY STRUCTURE DESIGN PROCESS
5.4.3.1
RECURSIVE SUBDIVISION OF SURFACE
In order to determine the structural pattern dimensions, recursive subdivision on surface with different patterns are done according to the surface curvature. Gaussian curvature is used for the analysis of the surface curvature.
According to the absolute value of Gaussian curvature on the surface, the number of subdivision increases. The parts that has less curvature is subdivided once and the parts that is of higher Gaussian curvature are subdivided twice, which will increase the stability of structure.
In addition to the increase of stability, another advantage of subdividing high curvature area of the surface recursively is that it enables the construction to be built more precise and easier.
The following diagrams illustrate the diagrid structural subdivision.
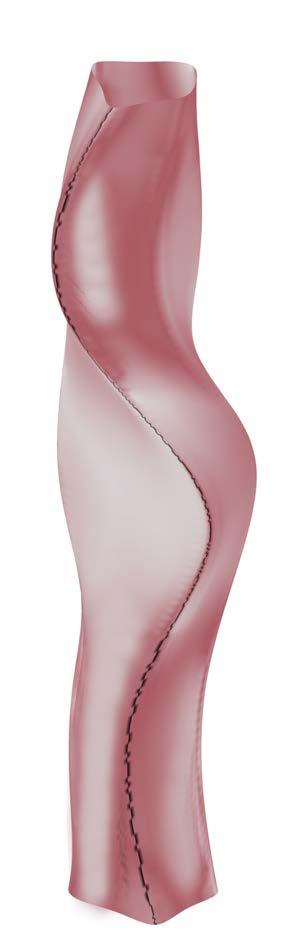
180 Absolute Curvature of Surface Subdivision Logic According to absolute curvature value of a surface
Structure Tower Design System
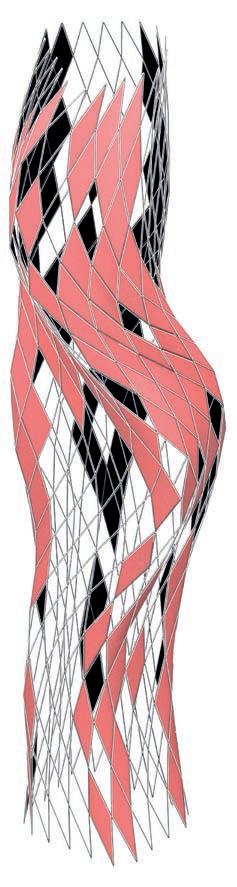
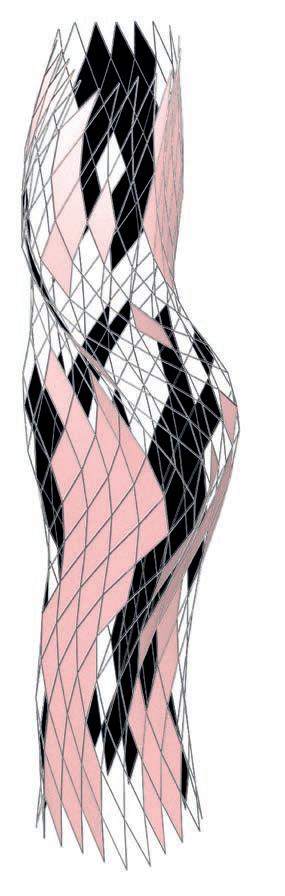
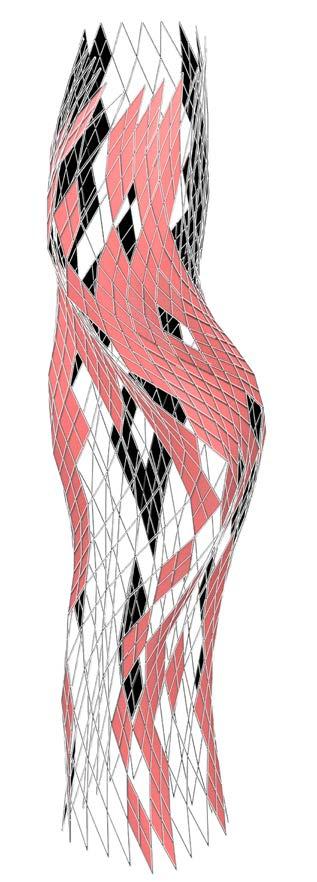
181 More Curvature Less Curvature Subdivided Structure Structure Tower Design System
5.4.4 STRUCTURE DESIGN DETAILS
The diagram shows the designed details for the connection of secondary structure to slab beams, the connection detail of diagrid structures to each other and the connection of external structure with the diagrid structure.
Diagrid structure used as a facade structure is designed as two layers in order to support the double skin facade.
External structure obtained as a result of agent based algorithm is designed as a steel pipe structure. External structure consists of 4 pipe structure in each corner and one main pipe structure that has larger radius in the centre. Pipes are cross braced in order to increase their durability against lateral loads.
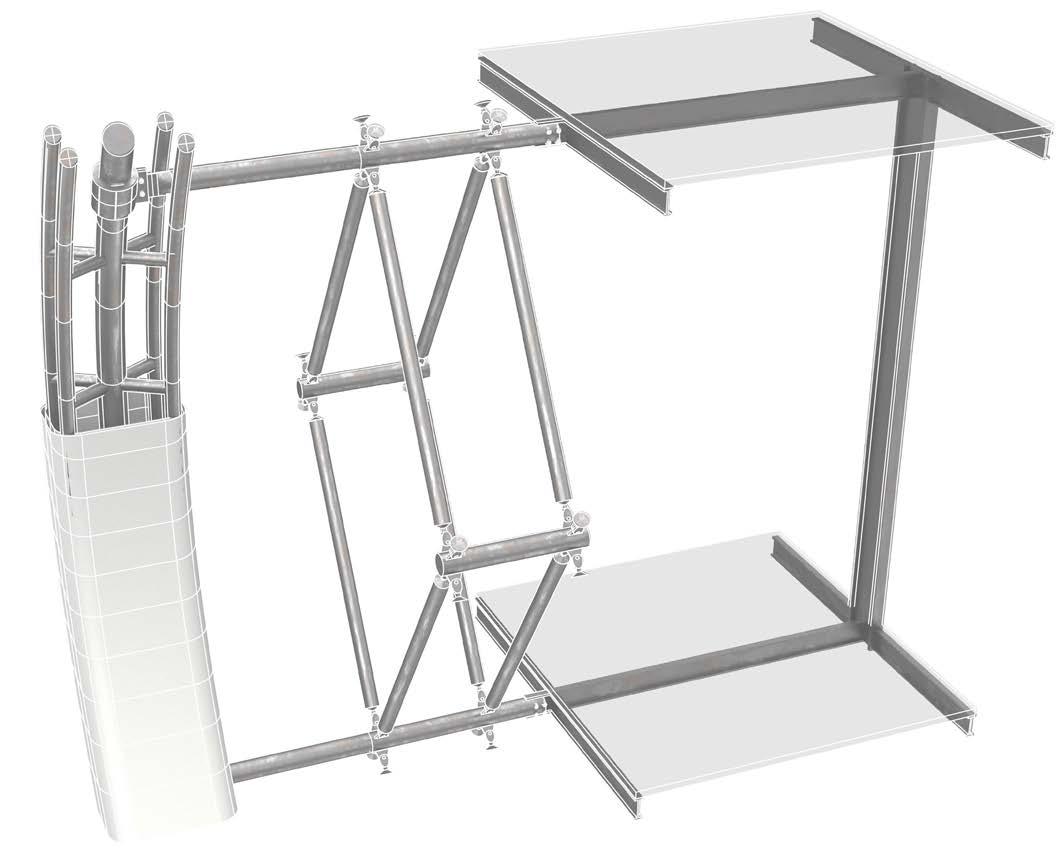
182
External Structure Slab Boundary Beam Core Structure 3 2 1
Structure Tower Design System
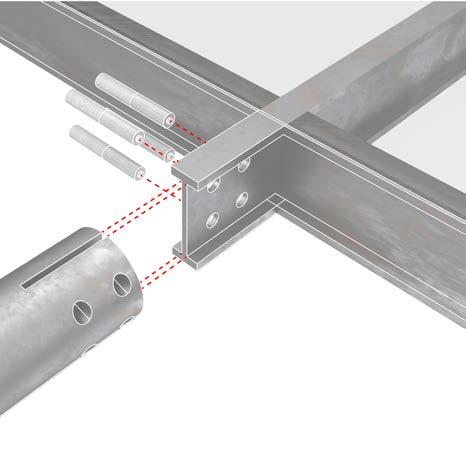
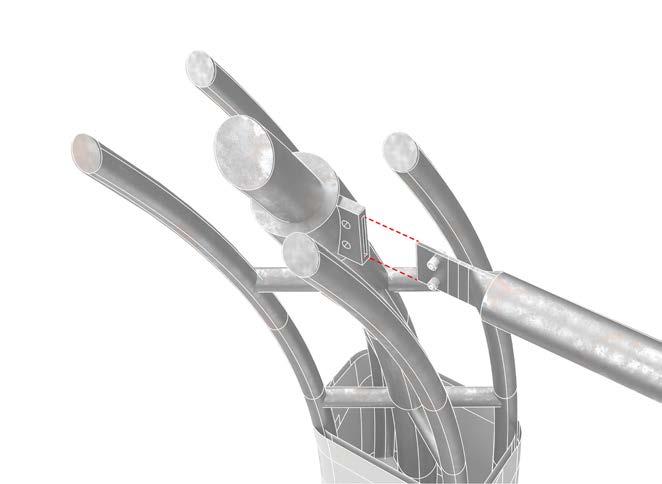
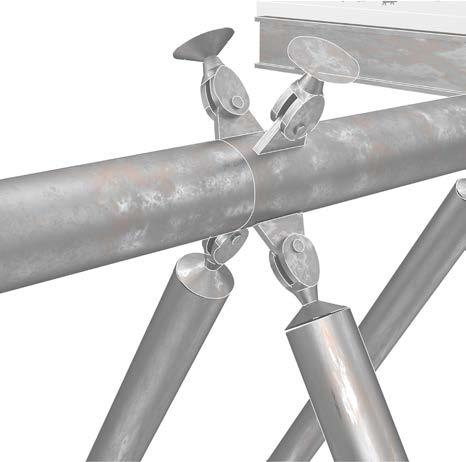
183
1
Diagrid- Slab Beam Connection
3 Diagrid connection detail 2 Structure Tower Design System
External structure -Slab Beam Connection
5.5 SPACE ORGANIZATION
5.5.1 FUNCTIONAL DISTRIBUTION ACCORDING TO SOLAR RADIATION


As previously mentioned, the distribution of function and the open spaces are included in the genetic algorithm. The objective was to maximize connectivity of each function that is determined according to the amount of solar radiation they receive.
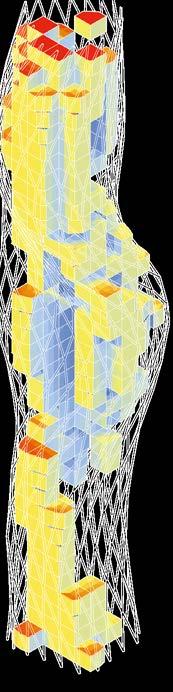
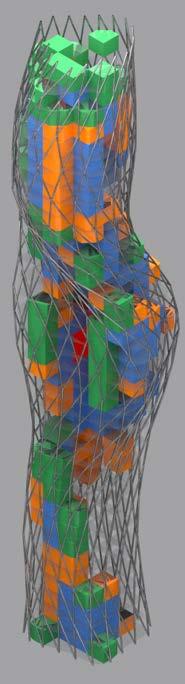
Functions are assigned to the selected spaces by the algorithm itself by considering the daytime usage and energy consumption of different functions. Spaces that are exposed to the most and least solar radiation are assigned as green areas, where aeroponic systems will be located.
According to the data obtained by “Energy +”, occupancy schedule for the residential spaces are limited with early mornings and evenings, therefore in order to use sunlight hours more effectively, office spaces are prioritized in terms of the solar radiation amount they receive.
World Health Organisation (WHO) recommends 25 square meters of green area per resident in urban developments. However, as built systems are mostly inorganic structures, it is preferred that organic mass is equivalent to the inorganic mass.
As a result, the overall distribution of the green areas occupy 50% of the whole area in the tower, where residential spaces and office spaces occupy 30% and 20% respectively.
184
Functional Relations Tower Design System
Distribution %
Residential 30% Offices 20%
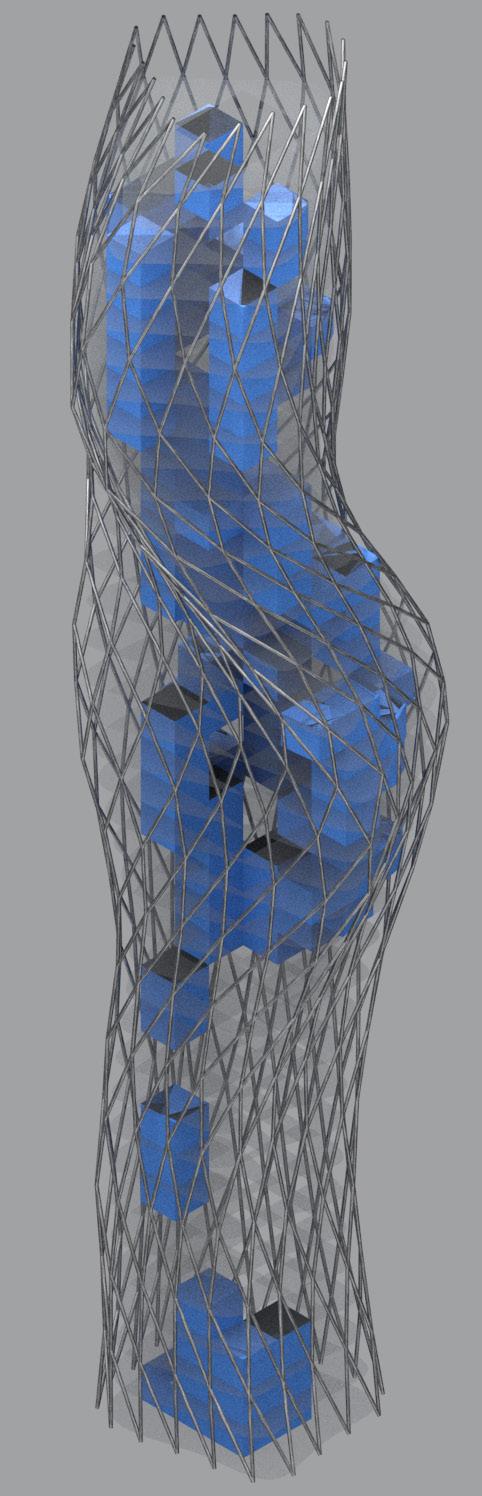
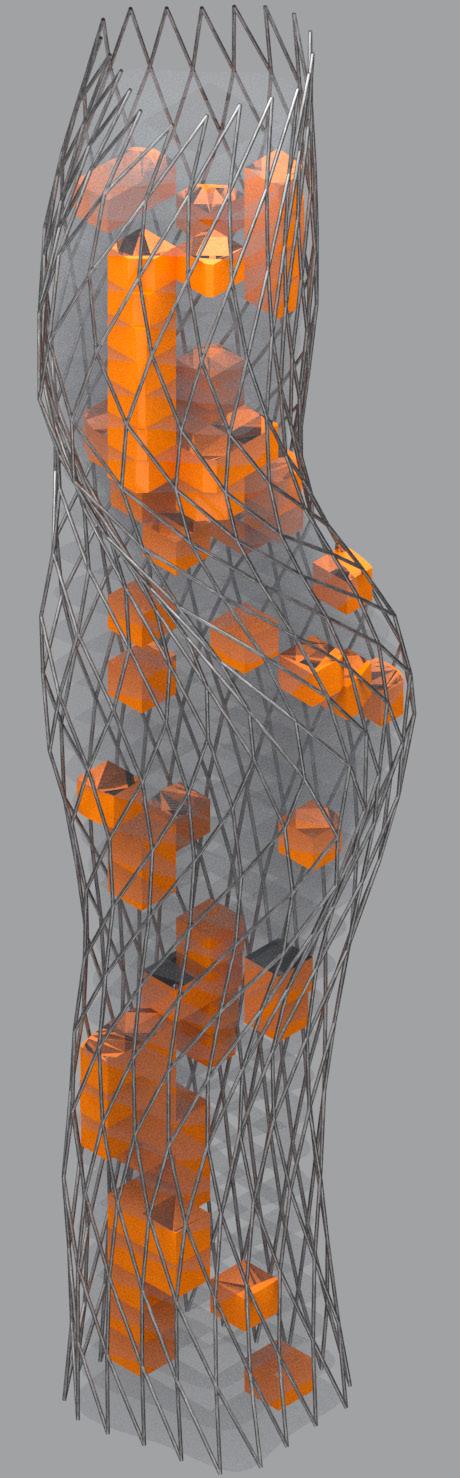
Green Zones 50%
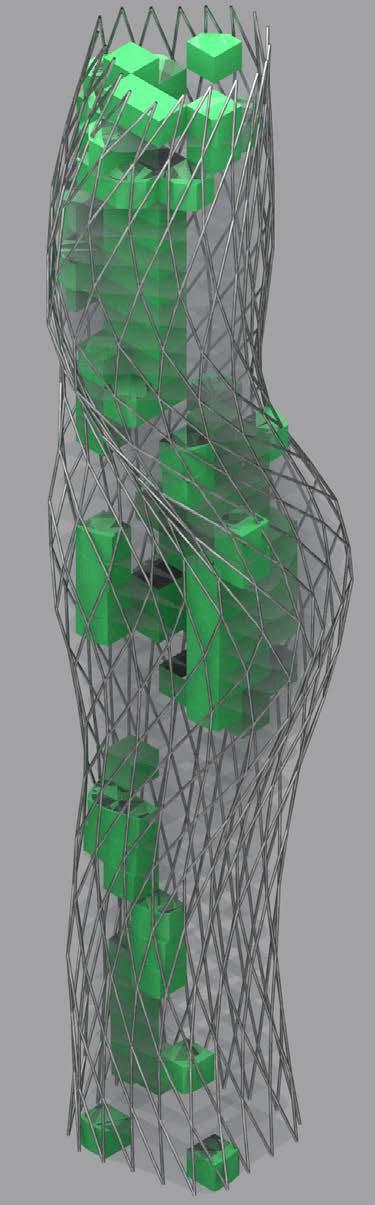
185
Functional Relations Tower Design System
5.5.2 CONNECTIVITY OF FUNCTIONS - METABALL STUDY
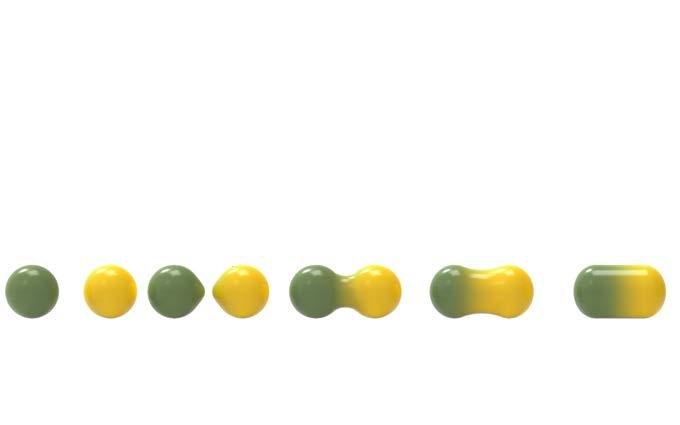
After determining the functional distribution in three dimensional environments, in order to increase the connectivity of same functions, each function is converted to a separate point cloud.
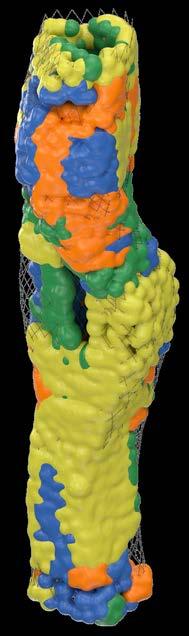
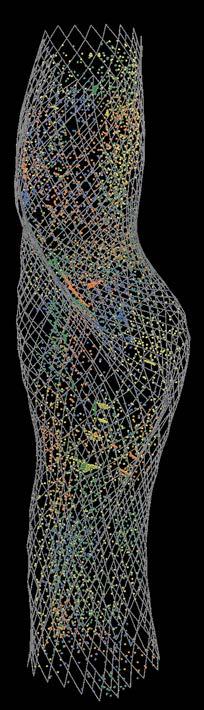
In that experiment, building’s certain portions that are defined as open spaces by the genetic algorithm also have a point cloud. The fundamental logic of including those spaces is to increase the connectivity of open spaces, which would eventually propose a climatically controlled large open space within the building, to be later defined as atrium. Those climatically controlled spaces are able to provide a suitable environment for plant growth.
In order to increase the connectivity of similar functions, each point is defined as a function in three-dimensions and a threshold value is defined. A graphical technique in computation called Metaball is used to show such relations within the building. A threshold value which is 1 meter is also chosen to define a solid volume. A typical function chosen for metaball is; Where; is the centre of the metaball. In such case, it is
Blinn, James F. n.d. “A Generalization
“Metaballs.” 2018. Wikipedia. https://en.wikipedia.org/w/index.php?title=Metaballs&oldid=832643078.
186
POINT CLOUD
METABALL CONNECTIVITY
Functional Relations Tower Design System
22.
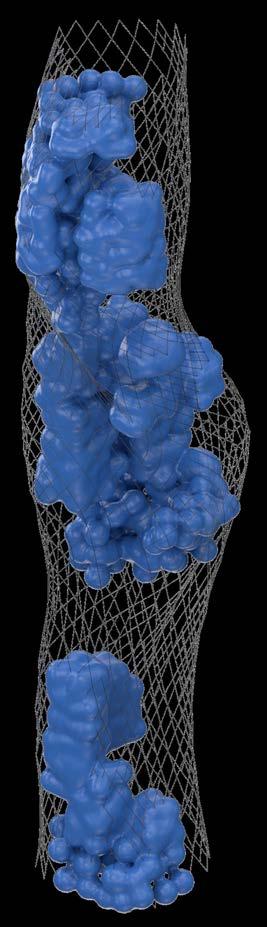
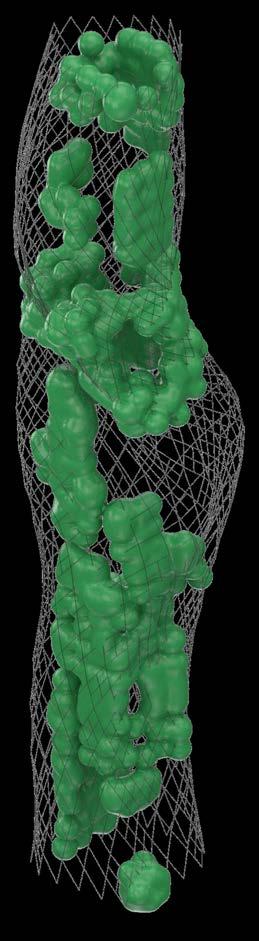
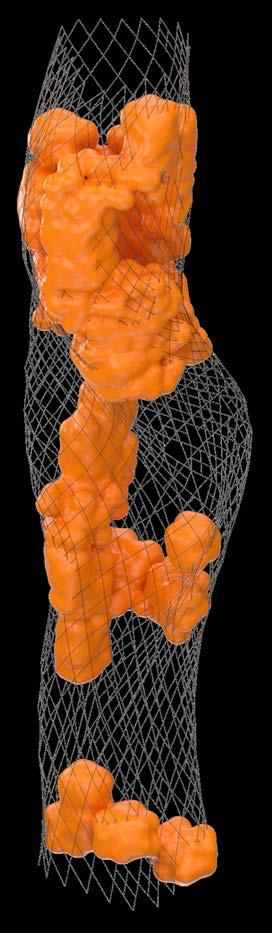
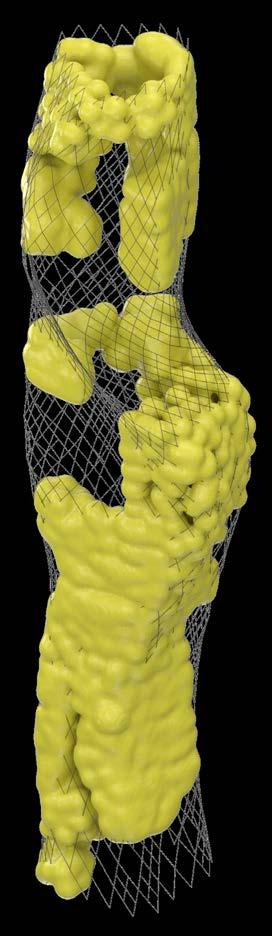
187 RESIDENTIAL OFFICES
OPEN
Functional Relations Tower Design System
GREEN AREAS
SPACES
5.5.3
FUNCTIONAL DISTRIBUTION
Using metaballs as a step before the final allocation of the functions within the three dimensional mass, in comparison to the output of the generic algorithm, has increased the relations between the similar functions by improving both vertically and horizontal circulation.
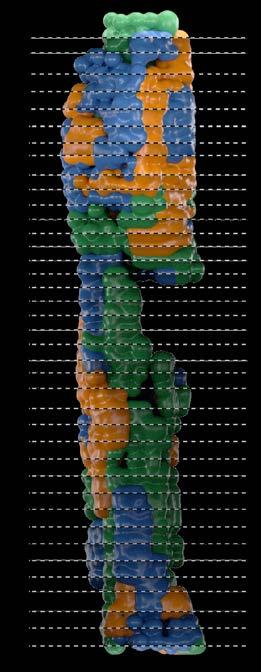
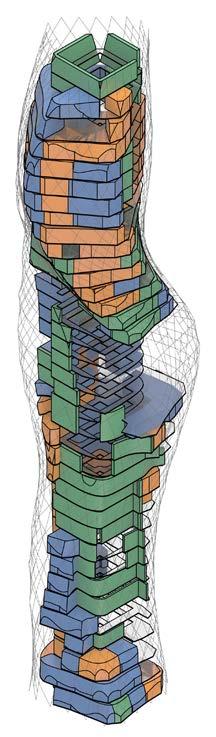
Although most of the functions, including open spaces, have been clustered together, there are areas where the functions are still separated from their clustered neighbours. Especially in terms of open spaces, that situation creates an advantage of using those areas to improve the cross ventilation within tower which is determined as a strategy to reduce relative humidity within the building.
Increasing the connectivity of open spaces also results in a height of six storeys, which can be used as a vertical garden to enhance its interaction with the users.
As a result, the organic spaces has greater spatial and environmental diversity for the users, as opposed to compartmentalization of the internal spaces.
OBSERVATION CONCLUSION
A total area of 4927 m2 residential, 3105 m2 office, and 2598 m2 of green area is obtained. 1102 m2 of green areas used as a floor area of microclimate zones. Those spaces will be used to increase the interaction of users with the constructed nature. 1496 m2 aeroponic area contributes to 8979m2 of total aeroponic production area.
188
Functional Relations Tower Design System
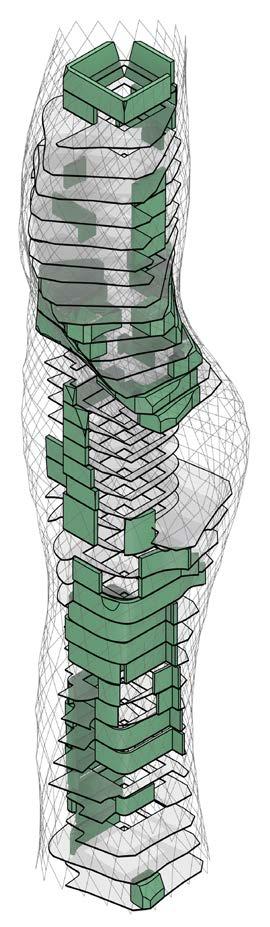
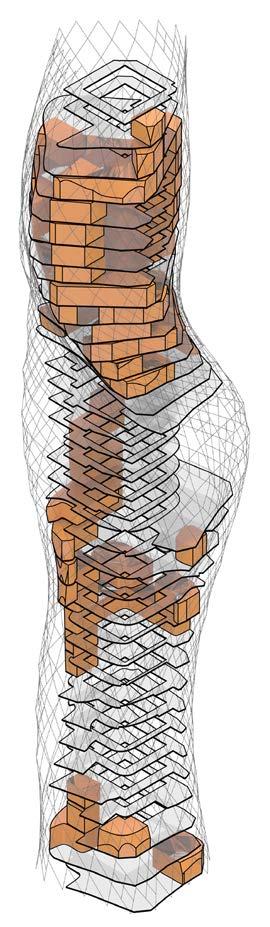
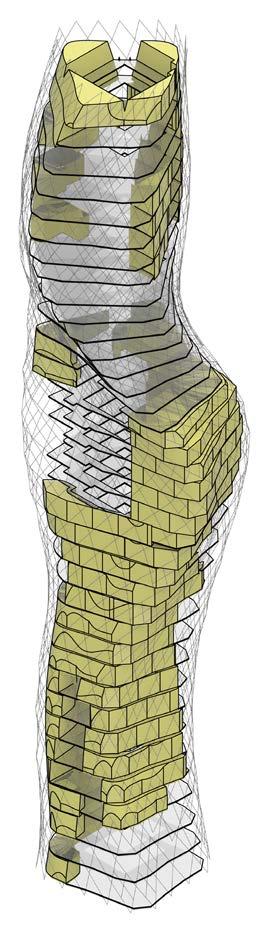
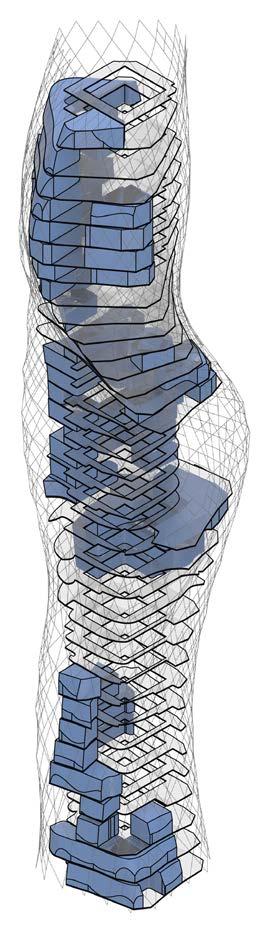
189
RESIDENTIAL
OFFICES GREEN AREAS OPEN SPACES Functional Relations Tower Design System
Total Area : 4927 m2 Total Area : 3105 m2 Total Area : 2598 m2
FLOOR PLAN ORGANIZATION
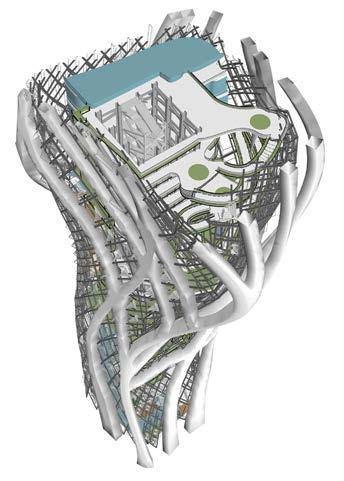
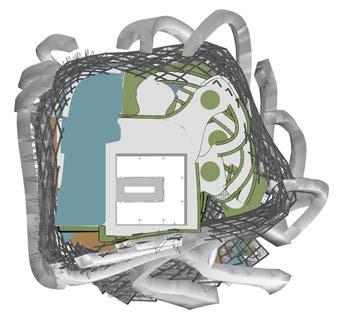
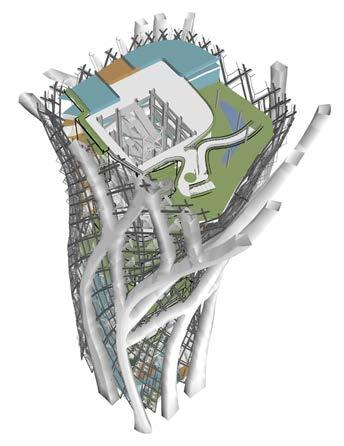
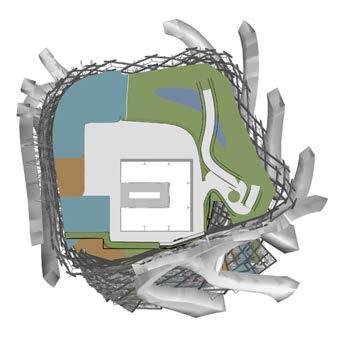
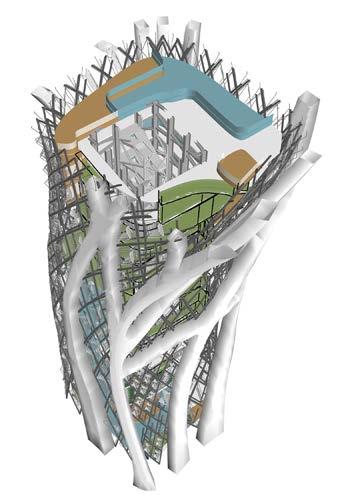
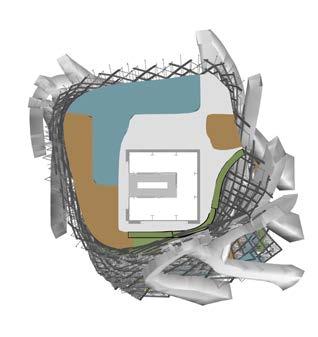
190
Floor Number : 16th Floor Top View Floor Number : 16th Floor Perspective View Office Residential Green Areas Floor Number : 19th Floor Top View Floor Number : 19th Floor Perspective View Floor Number : 23th Floor Top View Floor Number : 23th Floor Top View 5.5.4 Functional Relations Tower Design System
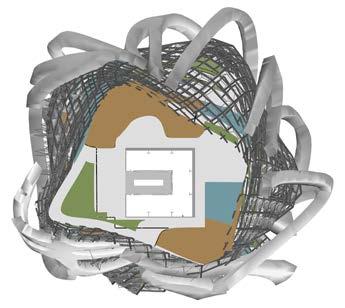
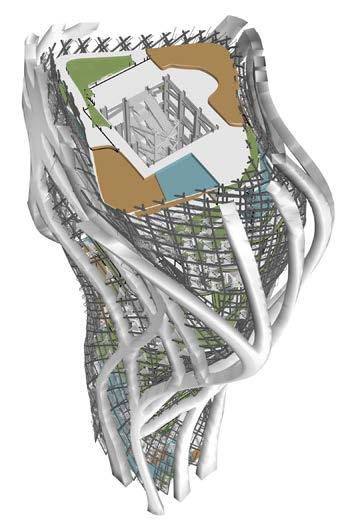
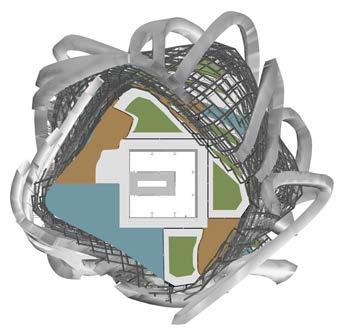
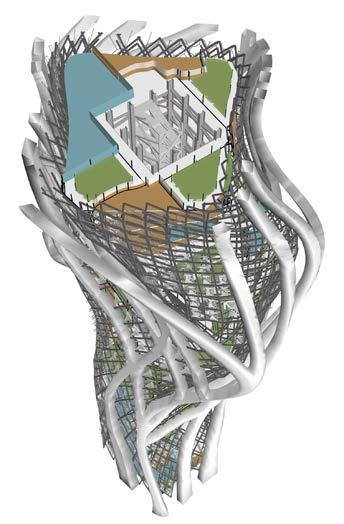
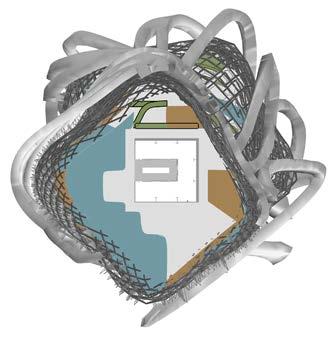
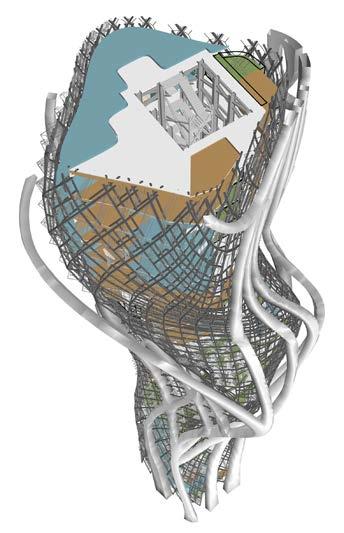
191 Floor Number : 26th Floor Top View Floor Number : 26th Floor Perspective View Floor Number : 28th Floor Top View Floor Number : 28th Floor Perspective View
Number : 36th Floor Top View
Number : 36th Floor Perspective View Functional Relations Tower Design System
Floor
Floor
5.6 VERTICAL CIRCULATION SYSTEM
The circulatory system consists of main elevators, local elevators, and stairs located in core area and atrium area. System is designed according to the number of users calculated based on the data obtained from “Energy + “ (HONEYBEE).
The values of the number of users per square meter are multiplied with the areas of each function every floor. The ratios are 0.07 , 0.03 , 0.02 used for office, residential and green areas respectively.
In order to determine the access levels of main elevators, the total population in the building is approximately divided by 3. The occupancy is calculated as 210 in the first 20 floors, 204 people between 20th to 30 floors and 237 people between 30th to 40th floors. Therefore, the main elevator system has three levels that contains two elevators in each level. All the elevator systems are located in the core area.
To enhance immediate access of users to essential facilities and to decrease the transportation time in peak hours, local elevators are included to the circulatory system. Local elevators provide transportation between 20th to 40th floor levels.
In addition to the elevator systems, main stairs are also located in core area. Continuous stairs are designed from the ground floor till the 40th floor. Stairs are also used to increase the connectivity in common spaces and connecting green areas to each other in the atrium space, which is designed with the purpose of increasing the interaction of users with the green environment provided in the atrium space.
192
Functional Relations Tower Design System
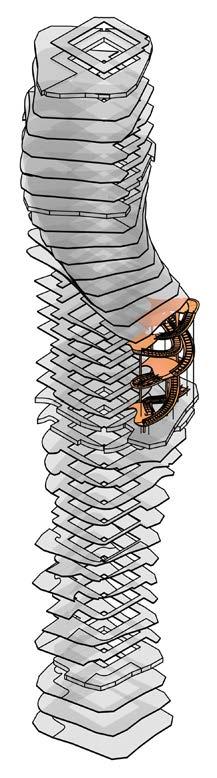
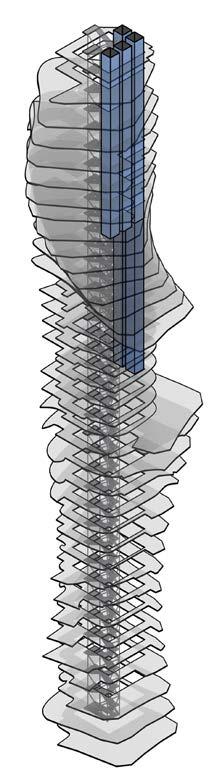
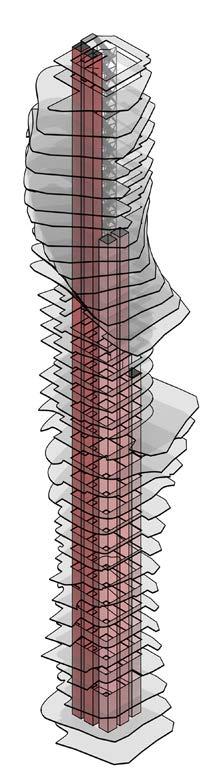
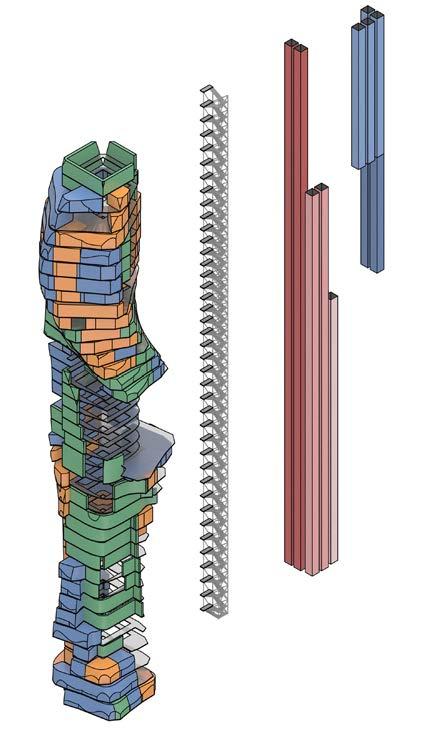

193 MAIN ELEVATORS CIRCULATION SYSTEM Stairs 10 20 20 Floor 210 Users 30 Floor 204 Users 40 Floor 237 Users 30 40 th th th th Main Elevators Offices 0,07 person/m2 0,03 person/m2 0,02 person/m2 Residentials Green Areas Local Elevators LOCAL ELEVATORS & STAIRS ATRIUM STAIRS Functional Relations Tower Design System
5.7 AGRICULTURAL SYSTEM
5.7.1 CROP / SEASON DAYLIGHT
In order to assign plants cultivated in aeroponic walls and rooms, direct sunlight hours analysis is run on the green spaces for each season.
For each season, green areas are separated into 3 different classes receiving different direct sunlight hours. For each class, the average of direct sunlight hours is taken into account in order to determine which plant species are more suitable to grow. Total area for each class is calculated in order to obtain the amount of crops that to be produced.
Total footprint area of green spaces that to be used as plant production spaces is calculated as 1496 m2. By considering the shelves number, the obtained area is multiplied by six. The shelf numbers are obtained by dividing the floor height ( 4500mm x 750mm) which is set as the required height for plant production. As a result, total plant production area is calculated as 8979 m2.
In spring, the average direct sunlight hours of each class is calculated as 3.5 , 4.5 and 6 hours. Considering the growth season and the sunlight hour requirements of the plants, Bok Choy, Cabbage and Spinach are assigned to the classes to be planted respectively. For each class, the total production area is calculated as 2100m2, 2479m2, and 4399m2 respectively, which will be used to calculate amount of produced crops in terms of kilogram.
During summer, the average of direct sun light hours of each class is calculated as 3 , 4 and 6 hours. The seasonal plants that receive adequate sunlight are selected as Pepper, Potato and Tomato. For each class the total production area is calculated as 1573m2, 2427m2 and 4978m2 respectively, which will be used to calculate the amount of produced crops in terms of kg.
194
Functional Relations Tower Design System
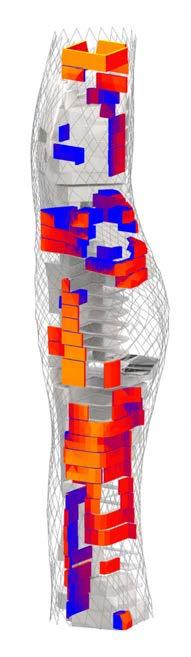
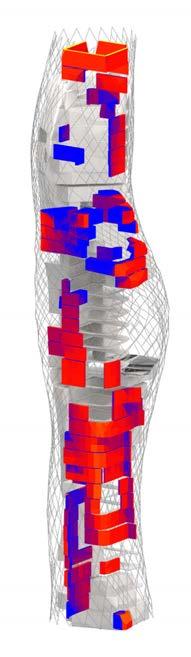
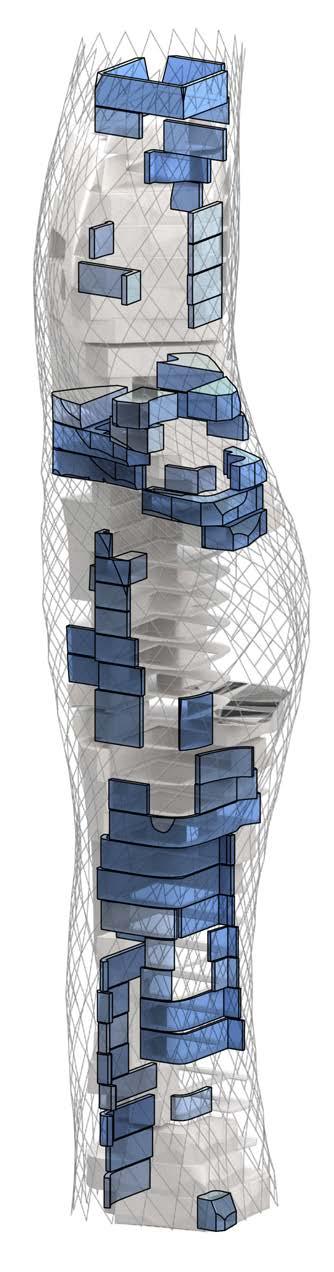
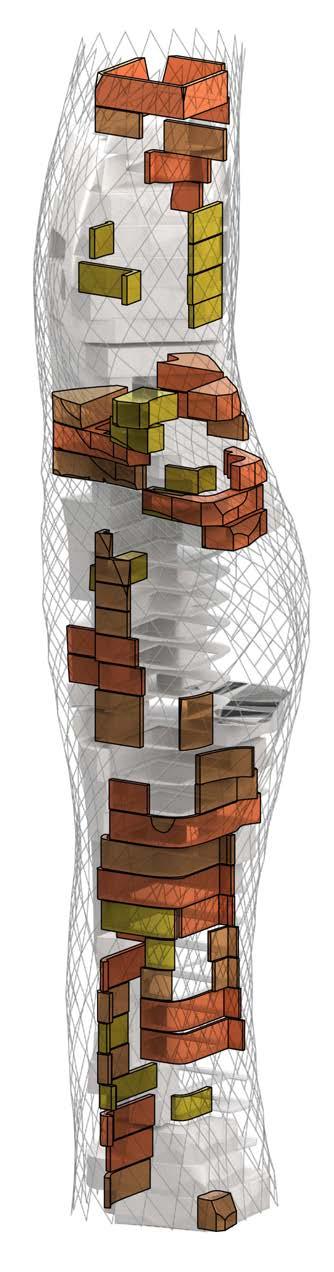
195 Tomatoes Summer Cabbage Spring Total Production Area : 8979 m2 Bok Choy Spinach Pepper Potatoes Selected Plants 2479 m2 Direct Sun Light Hours Total Area of Production 3.5 Hours 4.5 Hours 6 Hours 2100 m2 4399 m2 Selected Plants 2427 m2 Direct Sun Light Hours Total Area of Production 3 Hours 4 Hours 6 Hours 1573 m2 4978 m2 Functional Relations Tower Design System
5.7.1 CROP / SEASON DAYLIGHT
In Autumn season, the average direct sunlight hours of each class is calculated as 3 , 5 and 7 hours. Considering the growth season and the sunlight hour requirements of the plants, Bok Choy, Cabbage and Potatoes assigned to the classes to be produced respectively. For each class the total production area is calculated as 2133 m2, 3451 m2 and 3394 m2 respectively, which will be used to calculate the amount of produced crops in terms of kg.
In winter, the average of direct sunlight hours of each class is calculated as 3 , 4 and 7 hours. Taking the growth season and the sunlight hour requirements of the plants into consideration, it is suitable to plant Peas, Bok Choy and Lettuce.. For each class the total production area calculated as 2706 m2, 2513 m2 and 3759 m2 respectively, which will be used to calculate the amount of produced crops in terms of kg.
196
Functional Relations Tower Design System
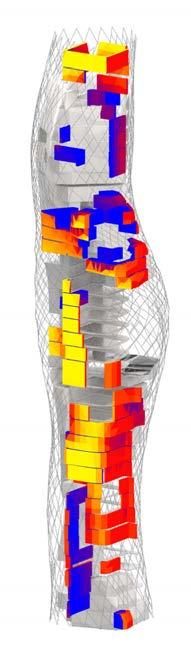
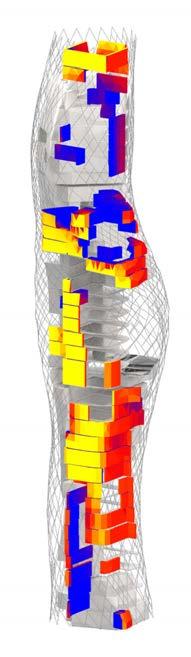
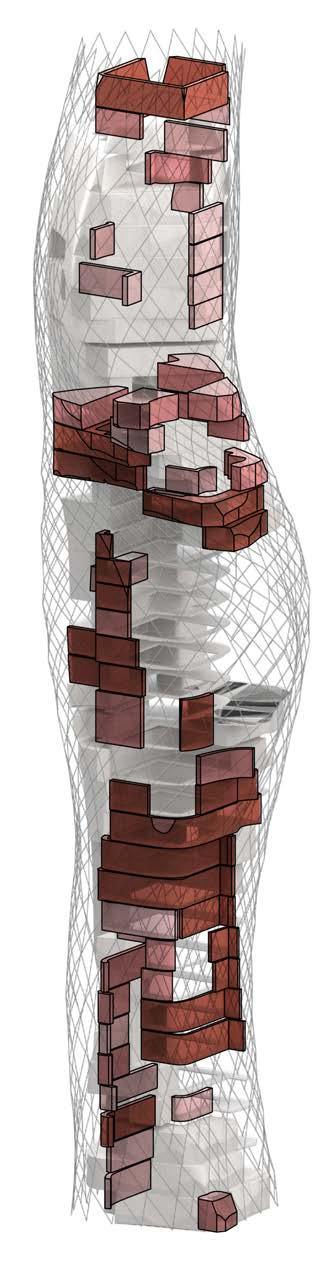
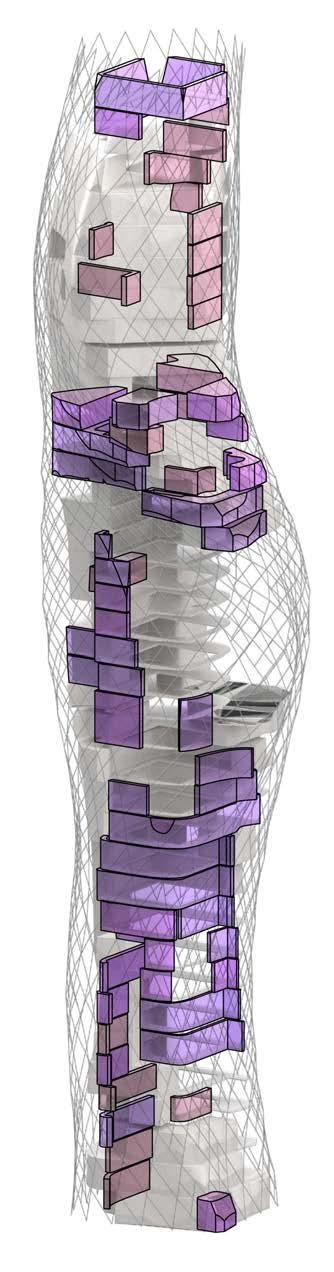
197 Autumn Winter Cabbage Bok Choy Potatoes Lettuce Peas Bok Choy Selected Plants 2513 m2 Direct Sun Light Hours Total Area of Production 3 Hours 4 Hours 7 Hours 2706 m2 3759 m2 Selected Plants 3451 m2 Direct Sun Light Hours Total Area of Production 3 Hours 5 Hours 7 Hours 2133 m2 3394 m2 Total Production Area : 8.979 m2 Functional Relations Tower Design System
5.7.2 AVERAGE CROP PRODUCTION WITH AEROPONICS
198 CROP SPECIES CROP PRODUCTION CROP PRODUCTION Kg/m2 - PER YEAR SEASON SPRING NORTH SUMMER EAST AUTUMN SOUTH WINTER WEST 12-16 kg AVG: 14 kg 16-20 kg AVG: 18 kg 6-8 kg AVG: 7 kg 7.8-10.4 kg AVG: 9.1 kg 8-12 kg AVG: 10 kg 10.4-15.6 kg AVG: 14 kg 0.6-2 kg AVG: 1.3 kg 0.78-2.6 kg AVG: 1.69 kg 3 items 4 items 2-4 kg AVG: 3 kg 2.6-5.2 kg AVG: 3.9 kg 0.5-1.5 kg AVG: 1 kg 0.65-1.95 kg AVG: 1.3 kg 4kg 5.2kg TOMATOES POTATOES CABBAGE SPINACH LETTUCE PEPPER PEAS BOK CHOY FARMS GREEN HOUSES AEROPONIC SYSTEMS 6-10 kg AVG: 8 kg 4-6 kg AVG: 5 kg 1.5-3 kg AVG: 2.5 kg 0.6-2 kg AVG: 1.3 kg 3 items 1-1.5 kg AVG: 1.25 kg 0.5-1.5 kg AVG: 1 kg 4kg
TOMATO POTATO CABBAGE SPINACH >12h Sunlight (hours) h6> h6> h41> 7.5 Planting depth (cm) 0.3 5.1 5.1 50 )mc( wor gnicapS 60 15-21 )keew( tsevrah emiT 16-20 14-18 5-6 35 Maximum height (cm) 081 35 0.27 Water uptake (Lcrop/day) 24.0 11.0 11.0 5 Planting density (crop/m 2 ) 20 11.47 21 70% 2.87 Crop production (crop/m 2 day) Maximum Temperature ( o C) Relative Humidity Transpirated water uptake (kg/day)* 15.77 30 30% 2.79 8.25 21 70% 1.77 13.24 24 70% 1.76 POTATO OTAMOT EGABBAC HCANIPS
*RH is 100% 0.99 Energy Demand (kWh/m 2 day) 59.0 08.0 0.80 Functional Relations Tower Design System
CROP PARAMETERS
The chart classifies the plants according to their planting seasons and which facade is more suitable according to their daylight requirements.
The chart also provides comparison between production amounts of selected plants in farms, green houses and aeroponic systems. Planting seasons are taken into consideration while calculating the produced weight of each specie per square metre.
While green houses provide around 80% increase in the amount of crops can be harvested compare to classical farming techniques, research reveals that, aeroponic systems provide more than 30% increase in the amount of production compared to greenhouses. For example, the average of the amount of tomatoes that can harvested from traditional green houses are 14 kg for each square meter, while it increases to 18 kg for aeroponic systems.
SOURCE. “#1 Article for 2018 - Growing with Hydroponics, Aeroponics and Aquaponics | AgriTechTomorrow.” n.d. Accessed January 6, 2019. //agritechtomorrow.com/article/2018/05/growing-with-hydroponics-aeroponics-andaquaponics/10733.
199
LET TUCE
>10h h6> h6> h6> h41> 1.5 0.2 0.2 5.1 5.1 30 5 -6 17-21 12-15 5-6 8-11 25 35 0.20 83.0 42.0 01.0 11.0 20 6 6 6 5.96 21 70% 1.77 20.28 27 50% 2.77 1.10 17 50% 2.45 13.24 24 70% 1.76 8.5 24 80% 1.77 Max.Height 180 cm Max.Height 90 cm Max.Height 60 cm Max.Height 35 cm Max.Height 25 cm Ground Level 0 cm Max.Height 3-7 cm LETTUCE
HCANIPS 0.80 59.0 58.0 0.80 0.80 Max. Height 180 cm Max. Height 90 cm Max. Height 60 cm Max. Height 35 cm Max. Height 25 cm Max. Height 3-7cm Ground Level 0 cm
PEPPER PEAS BOK CHOY
REPPEP SAEP YOHC KOB
Functional Relations Tower Design System
5.7.3 CROP PRODUCTION AMOUNT


Following chart provides information on the average year long and daily production amount of each selected plants that can be produced in tower.

The calculations are done by multiplying the production area for each plant and the average of production per meter square for each plant. Areas are obtained from the plant classification.


200
CROP SPECIES SEASONS SPRING PRODUCTION AREA (m2) - - 4978m2 90.599,6 kg - - 1573m2 20.449 kg - - -2479 m2 22.558,9kg -4.399m2 7.434,31 -- - -2.100m2 8.190 items -- - 2.427 m2 12.620,4 kg PRODUCTION AREA (m2) AMOUNT OF PRODUCT(kg) AMOUNT OF PRODUCT(kg) SUMMER TOMATOES POTATOES CABBAGE SPINACH LETTUCE PEPPER PEAS BOK CHOY
Functional Relations Tower Design System
201 SEASONS - - - - 90.559,6 kg 248,22 kg - - - - 20.449 kg 56.02 kg - - 3.759 m2 14.660,1 kg 14.660 kg 40.16 kg 3.451 m2 31.404 kg - - 53.962,9 kg 147,84 kg - - - - 7431,3 kg 20,36 kg - - 2.706 m2 3.517,8 kg 3517,8 kg 9,63 kg 2.133 m2 8.317,7 kg 2.513 m2 9.800,7 kg 26.308,7 kg 72,07 kg 3.394 m2 17.648,8 kg - - 30.269,2 kg 82,92 kg PRODUCTION AREA (m2) PRODUCTION AREA (m2) AMOUNT OF PRODUCT(kg) AMOUNT OF PRODUCT(kg) AUTUMN WINTER YEAR-LONG PRODUCTİON (kg) DAILY AVERAGE PRODUCTION(kg)
Functional Relations Tower Design System
5.8 FAÇADE SYSTEM
In order the increase the comfort zone of the users in subtropical humid climate conditions in Shanghai, The Responsive Facade System that consists of panels is designed.
High relative humidity, with an average of 80%, requires continuous natural ventilation. However the amount of relative humidity is affecting the ventilation in a negative way. This situation reveals the importance of providing cross ventilation within the building.
Responsive behaviors of the facade are classified into 2 groups: seasonal responses and daily responses. Seasonal responses focus on the sun orientation and aims to control the effects of total amount of solar radiation on the tower.
In order to increase ventilation efficiency in the tower, the facade system is designed to respond sudden changes in the wind direction and speed.
Controlled natural ventilation is highly preferable to provide a suitable environment for plant growth in the spaces that where aeroponics located. Facade system is responsible for creating a controlled micro climate for aeroponics in terms of temperature and relative humidity.
To control the natural ventilation and the amount of solar radiation, two different types of panels are designed. These panels are referred to as pressure control panels and open/close mechanism panels. Selection of panels are done according to the function space they are facing. Panels that are facing residential units and offices are assigned as open/close mechanism panels under control of the users. Panels that are facing aeroponic zones which have their own microclimate conditions, are assigned as pressure control panels.
Each panel type is then analysed in terms of the amount of solar radiation they receive. As a result of the analysis, sun louvres are added to the panels that have more solar radiation than the average.
202 Chapter Main Heading
Façade Design System
Seasonal
Solar Radiation
Indoor spaces
Temperature
Daily
Natural
Relative Humidity
203 Chapter Main Heading
System [Panels]
Facade
Orientation Adapt
Sun
Control
Speed Change
Ventilation Control Wind direction & Wind
Tower Design System
5.8.1 PANEL CLASSIFICATION PANELS
FACING TO FUNCTIONAL AREAS
VENTILATION CONTROL BY OPEN&CLOSE MECHANISM
PANELS WITH SHADING MECHANISM
SOLAR RADIATION ANALYSIS
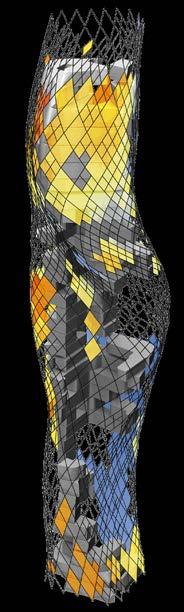
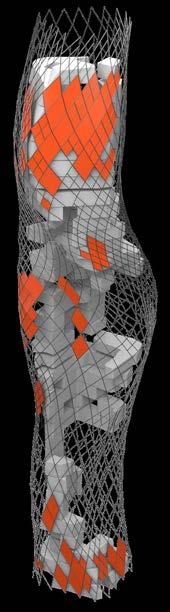
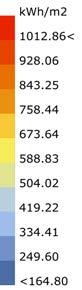
PANELS WITHOUT SHADING MECHANISM
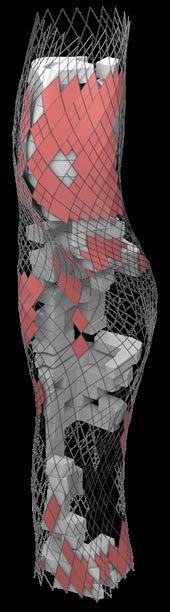
204
L
essSolar Radiation More SolarRadiation Panel Development Façade Design System
FACING TO AEROPONICS
VENTILATION CONTROL BY PRESSURE DIFFERENCE
PANELS WITH SHADING MECHANISM
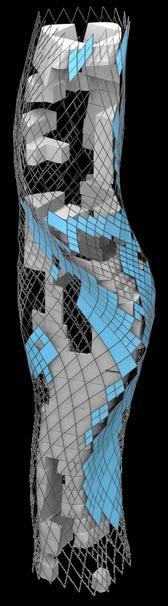
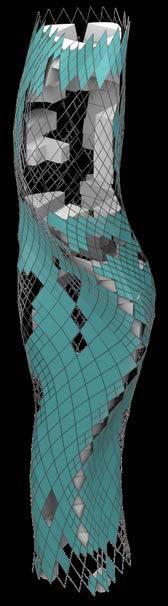
SOLAR RADIATION ANALYSIS
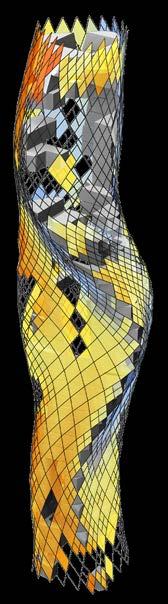
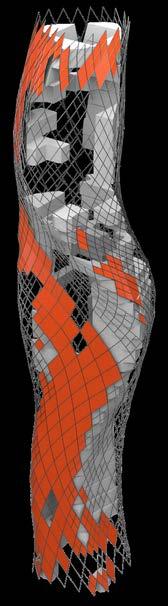
PANELS WITHOUT SHADING MECHANISM
205
LessSolar
More SolarRadiation Panel Development Façade Design
Radiation
System
5.8.2 PRESSURE CONTROL PANEL
Secondary structure (Double Diagrid structure) determines the size of panels. A panel system is designed to fit in each diagrid.
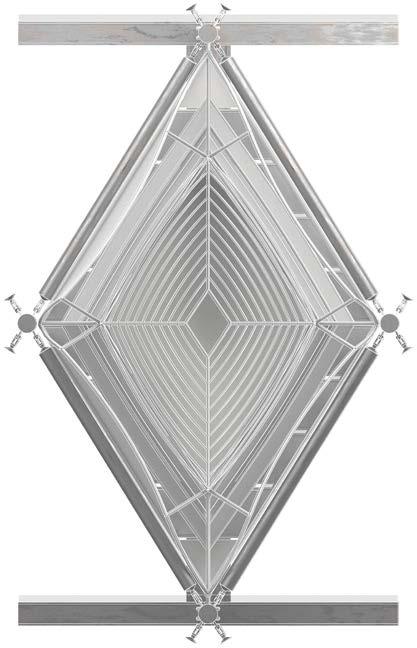
As previously mentioned, the pressure control panels are designed to control the micro climate of the spaces that aeroponics are located in. Having a control on microclimate requires responsive behaviors in order to adapt the changing external conditions such as changing wind directions, changing wind speeds and air temperature.
In order to increase Coanda effect, curvature values obtained from the previous panel experiments are used while designing the panel. By locating air intakes on convex surfaces, the total amount of air gets inside of the panel increased.
From interior to exterior, each panel consists of interior air intake compartment, panel frame, pressure control compartment, exterior air intake compartment and kinetic sun louvres.
Kinetic sun louvres are responsible for adapting to seasonal changes on sun orientation in order to have an additional control on interior air temperature.
Exterior air intake component is controlled by the volume of air in to the buffer zone, by adjusting the opening angles of the air gates. Meanwhile, the interior air intake component is designed to control the volume of the air that gets in the micro climate zone.
As introduced previously in facade systems chapter, pressure control compartment is responsible for controlling air speed in buffer zone which affects the pressure difference between different façades and result with a controlled ventilation for the microclimate. This results in an additional layer of air temperature and humidity control.
206
Panel Development
Pressure Control Panel Elevation
Façade Design System
Primary & Secondary Structure Connection Detail
Kinetic Sun Louvres
Air Intake Component
Pressure Control Component
Panel Frame
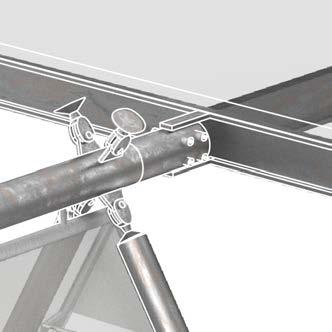
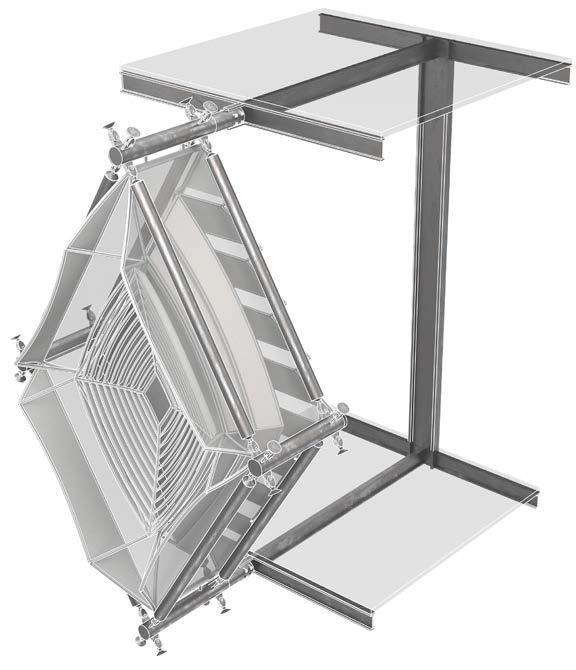
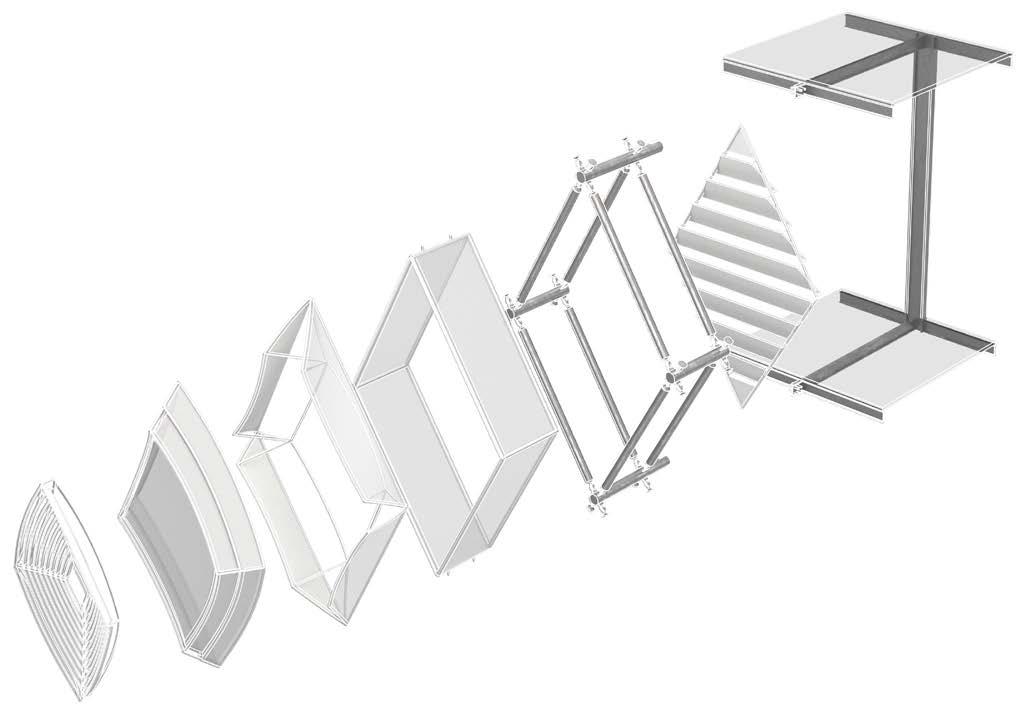
Air Intake Component
Facade Diagrid Structure
207
Panel Development Façade Design System
Slab Beams Column- Core
PRESSURE CONTROL PANEL WORKFLOW
In order to address the main concern of Shanghai’s subtropical climate by reducing interior relative humidity, cross ventilation efficiency is increased by providing controlled pressure difference between different façades.
Pressure controlled panel is designed based on Bernoulli’s principle and Venturi equations. Venturi effect states that the velocity of incompressible fluids must increase as they pass through a constriction in accordance with the principle of mass continuity. Bernoulli’s principle states that an increase in the speed of fluid occurs simultaneously with a decrease in pressure due to the principle of conservation of mechanical energy.
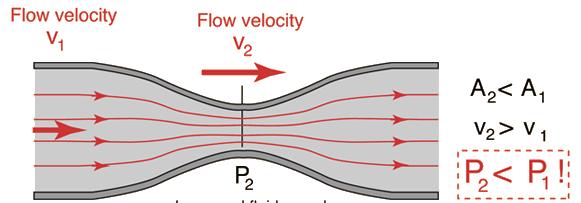
Based on those principles, a change in the buffer zone depth and a change in the air velocity in the buffer zone enable the control of pressure difference on different façades in the tower.
Ashrae standards recommends an optimum of constant air circulation as 0.8m/s, for providing a comfortable environment for users. Therefore, regardless of the changing exterior wind velocity, buffer zone depth is designed with the ability to vary between 10 to 100 centimetres, in order for pressure difference on different facades to be kept constant which results in a constant air circulation.
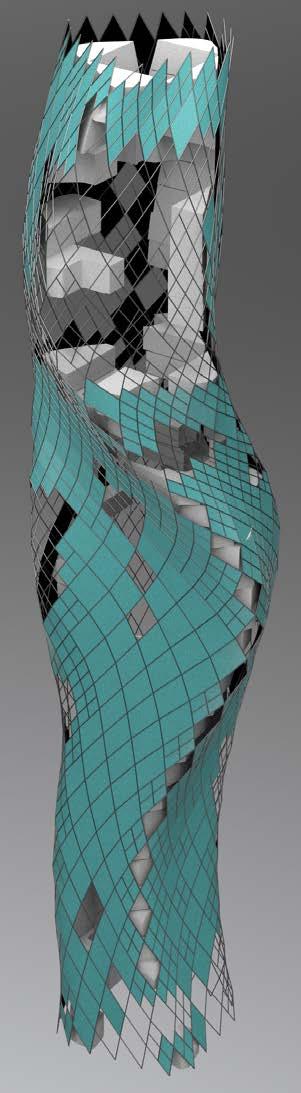
208 Increased fluid speed Decreased interior pressure P 1 P 2
5.8.3 Panel Development Façade Design System
Panel Distribution Map
SOURCE. Chennu, Vinodh Reddy. 2017. “Bernoulli’s Principle and Equation.” ME Mechanical (blog). May 3, 2017. https://memechanicalengineering.com/bernoullis-principle-and-equation/.
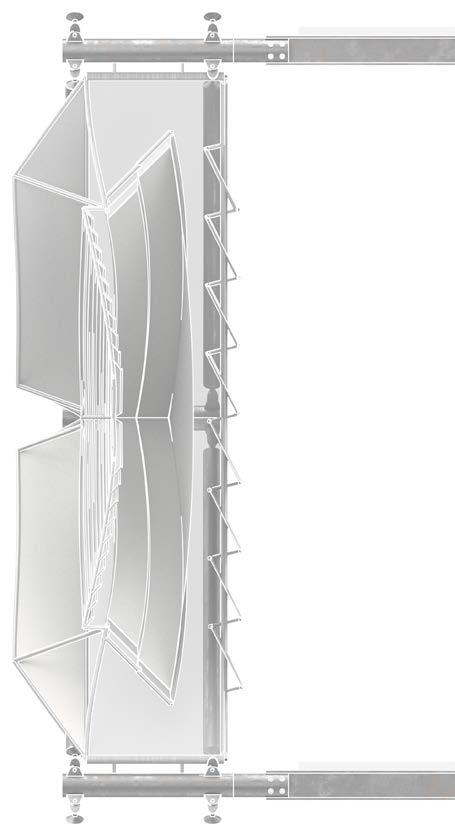
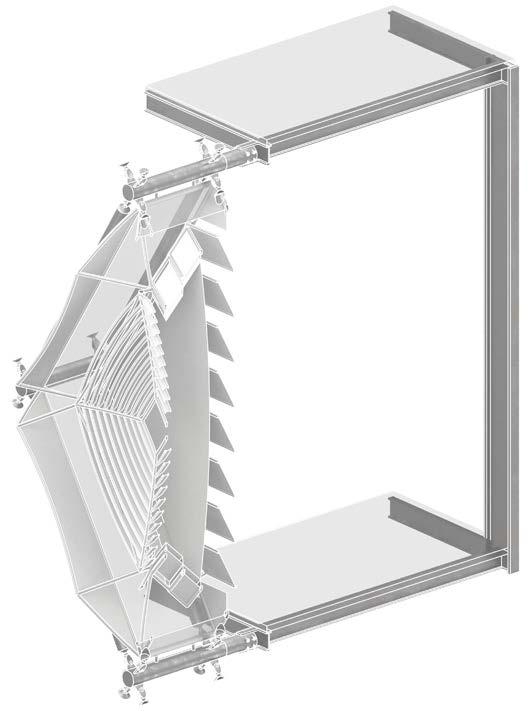
209 +Inside Variable Dimension Outside Outside Wind V Target Air Circulation Speed V=0.8 m/s A A P P 1 2 1 2 Buffer Zone Depth Change & Pressure Change Panel Development Façade Design System
OPEN-CLOSE MECHANISM PANEL
Panels that are controlling ventilation by opening and closing mechanism are the ones facing residential and offices. In order for design to respond to all wind directions, air gates are designed with the capability of rotating according to changing wind direction.
CFD experiments in the facade system development reveal that Coanda effect causes a tendency in airflow to follow convex surfaces. By rotating the air gates perpendicular to the wind direction, air intake rate increased.
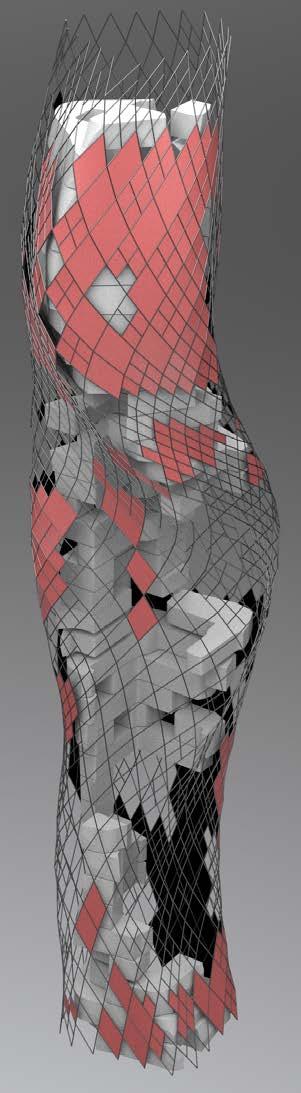
If we consider the wind behaviours as they hit the building surface, due to a pressure difference, wind can flow in any direction and magnitude. Therefore a responsive mechanism is designed to adapt to changing wind directions in every axis.
Each air gate is connected to the frame of the panel from 4 corners, where telescopic mechanism is introduced to arrange the angle between each air gate’s normal vector and the wind direction vector.
210
Panel Distribution Map Panel
5.8.4
Development Façade Design System
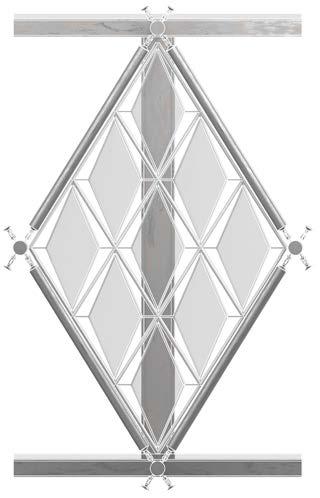
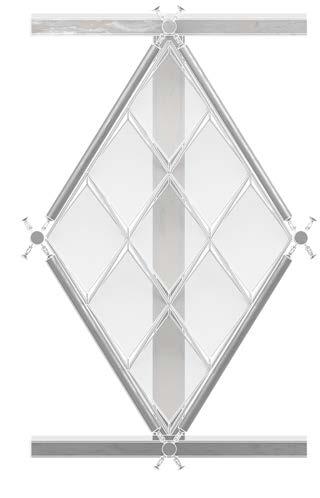
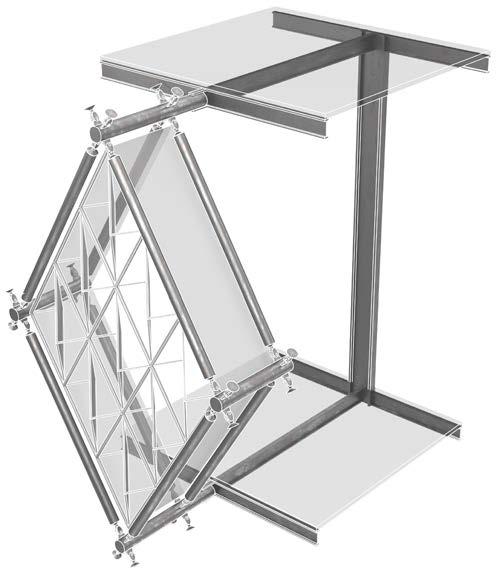
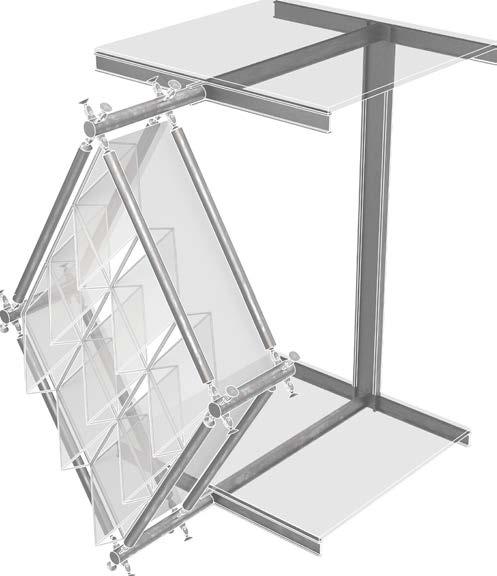
211 Wind Direction Wind Direction Front View Front View Panel Development Façade Design System
5.8.5 PANEL ROTATION
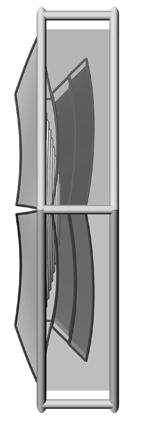
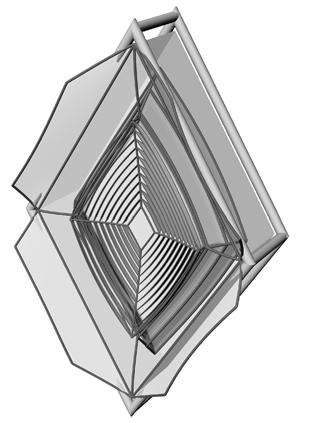
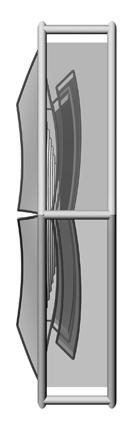
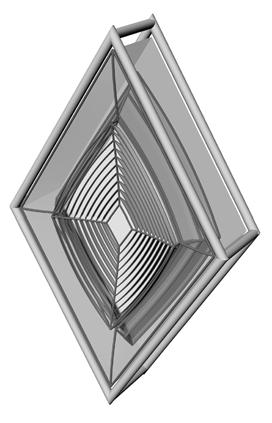
212
Buffer Zone Depth Buffer Zone Depth Hİigh Air Velocity Low Pressure Low Air Velocity High Pressure
Panel Development Façade Design System
Pressure Control
Panels- Closed Air Gate
Pressure Control Panels- More Buffer Zone
Depth Pressure
Control Panels- Open Air Gate Pressure Control Panels- Less Buffer Zone Depth
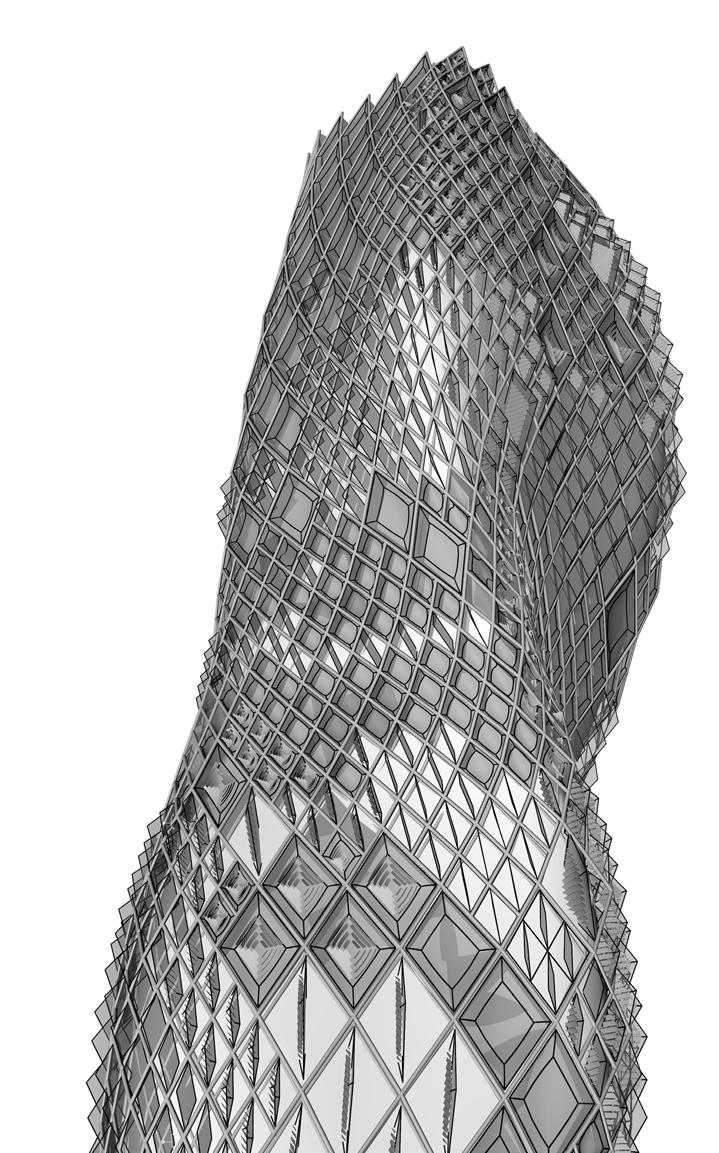
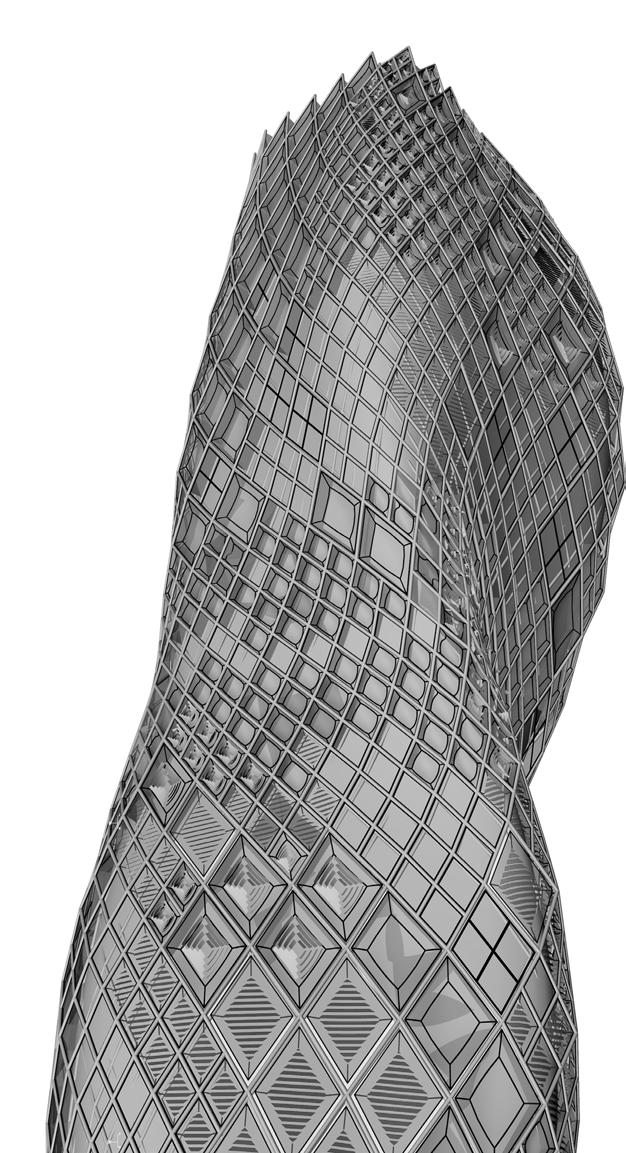
213
Panels facing with Residentials and Offices - Closed
Panel Development Façade Design System
Panels facing with Residentials and Offices - Opened
5.9 VERTICAL SYSTEM PROPOSAL
Microclimate Zones
Atrium
Aeroponic Rooms
Circulation System

214
Vertical System Proposal Architectural Proposal
Core Structure
Functional Spaces
Aeroponic Walls
Thicker Slab Beams for extra loads of green areas
Roof Garden Green Area
Aeroponic Room
Atrium Stairs
Atrium Water Storage
Atrium Green Area
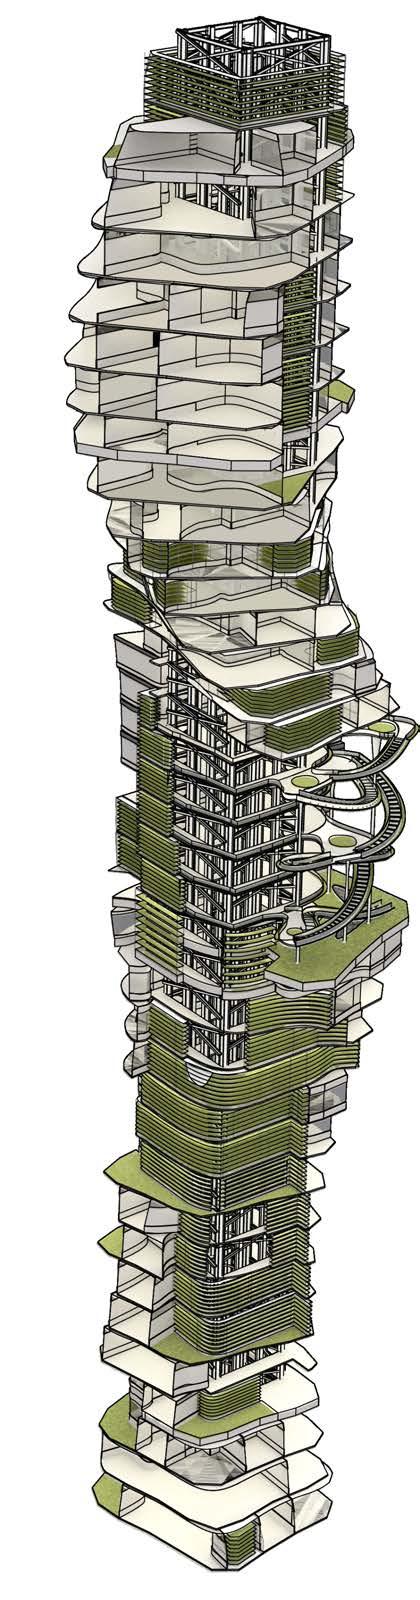
215 Vertical System Proposal Architectural Proposal
In order to maintain ventilation and privacy at the same time, the openings of interior residential walls are designed above from the eye level. However, office spaces are designed as open spaces which are separated by glass louvre walls in order to enhance cross ventilation.
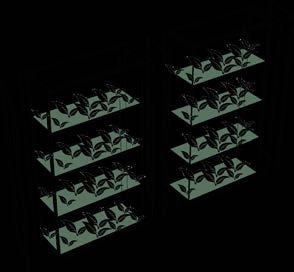
Depending on the depth of micro climate spaces from the facade, green areas are classified in 2 groups which are aeroponic walls and aeroponic rooms. If the microclimate space depth is less than 3 meters, aeroponic walls are assigned to create boundary of microclimate. This is separated from the interior of tower so that specific climatic conditions can be under controlled. If the depth is more than 3 meters, aeroponic rooms are created, consisting of aeroponic shelf for crop production and circulation space for crop collection.
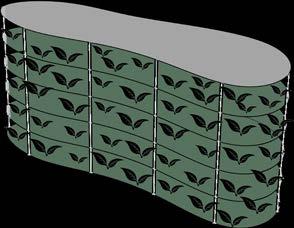
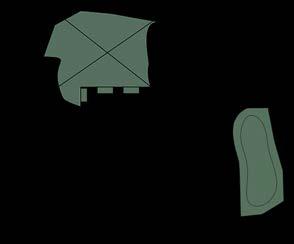
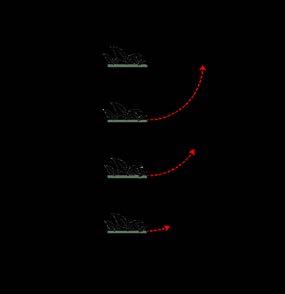
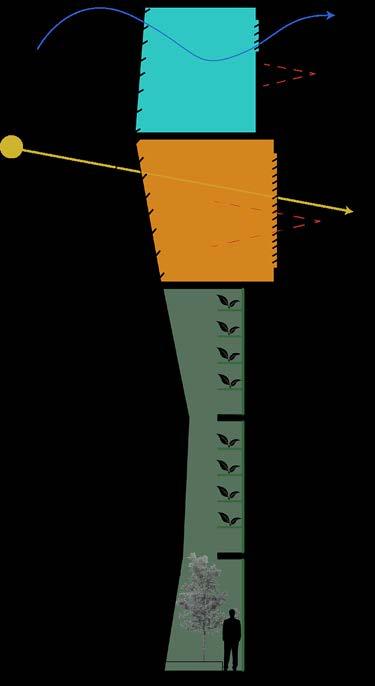
216
FLOOR PLAN
AEROPONİIC WALLS
AEROPONİIC WALL OPENINGS
Adaptation System Post Evaluation
AEROPONIC ROOM SHELF
AEROPONIC ROOMS
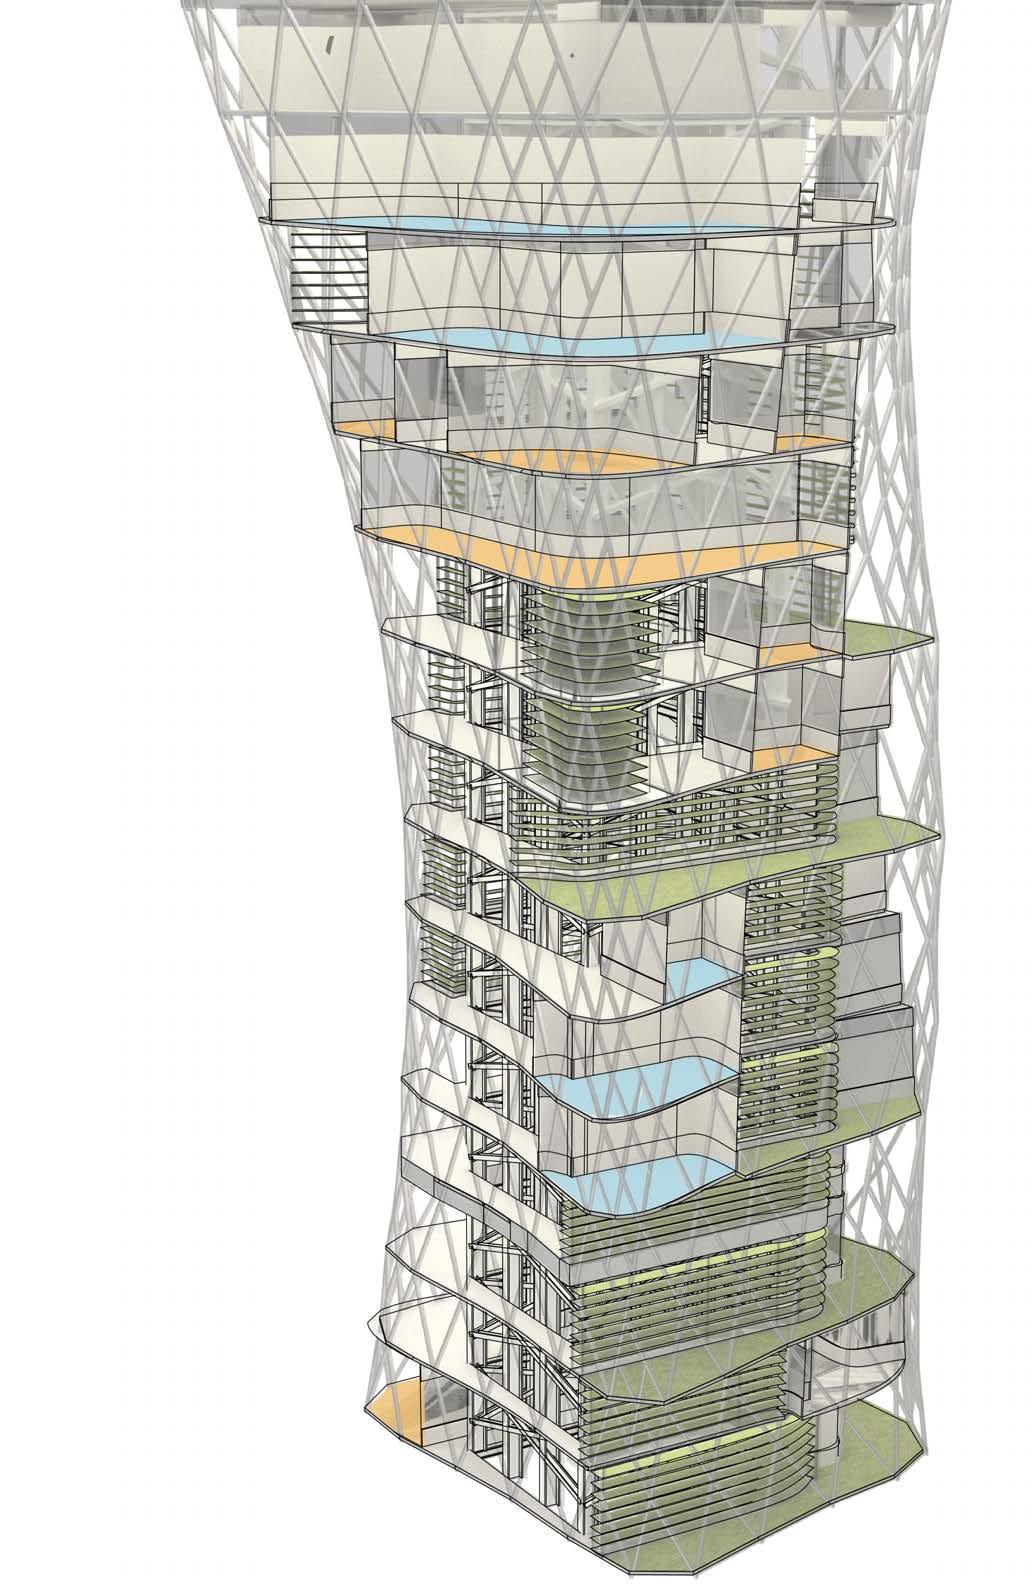
AEROPONIC WALL GREEN AREAS
GREEN AREAS RESIDENTIAL OFFICE
217 RESIDENTIAL OFFICE
Adaptation System Post Evaluation
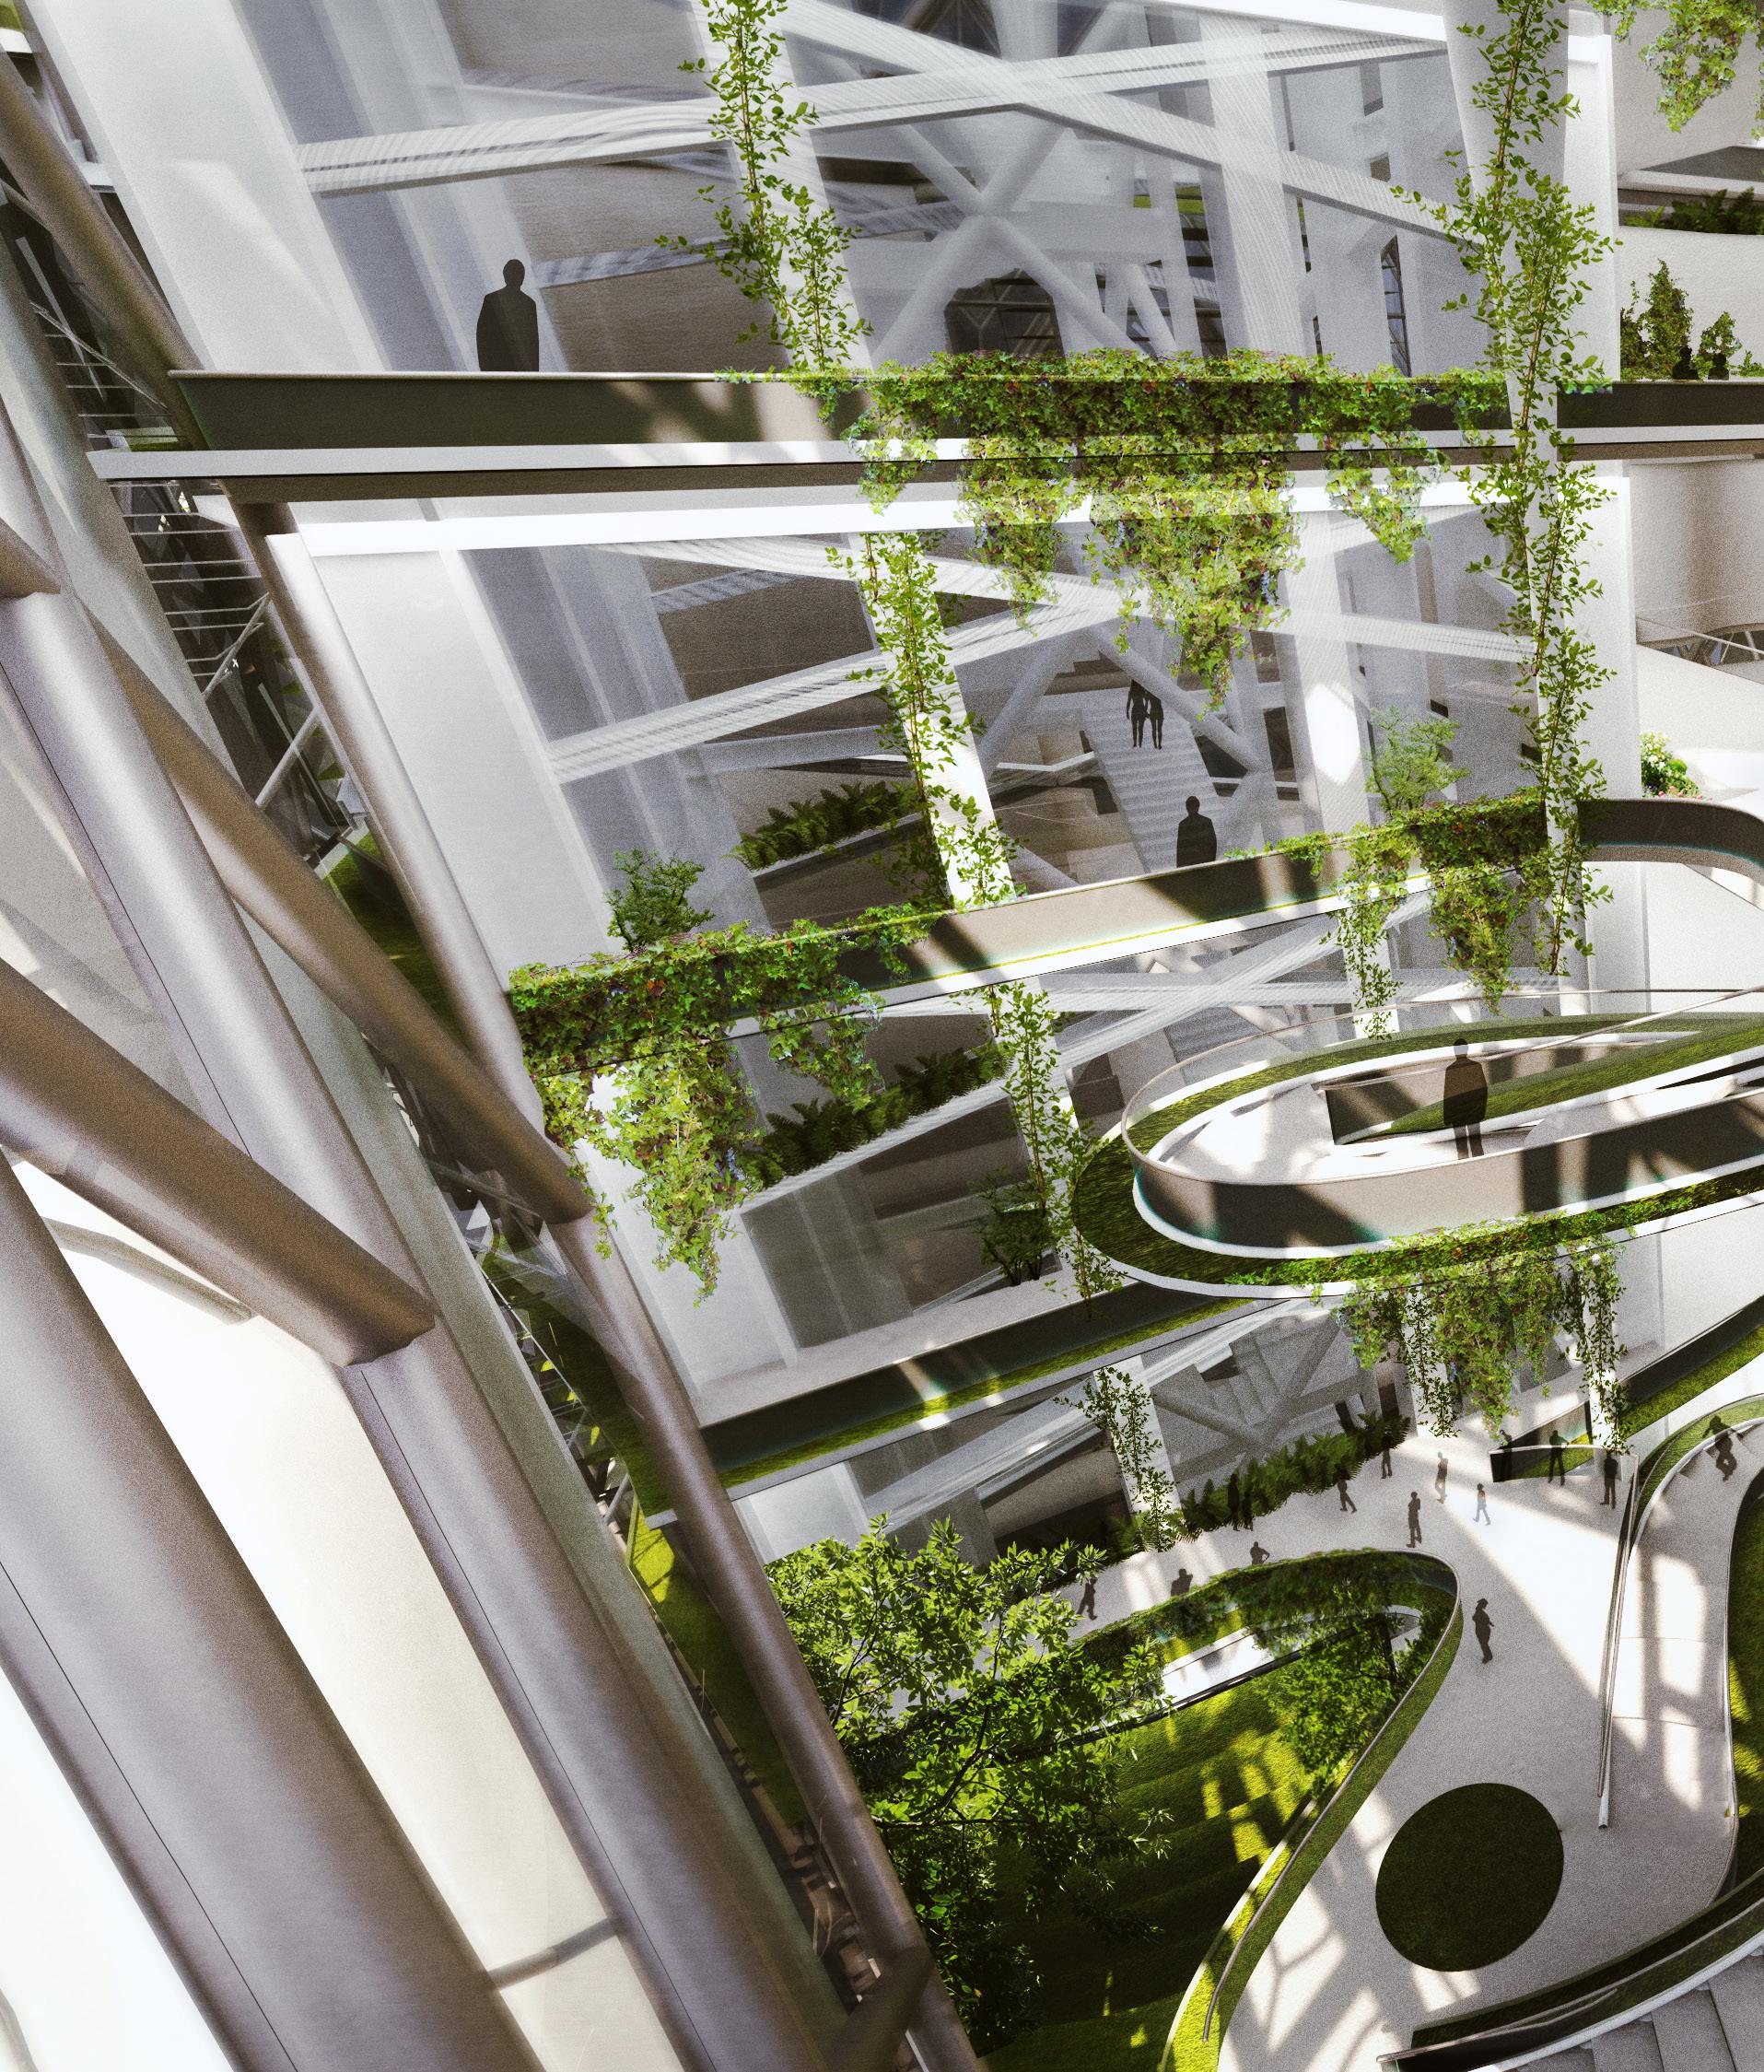
218 Architectural Proposal
Atrium - Vertical Garden
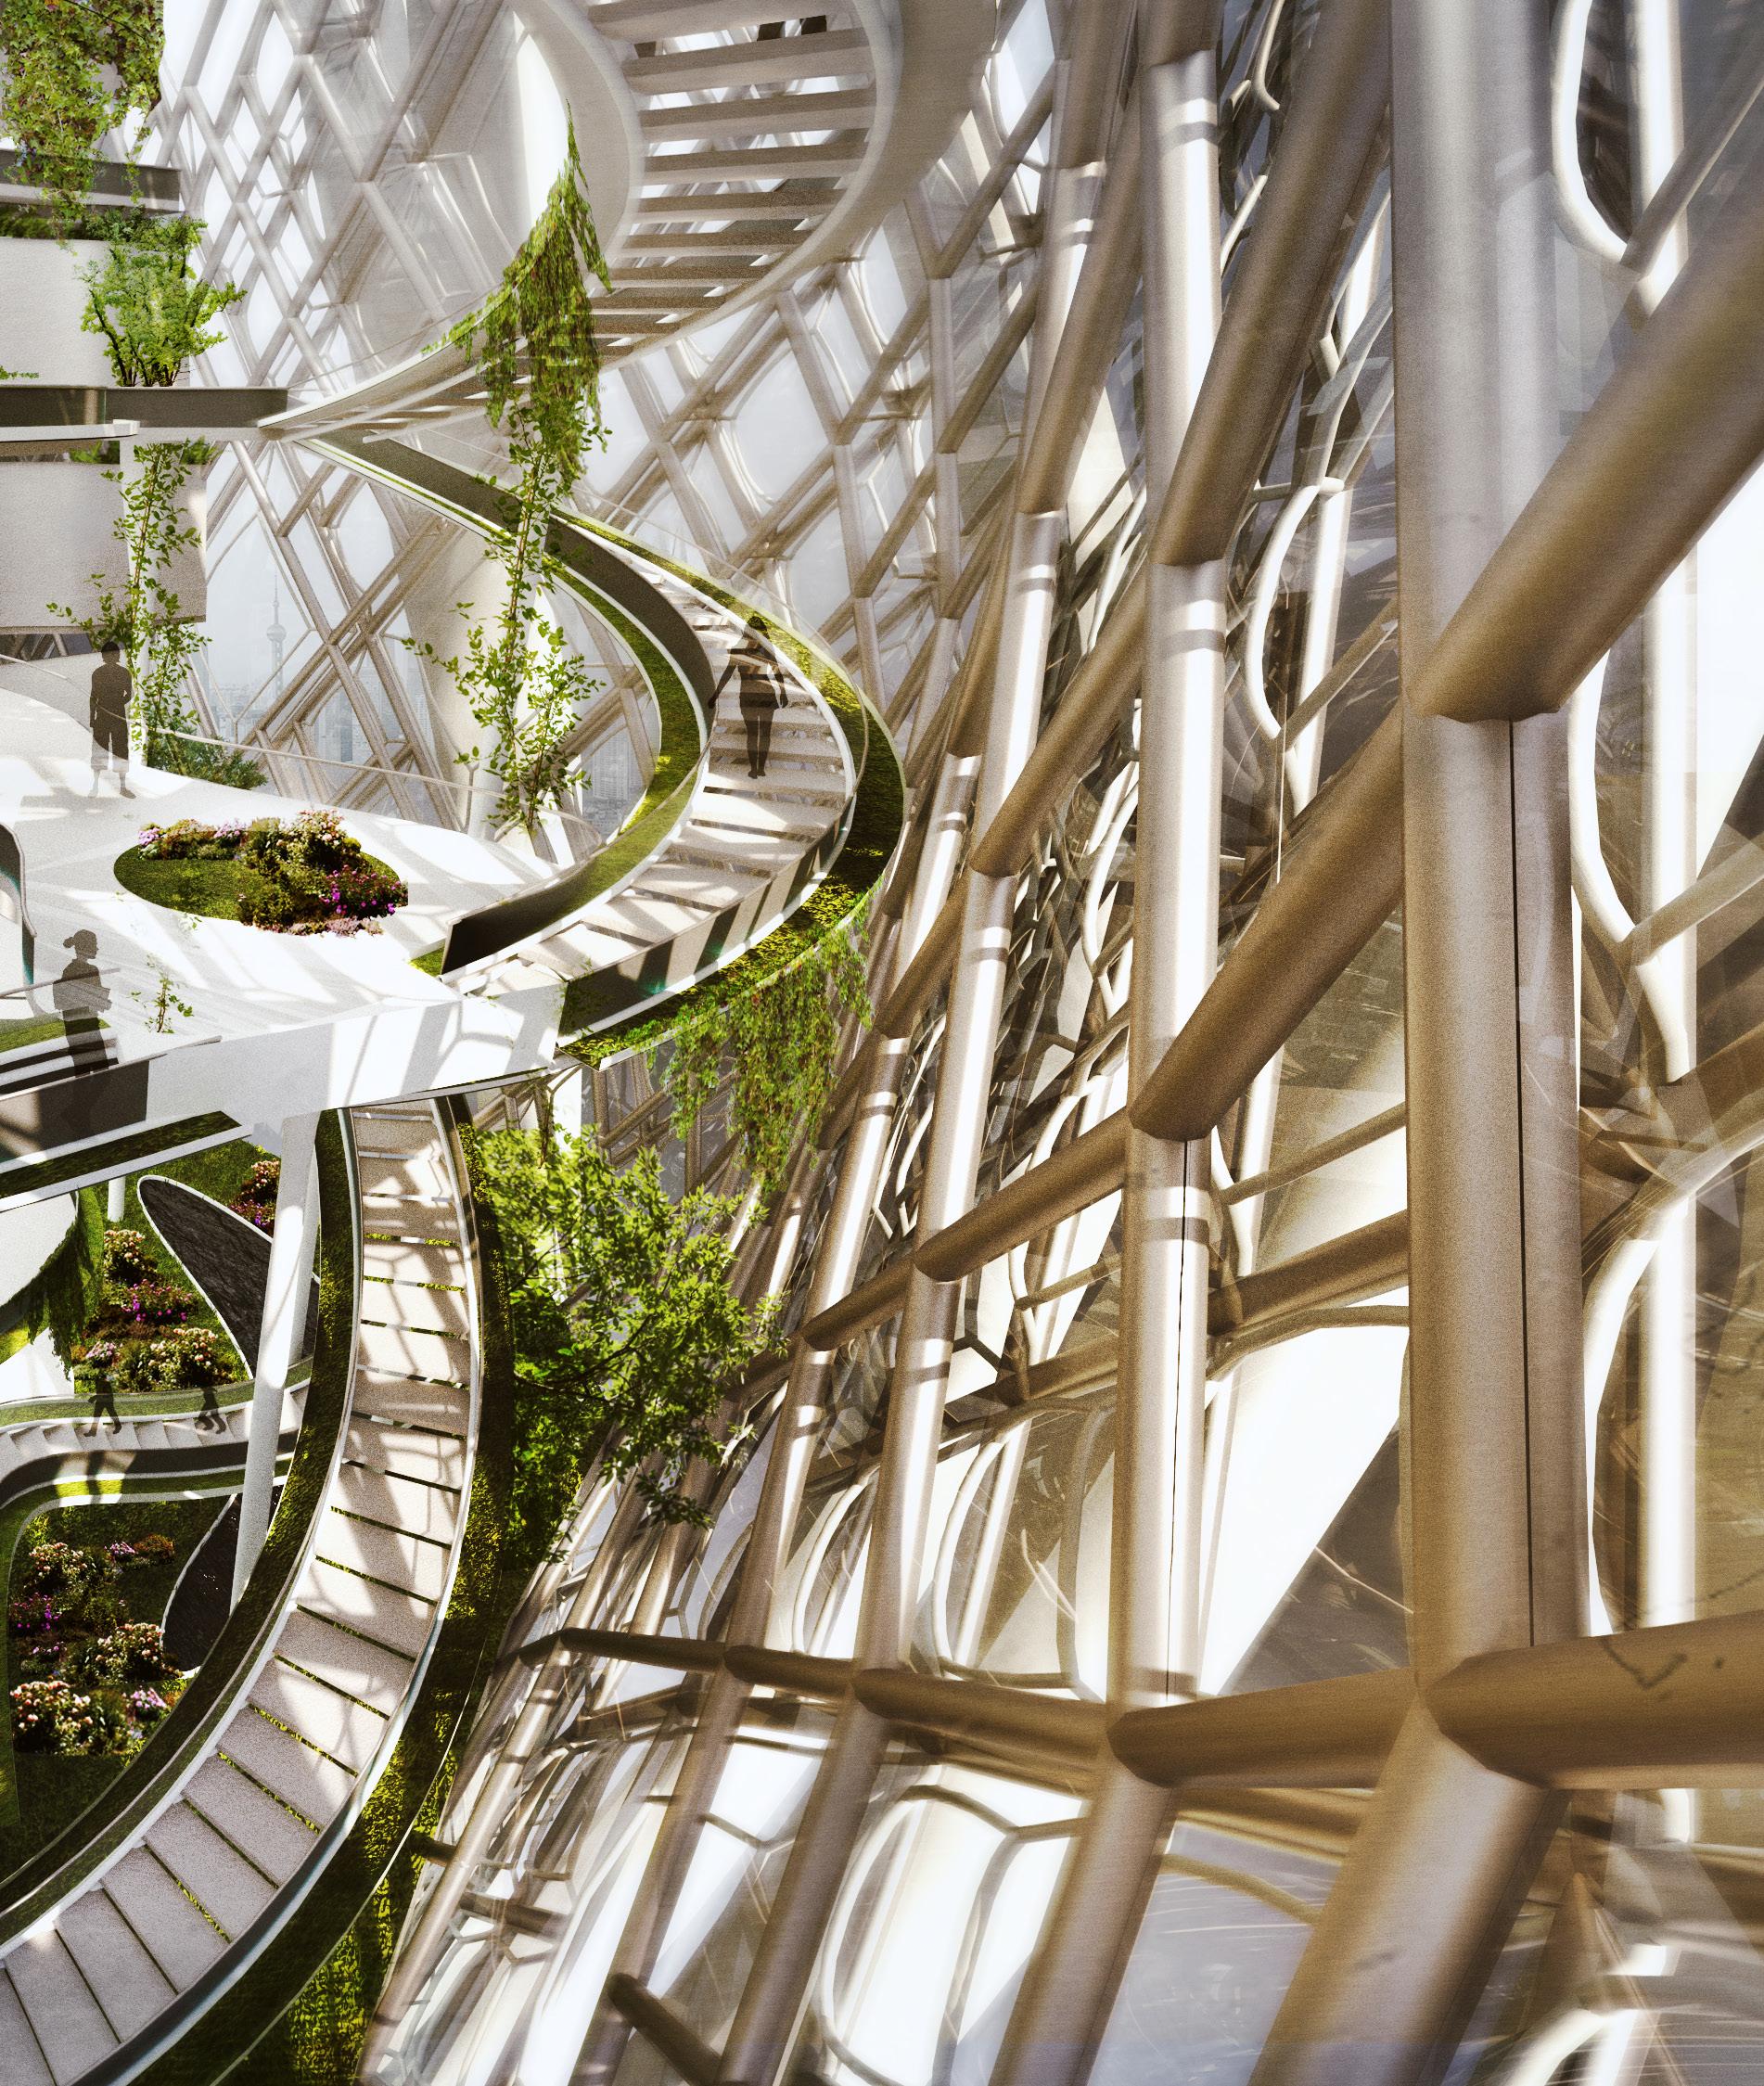
219 Architectural Proposal
Atrium - Vertical Garden
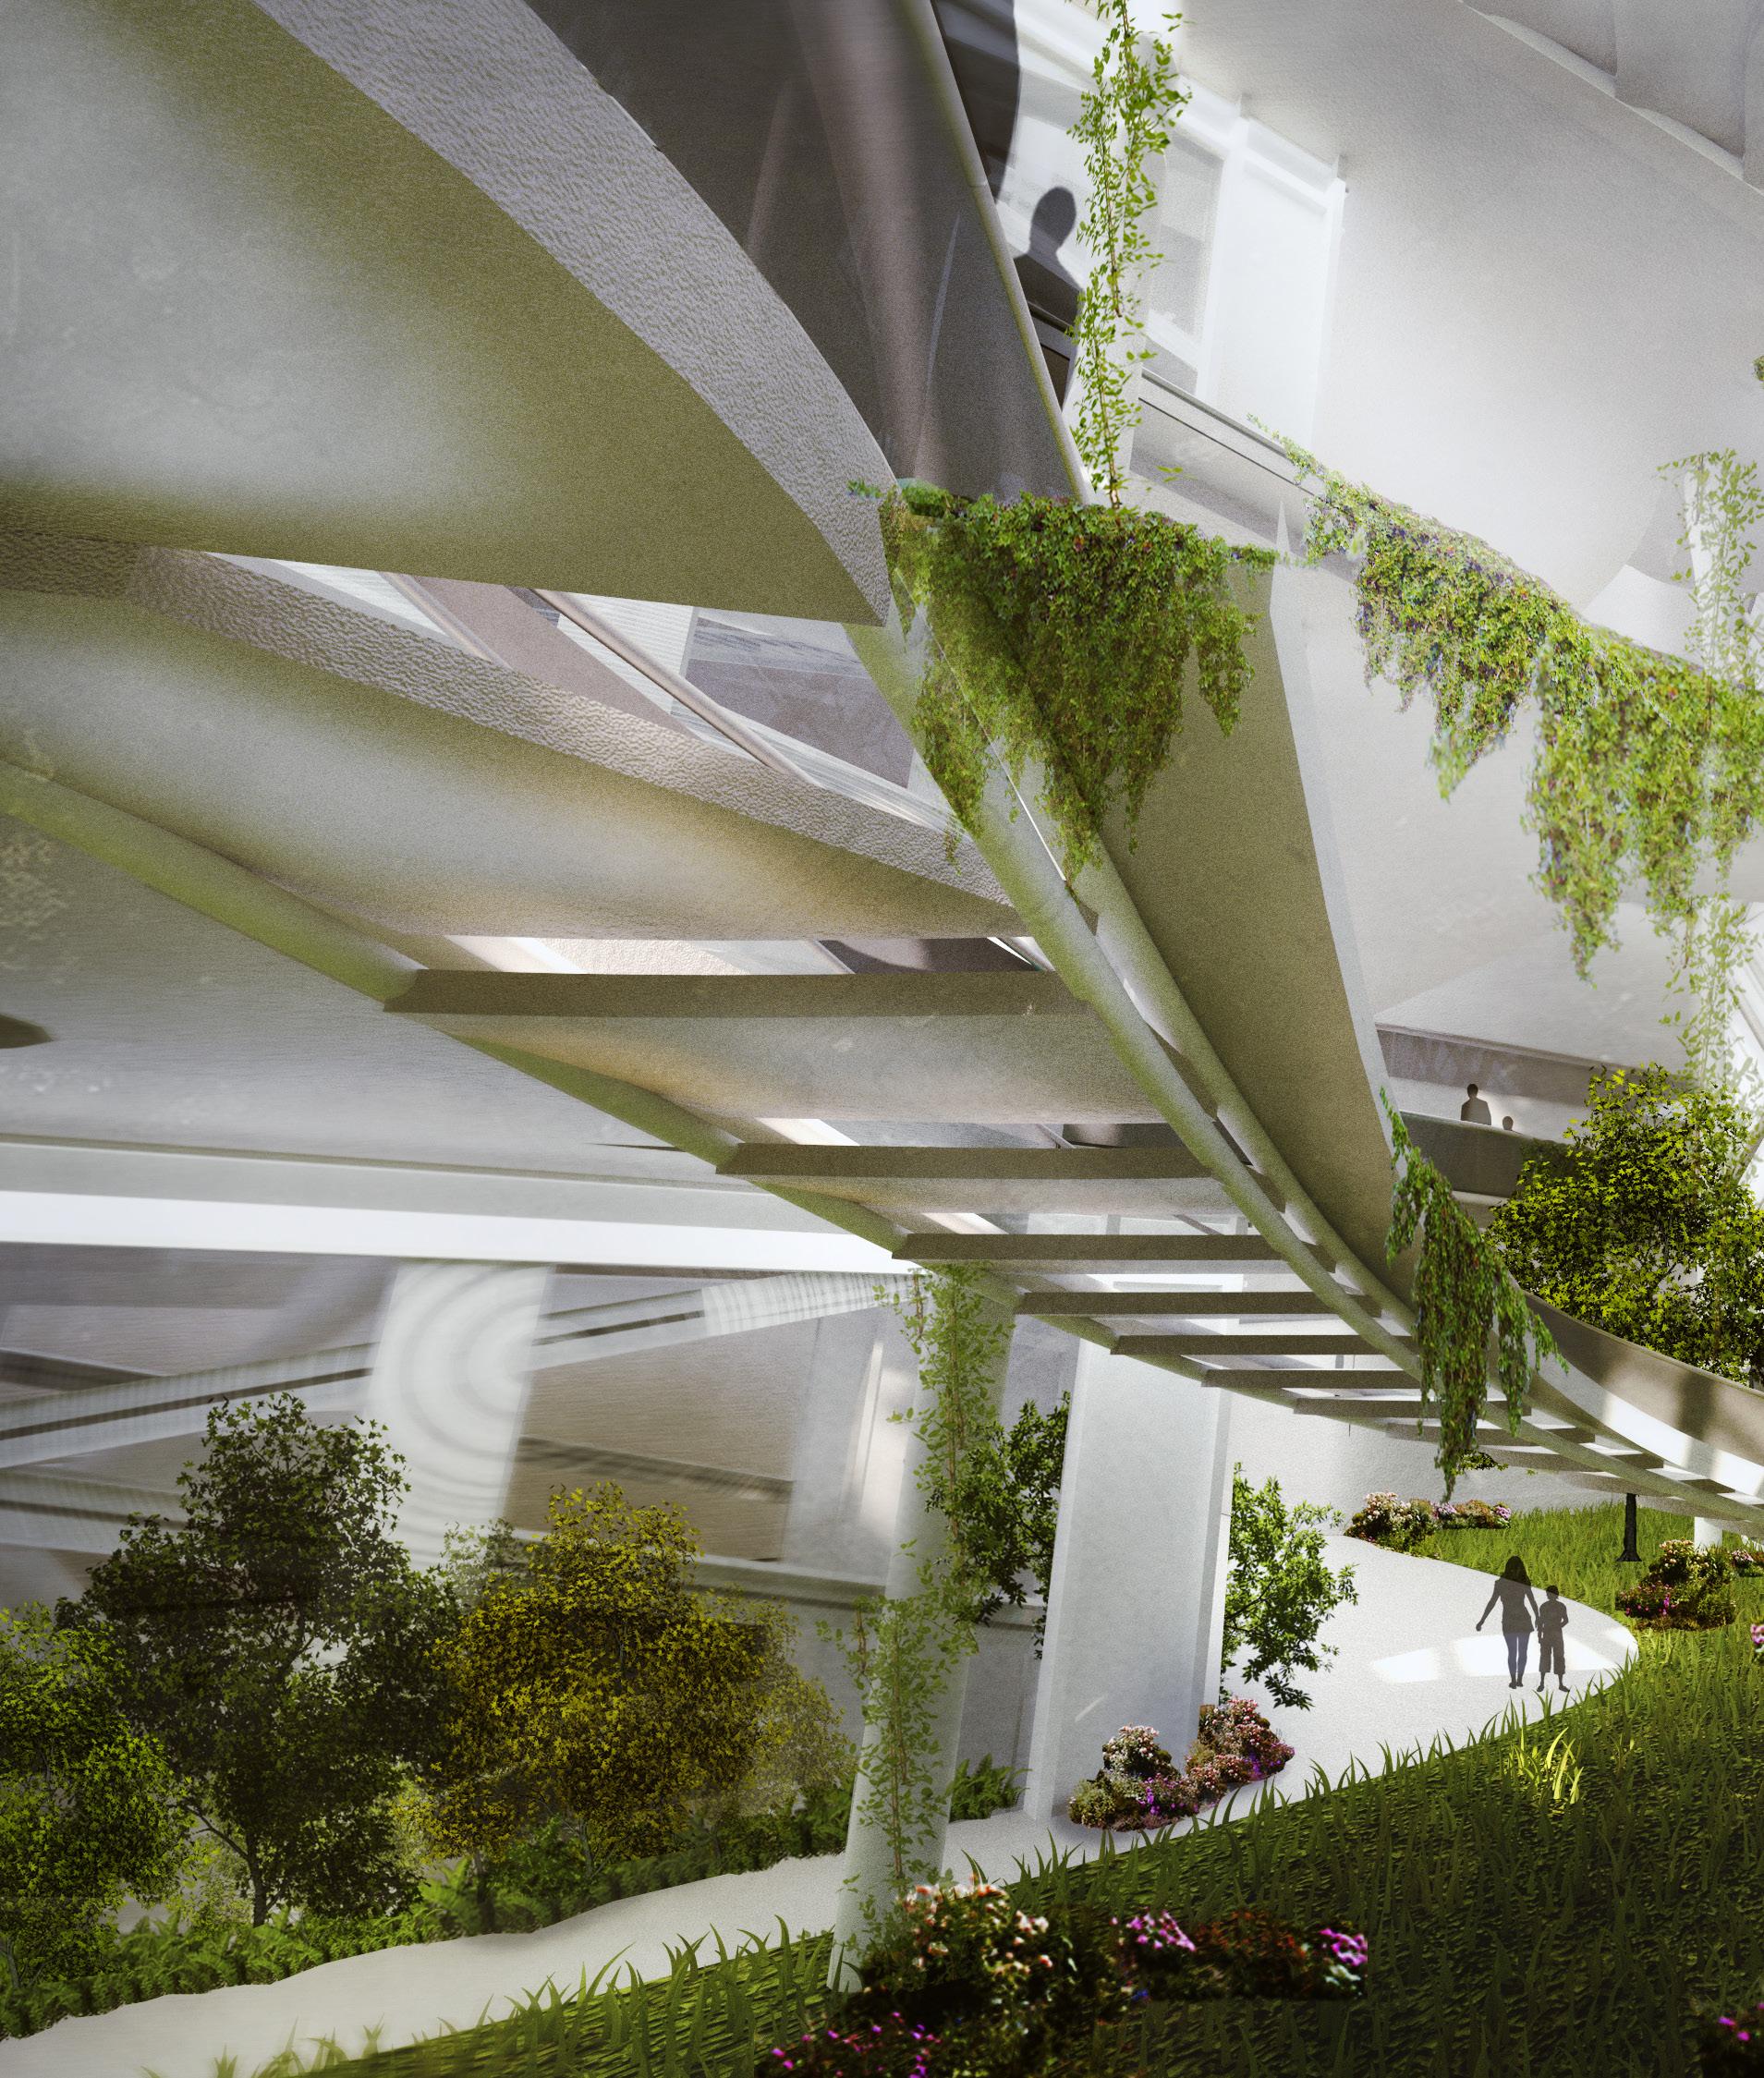
220 Architectural Proposal
Atrium - Vertical Garden
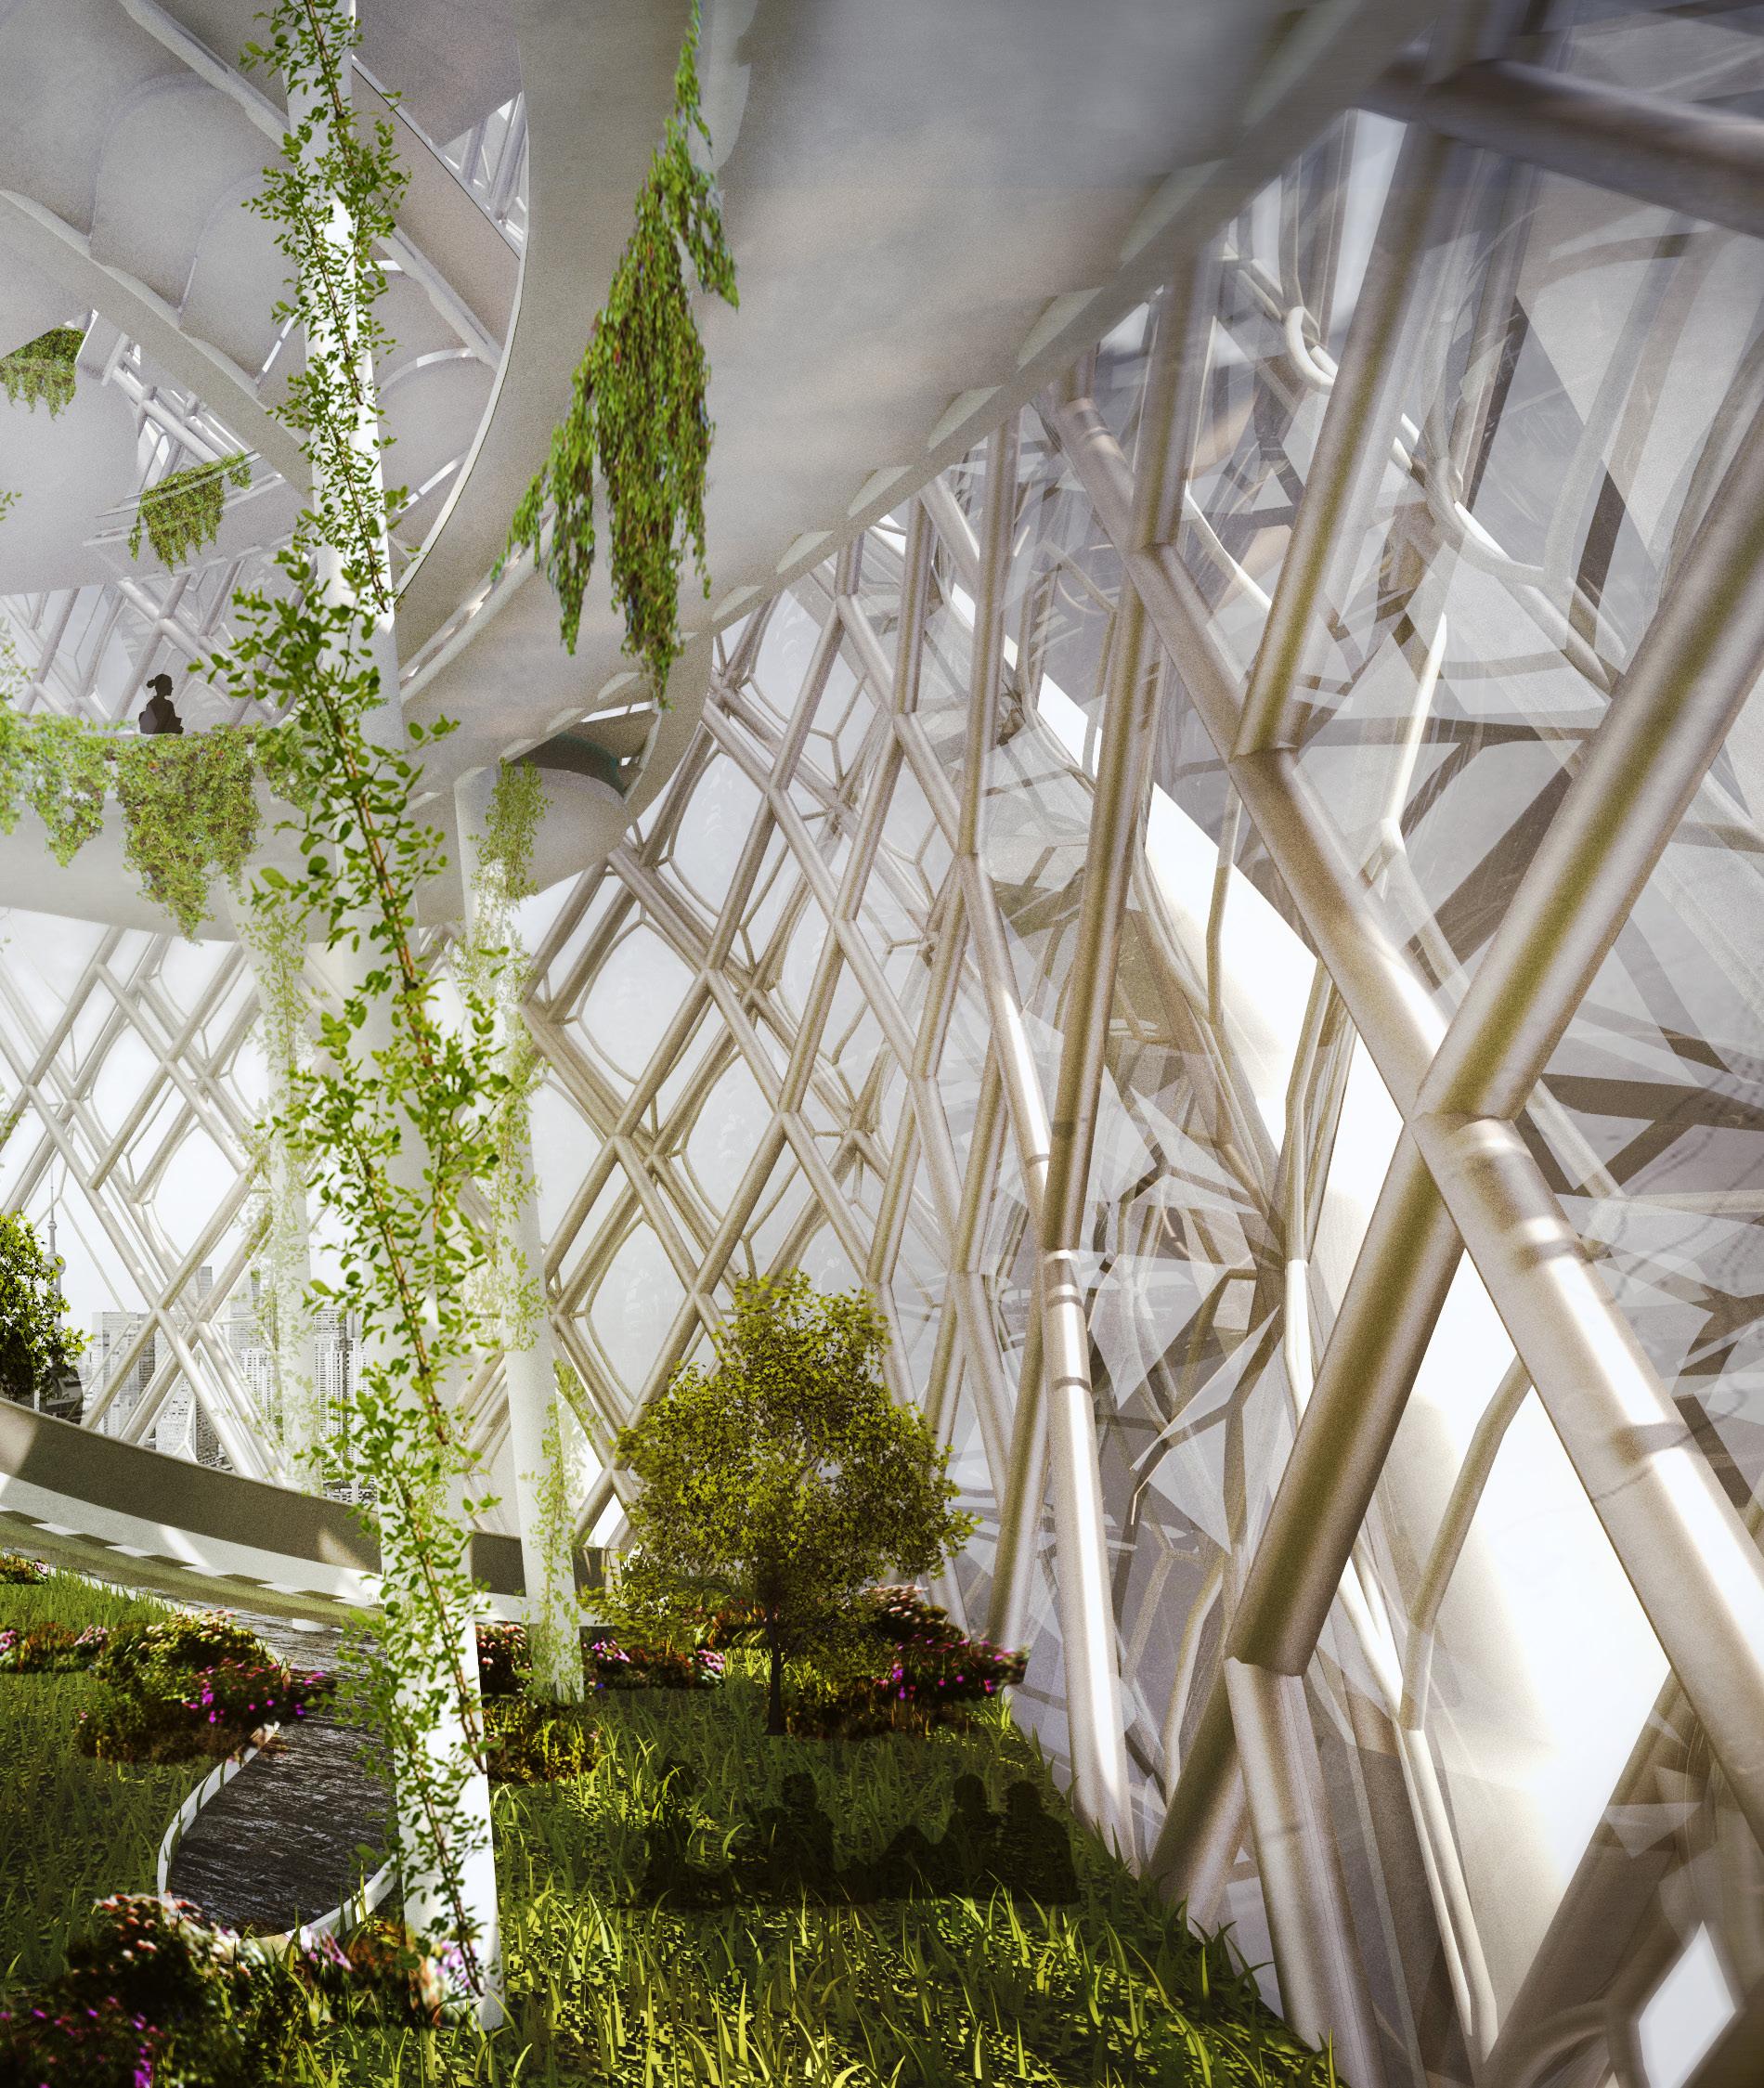
221 Architectural Proposal
Atrium - Vertical Garden
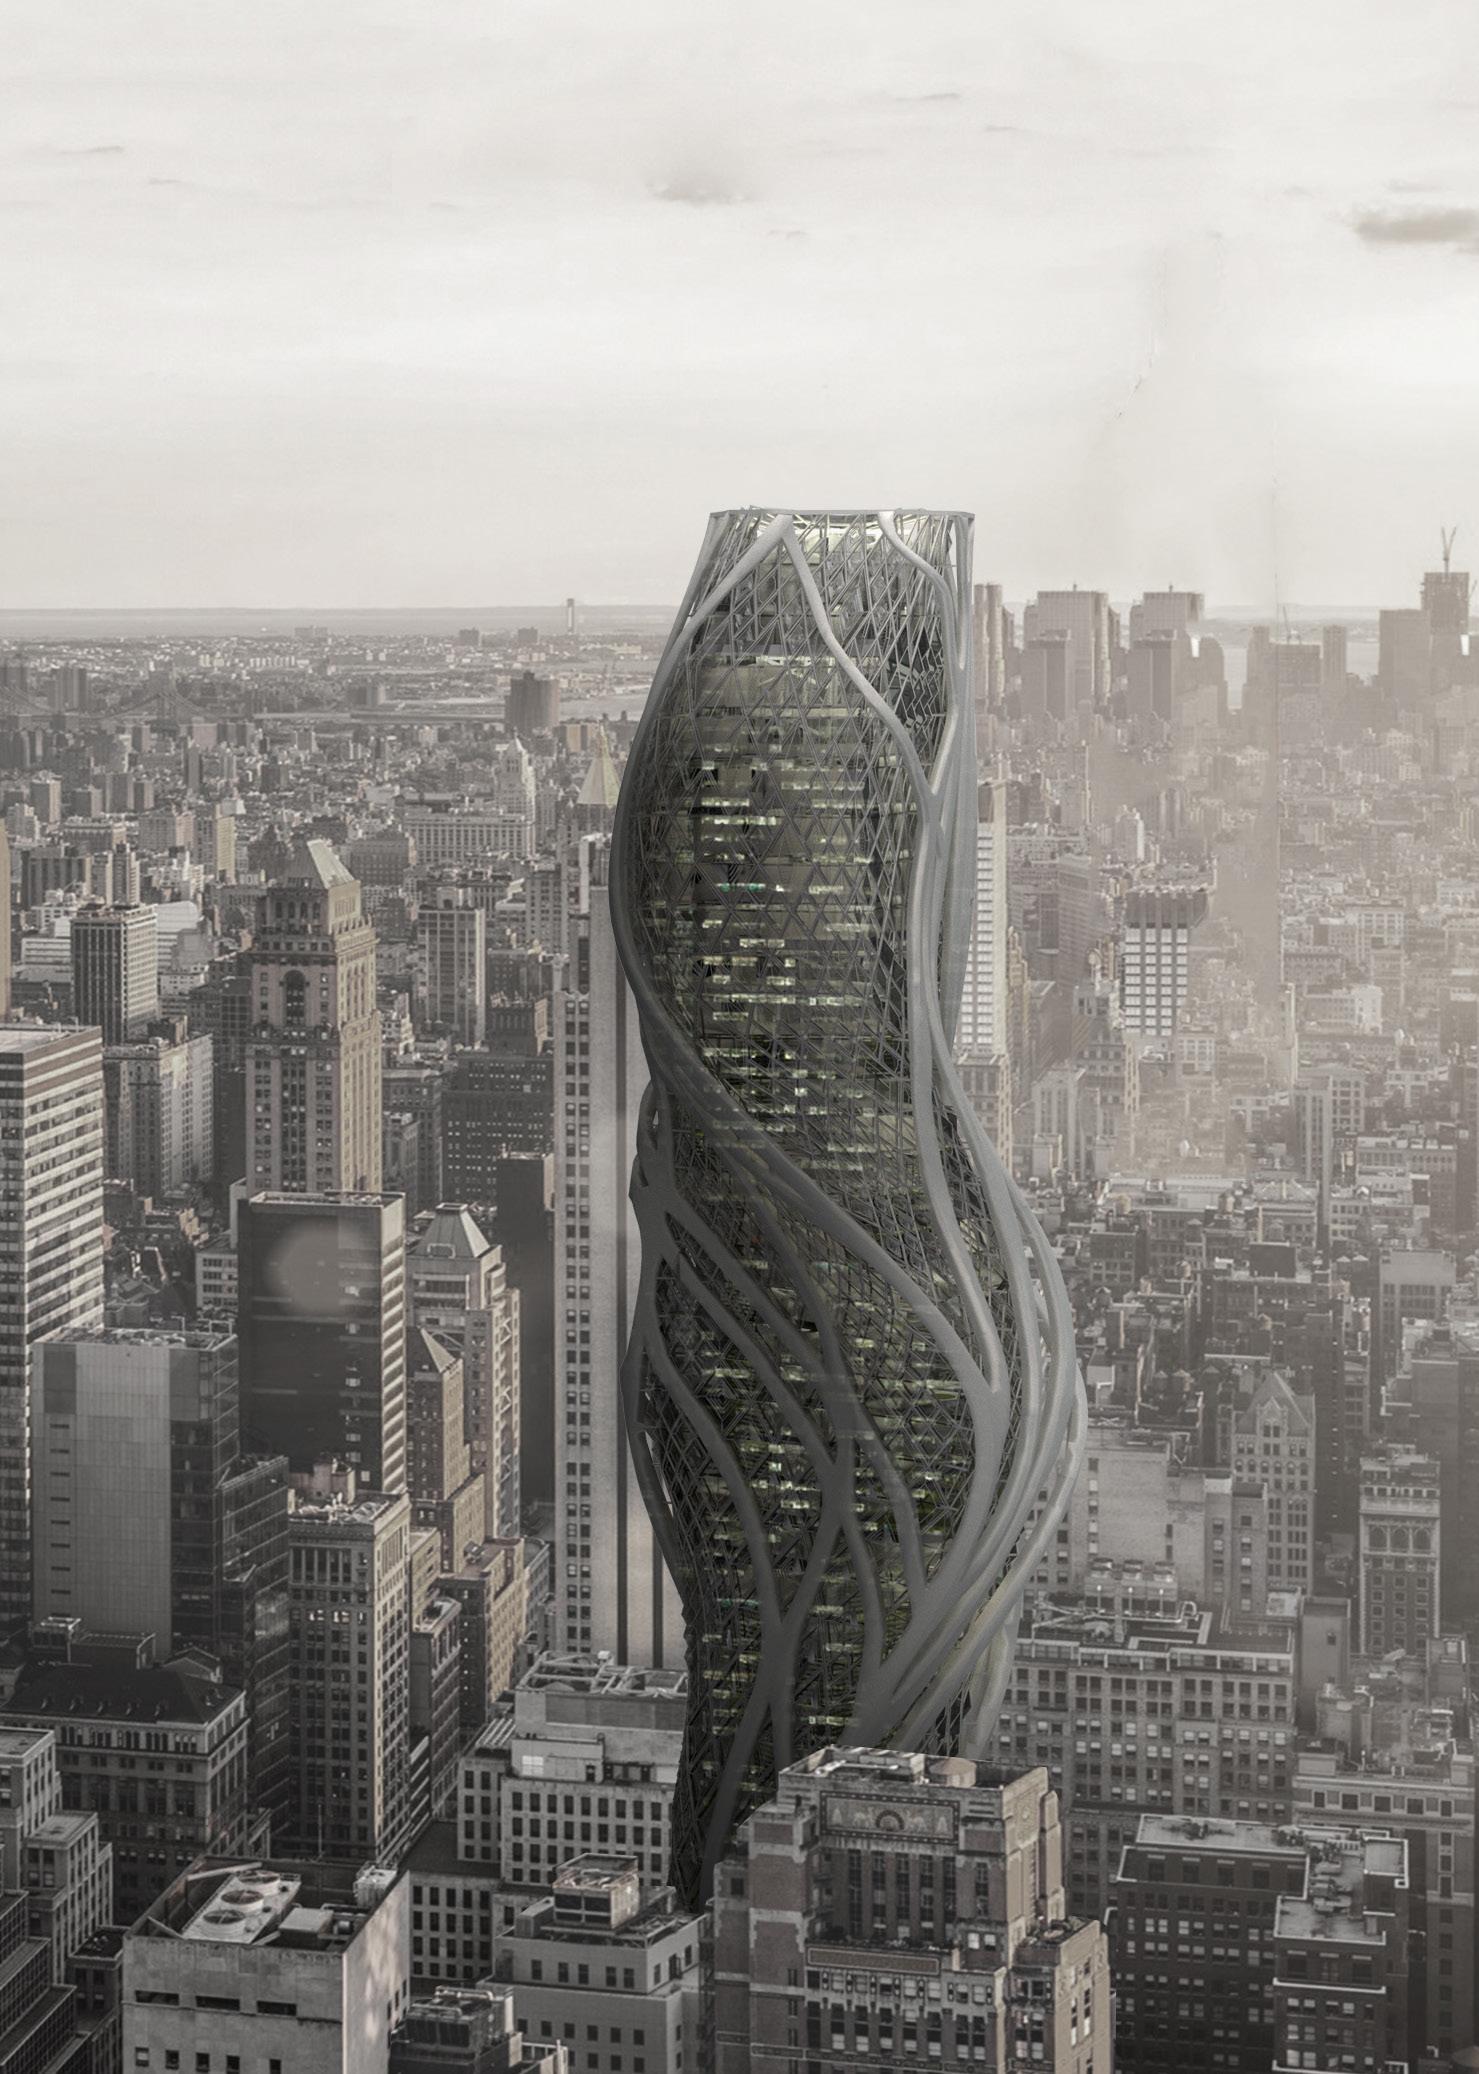

223
Aerial View
6. post evaluation
6.1 INTERIOR AIR CIRCULATION
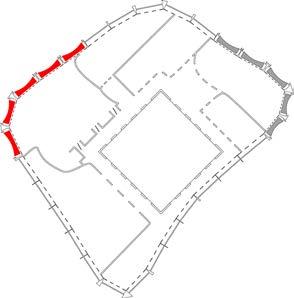
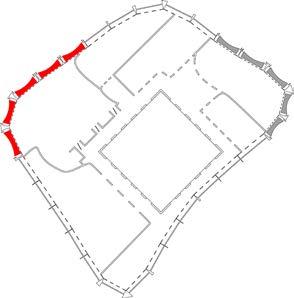
OBSERVATION
In order to understand the effect of pressure difference in the buffer zone to the air ventilation inside the tower, different buffer zone depth of high pressure façade (100cm, 50cm, 25cm) is tested against the same buffer zone depth of low pressure façades (10cm).
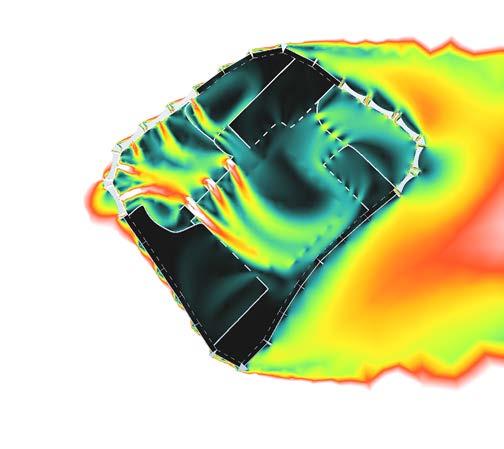
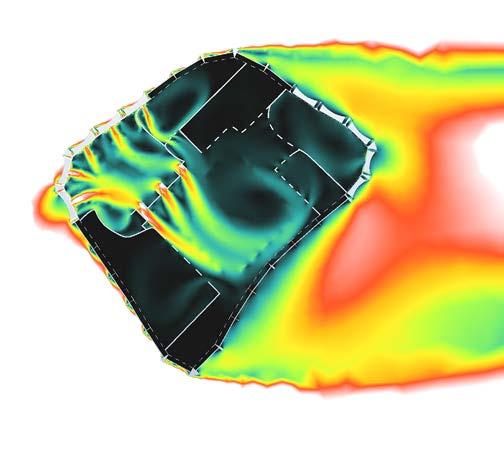
Panels that control the ventilation with pressure difference on different façades have an efficient control on the total amount of volume circulated in micro climate zones that aeroponics are located.
Hence it is possible to have a responsive mechanism to control micro climate according to the plant growth conditions. In addition to zones of aeroponic systems, pressure difference panels have also an effect on ventilation of functional spaces.
226
Low Pressure Low Pressure High Pressure Low Pressure Low Pressure High Pressure High Pressure Buffer Zone Depth : 10cm Low Pressure Buffer Zone Depth : 20cm High Pressure Buffer Zone Depth : 20cm Low Pressure Buffer Zone Depth : 20cm
6.1.1 BUFFER ZONE DEPTH
Interior Air Circulation Post Evaluation
CONCLUSION
As the pressure difference between the buffer zones located in high and low pressure facade increase, the total volume of air circulated inside caused by cross ventilation increase as well.
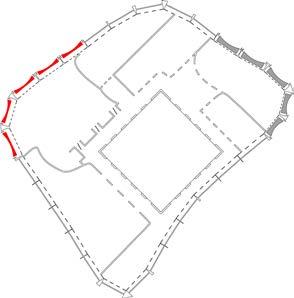
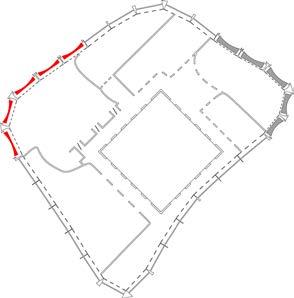
Due to conservation of mechanical energy, the buffer zone depth in high-pressure facade should be maximized so air can flow slower inside the buffer zone. This results in a higher pressure, and increase of pressure difference. Air ventilation speed reaches to 2.70m/s at most, with an exterior wind speed of 5m/s.
Ventilation speed for functional areas are calculated between 0.4 m/s and 0.9m/s, and without any effects of open/close mechanism panels.
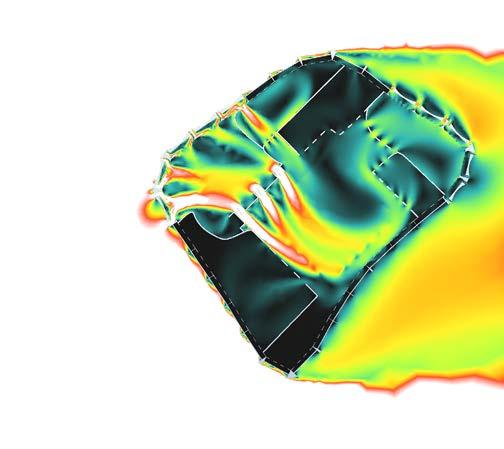
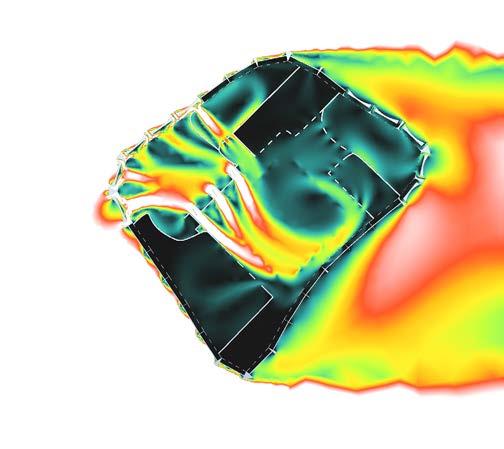
227
<0.00 0.30 0.60 0.90 1.20 1.50 1.80 2.10 2.40 2.70 3.90 3.00 4.20 3.30 4.50 3.60 5.00 m/s v Low Pressure Low Pressure High Pressure Low Pressure Low Pressure High Pressure High Pressure Buffer Zone Depth : 50cm Low Pressure Buffer Zone Depth : 20cm High Pressure Buffer Zone Depth : 70cm Low Pressure Buffer Zone Depth : 20cm Interior Air Circulation Post Evaluation
6.1.2 ALLOCATION OF OPEN&CLOSE MECHANISM PANELS
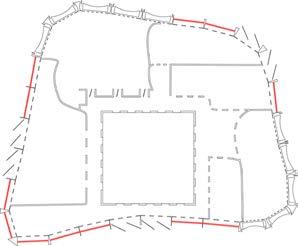
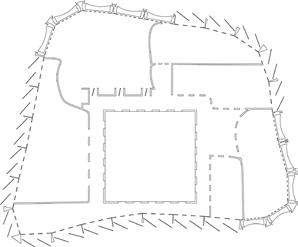
OBSERVATION
In this experiment, in order to control the direction and amount of volume of the air circulated, different angles of air gates towards the wind direction and different allocation of open panels are tested.
It is observed that, when the air gate is perpendicular to the wind direction, the volume of air circulated increases. The amount decreases, as the angle between the normal direction of air gate surface and the wind direction vector reaches to 180 degrees.
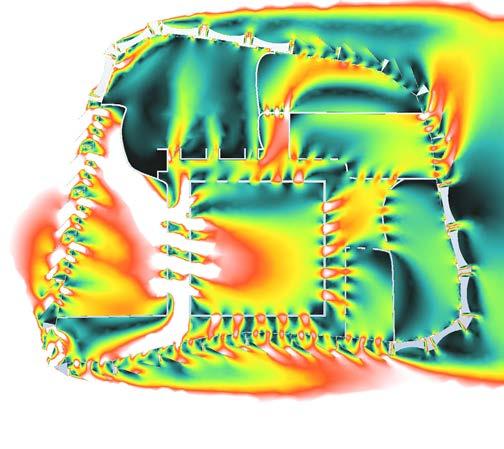
It is also observed that open/close panels are effective in order to increase the air ventilation speed in functional areas.
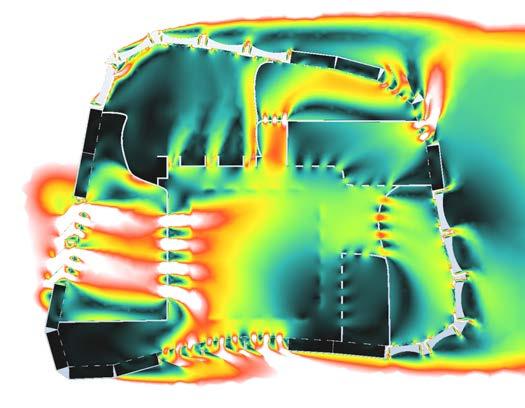
228
5m/s 5m/s
Interior Air Circulation Post Evaluation
CONCLUSION
When the outside wind velocity is 5m/s, the interior air circulation speed caused by cross ventilation reaches to 3m/s, much higher than the target air ventilation speed of 0.8m/s.
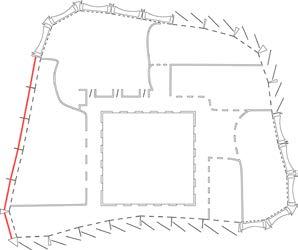
Experiments reveal that it is possible to decrease the air ventilation speed with the kinetic mechanisms of the panels, it can also be stated that the air ventilation speed can be decreased to the target level.
Even with the panels of functional spaces closed, air flow in the functional spaces are measured to be 0.9m/s due to pressure difference occurring from wind speed difference in functional areas and in the core area.
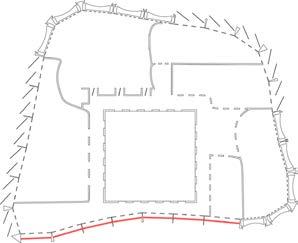
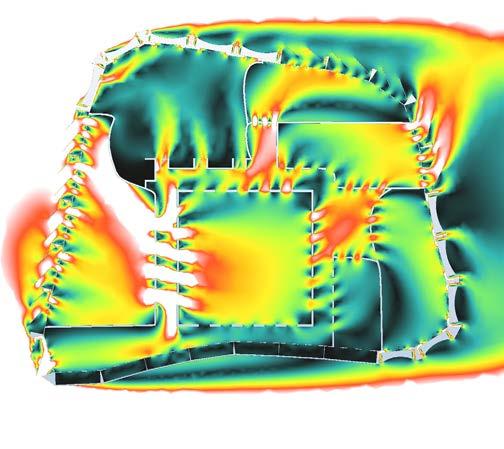
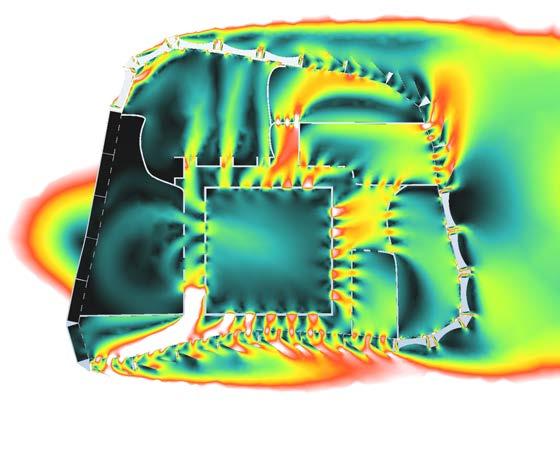
229 <0.00 0.30 0.60 0.90 1.20 1.50 1.80 2.10 2.40 2.70 3.90 3.00 4.20 3.30 4.50 3.60 5.00 m/s v
5m/s 5m/s Interior Air Circulation Post Evaluation
6.1.3 WIND DIRECTION
OBSERVATION
Due to the daily and seasonal wind direction changes, it resulted in similar interior ventilation in all exterior wind directions. This experiment illustrates the interior ventilation efficiencies in north, south, east and west directions.
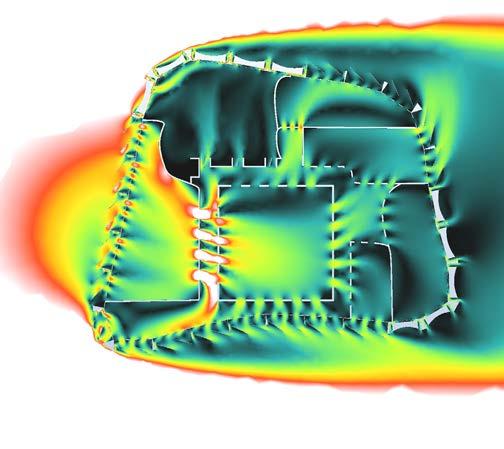
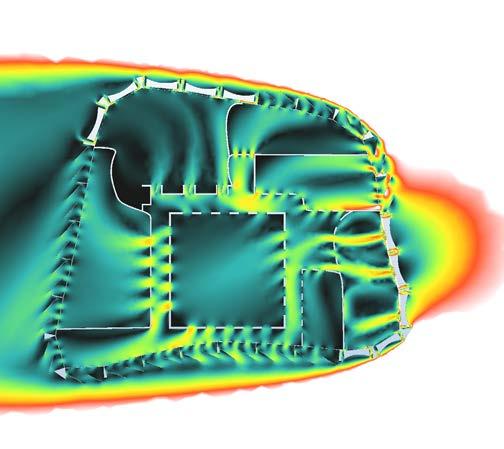
It is observed that, the pressure control panels in the micro climate zones where aeroponic systems are located have similar interior air ventilation regardless of wind direction. However the cross ventilation, where the ventilation is controlled by panels that work with open/ close logic (residential and office areas), is affected more by the changing wind direction. It is observed that, within residential and functional spaces, the air ventilation is rapidly increasing when the panels are perpendicular to the wind direction.
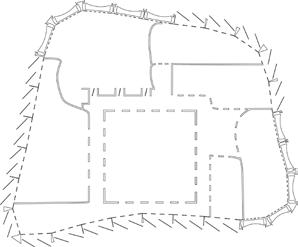
230 N
5m/s 5m/s
Interior Air Circulation Post Evaluation
CONCLUSION
In conclusion, according to the CFD analysis results, regardless of wind direction, target air speed of 0.8m/s is achieved within all changing wind directions.
Depending on the zones that have panels with open&close logic, air ventilation speed reaches to 2.70 m/s.
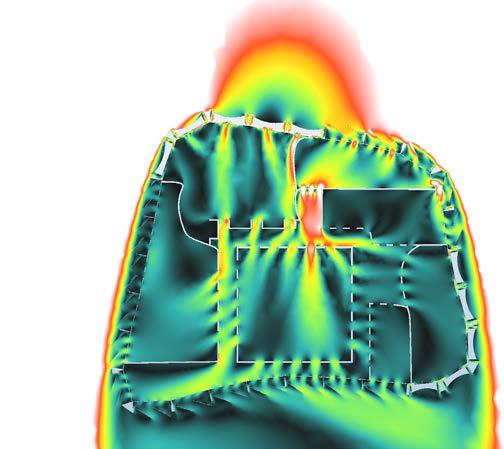
Regardless of the wind direction, the air ventilation speed on the microclimate zones have a similar velocity of around 0.9 m/s.
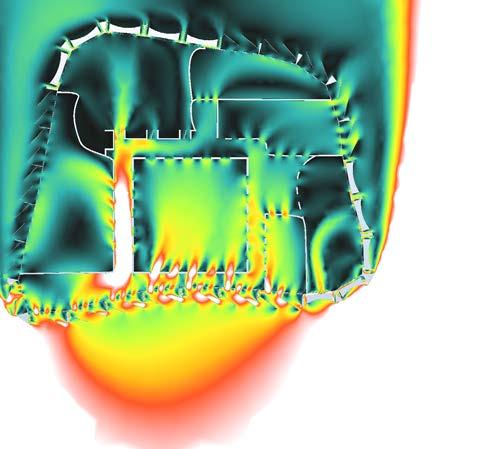
231 <0.00 0.30 0.60 0.90 1.20 1.50 1.80 2.10 2.40 2.70 3.90 3.00 4.20 3.30 4.50 3.60 5.00 m/s v
5m/s 5m/s Interior Air Circulation Post Evaluation
OBSERVATION
In this experiment, the effect of different external wind speed on interior ventilation is examined. Due to different responses of various types of panels on exterior wind, the observations can be separated for micro climate zones and functional areas.
In terms of functional areas, the air circulation is directly affected by the exterior wind speed. Faster wind results in an increased speed of ventilation inside of the functional areas. However, the effect of exterior wind speed on micro climatic zone’s ventilation is much more limited. That situation provides a better control in order to create a micro climate suitable for plant growth conditions.
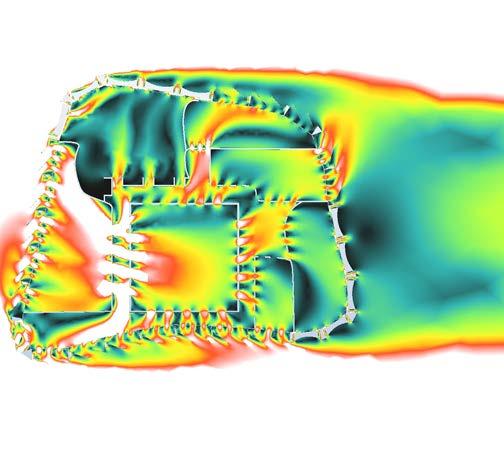
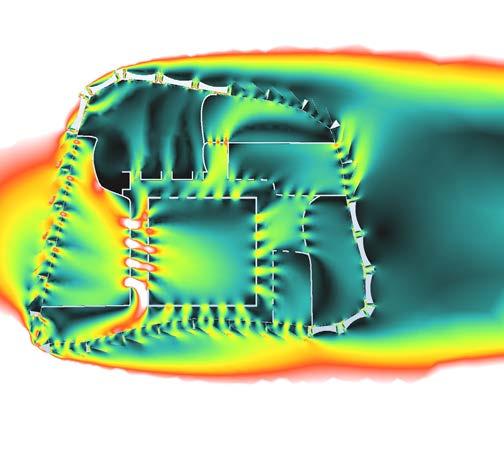
232
10m/s 5m/s 6.1.4 WIND SPEED TEST Interior Air Circulation Post Evaluation
CONCLUSION
While changes in external wind speed can affect functional spaces by providing cross ventilation, it is observed that micro climate zones in which the aeroponics are located, only minor changes in terms of air ventilation speed occured.
The ventilation speed in functional areas varies between 1.5m/s and 5+m/s, depending on the external wind speed.
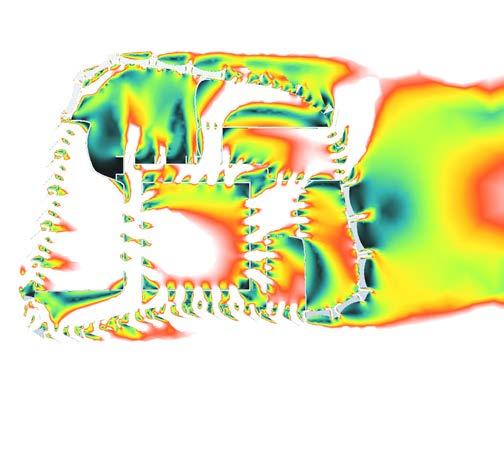
In the spaces that the air ventilation provided by pressure difference panels, air ventilation speed varies between 0.3m/s and 1.8m/s depending on the exterior wind speed.
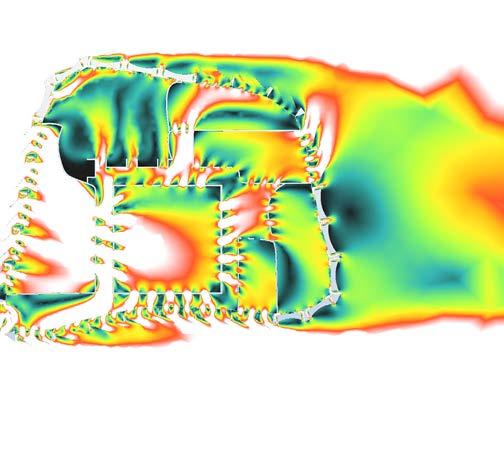
233
<0.00 0.30 0.60 0.90 1.20 1.50 1.80 2.10 2.40 2.70 3.90 3.00 4.20 3.30 4.50 3.60 5.00 m/s v 15m/s 20m/s Interior Air Circulation Post Evaluation
OBSERVATION
In order to enhance the natural ventilation provided by core area, different roof designs are tested to provide better chimney effect inside the tower. Convex and concave, and concave with multiple air exhaust, are tested to see the effect of roof design on air extraction.
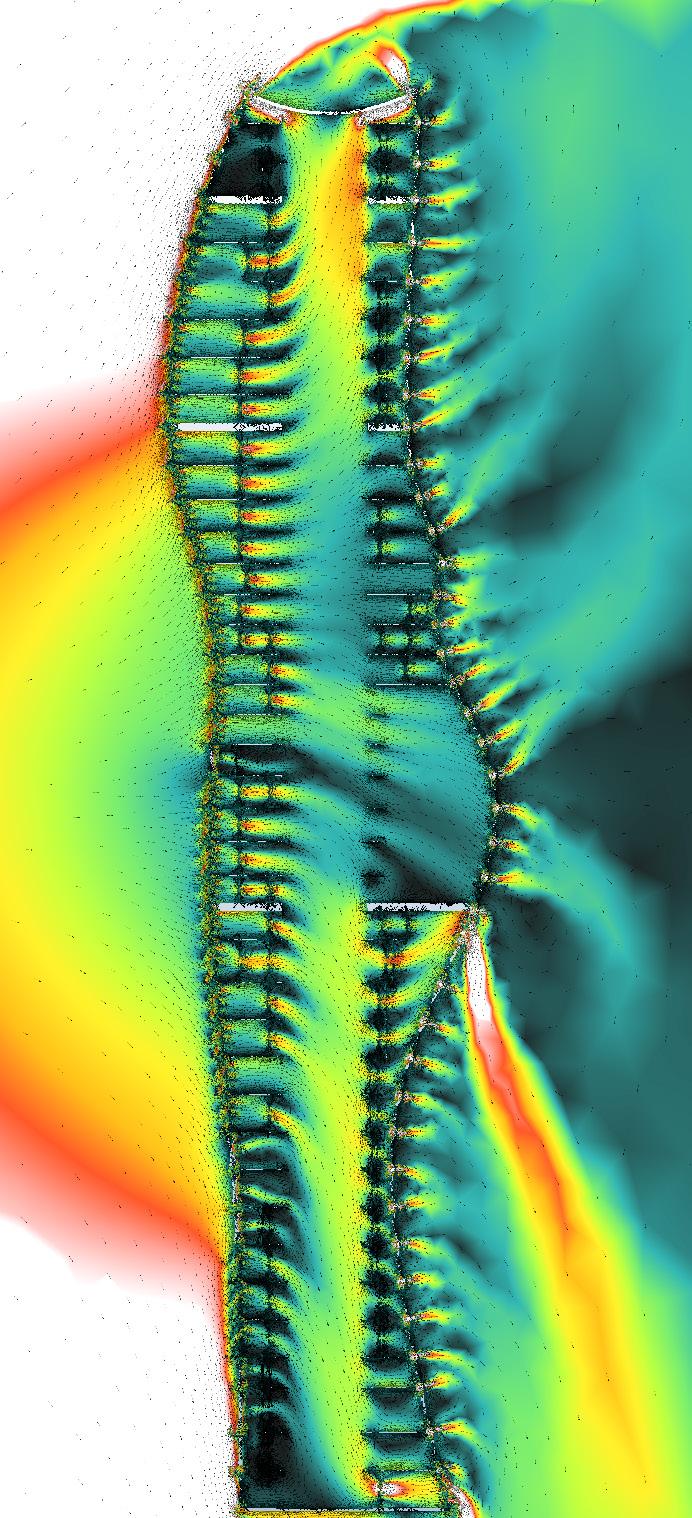
It is observed that since the air flow tends to follow convex surfaces, concave roof designs create a negative pressure on top of the roof which fundamentally enhances the amount of air extracted because of the chimney effect. In addition, the increasing number of air outlet on the roof results in an increasing amount of air extracted.
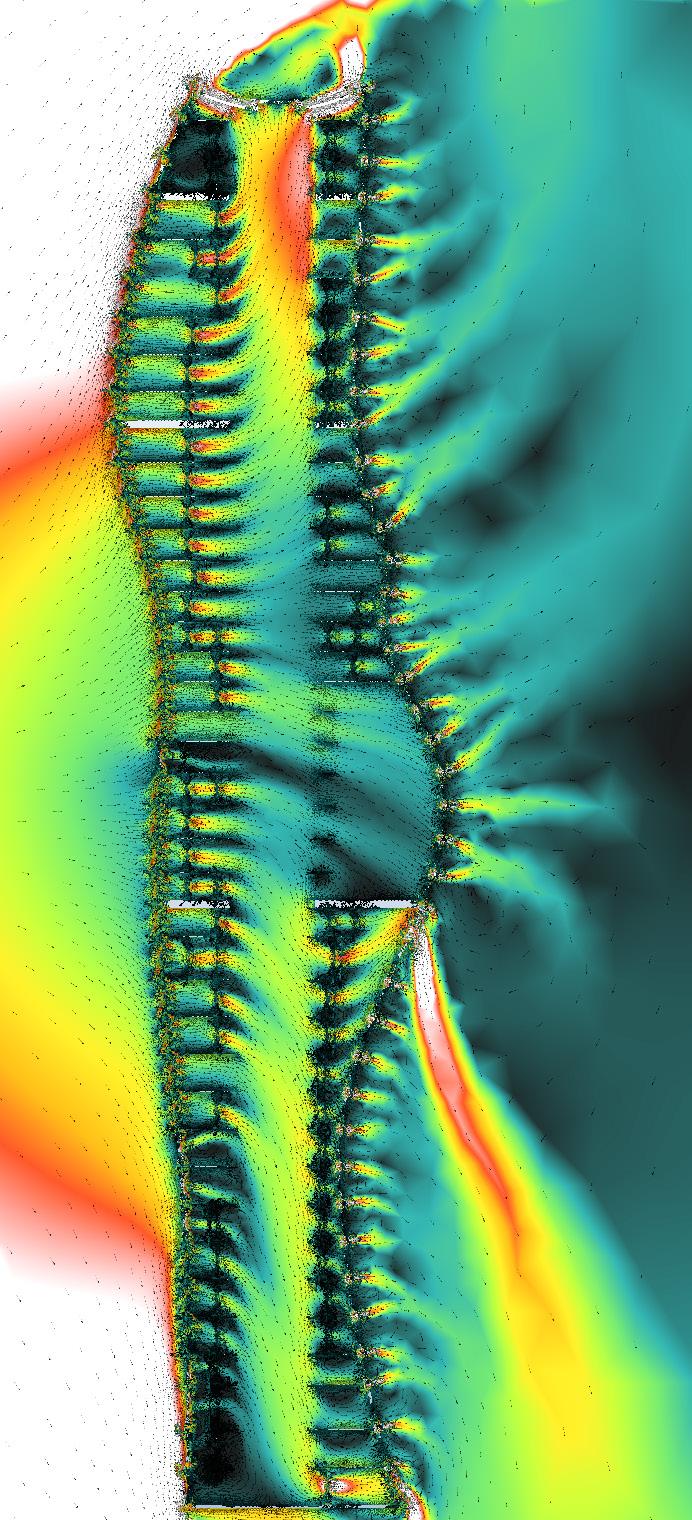
234
Interior Air Circulation Post Evaluation
6.1.5 ROOF TEST
CONCLUSION
As a result, option 1 is selected, in order to create a negative pressure on top of the roof with its concave design, and increased number of air outlets provided an increased amount of air extracted from the roof.
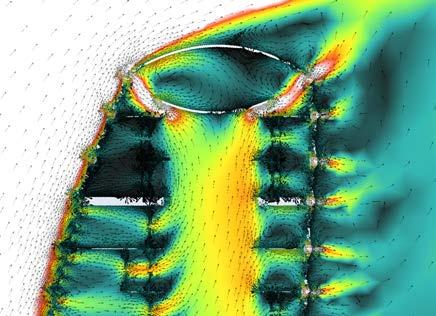
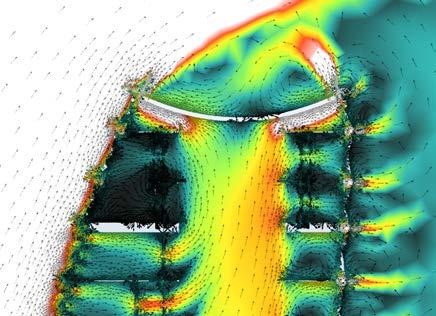
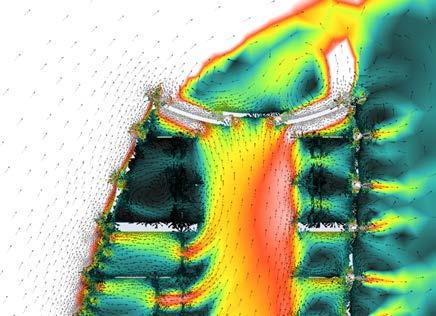
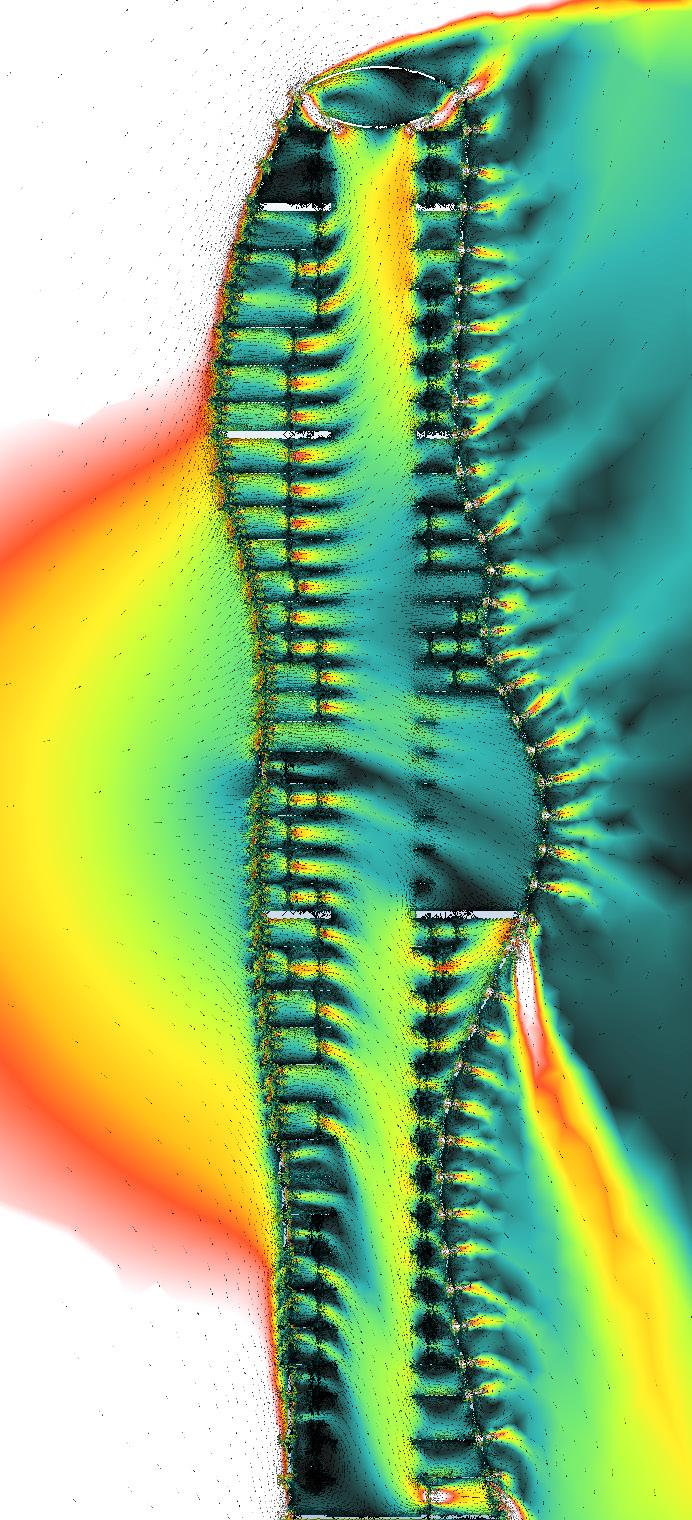
235 <0.00 0.30 1.60 2.90 3.20 4.50 5.80 6.10 7.40 8.70 12.90 9.00 13.20 10.30 14.50 11.60 15.00 m/s v
Interior Air Circulation Post Evaluation
6.2 CONCLUSIONS
This thesis project focuses on possible architectural solutions, that can be implemented on high-rise buildings, for food security problem. When the reasons of food security issue analysed, such as rapid population increase, Shanghai selected as a location to focus on.
The ambition was to design a bioclimatic tower, which can continuously adapt to its external and internal governing parameters to achieve better living conditions while providing a suitable environment for plant growth conditions under subtropical climate conditions.
In order to achieve that ambition, a tower system is designed by considering external load and climatic conditions of the selected region. In addition to those parameters, tower system is designed by considering architectural solutions ,such as vertical gardens in atrium space, to increase the interaction of occupants with its internally constructed ecosystem.
Due to the climate of Shanghai, cross ventilation techniques are implemented on tower both by providing open spaces within the tower and by designing a responsive facade system that continuously adapt to the changing external factors such as wind direction, wind velocity and air temperature.
In order to provide suitable environment for plant growth, spaces that have their own controlled microclimate are created on a responsive panelized facade. Aeroponic systems are added to the tower due to their low structural weight and low requirement of water.
To measure the efficiency of responsive facade design on providing a controlled environment both for plant growth and for human comfort levels, various Computational Fluid Dynamic analysis are run. The results reveals that responsive facade is capable of controlling the cross ventilation inside of the tower by controlling the pressure differences in buffer zones on different façades of the tower.
236
Conclusion Post Evaluation
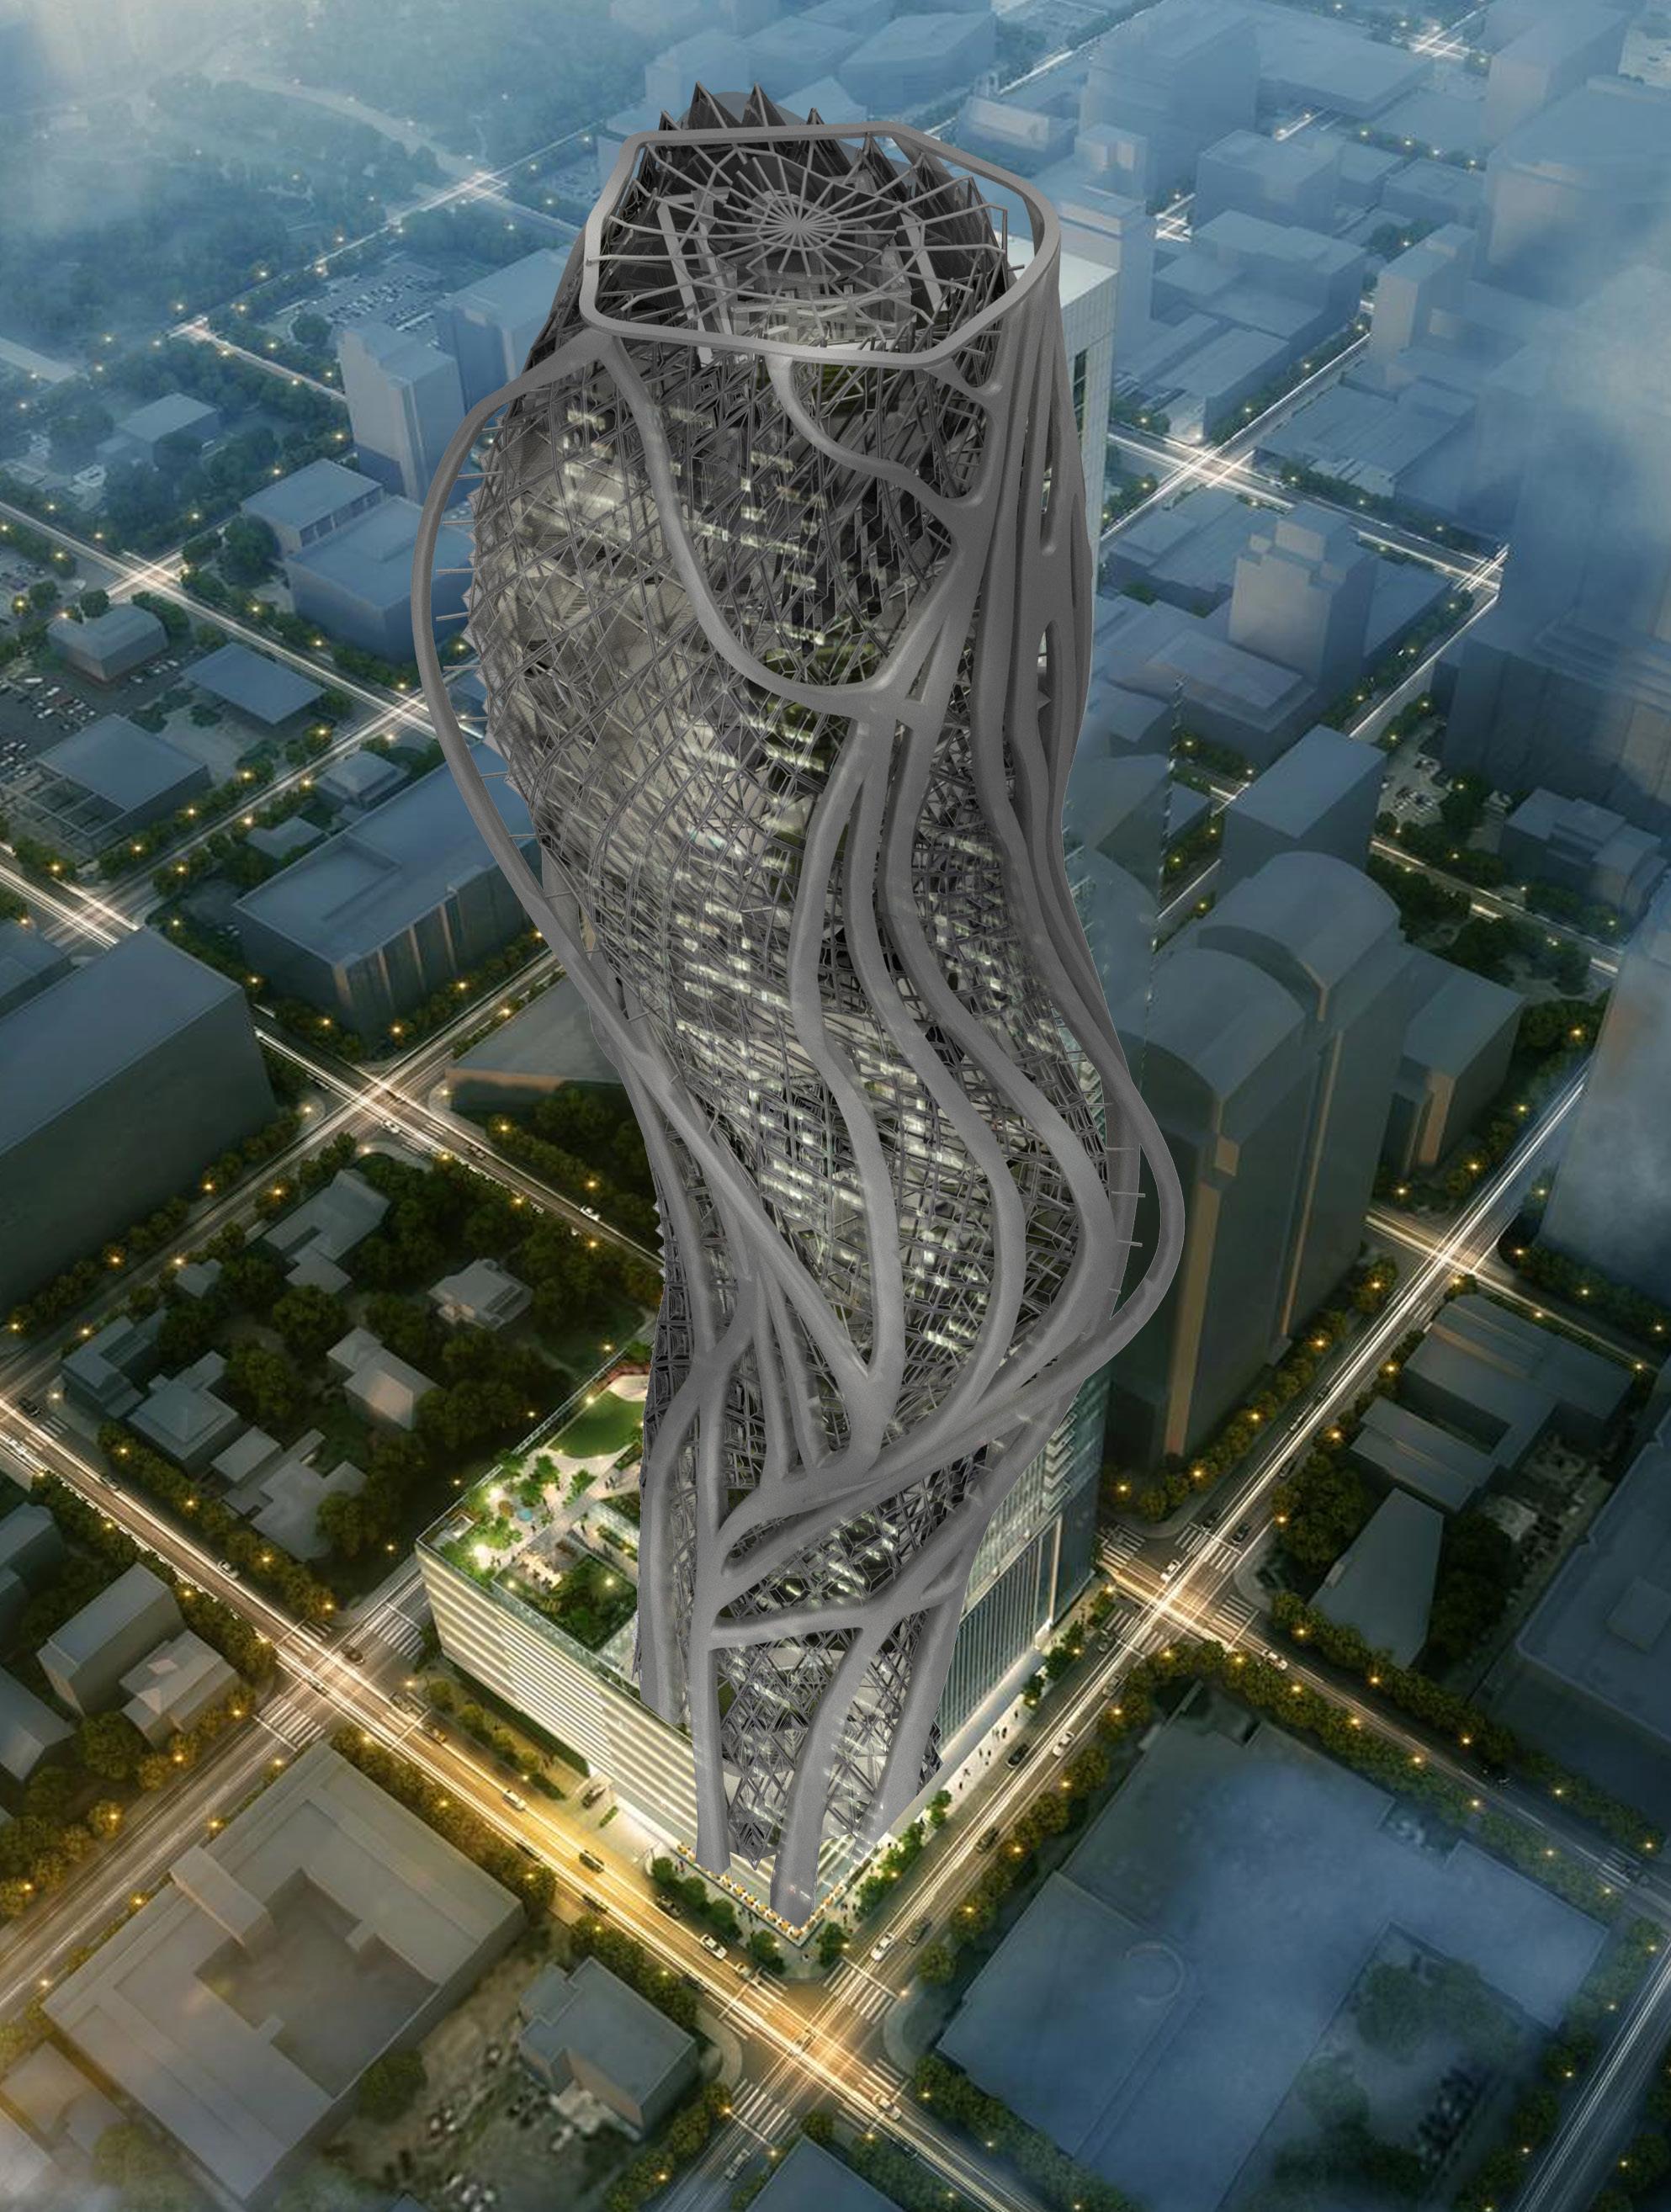
Conclusion Post Evaluation
7. further studies
7.1 FURTHER STUDIES
Some optional inquiries are suggested to expand on the initial proposal of the project.
Firstly, further research can explore the amount of energy spent during skyscraper construction phase and how can be possible to calculate carbon footprint for minimize the impact on the cities.
Secondly, development in water collection and distribution system for high-rise building remain a problem for highdensity structures.
Thirdly, renewable construction materials which can improve structural properties for towers may be developed.
Finally, bioclimatic principles for a tower can be extended for new case studies in different scales and contexts.
240
Further Studies
241 Further Studies
8. bibliography
BOOKS AND ARTICLES
FOOD & AGRICULTURE ORGANIZATION. FUTURE OF FOOD AND AGRICULTURE 2018: Alternative Pathways to 2050. S.l.: FOOD & AGRICULTURE ORG, 2018.
“Tube Structural System - Designing Buildings Wiki.” n.d. Accessed January 7, 2019. https://www. designingbuildings.co.uk/wiki/Tube_structural_system?fbclid=IwAR2thGf7ptuajgy-cBnz-ikaxYmLZ8ZJ99WDgk8Jv 33MZCk4nFYPvnUN1ik.
Mendis, P, T Ngo, N Haritos, A Hira, B Samali, and J Cheung. n.d. “Wind Loading on Tall Buildings,” 14.
“The Future of Food and Agriculture.” 2017. FAO.
C. Nicholas Raphael, Professor, Jinan Li, and Senior Programer. n.d. “POTENTIAL URBAN HAZARD ZONES OF SHANGHAI PRC.Pdf.” Department of Geography and Geology Eastern Michigan University Ypsilanti, MI48197 2389 Timbercrest Ct. Ann Arbor, MI48106.
Team, ME Mechanical. 2016. “Overview of Psychrometric Chart.” ME Mechanical (blog). April 13, 2016. https:// me-mechanicalengineering.com/psychrometric-chart/.
“World Population Projected to Reach 9.7 Billion by 2050 | UN DESA | United Nations Department of Economic and Social Affairs.” n.d. Accessed September 5, 2018. 2015-report.html.
Seto, Karen C. n.d. “Urban Growth in China: Challenges and Prospects,” 35.
“National Bureau of Statistics of China >> Census Data.” n.d. Accessed October 13, 2018. http://www.stats.gov. cn/enGliSH/Statisticaldata/CensusData/.
“Urbanization.” n.d. Our World in Data. Accessed September 29, 2018. https://ourworldindata.org/urbanization.
“CO一 and Other Greenhouse Gas Emissions.” n.d. Our World in Data. Accessed December 30, 2018. https:// ourworldindata.org/co2-and-other-greenhouse-gas-emissions.
“List of Tallest Buildings in Shanghai.” 2018. Wikipedia. https://en.wikipedia.org/w/index.php?title=List_of_ tallest_buildings_in_Shanghai&oldid=875474744.
244 Books and Articles Bibliography
“World of Change: Sprawling Shanghai.” 2017. Text.Article. March 13, 2017. https://earthobservatory.nasa.gov/ world-of-change/Shanghai.
“Humid Subtropical Climate | Climatology.” n.d. Encyclopedia Britannica. Accessed December 30, 2018. https:// www.britannica.com/science/humid-subtropical-climate.
project, The World Air Quality Index. n.d. “World Health Organization: 2014 Air Pollution Ranking.” Aqicn.Org. Accessed December 30, 2018. http://aqicn.org/search/vn/.
“Air Pollution: Does It Get Worse before It Gets Better?” n.d. Our World in Data. Accessed December 30, 2018. https://ourworldindata.org/air-pollution-does-it-get-worse-before-it-gets-better.
Institute of Space Systems. 2013. “Feasibility Study VerticalFarm EDEN.Pdf.”
“13 Vertical Farming Innovations That Could Revolutionize Agriculture.” 2018. July 4, 2018. https:// interestingengineering.com/13-vertical-farming-innovations-that-could-revolutionize-agriculture.
“Plant Care Mother-in-Laws Tongue | House Plants.” n.d. /plant_care_mother_in_laws_tongue.
InterMari. 2017. “Pilea Peperomioides | Chinese Money Plant Care & Info.” Houseplant Central (blog). February 12, 2017. https://houseplantcentral.com/pilea-peperomioides-chinese-money-plant-care-info/.
Michael Boduch and Warren Fincher. 2009. “Standards of Human Comfort.” UTSoA - Meadows Seminar Fall 2009. https://soa.utexas.edu/sites/default/disk/preliminary/preliminary/1-Boduch_Fincher-Standards_of_ Human_Comfort.pdf.
“Skyscraper Design and Construction.” 2018. Wikipedia. https://en.wikipedia.org/w/index.php?title=Skyscraper_ design_and_construction&oldid=865315420.
Erik Hallebrand and Wilhelm Jakobsson. 2016. “Structural Design of High-Rise Building.” 2016. http://www. byggmek.lth.se/fileadmin/byggnadsmekanik/publications/tvsm5000/web5213.pdf. Kovačević, Ilda. 2018. “MODERN STRUCTURAL CONCEPTS FOR HIGH-RISE BUILDINGS.” САВРЕМЕНА ТЕОРИЈА И ПРАКСА У ГРАДИТЕЉСТВУ 13 (1). https://doi.org/10.7251/STP1813549K.
245 Books and Articles Bibliography
“Capital Gate Tower, Abu Dhabi.” n.d. http://www.ctbuh.org/TallBuildings/FeaturedTallBuildings/ CapitalGateTowerAbuDhabi/tabid/3380/language/en-GB/Default.aspx.
“Capital Gate Floor Plans - Abu Dhabi.” n.d. http://www.worldfloorplans.com/floorplans/Capital-Gate-Level-05. shtml.
“CoreDesign.Pdf.” n.d https://www.sefindia.org/rangarajan/CoreDesign.pdf.
Yeang, Ken, Ivor Richards, and The Images Publishing Group. 2013. Eco Skyscrapers, Volume 2 / Ken Yeang ; [Edited by Lucy Bullivant]. Mulgrave, Vic. : Images Publishing, 2011.
Yeang, Ken. 2002. Reinventing the Skyscraper : A Vertical Theory of Urban Design.
“Burj Khalifa.” 2018. Wikipedia. https://en.wikipedia.org/w/index.php?title=Burj_Khalifa&oldid=875993083. Safa Aboelssaad. 08:44:13 UTC. “Burj Khalifa.” Engineering. https://www.slideshare.net/safaamohammed5496/ burj-khalifa-48217403.
“Double Skin Façade: The State of Art on Building Energy Efficiency.” 2016. ResearchGate. January 2016. https:// www.researchgate.net/publication/274194137_Double_Skin_Facade_The_State_of_Art_on_Building_Energy_ Efficiency.
Lau, Gina Letízia. 2015. “Sustainable High-Rise Construction in Shanghai,” July, 11.
“Shanghai Tower.” 2018. Wikipedia. https://en.wikipedia.org/w/index.php?title=Shanghai_ Tower&oldid=874323105.
“Shanghai Tower - The Skyscraper Center.” n.d. Accessed December 30, 2018. http://www.skyscrapercenter. com/building/shanghai-tower/56.
Zhaoa, X., J.M. Ding, and H.H. Suna. 2011. “Structural Design of Shanghai Tower for Wind Loads.” Procedia Engineering 14: 1759–67. https://doi.org/10.1016/j.proeng.2011.07.221.
“Responsive Skins.” n.d. Responsive Skins. Accessed December 30, 2018. https://yazdanistudioresearch. wordpress.com/.
Kamil Sharaidin. 2014. “Kinetic Facades: Towards Design for Environmental Performance.”
Peter Oborn with Edwin Heathcote, Edward Denison and Eric Ormsby. 2013. Al Bahr Towers : The Abu Dhabi Investment Council Headquarters. Chichester : Wiley,.
246
Books and Articles Bibliography
Bibliography
Books and Articles
“Al Bahar Towers, Abu Dhabi.” n.d. Accessed December 30, 2018. http://www.ctbuh.org/TallBuildings/FeaturedTallBuildings/ FeaturedTallBuildingArchive2012/AlBaharTowersAbuDhabi/tabid/3845/language/en-GB/Default.aspx.
“T. R. Hamzah and Yeang Sdn Bhd|Ecoarchitecture| Ecomasterplanners| Green Design|Ecoinfrastructure|Eco Masterplanning and Eco Architecture Malaysia | Eco Architects | Eco Infrastructure.” n.d. Accessed December 30, 2018. http://www.hamzahyeang.com/echo-architects-malaysia-projects/.
EARLST2007. n.d. An Interview with Architect Ken Yeang, on CNN’s ’Just Imagin. Accessed December 30, 2018. https://www. youtube.com/watch?time_continue=1&v=H1P1kkcEzWM.
Hart, Sara, Ecoarchitecture – The Work of Ken Yeang, John Wiley & Sons (2011), UK Powell, Robert Rethinking the Skyscraper: the complete architecture of Ken Yeang, Thames & Hudson (1999), ISBN 0-50028155-6
“How to Heat and Cool a Supertall.” 2015. ÜBERWELLTM (blog). November 11, 2015. http://uber-well.com/how-to-heat-andcool-a-supertall/.
“Coandă Effect.” 2018. Wikipedia. https://en.wikipedia.org/w/index.php?title=Coand%C4%83_effect&oldid=871955756.
Kozai, Toyoki, Genhua Niu, and Michiko Takagaki, eds. 2016. Plant Factory: An Indoor Vertical Farming System for Efficient Quality Food Production. Amsterdam ; Boston: Elsevier/AP, Academic Press is an imprint of Elsevier.
“Aeroponics.” 2018. Wikipedia. https://en.wikipedia.org/w/index.php?title=Aeroponics&oldid=869011534.
“AeroFarms Technology.” n.d. AeroFarms (blog). Accessed December 30, 2018. https://aerofarms.com/technology/.
Reza, Md, Mahmud Riazi, and M Khan. 2016. “Productivity And Profitability Of Sugarcane Production In Northern Bangladesh.” Indian Journal of Commerce and Management Studies 7 (1): 38.
“Yield Stress - an Overview | ScienceDirect Topics.” n.d. Accessed January 6, 2019. https://www.sciencedirect.com/topics/ materials-science/yield-stress.
“What Is the Meaning of the Von Mises Stress and the Yield Criterion?” 2017. SimScale. April 19, 2017. https://www.simscale. com/blog/2017/04/von-mises-stress/.
Blinn, James F. n.d. “A Generalization of Algebraic Surface Drawing.” ACM Transactions on Graphics 1 (3): 22.
“Metaballs.” 2018. Wikipedia. https://en.wikipedia.org/w/index.php?title=Metaballs&oldid=832643078.
“#1 Article for 2018 - Growing with Hydroponics, Aeroponics and Aquaponics | AgriTechTomorrow.” n.d. Accessed January 6, 2019. //agritechtomorrow.com/article/2018/05/growing-with-hydroponics-aeroponics-and-aquaponics/10733.
Reza, Md, Mahmud Riazi, and M Khan. 2016. “Productivity And Profitability Of Sugarcane Production In Northern Bangladesh.” Indian Journal of Commerce and Management Studies 7 (1): 38.
“Al Bahar Towers, Abu Dhabi.” http://www.ctbuh.org/TallBuildings/FeaturedTallBuildings/AlBaharTowersAbuDhabi/ tabid/3845/language/en-US/Default.aspx.
“‘One Ocean’s’ Kinetic Facade.” http://compositesandarchitecture.com/?p=68.
247
Bibliography
Diagrams and Images
DIAGRAMS AND IMAGES
Pag10
“ASIA.” n.d. Sartorial Trips. http://www.sartorialtrips.com/asia/.
Page16, page 20 ©Blackstation
Page22
“Song Dynasty.” n.d. Spread of Civilizations in East Asia. Accessed January 5, 2019. http:// thetwogoldenagesofchina.weebly.com/song-dynasty.html.
Page25
LSE Cities Density Cities Map: “2011_chw_2050_01.Gif (1092×1221).”. https://files.lsecities.net/ files/2011/11/2011_chw_2050_01.gif.
Page 26
http://worldpopulationreview.com/world-cities/shanghai-population/
Seto, Karen C. n.d. “Urban Growth in China: Challenges and Prospects,” 35. “National Bureau of Statistics of China >> Census Data.” http://www.stats.gov.cn/enGliSH/Statisticaldata/ CensusData/
Page 27
“Panorama Dalla Rocca Di Gibilterra - Picture of The Rock of Gibraltar, Gibraltar - TripAdvisor.” https://www. tripadvisor.co.uk/LocationPhotoDirectLink-g187510-d232389-i154467439-The_Rock_of_Gibraltar-Gibraltar. html.
Events, Y. C. W. n.d. “Hong Kong – Hong Kong – Successes in Artificial Intelligence with Esther Wong [Monday, August 27].”
YCWhttp://www.youngchinawatchers.com/category/locations/hong-kong/.
Page 29
“World_ghg_flow_chart_2005.Png (1500×1081).” http://www.wri.org/sites/default/files/world_ghg_flow_ chart_2005.png
Page 31
10MostToday. 2013. “10 Tallest Buildings In The World.” 10 Most Today (blog). July 5, 2013. https://10mosttoday.com/10-tallest-buildings-in-the-world/. “Building... - GRA Office Photo.” n.d. Glassdoor. https://www.glassdoor.co.uk/Photos/GRA-Office-Photos-IMG238264.htm.
Page35
“Holdridge Life Zones.” 2018. Wikipedia. https://en.wikipedia.org/w/index.php?title=Holdridge_life_ zones&oldid=847677283.
248
Diagrams and Images Bibliography
page 38
project, The World Air Quality Index. n.d. “Shanghai Air Pollution: Real-Time PM2.5 Air Quality Index (AQI).” Aqicn.Org. http://aqicn.org/city/shanghai/. Ritchie, Hannah, and Max Roser. 2019. “Air Pollution.” Our World in Data, January. https://ourworldindata.org/ air-pollution.
Page 40
“Spatiotemporal Variation of Landscape Patterns and Their Spatial Determinants in Shanghai, China.” n.d. ResearchGate
https://www.researchgate.net/publication/321996207_Spatiotemporal_variation_of_landscape_patterns_and_ their_spatial_determinants_in_Shanghai_China.
Page 43
“Urban Agriculture Integration Typology.” n.d. Association for Vertical Farming (blog). https://vertical-farming. net/vertical-farming/integration-typology/.
Page 48
“Growing Palms Indoors - Learn About Bamboo Palm Care https://www.gardeningknowhow.com/houseplants/ bamboo-palm/grow-bamboo-palm-indoors.htm.
“7c748082-C1f2-4e8b-8b84-5a0f724700df.Jpg (800×800” https://2ecffd01e1ab3e9383f0-07db7b9624bbdf022 e3b5395236d5cf8.ssl.cf4.rackcdn.com/Product-800x800/7c748082-c1f2-4e8b-8b84-5a0f724700df.jpg.
“CHINESE MONEY FAUX PLANT.” n.d. The Banyan Tree Furniture Pty Ltd. https://thebanyantree.com.au/ products/chinese-money-plant.
Page 55-57
“Willis Tower (Formerly Sears Tower).” n.d. SOM. Accessed January 5, 2019. http://www.som.com/projects/ willis_tower_formerly_sears_tower.
©SOM ©EzraStoller
Page 59
Sarkisian, Mark P. 2012. Designing tall buildings: structure as architecture. New York: Routledge.
Page 60
“Leaning Tower of Abu Dhabi Snares Record - Emirates24|7 https://www.emirates247.com/eb247/companiesmarkets/construction/leaning-tower-of-abu-dhabi-snares-record-2010-06-06-1.251973.
249
Page 61
“Capital Gate Floor Plans - Abu Dhabi.” http://www.worldfloorplans.com/floorplans/Capital-Gate-Level-05.shtml.
“Capital Gate Tower, Abu Dhabi.” http://www.ctbuh.org/TallBuildings/FeaturedTallBuildings/ArchiveJournal/ CapitalGateTowerAbuDhabi/tabid/3380/language/en-GB/Default.aspx.
Page 63
“Dancing Towers by Zaha Hadid | Yanko Design.” n.d. Accessed December 30, 2018. http://www.yankodesign. com/2007/04/19/dancing-towers-by-zaha-hadid/. siteadmin. 2015. “CCTV HEADQUARTERS.” High Quality Customised Private and Small Group Tours | U China Travel (blog). August 6, 2015. https://www.uchinatravel.com/2015/08/06/cctv-headquarters/.
“Burj Khalifa Tower “ n.d. Accessed December 30, 2018. https://allthingscruise.com/wp-content/uploads/ DSC_0105.jpg.
Page 65
“Burj Khalifa - Wikipedia.” https://en.wikipedia.org/wiki/Burj_Khalifa.
“INTEGRAL APPROACH TO ENHANCE ENGINEERING EDUCATION IN AN OFFSHORE UNIVERSITY CAMPUS.” n.d. ResearchGate. https://www.researchgate.net/publication/266881490_INTEGRAL_APPROACH_TO_ENHANCE_ ENGINEERING_EDUCATION_IN_AN_OFFSHORE_UNIVERSITY_CAMPUS/figures?lo=1
Page 67
“Aldar Headquarters Round Building - Al Raha Gardens.” http://www.weltrekordreise.ch/bilder%20 ae/208-P1040511.jpg.
Page 68
Barbosa, Sabrina, and Kenneth Ip. 2016. “Predicted Thermal Acceptance in Naturally Ventilated Office Buildings with Double Skin Façades under Brazilian Climates.” Journal of Building Engineering 7 (September): 92–102. https://doi.org/10.1016/j.jobe.2016.05.006.
Page 69
“Double Skin Façade: The State of Art on Building Energy Efficiency.” 2016. ResearchGate. January 2016. https:// www.researchgate.net/publication/274194137_Double_Skin_Facade_The_State_of_Art_on_Building_Energy_ Efficiency.
Page 71
“Shanghai Tower Is the World’s Second Tallest Building.” 2018. Designboom | Architecture & Design Magazine. January 15, 2018. https://www.designboom.com/architecture/shanghai-tower-china-tallest-building-skyscrapergensler-01-15-2017/.
“Shanghai Tower Core.” n.d. https://i.pinimg.com/originals/25/21/69/25216983bc8adca90864578c70081b03. jpg.
Welch, Adrian. 2016. “Shanghai Tower: Skyscraper China.” E-Architect. November 5, 2016. https://www.earchitect.co.uk/shanghai/shanghai-tower.
250
Diagrams
Bibliography
and Images
Diagrams and Images Bibliography
Page 72
“Exclusive Photos: World’s Largest Computerized Façade Cools Aedas’ Al Bahr Towers.” https://inhabitat.com/ exclusive-photos-worlds-largest-computerized-facade-cools-aedas-al-bahr-towers/.
“One Ocean Pavillon Yeosu | Knippers Helbig Advanced Engineering” https://www.knippershelbig.com/en/oneocean-pavillon-yeosu.
“Light Matters: Mashrabiyas - Translating Tradition into Dynamic Facades.” 2014. ArchDaily. May 29, 2014. http://www.archdaily.com/510226/light-matters-mashrabiyas-translating-tradition-into-dynamic-facades/.
Page 73
Karanouh, Abdulmajid, and Ethan Kerber. 2015. “Innovations in Dynamic Architecture.” Journal of Facade Design and Engineering 3 (2): 185–221. https://doi.org/10.3233/FDE-150040.
Page 75-77
“Interview with Ken Yeang for Share-Architects.Com.” 2017. RIFF Bucharest (blog). April 27, 2017. http:// bucharest.ieriff.eu/interview-ken-yeang-share-architects-com/.
“T. R. Hamzah and Yeang Sdn Bhd|Ecoarchitecture| Ecomasterplanners| Green Design|Ecoinfrastructure|Eco Masterplanning and Eco Architecture Malaysia | Eco Architects | Eco Infrastructure.” n.d. Accessed January 5, 2019. http://www.hamzahyeang.com/.
Page 76
“Solaris - Singapore Science Centre.” 2012. E-Architect. July 27, 2012. https://www.e-architect.co.uk/singapore/ solaris-singapore.
Page 78
www.borgenmagazine.com/wp-content/uploads/2013/11/polluted-chinese-city_opt1.jpg.
“Anyone Got a Light? Incredible Photos Taken from the Air Show China’s Sprawling Maze of Tobacco Fields.” 2001. GhanaNation.Com (blog). November 30, 2001. https://www.ghanagrio.com/articles/uk/19210-anyonegot-a-light-incredible-photos-taken-from-the-air-show-china-s-sprawling-maze-of-tobacco-fields.html.
Page 95
“90 (756×636).” n.d. Accessed January 5, 2019. https://cdnassets.hw.net/dims4/GG/71ee055/2147483647/ resize/876x%3E/quality/90/?url=http%3A%2F%2Fcdnassets.hw.net%2F03%2Fe8%2Fae8ec5144033985edeae3 3de1b02%2Fshanghaitower-gensler-diagram2.jpg.
“Bernoulli’s Equation.” n.d. https://www.princeton.edu/~asmits/Bicycle_web/Bernoulli.html.
251
9. appendix
APPENDIX I: ARDUINO CODE
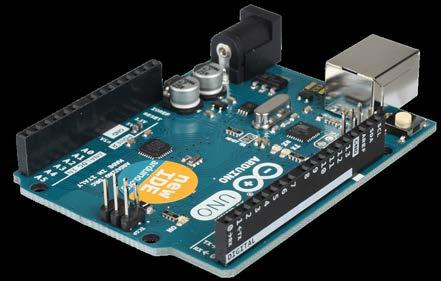
The speed sensor uses only 1 pin that goes from Low to High to detect holes in the encoder disc.
Since we will be using Interrupt zero to read the speed sensor, we need to connect it to Pin 2 (interrupt 0 pin) on the UNO. Were are also using the L9110 motor driver to control the speed and direction of the geared DC motor.
Pin 2 is connected to the trigger pin of the speed sensor.
5V and GND is connected to the UNO
We connect the potentiometer to 3.3V and GND and use the Analog Pin 1 (A1) to read the value.
Pin 6 and Pin 9 are connected to B-1A and B-1B of the L9110
Power and GND of the L9110 are connected to an external 5V 2A power supply since DC motors can require more current than the UNO can provide.
We will use interrupts and the TimerOne library in our code.
The TimerOne will be used to wait 1 second before displaying the speed of our motor in the serial monitor window.
Interrupts are used so that we can control the speed and direction of our motor at the same time that we read the trigger pin of the speed sensor and to display information in the serial monitor.
So every time the speed sensor pin goes High, interrupt zero will be called since it’s connected to Pin 2 of the UNO (which is the interrupt 0 pin), thus increasing the counter variable by 1.
Then when Timer1 reaches 1 second it will call another interrupt to display the results, and reset everything back to zero to start over again.
As you can see in the code, we are using the counter value after 1 second elapsed and dividing it by 20 since our encoder disc has 20 holes. Thus giving us the number of revolution per second.
254
Temperature Sensor
ARDUINO_UNO_A02
Light Sensor
SOURCE. brainy-bits. n.d. “How to Use a Speed Sensor with Arduino.” Brainy-Bits (blog). https://www.brainy-bits.com/speedsensor-with-arduino/.
Arduino Appendix I
// named constants for the switch and motor pins int lightSensorPin = A0; int analogValue = 0;
const int motorPin = 9; // the number of the motor pin unsigned long startMillis; //some global variables available anywhere in the program unsigned long currentMillis; const unsigned long period = 1000;
void setup() {
// initialize the motor pin as an output: pinMode(motorPin, OUTPUT);
// initialize the lightSensorPin as an input: pinMode(lightSensorPin, INPUT);
void loop() {
// read the state of the light sensor value: analogValue = analogRead(lightSensorPin);
if(analogValue > 300){
digitalWrite(motorPin, HIGH); delay(5000);
while (analogValue > 300){
digitalWrite(motorPin, LOW);
255
Arduino Motor Humidity Sensor
Wind Speed Sensor
}
} } } Arduino Appendix I
APPENDIX II: HUMIDITY RATIO ANALYSIS
Further studies about humidity ratio were done according to the context: Shanghai.
In order to an accurate building performance for plants growth and higher comfort levels for indoor spaces, it is critical to detect the regions where humidity ranges changes seasonly.
As the following diagram illustrates, higher glazing factor correspond to higher temperature and a lower relative humidity percentage which means that it is needed higher humidity for decreasing temperature. Thus, indoor spaces will not be overheated and naturally ventilated overall seasons.
In particular, it is observed autumn keep a high relative humidity percentage during three months consecutively and during a day those percentages do not considerably change.
256
Humidity Appendix II


257 Max.Relative Humidity Min.Relative Humidity Max.Relative Humidity Min.Relative Humidity 65 % 50 % 55 % 50 % 70% 65 % 35 % 30 % SPRING 75 % 65 % 70% 68 % 70% 65 % 65% 60 % SUMMER AUTUMN AUTUMN WINTER Humidity Appendix II
SOURCE. “Kinetic Facades | Responsive Skins.” https://yazdanistudioresearch.wordpress.com/2011/02/10/kinetic-facadeproducts/.
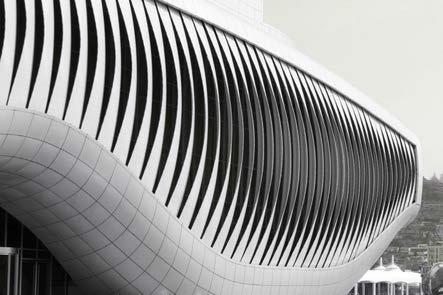
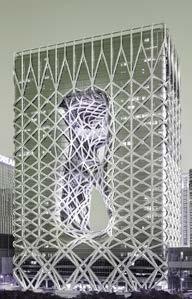
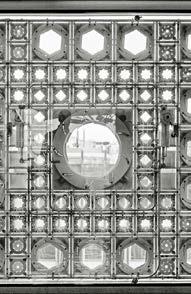
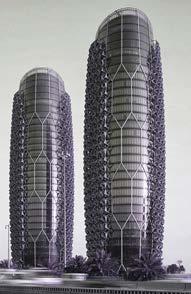
“The Skyscraper Center.” n.d. http://www.skyscrapercenter.com/.
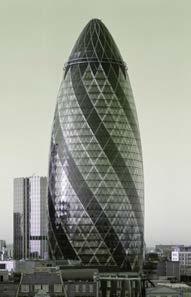
“Al Bahar Towers, Abu Dhabi.” http://www.ctbuh.org/TallBuildings/FeaturedTallBuildings/AlBaharTowersAbuDhabi/ tabid/3845/language/en-US/Default.aspx.
“‘One Ocean’s’ Kinetic Facade.” http://compositesandarchitecture.com/?p=68.
258 NAME DOUBLE SKIN FACADE KINETIC FACADE HEIGHT-FLOOR NUMBER KINETIC ELEMENTS YEAR ST MARIE Norman Foster London 180m / XX Floors 2004 MORPHEUS TOWER Zaha Hadid Architects Macau 155.2m / 40 Floors 2008 AL BAHAR TOWERS Aedas UK Abhu Dhabi 2012 1000 photovoltaic panels called “Mirhabiya” 113 photosensitive panels 108 fiberglass lamellas INSTITUT MONDE ARABE Jean Nouvel Paris 1988 ONE OCEAN SOMA SouthKorea
High-Rise Building References Appendix III
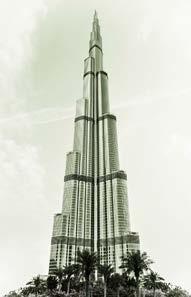
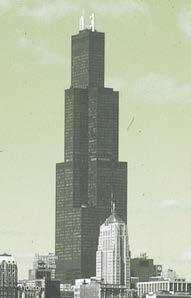
259 CORE DESIGN DETAILS PLAN TYPE YEAR SHANGHAI TOWER Gensier Shanghai 632m / 128 Floors 2015 BURJ KHALIFA SOM Dubhai 828m / 163 Floors 2008 SEARS TOWER Fazlur Rahman Khan Chicago 442.1 m / 110 Floors 1973 High-Rise Building
III
References Appendix
260
