Paris Nikitids, Felipe Oeyen, Lorenzo Santelli, Fun Yuen, Dr. Alvaro Velasco Perez
Student Names
Fabiana Aja (MArch), Hosein Shahhoseini (MSc), Deniz Uluköy (MArch)
Declaration
“I certify that this piece of work is entirely my/our and that my quotation or paraphrase from the published or unpublished work of other is duly acknowledged.”
Signature of Students
Fabiana Aja
Deniz Uluköy Hosein Shahhoseini
Date Semptember 22, 2024
Acknowledgements
Our team would like to express the immense gratitude towards the programme faculty, colleagues, and companions for their continuous efforts in the process of this design research. In particular, crediting the crucial guidance of co-directors Dr. Elif Erdine, Dr. Milad Showkatbakhsh, founding director Dr. Michael Weinstock, along with the tutors Dr. Alvaro Velasco Perez, Lorenzo Santelli, Felipe Oeyen, Paris Nikitidis, and Fun Yeun. The genuine efforts of all the fore-mentioned people respectively, helped the team reflect on their notable insights to push the boundaries of this collective, ongoing design research. All the progress that has been achieved so far, would be revised furthermore for the future exploration of this project, especially in the MArch. phase.
Above all, a special appreciation towards our families and friends who helped us pursue our dreams with their unconditional support.
Abstract
This thesis addresses the critical environmental challenges of rapid urban expansion in developing countries, focusing on the impact of urban growth on aquatic ecosystems. The research centres on Xochimilco, a UNESCO World Heritage site in Mexico City, renowned for its ancient Aztec chinampa system—a sustainable agricultural practice that once achieved a delicate balance between food production and ecological management. However, unchecked urbanization has disrupted this balance, resulting in water contamination, reduced agricultural productivity, and a compromised water cycle.
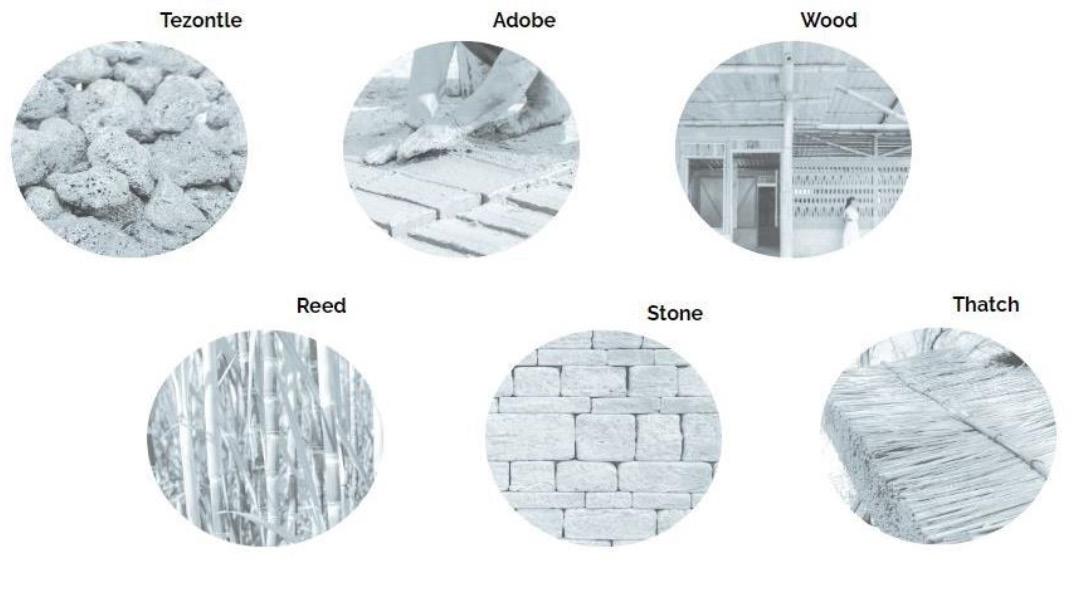
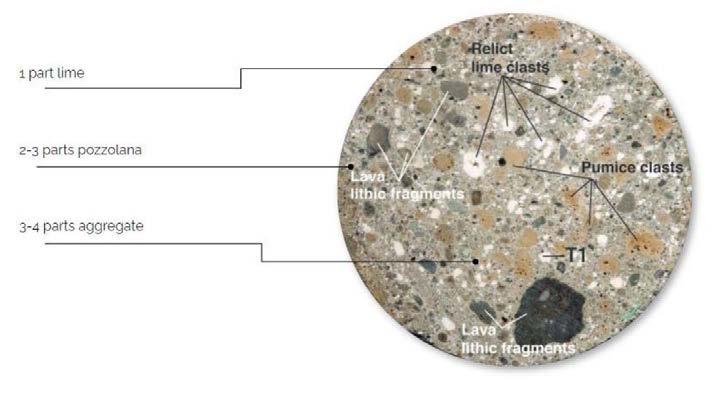
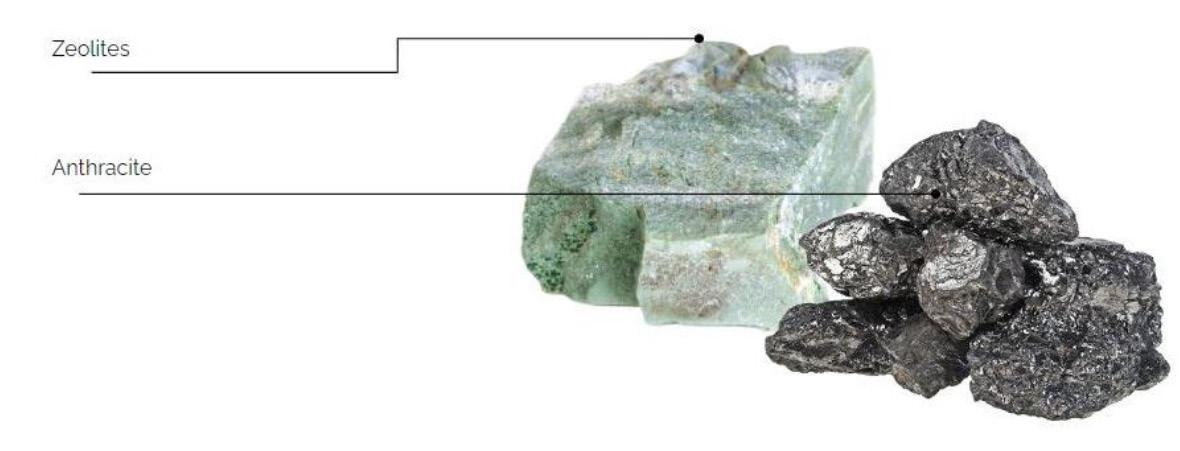
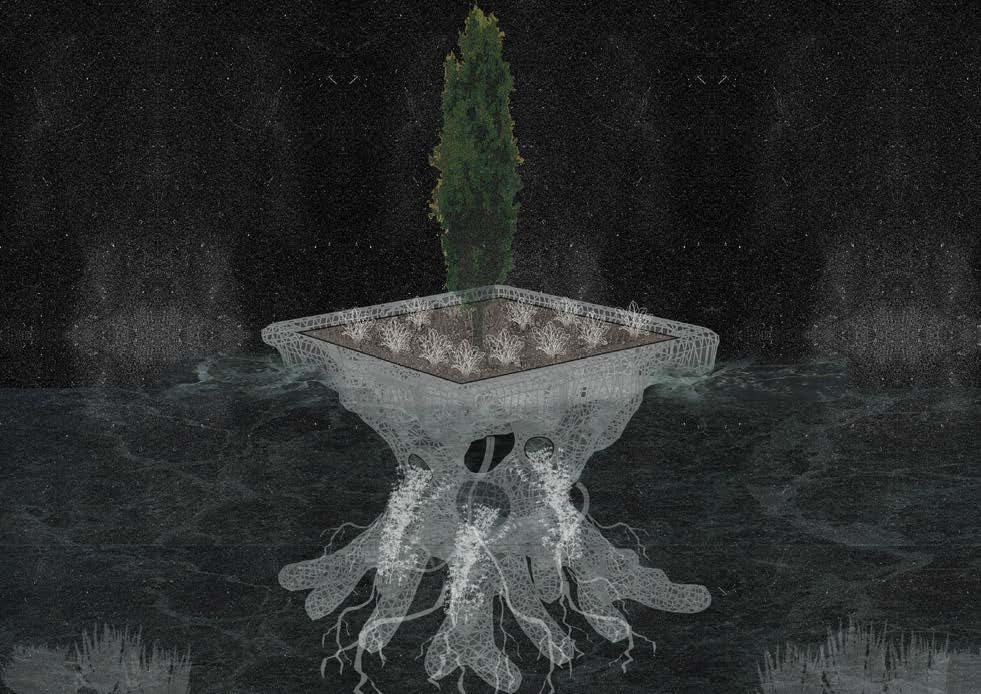
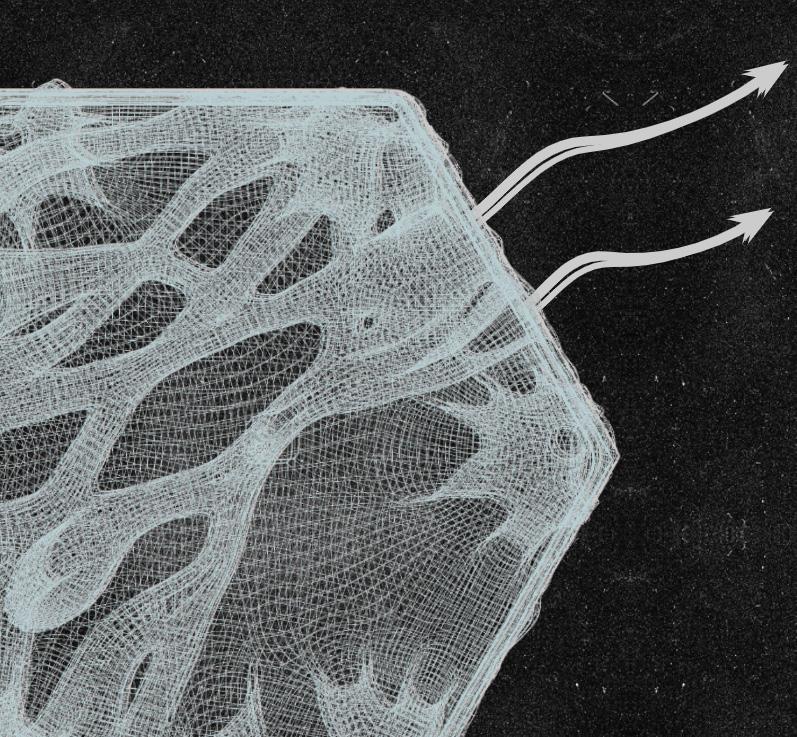
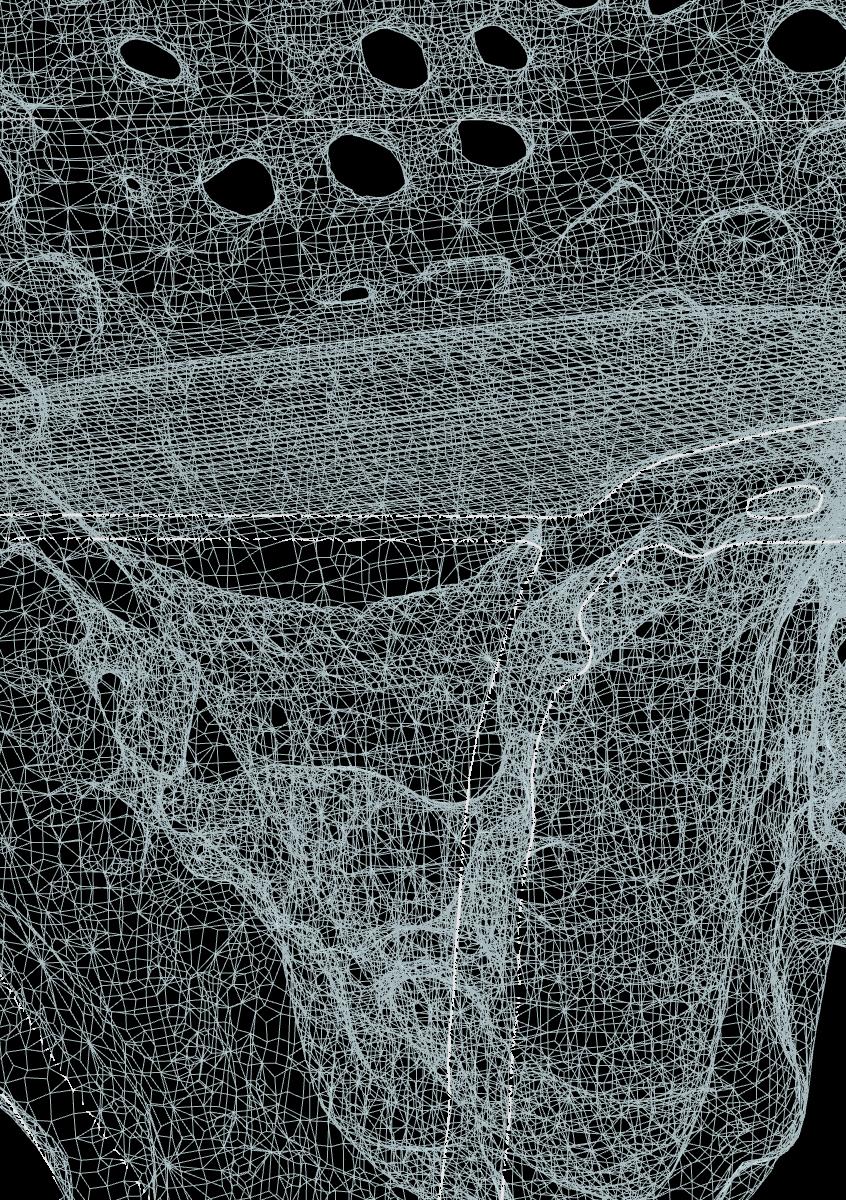
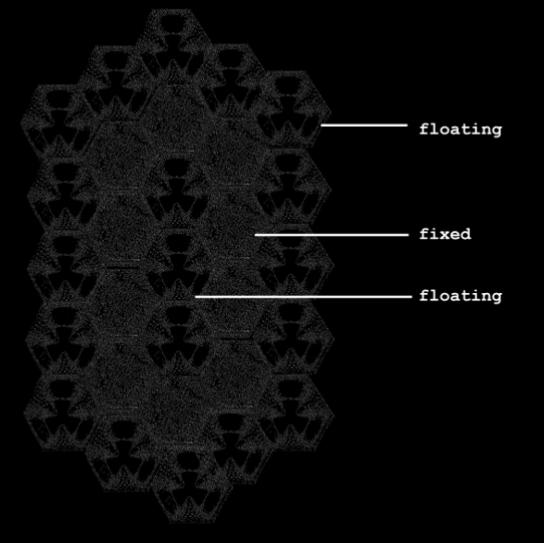
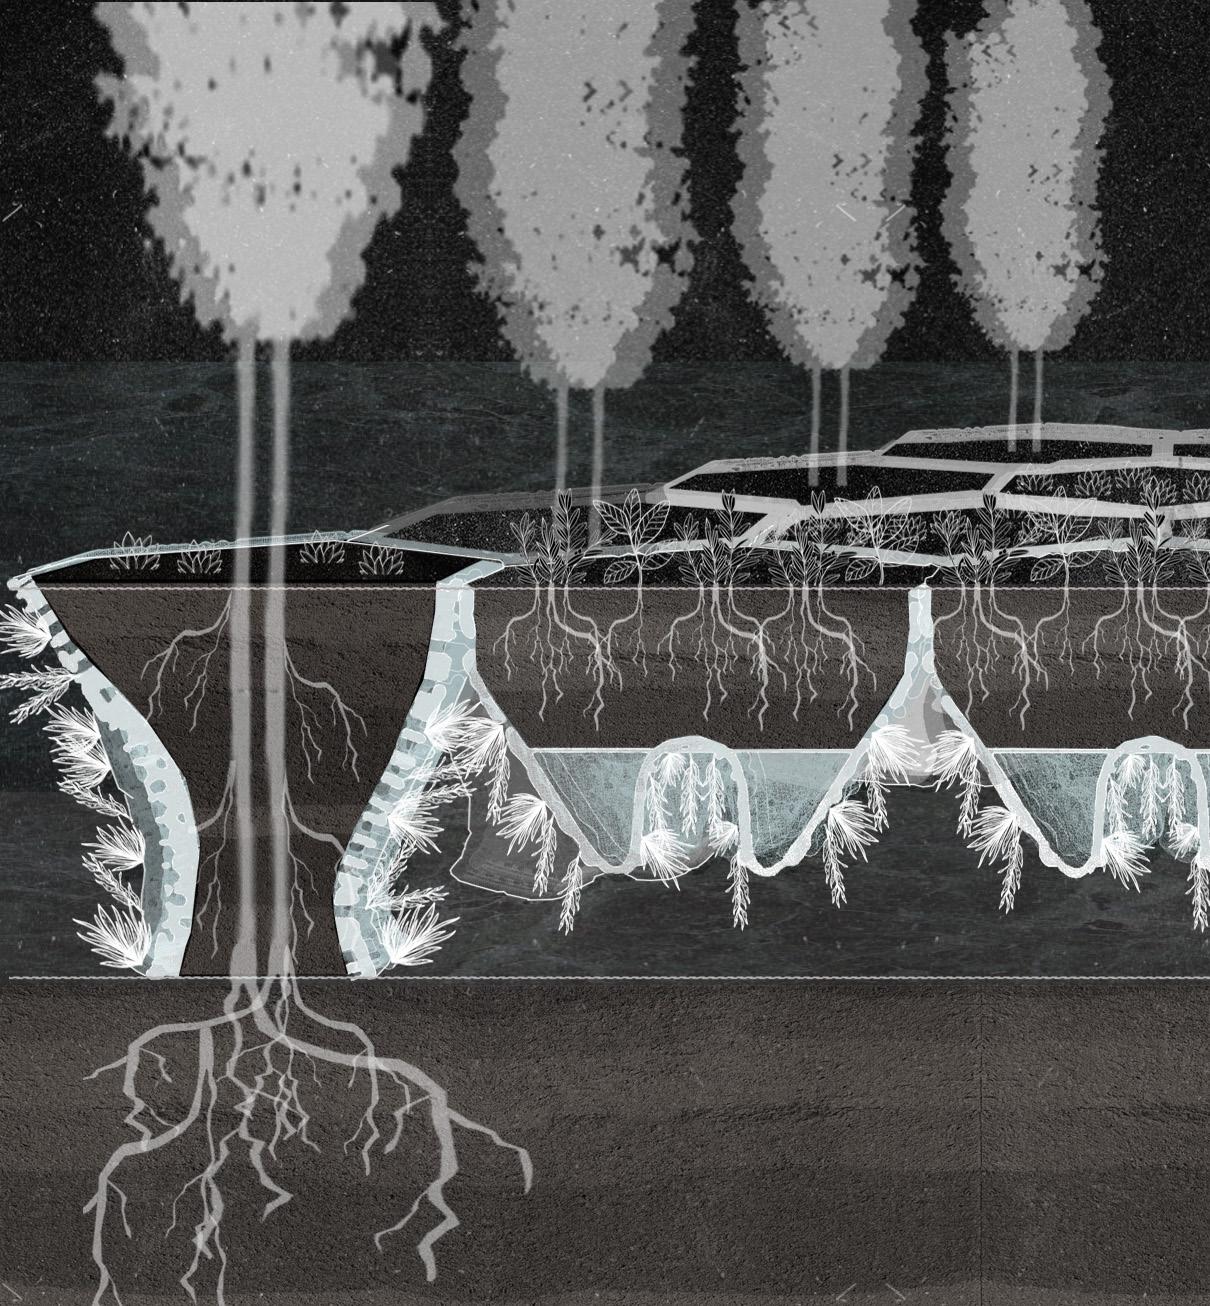
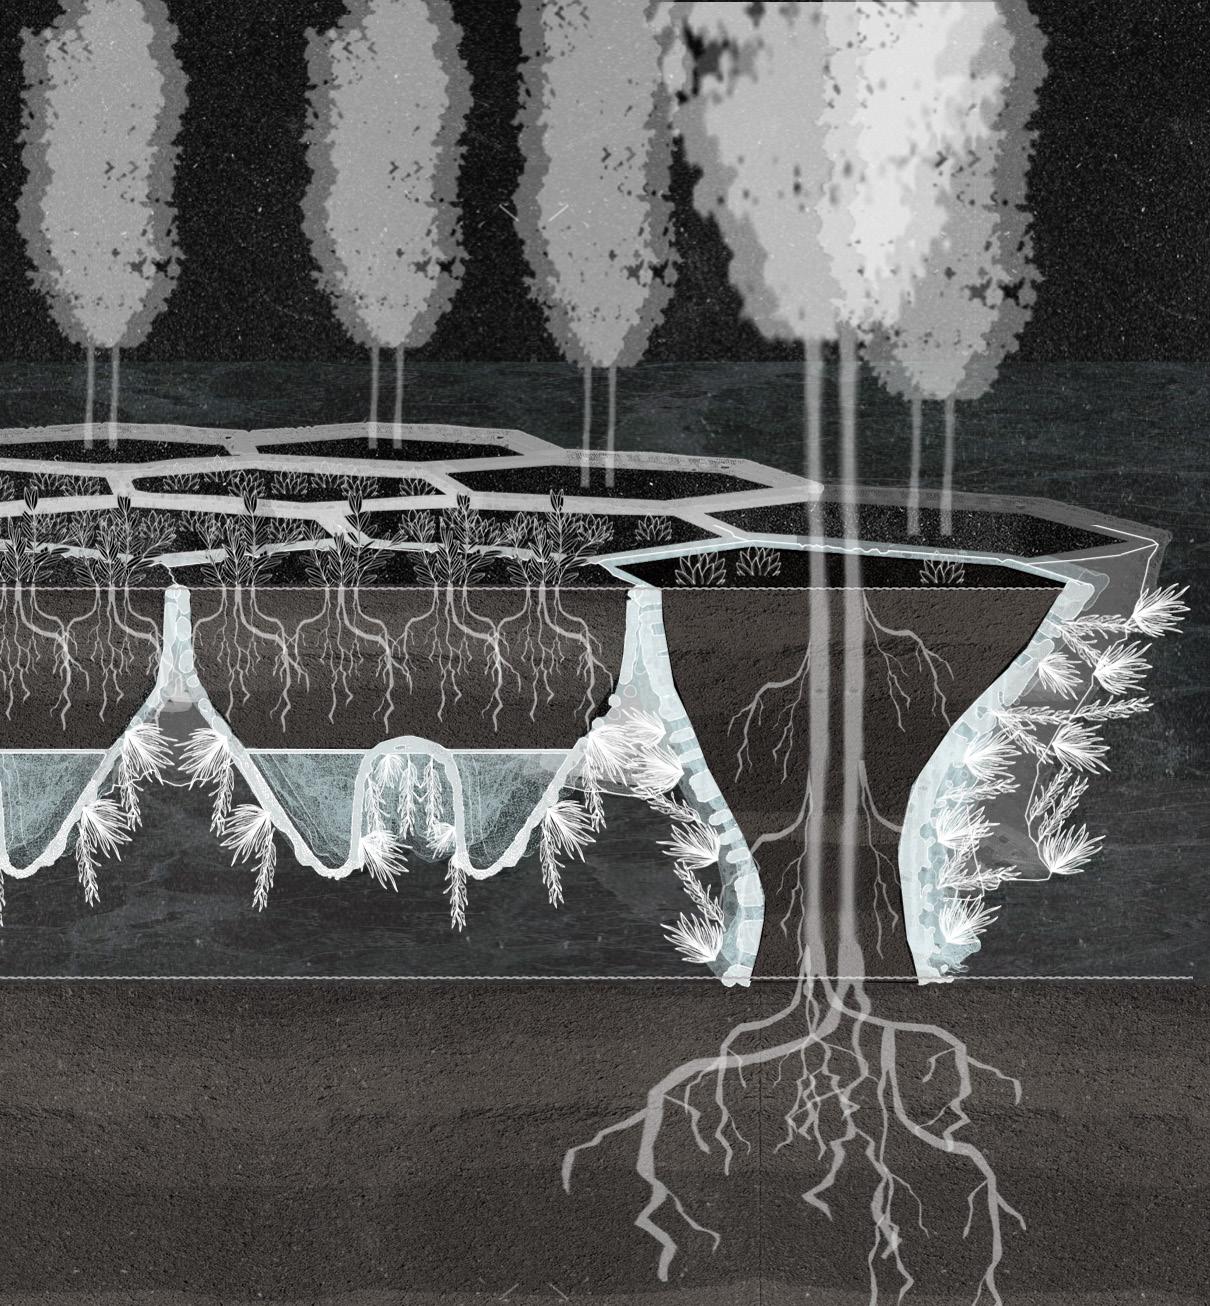
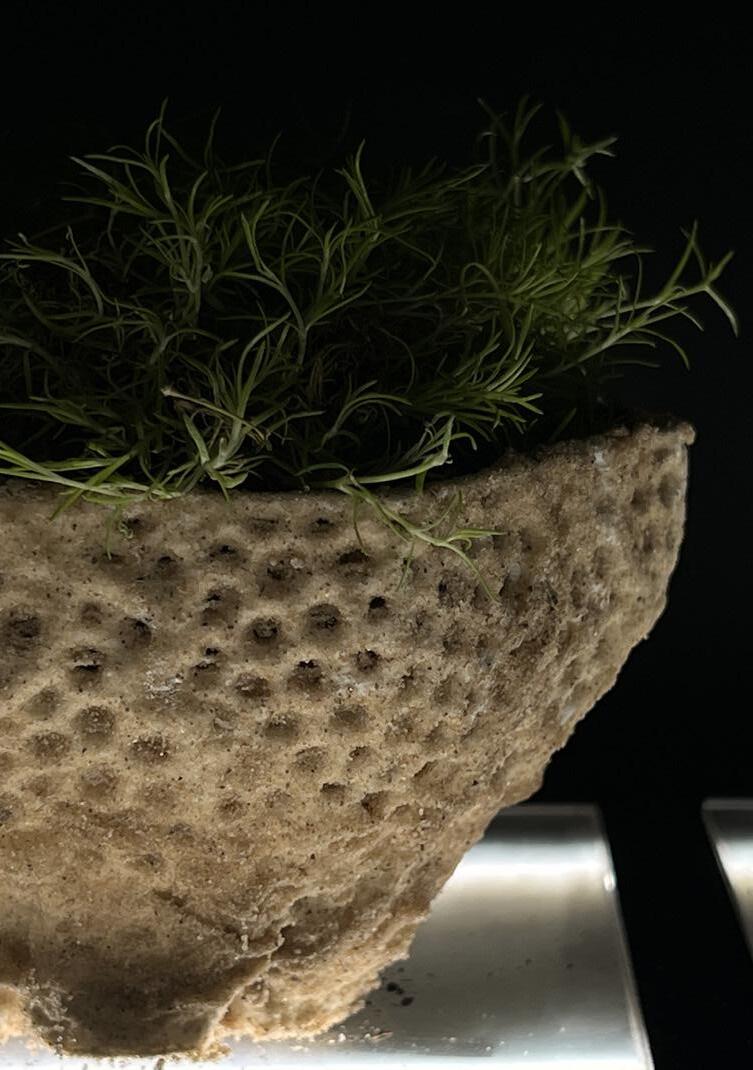
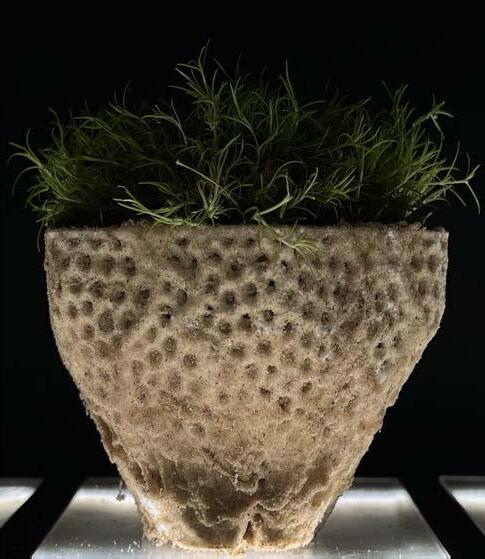
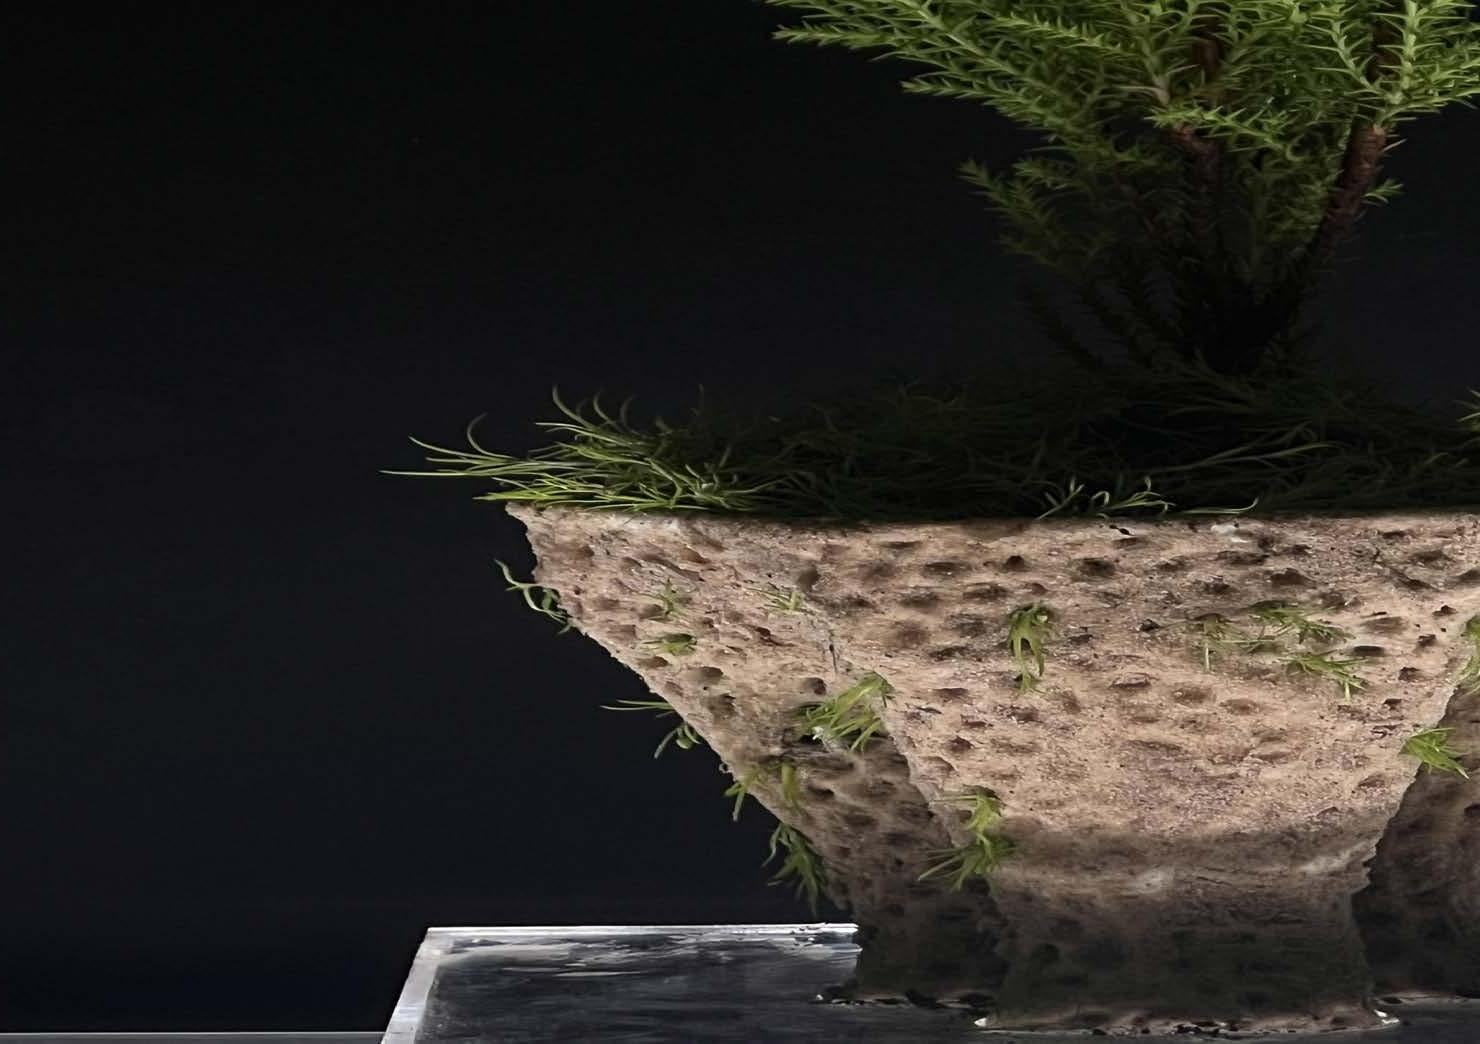
To address these issues, this thesis proposes a modern reinvention of the chinampa system using a modular structure of hexagons crafted from sustainable materials such as tezontle (volcanic rock), adobe, and volcanic ash. By integrating contemporary scientific, architectural, and technological approaches—such as design and structural optimization, along with the combination of zeolite and pozzolana for filtration—the system features a porous design that facilitates the cleaning of polluted water, supported by the incorporation of oxygenating plants. The modular design also includes agricultural platforms that enhance biodiversity and promote sustainable crop production, reflecting the ecological practices of pre-Hispanic times.
The study employs a phased methodology, beginning with environmental mapping and analysis to identify vulnerable areas within Xochimilco. Using simulations and microclimatic data, the research strategically places these floating systems to maximize ecological benefits. The aim is to develop a new urban fabric that aligns with Xochimilco’s water systems, fostering resilience, ecological restoration, and sustainable development. By blending Indigenous knowledge with modern technology, this thesis offers a blueprint for urban development that prioritizes water sustainability and restores the ecological balance of the ancient chinampa system.
Introduction
This thesis addresses the role of rapid urbanization on freshwater ecosystems in developing countries by reinventing the chinampa system in Mexico City’s Xochimilco district, a World Heritage site. Almost 1,000 hectares of urban areas have unregulated expansions on previously agricultural land, resulting in severe environmental deterioration of one important freshwater ecosystem—contaminated water, loss of biodiversity, and a disrupted water cycle. Chemical and untreated raw sewage that flows into the lake further exacerbates the situation by aggravating seasonal flooding and evaporation.
The proposed solution is to modernize the Chinampa system to resolve water contamination, purify the water, rehabilitate ecological balance, and create a balanced, resilient, amphibious aquatic environment. The research is supported by six worldwide case studies of water cities to explore the strategies of linking urbanization with marine life.
The process leads to a multi-phase design methodology, starting with context analysis, during which environmental and socio-economic data is collected to analyze the site and map specific constraints such as seasonal flooding, water contamination, and increased evaporation in order to make targeted interventions. The second stage involves urban system design, simulating water movements with computational fluid dynamics (CFD), and using these parameters to propose an adaptive urban framework by understanding water flow and dynamics. Finally, material research investigates regenerative materials for water treatment and resilient structures to enable a new water-logged urban fabric that addresses water pollution, restores chinampas practice and enhances ecological resilience in Xochimilco.
Acknowledgments
Abstract
Introduction
Domain
Introduction
Global Urban Problematics
Case Studies
Comparative Evaluation
Xochimilco’s Biome
Site Analysis
Discussion
Methodology
Introduction
Parametric
Research Development
Introduction
Contextual Analysis and Space Syntax
Urban System and Morphological Design
Material Exploration and Advanced Fabrication
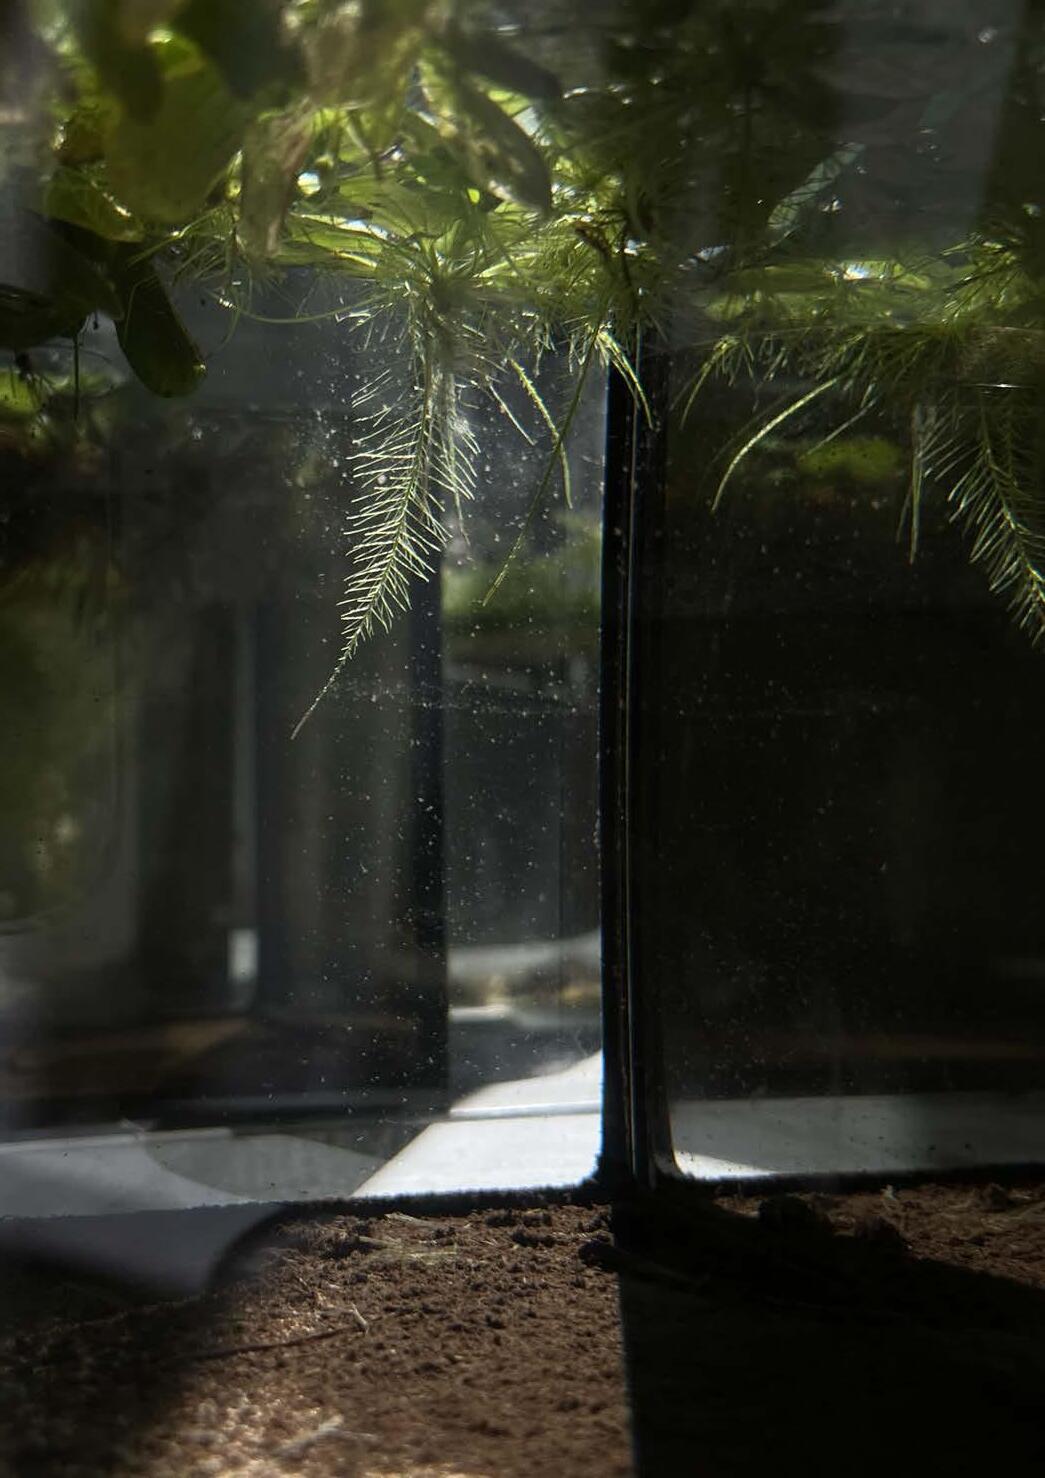
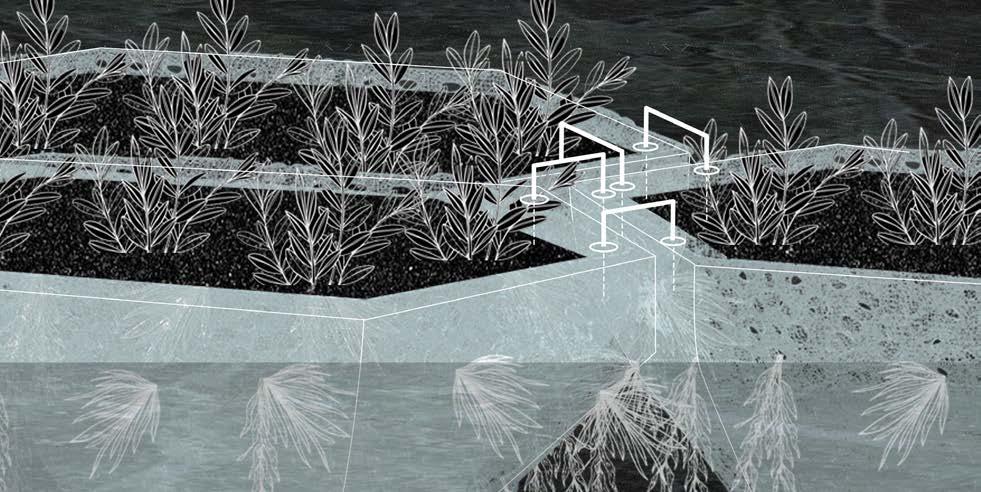
Water Purification and Oxygenation
Discussion
Design Development
Introduction
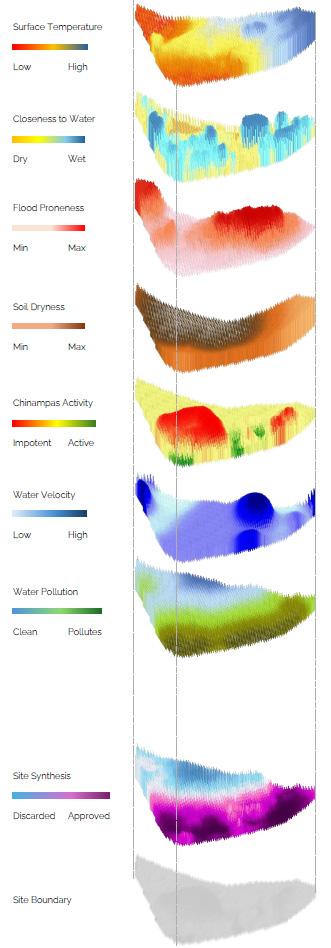
Site Synthesis
Global Scale
Regional Scale
Local Scale
Discussion
Design Proposal
Introduction
Site Selection
Incremental Plan
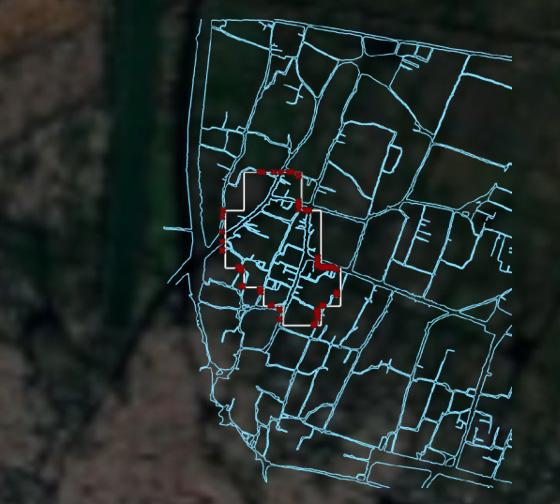
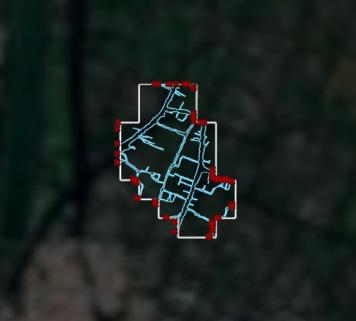
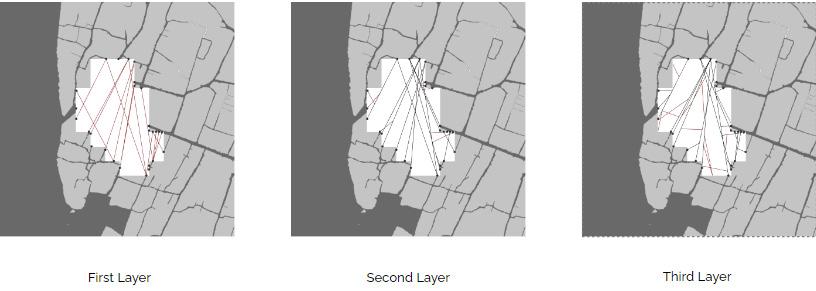
Canal Network Generation
Local Scale, Component Generation
CHAPTER I
Chapter Overview
The following chapter covers the areas of study as well as the subsequent research that was conducted. This chapter focuses on understanding the global problem of the exacerbated growth of urban fabrics which need to expand into water bodies creating aqua-fabrics. To understand the phenomenon of aqua-fabrics, six case studies are presented and analysed using a list of parameters that fit the line of research conducted in this dissertation. The chapter concludes with the selected site and study area, providing a detailed overview of its current condition as well as the reasoning behind choosing it.
Global Urban Problematic
The uncontrolled growth of urban tissue and extension of developing cities without urban restrictions leads to sparse development. Lacking formal planning and regulatory oversight creates an informal architecture with poor waste management systems, little access to clean water and sanitation, and inadequate infrastructure. Eventually, this results in ineffective land utilization but also worsens social interaction, environmental harm, ecosystem disruption, biodiversity loss, and exhaustion of natural reserves.1
Rapid urbanization in developing countries presents significant obstacles to water resource management, particularly in maintaining water bodies’ sustainability and quality. (Hernandez et al., 2023) As a result, vast amounts of untreated sewage and industrial waste have been channelled directly to lakes, rivers, and canals. Lack of adequate management of water usage could aggravate the problem of water shortage and contamination, which could harm human health and ecological harmony.2
1 McKinney & University of Tennessee, 2009
2 Charles J. Vörösmarty et al., “Emerging Threats to Surface Water Quality in China: Assessing the Potential for Water Pollution Disasters,” Global Environmental Change 45 (2017): 108-120, https://doi.org/10.1016/j.gloenvcha.2017.04.005.
Case Studies
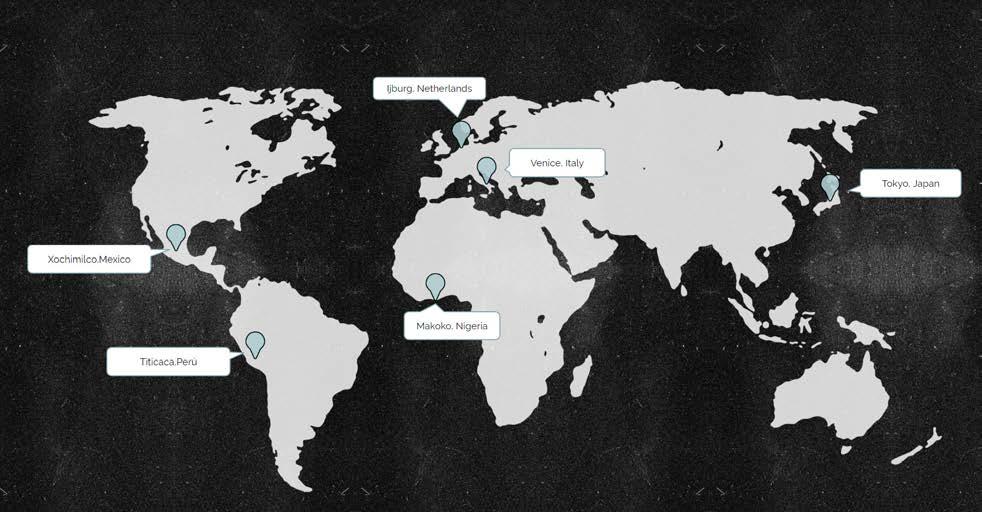
In response to these problems, the research frames the key problematic features by analysing six case studies dealing with water bodies. At the same time, a final site is selected after in-depth observation from a series of representative case studies. By comparing and evaluating seven criteria—urban growth, water management, material, climatic vulnerability, network, biodiversity, and food production—it maps out how multiple facets of floating urban fabrics are interconnected, ranging from urban morphology to ecosystem quality.
Figure 1. Selected case studies, located on the world map.
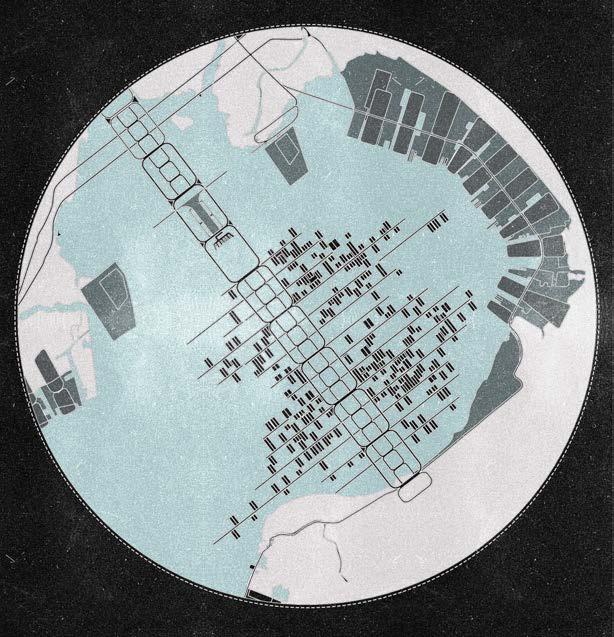
Kenzo Tange’s Vision for Tokyo
In 1960, Kenzo Tange proposed a visionary urban plan for Tokyo Bay to address post-war urbanization challenges like overpopulation, traffic congestion, and housing shortages. Influenced by the Metabolism movement, Tange envisioned cities as adaptable, living organisms capable of growth and expansion over the water.
Figure 2. Kenzo Tange’s plan for Tokyo, 1960.
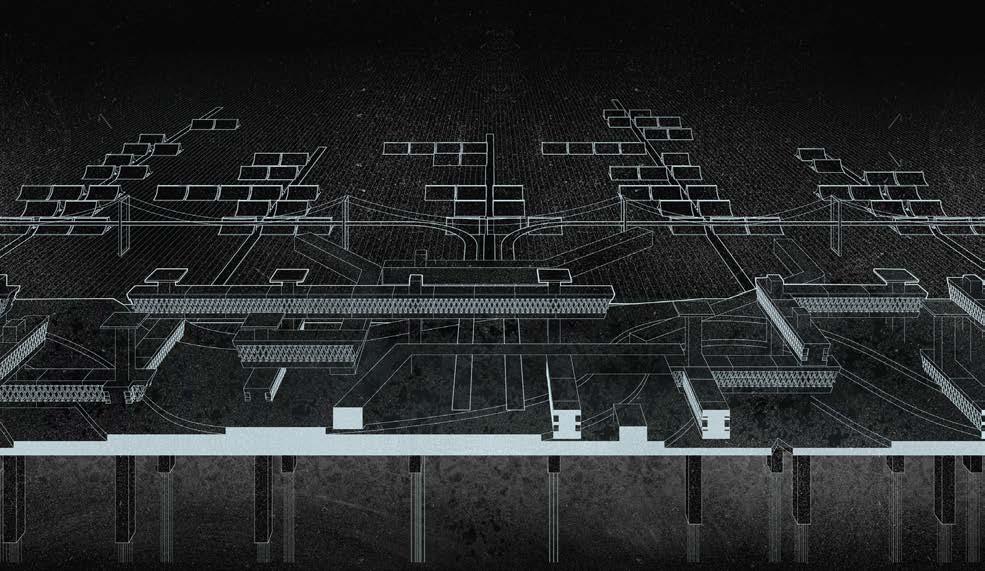
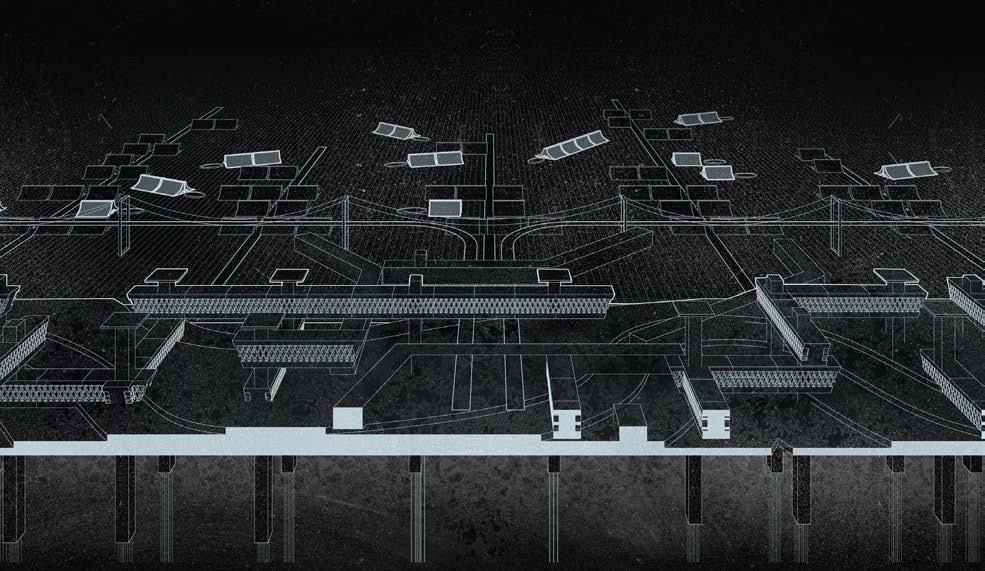
The plan’s core feature was a spinal axis across Tokyo Bay, connecting the city centre to underdeveloped areas. This spine would support a multi-layered grid, replacing traditional two-dimensional zoning with a flexible, three-dimensional system. While innovative, the plan exposed the tension between architectural ambition and ecological realities. Ultimately, it was never realized due to these complexities. 1
In a contemporary context, Tange’s emphasis on flexibility and adaptability in urban design is especially relevant; modern cities face rapid population growth, shifting economic conditions, and unpredictable environmental challenges. Tange’s vision of a dynamic urban fabric, where infrastructure and buildings could evolve and reconfigure over time, offers valuable lessons for today’s urban expansions dealing with water bodies. His design anticipated the need for cities to be adaptable and resilient, capable of responding to changing social, economic, and environmental pressures. Though unrealized, Tange’s plan remains a powerful case study in designing cities that can grow sustainably and fluidly, highlighting the importance of flexible infrastructure in shaping future urban landscapes.1
1 Buildings and roads would attach to the spine, allowing the city to grow and adapt over time. However, the proposal raised significant environmental and logistical concerns. Expanding over water posed financial, political, and technical challenges, as well as highlighted the environmental risks of large-scale interventions on natural ecosystems. Alison G. Kwok, “Can We Talk?: Women in the Design Studio,” in Proceedings of the 96th Annual Meeting of the Association of Collegiate Schools of Architecture, March 27-30, 2008, 52-58, https://www.acsa-arch.org/proceedings/Annual%20Meeting%20Proceedings/ACSA. AM.96/ACSA.AM.96.52.pdf.
Figure 3, 4 & 5. Section of Tange’s proposal were flexibility of the aqua-fabric is seen
Ijburg Expansion, Netherlands
The Ijburg expansion in Amsterdam is a significant urban development project designed to address land scarcity by creating artificial islands on the IJmeer lakebed. Initiated in the 1990s, this project aimed to alleviate Amsterdam’s housing shortage by constructing an archipelago of seven islands, reflecting the Dutch tradition of innovative water management. A key design feature relevant to the discussion of growth on water bodies is the concept of immovable floating houses. While these floating homes were envisioned as an integral part of the project’s water-based community, their static nature mirrors the broader issue of unadaptable urban planning. This raises important questions about how rigid water-based developments might impact future growth and ecological balance, especially as cities face increasing pressures from climate change and urbanization.
Figure 6. Ijburg’s expansion plan, 1997
In the broader context of urban development, Ijburg raises important questions about the sustainability and adaptability of water-based projects. As cities increasingly turn to innovative solutions to combat land scarcity and climate risks, such as rising sea levels and increased precipitation, the challenge of balancing immovable designs with flexible, adaptive growth becomes crucial. The case of Ijburg underscores the need for urban environments that can evolve over time, reflecting the necessity of resilience in addressing contemporary environmental and demographic challenges.1
Figure 7. Section of the Ijburg Expansion, the man-made islands can be appreciated.
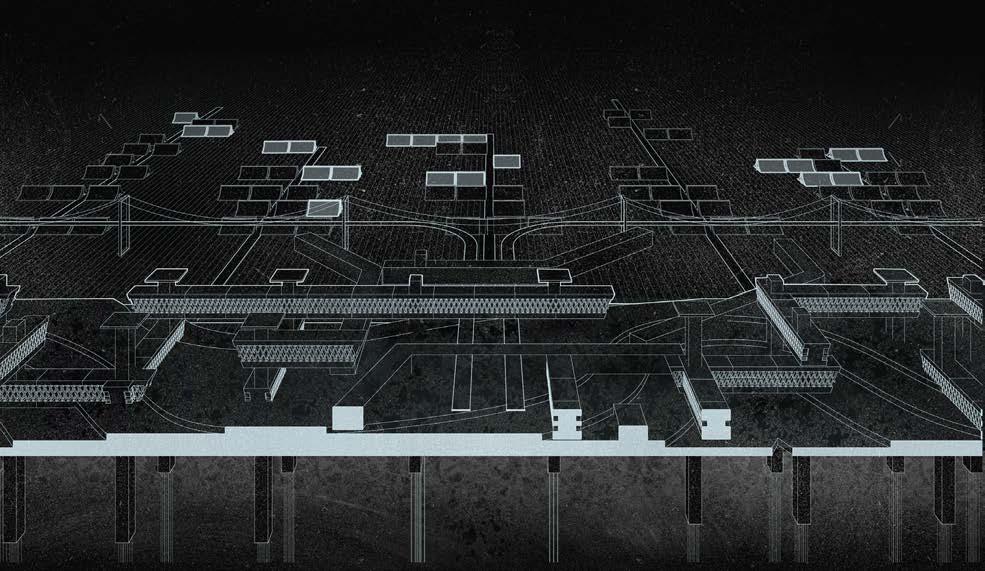
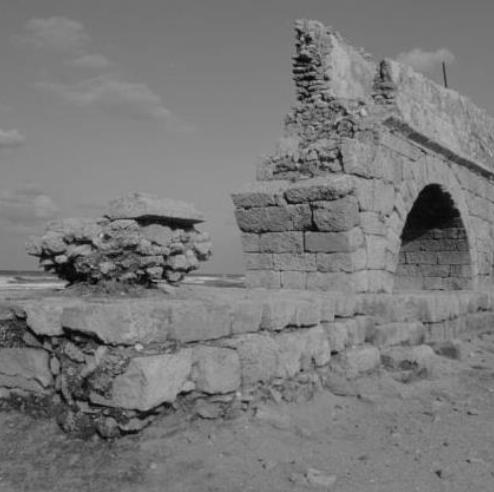
Venice, Italy
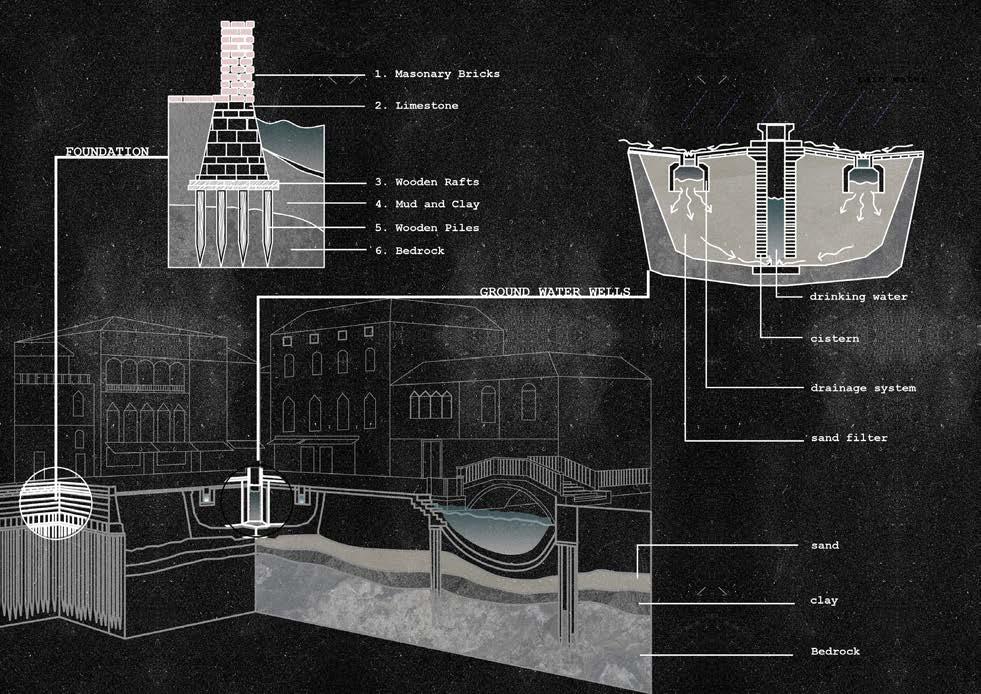
One of the most singular port cities in the world, Venice, has a complex system of canals as its ‘arteries’, the waterways that shaped its urban morphology as well as its identity and main means of transport. Venice, taken as case study, is studied through four key factors; the resistance of the construction materials toward flooding, erosion, saline corrosion and microbial activity. Also, beside the fore-mentioned factors, the foundation of the urban fabric and the layers of groundwater wells are important aspects to consider in the lateral evaluations.1
1 The city’s sewage infrastructure continues to rely on tidal forces to flush waste through the canals, but now incorporates septic tanks and modern sewage treatment systems to limit lagoon contamination. Venice’s urban infrastructure has evolved in a continuous balancing act between preserving its identity and adapting to contemporary environmental pressures. Luigi D’Alpaos and Daniela D’Alpaos, “Flooding Risk of Venice: Influence of Natural and Anthropogenic Land Subsidence and Sea Level Rise,” Geomorphology 376 (2021): 107568, https://doi.org/10.1016/j. geomorph.2021.107568.
Figure 8. Venice’s Urban fabric division.
Venice’s construction materials work with environmental forces such as flooding, erosion and saltwater corrosion, rather than against them. The city is constructed on Istrian limestone and supported by brickwork built on wooden piles dug into the clay of the Venice lagoon. Although some of the wood used in these piles, such as alder, has been susceptible to bacterial decay, it’s still an important part of the system of foundations that supports the city’s buildings, even in a partially degraded condition.1
1 Nicola Macchioni, Benedetto Pizzo, and Chiara Capretti, “An Investigation into the Preservation of Wood from Venice Foundations,” Construction and Building Materials 111 (2016): 652–661, https://doi.org/10.1016/j.conbuildmat.2016.02.144.
Figure 9. In the section bellow it is appreciated the intricate well system and foundations used in Venice
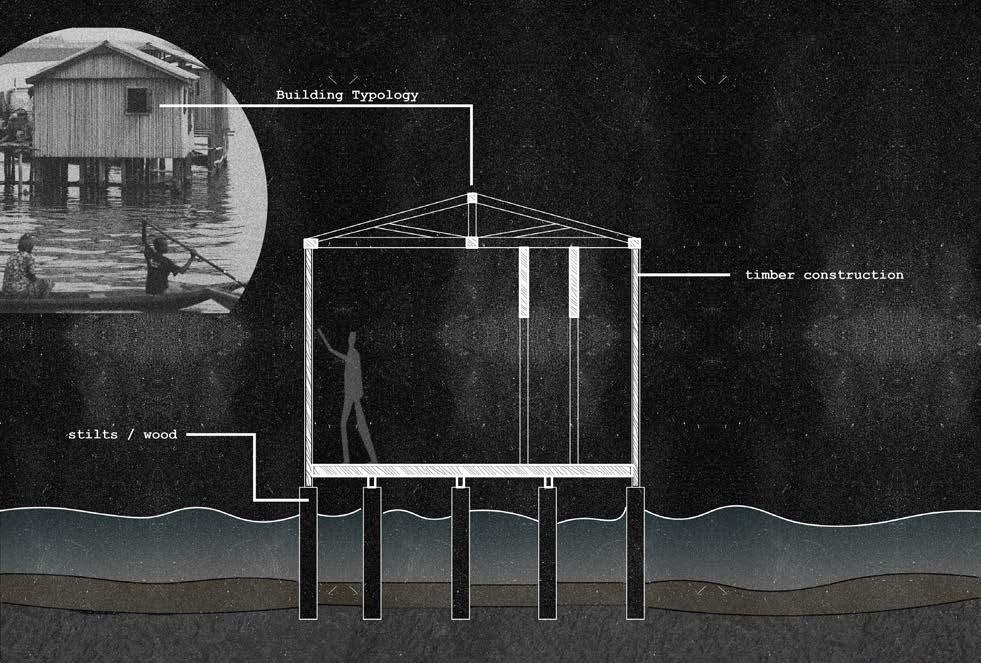
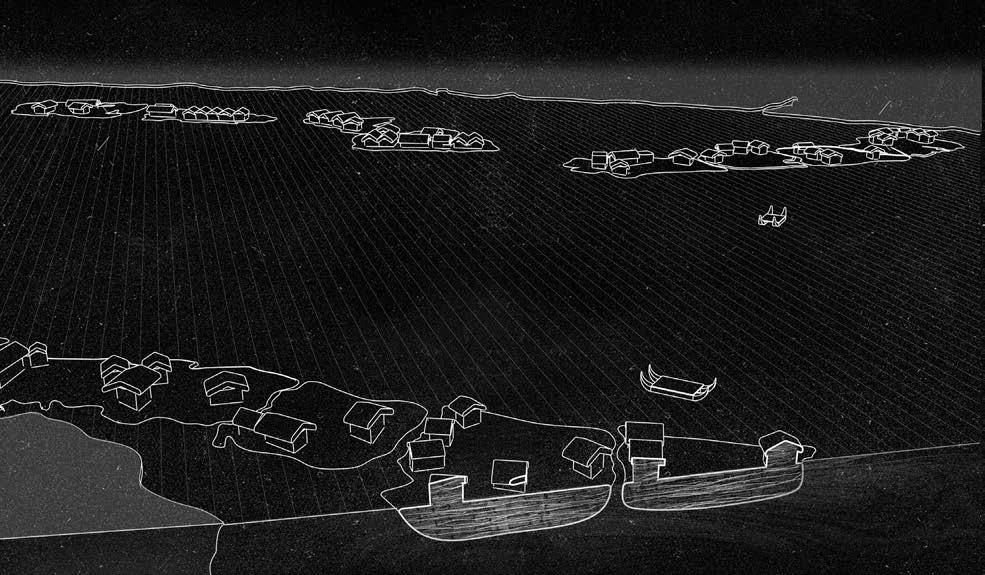
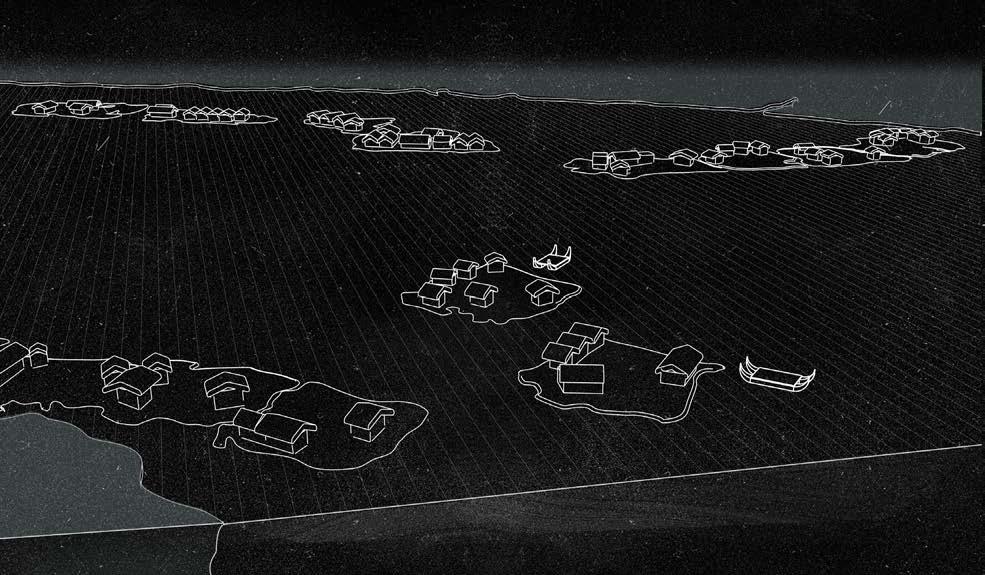
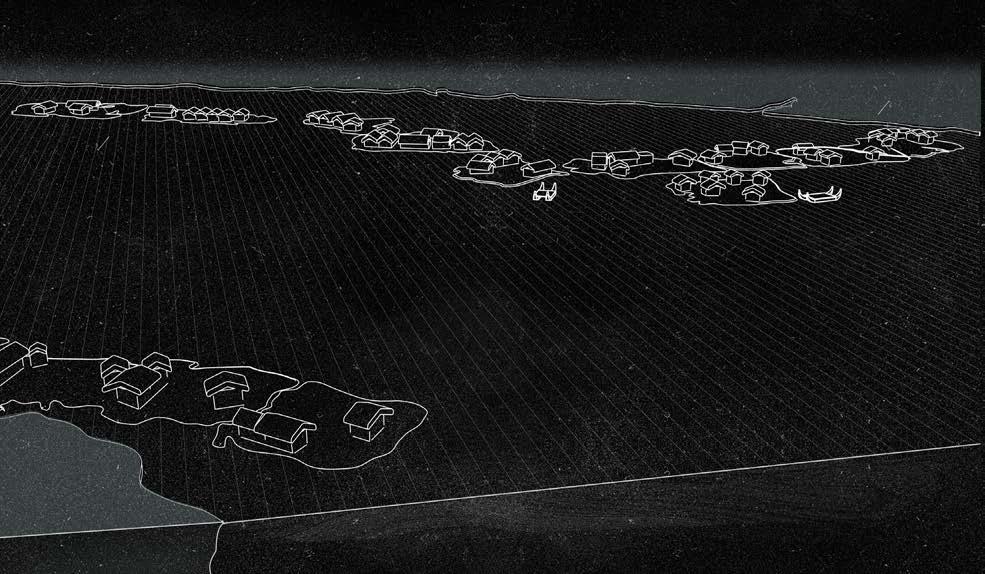
Makoko, Nigeria
Makoko, Nigeria’s oldest slum, is a coastal settlement in Lagos, partially built on stilts above the Lagos Lagoon. Home to over 100,000 people, it faces severe poverty, lacking essential services like electricity, schools, healthcare, and waste management. The community is inhabited mainly by the Egun people, who migrated from Badagary and Benin and rely on fishing for their livelihood. Over time, the lagoon has divided into informal waterways, with residents using canoes as transportation.1
1 Ola-Dele Kuku, “Environmentally Responsive Design: A Study of Makoko Floating School Building,” Proceedings of the 1st African International Conference on Industrial Engineering and Operations Management, 2019, https://www.researchgate.net/publication/337935560
Figure 10. Makoko Floating Settlement
The case of Makoko is analysed through the lens of its reconfigurability, or how changeable its structures are, and its building materials, which are largely sourced from local bamboo and tropical timber – naturally waterproof and resistant to rot. Makoko’s urban geography is shaped by its watery context: houses rise on stilts and floating houseboats, and – as generations come and go – the layout of settlements is in a constant state of flux. This informal built environment is connected by the shifting waterways through which its inhabitants move daily, welcomed as they continue to innovate and respond creatively to their changing environment. As the urbanisation of Africa continues apace, it would be wise to take note of individuals and communities such as those in Makoko, who not only know how to survive in a watery realm but do so in ways which offer exciting new perspectives on life at the water’s edge.
Figure 11. Makoko’s pile system
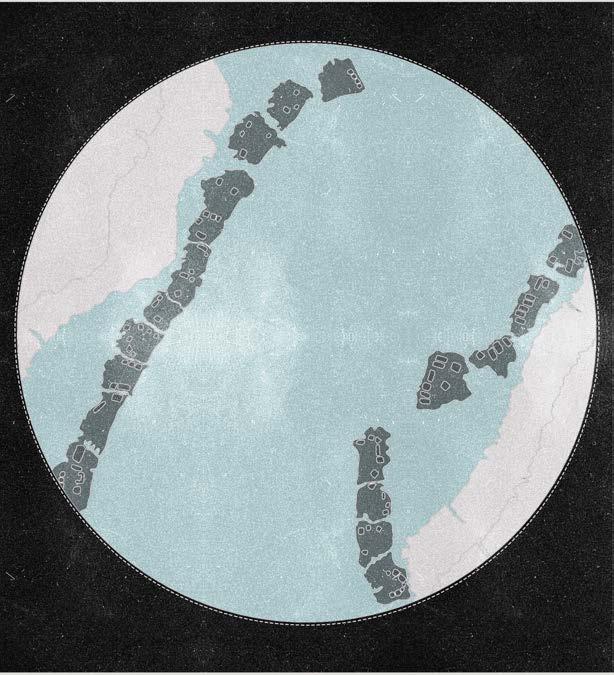
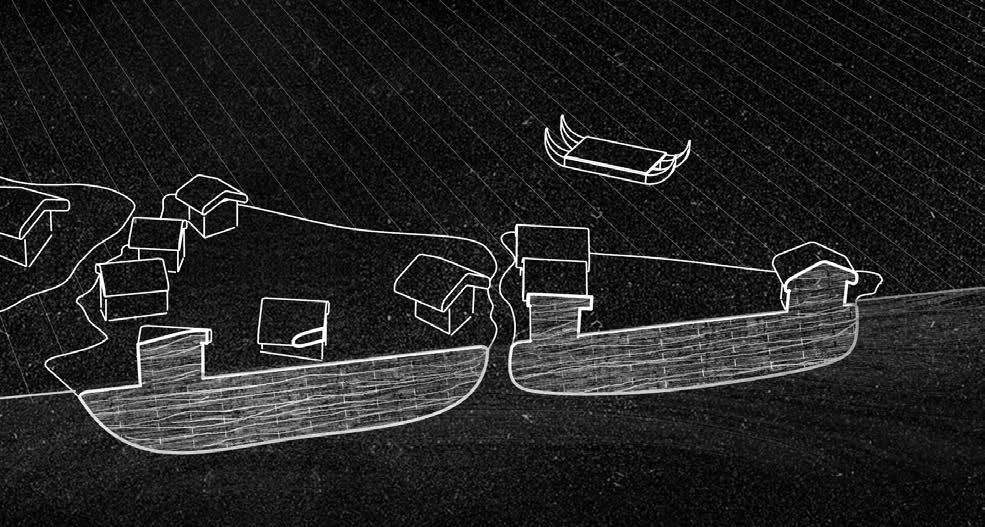
Urus Community, Lake Titicaca, Peru
The Uros settlement on Lake Titicaca is a remarkable example of human ingenuity and adaptation in an extreme environment. Situated on the world’s highest navigable lake, Lake Titicaca, which straddles the border between Peru and Bolivia, the Uros people have occupied this region for centuries, with their origins dating back to pre-Incan times. The Uros people are renowned for their unique method of living on floating islands constructed from totora reeds, a local plant that thrives in the lake’s shallow areas. This technique not only showcases their deep connection with the natural environment but also exemplifies a sophisticated approach to sustainable living in a challenging ecosystem. One specific design aspect of their settlement is the use of totora reeds to create floating islands; these islands are buoyant and resilient, reflecting a design optimized for the water-based environment.
Figure 13. Representation of the weaving technique employed by the Urus for the making of the floating islands and their homes.
Figure 12. Urus Floating Settlement
However, the practice also involves a constant cycle of maintenance and replenishment, as the reeds at the bottom of the islands deteriorate over time and require replacement.1
Dealing with the presented topic of exacerbated growth on water bodies and the challenges of correct water management, the Uros’ method of using natural materials for building and maintenance is particularly relevant. The continual upkeep of these islands requires a careful balance of resources and labour, highlighting the broader issue of sustainable resource management in aquatic environments. This traditional approach contrasts sharply with modern urbanization pressures, which often lead to detrimental effects on water bodies through pollution, overuse, and habitat destruction.
1 Edwin E. Ikhuoria and Kenneth E. Odaro, “Urbanization and Its Implications for Sustainable Development in the Developing Countries,” Proceedings of the World Sustainable Building Conference, 2011, https://www.irbnet.de/daten/ iconda/CIB21650.
Figure 6. Urus Informal Settlement.
As global concerns about climate change and environmental degradation intensify, the Urus’ method serves as a valuable case study in adaptive design and resource management. By examining their practices, insights are gained into how traditional knowledge can inform contemporary strategies for sustainable living and environmental stewardship. This intersection of historical techniques and modern challenges underscores the need for innovative solutions that respect and integrate with natural systems, offering lessons for both small-scale and large-scale water management efforts in today’s rapidly evolving world.
Figure 13,14,15. Urus’ dynamic aqua-fabric is explored in these sections, showing how the islands may be moved around as needed.
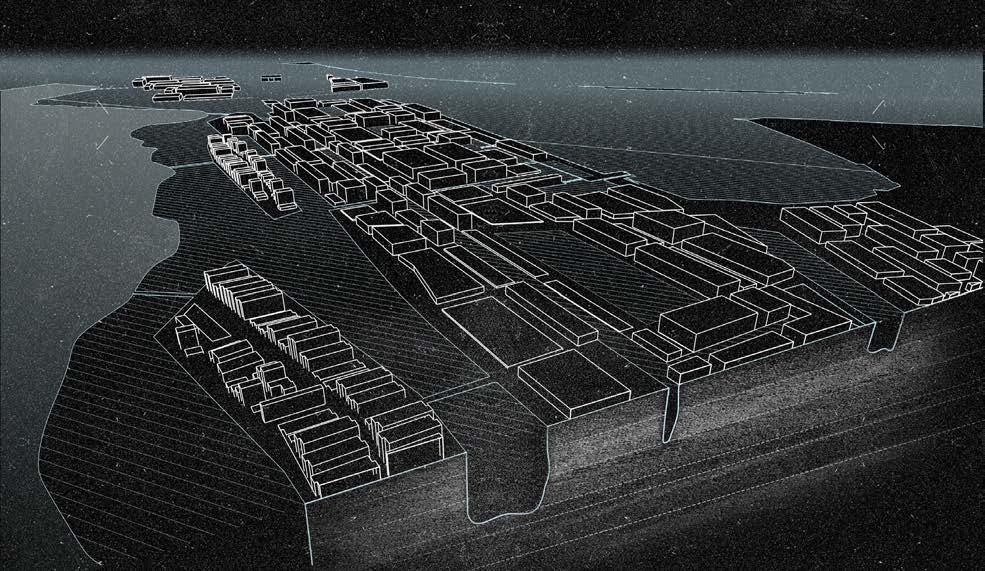
Xochimilco’s Floating Settlement Mexico City
Xochimilco or “where the flowers grow” from its Nahuatl original name, is one of the last remaining lakes of a five central interconnected lacustrine system that once created a wetland ecosystem contained by the valley of Mexico. The Xochimilco lake was initially inhabited by the Xochimilca people, who later became part of the larger Aztec civilization forming the Aztec City of Tenochtitlán, which housed two hundred thousand inhabitants. Tenochtitlán was established on a small island in the middle of the now-extinct Texcoco Lake. The rapid growth of the city and its people was suddenly stopped by the lack of land, thus, as an answer to this problem, the Aztecs developed the Chinampa system to aid in the growth patterns of their urban fabric.1
1 Circular Water Stories, “Chinampas: Agriculture and Settlement Patterns,” accessed September 18, 2024, https:// circularwaterstories.org/analysis/chinampas-agriculture-and-settlement-patterns/.
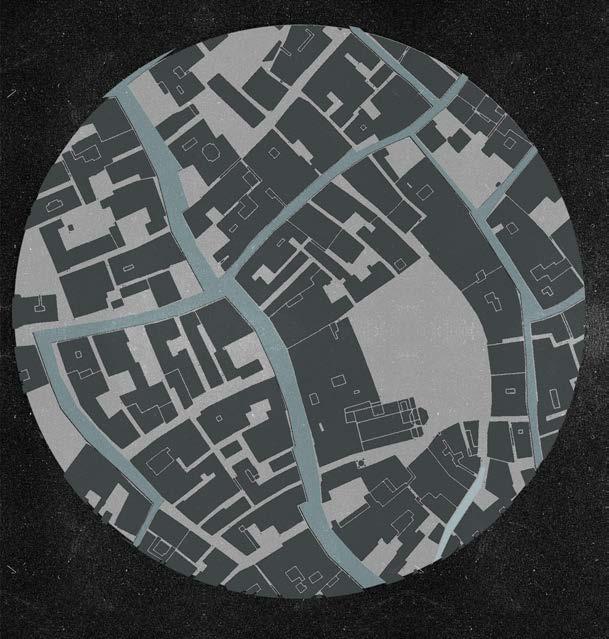
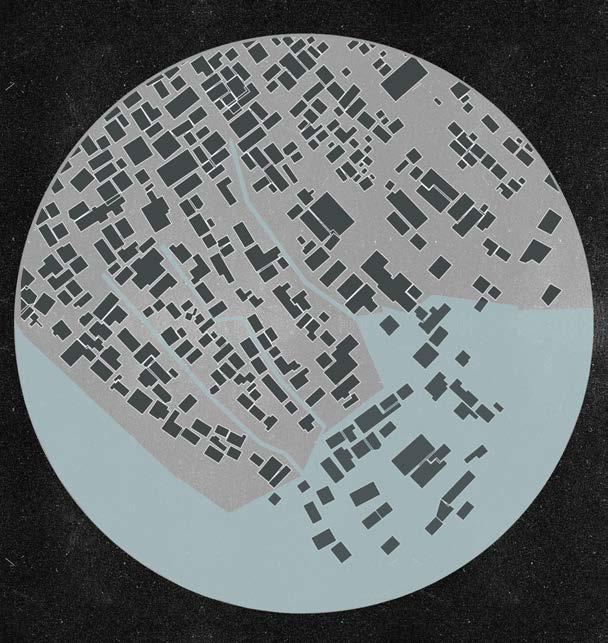
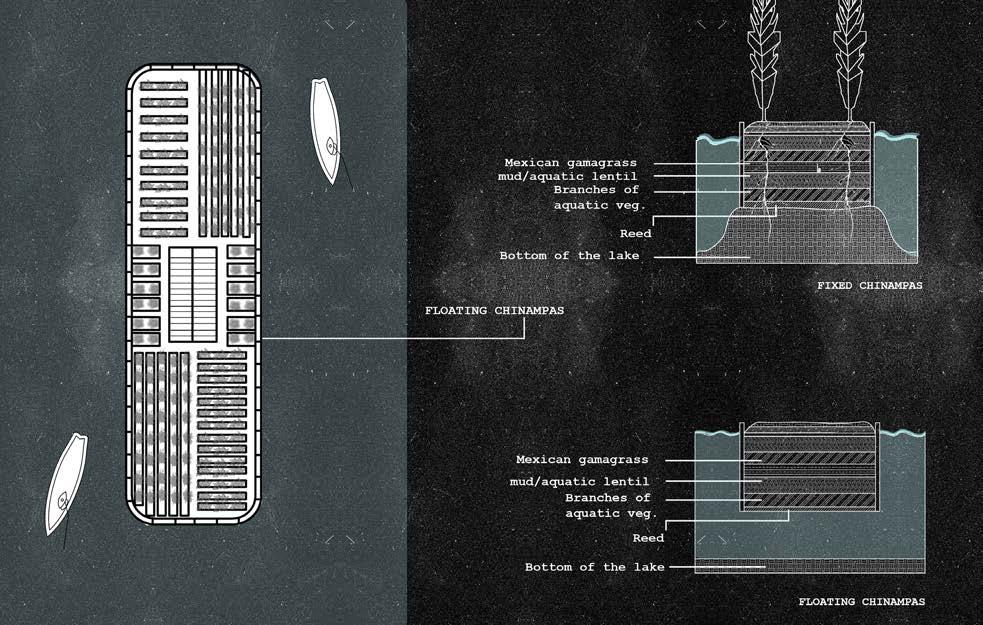
Figure 16. Map of Xochimilco, Mexico City
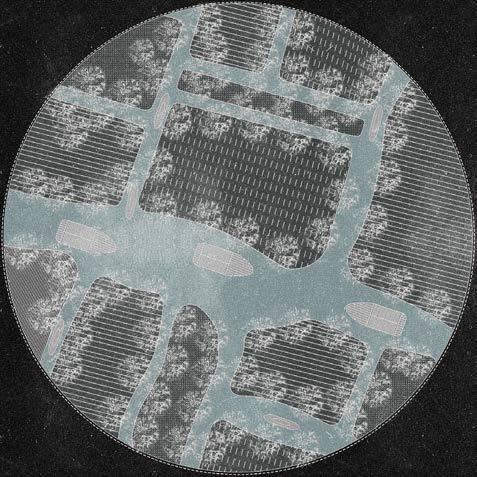
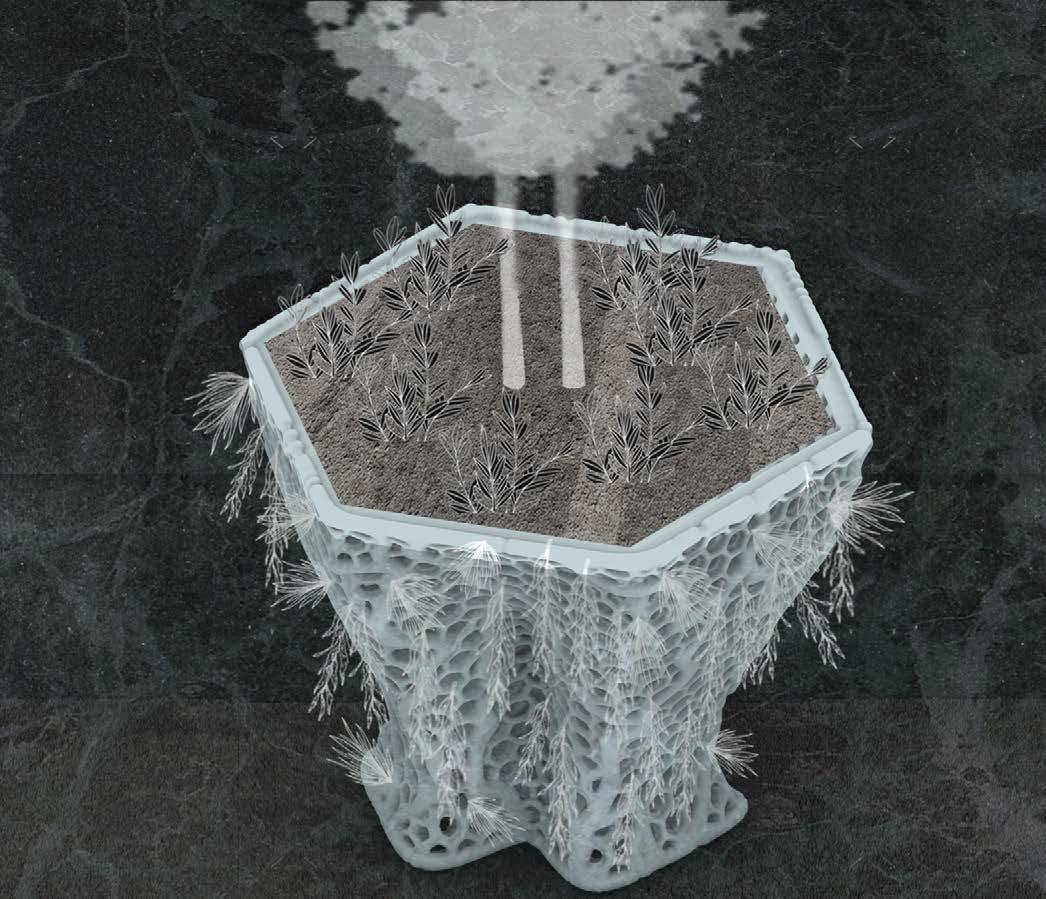
The Chinampa system involved utilizing shallow waters to expand areas of the island for habitation and farming through a land-water management approach. This allowed the gradual expansion of their territory into the surface water, effectively transforming Tenochtitlan into a “floating city.” These artificial 10th-century AD islands not only aided in the growth of the urban space but also became the source of agriculture for the city.
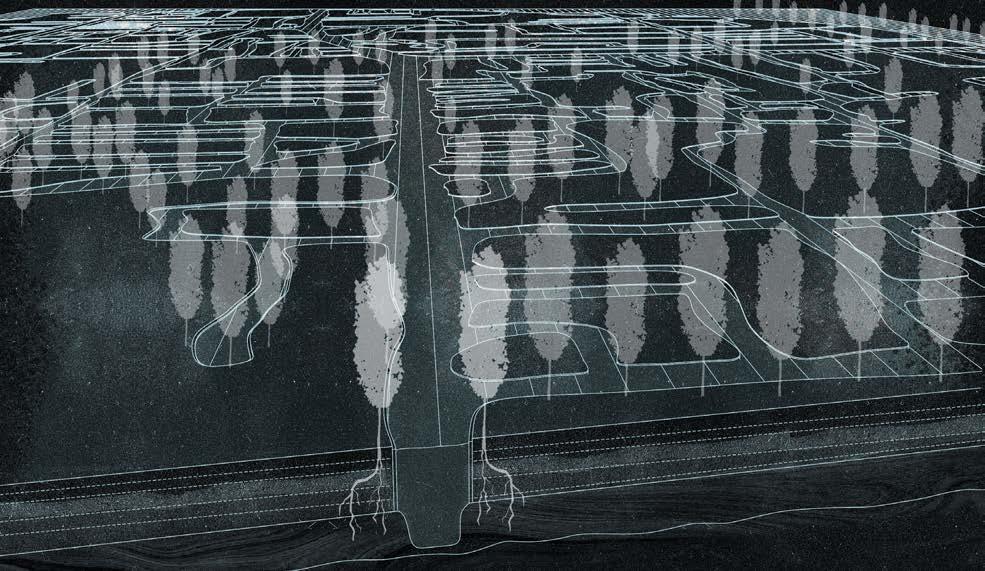
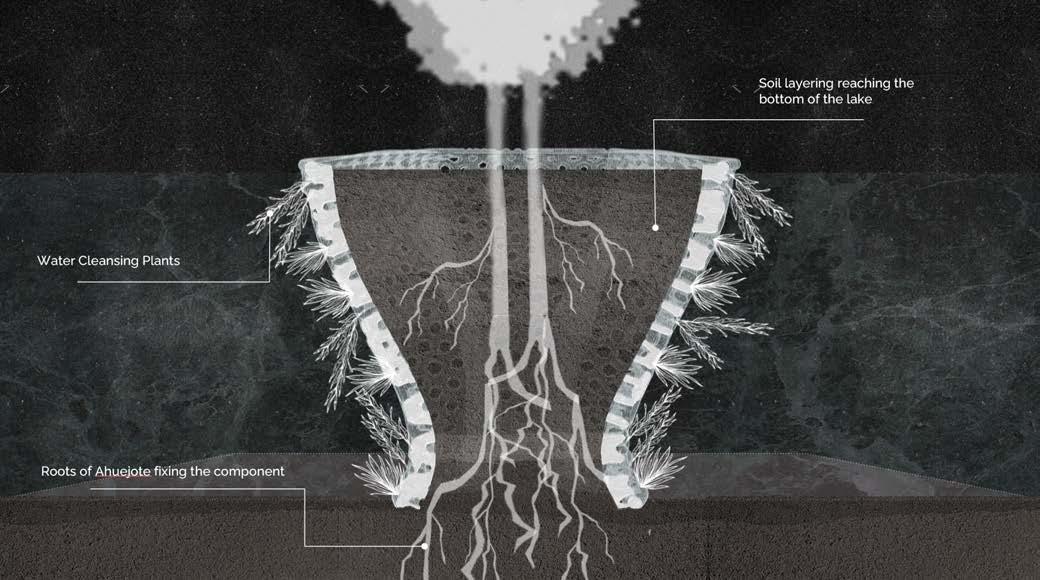
The Chinampas were created through rafts constructed from reeds and enclosed in rectangular shapes with wattle fencing. These rafts were then layered with mud and lake sediments and were carefully chosen to mix with biodegradable and nutrient-rich topsoil composed of grass, leaves, and husks. With each layer added repeatedly, numerous artificial islands emerged, reshaping the landscape into a new pattern. In the first stage of the Chinampa’s construction, it could be used as a portable land area that the Aztecs tethered to their canoes, relocating them within the lagoon according to Tenochtitlán’s territorial requirements. To stabilize some of the Chinampas, as needed, they anchored them by planting trees like the “Ahuejote” in the corners and borders of the rafts, where roots grew to then secure the floating chinampa to the lakebed.1
1 Ibid
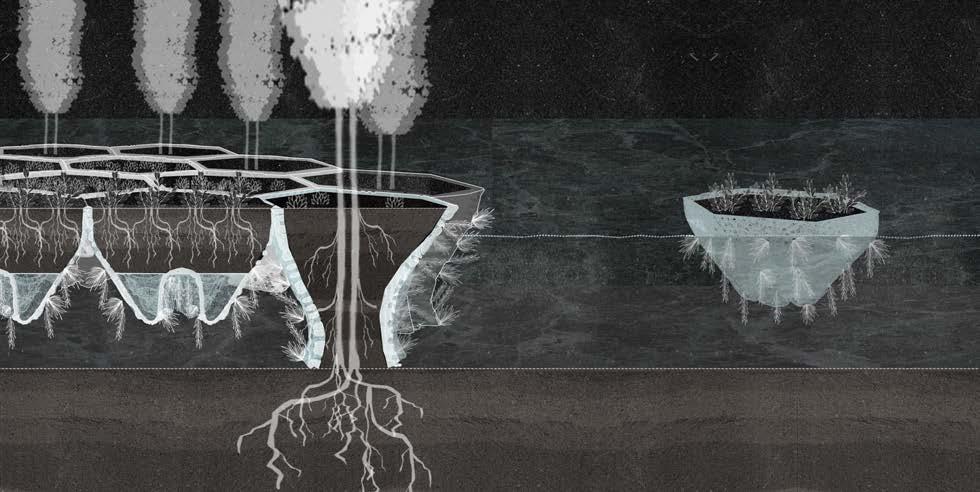
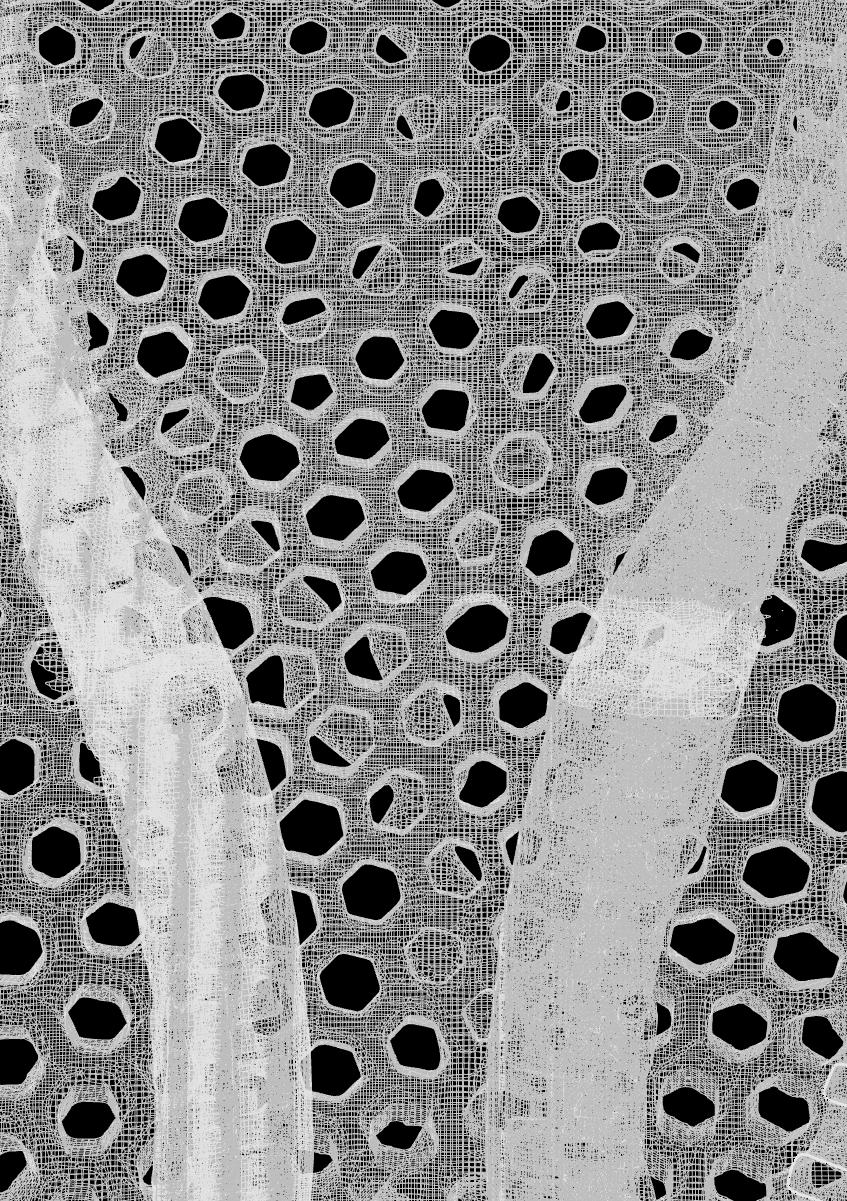
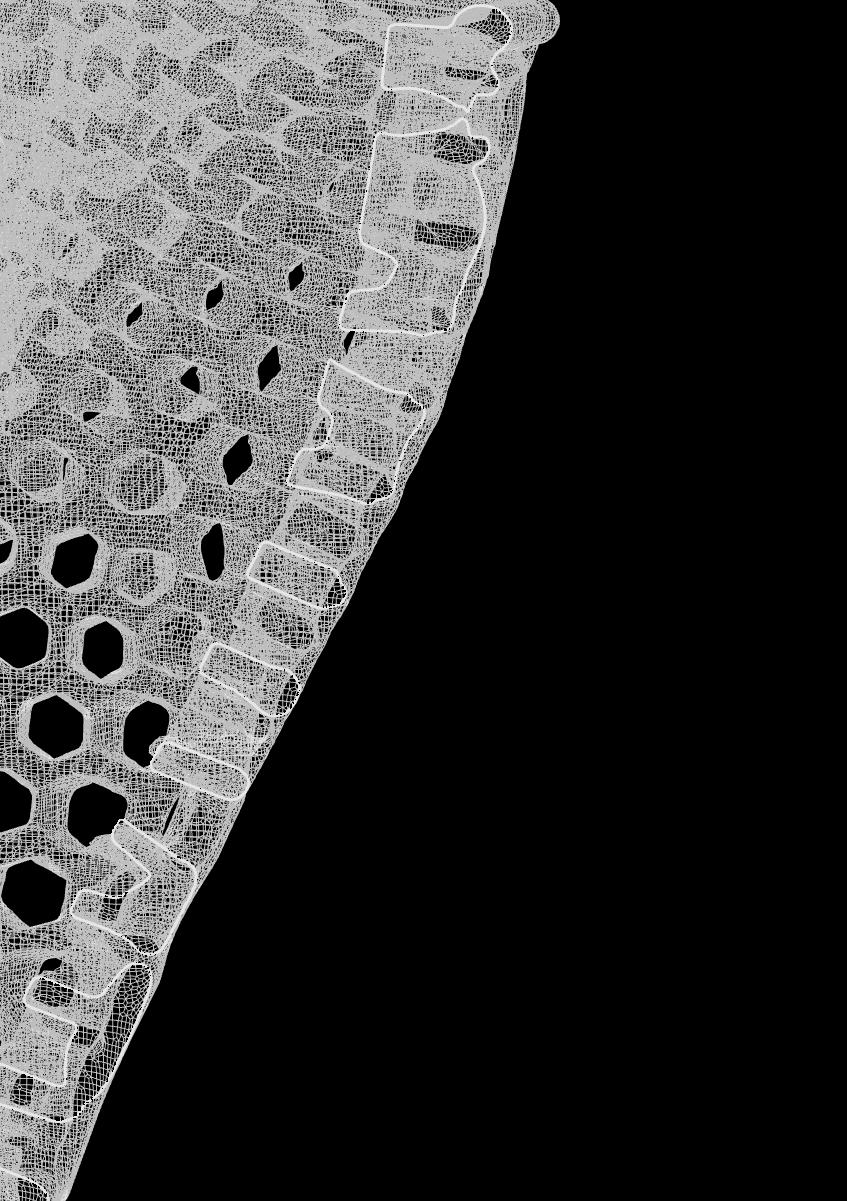
Figure 17. Structural section of Xochimilco’s settlement.
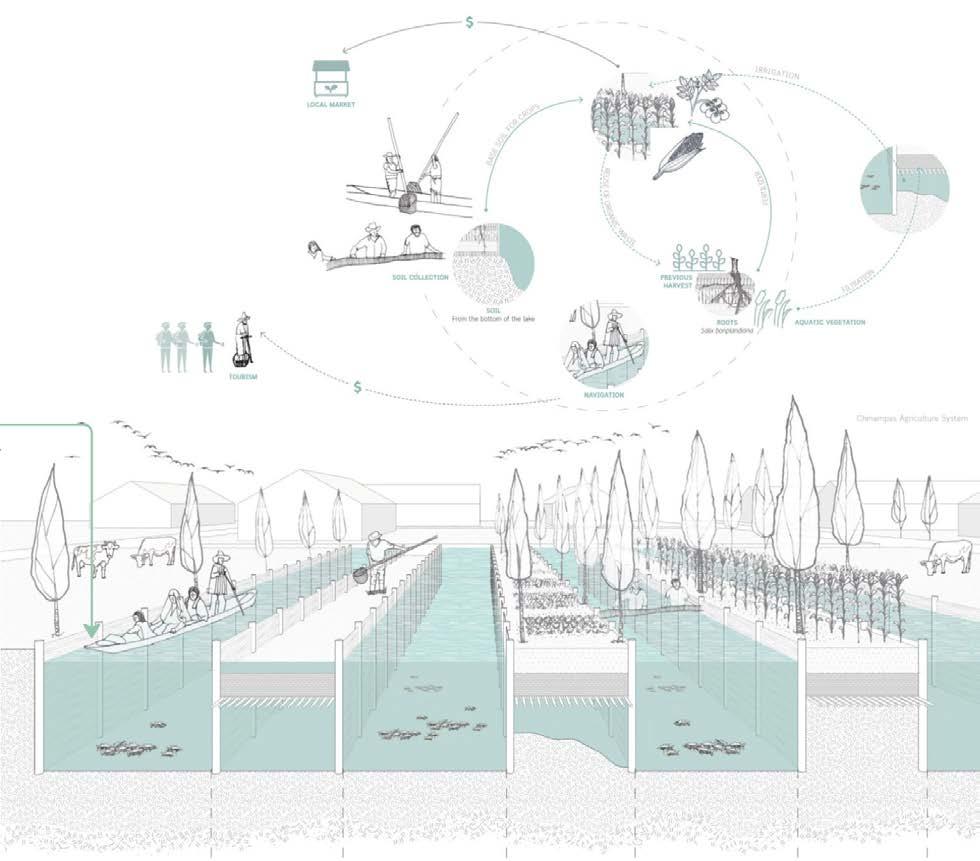
The system not only proved to be effective for the growth of the urban fabric. Additionally, it created a symbiotic system between nature and human-made construction, where the created architecture not only did not negatively impact the ecosystem in which it stands but it demonstrated to be capable of enhancing its biodiversity. Due to this, the Chinampas continue to be utilized sustainably for agriculture; farmers employ roots, lake bottom mud, and organic waste from previous harvests to maintain and expand the Chinampas, utilizing and recycling 100% of the resources from the fields, following the practices of their ancestors. By incorporating organic matter into the construction of the land layers water filtration and absorption is enabled into the upper soil layers, facilitating natural irrigation.
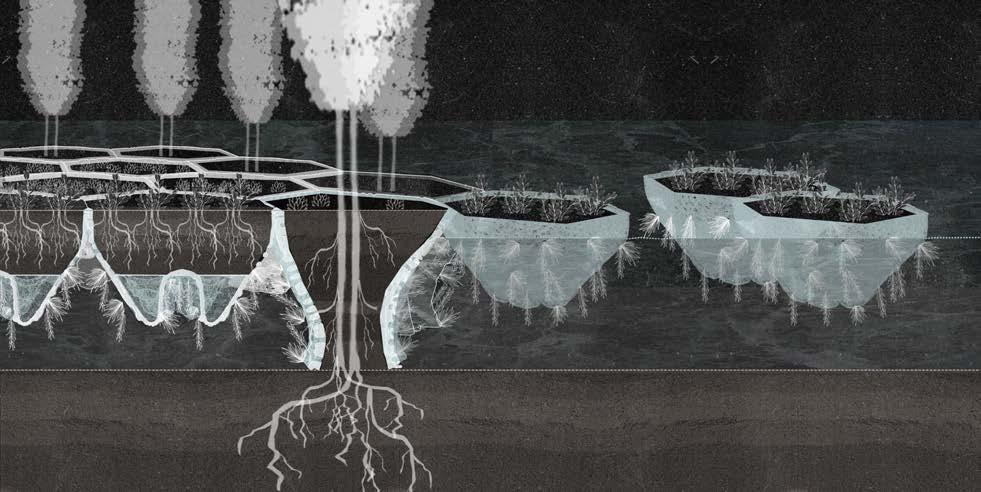
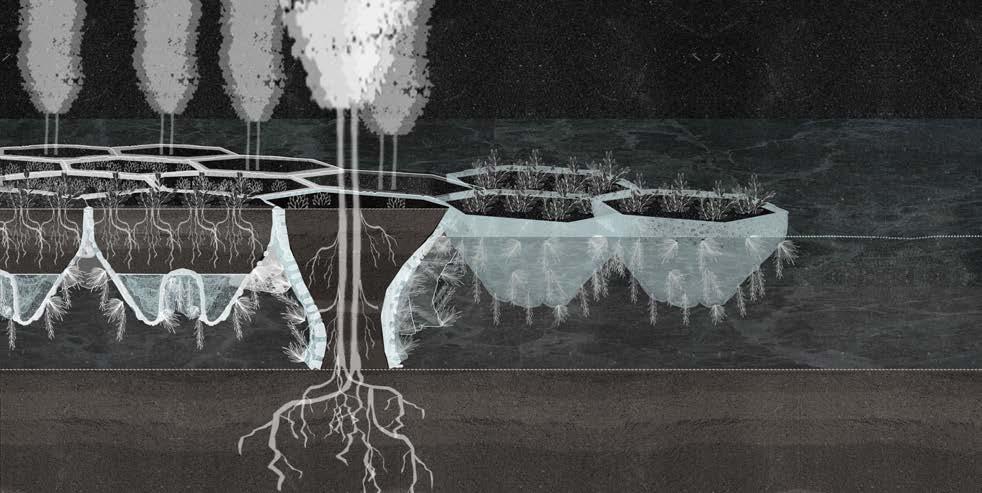
Figure 18. Schematic section of Xochimilco’s settlement and the canals created as a result of the chinampas
Simultaneously, the system aids in water retention by filtering the subsoil, preventing erosion and subsidence. Its circular nature offers valuable insights into landscape-oriented approaches to water-dependent cultivation. From this perspective, as well as its sustainable and self-sufficient urban approach, one can delve into the significance of this traditional water system in addressing contemporary challenges.1
1 “Location of the Protected Area of Xochimilco Wetland and Irregular Settlements Within It,” ResearchGate, accessed September 18, 2024, https://www.researchgate.net/figure/ Location-of-the-Protected-Area-of-Xochimilco-wetland-and-irregular-settlements-within-it_fig1_342177834.
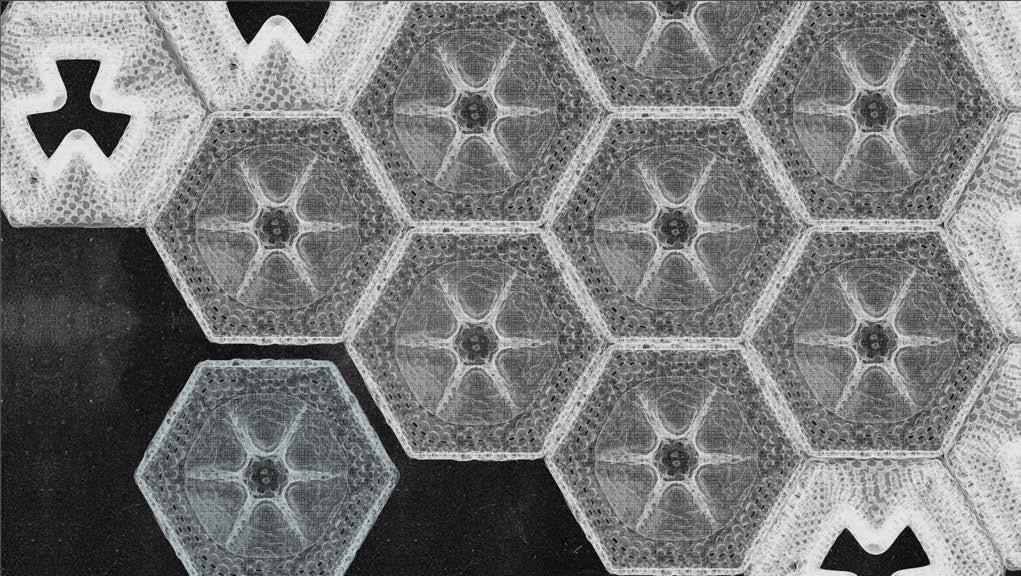
Figure 19, 20. Plan view and schematic section of Xochimilco’s chinampa aqua-fabric
Establishing the Relationships
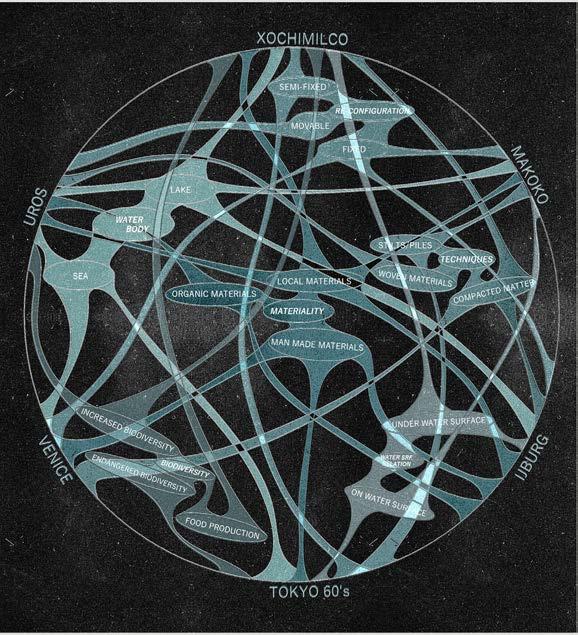
Having explored the six case studies, a visual summary is made, in which it is observed where each case meets and where they divert from one another. In this way, it is possible to reach a first evaluation of what factors operate in each urban fabric that grows and is built on water bodies, giving a preliminary overview of the phenomenon of aqua-fabrics.
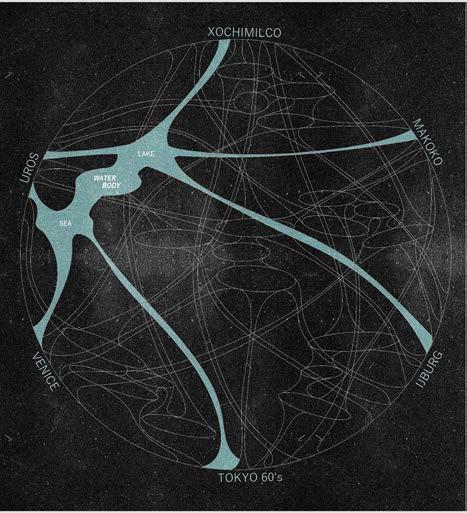
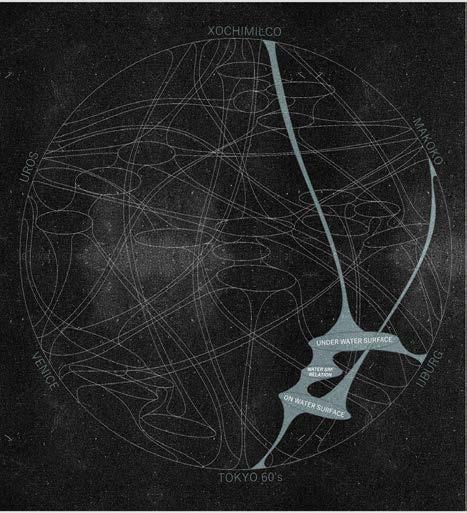
The analysis of the six case studies on urban fabrics built in water bodies reveals distinct factors that influence their development and interaction with their environments. Firstly, the water body type distinguishes the cases: Xochimilco, Makoko, Ijburg, and Uros are situated in lacustrine systems, while Tokyo and Venice are built in marine environments. This difference affects their construction techniques and materials, with varying impacts on the aquatic biome. For instance, Tokyo and Makoko’s urban fabrics primarily extend over the water surface with minimal floating elements, whereas Xochimilco, Uros, Venice, and Ijburg incorporate submerged components, influencing their building techniques and interaction with the aquatic environment.
Figure 21. Diagram of case studies’ relations
Figure 22,23,24,25. Schematic analysis diagrams of case studies
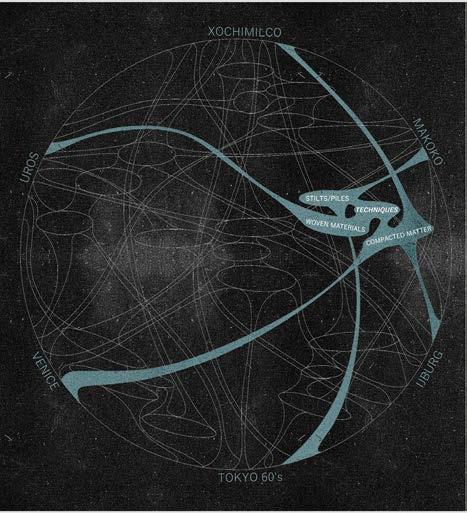
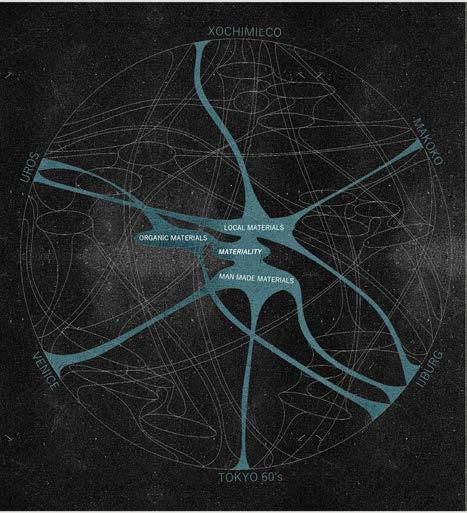
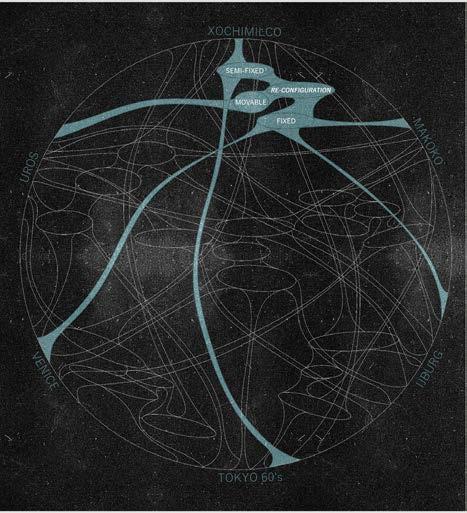
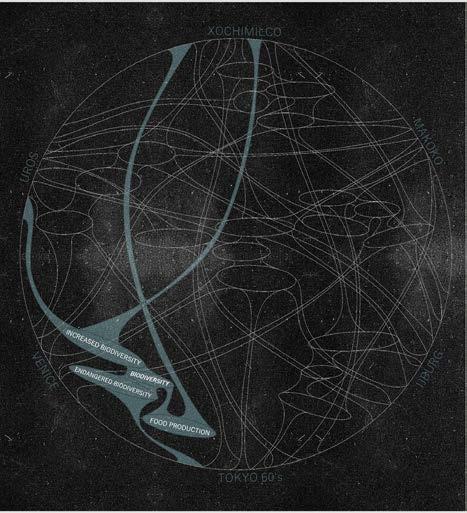
The adaptability of these urban fabrics varies significantly: Makoko, Ijburg, and Venice use fixed structures, while Tokyo and Xochimilco employ semi-fixed systems that allow for some mobility, on the other hand, Uros features entirely movable floating islands. Building techniques also differ: Ijburg, Venice, and Xochimilco use compacted matter, while Makoko and Tokyo rely on stilts or piles, while Uros uniquely uses woven materials. Regarding materiality, Ijburg, Venice, and Tokyo use man-made materials, potentially impacting the biome negatively, while Makoko, Uros, and Xochimilco use organic and local materials, fostering a more symbiotic relationship with the environment. Biodiversity impacts are mixed; Uros and Xochimilco enhance biodiversity and support food production, whereas Tokyo and Ijburg’s approaches potentially disrupt local ecosystems.(1)
Figure 26,27. Schematic analysis diagrams of case studies
Establishing the Parameters
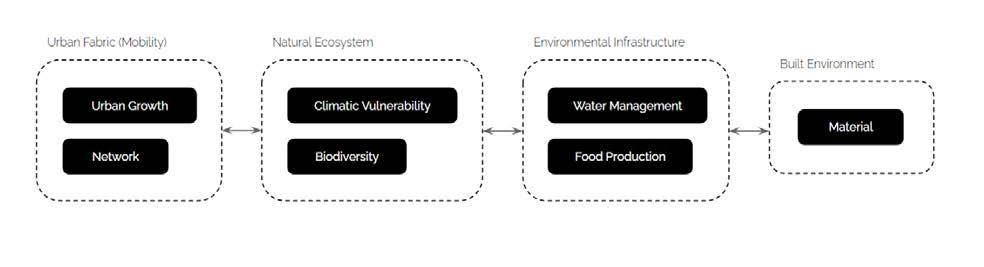
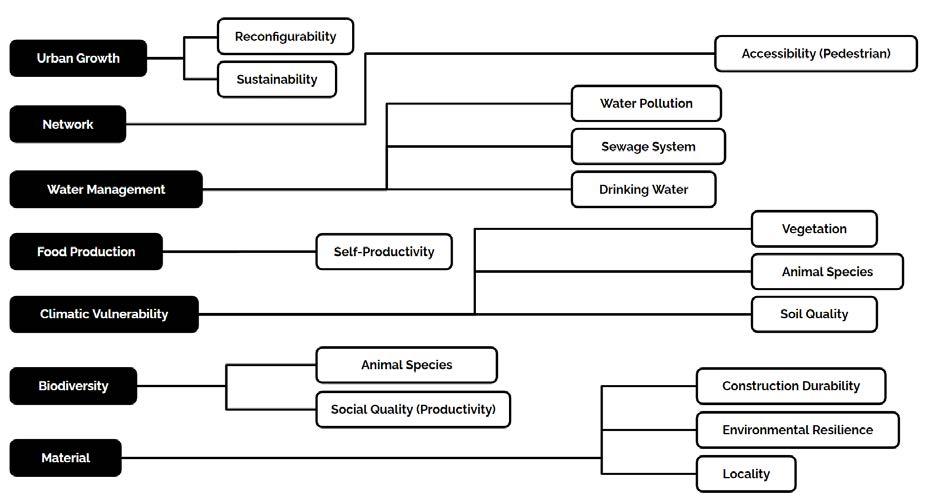
This part analyses the existing relationships and differences among the case studies to illustrate the correspondent functioning of each single aqua fabric, from the building construction techniques to the biome interactions. Seven parameters have been defined as a reference to quantify the case study impacts and divided into four groups representing the four dimensions identified within a floating urban fabric: fabric, building, infrastructure, and biome.
The parameters have been used to evaluate each case study, reflecting on their functionality and producing design abstractions directly applicable to future on-site developments. A classification was assigned to each parameter to facilitate comparison. For instance, parameters like urban growth and network were evaluated for the urban fabric group. The parameter of urban development success reflects the fabric’s ability to provide “sustainable” and “reconfigurable” development of infrastructures over time, a past success measured by the degree of flexibility it accommodates. The parameter of the network was evaluated in terms of pedestrian accessibility, which in turn reflects an urban fabric’s functionality, where greater accessibility ranks higher on the parameter of urban development success. A clear hierarchy was established in all the parameters through this systematic approach.
Figure 28. Flowchart of establishing the evaluation criteria.
Figure 29. Flowchart of establishing the evaluation Parameters and factors.
Group I: Urban Fabric
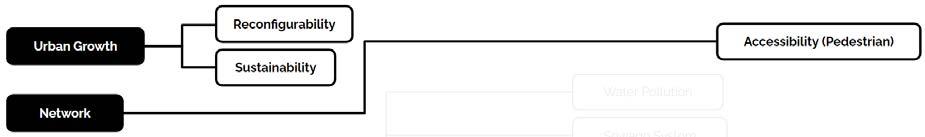
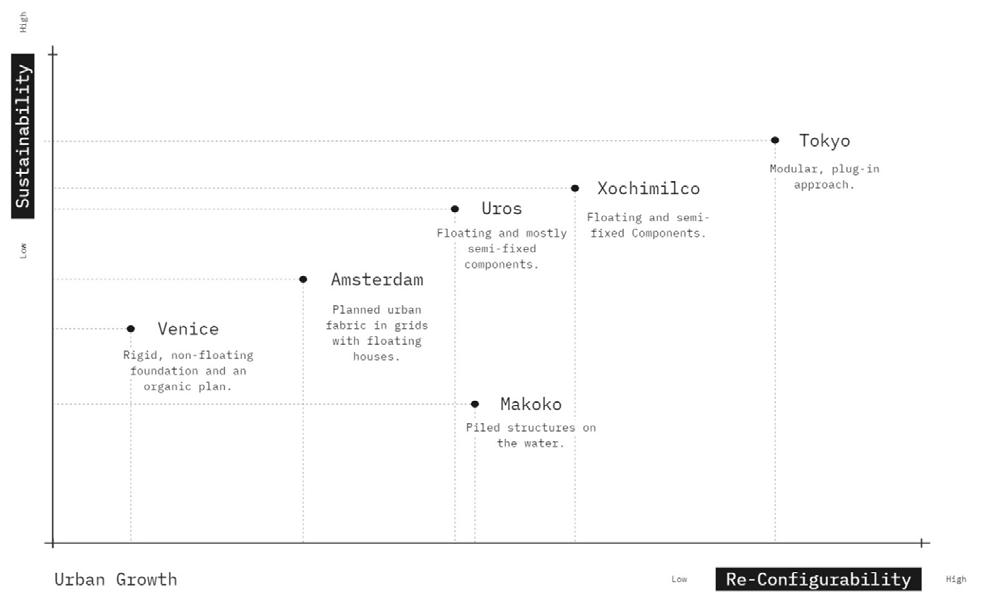
Parameter I: Urban Growth
Measured by: High level of reconfigurability and sustainability
The first group deals directly with the urban fabric and is categorized into two parameters: urban growth and network. The study analyzed reconfigurability and sustainability in Tange’s vision for Tokyo, the Uros floating islands, Makoko, and Xochimilco. In Tange’s design, the use of Tokyo Bay was tacked vertically and horizontally to extend the city during a post-war challenge. It had the combination of transport, living, and commercial precincts with a solid emphasis on land use, green areas, and resilient urban infrastructure supporting a sustainable ecosystem devoid of urban congestion and scant housing.
The floating islands created by the Uros on Lake Titicaca are a prominent example of the mixture of local knowledge and work practices to achieve a self-sustaining habitat. Similarly, the informal settlement of Makoko in Lagos Lagoon is a prime example of how poor communities adapt to socio-hydrogeological challenges through self-organized, aquatic-based lifestyles.
Figure 30.Flowchart of establishing the evaluation Parameters and factors.
Figure 31. Schematic graph of evaluating the urban network parameter.
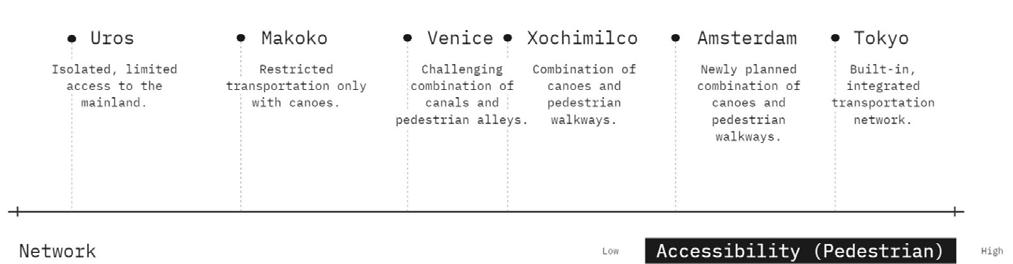
Parameter II: Canal Network
Measured by: High Pedestrian Accessibility
Kenzo Tange’s plan for Tokyo “was characterized by an interconnecting web of avenues and greens” that allow a steady pedestrian flow throughout the city from one area to another. For the Indigenous people of Lake Titicaca, the Uros have piers of narrow pathways in reed for increased pedestrian flow and transportation on top of their unpremeditatedly situated islands. The boardwalks/stilts in Makoko slum are improvisations on the inextricable aqua-marsh landscape as adaptive uses in promoting pedestrians with the disadvantages of space and money.
Figure 32. Schematic graph of evaluating the urban growth parameter.
Group II: Natural Ecosystem and Biodiversity
Parameter III: Climate Vulnerability
Measured by: Rising of Water Levels, Extreme Winds, High Temperature
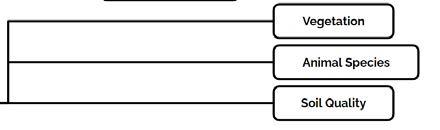
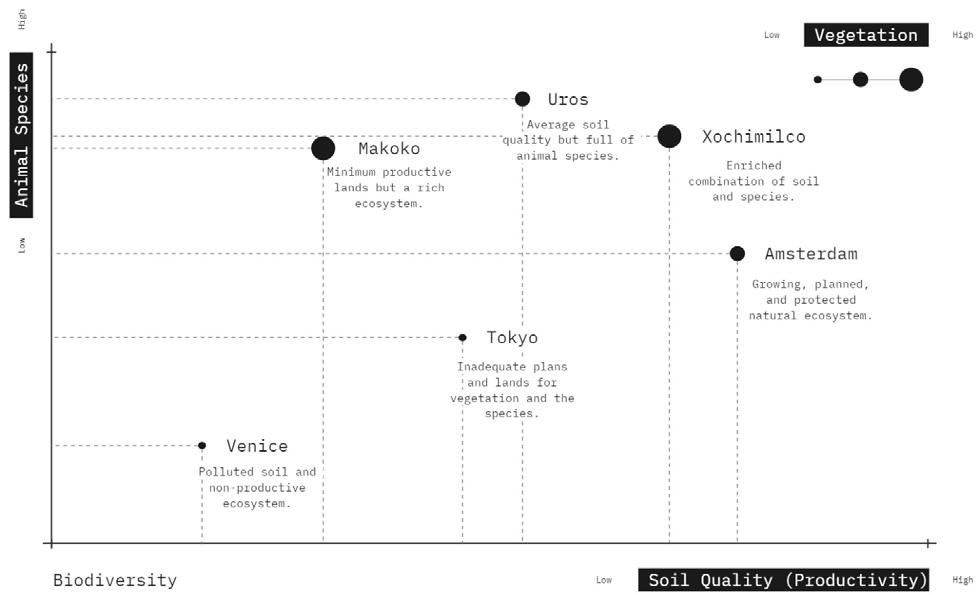
Parameter IV: Biodiversity
Measured by: Diversity in Animal Species & Vegetation, Soil Quality (Productivity Levels)
Key impacts can be unpacked by assessing biodiversity indicators in the six studies – specifically, soil quality, vegetation, and animal species relevant to the aquatic environment.
Tange’s Tokyo intertwines green infrastructure and artificial islands to boost urban biodiversity. However, the encroachment of urban development on surrounding natural areas puts pressure on soil quality and quantity. The floating reed islands of the Uros people of Lake Titicaca create the physical conditions to support specific vegetation and bird species in their isolated aquatic world while continuously needing to find appropriate techniques to maintain soil fertility. While Makoko’s informal settlement is seemingly self-sufficient, the high density of dwellings burdens local biodiversity through a lack of quality soil and vegetation, affecting local fauna.
Figure 33.Flowchart of establishing the evaluation Parameters and factors.
Xochimilco’s chinampas (floating gardens) help preserve ancient agricultural biodiversity through various plant crops and wildlife, although urban development severely pressures the quality of local soils and waters. Venice’s lagoon ecosystem has diverse marine and bird species but is increasingly affected by pollution and habitat loss. Building on ecological engineering, Ijburg has successfully promoted islands and their watery environment with green roofs, artificial wetlands, and various species—but it needs to manage soil and water quality continuously.
Schematic graph of evaluating the biodiversity parameter.
Group III: Environmental Infrastructure
35.Flowchart of establishing the evaluation Parameters and factors.
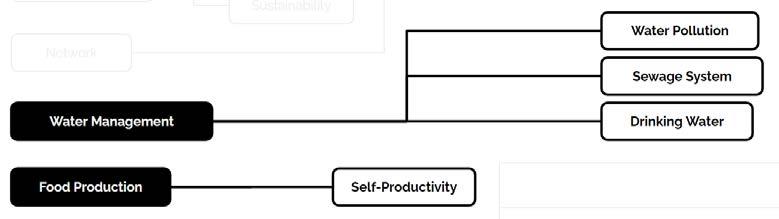
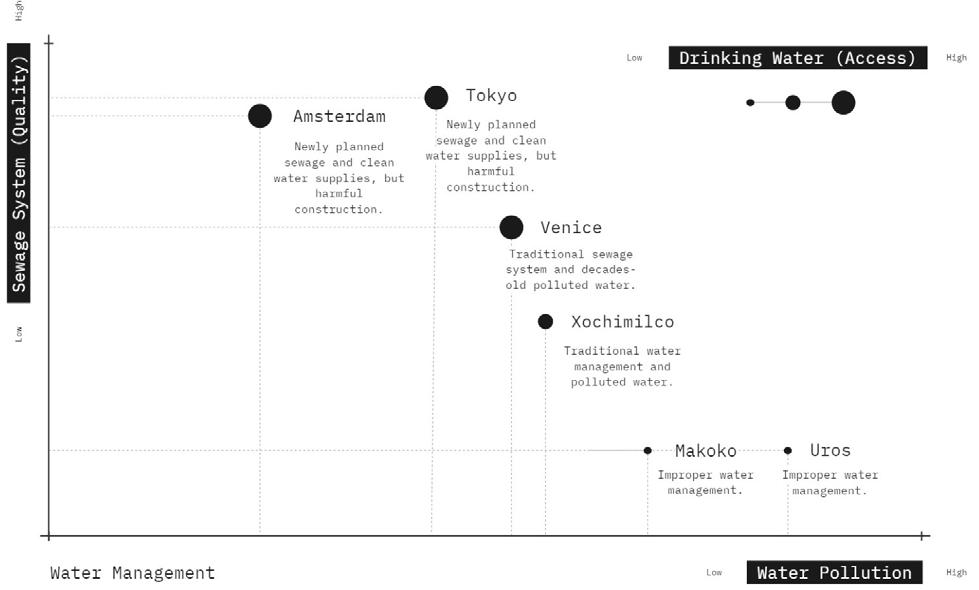
Parameter V: Water Management
Measured by: Water Pollution Levels, Sewage System, Drinking Water
Tange’s Tokyo incorporates advanced sewage and water treatment infrastructures with the city’s growth to mitigate water pollution and provide potable water. The Uros, living in the world’s highest navigable lake, Titicaca, have trouble dealing with urban water pollution (lake eutrophic through conventional agricultural production) and securing clean drinking water. Makoko’s existence on the water as an informal settlement shows a lack of sewage infrastructure, severely polluting the water. Access to clean drinking water could also be uncontrollable.
Figure
Xochimilco’s vertical axis drainage system, which is a water control system, consists of a traditional canal system that results from the built Chinampas. However, today, it suffers from water pollution through urban runoff and agricultural pollution and needs intensive treatment for more reliable access to clean water. Although Venice has sophisticated sewage and water treatment systems, which help protect the lagoon from excessive pollution and hydraulic threats by managing tides, flooding, and eustasy, the high concentration of tourists threatens the water and needs intensive interventions. Ijburg uses state-of-the-art engineering techniques to cope with sewage, minimize water pollution, and fully cover treatment procedures with advanced water treatment plants.
Figure 36. Schematic graph of evaluating the water infrastructure parameter
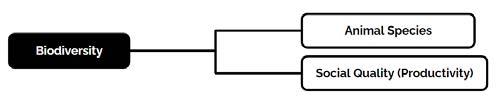
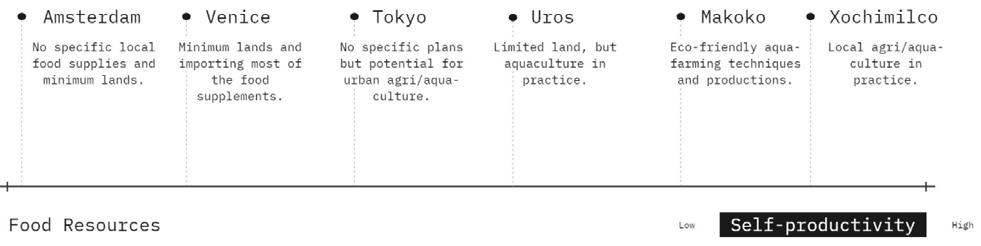
Parameter VI: Food Production
Measured by: Level of Self-Productivity
Tange’s blueprint for Tokyo has a large percentage of dark grey and a focus on modern urban structure and infrastructure, where food production for self-sufficiency is limited, and all sustenance is imported from outside. The Uros people focus heavily on self-sufficiency through crops and fishing. Still, because there is so little space for agriculture and they are constrained to the land surrounding the lake which is not very fertile, hence their production is very limited. While the settlement of Makoko in Nigeria is highly overcrowded and poor, it relies almost entirely upon fishing and urban agriculture to meet its food needs. The city has understood the usefulness of valuing self-sufficiency to manage this urban settlement, providing significant benefits to residents of what would otherwise be an informal settlement.
Xochimilco’s chinampa production reflects a high degree of self-productivity, which allows it to be relatively independent and not import food; instead, it grows what is needed. Its recent historical legacy of abundance has also allowed it to preserve traditional ways of life. Venice achieved food self-sufficiency in the past by trading with Asia and Europe. Now, it is an important European tourist destination and imports most of its food from the outside, although an increasing number of urban gardens can be found there. Ijburg also focuses on urban agriculture and community gardens, which produce food for residents’ self-sufficiency.
Figure 37. Schematic graph of evaluating the food production parameter.
Group IV: Built Environment
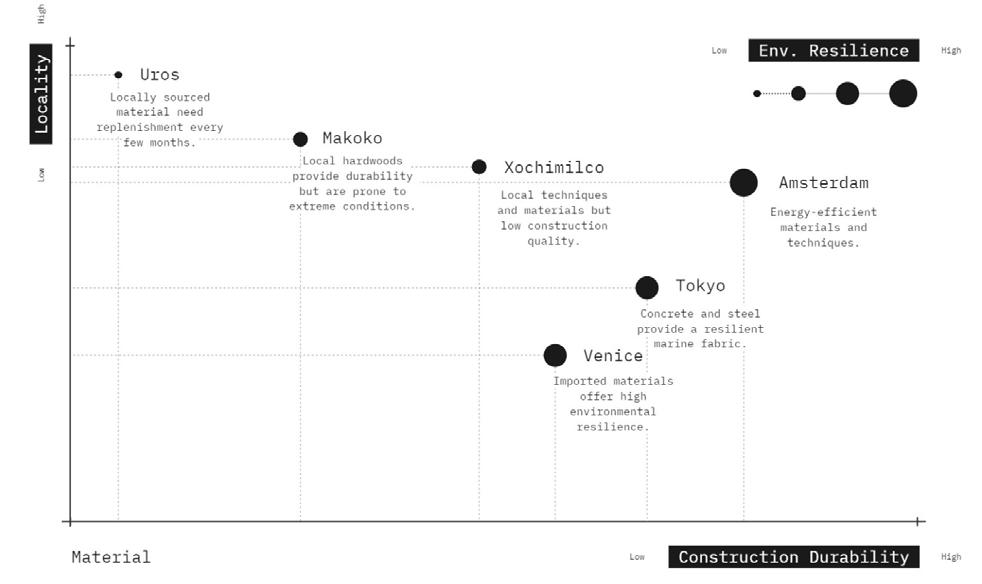
Parameter VII: Material
Measured by: High Construction Durability, Environmental Resilience, Locality
Tange’s Tokyo uses reinforced concrete and steel frames to withstand seismic risk and rising sea levels, integrating floating platforms and elevated structures to increase durability and environmental resilience. The floating islands of the Uros people are constructed out of totora reeds. This material achieves structural flexibility while being buoyant—the community must reroof their islands yearly because the reed fronds wear away and decompose. The informal settlement of Makoko used a mix of wood, corrugated metal, and concrete at the foundations to continue lagoon living when provincial authorities introduced a remediation program. The timber and metal substrates provide some flexibility but would likely be vulnerable to damage from flooding. Concrete would give some protection on the foundations, but the structure should be designed to last only as long as the period between planned evacuations.
Floating logs in Xochimilco, Mexico, use organic materials for its chinampas, building soil up by adding silt and using water hyacinth, papyrus, and around 210 different aquatic plants bound by and with the reeds to create fertile, stable topon that need maintenance to keep production high with continuous replenishment. The historic city of Venice uses brick, limestone, and timber, creating a durable substrate resistant to the lagoon’s saltwater. Still, the structures require regular repair and maintenance from saltwater erosion and subsidence. Ijburg in Amsterdam uses reinforced concrete and steel – with floating foundations and water-resistant materials to increase durability and ability to respond to fluctuating year-on-year conditions. The polder uses green roofs to increase environmental resilience and provide more manageable stormwater.
Figure 38.Flowchart of establishing the evaluation Parameters and factors.
Figure 39. Schematic graph of evaluating the material parameter.
Comparative Evaluation Conclusion
The study gauged strengths and weaknesses in urban growth, network accessibility, climate vulnerability, biodiversity, water management, food production, and material use. This informed the proposal by identifying materials and structural approaches that offer the best balance of reconfigurability and stability in marine environments and understanding various structures and material responses to water-related challenges. The comparative analysis of urban environments adjacent to and on water bodies highlights the need to integrate land and water systems for sustainable development. Case studies of Tokyo, the Uros of Lake Titicaca, Xochimilco, Makoko, Venice, and Ijburg show that viewing water bodies merely as boundaries for urban expansion is increasingly inadequate. Among these, Xochimilco in Mexico stands out for its exceptional conceptual framework. The chinampas of Xochimilco embody a harmonious integration of land and water, where the two are not seen as opposing elements but as components of a unified biome. This symbiotic relationship allows for a dynamic urban environment where development does not come at the cost of environmental degradation but rather contributes to an enriching ecological design. Xochimilco’s approach offers a transformative model for urban growth, demonstrating how a flexible and adaptive system can enhance both the urban fabric and the surrounding water biome.
Tokyo’s advanced water and sewage treatment systems underscore the significance of high-tech infrastructure in managing pollution as well as the possibility of flexibility and reconfiguration in an urban fabric. However, despite its modern facilities, the city grapples with the environmental pressures of high population density. While with Uros people, with their floating islands, highlight traditional adaptation to aquatic environments as well as the usage of local and natural, Venice’s sophisticated systems are hindered by pollution from heavy tourist traffic, showing that even advanced solutions can be vulnerable. Ijburg’s innovative technology for managing sewage and water quality highlights the potential of modern solutions but requires strict oversight to maintain balance, its use of nonlocal sourced materials prove disrupting to the lake’s biome.
These case studies collectively argue for a conceptual shift: water bodies should be seen as integral to a flexible, adaptive urban system rather than mere boundaries. Xochimilco’s approach demonstrates how to achieve a sustainable balance between urban growth and environmental stewardship. The lessons from these cases emphasize the need for adaptable urban fabrics that address both human and environmental needs, ensuring effective water management and ecological harmony.
Rethinking Urban Growth: Sustainable Integration of Water Bodies and
Urban Environments
The comparative analysis of urban environments adjacent to and on water bodies highlights the need to integrate land and water systems for sustainable development. Case studies of Tokyo, the Uros of Lake Titicaca, Xochimilco, Makoko, Venice, and Ijburg show that viewing water bodies merely as boundaries for urban expansion is increasingly inadequate.
Among these, Xochimilco in Mexico stands out for its exceptional conceptual framework. The chinampas of Xochimilco embody a harmonious integration of land and water, where the two are not seen as opposing elements but as components of a unified biome. This symbiotic relationship allows for a dynamic urban environment where development does not come at the cost of environmental degradation but rather contributes to an enriching ecological design. Xochimilco’s approach offers a transformative model for urban growth, demonstrating how a flexible and adaptive system can enhance both the urban fabric and the surrounding water biome.
Tokyo’s advanced water and sewage treatment systems underscore the significance of hightech infrastructure in managing pollution as well as the possibility of flexibility and reconfiguration in an urban fabric. However, despite its modern facilities, the city grapples with the environmental pressures of high population density. The Uros, with their floating islands, highlight traditional adaptation to aquatic environments as well as the usage of local and natural materials yet face challenges from agricultural run-off affecting water quality. Makoko demonstrates the opportunity of urban expansion on water bodies, yet its unplanned growth poses severe health risks due to inadequate sewage infrastructure and illustrate the dire consequences of poor water management.
Venice’s sophisticated systems are hindered by pollution from heavy tourist traffic, showing that even advanced solutions can be vulnerable. Ijburg’s innovative technology for managing sewage and water quality highlights the potential of modern solutions but requires strict oversight to maintain balance, its use of nonlocal sourced materials prove disrupting to the lake’s biome.
These case studies collectively argue for a conceptual shift: water bodies should be seen as integral to a flexible, adaptive urban system rather than mere boundaries. Xochimilco’s approach demonstrates how to achieve a sustainable balance between urban growth and environmental stewardship. The lessons from these cases emphasize the need for adaptable urban fabrics that address both human and environmental needs, ensuring effective water management and ecological harmony.
Figure 40. Representative view of an aqua-fabric
Figure 41. Representative view of Xochimilco
Site and Area of Study: XOCHIMILCO, Mexico City
The uncontrolled growth phenomenon is constantly visible in developing countries, which often have no specific growth plans or well-thought-out extension patterns for urban tissue; this, combined with the country’s poor economic management, gives rise to the informal growth of the cities. This problematic situation has been exacerbated in Mexico City, one of the biggest developing cities in Latin America. This growth pattern has affected the borough of Xochimilco.
As stated in the case study area, Xochimilco was part of the lacustrine system of the Valley of Mexico. With the arrival of the Spaniards, the decision was made to dry the lakes as the European vision for urban construction did not fit the aqua-fabric system of the Aztec City of Tenochtitlan seeing that the lakes did not have a natural outlet for water to flow, leading to several floods in the new Spanish city.1 With the city’s continuous growth, each lake was dried until only a few were left, the Xochimilco Lake being one of them.
Today, Xochimilco remains in the southeast of Mexico City with the same chinampa system created in the 13th century, nominated a UNESCO heritage site for its remarkable 100% sustainable system.2 However, the city is no longer the same; as it reaches its expansion limits, it eats up Xochimilco. This exacerbated growth has resulted in the arrival of informal housing resulting in 300 hectares of urbanized chinampas. This unplanned growth has disrupted the carefully balanced biome of the lake due to the dumping of wastewater into the canals. When the chinampas are urbanized in this manner, their agricultural potential is lost creating “dead” chinampas. To make the matters worse, the growth of the city has forced some of the “chinamperos”3 to take on industrialized farming techniques such as the use of pesticides and fertilizers in the crops as means to keep up with the food demands of the population; this adds to the water pollution due to the chinampas direct connection with the lake in its intricate natural irrigation system.4
Having analysed and evaluated Xochimilco in the previous section of case studies and their parameters, the borough was chosen as the site and area of study due to its remarkable aqua-fabric system as well as the current challenges it withstands. This project aims to use the traditional chinampa system as an area of learning opportunity as well as to redefine it by implementing a new aqua-fabric that may address the water management issues brought by the unplanned urban growth and thus restore the balance of the lake biome. Additionally, it may serve as an experimental opportunity for future urban tissues that may grow on and deal with water bodies.
1 “Chinampas Agriculture and Settlement Patterns.” Circular Water Stories. Accessed March 22, 2024. https://circularwaterstories.org/analysis/chinampas-agriculture-and-settlement-patterns/.
2 Centre, UNESCO World Heritage. “Historic Centre of Mexico City and Xochimilco.” UNESCO World Heritage Centre. https://whc.unesco.org/en/list/412/.
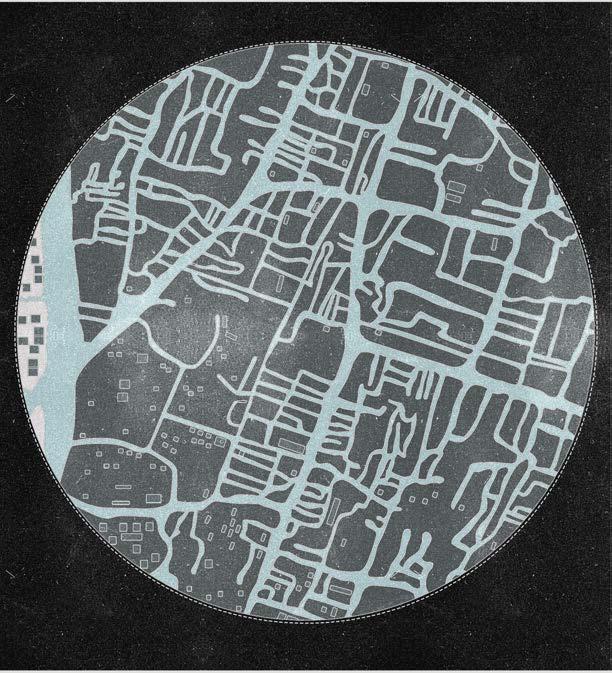
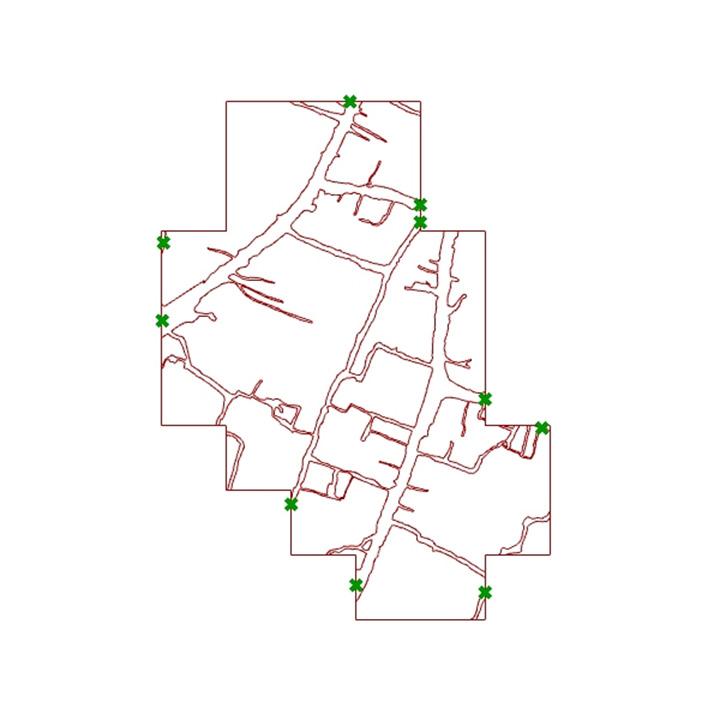
Xochimilco is located in the southern part of Mexico City, Mexico. It is situated within the borough of Xochimilco, one of the 16 administrative divisions of the capital city. Xochimilco lies approximately 28 kilometres (17 miles) south of the historic centre of Mexico City and covers an area of approximately 125 square kilometres (48 square miles). Its coordinates are roughly 19.2629° N latitude and 99.1049° W longitude.
Figure 42. Location of the borough of Xochimilco in Mexico City
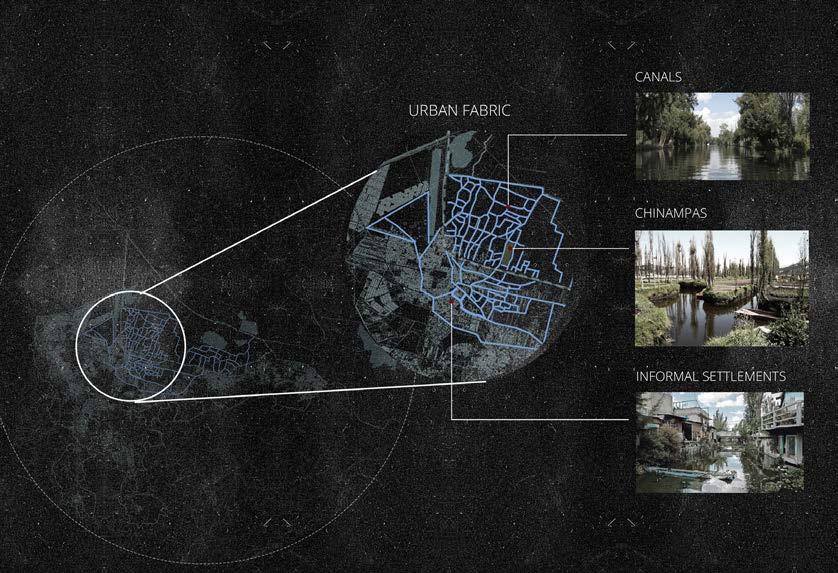
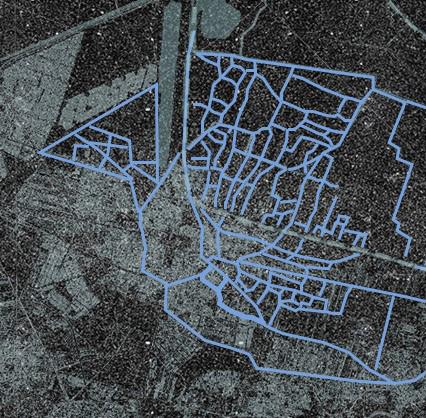
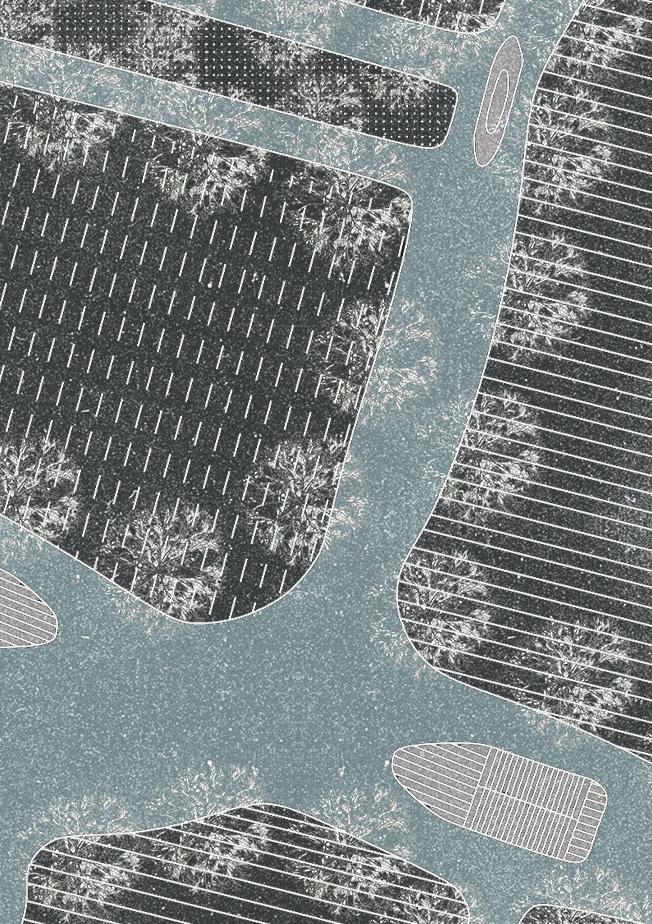
Urban Fabric
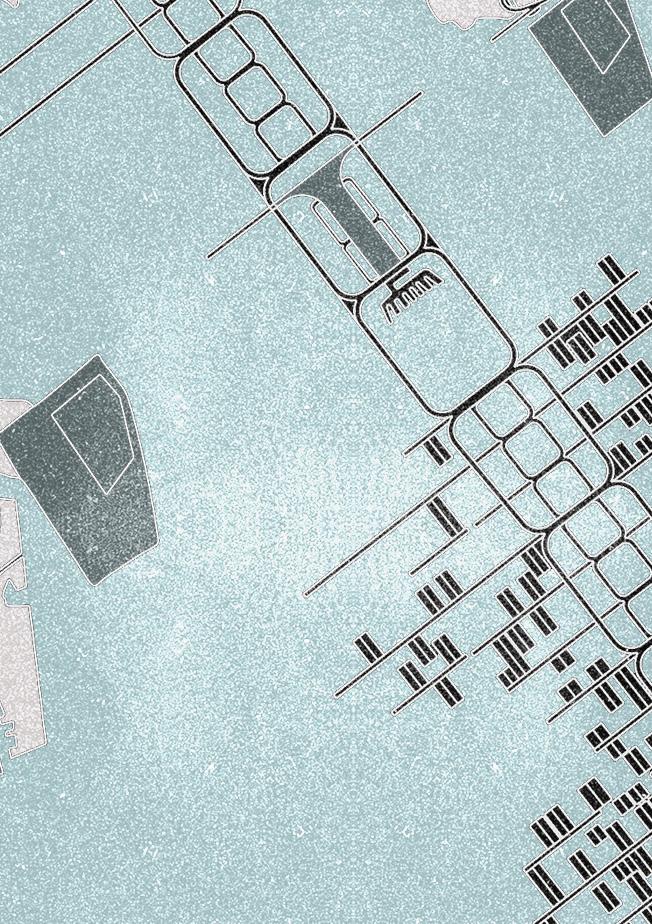
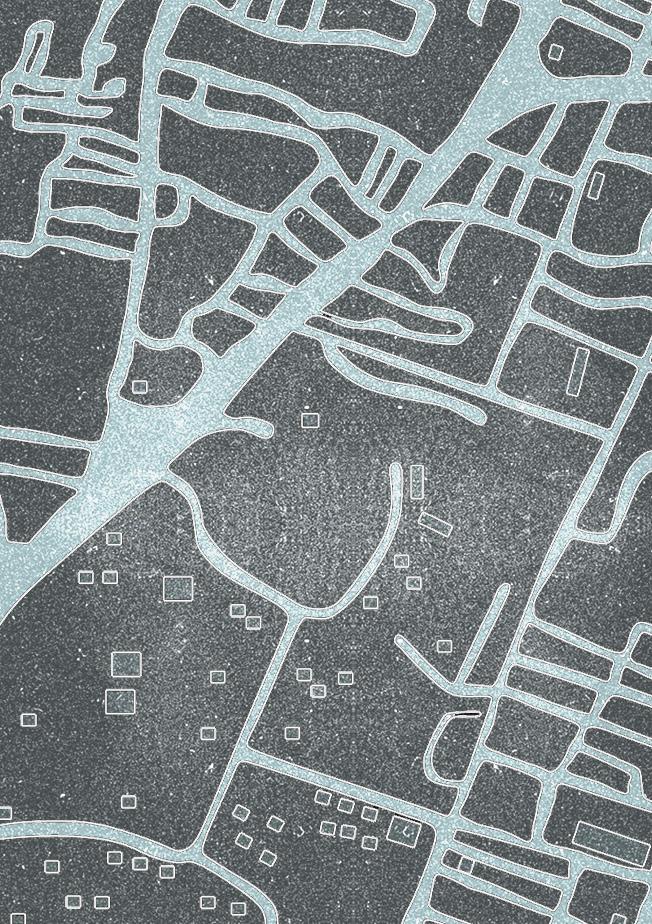
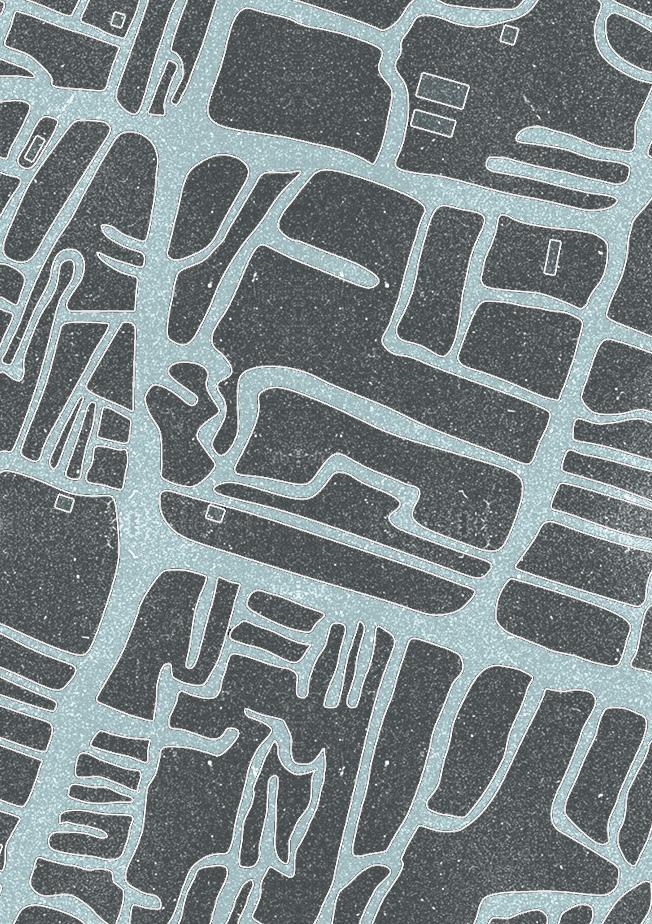
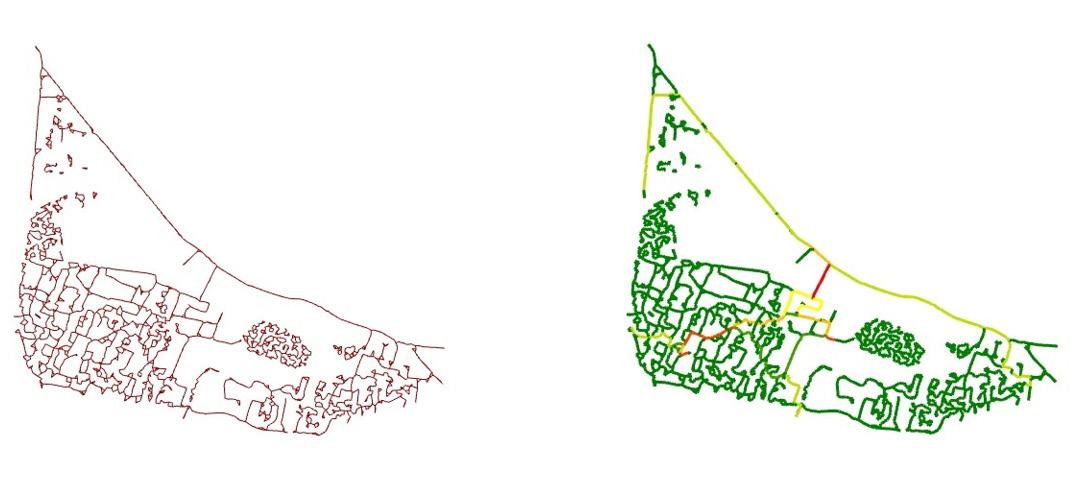
The following maps show Xochimilco’s urban fabric, highlighting a very particular organization with a combination of land urban tissue and aqua fabric. The canals are a result formed by the placement of the fixed chinampas in the lake. The canals create the overall connection of the urban tissue in the borough.
Figure 44. GraphicalDescription of Xochimilco’s urban fabric
Figure 43. Map of Xochimilco’s urban fabric
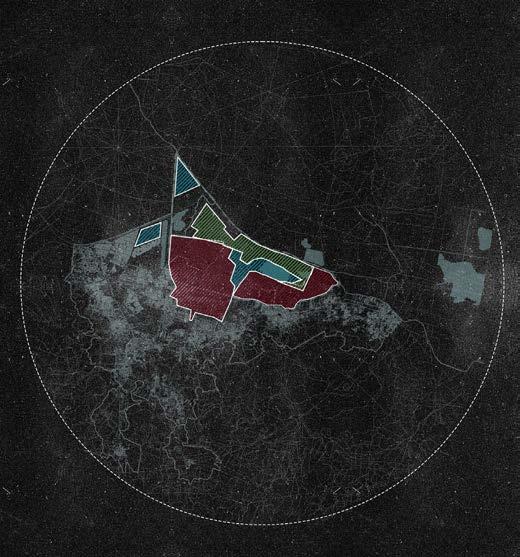
Chinampa Area
The following maps shows the areas of chinampas in the site.
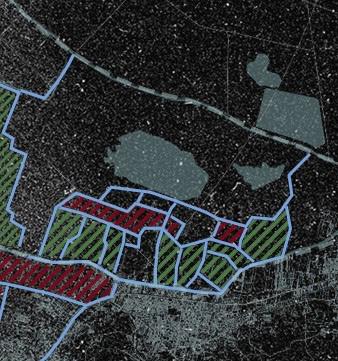
Figure 45. Zoning map of site; wetlands (blue), agricultural (green), and chinampas (red)
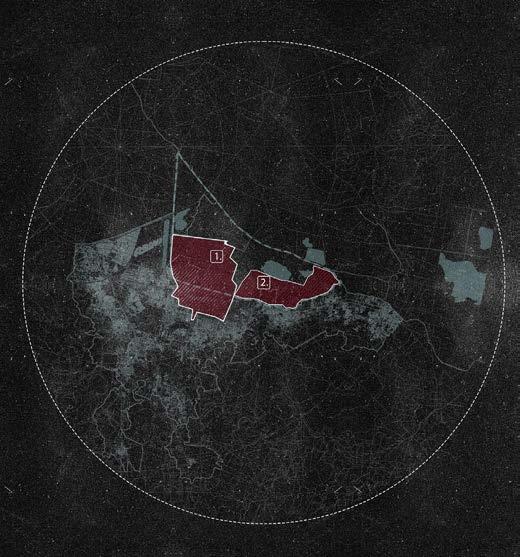
Figure 46. Chinampa zoning: (1) Xochimilco, (2) San Gregorio Atlapulco
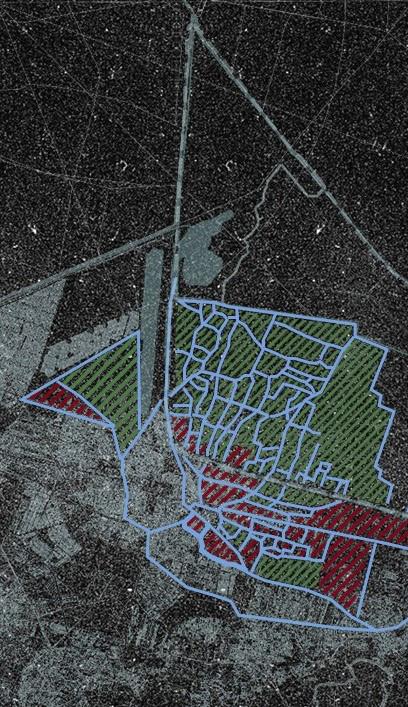
Active Chinampas
Active chinampas are farmed plots closely manicured to produce various vegetables, flowers, and medicinal plants. The distinguishing features of an active chinampa are:
Simple Cultivation: Farmers plant, tend, and harvest crops regularly throughout the year using traditional farming methods passed down over generations.
Irrigation Management: These chinampas are supplied by well-maintained canals that provide them with enough water for irrigation, and the canals themselves act as natural filtration systems to replenish their soil.
Biodiversity: Maintained chinampas support a large and diverse range of plant species, which, in turn, support many insect and animal species, helping to maintain the area’s overall ecological health.
Inactive Chinampas
Recently abandoned chinampas have been plots once under agricultural production but have fallen out of use, perhaps due to urbanization, contamination, or economic change. Inactive chinampas are those plots that include evidence of abandonment, including:
Overgrowth: Left fallow, weeds, and other non-native species can take over chinampas, depleting soil quality and fertility.
Issues with Water Management: Unused canals surrounding Chinampas will get silted up or polluted, preventing the existence of a functioning irrigation system and degrading the water’s quality.
Chinampas risk loss of biodiversity if they are not actively managed
1. Native species of flora and fauna can be displaced by invasive species 2. Habitat for the axolotl (an endangered species native to the area) can deteriorate.
Conservation Ceiling: In their inactive state, chinampas can become dangerous hotspots of pollution and habitat degradation, and restoration—removing weeds, opening canals, and reintroducing native species—requires a great deal of labour.
Figure 46. Chinampa zoning: (1) Xochimilco
Figure 47. Chinampa zoning: (2) San Gregorio Atlapulco
Canal Network System
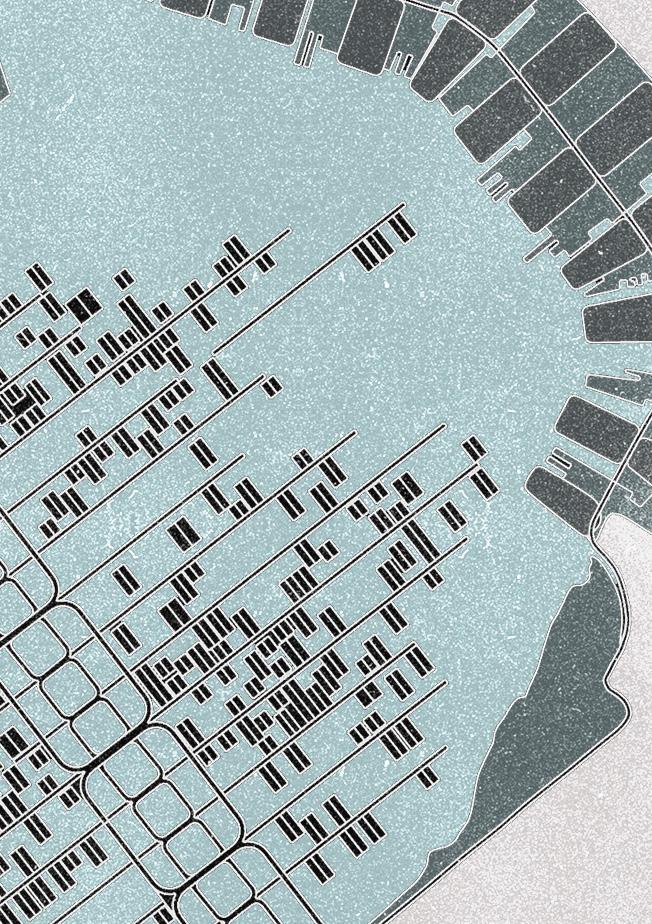
The canal system of Xochimilco is part of the original lacustrine network of canals and islands. This vast network of channels once sustained the chinampa fields around the central part of the lake and constitutes an integral part of the region’s hydrology and ecology. The purposeful design of the chinampa system at the foundation of the canal network gives water distribution and irrigation to the Xochimilco area a specific complexity. Much of this distribution still depends on water inlets along the canal edges but engineered, gravity-fed pipelines also facilitate and direct the water flow. This distribution system maintains channels with appropriate velocity and depth to prevent stagnation and ensure sufficient irrigation. Seasonal changes in the amount of water flowing through the canals are controlled by supply from rainfall and urban use. This temporal variation is part of a dynamic balance, essential to avoid problems such as water pollution, sedimentation, and increased evaporation levels due to over-extraction. Proper management of the rhythm of the canals is vital to maintaining an ecological balance and the diversity of life along the river system, which serves the traditional chinampas of Xochimilco and its unique cultural landscape.
Figure 48. Canal Network of the Xochimilco Lake
Figure 49. Canal Network of the Xochimilco Lake (zoom in).
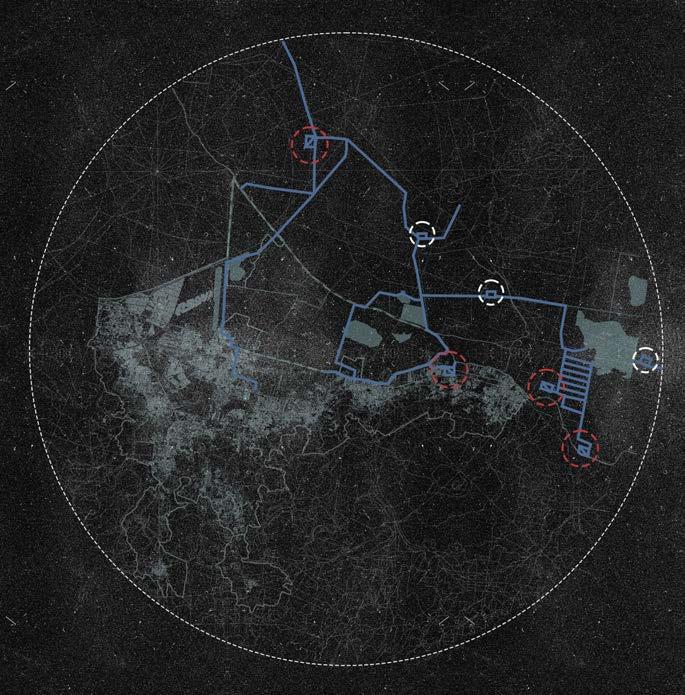
Water Inlets
The water inlets that feed the lake can be divided seasonally into dry and rainy seasons. During the rainy season, the lake receives its water from the drainage brought by the mountains in the south, and its inlet points can be seen in the following map:
Figure 50. Map of water inlets and outlets during the rainy season
During the dry seasons, the lake receives water inputs from a treated wastewater pipeline. The local government took this action because of the over-exploitation the lake receives; Mexico City faces a problem in feeding its water supply, and because of this, the remaining lakes found in the valley are being pumped for water. Xochimilco is being over-extracted and is facing a lowering of its usually constant water levels. The government opts to pump the lake with treated wastewater to mitigate this.
The following map shows where the lake receives water during periods of low rain, thus having a low water level (“estiaje” in Spanish). These months are usually during the hottest seasons experienced in Mexico City: March, April, and May. The water that it receives during these periods is from wastewater treatment plants. There are other areas that “re-pump” the water from these plants so that it may expand through the network effectively. Dark blue is the color of the distribution pipes, the white dashed circles are the “re-pumping” areas, and the red dashed circles are the wastewater treatment plants.
Figure 51. Map of water inlets and outlets during the dry season.
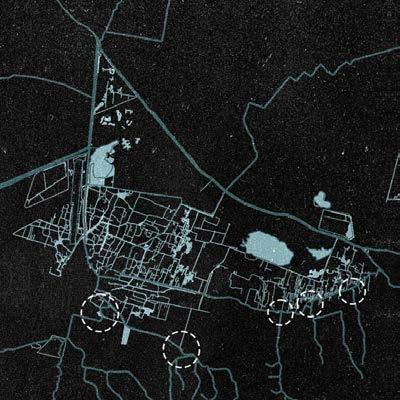
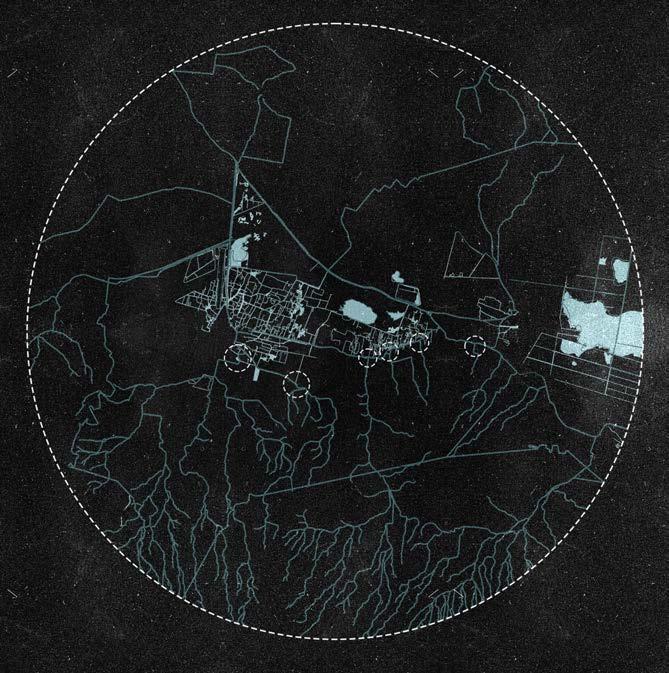
Flood Prone Areas
In the following map areas prone to flooding can be observed: this type of analysis can help the research by informing the deployment of the proposed aqua-fabric into the most optimal scenarios for water harvesting and management. In general, the proposed design will showcase a time-based collective in response to water movements.
Figure 52. Map of pin-point locations highly prone to flooding
Figure 53. Map of areas highly prone to flooding
Water Flow
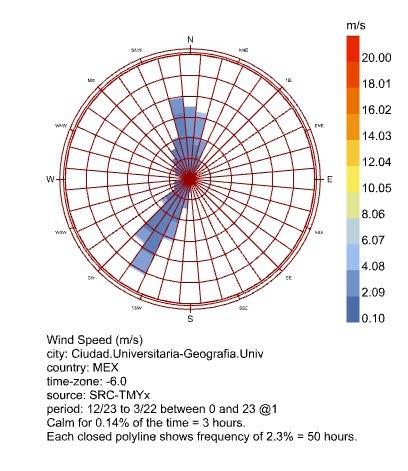
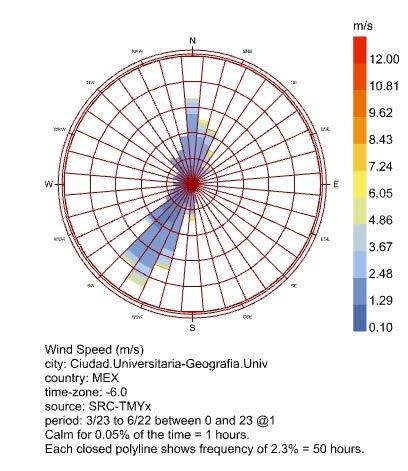
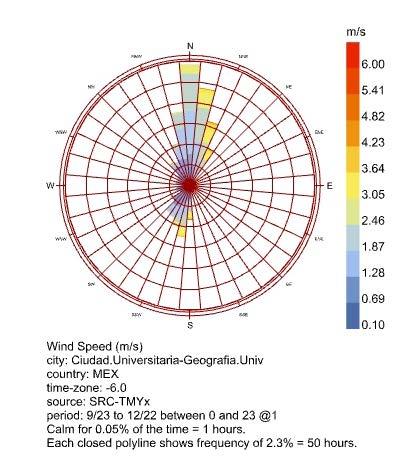
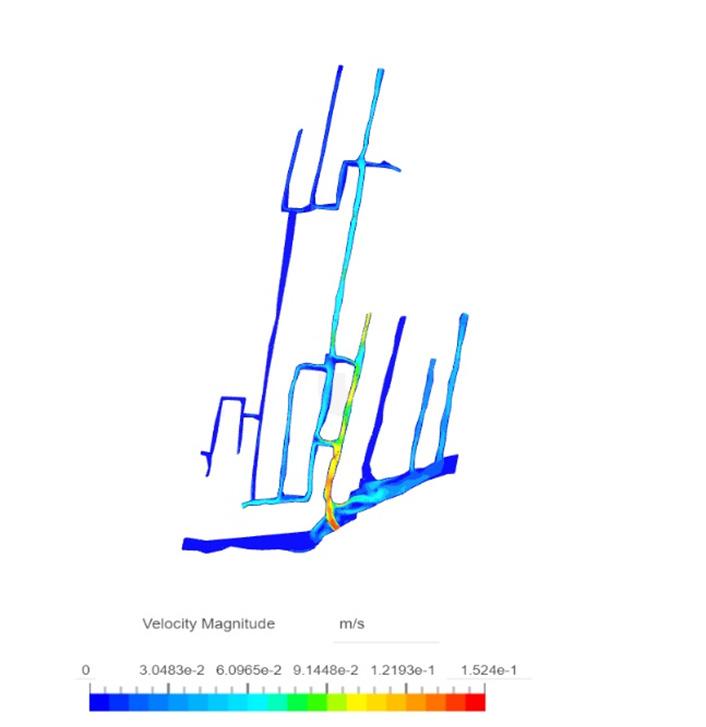
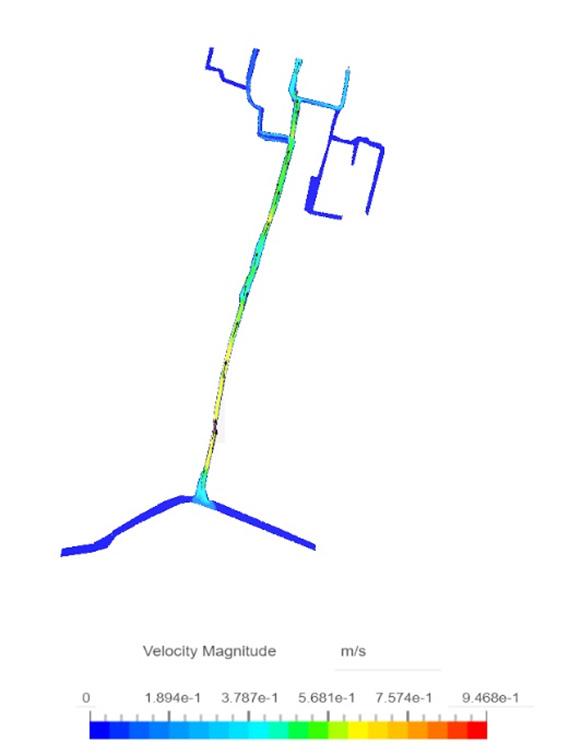
Xochimilco’s hydraulic system consists of a network of canals and pipelines that control its water flow. A significant part of the system allows for managing natural and artificial water inputs, such as rainfall runoff. During the rainy season, from June to September, the canal system receives enormous amounts of water runoff from surrounding mountains, raising water inputs to ensure the proper operation of the hydrological cycle. During the dry season, a sophisticated pipeline network introduces treated wastewater from October to May to promote diversified farming and maintain water levels. The purpose of this pipeline network is to prevent desiccation and guarantee constant hydration of the chinampas.
One of the parameters that affect this system is the velocity of the water, which modulates the transport of sediments and nutrients and contributes to the proper functioning of the entire aquatic ecosystem of this network. The speed of the water in the main canals varies, averaging between 0.1 and 0.3 meters per second across the canals of the network, and can vary by season and precise location. This velocity helps prevent stagnation, which could otherwise lead to eutrophication and a lowering of the water quality. The controlled water flow in the canals aids in a more efficient water distribution to every part of the Chinampa system.
With a hydraulic network of great precision, this adaptable system manages the water flow and velocity across a diverse ecological gradient. In reducing energy losses, this basic hydraulics of optimizing power has tremendous benefits for maintaining environmental and agrarian productivity across the system. It helps support the ecological water balance, provides better contention of pollution, and underscores access to the rich biodiversity that this UNESCO world heritage entails. With a higher volume of water (lower energy losses = higher productivity) flowing faster, the two functions – hydraulic management and traditional agriculture – are ensured. Merely focusing on the cultural preservation of Xochimilco would not have sufficed.
Figure 54. Map of water flow
Hydrology: Pollution, Extraction, and Invasive Species
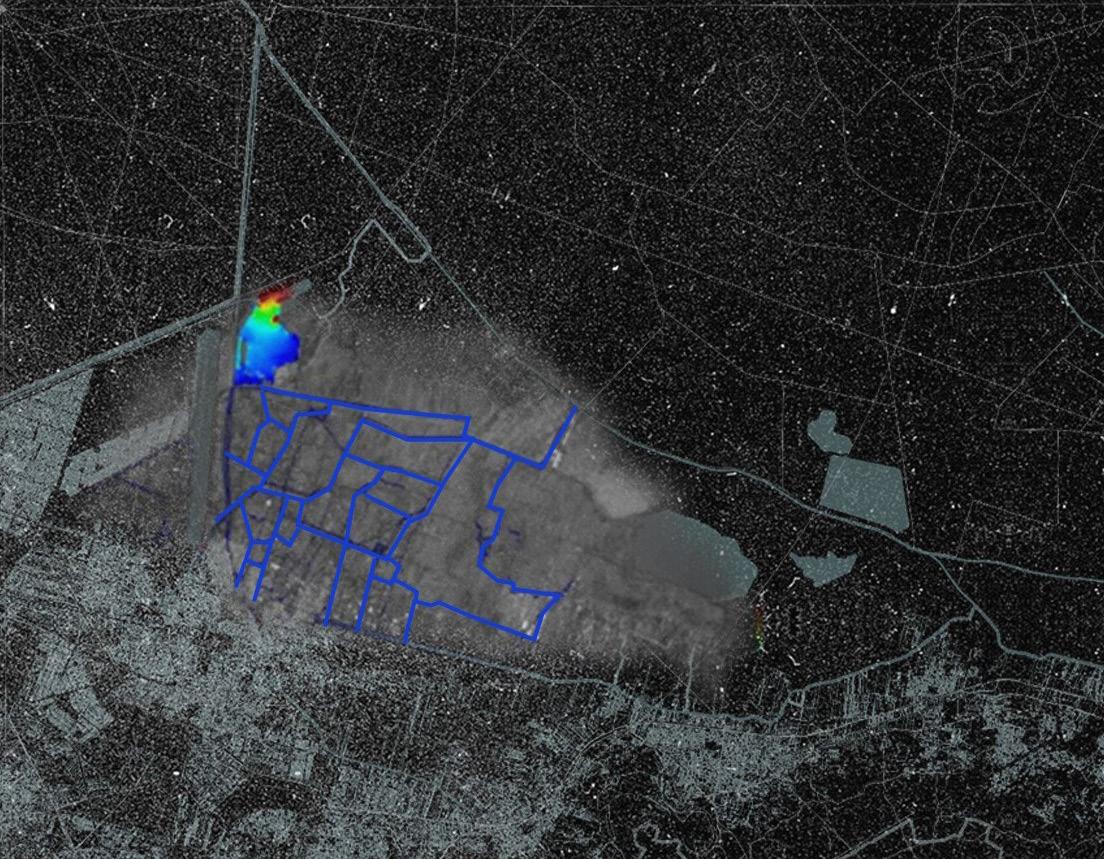
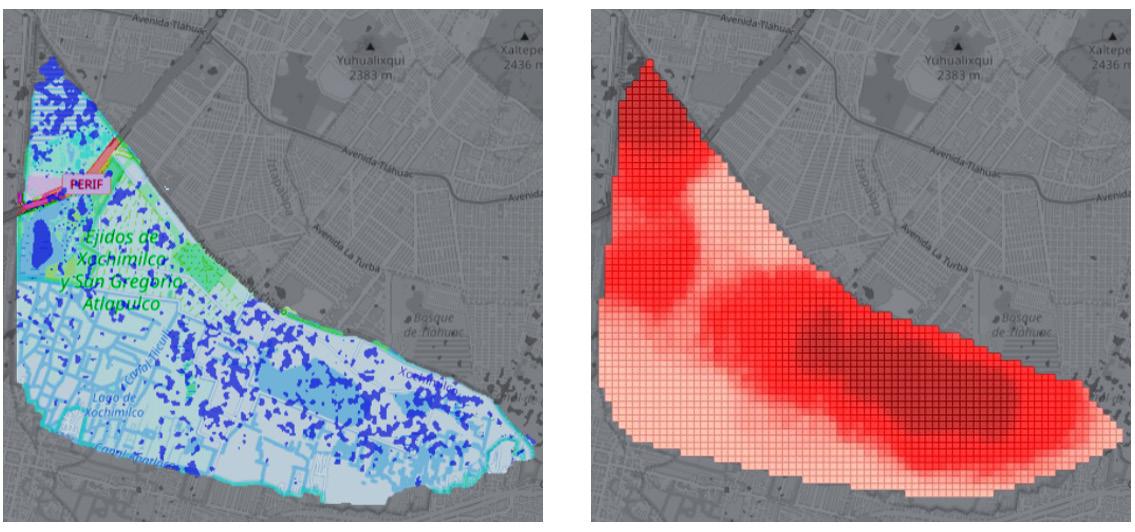
As previously stated, the rapid urban growth in Mexico City has had a substantial impact on Xochimilco, inflicting its land Use Change with the expansion of urban areas encroaching the agricultural land and natural habitats, reducing the area available for traditional chinampa agriculture and the increasing infrastructure development has led to habitat fragmentation and increased runoff, contributing to the pollution and siltation of the canals. This has resulted in the tampering of the ecological balance of Xochimilco due to various factors that risen with this rapid growth. The canals of Xochimilco are increasingly polluted with industrial and domestic waste. This pollution affects the water quality and the health of the aquatic ecosystem, including the famous chinampas. Invasive species such as the water hyacinth have invaded the canals, disrupting native flora and fauna and complicating water navigation and maintenance; researchers have pointed out that when the lily is nourished with contaminated water, the canals become atrophied, the lily takes root and damages the roots of the typical and main trees of the place, the main fixtures of the chinampas, the Ahuejote . On the other hand, fish such as tilapia reproduce and eat the eggs of the endemic fish of Xochimilco, the axolotl. With canals covered with lilies, the access route to the chinampas is lost, which are abandoned as agricultural production areas, are urbanized and create more sewage discharges. Also, the excessive extraction of water for urban and agricultural use has lowered the water table and reduced the flow of clean water into the canals, leading to stagnation and further pollution.
Chinampas are disappearing today, as a consequence of pollution and garbage that makes them useless for cultivation and, finally, they are sold to lay more cement for urban construction. Thus, the declaration of a World Heritage Site granted by UNESCO in 1987 has been put at risk yet the main contradiction is due to the lack of natural water and the supply of treated water, which, along the way, becomes contaminated by discharges of drainage from residential houses built irregularly on the banks of the canals. Based on information provided by the Ministry of Urban Development and Housing, Xochimilco is the district with the most illegal settlements in the Federal District, a part of them on the chinampas, where only agricultural use is allowed.
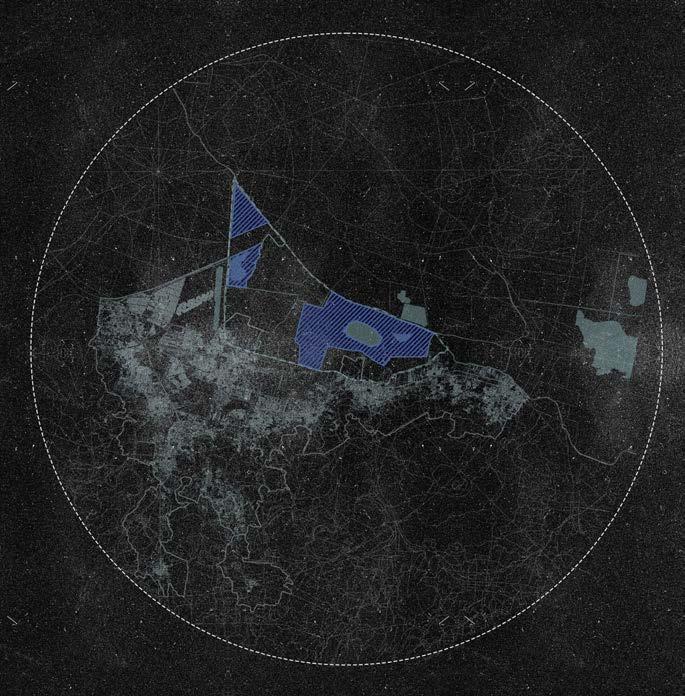
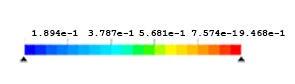
In the following map, it is seen the zoning of the areas not connected to the drainage network is presented in red, in orange the areas with drainage networks that discharge to the water bodies of the lake area, and in green the areas with drainage networks that send their waters to the drainage system of the Valley of Mexico.
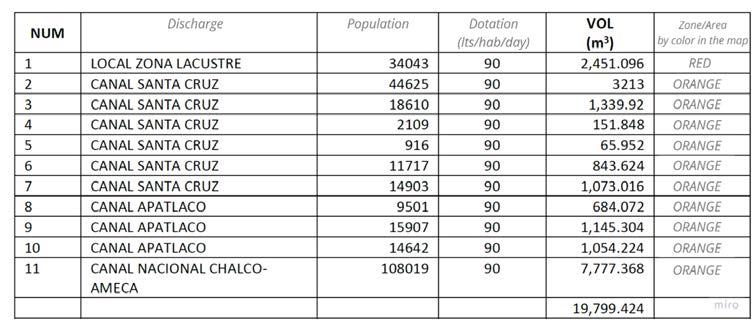
Figure 54. Zones that directly dump their sewage to the lake, in the table below it seen the color coding as well as the volumes of dumped sewage water.
Site Analysis Discussion
The site analysis of Xochimilco highlights how the effects of historical, environmental, socio-demographic, and urban issues can affect a town. Xochimilco is a town in the south of Mexico City that measures 125 sq km and has a well-known chinampa agricultural system. Urban expansion has caused problems such as water contamination, a decline in biodiversity, inefficient land use, and a high level of informal housing. The town’s population stands at 415,000. Chinampas are a form of farming that originated in Mexico and is responsible for one-third of the town’s production. Despite this, traditional chinampa farming practices are threatened by modern urban pressure. Travelers who visit the city can still witness the town’s rustic, surrounded by canals where locals sell handicrafts. To draw attention to the erosion of this unique but fragile social fabric, the city has been named a World Heritage Site.
This network of canals and pipelines assures water balance in an overall system but faces pollution, over-extraction of water, and seasonal water flow variations. Reusing wastewater during dry seasons increases complexity by introducing other quality issues. The research uses site survey analysis and computational fluid dynamics (CFD) simulations to identify urban problems like flooded areas, pollution, and evaporation. It proposes adaptive urban parts to successfully manage water resources while increasing Xochimilco’s ecosystem and cultural values. Overall, understanding the site’s current situation by mapping both active and inactive chinampas, canals, water inlets, and water flows offers clear insights into areas of intervention and recovery. These, complemented by a knowledge of seasonal changes in water management and the processes of flooding, absorption, and extraction, allow one to recognize and address problems of pollution and biological invasions. Maps help innovate strategies to improve water flow, preserve biodiversity, and protect against environmental deterioration.
It allows for a precise assessment of opportunities, threats, and challenges, enabling the proposal to tackle them in detail, from how to put abandoned chinampas back into use to improving the flow of water channels to avoid pollution and identifying where natural water sources must be taken advantage of, where the flooding of land is likely, where evaporation losses could be minimized – and how natural water harvesting and storage associated to water retention could be implemented.
Figure 1. Selected case studies, located on the world map.
Figure 2. Kenzo Tange’s plan for Tokyo, 1960.
Figure 3, 4 & 5. Section of Tange’s proposal were flexibility of the aqua-fabric is seen
Figure 6. Ijburg’s expansion plan, 1997
Figure 8. Venice’s Urban fabric division.
Figure 9. In the section bellow it is appreciated the intricate well system and foundations used in Venice
Figure 10. Makoko Floating Settlement
Figure 11. Makoko’s pile system
Figure 12. Urus Floating Settlement
Figure 13,14,15. Urus’ dynamic aqua-fabric is explored in these sections, showing how the islands may be moved around as needed.
Figure 16. Map of Xochimilco, Mexico City
Figure 17. Structural section of Xochimilco’s settlement.
Figure 19, 20. Plan view and schematic section of Xochimilco’s chinampa aqua-fabric
Figure 21. Diagram of case studies’ relations
Figure 22,23,24,25.
Schematic analysis diagrams of case studies
Figure 26,27. Schematic analysis diagrams of case studies
Figure 28. Flowchart of establishing the evaluation criteria.
Figure 29. Flowchart of establishing the evaluation Parameters and factors.
Figure 30.Flowchart of establishing the evaluation Parameters and factors.
Figure 31. Schematic graph of evaluating the urban network parameter.
Figure 32. Schematic graph of evaluating the urban growth parameter.
Figure 33.Flowchart of establishing the evaluation Parameters and factors.
2016-peg - plan desarrollo sustentable xochimilco.pdf. Accessed July 22, 2024. https://centrogeo. repositorioinstitucional.mx/jspui/bitstream/1012/313/1/2016-PEG%20-%20Plan%20Desarrollo%20 Sustentable%20Xochimilco.pdf.
Agua. Distrito Federal. Accessed July 22, 2024. https://cuentame.inegi.org.mx/monografias/informacion/df/territorio/agua.aspx?tema=me&e=09.
Alvarado, Rocío González. “Canales de Xochimilco, Con Agua Contaminada Y Pestilente.” La Jornada, January 11, 2024. https://www.jornada.com.mx/noticia/2024/01/11/capital/canales-de-xochimilco-con-agua-contaminada-y-pestilente-6155.
Análisis del Estado de Conservación Ecológica del Sistema ... Accessed July 22, 2024. https://www.azp. cdmx.gob.mx/storage/app/uploads/public/58b/6f8/f0e/58b6f8f0e0810036820882.pdf.
“Contaminados, Los Sistemas Acuticos de Xochimilco.” Boletines. Accessed July 22, 2024. https://www. dgcs.unam.mx/boletin/bdboletin/2002/2002_1026.html.
Coolhuntermx. “Sobre La Importancia Del Agua y La Labor de Chinampas En Xochimilco, Ciudad de México.” ArchDaily México, July 20, 2021. https://www.archdaily.mx/mx/965408/sobre-la-importancia-del-agua-y-la-labor-de-chinampas-en-xochimilco-ciudad-de-mexico.
Crisis ambiental en xochimilco, Espacio Emblemático de ... Accessed July 22, 2024. https://www.insp. mx/images/stories/Noticias/Salud_Poblacional/Docs/111103_nsp1.pdf.
Delegacionxochi. “La Problemática Del Abastecimiento Del Agua En Xochimilco.” xochimilco, February 3, 2016. https://delegacionxochi.wixsite.com/xochimilco/single-post/2016/02/02/la-problem%C3%A1tica-del-abastecimiento-del-agua-en-xochimilco.
Delegacionxochi. “La Problemática Del Abastecimiento Del Agua En Xochimilco.” xochimilco, February 3, 2016. https://delegacionxochi.wixsite.com/xochimilco/single-post/2016/02/02/la-problem%C3%A1tica-del-abastecimiento-del-agua-en-xochimilco.
Diagnóstico Urbano Ambiental Para determinar El Grado de ... Accessed July 22, 2024. http://centro. paot.org.mx/documentos/paot/estudios/XOCHIMILCO.pdf.
Diagnóstico Urbano Ambiental Para determinar El Grado de ... Accessed July 22, 2024. http://centro. paot.org.mx/documentos/paot/estudios/XOCHIMILCO.pdf.
Dirección General de Repositorios Universitarios, Universidad Nacional Autónoma de México. “Repositorio Institucional de La UNAM.” Ir al inicio. Accessed July 22, 2024. https://repositorio.unam.mx/.
Estudio para la elaboracion de un sig participativo. Accessed July 22, 2024. https://paot.org.mx/contenidos/paot_docs/pdf/Informe_Final_Xochimilco.pdf.
Estudio para la elaboracion de un sig participativo. Accessed July 22, 2024. https://paot.org.mx/contenidos/paot_docs/pdf/Informe_Final_Xochimilco.pdf.
INEGI. Accessed July 22, 2024. https://www.inegi.org.mx/contenidos/productos/prod_serv/contenidos/espanol/bvinegi/productos/nueva_estruc/702825191160.pdf.
INEGI. Accessed July 22, 2024. https://www.inegi.org.mx/contenidos/productos/prod_serv/contenidos/espanol/bvinegi/productos/nueva_estruc/702825191160.pdf.
CHAPTER II
Chapter Overview
This design research consists of three main phases after conducting the initial site-specific exploration of problems to find their respective solutions; firstly, contextual analysis and employing general civic theorems of space syntax, second phase would be the urban system design in the global and regional scale, and the third phase would focus on design in the local scale accompanied by prototyping and its relevant studies. These procedures would be the result of thorough research and understanding of various case studies that were discussed in the previous chapters, which led to a collective knowledge of the problematic features and challenges of similar biomes. Therefore, the three main phases of this design research would solely focus on the chosen context by accumulating a comprehensive knowledge about the environmental and socio-economic situation of the region of Xochimilco in Mexico City.
Also, in order to solve the problematic challenges along the process, various state-of-the-art tools would be employed to address each issue. The acquired tools and techniques that would be discussed further along the next chapters, would be arranged, tested, and analyzed practically according to their relative criteria and conditions.
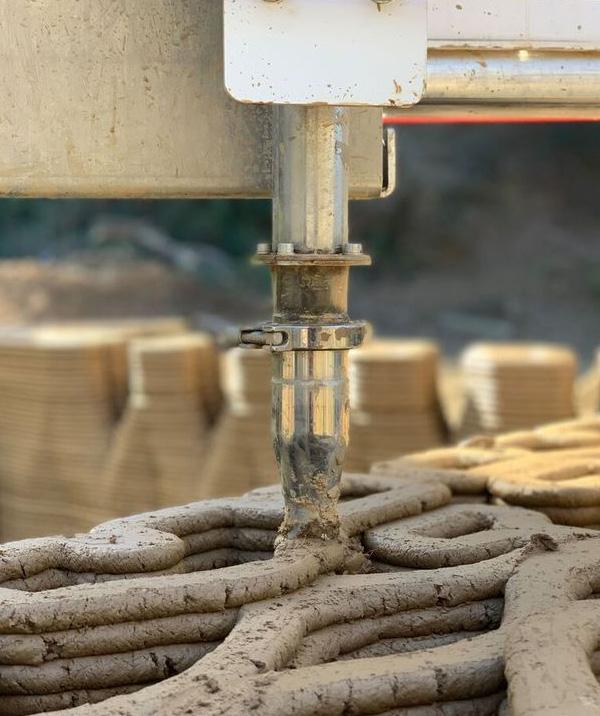
Figure 1. Clay printing with robots
Parametric Environmental Analysis
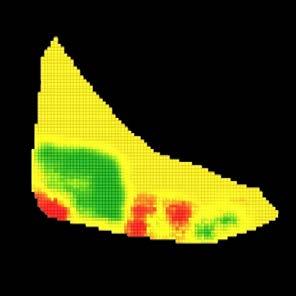
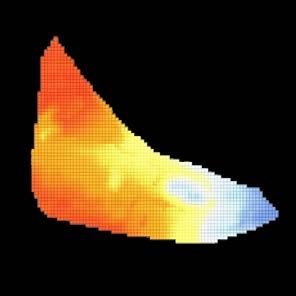
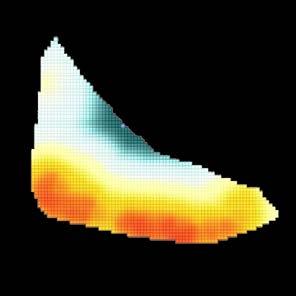
Starting from the first phase, the existing conditions of the selected site must be studied. Therefore, the first step would be to collect all the environmental and socio-economic data about the location from sources such as the government, NASA and Google imagery services, and local independent organizations. These data would help the research team perform a thorough investigation on the existing challenges, their specific time, and their geographic location. To synthesize the collected data, all the values would be projected and placed on their respective places on the site’s map. Then, this overlayed dataset would be visualized according to the values of each location within the pre-defined boundaries of the site.
The next step would be to pixelate the site boundary into smaller square shapes of a particular dimension. Afterward, all these pixels would have a column of values represented by a single, remapped number between 0 and 1. Based on each of the defined problems that the team has decided to focus on, a range of values derived from various references would be used for the synthetic process of site selection within the boundaries of the selected region of Xochimilco. This process would result in specific pixels that each would be dealing with one particular problem, or a few of them, and would need a data-driven design pipeline as the solution. So, the other process in this phase would be to understand and analyze the existing design topologies of the context. Thus, research clusters would be formed to review and assess the urban fabrics, morphologies, and local techniques that already exist or used to exist within the ecosystem and its similar biomes. Notably, all the processes in this first phase, from overlaying the data to evaluating the site by synthetic pixelation, will be done digitally through workflows in Grasshopper.
Figure 2. Referenced research on urban data mapping and synthesis.
Space Syntax
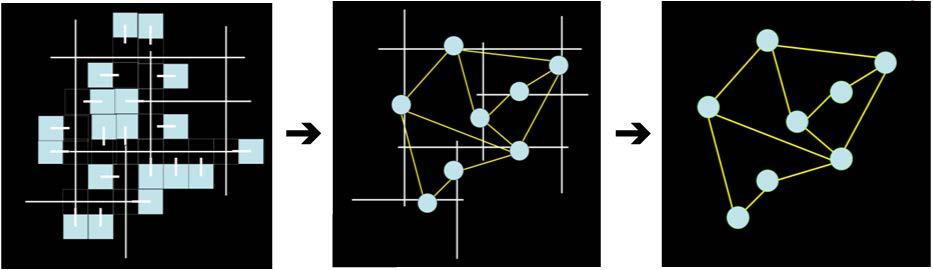
As the focus has been set on refining the protected region of Xochimilco through data-driven analysis and design, the status quo of the space syntax within the site boundaries will also be explored in this phase. Therefore, after analyzing the site and synthesizing the exact geographic locations to implement the design solutions, a thorough network analysis would have to be done to find the problematic zones of the site. In this experiment, the network of water canals for the canoes and the pedestrian network on the land will be analyzed in Grasshopper and through Computational.
Fluid Dynamics (CFD) analysis. After evaluating the network of water canals through parameters such as closeness and betweenness along the critical locations of the selected boundaries, a proper plan to refine the existing network would be proposed in the following phase. The plan would focus on spreading the predicted traffic of canoes along the selected site by a new set of canals according to defined objectives, while maintaining the existing patterns as much as possible to reach an optimum state of functionality.
After selecting the boundaries within the overall site and conducting research on the space syntax of the site, the design process would begin. To find the best design solutions for each problematic challenge within the selected boundaries, the second and third phases of the design research would proceed in a hybrid manner. These two parallel research agendas complement each other and create a horizontal means-and-ends research pipeline. One pipeline would focus on the urban system and topological design in the global and regional scale, and the other one on morphological design, material exploration, and advanced fabrication in the local scale.
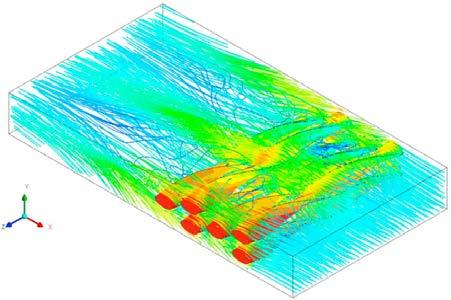
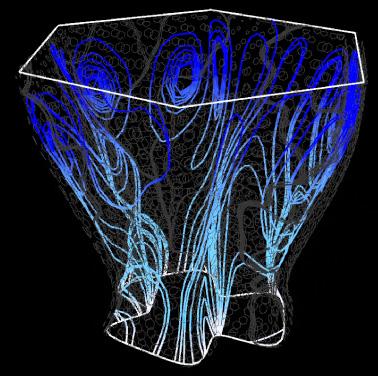
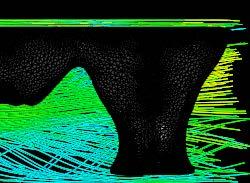
Figure 3. Referenced experiment on water flow and velocity with Sim Scale software.
Figure 4. Referenced research on space syntax and network (link) generation.
Generative Form Finding
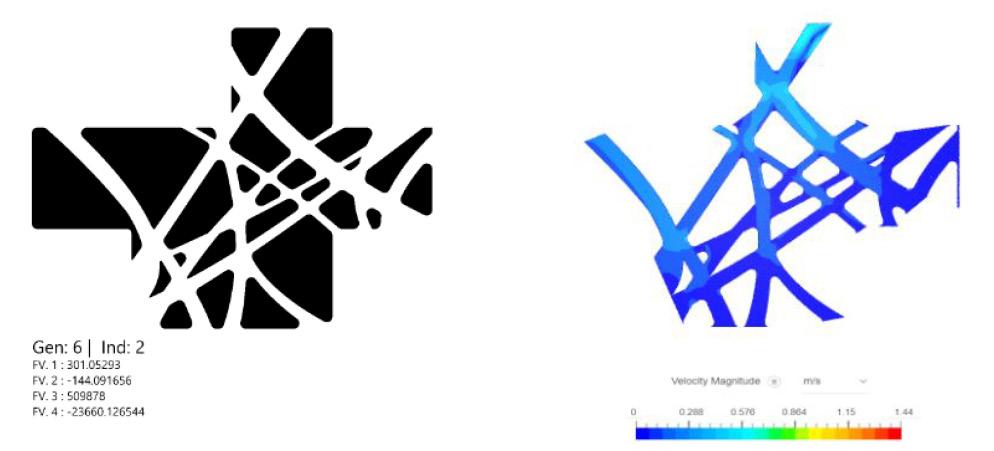
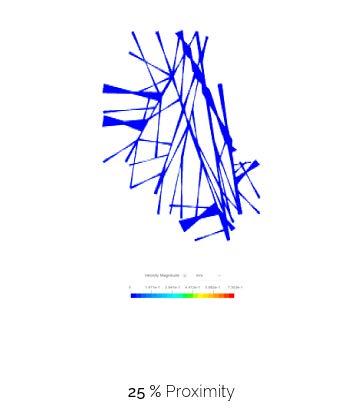
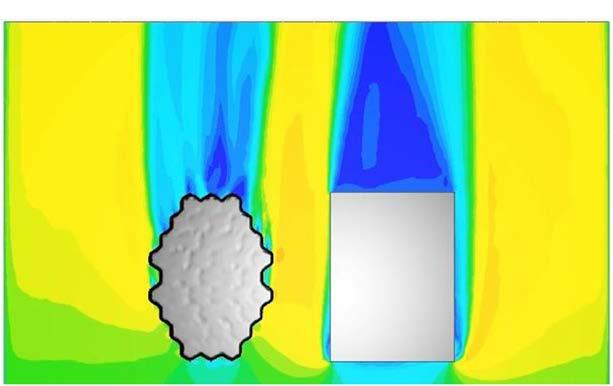
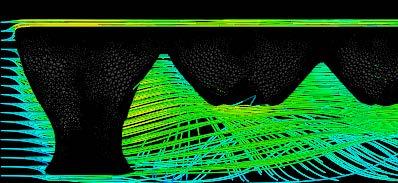
The second phase starts by understanding the spatial requirements for the pre-defined challenges in the selected problematic zones. This process consists mainly of studies on water flow and network. While the water purification studies would be done in the third phase through physical experiments, water flow and behavior would be the main driving force of network generation in the second phase. Thus, a thorough analysis of the water inlets and outlets throughout the region using Computational Fluid Dynamics (CFD) simulation would be crucial to understand how water behaves in the existing canals. This simulation not only depicts the behavior of the water but also provides the values of velocity and pressure to be mapped further along the site.
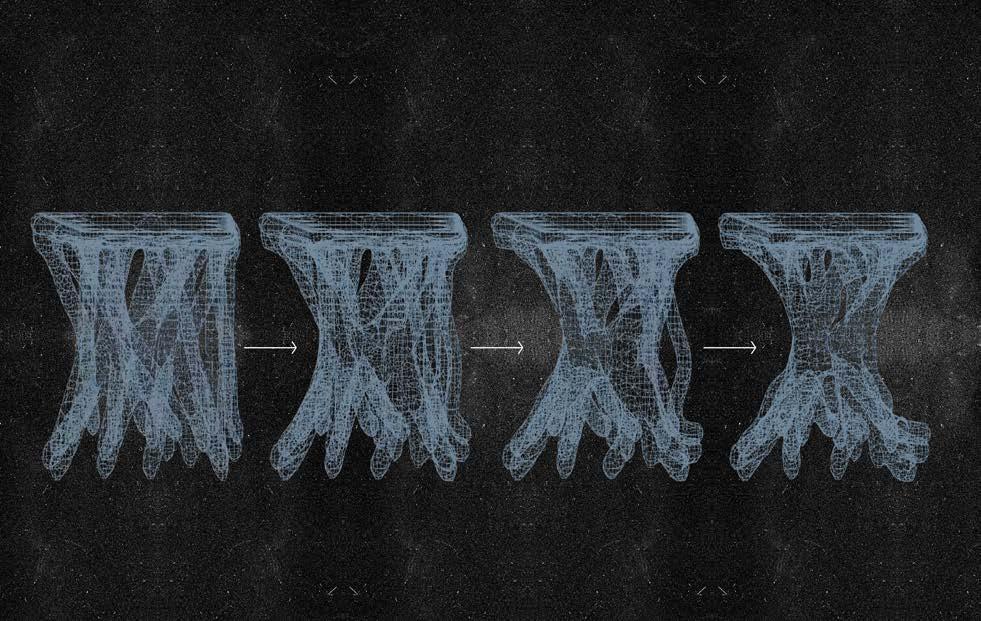
The fore-mentioned analytical procedures would be the driving data to create evolutionary pipelines for the design. These pipelines that are made in the digital workflow using Grasshopper, would be generating various options for different scales of the design. This process starts from generating the canal network of the selected site boundary, and then, the morphology in the local scale. The goal of the second phase would be to find the best design solutions to generate and a refined network of water canals that would lead to the creation of a new urban fabric within the selected boundaries of the site. Thus, understanding how the design of the morphology would perform and impact the regional scale would be crucial, including the material and structural feasibility studies.
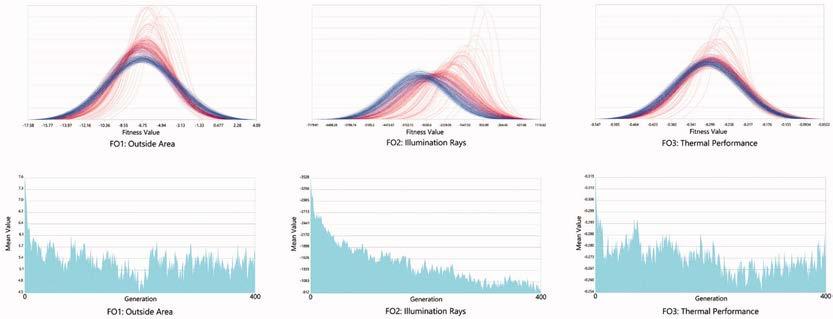
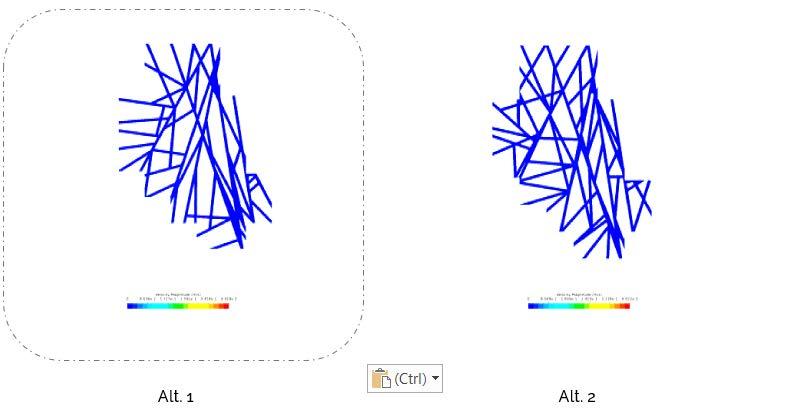
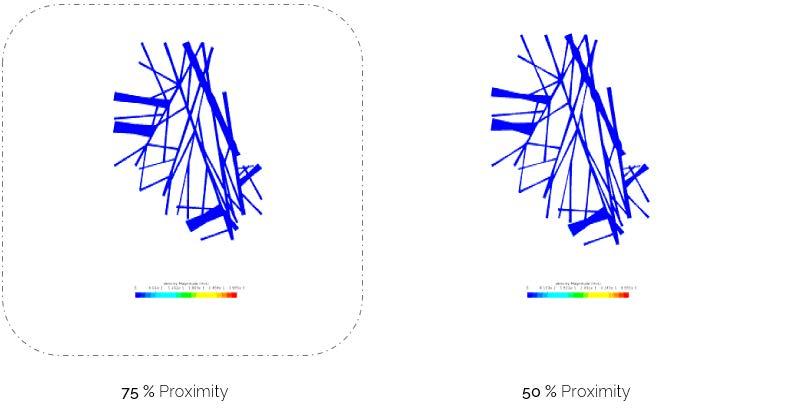
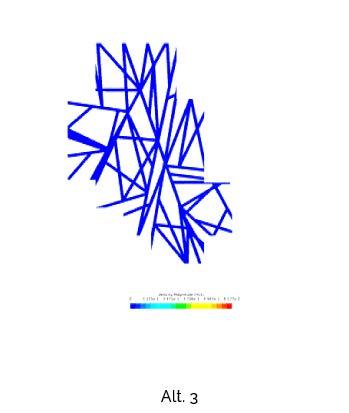
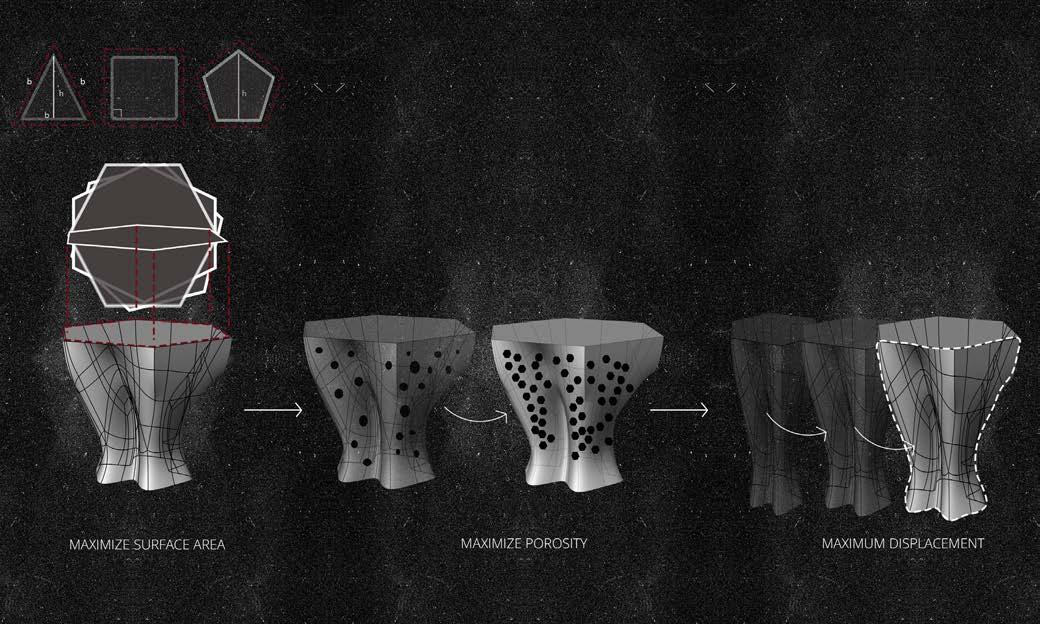
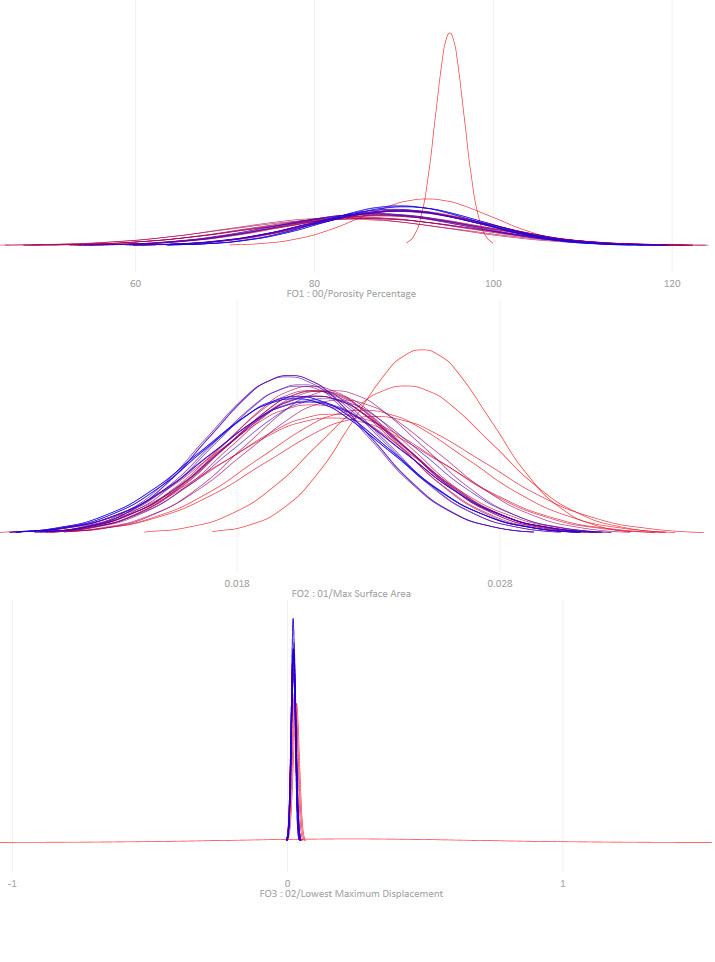
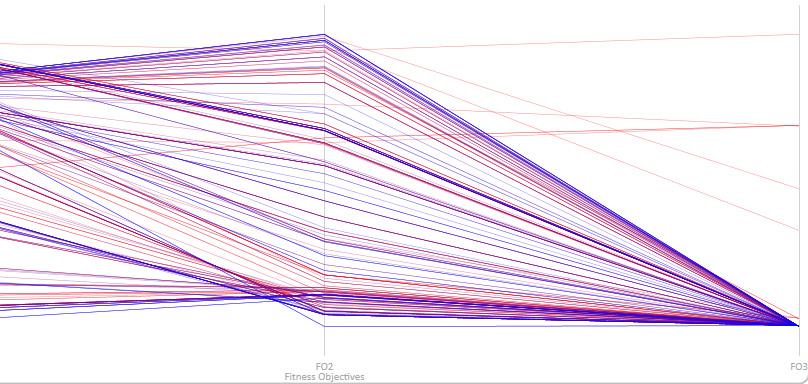
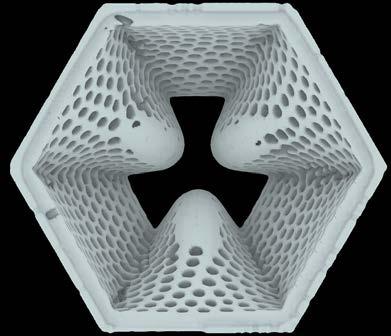
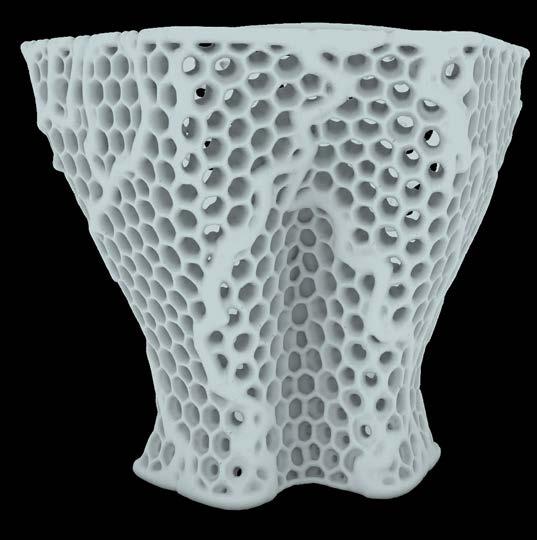
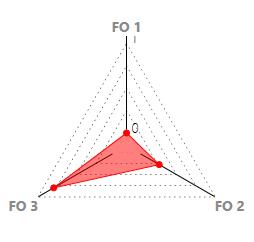
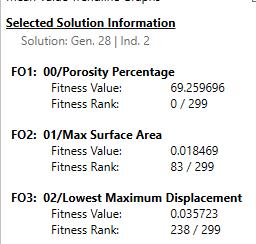
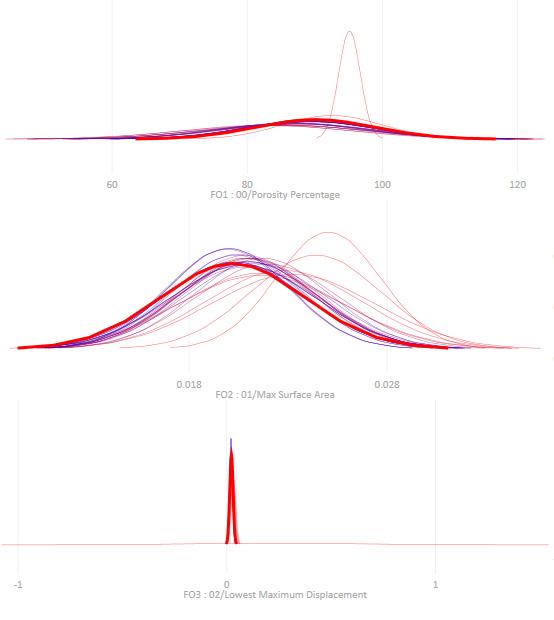
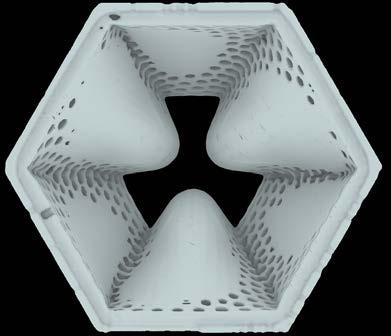
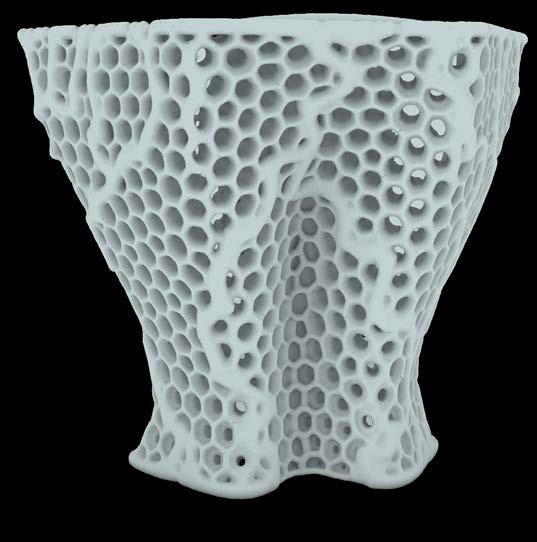
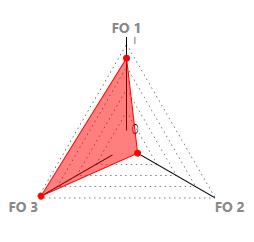
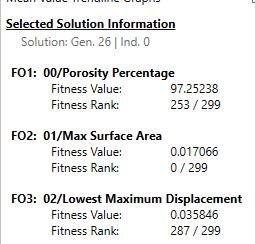
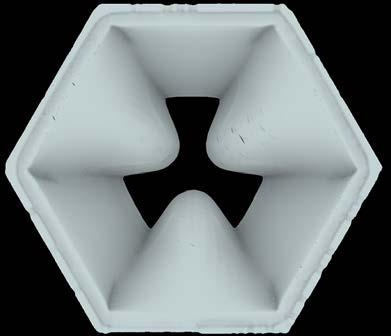
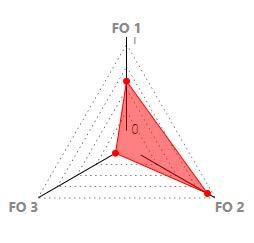
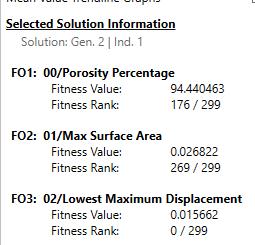
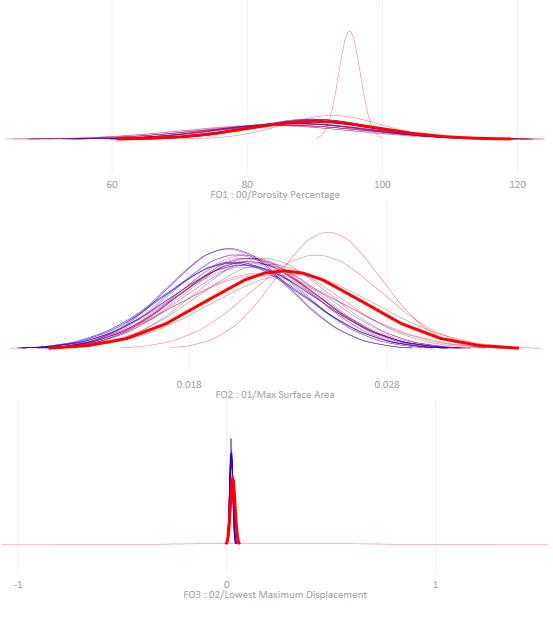
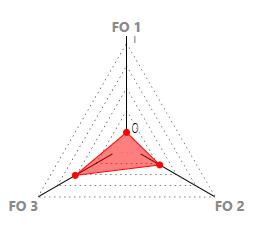
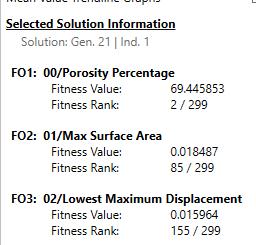
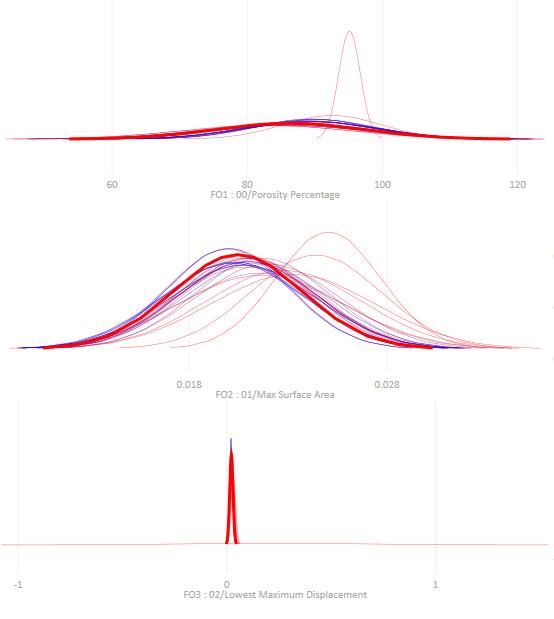
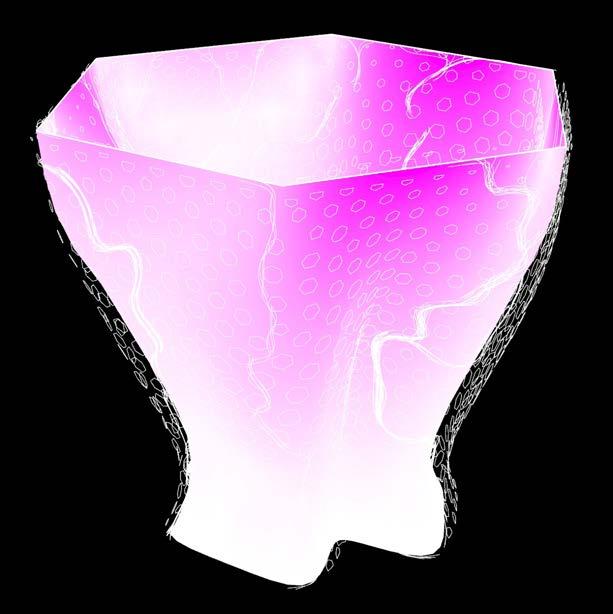
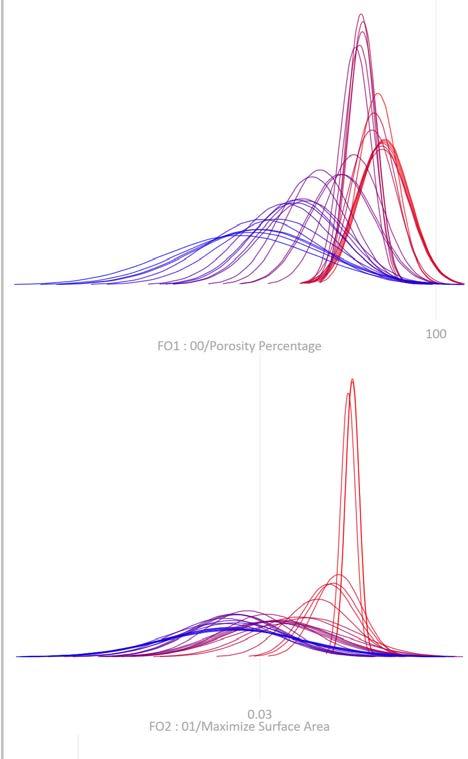
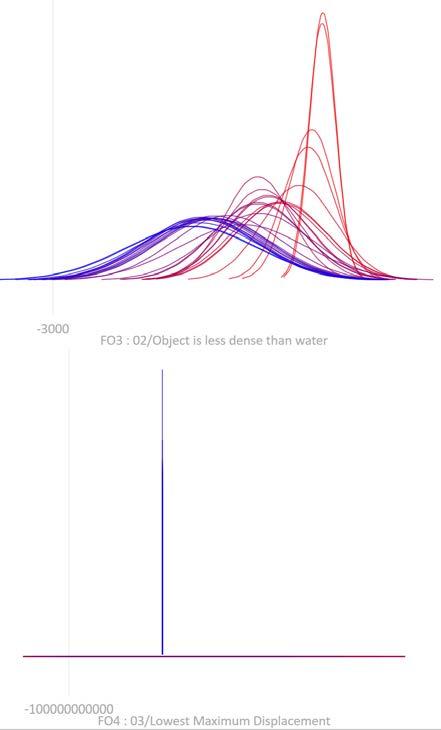
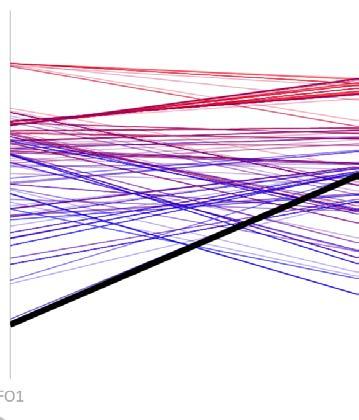
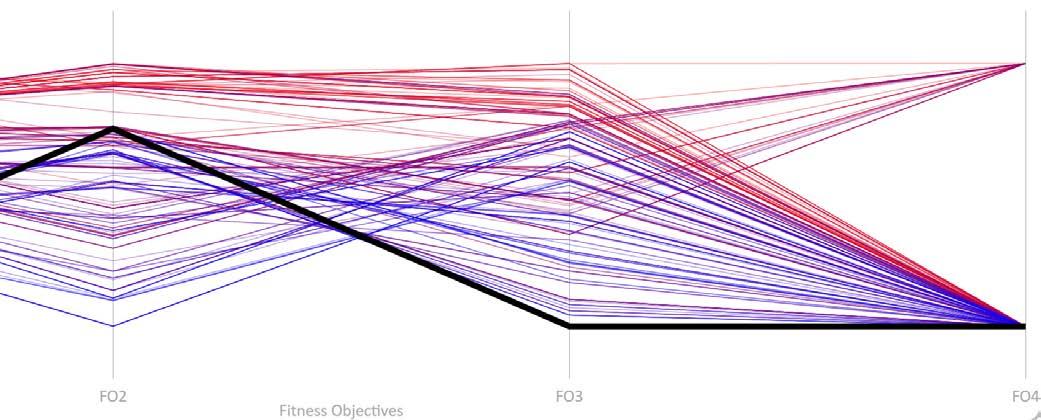
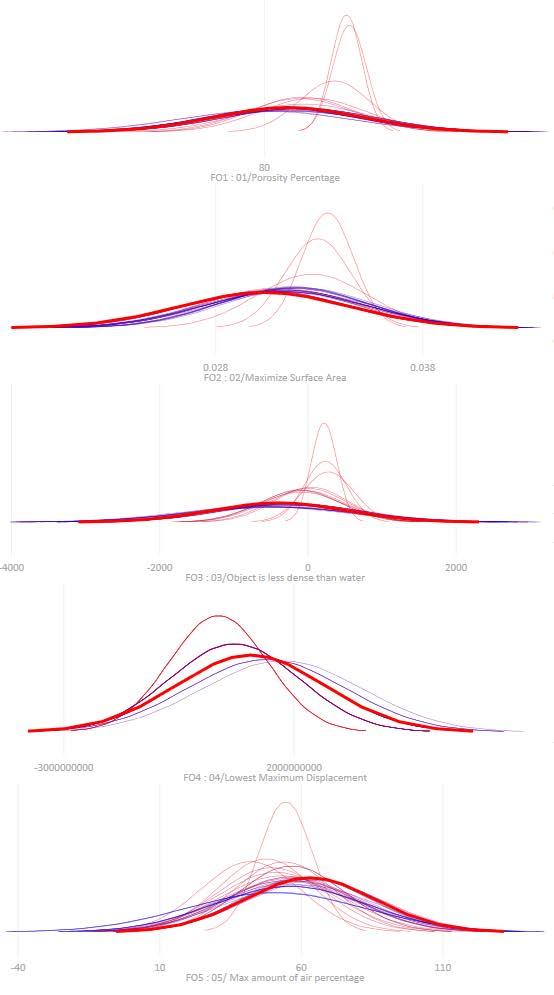
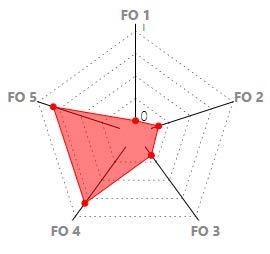
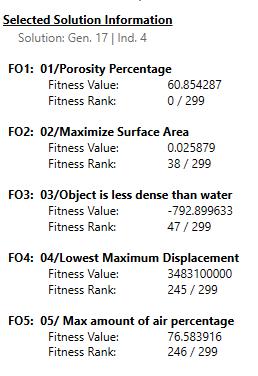
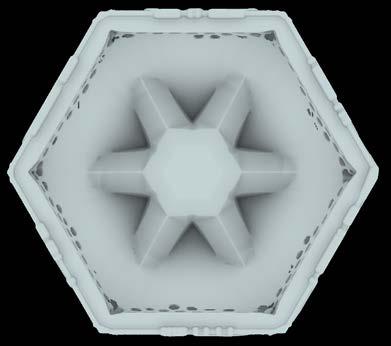
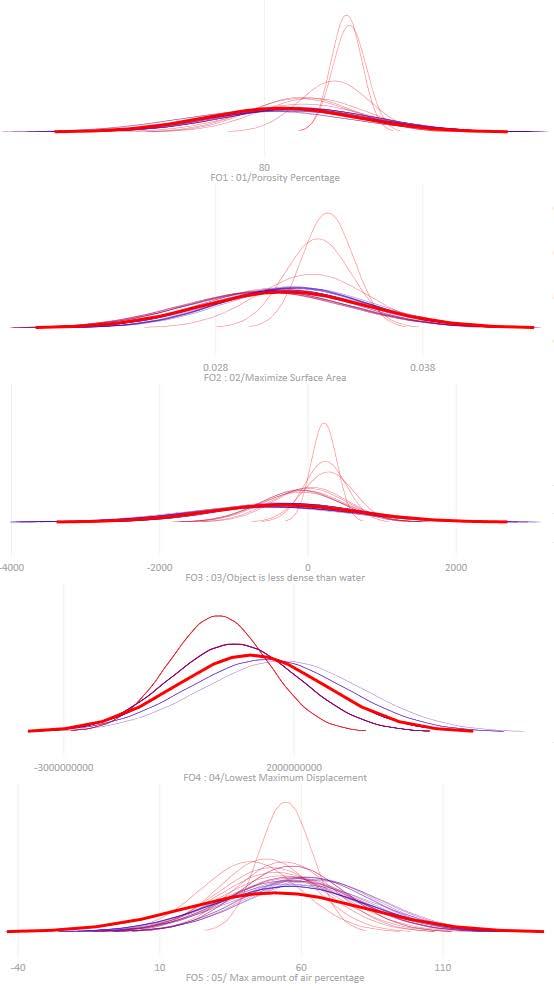
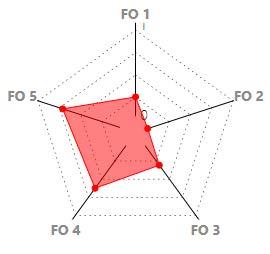
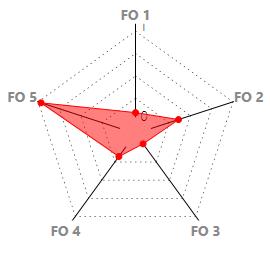
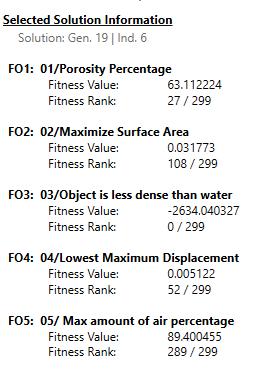
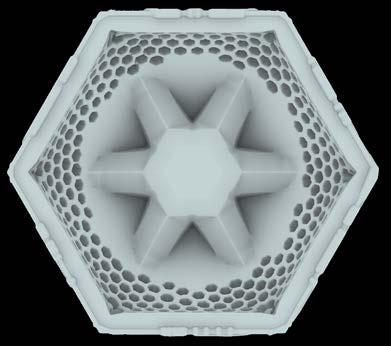
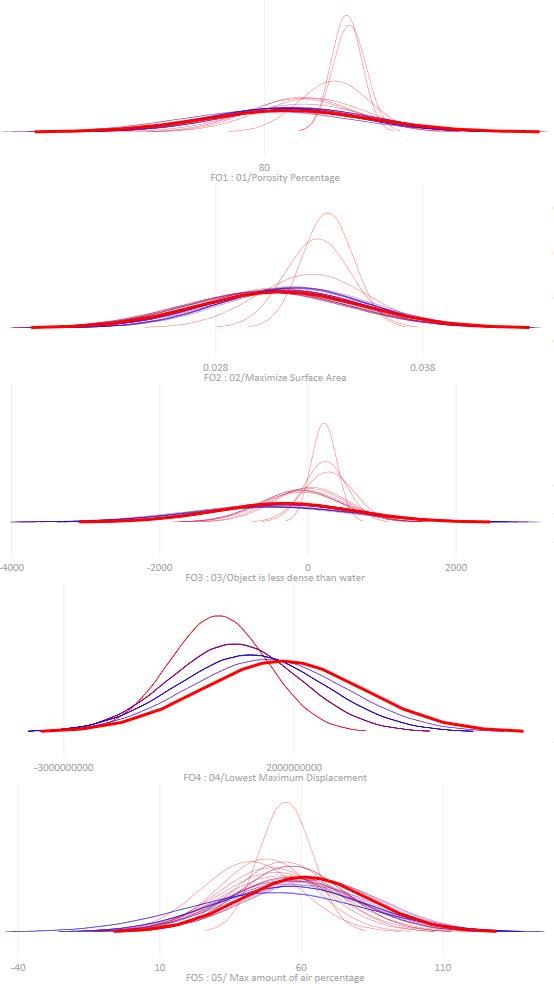
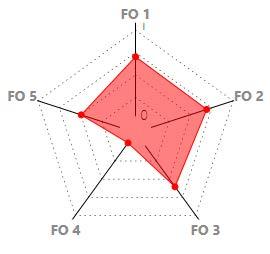
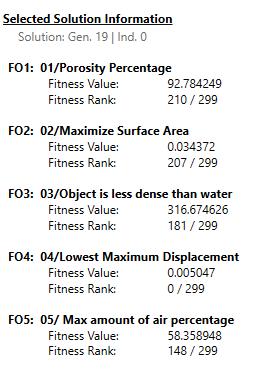
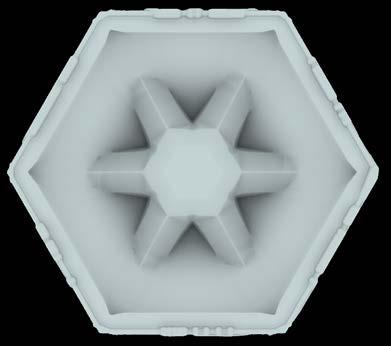
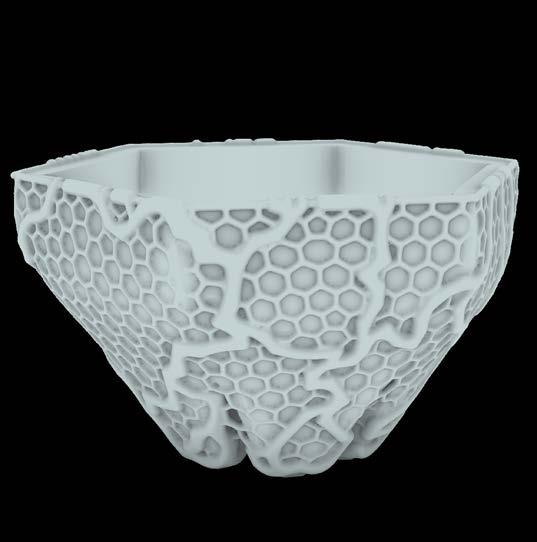
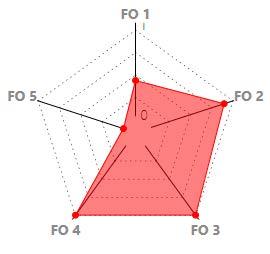
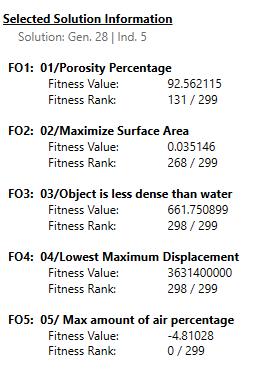
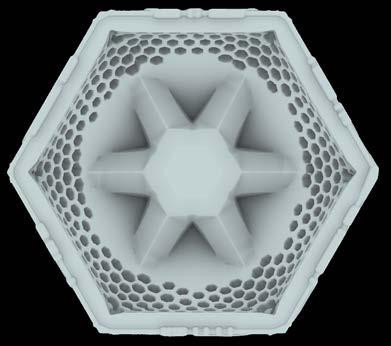
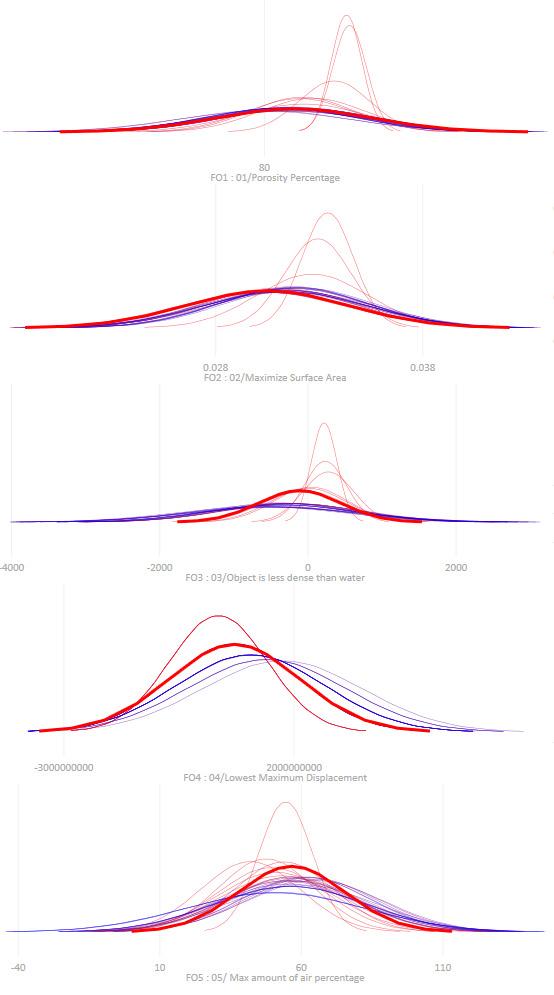
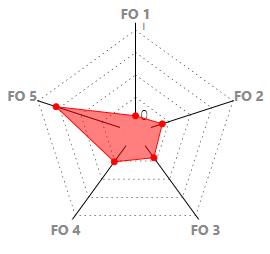
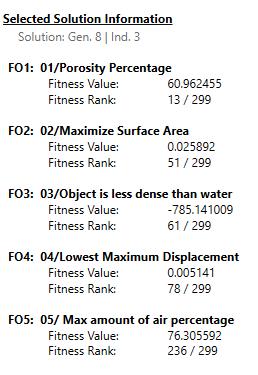
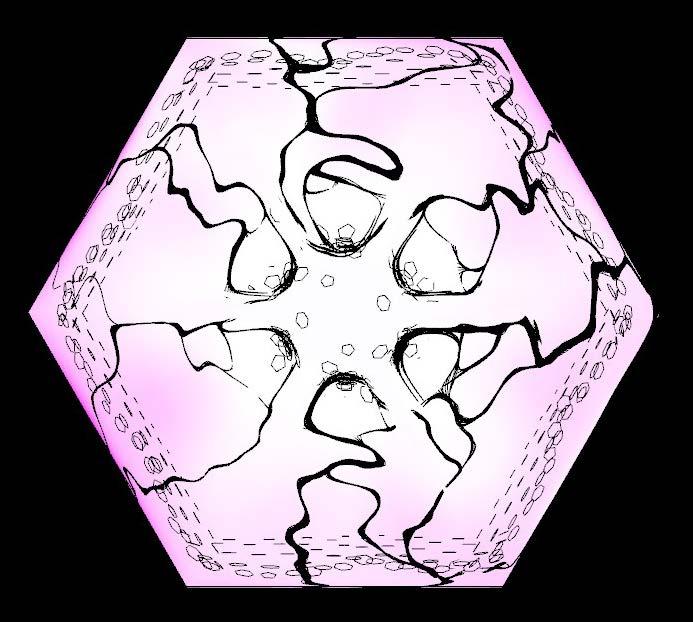
In the third phase, the morphology in the local scale would be generated and evaluated based on a given set of criteria. The criteria set would include structural performance, material consumption, and feasibility of fabrication. Another important form-defining factor is buoyancy. The term is calculated through a formula and clears whether an object can float on a fluid with its specific characteristics. As both water velocity and buoyancy values are numerical, they would be used in the digital workflow of the form finding. The environmental conditions would feed this workflow, and the final design solution would be achieved through the evolutionary algorithms of Wallacei1 by setting up the objectives derived from water studies.
1Grasshopper plugin of design and optimization based on evolutionary algorithms, developed by Dr Mohammed Makki, Dr Milad Showkatbakhsh and Yutao Song
Figure 5.Referenced research on evolutionary graphs of a design prototype with Wallacei.
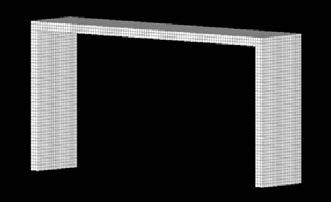
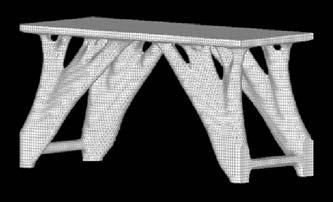
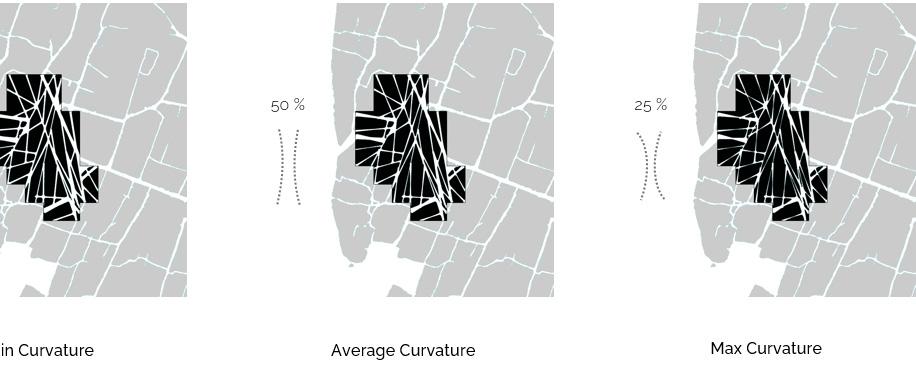
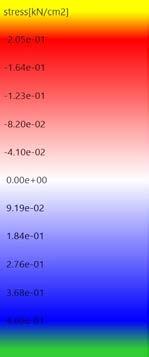
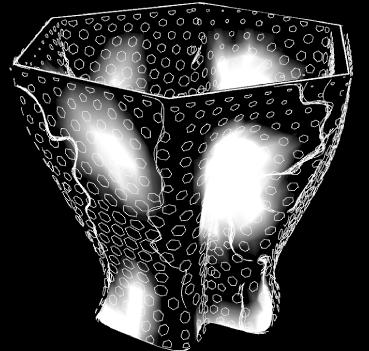
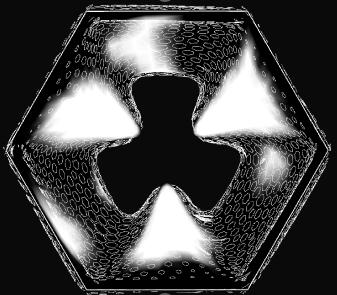
Structural Analysis/ Optimization
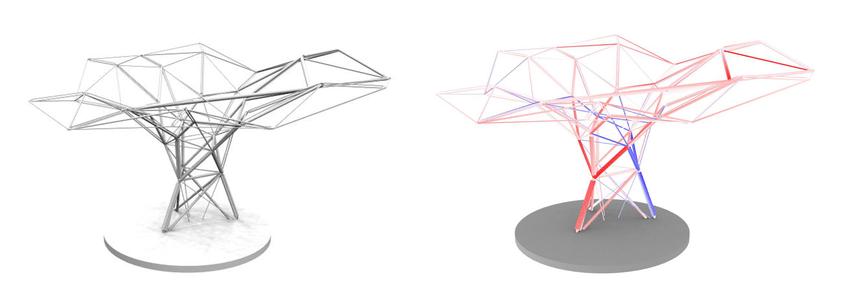
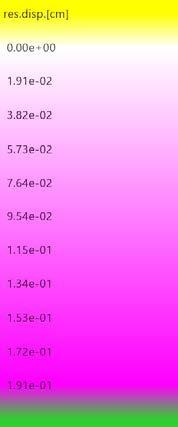
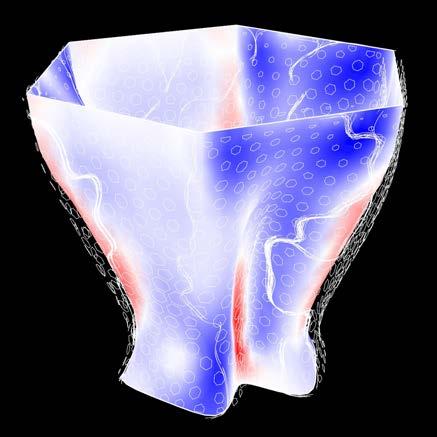
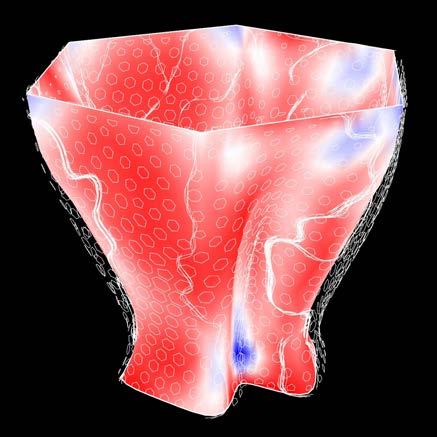
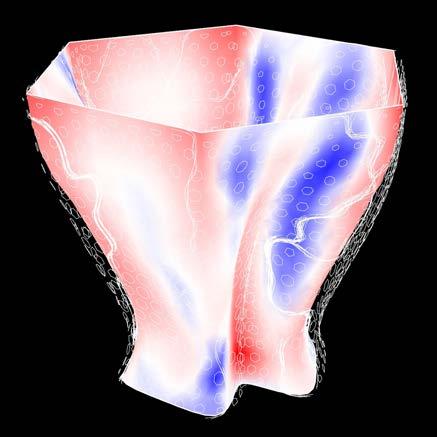
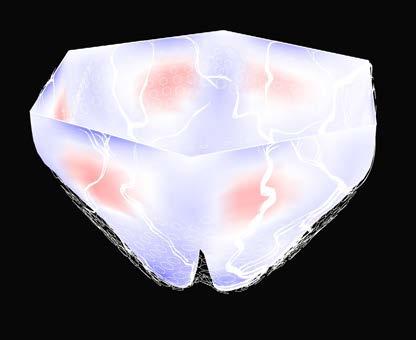
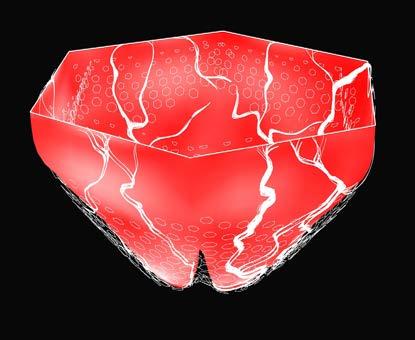
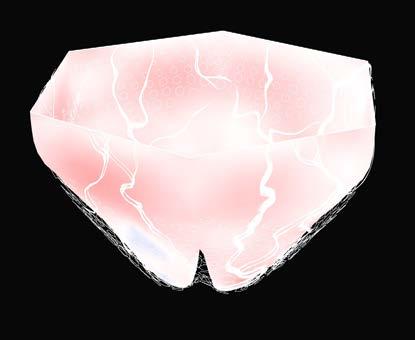
Opposite to the first phase, the second and third phases would not be concluded as they would be influencing each other in parallel, yet connected workflows. Therefore, the workflows of second and third phases would remain open until the very last moment of decision-making for the design solution. Considering the first phases of the research, this phase would focus on the structural feasibility of the design morphologies. To generate ecologic sub-systems and products that enhance the environmental conditions of the biome, these products would require deeply exploration and evaluation in terms of structural and material systems As a result, a structural analysis pipeline would be created and integrated within the generative design pipelines. The suggested tool for this stage is a developed structural analysis for Grasshopper called Karamba which has various measurements such as displacement against external forces of gravity and water flow. Each of the evaluated parameters can be defined as objectives for the final design outputs.
While these plants are being experimented on, a thorough understanding of the available local material -such as the soil- and their features would also be explored. These material studies, plus the realization of the structural functionality of the existing Chinampa system, would fuel the digital workflows of the second phase of the design.
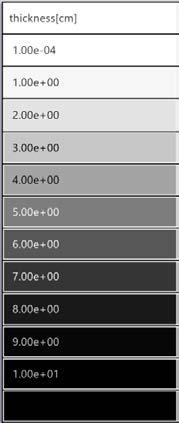
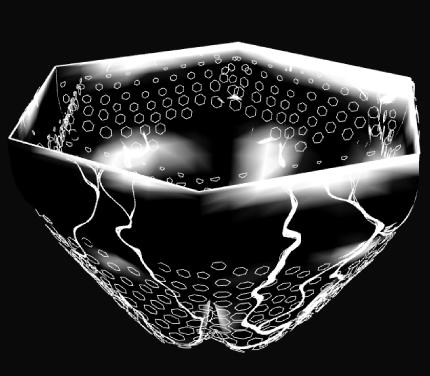
Also, in terms of the material consumption and structural optimization, the structures of the generated morphologies would be tested and refined using BESO. This algorithm helps identify the unnecessary elements of a structure and optimizes it by reducing the amount of material. This process could be integrated within an already existing evolutionary pipeline or be performed after running the generative design process.
Figure 6. Referenced research on structural analysis using Karamba in Grasshopper.
Figure 7. Referenced research on structural optimization of a morphology using BESO.
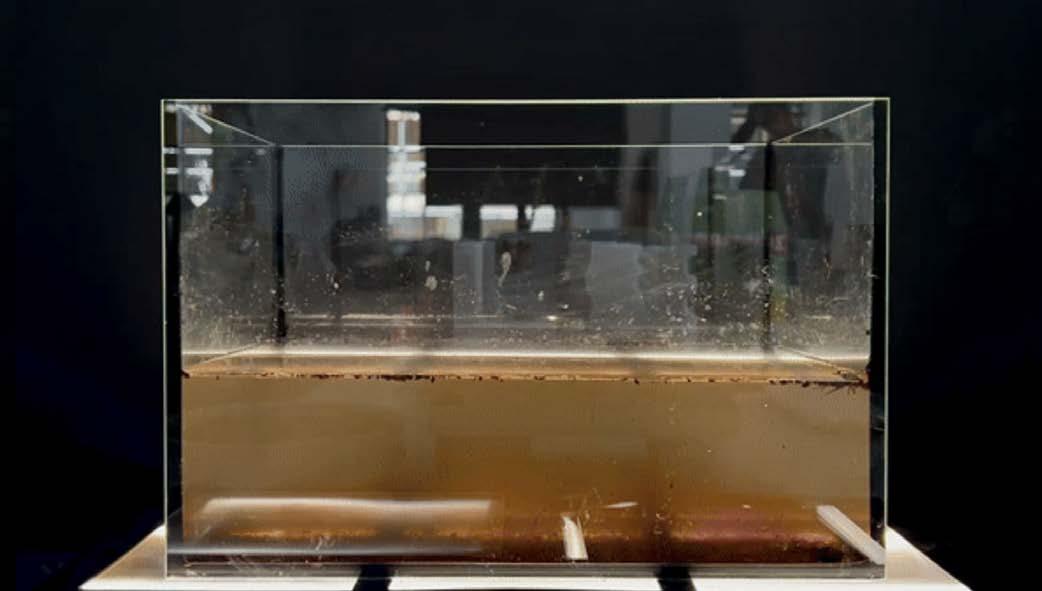
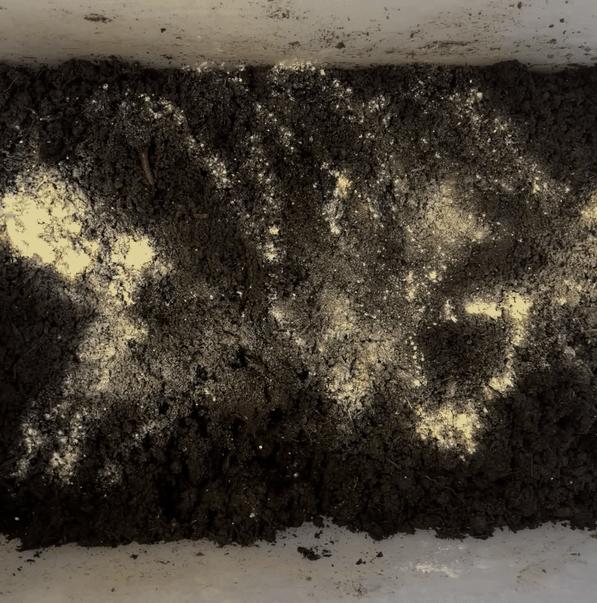
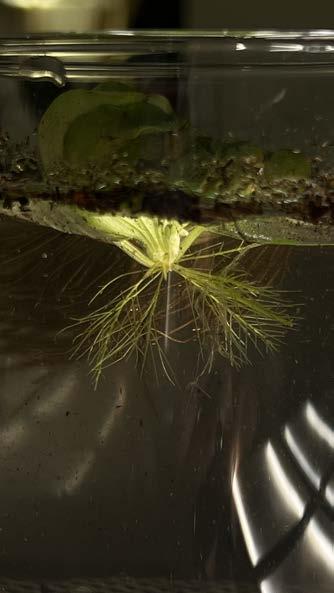
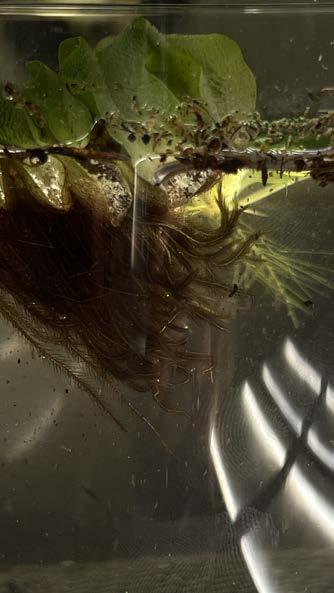
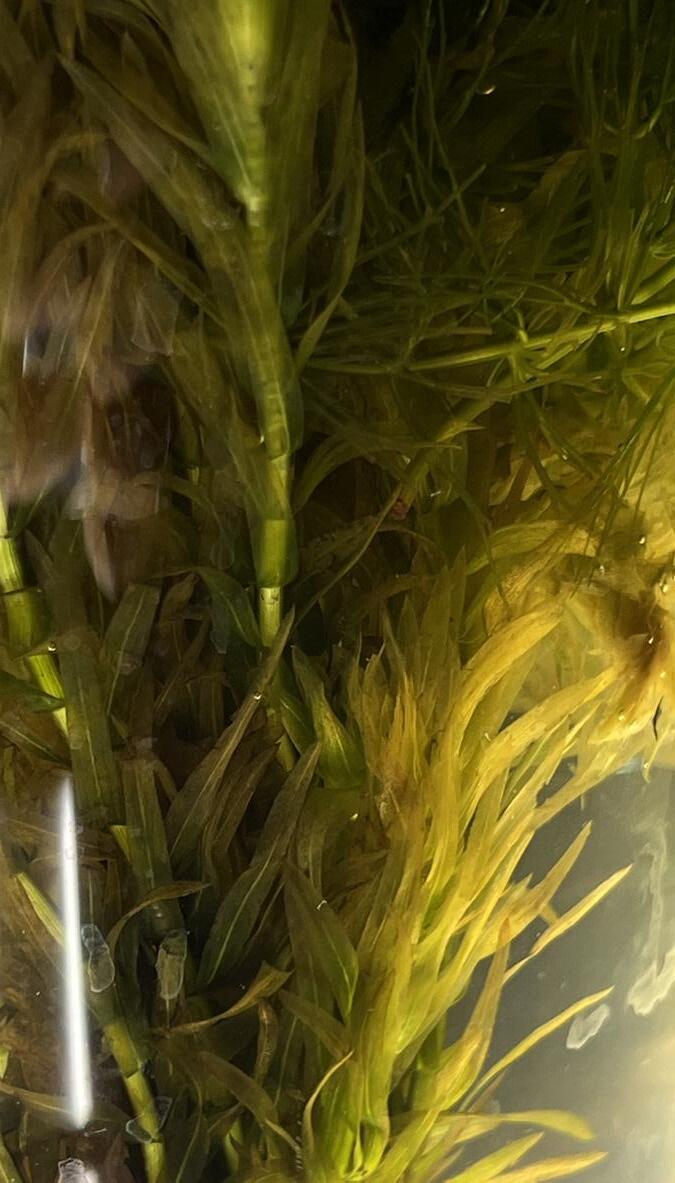
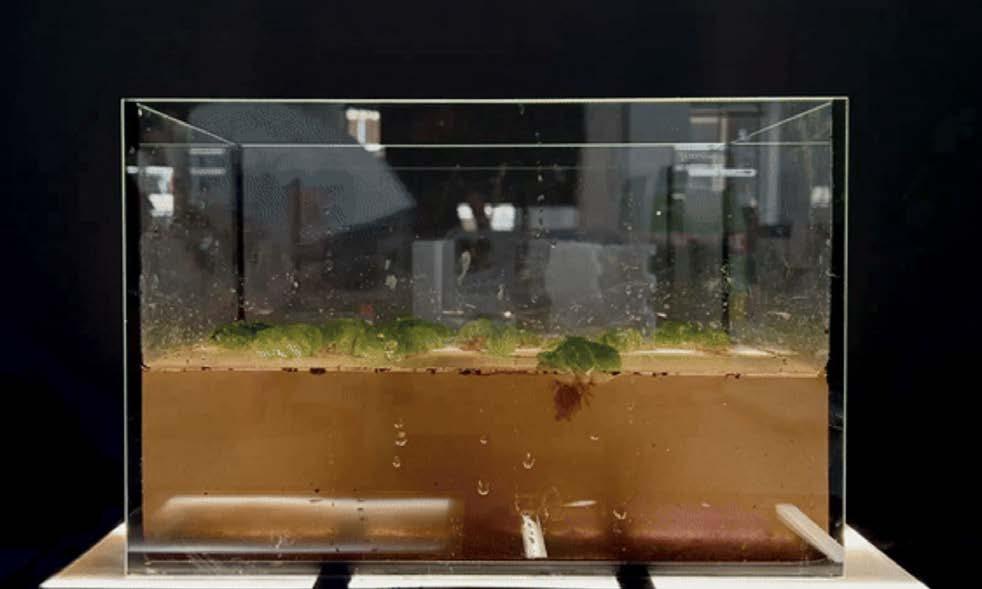
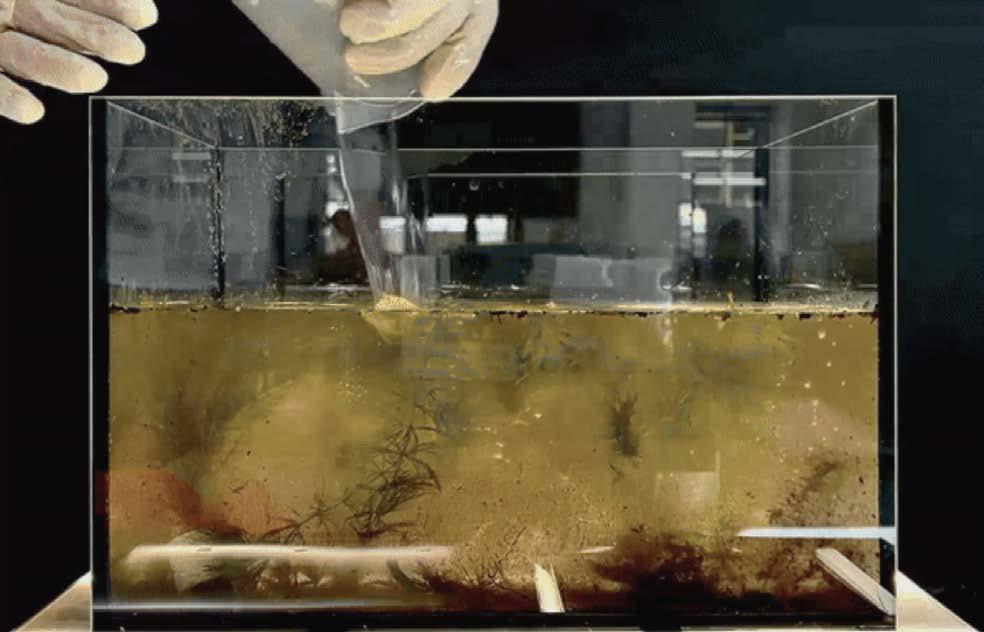
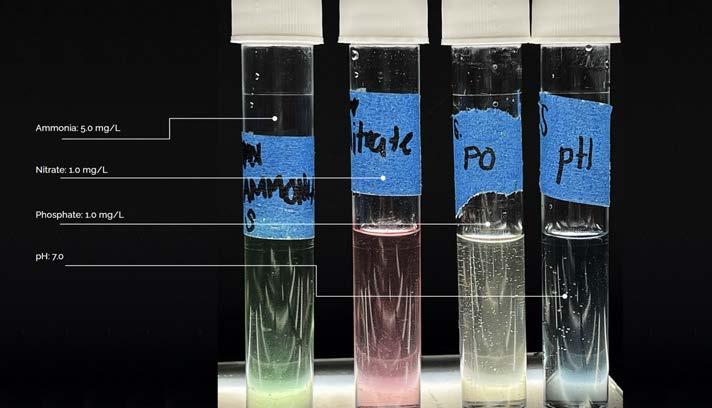
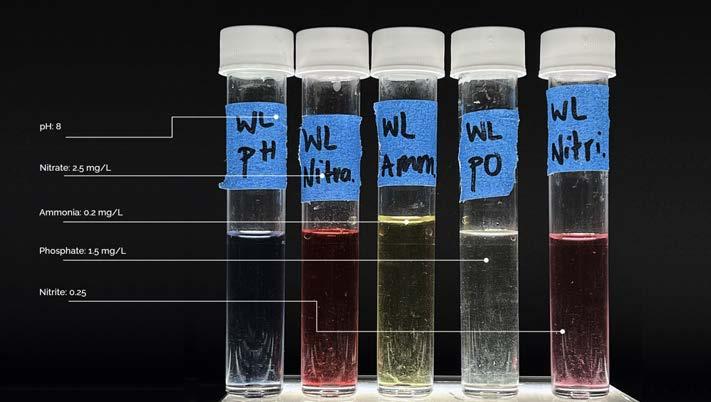
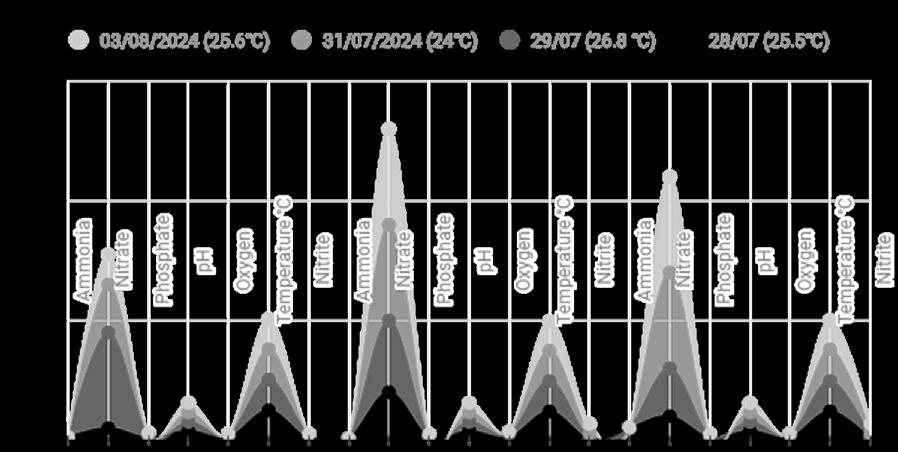
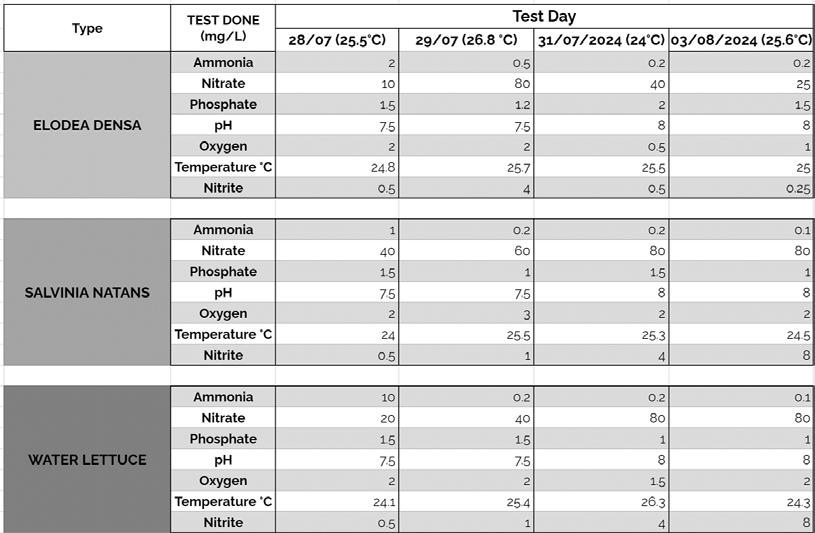
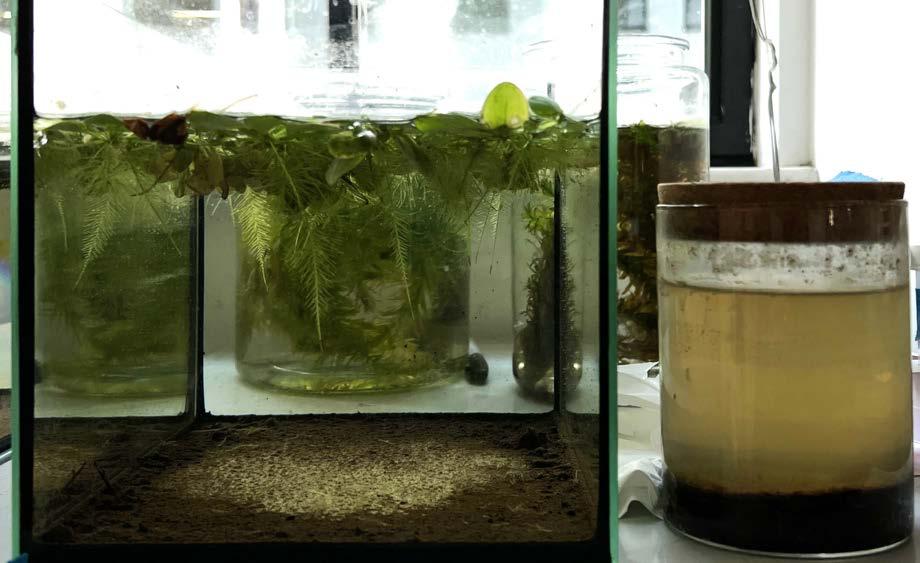
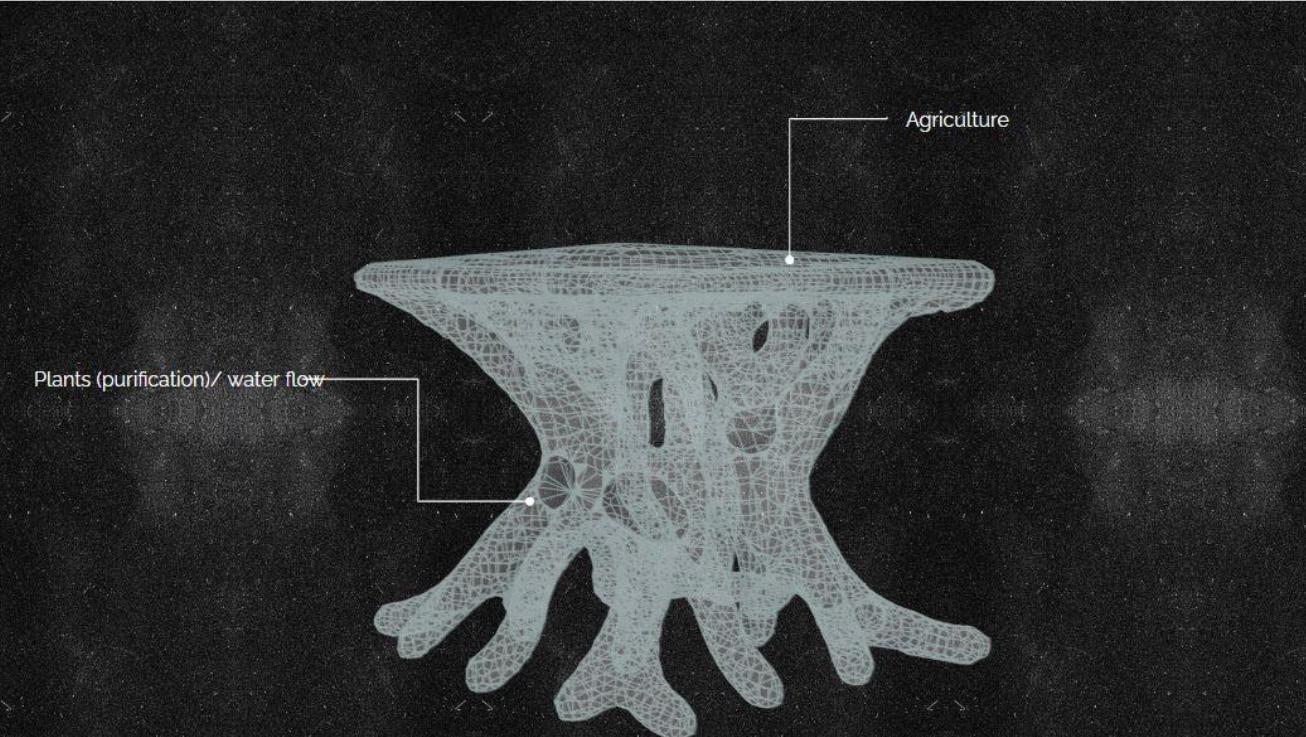
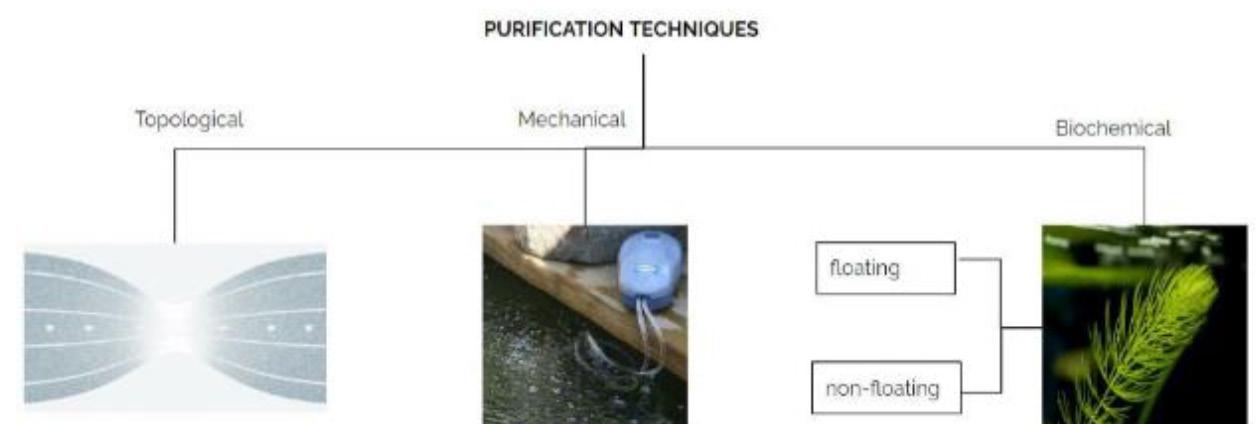
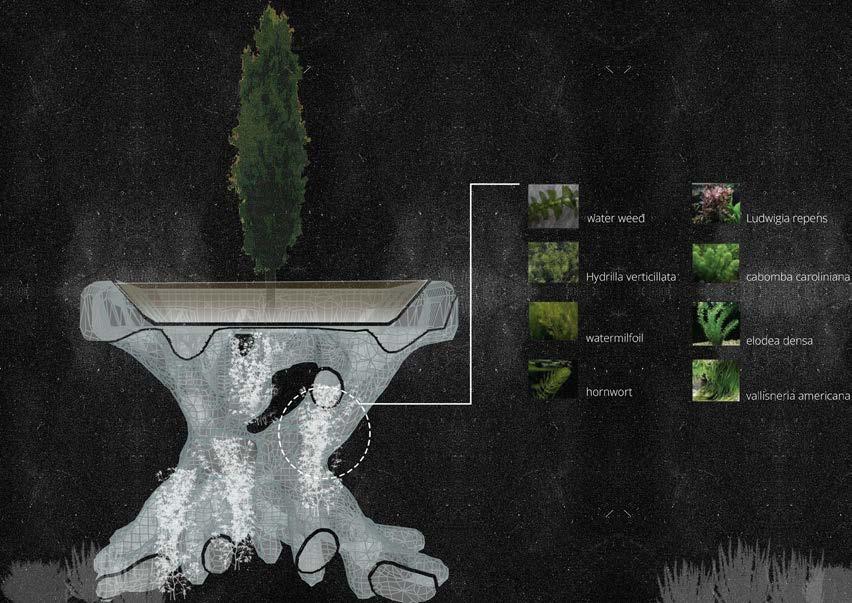
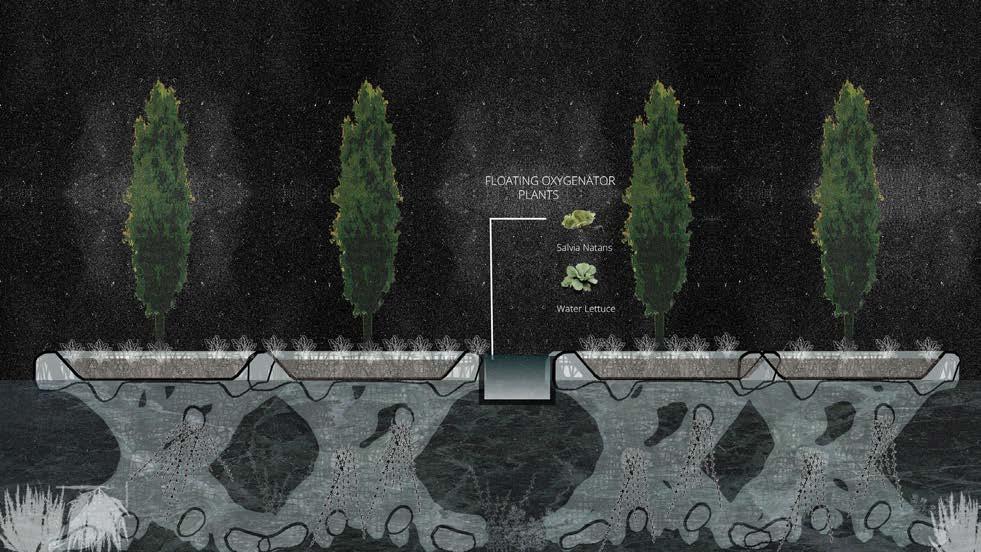
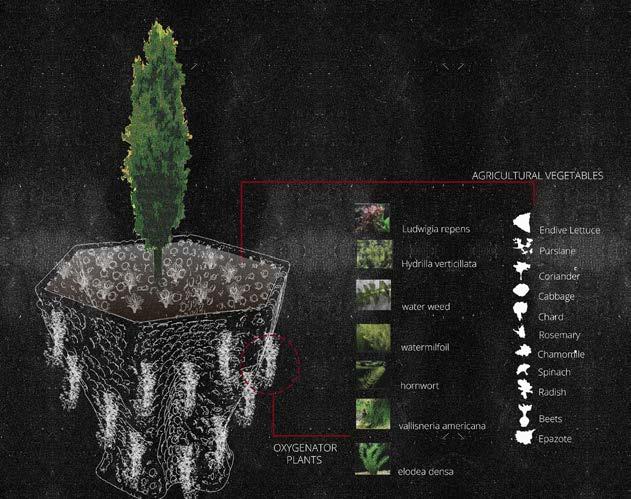
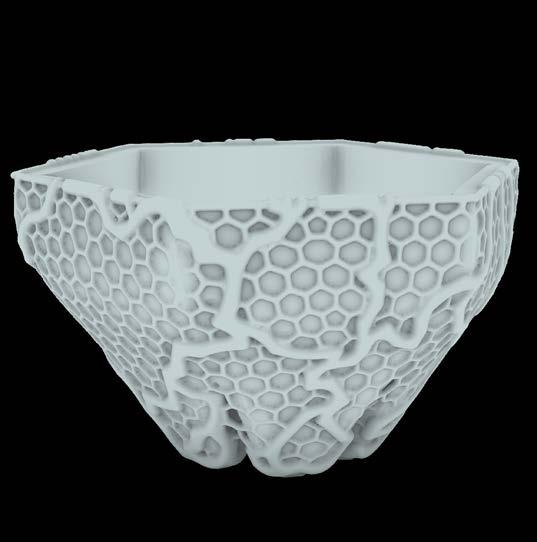
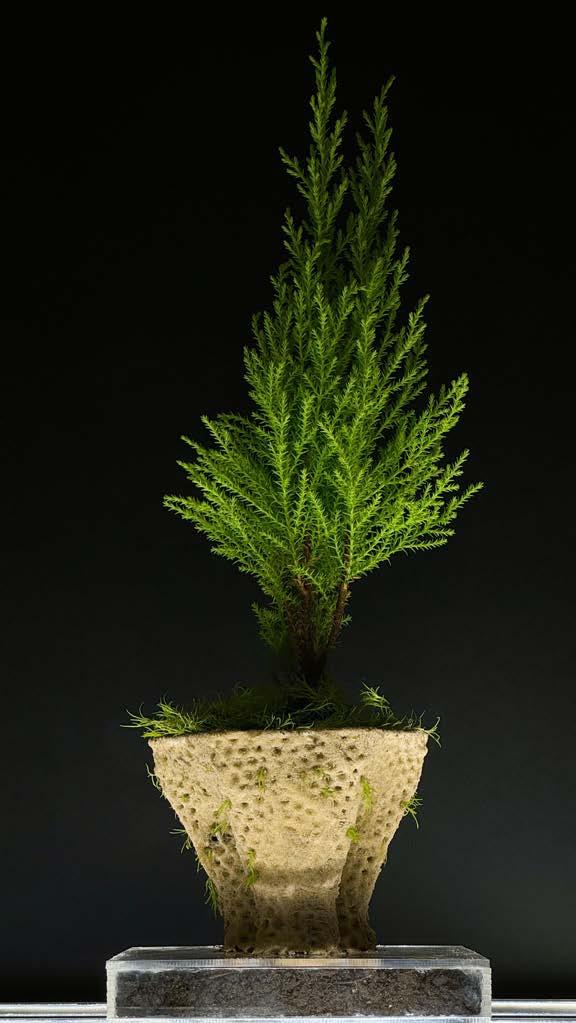
Water Purification Setup
Considering the first three phases of the research, the third phase would focus on the regional and local scale of the design, to generate ecologic sub-systems and products that enhance the environmental conditions of the biome. The morphologies would host local or imported plants that help purify the quality of the water. The specification of plants and their attributes will be realized by running physical experiments on the matter explored in the following chapters. These products require deeply exploring various material systems and experimentations that evaluate their profile and applicability.
As a result, multiple plants and creatures familiar or existing in the local context would become the experimental solution for the water purification setup. While these plants are being experimented on, a thorough understanding of the available local material -such as the soil- and their features would also be explored. These material studies, plus the realization of the structural functionality of the existing Chinampa system, would fuel the digital workflows of the second phase of the design.
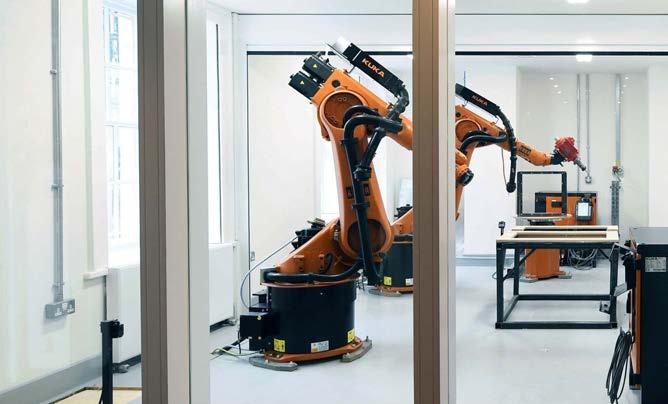
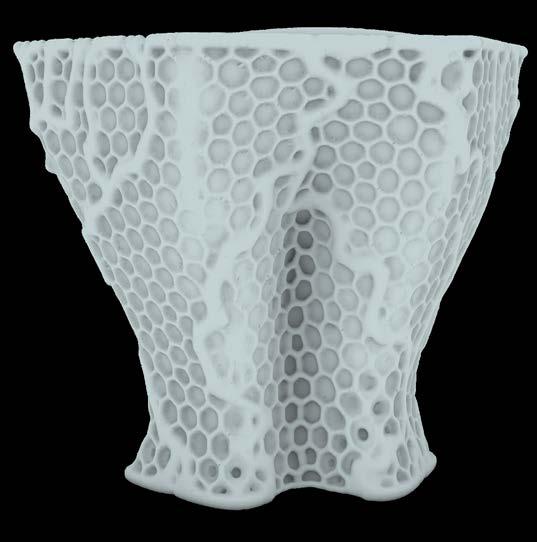
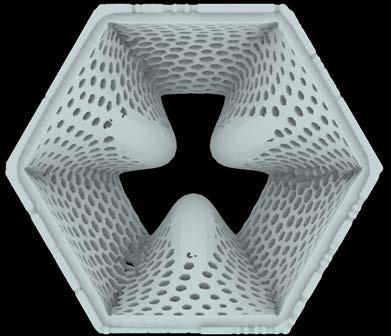
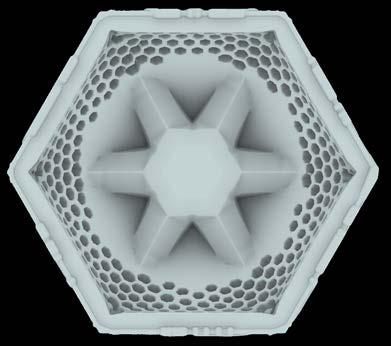
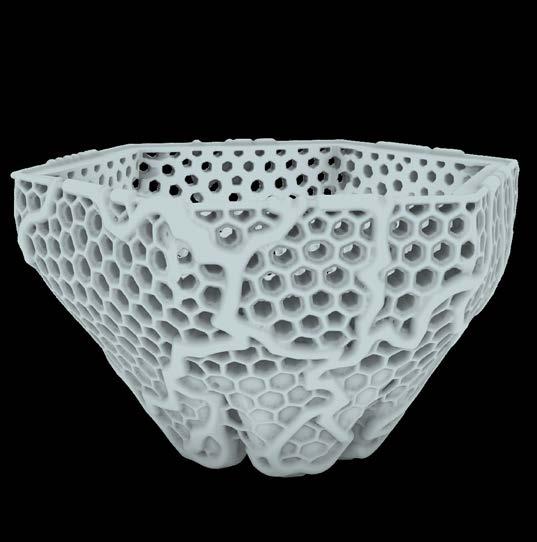
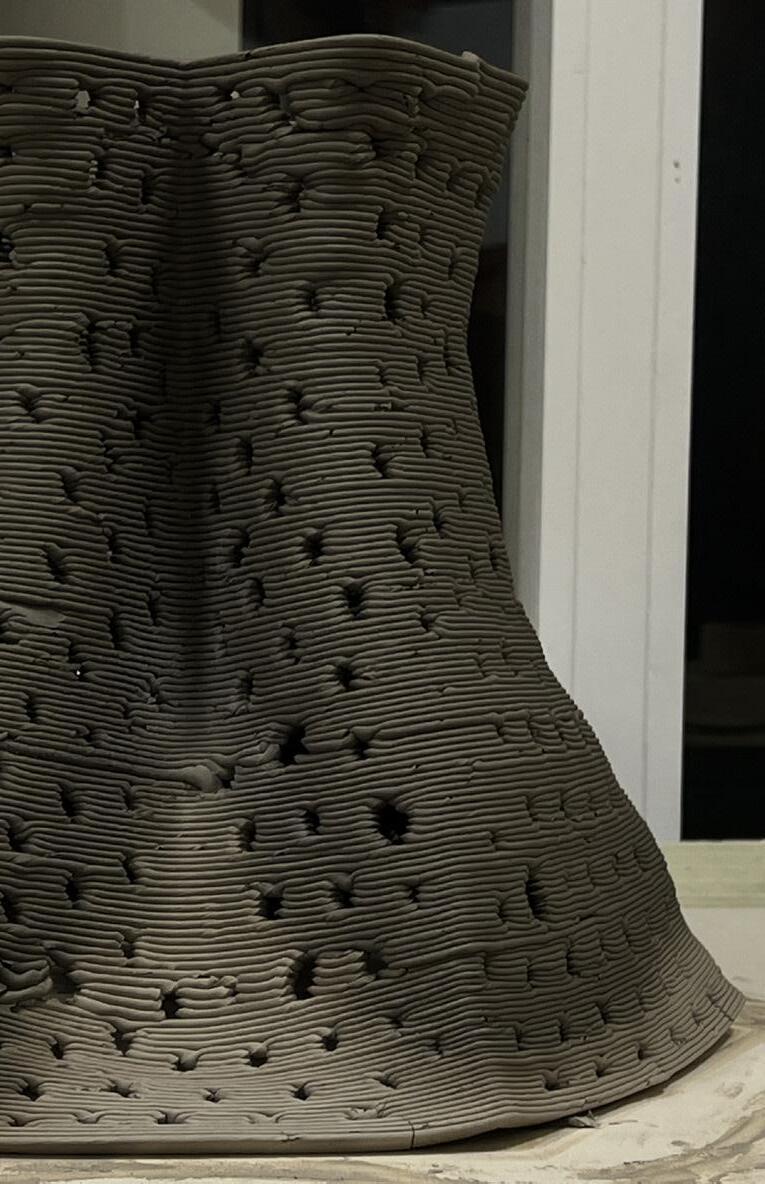
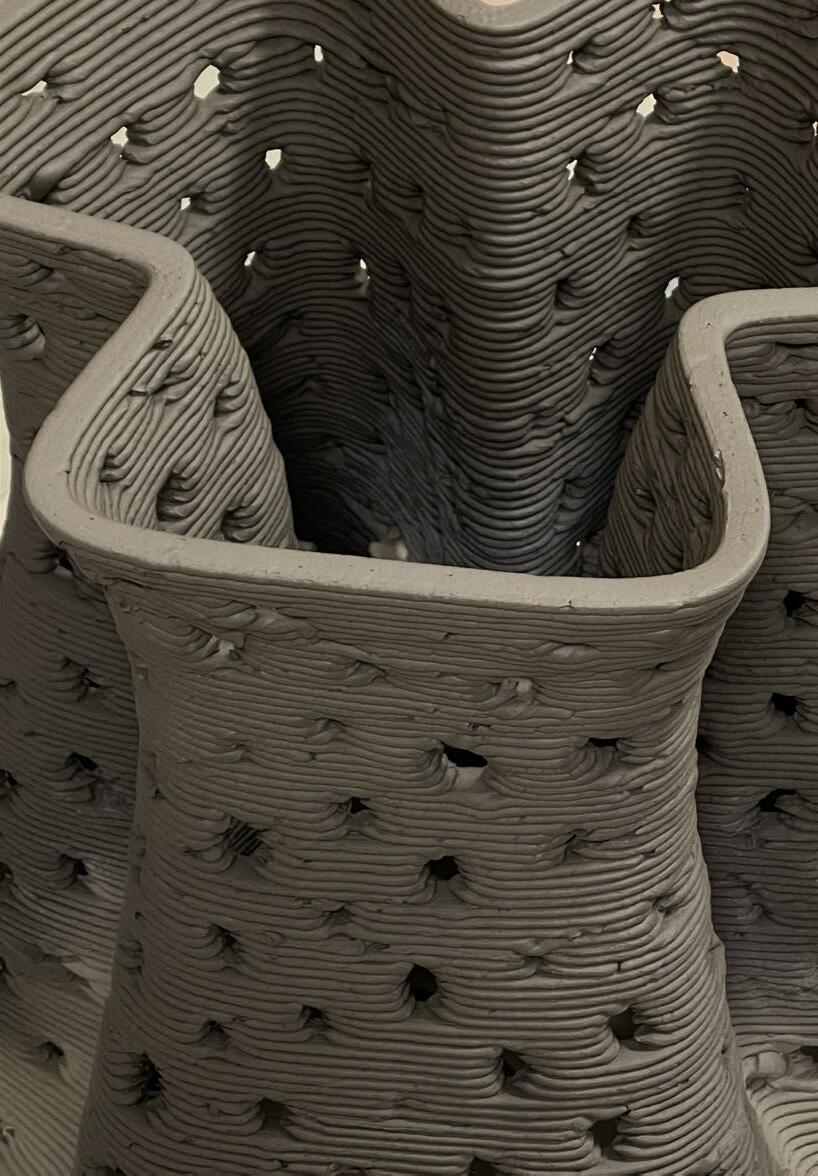
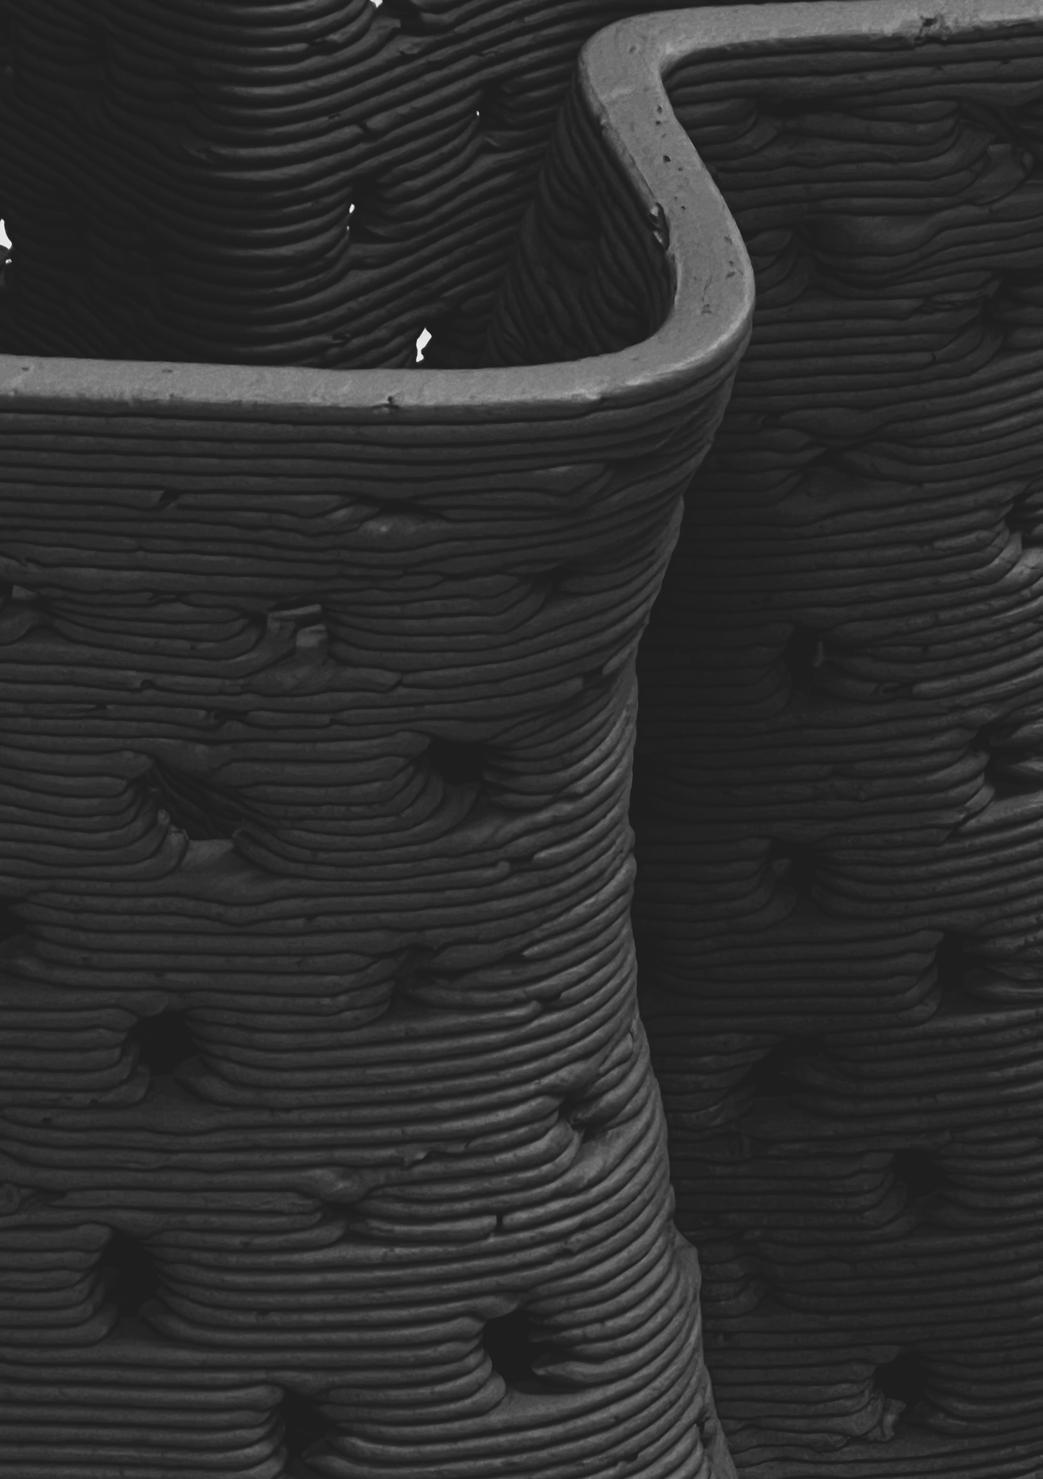
Advanced Fabrication
Eventually, to experiment with the designed products, advanced fabrication tools would have to be explored to state their level of efficiency and prototyping feasibility. By understanding the context of the project and the feasibility of building upon a region prone to environmental challenges and informal living, the design applications would have to foster a relatively inexpensive, buildable logic. Therefore, the idea of designing all the components based on a single mold would be explored. This idea would allow various forms to take shape if built with the same simple logic in the digital workflows. Thus, the concept of employing an adaptive mold for constructing and assembling the components would also be explored and analyzed in the digital workflow.
Figure 8. Architectural Association’s Digital Prototyping Laboratory (DPL).
Discussion
The overall design approach of this design research would be to regenerate the outdated urban tissue of the protected area of Xochimilco. The regenerated urban tissue would not act as a separate, disconnected part of the urban fabric of Mexico City, but as an integrated part of a bigger and more extensive civic ecosystem. The main goal of refining and creating this new urban tissue would be the functionality of a mal-functioning ecosystem that co-habits human and non-human creatures. This process of urban system generation consists of defining various spatial topologies using evolutionary algorithms in the computational workflows. Also, to create a system that is alive and responsive to the social and environmental stimuli, an automation procedure would be necessary to transform this urban system from a static product to a dynamic system that would allow it to change its configuration accordingly. Other than the fore-mentioned procedures, some of these processes consists of various experiments and explorations that primarily rely on a thorough understanding of the water behavior. However, the dedicated time available to this design research in the MSc. phase might not be adequate to perform all the experiments, although most of the experiments are executable in a semi-professional lab.
Figure 2. Urban pixelated data analysis
Yuhan Zhou and Qihao Weng, “Building up a Data Engine for Global Urban Mapping,” Remote Sensing of Environment 311 (2024): 114242, https://doi.org/10.1016/j.rse.2024.114242.
Figure 3. CFD Analysis with Sim Scale Software “3D Streamline of Air-Water Flow.” ResearchGate. Accessed, 2024. https://www.researchgate.net/figure/3D-Streamline-of-air-water-flow_fig5_346451426.
Figure 5. Analytic Graphs of an Evolutionary process Using Wallacei. Showkatbakhsh M, Kaviani S. Homeostatic generative design process: Emergence of the adaptive architectural form and skin to excessive solar radiation. International Journal of Architectural Computing. 2021;19(3):315-330. doi:10.1177/1478077120951947.
Figure6. Structural analysis with Karamba
“Smart Nodes Pavilion - Towards Custom-optimized Nodes Applications in Construction,” ResearchGate, accessed, 2024, https://www.researchgate.net/publication/315882826_SmartNodes_Pavilion_-_ Towards_Custom-optimized_Nodes_Applications_in_Construction.
Figure 7.Structural optimization with BESO
Ming-Hui Huang and Yi-Min Xie, “Advantages of Bi-Directional Evolutionary Structural Optimization (BESO) Method,” accessed, 2024, https://www.semanticscholar.org/paper/Advantages-of-Bi-Directional-Evolutionary-%28BESO%29-Huang-Xie/08152e52511ebe12ca051e5ef537ad85e34e5901.
Yuhan Zhou and Qihao Weng, “Building up a Data Engine for Global Urban Mapping,” Remote Sensing of Environment 311 (2024): 114242, https://doi.org/10.1016/j.rse.2024.114242.
3D Streamline of Air-Water Flow.” ResearchGate. Accessed, 2024. https://www.researchgate.net/ figure/3D-Streamline-of-air-water-flow_fig5_346451426.
Showkatbakhsh M, Kaviani S. Homeostatic generative design process: Emergence of the adaptive architectural form and skin to excessive solar radiation. International Journal of Architectural Computing. 2021;19(3):315-330. doi:10.1177/1478077120951947.
“Smart Nodes Pavilion - Towards Custom-optimized Nodes Applications in Construction,” ResearchGate, accessed, 2024, https://www.researchgate.net/publication/315882826_SmartNodes_Pavilion_-_ Towards_Custom-optimized_Nodes_Applications_in_Construction.
Ming-Hui Huang and Yi-Min Xie, “Advantages of Bi-Directional Evolutionary Structural Optimization (BESO) Method,” accessed, 2024, https://www.semanticscholar.org/paper/Advantages-of-Bi-Directional-Evolutionary-%28BESO%29-Huang-Xie/08152e52511ebe12ca051e5ef537ad85e34e5901.
CHAPTER III
RESEARCH DEVELOPMENT
Chapter
Overview
After analyzing various case studies and selecting the protected area of Xochimilco as the final site, the research development was divided into four main phases for development. Each phase consists of various tools, techniques, and experiments that are explored according to the site-specific features of each of the problematic challenges of the selected site. It is also noteworthy that the protected area of Xochimilco represents a common, predicted condition for the global future. Thus, the experiments and developments of design would aim to tackle the global issue of the rising water levels and exacerbated growth of population.
The studies and experiments of this chapter would be performed either in the digital and physical workflows according to each experiment’s conditions. The digital experiments include integrated digital pipelines for the urban data mapping, form finding, structural analysis, and fabrication. Also, the physical experiments include testing the local plants and other tools to tackle the problem of water pollution of the selected site. After evaluating each experiment accordingly, they would be refined and performed at a higher level of complexity in the next chapter.
I. Contextual Analysis and Space Syntax
This phase focuses on on-site analysis and synthesizing the challenges and problematic zones within the context. First, the site would be analyzed environmentally by inputting the collected data in the related digital workflows. The site boundary would be divided into pixels with specific dimensions. Eventually, three zones will be selected according to the three main defined challenges in the context of the water. A thorough network analysis will be done across the whole region before experimenting with different materials and form-finding techniques to find design solutions. This experiment would give insight into the functionality of the canal network in the area.
I. I Wind Analysis
To understand the patterns of wind flow within the region, an environmental analysis pipeline was created using Lady Bug1. This pipeline receives the geographic location of the site and outputs the environmental information such as wind pattern and sun radiation. As a result, the prevailing wind patterns of the region were graphed for each season. The graphs indicate that the wind patterns could be divided into two categories of dry and rainy season and this could influence the design dynamics for the future. Also, the prevailing wind directions would be an important objective for the network generation in the design development.
1 A Grasshopper plugin developed mainly for environmental analysis.
Figure 1. Wind pattern analysis of Xochimilco, from the left: winter, spring, summer, and fall
I. 2 Urban Data Mapping
The next step in continuation of the environmental analysis would be to transform the collected data into useful information. In this step, the collected data would have to be location-based and scalable, so the mapped information could guide the team towards choosing specific boundaries within the region for further development. Therefore, the data that was collected previously from different sources including satellite imagery and local organizations, would be processed in Grasshopper and the mapped again on the map. In order to make this transformed information readable, all the values would have to be remapped later, preferably to a number between 0 to 1. The final result of this experiment would lead to the final site selection.
After transforming the collected environmental data into information for each specific location on the region, a pixelation process would begin to enable site selection as a result of this parametric evaluation. Based on the scalability of the collected data maps, the dimension of the pixels could not be smaller than approximately 100 meters for each edge, otherwise, the values for each pixel would not be differentiable from its surrounding pixels. Eventually, although the mapped data might not show much recognizable difference between some pixels, however, the values indicate slight differences that are matching the collected data. (Figure 2)
Figure 2. Collected map of flood-prone zones (left), and the pixelated flood-proneness data of the site (right).
I. 3 Existing Network Analysis
After mapping the collected data on the site, the network would have to be experimented and analyzed in terms of the water canal links by parameters such as closeness and betweenness. These parameters would be measured by the accessibility of the water canals to the central zones of attraction within the context, and in Grasshopper. (Figure 3)1
The experiment indicates that after adding a number of points as the origins of entering the region and a few points as the attractors for the selected zones, some of the canals would not perform well. As the graphs visualize the parameters, the canal network would need to be refined to spread the probable traffic evenly along all the paths. This experiment’s results and insights would be used in the design development phase to propose a new refined network of water canals, So, the new network of canals in the selected boundaries would have to improve the values such as betweenness and closeness as objectives.
Figure 3. Map of existing water bodies/canals (left) and the schematic network analysis of it (right).
1The schematic network analysis shows the betweenness value for the water canals/bodies. The green color indicates a low passage along the canal, while yellow and red colors show medium and high levels of passages, respectively
II: Urban System and Morphological Design
As one of the main focuses of this design research in regards to the selected site is water pollution, the design has to address the issue of pollution in different scales. Based on studies, the less the flow of the water, the more potential there is for the pollution to stay and develop in the water. Therefore, in the form finding or network generation processes, the objectives would be set by studying the behavior and specific features of the water, such as velocity and flow.
In this phase, the experiments are focused on the water studies such as flow. So, to tackle the problem of seasonal flooding, we begin by running Computational Fluid Dynamics (CFD) simulations to understand the water flow around the whole region. This experiment would give us insights into the intensity of the water flow and the regular behavior of the water. In this experiment, all the region’s water bodies were identified with their number of inlets and outlets along the whole water network. Then, because of the site’s enormous scale, the water networks were divided into more minor scales, including inlets and outlets. (Figure 4)
Figure 4. CFD analysis of two water inlets around the selected region.
After running the simulations with Sim Scale1, the values would be imported into a digital workflow in Grasshopper to map the whole water network. This experiment would give us the values of velocity and pressure to input into the contextual synthesis. The graphs specifically indicate the lack of water flow as it distances from the initial inlets. Therefore, the new network generation would have to provide a set of links that spreads the water velocity as much and as even as possible. Furthermore, to understand the concept of floating and its feasibility studies, the final selected components in the local scale would undergo flow and buoyancy analysis in the digital workflows of Grasshopper and CFD software. The morphology of the components would also have to increase the water flow, possibly by a thorough understanding of Venturi effect.2
1 third-party software, not-integrated in Grasshopper that is used for various purposes regarding the Computational Fluid Dynamic (CFD) analysis.
2 A set of principles in physics on how flow would increase or decrease, for example by changing the thickness of a canal.
III: Material Exploration and Advanced Fabrication
This phase would focus on material exploration, specifically local materials in Xochimilco, and techniques that allow us to delve deeper into actualizing the morphological concepts. In this phase, the materiality and structural feasibility would be explored for various purposes, such as water purification and evaporation. Also, as food production is one of the context’s most vital professions and objectives, the feasibility of employing these sub-systems would be explored. These sub-systems might include aqua-farming, aquaponics, and aeroponics. The experiments in this phase would be done in the physical workflow of the design research.
Figure 5. Locally sourced materials close to region of Xochimilco.
In the case of Xochimilco, much focus has been given to the application of materials that are regional and in tune with ecological and cultural patrimony. Primary materials include tezontle, adobe, wood, cane/reed, thatch, and stone-product materials traditionally used for several centuries in classic building construction. Tezontle is a lightweight volcanic rock preferred because of its strength and suitability for the humid climate. Manufactured from local clay and sand, adobe provides natural insulation necessary in the Valley’s capricious climate. The structural wood is from native tree species and reed and thatch are sourced from local wetlands, supporting biodiversity while embodying sustainable material flow.
Stone is valued for its temperature-moderating qualities and its resilience in construction, minimizing processing and transport, while reinforcing the region’s cultural identity. Additional materials like zeolite and pozzolana, known for their water purification properties and structural durability, are incorporated to enhance underwater structures. This approach supports long-lasting, sustainable construction while respecting local resources, though it does not necessarily advocate a complete return to traditional methods.
Figure 6. Ancient use of Pozzolana, Italy.
Pozzolana (Figure 6) is a naturally or artificially produced highly silicious and aluminous material that combines, in the presence of water, at room temperature with calcium hydroxide to form compounds possessing cementitious properties. However, pozzolana itself is not a binding material but its reaction favors the formation of C-S-H, enhancing concrete strength and durability against chemical attacks. Traditionally used since Roman times, pozzolana improves concrete durability and reduces the environmental footprint of construction by decreasing Portland cement consumption.
Made by wet- volcanic origin (the pozzolan) with powdered hydrated lime, a Roman engineer’s mortar and/or concrete for bridges or other masonry and brickwork might consist of two parts of pozzolan by weight to one part of the lime. Physical and chemical properties make zeolites and anthracite very effective in the water purification system at Xochimilco. Natural microporous minerals, zeolites have high ion exchange capacity, hence efficiently adsorbing ammonium and other contaminants, which, on the other hand, makes them cost-effective for purifying used water or runoff from fertilized areas. Anthracite is a type of hard coal that happens to have a porous structure, allowing it to provide high adsorption capability, effectively filtering out suspended solids and organic contaminants. Combined with zeolites, it provides an overall solution for the cleansing of Xochimilco’s waters in support of its aquatic ecology and traditional agriculture.
Figure 7. composition of the ancient cement mixture, made with Pozzolana
Figure 8. Two locally-found, water cleansing minerals in Xochimilco.
To summarize, the material research phase in Xochimilco involves regional materials like tezontle (a type of volcanic rock), adobe, and volcanic ash combined with advanced scientific, architectural, and technological methodologies of today in design and structural optimization. Further, the use of zeolite and pozzolana in the filtration process itself helps to support the technical evolution of the water purification system, along with improving the submerged structure’s mechanical strength and chemical resistance.
It is, however, worth considering the potential issues regarding the sustainable sourcing of these materials and trade-offs likely to be made in their specification. Life Cycle Assessment (LCA)1 analysis of such materials and the use of LCA within the design process will become vital in ensuring that the sustainability of their use remains within environmentally acceptable limits. This will be factored into the proposal with a view to better water quality and ecological balance in the canals and chinampas, ensuring that the materials used are feasible with the long-term sustainability of Xochimilco.
IV: Water Purification Experiment Using Oxygenating Plants
To assess the efficacy of oxygenating plants in purifying polluted water, an experiment was conducted using three different species known for their water-cleaning properties as well as their local availability on site. The objective was to determine how these plants could affect various water quality parameters over time, specifically in a recreated environment that mirrors the conditions of the Xochimilco polluted lake.
IV.I. Experiment
Methodology
The experiment began with the recreation of the polluted water found in the lake, modelled after the contamination levels reported in a detailed study by UNAM’s (Universidad Nacional Autónoma de México) Ecological Restauration Department . UNAM’s Report divided the lake by zones, in the study it was evident that the most polluted areas are located in zone B and C, thus these were the chosen levels to replicate; this involved replicating the specific concentrations of pollutants, including nitrites, nitrates, ammonium, phosphates, as well as the pH levels and temperature observed in the actual lake. (Figure 9)
9. The graphs above show the recorded temperature, pH, nitrate, oxygen, ammonium, and phosphate levels in various zones of the Xochimilco lake.
Figure 9. The graphs above show the recorded temperature, pH, nitrate, oxygen, ammonium, and phosphate levels in various zones of the Xochimilco lake.
Figure
UNAM states in the report that the “dissolved oxygen levels are higher than 4 mg/L in all zones, with zones A and F reaching the highest levels. The monitored channels are mainly primary channels that are very long and wide, which allows the action of the wind as a promoter of oxygenation of the water column. Zone A, on the other hand, includes considerably wide channels such as the Tlilac lagoon, the Virgen lagoon, and Paso del Águila, through which trajineras and motorized canoes continually pass, contributing to the increase in oxygenation levels.” This information will later be used in an addition to the experiment in which oxygenating machines are used in combination to the plants to test whether the polluted water is cleaned faster.
IV.II. Experiment Procedure
To Replicate the water polluted levels chemicals such as pesticides and plant fertilzers were used, these are also some of the main pollutants found in the lake, as stated in UNAM’s Report: “regarding the nutrient levels (ammonium, nitrates and phosphates), these showed a strong influence from human activities and different land uses. Phosphates showed high values typical of hypereutrophic systems (> 0.1 mg/L). All zones presented values higher than 1 mg/L except for zone F, which is practically isolated from the rest of the system, not being associated with any type of agricultural activity nor exhibiting influence from urban discharges. These results indicate that contamination by fertilizers in the lake system is high.”1
1 Imaz Gispert, Mireya, Luis Zambrano González, Juan Ansberto Cruz Gerón, Adriana Martínez, and Luis Gutiérrez. Tech. Análisis Del Estado de Conservación Ecológica Del Sistema Lacustre Chinampero de La Superficie Reconocida Por La UNESCO Como Sitio Patrimonio de La Humanidad En Xochimilco, Tláhuac y Milpa Alta. Mexico City: UNAM, 2014.
Figure 9. The graphs above show the recorded temperature, pH, nitrate, oxygen, ammonium, and phosphate levels in various zones of the Xochimilco lake.
9. The graphs above show the recorded temperature, pH, nitrate, oxygen, ammonium, and phosphate levels in various zones of the Xochimilco lake.
9. The graphs above show the recorded temperature, pH, nitrate, oxygen, ammonium, and phosphate levels in various zones of the Xochimilco lake.
9. The graphs above show the recorded temperature, pH, nitrate, oxygen, ammonium, and phosphate levels in various zones of the Xochimilco lake.
Figure
Figure
Figure
Figure 10. Chemical variables getting measured to mimick the polluted water quality.
Figure 10. Chemical variables getting measured to mimick the polluted water quality.
Other than mimicking the water conditions of the lake of Xochimilco, additionally, soil and sediment samples were also recreated according to the soil typology found in the lake, this to further simulate the natural environment in which these plants would operate.
Figure 11. Process of mimicking the soil type of sediments found in the lake.
Figure 11. Process of mimicking the soil type of sediments found in the lake.
Eventually, some of the pesticides and fertilizers were measured to mimic the pollutant levels. (Figure 45) Then, three types of oxygenating plants were selected for this study, each known for their potential to improve water quality. The plants were introduced into the recreated polluted water environment, where they were allowed to acclimate and begin their natural purification processes. (Figure 46)
Figure 12. rom left to right, Water Lettuce, Elodea Densa, and Salvinia Natans, as the locally accessible plants used in water purification experiment
As a first step, the plants are introduced in the tank with clean water and the mimicked sediments and left to acclimate for several hours. Once the acclimation period is over, 750 ml of purely polluted water is introduced to the tank holding the plants and the sediments.
Figure 13. The process of mimicking the polluted water quality in the sample fish tank
To monitor the effectiveness of the plants, water quality testing was performed at regular intervals using a comprehensive water testing kit. The kit measured levels of nitrite, nitrate, ammonium, dissolved oxygen, pH, and phosphate. These parameters are critical indicators of water health and are particularly relevant in evaluating the success of the plants in reducing pollution.
Figure 14. Collected and measured chemicals for starting the mimicking process.
Figure 14. Collected and measured chemicals for starting the mimicking process.
IV.III. Experiment Results
Over the course of the experiment, the water quality showed notable improvement across most parameters. Specifically:
IV.III.I. Ammonium, and Phosphate Levels: These levels steadily decreased over time, indicating that the oxygenating plants were actively absorbing these compounds or facilitating their breakdown in the water.
IV.III.II. Dissolved Oxygen: The oxygen levels in the water increased, suggesting that the plants were effectively oxygenating the environment, which is crucial for sustaining aquatic life and promoting the breakdown of organic pollutants.
IV.III.III. pH Levels: The pH of the water gradually stabilized within a more neutral range, which is beneficial for the overall health of the aquatic ecosystem.
Figure 15. The graph represents the mapped measurements of the water in the sample tank
However, one exception to this trend was observed with the nitrate and nitrite levels, which did not decrease as expected. This suggests that while the plants were effective in reducing other forms chemical compounds, nitrites and nitrates either persisted in the environment or were not sufficiently absorbed by the plants. This could be due to various factors, such as the type of plants used, the specific environmental conditions, or the rate of nitrate uptake by the plants.
Figure 16. The table represents the mapped measurements of the water in the sample tank.
The figure below demonstrates, visually understandable, the changes in the water over time, showing after 20 days the comparison between the control group and the tank where the plants were introduced in which it is visibly seen that the water has cleared up drastically. (Figure 17). The persistent nitrate and nitrite levels highlight a limitation in the purification capabilities of the selected plants. Further research could explore additional plant species or complementary purification methods to address this gap and optimize the overall effectiveness of such natural water treatment systems.
Figure 17. The sample tank photographed after 15 days of inputting the purifying plants (right) and the polluted water control group (left) used as a c omparison point.
V. Discussion
All the experiments gave us valuable insights into employing the design solutions on various scales. As a result, all the experiments will be further developed in the next chapter separately or included in the design workflow. However, some experiments would not be performable, considering the limited time, budget, and facilities. As such, experiments with self-healing concrete would not be affordable in this design research, but they would be ideal and crucial to designing solutions for the future.
The physical experiment in particular, demonstrated the potential of oxygenating plants to significantly improve water quality in polluted environments, particularly by reducing ammonium, and phosphate levels, and increasing dissolved oxygen. However, the persistent nitrate and nitrite levels highlight a limitation in the purification capabilities of the selected plants. Further research could explore additional plant species or complementary purification methods to address this gap and optimize the overall effectiveness of such natural water treatment systems.
Overall, there were implications on the digital and physical experiments that would guide the team into expanding these into more complex experiments. Some of these experiments such as contextual analysis and pixelation were defined and evaluated enough to be used for the design proposal, however, some of them like the network and CFD analysis on the water canals would have to be taken a step further. Therefore, there would be two challenges for performing more complex experiments that would lead to design solutions; first is the limitations in tools and techniques and second, is the integration of such tools into a single pipeline, preferably in Grasshopper.
Figure 18. The sample tank photographed after 20 days of inputting the purifying plants
Figures
Figure 1. Wind Pattern Analysis of Xochimilco in Winter, Spring, Summer, and Fall. Produced by the Authors.
Figure 2. Collected Map of Flood-Prone Zones and the Pixelated Flood-Proneness Data of the Site. Produced by the Authors from: 1 Imaz Gispert, Mireya, Luis Zambrano González, Juan Ansberto Cruz Gerón, Adriana Martínez, and Luis Gutiérrez . Tech. Análisis Del Estado de Conservación Ecológica Del Sistema Lacustre Chinampero de La Superficie Reconocida Por La UNESCO Como Sitio Patrimonio de La Humanidad En Xochimilco, Tláhuac y Milpa Alta. Mexico City: UNAM, 2014.
Figure 38. Map of Existing Water Bodies/Canals and the Schematic Network Analysis of it. 73
Produced by the Authors from: Dirección General de Repositorios Universitarios, Universidad Nacional Autónoma de México. “Repositorio Institucional de La UNAM.” Ir al inicio. Accessed July 22, 2024. https://repositorio.unam.mx/.
Figure 3. CFD Analysis of Two Water Inlets Around the Selected Region. Produced by the Authors.
Figure 4. Locally Sourced Materials Close to the Region of Xochimilco. Dirección General de Repositorios Universitarios, Universidad Nacional Autónoma de México. “Repositorio Institucional de La UNAM.” Ir al inicio. Accessed July 22, 2024. https://repositorio.unam.mx/.
Figure 5. Ancient Use of Pozzolana, Italy.
Imaz Gispert, Mireya, Luis Zambrano González, Juan Ansberto Cruz Gerón, Adriana Martínez, and Luis Gutiérrez. Tech. Análisis Del Estado de Conservación Ecológica Del Sistema Lacustre Chinampero de La Superficie Reconocida Por La UNESCO Como Sitio Patrimonio de La Humanidad En Xochimilco, Tláhuac y Milpa Alta. Mexico City: UNAM, 2014.
Figure 6. composition of the ancient cement mixture, made with Pozzolana.
Imaz Gispert, Mireya, Luis Zambrano González, Juan Ansberto Cruz Gerón, Adriana Martínez, and Luis Gutiérrez. Tech. Análisis Del Estado de Conservación Ecológica Del Sistema Lacustre Chinampero de La Superficie Reconocida Por La UNESCO Como Sitio Patrimonio de La Humanidad En Xochimilco, Tláhuac y Milpa Alta. Mexico City: UNAM, 2014.
Figure7. Two Locally-Found, Water Cleansing Minerals in Xochimilco. Dirección General de Repositorios Universitarios, Universidad Nacional Autónoma de México. “Repositorio Institucional de La UNAM.” Ir al inicio. Accessed July 22, 2024. https://repositorio.unam.mx/.
Figure 44. The Graphs Showing the Recorded Temperature, pH, Nitrate, Oxygen, Ammonium, and Phosphate Levels in Various Zones of the Xochimilco Lake. Alvarado, Rocío González. “Canales de Xochimilco, Con Agua Contaminada Y Pestilente.” La Jornada, January 11, 2024. https://www.jornada.com.mx/noticia/2024/01/11/capital/canales-de-xochimilco-con-agua-contaminada-y-pestilente-6155.
Figure8. Chemical Variables Getting Measured to Mimic the Polluted Water Quality. Captured by the Authors.
Figure 9Water Lettuce, Elodea Densa, and Salvinia Natans, as the Locally Accessible Plants for the Water Purification Experiment.
Captured by the Authors.
Figure10. The Process of Mimicking the Polluted Water Quality in the Sample Tank. Captured by the Authors.
Figure11. Collected and Measured Chemicals for the Mimicking Process. Captured by the Authors.
Figure12. The Graph representing the Mapped Measurements of the Water in the Sample Tank. Produced by the Authors.
74
Figure13. The Table Rrepresenting the Measurements of the Water in the Sample Tank. Produced by the Authors.
Figure 14. The Sample Tank Photographed After 7 days of Inputting the Purifying Plants. Captured by the Authors.
1. Biorock: A Sustainable Technology for Marine Ecosystem Restoration. Goreau, T.J., & Hilbertz, W.H. (2005). Marine ecosystem restoration: Costs and benefits for coral reefs. World Resource Review, 17(3), 375-409.
2. Self-Healing Concrete with Microencapsulated Healing Agents. Wang, J.Y., Soens, H., Verstraete, W., & De Belie, N. (2014). Self-healing concrete by use of microencapsulated bacterial spores. Cement and Concrete Research, 56, 139-152. doi: 10.1016/j.cemconres.2013.11.009.
3. Self-Healing of Cracks in Concrete Using Microorganisms. Jonkers, H.M. (2011). Bacteria-based self-healing concrete. Heron, 56(1-2), 1-12.
4. Imaz Gispert, Mireya, Luis Zambrano González, Juan Ansberto Cruz Gerón, Adriana Martínez, and Luis Gutiérrez. Análisis Del Estado de Conservación Ecológica Del Sistema Lacustre Chinampero de La Superficie Reconocida Por La UNESCO Como Sitio Patrimonio de La Humanidad En Xochimilco, Tláhuac y Milpa Alta. Mexico City: UNAM, 2014.
5. Dirección General de Repositorios Universitarios, Universidad Nacional Autónoma de México. Repositorio Institucional de La UNAM. Accessed July 22, 2024. https://repositorio.unam.mx/.
6. Alvarado, Rocío González. “Canales de Xochimilco, Con Agua Contaminada Y Pestilente.” La Jornada, January 11, 2024. https://www.jornada.com.mx/noticia/2024/01/11/capital/canales-de-xochimilco-con-agua-contaminada-y-pestilente-6155.
CHAPTER IV
DESIGN DEVELOPMENT
Chapter Overview
This chapter delves into the development of architectural designs that specifically address the complexities of urban water environment of Xochimilco that has been studied in the previous chapters, focusing on the creation of floating structures that not only accommodate human activity but also mainly look for the purification of the polluted water in the lake.
The design strategy presented here is rooted in a dual approach that considers both macro and micro scales. At the urban scale, divided into phase I and II, the chapter explores how the strategic aggregation of these floating structures, designed to enhance water flow, can significantly improve water quality across large, polluted bodies of water. The unique shape and spatial arrangement of the proposed modules are engineered to accelerate water movement, thereby reducing stagnation and promoting natural cleansing processes.
On the local level, the chapter investigates the integration of advanced water purification techniques within the architectural components themselves, explored in the previous chapter. Together, these elements create a synergistic system that not only supports urban infrastructure but also actively contributes to the ecological health of the water body. Through the intersection of global urban design principles and site-specific innovations, this chapter illustrates how the design of floating structures can offer a sustainable solution to the challenges water management in search of purification of the lake’s system.
Figure 1. Morphology Experiment
I. Site Synthesis
Starting from the collected data, the existing conditions of the selected site must be studied. Therefore, after studying and evaluating the collected information, a thorough synthetic selection process would be followed upon to result in the selected boundaries. Eventually, these selected boundaries would be divided into am incremental plan for building the proposal.
I.I. Mapping/Filtration of the Collected Data
The existing conditions of the selected site must be studied. Therefore, the first step would be to collect all the environmental and socio-economic data and information about the location from sources such as the government, NASA and Google imagery services, and local independent organizations. These data would help the research team thoroughly investigate the challenges, their specific time, and their geographic location.
The next step would be to pixelate the site boundary into smaller square shapes of a particular dimension, in this case 100 to 100 meters. All these pixels would have a column of values represented by a single, remapped number between 0 and 1. These pixelated values would then be used in the synthesis of site selection process.
Figure 2. Pixelated data mappings of the protected region of Xochimilco, from the left, surface temperature, water pollution, and activity of the chinampas.
I.III.
I.II. Evaluation Criteria
Based on each of the defined problems that the team has decided to focus on, a range of values derived from various references would be used for the synthetic process of site selection within the boundaries of the selected region of Xochimilco. This process would result in specific pixels that each must be dealing with a particular problem, or a few of them, and would need a data-driven design pipeline as the solution.
Therefore, the maps that would be selected here are divided into two groups; must-haves and preferences. The first group consists of water pollution, activity of the Chinampas, and the dryness (saltiness) of the soil. This group includes data that would be inevitable in the site selection process and focus on the main objectives of the proposal. Meanwhile the second group would help us choose a site which is more vulnerable according to the initial evaluation criteria. This group is consisting of closeness to water sources, water velocity, flood proneness, and surface temperature.
Weighting System
The weighting values for each of the remapped data would be according to the importance of each one. As such, maps of water pollution and activity of the Chinampas would have the multiplier of three as the most crucial ones. Then comes soil dryness, water velocity, and flood proneness with the multiplier effect of two. And eventually closeness to water sources and surface temperature would have the same value without getting multiplied.
I.IV. Synthesis
After defining the weighting system of the mapped data, the final step would be to overlay all the remapped values on the same pixelated base. As the base site consists of 2267 pixels of 100 to 100 meters, the remapped, weighted values would be summed up and then remapped again on the base. Therefore, each of the pixels would have a unique score that verifies its vulnerability to be ranked in the selection order. (Figure 3)
II. Global Scale
The weighting values for each of the remapped data would be according to the importance of each one. As such, maps of water pollution and activity of the Chinampas would have the multiplier of three as the most crucial ones. Then comes soil dryness, water velocity, and flood proneness with the multiplier effect of two. And eventually closeness to water sources and surface temperature would have the same value without getting multiplied.
Figure 3. Synthesized mapping of the collected and weighted data.
II.I. Mapping the Existing Water Canals
The weighting values for each of the remapped data would be according to the importance of each one. As such, maps of water pollution and activity of the Chinampas would have the multiplier of three as the most crucial ones. Then comes soil dryness, water velocity, and flood proneness with the multiplier effect of two. And eventually closeness to water sources and surface temperature would have the same value without getting multiplied (Figure 4).
Figure 4. Intersections of the existing network and the selected boundary.
The next step would be to create a script that would generate new canals that connect the previous inlets and outlets of the water. This process would generate the first hierarchy of the canal network based on four objectives. These objectives that are driven by the environmental conditions of the region, are consisting of the orientation of the canals according to the prevailing wind flow, increasing the water flow based on the Venturi effect, evenly distributed network based on the betweenness values of each segment, and eventually closeness to the ideal size of 600 sqm2 for each of the generated islands in-between the canals. As a result, a variation of canal networks would be generated through an evolutionary process with Wallacei in Grasshopper. (Figure 5, left)
The last step would be to analyse the water flow through inlets and outlets throughout the region will be done using computational fluid dynamics (CFD) simulation to understand how water behaves in flooding and regular occasions. This simulation not only depicts the behaviour of the water but also provides the values of velocity and pressure to be mapped further along the site. (Figure 5, right)
II.II. Canal Network
Figure 5. The new generated network (on the left) and its CFD analysis of water flow (on the right).
II.III. Network Hierarchy Generation
After generating the first layer of the canal network based on the given objectives, a second layer of canals would be generated to create a hierarchy within the network of the canals. This second layer would provide more access in smaller scales for the inhabitants to travel between the islands within the selected boundaries.
(Figure 6)
Figure 6. The new generated network hierarchy.
III. Regional Scale
The second and third phases of the design research would proceed in a hybrid manner to find the best design solutions for each problematic area. These two parallel research agendas complement each other and create a horizontal means-and-ends research pipeline; one focuses on urban system design and morphological experiments, and the other focuses on material and structural feasibility studies.
The overall structural optimization of the aggregation of the components serves to magnify the Venturi effect. This dramatically enhances water purification efficiency, developing synergy with the agricultural system. In a continuous and connected network, water moves by gravity at an accelerated flow rate, reduced pressure, and increased oxygen levels. This allows physical purification mechanisms for filtration and supports increased rates of aerobic microbial activity and nutrient uptake. Oxygen-rich water circulates between the agricultural and aquatic layers, establishing a closed system. Aquatics gives water and nutrients to the crops, while crops provide oxygen, CO2, and nutrients essential in maintaining aquatic life, hence making it a sustainable cycle.
Figure 7. Sketch of the regional scale, showing an island standing on top of morphologies and soil containers.
IV. Local Scale
The conceptualization of the floating architectural morphology necessitated a careful equilibrium among form, functionality, and structural integrity to mitigate lake water pollution. To achieve this, four distinct methodologies were implemented: geometric design, periodic minimal surfaces, agent-based behavioral modeling, and topological optimization. The hexagon was selected as the primary geometric configuration because of its efficient tessellation properties, which offer a stable and adaptable framework for the arrangement of cohesive elements. This geometric structure functioned as the basis for arrangements that satisfied both functional requirements and structural demands.
The design of the floating structure was meticulously developed through a process that integrated ecological sensitivity with advanced technological methodologies. Each element of the structure’s morphology was purposefully crafted to contribute to the purification of the lake’s water, while also supporting sustainable aquaculture and fostering biodiversity. The core principles guiding the design include integrating porosity, strategically placing funnels to enhance water dynamics, incorporating oxygenating plants, and applying topological optimization to create a resilient and efficient structural system.
IV. I. Primary Design Explorations
Figure 8. Various experiments and methods that were explored for the form finding process.
IV. I.I. Periodic Minimal
Surfaces
Periodic minimal surfaces (PMS) were initially considered as a potential morphological approach due to their inherent characteristics, specifically their openings, which would facilitate water flow and contribute to a porous, lightweight structure. The concept of using PMS was attractive because it aligned with the goal of creating a morphology that was both environmentally responsive and structurally efficient, however, despite their advantages, PMS presented significant constraints, particularly in terms of structural feasibility and construction complexity thus the design approach moved towards creating two morphological approaches: one that involving agent-based behavioral approach and the second using topological optimization as the overall base.
IV. I.II. Agent-Based, Behavioral
This approach leveraged agent-based behavioral modeling to explore how individual hexagonal elements could dynamically interact and organize themselves. This method focused on creating a morphology that could adapt to environmental conditions such as water currents and load variations. The resulting design emphasized flexibility and self-organization, allowing the structure to respond to changing conditions fluidly and resiliently.
IV. I.III. Topological Geometry
Another explored method is the topological form finding, and optimization of material distribution within the hexagonal geometry to maximize strength using a minimum amount of material. This ensured a lightweight yet structurally sound design for the aquatic environment and was easy to construct.
IV. II. Design Process
All the techniques were validated for environmental adaptability, structural stability, and effective material use. The agent-based approach generated a kinetic, responsive morphology, while topological optimization granted robustness and practicality.
The new morphology is designed to become an underwater structure with bone-like extracellular matrix complexity, much like in the case of stony coral. The twisted lattice from macro to micro scales and porous form provide cavities and spaces for aquatic plants and biofilms. These bio-fabricators highly contribute to the natural filtration process, entailing the capture of particles and enhancing nutrient uptake and pollutant decomposition. Biological activity and structural complexity interact with one another to help increase water cleaning efficiency and foster a balanced ecological environment. (Figure 9)
Figure 9. Wireframe sections of the generated morphology through evolutionary algorithms.
The morphology works on a double level: the top part is like a chinampa- a bed for farming with solid grounds for farming practices, allowing direct nutrient exchange between water and plant roots. The bottom part has a complicated lattice with small interstices as a cleaning module. Aquatic plants would be strategically placed to increase surface area, allowing better water flow and improving the cleaning process through nutrient uptake and biofilm formation.
(Figure 10)
This design avoids stagnant zones, ensuring continuous water movement through the interstitial spaces, which boosts oxygenation and supports aerobic microbial activity for pollutant biodegradation. It also stabilizes surrounding sediments, limiting erosion. By mimicking natural processes, the system purifies water, supports crop growth, and minimizes artificial inputs like chemical fertilizers and water treatment, fostering an ecologically balanced, self-sustaining system.
Figure 10. The isometric view of the morphology shows the functionality of it.
IV. III. Water Purification Features
These different purification strategies cooperate in water quality improvement:
4.3.1.Topological Purification: Geometrical conceptions achieve larger water flow, mixing, and oxygenation, as Venturi effects, stimulating particle settling and clear waters.
4.3.2. Mechanical Purification: This process uses oxygenation machines to maintain high dissolved oxygen levels, accelerating organic matter decay and preventing anaerobic conditions.
4.3.3. Biochemical Purification: The aquatic plants absorb the additional nutrients, reduce eutrophication, retard algal growth, and help microbes attack organics. The submerged plants further stabilize the sediments and assist in bioremediation. Cumulatively, these approaches provide an integrated approach to water treatment, enhancing nutrient balance in an effort towards sustainable ecosystems.
Figure 11. The graph shows three main categories of features to be implemented within the design application.
This section (Figure 11) deals with the applications of non-floating plants such as Waterweed, Hydrilla, Watermilfoil, Hornwort, Ludwigia, and Cabomba in vertical pockets. These plants help absorb excess nutrients, oxygenate the water, and inhibit algal blooms, thereby increasing clarity. The design has been done to ensure continuous oxygenation and optimum plant growth according to their requirements. These plants improve water quality by filtering nutrients, reducing nitrates and phosphates, and supporting a balanced aquatic environment.
The subsystem configuration allows maximum water flow and cleaning, hence a dynamic aquatic ecosystem that maintains homeostasis. The structural features resemble the chinampa system, in which modified canals enhance water circulation and oxygenation-nutrition distribution while removing impurities. (Figure 12)
The design consists of connected channels in the vertical direction with plant pockets to orient the flow of water. There are faster and slower zones for mixing and settling pollutants. Plants such as Hydrilla verticillata and Watermilfoil are placed to ensure maximum nutrient uptake, oxygenation, and sediment stabilization. Floating plants Salvinia natans, Water Lettuce, and Duckweed regulate temperature and light conditions, hence helping in algal control. They are located on nutrient-rich sites to filter runoff. Cyclical water flow prevents stagnation and, therefore, supports aerobic conditions for water purification. Besides, the floating plant coverage is controlled to prevent overshadowing of submerged vegetation. Generally, this system improves water movement and aquatic ecology.
Figure 12. The section illustrates the placement of the non-floating aquatic plants that help purify the water quality. Each plant is already existing in the Xochimilco area
13. The section illustrates the configuration of each component, creating a new canal network in between.
14. Schematic isometric of the generated and refined morphology that depicts functionality
Figure
Figure
V. Discussion
In conclusion, the proposed underwater morphology integrates aquatic systems and agriculture in a balanced design inspired by chinampas. The system employs multi-scale, porous structures for anchoring plants and purifying polluted water, using cavities and channels to optimize water flow, nutrient uptake, and pollutant breakdown through microbial life. Hydraulic dynamics will avoid stagnation and anaerobic conditions, supporting a topological, mechanical, and biochemical water purification system. Topological design enables various forms of water circulation to improve mixing, while mechanical oxygenation maintains adequate oxygen levels. Biochemical processes include the use of aquatic vegetation for filtration and sediment stabilization.
However, the development of this morphology was terminated due to various issues that arose during the development process. The structure could not be optimized, as it was unstable or strong enough to withstand the dynamic aquatic environment. Moreover, the modularity and tiling of each chinampa were highly problematic: the complexity of the design prevented easy replication of the model on a large scale, hence limiting the possibility of broader applicability. The configuration lacked adequate porosity and would inhibit its effectiveness in supporting the exchange of nutrients and water flow. The proposed morphology also required significant area coverage over the lake, encroaching on space used by existing chinampas, thus countering the aim of creating a modular and easily deployable system. These limitations hindered the implementation of the design and thus prevented it from becoming a viable solution for large-scale ecological restoration.
Figure 15. Morphology venturi effect sketch
Figures
Figure 1. Schematic Isometric Drawing of the Generated and Refined Morphology. Produced by the Authors.
Figure 2. Pixelated Data Mappings of Surface Temperature, Water Pollution, and Activity of the Chinampas. Produced by the Authors.
Figure 3. Synthesized Mapping of the Collected and Weighted Urban Data. Produced by the Authors.
Figure 4. Intersections of the Existing Network and the Selected Boundary. Produced by the Authors.
Figure 5. The New Generated Network and its CFD Analysis of Water Flow. Produced by the Authors.
Figure 6. The New Generated Network Hierarchy. Produced by the Authors.
Figure 7. Sketch of the Regional Scale, Showing an Island on Top of Morphologies and Soil Containers. Produced by the Authors.
Figure 8. Various Experiments and Methods Explored for the Form Finding Process. Produced by the Authors.
Figure 9. Wireframe Sections of the Generated Morphology Using Evolutionary Algorithms. Produced by the Authors.
Figure 10. Schematic Isometric Drawing of the Generated and its Functions. Produced by the Authors.
Figure 11. The Graph Showing Three Main Features for the Possible Design Applications. Produced by the Authors.
Figure 12. Schematic Section Drawing of the Generated Morphology with Non-Floating Aquatic Plants Purify the Water Quality. Produced by the Authors.
Figure 13. Schematic Section Drawing of the Generated Morphologies and their Tessellation. Produced by the Authors.
Figure 14. Schematic Isometric Drawing of the Generated and Refined Morphology. Produced by the Authors.
INEGI. Accessed July 22, 2024. https://www.inegi.org.mx/contenidos/productos/prod_serv/contenidos/espanol/bvinegi/productos/nueva_estruc/702825191160.pdf.
Coolhuntermx. “Sobre La Importancia Del Agua y La Labor de Chinampas En Xochimilco, Ciudad de México.” ArchDaily México, July 20, 2021. https://www.archdaily.mx/mx/965408/sobre-la-importancia-del-agua-y-la-labor-de-chinampas-en-xochimilco-ciudad-de-mexico.
Jayakrishnan, S., Chakravarthy, P., & Department of Aerospace Engineering, Indian Institute of Space Science and Technology, 695547, India. (n.d.). Flux bounded tungsten inert gas welding for enhanced weld performance—A review. In Journal of Manufacturing Processes (Vol. 28, pp. 116–130). http:// dx.doi.org/10.1016/j.jmapro.2017.05.023
CHAPTER V
DESIGN PROPOSAL
Chapter Overview
After evaluating each experiment accordingly, they were refined and performed at a higher level of complexity to prepare the necessary tools and techniques to propose the design applications of this research. In the process of experimentation and design development, various pipelines were created for each experiment that would provide the base workflow for the design proposal. Therefore, each of the proposal sections would use one or more of the created pipelines to solve the defined challenges and progress respectively.
The notable decision that was taken within developing the design is inter-connecting the pipelines of the digital workflow to one another. Despite requiring more amount of work in terms of quantity and quality, it would provide a thorough and consistent digital workflow that is parametrically interchangeable according to demands. Thus, the design proposal in its ideal form, consists mainly of an urban design system that could be applicable to any location on this planet, in case the respective data is injected to the system.
Figure 1. Robot arm clay printing
Global Scale, Urban fabric Generation
I. Site Selection
The chosen region has bounding boundary of 6.8 to 7.6 kilometers. So, in order to select a boundary within the region as our site, the region was pixelated into squares of 100 to 100 meters. The criteria with which the data would be analyzed and represented consist of socio-economic and environmental conditions such as sun radiation, wind, water quality, and vegetation.
I. I. Urban Data Mapping
The data was collected and translated from satellite imageries and geo-located numerical data. Then a thorough process was done in the digital workflow using image processing and prediction through machine learning to convert all the images into numbers for each pixel. Therefore, the data was represented the pixels with maps such as surface temperature, flood proneness, soil dryness, and water pollution. (Figure 2, top)
I. I. Weighted Selection Synthesis
The site synthesis aims to represent the information and indicate the vulnerability of each pixel among the whole region through overlaying all the collected, remapped, and translated data.
So, these data were weighted based on their importance in the so-called “must-haves” and “preferred” categories based on their relevance to contextual concerns. The main reason for applying different weights to each of the represented data mappings is the difference in their importance to the design challenges. As the design research would prioritize and focus on some aspects more than the rest, some of the maps such as water pollution or flood proneness would have the highest weight. As a result, all the pixels would be ranked based on their values of vulnerability which is basically a remapped number between 0 to 1. (Figure 2, bottom)
Figure 2. Mapped and synthesized urban data
II. Incremental Plan
Due to the selection criteria and synthesis result, and in order not to force the inhabitants of the region to live within the boundaries of the new proposal, we opted to select three zones for the incremental proposal. These three zones would be selected based on their values according to the evaluation criteria. Therefore, the first zone would be the most vulnerable, polluted zone among the whole region, and each zone would be built incrementally over time in this plan to complete the refinement of the region gradually.
In order to familiarize the inhabitants of the protected region with the new plans, as the time goes by, the area of the selected sites would get bigger. This process would allow the designers to start by making smaller changes within the region and refine the new pipelines by receiving thorough feedback on the previous implemented zone. As a result, the protected area of Xochimilco would be refined over time and according to the socio-economic conditions of the governing bodies.
Figure 3. Selected site boundaries for incremental development plan, from the left, phase 1,2, and 3.
III. Canal Network Generation
III. I. Existing Canal Network
The first step to develop the design would be to understand how the existing water pipeline is functioning within the region. In dry seasons, an artificial flow of water would be injected into the region’s canals from the northern edge, and in the rainy seasons, there are natural flows of water from the mountains in the southern part because of the elevated topography. (Figure 67)
To understand the existing water pipeline in more details, we zoom in to the selected boundary of the first phase. The existing canal network’s intersections with the selected boundary were identified and when analyzed in terms of water flow and network, the results stated that the fabric consists of massive soil blocks and a disproportionally connected network, that leads to a non-adaptive urban fabric residing on polluted water bodies. (Figure 4)
Figure 4. Existing seasonal water inlets around the region, northern ones for the dry seasons, and southern ones for the rainy seasons.
To generate the canals, an evolutionary process was created to generate a new network of water canals that has three layers of canals within a sequential evolutionary process that gets refined after each step through a feedback loop. Then the generated networks were analyzed through computational fluid dynamic workflows optimized according to the venturi effect for a continuous water flow to reach the final network in the global scale. (Figure 5)
III. II. Canal Network Generation
Figure 6. Flowchart of the evolutionary process of network generation.
Figure 5. Intersections of the existing canal network with the selected boundary of phase 1, locating the intersections on the left, and zoomed in on the right
The three layers of network are supposed to cover the selected boundary with an optimum network distribution and were generated from this random-looking network to a rationalized one by Identifying four main objectives for the generative process that are increasing the water flow, closeness to the orientation of prevailing winds, evenly distributed network, and similarity of the generated islands in between. (Figure 10)
Three final phenotypes were selected out of 1000 options that were slightly performing differently within the objectives. Then based on the CFD analysis on the final three options in regards to the water flow, The top-performing one was selected. (Figure 8)
Eventually the final network was optimized in terms of the width of the canals and its effect on the water flow, analyzed and optimized once more with through the CFD workflows, and the final network of canals and islands was created in the global scale. (Figure 7)
Figure 7. The network generation through three layers of its hierarchy
Figure 9. The network generation through three layers of its hierarchy
8. CFD analysis on the top three performing generated networks, best one on the left was selected
10.
CFD analysis that resulted into selecting the option on the left, with the minimum curvature of each canal.
Figure
Figure
TFinal
Local Scale, Component Generation
To reach the morphology of the local component, it was taken into consideration the complexities seen in the site analysis such as the increasing informal settlements that bring pollution to the waters of the lake; seeing how the current urban growth does not fit the traditional chinampa system and is “killing” the chinampa, chinampa that is not agriculturally worked will cease to function, it is because of this that an urban measure must be approached by eliminating the “dead” chinampas and placing a reinterpreted design which strives to purify the polluted waters of Lake Xochimilco where a harmonious blend of ancient wisdom and modern techniques are pursued. To achieve this a set of goals are appointed setting a design logic and process.
Figure 11. Abstraction sketch of floating phenotype
Stage I: Design Logic and Process
The initial goal was to make the system more modular. By incorporating modular design principles by incorporating modular geometry, the hexagonal shape was selected for its efficiency in tessellation, offering a stable and flexible base that allows for a cohesive arrangement of elements; this allows the reconfigured chinampas to become more adaptable and suitable for modern urban environments. Analysis revealed stagnant water and pollution buildup in the canals; to improve water flow, curved tunnels were introduced, creating a pathway for circulation. The overall concept was to break up the chinampas into modular sections to promote better water movement. As it was seen in the regional stage, there are two forms to be approached in the local scale, a floating morphology in which the agricultural application is maintained and a fixed morphology which reaches the lakebed allowing the roots of the Ahuejote tree to fix the component to the soil as studied in the chinampa system. The concept behind this modular hexagonal structure is to merge traditional ecological practices with modern design principles to address urban and environmental challenges. Inspired by the ancient chinampa system, the structure is designed to enhance water filtration, increase biodiversity, and promote sustainable urban growth.
Figure 12. Transformation of the old chinampas to the new system with hexagonal tessellation.
Figure 13. The potential effect of the hexagonal tessellation on the water flow based on the Venturi effect
As a second instance, specific objectives were established to create optimal performing phenotypes. These objectives include maximizing surface area for placement of oxygenating plants in the outer shell of the component as well as allowing the layering of mud, vegetation, and organic matter seen in the original chinampa system. Ensuring a high percentage of porosity for water flow and filtration resulting in natural water irrigation as previously studied. Minimizing the level of displacement was crucial to achieve structural stability and balance between the opposing forces of soil inside the component and the water that surrounds its outer shell. For the floating component’s morphology, the same objectives were utilized yet the principles of buoyancy were incorporated.
With this design objectives an initial morphology is reached; the resulting component creates a “basket” shaped structure that allows levels of porosity as well as containment for the placement of the layered soil. The component showcases a rugged multi-layered outer shell that may host an environment for a wide variety of plants, amphibians and other water creatures found in the lake, the open-pored surfaces support roots and climbing plants, by creating orientation and porosity, water absorption and conductivity is possible.
Figure 14. The resulted basket-shaped component that would allow purifying plants to live upon it
14. A depiction of the logic and objectives to generate the morphology through the evolutionary algorithms
Figure
Stage II: Component Optimization and Post Analysis
Form finding continues with computational optimization, this process helps streamline the design process, ensuring that the resulting morphology meets the desired performance criteria, and enabling the discovery of innovative solutions. By defining and optimizing a set of fitness objectives it was possible to improve the performance of the morphology in terms of the specific criteria set such as maximizing the component’s surface area, minimizing displacement, maximizing the percentage of porosity, and, in the case of the floating morphology, minimizing the component’s density, as well as rising the percentage of air inside a section of the component in which a chamber of air is set at the base mimicking the buoyancy techniques seen in boats. By defining different fitness objectives often trade-offs are involved; for instance, when maximizing the surface area the density of the component may increase, affecting its buoyancy. By using optimization, it was possible to explore these trade-offs systematically and find a balance that meets the desired requirements. Exploring the wide range of possible morphologies and evaluating them against multiple objectives, new and unexpected solutions emerge, identifying those that best meet the fitness criteria. These solutions are evaluated by quantifying the performance of the different phenotypes against the set of fitness objectives, providing a data-driven basis in the choosing of the final component. This optimization was done by running the Wallacei, an evolutionary engine that allows users to run evolutionary simulations in Grasshopper 3D.
Optimization Results:
Fixed Component
The first optimization process has been run over the fixed morphology of the component. Three fitness criteria (FC) have been set as targets for the optimization:
I. Porosity Percentage
Through this FC a maximization of the overall porosity (calculated as a ratio between the “carved” empty volume and the original volume of the thickened mesh) has been pushed.
II. Surface Area
With this FC a maximization of the overall surface area has been searched, in order to foster the attachment of plants to the surface of the component.
III. Maximum Displacement
Through the minimization of this value, the stability of the component can be assured under the difference pressures acting simultaneously on it.
The Standard Deviation graphs, along with the Parallel Plot, display a counterbalancing effect emerging between the Porosity Percentage and the maximized Surface Area.
Nevertheless, the displacement values do not perform as effectively along the set of generations. This likely to be induced by the very stable set of forces acting onto the phenotypes along the generations, with the changing porosity not evidently affecting the displacement performance among the limits set by the optimization.
Figure 15. Standard deviation and Parallel Coordinate Plot resulting from the optimization.
Best Performing Phenotype For Fitness Criteria 01
The phenotype that best performed in terms of Maximised Surface Area criteria (FC01) shows a certain balance between Surface Area and Porosity.
This balance eventually identifies this solution as the generally best performing component.
16. Best performing fixed phenotype fro FCO1, with its objective values, standard deviation.
Figure
Best Performing Phenotype For Fitness Criteria 02
The phenotype that best performed in terms of Maximised Surface Area criteria (FC02) shows a certain balance between Surface Area and Porosity.
This balance eventually identifies this solution as the generally best performing component.
17. Best performing fixed phenotype fro FCO2, with its objective values, standard deviation.
Best Performing Phenotype For Fitness Criteria 02
Figure
Best Performing Phenotype For Fitness Criteria 03
The phenotype that best performed in terms of Displacement criteria (FC03) shows a clear lack of Porosity.
The “folds” of the morphology show a filled thick wall, which aligns with the need for an increased cross section in those lower areas of the shell being in contact with an increased pressure caused by both the surrounding water and the contained soil as the depth increases.
Figure 18. Best performing fixed phenotype fro FCO3, with its objective values, standard deviation.
Best Average Performing Phenotype
This balance eventually identifies this solution as the generally best performing component, having values closer to center.
19. Best performing fixed phenotype, with its objective values, standard deviation.
Figure
F.E. Analysis: Maximum Displacement
The diagram displays the distribution of displacement under the test load case: it is constituted by the gradient of water pressure (increasing with depth) acting normally to the external surface of the shell, and the inner pressure caused by the soil.
Figure 20. The Karamba diagrams represent the displacement and average stress along the fixed shell, respectively.
F.E. Analysis: Principal Stress 1, 2, and Equivalent
The above diagrams represent, respectively, the 1st principal stresses, 2nd principal stresses and the average stress along the shell.
The gradients show quite clearly that the crucial parts for the structural stability of the component correspond roughly to both the upper edges of the hexagonal opening and the concavities located in the lower section. Specifically, the stress increases with the closeness to the “nervatures” displayed by the morphology in its tapering along the height.
B.E.S.O. Shell Optimization:
The BESO (bi-directional optimisation) run on the shell outputs a gradient which indicates the areas where material could be removed without affecting the overall component’s performance under stress. Notice the consistency with the stress analysis previously showed.
Figure 21. The Karamba diagrams represent BESO results and force flow diagram
Force Flow Diagram
Finally, the Force Flow diagram showcases the main action directions of the shell’s internal reactions. The shell is noticeably affected by bending moments where the force flow arranges in swirling patterns. The upper sections of the component have to respond to this structural condition that is clearly highlighted.
Optimization Results: Floating
Component
Figure 22. Standard deviation and Parallel Coordinate Plot resulting from the optimization.
A second optimisation process has been run over the floating morphology of the component. This time five fitness criteria (FC) have been set for the optimisation, adding further criteria to the previous ones:
I. Porosity Percentage
Through this FC a maximisation of the overall porosity (calculated as a ratio between the “carved” empty volume and the original volume of the thickened mesh) has beenpushed.
II. Surface Area
With this FC a maximisation of the overall surface area has been searched, in order to foster the attachment of plants to the surface of the component.
III. Buoyancy
The presence of air inside the component, determines, along with the amount of soil contained for cropping, the theoretical density of the unit. To be kept afloat, the component needs indeed to keep a theoretical density that is smaller than water.
IV. Maximum Displacement
Through the minimisation of this value, the stability of the component can be assured under the difference pressures acting simultaneously On it.
V. Maximum Amount of Air Percentage
As previously mentioned, the volume of air affects not only the buoyancy of the component , but also the amount of soil, together with the overall loads system acting onto the shell.
Best
Performing Phenotype For Fitness Criteria 01
The phenotype that best performed in terms of Porosity (FC01) shows an intuitively predictable alignment with a good performance in terms of overall density.
Figure 23. Best performing floating phenotype for FCO1, with its objective values, standard deviation.
Best
Performing Phenotype For Fitness Criteria 02
The phenotype that best performed in terms of Surface Area (FC02), at the contrary of the previous scenario, displays a very unfavourable result in terms of buoyancy. An addition of material along the shell areas can surely benefit the resistance to extreme deformations; nevertheless, the additional surface area appears to be generated on the inner side of the component, thus not being able to create a real benefit for the attachment of plants on the outer side.
Figure 24. Best performing floating phenotype for FCO2, with its objective values, standard deviation.
Best Performing Phenotype For Fitness Criteria 03
The phenotype that best performed in terms of Air content criteria (FC03) aligns to the best performance option in terms of overall porosity.
25. Best performing floating phenotype for FCO3 with its objective values, standard deviation.
Figure
Best Performing Phenotype For Fitness Criteria 04
The phenotype that best performed in terms of Displacement minimisation (FC04) is very close to the component that maximised the surface area, by thickening and filling most part of the shell surfaces and folds.
Figure 26. Best performing floating phenotype for FCO4 with its objective values, standard deviation.
Best
Performing Phenotype
For Fitness Criteria 05
The phenotype that best performed in terms of Maximised Surface Area criteria (FC05) shows an interesting result in terms of buoyancy: indeed, the overall theoretical density reached by this option does not provide a significant advantage in terms of floating, showing that the balance in the air-soil ratio is quite significant.
27.
performing floating phenotype for FCO5 with its objective values, standard deviation.
Figure
Best
Best Average Performing Phenotype
The best performing option displays clearly what mentioned for the best performing component in terms of FC05: the air quantity has to be well balanced to avoid unnecessary losses in soil quantity and porosity, which would also affect strongly the agricultural performance of the unit.
28. Best performing floating phenotype with its objective values, standard deviation.
Figure
F.E. Analysis: Maximum Displacement
The diagram displays the distribution of displacement under the test load case: it is constituted by the gradient of water pressure (increasing with depth) acting normally to the external surface of the shell, and the inner pressure caused by the soil.
Figure 29. The Karamba diagrams represent the displacement and average stress along the fixed shell, respectively.
F.E. Analysis: Principal Stress 1, 2, and Equivalent
The above diagrams represent, respectively, the 1st principal stresses, 2nd principal stresses and the average stress along the shell. The gradients result far smoother than for the static counterpart. The shape of the floating component seems to favour a structural stability, probably affected by the shallowness of the object compared to the fixed option.
B.E.S.O. Shell
Optimization:
The BESO (bi-directional optimisation) run on the floating shell, aligns to the results displayed above by the stress analysis: the shell can be quite uniform, while a subtraction of material is suggested solely on the upper edges, where the pressure of both soil and water is less effective.
Figure 30. The Karamba diagrams represent BESO results and force flow diagram
Force Flow Diagram
Finally, the Force Flow diagram draws once again swirly patterns onto the upper areas of the floating component. These are though well distributed, explaining the well distributed stresses along the surface of the shell.
Stage III: Final Components
After performing the computational evolutionary optimization in conjunction with the finite element analysis and Bi-directional Evolutionary Structural Optimization the best performing phenotype for the fixed and the floating component are chosen as the final designs.
The resulting final fixed morphology measures three meters in diameter and features a high percentage of porosity allowing water filtration, this promotes the natural irrigation of the system as it was studied in the original chinampa system. The fixed morphology creates a woven pot structure, to be filled with layers of soil and organic matters until reaching the lakebed, as the original chinampa features. The structure is then fixed by allowing the Ahuejote tree to grow roots to the bottom of the lake. The outside walls of the woven structure allow the oxygenating plants to latch on and grow while purifying the flowing water of the lake. This axonometric view shows the final morphology that will serve as a boundary and an anchor for the rest of the system.
Figure 31. Final architectural drawings of the fixed component plan view (left), section (top right), and axonometric (right down).
Floating Component
The final floating component also measures three meters in diameter and is subdivided into two: with a high percentage of porosity in its top portion and with no porosity in the lower portion, looking to create closed chambers that allow it to be buoyant. Unlike the fixed component, this morphology will remain floating allowing dynamism in the overall system as it may change positions if needed. To allow the component to float, buoyancy seen in boats was studied and repeated by creating a chamber of air in the base of the component, making it less dense than water thus resulting in floatation. The upper part of the component is filled with layers of soil and organic matter creating a rich ground for cultivation and, due to the porosity created in this top section, natural irrigation of the crops is also possible. In the outer shell of the component oxygenating plants are grown to purify the water of the lake.
Figure 32. Final architectural drawings of the floating component plan view (left), section (top right), and axonometric (right down).
Morphology Conclusion
The overall structure is conceived as a thin, yet resilient shell that supports both the soil needed for aquaculture and the ecological processes that may purify the water. The shell is to be constructed from lightweight, durable materials that are resistant to the harsh conditions of the aquatic environment. Its thin profile allows it to float effortlessly on the surface of the lake, while its porous design ensures that it interacts continuously with the water, facilitating the exchange of nutrients and gases.
The fixed component, filled with soil and interwoven with the roots of the Ahuejote, provide stability and anchor the component in place, not only securing the floating structure but also enhancing the ecological connectivity between the structure and the lakebed. The hollow legs in the floating component pursue the buoyancy of the design and allow the dynamism needed in the regional scale to address the issues presented by the two marked seasons of the site. The multi layered approach of both components shell create microhabitats for various aquatic organisms, contributing to the overall biodiversity of the lake whilst permitting the placement of oxygenating plants that may purify the water.
This modern take of the chinampa is an intricate and sustainable solution that honours the traditional methods of the past while addressing the environmental challenges of the present. By integrating advanced techniques such as porosity, oxygenating plants, and computational optimization, the design offers a comprehensive approach to water purification and ecological restoration in Lake Xochimilco. Through this innovative design, the floating structure not only contributes to the health of the lake but also supports the continuation of the region’s rich cultural and agricultural heritage.
Figure 33. Final architectural section of aggregated components.
Local to Regional Relevancy
In the regional scale, component aggregation enhances the Venturi effect, which significantly boosts water purification efficiency and supports the cropping system. By arranging components into a continuous, overlapping network, the system ensures an uninterrupted flow of water. Gravity drives the water along the network’s surface, accelerating flow velocity and reducing pressure, which increases water oxygenation. This enhanced flow improves purification by filtering particles and promoting biological processes like aerobic microbial activity and nutrient absorption by plants.
The system is closed-loop: oxygen-rich water circulates to the upper agricultural layer, while water from this layer filters down to the aquatic layer. The aquatic environment supplies water and nutrients to the crops, and in return, the crops provide oxygen, CO2, and nutrients necessary for the aquatic organisms and plant growth. cultural and agricultural heritage.
Figure 34. Final architectural plan view of aggregated components.
Aggregation Logic
In the regional scale, component aggregation enhances the Venturi effect, which significantly boosts water purification efficiency and supports the cropping system. By arranging components into a continuous, overlapping network, the system ensures an uninterrupted flow of water. Gravity drives the water along the network’s surface, accelerating flow velocity and reducing pressure, which increases water oxygenation. This enhanced flow improves purification by filtering particles and promoting biological processes like aerobic microbial activity and nutrient absorption by plants.
The system is closed-loop: oxygen-rich water circulates to the upper agricultural layer, while water from this layer filters down to the aquatic layer. The aquatic environment supplies water and nutrients to the crops, and in return, the crops provide oxygen, CO2, and nutrients necessary for the aquatic organisms and plant growth.
Figure 35. Diagram of component aggregation logic.
Figure 36. Final architectural section of aggregated components.
Following this logic, the floating component is destined for agriculture thus is left in the center of the aggregation, surrounding them come the fixed components thus creating a perimeter that fixes the components in the centre. Floating components that are not destinated for agriculture, are then aggregated around the fixed component boundary as needed to result in the flow of water requiered to meet the seasonal stream.
Seasonality Movement
The seasonality versatility that the system is able to achieve at a regional and global level is granted by the floating components that are aggregated around the boundary of the fixed. These floating components may be moved around by being tied to canoes and thus relocated or clustered in areas that facilitate the flow of the present season. During the rainy season the natural flow of the water comes from the south as the irrigation comes from the skirts of the mountains whilst during the dry season the flow of the lake changes coming from the wastewater treatment plants located on the north of the site. By having floating components, the urban fabric becomes dynamic, changing to address the water movement of each season, resulting in a more pronounced flow that oxygenates the lake yearly and enhancing the water management of the fabric.
Figure 36. Final architectural section of aggregated components.
Figure 36. Final architectural section of aggregated components.
The joinery functions in a very simple manner, in the borders of each morphology, cylindrical holes are drilled allowing the placement of a staple like anchor that joins and fixes the compontents together. When needs, the anchor is lifted allowing to move the component to its new location were the anchor will be placec again.
Figure 37. Joinery representation
Computational Fluid Dynamics Analysis
This figure presents a new design concept based on the left shape versus the right rectangular chinampa form. The latter is the traditional form of a chinampa. For fluid dynamical purposes, the gradient colors around the shapes likely represent water flow or distribution of pressure. The rectangular chinampa form gives rise to sharper, more concentrated flow patterns, as can be inferred from the more pronounced color changes. This would suggest that this shape is more disruptive to the water flow and may cause higher turbulence or local stagnation areas.
On the other hand, the flow is dissipated much more smoothly by the hexagonal design because of the edges in the shape, allowing for a more uniform and broad interaction with the fluid. Such a softer flow distribution indicates the hexagonal design’s ability to minimize turbulence and enhance water circulation, thusoffering better oxygenation and nutrient distribution in the chinampa system.
Figure 38. CFD comparative analysis of the chinampa systems.
Above, one can see the traditional rectangular chinampa, while to the right, the new morphology aggregated. Some differences appear evident when analyzing fluid dynamics around these forms. The flow in the left-side chinampa structure is more uniform, and the fluid travels in parallel lines over and around its rectangular shape. Yet, this trend does suggest that this flow resists at the edges and allows pockets of stagnation and less dynamic water movement within the system.
On the right, the new morphology of a more complicated form introduces varied water flows. Contours in this design, supported by multiple legs or columns, break up the flow, creating vortex-like patterns, which also promote better water circulation under and around the structure.
Figure 38. CFD comparative analysis of the chinampa systems.
Fabrication
Scaled 3D Printed Morphologies
In order to achieve an inter-connected structural system and uniform material properties, 3d printing tools with different scales and techniques were explored for prototyping the final morphology. The initial test were done using 3d printers in scale of 1 to 200 and plastic filaments. As the 3d printing devices function with an integrated algorithm to calculate how it should print, the results gave us an insight on whether the form could be printed without any supports with the right algorithm. This experiment provided us feedbacks that eventually informed back the form finding process to refine the structural setup of the morphology for printing.
Figure 39. 3D printed physical models of floating (left) and fixed component (right)
3D Printed Morphologies with Robotic Arms
The final exploration was done as a resemblance of the actual fabrication of the morphology in the site, through a scaled printing with the robotic arms with a clay mixture that is close to the proposed material. This large-scale print that was the biggest clay-printed prototype of the school’s Digital Prototyping Laboratory (DPL) by the time of documentation. As a result of its size and challenging form, the printing happened to be quite technically difficult. The team were eventually successful in printing a sample of the final morphology in scale of 1 to 50.
Figure 40. 3D printed Fixed component in clay with robotic arm.
Considerations
However, due to various factors in place that regularly occur for such processes, the final printed prototype was cracked in 3 parts. The three cracked parts were exactly located where the maximum stress of the structure was visible previously in the analysis. These challenges would give us appropriate guidance on developing the form and its fabrication step-by-step over time, to eventually reach an optimum point of structural knowledge and fabrication technique.
Figure 41. 3D printed Fixed component in clay with robotic arm.
Future Research
This multi-scalar design research has already covered various aspects of the life of chinamperos1, however, there are still undiscovered areas of the design left for future explorations. Therefore, this design research could continue in the March phase on three main areas that were recognized:
Scaled 3D Printed
Morphologies
The site’s environmental conditions could be divided into two timelines: the dry and rainy seasons. Therefore, the environmental and socio-economic information about the site could be used in a pipeline with machine learning algorithms1 to define new urban organizations for different periods. Thus, the aim would be to make the new urban setup self-organizing and active to the external stimuli, including seasonal changes in the weather or food production resources.
This process would tackle an important centuries-old challenge of static urbanism and propose a dynamic urban fabric that could change periodically or in specific timelines. As the selected site is based on the water and the components could be floating, a strong starting step ahead could be provided for proposing a potential in an adaptive urban configuration.
1 For similar purposes regarding automated generative models, Lunch Box which is a Grasshopper plugin that also includes machine learning components could be used.
1 Local farmers who work on the chinampas.
As the polluted areas and other malfunctioning zones are located around the setup of informal living, a new model for the urban tissue in the selected boundaries could be proposed to find a more classified solution for the people’s lives and work dynamics. In this new urban tissue, spatial requirements would be imported to a digital workflow that includes network analysis to run another evolutionary process to define the new urban organization.
As partially indigenous people are living informally upon the selected site, no spatial programming or zoning were provided in this phase of the design research to not impose more than necessary to the inhabitants. However, by studying how people are already living in the region and transforming that information to the input data of a model, it would be possible to generate architectural programming and also documentation through an automated process. The model for this automation could be made either using machine learning algorithms or image processing techniques. In this case, as the input data set might have an enormous set of rows, image processing and GAN1 could be a more comfortable solution. For such, a similar study that were done using the same technique could be a role model. (Figure x)
The fabrication of the final morphological prototype was done by 3d printing using a robotic arm. This process used a clay mixture as the material for printing. As per the physical experiments and material studies of this proposal, a decisive area for future research could be the actualization of using fore-mentioned material mixtures such as Pozzolana for the 3d printing. Therefore, the challenge of putting the clay-printed morphology and baking it in advance would be tackled.
Also, the process of 3d printing with the robotic arms depends on a variety of parameters that might change every time. These parameters would include the robotic arm itself, the material mixture, the printing thickness, or even the room temperature. Therefore, all these parameters would have to be experimented on to achieve an optimum result of 3d printing, which would eventually allow us to fabricate a complex geometry with a uniform material and structural system in the future.
Spatial Programming
Advanced Fabrication
Discussion
This design research tackled various problems of the context with design solutions in three different scales of global, regional, and local. It is crucial to understand that after studying the main research interests and concerns of this research, the main reason for selecting the protected area of Xochimilco was not only the environmental problems that have occurred there, but also for the invaluable heritage that their people had left for us. Therefore, Xochimilco becomes a forgotten, abandoned area that used be a very innovative community on the water bodies. Thus, the research and design process started to take this urban fabric into the present and also, to make it updated for an unforeseeable future which is yet to come.
In order to tackle and answer the improper environmental and socio-economic challenges of this context, various design solutions were aligned in progressive workflows to address each problem. As a result, each design solution might provide an answer to one or more problems. Although, the links and feedback loops in-between the pipelines would help address all the identified challenges at the same time. Also, another important feature of these inter-connected workflows is the fact that regardless of any kind of interruptions in the system, the urban system model would still be able to embrace and reflect on the changes to the inputs. On the other hand, this connectivity of the pipelines and the integrated feedback loops of the system, would create a multi-layer data input and output that slows down the whole process to some extent.
Figure 42. 3D printed physical model of fixed component
Figure 4. Existing seasonal water inlets around the region, northern ones for the dry seasons, and southern ones for the rainy seasons.
Figure 5. Intersections of the existing canal network with the selected boundary of phase 1, locating the intersections on the left, and zoomed in on the right
Figure 6. Flowchart of the evolutionary process of network generation.
Figure 7. The network generation through three layers of its hierarchyFigure 8. CFD analysis on the top three performing generated networks, best one on the left was selected
Figure 8. CFD analysis on the top three performing generated networks, best one on the left was selected
Figure 9. The network generation through three layers of its hierarchy
Figure 10. TFinal CFD analysis that resulted into selecting the option on the left, with the minimum curvature of each canal.
Figure 11. Abstraction sketch of floating phenotype
Figure 12. Transformation of the old chinampas to the new system with hexagonal tessellation.
Figure 13. The potential effect of the hexagonal tessellation on the water flow based on the Venturi effect
Figure 14. A depiction of the logic and objectives to generate the morphology through the evolutionary algorithms
igure 15. Standard deviation and Parallel Coordinate Plot resulting from the optimization.
Figure 16. Best performing fixed phenotype fro FCO1, with its objective values, standard deviation.
Figure 17. Best performing fixed phenotype fro FCO2, with its objective values, standard deviation.
Figure 18. Best performing fixed phenotype fro FCO3, with its objective values, standard deviation.
Figure 19. Best performing fixed phenotype, with its objective values, standard deviation.
Figure 20. The Karamba diagrams represent the displacement and average stress along the fixed shell, respectively.
Figure 21. The Karamba diagrams represent BESO results and force flow diagram
Figure 22. Standard deviation and Parallel Coordinate Plot resulting from the optimization.
Figure 23. Best performing floating phenotype for FCO1, with its objective values, standard deviation.
Figure 24. Best performing floating phenotype for FCO2, with its objective values, standard deviation.
Figure 25. Best performing floating phenotype for FCO3 with its objective values, standard deviation.
Figure 26. Best performing floating phenotype for FCO4 with its objective values, standard deviation.
Figure 27. Best performing floating phenotype for FCO5 with its objective values, standard deviation.
Figure 28. Best performing floating phenotype with its objective values, standard deviation.
Figure 29. The Karamba diagrams represent the displacement and average stress along the fixed shell, respectively.
Figure 32. Final architectural drawings of the floating component plan view (left), section (top right), and axonometric (right down)
Figure 33. Final architectural section of aggregated components.
Figure 34. Final architectural plan view of aggregated components.
Figure 35. Diagram of component aggregation logic.
Figure 36. Final architectural section of aggregated components.
Figure 37. Joinery representation
Figure 38. CFD comparative analysis of the chinampa systems.
Alvarado, Rocío González. “Canales de Xochimilco, Con Agua Contaminada Y Pestilente.” La Jornada, January 11, 2024. https://www.jornada.com.mx/noticia/2024/01/11/ capital/canales-de-xochimilco-con-agua-contaminada-y-pestilente-6155.
“Biorock: A Sustainable Technology for Marine Ecosystem Restoration.” Goreau, T.J., & Hilbertz, W.H. (2005). Marine ecosystem restoration: Costs and benefits for coral reefs. World Resource Review 17(3): 375-409.
Centre, UNESCO World Heritage. “Historic Centre of Mexico City and Xochimilco.” UNESCO World Heritage Centre. Accessed, 2024. https://whc.unesco.org/en/list/412/.
“Chinampas Agriculture and Settlement Patterns.” Circular Water Stories. Accessed March 22, 2024. https://circularwaterstories.org/analysis/chinampas-agriculture-and-settlement-patterns/.
Coolhuntermx. “Sobre La Importancia Del Agua y La Labor de Chinampas En Xochimilco, Ciudad de México.” ArchDaily México, July 20, 2021. https://www.archdaily.mx/mx/965408/ sobre-la-importancia-del-agua-y-la-labor-de-chinampas-en-xochimilco-ciudad-de-mexico.
Crisis ambiental en xochimilco, Espacio Emblemático de ... Accessed July 22, 2024. https://www.insp.mx/images/stories/Noticias/Salud_Poblacional/Docs/111103_nsp1.pdf.
Delegacionxochi. “La Problemática Del Abastecimiento Del Agua En Xochimilco.” Xochimilco, February 3, 2016. https://delegacionxochi.wixsite.com/xochimilco/single-post/2016/02/02/la-problem%C3%A1tica-del-abastecimiento-del-agua-en-xochimilco.
Domingos, Pedro. The Master Algorithm: How the Quest for the Ultimate Learning Machine Will Remake Our World. New York: Basic Books, 2015.
Dirección General de Repositorios Universitarios, Universidad Nacional Autónoma de México. “Repositorio Institucional de La UNAM.” Accessed, 2024. https://repositorio.unam.mx/.
Gispert, Mireya Imaz, Luis Zambrano González, Juan Ansberto Cruz Gerón, Adriana Martínez, and Luis Gutiérrez. Análisis Del Estado de Conservación Ecológica Del Sistema Lacustre Chinampero de La Superficie Reconocida Por La UNESCO Como Sitio Patrimonio de La Humanidad En Xochimilco, Tláhuac y Milpa Alta. Mexico City: UNAM, 2014.
Jonkers, H.M. “Self-Healing of Cracks in Concrete Using Microorganisms.” Heron 56(1-2), 1-12. 2011.
Showkatbakhsh M., and S. Kaviani. “Homeostatic Generative Design Process: Emergence of the Adaptive Architectural Form and Skin to Excessive Solar Radiation.” International Journal of Architectural Computing 19, no. 3 (2021): 315-330. doi:10.1177/1478077120951947.
Smart Nodes Pavilion - Towards Custom-optimized Nodes Applications in Construction. ResearchGate. Accessed, 2024. https://www.researchgate.net/publication/315882826_SmartNodes_Pavilion_-_Towards_Custom-optimized_Nodes_Applications_in_Construction.
Wang, J.Y., Soens, H., Verstraete, W., & De Belie, N. “Self-Healing Concrete with Microencapsulated Healing Agents.” Cement and Concrete Research 56 (2014): 139-152. doi: 10.1016/j.cemconres.2013.11.009.
Zhou, Yuhan, and Qihao Weng. “Building up a Data Engine for Global Urban Mapping.” Remote Sensing of Environment 311 (2024): 114242. https://doi.org/10.1016/j.rse.2024.114242.
CHAPTER VI
This scientific design research, were produced with various processes of design and related evaluation that are supported by thorough and complex tools and techniques. However, as this is, and will be, an ongoing design research, discussing the overall outcomes of both the result and its procedures would be crucial.
In this chapter, three main discussions are included that reflect on the endeavors of the authors during the past few months in the MSc. phase. These discussions are noted as overview, limitations, and conclusion to address the March. phase more clearly. Thus, each of these sections would discuss the challenges, deficits, possibilities, and the potentials of this project for the future research continuation to help achieve more precise and sustainable solutions.
Limitations
In terms of the technical aspects of the design, there are a few agendas that could be further explored. These areas include urban network generation, structural optimization, material exploration, and advanced fabrication. All of which, could have been experimented on more deeply if it was not to prioritize creating the general urban model. Therefore, with this model in place, such agendas and other uncovered issues could be addressed and included in the feedback loops of the general urban system.
Also, the design solutions of this research might come handy for numerous problems, however, due to the scale of the project, this design research still must improve in various ways. As the pipelines are all connected to one another, with the rather short period of time available to the team, the workflows proved to be requiring heavy hardware and software.
Eventually, as per the predictable case for any design research, the available time for the team to delve deep into the contextual challenges and providing solutions might have not enough to reach the optimum answers. This challenge would be addressed more properly in the next phase of this ongoing design research as the contextual analysis has been done to an appropriate extent and also, the pipelines have been created. Therefore, the optimization of the pipelines and addressing the uncovered aspects of the design could provide more noticeable and refined results for the design applications.
Conclusions
The final proposal of this design research in the MSc. phase has provided design solutions in three different scales of global, regional, and local. The main goal of this project in the global and regional scales was to create a multi-layer urban system model, that could be able to provide design solutions to similar biomes around the globe. Meanwhile, in the local scale, the design process focused on tackling a specific challenge of the selected biome which is water pollution. Therefore, as a result of thorough understanding of the contextual conditions and the potential of our tools and techniques, different problems were tackled in a unique scale.
The design process created various pipelines in the digital and physical workflows to find the solutions. The tools that were explored, were all part of an inter-connected set of pipelines. These pipelines were linked backand-forth with general and detailed feedback loops that were informing each phase of the design research. However, the limitations of time and scale were also decisive in providing the ultimate answer for each challenge, that must be addresses in the future March. phase of this ongoing design research.
This multi-layer urban model would have to be informed by the environmental and socio-economic conditions of the chosen biome to provide a contextually-revised answer. Thus, by reviewing the global warming and the challenge of rising sea levels, the idea of living on the water could be an alternative to dense-populated urban areas in the world. This rather utopian idea of an urban model might look close to the concept of the Master Algorithm -the book by Pedro Domingos- and seem unrealistic or too complex at the moment, however, the concept of such urban models could be achieved by the progress of artificial intelligence in the near future.