COLLECTIVE MORPHOGENESIS
MASTER OF ARCHITECTURE DISSERTATION
2012 - 2014
Viral Doshi Mehnaj Tabassum
EMERGENT TECHNOLOGIES AND DESIGN
Michael Weinstock
George Jeronimidis
Evan Greenberg
Mehran Gharleghi
Wolf Mangelsdorf
Director Director Studio Master Studio Tutor Visiting Professor
ARCHITECTURAL ASSOCIATION SCHOOL OF ARCHITECTURE
GRADUATE SCHOOL PROGRAMME
COVERSHEET FOR SUBMISSION 2012-14
PROGRAMME: Emergent Technologies and Design
TERM: 2014 - Term 4
COURSE TITLE : Master of Architecture Dissertation
COURSE TUTORS: Michael Weinstock, George Jeronimidis Evan Greenberg, Mehran Gharleghi
SUBMISSION DATE: 14 February 2014
STUDENT NAMES: Viral Doshi Mehnaj Tabassum
SUBMISSION TITLE: Collective Morphogenesis
DECLARATION:
“I certify that this piece of work is entirely my/our own and that any quotation or paraphrase from the published or unpublished work of others is duly acknowledged.”
Signature of Student(s): Viral Doshi [M.Arch] Mehnaj Tabassum [M.Arch]
Date: 14 February 2014
ACKNOWLEDGEMENTS
We would like to thank our families, tutors and friends for support and encouragement throughout the project.
In addition, the invaluable help of Marco Corazza and Axel Körner is greatly appreciated.
A special thanks to:
Emtech Staff
Michael Weinstock
George Jeronimidis
Evan Greenberg
Mehran Gharleghi
London Metropolitan University
CassWorks
Robert Mull
Marcus
Andy Hills
Mark Angus
Morphogenesis is the process by which natural systems produce organized arrangements.
TABLE OF CONTENTS
ABSTRACT INTRODUCTION DOMAIN SYSTEM DEVELOPMENT SYSTEM PROPOSAL SYSTEM EVALUATION REFERENCES
13 15
APPENDIX
FLOOD CONDITIONS OVERVIEW OVERVIEW OVERVIEW BIBLIOGRAPHY SCRIPTS SITE SCENARIO HOUSING ORGANISATION PARTS TO WHOLE IMAGE INDEX DIAGRAM INDEX HYDROLOGICAL SYSTEM MATERIAL + CULTURE NETWORK TOPOLOGICAL ANALYSIS VISUALISATIONS SITE STRATEGY CASE STUDY WATER NETWORK PROGRAMME ORGANISATION OVERVIEW 20 144 200 246 264 267 208 250 214 218 224 150 156 170 180 19 140 198 244 262 270 COUNTER FLOOD STRATEGIES 30 REGIONAL STUDIES AMBITION 38 50 Current Situations Types River Morphology Coastal Morphology Existing Construction Technique Fibre Composites Fibres Polymers Fabric and Sandwich Panels Structural Core Current Situation Internal Logic Existing Typology Design Drivers Initial Tests Aggregation Tests Programmes Public Building Type Housing Type Rainwater Collector Type Forming Process Bending Parametrisation Material Adaptation 21 22 24 28 69 70 72 74 76 78 111 114 116 119 120 124 131 132 134 136 81 90 102 145 146 148 201 202 206 247 248 209 251 252 254 256 258 214 215 219 220 222 151 157 160 166 171 172 176 181 182 186 Flotation Barrier Diversion Dispersion Natural Systems Bangladesh Causes of Flooding Effects of Flooding Mitigation Strategies 31 32 33 34 36 39 42 44 48 Flood Maps Physical Features Extraction of Forces Ponds Pressure Zones Orientation Process Environmental Driver Branching Natural Systems System Phasing Housing Programme Housing + Network Culturally Driven System Ground Network Elevated Network Panelisation Pressure Mapping Opening Breakwater Community Structure Hydrological Structure Angkor Water System Proposed System Primary Channels Secondary Channels Patch Types Patch Distribution Fresh Water Relation 1
GEOMETRY STUDY MATERIAL SCIENCE STAGES SITE CONDITIONS STRATEGY FORM GENERATION RESEARCH EXPERIMENTATION POTENTIALS DIGITAL TOOLS OVERVIEW OVERVIEW OVERVIEW 56 110 118 130 68 80 102 58 54 108 66 2 4 3 5 6 7 8 9
METHODS
ABSTRACT
Many simple elements comprise a complex system, where the relationship that exists between each element is significant. Two characteristics inform complexity: differentiation at the material level and functional integration occurring at the structural/component level.
Situated on a delta, as well as occupying a coastal geometry which ushers in storms, the situation of Bangladesh faces a perpetual phasing of [persistent cycle of] inundation. Current infrastructure does little to reduce the widespread devastation that occurs from cyclones and floods, in the existing rural settlements. Yet a massive barrier strategy cannot be adopted in such a scenario where the cycle of water remains an integral part of an agricultural community.
As flood prone areas often deal with unstable ground conditions, Bangladesh would serve as the prime site for the application of lightweight and highly resistant structures made of fibre composites. Current architectural typologies narrowly focus on creating a large enclosure to situate as many people as possible throughout the duration of the storm, with no
consideration for the occupancy time frame as well as internal usage.
By emphasizing programmatic drivers, the architectural framework will be adapted for various uses of wind and water as the precursor for complexity in spatial organisation, network connectivity and aggregation techniques.
Collective Morphogenesis focuses on the translation of biological processes into behaviours embedded at differing scales, at the material system level as well as a global aggregation. The M.Arch goal will be to generate a village morphology through an extensive research driven by cultural context, ecological system responses, strategies of organisation, network connectivity and flow dynamics.
Collective Morphogenesis Emergent Technologies and Design 13 12
INTRODUCTION
Force is the appropriate term for our conception of the causes by which [] forms and changes of form are brought about….the form of an object is a “diagram of forces”
[D’Arcy Thompson]
Nature has adapted the morphology of living systems in both material and geometry, to conform to the extreme environments in which it is situated.
Research will concentrate on the application of a range of adapted building morphologies to the site context of Bangladesh, where implementation of a new material system would be ideal in dealing with flooding and cyclone conditions. Through the study of ecological responses to tide fluctuations as well as wind pressures, aspects of soft strategies will be studied and incorporated by studying the village dynamic. Morphological influences to the building system will look at aggregation strategies, not only for reduction of flow velocity, minimisation of impact, but also governing parameters of function. The architectural aim will be to contextualize the framework of the site, and manifest the hydrological needs of an existing village faced with the challenges of the shoreline dynamic.
To understand the relationship between architecture and environment, the methodology will take into account the conditions defining the site as well as how to integrate both a functional usage of water and the existing social infrastructure. Along with a site specific analysis concerning both the climate and village composition, a study will be undertaken to understand natural systems responses and counter
strategies to flooding. Multiple parameters will lead to a highled adapted collective morphology, to not only function in the pressurised environment of a cyclone, but to also anticipate the longer timeframes attributed to inundation of the coast.
The methodology of the project is broken down into multiple levels of research, as follows:
The Domain will set out the current situation regarding rising water level as a global crisis. The current methods of dealing with floods and causes of flooding will be analysed. The chapter will conclude with selection of a site and setting out the ambition for the project.
The Methods chapter will document the various steps taken during the process of developing a multilayered strategy for dealing with flood and will also discuss the tools to be utilised for analysis.
In the Material Science chapter, the focus will be on developing a new material fabrication system for dealing with flood conditions. The adaptation of the material system within the context of the chosen site will also be discussed in the chapter.
The exploration of possible geometries based on the data gathered in the material research will be
undertaken in the Geometry Study chapter. The site forces and factors that will influence the design will also be introduced for further development.
The System Development chapter will highlight the intrinsic relationship of water to the chosen site context, and will look at establishing a hydrological system suited for the environment. The principles of establishing an aggregation strategy will be developed in this chapter.
The principles established in the study of hydrology, typology and organisation will be used in System Proposal to develop a multi-layered system for dealing with floods. It will also document the application of different aspects of the system in different scenarios.
The System Evaluation chapter will focus on assessing the proposed design in its parts, including how this new system can correspond to the traditional methods already in place.
Collective Morphogenesis Emergent Technologies and Design 15 14
DOMAIN 1 1.1 Overview 1.2 Flood Conditions 1.3 Counter Flood Strategies 1.4 Regional Studies 1.5 Ambition
OVERVIEW
Flooding has become one of the most disastrous events recently as climate change and rising sea levels have completely altered the hydrological system. As so many factors can influence the water level, it is difficult to forecast accurately. Rather, many nations are slowly learning that they are not exempt from intense floods, and measures must be taken to anticipate an overflow of water. Investment in defenses should look at a range of timeframes, including long term infrastructure and buildings, as well as easily affected ground conditions.
This chapter documents the forces and factors which influence flooding and the coastal zone. Appropriate case studies undergo research distinguish adaptation through man-made and natural response strategies. Analysis of these hard and soft strategies will allow for a later exploration on developing an approach.
The research in this dissertation is concerned with understanding the dynamic environment of which flooding creates and how a new integrated system can be implemented at a village scale. The development of such a system will incorporate multiple tiers of organisation and adapt for the various phases of inundation.
[For] the tendency to equality of action, or to the establishment of a dynamic equilibrium...as any member of the system may influence all the others, so each member is influenced by every other. There is interdependence throughout the system.1
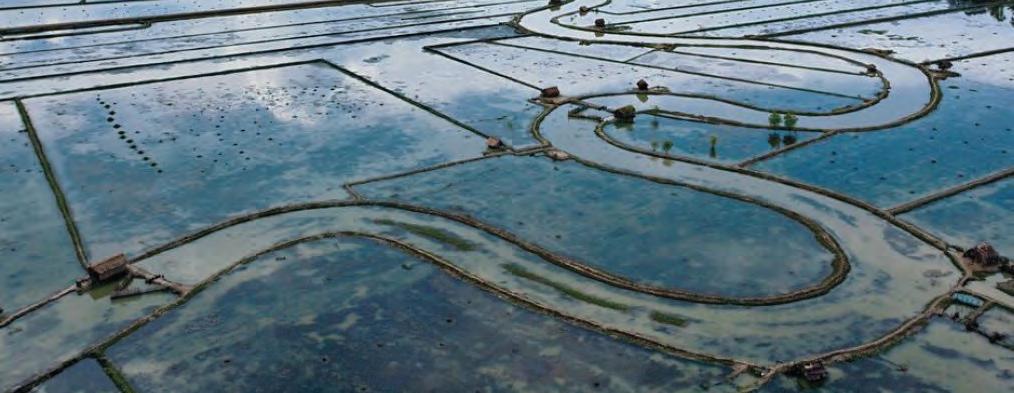
Collective Morphogenesis Emergent Technologies and Design 19 18 1
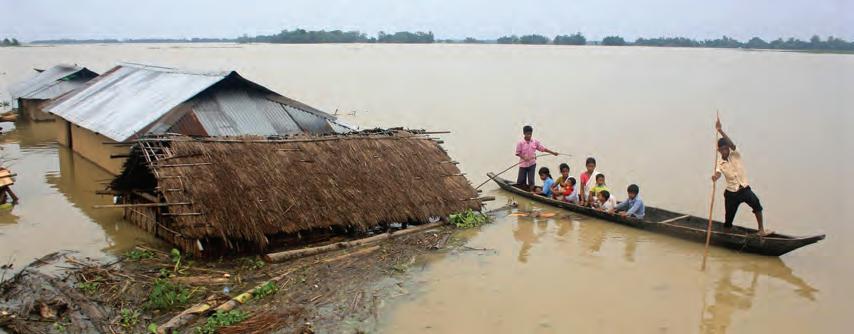
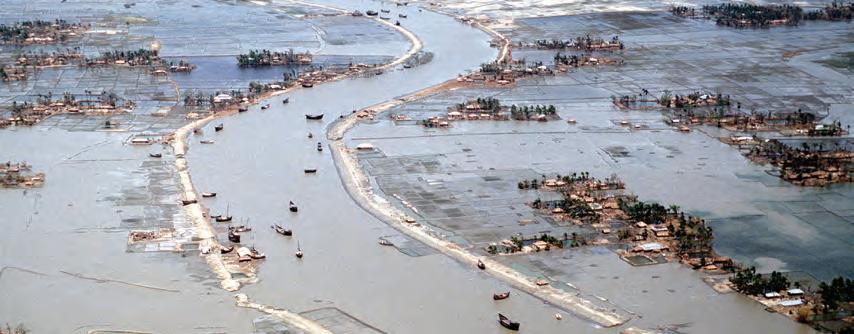
IMG_1.01 Flooded river and agriculture fields in Bangladesh
DOMAIN
1 Gilbert, G.K. 1877 pg. 123-124
DOMAIN FLOOD CONDITIONS
CURRENT SITUATION
FLOOD INTRODUCTION
The current situation the world faces is a higher range of extreme weather, mainly in the form of storms and floods. Per the United Nations, this extreme weather is a direct result of global warming, and the earth is likely to see a 90% increase in frequent heavy rainfall. As the population sustained on the planet also increases, architecture becomes faced with the necessity to adapt to these extreme pressures.
Floodplains are often built upon, as they prove to be flat open grounds, however, also act as an overflow basins for heavy rainfall as well as rivers breaching their banks. From the 2013 flash flood in Germany, the severe storms in New York City, to the cyclone impacts on the coastal region of the Southeast Asian countries, water is becoming a concern for all.
In a destructive sense, the effects of floods include the loss of life as well as destruction of infrastructure. It manipulates the dynamic of the landscape, levelling a new horizontal plane under which everything becomes submerged. One of the main problems from floods is the disconnection that occurs: as objects are moved out of their position [cars, houses, people], being able to locate these things are difficult. A loss of the energy may result due to damage to power transmission, while the effect on potable water is tremendous.
1 http://www.un.org/apps/news/story.asp/story.as
p?NewsID=40440&Cr=climate+change&Cr1=#.UvfJlvRdV8E
It seems ironic that even surrounded by so much water, the loss of drinking water causes some of the most problems for the affected population. The workings of a civilization [in its primitive sense] relies heavily on the separation of sewage from its water supply. Floods disrupt this channelling of waste, instead severe water contamination can occur, leading to a risk of water-borne diseases.
In regards to the land itself, floods destroy farmland including crops and animals, putting a pressure on food supplies. As the land becomes saturated with water, the flood is even more difficult to dissipate over time. Many factors influence the oncoming of a flood, whether it be typologies of river overflow, tidal surges or based on high percentages of rainfall. Regardless of the reasons, as inundation of the land becomes a more frequent phenomenon, cities and the urban development need to reconsider its adaptation to the cycle of water.
Collective Morphogenesis Emergent Technologies and Design 21 20 1
DIA_1.01 Flood Risk World Map, adapted
Flood Risk Zone (Extreme Vulnerability) Flood Risk Zone (High Vulnerability)
DIA_1.02 Types of flooding
Floods are an interesting example of a disaster situation because so many factors can influence its impact, including its sources. Furthermore, where other disasters occur within a relatively short period, floods can last for a long time, as the water often has no way to recede.
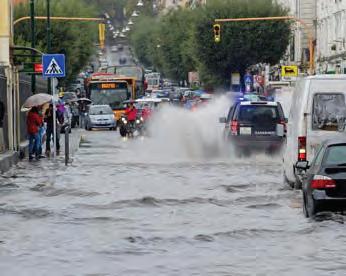
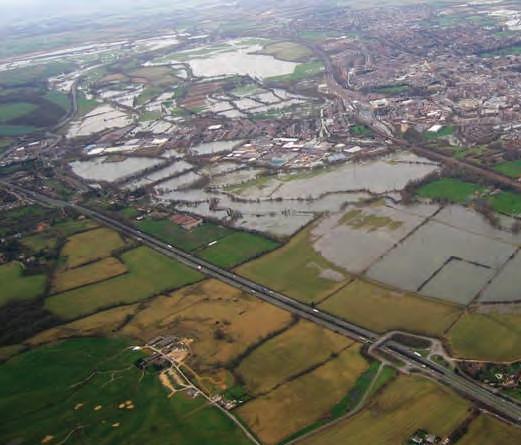

Surface water flooding is regards the concentration of water in the ground, where the oversaturated ground is unable to hold any more water from rainfall. Rivers can be flooded based on the amount of water it can hold, and if this amount exceeds capacity. Coastal inundation refers to changes in the tide or weather pattern in which the sea levels rise. Groundwater flooding is caused by a heavy rainfall impacting the naturally stored water in the ground to rise to the surface.
Coastal flooding is unlike the other sources mainly due to the magnitude of pressures that are linked to it. The coastal region being flooded by the sea is usually precipitated by a storm, where strong winds push the water and create high waves. This is different from river flooding as the latter is directly a result of heavy rain. Since storms over the water are generated in a low pressure area, this contributes to the higher sea level impacting the coast.
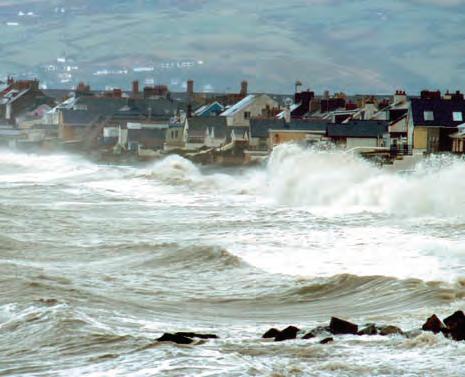
Storm surge refers to the abnormal rise of the water generated by a storm, above the predicted tide levels. Meanwhile, a storm tide is the rise of the water level due to a combination of both the storm surge and the tide level.1 In order to calculate the total amount of water affecting the coast, factors such as storm surge, tide conditions, waves and rivers must be taken into account. If a storm surge coincides with high tide, the storm and the rise in water can cause extreme flooding and have devastating effects on the coast.
Coastal flooding usually has such a tremendous effect due to the many parameters present. If the coastal area is also in proximity of river inflow, multiple types of flooding can occur at once.
1 http://www.stormsurge.noaa.gov/overview_ causes.html
Collective Morphogenesis Emergent Technologies and Design 23 22 1 TYPES
PRINCIPAL TYPES COASTAL FLOODING
Normal Conditions Flood Conditions Mean Sea Level 15 ft surge 17 ft surge FLOODING TYPES Surface Water River Coastal Groundwater Conditions Flood Conditions Mean Sea Level 15 ft surge 17 ft surge FLOODING Surface Water Coastal
IMG_1.03
DOMAIN FLOOD CONDITIONS IMG_1.04
IMG_1.02 Surface flooding in Naples
River flooding
Coastal Flooding IMG_1.05 Groundwater flooding in Oxford
DOMAIN FLOOD CONDITIONS
RIVER SYSTEMS
Rivers are some of the most active agents in the concept of landscape evolution, as they have a large impact on the movement of sediment and shaping of the landform. Even within its course, it changes in energy, discharge, velocity and load. With the change in sea levels and climatic patterns, as well as human manipulation, the morphology of rivers in their respective environment can be determined at both spatial and temporal scales.
The principle factors governing the morphology of river systems are streamflow, sediment load and the physical geographic setting and history. Essentially, the ideal alluvial river forms as a situation where a stream of water falls into a large geological depressure with an outlet at a fixed location.
River characteristics reflect changes in environmental conditions, while having a tendency to assume forms minimizing expenditure of energy. Furthermore, the forms are also derived from a tendency to distribute even energy expenditure along the channel segment. Essentially, the factors contribute to the alteration, adjustment and establishing a state of equilibrium
within the river morphology.2 This can primarily be seen in in how the river is affected by its geologic restraints. Rivers in valleys exert some degree of control on its lateral form, where deltas differ in that they are river-deposited surfaces built into the body of water.
In its course, the river starts from an upper level which is only v-shaped valleys, to the middle reaches of a deeper and wider channel, ending in the lower course of a channel at its widest and deepest. The cross-sectional area of the river increases as a result, with other factors such as the nature of the bedload shifting from large and angular to smaller and smoother. Processes within the river change from a vertical erosion with hydraulic action decreasing to lateral erosion, to ending in alluvial deposition. This is the long profile of the river, in which the change in gradient is experienced with longer distance. At the upper valley, the friction of the bedload causes slower movement which changes to faster laminar flow in the lower course as the channel becomes deeper and smoother.
2 Leopold, Luna. River Morphology as an Analog to Darwin’s Theory of Natural Selection. Proceedings of The American Philosophical Society. Vol.138, No.1. 1994 pg 33.
DIA_1.03 Types of river, adapted
Collective Morphogenesis Emergent Technologies and Design 25 24 1 RIVER MORPHOLOGY
1 Kellerhals, Rolf; Church, Michael. The Morphology of Large Rivers: Characterization and Management. Proceedings of the International Large River Symposium. Canada. Spec. Publ. Fish. Sci. 106. pg. 31.
Occasional no overlapping infrequent overlapping no overlapping but frequent islands frequent overlapping continuous overlapping with 2 or more flow branches Irregular Regular Split Irregular meanders Straight Sinuous Regular meanders Anastomosing CHANNEL PATTERN CHANNEL ISLANDS Occasional no overlapping infrequent overlapping no overlapping but frequent islands frequent overlapping continuous overlapping with 2 or more flow branches Irregular Regular Split Irregular meanders Straight Sinuous Regular meanders Anastomosing CHANNEL PATTERN CHANNEL
ISLANDS
DOMAIN FLOOD CONDITIONS
FLOOD HYDROLOGY + FLOODPLAIN
The inter-relationship between the forces and parameters of hydrology, physical geography and engineering arerequire understanding in dealing with a flood. Although some level of implementing dam strategies is popular, they prove to be ineffective under conditions of major flooding in large river basins. Rather, strategies based on the dynamic of the river and flow conditions over floodplains are necessary for the long run.

The outflow of the river onto a floodplain creates a natural condition of a reservoir, where the reservoir ameliorates the peak of the flood. The channel of the river is maintained large enough to only contain moderate discharge, so the flow over the floodplain is necessary... Due to its nearly level surface, modern development of the floodplain occurs constantly. However, as the floodplain is essentially part of the river, when the outflow occurs, it results in extensive damage to the urban expansion.
Furthermore, agriculture is a main component of the development as it requires the maximum land area. The details of direction, velocity, depth and variability need to be studied in to order to merge both development as well as allowing for natural floodplain storage to occur.
Collective Morphogenesis Emergent Technologies and Design 27 26 1
1 Leopold, Luna B., 1994, Flood Hydrology and the Floodplain, in Coping with the Flood: The Next Phase, White, G.F., and Myers, Mary F., ed., Water Resources Update, Spring issue, pg 11.
RIVER MORPHOLOGY
IMG_1.06 Missouri river flooding
Aa TYPE PLAN VIEW CROSS SECTION DOMINANT SLOPE DESCRIPTION very steep, deeply entenched steep, entrenched and cascading moderate entrenchment and gradient low gradient and meandering, alluvial channels braided channel, eroding banks anastomizing channels, extensive floodplains low gradient meandering, very efficient low gradient meandering entrenched channel entrenched gully with low width to depth ratio A B C D Da E F G <1.4 ENTRENCHMENT RATIO <1.41.4 to 2.2>2.2 n/a >2.2 >2.2 <1.4 <1.4 <12 WIDTH / DEPTH <12 >12 >12 >40 variable <12 >12 <12 >10 SLOPE 0.04 to 0.100.02 to 0.039<0.02 <0.04 <0.005 <0.02 <0.020.02 to 0.039 DIA_1.04 River morphology,adapted
DOMAIN FLOOD CONDITIONS
THE COAST
Coastal zones are very dynamic areas as they generally face large amounts of pressure from both wind and water. Not only is the environment constantly changing, but the land itself is constantly shaped and reshaped by the water’s influence. As the sea level increases, and globally climate change occurs, coasts face increasing amounts of severe storms, surges, erosion and salt water intrusion.
Over half of the world’s population resides within 60km of the shoreline and themselves affect the coastal morphology.1 However, while human activity has influenced climate change to begin with, direct impact is felt through the degradation of natural buffers such as salt marshes, mangroves, coral reefs and sand dunes. As the urban development of the coastal zones increases, more people will be susceptible to the lashback of nature, while they themselves disturb the natural order. Large scale engineering works to try and tame the coastline but instead destroys the balance of the region’s water system, often starving further out rivers, lakes or wetlands.
What is necessary is to understand to some level that not every place is buildable, and any infrastructure to be imposed in such a temporal environment should be able to adapt accordingly. Rather than build barriers to block out water, soft systems similar to those found in natural barriers need to be implemented for the coast.
WAVES
One of the important factors of erosion is the type of wave impacting the site and the distance it has travelled. The length of time and space that a wave has travelled is called fetch, where the larger the fetch, the larger the wave that is generated.
Large oceans produce destructive waves, which have a large wave height and short wave length. Their high downward force and strong backwash allow them to erode land. Storms with high wind speeds can also form destructive waves, making the shoreline a highly pressurised zone. Constructive waves have low wave height, a long wave length and a lower frequency. These can help move sediment further inland and essentially, help build up land.

TOPOGRAPHY
Another factor driving the coastal morphology relates to the geometry of the coast and its orientation to the natural forces. Even though a particular coast may be prone to large fetch, due to its orientation to the oncoming waves, may be protected from destructive waves. Other protection may include islands or offshore barriers which act as the primary impact point where energy is dissipated. Prevailing wind may also influence the way the coastline is affected by waves, by offering a drag resistance.

Collective Morphogenesis 29 28 1 COASTAL MORPHOLOGY
IMG_1.07 Wave refraction occurring at the coast
A B C D A’ B’ C’ D’ Headland Bay wavelength height trough crest headland bay A B C D A’ B’ C’ D’ Headland Bay dominant wind direction parabolic dune foredune dune deflation basin wavelength height trough crest headland bay
1 R.K.Turner, S.E.Subak, W.N.Adger. Pressures, Trends and Impacts in the Coastal Zones: Interactions Between Socio-Economic and Natural Systems. CSERGE Working Paper GEC 95-09.
DIA_1.05 Wave energy on a coastline, adapted
DIA_1.06 Geomorphology of a coastal dune [soft strategy], adapted
DOMAIN COUNTER FLOOD STRATEGIES
LIVING WITH WATER flood strategies
WITH WATER flood strategies
BUILT FORMS: FLOTATION
LIVING WITH
flood strategies
LIVING WITH WATER flood strategies
DEFENSE STRATEGIES
Various defense tactics are utilised in order to control floods and rising water levels in waterways. Inacting barriers or dams as a defense mechanism has a great impact on the environment as they have a direct influence on the existing water systems in place. Similary, diversion [in a larger scale] of a river’s natural flow can have larger dramatic effects downstream.
FLOAT HOUSE, NEW ORLEANS, USA
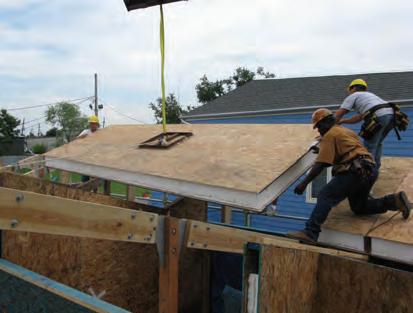
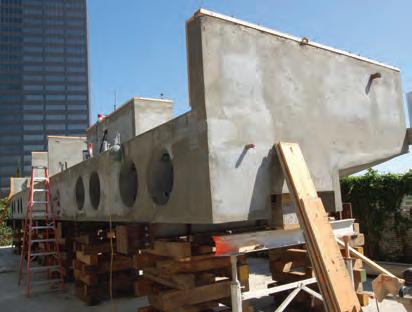
In the U.S., over 36 million people presently face the risk of flooding. Therefore, Float House project was created with the aim to create a sustainable way of living; protect flooding, provide its own water and power needs and survive in the flood water. The project was a direct result of the catastrophe experienced in the aftermath of Hurricane Katrina.
LIVING WITH WATER flood strategies
LIVING WITH WATER flood strategies
Flotation as an approach reacts to the rise of water level by adapting to it. In some scenarios, this is a viable option [regions facing minimal environmental pressures], however, flotation has no impact on the flood itself. Dispersion is a tactic applicable for more pressurised zones, like the coast, where the initial energy of the force of water is dissipated on the many objects.
It is important to distinguish between hard and soft strategies and the effects of each to implement them properly to the site context.
DIA_1.07 Built form strategies for countering flooding
WATER flood strategies
TYPES OF FLOOD DEFENSE
The Float House was developed as a prototype for prefabrication with the key feature being that it is an affordable house that can be adapted to meet the needs of flood zones worldwide. The primary element to this project is its buoyant system, which comprises a modular chassis made of an expanded polystyrene foam block, coated in glass fibre reinforced concrete, with all required electrical, mechanical and plumbing systems pre-installed. When flood water rises, the system allows for moving 12 feet vertically along two steel guide posts, which are anchored to the concrete pads with six 45-foot deep piles constructed on the site

1 http://morphopedia.com/projects/float-house, date visited 10th Oct 2013.
DISPERSION FLOTATION BARRIER DIVERSION 1 2 3 4

Collective Morphogenesis Emergent Technologies and Design 31 30 1
IMG_1.08 Lightweight slab construction
IMG_1.09 Roof panels craned into place
IMG_1.10 Float house overview
DISPERSION FLOTATION BARRIER DIVERSION 1 2 3 4 DISPERSION FLOTATION BARRIER DIVERSION 1 2 3 4 LIVING
DISPERSION FLOTATION BARRIER DIVERSION 1 2 3 4
DIA_1.08 House assembly
FLOTATION BARRIER DIVERSION 1 2 3 4
DISPERSION
DISPERSION FLOTATION BARRIER DIVERSION 1 2 3 4
DISPERSION FLOTATION BARRIER DIVERSION 1 2 3 4
WATER
DISPERSION FLOTATION BARRIER DIVERSION 1 2 3 4
DOMAIN COUNTER FLOOD STRATEGIES

BUILT FORMS: BARRIER AND DIVERSION
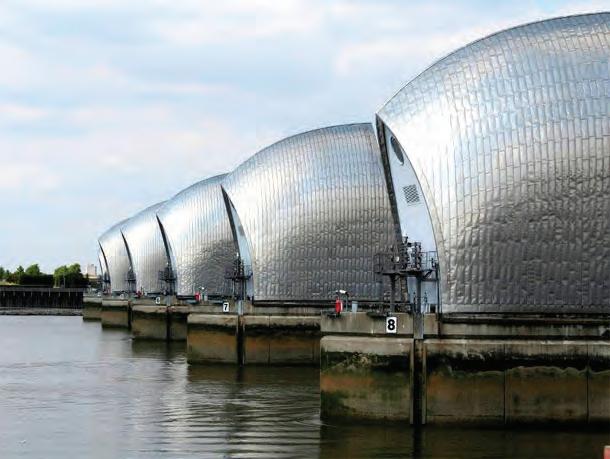
The Thames Barrier is a flood barrier which comprises 10 independent gates that span 520 meters across the Thames at Woolwich Reach, east of London. It was designed to prevent surge tide and to protect London from tidal flooding until the year 2030. Each main gate has a semi-cylindrical shape. Under normal tide conditions, six of the gates lie flat with concrete sills in the riverbed, allowing flow and ships to pass through freely. The gates are controlled by their own hydraulic power packs, which can raise the gates to flood defensive position in 15 minutes in an emergency, holding back the water loads of up to 9,000 tonnes each. Since 1982 the barrier has been raised over 70 times when tide forecasts have reached critical levels.
Thames Barrier has 520m spans, 61 m. each, across the river. One of the key aspects about the design is that the floodgates can be raised to allow some water to flow underneath so that the upstream and downstream equilibrium can be maintained as much as possible.1


G-CAN PROJECT, JAPAN
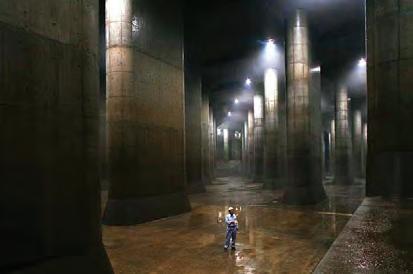
Japan has faced six major floods since 1979, there has been a significantly increase in flow of river and floods. For Japan, it is rather difficult to widen the river or acquire the land for infrastructure improvement. Furthermore, construction of elevated structure is impossible in tightly populated Japan large cities. Appropriate use of the underground is the key for refurbishment of the degrading environment of urban areas in Japan.
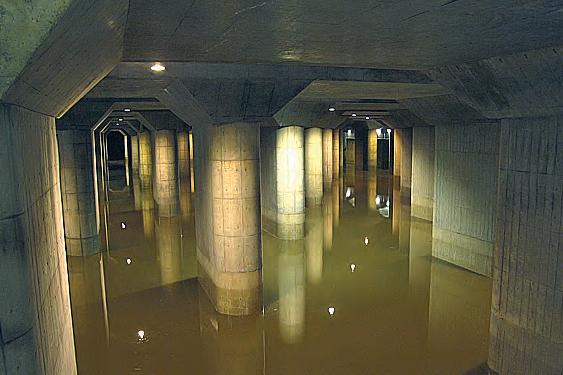
The Metropolitan Area Outer Discharge Channel Tunnel or G-Cans project is a gigantic underground infrastructure, waterway and water storage whose primary function is to collect vast amounts of water. The underground system prevents the city from

flooding from heavy
The system design consists of four tunnels, standing at 25.4m tall, 78m wide and 177m long. The main tank was built as a huge aqueduct to be operated when the precipitation exceeds the limit. The rainfall will be pumped up to 200 tons of water and transported to the Edogawa River and several smaller rivers along 6.5 kilometers. Its engineering and excavation are a combination of concrete with innovative structures, technology and materials, which is controlled from an operation centre.1

1 Ibid, Chao-Yi Chen.
Collective Morphogenesis Emergent Technologies and Design 33 32 1
IMG_1.14 Column arrangement for diverting water
IMG_1.17 Overview of G-Can Project
IMG_1.15 Internal view with no water IMG_1.16 Internal view with some areas with water
rains during typhoon seasons, as well as tsunamis.
THAMES BARRIER, UNITED KINGDOM
GATES OPEN: Normal conditions GATES CLOSED: during a storm IMG_1.11 Six
IMG_1.12
IMG_1.13
DIA_1.09
1 Chao-Yi Chen, (2011), ‘Responsive Transformation: Ecological flood mitigation strategies’. M.Arch Thesis, Architectural Association School of Architecture, London
gates of Thames barrier
Overview of Thames barrier
Thames barrier across river Thames
Principles of Thames barrier
DIVERSION_bamboo barrier 4


DOMAIN COUNTER FLOOD STRATEGIESLIVING WITH WATER flood strategies
DIVERSION 4
Bamboo Barrier - Khun Samutchine, Thailand
Acts to breakdown the oncoming speed of waves
Can trap sediment through levels of porosity and filtration
BAMBOO BARRIER, THAILAND
flood strategies
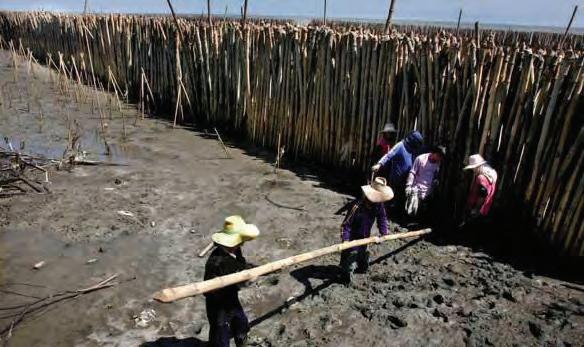
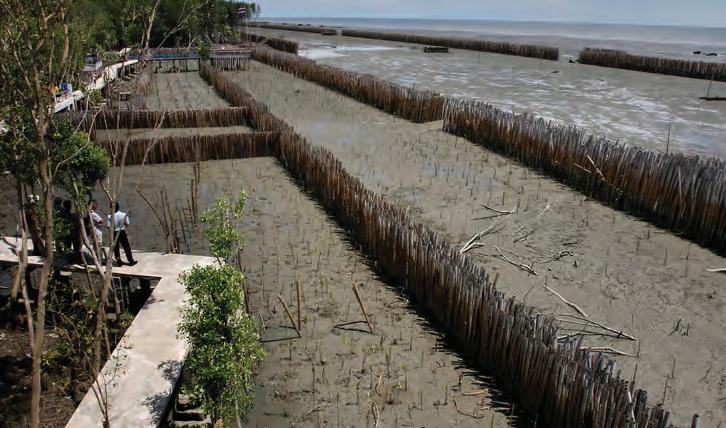
Khun Samutchine, located at southern part of Bangkok in Thailand, is a small village which is the most susceptible to direct impacts of coastal erosion. In the past 30 years, the sea water has swallowed more than one kilometre of land in Khun Samutchine. At the beginning, villagers established the breakwaters made from concrete poles, crushed rocks or sandbags to reduce the wave intensity. However, they were unaffordable and didn’t allow for essential exchange of fresh and ocean waters.
Barrier Khun Samutchine, Thailand
breakdown the oncoming speed of waves sediment through levels of porosity and filtration


Then the villagers came up with a scheme using bamboo poles packed tightly together and laid out in three rows along the coastline as barriers. This not only declined the force of the waves but also trapped sediment from the seawater and prevented silt from being washed away, allowing for a more natural interplay between the marine and fresh water environments at the same time. The advantage of this technique is relatively low cost and an ecological solution to cope with this global problem. In the past two years, the sediments behind the bamboo rows have accumulated up to three feet high and increased 100 yards of land. A number of mangrove saplings were planted between each bamboo screen, with the hope that the new mangrove forests will act as natural barriers soon.1
1 Chao-Yi Chen, (2011), ‘Responsive Transformation: Ecological flood mitigation strategies’. M.Arch Thesis, Architectural Association School of Architecture, London

DIVERSION_bamboo barrier

BUILT FORMS: DISPERSION
DIVERSION_bamboo

Collective Morphogenesis Emergent Technologies and Design 35 34 1
Velocity Magnitude [m/s] 1 barrier Velocity experienced at rectangular grid barrier Test 1 2 barriers Test 2 3 barriers Test 3 0.0 1.5 2.5 3.5 4.5 5.5 6.5 7.5 8.5 10.0
barrier Triangular Grid- CFD Analysis LIVING WITH WATER flood strategies Test Setup Velocity experienced at triangular grid barrier Flow velocity: 5 m/s Surface Pressure: 0 PA Water 20.9 5.0 5.0 5.0 5.0 5.0 Bamboo poles Diameter 10cm 1 barrier Test 1 2 barriers Test 2 3 barriers Test 3 Velocity Magnitude [m/s] 0.0 1.5 2.5 3.5 4.5 5.5 6.5 7.5 8.5 10.0 DIVERSION_bamboo barrier 4 Triangular Grid- CFD Analysis LIVING WITH WATER flood strategies Velocity experienced at triangular grid barrier Flow velocity: 5 m/s Surface Pressure: 0 PA Water Bamboo poles Diameter 10cm 1 barrier Test 1 2 barriers Test 2 3 barriers Test 3 Velocity Magnitude [m/s] 0.0 1.5 2.5 3.5 4.5 5.5 6.5 7.5 8.5 10.0 DIVERSION_bamboo barrier 4 Rectangular Grid- CFD Analysis LIVING WITH WATER flood strategies Flow velocity: 5 m/s Surface Pressure: 0 PA Diameter 10cm Velocity Magnitude [m/s] 1 barrier Test 1 2 barriers Test 2 3 barriers Test 3 0.0 1.5 2.5 3.5 4.5 5.5 6.5 7.5 8.5 10.0 DIVERSION_bamboo barrier 4 Rectangular Grid- CFD Analysis LIVING WITH WATER flood strategies Water Flow velocity: 5 m/s Surface Pressure: 0 PA 20.9 5.0 5.0 5.0 5.0 2.0 5.0 Bamboo poles Diameter 10cm Velocity Magnitude [m/s] 1 barrier Test Setup Velocity experienced at rectangular grid barrier Test 1 2 barriers Test 2 3 barriers Test 3 0.0 1.5 2.5 3.5 4.5 5.5 6.5 7.5 8.5 10.0 DIVERSION_bamboo barrier 4 Triangular Grid- CFD Analysis LIVING WITH WATER flood strategies Test Setup Velocity experienced at triangular grid barrier Flow velocity: 5 m/s Surface Pressure: 0 PA Water 20.9 5.0 5.0 5.0 5.0 2.0 5.0 Bamboo poles Diameter 10cm Velocity Magnitude [m/s] 0.0 1.5 2.5 3.5 4.5 5.5 6.5 7.5 8.5 10.0
Rectangular Grid- CFD Analysis Water Flow velocity: 5 m/s Surface Pressure: 0 PA 20.9 5.0 5.0 5.0 5.0 2.0 5.0 Bamboo poles Diameter 10cm Velocity Magnitude [m/s] 1 barrier Test Setup Velocity experienced at rectangular grid barrier Test 1 2 barriers Test 2 3 barriers Test 0.0 1.5 2.5 3.5 4.5 5.5 6.5 7.5 8.5 10.0
4 Triangular Grid- CFD Analysis Test Setup Velocity experienced at triangular grid barrier Flow velocity: 5 m/s Surface Pressure: 0 PA Water 20.9 5.0 5.0 5.0 5.0 2.0 5.0 Bamboo poles Diameter 10cm Velocity [m/s]
DIA_1.10 Analysis of bamboo arrangements in CFD
IMG_1.18 Bamboo rows for reducing the speed of waves
IMG_1.19 Trapping of sediments from seawater
DOMAIN COUNTER FLOOD STRATEGIES
MANGROVE
Natural systems such as mangroves have not only adapted to the high saline conditions, but also act as a filtration barrier at the coastline. Due to their highly intricate root system, they are able to withstand adverse environmental conditions such as high pressures from tidal surges and strong winds. Their root systems act as anchors to stabilize the substrate which they are situated on, impacting the coastal morphology by reducing erosion.
Mangroves have developed a system of aerial roots which stabilize the tree by widening its base area, while keeping it raised out of the water. The tangled criss-crossing and looping network of the roots helps to collect sediments. Two aerial root types include plank roots and stilt roots. Plank roots are horizontal roots that also are extended vertically over their length and act as buttresses, while stilt roots act as porous props.

The density of the mangrove forest is important to consider, including the diameter of the roots and trunks, since layering of the elements create for the filtration barrier. A mangrove forest can attenuate waves significantly over a relatively short distance, where the wave energy is reduced by 75 percent in the wave passage through 250 metres of trees.1

Collective Morphogenesis Emergent Technologies and Design 37 36 1 NATURAL SYSTEMS
Wave attenuation through a forest Normalized energy E[norm] 1 1 1.8 m high tide level 2 3 4 ZONE 00.50.25 80 m 80 m 100 m 20 m 0.751.01.25 2 3 4
DIA_1.12 Comparison of strategies for countering flood
prop roots 2.02.53.03.54.04.55.05.56.06.5>6.5 mean water table (m) PLANK ROOTS layering of dense roots = no porosity PROP ROOTS layering of stilts roots = porosity 0 2 4 6 8 10 12 sedimentation (cm/yr) 1 2 LIVING WITH WATER natural systems ADVENTITIOUS ROOTS 1 plank roots prop roots <1.5 0 20 40 10 30 50 2.02.53.03.54.04.55.05.56.06.5>6.5 mean water table (m) PLANK ROOTS layering of dense roots = no porosity PROP ROOTS layering of stilts roots = porosity percent of individuals 0 2 4 6 8 10 12 sedimentation (cm/yr) 1 2 ADVENTITIOUS ROOTS 1 plank roots prop roots <1.5 0 20 10 2.02.53.03.54.04.55.05.56.06.5>6.5 mean water table (m) PLANK ROOTS layering of dense roots = no porosity PROP ROOTS layering of stilts roots = porosity percent of individuals 0 2 4 6 sedimentation 2 DIA_1.11
IMG_1.20 Mangroves with prop roots IMG_1.21 Mangroves
roots local regional global New York Tokyo London * Natural Systems Man Made Systems Float House Thames Barrier Metropolitan Discharge Channel Mangroves Diversion Dispersion Thailand Bamboo flood barrier STRATEGY SCALE: Barrier Flotation CLASSIFICATION low medium high New York Tokyo London * Natural Systems Man Made Systems Float House Thames Barrier Metropolitan Discharge Channel Mangroves Diversion Dispersion Thailand Bamboo flood barrier STRATEGY GRADE: Barrier Flotation CLASSIFICATION local regional global New York Tokyo London * Natural Systems Man Made Systems Float House Thames Barrier Metropolitan Discharge Channel Mangroves Diversion Dispersion Thailand Bamboo flood barrier STRATEGY SCALE: Barrier Flotation CLASSIFICATION low medium high New York Tokyo London * Natural Systems Man Made Systems Float House Thames Barrier Metropolitan Discharge Channel Mangroves Diversion Dispersion Thailand Bamboo flood barrier STRATEGY GRADE: Barrier Flotation CLASSIFICATION
1 Massel, S.R.; Furukawa, K.; R.M. Brinkman. Surface Wave Propa
Wave attenuation through mangrove forest, adapted
with plank
DOMAIN REGIONAL STUDIES
Storm Surge Inundation
Few countries can be mentioned in relationship to the effects of global warming, than those lying in Southeast Asia, specifically, Bangladesh. Bangladesh consists of a coastal population of 1,000 persons per square kilometre. The country is situated on a delta which yields high productivity and supports an agricultural community, however, due to its position, is also assaulted by natural disasters. Another issue is that the Ganges-Brahmaputra-Meghna delta system is one of the largest in the world, which results in high flood risk.
Wind Speed
Current changes in climatic flows show increase in significant changes in weather patterns worldwide. This is none more apparent than in the increase in tropical cyclones yearly and continuous rising water levels due to the affects of global warming. The country of Bangladesh has the worlds 8th largest population and is defined by a morphology of low lying, flat land and large coastal areas, all of which make the country highly exposed to tropical cyclones and flooding.
Water Speed
track that moves forward and back] makes it difficult to forecast.1 The boundaries of the country are detrimental to its survival, in that the geometry of the coastline helps to funnel in cyclones mainland.
Wind and water are both critical parameters in understanding the coastal region of Bangladesh. Winds can rise from 62 km/hr [17.2 m/s] at a depression level, to 118 km/hr [32.8 m/s] at a severe cyclone intensity.2 Furthermore due to cyclones, storm surges are generated by a drop in pressure and through wind stress. The funnel configuration at the coast also causes higher storm induced waves compared to a straight coast line.
Initial effects of the storms include wide spread damage to assets, including infrastructure and agricultural goods as well as loss of life. Secondary areas of concern include safe sanitation, longer term food and nutrition security, rehabilitation and repair of agriculture land.
36 hrs
Water Level
18 -48 hrs 2-8 Weeks
The early summer and late rainy season are the typical cyclone seasons in Bangladesh. Each year the country is hit with severe storms, due to the phenomenon of recurvature in the Bay of Bengal, causing the disproportional large impact of storms on the country. Recurvature of the storm [following a
1 http://meteorologytraining.tpub.com/14010/ css/14010_216.htm
2 Flierl, G.R., and A.R. Robinson, 1972. Deadly surges in the Bay of Bengal: Dynamics and storm tide tables. Nature, 239, 213-215.
Collective Morphogenesis Emergent Technologies and Design 39 38 1 BANGLADESH
Evacuation Period
Cyclone Duration
Depression 62 km/h Cyclonic Storm 63-87 km/h Severe 88-117 km/h Hurricane +118 km/h Maximum wind speed recorded in Bangladesh Wind Velocity Storm Surge (1.5m) Innundation from Coast (km)
Flood Water Receding Period
Up to 5 m/s Dependant on factors like terrain and rainfall
Buildings usually raised to 4m level in order to allow the water to pass through. 85 1.5 1 115 2.5 1 135 3.0 1.5 165 3.5 2 195 4.8 4 225 6.0 4.5 235 6.5 5 260 7.8 5.5 2 J J F MMA A SO N D 4 6 8 10 12 14 02550 100 200 (km) Chandpur Laldair Char Chandmari Dhaka 235 km/h
DIA_1.15 Quantitative graphics describing the weather conditions of Bangladesh
Above normal flood level Flash flood River flood Rainwater flood Rainwater and river flood Tidal flooding Occasional flash flood 02550
(km) 02550
A COASTAL REGION
100 200
100 200 (km)
Dhaka
Sundarbans
Dhaka
Sundarbans
DIA_1.13 Map of Bangladesh showing cyclones tracks, adapted DIA_1.14 Map of Bangladesh showing flood types, adapted
DOMAIN SITE SCENARIO
THE REALITY OF WATER
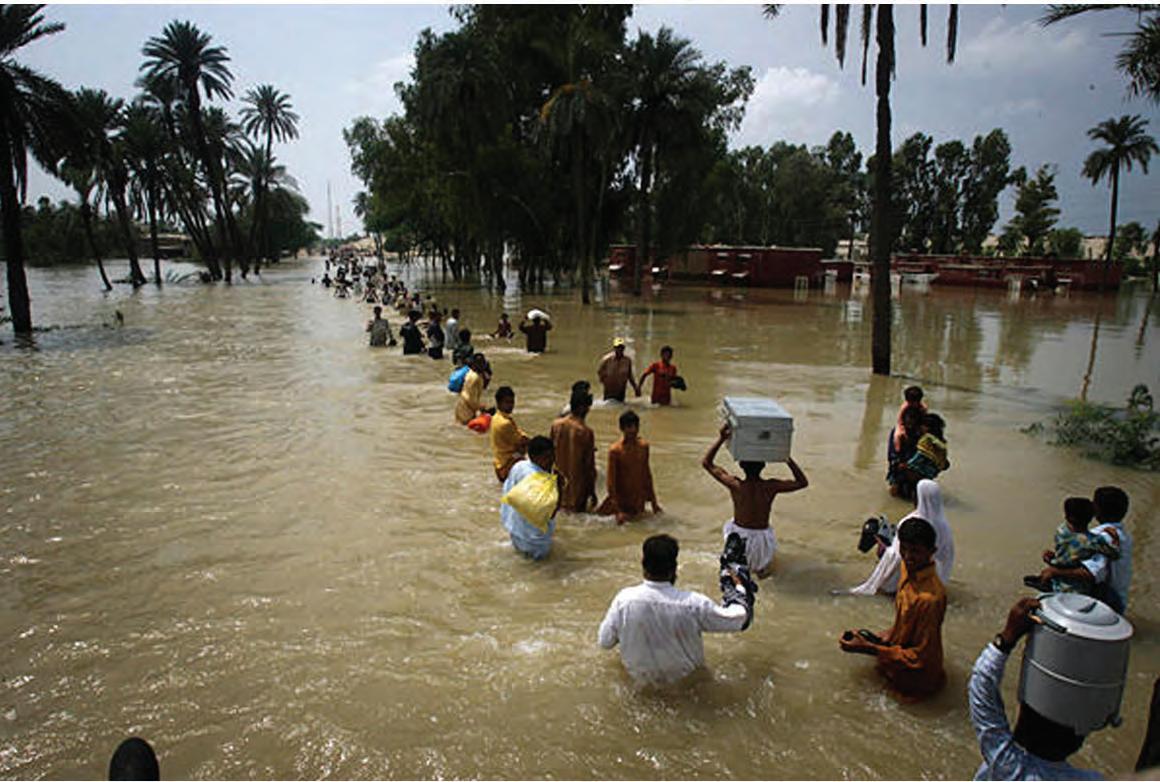
“One hundred million people live and die by the river.” Yet the current systems in place are not able to cope with the drastic results that cyclones and floods cause. Much of problem begins with Bangladesh’s position on the delta connecting to the flow of three different major rivers: the Ganges, Brahmaputra and Meghna. The concentration of water experienced in Bangladesh is heavily dependent on the magnitude of precipitation in the three river basins. The river system is beyond the control of the country, as the headwaters orginate from the Himalayas glacier melt water.
Furthermore, the rivers flow through Tibet and India before merging to form the Ganges Brahmaputra River Basin in Bangladesh, from where the water flows to the Bay of Bengal. This means that any manipulation that the other countries have on the river system creates larger impacts downstream. As Bangladesh itself is low-lying with about 60% of the land lying lower than 6m above sea level, the crisscrossed river and tributary system breaks up the land and causes it to be continously waterlogged.
Factors of natural geometry which induces a flow path for storms and its climate of a heavy rain season all add to the the country having to drain out a huge amount of excess water. However, Bangladesh’s existing drainage channels aren’t able to handle the capacity of runoff, and instead an inundated period exists for a long time. What is crucial is understanding the current situation more thoroughly and implementing a new building strategy in relation to its dynamic environment.
1 http://www.theguardian.com/global-development/2013/jan/23/bangladesh-floods-harbingers-disaster
IMG_1.22 Destructive effects of water
IMG_1.23 Necessity of water for agriculture
THE NECESSITY OF WATER
Agriculture forms the basis for the Bangladesh economy, as it is has historically functioned as an agrarian society. Thus, the land exists as an extremely important factor in the survival of the people. The performance from the agricultural sector has a major impact on macroeconomic objectives like employment generation, poverty alleviation and food security.1
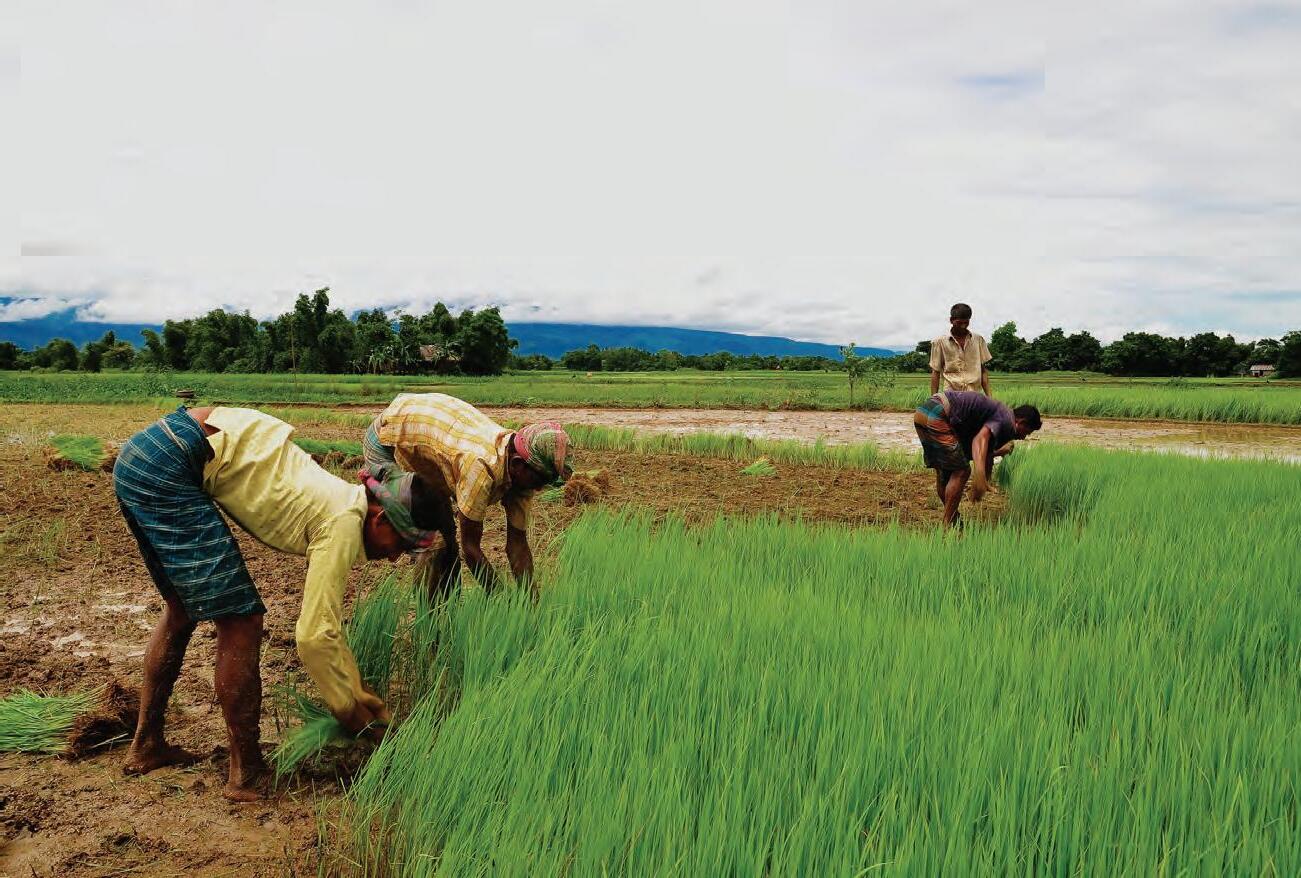
Around 80% of the total population lives in the rural areas, with high levels of rural poverty existing. As the economic situation of so many people is tied to environment, the country’s vulnerability to natural disasters foster high levels of poverty. With the country’s population growing and urbanisation spreading laterally, the available land for crops is also diminishing.
In terms of growth, Bangladesh is the largest producer of natural jute, as well as a major factor in the production of rice [a staple food]. Disasters such as floods have a major influence on the agricultural productivity, often destroying the crops of that season. Due to its position on the floodplain delta, every year, about 20 to 30 percent of the country floods, causing severe damage to agriculture and infrastructure.
However, simply creating a barrier against the floods is not a viable strategy, as due to its agriculture pattern, some level of flooding is necessary for the soil to be fertilized. Thus, strategies that look at the flood as not only a destructive force but rather also a necessity for a way of life, should be considered.
1 http://www.discoverybangladesh.com/meetbangladesh/agriculture.html
Collective Morphogenesis Emergent Technologies and Design 41 40 1 BANGLADESH
REGIONAL STUDIES
Heavy monsoon rains
Snow + glacier melt
High river discharge
Sediment transport
CAUSES OF FLOODING
Deforestation
Vegetation
Land usage type + intensity
Heavy monsoon rains
High river discharge
Sediment transport
Construction of embankments
Farakka Barrage
Heavy monsoon rains
High river discharge
Change of water course + Riverbank erosion
Soil saturation + waterlogging
Geological depression + Flat topography
High tides, rising of mean sea level
Embankment breaching
DIA_1.16 Causes of flooding in Bangladesh, adapted
DIA_1.17 Effect of different flood types occurring in Bangladesh, adapted
crops adjusted with inundation
moderate restriction
limited to crops
moderate
activities: severe restriction
mainly crops, infrastructure and urban centres
relatively high
Human activities: severe restriction
extensive to crops + fisheries, lives, property, all types of infrastructure
very high
required + extensive relief effort + international support
activities: exceptional restriction
extensive to crops + fisheries, lives, property, all types of infrastructure
extremely high
required + extensive relief effort + international support
Collective Morphogenesis Emergent Technologies and Design 43 42 1
RIVERS [Himalayas]
Highland Lowland
Topography
Floods Lowland Lowland RIVERS [Indian Plains]
[Bangladesh Floodplains]
NORMAL 21 0.5 31,000
Damage:
Economic
May
MODERATE 21 26 0.3 31,000
Human
Damage:
Economic loss:
Evacuation:
SEVERE 26 34 0.1 38,000 - 50,000 Human
Damage:
Economic
Evacuation:
effort CATASTROPHIC 34 38.5 0.05 50,000 - 57,000
loss:
Evacuation:
EXCEPTIONAL > 38.5 0.05
57,000
Damage:
Economic loss:
Evacuation:
AREA FLOODED [sq. km] PERCENT FLOODED [%] PROBABILITY OF OCCCURRENCE FLOOD TYPE PHYSICAL PARAMETERS AFFECTED FLOOD CLASSIFICATION
FLOODS
DOMAIN
Human activities: slight restriction
loss: minimum
increase soil fertility
- 38,000
activities:
not necessary
loss:
required + relief
Damage:
Economic
>
Human
DOMAIN REGIONAL STUDIES
EFFECTS OF FLOODING
water contamination
definition: outcome:
with the rise in water, contamination of all water sources occur through the mixing of waste and [often] dead bodies

network disruption
adverse health outcomes occur due to inundation including risk of water-borne diseases and a severe lack of potable water
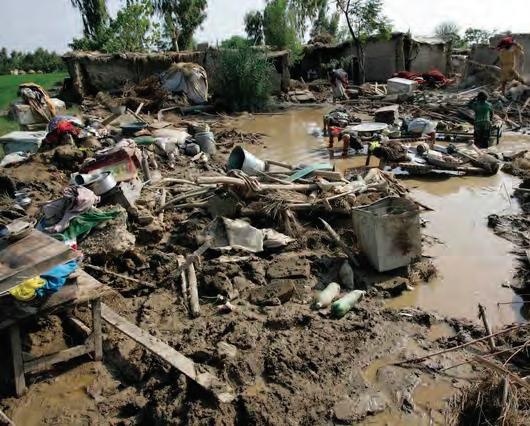
definition: outcome:
floodwaters create a new horizon with the roads and railways being swept away; creates difficulties in communication
EFFECTS OF FLOODING
agricultural impact
movement of residents and rescue efforts after the initial storm is difficult, creates problems in relating any information
definition: outcome:
inundation of land for long periods of time drowns crops; has a huge impact as Bangladesh is a largely agrarian society


ground conditions
people rely heavily on agriculture for food and economy; destroyed crops creates a scarcity in an already impoverished nation
definition: outcome:
flood water pressure cause extreme sediment movement; existing ground has high concentration of water and is easily manipulated
destruction of housing
definition: outcome:
typology of housing is unable to withstand inundation, often collapses or is swept away with the flow of the water
existing ground is already heavily saturated due to position on delta; flow of water can dramatically change the boundaries of land weak materials unable to deal with environmental pressures causes widespread destruction, leaving many homeless
Collective Morphogenesis Emergent Technologies and Design 45 44 1
DIA_1.18 Negative effects of flooding
IMG_1.24 Scarcity of fresh water
IMG_1.25 Altered ground condition
IMG_1.26 Water contamination
IMG_1.28 Network disruption caused because of flooding
IMG_1.27 Destruction of housing
EFFECTS OF FLOODING DOMAIN REGIONAL STUDIES
WATER CONTAMINATION + GROUND CONDITION
Flooding is generally a normal occurrence in Bangladesh, as due to its location and dependence on so many water body factors, it is dramatically affected by any relative shift in flow. If within tolerable limits, the floods act to bring in new sediment over the agricultural lands and fertilize them for the next crop season. This cyclical flooding replaces the need for artificial irrigation systems to be put in place and creates extremely fertile land for growth. However, during severe floods, more than a generous amount of land can be potentially underwater [this may exceed 55% of the total country area].

As there is a poor drainage system in the country, the water flow exceeds the holding capacity of rivers, canals and floodplains, causing widespread destruction. The floods themselves can be categorized based on monsoon season, flash floods and tidal surges. Each of the flood types have various duration lengths and area dangerous in their own way. The monsoon flood is a direct result of rainfall so it takes a longer time to accumulate, often pushing the limits of rivers over their banks. Flash floods often occur in the valleys of the hills in the northern region of the country, occurring fast and leaving as quickly. Tidal floods occur with a lot of pressure, as the coast of Bangladesh is met with strong winds and storms, but can last for a short time as the water recedes back into the sea.
River flooding generated through all three types, has a large influence, since the combined annual waters from 3 main rivers: the Ganges, Brahmaputra and Meghna flow through the country through a single outlet in the Bay of Bengal. The effects are thus faced at almost every point in the country [other than the North which is generally protected by hills].

The major impacts felt by the floods relates to the nature of crops being destroyed after long term inundation, loss of roads and other infrastructure as they are swept away. The water spreads laterally and contaminates all other sources of groundwater it touches. This is a major problem as the poverty in Bangladesh cannot cope with such an extreme environment where drinking water has diminished and the agriculture has been drowned. Because the ground holds so much water generally, the soil conditions in Bangladesh are quite soft and malleable. With the force of water pressure from rivers or coasts, sediment can be moved and manipulated dramatically, with banks being swept away quickly. This creates for unsafe building conditions, not to mention the damage the wind pressures from cyclones can do to traditional housing. To implement a new system for flood mitigation, all these effects of flooding [both positive and negative] must be analysed thoroughly.

Collective Morphogenesis Emergent Technologies and Design 47 46 1
IMG_1.29 Destruction of crops
IMG_1.30 Securing land by building embankments
IMG_1.32 Network disruption
IMG_1.31 Alteration of ground condition near coast
IMG_1.33 Flooded agricultural land
DOMAIN REGIONAL STUDIES MITIGATION STRATEGIES
RELIEF EFFORTS
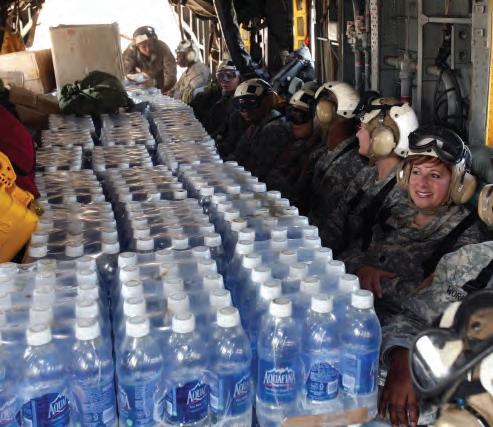
Cyclones and severe flooding do not occur within the exact timeframe from year to year, and the severity of the disaster is also inconsistent. Due to the poverty of the region, relief efforts from international sectors are necessary for rehabilitation efforts. Following the immediate aftermath of the disaster, media sensation allows for the pouring in of funds as this is the point where the situation is most clearly highlighted as breaking news. Weeks following, however, see the relief efforts trickle to a halt as the cyclone becomes old news to the rest of the world.


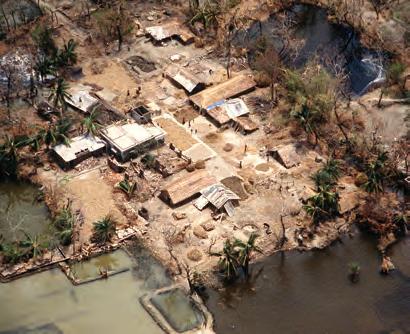
An essential problem rests in this cycle, as rehabilitation lies on a larger time scale than simply a month. The Bangladeshi coast is one of the most dangerous in the world in relation to the number of people affected and the amount of cyclones and storm surges that are experienced. Houses are completely destroyed through the pressures while roads and other infrastructure are simply washed away with the water. Floods can remain stationary for weeks, causing many problems with potable water sources. People’s livelihoods and necessary resources are devastated and the rehabilitation period reflects this constant cycle of rebuilding.

It is evident that the existing strategies in place are not enough to cope with the scale of disasters that occur so frequently. Emergency relief services cannot deal with the amount of people that are left homeless as well as the huge environmental impacts. Due to further lack of proper coordination, much of the relief aid is distributed inconsistently, and generally the further away from the main roads residents live, the less relief materials they will receive.
Longer time frames need to be considered as a general design stategy, one which anticipates the magnitude of pressures a building will endure during a storm, as well as the environment that remains. It is critical to mention that simply barricading the village from a storm is not enough, although this may provide the desired result of saving lives from the storm, agricultural land relies on the seasonal flooding to replenish its resources. As Bangladesh is an agrarian society, a properly designed flood management program cannot block, but rather, endure the storm.
Collective Morphogenesis Emergent Technologies and Design 49 48 1
L to R
IMG_1.34 Flood and cyclone warning system
IMG_1.35 Evacuation during cyclone phase
IMG_1.36 Damage assessment
rebuilding shelters
CYCLONE warning evacuation PREPARATION DAMAGE ASSESSMENT EMERGENCY AID food clean water temporary housing medical services 1 - 4 days 1 week - 1 month 12-36 hrs REHABILITATION 6 months - 1 year rebuilding shelters tube well construction livelihood medical services CYCLONE warning evacuation PREPARATION DAMAGE ASSESSMENT EMERGENCY AID food clean water temporary housing medical services 1 - 4 days 1 week - 1 month 12-36 hrs REHABILITATION 6 months - 1 year 1 2 3 4 5
IMG_1.37 Relief and temporary aid services DIA_1.19 Time frame for relief efforts
tube well construction livelihood medical services
PROGRAMMATIC
PHASES OF FLOODING
STRATEGY
CONDITIONS:
storm surge lateral pressures wind speeds
stationary elevated water level environmental pressures negligent
1-‐
4
days 1-‐12
weeks4
months
Our project Collective Morphogenesis concerns the dynamic environment that flooding creates, and our intent is to develop architectural typologies adapted for these very different phases. The project is situated in the country of Bangladesh due to its geographical location, and low lying topography found at the delta floodplain. The country not only faces extreme conditions of cyclones but also various types of flooding, ranging from breaching of its extensive river system to storm surges.
The flooding that occurs in Bangladesh can be broadly be classified into three main types, which includes a cyclonic condition, an inundation period and seasonal flooding. The time frame for these conditions ranges from one to four days during the intial storm, to up to 4 months with an elevated water level. The vast differentiation in the time frames means that the design will need to facilitate the requirements of each.
0 - 4 days [including preparation]
0 - 12 weeks
June - November [monsoon season]
water accumulation at river banks environmental pressures negligent programmes contained within shelter
90% of exterior programmes functioning limited programmes exterior of shelter
ASSESSMENT:
aggregation will need to withstand extreme pressures of wind + water
inundation will require an alternative network system
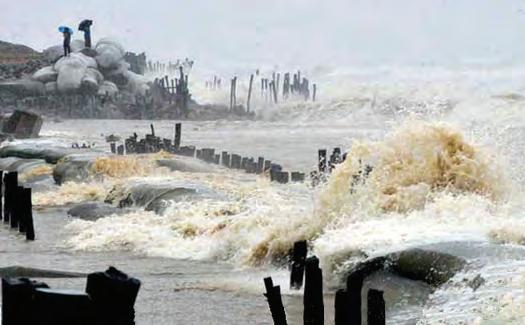
village structure will need to be maintained in a long flooded period
continuation of existing programmes on the ground
some flooding allowed over agricultural land
L to R
IMG_1.38 Storm surge near the coast
IMG_1.39 Water accumulation in agriculture land
IMG_1.40 Stagnant high water levels
DIA_1.20 Flood phases occurring in Bangladesh

In the highly pressurised situation of a cyclone, the intervention will need to account for how to protect the village from wind and water forces. However, this emergency situation exists for a very short time, so any type of permanent structure would need to have another function to serve its full potential. In the case of extreme flooding, a stagnant increased water level prevents villagers from being able to access fresh water as well having adequate movement paths. Being able to continue on with their lives even in a flooded state becomes important. The third outlined phase of seasonal flooding is not an emergency condition, but rather should be considered as a means to engender growth in other times. As the rivers overflow and water collects at the banks, some of this abundant water can be distributed to agriculture and also stored for later usage.

Collective Morphogenesis Emergent Technologies and Design 51 50 1
emergency situation normal situation emergency situation
TIME PERIODS
1. CYCLONE
2. SEVERE FLOOD 3. SEASONAL FLOOD
DOMAIN
TIME
PERIODS
FLOOD INUNDATION CYCLONE emergency
situa3on
AMBITION PROGRAMMATIC
SEASONAL
emergency
situa3on normal
situa3on
STRATEGY
SITE
METHODS 2
2.1 Overview 2.2 Stages 2.3 Digital Tools
OVERVIEW
This chapter documents the various steps and methods established during the exploration process of creating a multi level aggregation strategy. It also details the importance of different digital tools in the process of form generation and distribution logics. The methodology for the research aims to integrate seemingly varying parts to function for the specific scenario of flood mitigation in Bangladesh.
Differentiation of steps is noted in the process where a level of interconnectivity between parts of the system are pursued. This interchange between different stages helps in transferring information from one to another and also becomes the medium of examination. The research begins by looking at a material composite and through deriving principles of site, can be fully applied within a larger organisation.
The method focuses on the development of a system ranging in scale from infrastructure, building typologies and network, all driven through cultural context.
[T]here is a balance or harmony in natural systems, which, dictated by the laws of physics, has gradually developed during the 4 billion years of Earth’s history. The desire to preserve this harmony must also be incorporated into any philosophy of water management....1

Collective Morphogenesis Emergent Technologies and Design 55 54 2 METHODS
IMG_2.01 Pattern of the water’s surface
1 Leopold, Luna B., 1977, A Reverence for Rivers, in Geology, v.5 (July), p.429-430.
1. CYCLONE
wind + water pressures
SITE
2. LONG TERM INUNDATION
access to specific community programmes
3. YEARLY MONSOON
water management
AGGREGATION
GEOMETRY
FUNCTION
optimisation
material limits
typologies
dissipation
distribution
collection
PROGRAMME
HYDROLOGICAL NETWORK
panelisation
network connectivity
typological analysis
MATERIAL EXPERIMENTATION
Understanding of mechanical properties and behaviour of fibre composite system
Extraction of parameters related to material behaviour and properties
Development of fabrication techniques and connections in relation to low tech production
GEOMETRIC EXPLORATION
CFD analysis for extraction of geometric principles in relation to properties of the material system
Development of different geometries based on the environmental pressures as well as incorporation of design drivers [material, programme, site]
RESEARCH DEVELOPMENT
VILLAGE
social + family structure community programmes
SYSTEM
PROGRAMMATIC PHASING STRATEGY
Research into the multiple time scales involved in flooding as a phenomenon
Site specificity in order to extract forces, and establish relationship of typology to phases
HYDROLOGICAL SYSTEM
Development of a three part water network including collection, movement and redistribution
Exploration of principles of channelling as a strategy and its geometric implications
CLUSTER ORGANISATION
Establishment of rules for distribution [and measurement] of programmes on site
Definition of programme relationships within cluster: local and regional hierarchies established in terms of shared attributes
SYSTEM DEVELOPMENT
CLUSTER ANALYSIS SYSTEM EVALUATION
Topological analysis of the optimised geometry in terms of fibre reinforcement and panelisation
Formulation of network to achieve connectivity between cluster arrangements
Assessment of the proposed system in terms of cultural context and phasing strategy
Understanding the flexibility of the system parts in their relationship to each other
Alternative proposals for application of system to site
SYSTEM PROPOSAL
Collective Morphogenesis Emergent Technologies and Design 57 56 2 METHODS
STAGES
STAGES
METHODS
Tools used for purposes of analysis were mostly CFD software and Strand 7. Although it was understood that simply testing one geometry [or a series of objects] in such tools doesn’t necessarily output exact behaviour of water flow, the results do allow for comparative studies.
In terms of the organisation, distribution logics were developed in Grasshopper [for Rhino] utilising genome lists of programme percentages. It must be emphasized that this is not the only method of generating programme. Other processes could also have been implemented, including cellular automaton (CA) or diffusion limited aggregation (DLA). Rulesets for these modelling generators are very different in setup and would have also required altered evaluation criteria. Since the distribution wasn’t the most critical part of the process, a more simplified logic was applied [to also be influenced more easily by other factors].
The water network could also have been achieved through DLA rather than a branching system. The DLA based on the principle of particle behaviour which cluster together to aggregates. The result of such aggregation could also lead to branching but it is time consuming as it depends on multiple iterations.
Through both physical and digital testing, material properties of the fibre composite system will be derived.
Different fabrication techniques will be explored during this stage in order to achieve a better integrated approach between the design process and the method of production. Feasibility in fabrication will directly be correlated to the site context at a later stage.
Digital tools such as Strand 7 shall be used to conduct finite element analysis (FEA) of the material for structural performance and deflections. This tool will be used to simulate the behaviour of the material and derive curvature limits.
After identifying the limits and defining the parameters which govern the behaviour of the material, a study will be made in exploring different geometries adapted for high environmental pressures.
To construct the digital setup for testing of geometries, environmental forces will be extracted from appropriate site conditions, and used to test within computational fluid dynamics (CFD). The geometries will be further developed based on the environmental pressures and on the geometrical framework defined by the material system. Elements of internal partitioning for programmatic usage will be incorporated to develop a range of typologies.
By examining case studies of existing strategies in dealing with the pressures of flooding and the coast, a multi phase strategy will be developed.
The strategy will outline to what extents water has an influence on culture, and how this can be incorporated into design principles. In such, a system will be defined as multiple levels of interdependence between the site, infrastructure and built form. Various drivers for the parts of the system will generated, including flood mitigation, utilisation of water and the social logic.
In each phase, the flooding impacts are differentiated and programmatic drivers defined. The hydrological system will develop from understanding principles governing traditional water systems as well as the existing site water usage.
Geometric rulesets for branching and evaluation criterion of spatial organisation will establish strategies of channelling on the specified site. To incorporate a multi-level water network, direction of flow, points of collection, and redistribution will be generated for social integration.
The optimisation process will be a two stage process in which performance of the developed geometries will be measured by differential weighting and fitness criteria. Parameters such as ease of fabrication, spatial performance, minimum surface pressure and minimum deflection will be considered while ranking different geometries.
The pressure on the surface of the geometry will be extracted with the help of computational fluid dynamics.
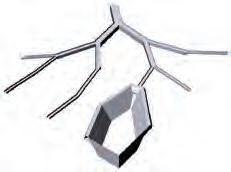
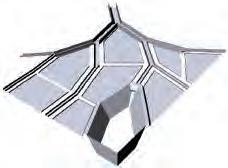

Analysis of the cluster geometry will include evaluation of stresses at the local scale. Topological analysis will generate information for where openings can be made in fabrication of the typology shell. Openings will be based on parameters such as sunlight direction, flood level and panel area.
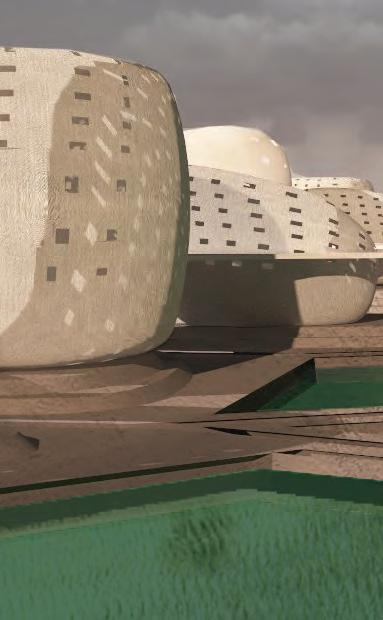
Connectivity of the buildings in a flooded state will be delineated through an elevated network. Application of the network will consider a hierarchy within the cluster organisation, of primary and secondary paths.
The design evaluation will look at comparison of the existing structure to the proposed typology, including substantiation of the benefits of the system.
The system itself will be understood as a sum of its parts, and highly flexible within a specified range. Certain parameters will be modified in order to fully situate both the hydrological system and geometrical principles to the context of the site.
Collective Morphogenesis Emergent Technologies and Design 59 58 2 METHODS
100cm 00-00 00-00 00-20 20-00 100cm b d 100cm 00-00 00-00 00-20 20-00 100cm
1.0 0.83 0.5 0.67 scale factor 1.0 0.83 0.5 0.67 scale factor 050100200 (m) PROGRAMMATIC PHASING STRATEGY GEOMETRIC EXPLORATION MATERIAL EXPERIMENTATION CLUSTER ANALYSIS SYSTEM EVALUATION CLUSTER ORGANISATION HYDROLOGICAL SYSTEM RC H above ground fresh water RC H above ground fresh water 4. Network modification based on housing typologies on primary network 5. Connecting housing typology to RC based on fresh water cluster relation 5. Secondary network connecting unconnected houses to respective RC LEVELS OF STORAGE STORAGE CAPACITIES TYPE 1. Local Family 2. Regional Neighbourhood 3. Global Village Small pond Medium scale pond Reservoir USAGE Aquaculture Collection: feeds into internal agriculture during dry season Collection: feeds into external agriculture during dry season Wet Season [Phase 3] Overflow from rivers distributed into ponds Dry Season [Phase 4] Collected water from ponds redistributed to agriculture fields distribution path distribution path sluices act as barrier channel gate opened to guide water water movement across fields Establishing fresh water collection connections Moving fresh water collection points Selection of fixed points based on most connected and extreme points ensuring maximum spread Fresh water collection points anchor points and moving housing points
2 METHODS
DIGITAL TOOLS
FINITE ELEMENT ANALYSIS (FEA)


The primary ambition of the research was to develop an integrated fibre composite material system. For achieving this goal, a finite element analysis tool would be one of the most crucial tools in computing the behaviour of materials in a digital environment. Even though FEA analysis is not always 100% in accordance with the physical experiments, the behaviour of the material is more or less similar. Because of the time constraints, it is not possible to conduct an exorbitant amount of physical tests and thus FEA becomes an efficient way of conducting experiments and simulating the material behaviour.

COMPUTATIONAL FLUID DYNAMICS (CFD)

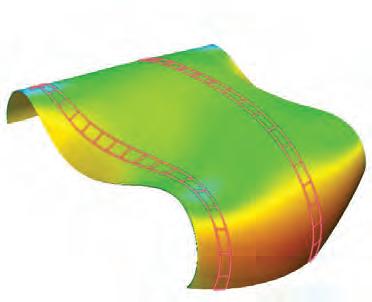
Computational fluid dynamics is used for solving and analysing problems related to fluid flows. It uses numbers and algorithms to compute the results.
Since one of the ambitions of the research was to develop a material system that could be used in a high pressure environmental conditions of wind and water, CFD becomes an important tool for flow simulation and pressuring mapping.
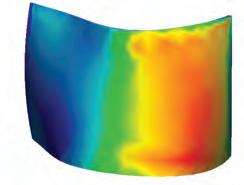
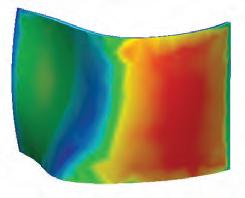
CFD as tool within this research will not only be used for visualisation but the numbers derived from CFD analysis will be translated as forces for topological analysis.

In order to optimise a building morphology according to wind and water pressures, it was necessary to develop a way to transfer surface pressures from the CFD analysis into Grasshopper and Karamba [for Grasshopper] in terms of structural optimisation.
The idea of this translation is based on a catalogue of possible geometries within a certain range of adjustments which are tested in CFD.
The experiments in CFD showed a relationship within the pressure, surface and angle between surface normals and the flow direction. In addition
to this relationship, the global geometry and the gradient of curvature changes (from positive to negative Gaussian curvatures) influence the pressure distribution on the surface. As a result, there are different pressure values for the same angle between flow direction and the surface normal.
Collective Morphogenesis Emergent Technologies and Design 61 60
Initial Geometry Optimised Geometry Maximum displacement: 48.4 cm Material Properties: 2 layers of Glass Fibre Fabric 4cm Thermoplastic foam core 2 layers of Glass Fibre Fabric Average surface pressure: -93.97 Pa FEA CFD Maximum displacement: 2.11 cm GEOMETRY computational analysis Static pressure [Pa] -1600 -2061.35 -1200 -800 -400 0 400 800 1200 1600 2114.88 Static pressure [Pa] 1200 1600 2114.88 Initial Geometry Optimised Geometry Maximum displacement: 48.4 cm Material Properties: 2 layers of Glass Fibre Fabric 4cm Thermoplastic foam core 2 layers of Glass Fibre Fabric Average surface pressure: 426.76 Pa FEA CFD Maximum displacement: 2.11 cm GEOMETRY computational analysis Static pressure [Pa] -1600 -2061.35 -1200 -800 -400 0 400 800 1200 1600 2114.88 Static pressure [Pa] -1600 -2061.35 -1200 -800 -400 0 400 800 1200 1600 2114.88 Initial Geometry Optimised Geometry Maximum displacement: 48.4 cm Material Properties: 2 layers of Glass Fibre Fabric 4cm Thermoplastic foam core 2 layers of Glass Fibre Fabric Average surface pressure: 426.76 Pa Average surface pressure: -93.97 Pa FEA CFD Maximum displacement: 2.11 cm GEOMETRY computational analysis Static pressure [Pa] -1600 -2061.35 -1200 -800 -400 0 400 800 1200 1600 2114.88 Static pressure [Pa] -2061.35 2114.88 Initial Geometry Optimised Geometry Maximum displacement: 48.4 cm Material Properties: 2 layers of Glass Fibre Fabric 4cm Thermoplastic foam core 2 layers of Glass Fibre Fabric Average surface pressure: 426.76 Pa Average surface pressure: -93.97 Pa FEA CFD Maximum displacement: 2.11 cm GEOMETRY computational analysis Static pressure [Pa] -1600 -2061.35 -1200 -800 -400 0 400 800 1200 1600 2114.88 Static pressure [Pa] -1600 -2061.35 -1200 -800 -400 0 400 800 1200 1600 2114.88
Inital Geometry Optimised Geometry
Average surface pressure: 426.7 Pa Maximum displacement : 48.4 cm Average surface pressure: -93.97 Pa Maximum displacement: 2.11 cm Initial Geometry Optimised Geometry Maximum displacement: 48.4 cm Material Properties: 2 layers of Glass Fibre Fabric 4cm Thermoplastic foam core 2 layers of Glass Fibre Fabric Average surface pressure: 426.76 Pa Average surface pressure: -93.97 Pa FEA CFD Maximum displacement: 2.11 cm GEOMETRY computational analysis Static pressure [Pa] -1600 -2061.35 -1200 -800 -400 0 400 800 1200 1600 2114.88 Static pressure [Pa] -1600 -2061.35 -1200 -800 -400 0 400 800 1200 1600 2114.88 -4.84e-07 9.08e+00 1.82e+01 2.72e+01 3.63e+01 4.54e+01 Displacement [cm] Initial Geometry Optimised Geometry Maximum displacement: 48.4 cm Material Properties: 2 layers of Glass Fibre Fabric 4cm Thermoplastic foam core 2 layers of Glass Fibre Fabric Average surface pressure: 426.76 Pa Average surface pressure: -93.97 Pa FEA CFD Maximum displacement: 2.11 cm GEOMETRY computational analysis Static pressure [Pa] -1600 -2061.35 -1200 -800 -400 0 400 800 1200 1600 2114.88 Static pressure [Pa] -1600 -2061.35 -1200 -800 -400 0 400 800 1200 1600 2114.88 2114.88 1200 400 -400 -1200 -2061.35 0 Static Pressure (Pa) Initial Geometry Optimised Geometry Maximum displacement: 48.4 cm Material Properties: 2 layers of Glass Fibre Fabric 4cm Thermoplastic foam core 2 layers of Glass Fibre Fabric Average surface pressure: 426.76 Pa Average surface pressure: -93.97 Pa FEA CFD Maximum displacement: 2.11 cm GEOMETRY computational analysis Static pressure [Pa] -1600 -2061.35 -1200 -800 -400 0 400 800 1200 1600 2114.88 Static pressure [Pa] -1600 -2061.35 -1200 -800 -400 0 400 800 1200 1600 2114.88 2114.88 1200 400 -400 -1200 -2061.35 0 Static Pressure (Pa) Initial Geometry Optimised Geometry Maximum displacement: 48.4 cm Material Properties: 2 layers of Glass Fibre Fabric 4cm Thermoplastic foam core 2 layers of Glass Fibre Fabric Average surface pressure: 426.76 Pa Average surface pressure: -93.97 Pa FEA CFD Maximum displacement: 2.11 cm GEOMETRY computational analysis Static pressure [Pa] -1600 -2061.35 -1200 -800 -400 0 400 800 1200 1600 2114.88 Static pressure [Pa] -1600 -2061.35 -1200 -800 -400 0 400 800 1200 1600 2114.88 -2.11e-08 3.95e-01 7.90e-01 1.18e+00 1.58e+00 1.97e+00 Displacement [cm]
PRESSURE MAPPING TOOL
DIA_2.02 CFD Pressure Mapping DIA_2.01 CFD Finite element analysis and computational fluid dynamics DIA_2.03 Measured Areas DIA_2.04 CFD Settings Air Solid Velocity: 41m/s 13.0 m 20.0 m Pressure: 0.0Pa 1500.02 800 0 -800 -1600 -2086.17 Static Pressure (Pa)
DIGITAL TOOLS
Area Load: 2kN/m
The following work flow explanation is based on a test surface. During the further development of the design this process will be revisited and adjusted. To take all those parameters into account an algorithm was developed to map the pressure values based on CFD simulations of similar geometries. The pressure along the surface was evaluated separately for concave and convex areas and those values are plotted into a graph. The angles between the surface normal at each measured point in CFD and the flow direction are mapped into a second graph. By overlaying both graphs, one is able to find for each angle the pressure value according to the location along the surface.

To map the value onto the surface the algorithm divides the global geometry into a dense mesh of evaluation points. Those points are divided on their location in convex and concave shaped areas and
0.5cm Glass fibre fabric, bidirectional, plain
stored accordingly in different domains. In the next step evaluation of the angle between the surface normal, in each of the evaluating points, and the flow direction is conducted.
The last step maps a force onto the points. If the point is within the pure convex shape, there is one pressure value for each angle. In areas of curvature change from convex to concave there is more than one possible pressure value. To find the right value, an interpolated curve is generated along the evaluation points in the direction of the flow and a second curve is mapped based in the curvature graph of the first. Intersections of those curves mark transitions from concave to convex and back again. All points along those curves are stored again in domains based on their location along the surface in concave and convex areas. Thus for each point in each sub-domain, one pressure value is extracted.
These values are translated into point loads on the mesh for the FEA analysis with Karamba [for Grasshopper] and are taken into account for geometrical and structural analysis of the global geometry.
This approach to transfer the pressure values from the CFD program into Grasshopper doesn’t supply 100% accurate values of forces acting on the surface, as it is an approximation. The areas of negative and positive pressures are correctly evaluated and tendency of pressure distribution follows the values based on CFD simulation. To get more accurate outcomes, the resulting surfaces will be analysed in CFD again to readjust the algorithm.
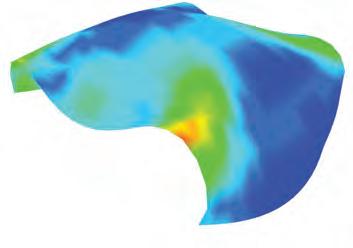

4.0cm Thermoplastic foam core
4.0cm Thermoplastic foam core
0.5cm Glass fibre fabric, bidirectional, plain 0.5cm Glass fibre fabric, bidirectional, plain
0.5cm Glass fibre fabric, bidirectional, plain


Collective Morphogenesis Emergent Technologies and Design 63 62 2 METHODS Surface Pressure [Pa] Angle [°] 0 45 90 135 180 12 3 456 89 10 1112 13 141516 17 1819 -600 -300 0 300 600 900 1200 1500 Surface Pressure [Pa] Angle between surface normal and flow direction [°] DOMAIN 0 Surface Pressure [Pa] Angle [°] 0 45 90 135 180 Surface Pressure [Pa] Angle between surface normal and flow direction [°] DOMAIN 1 DOMAIN 2 DOMAIN 3 12 3 456 7 89 10 1112 13 141516 17 18 19 -800 -600 -400 -200 0 200 400 600 800 DIA_2.05 Shell Cross-section DIA_2.06 Pressure Direction Relation Concave DIA_2.07 Pressure - Direction Relation - Convex
DIA_2.08 Initial Surface DIA_2.09 Synclastic area Domain 0 DIA_2.10 Anticlastic Area DIA_2.11 Anticlastic Area Domain 1 (convex) DIA_2.12 Anticlastic Area Domain 2 (concave) DIA_2.13 Anticlastic Area Domain 3 (convex) DIA_2.14 Acting Forces DIA_2.15 van Mises Stress - Outer layer (concave) DIA_2.16 Displacement -0.57 10.3 19.9 29.6 36.3 49 58.7 68.3 78 Stress[kN/cm ] -2.26e-07 2.83 5.65 8.48 11.3 14.1 17 19.8 22.6 Displacement (cm) PRESSURE
MAPPING TOOL
Collective Morphogenesis 65 MATERIAL SCIENCE 3 3.1 Overview 3.2 Research 3.3 Experimentation 3.4 Behaviour 3.5 Potentials
OVERVIEW
Natural disasters like floods and cyclones not only have a devastating impact on infrastructure, economy, health but also have repercussions on social life. Moreso, these impacts are magnified when a rural environment is considered. In a village, people are predominantly dependant on agriculture as their main occupation and the houses are built out of materials that tend to be destroyed during flooding or severe storms.
This chapter documents the exploration of a new material system which could deal with harsh climatic pressures of water and wind, such as those faced on the coast. Reseach begins by looking at industries which currently focus on highly pressurised environments, and continues in investigating the potential of fibre composites as a new material system for architectural application. It also documents the various steps taken in understanding the limitation of the material along with a calibration process between the physical and the digital experiments.

The goal was to establish a basis for generating a building morphology, which would not only take into account the programmatic necessities but also consider material properties as one of its parameters.
The Kyoto protocal on global climate change has resulted in an acceleration of the transition towards a sustainable and more environmentally friendly economy. This transition is mainly realized by a shift in the use of agricultural crops from food to energy and a shift in the use of petrochemicals to renewable resources....1
Collective Morphogenesis Emergent Technologies and Design 67 66 3 MATERIAL SCIENCE
IMG_3.01 Thermoplastic foam core
1 Islam, Mohammad Shahidul; Ahmed, Sheikh Kamal. The Impacts of Jute on Environment: An Analytical Review of Bangladesh. Journal of Environment and Earth Science. Vol. 2, No. 5 2012.
RESEARCH EXISTING CONSTRUCTION TECHNIQUE
IMG_3.03 Wattle and Daub construction in Bangladesh
One of the leading issues with the geography of Bangladesh is not simply its dynamic climate but also the types of responses put forth culturally. For one thing, due to its poverty and lack of stone as a natural material, Bangladesh villagers [especially on the coast] are limited to resources available locally. Specifically this results in building homes constructed from mud brick and/or bamboo. Where the mudbrick acts as a more stable element in terms of dealing with wind pressures, this style of building fails in long-term inundated periods.
To counter seasonal levels of high water levels, villagers build an earthen plinth with cement stabilised earth capping, onto which the house rests away from the flood water. However, the destructive flood which occurs every 5 - 7 years rises much higher than the 0.5m to 1.0m plinth and greatly damages the structural integrity of the house. On the other end of the material spectrum, bamboo, even when treated, may create a less dense surface material in which flood waters can flow through. However, bamboo as a light material is unable to withstand the pressures of wind and tidal surges that often are a result of cyclones.

These types of housing construction are called “kutcha”, or “kacca” depending on the region, regarding their temporal nature. Kutcha literally

means unripe, which in terms of building construction, can be seen as a relatively unfinished or unstable housing condition. The flimsiness of the material reflects its temporary existence in the dynamic conditions in which they are utilised.
Even a combination of the two materials as a composite building system [a construction using bamboo framing with mud brick] is not able to withstand these pressures of wind and water. This results in demolition of houses every 2-3 years and re-construction of the same once the floods are over. The technique used for constructing these houses is very low-tech and allows for reassembly in a short period of time.
Thus, to have a long term solution for this continual process of demolition and reconstruction, it is important to research a new material system which can be manufactured with minimal skills and be able to withstand the high environmental pressures. This investigation into existing constructing methods and materials led the research into a study of fibre composites because of its high strength properties, ability to withstand pressures, and also being corrosion resistant. The first part of the research focuses on development of a material system which can be manufactured with relatively low-technology, while having high structural properties.
Collective Morphogenesis Emergent Technologies and Design 69 68 3 MATERIAL SCIENCE
IMG_3.02 Bamboo housing in Bangladesh
DIA_3.01 Construction of bamboo houses DIA_3.02 Construction of double layer bamboo framing in mud house
DIA_3.03 Wattle-and-daub construction
COASTAL HOUSING: “KUTCHA” HOUSES
OTHER INDUSTRIES
Fibre composites are currently being utilised for high performance applications such as the field of automotive industry, aerospace industry and the manufacture of boats and sails. Its usage is targeted towards fields which deal with extreme conditions like high wind and water pressures. One of the advantages of using this material system in extreme climatic situations is its high strength to weight ratio. However, very few efforts have been made in exploring fibre composites as a building material in the field of architecture.



These industries deal with producing highly optimised geometries which could function in pressurised environments. The material composition within these geometries can be adjusted to highly predefined structural and spatial demands which gives an advantage in using fibre composites. The associated fields of industry are concerned with developing geometries which behave as shell structures. The behaviour of every part of the geometry is geared towards being a structural element and is optimised for its performance. Thus, the development of the geometrical form and its structural performance are integrated within the design. Research into geometrical exploration will focus on the concepts used in these industries including understanding the role of shell structures.
Fibre composite structures are generally made up of two different materials of different mechanical properties, where fibres take the tensile loads and matrix like resin take the compression loads. In order to develop architectural typologies that can deal with high environmental pressures, understanding the behaviour of the material becomes the one of the most important steps. The research into fibre composites as a material system was driven by two main drivers of understanding the behaviour and the limits of the material, and low-tech fabrication techniques which would not rely on creating moulds for every differentiated geometry.
Collective Morphogenesis Emergent Technologies and Design 71 70 3 MATERIAL SCIENCE
IMG_3.04 Automotive Industry IMG_3.05 Offshore application IMG_3.06 Sails / Boats / Yachts
FIBRE COMPOSITES RESEARCH
Glass fibres are melted glass which is drawn into fibres. After the melting process it is pressed through nozzles in a diameter of 2mm. High speed winding of the fibres reduces the initial diameter to 9-24 μm. Since all glass fibres are sensitive to notches, and tend to corrode under direct weather influence they have to be coated or embedded in a polymer substance.
Glass fibres themselves can be categorised between E-glass [electric glass], the standard product which is subject to attack in basic environment; AR-glass (alkaline glass], a textile reinforcement for concrete; C-glass [corrosion glass), a high chemical resistance; and R- and S-glass [resistance, strength glass], a high heat and fatigue resistance.


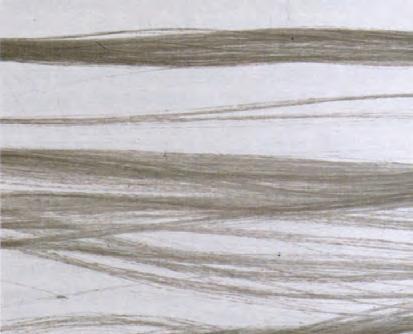
Due to their amorphous structure glass fibres exhibit an isotropic behaviour, almost equal tensile and
compression strengths and they are linear elastic. Furthermore they can endure extremely high temperatures up to 250°C which have no influence on their mechanical properties.
Although they appear white because of light reflection from their circular cross section, the single fibres are actually transparent. Glass fibres embedded in a clear polymer matrix material of the same light refraction coefficient as the glass fibres appear clear. Translucent fibre reinforced composites [with a translucence up 85%] with less reflection can also be produced. Therefore this is the only translucent material which can span large distances.
Glass fibre reinforced polymers are efficient when used with glass, as it has a similar coefficient of extension, no elastic layers are needed, and it is adequate for structural frameworks.
For the production of carbon fibres, polymer fibres, especially polyacrylonitrile fibres, are carbonised in the process. They are heated to high temperatures [up to 3,000°C] repeatedly in order to separate all other elements from carbon. Simultaneously, the fibres are stretched. The specific properties for different types of carbon fibres are adjustable by temperature levels.
The carbonisation process is extremely energy demanding, which results in one reason for the high price of carbon fibre materials. The production is based on natural resources such as oil, therefore current research is concerned with alternative raw materials such as mineral pitch and coaltar. Natural carbon substances [graphite, diamond] cannot be processed into fibres. These fibres are very brittle and sensitive to buckling, thus they are coated with epoxy resin.

Even though the production is energy demanding, the corrosion resistance and long life spans of carbon
fibre materials are valid arguments for their use in fibre reinforced polymers.
Carbon fibres exhibit a higher E-modulus than all other fibres. Their mechanical properties are more adjustable to mechanical demands as compared to glass fibres. One difference is mainly between Standard modulus fibres [high tensile, HT] with high tensile strength, High Modulus [HM] fibres with high material stiffness and Intermediate modulus [IM] fibres with moderate strength and material stiffness.
Single fibres are anisotropic exhibiting higher tensile than compression strength. The thermal expansion is negative in the fibre direction and positive in the transverse direction. The main advantages of carbon fibres concern its dynamic properties: low weight, corrosion resistance, and the lack of exhibition of significant creep under long term load.
Due to the coloration of carbon fibres as black, any carbon fibre reinforced polymer appears opaque.
Collective Morphogenesis Emergent Technologies and Design 73 72 3 MATERIAL SCIENCE
IMG_3.07 Glass fibre filaments
IMG_3.08 Glass fibre strands
GLASS FIBRES
IMG_3.09 Carbon fibre filaments
CARBON FIBRES
FIBRES RESEARCH
IMG_3.10 Carbon fibre pre-preg tape
POLYMERS
To create fibre reinforced polymers, the matrix materials play a large role in adjusting the technical properties to the specific needs. The high number of different polymers and the possibilities of property adjustment make this a large field. Factors important for architectural applications are the protection against environmental influences [UV, chemical], surface behaviour in terms of transparency, colour and finishing. These properties can be controlled by various additives and fillers.
Polymers are divided in 3 different groups, thermoplastics, elastomers and thermosets. Thermoplastics exhibit no cross linking between their molecular chains and are thus mouldable after primary heating and forming. Once cooled the molecular arrangement allows the material to be rigid. Compared to thermosets the mechanical properties are low.
Elastomers, such as rubber consist of weak cross links between the molecular chains. After the cross links are initially set, they cannot be melted once again. Elastomers are very extensible.
Thermosets exhibit very strong crosslinks and good mechanical properties compared to elastomers and thermoplastics. After cross linking, they are rigid and can’t be melted or moulded again. Above the glass transition temperature they exhibit loss of mechanical properties. This temperature is dependent on the matrix material and affects the molecular organisation [changing from crystalline to amorph], colour and water resistance. For fibre reinforced polymers thermosets are mainly used, especially epoxy, vinylester and polyester.
BONDING PROPERTIES
The overall bonding properties depends on both the resin and the fibres. Treatment of the fibre surface leads to increased bonding properties. Epoxy resin exhibits excellent bonding results due to the adhesion properties.
To effectively use the tensile strength within a FRP it is necessary for the resin to be able to deform in the same way as the fibres. Compared to metals, composites acquire a strong resistance to fatigue. Those properties are influenced to a large degree by the resin used, thus epoxy has shown to be more useful than polyester and vinylester.
To meet industry demands for chemical and fire resistance properties, special additives are necessary.
POLYMERS
IMG_3.11 Thermoplastic - no cross links, adapted IMG_3.12 Elastomer - weak cross links, adapted IMG_3.13 Thermoset - strong cross links, adapted
EPOXY RESINS VINYL ESTER MECHANICAL PROPERTIES OF RESIN SYSTEMS
Epoxy resins are the most durable resins with the highest mechanical properties, high adhesive properties and resistance to water. Therefore they are of special importance to the aerospace industry, high performance boats or finish coating.
Liquid resin added with a hardener form a low viscosity material which is easy to mould. The curing time depends on the chosen hardener and the temperature [between 5 and 150]. The low shrinkage of epoxy resins reduces print through and internal stresses. The circular molecule structure in the middle of the epoxy chain absorbs mechanical and thermal stresses, leading to very high mechanical properties.
POLYMERS
POLYMERS
Vinylester resins exhibit a high resistance to water as well as chemicals. It is sometimes used as coating material for polyester composites, due to this water resistance property.
POLYESTER RESINS
Polyester resins are most widely used in the marine industry. They are produced by mixing an alcohol with a dibasic acid water. Additives such as styrene reduces the viscosity and enables the resin to cure by cross linking the molecule chains. Polyester resin can be used under low pressure.
Unsaturated polyester resins cure under normal conditions and are common, where saturated ones are more complex to work with.
The two most important mechanical properties of resin systems are the tensile strength and the stiffness. Due to rearrangement of the molecular structure there is less shrinkage in epoxy resin [2%] than in ester group resins [8%].
REACTION TO WATER
Polyesters and vinylester occur a loss of 35% of their shear strength after one year in water while epoxy resin remains 90% 1
DIA_3.01 1Gurit (2013). Guide to composites. [ONLINE] Available at: www.gurit.com_files_documents_guide-tocomposites-v5pdf. [Last Accessed 19 May 2013].
on resins, adapted
Collective Morphogenesis Emergent Technologies and Design 75 74 3 MATERIAL SCIENCE
Thermoplastic no cross links Elastomer weak cross links Thermoset strong cross links Thermoplastic no cross links Elastomer weak cross links Thermoset strong cross links Thermoplastic no cross links Elastomer weak cross links Thermoset strong cross links
DIA_3.04 Tensile strength and E-Modulus [different resins], adapted DIA_3.05 Influence of water
Polyester Vinylester Epoxy 0 60 304050 7080 1020 0 3.0 2.72.82.93.13.2 2.52.6 Tensile strength [MPa] [%] remaining properties after long term water exposure E-Modulus [GPa] Polyester Vinylester Epoxy 0 60 2040 80100
Polyester Vinylester Epoxy 0 60 304050 7080 1020 0 3.0 2.72.82.93.13.2 2.52.6 Tensile strength [MPa] [%] remaining properties after long term water exposure E-Modulus [GPa] Polyester Vinylester Epoxy 0 60 2040 80100
RESEARCH
IMG_3.14 Weaving patterns: plain, twill, satin
FABRICS
In the field of composite technology, the term fabric describes a manufactured assembly of continuous fibres into a flat sheet of one or multiple layers. By mechanical interlocking achieved through various weaving techniques the fibres are kept in place. The arrangement of those different layers can be oriented unidirectionally, 0/90° as well as multi-axial.
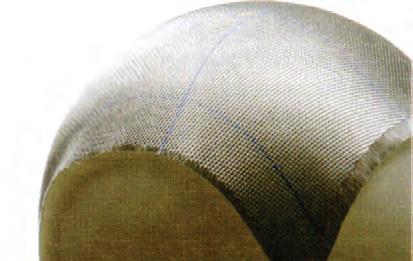
Unidirectional fabrics are composed of a fibre volume fraction of a minimum 75% in one direction. The higher the percentage in one direction, the more efficient is the use of fibres according to the force flow within the composite. Only the
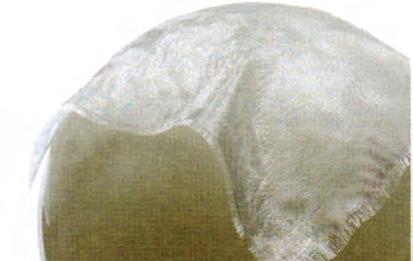
use of unidirectional prepreg tapes exhibit higher mechanical properties.
If the specific application demands more than one fibre direction, the use of 0/90° and multi axial fabrics is reasonable. The majority of 0/90° fabrics are produced by interlacing warp and weft fibres in regular weaving patterns. Different weaving techniques lead to different draping behaviour as shown in IMG_1.19 and IMG_1.20.
To avoid stress points at the intersections of warp and weft it is also possible to stitch the different
layers in multiple directions together into non-crimp fabrics. Mechanical properties can be improved by 20% simply by the stitching itself.
To respond to different structural demands in different directions, hybrid fabrics are made of different structural fibres, for example carbon fibres in warp [0°] and glass fibres in weft [90°].
If the structural requirements demand a multilayer lamination, each layer should be made with the fibre material fabricated in the certain position of the laminate.
SANDWICH PANELS
Although fibre composites are strong in terms of strength to weight ratio, the material itself is quite thin. Composites made from fibre composites also result in low thickness and thus lack stiffness. In order to overcome this disadvantage it is possible to implement structural ribs or add more layers to increase the thickness of the laminate itself. In both methods, the weight will increase and layers of fibres would be added to the complex by being positioned near the neutral axis.
Another way to increase the stiffness of fibre composite structures is the introduction of core

materials. High strength skins made of fibre reinforced polymers are layered on either side of a core in order to increase thickness. By adding low density core materials, the resultant structure behaves similar to an I-beam, in which the flanges take the main compression and tensile loads. The core material has to be able to take the shear loads between the outer skins.
The most common core materials usually consist of polymer foam, aluminium or aramid honeycomb or balsa wood. Essentially, the cores are generally light material but which can add greater thickness [and
stiffness] to the composite. The resulting stiffness of a sandwich panel can be calculated with the formula:
EI = (Eskin x (d³- c³) x b) / 12, d= sandwich thickness, c= core thickness, b width
Due to the low density of the core material there is a very high ratio between added weight and the increase of stiffness.
Collective Morphogenesis Emergent Technologies and Design 77 76 3 MATERIAL SCIENCE
CORE MATERIALS Factor thickness Factor E-Modulus 0 10 20 30 40 50 60 1 3 5 7 Relative Stiffness: 1 Relative Stiffness: 4.5 Relative Stiffness: 18 Relative Stiffness: 43 tension d 2 x d 4 x d 6 x d compression shear high strength outer layer high strength outer layer core material Factor thickness 60 40 20 0 3 1 5 7 Factor E-Modulus Factor thickness Factor E-Modulus 0 10 20 1 Relative Stiffness: 1 Relative Stiffness: 4.5 Relative Stiffness: 18 Relative Stiffness: 43 d 2 x d 4 x d 6 x d high strength outer Factor thickness 20 0 3 1 5 7 Factor E-Modulus Factor thickness Factor E-Modulus 0 10 20 1 3 5 7 Relative Stiffness: 1 Relative Stiffness: 4.5 Relative Stiffness: 18 Relative Stiffness: 43 tension d 2 x d 4 x d 6 x d compression shear high strength outer layer high strength outer layer core material Factor thickness 20 0 3 1 5 7 Factor E-Modulus DIA_3.06 Sandwich panel DIA_3.07 Stresses in sandwich panel, adapted DIA_3.08 Core thickness / relative stiffness
FABRIC AND SANDWICH PANELS RESEARCH
Possible curvatures
Geometry control
Connections in plane
Connections out of plane
Mech. properties core Mech. properties laminate


Thickness adaptability
Local adaptability
Translucence
Ease of lamination
Thermal conductivity

Acoustic insulation
STRUCTURAL CORE
CORE MATERIALS
Current techniques with fibre composite industries use individualized moulds for each panel, which doubles the material required and is therefore quite wasteful. The second issue is that to make the system practical there would need to be a rationalisation of the geometries to a limited range in order to reduce the amount of moulds required. Considering the aspirations for the system, which would be optimised for specific environmental pressures, this could be potentially limiting when creating global forms.
This led to the examination of alternative materials and techniques that could combine both the forming of panels with the need for a base material. The concept was to find a secondary material that could be an intrinsic part of geometry form-work while also serving as the base material onto which the glass fibre and resin could be directly applied.

Within the world of advanced composites there are various core materials that serve the purpose of adding thickness and deflection resistance. Primarily these are aluminium honeycomb and PVC based foam core, both of which were tested to determine best bonding properties with the glass fibre and resin. Also, exploration included the range of curvatures which were achievable [as this would ultimately dictate the limits of the system] and whether the material was able to maintain its stiffness prior to creating the composite [and not
deflect out of shape, creating inaccurate, difficult to control results].
Aluminium honeycomb has an advantage of possessing a high strength to weight ratio. Along with good structural properties the honeycomb aesthetic properties allows light penetration due to the cellular nature of the material. However, in testing, the honeycomb core could not withstand pressure applications, making lamination with glass fibre and resin difficult. The core was also poor at achieving a controllable curvature and would make connections out of plane difficult, making the joining of adjacent panels problematic.

Close cell PVC foam is an extremely lightweight rigid material that exhibits a modulus transformation through heating it at 80°C, and can be pushed and formed into different shapes. Once cooled it returns to its original modulus but in the newly formed shape. Another advantage of the thermoplastic foam was in creating excellent rigid bonding surface which did not require vacuum forming to achieve an acceptable bond [however it was noted that the pressure forming produced a higher quality end product]. Within a comparative classification the foam generally performed much better than the honeycomb core, as indicated in DIA_3.09, and therefore was chosen to move forward with.

Collective Morphogenesis Emergent Technologies and Design 79 78 3 MATERIAL SCIENCE
- - + +
HONEYCOMB CORE
THERMOPLASTIC FOAM CORE
geometry fabrication structure properties
IMG_3.15 Deformation of cells
DIA_3.09 Comparison of honeycomb and thermoplastic foam material properties and fabrication ease
RESEARCH
FORMING PROCESS EXPERIMENTATION
METHOD
The interest in researching about mould-less techniques led to an exploration of new fabrication methods using the foam core material and glass fibre. The research procedure was restricted to the largest heating mechanism available to heat PVC foam for experimentation. The vacuum former with heating filaments on the top end was used as it provided the best control of thermal exposure in terms of available facilities.
The first attempt to create a mould-less system was developed using metals rods. By adjusting the position of the rods, panels could be formed by

pressing the heated foam onto the guides. DIA_3.07 and DIA_3.08 highlight the forming process.


The technique for creating lightweight fibre composite parts occur in stages as follows:
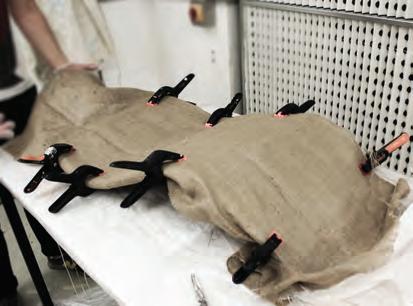

1. Heating the core material
2. Formation on an adjustable mould system
3. Application of the fibre and resin
4. Creating the lay up stack
5. Vacuum forming

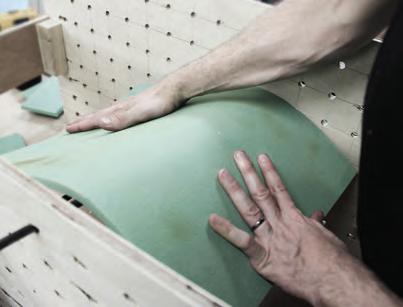


The fabrication of two panels describing each of these processes is described in detail in images 1-9
ISSUES
This adjustable rod system had some issues in achieving a continuous surface system. It was observed that since two panels were formed independently and then connected, the connecting edges were always uneven which resulted in discontinuity of the surface. Even though the layers of glass fibre would essentially create a continuous exterior surface, the core material would be disconnected at the joint, resulting in problems moving forward. An alternate forming system needed to be developed in order to form panels for continuous surfaces.
Collective Morphogenesis Emergent Technologies and Design 81 80 3 MATERIAL SCIENCE
Heating foam on the vacuum former
Glass fibre and epoxy resin applied onto foam
Unpack after 8 hours of cure time
Adjustable mould
Composite lay up- peel ply, breather cloth, release film
Removing peel ply, breather cloth and release films
Application of foam onto digitally informed configuration
Vacuum bag panels to pressurize the lay up
Consistent final finish
IMG_3.16 Process of vacuum lay-up
DIA_3.10 Forming of the panel on the adjustable rod system
DIA_3.11 Connection of the two panels creates an uneven edge condition
FORMING PROCESS EXPERIMENTATION
FORMING OF PANELS
The process of forming the panels involved individually heating each piece in the vacuum former for approximately 10 seconds on each side, up to a temperature of 800 C. The heated piece was then pressed onto the frame, with force applied at the edge curves and retained there for 30 seconds until the material cooled.


Initially the deflection rate for the thermoplastic foam was 10 %, in which the material did not stay consistent to the frame curvature required. Instead cut line patterns were developed, with the lines following the direction of curvature in the panel respective to its location within the surface. The removal of material from the foam was tested at varying percentages in order to optimise a cutting pattern for the curvature required in the panel.
The intent was not to cut the pattern all the way through the thickness of the material, the foam would exhibit different behaviour with lack of continous material. For instance, where plywood achieves its strength through each layer of differentiated fibre directionality, scoring of the surface to achieve desired flexibility is dependent on the number of layers. For plywood with greater thickness, cutting of slots through all layers is the most reliable method.
Meanwhile, the foam is not based on fibre direction or layering, but rather a closed cell structure which is based on a polymer matrix with air bubbles incorporated within. Thus due to the thermoplastic foam composition, it is not critical in the removal of material to cut through the thickness for a release in surface tension. This also allowed for the applied pattern to be continuous lines rather than a series of slots. Several depths of the cut pattern were tested before a 50% cut was selected as the optimum depth.
INTRODUCTION OF PATTERN
Two parameters were key in establishing the cutting pattern: the depth of the cut and the spacing of the cut lines [essentially the percentage of pattern lines applied to each measured curvature gradient].
The introduction of the pattern proved to minimise the deviation of the formed panel from the edge curves. The percentage of pattern lines was applied based on each measured curvature gradient.
Collective Morphogenesis Emergent Technologies and Design 83 82 3 MATERIAL SCIENCE
IMG_3.18 Process of achieving material curvature
IMG_3.19 Heated foam panel applied to frame
IMG_3.17 Patterned panel minimizes deviation from frame
IMG_3.20 Patterned panel minimizes deviation from frame
PATTERN COMPUTATION
Pattern analysis and computation is derived directly from the curvature of the panel itself. The initial panel is subdivided into a grid of uv points, with both the u count and v count as [10]. This generated point list is manipulated to achieve the isocurves in both directions, as dependent on the surface curvature of the panel.
A python script was composed allowing for the generation of spheres based on a start point. One initial sphere is generated on the start point, its radius based on the normal of the point on the surface. The intersection of the sphere and the isocurve locate the center point of the adjacent new sphere. The spheres themselves are given boundary conditions in their radius size. A minimum of 17 mm and a maximum of 50 mm were allowed

as radii dimensions so as optimise the number of intersections achieved on the surface. Once the definition has run through the creation of new spheres until no more can be generated onto the surface, the resultant intersection points formulate the new point grid.
To derive a grid of points, the definition must calculate intersection points in both the u and v directions. Connection of the points in the respective directions results in continuous lines throughout the surface [the cutting pattern].
What is critical regarding patterning of the surface is that the point grid is controlled through the number of isocurves determined. However, since the spheres themselves are not dependent on the base surface
grid, the intersection points follow directly the amount of curvature experienced at each particular start point. Each sphere influences the next in terms of location placement, but is allowed to grow through the variable of the normal vector.
The final cut pattern achieves a density of lines differentiated by the curvature of the surface, but controlled through the initial surface grid.
DIA_3.13 Curvature analysis for pattern
CURVATURE ANALYSIS
1. SUBDIVISION 2. ISOCURVES 3. SPHERES initial surface uv grid initial surface lines based on surface division generation of spheres based on normal vectors
DIA_3.12 Pattern generation onto surface
4. INTERSECTION
5. CUTTING PATTERN [U] point grid from intersection of spheres and isocurves
panel curvature determines density connection of points to create continuous lines process applied in other direction to derive lines
5. CUTTING PATTERN [V]
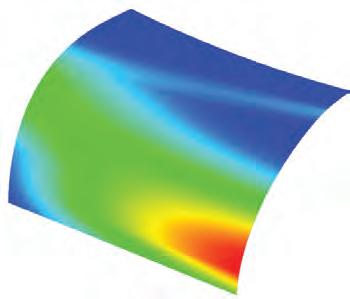
Collective Morphogenesis Emergent Technologies and Design 85 84 3 MATERIAL SCIENCE
Mean Curvature Range .003926 .00139
FORMING PROCESS EXPERIMENTATION
FORMING PROCESS EXPERIMENTATION
DIA_3.15 Connection between two adjacent panels
Joining of two panels
Joining of two panels
Glass fibre lap joint
Thermoplastic foam panel
Edge frames of thermoplastic foam


Layers of glass fibre with resin
After understanding the necessity of creating pattern in order to counter the deflection the next set of experiments were conducted in order to test whether openings could be created within the surface. It was also necessary to test surface continuity and change in the direction of the surface by the method of surface branching along with connections between panels. Table top experiments were conducted to test these two concepts.
As shown in the adjoining diagrams and pictures, it was possible to connect two surfaces through branching. This system would allow later in development of a floor and roof system where vertical surfaces could be connected to the horizontal surfaces. The corners would additionally be reinforced with branching which will help in reducing deflection under load. The branching system not only had an advantage of achieving change in the direction of the surface but also created variable thickness within the surface.
In order to create openings, surface splitting was tested as one of the methods. In this method, two adjacent surfaces were formed with different curvatures such that an opening would be created in between while maintaining the surface continuity at the edges. Even though these aspects were not measured and digitised completely it was possible to fabricate surfaces using this concept.
CONNECTIONS
The connection between the panels was imagined to be a simple butt joint. The butt joint between the panels would then be reinforced with layers of glass fibre which would be overlapped. The adjoining diagram shows the joinery detail between two adjacent panels. Appropriate number of layers would reinforce the connection while increasing the strength of the panels.
Collective Morphogenesis Emergent Technologies and Design 87 86 3 MATERIAL SCIENCE
SURFACE SPLIT CONNECTIONS
BRANCHING DIA_3.14 Issues and conclusions from fabrication process
BRANCHING AND OPENINGS
FORMING PROCESS EXPERIMENTATION
DIA_3.17 Edge curves are created with the core material, it is heated and pushed into shape
CREATING
FRAMES WITH EDGE CURVES
Small scale physical and digital experiments of panel deformation showed the importance of creating edge profiles, for panel formation as well as creation of depth. The principle of improving the cross section of the material system also led to the concept of using edge profiles as reinforcement. Thus a framework of edge profiles would be created and the panels would be formed onto the framework. The edge profiles served a number of functional purposes, allowing the creation of a sandwich panel with a depth that could be manipulated according to the pressure exerted on the surface and also acting as joining method between two panels. The system is not dissimilar to that of a timber stud framing system providing thermal and acoustic insulation and contributing to the overall structural performance.
of the global geometry and the depth would be created through the stacking of edge curves on top of one another in 10 mm increments.
The panels would then be laminated onto the frame using quick set epoxy resin glue. Each panel would be offset to create a positive and negative lip that alternates creating an interlocking system to connect panels together. The system could be utilised either in creating a consistent depth or a differential depth where necessary. In the case of creating beams this could also be achieved by introducing both differential thickness and curvature to achieve a waffle roof or floor system.
Panel with edge curves
Forming of panel of edge curves
Heating and forming of edge curves
DIA_3.18 Two edge curves are added to complete the frame and allow for depth to be created
The mould free concept of the material system within the context of the research is a framing system that then fulfils functional requirements contributing to architectural performance. The edge curves that form the frame would be extracted from the panelisation
In order to create panels on the edge frame, it was important to understand the bending behaviour of edge curves. A series of digital experiments were undertaken in order to parametrise the bending behaviour of thermoplastic foam with patterns.
DIA_3.19 A rigid frame is created that then the patterned panel can be formed onto
Milling of edge curves
DIA_3.16 Forming of edge curves to achieve a sandwich panel
DIA_3.20 This is heated and formed onto the frame allowing for application of resin and glass fibre
DIA_3.21 Differential thickness
Current thickness of the material is approximately 10 mm, a variable depth or would be required to created a viable architectural material system.
Collective Morphogenesis Emergent Technologies and Design 89 88 3 MATERIAL SCIENCE 10
10 10 10 10
Connection between panels
BENDING PARAMETRISATION BEHAVIOUR
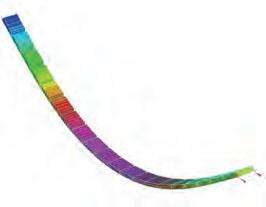



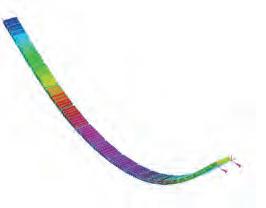





To parametrise the bending behaviour of the edge profiles, different slotting pattern distributions were simulated in Strand7 to evaluate the shift of the bending curvature based on the pattern. Therefore we started with an equal distribution of 20 slots in a strip of 1m length. After that we shifted the pattern distribution in increments of 10% in one direction of the strip. The resultant test strips exhibit therefore slotting distributions of 50%/50%, 60%/40%, 70%/30% and 80%/20%. This means that in the case of the 80%/20% distribution, the slots 1-10 are in 80% of the length of the test strip while the slots 1120 are located in the remaining 20% of the strip. The 80%/20% distribution is the maximum density shift we could archive, based on slotting w idth of 3mm in the CNC milling machine.
To evaluate and interpolate the curvatures and apex shift based on the different patterns one side of the strip was moved towards the other end by increments of 5% of the initial length.


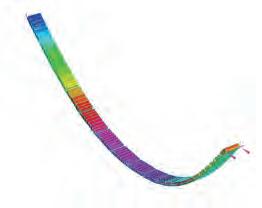




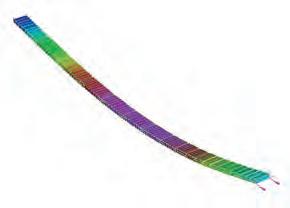

Collective Morphogenesis Emergent Technologies and Design 91 90 3 MATERIAL SCIENCE Steps Pattern Spacing Distribution Pattern Spacing Distribution Pattern Spacing Distribution Pattern Spacing Distribution 0.8 0 20 1.0 Steps 0.7 0 20 1.0 Steps 0.6 0 20 1.0 Steps 0.5 0 20 1.0 PATTERN DISTRIBUTION50%_50% PATTERN DISTRIBUTION60%_40% PATTERN DISTRIBUTION70%_30% PATTERN DISTRIBUTION80%_20%
CURVATURE PARAMETRISATION - EDGE CURVES
edge profile
DIA_3.22 Pattern generation for bending parametrisation
Collective Morphogenesis Emergent Technologies and Design 93 92 3 MATERIAL SCIENCE Rest Length 95% Rest Length 90% Rest Length 85% Rest Length 80% Rest Length 95% Rest Length 90% Rest Length 85% Rest Length 80% Rest Length 95% Rest Length 90% Rest Length 85% Rest Length 80% Rest Length 95% Rest Length 90% Rest Length 85% Rest Length 80% Steps Pattern Spacing Distribution Pattern Spacing Distribution Pattern Spacing Distribution Pattern Spacing Distribution 0.8 0 20 1.0 Steps 0.7 0 20 1.0 Steps 0.6 0 20 1.0 Steps 0.5 0 20 1.0 centre centre centre centre apex shift apex shift apex shift apex shift apex shift apex shift apex shift apex shift apex shift apex shift apex shift apex shift PATTERN DISTRIBUTION50%_50% PATTERN DISTRIBUTION60%_40% PATTERN DISTRIBUTION70%_30% PATTERN DISTRIBUTION80%_20% DIA_3.23 Pattern distribution with various percentages edge profile
BENDING PARAMETRISATION BEHAVIOUR
BENDING PARAMETRISATION BEHAVIOUR
*(1/3 * rest length * c)
rest length * c)
B CP2=-t *(1/3 * rest length * c)
CURVATURE PARAMETRISATION- EDGE CURVES
For the curvature parametrisation the dependence between rest length, pattern distribution and the tangent vectors at the end points of the test pieces were analysed. Doing this allowed the redrawing of the curves based on those parameters with a B-spline of degree 3 with four control points. To create this curve the endpoints are copied in the directions of the tangent vectors. The lengths of those vectors are depending on the rest length as well as the pattern distribution.
The bending curve of the equal pattern with a rest length of 80% was analysed first. Since the tangent vectors at the end points are axisymmetric to the centre axis it was possible to calculate a value for the maximum amplification of the tangent vectors. Therefore the length of the vectors in this case can be calculated with: 1/3 * rest length * c, with c=1.62 in case of rest length 80%. For the steps between rest length 80% and 100% the factor c has to be remapped between 1.00 and 1.62 according to the rest length. That means for reduction of 0%: c=1, for reduction 20%: c= 1.62.
In the next step the relation to the pattern shift was examined to introduce one more variable (v) to influence the vector of movement. The curve for the pattern shift 80%_20% could be redrawn with the following to equations for amplification of tangent vectors: at point A: v*2/3*rest length*c and at point B: (1-v) 2/3*rest length*c with v=0.85. For the steps between the pattern distribution of 50%_50% and 80%_20% the value of v varies between 0.5 (50%_50%) and 0.85 (80%_20%). Based on those values an approximation of all possible bending curvatures within this range is possible.
Collective Morphogenesis Emergent Technologies and Design 95 94 3 MATERIAL SCIENCE A CP1 tA tA tA tA tA tA tB tB tB t tB tB CP1 CP1 CP1 CP1 CP2 CP2 CP2 CP1 CP2 CP2 CP2 B A B A B A B A B A B Pattern Distribution: 50%_50% Rest Length: 80% Movement: 20% c = 1+(20*(1.62-1)/(20-0) = 1.62 Strand 7 result Parametrised curve A CP1=tA*(1/3 * rest length * c) A CP1=tA*(1/3 * rest length * c) A CP1=tA*(1/3 * rest length * c) A CP1=tA*(v*2/3 * rest length * c) A CP1=tA*(v*2/3 * rest length * c) A CP1=tA*(v*2/3 * rest length * c) B CP2=-tB*(1/3 * rest length * c) B CP2=-tB*((1-v)1/3 * rest length * c) B CP2=-tB*((1-v)1/3 * rest length * c) B CP2=-tB*((1-v)1/3 * rest length * c) B CP2=-tB*(1/3
rest
c)
Pattern Distribution: 80%_20% Factor: 0.8 Rest Length: 80% Movement: 20% c = 1+(20*(1.62-1)/(20-0) = 1.62 v = 0.8*(0.85-0.15)/(0.8-0.2)) = 0.85 Strand 7 result Parametrised curve Pattern Distribution: 70%_30% Factor: 0.7 Rest Length: 80% Movement: 20% c = 1+(20*(1.62-1)/(20-0) = 1.62 v = 0.7*(0.85-0.15)/(0.8-0.2)) = 0.70 Strand 7 result Parametrised curve Pattern Distribution: 60%_40% Factor: 0.6 Rest Length: 80% Movement: 20% c = 1+(20*(1.62-1)/(20-0) = 1.62 v = 0.6*(0.85-0.15)/(0.8-0.2)) = 0.60 Strand 7 result Parametrised curve Pattern Distribution: 50%_50% Rest Length: 90% Movement: 10% c = 1+(10*(1.62-1)/(20-0) = 1.31 Strand 7 result Parametrised curve Pattern Distribution: 50%_50% Rest Length: 99% Movement: 1% c = 1+(1*(1.62-1)/(20-0) = 1.03 Strand 7 result Parametrised curve A CP1 tA tA tA tA tA tA tB tB tB tB tB tB CP1 CP1 CP1 CP1 CP2 CP2 CP2 CP1 CP2 CP2 CP2 B A B A B A B A B A B Pattern Distribution: 50%_50% Rest Length: 80% Movement: 20% c = 1+(20*(1.62-1)/(20-0) = 1.62 Strand 7 result Parametrised curve A CP1=tA*(1/3 * rest length * c) A CP1=tA*(1/3 * rest length * c) A CP1=tA*(1/3 * rest length * c) A CP1=tA*(v*2/3 * rest length * c) A CP1=tA*(v*2/3 * rest length * c) A CP1=tA*(v*2/3 * rest length * c) B CP2=-tB*(1/3 * rest length * c) B CP2=-tB*((1-v)1/3 * rest length * c) B CP2=-tB*((1-v)1/3 * rest length * c) B CP2=-tB*((1-v)1/3 * rest length * c) B CP2=-tB*(1/3 * rest length * c) B CP2=-tB*(1/3 * rest length * c) Pattern Distribution: 80%_20% Factor: 0.8 Rest Length: 80% Movement: 20% c = 1+(20*(1.62-1)/(20-0) = 1.62 v = 0.8*(0.85-0.15)/(0.8-0.2)) = 0.85 Strand 7 result Parametrised curve Pattern Distribution: 70%_30% Factor: 0.7 Rest Length: 80% Movement: 20% c = 1+(20*(1.62-1)/(20-0) = 1.62 v = 0.7*(0.85-0.15)/(0.8-0.2)) = 0.70 Strand 7 result Parametrised curve Pattern Distribution: 60%_40% Factor: 0.6 Rest Length: 80% Movement: 20% c = 1+(20*(1.62-1)/(20-0) = 1.62 v = 0.6*(0.85-0.15)/(0.8-0.2)) = 0.60 Strand 7 result Parametrised curve Pattern Distribution: 50%_50% Rest Length: 90% Movement: 10% c = 1+(10*(1.62-1)/(20-0) = 1.31 Strand 7 result Parametrised curve Pattern Distribution: 50%_50% Rest Length: 99% Movement: 1% c = 1+(1*(1.62-1)/(20-0)
Strand 7 result Parametrised curve CP1 tA tA tA tA tB tB tB tB tB tB CP1 CP1 CP1 CP1 CP2 CP2 CP2 CP1 CP2 CP2 CP2 B A B A B B A B A B Pattern Distribution: 50%_50% Length: 80% Movement: 20% 1+(20*(1.62-1)/(20-0) = 1.62 Strand 7 result Parametrised curve A CP1=tA*(1/3 * rest length * c) A CP1=tA*(1/3 * rest length * c) A CP1=tA*(1/3 * rest length * c) CP1=tA*(v*2/3 * rest length * c) A CP1=tA*(v*2/3 * rest length * c) A CP1=tA*(v*2/3 * rest length * c) B CP2=-tB*(1/3 * rest length * c) B CP2=-tB*((1-v)1/3 * rest length * c) B CP2=-tB*((1-v)1/3 * rest length * c) B CP2=-tB*((1-v)1/3 * rest length * c) B CP2=-tB*(1/3 * rest length * c) B CP2=-tB*(1/3 * rest length * c) Pattern Distribution: 80%_20% Factor: 0.8 Length: 80% Movement: 20% 1+(20*(1.62-1)/(20-0) = 1.62 0.8*(0.85-0.15)/(0.8-0.2)) = 0.85 Strand 7 result Parametrised curve Pattern Distribution: 70%_30% Factor: 0.7 Rest Length: 80% Movement: 20% c = 1+(20*(1.62-1)/(20-0) = 1.62 v = 0.7*(0.85-0.15)/(0.8-0.2)) = 0.70 Strand 7 result Parametrised curve Pattern Distribution: 60%_40% Factor: 0.6 Rest Length: 80% Movement: 20% c = 1+(20*(1.62-1)/(20-0) = 1.62 v = 0.6*(0.85-0.15)/(0.8-0.2)) = 0.60 Strand 7 result Parametrised curve Pattern Distribution: 50%_50% Rest Length: 90% Movement: 10% c = 1+(10*(1.62-1)/(20-0) = 1.31 Strand 7 result Parametrised curve Pattern Distribution: 50%_50% Rest Length: 99% Movement: 1% c
Strand 7 result Parametrised curve CP1 tA tA tA tA tB tB tB tB tB tB CP1 CP1 CP1 CP1 CP2 CP2 CP2 CP1 CP2 CP2 CP2 B A B A B B A B A B Pattern Distribution: 50%_50% Length: 80% Movement: 20% 1+(20*(1.62-1)/(20-0) = 1.62 Strand 7 result Parametrised curve A CP1=tA*(1/3 * rest length * c) A CP1=tA*(1/3 * rest length * c) A CP1=tA*(1/3 * rest length * c) CP1=tA*(v*2/3 * rest length * c) A CP1=tA*(v*2/3 * rest length * c) A CP1=tA*(v*2/3 * rest length * c) B CP2=-tB*(1/3 * rest length * c) B CP2=-tB*((1-v)1/3 * rest length * c) B CP2=-tB*((1-v)1/3 * rest length * c) B CP2=-tB*((1-v)1/3 * rest length * c) B CP2=-tB*(1/3 * rest length * c) B CP2=-tB*(1/3 * rest length * c) Pattern Distribution: 80%_20% Factor: 0.8 Length: 80% Movement: 20% 1+(20*(1.62-1)/(20-0) = 1.62 0.8*(0.85-0.15)/(0.8-0.2)) = 0.85 Strand 7 result Parametrised curve Pattern Distribution: 70%_30% Factor: 0.7 Rest Length: 80% Movement: 20% c = 1+(20*(1.62-1)/(20-0) = 1.62 v = 0.7*(0.85-0.15)/(0.8-0.2)) = 0.70 Strand 7 result Parametrised curve Pattern Distribution: 60%_40% Factor: 0.6 Rest Length: 80% Movement: 20% c = 1+(20*(1.62-1)/(20-0) = 1.62 v = 0.6*(0.85-0.15)/(0.8-0.2)) = 0.60 Strand 7 result Parametrised curve Pattern Distribution: 50%_50% Rest Length: 90% Movement: 10% c = 1+(10*(1.62-1)/(20-0) = 1.31 Strand 7 result Parametrised curve
Distribution: 50%_50% Rest Length: 99% Movement: 1% c = 1+(1*(1.62-1)/(20-0) = 1.03 Strand 7 result Parametrised curve DIA_3.24 Bending curve analysis with tangent vectors
*
length *
B CP2=-tB*(1/3 * rest length * c)
= 1.03
= 1+(1*(1.62-1)/(20-0) = 1.03
Pattern
A CP1 tA tA tA tA tA tA t tB t tB tB tB CP1 CP1 CP1 CP1 CP2 CP2 CP2 CP1 CP2 CP2 CP2 B A B A B A B A B A B Pattern Distribution: 50%_50% Rest Length: 80% Movement: 20% c = 1+(20*(1.62-1)/(20-0) = 1.62 Strand 7 result Parametrised curve A CP1=tA*(1/3 * rest length * c) A CP1=tA*(1/3 * rest length * c) A CP1=tA*(1/3 * rest length * c) A CP1=tA*(v*2/3 * rest length * c) A CP1=tA*(v*2/3 * rest length * c) A CP1=tA*(v*2/3 * rest length * c) B CP2=-tB*(1/3 * rest length * c) B CP2=-tB*((1-v)1/3 * rest length * c) B CP2=-tB*((1-v)1/3 * rest length * c) B CP2=-t *((1-v)1/3 * rest length * c) B CP2=-tB
Pattern Distribution: 80%_20% Factor: 0.8 Rest Length: 80% Movement: 20% c = 1+(20*(1.62-1)/(20-0) = 1.62 v = 0.8*(0.85-0.15)/(0.8-0.2)) = 0.85 Strand 7 result Parametrised curve Pattern Distribution: 70%_30% Factor: 0.7 Rest Length: 80% Movement: 20% c = 1+(20*(1.62-1)/(20-0) = 1.62 v = 0.7*(0.85-0.15)/(0.8-0.2)) = 0.70 Strand 7 result Parametrised curve Pattern Distribution: 60%_40% Factor: 0.6 Rest Length: 80% Movement: 20% c = 1+(20*(1.62-1)/(20-0) = 1.62 v = 0.6*(0.85-0.15)/(0.8-0.2)) = 0.60 Strand 7 result Parametrised curve Pattern Distribution: 50%_50% Rest Length: 90% Movement: 10% c = 1+(10*(1.62-1)/(20-0) = 1.31 Strand 7 result Parametrised curve Pattern Distribution: 50%_50% Rest Length: 99% Movement: 1% c = 1+(1*(1.62-1)/(20-0) = 1.03 Strand 7 result Parametrised curve A CP1 tA tA tA tA tA tA tB tB tB tB tB tB CP1 CP1 CP1 CP1 CP2 CP2 CP2 CP1 CP2 CP2 CP2 B A B A B A B A B A B Pattern Distribution: 50%_50% Rest Length: 80% Movement: 20% c = 1+(20*(1.62-1)/(20-0) = 1.62 Strand 7 result Parametrised curve A CP1=tA*(1/3 * rest length * c) A CP1=tA*(1/3 * rest length * c) A CP1=tA*(1/3 * rest length * c) A CP1=tA*(v*2/3 * rest length * c) A CP1=tA*(v*2/3 * rest length * c) A CP1=tA*(v*2/3 * rest length * c) B CP2=-tB*(1/3 * rest length * c) B CP2=-tB*((1-v)1/3 * rest length * c) B CP2=-tB*((1-v)1/3 *
B
Pattern Distribution: 80%_20% Factor: 0.8 Rest Length: 80% Movement: 20% c = 1+(20*(1.62-1)/(20-0) = 1.62 v = 0.8*(0.85-0.15)/(0.8-0.2)) = 0.85 Strand 7 result Parametrised curve Pattern Distribution: 70%_30% Factor: 0.7 Rest Length: 80% Movement: 20% c = 1+(20*(1.62-1)/(20-0) = 1.62 v = 0.7*(0.85-0.15)/(0.8-0.2)) = 0.70 Strand 7 result Parametrised curve Pattern Distribution: 60%_40% Factor: 0.6 Rest Length: 80% Movement: 20% c = 1+(20*(1.62-1)/(20-0) = 1.62 v = 0.6*(0.85-0.15)/(0.8-0.2)) = 0.60 Strand 7 result Parametrised curve Pattern Distribution: 50%_50% Rest Length: 90% Movement: 10% c = 1+(10*(1.62-1)/(20-0) = 1.31 Strand 7 result Parametrised curve Pattern Distribution: 50%_50% Rest Length: 99% Movement: 1% c = 1+(1*(1.62-1)/(20-0) = 1.03 Strand 7 result Parametrised curve edge profile
CP2=-tB*((1-v)1/3 * rest length * c) B CP2=-tB*(1/3 * rest length * c) B CP2=-tB*(1/3 * rest length * c)
Area Load: 2kN/m

BENDING PARAMETRISATION BEHAVIOUR
0.5cm Glass fibre fabric, bidirectional, plain
To get a better understanding of how the curvature of surfaces can improve their structural performance, a series of simple experiments were conducted digitally where single and double curvature was introduced to an initially flat sheet and measured for the displacement under equal loading conditions of 2 kN/m². The initial flat sheet is 5m x 5m, made of 4cm foam core with 0.5 cm of glass fibre in epoxy matrix with an fibre/resin volume ratio of 50/50. The calculated E-modulus is 15 kN/mm².

In the first series we introduced single curvature
4.0cm Thermoplastic foam core
0.5cm Glass fibre fabric, bidirectional, plain
0.5cm glass fibre fabric, bidirectional, plain 0.5cm glass fibre fabric, bidirectional, plain




4.0cm thermoplastic foam core

Flat sheet displacement 165.8 cm
CURVATURE PRINCIPLES by lifting two control points of opposing sides by increments of 10 cm. For the second experiment we introduced synclastic double curvature by lifting the centre control points of all four edge curves by the same increments. The third experiment creates anticlastic double curvature. The centre control points of two opposing sides are moved by increments of 10 cm. While the first moves in the positive z axis, the second moves by the same value in the negative z axis.
Under the pure vertical load the synclastic double
curved surface exhibited the best performance, the anticlastic double curved surface shows the largest deformation after 10 increments. Since in the experiment just vertical forces occur, the performance of the surface improves if the angle of mean curvature directions and force vector decreases. Otherwise, the surface performs better as more curvature occurs in the direction of force flow. Since the anticlastic test piece exhibited areas with 0 mean curvature perpendicular to the acting force, the performance is far behind the synclastic.
DOUBLE CURVATURE LIMITS - PHYSICAL TEST
Structural performance of a surface increases when it is modified from a planar surface into a curved surface as explained within the previous experiment. Induced curvature of a singly curved surface, due to the tension on the surface, performs better than the planar surface, while a doubly curved surface performs better than the singly curved [2 > 1 > 0]. In order to test the double curvature limits of the thermoplastic foam a series of experiments were conducted. While single curvatures had been tested previously in the physical constraints, various frameworks with differentiated curvatures were set up to also test limits of double curvature. Once these limits were attained, the goal was to be able to plug

the measurements into a computational analysis tool to establish attainable curvature in the global geometry.



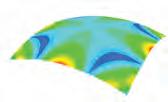

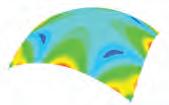
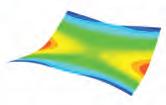
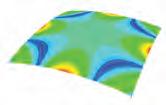



While within this research the actual limits of the material were not able to be fully investigated, certain double curvature constraints were established. For the test, a framework of MDF was created, such that the radius of one edge was 500 mm while radius at the adjacent edge was maintained at 400 mm. Essentially, this would form an anticlastic doubly curved panel. A digital model of the surface was created in order to simulate curvature and generate a resultant pattern. The
unrolled surface was cut and inscribed with the pattern using a milling machine and heated for 8 seconds on both sides under a temperature of 80oC. The heated foam was then pressed against the MDF framework, such that all four edges of the panel met with edges of the framework.
After testing of various curvatures, the formation of the panel was successful, and the double curvature limits were set using these radii. These limits would be implemented within the process of panelisation where each panel would be tested for its curvature.
DIA_3.26 Curved edge profile using MDF framework

Collective Morphogenesis Emergent Technologies and Design 97 96 3 MATERIAL SCIENCE 400mm 500mm
panels 10 increments of 0.1 m anchor points 10 increments of 0.1 m 10 increments of 0.1 m 5.00 m 5.00m 5.00 m 5.00m 5.00 m 5.00m 10 increments of 0.1 m anchor points 10 increments of 0.1 m 5.00 m 5.00m 5.00 m 5.00m 5.00 m 5.00m 10 increments of 0.1 m anchor points 10 increments of 0.1 m 10 increments of 0.1 m 5.00 m 5.00m 5.00 m 5.00m SERIES 1 SERIES 2 SERIES 3 Step 01 - disp: 76 mm Step 01 disp: 11 mm Step 01 - disp: 868 mm Step 06 - disp: 24 mm Step 06 - disp: 6 mm Step 06 - disp: 641 mm Step 03 - disp: 36 mm Step 03 disp: 7 mm Step 03 - disp: 72.3 mm Step 08 - disp: 22 mm Step 08 - disp: 6 mm Step 08 - disp: 608 mm Step 05 - disp: 2.6cm Step 05 disp: 6 mm Step 05 - disp: 661 mm Step 10 - disp: 22 mm Step 10
IMG_3.21 Heated foam pressed onto framework IMG_3.22 Panel formation on the framework IMG_3.23 Doubly curved panel
- disp: 6 mm Step 10 - disp: 583 mm
10 increments of 0.1 m anchor points 10 increments of 0.1 m 10 increments of 0.1 m 5.00 m 5.00m 5.00 m 5.00m 5.00 m 5.00m
DIA_3.25 Test setup and principles
BENDING PARAMETRISATION BEHAVIOUR
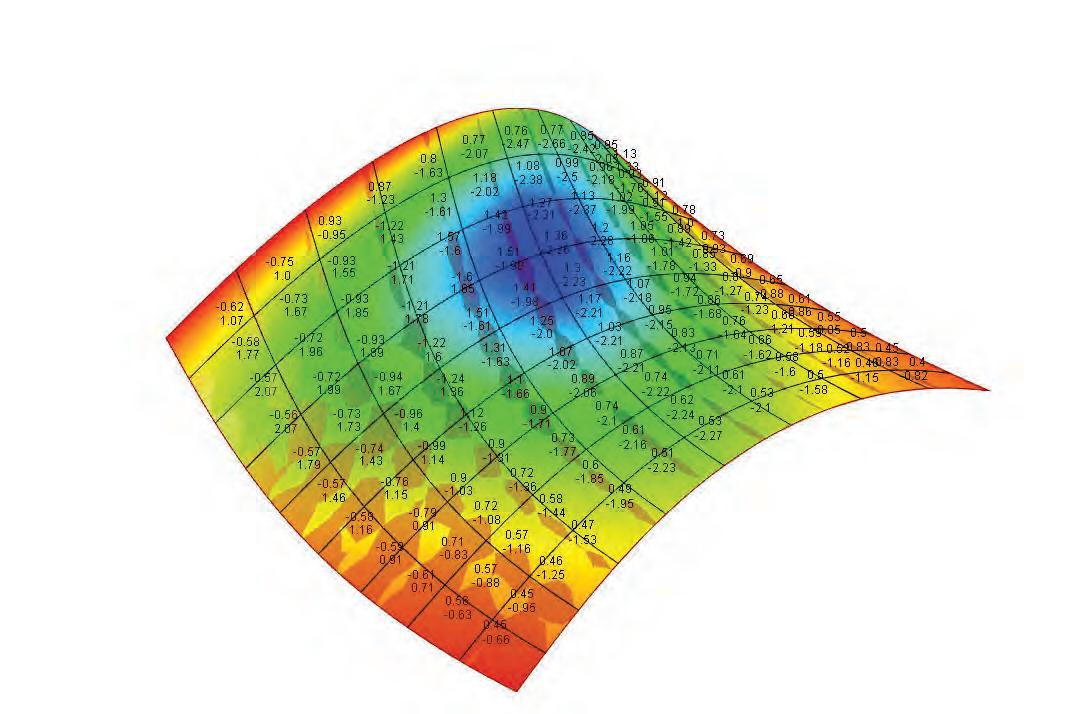
By adjusting the patterning and twist of the bent edge profiles it is possible to generate surfaces of different synclastic as well as anticlastic curvatures. To keep control of the bending behaviour we limited the bending by a movement of one end of the edge profile by 20% of the initial length. With this bending it is possible to generate an angle of 90°.


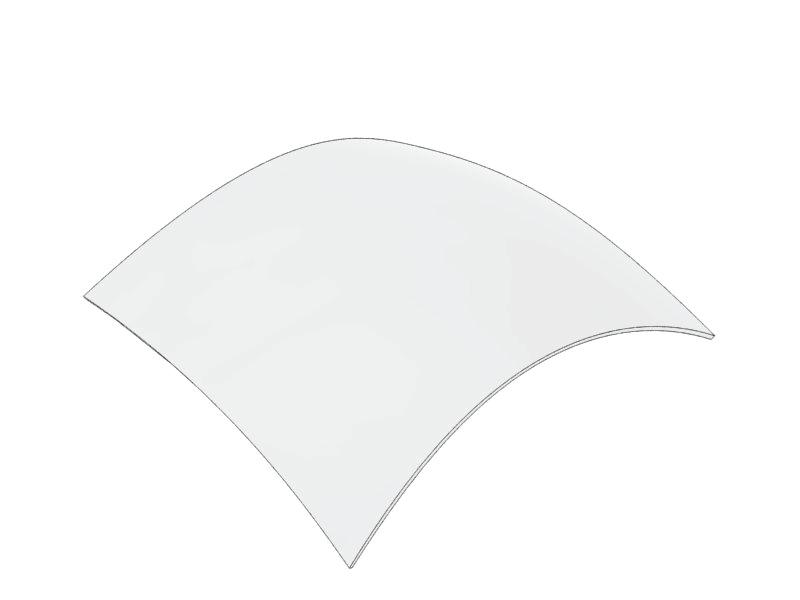


Due to the material properties of the thermoplastic foam, curvatures in one direction cannot exhibit a lower radius than 10 cm. This is in order to control the deformation and the spring back after the thermoforming process without connecting the piece permanently in position. To test the limitations of double curved panels, a series of physical experiments was made to analyse the maximum achievable double curvature. Possible double curvature is kept within certain limitations, since the material needs to be stretched or compressed in certain areas to achieve doubly curved surfaces.


Although it was not possible to fully explore those limits, single panels of 40cm/40cm with principle curvature in radius of 40cm in one direction and 50cm in the perpendicular direction, synclastic and anticlastic, were achieved. In this range we set the curvature limits for further processes. Later, these limits will be integrated in the panalisation algorithm to test each panel in terms of their ability to be produced. To analyse if a certain panel is within the possible curvature range, the principal curvatures on the surface are measured on a grid of points on the surface and evaluated on two criteria (curvature values are based on the unit metre1):

1. If the absolute value of min. or max. value exceeds the limit of 10 and the curvature in the perpendicular direction is lower than 0.2, the panel cannot be produced
2. If both absolute values of max. and min. principal curvature are higher than 0.2 and the absolute value of Gaussian curvature 7.5 (the assumed limit out of our physical tests) the panel cannot be produced
1 The unit metre was chosen for the later connection of the algorithm with karamba for grasshopper
Collective Morphogenesis Emergent Technologies and Design 99 98 3 MATERIAL SCIENCE + 2.40 Gaussian Curvature - 5.06 c 30%_70% 15% d 0%_0% 0% a 30%_70% 15% b 0%_0% 0% Edge: Pattern Distribution: Movement: c 70%_30% 10% d 50%_50% 6% a 30%_70% 15% b 20%_80% 6% Edge: Pattern Distribution: Movement: c 80%_20% 13% d 50%_50% 4% a 30%_70% 13% b 75%_25% 10% Edge: Pattern Distribution: Movement: + 0.1 Gaussian Curvature - 0.1 + 2.40 Gaussian Curvature - 5.06 c d a b c d a b c 30%_70% 15% d 0%_0% 0% a 30%_70% 15% b 0%_0% 0% Edge: Pattern Distribution: Movement: c 70%_30% 10% d 50%_50% 6% a 30%_70% 15% b 20%_80% 6% Edge: Pattern Distribution: Movement: c 80%_20% 13% d 50%_50% 4% a 30%_70% 13% b 75%_25% 10% Edge: Pattern Distribution: Movement:
DIA_3.29 Synclastic and anticlastic curvature limits
+ 0.08 Gaussian Curvature - 3.16 + 0.1 Gaussian Curvature - 0.1 + 2.40 Gaussian Curvature - 5.06 c d a b c c d d a a b b c 30%_70% 15% d 0%_0% 0% a 30%_70% 15% b 0%_0% 0% Edge: Pattern Distribution: Movement: c 70%_30% 10% d 50%_50% 6% a b 20%_80% 6% Edge: Pattern Distribution: Movement: c 80%_20% 13% d 50%_50% 4% a 30%_70% 13% b 75%_25% 10% Edge: Pattern Distribution: Movement:
GEOMETRIES AND CURVATURE LIMITS
panels
BENDING PARAMETRISATION BEHAVIOUR
SURFACE TRANSLATION PROCESS
Based on all the information received from the physical and digital exploration of the bending behaviour and the material limitations, a grasshopper and python algorithm was developed to translate an initial reference surface into the material system. The algorithm includes the subdivision of panels, adjustment of the panel geometry based on the material behaviour and evaluation of whether the generated panels are achievable within the system.
Pattern Distribution: 30%/70% Movement 15%
First, the initial surface is subdivided into panels based on the size limits of the foam boards [1200mm x 2400mm]. The subdivision follows geodesic curves, whereby points on opposite edges of the surface are connected with shortest curve on the surface. The geodesic curve was chosen to ensure that all edge profiles are planar curves which can be unrolled into straight strips for cutting. Furthermore the geodesic curves follow a similar line that a strip of incompressible material would follow on a curved surface. This means that for each point along the curve, the plane perpendicular to the curve includes
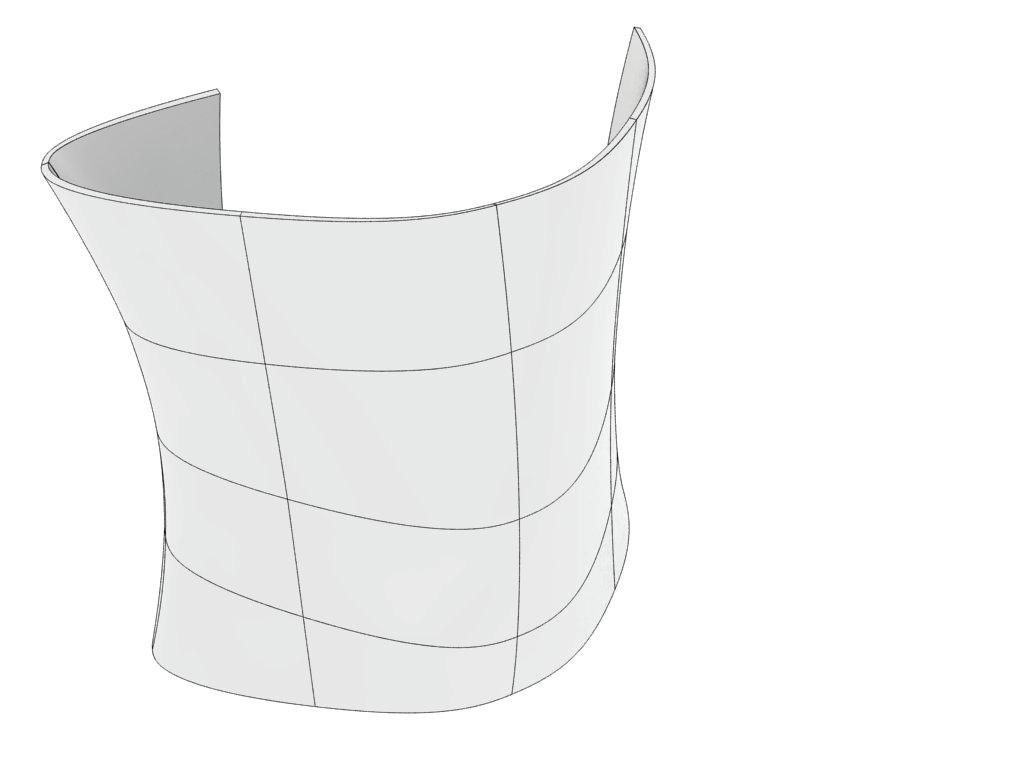


the normal vector of the surface on this point. In the following step, the algorithm evaluates intersection points of each geodesic curve in the U direction with every geodesic curve in the V direction. Polylines are generated for each geodesic curve at each intersection point. The tangent vectors of the geodesics are evaluated based on the intersection points.
Pattern Distribution: 30%/70% Movement 15%
For each segment of the reference polylines, two tangent vectors are created. By comparing the angles between these vectors and the line segments to
the length of the respective segments, it is possible to calculate the length of the bent arc between the endpoints of the segment. The pattern distribution on the material to achieve a similar bending curve can be also be determined. The algorithm calculates a reference angle to determine both angles between vectors and line segments. This information combined with the length of the segment is used to extract the length of the arc [refer to Bending Parametrisation in the Appendix, Page 246]. By calculating the deviation between the two angles the pattern distribution can be defined.
With this information, the length of the tangent vectors is determined to move the endpoints of the line segments, creating control polygons for the edge profiles. By generating B-spline curves through the points of those control polygon, the edge profiles are created. The actual panels are built by achieving a surface through adjacent profiles.
Once the surface is produced, it is tested to check whether it falls within curvature limitations, as previously detailed. The algorithm evaluates the principle and Gaussian curvature for each panel
against the extracted criteria. In the evaluation of the later geometrical and structural surface optimisation process, the ability of the curvature to be produced plays an important role. To implement this, the algorithm contains a value which indicates if the surface is possible or not.
The fitness criteria works in such a way that once the all surfaces which exceed the curvature limitations are “killed” to disable their progression in the optimisation process.
1. INITIAL SURFACE
2. REFERENCE POLYLINE subdivision based on geodesic curves evaluation of intersection points
4. EDGE CURVES calculation of angles between tangent vectors generation of edge profiles
3. CONTROL POLYGONS
Collective Morphogenesis Emergent Technologies and Design 101 100 3 MATERIAL SCIENCE
DIA_3.30 Process of surface translation to edge curves
surface
The material system developed in this chapter can be further extended by incorporating natural fibres along with glass fibres. Natural fibres are available abundantly in Bangladesh, which is predominantly an agrarian country. Incorporation of natural fibres with glass fibre would mean less dependency on synthetic fibres and a hybrid material system could be developed.
Natural fibres can be differentiated into three separate types: mineral fibres [e.g. asbestos], animal fibres [e.g. silk) and vegetable fibres [e.g. flax]. For the building industry, vegetable fibres are of interest. Even through hemp and flax may possess high strength properties, the values are still not comparable to glass and carbon fibres.
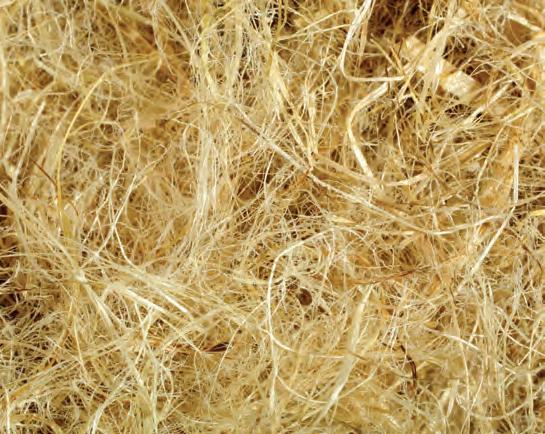
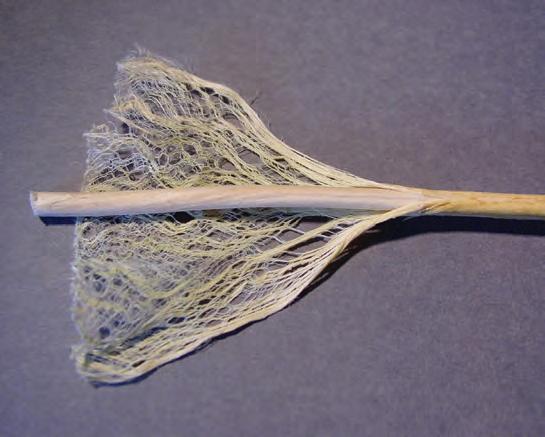
Due to limited natural resources the development from natural materials to synthetic is reversed, but bio fibres are still rarely used. There is current research in this field to integrate more natural fibres to the industry, since there are many environmental and resource advantages for the use of this type of fibre. The production of natural fibres is by far less energy demanding compared to carbon or glass fibres and the product can be recycled in combination with thermoplastics.
Some natural fibre materials can already compete with ABS, PP/glass fibre and some GFRP, but the corrosion resistance and weather impact is not on the same level as glass or carbon fibre reinforced epoxy resin. In view of future development, the use of natural fibres and bio- resins will become relevant and the use of local fibres opens a promising integration of production in regions like Bangladesh.
Polymers play an important role in creating fibre composites and achieving its full strength. Resin matrices currently used in fibre composites have a high mechanical strength but have a disadvantage of being expensive as well as non-degradable. The epoxy resin used in development of the material system could be in future be replaced with bio-resins. Bio-resins are polymers which are derived from renewable resources. Even though the mechanical properties of bio-resins are not as much as chemical produced resins, it could become an effective replacement strategy to cut down the cost of the material without compromising the overall strength.
Bio-resins have a clean and efficient production process with no hazardous emissions. They are also formaldehyde free, thus removing the risk of exposure to a carcinogenic compound and providing major benefits for both environmental health and personal safety. The use of plant oil in bioresins creates polymers with a greater intrachain length than tradition resins. On curing, this property produces a structure than can be less brittle allowing for improved impact resistance in structural applications. 1
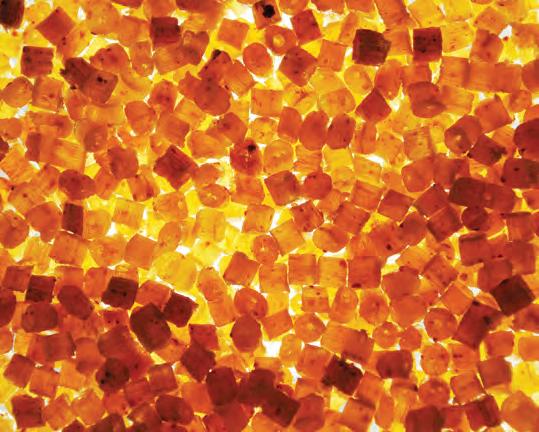
1 http://www.cambridge-biopolymers.com/Bioresin.htm

Collective Morphogenesis Emergent Technologies and Design 103 102 3 MATERIAL SCIENCE MATERIAL ADAPTATION
BIO- RESINS
IMG_3.24 Hemp fibres
IMG_3.25 Hemp fibres
IMG_3.26 Bio resin pellets
IMG_3.27 Soy resin pellets
NATURAL FIBRES
POTENTIALS
POTENTIALS
MATERIAL RESEARCH FABRICATION
FABRICATION MATERIAL RESEARCH
MATERIAL ADAPTATION
TESTED
MATERIAL
SYSTEM
TESTED MATERIAL SYSTEM
MATERIAL RESEARCH FABRICATION
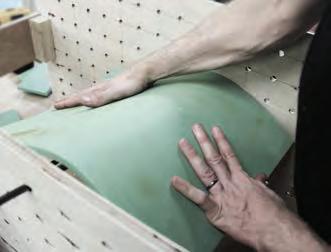

Bangladesh is one of the three major producers of jute, with 70% of its produce being exported. Jute requires plain alluvial soil and standing water, perfect for the conditions surrounding the Ganges delta. Successful cultivation occurs during the monsoon season with the summer following directly after.
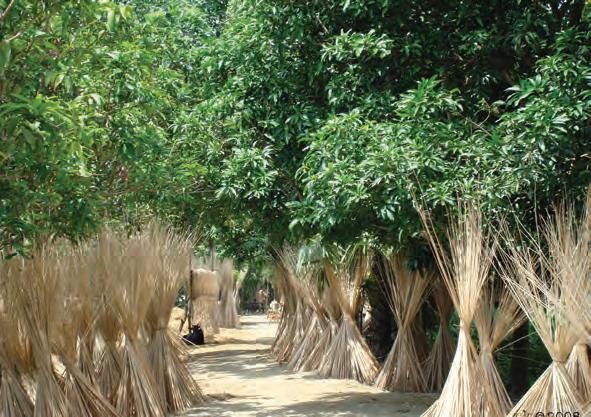
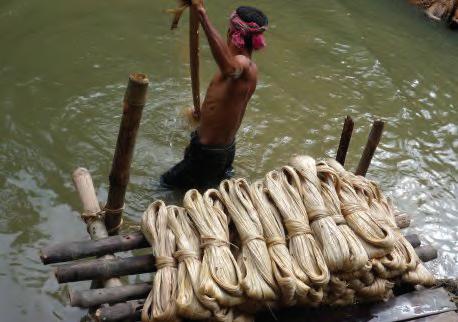


Beyond the textile industry, jute is being used with non-woven and composite technologies to manufacture nonwovens, technical textiles and composites. There is a very big potential of incorporating this jute industry into construction industry. Jute can be combined with glass fibre and bio-resins and the composite material system can be produced locally without reliance on importation of expensive materials.
The production of fibre crops has a much smaller impact on the environment compared to the energy and extraction process required for synthetic products. Furthermore, jute is an annually renewable energy source with a high biomass production per unit land area.1 Being able to adapt the fibre composite material system to Bangladesh, by utilising local materials, becomes one of the biggest proponents of developing in a country with minimum financial resources.
1 Islam, Mohammad Shahidul; Ahmed, Sheikh Kamal. The Impacts of Jute on Environment: An Analytical Review of Bangladesh. Journal of Environment and Earth Science. Vol. 2, No. 5 2012.
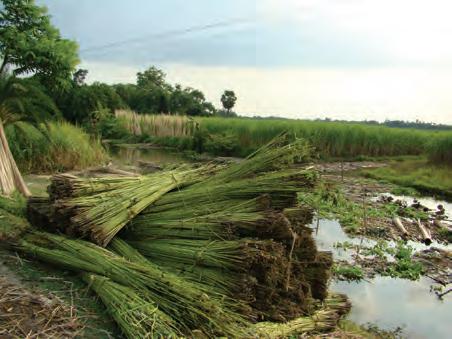
FABRICATION MATERIAL RESEARCH
exhibits
a
lower
E-‐modulus
than
other
fibres;
jute
is
widely
available

once
formed,
acts
as
the
external
skin
as
well
as
providing
a
structural
thickness

high
adhesive
and
mechanical
proper4es
to
4e
in
all
elements
together
NATURAL FIBRES THERMOPLASTIC FOAM BIO-RESINS 1 2 3

MSc Presentation
APPLIED MATERIAL SYSTEM
MATERIAL
SYSTEM
ADAPTED
FOR
SITE
DIA_3.31 Material translation
Collective Morphogenesis Emergent Technologies and Design 105 104 3 MATERIAL SCIENCE
JUTE CULTIVATION + APPLICATION
IMG_3.28 Harvesting of Jute
IMG_3.29 Retting of Jute IMG_3.30 Drying of Jute
IMG_3.31 Jute production
1 2
GLASS FIBRE THERMOPLASTIC FOAM
Composite Morphogenesis
STUDY 4
4.1 Overview 4.2 Site Conditions 4.3 Strategy 4.4 Form Generation
GEOMETRY
OVERVIEW
The geometry study chapter focuses on establishing the material system into an applied functional architectural scale. In this, an appropriate site is selected based directly on the advantages of the previously researched material properties.
An evolution of a building typology is derived for Bangladesh, one that exploits the material system to deal with the extreme environmental pressures that the country deals with on a yearly basis. The research starts with critical analysis of the existing shelter typology in terms of both form and overall function. Development of a catalogue of responsive geometries for site specific conditions is pursued, with consideration for environmental pressures as well as programme.
Material, environment and programme drivers are specified in the development of geometry at varying stages and in varying degrees of influence. Resultant geometries are tested and analysed based on optimisation of the system, keeping in mind material behaviour, environmental forces and spatial organisation.
[Major developments in the science of form] is based on the need to link physical processes of growth to form, but it has also been aided by the study of natural forms based on the emergence of a geometry of the irregular. 1
IMG_4.01 Cyclone Nargis over Bangladesh
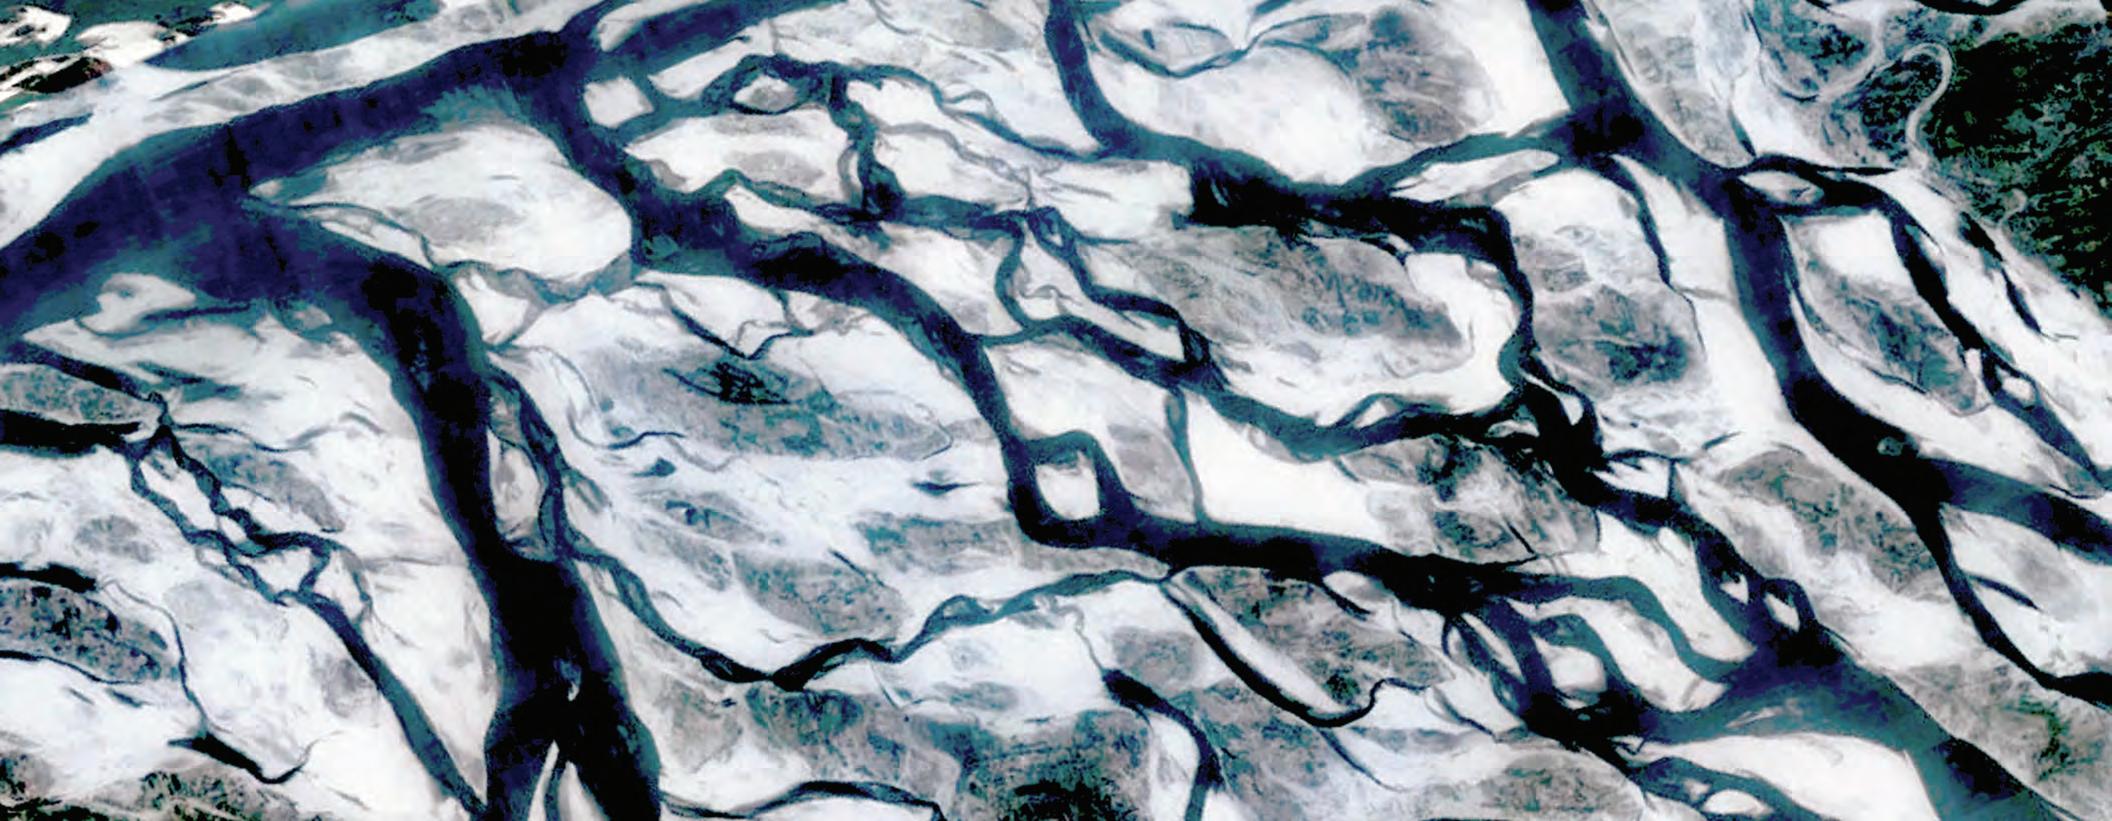
Collective Morphogenesis Emergent Technologies and Design 109 108 4 GEOMETRY STUDY
1 Batty, Michael; Longley, Paul. Urban growth and form: scaling, fractal geometry, and diffusion-limited aggregation. Environment and Planning A, 1989, volume 21, pg. 1447.
RESPONSE TO CYCLONES
Current architectural response to this yearly catastrophic events is the building of cyclone shelters that function as public buildings typically owned by the government or NGOs [non-governmental organization] agencies. These shelters are built with the main focus of accommodating as many people as possible during a cyclone period with a priority to minimise the number of casualties.

In order to deal with this catastrophic events, the government of Bangladesh have proposed to build 2000 new cyclone shelters by 2015. The size of these cyclone shelters has been based on a generic concept that accommodates 800-1200 people at 1.5 m² allotted per person, roughly resulting in structures 1200-2000 m² in size. The buildings generally are comprised of one large space that is used for both sleeping and public areas and essential amenities such as toilets and basic kitchen facilities.
The morphology of these structures varies, however typically is constructed using the same parts, a large concrete box that is raised on a series of stilts. Avoiding the impact of the water is key to this design approach; the stilts are situated on a small plinth that further helps in dealing with water and functions as a public gathering space for the community when there are not storms. These strategies have been affective in dealing with the impact of storms and saving lives during the most violent period of the cyclone and flooding.
Collective Morphogenesis Emergent Technologies and Design 111 110 4 GEOMETRY STUDY
Dhaka 02550 100 200 (km) Dhaka 02550 100 200 (km) wind risk moderate risk cyclone shelter high risk Dhaka 02550 100 200 (km) Dhaka 02550 100 200 (km) wind risk moderate risk cyclone shelter high risk
IMG_4.02 An existing shelter typology found in Bangladesh
SITE CONDITIONS
DIA_4.01 Map of Bangladesh indicating current cyclone shelters location, adapted DIA_4.02 Map of Bangladesh indicating the areas vulnerable to cyclones, adapted
CURRENT SITUATION
SITE CONDITIONS
FLOODING PHASES AND APPLICABLE PROGRAMMES
PHASES
1. Cyclone
CONDITIONS Wind pressures Water Flow
2. After storm Flood situation
PERIOD
1 - 4 days
CURRENT SITUATION
0 - 12 weeks
PROGRAMME POSSIBILITIES
Shelter strategy to house coastal residents during preparation for and the onset of severe storms
Shelter for residents where the cyclone itself has passed however the ground remains in a flooded state
3. Rehabilitation Normal unflooded conditions 42 - 52 weeks
TYPOLOGIES BASED ON PROGRAMME
GLOBAL GEOMETRY
1. Closed form
Usage of different types of areas based on programmes necessary for a typical village [public buildings / housing strategies]
AREA 0 - 50 sqm
2. Closed form 50 - 100 sqm storage / habitable 0
ANALYSIS OF DESIGN DRIVERS
FLOODING PHASES
Bangladesh, while fluctuating within an extreme range in climate, can be differentiated by flood phases. The architectural response in this context should be able to anticipate the conditions involved and be able to adapt to these changes. The interest in a shell structure grew from its structural capacity, while the material science would allow for inundation within the flood itself.
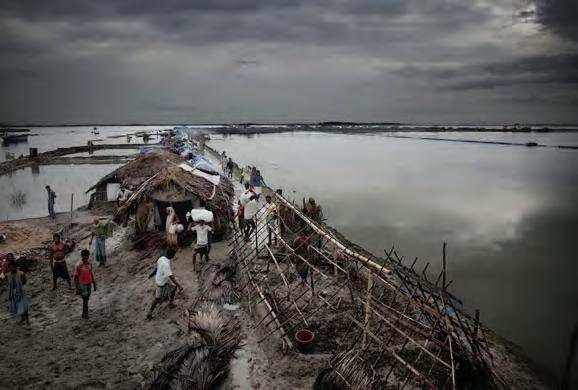
In a country where the environmental parameters range from unstable ground conditions, to rising flood waters and extreme wind forces from a cyclone, a geometry is necessary to tackle all these phases. However, the cyclone lasts for a short time compared to the resilience of the structure and its spatial capability for the rest of the year. It needed to function as an infrastructure which could become more than a shelter.
Programmatic use of the space as well as structural and environmental optimisation should inform the geometry and distribution of the shelter, from its internal partitioning at the local scale, global form of the single and aggregation of multiple elements. It should take into account the different parameters related to coping with flooding and non-flooding conditions. A study into existing typology of the shelter along with a research into organisation structure of a village should influence the design and the distribution of shelters.
chamber division
PROGRAMMES storage / breakwater storage housing public building
DESIGN DRIVERS CONSIDERATIONS PROGRAMMATIC GOALS
shelter typology: housing shelter typology: public building wind pressure
Collective Morphogenesis Emergent Technologies and Design 113 112 4 GEOMETRY STUDY
GLOBAL GEOMETRY
water velocity
CORE
0
1
Double connection 200 - 300 sqm large
habitable
2 CAPACITY 0 12 - 24 24 - 48 48 - 72
3. Single connection 100 - 200 sqm small chamber division habitable + water collection
4.
+ water collection
IMG_4.03 Flooding in Bangladesh
STRUCTURAL PROBLEMS
SITE CONDITIONS
PUBLIC OPINION REGARDING CYCLONE MANAGEMENT
PLANNING PROBLEMS
A case study regarding a region of Bangladesh, the Kalapara Upazila, looks at the problems related to the existing cyclone management programme.
A. Poor condition of cyclone shelters
From a total of 113 cyclone shelters that exist in this region, only 71 have water supply facilities and 88 have toilets. Furthermore, 30% of residents do not go to shelters due to a security concerns.
B. Lack of coastal embankments
No coastal embankments were found in this area.
C. Lack of guidelines for cyclone proof house construction
Cylcone damage to houses is extensive due to the building materials used and construction methods. There are no initiatives or a training programme for constructing cyclone proof houses.
D. Training and public awareness
There is no training programme for the local people to develop skills in relation to cyclone preparation.
E. Local disaster action plan related problems
No disaster mitigation committees exist to reduce diaster risk as a overall community.
F. Relief work related problems
Once the cyclone has passed, locals find it extremely difficult to receive relief materials in order to commence with the rehabilitation period.
G. Problems related to warning system
The current warning system, while expanding, is mostly based on volunteers and media coverage. Due to the remoteness of some villages from any type of main network, rural people often are deprived.
A. Poor condition of cyclone shelters
B. Lack of coastal embankments
C. Lack of guidelines for cyclone proof house construction
D. Training and public awareness
E. Local disaster action plan related problems
F. Relief work related problems
G. Problems related to warning system
DIA_4.03 Survey regarding cyclone management
52% of problems can be tackled through the implementation of a new system
direct results of existing building typologies
Bangladesh’s coastal areas generally face more than one cyclone, and then with different velocities every year. Regardless of preparation practices, the impacts of a cyclone can be felt in terms of losses of human life, destroyed housing, affected crops and network being washed away.
Based on the research conducted within the Journal of Bangladesh Institute of Planners, a case study of the Kalapara Upazila in the Patuakhali district highlights the problems within the existing practices. The paper touches on how this coastal region in south-western Bangladesh, while prone to cyclones, does not have efficient cyclone management measures in place. The weakness of system, according to the locals there, was shown to be divided between infrastructural conditions and a poor planning system. Using this data, the strategy of re-building should concern itself with the problems faced in the existing housing and shelters, and how these could be met.
For instance, since the coast is constantly met with various intensities of pressures, coastal embankments or other types of primary defense strategies would greatly reduce velocities moving further inland. In terms of the cyclone shelters, people need to be able to use these facilities for a prolonged period of time, and thus, such structures must function as more than a simple shell. In terms of housing, lack of adequate materials in the face of such storms, as well as poor construction methods cause for widespread habitat failure.
Collective Morphogenesis Emergent Technologies and Design 115 114 4 GEOMETRY STUDY
INTERNAL LOGIC 21 14 17 9 2 11 26 A B C D EF G
1 S. Ahamed, M.M. Rahman, M.A. Faisal. “Reducing Cyclone Impacts in teh Coastal Areas of Bangladesh: A Case Study of Kalapara Upazila.” Journal of Bangladesh Institute of Planners, Vol.5, December 2012.
A B C
PUBLIC OPINION REGARDING CYCLONE MANAGEMENT
FLOODING PHASES
EXISTING TYPOLOGY SITE CONDITIONS
While the current shelters are suitable for saving lives during catastrophic periods in the cyclone season, a number of issues can be identified with the current typology. The shelters are simplistic in their approach to what programme is supplied and the way in which the space is utilized by communities during the cyclone period and throughout the year. Primarily the programme is comprised of large spaces used for storing as many people as possible, support facilities, such as small kitchens and bathrooms and occasionally small ancillary spaces that are used as classrooms.
The current cyclone shelters are made up of reinforced concrete which can resist the forces of wind and water, but over time, falls into disrepair and requires repetitive maintenance. Due to lack of funds and ownership, these shelters tend to decay and become increasingly unsafe for use.
The first issue that arises around the current architectural approach is the global form of the shelters have no affect on water flow, neither slowing down the velocity nor blocking it out in any sort of way. The water passes through the column cluster and therefore still has considerable damaging potential beyond the location of the shelter. This leads to an issue of repeated widespread destruction of infrastructure leading to displacement and relocation and continual habitation in water logged areas [leading to secondary longer term health crisis issue such as safe sanitation, clean water supply and nutrition support].
The current cyclone shelters are located far away from the village and not integrated within the village dyanmic itself. This makes the use of cyclone shelters quite difficult as people have to travel for long distances for refuge. Coupled with that, the design of the shelters, while adequate, provides inhumane living conditions for long periods of time. There is limited capacity to adequately shelter the current numbers leading to overcrowding and unhygienic conditions during evacuation periods. The shelters are comprised of large floor spaces which lack sensibility towards privacy and organisation. Also the design does not consider the usage and functionality of cyclone shelters once the storm has passed, thus creating an overengineered structure with limited utility.
Collective Morphogenesis Emergent Technologies and Design 117 116 4 GEOMETRY STUDY gathering space columns primary circulation secondary circulation Plinth TYPICAL CYCLONE SHELTER 4m 7m accessible roof 2 5 3 4 1 4m 1 2 3 4 5 concrete box raised above flood impact line plinth/ public gathering space concrete columns accesible roofs circulation gathering space columns primary circulation secondary circulation Plinth TYPICAL CYCLONE SHELTER 4m 7m accessible roof 2 5 3 4 1 4m 1 2 3 4 5 concrete box raised above flood impact line plinth/ public gathering space concrete columns accesible roofs circulation gathering space columns primary circulation secondary circulation Plinth TYPICAL CYCLONE SHELTER 4m 7m accessible roof 2 5 3 4 1 4m 1 2 3 4 5 concrete box raised above flood impact line plinth/ public gathering space concrete columns accesible roofs circulation
DIA_4.04 Existing Cyclone Shelter Typology, adapted
DIA_4.05 Existing Cyclone Shelter Typology, programmatic arrangement, adapted
ANALYSIS + ISSUES INFLUENCE ON FLOOD WATER MATERIALITY AND MAINTENANCE LOCATION AND LIVING CONDITION UP UP UP gathering space Plinth Room 1 Room 2 Room 3 GROUND FLOOR FIRST FLOOR entrance location UP UP UP gathering space Plinth Room 1 Room 2 Room 3 GROUND FLOOR FIRST FLOOR entrance location
DIA_4.06 Cyclone Shelter, internal partitioning, adapted
STRATEGY
PROPOSAL/ STRATEGY
The existing cyclone shelter functions efficiently in the case of cyclones and flooding but fails to be used after the cyclone has passed. Over the years, the maintenance and repair work of these structures has also been a big issue which leads to dilapidation of these shelters. The strategy adopted for building new cyclone shelters was to divide the volume into smaller elements, which in aggregation have a larger effect of flood water rather that building a huge structure which has very minimal effect. The arrangement of these shelters would not only help in reduction of velocity and channelling the water but would also work as interconnected buildings.
The proposal looks utilising the developed material system architecturally, where it would deal with the following aspects at both a local and global scale:
• Optimised performance for withstanding the strong winds and storms surges of cyclones i.e. slowing down flood water and diverting its path
• Limited maintenance
• Improvement of spatial qualities such as light and cross ventilation


• Consider local environmental conditions including high temperatures and humidity
• Shelters to serve a dual purpose of public building [for the community and as a cyclone shelter]
• Creating clusters of public building typologies
that collectively manage the environmental pressures
Furthermore, in reference to the site itself, the fabrication techniques employed in the material system advocated for implementation within situations where a highly complex procedure was not necessary. In the current fields of naval and flight industries, such precision is required. However, Bangladesh is a country which has an extensive background in manual labour as opposed to reliance on highly technical factories. This itself would allow for the expansion of a material system which can be produced with low labour expertise, at both the individual material level as well as the composite joinery level.
ANALYSIS OF DESIGN DRIVERS
DESIGN DRIVERS
LARGE SINGLE VOLUME
Higher increase of velocity at edges and within the columns [yellow]
MULTIPLE SMALL VOLUMES
Increase of velocity, however, less than experience at the single large volume
DESIGN DRIVERS CONSIDERATIONS
PROGRAMMATIC GOALS
ENVIRONMENTAL PRESSURES
MATERIAL CONSTRAINTS
shelter typology: housing shelter typology: public building curvature limits fabrication efficiency
wind pressure flood water water velocity

Collective Morphogenesis Emergent Technologies and Design 119 118 4 GEOMETRY STUDY
9 / 100 / 100 / 2 63 / 30 / 0 / 0 2 / 34 / 100 / 0 100 / 93 / 16 / 4 9 / 100 / 100 / 2 63 / 30 / 0 / 0 2 / 34 / 100 / 0 100 / 93 / 16 / 4 9 / 100 / 100 / 2 63 / 30 / 0 / 0 2 / 34 / 100 / 0 100 / 93 / 16 / 4
Single
Multiple volumes
volume
8.7 8 7 3 4 5 2 1 0 6 Velocity magnitude (m/s) DIA_4.07 Translation of a large volume to multiple small volumes
GLOBAL GEOMETRY
STRATEGY
GEOMETRY


AND FLOW STUDY

After establishing the strategy for developing a new building typology based on material explorations, the geometrical framework was driven by environmental forces and spatial performance as parameters. As the new building typology had to withstand the environmental pressures of flooding and cyclone and have an effect on the flood water, different shapes where tested in computation fluid dynamic environment.
Testing of an initial geometry began with three specific angles as aligned to the direction of flow. The most optimised object in terms of surface pressure is a flat object positioned parallel to the flow and the least optimised is a flat object perpendicular to the flow. In terms of velocity however, the parallel object has the least effect on the flow of water, and architecturally produces the least internal space. Based on this, the base object to be manipulated beginning with 45 degree angles at all sides [a rotated square].

The base object was manipulated in terms of the corner angles [90; 60; 30] as well as how many corners are affected. Various levels of curvature were also tested, generated through interpolation of curves at specified control points. This set of geometries were tested at a constant width with variant dimensions of length. All models were analysed against a water flow of 5 m/s. The goal of these experiments was to establish a rule set which would help in the design development process and also establish certain limits for optimisation process.
DIA_4.08 Testing of initial surface positions as based on pressure and effect on flow
The fabrication process and the material testing became the primary drivers for geometry exploration along with environmental pressures and spatial performance. The idea of developing a closed shell structure, taking into account the limits of the material, was one of the crucial factors for geometrical exploration.
The initial set of experiments were conducted with a square as a primitive. A set of modifications were applied to the square in order to avoid corners which are not desirable in a shell structure. The modification rules were based on number of control points and interpolation was used as a method for creating a closed shape. The first six shapes were created with 8 control points, and the next six were created through 4 control points as shown in the diagrams. As different angles have different influence on water flow, the initial shapes tested combination of different angles.
In order to extract principles of how different parameters result in certain effects on the flow of water and vice versa, these shapes were tested for its performance with the help of computational fluid dynamics [CFD].



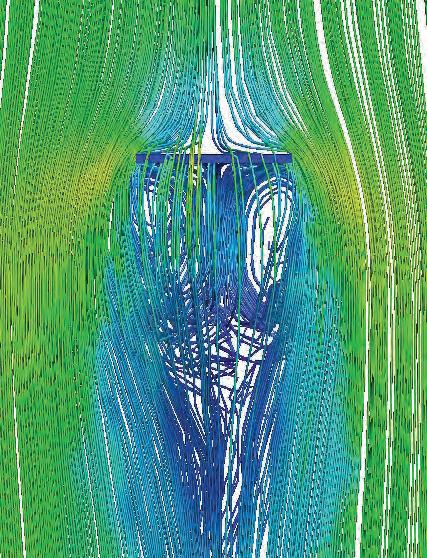
Collective Morphogenesis Emergent Technologies and Design 121 120 4 GEOMETRY STUDY
BACK SURFACE - PRESSURE FLOW - VELOCITY IMPACT SURFACE PRESSURE
INITIAL
90 degree [4] sides 60 degree [1] side 30 degree [1] side 60 degree [2] sides [60] [30] degree [1] [1] side 30 degree [2] sides [2] Corners [2] Curve D2 [4] Corners [0] Curve D2 [0] Corners [4] Curve D2 [2] Corners [2] Curve D2 [0] Corners [4] Curve D2 a 1.7 a 3.7 a 90 degree [4] sides 60 degree [1] side 30 degree [1] side 60 degree [2] sides [60] [30] degree [1] [1] side 30 degree [2] sides [2] Corners [2] Curve D2 [4] Corners [0] Curve D2 [0] Corners [4] Curve D2 [2] Corners [2] Curve D2 [0] Corners [4] Curve D2 a 1.7 x a 3.7 x a 90 degree [4] sides 60 degree [1] side 30 degree [1] side 60 degree [2] sides [60] [30] degree [1] [1] side 30 degree [2] sides [2] Corners [2] Curve D2 [4] Corners [0] Curve D2 [0] Corners [4] Curve D2 [2] Corners [2] Curve D2 [0] Corners [4] Curve D2 a 1.7 x a 3.7 a 90 degree [4] sides 60 degree [1] side 30 degree [1] side 60 degree [2] sides [60] [30] degree [1] [1] side 30 degree [2] sides [2] Corners [2] Curve D2 [4] Corners Curve D2 [0] Corners Curve D2 [2] Corners [2] Curve D2 [0] Corners [4] Curve D2 a 1.7 x a 3.7 x a 90 degree [4] sides 60 degree [1] side 30 degree [1] side 60 degree [2] sides [60] [30] degree [1] [1] side 30 degree [2] sides [2] Corners [2] Curve D2 [4] Corners [0] Curve D2 [0] Corners [4] Curve D2 [2] Corners [2] Curve D2 [0] Corners [4] Curve D2 a 1.7 x a 3.7 x a 90 degree [4] sides 60 degree [1] side 30 degree [1] side 60 degree [2] sides [60] [30] degree [1] [1] side 30 degree [2] sides [2] Corners [2] Curve D2 [4] Corners [0] Curve D2 [0] Corners [4] Curve D2 [2] Corners [2] Curve D2 [0] Corners [4] Curve D2 a 1.7 a 3.7 x a 90 degree [4] sides 60 degree [1] side 30 degree [1] side 60 degree [2] sides [60] [30] degree [1] [1] side 30 degree [2] sides [2] Corners [2] Curve D2 [4] Corners [0] Curve D2 [0] Corners [4] Curve D2 [2] Corners [2] Curve D2 [0] Corners [4] Curve D2 a 1.7 a 3.7 a 90 degree [4] sides 60 degree [1] side 30 degree [1] side 60 degree [2] sides [60] [30] degree [1] [1] side 30 degree [2] sides [2] Corners [2] Curve D2 [4] Corners [0] Curve D2 [0] Corners [4] Curve D2 [2] Corners [2] Curve D2 [0] Corners [4] Curve D2 a 1.7 x a 3.7 x a CHANGE OF ANGLE [width constant] [length variable] CHANGE OF CURVATURE [width variable] [length variable] DIA_4.09 Catalogue of changes applied to geometry CHANGE OF ANGLE + CURVATURE 1.1 1.2 1.3 1.4 1.5 1.6 2.1 2.2 2.3 2.4 2.5 2.6 DIA_4.10 Catalogue of individuals extracted for initial tests
TESTS
GEOMETRY EXPLORATION
STRATEGY

In order to understand the influence of curvature and different parameters on water flow, few CFD tests were undertaken with the geometries established in the first step. The two- dimensional shapes were extruded as straight sections and simulations were conducted with water speed of 5 m/s. The results of the experiments were observed and certain rules were established for further exploration.
The tests showed that the geometries with straight surfaces had more influence on water with respect to reducing the speed of water, but it also had a higher level of pressure exerted by water on the surface. Even though the geometry with curved surfaces had less influence on the flow of water, the pressure induced on the surface was reasonably lower than that in first case. Also, the increase in the velocity of water was much lesser in the second case compared to the first one.
The experiments showed the influence of curvature on the flow of water and the related pressure changes. By changing the straight surface geometries to curved surface geometries, the pressure induced on the surface was reduced dramatically and the increase in the speed of water reduced considerably. Both these factors play an important role while dealing with high pressure environmental conditions as the build form not only has to with stand the pressures but also has to have an influence on the flood water.
P/A = 2.92


L/W = 1.36


CONCLUSIONS
After establishing the effect of curvature on the flow of water, the next set of experiments were conducted to understand the relationship between the leading angle, the size and the pressure exerted on the surface. For this, the width of the geometries was kept as a constant, while its ratio of perimeter to area was increased gradually, such that the angle facing the flow was different than the leeward angle.
Two sets of experiments were conducted: first the geometries were tested with the smaller angle facing the direction of the water and then larger angle facing the direction of the water. A comparison of the resultant data, including the increase in velocity and maximum positive and negative pressures on the surfaces, was undertaken to establish a geometrical framework.
Collective Morphogenesis Emergent Technologies and Design 123 122 4 GEOMETRY STUDY +P - 14410.2 Pa -P - 13764.7 Pa V 7.95 m/s +P 17324.3 Pa -P - 22146.2 Pa V 8.3 m/s +P - Positive pressure -P - Negative Pressure V - Maximum Velocity +P - 16309.3 Pa -P - 12304.7 Pa V 7.3 m/s +P 20937.6 Pa -P - 22635.3 Pa V 7.92 m/s 1.1 2.1 1.2 2.2 OBSERVATIONS 9 Velocity Magnitude (m/s) 2.7 3.6 4.5 5.4 6.3 7.2 8.1 1.8 0.9 0
DIA_4.11
Initial curvature test in CFD
+P 16309.3 Pa -P - 12304.7 Pa V 7.3 m/s +P - 16045 Pa -P - 11080.2 Pa V - 7.7 m/s +P 15718.5 Pa -P - 8762.2 Pa V 6.3 m/s +P - 15924.7 Pa -P - 6690.62 Pa V - 7.2 m/s +P 16272.5 Pa -P - 6862.37 Pa V 5.8 m/s +P - 16789.8 Pa -P - 5041.24 Pa V - 6.4 m/s
P/A
L/W
L/W
P/A
L/W
The results of the experiments showed that the length of geometry has a direct relation to the amount of negative pressure induced on the surface. Also it showed that when larger angle is facing the direction of water the amount of positive pressure increases but the amount negative pressure reduces considerably. Results showed that the area with reduced velocity of water is higher when the angle facing the flow is greater than the leeward angle. The length and the curvature of the geometry along with the windward angle has a direct impact on the increase in the velocity of the water. The rules established with this experiment along with the spatial organisation logic would become the drivers for the geometry exploration in next steps. P/A = 3.5 L/W = 2.73 P/A = 3.5 L/W = 2.73
= 2.92
= 1.36 P/A = 3.37
= 2.36
= 3.37
= 2.36
DIA_4.12 Tests demonstrating length of individual versus direction of flow
INITIAL TESTS
1.37 y
AGGREGATION TESTS


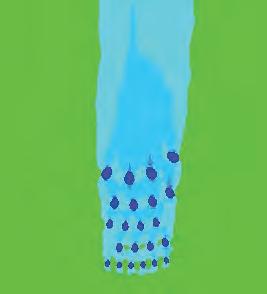
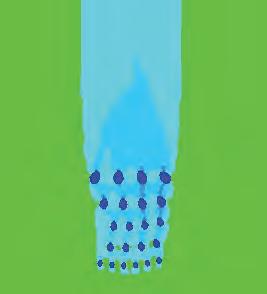
After establishing that the aggregation incorporating different sized geometries performed better than the aggregation of the same sized geometry, further exploration focused on the effect of a radial organisation versus the linear. Tests were carried out in a similar way as the previous experiments were the values for x and y spacing were used.
Variation was introduced where the curvature of line was incrementally increased from the last row to the first such that the geometries in the last row were arranged linearly while that in the first row were arranged radially. The next test was undertaken where all rows were radially arranged and each geometry was aligned to the centre of the respective arc. It was observed that the area of influence in the second test was much higher than the first and the increase in the velocity of water was significantly lower.


Following these results, a radial pattern for aggregation was used but instead of rotating the geometries towards the centre of respective arc, they were aligned parallel to the flow of water. It was concluded from this experiment that because of rotation, the velocity of water around the geometries increased in the first experiment while in the second experiment the increase in the velocity was lower. The rotated geometries also had a lower maximum pressure values than the aligned geometries.

Collective Morphogenesis Emergent Technologies and Design 127 126 4 GEOMETRY STUDY X DISTANCEY DISTANCE- ve P(Pa) + ve P (Pa) Max Velocity (m/s) 6.9 1.42 x 22624.9 -11852 1.37 y radial gradient 1.37y water direction 1.37y X DISTANCEY DISTANCE- ve P(Pa) + ve P (Pa) Max Velocity (m/s) 1.42 x 1.37 y X DISTANCEY DISTANCE- ve P (Pa)+ ve P (Pa) Max Velocity (m/s) 6.15 1.42 x 23212.6 -10504.3 1.37 y radial gradient 1.37y water direction 1.37y X DISTANCEY DISTANCE- ve P(Pa) + ve P (Pa) Max Velocity (m/s) 6.9 1.42 x 22624.9 -11852 1.37 y X DISTANCEY DISTANCE- ve P (Pa)+ ve P (Pa) Max Velocity (m/s) 6.15 1.42 x 23212.6 -10504.3 1.37 y 1.37y water direction 1.37y X DISTANCEY DISTANCE- ve P(Pa) + ve P (Pa) Max Velocity (m/s) 6.9 1.42 x 22624.9 -11852 1.37 y X DISTANCEY DISTANCE- ve P (Pa)+ ve P (Pa) Max Velocity (m/s) 6.15 1.42 x 23212.6 -10504.3 1.37 y 1.37 y X DISTANCEY DISTANCE- ve P(Pa) + ve P (Pa) Max Velocity (m/s) 6.0 1.42 x 24811 -10863.6 1.37 y AGGREGATION DISTRIBUTION Individual Size 1.0 - 6 0.83- 8 0.67- 4 0.5- 3 Total - 22 1.0 0.5 0.67 0.83 scale factor Radial Test Rotated Objects Linear to Radial 9 Velocity Magnitude (m/s) 2.7 3.6 4.5 5.4 6.3 7.2 8.1 1.8 0.9 0 9 Velocity Magnitude (m/s) 2.7 3.6 4.5 5.4 6.3 7.2 8.1 1.8 0.9 0 DIA_4.17 Comparison of arrangement strategies
STRATEGY
X DISTANCEY DISTANCE- ve P(Pa) + ve P (Pa) Max Velocity (m/s) 0.67- 4 0.5- 3 Total - 22
RADIAL AGGREGATION 22750 20000 16000 12000 8000 4000 -4000 -8000 -12000 0 Static Pressure (Pa)
X DISTANCEY DISTANCE- ve P(Pa) + ve P (Pa) Max Velocity (m/s) 6.0 1.42 x 24811 -10863.6 1.37 y AGGREGATION DISTRIBUTION Individual Size 1.0 - 6 0.83- 8 0.67- 4 0.5- 3 1.0 0.5 0.67 0.83 scale factor
1.37 y
AGGREGATION TESTS
The concept of building multiple small shelters instead of one large shelter was evaluated in the aggregation process. The results of the experiments showed how geometries of different sizes have a better effect on reducing the flow of water than geometries of same size. This not only allows for differentiation in scale and size between geometries but also gives an opportunity to differentiate in the programmatic use of them.
The aggregation of different size geometry will not be governed only by spacing rules. The organisation structure of a village settlement, the different phases of flood, the function of water and the connectivity between the structures would also add in defining the aggregation strategy. The range in size of the geometries will be influenced by the number of people in a village and the programme related to the shelters.
The other parameters that will contribute to the aggregation strategy will be studied in the further chapters and an appropriate flood mitigation scheme will be devised as a design proposal.
DIA_4.18 Aggregation tests showing reduction of velocity in different variations: the radial test with rotated objects performed the best
Collective Morphogenesis Emergent Technologies and Design 129 128 4 GEOMETRY STUDY water direction water direction water direction water direction 474.99 786.45 16339.03 19263.68 11418.38 0 0 5.2-6.1 5-5.19 4.5-4.99 4- 4.49 3.2-3.99 3-3.19 2.5-2.99 0 370.70 10475.01 13338.79 12313.62 5163.9 7858.31 5.2-6.1 5-5.19 4.5-4.99 4- 4.49 3.2-3.99 3-3.19 2.5-2.99 0 286.22 12108.50 5.2-6.1 5-5.19 4.5-4.99 RADIAL TEST ASCENDING ARRANGEMENT SAME SIZE 4 ROWS 0% 0.08% 3.40% 0 286.22 12108.50 5.2-6.1 5-5.19 4.5-4.99 0% 0.08% 3.40% 49520.33 Total 13.9% 0% 0.10% 2.94% 3.75% 3.46% 1.45% 2.20% 0 370.70 10475.01 13338.79 12313.62 5163.9 7858.31 5.2-6.1 5-5.19 4.5-4.99 4- 4.49 3.2-3.99 3-3.19 2.5-2.99 49520.33 Total 13.9% 0% 0.10% 2.94% 3.75% 3.46% 1.45% 2.20% 48282.5 Total 13.57% Area (m2) Velocity (m/s) Percentage Area (m2) Velocity (m/s) Percentage Area (m2) Velocity (m/s) Percentage 0.13% 0.22% 4.59% 5.42% 3.21% 0% 0% 474.99 786.45 16339.03 19263.68 11418.38 0 0 5.2-6.1 5-5.19 4.5-4.99 4- 4.49 3.2-3.99 3-3.19 2.5-2.99 48282.5 Total 13.57% Area (m2) Velocity (m/s) Percentage 0.13% 0.22% 4.59% 5.42% 3.21% 0% 0% Area (m2) Velocity (m/s) Percentage Area (m2) Velocity (m/s) Percentage RADIAL TEST ASCENDING ARRANGEMENT SAME SIZE - 4 ROWS 474.99 786.45 16339.03 19263.68 11418.38 0 0 5.2-6.1 5-5.19 4.5-4.99 4- 4.49 3.2-3.99 3-3.19 2.5-2.99 0 370.70 5.2-6.1 5-5.19 ASCENDING ARRANGEMENT SAME SIZE - 4 ROWS 0% 0.10% 0 370.70 5.2-6.1 5-5.19 0% 0.10% 48282.5 Total 13.57% Area (m2) Velocity (m/s) Percentage Area (m2) Velocity (m/s) Percentage 0.13% 0.22% 4.59% 5.42% 3.21% 0% 0% 474.99 786.45 16339.03 19263.68 11418.38 0 0 5.2-6.1 5-5.19 4.5-4.99 4- 4.49 3.2-3.99 3-3.19 2.5-2.99 48282.5 Total 13.57% Area (m2) Velocity (m/s) Percentage 0.13% 0.22% 4.59% 5.42% 3.21% 0% 0% Area (m2) Velocity (m/s) Percentage ASCENDING ARRANGEMENT SAME SIZE - 4 ROWS 5.2- 6.10 Velocity Magnitude (m/s) 5.0- 5.19 4.5- 4.99 4.0- 4.49 3.2- 3.99 3.0- 3.19 2.5- 2.99 5.2 6.10 5.0 5.19 4.5 4.90 4.0 4.49 3.2 3.99 3.0 3.19 2.5 2.99 Velocity Magnitude (m/s) min. velocity tail min. velocity tail
water direction water direction water direction water direction
STRATEGY
CONCLUSION 474.99 786.45 16339.03 19263.68 11418.38 0 0 5.2-6.1 5-5.19 4.5-4.99 4- 4.49 3.2-3.99 3-3.19 2.5-2.99 0 370.70 10475.01 13338.79 12313.62 5163.9 7858.31 5.2-6.1 5-5.19 4.5-4.99 4- 4.49 3.2-3.99 3-3.19 2.5-2.99 0 286.22 12108.50 14082.60 11927.91 5413.49 4212.55 5.2-6.1 5-5.19 4.5-4.99 4- 4.49 3.2-3.99 3-3.19 2.5-2.99 0 371.66 5.2-6.1 5-5.19 RADIAL TEST ROTATED OBJECTS RADIAL TEST ASCENDING ARRANGEMENT SAME SIZE - 4 ROWS 48031.27 Total 13.5% 0% 0.08% 3.40% 3.96% 3.35% 1.52% 1.18% 0 286.22 12108.50 14082.60 11927.91 5413.49 4212.55 5.2-6.1 5-5.19 4.5-4.99 4- 4.49 3.2-3.99 3-3.19 2.5-2.99 48031.27 Total 13.5% 0% 0.08% 3.40% 3.96% 3.35% 1.52% 1.18% 0% 0.10% 0 371.66 5.2-6.1 5-5.19 0% 0.10% 49520.33 Total 13.9% 0% 0.10% 2.94% 3.75% 3.46% 1.45% 2.20% 0 370.70 10475.01 13338.79 12313.62 5163.9 7858.31 5.2-6.1 5-5.19 4.5-4.99 4- 4.49 3.2-3.99 3-3.19 2.5-2.99 49520.33 Total 13.9% 0% 0.10% 2.94% 3.75% 3.46% 1.45% 2.20% 48282.5 Total 13.57% Area (m2) Velocity (m/s) Percentage Area (m2) Velocity (m/s) Percentage Area (m2) Velocity (m/s) Percentage Area (m2) Velocity (m/s) Percentage 0.13% 0.22% 4.59% 5.42% 3.21% 0% 0% 474.99 786.45 16339.03 19263.68 11418.38 0 0 5.2-6.1 5-5.19 4.5-4.99 4- 4.49 3.2-3.99 3-3.19 2.5-2.99 48282.5 Total 13.57% Area (m2) Velocity (m/s) Percentage 0.13% 0.22% 4.59% 5.42% 3.21% 0% 0% Area (m2) Velocity (m/s) Percentage Area (m2) Velocity (m/s) Percentage Area (m2) Velocity (m/s) Percentage RADIAL TEST - ROTATED OBJECTS RADIAL TEST ASCENDING ARRANGEMENT SAME SIZE 4 ROWS 474.99 786.45 16339.03 19263.68 11418.38 0 0 5.2-6.1 5-5.19 4.5-4.99 4- 4.49 3.2-3.99 3-3.19 2.5-2.99 0 370.70 10475.01 13338.79 12313.62 5163.9 7858.31 5.2-6.1 5-5.19 4.5-4.99 4- 4.49 3.2-3.99 3-3.19 2.5-2.99 0 286.22 12108.50 14082.60 11927.91 5413.49 4212.55 5.2-6.1 5-5.19 4.5-4.99 4- 4.49 3.2-3.99 3-3.19 2.5-2.99 0 371.66 10388.96 10483.46 11322.23 7314.78 5830.32 5.2-6.1 5-5.19 4.5-4.99 4- 4.49 3.2-3.99 3-3.19 2.5-2.99 RADIAL TEST ROTATED OBJECTS RADIAL TEST ASCENDING ARRANGEMENT SAME SIZE - 4 ROWS 48031.27 Total 13.5% 0% 0.08% 3.40% 3.96% 3.35% 1.52% 1.18% 0 286.22 12108.50 14082.60 11927.91 5413.49 4212.55 5.2-6.1 5-5.19 4.5-4.99 4- 4.49 3.2-3.99 3-3.19 2.5-2.99 48031.27 Total 13.5% 0% 0.08% 3.40% 3.96% 3.35% 1.52% 1.18% 45711.41 Total 12.85% 0% 0.10% 2.92% 2.95% 3.18% 2.05% 1.64% 0 371.66 10388.96 10483.46 11322.23 7314.78 5830.32 5.2-6.1 5-5.19 4.5-4.99 4- 4.49 3.2-3.99 3-3.19 2.5-2.99 45711.41 Total 12.85% 0% 0.10% 2.92% 2.95% 3.18% 2.05% 1.64% 49520.33 Total 13.9% 0% 0.10% 2.94% 3.75% 3.46% 1.45% 2.20% 0 370.70 10475.01 13338.79 12313.62 5163.9 7858.31 5.2-6.1 5-5.19 4.5-4.99 4- 4.49 3.2-3.99 3-3.19 2.5-2.99 49520.33 Total 13.9% 0% 0.10% 2.94% 3.75% 3.46% 1.45% 2.20% 48282.5 Total 13.57% Area (m2) Velocity (m/s) Percentage Area (m2) Velocity (m/s) Percentage Area (m2) Velocity (m/s) Percentage Area (m2) Velocity (m/s) Percentage 0.13% 0.22% 4.59% 5.42% 3.21% 0% 0% 474.99 786.45 16339.03 19263.68 11418.38 0 0 5.2-6.1 5-5.19 4.5-4.99 4- 4.49 3.2-3.99 3-3.19 2.5-2.99 48282.5 Total 13.57% Area (m2) Velocity (m/s) Percentage 0.13% 0.22% 4.59% 5.42% 3.21% 0% 0% Area (m2) Velocity (m/s) Percentage Area (m2) Velocity (m/s) Percentage Area (m2) Velocity (m/s) Percentage RADIAL TEST ROTATED OBJECTS RADIAL TEST ASCENDING ARRANGEMENT SAME SIZE - 4 ROWS min. velocity tail min. velocity tail
Each
FORM GENERATION PUBLIC BUILDINGS


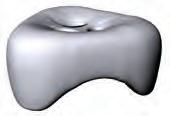
Connection to main road
Typologies need to be understood in relation to the site context they will be implemented on. The existing social dynamic of a village in Bangladesh is based on both family and neighbour relationships. Houses are arranged so that they contain a semiprivate courtyard which can be combined to become a shared space. This level of openness and building is incorporated within the organisation of houses, courtyards, agriculture, ponds and a network.
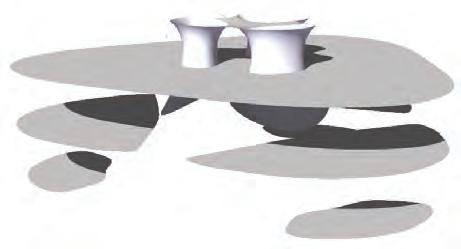


For a medium sized rural village, anywhere between 800 and 1200 villagers would comprise the population. Shared programmes including health services, a religious centre as well as a grade school would serve the village and be incorporated within larger more centralised structures.

BUILDING TYPOLOGIES
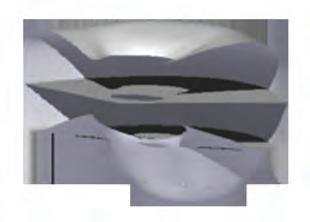
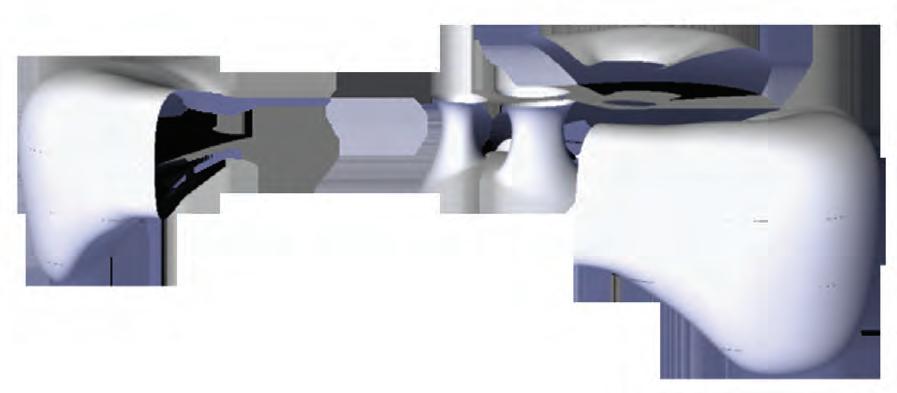


A village size of 1000 residents was used to translate into the proposed building typologies. The population was divided in relation to what constituted a typical family size [6 people] to the total number of families the project needed to incorporate. As each housing typology could hold 2 families, a total of 83 typologies were needed to serve the village. In addition to this, public buildings were defined as a school, a clinic and a mosque and each configured for the capacity they would need to maintain.
Additional parts of the village, such as a network and how to address ponds would be tackled later in the project as different systems.
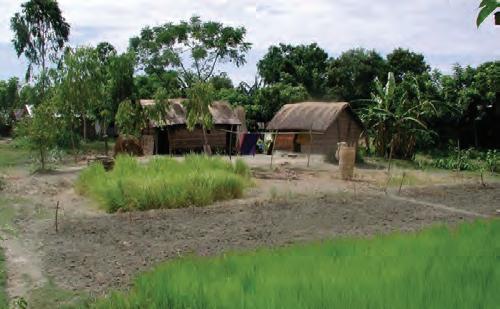
Collective Morphogenesis Emergent Technologies and Design 133 132 4 GEOMETRY STUDY River Village housing public building Main Road Agricultural land pond pond pond
VILLAGE COMPOSITION VILLAGE COMPOSITION TYPOLOGY CAPACITY REQUIRED NUMBER [1000 residents] HOUSING mosque clinic school RELIGIOUS CENTRE HEALTH SERVICES EDUCATION CENTRE
allotted
Agricultural land
DIA_4.21 Composition of a typical village DIA_4.22 Target population and programmatic requirements
Housing
space network
1000 people
Agricultural land
Connection to main road Secondary paths: house to house
Housing
Connection to main road Secondary paths: house to house 1000/6 [per family] = 134 Agricultural land
Secondary paths: house to house 1000 / 6 = 167 families
BUILDINGS
6
2
residents
1000 x .2 =
residents
of males [1000 x .5] x .7 = 350 residents school clinic mosque Changing programme schedule during the day including specific age/gender ranges 83 1 1 1
typical family is calculated as a father, a mother, an elderly parent and 3 children PUBLIC
1000 / 3 = 334 people per public building housing 2 families per housing type
x 2 = 12 residents 2 children per family [primary school] 167 x
= 334
20% of village population
200
70%
COMPOSITION OF A VILLAGE
IMG_4.04 Houses clustered around central open space
Level 1 Entrance Level 2 Level 1 Entrance Level 2 Level 1 Entrance Internal organisation of one leg Level 2 Level 1 Entrance Three ground connections Internal organisation of one leg Level 2 0 1.5m 4m 6.5m ONE LEG SUPPORT FOR PUBLIC BUILDING 0 1.5m 4m 6.5m ONE LEG SUPPORT FOR PUBLIC BUILDING
IMG_4.05 Agriculture land and housing organisation
DIA_4.23
Internal organisation of public building
FORM GENERATION HOUSING TYPE
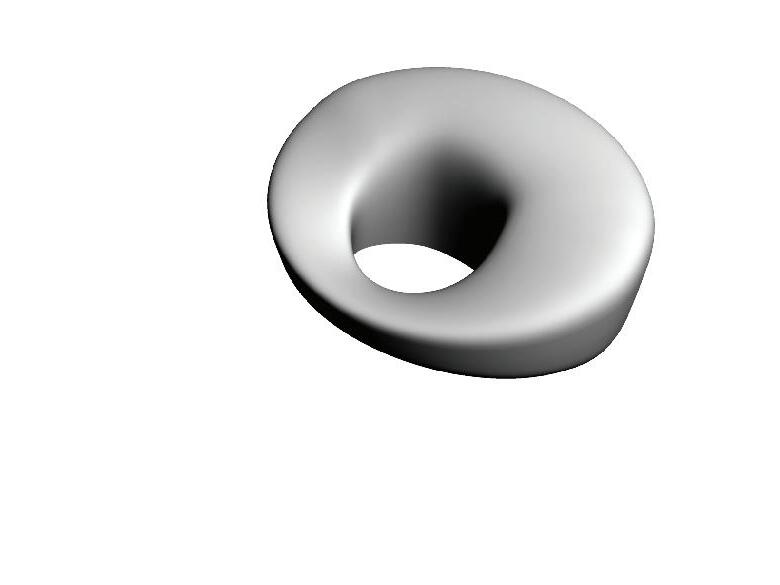


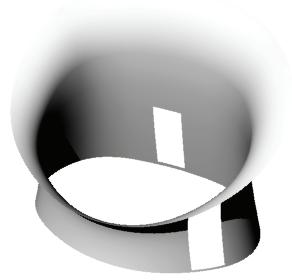

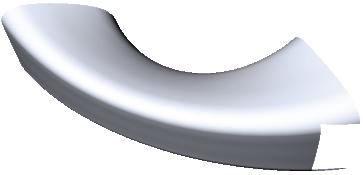


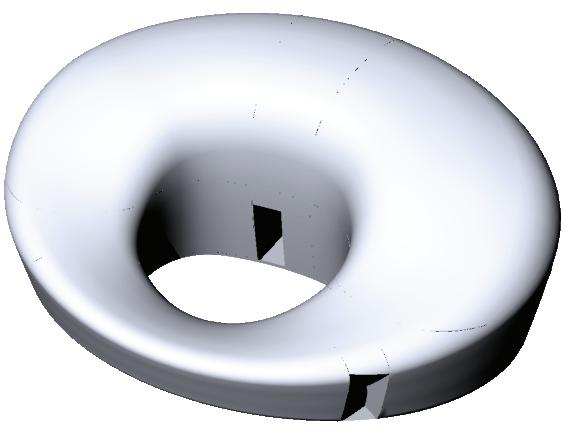
The housing typology was constructed by looking at the way the typical house organisation occurs in a village. As the social logic of Bangladesh follows family ties, generally multiple extended family houses locate themselves around a shared space. This semi-private courtyard is important in terms of both culture as well as religion, since the house is primarily the domain of females. The courtyard serves as the place for casual social interaction within the safety of the home, as well as an extension of domestic activities. For instance, animals are allowed to wander within this space and much of preparation of grain or large quantities of food storage can occur here. By this logic, it was important to translate the courtyard into the new housing typology since it has a large impact on a family using its adjacent space.
The courtyard is accessed through outer lower part of the housing ring, which serves a dual purpose of storage area [animals and other possessions] as well as acts as a wall against an increase in water level. As the “hollow wall” is 1.5m in height, any flood level over this amount will also flood the courtyard. Although the fibre composite material system is resistant to water damage and the typology is designed to not intake any water, two floors exist for each family space so as in the case of any water penetration, the family can move to an elevated level with ease.
As compared to the existing housing, the new typology attempts to shield itself from normal levels of flooding where the mudbrick and bamboo housing fails in most floods. In this, we incorporate a range of flexibility with the dynamic environment: anticipation of most situations and submission to the more extreme conditions.
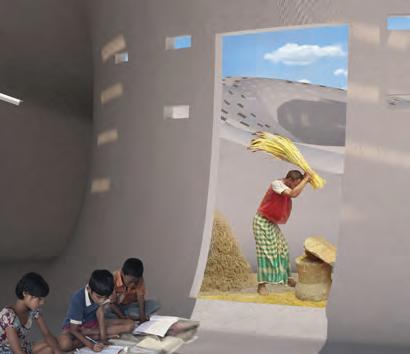
Collective Morphogenesis Emergent Technologies and Design 135 134 4 GEOMETRY STUDY Family 1 Space
Entrance to courtyard from outside Storage accessed from courtyard Dual floor family space Protected courtyard main roadcourtyardhouse public semi-privateprivate 0 m 0 m +1.6 m 0 m +1.6 m main roadcourtyardhouse public semi-privateprivate 0 m +1.6 m 0 m +1.6 m main roadcourtyardhouse public semi-privateprivate 0 m 0 m +1.6 m 0 m +1.6 m 0 m +1.0 m 0 m +1.6 m 0 m +1.6 m main roadcourtyardhouse public semi-privateprivate 0 m +1.0 m 0 m 0 m +1.6 m main roadcourtyardhouse public semi-privateprivate 0 m +1.0 m +1.0 m +1.6 m 0 m +1.6 m 0 m +1.6 m TRADITIONAL HOUSING LOGIC FLOOD SCENARIO [+1.6m] HOUSING TYPOLOGY FLOOD SCENARIO [+1.0m , +1.6m] main roadcourtyardhouse public semi-privateprivate 0 m +1.0 m 0 m +1.0 m 0 m +1.6 m 0 m +1.6 m 0 m +1.6 m main roadcourtyardhouse public semi-privateprivate 0 m +1.0 m 0 m +1.0 m 0 m +1.6 m 0 m +1.6 m 0 m +1.6 m
Family 2 Space
HOUSING
DIA_4.24 Housing typology and function of protected courtyard DIA_4.25 Internal organisation of programmes within housing typology
FORM GENERATION RAINWATER COLLECTOR TYPE
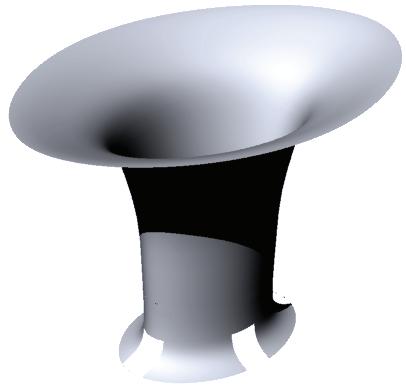
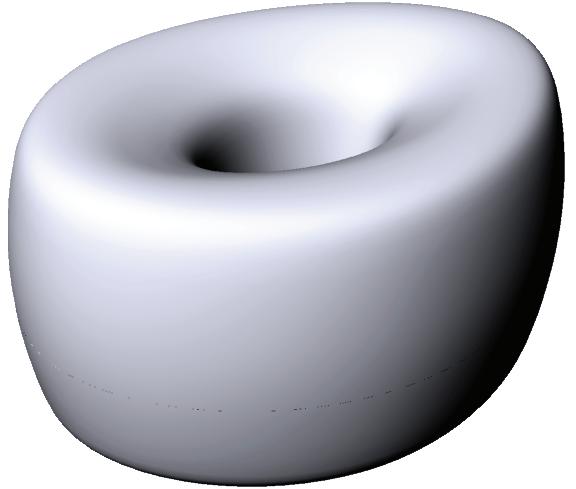


AMOUNT OF WATER USED FOR HOUSEHOLD ACTIVITIES
ACTIVITIES PER CAPITA CONSUMPTION PER DAY (litre)
Kitchen
Drinking Water
Personal Hygiene
Bathing + washing clothes
Toilets
AMOUNT OF WATER USED FOR HOUSEHOLD ACTIVITIES
of the house
AMOUNT OF WATER USED FOR HOUSEHOLD ACTIVITIES
ACTIVITIES PER CAPITA CONSUMPTION PER DAY (litre)
ACTIVITIES PER CAPITA CONSUMPTION PER DAY (litre) Kitchen Drinking Water Personal Hygiene
Kitchen
Bathing + washing clothes
Drinking Water
Personal Hygiene
Bathing + washing clothes
CAPACITY OF RAINWATER COLLECTOR
320 m³ = 320,000 liters
1 person
2 families [12 people]
CAPACITY OF RAINWATER COLLECTOR
320 m³ = 320,000 liters
CAPACITY OF RAINWATER COLLECTOR
320 m³ = 320,000 liters


CONSUMPTION: 104 liters per day [Bangladesh villager standard usage]
CONSUMPTION: 150 liters per day [UK standard usage]
12 weeks [max inundation]
1 person
1 person
2 families [12 people]
2 families [12 people] 12 weeks [max inundation]
12 weeks [max inundation]
CONSUMPTION: 104 liters per day [Bangladesh villager standard usage]
320,000 liters / 104 liters per person
= 3077 days of supply for 1 person
320,000 liters / 104 liters per person = 3077 days of supply for 1 person
320,000 liters / [104 x 12 people]
= 256 days of supply for 12 people
320,000 liters / [104 x 12 people]
= 256 days of supply for 12 people
320,000 liters / [104 x 84 days]
= 36 people to supply for 12 weeks
320,000 liters / [104 x 84 days]
= 36 people to supply for 12 weeks
320,000 liters / 150 liters per person
CONSUMPTION: 150 liters per day [UK standard usage]
= 2133 days of supply for 1 person
320,000 liters / 150 liters per person = 2133 days of supply for 1 person
320,000 liters / [150 x 12 people]
= 177 days of supply for 12 people
320,000 liters / [150 x 12 people]
= 177 days of supply for 12 people
320,000 liters / [150 x 84 days]
= 25 people to supply for 12 weeks
320,000 liters / [150 x 84 days]
= 25 people to supply for 12 weeks
CONSUMPTION: 104 liters per day [Bangladesh villager standard usage]
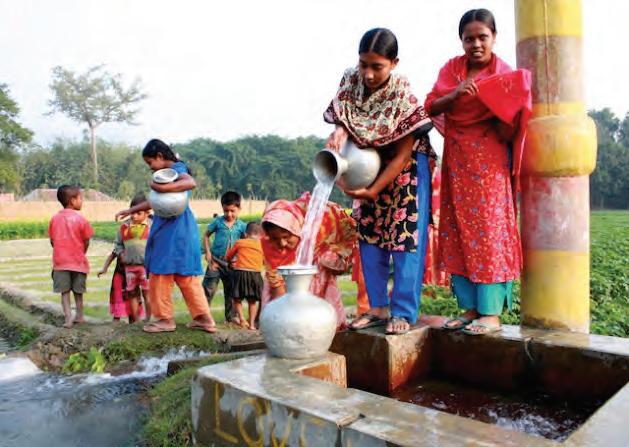
One of the main problems faced in Bangladesh is that although there is extensive amounts of water found in rivers and the coast, much of this water is not potable. Furthermore, when long term flooding occurs, the quantities of drinking water available become even less due to fresh water sources mixing with saline water. Extraction of ground water itself is a problem since arsenic exists naturally in the land and many wells are contaminated.1 Since Bangladeshi farmers require such extensive amounts of water, extraction from the ground can lead to depletion of the water table during times of minimal rainfall.
320,000 liters / 104 liters per person
= 3077 days of supply for 1 person
320,000 liters / [104 x 12 people]
= 256 days of supply for 12 people
The availability of water greatly fluctuates during the year, since during the monsoon, the country faces a barrage while the dry seasons sees extremely little rain. As there is no infrastructure in place to adequately deal with this constant shift, the population [mainly the part that deals with agriculture] suffers greatly.
1 Hedrick, Saima. http://thewaterproject.org/ water-in-crisis-bangladesh.php
Internal
320,000 liters / [104 x 84 days]
= 36 people to supply for 12 weeks
Instead of relying completely on water from the ground [with the rising scare of arsenic], the project proposes an alternative method to obtaining drinking water. Since during the case of a cyclone or flood, water is extremely scarce, a typology was derived which would collect rainwater during the monsoon. The size of the rainwater typology was generated through both the capacity of how much water could be stored, as well as the overall footprint of the geometry itself.
CONSUMPTION: 150 liters per day [UK standard usage]
320,000 liters / 150 liters per person
= 2133 days of supply for 1 person
320,000 liters / [150 x 12 people]
= 177 days of supply for 12 people
Through establishing the consumption rate in a typical Bangladeshi village, calculations were made for how many people can be supplied and for what period of time. With a full capacity of 330 cubic meters, one rainwater collector is able to sustain 6 families for an inundation period of 12 weeks. The storage capacity can be increased if the planar cap is raised to higher than a 3.0 metre level above ground level. However, as there are a few alternative ways of obtaining potable water, it is not absolutely necessary to supply rainwater all year round.
320,000 liters / [150 x 84 days]
= 25 people to supply for 12 weeks
Filtration
+3.0m
Collective Morphogenesis Emergent Technologies and Design 137 4 GEOMETRY STUDY +3.0m
Total
8.4 2.5 2.9 46.6 6.7 12.1 4.0 83.2 20.8 104
Toilets Cleaning of the house Other purposes Subtotal 25% Tolerance Factor
Consumption
Other
Subtotal 25% Tolerance
Total Consumption 8.4 2.5 2.9 46.6 6.7 12.1 4.0 83.2 20.8 104
Toilets Cleaning of the house
purposes
Factor
0
Other
Subtotal 25% Tolerance Factor Total Consumption 8.4 2.5 2.9 46.6 6.7 12.1 4.0 83.2 20.8 104
Cleaning
purposes
Geometry of the Rainwater collector typology
funnel shaped core designed to harvest rainwater
and storage of rainwater for later usage
RAINWATER COLLECTOR PROBLEMS WITH THE EXISTING WATER CYCLE
IMG_4.06 Women collecting water from a pump
DIA_4.26 Fresh water requirement calculation
DIA_4.27 Rain water collection and filtration
SYSTEM DEVELOPMENT 5 5.1 Overview 5.2 Site Scenario 5.3 Site Strategy 5.6 Programme Organisation 5.4 Case study 5.5 Water Network
OVERVIEW
Geometrical exploration looked at different typologies which could function from smallest scale of breakwater to largest scale of public building in a flooding scenario. This chapter documents the process of aggregation and clustering of different typologies with influences of social logic along with hydrological impact. The usage of water and the availability of fresh water for drinking are few of the primary concerns during a flooding and a cyclonic condition. The clustering logic tries to incorporate the existing village structure and look at different relationships that exist in a village both in terms of social organisation as well as hydrological dependence.
Research begins by locating a site scenario and mapping out environmental forces to be able to continue the process of generating a multi-phase system. Traditional methods of using water are studied as precedents and principles extracted accordingly, which can be adopted in developing the hydrological system.

The aim of this chapter was to develop a relationship based system, which at various levels function during the different phases of flooding. The relationships are predominantly influenced by the dynamic phase of flooding where banks of river are breached and certain areas are prone to flooding.
[C]omplexity originates from systems with a large number of interacting elements…. multi-level and intertwined bottom-up and top-down exchange of information may be characteristics of complex systems…1
Collective Morphogenesis Emergent Technologies and Design 141 140 SYSTEM DEVELOPMENT 5
IMG_5.01 Overview of shifting shoreline
1 Robert, Martin. A Broader Perspective about Organization and Coherence in Biological Systems. European Conference on Complex Systems (ECCS) 2012.
PHASES
CONTEXT PHASES
PROGRAMMATIC TIME PERIODS
PROGRAMMATIC
TIME
PERIODS
CYCLONE
INUNDATION
SEASONAL
FLOOD
CYCLONE INUNDATION SEASONAL FLOODING
storm
surge
lateral
pressures
high
wind
speeds `

In order to aggregate/ cluster the typologies, it was important to revisit the different phases of the flooding. The two main phases of the flooding which are dynamic in nature are that of cyclone and season flooding. The characteristic of the forces are completely different in these two phases and different strategies are required to counter these conditions. While the cyclone condition faces extreme pressures from wind and water, the forces are negligent in seasonal flooding.
flooding does not have huge impact on housing and infrastructure but mainly affects the agricultural land and river morphology. Over time the soil condition around the river becomes waterlogged and loose which enables chunks of land to melt away into the water. The strategy of redirecting some of the water can be adopted in order to protect certain areas from flooding every year and the water can be re-used for agricultural purpose. Thus loss of land because of flooding can be controlled over time and an efficient method of using water can be established.
In order to execute these strategies, it was necessary to situate the site within coastal areas which faces danger from both cyclone condition as well as seasonal flooding. Research was undertaken to locate the site and important data of flooding patterns, topography, existing programs and site forces were mapped out. This information would help in establishing different strategies for organisation of typologies. Along with this physical information of site, a study was also conducted to understand the structure of a village and how the existing cultural data can be incorporated within the organisation scheme.
sta3onary
elevated
water
level
environmental
pressures
negligent `
stationary elevated water level environmental pressures negligent water accumulation at river banks environmental pressures negligent storm surge lateral pressures high wind speeds
water
accumula3on
at
river
banks
environmental
pressures
negligent `
During the cyclone phase, the immediate requirement is to shelter people during a time of complete lock down. Once inside the shelter, no one is allowed to open any windows or doors or step outside, as the high pressures could cause damage to the overall structure. Our strategy of reducing the impact of the water on buildings becomes one of the primary goals during this phase so that destruction of houses is minimised as much as possible. Many natural systems have been adopted for a barrier strategy such as planting of mangroves along the coastline. However, while this does reduce the impact by a method of dispersing the forces through layering, growing of mangrove forests take long periods of time.
The seasonal flooding phase occurs almost every year during the monsoon season. This kind of

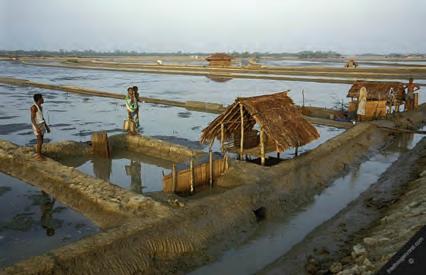
Collective Morphogenesis Emergent Technologies and Design 143 142 SYSTEM DEVELOPMENT 5
CYCLONIC CONDITION
DIA_5.01 Phases of flooding in Bangladesh
02550 100 (km)
FLOOD MAPS SITE SCENARIO
SITE LOCATION
In order to select a site, the various zoning of the coastal area in Bangladesh was researched in terms of risk of flooding. The low delta region makes it susceptible to numerous floods and cyclone storm surges. The flood risk maps DIA_5.02 shows the areas prone to storm surges and high winds.
A site was selected in the Barguna province of Bangladesh which is located in proximity to Sundarbans, the largest continous mangrove forest in the world. This site predominantly lies in the area of storm surges larger than 1m as indicated in the map. It has a total population of 848,554 and was affected the most by cyclone Aila in 20091 It is bounded by rivers on two sides and the coast on the third side thus making it highly susceptible to both coastal and seasonal/river flooding.
The maps on the adjoining page shows the flooding pattern recorded before and after the cyclone had passed after cyclone Aila. The maps indicate the extent of flooding during the cyclone period and the existence of water bodies during the seasonal flooding. It can be observed that apart from the major river abutting the site many small rivers and canals cut into the land making it prone to multiple sources of river flooding.
1 http://www.banglapedia.org/HT/B_0349.htm
02550 100 (km)
02468 km
Collective Morphogenesis Emergent Technologies and Design 145 144
SYSTEM DEVELOPMENT 5
DIA_5.02 Coastal Areas effected by cyclones and storm surges, adapted
Larger than 1m storm surge Less than 1m storm surge High wind area
Dhaka Patharghata
Larger than 1m storm surge Less than 1m storm surge
High
wind area
Dhaka Patharghata
DIA_5.03 Flood dynamic map showing the draw off between 1st of June 2009, a few days after the passage of the Aila Cyclone, over the Patharghata area, Barguna Province, adapted
Seasonal Flooding Flooding after cyclone Sundarbans
The adjoining map shows the distribution of different programmes within the Patharghata area of Barguna province. Around 57 cyclone shelters are located in this area, catering to more than 162,025 people . It can be discerned from the map that many cyclone shelters also perform the function of primary or secondary schools during the non-cyclonic condition.
The topography of the area can be understood by observing the sections both in E-W direction and N-S direction. The land form does not have any undulation and is predominantly flat over the entire region due to the floodplain delta. This makes the movement of the water during and after the flooding difficult and water remains on the surface for long durations. The sections also indicate the level of ground above the main sea level and the average height of high tide. At the coast, it is apparent that the rivers do not have elaborate embankment schemes/polders, which blocks water from easily reaching the surface and spreading inland.
In order to map out the forces acting on this area, a more specified site area was selected near the intersection of two rivers such that it faces two forces one from the coast and the second from river flooding. [DIA_5.04]
1 http://www.banglapedia.org/HT/P_0128.htm
http://www.dmic.org.bd/csdb/
Collective Morphogenesis Emergent Technologies and Design 147 146 SYSTEM DEVELOPMENT 5
sea level
Mean
Section at the coast (Y)
high tide 2.01 m) 4 m Mean sea level
A-A Section B-B Y X Z Average high tide 2.01 m) Sunderbans Sea River River E Sea W S S N W E W E River River N Sunderbans Sea 4 m Average water level 2 m Settlement Road Sea River Road Settlement Primary school A A B B High school Rural Market Growth Centre Cyclone shelter Clinic Union Family Welfare Main road Settlement Sunderban 01.53 6 (km) DIA_5.04
DIA_5.05
Section across river (Z) Average
Section at the coast (X) Section
Translation of a large volume to multiple small volumes
Sections showing the topography of the coastal areas
PROGRAMS AND TOPOGRAPHY
PHYSICAL FEATURES Patharghata SITE SCENARIO
AND FORCES
The selection of the site near the intersection of two rivers was followed by mapping of the predominant site forces arising out of flooding. As the site is located near a major river and is close to the sea, it is prone both to coastal flooding and seasonal flooding. Since the coastal flooding has greater velocity of water and has a large impact in terms of destruction of housing and infrastructure, it is classified as the primary force and the river flooding as the secondary force.
The diagrams indicate the direction of the forces, where primary and secondary are essentially perpendicular to each other. Mapping of these forces becomes one of the important steps as it determines the organisation and orientation of different typologies within the site. Since breakwater was the first line of defense that would face the maximum pressure from coastal pressures and its role was to reduce the speed of water, the organisation of breakwater was purely determined by direction of the primary force.
Beyond the zoning of the breakwater types as the boundary conditions, the velocity of water and the pressure exerted on geometries would be reduced. Thus, the organisation of the other typologies could be influenced to a lesser degree by site forces, with more weight to social structure and the usage of water.
Collective Morphogenesis Emergent Technologies and Design 149 148 SYSTEM
5
Ponds Settlement Farmland Road River Bishkhali Main Road 050100200 (m) 50200500m 50200500m Secondary
Primary
50200500m 50200500m
DEVELOPMENT
EXTRACTION OF FORCES
Force : River Flooding
Force :Tidal flooding
Secondary Force : River Flooding Primary Force :Tidal flooding
SITE
DIA_5.06 Physical features of site
DIA_5.07 Primary and secondary site forces
SITE SCENARIO
ORGANISATION
Once the site forces were mapped, an initial grid was setup based on the primary and secondary forces. The strategy for the cyclone phase was primarily to reduce the impact of water on built forms and reduce the velocity of water as much as possible. For that the breakwater typology was enacted as the first line of defense. Due to the smaller size of breakwaters, these geometries were designed to be uninhabited storage spaces, with their primary function to act impact surfaces to reduce overall velocity.
The previous experiments concerning radial aggregation was used as a reference and an initial radial grid was established based on primary and secondary forces. Arrangement of breakwaters would be located on periphery of this grid and be modified for footprint area. More than simply protecting the shore, over time the organisation of breakwater would help in reclaiming some portion of land by obstructing the flow of water but still allowing for sedimentation to occur. This kind of organisation disperses and diffuses the velocity of water rather than completely blocking the flow and causing overflow at other points of the existing water network. To understand the relationship between size and spacing of typologies and curvature of radial organisation, experiments were conducted and the results were analysed to choose the best arrangement.
Collective Morphogenesis Emergent Technologies and Design 151 150 SYSTEM DEVELOPMENT 5 breakwater secondary force functions channelling functions collection breakwater primary force river river breakwater secondary force functions channelling functions collection breakwater primary force river river breakwater secondary force functions channelling functions collection breakwater primary force river river breakwater secondary force functions channelling functions collection breakwater primary force river river 50200500m Primary _Secondary_Tertiary Forces Initial Grid: Primary + Secondary 1050100m breakwater primary force breakwater secondary force function housing clusters function agriculture + Primary Force Secondary Force DIA_5.08
Initial grid based on Primary and Secondary forces
DIA_5.09 Organisation based on site forces
DIA_5.10 Breakwater as first line of defense
DIA_5.11 Orientation of breakwaters per location on site
BREAKWATER
DIA_5.12 Modified breakwater strategy per forces
breakwater primary force breakwater secondary force function housing clusters function agriculture
SITE STRATEGY
SITE STRATEGY
FUNCTION AND CONCLUSION
The previous experiments concerning the arrangement of breakwaters on the site showed the relationship between the size of the geometry and curvature of the arc that each element would be placed on. The principles were extracted from the experiment and were incorporated such that the breakwaters act as the first line of defense designed to absorb the energy of the waves which hit them.
Many countries have adopted this method of a breakwater strategy by using stones and other man made geometries. By stacking heavy concrete objects with many irregular edges on top of each other, a porous sloping wall is constructed which breaks up the initial energy. Similarly, natural systems like mangrove forests along the coast line help in reducing the pressure exerted by the water as the
roots of the plant act in dispersing the flow. Both of these examples use a strategy of multiple elements tying together to perform as a single interlocked network of geometries. The proposed strategy is different in that each breakwater is significantly larger and spaced far apart enough to act as single elements.
The advantage of close shell structure is that during the non-cyclone period these could function as storage spaces for agriculture. Since these typologies would face the maximum pressure of water, the number of glass fibre layers used within its surface composition would be much higher and the ground connection would be more structured than the other inland typologies. The surface depth of the material system would also vary based on the location of
breakwater in the overall arrangement [as the ones in the front face more pressure than latter]. Thus, it became important to adopt the fibre composite properties for the breakwaters, since each object performs as a solitary element as well as within a larger organisation.
Where the arcs intersect, a modification of the organisation was applied such that the intersection forms the pathway for water channels which will be explained in the next part of the chapter. Since the breakwater typologies were uninhabitable storage spaces and had to face the maximum pressure, the organisation was purely based on the site forces. To distribute the habitable typologies, research was conducted into understanding the social parameters and water relations existing within the site.
Collective Morphogenesis Emergent Technologies and Design 155 154 SYSTEM DEVELOPMENT 5
BREAKWATER
start of canal cross-section [change of topography]
BREAKWATER INLET change of orientation and position of inlet adjacent objects based on channelling strategy
BREAKWATER orientation and position of objects based on multiple arcs
OPTIMAL FORM + ARRANGEMENT AS BOUNDARY CONDITION
DIA_5.14. Function and arrangement of breakwater on site
VILLAGE STUDY
LOCAL SCALE: FAMILY
LOCAL SCALE: FAMILY
LOCAL SCALE: FAMILY
COMMUNITY STRUCTURE
BASIC SOCIAL UNIT: STRUCTURE ORGANISATION
BASIC SOCIAL UNIT: STRUCTURE ORGANISATION
BASIC SOCIAL UNIT: STRUCTURE ORGANISATION
DIVISION OF THE COUNTRY
REGIONAL SCALE: NEIGHBOURHOOD
REGIONAL SCALE: NEIGHBOURHOOD
REGIONAL SCALE: NEIGHBOURHOOD
SOCIAL CLUSTER: ORGANISATION
SOCIAL CLUSTER: ORGANISATION
SOCIAL CLUSTER: ORGANISATION
social cluster
social cluster
typology
The division of Bangladesh follows a social structure that is embedded in the way power is divided within the country. Administrative power is broken down increasingly based on geographical factors since spatial societies were formed with various differences in topography, settlement and cropping pattern. Local governments are emphasized, since the characteristics and relationships regarding Bengali culture fully instituted at a village scale. Within the history of development of civilization and empires in South Asia, there has always been a relationship of alliance between the highest ruling power, and the segregated nature of the villages.

The most important characteristic to note regarding villages is based on their self-governing institution, mainly that each is equipped with its own infrastructural body. From developing an internal group of specialist professions, to sharing of community programmes such as religious centres, villages came to be in a large part by self-governing themselves.
As much of the country is agrarian, the land to which the people settle into become completely enter-twined in the society and the culture that emerges. Thus, there is no uniform pattern that can be determined from village to village, however, the underlying structure of social programmes can be understood.
groups of households in a certain region
groups of households in a certain region
GLOBAL SCALE: VILLAGE
GLOBAL SCALE: VILLAGE
GLOBAL SCALE: VILLAGE
COMMUNITY PROGRAMMEORGANISATION
COMMUNITY PROGRAMMEORGANISATION
COMMUNITY PROGRAMMEORGANISATION
multiple neighborhoods arranged to share certain amenities
multiple neighborhoods arranged to share certain amenities
Collective Morphogenesis Emergent Technologies and Design 157 156 SYSTEM DEVELOPMENT 5 Bangladesh Divisions Districts Upazilas Union Parishads Wards Mahalla Village Para Bari Ghar 1 7 64 500 4,451 1 2 3 4 5 6 7 8 9 10 11 national village development neighborhood individual
ADMINISTRATIVE POWER REGION ASSOCIATED DESIGN SCALES regional government local government village level family structure DIA_5.15 Administrative division in Bangladesh IMG_5.02 Social organisation within a village in Bangladesh
extended household CHULA nuclear family PARIBAR homestead BARI house GHAR family PARIBAR
of households in
certain region
cluster PARA
neighborhoods arranged to share certain amenities village GRAM River Village Main Road Agricultural land
groups
a
social
multiple
+ + ++ + pond pond pond
CHULA
PARIBAR homestead BARI house
family PARIBAR
extended household
nuclear family
GHAR
PARA
village GRAM River Village Main Road
land
Agricultural
+ + ++ + pond pond pond
household CHULA
PARIBAR homestead BARI house GHAR family PARIBAR
extended
nuclear family
PARA
village GRAM River Village Main Road
land
Agricultural
+ + ++ + pond pond pond
The aspects of family life is extremely important in the way society develops in a Bangladesh village. At its root, the family is the basic social unit in which relationships are formed. The extension of the family house follows a patrilineal growth, where children grow up in the house of their father. Once married, male children develop their own part of the house [or create an alternate house altogether], so as to retain original ties with the family.
Multiple groups of these family arrangements form a type of neighbourhood, or para. Social ties beyond the extended family, are strongest at this level, as they make up the nearest neighbour relationships. The village itself is derived through the organisation of neighbourhoods which all share community programmes, such as a religious centre, education buildings and health services.
Beyond the architecture typologies which determine the village, agricultural land is also mapped out, as farming is a major part of the rural society. Coastal villages often use natural ponds, as well as creating artificial ones, for aquaculture [fisheries and shrimp farms]. Thus, the landscape becomes an important component in the structuring and mapping of the village.
COMMUNITY STRUCTURE VILLAGE STUDY
size: small large
Community structure
SHARED AQUACULTURE
SPATIAL RELATIONSHIPS
In order to understand the spatial relationships and social logic existing in a village, the organisation of the village was broken down into three main categories. A typical village consists of household at the smallest level and neighbourhood as the largest.
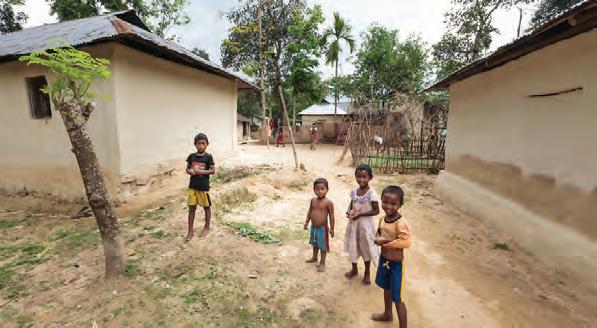
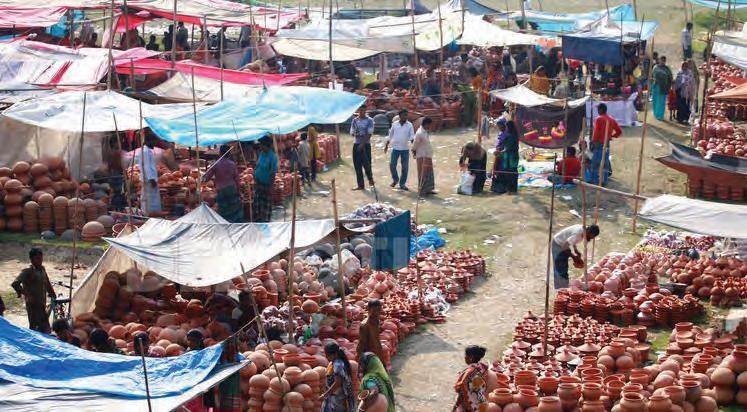
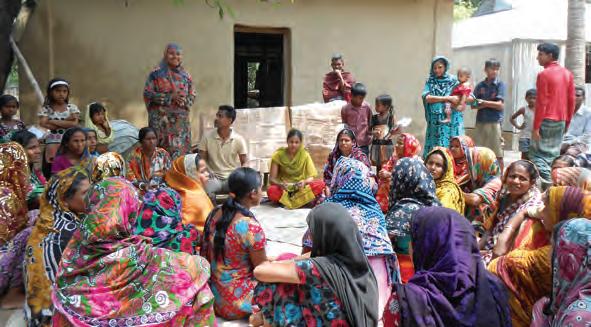
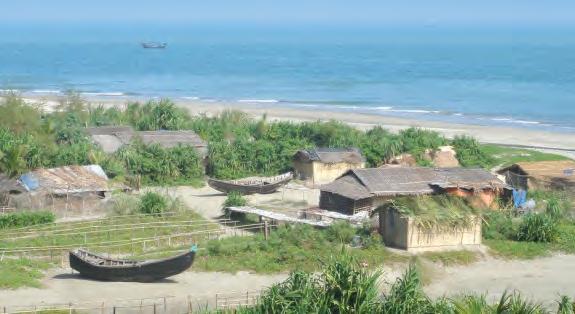
Sharing amenities and infrastructure are key aspect of any village as it allows for more social interaction between people. These shared spaces become the centre of activity and connect people to each other. In looking at the organisation structure, sharing of amenities can be noticed at all three levels. At the smallest level, multiple houses share a central open space which becomes the place where people interact. This space is used not only as common central space for interaction but also function as place where crops are dried after harvesting.
Bangladesh has a culture of shrimp farming and fish farming. Many aquaculture ponds can be noticed in the coastal areas of Bangladesh. The aquaculture ponds are both natural as well as man-made. At the cluster level, large aquaculture ponds become the shared amenities where 2 to 3 household consisting of 10 to 15 families share a pond. Thus within the social structure aquaculture ponds play an important role acting as shared spaces.
SHARED NETWORK AND CERTAIN AMENITIES
At the neighbourhood level many necessary amenities like fresh water supply and network are shared between clusters. The shared network becomes one of the most important aspect of the village as it connects cluster of houses to each other. In a flooded condition network disruption becomes one of the huge problems as people are unable to commute from one place to another.
Thus it can observed from the study that shared amenities are integral to social structure and play an important role in organisation of a village. It also showed water in form of aquaculture ponds being one of the major aspects in the livelihood of the people. In order to organise the habitable typologies on site, social structure would play an important role along with consideration of site forces.
Collective Morphogenesis Emergent Technologies and Design 159 158
5
SYSTEM DEVELOPMENT
THE STRUCTURE OF THE VILLAGE
IMG_5.03 Organisation of houses around central open space
IMG_5.04 Organisation of houses near the coast line
IMG_5.05 Temporary market environment in a village
IMG_5.06 Community gathering in a viillage
HOUSEHOLD
SHARED CENTRAL OPEN SPACE
POND
size: small large
CLUSTER
NEIGHBOURHOOD
DIA_5.16. Social organisation and spatial relationship
After understanding the principles of social structure existing in a village, the next step in the research was to look at the water dependency of a village. Bangladesh is predominantly an agrarian country. About 80% of Bangladesh’s rain falls during the monsoon season which extents from June to October. Water in this period is available abundantly and is enough for cultivation of crops. However, Bangladesh also has summer season [or dry season] which faces an acute shortage of water for agriculture. The dry season extents for almost 5 months of the year, making cultivation of crops difficult.
Rice and jute are the primary crops cultivated in Bangladesh and the water requirement for both the crops is high compared to any other crops. They are grown in plain alluvial soil conditions and need a a relatively large volume of stagnant water for growth . The production of these primary crops can only occur in climates of high rainfall, with cultivation suspended during the summer. In order to extent the growing period to be year round, where rice and jute can be cultivated during three crop seasons, availability of water during the dry season becomes a crucial aspect. This can be achieved by trapping and collecting some of the flood water during the rainy season and recirculating it within a drier period to the agricultural fields.
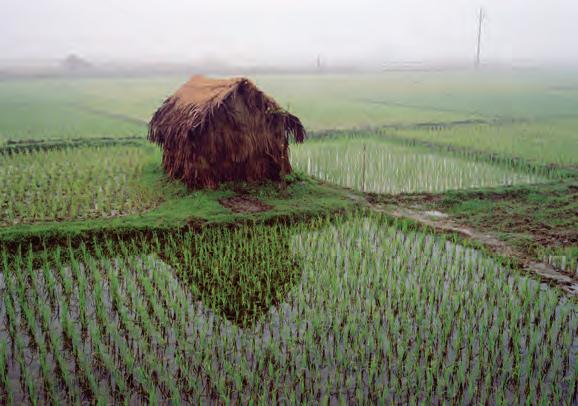
Even though flooding is the biggest concern, the potential of using some of the flood water for agriculture and the fact that it makes the soil more alluvial will be explored as a design strategy in the next steps of the research.
1 http://ancienthistory.about.com/od/atlas/qt/climateBangla.htm. Last accessed: 30th Jan 2014.
2 http://www.tourtobangladesh.com/Crops-ofBangladesh.php. Last accessed: 30th Jan 2014.
HYDROLOGICAL STRUCTURE
AQUACULTURE PONDS
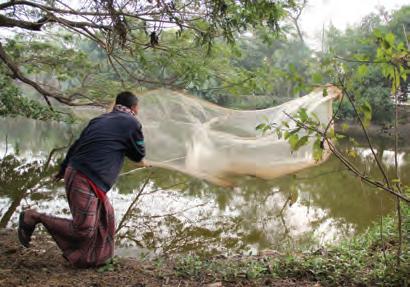
Apart from water being the necessity for agriculture, it is also necessary for fish farming. The coastal areas of Bangladesh are slowly integrating a culture of fish farming and shrimp farming. There are about 1,288,222 ponds in Bangladesh having an area of 0.114 ha per pond and 21.5 pond per mauza (BBS, 1997). About 17% of these ponds are derelict and probably dry up in the dry season . Within the coastal areas, aquaculture ponds have become one of the primary features occupying the landscape.

These aquaculture ponds are usually shared by neighbours and become a source of income for the families. Aquaculture ponds within the coastal areas are both natural as well as man-made. As the ground levels are relatively flat, in order to raise the plinth level of the house, soil is acquired by digging the ground. Ponds are generated through this process of extraction of land where the area from where is soil is unearthed fills with water. Over time families manipulate the boundaries of the pond for fish farming. The depth and the size of the aquaculture ponds varies based on the type of fish farmed.


Apart from the large ponds which are shared by a neighbourhood, smaller local ponds owned by individual families can also be observed in the landscape. Water usage in the site is not only required for agricultural purposes but is also necessary to carry out aquaculture as a support economy. These sources of income need considerable attention while organising the housing typologies on site.
1 http://users.physics.harvard.edu/~wilson/arsenic/ conferences/Feroze_Ahmed/Sec_2.htm. Last accessed: 30th Jan 2014.
2 http://www.worldfishcenter.org/resource_centre/ WF_2970.pdf. Last accessed: 30th Jan 2014.
Collective Morphogenesis Emergent Technologies and Design 161 160 SYSTEM DEVELOPMENT 5
IMG_5.08 Fish farming in an aquaculture pond
IMG_5.10 Shrimp farming in an aquaculture pond
IMG_5.09 Agricultural land and aquaculture pond
350
IMG_5.11 Shared aquaculture ponds
mm approx.
Small
Dykes to ensure adequate water level
ditch for fish
600 mm
Raised earthwork also access paths
IMG_5.07 Overview of paddy fields showing the necessity of water for rice cultivation
AGRICULTURE
DIA_5.17 Mean monthly rainfall and the corresponding groundwater level,adapted
JFM AMJJASOND groundwater rainfall dry season crop season 500 mm 300 mm 100 mm 0 mm
DIA_5.18 Typical section through paddy fields showing the different features of agriculture,adapted
VILLAGE STUDY
VILLAGE STUDY
HYDROLOGICAL STRUCTURE
One of the major problems faced during and after flooding is that of supply of fresh water for drinking and cooking. In a village, fresh water is acquired by extracting water from ground water with the help of tube wells. However, this affects the ground water level over time and depletes the water resource.
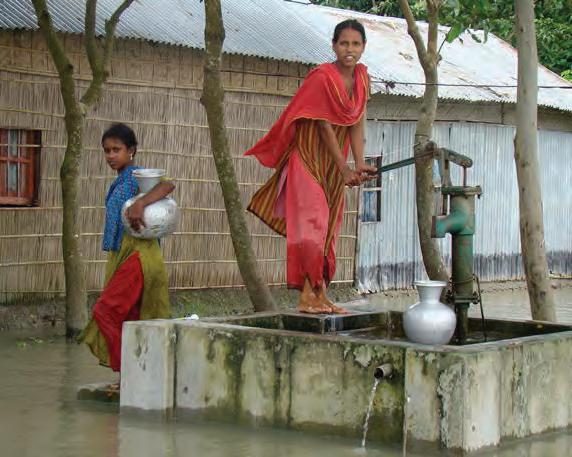
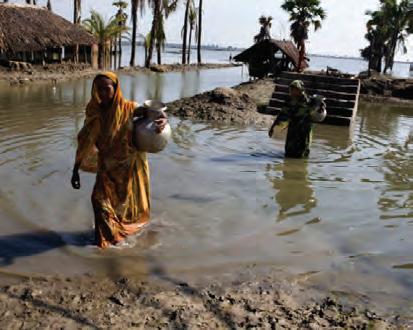
Tube wells are not only used for acquiring fresh water but are also used for agricultural purpose. This has a significant impact on ground water resources and makes the soil non-fertile. Apart form the ecological consequences, the presence of arsenic in the groundwater raises health problems1 In a village structure, tube wells for fresh water become the amenity which is shared at a neighbourhood level. Generally a village would have 1 or 2 tube wells depending on the population of the village. As these tube wells are located far from the village, accessibility to them becomes difficult during and after the flood, which makes supply of fresh water unavailable. As the condition of stagnant water due to flooding can last for few weeks, any hindrance in the supply of potable water to the village is a major health risk.
In looking at the existing conditions, aspects of limited availability of fresh water, as well as difficult access will be key factors in driving the organisation of the clusters. As the people’s livelihoods depend on its hydrological culture, the proposed system design will attempt to integrate the many uses of water.
1 http://www.who.int/bulletin/volumes/90/11/11-101253/en/index.html. Last accessed: 30th Jan 2014. http://users.physics.harvard.edu/~wilson/arsenic/ conferences/Feroze_Ahmed/Sec_3.htm. Last accessed: 30th Jan 2014.
VILLAGE WATER DISTRIBUTION
existing condition
deep tubewell
village houses
ground water extraction [for housing]
agriculture fields
ground water extraction [for agriculture]
shallow treadle well
VILLAGE WATER DISTRIBUTION
proposed relationships
village housing typologies
rainwater collector [for housing]
village housing typologies
channels
collection ponds
Collective Morphogenesis Emergent Technologies and Design 163 162 SYSTEM DEVELOPMENT 5
FRESH WATER SUPPLY
SHALLOW AQUIFIER (FINE MATERIALS) DISCHARGE
DEEP AQUIFIER (COARSE MATERIALS) WATER FLOW
Power operated tube wells (Agriculture) Manually operated tube wells (Agriculture)
Manually operated shallow tube wells (Drinking water)
IMG_5.12 Women wading through the water in order to reach a tube well for potable water
IMG_5.13 Fresh water collection for drinking and cooking
DIA_5.19 Reliance on groundwater for drinking and agriculture, adapted
Reliance on groundwater for livelihood
DIA_5.20 Water distribution within a village
SYSTEM DEVELOPMENT 5 ANGKOR WATER SYSTEM
WATER MANAGEMENT NETWORK
The Khmer civilization at the Greater Angkor area flourished for more than 6 centuries, mainly due to the spatial organisation and development of an extensive water network. Each stage of the network mapped out existing locations from the succession of natural rivers and moved large quantities of water to man made reservoirs called barays. A system of embankments, channels and barays allowed for a distribution of water to areas that needed them, as well as draining out any excess amounts to a southern lake.

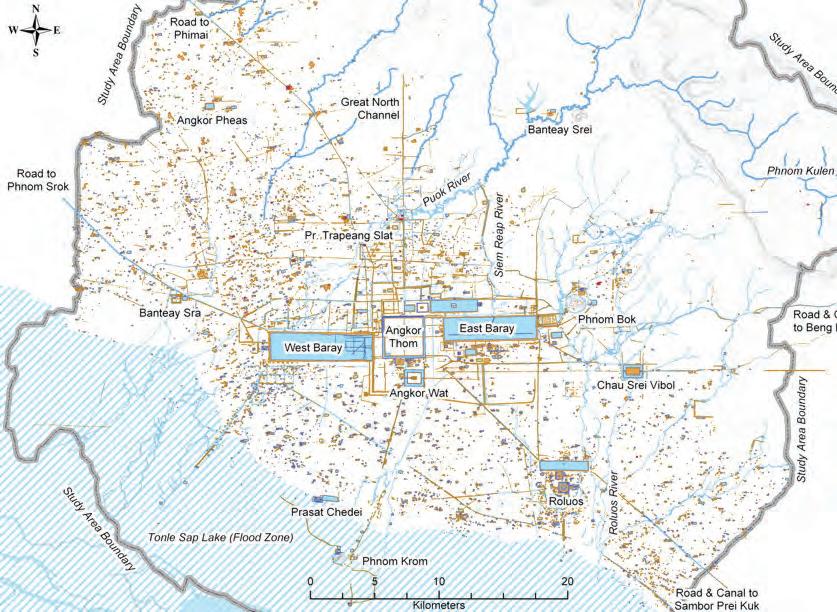
Much of their success as a civilization came from directionality of the existing water systems and how they could be manipulated. Using the natural slope of the land, movement of the water could be construed quite simply. The sheer scale of the water network is reflected in the sizes of the barays, which filled with water from both the rivers and monsoon rain, and later used to flood the rice fields.
CASE STUDY
Zone A
Collection Zone
The main feature of the Angkor water system involved using north to south running canals to supply water to barays. The many levels of addition that occurred through its existence serve to show how productive it was and how stable the system proved to be. However, this stability may have possibly led to its downfall as the system was unable to cope with any changes to the external forces it depended on. The additions to the network after the 12th century function to mainly dispose of water rather than store it.1 This means that there was most likely an increased flow from the north which the residents had trouble coping with.
Zone B
Storage / Holding zone
Another hypothesis concerns the siltation of the system, where due to the location of its relatively flat topography, ongoing natural sedimentation affected both the flow of rivers and the canals. In this theory, the argument is not that the rivers distributed too much water but rather over time, the build up of sediment caused the system to fail. One partial reason to this may have also been through the design of the canals themselves. To address flow management, all canals were oriented at 900 turns to slow down the flow and remove suspended sediment. As every canal from the mouth of the river to the internal organisation had right angle turns, sediment became trapped and collected at multiple points of the system.
It becomes important to realize both the principles attached to Angkor, as well as the constraints involved. In order to derive a similar water management scheme, the functionality of the tri-part hydrological system was analysed in its stages. It was also important to understand how to scale down such a vast network into smaller parts.
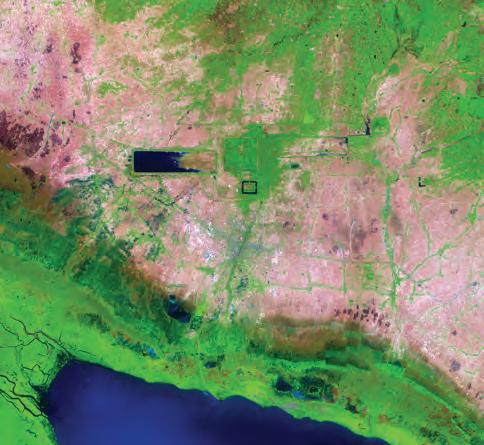
Zone C
Drainage / Dispersal zone
1 R Fletcher, C. Pottier, D. Evans, M. Kummu. The Development of the Water Management System of Angkor: A Provisional Model. 2008.
Collective Morphogenesis Emergent Technologies and Design 167 166
0 kilometres 5101520 0 kilometres 5101520 0 kilometres 5101520
2 Molyvann, Vann. Modern Khmer Cities. Phnom Penh, Cambodia: Reyum. Chicago, USA. 2003.
ISSUES WITH THE SYSTEM
DIA_5.22 Zoning of the Angkor water network, adapted.
IMG_5.14 The updated map of Greater Angkor [prepared by Damian Evans]
IMG_5.15 An aerial view of Angkor, including the East baray IMG_5.16 The moat surrounding Angkor Wat the largest temple complex]
In order to incorporate the principles extracted from the study of Angkor water system, the existing water system was mapped out. Water collection ponds and the extents of local rivers were analysed, including the topopgraphy of the land. As there is very little differentiation in elevation at the coast, any
FLOODING EXTENT
The concept of building multiple small shelters instead of one large shelter was evaluated in the aggregation process. The results of the experiments showed how geometries of different sizes have a better effect on reducing the flow of water than geometries of same size. This not only allows for differentiation in scale and size between geometries but also gives an opportunity to differentiate in the programmatic use of them.
change in hydrology is felt extensively. These maps show relative boundary conditions and breaches during an increased water level [and rainfall]. More indepth calculations of amounts of flood levels were conducted for system storage requirements.
Collective Morphogenesis Emergent Technologies and Design 169 168 SYSTEM DEVELOPMENT 5
SEASONAL FLOODING
050100200 (m)
050100200 (m)
DIA_5.23 Map showing condition during a non-flooded situation
DIA_5.24 Map showing extent of flooding
WATER NETWORK
PROPOSED SYSTEM
FLOOD EXTENT
In the study of Angkor water system, a three-tier water system was identified as a principal concept in moving water. However, the scale of water system utilised was vast and the course of the river was altered over time making it one the reasons for the failure of the system. While on the other hand, the people of Nile civilization had to use the pattern of flooding and moved water into agriculture areas without storing it, without complete manipulation and alteration of the flow of the river.
A combination of both systems was imagined as one of the ways of dealing with seasonal flooding in Bangladesh. In this strategy, some of the flood water can be moved inland and stored at various collection locations, thus reducing the pressure on the lower areas near the river. In doing so a three- tier system was established similar to one used in Angkor water system, but at a relatively smaller scale. The flood water arising out of overflow of river can be moved with the help of channels and be collected in existing and new ponds. Based on the amount of water to be moved, new reservoirs might be needed to be created along with using existing ponds. This water once collected on different parts of the site can be
used and re-distributed during the dry season for agriculture purpose. This would help in extending the crop season and crops can be cultivated in both monsoon as well as the dry season.
Since Bangladesh has a culture of using aquaculture ponds for fish and shrimp farming some amount of water can be directed to aquaculture ponds which would act as relief points for the overall water network. The idea behind establishing such a water system was to interfere as little as possible with the natural flow of the river and reduce the overall impact on the land due to season flooding. The main objective was not to create physical barriers or change the course of flooding but by adding smaller intervention control some amount of flooding. This kind of water system also does not depend on heavy engineering methods but relies on local knowledge of creating channels and maintaining them.
Also in order to trap some of the flood water arising out of seasonal flooding, methods for mapping the the extent of flood occurring every year were established. This would help in creating the channels for water movement and directing the water on site.
Collective Morphogenesis Emergent Technologies and Design 171 170 SYSTEM DEVELOPMENT 5 DIA_5.25
Three- tier water system
PHASE 3 seasonal flooding movement 1 collection 2 redistribution 3
DIA_5.26 Application of three-tier system.
50% 20% 50%
Seasonal flooding magnitude
Existing Ponds
MOVEMENT OF OVERFLOW movement of flood water from coast to inland
COLLECTION percentage of water to be collected at existing and new ponds RE-DISTRIBUTION
movement of stored water for agriculture
THREE-TIER SYSTEM
SYSTEM DEVELOPMENT 5 PRIMARY CHANNELS
total area of water collection
WATER NETWORK
3 water collection points division of 1 collection into relief points + 2m
2 water collection points4 water collection points
BREAKWATER primary path inbetween the arcs of breakwater
BREAKWATER primary path inbetween the arcs of breakwater
EXISTING PONDS using the location of existing aquaculture to generate new collection points
EXISTING PONDS using the location of existing aquaculture to generate new collection points
BREAKWATER orientation and position of objects based on multiple arcs
BREAKWATER orientation and position of objects based on multiple arcs
start of canal cross-section [change of topography]
start of canal cross-section [change of topography]
Primary channels are initially located on the site by relating the path of water to the existing ponds. To determine the new water storage location, a point is found based on equal distance to two existing ponds. Once this endpoint is established, a direct path starting from the inlet of the respective breakwater to the point is mapped. Consideration is given to the organisation of the primary paths in which distance from path to path is relevant in order to get maximum spread across the site. Furthermore, in terms of programme application [to be generated at a later stage], variable distances are key to obtaining different branching patterns. The distance is controlled with a minimum of 70m length and a maximum of 125m such that spans will not be too long or too short.
Organisation logic also follows a line of continuity in which clusters forming the village can be situated. This level of connectivity is pursued in both the water network and in terms of village structure.
BREAKWATER INLET change of orientation and position of inlet adjacent objects based on channelling strategy
BREAKWATER INLET change of orientation and position of inlet adjacent objects based on channelling strategy
DIA_5.28 Calculation of amount of water to be moved
Collective Morphogenesis Emergent Technologies and Design 173 172
CONTROL PARAMETERS Total Area of flooding Height of stagnant water (assumed) 90,350 sq.m 1 meters 20% 30% 40% 50% Volume of stagnant water 90,350 cu.m ALLOWANCE FOR FLOODING @0.6M HEIGHT (assumed) Percentage of water to be moved TARGET Volume of water to be stored Are required for storing water (@ 2m height) Area 18,070 27,105 36,140 45,175 18,070 27,105 36,140 45,175 18,070 27,105 36,140 45,175 Total Pond Area available: 4,206 sq.m. Volume of water that can be stored in existing ponds 4,206 x 2 8412 cu.m - 8412 - 8412 - 8412 - 8412 Height for ponds (considered available): 2 meters cu.m cu.m cu.m cu.m cu.m cu.m cu.m cu.m 9,658 18,693 27,728 36,763 sq.m sq.m sq.m sq.m 4829 9,346.5 13,864 18,882 69 x 69 96 x 96 117 x 117 137 x 137 x 1 x 1 x 1 x 1 50%45,175 45,17545,175 - 8412 cu.m cu.m 36,763 sq.m 18,882 137 x 137 x 1 3m 2m 1m 0 capacity of pond
allowance for flood water negligible height normal level maintained
COLLECTION POINTS AND CHANNELS
DIA_5.27 Calculation of amount of water to be moved
BOUNDARIES
PRIMARY CHANNELS
PRIMARY PATHS
3. road
2. breakwater
1. river
ZONING
Three intersection points are formed because of four breakwater arcs. The 5 primary channels are established such that the intersection points near the major river has two primary channels each, and the one on the minor river side. The channels themselves are organised such that a continuous area for clustering of houses is possible [as explained in the previous page].
In this method, two clear zones are formed with the establishment of primary channels [as shown in the DIA_5.30]. Specifically: 1. an internal zone for clustering of housing, and 2. an external zone where agriculture land can be distributed. Since the idea behind development of the channelling system was to move water, the distribution in the two zones would be differentiated by programmes. The goal of channelling within the housing cluster zone would be to move the water while reducing the speed as much as possible, while in the agriculture zone would be to spread across the entire area to ensure all agriculture fields are irrigated with water.
As water network is a physical entity which divides the land into regions, channelling as a strategy would not only look at the movement of water, but also ensure that land is not divided at all sides. These small island patches would create situations where connectivity becomes an issue.
secondary agriculturehousing cluster less branchingmax. branching
DISTRIBUTION
Collective Morphogenesis Emergent Technologies and Design 175 174 SYSTEM
5
DEVELOPMENT
proximity of primary paths for creating continuity of housing spaces ORGANISATION evaluation of distance from new pond storage points to primary path hierarchy of distance calculation is based on channel adjacency 1-2: 3: 4: 5: Channel A to B1 B1 to B2 B2 to C1 C1 to C2 Channel A B1 B2 C1 C2 line of continuity primary canal 2 path overlap collection point 4 path overlap inlet inlet 1 2 3 4 5
DIA_5.29 Organisation of channels on site
WATER NETWORK
DIA_5.30 Internal and external zones created by primary channels
BRANCHING
Branching was adopted as a geometric adaptation of channelling the water through the aggregation of housing. As the aim was to reduce the velocity of the water coming inland, breaking up the direction of flow through branching would be key. In order to derive some rules of growth, experiments were conducted to test angle, length and the growth pattern. The initial tests began with three start points on one primary channel with neighbouring primary channel as a boundary condition. Critical values of volume of water, coverage area and number of connections where calculated in order to extract some principles of growth. DIA_5.31 shows the variables and the evaluation criteria for the resultant experiments using different parameters of growth.
CONCLUSION
The main aim of the branching was to achieve maximum spread in the confined boundary while reducing the speed of water. Different length ranging from minimum of 5m to maximum of 56m were tested. The experiments showed that within a confined boundary, even though length of up to 10m had the best spread, the patches created by the branching was very small and length more than 35 m left patches that were very large to manage. The average area created by a channel of a length between 15 - 30 m with an angle ranging between 30 to 50 degrees was suitable for working with the footprint of typologies developed. The water holding capacity was observed to be highest in branching where maximum number of branches were of 5 m length. Thus a range of lengths was established based on these experiments, based on water holding capacity and patch size created. The next experiment was conducted, to understand the relationship between angle of branch and time taken for water to travel a specified distance.
SECONDARY CHANNELS
DIA_5.31 Rules for secondary channeling
EXPERIMENTS
DIA_5.32 Experiments and calculation of branching experiment
Collective Morphogenesis Emergent Technologies and Design 177 176
1 2 3 4 angle differentiation Volume per Tree [A1, A2, etc] Sec.: B1: B2(+): len. x num. x 6 len. x num. x 3 len. x num. x 1 A1 A2 Primary Channel A A1 A2 A1 A2 A1 : 6 branches A2: 14 branches
SYSTEM DEVELOPMENT 5
CLUSTERS INPUT [ASSIGNED VALUE] VARIABLES FITNESS CRITERIA Leftover volume of storage Primary channel Length of branch [Max.: 16 m] [Min.: 5 m] Volume of water distributed Angle of following generation branches: 50˚/30˚/30˚ Start points count: [Max.: 30] [Min.: 2] Enclosed area: spread Number of tertiary branches + + + + + short to long scalinglong to short scaling area of coverage per branch 393 4561.2 11.7 306.5 81.6 11481.2 29.2 218 3783.2 11.7 393.6 140.0 9447 43.3 132 3023.4 11.7 1231.5 187.6 7316.9 55.4 114 3689.8 47.0 1259.2 234.1 8133.4 71.3 Test 1 Test 2 Test 3 Test 4 Test 5 Test 6 Test 7 Test 8 Test 9 89 3458.4 47.0 1174.7 285.0 7480.8 84.1 77 3458.4 47.0 1259.2 280.6 6989.7 90.8 428 5359.9 21.1 347.9 72.7 13021.1 30.4 881 6210.3 11.7 220.3 34.5 14895.5 16.9 192 4367.8 47.0 881.0 142.4 9158.4 47.7 Nos. of connecti on points Capcity of the system Min.area in a generati on Max.area in a generati on Average area in generati on Total infl uenced area Total infl uenced area/ Nos. of connection Min. length Max. length Generation Min. length Max. length Generation Min. length Max. length Generation Min. length Max. length Generation Min. length Max. length Generation Min. length Max. length Generation Min. length Max. length Generation Min. length Max. length Generation Min. length Max. length Generation 10m 32m 11 10m 32m 10 10m 56.8m 7 5m 16m 25 5m 16m 18 5m 50.4m 10 5m 16m 24 5m 16m 43 5m 32m 43
BRANCHING DISTRIBUTION FOR
TEST 1 TEST 2 TEST 3 TEST 4 TEST 5 TEST 6 TEST 7 TEST 8 TEST 9
WATER NETWORK
SECONDARY CHANNELS
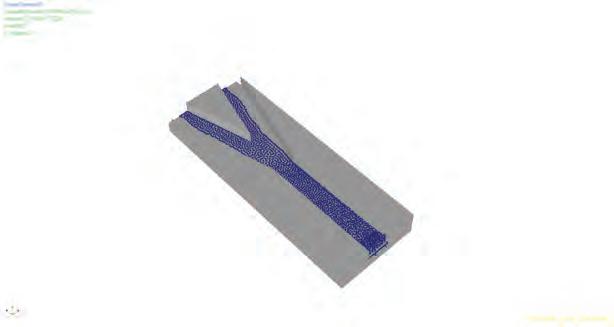
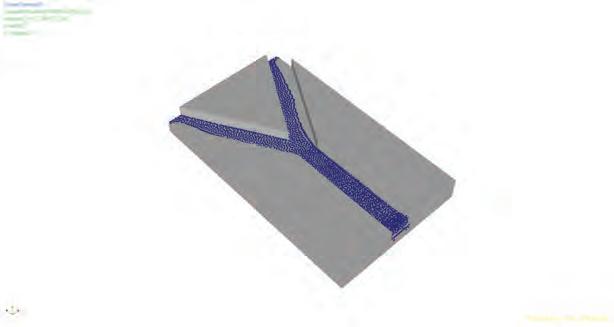

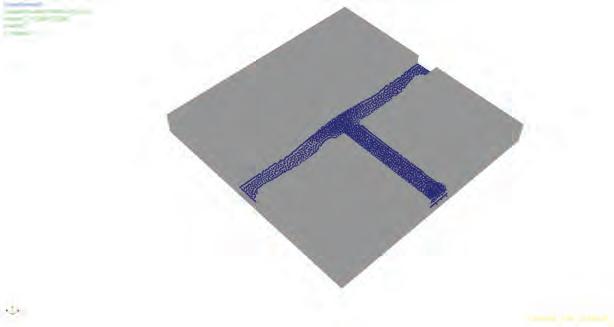
After establishing the length that could be used for moving water, the next experiment was undertaken to understand the influence of angle on time taken for water to reach a specified distance. The main purpose of the experiment was to establish how by manipulating the angle of branch, the time for moving water can be altered. Even though speed of water plays an important role in determining the time taken, for the experiments the speed of water was kept consistent. Knowing the angle and the length of branch along with the speed of water, it can be predicted which areas get flooded faster than others. The experiments were conducted in Realflow to simulate water flow. All experiments were measured with same input parameters.
The experiments were conducted with same perimeters and only the angle was changed with each iteration. The angle tested ranged from 15o to 90o from the direction of the flow. Results from the simulations showed that more acute the angle [i.e closer to 15o ] the less time it takes for water to reach the desired distance. When the angle of branch is 90 to that of input, it takes considerably longer time for water to reach the desired distance. Thus by knowing the speed of the water and angle of the branch along with the distance, it can be identified which areas gets flooded faster than others. The principles extracted from the branching test of both length and angle would be used in developing a water network once the typologies and new ponds for water collection would be established, which will be explained later in the process.

Collective Morphogenesis Emergent Technologies and Design 179 178 SYSTEM DEVELOPMENT 5 a a a o 120 90 135o a a Inlet Inlet Inlet Inlet Inlet Inlet B1 B1 B1 B1 B1 B1 B2 B2 B2 B2 Inlet B1 B2 B2 Inlet B1 B2 B2 90 o Inlet t = 155 t = 149 t = 145 B1 B2 150 o 165 a a o 60 30 Inlet Inlet Inlet Inlet B1 B1 B1 B2 B1 B2 B2 Inlet B1 B2 B2 Inlet B1 B2 t = 135 t = 132
BRANCHING CONCLUSION
DIA_5.33 Time based experiments for channel angles
WATER NETWORK
PROGRAMME ORGANISATION

SYSTEM DEVELOPMENT 5 PATCH TYPES
PATCH TYPES
condition showing primary programme with percentages of supporting programme types
Programme Types:Housing [H] Agriculture [A], Water Collection [W]
DIFFERENTIATION OF PROGRAMMES
The study of the social and the hydrological structure existing in the village, showed the inter-relation between the organisation of a village and its dependency on water. Thus, it became important to incorporate some of the aspects of an existing village structure in the new organisation.
HOUSING PATCH
requires shared ground level water collection
collection required from channeling: 20sq.m. per typology
AGRICULTURE
division of land into crop patches
AGRICULTURE division of land into crop patches
collection of water not required / tertiary branched channels to separate fields
WATER COLLECTION
WATER COLLECTION
maximize number of ponds created channels lead to collection ponds
collection of water not required / tertiary branched channels to separate fields


maximize number of ponds created channels lead to collection ponds
In doing so, three different patches with direct relationship with water were developed to cluster the habitable typologies. As shown in the DIA_5.34 three patches in forms of housing [H], agriculture [A] and water collection [W] were developed. The use of water in these patches was imagined to be different varying from an aquaculture pond in a housing patch, to water for irrigation in an agriculture patch and reservoirs in the water collection patch. The volume of water that can be stored in each patch was dependant on the patch type where the largest capacity would be maintained in the water collection patch and least in the agricultural patches. The main purpose of the distribution fo water in an agriculture patch concerned division of the land into smaller fields. This would affect both the irrigation as well as land ownership within that region.
A further housing patch was later added to differentiate between internal housing [H] clusters and external housing situated near agriculture [HA]. The internal H patch would create its own shared pond while the HA patch would utilise adjacent agriculture fields as a means of aquaculture.
Collective Morphogenesis Emergent Technologies and Design 181 180
typology collection typology collection collection channels channels ground space
typology collection typology collection collection channels channels ground space
typology channels collection ground space
DIA_5.34 Patch types with direct relationship with water
PROGRAMME ORGANISATION
and agriculture given same weight in both genome and input
Once 4 types of patches were established, a genome based radial growth strategies was adopted for organisation of these patches. The growth was such that, the public building typology became the centre of growth and patches were radially organised. As three public buildings were needed for the size of the targeted village, three start points were established on site.
The primary channels became the boundaries for the growth and the organisation was restricted within the internal cluster zone. Different start points were given varied percentages of patches based on its location on site. For example, start point 3 which was located in proximity to the river on the north had higher ratio of [W] patches in the genome than the other start points. In order to evaluate the growth, different start points were tested while keeping the genome fixed. Within each growth sequence, to maximise the patch distribution the growth direction was also altered for start points. The starts point were based on the distance between the public buildings and four iterations were tried out and evaluated.
This initial distribution of programmes/patches as a step was undertaken to get the possible location of habitable typologies with certain relationship between agriculture land and water collection areas.
Allocating start points on the site based on overlap areas of the primary channels
Allocating start points on the site based on overlap areas of the primary channels
rating is maximised, water has the least influence at the centre start point
to

at North gives water a higher rating in the input
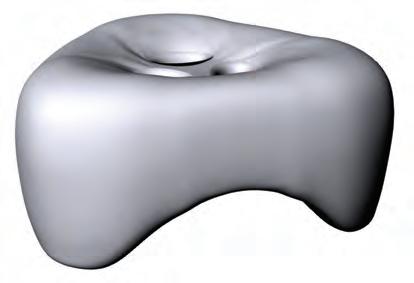
Collective Morphogenesis Emergent Technologies and Design 183 182
1 2 1 2 1 2 B C A
SYSTEM DEVELOPMENT 5 PATCH DISTRIBUTION
1 boundary curve 3 boundary curves 2 boundary curves
CONDITION
DIRECTION Housing [H] Housing+ Agricutlure [HA] Water collection [W] Agriculture [A] 1 2 1 2 1 2 B C A
BOUNDARY
GROWTH
1 boundary curve 3 boundary curves 2 boundary curves
GROWTH DIRECTION 2 2 2 2 3 3 3 3 1 1 1 1 1 to 2: 132m 2 to 3: 125m 3 to 1: 164m Distance bet. typologies 1 to 2: 75m 2 to 3: 90m 3 to 1: 132m Distance bet. typologies 1 to 2: 90m 2 to 3: 109m 3 to 1: 180m Distance bet. typologies 1 to 2: 43m 2 to 3: 43m 3 to 1: 43m Distance bet. typologies Location of start point = public programme type HHWA A HH H+A H+A A HH+A HH W W AAH H+AH+A H WA H+A H+A H+A 3.5 3.0 2.5 1.0 1.0 1.0 1.0 1.0 1.5 1.01.5 2.0 1.5 1.5 1.5 2.5 GENOME LIST START POSITION INPUT Point 2 Point 3 Point 1 DIFFERENT START POSITIONS WEIGHTING housing
proximity
housing
Habitable Types
BOUNDARY CONDITION
river
SETUP
DIA_5.35 Public building as centre of patch distribution
DIA_5.36 Genome based experiments for patch distribution
PROGRAMME ORGANISATION
H+A735%622%727%20
A418%622%831%18 W318%311%623%12
CONTINUOUS H cells
H:
H+A: 15 14 housing capacity x 36 x 24 = 540 = 336 876
+ DISCONNECTED H cells
H:
+
H+A: 20 18 housing capacity x 36 x 24 = 720 = 432 1152
1152 [capacity] / 38 [cells]
3 [# of disconnections] x 0.3 [factor]
CONTINUOUS H cells
H:
H629%1042%621%22
H+A838%625%725%21
A419%521%932%18
W314%313%621%12
H+A: 15 17 housing capacity x 36 x 24 = 540 = 408 948
+ DISCONNECTED H cells
H:
H+A: 17 18 housing capacity x 36 x 24 = 612 = 432 1044
CAPACITY OF HOUSING CELLS
2 boundary curves
1 boundary curve
3 boundary curves
DISTRIBUTION AND EVALUATION
The diagram on the left shows the results of the patch distribution based on different start points. As the primary objective of the growth was to establish a possible location of housing typologies, the system was evaluated based on the number of housing patches as the primary target.
H+A1134%522%635%22
A825%522%529%18
W39%313%318%9
1044 [capacity] / 35 [cells]
1 [# of disconnections] x 0.3 [factor] 29.83
CONTINUOUS H cells
Allocating start points on the site based on overlap areas of the primary channels
BOUNDARY CONDITION
H:
H+A: 21 19 housing capacity x 36 x 24 = 756 = 456 1212
+ DISCONNECTED H cells
H:
23 22 housing capacity x 36 x 24 = 828 = 528 1356
H+A: 1356 [capacity] / 45 [cells]
1 [# of disconnections] x 0.3 [factor]
- 0.3
CONTINUOUS H cells
H:
H+A: 15 15 housing capacity x 36 x 24 = 540 = 360 900
+DISCONNECTED H cells
H:
H+A: 24 23 housing capacity x 36 x 24 = 864 = 552 1416
1416 [capacity] / 47 [cells]
4 [# of disconnections] x 0.3 [factor]
Each point checks within a specified range for possible RC locations Selected RC locates max. 5 H points to supply
Unselected
a. b.
The size of the cell for the growth was determined by the size of the typologies such that, a housing patch would not have more than 3 typologies in each patch. In addition to the size of the typologies, a minimum space between the typologies and a minimum area for aquaculture pond were added, thus giving the size of the cell to be used. The system was evaluated based on the number of people that can be housed within the distribution. An additional criteria of continuity between the housing patches was added in order to ensure least number of housing cells disconnected from the main clustering of housing patch.
In a flooded condition, it is not ideal to have individual houses secluded from the main clustering. The continuity of housing criteria ensures that each housing typology becomes a part of a larger cluster, and no typology is secluded from the main village. One setup was selected from the four iterations for further development based on the two evaluation criteria.
Housing [H]
Housing+ Agricutlure [HA]
Water collection [W] Agriculture [A]
Collective Morphogenesis Emergent Technologies and Design 185 184 SYSTEM DEVELOPMENT 5
PATCH DISTRIBUTION
TYPE TOTAL Amount%Amount%Amount%
H1031%1043%318%23
Gen.6-4-3Total32-23-17-72 TYPE TOTAL Amount%Amount%Amount%
Gen.3-4-5Total18-24-28-73 TYPE TOTAL Amount%Amount%Amount%
H629%1244%519%23
Gen.3-5 5 Total17-27 26 73 TYPE TOTAL Amount%Amount%Amount% H318%1746%421%24 H+A745%924%737%23 A218%822%526%15 W318%38%316%9 Gen.2-6-4Total11-37-19-70 POINT 1 POINT 2 POINT 3 POINT 1 POINT 2 POINT 3 POINT 1 POINT 2 POINT 3 POINT 1 POINT 2 POINT 3 SETUP 3 SETUP 2 SETUP 1 SETUP 4 CAPACITY
H+A: 23 22 housing
x 36
24 = 828 = 528 1356 CAPACITY
H+A:
36
CAPACITY
H: H+A:
CAPACITY
H+A: 24
36
1 cell 1 cell 1 cell 1 cell Disconnection 1 cell 1 cell 1 cell 2 cells 1 cell 1 cell 4 cells 3 cells 3 cells KILL KILL KILL
[all H cells] H:
capacity
x
[all H cells] H:
22 21 housing capacity x
x 24 = 792 = 504 1296
[all H cells]
23 20 housing capacity x 36 x 24 = 828 = 480 1308
[all H cells] H:
23 housing capacity x
x 24 = 864 = 552 1416
29.83
30.13
29.53
- 0.3
30.32 29.42 - 0.9
30.13 28.93 - 1.2
GROWTH
a. b.
a. Start
Initial point distribution H and H+A H RC 3
Each point checks within a specified range for possible RC locations Selected RC locates max. 5 H points to supply 1 2
SELECTED HOUSING DISTRIBUTION POINT DISTRIBUTION FOR TYPOLOGIES POINTS FOR TYPOLOGIES
DIA_5.37 Distribution and evaluation of patch distribution
PROGRAMME ORGANISATION
Once the best housing distribution was selected from the iterations, the next step in the process was to establish fresh water clusters. The function of the two habitable typologies was differentiated by the function of the central core. The function of the central core in rainwater typology [RC] was to collect rain water, filter it and store it and in housing typology [H] was to act as protected courtyard. Thus the relationship between the housing typology and the rainwater typology becomes essential in order to ensure continuous supply of fresh water to the housing typology. This was described as above ground water collection.
In doing so, the best housing distribution was selected and points were distributed within [H] patch based on the capacity established. The points were randomly distributed such that the overall target population was reached and no patches would have more than 3 points. The fresh water clusters are established with these points as point of reference and a relationship algorithm is run. The algorithm starts with one point as start point and establishes location of possible RC’s within a certain distance.
Once the RC’s are located the next step is to connect the neighbouring points to the nearest RC, such

that no RC has more than 5 points connected to it based on the capacity established in the geometry development chapter. Different distances were tested between RC to RC and RC to H and the process was evaluated. This way fresh water cluster are established, in order to ensure each housing typology has access to fresh water within its vicinity and people do not have to travel long distances in a flooded condition.
RC : H above ground fresh water
RC : H above ground fresh water
Collective Morphogenesis Emergent Technologies and Design 187 186 SYSTEM
5
DEVELOPMENT
FRESH WATER RELATION
+ Each point checks within a specified range for possible RC locations Selected RC locates max. 5 H points to supply a. b. Each point checks within a specified range for possible RC locations Selected RC locates max. 5 H points to supply a. b. a. Start point Unselected Initial point distribution H and H+A H selected RC selected 3 SELECTED HOUSING DISTRIBUTION POINT DISTRIBUTION FOR TYPOLOGIES POINTS FOR TYPOLOGIES 1 2
FRESH WATER CLUSTERS
DIA_5.38 Point distribution for rainwater collector and housing relations
DIA_5.39. Above ground fresh water relation
PROGRAMME ORGANISATION
FRESH WATER RELATION
RC : H above ground fresh water
RC : H above ground fresh water
The first experiment in establishing the fresh water clusters was to test different distances between RC to RC and RC to H. Multiple tests were conducted with different distances while maintaining the same start point. The experiment was evaluated with variable fitness criteria including the number of unconnected H points, number of RC points and the ratio of H points to RC points.
The diagram on the left demonstrates a few of the results concluded from the experiments. The distances within the experiment vary from 16m to 30m for RC to H relationships, and 30m to 60m for RC to RC network. The algorithm also connects all the RCs within a distance of 50m (to ensure fresh water supply points at every 50m) of each other indicated as red line in the diagrams. As fresh water supply to all housing points becomes one of the major criteria, the experiments with most unconnected housing point are considered the least successful. The relationships are evaluated on 6 equally weighted criteria and the fittest organisatin is selected for further development.

Collective Morphogenesis Emergent Technologies and Design 189 188 SYSTEM DEVELOPMENT 5 *Equal preference WEIGHTING 20% 16% 16% 16%16%16% Total 0.61 0.27 0.19 0.16 0.21 0.21 0.19 0.16 0.16 0.12 0.07 0.05 0.08 0.10 0.13 0.16 0.48 0.48 0.28 0.16 0.08 0.11 0.13 0.16 0.99 0.63 0.32 0.11 Test A1 113 23 32 58 1559.22 1.8112 752.60 Test A2 113 10 32 71 1159.18 2.2212 1054.80 Test A3 113 7 28 78 710.10 2.787 1307.25 Test A4 Test A1 Test A2 Test A3 Test A4 113 6 24 83 484.32 3.464 1593.49 H/RC1H:1RC Total connectivity between RC:H(m) Points # of unconnected H units # of RC units# of H units Total connectivity between RC (m)----
leftover H points [unconnected]
5
collectors
H points SELECTED RC : H CONNECTIONS EVALUATION Weighted value= value/best value x percentage
24 Rainwater
Connected
RC : H RC : RC Max. distance (m) Relation 16 30 A1 RC : H RC : RC Max. distance (m) Relation 25 60 A3 RC : H RC : RC Max. distance (m) Relation 30 60 A4 RC : H RC : RC Max. distance (m) Relation 25 50 A2
DIA_5.40 Experiments for RC and H relation
PROGRAMME ORGANISATION
SYSTEM DEVELOPMENT 5 FRESH WATER RELATION
*Preference given to housing without access to fresh water and reducing 1 H to 1RC
Once the distances between RC To RC and RC to H were fixed from the previous experiment, the next step was to find the optimum number of RC in relation to the H. For this, different start points were tested on site keeping the distances constant.
Multiple start points were tested and the relations were evaluated with preference given to number of unconnected houses. Less preference was given to connectivity between RC’s as this would be achieved by relaxation process, which will be explained further on. Few of the results are shown in the adjoining diagrams. The experiments were evaluated on the same fitness criteria as before but this time differential weighting was used to select the fittest. The preference was given to least number of unconnected H points and the ratio of H points to RC points.
One result was selected from various experiments and was modified to ensure each housing points is connected to a RC. Some connections were removed and few connections were added and all H points were connected RC with maximum of 5 H points connected to 1 RC point.
Collective Morphogenesis Emergent Technologies and Design 191 190
RC H RC RC Max. distance (m) Relation 16 30 A4.1 Start pt: 1 Start pt: 3 RC H RC RC Max. distance (m) Relation 16 30 A4.3 RC H RC RC Max. distance (m) Relation 16 30 A4.2 RC H RC RC Max. distance (m) Relation 16 30 A4.4 Start pt: 2 Start pt: 4
WEIGHTING 25% 10% 15% 20%25% 10% Total 0.04 0.08 0.02 0.04 0.02 0.02 0.07 0.02---0.03 0.07 0.11 0.05 0.08 0.07 0.04 0.08 0.15 0.10 0.25 0.05 0.10 0.09 0.10 0.09 -0.01 0.02 -0.09 0.09 Test A4.1 113 5 24 RC:RC connection Unconnected housing Start point Housing points RC points H:RC connection Removed connection New connection Housing points RC points H:RC connection 84 421.32 3.504 1593.49 Test A4.2 113 7 24 82 644.06 3.42 3 1566.87 Test A4.3 113 4 27 82 800.23 3.04 6 1603.18 Test A4.4 Test A4.1 Test A4.2 Test A4.3 Test A4.4 113 5 24 84 516.87 3.50 2 1558.14 H/RC1H:1RC Total connectivity between RC:H(m) Points # of unconnected H units # of RC units# of H units Total connectivity between RC (m) EVALUATION SELECTED RC:H CONNECTIONS MODIFIED RC:H CONNECTIONS
DIA_5.41 Experimentation and evaluation of RC and H relation based on start points
FRESH WATER CLUSTERS
RELAXATION
The point distribution for establishing the fresh water relation, was essentially based on random points. The first step of distributing points in a housing cell was not generated on any distance and were randomly assigned. The number of points assigned was based on whether the patch was an H [3 point] or an HA [2 point]. This step led to creating the cluster through establishment of above ground water collection.
Once the cluster relationship has been determined, such that every housing point as access to fresh water supply, relaxation as a process was undertaken. This process was to ensure the distance between housing points and freshwater supply points was maintained a certain distance to allow for access in flooded situations. The minimum distance was established based on the size of the typologies and the maximum distance was based on a comfortable distance to travel in a harsh climatic condition. Thus the distances were set as a minimum of 15m and a maximum of 40m as the range and any housing points below or above this range was allowed to move. In addition, to achieve a continuous network of freshwater points, a maximum distance between the rainwater collectors was established to be 40m. A heirarchy of relationships was maintained, first
PROGRAMME ORGANISATION
amongst the rainwater collectors [RC] and secondly within the housing units [H], as explained in the next paragraph.
The process began by creating an initial network of RC points based on the established distance. Every point which is at a distance of less than 60m from other point is connected with a line. The lines crossing the primary canals are used as repelling boundaries to ensure that no RC points cross the primary canals and move on the other side. Once this first network of lines is established, the lines themselves act as springs which is given a rest length it needs to achieve based on the distance from neighbouring point. The whole system is allowed to relax with help of anchor points. The most connected RC points and the boundary RC points are selected as fixed points to allow for maximum spread on the site. This way the RC points are moved to ensure every RC point is within a maximum distance of 40m from each other.
The next step of the relaxation process, which happens simultaneously with the movement of RC points, deals with movement of H points. For this a network of H points is established along with the
already existing network of RC points. In addition the fresh water cluster relationship are also considered for movement of points. More preference is given to the rainwater cluster relationship than the H to H distance since fresh water is more crucial in an emergency situation than a link to neighbours. The distance for RC to H points is based on the minimum and maximum distances and any amount smaller or larger than the range has the flexibility to move. This process of movement of RC and H points is undertaken to ensure travel distances which become and important factor in extreme climatic conditions are kept as minimum as possible.
Establishing fresh water collection connections
Establishing
Movement
of
fresh water collection points
Selection of fixed points based on most connected and extreme points ensuring maximum spread
Selection of fixed points based on most connected and extreme points ensuring maximum spread
Movement of housing points related to the fresh water collection points
Fresh water collection points as anchor points and moving housing points
Collective Morphogenesis Emergent Technologies and Design 193 192
5 FRESH WATER
SYSTEM DEVELOPMENT
RELATION
fresh water collection connections Moving fresh water collection points
DIA_5.42 Principles of relaxation process
PROGRAMME ORGANISATION
SYSTEM DEVELOPMENT 5 FRESH WATER RELATION
Iteration - 0 Iterations - 200
Iterations - 600
Iterations - 350
Iterations - 800
Iterations - 1000
Iterations - 200
iterations - 200
RELAXATION
iterations 600
Iterations - 600
The diagrams show the relaxation process of RC and H points. It can be observed from the DIA_5.45, the distribution of points in iteration 1000 has a larger spread than distribution in iteration 200. DIA_5.44 shows a part of the overall distribution through number of iterations. By undertaking the relaxation process it is ensured that the rainwater clusters, which were formed based on the neighbouring points, are maintained within certain distances. Also the distance between the housing points and the RC points is ensured with this process.
Iterations -1000
Iterations - 1000
moving housing points based on distance from Fresh water collection points
Collective Morphogenesis Emergent Technologies and Design 195 194
DIA_5.43 Principles of relaxation process
DIA_5.44 Principles of relaxation process
6.1 Overview 6.2 Housing Organisation 6.3 Hydrological System 6.4 Network 6.5 Topological Analysis 6.6 Visualisation
SYSTEM PROPOSAL 6
The previous chapter of system development looked at establishing the relation of cluster organisation based on relationship with water. Fresh water supply, which is one of the crucial factor during and after flooding was given highest priority. Since, one of the typologies had the potential of collecting water, this was used as one of the primary drivers for organisation.
As the primary project ideal was to move the water from the flooded riverbanks to controlled storage areas during the seasonal flooding, the next driver for the organisation was based on collection of the relocated water. This chapter begins with specifying the collection points in the form of ponds, and how this can engender housing organisation. Branching of the hydrological system [which is an essential part for movement of water] is re-introduced in this chapter to be influenced by pond locations. The design proposal also documents the methodology in dealing with the second phase of flooding which is a relatively static situation.
The fibre composite material system is also developed further in this chapter, with a topological analysis is carried out to check for deformation against the environmental factors of wind and water. Finally, the chapter concludes with visualisation of the multi-tiered system in different environmental conditions, showing the possible scenarios throughout a year.
OVERVIEW IMG_6.01 Cultivation of Jute
Since nothing can exist that does not fulfil the conditions which render its existence possible, the different parts each being must be co-ordinated in such a way as to render possible the existence of the being as a whole, not only in itself, but also in its relations with other beings, and the analysis of these conditions often leads to general laws which are as certain as those which are derived from calculation or from experiment. 1 1 Baron Georges Cuvier Le Règne Animal distribué d’ Après son Organisation (1817), 6. Translated in E. S. Russell, Form and Function: A Contribution to the History of Animal Morphology (1916), 34.

Collective Morphogenesis Emergent Technologies and Design 199 198 SYSTEM PROPOSAL 6
RC : H above ground fresh water
RC : H above ground fresh water
Once the fresh water clusters were established, the next step was to locate the ponds for collection of flood water. This water would be stored in large reservoirs primarily for agricultural purposes and to a smaller scale, in localised aquaculture ponds. As ponds are an integral part of the village culture of Bangladesh, these are located such that it allows for maximum social interaction between people.
For establishing the ponds, only the housing points of H cells are considered. The other housing points which belong to HA cells are not included as these points would have more agriculture area than water collection area. An area of 30 sq.m/ per house is devised for each pond and is located such that it is central to the respective housing points it will supply. In order to maximise social interaction between families, ponds were shared between housing points of more than two different fresh water clusters with a maximum 4 houses sharing one pond.
The diagram on the right shows the rules for establishing the ponds. More weightage was assigned to the location and the size of the ponds and the geometry of the pond was based on an initial Voronoi space division pattern using the point distribution logic. It should be understood however, that the geometry was derived in direct relationship to geometric constraints and in order to fully integrate the pond culture, further research concerning aquaculture would need to be taken, including the fish varieties which are farmed.

H : H surface water

Collective Morphogenesis Emergent Technologies and Design 201 200 SYSTEM PROPOSAL 6
Area of pond = No. of H x 30 sqm 2H Location of pond = shared point / edge 3H 4H POND AS SHARED ENTITY LOCATING PONDS 1 2 POND AREA PER HOUSE 3
SURFACE WATER COLLECTION
DIA_6.01 Fresh water and surface water collection
FINAL LOCATION OF PONDS HOUSING ORGANISATION PONDS
DIA_6.02 Rules and area for ponds location
HOUSING ORGANISATION
PRESSURE ZONES
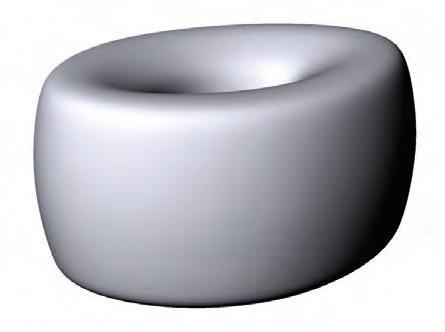

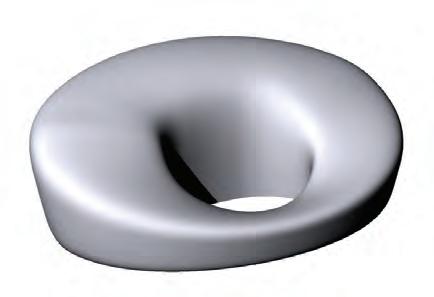


The aggregation setup was analysed for performance in CFD and three different pressure zones [microclimates] were established. The results illustrate how the pressure distribution is not uniform

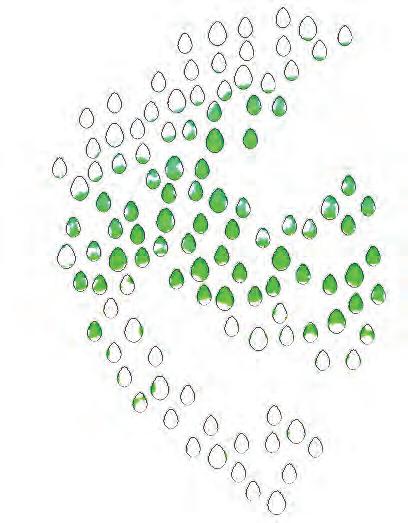

Collective Morphogenesis Emergent Technologies and Design 203 202
High Pressure Zone Medium Pressure Zone Low Pressure Zone
SYSTEM PROPOSAL 6
Low Pressure Zone FRESH WATER AND SURFACE WATER CLUSTERS TYPOLOGIES BASED ON PRIMARY FORCE STATIC PRESSURE [Pa] Primary site force STATIC PRESSURE [Pa] STATIC PRESSURE [Pa] 40000 -8149.3 30000 12000 24000 0 40000 -8149.3 30000 12000 24000 0 40000 -8149.3 30000 12000 24000 0 Medium pressure Zone High Pressure Zone DIA_6.03 Pressure distribution on housing typologies DIA_6.04 Pressure zones based on pressure distribution
DIA_6.05 Variation in housing typologies
PRESSURE ZONES HOUSING ORGANISATION


INITIAL ORGANISATION OF HOUSING TYPOLOGY
HOUSING VARIATION
Three typologies were developed based on three pressure zones established in the previous step. The typologies were differentiated in the footprint as shown in DIA_6.05 Even though the footprint was modified, the total area touching the ground was kept constant at this stage. Each of the typologies would house 2 families consisting of 10-12 people, and changing the footprint would limit the overall population.


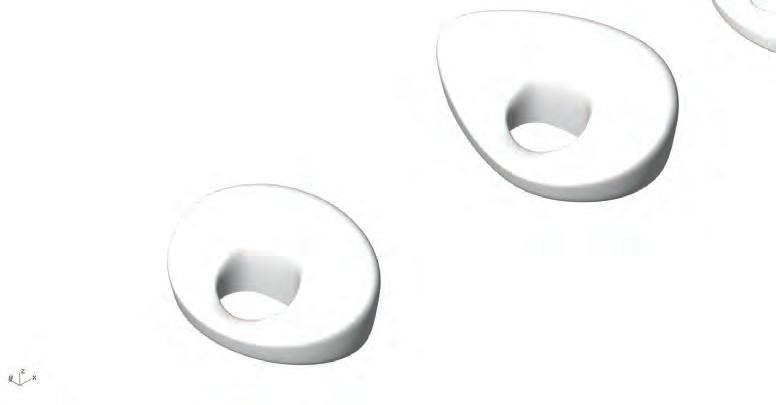
The typologies were tested in CFD and the maximum, minimum, and average pressures on windward and leeward sides, respectively, were noted. As water exerts a higher pressure than air, only water direction was considered as primary force in the experiments. The results showed that not all the typologies had the same effect on speed of water. The area with speed of water less than 4 m/s varied in all three cases. The pressure distribution on the surface was also differentiated with maximum positive pressure of 20168.6 Pa and maximum negative pressure of -35637.5 Pa.


The results showed that some typologies behaved better in terms of reducing the speed while some performed better in having less pressure exerted on the surface. Thus, these three typologies were used in the three pressure zones based on its performance.


MODIFIED ORGANISATION OF HOUSING TYPOLOGY
DIA_6.06 Housing organisation based on pressure zones
Collective Morphogenesis Emergent Technologies and Design 205 204
Max. +ve Pressure: 18036.6 Pa Min. - ve Pressure: -30407.6 Pa Avg. Pressure (leeward): -10992.1 Pa Avg. Pressure (windward): -8818 Pa Max. +ve Pressure: 20168.6 Pa Min. ve Pressure: -35637.5 Pa Avg. Pressure (leeward): -12443.4 Pa Avg. Pressure (windward): -12309.3 Pa Max. +ve Pressure: 17702.3 Pa Min. - ve Pressure: -22580 Pa Avg. Pressure (leeward): -9536.3 Pa Avg. Pressure (windward): -10342.4 Pa Max. Velocity: 9.45 m/s Total percentage of area < 4 m/s: 11.70% Max. Velocity: 9.29 m/s Total percentage of area < 4 m/s: 14.74% Max. Velocity: 8.14 m/s Total percentage of area < 4 m/s: 18036.6 -24000 -30407.6 0 6000 -12000 20168.6 -24000 -35637.5 0 1000 -12000 17702.3 STATIC PRESSURE [Pa] STATIC PRESSURE [Pa] STATIC PRESSURE [Pa] 9.45 1.5 0 7.5 5.5 3.5 9.29 1.5 0 7.5 5.5 3.5 8.1 1 0 7 5 3 VELOCITY [m/s] VELOCITY [m/s] VELOCITY [m/s] -14000 -22580 0 12000 -6000 High Pressure Zone Low Pressure Zones Medium Pressure Zone 11.30%
SYSTEM PROPOSAL 6
HOUSING ORGANISATION
Orientation based on primary force



Orientation based on connectivity (rotated towards RC)
Orientation based on maximum allowance in pressure zones


Once the housing typologies were organised based on the pressure zones, the next step was to orient them based on connectivity to RCs and pond locations. A series of test were conducted, in order to establish the allowed rotation tolerance of the typology from the primary force direction.
The test were conducted in increments of 5o starting from 0o up to 40o from the direction of the primary force. The results showed that when the angle of rotation was more than 35o the negative pressure on the typology increased dramatically, while the positive pressure on the typology was more or less similar. The positive and the negative pressures were observed to be the least when the geometry was not rotated and the angle was 0o Based on this result a range of -35o to 35o was set as the limits for rotation.
The rotation of typology was establish in order to have better connectivity between the RC and the housing typologies. The typologies were oriented such that the internal protected courtyard faced the ponds while the side surface necessary to connect to the elevated network faced the rainwater typology.

Collective Morphogenesis Emergent Technologies and Design 207 206 SYSTEM PROPOSAL 6
HOUSING ORIENTATION 0 10 20 30 40 velocity = 5 m/s Test 1 Test 1Test 2Test 3Test 4Test 5 Test 2 Test 3 Test 4 Test 5 velocity = 5 m/s velocity = 5 m/s velocity = 5 m/s velocity = 5 m/s Max. + Pressure Min. - Pressure Avg. Pressure (windward) Avg. Pressure (leeward) 18036.6 6000 0 6000 -30407.6 -18000 Static Pressure (Pa) Static Pressure (Pa) 18229.9 8000 0 -8000 -20000 -31335.3 Static Pressure (Pa) 18552.2 10000 0 -32109.4 -20000 -10000 Static Pressure (Pa) 19206.3 10000 0 -10000 -35934.7 -20000 Static Pressure (Pa) 19426.6 10000 0 -44465 -35000 -25000 -15000 x z y x z y x z y x z y x z y 18036.6 Pa -30407.6 Pa -8818 Pa -10992.1 Pa 18229.9 Pa -31335.3 Pa -10107.3 Pa -12630.3 Pa 18552.2 Pa -32109.4 Pa -6201.3 Pa -10135.4 Pa 19206.3 Pa -35934.7 Pa -5267.6 Pa -9753.1 Pa 19426.6 Pa -44465.0 Pa -6813.87 Pa -11664.2 Pa DIA_6.07
Variation in housing typologies
ORIENTATION
DIA_6.08 Housing organisation based on pond locaiton and pressure distribution
BRANCHING HYDROLOGICAL SYSTEM
Branching that reaches reservoirs are deleted as tertiary branching should not supply main collection.
1.
RESERVOIRS
Established reservoirs are supplied directly from primary channels
2.
Straight and 90˚ angles:
for direct flow and trapping sediment to regulate agriculture field dimensions and corners
Once the typologies were organised and cluster were formed along with the location of the ponds, it was possible to re-visit the water network. The principles extracted from the initial branching experiments in the system development chapter were adopted for branching along with additional criteria for modification.
Internal agriculture areas require alternate branching angles
ADD BRANCHES ANGLE TOLERANCE
Branching that clashes with typologies are allowed a rotation tolerance up to 20˚ from origin to continue spread.
As the previous experiments of branching showed that multiple start points on the same branch created smaller patches, the experiments were conducted with single point for growth. Various test were conducted with different location of start points on the primary channel and different growth direction. A branching algorithm was run which started from the selected points and branches grew simultaneously at all points. The primary goal of the branching growth was to reach the ponds locations set as attractors, while maximising the spread of the branches. The tests were evaluated based on the water holding capacity of the secondary and the tertiary channels while giving consideration to number of ponds that were left over as unsupplied by the water system.
One branching arrangement was selected from the various tests and was further modified due to the complication of existing locations of programmes and typologies. As the branching did not consider the location of the typologies during the growth, some branches had to be killed as they were intersecting with the footprint of the typologies. Other modications such as angle rotation tolerance were allowed for the branching system to collaborate with the cluster organisation.
Branching to reach ponds must avoid footprint of cluster organisation
Collective Morphogenesis Emergent Technologies and Design 209 208
Test 1 Test 2 Test 3 Test 4 spread Unconnected Ponds:4 7 5 2 spreadspreadspread 540 6280.8 5322.4 5537.6 5916 540 540 540 Test 1 Test 2 Test 3 Test 4 spread Unconnected Ponds:4 7 5 2 spreadspreadspread 540 6280.8 5322.4 5537.6 5916 540 540 540 BRANCHING 1. START POINTS 2. POND LOCATIONS 3. SPREAD + + modifications housing agriculture reservoirs BRANCHING 1. START POINTS 2. POND LOCATIONS 3. SPREAD + + modifications housing agriculture reservoirs
SYSTEM PROPOSAL 6
KILL BRANCHES BRANCHING MODIFICATIONS 1
AGRICULTURE CLUSTER
2 3
WATER NETWORK
DIA_6.10 Modification based on programme organisation DIA_6.09 Branching test and evaluation
SYSTEM PROPOSAL 6
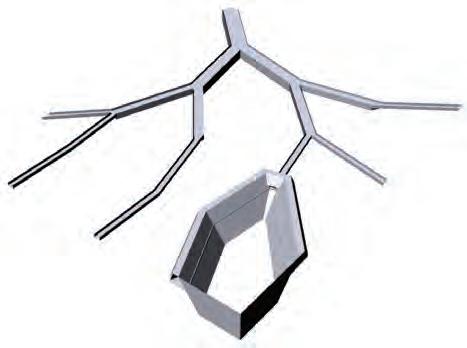
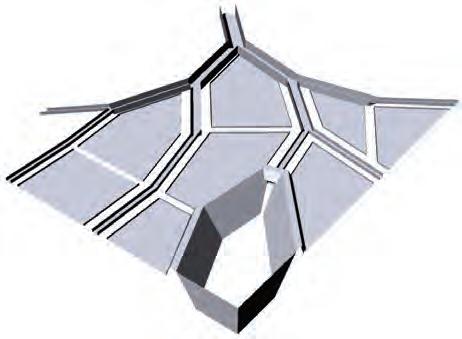
HYDROLOGICAL SYSTEM
RESERVOIRS
+
BRANCHING
HYDROLOGICAL SYSTEM
Reservoirs: Primary Collection
DIRECT FLOW [FAST]
1
Relief Ponds: Secondary Collection
SOME DIVERSION [MODERATE]
2
Wet
The selected branching distribution was modified considering the programme distribution and the organisation of the clusters. By establishing a water network for movement of water during the seasonal flooding phase, it was possible to capture certain amount of water which could be used for both agriculture and aquaculture purpose.
Dry
In doing so, a three tier hydrological system was achieved where water would get first collected in the reservoirs located on the primary channels. Second the aquaculture ponds would act as relief ponds for the water network and the third water stored in the tertiary channels could be used for irrigation purpose. The distribution speed of water is varied within this three-tier water network where its moves the fastest to reservoirs and slowest to agriculture land. The adjoining diagram shows how the water can be redistributed into agricultural area during the dry season with the help of sluices.
Branching for agriculture
MAXIMUM DIVERSION [SLOW]
3
Collective Morphogenesis Emergent Technologies and Design 211 210
Selected branching distribution Modified branching distribution
LEVELS OF STORAGE STORAGE CAPACITIES TYPE 1. Local / Family 2. Regional / Neighbourhood 3. Global / Village Small pond Medium scale pond Reservoir USAGE Aquaculture Collection: feeds into internal agriculture during dry season
feeds into external agriculture during dry season
THREE-TIER WATER NETWORK
Collection:
Season
3]
from rivers distributed into ponds
[Phase
Overflow
Season [Phase 4] Collected water from ponds redistributed to agriculture fields distribution path distribution path sluices act as barrier channel gate opened to guide water water movement across fields
AGRICULTURE CLUSTER
DIA_6.11 Branching modification DIA_6.12 Water distribution path in different phases
Hydrological network with cluster organisation
DIA_6.13
PHASES
CONTEXT PHASES
CONTEXT PHASES
INUNDATION
PROGRAMMATIC TIME PERIODS
PROGRAMMATIC
TIME
PERIODS
PROGRAMMATIC
TIME
PERIODS
The inundation phase of the flooding is a not as dynamic as the other two phases of flooding. This is a condition where the environmental pressures experienced from wind and water are minimum, however but water is accumulated over large areas. This condition is usually an after effect of cyclone or a storm where vast areas of land are left with an elevated level of stagnant water.
As the flood essentially metamorphs the understanding of the ground condition by creating a new horizon, alternate methods of response strategies must be implemented. The critical factors that need to be assessed in this phase are primarily sources of fresh water and network connections. All ground water sources are affected by the flood water and people have extreme difficulty in attaining potable water.
CYCLONE
CYCLONE
INUNDATION
INUNDATION
SEASONAL
FLOOD
SEASONAL
FLOOD
CYCLONE INUNDATION SEASONAL FLOODING
As most part of the coastal area of Bangladesh, lies below sea level, inundation is often faced by villages located on the coast. The existing condition of a high groundwater table worsens any situation where additional water is applied to the land. The excess water is unable to percolate through the soil or be drained out due to the lack of sewage infrastructure in the country. The water level is quite high in this phase of flooding making it very difficult to commute from one place to another. Since the water is not physically moved anywhere, the high flood level can last for long periods of time, causing disruption in connectivity and damaging buildings.


Where the cyclone lasts for only a couple of days, the flood can last for months, so large supplies and resources are necessary to survive. Furthermore, within such an extended time period, people need to be able to continue [to some degree] on with their lives rather than wait out the water. Movement and social interaction should be implemented for the village dynamic to continue functioning through the duration of the phase.
storm
surge
lateral
pressures
high
wind
speeds `
storm
surge
lateral
pressures
high
wind
speeds `


DIA_6.14 Phases of flooding in Bangladesh
sta3onary
elevated
water
level
environmental
pressures
negligent `
sta3onary
elevated
level
environmental
`
stationary elevated water level environmental pressures negligent water accumulation at river banks environmental pressures negligent storm surge lateral pressures high wind speeds
water
accumula3on
at
river
banks
environmental
pressures
negligent `
water
accumula3on
at
river
banks
environmental
pressures
Collective Morphogenesis Emergent Technologies and Design 213 212 SYSTEM PROPOSAL 6
GROUND AND ELEVATED NETWORK NETWORK
ALTERNATE NETWORK
Network disruption is one of the biggest arising out of inundation phase of the flooding. One of the reasons for failure of current cyclone shelters is because of network disruption. In order to deal with the issue of network disruption during the inundation phase, two modes of connectivity were imagined for two levels of flood. Since agriculture land and the water channels require a bund wall, this would function as alternate mode of connectivity when the flood water is not more than 1 m above the ground level. As the water channels and the agriculture land are integrated within the cluster organisation, the bund walls would function effectively for commuting.
When the water level crosses the 1m level above ground, bund walls adjacent to channels would be submerged in water making any movement at ground level almost impossible. Hence, an alternate network strategy of elevated network was considered for inter-cluster commuting and accessibilty to the fresh water locations and public buildings. This elevated network would be fabricated using local sustainable materials such as bamboo and jute ropes, which are well known construction methods in Bangladesh. The diagram on the right shows the process in establishing an elevated network within the aggregation, with hierachy of programme.
1. Network of fresh water supply
2. Lines crossing ponds disconnected
3. Primary network connecting all fresh water supply points
4. Network modification based on housing typologies on primary network
5. Connecting housing typology to RC based on fresh water cluster relation
5. Secondary network connecting unconnected houses to respective RC
Collective Morphogenesis Emergent Technologies and Design 215 214 SYSTEM PROPOSAL 6
DIA_6.15 Normal condition
DIA_6.16 Use of bund walls as alternate network in flooded condition
DIA_6.17 Elevated network principles
ELEVATED NETWORK
GROUND CONNECTION
The elevated network was considered as an additional connection of the housing typologies and the rain water typologies at 2.5m above ground level. This would ensure supply of fresh water even during the inundation period, which is not a viable option in the existing situation. In order to have access to the ground in non-flooded conditions, points were established on the primary path where the elevated network could touch the ground.
This ground connection was established around the rain water typology in form of ramps abutting the surface as shown in the diagram. The most connected RCs in the network were selected as the locations where the relationship to the ground would be maintained. These points were defined such that every housing typology has a ground connection within a distance less than 50m. Furthermore, every house would be given more than one pathway to reach the ground [in the case of a blocked path]. As the rainwater collector units have internal space, these would serve as points for the people to gather in the case of an evacuation.
The diagram on the left represents a typical scenario in which the house has two ways of reaching the ground within a distance of 50 m.
Collective Morphogenesis Emergent Technologies and Design 217 216 6 SYSTEM PROPOSAL 2 1 2 1 2 1 2 1
+2.5 M +1.5 M
DIA_6.18 Primary and secondary elevated network
DIA_6.19 Typical scenario showing the possible routes for ground connection
DIA_6.20 Axonometric view and section showing the elevated network and connection to ground
TOPOLOGICAL ANALYSIS
DIVIDING SURFACE DIVIDING IN U-DIRECTION DIVIDING IN V-DIRECTION

In order to avoid a high number of very small panels, the whole surface was divided into different areas for the panelisation.
In the next step the outlines of those areas are subdivided into multiple parts. The amount is dependent on highest length V-lines within the respective area divided by the maximum panel length of 2.40 m.
The points on the opposite outlines are connected with geodesic curves on the surface and create the panel subdivision in U-direction.
For the subdivision in V-direction the geodesic lines are divided in multiple parts, dependent to the maximum length of the geodesic divided by the maximum panel width of 1.20 m.
The intersections points on the curves in both directions are then connected with polylines.


DIA_6.21
PANELISATION
The topological analysis was conducted as a method to determine how the typologies would be produced. Since the typologies are habitable, it was important to regulate how light and ventilation would occur internally. These factors were dependant on two main steps: by determining the size of the panels and the orientation of the typology.
For the panelisation process, a python script was used as described in Material Science chapter “Bending Parametrisation”. Also for the design
proposal the orientation of panels is based on geodesic lines on the shell geometry to ensure flat edge profiles with consistent tangent vectors on either side. In order to promote efficiency, the panelisation takes into consideration the largest size the panel can be based on material dimension standards. To allow for light into the shell structure, openings were incorporated and analysed for feasibility and structural integrity, as shown in the following steps.
TANGENT VECTORS TANGENT VECTORS PANEL SURFACES
The tangent vectors of the surface on each intersection point in U- and V-direction are evaluated.
Those tangent vectors and on the comparison of the length of each segment of division curves [initial length] and polylines [rest length] are used to generate the control points of the panel edges.
With these edges the panel surfaces are rebuilt, based on the bending behaviour of the foam.
Each panel is tested again in terms of curvature to check whether production within the material limit is possible.
Collective Morphogenesis Emergent Technologies and Design 218 SYSTEM PROPOSAL 6
Panelisation process detailed
PANELISATION
TOPOLOGICAL ANALYSIS
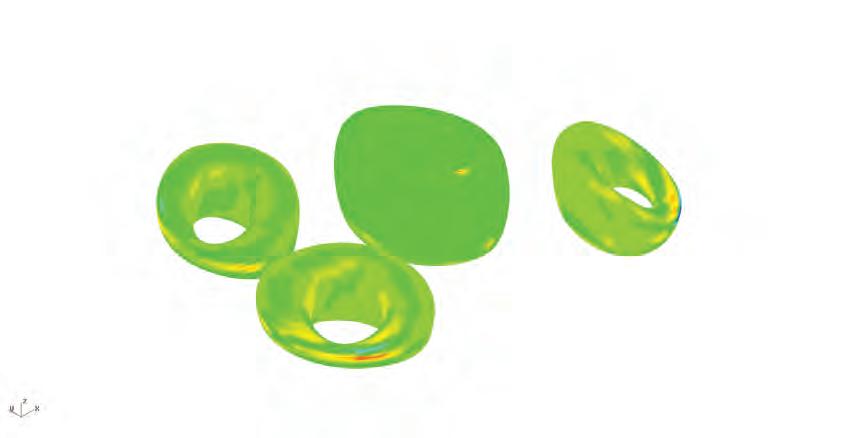
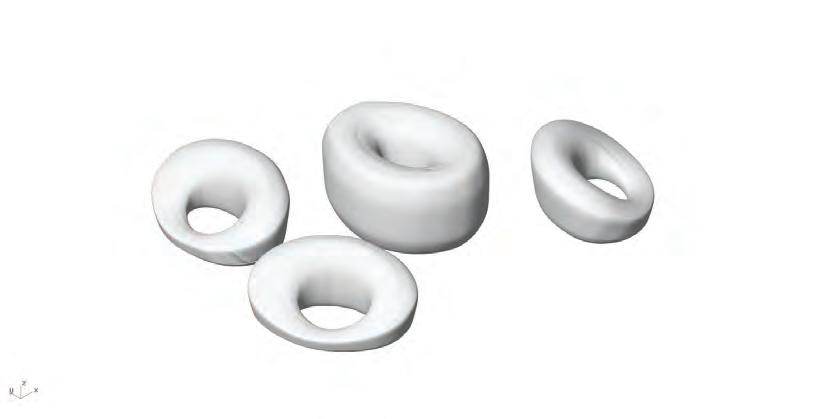
ENVIRONMENTAL SETUP PANELISATION OF INDIVIDUAL TYPOLOGIES
STATIC PRESSURE - WIND
PRESSURE MAPPING


PARTITIONING WITH FLOORS FORCES APPLIED ONTO FLOORS REACTION FORCES AT FLOORS
PANELISATION OF SURFACE PRINCIPLE STRESS VECTORS stresses on the surface are mapped to determine limits of openings [material removal]

QUARTER DIVISION OF PANEL each panel is subdivided into 4 along the midpoints in order to prevent openings over frames
OPENING BASED ON STRESS openings start at the centre of each subdivision, each dimensioned per surface stresses

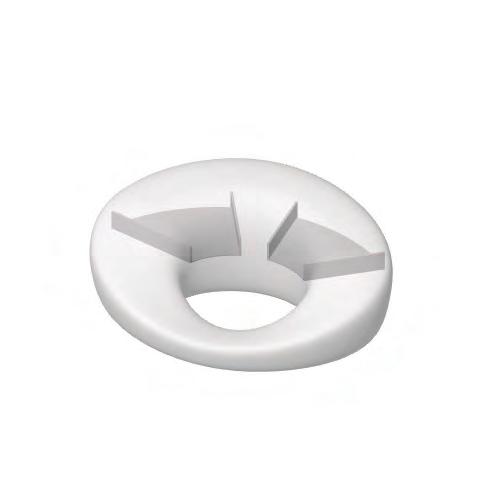
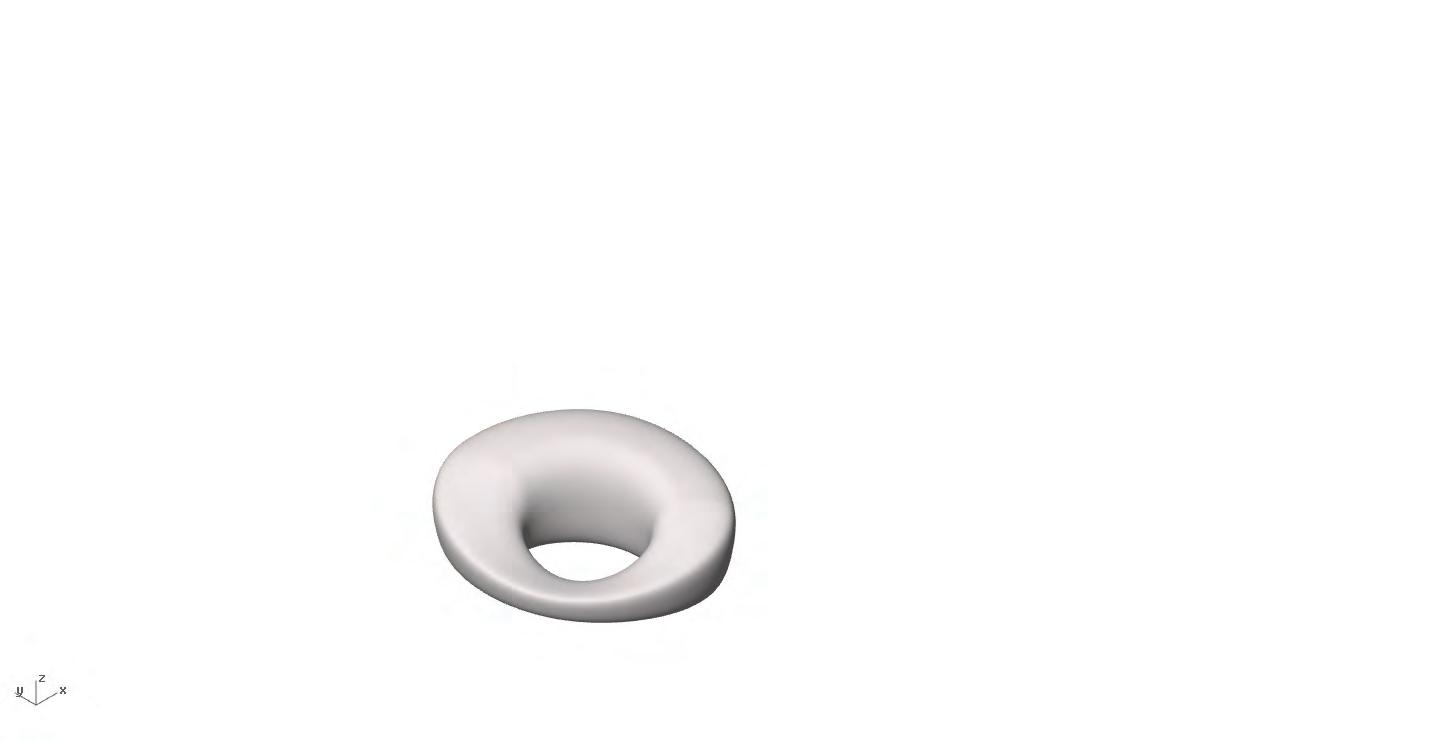
STATIC PRESSURE - WATER
CLOSED SHELL PRINCIPAL STRESS 1
subdivision patch were evaluated. If the amount of pressure exceeded a certain threshold the panel was not allowed an opening at that particular position.
Any number experienced below this threshold demonstrated a feasible location for an opening to be created. The size of the openings ranges from 60/60 cm for the smallest acting forces, to 10/10cm for the stated threshold.
CLOSED SHELL PRINCIPAL STRESS 2
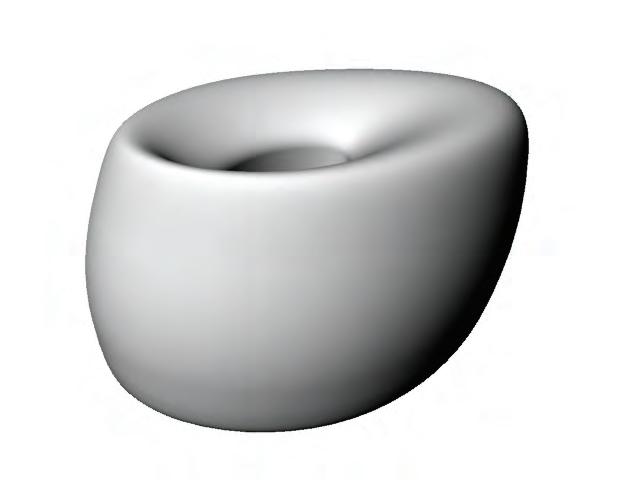
Collective Morphogenesis Emergent Technologies and Design 221 220
water velocity 5 m/s wind velocity 40 m/s x y z PANELISATION
SYSTEM PROPOSAL 6
Static Pressure[Pa] 17628.8 10000 0 -5000 -10000 -20000 -25000 -35000 Static Pressure[Pa] 1121.32 400 0 400 -1200 -2000 2800 -3318.05
DIA_6.22 Environmental setup and pressure mapping on floor system
DIA_6.23 Opening principles based on principal stress
DIA_6.24 Pressure distribution and principal stresses
TOPOLOGICAL ANALYSIS

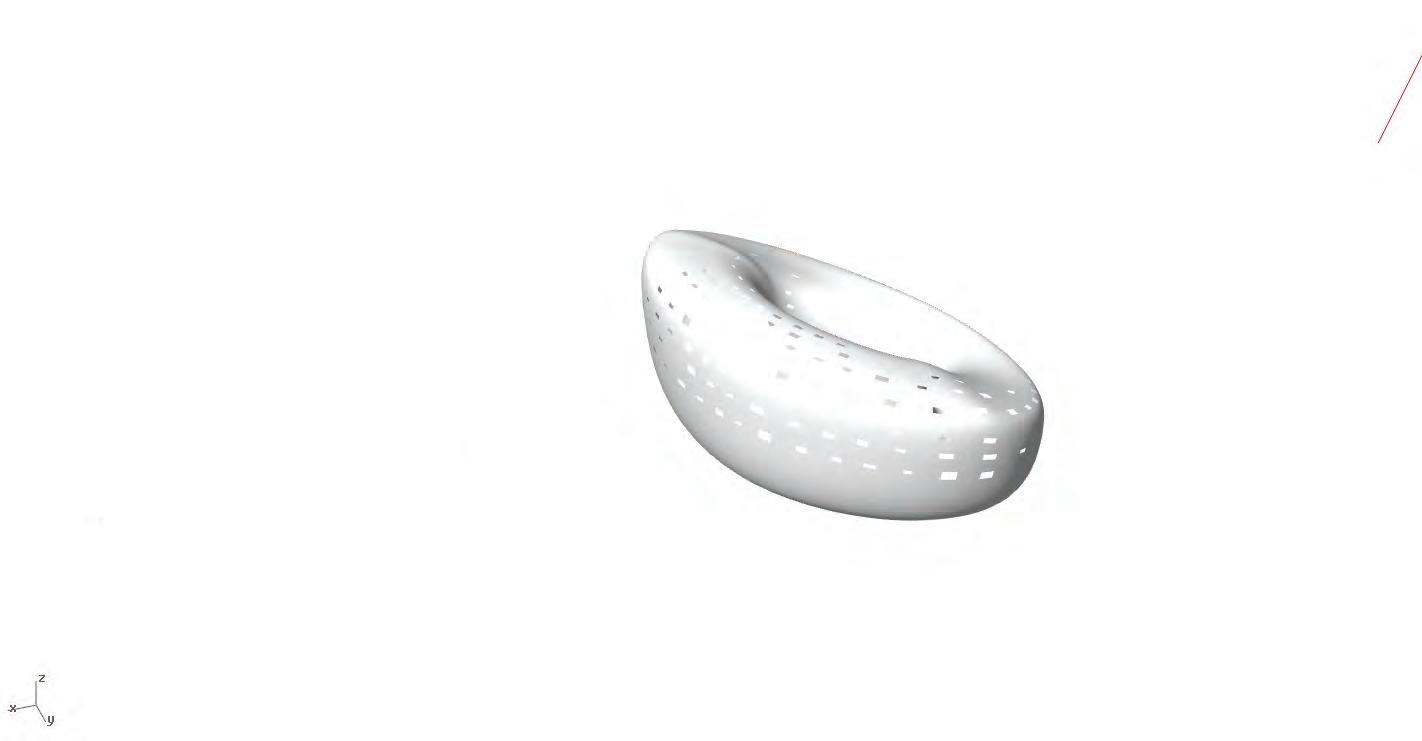


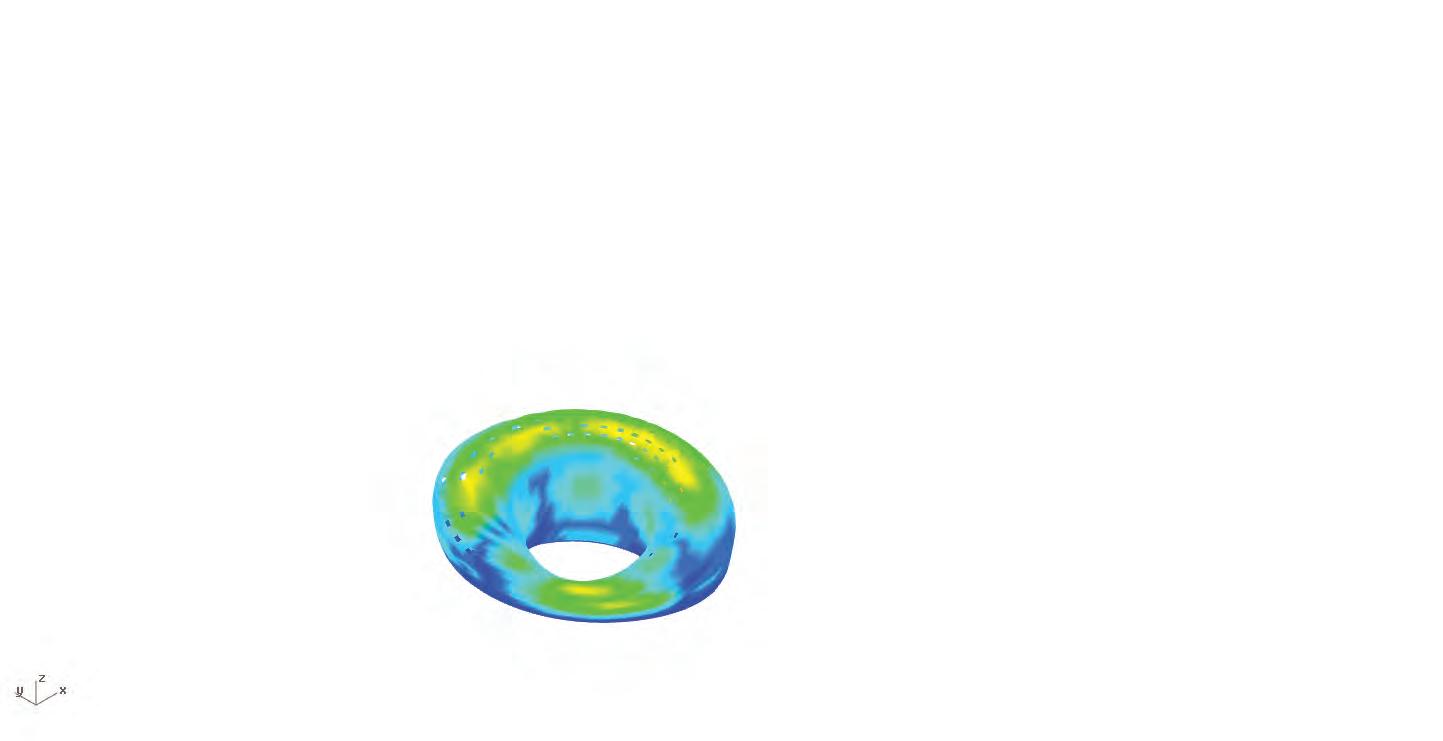

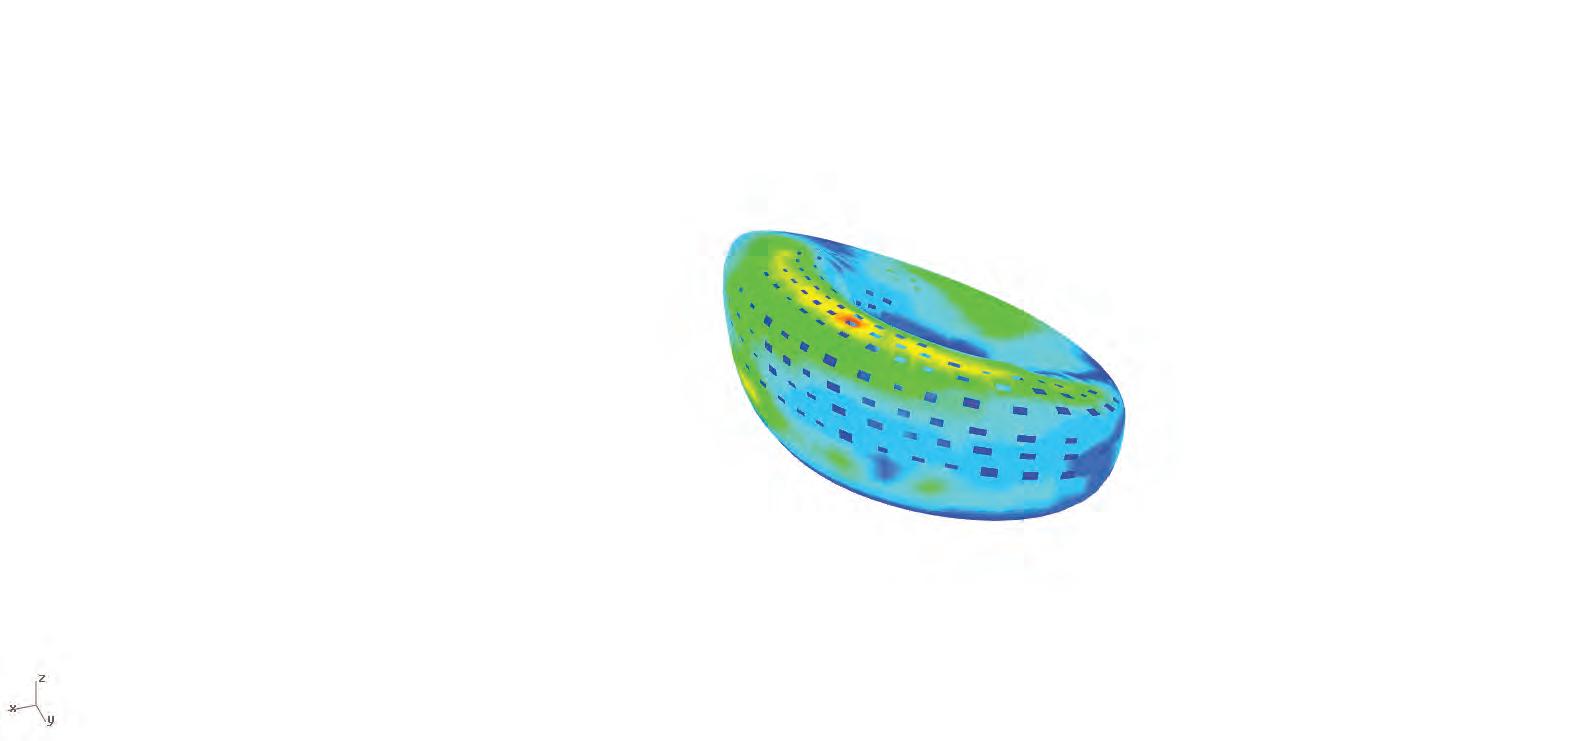
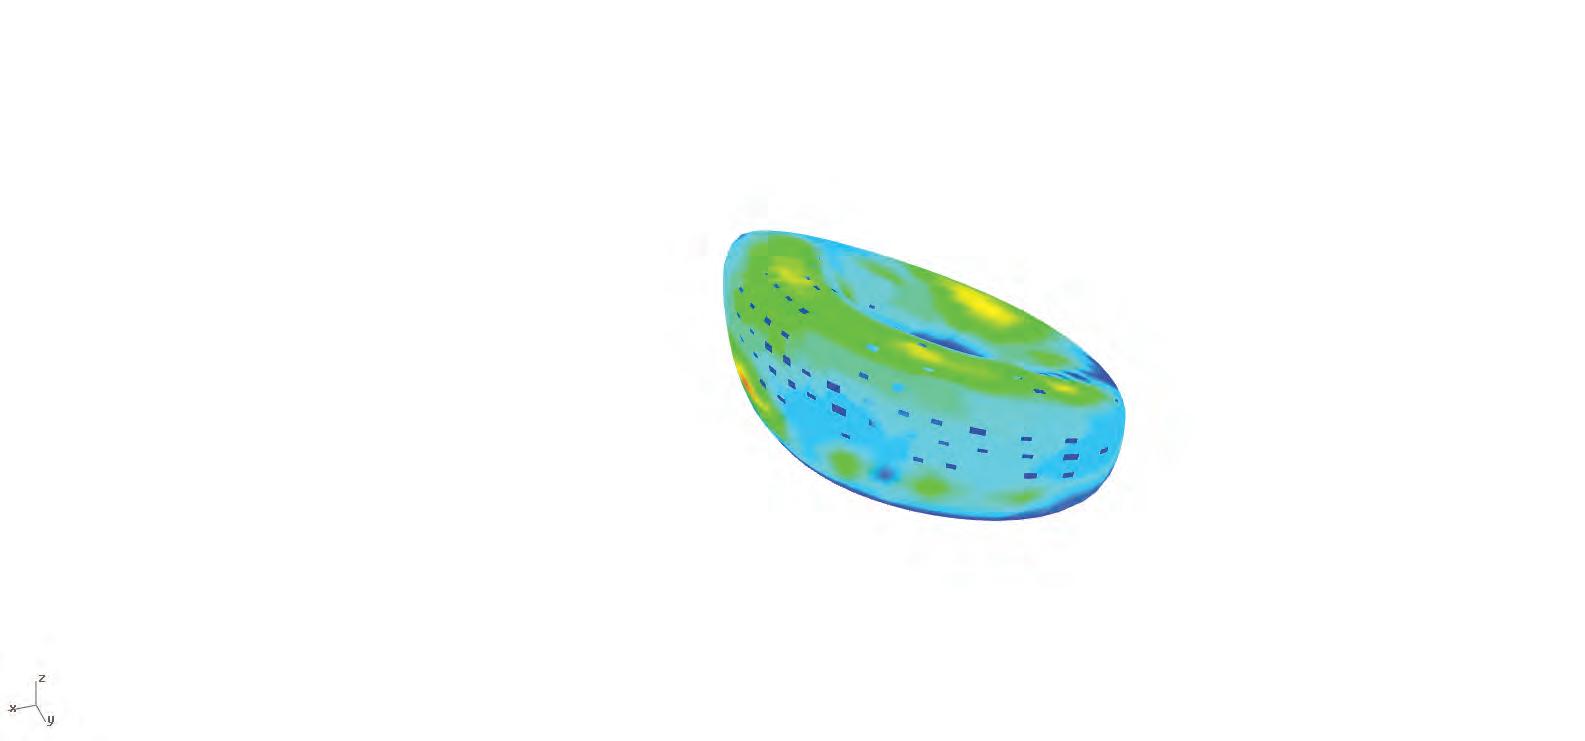


SURFACES CONSIDERED SURFACES OMITTED
1 kN / m²
For creating the openings apart from the stresses an additional criteria of sunlight was added. This would allow for differentiation of openings in typologies based on its location in the cluster and the surface area. Since, Bangladesh lies in the northern hemisphere, north light was considered as good source of light. Thus, panels facing the south were omitted. Only the north facing panels were considered for creating openings after the consideration of the stress value.
2 kn / m2
The structural impact of the openings was analysed based on the four pressure thresholds [8.00 kN/m², 4.00 kN/m², 2.00 kN/m² and 1.00 kN/m²]. To do this, the principle forces of each individual experiencing defined load cases [environmental pressure and floor reaction forces] and displacement, were evaluated. As the pressure thresholds increased, the displacement also increased with maximum displacement of 375 mm experienced. An additional reinforcement would be required to check this shift by either a method of adding more layers of glass fibre or increasing the core depth. Furthermore, the edges of the entrance areas were not taken into account in this step [to keep the force distribution on the shell as consistent as possible for the first layer of the topological analysis]. This would also need to be fully evaluated at a later stage.
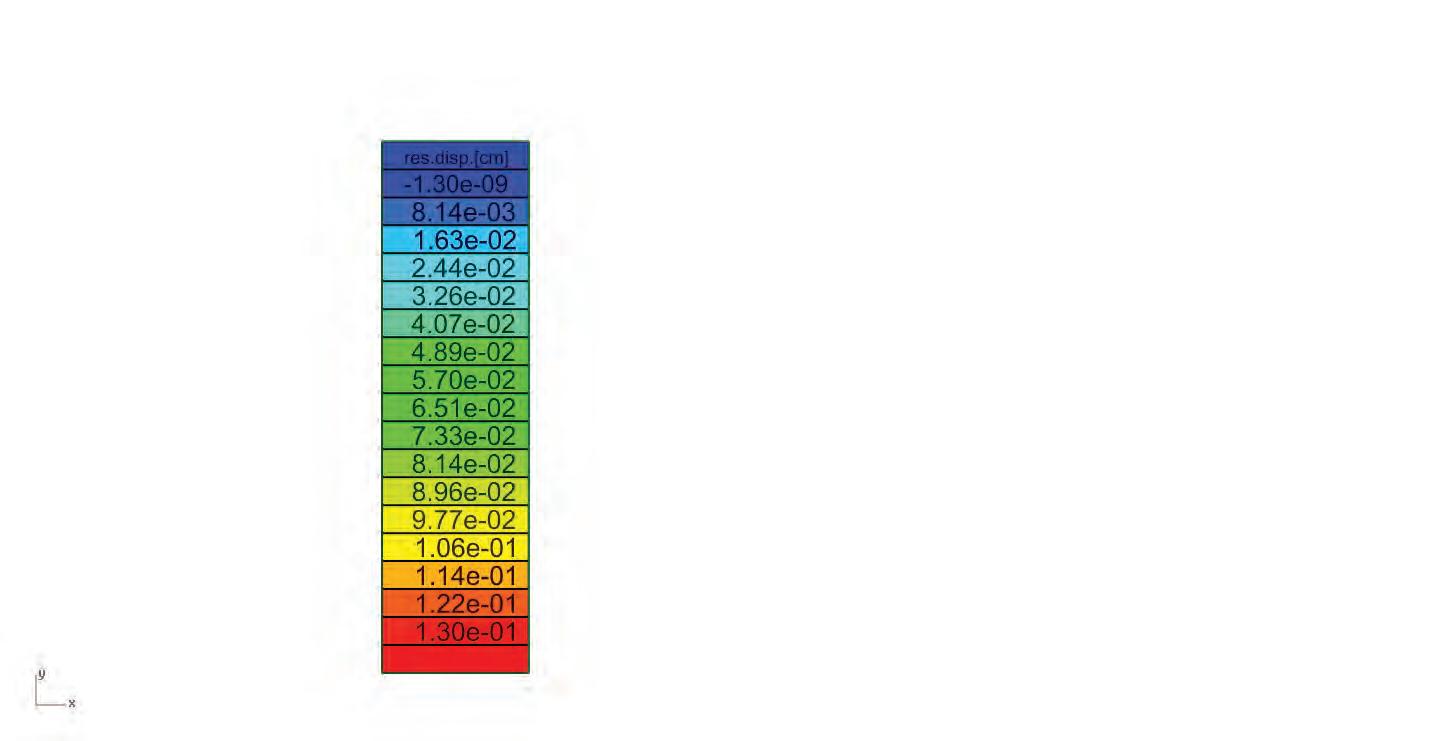


4 kn / m2
8 kn / m2
Emergent Technologies and Design 222
6 OPENINGS BASED ON STRESSES -1.30e-08 2.30 Displacement (cm) 11.77e-01 9.33e-01 6.07e-01 2.44e-01 -1.41e-08 2.41e Displacement (cm) 3.06e 8.92e-01 6.40e-01 2.64e-01 -1.75e-08 3.75e Displacement (cm) 2.31e 9.76e-01 6.47e-01 2.19e-01 -1.70e-08 2.70e Displacement (cm) 3.28 9.52e-01 6.33e-01 3.20e-01
Total Nos. of surfaces 680 Nos. of discarded surfaces - 621 Total Nos. of surfaces 680 Nos. of discarded surfaces - 577 Total Nos. of surfaces 680 Nos. of discarded surfaces - 558 Total Nos. of surfaces 680 Nos. of discarded surfaces - 550 Total Nos. of surfaces 680 Nos. of north facing area- 59 Area - 43.12 sq.m Total Nos. of surfaces 680 Nos. of north facing area- 103 Area - 71.09 sq.m Total Nos. of surfaces 680 Nos. of north facing area- 122 Area - 75 sq.m Total Nos. of surfaces 680 Nos. of north facing area- 130 Area - 77 sq.m
SYSTEM PROPOSAL
OPENINGS
1 KN/M 2 KN/M 4 KN/M 8 KN/M OPENINGS DISPLACEMENT
DIA_6.25 Openings based on principal stresses and orientation


Dry season / December Wet season / April Monsoon Season / August
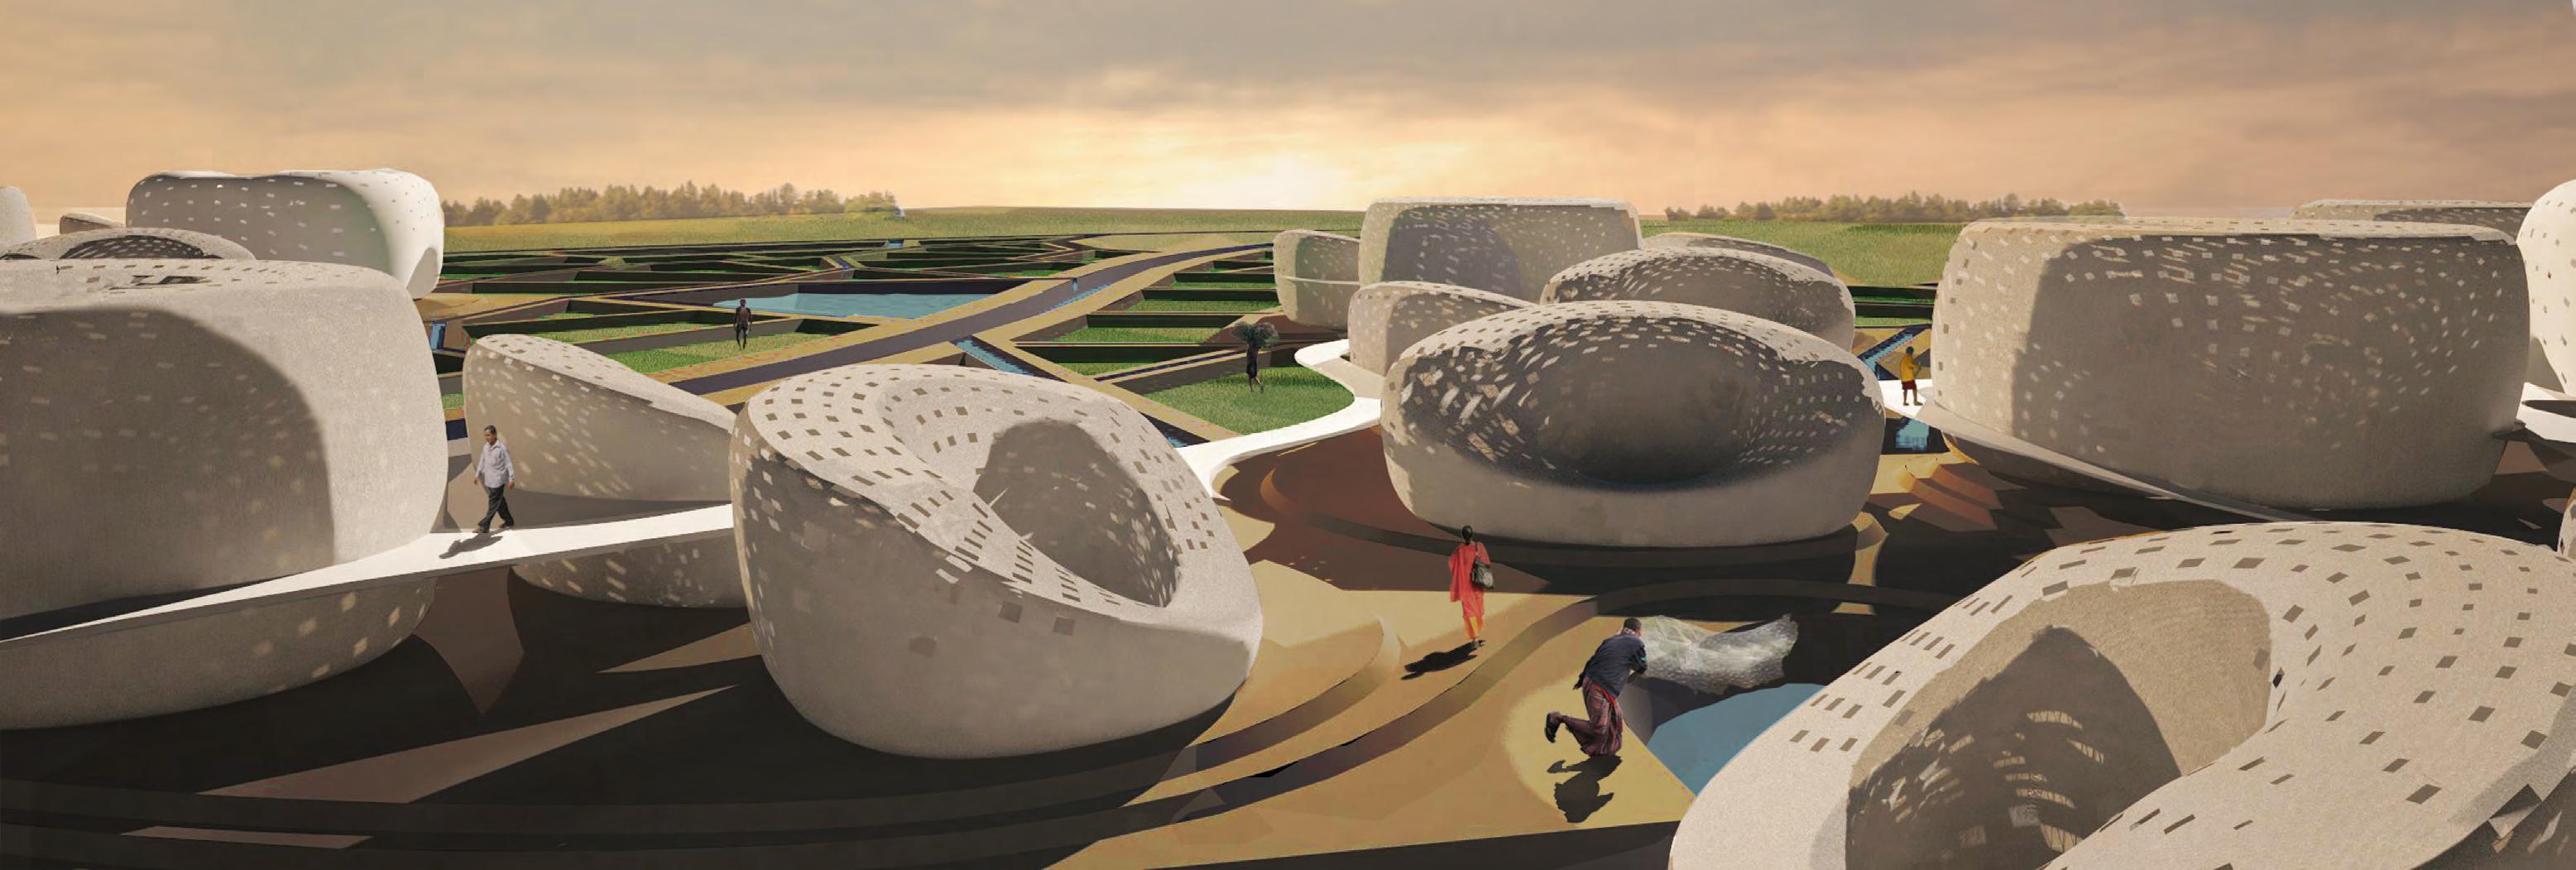


NETWORK BUILTFORM AGRICULTURE HYDROLOGICAL SYSTEM TOPOGRAPHY NETWORK BUILTFORM AGRICULTURE HYDROLOGICAL SYSTEM TOPOGRAPHY NETWORK BUILTFORM AGRICULTURE HYDROLOGICAL SYSTEM TOPOGRAPHY NETWORK BUILTFORM AGRICULTURE HYDROLOGICAL SYSTEM TOPOGRAPHY BOUNDARIES

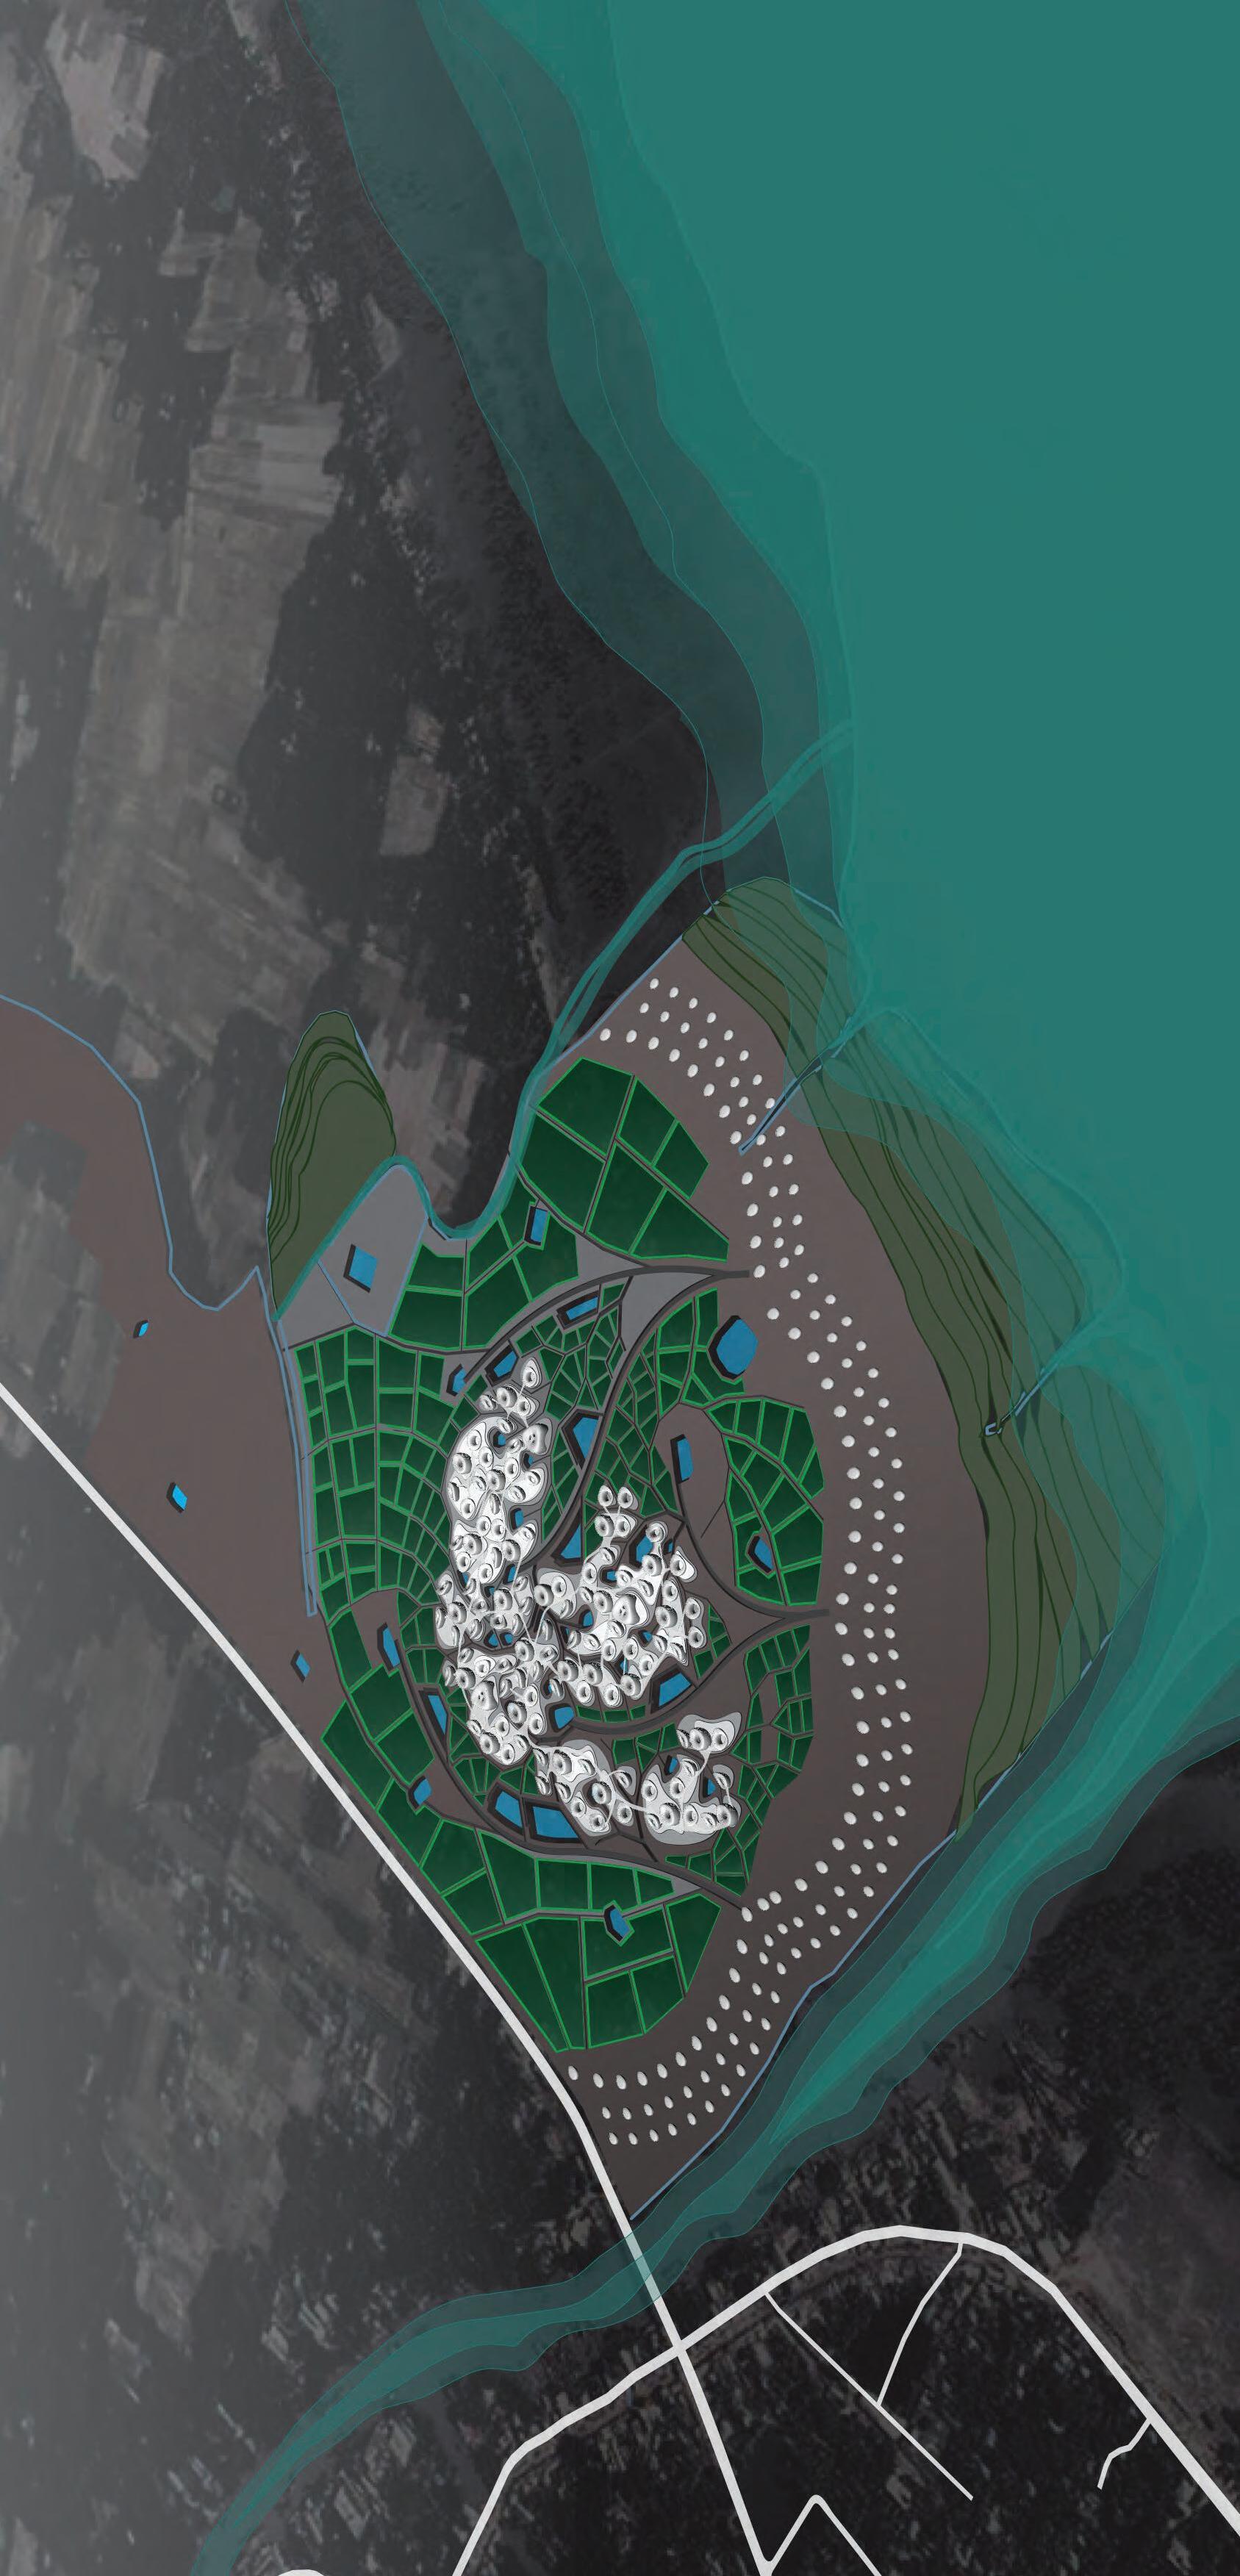


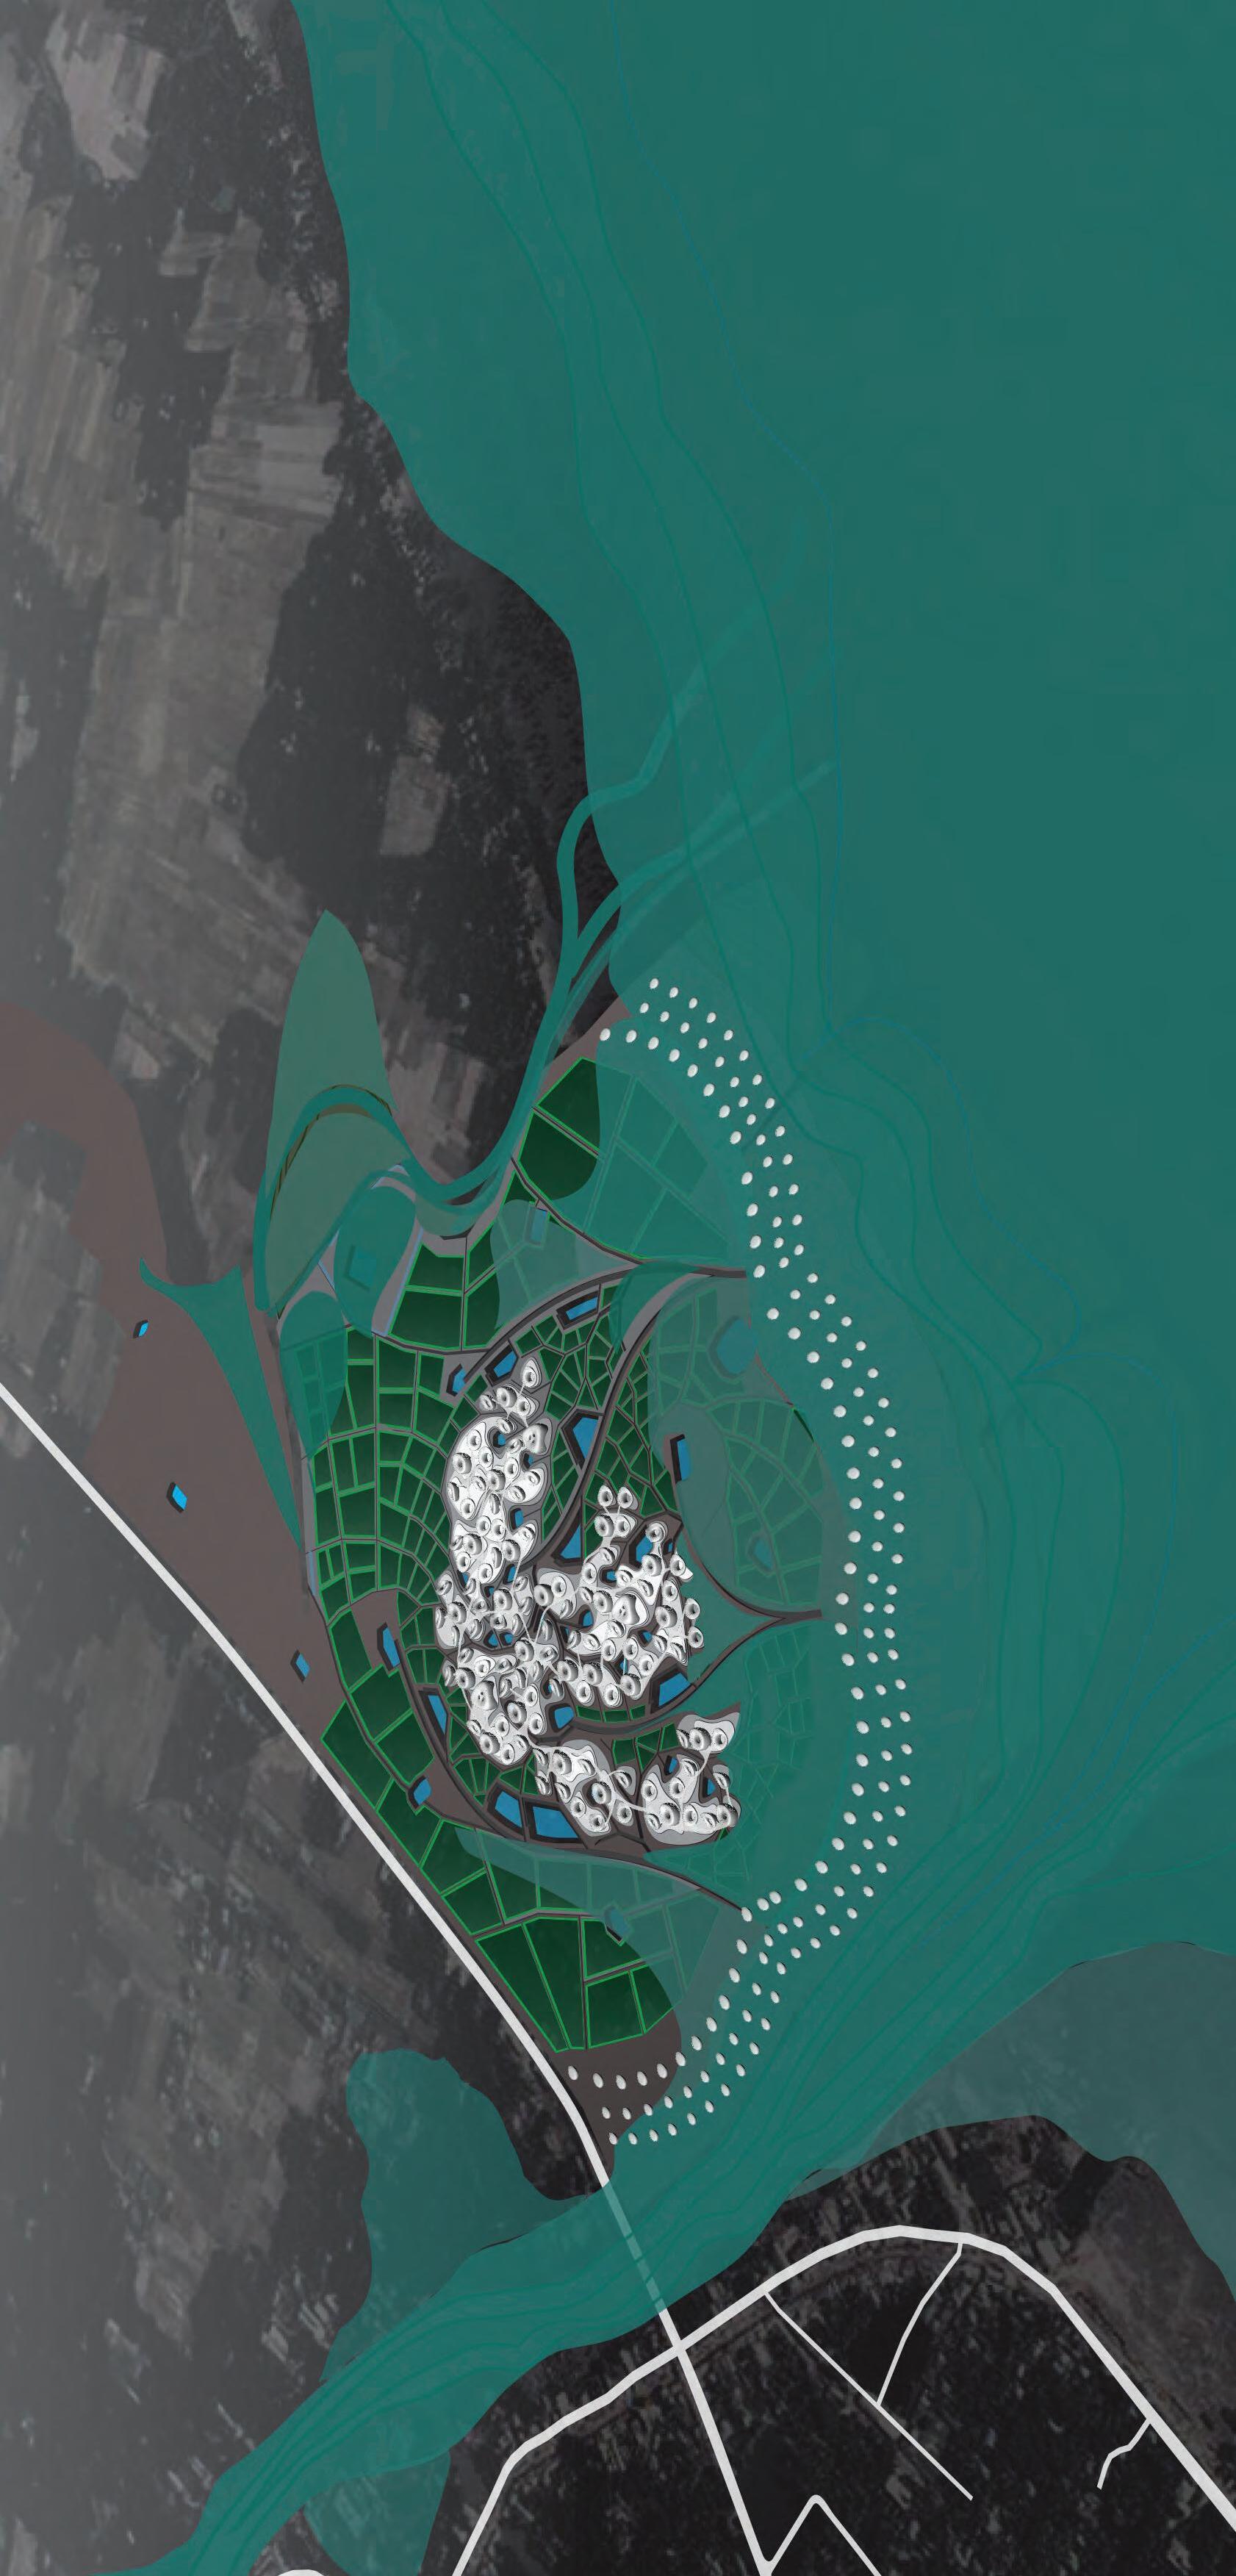

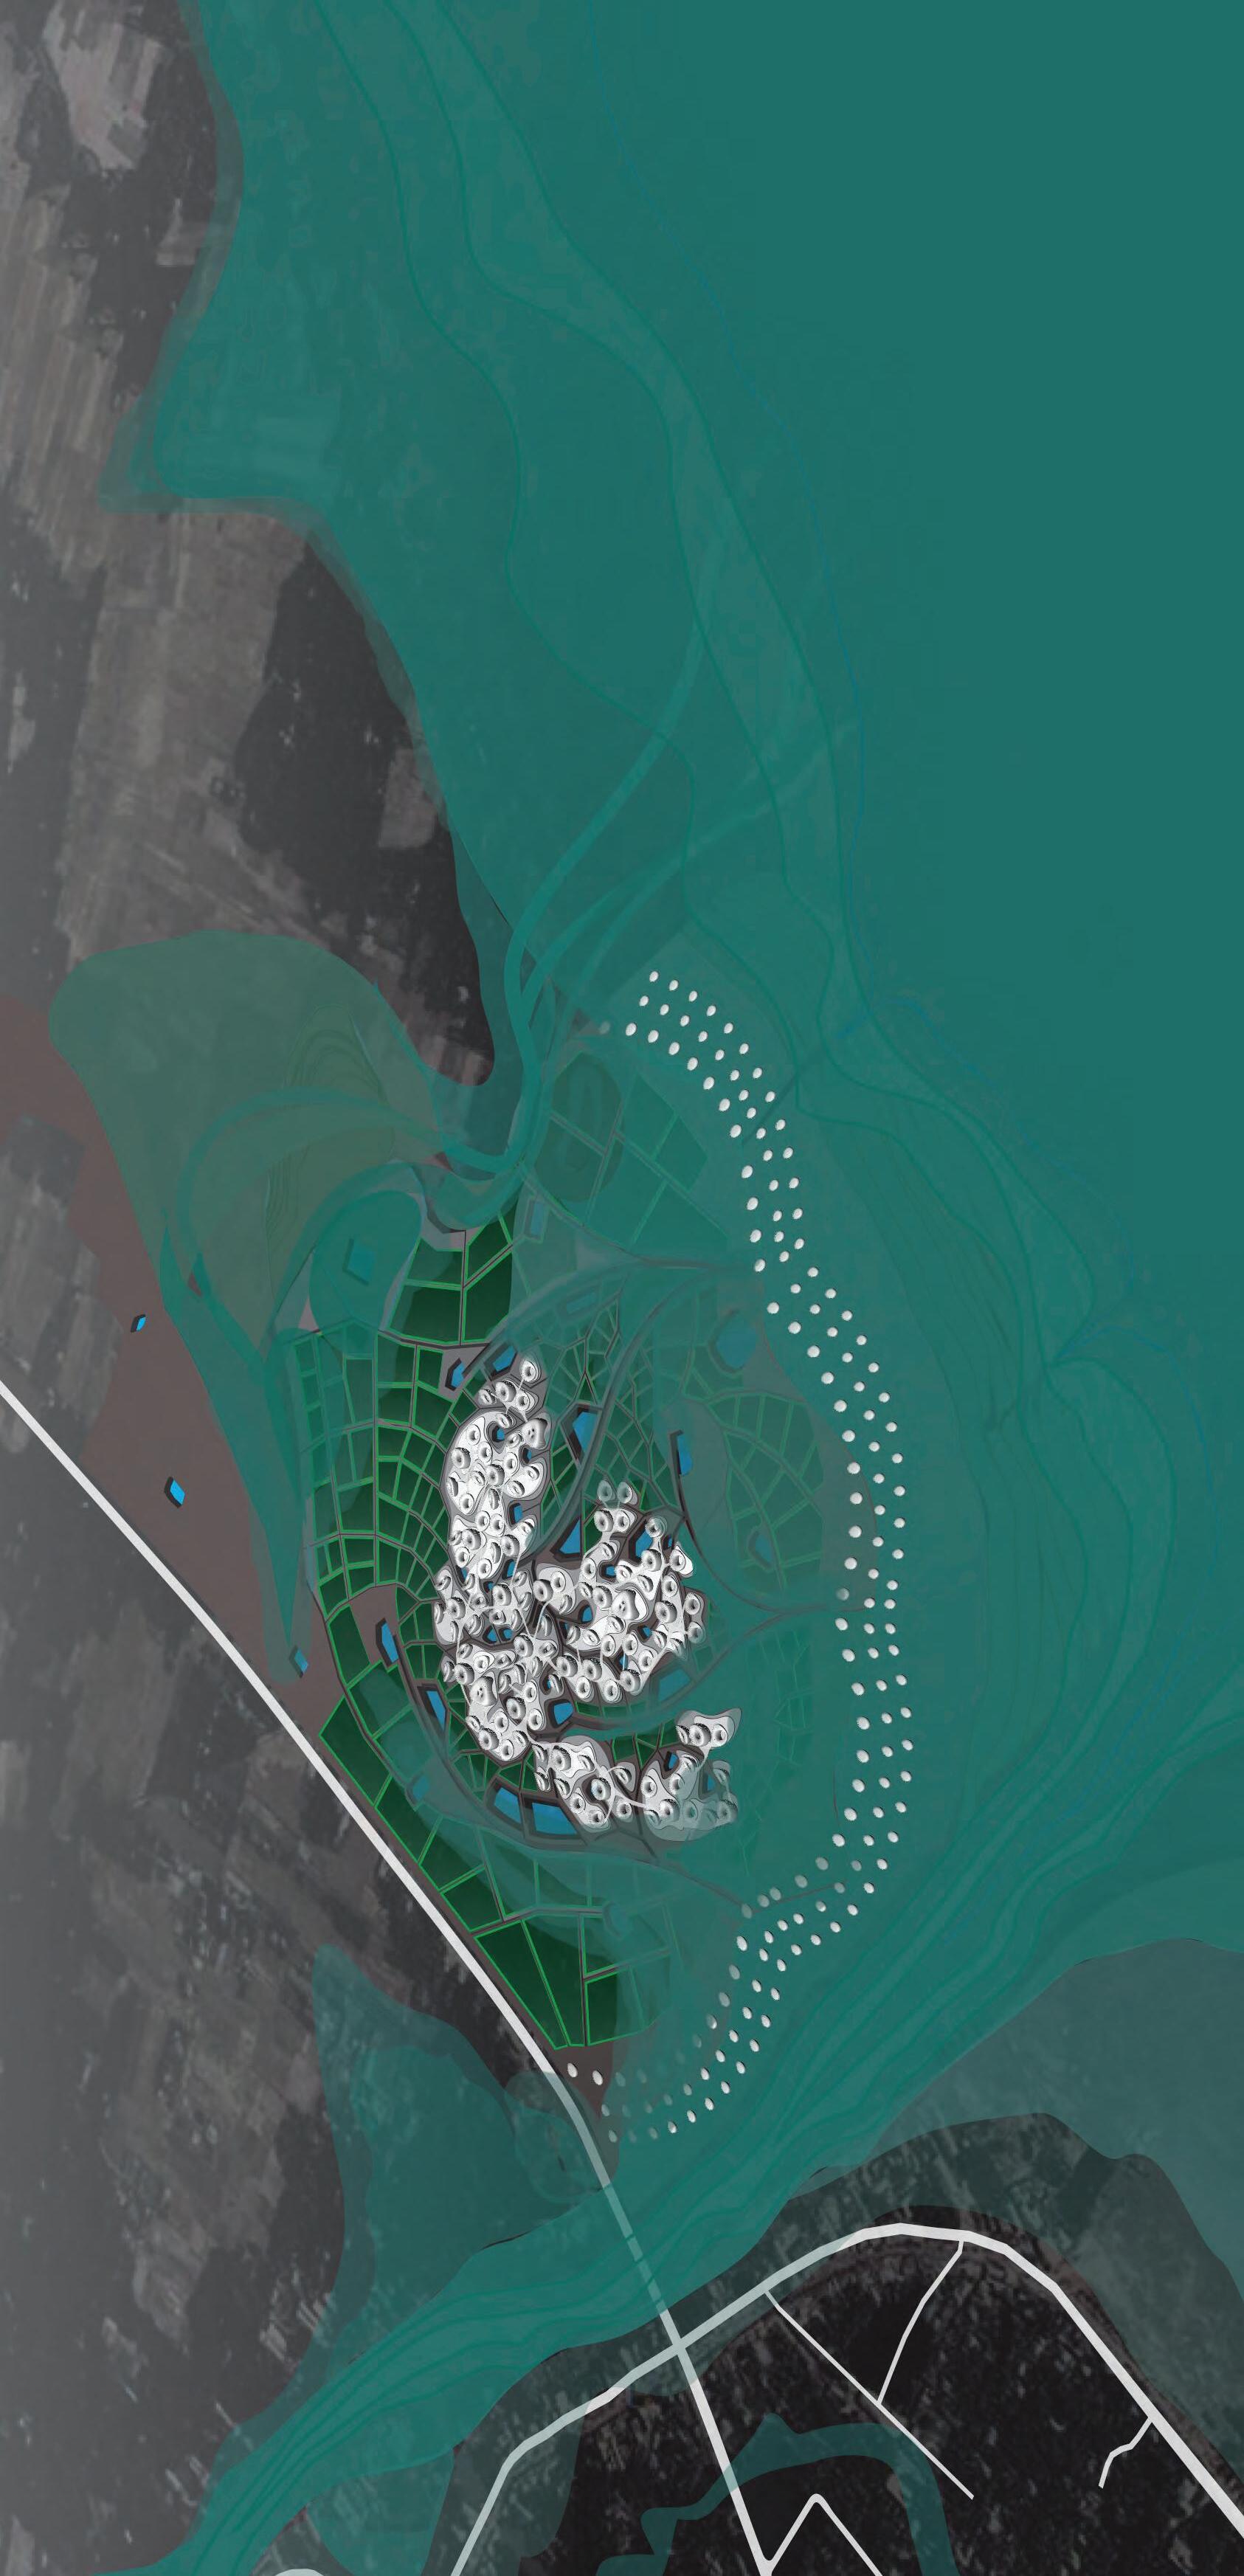

SYSTEM EVALUATION 7
7.1 Overview 7.2 Parts to Whole 7.3 Material + Culture
OVERVIEW
In looking at multiple phases, the project attempted to create a multi-tiered system adapted for its environment. Rather than creating a floating building as a defense, or simply building barrier walls to distance residents from a natural occurrence, the strategy tried to anticipate the cyclical changes. Bangladesh as an agrarian society needs the floods as much as it wants to protect itself from it. Monsoon season acts as both a relief to expel the pressure of the hot dry season and can also end up as a disastrous event.
However, even though the system was designed weighing certain aspects, it is important to understand it as an experiment, where the potential limits were tested. This is especially critical in terms of application of the material system and its geometric morphology into typologies. The geometry began as a series of explorations from a simple footprint and obtained its form through testing in fluid dynamics, resulting in geometries that are optimal for flow.
In the next chapter, the goal is to scale back from the established geometry limits and recognize how alternative solutions can be implemented for continous functionality. At each stage of the system, cultural and site context can be implemented with a higher weightage on the resultant form than simply environmental pressures.
IMG_7.01 Rice fields
Hierarchical organization in biological systems thus is characterized by an exquisite array of delicately and intricately interlocked order, steadily increasing in level and complexity and thereby giving rise neogenetically to emergent properties.1

Collective Morphogenesis Emergent Technologies and Design 245 244 7 SYSTEM EVALUATION
1 Clifford Grobstein
The elevated network is based directly off of the positioning of typologies and is able to alter its form accordingly. Hierarchy of connections between programmes would still govern the development of paths.
connections between programmes would still govern the
BUILT FORM
BUILT FORM AGRICULTURE
Environmental pressures acted as a primary driver of the built forms with social logic applied to a lesser degree. As the critique is that there are inherent problems with the existing material systems, the typologies perform at longer time frames than simply storm to storm.
is that there are inherent problems with the existing material of housing and rainwater types, with areas for crop growth denoted both internally (within the primary channels) and
Locating agriculture is primarily derived through the clustering of housing and rainwater types, with areas for crop growth denoted both internally (within the primary channels) and externally. Initial percentage of agriculture is denoted through distribution, and later informs the water system.
SYSTEM EVALUATION
of branching channels and ponds. Water levels exceeding the total capacity will overflow into areas of low-lying agriculture fields.
The building morphology should drive a cultural change rather than simply continue to be destroyed by the many disasters and pressures it faces.
WATER NETWORK
WATER NETWORK
The water network is the most affected part of the system, where main reservoirs are established through distribution and smaller ponds through clusters relationships. Channels are influenced by water collection areas and agriculture fields.
smaller ponds through clusters relationships. Channels are
It was possible to test many aspects of the system, from global arrangement of single buildings to local reinforcements, and to develop the basic framework for a fibre composite material system and building morphology. While the process started with the establishment of a basic geometrical framework, the overall goal was to relate the material properties to a particular site. The adapted building morphology criticized the existing housing in terms of material as well as form in a larger time frame than what is currently considered. These aspects of form generation and optimisation are treated a bit differently in comparison to the hydrological system that was developed. This is due to the research attempting to utilise the limits of the material system, rather than fall back to the existing strategies in place, which largely fail.
In terms of the water system, our target goal for collection was achieved through the implementation
While the criticism may be that the typologies don’t necessarily take fully into account the exact way in which villagers live, it should be stated that the way the villagers live is not a sustainable option any longer. Mud and bamboo houses routinely collapse or get swept away in the force of a cyclone, which leaves the people to rebuild every few years. The situation must be perceived differently, as not only a means to save the people for a couple of days but rather consider the long term investment in a country’s economy. Bangladesh is one of the nations that faces the most impact from a shift in the sea level and climate change. Furthermore, due to the vast population that it holds and the fact that most of the country contains so much surface water, being able to exist in such dynamic environments is key.
Many parts of our process were generated through parameters established and rulesets applied, however, the system can, unfortunately, be seen as relatively linear. While there are moments where one part of the system influences the generation of another [for instance, ponds and clusters], sufficient feedback loops between all the parts are not adequately implemented. It is more important to see the parts as semi-flexible, with both governing rules and secondary relationships. Thus the proposal does not attempt to create the perfect hydrological and fibre composite material fabricated village, but rather an example of how establishing principles at each level, they can collectively function.
Nos. Length (m) Width (m) Area (m²) Depth (m)
Primary 1 13654146022920 4371.2
Secondary 1 36031803540
T1.1 48021602320
T1.2 1215523101310
T1.3 275000.753750.75281.2
Primary 2 12534101222024 3056
Secondary 2 35631683504
T2.1 36021202240
T2.2 610822161216
T2.3 81280.75960.7572
Primary 3 1146458421168 2532.1
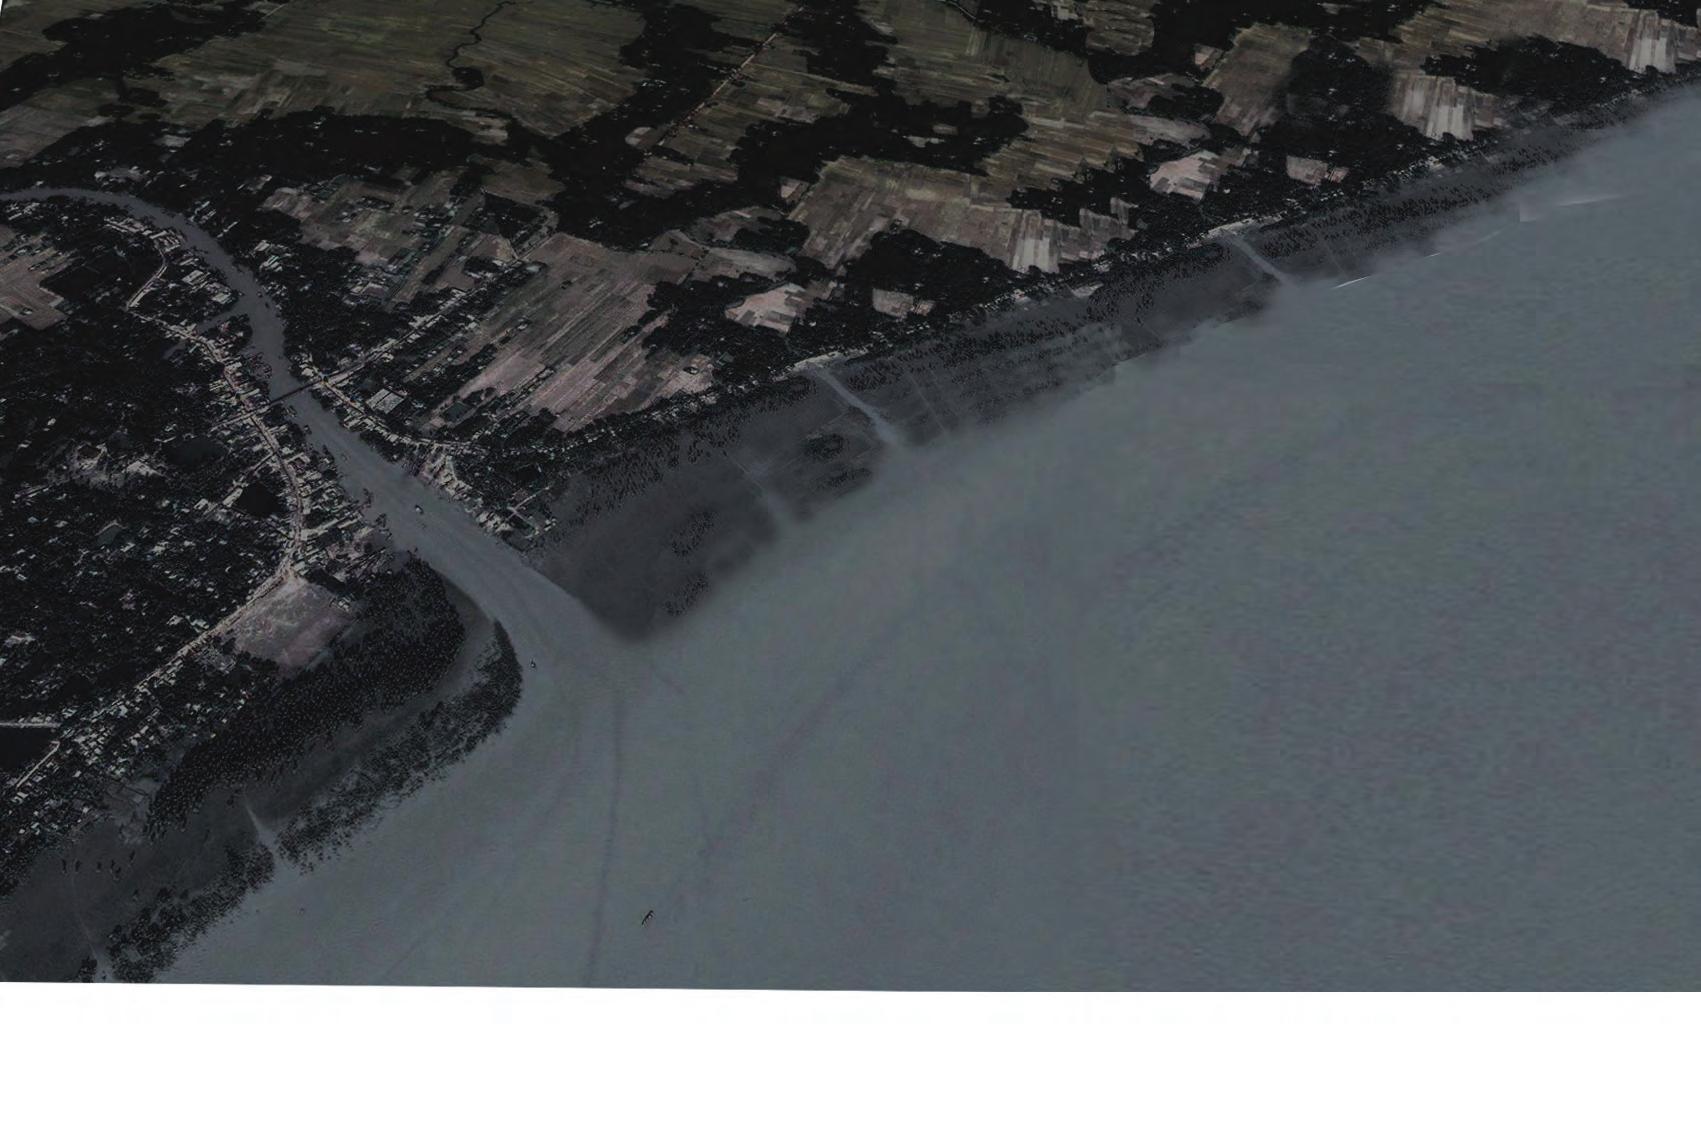

Secondary 3 2323963288
T3.1 35621122224
T3.2 2035827161716
T3.3 132420.75181.50.75136.1
DIA_7.02
Primary 4 12834113222264 3900.9 Secondary 4 4 6231863558
T4.1 46621322264
T4.2 1730226041604
T4.3 193750.75281.20.75210.9
Primary 5 1246498421968 3352
Secondary 5 36031803540
T5.1 35021002200
T5.2 1323224641464
T5.3 173200.752400.75180
Relief ponds 20--1621.646486.6 6486.6
Reservoirs 9--6779.6427118.4 27118.4
Collective Morphogenesis 247 7 SYSTEM
NETWORK
EVALUATION
NETWORK
WHOLE
PARTS TO
DIA_7.01 Evaluation of the proposed system in parts
PROCESS
DIA_7.01 Evaluation of the proposed system in parts
Capacity of the hydrological system
Total Capacity (m ) Total Vol. per branch (m3) Volume of water Nos. Length (m) Width (m) Area (m²) Depth (m) Total Vol. per Volume of water (m ) 50817.31
EVALUATION PARTS TO WHOLE
EVALUATION OF THE WATER NETWORK
The hydrological system designed for the site is composed of functions primarily for movement of water and storage. Some of the initial branching tests had been to find distribution angles to manipulate the speed of the water through the channels. To check whether the systems in place functioned according to these principles, one tree of the water network was further tested to include the various types of primary, secondary and tertiary branches. Furthermore, the extracted tree also had the three parts of the system: reservoirs as the largest collection unit, smaller ponds for aquaculture and distribution to agriculture.
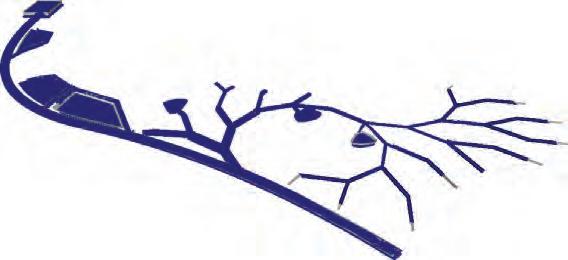
By simulation of the water flow through this interconnected network, results showed how the different levels were received water and in what order. The primary branch and reservoirs were filled directly with tertiary branching for agriculture only receiving water once all the collection elements were at capacity. The system would therefore work to store water primarily before allowing the flow of water to dissipate across the site.


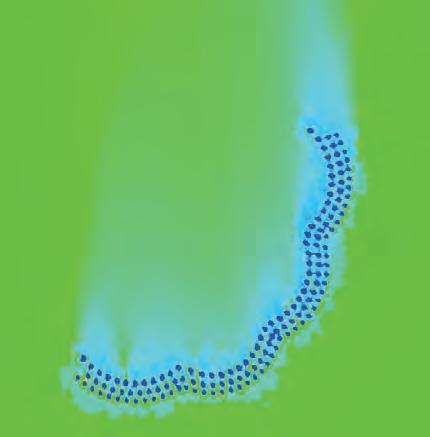


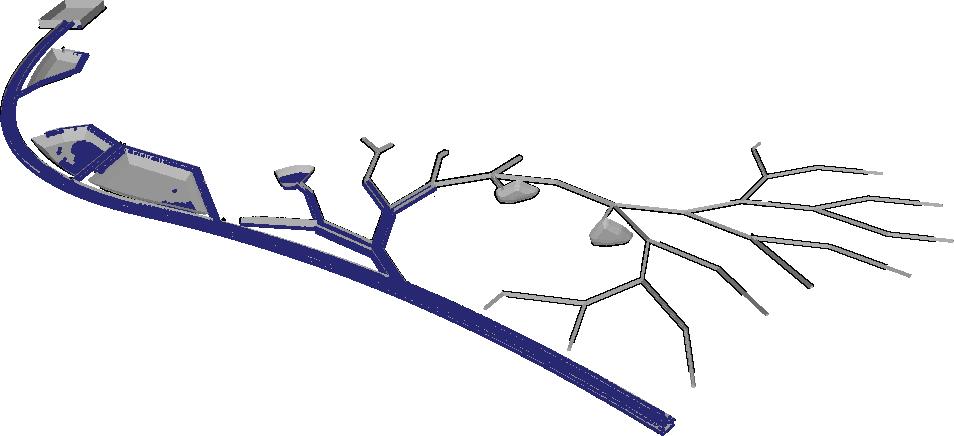
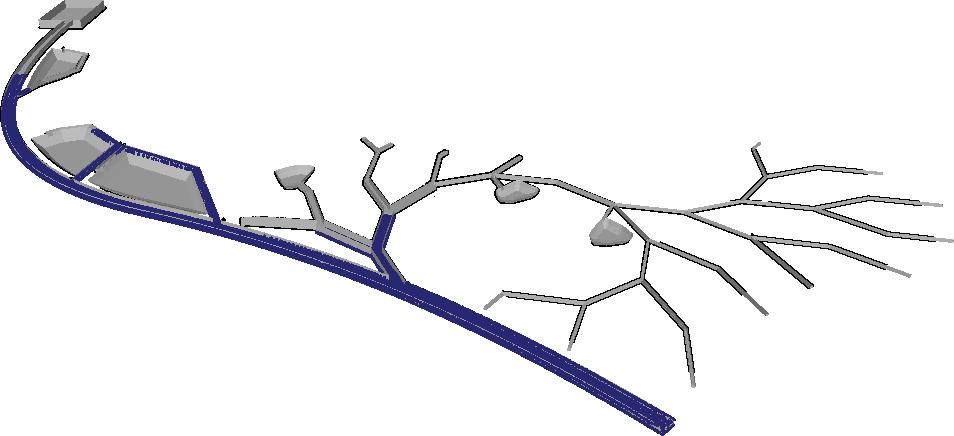

ENVIRONMENTAL DRIVER
APPLICATION OF THE MATERIAL SYSTEM
The fibre composite material system performs to its optimal properties when it is executed as a shell structure. Due to its high strength ability, the shell can withstand the high winds that come from the coast by distributing pressure evenly across its surface. The typologies were designed in direct reference to this strategy of creating building envelopes which could function in these highly pressurized environments. However, as the initial objects closer to the southern coast took the brunt of the forces, the later half of the aggregation does not need an optimised geometry for wind pressure. Instead, the material system can act as a defensive strategy enacted to provide a differentiated microclimate.
REDUCTION OF VELOCITY
In reduction of the pressure, the position of the typology in relation to the aggregation is important. The breakwater system functions as the first line of defense to take the brunt of the force. As the typologies aren’t habitable, they retain the most optimised form for water pressures. Within the latter part of the aggregation, housing and rain water collector types are arrayed based on relationships of social cluster. In order to determine how much of the material system was necessary to lower the speed of the floodwater, various levels of typology implementation were tested in CFD. Using the tests, the length of contours of reduction were measured. Based on the results, it can be seen that the breakwater and rainwater combination is adequate in reducing velocity and utilising a minimal amount of typologies to be implemented on site.
Collective Morphogenesis Emergent Technologies and Design 249 248 7
SYSTEM
Inlet Primary filled Inlet to secondary + reservoirs Filling of secondary + reservoirs Inlet to tertiary + ponds System capacity DIA_7.03 RealFlow
time based particle simulation of one tree
DIA_7.04 CFD velocity mapping of reduced objects on field
MATERIAL + CULTURE
Growth and extension within a 15 year period
NATURAL SYSTEMS
Stage 2: Sapling 1-2 years old tree
Base spread: .2m dia.
3mspacing
The breakwater system was designed with the principle of creating a large number of volumes which can act together in breaking up the initial forces. While we looked at natural strategies concerning mangroves briefly in the Domain chapter, a replacement alternative method is considered using these trees.
Stage 4: Fully stabilised tree 4 - 7 years old tree
Base spread: 1.7m dia.
In placement of the mangroves on the site, it is important to evaluate their growth time scale, as usually saplings are relocated to a site and spaced between 2 to 3 meters apart. The sapling will barely be able to survive in harsh wind conditions, let alone act as a protective measure for inland habitation. To ensure optimal growth for mangroves to develop into mature trees, the fibre composite breakwaters can be situated as the first phase with saplings located around and behind. Within a 6 to 7 year time period, mangroves stabilise their footprint by developing an intricate stilt root system. At this stage, breakwaters can be removed to allow the mangroves to fully root themselves into the ground.
As the root network becomes more tangled and distributed, the mangroves can become a natural defense in relatively the same way breakwaters were used, as a dispersion strategy to break up the flow. In this way, the material system can be seen as both a way to protect within a specified period while engendering growth of a natural barrier.
Stage 6: Fully mature 10 - 15 years old tree
Base spread: 2.4m dia.
Collective Morphogenesis Emergent Technologies and Design 251 250 7 SYSTEM EVALUATION 1.0 m 0years 1234567891011121314 2.0 m 3.0 m 4.0 m 15
main stem dia.: stilt root dia.: 50 mm 10 - 20 mm main stem dia.: stilt root dia.: 100 mm 25 40 mm main stem dia.: stilt root dia.: 200 mm 50 - 70 mm
DIA_7.05 Mangrove growth succession over a 15 year period
REPLACEMENT TREE STRATEGY
MANGROVE ROOTS
DIA_7.06 Mangrove root growth and spread to create a porous barrier
MATERIAL + CULTURE

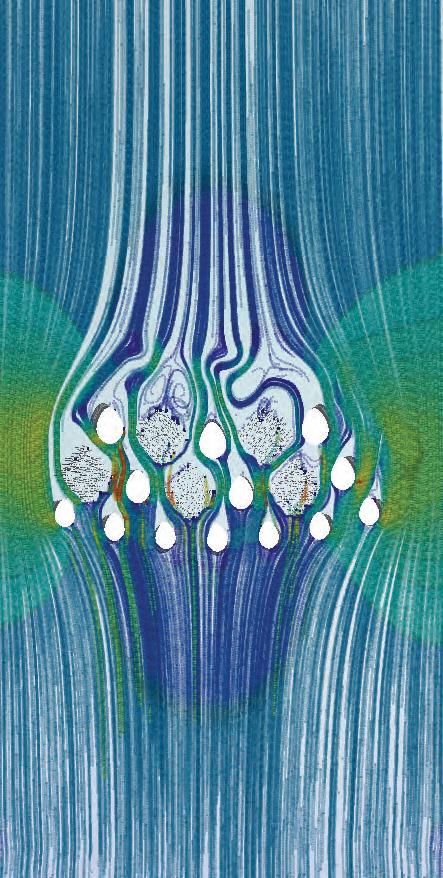

REPLACEMENT TREE STRATEGY


As a replacement strategy, a collection of mangrove root systems [9 mangrove trees] were tested against the proposed breakwater geometry. Due to the application of many small elements, it had a very good effect in reducing the speed of the water from 5m/s to 1 m/s. In the larger aggregation, rather than replace all three rows of the breakwater system to mangroves, a more integrated field of elements was created. The first row remained as breakwater, with the second and third rows being replaced with a mangrove root collections at every other location. In doing this, the number of breakwater elements necessary to form the boundary arcs are greatly reduced by adapting a natural barrier system.
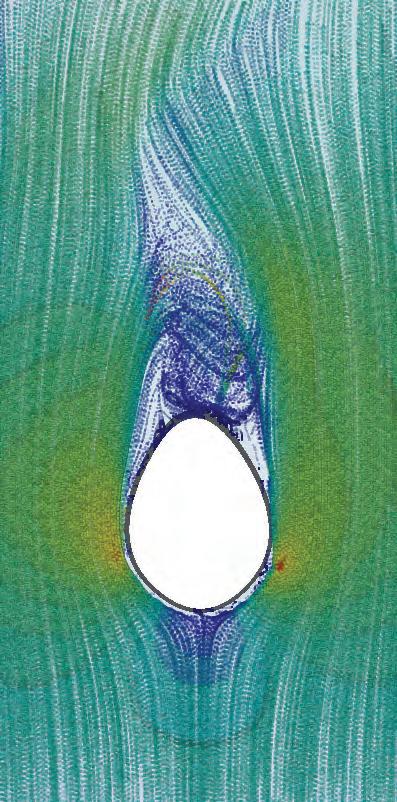
The renders on the right show the replacement strategy in which over time, the mangrove trees would grow and the breakwater elements would be removed accordingly as they would be no longer necessary.

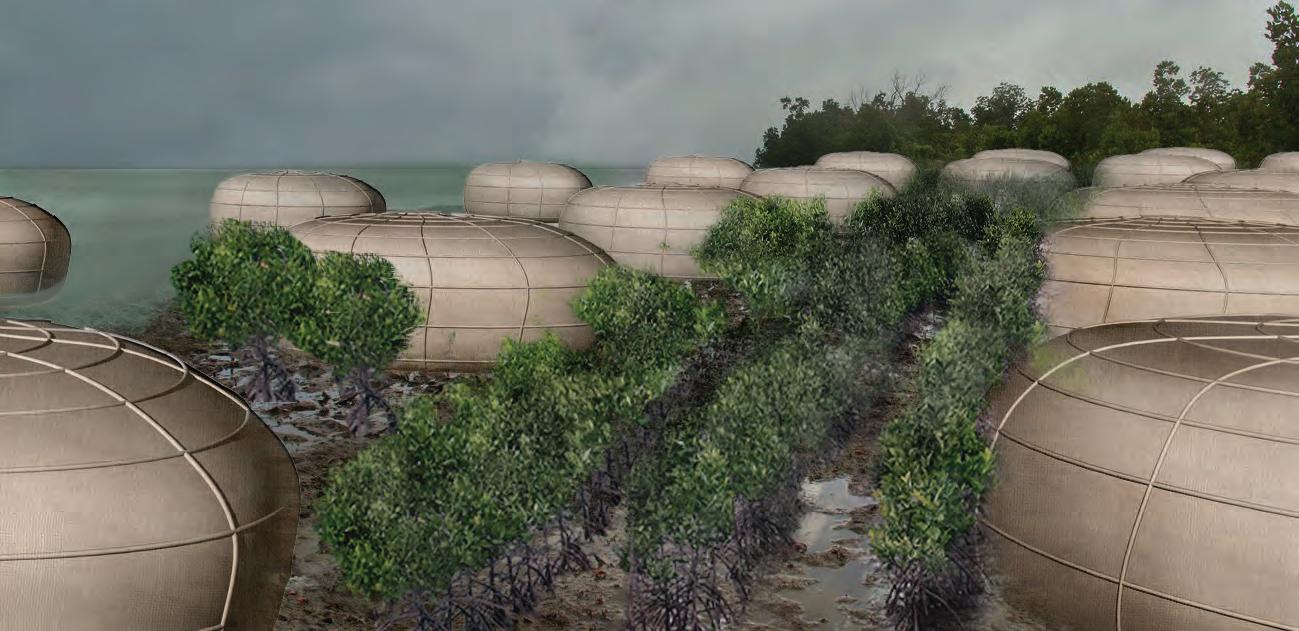
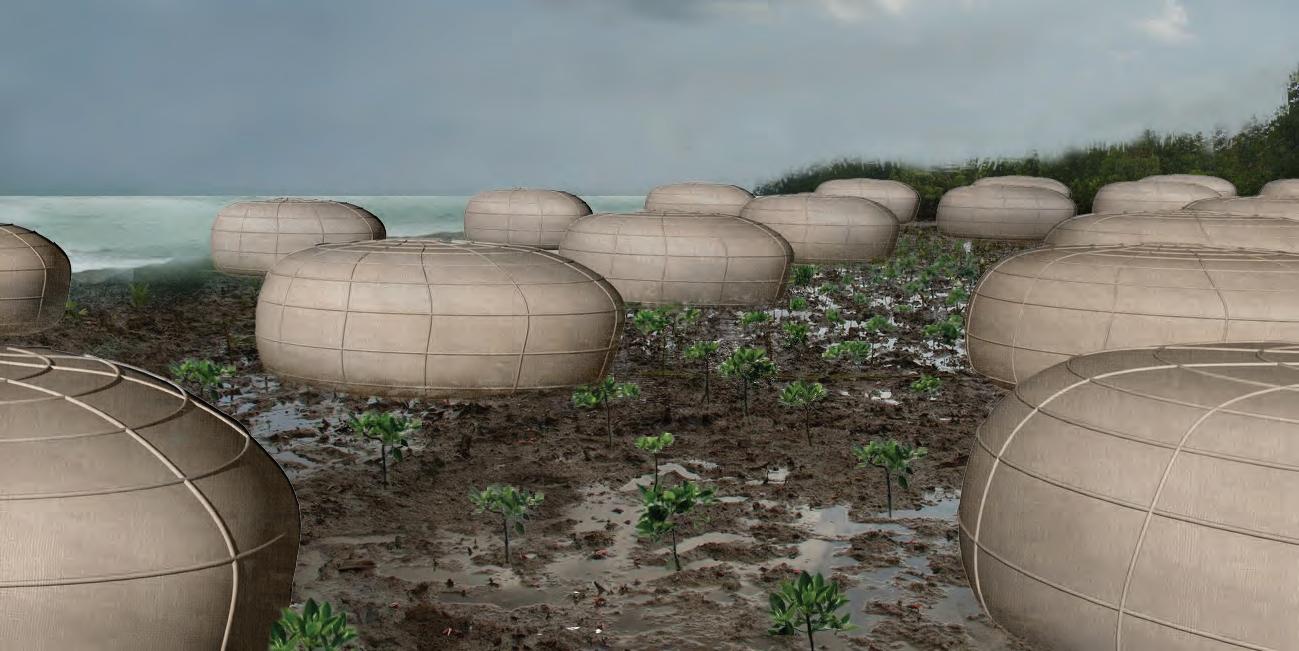
Emergent Technologies and Design 253 252 7
SYSTEM EVALUATION
DIA_7.07 [left] SImulation of replacement mangrove root system strategy and its influence on the flow of water
Phase
of
SYSTEM
IMG_7.02 [right] Phasing strategy of mangrove growth as the new boundary condition and removal of breakwaters accordingly 9.581 Velocity [m/s] 8.297 6.775 4.790 0 11.2 Velocity [m/s] 9.7 7.9 5.6 0
Phase 1: Saplings Phase 2: Mature trees with stilt roots 8.4 Velocity [m/s] 7.2 6.2 4.6 0 13.3 Velocity [m/s] 11.5 9.45 5.6 0
3: Developed forest
root structure
PHASING
EXISTING TYPOLOGY
SINGLE ELEMENT acts as a shelter/ protection against oncoming storm
characteristics
large one or two floor spaces to hold up to 3000 people on a single level
result spatially uncomfortable for long periods; lack of privacy
HOUSING PROGRAMME
AGGREGATION
characteristics
acts as a shelter/ protection against oncoming storm
multiple small levels oriented at different heights
less people are accommodated however spatial differentiation creates privacy
single building multiple elements
since typology is a singular large space, usually becomes a public building or remains empty
result because community is not tied to the building [leaves after the storm], the shelter often falls into disrepair
differentiation in size allows for the village population to be broken into many buildings based on programmes
community integration in the cluster level organisation of shared amenities
external suction with an internal pressure increase can cause house to explode windward face collapses from pressure of wind force
PROGRAMME EVALUATION
Where the existing shelter typology can hold a very large number of people [essentially a small village in Bangladesh], the new system tries to accommodate the village within multiple small units in order to work as an aggregation.
3 months or so. Rather than invest in these concrete boxes, a new material system can be fabricated in Bangladesh and applied accordingly to its context. In this way, the idea of a cyclone shelter is not simply one object, but could instead become a much smaller unit and function as one’s home.
lightweight structures can be overturned
SINGLE ELEMENT
characteristics
completely enclosed heavy concrete box raised above flood
distanced from the flood plane; large volume composed of heavy material at the wind level
result no effect on storm
completely enclosed shell structure touching the ground
curvature of exterior shell geometry is adapted for wind and water direction [at both planes]
geometry optimised for water pressure on surface
collapse of the entire house frame leaning in the direction of wind flooding of the house at ground level
AGGREGATION
single building multiple elements
DIA_7.09
characteristics
generally spaced far from each other as a single can accommodate a large portion of village population
result no effect on storm
DIA_7.08 Evaluation of existing shelter with the proposed material system typologies
differential sizing of elements are accommodated within spacing as well, in order to act as a village replacement strategy
reduces the water velocity though aggregation [soft resistance strategy]
ORIENTATION USING TRADITIONAL HOUSING
The programmatic differentiation between the two typologies can be seen within the break down of the internal space, through levels in order to distribute the population. Generally, the existing shelter tries to fit in the maximum amount of people within a single [or double] floor building, with space of 1.2 square meters per person. The proposal looks at division of the capacity through the size of families, as a typical family in Bangladesh is considered to be 6 people. More so, the material system is broken down into the primary programmes necessary to survive a storm, and function for the other dynamic seasons.
ORIENTATION USING TRADITIONAL HOUSING
Within the time frame of a storm, the level of comfort in the large scale shelter would be minimal as the phase of the cyclone and the flood can last for
To do this feasibly, the project proposes a phasing strategy of the fibre composite typologies, where by applying first the breakwaters and the rainwater collectors in our material system, the people could adapt to this new way of building. Since neither typology is primarily habitable (the rainwater collector can in essence hold a number of people), the village can continue functioning using the existing local materials for construction of their homes. As the breakwaters significantly reduce the speed of the water and the rainwater collectors can store fresh water and also be utilised as community spaces (for each cluster), housing on stilts can be implemented for the situations of flooding.
Aligned houses create long tunnels for wind to flow through
Aligned houses create long tunnels for wind to flow through
Staggered houses create breaks in the wind flow
Staggered houses create breaks in the wind flow
Collective Morphogenesis Emergent Technologies and Design 255 254 7 SYSTEM
EVALUATION
PROPOSED TYPOLOGIES PROGRAMME EVALUATION EXISTING TYPOLOGY PROPOSED TYPOLOGIES
FORM EVALUATION MATERIAL + CULTURE
The negative impacts of cyclones on houses, adapted
HOUSING + NETWORK
ALTERNATIVE MATERIAL SYSTEMS


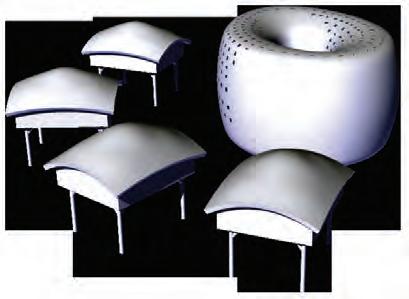
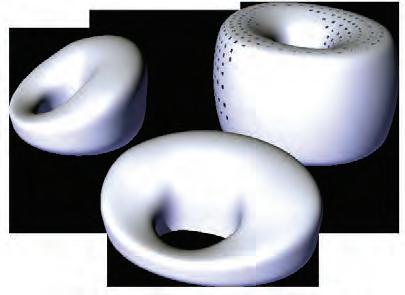


Utilising local materials in conjunction with specific function-oriented fibre composite typologies would allow for a more realistic approach to site intervention. Catastrophic storms don’t occur yearly, and a material phasing strategy would allow for the villagers to gradually shift to the high strength material system, as necessary. In the situation of severe storm, where a cyclone destroys much of the houses [even through the breakwater and rainwater type defenses], we propose that the material system typologies be implemented at that point with a much more indepth look at culturally driven spatial parameters. By this time, the local people will begin to relate to first phase implemented typologies in terms of both fabrication [utilising the jute they cultivate] as well as the programmatic and functional benefits of a material system which can survive long term inundation.

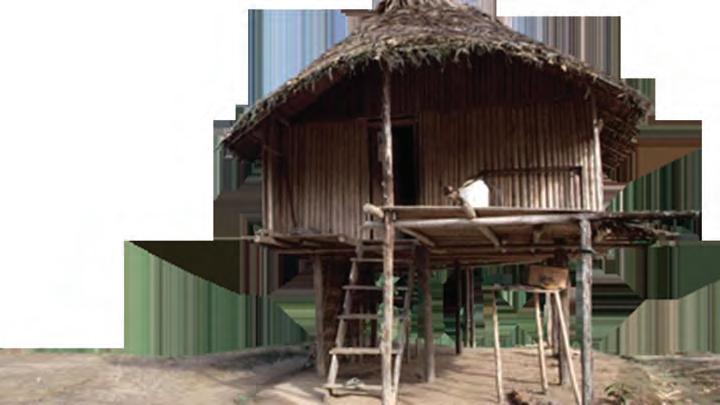

ELEVATED NETWORK
Within the scope of the design proposal, the network was generated through looking at relationships between programmes. However, it was not defined in terms of material and fabrication. In looking at the local materials available for building, by slightly modifying the existing bamboo bridges which are strung together for floods, we propose creating an elevated network out of the same material, but with a look at longer time frames. By essentially turning a pyramid with the tip to the ground, a platform can be formed at the top with the base acting with minimal impact to the ground. The benefit of this is that essentially we create a type of aggregation strategy for the network as well, where multiple small objects have a footprint to slow down the velocity of water. Pathways are elevated to 3 meters off the ground that in times of a flooded ground condition, the water will still be allowed to flow around the bases as well as maneuvering of boats. The bamboo structure is light, strong and creates a porous infrastructure where people still have ground space as well as retain network connectivity in a flood.


Collective Morphogenesis Emergent Technologies and Design 257 256 7 SYSTEM EVALUATION
DIA_7.10 Pressure distribution from flat to curved surface
DIA_7.11 Single typology and cluster organisation [traditional]
IMG_7.03 Traditional house on stilts
DIA_7.12 Single typology and cluster organisation [proposed]
DIA_7.13 Parts of the proposed bamboo constructed
DIA_7.14 A view of the compiled elevated network
CULTURALLY DRIVEN SYSTEM
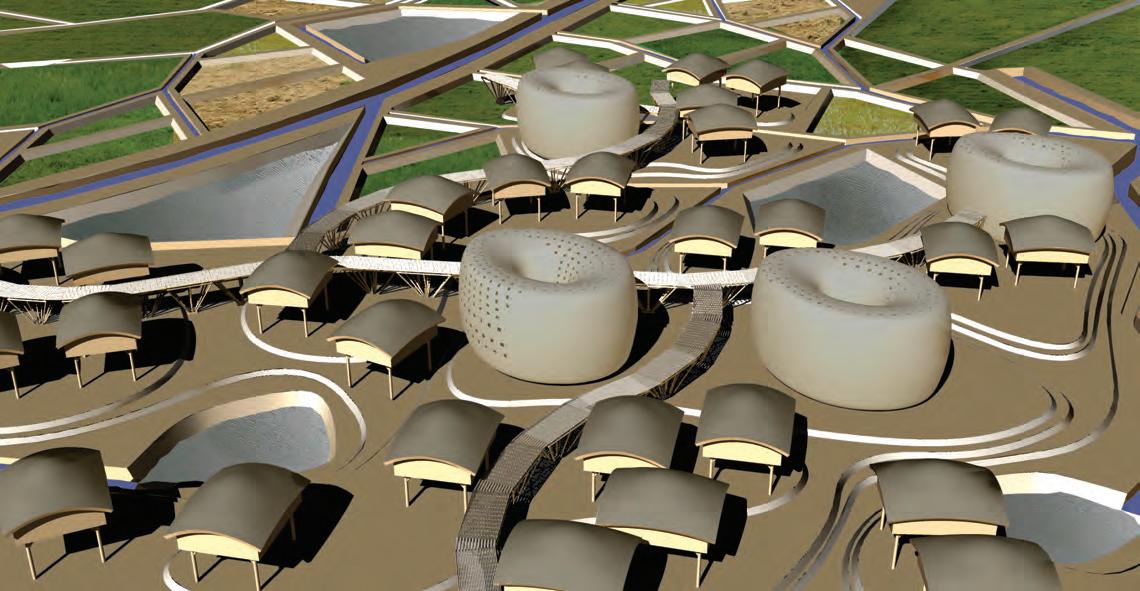
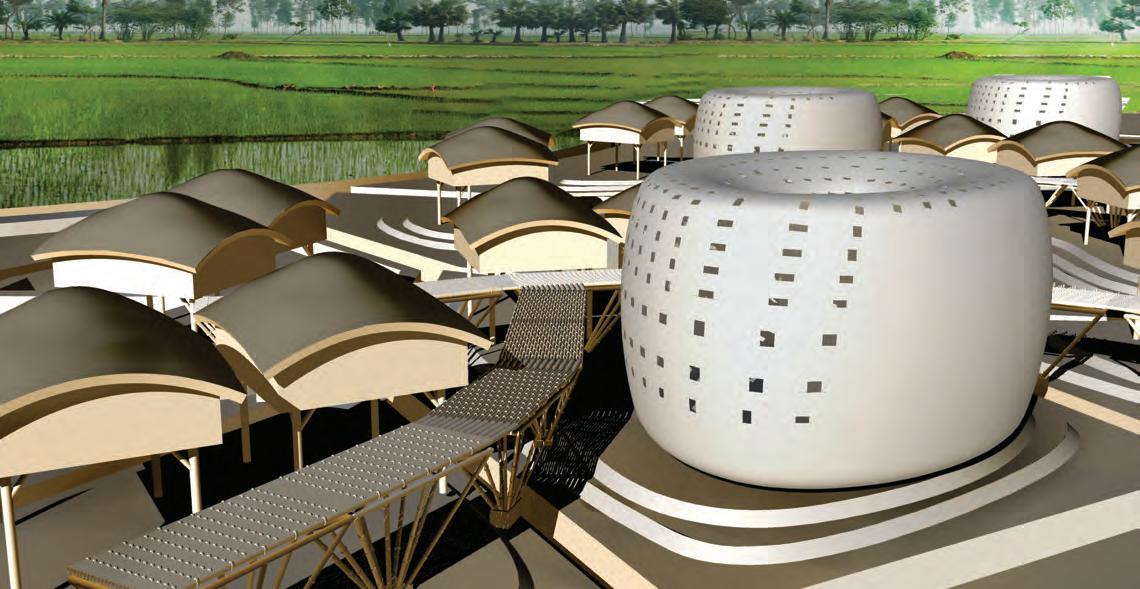
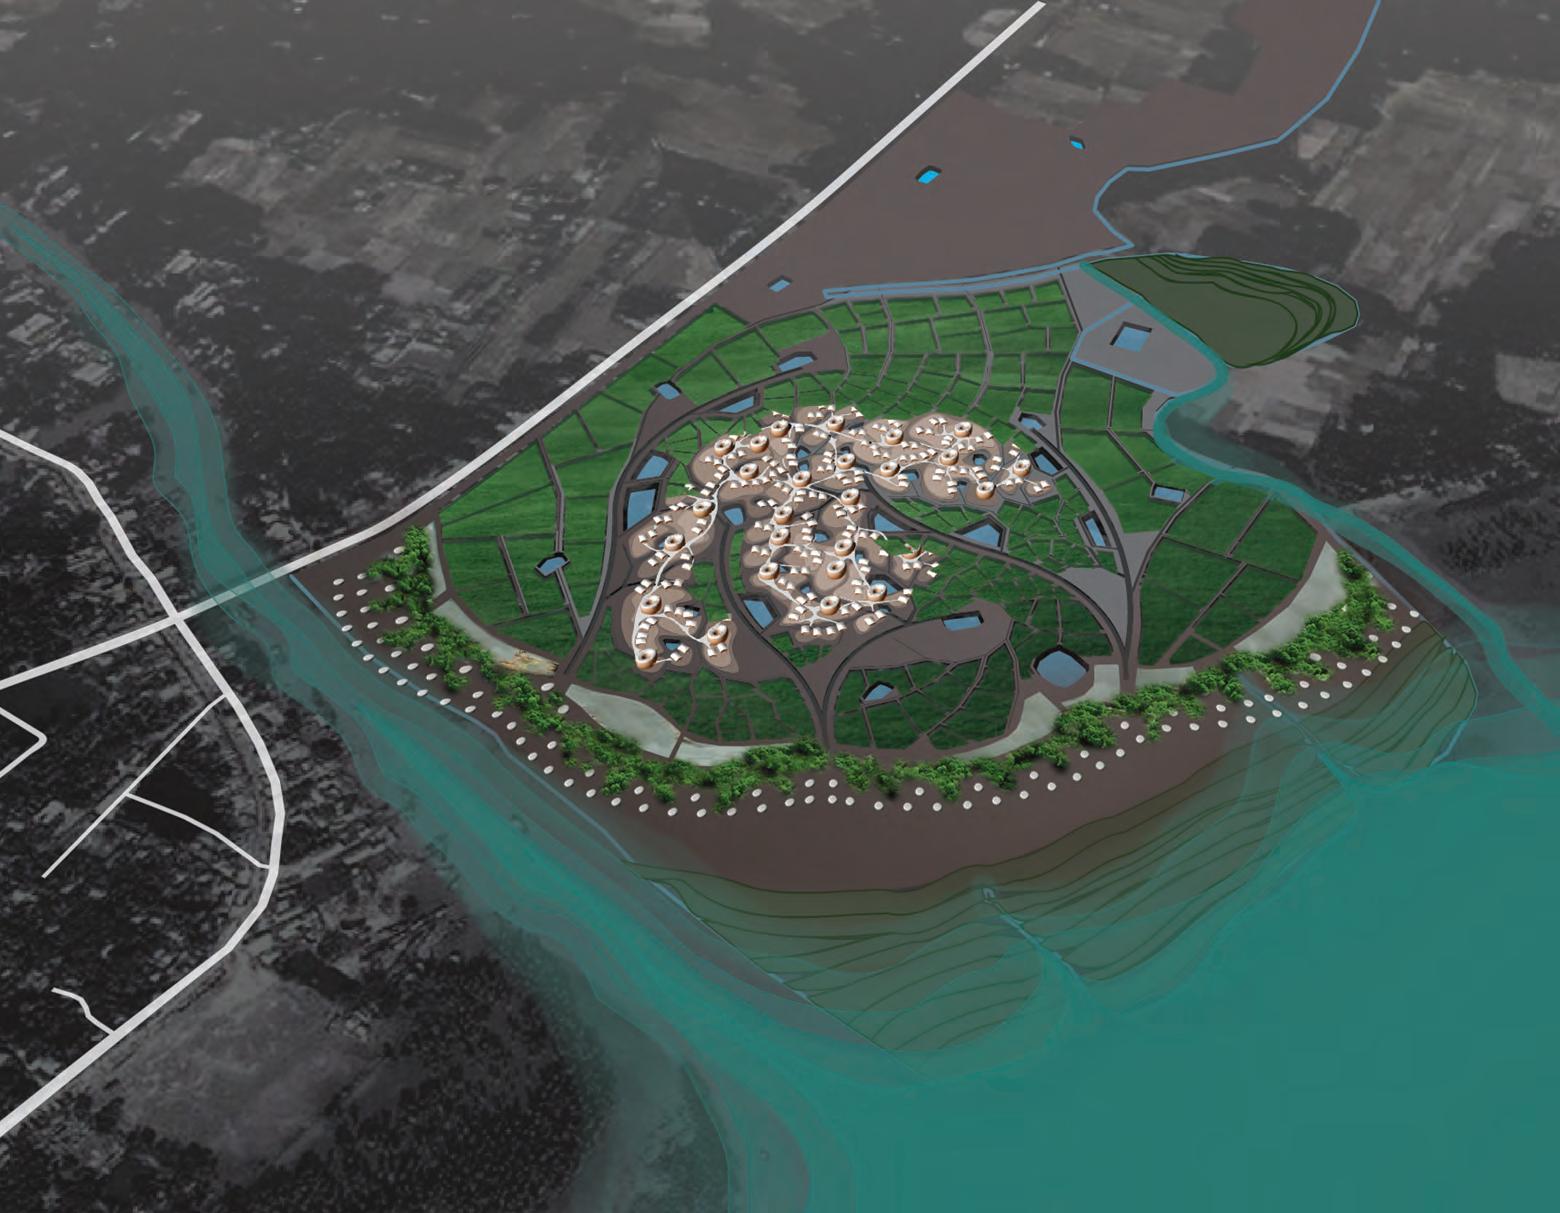
Collective Morphogenesis Emergent Technologies and Design 259 258 7
SYSTEM EVALUATION MATERIAL + CULTURE
Cluster View
Neighbourhood View
APPENDIX 9 REFERENCES
8.1 Bibliography 8.2 Image Index 8.3 Diagram Index
8
BIBLIOGRAPHY
BOOKS JOURNALS WEBSITES
Bird, Eric Charles Frederick. (2000) Coastal Geomorphology: an introduction. Chichester: WileyBlackwell.
Chen, Chao-Yi. (2011). Responsive Transformation: Ecological flood mitigation strategies 1st ed. England. AA School of Architecture
Gürdal, Zafar; T. Haftka, Raphael; Hajela, Prabhat (1999). Design and Optimization of Laminated Composite Materials. 1st ed. USA: John Wiley & Sons.
Huq, Saleemu; Ayers, Jessica. (2008). Climate Change Impacts and Responses in Bangladesh. International Institute for Environment and Development.
Khan, Saquib Ahmad; Hossain, Ali. (January 2012) Coastal Flooding Impacts and Adaptation Measures for Bangladesh. Dhaka: LAP Lambert Academic Publishing.
Knippers, Jan; Cremers; Gabler; Lienhard. (2011). Construction Manual for Polymers + Membranes. 1st ed. Germany: Institur für internationale Architektur-Dokumentation Gmbh & Co.KG, Munich.
Nicholls, R.J., P.P. Wong, V.R. Burkett, J.O. Codignotto, J.E. Hay, R.F. McLean, S. Ragoonaden and C.D. Woodroffe, (2007). ‘Coastal systems and low-lying areas’. In: (M.L. Parry, O.F. Canziani, J.P. Palutikof, P.J. van der Linden and C.E. Hanson), Climate Change 2007: Impacts, Adaptation and Vulnerability. Contribution of Working Group II to the Fourth Assessment Report of the Intergovernmental Panel on Climate Change. 1st ed. England: Cambridge University Press. pp.315-356.
G. R. Flierl, A.R. Robinson. (1972). Deadly surges in the Bay of Bengal: Dynamics and storm tide tables Nature. 239 , pp.213-215
Agarwal, Ankush. (March, 2007) Cyclone Resistant Building Architecture. Gol-UNDP, Disaster Risk Management Programme. [ONLINE]. Available at http:// nidm.gov.in/PDF/safety/flood/link2.pdf
Ahamed, Sharbari; Mizanur Rahman, Mohammad; Amir Faisal, Mostofa. (December, 2012) Reducing Cyclone Impacts in the Coastal Areas of Bangladesh: A Case Study of Kalapara Upazila. Journal of Bangladesh Institute of Planners, Vol. 5. [ONLINE]. Available at http://www.bip.org.bd/SharingFiles/ journal_book/20130820141417.pdf
Al-Amin, M.; Mahmud, K.; Hosen, S.; Islam, M. Akhsanul. (December 22-24, 2011). Domestic water consumtion patterns in a village in Bangladesh. 4th Annual Paper Meet and 1st Civil Engineering Congress. Dhaka. [ONLINE]. Available at http:// iebconferences.info/356.pdf
Anwar, Ali. (1999). Climate change impacts and adaptation assessment in Bangladesh Climate Research [Clim Res]. 12 (), pp.109-116 [ONLINE]. Available at http://www.int-res.com/articles/cr/12_2/ c012p109.pdf
Basir Zisan, Md.; Alam, M.R.; Hasan, Md. Mehedi; Akter, Sayeda Saima. (2013). Cyclone Resistant Low Cost Housing in Coastal Area of Bangladesh. Internaltional Journal of Science, Environment and Technology. Vol. 2, No. 1. pp.48-55. [ONLINE]. Available at http://www.int-res.com/articles/cr/12_2/ c012p109.pdf
Fletcher, Roland; Pottier, Christophe; Evans, Damien; Kummu, Matti. (2008) The Development of the Water Management System of Angkor: A Provisional Model. IPPA Bulletin 28. pp. 57-66. [ONLINE]. Available at http://ejournal.anu.edu.au/index.php/ bippa/article/viewFile/642/630. [Last Accessed 23 December 2013].
Islam, Mohammad Shahidul; Ahmed, Sheikh Kamal. The Impacts of Jute on Environment: An Analytical Review of Bangladesh. Journal of Environment and Earth Science. Vol. 2, No. 5 2012.
Kellerhals, Rolf; Church, Michael. (1989). The Morphology of Large Rivers: Characterization and Management. Dodge [ed.] Proceedings of the International Large River Symposium. pp. 31-48. [ONLINE]. Available at http://www.for.gov.bc.ca/hfd/ library/ffip/Kellerhals_R1989.pdf
Leopold, Luna B. (1994) River Morphology as an Analogy to Darwin’s Theory of Analog Natural Selection. Proceedings of the American Philosophical Society, Vol. 138, No. 1.
Rashid, Rumana. (September 15-24, 2007)
Traditional House of Bangladesh: Typology of house according to materials and location. Virtual Conference on Sustainable Architectural Design and Urban Planning. [ONLINE]. Available at http://www. ijset.net/vol-5a/IJSET%206.pdf
Werle, DIrk; C. Martin, Timothy; Hasan, Khaled, (2000). Flood and Coastal Zone Monitoring in Bangladesh with Radarsat ScanSAR: Technical Experience and Institutional Challenges Johns Hopkins APL Technical Digest. 21 (1)
Ahmed, Feroze. Water supply situation analysis, Bangladesh. [ONLINE]. Available at http://users. physics.harvard.edu/~wilson/arsenic/conferences/ Feroze_Ahmed/Sec_2.htm [Last Accessed 25 November 2013].
Belton,Ben; Karim, Manjurul; Thilsted, Shakuntala; Murshed-E-Jahan, Khondker; Collis, William; Phillips, Michael. Review of Aquaculture and Fish Consumption in Bangladesh. [ONLINE]. Available at: http://www.worldfishcenter.org/resource_centre/ WF_2970.pdf [Last Accessed 14 November 2013].
Bhatt, Himansshu. Experts suggest storing flood water for future use. [ONLINE] Available at: http:// articles.timesofindia.indiatimes.com/2012-06-05/ surat/32055292_1_flood-water-rain-water-ukai-dam. [Last Accessed 08 October 2013].
Campbell-Dollaghan, Kelsey. Local Solutions: Floating Schools in Bangladesh. [ONLINE]. Available at http:// www.archdaily.com/307128/local-solutions-floatingschools-in-bangladesh/. [Last Accessed 15 November 2013].
Fisher, Jack B.; Honda, Hisao. Branch Geometry and Effective Leaf Area: A Study of Terminalia-Branching Pattern. [ONLINE]. Available at http://www.jstor.org/ stable/2442408. [Last Accessed 12 October 2013].
Fisher, Jack B.; Honda, Hisao. Ratio of tree branch lengths: The equitable distribution of leaf clusters on branches. [ONLINE]. Available at http://www. pnas.org/content/76/8/3875.full.pdf. [Last Accessed 15 October 2013].
Hasan, M.; Ullah, M.S.; Gomes, C.D. Rural houing in Bangladesh: An inquiry into housing typology, construction technology and indigenous practices. [ONLINE] Available at: http://groups.exeter.ac.uk/ housingandhazards/Hasan%20et%20al%202000.pdf
[Last Accessed 22 January 2014].
Nangia, Sangeeta; Biswas, Soumitra. Jute Composite: Technology & Business Opportunities. [ONLINE]. Available at http://www.tifac.org.in/index. php?option=com_content&id=545:jute-compositetechnology-a-business-opportunities-&catid=85:publi cations&Itemid=952 [Last Accessed 26 January 2014].
Rahman Khan, Sirajur. Cyclone Hazard In Bangladesh [ONLINE] Available at: http://www.adpc.net/casita/ case_studies/coastal%20hazard%20assessment/ modelling%20cyclone%20hazard%20in%20 bangladesh/background_information_on_the_ storm_surge_modelling.pdf. [Last Accessed 01 December 2013].
Yee, Amy. In Bangladesh, More Shelter From the Storms. [ONLINE]. Available at http://opinionator. blogs.nytimes.com/2013/07/24/in-bangladesh-moreshelter-from-the-storms/?_r=0 [Last Accessed 12 October 2013].
Ministry of Water and Irrigation, Flood Mitigation Strategy. [ONLINE]. Available at http://wescoord. or.ke/documents/Keydocs/FloodMitigationStrategy_ MoWI_200906.pdf [Last Accessed 11 October 2013].
The Royal academy of Engineering, C&BE, Construction skills, The Mathematics of Water Flow in Channels. [ONLINE]. Available at http://
www.raeng.org.uk/education/diploma/maths/pdf/ exemplars_advanced/7_hydraulics.pdf [Last Accessed 15 November 2013].
Xinhua News Agency, Floodwater a friend, not foe. [ONLINE]. Available at: http://www.chinadaily.com. cn/china/2006-03/25/content_552148.htm [Last Accessed 08 October 2013].
- - - - -
Bangladesh - The Society and Its Environment. [ONLINE]. Available at http://www.mongabay.com/ reference/country_studies/bangladesh/SOCIETY.html [Last Accessed 10 November 2013].
Bangladesh’s Enhancing Resilience programme. [ONLINE]. Available at: http://www.mrfcj.org/pdf/ case-studies/2013-04-16-Bangladesh.pdf [Last Accessed 15 October 2013].
Gender Human Security and Climate Change in Bangladesh. [ONLINE]. Available at http://www. wedo.org/wp-content/uploads/bangladesh-casestudy.pdf [Last Accessed 10 October 2013].
Rural Architecture available at http://www. banglapedia.org/HT/A_0356.htm [Last Accessed 10 November 2013].
Social structure of the village. [ONLINE]. Available at https://sites.google.com/site/bdguiber/home/6english/bangladesh/adivasy/adivasi-and-ethnicgroups-in-bangladesh-1/tribal-and-ethnic-groups/ santal-1/santals-of-bangladesh-by-fr-luigi-pussetto/ santal-of-bangladesh/social-structure-of-the-village. [Last Accessed 22 November 2013].
Collective Morphogenesis Emergent Technologies and Design 263 262 REFERENCES 8
- - - - -
IMAGE INDEX
IMG_1.01 - http://www.bdinn.com/wp-content/ uploads/2011/04/Bangladesh_2.jpg
IMG_1.02 - http://static.guim.co.uk/ sys-images/Admin/BkFill/Default_image_ group/2011/11/7/1320686941348/-Floods-inNaples-007.jpg
IMG_1.03 - http://images.nationalgeographic.com/ wpf/media-live/photos/000/354/cache/mississippiriver-historic-floods-2011_35440_600x450.jpg
IMG_1.04 - http://www.geologywales.co.uk/storms/ march08b.htm
IMG_1.05 - http://www.bgs.ac.uk/research/ groundwater/images/oxfordflooded_large.jpg
IMG_1.06 - http://www.cruiseinturkey.net/wpcontent/uploads/2011-missouri-river-floodingpics-10.jpg
IMG_1.07 - http://science.kennesaw.edu/~jdirnber/ oceanography/LecuturesOceanogr/LecWaves/ refraction.gif
IMG_1.08/09/10 - http://morphopedia.com/ projects/float-house
IMG_1.11 - http://webarchive.nationalarchives.gov. uk/20110118095356/http://www.cabe.org.uk/files/ uploads/image/efw-06.jpg
IMG_1.12 - http://news.bbc.co.uk/local/london/hi/ people_and_places/newsid_8079000/8079732.stm
IMG_1.13 - http://en.wikipedia.org/wiki/Thames_ Barrier
IMG_1.14 - http://1.bp.blogspot.com/QXQ4FeZ0oR8/T2ULY9fV_JI/AAAAAAAAAss/ysXvl_ lxVLg/s1600/G-Cans2.jpg
IMG_1.15 - http://www.iloe.pro/gcans_fichiers/ images/tokyo_g-cans-03.jpg
IMG_1.16 - http://www.sainokuni-kanko.jp/eng/ sightseeingspot/028.html
IMG_1.17 - http://www.michaeljohngrist. com/2009/04/g-cans-underground-templesaitama/#sthash.4SuXitCB.dpbs
IMG_1.18/19 Chao-Yi Chen, (2011), ‘Responsive Transformation: Ecological flood mitigation strategies’. M.Arch Thesis, Architectural Association School of Architecture, London
IMG_1.20 - http://tbeartravels.files.wordpress. com/2012/09/mangrove3.jpg
IMG_1.21 - http://farm2.static.flickr com/1181/1110143866_d1304698fd.jpg
IMG_1.22 - http://1.bp.blogspot.com/jJe0V6QEXqM/TnzUUjhpCWI/AAAAAAAAFvw/ sef4IgB3Isg/s1600/pakistanfloods.jpg
IMG_1.23 - http://images2.wikia.nocookie. net/__cb20111208061833/genealogy/images/4/45/ Agriculture_of_Bangladesh_11.jpg
IMG_1.24 - http://farm4.staticflickr.com/3355/35701 89975_73a41aee4c_z.jpg
IMG_1.25 - http://sairafatemah.files.wordpress. com/2010/06/flood-2.jpg
IMG_1.26 - http://centralasiaonline.com/shared/ images/2010/08/04/nowshera2.jpg
IMG_1.27 - http://petercaton.co.uk/wp-content/ uploads/galleries/post-356/c84-sinkin%20 sundarbans29.jpg
IMG_1.28 - http://www.gg2.net/newImage/ original/1340870266_Flood%20in%20Jajmukh.jpeg
IMG_1.29 - http://upload.wikimedia.org/wikipedia/ commons/0/04/Flooded_village_after_1991_
cyclone.jpg
IMG_1.30 - http://cdn.physorg.com/newman/gfx/ news/hires/2009/bangladeshiv.jpg
IMG_1.31 - http://2.bp.blogspot.com/k7QiarL6BAc/T_XGAOe6w-I/AAAAAAAAABo/ gKEcFA3L_Rg/s1600/Bangladesh-Floods.jpg
IMG_1.32 - http://farm8.staticflickr.com/7124/75346 46948_5a40422c9d_z.jpg
IMG_1.33 - https://encrypted-tbn0.gstatic.com/ images?q=tbn:ANd9GcQNTJlgqn-oDbB4Tl5fFWRIx0Iu HwxgBz4u0OF03u5t3uc2Qo0N
IMG_1.34 - http://www.straitstimes.com/sites/ straitstimes.com/files/imagecache/story-galleryfeatured/27987916e.jpg
IMG_1.35 - https://www.toledoblade.com/ image/2008/05/04/800x_b1_cCM_z/Cyclone-kills-atleast-351-in-Myanmar-state-run-TV-reports-3.jpg
IMG_1.36 - http://petercaton.co.uk/wp-content/ uploads/galleries/post-356/c84-sinkin%20 sundarbans29.jpg
IMG_1.37 - http://usarmy.vo.llnwd.net/e2/images/2007/11/29/10794/size0-army.mil-2007-1129-111443.jpg
IMG_1.38 - http://www.dutchwatersector.com/ uploads/2013/05/dws-mahasen-coast-waves2-525. jpg
IMG_1.39 - http://www.gg2.net/newImage/ original/1340870266_Flood%20in%20Jajmukh.jpeg
IMG_1.40 - http://www.fredhoogervorst.com/oni. app/local/upload/12675.jpg
IMG_2.01 - http://upload.wikimedia.org/wikipedia/ commons/1/16/Water_Ripples_1.jpgg
IMG_3.11/12/13 - Jan Knipper, Cremers, Gabler, Lienhard, (2011). Construction Manual for Polymers + Membranes. 1st ed. Germany: Institur für internationale Architektur-Dokumentation Gmbh & Co.KG, Munich. p. 31
IMG_4.01 - http://patternsofnature.files.wordpress. com/2012/03/braided-rivers2.jpg
IMG_4.02 - http://www.uwec.edu/jolhm/eh2/ molnar/images/shelter%206.jpg
IMG_3.01 - http://polymers-ppi.com/old/image15.gif
IMG_3.02 - http://thewe.cc/weplanet/garden_ grows_greener_2.html
IMG_3.03 - http://bangladeshunlocked.blogspot. co.uk/2011/03/follow-yellow-and-red-brick-road. html
IMG_3.04 - http://tager.seesaa.net/ article/209409711.html
IMG_3.05 - http://cdn.greenoptimistic.com/wpcontent/uploads/2013/05/Wind-turbine.jpg
IMG_3.06 - http://www.uk.northsails.com/ Portals/29/images/2012ProductUpdates/ SambaR800%2712.jpg
IMG_3.07 - Jan Knipper, Cremers, Gabler, Lienhard, (2011). Construction Manual for Polymers + Membranes. 1st ed. Germany: Institur für internationale Architektur-Dokumentation Gmbh & Co.KG, Munich. p. 51
IMG_3.08 - http://www.easycomposites.co.uk/ images/products/large/80g-Chop-Strand-Mat.jpg
IMG_3.09 - Jan Knipper, Cremers, Gabler, Lienhard, (2011). Construction Manual for Polymers + Membranes. 1st ed. Germany: Institur für internationale Architektur-Dokumentation Gmbh & Co.KG, Munich. p. 51
IMG_3.10 - http://plasticker.eu/news/images/_ news/13492_f.01.jpg
IMG_3.14 - Jan Knipper, Cremers, Gabler, Lienhard, (2011). Construction Manual for Polymers + Membranes. 1st ed. Germany: Institur für internationale Architektur-Dokumentation Gmbh & Co.KG, Munich. p. 51
IMG_3.24
http://www.marysrosaries.com/collaboration/ images/a/a4/Hemp_stalk_-_Hanfstengel.jpg
IMG_3.25 - http://www.buitex.fr/img/matieres/bg5. jpg
IMG_3.26 - http://www.manitou-thefashionspirit. com/wp-content/uploads/2013/07/Jute_Cultivation_ and_Processing_Bangladesh_2.jpg
IMG_3.27 - http://icbp.com.my/images/img0004.png
IMG_3.28 - http://www. compositesmanufacturingblog.com/2012/05/ univenture-cracks-bonding-issue-with-bio-fibers/
IMG_3.29 - http://static1.demotix.com/sites/ default/files/imagecache/a_scale_large/2100-6/ photos/1371774494-jute-cultivation-acreage-inbangladesh-rises-7_2176006.jpg
IMG_3.30 - http://www.icimod.org/ photocontest/2013/cache/md-mirazulislam/20130410_224001.jpg_460.jpg
IMG_3.31 - http://meanderingmemos.files. wordpress.com/2008/08/dsc02246-1.jpg
IMG_3.32 - http://sabsmb.files.wordpress. com/2012/07/jute_bangladesh-04_large.jpg
IMG_4.03 - http://www.theguardian.com/ environment/gallery/2009/jul/28/flooding-banglades h#/?picture=350903759&index=1
IMG_4.04 - http://www.rawstory.com/rs/wpcontent/uploads/2012/05/shutterstock_51887617615x345.jpg
IMG_4.05 - http://i1.trekearth.com/photos/73365/ gram.jpg
IMG_4.06 - http://ipsnews-net.wpengine. netdna-cdn.com/Library/2013/05/womencollecting-water-from-an-electric-pump-deeptubewell-in-Chapainawabganj.-photo-credit-ASMShafiqur-Rahman-629x447.jpg
IMG_5.01 - http://www.kksblog.com/wp-content/ uploads/2012/12/shoreline.jpg
IMG_5.02 - ttp://www.bing.com/images/search?q=b angladesh+villages+meetings&go=&qs=n&form=QBI R&qft=%2Bfilterui%3Aimagesize-large&pq=banglades h+villages+meetings&sc=0-20&sp=-1&sk=#view=deta il&id=986849B521AD072079799925CA64DB0FF4BAD 371&selectedIndex=12
IMG_5.03 - http://cdn.c.photoshelter.com/imgget2/I0000Jb0G3wlVJ1Y/fit=1000x750/khasitribesrimangal-bangladesh-10.jpg
IMG_5.04 - http://www.rawstory.com/rs/wpcontent/uploads/2012/05/shutterstock_51887617615x345.jpg
Collective Morphogenesis Emergent Technologies and Design 265 264 REFERENCES 8
1. DOMAIN
2. METHODS
4. GEOMETRY STUDY
5. SYSTEM DEVELOPMENT
3. MATERIAL SCIENCE
IMG_5.05 - http://static4.demotix.com/sites/ default/files/imagecache/a_scale_large/1800-2/ photos/1362509795-traditional-village-fair-inbangladesh_1846452.jpg
IMG_5.06 - http://tuhinroy.files.wordpress. com/2013/04/dscn1631.jpg
IMG_5.07 - http://www.thedriftingwinemaker. com/2012/04/bali-paddy-fields-and-cattle-egrets. html
IMG_5.08 - http://farm9.staticflickr.com/8007/73917 76596_79e56b1467_b.jpg
IMG_5.09 - http://www.onearth.org/files/onearth/ article_images/08sum_bangladesh_a_slideshow.jpg
IMG 5.10 - http://upload.wikimedia.org/wikipedia/ commons/b/b1/Bangladesh_Fishing_2006.jpg
IMG_5.11 - http://www.khamarbd.com/old/11_ June/Scientific%20Entry.htm
IMG_5.12 - http://www.stuartmatthews.eu/index. php/stories/changing-tides-an-uncertain-future/
IMG_5.13 - http://practicalaction.org/blog/wpcontent/uploads/2013/11/flood-proof-well-inbangladesh1.jpg
IMG_5.14 - http://1.bp.blogspot. com/_76xUgRgjZYM/RsDR0NGiPMI/AAAAAAAABj8/ Hqx2evarDtY/s1600/Angkor+urban+sprawl++study+area.jpg
IMG_5.15 - http://eoimages.gsfc.nasa.gov/ images/imagerecords/4000/4995/aster_ angorwat_17feb04_15m.jpg
IMG_5.16 - http://humanandnatural.com/data/ media/44/angkor_wat_aerial_view.jpg
IMG_6.01 - http://static.panoramio.com/photos/ large/12545229.jpg
IMG_7.01 - http://wallpoper.com/ images/00/44/05/01/rice-field-naturesunset_00440501.jpg
IMG_7.03 - http://www.bbc.co.uk/schools/ gcsebitesize/geography/images/house_on_stilts.jpg
DIA_1.01 http://www.careclimatechange.org/index. php?option=com_content&view=article&id=4 2%3A+humanitarian-implications-of-climatechange%3D42&Itemid=44
DIA_1.03 - http://www.for.gov.bc.ca/hfd/library/ffip/ Kellerhals_R1989.pdf
Kellerhals, Rolf and Church, Michael. The Morphology of Large Rivers: Characterization and Management. in D.P. Dodge [ed.] Proceedings of the International Large River Symposium. 1989. Pg 34.
DIA_1.04 - http://www.for.gov.bc.ca/hfd/library/ffip/ Kellerhals_R1989.pdf
Kellerhals, Rolf and Church, Michael. The Morphology of Large Rivers: Characterization and Management. in D.P. Dodge [ed.] Proceedings of the International Large River Symposium. 1989. Pg 34.
DIA_1.05 - http://earthds.info/pdfs/EDS_15.PDF
Hamblin, Kenneth W. and Christiansen, Eric H. Shoreline Systems, Chapter 15. Prentice Hall. Earth’s Dynamic Systems. 1995 – 2010.
DIA_1.06 - http://www.nature.com/scitable/content/ ne0000/ne0000/ne0000/ne0000/25854505/1_2.
jpgBird, E. Coastal Geomorphology: An Introduction. Brisbane, Australia: John Wiley and Son, 2000.
DIA_1.08 - http://morphopedia.com/projects/floathouse, date visited 10th Oct 2013.
DIA_1.09 - http://bldgblog.blogspot. co.uk/2005_11_01_bldgblog_archive.html
DIA_1.11 - http://www.fao.org/docrep/010/ag127e/ ag127e09.htm
DIA_1.13 - http://www.islandnet.com/~see/weather/ events/sigcyclonebangladesh-images.htm
DIA_1.14 - http://www.islandnet.com/~see/ weather/events/sigcyclonebangladesh-images.htm
DIA_1.15 - http://www.adpc.net/casita/case_studies/ coastal%20hazard%20assessment/modelling%20 cyclone%20hazard%20in%20bangladesh/ background_information_on_the_storm_surge_ modelling.pdf
DIA_1.16 - http://freshclick.wordpress. com/2009/03/27/causes-of-the-flooding-inbangladesh/
DIA_1.17 - http://www.rrcap.ait.asia/pub/soe/ bangladesh_disasters.pdf
Regional Resource Centre for Asia and the Pacific.
Publication: State of the Environment Report –Bangladesh -2001. Part III: Key Issues: Natural Disasters. Pg. 93-117
Mohammad and Amir Faisal, Mostofa. Reducing Cyclone Impacts in the Coastal Areas of Bangladesh: A Case Study of Kalapara Upazila. Journal of Bangladesh Institute of Planners Vol. 5. December 2012. pg 185-197.
DIA_4.04/05/06 http://www.wmo.int/pages/ publications/bulletin_en/archive/60_2_en/60_2_ bangladesh_en.html
DIA_4.26 - http://www.waterwise.org.uk/data/ resources/25/Water_factsheet_2012.pdf - UK water standard http://iebconferences.info/356.pdf- Bangladesh water standard
DIA_3.01/02/03 - https://www.google. com/url?q=http://unaus.eu/pdf/A014. pdf&usd=2&usg=ALhdy29OKKifx3Bo_gW_ KBgMOS7MFSj2yg
DIA_3.04 - Gurit (2013). Guide to composites. p.22
DIA_3.05 - Gurit (2013). Guide to composites. p.23
DIA_3.06 - Gurit (2013). Guide to composites. p.15
DIA_3.07 - http://voodoohotrods.com/Library_ ImagesContent/3F8E20B7.jpg
DIA_3.08 - http://boatdesign.net/articles/foam-core/
DIA_5.02 - http://www.uwec.edu/jolhm/eh2/ molnar/map.htm
DIA_5.03 - http://www.disasterscharter.org/web/ charter/activation_details?p_r_p_1415474252_ assetId=ACT-256
DIA_5.04 - http://www.lged.gov.bd/ViewMap2. aspx?DistrictID=2 http://www.dmic.org.bd/csdb/
DIA_5.15 - http://www.slideshare.net/fahim002/ administrative-structure-of-bangladesh
DIA_5.18 - http://www.virtualbangladesh.com/ bd_geog_climate.html
DIA_5.19 - http://practicalaction.org/ricefishculture
DIA_4.01 - http://climatechange.worldbank.org/ sites/default/files/documents/EACC_Bangladesh.pdf
DIA_4.02 - http://www.uwec.edu/jolhm/eh2/ molnar/map.htm
DIA_4.03 - Ahamed, Sharbar; Mizanur Rahman,
DIA_5.20 - http://users.physics.harvard.edu/~wilson/ arsenic/conferences/Feroze_Ahmed/Sec_2.htm
DIA_7.08 - http://nidm.gov.in/PDF/safety/flood/ link2.pdf
Collective Morphogenesis Emergent Technologies and Design 267 266 REFERENCES 8
6. SYSTEM PROPOSAL
7. SYSTEM EVALUATION
1. DOMAIN
3. MATERIAL SCIENCE
4. GEOMETRY STUDY
5. SYSTEM DEVELOPMENT
7. SYSTEM EVALUATION
IMAGE / DIAGRAM INDEX
9.1 Scripts 9.2 Material Fabrication 9.3 Hydraulic System 9.4 Physical Models
APPENDIX 9
BENDING PARAMETRISATION
The following script was developed to translate a given surface into curved panels based on the described material system.
After the surface is panelised based on geodesic curves, the intersection points of those geodesic curves in U and V direction are connected with polylines. Those polylines are referred to the python script and act as control polygons to compare to the tangent vectors on each control point to the distance between them. With those information it is possible to interpolate the necessary slotting pattern for each edge profile and the panelised surfaces are redrawn based on the material behaviour.
The Data collected in the output Apex Shift and Twist Angles can be fed into the milling files for the slotting pattern on the edge curves respectively to the forming jig, combined with informations about edge length and rest length.
PYTHON SCRIPT
import rhinoscriptsyntax as rs
import Rhino import math import clr
clr.AddReference(“Grasshopper”)
import Grasshopper as gh from System import Object
BentSurface=[]
noSurface=[]
additionaTangs=[]
EdgeCurvesU=[]
EdgeCurvesV=[]
ContrPts=[]
segmentsU=[]
tangLinesUA=[]
tangLinesUB=[]
NewEdges=[] ContrPol=[]
Apex_shift=[]
Bending_ParameterU=[]
Bending_ParameterV=[]
TwistAngle=[]
EdgeProfile=[]
SCRIPTS
#:::::::::::::::::CONSTANT VALUES::::::::::::::::::::
startV=0.1
endV=0.9
# Material constant for bending lenght Domain matC=1.62
def edgecurves(u_Poly, EdgeCuves,BendPara): for i in range (len(u_Poly)): edgesNest=[]
Bending_Parameter=[]
#::::::::::::::SEGMENTS:::::::::::: seg_U=[]
ControlPoints=[]
seg_U=rs.ExplodeCurves(u_Poly[i]) for line in range(len(seg_U)): segmentsU.append(seg_U[line])
#::::::::::::::CONTROL POINTS____ EVALUATION
POINTS:::::::::::::::::
domain=rs.CurveDomain(seg_U[0])
ControlPoints=rs.CurvePoints(u_Poly[i])
#::::::::::::::COMPARE INTERPOLATION
CURVE::::::::::::::::::::::::: compareCurve=rs. AddInterpCurve(ControlPoints,3) dom=rs.CurveDomain(compareCurve)
#:::::::::::::Tangent Vectors::::::::::::: intersection=rs.CurveCurveIntersection(u_ Poly[i],compareCurve)
#print len(intersection)
evaluationPt=[]
evaluationParam=[] compareTangent=[]
for cp in range(len(ControlPoints)): closept=rs.CurveClosestPoint(compareCurve,C ontrolPoints[cp]) evaluationPt.append(ControlPoints[cp])
evaluationParam.append(closept)
for tang in range(len(evaluationParam)): tangente=rs.CurveTangent(compareCurve,eval uationParam[tang]) compareTangent.append(tangente)
#print len(evaluationPt)
#print “len seg_U:”,len(seg_U)
#print “len tangent:”, len(compareTangent)
#:::::::::::::::::::::Compare Tangents::::::::::::::::::::::::: for seg in range(len(seg_U)): controllPoints=[]
intersection=rs.CurveCurveIntersection(seg_U[ seg],compareCurve)
#print len (intersection)
#::::::::::::::If edgecurve is anticlastic:::::::::: if len(intersection)==3: #additionalCP=intersection[1][3] #additionalParam=intersection[1][7] movePtA=rs.PointAdd(evaluationPt [seg],compareTangent[seg]) tangLineA=rs.AddLine(evaluationPt[seg],m ovePtA)
#movePtAB=rs.PointAdd(additionalCP,10*a dditionalTang) #tangLineAB=rs. AddLine(additionalCP,movePtAB) movePtB=rs.PointAdd(evaluationPt[seg+1],compareTangent[seg+1])############### tangLineB=rs.AddLine(evaluationPt[seg+1], movePtB) angleA=rs.Angle2(seg_U[seg],tangLineA)
if InitialAngle==0 : tangFactor=0.5 #tangFactor2=0.5 #Bending_Parameter.append(tangFactor)
else:
tangFactor=math.fabs(((endV+startV)/2)DifferenceAngle*((endV-startV)/(InitialAngle-(-
InitialAngle)))) #Bending_Parameter.append(tangFactor) if tangFactor<0.1: tangFactor=0.1 #Bending_Parameter. append(tangFactor) elif tangFactor>0.9: tangFactor=0.9 #Bending_Parameter. append(tangFactor) bendFactor=math. fabs((1+(InitialAngle*((matC-1)/(52.5-0))))) #bendFactor2=1+(InitialAngle2*((matC-1)/ (52.5-0)))
# MOVE POINTS lengthSeg=rs.CurveLength(seg_U[seg])
contrPT1=rs.PointAdd(evaluationPt[seg],co mpareTangent[seg]*0.5*tangFactor*bendFactor*len gthSeg*2/3) contrPT2=rs.PointAdd(evaluationPt[seg+1],(1*compareTangent[seg+1])*(0.5*tangFactor)*bendF actor*lengthSeg*2/3) # EDGE CURVES controllPoints.append(evaluationPt[seg]) controllPoints.append(contrPT1) controllPoints.append(contrPT2) controllPoints.append(evaluationPt[seg+1])
edge=rs.AddCurve(controllPoints) NewEdges.append(edge) edgesNest.append(edge) Bending_Parameter.append(tangFactor)
else: #::::::::::::::If edgecurve synclastic controllPoints=[] movePtA=rs.PointAdd(evaluationPt[seg],co mpareTangent[seg]) tangLineA=rs.AddLine(evaluationPt[seg],m ovePtA) movePtB=rs.PointAdd(evaluationPt[seg+1],c ompareTangent[seg+1])
tangLineB=rs.AddLine(evaluationPt[seg+1], movePtB) yPoint=rs.EvaluateCurve(compareCurve,0.5
+seg-1)
plane=rs.PlaneFromPoints(evaluationPt[seg] ,evaluationPt[seg+1],yPoint) angleA=rs.Angle2(seg_U[seg],tangLineA) tangLinesUA.append(tangLineA) tangLinesUB.append(tangLineB) angleB=rs.Angle2(seg_U[seg],tangLineB)
InitialAngle=(angleA[0]+angleB[0])/2
DifferenceAngle=angleA[0]-angleB[0]
if InitialAngle==0: tangFactor=0.5
#Bending_Parameter.append(tangFactor)
else:
tangFactor=math.fabs(((endV+startV)/2)-
DifferenceAngle*((endV-startV)/(InitialAngle-(InitialAngle))))
#Bending_Parameter.append(tangFactor)
if tangFactor<0.1: tangFactor=0.1 elif tangFactor>0.9: tangFactor=0.9
#print tangFactor bendFactor=math. fabs(1+(InitialAngle*((matC-1)/(52.5-0)))) #print bendFactor # MOVE POINTS lengthSeg=rs.CurveLength(seg_U[seg])
contrPT1=rs.PointAdd(evaluationPt[seg],co mpareTangent[seg]*tangFactor*bendFactor*length Seg*2/3) contrPT2=rs.PointAdd(evaluationPt[seg+1],(1*compareTangent[seg+1])*(1tangFactor)*bendFactor*lengthSeg*2/3)
# EDGE CURVES controllPoints.append(evaluationPt[seg]) controllPoints.append(contrPT1) controllPoints.append(contrPT2) controllPoints.append(evaluationPt[seg+1])
edge=rs.AddCurve(controllPoints) Polygon=rs.AddPolyline(controllPoints) ContrPol.append(Polygon) NewEdges.append(edge) edgesNest.append(edge)
Bending_Parameter.append(tangFactor) EdgeCuves.append(edgesNest) BendPara.append(Bending_Parameter)
#::::::::::::::::::::::::::CALL DEFINTION:::::::::::::::::::::::::::: edgecurves(u_Curves,EdgeCurvesU,Bending_ ParameterU) edgecurves(v_Curves,EdgeCurvesV,Bending_ ParameterV)
#:::::::::::::::Create Surfaces::::::::::::::::::::::::::::::::: #print “U:”, len(EdgeCurvesU) #print “U[0]:”, len(EdgeCurvesU[0]) #print “V:”, len(EdgeCurvesV) #print “V[0]:”, len(EdgeCurvesV[0])
# Sort U and V Directions if len(EdgeCurvesV)>=len(EdgeCurvesU): UVDif=len(EdgeCurvesV)-len(EdgeCurvesU) for ed in range(len(EdgeCurvesU)-1): for e in range(len(EdgeCurvesV[ed])+UVDif):
Curves=[]
Bending=[] Angles=[] Curves.append(EdgeCurvesU[ed][e])
Bending.append(Bending_ParameterU[ed] [e])
Curves.append(EdgeCurvesV[e][ed])
Bending.append(Bending_ParameterV[e] [ed])
Curves.append(EdgeCurvesU[ed+1][e])
Bending.append(Bending_ ParameterU[ed+1][e])
Curves.append(EdgeCurvesV[e+1][ed])
Bending.append(Bending_ParameterV[e+1] [ed])
Apex_shift.append(Bending)
EdgeProfile.append(Curves)
srf=rs.AddEdgeSrf(Curves) BentSurface.append(srf) tang0=rs.CurveTangent(Curves[0],0) tang1=rs.CurveTangent(Curves[2],0) tang2=rs.CurveTangent(Curves[0],1) tang3=rs.CurveTangent(Curves[2],1) tang4=rs.CurveTangent(Curves[1],0) tang5=rs.CurveTangent(Curves[3],0)

Collective Morphogenesis Emergent Technologies and Design 271 270 APPENDIX 9
else:
tang6=rs.CurveTangent(Curves[1],1)
tang7=rs.CurveTangent(Curves[3],1)
angle0=rs.VectorAngle(tang0,tang1)
Angles.append(angle0)
angle1=rs.VectorAngle(tang4,tang5)
Angles.append(angle1)
angle2=rs.VectorAngle(tang2,tang3)
Angles.append(angle2)
angle3=rs.VectorAngle(tang6,tang7)
Angles.append(angle3)
TwistAngle.append(Angles)
print Angles
UVDif=len(EdgeCurvesU)-len(EdgeCurvesV)
for ed in range(len(EdgeCurvesV)-1): for e in range(len(EdgeCurvesU[ed])+UVDif):
Curves=[]
Bending=[]
Angles=[]
Curves.append(EdgeCurvesV[ed][e])
Bending.append(Bending_ParameterV[ed] [e])
Curves.append(EdgeCurvesU[e][ed])
Bending.append(Bending_ParameterU[e] [ed])
Curves.append(EdgeCurvesV[ed+1][e])
Bending.append(Bending_
ParameterV[ed+1][e])
Curves.append(EdgeCurvesU[e+1][ed])
Bending.append(Bending_ParameterU[e+1] [ed])
EdgeProfile.append(Curves)
srf=rs.AddEdgeSrf(Curves)
Apex_shift.append(Bending)
BentSurface.append(srf)
tang0=rs.CurveTangent(Curves[0],0)
tang1=rs.CurveTangent(Curves[2],0)
tang2=rs.CurveTangent(Curves[0],1)
tang3=rs.CurveTangent(Curves[2],1)
tang4=rs.CurveTangent(Curves[1],0)
tang5=rs.CurveTangent(Curves[3],0)
tang6=rs.CurveTangent(Curves[1],1)
tang7=rs.CurveTangent(Curves[3],1)
angle0=rs.VectorAngle(tang0,tang1)
print angle0
Angles.append(angle0)
angle1=rs.VectorAngle(tang4,tang5)
Angles.append(angle1)
angle2=rs.VectorAngle(tang2,tang3)
Angles.append(angle2)
angle3=rs.VectorAngle(tang6,tang7)
Angles.append(angle3)
TwistAngle.append(Angles)
#print angles
#:::::::::::::::::CURVATURE CHECK::::::::::::::::::::
for sf in range (len(BentSurface)):
#surf=rs.RebuildSurface(BentSurface[sf],[3,3],[5,5])
#print surf
rebSurf=rs.RebuildSurface(BentSurface[sf])
countU=6
countV=6
maxCurv=[]
minCurv=[]
dblCurv=[]
gaussCurv=[]
for u in range (1,countU-1,1):
for v in range (1,countV-1,1):
UV=[u*(1/(countU-1)),v*(1/(countV-1))]
Curvature=rs.SurfaceCurvature(BentSurface[
sf],UV)
maxCurv.append(math.fabs(Curvature[2]))
minCurv.append(math.fabs(Curvature[4]))
dblCurv.append(math.fabs(Curvature[2])+math. fabs(Curvature[4]))
gaussCurv.append(Curvature[6])
#print maxCurv[((countU-2)*(countV-2))-1]
#print minCurv[0]
#print “dbl”, dblCurv[((countU-2)*(countV-2))-1]
#print “gauss”, gaussCurv[((countU2)*(countV-2))-1]
for pc in range (len(maxCurv)):
if ((maxCurv[pc]<=0.2) and (minCurv[pc]>10)): # or (dblCurv[((countU-2)*(countV-2))-1]>3):# or (gaussCurv[0]<-10) : noSurface.append(BentSurface[sf])
print “min”, minCurv[pc] elif ((maxCurv[pc]>10) and (minCurv[pc]<=0.2)): noSurface.append(BentSurface[sf])
print “max”, maxCurv[pc],pc elif maxCurv[pc]>0.2 and minCurv[pc]>0.2 and gaussCurv[pc] >=7.5: print “gauss”,gaussCurv[pc] noSurface.append(BentSurface[sf])
if len(noSurface)>0:
Check=0
else:
Check=1
print TwistAngle def pythonListTGhDataTree(pythonList):
# Create GH datatree dataTree = gh.DataTree[float]()
# Add pythonlist sub lists to dataTree for i,l in enumerate(pythonList): for v in l: dataTree.Add(v,gh.Kernel.Data.GH_Path(i))
return dataTree
def pythonListGeoTGhDataTree(pythonListGeo):
# Create GH datatree dataTree = gh.DataTree[Object]()
# Add pythonlist sub lists to dataTree for i,l in enumerate(pythonListGeo): for v in l: dataTree.Add(v,gh.Kernel.Data.GH_Path(i))
return dataTree
TwistAngles= pythonListTGhDataTree(TwistAngle)
Apex_shifts= pythonListTGhDataTree(Apex_shift)
EdgeProfiles= pythonListGeoTGhDataTree(EdgeProf ile)
Panels=BentSurface
Error=noSurface
a=NewEdges
g=EdgeCurvesU
h=EdgeCurvesV
BRANCHING
The following script was developed to generate the water network. The scripts takes into account the number of start points, length and the angle between branches. It was developed such that branches could grow simultaneously from multiple points and clashing between the branched was avoided.
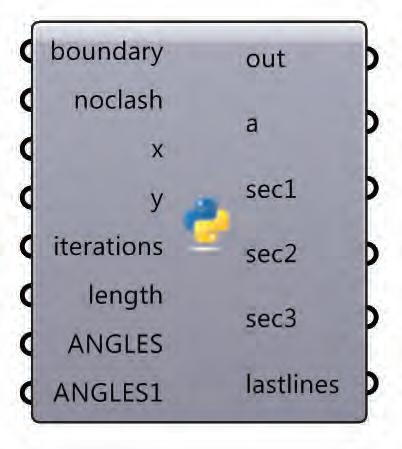
angle1 = a1
angle2 = a2
newUnitVec1 = rs.VectorUnitize(vector[i])
rotUnitVec1 = rs.VectorRotate(newUnitVec1,ang
le1,[0,0,1])
scaledVec1 = rs.VectorScale(rotUnitVec1,distan ce)
newPoint1 = rs.VectorAdd(point[i],scaledVec1)
newLine1 =rs.AddLine(point[i],newPoint1)
newUnitVec2 = rs.VectorUnitize(vector[i])
import rhinoscriptsyntax as rs curves=[] count=0 sec1=[] sec2=[] sec3=[] counter=0 lastlines=[] def recursion (point,vector,gens,count,counter,a1 ,a2): if gens== 0: return length1=len(point) clashcurves= boundary looppoints=[] loopvectors=[] for in range(length1): if count<10: distance = length[0]
angle1 = a1 angle2 = a2 elif count<20:
distance= length[1]
angle1 = a1
angle2 = a2
elif count<30:
distance= length[2]
angle1 = a1
angle2 = a2
elif count<41:
distance= length[3]
angle1 = a1
angle2 = a2
elif count>49:
distance= length[4]
rotUnitVec2 = rs.VectorRotate(newUnitVec2,ang le2,[0,0,1])
scaledVec2 = rs.VectorScale(rotUnitVec2,distan ce)
newPoint2 = rs.VectorAdd(point[i],scaledVec2)
newLine2 =rs.AddLine(point[i],newPoint2)
if noclash:
clashlist=clashcurves list1=[]
list2=[] for c in clashlist:
intersection1 = rs.CurveCurveIntersection(n ewLine1,c,5)
if intersection1:
intCoords1 = intersection1[0][1] intPoint1 =rs.AddPoint(intCoords1) if (rs.PointCompare(intPoint1,point[i]) == False) and (rs.IsPointOnCurve(newLine1,intPoint1) :
list1.append(1)
else: list1.append(0)
intersection2 = rs.CurveCurveIntersection(n
ewLine2,c,5)
if intersection2: intCoords2 = intersection2[0][1] intPoint2 =rs.AddPoint(intCoords2) if (rs.PointCompare(intPoint2,point[i]) == False) and (rs.IsPointOnCurve(newLine2,intPoint2)
list2.append(2)
else: list2.append(0) if counter==0: if list1.count(1)==0: clashlist.append(newLine1) loopvectors.append(scaledVec1) looppoints.append(newPoint1) curves.append(newLine1)
sec1.append(newLine1) if list2.count(2)==0: clashlist.append(newLine2) loopvectors.append(scaledVec2) looppoints.append(newPoint2) curves.append(newLine2) sec1.append(newLine2) elif counter >=1 and counter <=2: if list1.count(1)==0: clashlist.append(newLine1) loopvectors.append(scaledVec1) looppoints.append(newPoint1) curves.append(newLine1) sec2.append(newLine1) if list2.count(2)==0: clashlist.append(newLine2) loopvectors.append(scaledVec2) looppoints.append(newPoint2) curves.append(newLine2) sec2.append(newLine2) else: if list1.count(1)==0: clashlist.append(newLine1) loopvectors.append(scaledVec1) looppoints.append(newPoint1) curves.append(newLine1) sec3.append(newLine1) if list2.count(2)==0: clashlist.append(newLine2) loopvectors.append(scaledVec2) looppoints.append(newPoint2) curves.append(newLine2) sec3.append(newLine2) if len(looppoints)==0 and len(loopvectors)==0: return recursion (looppoints,loopvectors,gens1,count+10,counter+1, a1,a2) recursion(x,y,iterations,0,0,ANGLES,ANGLES1) a= curves
Collective Morphogenesis Emergent Technologies and Design 273 272
9 APPENDIX
PYTHON SCRIPT
SCRIPTS
APPENDIX 9
BRANCHING FOR AGRICULTURE INPUT [ASSIGNED VALUE] VARIABLES FITNESS CRITERIA
Length of branch [Max.: 100 m] [Min.: 16m]
Volume of storage capacity
Primary channel
Boundaries
Angle of branch: allowed maximum 10˚ movement at start point
Start points count: [Max.: 30] [Min.: 2]
Distance between start points on primary
No intersections allowed
DISTRIBUTION_New ponds + Agriculture [ outer boundary channels]

DISTRIBUTION_New Ponds + Agriculture [outer boundary] channels
HYDRAULIC SYSTEM
DIA_9.05 Branching rules for external agriculture
Existing road as a boundary condition
DISTRIBUTION_New Ponds + Secondary branching
DISTRIBUTION_New Ponds + Secondary branching
secondary path primary channel
rotation of branch allowed to deviate 10˚
distance between points no clash rule
DISTRIBUTION_Capacity of New Ponds + Tertiary branching
DIA_9.07 Phases of hydraulic system
DISTRIBUTION_Capacity of New Ponds + Tertiary branching
of water once flood has receded
larger capacity at agricultural side affects branching for housing
DIA_9.06 Differentiated branching growth for external and internal side
Collective Morphogenesis Emergent Technologies and Design 277 276
+ + + + + Primary channel Secondary channel Branch 1 Branch 2 Branch 3 Area of Branch 1 (sq.m) Area of Branch 2 (sq.m) Area of Secondary channel (sq.m) Volume of water in Secondary channel (cu.m) Volume of water in Branch 1 (cu.m) Volume of water in Branch 2 (cu.m) Total Volume of Water (cu.m) Length of Branch1 (m) Length of Secondary (m) Total Length of channel (m) Number of Generation Cluster Side Number of nodes on External Side Agircultural Side Volume of water (cu.m) Total Length of channel (m) Area of channel (sq.m) Maximum Length of channel (m) Number of connections Minimum Length of channel (m) Length of Branch 2 (m) Total Volume of Water in the channels (cu.m) 360 240 360 180 120 540 3 3 3513 390 1171 47 12 15.5 240 600 400 600 300 200 900 5 5 2942 327 980 47 10 16 400 600 1200 450 300 150 1650 4 5 2052 228 684 47 7 16 1200 600 600 450 300 150 1050 4 5 3440 382 1146 83 7 22 600 600 1430 150 300 50 1780 5 5 985 109 328 19 7 11.5 1430 Agriculture Cluster a b c d e Area of Branch 1 (sq.m) Area of Branch 2 (sq.m) Area of Secondary channel (sq.m) Volume of water in Secondary channel (cu.m) Volume of water in Branch 1 (cu.m) Volume of water in Branch 2 (cu.m) Total Volume of Water (cu.m) Length of Branch1 (m) Length of Secondary (m) Total Length of channel (m) Number of Generation Cluster Side Number of nodes on External Side Agircultural Side Volume of water (cu.m) Total Length of channel (m) Area of channel (sq.m) Maximum Length of channel (m) Number of connections Minimum Length of channel (m) Length of Branch 2 (m) Total Volume of Water in the channels (cu.m) 360 240 360 1080 720 240 2040 180 120 540 3 3 3513 390 1171 47 12 15.5 240 5553 600 400 600 1800 1200 400 3400 300 200 900 5 5 2942 327 980 47 10 16 400 6342 600 1200 450 1350 1200 1200 3750 300 150 1650 4 5 2052 228 684 47 7 16 1200 5800 1200 600 3150 5 3440 382 1146 83 7 22 6590 1200 1430 3080 5 985 109 328 19 7 11.5 4065 Agriculture Cluster a b c d e Primary channel Secondary channel Branch 1 Branch 2 Branch 3 Length of Branch1 (m) Length of Secondary (m) Total Length of channel (m) Number of Generation Cluster Side Number of nodes on External Side Agircultural Side Volume of water (cu.m) Total Length of channel (m) Area of channel (sq.m) Maximum Length of channel (m) Number of connections Minimum Length of channel (m) Length of Branch 2 (m) 180 120 540 3 3 3513 390 1171 47 12 15.5 240 300 200 900 5 5 2942 327 980 47 10 16 400 300 150 1650 4 5 2052 228 684 47 7 16 1200 300 150 1050 4 5 3440 382 1146 83 7 22 600 300 50 1780 5 5 985 109 328 19 7 11.5 1430 Agriculture Cluster a b c Agircultural Side Total Length of channel (m) Maximum Length of channel (m) Number of connections Minimum Length of channel (m) 390 47 12 15.5 327 47 10 16 228 47 7 16 382 83 7 22 109 19 7 11.5 Agriculture Cluster a b c d
STORAGE_Collection
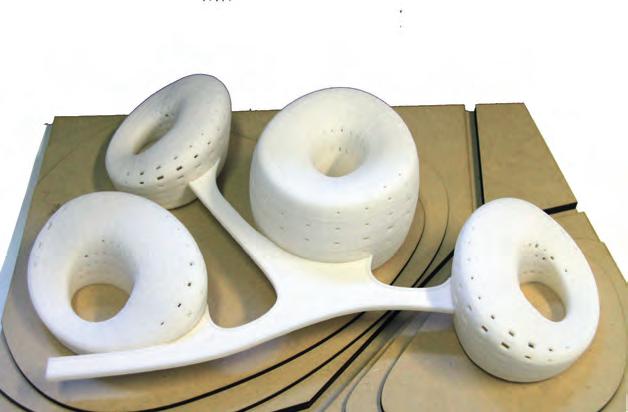
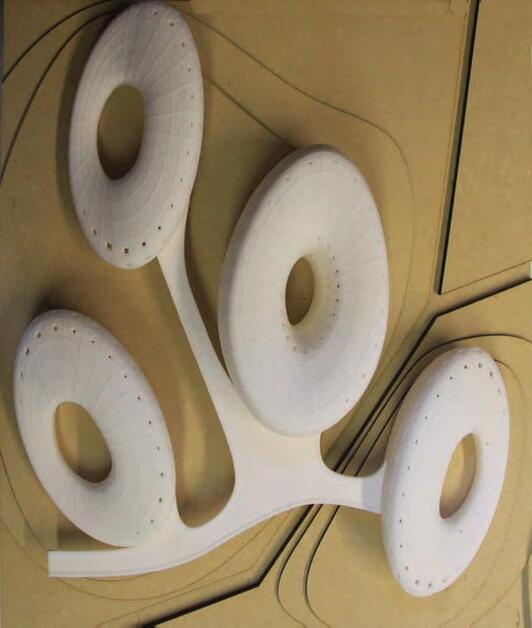
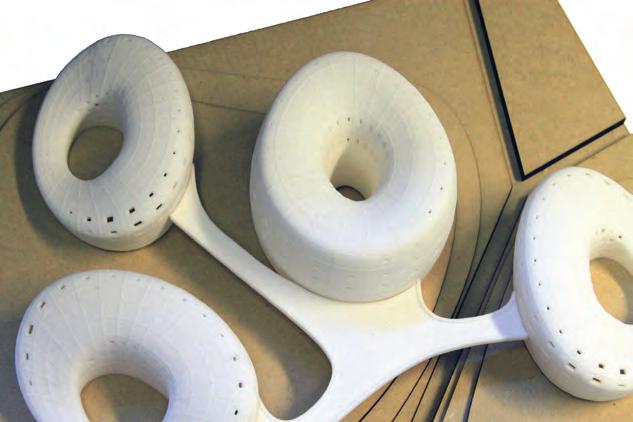


Collective Morphogenesis Emergent Technologies and Design 279 278 47 109 106 104 133 149 42 43 BRAIDING BARRIER repetitive objects allows smooth flow follows object curvature pockets of space orientation of object disrupts flow SINGLE OBJECT object is unaffected flow around the first 47 109 106 104 133 149 42 43 BRAIDING BARRIER repetitive objects allows for smooth flow POCKETS1 2 3 4 flow follows object curvature into pockets of space wide orientation of object disrupts flow SINGLE OBJECT second object is unaffected by flow around the first 4 3 2 47 109 106 104 133 149 42 43 BRAIDING BARRIER repetitive objects allows for smooth flow POCKETS1 2 3 4 flow follows object curvature into pockets of space wide orientation of object disrupts flow SINGLE OBJECT second object is unaffected by flow around the first 4 3 2 47 109 106 104� 133 149 42 BRAIDING BARRIER repetitive objects allows for smooth flow 2 3 4 wide orientation of object disrupts flow SINGLE OBJECT second object is unaffected by flow around the first 1 4 3 2 106 104 133 149 BARRIER 3 4 wide orientation of object disrupts flow SINGLE OBJECT second object is unaffected by flow around the first 1 4 3 2 47 109 106 104 133 149 42 BRAIDING BARRIER repetitive objects allows for smooth flow 2 3 4 wide orientation of object disrupts flow SINGLE OBJECT second object is unaffected by flow around the first 4 3 2 106 104 133 149 BARRIER 3 4 wide orientation of object disrupts flow SINGLE OBJECT second object is unaffected by flow around the first 1 4 3 2 133 149 BARRIER 4 wide orientation of object disrupts flow 4 3 MORPHOLOGY DRIVEN BY FUNCTION 0 1 2 3 4 Initial state Orientation Single object extension Joinery Wall Object unification Outlet Inlet DIA_9.08 Function and morphology
MORPHOLOGY AND PHYSICAL MODELS APPENDIX 9


