Glossary
Aided Assembly : Process of planning and producing a designed part through an aid of information for enhancing the assembly process. The information can be through various physical or digital states and the aid can be via additional means like computers or robots.
AR- Augmented Reality : Technology used to blend computer generated virtual objects or environments with real world environments by providing a composite view.
Automated Assembly : An assembly process where the use of automation by mechanical or electric means is imbibed to control the operation. The purpose is to reduce potential exposure, time and effort with a goal to maintain or improve quality.
BIM - Building Information Modelling: A process involving the generation and management of digital representations of physical and functional characteristics of places. A BIM is a shared knowledge resource for information about a facility forming a reliable basis for decisions during its life-cycle; defined as existing from earliest conception to demolition.
CAD- Computer Aided Design: The use of computer systems to assist in the creation, modification, analysis, or optimization of a design.
CAM- Computer Aided Manufacturing: The use of computer software to control machine tools and related machinery in the manufacturing of work pieces.
FEA- Finite Element Analysis: A computerized method for predicting how a product reacts to real-world forces, vibration, heat, fluid flow, and other physical effects.
FEM- Finite Element Methods: Technique for finding approximate solutions to boundary value problems for partial differential equations.
Game engine : A software framework designed for the creation and development of video games where core functionality typically includes a rendering engine for 2D or 3D graphics, a physics engine or collision detection, localization support and a scene graph.
HD- High Definition : Hi-def or HD, commonly refers to an increase in display or visual resolution over a previously used standard. Generally any video image with considerably more than 480 to 576 horizontal lines is considered high-definition.
HUD- Head Up Display : In video gaming, the HUD or Status Bar is the method by which information is visually relayed to the player as part of a game’s user interface. The HUD is frequently used to simultaneously display several pieces of information.
8 Transient Systems Transient Systems
Interactive physics simulation : Digital simulations by computational tools or engines with predefined solvers and relationships of physical parameter (e.g., gravity, force, speed, spring constants) that can be measured for interactive simulation, optimization and form-finding.
Object Recognition : A task within computer vision of finding and identifying objects in an image or video sequence. This task is still a challenge for computer vision systems and many approaches to the task have been implemented over multiple decades.
Object Tracking : The process of locating a moving object or multiple objects over time using a camera. It has a variety of uses, some of which are: human-computer interaction, security and surveillance, augmented reality and video editing.
MAR- Mobile Augmented Reality : Technology where augmented reality is incorporated in mobile devices like phones, tablets, glasses etc using applications that can integrate user surrounding context into virtual information and overlay digital information on existing surroundings through the devices.
Mega Events : Short term large scale leisure and tourism events, such as Olympic games or World fairs, which have long term impacts or consequences for the hosting locations.
Rigid body dynamics : The study model of movement of systems of interconnected bodies under the action of external forces. The model assumes that the bodies are rigid, which means that they do not deform under the action of applied forces,which simplifies the analysis by reducing the parameters describing the configuration of the system to the translation and rotation of reference frames attached to each body.
Spring system : In engineering and physics, a spring system or spring network is a model of physics described as a graph with a position at each vertex and a spring of given stiffness and length along each edge.
Transient Systems : Transient systems are open systems in architecture that maintain stability by adjusting, adapting or transforming to the forces of change with time.
VR- Virtual Reality : Virtual reality is an artificial environment that is created with software and presented to the user in such a way that the user suspends belief and accepts it as a real environment. The environment can be interacted with in a seemingly real or physical way by a person using special electronic equipment however virtual reality it replaces the real environment with a digital one.
4D- Fourth Dimension : the dimension of time, which is necessary in addition to three spatial dimensions to specify fully the position and behaviour of a point or particle
9 Glossary
Transient Systems 10 Transient Systems
This research explores transient architectural systems as a means of regulating the long term consequences of ‘mega events’. Mega events are large scale events such as the Olympic games which have long term consequences for the cities that host them. Within this context, the research studied the potentials of using folded sheet configurations to create a portable and reconfigurable structure as a temporary arena for use in such events. Through a series of digital and physical experiments a component based folded sheet system was developed. The use of the proposed structure after the event was as important as its use during the event and the design team therefore attempted to explore the ability of the material system to adapt to different contextual and programmatic scenarios. The post-event use of a market was proposed and structural and environmental analysis of the system at various scales were used to understand the properties of the folded sheet system in different configurations and develop protocols for its use. For both iterations of the structure, an assembly and structural logic were devised as both designs acted at different scales and performed different functions.
The reversibility of the system was one of the main design drivers and for this purpose different assembly methods were evaluated. It was understood that the data for the system’s assembly and disassembly was as important as the component design itself and therefore specific attention was given to developing methods for linking assembly data to the system components. As part of these explorations, object tracking and Augmented reality applications were explored as tools for overlaying real-time construction information for the assembly and disassembly of the system components. Experiments across multiple scales were conducted to study the various methods of translating digital geometrical information into a series of guided physical manipulations. The research was conducted in Msc and MArch phases and concluded with an outline of the proposed assembly, disassembly and reconfiguration strategy for the structure as well as an overview of the detailing and material requirements of the component. The viability of using the proposed guided assembly methods was also assessed and suggestions for its implementation into realistic construction scenarios were given.
11 Abstract
Abstract

1. Introduction
Transient systems in architecture are being developed as a response to a rise in impermanent structures needed for temporary events. These systems are designed to change in response to feedback and maintain their stability by making adjustments based on the needs of their users. These characteristics of transient systems offer a degree of control and flexibility throughout the life of a structure on both the material and building scale. This allows for a level of architectural adaptability which extends the life of a structure allowing it to be used and re-used multiple times.
Concepts such as ‘pre-cycling’ are being introduced in architectural construction where a strategy for the second and third lives of a building is devised to prolong its period of usefulness before it needs to be demolished. While on a building scale this translates to the design of an adaptable building, on a material level, this concept requires a degree of flexibility within the construction method itself as well as in the material system. (Kenneth Powell,1994)

Introduction 13
One of the most challenging aspects of the construction industry is building redundancy which leads to the demolition and unnecessary disposal of structures and their parts. Most buildings are demolished with no or little attempts for recovery of their constituent parts causing a large scale problem of material waste and exploitation of resources. (Durmisevic and Yeang, 2009)
Buildings are designed for a single life or use, and their assembly processes reflects the lack of consideration for future adaptability of the systems and their components. In current building systems, the functions and materials are integrated into one closed and dependent structure. These structural systems do not allow for alteration or disassembly due to their lack of flexibility and rigid nature. Such inability to remove and exchange building systems and their components results not only in significant energy and material consumption but also causes increased waste production and lack of spatial adaptability. If the building sector is to respond to such global environmental and economic challenges, it needs to adopt new construction methods. Rather than destroying structures and built systems to adapt them to new
Transient Systems 14 Transient Systems
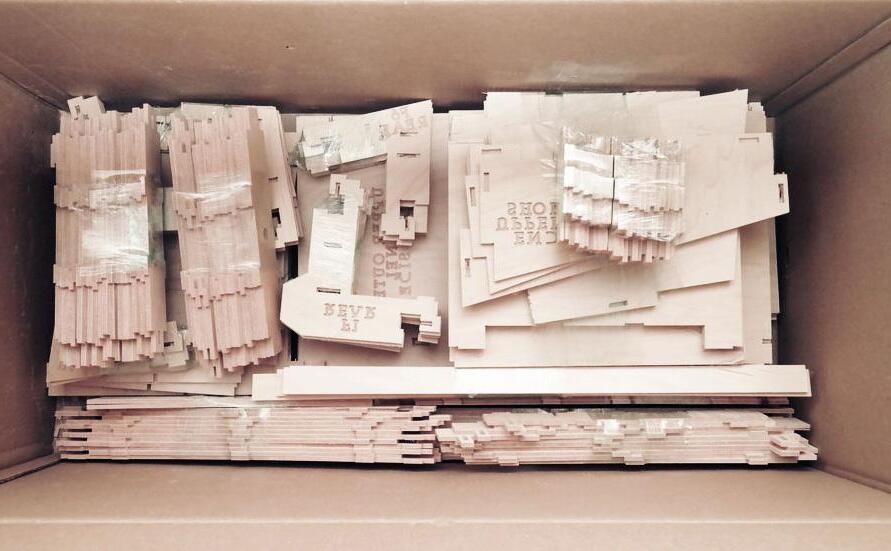
Img 1.1 (Top)
WikiHouse components fabricated and packed in a container that can be assembeled into a structure for a residence.
Img 1.2 (Right)
A dismantled Volkswagen Golf M2 with all the parts ready to be assembled.
requirements, structures need to be disassembled with the potential for their components to be reassembled in new configurations. This requires considerations for how parts of the built systems are accessed and replaced, and how they are integrated so that they can be replaced later on.

Temporary structures are currently being used in environments which require quick and easy to assemble units such as for mining and natural gas extraction sites, emergency housing for natural disasters or mega events. In these cases the elements could be sent out as a kit, assembled in a week and used for up to few years before they are reconditioned and re-used. Solutions like WikiHouse and Ikea products also propose houses that can be designed, shipped and built from a “kit”. One has only to look at the pre-assembly of roof trusses, advances in panelized construction, and the prefab industry to see that many of the components are already in place. Off-site manufacturing of such system components have the advantages of being built in controlled environments, to tight tolerances, and gaining efficiencies of robotic fabrication. When combined with computerization and modular
design, the possibilities for customizing allow users to make their own changes throughout the life of the building. These temporary structures can also be used to address the bigger question of embodied energy and the effective use of materials. (Durmisevic and Yeang, 2009)
To explore the possibilities of transient architecture the Idea of Design for disassembly was considered for the development of the system. Design for Disassembly i.e, DfD in the built environment can be defined as “the design of buildings to facilitate future change and the eventual dismantlement (in part or whole) for recovery of systems, components and materials. This design process includes developing the assemblies, components, materials, construction techniques and information management systems to accomplish this goal”. (Brad
Guy and Nicholas Ciarimboli, 2008)
Introduction 15
2. Domain
“Mega-Events (large scale leisure and tourism events, such as Olympic Games and World Fairs) are shortterm events with long-term consequences for the cities that stage them. They are associated with creation of infrastructure and event facilities often carrying long-term debt and always requiring long-term use programming. In addition, if successful they project a new (or renewed) and perhaps persistent and positive image and identity of the host city through national and international media, particularly TV, coverage. This is usually assumed to have long-term positive results in terms of tourism, industrial relocation, and inward investment.”
 Roche, 1994
In this study mega-events will be understood as being temporary touristic events which have a lasting impact on the host country and its population. These events have evolved as catalyst for economic growth in developing countries as they not only provide a source of financial gain but are also seen as a way to refresh a counties image through increased publicity. For the purposes of this study, the Olympic Games have been selected as the focus of the research since they have a much larger impact on their host country then other similar scale events (such as the FIFA World cup or World Expos) due to their high cost , number of visitors and relatively short duration.
Domain 17
Olympics
The Olympic Games have a significant effect on their host cities due to their high costs, number of visitors and relatively short duration.
The Olympics are considered to be a leading global athletic competition. They can be described as a cultural phenomenon with growing worldwide influences, which have strong impacts on host cities along with long-lasting effects. Olympics are often used as an opportunity for implementing urban strategies for the regeneration of a particular zones; as well as infrastructure development and economic growth for a host city. (Sivaev, 2013)
Since the large profit of $2.3 billion was realised through 1984 Olympics in Los Angeles, the number of cities bidding to host the Olympics have increased significantly. Although a positive economic impact was not seen again until Barcelona Olympics 1992, which registered a direct benefit of $30 million. Cities of developing countries such as Beijing and Rio de Janeiro have tried similar reforms. The major impact on Barcelona was not the immediate financial profit, but the long-lasting legacy and tourism development as a result of its improved image. Even though there are many examples of cities that have benefited from hosting the Games, it is still unclear what the exact reasons and preconditions for such success are. (Berger, 2013)
Chapter 2 18 Transient Systems
Fig 2.1 (Top Right) Comparative radar chart for mega events with multivariate data in relation to the resources and measures involved.
Fig 2.2 (Bottom Right) Bar charts showing information comparing Olympics held at London and Greece.
Mega Events
Population (million)
Tickets Sold (million)
Number of Venues Permanent Venues Temporary Venues
Existing Venues
Cost (billion £)
Athens, Greece (2004)
London, UK (2012)
Domain 19 0 6 12 Participants (Hundreds) World Expo Olympi c Ga World Cup Venues (Locations) Cost (Billion $) Duration (Weeks) Visitors (Million) Participants (Hundreds) World Expo Olympic Games World Cup Visitors (Million) 3.1 3.8 36 31 8.9 1 4 8.2 8.2 34 8 7 19 9
Expo Olympic Games World Cup
World
The Impact of Olympics
Past studies in relation to the impacts of Olympic Games on their host cities indicate that if a host city has a pre-defined strategy for the games it leads to a notable positive effect, not only for the 16 days of hosting the Games, but also for the post-game period and the lasting legacy. Most bidding cities focus mainly on winning the bid itself and staging successful games, however they neglect the post-game scenarios. The impact these games have on the host city or region are complex and extensive. The prevalent worldwide opinion on effects of hosting mega-events is that they primarily lead to positive results. However, when separate cases of cities hosting the Olympic games are analysed, this is not necessarily applicable to all of them. (Cashman,
2002)
One of the most distinguishable impact for the Olympic games is the transformation of urban spaces. Hosting such an event involves the construction of stadia and upgrades for an efficient transport network. Moreover, infrastructure development which is not directly related to the Olympics also increases. Since
Chapter 2 20 Transient Systems
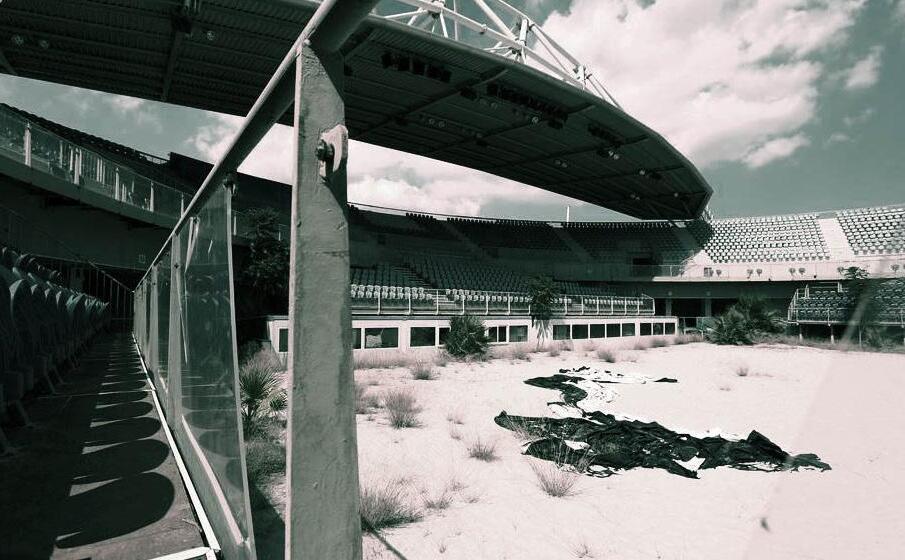
Img 2.1 (Above)
Photograph of a sports stadium left abandoned in Athens, Greece.
Img 2.2 (Right)
London Olympic stadium which was built for 2012 with parts to be disassembled and adapted to the post game requirements.
hosting the Games requires vast investments in the built environment, socio-economic factors are often used for urban regeneration processes. If implemented successfully, the urban transformation is undoubtedly positive. (Malfas,
 Theodoraki, Houlihan,
2004)
As an expensive and highly complex activity, the games involve both private (commercial) and public (governmental) interests for maximised financial profit,as well as social and economic benefits. Perhaps the major motivation for hosting the Olympics is the opportunity for improving the international image of the host city and to benefit from an increased stream of tourists, foreign investments and influx of skilled workers. (Sivaev, 2013). The increased demand, which is achieved mainly through increased tourist inflow results in boosted business activities. This leads to higher employment, extra profits and therefore higher total income. The negative effect from this process is the possibility of rapid inflation before and during the Games. There is also evidence of eviction of locals, forced to move either temporarily for the Games period or permanently so that the residential area can be demolished and Olympic-
related construction can take place. Therefore it is of great importance for the host city to evaluate and plan the investments. If the venues do not meet an adequate use after the Games there is a risk of them being abandoned. In the recent years debates have taken place on whether it is costeffective to maintain the Olympic venues after the games, this has opened up possibilities and tendencies for temporary buildings construction and multipurpose permanent venues for such events. (Malfas,
Theodoraki, Houlihan, 2004)
Sustainable Development
The 2004 summer Olympic games in Athens, have emerged as a symbol for poor planning and damage that Olympics can cause to a host city. Through the Olympic Games, Athens was given the opportunity to acquire world class sporting venues for a long-term use. Hence most of the venues were built as permanent structures. Thousands of additional tourists were expected during and after the games, for which accommodation facilities also needed to be provided. (Kasimati, 2006 )
Domain 21
According to the initial strategy for the Olympic project, as stated in the Athens Bid File in 1997, the Athens region would benefit significantly from the development and upgrade of the infrastructure and facilities – financially, socially and culturally. The aim was the improvement of Athens’ image and urban development of the area to promote year round tourism. However the lack of a proper post-Olympic plan lead to a drastic mismanagement of resources. Although various scenarios for the post-Olympic, such as reuse of the facilities had been developed, the future of more than 25 Olympic venues was still unresolved. Many of the venues were abandoned such as the venue for ice hockey which was built as a permanent structure even though Greece does not have a national team or the beach volleyball venue which is not being used currently since the sport is being practiced outdoors on the natural beaches. (Kasimati, 2006 )
Following the economic failure of the 2004 Olympics, future host cities have opted for a sustainable approach to the games where proper strategic architectural planning for the postOlympic use of the stadiums and new facilities

Chapter 2 22 Transient Systems
Img 2.3 (Above)
Aerial photograph of London Olympics 2012 showing the urban development of east London.
is taken into account. In contrast to what was done in Athens, the London 2012 Olympics enforced sustainability as a key driver for the design, management, town planning, and building operations. The project execution combined new, existing and temporary venues with a focus on sustainable procurement, use of sustainable materials and sustainable designs that were applied consistently across all venues. (Aukett, 2012).
The 2012 Olympics design strategy was based on a set of key sustainable guidelines:
• Reduce overall footprint of the venues
• Design modular sets rather than bespoke
• Minimise materials with high environmental impact
• Explore opportunities for energy efficiency
• Reduce need for ventilation and air conditioning
• Designing for temporary removable infrastructure
Furthermore an integrated urban strategy was devised for the construction of the Olympic Park which was seen as an opportunity for the urban revival of East London. Large residential developments were constructed near the Olympic Park, which were converted for residential use after the Games including Stratford City which became a major business centre. After the Games, the Lower Lea Valley benefited from one of the largest new urban parks in Europe, with an enhanced network of restored waterways and new wildlife habitats. The Park formed a part of London’s extensive green network, linking into the wider Lea Valley Park. There were worldclass sports facilities available for both local use and as training grounds for elite athletes and it provided a foundation for hosting future worldclass events. (Eurosport, 2012)
Rio Olympics 2016
As a context for the study, the research proposal will be targeted at the upcoming 2016 Olympics in Rio de Janeiro, Brazil. The decision to host the games in Rio formed part of the Brazilian government’s plan to regenerate the city and promote it globally through the medium of sports.
In the report submitted as part of the bidding process, the city’s authorities emphasised that hosting the 2016 Olympic games would speed up the transformation of the city through major infrastructure investments for the long term development of Rio de Janeiro. In the report it was stated that the development strategy takes into account the post-Olympic use of the buildings and infrastructure that will be created as a means of further developing the city’s landscape. (International Olympic Comitee, 2011)
Investigations will be directed towards improving the city’s infrastructure and regenerating the poorer areas of the city. The authorities claim that the Olympics will be a form of ‘self affirmation’ for the Brazilian people as this will be the first time that the games will be held in a South American country. Based on this fact, the government believes that the investment in the infrastructure required for the Olympic games will be worthwhile and can be viewed as an investment in the country’s future. Most of the city’s Olympic investment will be spent on building the sporting venues required to host the Olympic events and developing the facilities required to handle the temporary increase in the city’s population . Over and above this, the city plans to invest a further USD 11.1 billion into infrastructure and transport systems for the city itself in order for it to be able to cope with the high number of tourists brought about by the games. As part of their strategy for a sustainable development plan, USD 685 million is to be set aside for the construction of temporary venues including the overlay and operations and the management of the villages for the media and technical officials which will contain over 25,000 people. (Rio 2016™ Organising Committee , 2013)
Domain 23
Sporting
Budget : Rio 2016 City
Budget : Rio 2016
Budget for Venues
2.82 billion USD
proposed as a budget for the 2016 Olympic games with over a quarter of it spent on venues.
11.1 billion USD
Budget for Games
additionally to be spent on improving the city’s infrastructure with a large portion of it being spent on new transport networks
Temporary Venues
As part of the measures to reduce negative environmental and economic impact of 2016 Olympics, the organisational committee had stated that it intended to use more sustainable practices in transportation, logistics, construction and urban improvement. Because of the various large scale sporting events held within the city in the past the committee intended to reduce the amount of new venues being constructed by using existing venues where possible. The aim was to avoid the construction of new facilities where venues already existed and limit new constructions only to the cases where there is a post-event demand criteria which validated their use after the games. Among the 36 venues to be used during the games, only 11 of them were constructed, 16 were to be housed in existing structures and the remaining 9 temporary. The committee believed temporary venues form a crucial part of the sustainability strategy since they can be used to house other events. The strategy highlights that these structures must have the capability of being disassembled, reused, processed and moved around so as not to go to waste after the Games.
(Rio 2016™ Organising Committee , 2013)
Chapter 2 24 Transient Systems
event
development
Fig 2.3 (Above) Graphs showing Rio 2016 sports and urban development budgets.
Fig 2.4 (Right) Chart showing venue distribution and sports to be held at Rio Olympics 2016.
Rio 2016 Venues New Competition Venues
Existing Competition Venues Temporary Competition Venues External Competition Venues
- Capabilities to be disassembled
-Reusable Properties
-City development potentials
-Recyclable Materials
-Post Olympic Adaptability
Domain 25 Football
Archery
Footbal
Canoe Wrestling Judo Basketball
FencingSwimming
New
BeachVolleyball
21% 26% 12% 41% Handball
Footbal Rowing Athletics Canoe Wrestling Judo Basketball Tennis Cycling FencingSwimming
External
26% 12% Handball Temporary External New Existing Sustainable
Football Football
Badminton Table tennis Boxing Cycling GymnasticsShooting Equestrian Sailing Diving Voleyball
Rowing Athletics
Tennis Cycling
Temporary Competition Venues
Competition Venues External Competition Venues Existing Competition Venues 7 9 4 14 Football Weightlifting
Pentathlon RaceWalkandCycling Marathom swimming Field hockey Cycling
Football Football Football Voleyball
Temporary Competition Venues New Competition Venues
Competition Venues Existing Competition Venues 7 9 4 14
Strategy
Transient Systems
Design for Disassembly is a process of designing a system that can be taken apart at the end of its usable life for the components to be reused and/or recycled.
Large span transient systems are being developed as a response to a rise in the need for impermanent structures for temporary events. Throughout this research, temporality was taken to be one of the proposed system’s main design drivers and the concept of ‘Designing for disassembly’ was explored. Design for Disassembly (DfD) in the built environment can be defined as “the design of buildings to facilitate future change and the eventual dismantlement (in part or whole) for recovery of systems, components and materials. This design process includes developing the assemblies, components, materials, construction techniques, information and management systems to accomplish this goal”. (Brad Guy and Nicholas Ciarimboli, 2008) For temporary architectures the responsibilities shared by architects and engineers dealing with consumption and waste in the 20th century have begun to shift. This results in a change in construction methods and material usage, because of the difficulties of determining what the future for any building holds. This has brought about changes in the way materials are used and recovered, and changes in how buildings are able to perform throughout their life cycle. (Gines. M & Beorkrem. C, 2009)
Chapter 2 26 Transient Systems
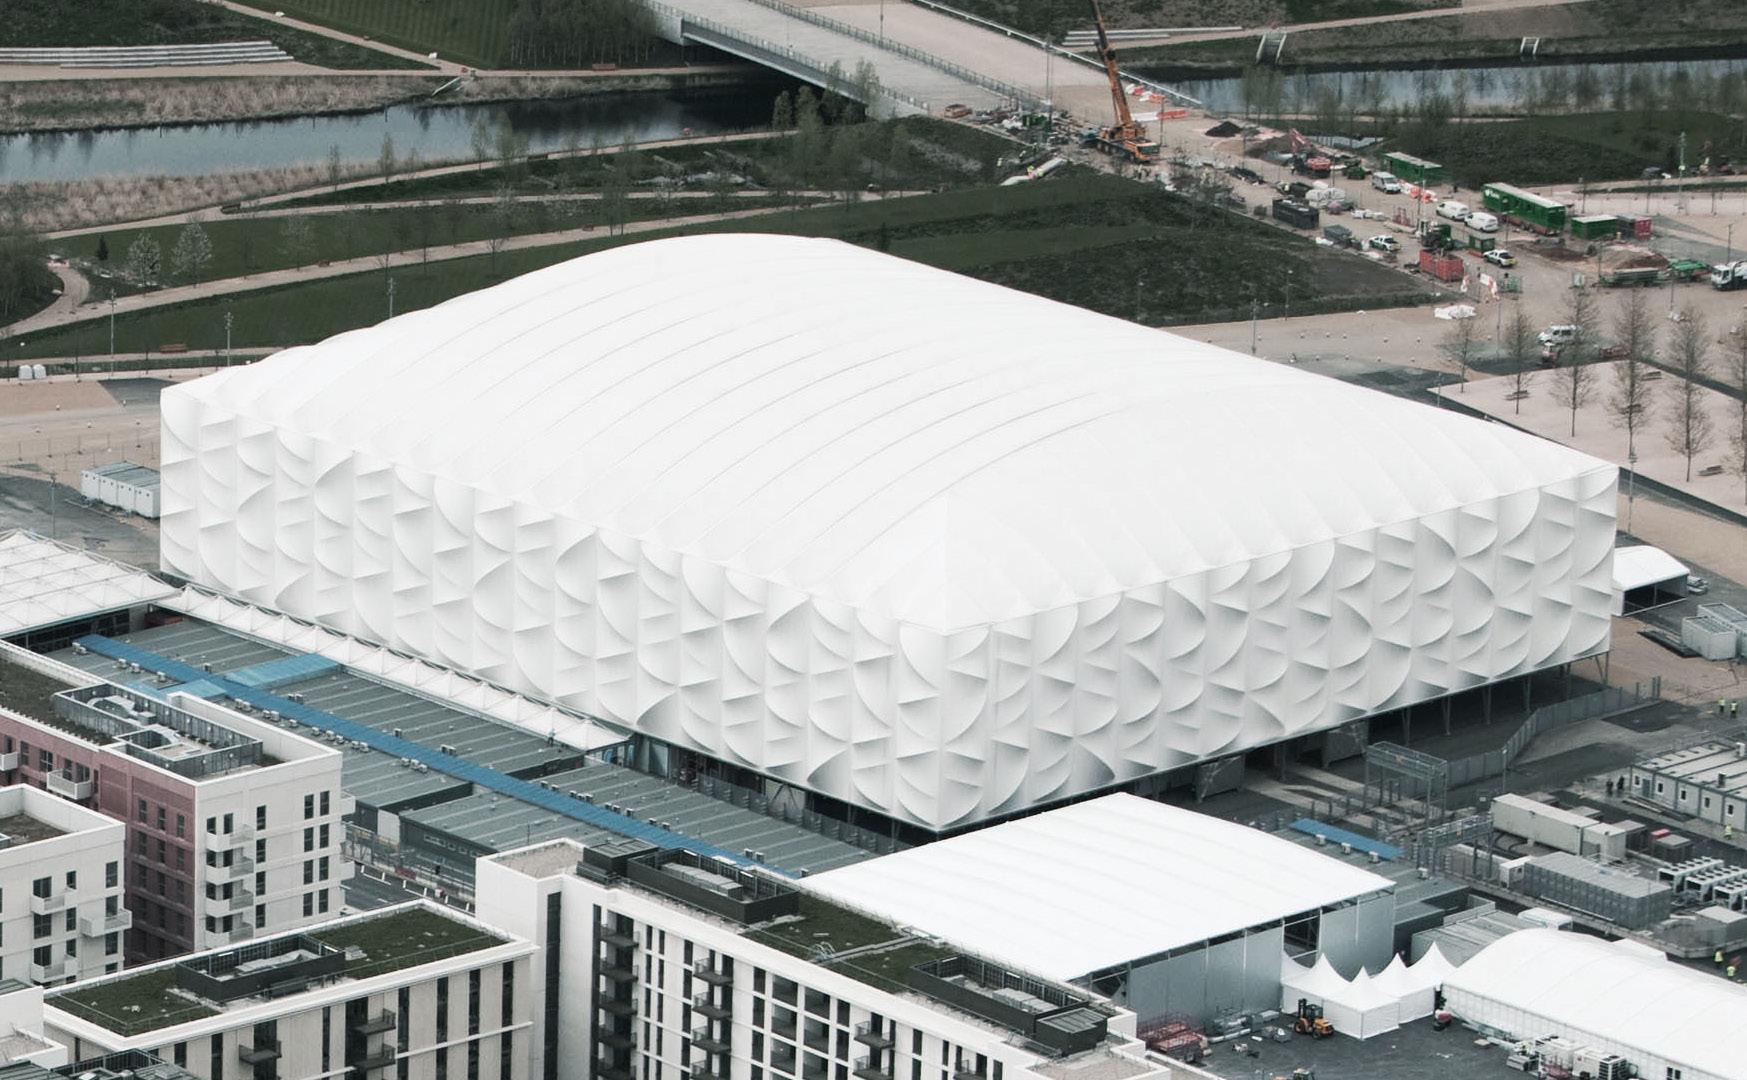
Img 2.4 (Right)
An aerial view of the London basketball arena which was a successful temporary structure used for Olympics.
Fig 2.5 (Next page) Charts explaining the types of transient systems.
Design for Disassembly
Design for Disassembly, is a new design model where the architect or designer may not typically be involved in a building’s demolition, but can be responsible for a building’s afterlife. The strategy defined during the conception of such structures can be responsible for defining the method of demolition or disassembly for the buildings leading to decisions in the construction process that can result in its “death” and burial in a landfill, or through the process of disassembly, creating the possibility for an “after-life” for the components that once stood together as an assembly. (Gines. M & Beorkrem. C, 2009)
Design for Disassembly, is one major method of optimization and performance enhancement of a structure. By considering holistic changes to assembly, component development, systems design and establishing a culture of re-usable building components and materials. Design for Disassembly can be a method of design that supports future change, it allows buildings to transform and adapt as society and patrons need it to. This method of design simply provides the
ability to recover, reuse, rebuild and reconfigure materials. (Hill Professional, 2003.)
Off-site manufacturing and fabrication techniques play a large role in the design for disassembly process. They have improved the efficiency of the construction process by allowing for the creation of unique building components to tight tolerances. These methods have introduced automation into parts of the construction process; however limitations in terms of their adaptability have restricted their on-site use. Furthermore in a fully automated assembly process most of the tools are suited to only one particular task and are not able to be adapted to different scenarios (Hill Professional, 2003.). These issues along with problems of material management, coordination and assembly sequencing of the components once they leave the factory environment have affected the efficiency of the overall process and hinder the introduction of automated techniques onto the construction site . (Gines. M & Beorkrem. C, 2009)
Domain 27
Frame Structures
Inflatable Structure
Modular Structure
Case Studies
- Olympic Basketball Arena, London, UK (2012)
-Olympic Shooting Arena, London , UK (2012)
Case Studies
- ArkNova Concert Hall, Matsushima, Japan (2013)
-Dragonfly Inflatable Pavilion, Jena, Germany (2009)
Olympic Basketball Arena, London, Uk (2012)
Case Studies
- KREOD pavilion Olympic 2012 London, UK (2012)
-IBM travelling pavilion 20 European cities (1983)
Chapter 2 28 Transient Systems
DfD in an Olympic Context
Portability, reconfigurability and flexibility are some of the major properties required for a system to be re-used. For the purposes of this thesis transient systems were categorized into 3 main groups in relation to their structure and construction:
1. Frame Structures
2. Inflatable Structures
3. Modular Structures
There have been successful executions of each structure as temporary venues however within the context of the Olympics, frame structures such as the London 2012 Basketball Arena are generally the most successful construction systems for temporary venues.
The 2012 Olympic Basketball Arena is one of the largest temporary competition venues built in the history of the Olympic Games. At a cost of € 49 million, the dimensions of the arena are longer than a football pitch and almost as tall as a sevenstorey building, the arena measures 115 metres in length and 35 metres in height. The structure is covered in 20,000 m² of a white recyclable PVC fabric. The design received planning permission in March 2009 on the condition that two-thirds of the materials and elements within the building can be reused or recycled after the Games.
The framework construction of the terraces are separate from the main structure and can be easily dismantled, allowing for maximum flexibility. At its maximum seating capacity, the Basketball Arena with 12,000 seats can also be used for handball games, as well as for other kinds of ball games during the Olympics. However the terrace flexibility allows for the seating capacity to be reduced to 10,000 for the greater space requirement of the Paralympic phase. Conversion of the multipurpose hall can be completed within a day thanks to the structures reconfigurability. The construction which occurred over a period of 6 weeks, consisted of erecting a 30m high rectangular volume made out of a steel portal frame which was then wrapped in 20,000 sqm of lightweight, phthalate-free and recyclable PVC plastic. An interwoven blackout layer was used in the roof fabric, this reduced most of the daylight during game sessions and maintained a fully
controllable artificial lighting system for use by the media and game spectators.
In the case of its deconstruction, the 12,000 seats are planned to moved to Silverstone for use in the Formula One car racing track and the outside structure may be shipped to Brazil for the 2016 summer Olympics. However according to the Brazilian officials, this scenario would probably not be realised due to the high transportation costs and storage issues which outweigh the cost of it being constructed from new in Brazil with locally sourced materials. For now the arena has been dismantled and is pending sale.
Domain 29
Aided Assembly
Aided assembly can be described as a “Process of planning and producing a designed part via an aid of information”.(Engelke,
The success of a temporary structure relies heavily upon its method of assembly and disassembly as well as the ways in which the assembly data is transmitted to the workforce. As part of this research into temporary structures, methods of linking assembly data with the building components were explored so as to develop protocols for an aided assembly process that can guide the structure’s reconfiguration.
On-site operations that cannot be fully or partially automated (and often involve human labourers) can be supplemented through the use of technologies which allow for the linking of the digital assembly data with the individual construction components. This guided assembly process is not a different form of building construction, but the addition of a new layer of construction data onto current methods (Gines & Beorkrem, 2009). On site construction methods currently rely upon craftsman-based construction processes, where a craftsman gathers construction knowledge through thousands of hours of apprenticeships and practice. “Assembly differs from construction in that it requires very little skill; it does not rely on information
Chapter 2 30 Transient Systems
1987)
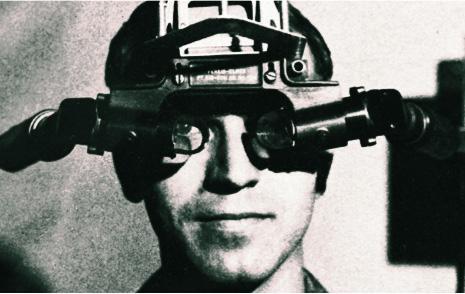
Img 2.5 (Right)
The “Sword of Damocles” head-mounted display, the original augmented reality headset, 1968.
Fig 2.6 (Next page) Augmented Reality and object tracking setup and requirements.
passed on through experience or development through apprenticeship. Assembly comes from a hierarchical understanding of groups of assemblies that are all connected through a series of steps.” . (Kieran and Timberlake, 2003)
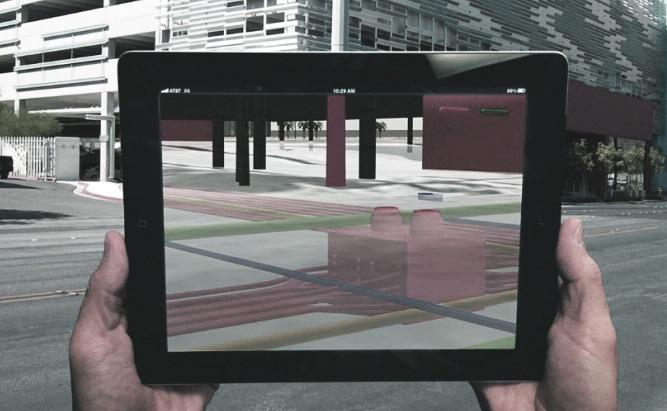
Guided assembly under this context is described as a “Process of planning and producing a designed part via an aid of information” (Engelke, 1987). In the past, physical guides such as paper manuals, diagrams for sequences or conductors who would orchestrate the sequence were the major controllers of guided assembly. However, since the development of modern technologies capable of storing and relaying large amounts of data, these analog guides have been replaced with digital information. With the rise of personal mobile devices capable of carrying large amounts of construction data, the link between building component and assembly data is being bridged (Mekni M & Lemieux, 2014). Within this context, object tracking and augmented reality are explored as another set of technological implementations which enhance the construction process by supplementing operations that cannot be fully or partially automated.
Digital Object Tracking (Augmented Reality)
“The term Augmented Reality (AR) is used to describe a combination of technologies that enable real-time mixing of computer-generated content with live video display.” (Azuma R,1997) These systems involve relaying real-time construction information or assembly logics to the user with the scope of improving the accuracy and reducing the duration of construction. The aim of this research was to assess the feasibility of using object tracking and augmented reality as real-time assembly aids, as well as the potential of applying this technology to construction scenarios. Through a series of experiments on different scales, different methods of overlaying construction information were tested and a guided assembly sequence for the system was developed.
Currently the process by which relevant data is acquired from physical space is through the tracking of image targets through a camera device, the processing of this information by object tracking software and finally the translation
Domain 31
Hardware
Software / Tools
a. Personal Laptop
b. HD Webcam
Image Targets
c. Game engine Software
e. 3D Modelling Software
g. Scripting Platform
d. Augmented Reality Extension
f. Parametric Modelling Software
h. Custom Developed Tools
i. Flat Image Target
k. Cuboid Image Target
Chapter 2 32 Transient Systems
of this data into geometrical information that the designer can use or attach information to. This information is then relayed back to the assembler through a hand held display or head-up display in order to guide him through the assembly process. Currently image targets have specific requirements and their quality can have a big effect on the entire process. Specifically, the images should be as big as possible in relation to the camera’s field of view, their patterns should be non-repetitive and finally they should include shapes with high contrast and colour differentiations. The targets for recognition could be flat, cuboid or cylindrical printed images, 3D Scanned objects or any scene photographed and uploaded into the software. On the other hand, any desired data or geometries could be scripted or imported inside the software and then projected into the used screen on top of the physical space video. In this occasion, image targets are only used for the positioning of the developed information on the screen and in relation to the camera. This allows for the positioning of 3D digital information or geometry onto a recorded space which can relay construction information to the user in real time and potentially create visual markers for the construction of complex geometries.
Opportunities and limitations
Augmented reality software could be explored in each stage of a project from the design phase to construction and eventually post completion (Rana Abboud,2014). In an architectural context, the on-site transmission of information could form the basis for discussions among the designers and clients, leading to potential changes and improvements. Under the same context, the augmented visualization can be used to test the scale of the project components while also for early clash detections. Furthermore, 4D content could also be visualized on-site or directly on the drawing boards so that different time phases of the project could further inform the design process. These technological implementations could serve as the interface between the virtual and real environment as a means of communicating all the relevant information to the interested parties. In Post-Completion, Mobile Augmented Reality (MAR) could be used to supplement facilities management procedures, for way finding and site navigation and in general as a means of interaction
between the users and the design space.
In this context MAR could be used for geo-locating data on site that could be directly linked to BIM applications thus helping with monitoring the site and the construction progress. Secondly, on site visualizations could be used for real time field updates , material management organisational tasks and 4D phasing of the construction sites. Overlaying different time phases of the construction could help in organising each task, in spotting potential hazards and in an attempt to improve the efficiency of the process while reducing the cost and time needed for completion. Finally, during the construction process, MAR applications could be used to support assembly and disassembly tasks. These means of enhancing the assembly processes of complex structures will form the main focus of this project under the context of portable reconfigurable structures.
However both hardware and software limitation have limited the use of AR as a viable construction tool. Currently the technology required to overlay digital information on the physical world is still in its infancy and even though it is available, is not yet able to allow for the successful implementation of augmented reality on the construction site (Judy Schriener,2014). In addition, on-site tracking challenges and the lack of industry standards are still drawbacks for the MAR applications in construction. Human factors are also a consideration for the industry. The users resistance to change could prove to be a significant issue since traditional techniques should first be proven to be less efficient in comparison to the new ways before they are abandoned or differentiated. Moreover, safety hazards are one of the main concerns for the industry since potential head-up display hardware used could distract the worker. Financial constraints are also an important issue preventing the uptake of MAR applications. Currently hardware and software development costs could still be expensive enough to prevent the construction industry from investing in relevant research and applications.
Domain 33
Current Architectural Applications
While several manufacturing businesses such as the automotive and aerospace industries have already found successful ways of implementing MAR as part of the assembly process, the examples are limited under an architectural context. An applicable study was conducted in 2015 at the UCL, London where an application was developed to enhance the assembly process of prototypes as a proof of concept. The application can be used for assembly sequence and positioning purposes of simple components in a small scale. As described by the authors, the project presented potentials as a tool for enhancing the assembly process through visual suggestions as well as limitations in scale and accuracy due to object tracking difficulties. (Buyuklieva Boyana & Kosicki Marcin , 2015)
In construction, mobile AR is being used to overlay BIM data onto the construction site. Under this context, AR users can undertake site inspections and directly monitor on-site work progress. On-site visualization is another possible design oriented
Chapter 2 34 Transient Systems
a. Personal Laptop b. Software/tools c. HD Webcam d. Image Targets
Img 2.6 (Right) Photograph showing overlay of BIM data on construction site.
Fig 2.7 (Above) Augmented Reality data system flowchart.
applications of MAR as shown by the work of the VTT Augmented reality research team, that in 2011 presented an intended hotel complex to local authorities for planning approval through AR. “The audience noted that the use of AR ‘gave a better impression of the building volume than other methods and helped them ‘to understand the plans’ Mobile AR Visualization of Jätkäsaari/Kämp Tower Plans in Helsinki City. (Rana Abboud,2014)
Experiment Goals
It was understood that the implementation of Augmented reality applications in construction within an architectural context is limited and still presented some constraints and drawbacks. However, the team decided to further explore aided assembly techniques and object tracking techniques in an attempt to identify its possible potentials as a construction aid for temporary structures. For the research, sheet folding was chosen as the process upon which all assembly data would be based and object tracking and augmented reality software were used as tools to guide the assembly of the proposed system. Experiments across multiple scales
were conducted to study the various methods of translating digital geometrical information into a series of guided physical manipulations. Through these experiments, the viability of using digitally guided assembly techniques, as well as the potential of applying them in construction scenarios was assessed. The research concludes with a description of the benefits and drawbacks of the possible scenarios in which the technology may be used, and outlines suggestions for the further developments of the system as a tool for the post-construction and evaluation.
Domain 35
Architectural Goals
As part of the design strategy for the proposed system, the first and second life of the structure were determined so as to act as the basis for all design decisions. The first life of the structure would be as one of the nine temporary venues required by the 2016 Rio Olympics proposal. It was decided that the venue for boxing will be tackled as it is one of the venues which requires a fully sheltered arena large enough to house 500 people and must span a maximum distance of 30m. The second life of the structure would be as a canopy structure for an outdoor street market, which are a common feature of Rio’s urban environment. The idea of precycling was considered during the design stage where the Olympic use was purely based on the functional requirements, however the post Olympic use was directed towards developing a sustainable strategy. The market function was not only considered as a contextual response but was looked upon as a socio-economic regenerator for the host city. Since both proposed uses operate at different scales, it was therefore necessary to design a structural system which was capable of achieving large spans as an arena while simultaneously being able to allow for the required reconfigurability of a street market.
Chapter 2 36 Transient Systems
Architectural system goals were established after understanding the contextual responses and deriving the design problems through precedents studies.
Fig 2.9 (Next page) Diagram explaining the properties of transient systems extracted as goals for the system.
Fig 2.8 (Right) System goal diagram for the first and second life of the structure.
Domain 37
Life
Arena Olympic
Life
Market Post Olympics 50 0 Weeks 16 0 Time Duration : 16 weeks Meters Maximum Span : 30 m 50 0 Weeks 15 0 Time Duration : 3 weeks Meters Maximum Span : 30 m
First
:
Duration Second
:
The qualities that facilitate this reuse of the structure were extracted through case studies. An analysis of the various possible construction and deconstruction techniques that allow for the required flexibility were carried out too and the desired properties required for the system where grouped into three main categories. The system would be designed to be transportable; integrated and re-configurable.
Transportable
For the system to be re-usable within the context of the Olympics, it must be designed to be transportable. To create truly sustainable and reversible architecture for the Olympic games the material system itself must not only be demountable but must be easy to transport to the location where it is required. As was the case with the London Basketball Arena, most reusable structures fail because the cost of transporting them from one location to the next sometimes outweighs the cost of rebuilding with new materials in the new location. Therefore designing the system to be easy to transport is a key factor for facilitating its reuse. In the case of the Olympics, the transportability requirements may occur on two levels; the national level and the international level. Once the Olympic games are over and the material system’s first use has ended, the material system may be transported to another location within the country itself to fulfil a secondary use that is related to the needs of that particular area or it may be transported overseas and be reused multiple times within the Olympic context. From previous examples, it has been seen that the latter scenario is not always practical since the cost of overseas transportation is high and political or logistical complications may arise. Therefore for the purpose of this thesis we will be considering transportability of the system within the immediate area to be the main target and international transportability to be a secondary goal.
Integrated
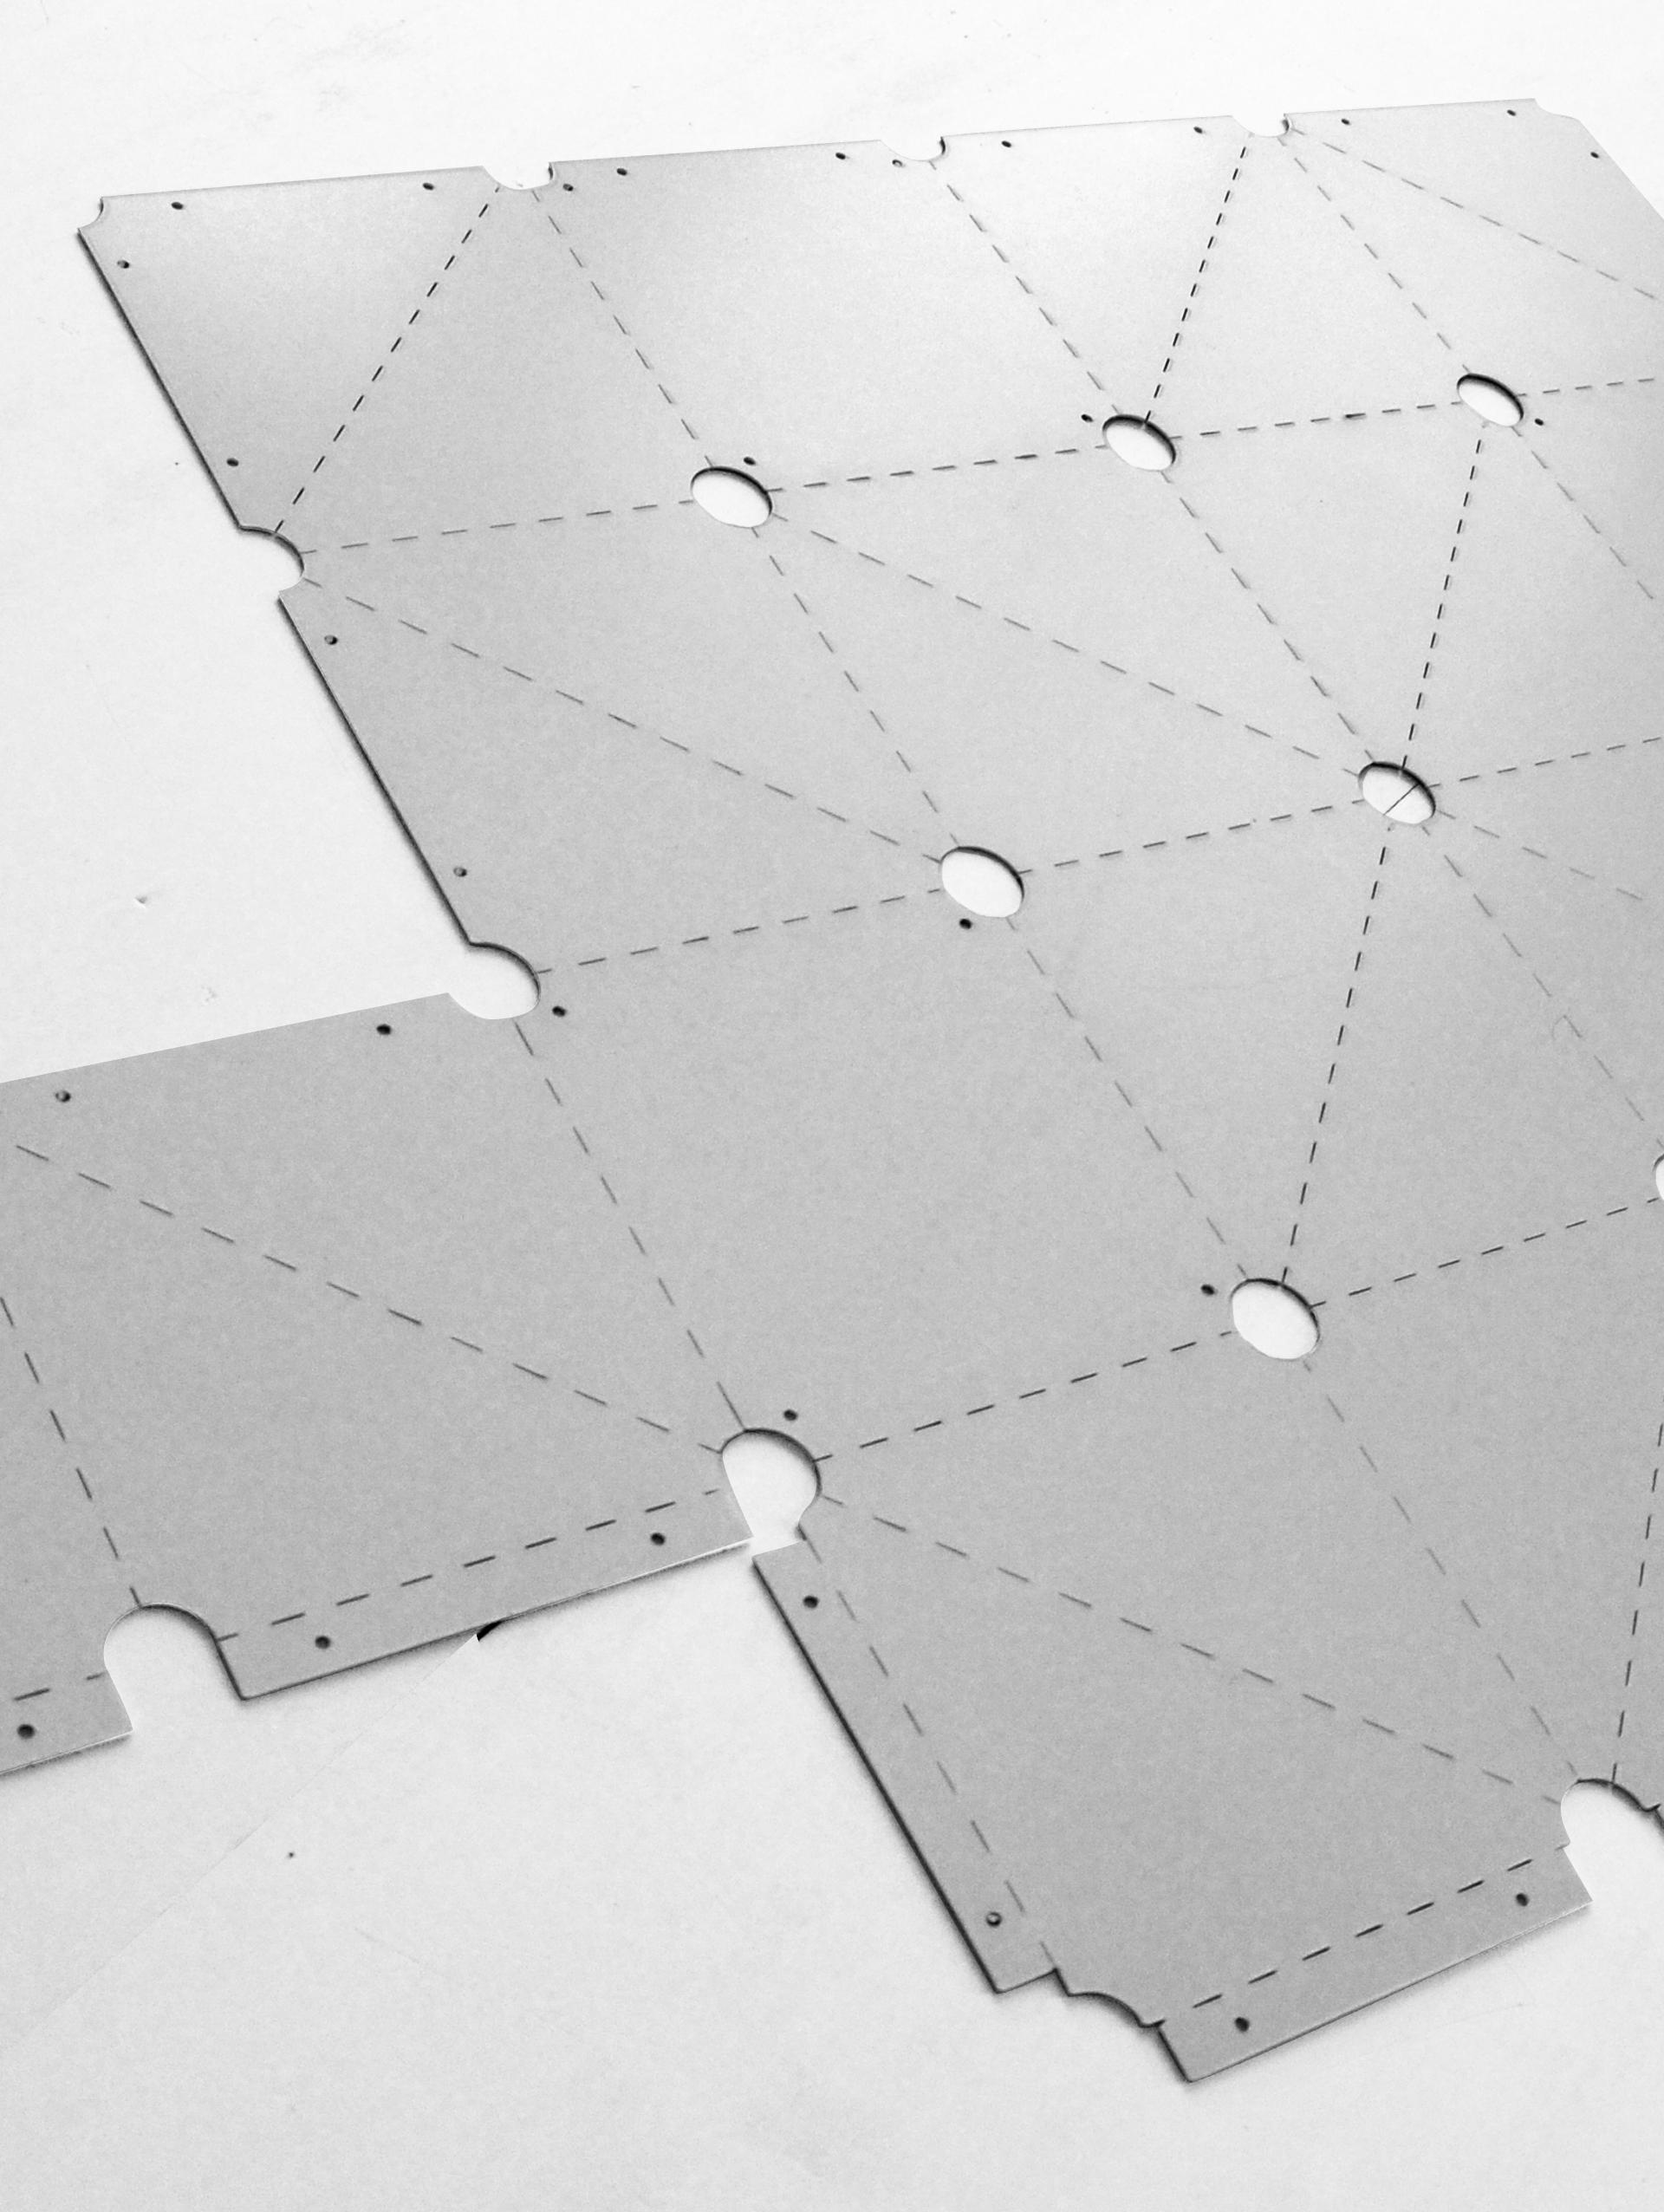
The ability for the system to be reused depends on its ease of construction and deconstruction. To facilitate these processes, it was decided to simplify the material system by integrating the
structural elements within the cladding or facing elements. This was done through the use of folds which would provide the structural depth and rigidity in the surface material while also integrate the surface and structure into one element. Through the design of a system which utilises surface folds as the main structural elements, it was possible to simplify the system and reduce the amount of separate parts therefore making it easier for the system to be assembled and disassembled.
Re-configurable
The reuseability of a system is limited by its ability to adapt itself to the requirements of the multiple functions that it will be required to perform. This reconfigurability within the system can be divided into 3 levels depending on the scales at which it acts. The local level of reconfigurability deals with each individual component that forms the material system and how each singular component can be altered to achieve different structural or functional requirements. The regional level relates to the interaction between one component and the next and how certain changes within one component may induce or effect changes within another. The global scale relates to the entire structure and how the overall form of the structure can be changed to achieve different functional and structural requirements across the whole system. For reconfigurability to be achieved across these scales, it was necessary to have standardised elements which can take various forms rather than multiple elements which have set forms. Standard components that can be reconfigured allowed for the system to be able to take various forms on the global scale through controlled manipulations at the local and regional scale.
Chapter 2 38 Transient Systems
Properties:
-Few separate parts
-Compact / Packable
-Lightweight
Properties:
-Integrated surface & structure
-Easy to assemble
-Composite functionality
Properties:
-Standardised Elements
-Multiple Configurations
-Alterable/Changeable
Domain 39
Re-Configurable Integrated Transportable

3. Methods
Methods explored for the purposes of developing the system included physical folding studies that led to the selection of a folding pattern. These were then studied further through digital simulations and physical prototypes to identify the pattern’s potentials and limitations in regards to the project ambitions. FEA tools were then used to analyse the structural performance of the system under various load conditions to achieve structural stability. Moreover, aided assembly and object tracking techniques were developed and evaluated for their potential capacities of enhancing the assembly process of complex reconfigurable structures. Environmental analysis like solar gain, shadow pattern and rain water runoff were studied in order to understand the performance of the system. These explorations coupled with the design ambitions led to the overall system development.

41 Methods
Folding
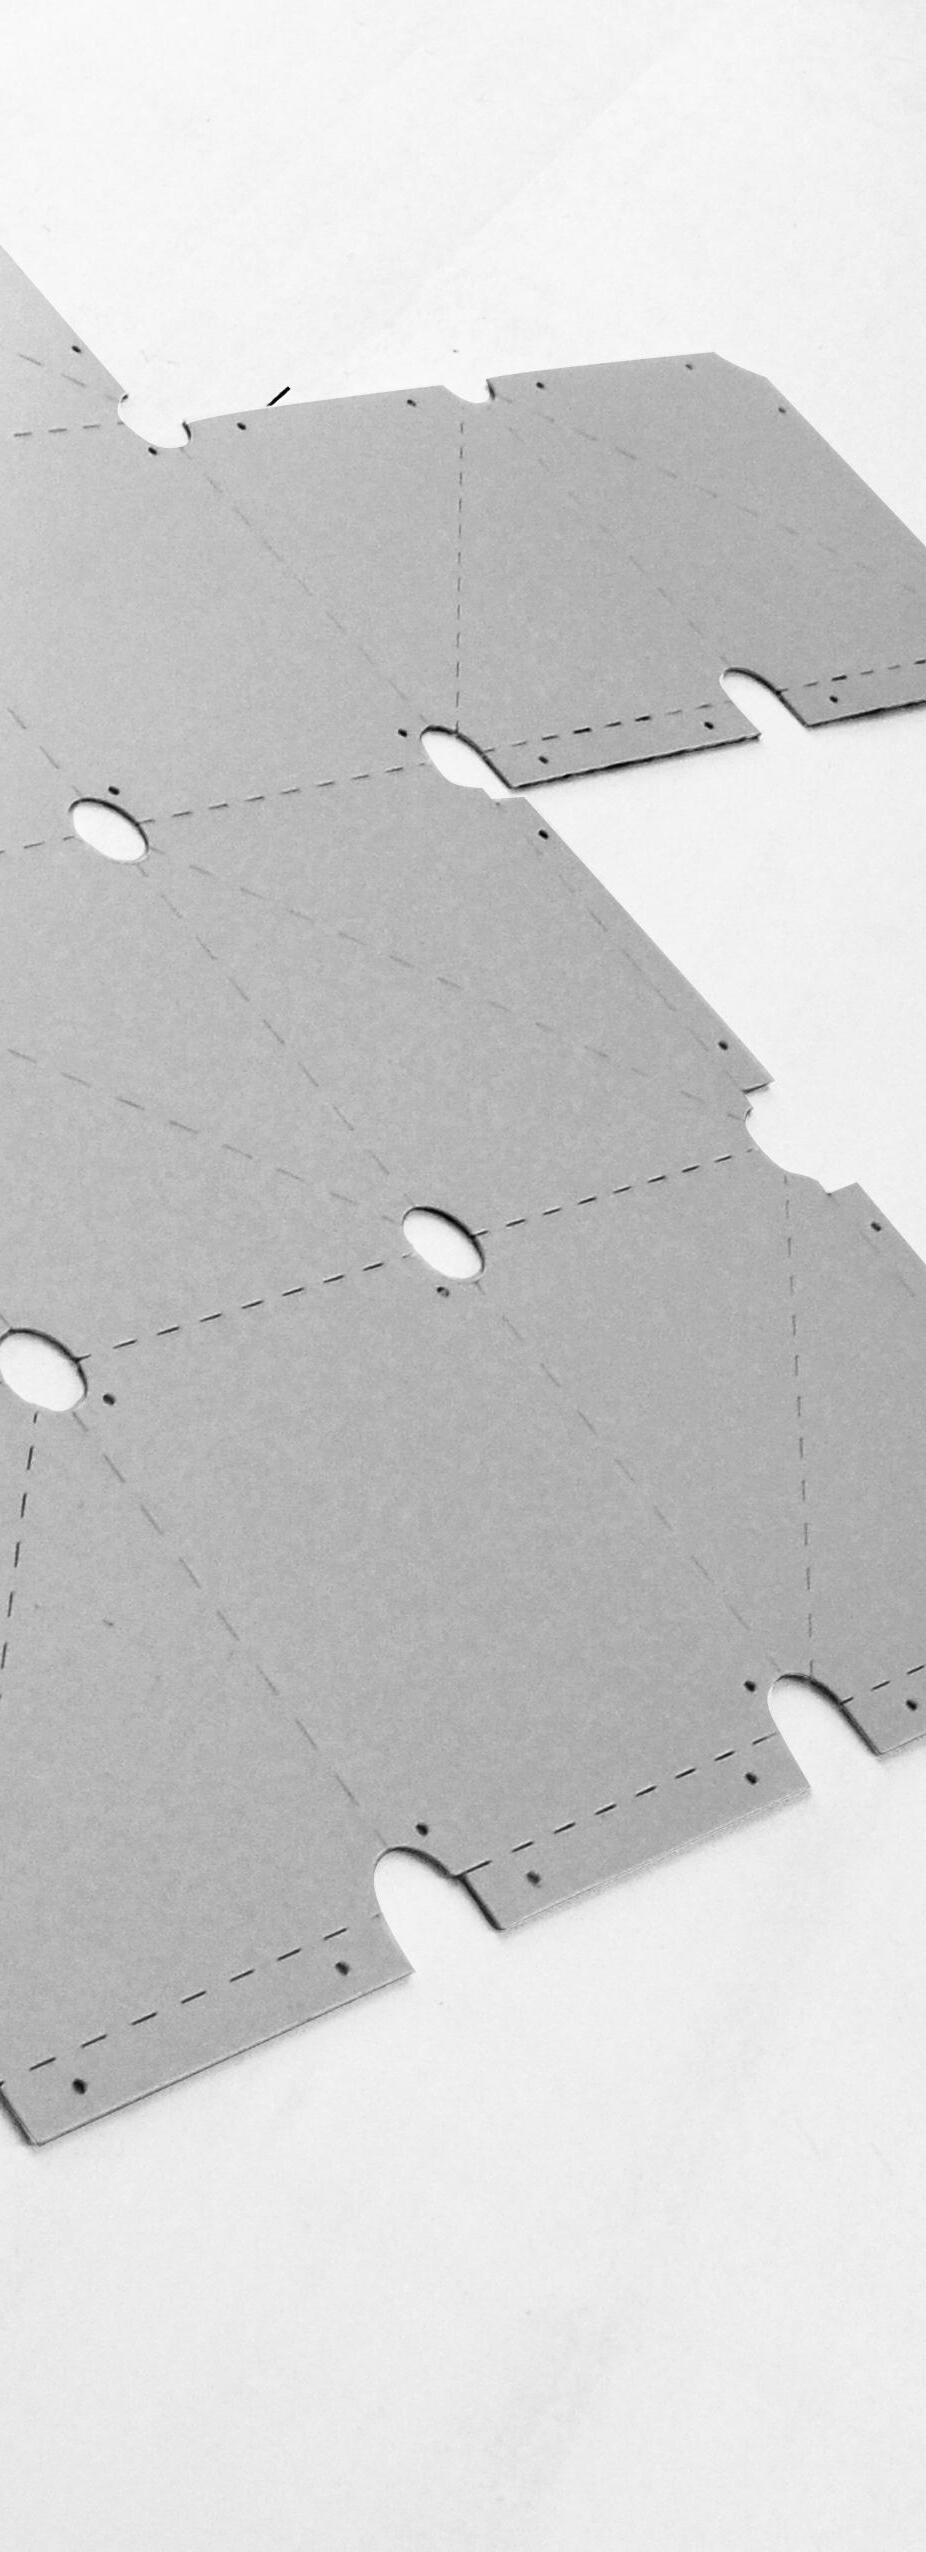
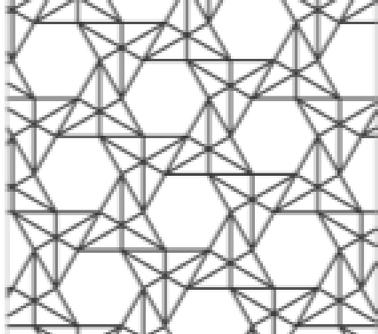
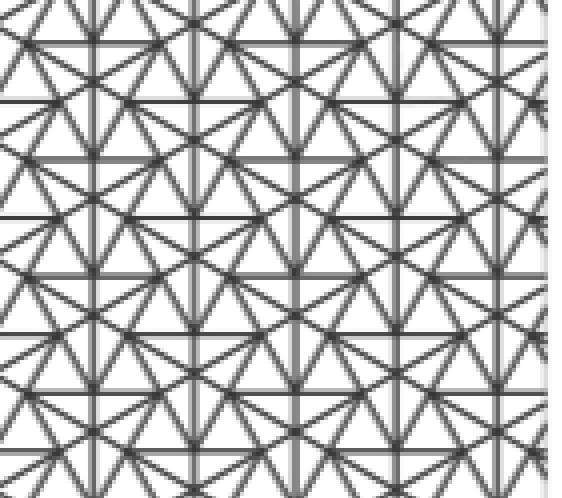
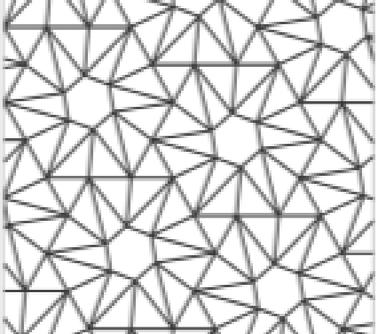
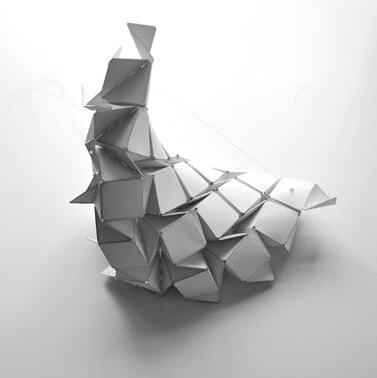
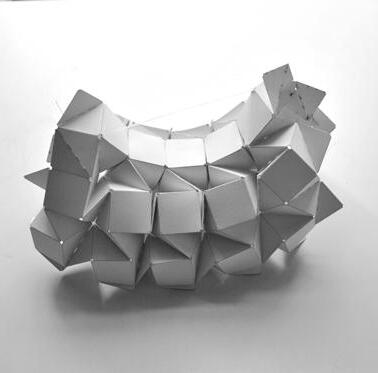
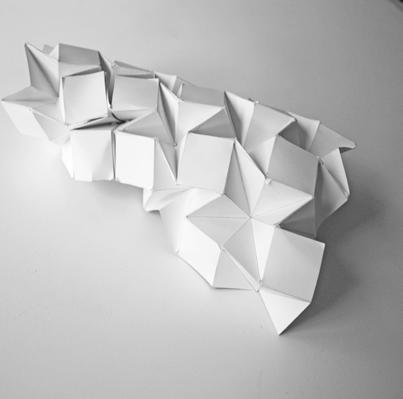
Folding methods were used to explore the geometrical capabilities of various folded tessellations.
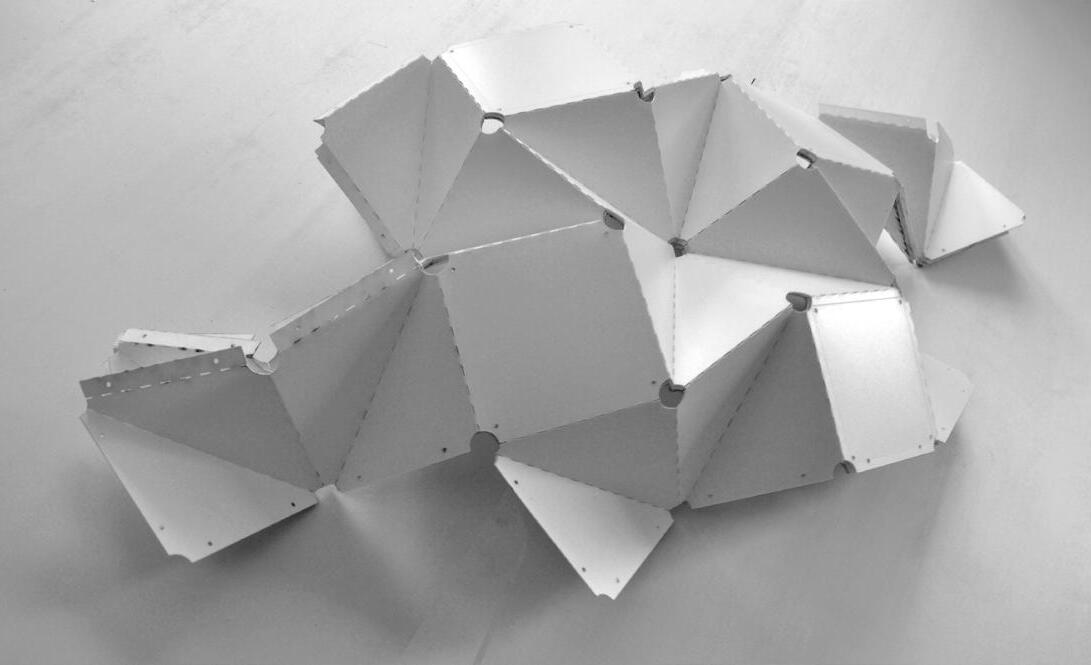
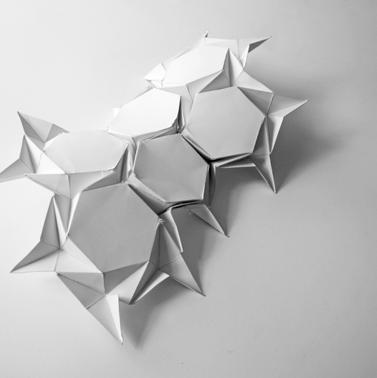
Paper Models
Physical folding experiments were used as a method of obtaining a repetitive pattern that can be translated into a component for the development of the material system. Following a series of geometrical studies it was decided to explore the folding of regular (a pattern created by repeating a regular polygon) and semi-regular tessellations (a pattern created by two or more regular polygons) as a means of creating complex doubly-curved surfaces from repeated components.(Math forum, 2014) Mountain-Valley folds were defined and translated into spatial and structural properties for the system. A series of physical tests were undertaken to understand the structural and geometric properties induced by these folds. These were divided in two stages; the first set was used to understand what tessellations can form a flexible surface once folded. The second set was aimed at studying what degrees of surface curvature was allowed by each folded surface. Theses techniques were helpful in establishing the folding patterns and extracting the geometric principles useful to develop the material system.
42 Transient Systems Chapter 3
Diagram explaining folding techniques used to develop physical experiments.
Fig 3.1 (Right)
Physical Experiments
a. Geometrical Studies
Methods
b. Ron Resch Patterns
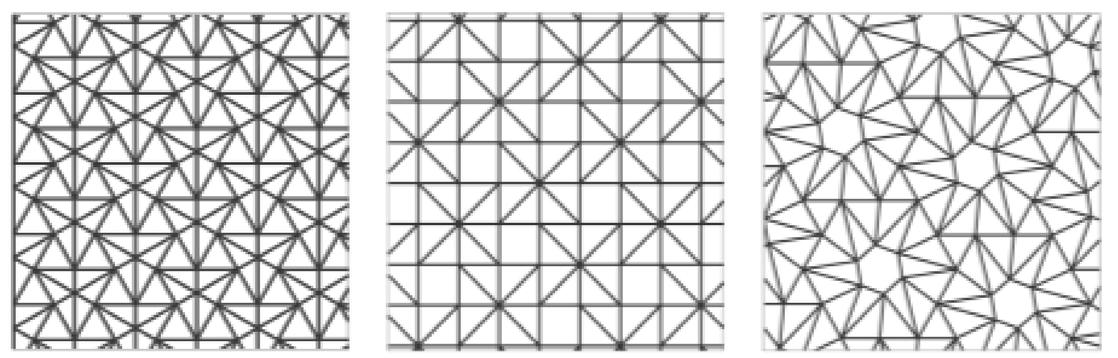
c. Physical Folding Tests
43
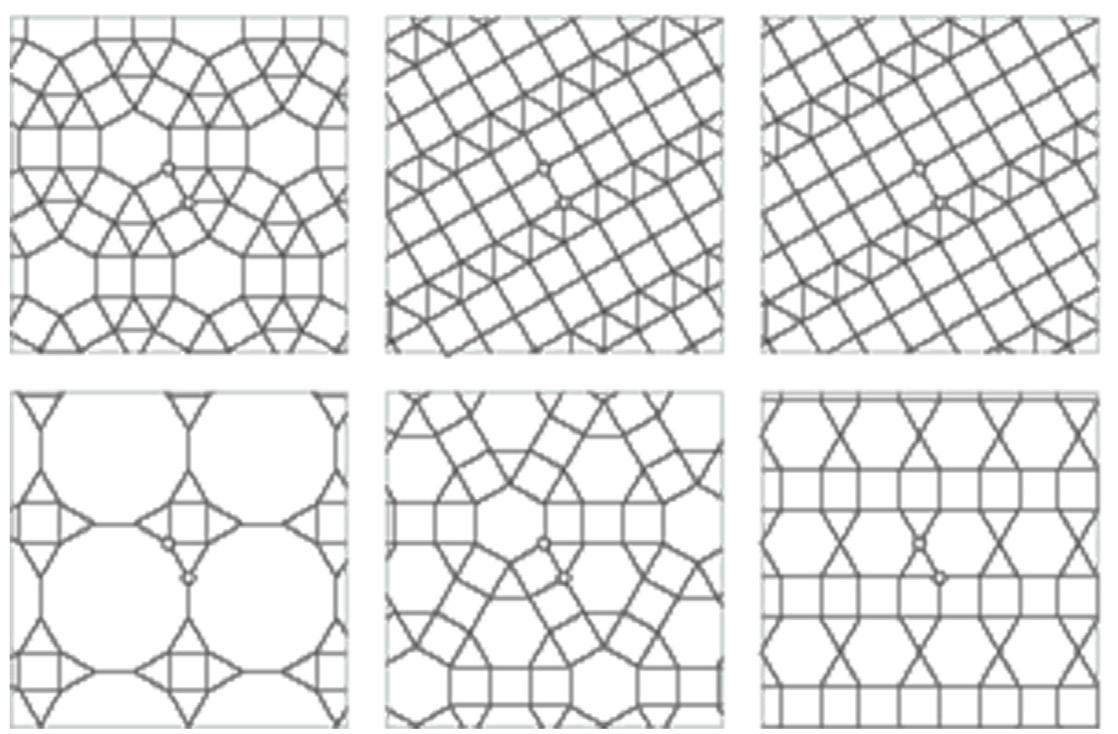
Folding Simulations
Rigid body Dynamics
Parametric and computational tools were used to further study the various methods of tessellating a surface to achieve the required forms. The first study involved the use of a rigid-body physics simulation through the movement of systems of interconnected bodies under the action of external forces. The assumption that the bodies are rigid (they do not deform under the action of applied forces) simplifies the analysis by reducing the parameters that describe the configuration of the system to the translation and rotation of reference frames attached to each body.(Tenenbaum, 2004) This allowed for an accurate representation of what surface curvature can be created by varying the degree of folding across the pattern surface. The second set of digital studies involved the use of a spring based simulation which treated all the lines and folds as separate springs that could be adjusted to the required length to simulate different degrees of folding. This simulation was not as accurate as the rigid body simulation however it allowed for a greater degree of control in the individual folds and therefore allowed for a better understanding of the surface possibilities.
44 Transient Systems Chapter 3
Diagram explaining digital techniques used to develop folding simulation.
Folding methods were used to develop flattened and folded states of spatial aggregation through physical and digital techniques.
Fig 3.2 (Right)
Digital Experiments
a. Generating Pattern
Methods
b. Spring Based System
c. Digital Simulation
45
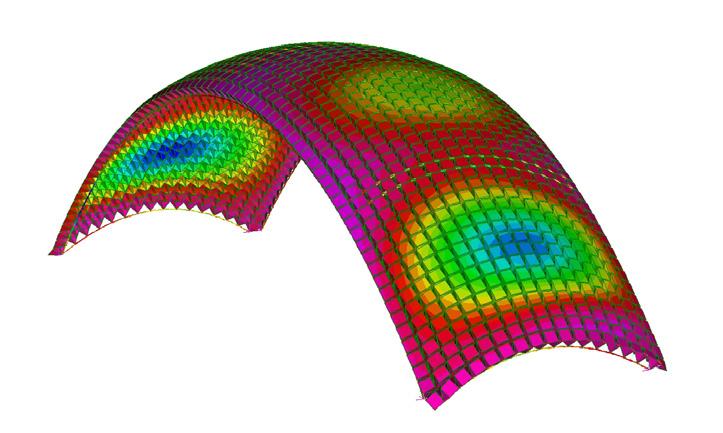
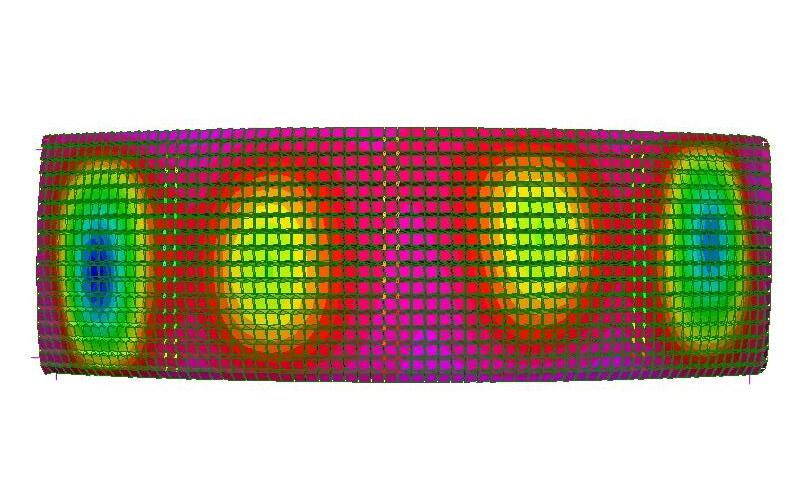
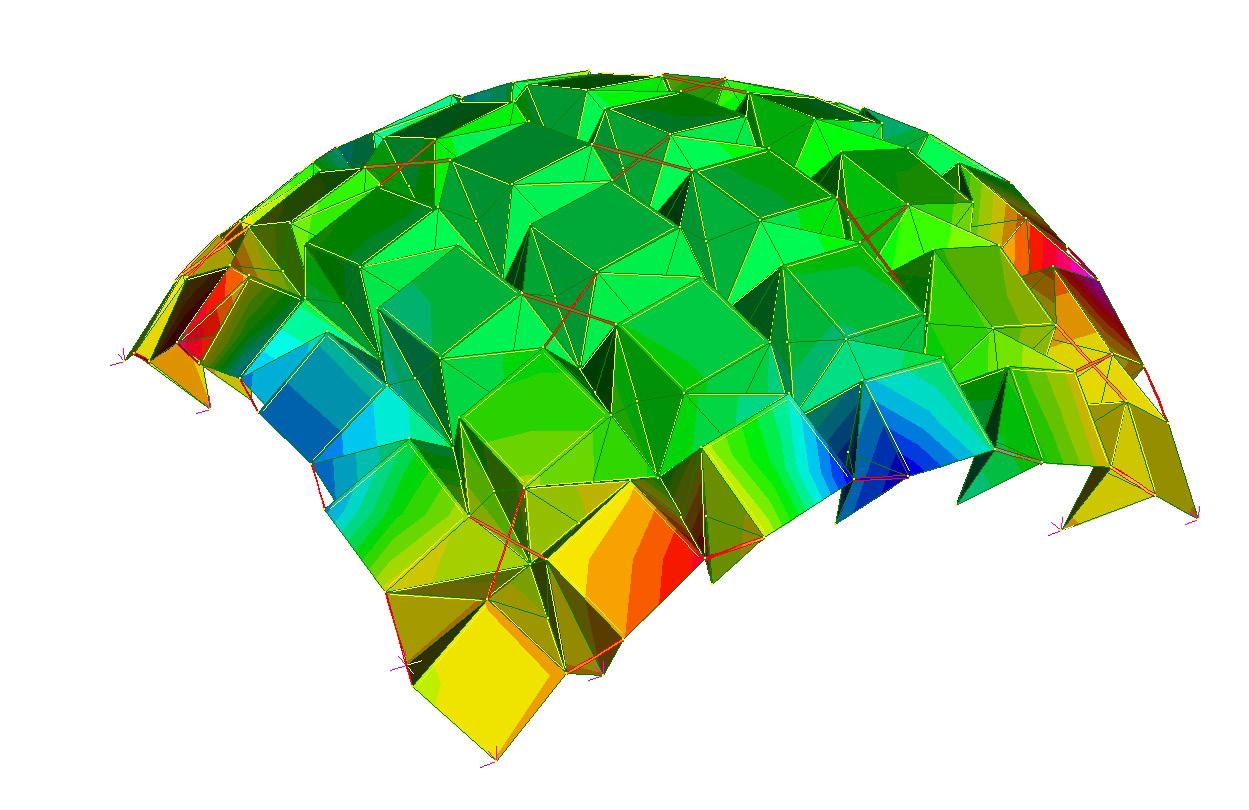
Finite Element Analysis
Using parametric modelling and finite element analysis software for establishing system logic and evaluating system performance.
Surface Studies
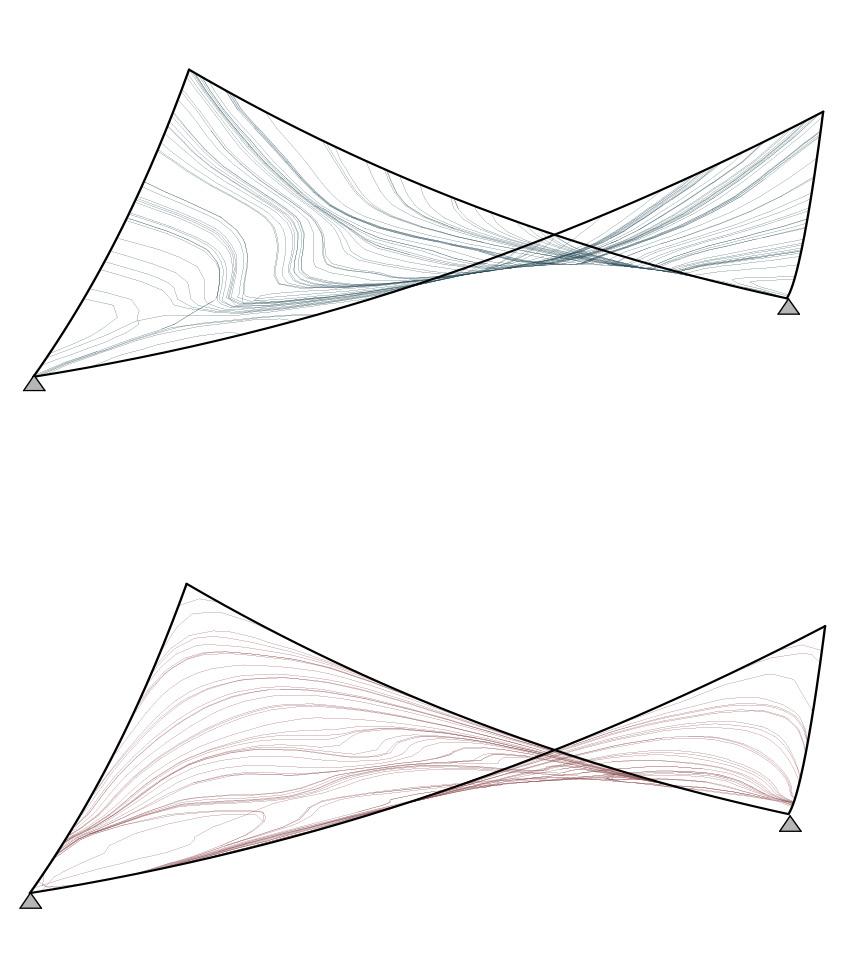
After establishing the fundamental geometrical parameters affecting the performance of the system, FEA software was used to develop an understanding of its mechanical properties. A parametric engineering plug-in was used for extracting the stress lines in the first and second principle directions of several surfaces with different degrees of curvature. (Reddy, 2006) The folded surfaces were then tested in the FEA software with locked and hinged connections in relation to the stress lines and values from the parametric plug-in. After analysing and comparing the results from these tests, rules were extracted and integrated into a locking algorithm for defining which areas of the pattern need to be locked in order to achieve the geometries defined in the design development. The FEA results were then used to establish the system potentials and limitations in terms of global geometries in relation to the system’s mechanical behaviour. The results of this analysis were integrated into the assembly sequence logic for the reconfigurable structure.
46 Transient Systems Chapter 3
Diagram explaining Structural analysis methods for establishing system logic and performance.
Fig 3.3 (Right)
Structural tests
a. Stress Evaluation
Methods
b. Component Locking
c. Deformation Evaluation
47
Augmented Reality Object Tracking
Using Game engine software with augmented reality extensions to transform physical characteristics to digital data and vice versa.
AR | Object Tracking
Game Engine Software and Augmented Realty extensions were used in a series of assembly experiments which were aimed at translating the geometrical characteristics of physical objects into digital data and vice versa. The process by which relevant data was acquired from physical space was through the tracking of image targets through a camera device. Studies were conducted in order for the team to identify the potentials and limitations of using these methods as an enhancement for the assembly process of complex structures. Printed image Targets (either flat or multifaceted cuboid ones) were processed by digital objecting tracking software through a HD web camera. The camera recognized the patterns and colour differentiations on the printed images and translated them into data that is fed to the game engine software through an AR extension. Desired data or geometries could be scripted or imported inside the software and then projected into the used screen on top of the physical space video. The results and observations retrieved using this technique were strictly related to the software and hardware used.
48 Transient Systems Chapter 3
Diagram explaining custom development tools for augmented reality.
Fig 3.4 (Right)
Custom developed tools
a. Object position in relation to the camera
c. Distance between tracked objects
e. Correct position suggestion ( by colour)
g. Simulating correct position (by colour)
i. Simulating assembly sequence (a)
b. Object orientation in relation to the camera
d. Angle between tracked objects
f. Correct orientation suggestion ( by colour)
h. Simulating correct orientation (by colour)
k. Simulating assembly sequence (b)
Game Engine Software | AR extensions
Game engines are 3D environments that are mostly used to animate and render scenes for game development. The significant difference from traditional 3D software is that in these environments the user can program the relation and behaviours of the produced geometries and inspect the results in real time. The geometries could either be produced inside the software or imported from other ones. The capacities and the efficient manner that these tools handle geometry could make them suitable for developing design applications. AR applications are tools that are used to overlay digital information in physical space. The data can be projected on laptop screens, mobile devices screens or through the use of head-up displays. In order for the extensions to project the data, the recognition of target images is necessary. Defined images or scanned 3D objects are uploaded into the software and when tracked by the device camera, data is projected accordingly. Through image target recognition, the extensions have the capacity of accurately overlaying data and geometry in physical space.
Tools Development
In order for this method to be suitable and beneficial for use under a design context, various scripting tools needed to be developed and tested. These tools served as a link between the game engine software and the AR extension that projects the relevant data onto the screen. For the purposes of this research, the developed tools could be summarized into two main categories. Firstly, the translation of the geometrical characteristics of objects into digital information. In specific, ways of acquiring an object’s orientation in relation to the camera,thus knowing its location in space. Furthermore, quantifying the geometrical relationships of objects in relation to each other after acquiring their individual characteristics (position and rotation). Secondly, the process of simulating the positioning of an object in physical space without the need for any other form of information. These scripting tools were developed for the successful integration of AR into an architectural context were these techniques could be used during the assembly process for the reconfigurable structure.
49 Methods
Environmental Analysis
Parametric modelling and environmental analysis software were used for evaluating the system’s performance.
Performance Studies
Various environmental factors were taken into consideration for the development of the system. Environmental analysis tools and plug-ins were used to analyse the performance of the system in a digital environment. Analysis tools used for measuring radiation gain, solar exposure and shadow distribution were used to gauge the developed system in relation to its context and surroundings. Local and regional scale studies were also undertaken to understand the effect that folding the pattern has on the solar gain across the surface. Similar studies and tests were also conducted for rainfall and water run off. The results were used to inform the structural analysis and design of the final structures. Shadow studies were also conducted using rendering software, however the results were mainly focused on the visual quality of the space and therefore quantitative data was not gathered. The results and observations for the environmental analysis tests were used as design inputs for the final form of the structure.
50 Transient Systems Chapter 3
Diagram explaining structural analysis methods for establishing the system logic and performance.
Fig 3.5 (Right)
Environmental Analysis
a. Solar Radiation
b. Shadow Distribution
c. Rain Water Run-off
51
Methods
4. Component Development
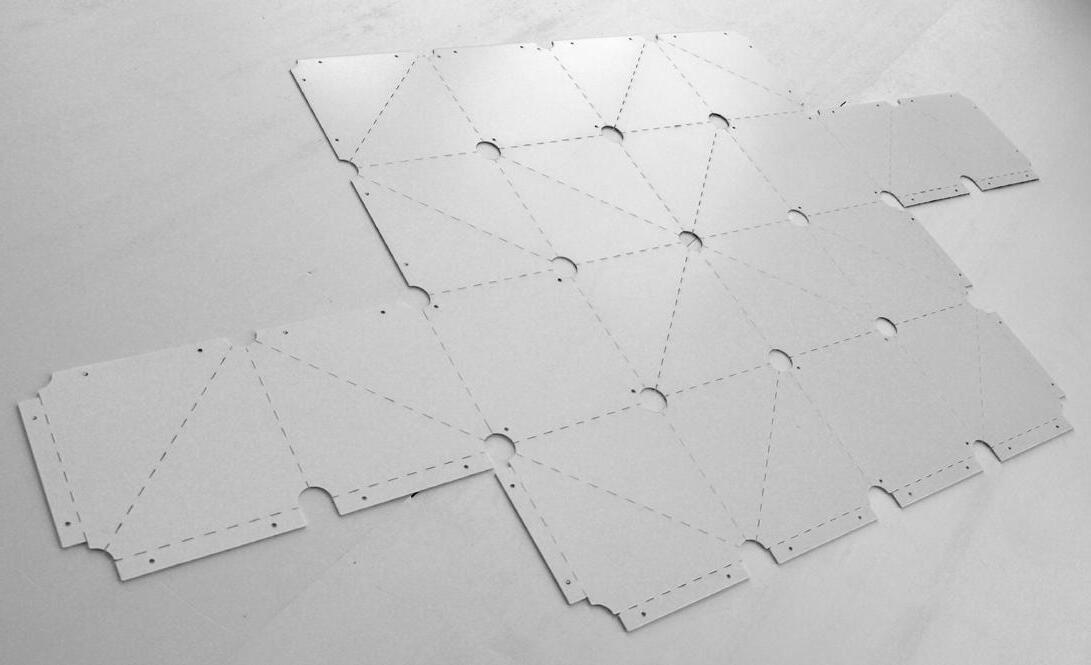
The Msc phase of the research was focused on developing a component for the system which was capable of addressing the transportation, structural and reconfiguration requirements of a temporary structure. A series of physical folding studies were conducted to study the different means of achieving multiple surface curvatures with regular components. These geometrical studies were then explored digitally on various scales and a series of FEA studies were conducted to understand the structural properties of the chosen patterns and their possible stable configurations. These tests were concluded with the development of a component locking logic that could be used to achieve stability in the overall structure. As the structure was to be assembled and disassembled multiple times, a set of assembly experiments were conducted to develop a guided assembly logic for the proposed system which would link assembly data to the individual components. Augmented Reality software and digital object tracking tools were explored as a means of overlaying assembly data on the component and guide the folding process. The design requirements for the component were then derived from the results of these explorations.
53 Component Development
Geometry Studies
The first studies were focused on exploring geometry through digital and physical tools to develop a component based on a folded sheet system.
The geometry studies were divided into two main explorations; the first aimed at pattern studies through paper models; the second aimed at digital simulations and manipulations of the pattern to derive a catalogue of geometries for a series of target surfaces. Throughout these explorations a set of regular and semi-regualr tessellation were studied. Specific attention was given to the non-periodic Ron Resch folding patterns because of their flexibility and ability to form a variety of different surface curvatures with regular primitives. These patterns were explored in detail through a series of physical and digital tests.
The patterns were analysed based on their capability to form multiple curvatures while still maintaining their structural properties. The first stage of the digital simulation exploration was to define the parameters which can be manipulated to generate different degrees of folding in the system accurately. Rigid body dynamics were used to define each polygon of the pattern and its relationship with its neighbouring polygons. The second set of digital simulations involved developing an algorithm that can not only simulate the folding but also provide the required control over the global geometry.
54 Transient Systems Chapter 4
Diagram explaining experiment setup for geometry and surface studies.
Fig 4.1 (Right)
Component Development
•
Pattern Experiments
• Hexagons | Triangles
• Triangles | Triangles
• Squares | Triangles

• Hexagons | Triangles
Surface Experiments


Cylindrical • Saddle

55
Pattern A Pattern B Pattern C Pattern D
Shape A
Saddle Shape B Surface A Surface B Surface C Surface D
Dome •
•
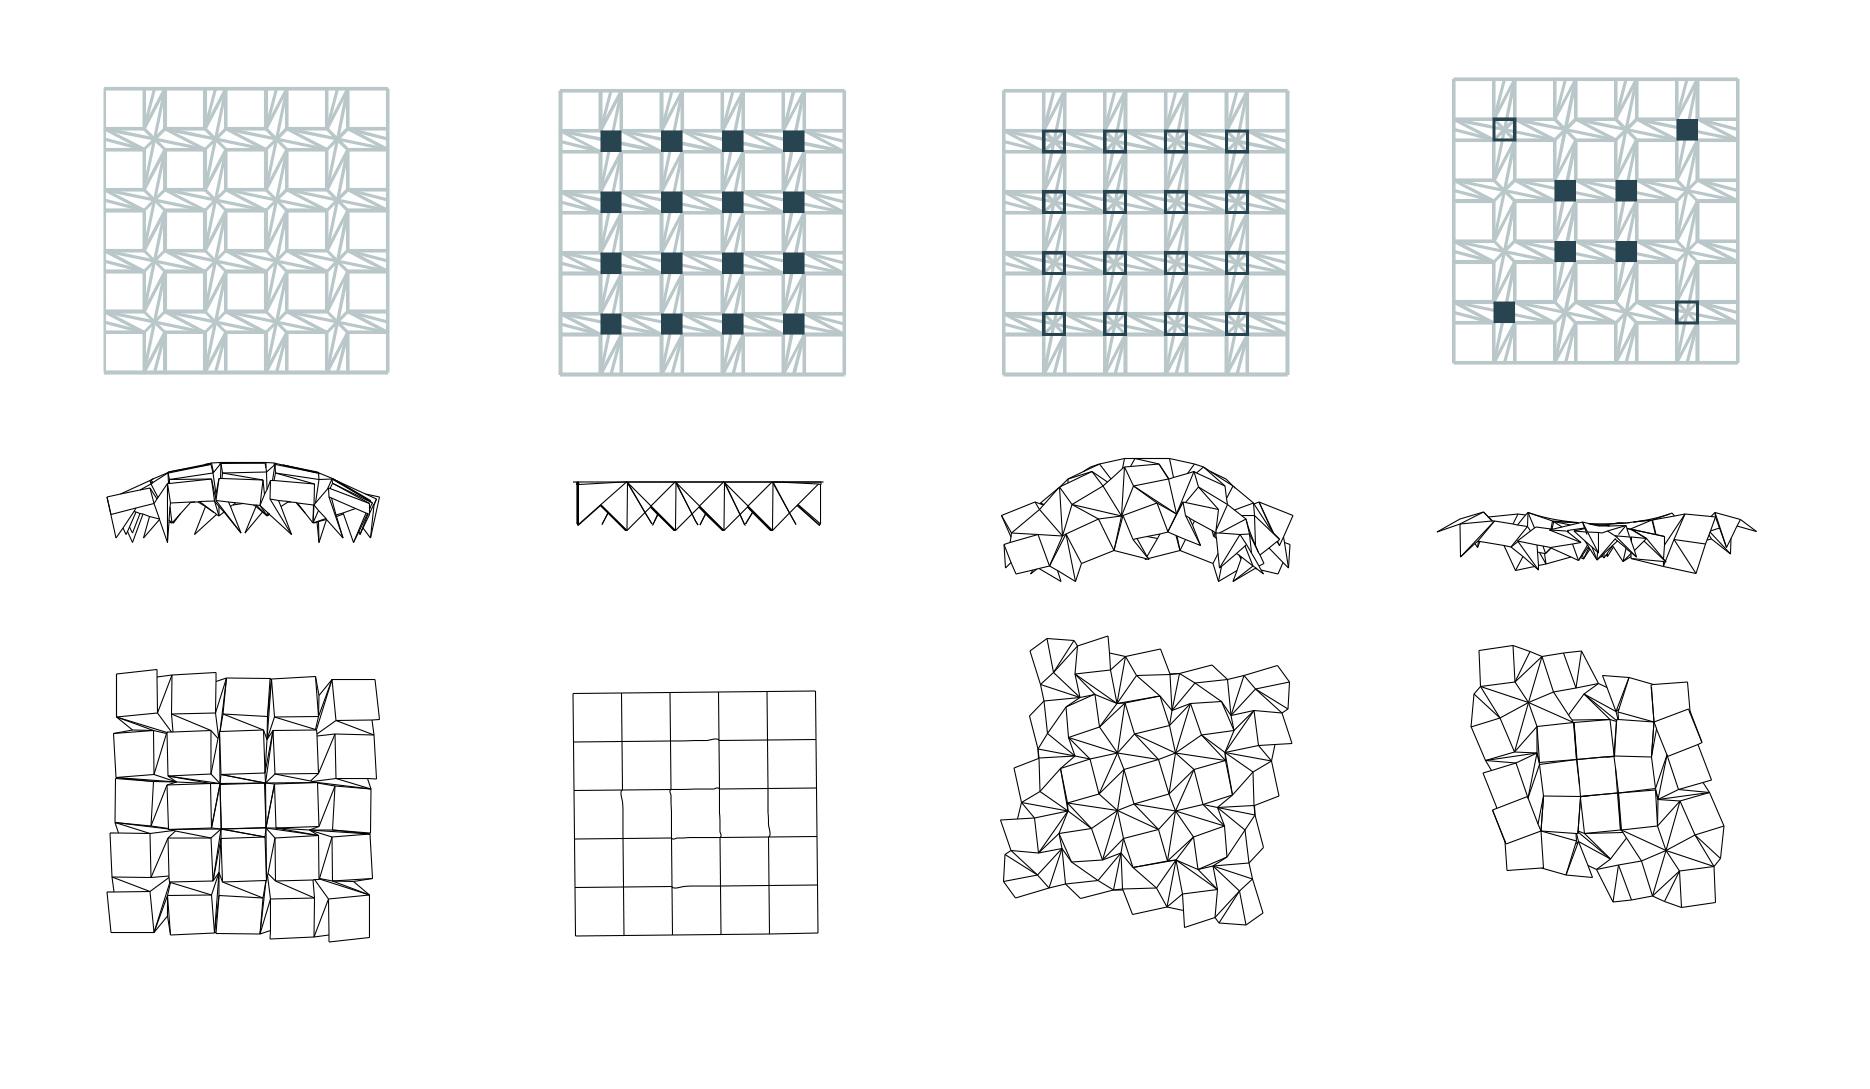
Folding Catalogue
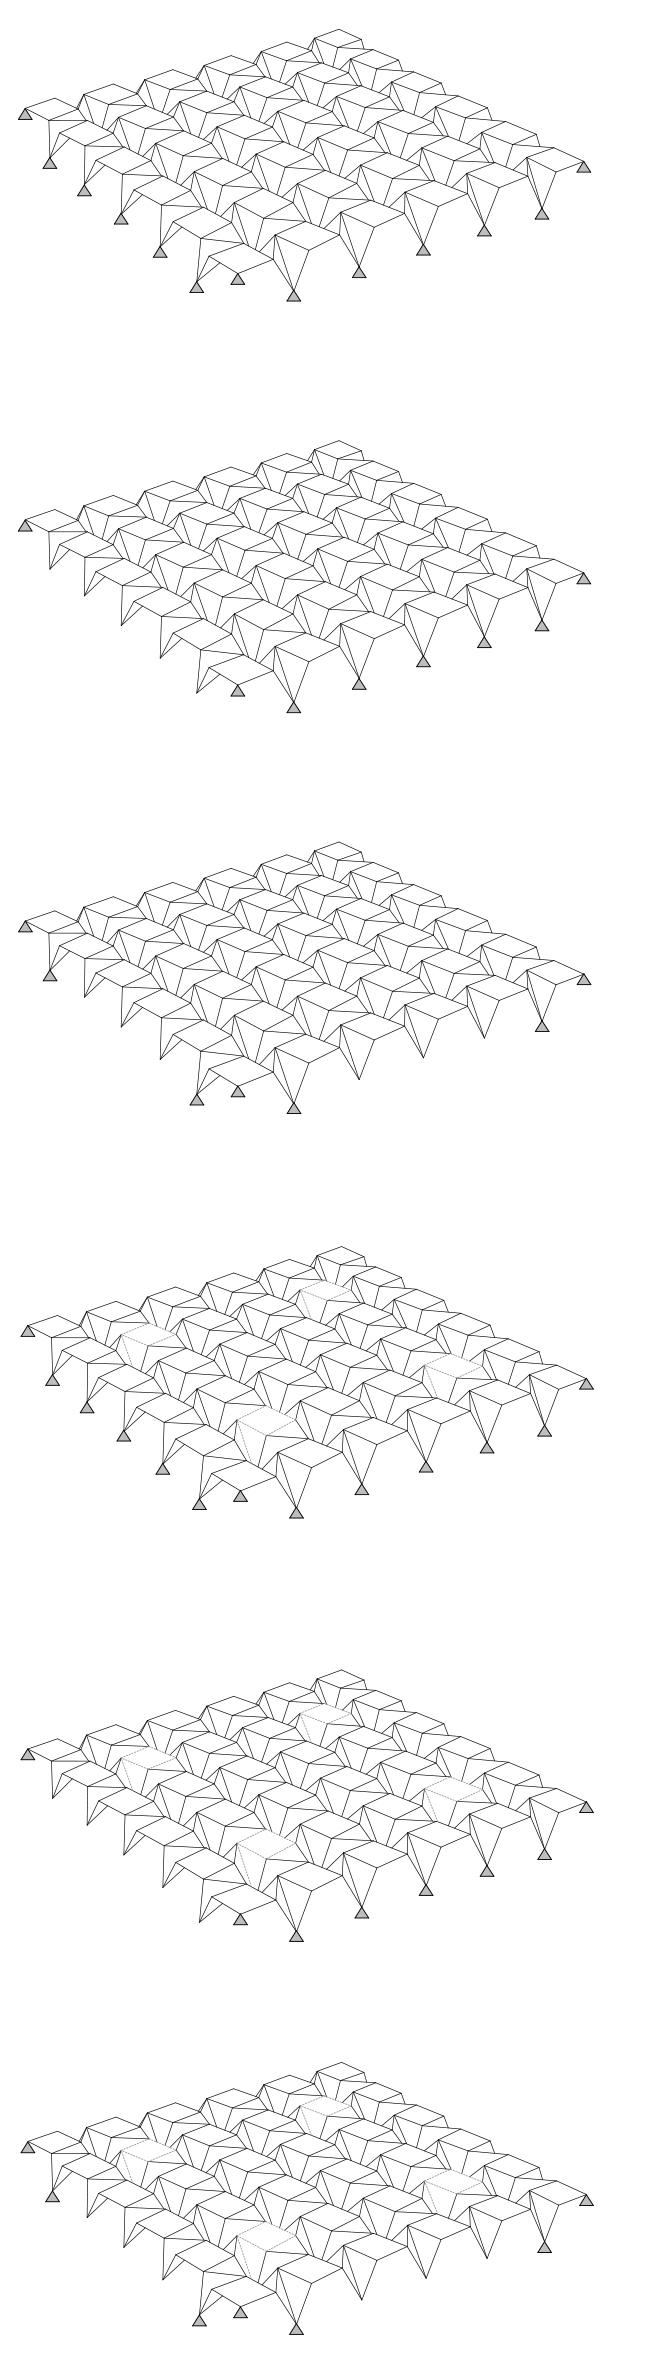
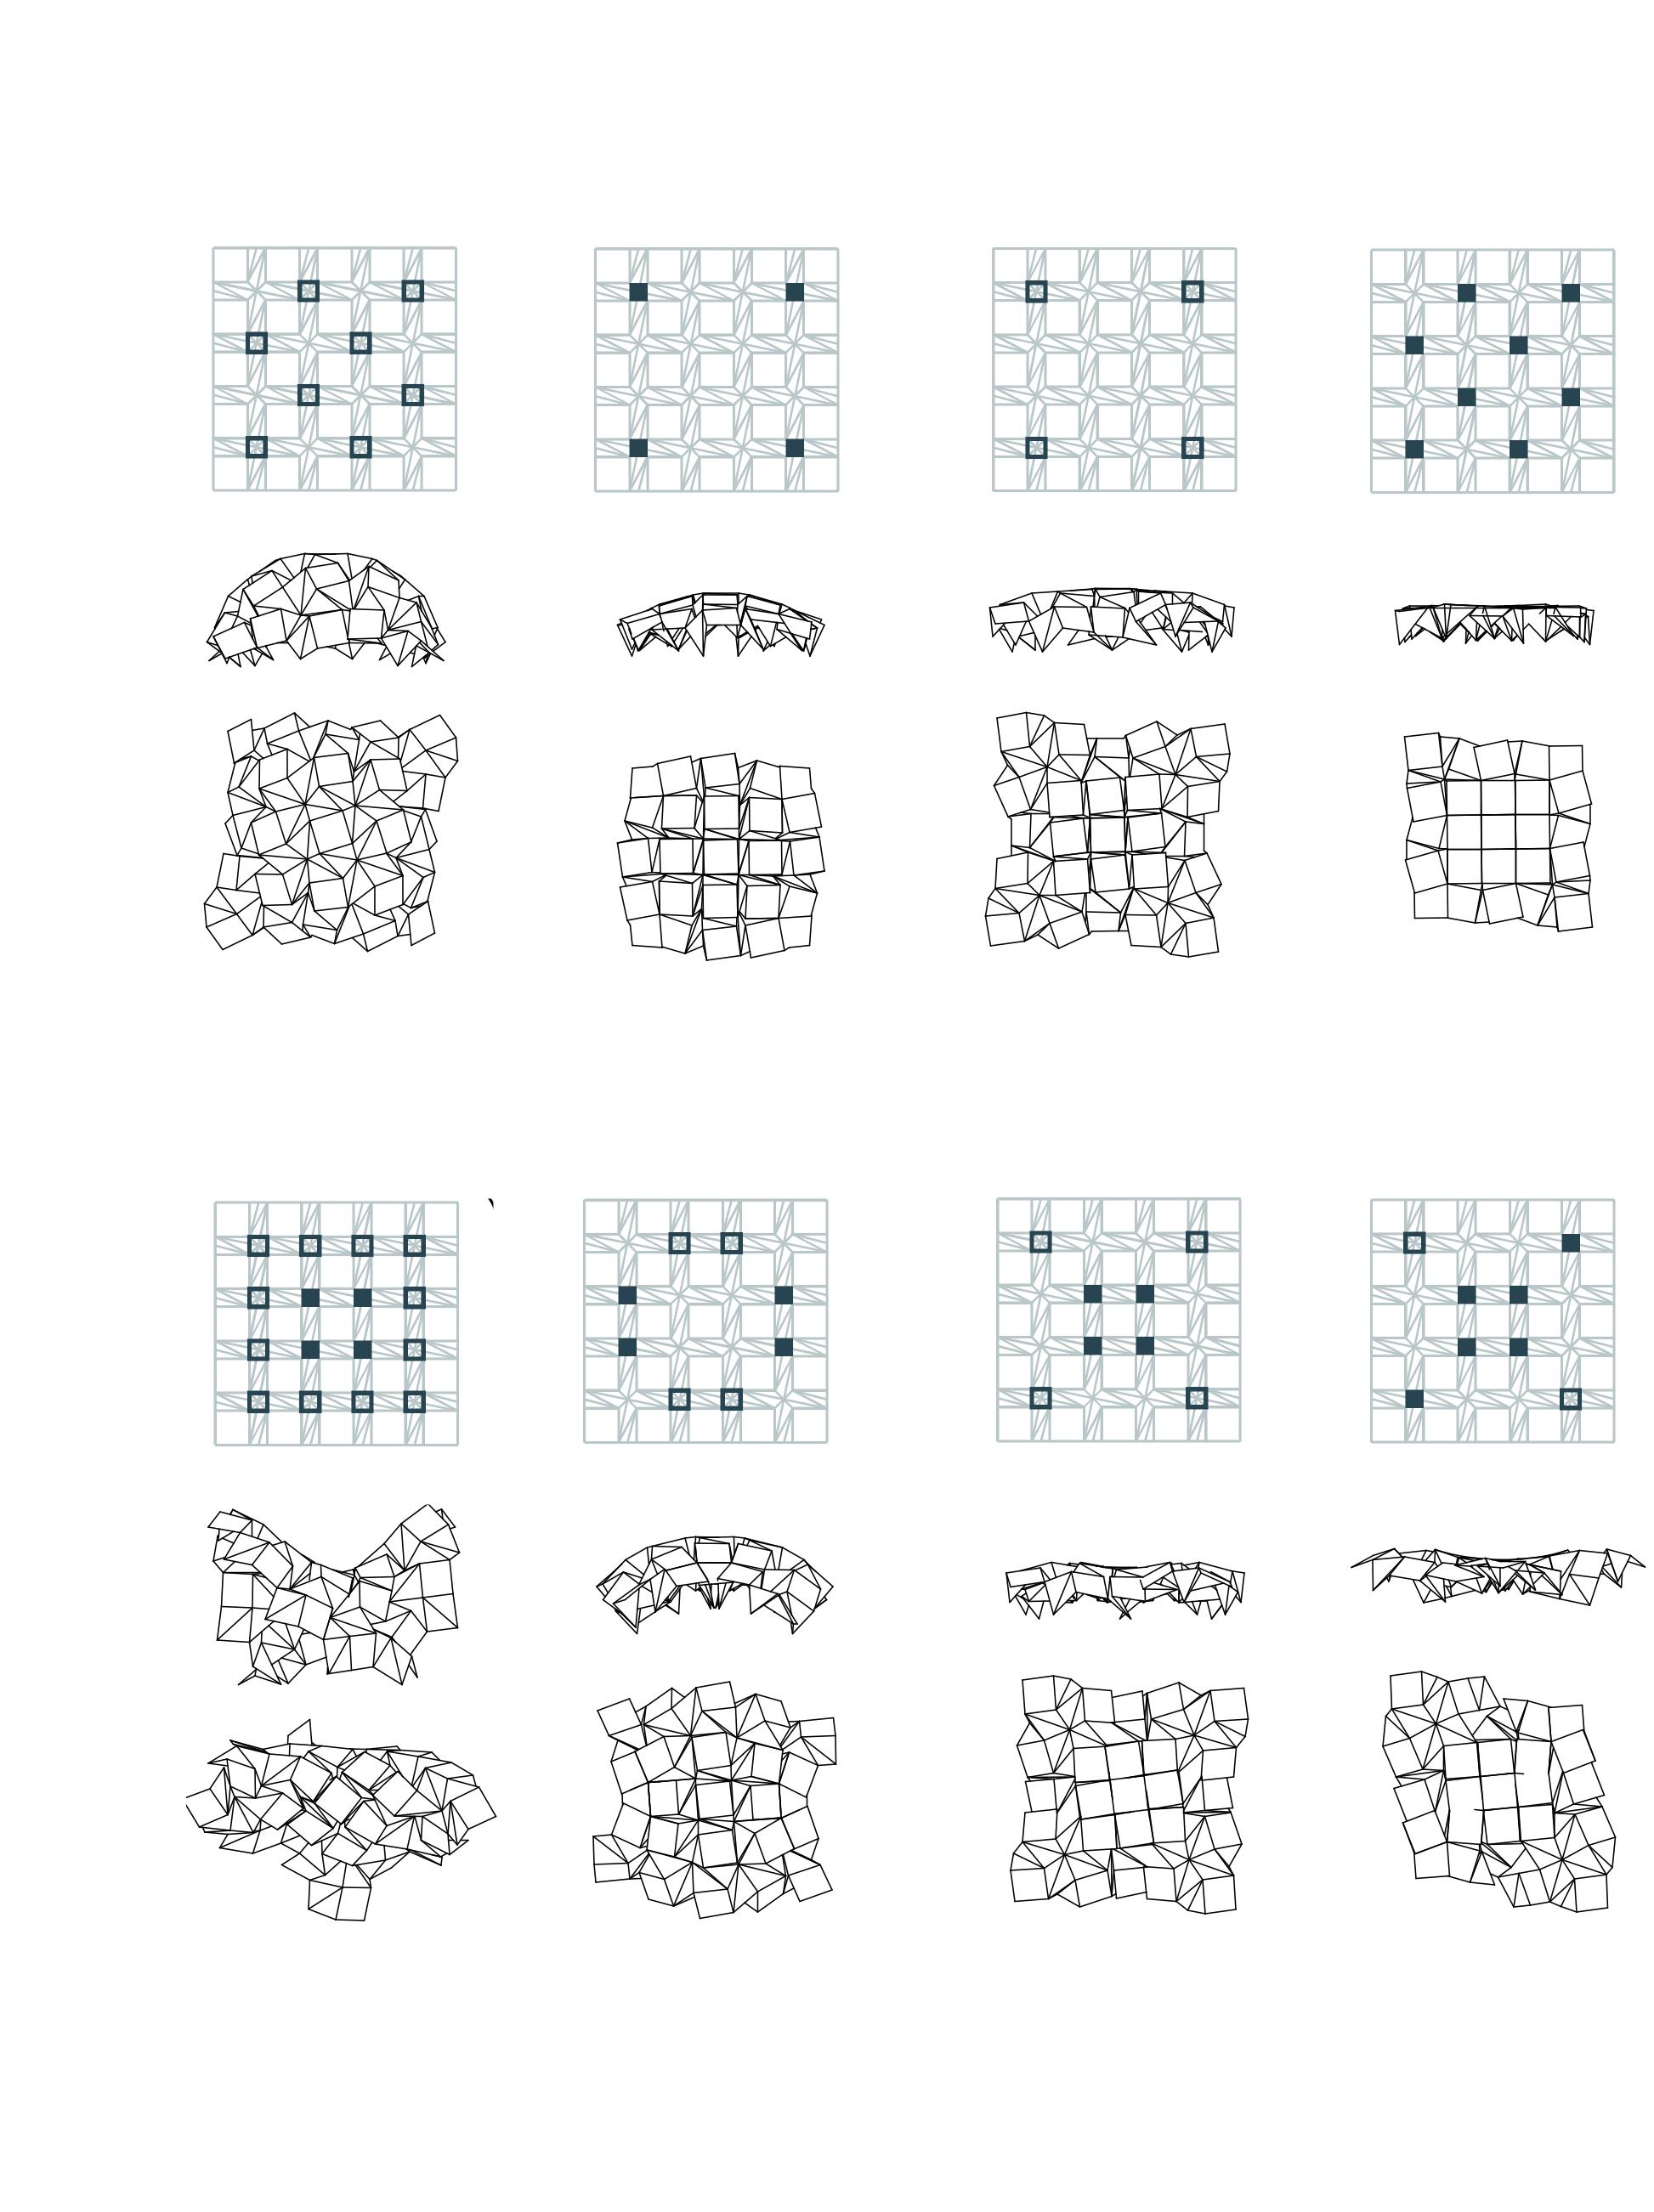
The digital models were then used to generate a folding catalogue of different forms. For the folding catalogue, a square and triangle Ron Resche tessellation of 5x5 components was folded into various forms by closing or opening certain joints. In the simulation the edges of the pattern were not anchored and the overall surface curvature was generated by locking the joints between the squares. When no joints were locked, the simulation generated a doubly curved domelike surface similar to what was exhibited by the physical model. Closing all the joints resulted in a flat surface while opening all the joints resulted in a synclastic surface. It was found that anticlastic double curvature was achieved when the joints in the centre of the pattern were closed along with two of the edge joints and the remaining two edge joints were opened. It was concluded that the pattern naturally formed synclastic curvatures and most locking configurations resulted in different dome-like shapes however in specific cases it was possible to achieve anticlastic curvature simply by locking the right configuration of joints.
56 Transient Systems Chapter 4
Type 1 Pattern Type 2 Pattern Type 3 Pattern Type 4
Pattern
Figure describing patterns explored by folding and locking specific components.
Fig 4.2 (Top)
Figure demonstrating the folding catalogue formed through folding experiments.
Fig 4.3 (Right)
Component Development
Folding Catalogue
57
Synclastic Curvature Zero Curvature Zero Curvature Synclastic Curvature Synclastic Curvature Zero Curvature Free Joints Open Joints Closed Joints Synclastic Curvature Synclastic Curvature Synclastic Curvature Zero Curvature Anticlastic Curvature Synclastic Curvature Anticlastic Curvature Anticlastic Curvature
Structural Studies
Two sets of experiments were carried out for four patterns in three folding stages in order to evaluate their structural performance as trusses and corrugated sheets.
From the geometry studies, four Ron Resch patterns were chosen for further analysis and evaluation based on their geometry, global form potentials and limitations, mechanical properties and material expenditure. Components were extracted from the patterns and tested under an applied gravity load in three stages of folding with the aim of understanding how different degrees of folding and changes in geometry affect resistance to external load. All components were tested as folded geometries with approximately the same area in the unfolded state. The process of folding was simulated using the digital tools developed in the geometry studies . The degrees of folding were set as a percentage where 0% was completely closed and 100% was unfolded. In the following experiments stage I is open at 0%, stage II is open at 30%, and stage III is open at 60%. Finite Element Analysis software was used for the structural tests where the components were represented as steel trusses with hollow circular cross-sections and 4mm aluminium plates. The following testes were aimed at determining the most suitable solution in terms of chosen pattern and structural elements configuration.
58 Transient Systems Chapter 4
Diagrams showing different components and patterns analysed for structural performance.
Fig 4.4 (Right)
Truss Experiment Results
The results from the truss experiments show that Pattern 01 was performing best with both the lowest peak and average stress values in all the stages of folding. Second in ranking was the quadrangular Pattern 02. It was found that the two best performing patterns were the ones with the largest structural depth. Although Pattern 03 had a considerably smaller structural depth when compared to the best performing patterns, the average stress values were similar. This was most likely because the pattern consisted only of triangles, which are the most rigid geometrical forms. Pattern 04 was the one experiencing highest stresses in all tests, which were a result of its the shallow structural depth and geometry. It was noted that there was a visible tendency for the components to experience less stress in stage III - 60% open state. There was a correlation between higher stress and lower deformation. Higher stress values indicate higher resistance to external load. In the single component tests these values were small but for the further design development a balance between acceptable deformations and stresses should be achieved.
Plate Experiment Results
The ranking of the plate experiments was similar to that of the truss experiments. The stress values in the three stages of folding however, indicated a slightly different system behaviour. Pattern 03 for example experienced lower peak stress in stage II when compared to stage I as opposed to the truss experiment. Pattern 04 peak stress for stage I was also distinctively higher. Compared to the truss experiment results, the peak stresses in stage I were higher for all patterns. However, they were similar in the other stages and it should be taken into consideration that these states of folding were more likely to be used in the design development process. The peak stresses were concentrated on the edges, therefore the connections between the plates should be able to accommodate for them. Another important result from the plate experiment was the lower average stress, which was reduced due to the component’s structural continuity - the forces were uniformly distributed along the plate. The reduced average stress and risk of shear led to the conclusion that the aluminium sheet system was more suitable.
59 Component Development Pattern 01 Pattern 02 Pattern 03 Pattern 04
After evaluating the structural performance of the chosen Ron Resch patterns and establishing which structural system was more suitable for the purpose of the project, the components were ranked according to 3 criteria:
1. Average Plate Stress : the values for mean plate stress in all three stages were averaged for every component since all folding states could be potentially used. The components with lowest mean plate stress were Pattern 01 and Pattern 02.
2. Minimum Surface Span : The components have the same area in the unfolded state. However, due to the different geometries of the patterns, the span they can achieve varies. The span taken into account in the ranking is the minimum one, taking into consideration the most unfavourable condition. The components with largest minimum span are Pattern 03 and Pattern 04.
3. Maximum Surface Depth: As it was established previously, the maximum achievable structural depth is a crucial parameter for the load resistance of the components. Moreover the larger surface depth can be potentially put into
60 Transient Systems Chapter 4
STAGE I STAGE II STAGE III
Diagrams showing different stages of opening and closing for four components.
Fig 4.5 (Top)
Comparative charts explaining stress values and span to depth ratios for all four components .
Fig 4.6 (Right)
use for the architectural application of the system. The components with largest surface depth were Pattern 01 and Pattern 02. Based on the ranking according to these criteria Pattern 02 and Pattern 03 were the best performing ones.
Aggregation Studies
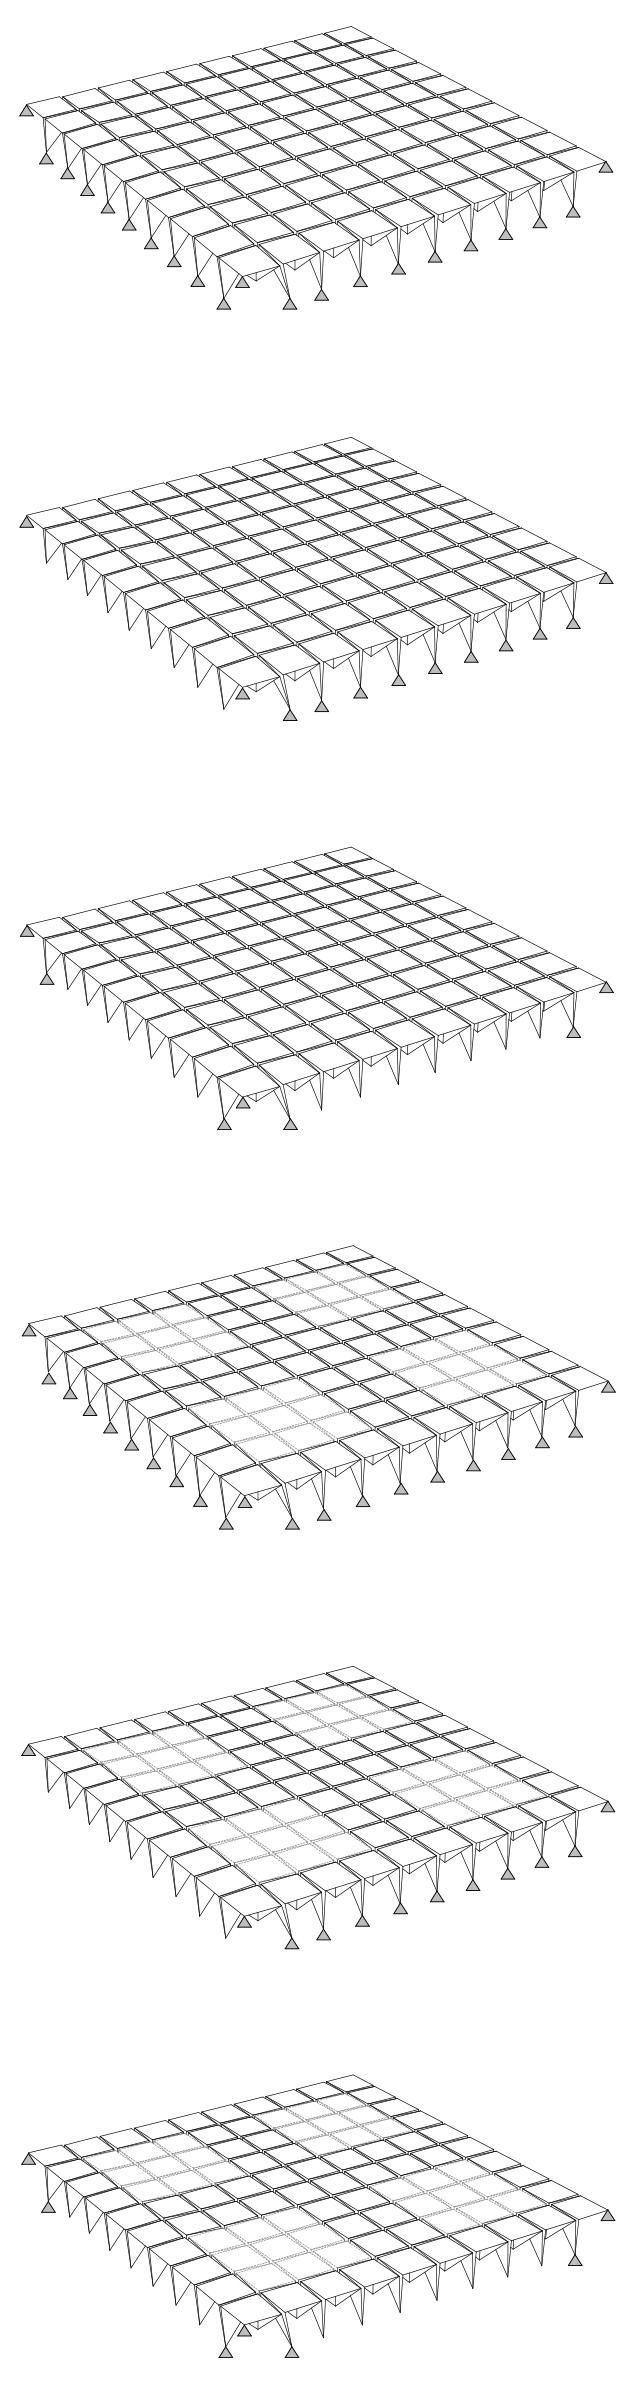
Based on the component evaluation experiments, two patterns (Pattern 02 and Pattern 03) were chosen for further analysis. Even though Pattern 02 was performing better in the initial FEA analysis, it was unclear if the same behaviour would be observed in an aggregation. Both patterns were applied on doubly curved surfaces (positive curvature) with anchor points along the periphery. Since in the preliminary experiments the components were tested as a completely rigid model, a question was raised as to if the locking of all connections is fully necessary. In the following experiment both models were tested with all connections being entirely rigid |1|, rigid connections only along the periphery |2|, as well as with maximum flexibility with rigid connections only close to the anchor points |3|
Experiment 1 | Component Studies

AIM:
1.To determine which pattern has the best structural performance.
2.To establish which structural elements configuration is more suitable for the proposed system.
Model Size:................................................1.5m x 1.5m
Material:.........................................................aluminium
Plate Thickness:....................................................4mm
Load:........................................................................gravity
Number of Components:...........................................1
RESULTS:
1. More stresses are concentrated on the edges where the flow of stresses in folded plates is similar to a truss system.


2. Deformations are higher compared to the truss experiments.
3. Due to the structural continuity and the uniformly distributed forces there is a considerably lower risk of shear. Moreover, as a result of the specific stress distribution, the average experienced stress is lower.
61
Development
Component
A.Avrg. Plate Stress: 0.05MPa B.Min Surface Span: 1.1m C.Max Surface Depth: 1.45m A B C A.Avrg. Plate Stress: 0.05MPa B.Min Surface Span: 1.5m C.Max Surface Depth: 1.07m B C A.Avrg. Plate Stress: 0.07MPa B.Min Surface Span: 2.0m C.Max Surface Depth: 0.62m A B C A.Avrg. Plate Stress: 0.17MPa B.Min Surface Span: 2.0m C.Max Surface Depth: 0.62 m B C A
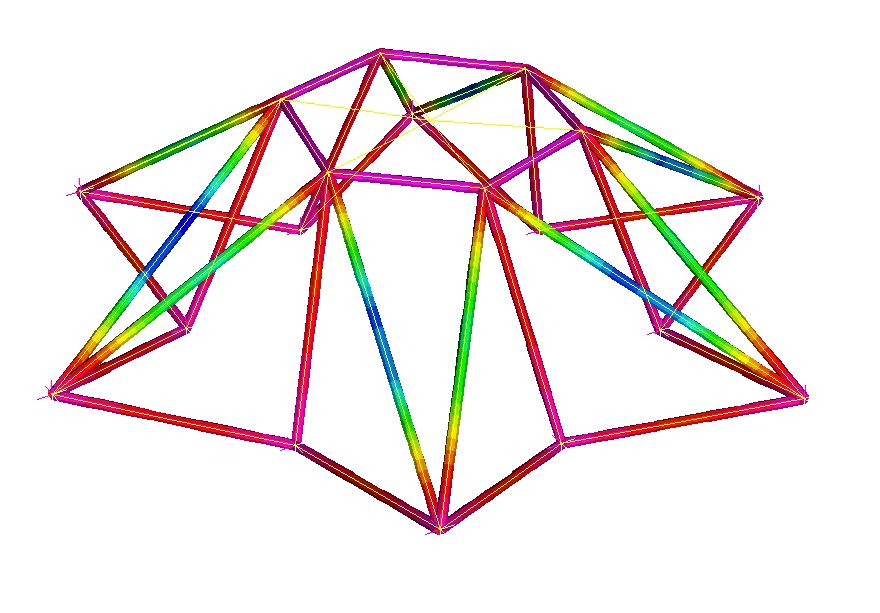
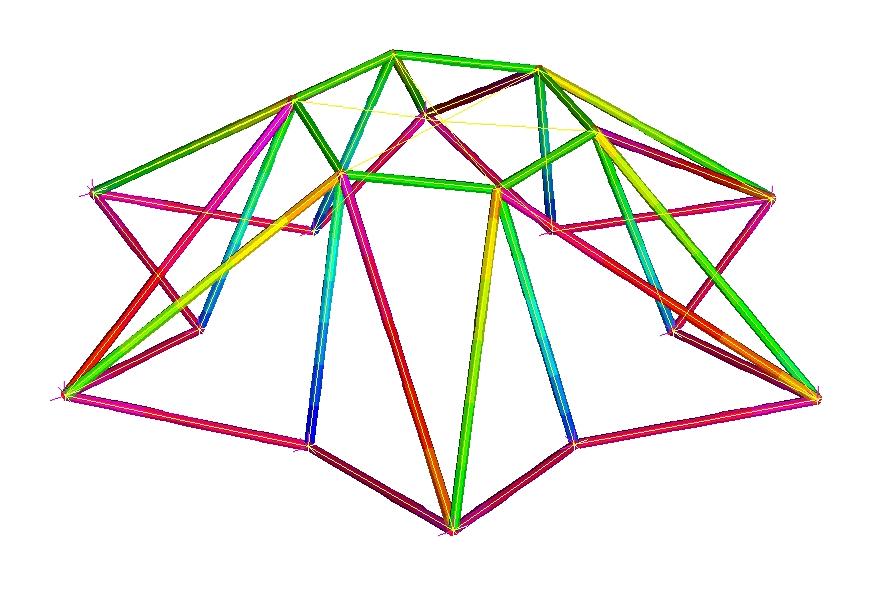
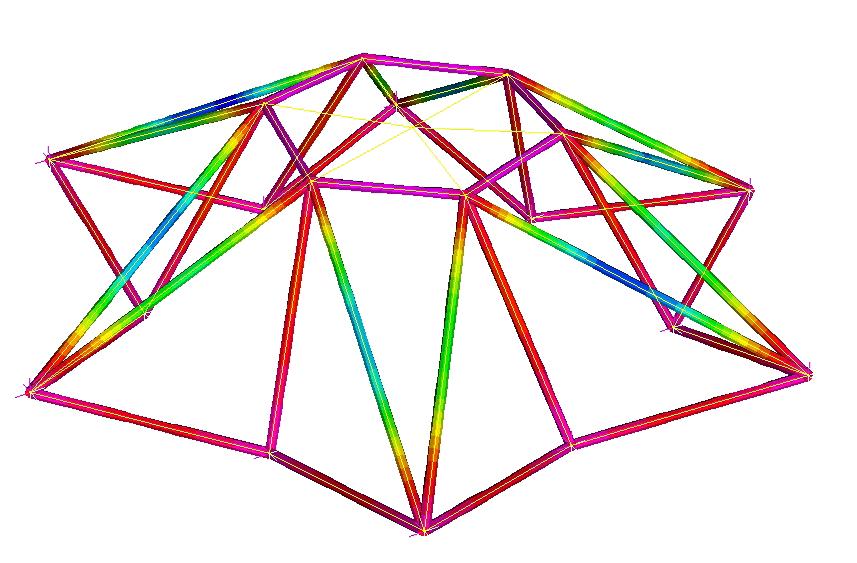
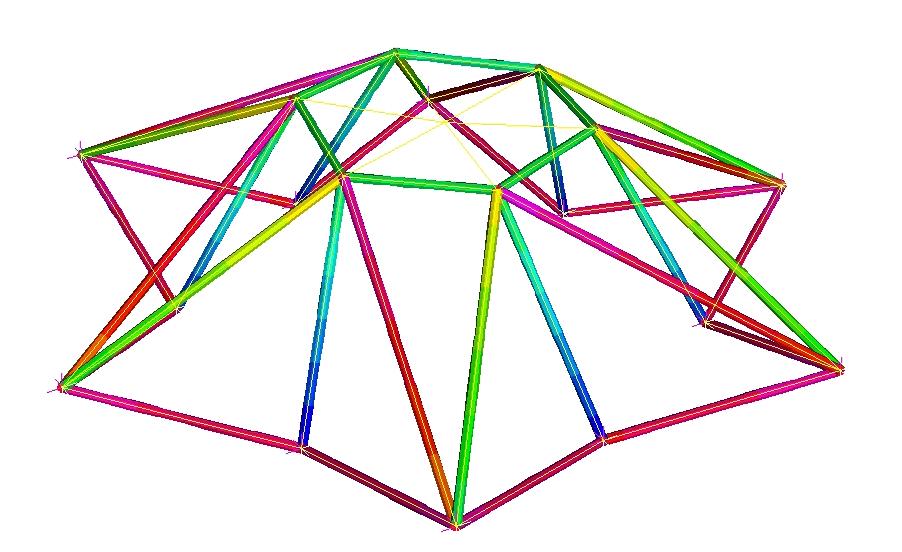
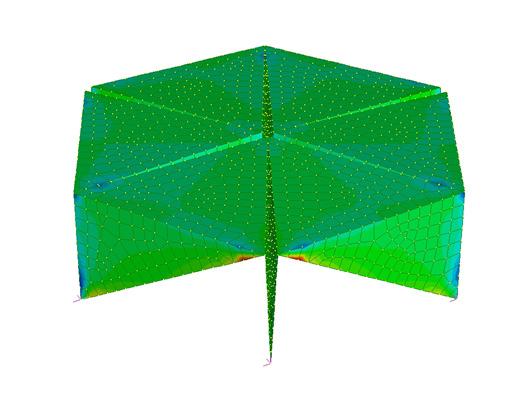
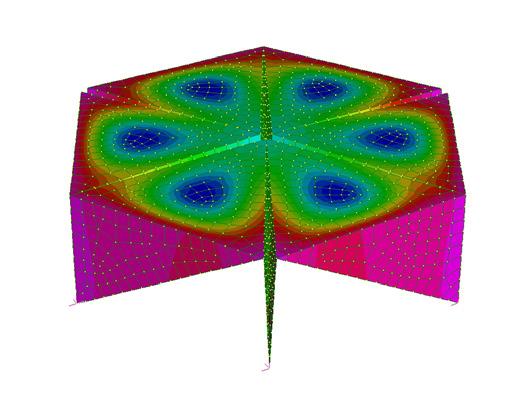
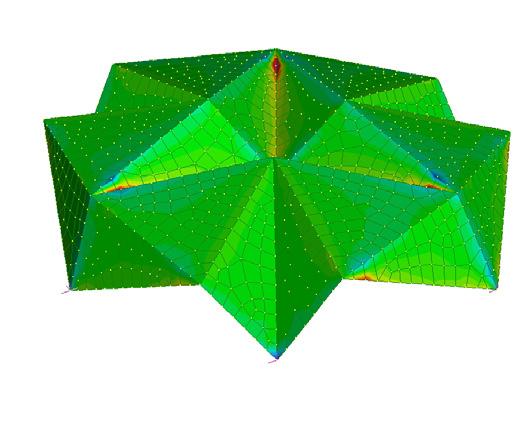
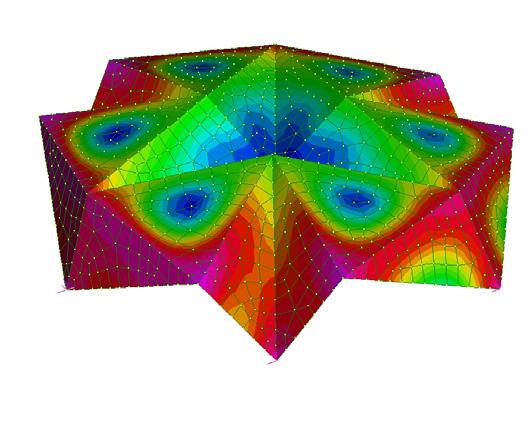
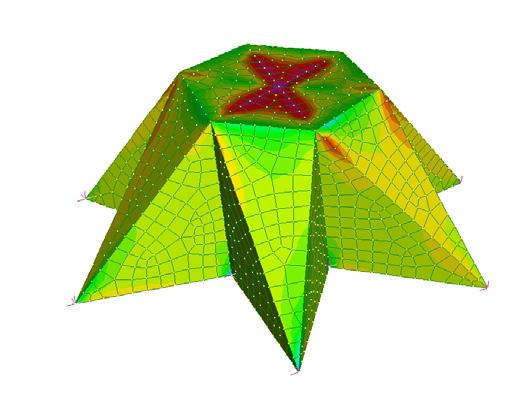
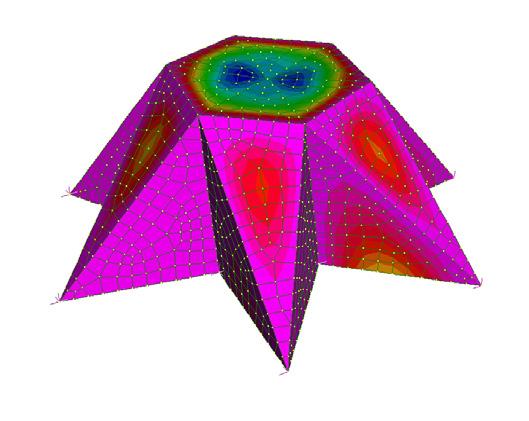
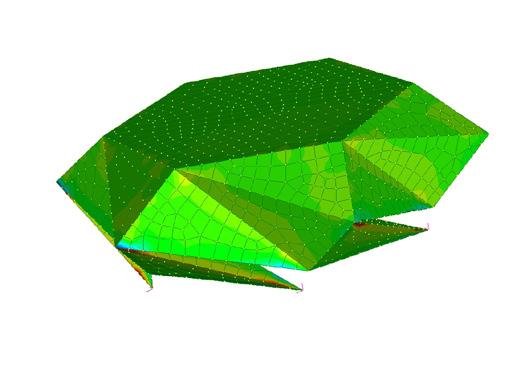
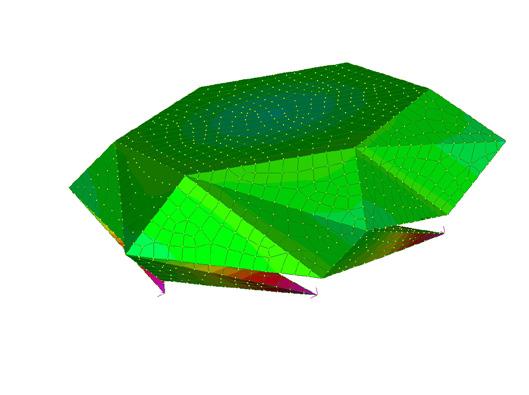
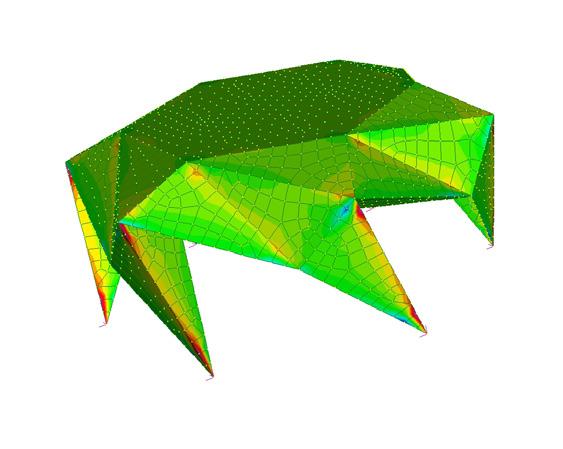
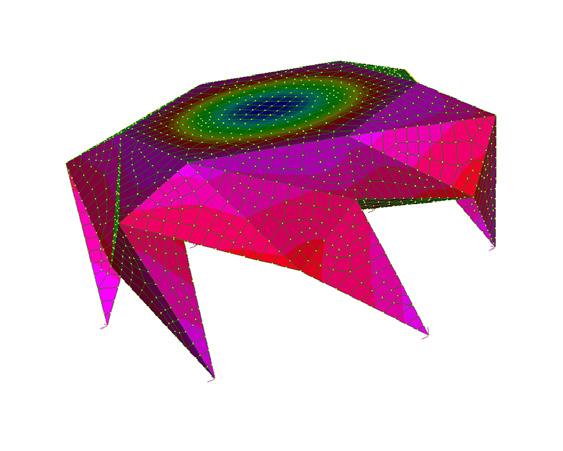
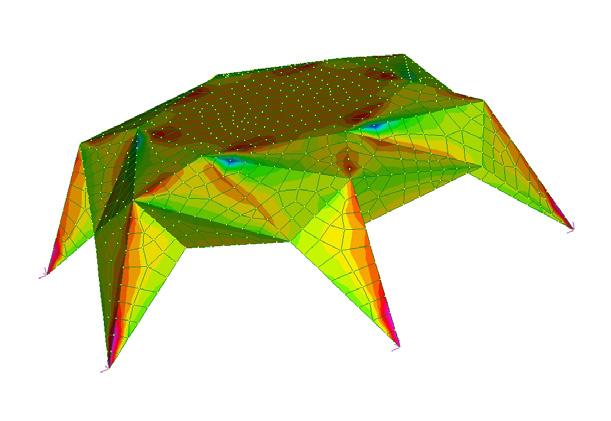
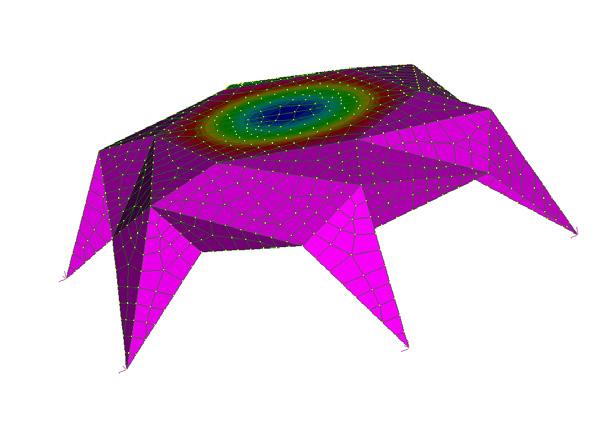
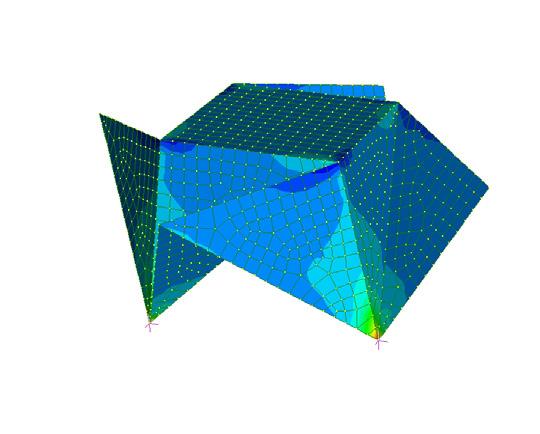
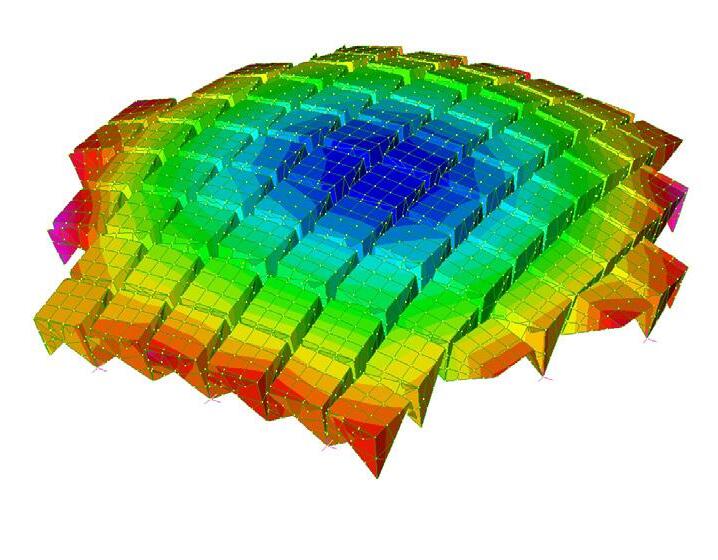
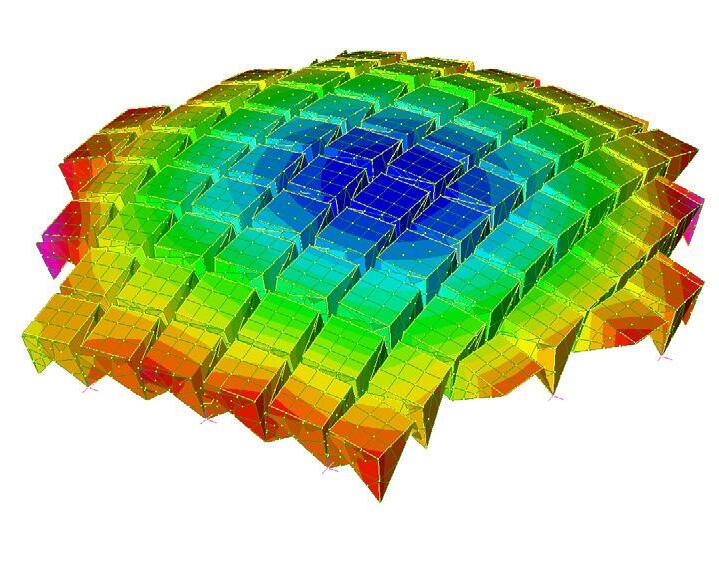
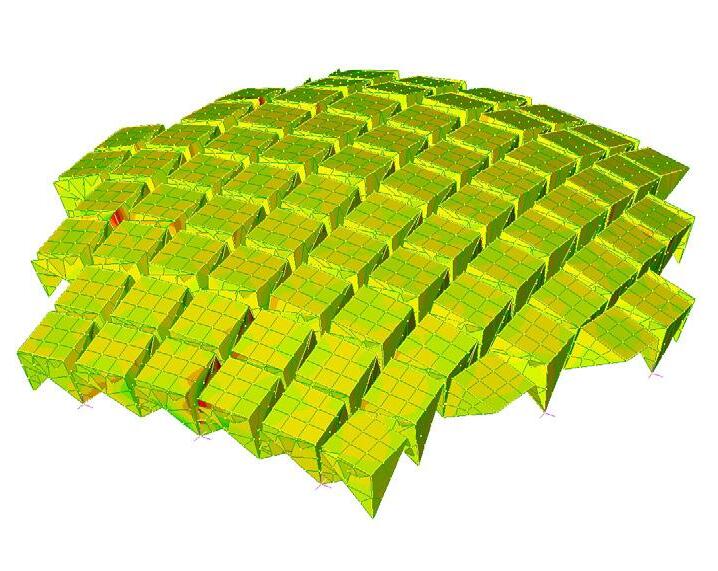
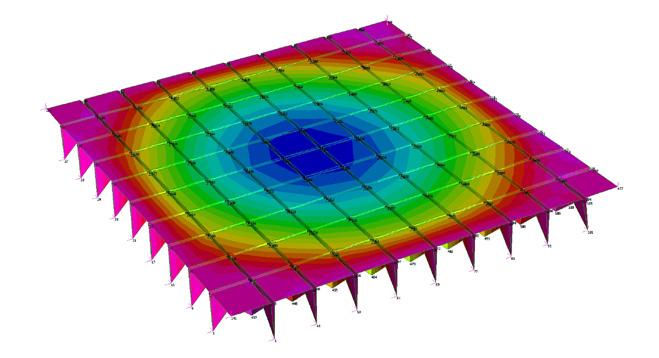
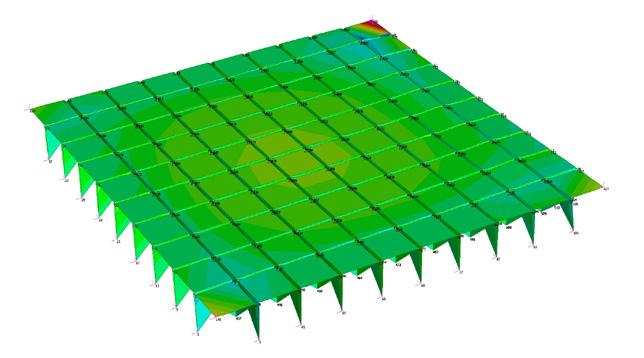
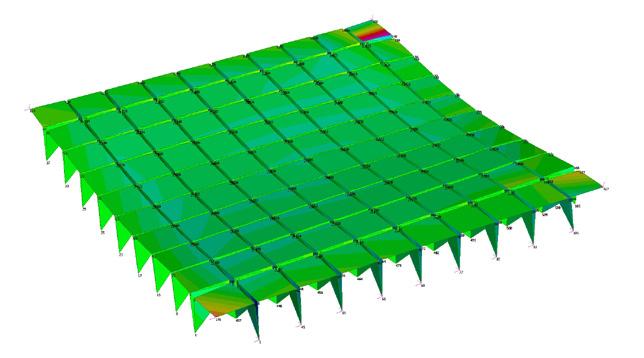
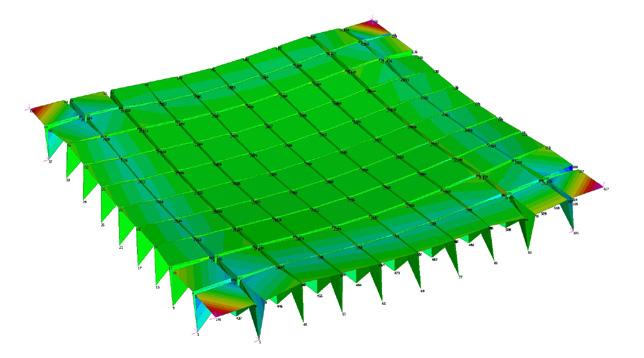
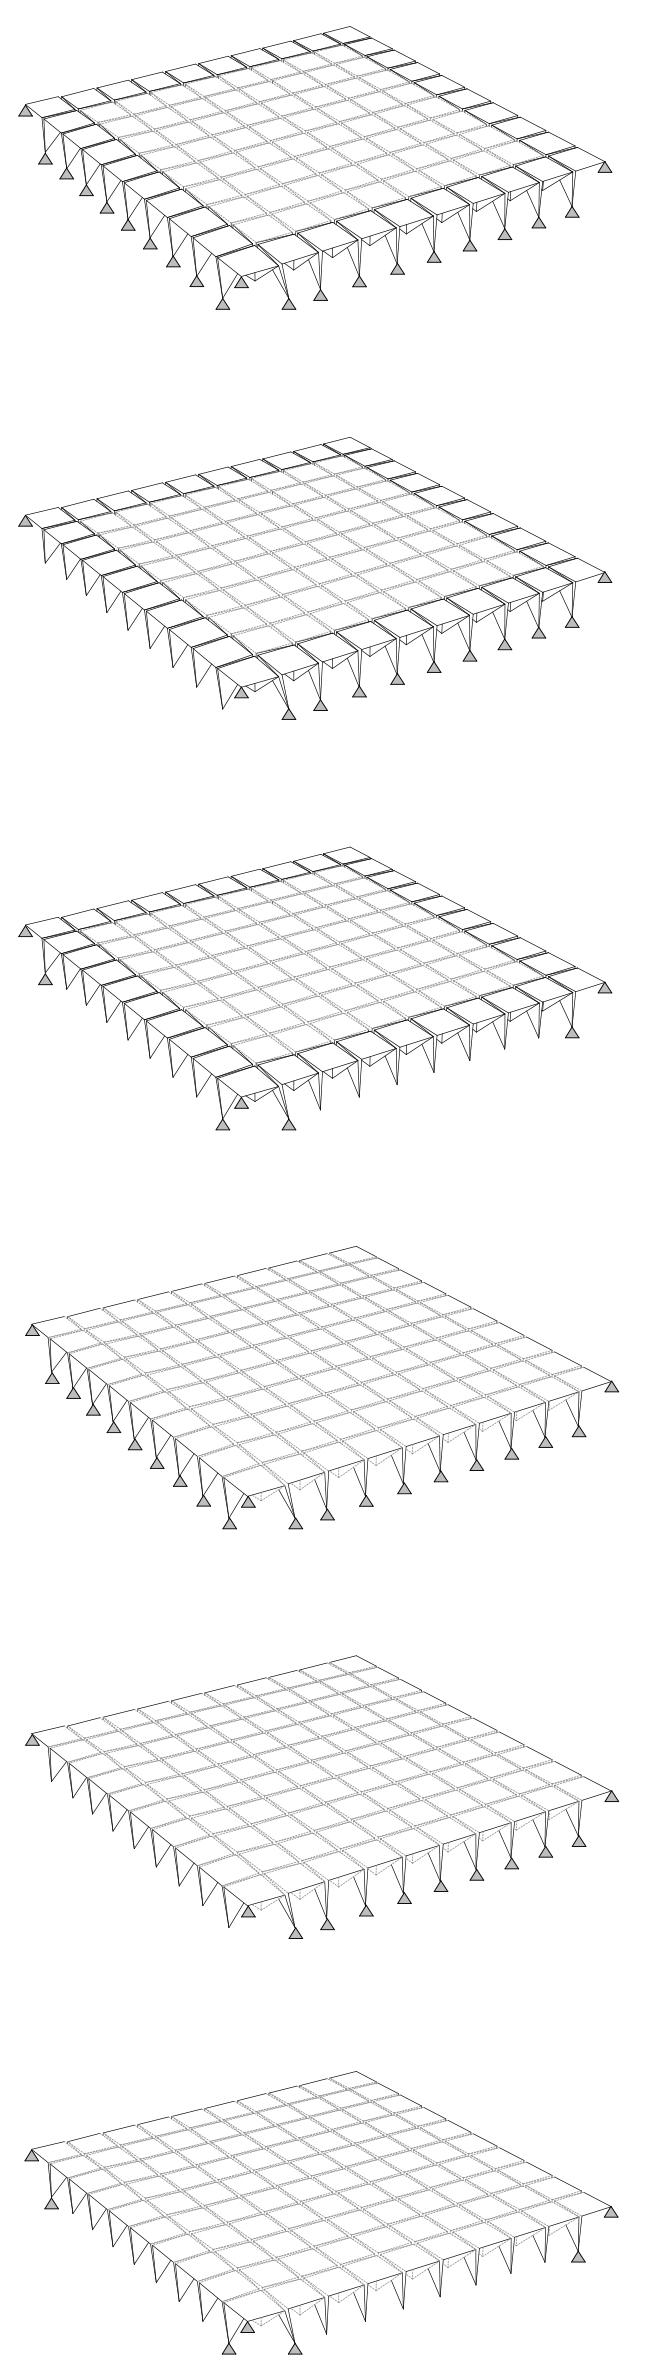
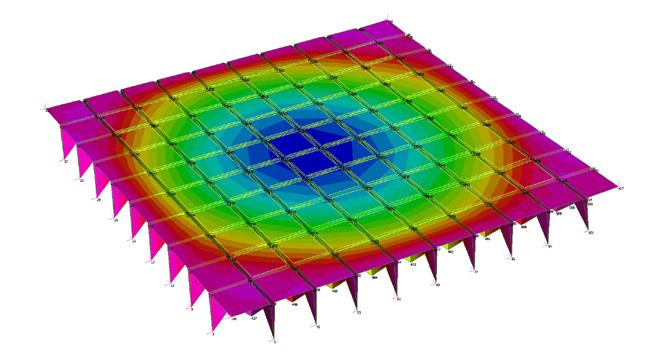
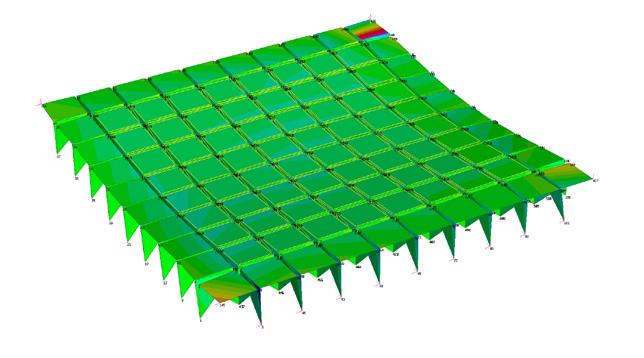
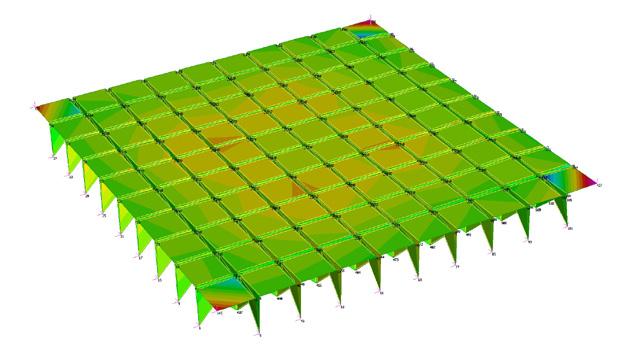
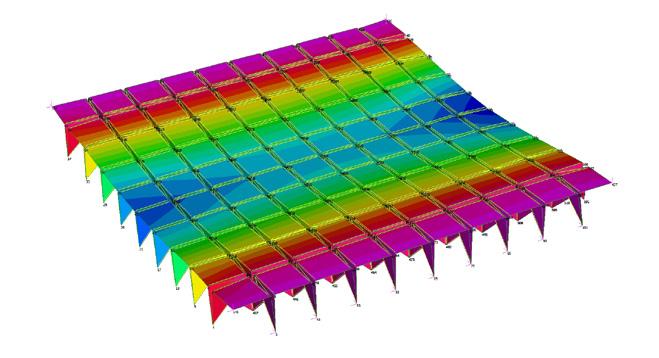
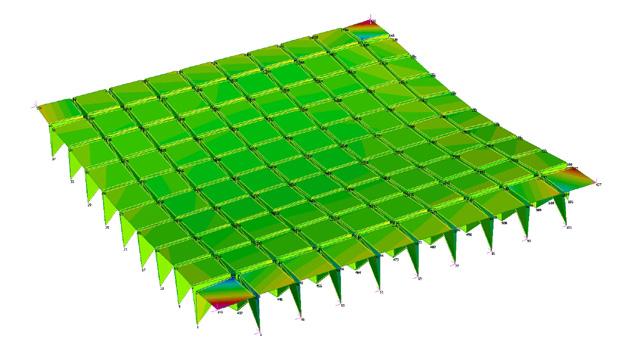
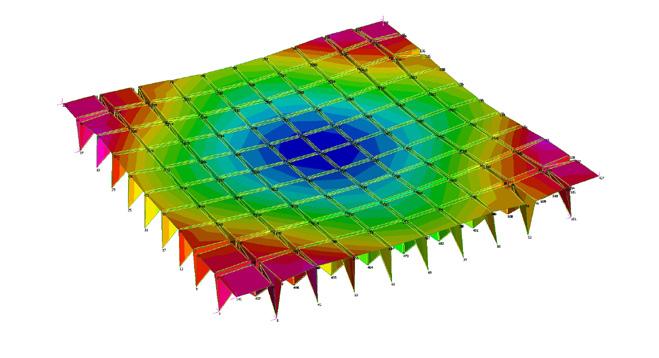
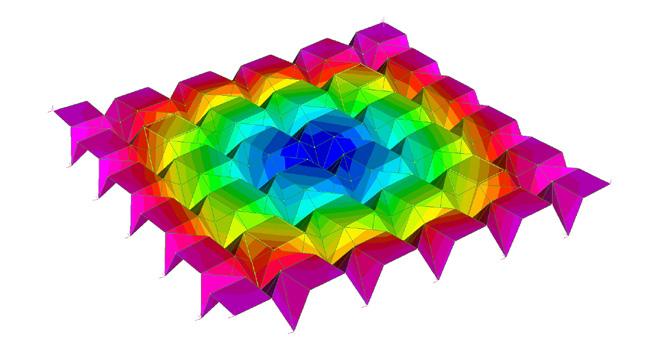
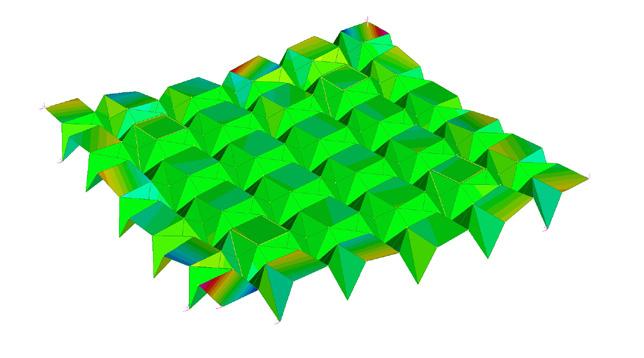
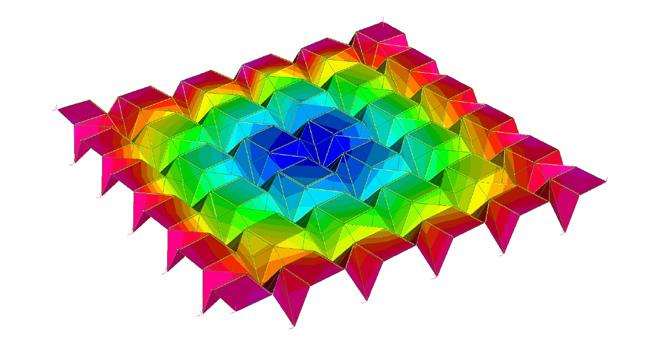
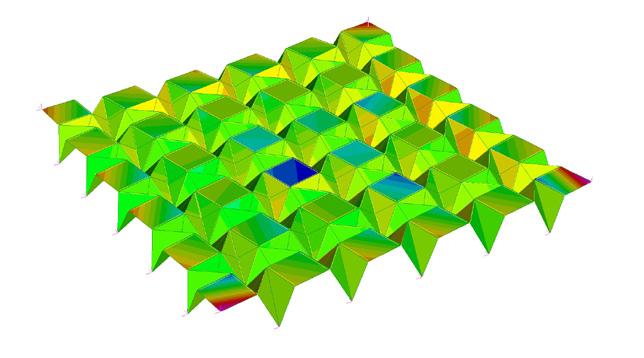
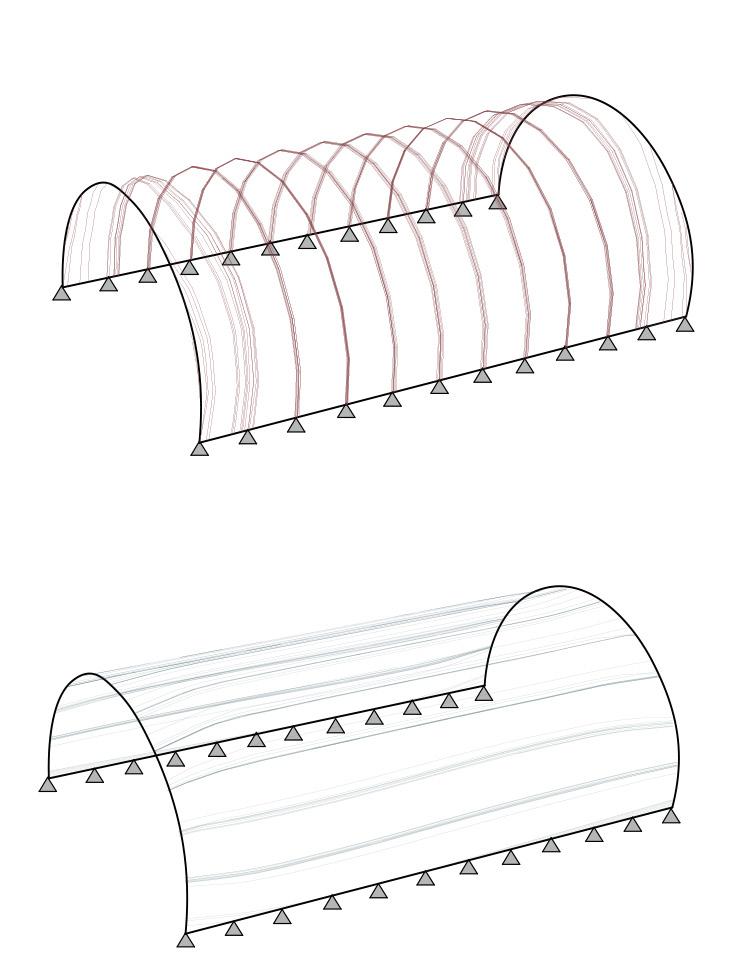
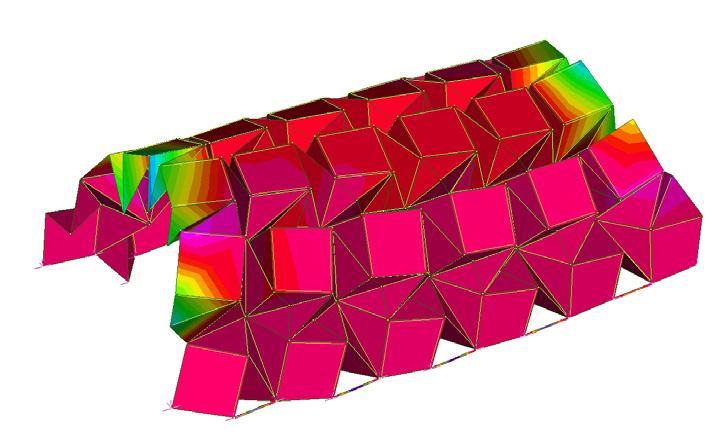
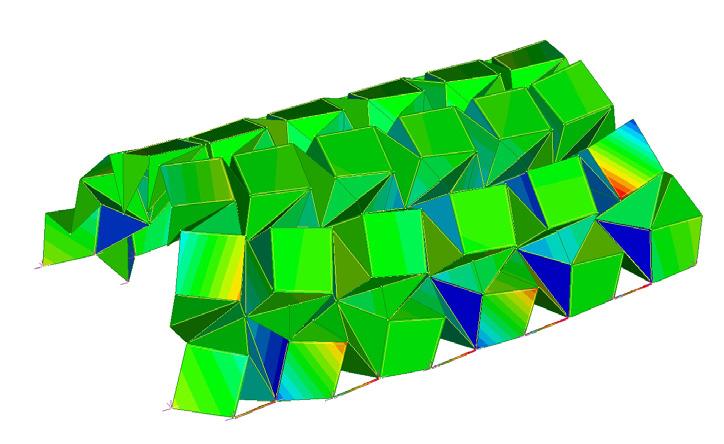
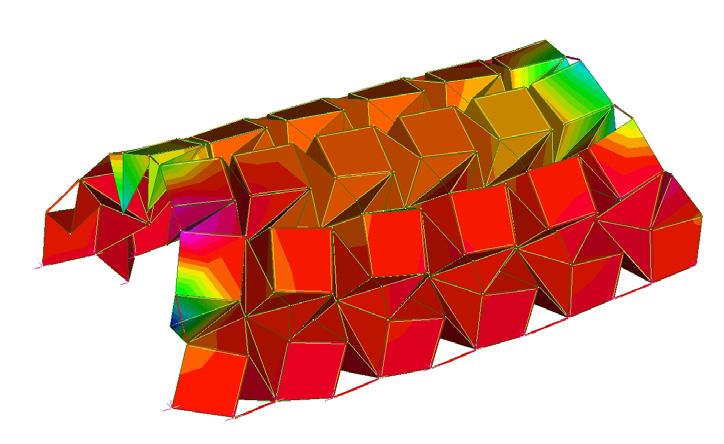
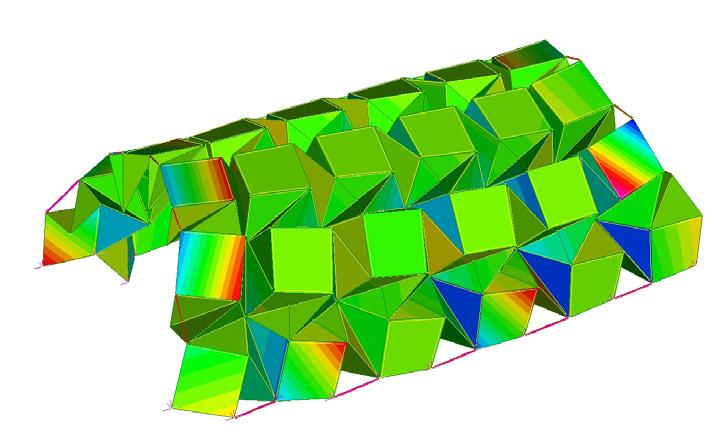
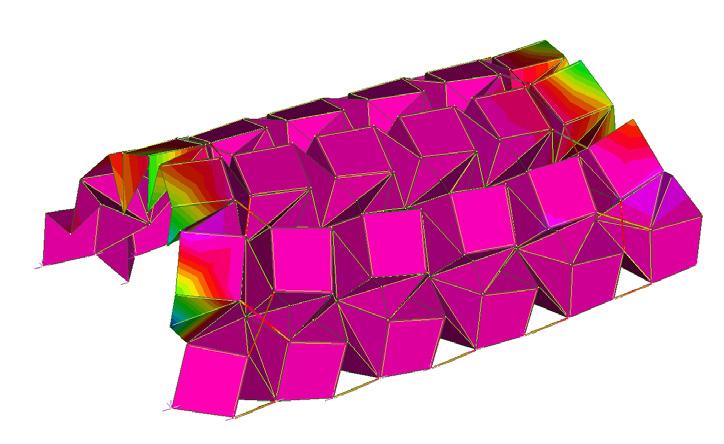
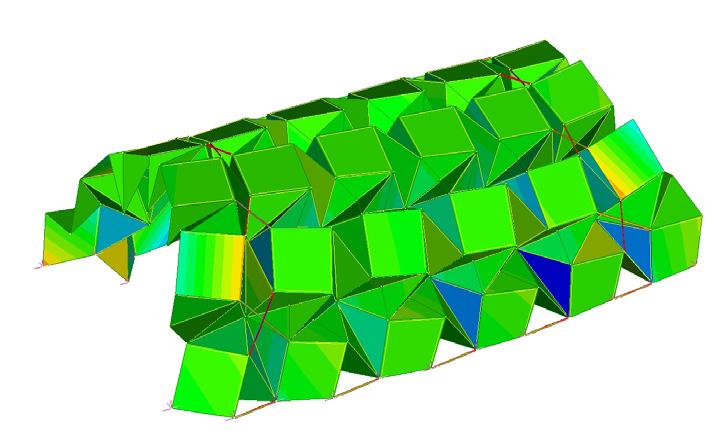
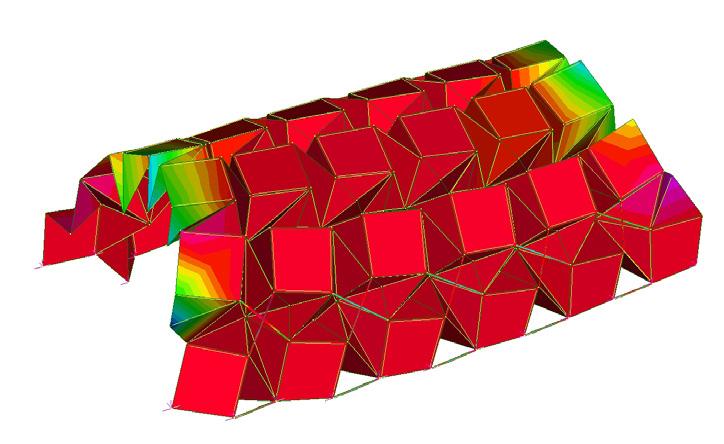
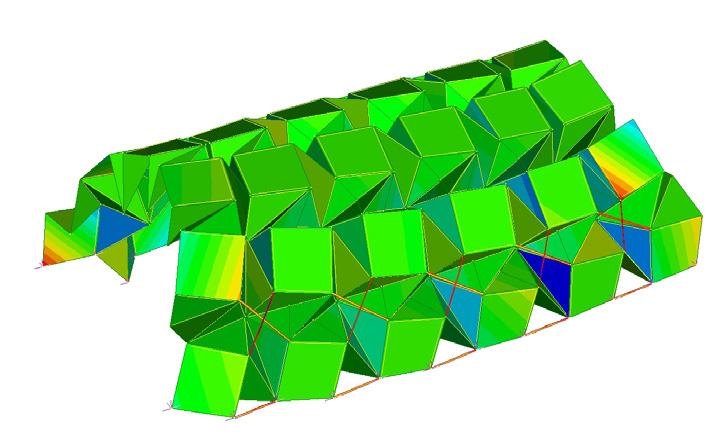
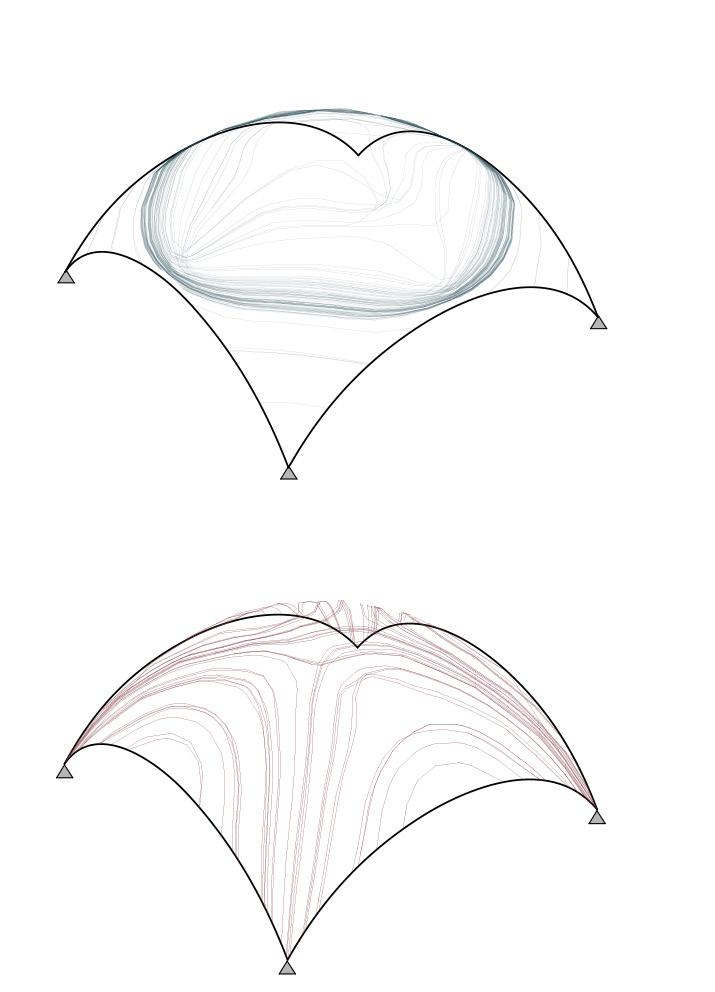
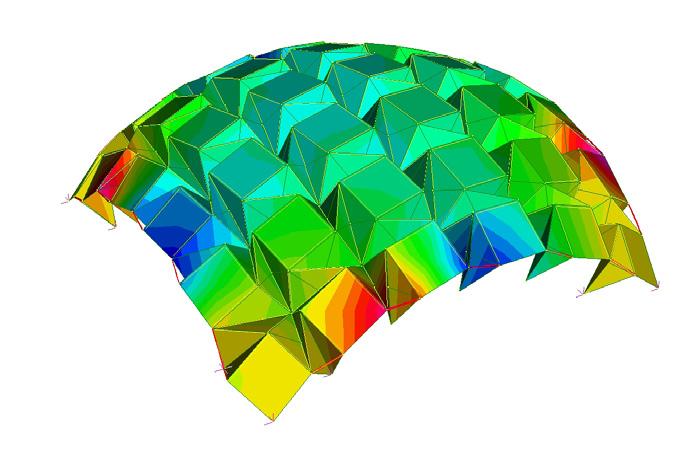
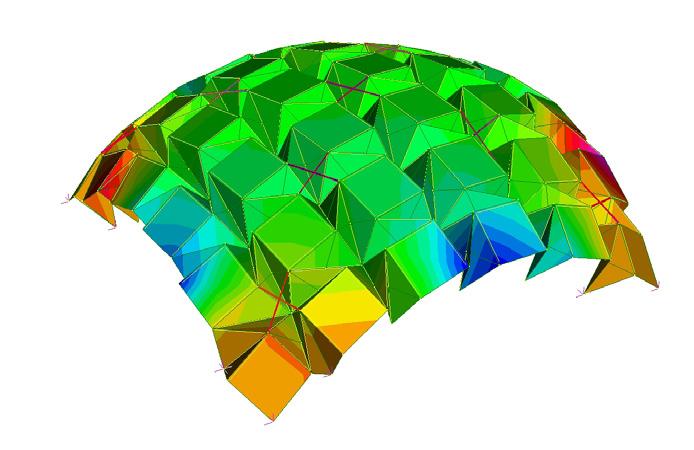
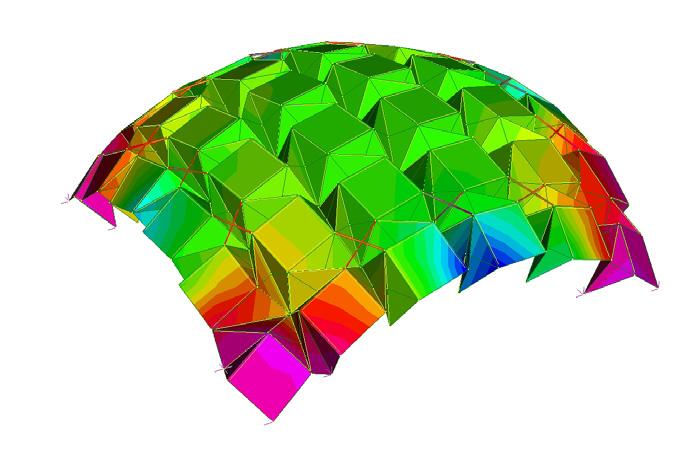
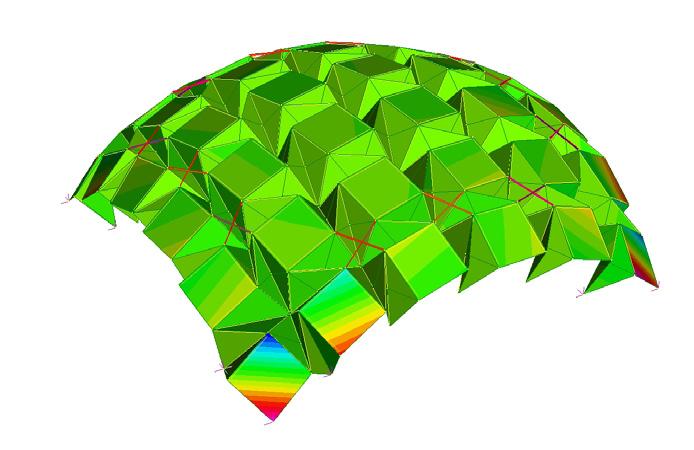
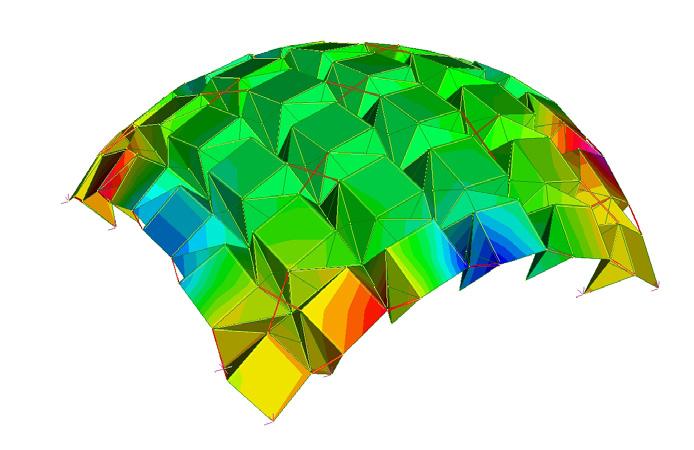
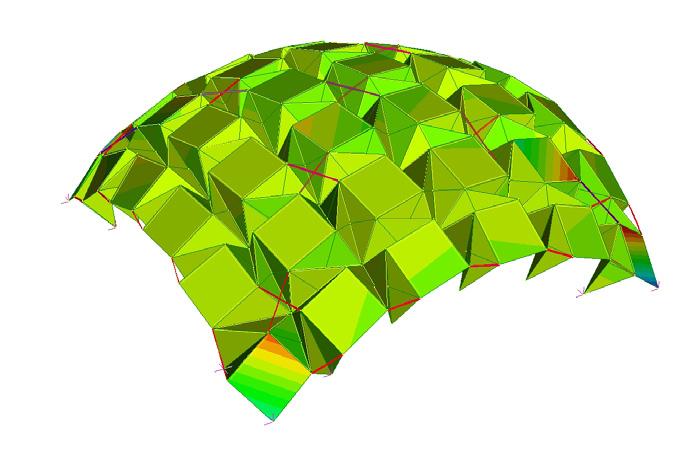
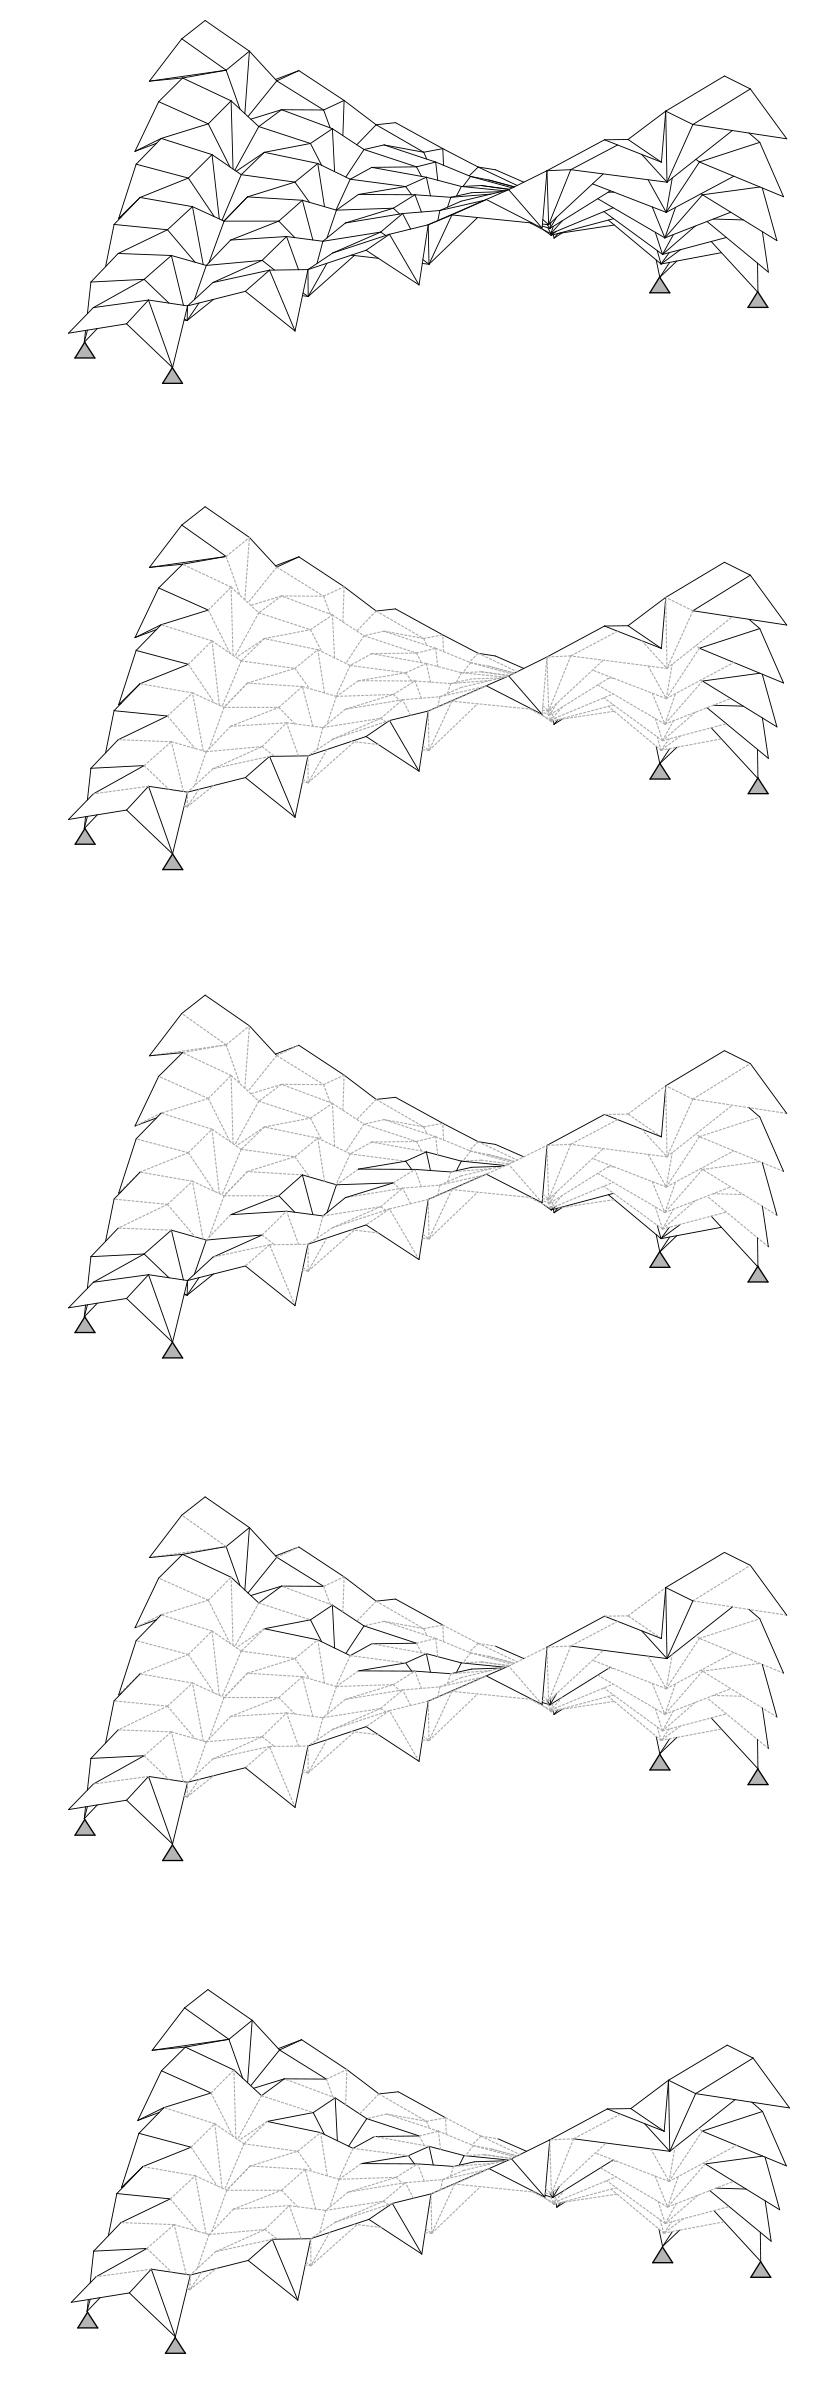
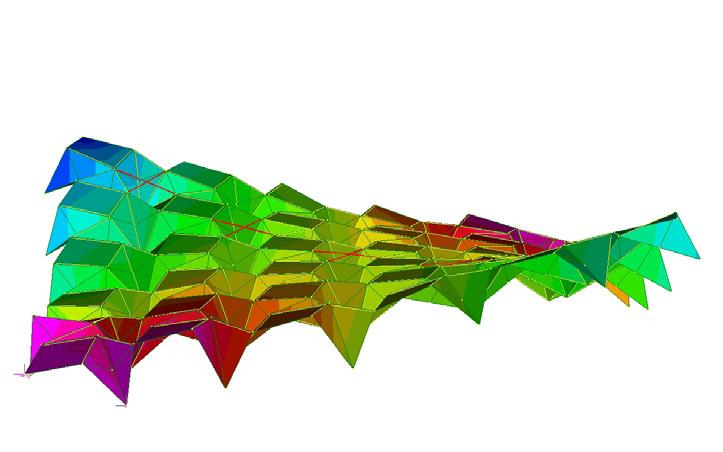
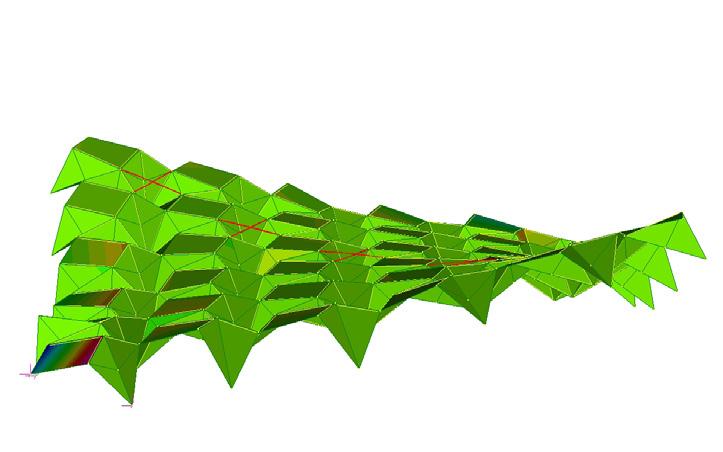
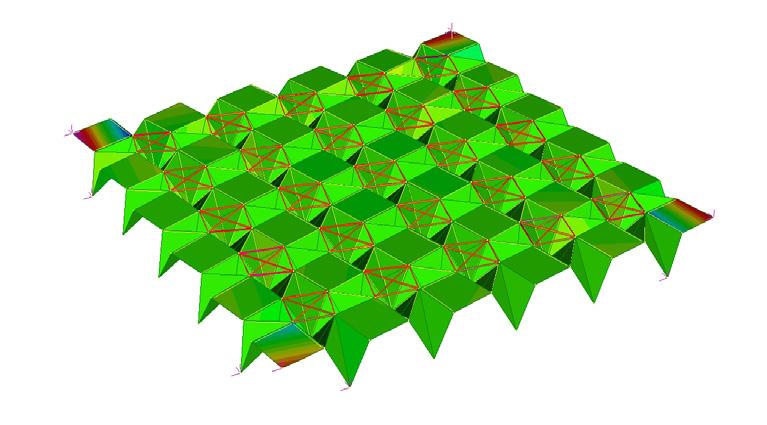
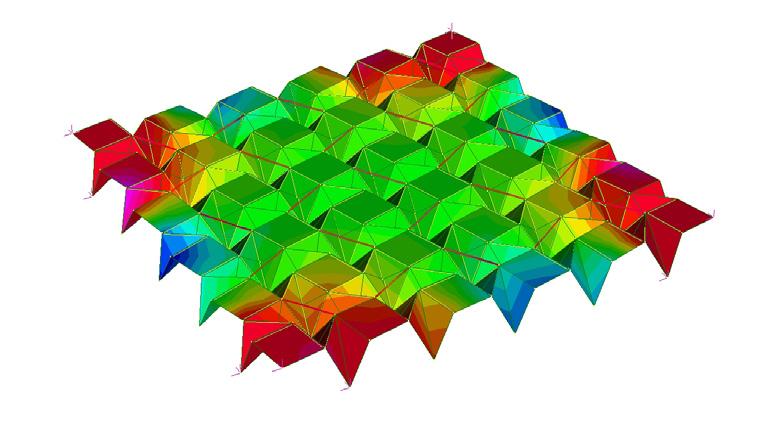
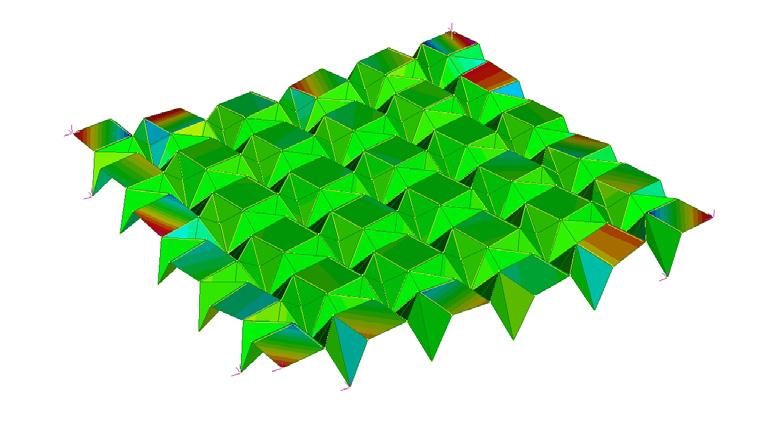
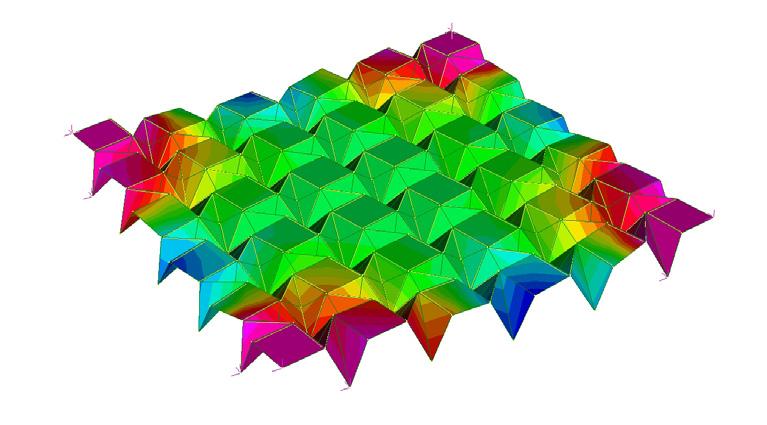
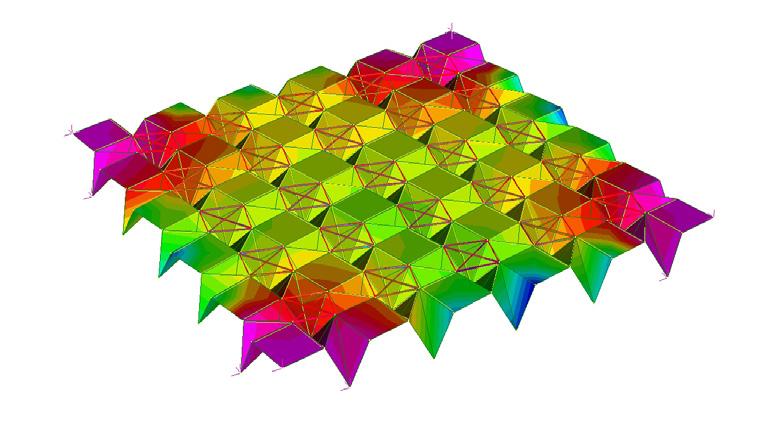
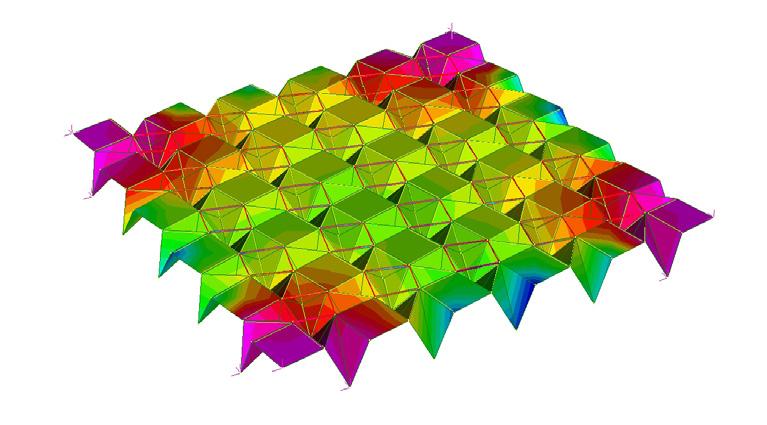
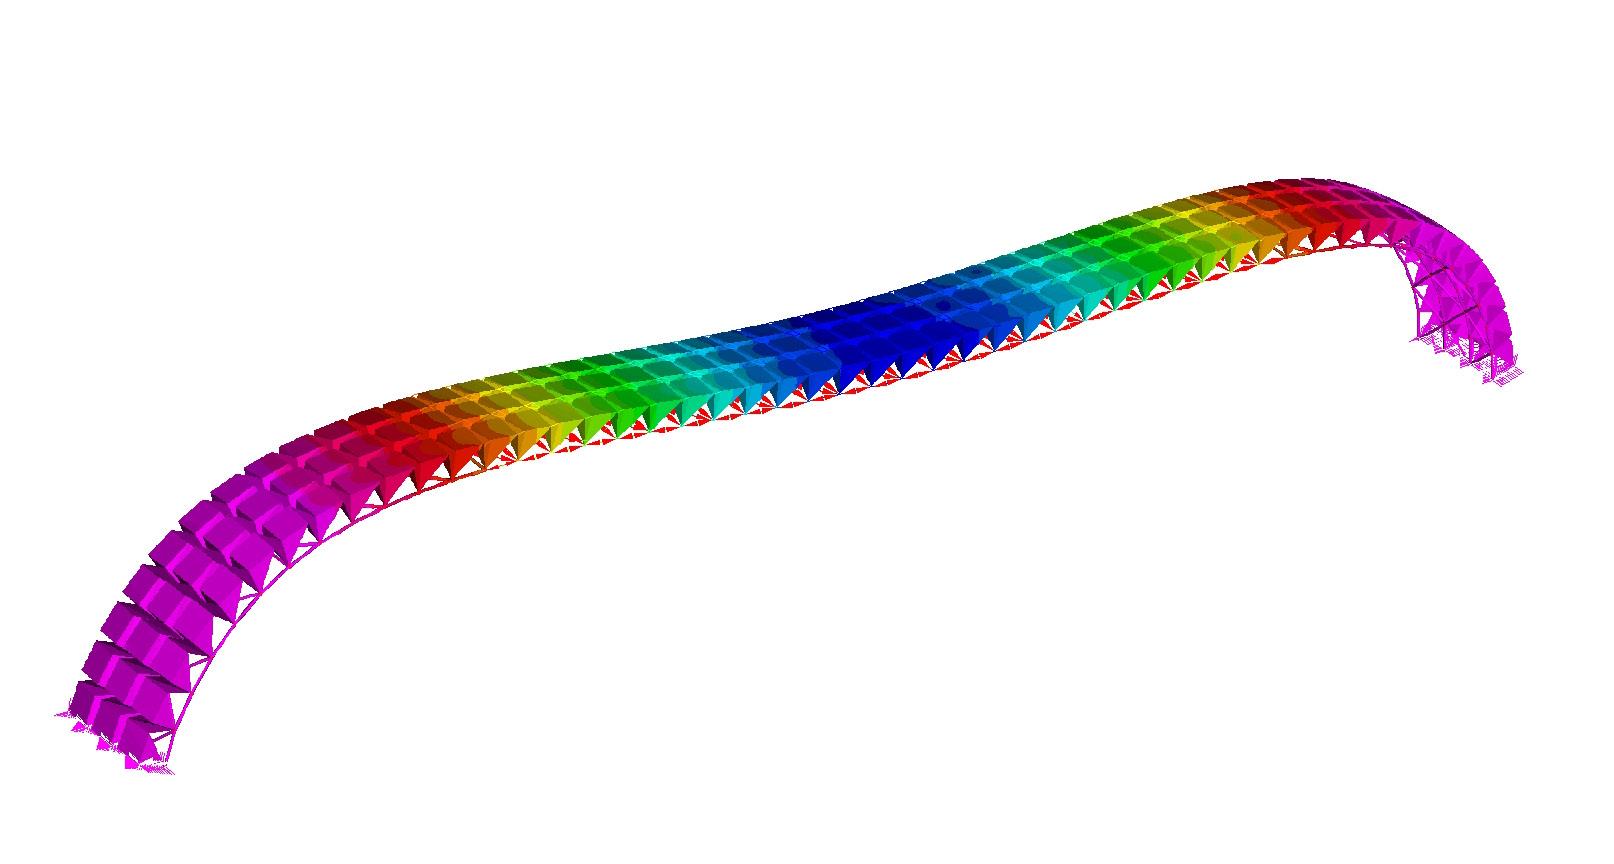
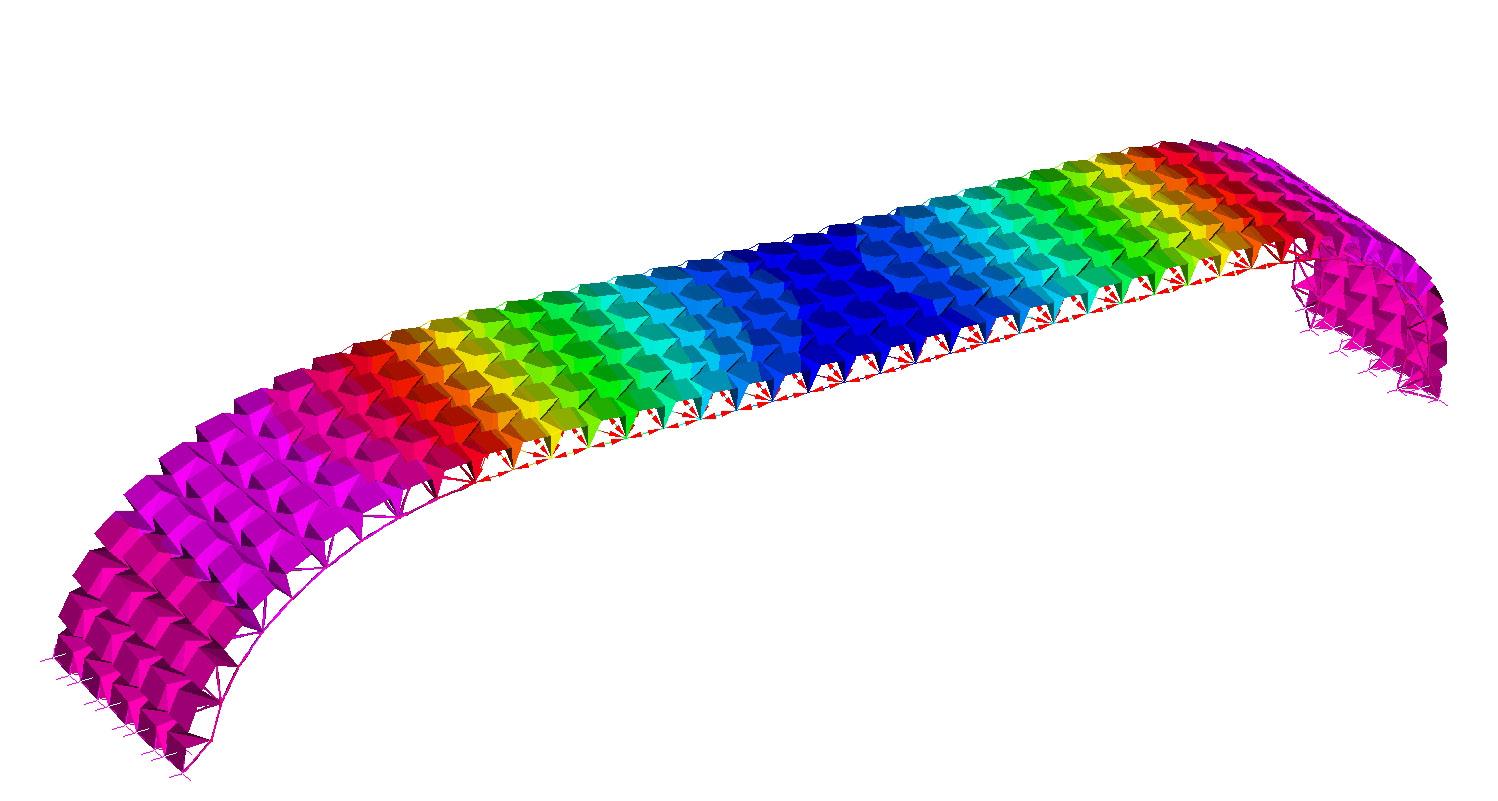
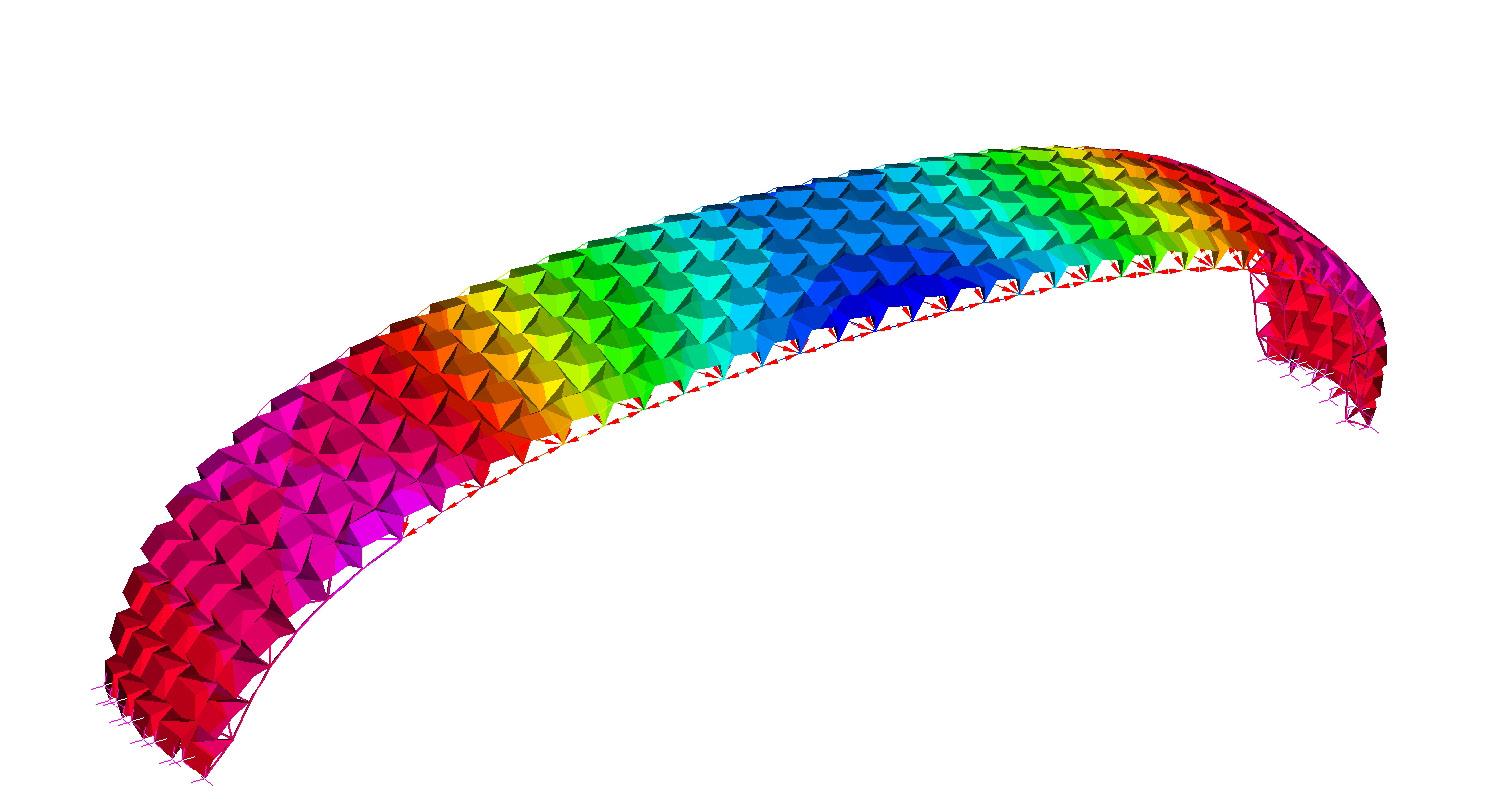
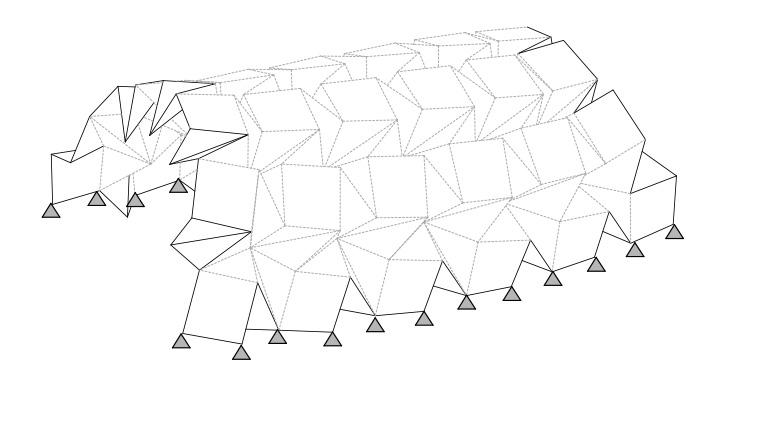
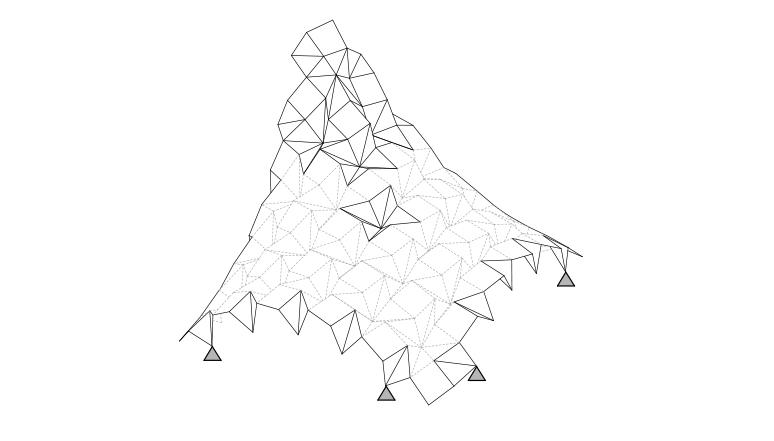
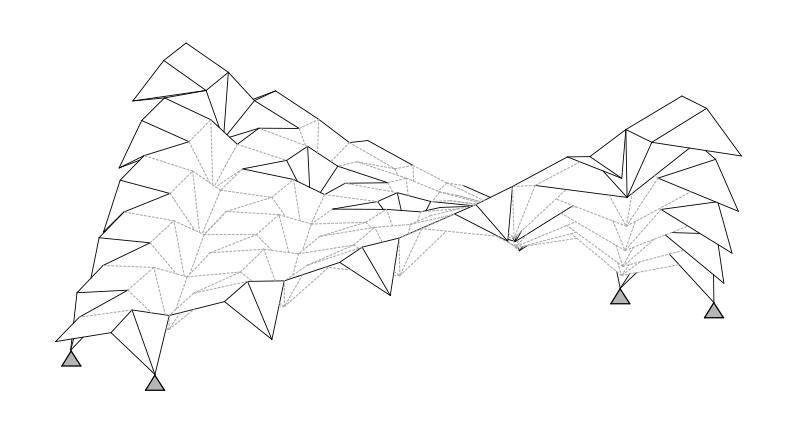
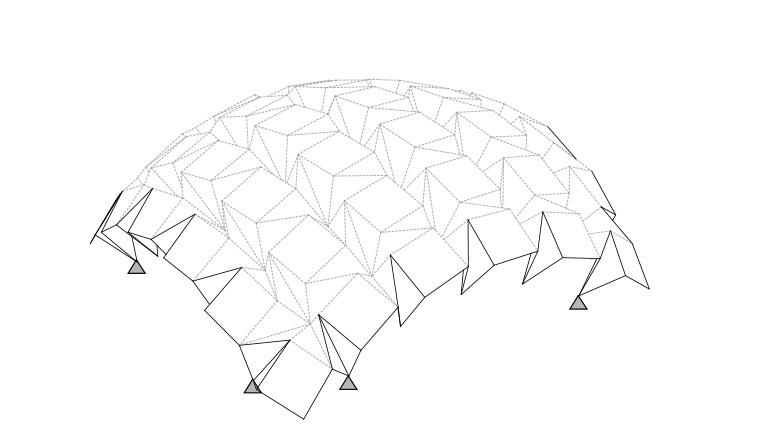
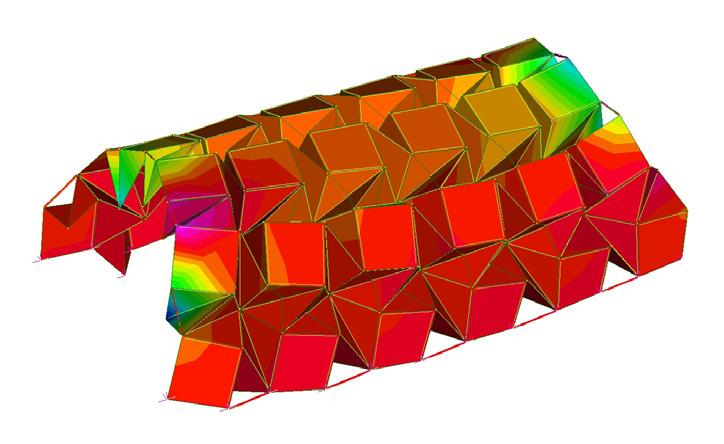
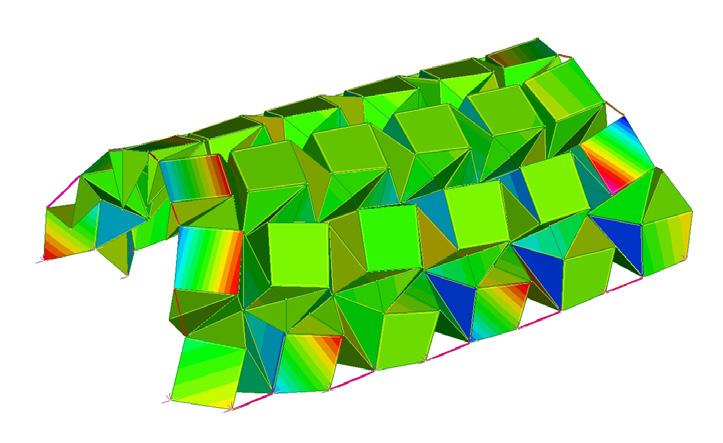
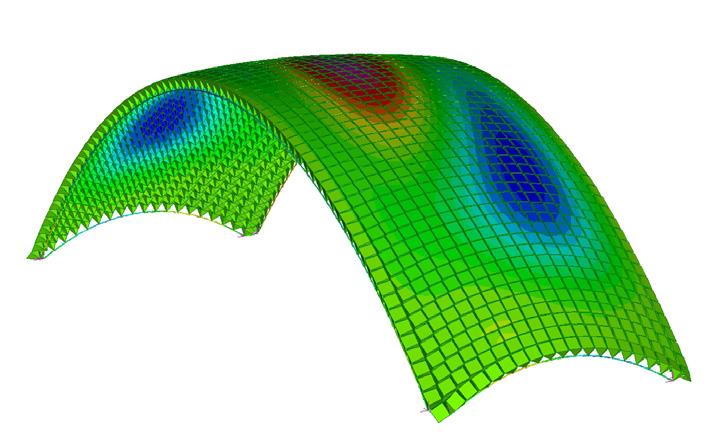
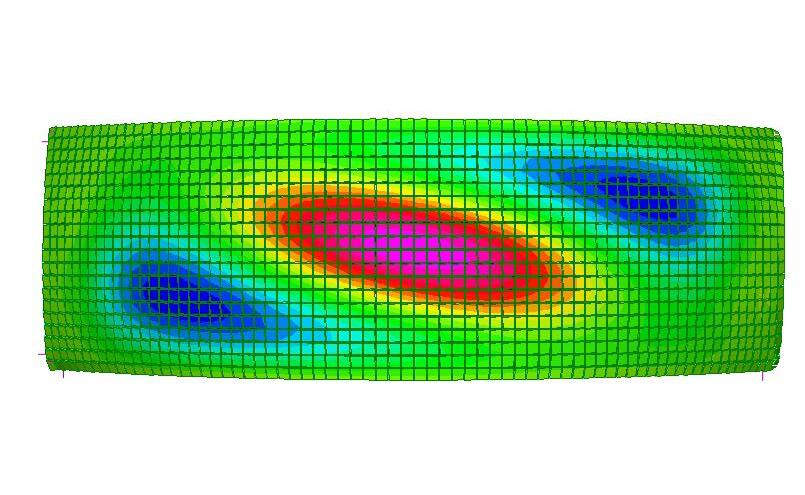
Due to software limitations, tests with completely hinged plate connections were not conducted. The ability to accurately simulate and control the geometry digitally was also taken into account as digital control over the folding process was crucial for the purposes of this project. As the number of unlocked components was increased, the maximum deformation values became higher. However, for a span of 15m the difference between deformation for completely rigid connections and completely hinged connections was only 7mm. This led to the conclusion that boundary conditions and global geometries were of great importance for the overall performance as opposed to joint rigidity.
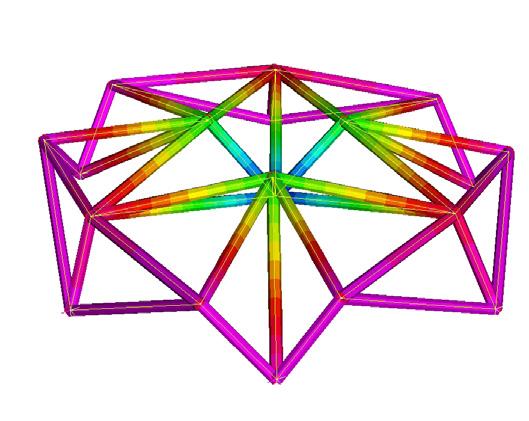
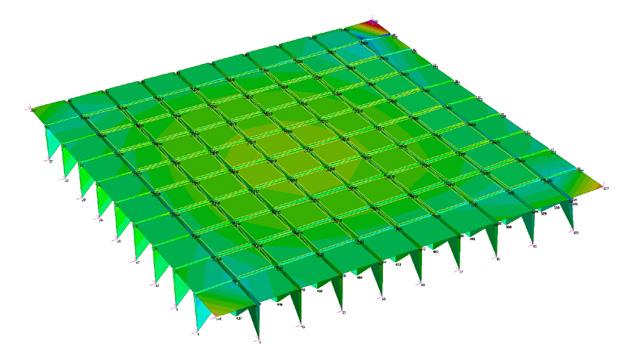
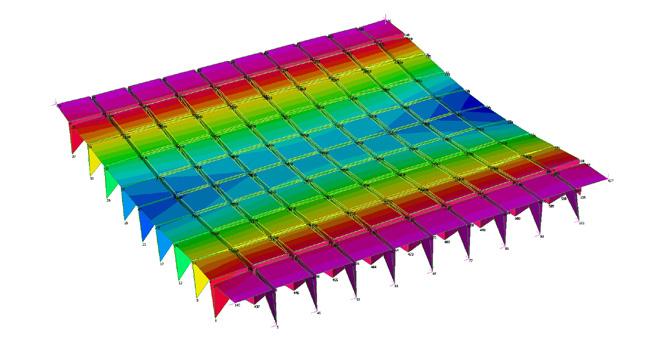
Although the peak values for mean plate stress remain relatively similar in all three cases, the stress values in the digital model with hinged connections were slightly higher ( by 0.4 MPa in compression and by 1.1 MPa in tension). This is due to the increased overall flexibility of the system and the decreased resistance to external load. The stresses became more equally distributed along the dome but highly concentrated close to the anchor points.
62 Transient Systems Chapter 4
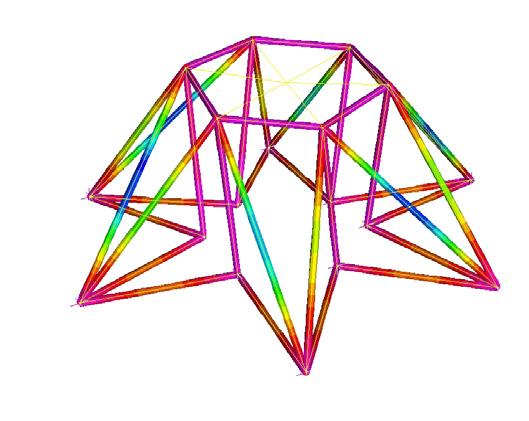
mm 100 0 MPa 15 0 mm 100 0 MPa 15 0
STATE II STATE I
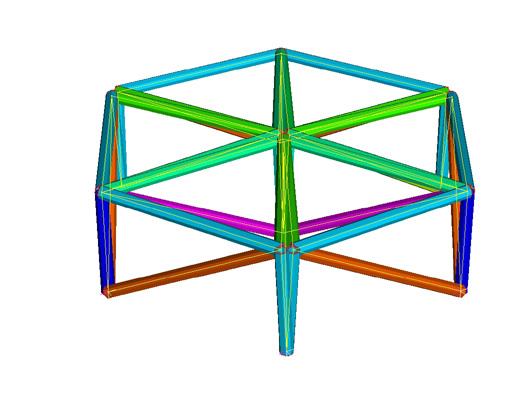
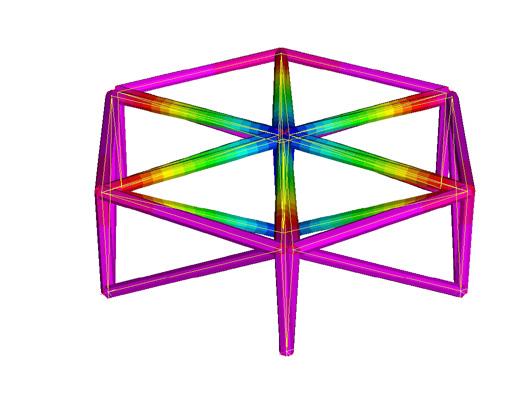
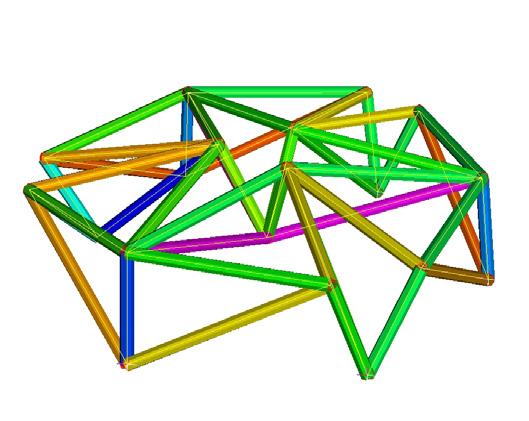
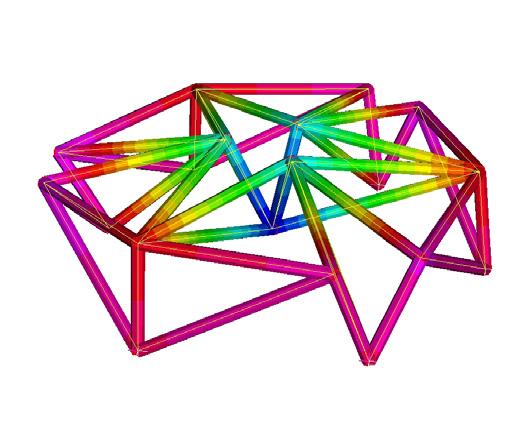
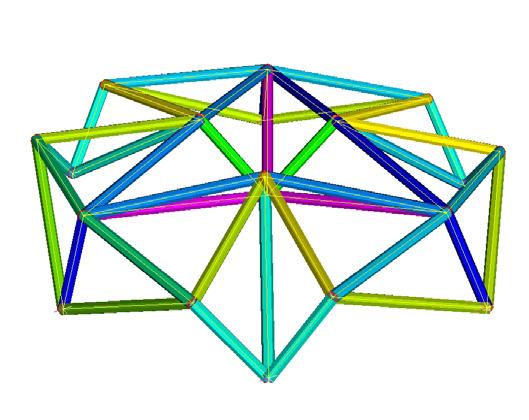
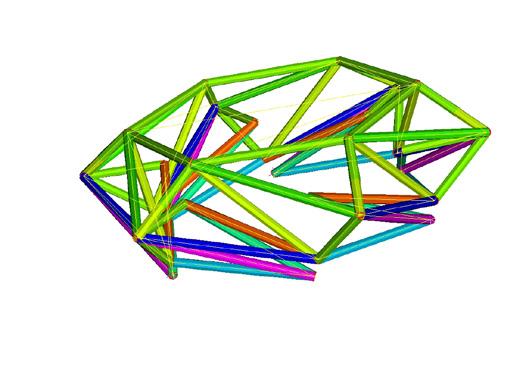
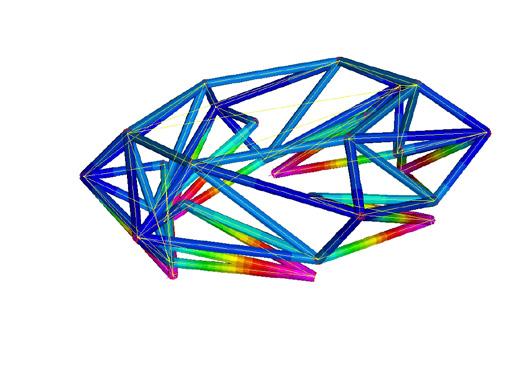
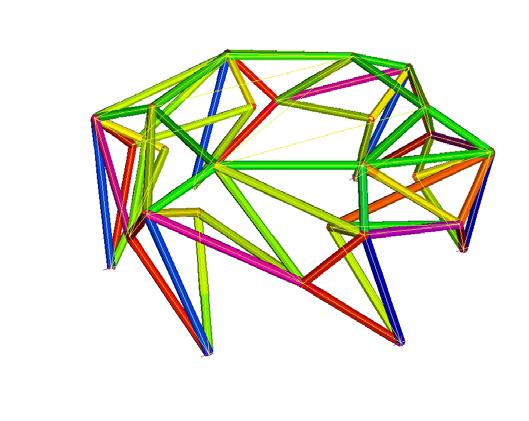
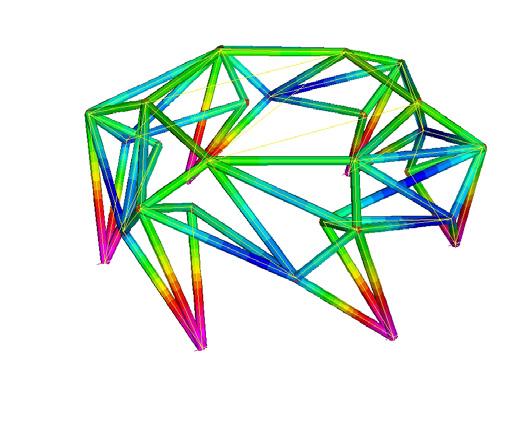
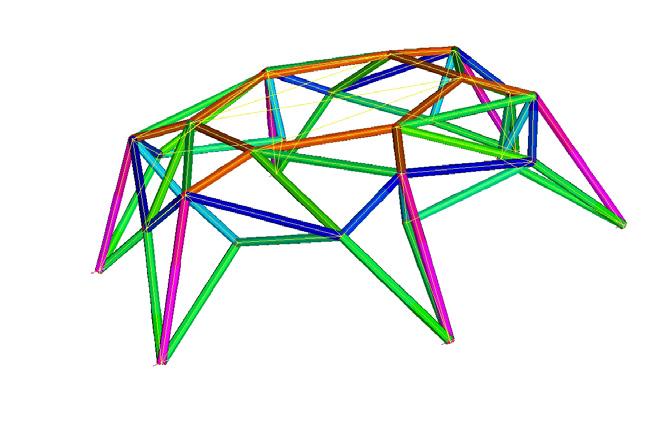
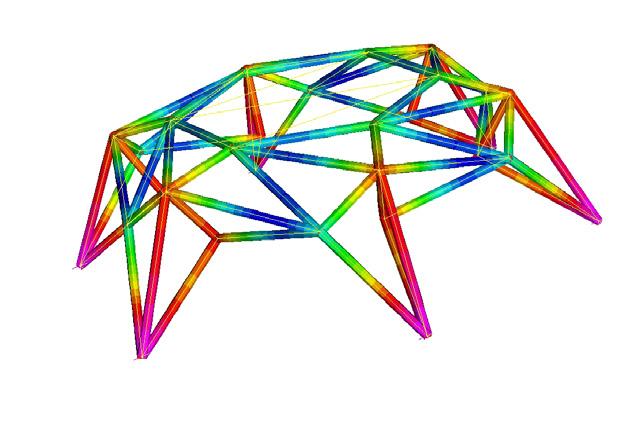
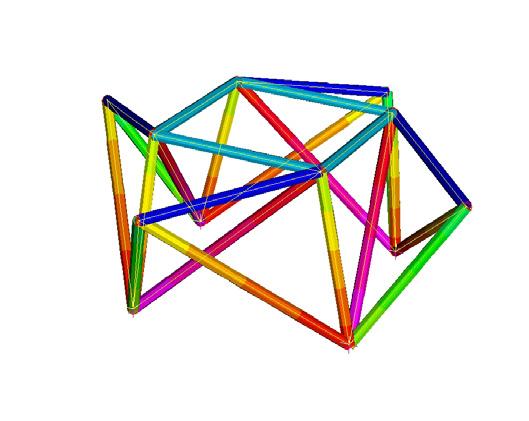
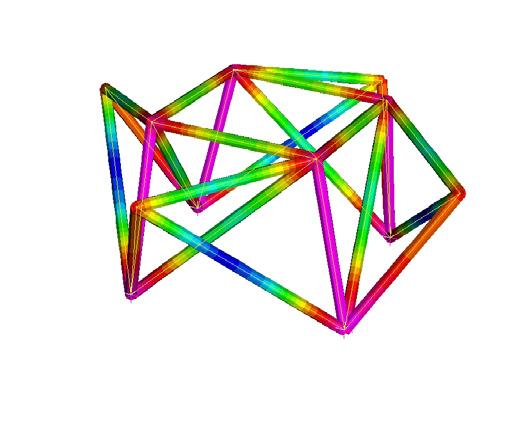
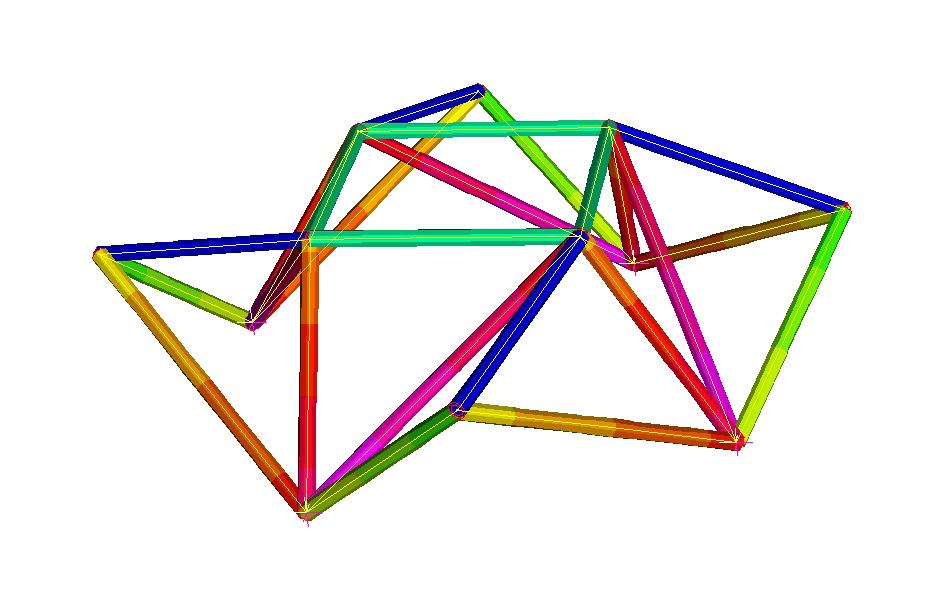
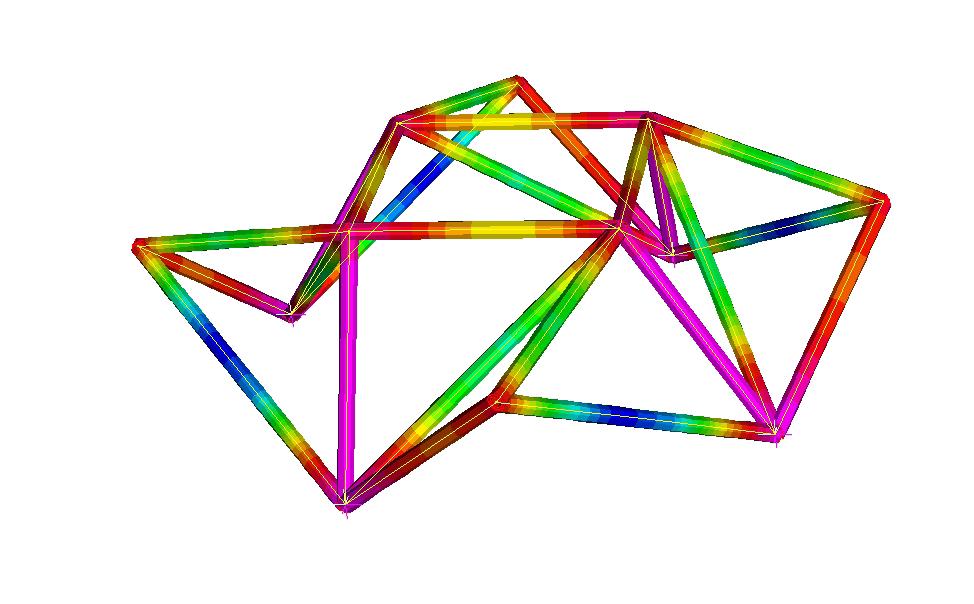
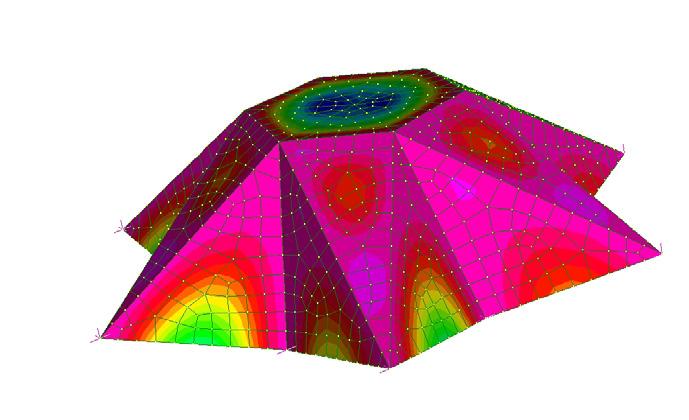
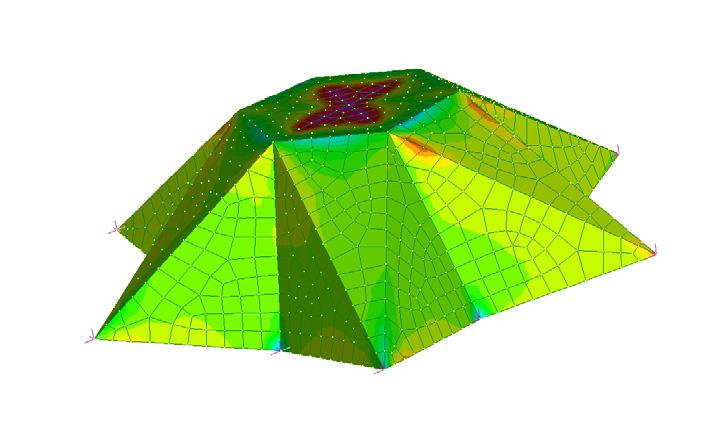
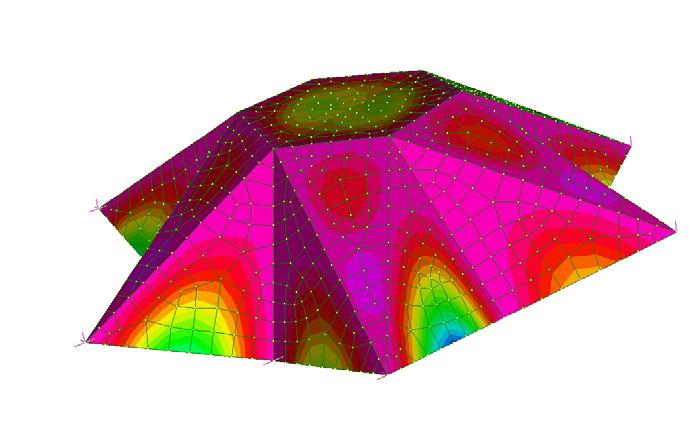
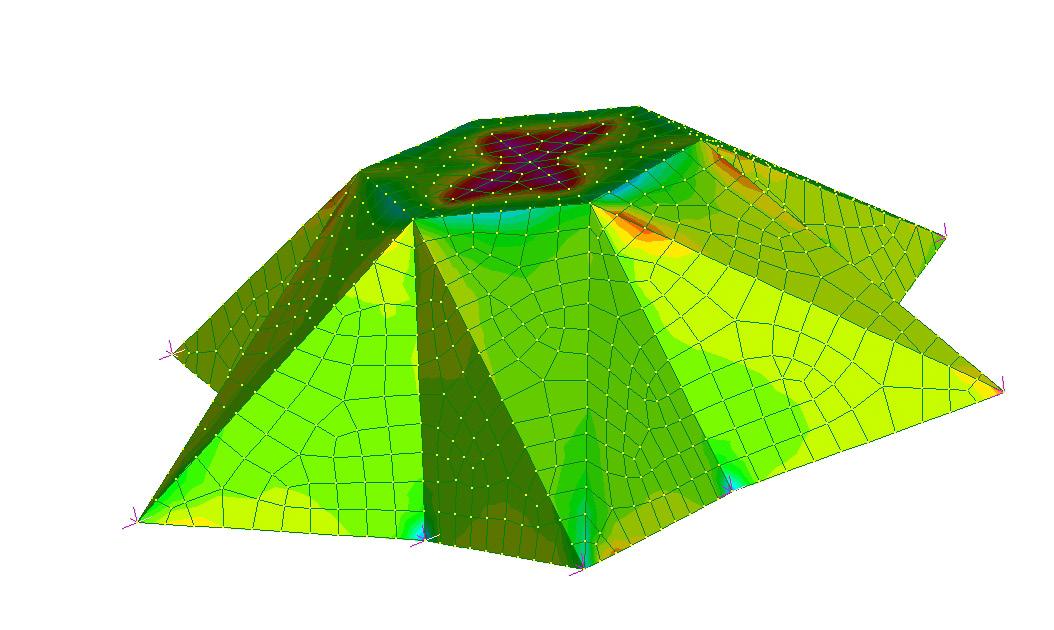
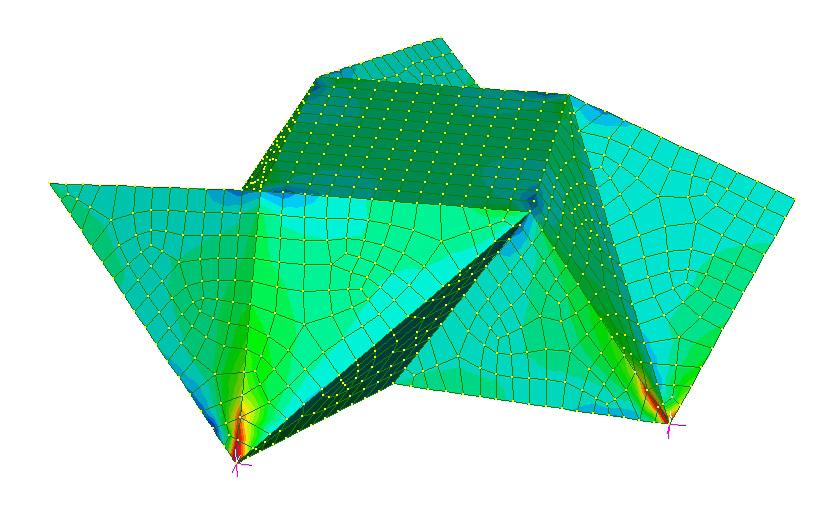
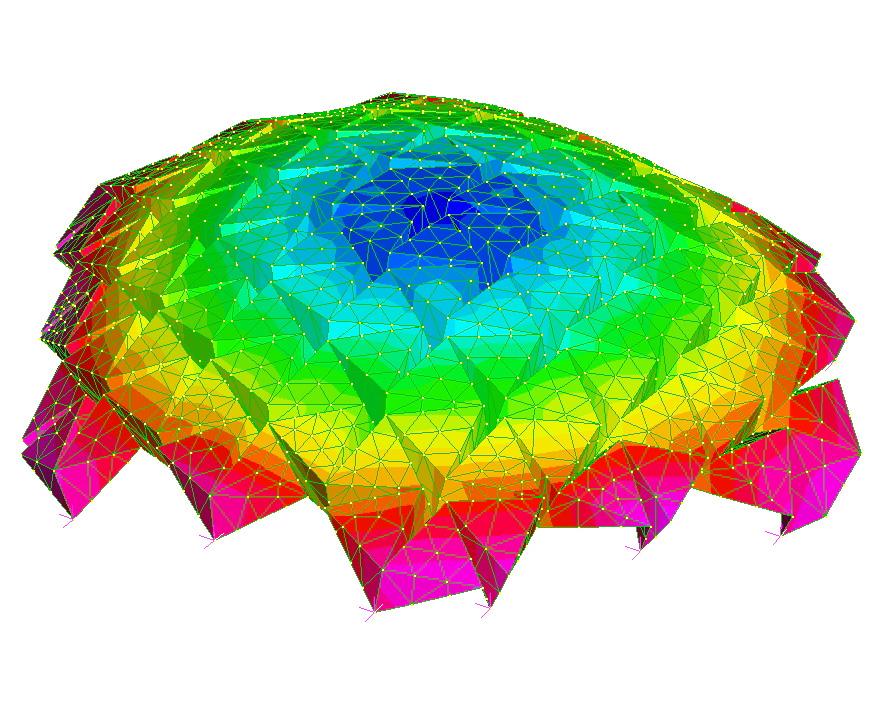
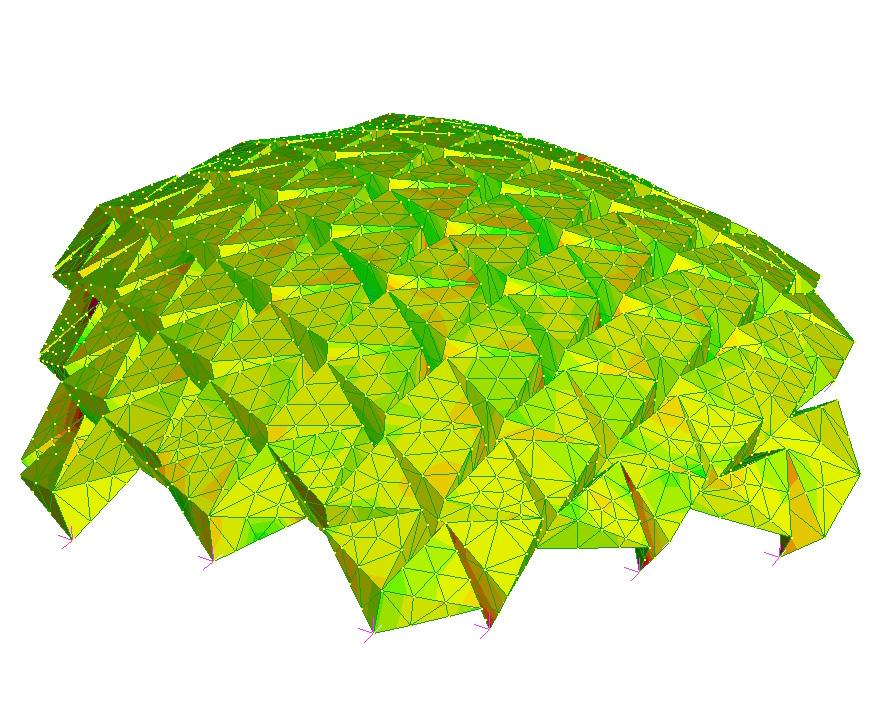
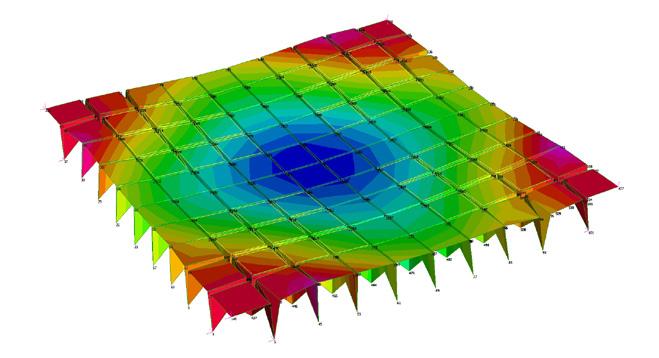
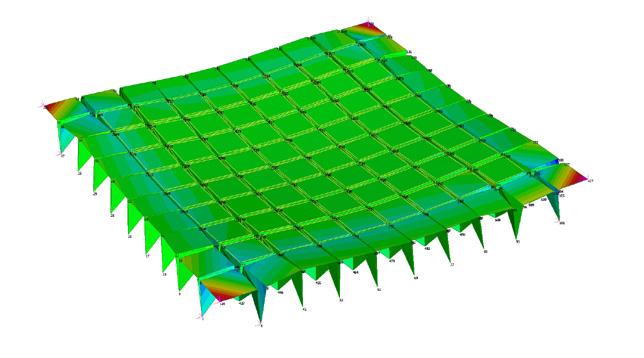
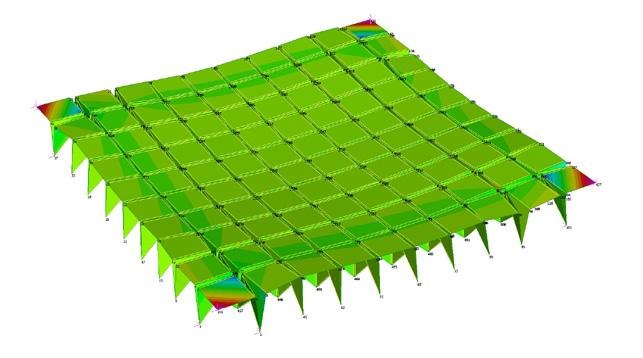
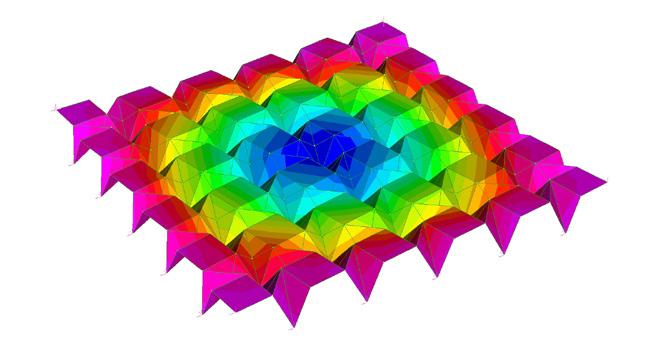
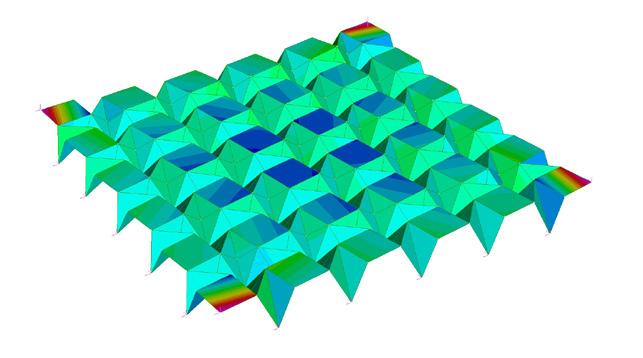
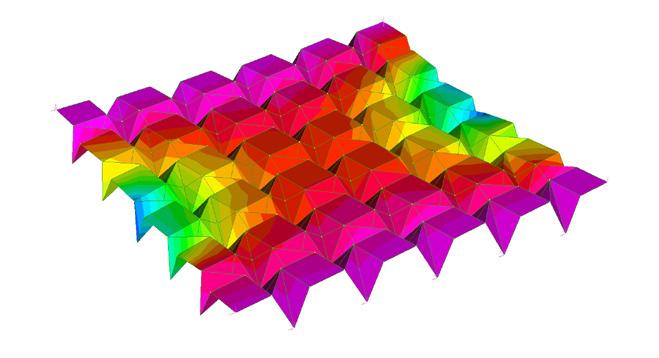
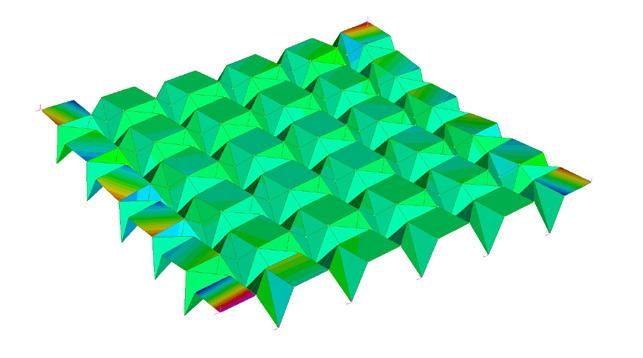
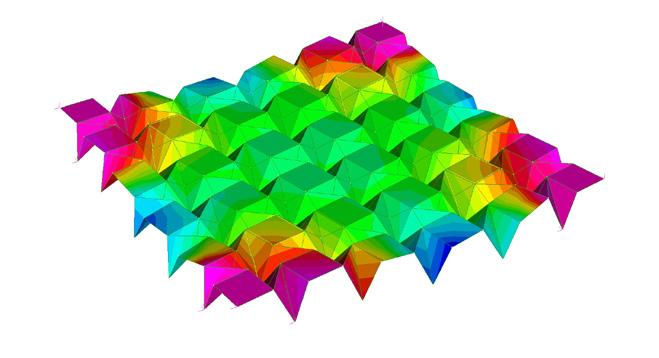
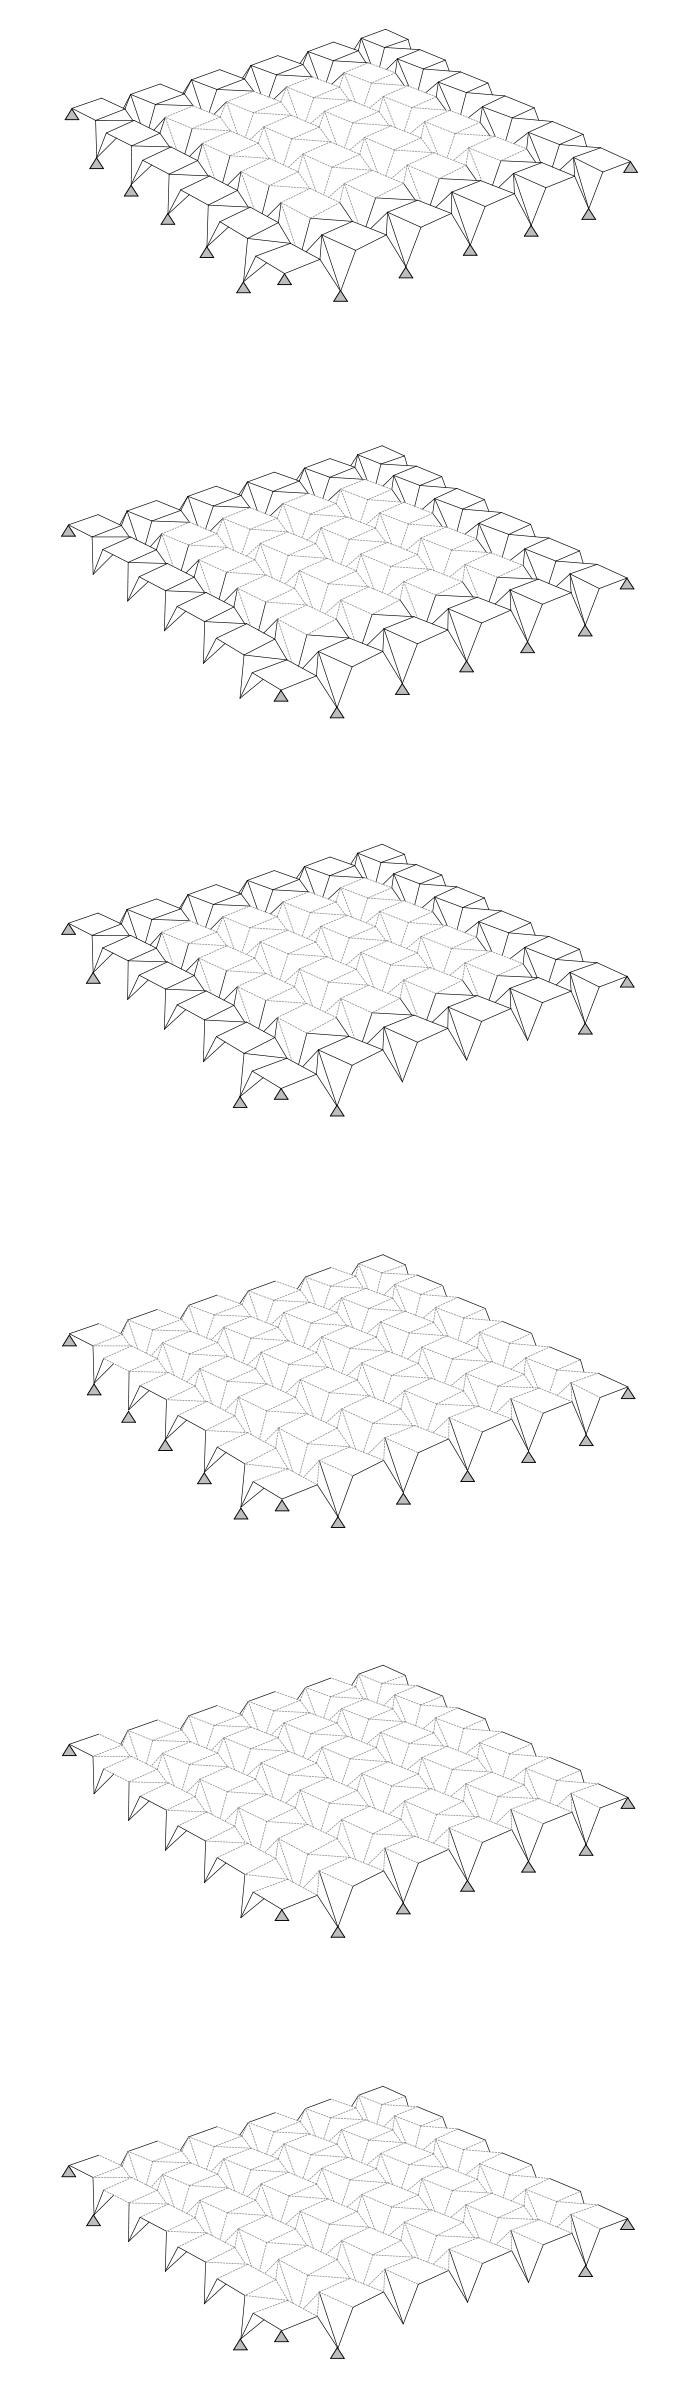
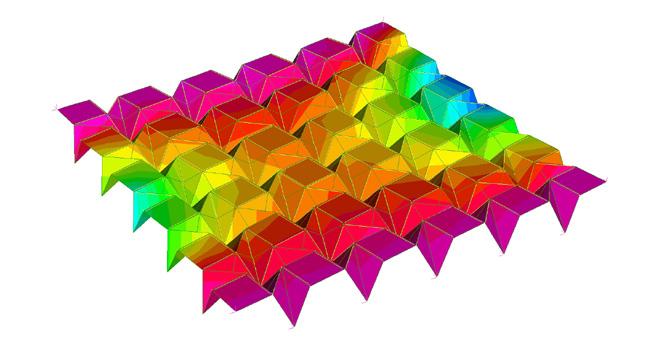
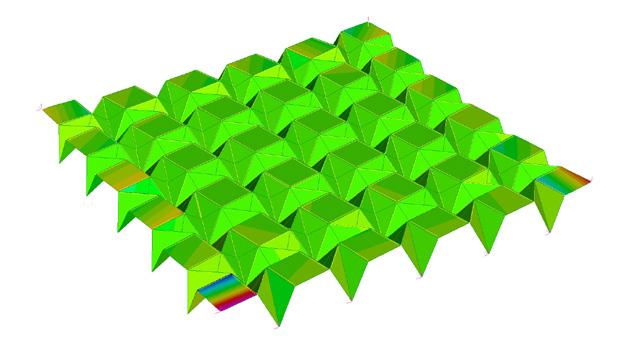
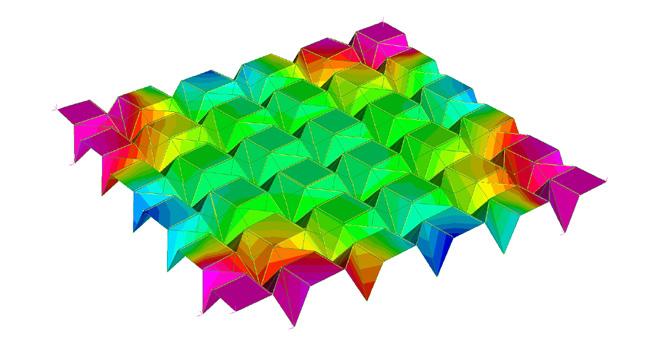
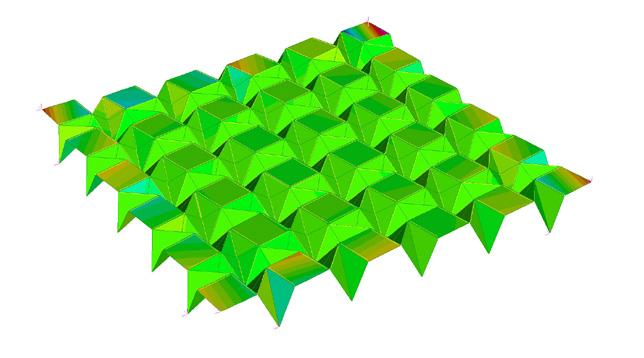
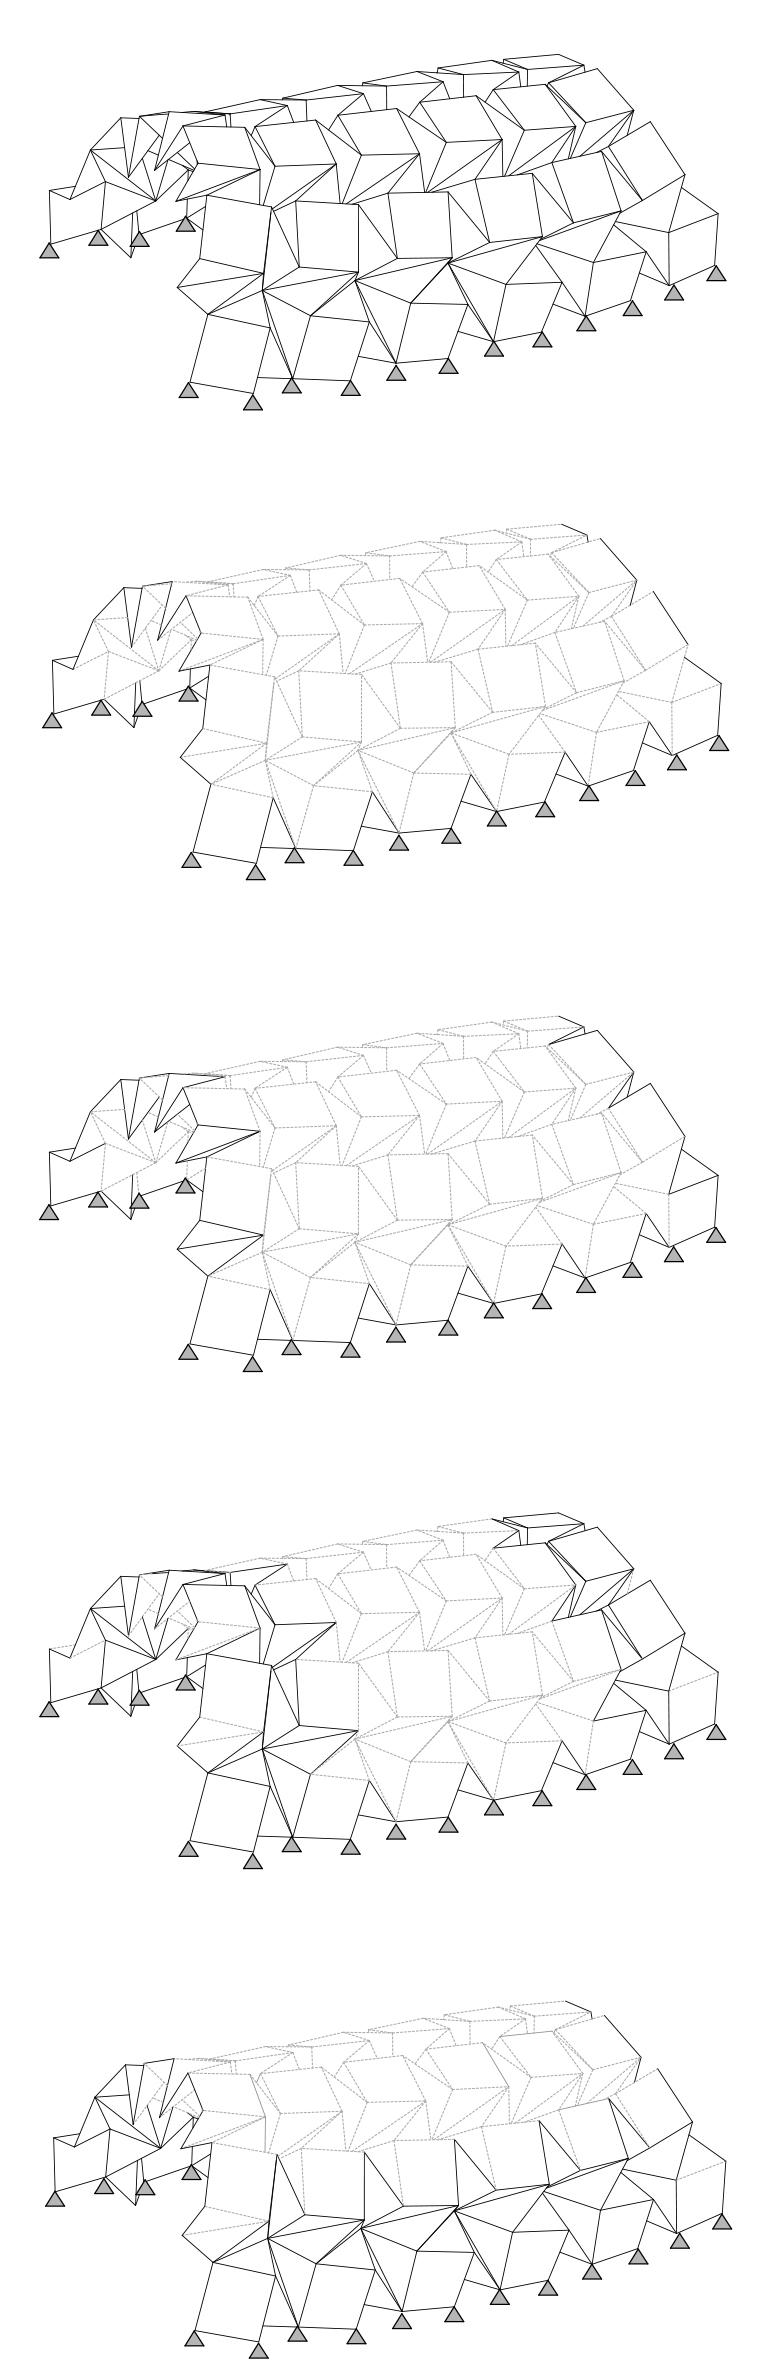
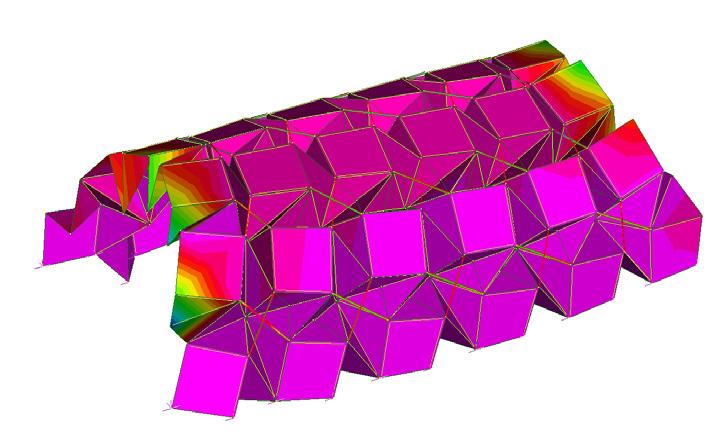
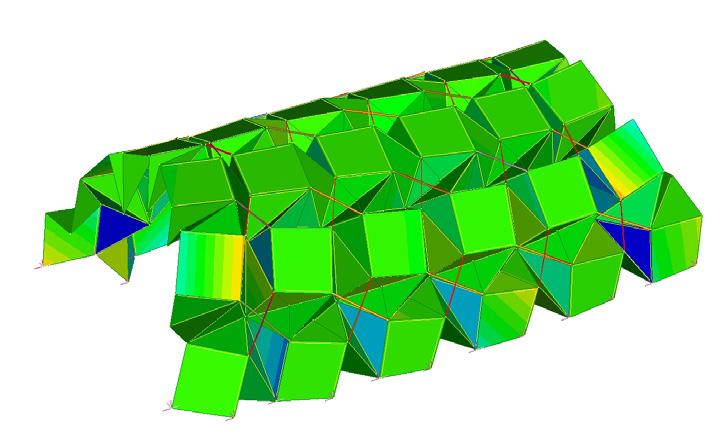
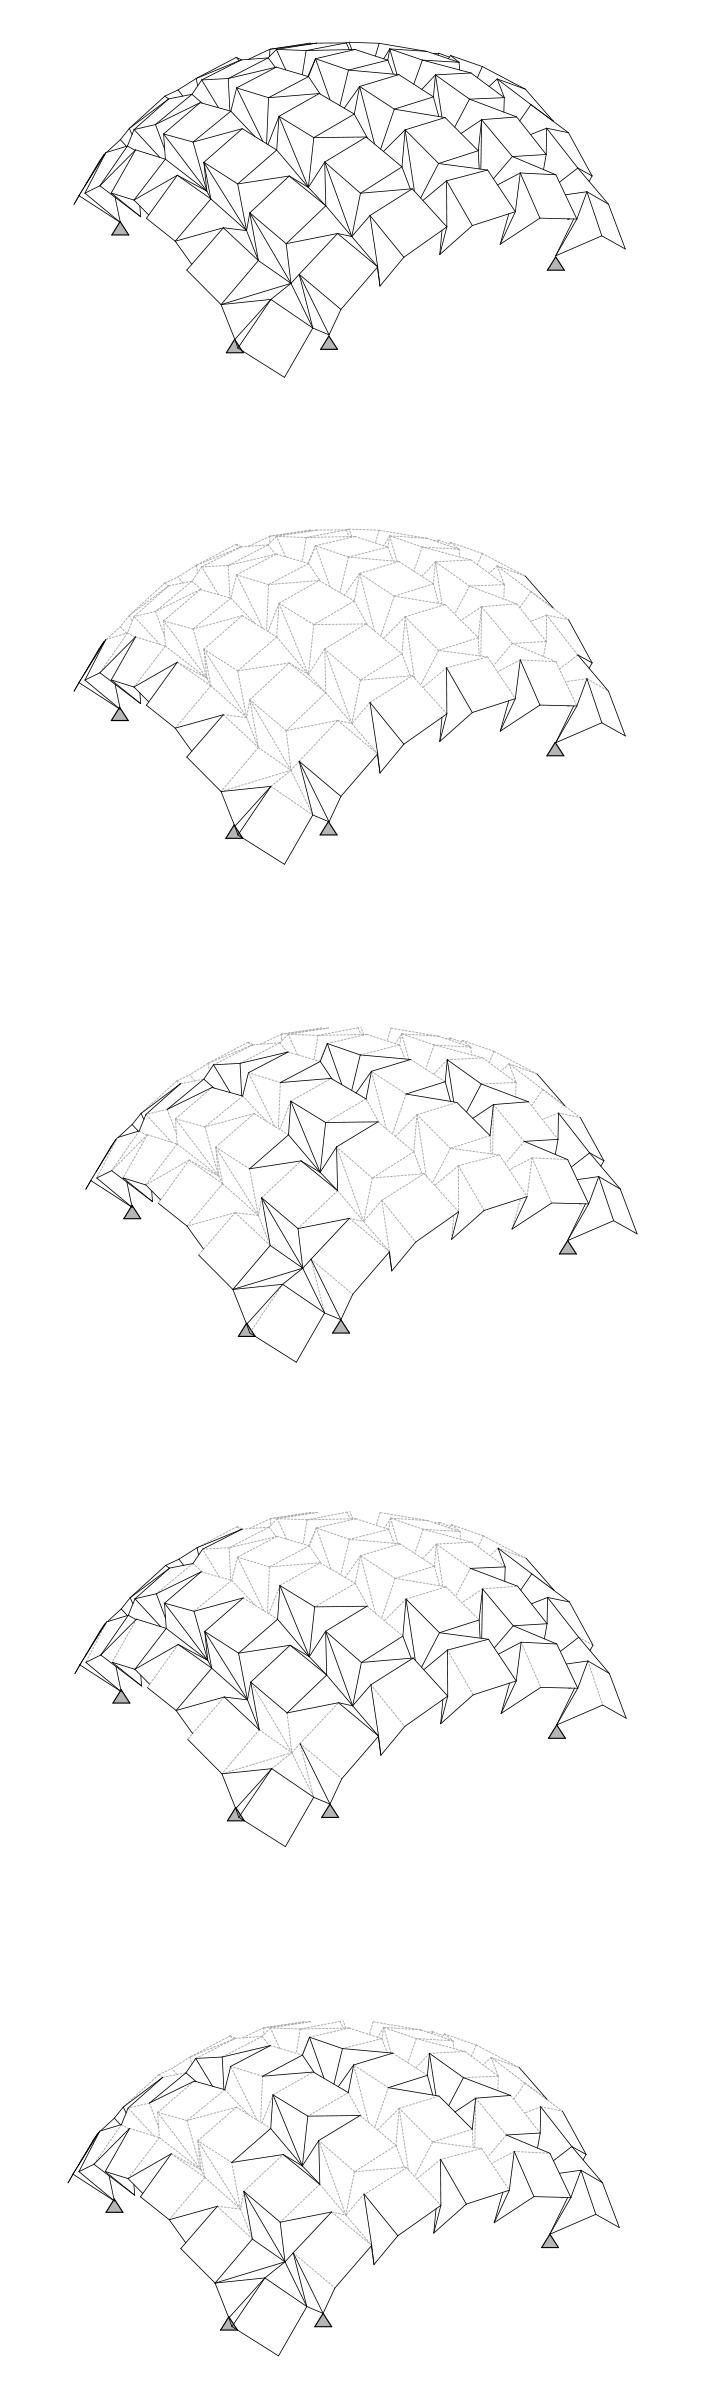
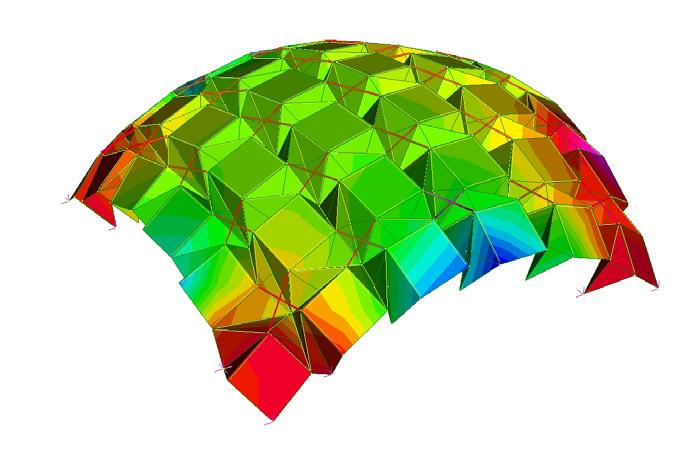
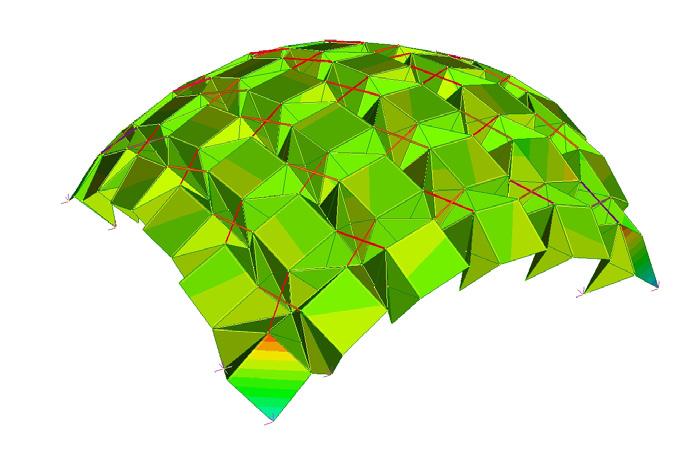
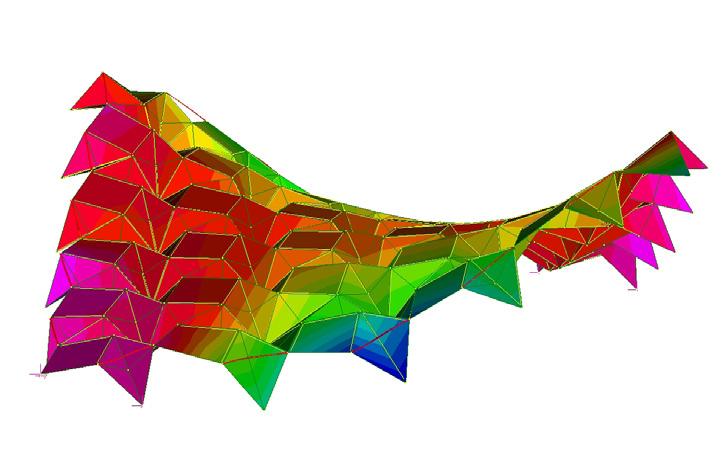
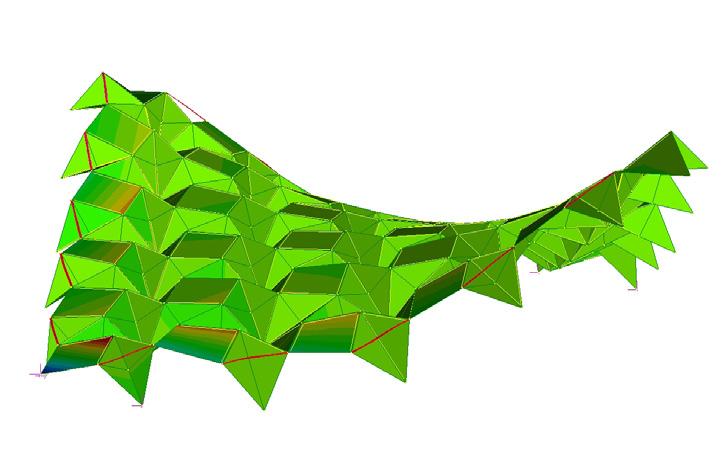
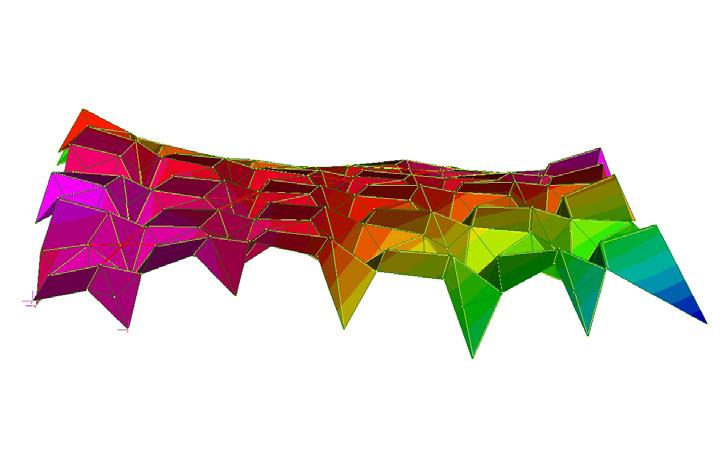
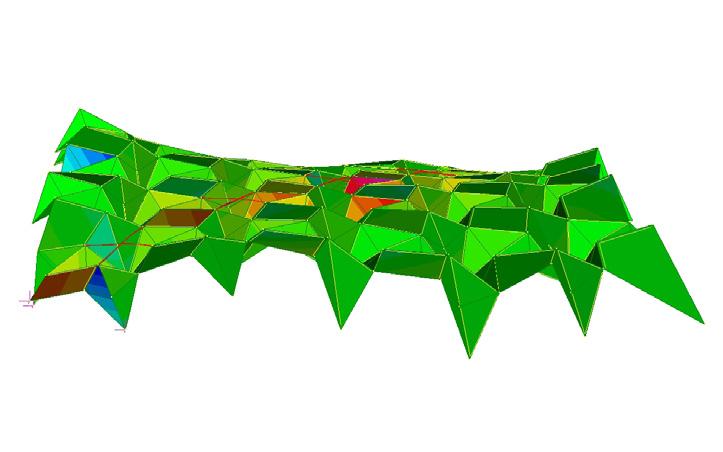
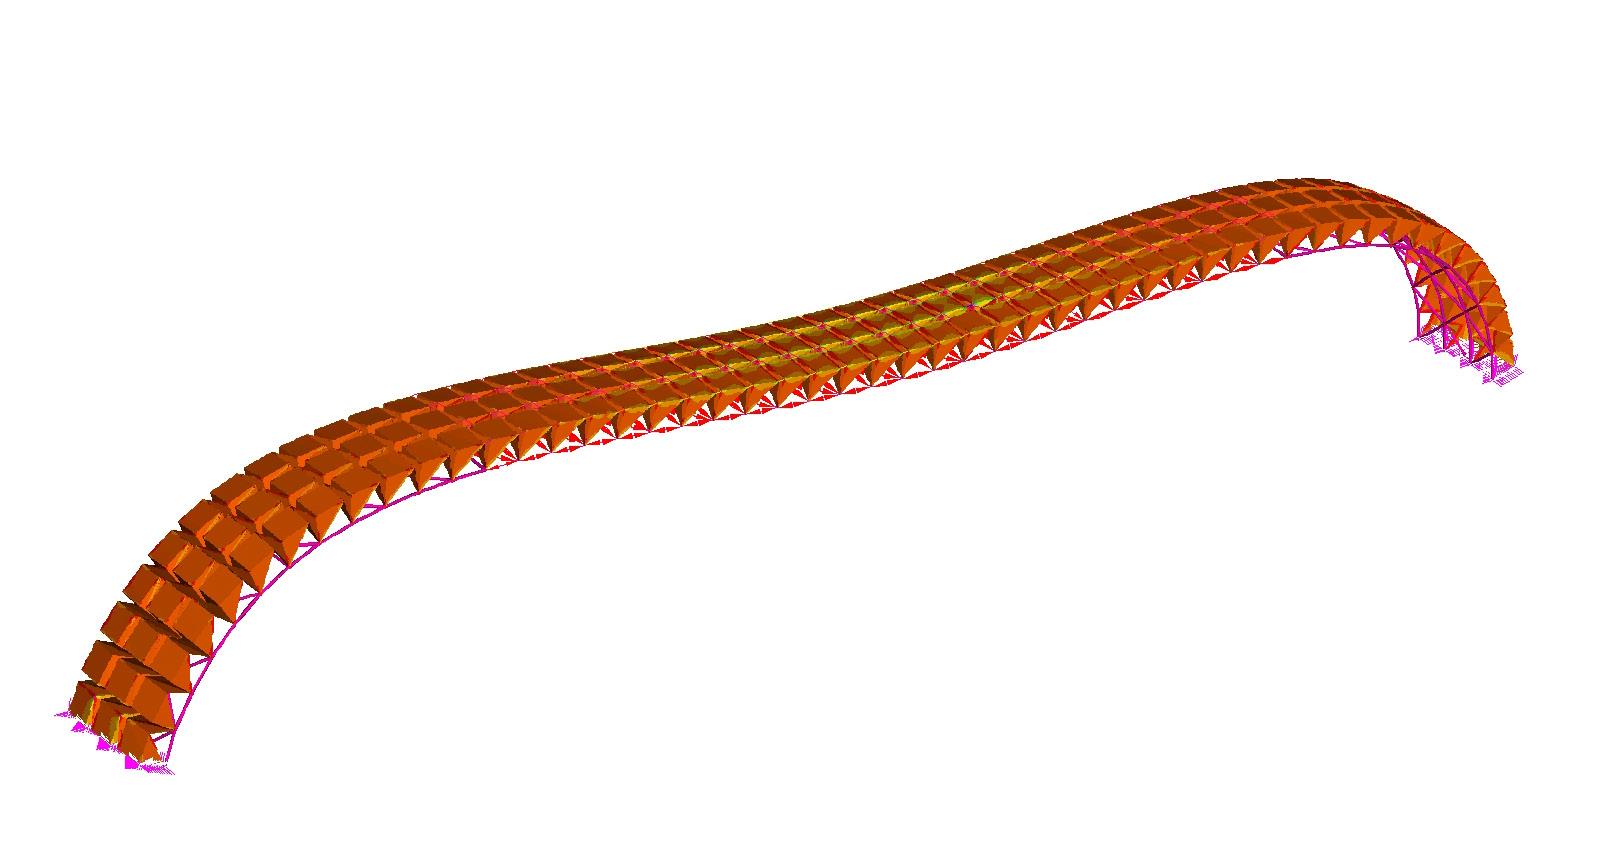
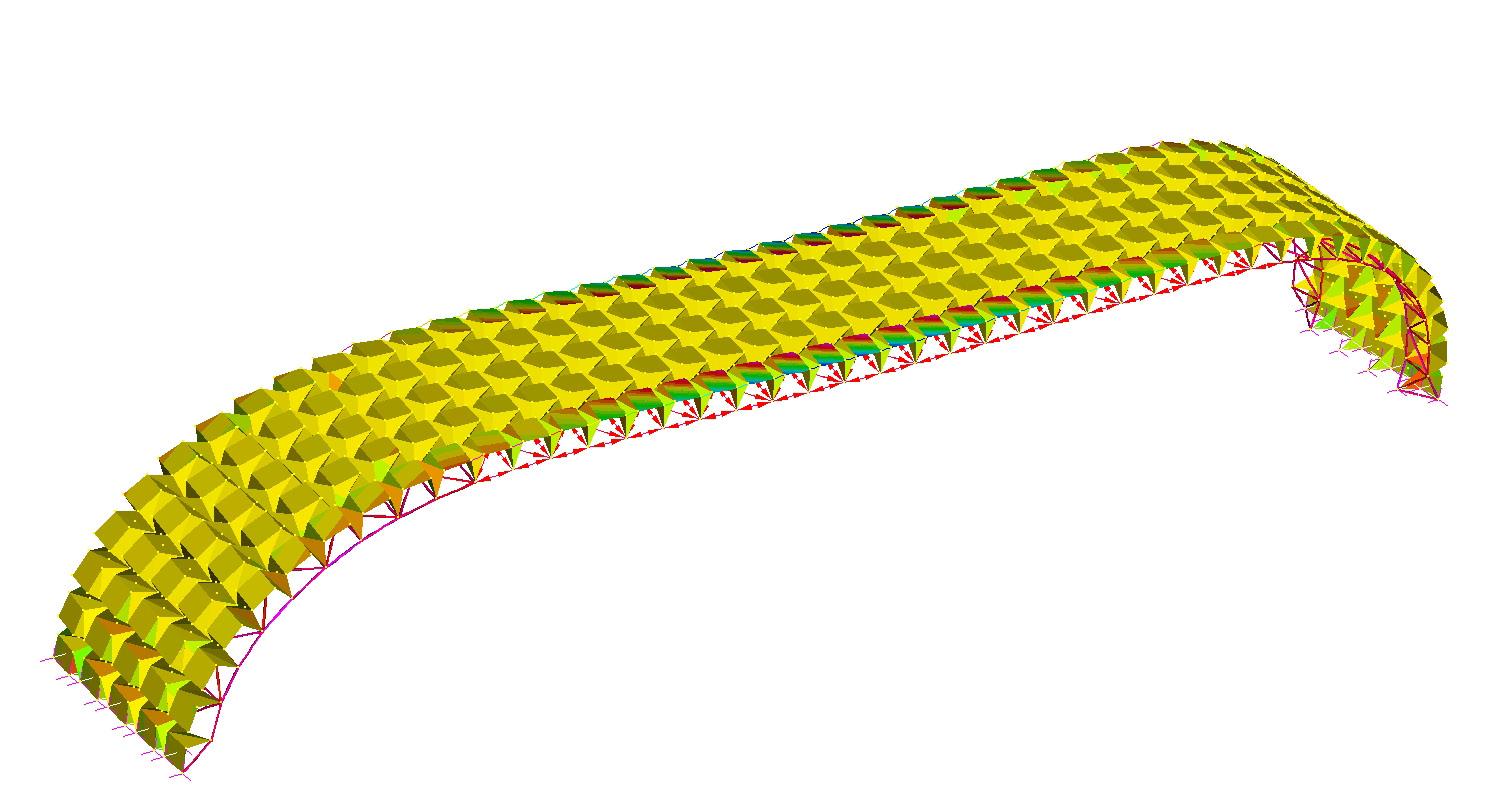
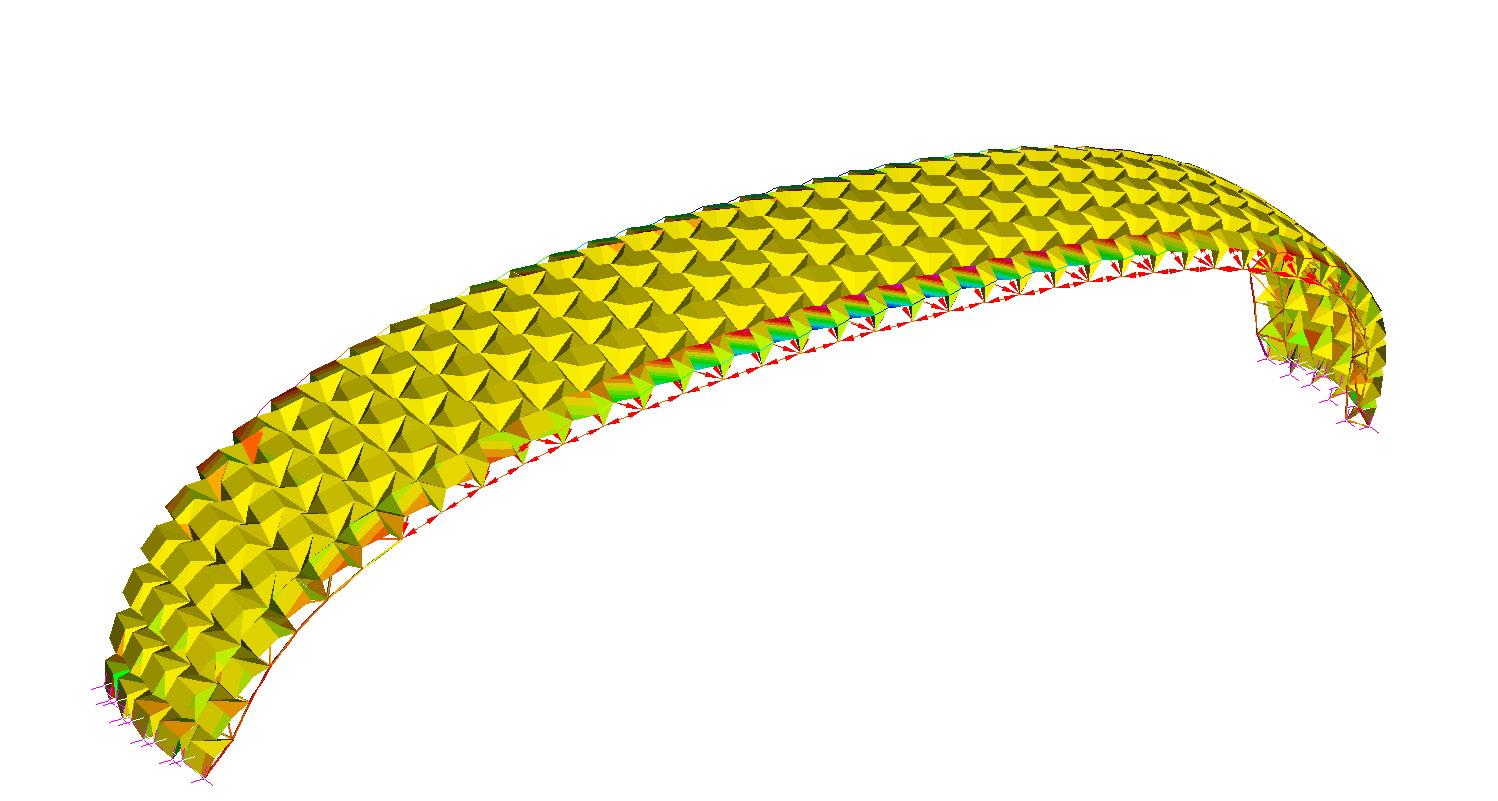
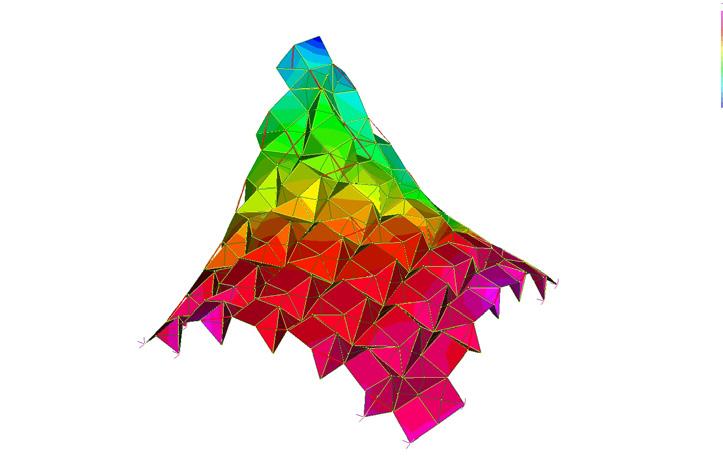
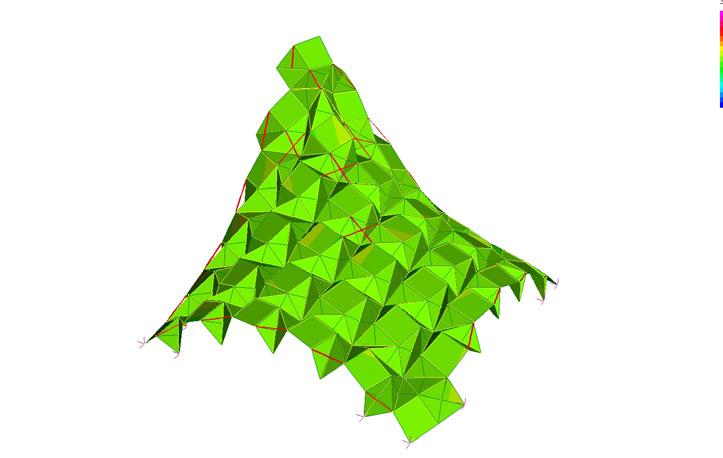
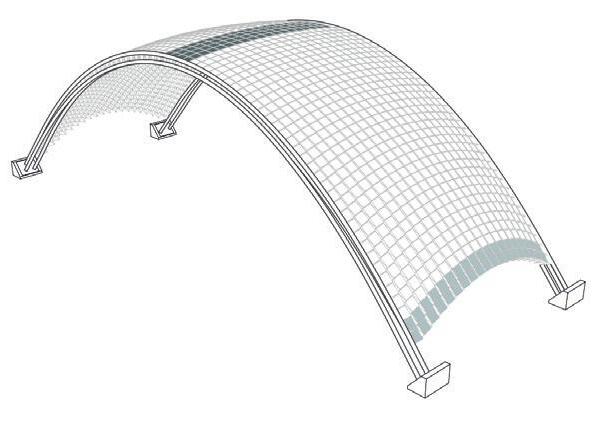
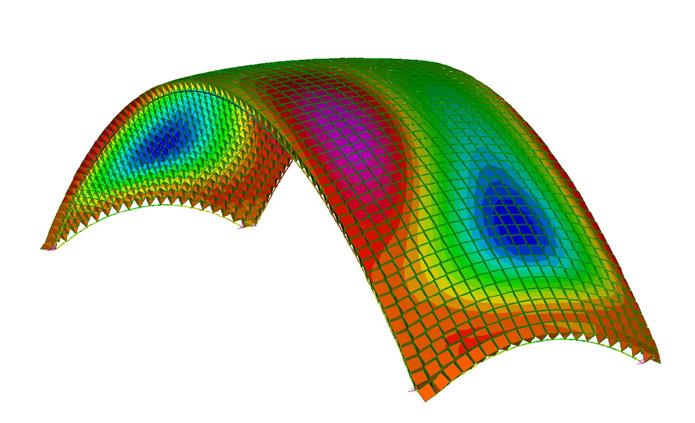
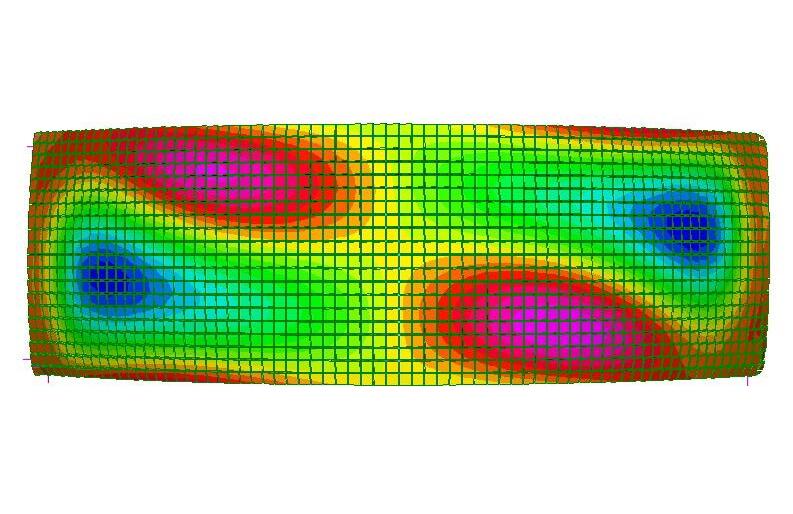
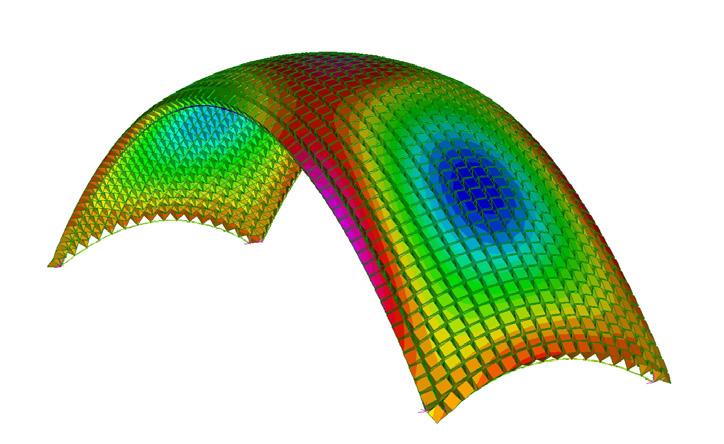
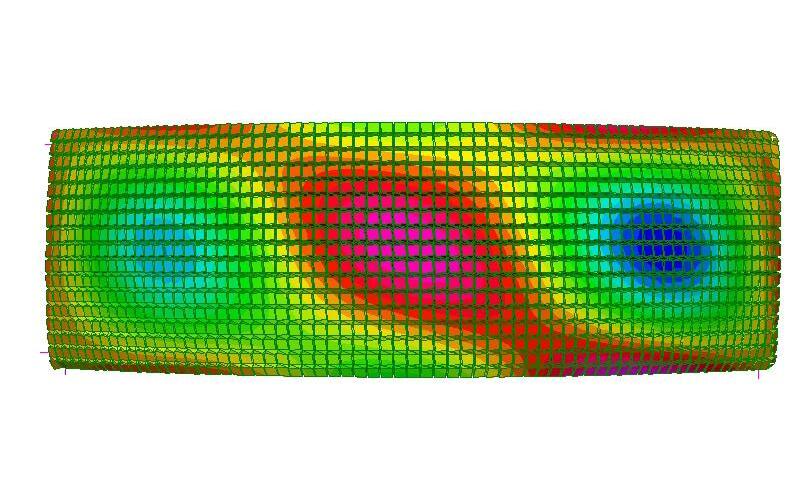
Dome aggregation with triangular pattern in State I & II.
Fig 4.7 (Top)
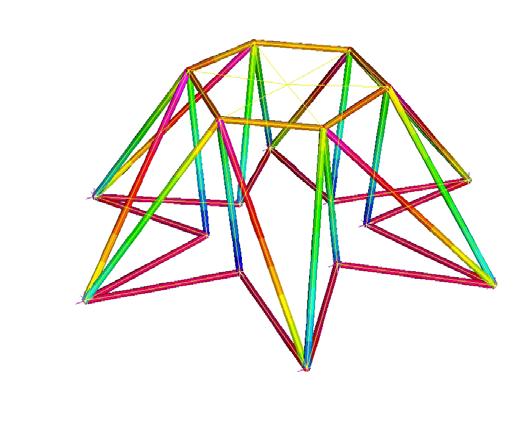
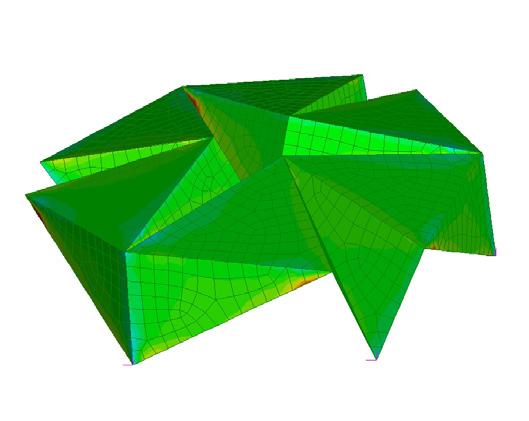
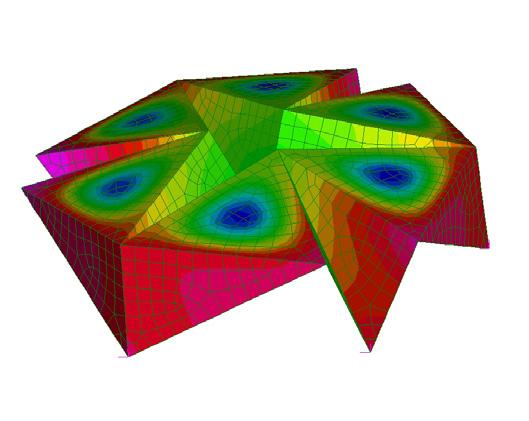
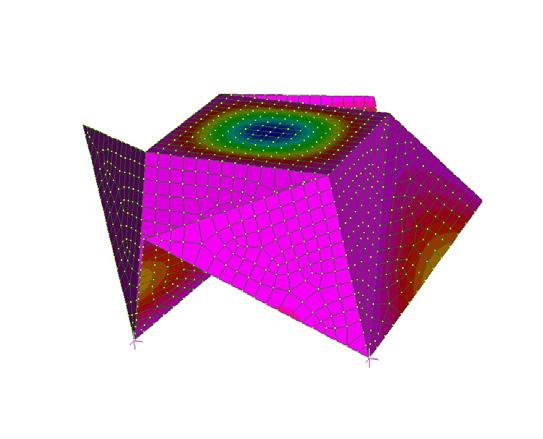
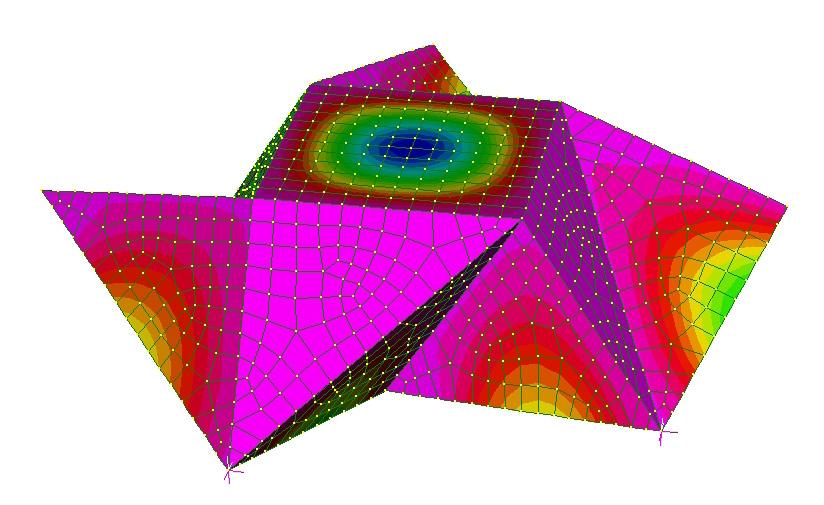
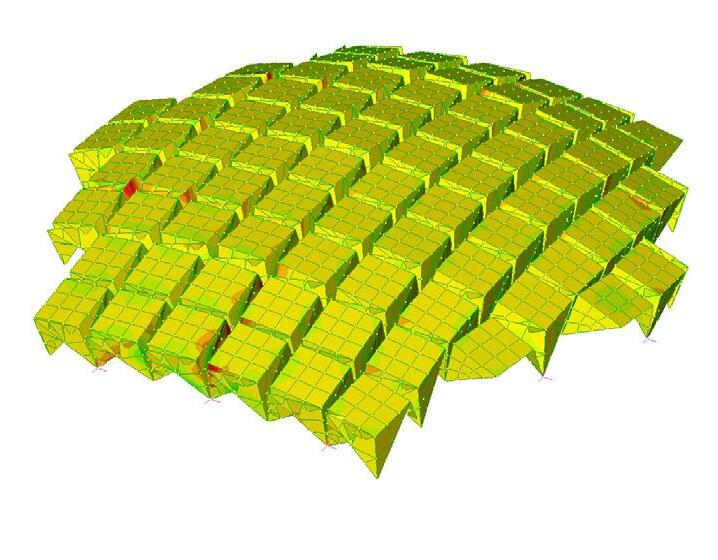
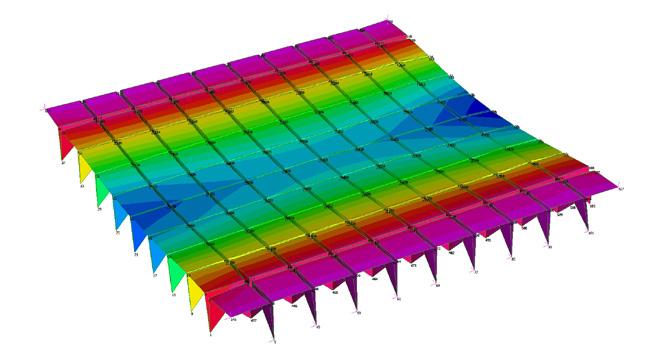
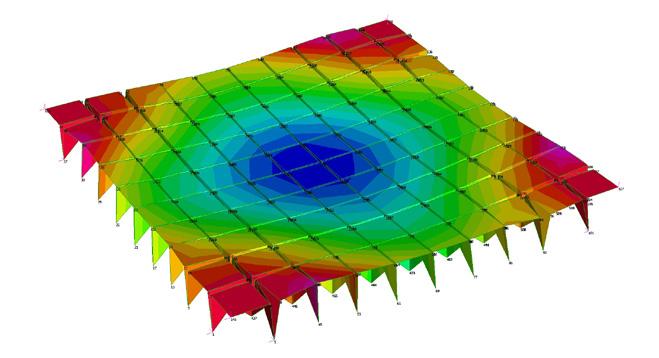
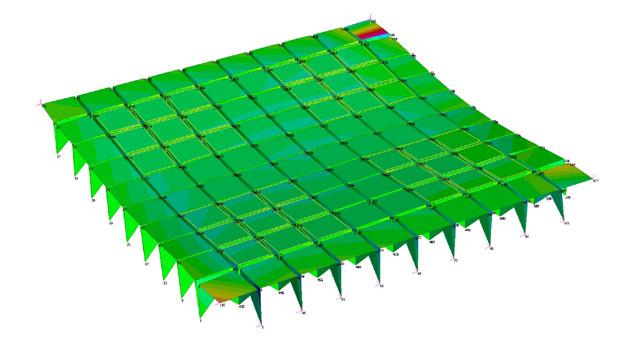
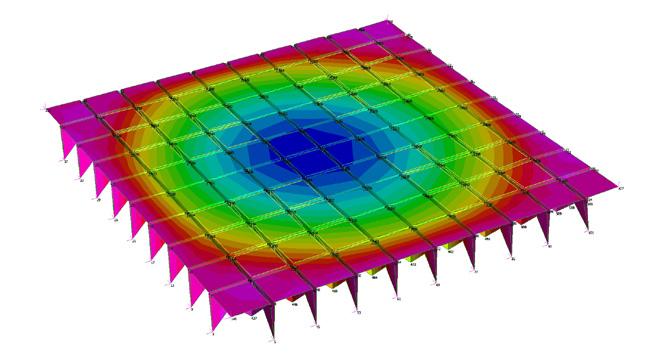
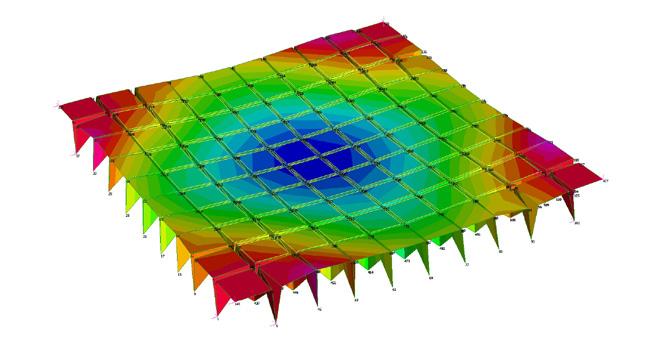
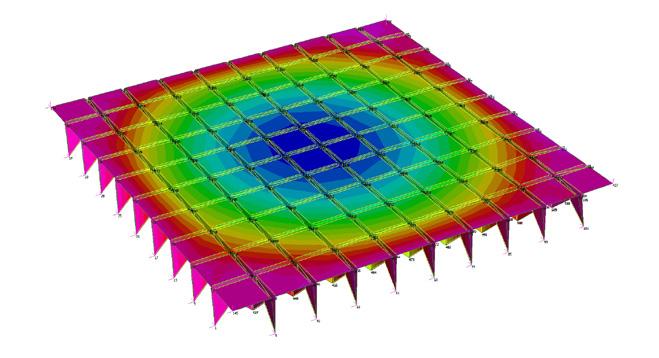
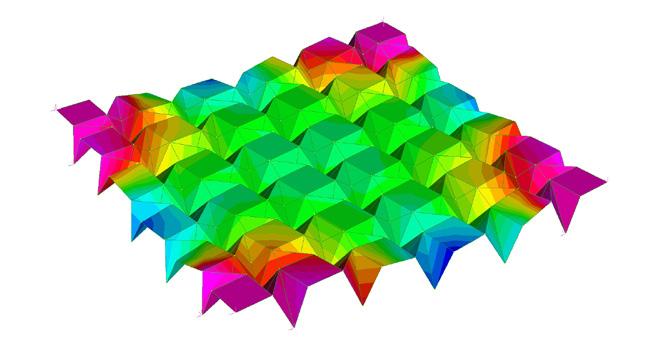
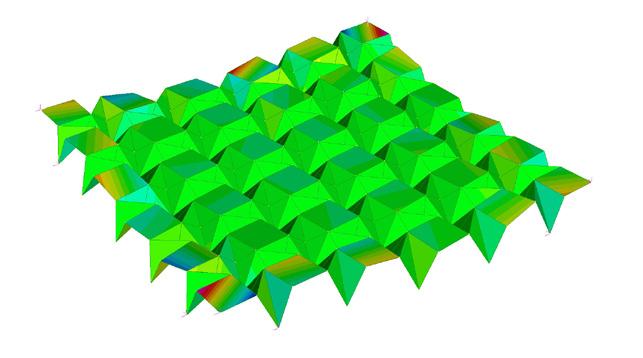
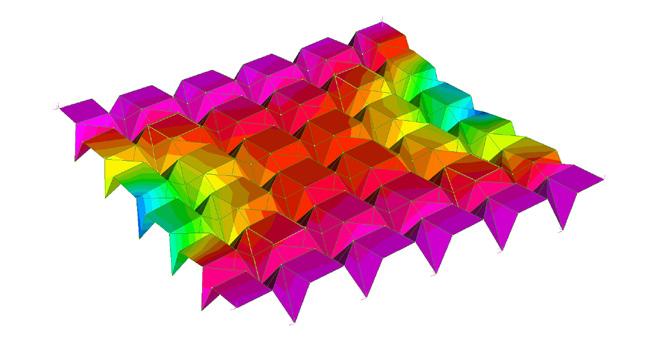
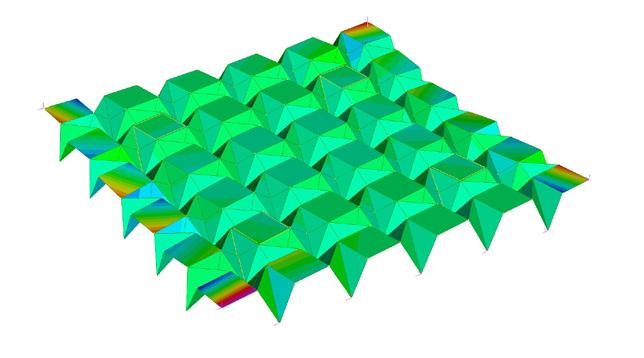
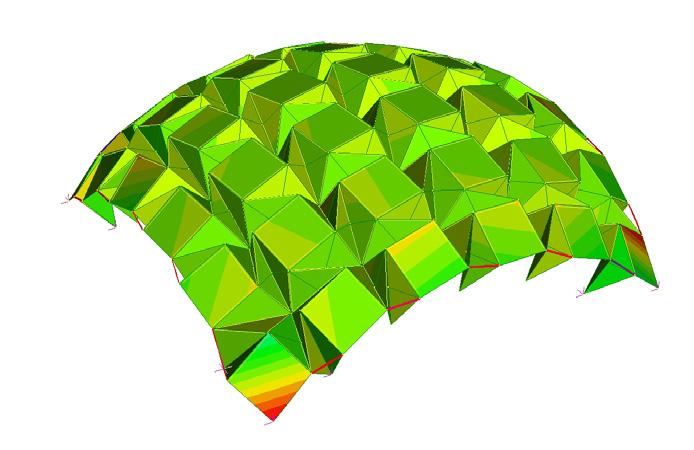
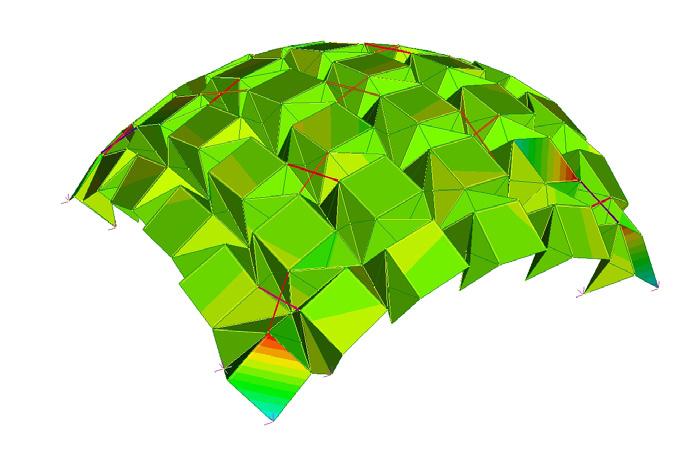
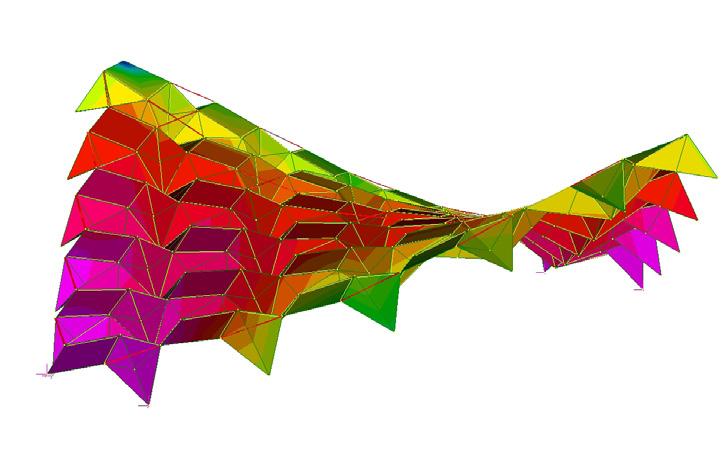
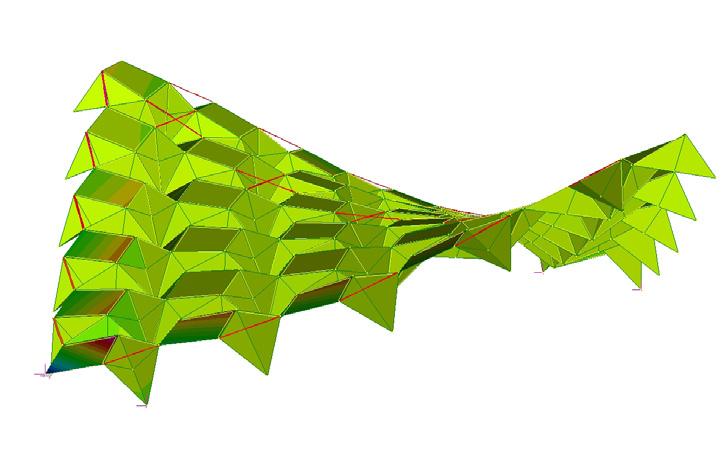
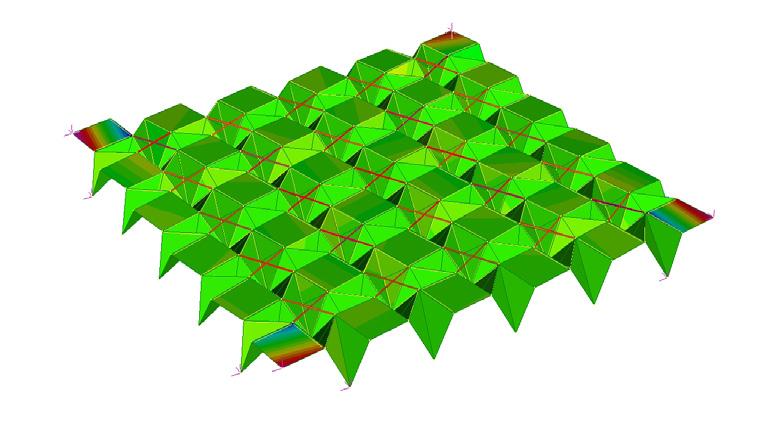
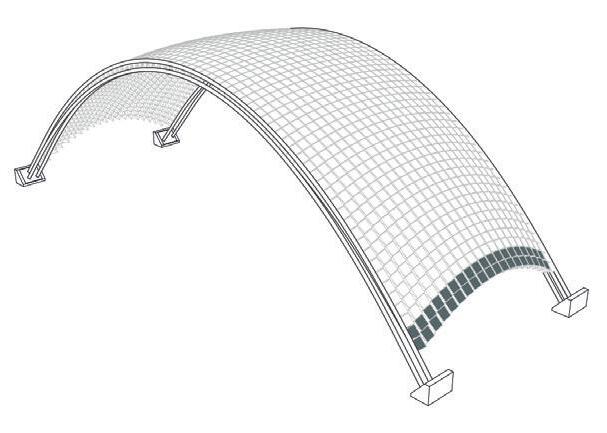
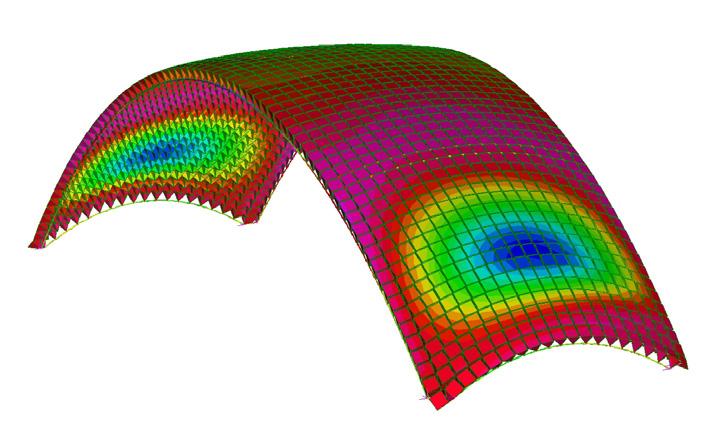
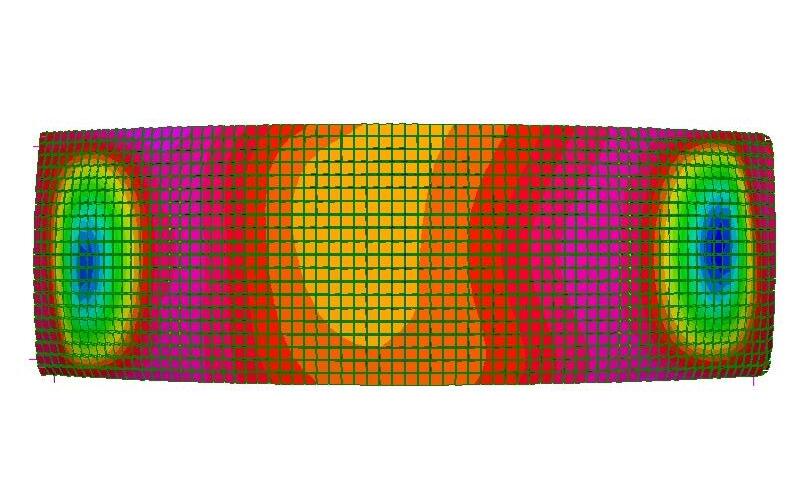
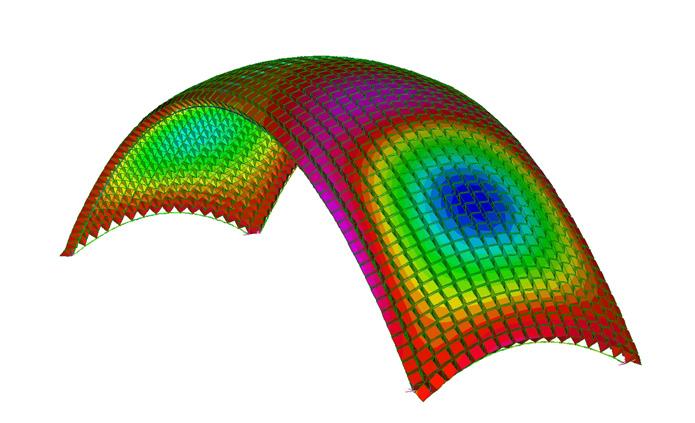
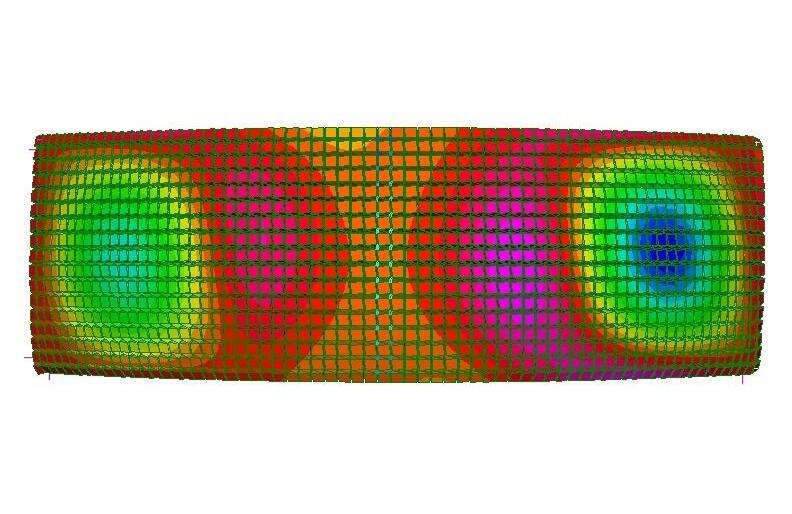
Dome aggregation with quadrangular pattern in State I & II.
Fig 4.8 (Right)
The results from the Finite Element Analysis of the model with the quadrangular pattern were similar to the ones from the model with the triangular pattern – increased deformation and peak mean stress values in the aggregation with plate joints with one degree of freedom of rotation.
Contrary to the results from the initial pattern tests of single components, however, the triangular pattern performed better as an aggregation. Overall the stress values in all conducted experiments were very low because of the geometry of the surface pattern. Furthermore the flexural rigidity of the system distributed the stresses uniformly along the pattern and caused it to settle in a state of equilibrium. Due to the difficulties experienced in simulating the triangular pattern, for the purpose of the digital simulations, the quadrangular pattern was chosen for further exploration of the system behaviour. Based on these results, the next series of explorations were focused on studying the effect of locked boundary conditions on the patterns rigidity as well as devising a strategy for the locking of the joints between the components to achieve structural stability.
Experiment 2 | Aggregation Evaluation
AIM:
1. To establish the correlation between joint rigidity and material system structural stability on self-weight load.
2. To evaluate the pattern performance
Model Size:..................................................15m x 15m
Material:......................................................aluminium
Plate Thickness:...................................................4mm
Load: .............................................................gravity
RESULTS:
1. Increased number of hinged connections does not lead to drastic change in deformation.
2. Overall the experienced stresses are low and they should not be a major factor influencing further explorations and design development.
3. The triangular pattern performs structurally better in aggregation. However, the quadrangular pattern is easier to obtain control over.
63 Component Development
mm 100 0 MPa 15 0 mm 100 0 STATE II STATE I MPa 15 0
Locking Experiments
From the FEA tests it was evident that for the different cases of freedom in the connections between the plates there was an insignificant difference in the values for deformation in the Z axis and the mean plate stress. However, the stress was slightly reduced in the more flexible configurations with a grid of rigid and hinged components due to the reduced load resistance and the settling of the components within the system. In the test with the maximum hinged joints and rigid connections, even though more connections were flexible, the peak stress values were higher. The stress across the panel was reduced and higher stresses were experienced in the plates connected to the anchor points. Overall the change in deformations in the different locking configurations was not more than 7mm. It was concluded that even in configurations with mostly hinged connections, a stable aggregation can be achieved. An important observation was that the highest deformation of almost 700mm occurred where the least anchor points were used (only in the four corners of the panel). Therefore the boundary conditions were crucial for structural stability and should be an important factor for the
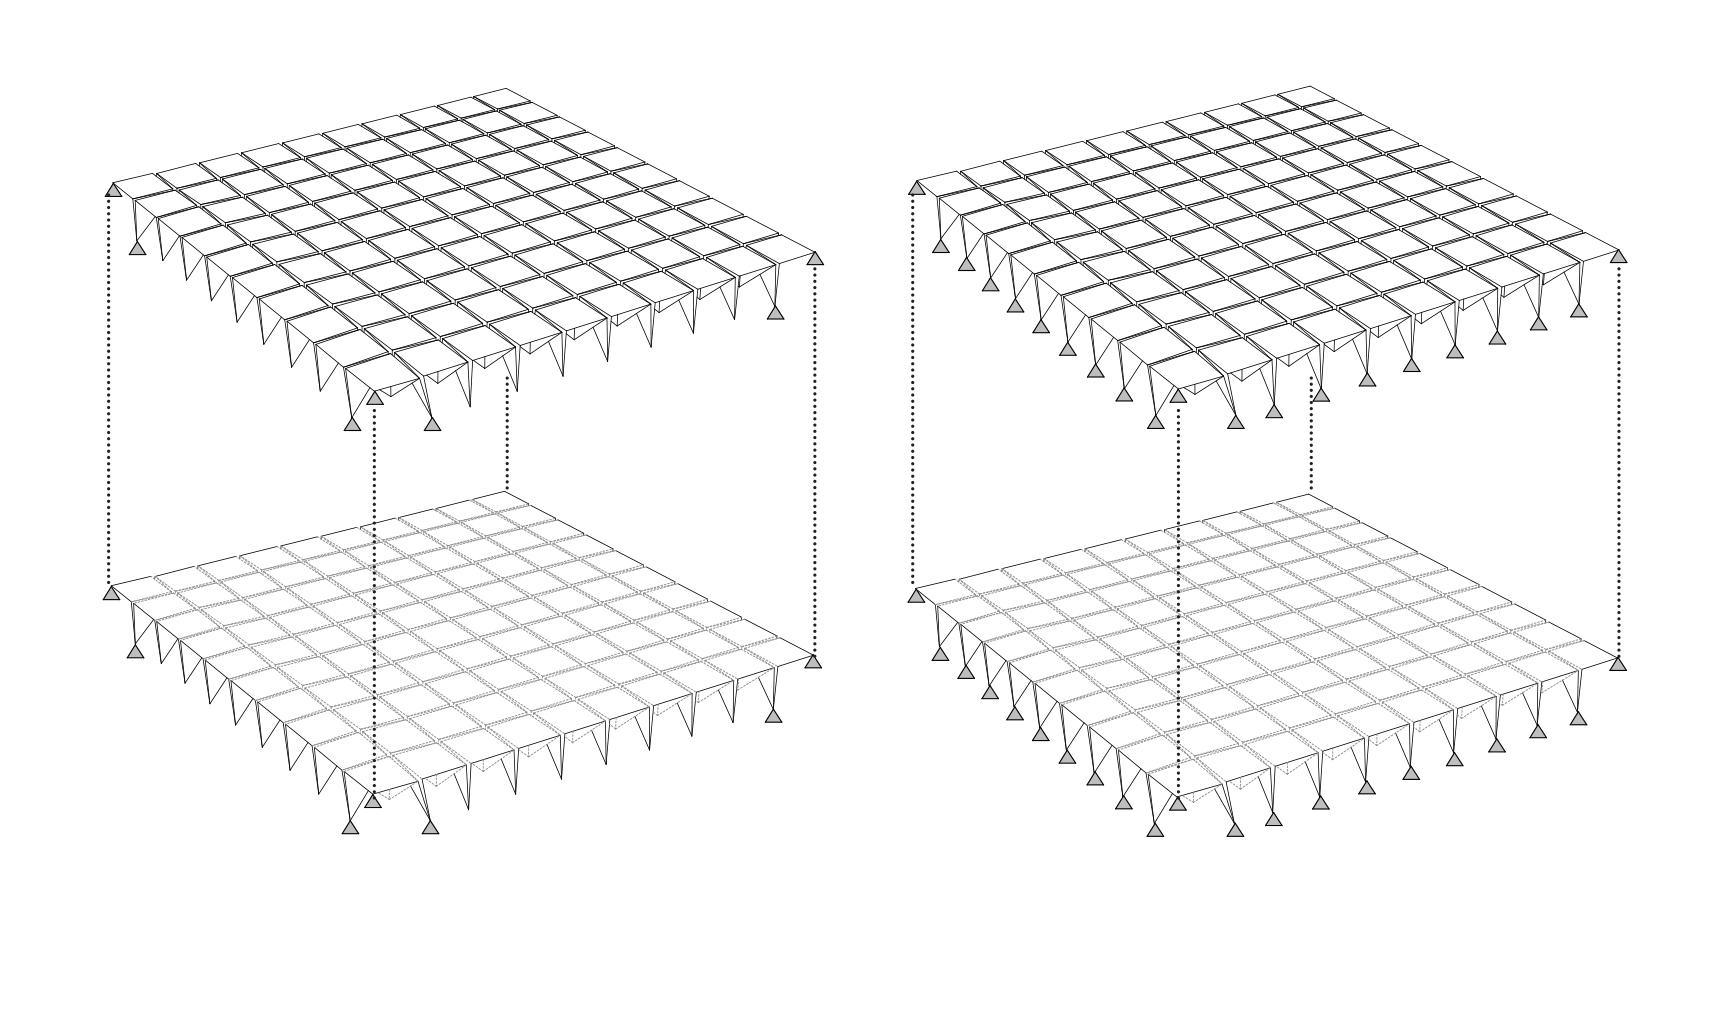
64 Transient Systems Chapter 4
c. Anchoring in the corners of the panel d. Anchoring along the edges of the panel
b. Hinged connections
a. Rigid connections
Closed components panel test set up with variations in number of hinged joints and number of anchor points.
Fig 4.9 (Top)
Open components panel test set up with variations in number of hinged joints and number of anchor points.
Fig 4.10 (Right)
system design.
In the second setup, a panel of the same size was tested with a reduced number of components. The same span was achieved with fewer components and therefore lower self-weight. Due to the lower self-weight of the panel, deformations and stresses were lower when compared to the previous testalmost 200mm less. The tendency for increased deformations and decreased stresses when more connections are hinged applies as well. Even though in the case of maximum hinged joints the peak stresses were slightly higher, the difference was not as significant as in the closed components tests. The maximum change in deformations in the different configurations was 26mm, which indicated that when components were more open, the anchoring was even more important than in the case of closed components. Overall the state of folding of the components affects the aggregation’s structural performance to a greater extent than the rigidity of the joints. Deformations in Experiment I were extremely high and this configuration is unlikely to be implemented in the final design. In order to reduce the deformations, surfaces with curvature variations needed to be examined.
AIM:
Locking Experiment 1 | Set Up
1. To establish the correlation between joint rigidity and system resistance to self-weight load.
2.. To determine how number and position of anchor points affect structural stability.
3. To investigate how degree of folding affects the mechanical behaviour of the system.
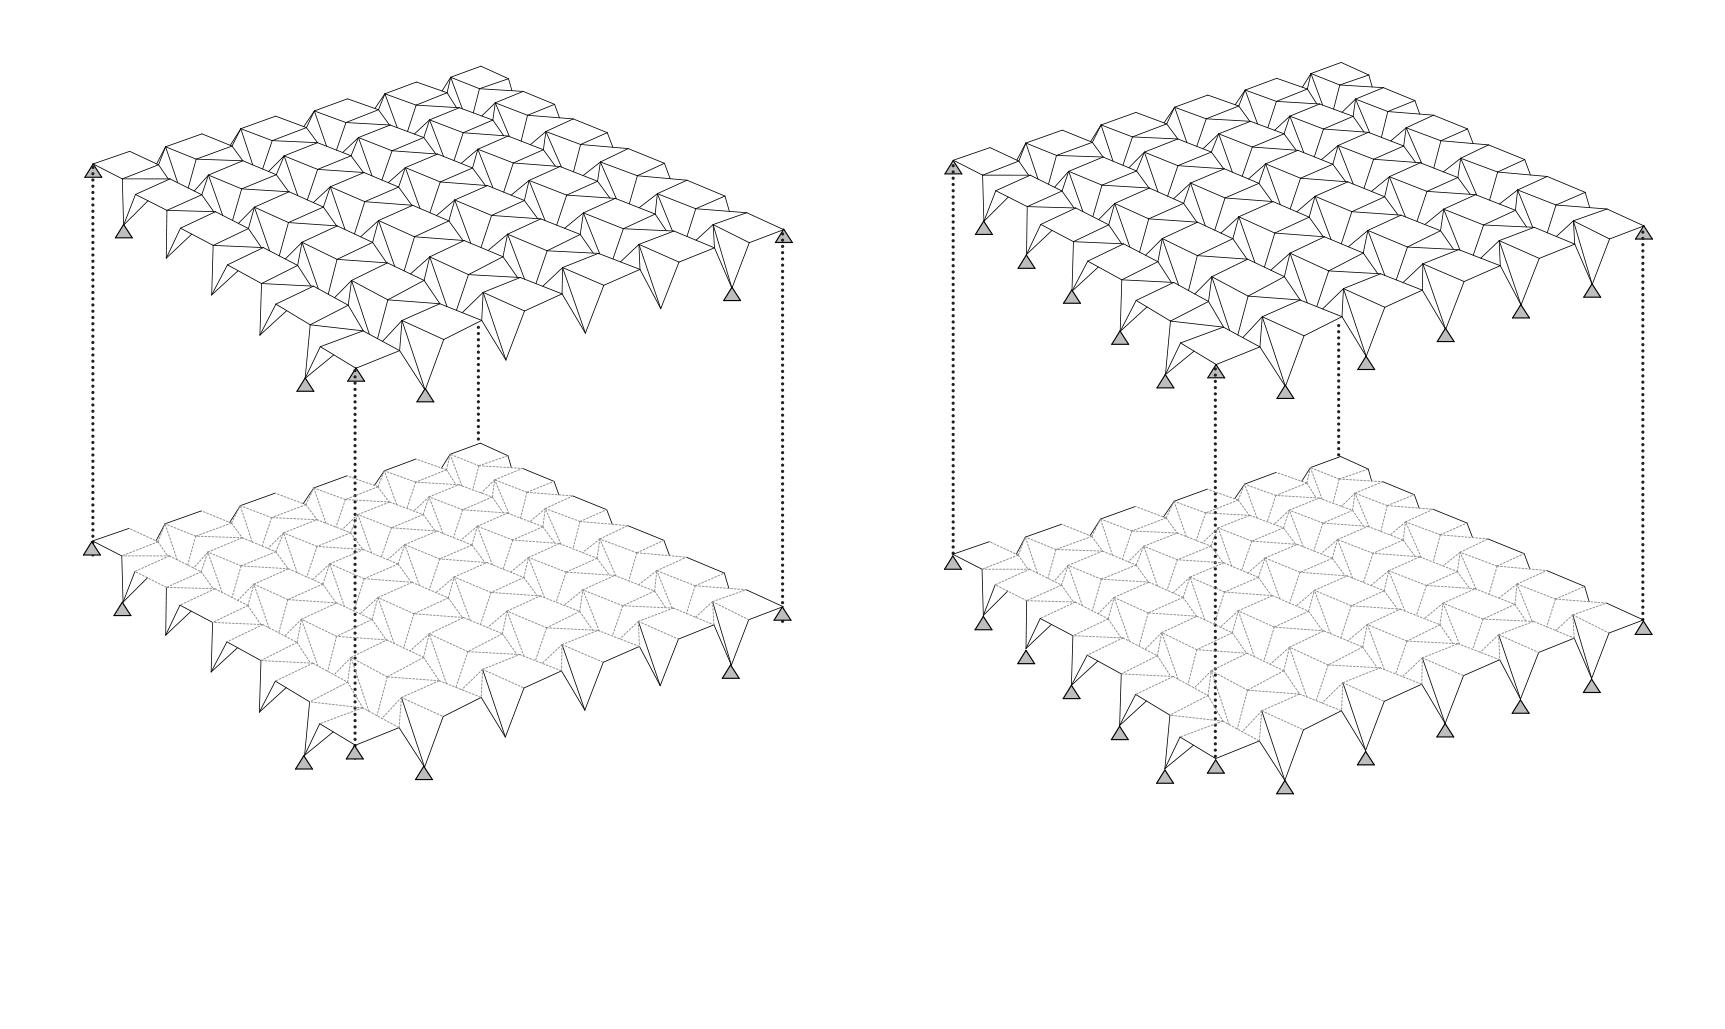
Model Size:....................................................10m x 10m
Material:........................................................aluminium
Plate Thickness:....................................................4mm
Load:...............................................................self-weight
RESULTS:
1. Number of anchor points is the most important factor determining the aggregation load resistance.
2. Aggregations with more open components perform better as opposed to aggregations with closed components
3. In the case of flat panels securing the edges with locked components is enough to ensure the aggregation stability.
65 Component Development
c. Anchoring in the corners of the panel d. Anchoring along the edges of the panel
b. Hinged connections
a. Rigid connections
Locking Experiment 2 | Synclastic Curvature Locking Experiment 2 | Single Curvature
AIM:
To establish the correlation between joint rigidity and system resistance to self-weight load.
AIM:
To establish the correlation between joint rigidity and system resistance to self-weight load.
Model Size:...................................................6m x 10m
Material:........................................................aluminium
Plate Thickness:....................................................2mm
Load: ...............................................................gravity
Number of Components:.........................................36
Model Size:..................................................8m x 8m
Material:........................................................aluminium
Plate Thickness:....................................................2mm
Load: ...............................................................gravity
Number of Components:.........................................36
RESULTS:
Minimum deformation is achieved by securing the boundary conditions and additionally locking components along first principal direction stress lines.
RESULTS:
Minimum deformation is achieved by securing the boundary conditions and additionally locking components along second principal direction stress lines.
66 Transient Systems
4
Chapter
Locking Experiment 2 | Anticlastic Curvature
Component Development
Locking Experiment 2 | Hybrid Curvature
AIM:
To establish the correlation between joint rigidity and system resistance to self-weight load.
AIM:
To establish the correlation between joint rigidity and system resistance to self-weight load.
Model Size:..................................................10m x 10m
Material:........................................................aluminium
Plate Thickness:....................................................2mm
Load: ...............................................................gravity
Number of Components:.........................................36
Model Size:..................................................8m x 8m
Material:........................................................aluminium
Plate Thickness:....................................................2mm
Load: ...............................................................gravity
Number of Components:.........................................36
RESULTS:
Minimum deformation is achieved by securing the boundary conditions and additionally locking components along first principal direction stress lines.
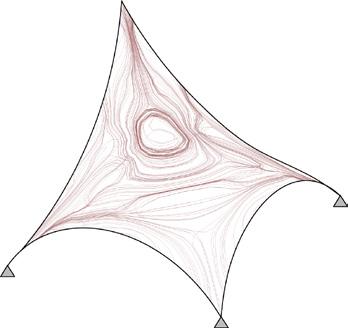
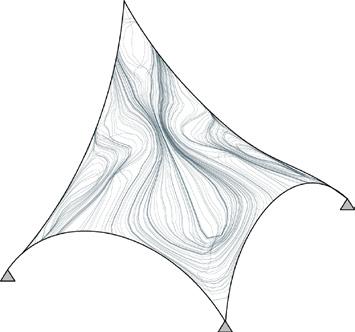
RESULTS:
Minimum deformation is achieved by securing the boundary conditions and additionally locking components along first principal direction stress lines in the anticlastic area.
67
Locking Studies | Results & Observations
Throughout the locking studies FEA was used to determine the logic behind the mechanical behaviour of the system. Principles of achieving structural stability in various conditions were extracted in order to develop not only global geometry designs but also to set the basis for the assembly sequence logic. It was established that positive curvature geometries perform better when compared to those with negative curvature. However, the limitations of the system can be overcome with components locked in crucial locations in relation to the experienced stresses and along the boundary conditions. Moreover, a locking mechanism design can be incorporated into the locking strategy that integrates mechanical behaviour principles and assembly logic. Throughout the process of digital simulation, the models were tested in an ideal scenario (hinged connections with complete degree of freedom of rotation) and difficulties might be experienced in terms of material and detailing in order to meet the simulated behaviour. Yet as a result of the system properties, which allows for tolerances, there is an opportunity for different material applications.
68 Transient Systems Chapter 4
Experiment setup for surfaces with different curvatures under structural analysis.
Fig 4.11 (Previous Page)
Principle stress line evaluation and locking mechanism.
Fig 4.12 (Top & Right)
Locking Studies | Locking Strategy
A locking strategy was developed based on the principles for achieving structural stability extracted throughout the locking studies. First the position of the anchor points for the targeted surface was identified. Then gravity load was applied on the surface and the stresses in first and second principal direction are determined. After analysing the surface curvature, the area with negative and positive curvatures are processed separately. The pattern was locked in the positive curvature area when principal in-plane compressive stress values are higher than 60kN/m (second principal direction). In the negative curvature areas components are locked in the case of tensile force lower than 30kN/m (first principal direction). The members of the quadrangular locking mechanism are treated separately in order to achieve higher accuracy. Components are locked with a different number of elements depending on the location of the experienced stress. Moreover, the elements are either rods or cables depending on the type of experienced force.
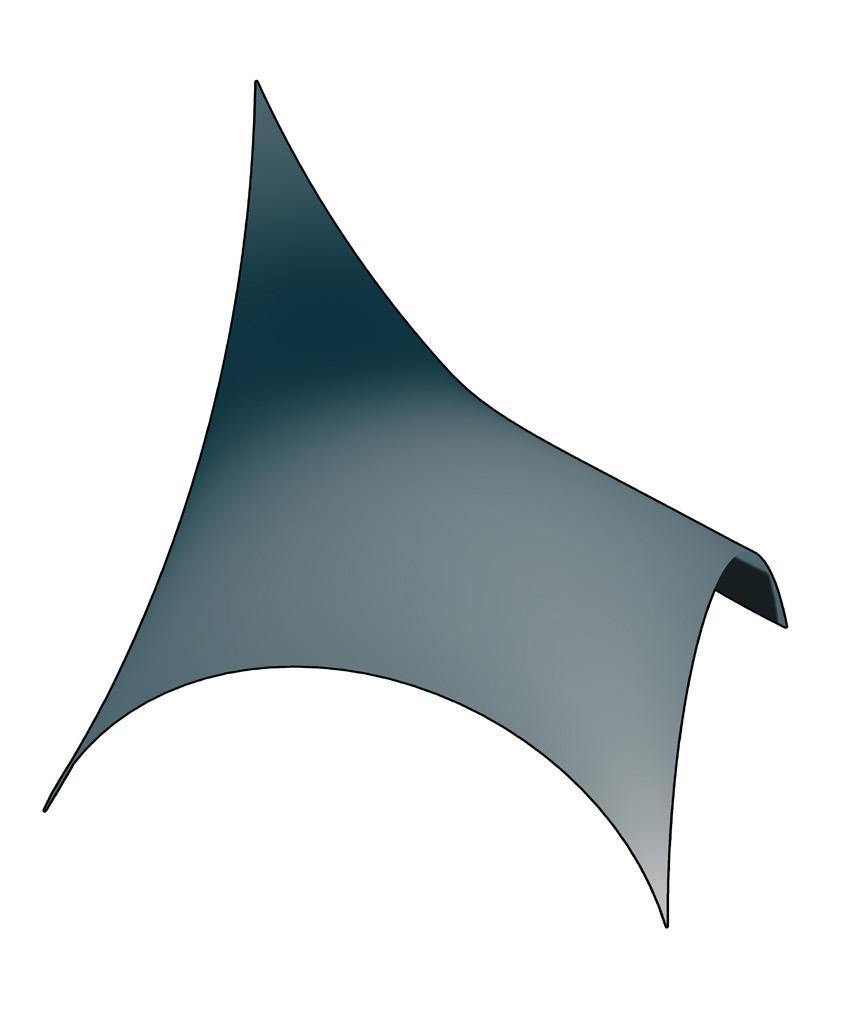
Locking Studies | Results
Locking Experiment 1
1. Number of anchor points is the most important factor determining the aggregation load resistance.
2. Aggregations with more open components perform better as opposed to aggregations with closed components
Locking Experiment 2
1. A locking strategy needs to be developed that incorporates locking components in tension or compression in relation to curvature and identified limit stress values.
2. Anticlastic curvature aggregations need to be avoided or additionally anchored.
Locking Experiment 3
After taking into consideration the lower number of elements and reduced deformation, the quadrangular mechanism was chosen as the most viable solution.
69 Component Development
Folding Experiments
The first set of experiments aimed at exploring the software potentials and limitations as well as developing AR tools.
AR Experiments | Object Tracking
The next set of experiments was focused on developing a folding logic for the pattern by linking the digital assembly data to the physical model. Object tracking and augmented reality software was used to overlay geometrical and assembly data over the physical models in real time. Experiments across multiple scales were conducted to study the various methods of translating digital geometrical information into a series of guided physical manipulations as a means of achieving the correct degree of folding within a component. Through these experiments, the viability of using digitally guided assembly techniques to relay the folding sequence of the pattern was assessed. These explorations were done in an attempt to identify the potentials and limitations of the overall process while also translating them into parameters that can later inform the design and assembly processes.
70 Transient Systems Chapter 4
AR experiment setup for calibration tests and local scale studies.
Fig 4.13 (Right)
AR Experiments | Setup
The Unity game engine and Vuforia Augmented Reality extension were used as digital tools for translating the geometrical characteristics of physical objects into digital data and vice versa. Defined image targets were uploaded into the software and were tracked by the camera to acquire an object’s location and rotation data from physical models. The rest of the setup included an HD Webcam, a tripod and various Image Targets. The targets were created and printed for the purposes of the tests and were 12x12cm large. The scale of the filmed test’s setup was limited to the size of a desk (90x120cm). It is important to note that the results and observations documented were strictly related to the specific hardware and software used as well as to the scale of the overall setup. The resolution of the camera, the lighting conditions and the quality of the image targets could have a big effect on the end results. Having this in mind, the team was interested in extracting the logic that could inform the design process rather than only focusing on the accuracy of the results and the efficiency of the process.
AR Experiments | Setup
AIM: Measure distance, angle, position and orientation of objects in physical space and in relation to the webcam. Simulate and overlay the predefined orientation targets.
Objects: Two flat image targets 12x12cm
Cuboid image target 12x12x12cm
Hardware: Personal Laptop
HD Webcam
Tripod
Software: Game Engine software
AR extension
3D modelling software
Parametric modelling software
Evaluation: accuracy / feasibility
71 Component Development
a. Personal Laptop b. Image Targets c. HD Webcam d . Tripod
Experiment 1 | Distance Calculation
Results: +/- 2mm accuracy
Experiment 2 | Object Location
Results: +/- 2mm accuracy, +/- 3° accuracy
Experiment 3 | Angle Calculation
Results: +/- 3° accuracy
Experiment 4 | Locking angle
Results: Feasible, +/- 3° accuracy
Experiment 5 | Locking Component
Results: feasible, limitations
Experiment 6 | Simulating Position
Results: Feasible, +/- 3° accuracy
Experiment 7 | Assembly Sequence (a)
Results: Feasible, Background was often “lost”
Experiment 8 | Assembly Sequence (b)
Results: Feasible, Advantages in relation to (a)
Set 1 | Calibration Experiments
These tests were conducted with 10x10 cm trackers in a test area of 100x120 cm with controlled lighting conditions and an HD webcam as an input device. The software’s capability of measuring distance and rotation were analysed and the minimum tolerances were recorded. It was shown that on a small scale, the position of one target in relation to another was measured with an accuracy of up to 2mm and its rotation was measured with an accuracy of up to 3°. It was concluded that with the setup used, the distances and rotations were measured with good accuracy under ideal conditions, but in low-light environments the software’s ability to track the target was reduced and this resulted in inaccurate readings. A set of folding experiments were then set up to explore the methods by which the process of folding is able to be enhanced through the use of object tracking and Augmented Reality. These experiments were conducted with a similar setup to the previous experiments with 10x10 cm trackers in a test area of 100x120 cm with controlled lighting conditions and an HD webcam. The aim of these small scale experiments was to understand which overlaid instructions were most successful in assisting the folding process.
72 Transient Systems Chapter 4
Images showing stills from the videos of calibration experiments using object tracking.
Img 4.1 (Right)

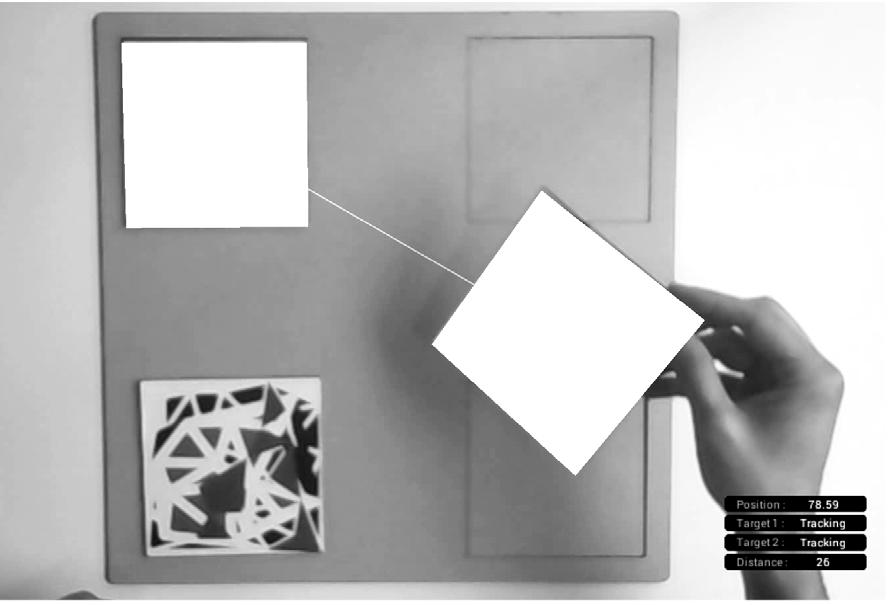


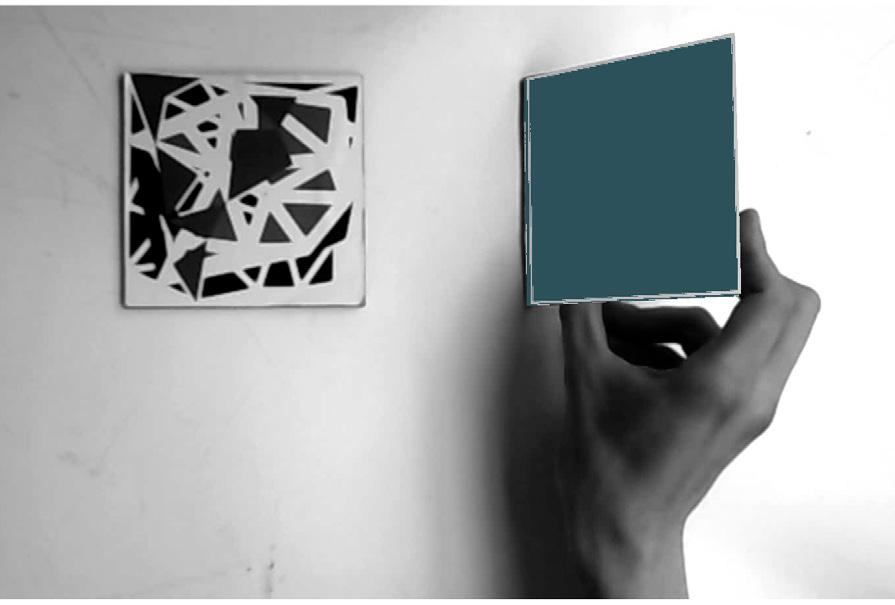
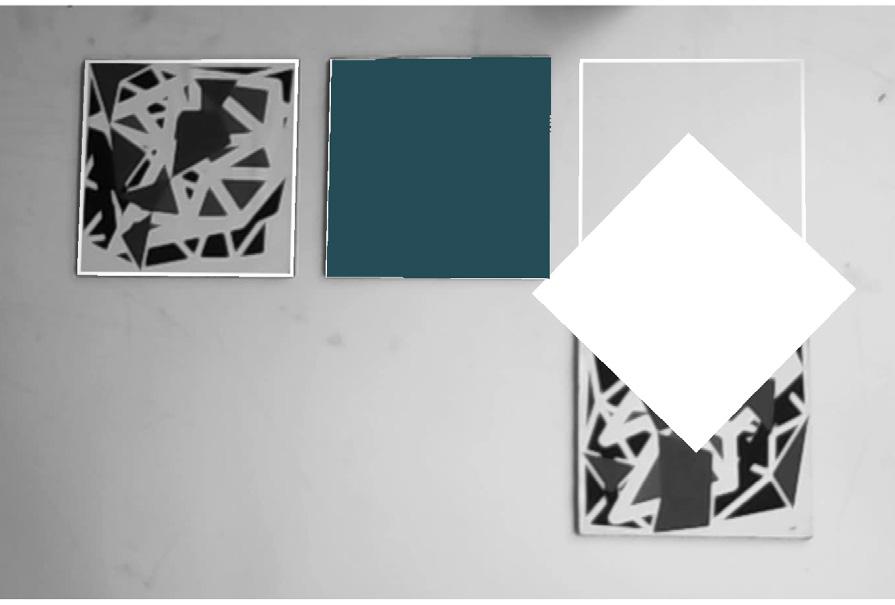
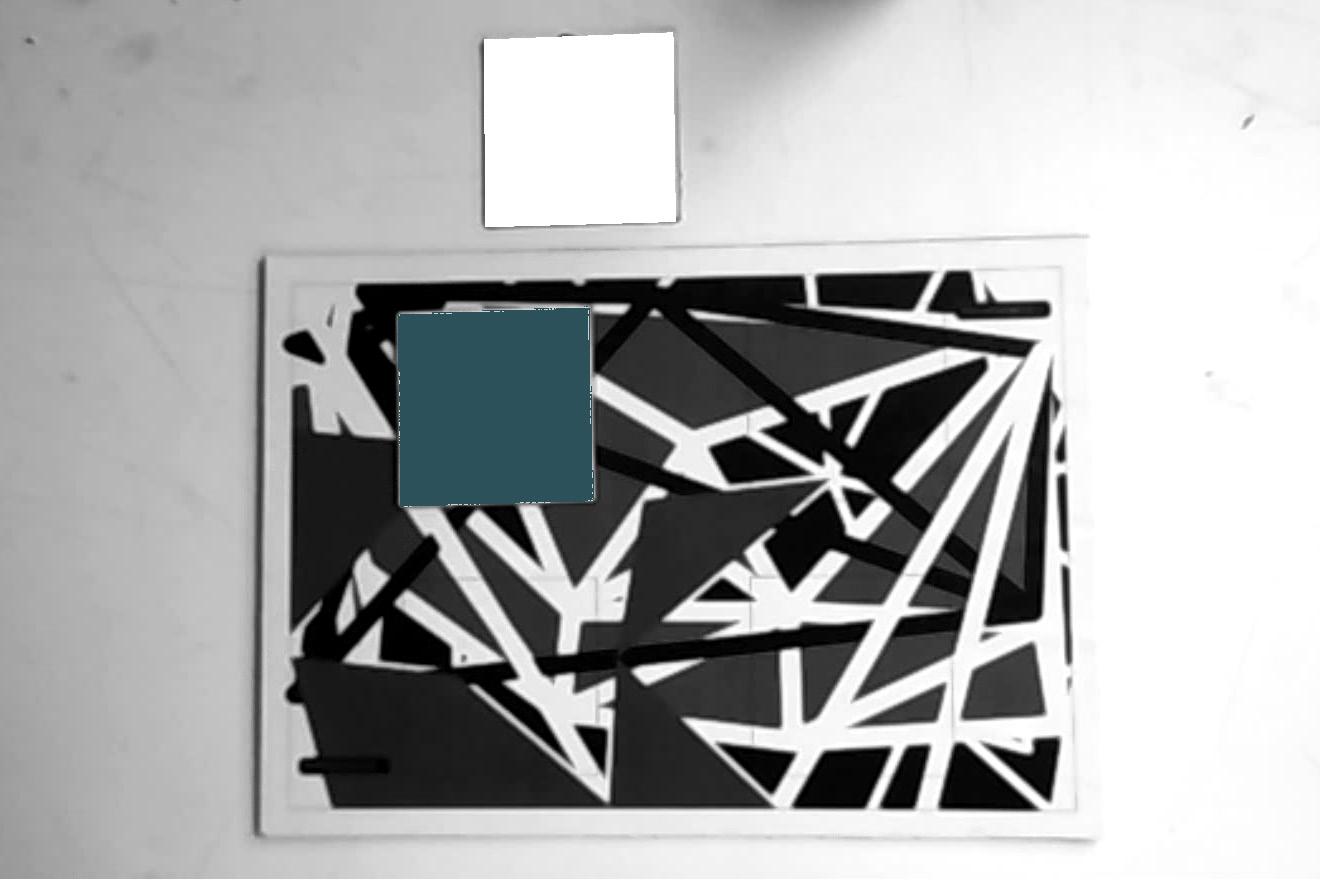
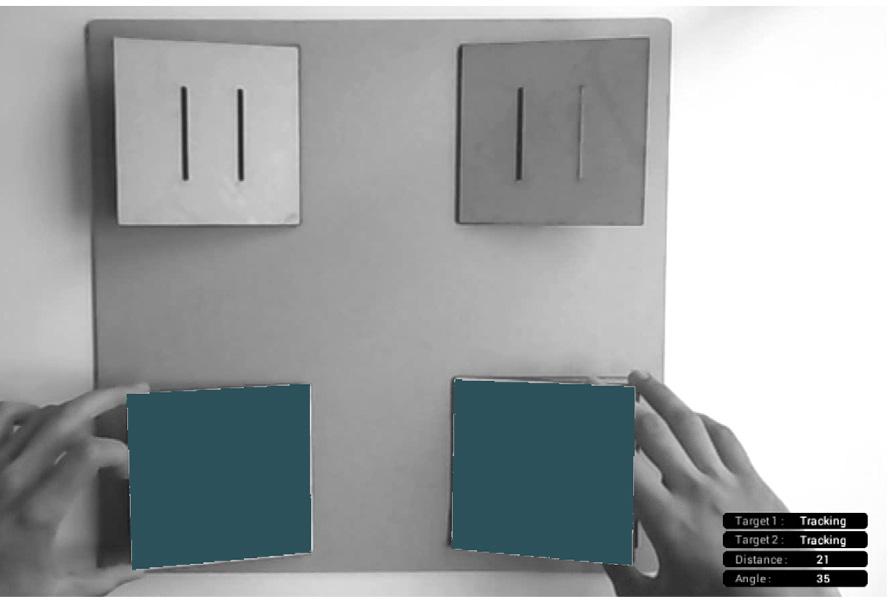
73 Component Development
Aim:
Objects:
Experiment Setup
Shape and lock an individual component into its final state by simultaneously positioning and orienting its four elements
Assembly Experiment 1 | Shaping component(a)
Locking angles & distances (simultaneously)
Single component (polypropylene)
Approx 50x50x25cm (unfolded)
Four printed flat image targets
Evaluation: Results:
Feasibility, Time, Efficiency
Feasible, Inefficient in regards to time
Challenging positioning process
In this experiment, the shaping and locking of an individual component was done by simultaneously trying to position and orient the total of its four faces into their final state. Colour changes were used to signify that the correct position and rotation angles had been reached. This was suggested by rectangles projected on top of the physical model and displayed through the laptop monitor. Simulations of travelling planes showing the needed manipulations were not used since the required translations were relevantly small. While the overall process proved to be feasible it presented some limitations. More specifically, it was difficult to manipulate all the elements at once while trying to match their orientation and position to the targets. For this reason, the next experiment was adjusted to allow for shaping and locking by successively manipulating each element in sequence in relation to the target planes.
74 Transient Systems Chapter 4
a. Folding Pattern Component Locking distances simultaneously Locking angles
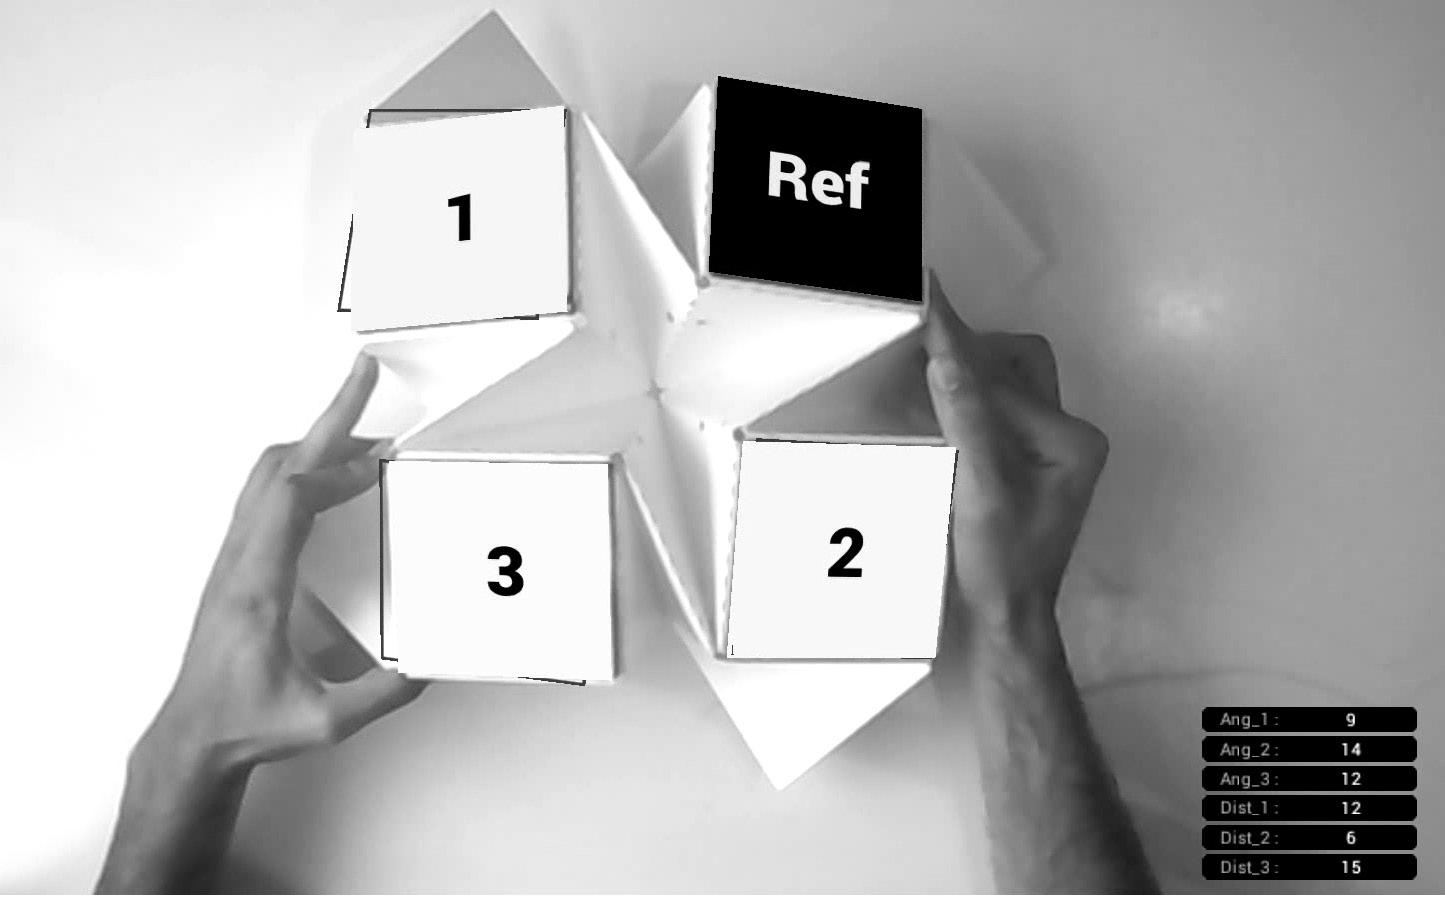
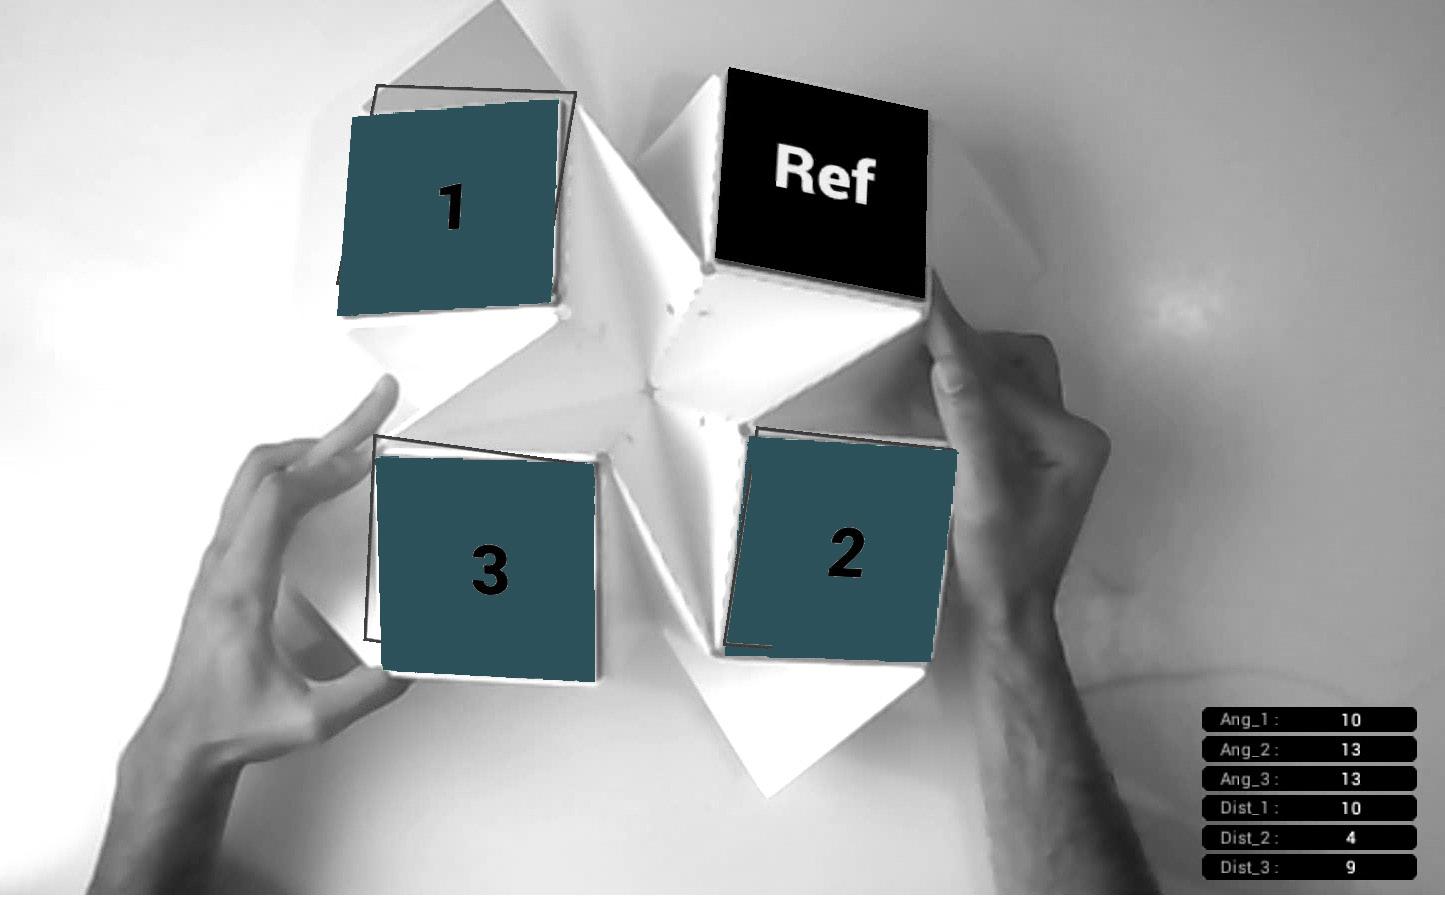
75
Component Development
Img 4.2
Images showing stills from the videos of AR experiments | Trackers measuring distance between each face
Img 4.3
Images showing stills from the videos of AR experiments | Trackers highlight when they reach exact position
Aim:
Objects:
Experiment Setup
Shape and lock an individual component into its final state by successively positioning and orienting its four elements one by one.
Assembly Experiment 2 | Shaping component(b)
locking angles & distances (successively)
Single component (polypropylene)
Approx 50x50x25cm (unfolded)
Four printed flat image targets
Evaluation: Results:
Feasibility, Time, Efficiency
Feasible, Time reduced to half, Challenging positioning process
In this case, the formation of an individual component was done by successively trying to position each of its four elements into their final state. A numbering system was used to indicate the order by which the elements needed to be placed while projected rectangles and changing colours were used to signify the correct position. The process proved to be easier than in the previous setup. Specifically, the time needed to lock a component was reduced by half since it was easier to match the target positions for separate elements. On the other hand, the process was still hard to accomplish since each element was positioned without taking into account the position of its neighbouring ones. Moreover matching the correct rotation angles was still quite challenging. For these reasons, the next experiment would attempt to achieve the component’s final state through locking only the distances of elements successively and in relation to their neighbouring faces and not to the target planes.
76 Transient Systems Chapter 4
Locking
Folding Pattern Component Locking distances successively
angles
Img 4.4
Images showing stills from the videos of AR experiments | Locking faces sequentially
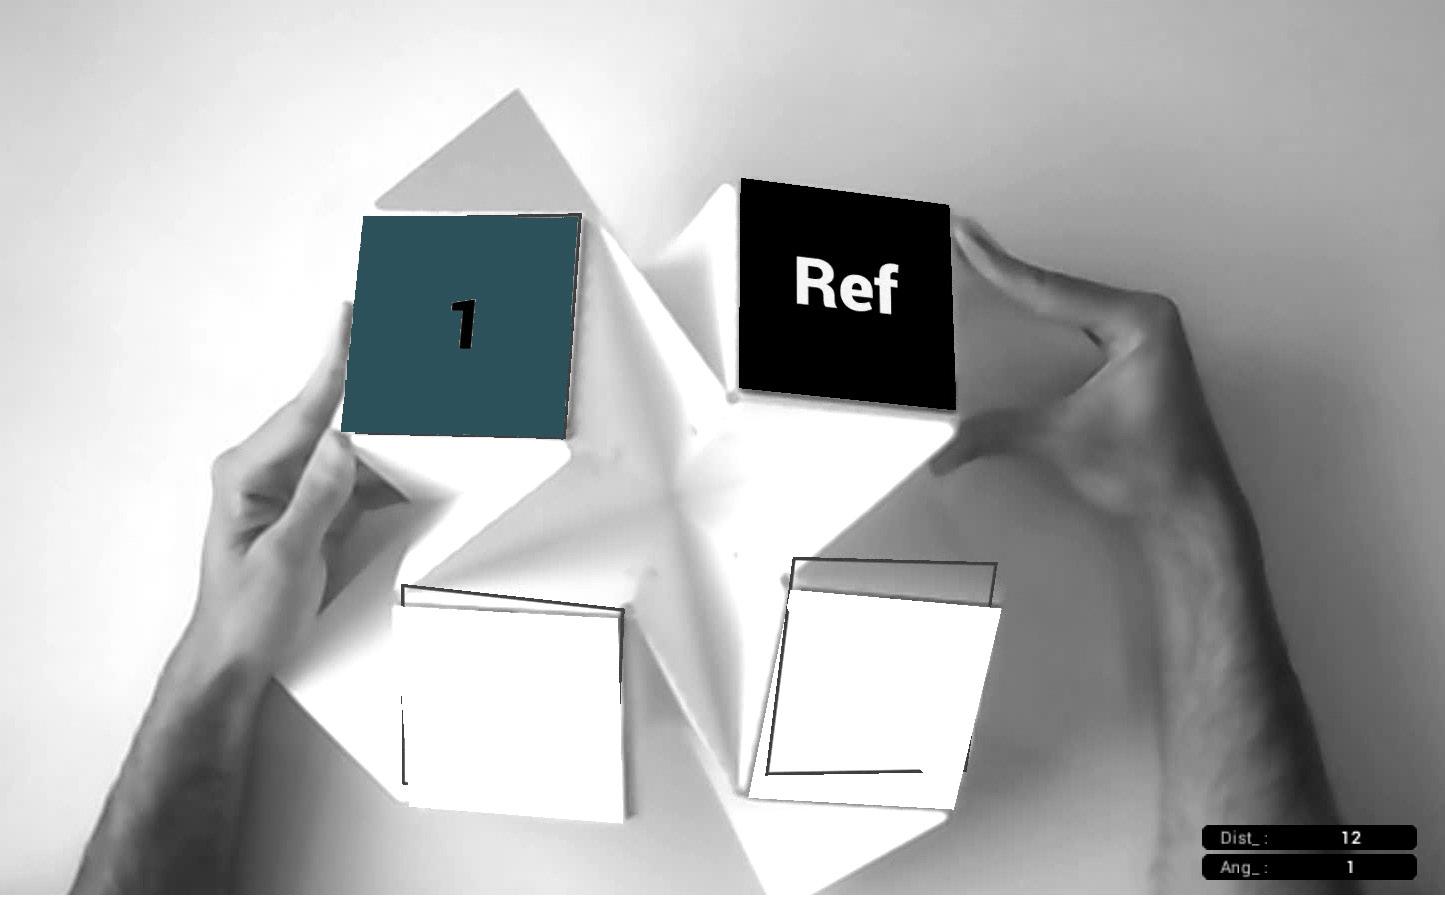
Img 4.5
Images showing stills from the videos of AR experiments | Locking sequence once face reaches the position
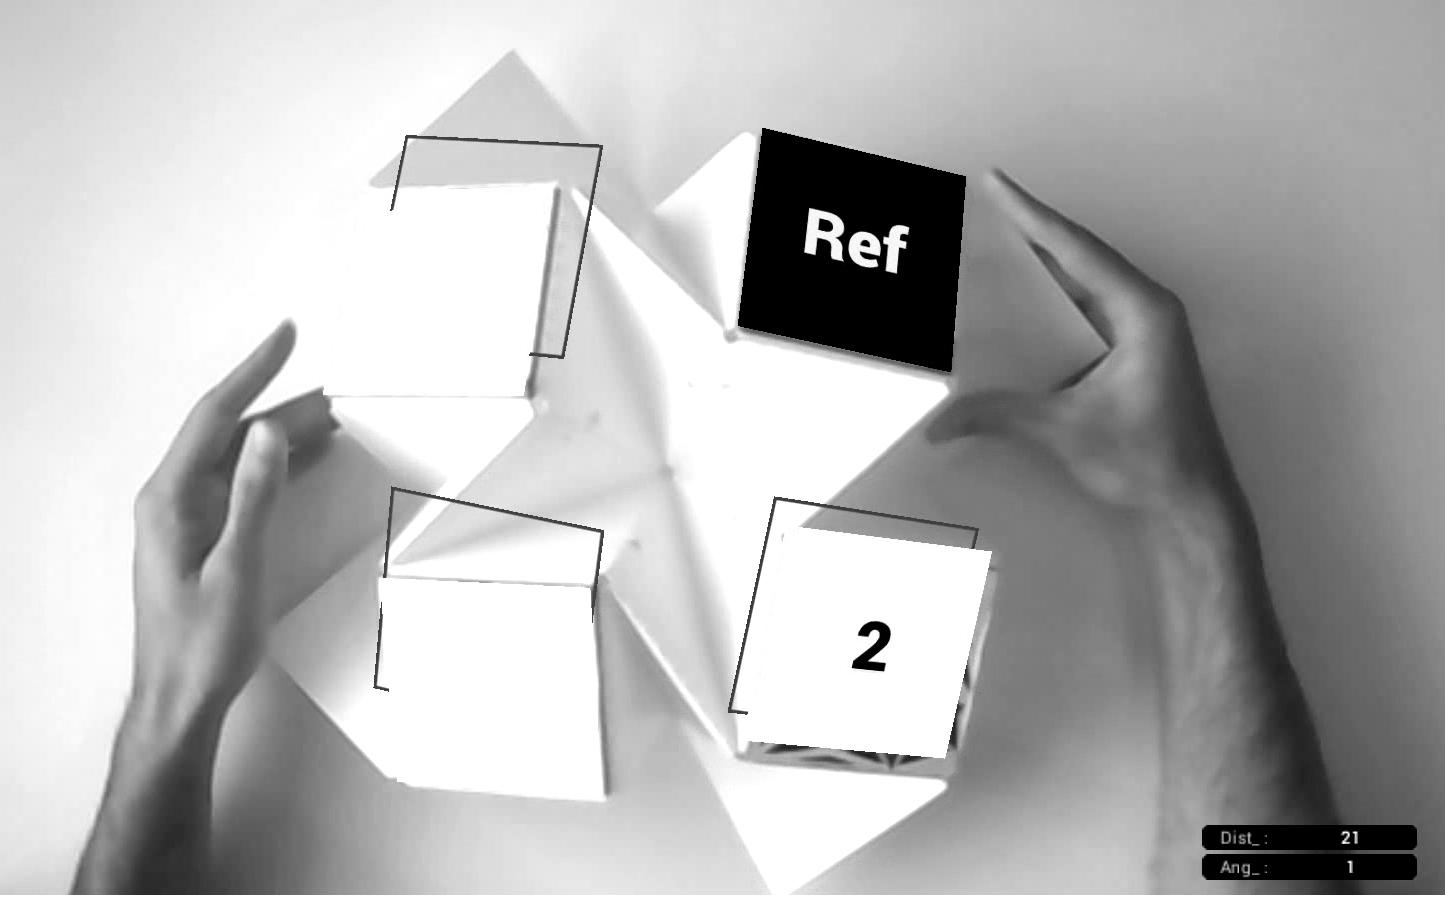
77
Component Development
Aim:
Objects:
Experiment Setup
Shape an individual component into its final state by successively locking the distances at its centre. Signify the locking elements ( tension & compression) as well as the locking sequence
Assembly Experiment 3 | Shaping component(c)
Locking distances at the centre (successively)
Evaluation: Results:
Single component (polypropylene)
Approx 50x50x25cm (unfolded)
Four printed flat image targets
Feasibility, Time, Efficiency
Feasible, Time reduced further UI beneficial for types & sequence
For this experiment, only the distances at the centre of the components were measured and locked. The goal was to achieve the final shape while reducing the amount of time needed. Furthermore, the user interface was updated to indicate which locking elements needed to be in tension and which in compression as well as to suggest the locking sequence. These additions facilitated the assembly and reduced the time for completion in relation to the previous attempts. Locking two elements in relation to each other was also easier since the required translations were smaller. In addition, the user interface was successful in relaying the locking order as well as what kinds of locks were needed. It is important to note that the shape achieved after this process was not the final one. The surrounding locking elements to be inserted during the aggregation process would finalize the desired shape.
78 Transient Systems Chapter 4
a. Folding Pattern Component Locking distances successively
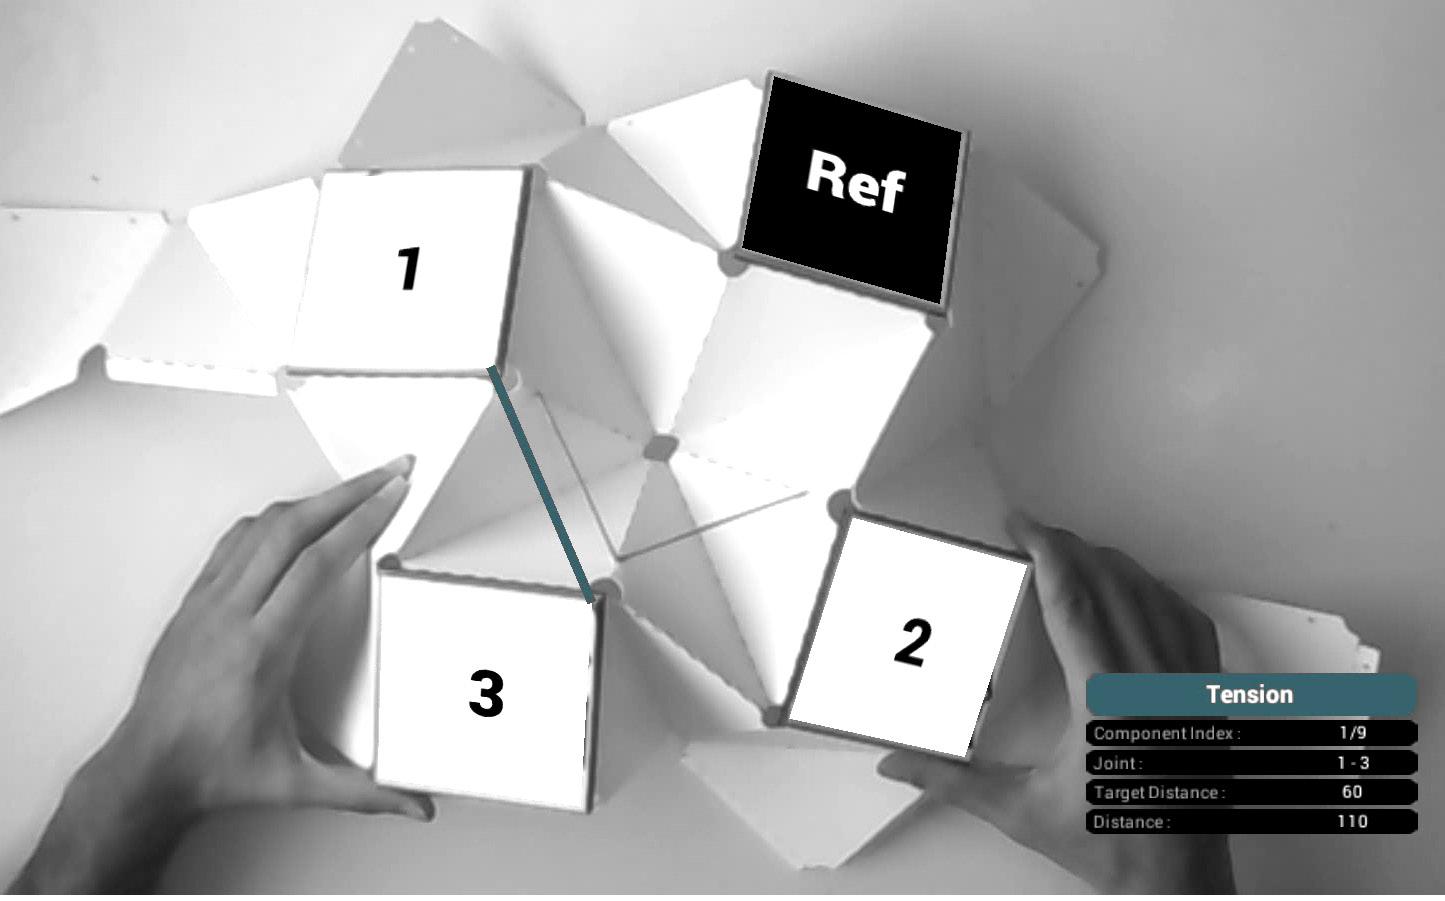
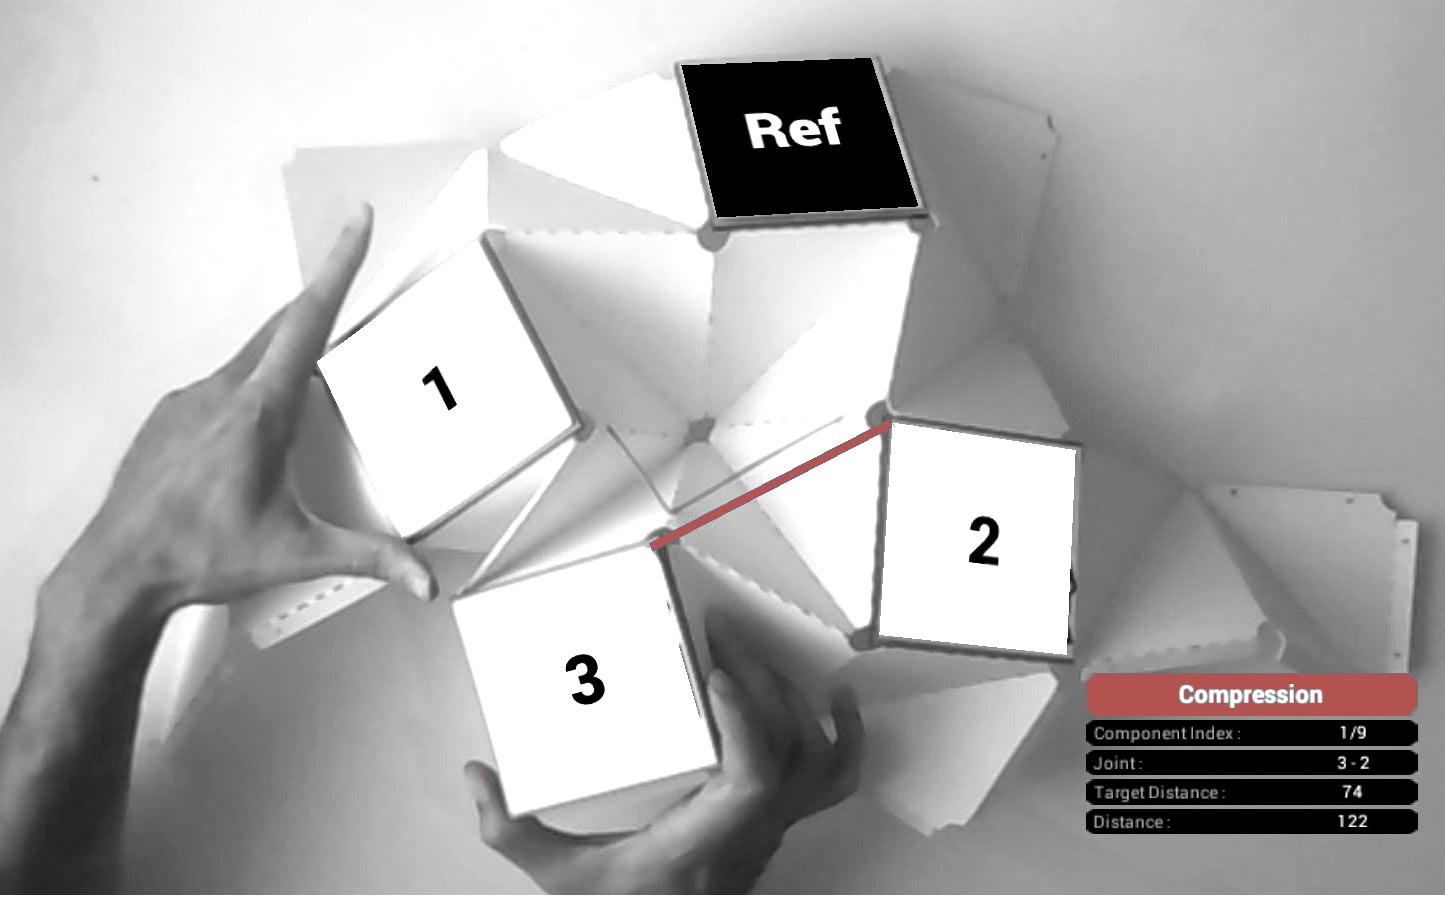
79 Component Development
Img 4.6
Images showing stills from the videos of AR experiments | Locking distance sequentially
Img 4.7
Images showing stills from the videos of AR experiments | Locking sequence and type of lock indicated
Experiment Conclusions
Through this set of folding experiments, methods of linking assembly data to the component were tested for the development of a folding logic for the system. Results and observations made throughout the study were related to the prototype material and to the chosen scale (1:10). It was concluded that the AR setup used was successful in suggesting the correct configuration for each component as well as its final position on the surface. Furthermore, the user interface was sufficient in displaying information about the shaping, locking and assembly sequence for the surface as well as which kind of locking elements are needed. The process revealed limitations mostly in terms of the object tracking software and inaccuracies in the final configuration. The camera, image targets quality and size as well as the material, locking details and scale were identified as the main issues. Larger and improved image targets, better hardware(camera), locking details with numbers signifying lengths and more flexible joints could improve the overall process.
80 Transient Systems Chapter 4
1. Flat individual component
2. Folded individual component
Component formation
Diagrams explaining the component formation experiments.
Fig 4.14 (Top)
Diagrams explaining the component locking experiments.
Fig 4.15 (Right)
Component locking
With regards to the folding process itself, it was concluded that folding and positioning the faces sequentially showed the best results. It also proved to be much easier to position the faces based on their distances in relation to their neighbours rather than their location and rotation.
Further developments of the system would involve an exploration of a locking strategy and detail based on these observations. It was also noted that in certain cases the component would not form the target shape even if all the locks were inserted as the effect of the neighbouring components within the aggregation was required for it to achieve its desired form. For this reason, the locking elements should be designed to allow for a degree of settling that would occur when the components are aggregated. These observations, along with conclusions from previous geometrical and structural analysis were used for the development of the project’s assembly process and sequencing.
Shaping components | Results
Shaping Component Experiment 1
Feasible, Inefficient in regards to time Challenging positioning process
Shaping Component Experiment 2
Feasible, Time reduced to half, Challenging positioning process
Shaping Component Experiment 3
Feasible, Time reduced further UI beneficial for types & sequence
Shaping Component Experiment 4
Feasible, Time consuming +/- 4cm accuracy, +/- 5° accuracy
81
Component Development
a. Shaping component | locking angles & distances (simultaneously)
b. Shaping component | locking angles & distances (sequentially)
Component Detailing
The individual component was to consist of four squares and sixteen identical triangles (3x3m).
Design Requirements
The parameters that affected the design of an individual component were:
1. The initial size of the material sheets.
2. The capacity of manipulating the shape without the use of machinery.
3. The weight and transportation limitations.
4. The possibility to maximize structural depth while folding.
5. The ability to be folded and handled manually.
Based on these specifications, the component was formed from four identical squares and sixteen identical triangles that were joined into a flat configuration. The final shape measured 3 x 3 meters in its unfolded flat state and approximately 1 x 1 meters when closed. The maximum depth that the folded component can achieve is approximately one meter (one sixth of its total length). This configuration was chosen since it created a structural depth of 0.5m when fully closed which satisfied the spanning requirements of the design without creating a component that was too large to manipulate by hand.
82 Transient Systems Chapter 4
Individual components with actual dimensions that are to be fabricated.
Fig 4.16 (Right)
83
Component “Valleys” 3.00m 1 2 3 4 1 1.50m 0.50m 0.50m 0.50m 1.00m 0.50m 0.50m 0.50m 3.00m 1.50m “Mountains” Individual Part Individual Component
Component Development
Comparision of Thickness and Weight with same stiffness
Dibond:
Thickness
Weight
Aluminium:
Thickness
Weight
Steel:
Thickness
Weight
Material
The results from the previous structural experiments were taken into account in the selection of a material. The component had to be lightweight in order to be handled and configured by hand as well as rigid enough to allow it to span large distances without additional supports. Material studies were carried out and Steel, Aluminium and metal composite panels were both analysed through a series of FEA test.
Because aluminium was lighter, it performed better than the steel sheets in the tests, however Aluminium composites like Hylite, Alucobond, Dibond were preferred as they had a thicker cross section than the aluminium sheets while still maintaining their lightweight and high resistance properties. Dibond, an Aluminium composite with a Polyethylene core was chosen due to its favourable structural properties, fabrication potentials and ability to incorporate hinges within the composite itself. It was therefore suggested that the faces of the proposed component will be made from an aluminium sandwich panel similar to Dibond.
84 Transient Systems Chapter 4
Thickness Weight Thickness Weight Thickness Weight 3 mm 3.8 Kg per sq.m 2.4 mm 6.5 Kg per sq.m 1.7 mm 13.3 kg per sq.m
Diagrams explaining the hinges and component formations through material experiments.
Fig 4.17 (Right)
Hinge Mechanism
Hinge connection for rotation
Hinges
Two types of folding rotations were evident that correspond to “mountains” and “valleys” folding types. Between triangles, only “valley” rotations occurred allowing only angles between 0 and 180 degrees. On the other hand, between each square only “mountain” rotations occurred allowing angles between 180 and 360 degrees. Hinge joints and folded plastic joints for these folds were both tested in a series of physical studies aimed at developing a joint detail for the panel.
It was found that on the small scale models, the flexible plastic joints performed better than the hinge joints since each component required 52 hinge joints which generated a large amount of friction that restricted the faces rotation. However on a larger scale, the flexible plastic joints were not scalable and mechanical hinge joints were preferred. It was also noted that the plastic joints would fail after multiple uses at a larger scale and therefore were not suitable for use in large constructions. Therefore an aluminium hinge joint was chosen as the preferred joint for the component.
Sheet
The component sheet was developed from faces made of dibond panels joint together with aluminium hinges. The faces were aggregated in 3 stages to form the component:
Stage 1: A square is combined with eight triangles to form a cross shaped element. To achieve that, two triangles are first joined together and are then aggregated around a central square.
Stage 2: Four of these cross shape elements are assembled and later combined into one surface which forms the unfolded base of a single component. Each Component was then folded into shape and locked using information supplied through augmented reality.
Stage 3: Aided assembly techniques were then used to indicate the assembly logic and locking strategy for the overall surface.
85 Component Development
a. Folded State b. Flat State
Locking Mechanism
Several panel setups for locking mechanism with different numbers of elements were tested in FEA software. Deformations and mean plate stress values were evaluated for the four cases. Through the subsequent comparative analysis the benefits and drawbacks of the locking mechanism geometries were assessed. However, the decision for which geometry was most suitable was not based only on results from FEA. Since one of the goals for the system’s development was a fast and efficient assembly process, locking the minimum number of components with the minimum number of elements was crucial. The quadrangular locking geometry (with or without diagonals) locks more edges when compared to the other two options. It also formed more triangles in the final configuration of the component which increased the overall structural rigidity. Deformations and mean plate stress values were lowest in the case with most locking elements. However, the results don’t differ significantly from the ones for a quadrangular locking arrangement, therefore the quadrangular mechanism was chosen as the most viable solution. Complete FEA results from this experiment can be found in the appendix.
86 Transient Systems Chapter 4 mm 150 0 mm 150 0 mm 150 0 mm 150 0
Diagrams explaining deformation analysis for locked joints.
Fig 4.18 (Top)
Diagrams explaining the types of locking joints analysed for structural performance.
Fig 4.19 (Right)
Component Development
Locking Joint Types
87
Size:
Area:
Face Size:
Material:
Image Targets:
Types of Locks:
Component Type:
Component
3 x 3 m (Flat state)
9 sq.m
0.5 m
Dibond
Four unique trackers
Structural & Friction
Edge (Peak stress)
Locked Component State :
Conclusions
The number and type of locks needed for each component was defined by the developed locking strategy and was dependent on the global aggregation and its curvature. The locking process would take place in relation to the global aggregation and the component would be folded based on the information obtained from the digital folding simulations. During the folding process, Augmented reality would be used to suggest the type and the number of locks necessary for that component. The locked component would later be attached in place to form the aggregation of a desired geometry. The proposed material used for the locking tension members was metal cable which could be secured at the required length indicated by the assembly instructions while the compression members would consist of metal rods which could be adjusted to the right length and secured in place. These tension and compression elements would be kept to a minimum within the structure and would only be placed in the locations defined by the locking algorithm.
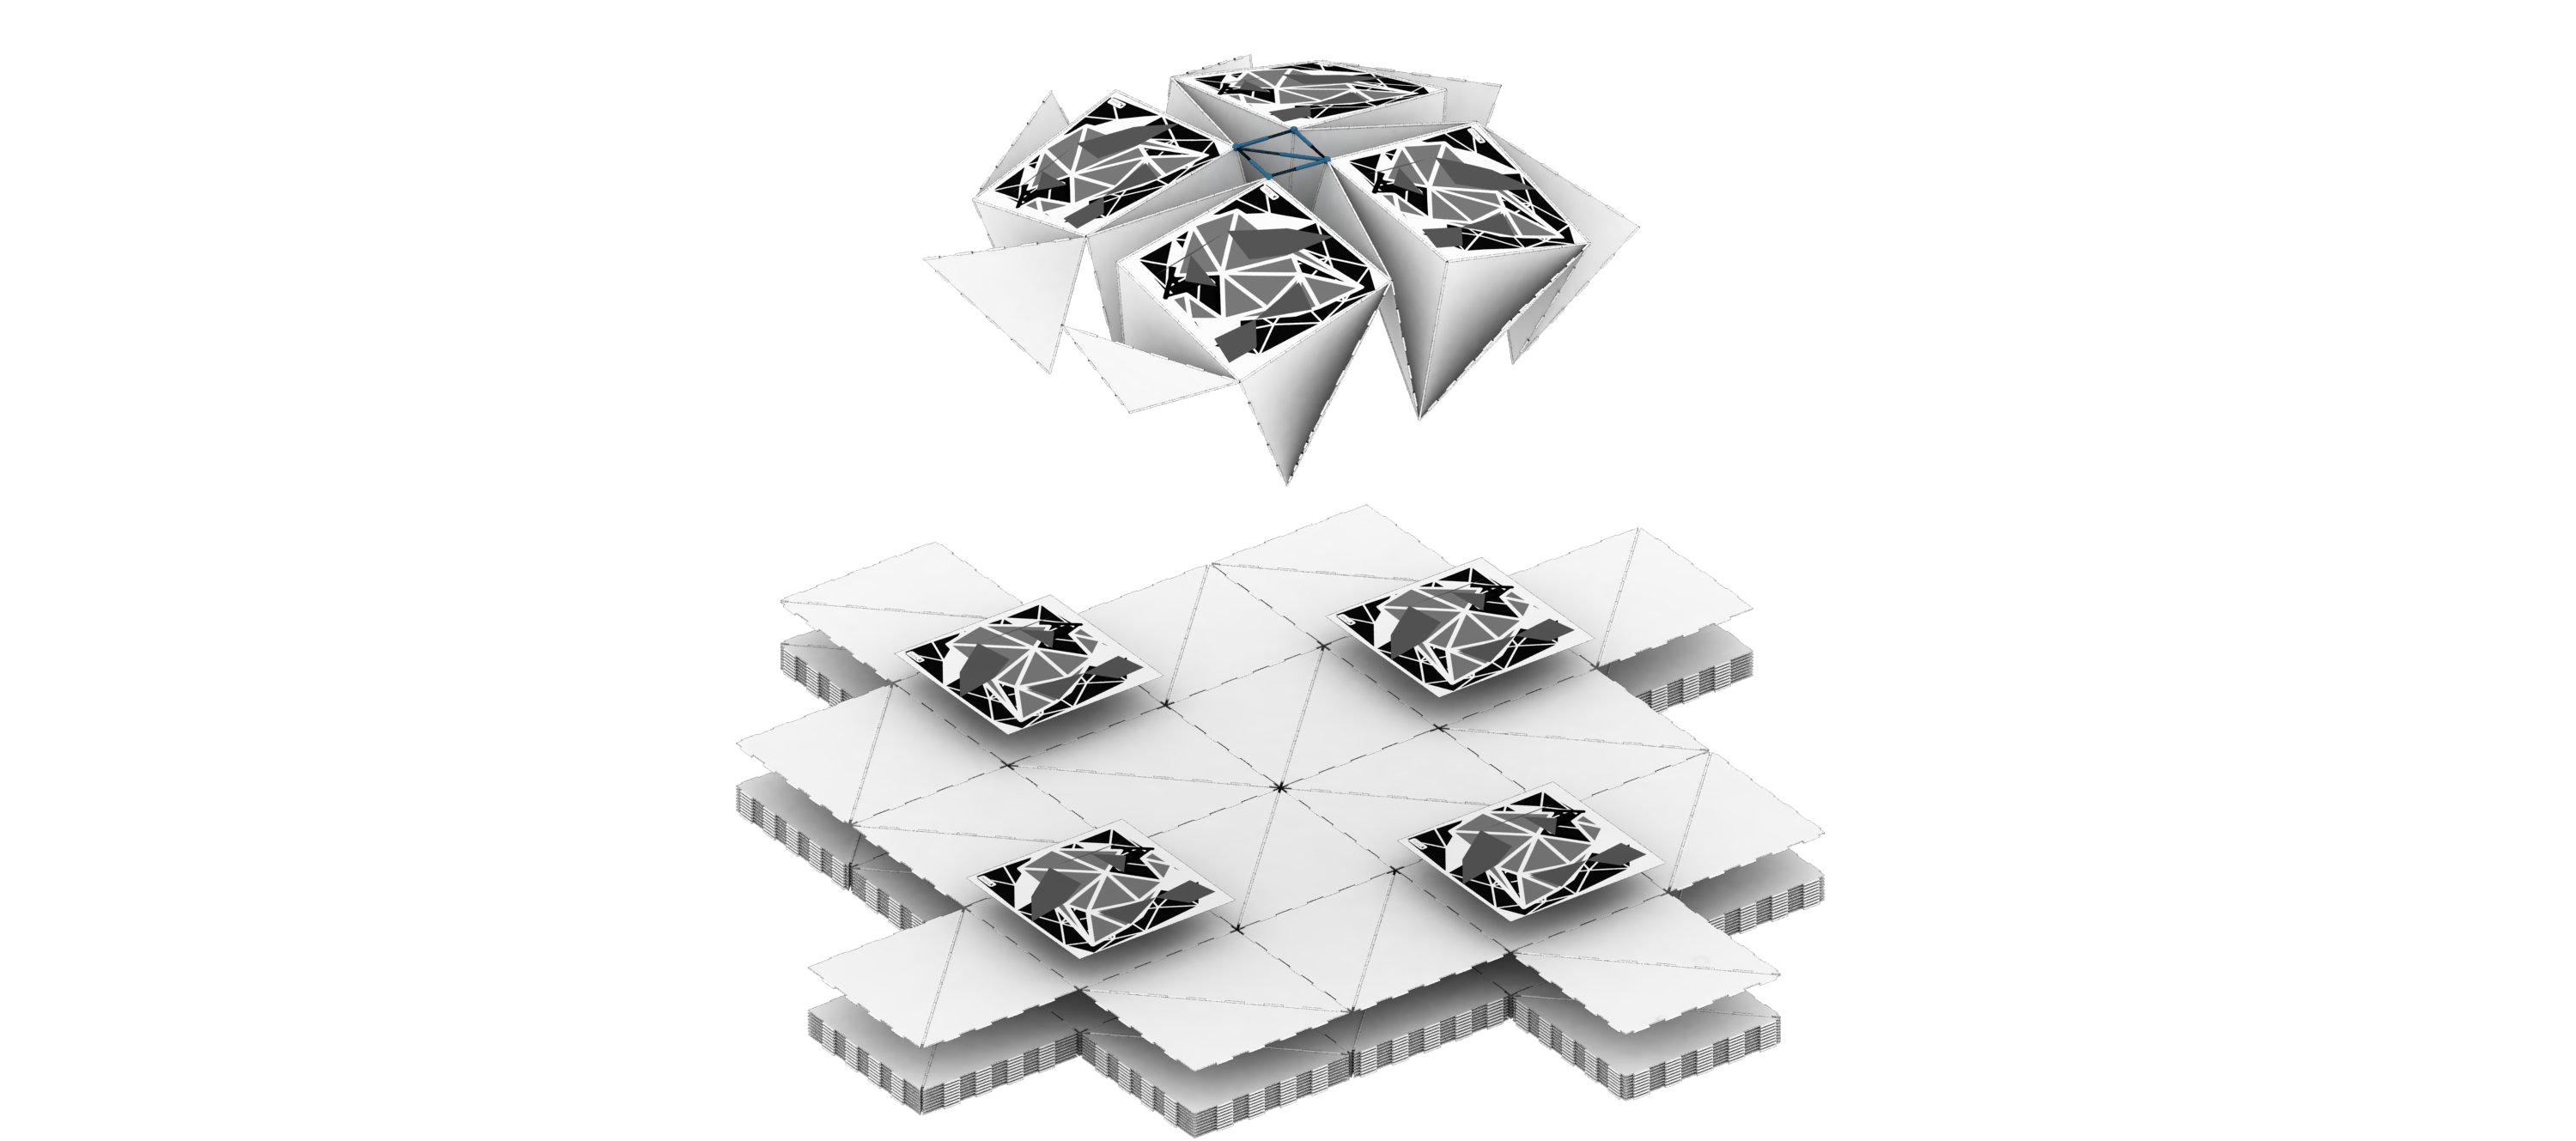
Locked Component
Image Trackers
88 Transient Systems Chapter 4
Aluminium Sheet
Polyethylene
89
Component Development
Msc Critical Evaluations
The Msc phase of this research was focused on developing a reconfigurable component for the system.
The Msc phase of this research was aimed at developing a reconfigurable material system for the construction of temporary large span structures through a series of geometrical, structural and assembly studies. The chosen folding pattern was first analysed and digitally simulated in order to identify the geometrical possibilities and limitations of the system. The digital explorations were informed through observations from physical prototypes which led to the successful simulation of the pattern’s folding behaviour. Different surface types (single or double curvature) were developed, all of which were composed of identical components configured into different shapes. The simulation was run using developed scripting tools for mapping the pattern on to various forms. FEA was then used to determine the structural properties of the developed surfaces as well as the locking strategy required for different degrees of surface curvature. The experiments conducted were focused on deriving principles for achieving structural stability under different load conditions for diverse shapes and spans. Under this context, various shapes were examined and stability was achieved through various techniques such as locked boundary conditions and component locking. Based on the results from these studies,
90 Transient Systems Chapter 4
Diagrams explaining the assembly process and sequence.
Fig 4.20 (Right)
Assembly process
Individual component Regional aggregation Global Aggregation Reconfiguration
a locking strategy for the defined surfaces was developed according to the different geometrical and structural characteristics (anchor points and surface curvature). Through this locking strategy, the amount, position and type of locking elements could be suggested and later implemented throughout the aided assembly process.
While the main focus of the Msc phase of the project was mainly on developing the material system, the next stage of the project will focus on the architectural applications of the system and how its geometrical flexibility can be exploited to achieve a different architectural outcomes. Attention will be focused on developing a reconfiguration strategy for the system which will outline the assembly and disassembly process while also exploring the possible configurations of the structure based on various programmatic and variable constraints. The various lives of the structure will be detailed and the programmatic and functional requirements of the system will be used as the design drivers which will dictate its form for each of its configurations. Through these multiple lives, different surface forms will be developed based on the requirements of the space.
The flexibility of the pattern will be explored and its ability to allow for differentiation across the surface based on the programmatic, environmental or structural requirements will be studied. The effect that opening or closing the pattern had on the performance of the structure will form the basis for the different design strategies and will dictate the structures final design outcomes.
The aided assembly methods studied during this phase of the project will be explored further with focus placed on their integration into a construction and deconstruction strategy for the system. The use of AR technologies for the assembly of full scale components will also be explored with the intention of assessing which parts of the construction sequence these technologies are best suited for and analysing possible methods for how they can be used in conjunction with existing construction methods or technologies to enhance the overall assembly process.
91 Component Development
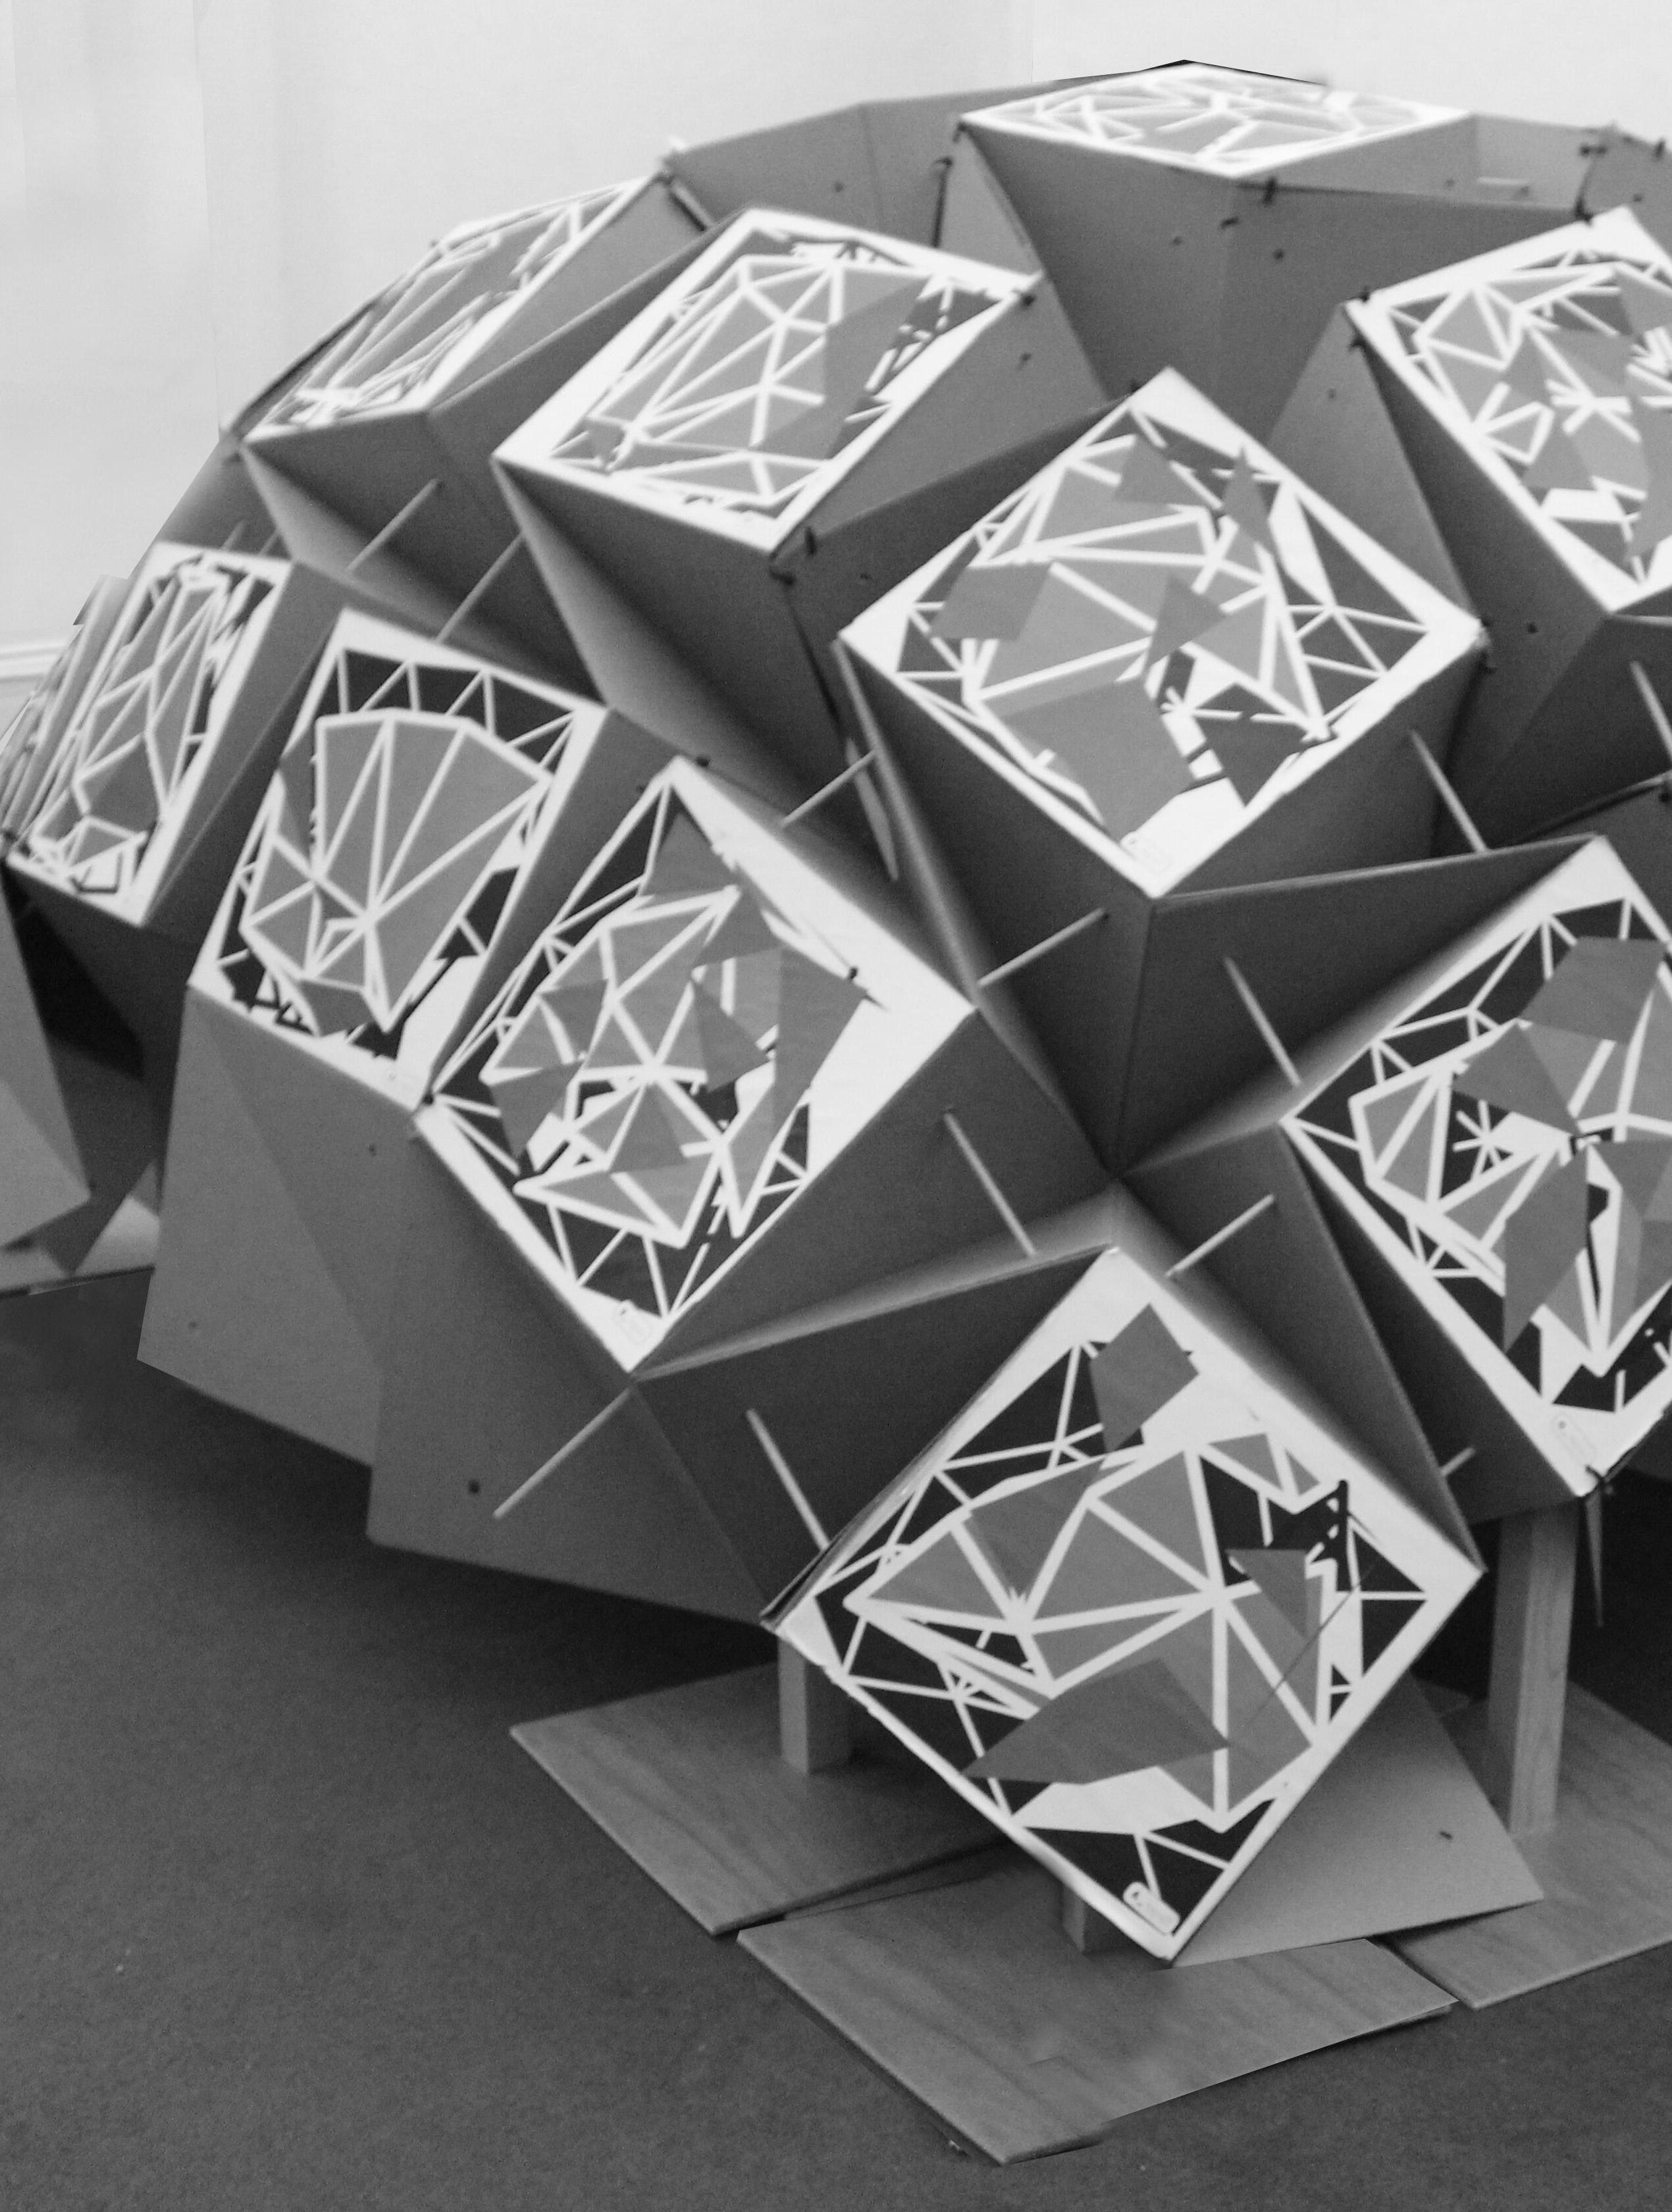
5. Component Aggregation
The next stage of the research was focused on understanding how the components behave as a structure. Through the analysis and construction of a 1:2 scale model of the system, methods for its design and assembly were developed. Structural and environmental analysis techniques were used to develop a strategy for the distribution of the components across a target surface as well as to develop an understanding of the degree by which each component should be opened or closed. The component developed during the Msc stage of the research was further detailed and different types of locking methods were explored in order to develop a locking strategy, along with an assembly sequence for the system. This assembly sequences were then tested through a series of AR experiments aimed at developing protocols for the guided assembly of the structure. These experiments explored the viability of using digitally guided assembly techniques as tools for the sequencing and assembly of the structure on a large scale. The chapter concludes with a description of the benefits and drawbacks of these methods and outlines a strategy for their application in the assembly of a final design.

93 Component Aggregation
Surface Geometry
The surface geometry for the pattern was developed through a catenary curve equation.
Through the structural and geometrical studies conducted during the Msc stage of the research it was found that the pattern was only able to form a limited amount of anticlastic surfaces without generating deformations within the faces of the components. As the digital models developed were based on spring systems, some of the patterns produced by the simulations could not be replicated with physical models as the faces were deforming beyond what could be achieved physically. To develop a better understanding of how the pattern behaves in different curvatures, a series of models were set up to analyse the deformation across the pattern’s surface. A maximum deformation of 5% of the original face’s edge length was used to identify which faces were deforming beyond the achievable limits. It was found that 27% of the faces in patterns mapped to anticlastic surfaces were deforming beyond the 5% threshold while patterns mapped to synclastic or singly curved surfaces only showed deformation in 1% of the faces. It was also noted that anticlastic curvatures required the more locks to maintain their shape than the synclastic or singly curved surfaces.
94 Transient Systems Chapter 5
Fig 5.1 (Right) Diagram explaining the deformation values for surfaces with different curvatures.
Component Aggregation
Monoclastic Curvature
Deformed Face
Un-deformed Face
a. Face Deformation: 0%
b. Locking Strategy : 20 Locks
Synclastic Curvature
Deformed Face
Un-deformed Face
a. Face Deformation: 0.1%
b. Locking Strategy : 20 Locks
Anticlastic Curvature
Deformed Face
Un-deformed Face
a. Face Deformation: 27.5%
b. Locking Strategy : 36 Locks
95
Catenary Equation
Based on the results from the previous experiment, it was concluded that the system performed better in synclastic and single curvature and therefore anticlastic forms were not explored further. All geometry studies were now focused on mapping the pattern to synclastic or single curvatures. A series of digital studies on arched and domed pattern formations indicated that the curvature of the arch generated by the folded pattern could be approximated using the formula for a catenary curve y = a cosh(x/a). This equation is used to approximate the curve formed by a hanging chain under its own weight where x and y describe the amount of displacement in the horizontal and vertical axis and a is a constant that is used to describe the degree of sag of the curve. The constant a could be used to control the tension along the curve and therefore the height of the arch. By adjusting the value of a it was possible to change the steepness of the arch and alter the degree of folding within the pattern where a completely flat curve resulted in fully closed components and a steep arch resulted in open components.
96 Transient Systems Chapter 5
Diagram explaining the setup for development of a syncalstic global surface.
Fig 5.2b (Right)
A curve graph equation explaining the relationship between the width and the height of a catenary curve.
b. Rigid Connection
c. Hinged Connection
a. Anchor Point
Fig 5.2a (Top)
Catenary Curve Graph
Component Aggregation
y = a cosh(x/a) Where a is a constant that describes the degree of sag in the curve.
97
x displacement y displacement a = 0.5 a = 1 a = 2
Curvature Generation Graph
Base Surface
The base surface was generated based on the four edge points that defined the anchor points for the pattern. From these four points a uv grid was generated from which the surface would be constructed. The distance between each of the anchor points was taken to be the horizontal distance x for the catenary equation and the value for the constant a which dictated the sag of the curve was altered to adjust the height of the arc and therefore the openness of the pattern.
Through this method, all four edge aches that would define the surface could be generated from the anchor points and a value for the constant a Each point on the uv grid was then moved up by a height h which was calculated based on the y values of the surrounding edge curves and the distance of the point to the edges. A separate constant b was used to act as a multiplier for the height h and while the constant a was used to control the curvature of the edge arches, the constant b was used to control the curvature of the whole surface. Both these constants could be used to vary the degree of openness in the pattern based on its functional requirements.
98 Transient Systems Chapter 5
Fig 5.3 (Above)
displacement h a = 0.7 a = 0.5 a = 0.3
Digital explorations describing the relation between the catenary equation and surface simulation.
x
Stage 1: Generation of a point grid based on the four edge points that are the anchor points for the surface.
Stage 2: Side arches are generated according to the catenary equation and the distance between the points.
Stage 3: A surface with double curvature was developed with the generated arches as edges.
Stage 4: Height manipulations are controlled to define the required geometry and curvature.
99 Component Aggregation a .Point Grid b .Side Arch
Fig 5.4 (Right) Diagrams explaining different stages of the digital surface generation process.
c .Surface Generation d .Curvature Control
Pattern Open Factor
The relationship between open factor of the pattern and overall surface curvature were used for developing varied global surfaces.
The amount at which the pattern was to be opened or closed was explored in a series of digital experiments which studied the effect of external environmental factors on the pattern. The first study explored the effect that opening or closing the pattern had on the solar radiation gain across the surface; the second explored the shadow pattern that could be generated by adding transparency to the pattern; and the third explored how the open state of the pattern effects the amount of rainwater collected on the surface. For the purpose of these studies a value labelled as “the open factor” was used to represent the state of openness in which the pattern was in. The open factor would represent a decimal between 1 and 0 where 0 represented a fully closed pattern and 1 represented a fully open pattern. A range of values were used thought the studies in order to obtain an understanding of the effect that different open factors had on the pattern’s performance. Results from these experiments were then used to understand the degree at which different areas of the pattern should be opened for the surface to perform best in its environment. All tests were performed with environmental data from the chosen site in Rio de Janeiro.
100 Transient Systems Chapter 5
Fig 5.5 (Right)
Global surfaces formed using varied open factors showing the change in curvature and pattern closure.
0.6
Model Size:...................4m x 4m
Component Face Size:...0.5 m Number of Components:...... 9
Open Factor : 0.1
Model Size:...................4m x 4m
Component Face Size:...0.5 m
Number of Components:...... 9
Open Factor : 0.3
Model Size:...................4m x 4m
Component Face Size:...0.5 m
Number of Components:...... 9
Open Factor : 0.6
Component Aggregation
101
1.0
0.0 Open
Open
Open
Factor -
Factor0.3
Factor0.1
1.0
0.0
1.0
0.0
Setup for Local Scale | Solar Radiation Analysis
AIM :
Measure incident solar radiation on the component to establish the correlation between degree of openness in the pattern and the total solar radiation gain for the same.
SETUP :
Model Size:................................................ 1m x 1m
Material:...................................................aluminium
Component Face Size:...................0.5m x 0.5m
Number of Components:.................................... 1
Location: Rio De Janeiro
Coordinates: 22.9068° S, 43.1729° W
Altitude: 87.9 ; Solar Azimuth 255.56
Study 1 | Solar Radiation
Solar Analysis studies were used to understand the relationship between the open factor of the pattern and the incident solar radiation of the overall geometry. The first set of analyses were conducted on a single component which was tested with different open factors using environmental analysis software.
It was found that the solar radiation collected by the fully closed component over the period of 1 year was less than that collected by the fully open component. This was occurring due to the shading effect of the mountain and valley folds which were more prominent in the closed state. The self shading generated in the closed pattern resulted in a 15% less solar radiation gain than in the open pattern. It was also noted that the orientation of the pattern did not effect the results significantly as the geometry was able to shade itself from all directions.
102 Transient Systems Chapter 5
Fig 5.6 (Top) Experiment setup for local scale solar analysis explaining the aims of the experiments.
Fig 5.7 (Right) Analysis results showing the solar gains for a period of one year on individual components.
103
Solar
kWh/m2 Solar
kWh/m2 Solar
kWh/m2 kWh/m2 2000 0 kWh/m2 2000 0 kWh/m2 2000 0 Open Factor0.6 Open Factor0.3 Open Factor0.1
Component Aggregation
Gain : 225
Gain : 238
Gain : 267
Setup for Regional Scale | Solar Radiation Analysis
AIM :
Measure incident solar radiation on the surface establish the correlation between degree of openness in the pattern and the total solar radiation gain for the same.
SETUP :
Model Size:............................................... 4m x 4m
Material:...................................................aluminium
Component Face Size:.................. 0.5m x 0.5m
Number of Components:.................................... 9
Location: Rio De Janeiro
Coordinates: 22.9068° S, 43.1729° W
Altitude: 87.9 ; Solar Azimuth 255.56
The second set of solar radiation studies was conducted on a 3X3 component structure mapped onto a domed surface. The setup from the previous tests was used and the pattern was studied with different open factors.
It was found that the difference between the annual solar gain of the fully closed pattern and fully open pattern was not as large as in the previous study. While the closed surface still displayed lower levels of annual solar gain, the overall domed form of the open surface generated more shade across the surface and therefore resulted in lower levels of solar gain than in the previous studies. It was therefore concluded that even though the open factor effects the amount of annual solar gain, the shade generated by the shape of the overall surface also plays a significant role and must be taken into account in the final design. It was also noted that even though opening and closing the pattern did effect the solar gain slightly, the effect of the folds when compared to a flat surface was shown to be significant.
104 Transient Systems Chapter 5
Fig 5.8 (Top) Experiment setup for regional scale solar analysis explaining the aims of the experiments.
A. Experiment Setup:
State 1 | Open Factor 0.1
B. Setup:
Component Aggregation
Fig 5.9
Radiation analysis | Regional Scale (Open factor 0.1)
Model Size:............................................... 4m x 4m
Material:...................................................aluminium
Component Face Size:.................. 0.5m x 0.5m
Number of Components:.................................... 9
A. Experiment Setup:
Total Radiaton: 300 kWh/m2
C. Results: 350
kWh/m2
2000
State 2 | Open Factor 0.5
B. Setup:
Model Size:............................................... 4m x 4m
Material:...................................................aluminium
Component Face Size:.................. 0.5m x 0.5m
Number of Components:.................................... 9
C. Results:
105
0
Fig 5.10
Radiation analysis | Regional Scale (Open factor 0.5) 0
Total Radiaton: 284 kWh/m2 350 0 kWh/m2 2000 0
kWh/m2 kWh/m2
Setup for Local Scale | Shadow Study
Compare shadow patterns and light distribution at a regional scale to establish relations between perforation of the components and light qualities of the space.
AIM : SETUP :
Model Size:................................................ 1m x 1m
Material:...................................................aluminium
Component Face Size:...................0.5m x 0.5m
Number of Components:.................................... 1
Study 2 | Shadow Distribution
The next stage of analysis was aimed at developing methods for controlling the light underneath the structure through the introduction of transparent or removable faces. Through a series of digital light studies using rendering software, the effect of different patterns of transparent faces on the surface were studied. Quantitative data was not gathered during these studies as the goal was to study the visual quality of the space and assess the light distribution. Throughout the studies, the square faces were kept opaque and the triangular faces of the pattern were made transparent so that the light beneath the pattern could be controlled through opening and closing the pattern. A set of studies were set up with different patterns of transparent faces which could be categorised into 3 groups: openings along the x - axis; openings oriented towards the y -axis; openings along both x and y axis. The best distribution of light was found in group 3 where alternate triangles oriented to both the x and y axis were replaced with transparent panels. This allowed light to enter from all angles and created an equal distribution of light
the interior of the structure.
106 Transient Systems Chapter 5
throughout
Fig 5.11 (Top) Experiment setup for regional scale shadow studies explaining the aims of the experiments.
Fig 5.12 (Right) Analysis results showing the shadow patterns experienced through different perforations.
Component Aggregation
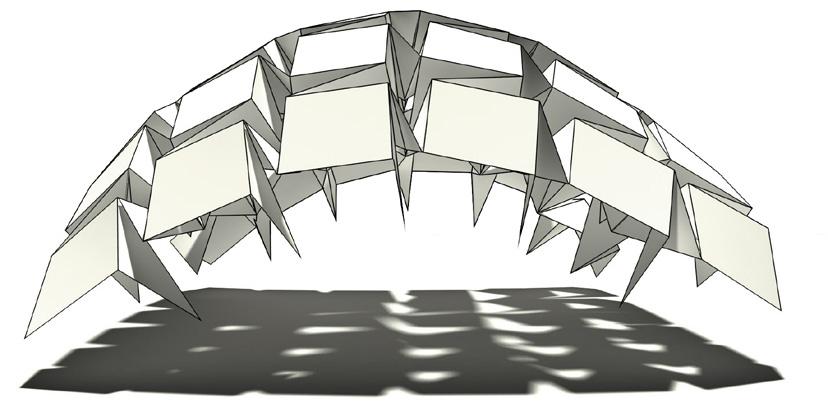
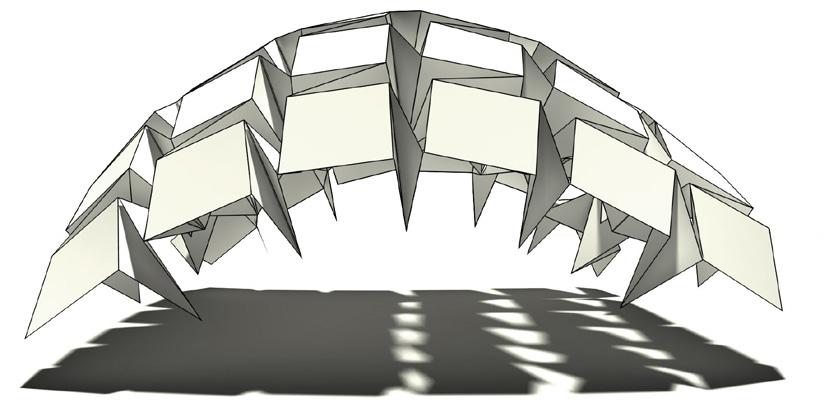
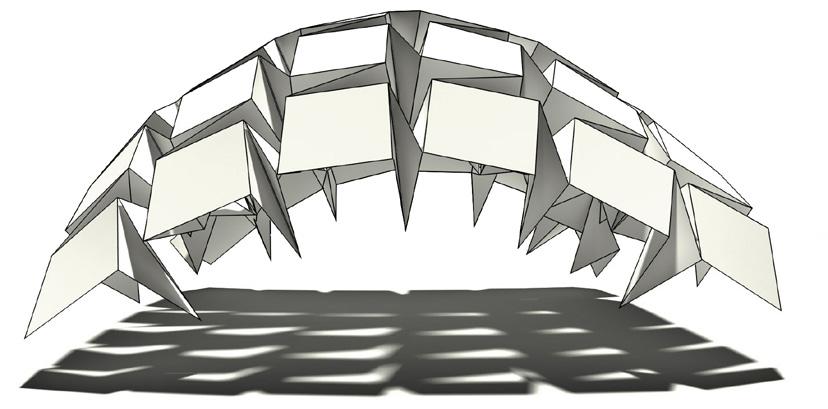
Location: Rio De Janeiro
Coordinates: 22.9068° S, 43.1729° W
Location: Rio De Janeiro
Coordinates: 22.9068° S, 43.1729° W
Altitude: 87.9 ; Solar Azimuth 255.56
Altitude: 87.9 ; Solar Azimuth 255.56 Open
Location: Rio De Janeiro
Coordinates: 22.9068° S, 43.1729° W
Altitude: 87.9 ; Solar Azimuth 255.56
107
0.6
Factor -
Open Factor0.6 Open Factor0.6 Sun Direction Sun Direction Sun Direction Perforation Distribution
Distribution
Perforation
Perforation Distribution
Setup for Regional Scale | Shadow Study
Compare shadow patterns and light distribution at a regional scale to establish relations between the open factor of the components and light qualities of the space.
AIM : SETUP :
Model Size:............................................... 4m x 4m
Material:...................................................aluminium
Component Face Size:.................. 0.5m x 0.5m
Number of Components:.................................... 9
A second set of studies were set up to analyse the effect that the open factor had on the light distribution underneath the pattern. For this study, a setup with openings along both the x and y axis was tested with an open factor of 0.1 (closed state) and 0.6 (open state). As with the previous set of studies, quantitative data was not gathered as the goal was to assess the visual quality of the space and analyse the light distribution. It was found that whereas the individual openings were larger in the open state, self shading generated by the surface curvature resulted in an unequal distribution of sunlight underneath the structure. In the closed state, even though the openings were smaller, all transparent faces allowed light to enter resulting in an equal distribution of light throughout the interior. It was concluded that opening and closing the pattern only effects the light distribution and does not effect the amount of light entering through the structure significantly. Altering the pattern of transparent faces had a greater impact on the amount of light entering through the pattern and its distribution and could be designed so as to achieve the desired light quality within the space.
108 Transient Systems Chapter 5
Fig 5.13 (Top)
Experiment setup for regional scale shadow studies explaining the aims of the experiments.
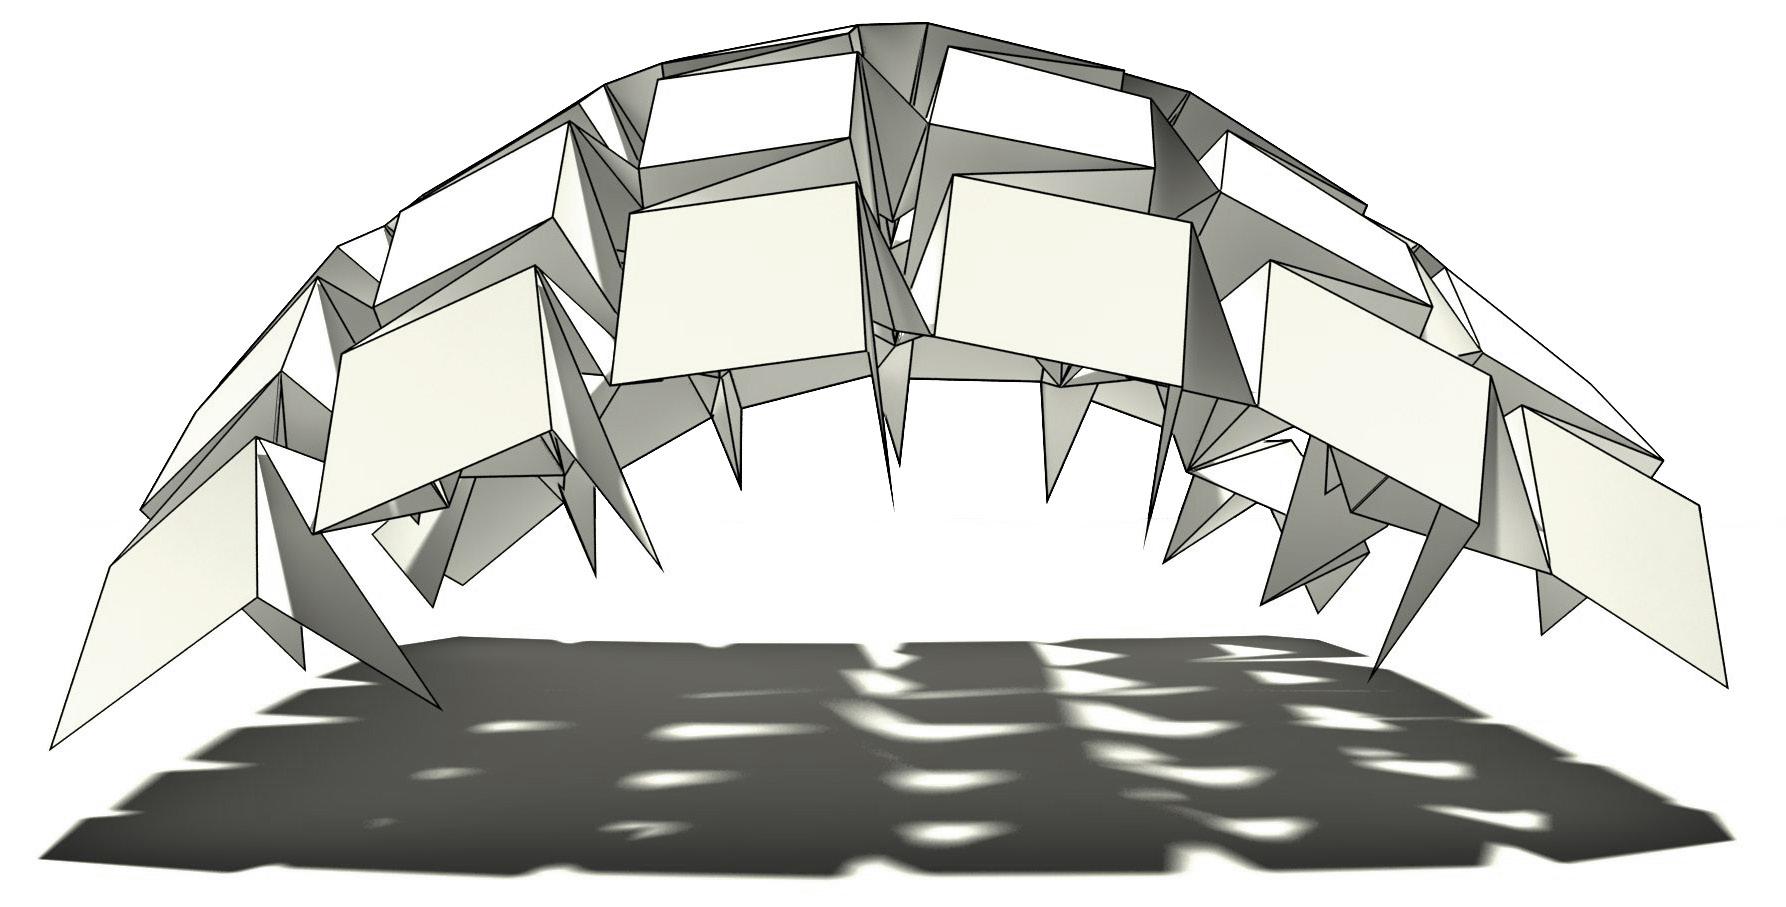
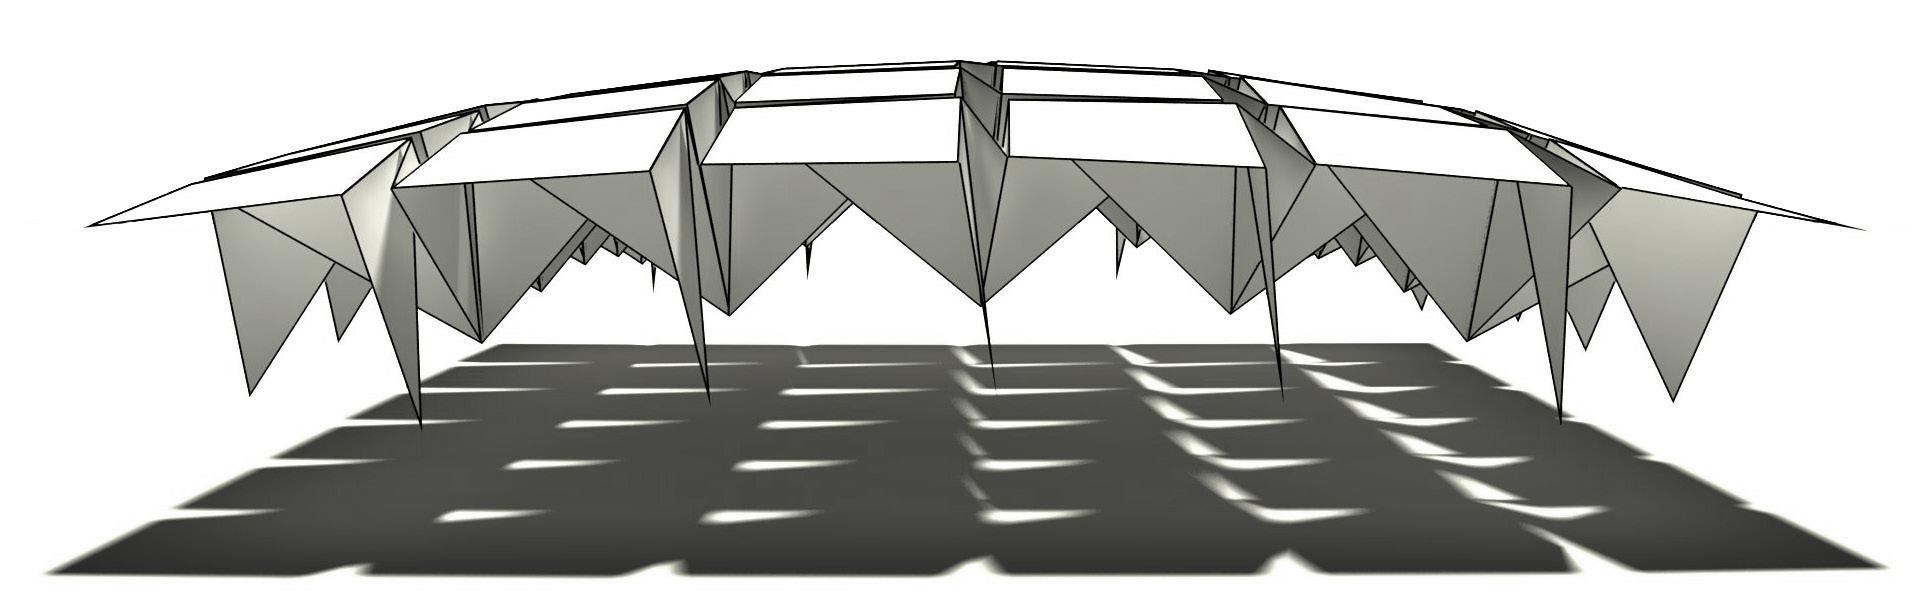
109
Component Aggregation
State 1 | Open Factor 0.1
State 2 | Open Factor 0.5
Fig 5.14
Shadow Study | Regional Scale (Open factor 0.1)
Fig 5.15
Shadow Study | Regional Scale (Open factor 0.5)
Setup for Local Scale | Rainwater Runoff Analysis
Measure the weight of water collected due to the component geometry to establish the correlation between degree of openness in the pattern and the additional load created.
AIM : SETUP :
Model Size:................................................ 1m x 1m
Material:...................................................aluminium
Component Face Size:...................0.5m x 0.5m
Number of Components:.................................... 1
Study 3 | Water Collection
A study of the relationship between the open factor of the pattern and the volume of rainwater collected was carried out to develop an understanding of how to design the surface so as to prevent excessive water loading on the structure. A first set of experiments was conducted on a single component in various open states and tilts. It was found that while the component with an open factor of 0.1 contained the least amount of water, it did not fully drain until it was tilted to 42 degrees. And while the pattern with a 0.7 open factor contained the highest amount of water (6kg) however it was able to drain all of the water when tilted by 11 degrees.
From these results it was concluded that in most cases the pattern was able to drain relatively well when the open factor was higher than 0.5 as even small tilts drained a large amount of water. However in cases where the component is perfectly upright, the open factor should be kept as small as possible as water is not able to drain from the pattern.
110 Transient Systems Chapter 5
Fig 5.16 (Top) Experiment setup for local scale rainwater run off explaining the aims of the experiments.
Fig 5.17 (Right) Analysis results showing the water run off and load addition for a component geometry.
Component Aggregation
Total Weight : 1.58 kg
Total Weight : 7.64 kg
Total Weight : 6.07 kg
111
Open Factor0.6 Open Factor0.3 Open Factor0.1
Setup for Regional Scale | Rainwater Runoff Analysis
AIM :
Measure the weight of water collected due to the surface geometry to establish the correlation between degree of openness in the pattern at a global level and the additional load created.
SETUP :
Model Size:............................................... 4m x 4m
Material:...................................................aluminium
Component Face Size:.................. 0.5m x 0.5m
Number of Components:.................................... 9
The next study explored the relationship between the open factor and the amount of water collected across an aggregation of components. As in previous experiments, a pattern of 3x3 components was tested with an open factor of 0.1 and 0.6. It was found that the pattern gathered more water in the closed state than in the open state. Even though the individual openings were smaller in the closed state, they did not have a angle of tilt high enough to drain. This resulted in a cumulative water weight of 37.89 kg in the closed state and 6.73kg in the open state where most of the water was able to drain out of the egde components. While opening the pattern did drain a large amount of the water, the remaining amount of water was concentrated around a group of components and would have created unequal loading across the structure. It was therefore concluded that a drainage system for the structure should be used in order to drain the components that cannot be tilted or closed. This could be done through a system of pipes which could run underneath the structure and drain the water once it has reached a certain weight. This system was not explored in detail as part of this research and could be studied as a further development for the system.
112 Transient Systems Chapter 5
Fig 5.18 (Top)
Experiment setup for regional scale rainwater run off explaining the aims of the experiments.
A. Experiment Setup:
Fig 5.19 Rainwater runoff analysis | Regional Scale (Open factor 0.1)
Component Aggregation
A. Experiment Setup:
State 1 | Open Factor 0.1 State 2 | Open Factor 0.5
B. Setup:
Model Size:............................................... 4m x 4m
...................................................aluminium
Face Size:.................. 0.5m x 0.5m
C. Results: 0.04
Total Water Collected : 0.0378 qm
Model Size:............................................... 4m x 4m
...................................................aluminium
Face Size:.................. 0.5m x 0.5m
of Components:.................................... 9
0
0.04
qm
113
0
Component
Number
Material:
of Components:.................................... 9
Material:
Component
C. Results: Number
qm 0 Kg 40
B. Setup:
Additional Weight : 37.89 Kg
0 Kg 40
Total Water Collected : 0.0067 qm
Additional Weight : 6.73 Kg
Fig 5.20 Rainwater runoff analysis | Regional Scale (Open factor 0.5)
For Experiment Video’s
Please Refer the CD
Assembly Experiments
Developed object tracking and augmented reality tools were tested and validated on a large scale setup.
Assembly Sequence
This chapter focuses on the implementation of augmented reality and object tracking methods as tools for overlaying real-time construction information for the assembly and disassembly of the proposed system. An assembly strategy for the structure was developed which included an assembly sequence and a strategy for placement of the supporting structure to aid the construction process. The process would take place in 3 stages:
1. The components attached to the anchor points of the structure will be assembled first and would be supported with a system of structural props during assembly.
2. The components surrounding the anchor points or the components in areas of high stresses which are structurally locked will then be assembled. Structural props may be required in certain areas.
3. The remaining components will be attached to the structure. Structural props will not be required for this phase of assembly. The viability of using aided assembly techniques to relay this assembly sequence to users was explored and its potentials as a construction aid were assessed.
114 Transient Systems Chapter 5
Fig 5.21 (Right) Diagram explaining the assembly sequence and strategy for placements of supporting structure.
Assembly Sequence
Partially locked and temporary locked components
Component Aggregation
Structurally locked components with high stresses
Anchor points and structural props for additional supports
115
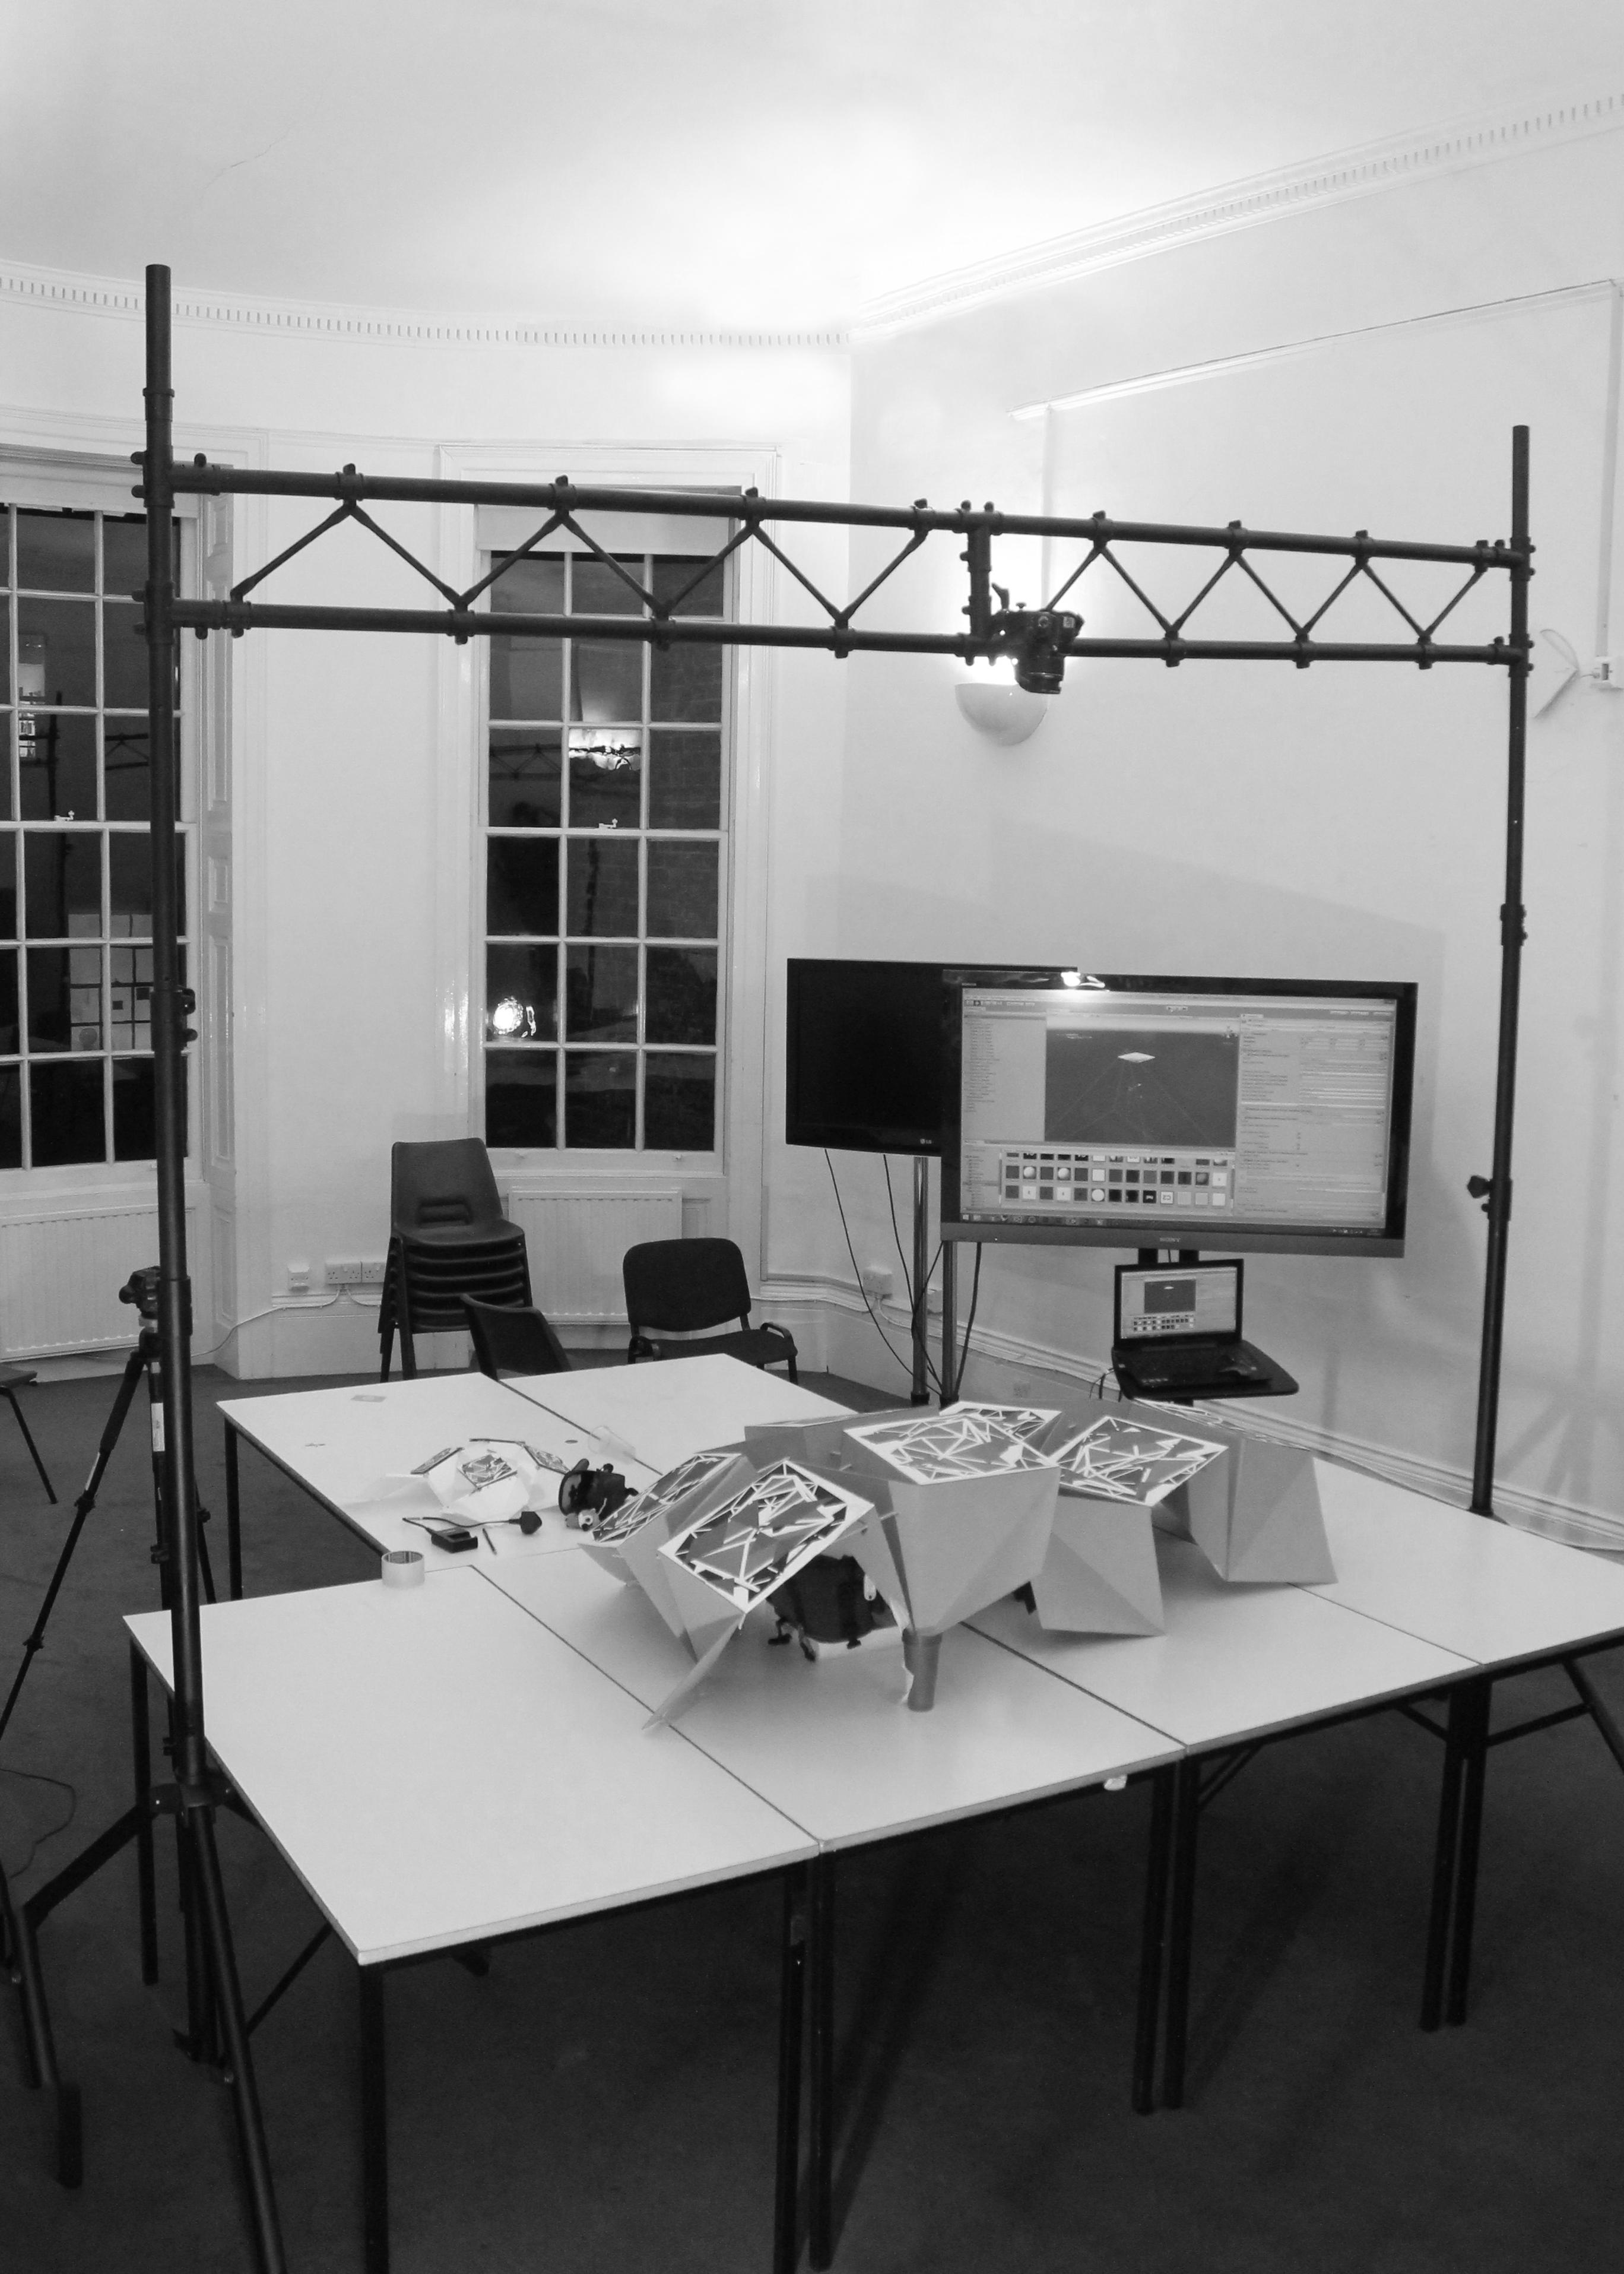
116 Transient Systems Chapter 5
Img 5.1 Image of the experiment setup conducted at 1:2 scale in a controlled environment.
Experiment Setup
As in the folding experiments conducted during the Msc phase of the research, the Unity game engine and Vuforia Augmented Reality extension were used as digital tools for translating the geometrical characteristics of physical objects into digital data for this set of experiments. The performance of the software on larger scales was a crucial factor for its use as a construction aid therefore this set of assembly experiments were conducted with a larger setup. For this reason, all the experiments were conducted at a scale of 1:2 of the proposed structure with 25 x 25 cm image targets.
A larger setup was required with a recorded test area of 300 x 300 cm. Live video feed was sent to the object tracking software through a Canon 450D camera which was fixed above the test area on a portable frame. Portable display devices were not explored as means of relaying information to the user since the focus of the research was mainly directed towards construction sequencing and therefore the data was relayed to the user from a stationary screen.
Construction data was based on a 2x2m synclastic surface consisting of 9 components. The data needed for constructing the structure was summed up to 125 different distances and 60 different angles to lock. Methods of relaying this assembly information to he user were studied for the development of an assembly sequence for the system. The effectiveness of the proposed construction method was tesed in 3 scenarios which related to the different stages of the assembly process: the component preparation stage, the site preparation stage and the component aggregation stage. These experiments were used to determine which assembly methods are effective at a larger scale and what level of accuracy can be achieved. As in previous experiments, on-screen colour indicators were used to signal when the component face was in the correct location. The results and observations made using these techniques were strictly related to the software and hardware used.
117
Component Aggregation
a. Temporary Setup b. Image Targets c. Canon 450D camera d . Stationary Screen
Locking distances successively
Experiment 1.1 | Component Locking
During the component locking stage, the folding sequence determined in previous experiments was explored on larger scale components and the accuracy of the AR setup was assessed. A 200x250 cm preparation area was set up with a Canon 450D camera used as a stationary input device. The overlaid instructions were used to fold the component into the required shape and to indicate which part of the component needed to be locked. On-screen colour indicators were used to signal when the component face was in the correct location. As in previous experiments, each face was indicated as being in the correct position when the distance between it and surrounding faces was equal to that of the digital model. For the purpose of these experiments different tolerances were tested where a 0% tolerance meant that the user interface would indicate that the component’s tracked face is in the intended location when its distance from the surrounding components is exactly equal to the intended distances. This experiment was repeated 10 times with variations in tolerances. It was found that at this scale, it took one person an average of
5 minutes to fold the component into the required shape and that the ideal tolerance for the distance between intended face location and the actual face location was 5%. Tolerances below 5% were not possible to achieve due to the limitations of the object tracking software and hardware whereas tolerances above 10% resulted in inaccurate component folding. It was also noted that the time for folding was initially above 10 minutes however with practice and repetition a constant 5 minute folding time was achieved even with tolerances lower than 5%. As with the previous folding experiments, in certain cases the component was not able to form the indicated shape as the effect of the neighbouring components within the aggregation would be required for it to achieve its desired form. It was also noted that in certain cases failure of the digital model to accurately simulate the components’ material behaviour led to differences between the physical and simulated component. For this reason it was concluded that locking elements should be designed to allow for a degree of flexibility and settling of the component.
118 Transient Systems Chapter 5
Folding Pattern Component
Component Aggregation

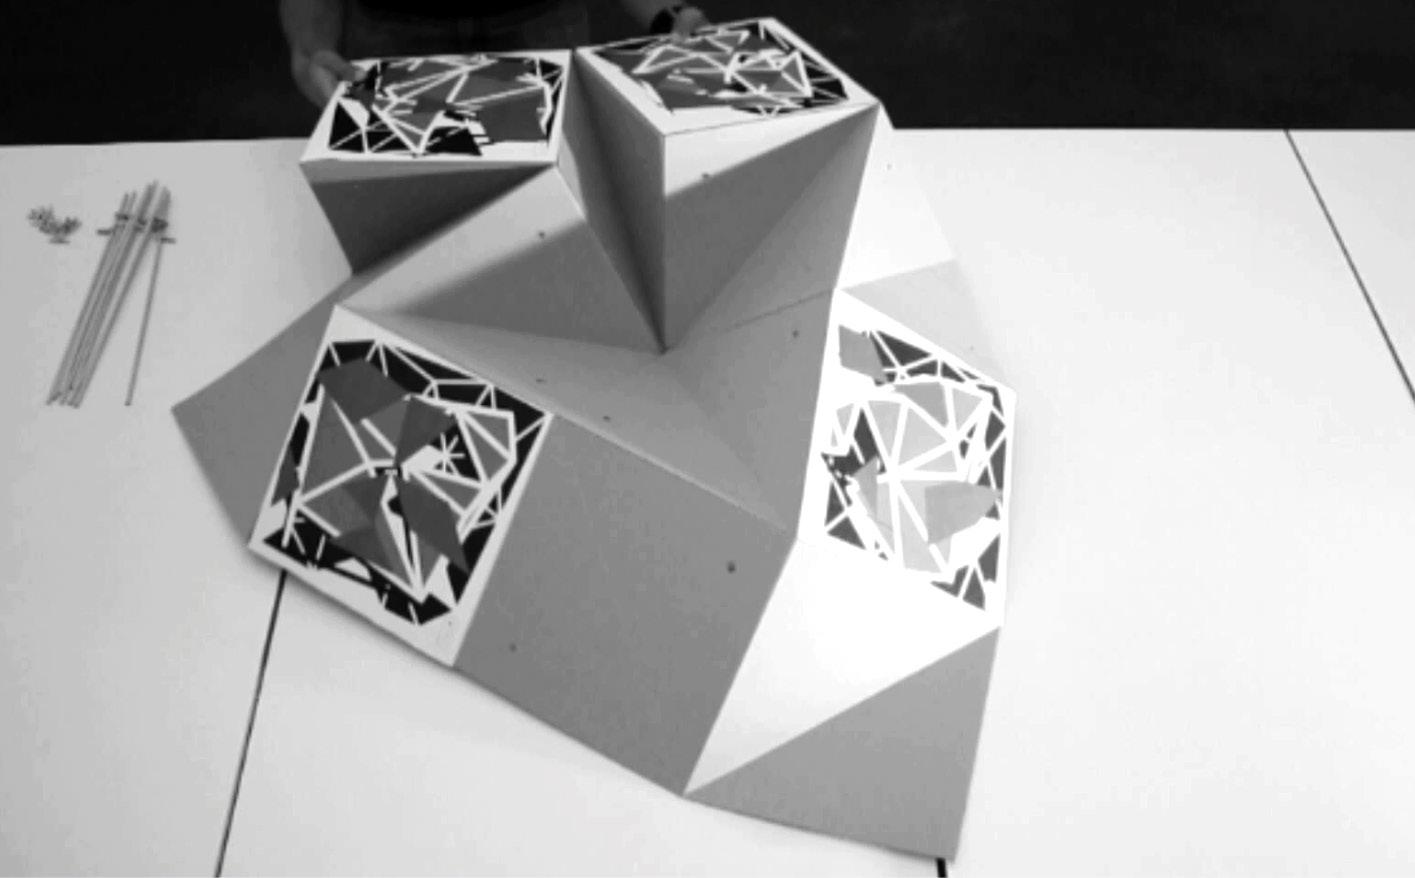
119
Img 5.2
Stills from the Video’s of the experiment 1.1 | Component folding
Img 5.3
Stills from the Video’s of the experiment 1.1 | Component Locking
Experiment 1.2 | Component Aggregation
Experiment Setup
Aim:
Lock two individual components according to the distance between them and form their final state as per the global geometry. Signify the locking elements as well as the locking sequence
Objects:
Two component (corrugated sheet)
Approx 25x25cm (each face)
Eight printed flat image targets
Evaluation:
Feasibility, Time, Efficiency
Results:
Feasible, Time reduced further UI beneficial for sequence
The next set of assembly experiments studied methods of joining and locking components at the required distances. As in previous experiments, 30x30cm trackers were used and colour indicators were used to signal the correct location. For this experiment, two pre-locked components were brought together and joined. Methods of joining the components were explored as well as the potential of the software to accurately indicate the position of the faces. After various attempts, a joining sequence was developed which involved locking one face in the first component based on its distance to a reference face in a second component. Limitations in terms of scale were encountered where inaccuracies between the intended face location and the actual face location became evident on the larger model. 10% tolerance settings had to be used for the process to be achievable. It was concluded that while the software was limited in terms of accuracy and could therefore not be used to accurately join two components, it was able to give an indication of a component’s location with respect to a target and could therefore be used to relay the assembly sequence or construction logic.
120 Transient Systems Chapter 5
Joining Two Components
Locking distances successively
Img 5.4
Stills from the Video’s of the experiment 1.2 | Joining two components
Component Aggregation
Img 5.5
Stills from the Video’s of the experiment 1.2 | Locking two components


121
Aim:
Experiment Setup
Experiment 2.1 | Site Preparation
Orient and prepare the site along with overlaying digital simulations in hybrid (physical and virtual) environments which can be used as a base to visualize and assemble the structure
Objects:
Evaluation:
Feasibility
Results:
Feasible, UI beneficial for visualisation & orientation
The site preparation experiments explored the use of AR as a tool for locating the structure on site as well as for setting up structural props for the system. These experiments were used to locate a 200x200 cm structure within a 300x300 cm test environment. A 50x50 cm tracker was used as the target for the base of the structure which was used to orient and locate a digital model of the structure as well as act as the base grid for locating and positioning the structural props. It was found that it was possible to use the proposed object tracking methods on the larger scale required by these experiments. The digital model served as a good indication of the location of the structure in relation to the base tracker and was used successfully to locate the structure in physical space. However perspective issues where the digital perspective of the model did not match the perspective of the physical world became noticeable on larger scales which resulted in an inaccurate representation of the final form. It was therefore noted that the software was capable of giving visual indications of the position of the structure however it was not able to accurately locate it within space due to tracking issues in larger scale environments.
122 Transient Systems Chapter 5
Simulation Designed Geometry Orienting Image Tracker
One printed flat image targets 50x50 cm size.
Component Aggregation
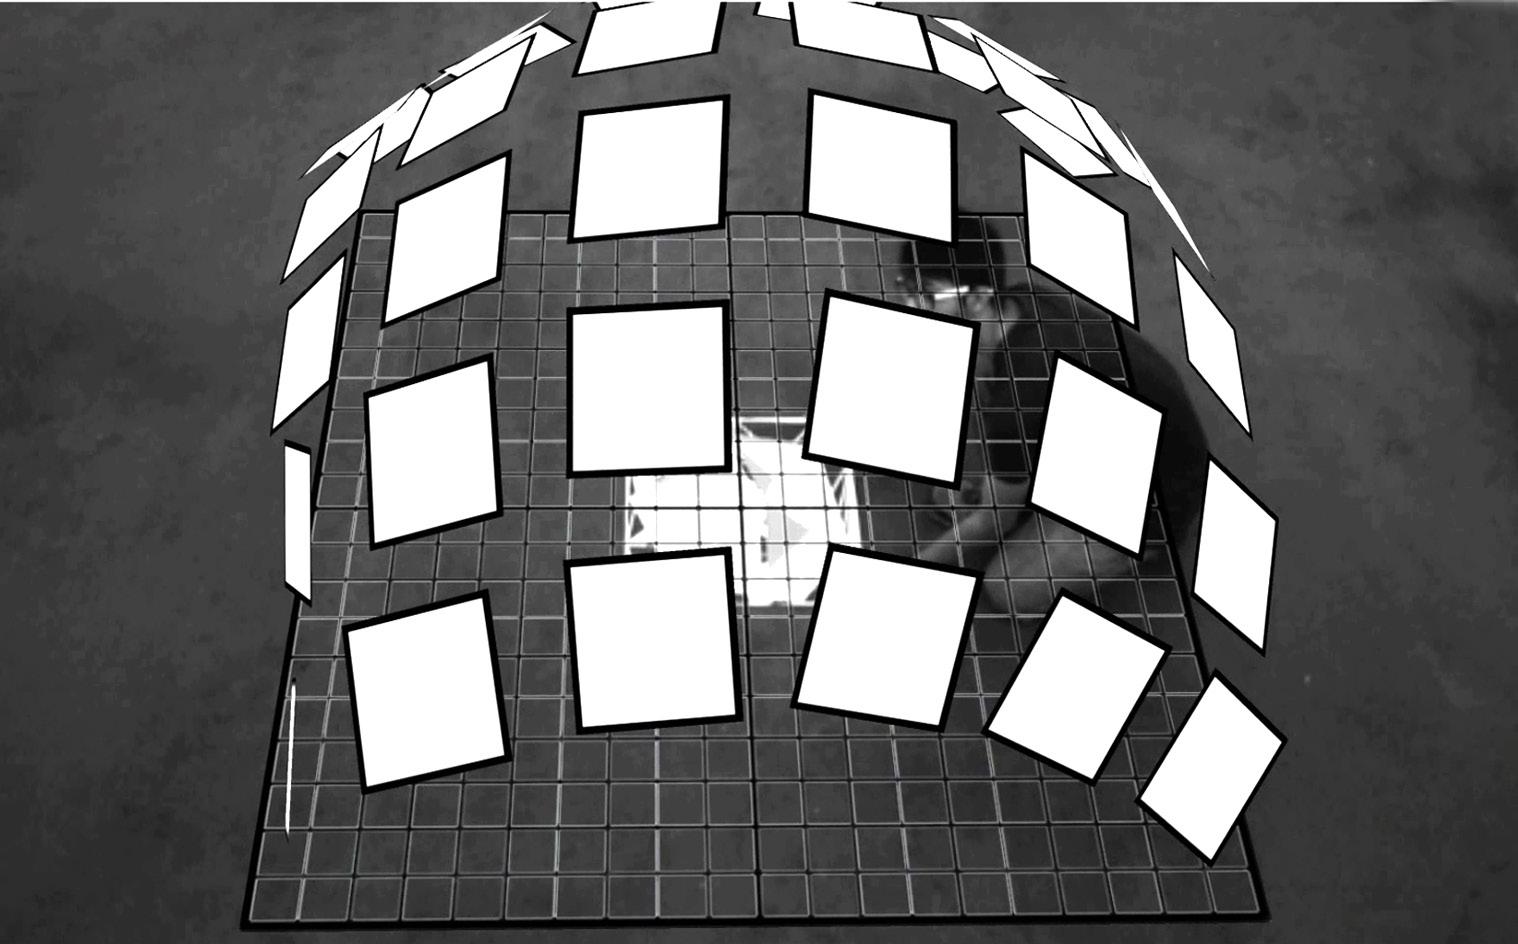
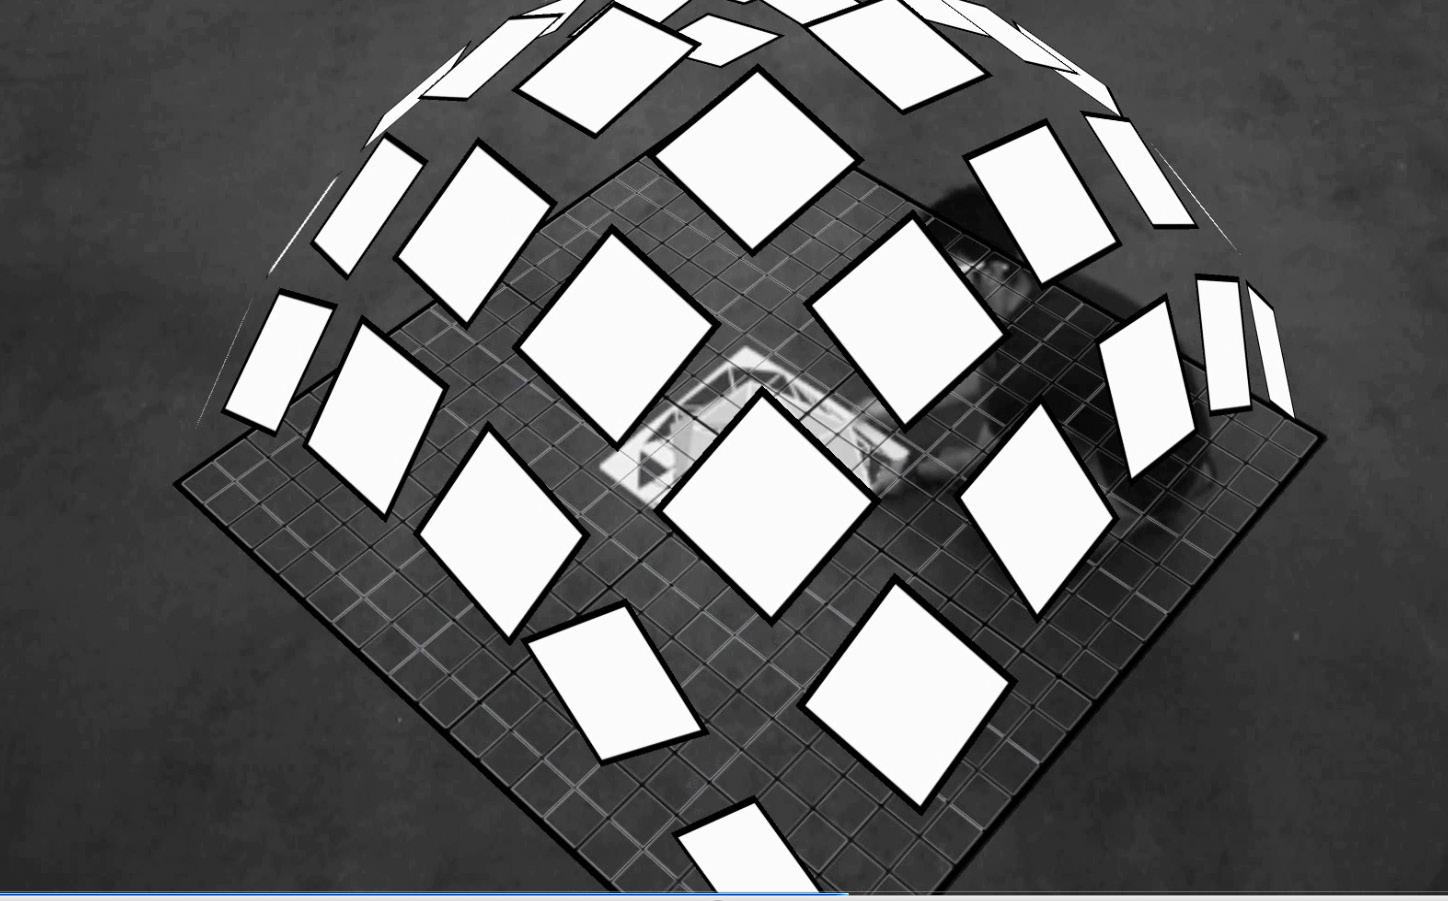
123
Img 5.6
Stills from the Video’s of the experiment 2.1 | Tracking and overlaying simulation on site
Img 5.7
Stills from the Video’s of the experiment 2.1 | Orienting digital data for site preparation
Aim:
Experiment Setup
Experiment 2.2 | Structural Props
Locate and place multiple structural props necessary for the structure to be locked and assembled according to the developed assembly sequence
Objects:
Evaluation:
Feasibility, Efficiency
Results:
Feasible, UI beneficial for selection, sequencing and locating
The next stage of site preparation experiments were focused on relaying the location of the structural props required for the system’s construction. A similar setup to the previous experiment was used with a 50x50 cm tracker used to locate the structure within a 300x300 cm test environment. As in the previous setup, the camera was kept in a stationary position and once the structure had been located on-site, the tracking behaviour of the base target was turned off so as to lock the digital model in relation to its surroundings. This was done so as to keep the model stable and reduce the flickering that was occurring due to the software’s limitations on larger scales. The setup was then used to indicate the location and height of the structural props through the overlaying of a digital assembly grid on the recorded physical environment. It was found that despite the perspective issues, it was possible to accurately position each of the props in their correct location using the overlaid information. However this experiment could only be conducted with a fixed camera and from a certain perspective. A different method and setup would be required for a portable camera.
124 Transient Systems Chapter 5
Multiple Structural props made up of 2x2 cm cross section of wood. One printed flat image targets
Simulating Construction Data
Locking Image Target
Component Aggregation
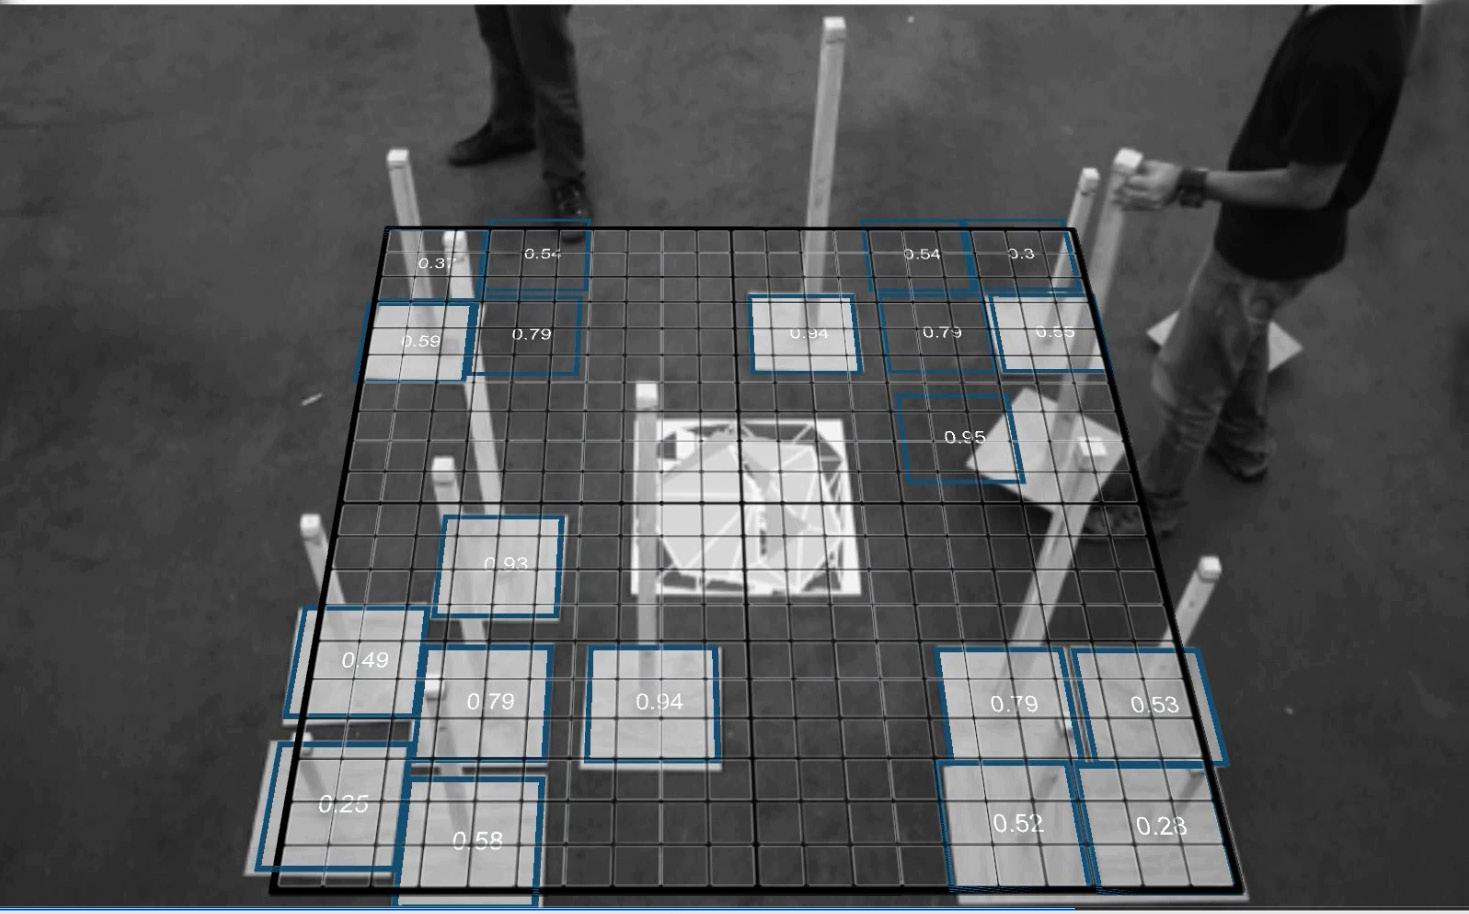
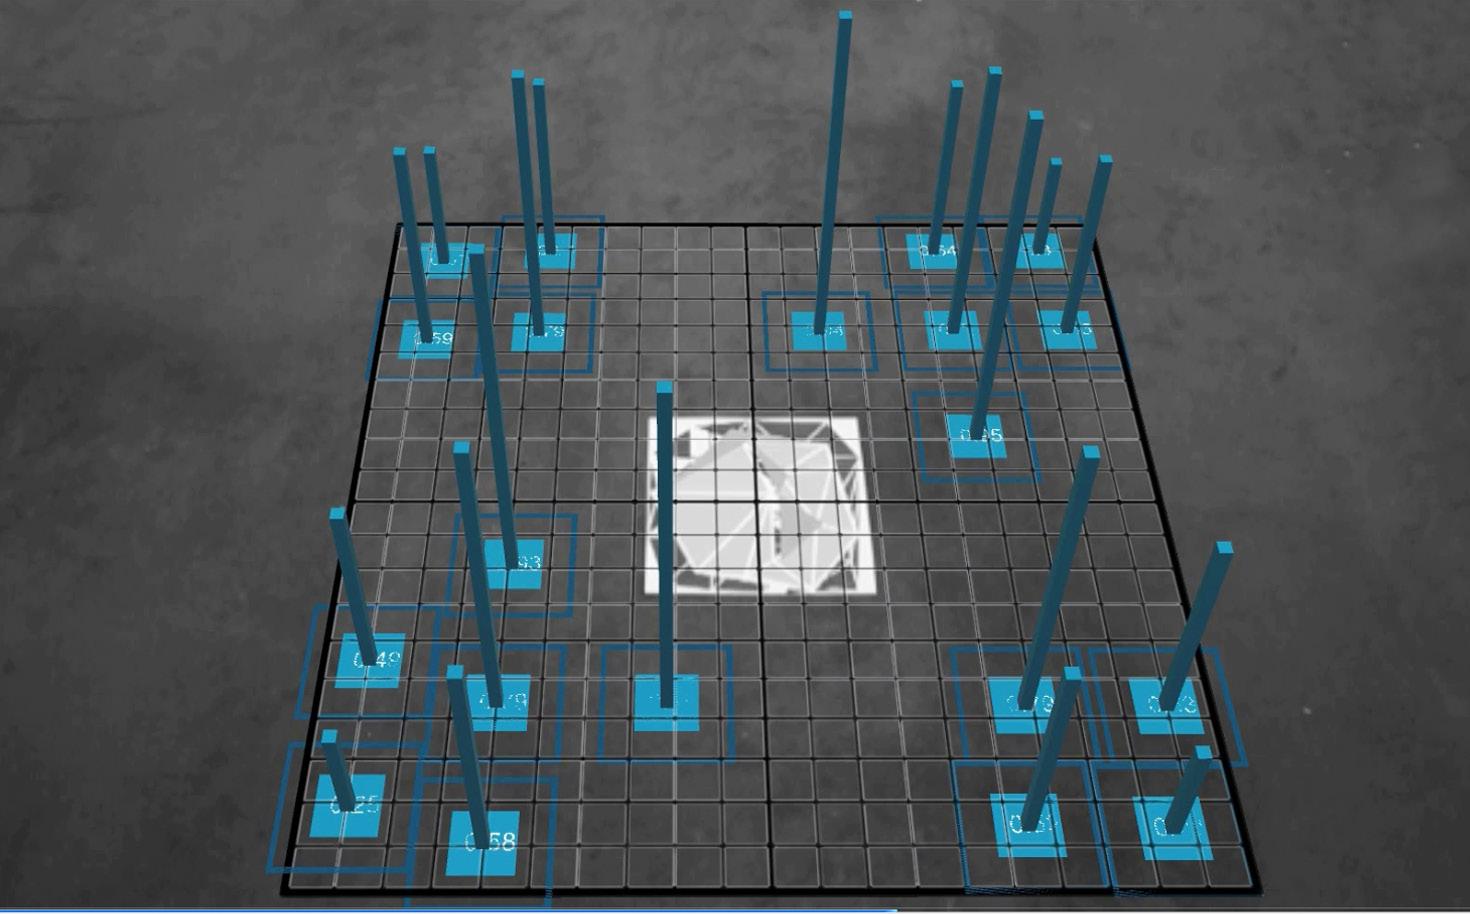
125
Img 5.6
Stills from the Video’s of the experiment 2.2 | Overlaying digital structural props in virtual environments
Img 5.7
Stills from the Video’s of the experiment 2.1 | Positioning physical props in relation to overlaid data
Aim:
Experiment Setup
Aggregate pre-locked components to assemble and form a global synclastic surface by relaying assembly information through augmented reality. Signify the component assembly as well as the locking sequence.
Objects:
Evaluation:
Feasibility, Time, Efficiency
Experiment 3.1 | Component Assembly
Results:
Feasible, Time reduced & UI beneficial for assembly, Viability of the tool
The final stage of the assembly sequence involved the aggregation of components to form the intended 200x200 cm structure. The main aim of this experiment was to assess the capability of using AR to relay this data to the assembler and outline the construction sequence for the efficient assembly of the structure. Once the flat sheets had been folded into the required shape and the structural props had been set up, AR was used to relay the assembly sequence to the assemblers and give a visual indication of the structure’s final form. It was noted that at this scale it would not be effective to use AR as a tool for accurately locating each of the individual components in their correct location; however it was found that the software is capable of relaying assembly sequence data and assisting component management. It was also noted that once the structural props had been placed in the correct position and the components had been accurately folded into shape, the exact position and orientation of each individual component was not needed to assemble the overall structure. The setup was also successful in relaying the predetermined assembly sequence to the assemblers.
126 Transient Systems Chapter 5
Multiple Components folded and locked individually with minimum one image tracker on each component
Simulating Assembly Data
Multiple Component Aggregation Image Target
Component Aggregation

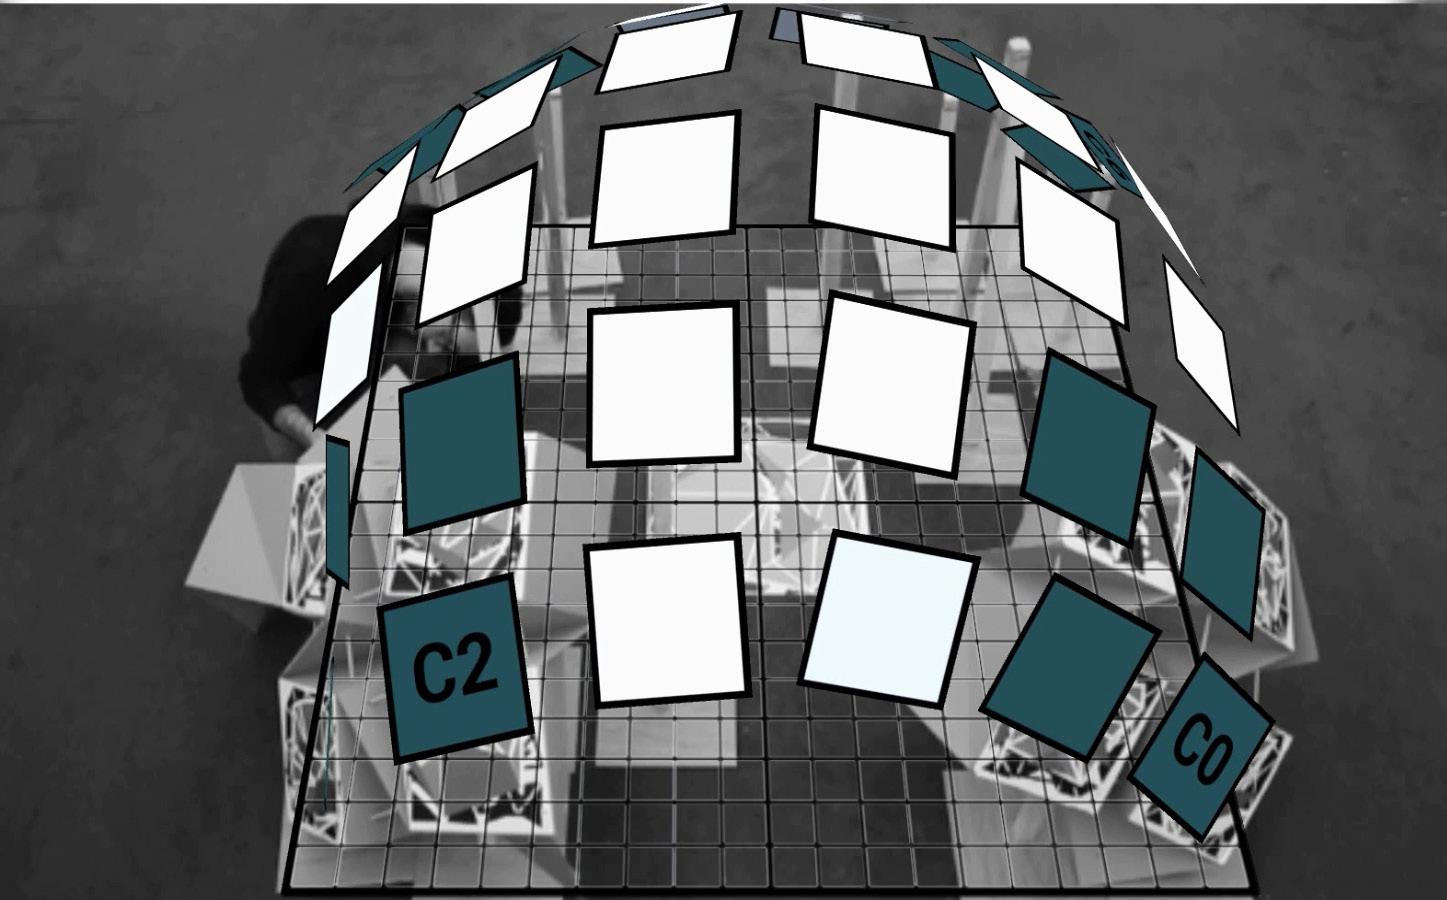
127
Img 5.8
Stills from the Video’s of the experiment 3.1 | Assembly of edge components with peak stresses
Img 5.9
Stills from the Video’s of the experiment 2.1 | Assembly of central components without supports
Experiment Conclusions
Throughout the research Augmented Assembly techniques were tested directly in relation to the chosen folding pattern and all observations were related to the prototype material, experiment setup and the chosen scales. The software was used effectively within controlled environments up to a scale of 200x200 cm and best results were achieved when tolerance allowances were built into the system. It was therefore concluded that it is important that the design of the component itself forms part of the development of a digitally guided assembly sequence.
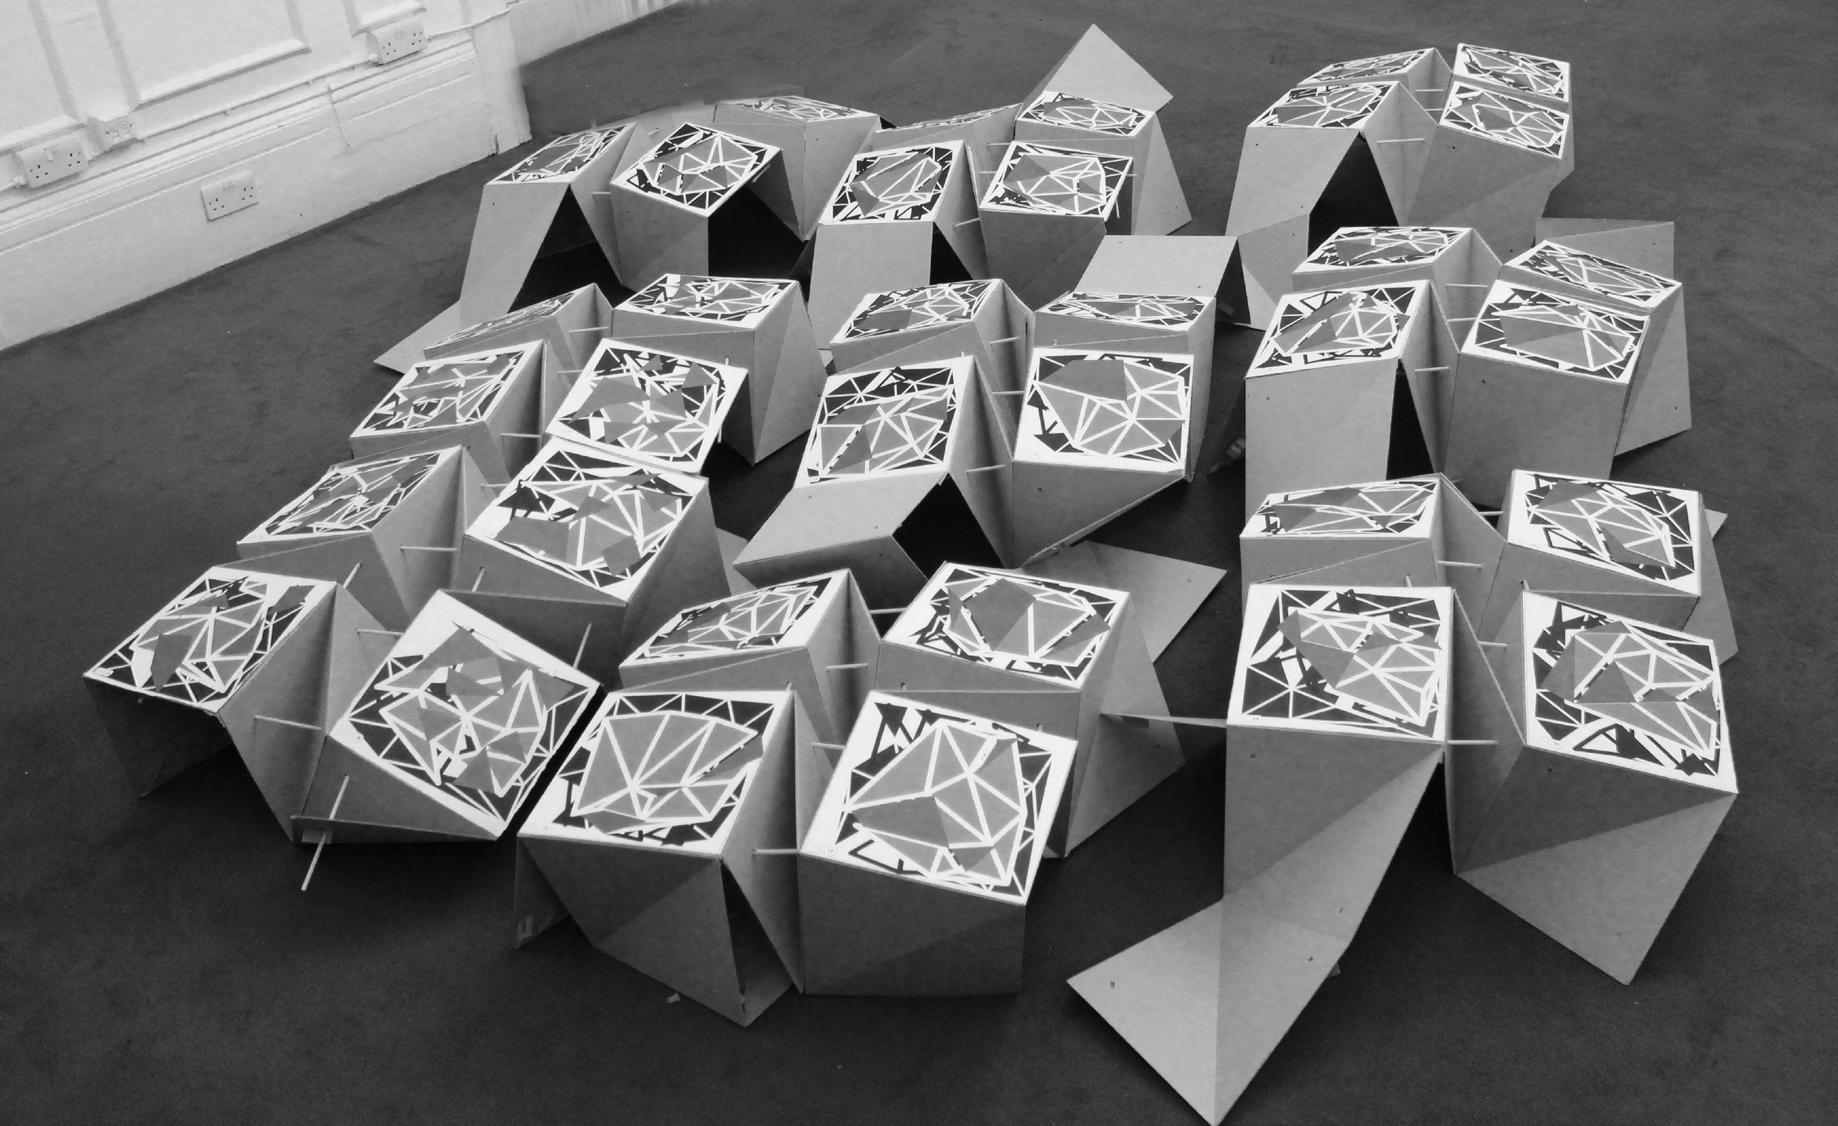
Manipulations which involve measuring distances were easier to guide using AR than manipulations involving rotations and for the technology to function efficiently both the component and its method of construction must dictate the type of digital information required for its assembly. The developed AR process was beneficial in suggesting the correct configuration for each component as well as its final position on the surface. Due to the complex geometrical manipulations required, the setup proved to be an efficient means of handling
all the construction information and transmitting it to the assembler. Moreover, through the designed user interface, suggestions about the surface formation were possible through simulations of the assembly sequence, colour indications and projected data through a stationary screen.
However, the process revealed limitations mostly in terms of the object tracking hardware and software used which were not able to function efficiently in poorly lit environments or on larger scales. The camera, image target quality and size were identified as the main issues which caused inaccuracies in the smaller scale tests. Even though a better camera and targets were used in the larger scale assembly experiments, issues with perspective and tracking difficulties restricted its use in larger construction scenarios. The inability to accurately simulate material behaviour digitally also created inaccuracies between the digital and physical worlds. This further affected the accuracy of the assembly experiments as even small differences between the physical and digital models sometimes
128 Transient Systems Chapter 5
Img 5.10 Images of all the components locked through developed tools and ready for aggregation
resulted in configurations which were not possible to achieve. All these factors limited the use of AR in a realistic construction scenario where lighting and background visual noise cannot be controlled. However it was concluded that if temporary controlled environments were to be set up on site, AR technology is capable of relaying the information for the accurate folding of individual components which could then be aggregated on site using more conventional methods of construction. In this scenario, AR technologies are able to act as a bridge between the factory and the site by extending the capabilities of current methods of construction. The guided assembly method developed for the system was just one possible method that could be used for folding the components. The object tracking techniques and methods of relaying data developed during the research can serve as the input to other manual or robotic techniques which can be introduced on site so as to enhance the overall process and guide construction.
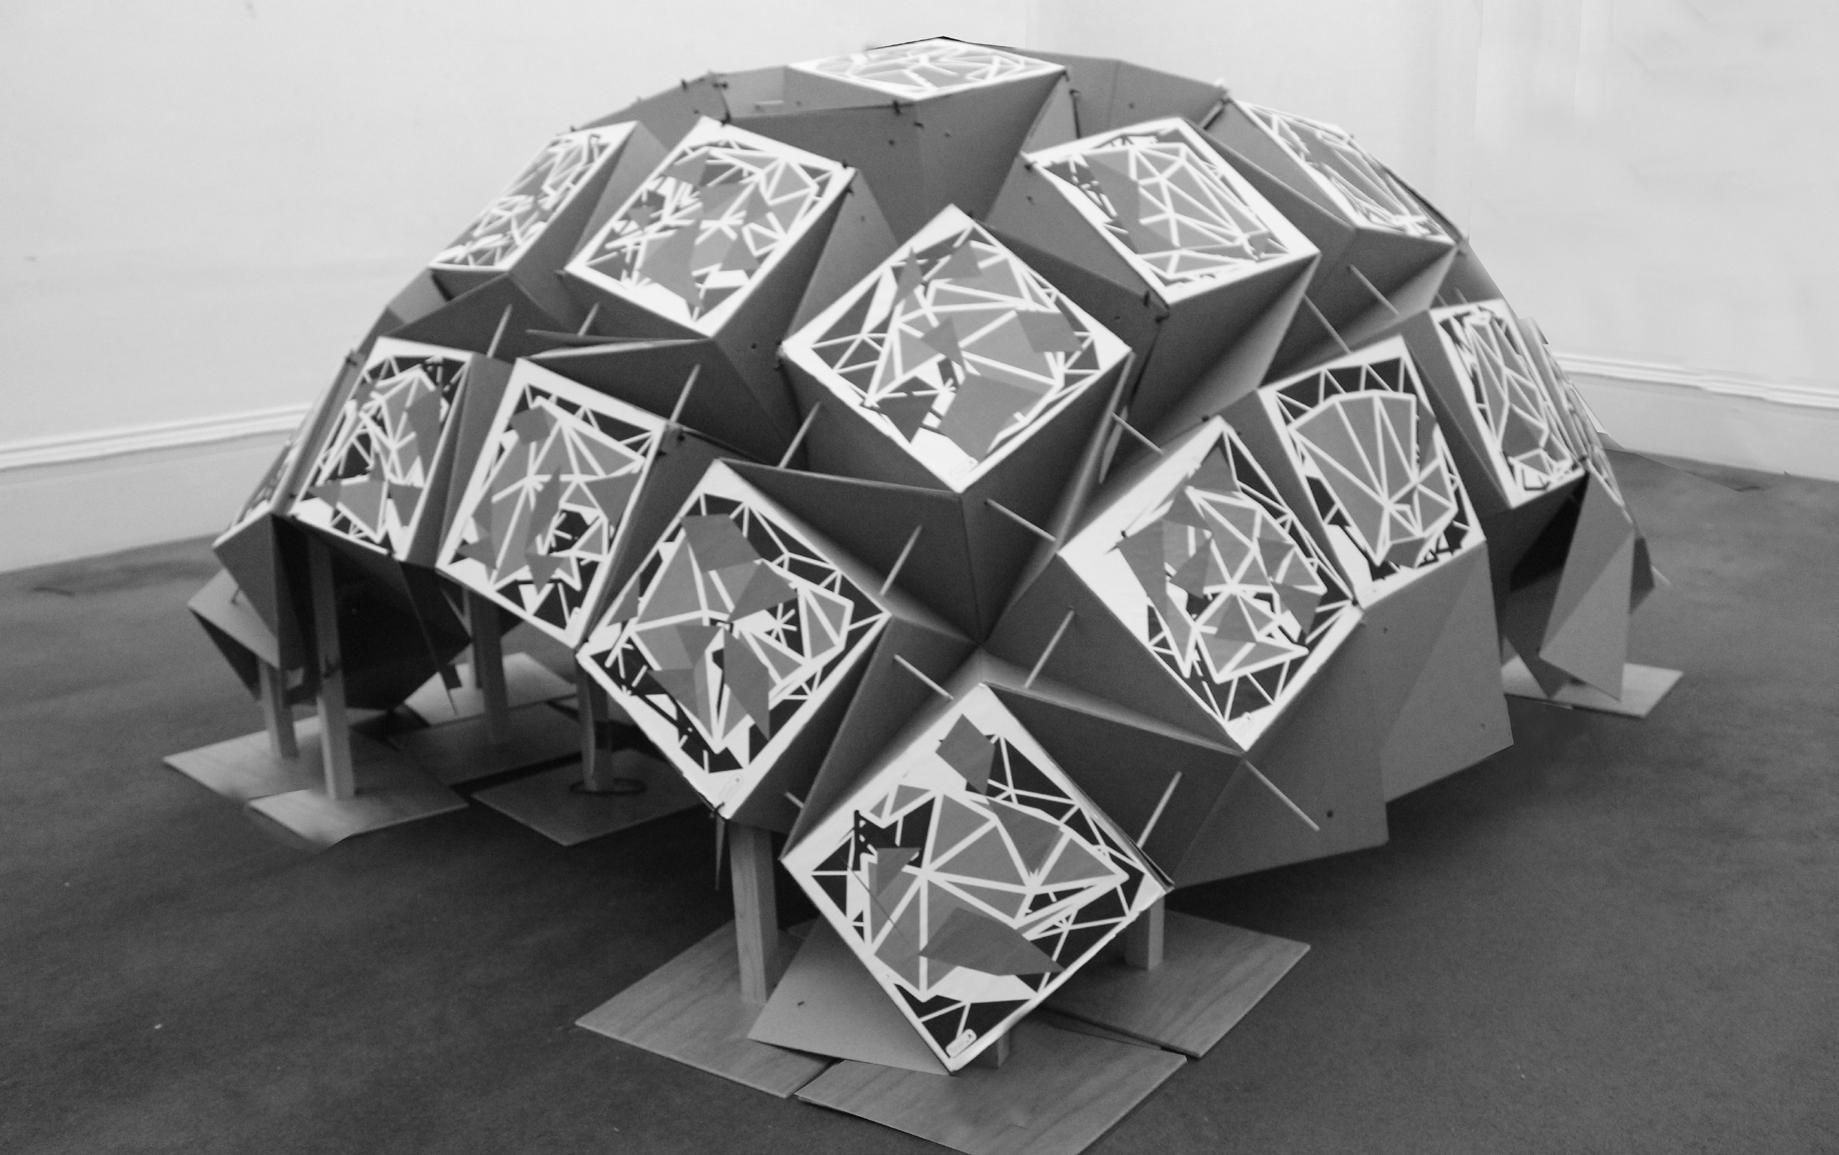
Further developments of the system would include an exploration into the possible integration
of the developed techniques with other on-site robotic or manual process. This can involve explorations into the use of AR as a tool for the post-construction evaluation of the system which could assess its performance and guide its disassembly. Further technological additions to the system could involve the use of embedded technologies such as RFID trackers to supplement the AR data and increase the efficiency and data extraction process. As the results from these experiments were limited to stationary setups in indoor environments, an exploration into the use of mobile devices as assembly guides in outdoor environments can also be explored. Furthermore, explorations into different assembly processes other than folding can be studied on various scales so as to assess the software’s capability to act as a flexible construction tool.
129
Component Aggregation
Img 5.11
Global geometry formed through aggregated components using augmented reality and object tracking
Locking Strategy
Various types of locks needed for the structure to be stable at an architectural scale were identified, devised and detailed.
Observations made during the folding and assembly experiments were used to understand the locking requirements of the system during the different stages of assembly. A strategy for locking the components was developed based on a hierarchy of locks which can provided different degrees of structural rigidity throughout the structure.
1. During the folding process a system of temporary locks are needed for the component to maintain its shape as it is assembled into the structure.
2. Once the component is folded into shape, a second set of structural locks are needed to lock the component in the structure and provide stability across the surface.
3. Another set of locks will be used to join one component to another. These locks must be fast and easy to assemble and must be removable for the structure’s disassembly.
4. The final system of locks will be used to secure the edge condition of the structure . As a detailed study of the locks was not the focus of this research, the designs presented in this chapter are only suggestions based on observations made during the assembly experiments. Further detailed locking studies would be required for the development of the system.
130 Transient Systems Chapter 5
Fig 5.22 (Right) Diagram explaining the locking strategy and different types of locking conditions used.
Locking Strategy
Structural Locks
Component Aggregation
Components with Peak stresses
Edge Condition
Stress Evaluation
131
Friction Lock
The folding and assembly studies have shown that a method for maintaining the components shape after the folding process is required otherwise it will not be possible for them to be assembled into aggregations. The lock itself must be easy to secure and release once the component has been folded into the required shape. As this lock will not be used to maintain permanent structural stiffness within the component, friction in the diagonal joints of the pattern can provided enough stiffness to lock the component temporarily during the folding process. It was therefore decided that friction joints along the hinges can act as a method of restricting movement in the component once it has been folded into shape. The friction lock for the system was proposed based on a standard hinge lock system which consisted of a threaded shaft that runs through the entire joint and could be tightened by turning the end caps to push the hinges towards each other. While this proposed lock provides a fast method for locking the structure in shape during the folding process, it does not provide permanent structural rigidity as temperature changes or vibrations may cause it to loosen and fail.
132 Transient Systems Chapter 5
Friction Lock
Fig 5.23 (Top)
Diagram explaining positioning and function of friction locks on a single component.
Fig 5.24 (Right)
Structural detail of for the lock and its description of the mechanism involved.
Component Aggregation
Detail : Friction Lock
Hollow Hinges
Hollow section allow the threaded rods to pass through and act as lockable hinges
End Caps
Screw caps that can be rotated to create friction between the hollow hinges and lock them temporarily
Threaded Shaft Solid Face
Threaded shaft that passes through the hingeto lock the mechanism
Solid faces that form the component consisting of an aluminium composite material
133
Structural Lock
The permanent lock was developed based on the locking experiments carried out during the first phase of the research where different systems of rods were used to lock the movement of the component faces. The most successful locking system analysed consisted of quadrangular arrangement of rods placed at the centre of the component which formed a triangular frame within the component and restrict its movement.
As the lengths of the rods would have to vary depending on the folding configurations of the component a method of adjusting the rod’s length would be required. A system consisting of an extendable threaded shaft was proposed which would be contained within an outer tube and could be turned to lengthen or shorten the rod. The locking strategy developed in the MSc phase of the research would be used to indicate whether a component requires this method of structural locking. This structural lock will be placed on the component once it has been folded into shape and all of the friction joints have been secured.
134 Transient Systems Chapter 5
Structural Lock
Fig 5.25 (Top)
Diagram explaining positioning and function of structural locks on a single component.
Fig 5.26 (Right)
Structural detail of for the lock and its description of the mechanism involved.
Component Aggregation
Detail : Structural Lock
Outer Tube
Outer tube with threading that can be used to move the shaft and lengthen and shorten the rod
Threaded Shaft
Threaded shaft that can be extended and controlled by screwing inwards or outwards
Hinge Connection
Hinge connections with extended rods within that can be fitted inside a ball connector
Ball Connector
Ball connector detail that allows the rods to fit in a pocket-hole joinery detail
135
3 x 3 m (Flat state)
Locked Component
Image Targets:
Four unique trackers
Structural & Friction
Edge (Peak stress)
Component Joining
Once the component had been locked, the next stage of the assembly process would involve linking one or more components together. Observations made during the assembly experiments were used to outline the properties of the joint and a possible design for the locking mechanism.
Results from the aggregation experiments indicated that a fast and simple system of linking two components was needed as the method of joining components significantly impacted the efficiency of the overall assembly process. The joint must also be able to be locked temporarily so as to maintain the pattern’s form during construction. To avoid adding complicated joints to the system, a method of joining the components by passing a rod through the edge hinges was proposed. This joint can then also be tightened to act as a friction lock between the two components. It was noted that this method of locking may be difficult to waterproof and may be impractical on a large scale however it is an indication of what is required to join components and further studies and experiments may be focused on resolving these issues.
Hinge Connection
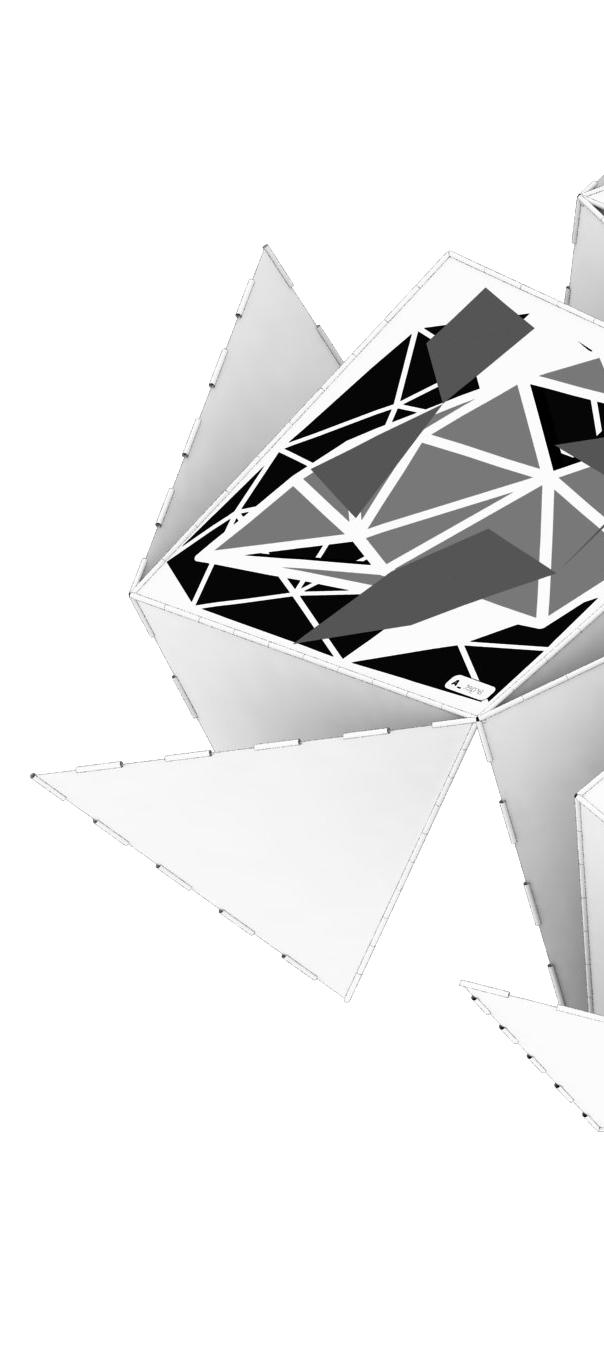
136 Transient Systems Chapter 5
Component Locked Component State : Size: Area:
Material:
Face Size:
Types of Locks: Component Type:
9 sq.m 0.5 m Dibond
Component Aggregation
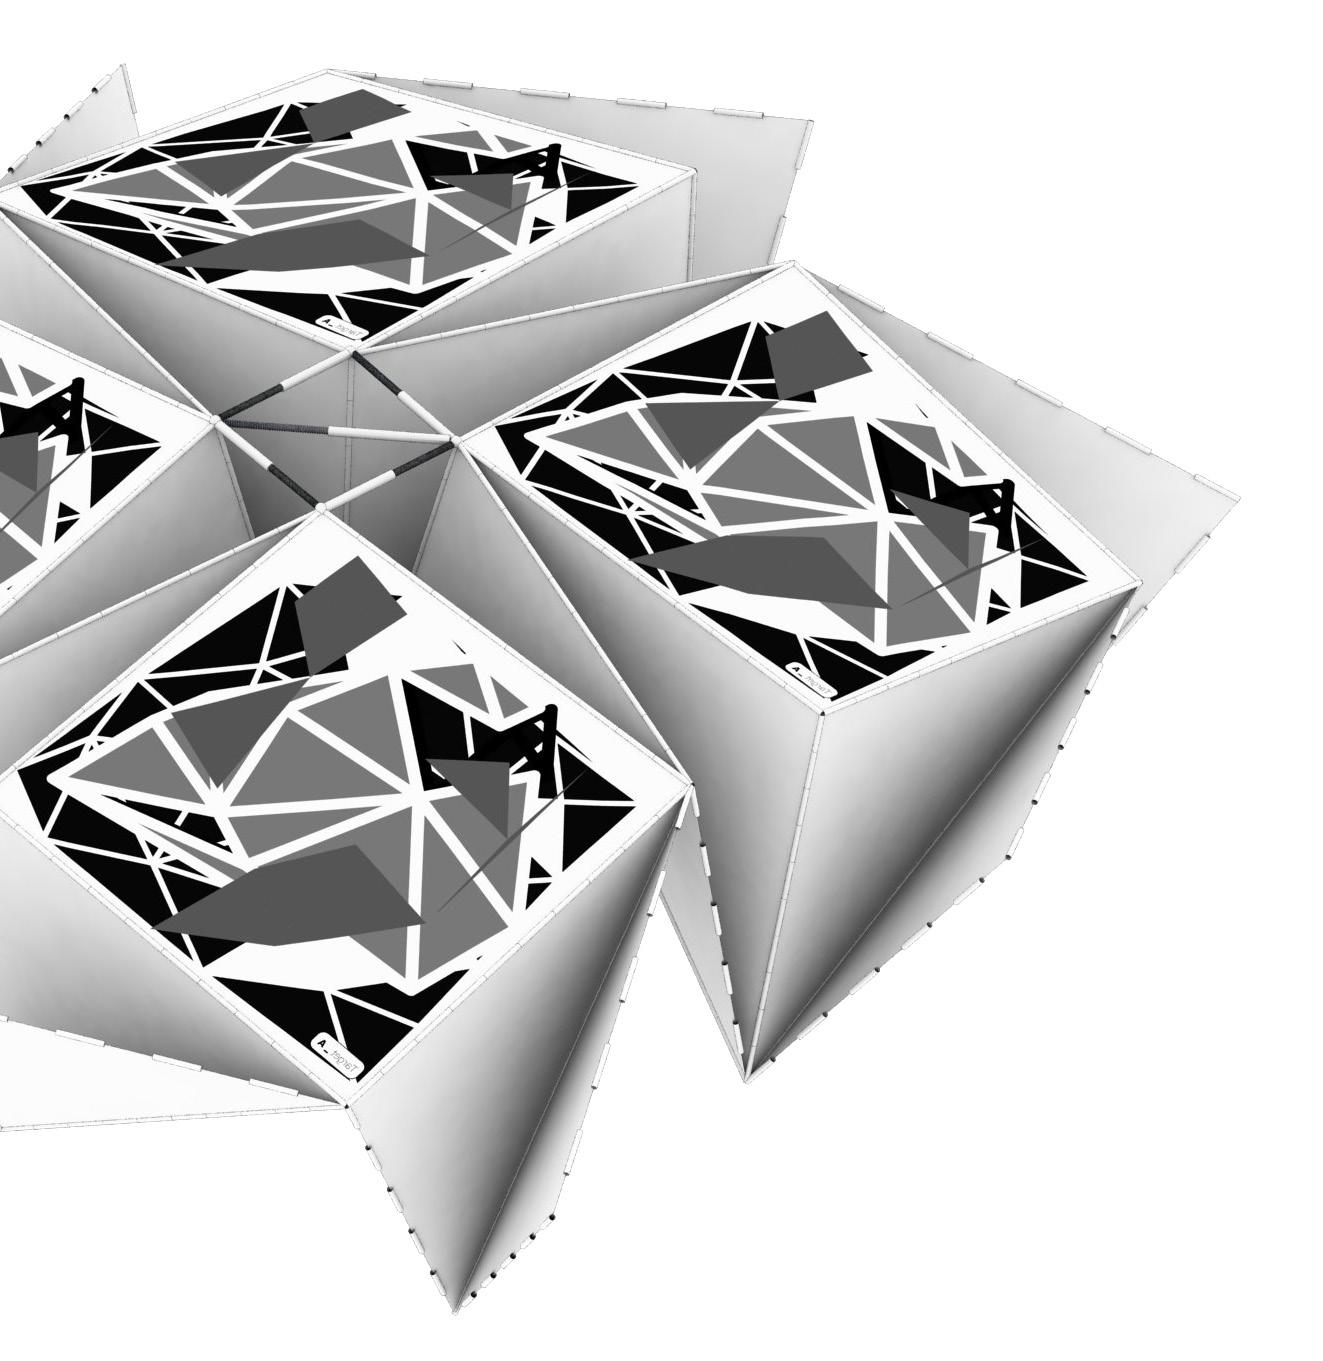
Structural Lock
Image Targets
137
Aggregation
Edge Condition
Structural analysis conducted during the Msc phase of the research has shown that locking the edge condition is necessary for achieving stability across the surface. It was found that locking the edges of the patterns forming single curvatures and synclastic curvatures reduces the deformation significantly. Based on these observations, it was suggested that the boundary can be locked through the addition of rods at the edge of the structure to create a triangular frame which restricts movement and acts as the supporting structure for the boundary of the pattern. A system of extendable rods similar to those proposed for the permanent locking joint can be used and attached to the boundary of the structure. Even though these rods are adjustable they must be also capable of being locked at the required length and maintain their stiffness. It was also noted that during the assembly experiments, the components at the anchor points and the ones along the boundary of the structure were assembled first so as to act as a supporting structure for the rest of the construction.
Locked Components Edge Condition

138 Transient Systems Chapter 5
State : Size: Area: Face Size: Material: Edge Condition: Types of Locks: Structural State: 4m x 4m x 2m 16 sq.m 0.5 m Dibond Triangular Frame Structural & Friction
(self load)
Locked Aggregation
Stable
Anchored Edges
Component Aggregation
Structural Locks
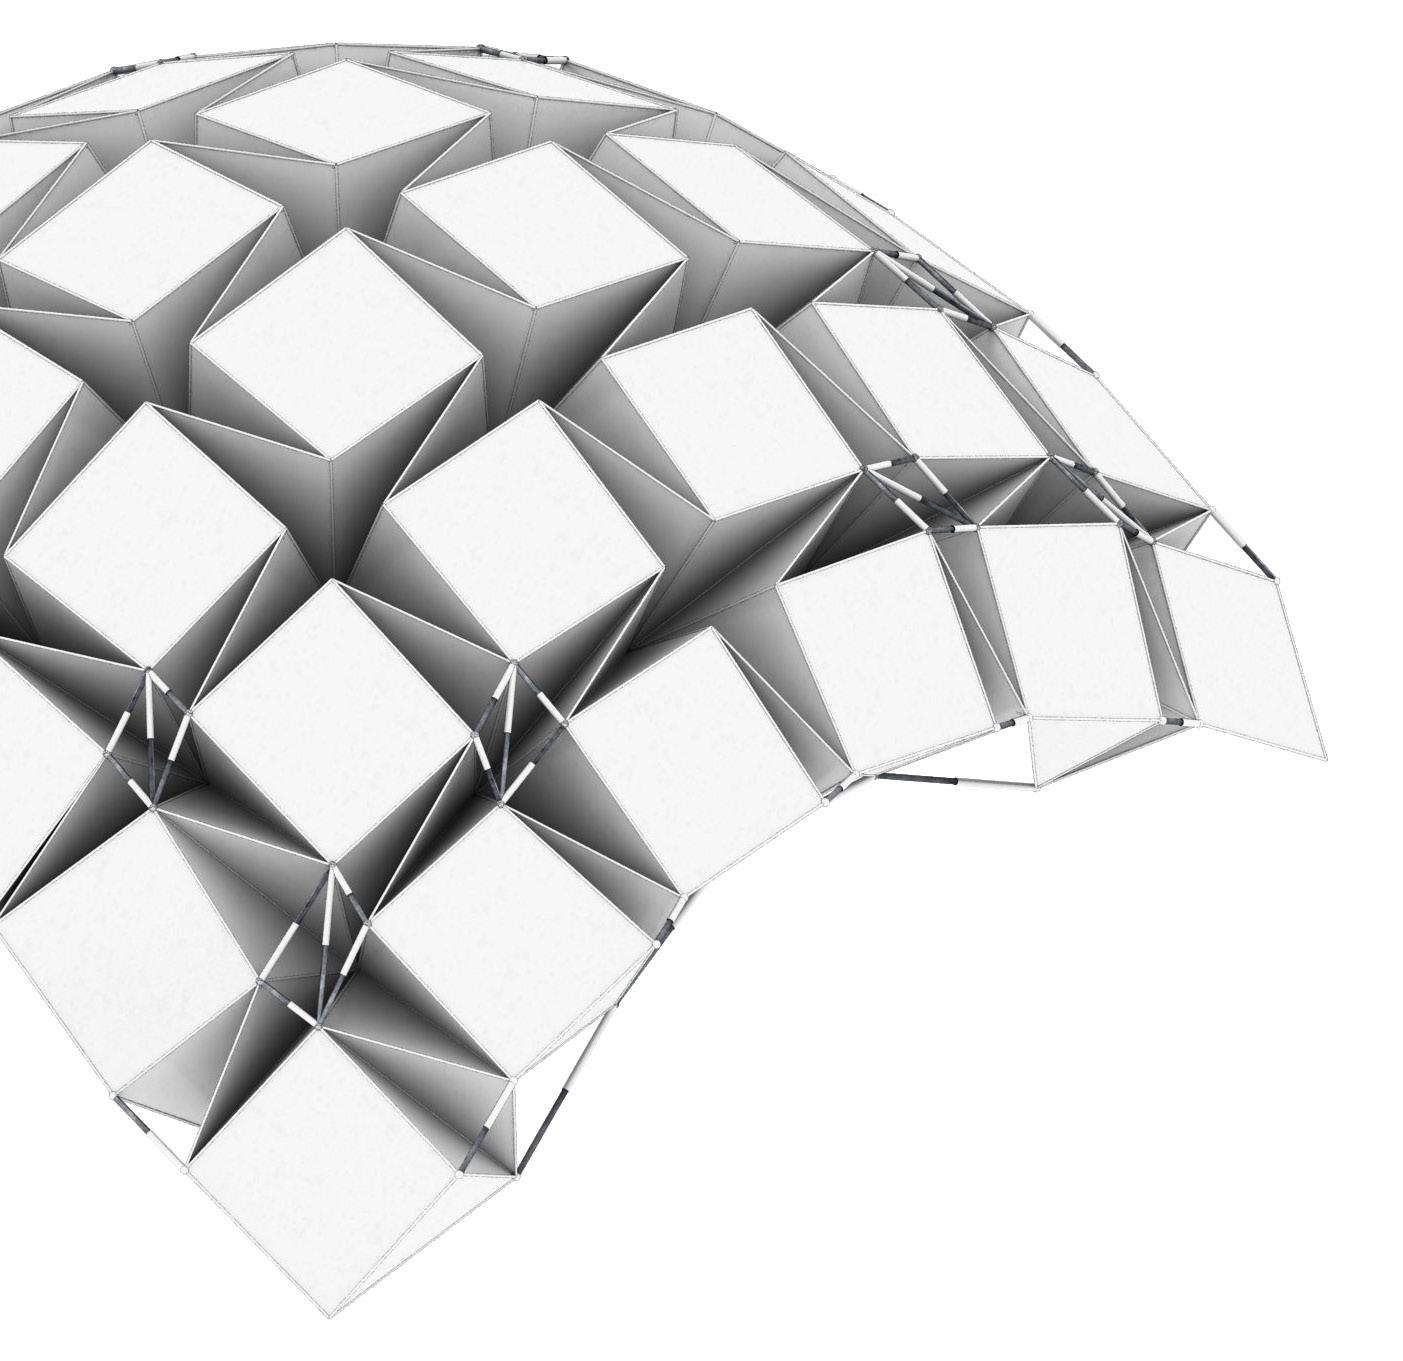
139
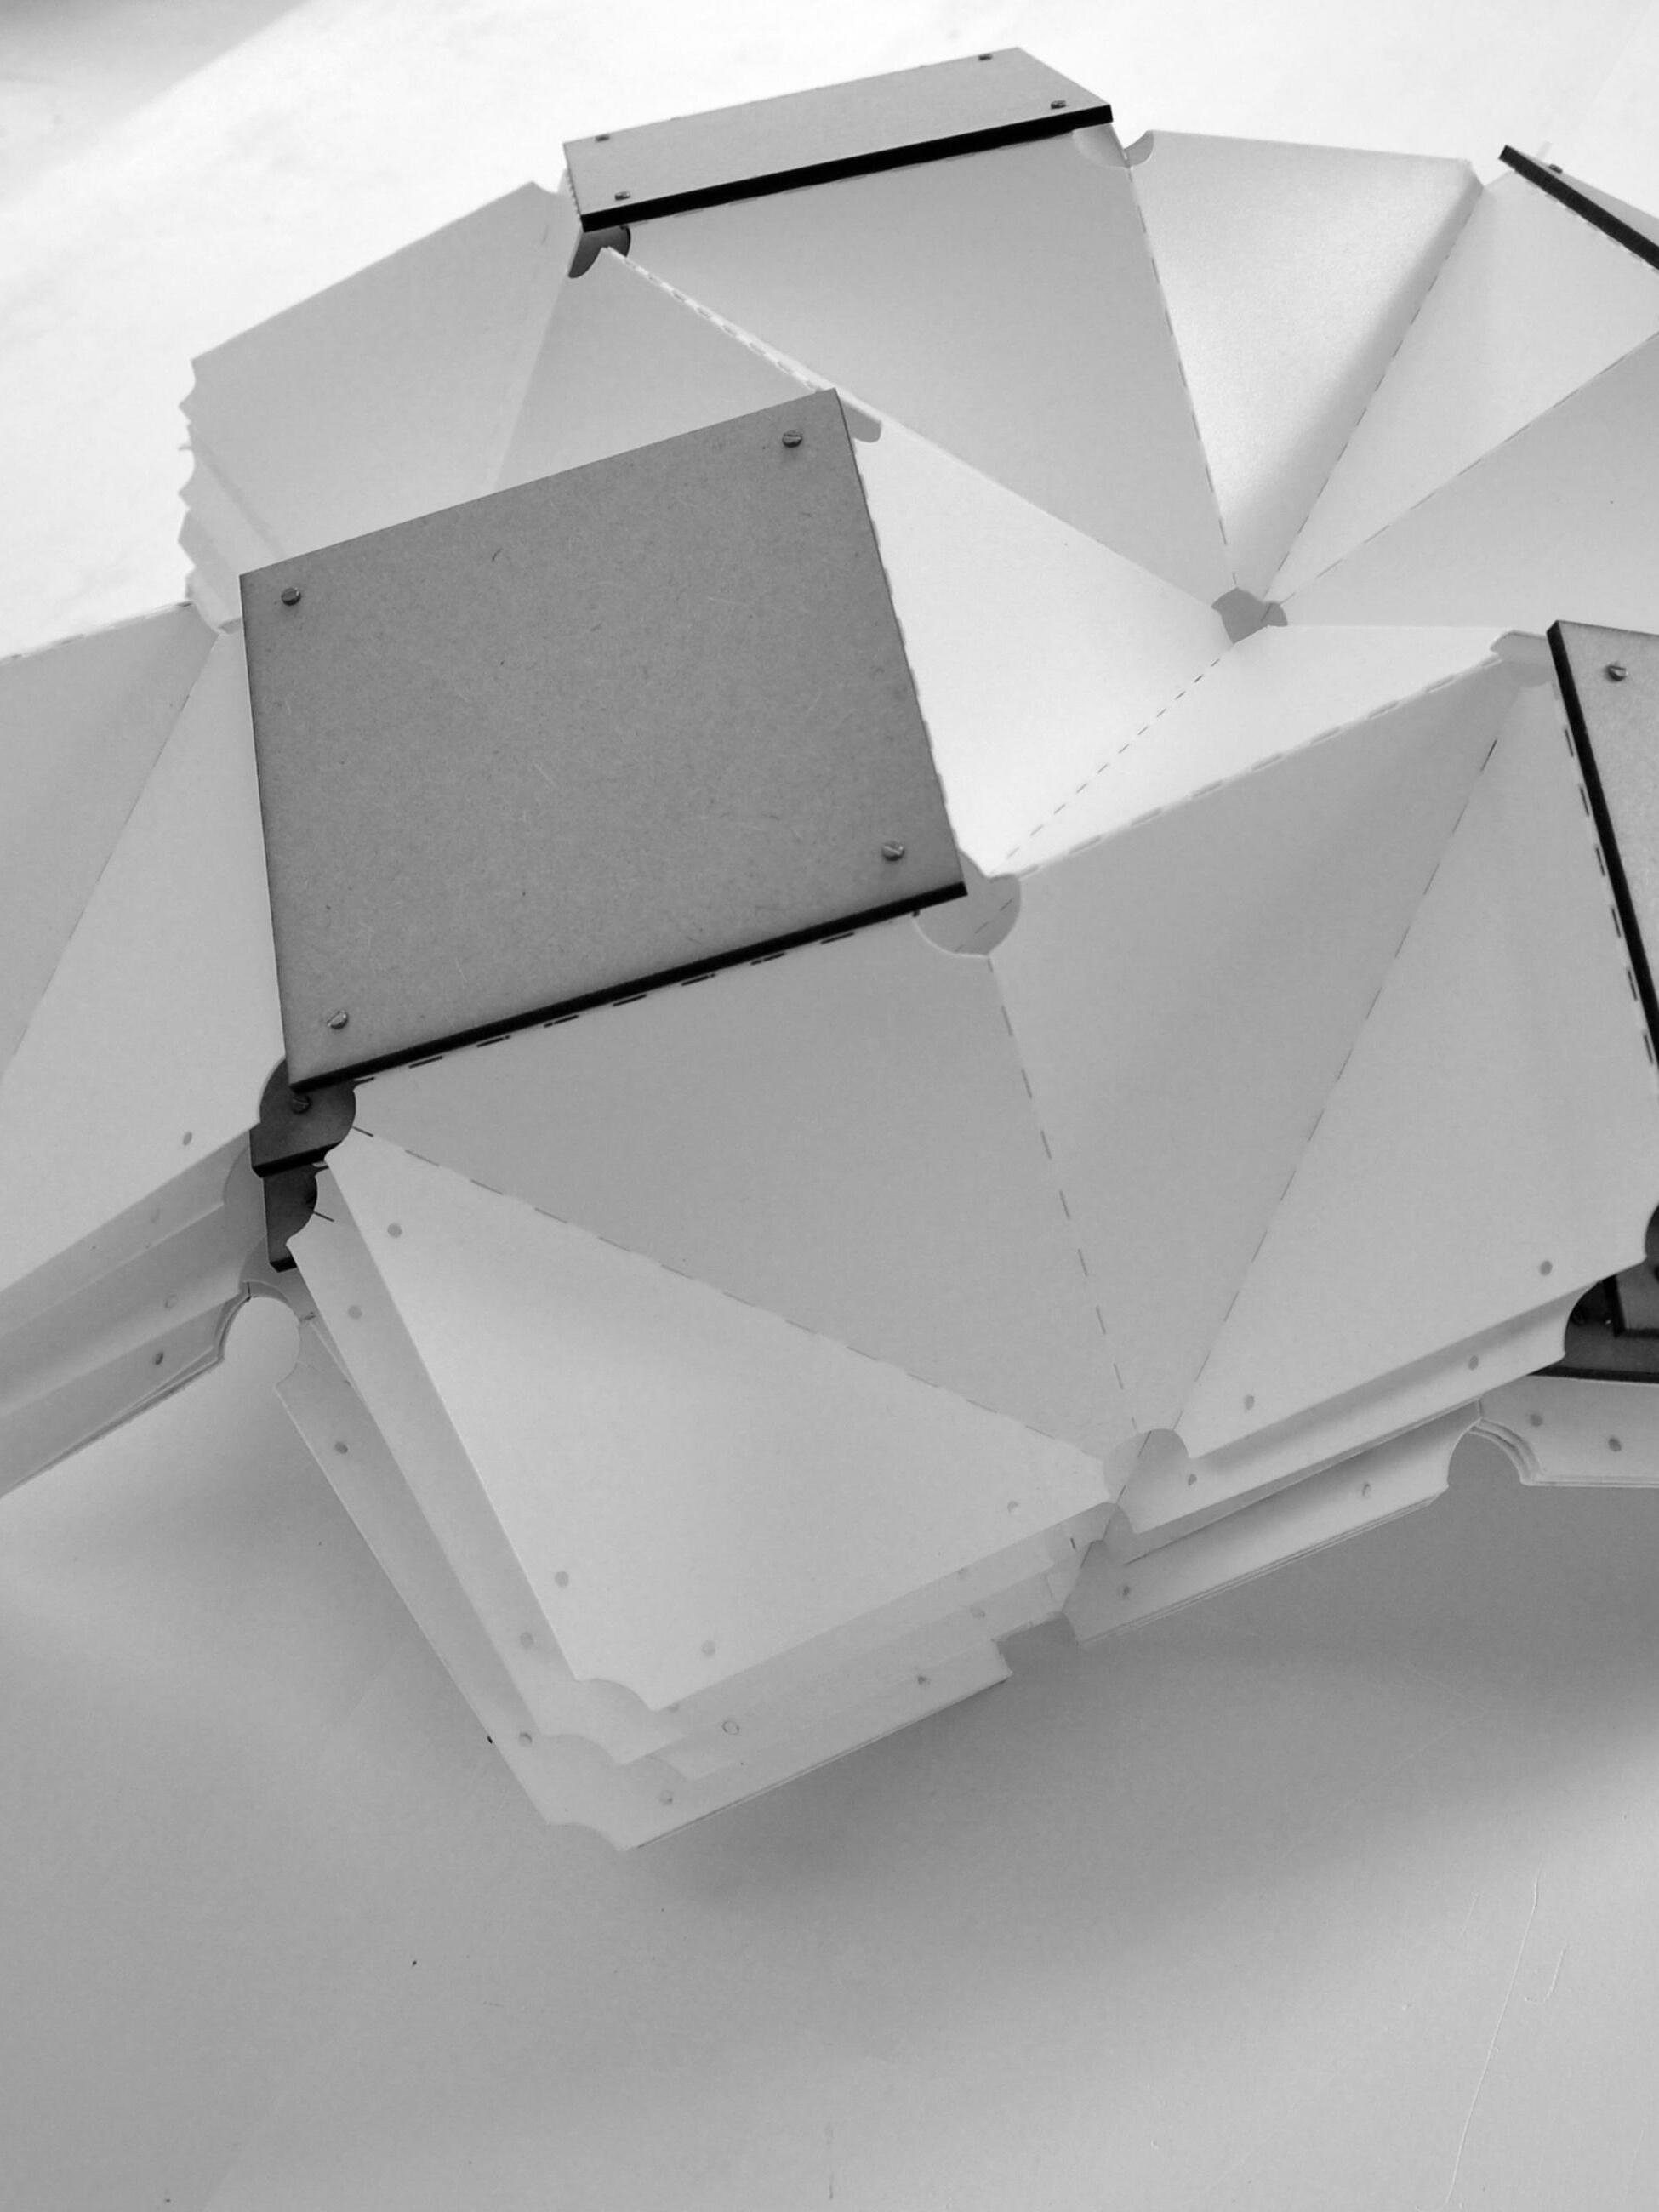
6. Design Development
As the proposed system was to function as a temporary and reconfigurable structure, the design development phase was focused on two separate architectural outcomes based on the two stages of its use; its Olympic use and its post-Olympic life. During the Olympic stage, the system was to function as a temporary arena for the 2016 Rio Olympics. After the 8 week period of the Olympics is over, the system was to serve the post-Olympic function of a canopy for an open air market. For both iterations of the system, an assembly and structural logic had to be devised since both designs acted at different scales and were required to perform different functions.
The final design proposals were developed through a series of structural studies and environmental performance tests which drove the form finding explorations. The chapter concludes with an assembly, disassembly and reconfiguration strategy for the proposed designs based on the results from the folding and assembly experiments.

141 Design Development
Design Goals
Two stages of use for the proposed system were explored based on the Olympic and post-Olympic design goals. In both its stages of use 3 main inputs were taken as the main drivers for the final form:
1. Functional Requirements: The operational requirements of the system during its period of use were the primary design driver for the final form.
2. Structural Requirements: The structural requirements were the secondary design driver and dictated what type of support structure or locking strategy would be needed.
3. Seasonal Requirements: The third design driver would be the seasonal requirements based on environmental analysis which would dictate the open factor of the pattern.
During both the Olympic and post-Olympic stage, the functional, structural and seasonal requirements would vary and therefore the ability of the system to respond to these changes was analysed.
142 Transient Systems Chapter 6
The final design proposals were developed through a series of structural studies and environmental performance tests.
Fig 6.1 (Right) Diagram explaining the design goals and the architectural ambitions of the developed system.
Programmatic Inputs
Functional Requirements
Form Optimization
Structural Constraints
Fixed Structure
Flexible Structure
Seasonal Inputs
Solar Radiation
Rainwater Run-off
Dynamic Inputs
People Flow
143
Design Development
Stage 1 - Arena
A boxing arena of 30 x 30 m capable of seating 500 spectators was chosen as the first stage of use for the system.
The sizes of Olympic arenas varies greatly based on the type of sport that they host. The largest temporary arena built was the London Basketball Arena which was able to span a distance of 115m and could contain up to 12,000 seats. While preliminary tests during the Msc stage were targeted at designing a structure capable of achieving similar spans, it was found that these spans were not achievable with the proposed system.
These large spans would also have imposed rigid structural constraints on the surface form and therefore restricted the amount of flexibility or variation possible within the surface. It was therefore decided to design a structure for a smaller arena such as those used for combat sports (such as boxing) as this allowed for greater emphasis to be placed on the material system rather then on the structure. A boxing arena of 30 x 30 m capable of seating 500 spectators was chosen as it provided the opportunity to test the patterns ability to span relatively large distances while not being too restrictive as to limit differentiation across the surface.
144 Transient Systems Chapter 6
Fig 6.2 (Right) Diagram explaining the inputs used for the design development of the architectural system’s first life.
Programmatic Inputs
Functional
• Maximum Seating Requirements
• Sporting Event Type and Requirements
• Duration of Event
Structural
• Maximum Span
• Minimum Height
• Component Size
• Locking Strategy
Design Development
Seasonal Inputs
Environmental
• Solar Radiation
• Rainfall
Static System
145
Singular Arch: Arena
Functional Requirements
Structural analysis conducted during the Msc stage of the research has shown that while locking the pattern along the boundary provides stability for small spans, it experiences significant deformation when spanning large distances. It was therefore decided that for spans above 10m a supporting structure would be required so as to reduce the amount of deformation experienced. Based on the analysis done during the Msc stage of the research, the structure for the arena would consist of 3 doubly curved arches as it was found that the pattern behaves significantly better as a doubly curved arch than as an arch with single curvature. The arch would be 10m wide and span a distance of 30m with a supporting structure along the boundary of the arch. The arena itself will contain 500 seats surrounding a 8x8m boxing ring. While the project was not focused on detailing the seating structure or support structure for the arena, a basic outline of the seating requirements were given as well as the proposed location for the anchor points and type of support structure required.
146 Transient Systems Chapter 6
Fig 6.3 (Top) Singular Arch forming a section of the arena.
Fig 6.4 (Right) Diagram explaining the design process and geometrical requirements of the arena.
Fig 6.5 (Next page) Diagram explaining the setup and result for arch structural tests.
Anchor Points
147
Design Development
Structural Logic Arch Parameters Design Logic 30 m 30 m 10 m 30 m
A. Experiment Setup:
Structural Requirements
Three structural experiments were set up to understand the behavioural properties of a pattern as a doubly curved arch. All experiments were set up with a doubly curved arch spanning 30 m with a primary support structure restraining the longest edges and acting as the primary structure for the system. For all the experiments, the pattern was tested in both an open (open factor of 0.5) and a closed (open factor of 0.1) state.
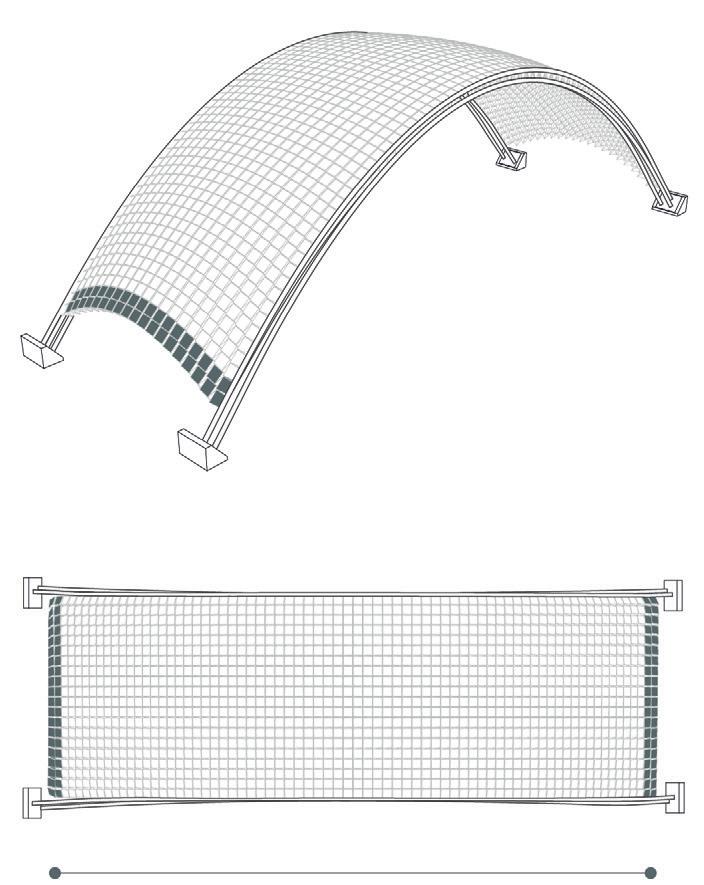
The first test measured the deformation of the arch when only the edges were locked. It was found that the arch deformed by 700mm when open and 350 mm when closed. A second experiment was then conducted with the same arch locked at the edges and at the centre. The deformation was reduced in both cases where 350mm of displacement was seen in the open state and 10mm of displacement was seen in the closed state. The final test was setup with locks at the edges of the arc, the middle and at every quarter of its length. The deformation in both the open and closed state were both within acceptable limits with a maximum displacement
B. Setup:
Model Size:..................................................10m x 30m
Material:......................................................aluminium
Component Face Size:............................0.5m x 0.5m
Number of Components:.......................................360
C. Results:
of 10mm experienced in the open state and a maximum displacement of 10mm experienced in the closed state. From these experiments it was concluded that locking the centre and edges reduced the deformations to acceptable levels for the closed arch more reinforcements were need to achieve the same levels in the open pattern. However as the results may vary depending on the shape of the arch, it was suggested that in general the pattern should be locked at every 7m along the arch (every quarter of its length) as this divides the pattern into 7X10m sections which reduces its deformation significantly. It must also be noted that these experiments do not take into account external factors such as wind load or water weight and even though indications of the type of supporting structure and anchor points were given, they were not studied in detail and only give an indication as to the type of supporting system that should be used. This supporting structure can be analysed as a further development to the research.
148 Transient Systems Chapter 6
Setup 1 | Edge Locked
700mm 700mm Open
Closed Pattern Deformation:
mm 0mm 0mm
Pattern Deformation: 680 mm
268
A. Experiment Setup:
Setup 2 | Edge and Centre Locked
B. Setup:
Design Development
Diagram
Model Size:..................................................10m x 30m
Material:......................................................aluminium
Component Face Size:............................0.5m x 0.5m
Number of Components:.......................................360
Open Pattern Deformation: 343 mm
0mm
C. Results: 350mm 350mm
Closed Pattern Deformation: 31 mm 0mm
the setup and result for the arch structural tests | Edge and Centre Locked
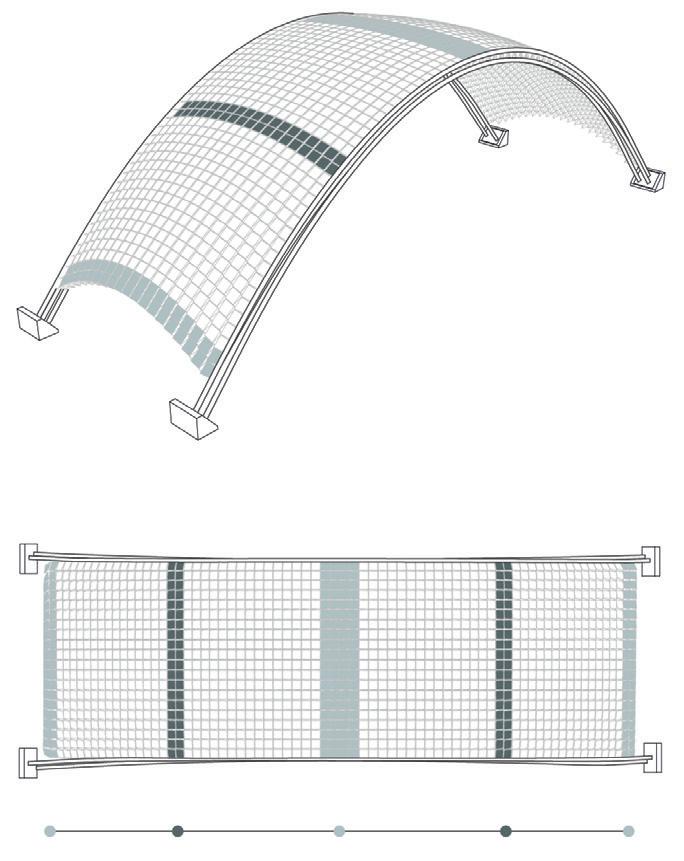
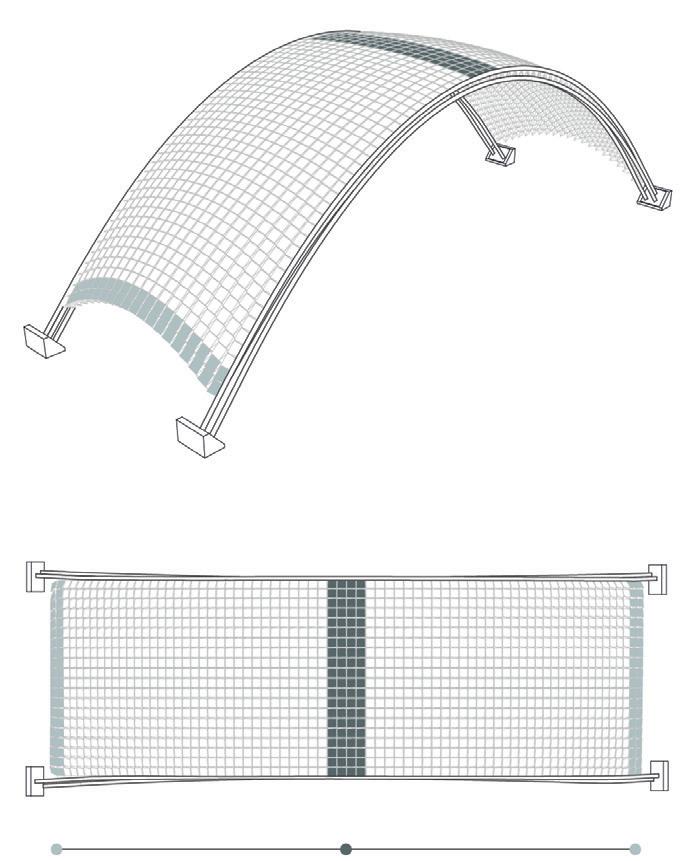
A. Experiment Setup:
Setup 3 | Edge, Centre and Intervals Locked
B. Setup:
Model Size:..................................................10m x 30m
Material:......................................................aluminium
Component Face Size:............................0.5m x 0.5m
Number of Components:.......................................360
Open Pattern Deformation: 10 mm
0mm
C. Results: 15 mm 15 mm
Closed Pattern Deformation: 11 mm 0mm
| Edge and Intervals Locked
149
Fig 6.6
explaining
Fig 6.7
Diagram explaining the setup and result for the arch structural tests
State 1 | Open Factor : 0.3
Arena Doubly Curved Arch
Model Size:..................................................10m x 30m
Maximum Height:..............................................12.5 m
Open Factor:................................................................ 0.3
Number of Components:.......................................360
State 2 | Open Factor : 0.6
Arena Doubly Curved Arch
Model Size:..................................................10m x 30m
Maximum Height:..............................................13.2 m
Open Factor:................................................................ 0.6
Number of Components:.......................................360
Seasonal Requirements
The open factor for the arena was then determined though a set of solar radiation gain studies and water weight studies. For both studies, the whole arena was tested in both the open (Open Factor : 0.6) and closed (Open Factor : 0.3) states and the results were compared. It was found that the solar gain for the open state was only marginally less than that of the closed state and was mostly occurring due to the self shading generated by the curvature of arches. However, the water collected by the arena in the closed state was 0.2kg/sqm less than that of the open state which resulted in a reduced water weight of 1000 kg across the whole surface. This significant increase in water weight is most likely occurring because the size of the pocket increases in the open state but its orientation is still similar to those of the closed state as the pattern must maintain the shape of the arch. The closed pattern was therefore chosen for the proposed design as it collected significantly less water but had only a slightly higher solar radiation gain. It must be noted that these results were related to the chosen form and vary depending on the shape of the arch.
150 Transient Systems Chapter 6
Fig 6.8a (Top) Diagram explaining the setup and result for the global level environmental tests | open factor 0.3.
A. Experiment Setup:
Arena State 1 | Open Factor : 0.3
B. Setup:
Design Development
Model Size:..................................................30m x 30m
Material:......................................................aluminium
Component Face Size:............................0.5m x 0.5m
Number of Components:.....................................1080
C. Results:
Water Weight: 0.504 kg/sqm (6444 kg)
Solar Gain: 802.69 kwh/sqm (9.98 x 10⁶ kwh)
Fig 6.8b
Diagram explaining
and
for the global level environmental tests | open factor 0.3
Arena State 2 | Open Factor : 0.6
A. Experiment Setup:
B. Setup:
Model Size:..................................................30m x 30m
Material:......................................................aluminium
Component Face Size:............................0.5m x 0.5m
Number of Components:.....................................1080
C. Results:
Water Weight: 0.760 kg/sqm (7696 kg)
Solar Gain: 793.20 kwh/sqm (8.03 x 10⁶ kwh) 0 kwh/sqm
151
1.0 kg/sqm
1000 kwh/sqm
0
kg/sqm
1.0
1000 kwh/sqm 0 kwh/sqm 0 kg/sqm
kg/sqm
the setup
result
Fig 6.8c
Diagram explaining the setup and result for the global level environmental tests | open factor 0.6
Arena Overview
The final design proposal for the arena would consist of 3 arches of 30 x 10m with a support structure running along the edges of the arch. The folded component system between the support structure will consist of 360 components per arch which will be in a closed state with an open factor of 0.1. The components will be locked at the edge conditions and along 7m intervals across the arch to reduce the amount of settling within the structure. The bowl itself will contain consist of a temporary seating structure for 500 spectators and will contain 4 entrances to the ring. As the arena would only be used for a period of 8 weeks, the main design drivers for the form were the programmatic and structural requirements. Environmental factors such as solar gain and shadow distribution were not taken into account as the period of use was too short for these factors to significantly effect the structure’s performance. It was therefore suggested that the pattern should be constructed with an open factor of 0.1 so as to improve its structural performance by reducing the amount of water weight collected on the surface.
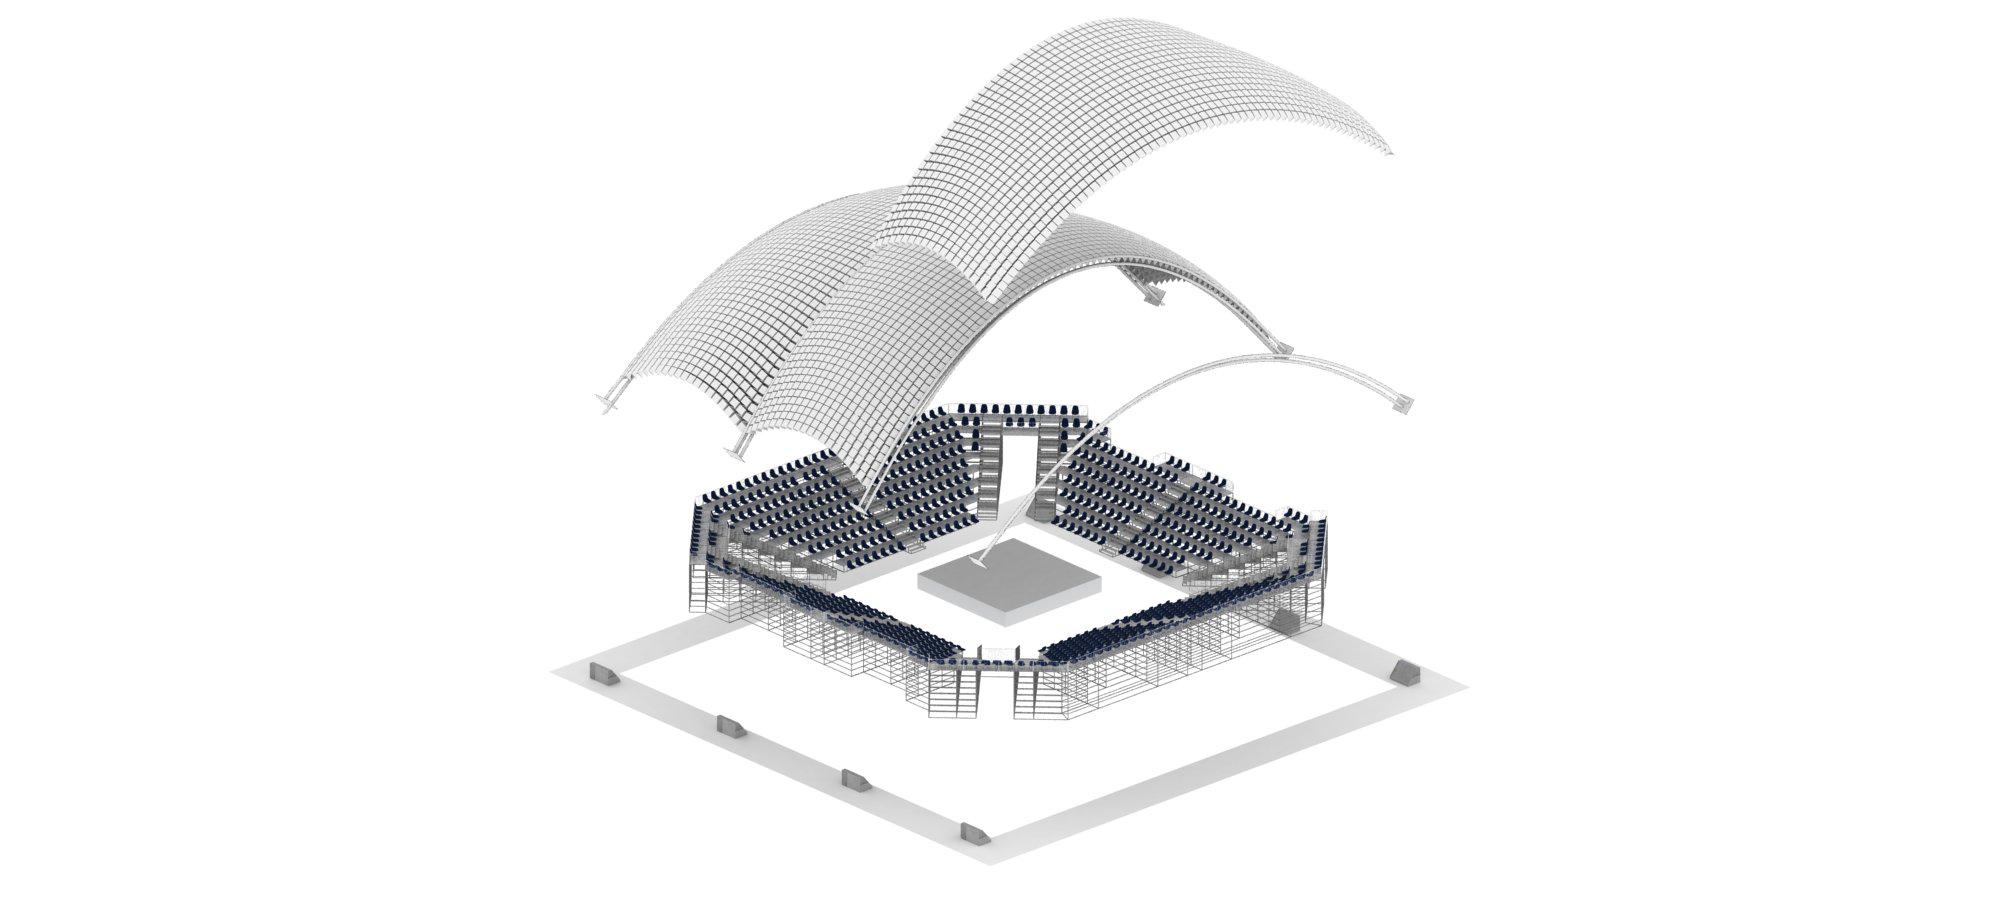
152 Transient Systems Chapter 6 Locked at 7m Intervals
First Life 0.1 Open Factor : Size: Area: Maximum Height: Maximum Span: Number of Users: Number of Components: Duration: 30 x 30 x 10 m (900 sq.m) 10 m 30 m 500-800 people 1080 8 weeks
Primary Structure
Anchor Points
153
Development Intervals
Design
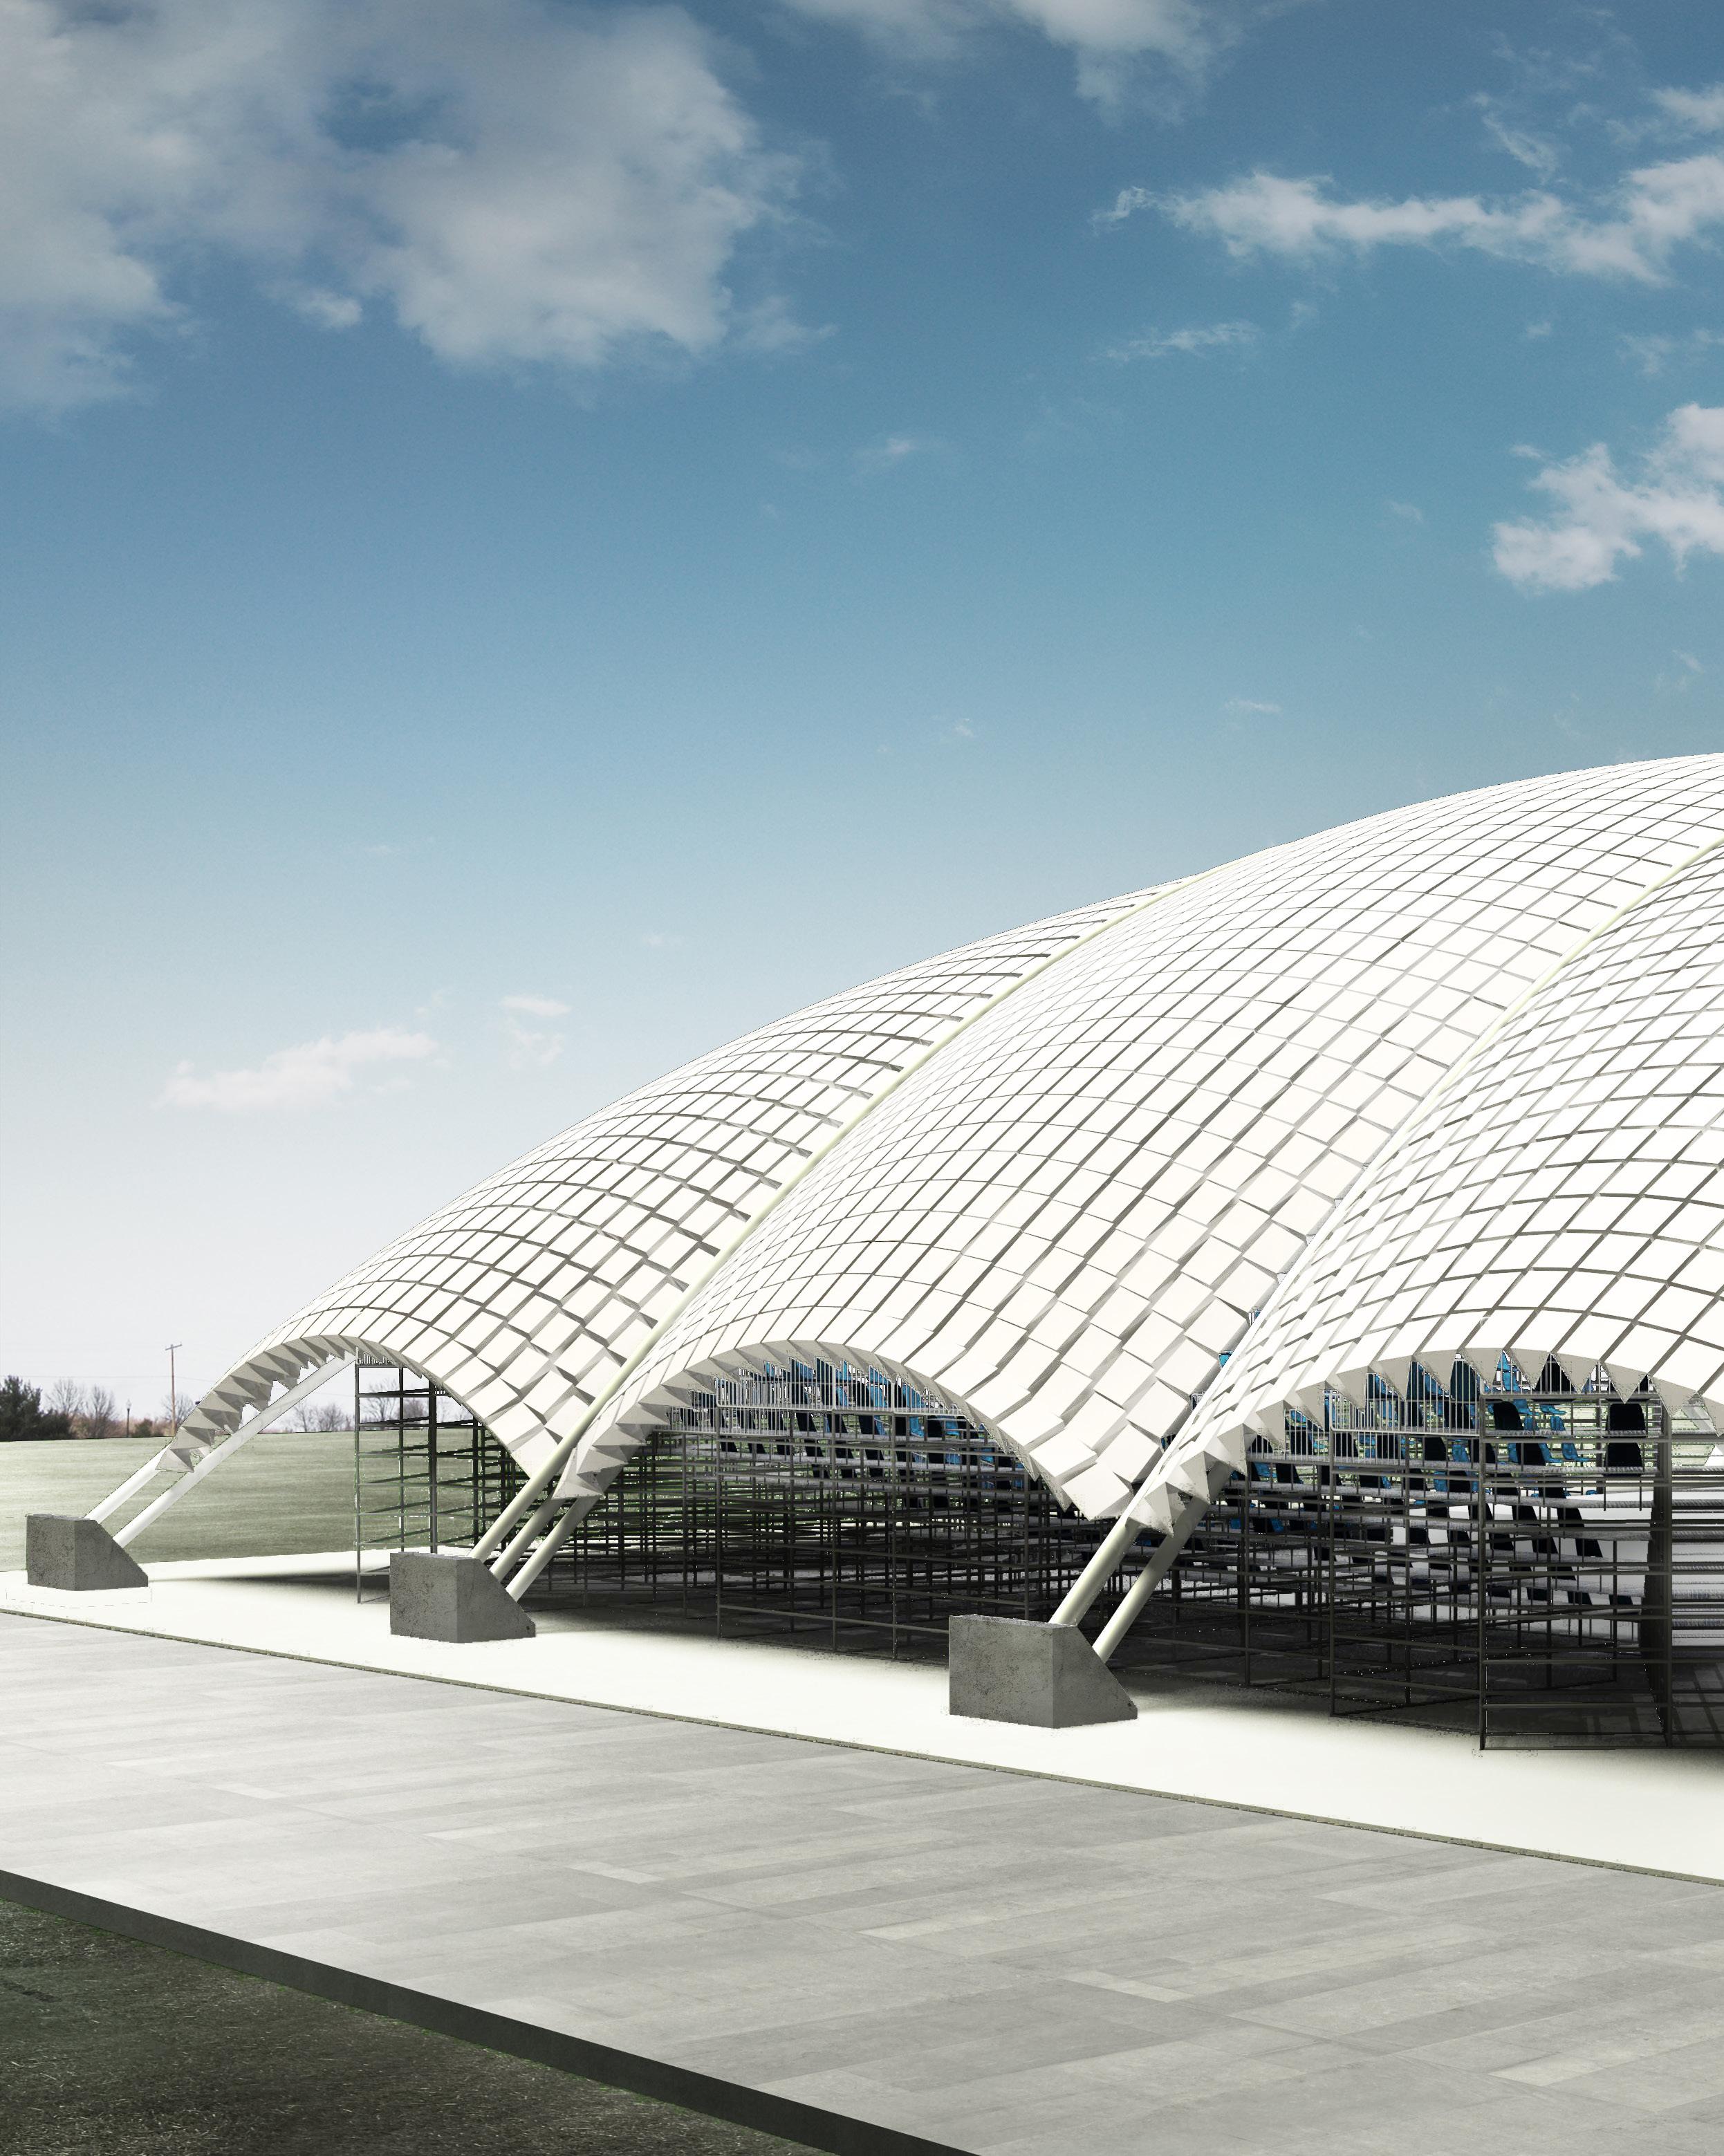
154 Transient Systems Chapter 6
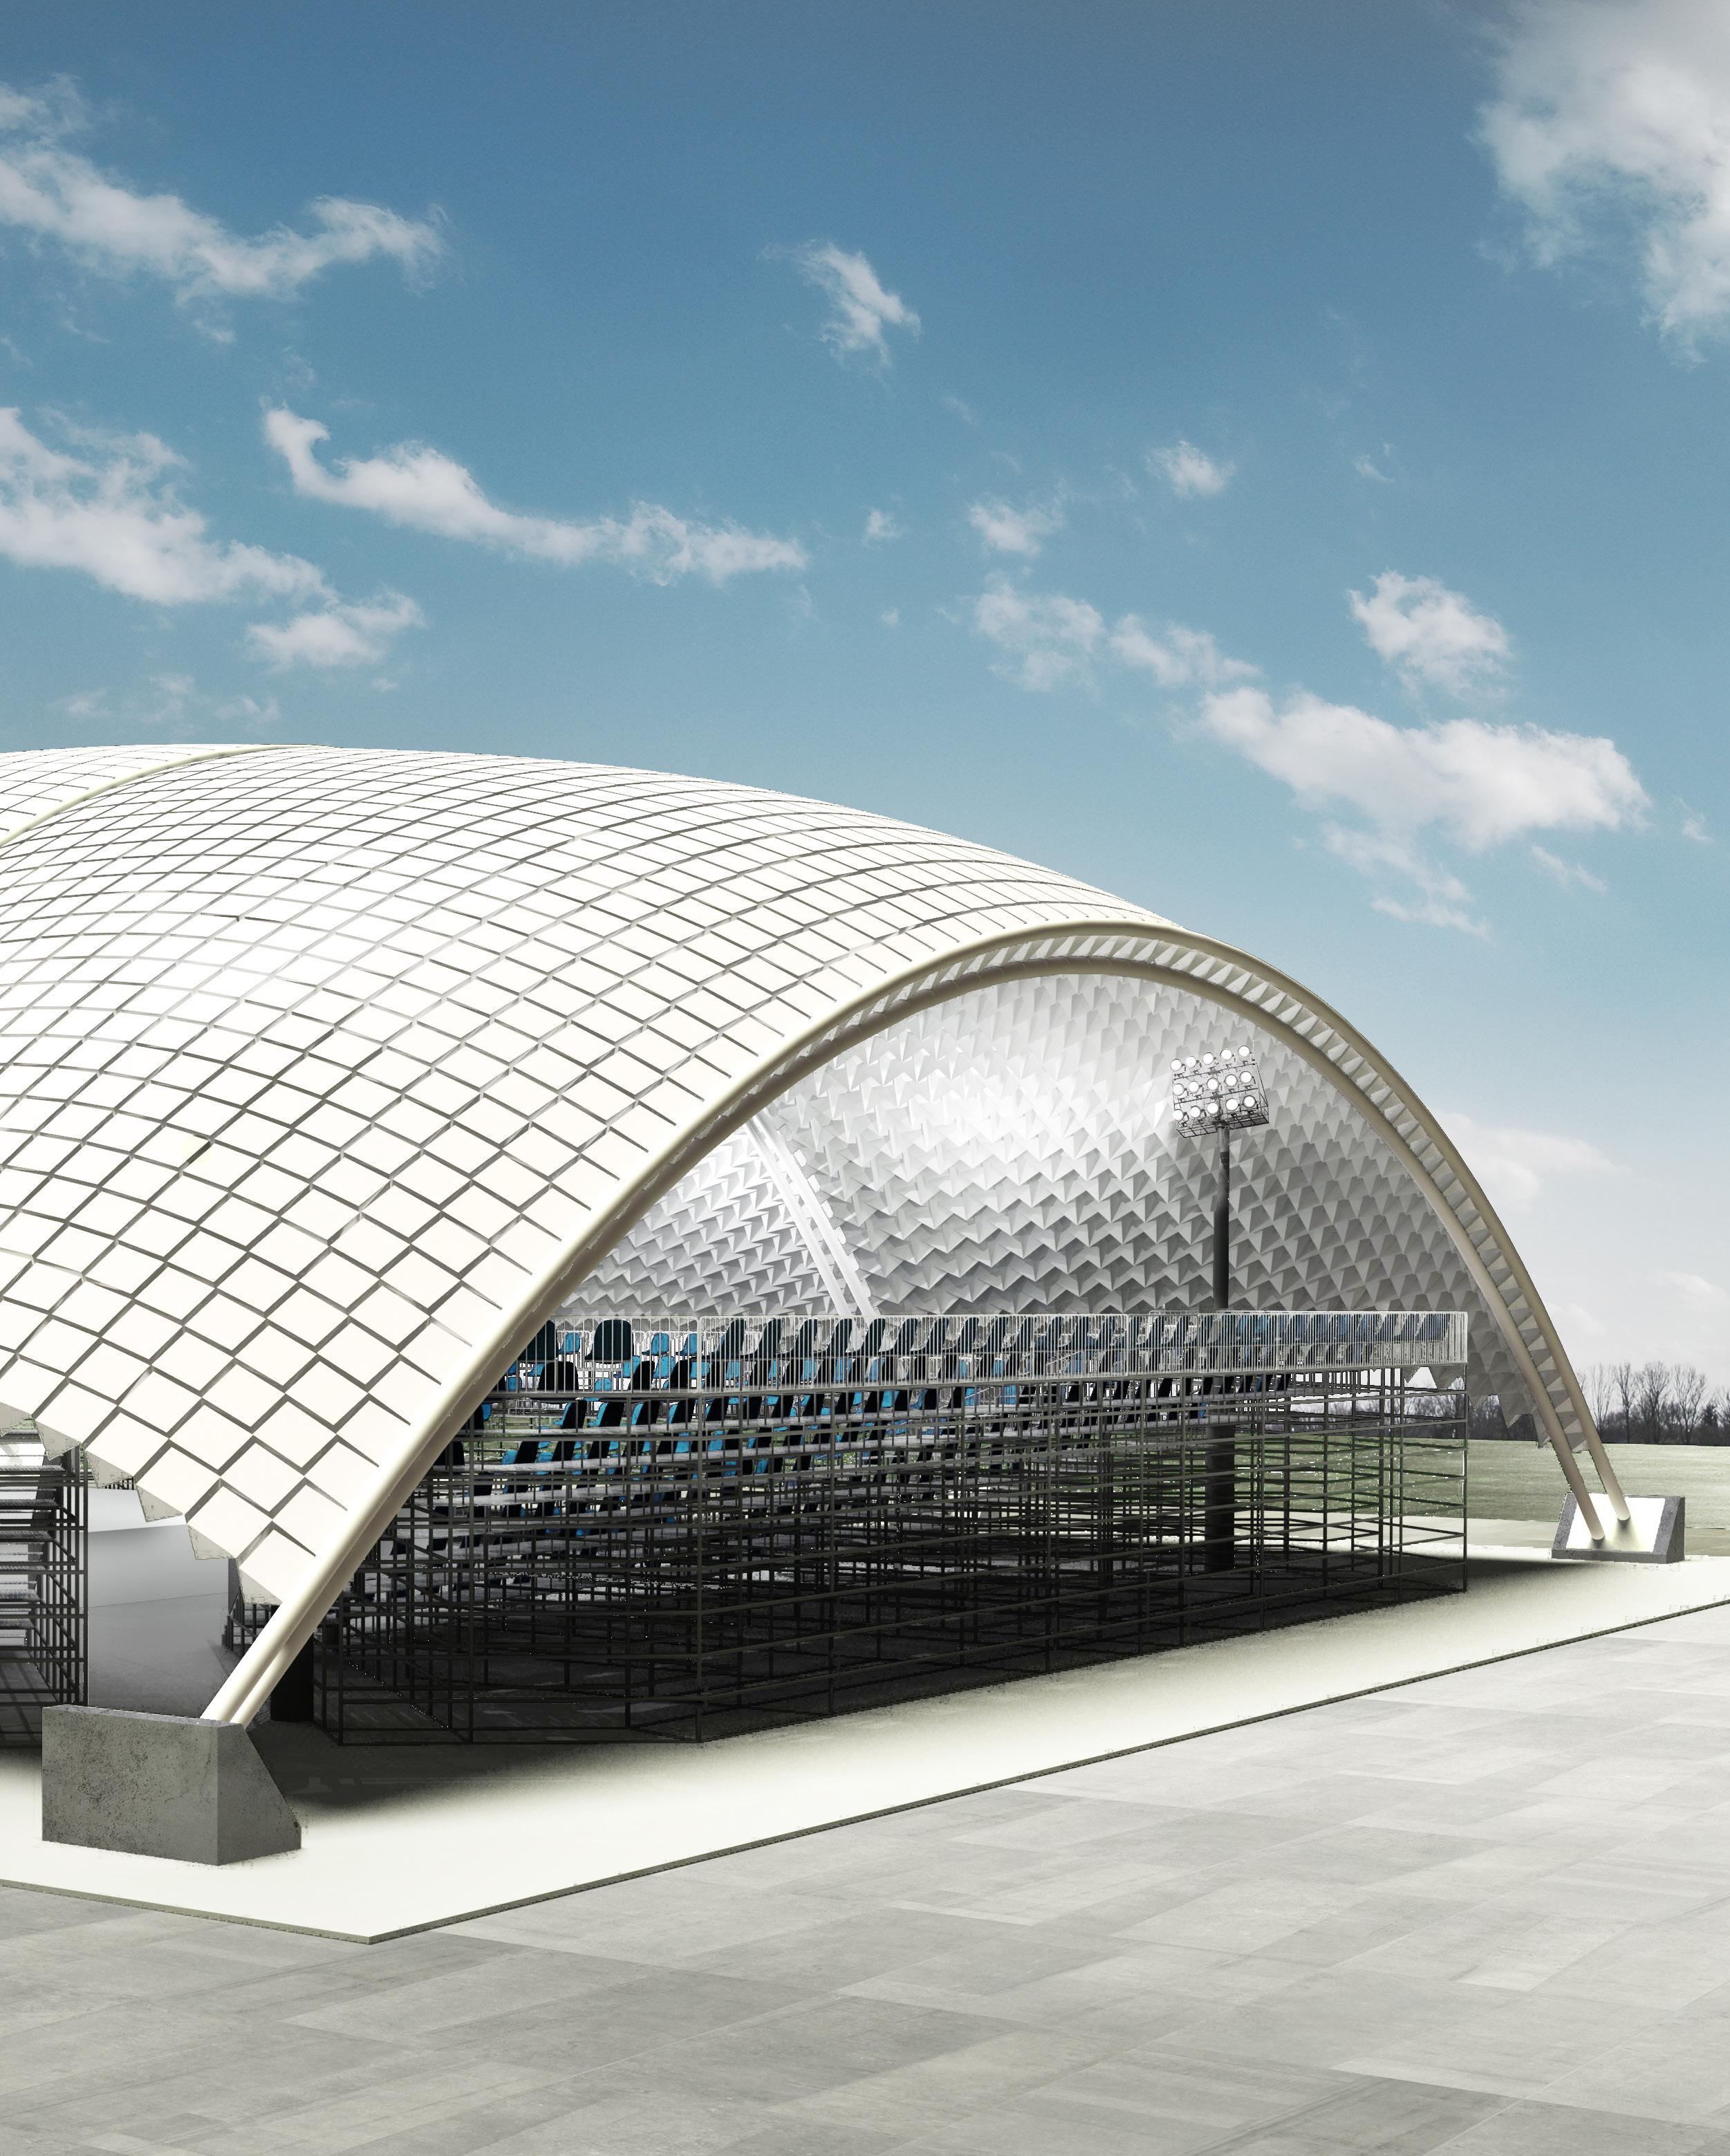
155
Design Development
Stage 2 - Market
The proposed market would have lower span requirements and would consist of an aggregation of smaller structures.
Following the system’s use as an arena during the Olympic games, a second post-Olympic use for the system was explored. While the spanning requirements of the arena restricted the type of forms that could be explored during its first stage of use, for the second stage it was decided to tackle a structure that required a smaller span and had a longer duration of use. A market was therefore chosen as the design outcome for the second life of the structure which would have lower span requirements and would consist of an aggregation of smaller canopy structures.
This allowed for the exploration of different synclastic forms achievable with the system as the form of the market was not restricted by strict functional requirements as in the case of the arena. The market would also be designed with a longer duration of use of 16 weeks and therefore would allow for other design inputs to be introduced to the system. Inputs such as environmental factors and changing functional requirements will have a larger effect on the success of the structure and will therefore be taken to be the market’s main design drivers.
156 Transient Systems Chapter 6
Fig 6.9 (Right) Diagram explaining the inputs used for the design development of the architectural system’s second life.
Programmatic Inputs
Functional
• Maximum stall requirements
• People flow
Structural
• Maximum Span
• Minimum Height
• Component Size
• Locking Strategy
Design Development
Seasonal Inputs
Environmental
• Solar Radiation
• Rainfall
Dynamic System
157
Singular Arch: Market
Functional Requirements
During the second life of the structure where the system was to serve as canopy for a street market, the ability of the system to respond to environmental conditions played a greater role in its overall performance and determined its success as a more permanent structural solution. The market was divided into a series of independent canopy structures which varied in size depending on the functional or seasonal requirements. These canopy structures were restricted to spans below 7m as previous studies have shown that it would require a secondary support structure for larger spans. The boundary arches of the surface were fixed to have a maximum height of 3 m and allow people to enter from all sides. The pattern at the centre of the surface could then be opened and closed based on environmental requirements. The proposed design will be a seasonal market and therefore the design will need to satisfy the environmental requirements of one particular season before it is dismantled and reassembled. By dividing the structure into a series of smaller sub structures, each area of the market can be tackled independently and can be modified or removed based on the seasonal requirements.
158 Transient Systems Chapter 6
Fig 6.10 (Top) Singular canopy forming a section of the market design.
Fig 6.11 (Right) Diagram explaining the design process and functional responses of the market design.
Fig 6.12 (Next page) Diagram explaining the setup and result for global level structural tests.
159 Design Development Design Logic 7 m 14 m 7 m 7 m
Setup 1 | All Components Locked
B. Setup:
Model Size:..................................................10m x 10 m
Material:......................................................aluminium
Component Face Size:............................0.5m x 0.5m
Number of Components:.......................................100
Structural Requirements
Structural experiments performed in the first phase of the research have shown that synclastic and single curvatures do not require an additional supporting structure for spans below 7m as long as the edge condition of the surface is locked. It was therefore decided to focus on small span synclastic structures for the design of the market. Based on previous explorations, the edge condition of the pattern was triangulated and locked using locking elements similar to those described in the previous chapter. Structural stability across the surface was then provided through a system of structural locks used to lock individual components. The location of these locks was determined through a series of tests which studied the effect of different locking configurations on the surface’s deformation. All tests were carried out on a 7X7m synclastic surface consisting of 9 components. The first experiments measured the deformation of the surface when all the components were locked. A maximum deformation of 8mm was recorded and while this was within acceptable limits, the
C. Results: 35 mm
Deformation: 8.3 mm
Plate Stress: 4.1 MPa
amount of locks used in the setup were high and therefore the next setups explored different locking strategies which involved fewer locks. The Second test was setup with only the components along its boundary being locked and it was found that the surface deformed by a maximum of 30 mm. While this deformation was still within acceptable limits, a final experiment was carried out so as to test whether better results can be achieved with a different setup. The final setup involved locking the components along the edge of the surface and along the areas with the highest stress (along the first principle stress lines). The maximum recorded deformation was 11mm. The results from the last setup displayed the best ratio between the number of component locks and the resultant surface deformation. It was therefore decided to use it as the basis for the market locking strategy where components along the boundary of the surface and within the areas with the highest stresses were locked. An indication of the anchor point design have been given however they were not the focus of the study.
160 Transient Systems
6
Chapter
A. Experiment Setup:
5
MPa
0
MPa 0mm
A. Experiment Setup:
Setup 2 | Edge Components Locked
B. Setup:
Design Development
Model Size:..................................................10m x 10m
Material:......................................................aluminium
Component Face Size:............................0.5m x 0.5m
Number of Components:.......................................100
C. Results: 35 mm
Deformation: 32.3 mm
Plate Stress: 3.3 MPa
Diagram explaining the setup and result for global level structural tests | Edge Components Locked
Setup 3 | Principle Stress Lines Locked
A. Experiment Setup:
B. Setup:
Model Size:..................................................10m x 10m
Material:......................................................aluminium
Component Face Size:............................0.5m x 0.5m
Number of Components:.......................................100
Deformation: 11.2 mm
0mm
Closed Pattern Deformation: 2.9 MPa
C. Results: 35 mm 5 MPa
0 MPa
Diagram explaining the setup and result for global level structural tests | Components with peak stress locked
161
5 MPa
0 MPa 0mm
Fig 6.13
Fig 6.14
Model Size:..................................................10m x 10m
Maximum Height:..............................................12.5 m
Open Factor:................................................................ 0.3
Number of Components:.......................................120
Model Size:..................................................10m x 10m
Maximum Height:..............................................13.2 m
Open Factor:................................................................ 0.6
Number of Components:.......................................120
Seasonal Requirements
The open factor of the canopy was determined through a series of environmental tests which measured solar radiation gain , shadow distribution and water weight gain. In the closed state (Open Factor - 0.3) the pattern collected less water than in the open state which resulted in a weight difference of 397kg across the surface. This was a significant difference as the water weight of the open state was 1/3 greater than that of the closed state. The annual solar gain varied slightly between the open and the closed surface with the closed surface collecting more solar gain than the open surface. As the market would have a longer duration of use, the visual quality of the interior space was taken to be main design driver for the system. Shadow studies in the previous chapter have shown that replacing faces oriented in two different directions will create an even distribution of light under the surface. Opening and closing the patten does not effect the light distribution significantly. It was therefore concluded that the water weight of the structure had the greatest seasonal effect on its performance and during the wet season the pattern should be kept in the closed state so as to reduce the amount of water collected.
162 Transient Systems
Chapter 6
State 1 | Open Factor : 0.3 A. Experiment Setup: B. Setup: State 2 | Open Factor : 0.6
Fig 6.15 (Top) Singular canopy forming a section of the market design.
A. Experiment Setup:
Market State 1 | Open Factor : 0.3
B. Setup:
Design Development
Fig 6.16
A. Experiment Setup:
Model Size:..................................................16m x 16m
Material:......................................................aluminium
Component Face Size:............................0.5m x 0.5m
Number of Components:.....................................360
C. Results:
Water Weight: 0.283 kg/sqm (773.5 kg)
0.5 kg/sqm 0 kg/sqm
Solar Gain: 877.88 kwh/sqm (2.06 x 10⁶ kwh)
1000
0.3
Market State 2 | Open Factor : 0.6
Model Size:..................................................16m x 16m
Material:......................................................aluminium
Component Face Size:............................0.5m x 0.5m
Number of Components:.....................................360
C. Results:
Water Weight: 0.433 kg/sqm (1170 kg)
Solar Gain: 879.42 kwh/sqm (2.12 x 10⁶ kwh)
Diagram explaining the setup and result for global level environmental tests | open factor 0.6
163
0.5 kg/sqm
1000 kwh/sqm
0 kwh/sqm 0 kg/sqm
B. Setup: kwh/sqm 0 kwh/sqm
Diagram explaining the setup and result for global level environmental tests | open factor
Fig 6.17
Second Life
Locked Along First Principal Stress Lines
Open Factor :
Market Overview
The final design proposal for the market consisted of a collection of independent 7x7m synclastic canopies. Each canopy covered an area of roughly 50 m2 and housed 10 stalls. The arches which formed the boundary of the canopies had a minimum height of 2.5m at their highest point so as to allow people to access the structure from all sides. This boundary also acted as the main structural support for the structure and the edge condition was triangulated and locked with structural elements. Components experiencing high stress were also locked along the first principle stress lines so as to provide additional support and reduce deformation. The open factor of the surface was to be kept in a closed state during the wet season so as to reduce rainwater collection and in an open state in the dry season so as to allow sunlight to enter through the transparent faces. An indication of the market stall layout and anchor point design has been given however they were not the focus of the study and they may be explored as a further development of the design.
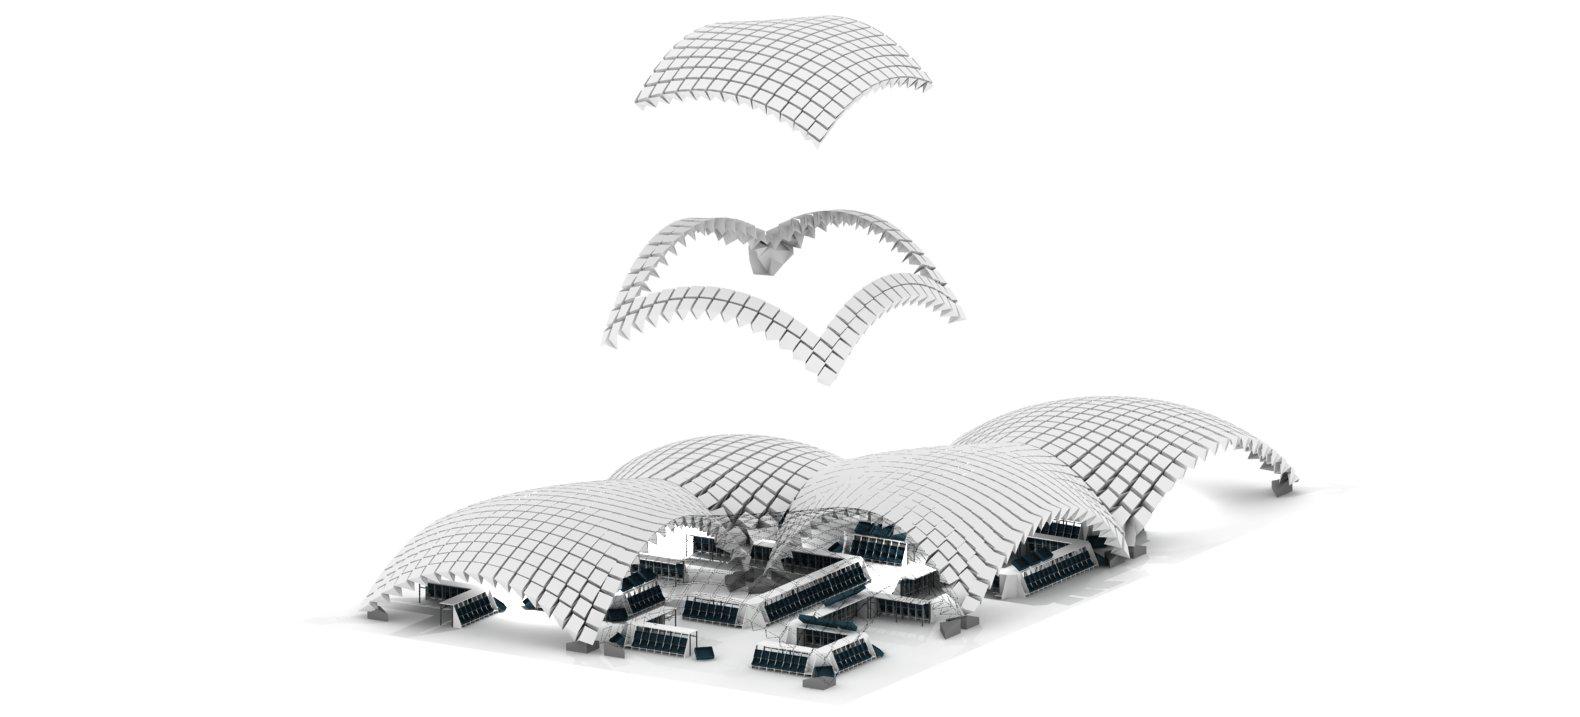
164 Transient Systems Chapter 6
0.1
Size: Area:
Maximum
Number of Users: Number of Components: Duration: 8 x 8 x 4 m (each unit) (64 sq.m) 4 m 8 m 100-150 people 360 (each unit) 16 weeks (seasonal)
Maximum Height:
Span:
Anchor Points
165
Design Development Locked Edge Condition
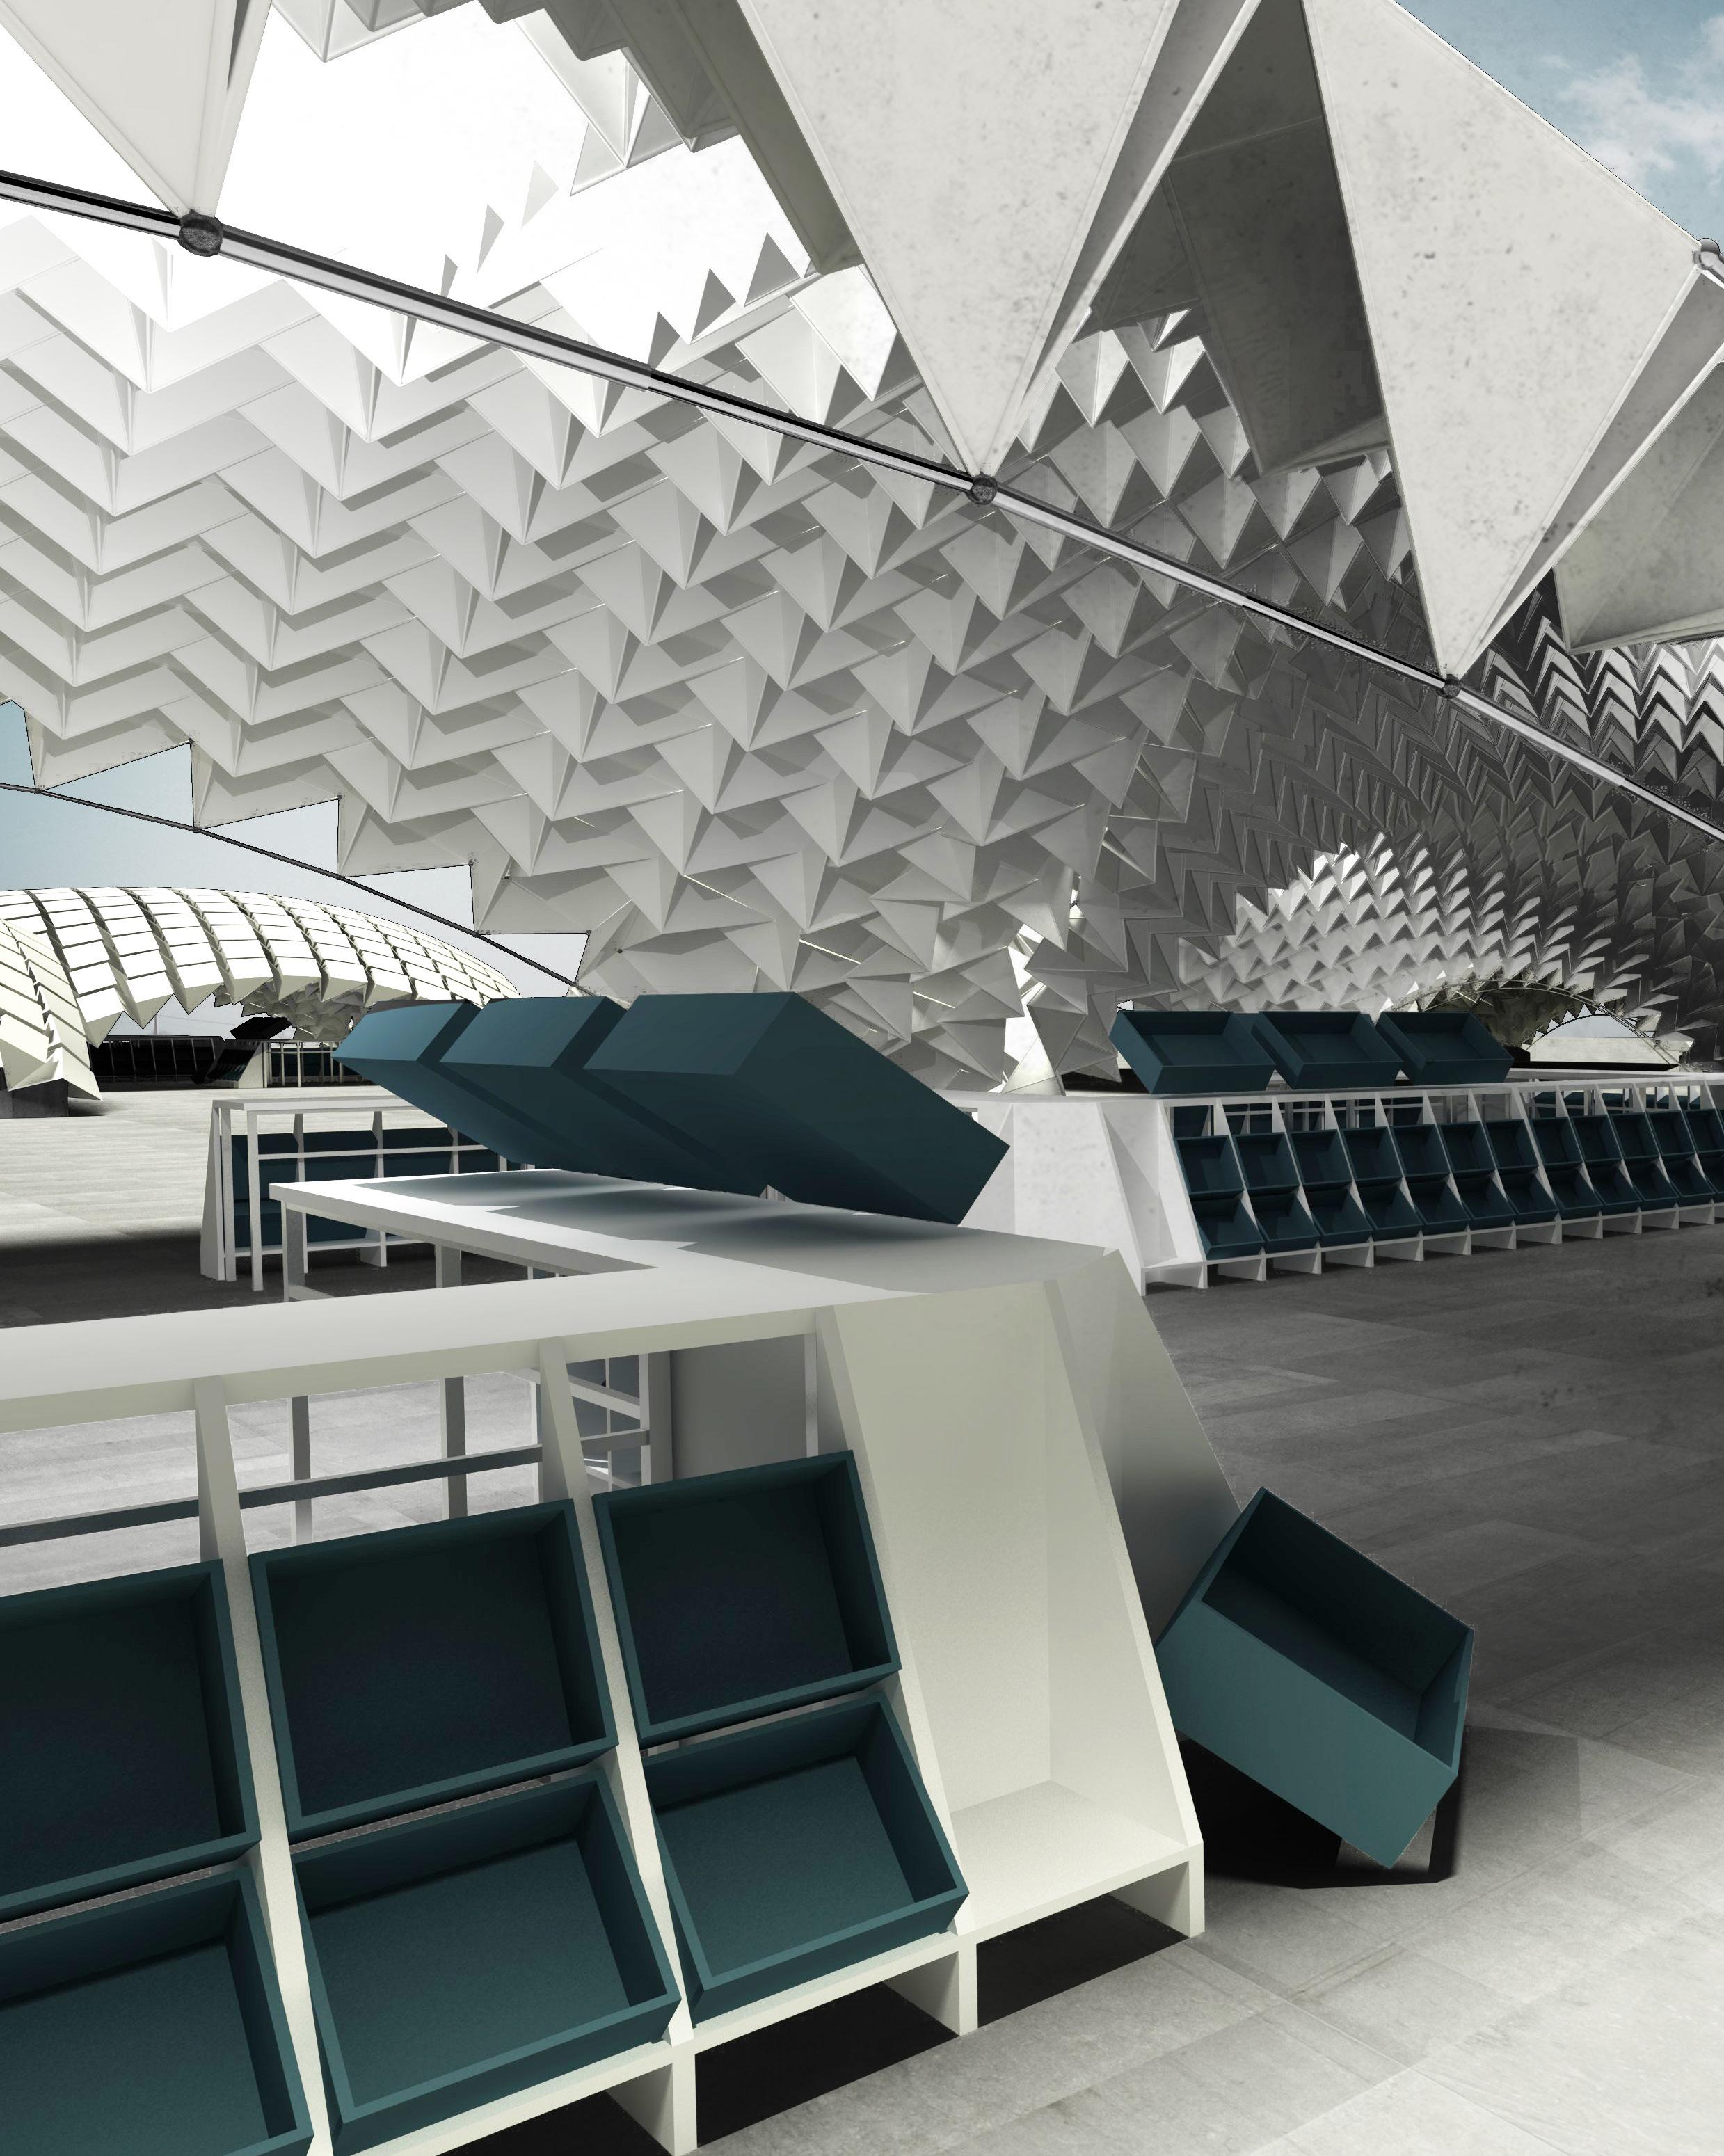
166 Transient Systems Chapter 6
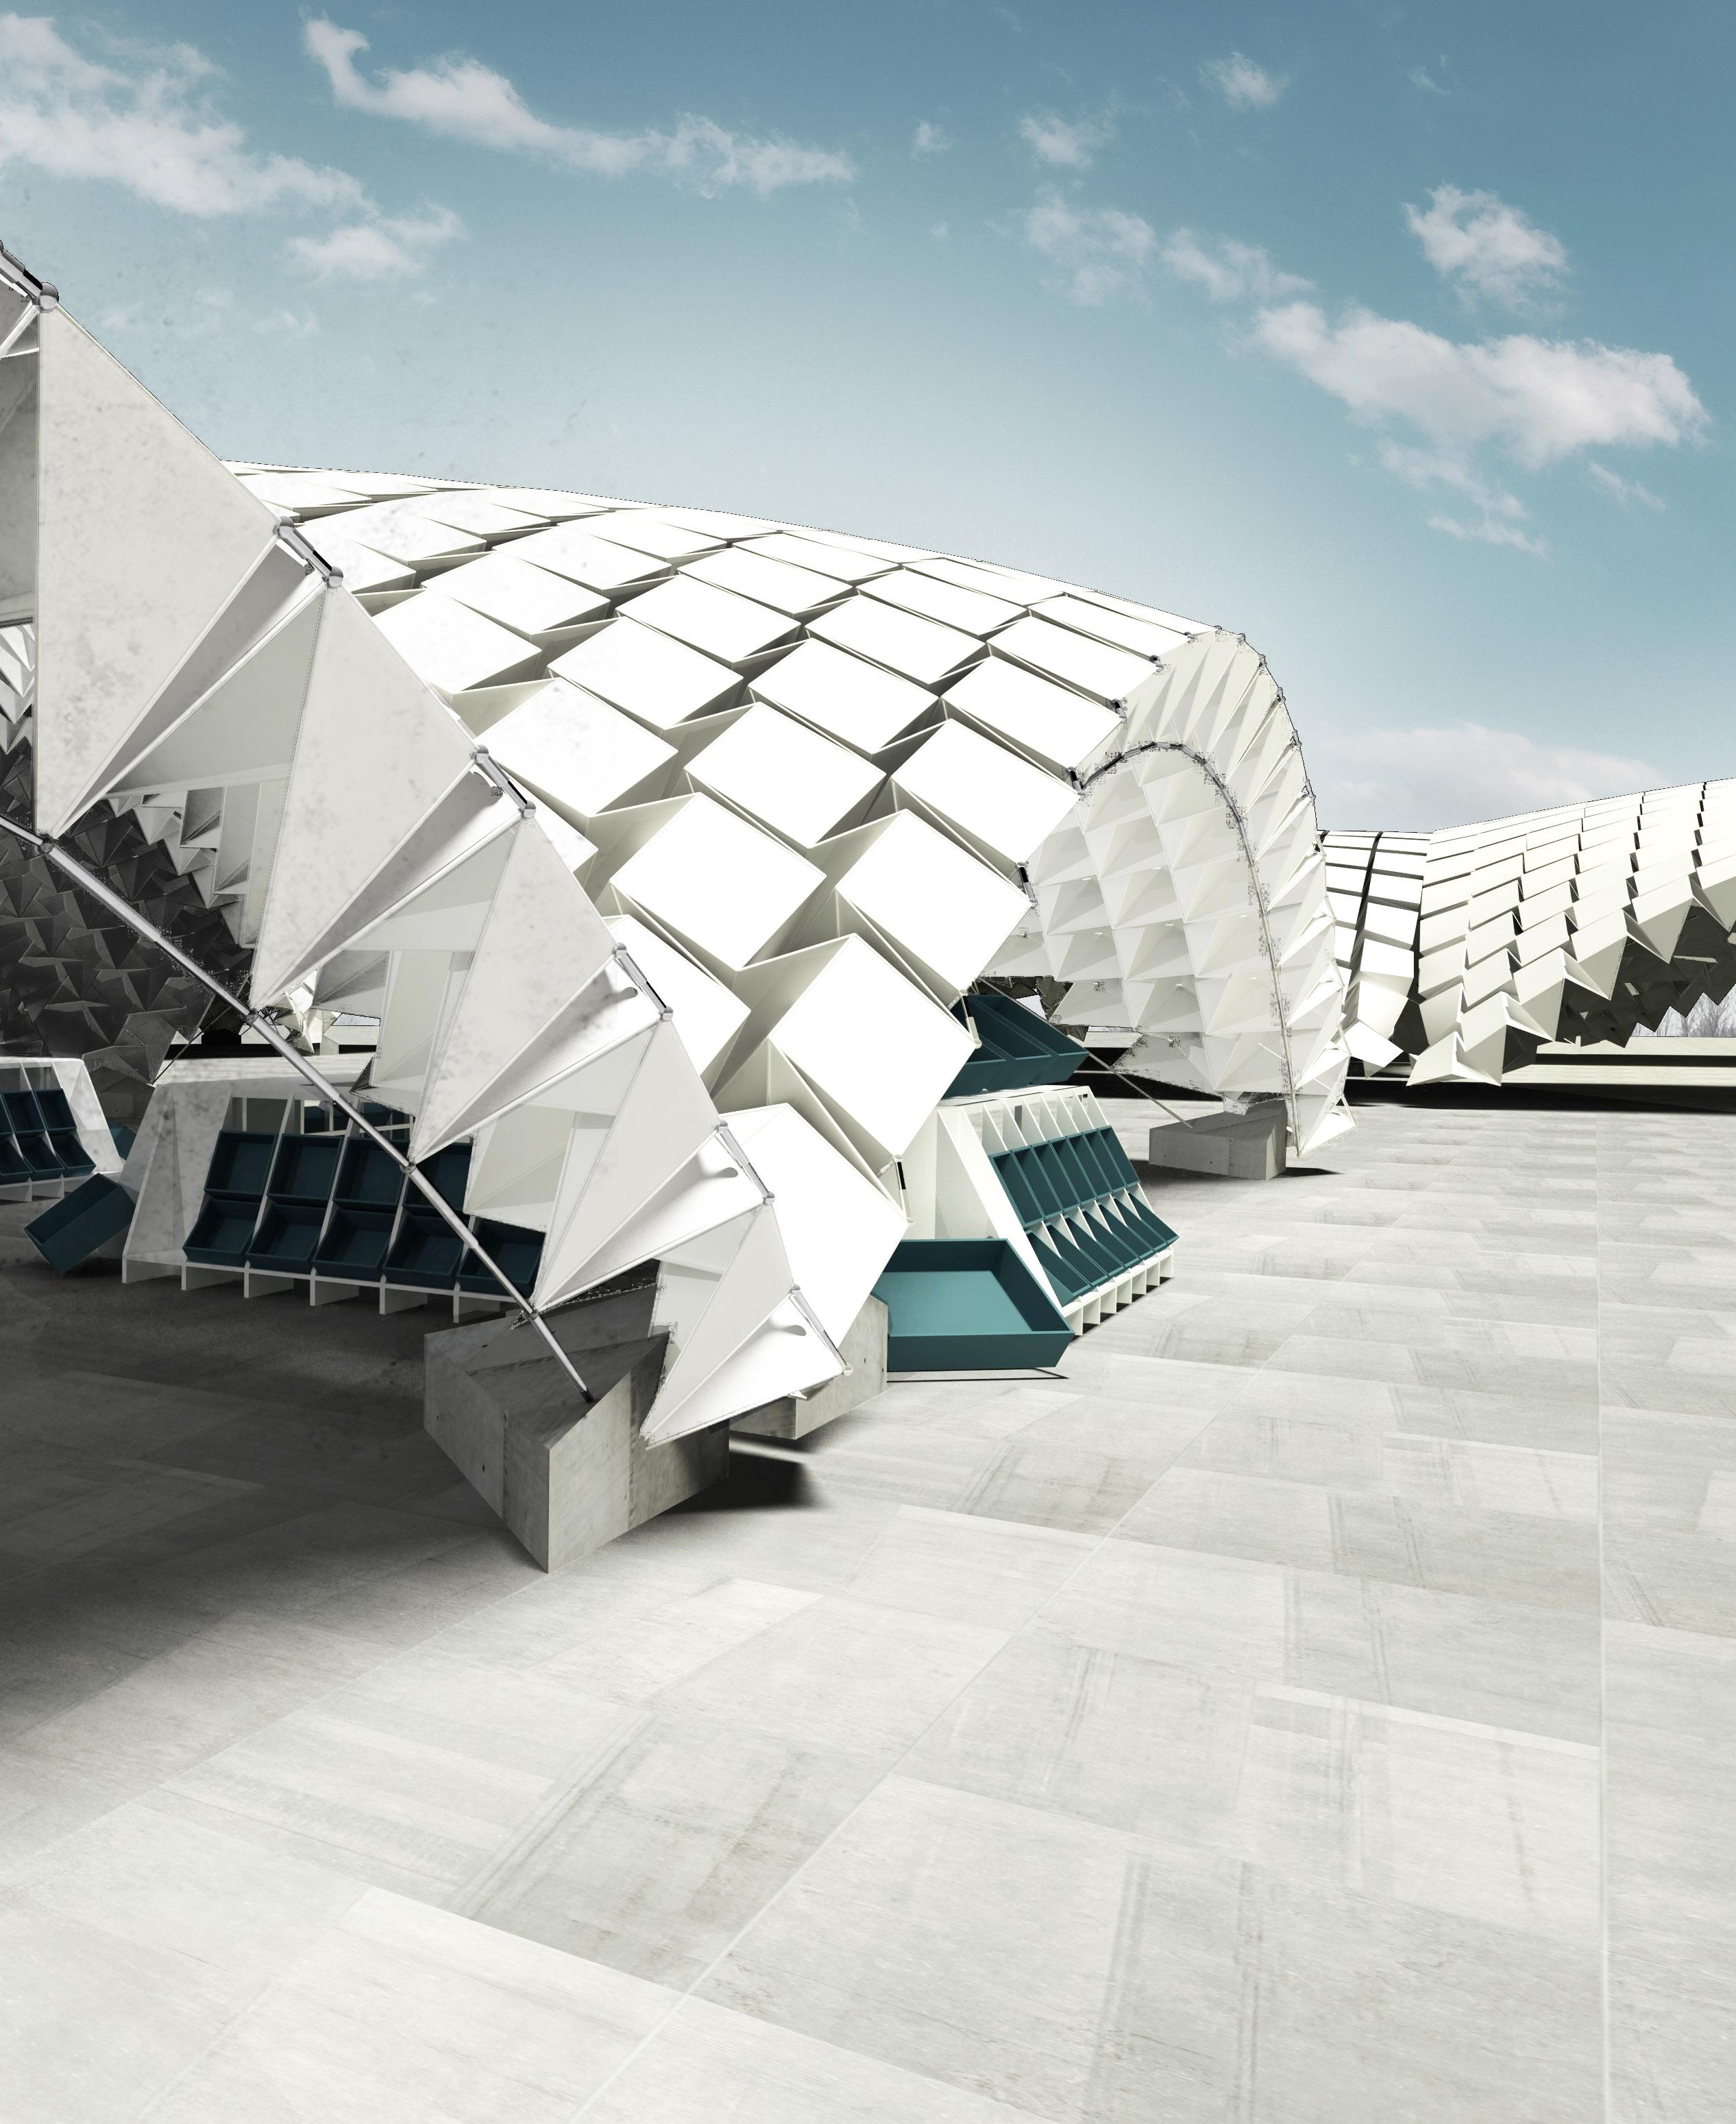
167 Design Development
For Assembly sequence animation
Please Refer to the CD.
Assembly Sequence
An assembly sequence for both design proposals was outlined as well as a reconfiguration strategy for the surface.
Once the final designs for both stages of use for the system had been developed, an overview of the assembly sequence was outlined. The components were designed to be stored as flat sheets which could be packed on top of each other and could be transported easily. The required structural locks must also be transported with the components but these consist of extendable steel rods which are easily dismantled and transported. Once the components arrive on site, an AR setup similar to the one used during the assembly experiments needs to be set up for the folding of the components. This setup must consist of a folding space of 2x2m which will be recorded from above using a camera that will provide live video feed to the AR software. The video feed along with the overlaid instructions will be relayed to the assembler through a stationary screen. As the component faces are 0.5m wide, a hand held display would not be able to record and display the entire component therefore it was decided that an overhead camera with a fixed screen would provide the best results. The area must also have controlled lighting conditions for the best accuracy to be achieved.
168 Transient Systems Chapter 6

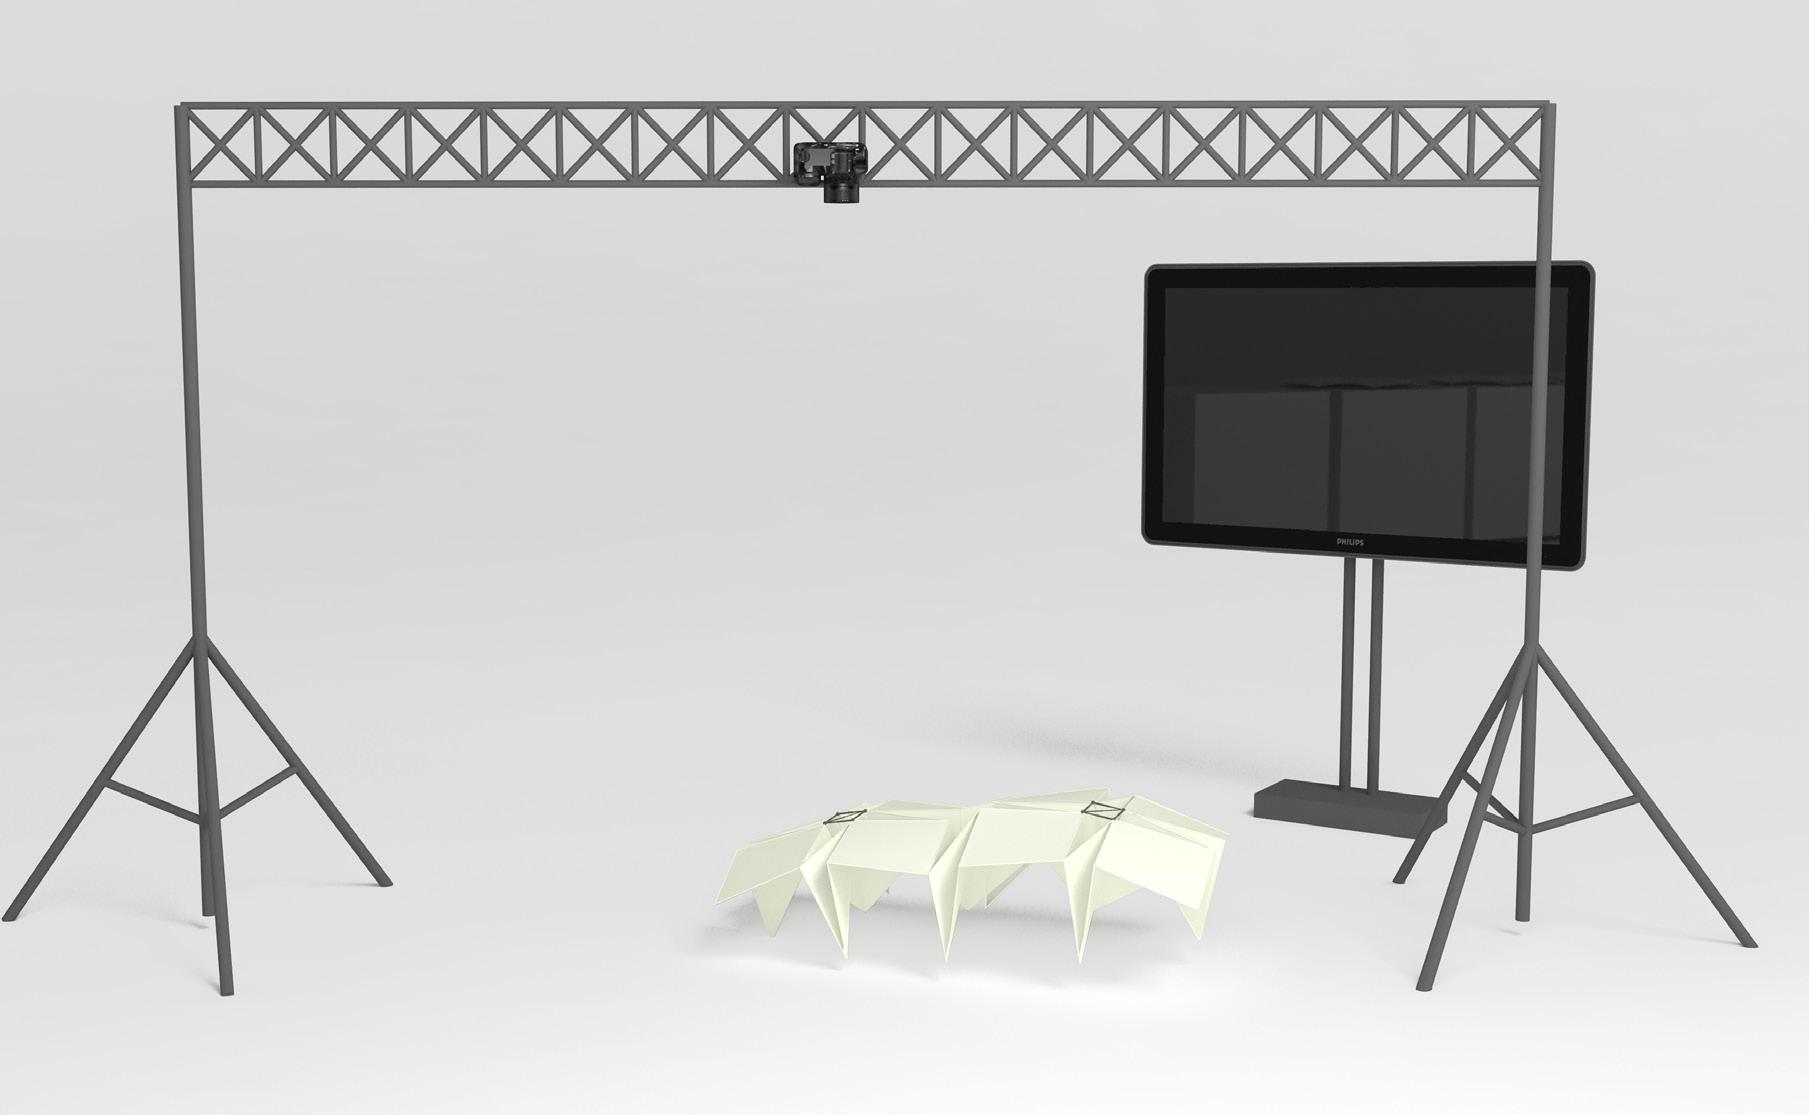
169 Design Development
Fig 6.18
Animation frame showing a flat component’s arrival on site an folding simulation process
Fig 6.19
Animation frame showing a temporary AR setup on site and locked components using AR
Assembly Sequence
Once the temporary folding environment has been set up on the site, the components can be individually folded into the required shape. From the assembly experiments it was found that each component takes roughly 5 minutes to fold and lock. It would therefore take around 90 hours to fold all the components required for the arena, however as the equipment used for the folding process is relatively accessible and cheep, multiple folding stations can be setup to speed up the process. The object tracking technology used can also be combined with robotic aids that can be brought on site to speed up the overall process. The object tracking software can serve as a sensory input for robot arms which can be set up on site and be used to fold the sheets with a high degree of precision and speed. It is suggested that for large scale constructions that contain over 1000 components such as the arena, robotic aids should be used to increase the efficiency of the folding process. However for the small scale constructions with less than 100 components such as the individual canopies of the market,

human assemblers are sufficient . This flexibility in assembly methods is required for the system’s success as a temporary structure as its assembly and disassembly sequence can be modified based on the system requirements tools available.
From the results of the assembly experiments it was found that the components could also be joined into aggregations of 3 - 4 components using the AR setup. These collections of components can then be taken on site and assembled into larger panels using a system of props. Robotic aids may potentially be used to speed up or improve the accuracy of the process but are not required. Once the components have been folded they will be aggregated on site into panel of 10 - 25 components using a system of props that will indicate the location of the edge conditions and boundary components. From the assembly experiments it was found that AR is not required for this part of the setup if the components are folded and locked in the right position and the props are in the correct locations.
170 Transient Systems Chapter 6
Fig 6.20
Animation frame showing a temporary construction props and component aggregation on site
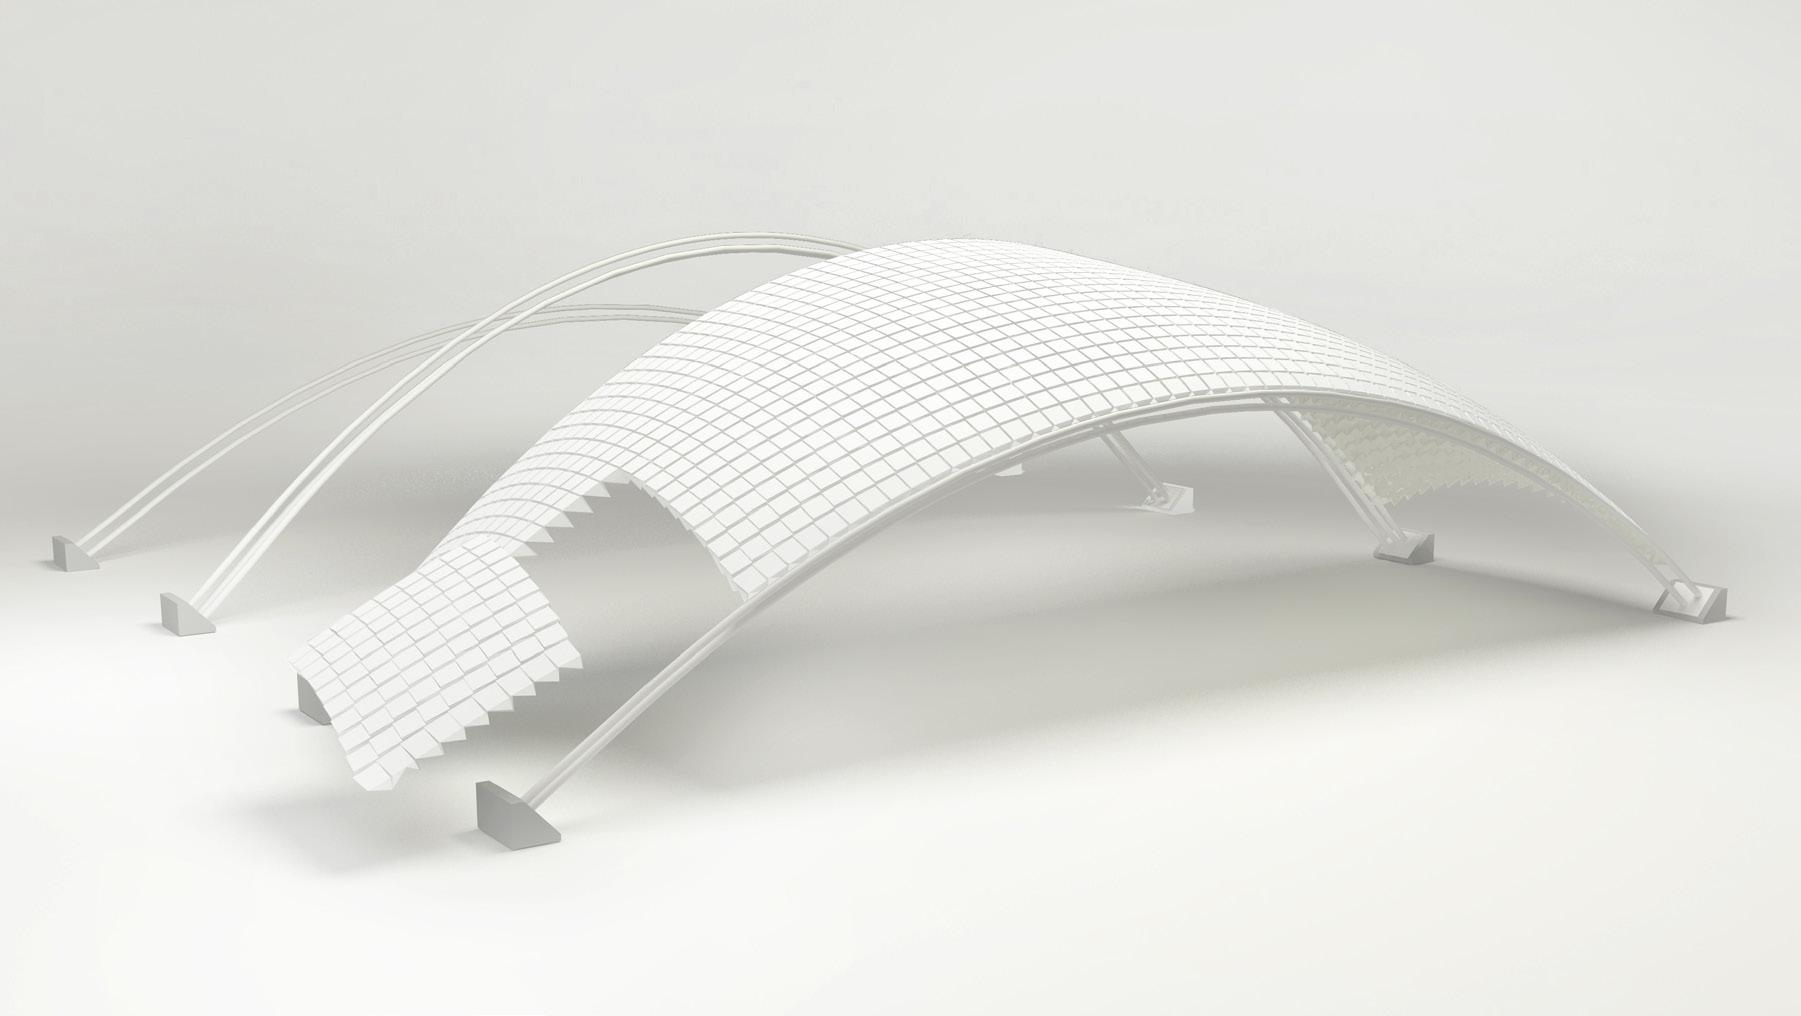
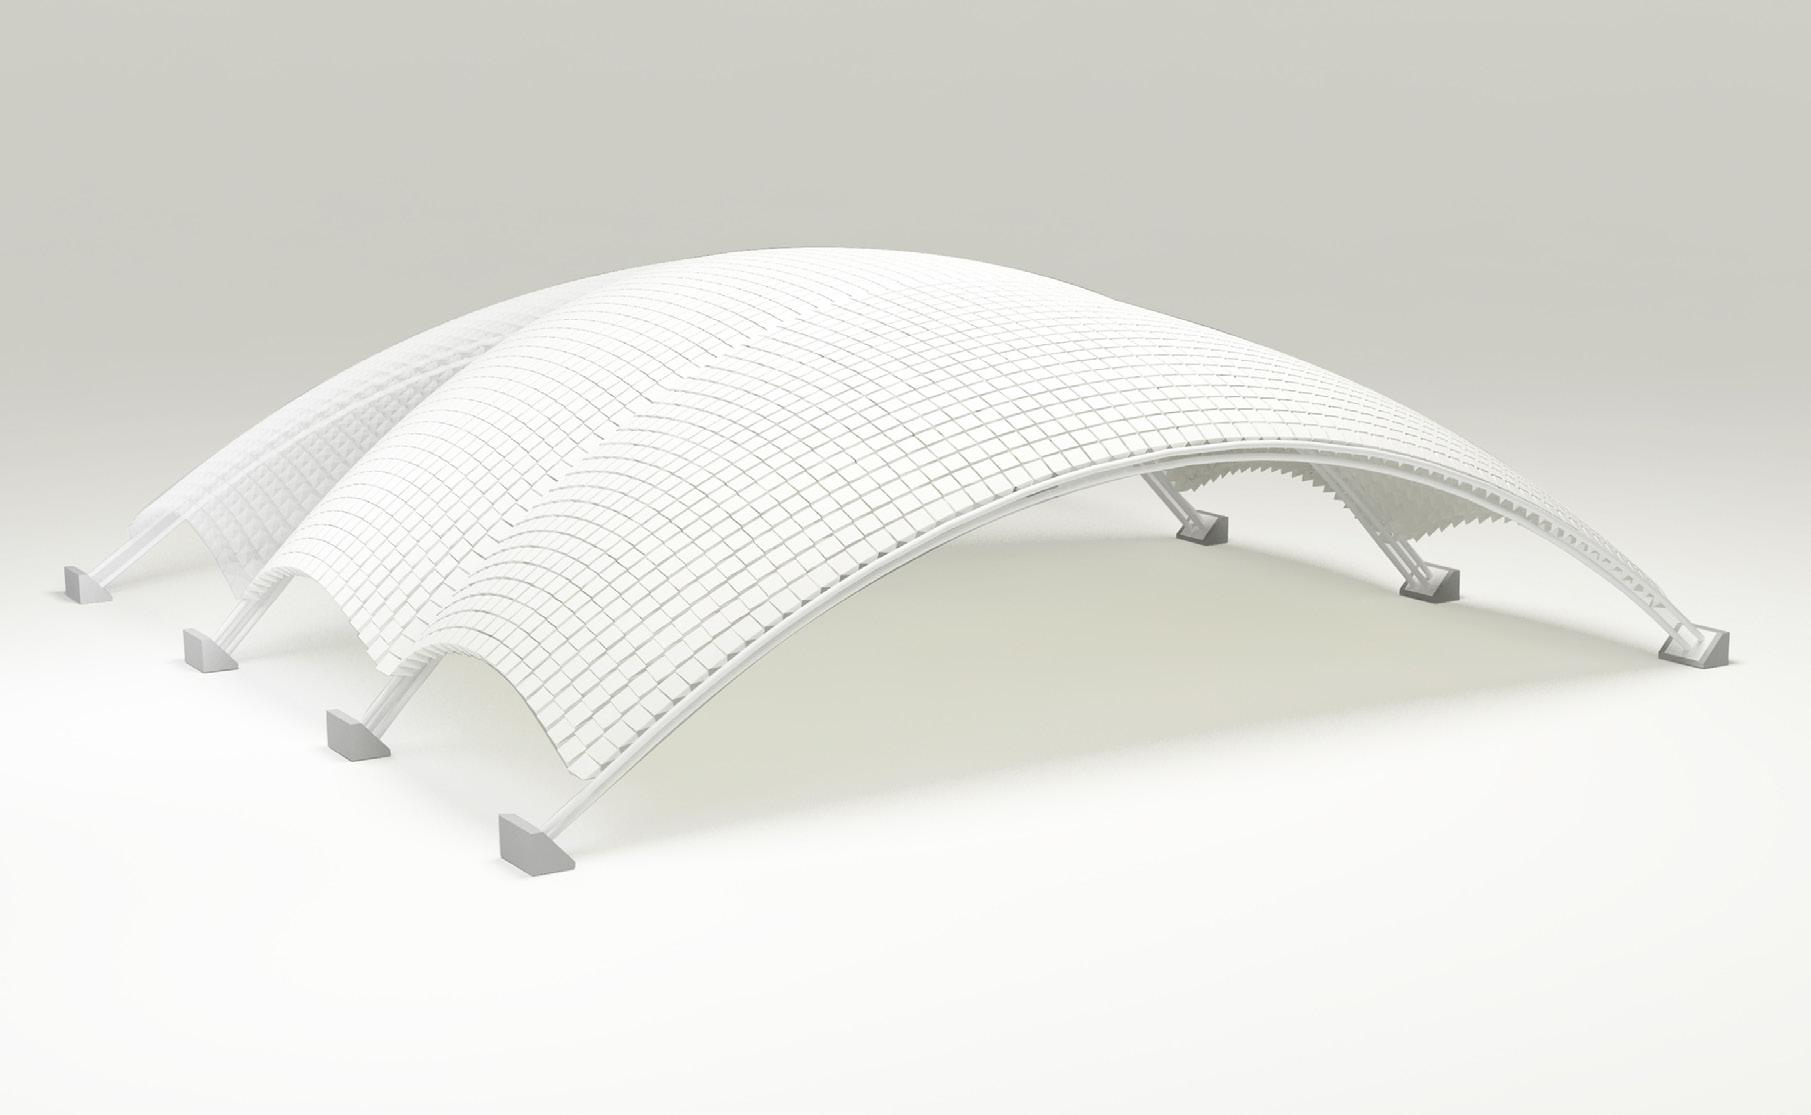
171 Design Development
Fig 6.21
Animation frame showing a primary structure for the arena and global aggregation
Fig 6.22
Animation frame showing a first life of the structure as arena for the olympic scenario
Reconfiguration Strategy
After the first stage of use of the structure, the components will need to be reconfigured to form the smaller canopy structures required for the market setup. Once the components have been disassembled from the structure, they will either be completely unfolded into flat sheets for transportation purposes or can be stored as aggregations of 3-4 components which can then be reconfigured into the new shape. The AR setup used in the previous experiments will be used to reconfigure the components. The structural joints will be removed from the components and the friction joints will be loosened so that the components can be folded into the new shape. Digital object tracking methods will be used to give indications of the components new shape. Once folded into shape, the components will be reassembled into panels and aggregated on site the form the new structure.

This reconfiguration of the structure would take place between its two stages of use or during its life as a market where the
ban be dissembled and rebuilt based on the functional or seasonal requirements. Transparent faces can also be added to the canopy as part of its reconfiguration so as to allow light through the structure and improve the interior quality of the space in relation to the seasonal requirements. The structure would not need to be reconfigured during its use as an arena as because of its short life of 8 weeks. It must be noted that the system was not designed to be reconfigurable as an aggregation and but must be dismantled for the reconfiguration to take place.
172 Transient Systems Chapter 6
small canopy structures
Fig 6.23
Animation frame showing a structural reconfiguration from the arena to the market


173 Design Development
Fig 6.24
Animation frame showing a component level reconfiguration for seasonal change | Closed factor
Fig 6.25
Animation frame showing a component level reconfiguration for seasonal change | Open factor

7. Conclusions
The main outcome of this research was the development of a digitally aided process for the reconfiguration of a component based system in order to meet the dual design goals required for both the first and second lives of a temporary structure. Through the development of this assembly process both positive and negatives outcomes were experienced in the various aspects of its design. The total observations were listed in relation to the different phases of the project:
Phase 1: form finding and folding simulations
Phase 2: surface and structural analysis
Phase 3: aided assembly using AR
It is important to note that while the project overview is described in phases, the overall process was a constant negotiation between the various aspects of the research and all the phases overlapped and informed each other. The listed conclusions will be taken into consideration both for re-examining the design as well as for the further development of the system.

175
Conclusions
Project Overview
The system development process presented both potentials and limitations to take into consideration for the project’s future development.
Pattern Geometry
A semi-regular tessellation developed by Ron Resch was used as the base geometry for the system as it allowed for the creation of a flexible system of regular components which were able to be aggregated in different ways. Variations in global form were achieved through the alteration of assembly data which dictated the shape of the component, its aggregation logic and position in the overall structure. Computational models in the form of spring-based physics simulations were used as a tool for generating the geometries from which the digital information for the guided assembly sequence was abstracted. These digital spring models allowed for the mapping of the folded pattern onto predetermined forms however since the face edges behaved like elastic springs, the exact edge lengths would vary and tolerances within the system had to be allowed due to differences between the simulated and physical material behaviour. Through a series of digital and physical studies, it was determined that lengths within tolerances of 5% greater or less than the edge’s actual length would produce folding simulations that could be achieved
Transient Systems 176 Transient Systems
Fig 7.1
Digital folding simulation process explained through a diagram.


 Parantap Bhatt
Nicolo Bencini
Parantap Bhatt
Nicolo Bencini