Architectural Association School of Architecture

Master of Science, Emergent Technologies and Design 2018-2019
Course Director Michael Weinstock
Studio Master Elif Erdine
Studio Tutor Alican Sungur
Studio Tutor Anitiopi Koronaki

Architectural Association School of Architecture
Master of Science, Emergent Technologies and Design 2018-2019
Course Director Michael Weinstock
Studio Master Elif Erdine
Studio Tutor Alican Sungur
Studio Tutor Anitiopi Koronaki
ARCHITECTURAL ASSOCIATION SCHOOL OF ARCHITECTURE
GRADUATE SCHOOL PROGRAMMES
PROGRAMME:
YEAR:
COURSE TITLE:
Emergent Technologies and Design
2018-19
MSc. Dissertation
DISSERTATION TITLE:
Multi-level Ecology
STUDENT NAMES: DECLARATION:
Fun Yuen (MSc.), Archit Mathur (MArch.), Yukie Takasu (MArch.)
“I certify that this piece of work is entirely my/our own and that any quotation or paraphrase from the published or unpublished work of others is duly acknowledged.”
SIGNATURE OF STUDENT:
(Fun Yuen)
DATE:
20 September, 2019
I would express my sincere gratitude to Michael Weinstock, Elif Erdine for their guidance in this project and during my time at the Architectural Association.
I would also like to express my gratitude to Alican Sungur, Antiopi Koronaki and George Jernomidis for their constructive criticism and insightful suggestions, both during the formation and development of the dissertation.
I would like to acknowledge the contribution of my fellow teammates, Yukie Takasu and Archit Mathur and thank them for the support throughout the project.
Finally, I would like to thank my family and friends for their love, support and encouragement throughout my study at the Emergent Technologies and Design programme.
This research aims to develop a multilevel open space network system in the high-density city of Hong Kong. The lack of open spaces in Hong Kong is a pressing concern as it relates to physical and mental illnesses and social isolation. Ineffective pedestrian circulation is also a contributing factor to the lack of social interaction of a community.
To address the concerns of open space deficiency and poor circulation, an urban and architectural system is designed to increase the open space area in the existing urban infrastructure. ‘Multilevel Ecology’ introduces an alternative circulation system, that comprises of a network of well connected, accessible green open spaces, creating places of social interest and interaction.
As the green open space area is increased, the irrigation demand goes up as well. To drive the city towards self-sustainability, local water harvesting strategies are adapted.
A multi-scalar approach is incorporated that responds to seasonal climatic conditions. Top-down approach at the global scale and a bottom-up approach at the local scale have been incorporated to comprehensively design spaces for the wellbeing of both the individual as well as the city.
1. Introduction............................................13
2. Domain...................................................17
High Density Cities
Hong Kong
High Rise Living
Open Space
Urban Greenery
Climate
Water Storage
Case studies
Conclusion
Research Question
4. Method...................................................47
Overview
Design Method
Design Analysis
Network Analysis
5. Research Development..........................55
Sai Ying Pun, Site Topography
Transportation network
Existing Open Spaces Evaluation
Program & Building Type
Sun light hours and wind direction
Storm Water Discharge System
Conclusion
Plant Research
Planting strategy
Speices Study
Hydrologic System
Irrigation Estimation
Rain water harvest system
Grey water
7. Design Development................................99
Experiments Overview
Open space system elements
Experiment I -Open space distribution
Experiment II -Network connection
Feedback Experiment
Planting Strategy
Water system
8. Design Proposal.....................................163
9. Conclusion.............................................177
System Refinements
Next Step
10. References...........................................181
Image References
Bibliography
Hong Kong was planned in the early 1900s with the land requirement assessments of the time. This did not account for the post industrialization boom in population. The rapid densification in the early 1900s coupled with inefficient urban planning with a lack of foresight has deteriorated the quality of life of the inhabitants of Hong Kong.
As the focus of planning is predominantly on satisfying occupancy, Hong Kong faces an acute lack of open space. The open space deficit has stemmed into both physical and mental wellbeing concerns. Open spaces act as places for interaction, the lack of which leads to a considerable increase cases of social isolation and mental illnesses.
The inadequate connectivity of spaces is also a shortcoming of the planning. Being limited to ground level connectivity does not work in Hong Kong as the density of buildings call for a three-dimensional network system as it is counterproductive and simply unpleasant to be bound to respective building cores.
To ultimately achieve this system, we will carry out our experiments in the area of Sai Ying Pun in Hong Kong. This urban patch comprises of all the key issues that we want to address. Being in the old district, Sai Ying Pun is packed to the brim with pencil towers and faces an eminent deficiency of open green spaces.
The topography is a major challenge due to its steep slope, and climatic conditions further adds to the unfavourable pedestrian conditions. Flash floods during peak rainfall months further contribute to the challenge. Sai Ying Pun like most districts in Hong Kong, does not subscribe to local rainwater treatment and storage.
We aim to explore the untapped strategies of multilevel connections and creating sustainable green social spaces of interest, by conducting experiments on this urban patch. These spaces will act as the new social hotspots and will be deeply integrated with the existing urban fabric.
We understand that by considerably increasing the amount of Green spaces, would require a large amount of water to maintain these spaces. We will also propose a rainwater harvesting strategy that creating the potential for the site to self-sustain its water needs.
[DOMAIN]
High density high rise living
Problems and potential
Livability
Open space
Urban greenery
Hong Kong
Climate
Water Shortage
Case Studies
Singapore green social housing
Hong Kong elevated walkway system
Ambition and Research Question
The chapter commences with a discussion on high-density cities, identifying the living conditions and elaborating on the problems of such cities. We will also establish the scope of the project by focussing on aspects that can be improved.
Subsequently, the study will be narrowed down to the highdensity city of Hong Kong, conducting in-depth research into how the city adapts and evolves in response to the continuous and rapid densification and land shortage. The potential to drive Hong Kong towards self-sustaining its water needs will also be investigated.
As this study hinges on theoretical concepts of spatial quality, urban livability in our context will be defined. The importance of spatial elements that directly affect the livability of an area such as green open spaces and connectivity drivers will be explored. Precedent studies will provide us with practical insights and demonstrate the extent to which these spatial elements are currently being utilized.
Consequently, the domain chapter will conclude by summarizing learnings from the studies, explaining the precise focus of the design project, informing the research question based on improving the livability of a high-density city without needing to wipe out the existing urban built structures.
Problems and potentials
The fundamental concept of density reflects the population per unit area. Density is also strongly related to the interactions between space and the people using the space. The perceptual limitations of most high-density cities relate to a negative peoplespace interaction.
It is commonly stated that cities with higher densities are more sustainable than low-density cities. Much contemporary urban planning, particularly in North America, the UK and Australia cope with urban sprawl systematically by developing sufficient infrastructure preemptively before the inflow of people. However, a region with a perfectly functional model that copes with high density is yet to be seen.
No two high-density cities have the same set of problems, but certain complications are identified as a trend common to most high-density cities. High-density cities’ residents cope with concrete environments packed with high-rise offices and residential buildings, acutely limited urban open space, a substantial urban heat island effect and high concentrations of roadside pollution that fail to disseminate from poorly ventilated street canyons. These factors, combined with crowding at the street level and in public areas have a detrimental impact on the livability of that area.
We must differentiate between ‘density’ and ‘crowding’. While ‘density’ is used to refer to the physical limitation of space, ‘crowding’ is the genuine psychological perception of the limitation of space (Ying-Keung Chan 1999). Social pathology is caused due to stress and social conflict of crowding, whereas high density may not necessarily lead to a perception of crowding or stress. Hong Kong, despite its density, can have high standards of liveability. It is a widespread belief that high-rise living is the driving factor for most of the negatives that relate to highdensity cities.
For the design and planning of high-density cities, the relationship between the dwelling buildings and the surrounding spaces in residential areas must be considered, not only from the physical aspect but also from the social perspective.
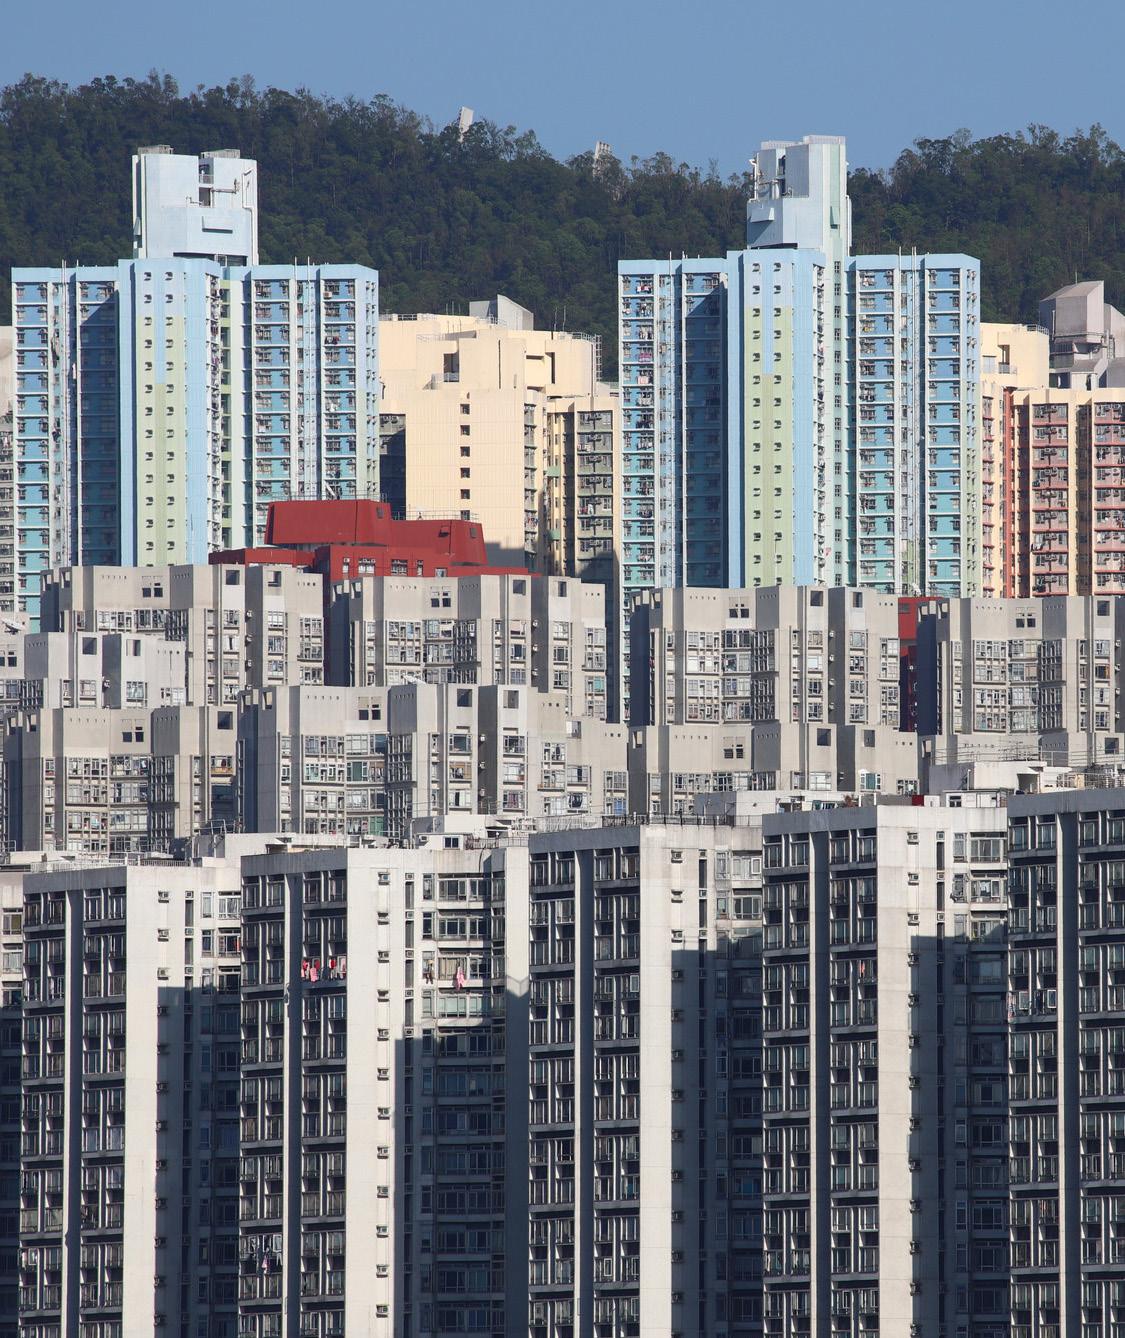
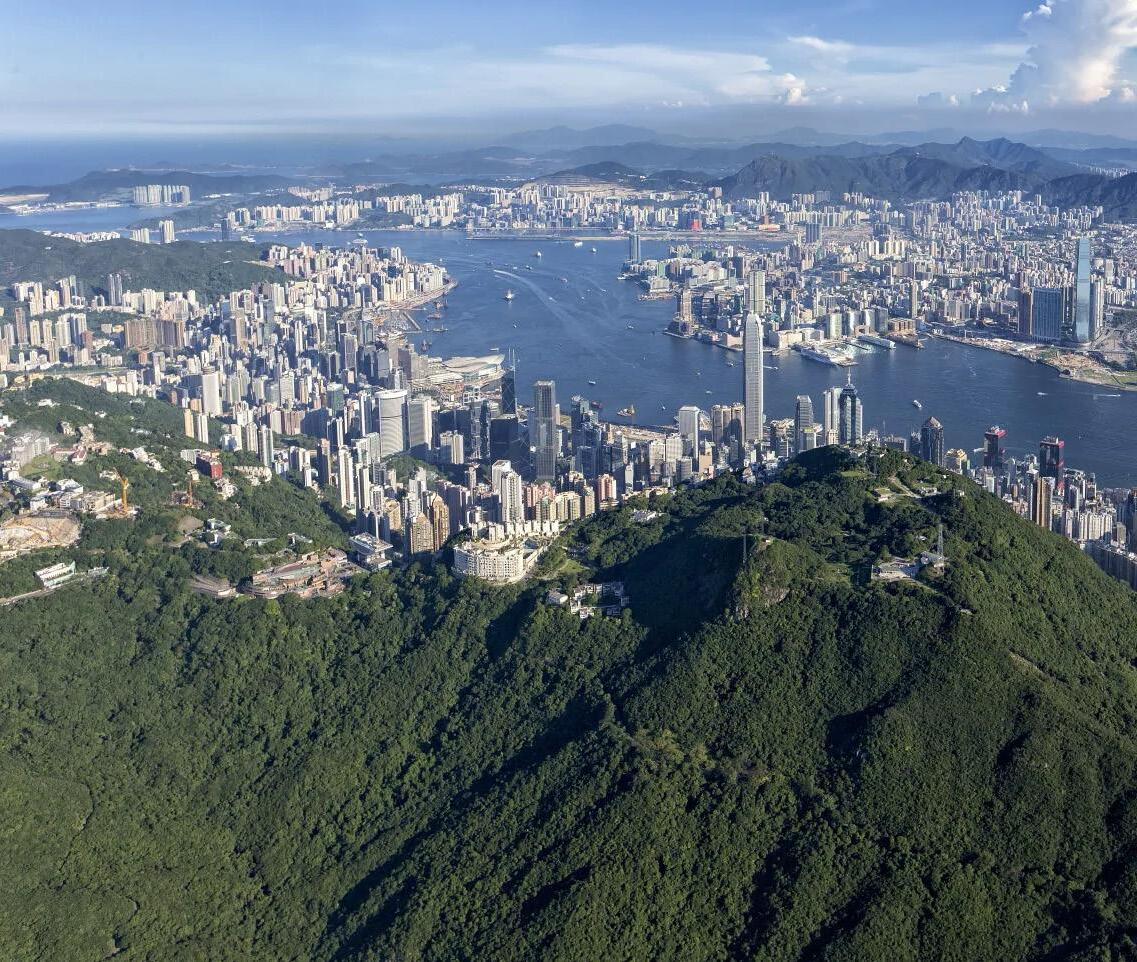
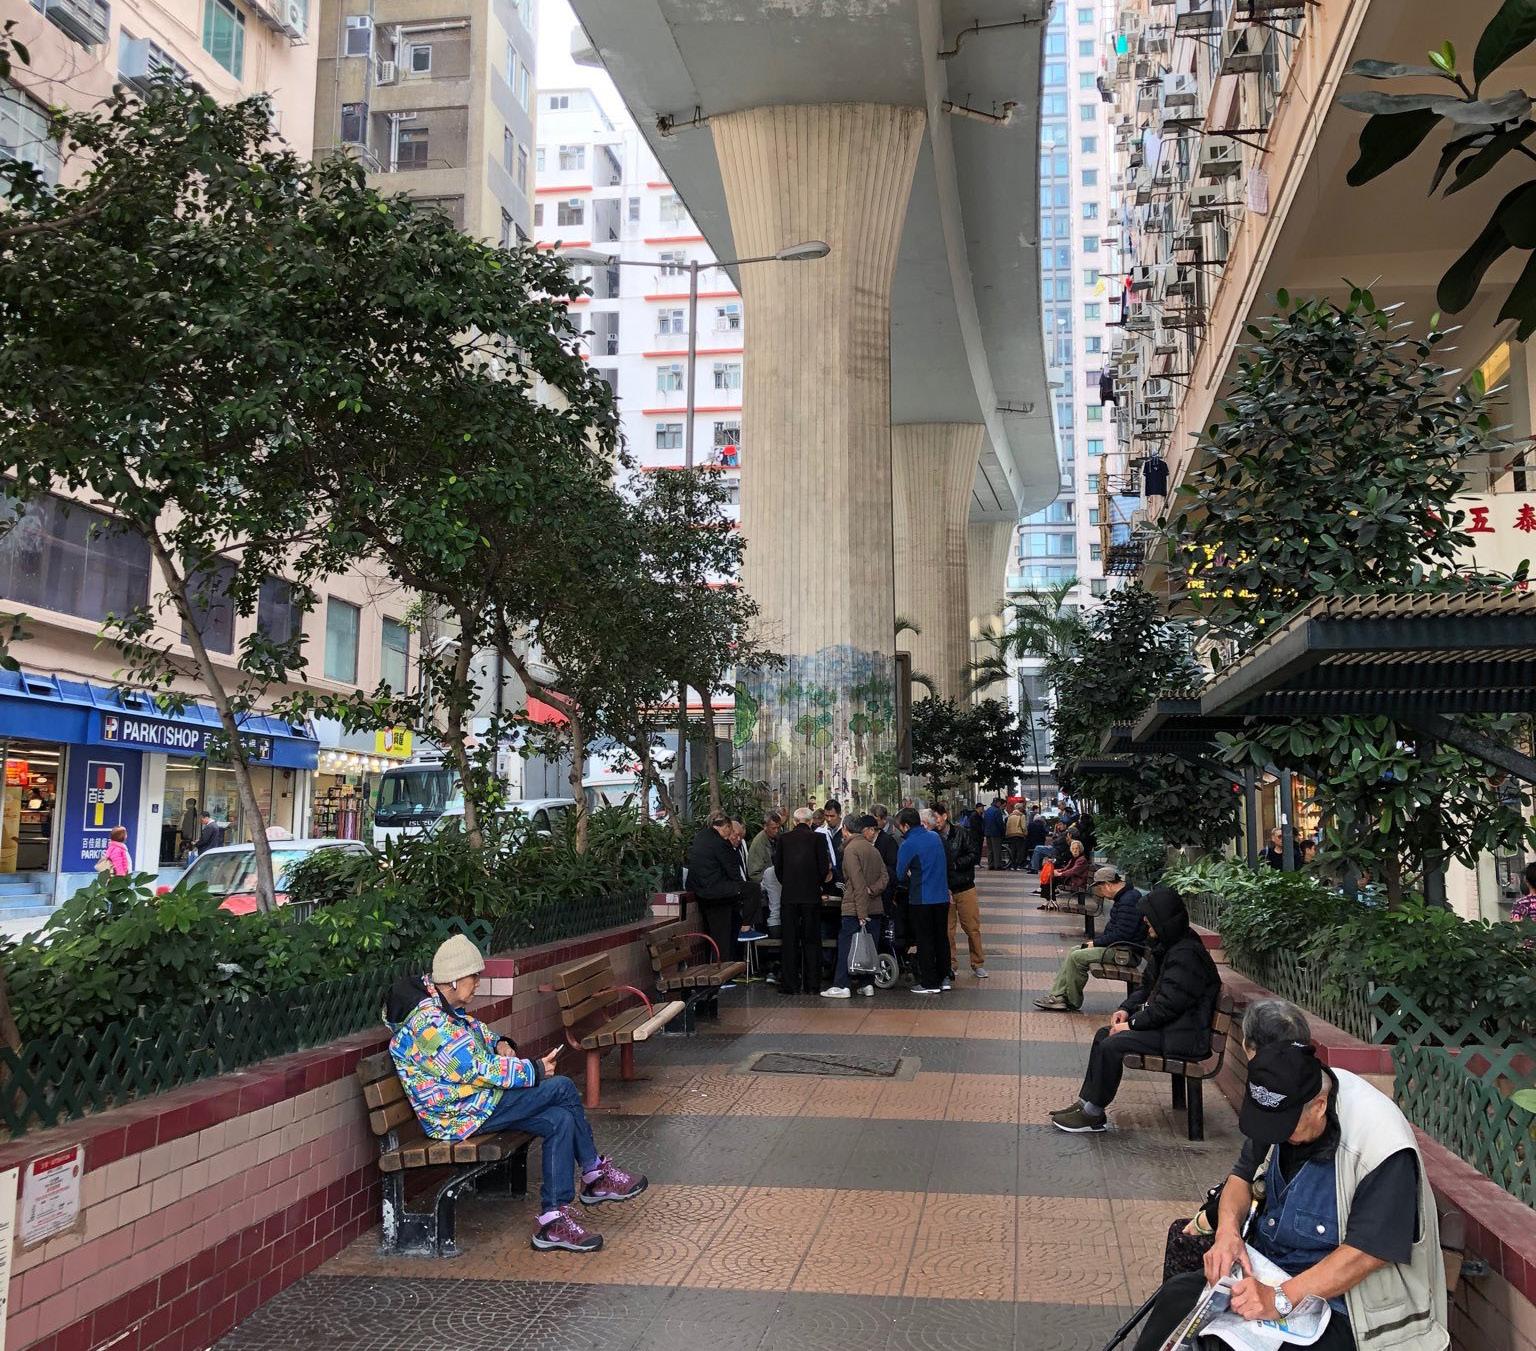
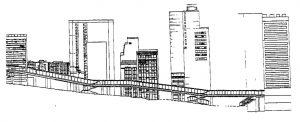
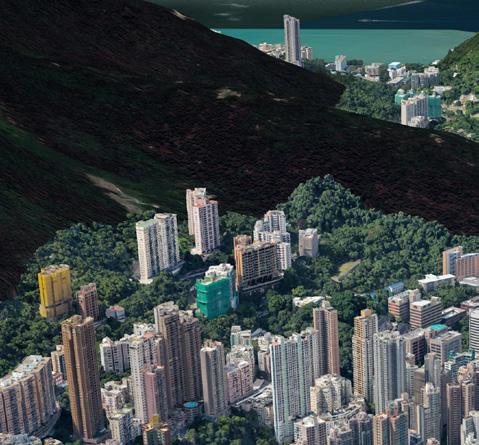
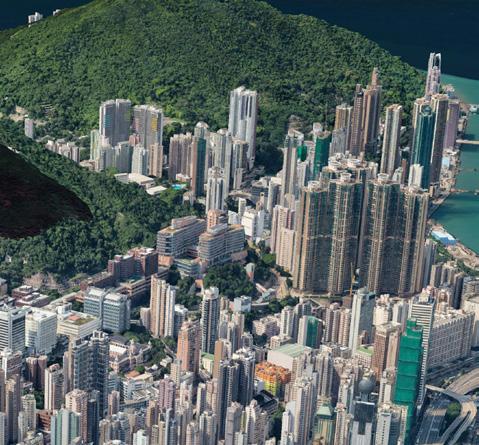
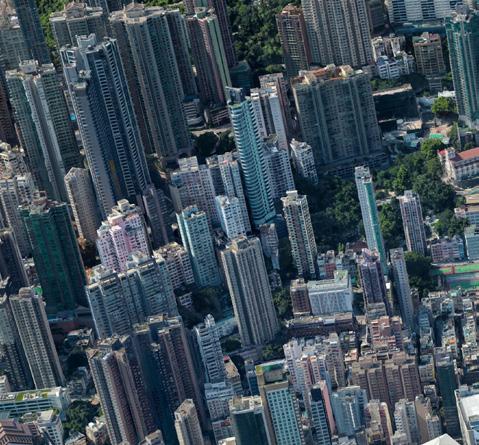
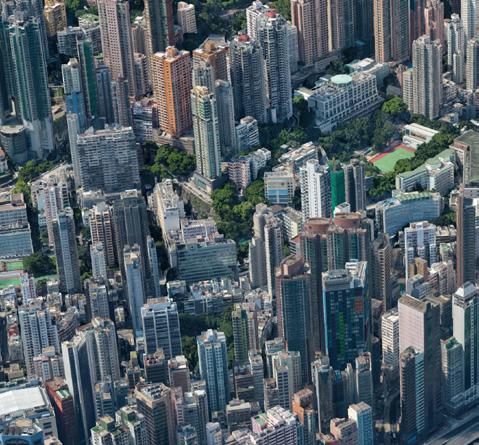
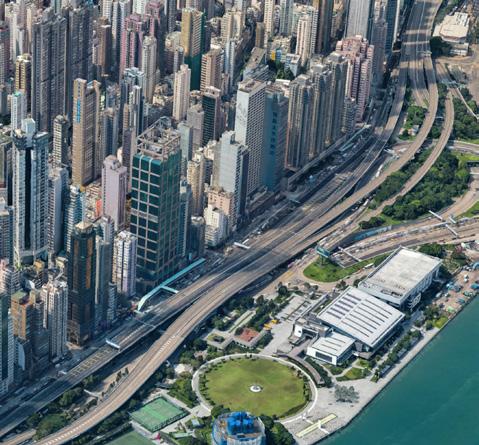
Fig.1. (prev. page) High Density Hong KongUnderstanding the context
Hong Kong was planned during the early 20th Century. Since then, the city has gradually grown to transform into a vertical city, due to various factors, such as a rapid population explosion, topographical limitations of hilly and coastal terrain, economic development and the pursuit of sustainable living for its populace (Stephen S. Y. Lau, Qianning Zhang 2015, 117-118).
Hyper-density, multifunctional and integrated development, land preservation, vertical mixeduse, and large vertical scale uniquely constitute the main characteristics of Hong Kong as a vertical city, compared to other global high-density cities.
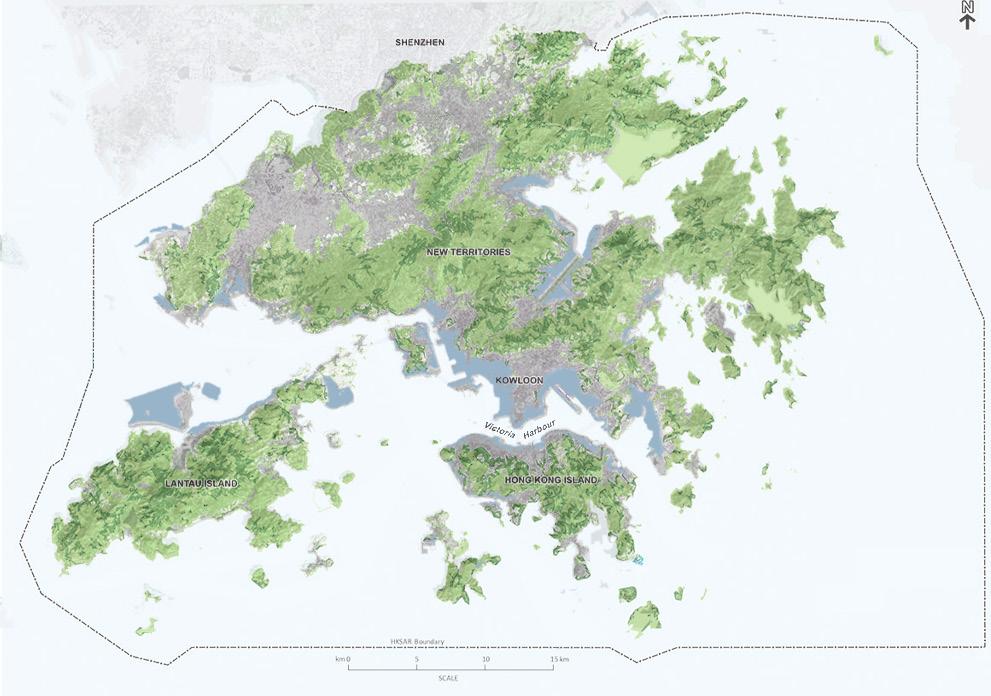
With a population of over 7.4 million people in an urban land area of just 120 km2, Hong Kong is one of the most densely populated places in the world. The
city has evolved into the quintessential high-density small-footprint city as it consists of several large mountainous islands, leaving only 30% of the city sufficiently flat to accommodate built form, the result of which is extensive land reclamation that restrains city growth (Barrie Shelton, Justyna Karakiewicz, Thomas Kvan 2011, 4-5). Additionally, more than 75% of this land comprises non-built-up areas (protected area), implying that the entire population must fit on the remaining 24% of the land.
Due to this, the people have no option but to adapt to an overcrowded living environment with depleting open space, less greenery, a lack of privacy and a high occurrence of noise disturbance at the community level. As a result, Hong Kong suffers in the world rankings of livable cities (Stephen S. Y. Lau, Qianning Zhang 2015, 117-118).
Pros and cons of high rise living and the evolution of buildings in Hong Kong
Living in a highrise building can come with many advantages such as the location, security, in-house amenities, administered maintenance and the view. It is widely accepted as the ‘efficient’ way of living in terms of space, built quality and resource proximity.
Though highrise living has its advantages, certain significant limitations can not be ignored. In order to achieve occupancy, high rises are designed to cut down on space as much as possible, reducing the dwelling area and common open areas within buildings which are essential for community living. Open spaces in highrises promote movement, interaction and create a potential for greenery, lack of access to which, may result in social alienation of a person.
Social deprivation and fragmentation unquestionably play a role in the general mental health of the inhabitants of any given area. The continued densifications of the cites may result in more people shifting to this way of living, further contributing to the high-density and the shortage of space. Although
the cons of highrise living are significant, they are not irreparable. Steps can be taken in planning and design to increase the quality of living in these megastructures.
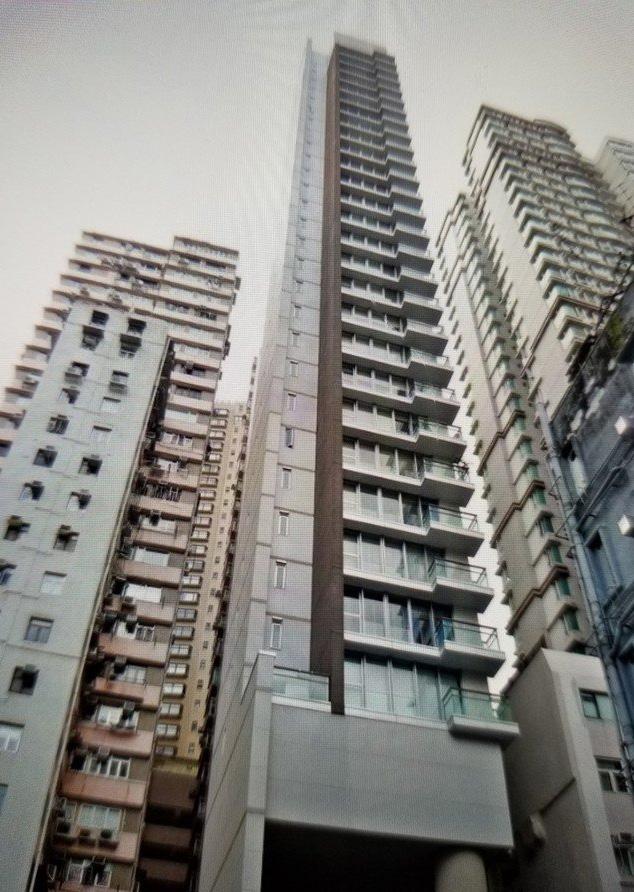
In the case of Hong Kong, the small sites that once used to have lowrise brick houses, today have highrises of the same prior footprint. Because of the lack of policy of land reclamation from private landowners, private developers only aimed at redeveloping the small sites for highest possible towers to maximize occupancy and profit, resulting in the fragmented “pencil” or “toothpick” development in the old districts (Chan, K. R., Chow, T. A., Lee, N. K.. 2015).
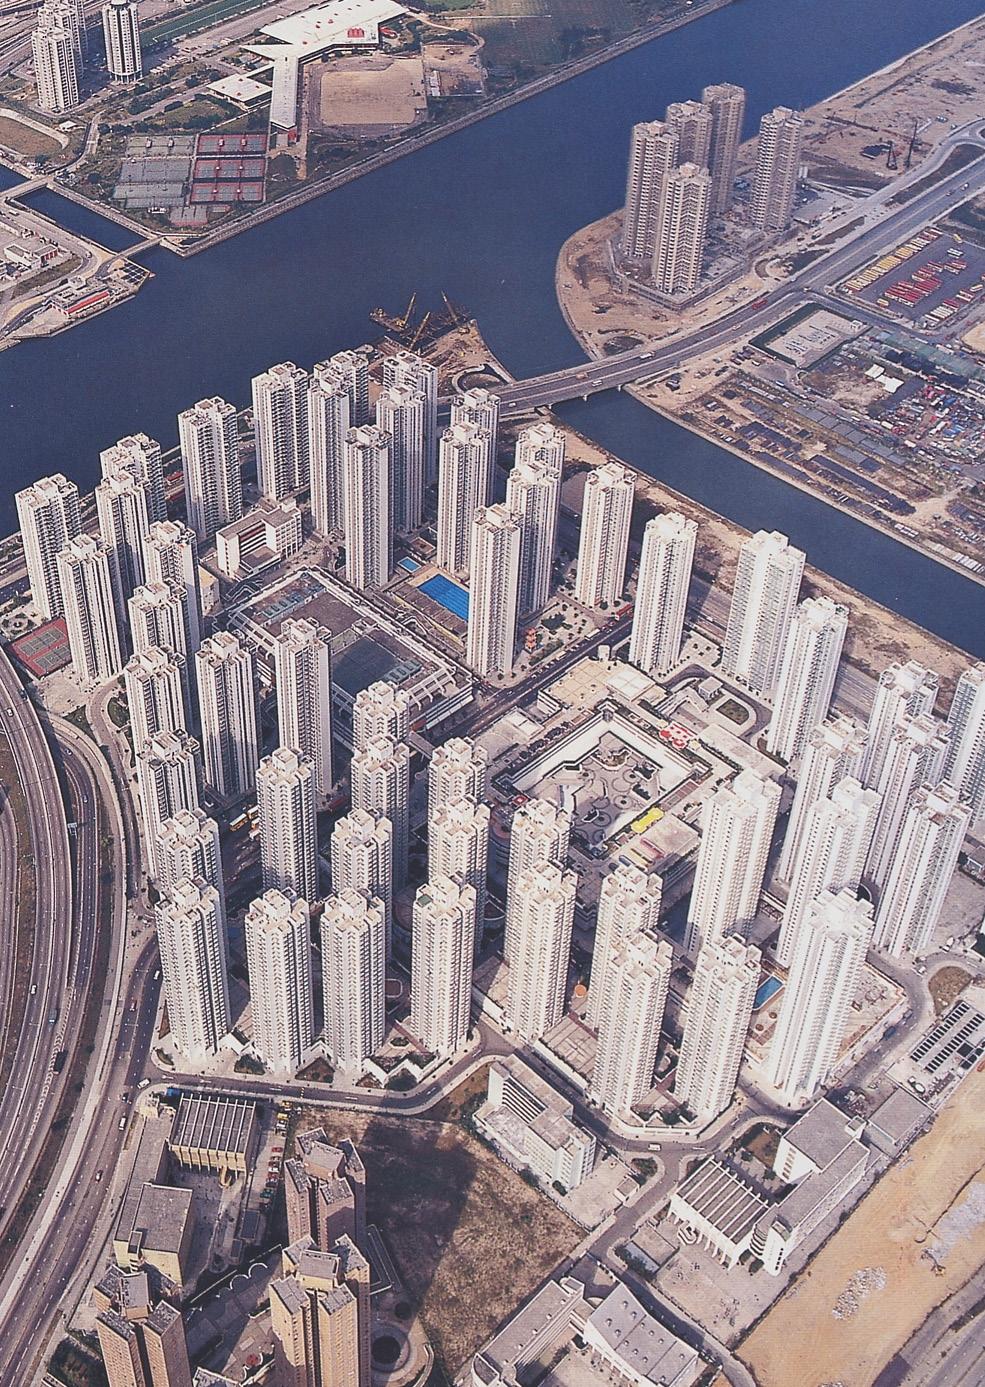
In the 1980s, to accommodate the rising population, the government released policy to reclaim the land that was utilized to build private mass housing estates. Contrary to the old district renewal, these estates built on the reclaimed flat land were planned with inclusive facilities and were considered to offer a higher quality of life.
During the early 1990s, the 15m full plot coverage bye-law was revolutionary to Hong Kong’s architecture and planning as it gave rise to the mixed-use tower + podium morphology; in which
the podiums were developed to have commercial programmes. This building type soon became ubiquitous and to this day, is the most common configuration seen in Hong Kong.
The podium and tower typology impacts the city in ways that the previous typologies did not. A podium with a large site coverage not only obstructs most of the wind to pedestrians but also traps air between podiums, affecting air quality (Edward NG, 2003). Additionally, the podium also blocks sunlight from reaching the pedestrian level.
The built morphology of Hong Kong adapts and repeatedly evolves to cater to the needs of the time. As the existing urban fabric is causing several socioenvironmental complications, there is a need for the built structure to evolve yet again.
Importance of open spaces in urban environments
Open spaces are open pieces of land that have no buildings or built structures and are accessible to the public. These can include parks, community gardens, schoolyards, playgrounds, public seating areas, public plazas and vacant lots. It provides recreational areas for its users and helps enhance the aesthetic and environmental quality of neighbourhoods.
The quality and quantity of open spaces are vital in determining the livability of an open area. According to the World Health Organization (WHO), an urban open space brings out numerous social and ecological advantages. These spaces encourage exercise in both grown-ups and children, promoting better physical wellbeing.
Living within walking distance from an open space can reduce health imbalances, improve wellbeing, and aid in the treatment of mental illness. Physical activity is a natural environment can help mild remedy depression and reduce physiological stress indicators. Additionally, these spaces encourage interaction, social equality and a sense of community.
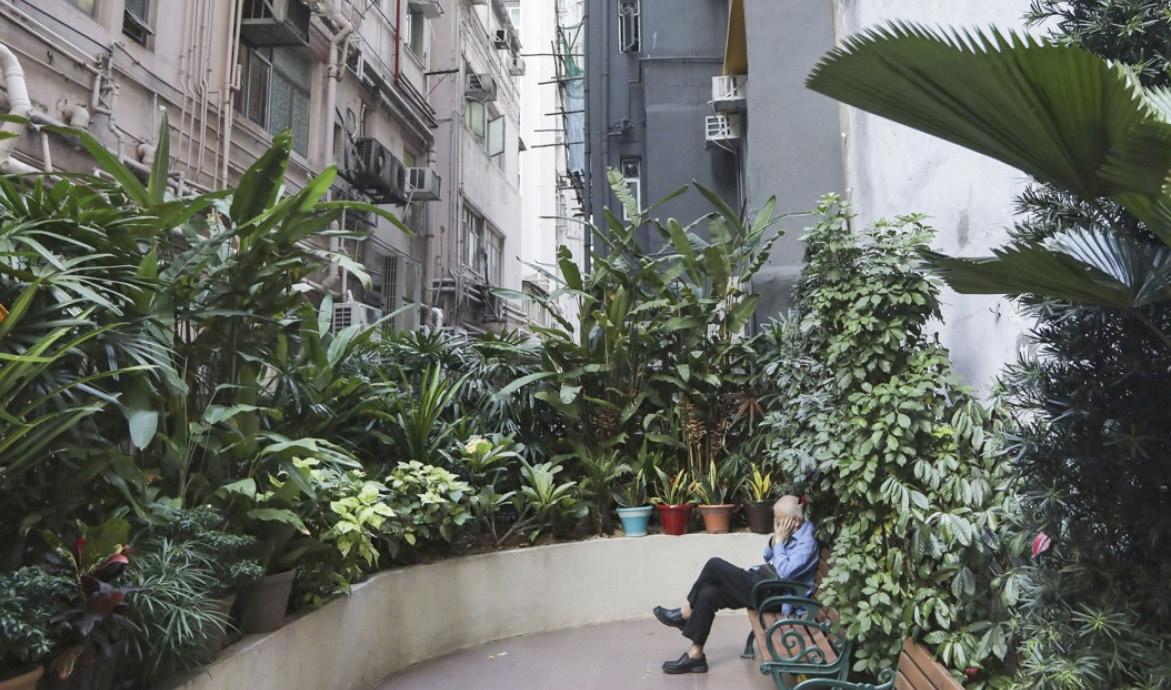
While a larger quantity of urban open spaces is necessary, there is a need for an increase in quality as well. In the context of Hong Kong, many pocket parks are not well designed. These are mainly dark spaces that lack seating and sufficient air circulation. These spaces need to be designed as inviting recreational spaces and must account for pleasurable user experience, irrespective of its size.
Since livability refers to the quality of life in a human living environment, this notion is concerned with optimizing the integrity and the performance of human life (Ellis and Roberts, 2016 Hagerty et al., 2001). An area’s livability can be evaluated in a wide range of contexts within the field of planning such as transportation, community development, resilience, spatial comfort and circulation.
The focus of this study will lie on the physical and mental wellbeing of citizens by introducing and integrating environmentally sensitive green open spaces within the urban fabric.
Importance of greenery in urban environments
Green spaces are critical elements contributing to the citizens’ health and the sustainability of the city. Living close to green open spaces assists individuals’ capability to mitigate stress and is related to a lower rate of depression and anxiety.
The environmental and ecological benefits of urban greenery include isolating air pollution particles and greenhouse gasses, facilitating wind circulation in areas with high built density, moderating the urban heat island effect, decreasing stormwater run-off and reducing noise pollution.
Biodiversity is used as a means of measuring how healthy a particular ecosystem is. A healthy ecosystem is capable of sustaining a wide variety of life. Urban biodiversity of a region contributes to creating breathable air to the supply of clean water, even seemingly insignificant insects provide vital ecological services including pest control,
pollination, and wildlife nutrition — conservation of biodiversity assists in maintaining ecosystem services that are essential for human life to persist.
With the increase of carbon emissions and nonnatural materials, it can be difficult for local flora and fauna to thrive. As 51% of the total population in the world now live in cities, there is a vast carbon footprint being created. One way to offset this carbon footprint is to support a healthy environment by increasing its biodiversity.
Urban environments can be developed to promote the integration of biodiversity with the introduction to green infrastructure. Using local plant species in green infrastructure such as sky gardens, green walls and green roofs can ensure that the local biodiversity in an urban area thrives.
Subtropical Hong Kong has four distinct seasonswarm and humid spring, hot and rainy summer, sunny autumn and pleasant-dry winter.
The comfortable range of outdoor humidity corresponding to Hong Kong temperatures lies between 30-60%. The humidity, however, is always above that. The highest humidity is generally recorded in April and May at 83% while the lowest is in December at 69%.
Summers
The peak summer months are between June and August in Hong Kong, coupled with frequent typhoons. June has the highest average rainfall, and there is a constant threat of summer showers, typhoons, and thunderstorms. Temperatures usually exceed 30 degrees during the day. The continuous scorching sun and low breeze result in extreme heat indices, which usually lasts till around July and August. Nights are also warm with an average temperature of 26 degrees.
Winter in Hong Kong by local standards is generally cold with temperatures ranging from 15°C-19°C. Winter usually starts in December and becomes cloudier towards February. The coldest month is January, and the temperature reaches 14-18 degrees. The winter months receive the least amount of precipitation. During these months, due to the lack
of water storage systems, Hong Kong imports all its water.
In September 2017, Hong Kong experienced typhoon Manghut and faced the highest wind speeds recorded in more than a decade.
These high winds take down trees, smash windows and even blow away roofs of smaller accommodations.
Sudden cloud-bursts almost always accompany typhoons. These instant heavy rains lay waste to the drainage system and result in flash floods.
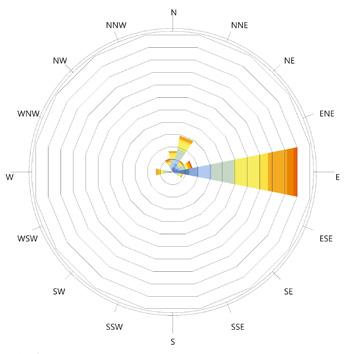
Wind
Present in a subtropical hot and humid climate, the wind velocity is dampened due to the perennial high humidity. The humidity, coupled with the building density, further minimizes the wind velocity. Housing estates built in the 1990s were so tall and dense, they were termed as “wall buildings” because they cut off air circulation in the neighbourhoods around them, trapping air pollution and bumping up summertime temperatures by several degrees.
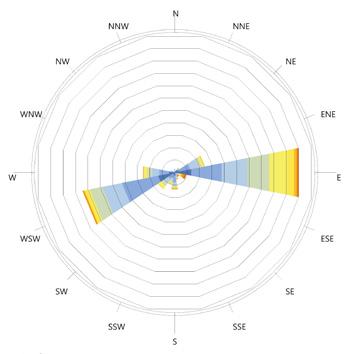
The prevailing wind blows from West to East in Hong Kong. This prevailing wind direction remains constant all year except for three months in the summer. From June to August, the prevailing wind flows from SouthWest.
(top) Maximum and minimum monthly temperature and maximum humidity throughout the year in Hong Kong
(middle) Average rainfall and number of rainy days for Hong Kong
(bottom) Number of typhoons and maximum speed in 10 years for Hong Kong
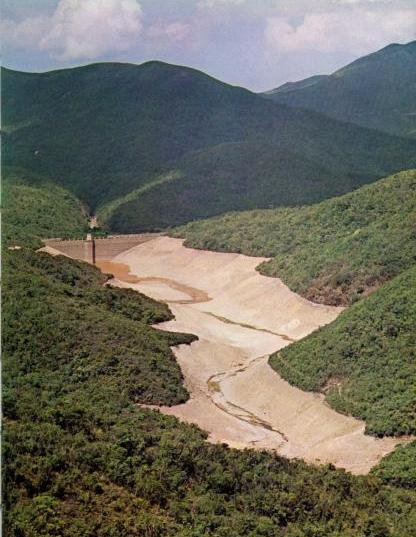
Shortage of fresh water supply
With no natural lakes, large rivers or underground water, Hong Kong faces the challenge of securing a stable and adequate supply of water to meet its development needs.
In the past decade, Hong Kong’s annual water consumption was over 920 million cubic metres. The annual net yield, covering only 20% to 30% of the total consumption, was inadequate to meet the huge demand.
Currently, Hong Kong does not reuse rainwater locally, missing the opportunity for building a selfsustainable system in individual areas . The gathering of rainwater in an appropriate way can be a permanent resolution to the water crisis in Hong Kong. This basic strategy is particularly workable in Hong Kong where there is a substantial downpour, and both the groundwater supply and surface water resources are inadequate. This is particularly applicable in hilly areas where the channelling of water from higher to lower ground is especially effective without the direct use of pumps.
Hong Kong sees low rainfall during winter and extremely heavy rainfall during summer . With an effective local rainwater harvesting system, the area may have the potential to be self-sufficient even during winter.
Systematic rainwater harvesting can help in irrigation with the minimum use of technology and is, therefore, cost-effective. This straightforward technique can help irrigate plants in green open spaces even during the dry months and can be utilized to revitalize the ground level water and improve its quality. It additionally creates a sense of social responsibility and mindfulness about the environment.
The grey water is also a relatively untapped resource in Hong Kong. The grey water from households is channelled into the storm water drains and ejected.
Bridging this enormous gap between the local yield and the local demand can be attempted by a new local conservation strategy.
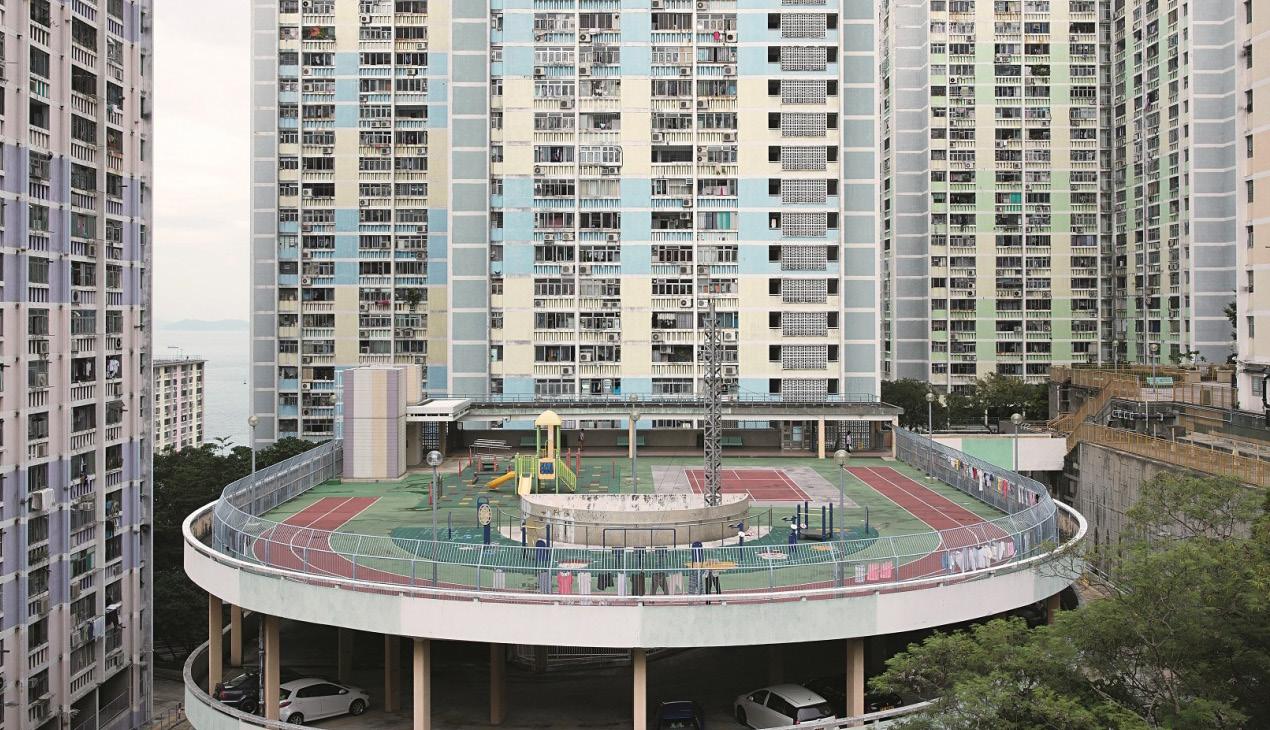
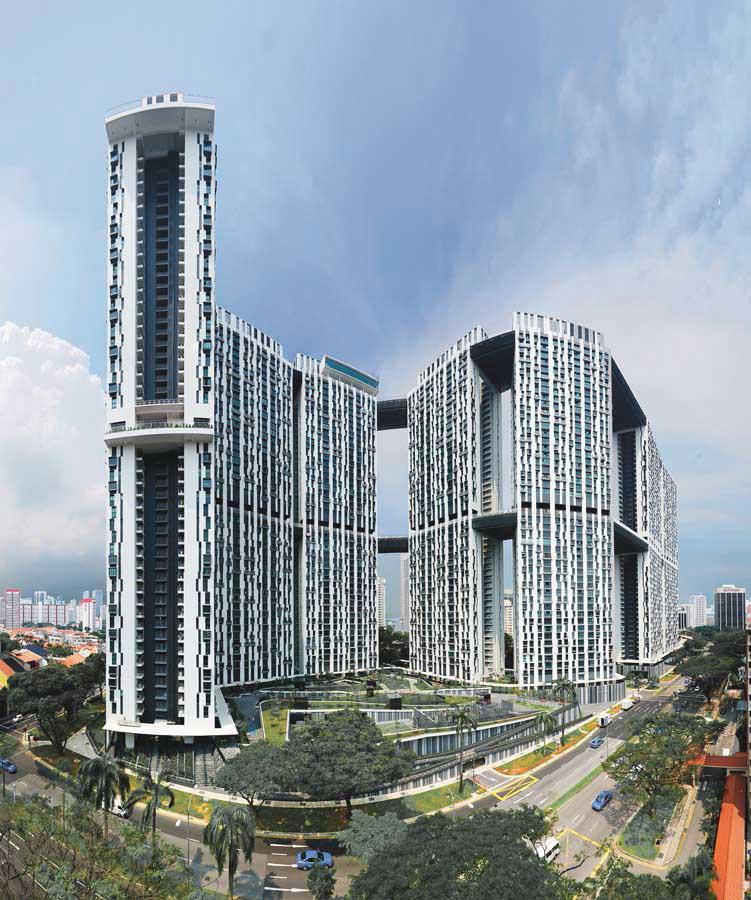
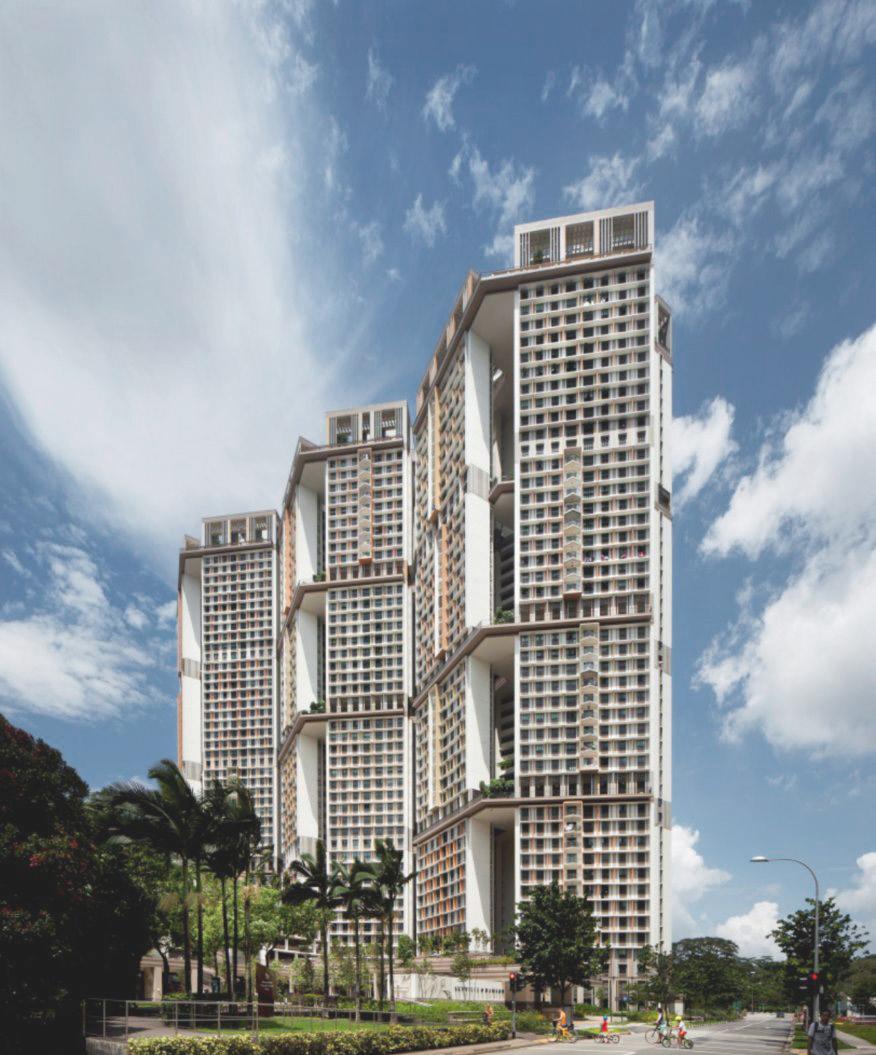
This case study demonstrates what happens when public spaces with specific priority are located on high levels within the building structure and their impact on privacy. Pinnacle at Duxton and Skyville at Dawson were chosen as case studies, as the estates are in a similar context of Singapore and because they have integrated sky gardens within their highrise, high-density housing typology. These projects are situated in a mixed public and private area in high-density high-rise buildings, challenging the norms of high-rise development by demonstrating that high-density towers can also be high amenity by clearly establishing community living and sustainability as their central themes.
Open spaces that are present on the ground level in generic projects are present at every five stories in Skyville and two levels in the Pinnacle. These green open spaces have increased accessibility and usage compared to projects with only ground floor access. The open spaces promote a sense of community and promote social interaction.
The multilevel social spaces in Skyville are strongly influenced by the structure of the building and
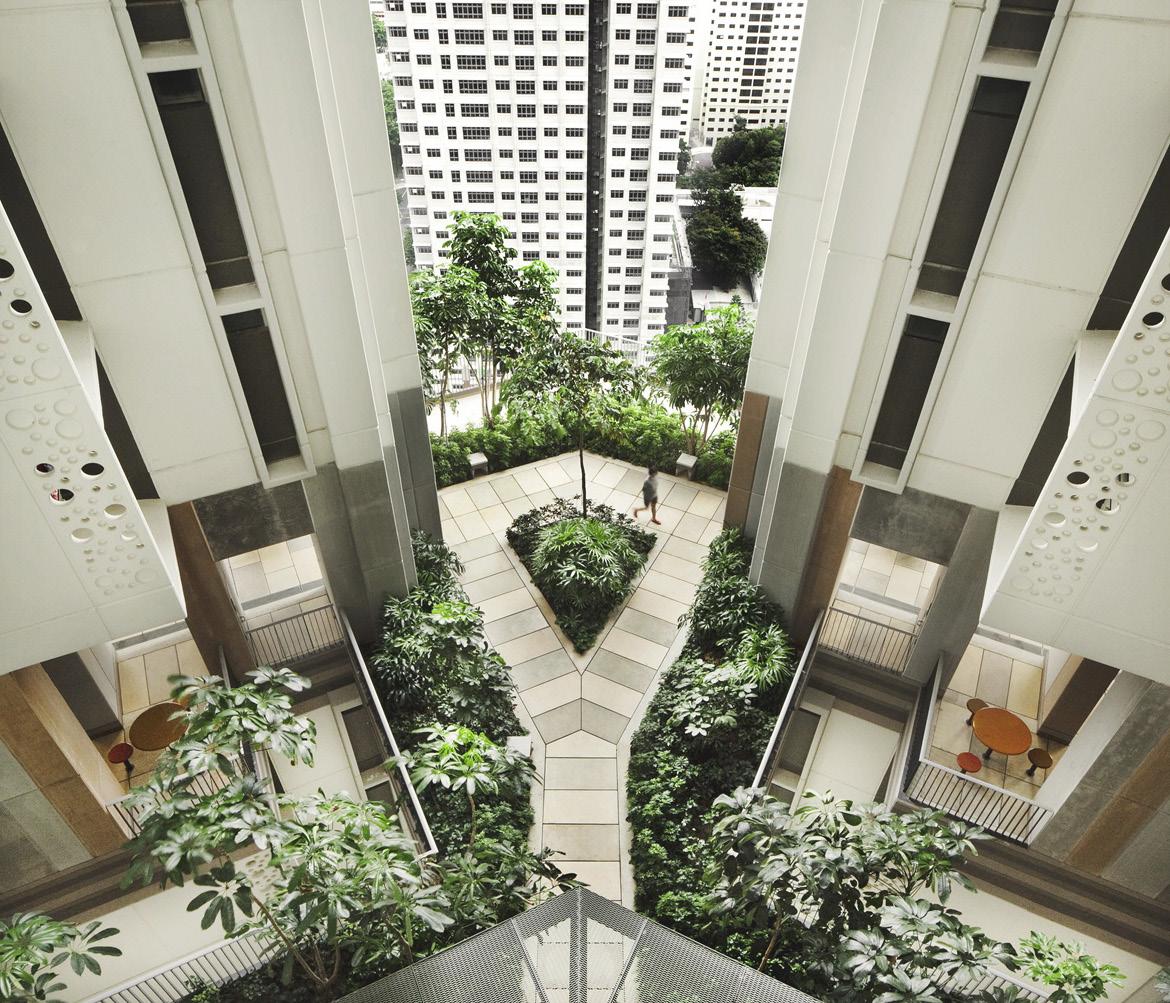
are designed to compose of many small pockets of greenery. This greenery does not only serve as landscape elements but also facilitate privacy, acting as barriers between public spaces and private accommodations. The Sky Garden on the roof is the most frequently used space by the residents as it provides excellent city views and is accessible to the public. On the other hand, the Pinnacle provides a broader array of amenities in the two levels of sky gardens including jogging tracks, playgrounds and sky gyms with well-shaded, open and breezy rest areas.
The higher accessibility of sky gardens at the Pinnacle may have a negative impact on its residents. Sky gardens isolated from the residential units may be preferred due to concerns over privacy and the related issues of noise and littering. The accessibility is not a pressing concern at Skyville as the public spaces programme is sedentary, which limits the use of the spaces (Dr Swinal, Na Hsi-En, 2017). A bioswale present on-site at Skyville that treats site storm water then discharges it into the city’s drainage system. No such sustainability measure is taken at the Pinnacle.
Fig.10. (next page top left) Exterior of The pinnacle @ Duxton in Dawson, Singapore
Fig.11. (next page bottom left) Sky garden of The pinnacle @ Duxton in Dawson, Singapore
Fig.12. (next page top right) Exterior of SkyVille in Dawson, Singapore
Fig.13. (next page bottom right) Sky garden of SkyVille in Dawson, Singapore
MULTI-LEVEL PUBLIC SPACES IN SINGAPORE’S PUBLIC HOUSING Case study of Skyville and Pinnacle at Duxton
of the activities available to residents (Dr Swinal, Na HsiEn, 2017).


The two projects also show that a balance of sustainability, communal living and occupancy can be achieved that may be in favour of the city as well as the residents.

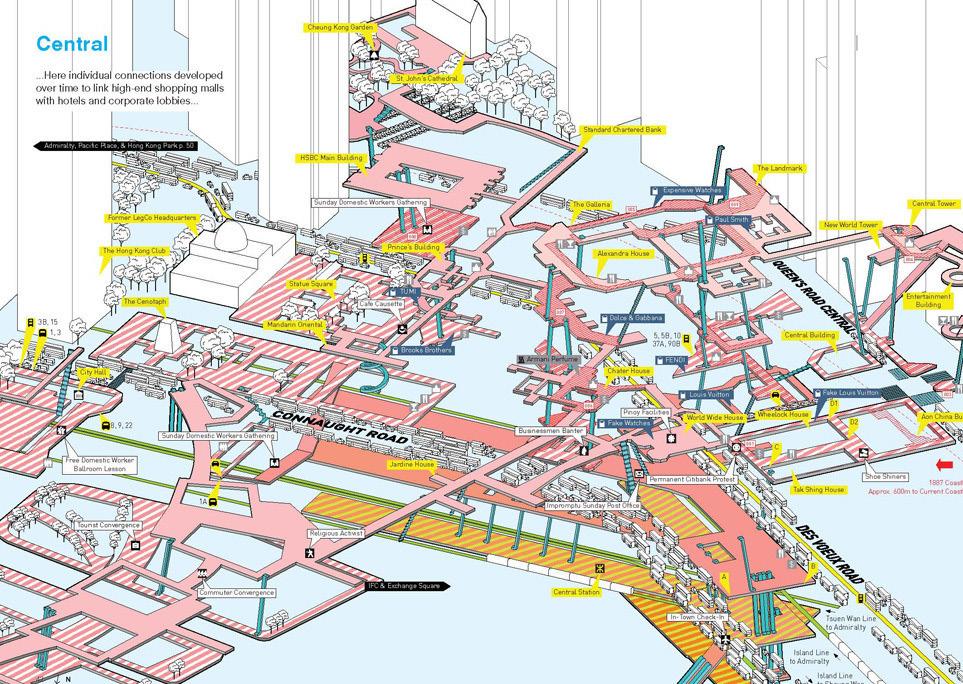
Case study of pedestrian connections, Central, Hong Kong
Hong Kong’s central business district, also known as Central, is connected with an effective pedestrian network, the development of which began in the 1960s.
The elevated pedestrian network was initially created to channel internal circulation within commercial centres when the city was undergoing rapid growth in the 1960s and 1970s. This pedestrian network prioritised pedestrian movement within Central’s commercial zone to encourage a consumer-oriented economy.
As the number of domestic buildings continued to grow, the city was unable to provide adequate public communication at ground level. Thus a framework of pedestrian planning was released that called for the provision of a three-dimensional pedestrian network comprising of multilevel links by elevated walkways and escalators, facilitating pedestrians able to move freely over vast areas segregated from vehicular traffic (Zheng Tan, Charlie Q., 2016).
Central’s Transit stations, open spaces, malls, parking structures, and streets are all independently operated urban systems that were envisioned to connect to and comply with each other at different levels through tunnels, ramps, escalators, conveyance belts, and lifts.
One of the main drivers for this was to address
the two main problems of the traffic situation in Central. Firstly, the limited widths of walkways were challenged to accommodate pedestrians during peak hours. Secondly, the limited access and the social hierarchy limited the connectivity with the streets below.
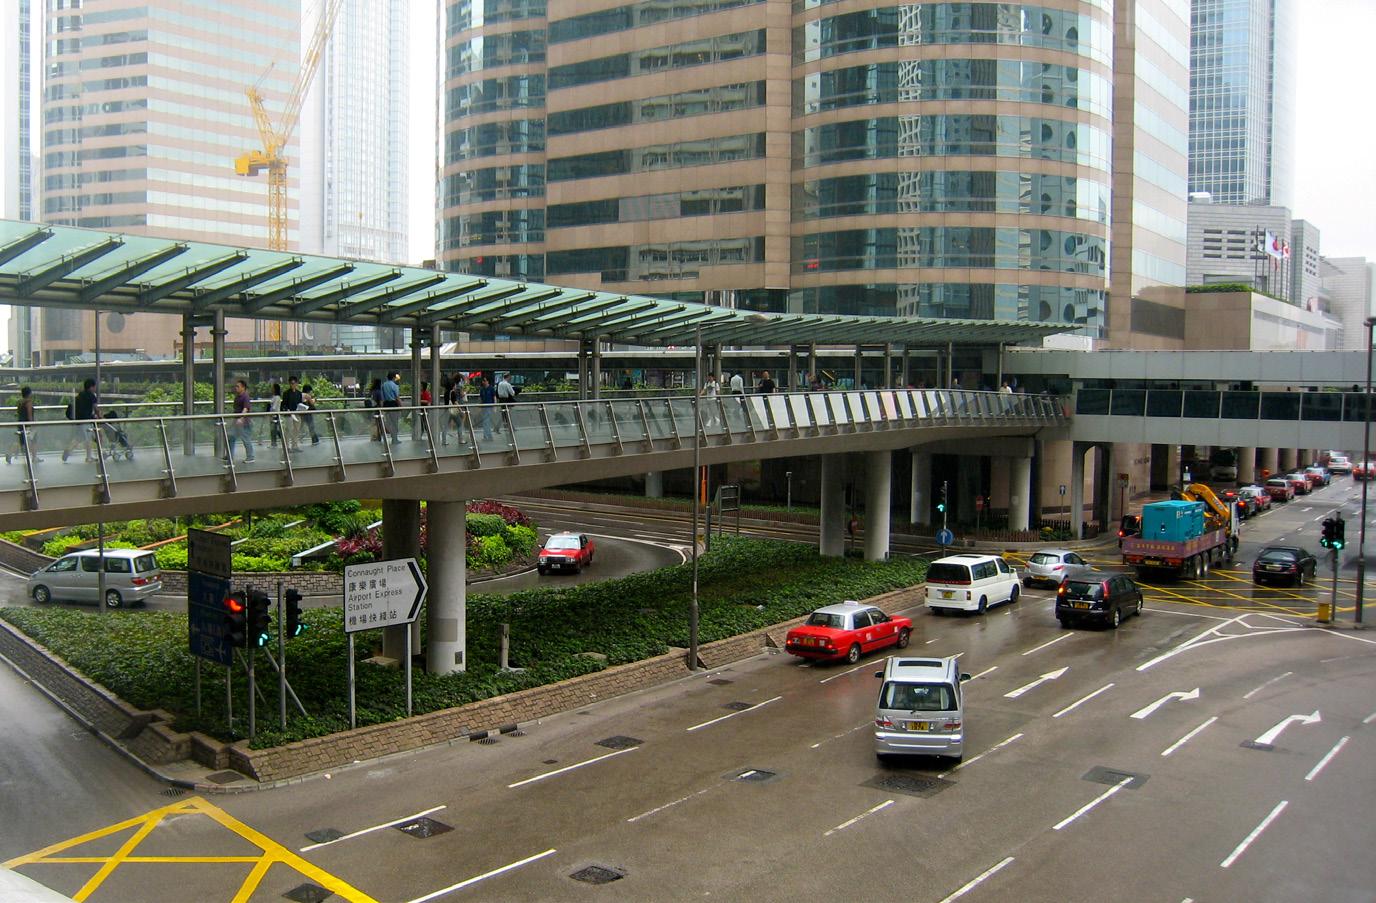
The Central Mid-Level Escalator is a prime example of how a creative solution of inaccessibility up the steep slopes resulted in the construction of escalators that have today become tourist attractions and iconic to Hong Kong. It provides the fastest way to reach the highest elevations of the urbanised area, which takes only 20 minutes. In contrast, it takes 27 minutes for a taxi (Wang Han, 2018).
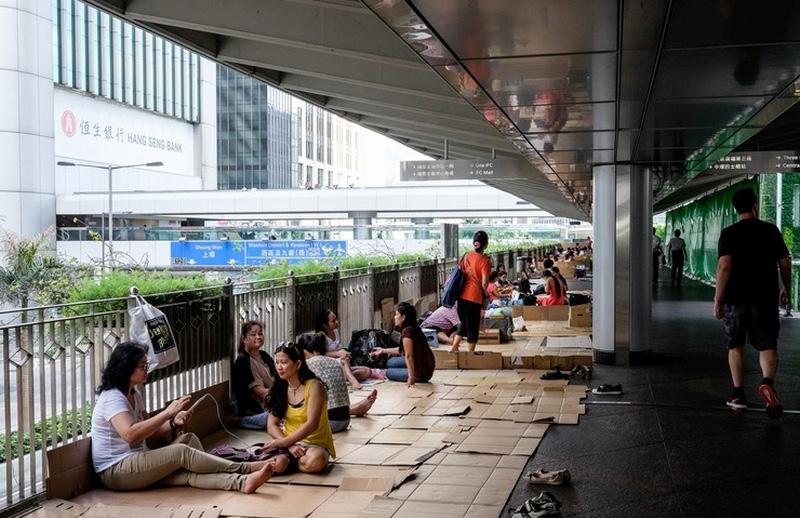
In the southwest part of the walkway system, there are mainly short span sky bridges connecting private commercial buildings. These are enclosed, protecting pedestrians from the weather elements and providing them with a continuous and comfortable climatecontrolled space (Wang Han, 2018). While on the northern side, there is an array of covered pathways and escalators providing access to areas that are at a higher elevation.
Furthermore, the usage of the proposed open spaces is designed to be dynamic. In the current scenario, during the weekends, the underprivileged gather in these areas to utilise them as a shaded communal space.
social space
multi-functional network infrastructure
Problems and ambition
Summarizing the domain, three crucial issues are identified, which will guide the studies in the research development stage. Further, the issues will be addressed by the corresponding strategies for the development of an integrated system. The three key aspects that will be addressed are:
Open space deficiency is one of the most pressing issues in high-density cities like Hong Kong. As land space resources approach saturation, elevated open spaces may be a viable solution. Assuming that introducing public spaces connected to private development is feasible, we aim to improve the current standards by introducing a system of multilevel open spaces.
It is imperative that these open spaces are well connected. Linked open spaces are not only beneficial for social interaction, but they also contribute to improving the urban ecology of the city. Being integrated or in proximity to primary pedestrian walkways increases both users and usability.
It is understood that the new infrastructure at this scale cannot be created in isolation. The increased amounts of open spaces would require a manifold increase in the water demand for the area. We aim to meet this water demand by introducing a currently non-existent rainwater harvesting strategy in order to drive Sai Ying Pun to not only be selfsustaining during the summers when rainfall is abundant, but also the winter when rainfall is scarce.
The three issues incorporate both social and environmental aspects and will be tackled at both urban and architectural scale. In the research development chapter, these issues will be explored in detail, pertaining to the selected site.
The ambition of this design research is to develop an ecological multi-level open space system for existing high-density areas.
Can a new configuration of Open Green Spaces mitigate the impact of the preceding urban planning of Hong Kong on liveability and the social fabric of the city, while creating a multilevel circulation network that is integrated with the existing urban fabric of the city?
RESEARCH DEVELOPMENT
Physical Topography
Building type & structure
Species parameters
Irrigation demand
Environmental Ventilation Sunlight hours
Layout strategies
Storm water management
Social Open space evaluation Walkability
DESIGN DEVELOPMENT
Proposed open space elements
Physical constraints
Rain water run-off
DESIGN PROPOSAL
Open space generation
Planting strategy
Hydrologic system
Global experiments
Network generation
Multi-level open space system
The information gathered from the domain comprises constructive input for formulating experiments to explore our research focus. To make use of its full extent, this data needs to be thoroughly studied, analysed and broken down. These involve digital tools as well as research of existing practices.
The complex systems in this project require the integration of several design and analysis tools at various scales. The methodologies incorporated to develop a systematic design strategy, have been essential to the process followed throughout our exploration. We believe it is imperative to develop the research at both global and local scale to get a comprehensive understanding of the site.
At the urban scale, to understand the composition and organisation of the existing urban tissue. A GA (Generative Algorithm) is used to find the optimal location and size of the open spaces. The result of this experiment is then used as the input for the network generation experiment. The network generation experiment is devised to create and optimise the network.
The solutions of global experiments are selected and studied individually through conducting a series of postanalysis on them. The post-analysis result will drive the selection of the fittest solution for the design proposal.
A feedback loop is the part of a system in which some portion (or all) of the system’s output is used as input for
future operations. Each feedback loop has a minimum of four stages. During the first stage, the input is created. During the second stage, the input is captured and stored. During the third stage, the input is analysed, and during the fourth stage, the insight gained from the analysis is used to make decisions(Margaret Rouse, 2019).
At the local scale, a planting strategy and a rainwater collection system will be incorporated in the generated open spaces. The results from the urban and local scales are then combined to form the design proposal.
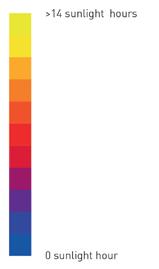
Multi-criteria optimization is used to combine different evaluation parameters into a physical design. Evaluating multiple criteria in a GA provides a range of solutions that can be individually evaluated and ranked based on the criteria. As no single solution is the best solution, the advantage of using this evaluation method is that it provides designers with the opportunity to decide which solution out of a plethora of iterations they deem fit.
These algorithms are designed to find the best combination of variables (genes) to produce fit solutions (phenotypes), using genetic principles of mutation, crossover and elitism to increase the speed of the process.
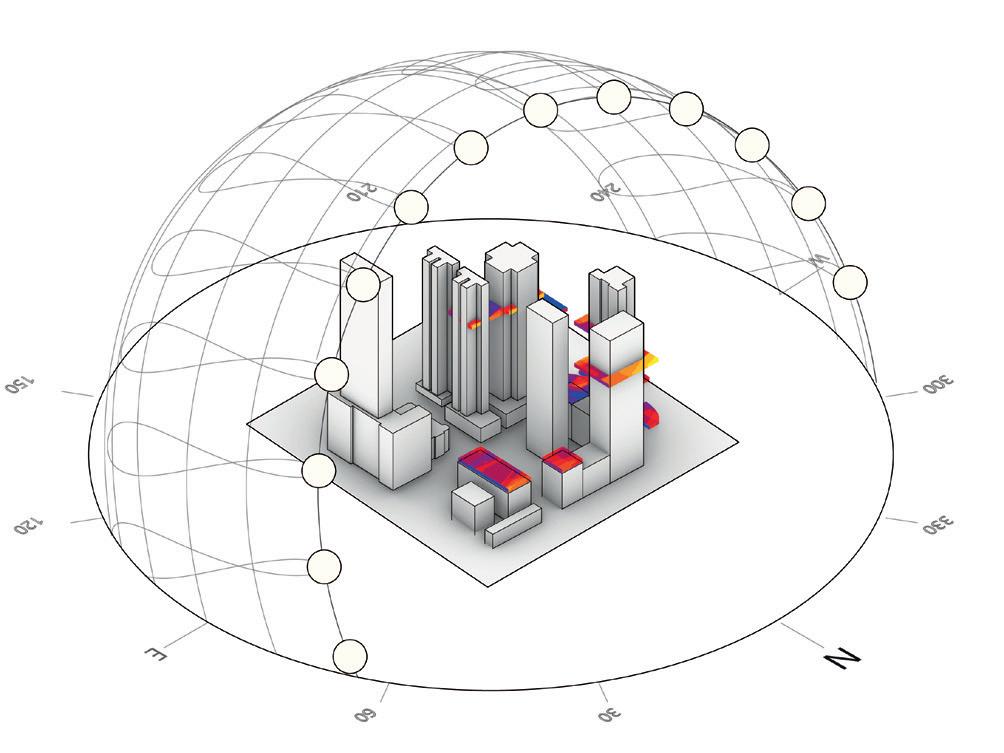
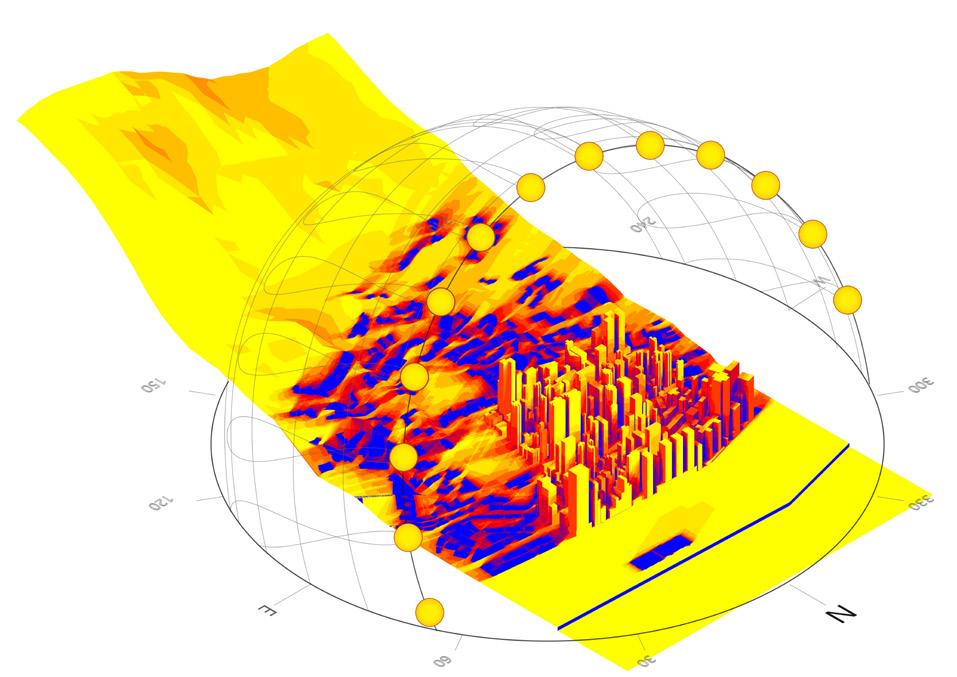
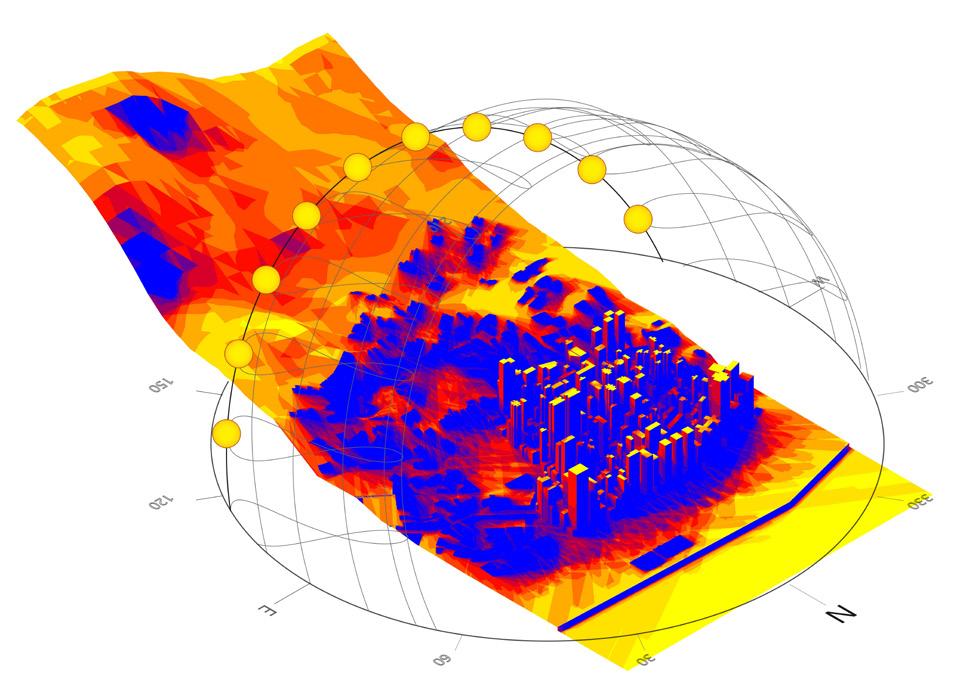
Sunlight hour analysis calculates the number of hours of direct sunlight received by input geometry using sun vectors from the simulated sun path of a region and during a target period.
This tool can be used to evaluate the number of hours of sunlight received by vegetation in an open space or the hours where direct sunlight might make a specific outdoor space comfortable or uncomfortable.
Pareto front which is a set of solutions, being chosen as optimal, if no objective can be improved without sacrificing at least one other objective.
 Example of sunlight hour analysis performed on for an analysis period for 14 hours
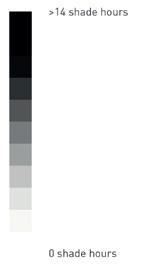
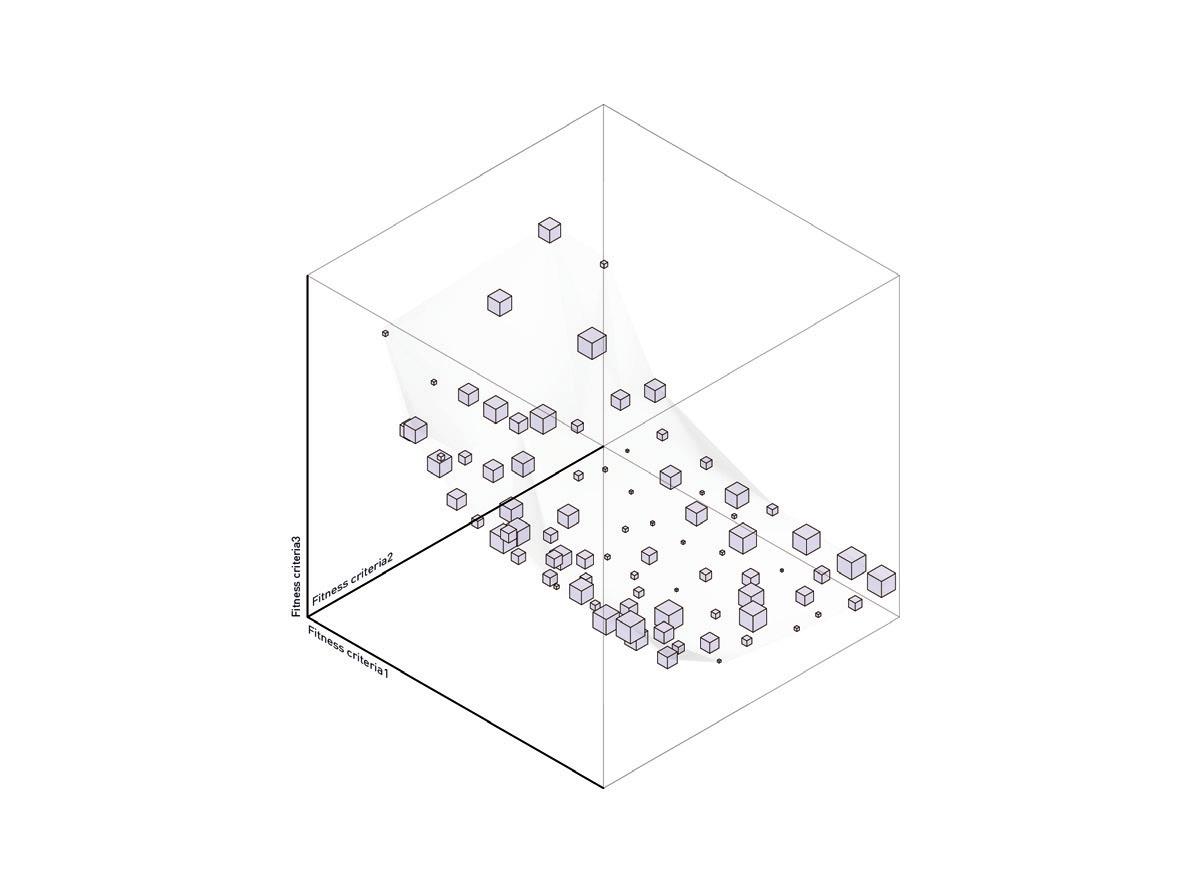
Shading analysis helps determine the areas of the input geometry that will receive less sunlight or remain in a shadow during a particular time of the year. With input data such as location, day of the tear and time of the day, an overlapping range of shadows is created which indicates the amount of time a particular area is in the shade over the day.
A shadow analysis done on the existing urban fabric of the site depicts the impact of the generated spaces on the site.
Computational Fluid Dynamics uses the ability of computers to quickly and efficiently tackle finite elements to analyse fluid flow-related problems in a specific environment. Surface pressures and velocity vectors can be calculated using this tool. Autodesk Simulation CFD software is used in this project first to analyse the wind flow on the selected site, the result of which is compared to the design proposal. CFD allows us to inform the design by quantitatively analysing wind velocities.
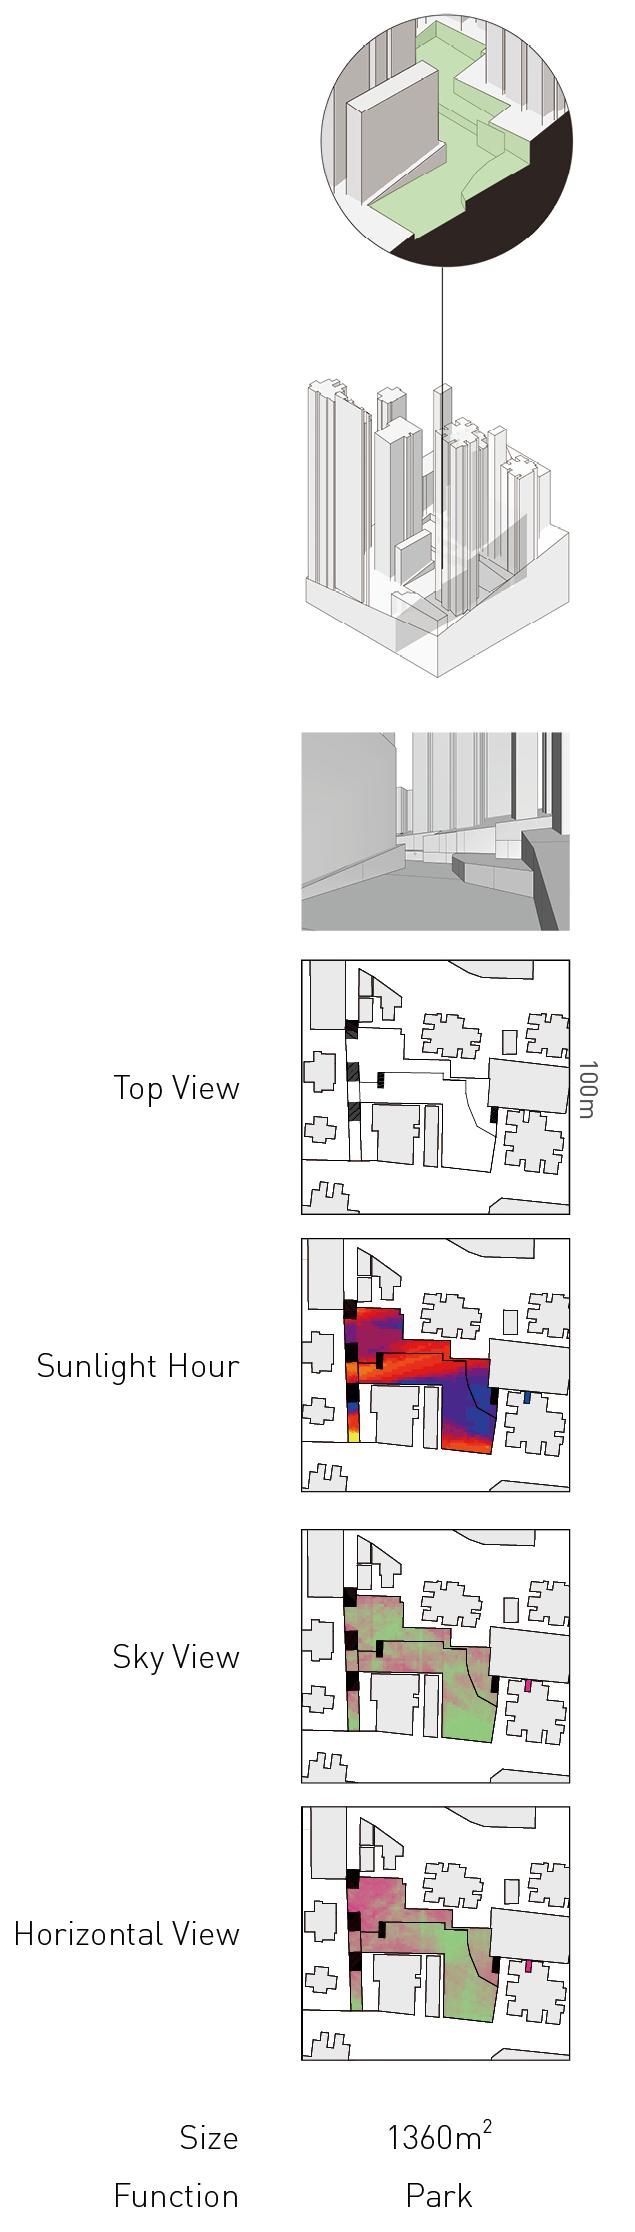
Example of shading analysis performed on for an analysis period for 14 hoursA Sky View Factor represents the ratio at a point in space between the visible sky and a hemisphere centred over the analyzed location.
Horizontal View Factor
Shading analysis helps determine the areas of the input geometry that will receive less sunlight or remain in a shadow during a particular time of the year. With input data such as location, day of the tear and time of the day, an overlapping range of shadows is created which indicates the amount of time a particular area is in the shade over the day.
A shadow analysis done on the existing urban fabric of the site depicts the impact of the generated spaces on the site.
Studying the SVF is essential since it is a measurement that can be used as a proxy for radiation, which influences air temperature and other related weather phenomena. SVF is a crucial ingredient to study urban climate and urban heat island effects, elements that are important for citizen well-being. Iso
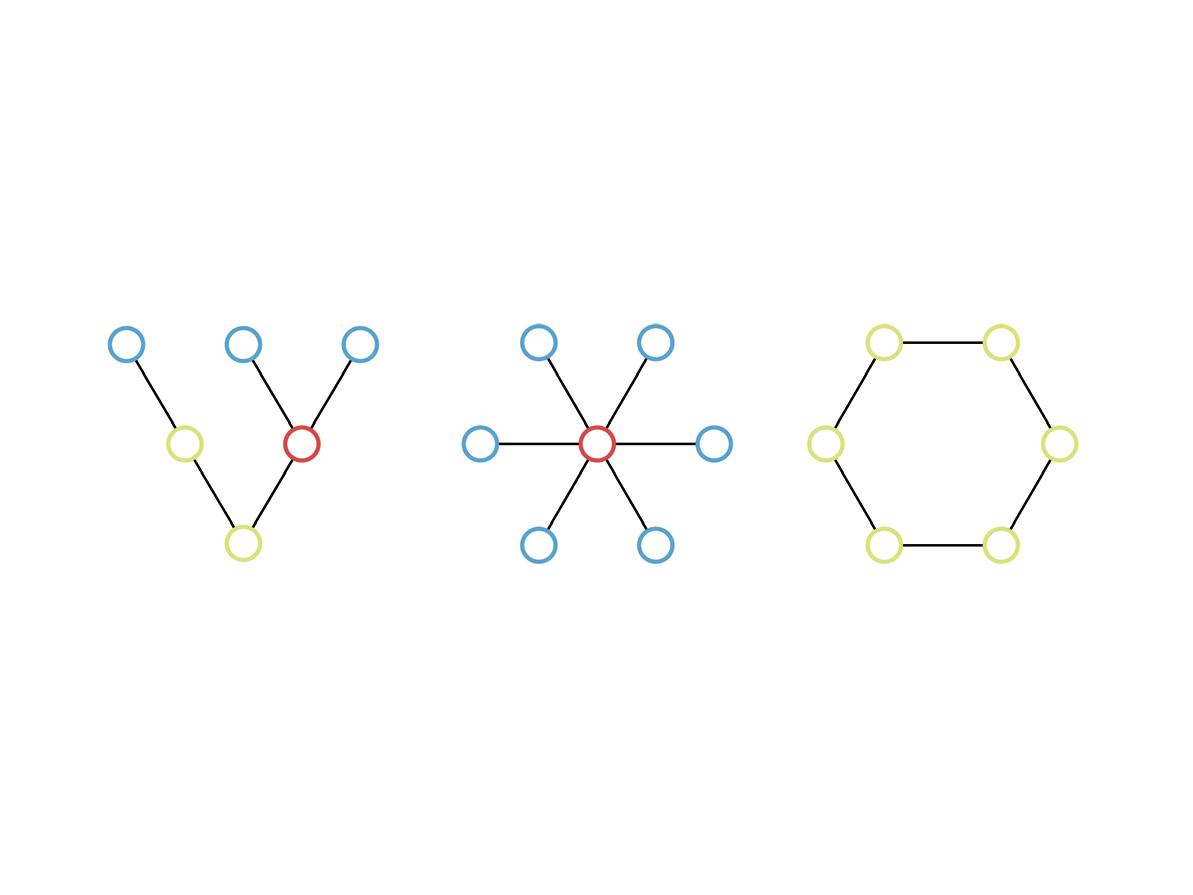
To evaluate topological relationships between the generated spaces and the existing urban fabric, a quantitative theoretical frame is used, namely the Network Theory, the principles of which are derived from Graph Theory. Betweenness centrality in graph theory, is a measure of centrality based on the shortest paths. In the case of this project, it shows how often an edge (path) happens to be present close to the shortest path between an origin and a destination. In a connected graph, closeness centrality of a node is a measure of centrality in a network, the more central a node is, the closer it is to all other nodes. The degree of closeness and betweenness centrality is measured within the GA and form the basis for the network system.
New Territories Lantau Island
Sai Ying Pun People's Republic of China (PRC)
Introduction to the selected site
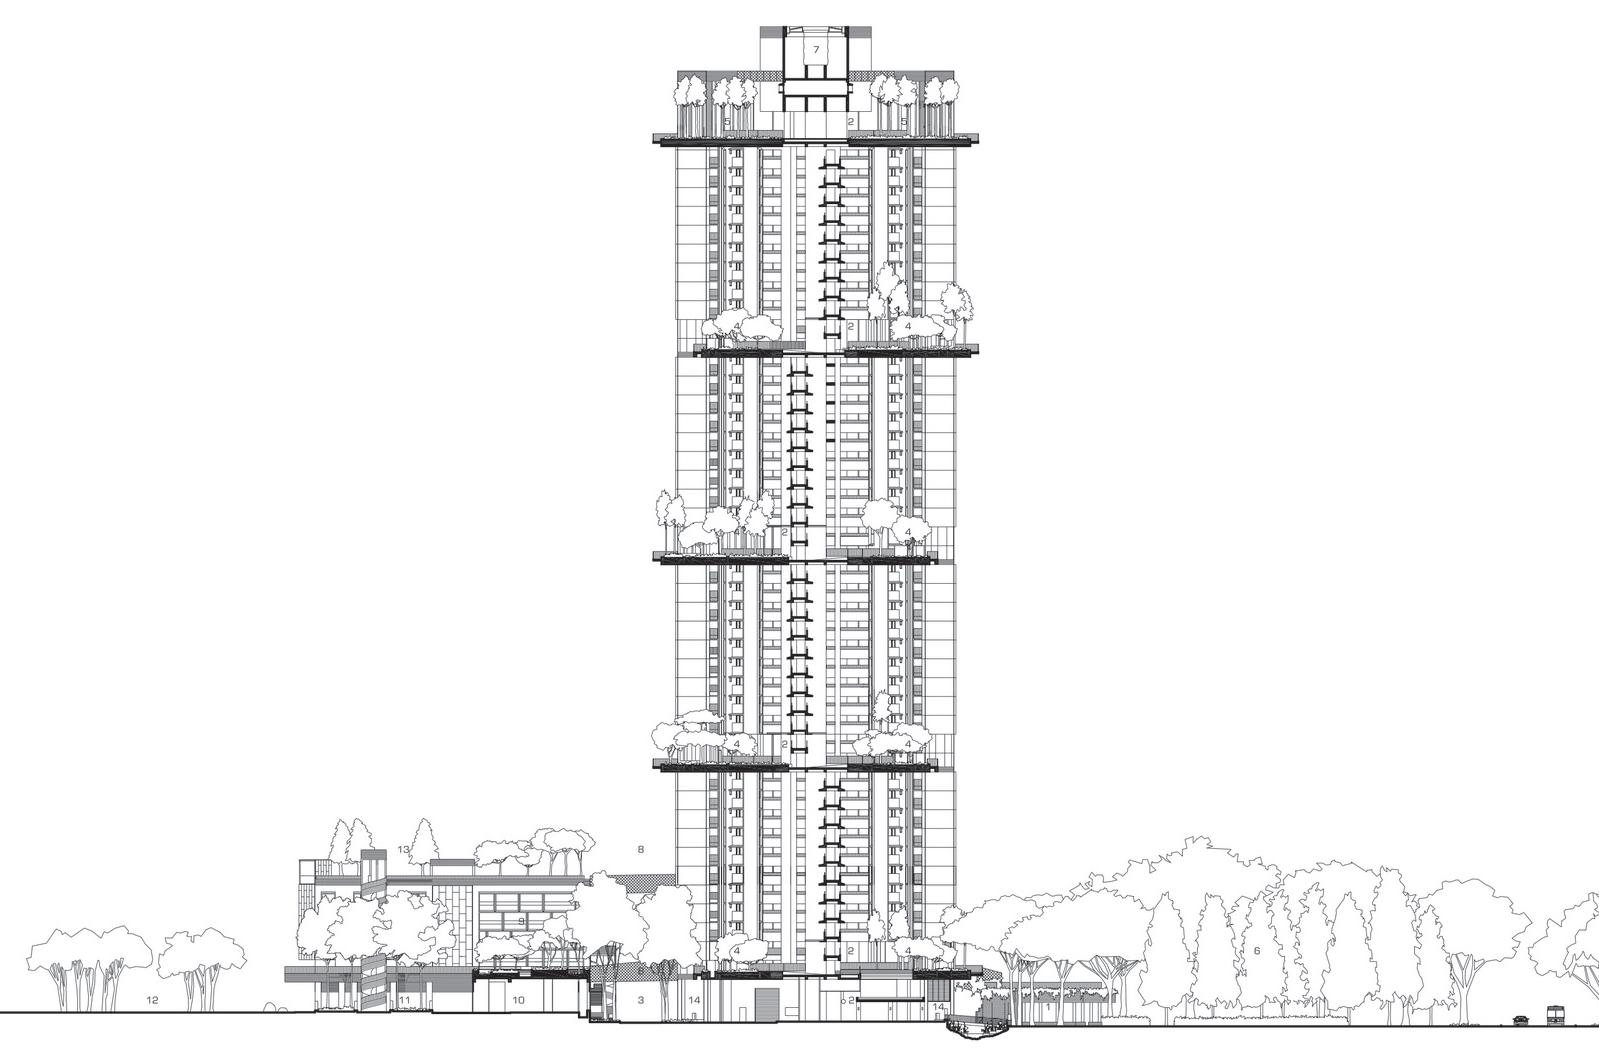
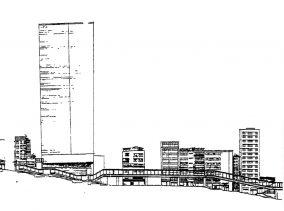
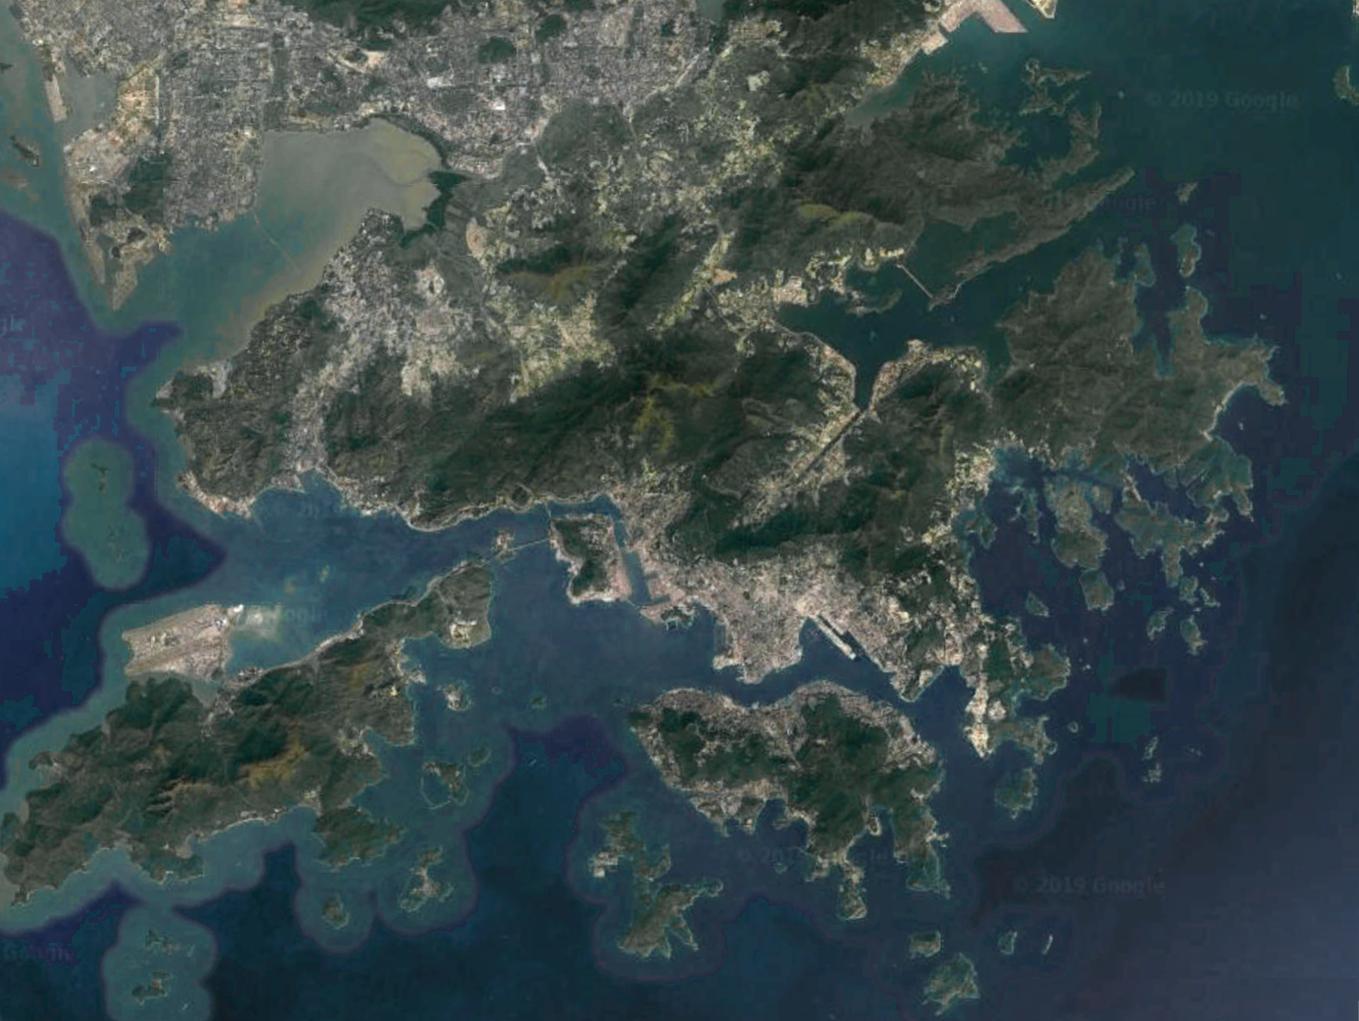
Sai Ying Pun is located in the old district of Hong Kong, sandwiched between the Belcher Bay and the Lung Fu Shan mountain range. This area is part of the old district planned in the early 1900s. The site division of the time is noticeable in today’s buildings as well. The small sites which formerly comprised of low-rise brick houses, now have skyscrapers of similar footprints. These slender skyscrapers are also called ‘Pencil Towers’.
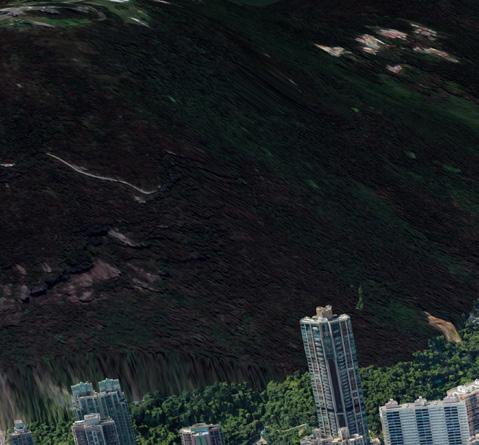
Located at the foothills of the mountain range, the site has a steep slope. The slope, coupled with the unfavourable climate makes pedestrian movement extremely strenuous.
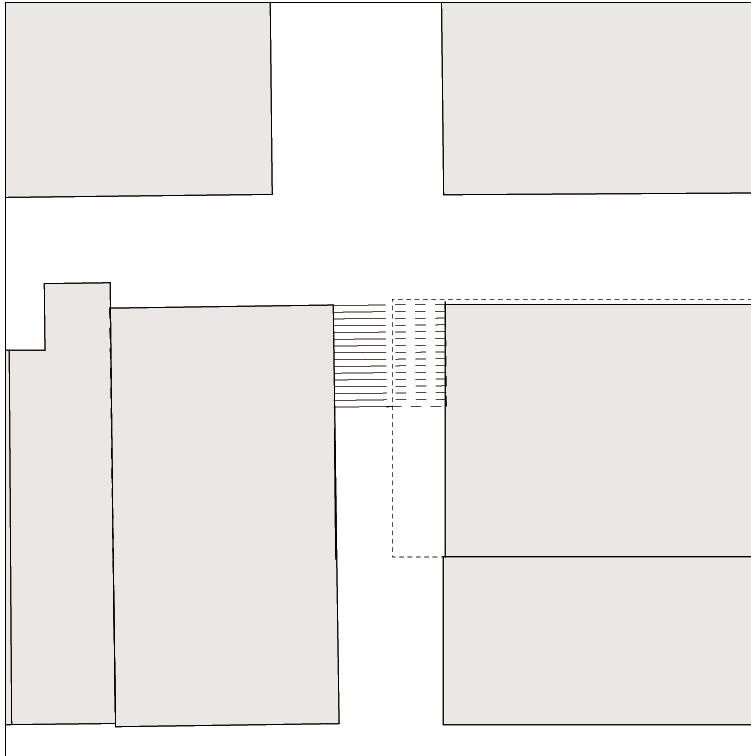
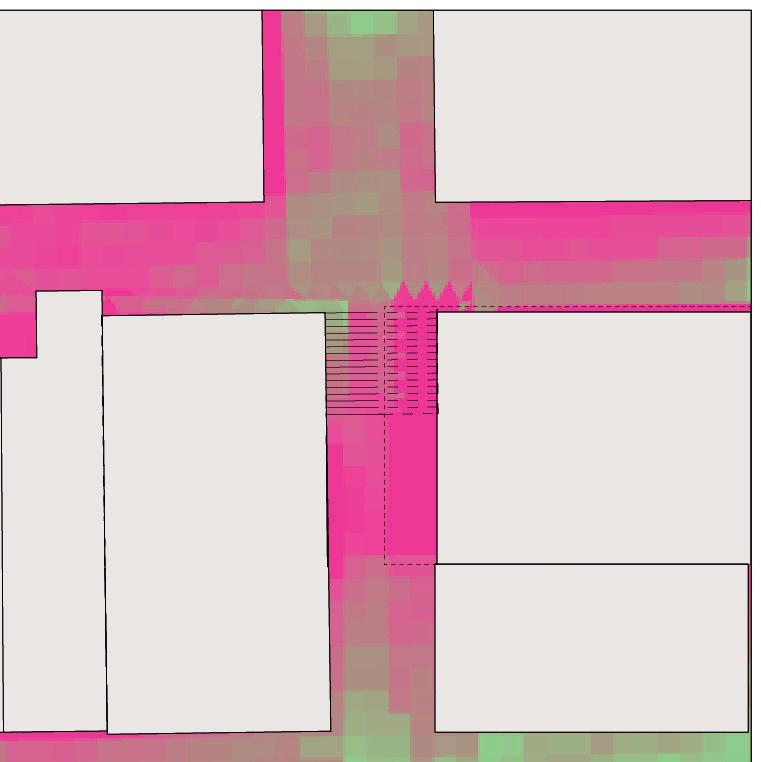
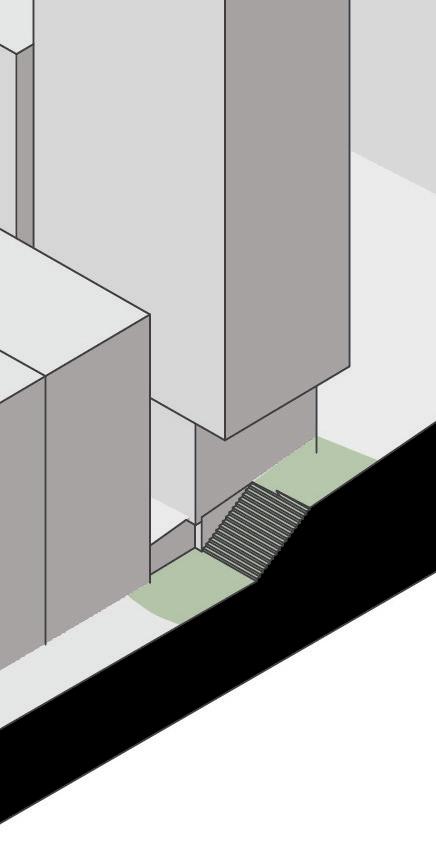
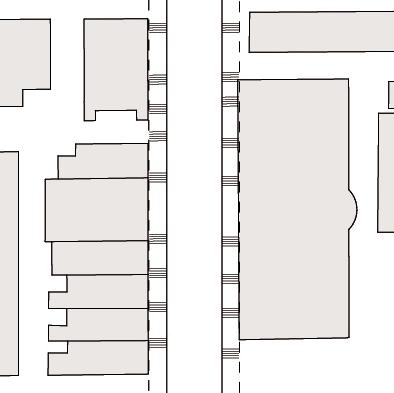
The datum of the buildings are generally created by cutting into the sloped land to create horizontal platforms. This method creates substantial differences between adjacent levels in the direction of the sloping terrain(N-S).
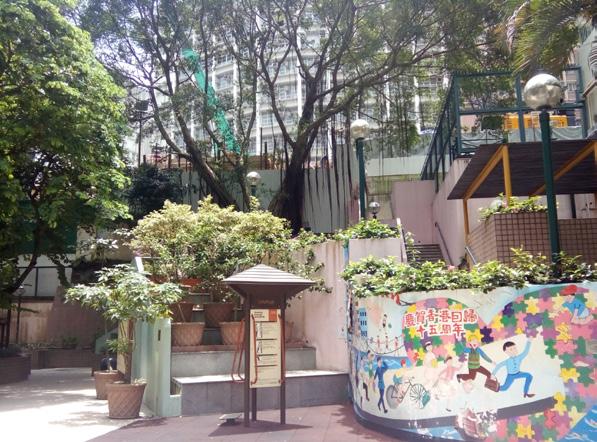
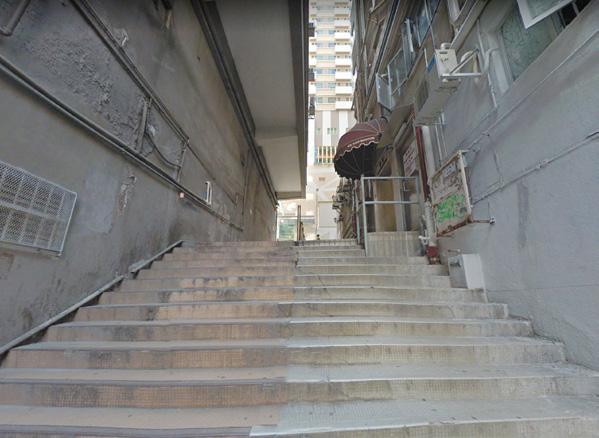
These level differences are bridged by a series of stairs throughout the area, with clear pedestrianized multilevel connections. These stairs are seldom used when it rains and during peak summers. Even though the commute via these stairs may be unfavourable, they are vital to the urban fabric of Sai Ying Pun.


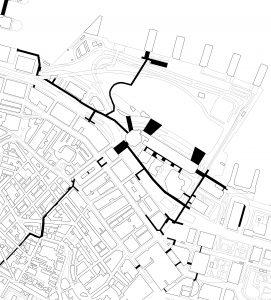
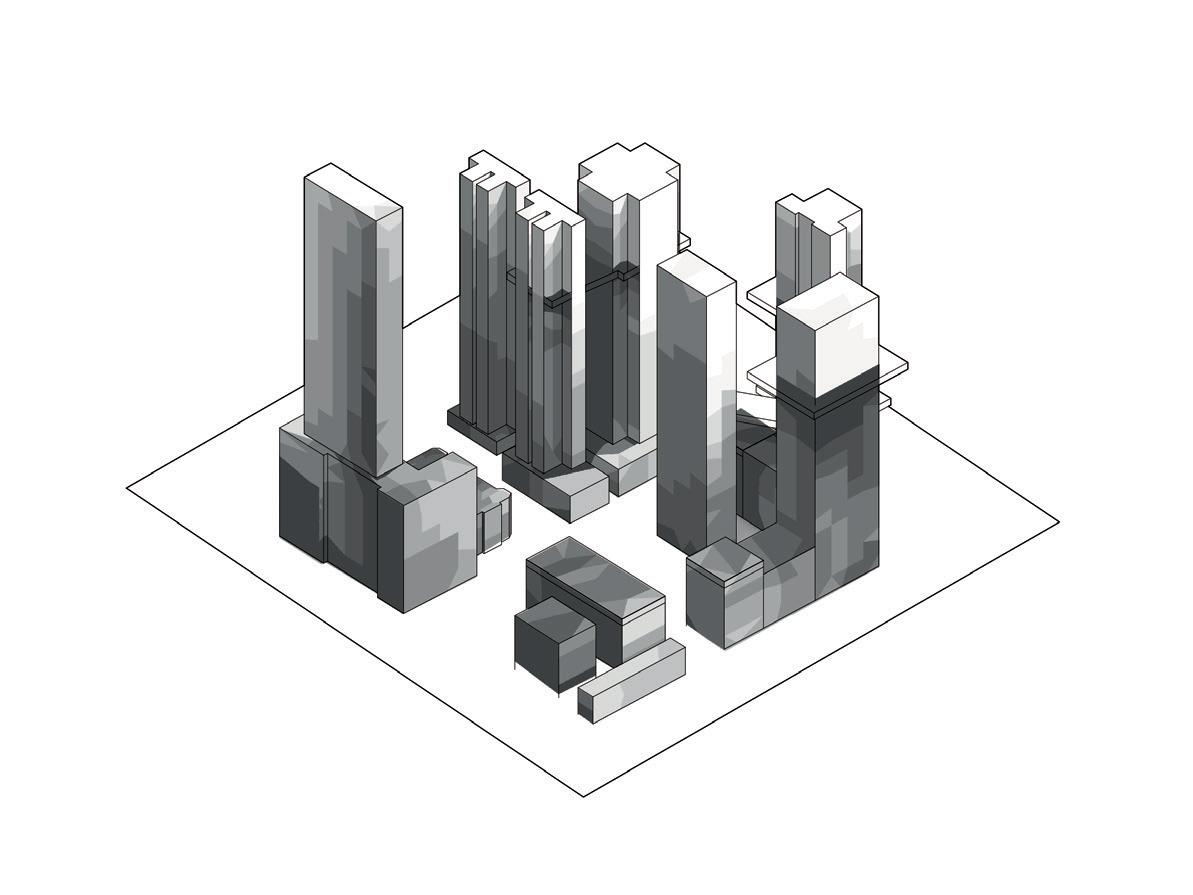
Accessibility study of the site
The area is well served by minibuses, City Buses, taxis, and the traditional Hong Kong tram. Many bus routes run along Des Voeux Road and Queens Road West which are located at the top and bottom of Sai Ying Pun respectively. Busses are limited to the two main roads due to the restrictions of the steep slope. Residents are forced to commute up and down the slope to gain access to the busses.
The Mass Transit Railway (MTR) is considered to be the most efficient means of public transportation in Hong Kong. It is regarded as one of the world’s leading railways for safety, reliability and costefficiency. Unlike other modes of public transport, the operational reliability of MTR trains is unaffected by traffic conditions. Compared to the road mass transit means, the MTR is also more accessible to residents on-site as there are four MTR exits within Sai Ying pun.
In the adjacent diagrams, the centres of the circles mark the exits to the MTR stations, and the circles represent a range of 5 minutes walking distance from the exits. This 5 minutes radius varies from different stations due to the variation in the sloped topography.
While generating the proposed multilevel network, important programmes such as the MTR exits will hold priority, such that connectivity to these places is enhanced.
sloped road stairs stairs + landing escalator
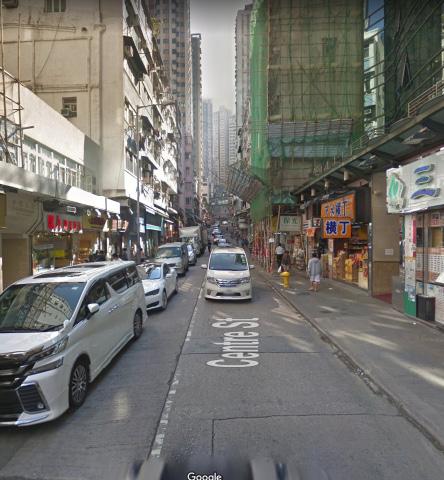
Walkability study of the site
The pedestrian circulation in Sai Ying Pun is bound to street level. Due to the steep topography, there is widespread usage of staircases and escalators on site.
The average inclination of pathways at the lower end of the site is 1:10 (height: length) ratio, while the standard for barrier-free (accessible to the disabled) is 1:12. Higher up the site, the slope gets steeper, which brings about the need to incorporate stairways in the pathways.
In the southern regions of the site, the slope gets as steep as 1:4. To access these areas, es-calators are constructed as this ratio is too steep for stairways. Vehicular traffic does not have access to this area as the slope may cause a blockage. Furthermore, though the streets get steeper up the site, the width continues to measure just 1.5 meters.
As the access to public busses is only on the north and south ends of the site, walking along the steep slope is unavoidable. These street conditions, coupled with environmental factors, makes the commute physically taxing.
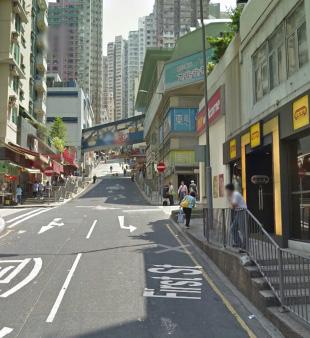
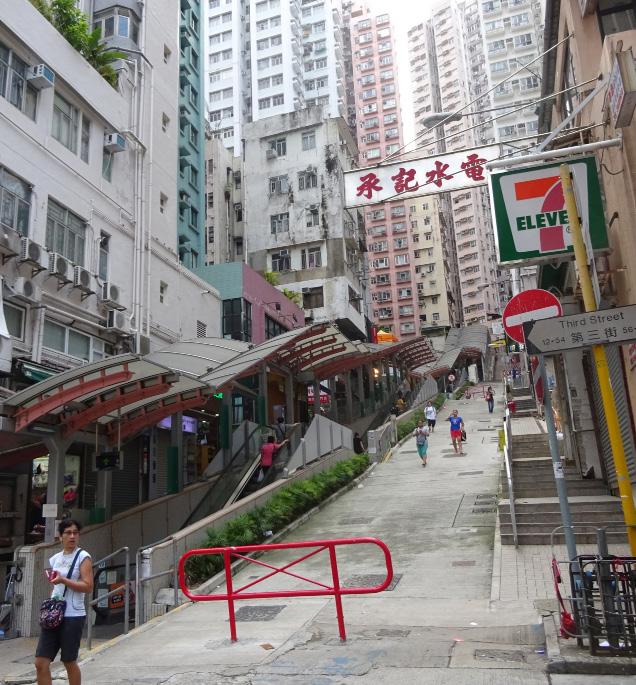
Map showing types of pedestrian road Fig.24. (next page left) Secondary Street (First Street) Fig.25. (next page middle) Central Street (Third Street) Fig.26. (next page bottom) Central Street (Queens Street)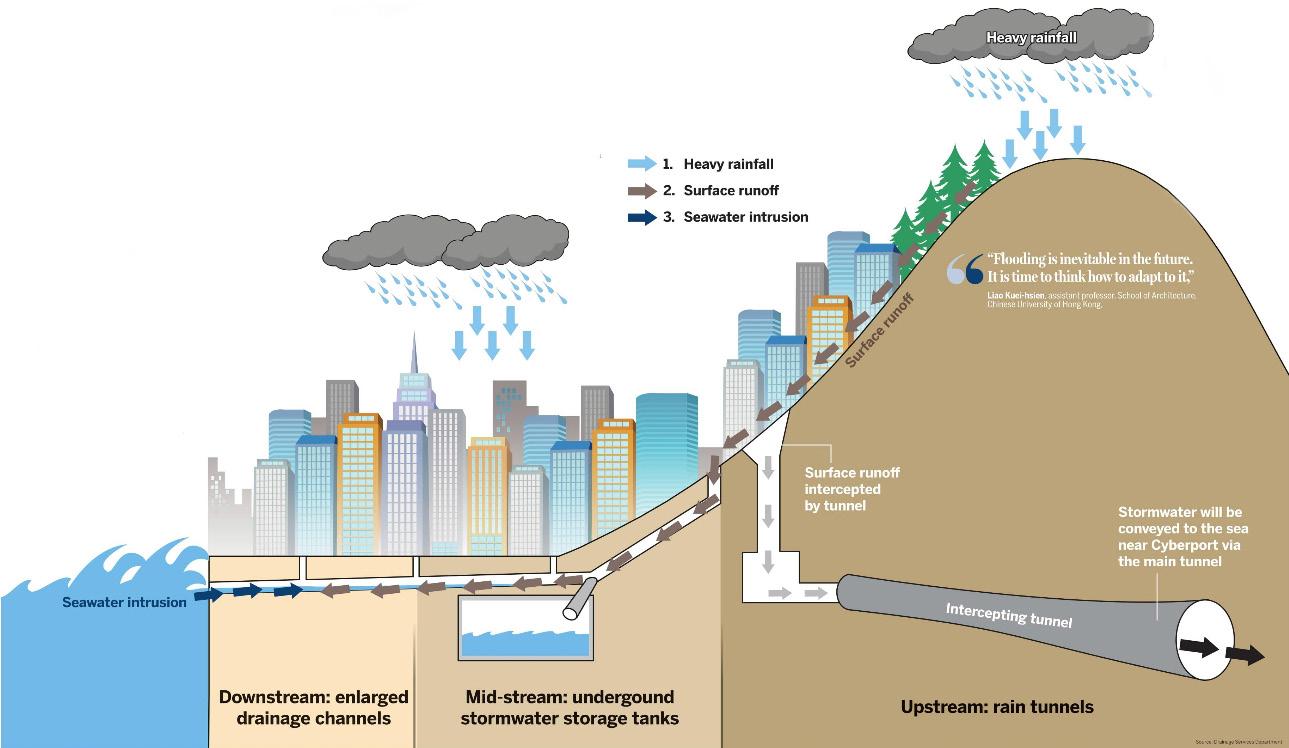
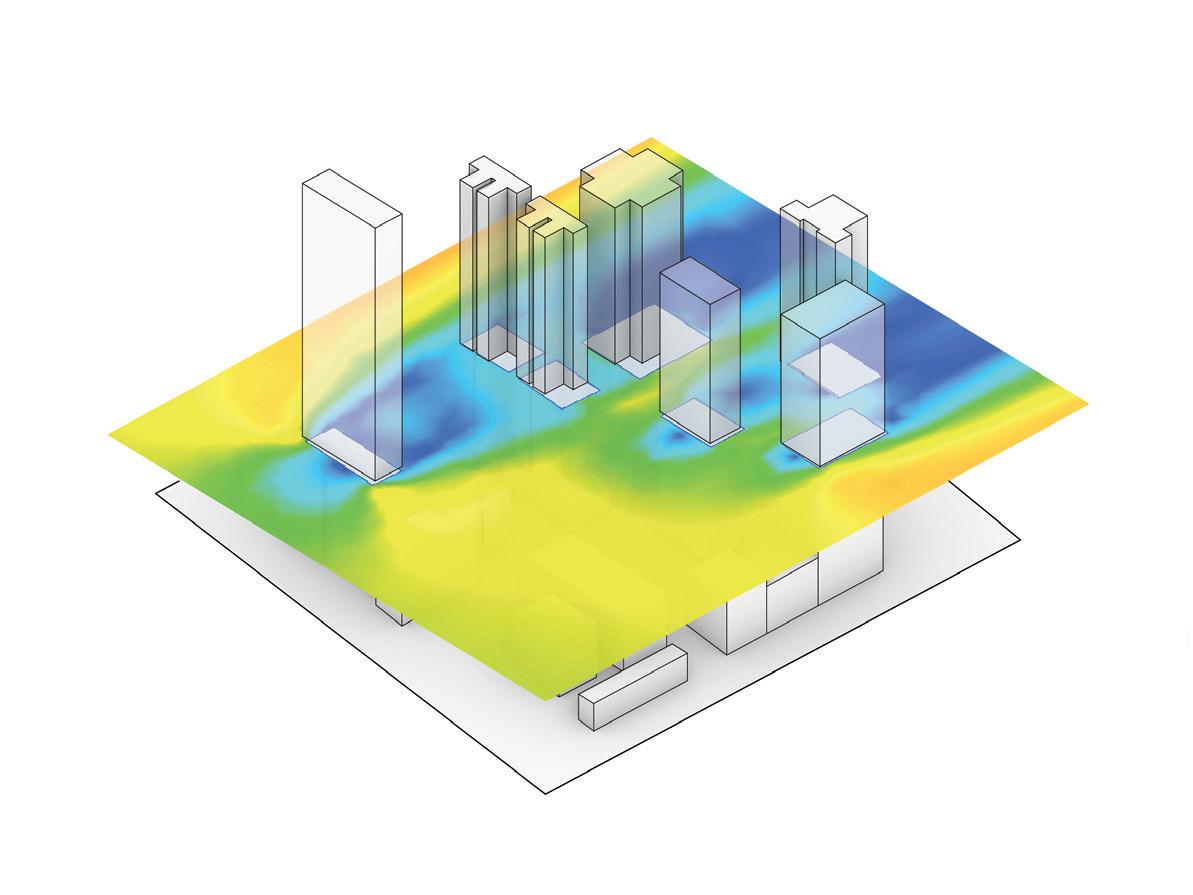
The strategy of building on top of the existing structure
By analysing the programmes, the built form corresponding to the programmes and their structure, we will derive strategies to integrate the elevated open spaces with the existing built structures.
Sai Ying Pun mainly comprises of two types of development - the pencil tower and the tower podium type. Most of the buildings on site belong to the pencil tower category. Since the site is part of the old development, small plot footprints are retained to the day resulting in slender towers. There are only a few cases of podium tower typology as this is part of the newer development.
Shophouses present on-site that are part of the old development as well and are going to be redeveloped in the near future. Commercial buildings are mainly developed on the seaside or in proximity to main roads, whereas up the hill, it is mostly residential areas.
Most buildings on the site are either concrete framed structures or hybrids of concrete framed and shear wall structures. The external and the internal walls, windows etc. are non-structural elements and can be modified as per the user need. This gives us the opportunity to create open spaces on the existing buildings by removing the non-structural elements without compromising on the structural integrity of the building.
residential - low rise
residential - tower
Commercial
Residential commercial - podium offices
hotel
Amenity
hospital/ clinic
school
wholesale market
car park
government community/ recreational/ market
Map of Sai Ying Pun showing the building types and programconcrete shear wall structure
shop house
commercial + residential concrete frame
pencil tower
concrete shear wall
Removal of non-structural elements to create new open spaces in existing buildings
cruciform tower tower + podium tower
concrete Shear wall
commercial + residential concrete frame + shear wall
concrete frame structure office/ commercial concrete frame
Assessment of existing open spaces
The Current open space standard in Hong Kong recommended by their government is 2m2/person, which is low considering that the current WHO standard of open space area is 9m2/person.
Furthermore, the existing green open spaces do not match the international standards in terms of user experience as well. These spaces are rendered unpleasant due to Hong Kong’s high built density. These are, for the most part, tiny pockets of dark areas that lack sufficient air circulation.
There is a rare spillage of sports facilities such as outdoor basketball or tennis courts with next to no surrounding vegetation.
Individual blocks currently do not have a standard regulation of the amount of Open Space that they must comprise of.
One of the largest parks on site is the Sun Yet Sen Memorial Park, the usage of which is low considering the available green area ratio of Sai Ying Pun. It is suspected that this is due to its location. Currently, the location of this park is entirely isolated sandwiched between the highway and the sea. The usage could have been much higher if it were integrated with the rest of Sai Ying Pun.
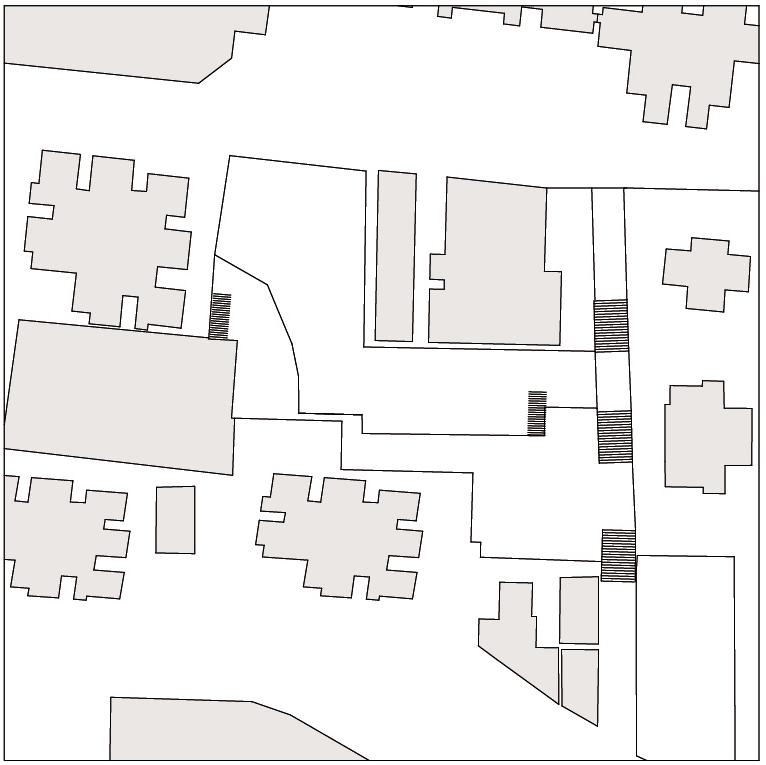
Map showing open space and building footprint in Sai Ying Pun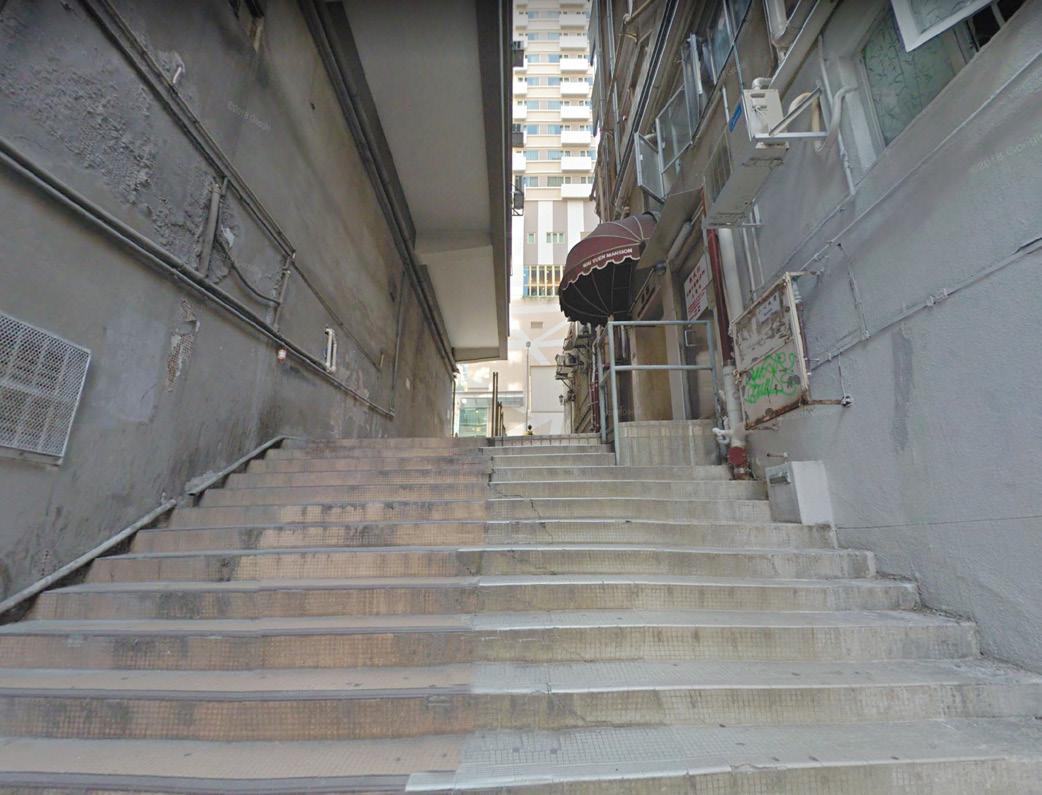


Due to the steep slope of the site, this park is situated on an incline that makes it difficult for certain groups of people to access. The incline is higher on the southern edge of the site because of the topography. A portion of the park receives a meagre amount of sunlight since high rise towers surround it.
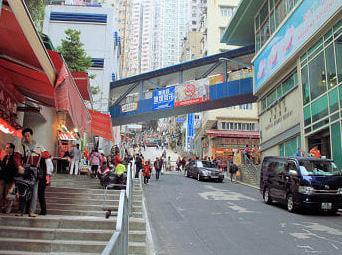
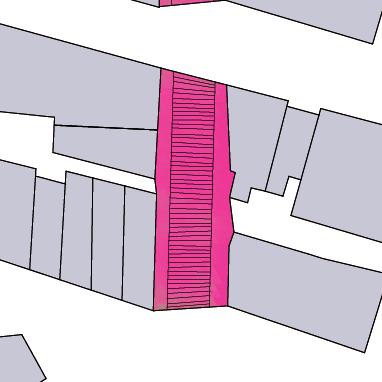
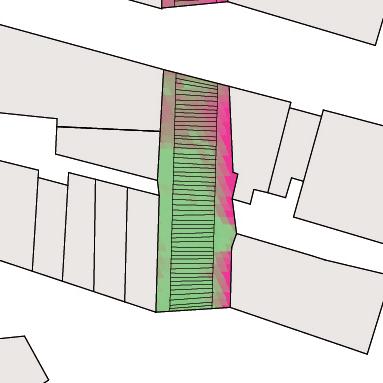
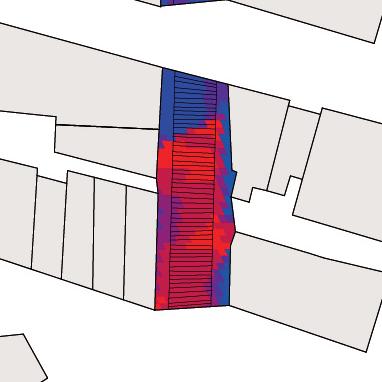
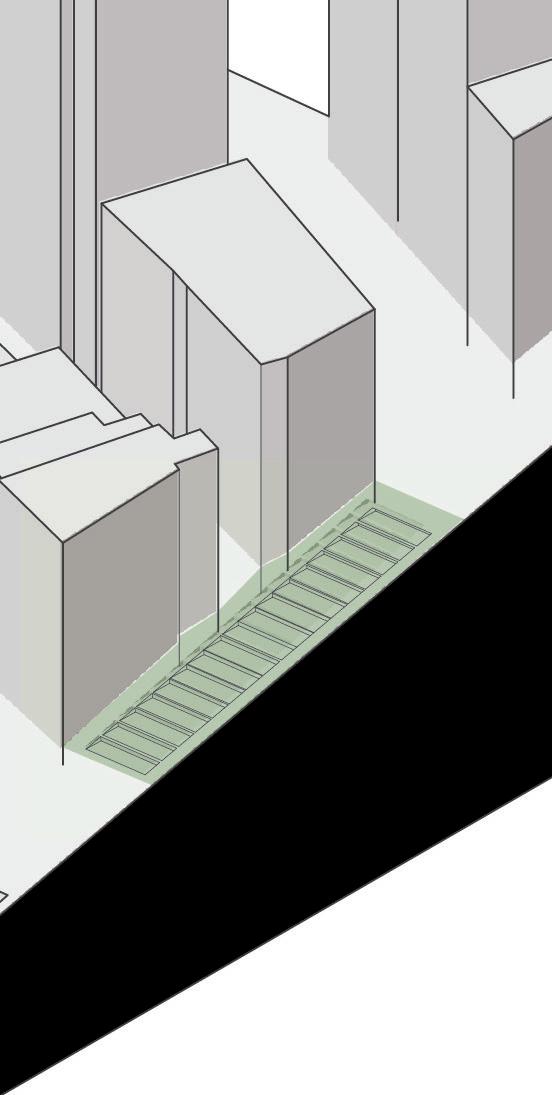
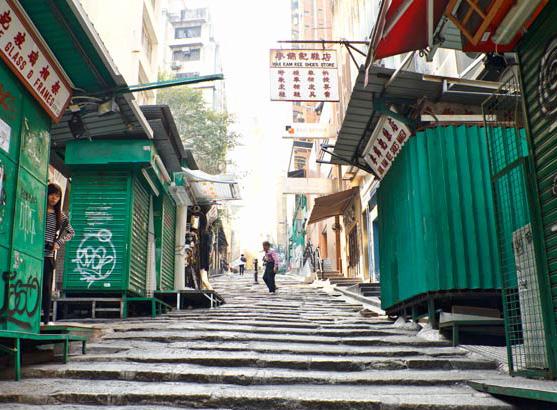
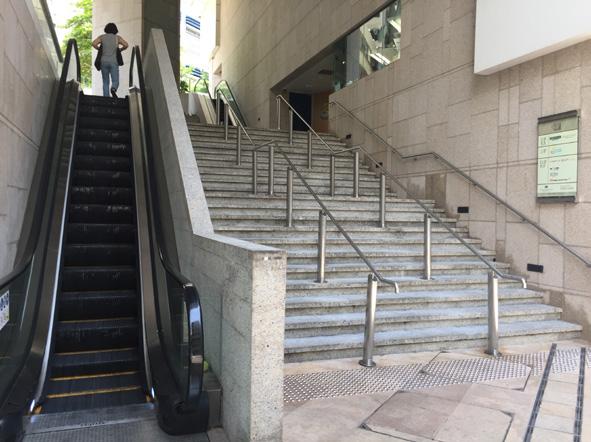
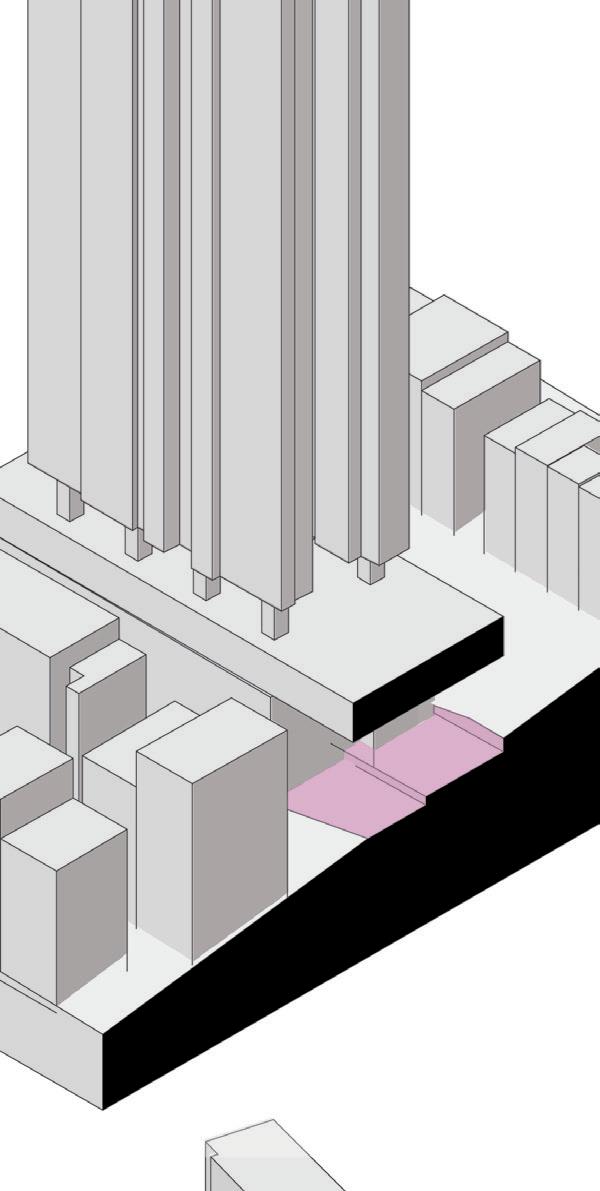
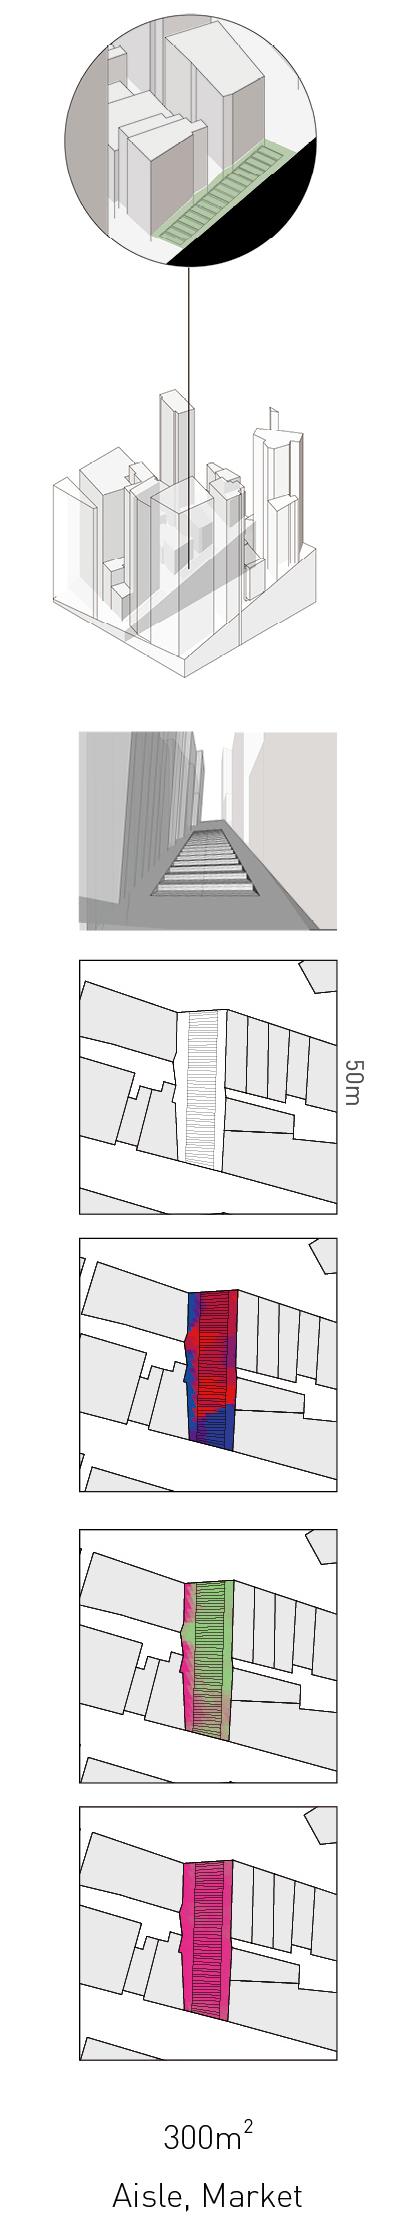
The stairways in Sai Ying Pun are a component of the street walkways and are incorporated to make the undulating topography accessible. These stairways take the width of the walkway and are generally quite narrow considering the pedestrian load. Staircases are generally sandwiched between the narrow streets and the building, resulting in a low sky view and are mostly dark spaces.
General Data
Length 10m
Width 5m
Area 100m 2
Type Aisle
Elements Stairs
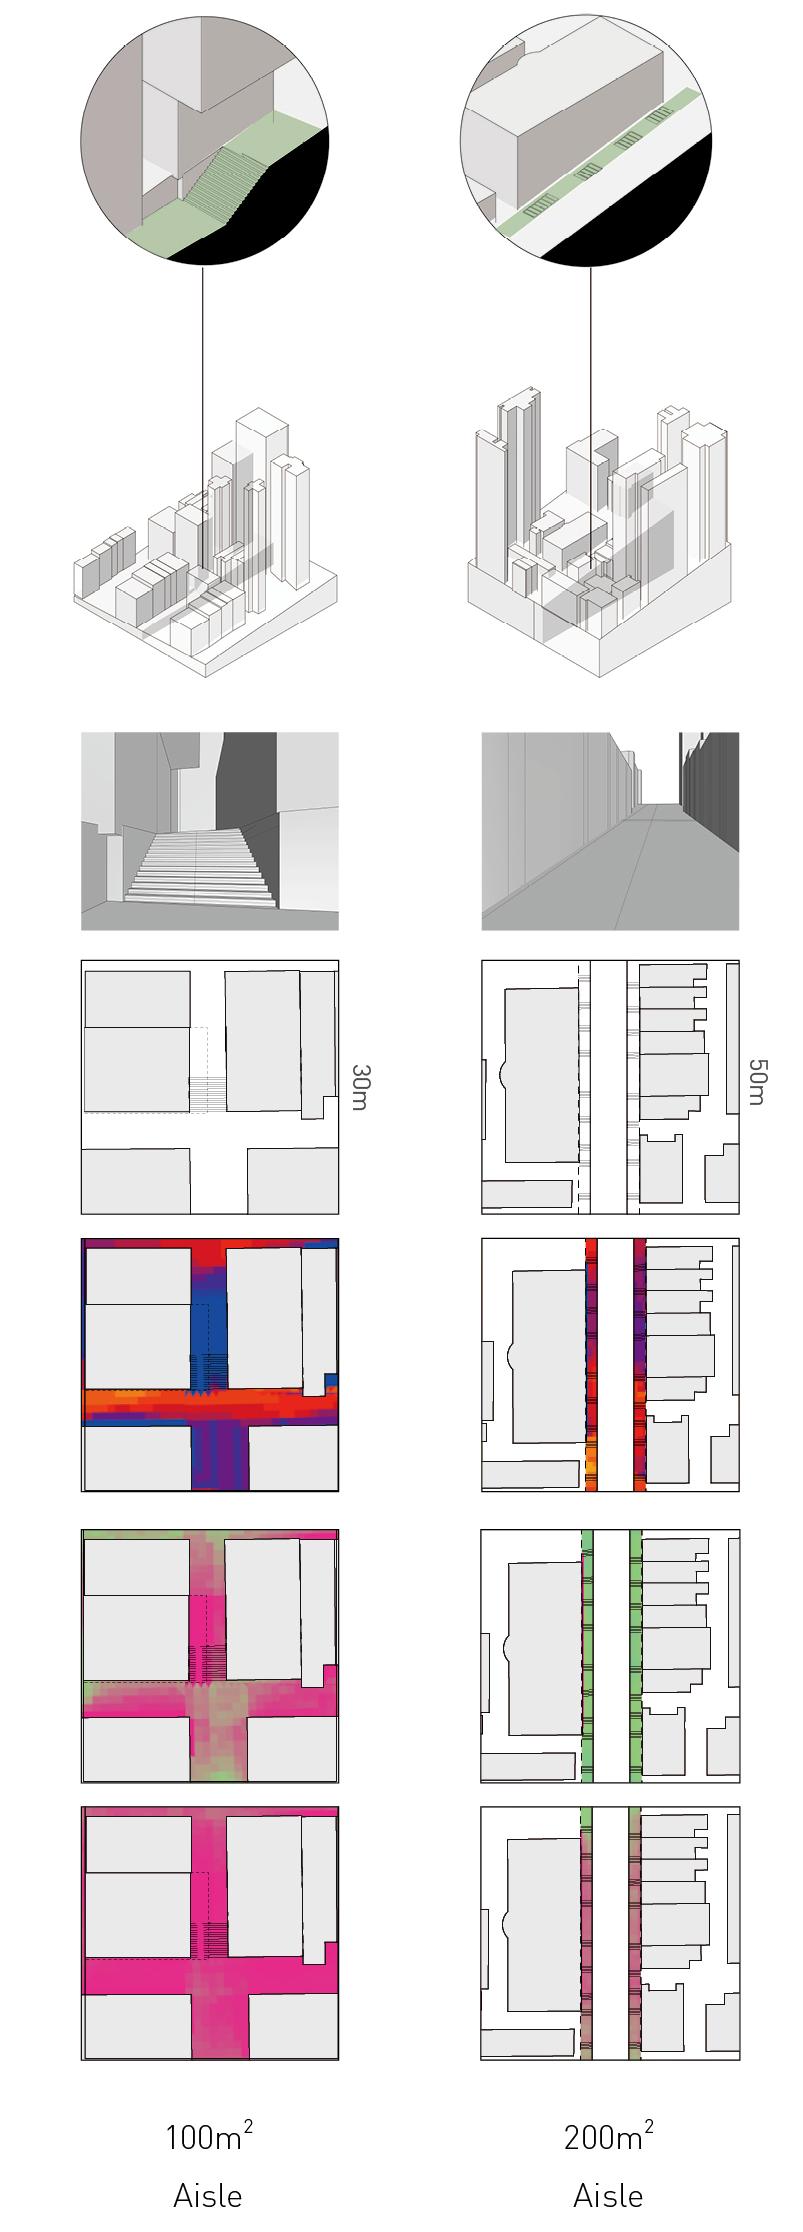
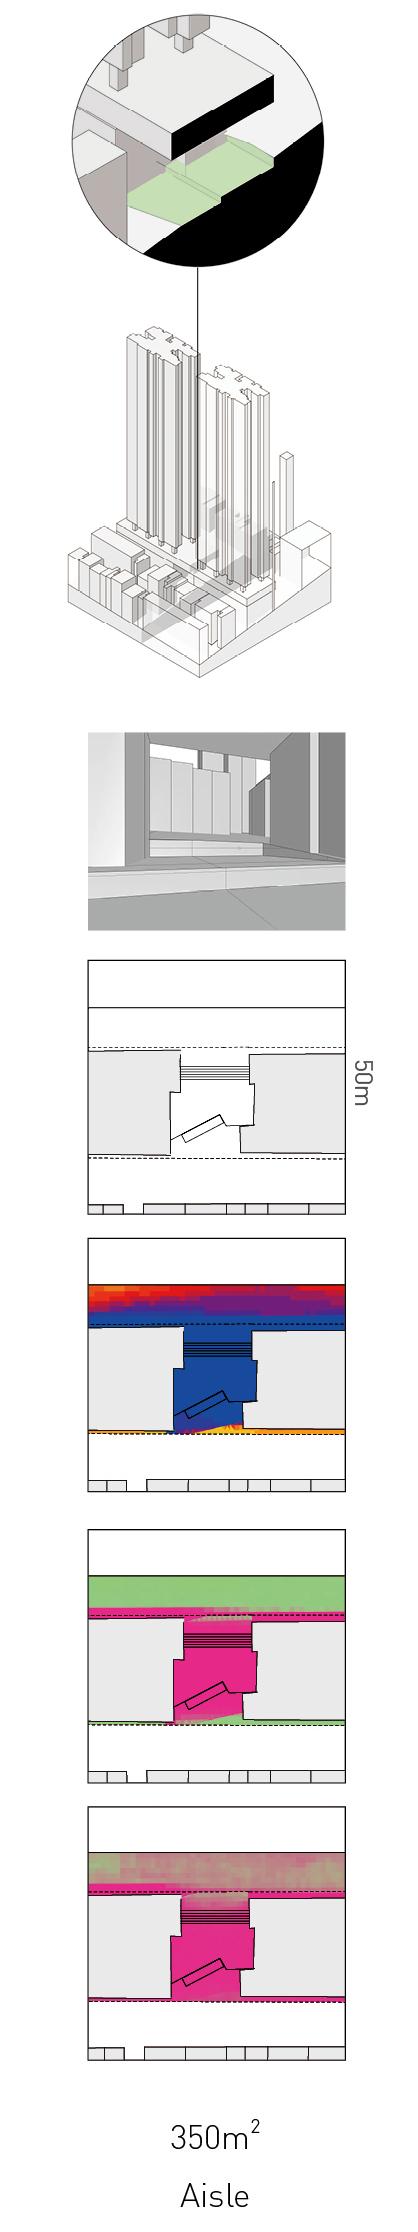
General Data
Length 50m
Width 2m
Area 200m 2
Type Aisle
Elements
Stairs, Light, Greenery, Benches
The sidewalks in Sai Ying Pun account for 70% of the lateral pedestrian circulation. The narrow paths in some areas along the slope are exceedingly steep and make pedestrian circulation particularly tasking. The sidewalks are also often used as seating areas for adjoining cafes. These pathways have a higher sky view and receive more sunlight compared to other open spaces as they are situated next to roads and lowrise buildings.
Alleys are narrow passageways between or behind buildings. As most buildings now have a frontage facing the streets, these alleys are seldom accessed. These narrow alleys are mainly used for collecting garbage and service entrances as they have low spatial quality. In some instances in the old district, due to the lack of open spaces, people are forced to use these dark alleyways as a spill out areas. The alleys in Sai Ying Pun are perceived to be dangerous due to the lack of usage and cases of unethical activities.
General Data
Length 30m
Width 10m
Area 300m 2

Type Aisle, Market
Elements
Steps, Small Shops
POSPD is defined as an open space in private development under private management where the general public are entitled to access, use and enjoy such POSPD. POSPD may be located on private land within a private development and/or on government land adjoining a private development (Development Bureau, 2019)

The provision of POSPD assists in achieving an integrated design optimises land use and synchronises the availability of public open space and the community’s needs

Creating open spaces in private developments for public use is an efficient way to enhance the urban environment. However, in recent years, public accessibility and standards of provision in POSPD, coupled with the conflicting interests between public users and private owners, especially those in private residential developments, have become causes of concern. These concerns stem from the accountability of maintenance and the problem of privacy of private spaces.
As these spaces are part of private development, they generally have built structures on top, due to which they receive a low amount of sunlight.
A quality open space should perform well environmentally, well connected to an efficient open space network, have a high perception of openness and urban greenery either directly or indirectly linked to space.
Most spaces in Sai Ying Pun do not perform well environmentally. Parks, alleys, staircases and privately developed do not receive sufficient sunlight and lack ventilation. Additionally, these spaces are not shaded, making pedestrian commute during rain and strong sunlight difficult.
Open Spaces such as alleys and individual staircases are not part of the primary routes that pedestrians take. Dark, secluded spaces as such are considered unsafe for occasional usage.
Openness is a perceptual quality of a space and is associated with analyzing the space to the physical size perceived by a user. Pocket spaces in Sai Ying Pun that have a low openness, occupied by many users, may evoke a feeling of claustrophobia.
None of the above categories of open spaces in Sai Ying Pun performs well in the spatial quality analysis. In subtropical climates, open spaces must shelter its users from the harsh sun as well as the rain. At the same time, the urban conditions dictate that there must be bright spaces that receive an ample amount of sunlight despite the wall effect imposed by the highrise.
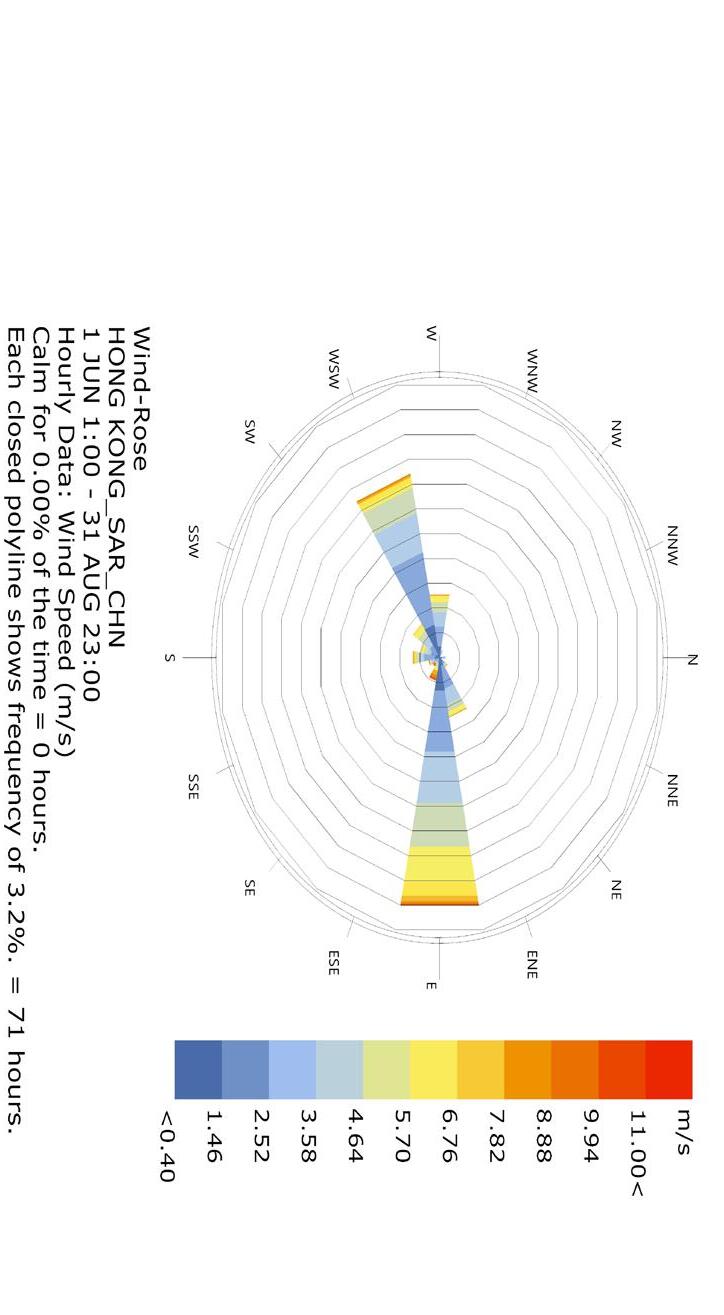
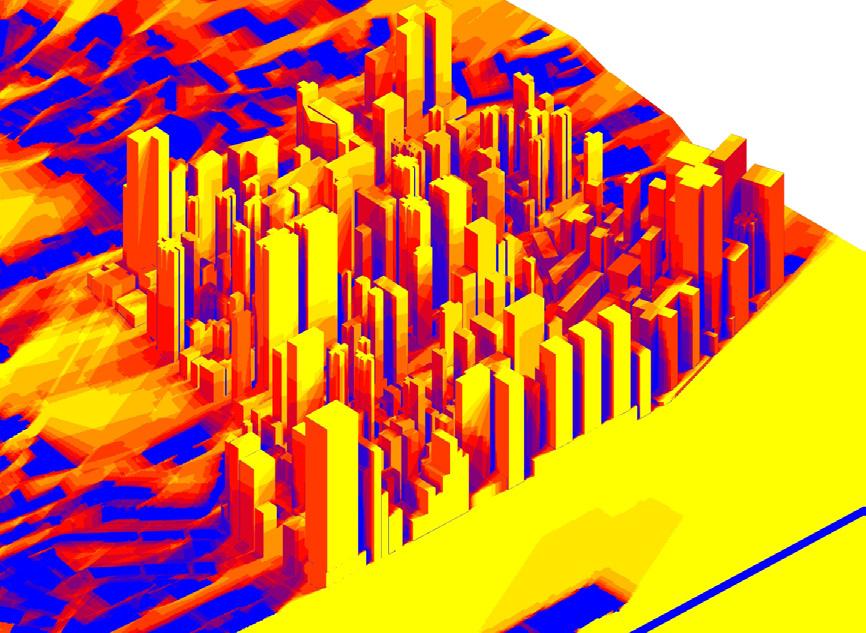
Sunlight hours and wind study
Summer
During summers, the site receives much sunlight. However, since the sun path is on North and not directly overhead, the streets and lowrise building in Sai Ying Pun receive insufficient sunlight.
From June to August, the prevailing wind flows from the south-west, which is obstructed by the hill. The lack of ventilation on-site further contributes towards the high humidity during these months.
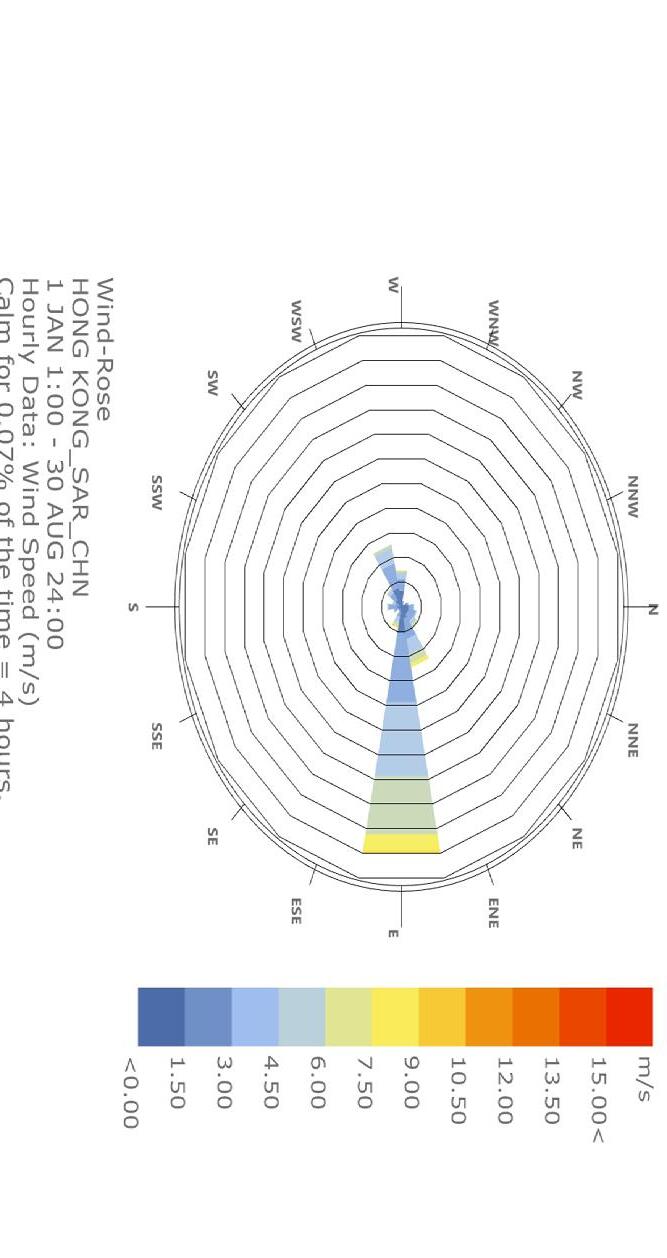
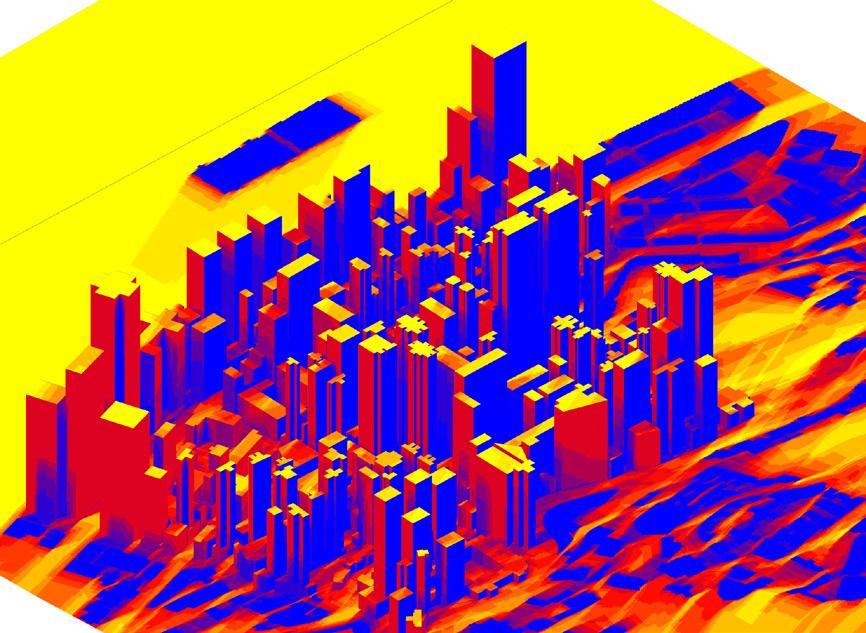
Winter
During winters, there is a shift in the sun path to the south. As the sunlight is received from the south, a large portion of it is obstructed by the hill, especially when the sun is low. Due to this, the northern faces of buildings receive a very low amount of sunlight. Due to this, the northern faces of buildings receive a meagre amount of sunlight.
The prevailing wind from September to April flows from the east. This wind carries moisture from the sea onto the site, contributing to the humidity. This data is essential for our later research, as it informs the planting strategy incorporated in the open spaces.
The solar hour analysis has been carried out during the summer and the winter solstice. These two days have been selected as these days correspond to the extremities in sunpath shifts.
With this analysis we aim aim to understand the amount of sunlight received by the existing buildings and the seasonal change in ground level pedestrian conditions.
The analysis will be setup in two ways. Firstly, sunlight hours will be measured on the built structures during the two time periods and secondly, sunlight hours will be measured on the street.
Since the sun path during the summer solstice is on the North of Hong Kong, 70% of the north facing facades receive more than 9 hours of sunlight.
However, this implies that south facing building facades receive significantly lower incident sunlight. 80% of the south facing building facades receive less than 4 hours of sunlight.
As the sun path during the winter solstice is on the North of Hong Kong, 100% of north facing building facades receive less than 4 hours of sunlight.
55% of the north facing facades however receive more than 7 hours of sunlight
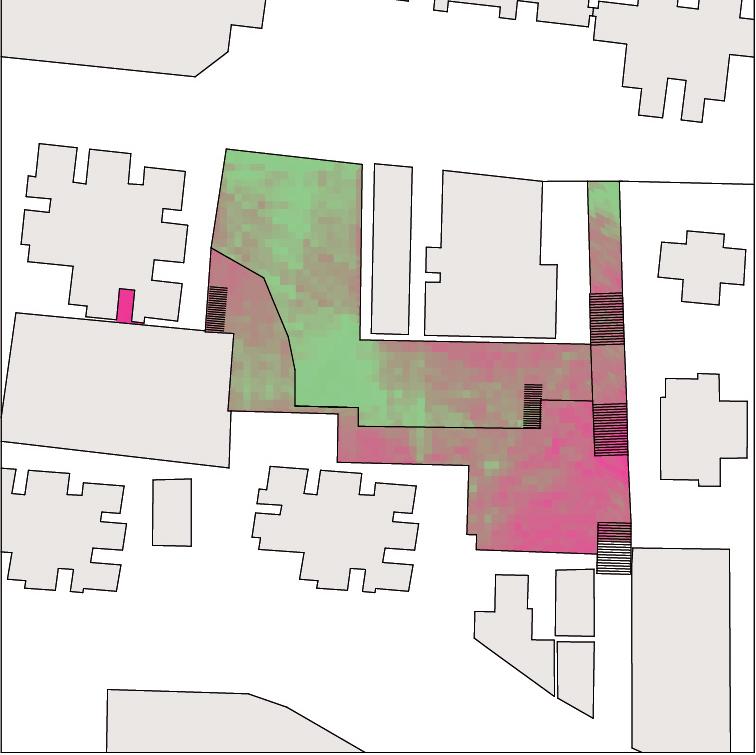
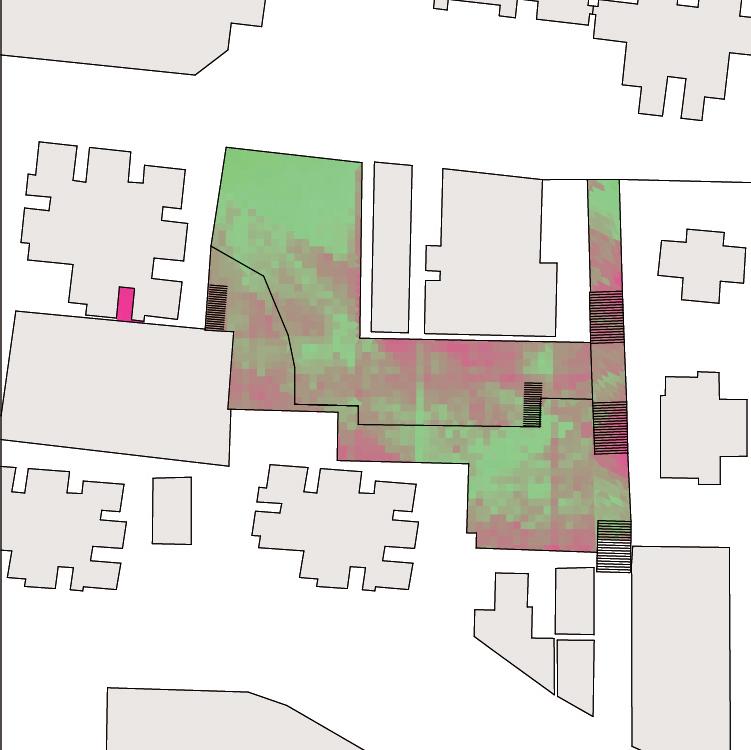
The ground level sunlight hour analysis during the summer solstice shows that since the sun path is relatively overhead, the streets receive about 5-7 hours of sunlight. The ground level on the site receives very low sunlight when the sun is at lower angles.
It is evident from the ground level sunlight hour analysis during the winter solstice that the streets barely receive any sunlight at all. Only a small percentage of land, most in West Sai Ying Pun receives more than 3 hours of sunlight.
The solar hour analysis on the buildings demonstrates that as the seasons change, different regions of the site will receive high and low amounts of sunlight. To address this phenomenon, a dynamic will be explored that will account for the summers as well as winters. The result portrays that though the ground level does not receive sufficient sunlight, higher levels of the buildings receive ample sunlight at least on one side, all year long. This further reinforces our decision to introduce multilevel open spaces on site.
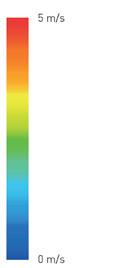
EXPERIMENT SETUP
Wind direction:
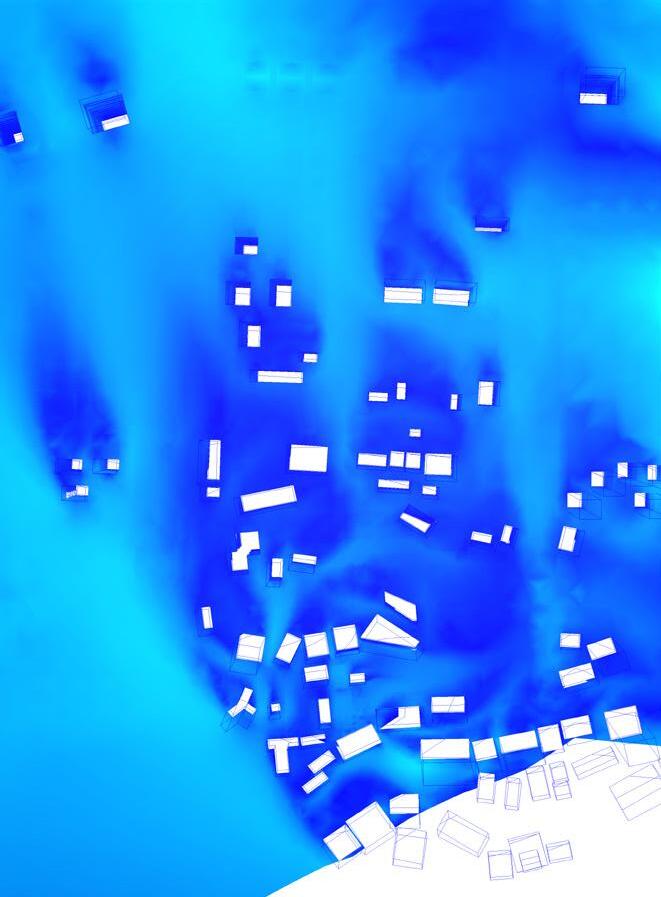


Wind speed: East 3 m/s
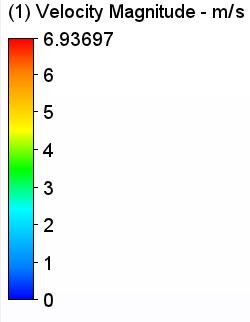
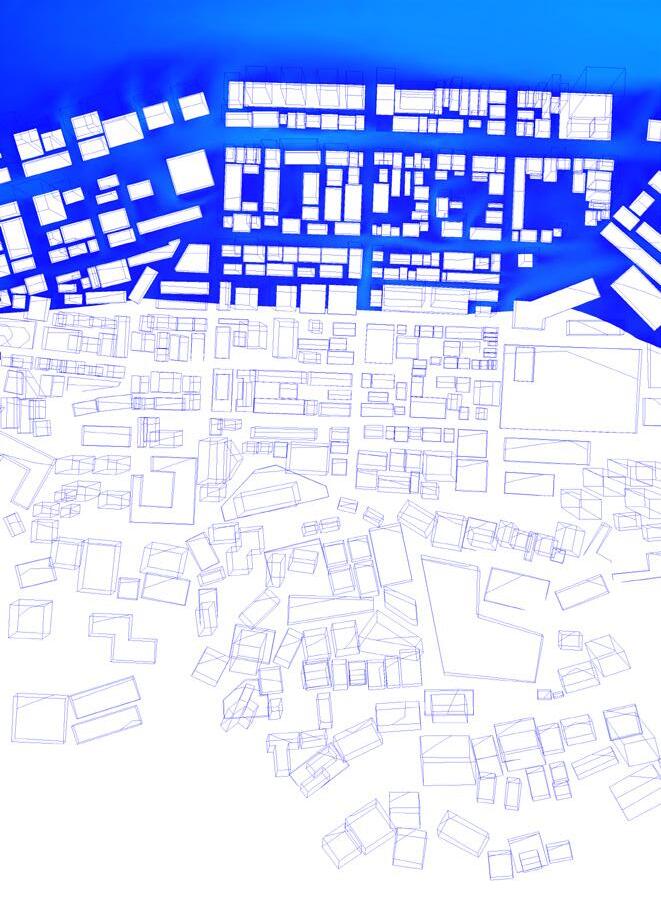
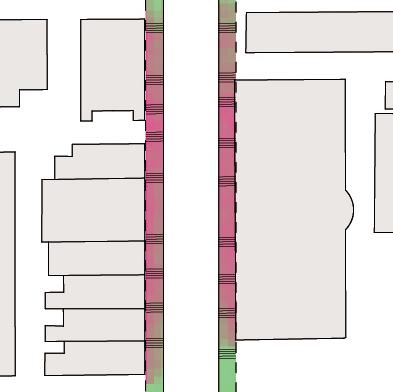
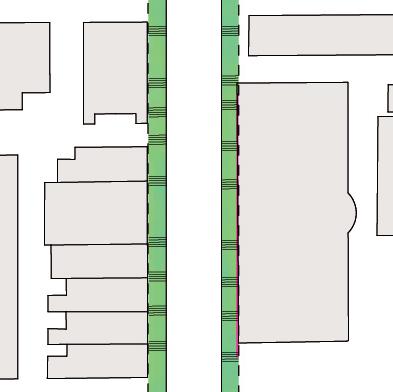
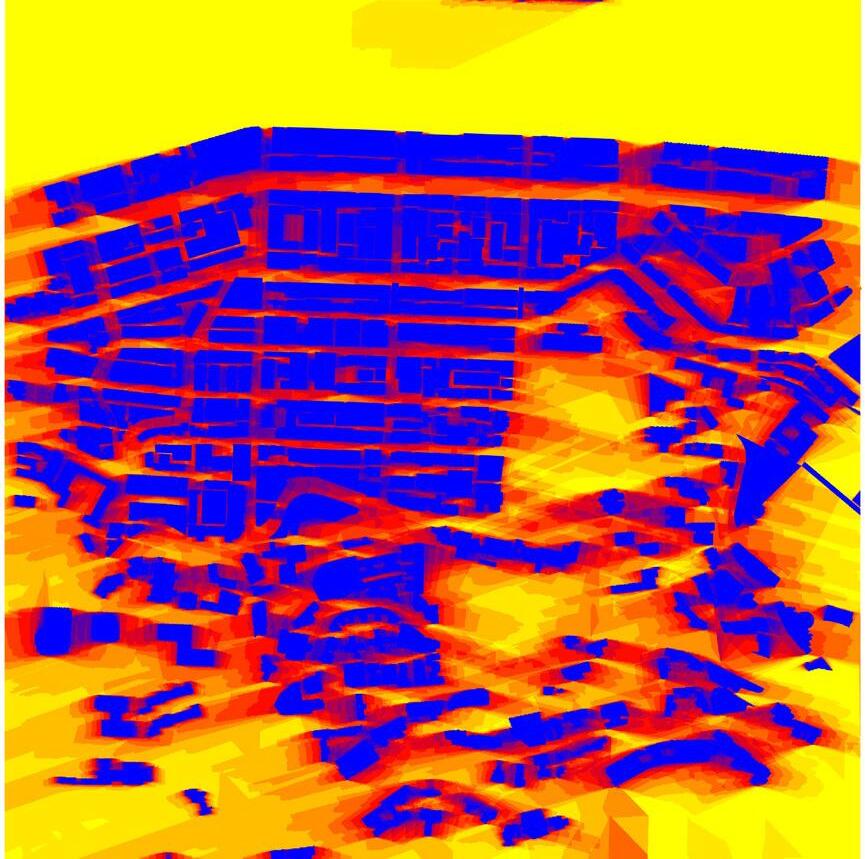
CFD Analysis has been conducted to evaluate the air ventilation of the existing site. As the intent of the project is to introduce a network of multilevel open spaces, it is important to analyse the wind flow concerning different altitudes.
Two types of incident winds are experienced at Sai Ying Pun. The prevailing wind in Sai Ying Pun flows from the east with an average velocity of 3m/s. As the site is located on the foothills, it experiences a downdraft from the mountains that flows from the south. The average velocity of this wind is set up to be 1.5m/s
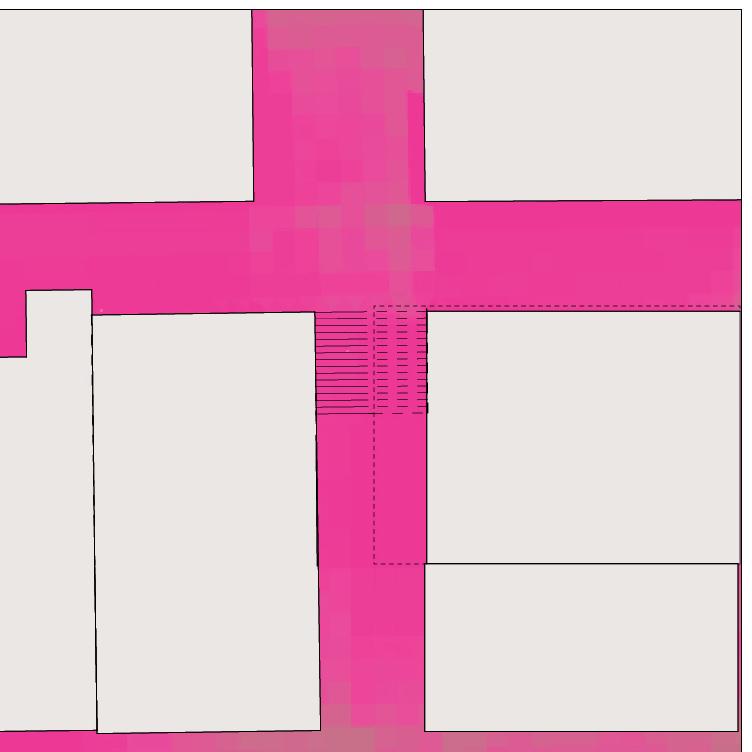
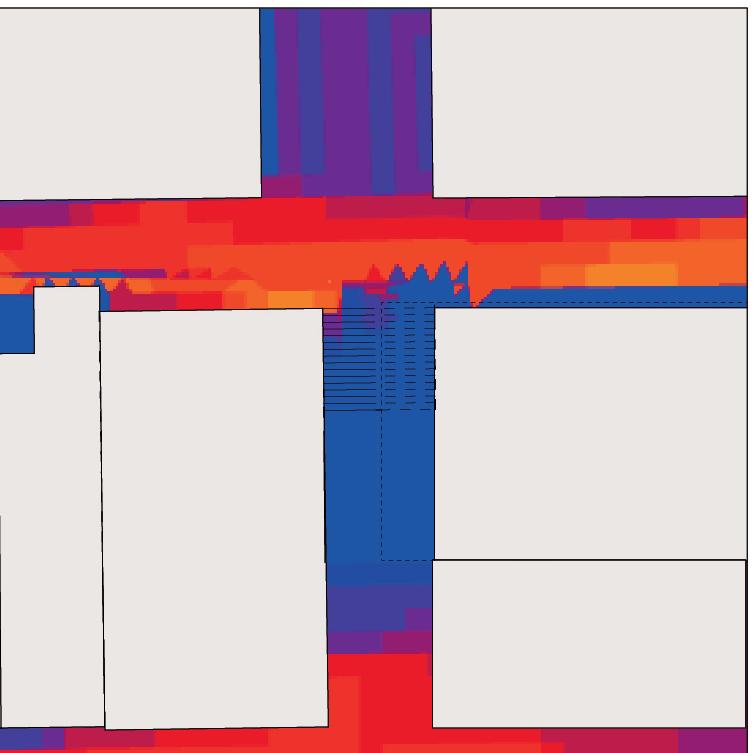
In the urban ventilation study, wind velocity through Sai Ying Pun is analysed at the height of 2 meters, 30 meters, 50 meters, 70 meters and 90 meters. The lowest point on the site has been considered to be level 0 to measure these heights.
Analysing the wind flow at multiple levels helps study the ventilation at the pedestrian level as the topography is undulating, and a single sectional plane does not show an overall picture.
The analysis is implemented on a highly dense urban patch without the great potential of air ventilation. The wind speed inside these patches goes lower than 1m/s, which is not perceived by the human body.
The 2m height analysis shows the ventilation conditions on the northern end of the site. The
wind velocity is not higher than 1m/s. The existing open spaces surrounded by buildings receive a negligible amount of wind flow.
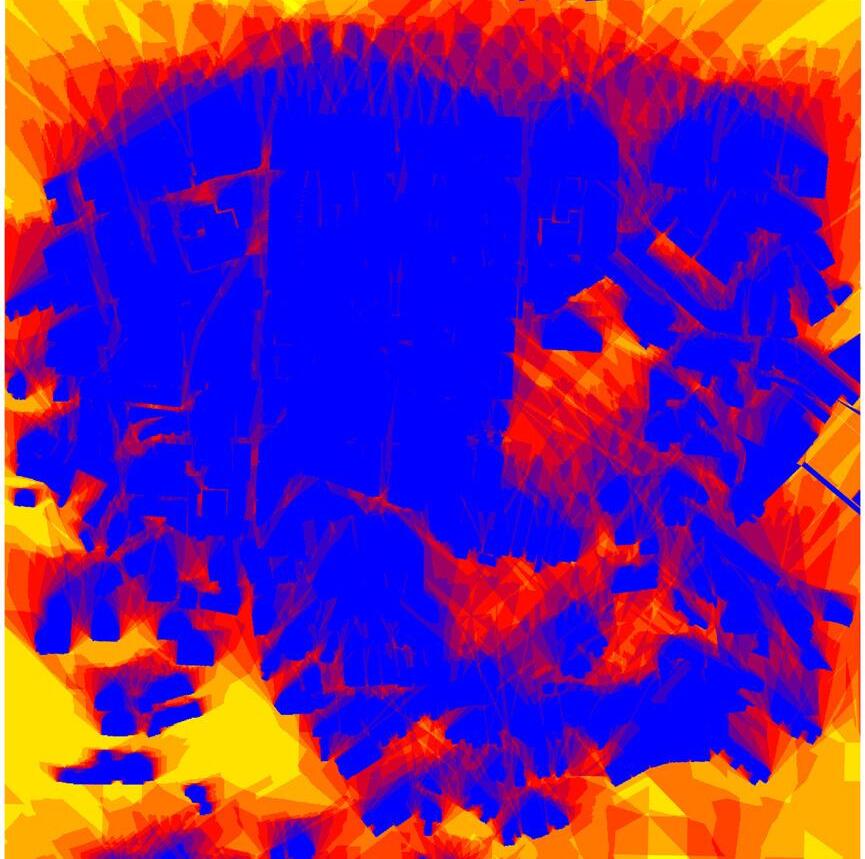
At lower levels, streets oriented in the East-West direction experience higher wind velocity than streets oriented in the North-South direction.
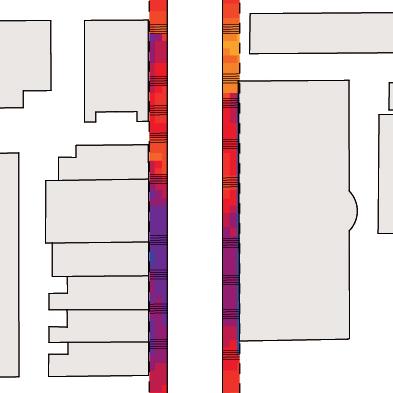
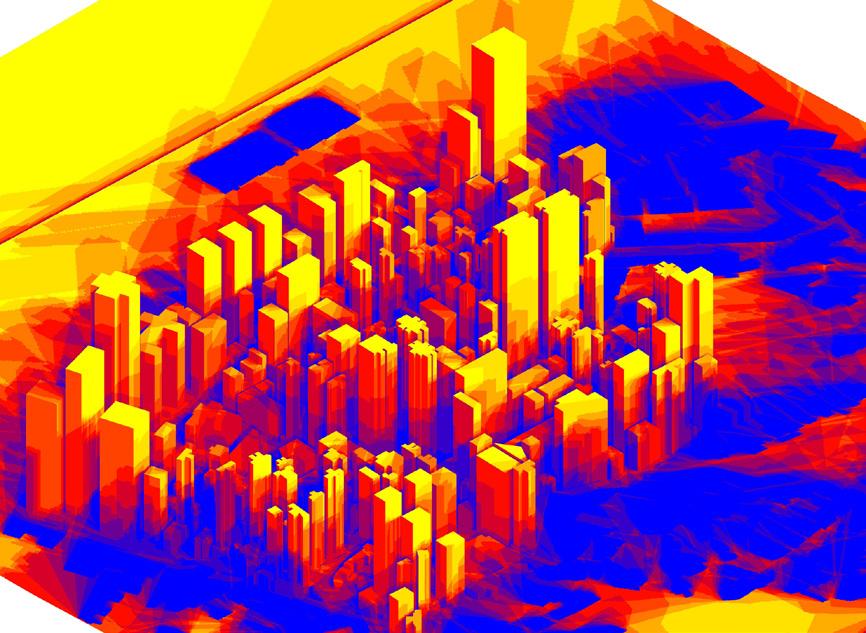
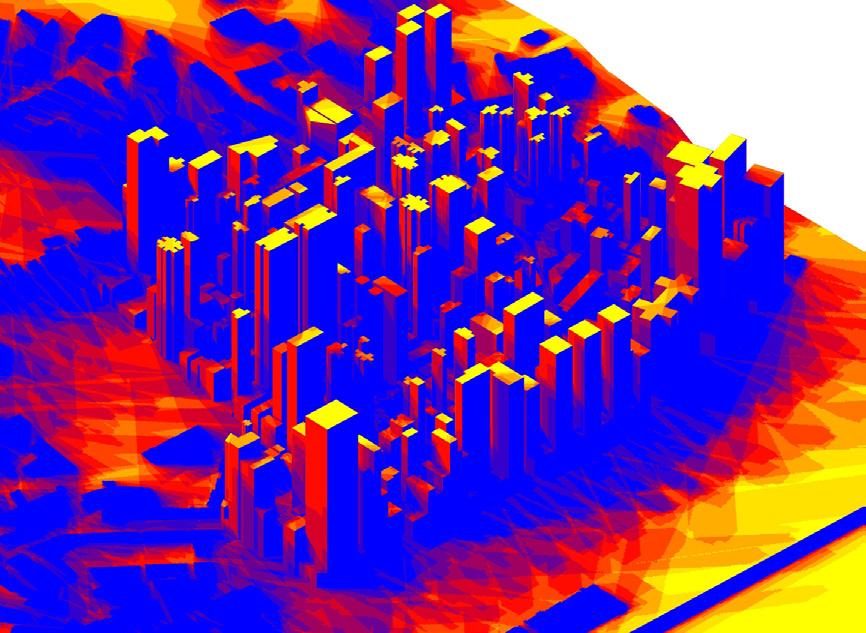
Since there is less density of high rise buildings in the east of Sai Ying Pun, the area experiences higher wind velocities as we can see at the 70m level.
It is noticeable that the ‘wall’ effect on site is responsible for the poor low ventilation in most of the areas on site. However, as observed in level 70 and 90, wind funnelling through buildings may also increase wind velocity.
Specific strategies are extracted that can be utilised in the design proposal to improve urban ventilation.
Streets oriented in the prevailing wind direction, East-West, enhance air ventilation in the urban fabric. The same principle can be applied to elevated open space for cross-ventilation.
As the wind velocity goes up with altitude, multilevel open spaces at higher altitudes will have better ventilation compared to open spaces at lower altitudes.
Open spaces that are situated at lower altitudes around East Sai Ying Pun would receive sufficient ventilation.
Problems and ambitions
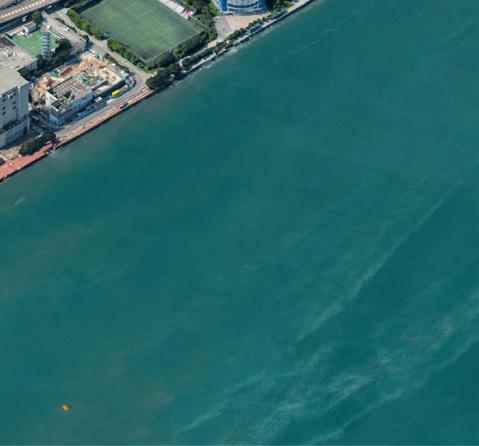
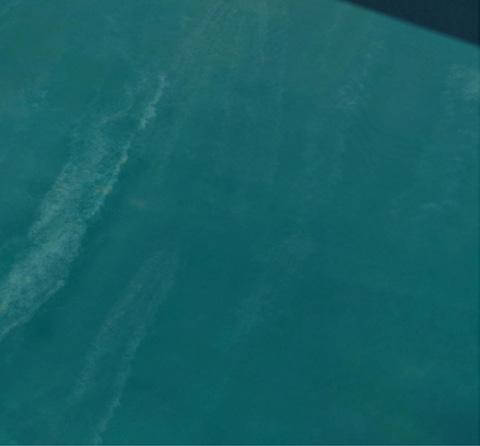
Located at the foothills, the site is vulnerable to floods during heavy rain. The existing sewage system is located on the hillside above Sai Ying Pun to protect the urban area from stormwater runoff. Within the urban area, there is a network of drains that collect stormwater and discharge it into the ocean.
There exists an underground water chamber that collects stormwater during heavy rains to prevent floods. This water is subsequently expelled into the ocean as well.
Since the concrete surface does not absorb, retain or slow down the water, the drainage system receives the complete load of the surface runoff. Often due to blockage or exceedingly high stormwater loads, the site experiences flash floods. There are currently no existing water retention or harvesting techniques incorporated on-site.
In our proposal ahead, we aim to introduce a rainwater collection system. Since the site receives heavy rainfall during the summer months, rainwater can be collected by the open spaces and stored on site. This stored water will be pumped up during the winter months of scarce rainfall and will be utilized for the irrigation of open spaces.
STORM WATER
UNDERGROUND
DRAINS
DRAINAGE TUNNEL
Research Development | Multi-level Ecology
UNDERGROUND
STORAGE TANK
SEA (LOCAL COAST)
SEA (HONG KONG SOUTH)
SEWAGE WATER
Stonecutters Island Water Treatment Work
Tunnel connection chamber
Preliminary Treatment Plant (PTW)
STORM WATER (WESTERN DRAINAGE TUNNEL)
Intake
Western drainage tunnel
The array of complications associated with Sai Ying Pun stem from the initial ineffective planning of the old district. The tightly packed towers have saturated the land available, forcing the city to compromise on elements that are essential for a healthy society.
The lack of open space in Sai Ying Pun is a pressing concern that cannot be solved with current ground level open space distribution. The multilevel open space system that we propose will not only increase the amount of open space in Sai Ying Pun but also the spatial quality of the open space.
Our analysis points out that a majority of the existing open spaces in Sai Ying Pun are dark, isolated spaces that are not integrated with the circulation routes. In order to address this, we aim to enhance urban ecology by connecting the open spaces and ensuring that they perform well environmentally. While providing shading for the spaces, a balance must be achieved such that there are ample sunlight and rain shade simultaneously. Unfavourable climatic conditions, inefficient pedestrian infrastructure and the steep slope make the commute incredibly tricky. The proposed multilevel open space network will be designed to offer an easy, quick and a barrier-free walking through the site, especially along the slope.
The existing pedestrian circulation does not have a programme based hierarchy, which means that links close to essential programmes have been given the same emphasis as links that receive a minimum pedestrian flow. It is essential to prioritize circulation elements that are in proximity to spaces with an important programme or high pedestrian flow.
As we aim to increase the amount of open space on-site, it is apparent that the water requirement of the site will go up manifold. Introducing a water retention system may be a step toward sustainability.
Definition and value projections
The objective of this research is to develop a set of holistic planting strategies that maximize the benefits of urban plantation and minimize the negative impacts that arise from developing hard infrastructure to bear such plantations.
By collecting, analysing and comparing the parameters that support growth of the plants, a catalogue of plants is developed for the open space system. This will allow the establishment of a set of criteria for selecting the suitable plants for the proposed spaces to achieve various design objectives.
The main goals of the proposed multi-level open space system are to provide quality spaces for social interactions and to mitigate the flooding problem on-site by reducing stormwater run-off.
Appropriate planting design can help enhance the spatial quality of proposed spaces, reduce stormwater run-off as well as enhance ecological biodiversity.
1. Enhanced spatial quality
Plants can help to improve the spatial quality by providing adequate shading at the required area. Plants also offer substantial social benefits to open spaces, improving air quality, absorbing noise and enhancing aesthetics.
2. Reducing stormwater run-off
A vegetated surface can reduce stormwater run-off by retaining the water in the plants and the soil. By intercepting and retarding precipitation hitting the ground, vegetation substantially diminishes both the volume and rate of stormwater runoff. This helps in protecting the soil from erosion and reducing flash floods.
3. Enhance ecological biodiversity
Biodiversity can be achieved by allowing species richness and species. The coexistence of different urban plants can enhance the overall health of the urban environment. By creating layers of connected spaces with vegetation, plants can establish an ecological corridor between animals of different tiers in the food chain. A recent study shows that a variation of tree height can enrich the urban bird species(Huang, Qiongyu, Swatantran, Dubayah, and Goetz, 2014).
There are substantial challenges faced pertaining to planting on high-rise buildings. As different plants have different requirements to thrive, there is a need to select appropriate species for different environmental conditions such as incident sunlight, wind resistance and altitude limitations.
Additionally, different plants also bear different properties that specifically relate to the requirements of distinct programmes. For example, plants around residential areas must have a widespread to increase privacy and noise insulation.
The structural limitations of the provided infrastructure are also a practical challenge. Generally, as open spaces at high altitudes comprise of lightweight plants that require a shallow soil depth.
Data collection and cataloguing
The principal environmental requirements to sustain plant growth include sufficient space for root and canopy development, adequate sunlight, water, mineral elements, and suitable temperatures for essential physiologic processes.
The planting strategy will give a higher priority while situating plants to essential parameters that are critical to the plant’s growth. Satisfying the essential parameters, such as shade cast and enhancing biodiversity, will be addressed.
In-Depth research has been carried out to study local species that thrive in the climate of Hong Kong. These species are categorized based on their essential parameters in order to gain insight into the species can correspond to specific planting sites.
Red Az alea Coral-p lan t San ch ez ia Sna ke Pl an t Moth er-in-Law s Ton
gu e
Lady P alm
Cape Lead wort
Myrte -leaved Leaf-flo we
Swiss Ch eese P lan t
Cerim an
Red Strap Fl ower
Lantan a
Dwa rf Ix or

Chin ese Ixo ra
Chin ese H biscus
Varieg ated Sky Fl ower Pe rf u me Flow er Tree Gold en Leave s
rella
Hon g Kon g Orch id T re e Sun shin e Tree Bul l Bay M ch elia ch ape ns s Dand y Rose App le Hon ey Myrtle
Weep in g Fig
Varieg ated Weep ing Fig
Batav a C nn amo n
Hain an Elaeo ca rp us
Commo n Garcinia
Cub an Bast
Quee n Crape Myrtle
Kwa -f ah
Frang ipan i
Chittagon g Ch ickrassy
Scaly T re e-fe rn
Sago Pal m
Chin ese Fan-p alm
Dwa rf Date P alm
Drago n Ju nipe r Bud dh ist P ine
Agl aia od orata var m croph yll na All ama nda Brazil Ra n tre e Japa nese Came llia Fuk ie n T ea Blee d ng Heart V n e Garden Croton Gold en De wdrop
rong w ind
There is a direct relation between the size of the plant, soil volume and its water retention capability.
The diagram shows the relationship between the plant height, its mature canopy diameter, soil depth, volume and weight and the corresponding water retention capacity.
As the plant height, its mature canopy diameter, soil depth and volume increase, the water retention capacity exponentially increases as well.
In the case of this project, there is a requirement to maximize water retention, to reduce run-off, resulting in reduced chances of flash floods. It is evident from the graph that larger trees account for higher water retention.
Taking into consideration the structural and spatial limitations of the planting site, a balance of functional limitations and water retention requirement needs to be achieved.
Definition and value projections
The hydrologic system is the entire cycle of water movement. It is a system of interrelated components, including the processes such as precipitation, evaporation, absorption and transpiration, in addition to those structures and devices that are used to manage the system. The hydrologic system is subject to different kind of weather pattern and spatial complexity and is dynamic.
Overview
The aim of devising this strategy is to address the lack of freshwater issue by introducing techniques of recycling water. The scope of this system is to establish a relationship between Stormwater received, greywater and the irrigation requirements in Sai Ying Pun.
The runoff coefficient (R) is a dimensionless coefficient relating the amount of runoff to the amount of precipitation received. It is a larger value for areas with low infiltration and high runoff (pavement, steep gradient), and lower for permeable, well-vegetated areas (forest, flat land).
Runoff coefficient is a multiplication factor used to establish the proportion of the volume of rainwater that can be collected relative to the volume that falls on the surface. It accounts for losses of rainwater due to evaporation and absorption by the construction materials.
The runoff coefficient is high when measured in areas with hard surfaces as the surfaces do not absorb or retain water. While in areas with widespread vegetative surfaces, the surface runoff coefficient is low due to the tendency of plants and soil to absorb water. The soil depth and plant height/ spread are inversely proportional to their corresponding runoff coefficient.
As Sai Ying Pun is a concrete jungle, it mostly comprises of hard surfaces with very low water permeability. The runoff coefficient of urban areas as such is considerably high.
Annual water consumption
Annual rainfall
Water imported from China
Water from Hong Kong’s catchment
Run-off Coefficient (Cr) of different surface types
Asphalt surfaced area
Pitched roof
Block pavement
Moss Sedum
Herbs
Concrete flat roof
Lawns Grass Sedum/ gass
Shrubs
Trees
Substrate thickness (mm)
Surface with vegetation
Hard surface
Rainwater runoff equation
R = P + I - ET - ΔS
R = Rainwater runoff
P = Precipitation (rainfall)
I = Irrigation (artificial)
ET = Evapotranspiration
ΔS = Change in storage
Rainwater runoff is the resultant sum of precipitation and the water required for irrigation, minus evaporation and storage change value
Rain water yield equation
Yr = Ac x Rm x Cr
where:
Yr = the weekly average rainwater yield (litre/week)
Ac = the collection area (m2)
Rm = the average weekly rainfall (mm)
Cr = the run-off coefficient
The volume of water that can be captured from the proposed open space can be estimated using the rain water yield model.
During summer months from May to August, Hong Kong receives heavy rainfall going up to 450mm; while during the winter months from October to March, precipitation low with a maximum of 150mm.
The precipitation received during the summer months is enough to irrigate 200% of the current open spaces. However, the rainfall received during the winter months falls short of the irrigation requirement.
With an effective local rainwater harvesting system, the area may have the potential to be self-sufficient even during the winter months.
Greywater
Greywater is relatively clean wastewater from baths, sinks, washing machines, and other kitchen appliances. This water has the potential to be locally treated and reused for irrigation of plants.
The local yield of grey water in Sai Ying Pun is higher than the total irrigation demand as the area is mostly residential, and the greywater yield remains virtually constant year long.
Annually, more than 300,000m3 of greywater can be utilized for irrigation with an efficient treatment system.
The irrigation demand of the area is calculated by the total amount of water required by the plants on site. To estimate the amount of water that needs to be produced, this annual demand is subtracted by the rainwater utilized by the plants.
As summer months receive a high amount of rainfall, the resultant irrigation demand is low, and since winter months receive low rainfall, the irrigation demands are high.
Precipitation + Irrigation demandEvapotranspiration = Surplus water
Overall system
The objective of this strategy is to enable the site to meet its water irrigation needs locally.
The summer months receive high rainfall that exceeds the irrigation requirements by 127,000m3. This excess water will be treated and stored in underground storage tanks for future use.
During the winter months, when the rainfall falls short of the irrigation demand by 150,000m3. In this case, water previously treated and stored is pumped up to the open areas for irrigation purposes.
The underground water storage containers will be clustered according to the buildings and the morphology of the urban grids. As high-rise towers have deep foundations, the storage will be located under roads or existing open spaces at a safe offset from built structures.
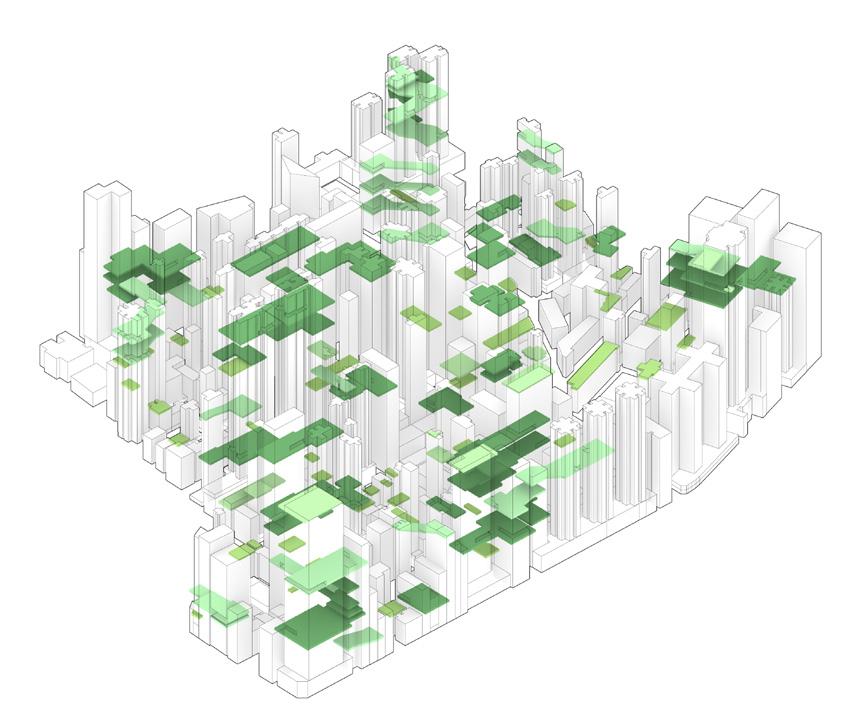
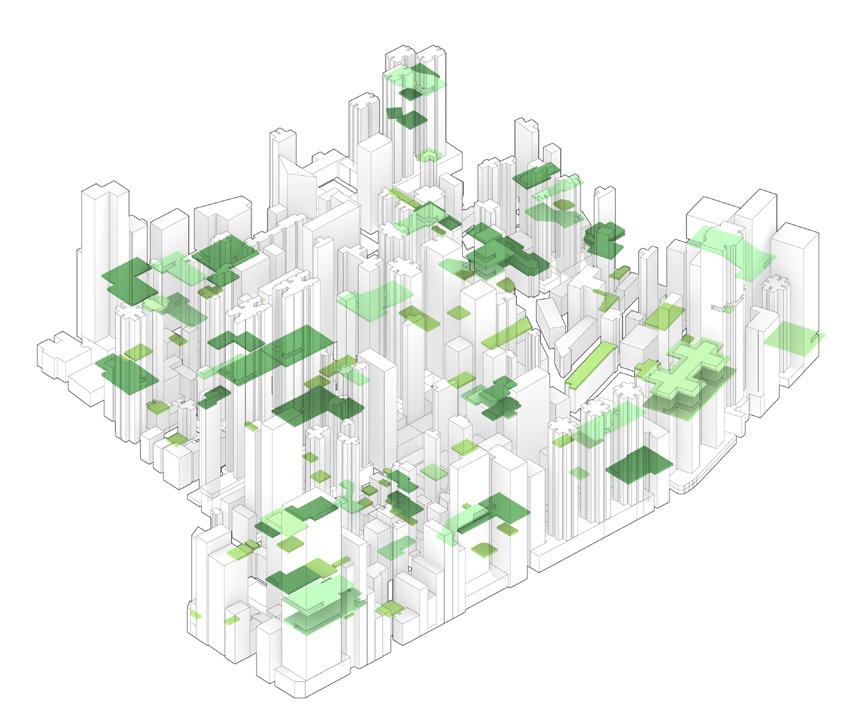
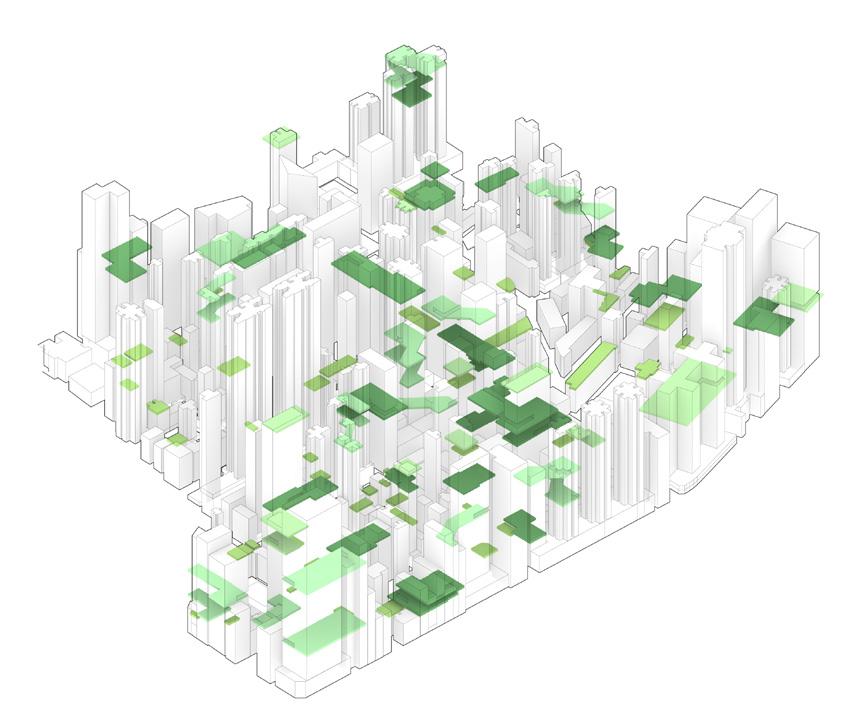
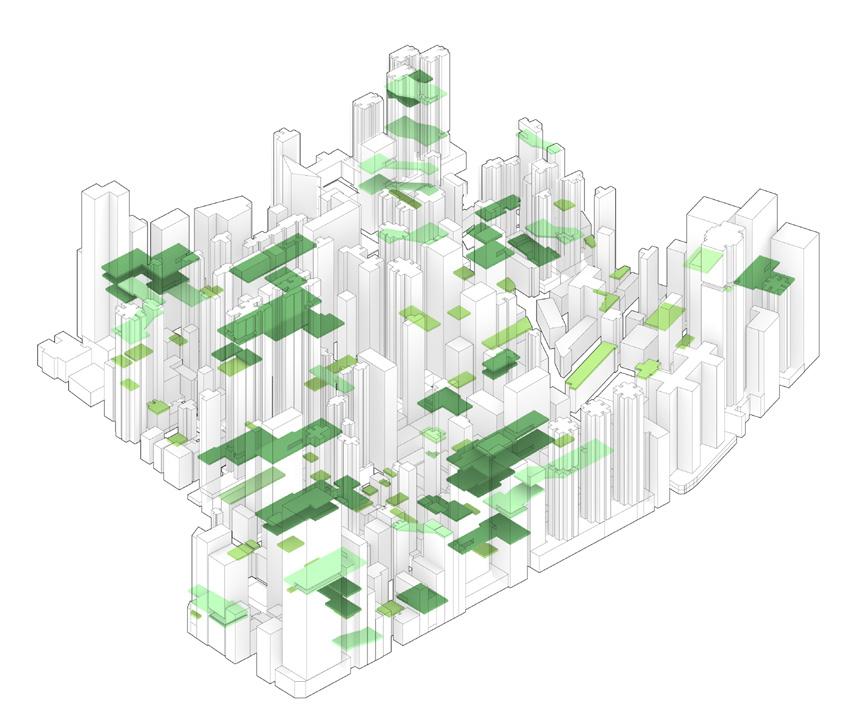
GLOBAL EXPERIMENT
Open space elements
Open space generation
Feedback loop
Result model
Result model with network experiment feedback
Result comparison
Integrated system
[Design Proposal]
Network generation
LOCAL SYSTEM
Planting strategy
Water system
Development of working design models
OPEN SPACE ELEMENTS
Based on the structural learning from the buildings on site, types of open spaces will be designed, which will define the relationship of the open spaces with the corresponding building.
OPEN SPACE GENERATION I
The types of open spaces previously designed will be distributed on site. Using generative algorithms, the size and location of these open spaces will be optimized.
NETWORK GENERATION
A selected result from open space generation I experiment is used as a primitive to conduct this experiment. A network is created to connect the generated open spaces to enhance urban connectivity and ecology.
OPEN SPACE GENERATION II (FEEDBACK LOOP)
Design insight is gained from analysis of network generation experiment result. To achieve a comprehensive, interrelated design system, adjustments are applied to the open space generation experiment by modifying the script.
COMPARISON OF OPEN SPACE GENERATION L AND GENERATION LL RESULTS
The results from the two open space generation experiments are compared to evaluate the effectiveness of the feedback operation.
PLANTING RESEARCH
The planting study conducted informs the selection and location of plants to be planted in the open spaces. The research also informs the hydrological system in determining the water irrigation requirement.
HYDROLOGIC SYSTEM
This strategy addresses the lack of freshwater issue by introducing techniques of recycling water. The strategy aims to drive the site into a self sustaining its water irrigation requirements.
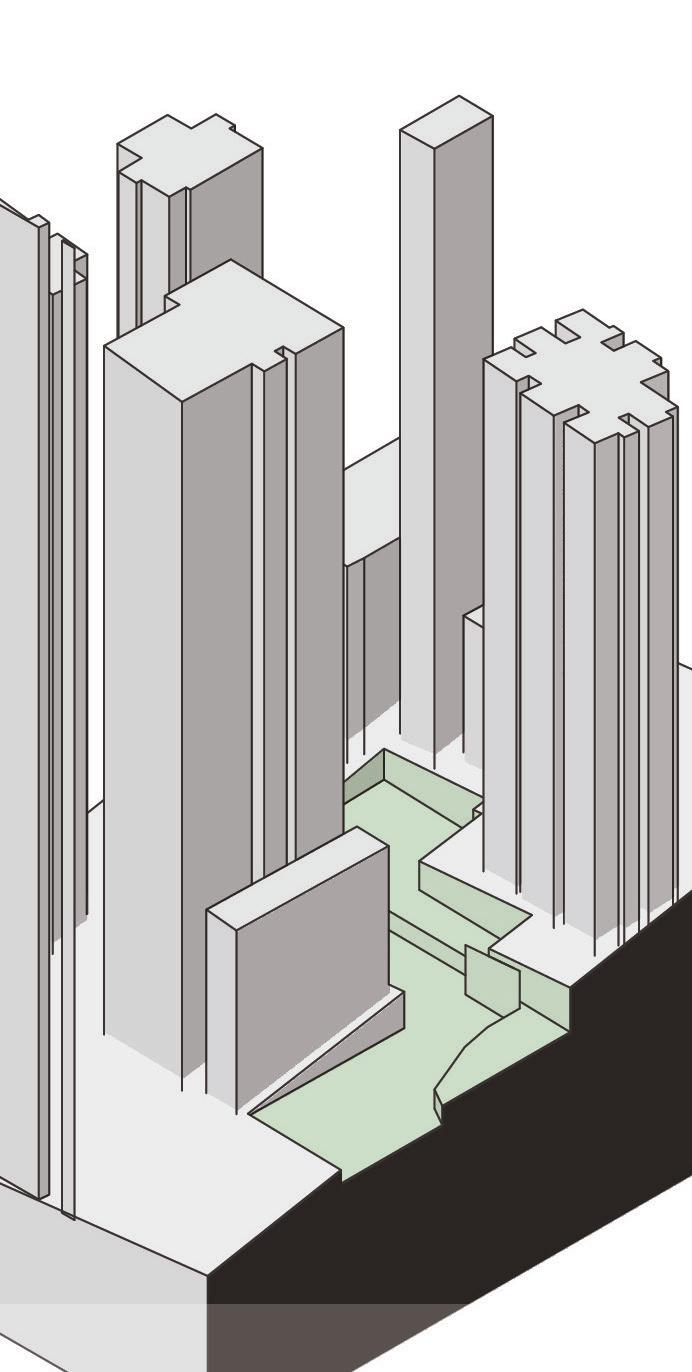
Configurations of the proposed open spaces
The structure of buildings in Sai Ying pun has been studied to understand the potential of possible connections to the buildings in the research development section.
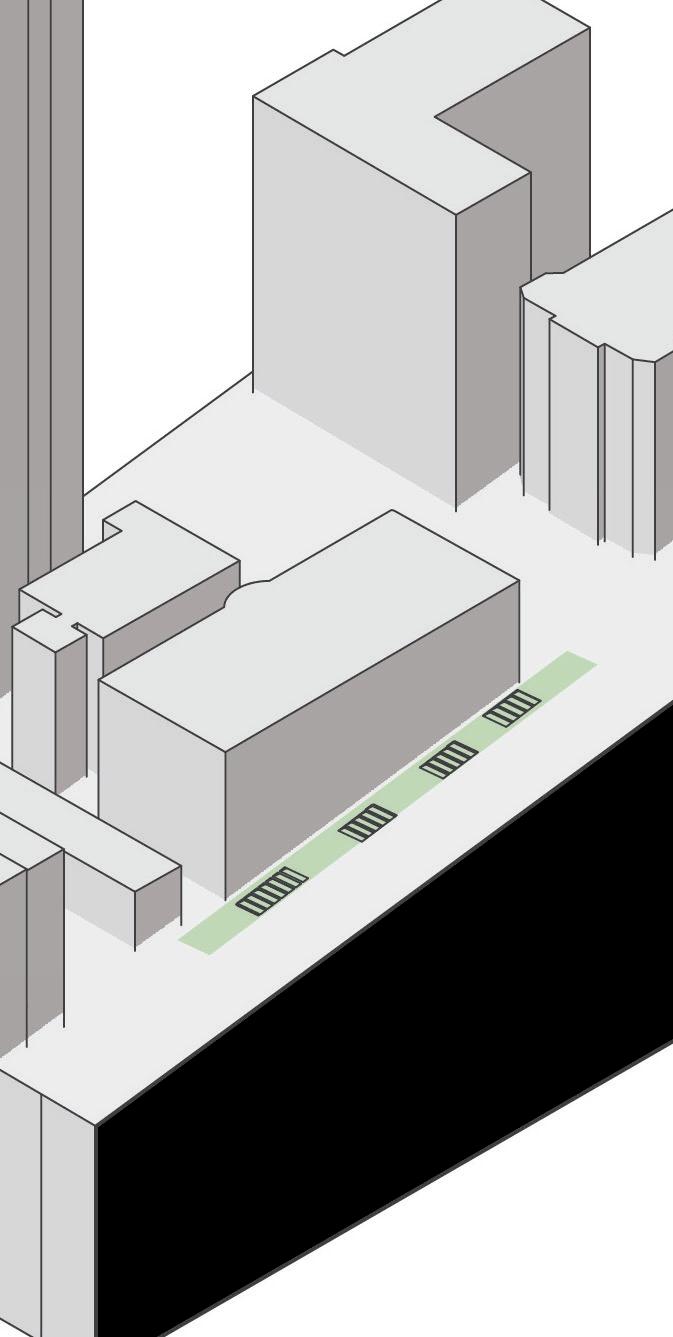
Four types of open space configurations are proposed based on a relationship with the structure of the existing buildings:
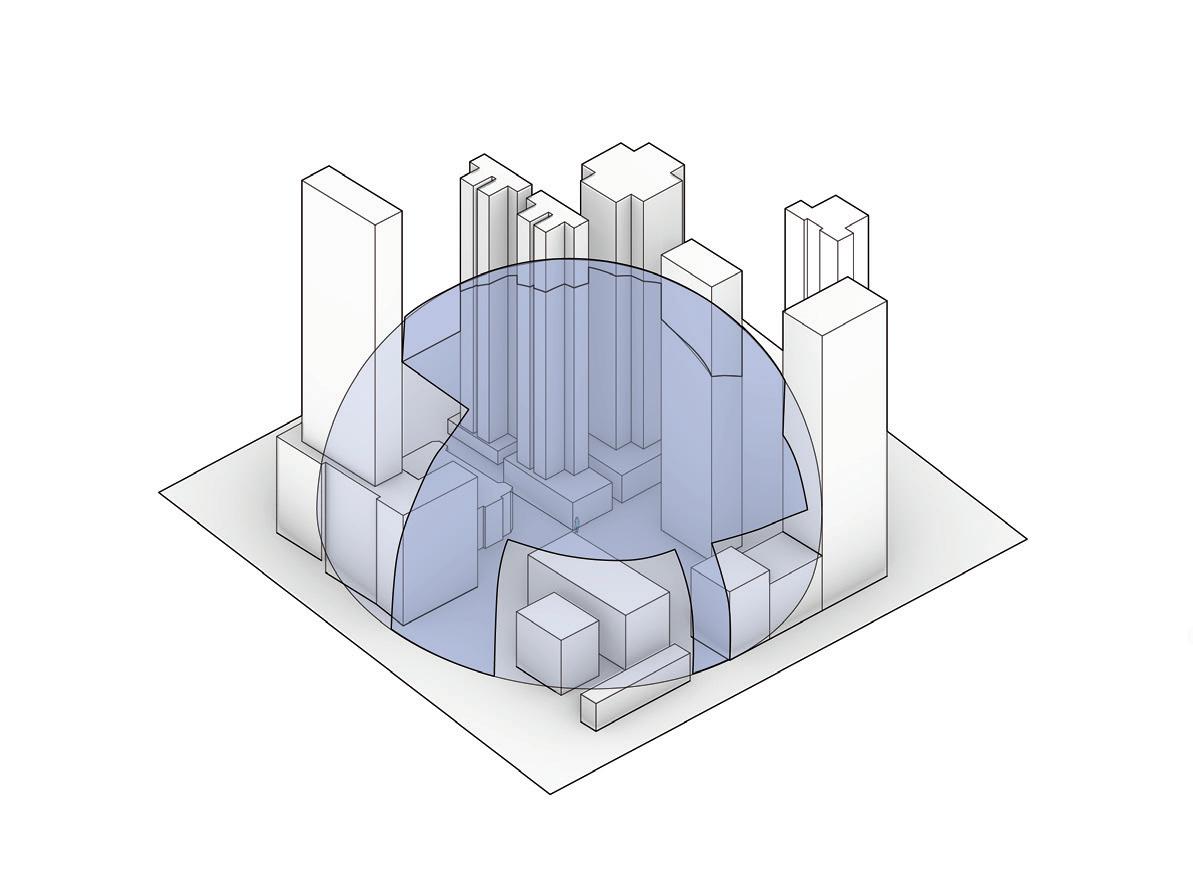
1. Cantilevers are spaces created by offsetting the building boundary, partially or entirely depends on the solar performance of the resulting areas. Cantilevers are created on towers that do not have any other towers in proximity. The Cantilever from the building is about 4-5 meters wide, considering the structural limitations.
2. Bridges are linear spaces created by connecting two buildings within a range of 20 meters. These bridges are not footbridges in the conventional sense. Rather they merely serve as a connection between the two buildings, and they are generous spaces between two buildings which provide opportunities for social interactions.
3. Hybrids are an amalgamation of the cantilever and bridge types. They are created when the two buildings are within a 10-meter range. As the resulting spaces are usually more significant in terms of foot-prints, these spaces would cast a larger shadow on the existing building compared to the bridge type. However, the hybrid type provides a less linear space and thus offer a more diverse opportunity for a different program.
4. Green roofs are spaces created on top of the lowrise shop houses. This type of space is limited to this building as it would create the least disruption to the existing structure as compared to the previous types as mentioned above. These spaces, unlike the rest, are closer to the ground level and tends to have a high degree of openness.
Location and size optimization
Ambition
This experiment aims to generate and distribute open spaces throughout the site based on criteria evaluating the spaces as well as their impact on the existing built fabric.
A multiobjective evolutionary algorithm is used to determine the type, the size as well as the location of the open spaces. The bridges, cantilevers and hybrids types of open spaces will be distributed based on the morphology of existing structures. Open spaces are assigned to spaces based on their relationship with the corresponding existing building’s cross-sectional area.
The generation size of the algorithm set up is 20 with an individual count of 10; in total, 200 solutions were generated.
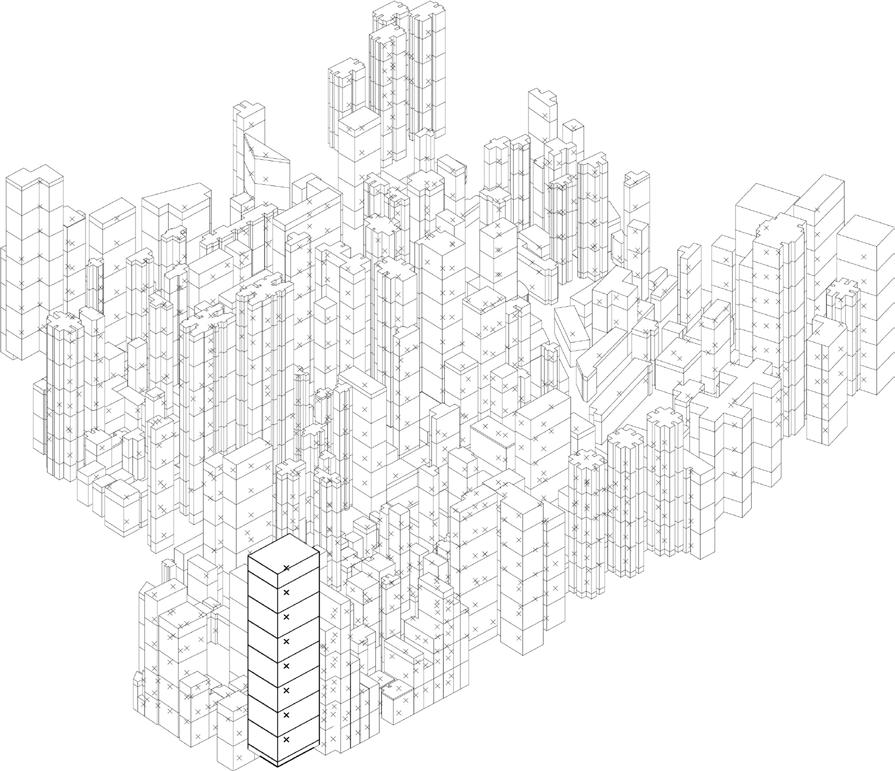
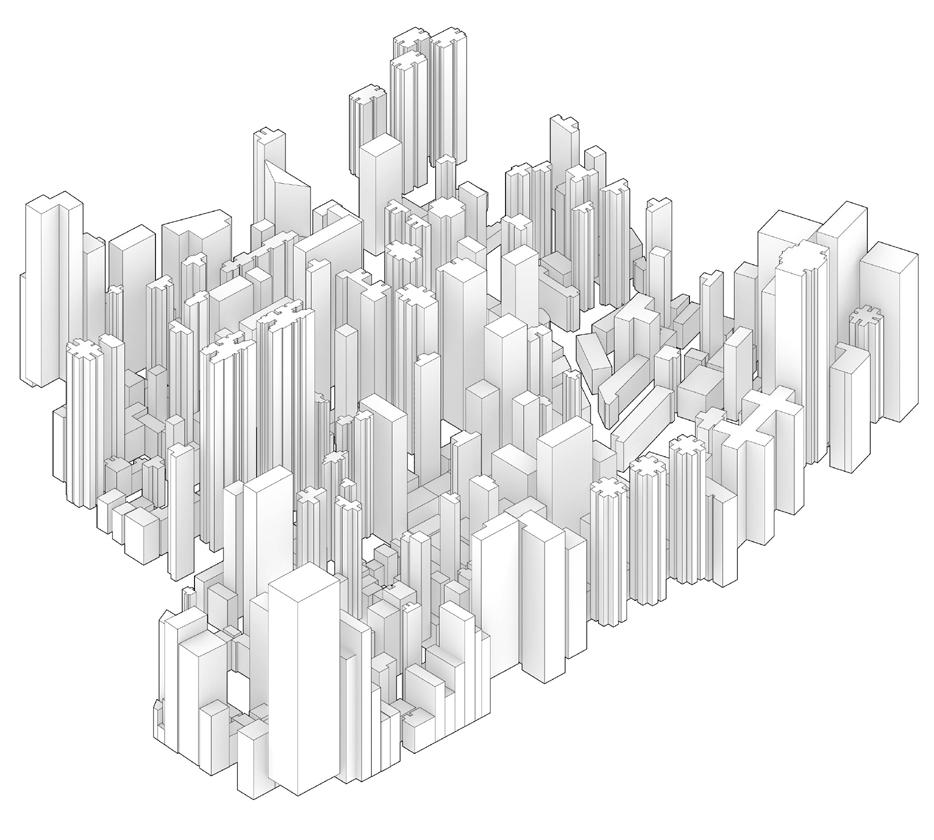
The body plan consists of the existing buildings on the site. The central axis of each building in the Z-direction has been identified, and points have been placed at every 20 meters on this axis. These points act as potential candidates, adjacent to which the open spaces are created. The decision to have a difference of at least 20 meters between two open spaces was taken to prevent overlapping of spaces in proximity and to reduce their impact on the existing buildings.
The different types of spaces created are roof gardens, bridges, cantilevers, hybrid of bridges and cantilevers and openings cut out in the existing structures for access.
Target
The desired outcome of this experiment is to achieve a 200% increase in the existing open space area.
At least 60% of the open spaces generated receive more than 5 hours of sunlight a day so that plants can flourish.
The open spaces created must impose a minimal impact on the existing urban fabric in terms of shadow cast and population displaced.
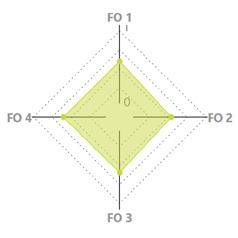
Fitness Criteria
FC
Type of Space
 3: SOLAR EXPOSURE maximize solar exposure in summer
FC 4: SOLAR EXPOSURE maximize solar exposure in winter
FC 1: VENTILATION maximize ventilation
FC 2: STREET & BUILDING SHADOW minimize shadow cast on surrounding buildings and street
3: SOLAR EXPOSURE maximize solar exposure in summer
FC 4: SOLAR EXPOSURE maximize solar exposure in winter
FC 1: VENTILATION maximize ventilation
FC 2: STREET & BUILDING SHADOW minimize shadow cast on surrounding buildings and street
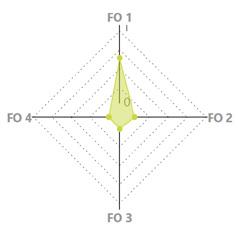
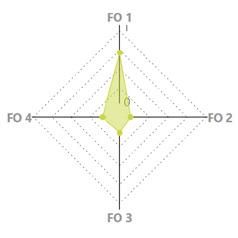
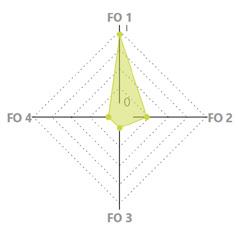
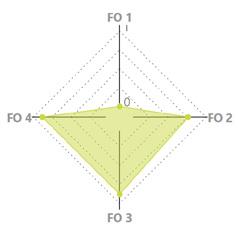
Selected individuals for further analysis
The following are the selected highest-ranking candidates corresponding to each of the fitness objectives, while candidate 5 ranks highest in the average of the objectives.
The candidate corresponding to the average of fitness objectives is not the best, nor the worst-performing in any of the fitness objectives, but a mediocre, substandard result.
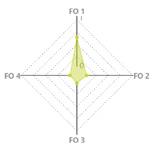
We can see from the results that the objective that maximises the volume of the void conflicts the other three objectives. This fitness objective is responsible for bringing down the performance of the other three objectives in the average result. For this reason, it is important to prioritise the fitness criteria. Giving lesser weight to FC1 will result in solutions that perform better in the other three objectives.
As the four fitness objectives do not carry the same weight, our design decision at this stage will be to prioritise the objectives in order to select the desired result.
The selected individuals are evaluated based on the type and number of open spaces they generate.
Analysing the open spaces in the selected individuals, we can see that the individual corresponding to the maximise void objective produces the least amount of open space while the first candidate performs the best as it produces the most significant amount of open space.
The selected individuals will be further analysed and processed through multiple environmental evaluations, to gain insight into their performances and gather sufficient information for the selection of one individual for the final architectural process are then evaluated through a series of post-analysis to derive the highest performing individual based on environmental criteria.
Fittest individual - AREA 10 Individual 20 generation (total 200 individual)
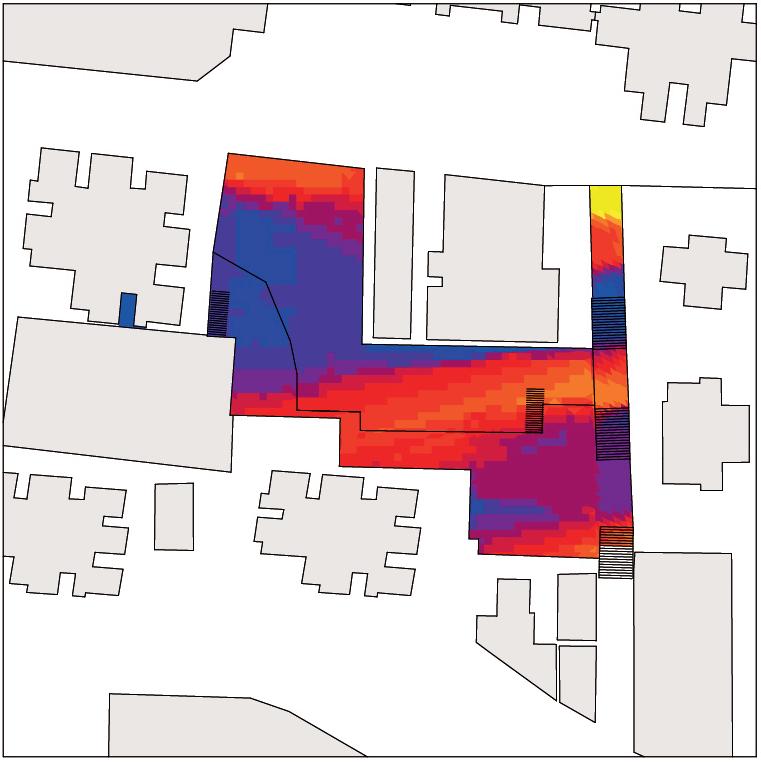
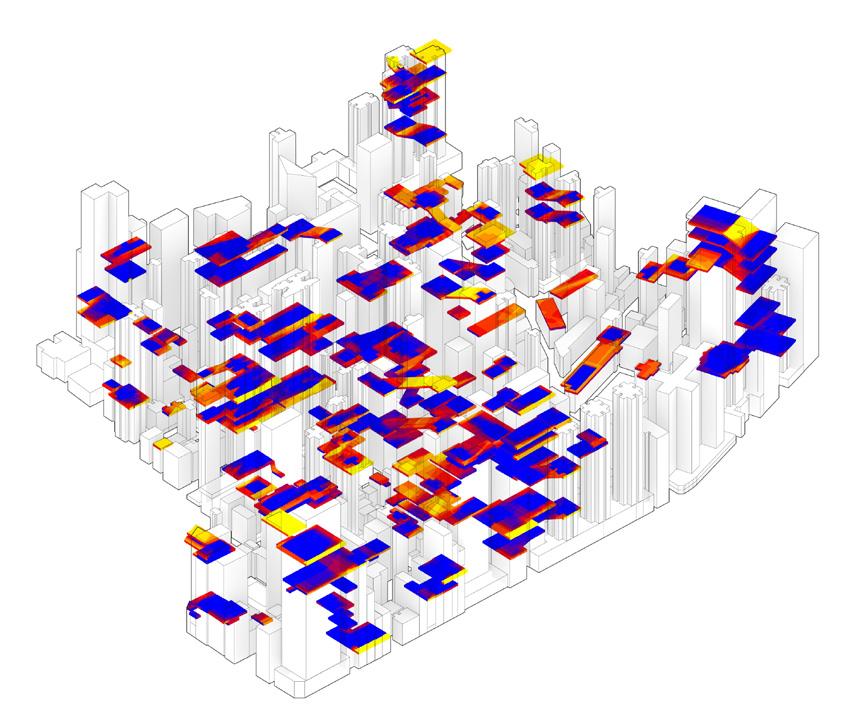
Assess the solar performance on open spaces of selected individuals
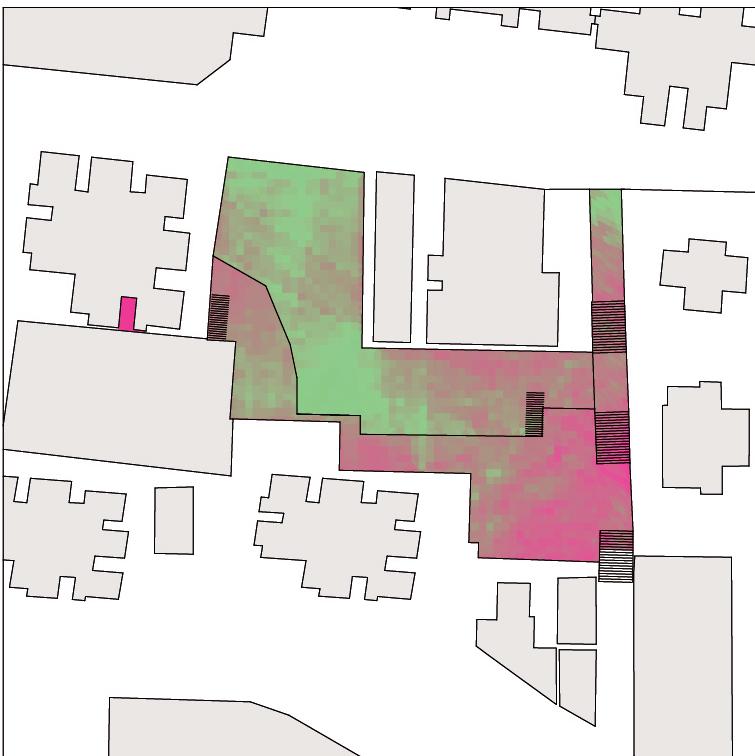
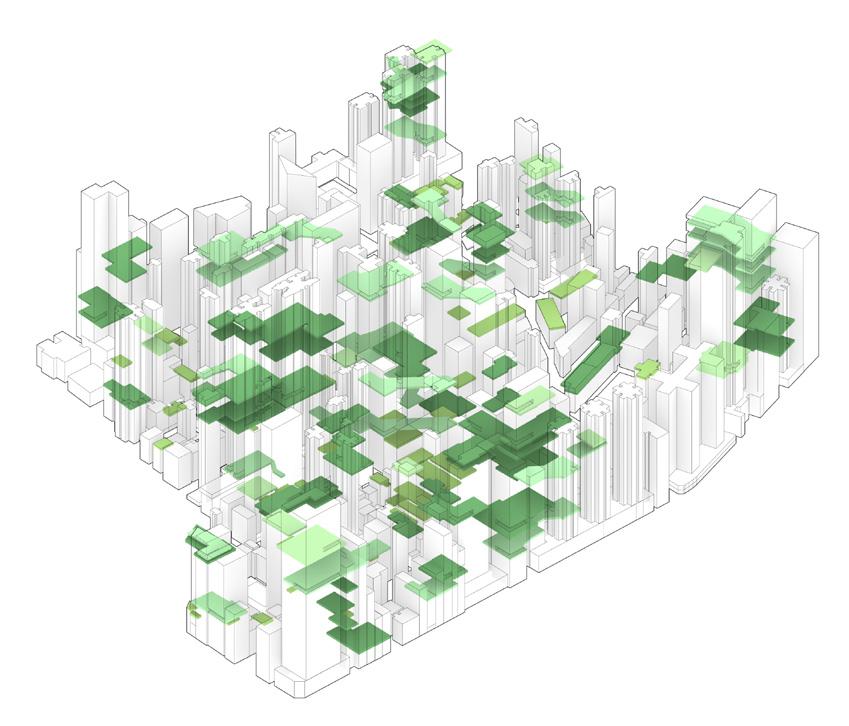
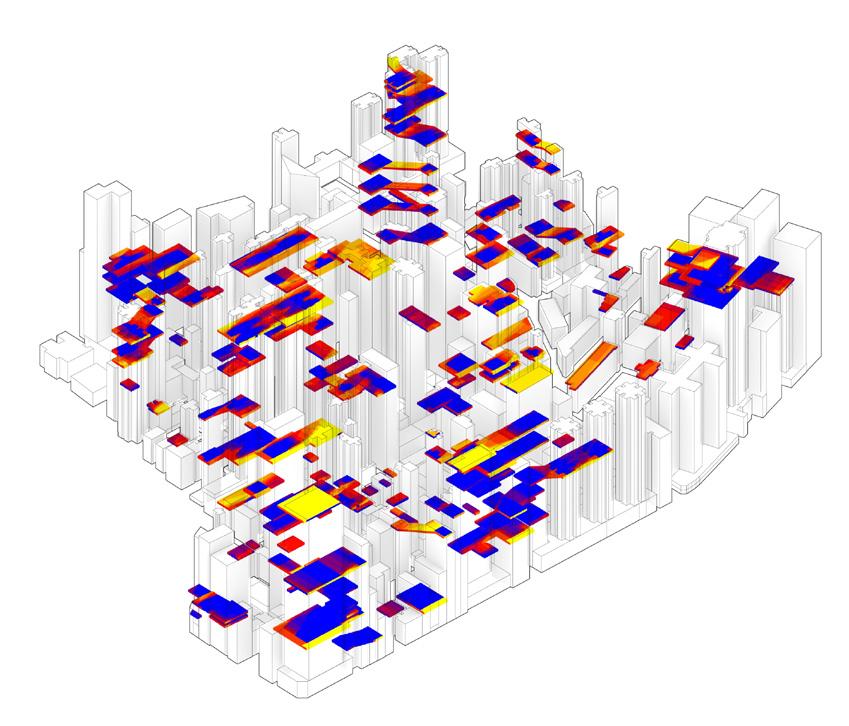
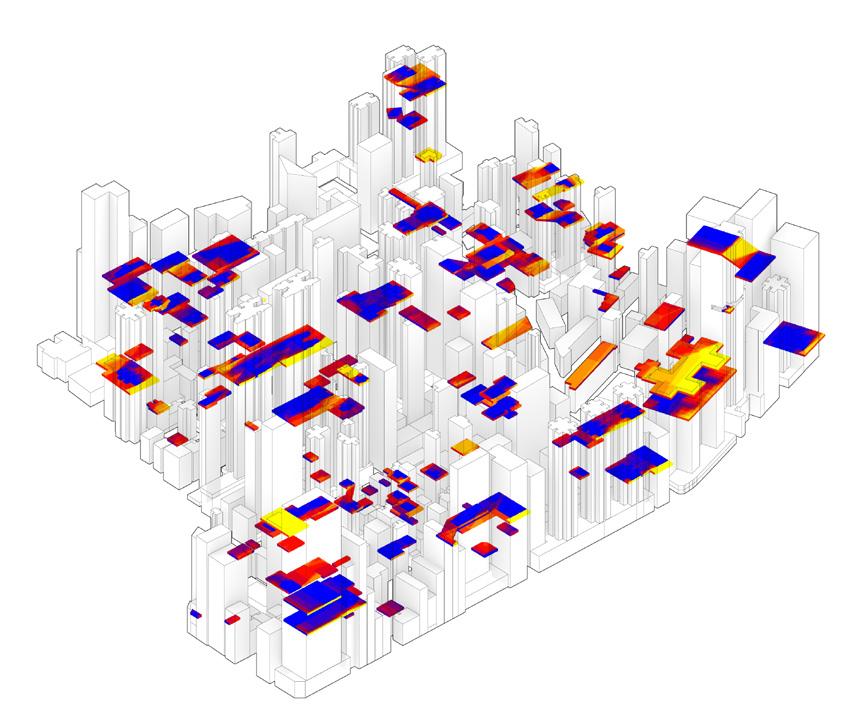
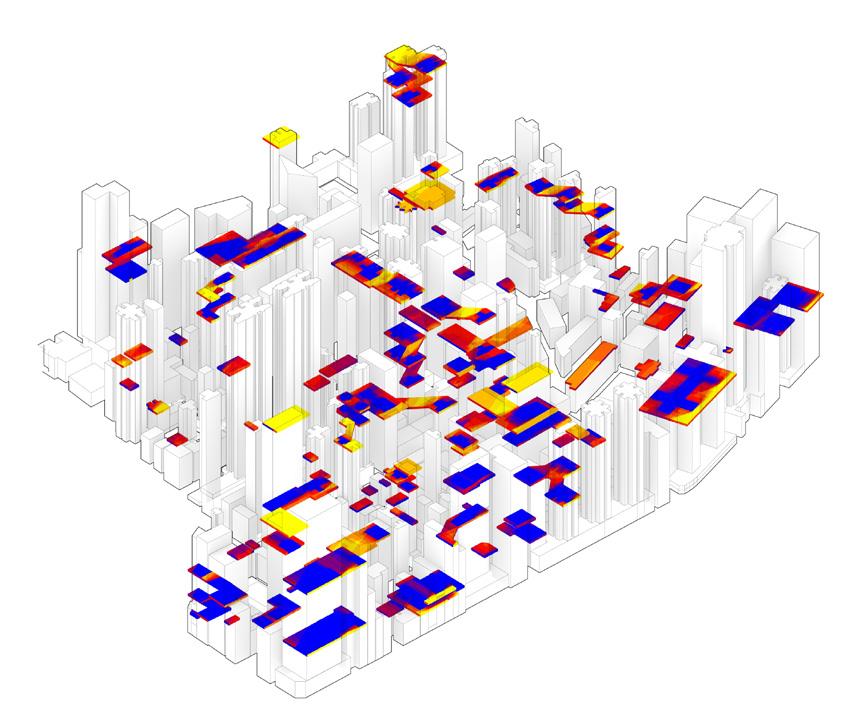
The result of the solar analysis on the generated open spaces shows that although maximizing the sunlight hours on the open spaces is a fitness objective, the post-analysis results have many variations.
As the design objective is to maximize the area with green spaces, candidates that receive more than 5 hours of sunlight on at least 60% of the space will be prioritized.
Observation
Although the first candidate has the maximum amount of area that receives high sunlight, it is not selected as it also has the maximum amount of area that receives the least amount of sunlight.
To find the right balance, we will compare the ratios of the area that receive high sunlight hours with the areas that receive low sunlight hours. Candidate 4 has the highest ratio. It will be given priority. 60% of the total area receives more than 7 hours of sunlight, while only 20% of the area receives less than 3 hours of sunlight during the period.
Fittest individual - solar exposure
Gen.0-Ind.6 | FC1 fittest
Design Development | Multi-level Ecology

Gen.19-Ind.3 | FC4fittest
Gen.16-Ind.5 | FC2 fittest Minimize shadow on existing buildings
Gen.4-Ind.2 | Relative diff. rank 0
Gen.18-Ind.5 | FC3fittest
Solar exposure configuration
1-4
Assess the percentage increase of shadow impact on the existing building of selected individuals
This analysis is carried out to understand the impact that the generated open spaces have on the buildings on site.
As Increasing the area of the results of the open space in the increase of shadow cast by them, this analysis aims to select a configuration of open space that corresponds to less than a 10% increase in shading compared to the current scenario. Individuals that achieve the desired open space area and create minimum shadow are prioritised.
The result of the shadow analysis portrays that there is a minimum deviation in the shadow cast by the results and the existing scenario. There is an approximately 3-4% increase in the shading in all the selected solutions. This range of increase in shading is acceptable as our target is to keep the impact under 10%. Since all the selected individuals fall in this range, this criteria in evaluation can be disregarded.
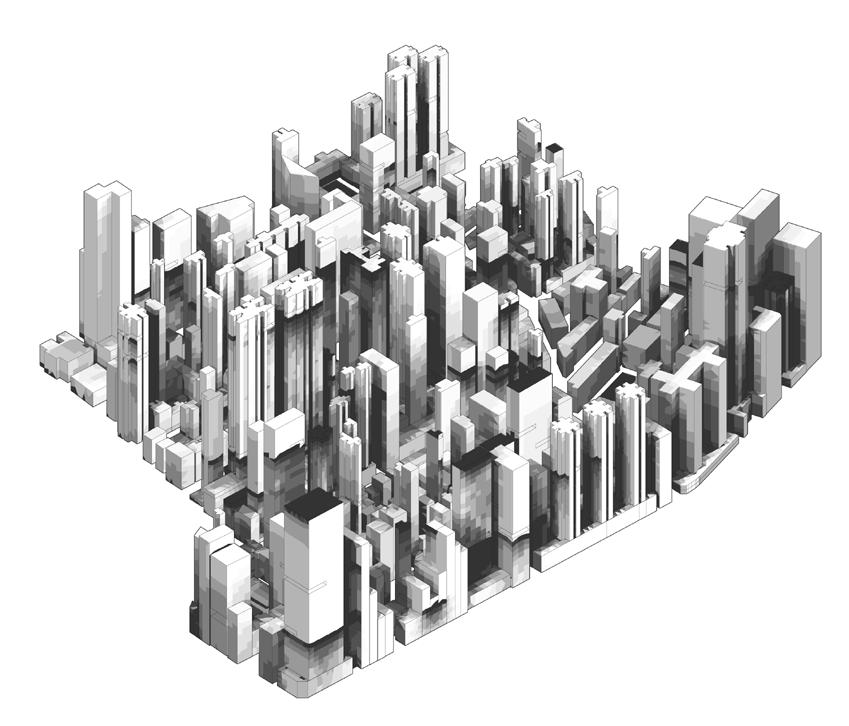
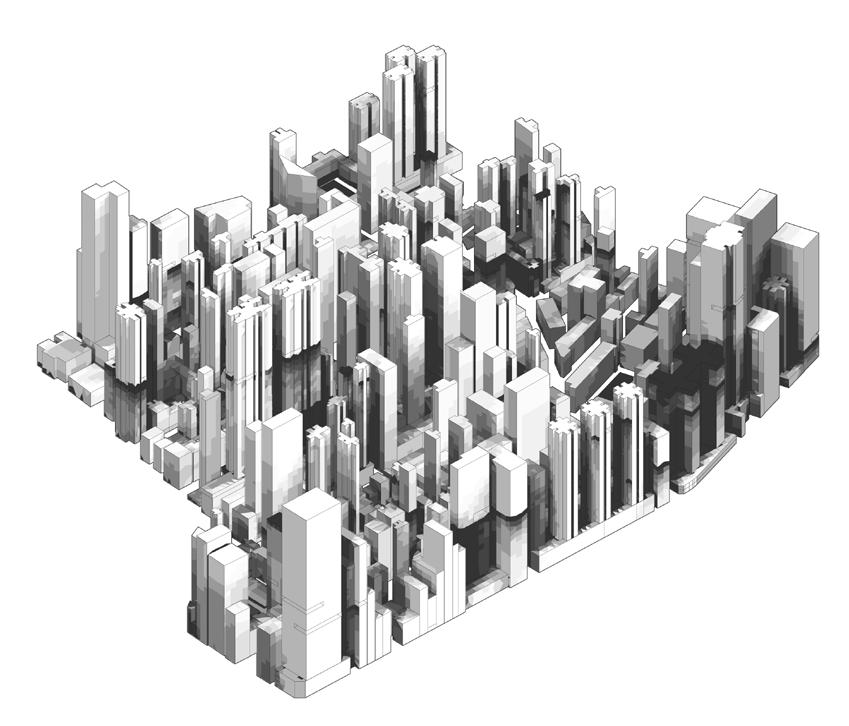

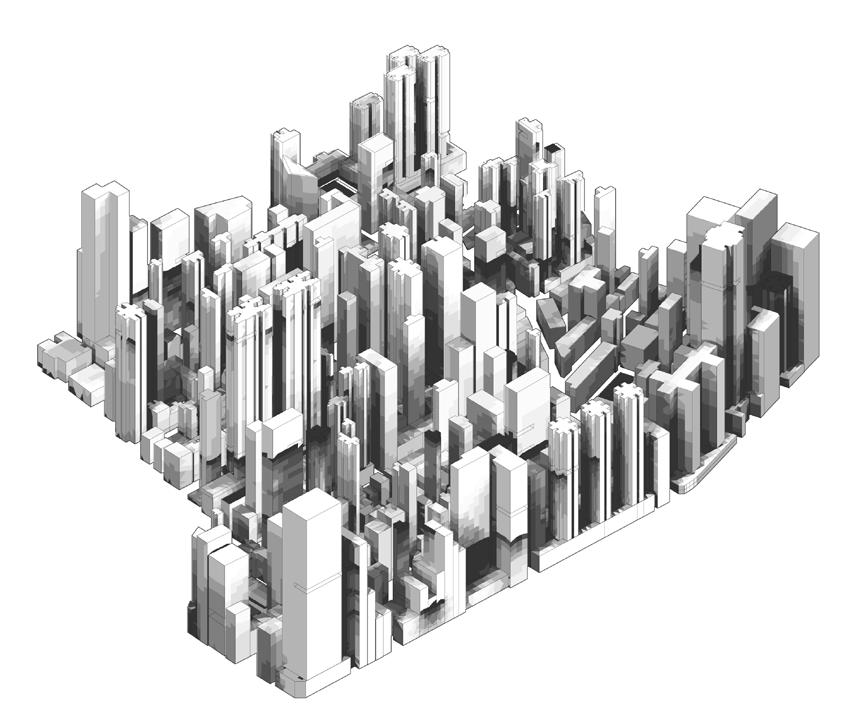
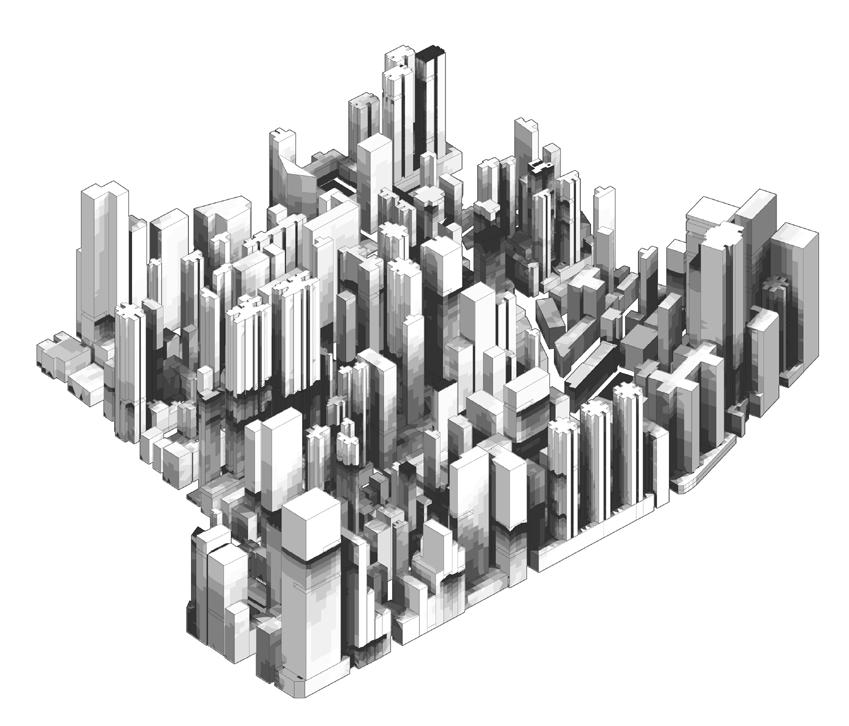
Assess the percentage increase of shadow impact on the ground level of selected individual
In this analysis, we aim to study the impact of the generated spaces on the ground level of the site. The result will be compared to the ground level shading imposed by the existing buildings to evaluate the impact of the open spaces.
The candidate that comprises of the minimum amount of spaces that are shaded for more than 5 hours during the summer solstice is prioritised.
Observation
Candidate 5 performs the best in this analysis, as when compared to the shading cast by existing buildings, the result portrays a 2.3% increase in area that receives more than 8 hours of shadow and a 1.8% increase in the area that receives 5-8 hours of shadow.
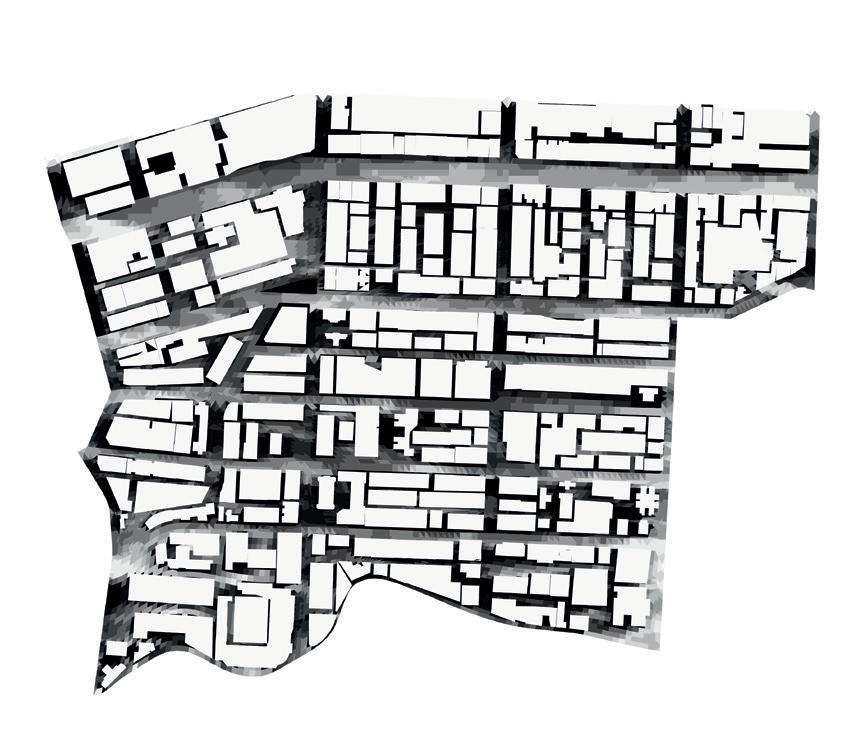
Gen.0-Ind.6 | FC1 fittest Maximize void volume
Gen.16-Ind.5 | FC2 fittest
Minimize shadow on existing buildings
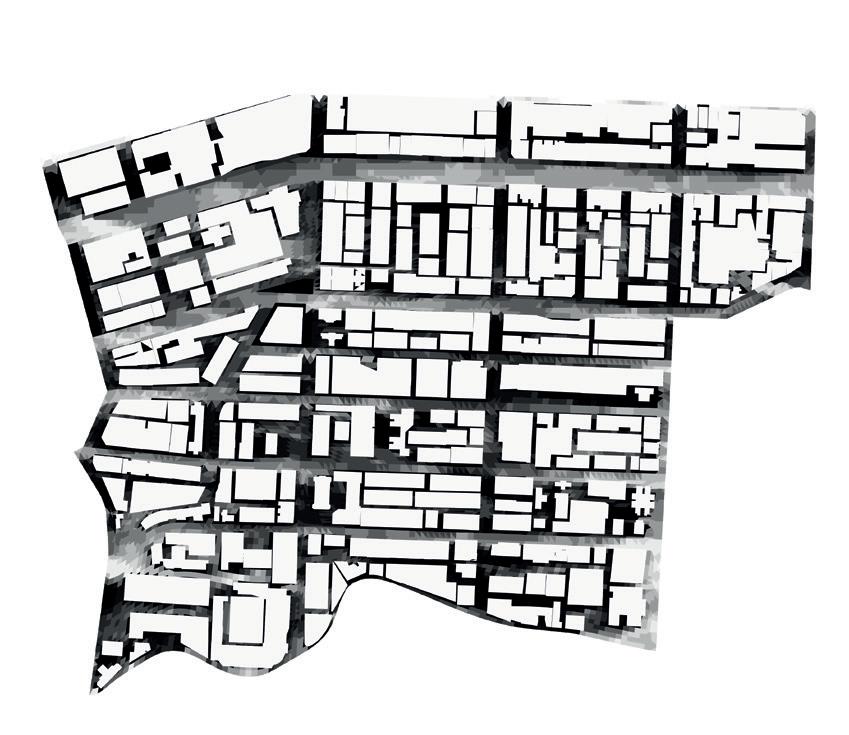
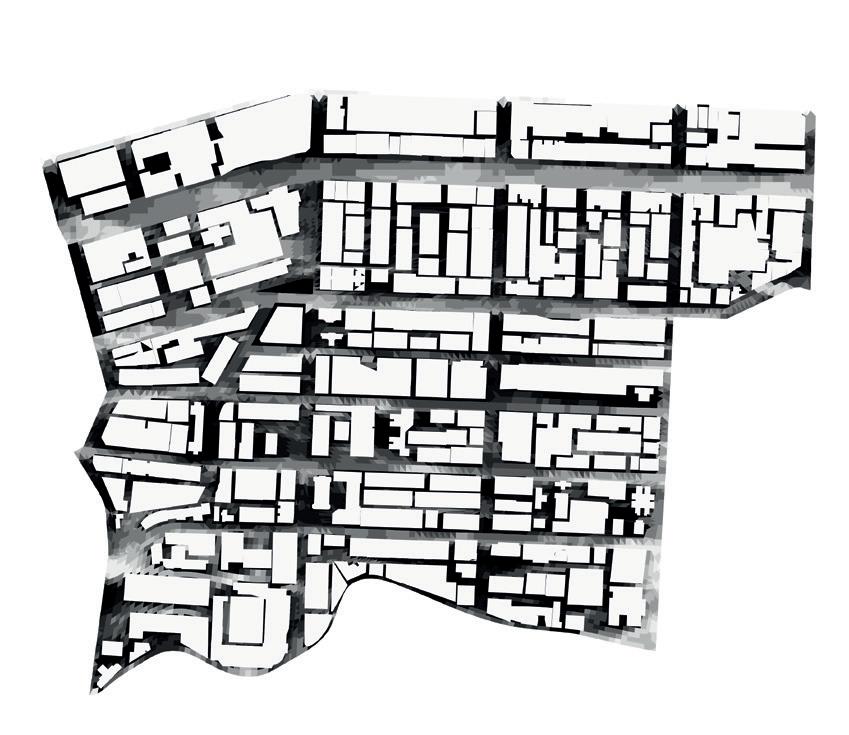
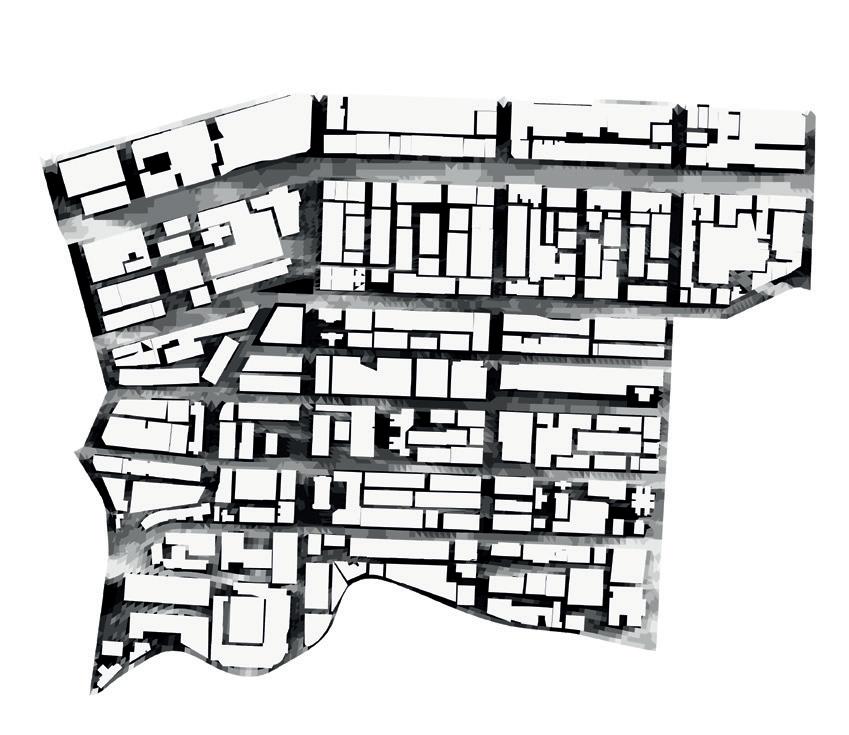
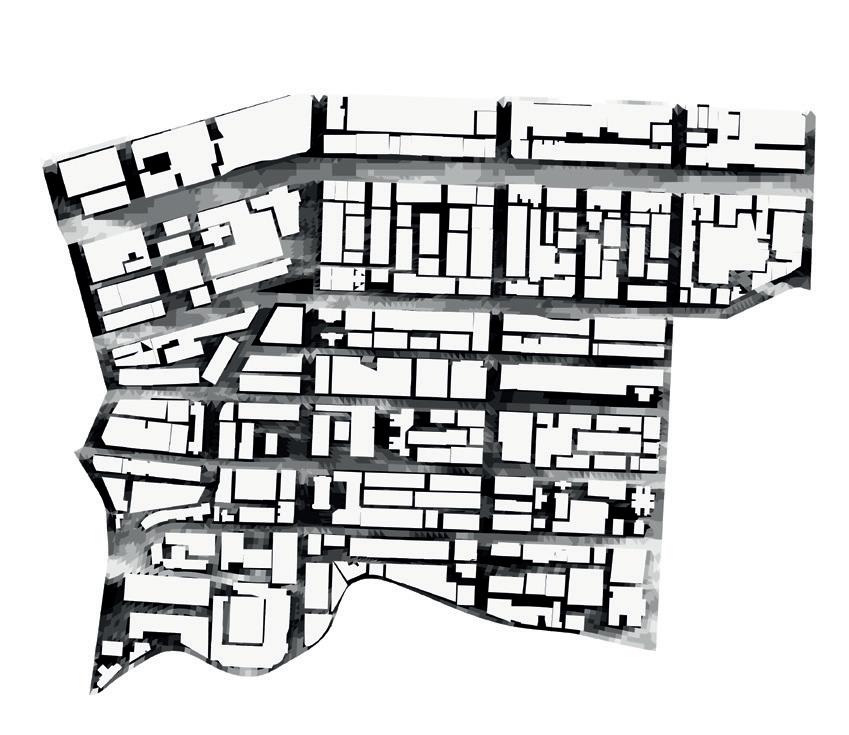
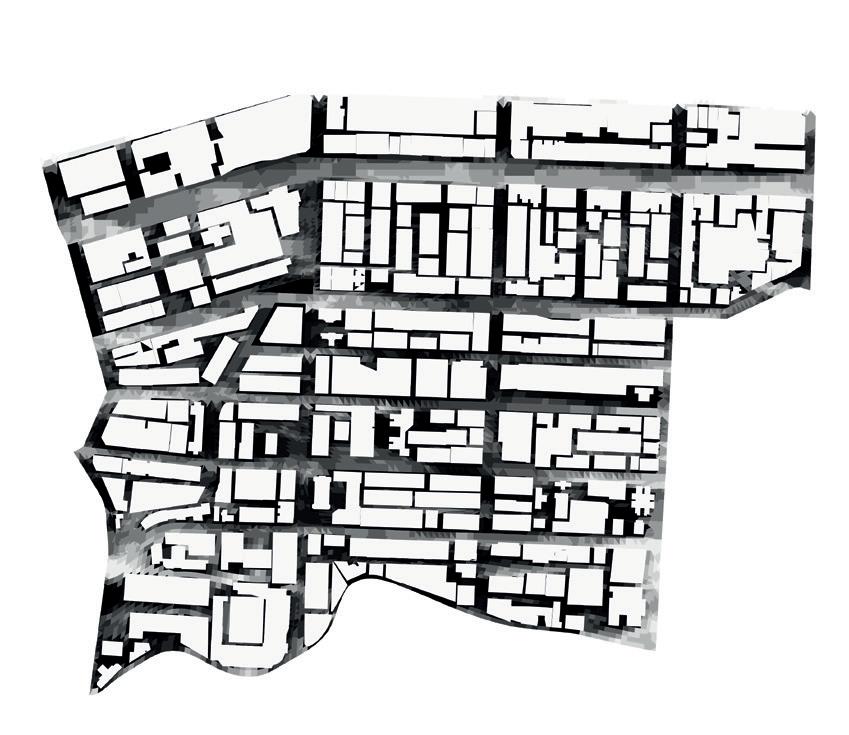
Gen.19-Ind.3 | FC4fittest Minimize shading on open space in summer Gen.4-Ind.2 | Relative diff. rank 0
Gen.18-Ind.5 | FC3fittest
Minimize shading on open space in winter
Gen. - Ind. | FC Fitness criteria
Relative change of shadow on ground compared to primitive
> 8 shadow hours
5-8 shadow hours
1-4 shadow hours
0 shadow hour
Shadow hour analysis
Summer solstice
21st June 6:00-18:00
Achievements and limitations
The desired distribution of open spaces has been achieved that has satisfied the open space area requirement by increasing the current open space by 200% as well as the sunlight hour requirement, where 60% of open space receives sufficient sunlight.
Although the total area of the open spaces is more than what we aimed to achieve, the spaces have a minimal impact on the existing buildings. This is achieved by creating an evaluation hierarchy.
In this hierarchy, the solar analysis was given the maximum priority as it is essential for the planting strategy as well as human comfort on the open spaces while the shading analysis was given the least priority as all the selected individuals minimally impacted the existing urban fabric.
A more in-depth evaluation of the existing structure of individual buildings may have increased the limitations of the open space distribution.
The units directly beneath the open spaces may receive insufficient sunlight. An alternate programme may be assigned to these units.
The selected individual affects a population of 1800 people. Giving priority to specific individuals could have considerably reduced this number. However, those individuals perform poorly in the remaining analysis.
Design
Gen.19-Ind.3 | FC4fittest, Average rank
Target
>10% shadow impact to context
Performance
Area of open spaces: 62,120 sq.m | +240%
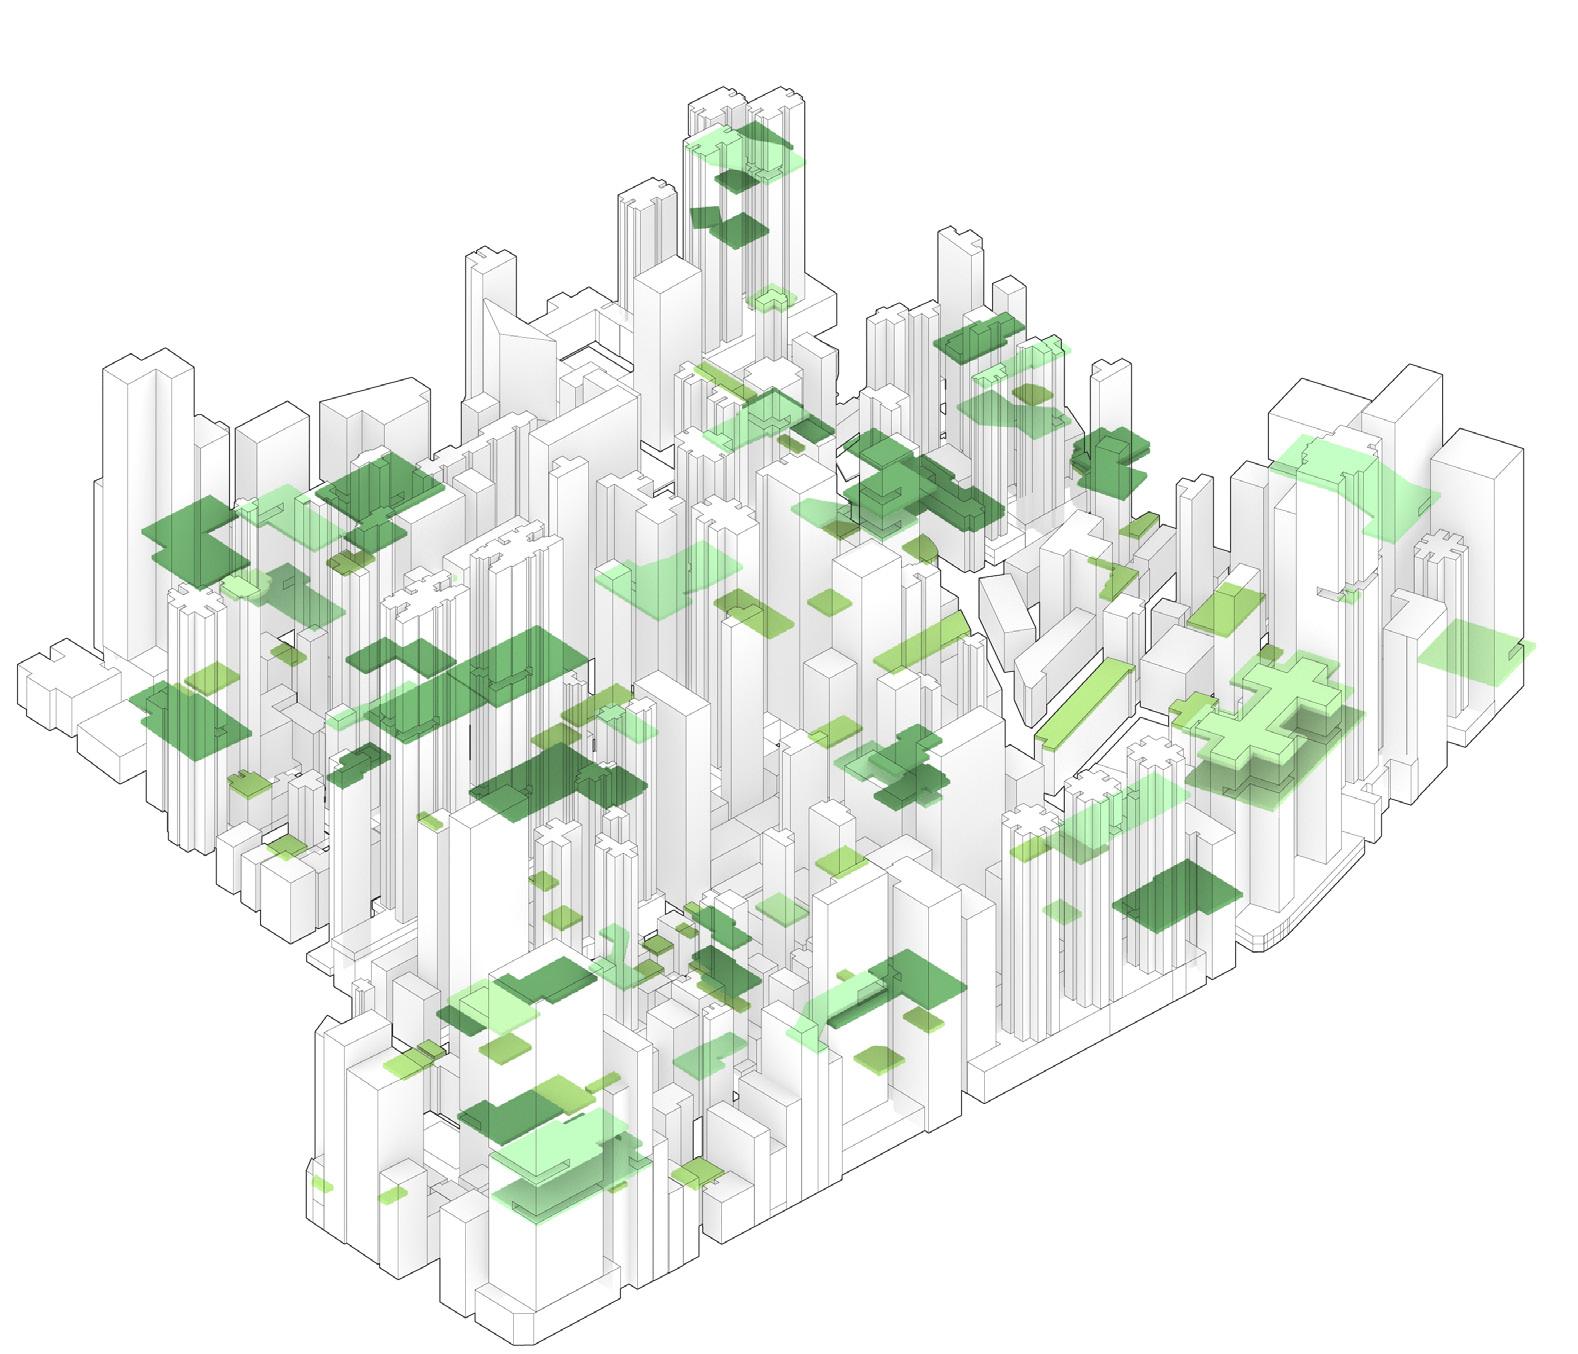
Number of spaces: 127 spaces
High sunlight hours area: 16,140 sq.m | 26% of total area
Absolute shaded area: 24,812 sq.m | 40% of total area
Shadow impact to existing context: +4% full shadow area
Estimated affected population: 1800
Ambition and design objectives
The aim of this experiment is to create an optimal network of the generated open spaces.
There can be a plethora of combinations in which these spaces can be connected. However, it is imperative to derive a strong connection logic for the network such that allows pedestrian commute along with green spaces, creates ample social opportunities and enhance urban ecology by creating a continuum of open space.
The desired outcome from this GA is to achieve a resilient network of interconnected open spaces that emphasises on programmes that require high connectivity. This can be achieved by breaking down the ambition into four fundamental design objectives.
1. Increase the number of green spaces with direct access from places of high pedestrian flow, such as the wet market and public transport access points. This would create social hubs that are highly accessible to the public.
2. Higher pedestrian flow should be channelled through larger open spaces to increase social interaction while making the commute more pleasurable.
3. Connecting open spaces to enhance ecology. Interlinking open spaces also links the programmes around the open space, thereby creating ecological heterogeneity.
4. Create a resilient network that provides alternate routes if certain links fail. Although a resilient network is considered inefficient with redundant links, it creates a stronger network system.
More green spaces are directly accessible from public transit
Design Objectives
interaction
Experiment Objectives
Increase degree value of important programs nodes
High betweenness centrality value of rroutes passing through large open space nodes
Connect as many greenery nodes as possible

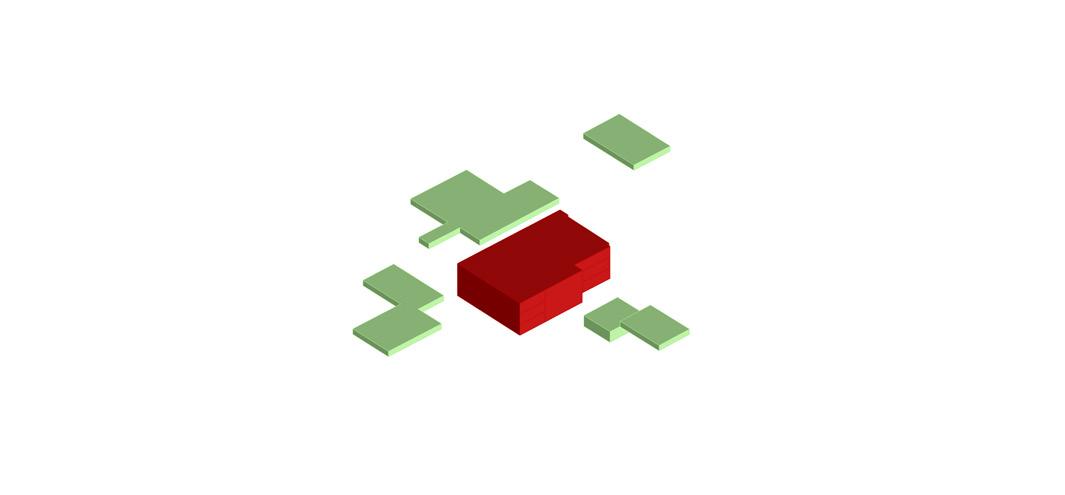
Increase connectivity of the network


In the following experiment, the result of experiment 1 will be used as primitive input. The primitive and the centroids of the generated open space comprise of the body plan in the GA.
Each iteration of the GA will begin with seven start points, four of which will be fixed and three variables. The range in which the start points connect to open space nodes is based on a span of 30 meters and an inclination of 18 degrees.
The fitness objectives in this experiment are:
1. Minimize the impact on the existing build. Since pass-by nodes are medians between two open spaces, they are required to cut through existing buildings without adding any spatial value.
2. Connecting a maximum amount of open spaces directly makes the network to create a resilient network that can substitute for failure in certain nodes or edges.
3. Enhance accessibility to the nodes that correspond to programme priority by connecting them to maximum open space nodes.
The nature of the connection will determine the type of connection elements. There are three types of connection elements.
1. Access points are created in the form of external or existing cores in the buildings, when starting nodes connect with vertically overhead nodes.
2. Direct connections are created between open space nodes when they are within a 15 meters proximity with no obstructions.
3. Pass-by connections are created when there are no nodes within span range, in which case these connections cut through existing buildings and act as medians between two open space nodes.
Design Development | Multi-level Ecology
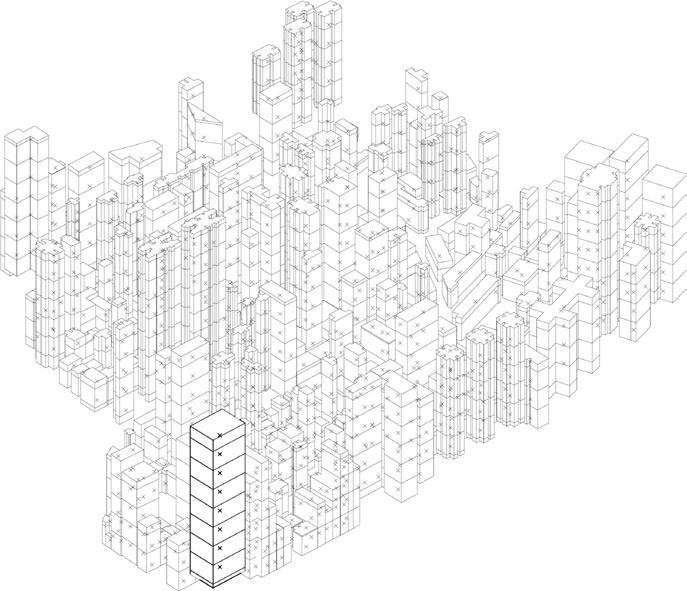
Open space Pass by node
FC 1: LESS IMPACT ON EXISTING BUILDINGS minimizing the number of pass by
FC 2: CONNECTING OPEN SPACES maximizing the number of connected open spaces
FC 3: ACCESSIBILITY OF MAJOR PROGRAM maximizing the degree value at mass-transit and market node
< 15m
TYPE 2:
< 15m
CONNECTION BETWEEN OPEN SPACES
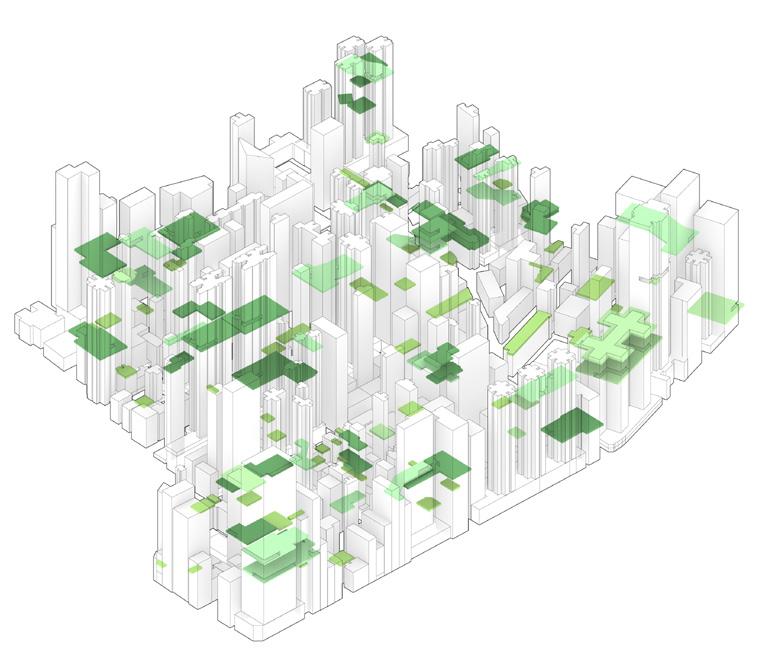
angle < 18°
angle < 18°
TYPE 3:
angle < 18°
123
The network generation begins with several starting points. These points are selected based on an access point hierarchy.
There are two ways in which the starting points are determined - fixed and variable. Firstly, the fixed starting points are assigned to important programmes that require high connectivity, mainly the wet market and the mass transit transport access points.
In the second scenario, the GA selects a set of existing open spaces or residue spaces as variable starting points. Every iteration will have a different set of variable points to allow the network to optimize.
In the beginning, each of the starting points evaluates its immediate surrounding to locate open space nodes within a specific range. This range is based on a span and an inclination angle that represents walkable gradient standard.
The starting points will connect to all the open space nodes that are present in this range. If there are no open space nodes available in the range, each starting point connects to one pass-by node in range. The open space and pass-by nodes will now act as the starting points and continue connecting to nodes within range.
This is a non-linear network, and the loop continues until two passby nodes are connected in each group, concluding the first stage of the network generation.
In stage two, the connected, open space nodes evaluate the presence of other open space nodes vertically above them. If present, the nodes will connect to the respective overhead nodes and begin connecting to the surrounding open spaces like in stage 1.
connection constraints activated points connected open space point connected by-pass space point existing building axis created connection
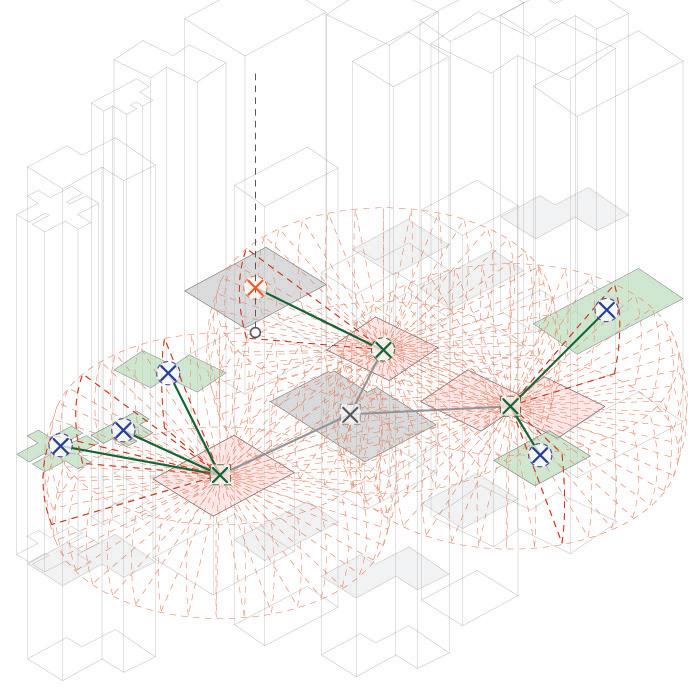
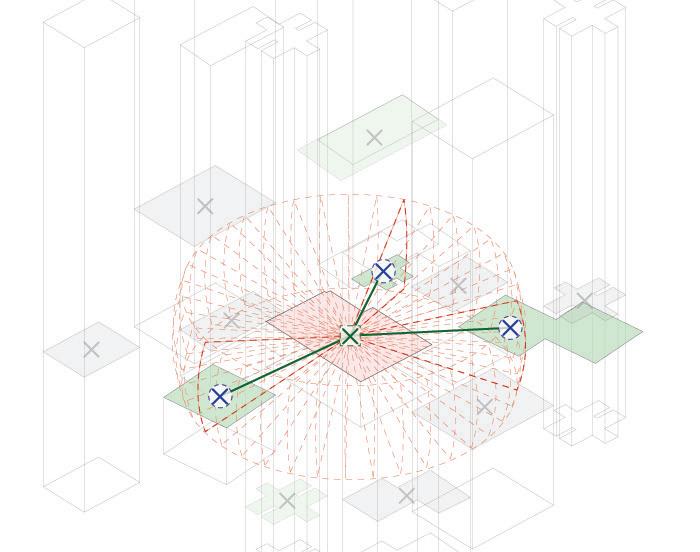
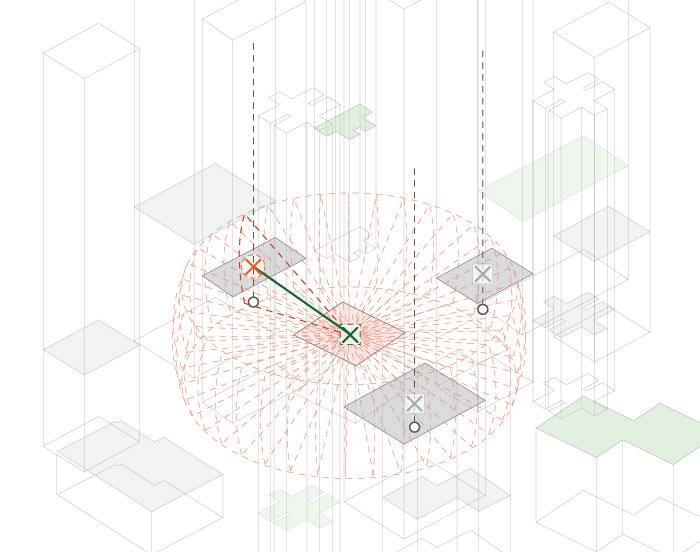
Selected individuals for further analysis
The following are the selected highest-ranking candidates that are corresponding to each of the fitness objectives.
The respective diamond graphs demonstrate that the three fitness objectives contradict each other. In order to select the highest performing individual, design objectives will be prioritised.
The selected candidates are analysed and compared to identify the candidate that best suits the desired criteria.
Fittest candidate of fitness criteria
Gen.77-Ind.0 | FC1 fittest
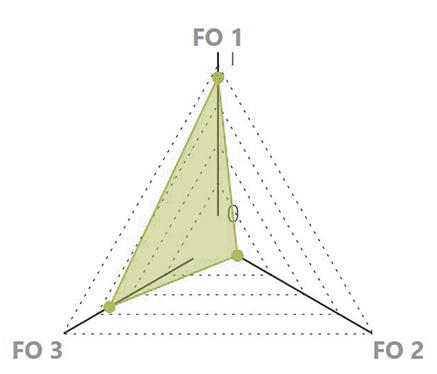
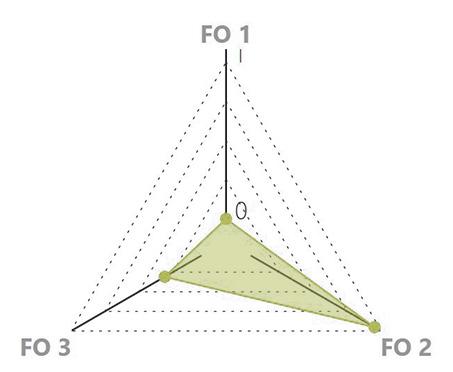
Minimize pass-by nodes
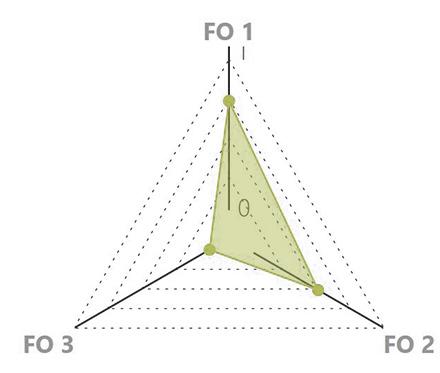
Gen.11-Ind.1 | FC2 fittest
Maximize area of connected open space
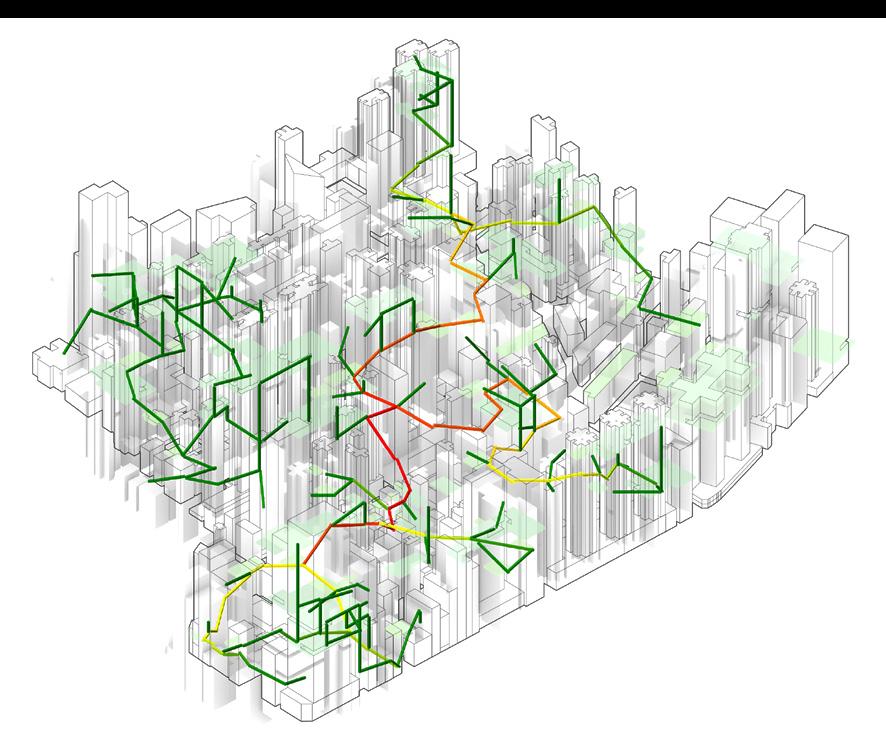
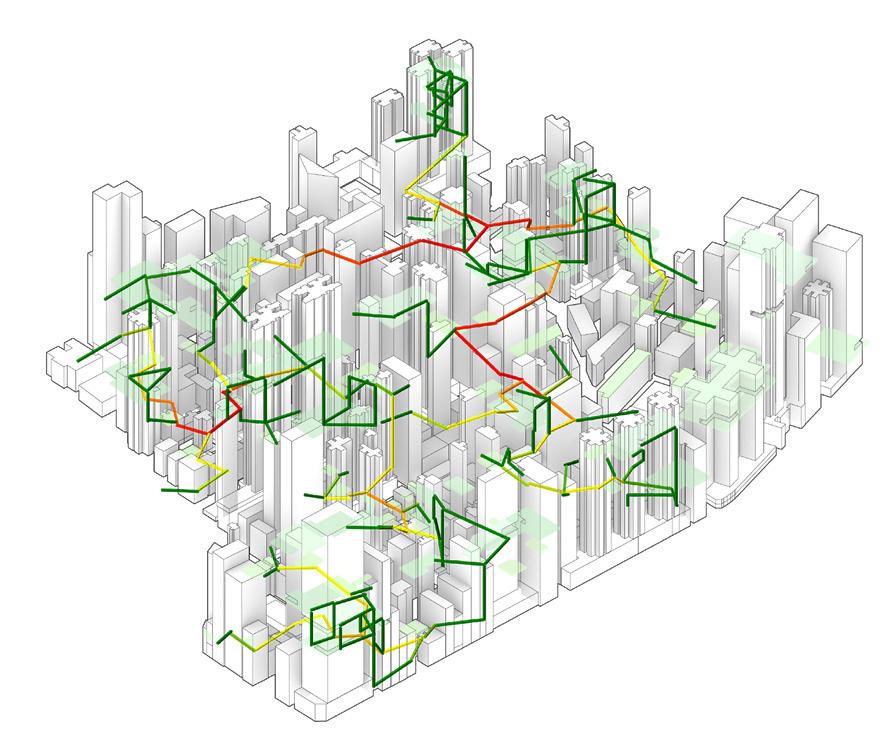

Gen.33-Ind.2 | FC3fittest
Maximize degree value to important programs
Comparison of high ranking individuals
In the following evaluation, the selected high performing candidates are compared with respect to betweenness centrality, network structure graph and the connectivity of green spaces.
1. Betweenness centrality is a measure of centrality based on the shortest paths. It shows how often an edge happens to be present close to the shortest path between an origin and a destination.
The result shows that although candidate 1 and 3 have edges with high betweenness, the areas corresponding to the high betweenness are restricted to one part of the site. While areas corresponding to edges with high betweenness in candidate 2 are distributed around the important programmes of the site, which is desirable.
2. The network structure graphs show that candidate 2 has the highest number of pass-by nodes, which is undesirable. However, candidate 2 also has the maximum number (89%) of spaces connected which is important for the resilience of the network.
3. In the third evaluation, the connectivity of large open spaces of the candidates is compared. Candidate 1 has only 34 of large open spaces and low connectivity. Though candidate 3 has efficient connectivity, it has a lower number of large open spaces compared to candidate 2. Candidate 2 has 51 open spaces with redundant links interconnecting them. This redundancy makes the network more resilient.
Betweenness Centrality graph (people flow)
Betweenness Centrality
Network structure graph

1
Design Development | Multi-level Ecology
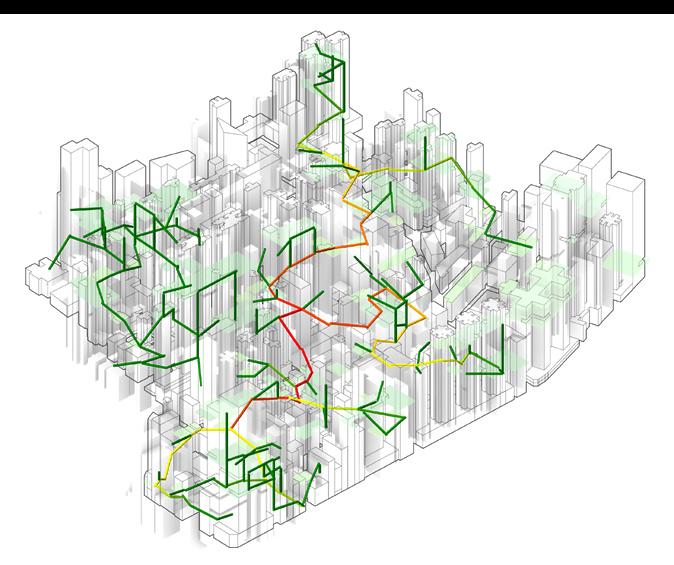
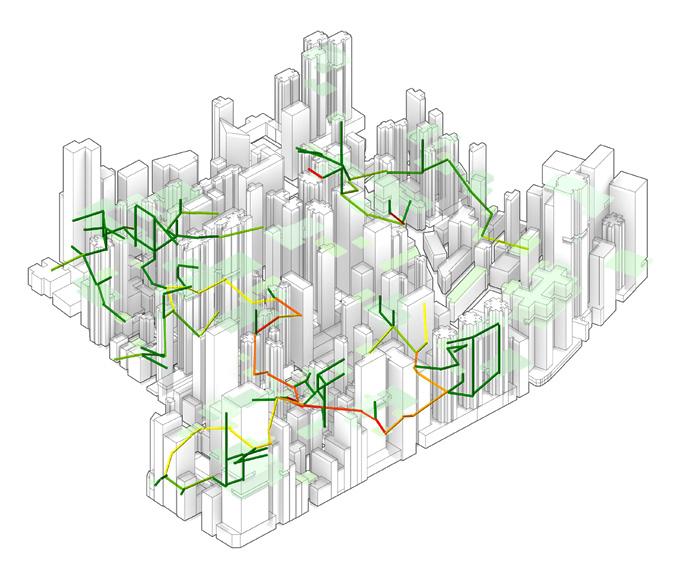
Connectivity of open spaces
Gen.77-Ind.0 | FC1 fittest
Minimize utilizing existing building
Gen.11-Ind.1 | FC2 fittest
Maximize area of connected open space
Spaces connected: 62%
Total no. of large open space: 34
Gen.33-Ind.2 | FC3fittest
Maximize connectivity to important programs
Spaces connected: 89%
Total no. of large open space: 51
Spaces connected: 85%
Total no. of large open space: 42
Achievements and limitations
Achievements
The selected candidate comprises a resilient network of interconnected open spaces that emphasises on programmes that require high connectivity.
The result increases the number of green spaces connected directly to important programmes such as the wet market and public transport access points. These programmes also have a high betweenness centrality value, improving their accessibility.
The larger open spaces have higher connectivity, channelling larger pedestrian flow through these spaces.
Limitations
Studying the pedestrian flow and movement patterns of the population could have resulted in the development of a more dynamic system.
The GA simulation of network optimization does not converge due to the conflicting fitness objectives. This result of this is that the fittest individual belongs to an early generation - 11.
A more effective balance between redundancy and efficiency can be achieved such that the network id both resilient and resourceeffectively.
Target
Connect as much open space nodes as possible
More direct open space connection to important program
High betweenness centrality value of routes passing through large open space nodes
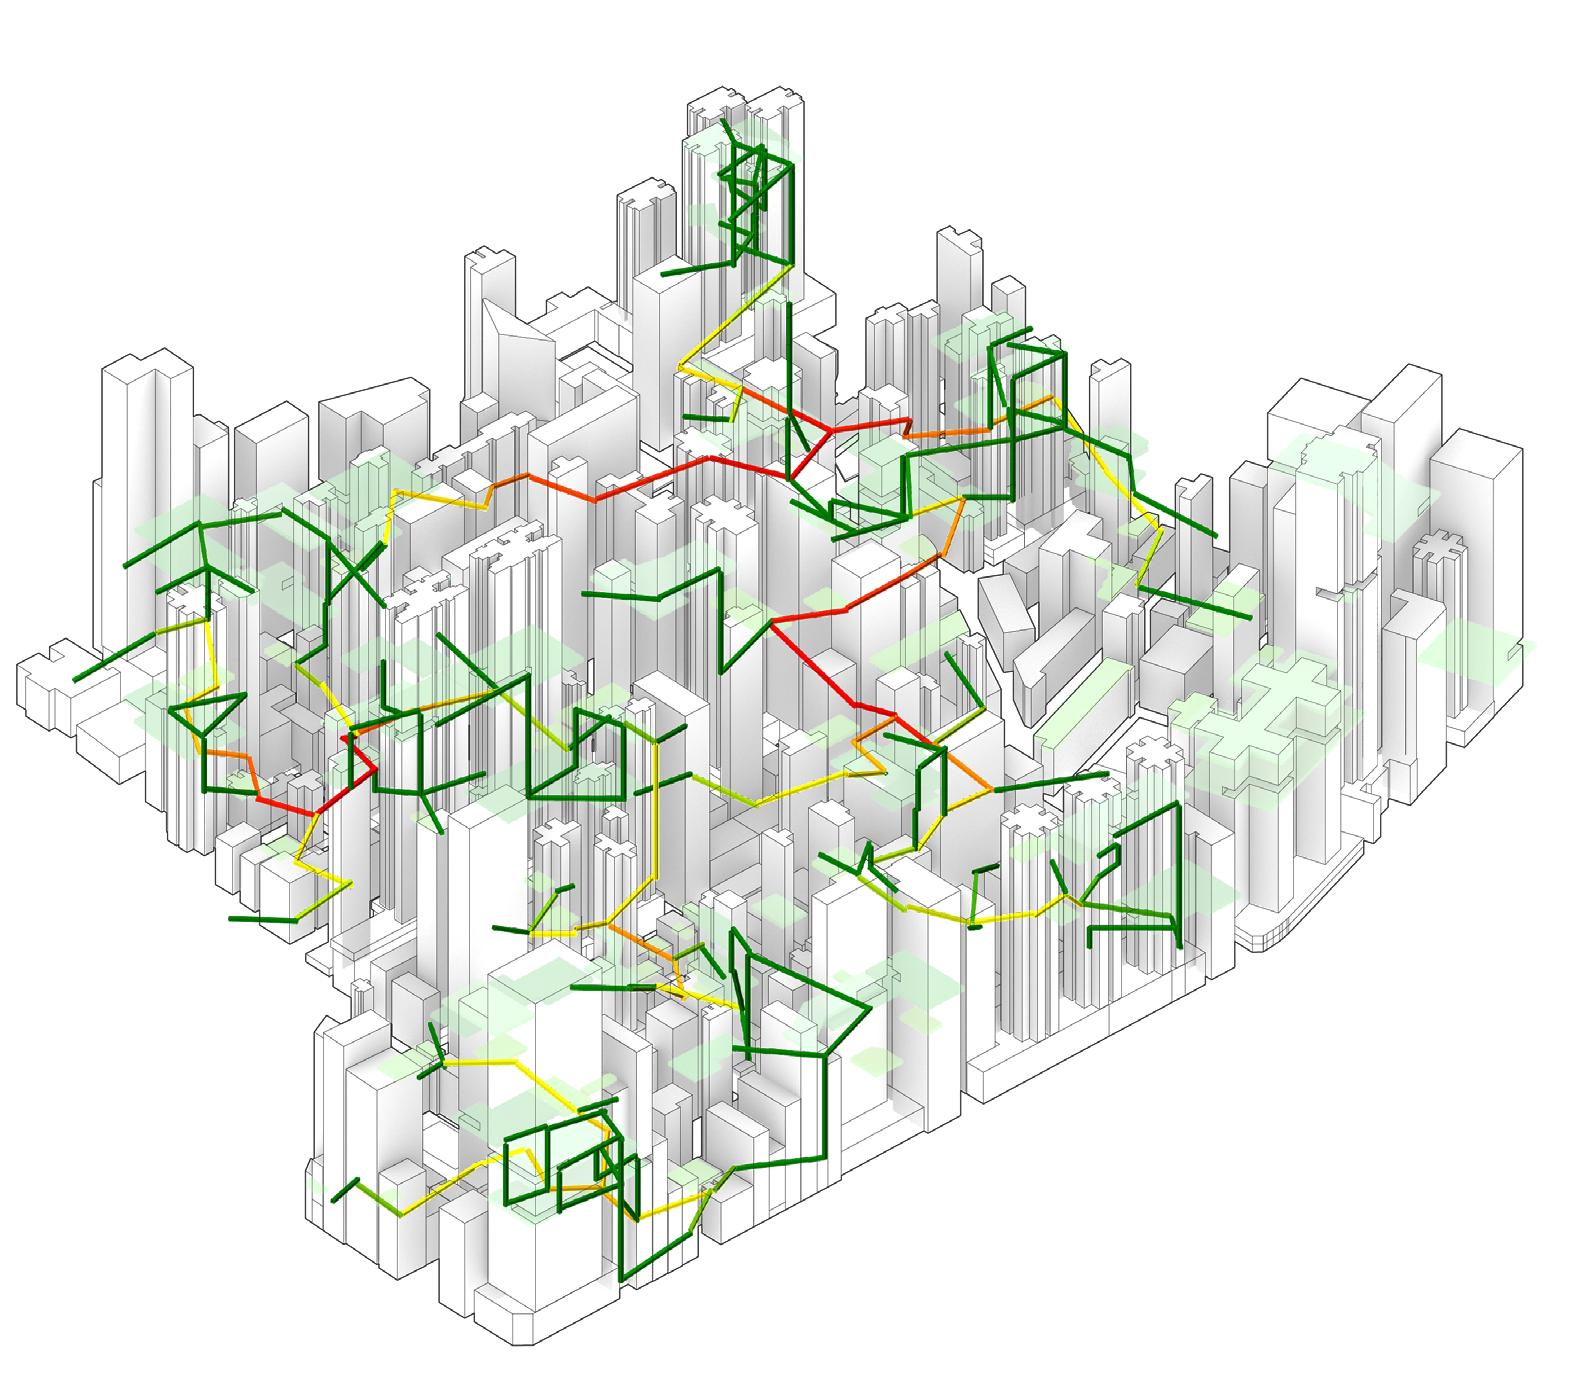
Performance
Percentage of connected open space: 89%
Number of pass-by nodes: 65
Directly accessible spaces from important program: 7
Betweenness centrality value at market node: high
•
Betweeness
Accessibility
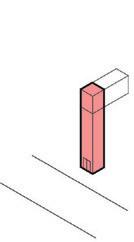
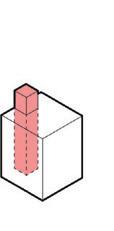
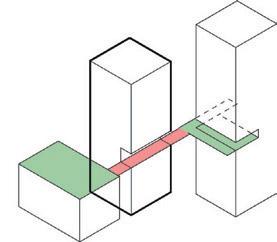
Physical
• More direct open space connection
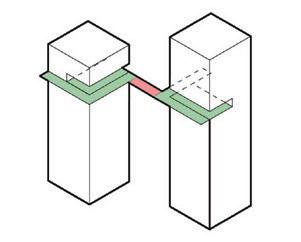
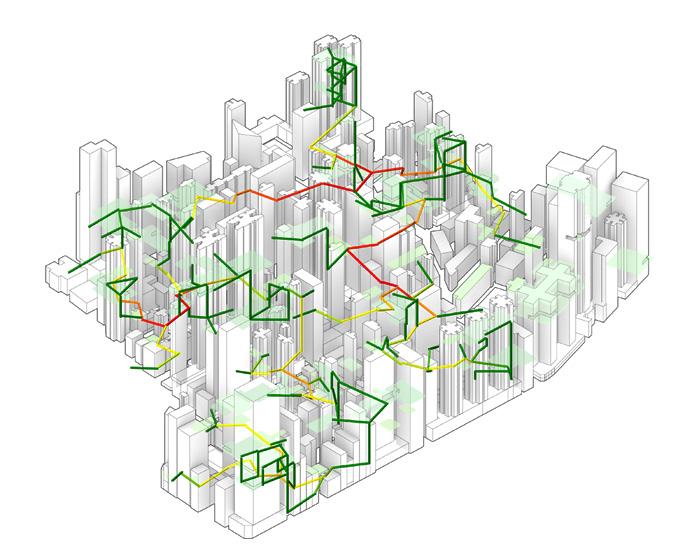
•
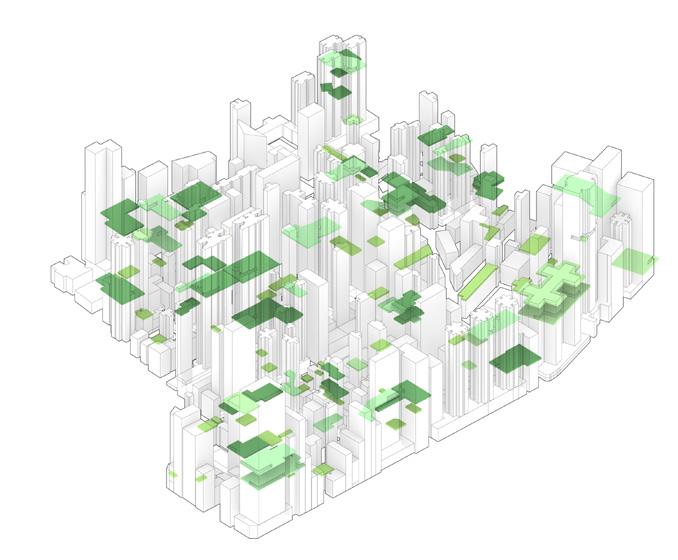
Targets and achievements
The result of experiment 1 shows that the three targets to achieve more than 200% of the existing open space area, 60% of which receives more than 5 hours of sunlight and to impose a less than 10% sading impact on the existing built space have been accomplished.
Similarly, the aims of experiment 2, which were to maximize connections, enhance people flow, and improve accessibility to important programmes have been achieved as well.
However, the success of the system cannot be evaluated by analyzing these experiments in isolation. It is imperative that the two experiments inform each other in order to develop a comprehensive system.
Open space elements
Open space generation
Feedback loop
Experiment I selected individual
Selected individual with network experiment feedback
Result comparison
Network generation
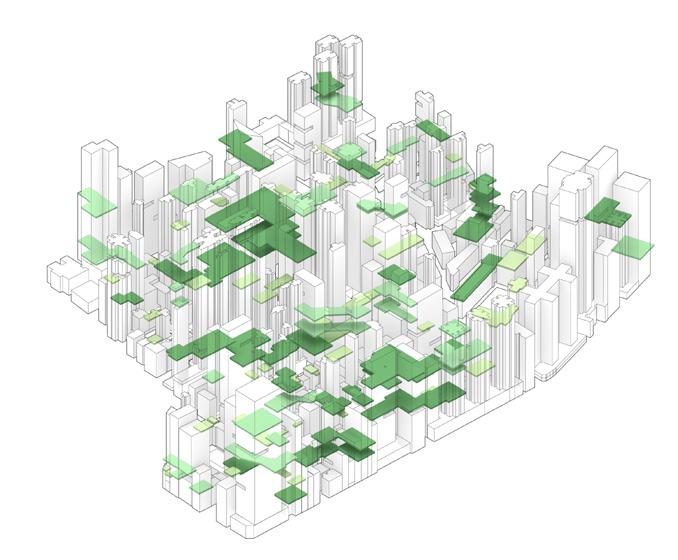
Experiment1 Gen.19-Ind.3 | FC4 fittest
Experiment I selected individual
Feedback Experiment Gen.17-Ind.6 | FC1 fittest
Selected individual with network experiment feedback
Ambition
The aim of the experiment is to create a feedback loop such that the results of both experiments 1 and 2 inform the other.
Development of the network of multilevel open spaces is not a linear process as the network generation must also inform the spatial distribution.
The setup of this experiment is the same as the setup of the open space generation experiment with one variable. The experiment script will now be modified such that the body plan points that are in proximity to the generated network will be prioritized. These points have a higher potential to be selected to create open spaces.
The steps to this experiment are not isolated steps but include the previously introduced experiments.
Through prior experiments, the sequence until the network generation has been established, as portrayed in the pseudo-code diagram.
Once the result of the network generation is achieved, it will be used as an input to inform the open space generation experiment.
The open space generation experiment will then be rerun, enabling it to create more open spaces in proximity to the generated network.
The result of the new open space generation will be revaluated and will also be compared to the result of the previous open space generation experiment.
At this stage, the loop will end if a balanced, integrated result of its component experiments have been achieved; else this result will now inform the network generation.
The results of the experiments will be compared in the following pages.
Pseudo CodeOPEN SPACE AREA AND HEIGHT - EXPERIMENT I EVALUATION OF SPACE GENERATED FROM EXPERIMENT I AND FEEDBACK EXPERIMENT
The above matrix organizes and plots the generated open spaces in experiment 1 according to their corresponding height and area.
As seen in the matrix, a majority of open spaces are located in 10m to 30m zone irrespective of size.
The open spaces with the largest area are located higher up as compared to spaces with a smaller area. This might create structural complications.
OPEN SPACE AREA AND HEIGHT - FEEDBACK EXPERIMENT EVALUATION OF SPACE GENERATED FROM EXPERIMENT I AND FEEDBACK EXPERIMENT
The above matrix organizes and plots the generated open spaces post network feedback in the experiment according to their corresponding height and area.
The majority of open spaces in this experiment are located in the 20m to 40m zone irrespective of size.
There are fewer large open spaces that are scattered at high heights.
The area of the cantilever type open spaces has substantially gone up while the area of the hybrid type has gone down.
OPEN SPACE AREA AND HEIGHT - RESULT OVERLAY EVALUATION OF SPACE GENERATED FROM EXPERIMENT I AND FEEDBACK EXPERIMENT
We can see that in the post feedback result, as the open spaces are situated closer to the important programmes, they are generated closer to the ground level.
Since the open spaces are closer to the ground level, a larger number of roof gardens are generated. However, due to offset limitations, the total area of the roof gardens is low.
As the towers that are more than 90 meters tall are rarely in proximity to each other, mostly cantilever open spaces are generated on them.
OPEN SPACE AREA AND SUNLIGHT HOURS - EXPERIMENT I EVALUATION OF SPACE GENERATED FROM EXPERIMENT I AND FEEDBACK EXPERIMENT
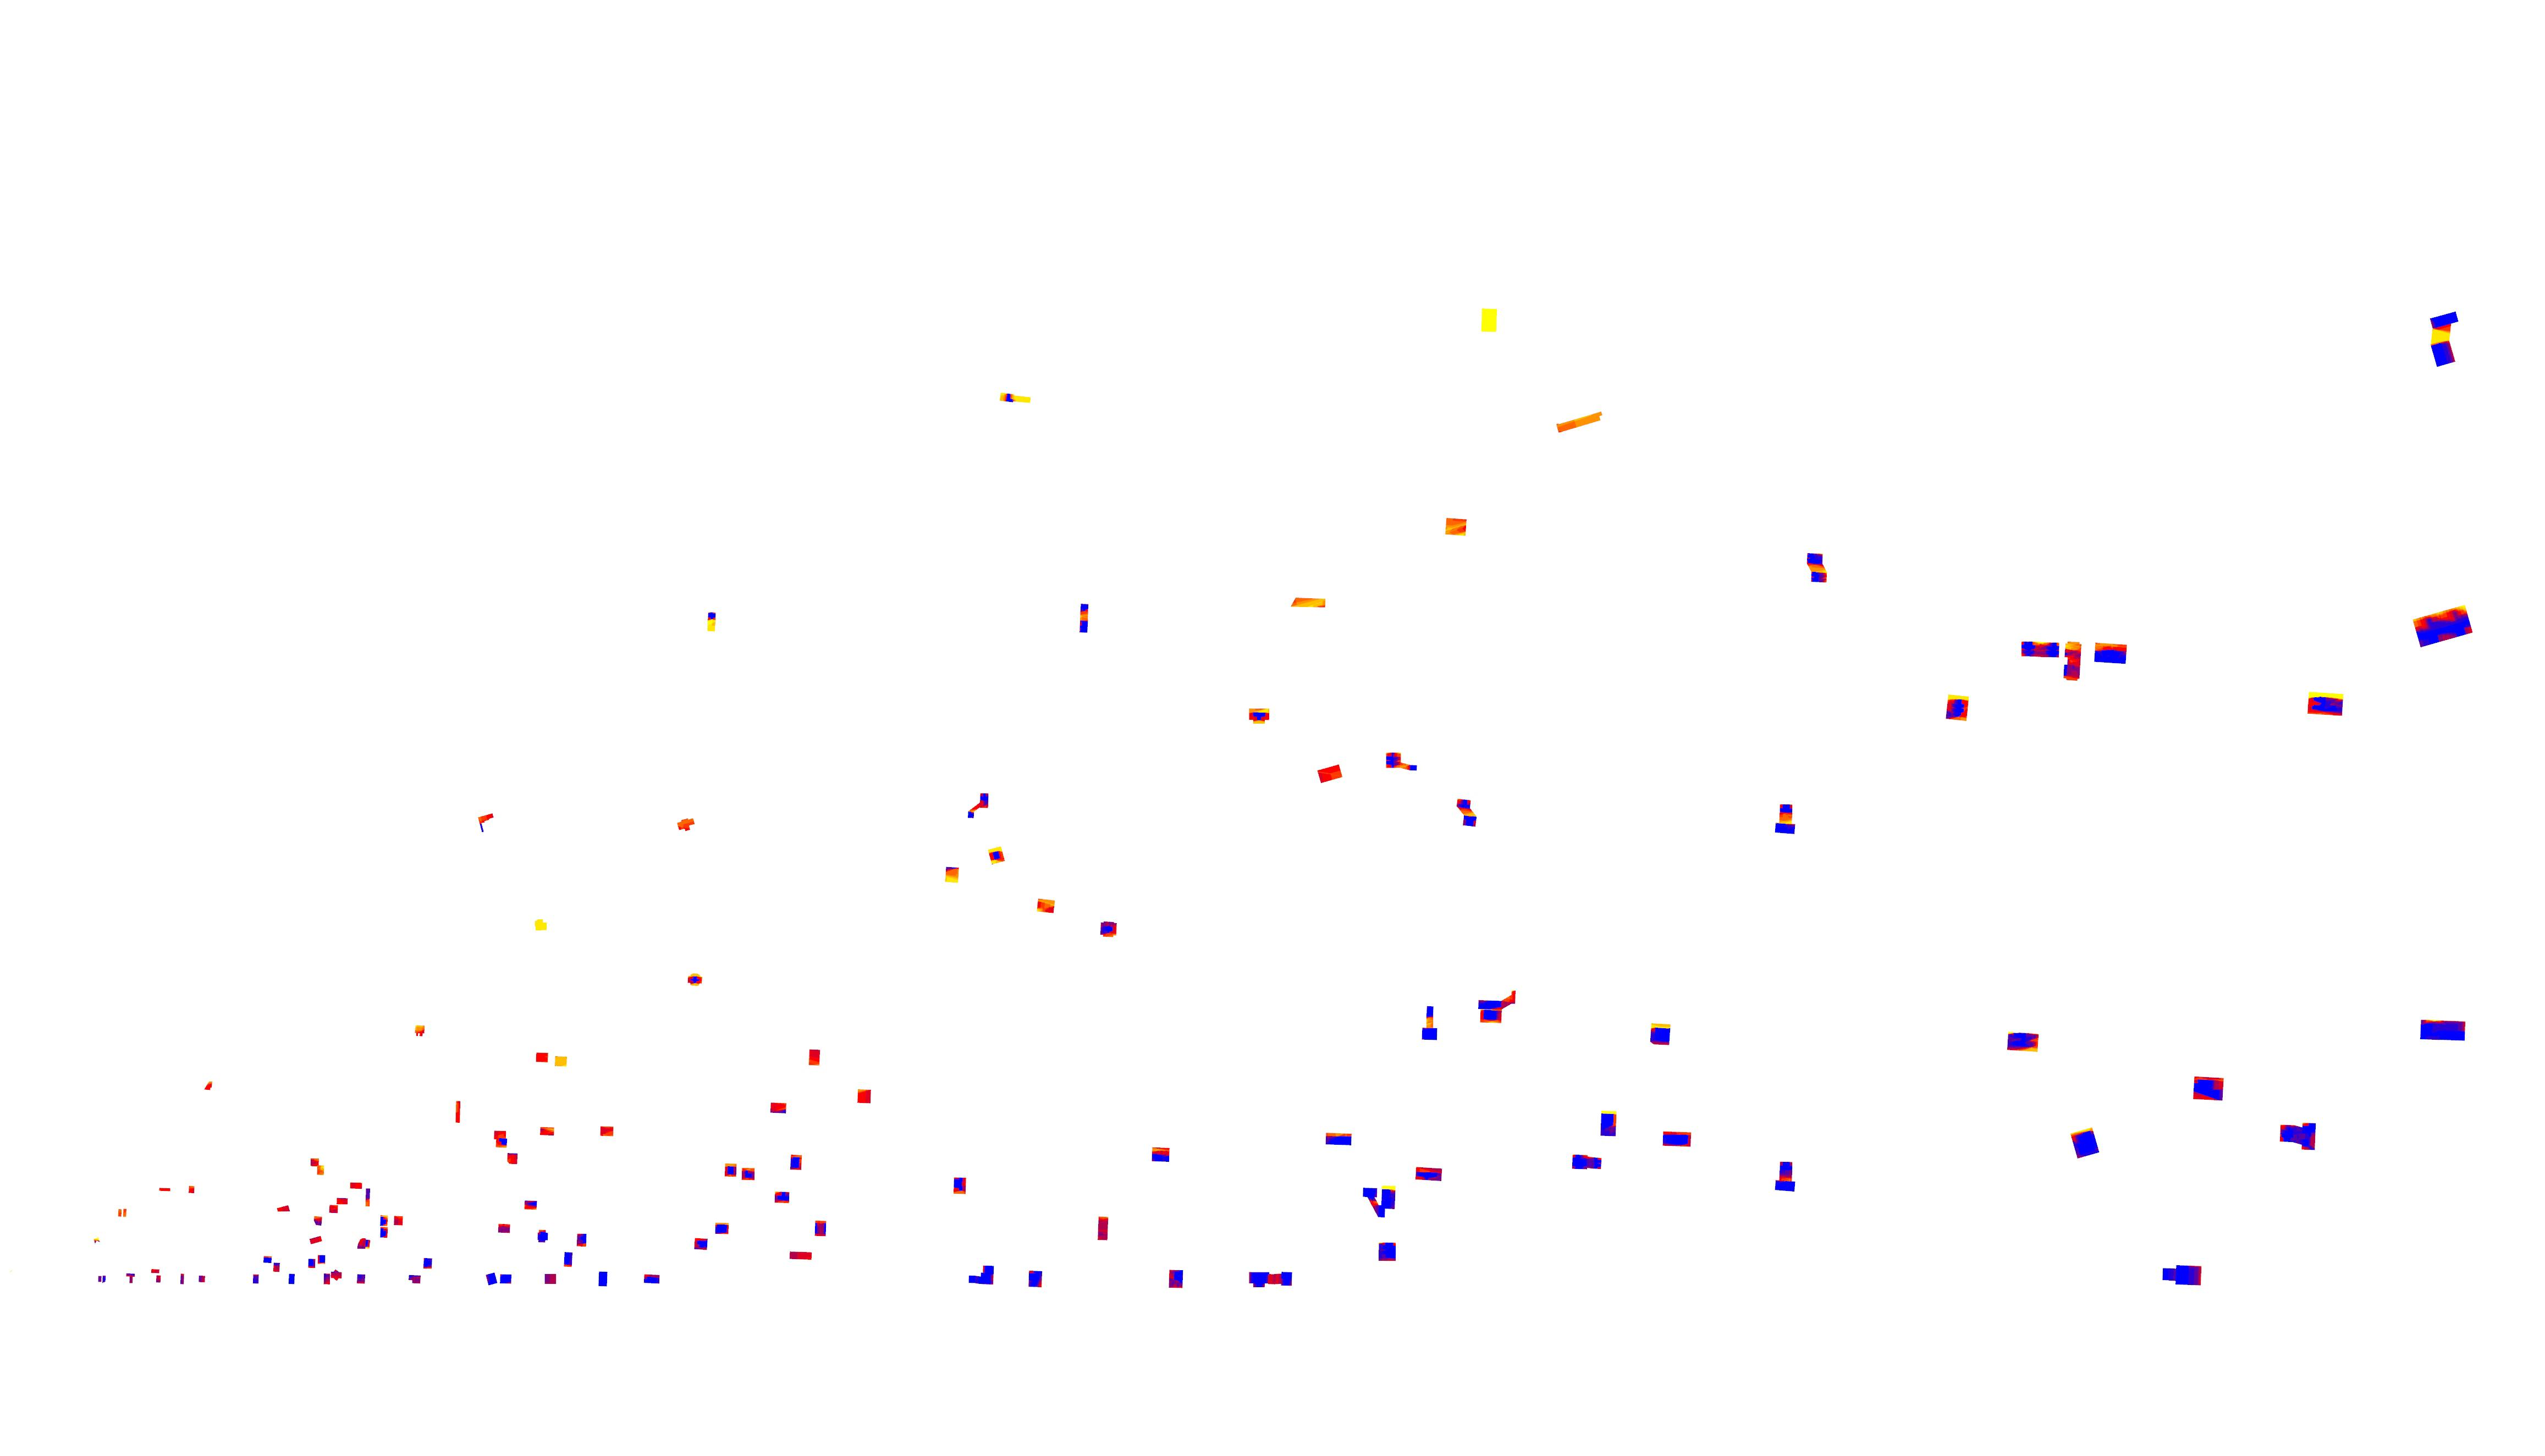
The above matrix organizes and plots the generated open spaces in experiment 1 according to their area and the amount of area that receives more than 5 hours of sunlight.
A direct relation between the size of space and sunlight hours can be drawn. Smaller spaces receive lesser amounts of sunlight and vice versa,
As seen in the matrix, the open spaces that are generated at lower heights, receive lesser amounts of sunlight.
OPEN SPACE AREA AND SUNLIGHT HOURS - FEEDBACK EXPERIMENT EVALUATION OF SPACE GENERATED FROM EXPERIMENT I AND FEEDBACK EXPERIMENT
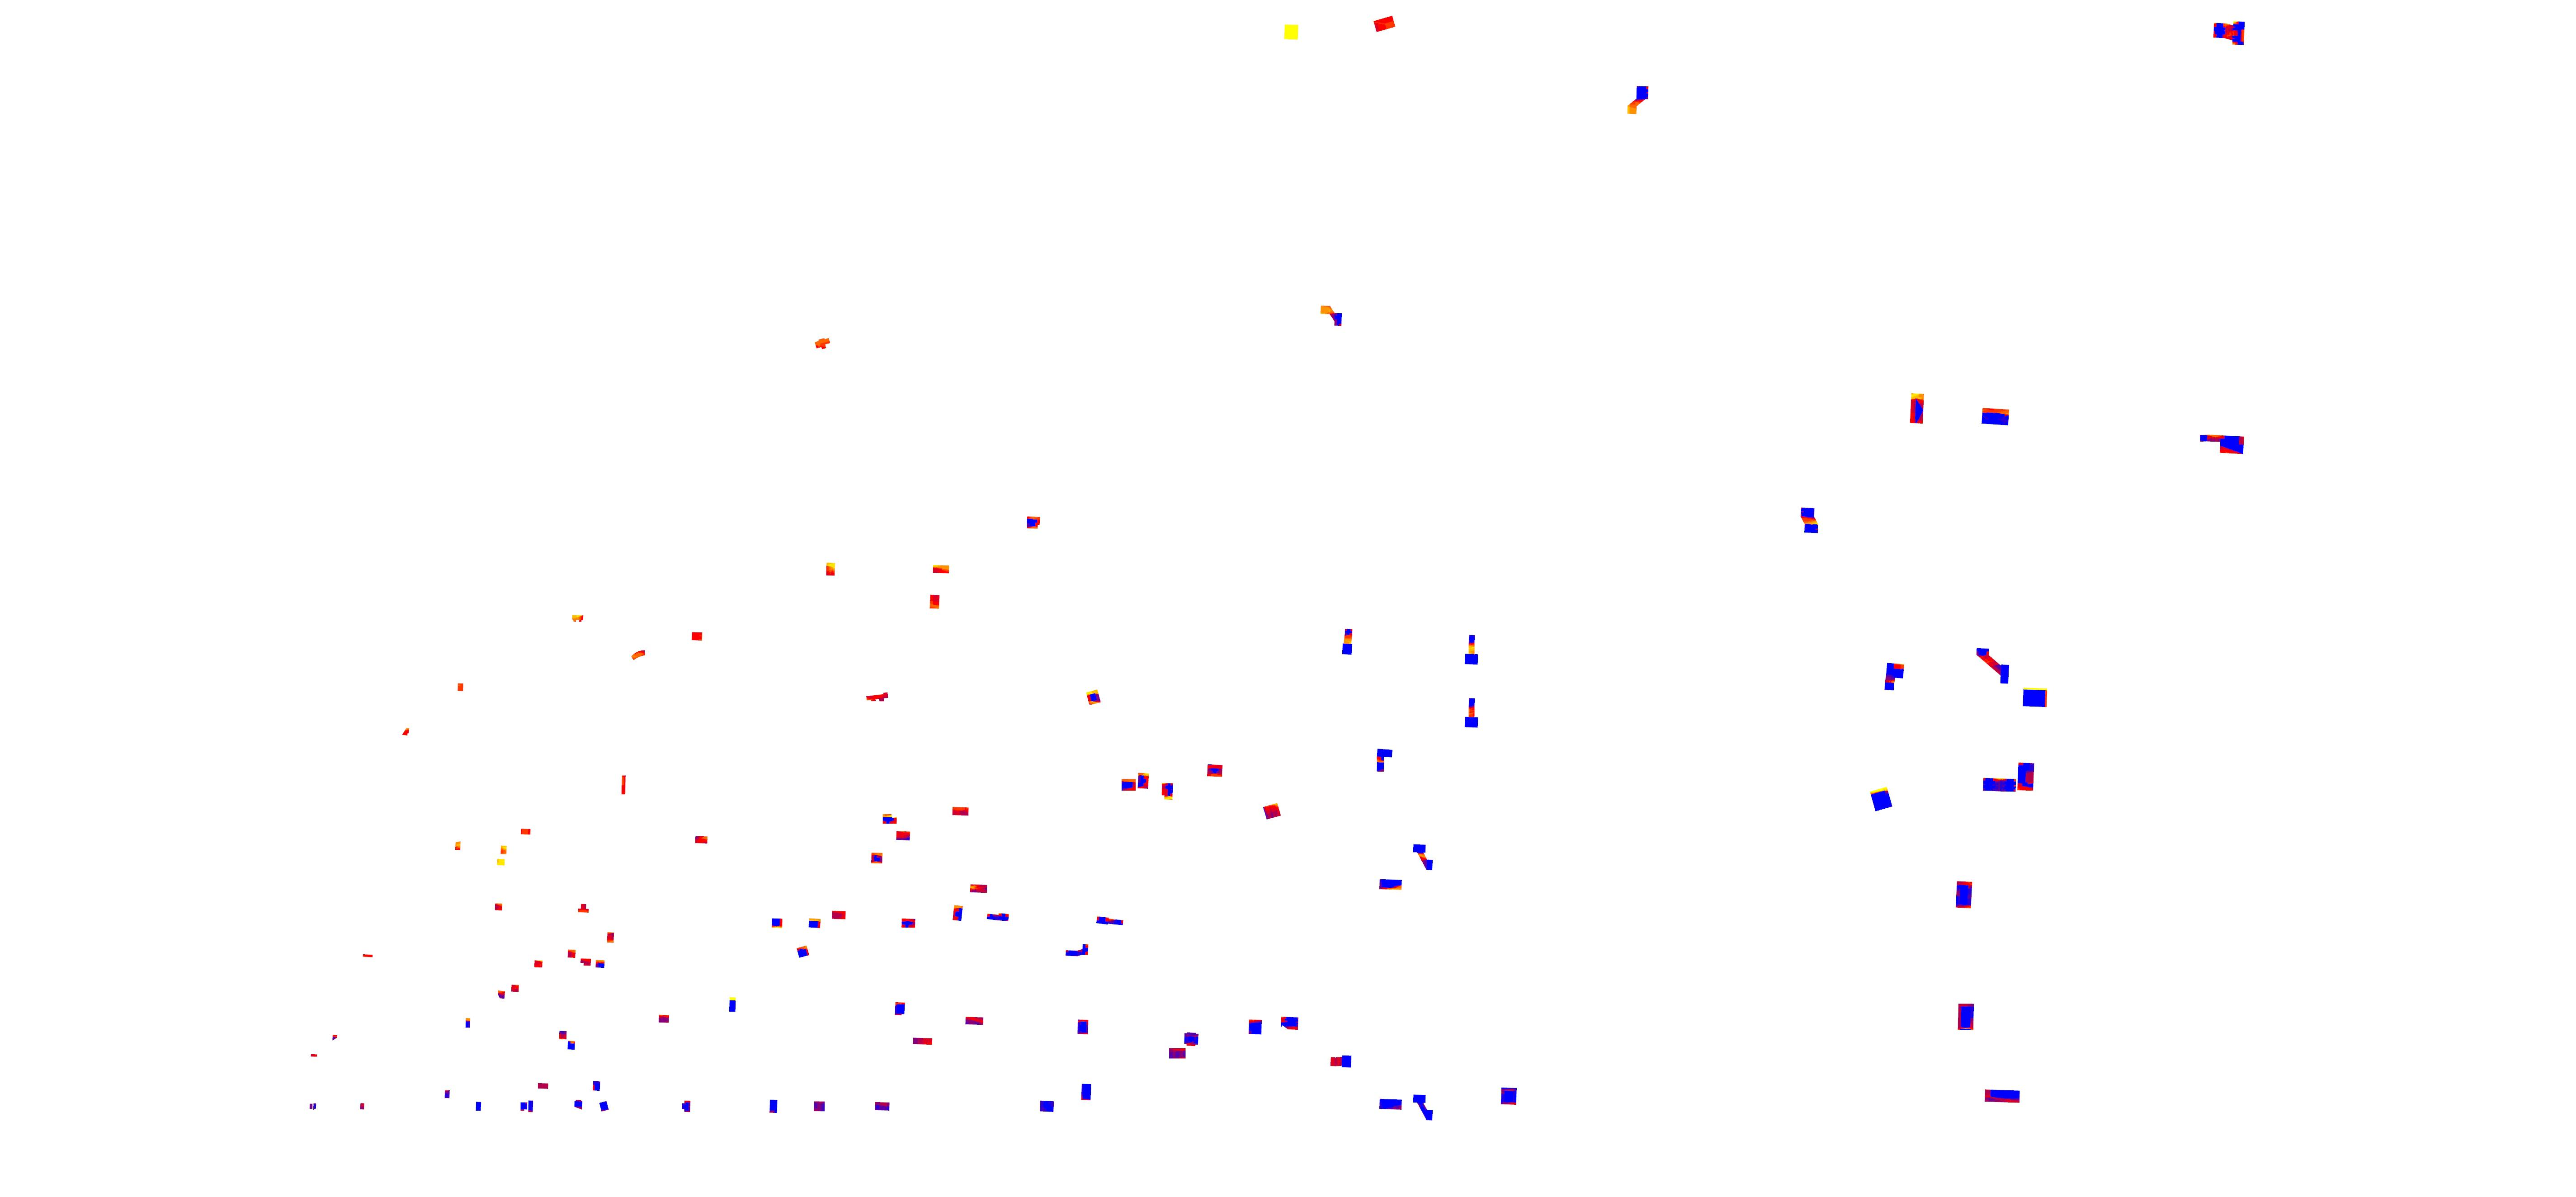
As seen earlier, in the post feedback result, as the open spaces are situated closer to the important programmes, they are generated closer to the ground level.
Due to this, it is clear that open spaces receive less sunlight as the buildings block the sun.
A majority of smaller spaces perform better than the larger ones. This may be because most of the larger
spaces are created by the bridge type and are shaded because they are directly subject to shadow from two buildings.
OPEN SPACE AREA AND SUNLIGHT HOURS - RESULT OVERLAY EVALUATION OF SPACE GENERATED FROM EXPERIMENT I AND FEEDBACK EXPERIMENT
The above matrix organizes and plots the generated open spaces in experiment 1 and the post feedback experiment, according to their area and the amount of area that receives more than 5 hours of sunlight.
The open spaces without an offset outline represent the results from experiment 1 and spaces without the outline represent results from the feedback experiment.
The spaces that were generated in experiment 1 perform better in solar hour analysis than the result from the feedback experiment. This is because the open spaces have been generated closer to the ground level to improve connectivity and accessibility.
The result will improve as more iterations of the feedback loop are run.
denser canopy trees to provide shade for north facing space
less dense-canopy trees as winter sun is desirable
Plant&fixtures
SurfaceMaterials
denser canopy and shorter trees
less dense canopy and taller trees
Tree/shrubsstabilisation
stormSubstrateforplant+ watercontrol
Structure
large tree as visual anchors alternate species to create urban rhythm
Planting layout and placement strategies
Cladding
Typical planting structure and their functional layers
Embedded planter and raised planter facing south and north respectively
Overview
The planting layout strategy combines the previously selected vegetation and infrastructure design. This infrastructure not only supports the vegetation but also contributes to spatial quality.
The planting strategy incorporated is dynamic in nature to respond to the environmental changes and due to the varied requirements of different types of spaces.
As illustrated in the adjacent diagrams, different spaces are designed with varying parameters that are based on essential growth parameters, direction of sunlight, shading and altitude.
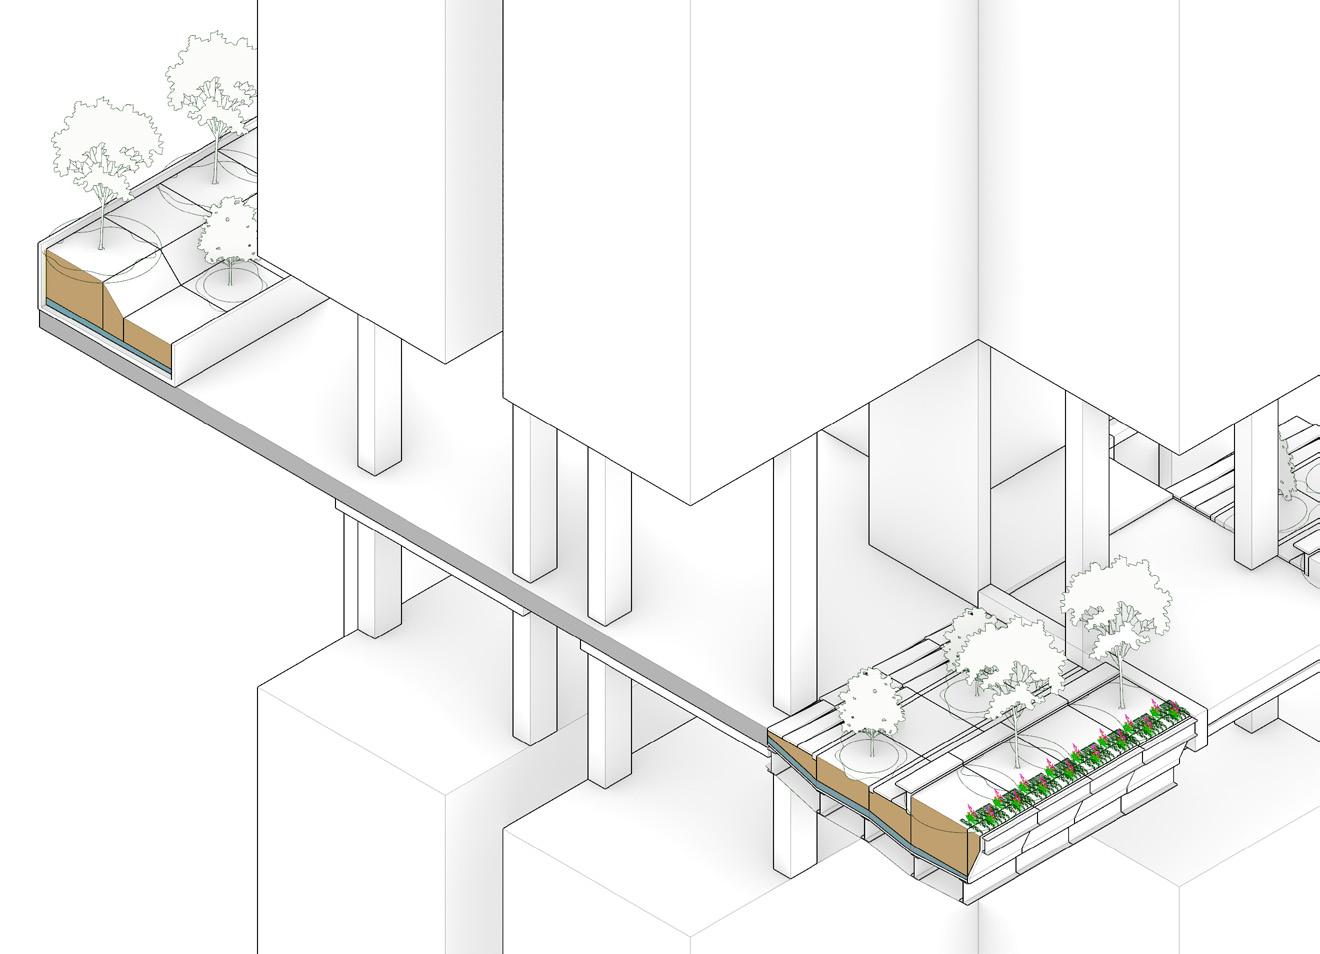
Since the sun path during the summer is on the North of Hong Kong, the North facing facades receive excessive sunlight. This issue is addressed by planting trees with dense canopies on the north facing open spaces.
The sun path during the winter months is on the South of Hong Kong, however since the sunlight hours are reduced, this sunlight is desirable. Therefore trees with less dense canopies are planted on the South facing open spaces.
Additionally, due to structural limitations, taller trees with dense canopies that weigh more are planted at lower altitudes while lighter trees that can withstand high wind velocities are planted at higher altitudes.
To provide shading, planters are designed to stand above ground. This enables the
to provide greater shading as well as provides public seating for space.
Additionally, taller trees with more extensive canopies are planted on the periphery of the open space in order to block direct incident sunlight while shorter trees are planted away from the periphery to increase shading.
In the above scenario, a sample cantilever type open space that faces the winter sun has been designed. Hong Kong receives low sunlight during winter months and thus, it is desirable to allow sunlight onto the open space.
The subsurface planters are used in these areas to allow the entire space to be accessible. Elevated planters are not used as there is no need to increase tree height.
Short trees and shrubs are planted to allow the sunlight to penetrate the open space.
The above diagram is a design of a sample cantilever type open space that faces the summer sun. The open space receives high sunlight hours during summer months, and therefore, the open space needs to be shaded.
To provide shading, planters are designed to stand above ground. This enables the tree canopy to provide greater shading as well as provides public seating for space.
Additionally, taller trees with more extensive canopies are planted on the periphery of the open space in order to block direct incident sunlight while shorter trees are planted away from the periphery to increase shading.
Diagram at the top is a design of a sample open space that is situated on the third floor of a highrise tower.
Heavy trees with a wide canopy are planted at this level to reduce noise pollution, improve air quality and enhance privacy.
As established before, Hong Kong has a deficiency of freshwater resources. Having increased the green open space area by 240%, the demand for water has risen manifold as well. This has been addressed by proposing a local water harvesting strategy that will drive the site towards selfsatisfying its water needs.
This system will need to be dynamic, functioning differently during different seasons based on precipitation received.
The driving principle of this system is to collect and store the excess surplus rainwater received by the site during the summer months and use this excess water during winter months when the precipitation is low.
As established with the result of the open space generation experiment, 66% of the total open space area is subject to vegetation (41000m2) based on this area. Irrigation requirement and water catchment values have been derived.
Precipitation
rainwater run-off from green spaces
excess rainwater
rainwater run-off from city surface
Existing sewage system
Existing
During the summer months from May to September, Hong Kong receives heavy rainfall going up to 450mm.
During these months, green open spaces can potentially reclaim approximately 58,500m3 of water through the generated spaces and surface runoff.
The irrigation requirement for the vegetation on the open spaces during these months is 38,000 m3 which is 65% of the total rainwater collected.
This implies that there is an excess of 20,500 m3 (35% of the rainwater collected) of rainwater that can be collected, treated and stored for future use.
Precipitation
Rainwater run-off from green spaces
Excess rainwater
Rainwater run-off from city surface
Existing sewage system
Grey water to green space
Existing sewage system
During the winter months from October to March, Hong Kong receives scarce rainfall going up to 150mm; During these months, green open spaces can collect 155,000m3 of water through the generated spaces and surface runoff.
The irrigation requirement for the vegetation on the open spaces during these months is 380,000 m3. This implies that the collected precipitation during the winter falls short by 225,000 m3.
During these months, the 205,000 m3 of water treated and stored will be pumped up to the spaces and will be available for use, resulting in only a 20,000m3 shortage.
With this system, more than 94% of the irrigation demand is met by locally storing rainwater.
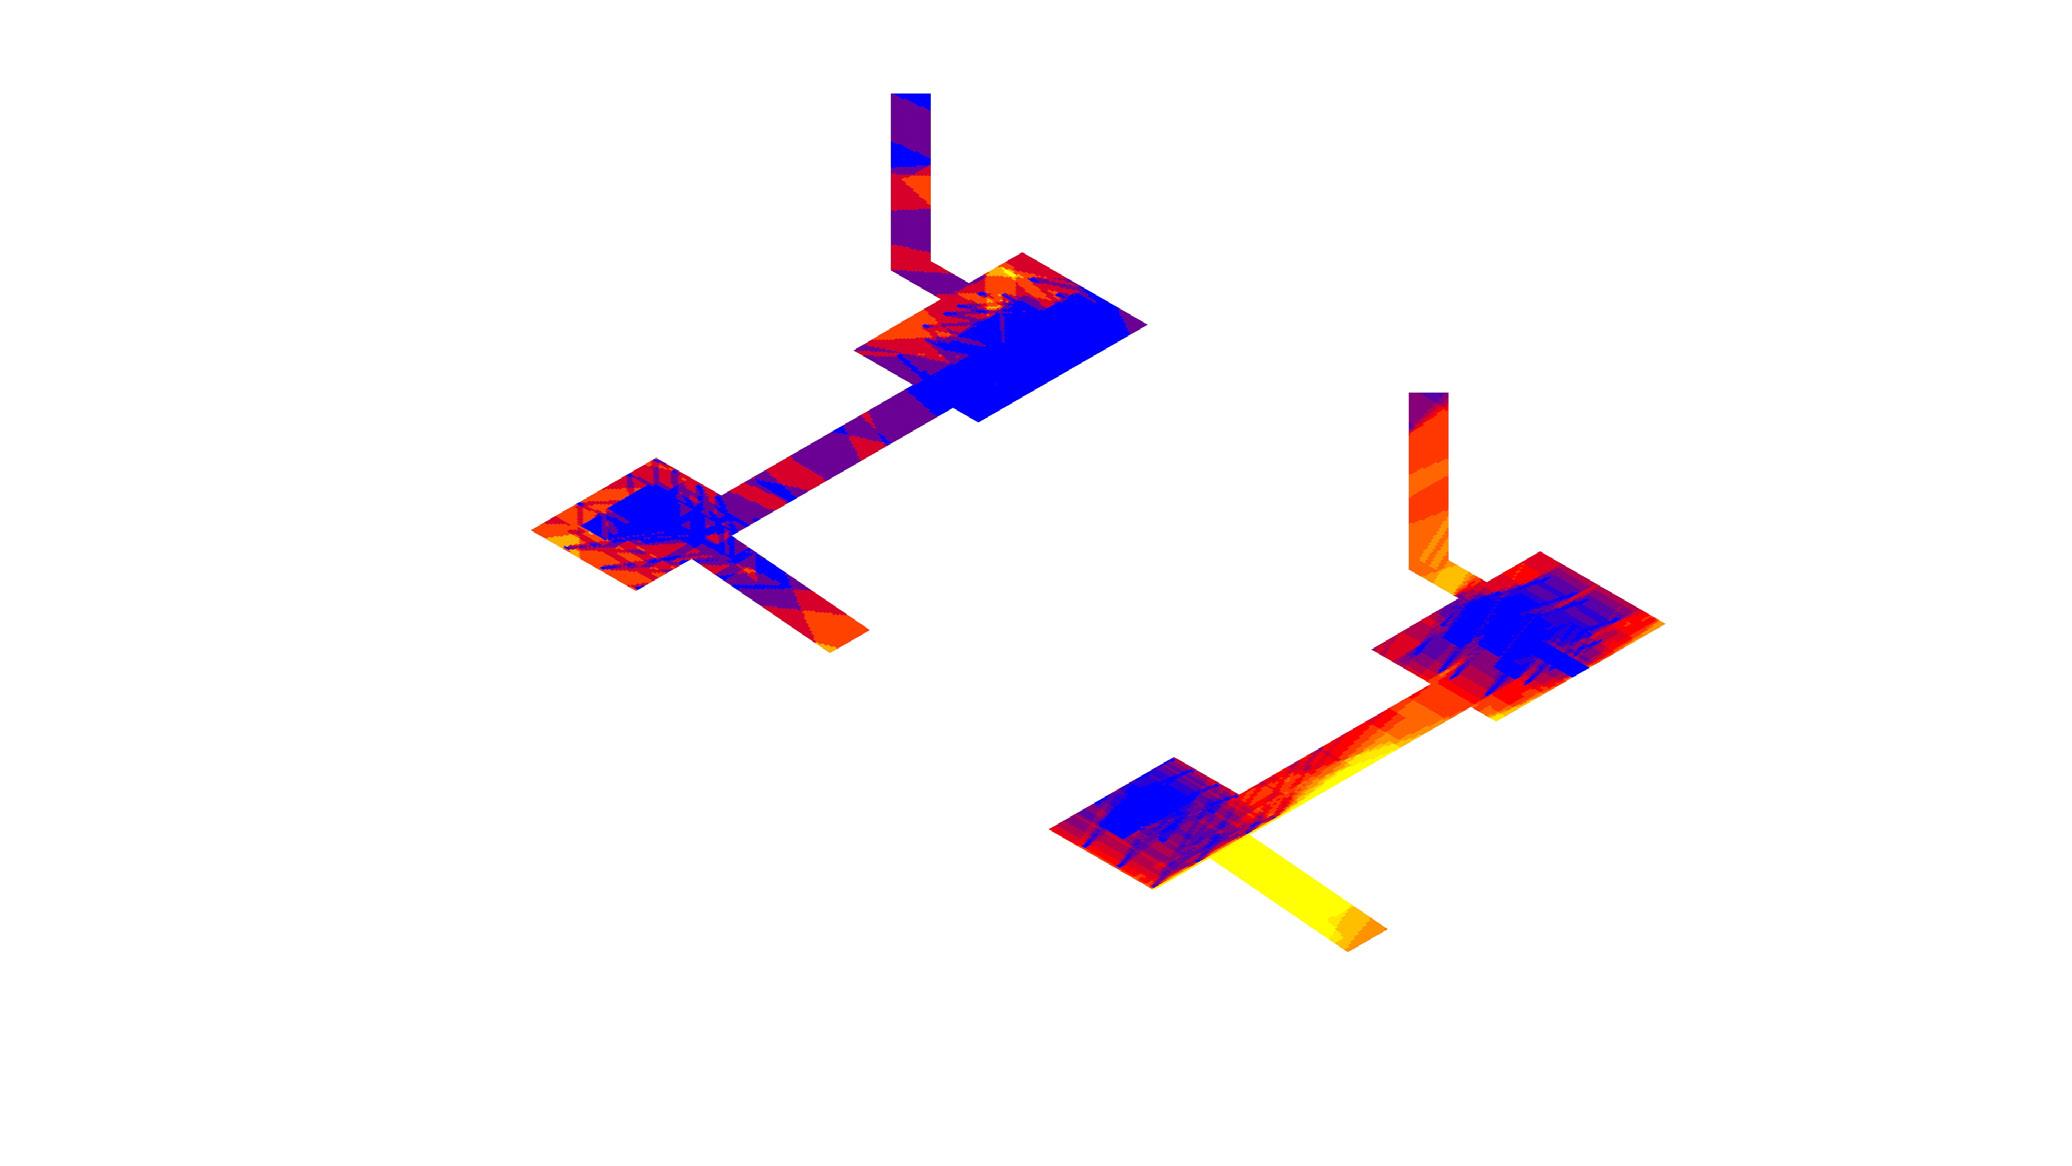
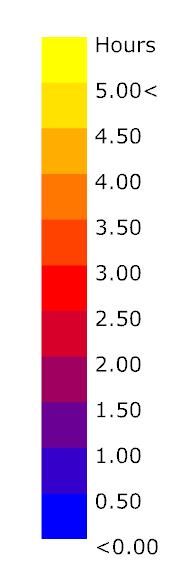
From the integrated result of the feedback experiment, an open space has been selected to be designed locally. The selected patch comprises of the bridge type open space configuration.
A solar analysis has been conducted on this patch to determine the specific areas where vegetation would be planted. The analysis is conducted during the summer and winter solstice.
The results of the analysis are then compared to arrive at a layout strategy. As the sunlight hours result during the winter solstice is low, it is more important to strategically place the plants, such that they receive sunlight even during the winters.
Therefore, trees are placed in the areas that receive more than 3 hours of sunlight during the winter solstice.
The walkways and open spaces have a permeable surface which enables water to seep through and get channelled to the underground storage tanks.
These walkways are well shaded with wide canopies on the northern side.
The series of sections through the walkway of the open space shows the details of the embedded planters and its drainage system.
The walkway has a minimum slope of 1:12, which makes it universally accessible.
elevated walkway
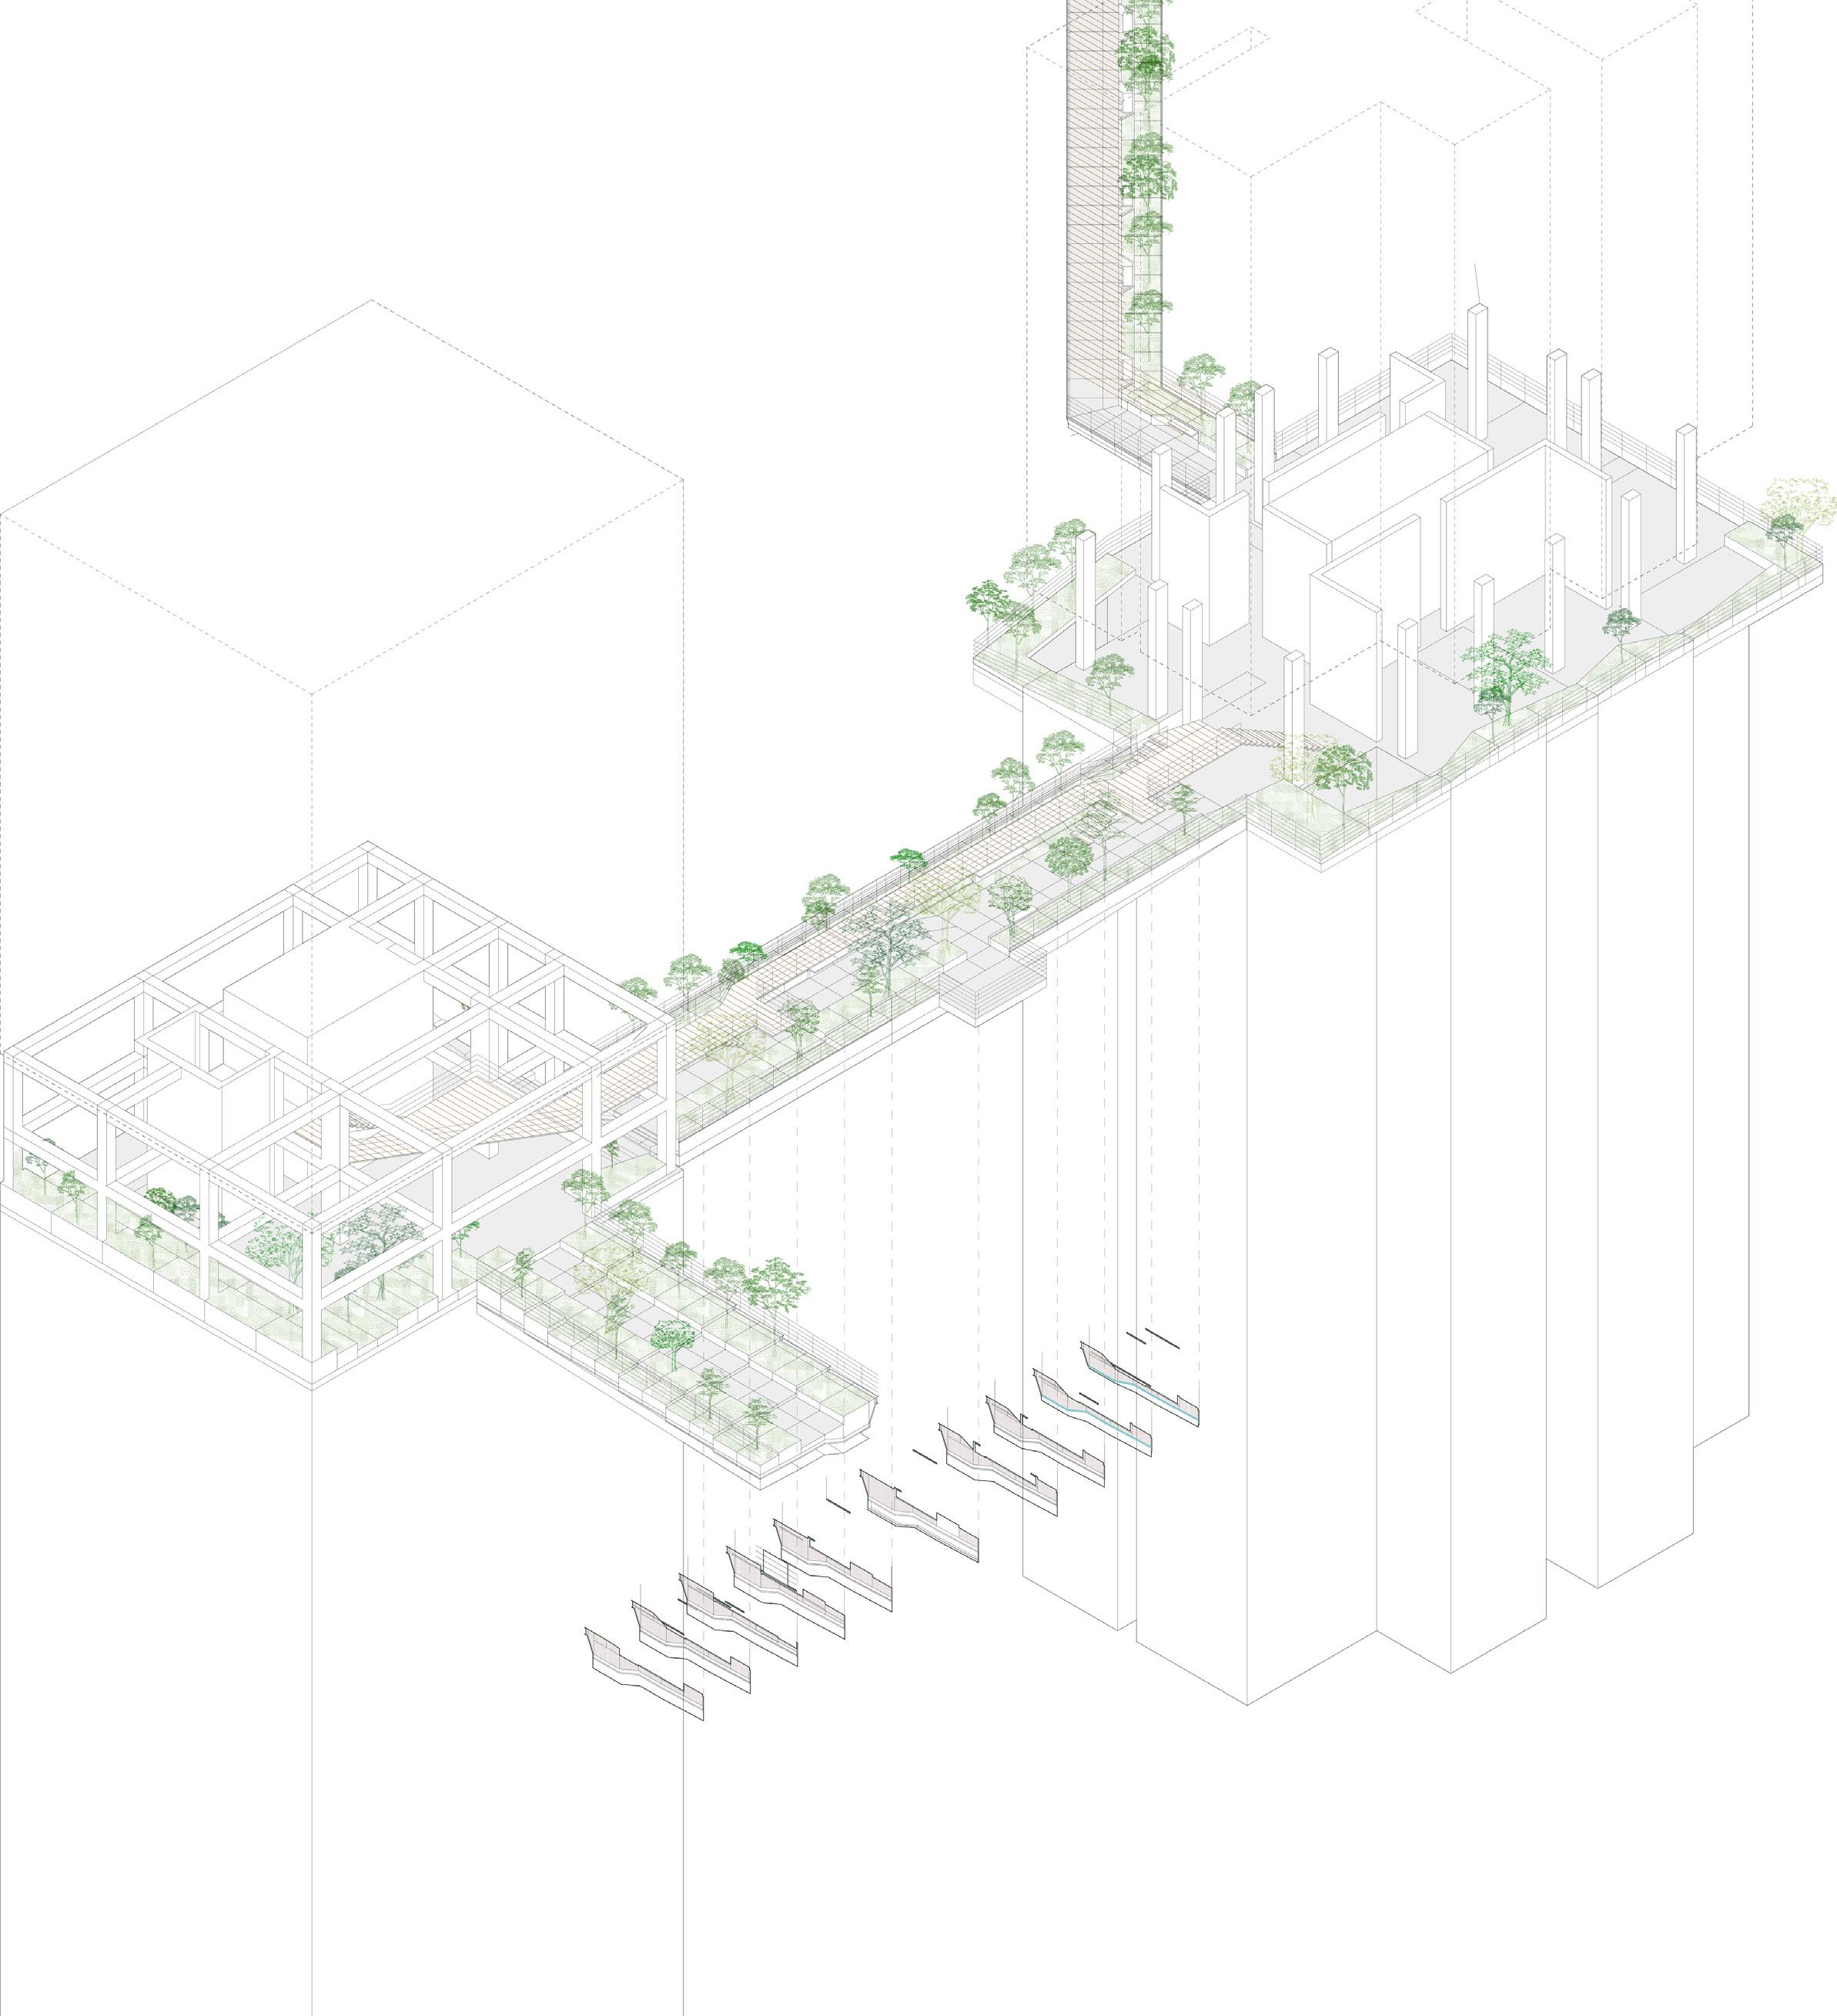
permeable pavements
water collection
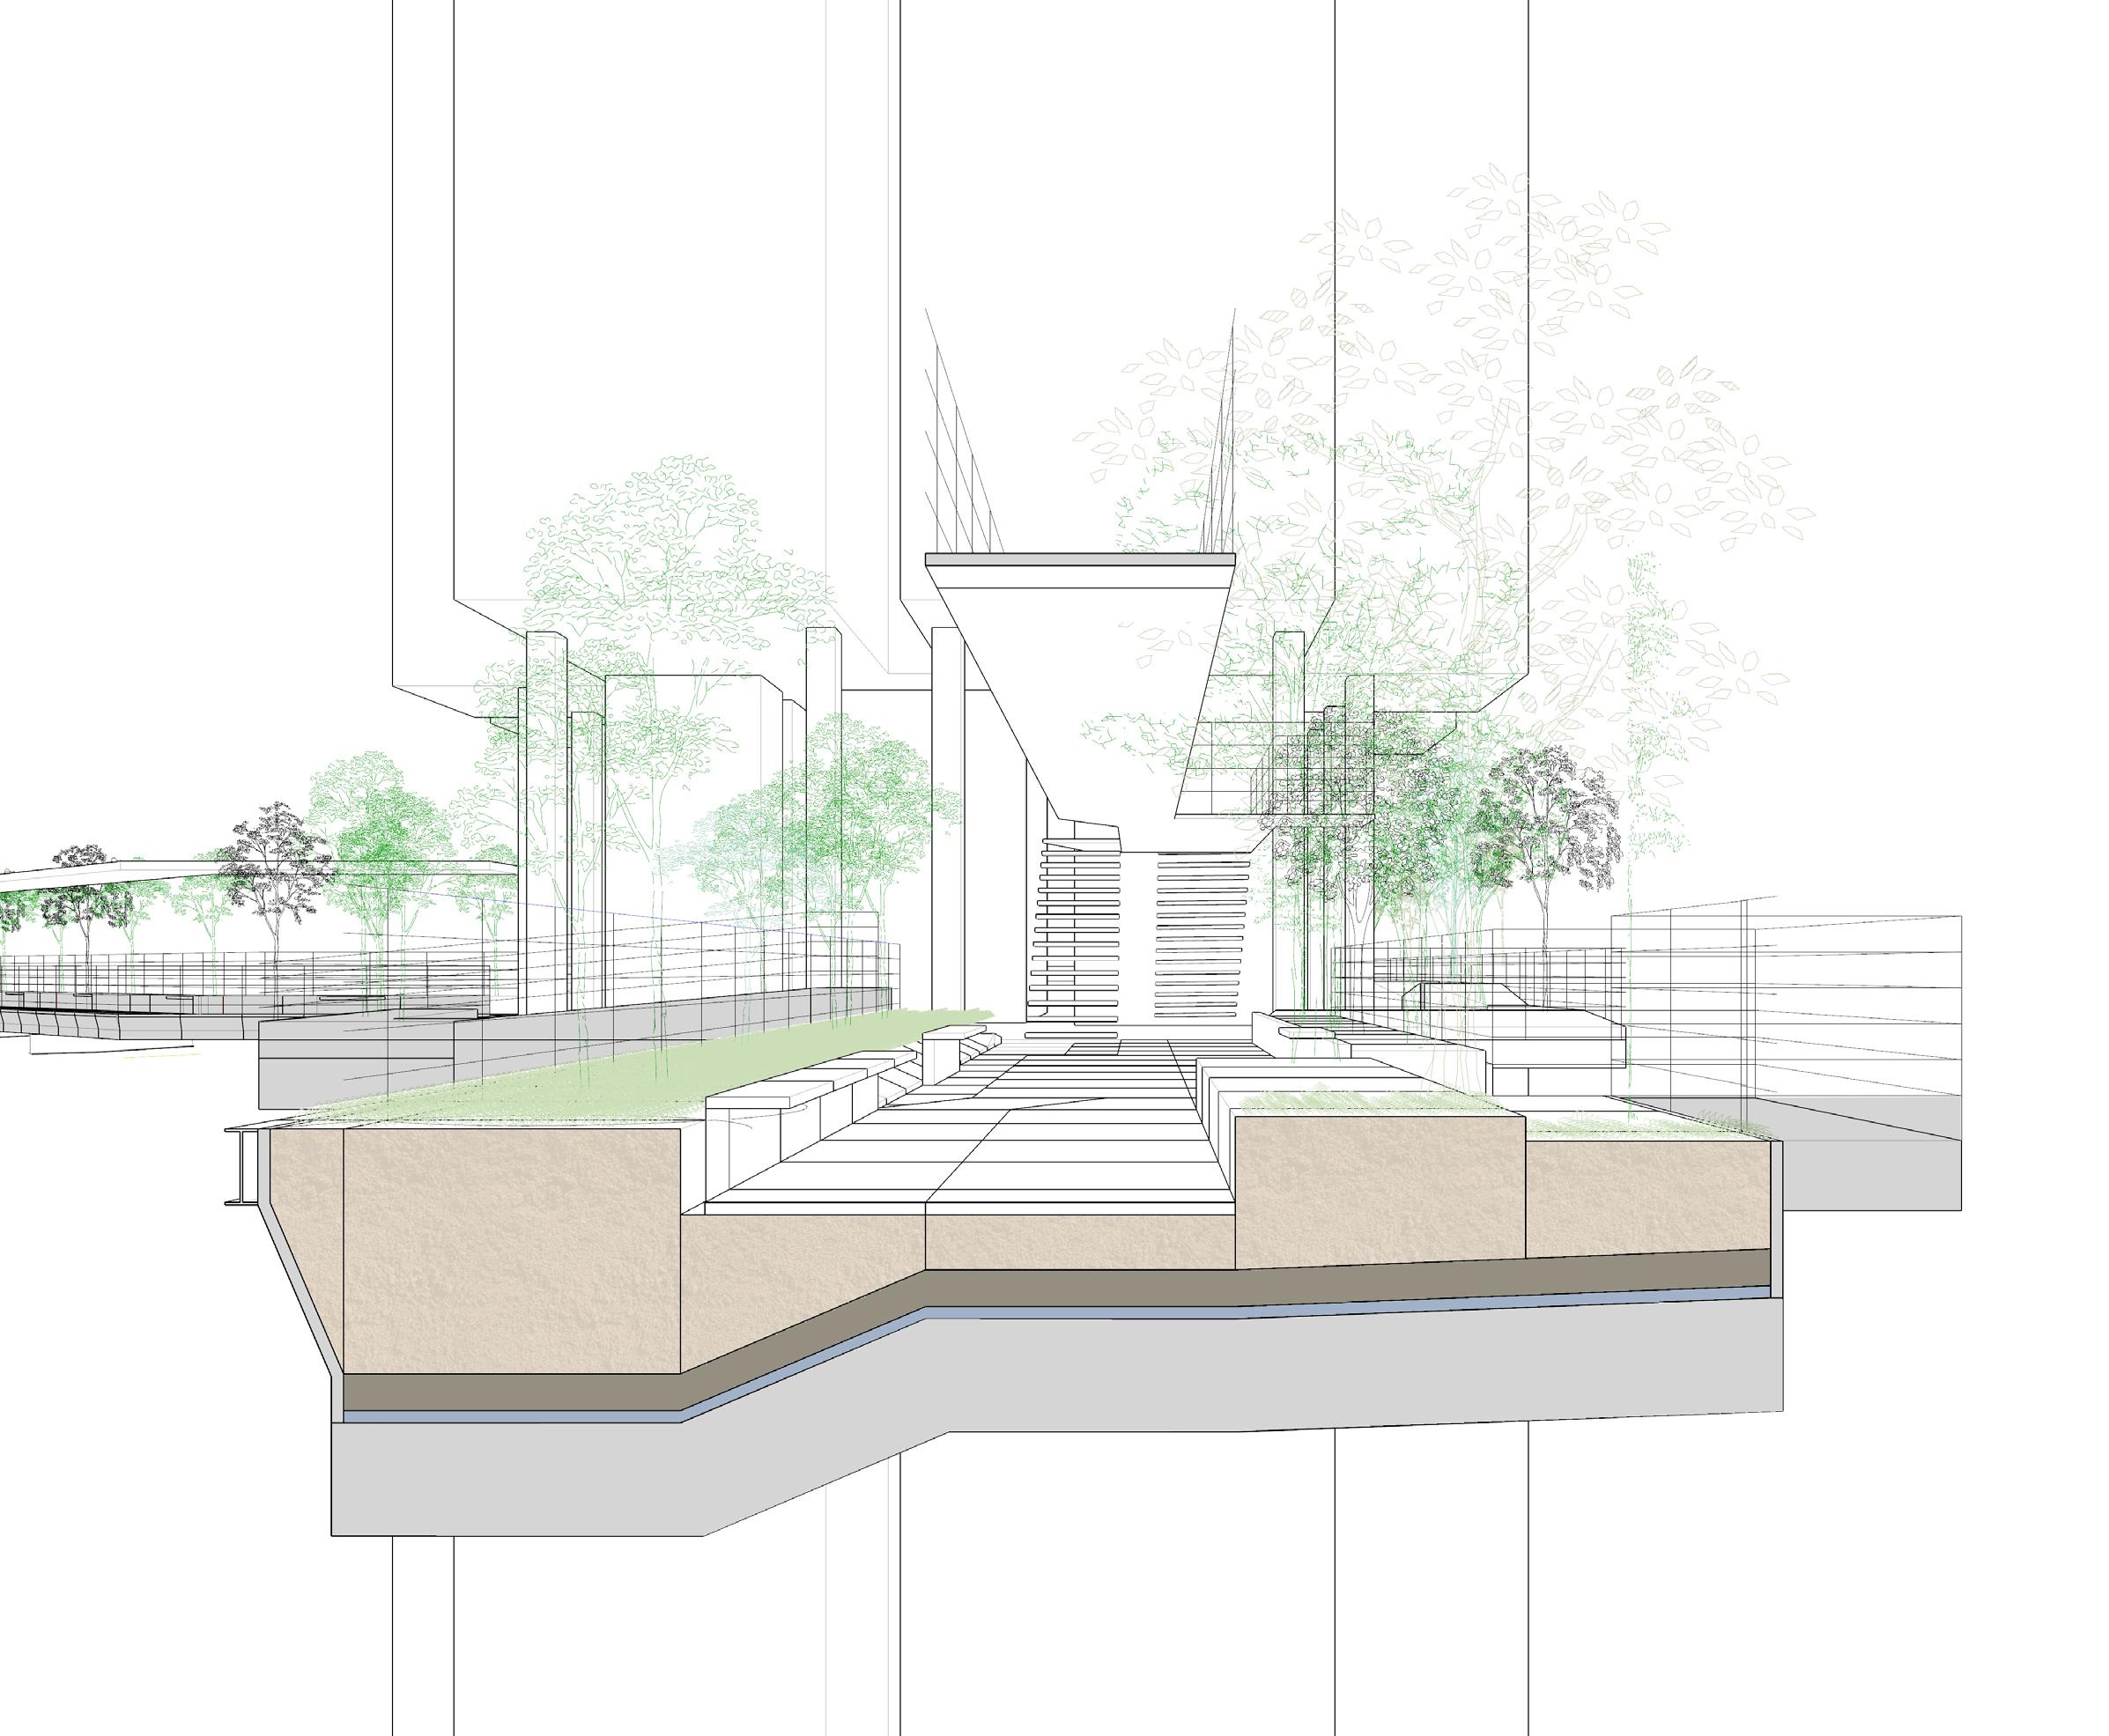
The following diagram portrays a section of an elevated walkway. This walkway has been designed to be dynamic, responding to seasonal environmental changes.
Since the sun path during the summer is on the North of Hong Kong, the north-facing edge receives excessive sunlight. This issue is addressed by planting trees with dense canopies on the north-facing open spaces. The planters on the north-facing edge of the walkway are elevated, which increases vegetation height and their shading factor.
The sun path during the winter months is on the South, however since the sunlight hours are reduced, this sunlight is desirable. Therefore planters on the south-facing edge are submerged into the walkway and are subject to short trees and shrubs to maximize sunlight gain.
The size of the planter also corresponds to the size of the trees that will be planted in them
The north side of the walkway comprises of sandy soil which allows water to seep in quickly and is collected under the southern planter. The slope at the bottom of the walkway ensures this unidirectional flow. The water is then channelled through drains to the underground storage tanks.
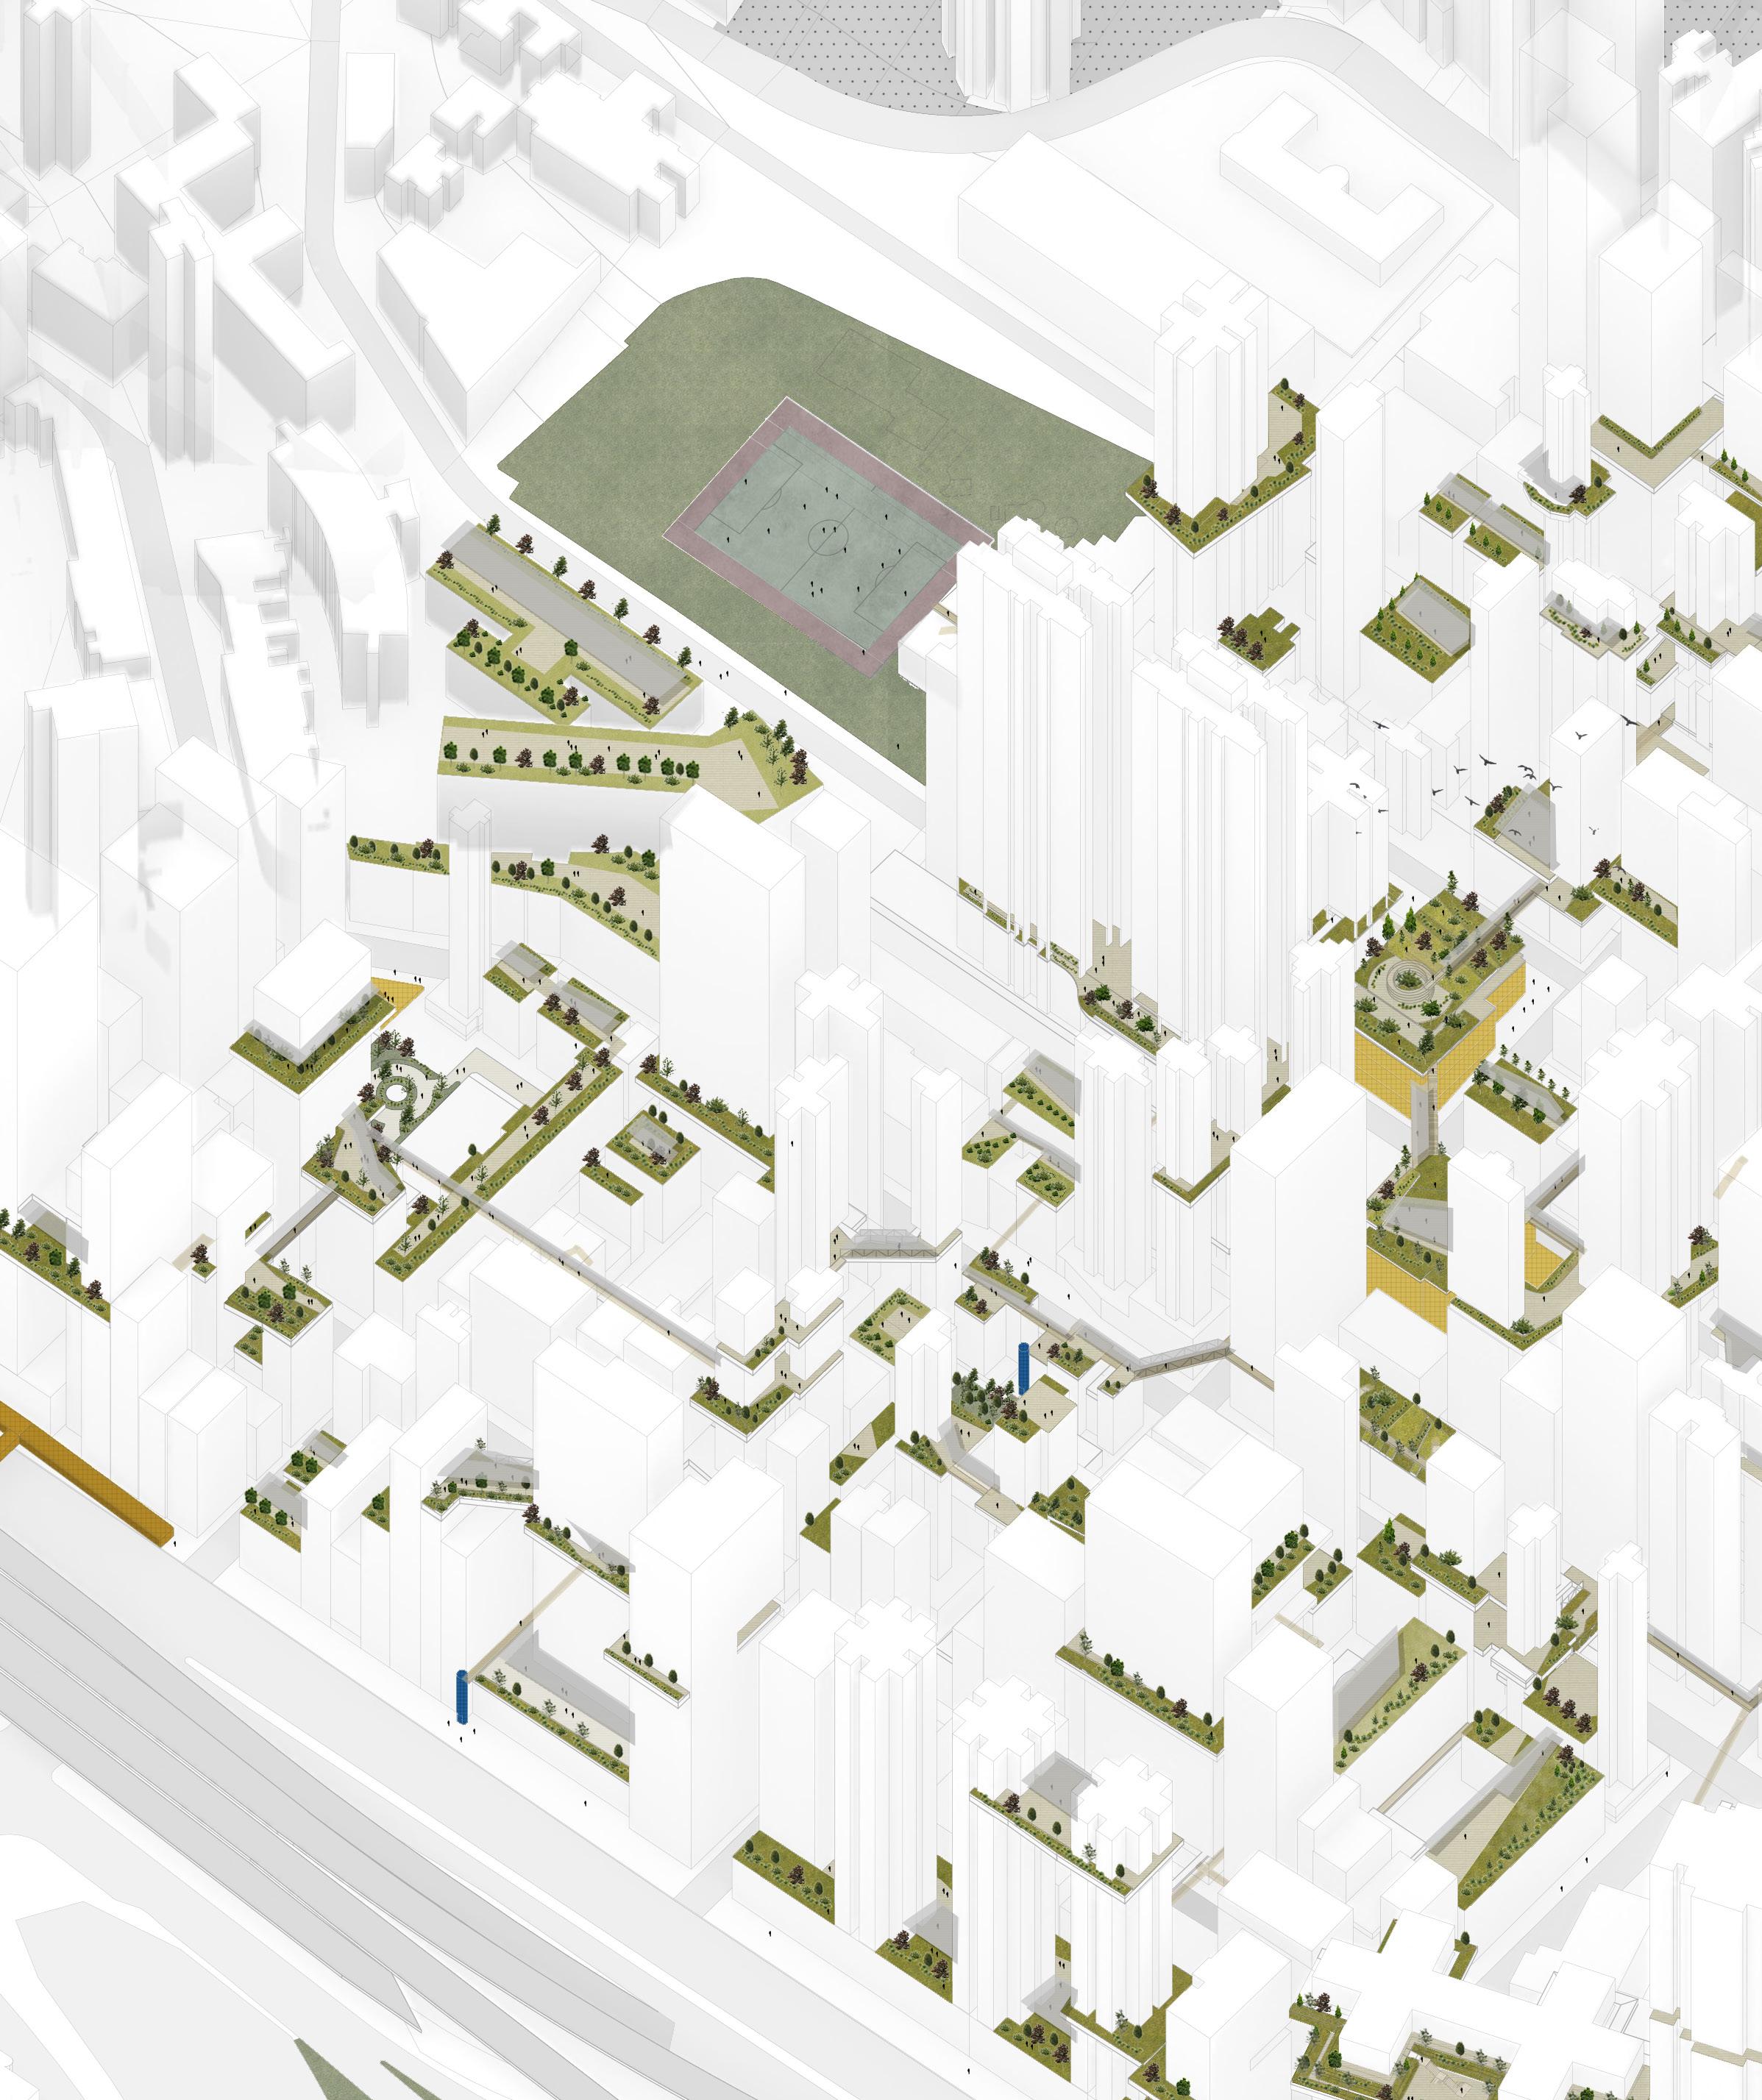
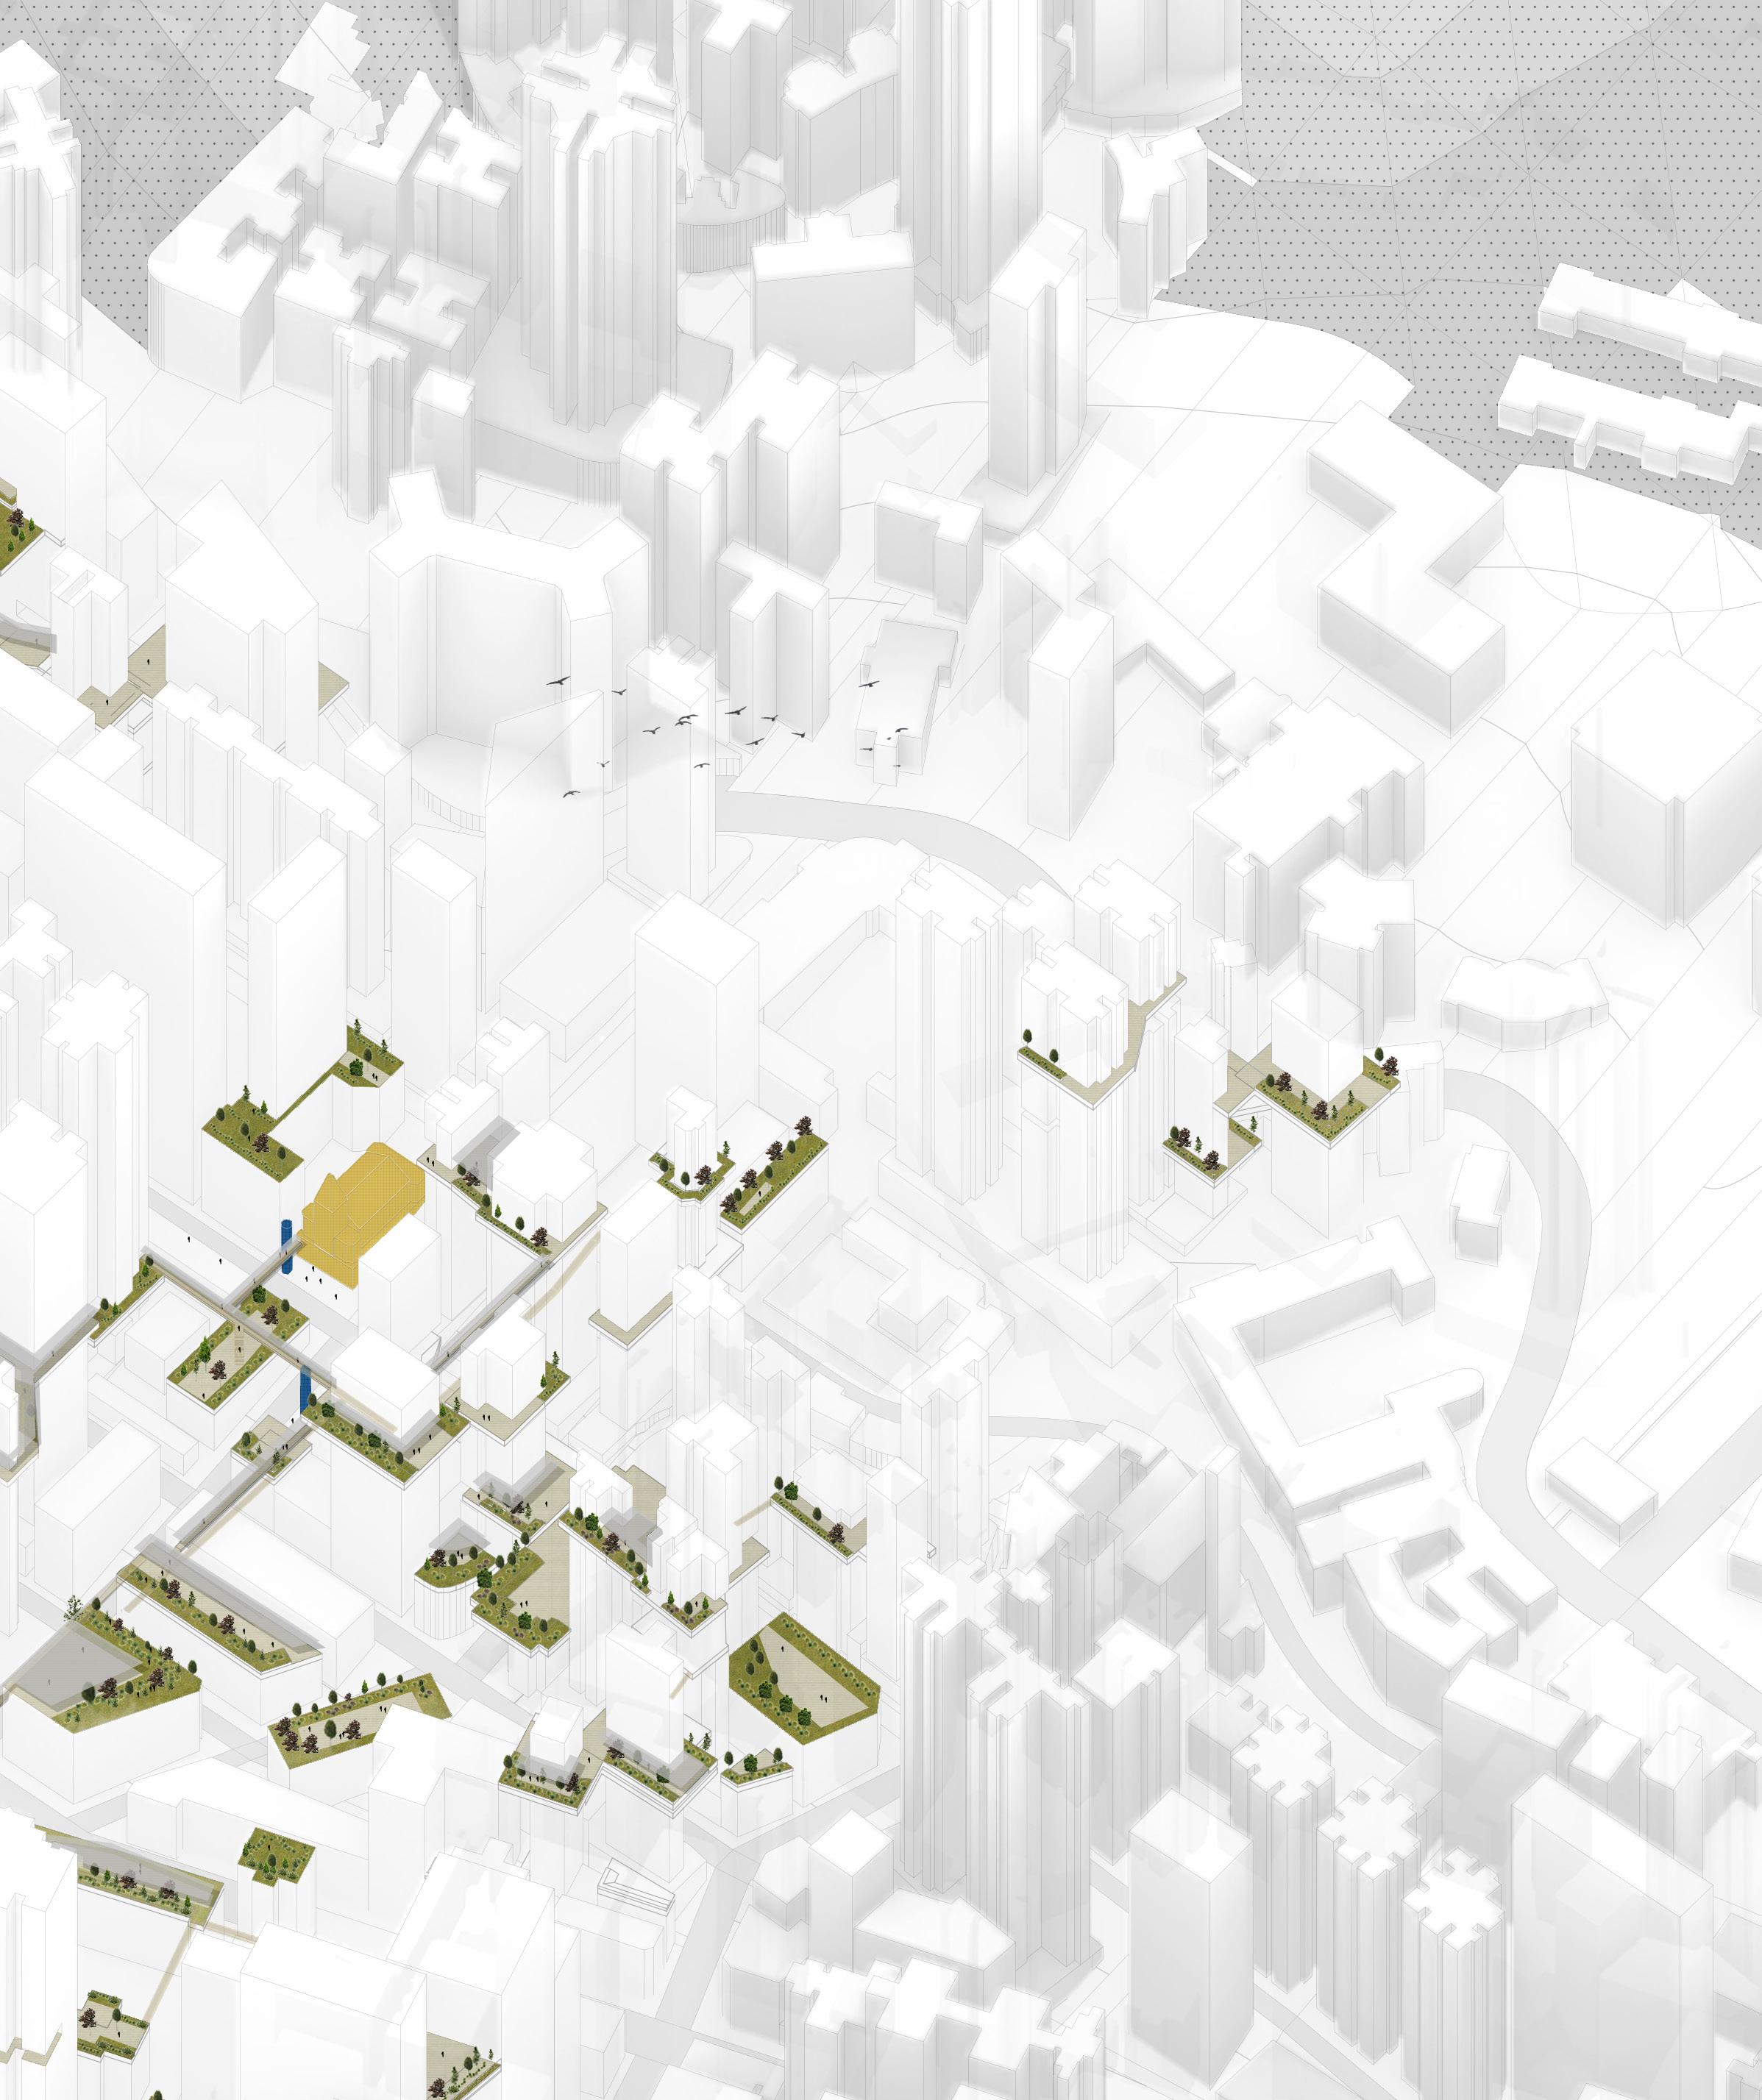
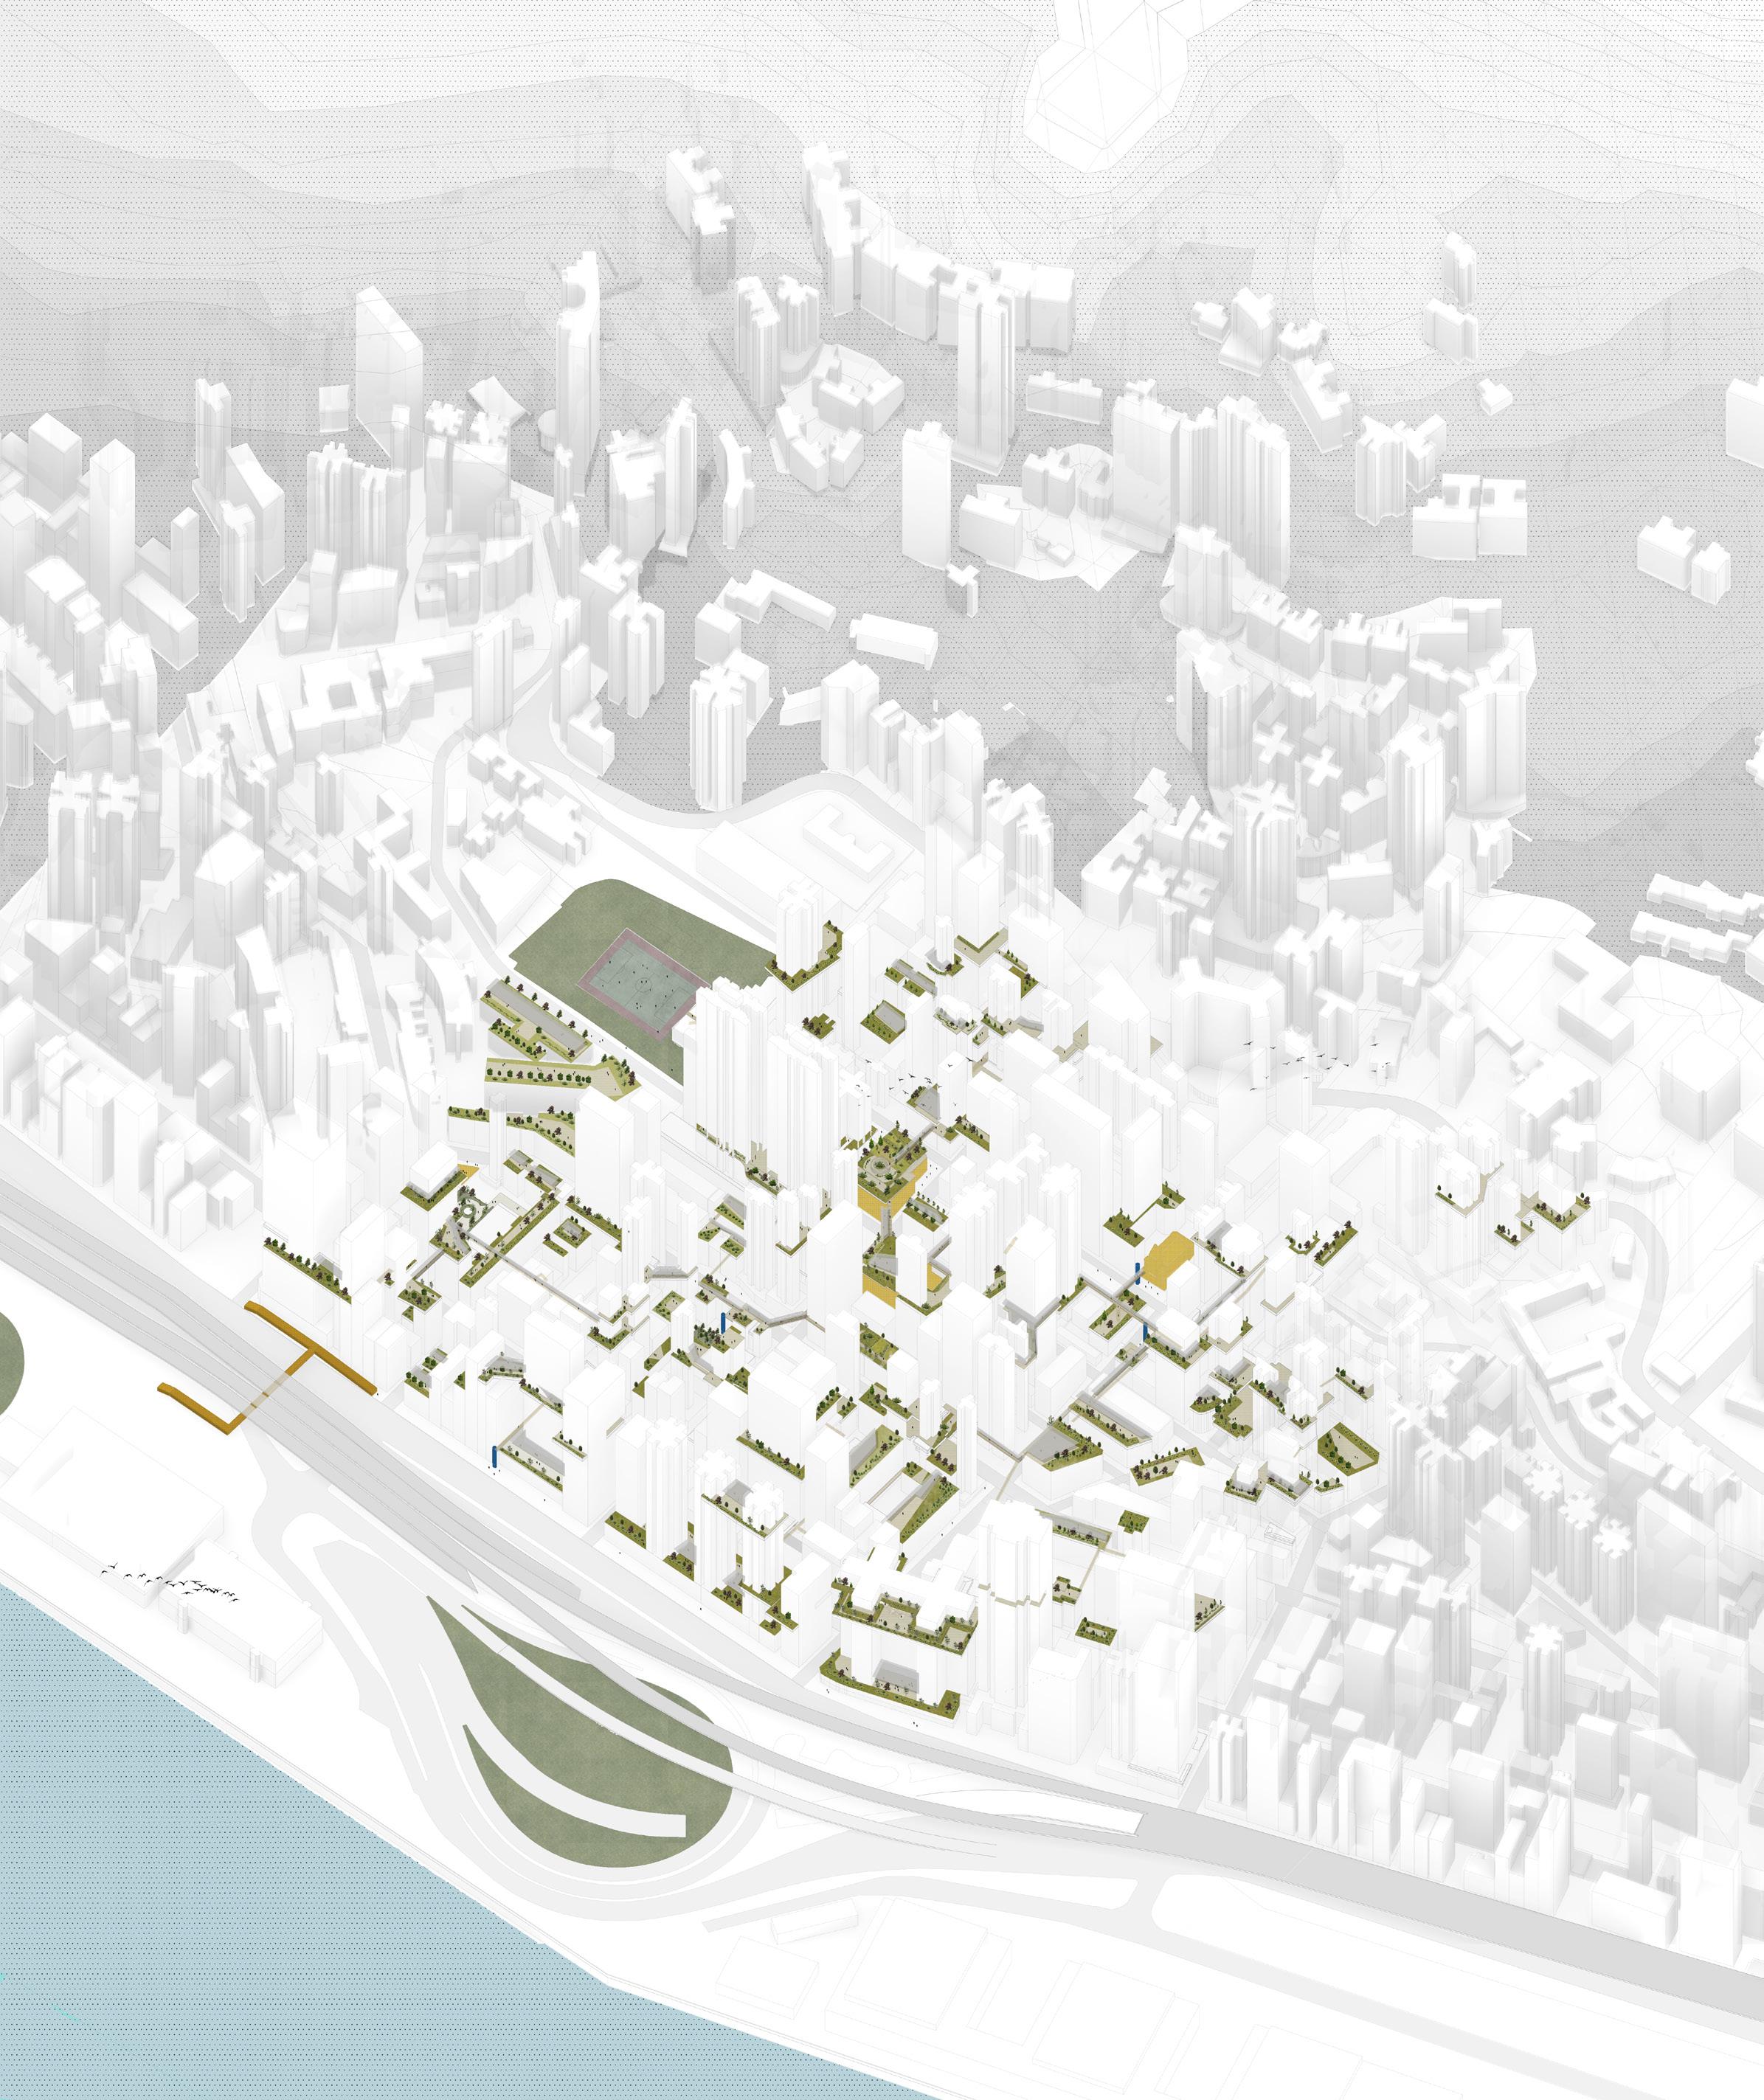
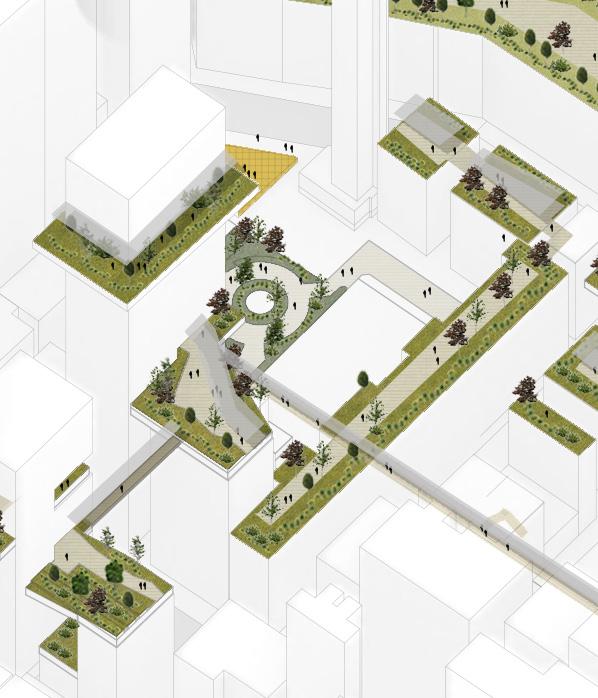
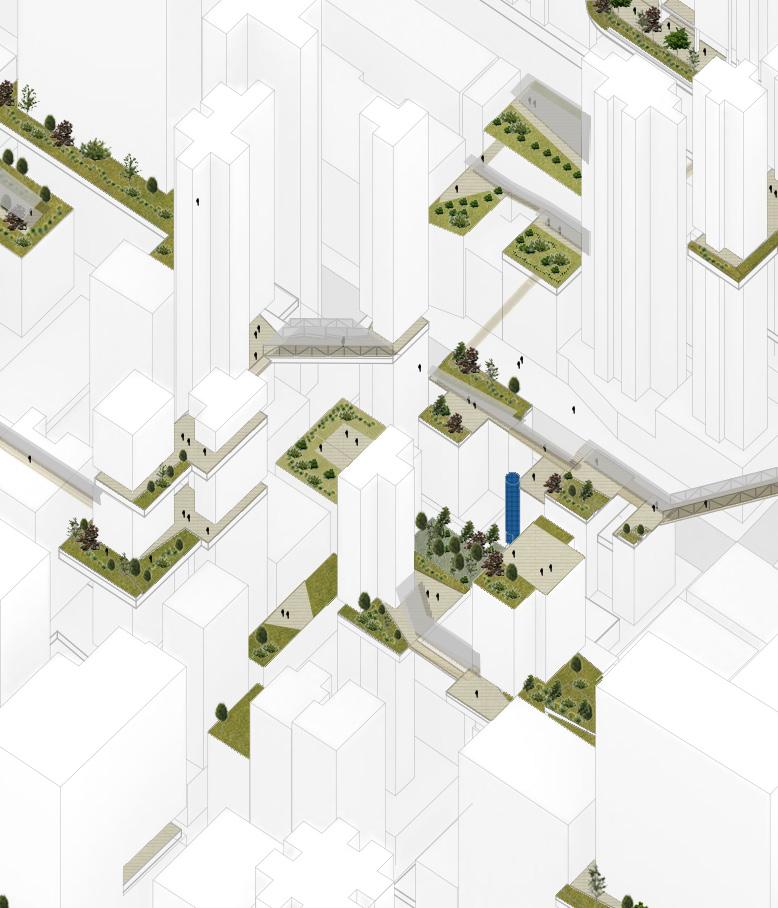
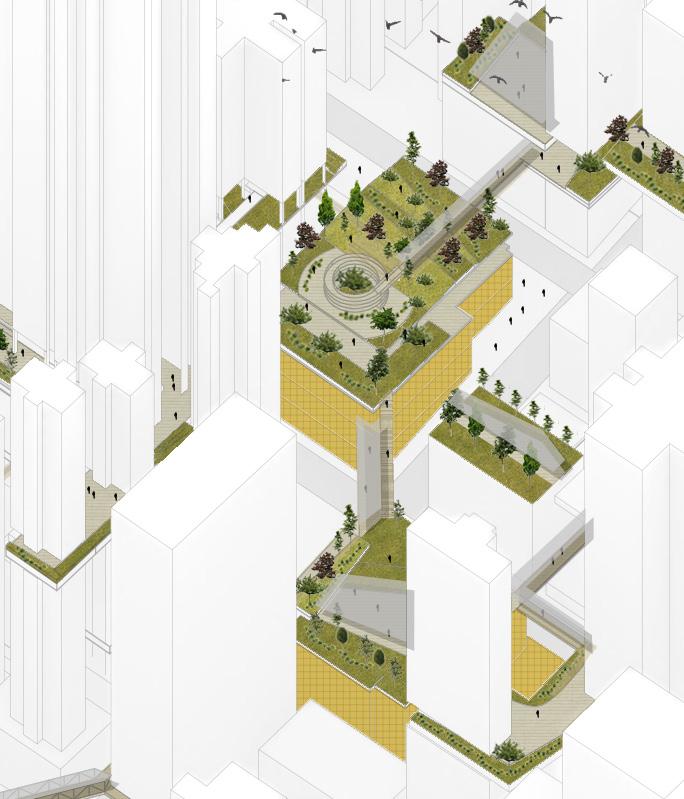
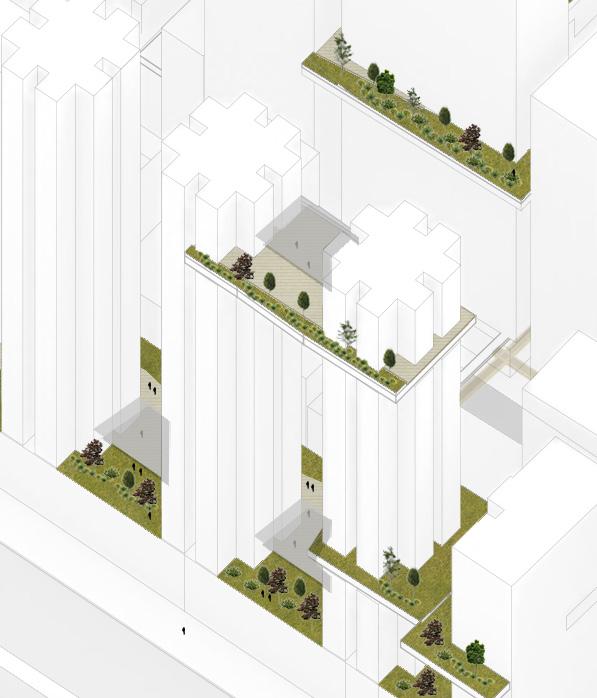
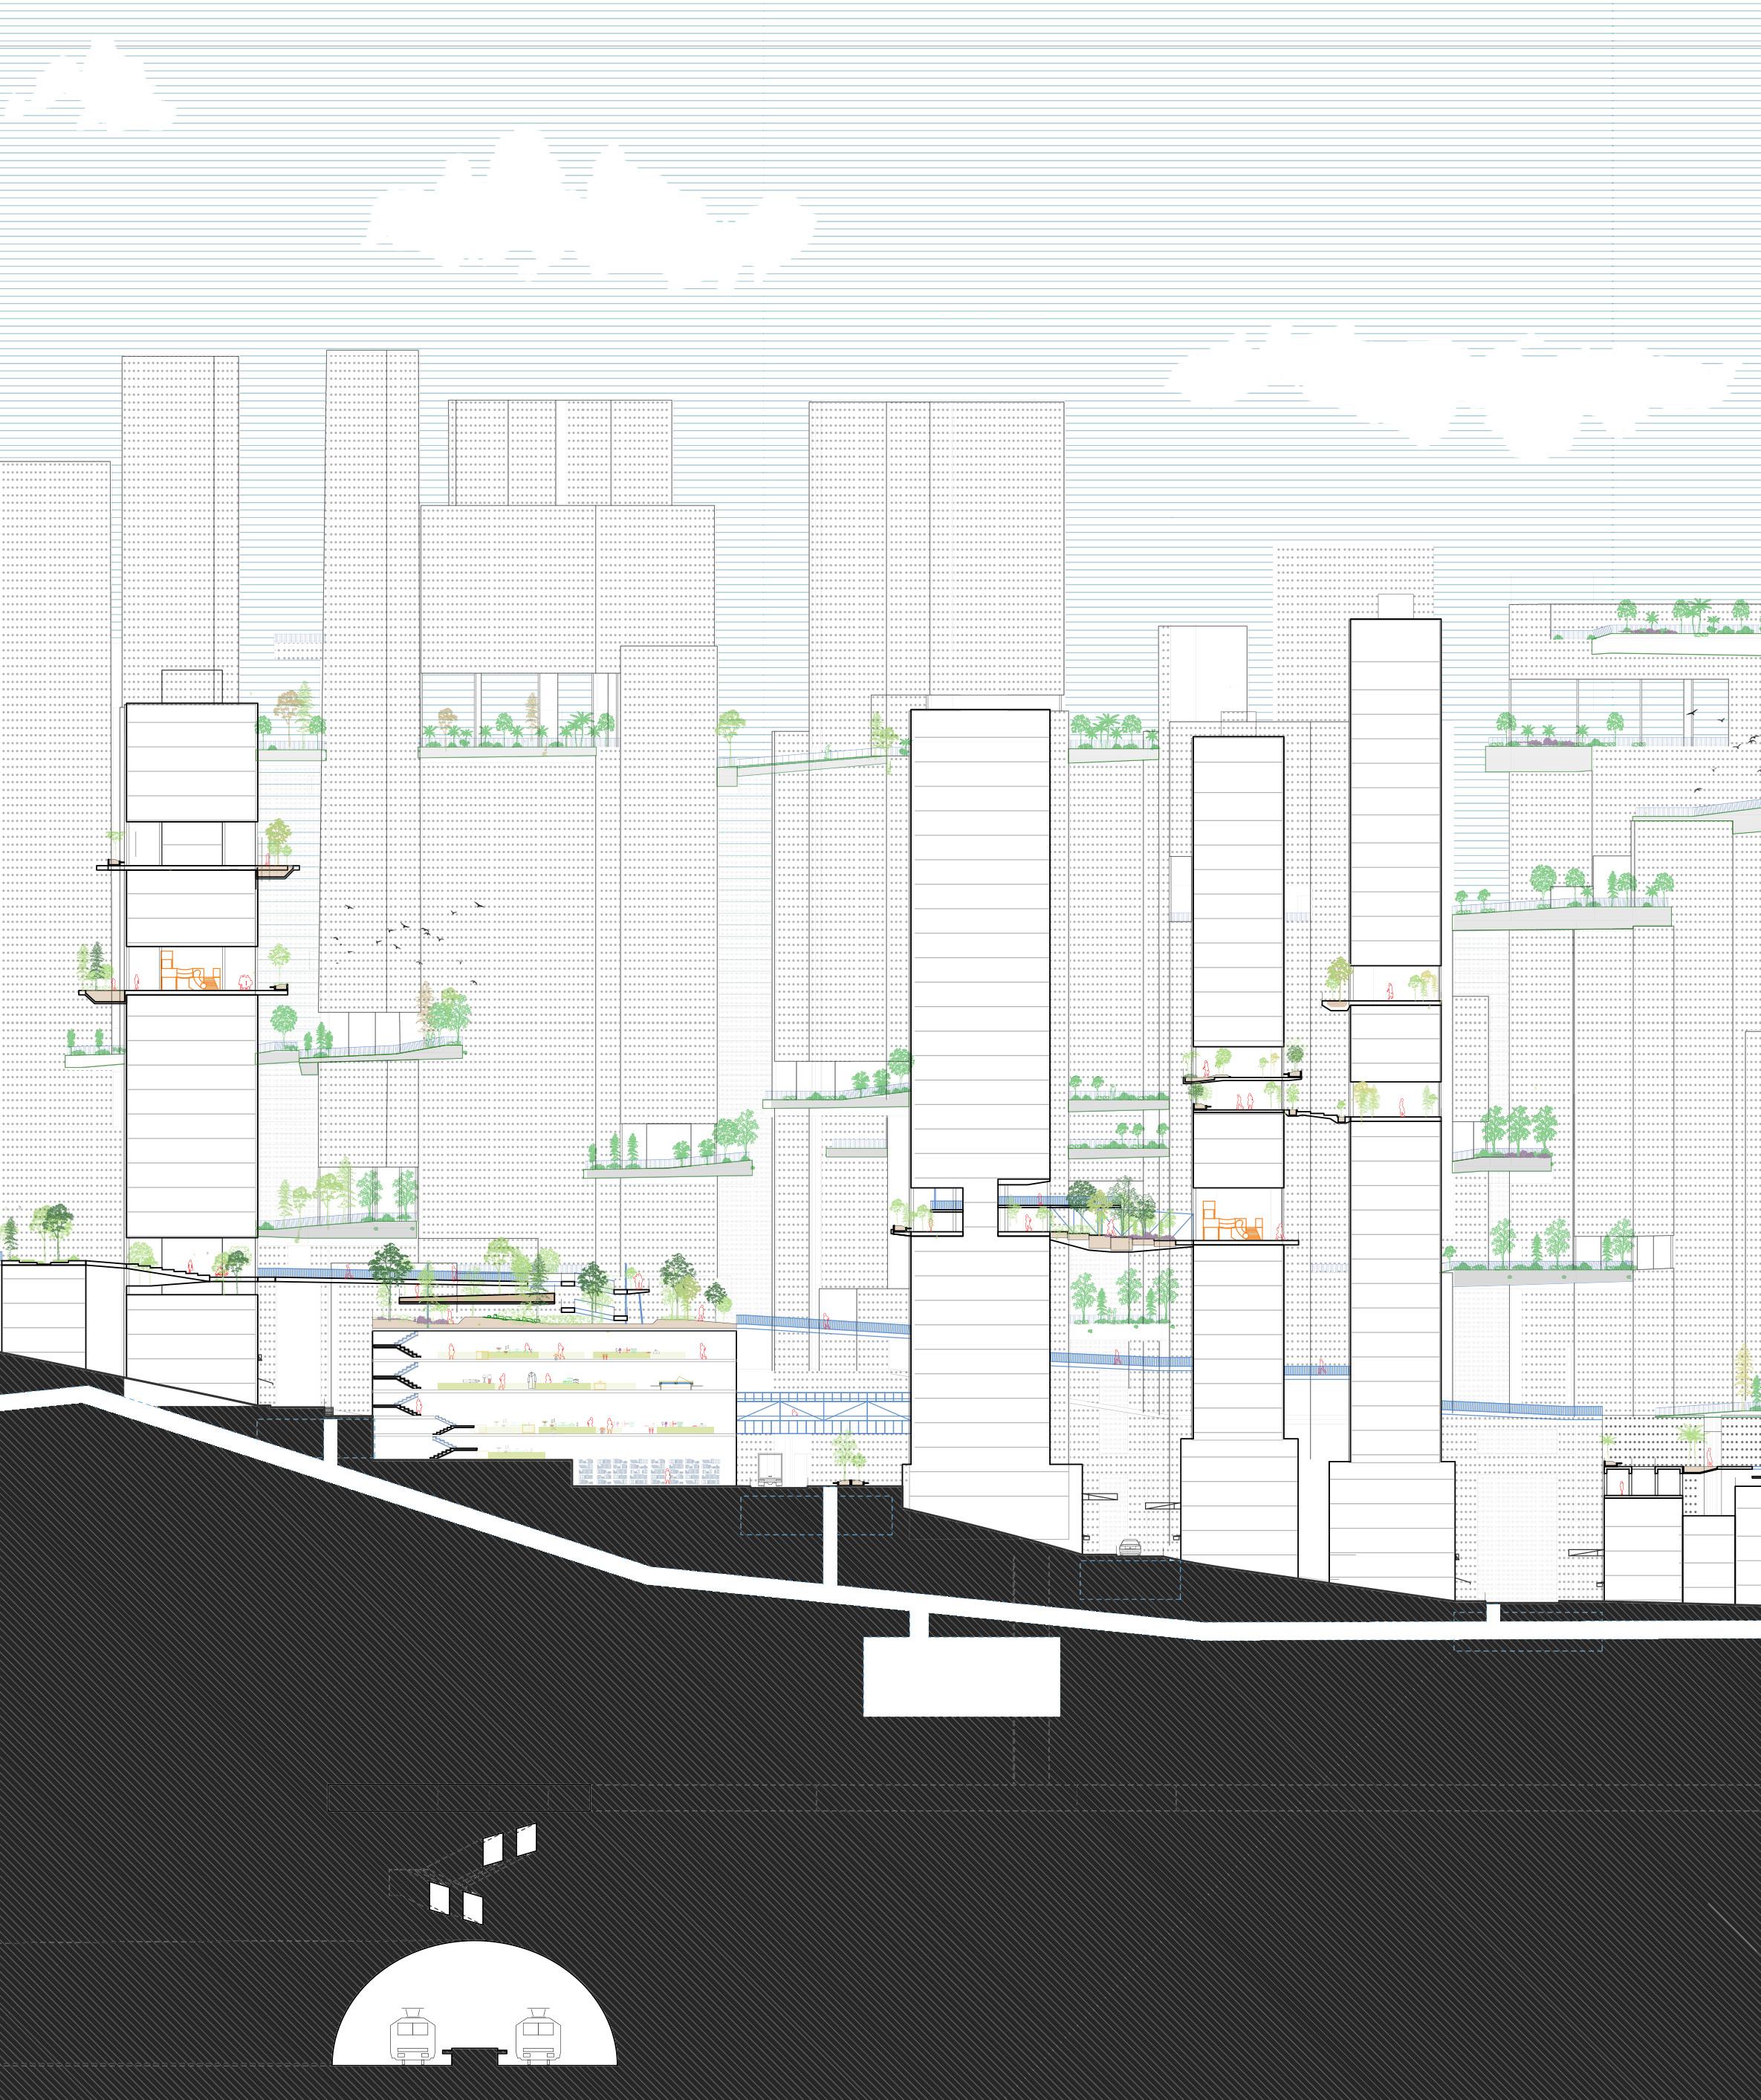
A top-down and bottom-up approach towards this project has provided a comprehensive perspective to the on-site issues and their potential to be improved. The integration on the two scales has resulted in an interconnected and interrelated system that undoubtedly improves the livability of the site.
Though more than 70% of Hong Kong’s land is protected ecosystems, the dense urban centres of the city have negligible biodiversity. Having introduced more than 16,000 m2 of vegetated land, this proposal could significantly enhance local biodiversity.
Combining both the top-down and bottom-up approach, a new network system of multilevel open spaces has been achieved. This system has upgraded the quality and quantity of green open spaces in Sai Ying pun, thereby enhancing ecology. The pedestrian circulation is undemanding and pleasant as it is integrated with urban greenery. This balanced, context-specific system embodies ‘Multilevel Ecologies.’
Although this design research has been conducted in the area of Sai Ying Pun, Hong Kong, this system may be potentially be applied to any high-density context with similar demographics.
The design research at the moment lacks materiality. There may be better solutions than using concrete to develop spaces in such an urban environment. Alternate materials may perform better environmentally and leave a smaller ecological footprint. Materials with high porosity may be fitting for the hot and humid climate.
An in-depth evaluation of the existing structure of individual buildings may have increased the limitations of the open space distribution. Techniques to increase the structural strength of proposed spaces could be explored to achieve larger spans or greater vegetation loads.
Studying the pedestrian flow and movement patterns of the population could have resulted in the development of a more dynamic system. A circulation network based on this would be more nuanced with a strong flow hierarchy.
Programme distribution on the proposed spaces could be explored. As these public spaces now have centrally located with the ease of accessibility, programmes of interest could further promote social interactions.
The complication of displacing residents has been sidelined in the research. Though this aspect was outside the scope, incorporating this study in the project may have increased its practicality value.
For practical reasons, urban projects are always implemented in stages. A timeline can be devised for a better understanding of the speed of development and future growth. Additionally, strategies will need to be incorporated, enabling the city to adapt to the rapid change and making this transition smooth.
Taking into consideration the refinements mentioned above, in the M.Arch stage, we will review and expand on Multilevel Ecologies.
At the local scale, surface materials will be investigated and incorporated into the design. This material system will
At the global scale, a timeline will be introduced. The timeline will divide the process into stages. Strategies will be incorporated to make the transition smooth. This timeline will also take into consideration the growth period of vegetation.
As the timeline matures, the need will arise to expand the boundaries of the network system. The design will account for future expansion.
Fig.1. (prev. page) High Density Hong Kong.......................................................................21 Skyrise Cities, (2019). High Density Hong Kong. Retrieved 15 August 2019, from https://skyrisecities. com/news/2018/11/high-density-hong-Kong
Fig.2. (top) Density of Hong Kong, Mexico City and London................................................21 urbanage.lsecities.net. Accessed September 10, 2019, from https://urbanage.lsecities.net/ search?content_type=[“data”]&theme=[17]&year=[“2015”].
Fig.3. High density city and its preserved area, Hong Kong...............................................22 Mishev, Dina. “Hong Kong’s Urban Jungle Is Real, Not a Metaphor for Concrete and Steel.” The Washington Post. WP Company, July 7, 2016, from https://www.washingtonpost.com/lifestyle/travel/ hong-kongs-urban-jungle-is-real-not-a-metaphor-for-concrete-and-steel/2016/07/07/bc6951d83c77-11e6-80bc-d06711fd2125_story.html.
Fig.4. (left) A residential precinct in Sha Tin, New Territories, Hong Kong, built in 1970s..24 City One Shatin (Phase 3C) - BEAM Plus Online Exhibition. Accessed September 10, 2019, from http:// greenbuilding.hkgbc.org.hk/projects/view/109.
Fig.5. (bottom) An example of a pencil tower, Hong Kong, built in 2010s............................24
“3262: Executive Homes.” , Wan Chai Apartment For Rent. Accessed September 15, 2019, from https://www.executivehomeshk.com/properties/wan-chai/5-star-street/3262.
Fig.6. A pocket park below the highway, Hong Kong..........................................................26
“Reimagining Hong Kong’s Pocket Parks.” thinking city //, April 5, 2019, from https://thinkingcity.org/ portfolio/reimagining-hong-kongs-pocket-parks/.
Fig.7. Open space on the platform level within a public estate, Hong Kong........................27 cyclub.happyhongkong.com. Accessed September 10, 2019, from http://cyclub.happyhongkong.com/ viewthread.php?tid=143136&authorid=&attach=.
Fig.8. Sit-out area with greenery in a high density area, Hong Kong..................................29
“Will a Lack of Open Space Damage Generations of Hongkongers?” South China Morning Post, July 20, 2018, from https://www.scmp.com/news/hong-kong/community/article/2118314/will-lack-openspace-damage-generations-hongkongers.
Fig.9. Empty reservoirs in Hong Kong...............................................................................32 “Water Shortages-Empty Reservoirs Means Water Rationing.” Gwulo. Accessed September 2, 2019, from https://gwulo.com/atom/30354.
Fig.10. (next page top left) Exterior of The pinnacle @ Duxton in Dawson, Singapore........................................................................................................................36 LaBarre, Suzanne. “World’s Best Skyscraper Awards Include Stout, Rusty School Building in England.” Fast Company. Fast Company, July 30, 2019, from https://www.fastcompany.com/1661720/ worlds-best-skyscraper-awards-include-stout-rusty-school-building-england.
Fig.11. (next page bottom left) Sky garden of The pinnacle @ Duxton in Dawson, Singapore........................................................................................................................36 “Pinnacle@Duxton.” Visit Singapore Official Site. Accessed September 2, 2019, from https://www. visitsingapore.com/see-do-singapore/architecture/modern/pinnacle-at-duxton/.
Fig.12. (next page top right) Exterior of SkyVille in Dawson, Singapore.............................36 “SkyVille @ Dawson.” The Skyscraper Center. Accessed September 6, 2019, from http://www. skyscrapercenter.com/building/skyville-dawson/14117.
Fig.13. (next page bottom right) Sky garden of SkyVille in Dawson, Singapore..................36 20 September, 2017 By Paul Finch. “Editorial: Revolutions Mean Mass Housing – and Should Mean Good Design.” Architectural Review. Accessed September 3, 2019, from https://www.architecturalreview.com/essays/letters-from-the-editor/editorial-revolutions-mean-mass-housing-and-shouldmean-good-design/10023545.article.
Fig.14. (prev. page top) Access diagram of The Pinnacle @Duxton.....................................39 Menz, Sacha. Public Space Evolution in High-Density Living in Singapore: Ground and Elevated Public Spaces in Public Housing Precincts. Zürich: ETH-Zürich, 2014.
Fig.15. (top) Section through The Pinnacle @Duxton showing green spaces at various levels..............................................................................................................................39
“ARC Studio Architecture Urbanism · Pinnacle @ Duxton.” Divisare. Accessed September 2, 2019, from https://divisare.com/projects/150328-arc-studio-architecture-urbanism-pinnacle-duxton.
Fig.16. (bottom) Section through SkyVille showing green spaces at various levels..............................................................................................................................39
Rojas, Cristobal. “SkyVille / WOHA.” ArchDaily. ArchDaily, December 8, 2016, from https://www. archdaily.com/800832/skyville-woha.
Fig.17. (top) Elevation of the Central Mid-level escalator and walkway system..................40 Han, Wang. “Hong Kong / Government Intervention (1980s) Central–Mid-Levels Escalator and Walkway System.” ASIAN CITIES RESEARCH, December 18, 2016, from http://fac.arch.hku.hk/asiancities-research/hong-kong-government-intervention1980s-central-mid-levels-escalator-andwalkway-system/.
Fig.18. [right] Location of Central Mid-level escalator and walkway system......................40 Han, Wang. “Hong Kong / Government Intervention (1980s) Central–Mid-Levels Escalator and Walkway System.” ASIAN CITIES RESEARCH, December 18, 2016, from http://fac.arch.hku.hk/asiancities-research/hong-kong-government-intervention1980s-central-mid-levels-escalator-andwalkway-system/.
Fig.19. (top) Elevated walkways and underground tunnels of Central.................................41 “Pin on History of Me.” Pinterest. Accessed September 10, 2019, from https://www.pinterest.jp/pin/25 5649716325156802/?lp=true.
Fig.20. (middle)Elevated walkways being utilized as social meeting spaces.......................41 “Eni’s Story: Why Bethune House Offers an Essential Lifeline for Domestic Workers Facing Abuse.” Hong Kong Free Press HKFP, July 23, 2018, from https://www.hongkongfp.com/2018/07/23/enisstory-bethune-house-offers-essential-lifeline-domestic-workers-facing-abuse/.
Fig.21. (bottom) Complex circulation under and over ground in Central.............................41 “Cities Without Ground A Hong Kong Guidebook.” Cities Without Ground / Maps. Accessed September 1, 2019, from http://citieswithoutground.com/maps/.
Fig.22. Location of Sai Ying Pun in Hong Kong...................................................................56 Google Maps. Google. Accessed September 1, 2019, from https://www.google.com/maps.
Fig.23. Aerial view of Sai Ying Pun, Hong Kong.................................................................57 Google Maps. Google. Accessed September 1, 2019, from https://www.google.com/maps.
Fig.24. (next page left)Secondary Street (First Street)......................................................60 Google Maps. Google. Accessed September 1, 2019, from https://www.google.com/maps.
Fig.25. (next page middle)Central Street (Third Street).....................................................60 Google Maps. Google. Accessed September 1, 2019, from https://www.google.com/maps.
Fig.26. (next page bottom)Central Street (Queens Street)..................................................60
“Category:2016 in Centre Street, Hong Kong.” Category:2016 in Centre Street, Hong Kong - Wikimedia Commons. Accessed September 2, 2019, from https://commons.wikimedia.org/wiki/Category:2016_ in_Centre_Street,_Hong_Kong.
Fig.27. stairs between buildings.......................................................................................65 Google Maps. Google. Accessed September 1, 2019, from https://www.google.com/maps.
Fig.28. Urban open space created from residue gap remaining from the redevelopment of the adjacent building.............................................................................................................65 Google Maps. Google. Accessed September 1, 2019, from https://www.google.com/maps.
Fig.29. Street view of a pocket park.................................................................................66
“第三街遊樂場.” Wikipedia. Wikimedia Foundation, May 4, 2019, from https://zh-yue.wikipedia.org/ wiki /第三街遊樂場
Fig.30. Street view of a stairway.......................................................................................67 Google Maps. Google. Accessed September 1, 2019, from https://www.google.com/maps.
Fig.31. Street view of a side walk......................................................................................68
“
亜美的時間 2 Amey’sTime2.” 2011 年 2 月 23 日香港・マカオ行 追記・完成版 - 亜美的時
間 2 Amey’sTime2. Accessed September 2, 2019, from https://blog.goo.ne.jp/anemone339/e/ d9ef6b27228bf2530df11ccad1a4afbb.
Fig.32. Street view of an alley...........................................................................................69 summerkid_summergirl. “[Hong Kong 6D5N] Stone Slabs Street 石板街 @ Pottinger Street, Central, Hong Kong.” Malaysian Flavours, November 13, 2016, from http://www.malaysianflavours. com/2014/07/hong-kong-6d5n-stone-slab-pottinger-street-central-hong-kong.html.
Fig.33. Street view of a POSPD..........................................................................................70 “ アイランドクレスト (Island Crest ).”
アイランドクレスト|賃貸住宅アパート|スターツ香港 Accessed September 1, 2019, from https://kaigai.starts.co.jp/hongkong/detail/4363.
“Atlas of Urban Expansion.” Atlas of Urban Expansion - Hong Kong, Hong Kong. Accessed August 27, 2019. http://www. atlasofurbanexpansion.org/cities/view/Hong_Kong_Hong_Kong.
Berg, Nate, and Nate Berg. “Hong Kong, the City Without Ground.” CityLab, August 20, 2012. https://www.citylab.com/design/2012/08/ hong-kong-city-without-ground/3000/.
Bolchover, Joshua, and Peter Hasdell. Border Ecologies: Hong Kongs Mainland Frontier. Basel: Birkhäuser, 2017.
Carine Lai: Unopened Space- Mapping Equitable Availability of Open Space in Hong Kong, Civic Exchange, 2017
“Ctbuh.org/Papers A Tale of Two Singapore Sky Gardens.” Accessed September 2, 2019. http://global.ctbuh.org/paper/3374.
‘Disconnection in a Highly Connected City - Essays | Urban Age’. Accessed 27 August 2019. https://urbanage.lsecities.net/essays/ disconnection-in-a-highly-connected-city.
“Does High-Rise Living Promote Social Isolation?” The Urbanist, August 30, 2016. https://blogs.crikey.com.au/theurbanist/2016/08/30/doeshigh-rise-living-promote-social-isolation/.
Frampton, Adam, Clara Wong, and Jonathan D. Solomon. Cities without Ground: a Hong Kong Guidebook. Novato, CA: ORO, 2018.
“Genesis and Evolution of a Vertical City in Hong Kong.” Accessed September 1, 2019. http://global.ctbuh.org/resources/papers/ download/2356-genesis-of-a-vertical-city-in-hong-kong.pdf.
‘High-Density Living in Hong Kong - Essays | Urban Age’. Accessed 27 August 2019. https://urbanage.lsecities.net/essays/high-density-livingin-hong-kong.
“HONG KONG PLANNING STANDARDS AND GUIDELINES Summary.” Accessed September 1, 2019. https://www.pland.gov.hk/pland_en/tech_ doc/hkpsg/sum/pdf/sum.pdf.
“Hong Kong Population 2019.” Hong Kong Population 2019 (Demographics, Maps, Graphs). Accessed September 1, 2019. http:// worldpopulationreview.com/countries/hong-kong-population/.
“Hong Kong Weather.” Guilin Tour Services. Accessed September 1, 2019. https://www.guilinchina.net/travel-guide/hongkong/weather.htm.
Lai, Carine. Unopened Space: Mapping Equitable Availability of Open Space in Hong Kong. Hong Kong: Civic Exchange, 2017.
‘Hong Kong Weather and Climate in Four Seasons’. Accessed 27 August 2019. https://www.guilinchina.net/travel-guide/hongkong/weather.htm.
Lau, Bryant. “Tesseract: Time Based Home Ownership Incentivisation Model.” Issuu. Accessed September 2, 2019. https://issuu.com/
bryantlauliangcheng/docs/final_publication_bryant_endgame.
Ng, Edward, and Vicky Cheng. ‘Urban Human Thermal Comfort in Hot and Humid Hong Kong’. Energy and Buildings 55 ,December 2012, 51–65. https://doi.org/10.1016/j.enbuild.2011.09.025.
“Public Open Space in Private Developments Design and ...” Accessed September 1, 2019. https://www.devb.gov.hk/filemanager/en/ content_582/Guidelines_English.pdf.
Rinaldi, Bianca Maria, and Puay Yok Tan. Urban Landscapes in HighDensity Cities: Parks, Streetscapes, Ecosystems. Basel: Birkh ä user, 2019.
Rojas, Cristobal. “SkyVille / WOHA.” ArchDaily. ArchDaily, December 8, 2016. http://www.archdaily.com/800832/skyville-woha.
Saieh, Nico. “Linked Hybrid / Steven Holl Architects.” ArchDaily. ArchDaily, September 9, 2009. http://www.archdaily.com/34302/linkedhybrid-steven-holl-architects/.
Tan, Zheng, and Charlie Q. L. Xue. “The Evolution of an Urban Vision: The Multilevel Pedestrian Networks in Hong Kong, 1965–1997.” Journal of Urban History. Accessed September 1, 2019. https://www.academia. edu/28702141/The_Evolution_of_an_Urban_Vision_The_Multilevel_ Pedestrian_Networks_in_Hong_Kong_1965_1997.
“The Illusion of Plenty - Civic-Exchange.org.” Accessed September 1, 2019. https://civic-exchange.org/wp-content/uploads/2017/05/WaterReport-English-final.pdf.
“The Vertical City, Part I: How Hong Kong Grew Up.” Zolima City Magazine, February 15, 2017. https://zolimacitymag.com/vertical-citypart-i-how-hong-kong-grew-up/.
“Typhoon Mangkhut.” Wikipedia. Wikimedia Foundation. Accessed September 1, 2019. https://en.wikipedia.org/w/index. php?title=Typhoon_Mangkhut&oldid=911324865.
“Urban Landscapes in High-Density Cities,” March 2019. https://doi. org/10.1515/9783035617207.
Yan, Y. Y. “RMetS Journals.” Royal Meteorological Society (RMetS). John Wiley & Sons, Ltd, November 5, 2007. https://rmets.onlinelibrary.wiley. com/doi/pdf/10.1002/wea.46.
Yiding, Liu. “HONG KONG/ THE MIXTURE OF THE PUBLIC AND PRIVATE IN THE DEVELOPMENT OF MULTILEVEL PEDESTRIAN NETWORK 196070S.” ASIAN CITIES RESEARCH, December 25, 2016. http://fac.arch. hku.hk/asian-cities-research/hong-kong-the-miture-of-the-publicand-private-in-the-development-of-multilevel-pedestrian-network1960-70s/.
Reddy, M. Janga, and D. Nagesh Kumar. “Elitist-Mutated MultiObjective Particle Swarm Optimization for Engineering Design.” IGI Global. IGI Global, January 1, 1970. https://www.igi-global.com/chapter/ elitist-mutated-multi-objective-particle-swarm-optimization-forengineering-design/112785.
“Sky View Factor Footprints for Urban Climate Modeling.” Urban Climate. Elsevier, June 14, 2018. https://www.sciencedirect.com/ science/article/pii/S2212095518301883.
“View Analysis.” Grasshopper Component Reference. Accessed September 1, 2019. https://rhino.github.io/components/ladybug/ viewAnalysis.html.
“View Factor.” Wikipedia. Wikimedia Foundation, March 13, 2019. https://en.wikipedia.org/wiki/View_factor.
Admin. “Intensive vs Extensive Green Roofs: What’s the Difference?” Green Roof Plan, April 11, 2012. https://www.greenroofplan.com/ intensive-vs-extensive-green-roofs/.
“HONG KONG PLANNING STANDARDS AND GUIDELINES Summary.” Accessed September 1, 2019. https://www.pland.gov.hk/pland_en/tech_ doc/hkpsg/sum/pdf/sum.pdf.
“Hong Kong Stair Archive 香港樓梯文獻庫.” Hong Kong Stair Archive. Accessed September 1, 2019. https://stairculture.com/archive/.
Huang, Qiongyu, Anu Swatantran, Ralph Dubayah, and Scott Goetz. ‘The Influence of Vegetation Height Heterogeneity on Forest and Woodland Bird Species Richness across the United States’. PloS One 9, August 2014
“Making New Jersey a Better Place.” New Jersey Audubon. Accessed September 1, 2019. https://njaudubon.org/.
“Public Open Space in Private Developments Design and ...” Accessed September 1, 2019. https://www.devb.gov.hk/filemanager/en/ content_582/Guidelines_English.pdf.
“Sky View Factor Footprints for Urban Climate Modeling.” Urban Climate. Elsevier, June 14, 2018. https://www.sciencedirect.com/ science/article/pii/S2212095518301883.
“Soil Types.” Soil types / RHS Gardening. Accessed September 1, 2019. https://www.rhs.org.uk/advice/profile?pid=179.
“Street Tree Selection Guide.” Greening. Accessed September 2, 2019. https://www.greening.gov.hk/en/knowledge_database/street_tree_ selection_guide.html.
The Water Efficiency Calculator for New Dwellings. Accessed September 2, 2019. http://sites.wrcplc.co.uk/partgcalculator/.
“Urban Flooding.” Urban Flooding - an overview | ScienceDirect Topics. Accessed September 1, 2019. https://www.sciencedirect.com/topics/ earth-and-planetary-sciences/urban-flooding.
“View Analysis.” Grasshopper Component Reference. Accessed September 1, 2019. https://rhino.github.io/components/ladybug/ viewAnalysis.html.
“View Factor.” Wikipedia. Wikimedia Foundation, March 13, 2019. https://en.wikipedia.org/wiki/View_factor.
“What Is Feedback Loop? - Definition from WhatIs.com.” SearchITChannel. Accessed September 16, 2019. https:// searchitchannel.techtarget.com/definition/feedback-loop.