
AcousticArchitecture
ACTIVE MATERIAL SYSTEM
Guangyuan Li | Mohamad El khayat [MSc] Emergent Technologies + Design | Architectural Association London | 2009/2010CONTENTS
DISCLAIMER
PROGRAMME: AA | EMERGENT TECHNOLOGIES AND DESIGN
TERM: MASTER OF SCIENCE, 2009 - 2010
STUDENT NAME: GUANGYUAN LI | MOHAMAD EL KHAYAT [MSc]
SUBMISSION TITLE: ACOUSTIC ARCHITECTURE - ACTIVE MATERIAL SYSTEM
COURSE TUTOR: MICHAEL WEINSTOCK
SUBMISSION DATE: 15 OCTOBRE 2010
DECLARATION:
“I certify that this piece of work is entirely my own and that any quotation or paraphrase from the published or unpublished work of others is duly acknowledged.”
PREFACE



Noise affects human physiological, as well as, psychological health. On the other hand, noise in itself is a form of energy that can be harnessed. Currently, this energy is wasted, specifically in city space. The aim of the research is to develop of an active material system that converts urban noise into electric energy.
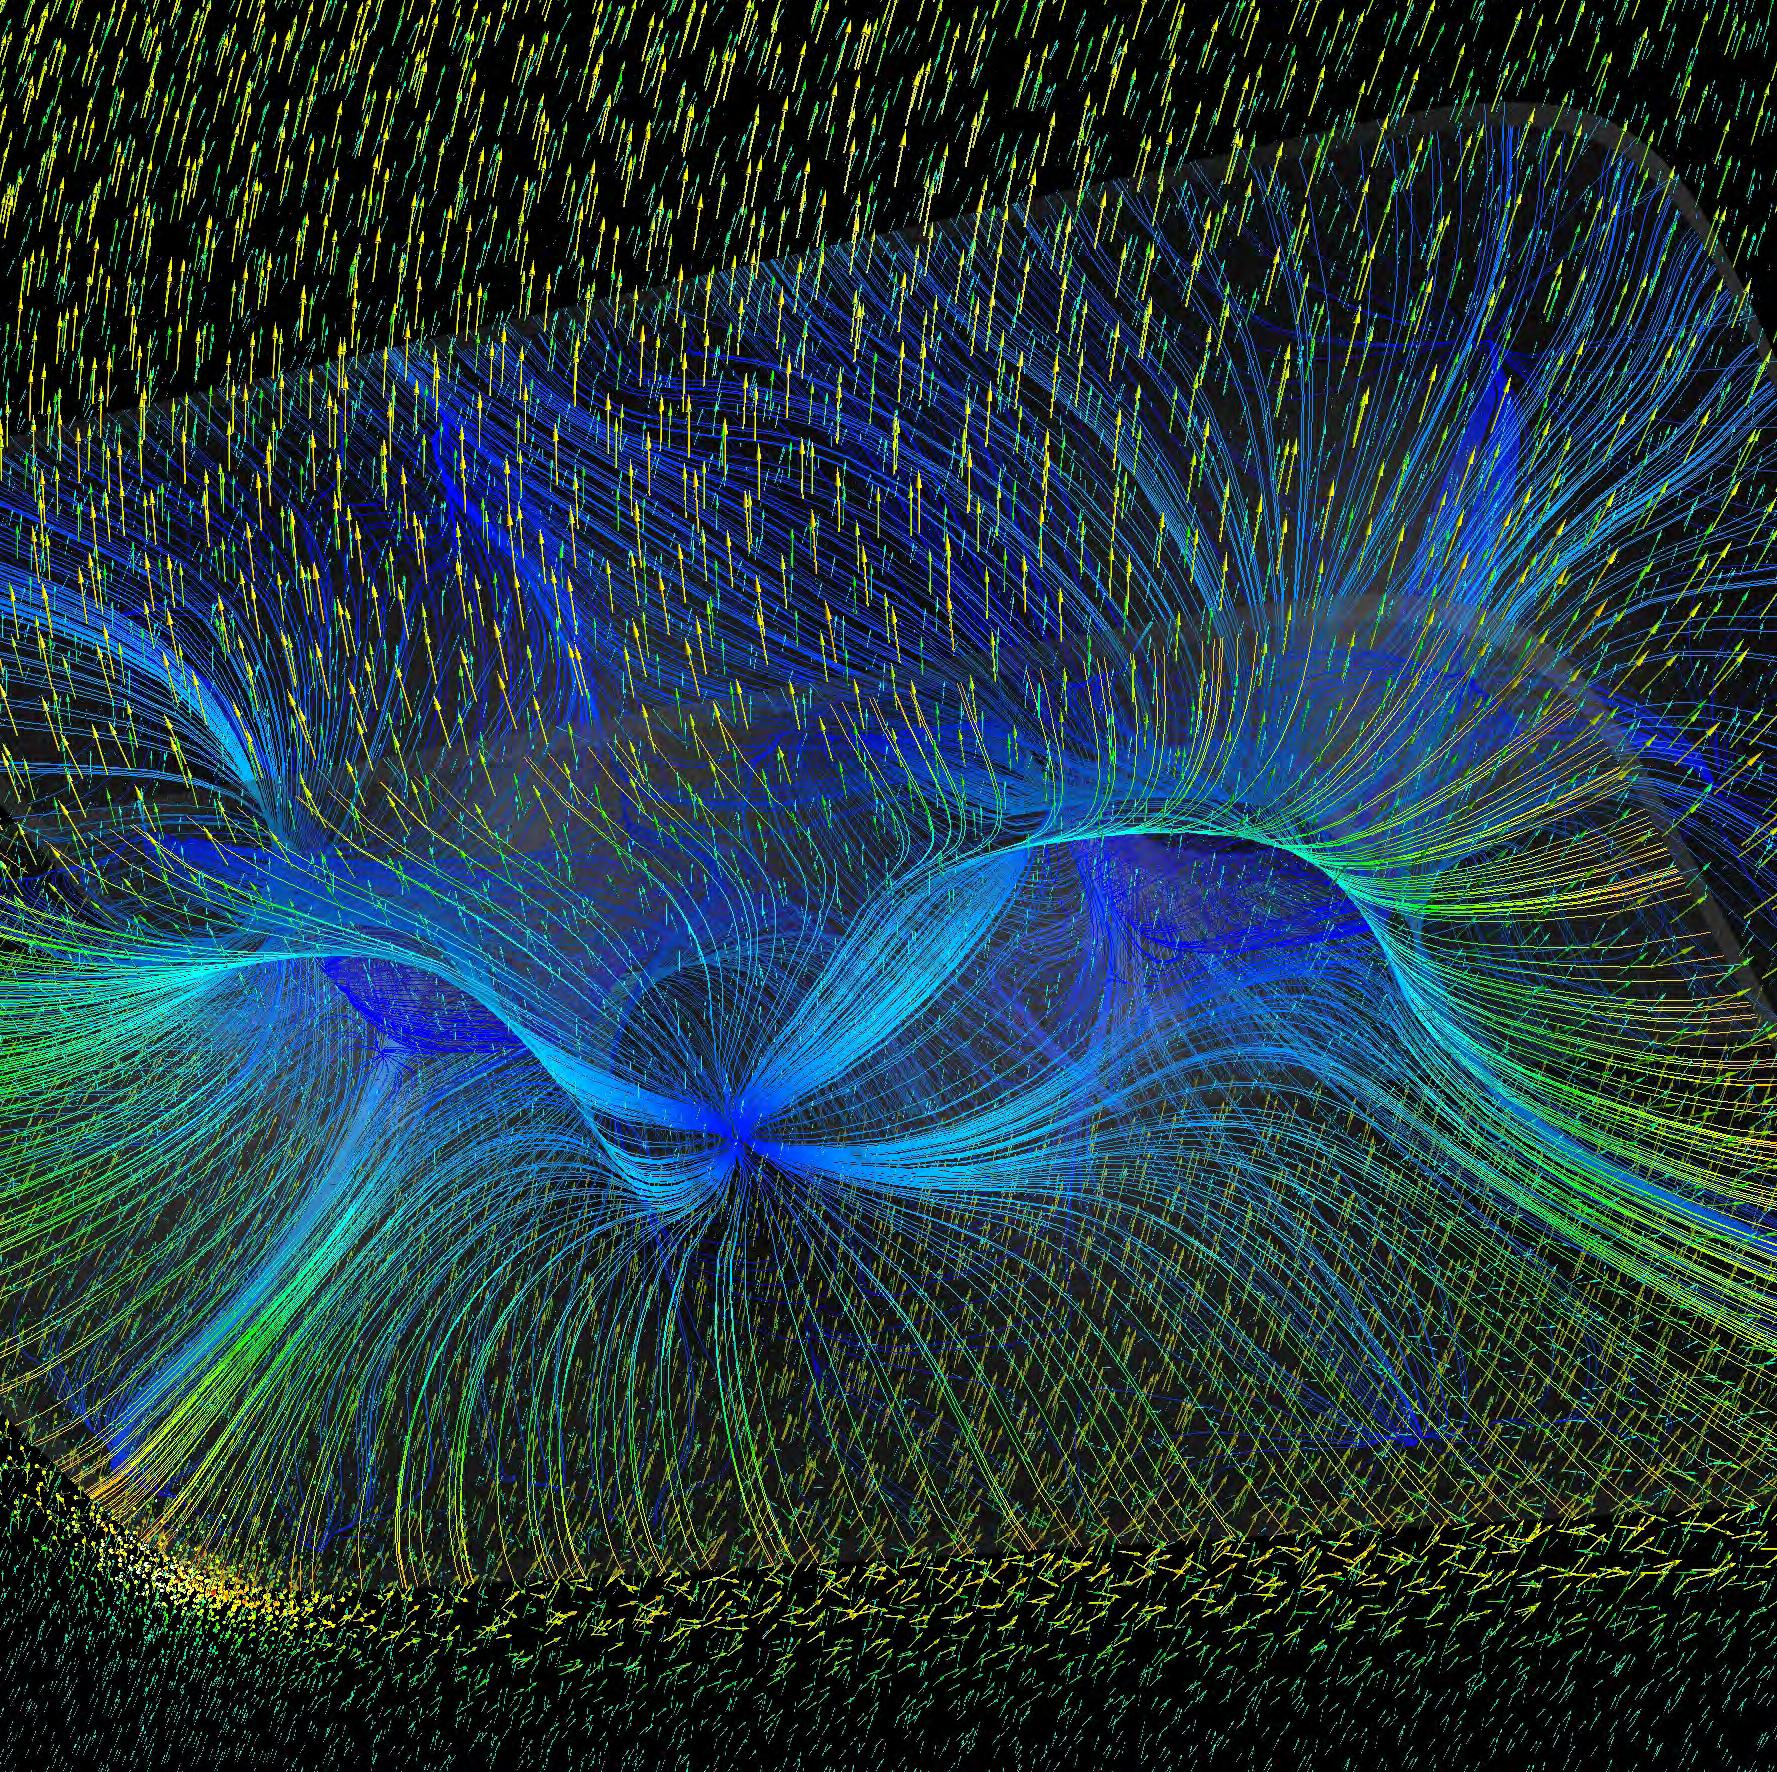
An investigation of intelligent arrangement through diverse levels of hierarchy was driven in order to perform this task. In order to explain the propagation of sound and the possibility of the acoustic energy conversion process, we explored different strategies and available technologies; such as material behaviour, digital simulations, and analysis; interactively cross-informing each other. The Cymatics tests, helped us realize the displacement of a vibrating plate, when subjected to various frequencies. The value of displacement became particularly large in some specific frequencies. Finally, Fluid Flow Dynamics analysis was deployed to simulate the pressures, and test the total deformation and velocity of the acoustic performance of the system.


We would like to thank Michael Weinstock for his constant involvement and invaluable guidance, George Jeronimidis, for his immense help in developing our research and performing the physical experiments. Also, many thanks to Christina Doumpioti, Toni Kotnik and Merate Barakat for their continuous help. Lastly, we are very thankful to our family and for their continuous support over these past months.
CHAPTER 01 DOMAIN
01.0 INTRO
01.1 DIFFUSED NATURAL ENERGY
01.2 NOISE ENVIRONMENT
01.2.1 NEGATIVE EFFECTS
01.2.2 POSITIVE EFFECTS
01.3 TYPES OF NOISE
01.3.1 TRAFFIC NOISE
01.3.2 INDUSTRIAL NOISE
01.4 PRECEDENTS
01.4.1 TYPES OF BARRIES
01.4.2 BARRIES ARRANGEMENTS
01.4.3 CONTEMPORARY TECHNIQUES
01.5 EVALUATION

01.0 INTRODUCTION
The first chapter focuses on the domain of the urban noise environment; which is the entire is basis of the thesis. Noise is always recognised as a harmful human-made element. However, once we closely study the principles of this intangible element, which is nothing but various physical materials acting similarly to solar, wind, and water energies, then we will have a chance to embed noise as a diffused energy into architectural aspect. The aim of the research is a to development an active material system that converts the impracticable urban noise into useful energy (ie:electricity).
Firstly, this chapter demonstrates the effects of noise, and then penetrates further beyond the auditory sensation to the general public technique of acoustic barriers. We will cover different types of barriers and materials along with an analysis of their
design and arrangements. Lately, it became apparent that environmental noise barriers are considered as architectural elements and not just street fixtures. However, they still are acting only as propagation of noise obstructions. Our central purpose is to combine design and performance, introducing not only an object that suppresses this shattered energy but also a system that utilizes it.
As we know that the renewable energy is becoming more common around the world, it refers to the energy resources that appear naturally and repeatedly in the environment without the fear of been drained out of our environment.

Noise is one kind of sound. The noise vibrations are especially enormous within the big cities. Can we exploit it as a new recyclable energy? Once we achieve our goal, the city will not only be an energy consumer but also a self-supplier, at the same time the urban environment will be improved.
DIFFUSED NATURAL ENERGY
Specialists have been predicting about present worldwide energy resources. Limited in quantity and cannot be replaced quickly after use these fuels are going to decrease to risky levels if consumption percentage remains identical or increase in future according to the analysts. The principal contributor to climate change is carbon emissions from fossil fuels. In addition the prices is becoming unaffordable, the cost to obtain them will continue to rise. Considering all these factors it is urgent to think about and adopt renewable energy sources which are pollution - free and an unlimitedly sustainable form of energies.
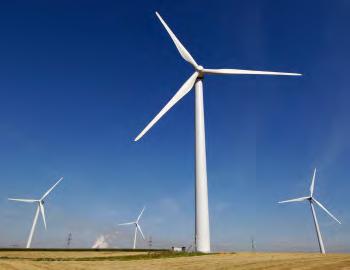
Renewable energy is becoming more common around the world, it refers to the energy resources that occur naturally and repeatedly in the environment without the fear of been drained out of our environment. One of the forms of renewable energy is wind energy; it is defined as the system that converts the kinetic energy of the wind into mechanical energy that can be exploited in a later stage for practical use. It is clear that wind is always going to blow across; wind turbines will keep on providing electricity
without any consideration of wind to blow off from our earth. Such energies which can go on to keep producing electricity without reducing supply energy it self is renewable resources that are widely distributed and cheap.
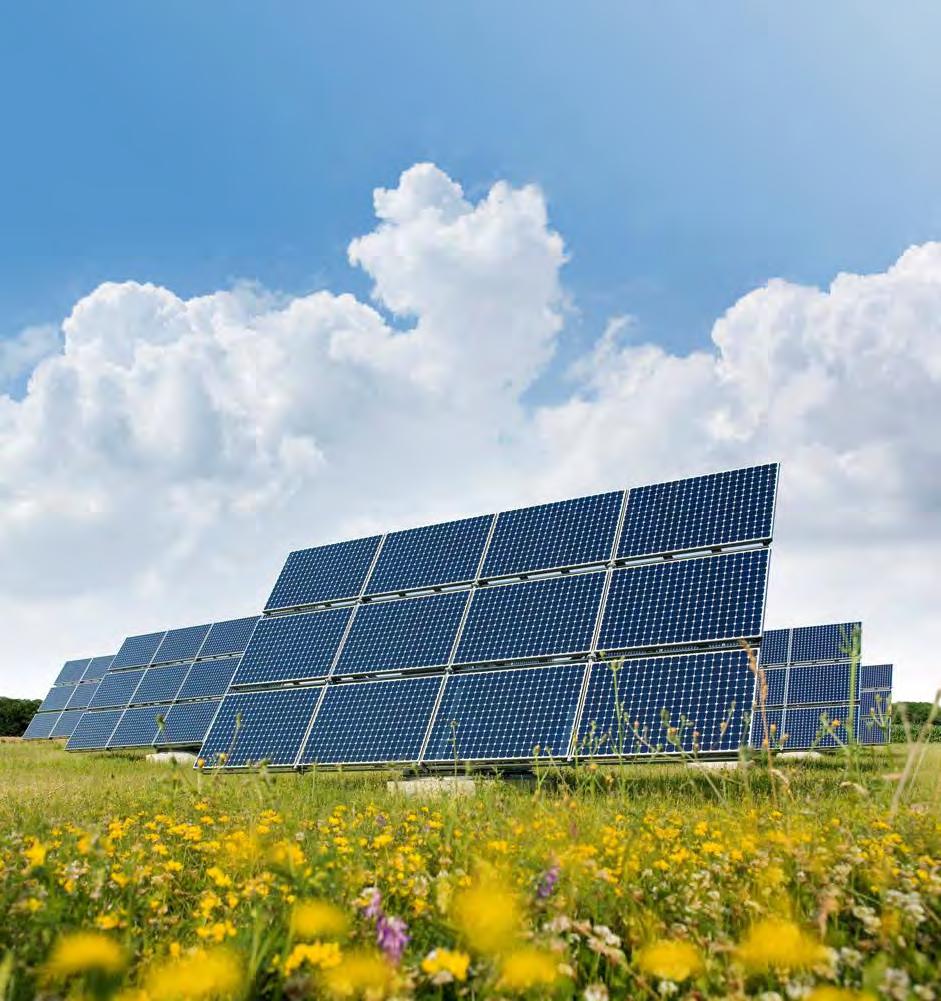
Sun is the main source of renewable energies and responsible for direct or indirect source of energies. Solar energy is radiant energy which is formed by the sun. Solar power technology can be used to heat, cool, and light our homes and businesses. The thrust for renewable energy sources is driven by a renewed worry for the atmosphere. Solar energy is the prototype of an environmentally friendly energy source.

Water contains potential energy, this energy can be converted into useful when water starts to flow, it will be transferred to kinetic energy and this will cause movement. As soon as water flows or falls, energy can be produced. Several devices, such as turbines and generators will organize the process. Nowadays, rivers and streams are re-directed through hydro generators to produce energy. This power will be supplied by generating energy from falling or streaming water and in addition it helps prevent flooding and supply a regulated flow of irrigation water.
Sound energy is the energy formed by sound vibrations as they travel through an exact medium. In a first stage sound vibrations creates waves of pressure which lead to some level of compression and rarefaction in the mediums through which the sound waves travel. As a result sound energy is a form of mechanical energy; it is not contained in disconnected particles and is not related to any chemical change, but is entirely connected to the pressure its vibrations cause.
[ Ref. Text: 01, 02, 03 ]

01.2 NOISE ENVIRONMENT
Every person is affected by noise pollution, up till now this problem is mainly ignored by the majority of people. Upon hearing loud noises and sounds, we might be annoyed and distracted but feel at a loss to do anything about it. If it considered it human or a machine-created, noise disturbs the activity and equilibrium of life. Despite the fact that traffic is considered to be the largest noise maker throughout the world, plenty of others that add to it, making our globe vulnerable to its effects, the other major sources of noise pollution are include industries, factories, construction work and highly populated urban areas.
The United states Environmental Protection Agency suggests a “safe noise level” of no extra than 55 decibels. Decibels are units of measurements of loudness that help to express how loud sounds are. For example, sounds that are inaudible range from 0 to 10 decibels; noises that are loud enough to harm your hearing are 150 decibels.
The primary effect of noise is a decrease in the effectiveness in working. Researches have proved the fact that human efficiency increases with noise reduction. Noise pollution affects sleep, eating habits, mood, concentration and body functions creating irritability and nervousness; it acts as a stress stimulator, increasing respiration, and heart rate. Fatigue source is another effect of noise, as a result, your blood pressure increases, leaving you defenceless to heart disease. Stress moreover contributes to lowered immunity.
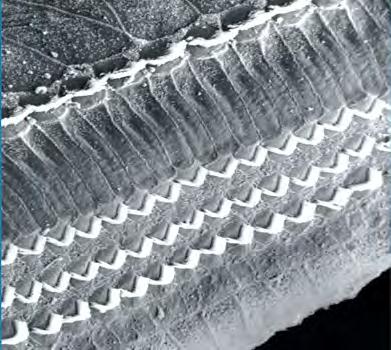
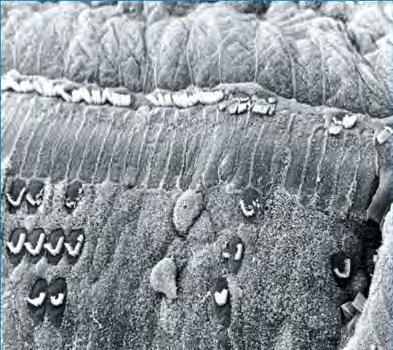
The most significant way that people are affected by noise is through hearing loss which is resulting from dysfunction in the inner ear. This is simple to determine and broadly considered and it may be very soft, resulting in minor difficulties with conversation, or as severe as total deafness where they are unable to detect or perceive at least some frequencies. Noise damage is increasing; all sources of damage must be considered to evaluate risk. When one is exposed to noise at high levels or for extended durations then hearing impairment will arise.
[ Ref. Text: 04, 05 ]

Shishi odoshi is a Japanese device set up in Japanese gardens as a type of water fountain. It is composed of a segmented tube, usually made of bamboo, pivoted to one side of its balance point. At a standstill, its heavier end is down and leaning on a rock. A trickle of water comes into the upper end of the tube and accumulates. It eventually moves the tube’s centre of gravity past the pivot, causing the tube to rotate and dump out the water to the pool. The heavier end then falls back against the rock, making a sharp sound, and the cycle repeats. This noise is intended to scare any deer which may be grazing on the plants in the garden in addition the sound effect of water is magical, and considered best stress reliever.
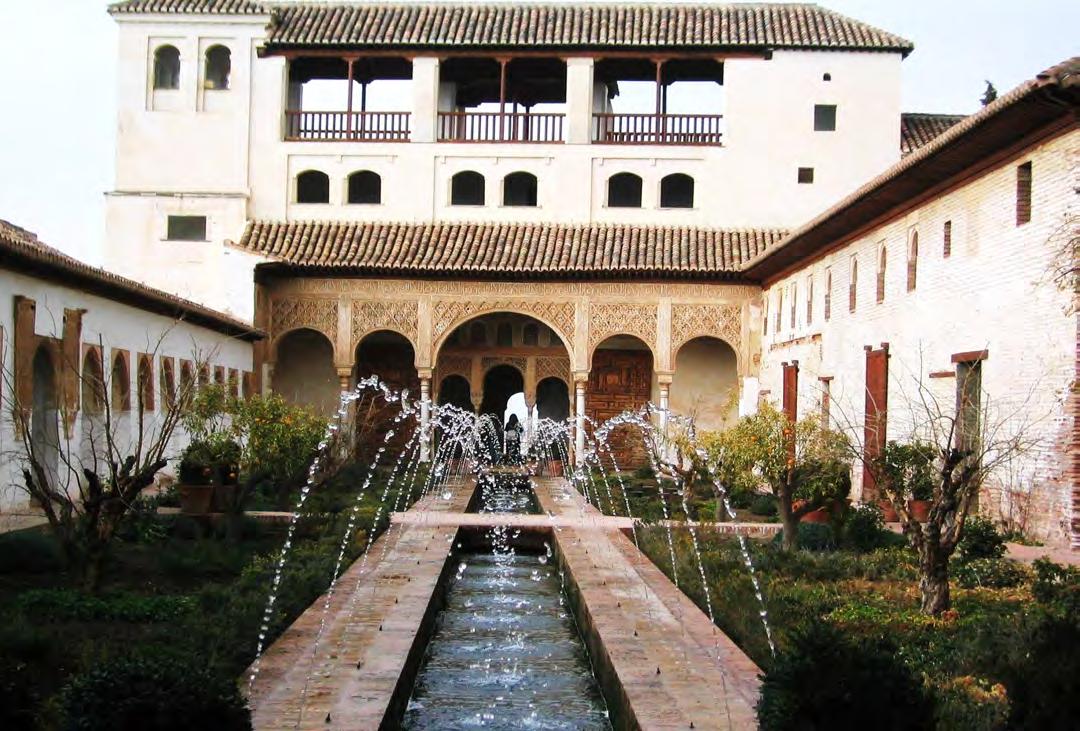
The peaceful sound of flowing water can be a great stress reliever and can help promote relaxation, have always been an essential part in most of old Arabian houses. Indoor waterfalls and indoor water fountains convert spaces into soothing natural environments rich. The sound of Water creates balance, harmony and prosperity in our environment.
01.3 TYPES OF NOISE
Noise pollution disturbs our health and activities in different way, the majority of society are now conscious that noise can damage hearing. Nevertheless, that disaster would capture the human race if nothing is done about noise. Human response to noise can vary significantly from a person to another; the loudness, frequency, and time pattern; the amount of background noise present before an intruding noise; are all factors that can influence individual response differently.
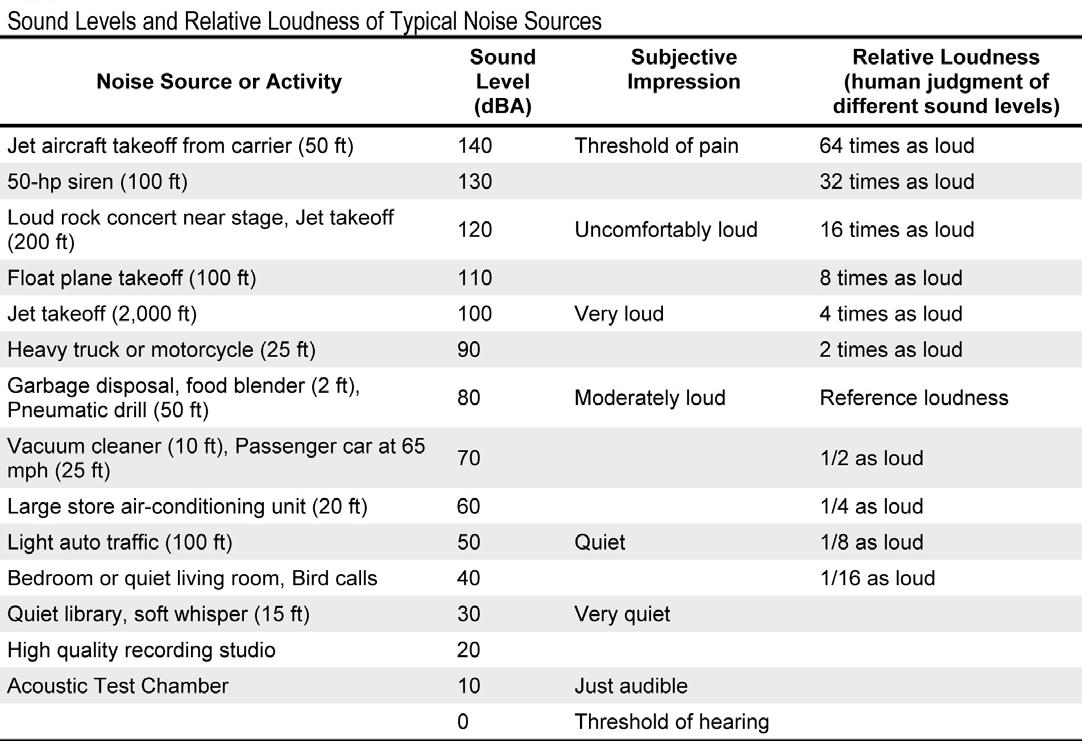
The human ear is sensible to sounds of different frequencies is measured by the Aweighted decibel scale (dBA) for example a 10 dBA change in noise levels is judged by most people as a doubling of sound level. The minimal change in noise level that a human ear can distinguish is about 3 dBA but an increase of 5 dBA or more are obviously perceptible.
Table 1 shows sound levels for some common noise sources and compares their relative loudness to that of an 80 dBA source such as a garbage disposal or food blender. Noise levels in a quiet rural area at night are typically between 32 and 35 dBA. Quiet urban nighttime noise levels range from 40 to 50 dBA. Noise levels during the day in a noisy urban area are frequently as high as 70 to 80 dBA. Noise levels above 110 dBA become intolerable and then painful; levels higher than 80 dBA over continuous periods can result in hearing loss. Constant noises tend to be less noticeable than irregular or periodic noises.
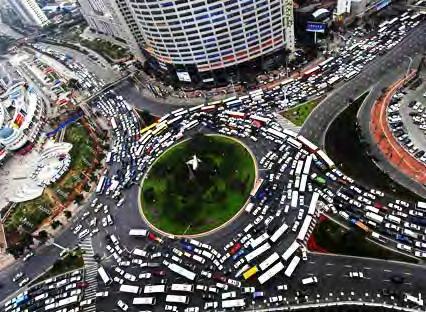
Vehicular traffic noise is one of the daily pollutions that we ignore, taking into consideration it to be annoying but not really detrimental to our health. In fact traffic noise especially in urban areas consistently ranks high on the list of citizens’ concerns and it acknowledged as a serious public health problem by the World Health Organization (WHO), and is considered very costly to society.
According L.C. den Boer A. and Schroten In their Delft report 2007 , more than 44% of the European Union population (about 210 million people) were frequently exposed to over 55 dB of road traffic noise, a level potentially dangerous to health. In addition, 35 million people in the EU (about 7%) are exposed to rail traffic noise above 55 dB. Millions of people indeed experience health effects due to traffic noise. The
central cause of most noise worldwide is generated by transportation systems, mainly motor vehicle noise, but also including aircraft noise and rail noise. An insufficient planning may also give rise to noise pollution, since association of industrial to residential land uses, for instance, often results in undesirable consequences for the residential acoustic environment.
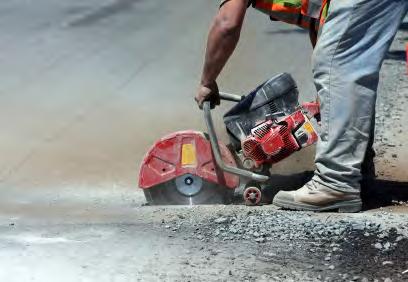
Industrial noise is also considered as a mainly types of noise pollution which directly linked to the heavy industries.
[ Ref. Text: 06, 07, 08 ]
TYPES
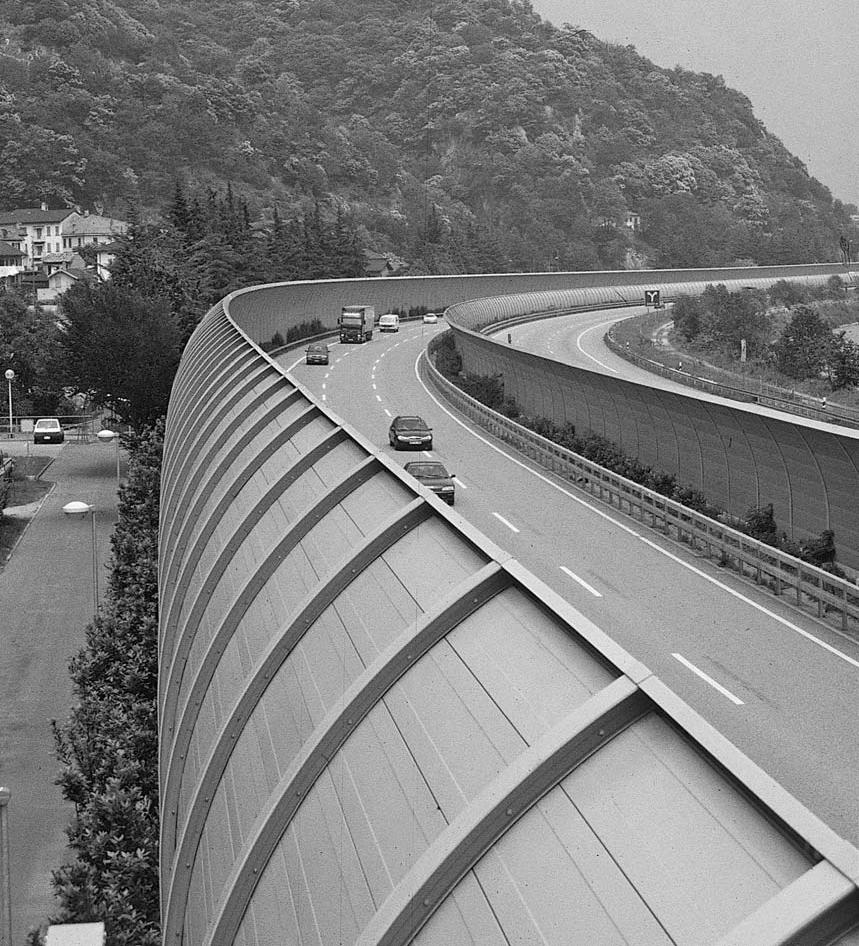
Noise barriers are solid obstructions built between the highway and the homes, designed to reduce diffracted as well as spreaded highway noise in neighborhoods. They do not entirely obstruct all noise they only reduce generally noise levels. Successful noise barriers reduce noise levels by 5 to 10 decibels. For example, a barrier which achieves a 10 dB reduction can reduce the sound level of a typical tractor trailer pass-by to that of a car.
The sound spreads into neighborhood from a busy highway; the acoustic barriers function is to decrease it by either absorbing, transmitting or reflecting it back across the highway. A sound barrier must cover all characteristics in order to be successful design, it should take into consideration the material, location, dimensions as well as shape. With a correct attention to these factors, the effects of shattered noise can be avoided.
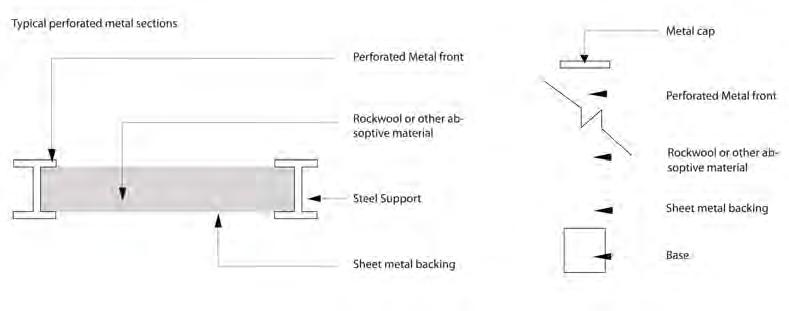
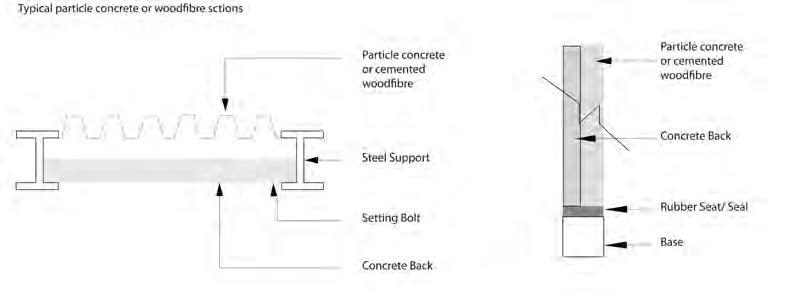
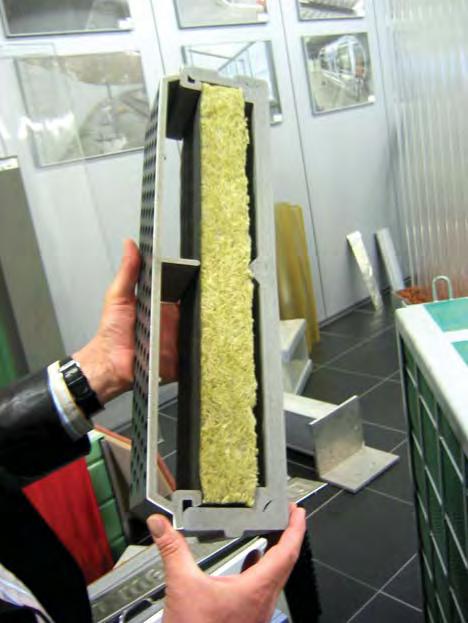
ABSORTIVE BARRIERS
There are three types of acoustic barrier, specifically reflective, absorptive and reactive which would initially be selected for acoustic reasons, each of these materials contain its special advantages and disadvantages and it is reliant upon the nature and the requirements of a certain project to determine if it suitable or not. In addition this choice will also determine the range of possible appearances. The materials used in noise barriers should be selected to guarantee factors such as corrosion resistance and resistance Absorptive and reactive barriers are constantly opaque, whereas reflective noise barriers may be opaque and act as visual barriers too, or they may be transparent and lighter in appearance. As for transparent barriers they allow light to properties or part which would if not be placed in the shadow. These barriers appear lighter in shape, but may have the advantage of partially screening open views to traffic.
Sound-absorptive barriers in specific situations must be argued on the basis of their cost effectiveness, they contain a porous element that absorbs noise such as mineral wool, fiberglass inside and wrapped up with polyester film are protected and enclosed within a skin, where the side facing the noise is perforated. These casings are usually made from timber, steel or aluminum sheeting and brick (Figure 17).
[ Ref. Text: 09, 10 ]

REFLECTIVE BARRIERS
Most common building materials such as wood, glass, metal and masonry have hard surfaces and thus reflect sound. i.e. they are considered “Reflective” barriers. Thus when sound strikes the surface of a reflective barrier, some energy is transmitted through the wall but the bulk is reflected back in the general direction of the noise source. Depending upon the roughness and shape of the surface, (and the wavelength of the sound), the sound may be fractured in different directions. Whereas a concave barrier will reflect noise back towards the source, a convex barrier may be used to reflect noise skywards.
Section
Sectional elevation
Concrete Barrier
Gaps in facade to resonating chamber
Back panel
Resonating chamber with mineral wool
Anchor to reinforced concrete foundation with micropiles
Micropiles
Cable through barrier section ties units together in case of movement through accident
REACTIVE BARRIERS
Reactive barriers are those which incorporate cavities or resonators designed to attenuate particular frequencies of noise. Sound enters these cavities via small holes or slots in the face of the barrier.
Combined resonator-cavity includes a number of cavity structures. The resonator cavities are constructed and arranged to captive energy of an assigned frequency. This structure includes cavities having a corresponding cavity volume and constructed to lock up a first frequency. A second cavity structure having its corresponding cavity volume and constructed to lock up a second precise frequency too. The cavity
volume corresponding to the second cavity structure is less than the cavity volume corresponding to the first cavity structure. Even though cavity resonators, built for different frequency ranges, have a variety of shapes, the basic principles of operation are the similar for all.
[ Ref. Text: 11, 12, 13, 14]
BARRIERS ARRANGEMENTS
Barrier arrangements- Opacity versus transparancy
1. Straight barrier:




4. Straight barrier with occasional windows


Barriers with transparent sections can benefit drivers and passengers by allowing views out but may disadvantage local people.
Barriers 3, 4 and 6 limit views to the traffic corridor but alows some views from the corridor , thereby creating interest for the driver and passengers.
Two barrier properties opacity and transparancy have different effects on drivers and local people.
In most instances, transparent panels have been designed for bridges or viaducts, since their lightweight appearance can be better integrated into the engineering design than opaque panels. Transparent barriers can usually be built taller and closer to buildings than most other barriers, as they:
• allow access to views, offering no visual obstruction or sense of claustrophobia;
• allow light to penetrate, retaining natural light conditions behind the barrier;
• are generally neutral and visually less intrusive.
Ref. Text: 15]



Different angles have different effects on performative and psychological manner.


CONTEMPORARY TECHNIQUES
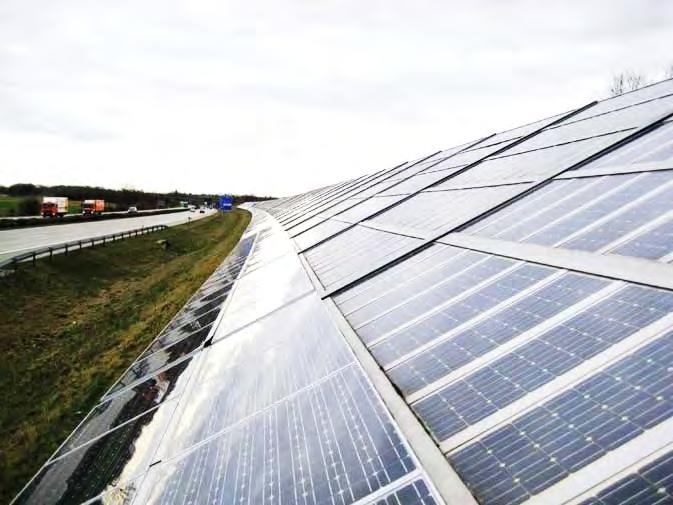
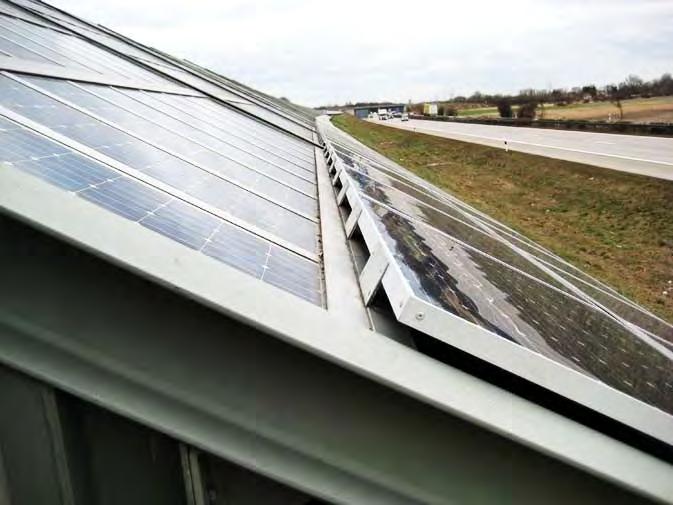
An intelligent integration between noise and energy was firstly implemented in 1989 in completing the first environmental noise barrier. the main objective is to supply and install renewable energy solutions. The solar PV panels require only daylight, not essentially sunlight, and are as a result capable of generating electricity.
The acoustic barrier includes photovoltaic modules was constructed in Switzerland beside the A13 highway Freising, Germany (Figures 23). The 6,000 m2 barrier is located on top of an earth mound and it is managed by the local council, and generates around 620 kW of power, which is sold back. The Freising barrier comprises two main sections that were built at two different phases. The 2002 stage, 320 metre long barrier, include 1,000 m2 of solar elements producing 122 kW power at a cost of €870,000. The potential in using photovoltaics panels on the available space along streets, railroad tracks or on
the facades of industry buildings is that they do not require any additional space. The barrier works as an energy source as well as a effectice noice silencer.
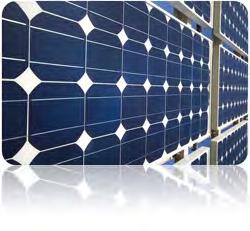
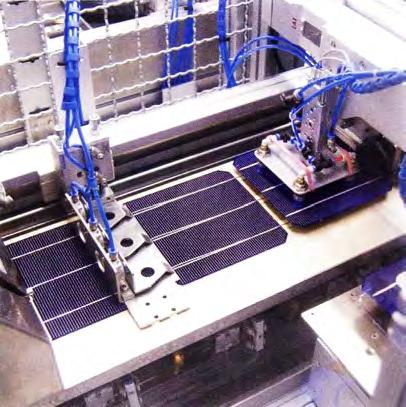
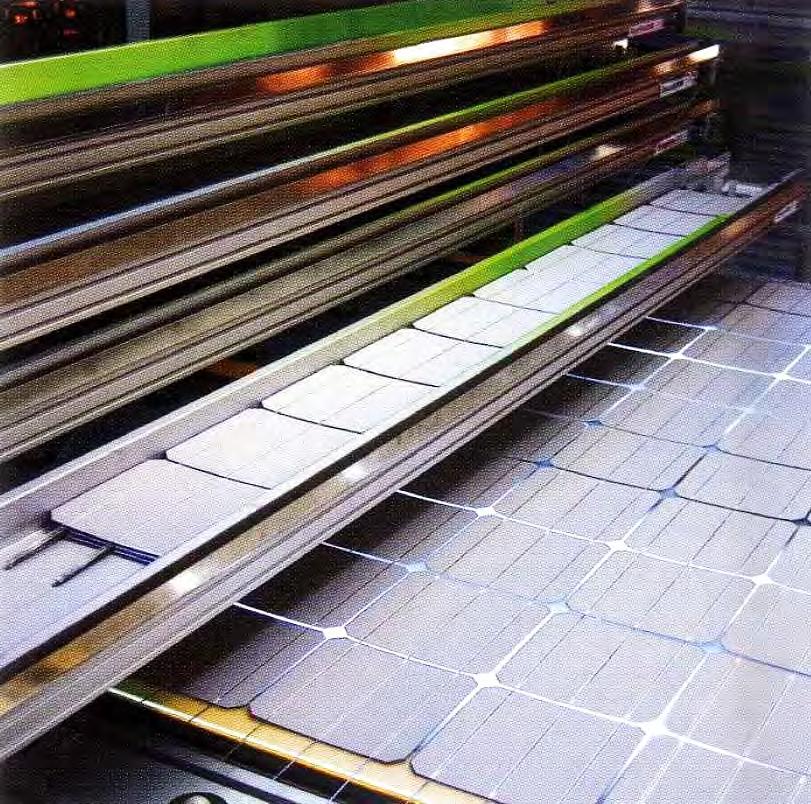
As the voltage and output of individual solar cells is inadequate for most applications, they are connected in series which means that the individual voltages are added together. Crystalline cells in the form of individual pieces with a side length of 100-156 mm can be arranged in any way within the module. However straight and hence simple interconnection is only possible with an orthogonal grid. For reasons of electrical insulation, the minimum distance between the cells must be about 2 mm. In the majority of standard crystalline modules, 9-12 cells for one cell string in the longitudinal direction first of all.
Thin soldered copper strips connect the front contacts (negative terminals) of a cell to the back contacts (positive terminals) of the adjacent cell. In modern module plants this is carried out automatically.
Only for bespoke production are the cells still partly soldered manually. In a typical module with 36-72 cells between four and six of these cell strings are placed alongside each other.
01.5 EVALUATION
The significant impact of primary energy resources and secondary energy forms, such as cost and climate change, show the need of a prospect of developing an alternative energy; which exists in abundance in Metropolitan Cities , such as Urban Noise,.
Noise is perceived as a harmful element that has a negative effect on human health. However, from the rarely positive effects of noise, we fairly search its phsical properties, and ask ourselves the question:” Can it be the next renewable energy?”
In summary, noise data in European countries show that noise is one of the largest problems affecting social development, and the overarching cause of most noise worldwide is generated by transportation systems and industral production. This provides an appropriate target for implementing the design strategies that are placed forward during the research.
Barriers are mainly an obstruction method that people used to limit noise levels. Effec-
tive noise barriers typically reduce noise levels by 5 to 10 decibels (dB), reducing the traffic noise loudness by, as much as, one half. Three types of barriers are introduced in this thesis: absorptive, reflective, and reactive barriers. The parameters of these barriers such as the length, height, angle, and material are recorded to instruct our further design.
Incorporating contemporary techniques are embedded within barrier elements allowing for multiple applications. For example, photovoltaic (PV) modules were constructed within noise barriers in Switzerland in 1989, which also act as solar energy converters during the day. Thus the main purpose of this research is to comprehend the different forms of energy and combine the uses to improve energy development.
In the following chapters, an introduction will be given to the World War Acoustic devices, and find out the relationship between their work and the Biological devices, which is the guideline of our design. Two main experiments will follow, in which a
new material - Piezo Ceramics is tested. Due to the outlined aims of this thesis, architectural form finding comes secondary to sound energy conversion. . Geometry optimization is then addressed, in an attempt to revisit the known notion of “form”, as a tool to increase traditional energy efficiency via geometry optimization. In conclusion, an 1:2 fabrication detail is designed, offering the topic “Noise Energy” great potential.
The next chapter introduces common methods of acoustic devices that were used in World War II?, followed by biological techniques to explain the principle of the “listening ears”. After covering these methods, a theoretical energy accumulative model is introduced providing a foundation for the development of the acoustic energy conversion proposal.
CHAPTER 02 METHODS
02.0 INTRO
02.1 ACOUSTIC LOCATION DEVICES
02.2 BIOLOGICAL SYSTEMS
02.2.1 BIOLOGICAL TRANSDUCER
02.2.2 BIOLOGICAL SENSING DEVICES
02.3 DEFINITION AND EXPLANATION
02.3.1 SOUND FREQUENCY
02.3.2 SOUND INTENSITY
02.3.3 SOUND POWER
02.3.4 RESONANCE
02.4 BASIC DESIGN STRATEGY
02.5 EVALUATION
02.0 INTRODUCTION
This chapter begins by studying the centralizing methods of the acoustic location devices in World War II. The aim is to provide an understanding for the propagation of sound. Although the shape of these devices are totally different, the application is always for concentrating the sound wave and transforming it into electronic signals, which lead to our design proposal.
The chapter then introduces the function of ear structure in biological systems, and find out the closely relationship between artificial devices and biological devices. After demonstrating the definitions of sound frequency, intensity, power and resonance, a fully understanding of physical properties of sound helps us create a theoretical energy accumulative model and explains its potential application as an energy conversion device.
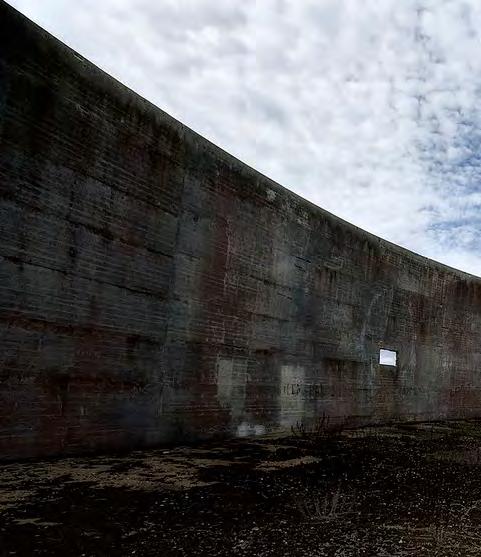
In the past century, people focus on the forms and sensory attributes of nature. Thousands of valuable designs are under the consideration of the functions and processes of biological system. As a result of reproductive processes, all living organisms exhibit patterns of development that unfold over time from some simpler form to a more complex one. Many sustainable design strategies are beginning to incorporate developmental thinking, with an emphasis on how products are created and then returned at the end of their “life” as useful input into another product. This is the reason and reality for us to develop our sound energy conversion methods.
[ Ref. Text: 18]
02.1 ACOUSTIC LOCATION DEVICES
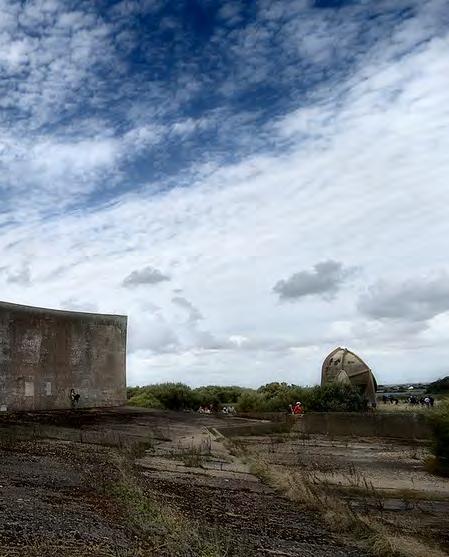
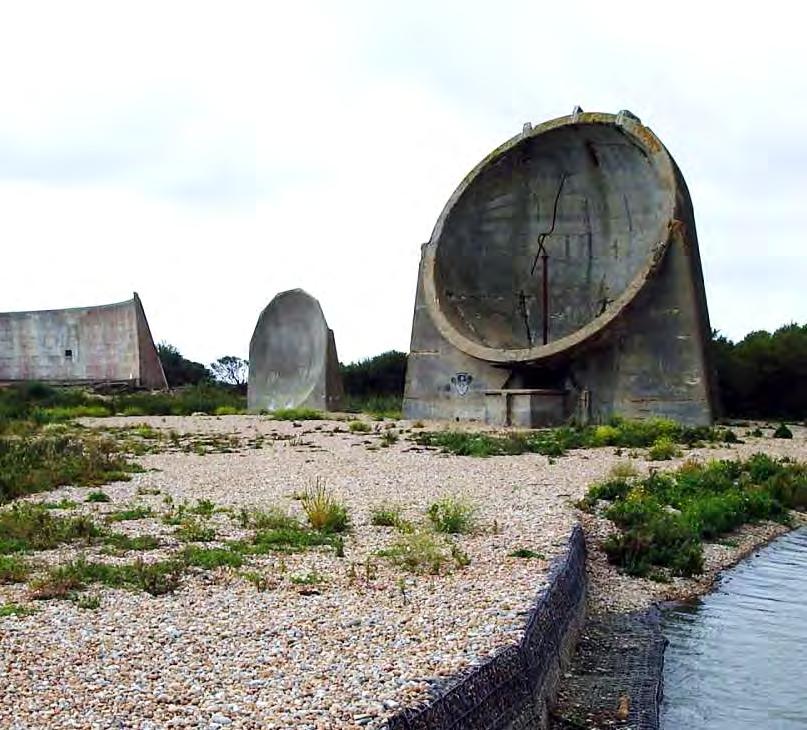
In order to give time for their guns to appoint enemy aircraft as soon as they came over, the British army was experimenting with the sound detection of aircraft by using immense concrete acoustic mirrors with microphones at their focal points.
Known as the “listening ears”, the Dungeness mirrors consist of three large concrete reflectors built between the 1920s–1930s before the World War I I. Their experimental nature can be discerned by the different shapes of each of the three reflectors: one is a long, curved wall about 5 m high by 70 m long, as the other two are dish-shaped constructions approximately 4–5 m in diameter.
The concrete sound mirrors were part of Britain’s national defence strategy, Microphones positioned towards the central point of the reflectors enabled an operator to detect the sound waves of aircraft far out over the English Channel and to signal the alarm to alert the army. Anti-aircraft defences were then deployed. The mirrors successfully gave Britain a fifteen-minute warning of a coming attack. The reflectors are not parabolic as sometimes imagined, but are in fact hemispherical mirrors.
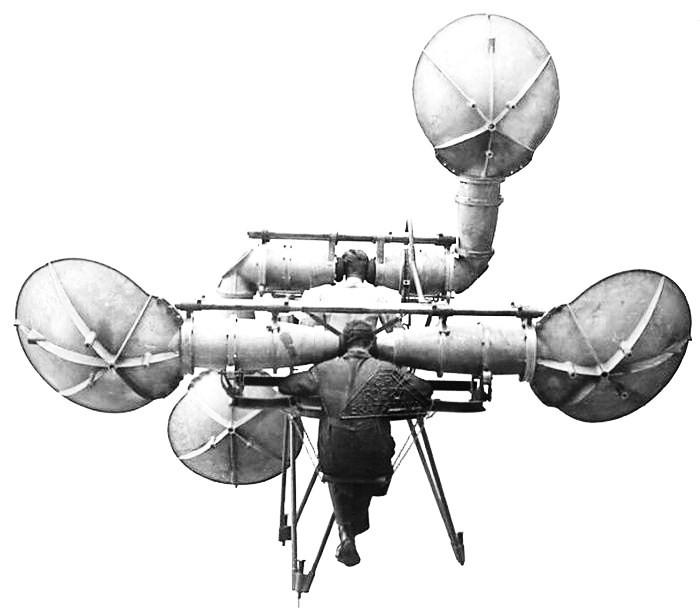
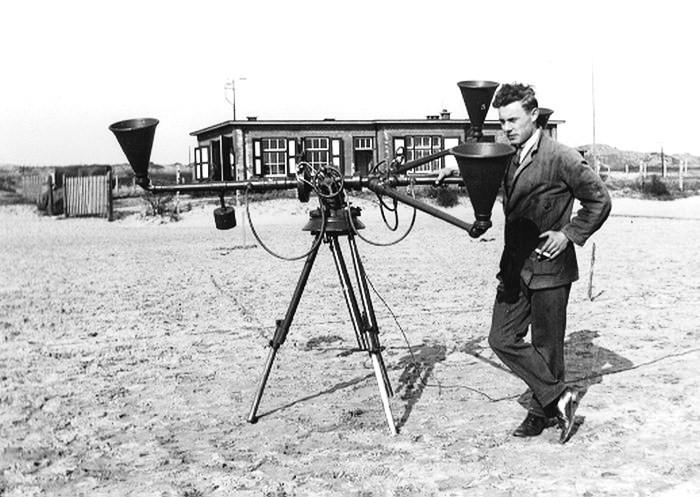
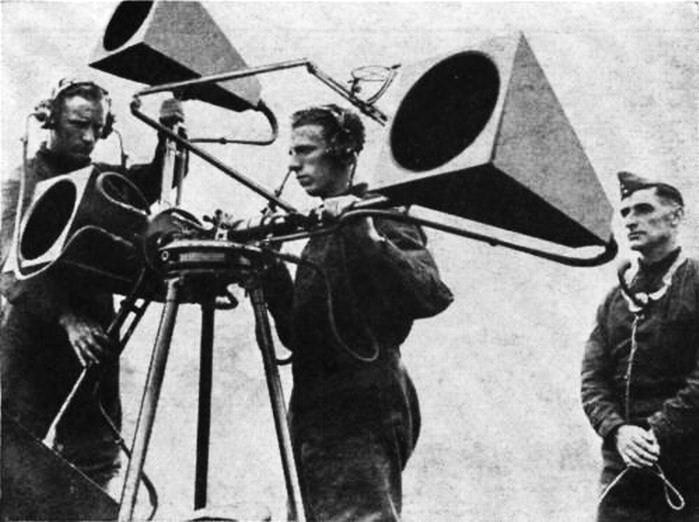
Microphones placed at the foci of the reflectors enabled a listener to detect the sound of aircraft far out over the English Channel. The reflectors are not parabolic as sometimes imagined, but are in fact hemispherical mirrors. This design element is their genius, because in addition to being able to detect range (over 30 km, or 20 statute miles, on a good day), they could also detect direction.
[ Ref. Text: 19]
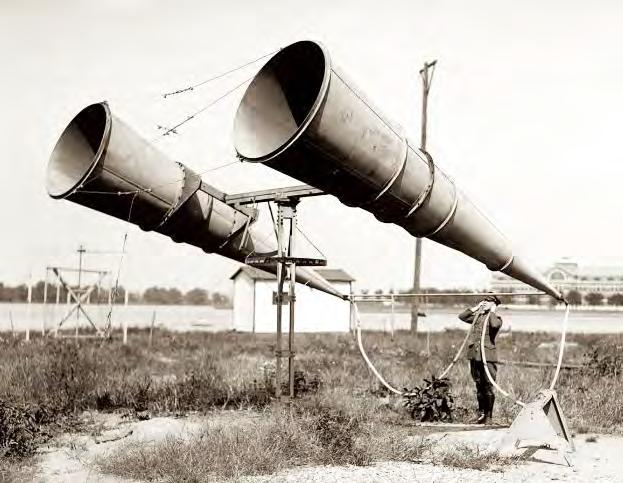
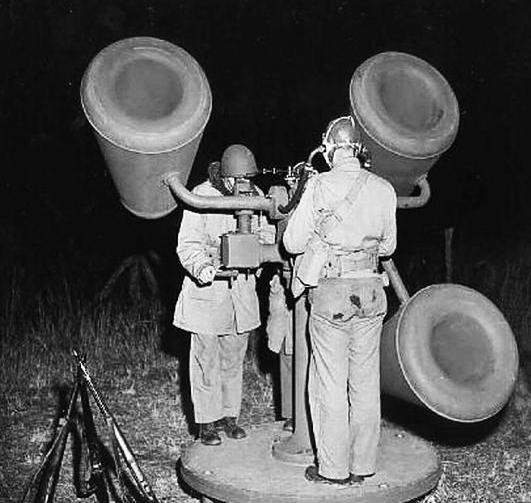
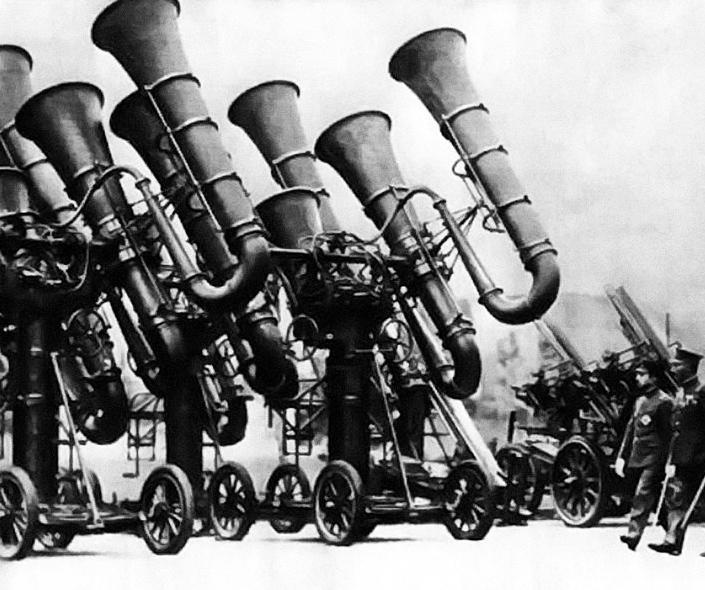
Acoustic mirrors had a limited effectiveness, and the increasing speed of aircraft in the 1930s meant that they would already be too close to deal with by the time they had been detected. The development of radar put an end to further experimentation with the technique. Nevertheless, there were long-lasting benefits.
The acoustic mirror programme, led by Dr William Sansome Tucker, had given Britain the methodology to use interconnected stations to pin point the position of an enemy in the sky. The system they developed for linking the ranging stations and plotting aircraft movements was given to the early radar team and contributed to their success in WW2; although the British radar was less sophisticated than the German system, the British system was used more successfully.
[ Ref. Text: 20 ]
02.2 BIOLOGICAL SYSTEMS
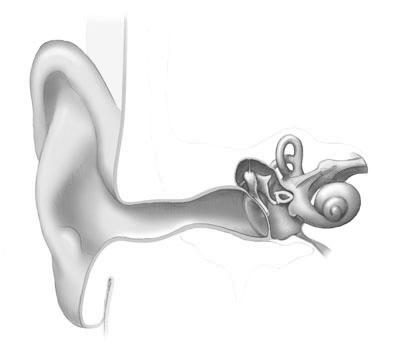
The tympano-ossicular system of all mammals sensitive to air-borne sounds must transform air vibrations to fluid vibrations in the inner ear by matching the acoustical impedances. Within the cochlea the energy of the fluid vibrations is transduced into nerve impulses.
In highly specialized mammals the morphology of these transformer and transducer mechanisms is adapted for the reception of extreme frequencies. Echolocating bats and whales possess different, but effective, specializations for the reception of ultrasonic frequencies. Moles and kangaroo rats, on the other hand, have specialized ear structures for the reception of low frequencies.
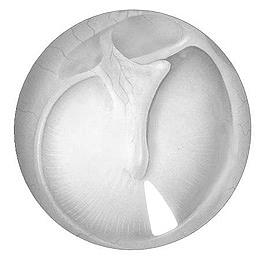
Once the sound waves travel into the ear canal, they vibrate the tympanic membrane, commonly called the eardrum. The eardrum is a thin, cone-shaped piece of skin, about 10 millimeters (0.4 inches) wide. It is positioned between the ear canal and the middle ear. The middle ear is connected to the throat via the eustachian tube. Since air from the atmosphere flows in from your outer ear as well as your mouth, the air pressure on both sides of the eardrum remains equal. This pressure balance lets your eardrum move freely back and forth.
The eardrum is rigid, and very sensitive. Even the slightest air-pressure fluctuations will move it back and forth. It is attached to the tensor tympani muscle, which constantly pulls it inward. This keeps the entire membrane taut so it will vibrate no matter which part of it is hit by a sound wave.
This tiny flap of skin acts just like the diaphragm in a microphone. The compressions and rarefactions of sound waves push the drum back and forth. Higher-pitch sound waves move the drum more rapidly, and louder sound moves the drum a greater distance.
[ Ref. Text: 21, 22 ]

BIOLOGICAL TRANSDUCER
Bat use sonar waves in order to spot their surroundings and track for food which is extremely sensitive and complex, several of them release sounds through their mouths, although others have a series of flaps around their nose which they utilize. They produce a regular supply of ultrasonic pulses and use their particular ear forms to listen to how the sounds bounce back.
The target-reflected echoes generate a reflection of the surroundings. This is used to determine obstacles as well as potential food. This system is called echolocation or biosonar and it functions within specific frequency ranges that suit their environment. The auditory system processes sound to create spatial images.
Echolocation broadly consists of two processes: the physical process and the biological process as well. The physical process involves transforming the emitted pulse to the tar-
get reflected echo at the bat’s ear as for the biological method, it involves transforming this target reflected echo so that the bat perceives the target. The acoustic signal passes through various stages in the auditory system throughout this process. This procedure also involves selecting the structure and the emission of the subsequently echolocating pulse.
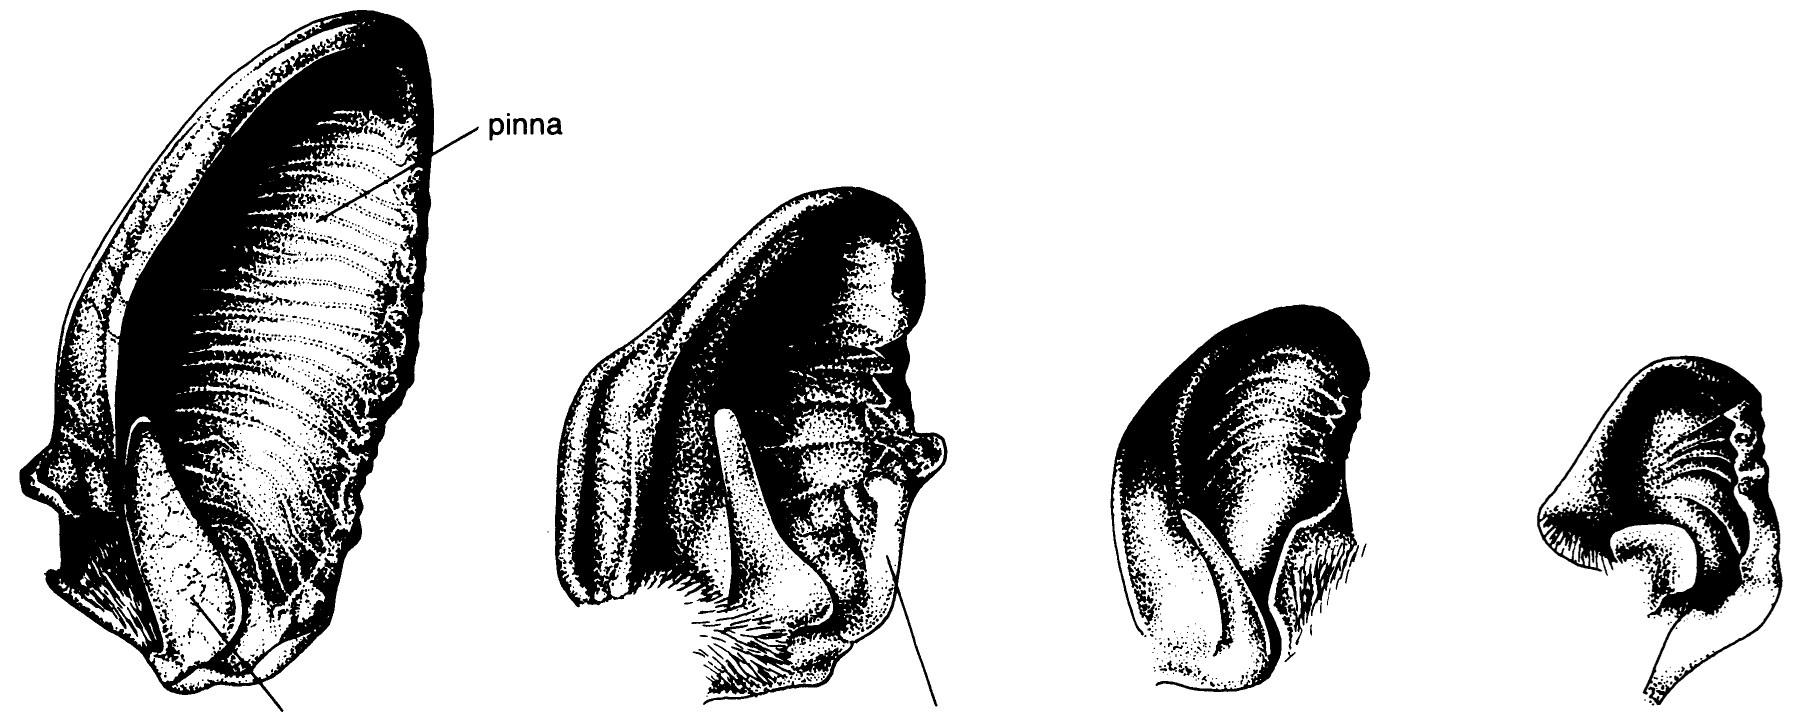
The bats harden the bones in their ears, so that they do not hurt their ears when producing any noise frequencies. The large ears bats can gather these sounds in echoes as well as filter some sound frequencies to give a better image of the surrounding environment. The highly complex brain runs the imaging system to provide balance and recognition of familiar objects.
[ Ref. Text: 23, 24]
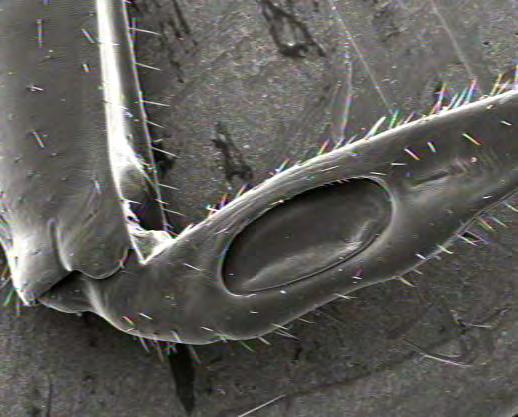

BIOLOGICAL SENSING DEVICES
Sensing and reactions in the natural system are entirely local. In his article Biodynamics Professor Jeronmidis explains that across all scales from plants to large mammals behavior is defined by the product of all associated actions.
The energy input or which is received from the environment is translated into electrical signal by biological sensing devices and in a later stage these signals generates a responsive performance. These materials systems are working as a interrelated network that combines material, sensors and actuators causing a reactive behavior
Mechanical changes in the environment such as movement, tension, sound waves and gravity are recognized by Sensory receptors. In all creatures plants and animals, these devices are called mechanoreceptors, which are are actually the only means by which information of the surroundings is gained and by which reactions to environmental changes are started. These energy transducers translate mechanical into electrical energy, which in turn triggers the nerve impulse.
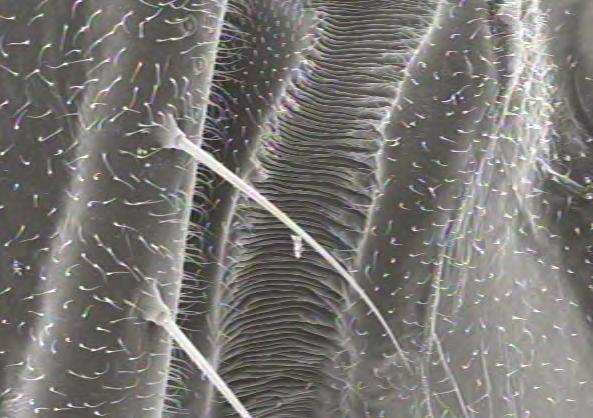
Some species of insects have receptors associated with the hairs on the body surface. They can detect sound when it vibrates the hairs. For example, the hairs on the antennae of male mosquitoes can detect females flying nearby. Many species have tympanic membranes (eardrums) located on their legs or abdomen.
[ Ref. Text: 25]
02.3 DEFINITION AND EXPLANATION
Understanding the morphology of noise energy requires understanding the propagation of sound wave and the methods of its energy conversion. Sound is a series of longitudinal or compression waves that travels through air or other materials. It is created by the vibration of objects, like the cone in a radio loudspeaker. A Sound wave has the same characteristics as any other type of waveform. It has wavelength, frequency, amplitude and velocity.
Wavelength
Wavelength (Amplitude is line density)
Amplitude
SOUND FREQUENCY
Wavelength
Wavelength is the distance from one crest to another of a wave. Since sound is a compression wave, the wavelength is the distance between maximum compressions.Longitudinal waves are waves that oscillate in the same path that the sound wave is moving. This is different than the up and down or transverse motion of a water wave.
Frequency
The frequency of sound is the rate at which the waves pass a given point. It is also the rate at which a guitar string or a loudspeaker vibrates.
The relationship between velocity, wavelength and frequency is:
Velocity = Wavelength x Frequency
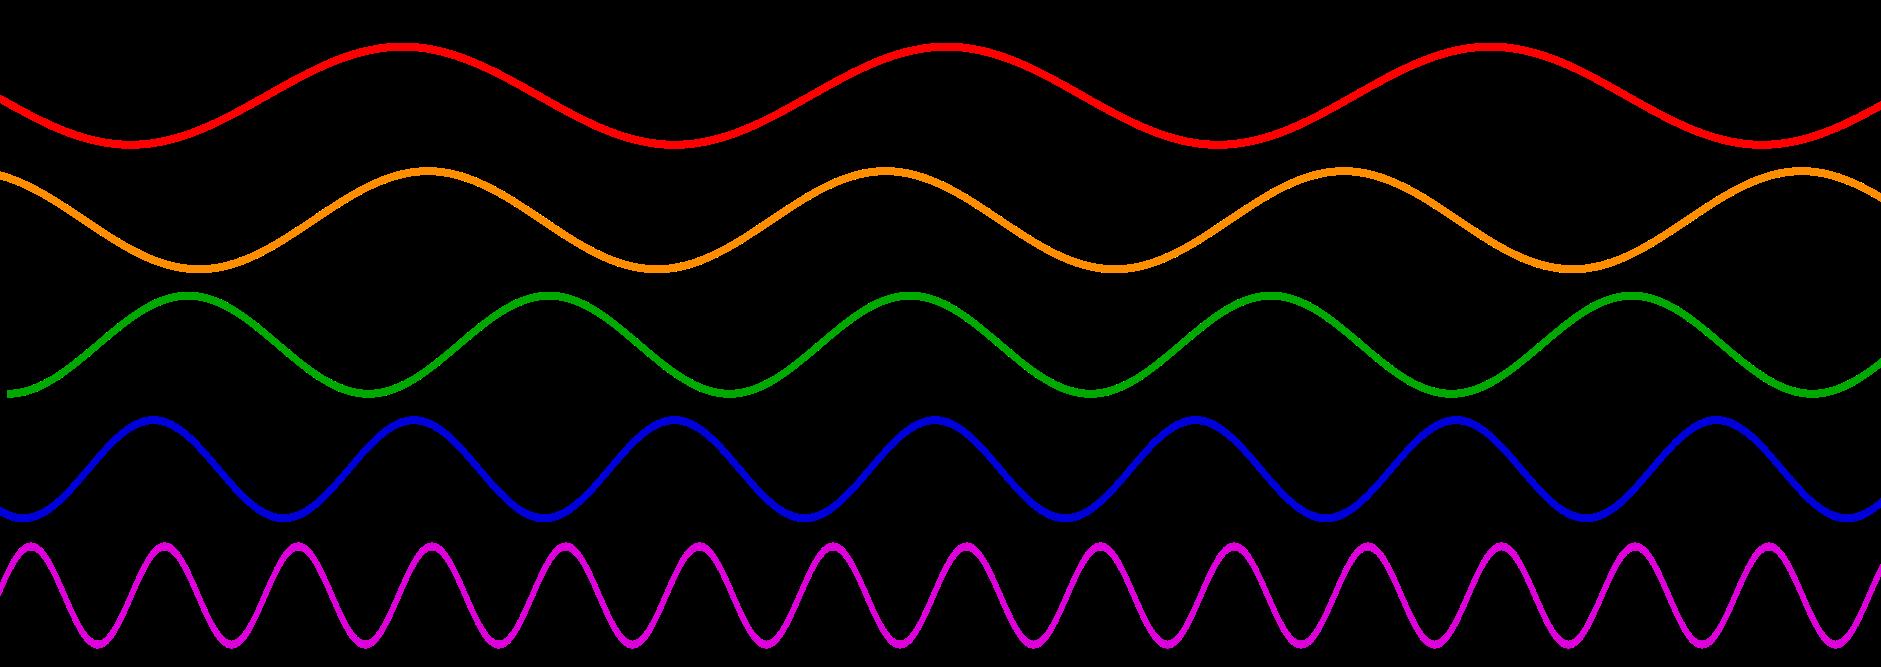
Fig. 44 Sinusoidal waves of various frequencies; the bottom waves have higher frequencies than those above. The horizontal axis represents time[Ref. Illustrative: 44]
Amplitude
Amplitude is the objective measurement of the degree of change in atmospheric pressure caused by sound waves. It is directly related to the acoustic energy or intensity of a sound.
[ Ref. Text: 26, 27]
SOUND INTENSITY
Decibels
The most-used acoustic measurement for intensity is the decibel (dB). Named in honor of Alexander Graham Bell. It is widely known as a measure of sound pressure level, but is also used for a wide variety of other measurements in science and engineering (particularly acoustics, electronics, and control theory) and other disciplines.
A decibel = 1/10 of a bel.
A decibel is a logarithmic measurement that reflects the tremendous range of sound intensity our ears can perceive and closely correlates to the physiology of our ears and our perception of loudness.
The Decibel
For power- like quantities
dB=10log
For Non-power Quantities
When referring to measurements of power or intensity, a ratio can be expressed in decibels by evaluating ten times the base 10 logarithm of the ratio of the measured quantity to the reference level. Thus, if L represents the ratio of a power value P1 to another power value P0, then LdB represents that ratio expressed in decibels and is calculated using the formula:
When referring to measurements of field amplitude it is usual to consider the ratio of the squares of A1 (measured amplitude) and A0 (reference amplitude). This is because in most applications power is proportional to the square of amplitude, and it is desirable for the two decibel formulations to give the same result in such typical cases. Thus the following definition is used:
If we picture a sound wave as an expanding sphere of energy, power is the total amount of kinetic energy contained on the sphere’s surface. By examining the formula below, you can see how power is a measurement of amplitude over time.
The unit of measurement for power is the watt, named after James Watt. 1 watt = 1 Newton of work per second
Situation and sound source
Rocket engine
Turbojet engine
Siren
Heavy truck engine or loudspeaker rock concert
Machine gun
Jackhammer
Excavator, trumpet
Chain saw
Helicopter
Loud speech vivid children
Usual talking
Typewriter 1,000,000 W 10,000 W 1,000 W
Refrigerator
W
W
W
W
The power of the original sound source along with distance of measurement from the sound source combine to form the intensity, Intensity can be measured as watts per square meter or w/m2. Intensity can be seen as amplitude over time over an area. As the surface area of the asound sphere expands, the amount of energy generated by the sound source is distributed over an exponentially increasing surface area. The amount of energy in any given square meter of the expanding sphere surface decreases exponentially by the inverse square law, which states that the energy drops off by 1/distance 2. So acoustic energy twice the distance from the source is spread over four times the area and therefore has one-fourth the intensity, or simply put, relative intensity is the reciprocal of the change in distance squared.
Tips
A few more relationships between amplitude, intensity and power: intensity equals the square of the amplitude, so if the amplitude of a sound is doubled, its intensity is quadrupled. Power is also proportional to amplitude squared, therefore power and intensity are proportional to each other.
[ Ref. Text: 29]
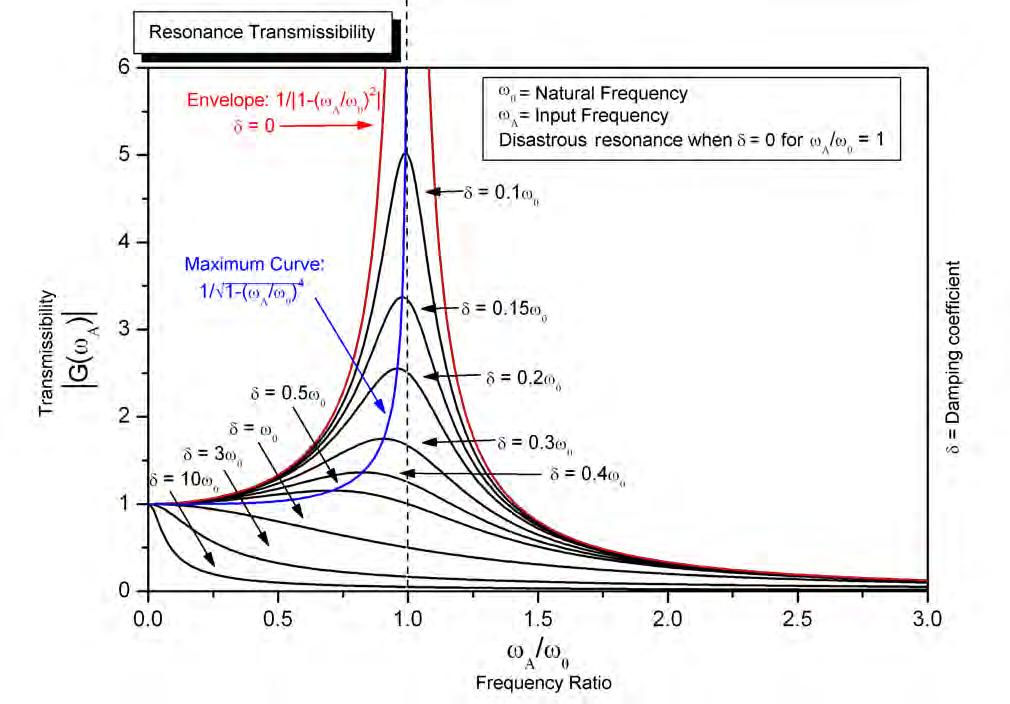
RESONANCE
In physics, resonance is the tendency of a system (usually a linear system) to oscillate with larger amplitude at some frequencies than at others. These are known as the system's resonant frequencies (or resonance frequencies). At these frequencies, even small periodic driving forces can produce large amplitude oscillations.
Resonance phenomena occur with all types of vibrations or waves: there is mechanical resonance, acoustic resonance, electromagnetic resonance, nuclear magnetic resonance (NMR), electron spin resonance (ESR) and resonance of quantum wave functions. Resonant systems can be used to generate vibrations of a specific frequency (e.g. musical instruments), or pick out specific frequencies from a complex vibration containing many frequencies. 02.3.4
Resonances occur when a system is able to store and easily transfer energy between two or more different storage modes (such as kinetic energy and potential energy in the case of a pendulum). However, there are some losses from cycle to cycle, called damping. When damping is small, the resonant frequency is approximately equal to a natural frequency of the system, which is a frequency of unforced vibrations. Some systems have multiple, distinct, resonant frequencies.
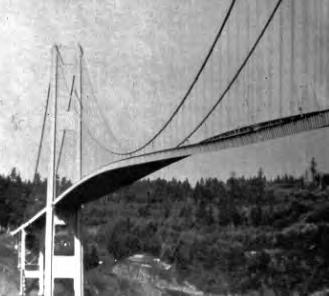
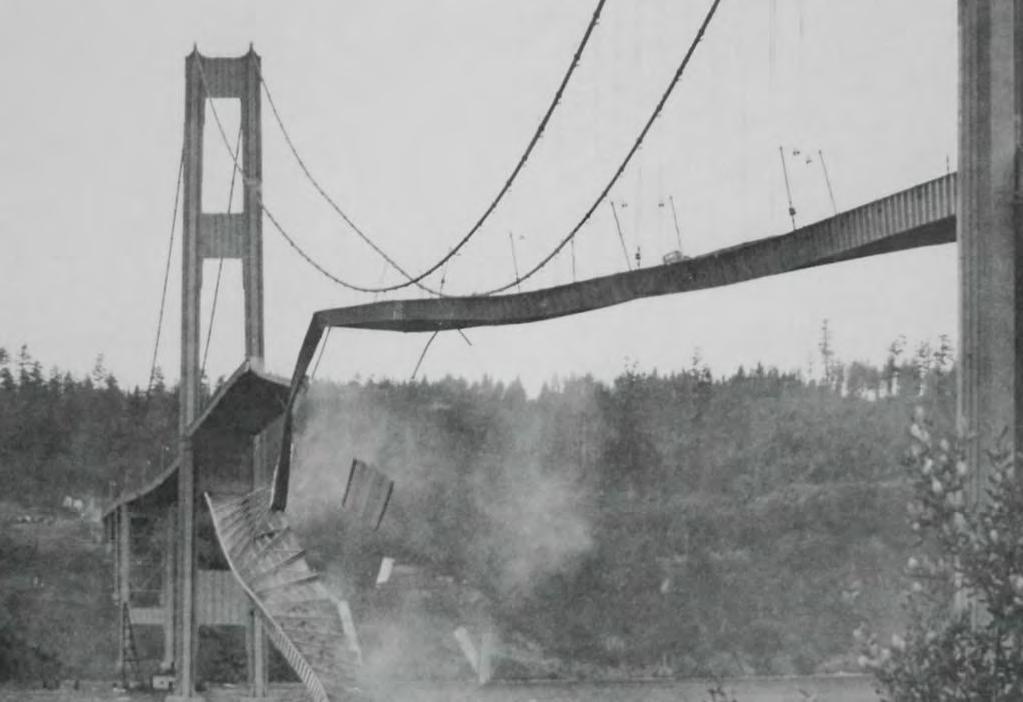
A key aspect of structural dynamic analysis concerns the behavior of a structure at “resonance.” The natural frequency of vibration of a structure --- whether a woodframe house or a radio tower --- corresponds to that structure’s resonant frequency. If a structure is subjected to vibration at its natural frequency, the displacements of that structure will reach a maximum (“resonance”). The greater the displacements, the greater the stresses that are developed in the framing members and connections of the structure. The Tacoma Narrows Bridge is an example of the destructive effects that resonance can have on a structure. However, in our case, we will try to use the resonance concept to achieve our goal.
[ Ref. Text: 30, 31]
02.4 BASIC DESIGN STRATEGY
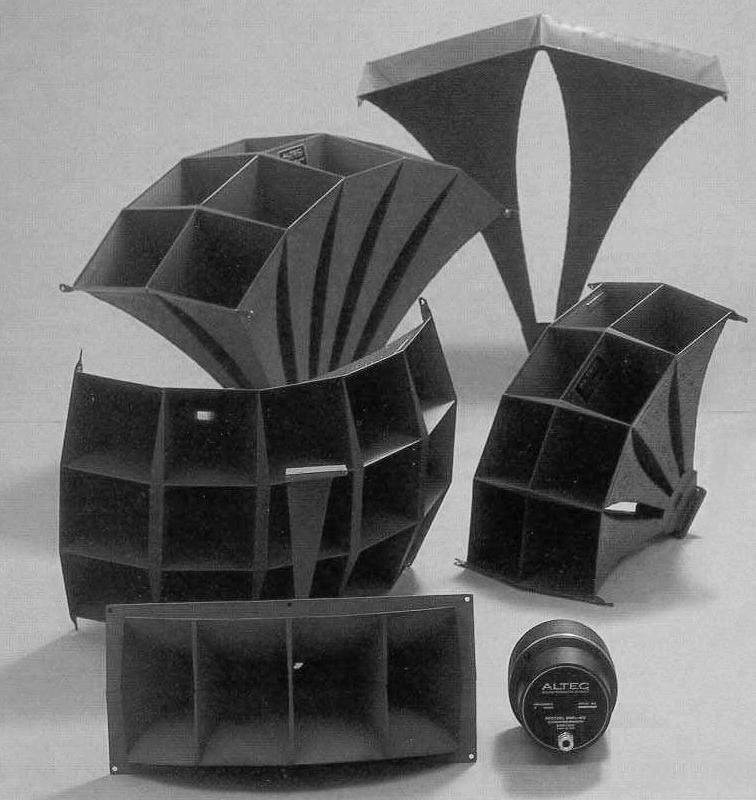
Basiclly the methods of collecting a diffused energy is the main challenge in our design, which is also directly link to the geometry aspect in architecture. We started learning some artificial equipments and find out their work principle. The horn can be thought of as an "acoustic transformer" that provides impedance matching between the relatively dense diaphragm material and the air of low density. The result is greater acoustic output from a given driver. The narrow part of the horn next to the speaker driver is called the "throat" and the large part farthest away from the speaker driver is called the "mouth".
Acoustic horns convert large pressure variations with a small displacement area into a low pressure variation with a large displacement area and vice versa. It does this through the gradual, often exponential increase of the cross sectional area of the horn. The small cross-sectional area of the throat restricts the passage of air thus presenting a high impedance to the driver. This allows the driver to develop a high pressure for a given displacement. Therefore the sound waves at the throat are of high pressure and
low displacement. The tapered shape of the horn allows the sound waves to gradually decompress and increase in displacement until they reach the mouth where they are of a low pressure but large displacement.
The cone is the oldest and simplest acoustic horn and, as the megaphone, is still used by cheerleaders and lifeguards as a passive amplifier of their voices. Because the conic section shape describes a portion of a perfect sphere of radiated sound, cones have no phase or amplitude distortion of the wavefront, which means the cone shape can also have a good performance in centralizing the sound wave.

[ Ref. Text: 32]


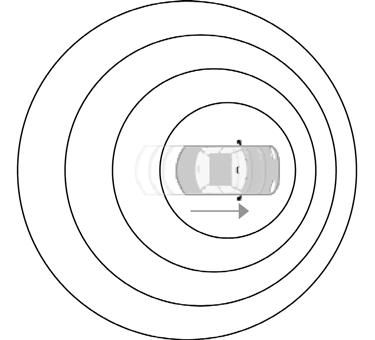
Once we found out the basic geometry for gathering the noise energy. A theoretical energy conversion process was defined. The traffic noise source will produce sound wave as an input, which is collected by the cone-shaped resonator and transformed to vibration. After that the amount of mechanical force from specific large vibration at the resonance frequency will change to electricity.


02.5 EVALUATION
In the first part of this chapter we introduced the acoustic location devices that were used during the World War II; these tools played an essential role in locating the enemy aircraft and allowing the British army defense some time in order to protect their territory. Studying the science behind these tools, and analyzing the link between the sound waves energy and the alarm once signaled as soon as the waves hits the reflector mirrors introduced us to the affiliation between the sound energy acting as an input, while transferring it into a mechanical output.
How can we abstract the engineering principals behind these devices, explore their techniques, take it a step further and use these energy waves in order to transform it into electricity? Experimenting with all the appropriate tools will be covered in the next chapter. There are several examples in biology that offers significant dynamic systems,
in the second part of the chapter we started researching the general mammalians auditory system and then we analyzed the specific bats acoustic structure that combines imaging and frequency where they reveal noticeable ear movements as part of their biosonar behaviors.
In addition we examined the signal detection of the cricket and green lace wings, how do they perceive energy through their sensors devices, and then transform it into a behavioral response. The study of biodynamic organization offered us constructive process where we applied them in our research project; they created a strategic development design where they helped us identifying each step and what it is related to, in order to finally achieve a successful design development.
CHAPTER 03 EXPERIMENTS
03.0 INTRO
03.1 CYMATICS EXPERIMENTS
03.2 DIGITAL SIMULATIONS FOR PLATE RESONANCE
03.3 ENERGY CONVERSION EXPERIMENTS
03.3.1 DEVICE CONSTRUCTION
03.3.2 PIEZO CERAMICS POSITION SETTINGS
03.4 CONTEMPORARY MATERIALS
03.4.1 PIEZOELECTRICITY PROPERTY
03.4.2 PIEZOELECTRICITY PRECEDENTS
03.4.3 PIEZO-CERAMICS MATERIAL TESTING
03.4.4 METHODS OF INCREASING EFFICIENCY
03.5 POWER STORAGE
03.6 RESONATOR PROTOTYPE ANALYSIS
03.7 RESONATOR GEOMETRY EVOLUTION
03.8 ACOUSTIC UNIT EXPLANATION
03.9 FINAL COMPONENT ANALYSIS
03.9.1 COMPONENT ANALYSIS IN ANSYS Inc.
03.9.2 COMPONENT ANALYSIS IN SYSNOISE L.M.S.
03.10 EVALUATION
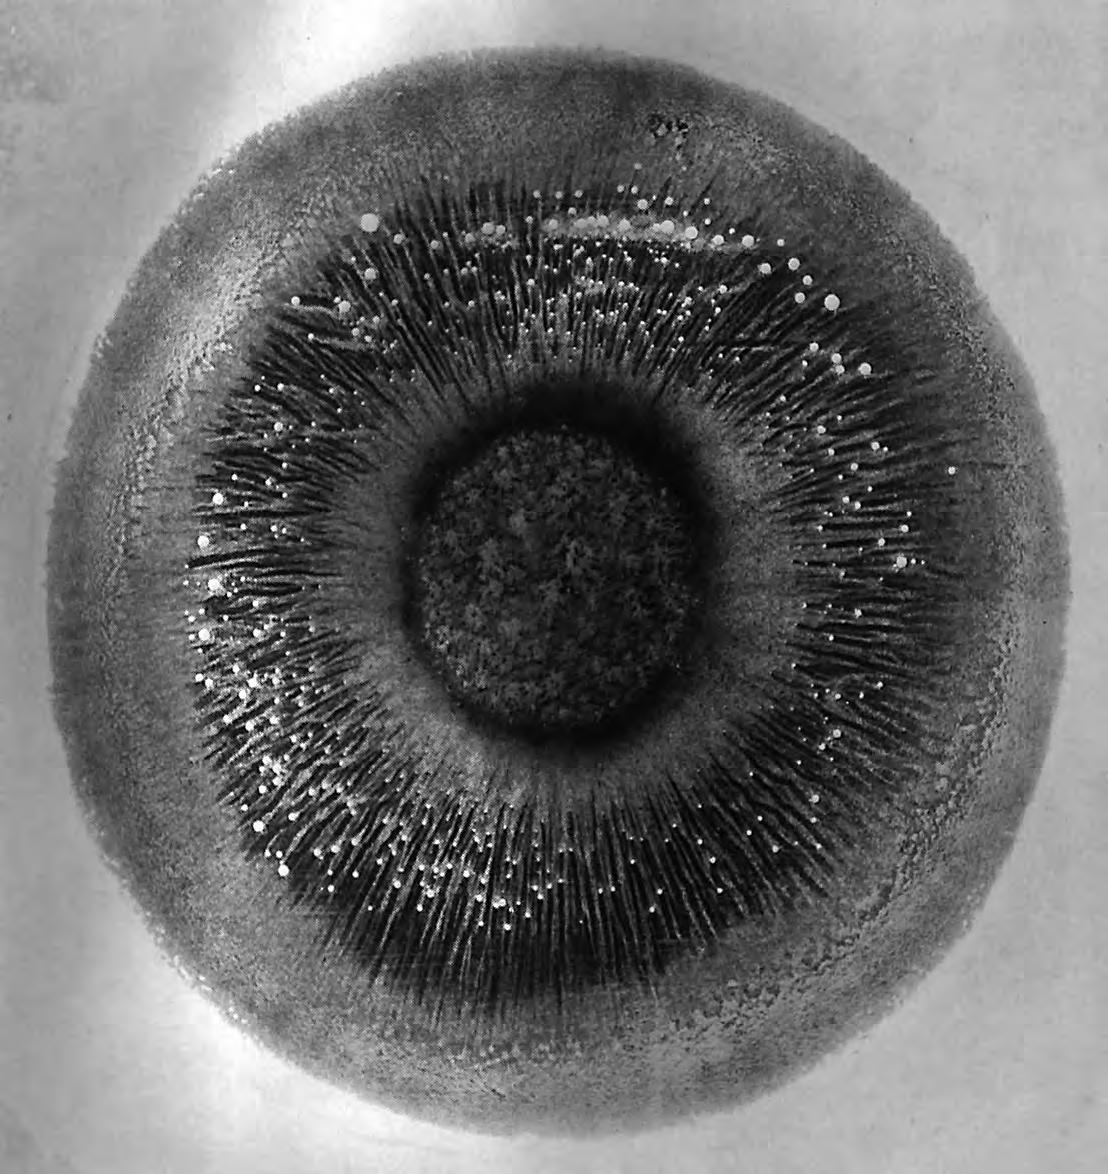
Fig. 54 A layer of glycerine has been made to vibrate by a tone acting upon a diaphragm. The result is a continuous formal pattern[Ref. Illustrative: 54]
03.0 INTRODUCTION
The Experiment Chapter begins by understanding the Hans Jenny’s Cymatics book and move forward one step from consciousness of cymatics patterns to the technology of sound vibration. Cymatics (from Greek, means “wave”) is the study of visible sound and vibration, a subset of modal phenomena. Typically the surface of a plate, diaphragm, or membrane is vibrated, and regions of maximum and minimum displacement are made visible in a thin coating of particles, paste, or liquid. Different patterns emerge in the exitatory medium depending on the geometry of the plate and the driving frequency. It was explored by Hans Jenny in his 1967 book, Kymatik (translated Cymatics). Inspired by systems theory and the work of Ernst Chladni, Jenny began an investigation of periodic phenomena but especially the visual display of sound. He used standing waves, piezoelectric amplifiers, and other methods and materials.
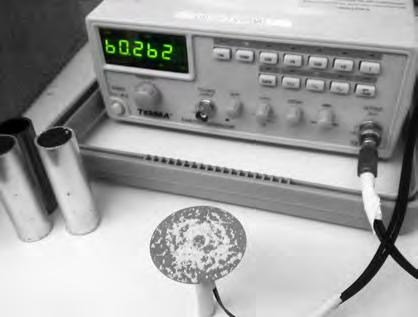
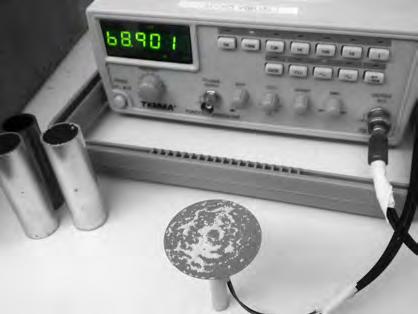
After imitating Jenny’s Cymatics experiments, we realized that the amplitude of the vibration is different in various frequencies. It became particularly large in some specific frequency. Combining the knowledge of resonance from Chapter 2, we analysed the
natural frequency of the plate in our experiment by Strand7. From the digital testing results, we fully understand the phenomenon of the Cymatics experiments, which was directly linked to the different displacement of the plate, at the same time, an accurate location of the maximum amplitude was possible to be defined.
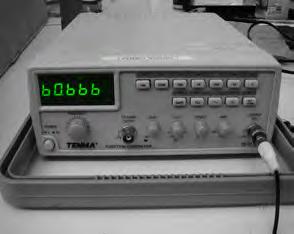
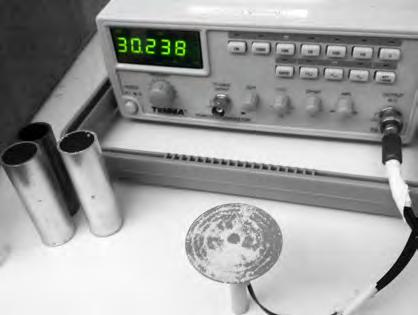
As soon as the digital simulation method was found, we set up our energy conversion device for transforming the acoustic energy to electricity. We used one acoustic generator which will simulate the sound environment in our site, and input it to the speaker box. The sound from the box will make an aluminium plate vibrate, especially in the resonance frequence. After that, our contemporary material - piezo ceramics will be glued at the accurate position which was analysed by Strand7, and react to the deformation of the plate. Its piezoelectricity property will helps to convert the vibration energy to electricity, which can be read by the multimeter.
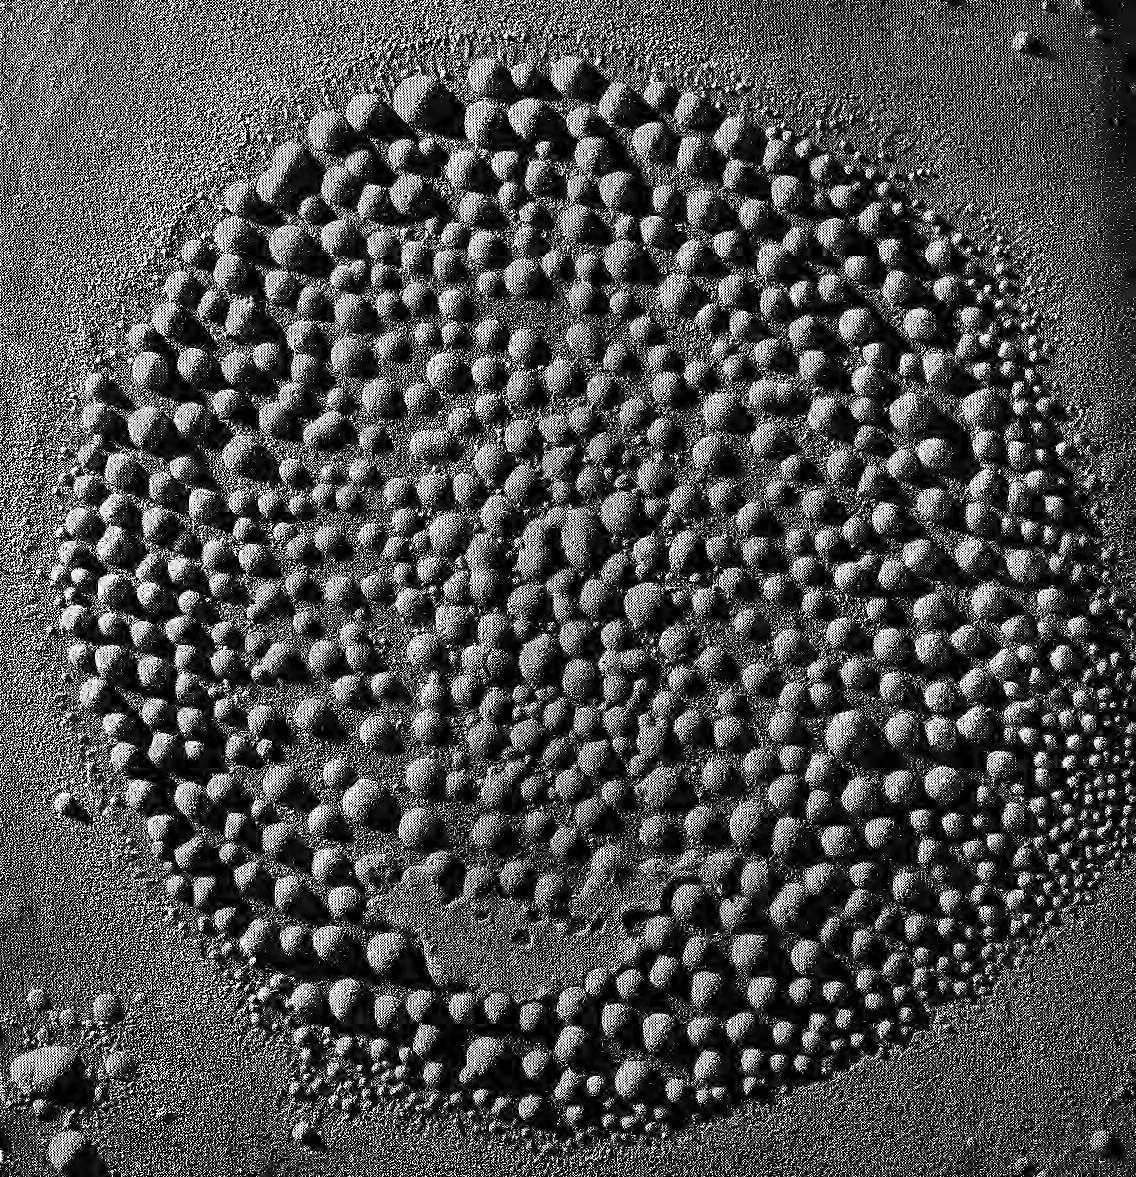
55]
Besides the two main device experiments, this chapter also contains several tests for increasing the efficiency of the acoustic energy conversion. Surface veil(a very thin fibreglass mat) took the place of the aluminium plate in order to reduce the weight but keep the similar stiffness property. The cone shape resonator was optimized by scripting, using the knowledge of fitness criteria from the Emergence course.
Finally, the component was test by ANSYS and SYSNOISE to guide the formation of whole acoustic system and the real fabrication which will be introduced in the next chapter.
[ Ref. Text: 33]
Steel plate(powder)/bowl(liquid)
CYMATICS EXPERIMENTS
Cymatics is the study of vibratory phenomena and the much larger world of their effects. Within the tradition of E.F.P. Chladni, who had laid down the experimental principles of acoustics (Die Acoustik, 1802), the word stretches to include such diversified works as G. V. Bekesey’s 1928 experiments with the cochlea to R. Heinberg’s Resonance (1977).
Undoubtedly, due to the apparent familiarity of the sound of the word, it may become occasionally confused with the more abstract theoretical schools of thought such as semantics, cybernetics, or semiotics. Hence great care must be taken to introduce cymatics as a formal subdiscipline of Physics, a laboratory science, and, as previously described, potentially a “general field” science which both unites and changes present knowledge within existing disciplines.
Initially, Dr. Hans Jenny (1904–77) conducted research in zoological morphology near his birthplace, Basel, Switzerland. By the 1950’s, he was induced by the problems of
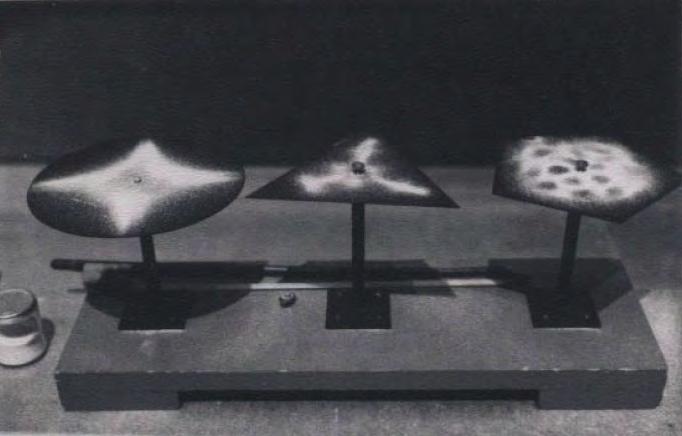
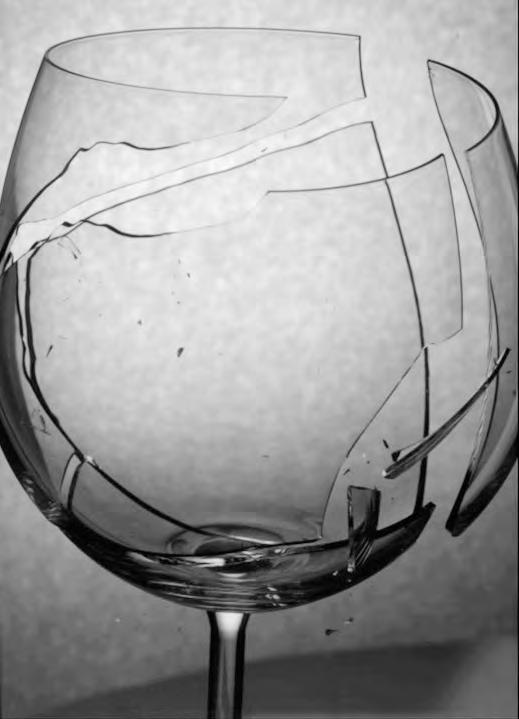
modern physiology and biology to study the phenomena surrounding experimental periodicity (Gesetz Der Weiderhulung, 1962). Testing the observable phenomenon that form is choreographed by vibration (cf. earthquake and geological formation relationship; mezzo soprano voice and shattered glass relationship), Jenny conducted a wide variety of experiments to discover the specific relationship between sound vibration and discrete substances. His experimental vibratory patterns were generated through a variety of devices from crystal oscillators and electronic tonoscopes to ordinary hand bells. His malleable materials covered a vast spectrum of gasses, liquids, and solids including mercury, kaolin paste, lycopodium powder, plastics, streams of gas, and flames. By measuring and altering the frequency and amplitude of vibrations, Jenny produced and reproduced a cornucopia of forms and patterns. Viewed in the aggregate, these vibrationally–induced shapes suggested precise relationships between frequency and form.
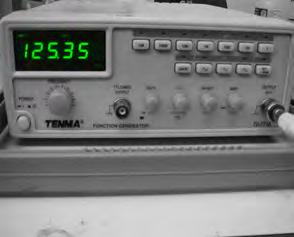
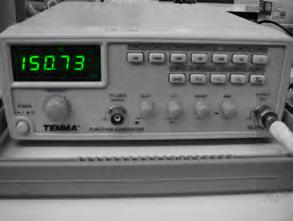
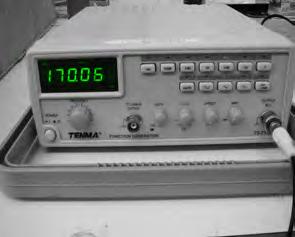
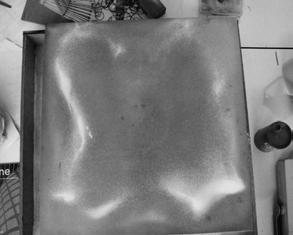
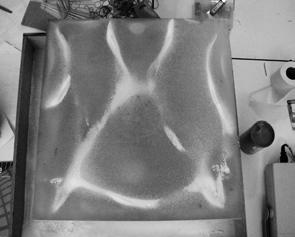
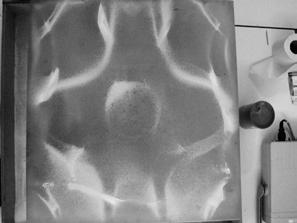
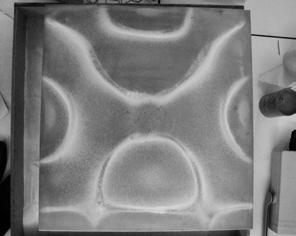
We used a sound generator to input different sound frequences ,which caused the vibration of the metal plate and forced the salt powder accumulating or dispersing in order to create different patterns(Figure 58,59). The formation of the patterns are related to the natural frequency of the plate, which will totally change according to 4 factors of the plate’s porperties:
• Shape
• Boundary condition
• Thickness
• Material properties.
[ Ref. Text: 34]
DIGITAL SIMULATIONS FOR PLATE RESONANCE
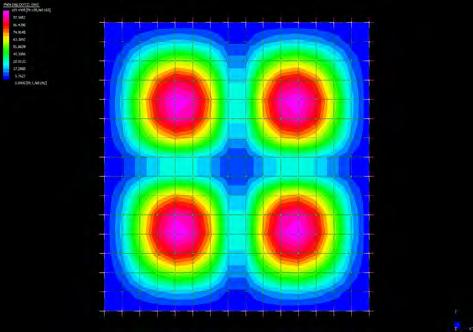
Strand7 is a an engineering simulation software, developing general-purpose finite element analysis system. It is used for the static, dynamic and heat transfer analysis of structures and comprises pre-processing, post-processing and solver functionality in a single application, also enables assigned material properties to be tested for the performance of digital models under simulated environmental parameters. During this research, a solver package named Natural Frequency was used for simulating the resonance property of the object.
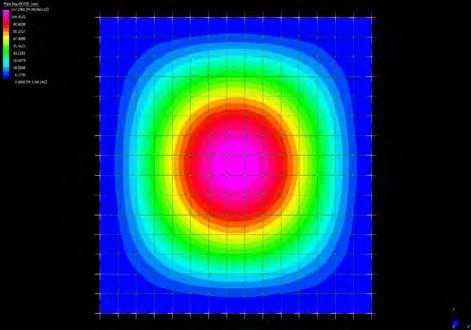
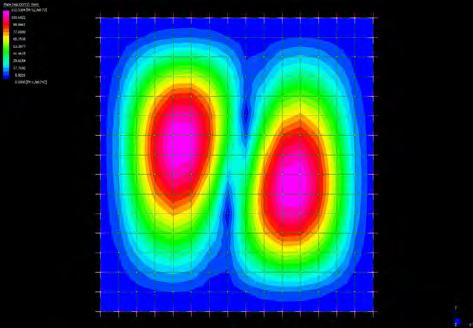
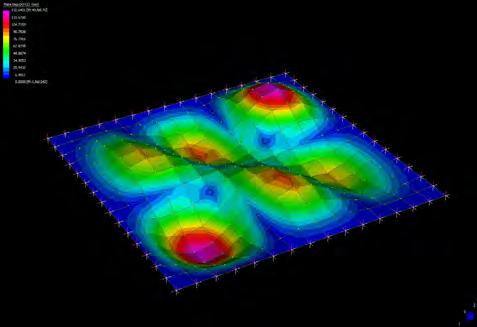
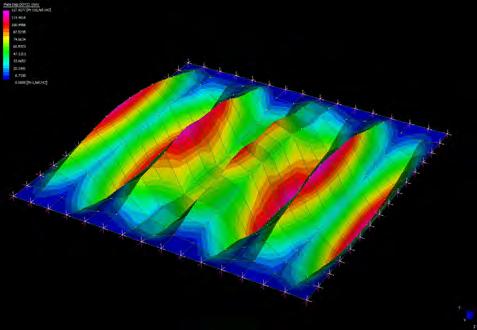
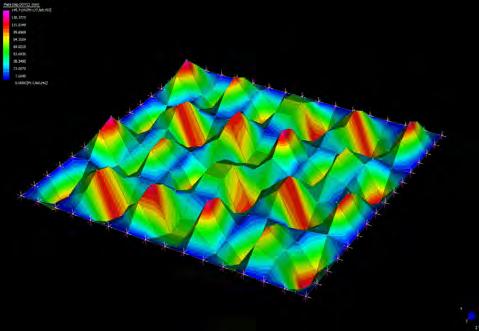
The Natural Frequency package allows multiple input informations that are directly relevant to the results which is the Total Displacement in resonance frequency. These inputs are: Geometry data for the model(Dimension and Thickness), Material data(Young’s Modulus, Poisson’s ratio and Mass density), Mesh data(Element quantity). In the above example, the colour coded graphical output demonstrates the directional deformation in the Z-axis. Blue color is where the
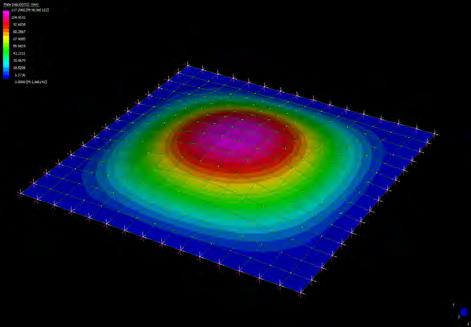
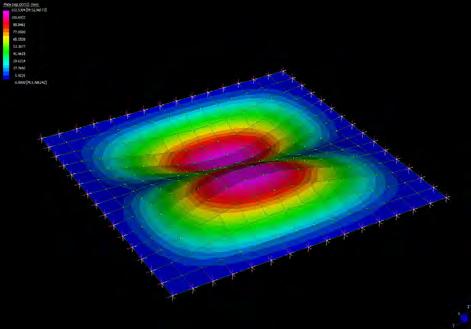
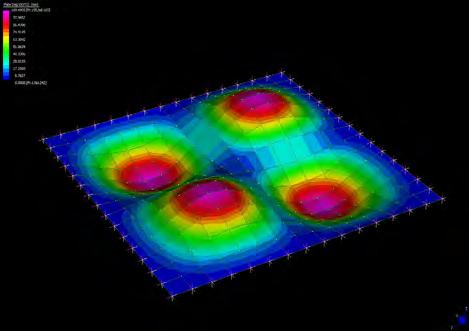
Fig. a at Frequency: 3.45578 Hz
Geometry
modulus E = 7.0×10⁴ MPa
Mesh data: High order elements: 15 × 15
Fig. b at Frequency: 7.11852 Hz
Geometry data: Plate dimension 80 cm × 80 cm Plate thickness 0.25 mm
Material data: Young’s modulus E = 7.0×10⁴ MPa Poisson’s ratio ν = 0.3 Mass density ρ = 2.7×10⁻⁹ T/mm3
Mesh data: High order elements: 15 × 15
Fig. c at Frequency: 16.2284 Hz
Geometry data: Plate dimension 80 cm × 80 cm
Plate thickness 0.25 mm
Material data:
Young’s modulus E = 7.0×10⁴ MPa
Poisson’s ratio ν = 0.3
Mass density ρ = 2.7×10⁻⁹ T/mm3
Mesh data:
High order elements: 15 × 15
Frequency: 24.3754 Hz
Geometry data:
Plate dimension 80 cm × 80 cm
Plate thickness 0.25 mm
Material data:
Young’s modulus E = 7.0×10⁴ MPa
Poisson’s ratio ν = 0.3
Mass density ρ = 2.7×10⁻⁹ T/mm3
Mesh data:
High order elements: 15 × 15 (as shown)
Frequency: 85.5275 Hz
Geometry data:
Plate dimension 80 cm × 80 cm
Plate thickness 0.25 mm
Material data:
Young’s modulus E = 7.0×10⁴ MPa
Poisson’s ratio ν = 0.3
Mass density ρ = 2.7×10⁻⁹ T/mm3
Mesh data:
High order elements: 15 × 15 (as shown)
Frequency: 126.566 Hz
Geometry data:
Plate dimension 80 cm × 80 cm
Plate thickness 0.25 mm
Material data:
Young’s modulus E = 7.0×10⁴ MPa
Poisson’s ratio ν = 0.3
Mass density ρ = 2.7×10⁻⁹ T/mm3
Mesh data:
High order elements: 15 × 15 (as shown)
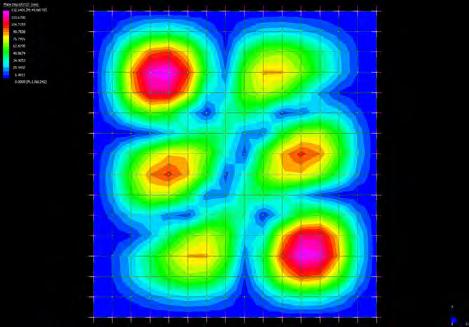
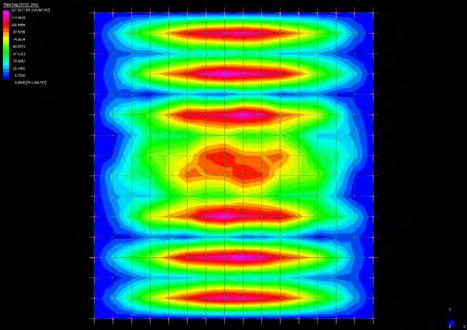
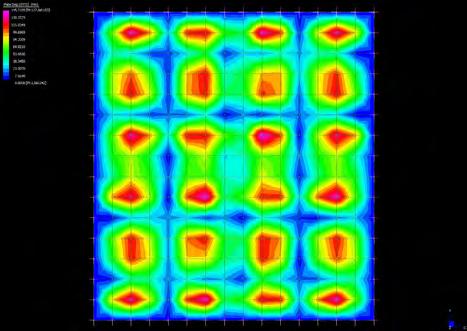
least deformation occurs; pink and red color are where the most deformation occurs in the positive and negative directions respectively, which can be seen more clearly from the perspective view on the right.
From the digital testing results, we fully understand the phenomenon of the pervious Cymatics experiments, which was directly linked to the various extent of the plate displacement, at the same time, this digital simulations provided a possibility of defining an accurate location of the maximum amplitude, which is an significant issue for our energy conversion device to be set up.
Cylindrical Resonator
03.3 ENERGY CONVERSION EXPERIMENTS
03.3.1
DEVICE CONSTRUCTION
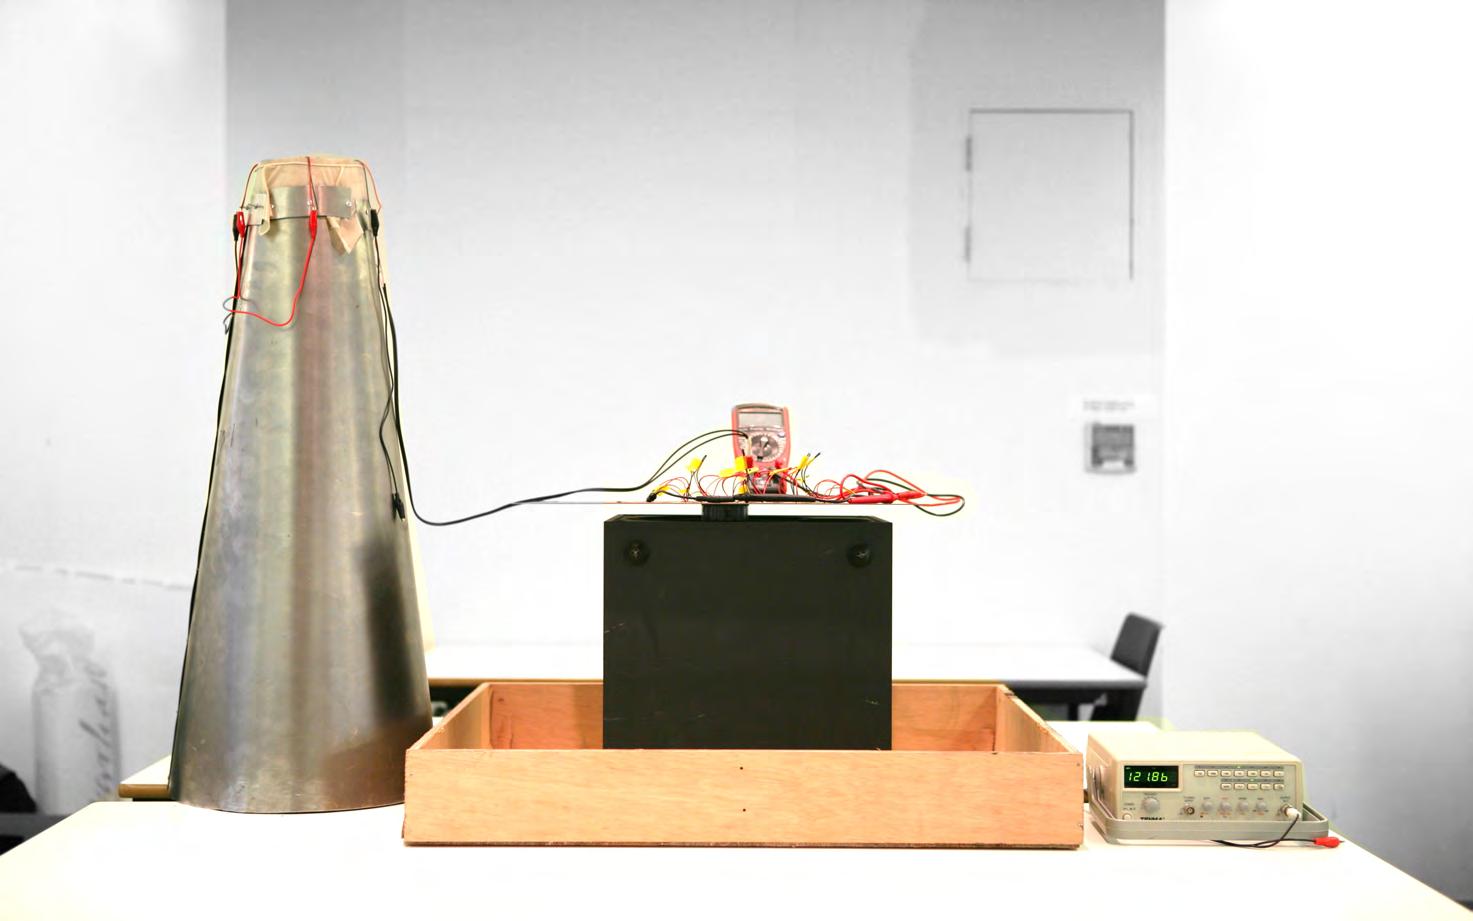
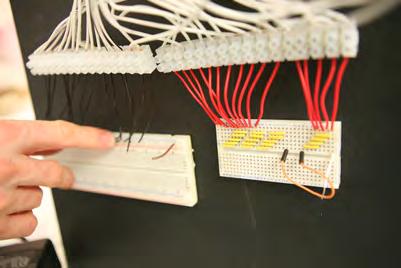
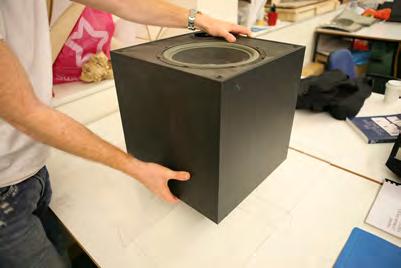
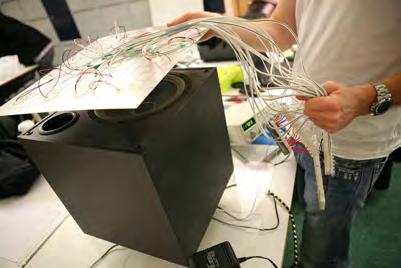
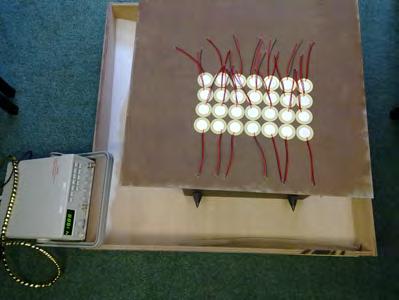
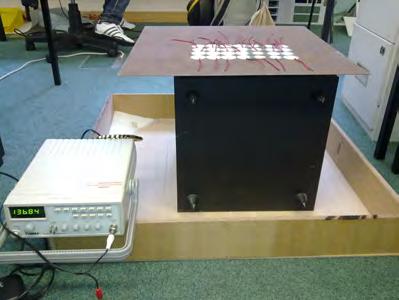
After observing the resonance patterns through the first physical experiment - Cymatics and understanding the results in Strand7 simulation, we set up our energy conversion device for approach our aim that transforming the acoustic energy to electricity.
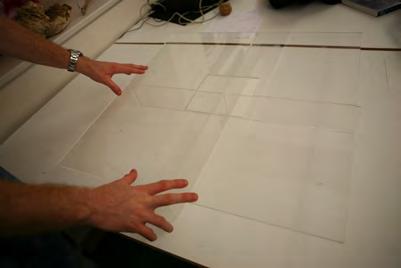
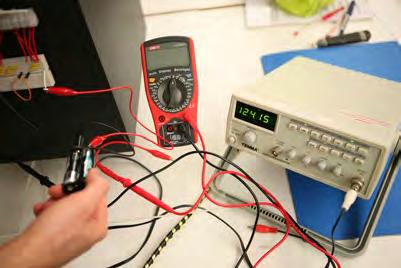
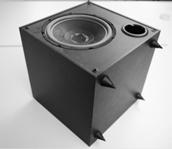
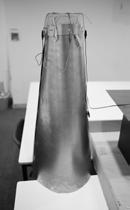
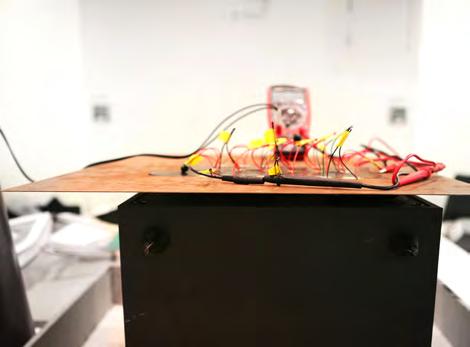
We used one acoustic generator which will simulate the sound environment in our site, and input it to the speaker box. The sound from the box will drive an aluminium plate vibrate, the amplitude is especially large in some resonance frequencies.
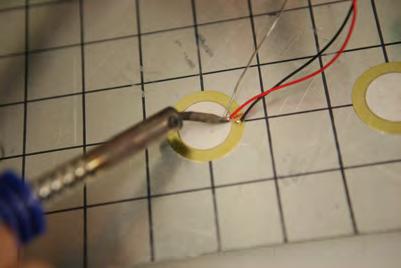
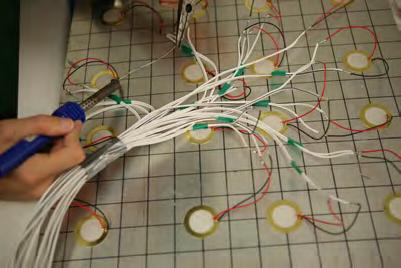
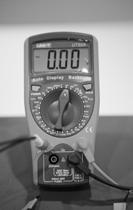
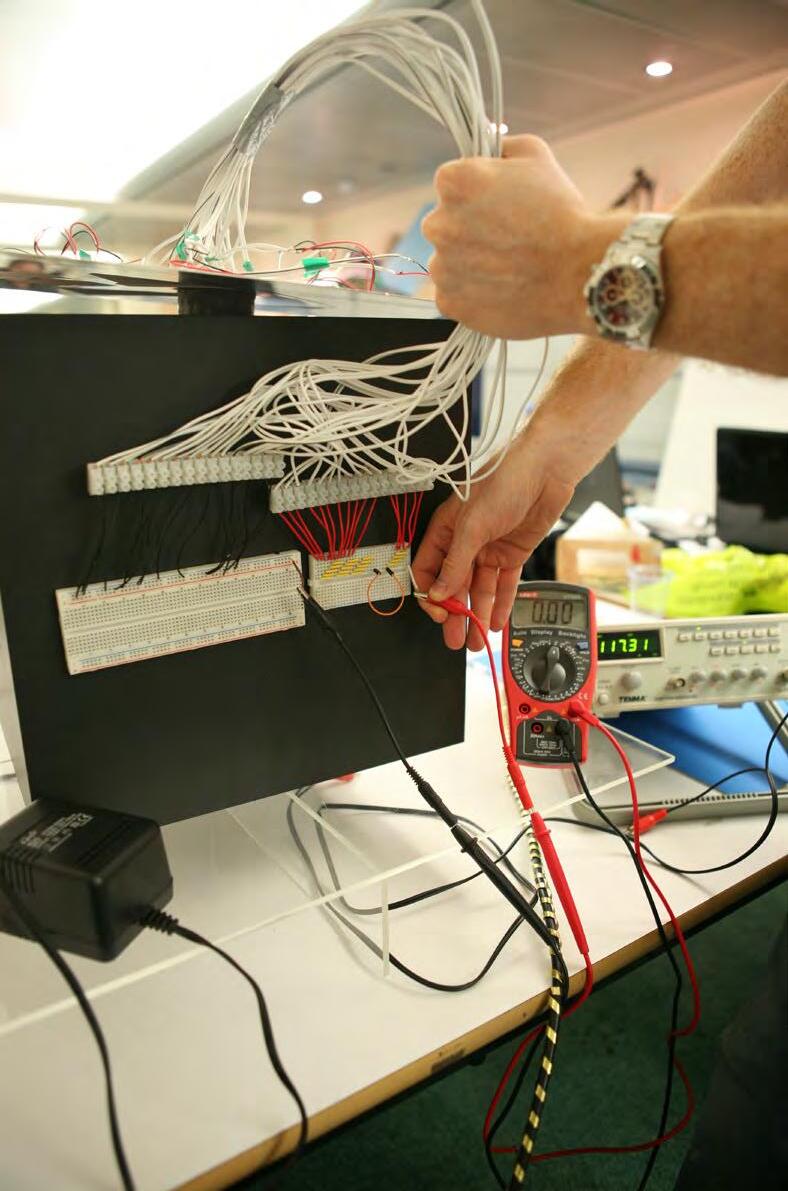
After that, we brought in a contemporary material - piezo ceramics which will be glued at the accurate position analysed by Strand7. The piezo can react to the deformation of the plate. Its piezoelectricity property will helps to convert the vibration energy to electricity, which can be read by the multimeter.
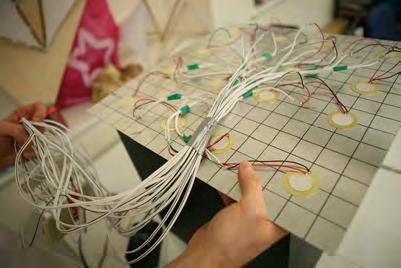
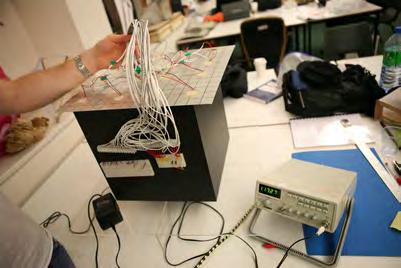
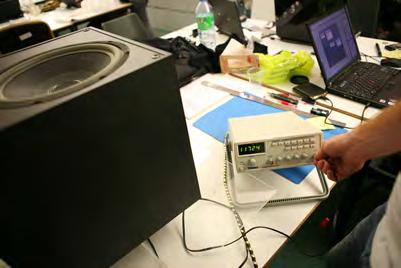
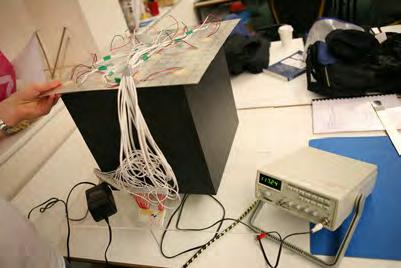
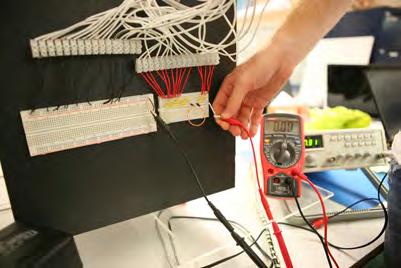

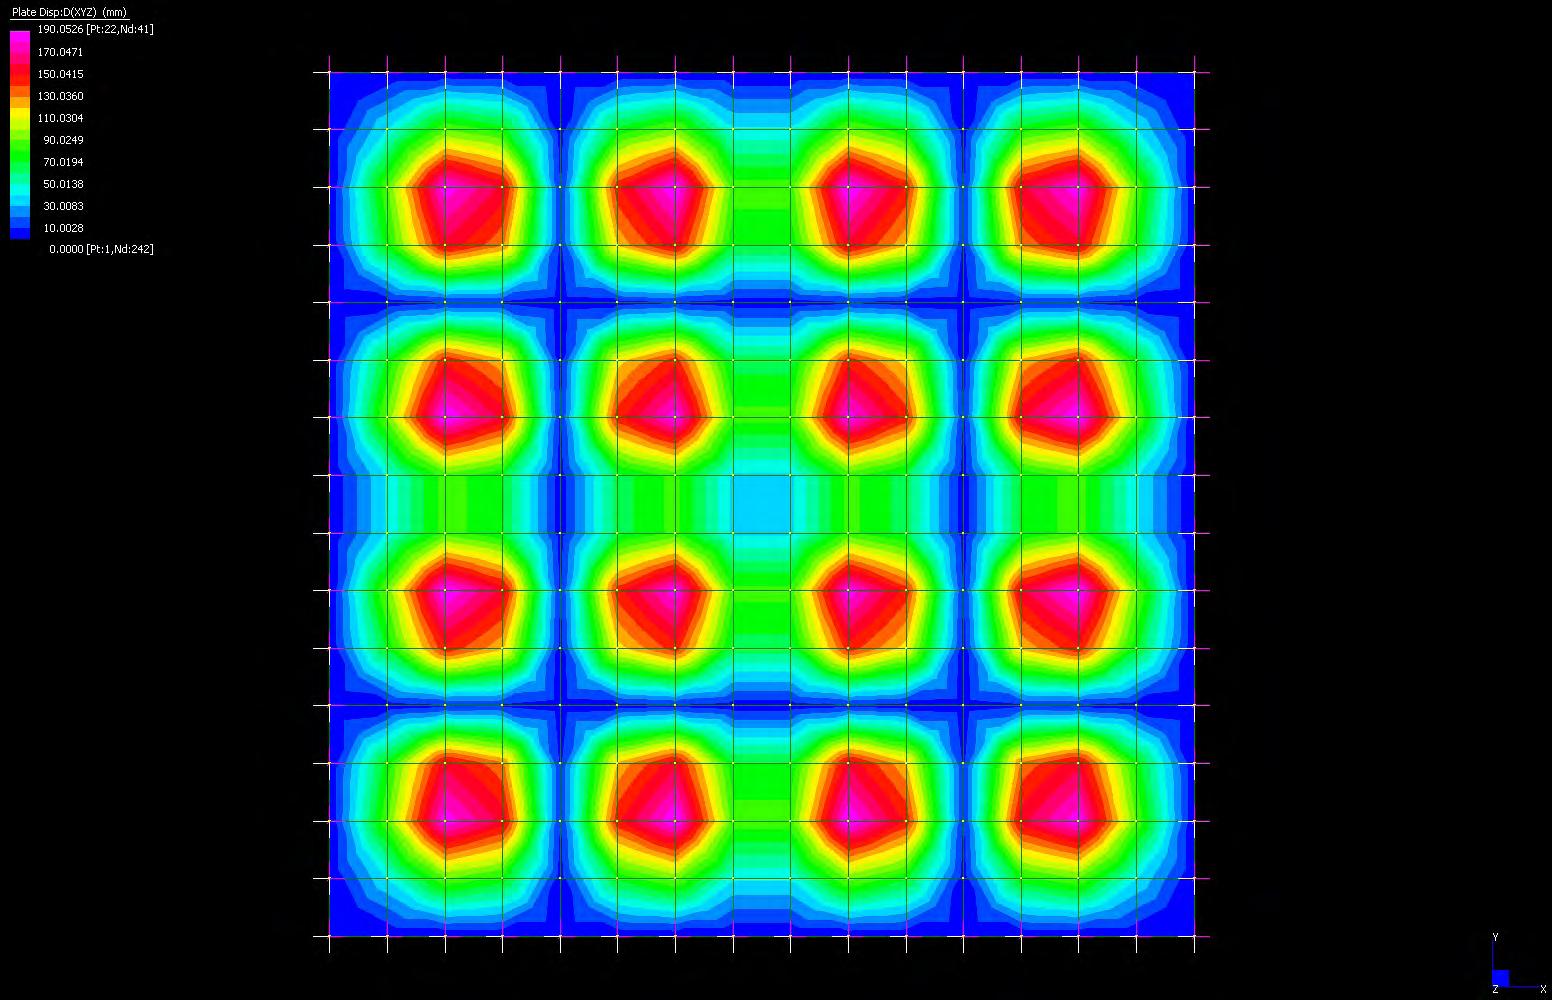
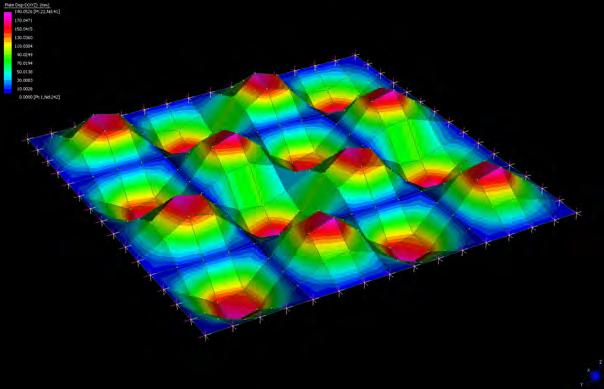
Total Displacement in the 125 Hz(resonance frequency) is analyzed by Strand7 with the input : Geometry data for the model(Dimension and Thickness), Material data(Young’s Modulus, Poisson’s ratio and Mass density), Mesh data(Element quantity). In the above example, the colour coded graphical output demonstrates the directional deformation in the Z-axis. Blue color is where the least deformation occurs; pink and red color are where the most deformation occurs in the positive and negative directions respectively, which can be seen more clearly from the perspective view on the right.
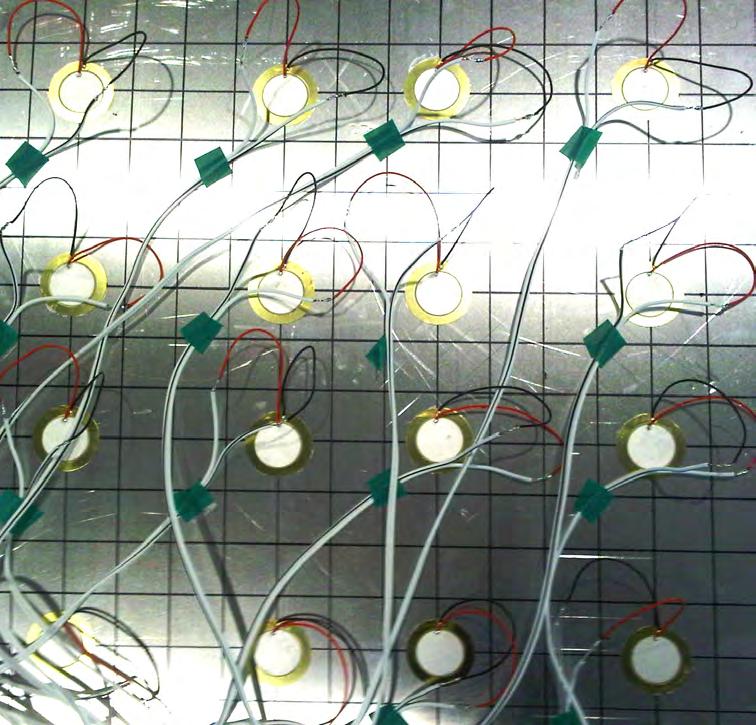
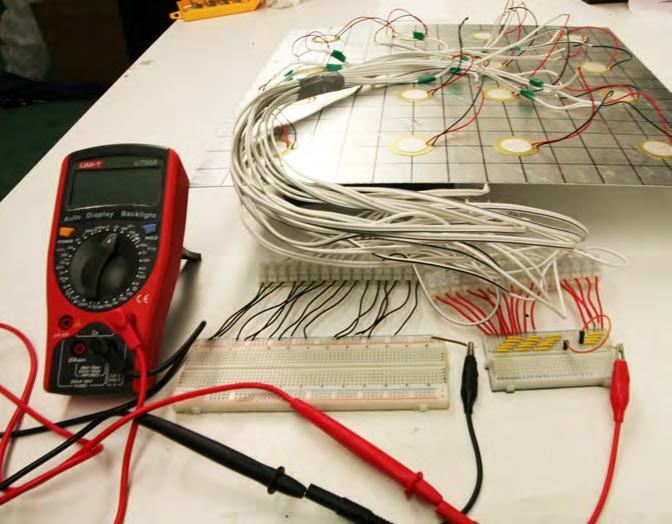
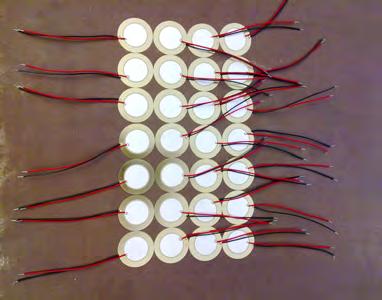
According to the Total Displacement analysis in the 125 Hz by Strand7. We placed the piezo ceramic pieces in the position of the red color where had the most positive or negative direction amplitude in order to get the maximum deformation, which also means the piezo ceramic in the accurate place(Figure 67) will have the best efficiency for energy conversion.
After that we calculated our circuit connection by the voltage control requirement of the capacitor(Figure 68).
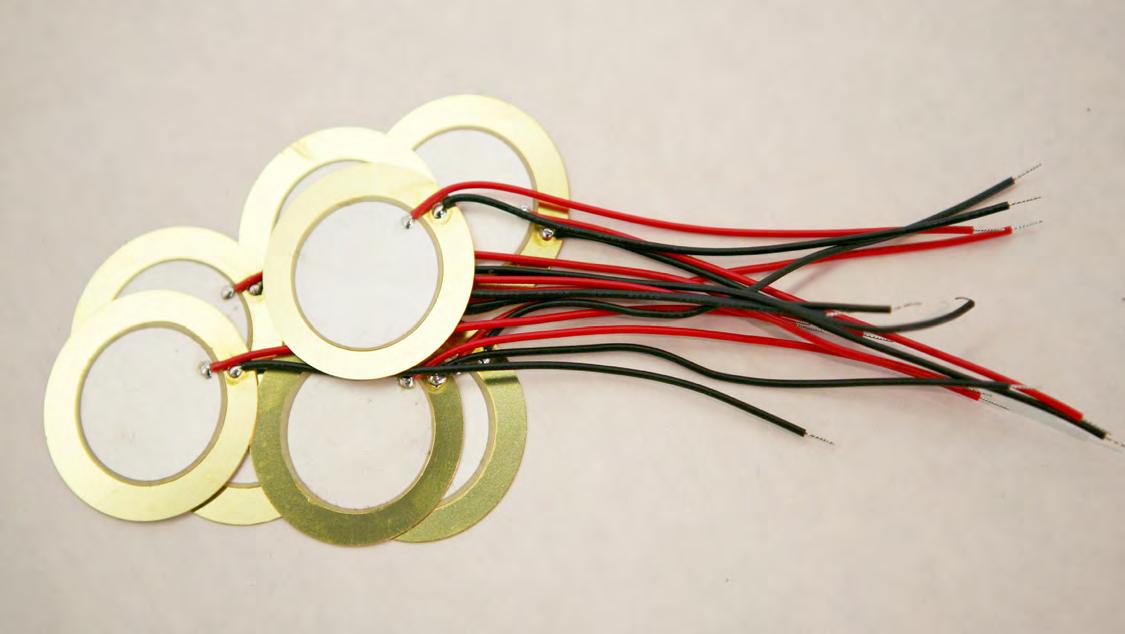
Piezo Ceramic Specifications:
operating voltage : 20V max
resonant frequency : 0.6kHz±0.5
resonant impedence : 1000Ω
electrostatic capacity : 70,000 ±30%
operating temperature : -20 to +70°C diameter : 30.0mm
depth : 0.23mm
weight : 2.0 grams
material : brass
termination : 4” wire lead
03.4 CONTEMPORARY MATERIALS
03.4.1
PIZEOELECTRICITY PORPERTY
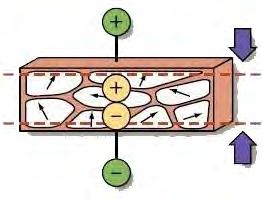
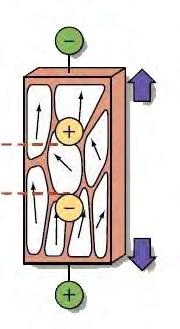
Piezoelectricity is the ability of some materials like crystals, certain ceramics, and biological matter such as bone to generate an electric field when a mechanical stress is applied( the substance is squeezed or stretched). The effect is directly connected to the change of polarization in crystals within the material’s capacity. As soon as the crystal is compressed, the ions in each unit cell are displaced causing the electric polarization to occur.
The piezoelectric result can now be observed in the crystal.
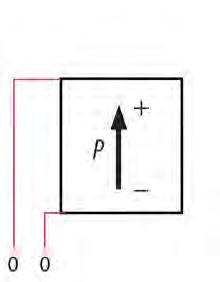
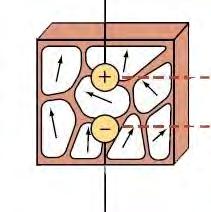
Figure 70 illustrates the piezoelectric effect. Figure (a) shows the piezoelectric material without a stress or charge. If the material is compressed, then a voltage of the same polarity as the poling voltage will appear between the electrodes (b). If stretched, a voltage of opposite polarity will appear (c). Conversely, if a voltage is applied the material will deform. Voltage applied
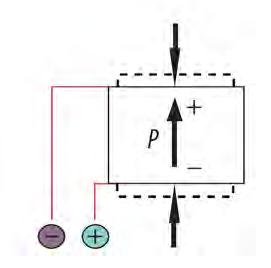
Shrinked state
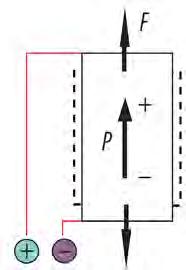
Shrinked state
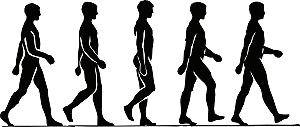
bodies of people move up and down walking the piezo electric blocks are squeezed, current is charged and stored in system.
As bodies of people move up and down by walking the piezo electric blocks are squeezed, current is charged and stored in battery system.

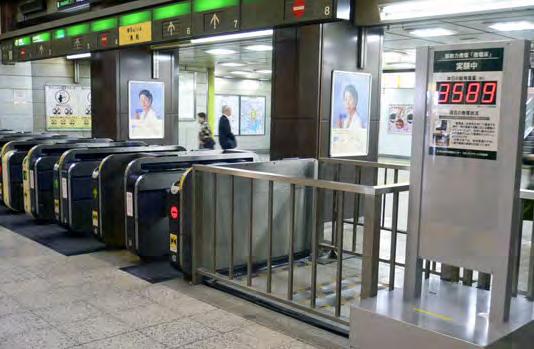
Example of ooring system is employed to collect elec power from the crowds.
Example of ooring system is employed to collect elec power from the crowds.


03.4.2
PIZEOELECTRICITY PRECEDENTS
As bodies of people move up and down by walking the piezo electric blocks are squeezed, current is charged and stored in battery system. The batteries are constatntly recharged by the movement pedestrians and used to power Led’s illumination. Example of flooring system is employed to collect electricity power from the crowds.
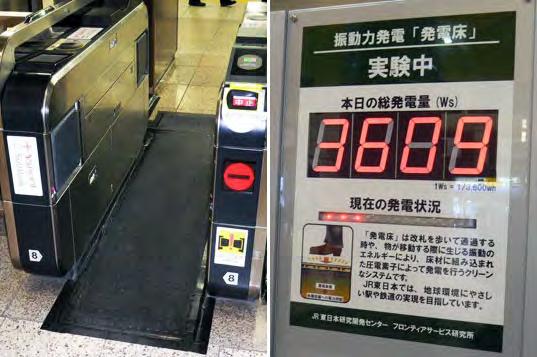
Recently, an increasing number of reports are emerging regarding the development of piezoelectric systems to harness the energy created from the movement of pedestrians and vehicles.
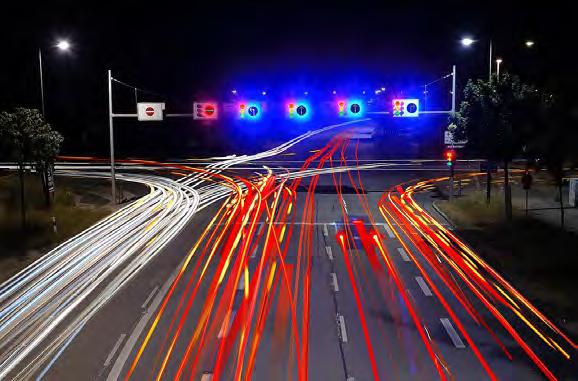
As reported in New Scientist 2007, Haim Abramovich at the Technion-Israel Institute of Technology in Haifa has developed a method of converting road vibrations into electricity. Abramovich claims that piezoelectric crystals are placed under the bitumen during construction and can ultimately generate up to 400 kilowatts per kilometre of 4 lane highway.
Equally interesting was the contunuing experiments by the East Japan Railway Company in harnessing the power of its millions of daily subway users through the use if piezo electric devices at heavily trafficed areas.
JR East began its experiment on December 2008 and continued it until February 2009. The power-generating floor covered an area of 25m 2 and was installed at 7 ticket gates and 7 staircase steps inside the gate.
The floors can produce 1,400 kilowatts each day, and the company is planning ultimately used the train station floors to power ticket gates and electronic display systems.
[ Ref. Text: 35]
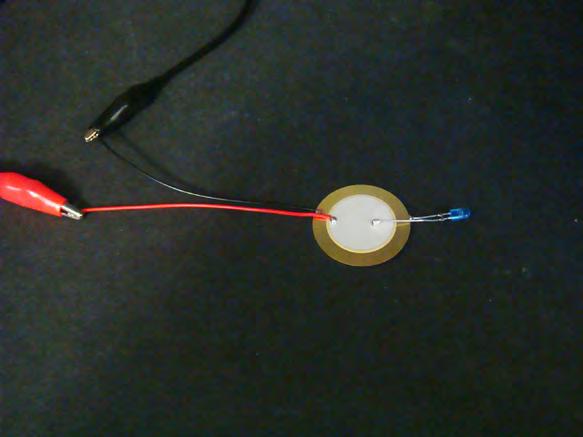
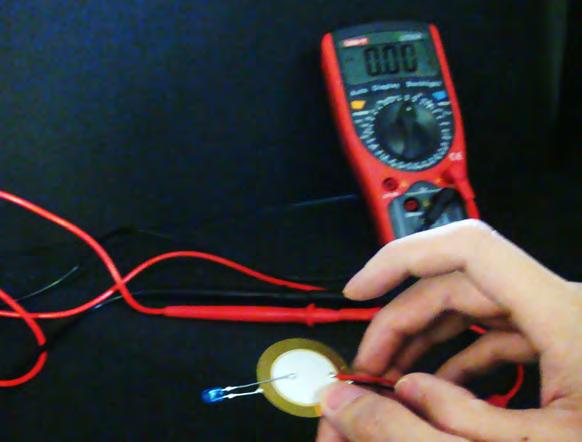
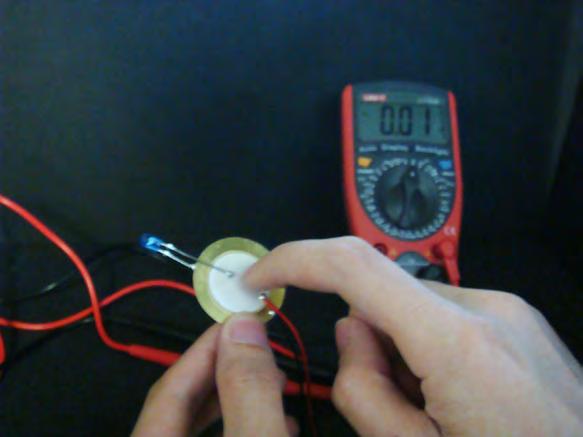
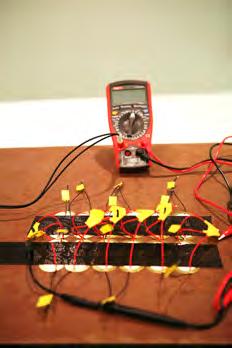
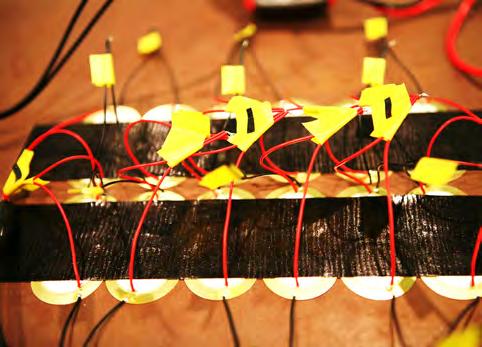
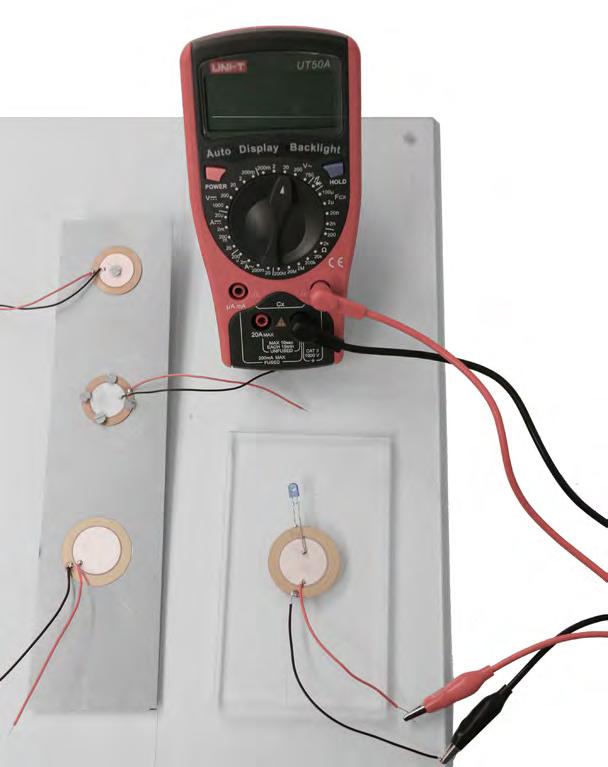
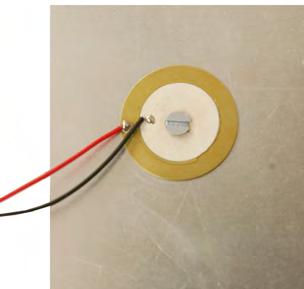
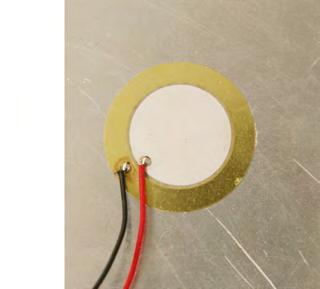
Beforce we connected the piezo ceramic with the aluminium. We did several test to see how can the piezo generates energy from or pressure. A simple piezoelectric disk (the kind that you use as a transducer/sounder) can be used in reverse to generate a momentary voltage. The above pictures show how an LED, soldered across the disks of a piezo, illuminates when the disk is tapped or pressed. From the tests, we noticed that the LED lights more effectively when the piezo is pressed rather than tapped.
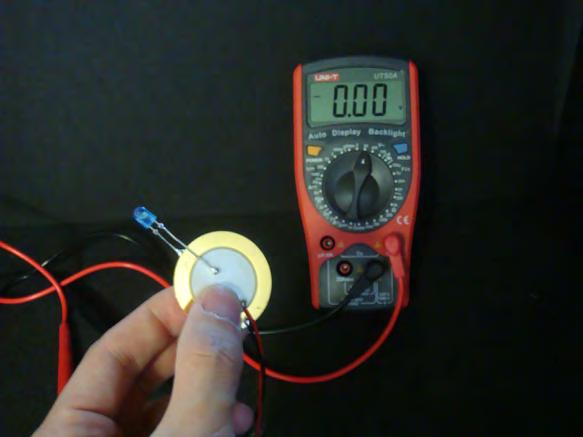
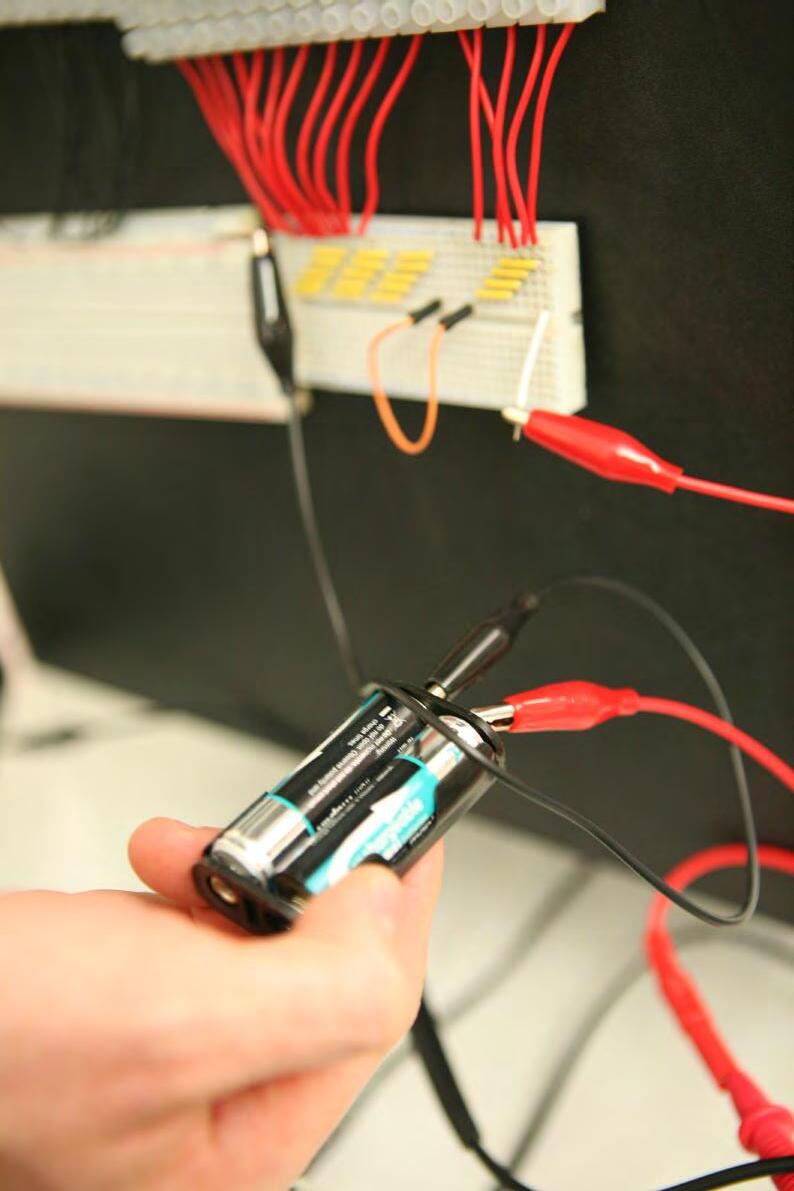
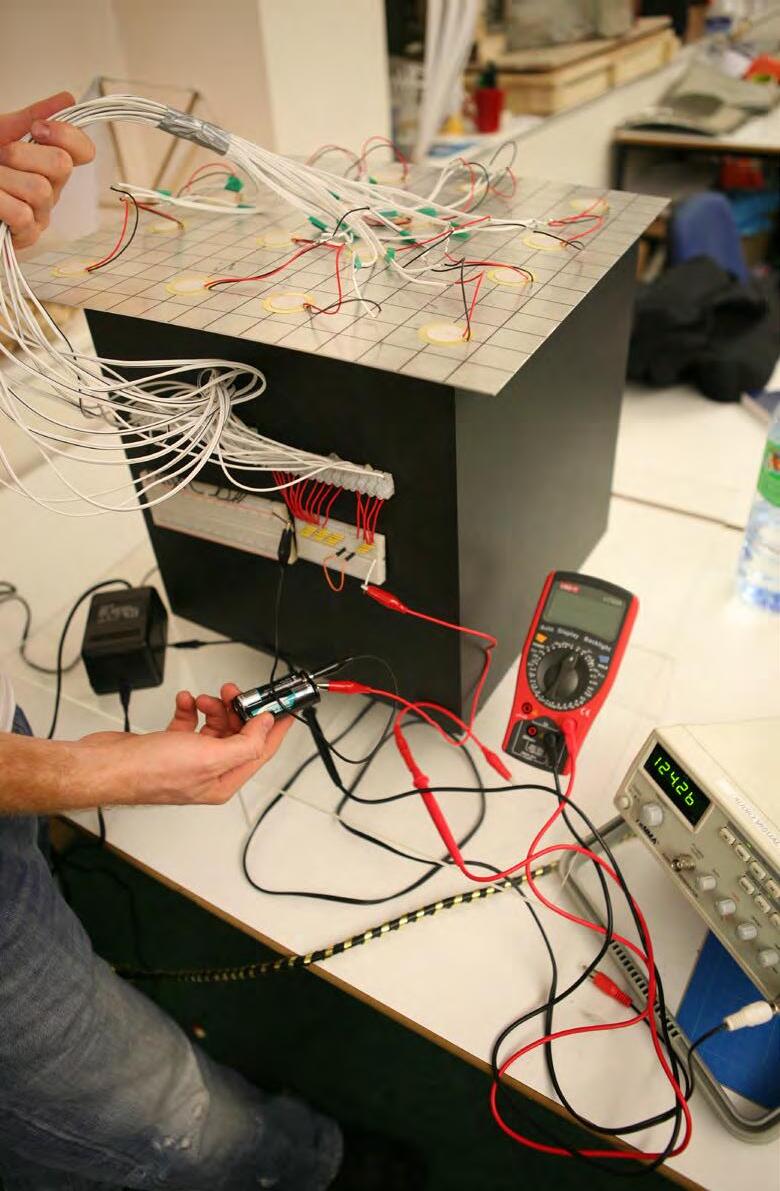
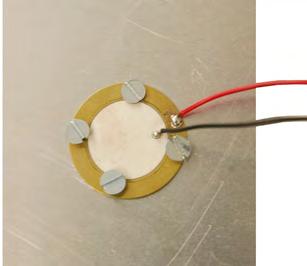
After we realized the conversion property of piezo, we began to link the piezos in to a circuit. The first piezo circuit was hybrid connected with series-parallel, which was very unstable. The voltage of this circuit was from 0-6. Some of the piezo ceramics didn't work during the testing. The second circuit was a parallel connection. The voltage was recorded around 3-6. All the piezo worked well in this circuit.
METHODS OF INCREASING EFFICIENCY
Methods of connection
The energy conversion property of piezo is depend on the deformation extent. How is the piezo connect to the plate decides how many energy it can generate. We tried three different types of connection:
(A) Bolt in the center;
(B) Bolt around the edge;
(C) Glue.
The first bolting connection is the weakest in three of them. It only generated around 1.5 volt. The reason is piezo disk just bolted in the central point which means it got the force from one point. However, once we glued the whole piezo to the plate, it created 6-9 volt, much higher than the first one. This is because when we used glue methods, the piezo will totally connect to the plate and get the maximum amplitude.

Material of plate
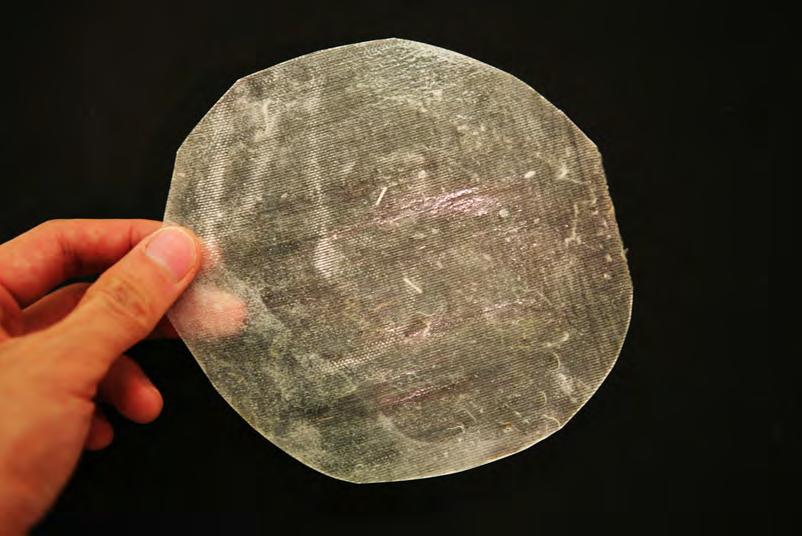
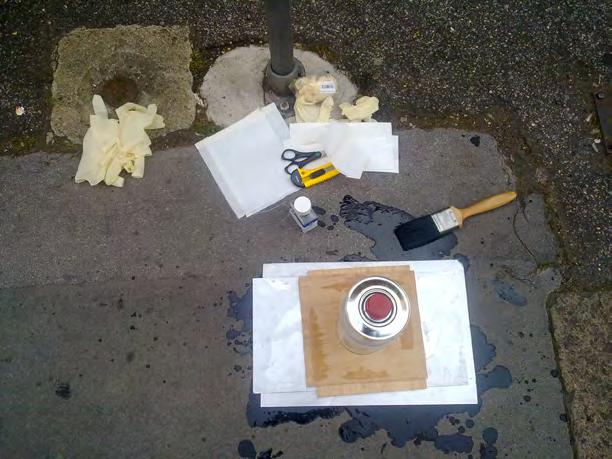
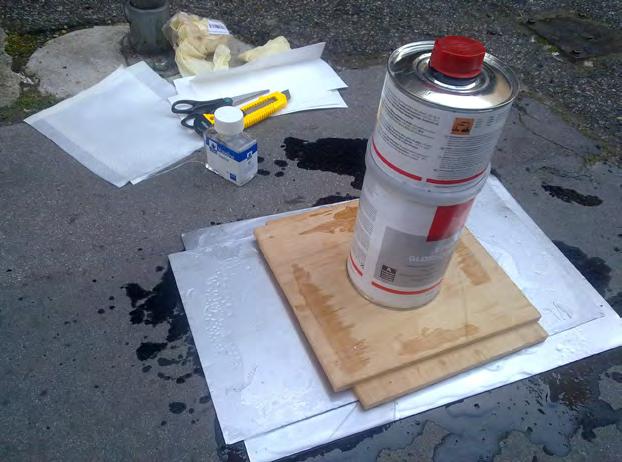
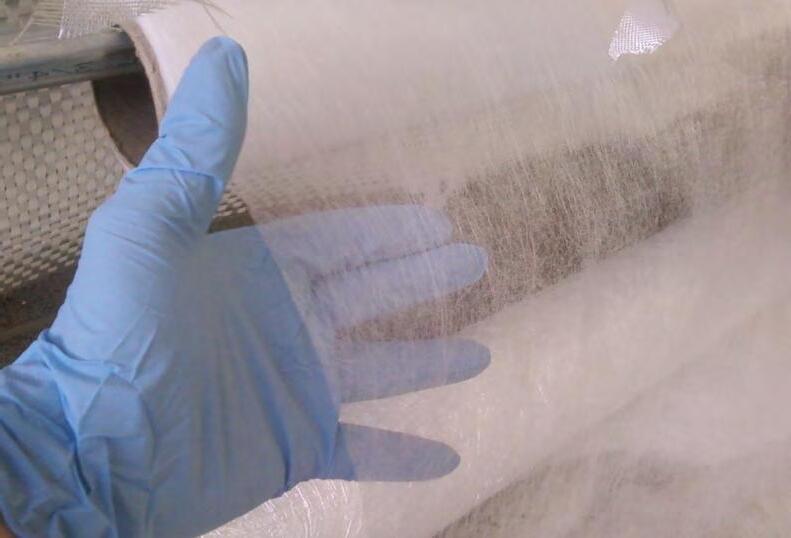
The vibration efficiency lead to the energy conversion. We tried to used surface veil instead of aluminum in order to keep the similar stiffness but reduce the weight.
Surface veil is a random reinforcement with low superficial density, and is produced from a fine (low tex) glass fibre. This material is used in LCM to provide a high quality surface finish by eliminating fibre strike-through and creating a resin rich surface layer, or alternatively where chemical resistance is required. The use of a surface veil may elimainate the need for a gel coat. A number of materials are commercially available based on either chopped or continuous filaments held together with either a polyester or PVA blinder, with typical superficial densities in the range 30-100 g/m2
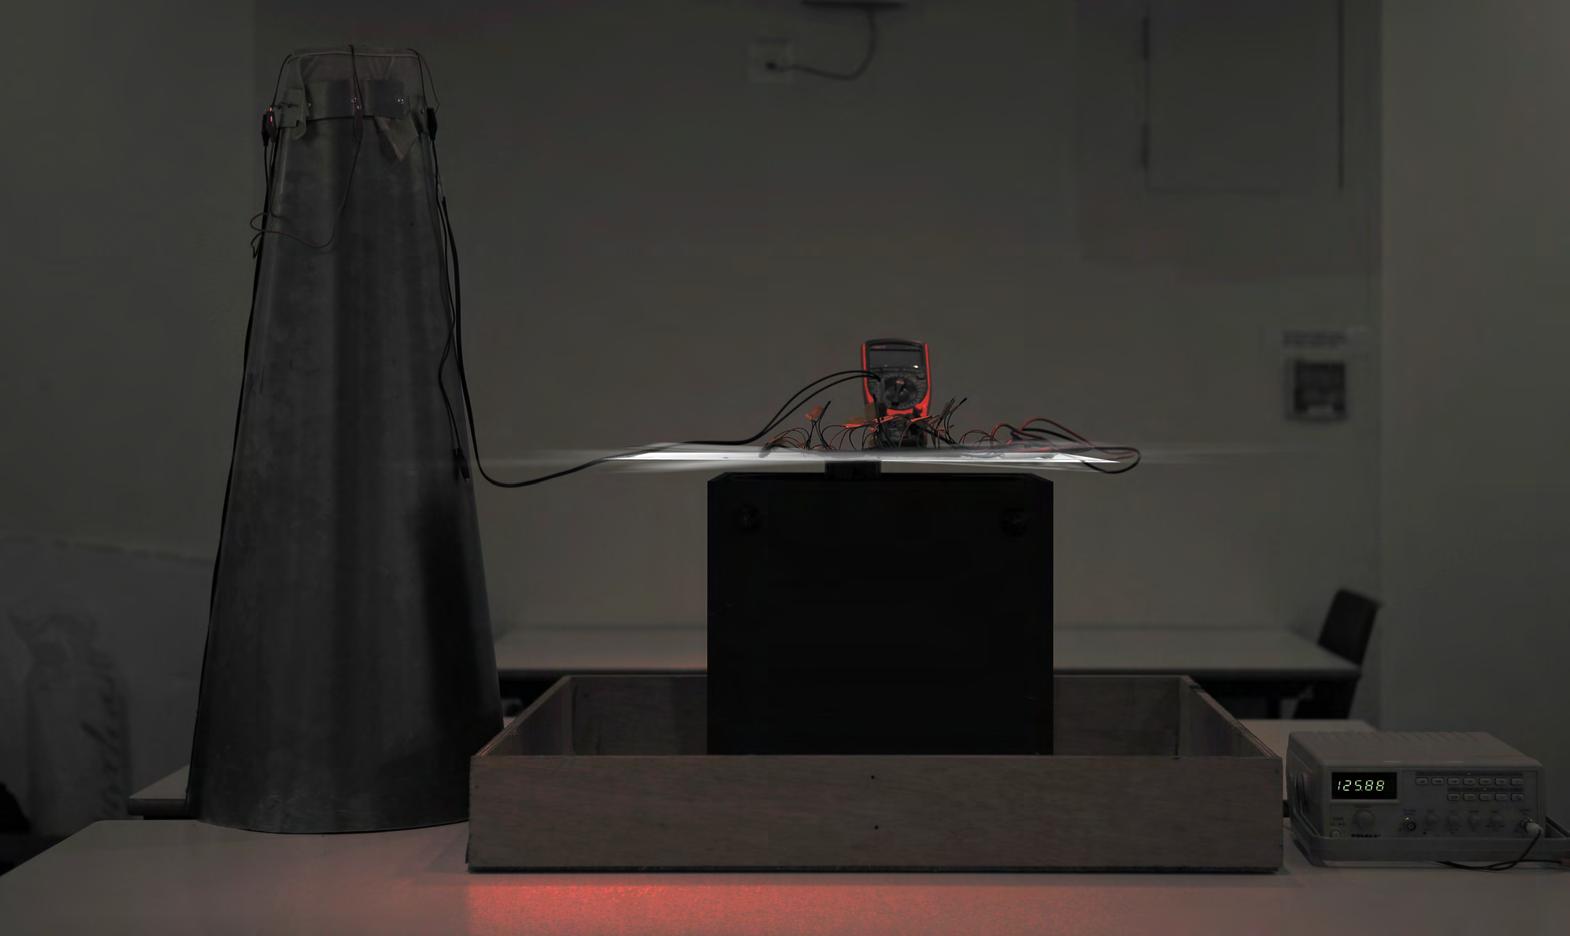
When using piezoelectric materials as a means of gathering energy from the surroundings, in most cases it is a necessity that a means of storing the energy generated be used. Without accumulating a significant amount of energy, the power harvesting system will not be a feasible power source for most electronics.
In our case, sound as a form of excitation energy was tested and it was found that it could generate power and was able to recharge a fully discharged battery without the use of external energy sources. We test the aluminum plate (41 cm x 41 cm) with 16 pieces of piezoelectric material(radius 1.5 cm) at 125Hz, 80dB(according to our site’s noise environment) for 2.5 hours. It totally charge 180 mAh, so the total energy is 1.2V x 180mAh = 216 Wh
The test is for a small piece of piezoelectric material. Once it’s used in a urban scale, which means the quantity is enormous, the energy harvesting is considerable.
According to the record from the digital multimeter, the efficiency of the piezo charging rise very high in the beginning. Half an hour later, there is a bottleneck appeared at around 90 mAh. After 1.5 hour charging, the harvesting was getting slower. We think this is because the fatigue property of the material.
03.6 RESONATOR PROTOTYPE ANALYSIS
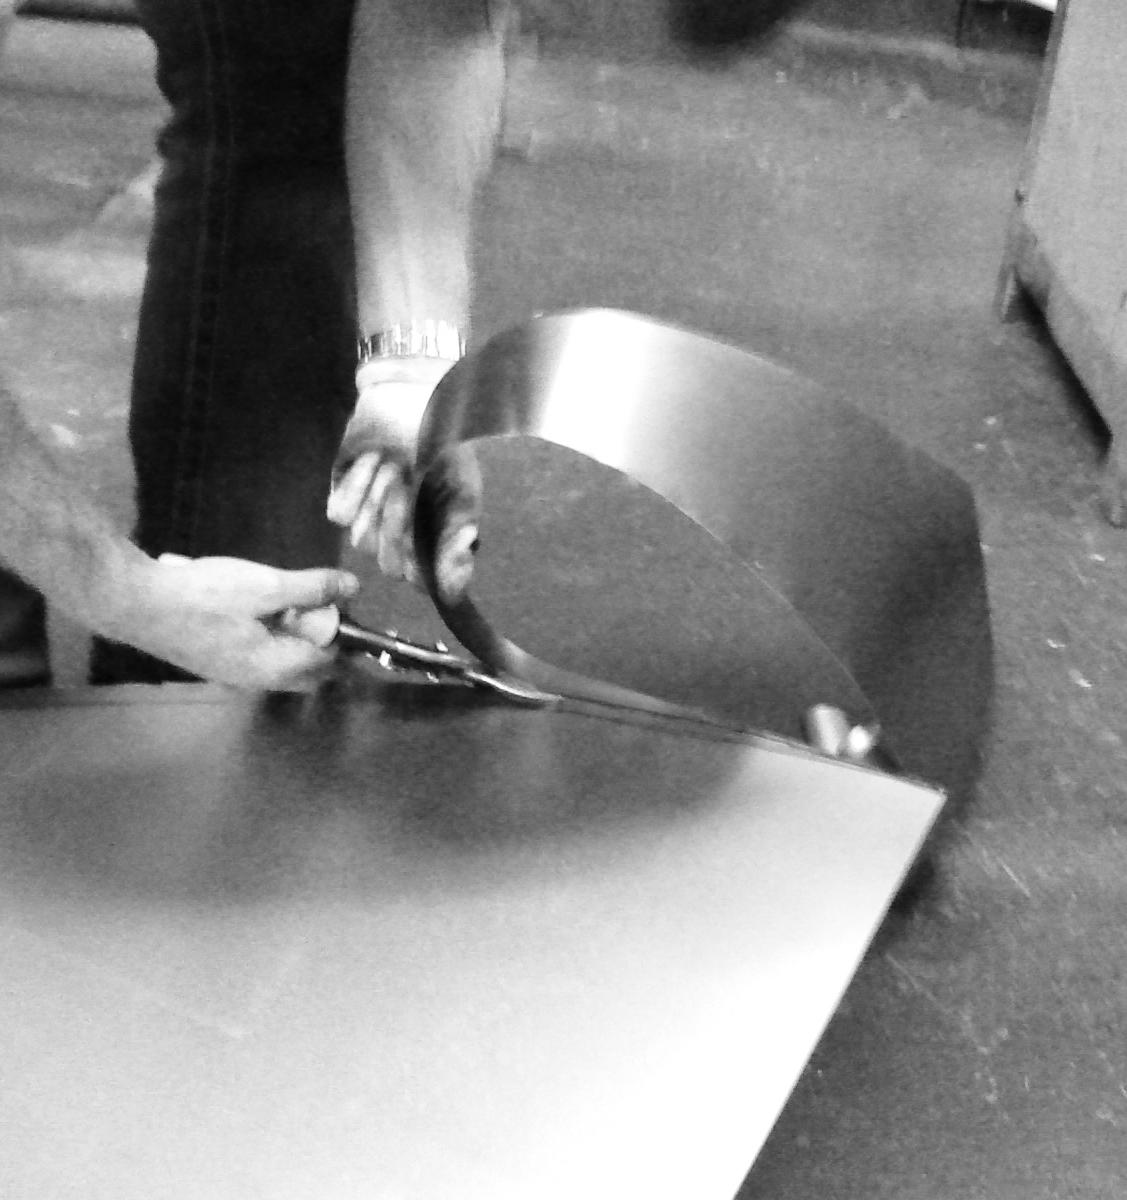
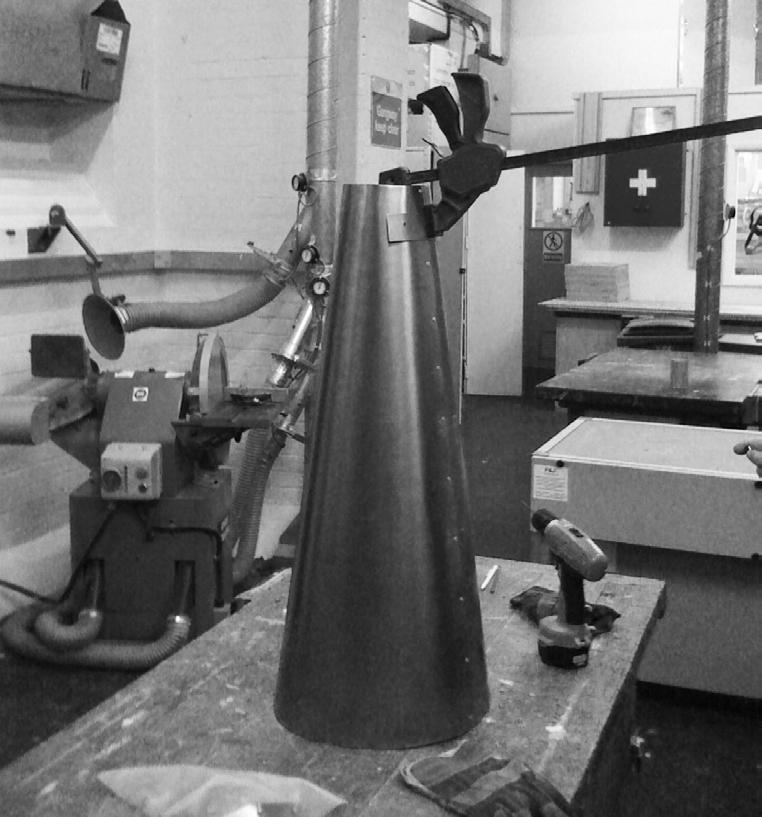
As part of the initial testing design we produced one prototype cone. The behavioural of the material was very important, sheet metal contain grain direction, and because they are stretched and aligned as the metal sheet is produced it was not possible to predict how does the metal will bend.
In order to fabricate the initial cone we designed it using computer aided software, and once cut the sheet using manual metal scissor, we pinpointed the exact location where the sheet should be joined and fix the whole module with locknuts. In a later stage we added the surface veil with the precise location of the piezoelectric components.
Rockwool acting as absorptive material
Piezoelectric Ceramics
Reinforced Concrete
Noise acting as Input
Materials of resonator prototype[Ref. Illustrative: 82]
Material data: Concrete
Density
2300 k m^-3
Coefficient of Thermal Expansion 1.4E-05 C^-1
Reference Temperature 22 C
Young’s Modulus
3E+10 Pa
Poisson’s Ratio 0.18
Bulk Modulus 1.5625E+10 Pa
Shear Modulus 1.2712E+10 Pa
Tensile Yield Strength 0 Pa
Compressive Yield Strength 0 Pa
Tensile Ultimate Strength 5E+06 Pa
Compressive Ultimate Strength 4.1E+07 Pa
Material data: Aluminium Alloy
Density
2770 kg m^-3
Coefficient of Thermal Expansion 2.3E-05 C^-1
Reference Temperature 22 C
Young’s Modulus
7.1E+10 Pa
Poisson’s Ratio 0.33
Bulk Modulus
Shear Modulus
Tensile Yield Strength
6.9608E+10 Pa
2.6692E+10 Pa
2.8E+08 Pa
Compressive Yield Strength 2.8E+08 Pa
Tensile Ultimate Strength 3.1E+08 Pa
Compressive Ultimate Strength 0 Pa
Total Mesh Displacement
Default Boundary
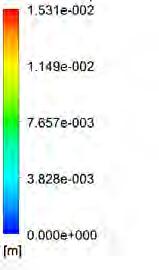
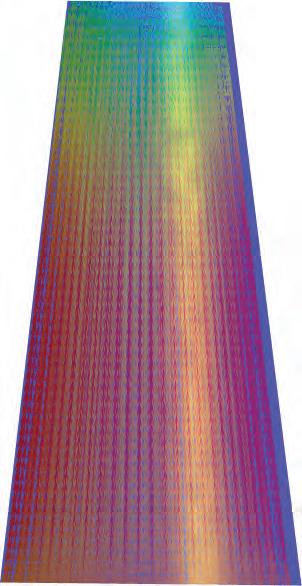
Total Displacement in the 1pa (equal to 90dB) environment is analysed by ANSYS FSI(Fluid Structure Interface)with the input : Resonator material(Concrete); Vibrating plate material(Aluminium Alloy); Fluid material(Air on 22C). In the above example, the colour coded graphical output demonstrates the directional deformation in the Z-axis. Blue color is where the least displacement occurs; red color is where the most deformation occurs in the positive and negative directions respectively, which can be seen more clearly from the zoom in view on the right.
RESONATOR GEOMETRY EVOLUTION
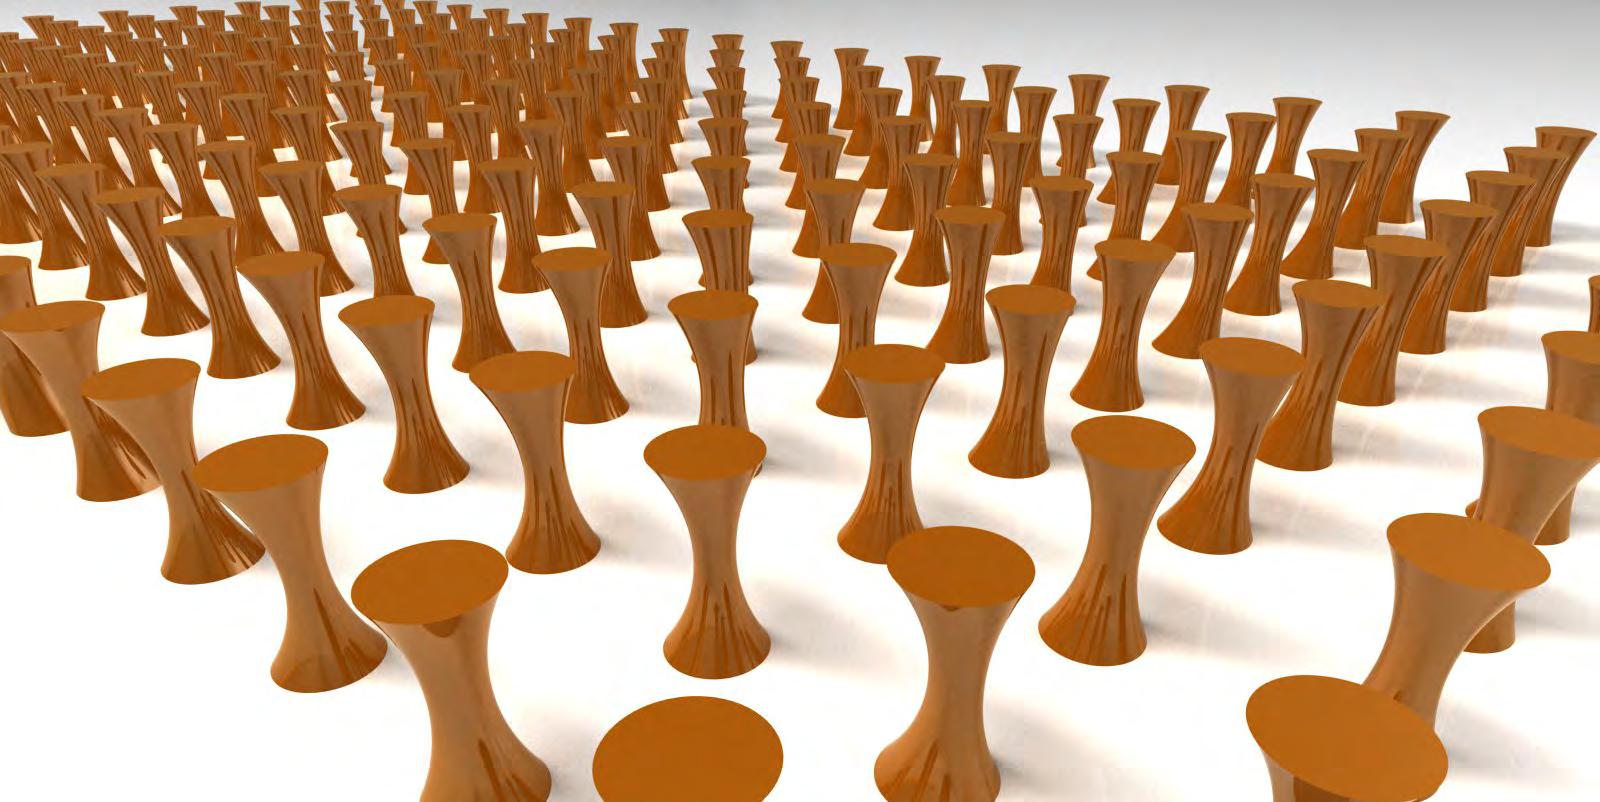
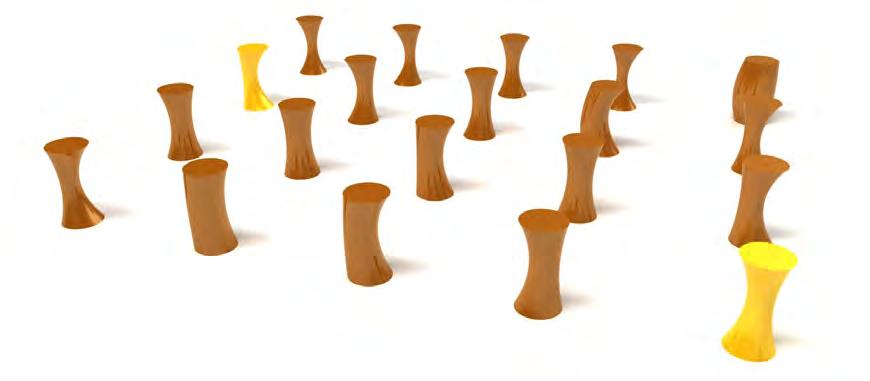
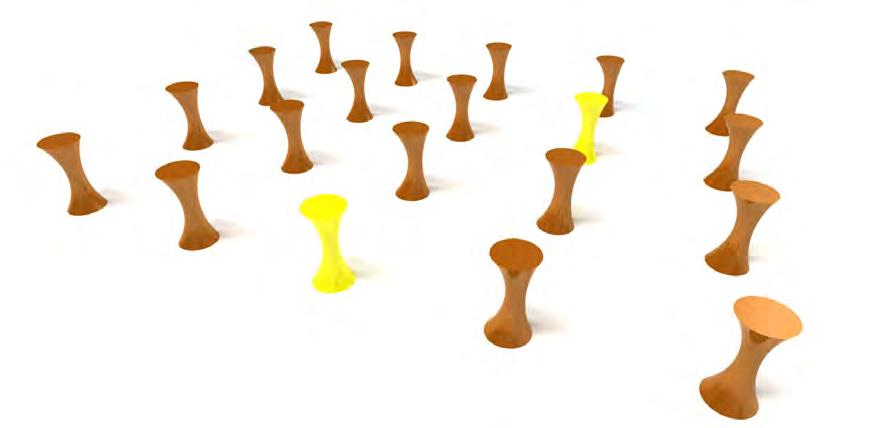
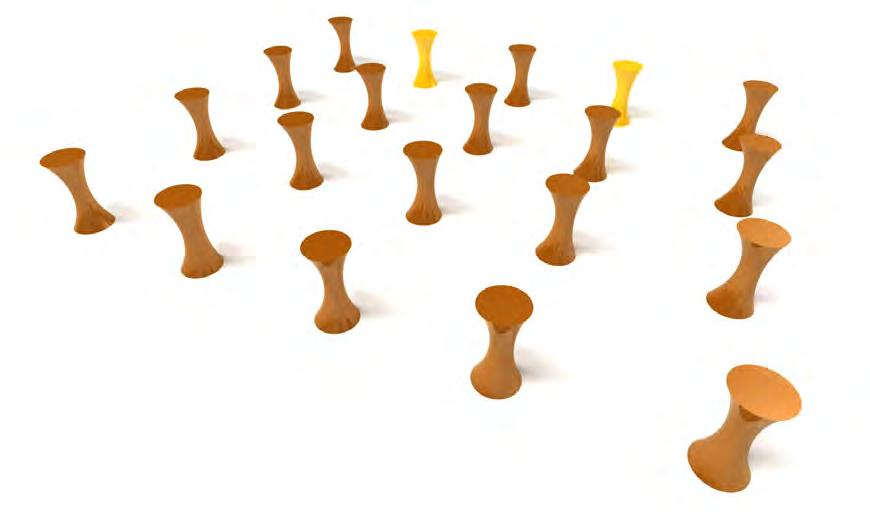
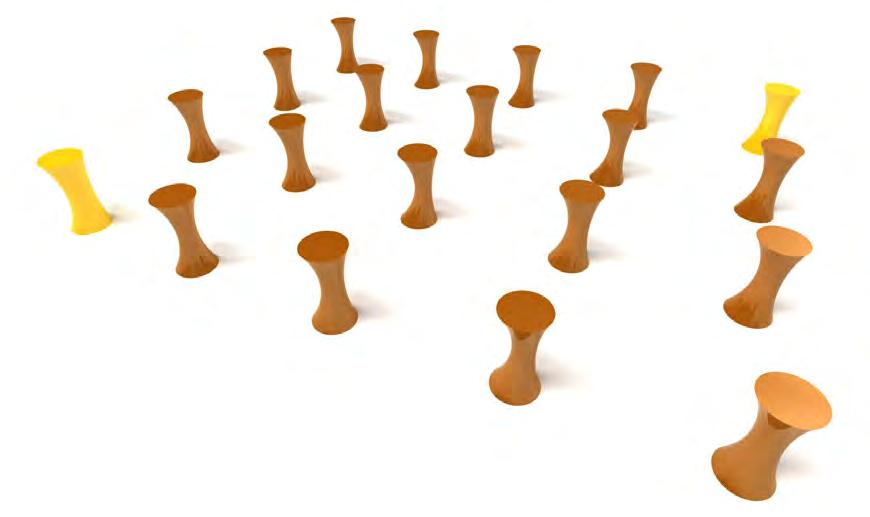
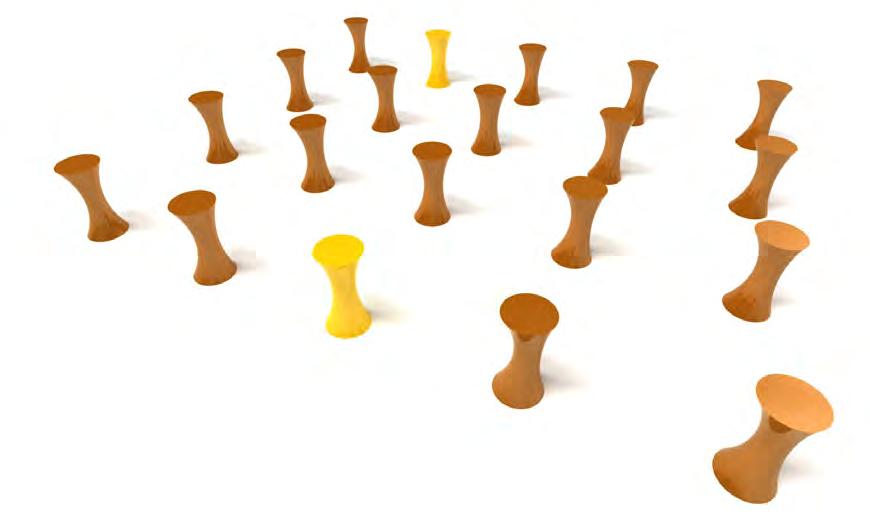
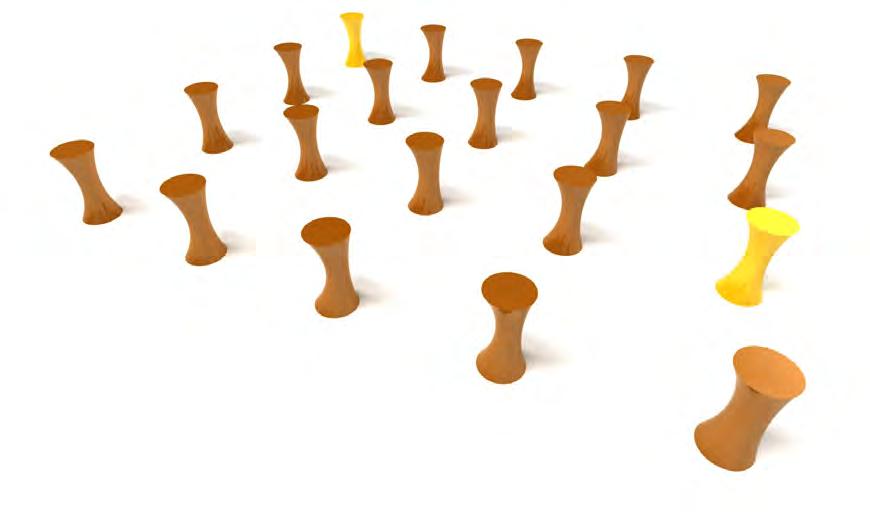
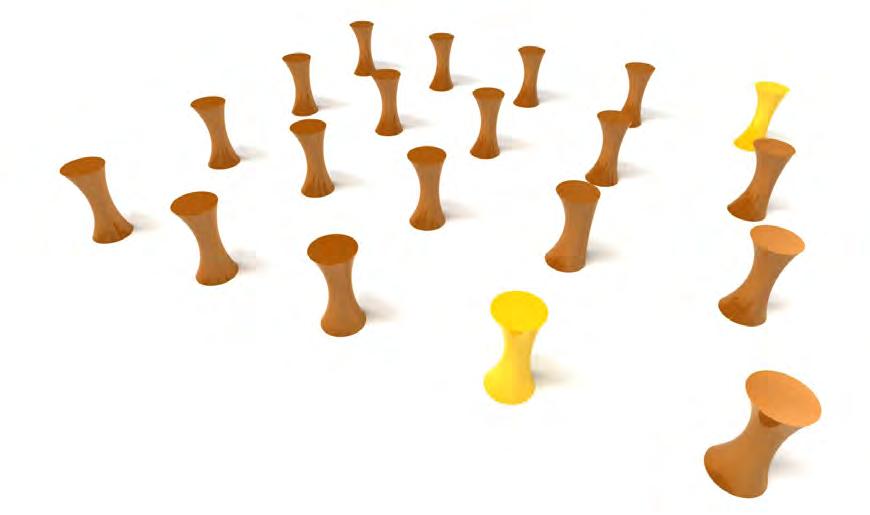
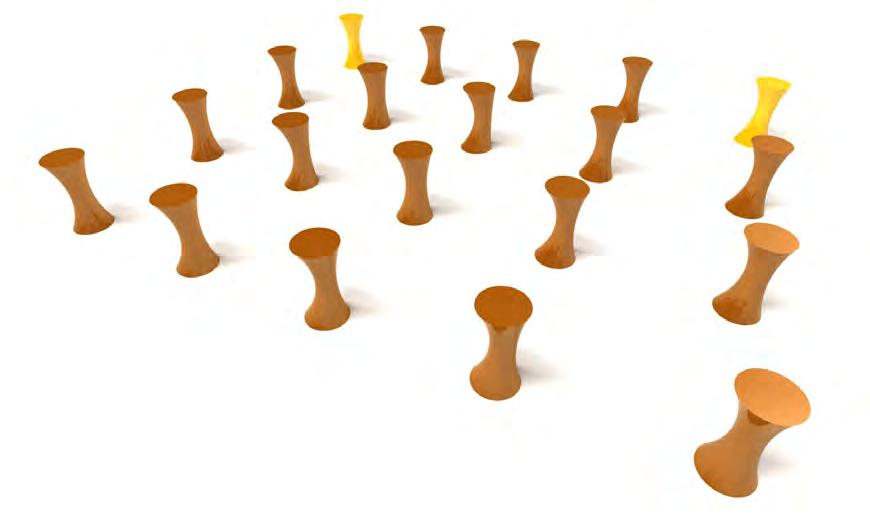
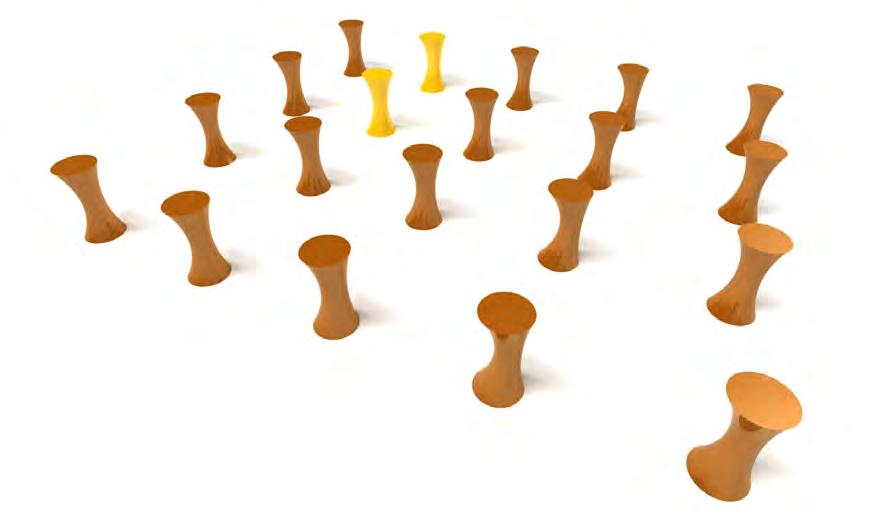
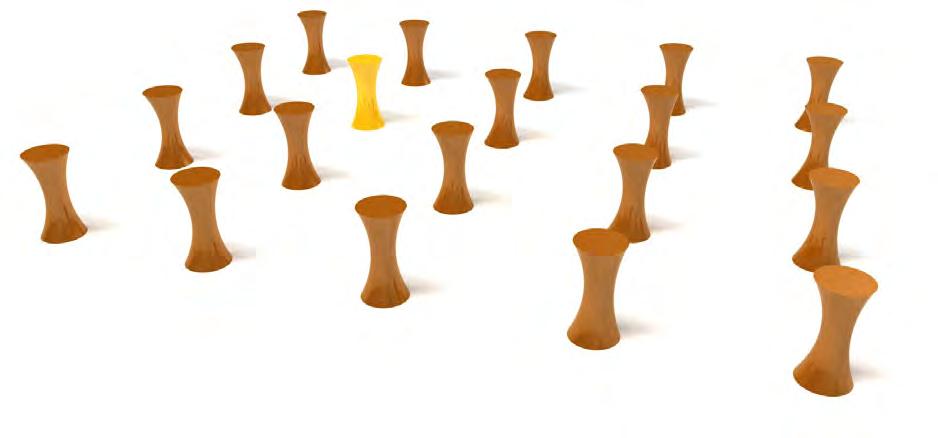
After analysing the cone-shaped resonator prototype, we considered to optimise the geometry as another method for increasing the energy conversion efficiency. The shape of the resonator was optimized by scripting, using the knowledge of fitness criteria from the Emergence course.
Each cone was defined by 3 circles: top, middle and bottom. Top and bottom circles are fixed. The middle one was randomly selected from scale, move and rotate options. We created 10 generations, each generation includes 20 populations. The fitness criteria is use the geometry volumn(simular to the noise boundary) divided by the middle circle’s surface area(simular to the piezo plate area). The result will be the amount of noise energy in unit surface. The larger the better. After that, we made a rank for each generation and selected the best two populations to do a cross over and mutation. Finally we got a fittest shape in the last generation which will be the geometry of our component.
objFitness(10)
objFitness(4) objFitness(11) objFitness(17)
objFitness(0) objFitness(14) objFitness(9)
objFitness(12) objFitness(16)
objFitness(15)
objFitness(18)
objFitness(5) objFitness(3) objFitness(8)
objFitness(6)
objFitness(7) objFitness(2) objFitness(13)
objFitness(1) objFitness(19)
objFitness(2) objFitness(13) objFitness(7) objFitness(15) objFitness(1) objFitness(14) objFitness(9) objFitness(11) objFitness(18) objFitness(0) objFitness(4) objFitness(5) objFitness(8) objFitness(16) objFitness(12) objFitness(8) objFitness(3) objFitness(10)
objFitness(19) objFitness(17) objFitness(6)
objFitness(10) objFitness(4) objFitness(11) objFitness(17) objFitness(0) objFitness(14) objFitness(9) objFitness(12) objFitness(16) objFitness(18) objFitness(5) objFitness(3) objFitness(8) objFitness(7) objFitness(2) objFitness(13)
objFitness(16)
objFitness(18) objFitness(3) objFitness(19)
objFitness(1) objFitness(6) objFitness(8)
objFitness(10) objFitness(14) objFitness(2) objFitness(4) objFitness(5) objFitness(7) objFitness(11)
objFitness(12) objFitness(13) objFitness(17) objFitness(15)
objFitness(0) objFitness(9)
objFitness(19) objFitness(0) objFitness(13) objFitness(14) objFitness(3) objFitness(6) objFitness(10) objFitness(11) objFitness(9) objFitness(17) objFitness(2) objFitness(1) objFitness(16) objFitness(8) objFitness(18) objFitness(12) objFitness(4) objFitness(5)
objFitness(7) objFitness(15)
objFitness(2) objFitness(16) objFitness(17) objFitness(19) objFitness(9) objFitness(6) objFitness(13) objFitness(18) objFitness(4) objFitness(6) objFitness(8) objFitness(10) objFitness(3) objFitness(5) objFitness(11) objFitness(12) objFitness(15) objFitness(0)
objFitness(7) objFitness(1)
objFitness(9)
objFitness(15)
objFitness(3) objFitness(4) objFitness(6) objFitness(11) objFitness(18 objFitness(13) objFitness(14) objFitness(0) objFitness(17) objFitness(16) objFitness(1) objFitness(5) objFitness(2) objFitness(10) objFitness(12) objFitness(7)
objFitness(8) objFitness(19)
objFitness(19)
objFitness(3)
objFitness(8)
objFitness(11)
objFitness(14)
objFitness(1)
objFitness(2)
objFitness(4)
objFitness(6)
objFitness(7)
objFitness(10)
objFitness(16)
objFitness(15)
objFitness(18)
objFitness(17)
objFitness(0)
objFitness(12)
objFitness(9) 4
objFitness(5) objFitness(13)
objFitness(15)
objFitness(19)
objFitness(5)
objFitness(9)
objFitness(16)
objFitness(8)
objFitness(14)
objFitness(1)
objFitness(5)
objFitness(2)
objFitness(4)
objFitness(18)
objFitness(0)
objFitness(11)
objFitness(13)
objFitness(17)
objFitness(12)
objFitness(10)
objFitness(7)
objFitness(6)
objFitness(11)
objFitness(16) objFitness(14) objFitness(19) objFitness(8) objFitness(12) objFitness(0)
objFitness(1) objFitness(4) objFitness(7) objFitness(5) objFitness(15) objFitness(6) objFitness(9)
objFitness(18) objFitness(13) objFitness(3)
objFitness(2)
objFitness(10) objFitness(17)
objFitness(11)
objFitness(1) objFitness(14) objFitness(4) objFitness(2) objFitness(3) objFitness(12) objFitness(13) objFitness(5) objFitness(16) objFitness(15) objFitness(17) objFitness(19)
objFitness(8) objFitness(7) objFitness(9) objFitness(10) objFitness(6) objFitness(0) objFitness(18)


03.8 ACOUSTIC UNIT EXPLANATION
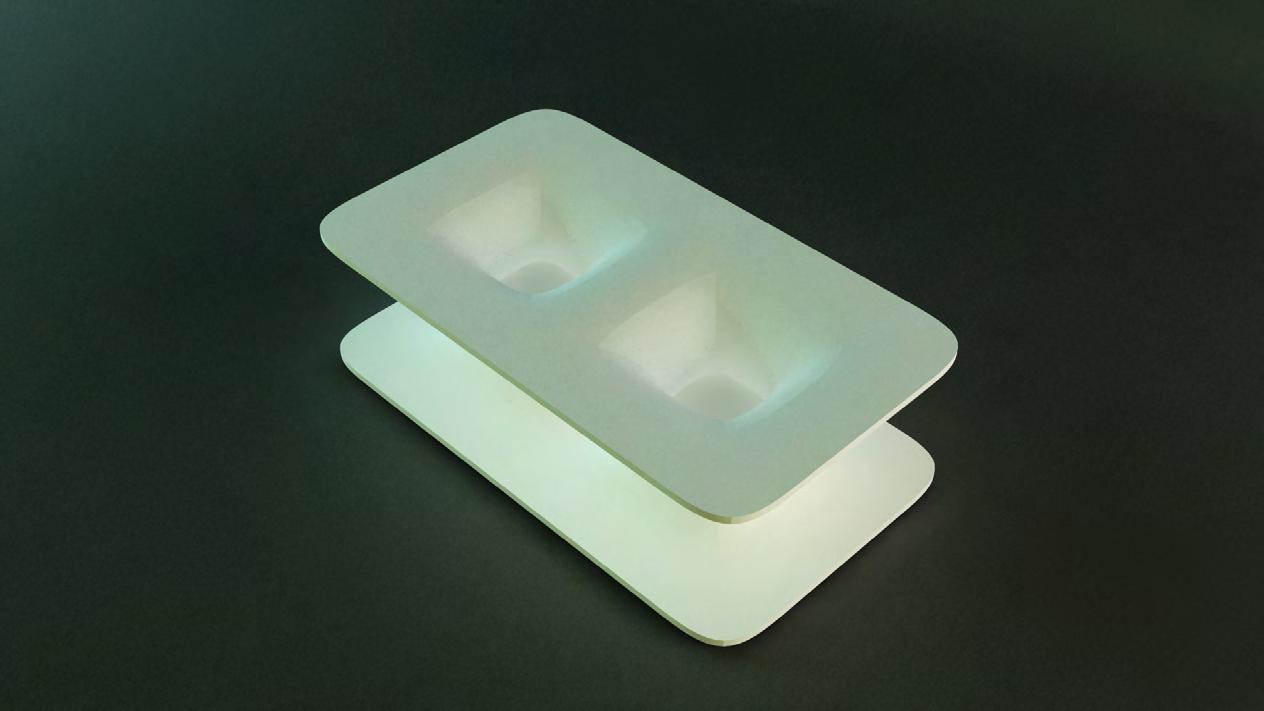
The piezoelectric effect is present in two domains, according to Henry A. Sodano, Daniel J. Inman in their Review on Power Harvesting from Vibration using Piezoelectric Materialsthe first is the straight piezoelectric outcome that describes the material’s ability to convert mechanical strain into electrical charge, as for the second effect is the conversion one, where is the capability to change an applied electrical potential into mechanical energy. The middle membrane that is embedded with the piezoelectric material, has the abilty to function as a sensor and the converse piezoelectric effect is accountable for its ability to function as an actuator.


in
The energy sound waves which will absorb will be converted from mechanical energy from the surrounding, usually ambient vibration and transform it into electrical energy that can be used to power other devices. (component section figure 88)
Acoustic Velocity Analysis in ANSYS by ANSYS
Vibrating example, the the Z-axis. deformaseen more
03.9.1
FINAL COMPONENT ANALYSIS
COMPONENT ANALYSIS IN ANSYS Inc.
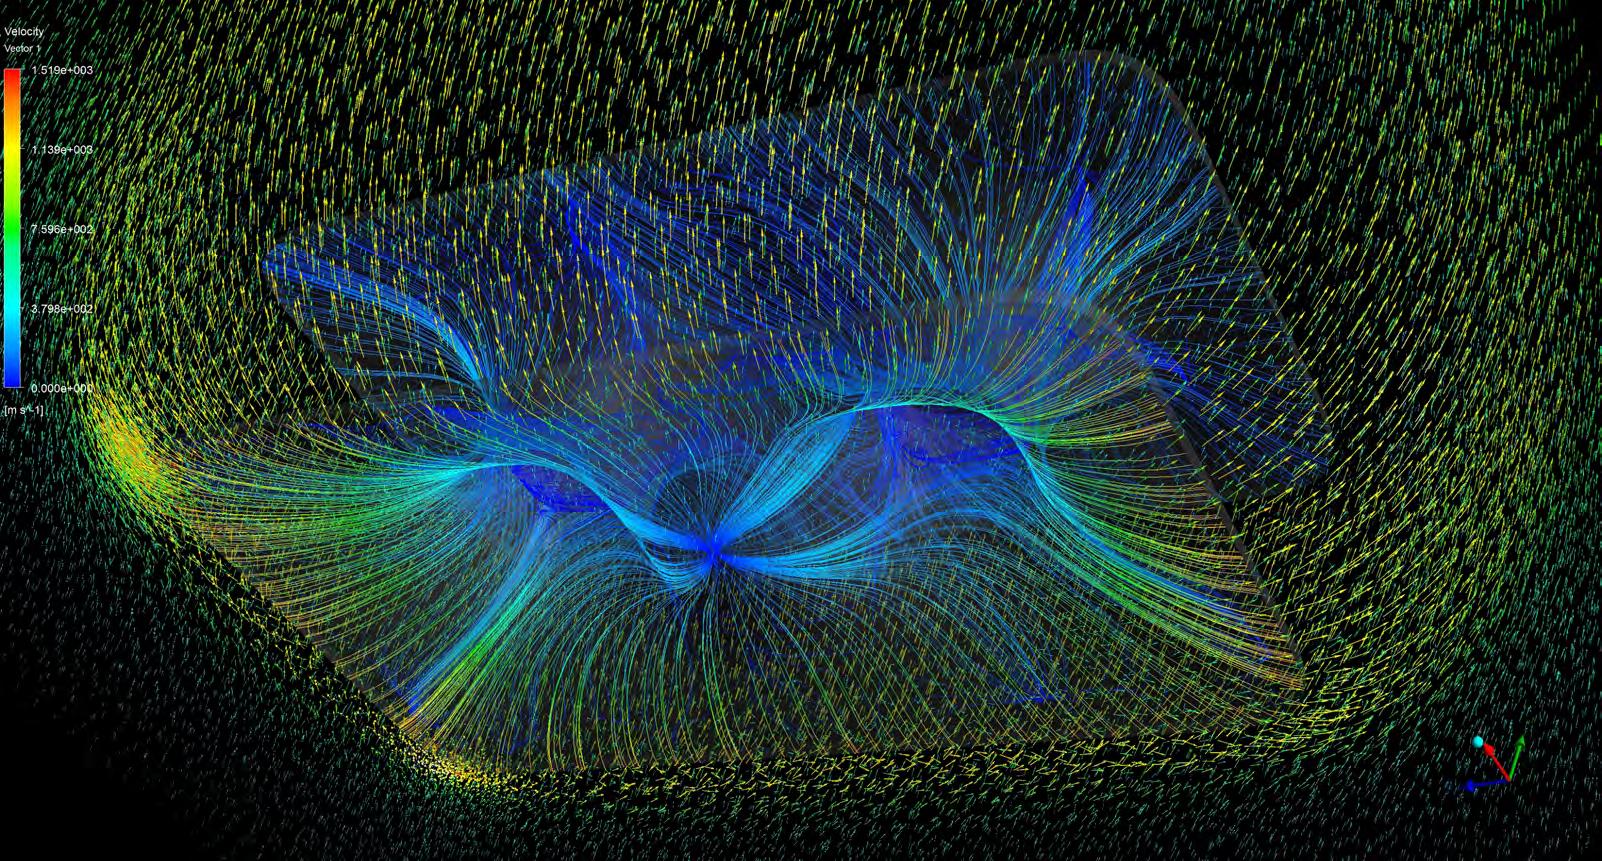
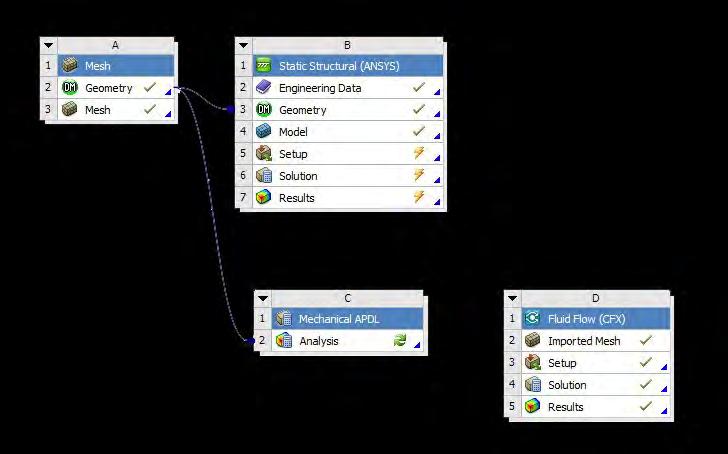
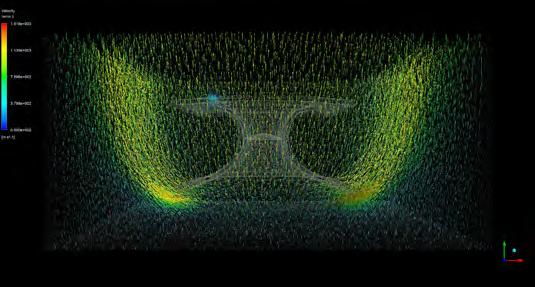
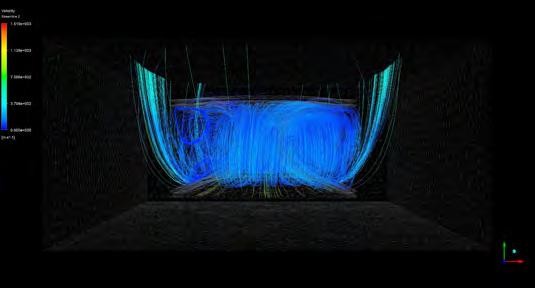
We use FSI(Fluid Flow (CFX) to Static Structural) package in ANSYS to simulate the Pressure, Total deformation and Velocity of the acoustic component in 1 Pa(equal to 90 dB) condition. The cone shape resonator prototype and the final optimized geometry were tested in the software and be compared to show the extent of efficiency change. However, it must be noted that: as is the case in any simulation the outputs gained from the digital simulations do not represent absolutes. Much higher accuracy and many more iterations of the simulations would be necessary for actual noise input and the damping condition as well as the component assemble methods.
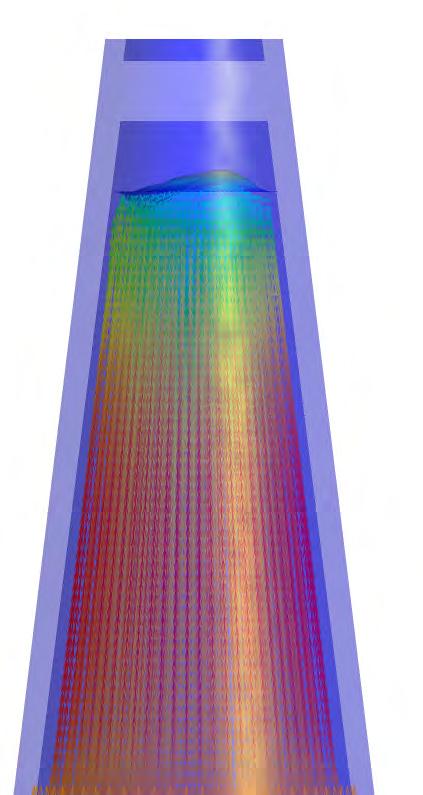
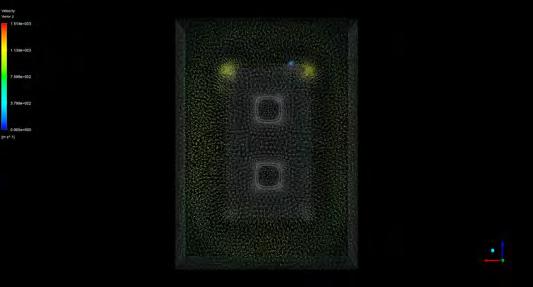
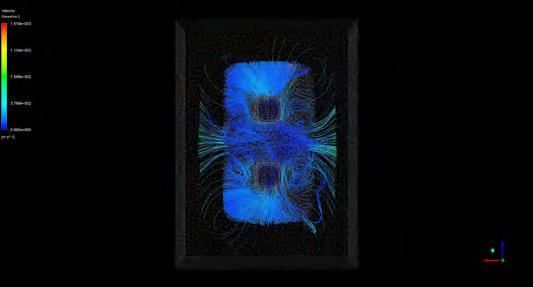
Velocity in the 1pa (equal to 90dB) environment is analyzed by ANSYS FSI(Fluid Structure Interface)with the input : Resonator material(Concrete); Vibrating plate material(Aluminum Alloy); Fluid material(Air on 22C).
The colour graphical output of the above picture demonstrates the velocity of acoustic element(fluid30) occurs on the surface of the component. Blue color is where the lower speed acoustic propagation; red color is where the higher speed acoustic propagation.
Set Up
The material properties for the acoustic fluid were defined as:
code:
!material properties for typical air
R, 1, 20e-6 !reference pressure (defaults to 20e-6) densair = 1.21
MP, DENS, 1, densair !air density
MP, SONC, 1, 344 !sound speed in air
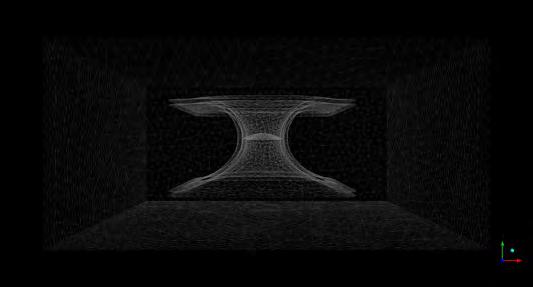
ANSYS FSI set up interface
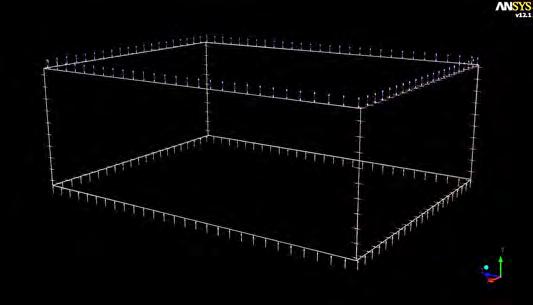
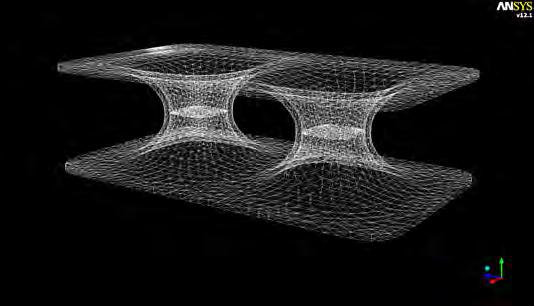
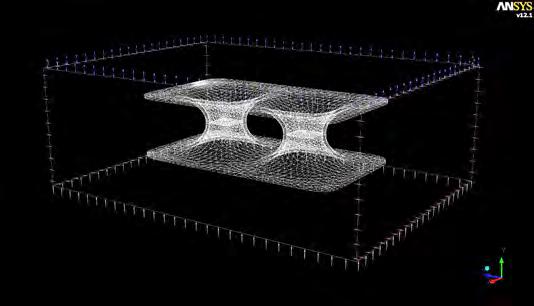
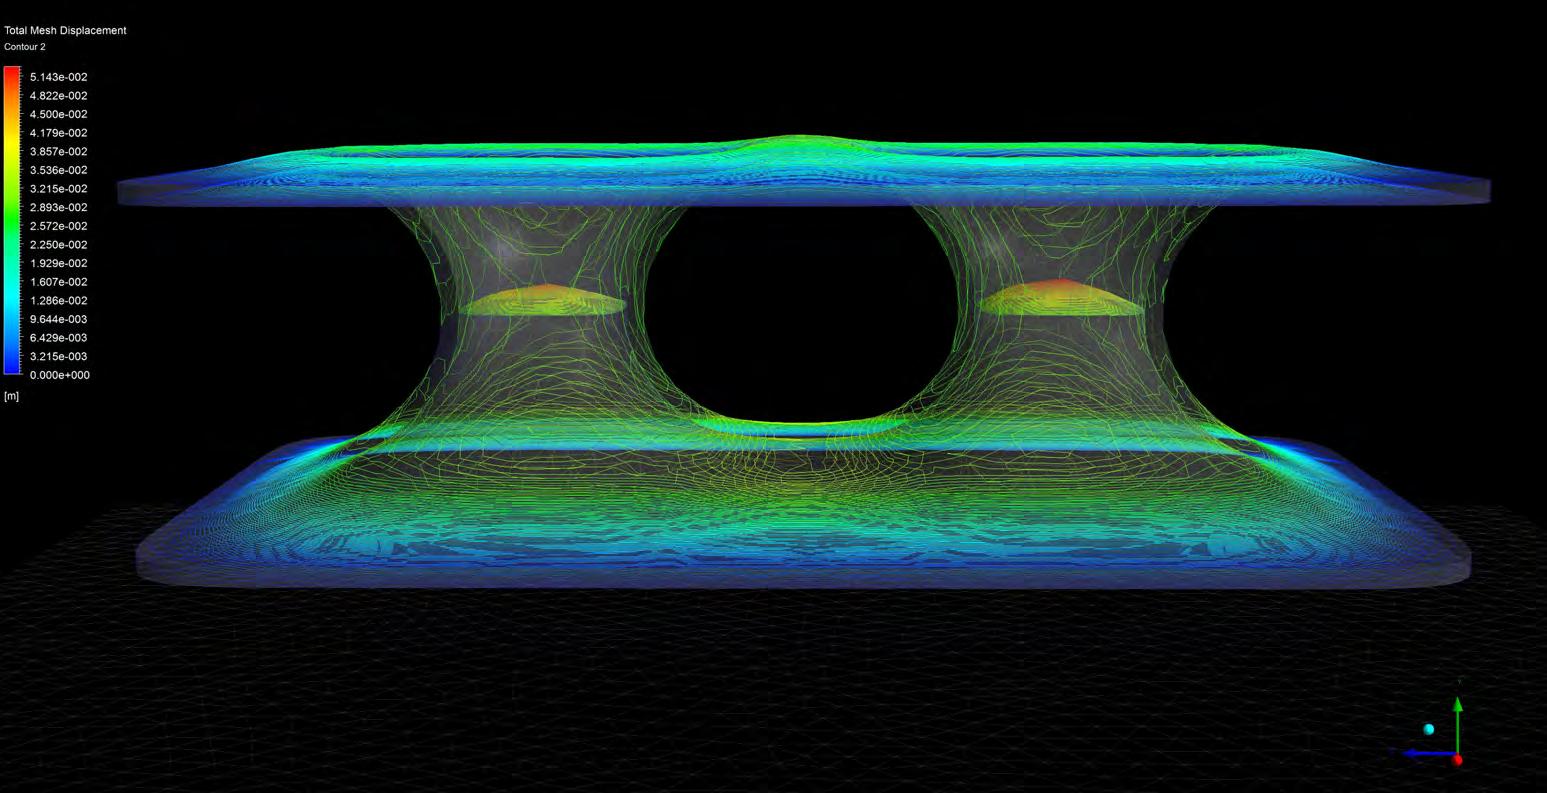
Total Mesh Displacement in the 1pa (equal to 90dB) environment is analyzed by ANSYS FSI(Fluid Structure Interface)with the input : Resonator material(Concrete); Vibrating plate material(Aluminum Alloy); Fluid material(Air on 22C).
The colour coded graphical output demonstrates the directional deformation in the Y-axis. Blue color is where the least displacement occurs; red color is where the most deformation occurs in the positive and negative directions respectively. As we can see from the above picture. The middle of the piezo plate has the maximum amplitude.
Displacement Analysis in ANSYS
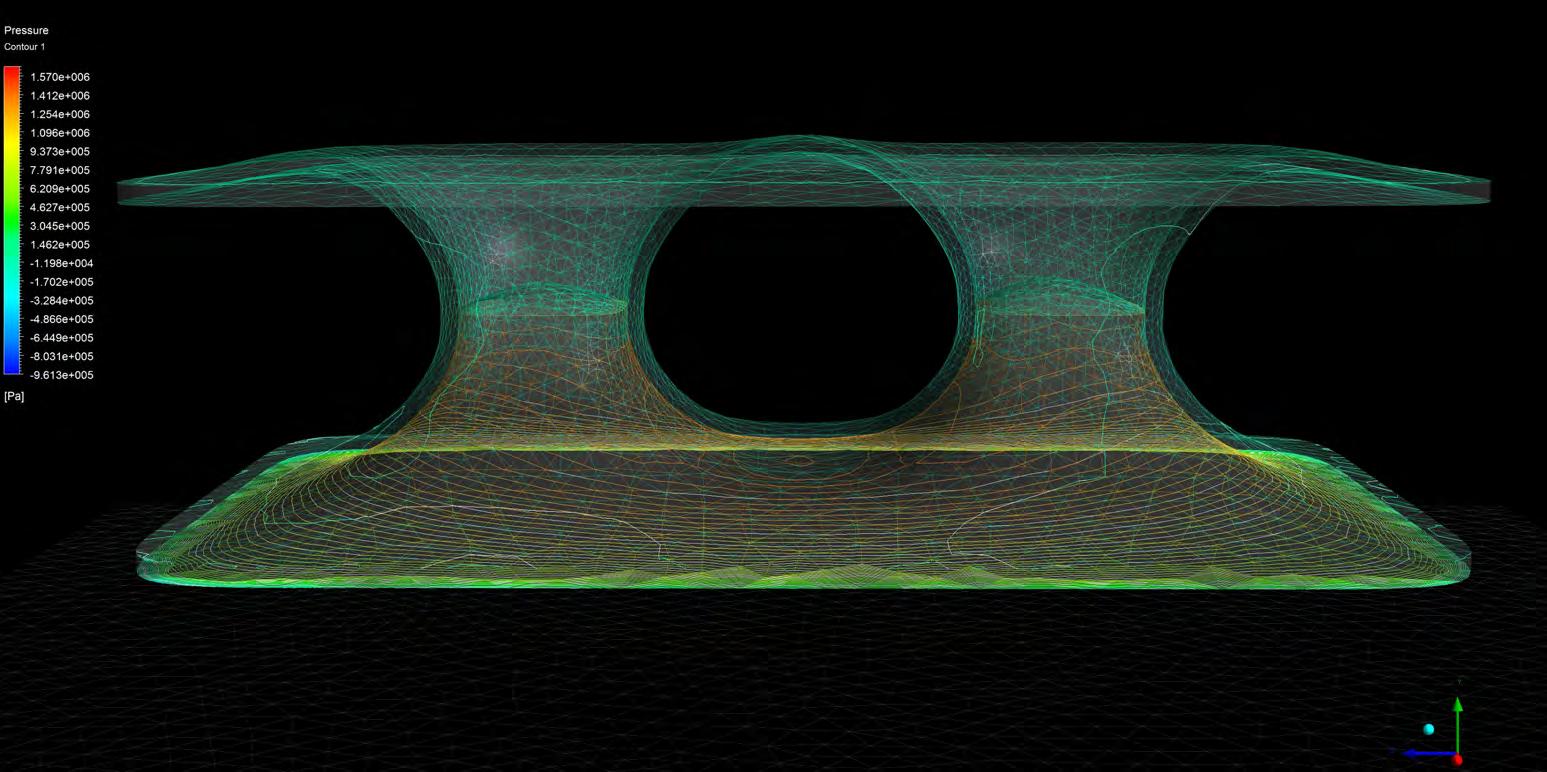
Acoustic Pressure is analyzed by ANSYS FSI(Fluid Structure Interface)with the input : Resonator material(Concrete); Vibrating plate material(Aluminum Alloy); Fluid material(Air on 22C).
The colour graphical output of the above picture demonstrates the Pressure of acoustic element(fluid30) occurs on the surface of the component.
Blue color is where the lower acoustic pressure; red color is where the higher acoustic pressure.
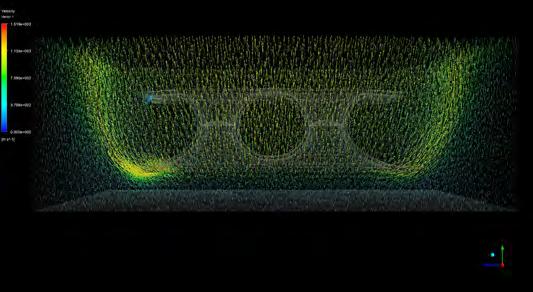
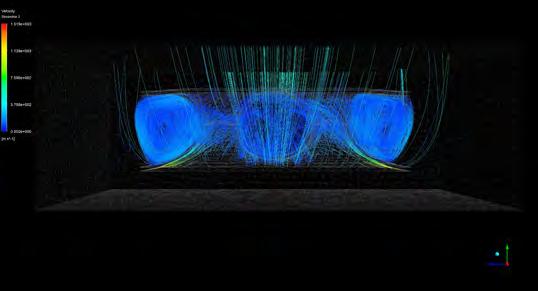

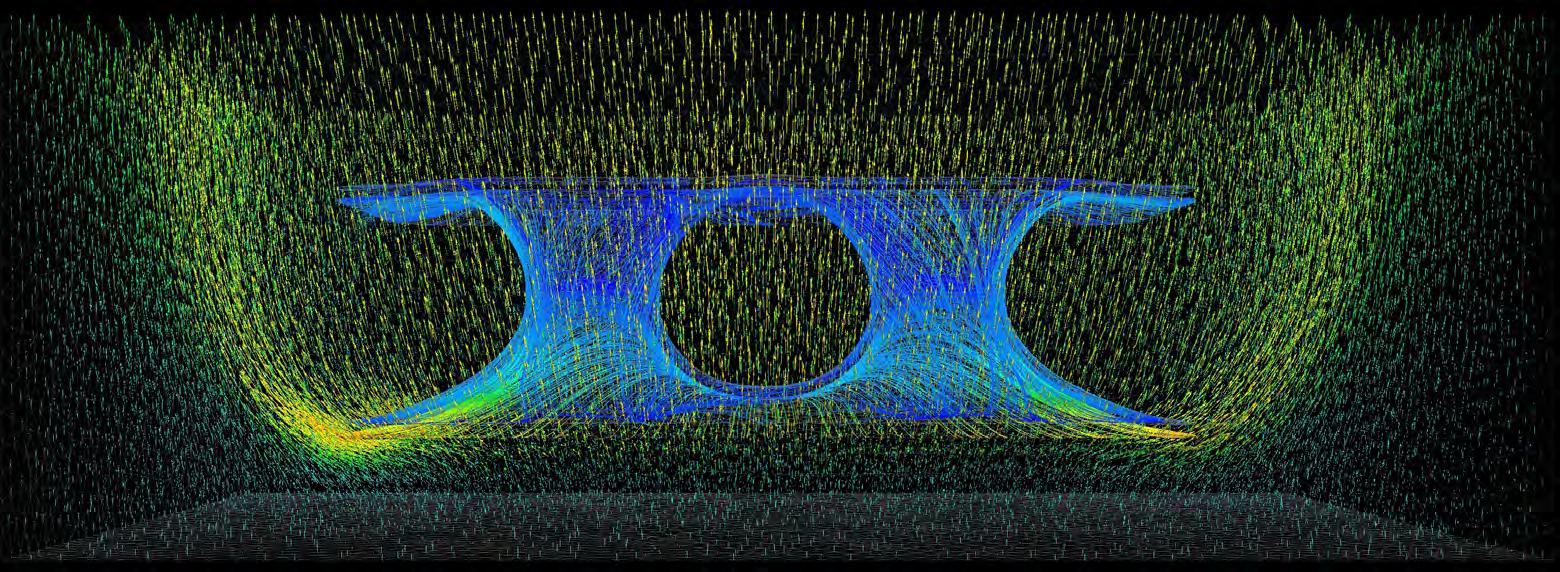
Velocity in the 1pa (equal to 90dB) environment is analyzed by ANSYS FSI(Fluid Structure Interface)with the input : Resonator material(Concrete); Vibrating plate material(Aluminum Alloy); Fluid material(Air on 22C).
The colour graphical output of the above picture demonstrates the velocity of acoustic element(fluid30) occurs on the surface of the component. Blue color is where the lower speed acoustic propagation; red color is where the higher speed acoustic propagation.
PROBLEM
There were a number of difficulties faced during the ANSYS simulation. One of the most issue is that ANSYS WORKBENCH can only use equations of pressure and velocity from air flow to simulate the acoustic condition, and the mesh unit have to be define as a special sonic unit(fluid30) by script. It doesn’t have any input for frequency simulation in FSI, which mean it can compare the efficiency of different geometries in the same condition but can’t give an accurate result in the specific noise environment.
SOLUTION
In order to solve the problem above, we use another acoustic analysis softwareSYSNOISE to simular the noise environment.

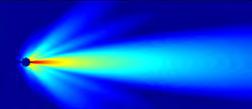
LMS SYSNOISE has been the world-leading simulation solution for vibro-acoustic design, troubleshooting, and optimization. From predicting the noise radiated from vibrating structures, simulating the sound inside a cavity, to estimating the sound field around the structure, or even calculating the structural response to an acoustic load, SYSNOISE can help us to optimize the vibro-acoustic performance of the product. According to our target we choose the Finite Element Method (FEM) analysis in SYSNOISE.
Finite Element Acoustics compared to the boundary element method, LMS Virtual.Lab Finite Element Acoustics offers a more advanced method for simulating acoustics. Like the boundary element method, it helps predict and improve the sound and noise performance of a broad range of systems. The main difference between the boundary element method and the finite element method is that for the latter you need to model the propagation area, that being air or water.
Finite element includes other advanced techniques, such as an infinite finite element method that helps the user to surround a reduced finite mesh so a radiated acoustic simulation can be performed without having to model the entire propagation area. LMS Virtual.Lab Finite Element Acoustics can be used to perform acoustic simulations in both time and frequency domains.
Like the boundary element method, the Finite Element Method (FEM) can simulate a fully coupled vibro-acoustic simulation to determine how acoustic sources affect the structure.
[ Ref. Text: 36]
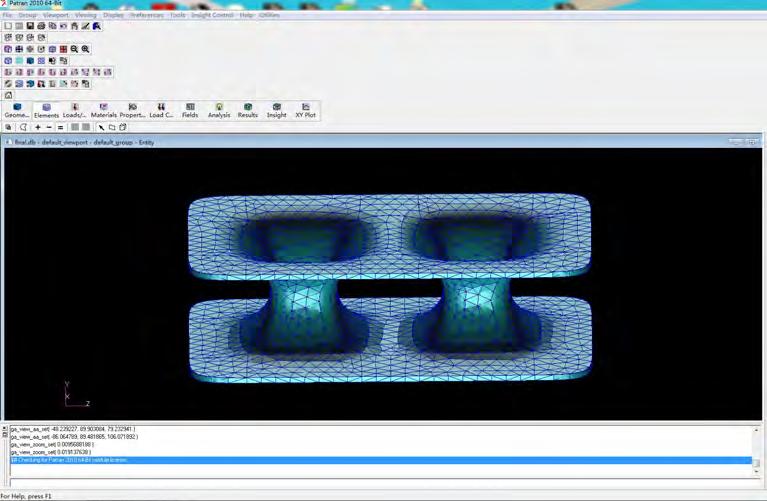
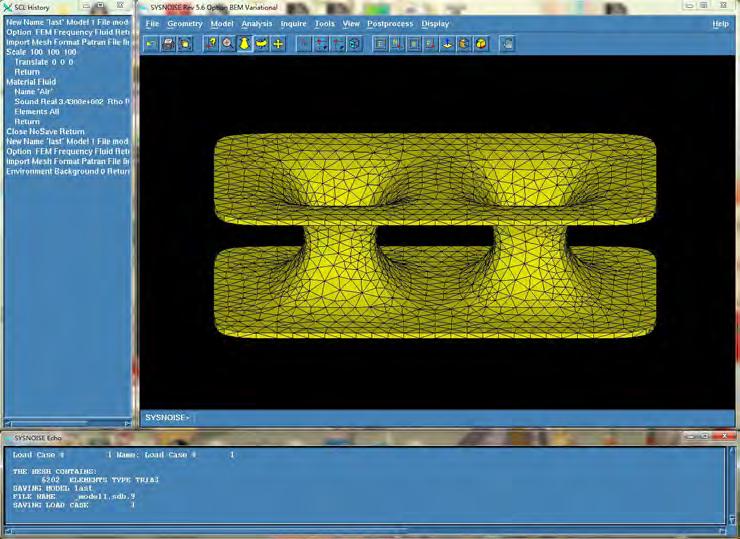
The complete analysis sequence consists of the following steps:
1. Transform the digital model from Rhino to Patran
2. Generate mesh from Patran
3. Start LMS Sysnoise - Create a new database - FEM module
4. Import the mesh from Patran
5. Check the mesh
6. Check the environment variable VELOBCMODE
7. Import the structural modes
8. Visualization of the structural modes
9. Generate boundary condition from experimental accelerations data
10. Visualization of the boundary condition
11. Import a field point mesh
12. Define the parameters of the analysis
13. Compute the acoustic field
14. Visualization of the acoustic field on the field point mesh
15. Compute the acoustic field
16. Visualization of the acoustic field on the field point mesh

Environment Check
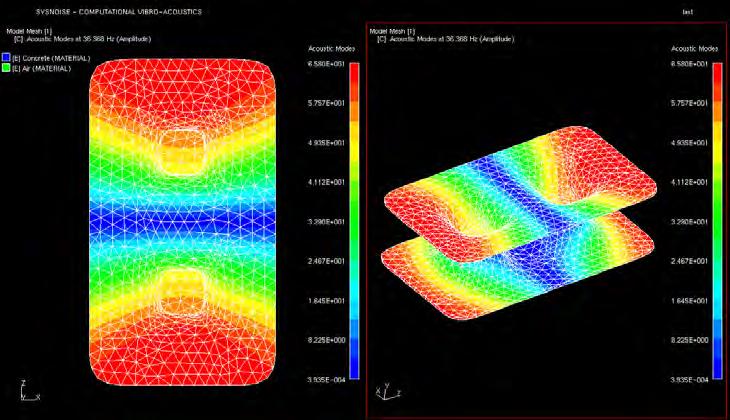
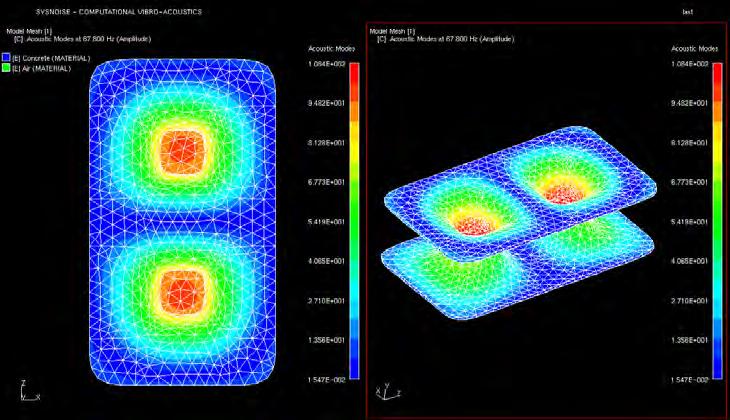
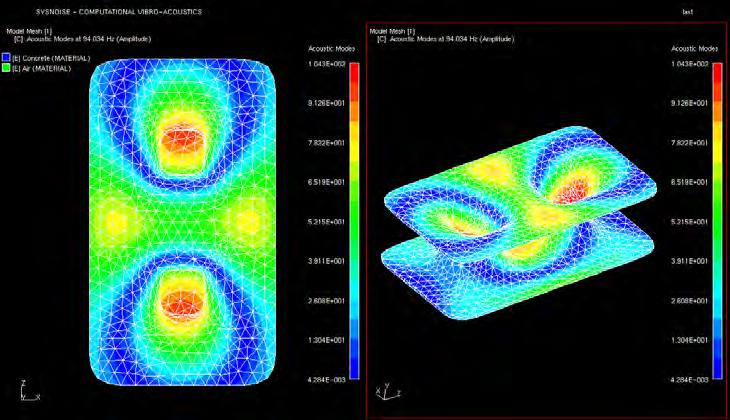
Acoustic Modes Analysis in SYSNOISE
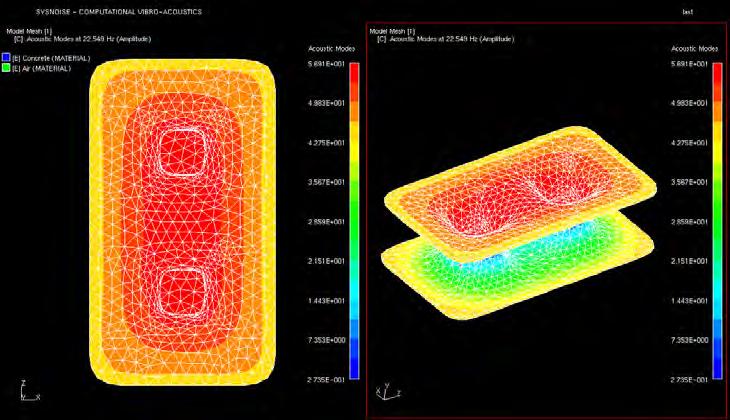
Testing Environment:
Material
Material
Material
Material
Acoustic Modes Analysis in SYSNOISE
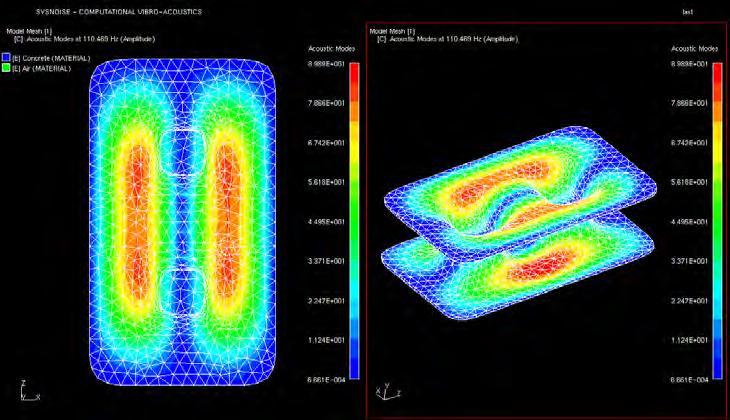
Testing Environment: 110.469 Hz
Structure Material Properties
Material Name: Concrete Density
Young’s Modulus Poisson’s Ratio
Tensile Yield Strength
Compressive Yield Strength
Tensile
Compressive
Strength Acoustic Material Properties
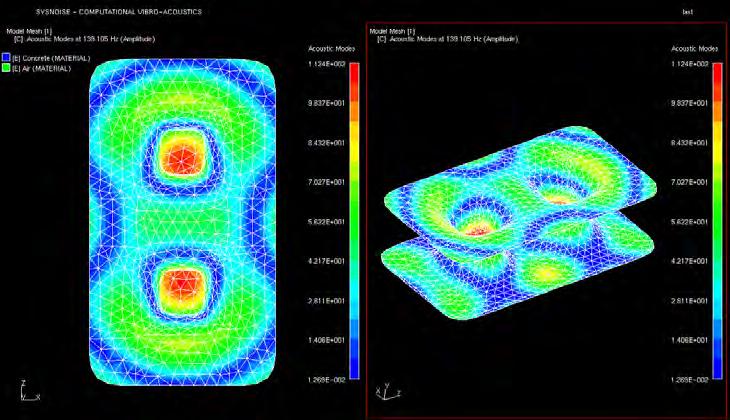
Testing Environment: 139.105 Hz
Structure Material Properties
Material
Young’s
Tensile
Compressive
Tensile
Compressive
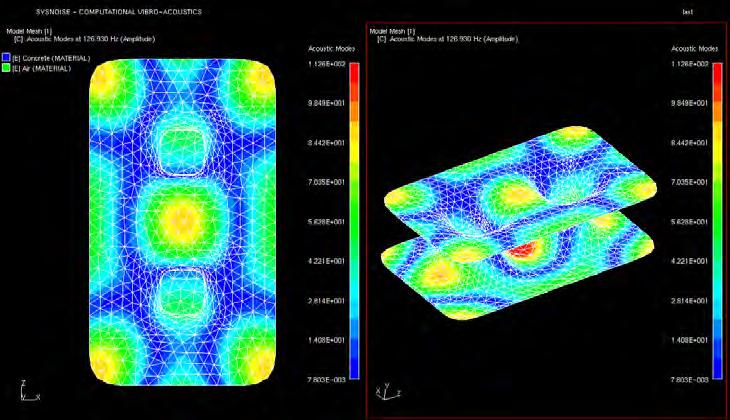
Testing Environment: 126.930 Hz
Structure Material Properties
Material
Acoustic Material Properties
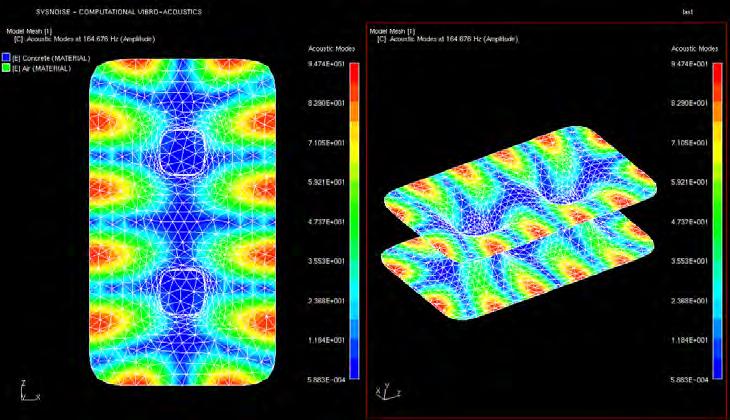
Testing Environment: 164.676 Hz
Structure Material Properties
Material
Tensile
Compressive
Tensile
Acoustic Material Properties
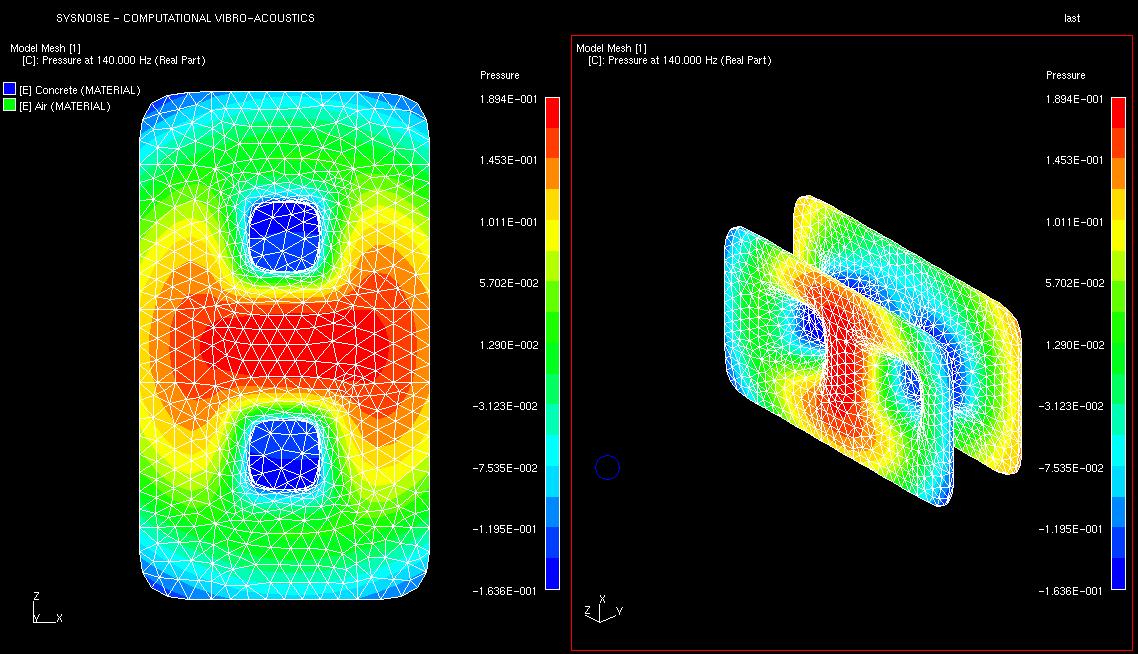
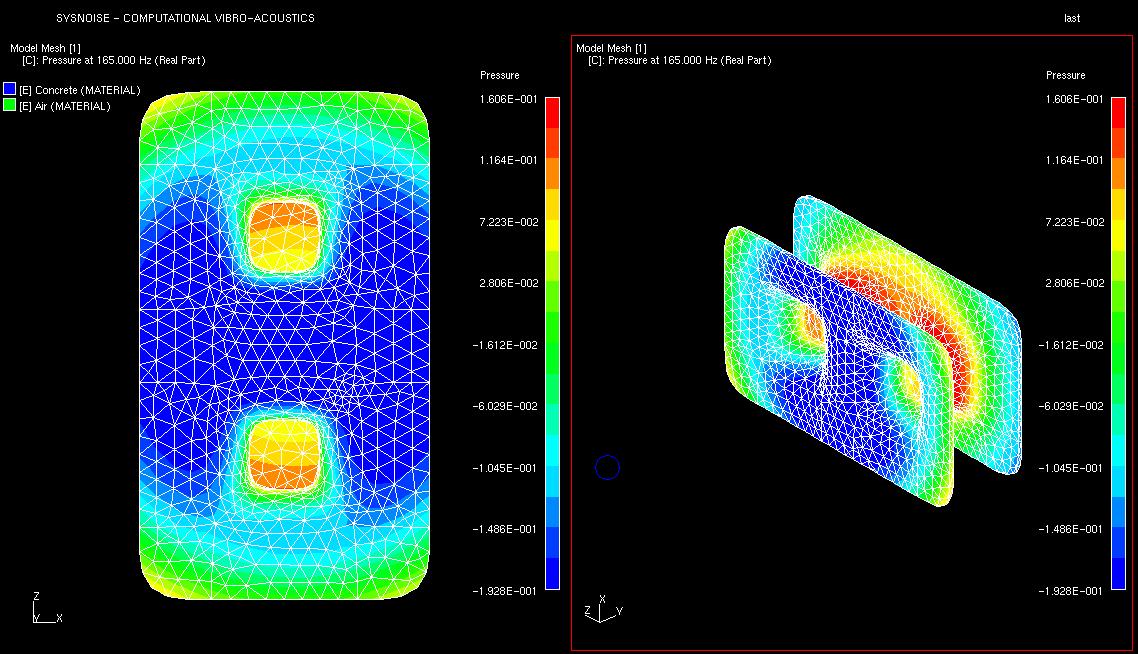
Pressure Analysis With Noise Source in SYSNOISE
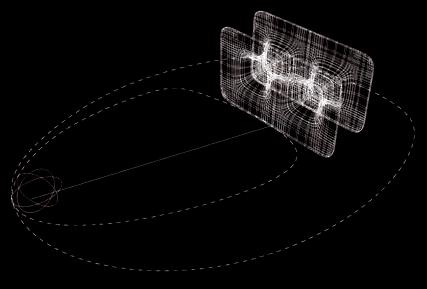
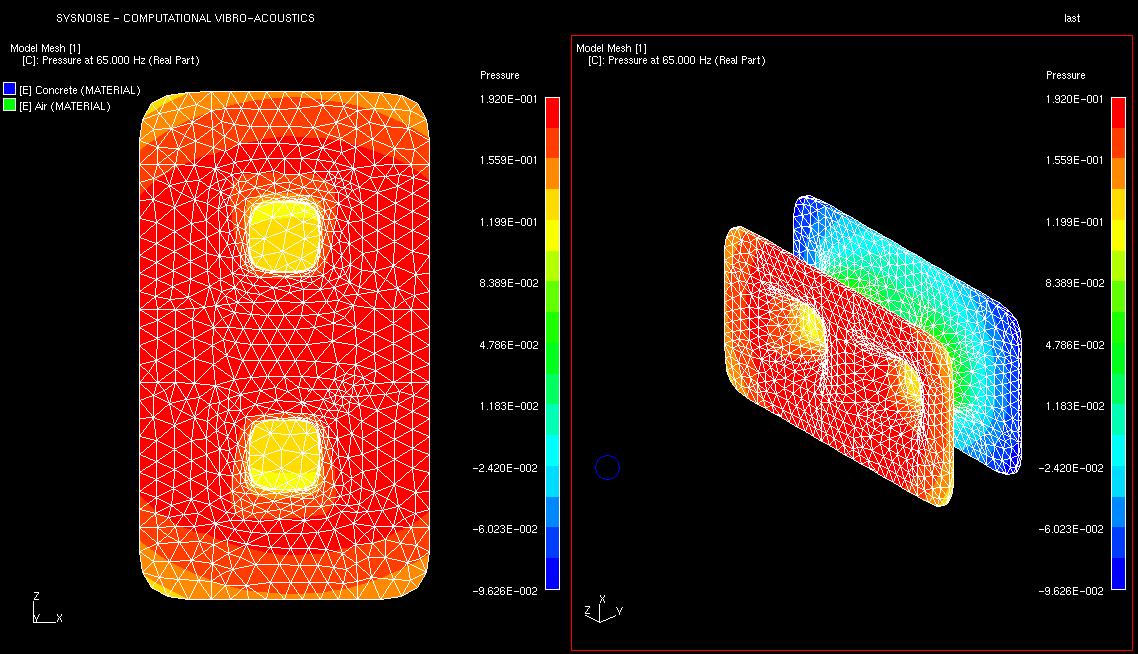

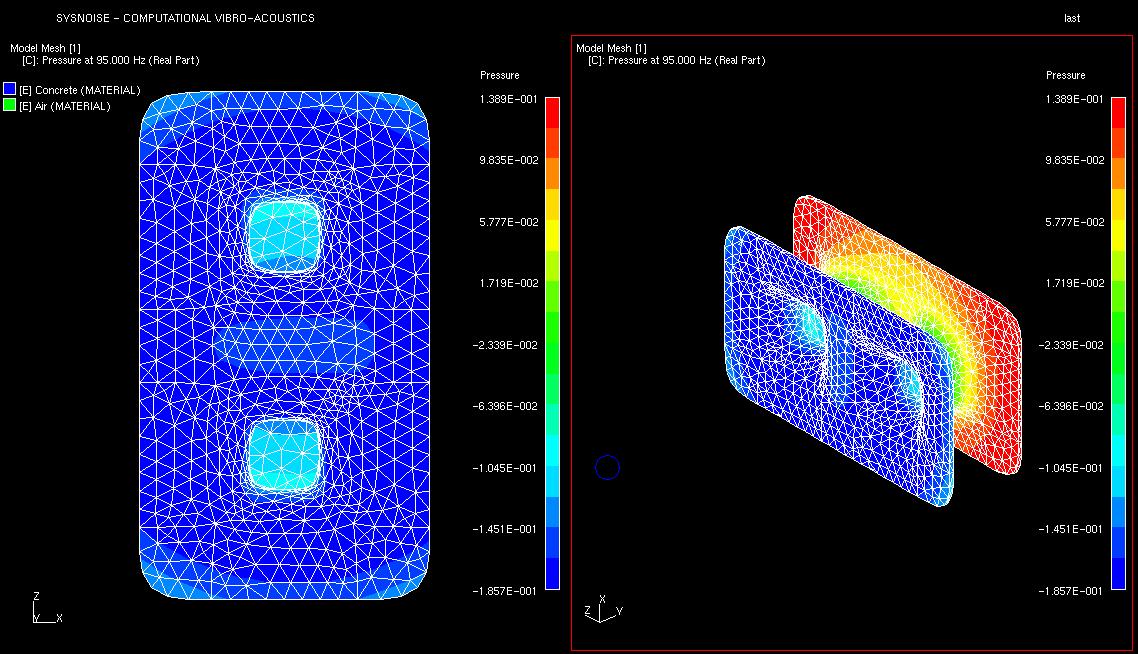
Pressure Analysis With Noise Source in SYSNOISE

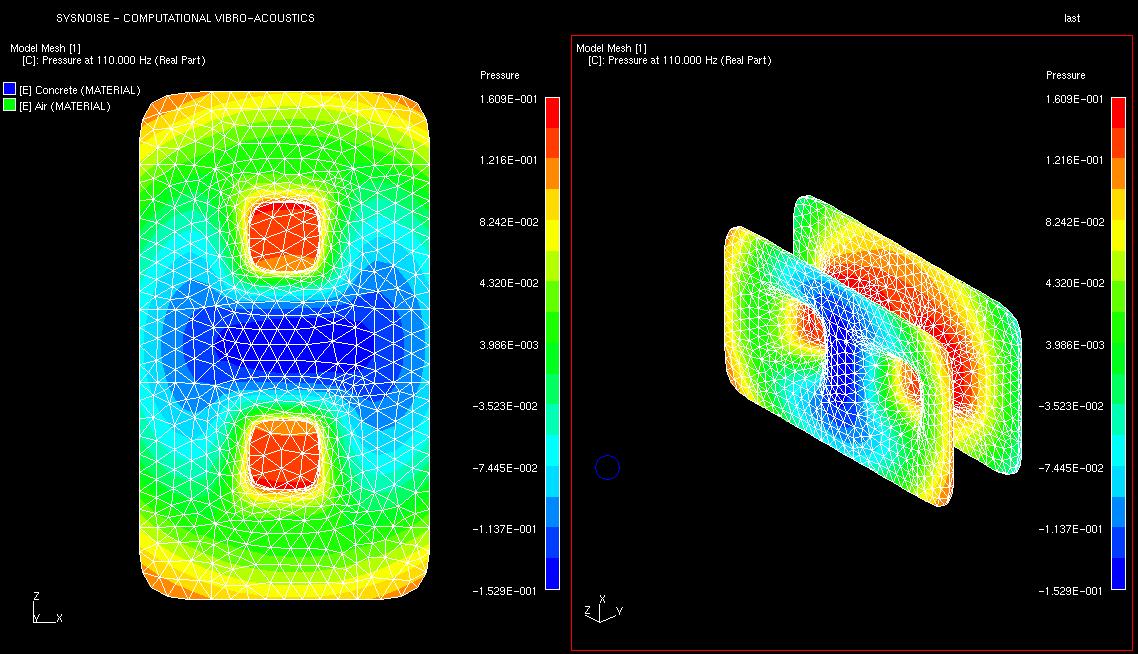

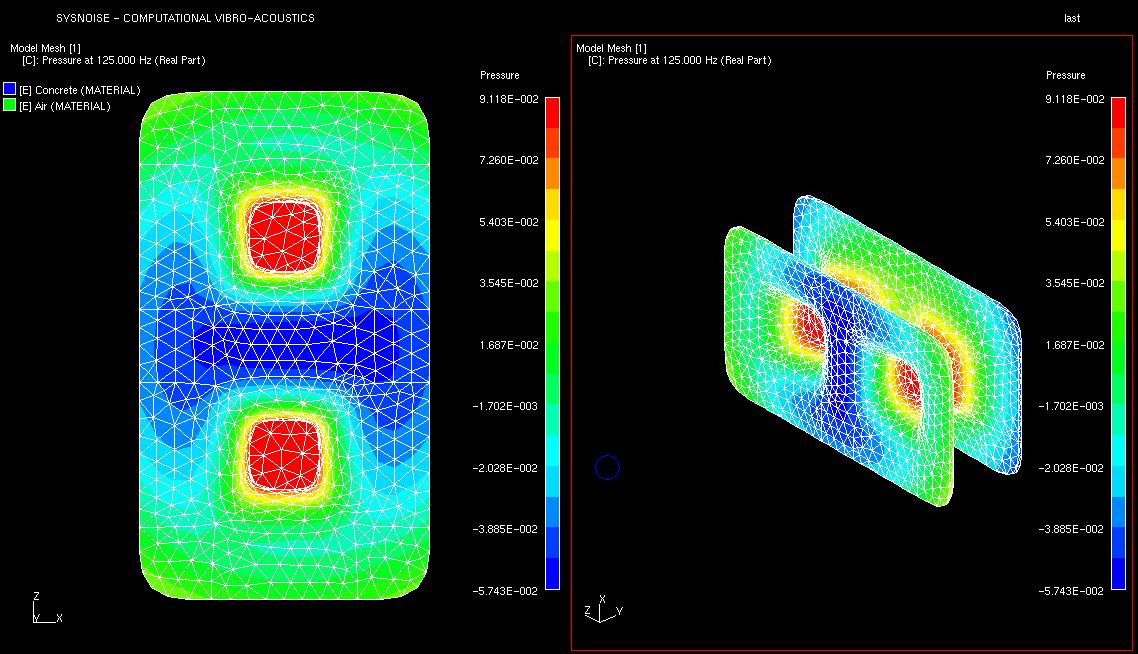
Pressure Analysis With Noise Source in SYSNOISE


CONCLUSION
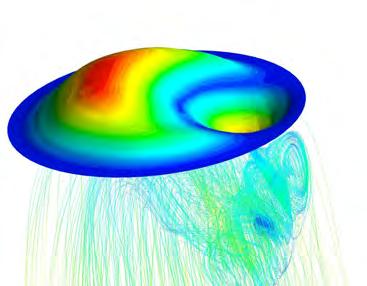
SYSNOISE provides the Acoustic Modes analysis in order to help us understand the resonance effect of the structure. It offers some important informations for the joint of component. For example, in 164.676 Hz the maximum pressure is around the edges of the component, which means it’s easy to crack when the components are join together. The Acoustic Pressure analysis with noise source can help us simular the real noise environment in order to get an accurate result or find out a better solution.
03.10 EVALUATION
This chapter covered two main physical experiments to explain the propagation of sound and the possibility of the acoustic energy conversion : the Cymatics experiment which helped us realize the displacement of vibration plate is different according to various frequencies and it became particularly large in some specific frequencies. The energy conversion experiment went further steps to open up the methods in chapter 2 which showed a great result in the end.
Besides the two main device experiments, the experiments chapter also contains several tests for increasing the efficiency of the acoustic energy conversion. Surface veil(a very thin fibreglass mat) took the place of the aluminium plate in order to reduce the weight but keep the similar stiffness property. The shape of resonator was optimized by scripting, using the knowledge of fitness criteria from the Emergence course.
In digital aspect, we use FSI(Fluid Flow (CFX) to Static Structural) package in ANSYS to simulate the Pressure, Total deformation and Velocity of the acoustic component in 1
Pa(equate to 90 dB) condition. The cone shape resonator prototype and the final optimized geometry were tested in the software and be compared to show the extent of efficiency change. However, it must be noted that: the outputs gained from the digital simulations do not represent absolutes. Much higher accuracy and many more iterations of the simulations would be necessary for actual noise environment and the damping conditions as well as the component assemble methods.
There were a number of difficulties faced during the ANSYS simulation. One of the most issue is that ANSYS WORKBENCH can only use equations of pressure and velocity from air flow to simulate the acoustic condition, and the mesh unit have to be define as a special sonic unit(fluid30) by script. It doesn’t have any input for frequency simulation in FSI, which mean it can compare the efficiency of different geometries in the same condition but can’t get an accurate result in the noise environment.
In order to solve the problems above, we used another software SYSNOISE to analyse the natural frequency of our component(in Acoustic Mode). The result of which can help us to avoid the negative effects(ie. crush) occur. After that, we simulated the noise environment in the software by creating a noise source(set up the same as ANSYS for 90 dB), and input the sound frequency from 65 Hz to 165 Hz. Finally we got a much more accurate result for the real situation.
In the next chapter, the analyzed component will be assemble to two types of facade and structure itself which starts the possibility of an acoustic system for cities. The adaptability of the system is introduced after that and an 1 to 2 component fabrication comes then. Later a traffic network and a blocks density network are brought in to explain our design strategy of the masterplan of our acoustic system.
CHAPTER 04 DESIGN DEVELOPMENT
04.0 INTRO
04.1 TRAFFIC NOISE ENVIRONMENT OF SITE CONTEXT
04.2 COMPONENT COMBINATION
04.3 ADAPTABILITY OF ACOUSTIC SYSTEM
04.3.1 ADAPT TO SAME FREQUENCY
04.3.2 ADAPT TO DIFFERENT FREQUENCIES
04.4 FABRICATION
04.5 EVALUATION


04.0 INTRODUCTION
Following the analysis of all the parameters and characteristics of the material systems generated in the experimentation section using Ansys CFX and Sysnoise softwares, an outcome emerges of this analysis that is a doubly curved material system that demonstrates advanced and fully integrated environmental properties, will act as a component for development towards architectural scale applications.
The design development begins covering the fabrication process of the component system, which promotes a high level of integration between constructions as well as performative capacity. As the systems increases in scale and three dimensional complexities, an exploration the integration of material behaviour and fabrication processes will be included. In a second stage we will introduce the site which is located in Beijing- china where the impact of the noise pollution is enormous where nothing breaks away from it and from the illustration which creates.
We will also analyse the high-congestions areas around major roads of the site and try to locate them and conclude where is the most appropriate location to introduce our system in order to achieve the optimum result.




Residential Density
Traffic and transport
Average commuting time (minutes)
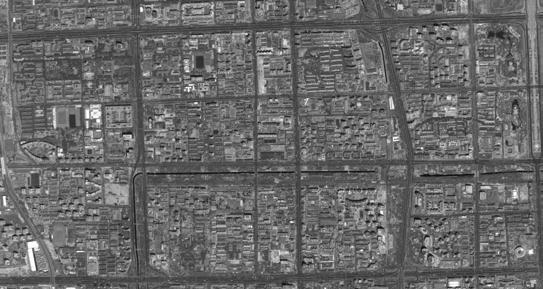
04.1 TRAFFIC NOISE ENVIRONMENT OF SITE CONTEXT
Beijing City is an independently administered municipal district and is the capital of the republic of china.
Beijing has a whole area of 16808 sq km,160 kilometres from east to west and over 180 kilometres north to south. She has 16 districts and 2 counties with Dongcheng, Xicheng, Xuanwu, Chongwen, Chaoyang, Haidian, Fengtai and Shijingshan in or close to the Beijing city proper and Fangshan, Mengtougou, Changping, Tongxian, Shunyi, Daxing, Huairou, Miyun, Pinggu and Yianqing in the outer suburbs. Metropolitan density
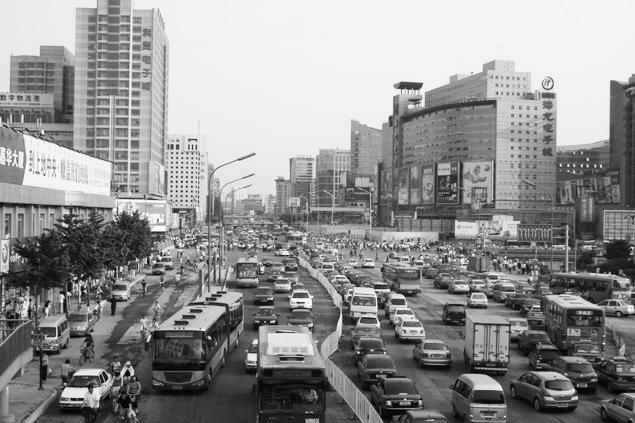
The City of Beijing, china, has been facing a constant increase in road traffic noise due to largely increase in prosperity, fast development and expansion of economy and tourism. It is considered to be one of the worst effected capitals due to abandoned and unrestrained traffic noise pollution. Our project will take place in the central of beijing ” across Xizhimen Bridge - Deshengmen Bridge -Peony Garden street intersection area; the impact of the city noise pollution is enormous where nothing breaks away from it and from the illustration which creates.
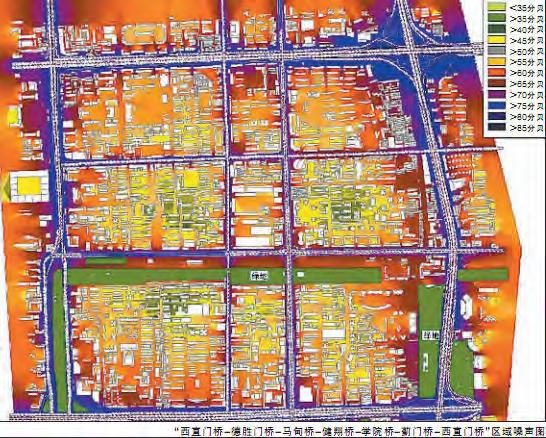


This noise map is a “rectangle” across Xizhimen Bridge - Deshengmen Bridge - Ma dian Bridge - Jianxiang Bridge - Xueyuan Bridge - Jimen Bridge - Xizhimen Bridge, occupys 12.7 square kilometers, geographically distribution of noise values are demonstrated with different color noise contours and grids. Our site is the intersection between Beitucheng West Rd and Beitaipingzhuang Rd, which is in the middle of the map.
The noise map, at first glance, likes an ‘abstract oil painting’. Noise in the urban areas is illustrated by different contour lines with different colors. The entire area represented by the noise from 85 decibels to 35 decibels.
Located near the long Freeway belt area has become a blue noise band, which means that there is at least as high as 75 dB. Several places near the city's main thoroughfares are displayed in red and purple, which indicates that the area around for 70 dB of noise value, and some residential community was shown as green and yellow, indicates that the noise values around 40 dB and around 45 dB, closer to the road higher of the value.
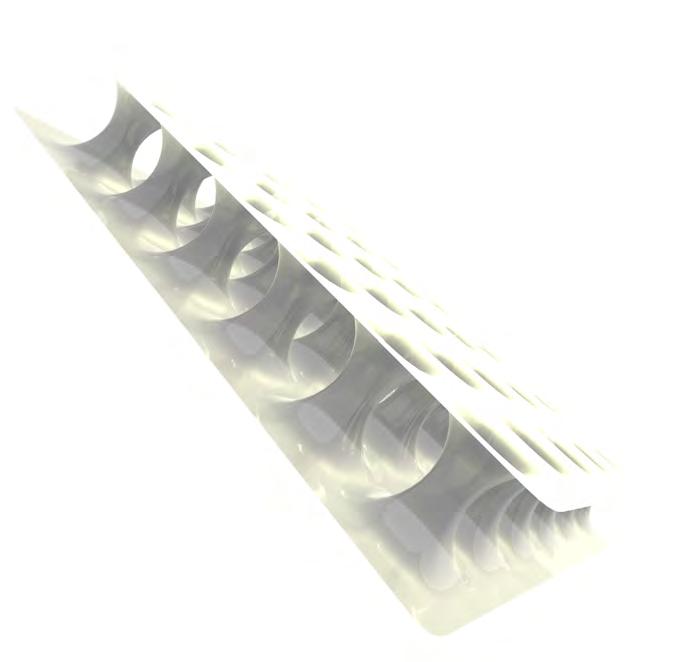
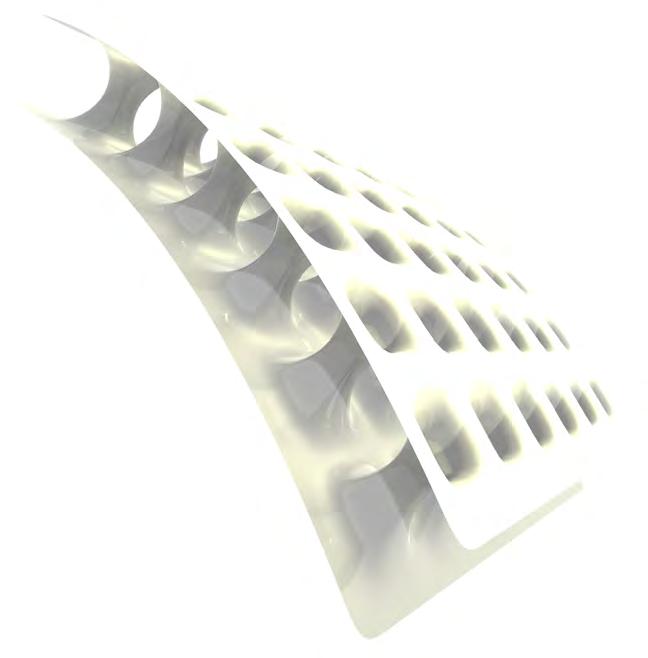
04.2 COMPONENT COMBINATION
The digitally driven production method will introduce a diverse logic of hierarchy in architecture, one that is based on local variation and differentiation in series. According to Bernard Cache “components are no more designed but calculated ” and this is exactly what we followed in designing our modular system, where each component is tested according to a specific frequency. The modification of parameters of design of the component will allow for the creation and production of several assembling logics.
We experimented two different assembly logic, one plain and one curvilinear and this in order to incorporate it into a façade system or structure which will perform as an possible of an acoustic system for cities.


04.3 ADAPTABILITY OF ACOUSTIC SYSTEM
From the previous experiment chapter, we have already known that the diameter of the piezo plate has the most effect to the energy conversion. In order to achieve the noise environment(our site is 125 Hz), our piezo plate will has the same diameter which is 41 cm.
However, the acoustic system can also adapt to different noise environments by changing the component’s diameter. In this situation, the system will not only work in a constant frequency but for a range.
04.4 FABRICATION
The path from the digital to production involves several steps. For fabrication purpose the component geometry was defined in a CAD system. The first step was automated carefully by implementing the cad model that will derive the component geometry from a given overall shape.
We automatically sliced the component into six slices each of which defined one after another and this in order to arrange the parts to fit the polyurethane foam boards and generate the machine code for the CNC milling tools.
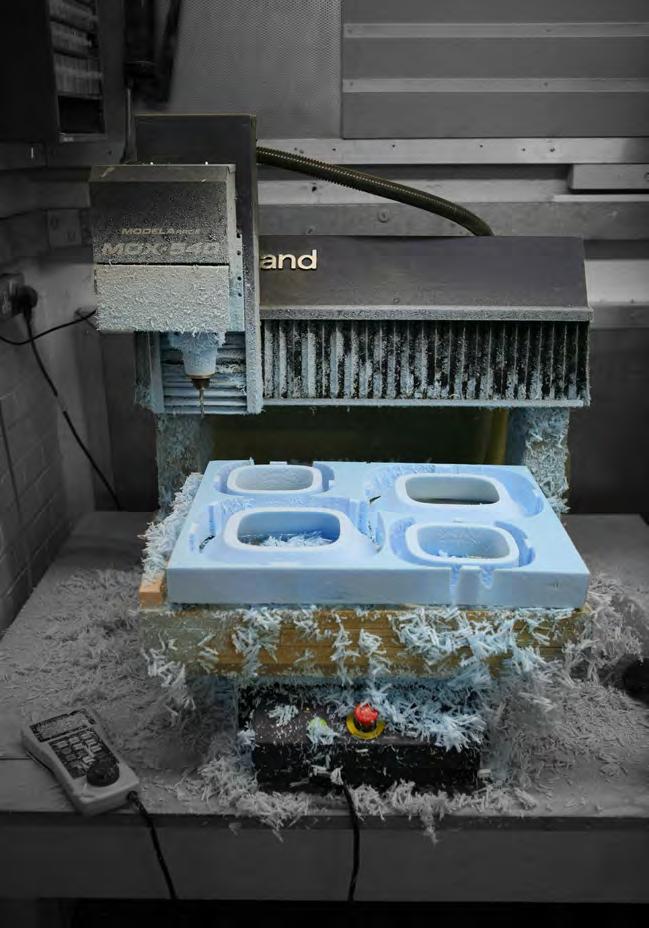
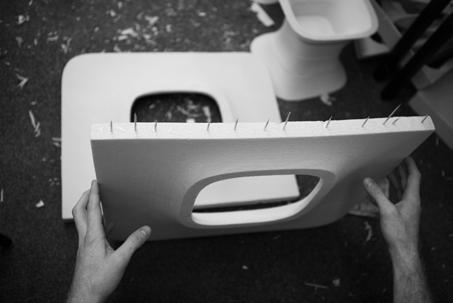
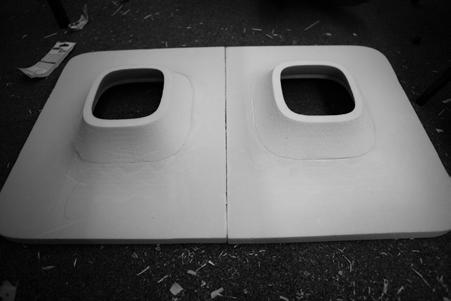
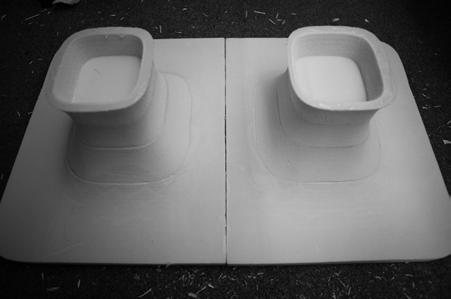
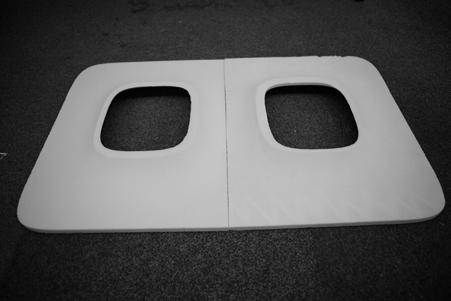
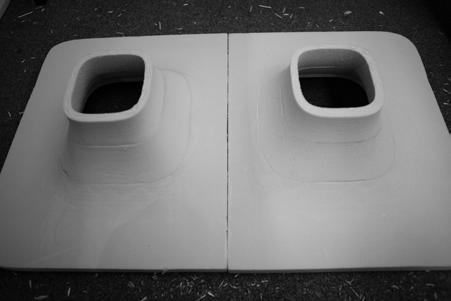
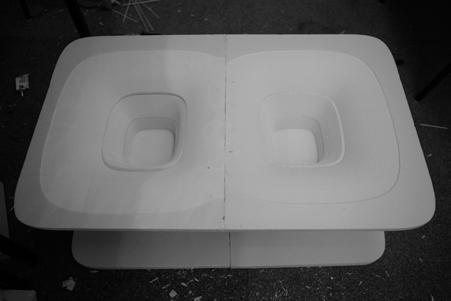
A 3 dimensional model of panel geometry was used in the CNC milling and once the polyurethane foams are cut to size, the pieces were then laid up using translucent laminating epoxy glass coat as the first layer.
Then layers of fiber reinforced in textile form sheets covered the whole component. The sheets were cut to size to fit the foam correctly and then each layer was manually laminated by itself and between each layer we adding unsaturated epoxy resin. Because the resins hardens very quickly the work had to proceed quickly too.
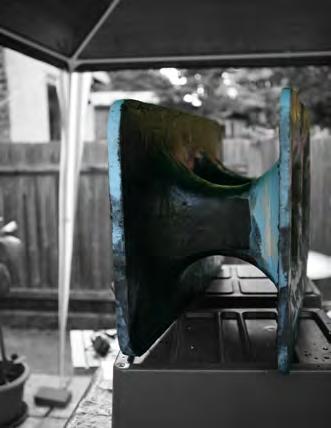
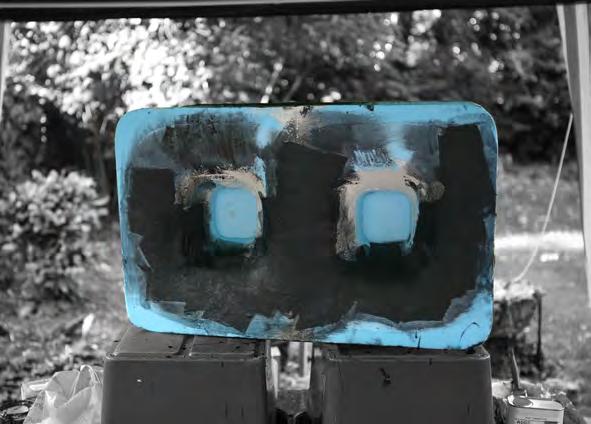

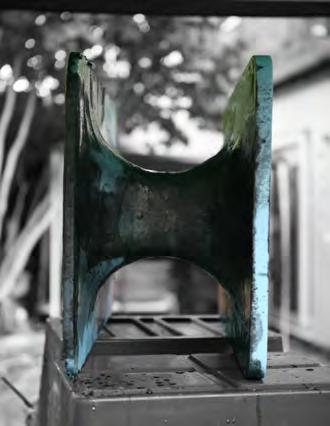
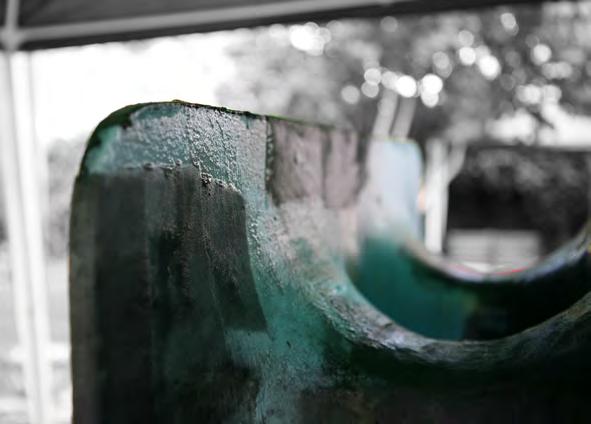
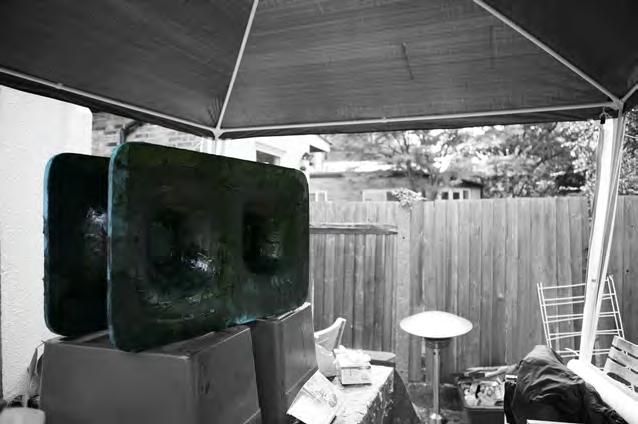
Once all the layers of fiber glass sheets cover the whole components, we added a last layer of resin. At the end before spraying the component, brushes or rollers are used to remove entrapped air as well as to ensure good fiber wetting.
[ Ref. Text: 37, 38]
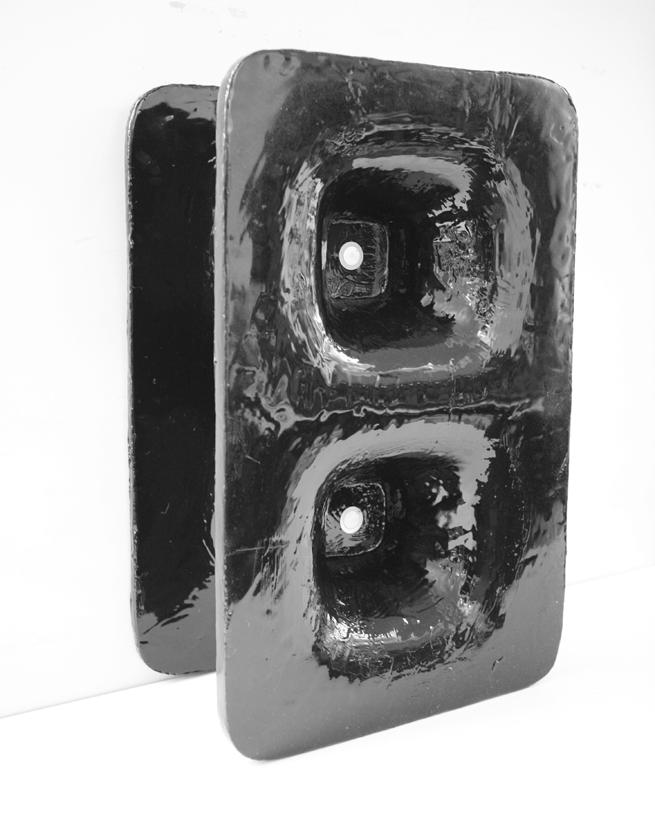
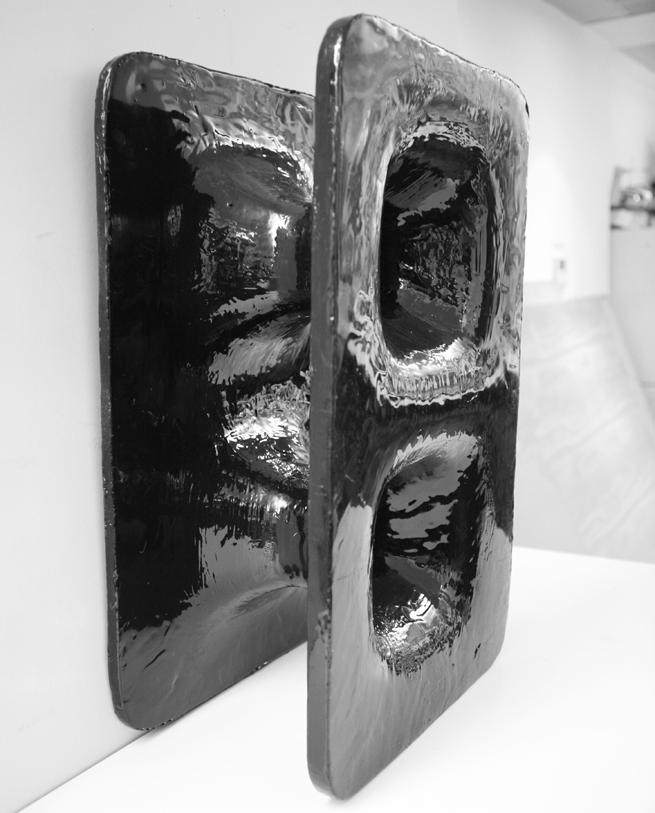
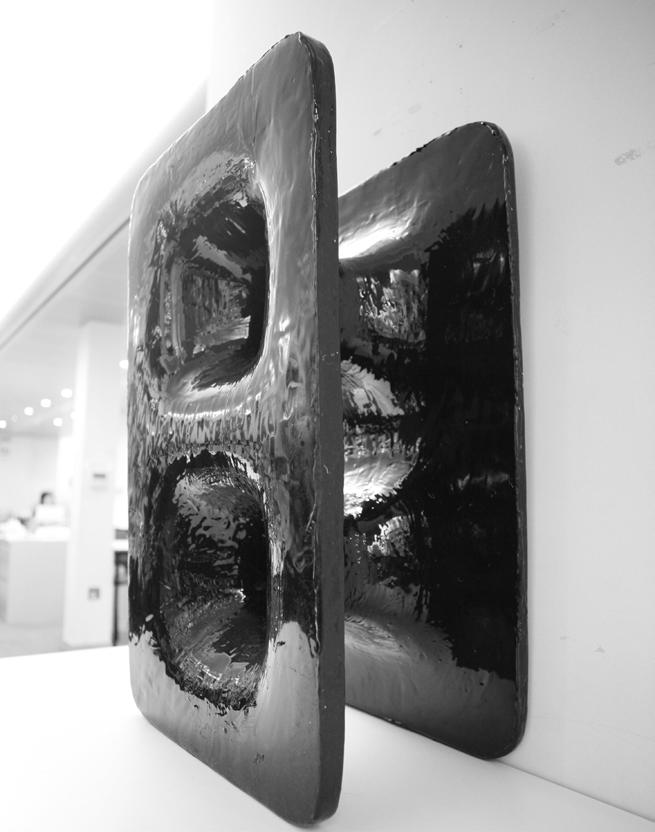
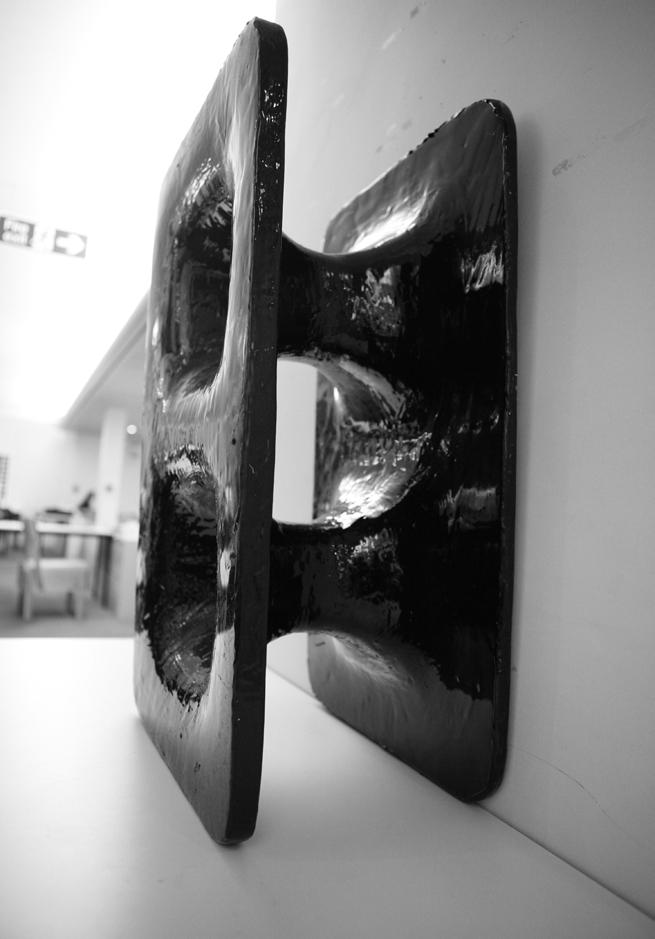
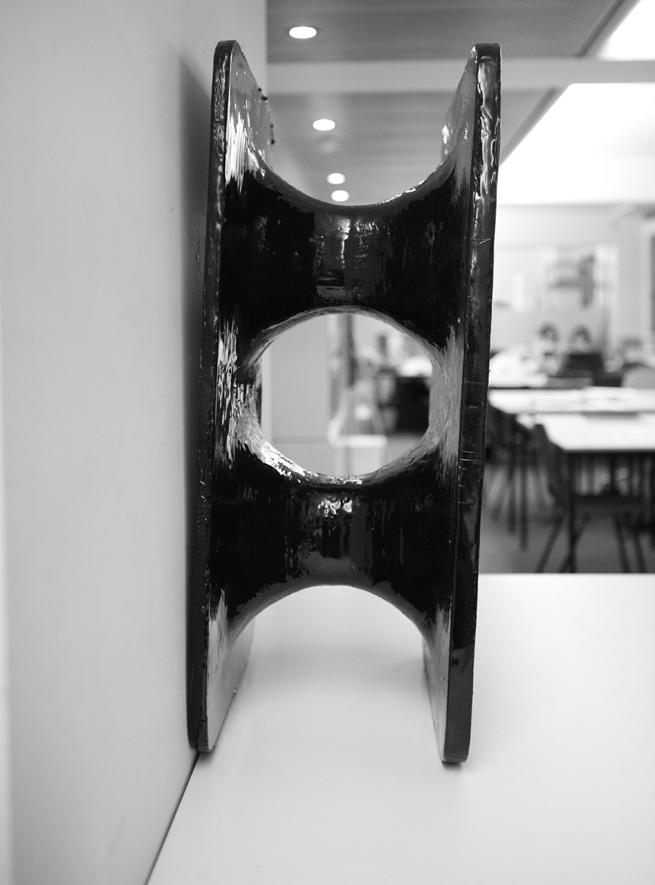
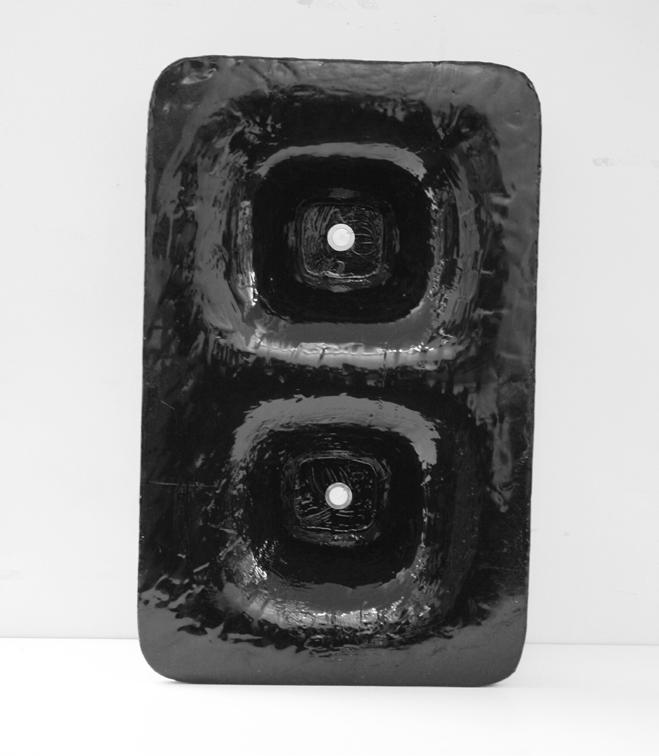
04.5 EVALUATION
When building with component the connection between becomes important, and the rapid prototyping with scale models neglects the connection details. The redistribution of each modular component with the project is designed to achieve the optimal effect sound wave energy/ electricity.
First reaction was to interact with existing buildings as much as possible, the component should respond to environmental and contextual inputs. The modular system needs connection joints as well as structural ribs in order to be a successful composition. This modular unit still needs an exploration of material form and fabrication; there is a compulsion to experiment with a wider range of joint system in order to achieve the finest solution, the system shouldn’t act as a simple urban accessory but it should contribute as an essential part of the city.
CHAPTER 05 DESIGN PROPOSAL
05.0 INTRO
05.1 DIGITAL FABRICATING SIMULATION
05.2 FURTHER DEVELOPMENT FOR PUBLIC SPACE
05.3 EVALUATION

05.0 INTRODUCTION
The City of Beijing has been facing a constant increase in road traffic noise due to high density urban fabric, fast development and expansion of economy. It is considered to be one of the worst effected capitals due to abandoned and uncontrolled traffic noise pollution. Our site is located across Xizhimen Bridge - Deshengmen Bridge, Peony Garden street intersection area defined by several sectors industrial, cultural, educational and residential.
After identifying the noise main urban sources in the chosen location, we allocated our system according to the most affected areas where the noise mechanical vibration is vastly concentrated. We shaped and designed our component in order to achieve an enhanced character for the area and to create a vital public space and recreational areas by improving the urban quality.
The goal of our local-global system is to absorb the noise energy which is an intrusive air-pollutant and possesses both auditory and non-auditory result on the exposed residents and this trough generating different scale network system which will reconceives the urban context. After defining its role in the city, the system will protect the inhabitants from the harmful sounds; it will capture the general wasted energy surrounding and converts it into usable energy for operating electrical devices.
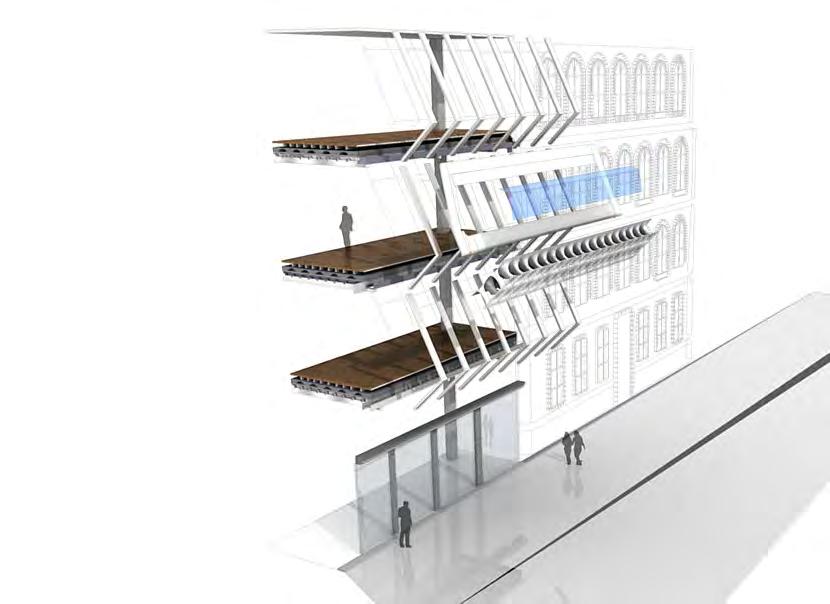
This small scale component can adapt to the existing buildings which are close to the traffic link in order to convert the urban noise in to usable electricity energy. 05.1 DIGITAL FABRICATING SIMULATION
We simulate the acoustic system to a single building (Fig. 105) by considering the noise propagation angle and the lighting condition.
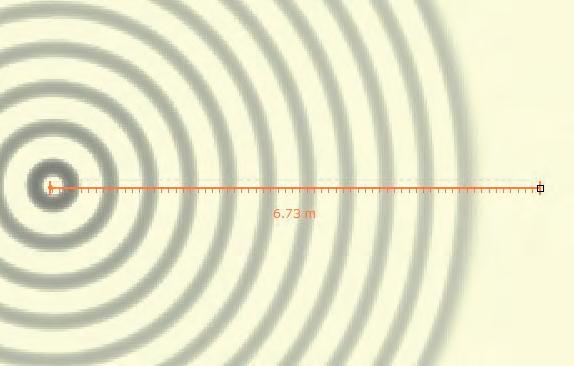
05.2 FURTHER DEVELOPMENT FOR PUBLIC SPACE Noise source Large scale devices
After the research of acoustic system adapting to existing buildings, we consider the possibility of a large scale device for public space.
Instead of using small scale components to generate an open space for people’s activities, we try to modify the component as a big device, which can work as a shelter for children playing around and convert noise as well.

The large scale device is created by 1/4 of the component’s single cone(Fig. a, b) . The position of the devices are defined by the acoustic shadows of the noise source.

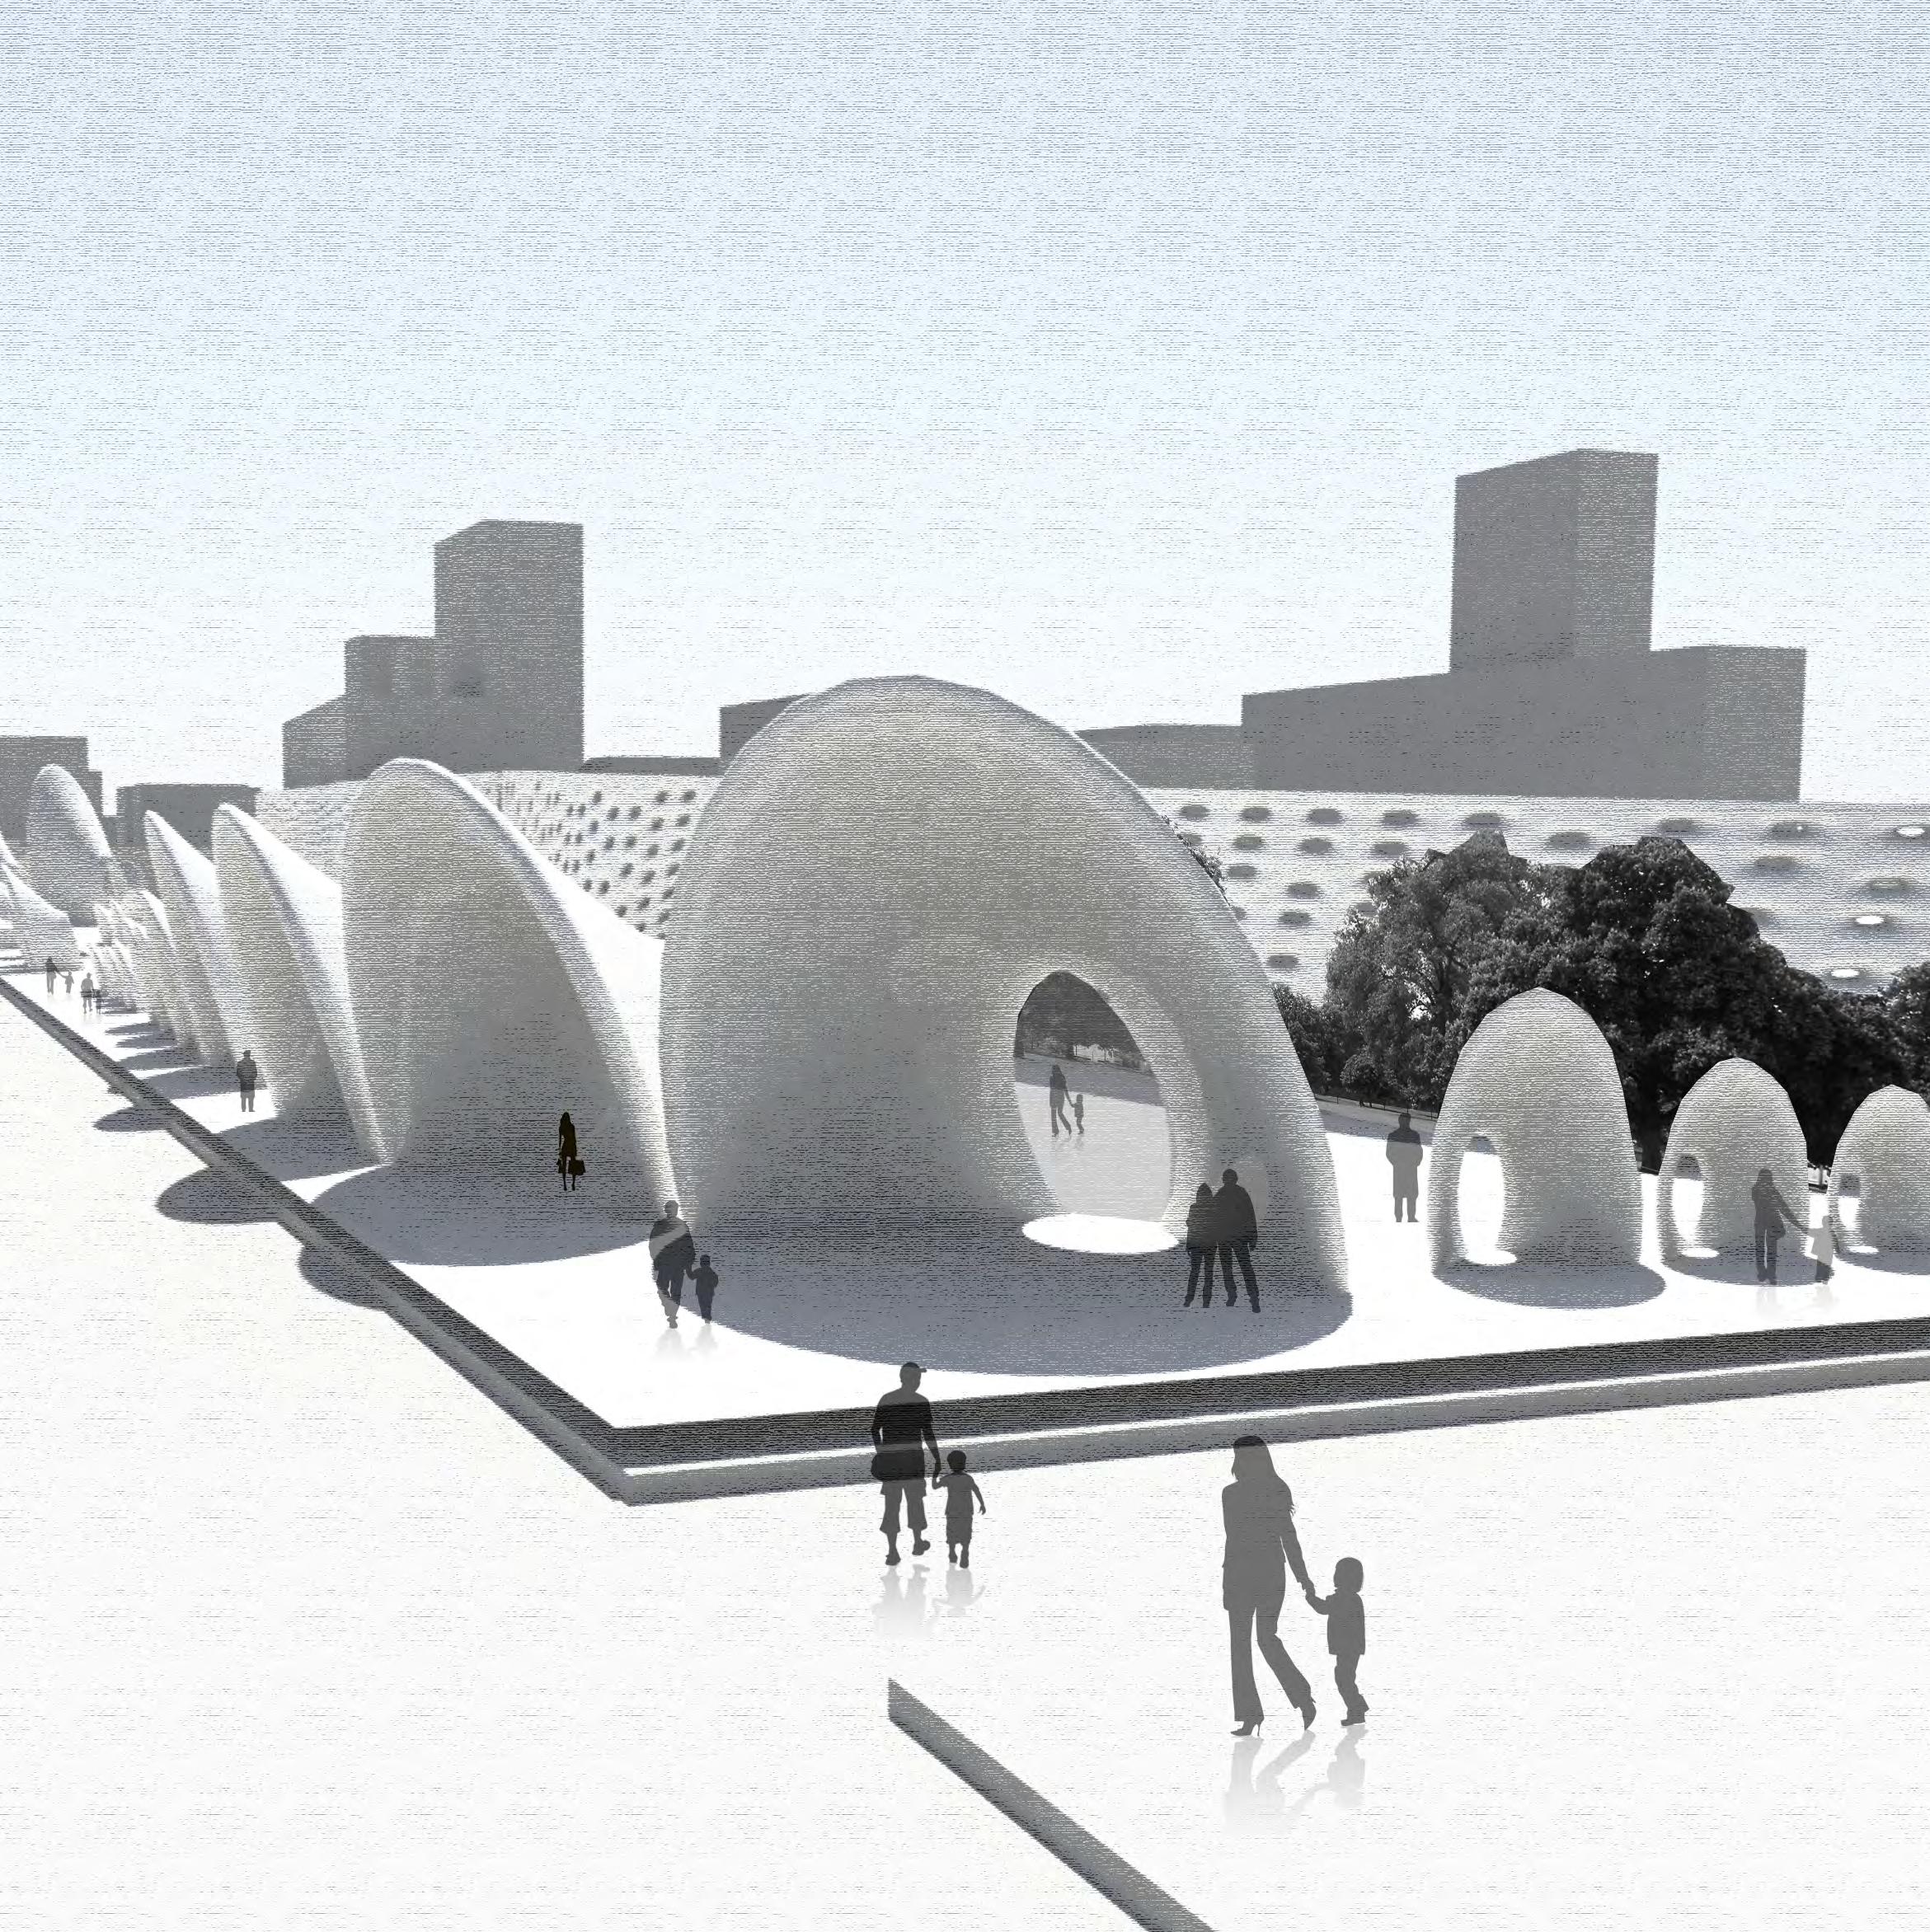

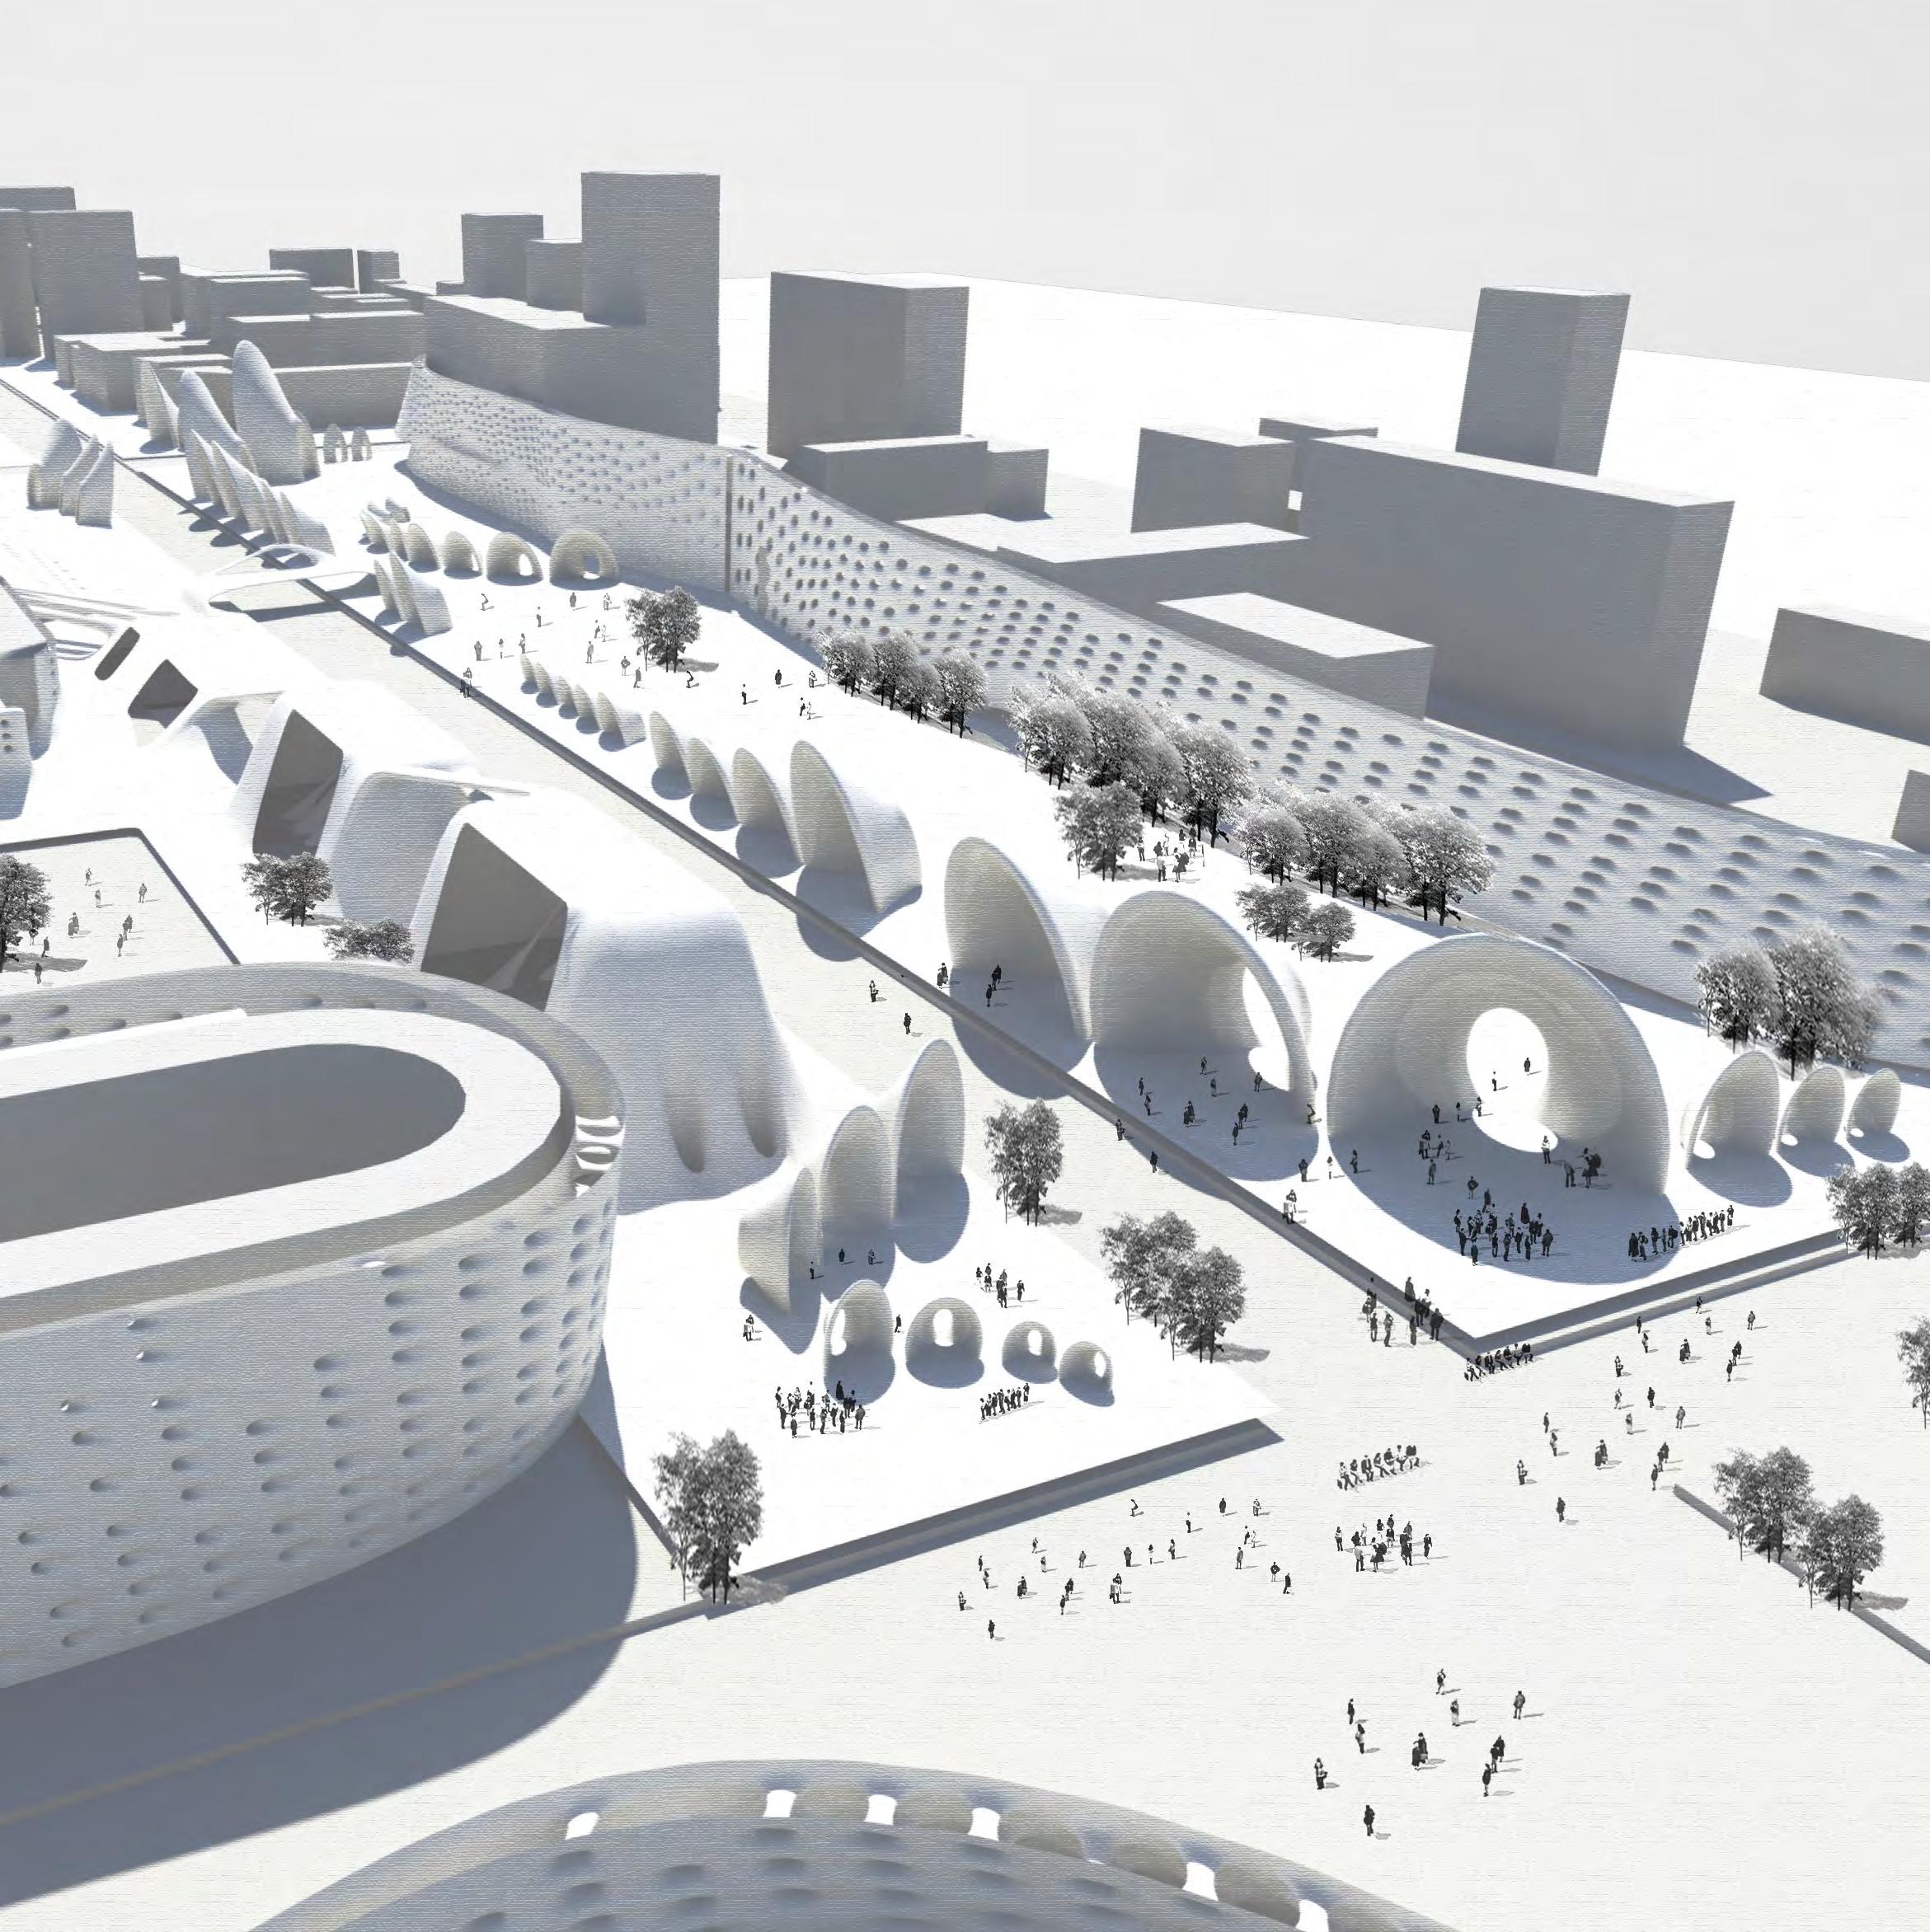

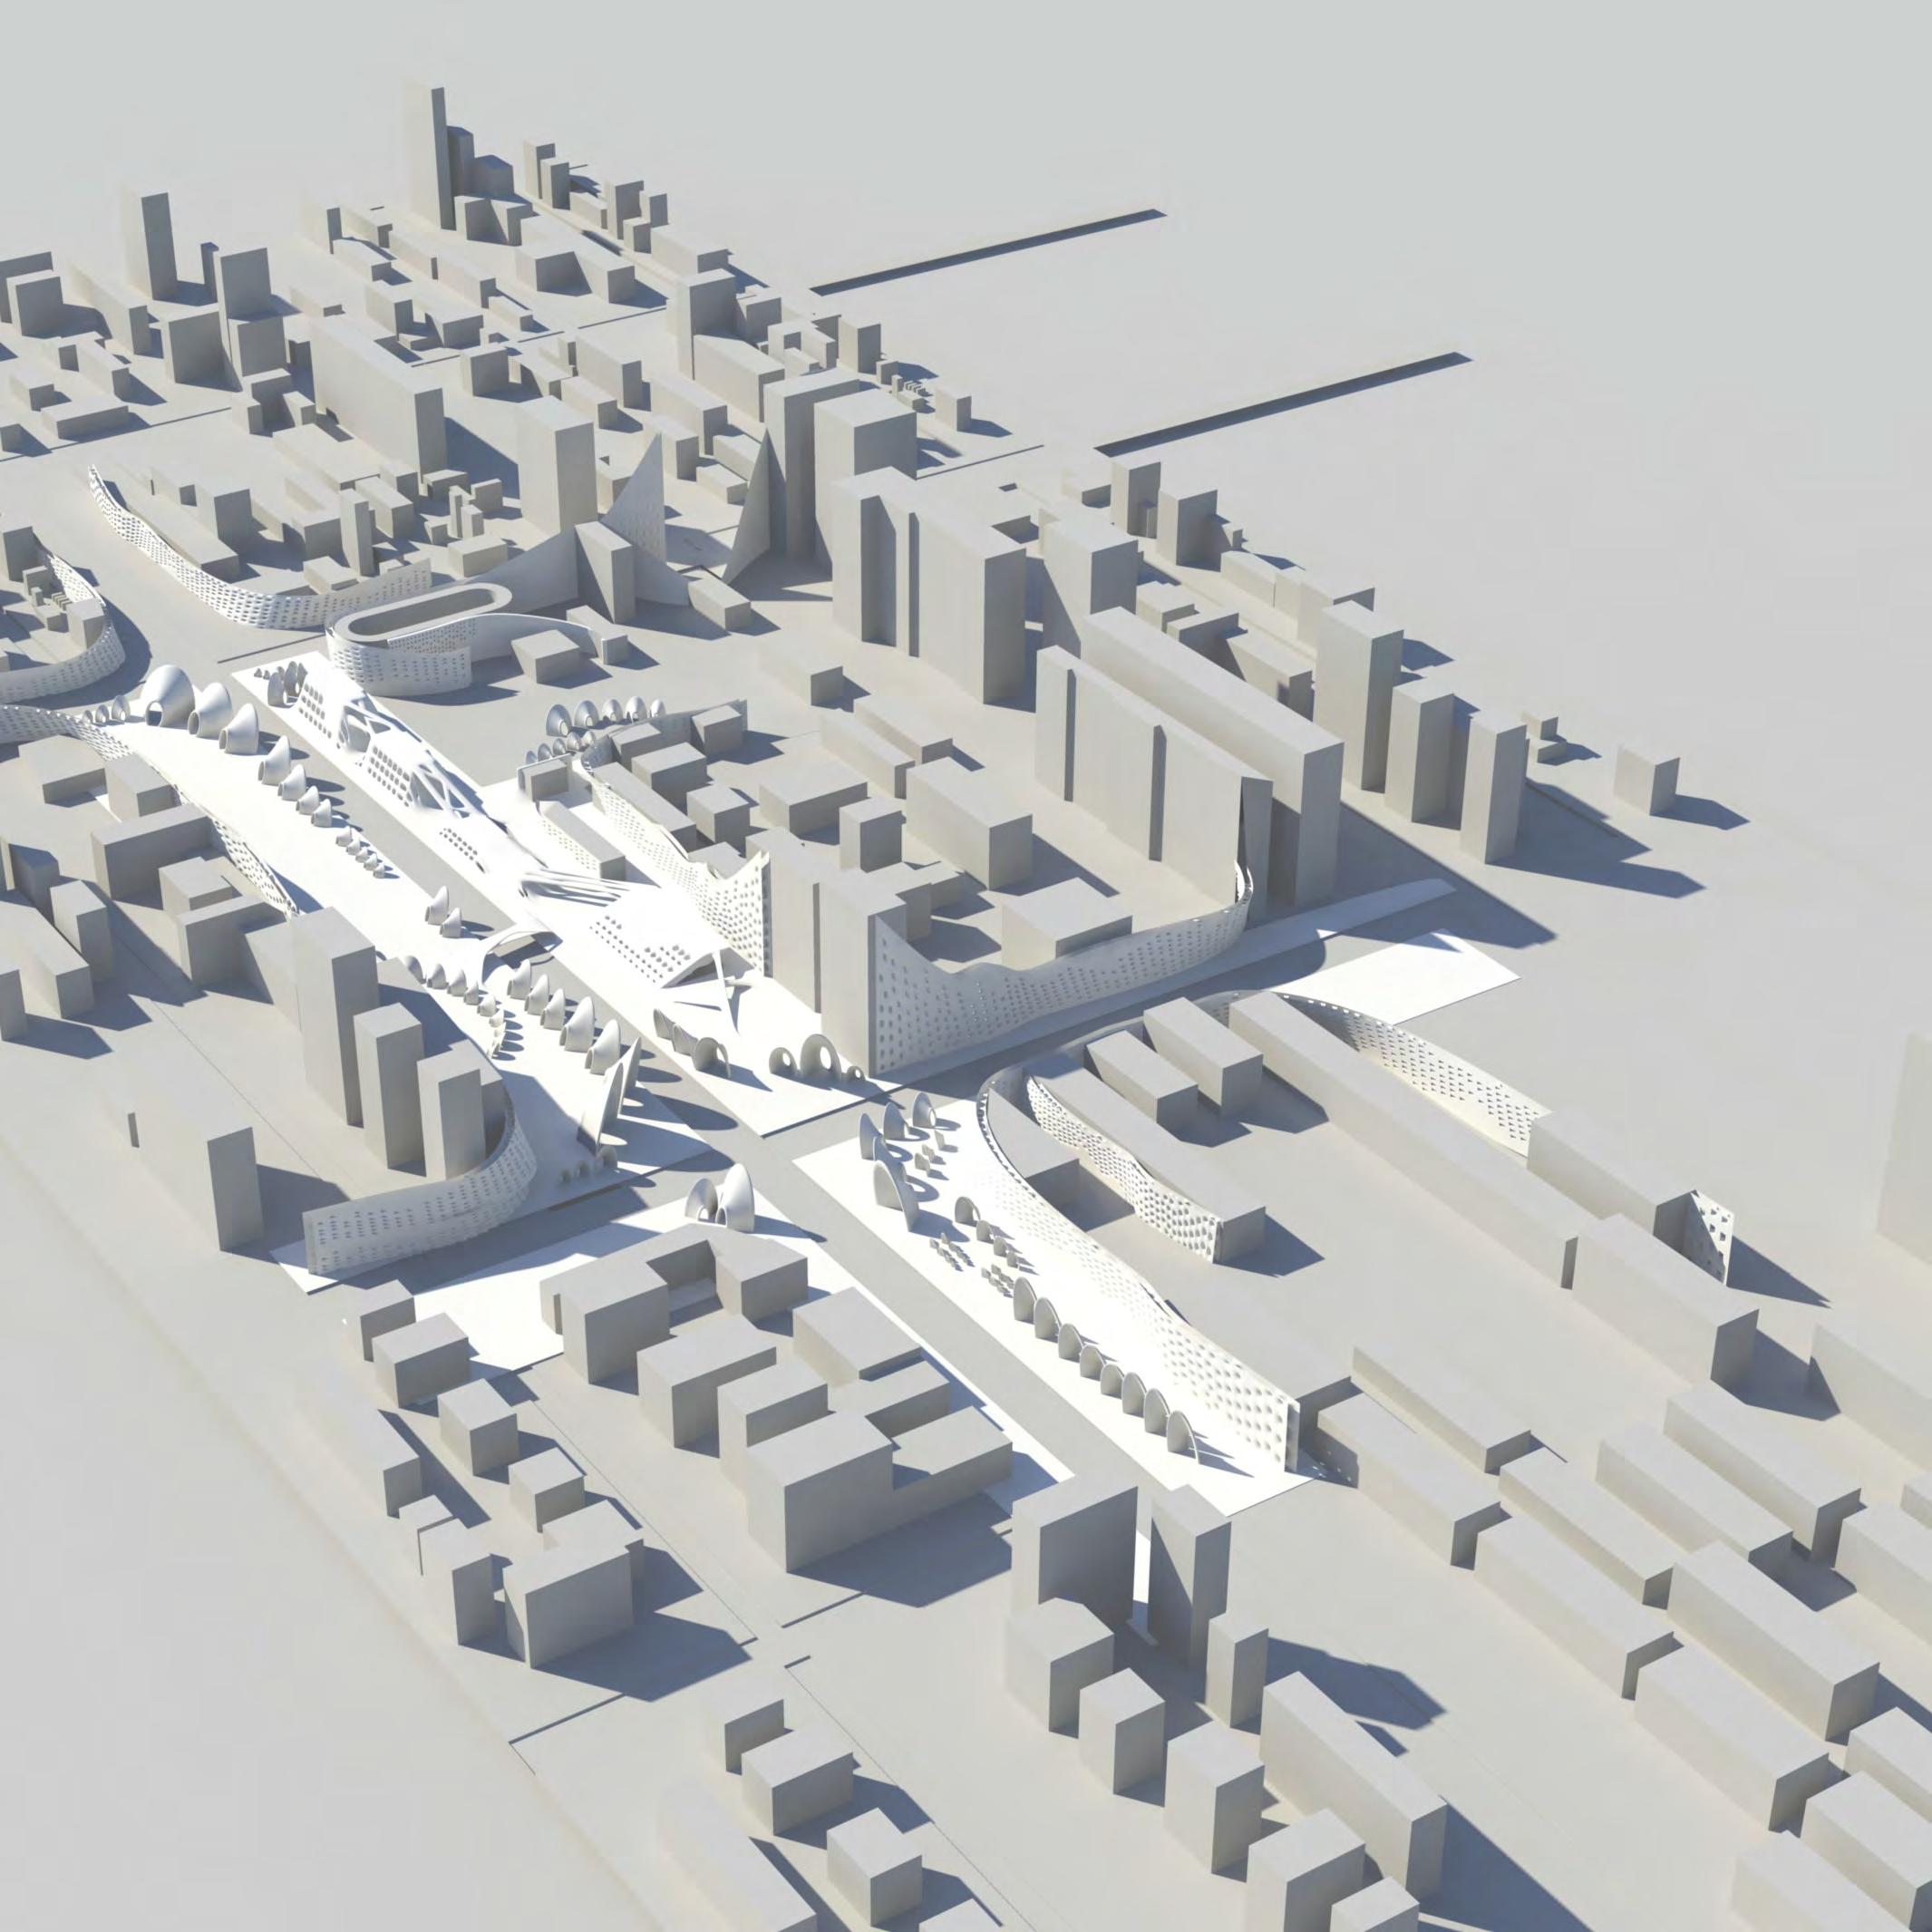
05.3 EVALUATION
The specified parameters in this section represent the acoustical system in the chosen site in the city of Beijing. As a result the suggested parameters can be varied, but still within an urban local- global scale.
We generated our system according to the most affected areas where the noise mechanical vibration is vastly concentrated, the long Freeway belt area has become a blue noise band, which means that there is at least as high as 80 dB. The configuration of the geometry of the system starting from the global level to the local level is generated through the interaction of the material system with the external input which the noise sound waves.
Therefore the presented model is not simply displaying the acoustical architectural assortment but also to indicate the capability that the physical characteristic can be differentiated through the changing parameters of the site according to noise frequency shadows. The large scale components were shaped and designed so that we can achieve an improved character for the area and to create a vital public space and recreational areas by improving the urban quality as we already mentioned in the introduction.
CHAPTER 06 CONCLUSIONS
Noise emerges as an environmental problem in many cities across the world. However, in this thesis we have argued that it may be considered as a wasted energy that could be useful.
The acoustic architectural research proposed an active material system that converts urban noise energy into electricity. We started by understanding the physical properties of sound, which helped us create a theoretical energy accumulative model and explain its potential application as an energy conversion device.
The study process was influenced by precedence research, as well as, the analysis of the biodynamic organization. Digital experiments created a strategy for design development. In order to increase the efficiency of the acoustic energy conversion, Fluid Flow analysis (CFX) where used; they helped us identifying each step and what it is related to, in order to finally achieve a successful design development. After de-
fining its role in the city, the system will protect the residents from the injurious sounds; it will capture the general wasted energy surrounding and harness usable energy for operating electrical devices.
Further research may be conducted to enhance the digital model, and its accuracy, as well as, reproducing analogue use for material studies. In the felid of acoustics and sound manipulation collaboration across many specialities is necessary to further develop the field; such as engineers, urban planners, material scientists and architects. This will ultimately improve the output performance of the used material, piezoelectric, in this research.
CHAPTER 07 APPENDIX
07.1 GEOMETRY EVOLUTION SCRIPTING
07.2 ACOUSTIC SYSTEM SCRIPT
07.1 RHINOSCRIPT
(for Geometry Evolution)
Option Explicit ‘Script written by <Guangyuan Li>
Call Main() Sub Main()
Dim pop, intLen, dnaArray, gens, i
Dim objects,fitnessArray,keepCount,sortedDNA,mutationRate
gens = 9 ‘generations
pop = 19 ‘population size per generation intLen = 40 ‘length of the dna keepCount = 2 ‘number of population we keep each generation mutationRate = 2’ percentage of mutation in genes
‘create dna population
dnaArray = CreateDNA (pop, intLen)
Dim arrArea
‘loop for n generations
For i = 0 To gens
Rhino.Print “----generation “ & i & “-----”
‘ build objects
objects = build(dnaArray, i)(0)
arrArea = build(dnaArray, i)(1)
‘ fitness (test dna)
fitnessArray = fitness(objects, dnaArray, gens,arrArea)
‘ sort (generation by fitness)
sortedDNA = sortDNA(dnaArray,fitnessArray,keepCount)
‘ crossover
dnaArray = crossover(sortedDNA, dnaArray,pop)
‘ mutate
dnaArray = mutate(dnaArray, mutationRate)
Next
‘---------genetic functions--------------
‘create dna population
Function CreateDNA(pop,intLen)
Dim dna(), i, j, strDNA, strSubDNA, intRan
‘loop to make each population dna
For i = 0 To pop
strDNa = “” ‘create empty dna string
ReDim Preserve dna(i) ‘ keeping that array to store informations
‘ loop for each letter In one dna string
For j = 0 To intLen ‘loop through array
‘ create a random number
intRan = CInt(Rnd * 6 + 1)
‘choose a letter based on random number
Select Case intRan
Case 1
Case 2
Case 3
Case 4
Case 5
Case 6
Case 7
End Select
strSubDNA = “A”
strSubDNA = “B”
strSubDNA = “C”
strSubDNA = “D”
strSubDNA = “E”
strSubDNA = “F”
strSubDNA = “G”
strDNA = strDNA & strSubDNA
Next
dna(i) = strDNA
Rhino.Print “dna(“ & i &”) = “ & dna (i)
Next
CreateDNA = dna
‘ choose a letter based on random number
‘ add string to array as dna
End Function
‘ build objects
Function build(dnaArray, gen)
Dim i, j, strAction
Dim objects(), objTemp
Dim strCirc1, strCirc2, strCirc3
Rhino.EnableRedraw False
Dim arrArea
ReDim arrArea(0)
‘loop through the dna and build objects
For i = 0 To Ubound(dnaArray)
‘create geometrical profiles
strCirc1 = Rhino.AddCircle(Rhino.WorldXYPlane,4.0) strCirc2 = Rhino.CopyObject(strCirc1, Array(0,0,0), Array(0,0,8)) Rhino.ScaleObject strCirc2, Array(0,0,8), Array(0.8,0.8,0),False
strCirc3 = Rhino.CopyObject(strCirc1, Array(0,0,0), Array(0,0,16))
‘ loop through dna letters , call function for each letter
For j = 1 To Len(dnaArray(i))
‘get letter from position in string strAction = Mid(dnaArray(i),j,1) ‘manipulate profiles based on dna letter
Select Case strAction
Case “A”
Case “B”
ScaleProfile strCirc2,1.1
ScaleProfile strCirc2,0.9
Case “C”
Case “D”
ScaleProfile strCirc2,1
RotateProfile_V strCirc2,2
Case “E”
Case “F”
RotateProfile_V strCirc2,-2
RotateProfile_H strCirc2,2
Case “G”
End Select Next
ReDim Preserve objects(i)
ReDim Preserve arrArea(i)
RotateProfile_H strCirc2,-2
arrArea(i) = rhino.CurveArea(strCirc2)(0)
objTemp = Rhino.AddLoftSrf(Array(strCirc1,strCirc2,strCirc3))
objects(i) = objTemp(0)
Rhino.DeleteObjects Array(strCirc1,strCirc2,strCirc3)
Rhino.CapPlanarHoles objects(i)
Rhino.MoveObject objects(i), Array(0,0,0), Array(20 * i, 20 * gen, 0)
Next
Rhino.EnableRedraw True build = array(objects,arrArea)
End Function
‘ fitness (test dna)
Function fitness(objects, dnaArray, gens,arrArea)
Dim i, objFitA, objFitB, objFitness(), arrCtr, minArea
minArea=Pi*2*2
‘loop through all the dna and return an array of fitness values
For i = 0 To Ubound(objects)
‘get surface volume
objFitA = Rhino.SurfaceVolume(objects(i))
‘make sure surface area larger then min area
If arrArea(i) < minArea Then arrArea(i)=minArea
End If
ReDim Preserve objFitness(i)
objFitness(i) = objFitA(0)/arrArea(i)
Rhino.Print “objFitness(“ & i & “)= “ & objFitness(i)
Next
‘return array fitness = objFitness
End Function
‘ sort (generation by fitness)
Function sortDNA(dnaArray,fitnessArray,keepCount)
Dim sortedFit, count,fitArray(),i
‘sort dna array in order of fittest
‘sort fitness array
sortedFit = Rhino.SortNumbers(fitnessArray)
count = 0
‘loop through dna
For i = 0 To Ubound(dnaArray)
‘ store only fit ones in new array
If fitnessArray(i) => sortedFit(Ubound(sortedFit)-keepCount) Then
ReDim Preserve fitArray(count)
fitArray(count) = dnaArray(i)
count = count + 1
End If
Next
‘return new array sortDNA = fitArray
End Function
‘ crossover
Function crossover(sortedDNA, dnaArray,pop)
Dim strDNA,dna(),strSubDNA1,strSubDNA2,i,j
‘loop through dna array
For i = 0 To Ubound(dnaArray)
strDNA = “”
ReDim Preserve dna(i)
‘loop through the sorted dna array
For j = 2 To Len(sortedDNA(0)) Step 2
‘ choose a letter from one strSubDNA1 = Mid(sortedDNA(0),j,1)
‘ choose a letter from another strSubDNA2 = Mid(sortedDNA(1),j - 1, 1)
strDNA = strDNA & strSubDNA1 & strSubDNA2
Next
‘replace dna with new mixed dna
dna(i) = strDNA
Next
crossover = dna
End Function
‘-----------mutate
Function mutate(dnaArray, mutationRate)
Dim i, tempArray(), j, intRan, strDNA, strSubDNA ‘loop through the dna
For i = 0 To Ubound(dnaArray)
strDNA = “”
ReDim Preserve tempArray(i) ‘loop through genes
For j = 1 To Len(dnaArray(i)) ‘use mutattion rate as a percentage conditional to mutate ‘if yes mutate randomly individual gen
If Rnd * 100 > 100 - mutationRate Then ‘create a random number intRan = CInt(Rnd * 6 + 1)
Select Case intRan
Case 1
Case 2
Case 3
Case 4
Case 5
Case 6
Case 7
End Select Else
strSubDNA = “A”
strSubDNA = “B”
strSubDNA = “C”
strSubDNA = “D”
strSubDNA = “E”
strSubDNA = “F”
strSubDNA = “G”
strSubDNA = Mid(dnaArray(i),j,1) End If
strDNA = strDNA & strSubDNA Next
tempArray(i)= strDNA
Next
mutate = tempArray
End Function
‘---------development geometry functions
‘ ScaleProfile
Function ScaleProfile (strObj,dblScale)
Dim arrCtr
arrCtr = Rhino.CurveAreaCentroid(strObj)
Rhino.ScaleObject strObj,arrCtr(0), Array(dblScale,dblScale,dblScale)
End Function
Function RotateProfile_V (strObj,dblAngle)
Rhino.RotateObject strObj, Array(0,0,0),dblAngle, Array(0,1,0)
End Function
Function RotateProfile_H (strObj,dblAngle)
Rhino.RotateObject strObj, Array(0,0,0), dblAngle,Array(0,0,1)
End Function
07.2 MAYA MEL
(for Acoustic Component)
//Script written by <Guangyuan Li>
global proc GlBridgeCmd(float $straight, int $divisions) {
string $selface[]= `ls -sl -fl -typ float3`; string $objname; string $rootTok[]; int $tokNum = `tokenize $selface[0] “.” $rootTok`; string $shpname = $rootTok[0]; string $shptest = `match “Shape” $shpname`;
Thereafter it gives the shape node if ($shptest == “Shape”)
{ string $parents[] = `listRelatives -fullPath -parent $shpname`; $objname = $parents[0]; } else
$objname = $shpname;
ConvertSelectionToEdges;
string $newSet = `sets`;
delete $selface; select -r $newSet;
string $brgNode[]= `polyBridgeEdge -ch 1 -divisions $divisions -twist 0 -taper 0.5 -curveType 2 -smoothingAngle 30`;
string $crvs[] = `listRelatives -typ “transform” -c $objname`; int $chldnm = size($crvs); int $x=$chldnm-1;
string $chldcrv = $crvs[$x];
string $childdup[] =`duplicate -rr $chldcrv`;
rebuildCurve -ch 1 -rpo 1 -rt 0 -end 1 -kr 2 -kcp 0 -kep 1 -kt 1 -s 1 -d 1 -tol 0.01 $chldcrv;
rebuildCurve -ch 1 -rpo 1 -rt 0 -end 1 -kr 2 -kcp 0 -kep 1 -kt 1 -s 1 -d 5 -tol 0.01 $chldcrv;
string $blendNode[] =`blendShape -frontOfChain $childdup[0] $chldcrv`;
setAttr ($blendNode[0] + “.” + $childdup[0]) $straight;
delete -ch $chldcrv;
delete $childdup[0];
select -noExpand $newSet; delete;
select -r $chldcrv;
print “Select Attribute Editor to access polyBridgeEdge node”; } global proc GlBridge()
{ if (`window -exists BridgeUI` != 1)
{ int $uiLabelWidth = 140; int $uiInputWidth = 240; int $uiWidth = ($uiLabelWidth + $uiInputWidth); window
-maximizeButton false -resizeToFitChildren false -title “GlBridge Tool” -iconName “GlBridge Tool” -menuBar false -wh 500 200 BridgeUI; showWindow BridgeUI; string $bridgeGenForm = `formLayout -numberOfDivisions 100`; string $bridgeColumn = `columnLayout -adjustableColumn true -rowSpacing 5`; rowLayout -numberOfColumns 3 -columnAttach 1 “right” 5 -columnWidth 1 $uiLabelWidth -columnWidth 2 $uiInputWidth straightRow; text -label “CurvyPath” -ann “Used to curve the extrusion. Straight is 0, Curved is 1, Exaggerated Curve is 2, negatives go in opposite dir”; floatSliderGrp -field true -minValue -5 -maxValue 5 -value 0 -pre 2 straightSlide; text -label “”; setParent..; rowLayout -numberOfColumns 3 -columnAttach 1 “right” 5
-columnWidth 1 $uiLabelWidth -columnWidth 2 $uiInputWidth divRow; text -label “Divisions” -ann “Initial number of divisions. Change in AE afterward”; floatSliderGrp -field true -minValue 0 -maxValue 100 -value 5 -pre 0 divSlide; text -label “”; setParent..; setParent..;
string $BridgeButton = `button -height 20 -label “Bridge Polys” -command “GlBridgeCmd (`floatSliderGrp -q -v straightSlide`, `floatSliderGrp -q -v divSlide`)”`;
string $CloseBridge = `button -height 20 -label “Close” -command “deleteUI BridgeUI”`; formLayout -edit
-attachForm $bridgeColumn “top” 2 -attachForm $bridgeColumn “left” 2 -attachControl $bridgeColumn “bottom” 2 $BridgeButton -attachForm $bridgeColumn “right” 2
-attachNone $BridgeButton “top” -attachForm $BridgeButton “left” 2 -attachForm $BridgeButton “bottom” 2 -attachPosition $BridgeButton “right” 0 50
-attachNone $CloseBridge “top” -attachForm $CloseBridge “left” 2 -attachForm $CloseBridge “bottom” 2 -attachPosition $CloseBridge “left” 0 50 -attachPosition $CloseBridge “right” 2 100 $bridgeGenForm; } }
07.2 MAYA MEL
(for Acoustic System)
//Script written by
<Guangyuan Li>//new file file -f -new
//draw a new curve on the side screen //rebuild curve select -r curve1 ; smoothCurve -ch 1 -rpo 1 -s 10 curve1.cv[“*”]; int $s=30; rebuildCurve -ch 1 -rpo 1 -rt
//get the U segments int $sU= `getAttr curve1.spans`; //2 more segments on revolveSurface int $r=$sU+2; //get the V segments int $sV=30; //2 more segments on revolveSurface int $c=$sV+2;
//revolve surface select curve1; revolve -n “PP1” -ch 1 -po 1 -rn 0 -ssw
-ax 0 0 1 “curve1” ; rotate -r 0 0 90 PP1; //duplicate surface duplicate; scale -r 1.2 1.2 1.2 PP2; //flip the normal dimation of the upper surface polyNormal -normalMode 0 -userNormalMode 1 -ch 1 PP2; //select surface select -r PP1 ; select -tgl PP2 ; //combine 2 surface as 1 object polyUnite -n “DOUBLESURFACE” -ch 1 PP1 PP2 ;
//select groups of each 4 sub-surfaces for($i=0;$i<($c-1)/3;$i++){ for($k=0;$k<($r-1)/3;$k++){ int $countK=($r-1)/3; //once bridge the sub-surface will be deleted and the whole order will change int $j=(1+$i*3)*$r+(1+$k*3)-(2*$k+$countK*4*$i); //select bottom sub-surface select -r DOUBLESURFACE.f[$j]; select -tgl DOUBLESURFACE.f[$j+1]; select -tgl DOUBLESURFACE.f[$j+$r-2*$k]; select -tgl DOUBLESURFACE.f[$j+$r-2*$k+1]; //select upper sub-surface select -tgl DOUBLESURFACE.f[$j+$r*$c-(2*$k+$countK*4*$i+2*$k)]; select -tgl DOUBLESURFACE.f[$j+$r*$c-(2*$k+$countK*4*$i+2*$k)+1]; select -tgl DOUBLESURFACE.f[$j+$r*$c+$r-(2*$k+$countK*4*$i+2*$k)-2*$k];
select -tgl DOUBLESURFACE.f[$j+$r*$c+$r-(2*$k+$countK*4*$i+2*$k)-2*$k+1];
//set variables float $straight; //cone segments int $divisions=2; //diameter control of cones float $taper=0.1+0.05*($k+$i); //parse selection of faces string $selface[]= `ls -sl -fl -typ float3`; string $objname;
//get name of object whose faces are selected string $rootTok[]; int $tokNum = `tokenize $selface[0] “.” $rootTok`; string $shpname = $rootTok[0]; string $shptest = `match “Shape” $shpname`;
//Test because the first time, the tokenize command gives the transform node. Thereafter it gives the shape node if ($shptest == “Shape”) { string $parents[] = `listRelatives -fullPath -parent $shpname`; $objname = $parents[0]; } else
$objname = $shpname;
//convert selection to edges ConvertSelectionToEdges;
//create set from selection string $newSet = `sets`; //delete faces delete $selface; //select edges select -r $newSet;
//bridge between edges using curves option string $brgNode[]= `polyBridgeEdge -ch 1 -divisions $divisions -twist 0 -taper $taper -curveType 2 -smoothingAngle 30`;
//select children of object string $crvs[] = `listRelatives -typ “transform” -c $objname`;
//get the size of selection int $chldnm = size($crvs); int $x=$chldnm-1;
//get most recent selection mark as child curve string $chldcrv = $crvs[$x];
//duplicate child curve string $childdup[] =`duplicate -rr $chldcrv`;
//rebuild child as one span 1 degree linear curve to straighten rebuildCurve -ch 1 -rpo 1 -rt 0 -end 1 -kr 2 -kcp 0 -kep 1 -kt 1 -s 1 -d 1 -tol 0.01 $chldcrv;
//rebuild as one span 5 degree linear curve rebuildCurve -ch 1 -rpo 1 -rt 0 -end 1 -kr 2 -kcp 0 -kep 1 -kt 1 -s 1 -d 5 -tol 0.01 $chldcrv;
//apply child as blendshape to the original curve string $blendNode[] =`blendShape -frontOfChain $childdup[0] $chldcrv`;
//set blend target to the straighten value passed to procedure setAttr ($blendNode[0] + “.” + $childdup[0]) $straight;
//delete history to get rid of blendshape delete -ch $chldcrv;
//delete childcurve duplicate delete $childdup[0];
//select and delete the new set select -noExpand $newSet; delete;
select -r DOUBLESURFACE ;
displaySmoothness -divisionsU 3 -divisionsV 3 -pointsWire 16 -pointsShaded 4 -polygonObject 3; subdivDisplaySmoothness -smoothness 3; }
CHAPTER 08 BIBLIOGRAPHY
1 What are renewable energies?
Retrieved from http://www.solarpowernotes.com/renewable-energy/what-is-renewable-energies.html
2 Daniel Liden: What is sound energy? Retrieved fromhttp://www.wisegeek.com/what-is-sound-energy.htm
3 Lenntech Water treatment & purification Holding B.V Retrieved fromhttp://www.lenntech.com/water-energy-faq.htm#ixzz10rup1chY
4 Noise Pollution
Retrieved fromhttp://www.karmayog.org/noisepollution/58.htm
5 Oracle Education Foundation Copyright Agent Retrieved from http://library.thinkquest.org/C005137F/Effects%20of%20noise%20pollution.htm
6 Ashlee Simmons, r How Does Noise Pollution Affect People? Retrieved from http://www.ehow.com/how-does_4563995_noise-pollution-affect-people.html
7 L.C. (Eelco) den Boer A. (Arno) Schroten Traffic noise reduction in Europe Report Delft, August 2007
8 Theo Bodin , Maria Albin- Road traffic noise and hypertension Retrieved from http://www.ehjournal.net/content/8/1/38
9 Guidelines on Design of Noise Barriers
Retrieved from http://www.epd.gov.hk/epd/english/environmentinhk/noise/guide_ref/design_barriers_content2.html
10 Benz Kotzen and Colin English published 2009 by Taylor & Francis. Environmental Noise Barriers- A guide to their acoustic and visual design Second edition
11 Integrated Publishing Retrieved from http://www.tpub.com
12 Effect of noise pollution Retrieved from http://library.thinkquest.org/C005137F/Effects%20of%20noise%20pollution.htm
13 Noise pollution Retrieved from http://www.karmayog.org/noisepollution/58.htm
14 Cavity Resonators
Retrieved from http://www.tpub.com/content/neets/14183/css/14183_57.htm
15 Benz Kotzen and Colin English published 2009 by Taylor & Francis. Environmental Noise Barriers- A guide to their acoustic and visual design Second edition
16 TNC Consulting AG - General Wille-Strasse [Photovoltaic barrier] Retrieved from http://www.tnc.ch/index.en.php
17 Bernard Weller, Claudia Hemmerle, Sven Jakubetz Details Practice- Photovoltaics issue- Technology Architecture and Installation ISBN-10: 303460369X
18 Bio-Inspired Design: What Can We Learn from Nature?
Retrieved from http://biomimicry.typepad.com/bioinspire/files/BioInspire.1-01.15.03.pdf
19 Acoustic Listening Devices
Retrieved from http://www.lilesnet.com/didjaknow/eardar/
20 Acoustic Listening Devices
Retrieved from http://www.lilesnet.com/didjaknow/eardar/
21 DOUGLAS B. WEBSTER Ear Structure and Function in Modern Mammals
Retrieved from http://icb.oxfordjournals.org/content/6/3/451.abstract
22 Ear structure
Retrieved from http://health.discovery.com/
23 Jonathan Wright - Bats Expert- ‘A’ levels in Zoology and Chemistry. ‘O’ Level in Biology. Retrieved from http://en.allexperts.com/q/Wild-Animals-705/Bats.htm
24 Jeronimidis,George- ‘Biodynamics’- Emergence: Morphogenetic Design Strategies-Architectural Design Journal edited by Michael Hensel, Achim Menges and Michael Weinstock, Academy Editions, London, Vol. 74 No 3 Issue –May/June 2004.
25 Jeronimidis,George- ‘Biodynamics’- Emergence: Morphogenetic Design Strategies-Architectural Design Journal edited by Michael Hensel, Achim Menges and Michael Weinstock, Academy Editions, London, Vol. 74 No 3 Issue –May/June 2004.
26 Overview of Sound Waves
Retrieved from http://www.school-for-champions.com/science/sound.htm
27 What is amplitude?
Retrieved from http://www.indiana.edu/~emusic/acoustics/amplitude.htm
28 Decibel
Retrieved from http://en.wikipedia.org/wiki/Decibel
29 What is amplitude?
Retrieved from http://www.indiana.edu/~emusic/acoustics/amplitude.htm
30 Resonance
Retrieved from http://en.wikipedia.org/wiki/Resonance
31 Natural (Resonant) Frequency
Retrieved from http://www.curee.org/projects/woodframe/element5/modules/seismic/frequency.htm
32 Horn loudspeaker http://en.wikipedia.org/wiki/Horn_loudspeaker
33 Cymatics
Retrieved from http://en.wikipedia.org/wiki/Cymatics
34 FROM CONSCIOUSNESS TO TECHNOLOGY: CYMATICS, WAVE PERIODICITY, AND COMMUNICATION
Retrieved from http://www.gebser.org/publications/IntegrativeExplorationFiles/Cooper.Consciousness.pdf
Surface tissue (veil) Retrieved from http://books.google.co.uk/
Finite Element Acoustics Retrieved from http://www.lmsintl.com/simulation/acoustics/finite-element-acoustics
Branko Kolarevic -Architecture in the Digital Age: Design and Manufacturing (2003) Taylor and Francis
Branko Kolarevic -Manufacturing Material Effects: Rethinking Design and Making in Architecture Kevin Klinger (Editor)
08.2 ILLUSTRATIVE
1 March, 2009 Rebecca Weeks Watson Six Ways To Grow Your Traffic For Free Retrieved from http://vator.tv/news/2009-03-03-six-ways-to-grow-your-traffic-for-free
2 Solar panels
Retrieved from http://www.mysod.co.uk/wp-content/uploads/2008/09/solarpanels.jpg
3 Wind turbines
Retrieved from http://blog.apartmentsearch.com/wp-content/uploads/2008/01/wind_energy.jpg
4 Water Energy
Retrieved from http://www.scienceprogress.org/wp-content/uploads/2009/06/daml.jpg
5 Breaking Glass
Retrieved from http://scripts.mit.edu/~tsg/www/list.php?letter=C
6 Noise energy http://www.roadtransport.com/blogs/big-lorry-blog/2010/08/shh-shh-the-noise-abatement-so.html
7 Cochlea pic
Retrieved from http://emusician.com/onstage/technical_features/saywhat_fig2_lg.jpg
8 Cochlea pic
Retrieved from http://www.ehow.com/how-does_4563995_noise-pollution-affect-people.html
9 Kakehi (Bamboo Fountain) in Portland Japanese Garden
Retrieved from http://www.flickriver.com/photos/35614822@N08/4014822746/
10 Al hambra
Retrieved from http://www.scienceprogress.org/wp-content/uploads/2009/06/daml.jpg
11 Table noise source, Sources: Beranek (1988) and EPA (1971)
Retrieved from http://www.drnoise.com/PDF_files/Traffic%20Noise%20Primer.pdf
12 Traffic Jam
Retrieved from http://www.fiatmio.cc/wp-content/uploads/2009/11/traffic-jam.jpg
13 Traffic Jam
Retrieved from http://www.accon-uk.com/images/acc/Noise-at-Work-1.jpg
14 Cantilevered aluminium barriers, Bellinzona, Switzerland
Benz Kotzen and Colin English (2009) Environmental Noise Barriers- A guide to their acoustic and visual design Taylor & Francis. P 92
15 Typical perforated metal sections
Benz Kotzen and Colin English (2009) Environmental Noise Barriers- A guide to their acoustic and visual design Taylor & Francis. P 137
16 Typical particle concrete or woodfibre sections
Benz Kotzen and Colin English (2009) Environmental Noise Barriers- A guide to their acoustic and visual design Taylor & Francis. P 137
17 Section of a aluminium barrier
Benz Kotzen and Colin English (2009) Environmental Noise Barriers- A guide to their acoustic and visual design Taylor & Francis. P 138
18 Cockpit at sunset photograph courtesy of ONL [Oosterhuis_Lénárd], Rotterdam, the Netherlands
Benz Kotzen and Colin English (2009) Environmental Noise Barriers- A guide to their acoustic and visual design Taylor & Francis. P 188
19 New Jersey ‘Laghi’ barrier with resonators
Benz Kotzen and Colin English (2009) Environmental Noise Barriers- A guide to their acoustic and visual design Taylor & Francis.
Note: This diagram has been reconstructed from the original.
20 Barrier arrangements
Benz Kotzen and Colin English (2009) Environmental Noise Barriers- A guide to their acoustic and visual design Taylor & Francis.
Note: This diagram has been modified from the original.
21 Angle effects
Benz Kotzen and Colin English (2009) Environmental Noise Barriers- A guide to their acoustic and visual design Taylor & Francis.
Note: This diagram has been modified from the original.
22 Angle effects
Benz Kotzen and Colin English (2009) Environmental Noise Barriers- A guide to their acoustic and visual design Taylor & Francis.
Note: This diagram has been modified from the original.
23 Contemporary techniques photovoltaic barrier
Benz Kotzen and Colin English (2009) Environmental Noise Barriers- A guide to their acoustic and visual design Taylor & Francis
24-25-26 Bernarhrd Weller, Claudia Hemmerle, Sven jakubetz
Details- Photovoltaic issue- Technology Architecture and Installation
27 The big sound mirror in Denge, Kent, England
Retrieved from http://commons.wikimedia.org/wiki/File:Large_acoustic_mirror_-Denge_-Kent_-England-19July2009.jpg
28 Acoustic devices
Retrieved from http://www.lilesnet.com/didjaknow/eardar/
29-30-31-32-33-34 Acoustic devices
Retrieved from http://www.lilesnet.com/didjaknow/eardar/
35 Ear illustration courtesy National Institute on Deafness
Retrieved from http://www.nidcd.nih.gov/
36 Ear drum Retrieved from http://www.airsilver.net/ch12.html
37 The shapes of the heads of bats Retrieved from http://www.scholarpedia.org/article/Echolocation_in_bats
38 Different Microchiropteran outer ears Auditory apparatus of bats (1984) Hill & Smith
39 Tropical katydids SEM by Anna Price Retrieved from http://www.wfu.edu/biology/batsandbugs/bug_ears.htm
40 Tropical Katydids Retrieved from http://canalphotos.org/7-23_canal_katydid_3_PS_rz.jpg
41 Green lacewings Sem by Greg Herzog Retrieved from http://www.wfu.edu/biology/batsandbugs/bug_ears.htm
42 Transverse wave (water wave) Retrieved from http://www.school-for-champions.com/science/sound.htm
Note: This diagram has been modified from the original.
43 Longitudinal or compression wave (sound) Retrieved from http://www.school-for-champions.com/science/sound.htm
Note: This diagram has been modified from the original.
44 Sine waves different frequencies Retrieved from http://en.wikipedia.org/wiki/File:Sine_waves_different_frequencies.svg
45 Definition of decibel Retrieved from http://femci.gsfc.nasa.gov/random/dB.html
Note: This diagram has been modified from the original.
46 Decibel Function Graph Retrieved from http://rfidsoup.pbworks.com/Decibel
Note: This diagram has been modified from the original.
47 Sound power Retrieved from http://en.wikipedia.org/wiki/Sound_power
Note: This diagram has been modified from the original.
48 Resonance Retrieved from http://en.wikipedia.org/wiki/File:Resonance.PNG
49 Tacoma, Washington--Tacoma Narrows Bridge Collapse, 1940 Retrieved from http://anengineersaspect.blogspot.com/2009_06_01_archive.html
50 Tacoma Narrows Bridge Retrieved from http://bridgehunter.com/wa/pierce/bh37083/
51 Multicell Retrieved from http://wiki.verkata.com/en/wiki/Horn_loudspeaker
52 Sections of cone geometry in different depth and diameter Note: This diagram is self-made.
53 Energy Conversion Strategy: Sound Source - Vibration Force - Electricity Note: This diagram is self-made.
54 Glycerine Has Been Made To Vibrate Retrieved from http://www.gebser.org/publications/IntegrativeExplorationFiles/Cooper.Consciousness.pdf
55 Powder Has Been Made To Vibrate Retrieved from http://www.gebser.org/publications/IntegrativeExplorationFiles/Cooper.Consciousness.pdf
57 Sound Images Retrieved from http://www.cymaticsource.com/
58 Various patterns are generated on the 41cm*41cm square metal plate in frequency 60Hz, 125Hz, 150Hz, 170Hz
Note: This is self-experiment pics.
59 Various patterns are generated on the 2cm radious piezo-ceramic in frequency 3kHz, 6kHz, 6.8kHz
Note: This is self-experiment pics.
60 Digital model set up for Natural frequency analysis of a thin Aluminium plate
Note: This is from Strand7 result pics.
61 Natural frequency analysis results of a thin Aluminium plate.
Note: This is from Strand7 result pics.
62 Natural frequency analysis of a thin Aluminium plate
Note: This is from Strand7 result pics.
63 Energy Conversion Device
Note: This is self-experiment pics.
64 Device Set Up
Note: This is self-experiment pics.
65 Device elements
Note: This is self-experiment pics.
66 Natural frequency analysis of a thin Aluminum plate.
Note: This is from Strand7 result pics.
67 Piezo Ceramics were glued on the accurate position of the aluminium plate Note: This is self-experiment pics.
68 The final circuit was defined by the voltage control requirement of the capacitor Note: This is self-experiment pics.
69 The piezo ceramic pieces Note: This is self-experiment pics.
70 Piezoelectric ceramics
Retrieved from http://electronicdesign.com/article/components/piezoelectric-ceramics-science-meets-
71 Copy illustration Retrieved from http://www.infoniac.com/user/greendan80/index.html
72 Generating power through human movement Retrieved from http://blog.gresleyabas.com.au/?tag=piezo
73 The East Japan Railway and the Piezoelectric Effect Retrieved from http://urbanneighbourhood.com/tag/power-systems/
74 A LED light was soldered to the piezo ceramic in order to test the eletricity power Note: This is self-experiment pics.
75 The first piezo circuit was hybrid connected by series-parallel. Note: This is self-experiment pics.
76 The second piezo circuit was a parallel connection Note: This is self-experiment pics.
77 Three different methods of piezo connection Note: This diagram is self-made.
78 Surface Veil Testing Note: This is self-experiment pics.
79 Device works at 125Hz Note: This is self-experiment pics.
80 Battery Charged by Piezoelectric Plate Note: This diagram is self-made.
81 Cone shape resonator prototype fabrication Note: This is self-experiment pics.
82 Materials of resonator prototype Note: This diagram is self-made.
83 Resonator prototype analysis by ANSYS FSI Note: This is from ANSYS WORKBENCH 12.1 result pics.¬
84 Resonator Geometry Optimization
Note: This is from Rhinoscript.
85 Final component render Note: This is from Rhino
86 Final component perspective section Note: This diagram is self-made.
87 Final component section with sound source Note: This diagram is self-made.
88 Final component section with piezo ceramics and electric wire
Note: This diagram is self-made.
89 Acoustic propagation through a hole Note: This diagram is self-made.
90 Site in Beijing
91 Noise map
92 Flat Facade component
Note: This is from Maya software
93 Curvy Facade Component
Note: This is from Maya software
94 Component diameter according to 125 Hertz
Note: This is from Maya software
95 Component diameter according to sound frequence range Note: This is from Maya software
96 CNC 2 axis machine- Foam cutting Note: This diagram is self-made.
97 Polurethane foam cut to size- top view
Note: This diagram is self-made.
98 Polurethane foam cut to size- side view
Note: This diagram is self-made.
99 Polurethane foam joined together
Note: This diagram is self-made.
100 Fiberglass sheets layers
Note: This diagram is self-made.
101 CNC 2 axis machine- Foam cutting
Note: This is self-experiment pics.
102 Component pieces join Note: This is self-experiment pics.
103 Component fabrication process Note: This is self-experiment pics.
104 1 : 2 component model Note: This is self-experiment pics.
105 Facade construction Note: This diagram is self-made.
106 Component in large scale providing pubilc space Note: This diagram is self-made.
