HIGH-TECTONIC CITY
Architectural Association School of Architecture

Master of Architecture, Emergent Technologies and Design

Co-Founder
Dr. Michael Weinstock
Course Director
Dr. Elif Erdine
Team Members
Berin Nur Kocabas
Debolina Ray
Zhang Yi
Architectural Association School of Architecture
Master of Architecture, Emergent Technologies and Design 2019 -20

High-Tectonic City [ M. Arch ]
Co-Founder
Dr. Michael Weinstock
Course Director
Dr. Elif Erdine
Studio Tutors
Alican Sungur
Eleana Polychronaki
Abhinav Chaudhary
Lorenzo Santelli
Team Members
Berin Nur Kocabas
Debolina Ray
Zhang Yi
2 3
ARCHITECTURAL ASSOCIATION SCHOOL OF ARCHITECTURE GRADUATE SCHOOL PROGRAMMES
PROGRAMME: Emergent Technologies and Design
YEAR: 2020-21
COURSE TITLE: M.Arch Dissertation
DISSERTATION TITLE: Hi - Techtonic City
STUDENT NAMES: Berin Kocabas [M.Arch], Debolina Ray [M.Arch], Yi Zhang [M.Arch]
DECLARATION:
" I certify that this piece of work is entirely my/our own and that any quotation or paraphrase from the published or unpublished work of others is duly acknowledged. "
SIGNATURE OF STUDENTS: [ Berin Kocabas ] [ Debolina Ray ] [ Yi Zhang ]
DATE: 29 January 2020
ACKNOWLEDGEMENT
In this project and throughout the time at the Architectural Association, we would like to express our sincere gratitude to Michael Weinstock and Elif Erdine for their guidance.
We would also like to express our appreciation to Alican Sungur, Eleana Polychronaki, Abhinav Chaudhary and Lorenzo Santelli for their constructive criticism and insightful suggestions during the creation and production of the dissertation.
Finally, we would like to thank our family and friends for the support and motivation that they gave us during our studies in the Emergent Technologies and Design program. Most importantly, their support helped us get through the unpredictable and tough pandemic. Last but not the least, we would like to thank each other for being present always and having each others back.
ABSTRACT
The urban development of a high density settlement (context being Tokyo Bay) facing pluvial and fluvial flooding is addressed in the present disseration. A resilient design approach is investigated through the generation, analysis and evaluation of an integrated hydrological system from Bay scale to the local scale.
The Bay scale through fluid dynamic tests and water channeling strategies is ensured to redirect and dissipate maximum wave energy before letting a less destructive flood water into the urban fabric at the local scale. Simultaneously, a strategy of soft landscape tissue with a combined mound and creek design in Tsukishima island as the local scale, is strategised to endure and show resiliency towards marine disasters such as storm surge and heavy rain fall.
The process explores the following equally important sub sytems: Water dissipation strategy through offshore breakwaters, channeling strategies to develop modified water network, Topography evolution/ modification for inland flood resiliency, density and program distribution with respect to context, Block morphology and building architecture for public and private spaces.
The development of the ist 2 sub-systems happens at the bay scale which informs the 3rd and 4th sub systems at the local scale. The design decisions for the ist 2 systems were derived more from scientific tests and analysis whereas the next 2 systems were developed first topologically and then geographically. The last system i.e the architectural system is derived first topologically by deriving spatial configuration and then morphologically as per its placement and aggregation in clusters.
Although investigated in parallel, all the subsystems adaptively operate as integrated parts of the hydrological system. Therefore, they inform each others decision in scale and morphology. In the end, the social logic of spaces is investigated from lowest point of the creek to highest point on land which creates dynamic open public and green spaces that is important in the highly dense case of Tsukishima Island.
This proposal of an integrated urban and water network system is developed in a manner so that it is applicable to other urban scenarios dealing with a similar set of issues, worldwide.
CONTENTS
TABLE OF CONTENTS
1. INTRODUCTION
2. DOMAIN
2.1 Marine disasters
2.1.1 The Tsunami phenomenon
2.1.2 World Statistics
2.1.3 Japan's geomorphological setting
2.1.4 Damage level and future predictions
2.2 Tokyo as context
2.2.1Marine problems
2.2.1.1 Types of Marine disasters faced by the city
2.2.1.2 Current engineering Solutions in place
2.2.1.3 Evacuation strategies in place
2.2.1.4 Conclusion
2.2.2 Urban issues
2.2.2.1 Population density and its problems
2.2.2.2 Lack of public and green spaces
2.2.2.3. Current site and Morphological limitations
2.2.3 Conclusion
2.3 Case study
2.3.1. Types of offshore barriers
2.3.2 Soft green tissue as fluid energy absorber
2.3.3 Metabolism architecture
2.4 Domain conclusion
2.4.1 Design Ambition
2.5 Research questions
2.6 Hypothesis
3. METHODS
3.1 Overview
3.2 Design Method
3.2.1 G. A. - multi criteria optimisation
3.2.2 Modular aggregation process
3.3 Design Analysis
3.3.1 Computational Fluid Dynamics
3.3.2 Hydrology Simulation
3.3.3 Data Remapping
3.4 Network Generation and Analysis
3.4.1 Pattern Generation
3.4.2 Syntactical Analysis
4. RESEARCH DEVELOPMENT
4.1 At Bay Scale
4.1.1 Analysis
4.1.1.1 Density Analysis
4.1.1.2 Elevation Analysis
4.1.1.3 Water velocity Analysis
4.1.1.4 Area extraction
4.1.2 Tests
4.1.2.1 CFD Tests on primitive barriers
4.1,2.2 Combined tests on modified barrier
4.1.3 Conclusion
4.2 At Intermediary Scale
4.2.1 Analysis
4.2.1.1 Curvature analysis
4.2.1.2 Width analysis
4.2.1.3 Tsunami analysis on site chosen
4.2.1.4 Ship route analysis
4.2.2 Tsunami cfd tests
4.2.2.1 Tests on basic channel types
4.2.2.2 Tests on integration channel types
4.2.3 Conclusion
4.3 At Local Scale
4.3.1 Analysis
4.3.1.1 Density in Tsukishima
4.3.2 Tests
4.3.2.1 CFD tests on tertiary channel cross section
4.3.2.2 Network test using space syntax analysis
4.3.3 Conclusion
4.4 Conclusion
5. DESIGN DEVELOPMENT
5.1 Barrier Application in Bay scale
5.1.1 Ecology analysis
5.1.2 Barrier development as per ship route
5.1.3 Barrier habitat generation
5.2. Channel modification at intermediary scale
5.2.1 Primary channel allocation using G.A.
5.2.2 Secondary channel allocation using G.A.
5.2.3 Post analysis with the modified channels and barrier application
5.3 Zoning/ Evacuation zones/ Tertiary channels/ Network generation in local scale
5.3.1 Zoning/evacuation center distribution using G.A.
5.3.2 Allocation of tertiary channel using G.A.
5.3.3 Transportation/ evacuation network
5.3.4 Syntactical analysis of generated networks
5.4 Architecture along tertiary channel
5.4.1 Space- filling module type
5.4.2 Aggregation Ruleset
5.4.3 Low - rise aggregation
5.4.4 Mid - rise aggregation
5.4.5 Program allocation along channel
5.4.6 Modular Facade detail
5.4.7 Single living unit detail
6. DESIGN PROPOSAL
6.1 100 year proposal plan
6.1.1 Urban fabric
6.1.2 Public spaces
6.1.3 Evacuation network utilisation
7. CONCLUSION
7.1 System Refinements
7.2 Next Step
8. REFERENCES
8.1 Image References
8.2 Bibliography
1. INTRODUCTION
14 15
Coastal towns and cities face the challenge of coping with various marine disasters both pluvial and fluvial flooding. They are dynamic areas as they generally face large amounts of pressure from both wind and water. The environment is constantly shaped and reshaped by the water's influence. As the sea level increases, and globally climate change occurs, coasts face increasing amounts of severe storms, surges, erosion and salt water intrusion.
For areas dealing with marine disasters such as Tsunami needs a better way of guiding and managing water. To prevent repeated social and economic losses as flooding from severe weather, tectonic movement, etc. building resilience in coastal communities becomes a vital need. [1]
Many of the coastal cities are a hub of trade and commerce and are highly populated. A flooding scenario hampers the growth and well being, but nevertheless, does not stop evolving. Thus, this situation calls for cities to inhabit water sooner or later, where the city's infrastructure needs to foster the conventional system to change and adapt in a better manner. A coastal city needs to build a relationship with the hydrological system, where new spatial functions are developed along a water network to create emergent urban scenarios that show resiliency to floods.
Domain
The domain will set out by introducing Tsunami: a major marine disaster as the driving topic. The world statistics and the geomorphological situation of tsunami prone areas are discussed, finally concluding with the site of test being the Tokyo Bay. Further on, the current situation regarding rising water level as a global crisis, the types of marine disasters and the respective issues faced by our site (context: Tokyo Bay) is discussed. The current methods of dealing with the same and their limitations will also be discussed.
Further on, the present density and population crisis in and around Tokyo and the issues regarding different aspects of urban spatial configuration and network will be discussed. The chapter will conclude with selection of a site and setting out ambition for the project.
Methods
The Methods chapter will document the various steps taken during the process of developing different layers that work together to deal with a 5m high tsunami or hurricane water (at bay scale); and the strategies developed inland to cope with flooding with respect to built space and model configuration and morphology at local scale. It will also discuss the tools utilised for analysis.
16 17
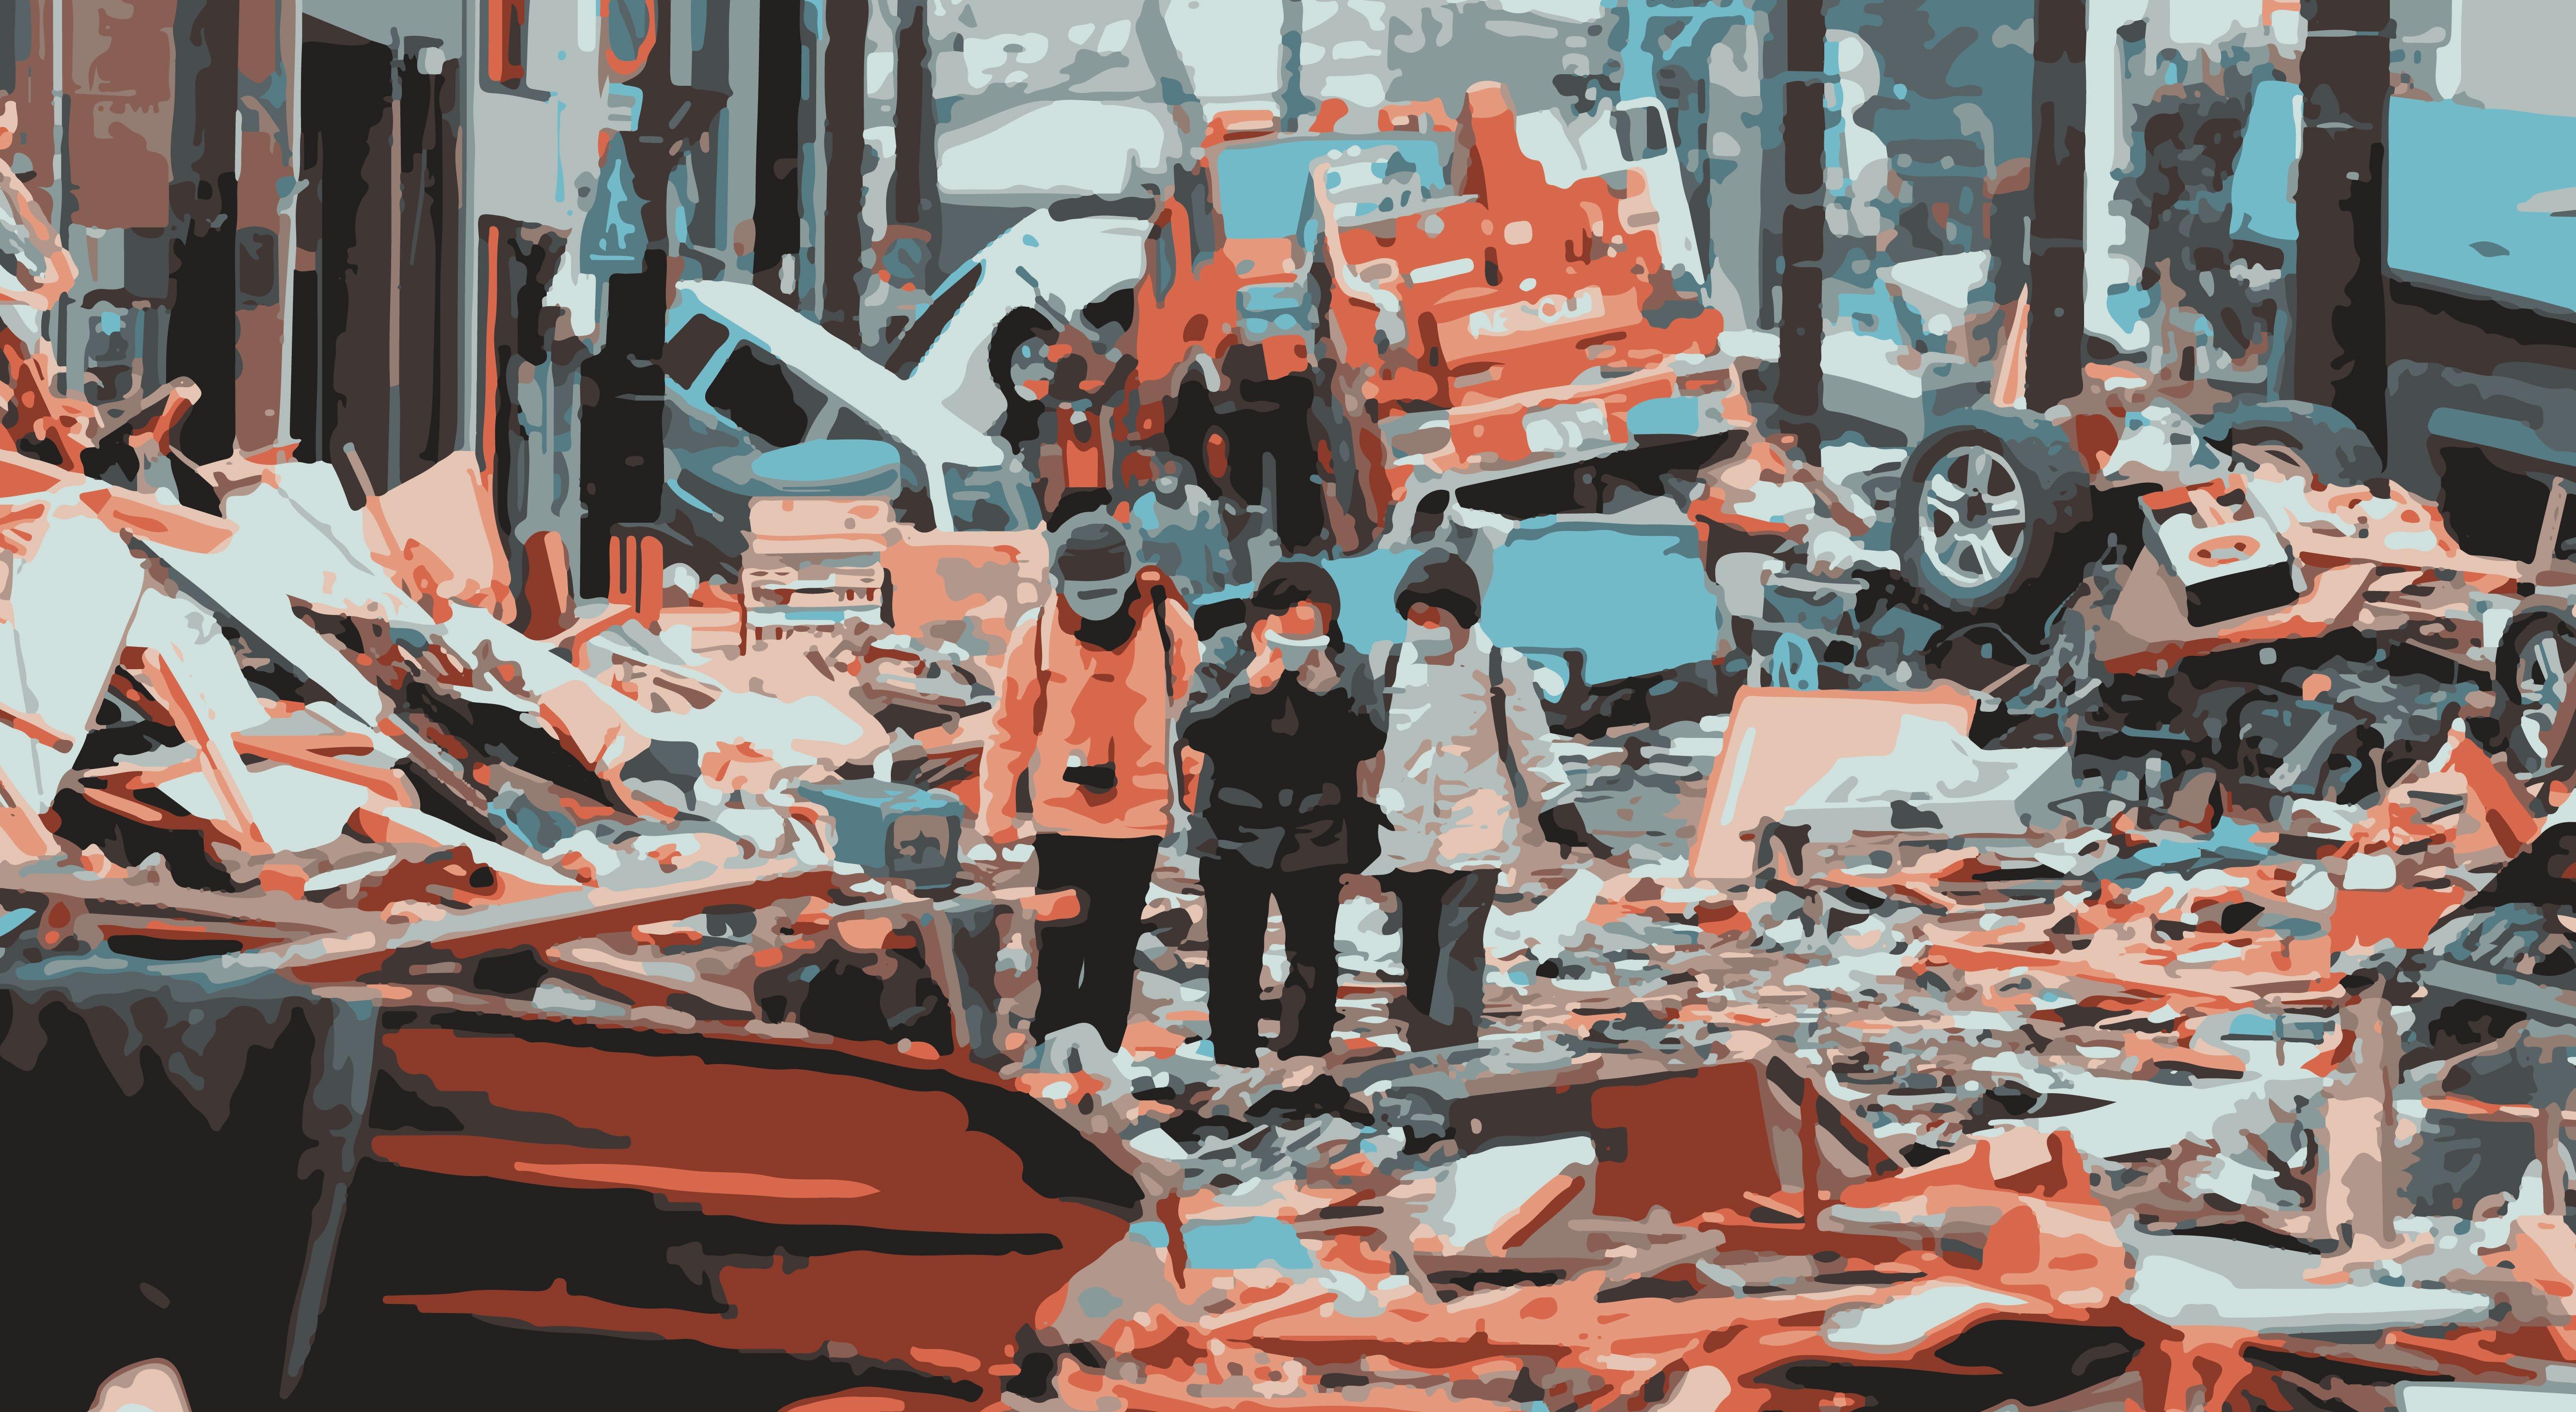
1. INTRODUCTION
Figure1.1: City After Tsunami
Research Development
In this chapter, the focus will be divided into 2 scales, the bay scale and the local scale. Experiments for wave energy dissipation and channeling will be set for the global scale whereas experiments dealing with topological data, urban network, land subdivision, water network and structuring of block aggregation in architectural scale will be resolved for the local scale.
Design Development
The Design development chapter will focus on optimising temporary water network (the creek volume + open pond storage volume) in conjunction to land subdivision (program distribution) and the different hierarchies of urban network.
It will also focus on cluster development where program distribution for public and private areas will be optimised along the network.
Design Proposal
This chapter will focus on design detailing the side by side workings of the different networks evolved at the end of Design development at the architectural scale. It will highlight the working of land morphology with respect to the buildings placed with the new spatial functions evolved (public open spaces)
Conclusion
This chapter will focus on the final design proposal’s workings and its limitations. It will also discuss the implications of the methods tested and design decisions taken on the site and surroundings and what steps can be taken for further developments.
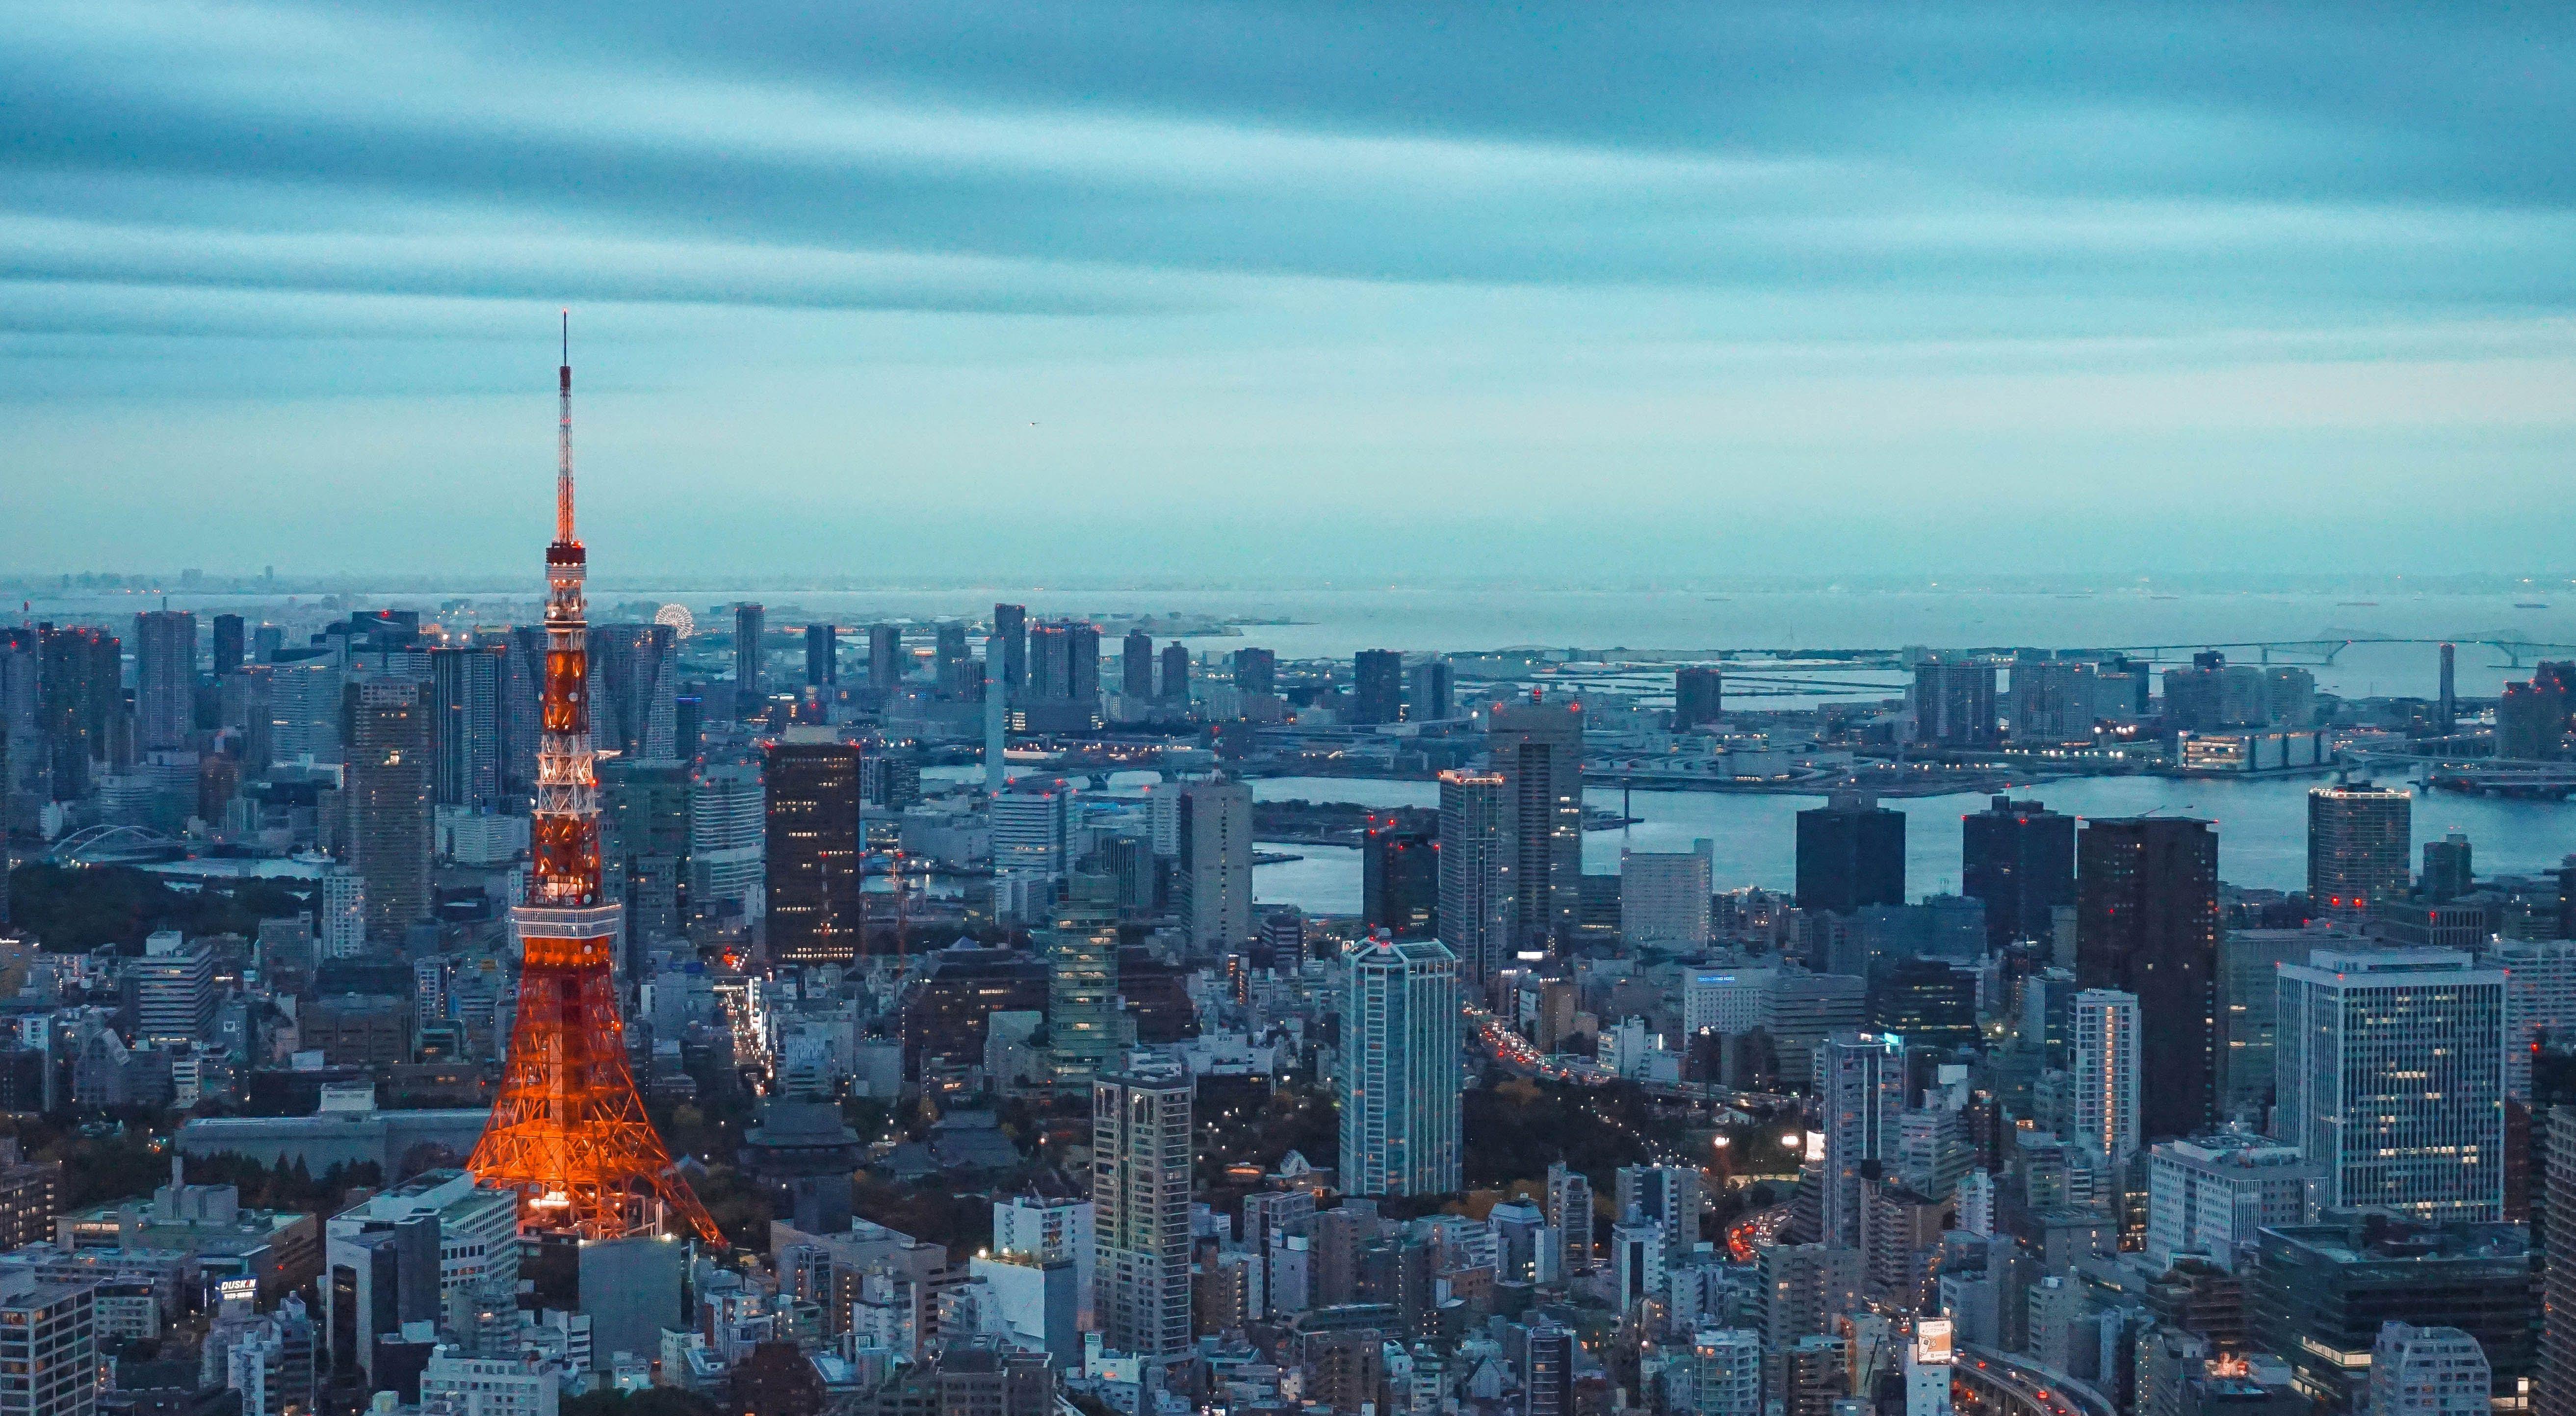
18 19
Figure1.2: City of Tokyo
2. DOMAIN
20 21
2.1 MARINE DISASTERS
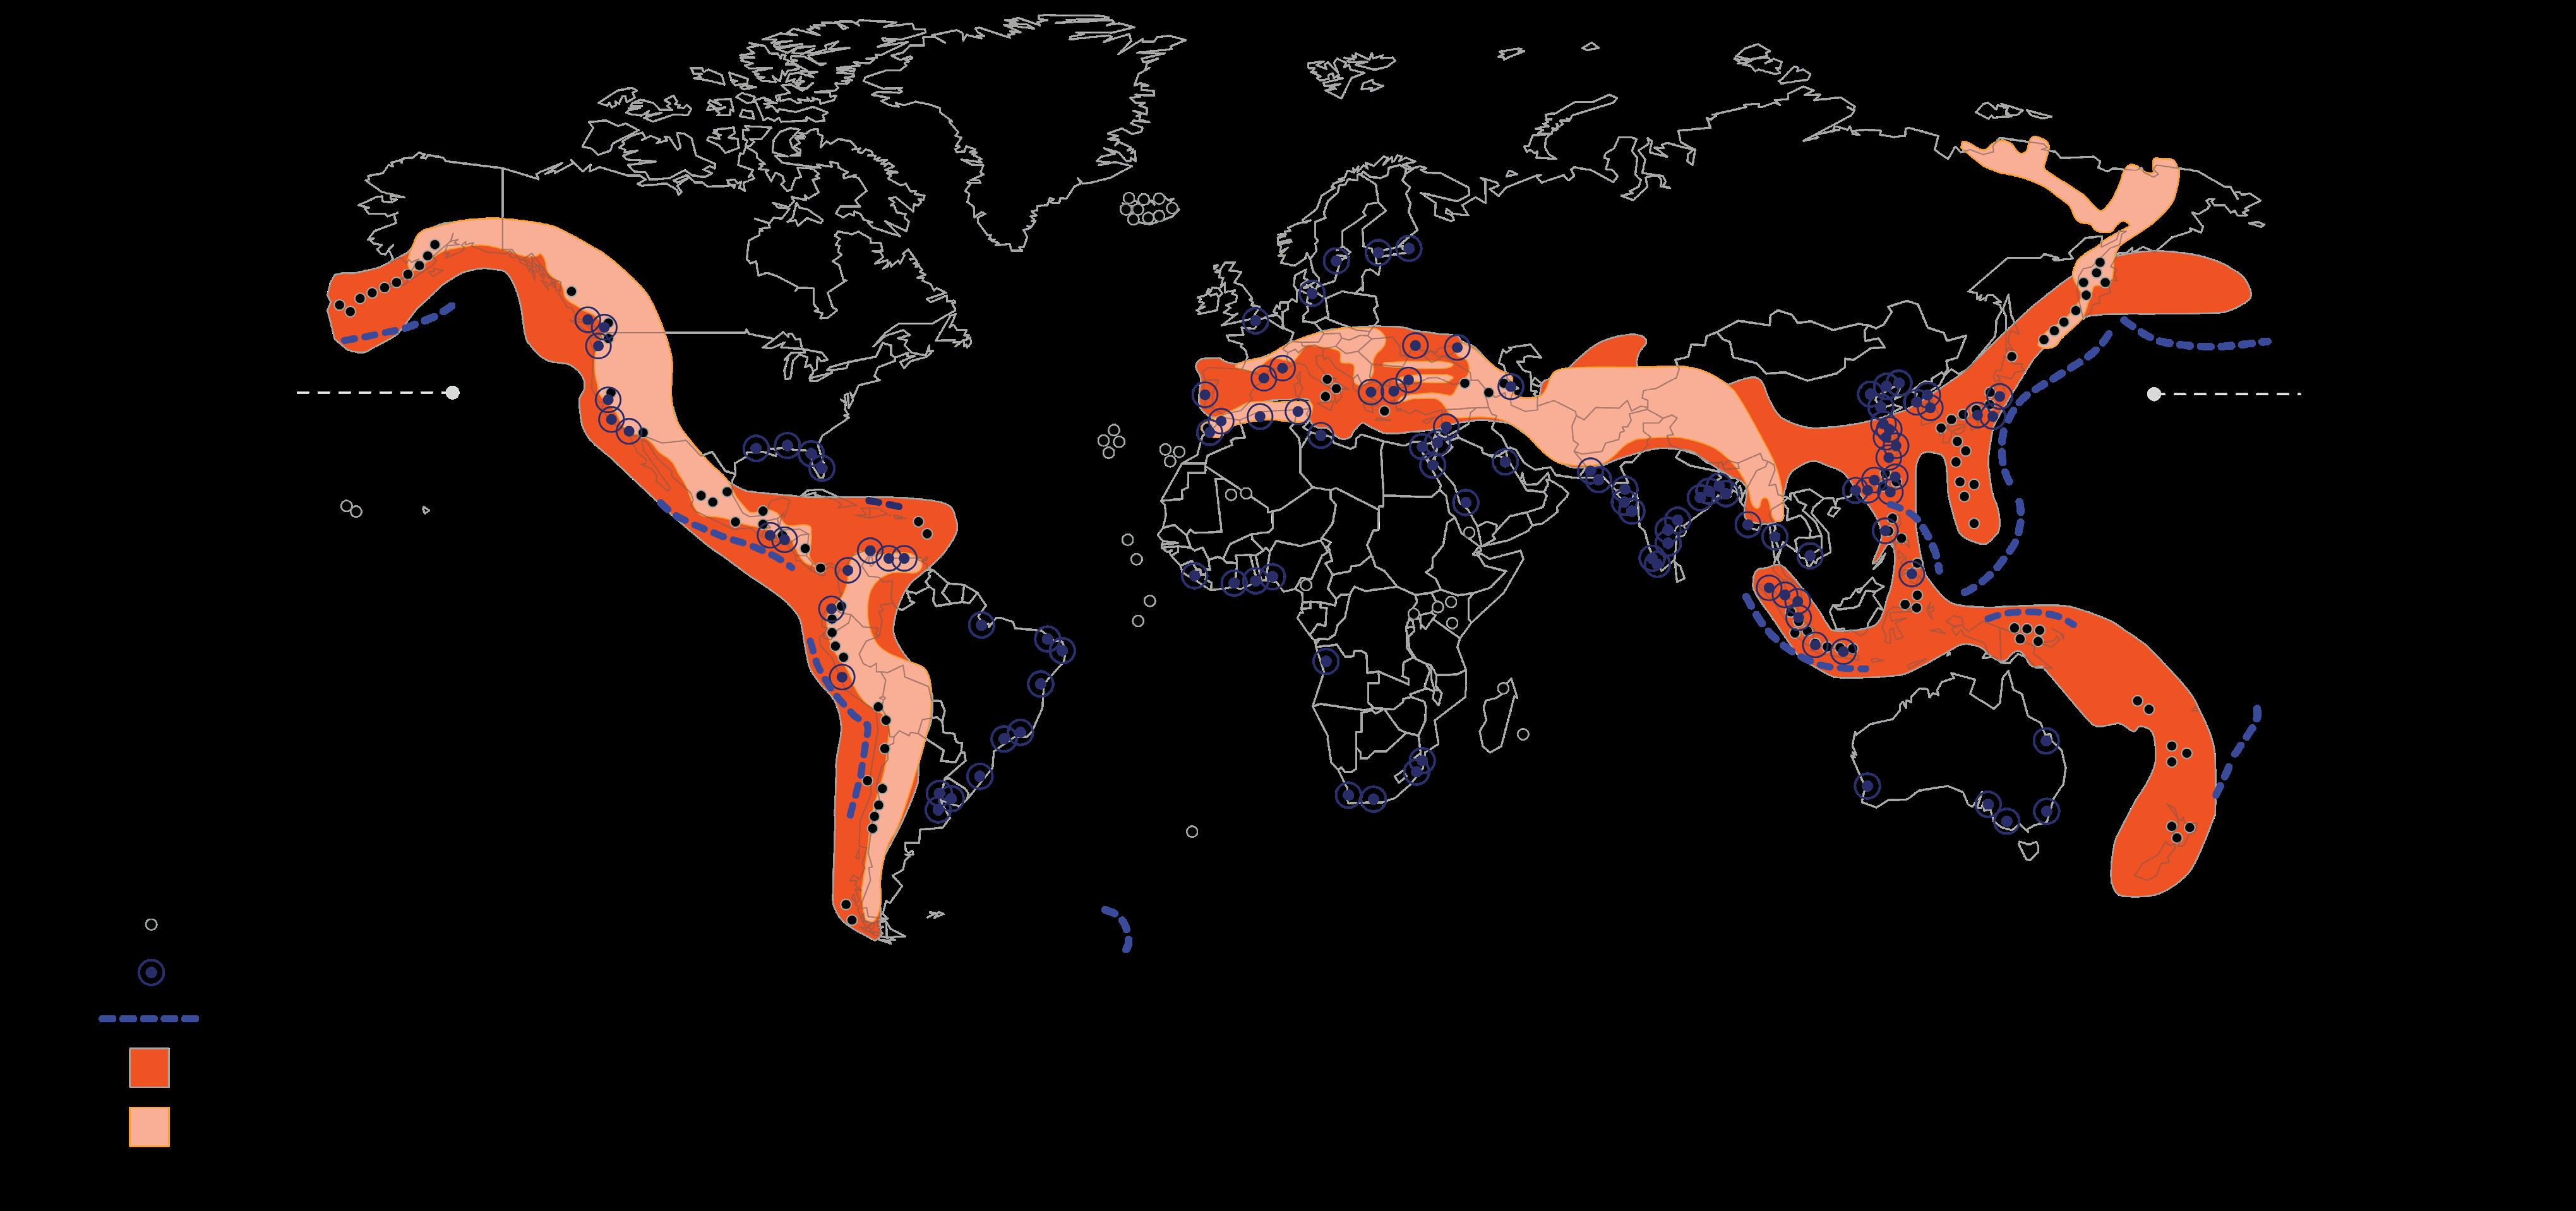
Typhoons and tsunamis are dangerous phenomena and marine disasters for our society and Japan has been exposed to both of these hazards. The risks of these hazards are getting bigger and bigger due to the growing population in the cities near these ‘dangerous’ coasts. From the past we have noticed that the impact of such hazards can be enormous. Very well known examples are the recent tsunami of 2011 in Japan and the typhoon Vera in Ise Bay (Japan) in 1959. Figure 1 shows the vulnerable coastlines in the world that are at risk for tsunamis and Figure 2 show the origins and tracks of the tropical typhoons together with the different names used around the world.
2.1.1 The tsunami Phenomenon
Tsunami (from Japanese tsu = harbour, nami = wave) [13] is a phenomenon that is generated due to large, undersea earthquakes at tectonic plate boundaries or less frequently caused by underwater landslides or volcanic eruptions. The sudden water displacement due to these events launches waves that oscillate in 2 directions from the source. Tsunamis race across the sea at up to 500 miles (805 kilometers) an hour (about as fast as a jet airplane). At that pace, they can cross the entire expanse of the Pacific Ocean in less than a day.
The tsunami phenomenon appears as the energy stored waves start propagating in the direction towards land. In deep ocean, tsunami waves may appear only a foot high, but the amplitude and energy increase significantly as it approaches to shoreline since the waves experience force from the seabed as it becomes
shallower. The wave is compressed and its velocity slows below 80 kilometers per hour. Its wavelength diminishes to less than 20 kilometers and its amplitude is magnified many times. This piling up of tsunami energy results in growth of the wave height.
As this behavior of the waves known as “shoaling effect,” it results in the upwards vertical movement on the wave crests that intensifies tsunami’s destructive force on the shoreline. [12]
22 23
Figure2.1.1: Tsunami Wave Propogation and Shoaling Effect https://www.britannica.com/science/tsunami
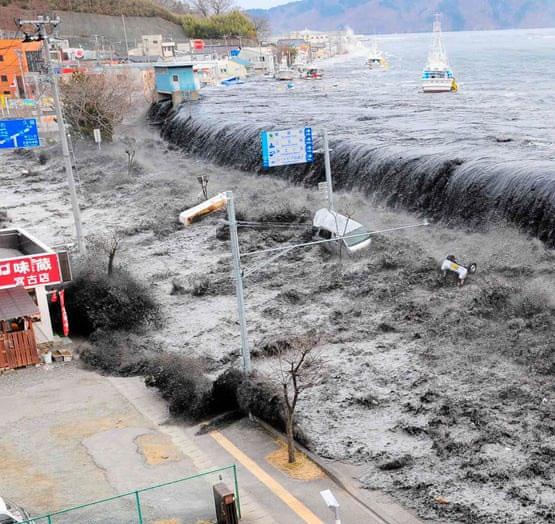
Figure 2.1.2: Tsunami hit on Japan
Cresting and inundation Propagation (open ocean)
Sea level
Depth not to scale
Earthquake epicentre
Generation
2.1.2 World Statistics
Port cities have grown to become successful habitats of new technology, trade and commerce and drivers of globalisation. They have always faced different challenges and have overcome difficult circumstances of change over generations. Yet, the most critical challenge being faced by many of these port cities is a high risk of coastal flooding due to storm surge and damage due to high winds.
Most of these largest port cities are found in Asia (38%), and many of them (27%) are located in deltaic settings, again mainly in Asia. Cities in deltaic locations tend to have higher coastal flood risk as a result of their tendency to be at lower elevations and experience significant (natural and anthropogenic) subsidence. [36].
According to an analysis done on coastal cities [36] most exposed to flooding, shows that about 40 million people (0.6% of the global population or roughly 1 in 10 of the total port city population in the cities considered here) are exposed to a 1 in 100 year coastal flood event.
When assets are considered, the current distribution becomes more heavily weighted towards developed countries, as the wealth of the cities becomes important. The total value of assets exposed in 2005 is estimated to be US$3,000 billion; corresponding to around 5% of global GDP in 2005 (both measured in international USD). The top 10 cities in this ranking are Miami, Greater New York, New Orleans,
Osaka-Kobe, Tokyo, Amsterdam, Rotterdam, Nagoya, Tampa-St Petersburg and Virginia Beach. These cities contain 60% of the total exposure, but are from only three (wealthy) countries: USA, Japan and the Netherlands.
24 25
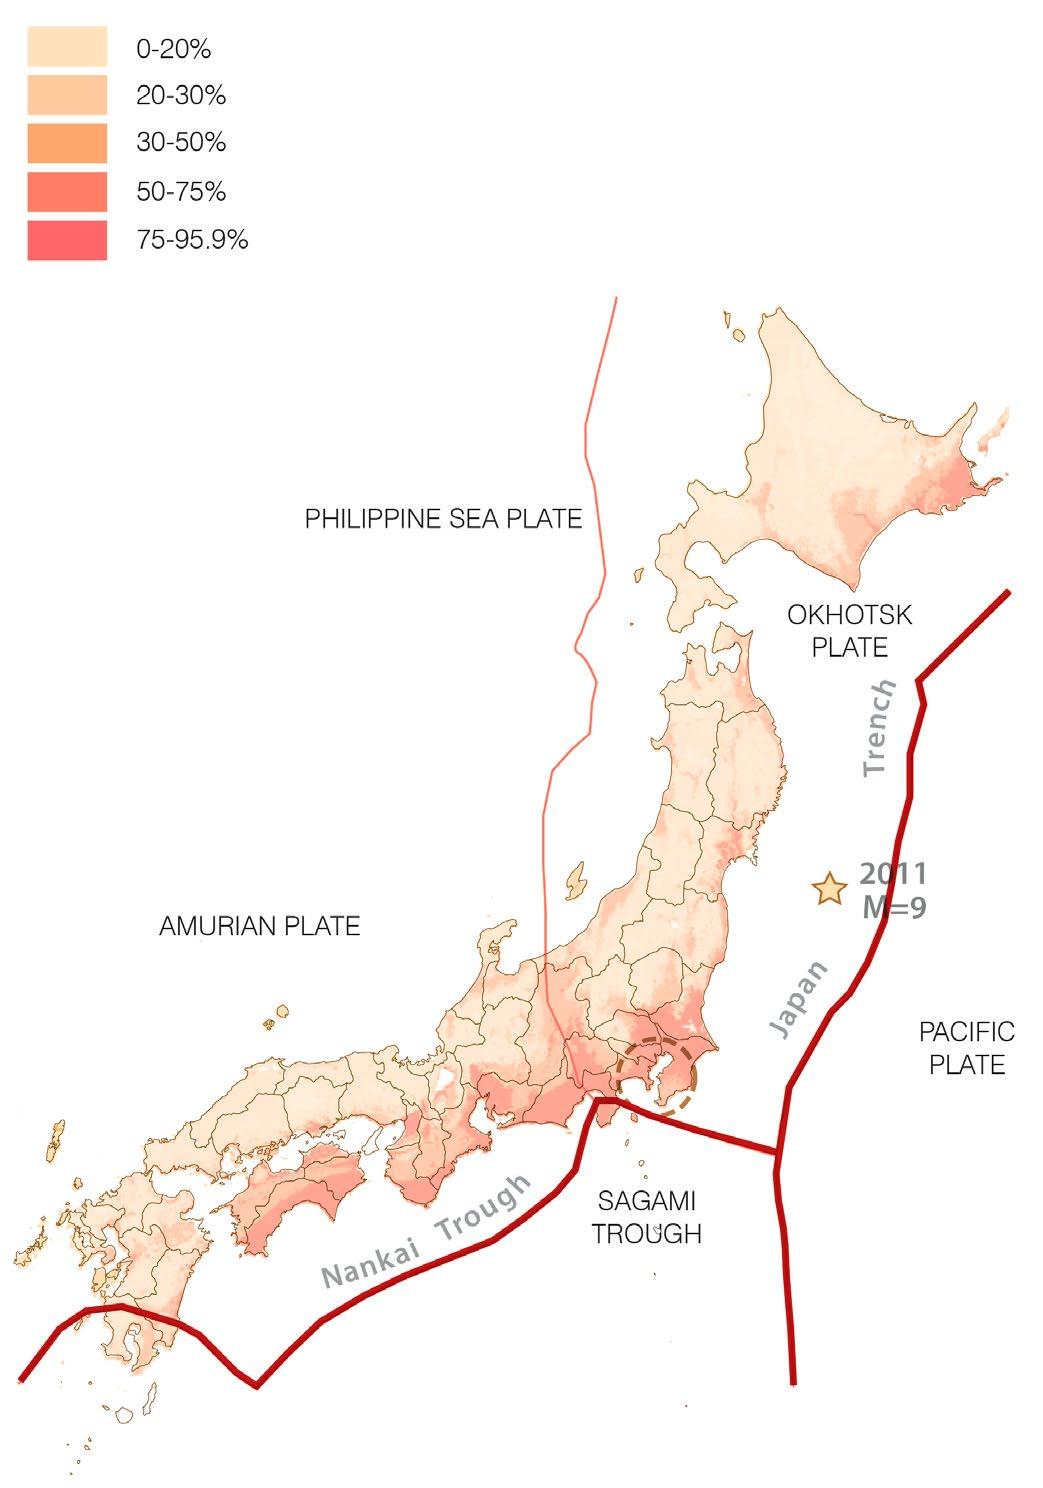
Figure 2.1.2: Ring of Fire
Great Earchquake Risk in Future 30 Years
ch_gruetze. “" Mw9.0 Earthquake Hits Japan, Causes Tsunami (Updated – 3).” paleoseismicity.org, March 11, 2011. https://paleoseismicity.org/mw89-earthquake-hits-japan-causes-tsunami/.
Solomon, Richard. “Tokyo’s Exposure to Tsunami, Explained.” Beacon Reports, June 4, 2017. https://beaconreports.net/en/tokyos-exposure-tokyo-bay/.
2.1.3 Japan’s Geomorphological setting
Japan is wedged among four major tectonic plates: the Pacific Plate, The North American Plate, The Eurasian Plate, and The Philippine Plate(Figure2.1.3). Most of the earthquakes, and activities in volcanoes and trenches occur near Japan due to its position. The Pacific Plate subducts beneath the Okhutsk Plate at the Japan Trench.[7][17] The earthquake generated due to these tectonic activities leads to Tsunamis. The major cities with a high human density (such as Tokyo Bay, Yokohama and Kawasaki), in Japan face the highest risk of life loss and financial crisis.
The activity in the Kanto plain region, as shown in fig 2.1.3, stretches across the middle of Honshu, midway between the northern half of the island (where seismicity is dominated by the Japan Trench) and the southern half (where seismicity is dominated by the Nankai Trough); which influences the majority impacts due to a tsunami on Tokyo Bay.[9]
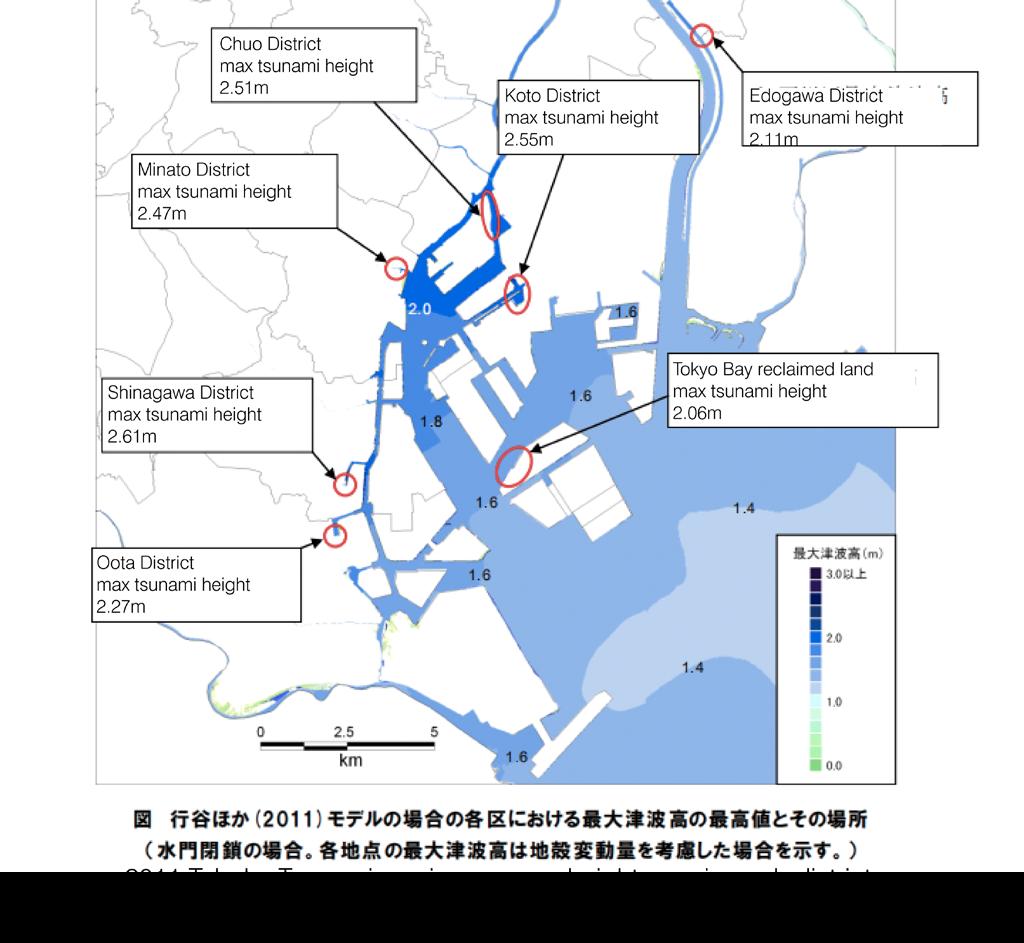
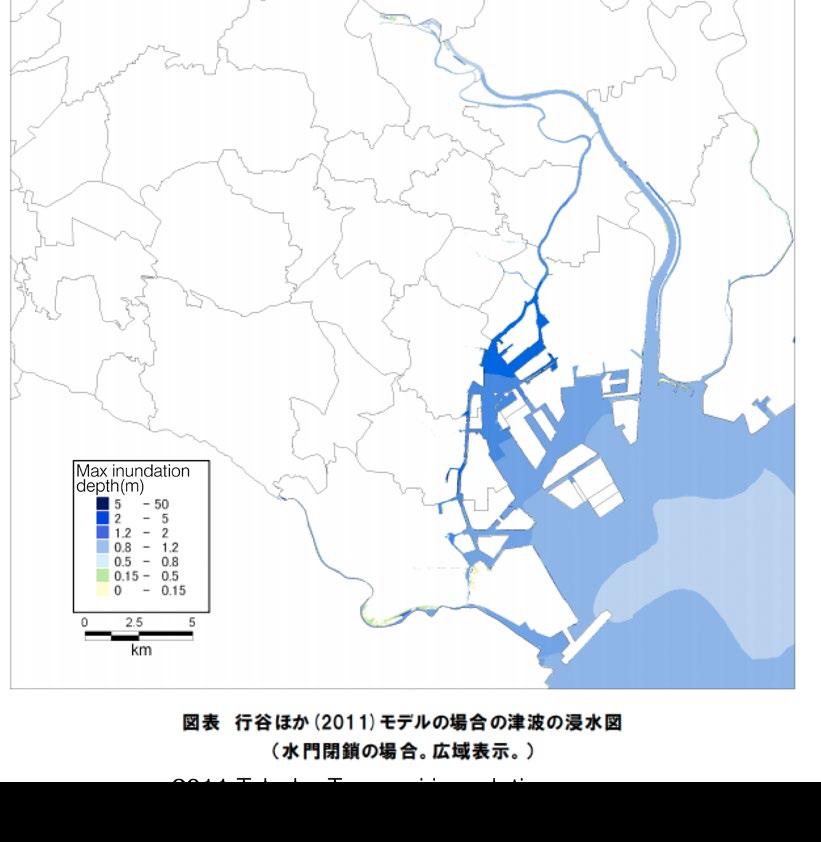
The topographic factor of bay’s mouth also increases its vulnerability to increased impact level. The wave energy concentrates and funnels through the V-shaped bay mouth, known as the Uraga Channel. As it moves inwards in an ever-shallowing shoreline, the energy gets pushed on to the reclaimed lands in the bay area.[10] Although most of the energy is absorbed by the lands in the bay mouth that form an S- shape, rest of the wave energy is still felt in the interiors of some channels in Tokyo Kanagawa prefecture islands, etc. (fig 2.1.6 & 2.1.7).
26 27
Velocity Echoing from the Bay Mouth
Figure 2.1.3: Figure 2.1.4: Figure 2.1.5:
Figures 2.1.6 & 2.1.7: Max tsunami heighs and inundation map
Velocity Reaches Tokyo-Kanagawa Prefecture
2.1.4 Damage level and future predictions
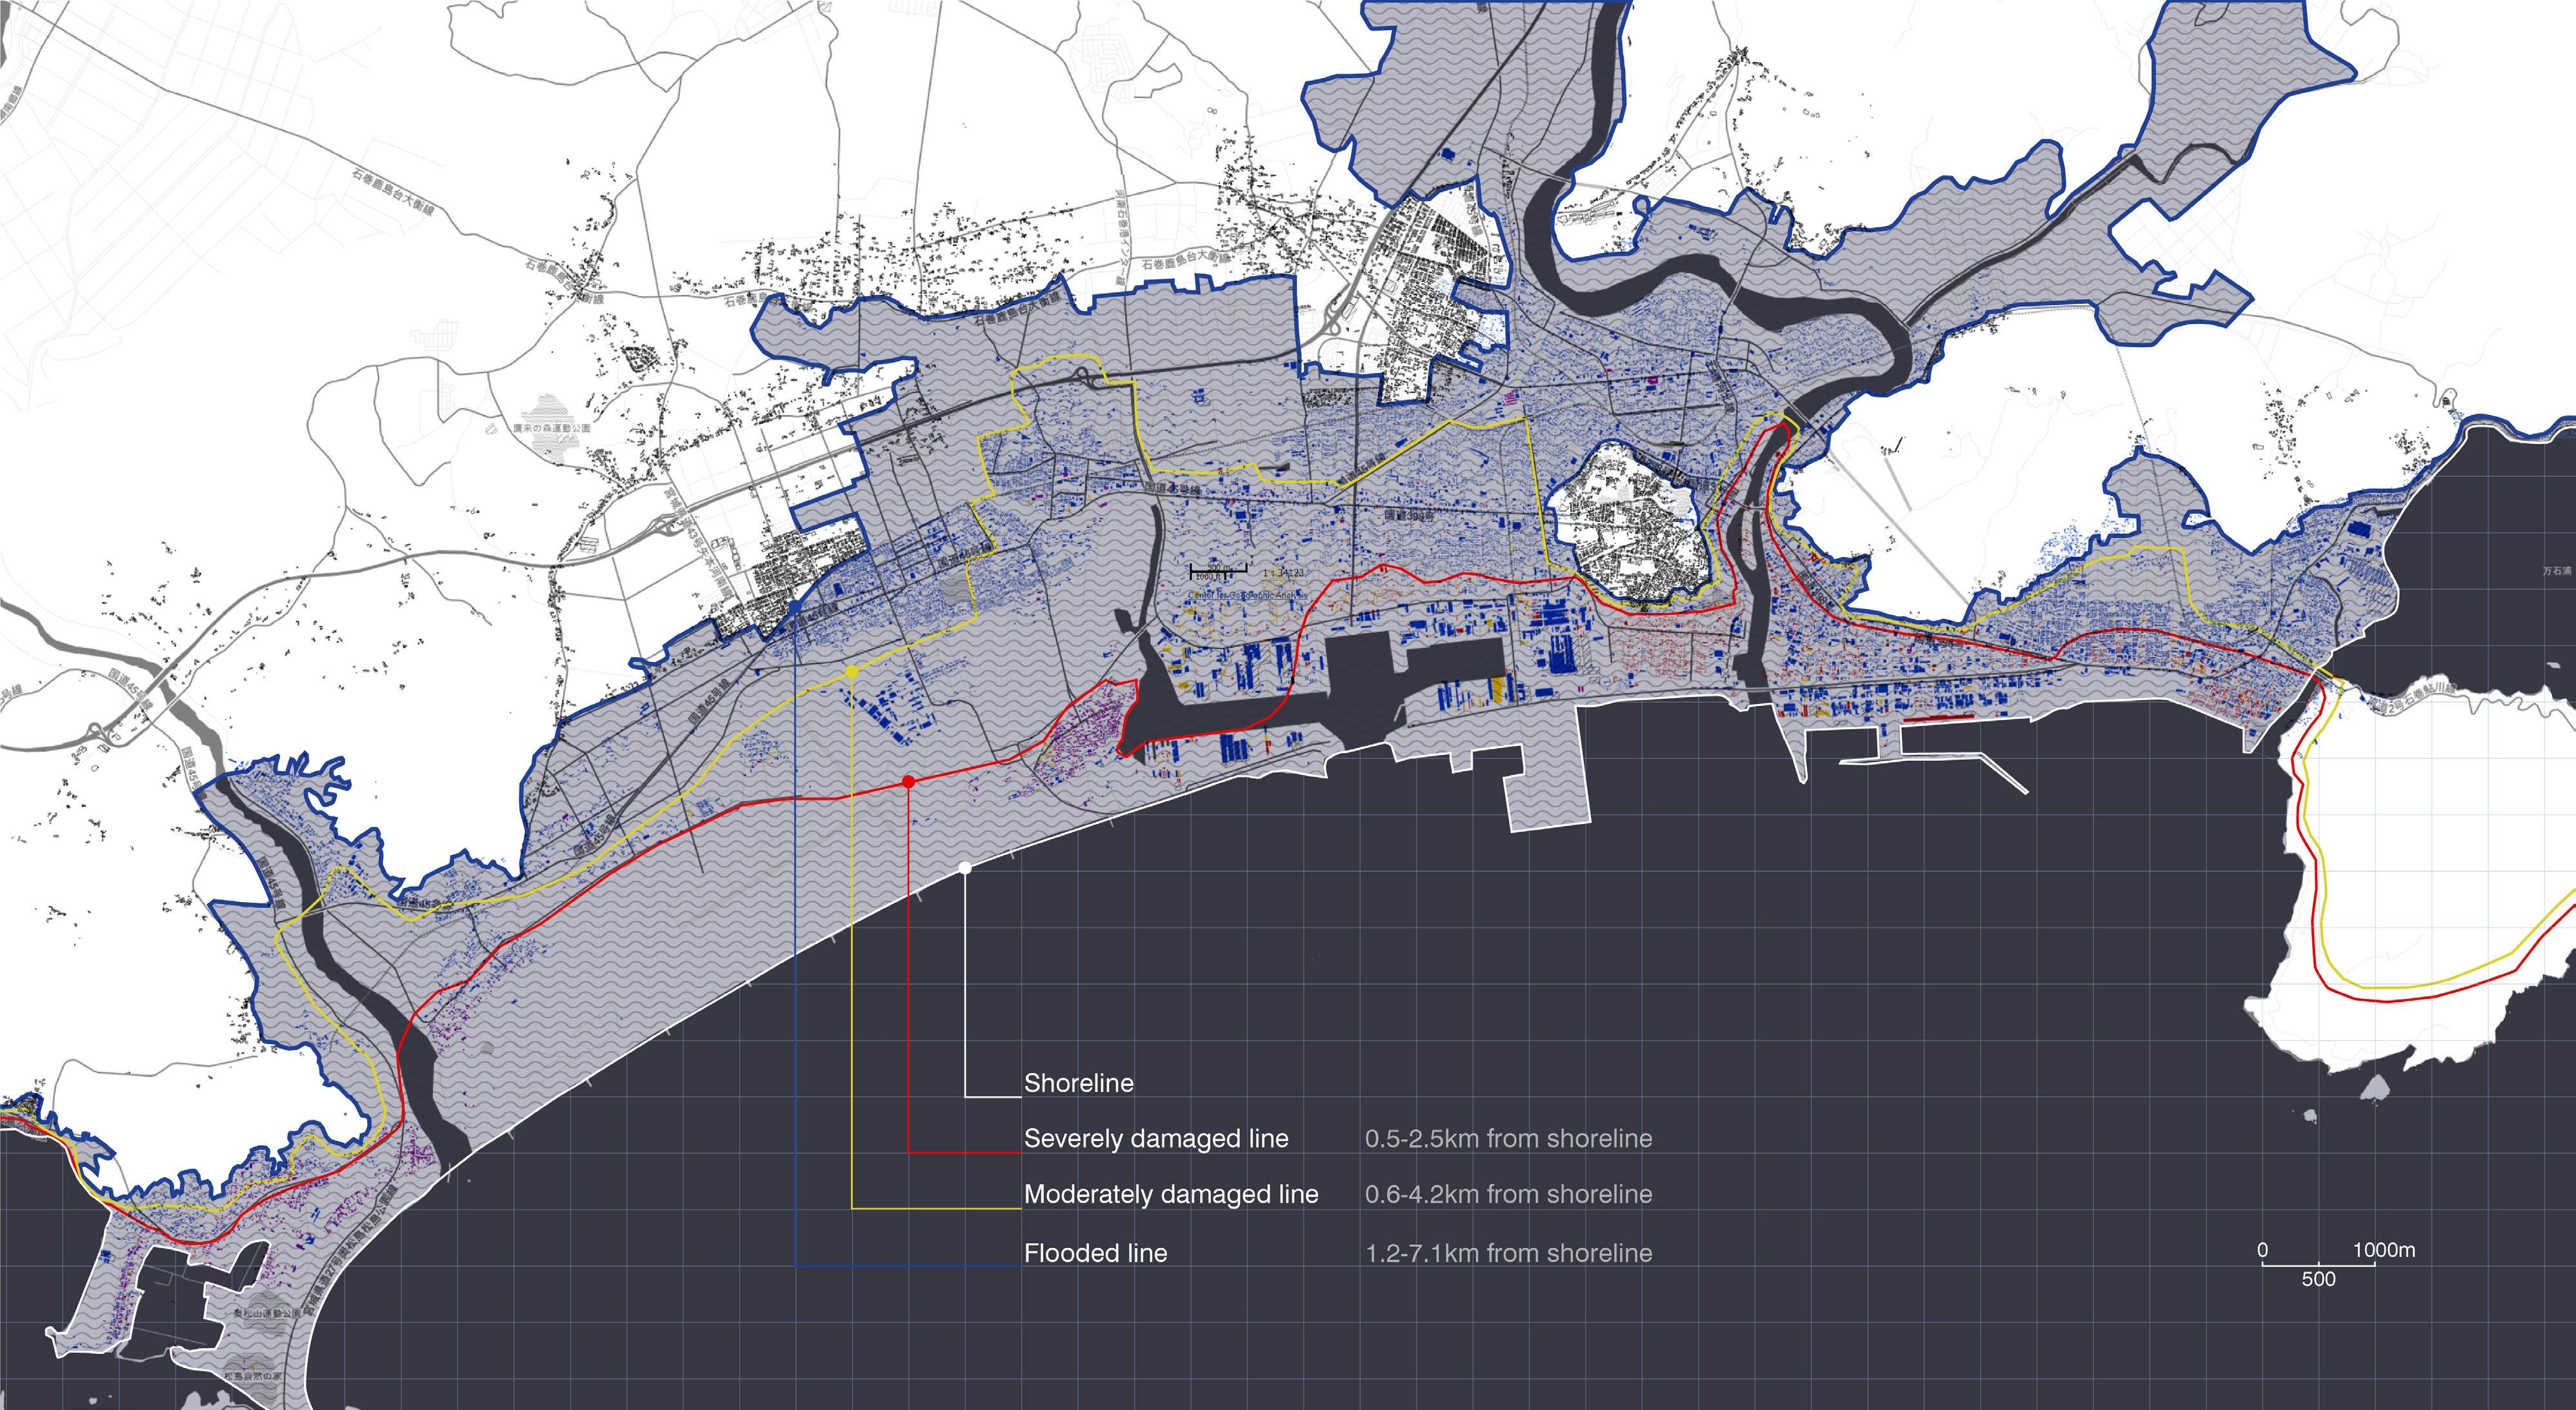
The 2011, Tohoku earthquake and tsunami was the most recent and unpredicted tsunami, that caused extensive and severe structural damage in north-eastern Japan, including heavy damage to roads and railways as well as fires in many areas, and a dam collapse.[26] The concerned researchers remapped the damage level in Higashima tsushima city, layering levels of damage as per distance from the front shoreline to inland (2.5km in this case) and impact level on low lying areas (water gushed until 7.1km inland in some low lying areas). This mapping is essential and gives a guideline for the areas that can be developed in a strategic manner and which areas need to be left out due to the uncopable levels of flooding and wave energy.
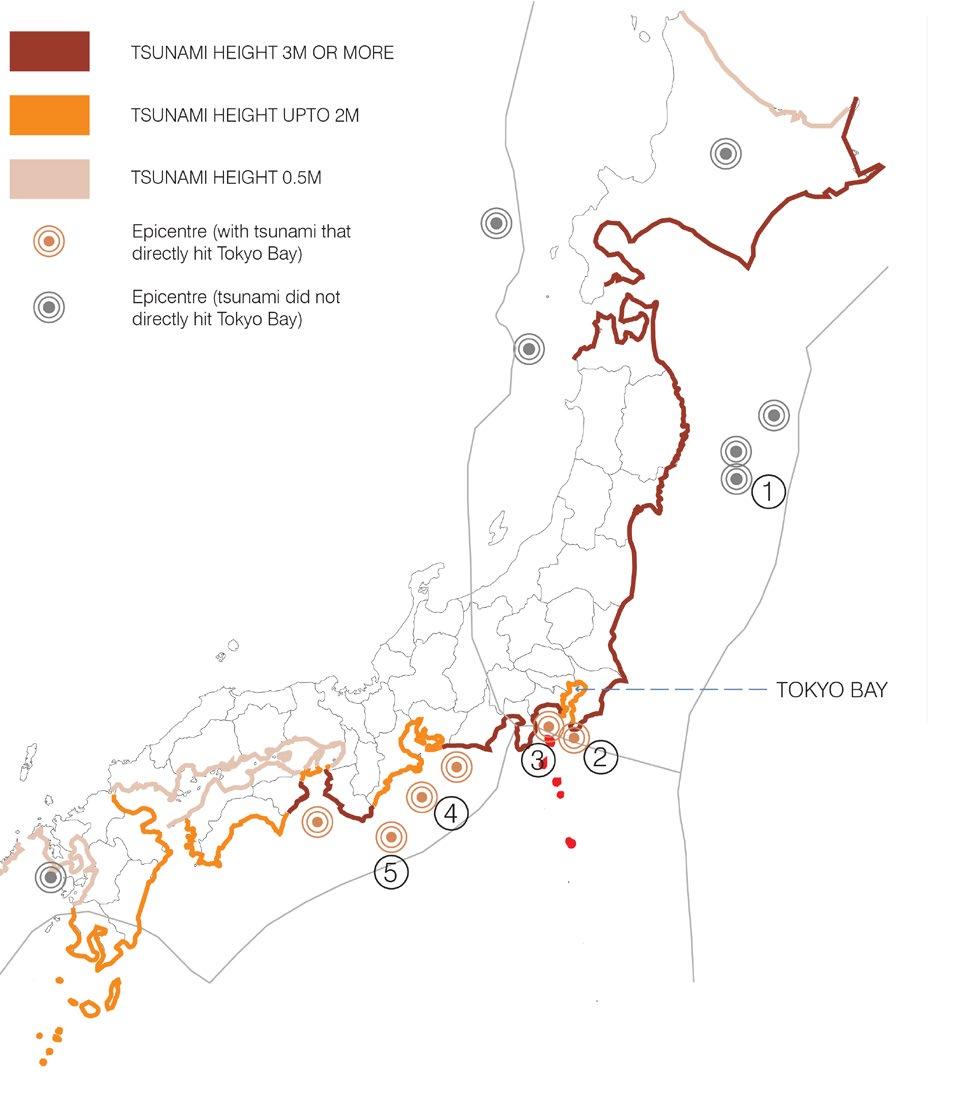
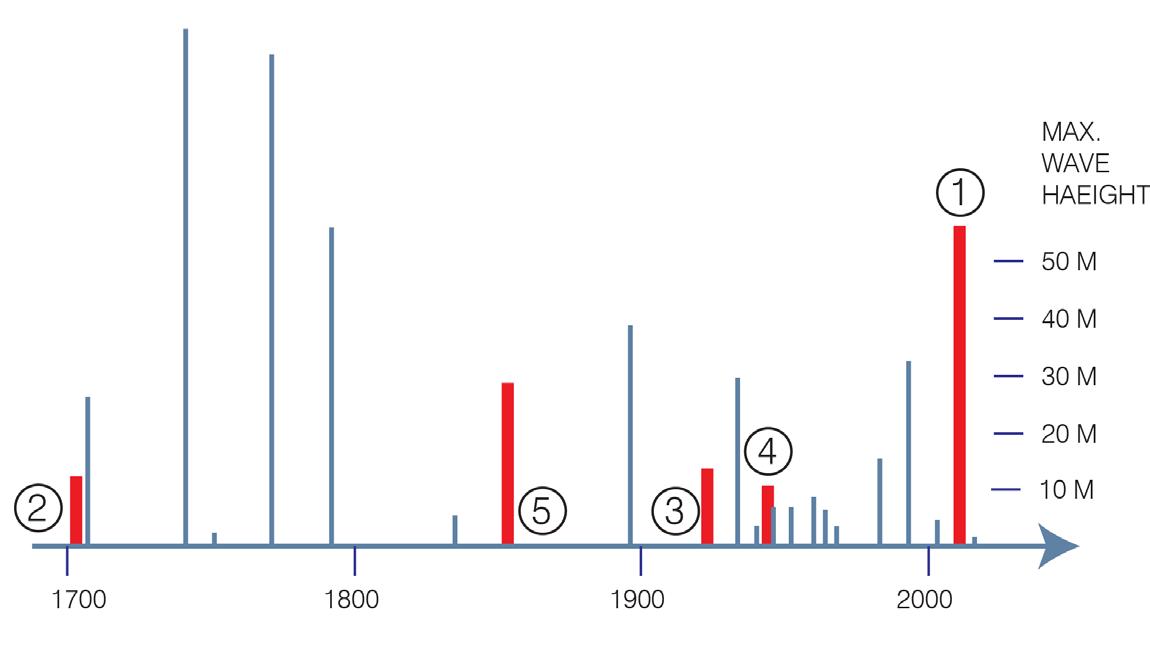
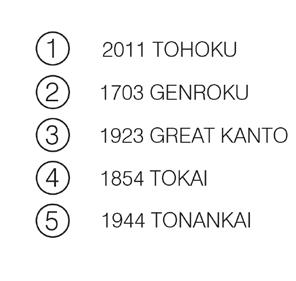
Historically, in a total of 141 tidal waves classified as a tsunami since 1684, a total of 130,974 people died in Japan. The diagram (Figure 2.1.9, now the below given chart) shows the 30 most destructive tsunamis that happened around Japan since 1703, in which 10 of these tsunamis are with a more than 20m wave height. [16].
Future predictions show that the rise in sea level in year 2100 will be enough to make the front areas marked in the map prone to heavy inundation and pose a threat to human life settled on these reclaimed land masses, due to a 5m High Tsunami. [15] Additionally, with the increase in sea level and rise in temperatures due to global warming, figures show that these island masses also will suffer from inundation due to heavier
rainfall and more frequent typhoons that will occur every 10 years.
The major problems of the unpredicted marine disasters are the evacuation time and the wave height/energy estimation. As the magnitude and the location of the source are unknown, the accuracy of the tsunami estimations prone to fail more. In those cases, the emergency alarms run after the tsunami waves are seen physically, causing a failure in the precautions. The disadvantage here is first the limited evacuation time, secondly the uncertainty of the wave height, where sometimes the hit of the second wave is also unknown. [30]
28
Figure 2.1.8: Damage Map
Figure 2.1.9: Past tsunami events
2.2 TOKYO AS CONTEXT
2.2.1 Marine Problems

Tokyo bay, also known as Edo bay, lies in the southern Kanto region of Japan, which spans the coast of Tokyo, Kanagawa Prefecture and Chiba Prefecture. It is connected to the Pacific Ocean by the Uraga Channel and is both the most populated and largest industrialized area in Japan The Japanese economy is also well developed in the coastal areas. Since Japan has only limited natural resources and therefore the economy mainly depends on foreign imports, this has led to well developed industries, especially around ports.

31
Figure 2.2.1
2.2.1.1 Types of Marine Disasters faced by the city
Tokyo is situated in a floodplain, between rivers and the sea, and has always been subject of flood risk. [4] Tokyo Bay has a surface of 1,500 km2. It is rectangular shaped, with an approximate length of 50 km and a width of 15 km in most of its length. The lands surrounding the bay are mostly a plain (called Kanto plain), except for the area close to the bay mouth, where there are larger ground elevations. Measures against floods have been taken since the Tokugawa Shogunate, about 400 years ago, when it was decided to divert Edo River and make it flow to Pacific Ocean through Japanese East Coast instead of Tokyo Bay.[4]
Marine disasters have the most impact in Tokyo Bay from 2 major reasons as follows: 1) Storm surge in low lying areas due to Typhoons, 2) Tsunami surges due to Tsunami’s rising from earthquakes, volcanic eruptions or under water landslide.
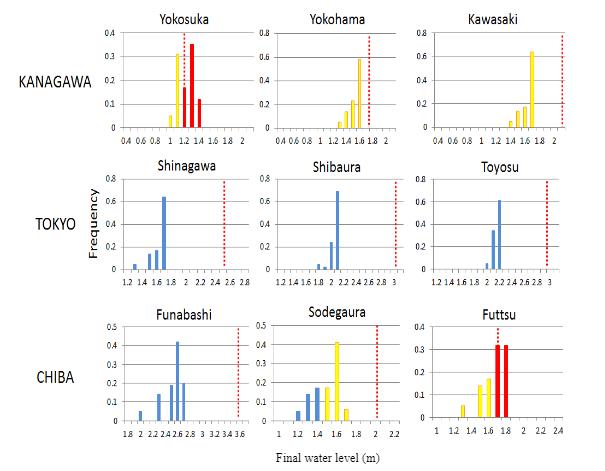
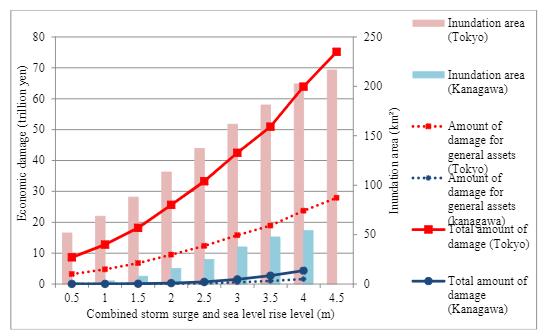
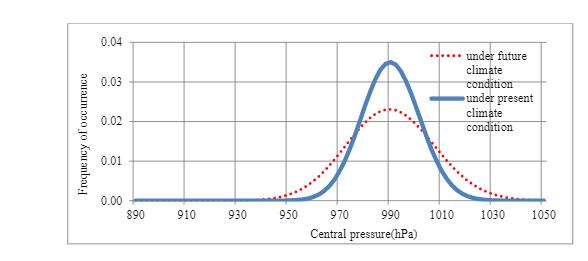
Yasuda (Yasuda 2010) has provided a probability distribution function of the central pressure, outlining the present and future expected distribution of typhoon intensity in the Tokyo Bay area. Beside intensification of the tropical typhoons, sea level rise is also a potential factor that could increase the chance of inundation in the low-lying areas around Tokyo Bay. The global sea level rose by an average around 1.7mm per year in the last century and satellite observations has shown that this has been increased to 3.7 mm per year since 2007. The IPCC 5AR (Church 2013) has shown a future projection of a worst scenario global sea level rise between 0.52 and 0.98 m higher than at present by the end of the 21st century. But recently many researchers believe that the sea level rise by 2100 is likely to exceed this range. This is because the IPCC 5AR has only comprised simple mass balance estimates of the contribution from the Greenland and Antartic ice sheets. Vermeer and Rahmstorf (Vermeer en Rahmstorf 2009) have argued a more extreme scenario of a sea level rise between the 0.81 and 1.90 m by the year 2100. Apart from tsunami and storm surge, Tokyo is also prone to flooding due to heavy rainfall during monsoons. [41]
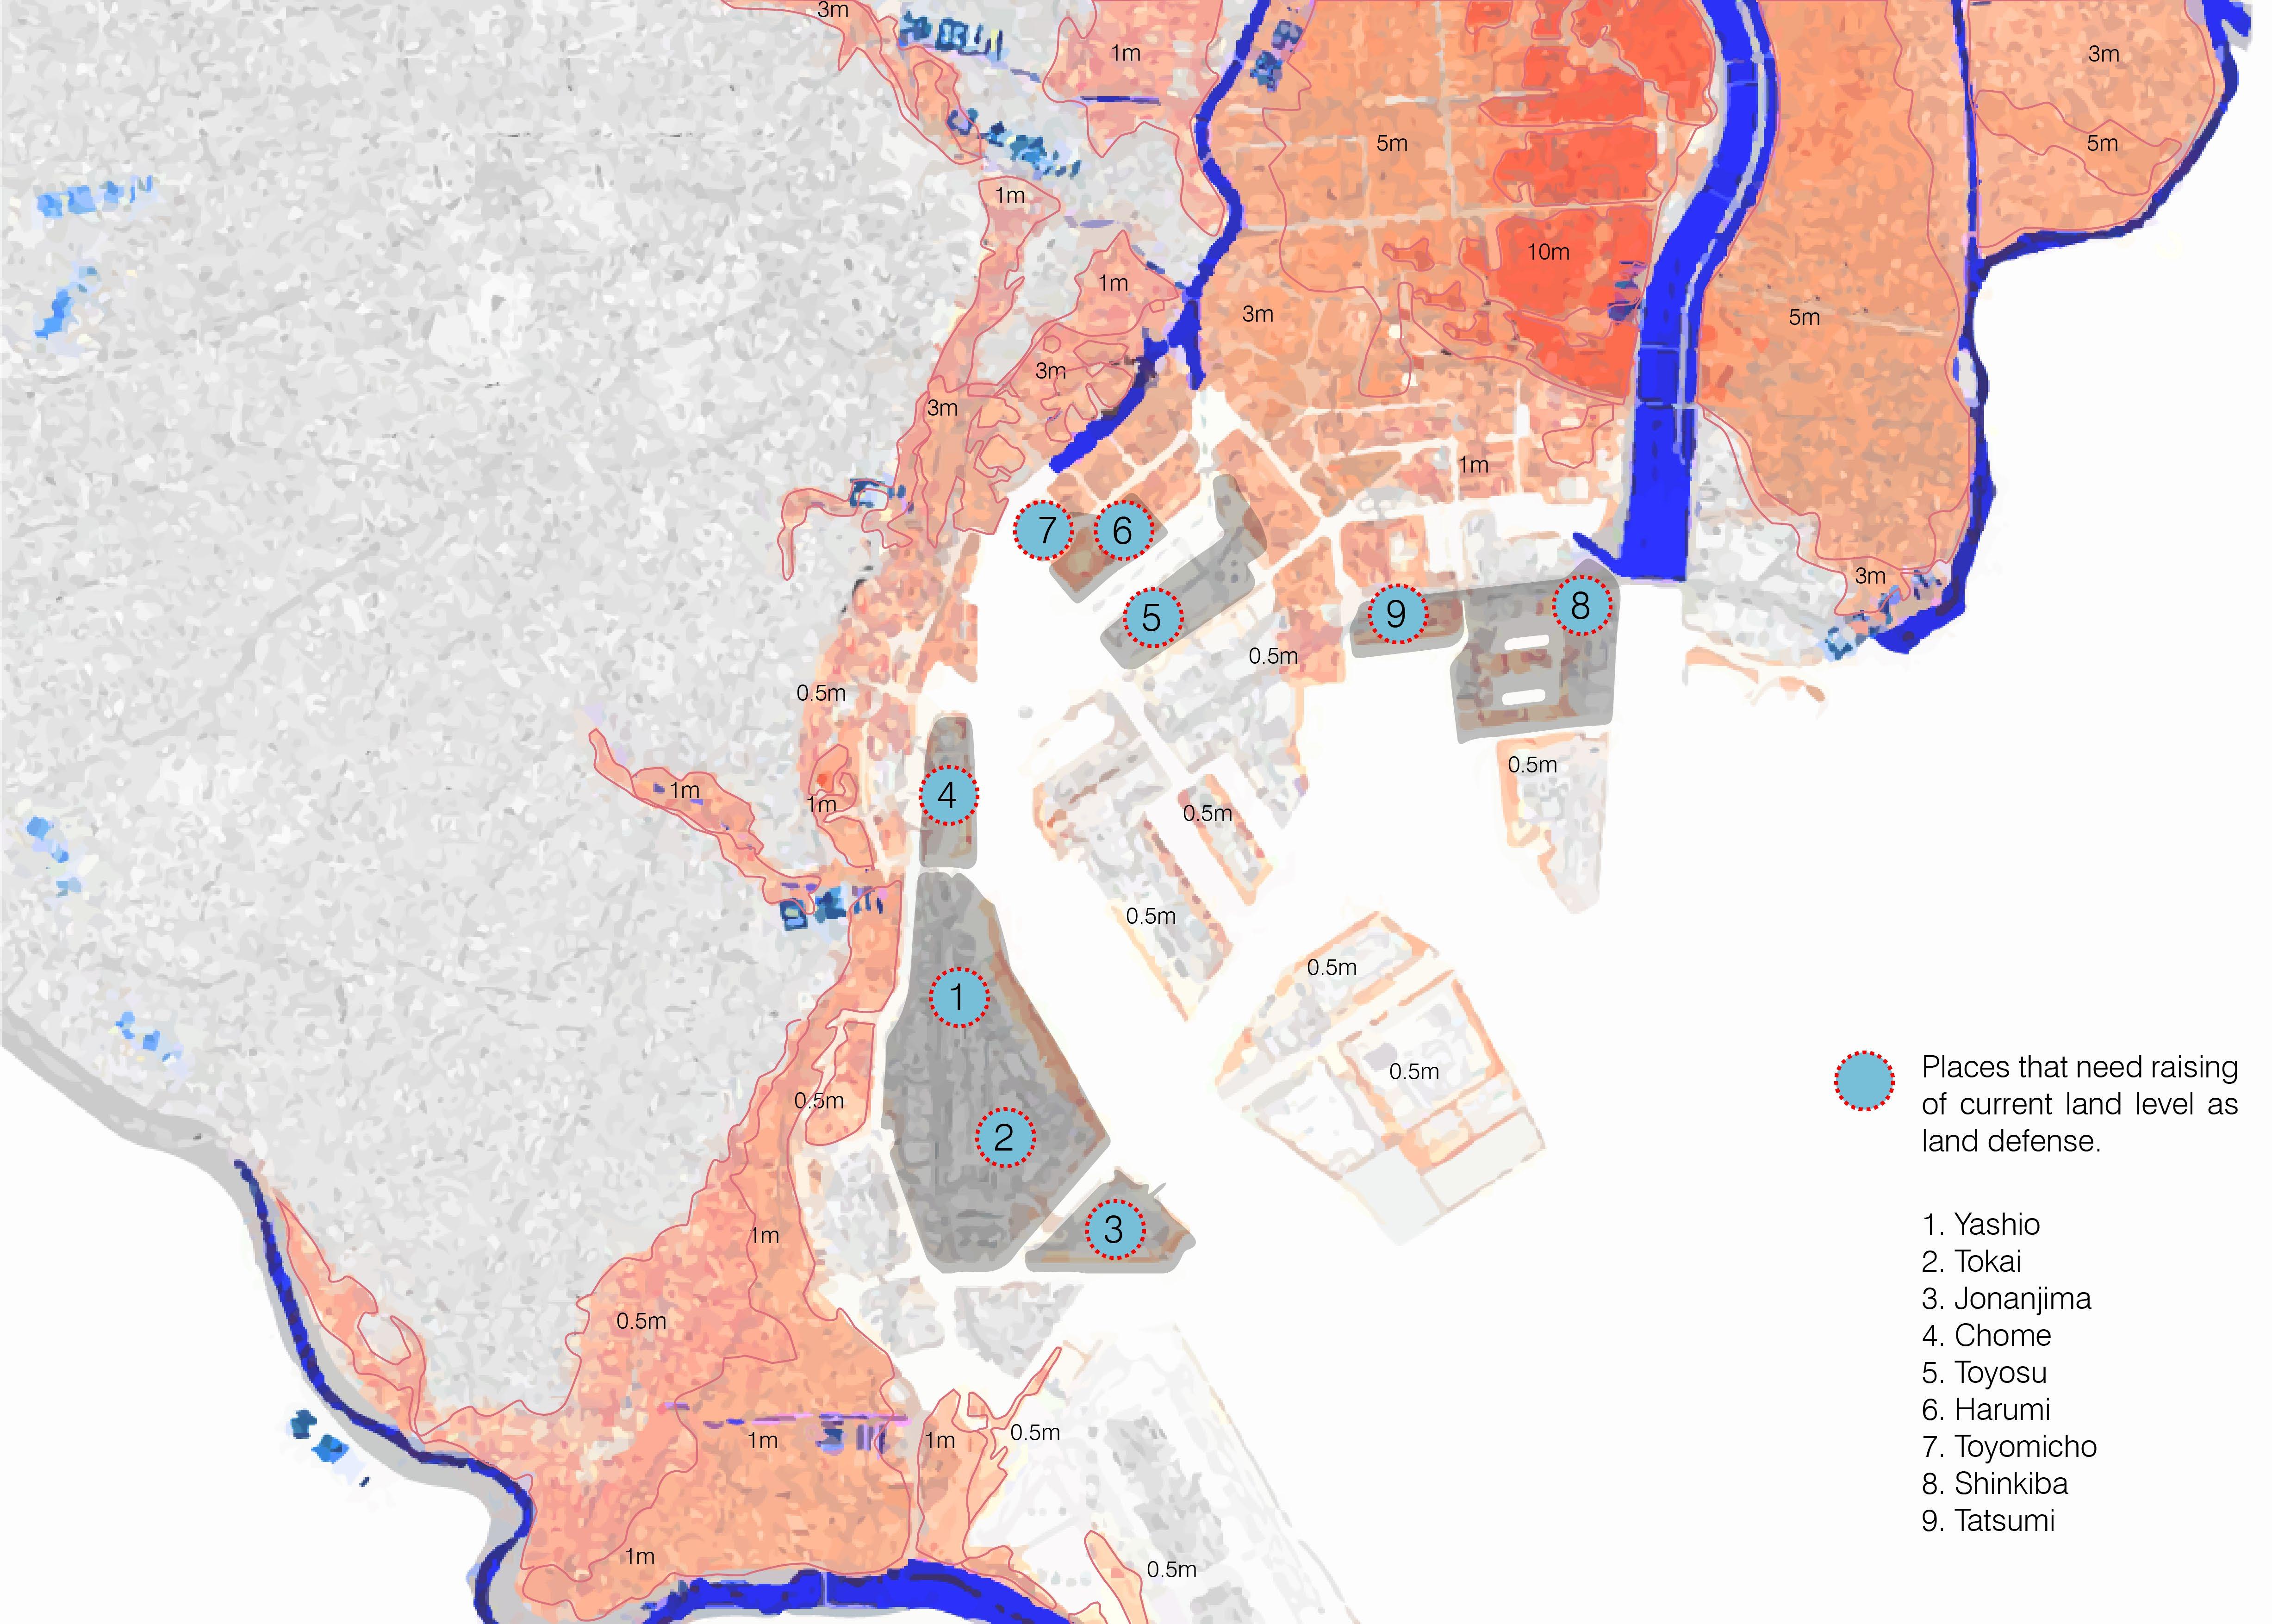
The Japanese government have issued area prone to flooding and damage in case of an extreme flood disaster of unprecedented scale (where they have considered extreme cases such as Tsunami, Typhoon surges and river flooding as well) such as breach in sea wall leading to inflow of Tsunami water, or failure of shutting down floodgates, with worst case scenario being the breaking of embankment along Arakawa River. Their analysis shows that the low-lying areas in Edogawa prefecture would be faced with the worst case scenario.[31]
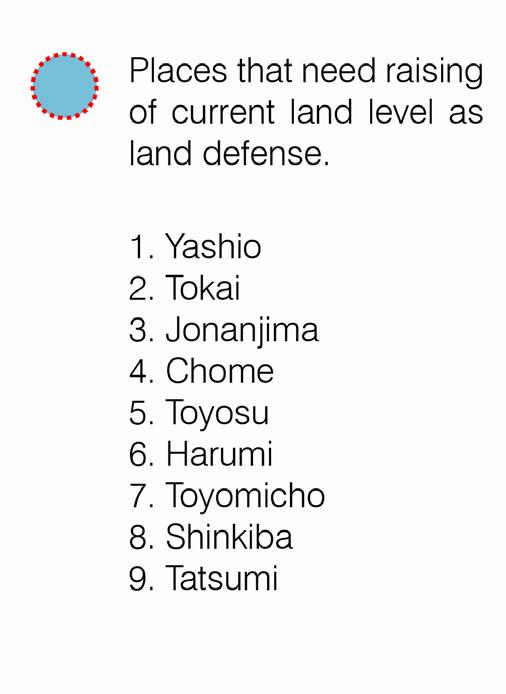
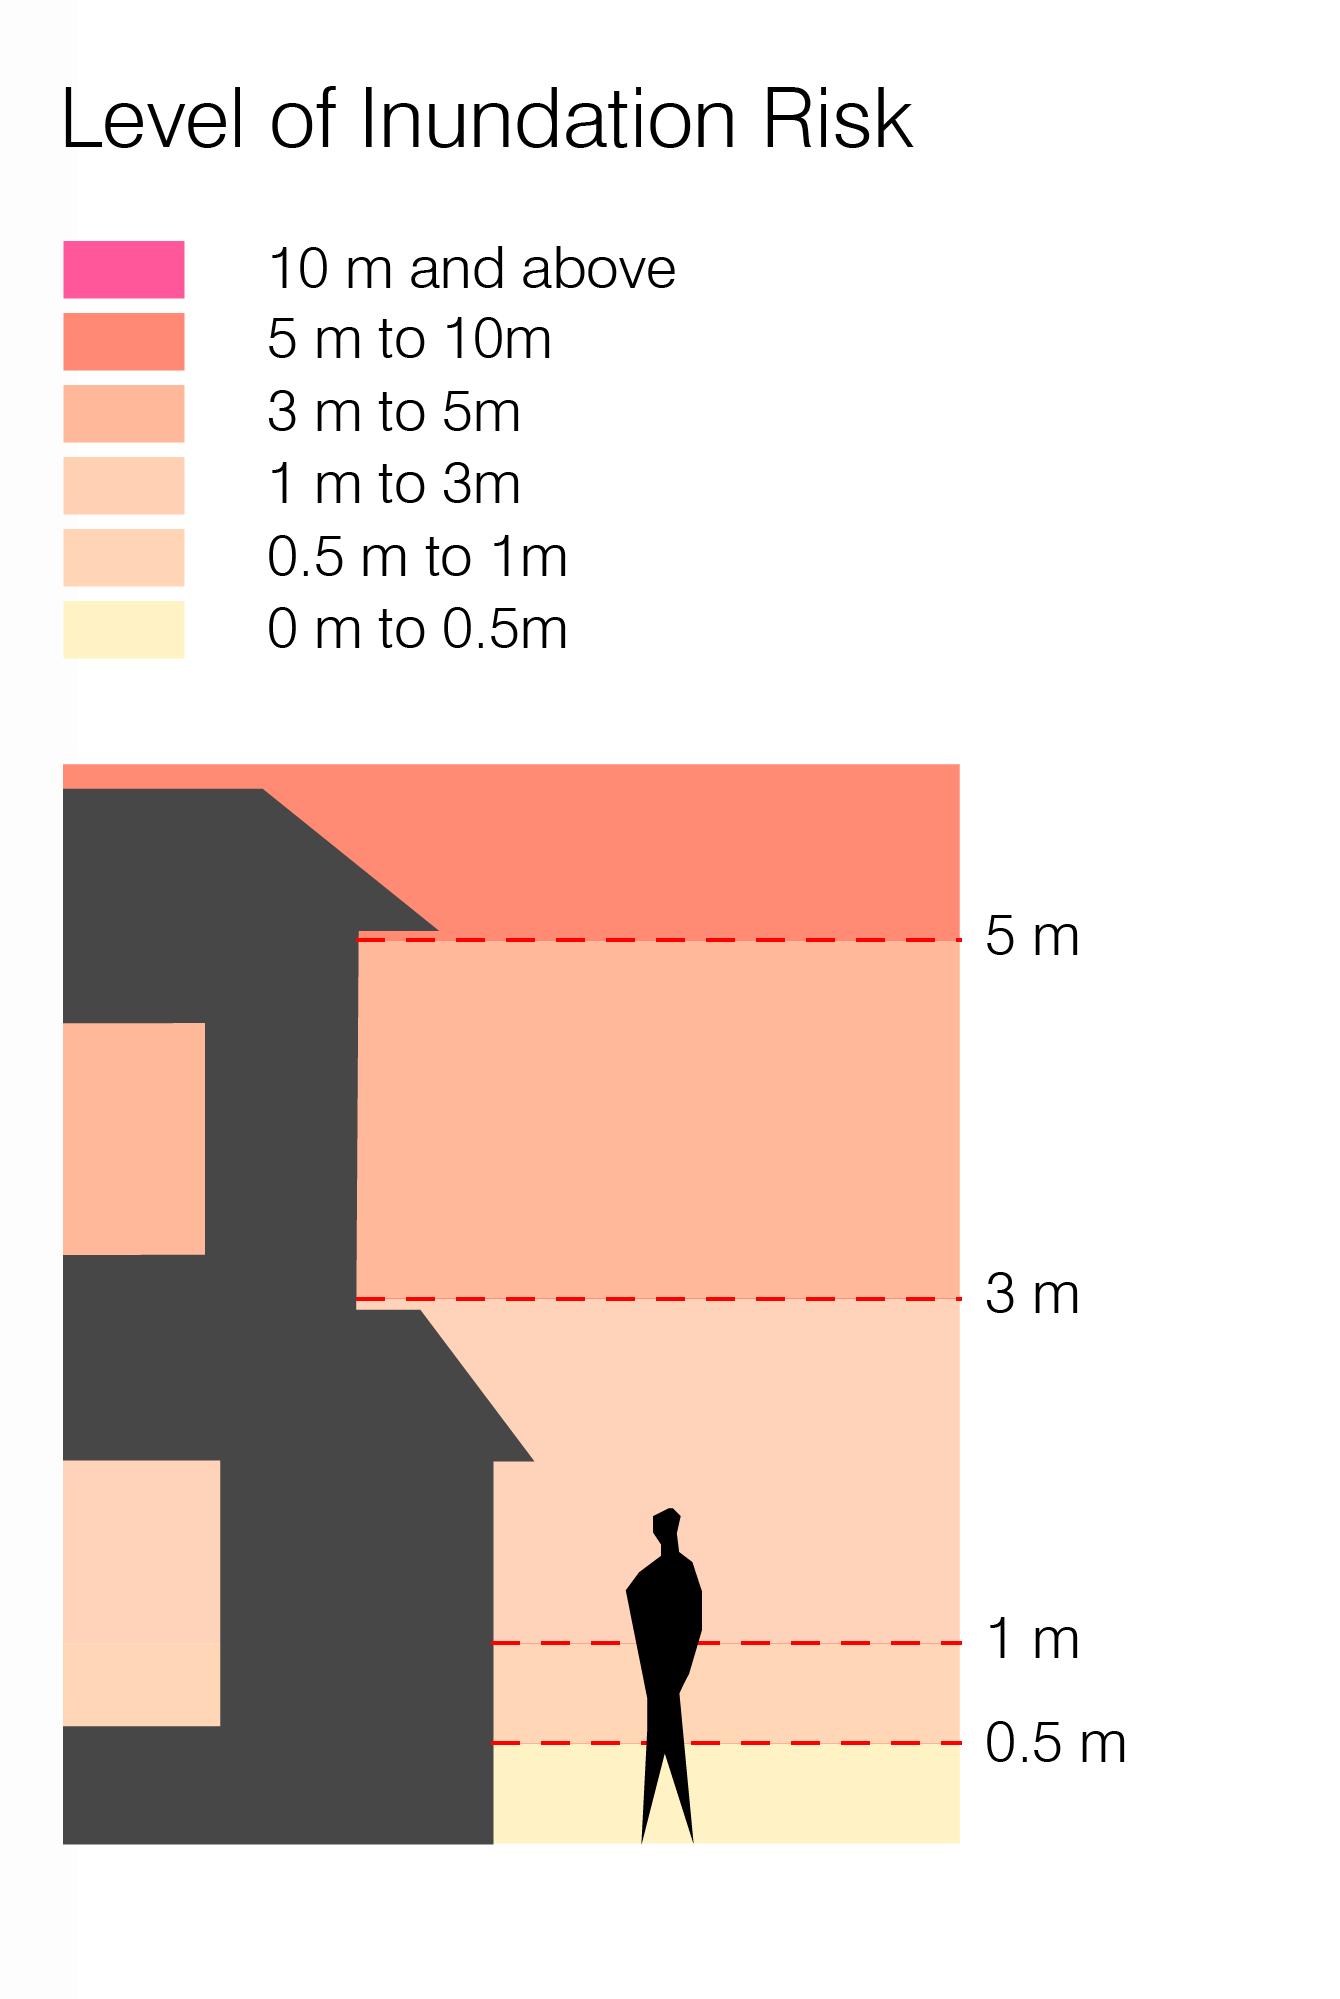
Specific areas marked in yellow, blue, and red circles, have been allotted as evacuation facilities for the locals which are public facilities such as elementary or junior high schools. The hazard map allocates areas from deep pink to light yellow, with deep pink showing inundation probability as high as 10 meters and yellow being as low as 0.5 meters. [31]
32 33
Figure 2.2.3: Present and future probability distribution of typhoon intensity at Tokyo Bay according to Yasuda
Figure 2.2.4: Total economic damage in Tokyo and Kanagawa for different inundation levels
Figure 2.2.2: Final water levels for the future typhoon in the year 2020 and a sea level rise scenario of 0.59m along different points in Tokyo Bay
2.2.1.2 Current Engineering Solutions
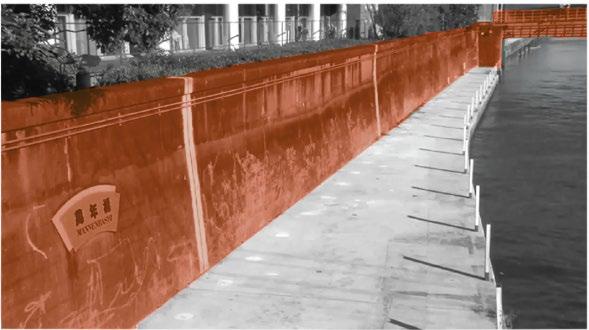
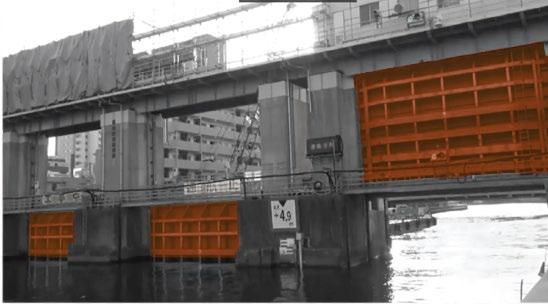
The existing hard defences in Japan (seawalls, revetments, floodgates) are mostly built in concrete, vulnerable to lateral forces as they are wall-like vertical structures. The concrete defenses can fail due to the tsunami wave energy when it hits, or before the hit, they can even break down by the seismic forces of the earthquake that triggered the tsunami. In the case of the seawalls or revetments' failure, the area behind them inundates with the sudden sea-level rise, even before the tsunami approaches.

Research shows that coastal defences might be not sufficient in year 2100. In case of upgrading the existing coastal defences, following will have to become mandatory which the authority considers apt: [4]
•Build new levees and elevate the existing ones at some areas.
•Elevate port area platforms outside the protection of dikes
34 35
Figure 2.2.5: Seawall and Imprisonment
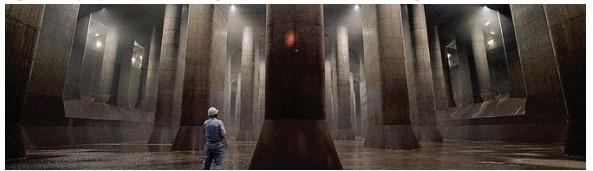
Figure 2.2.6: Existing water storage infrastructure in Tokyo
36 37
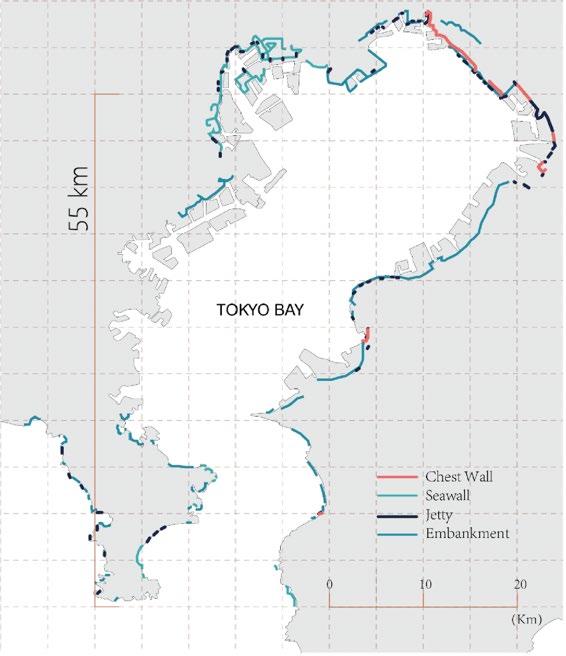
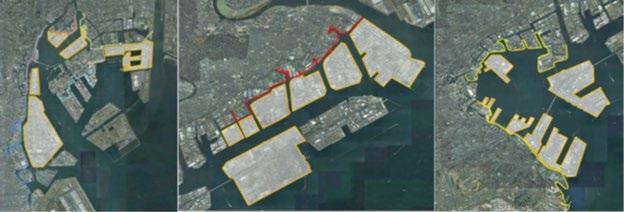
Figure 2.2.7: Existing Defense & Topography Map
/
Figure 2.2.8: The length of considered levees and platform surfaces can be seen in the following figure
Seawall
Revetments
In Land Locks
Flood gates
Figure 2.2.9: Existing Defenses
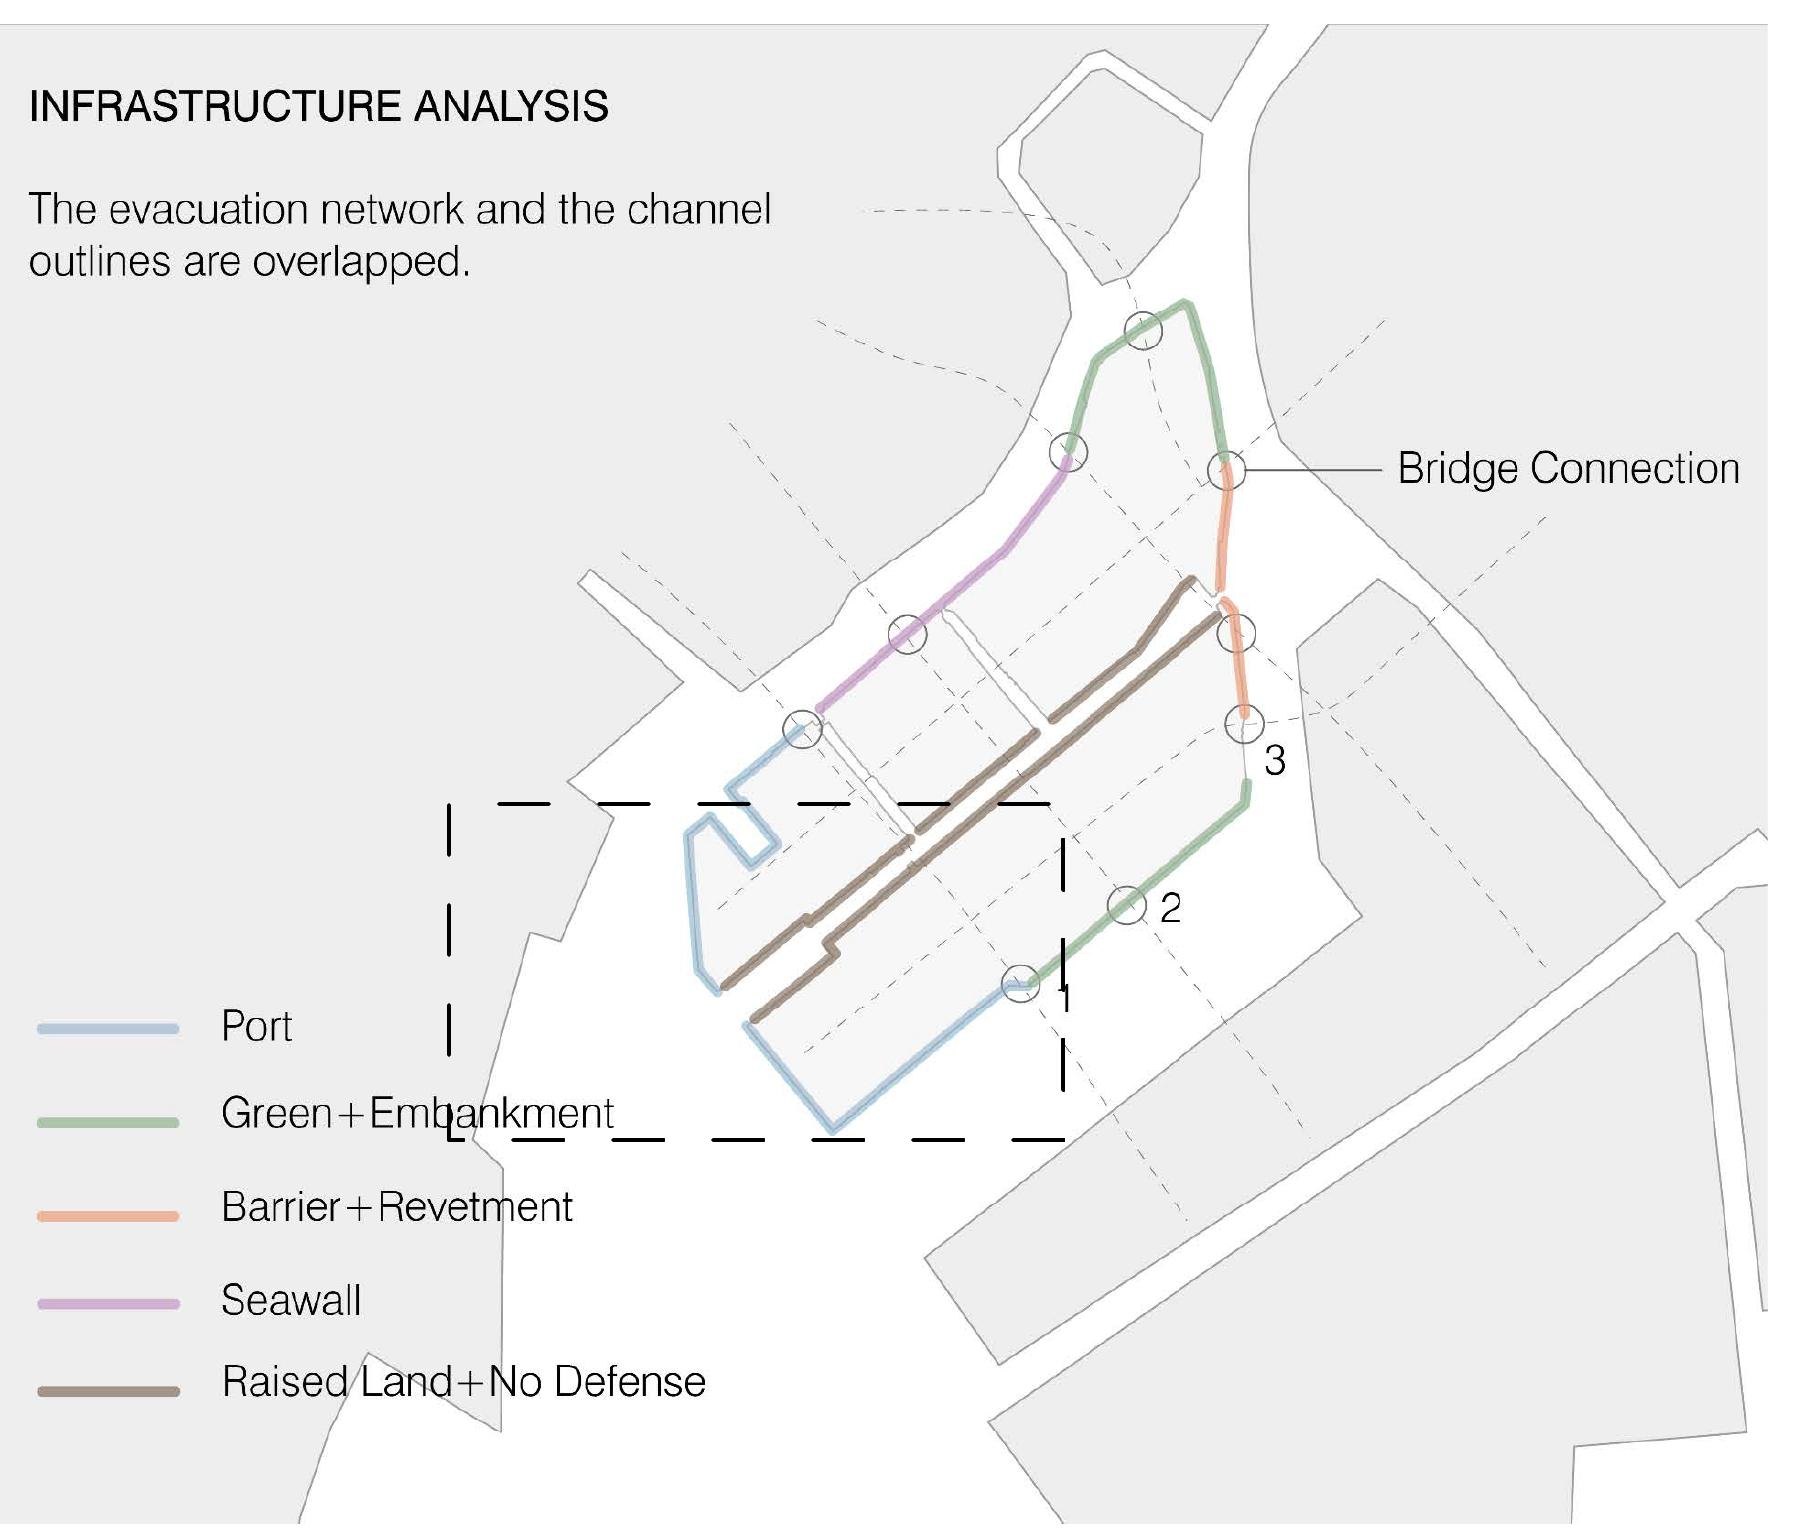
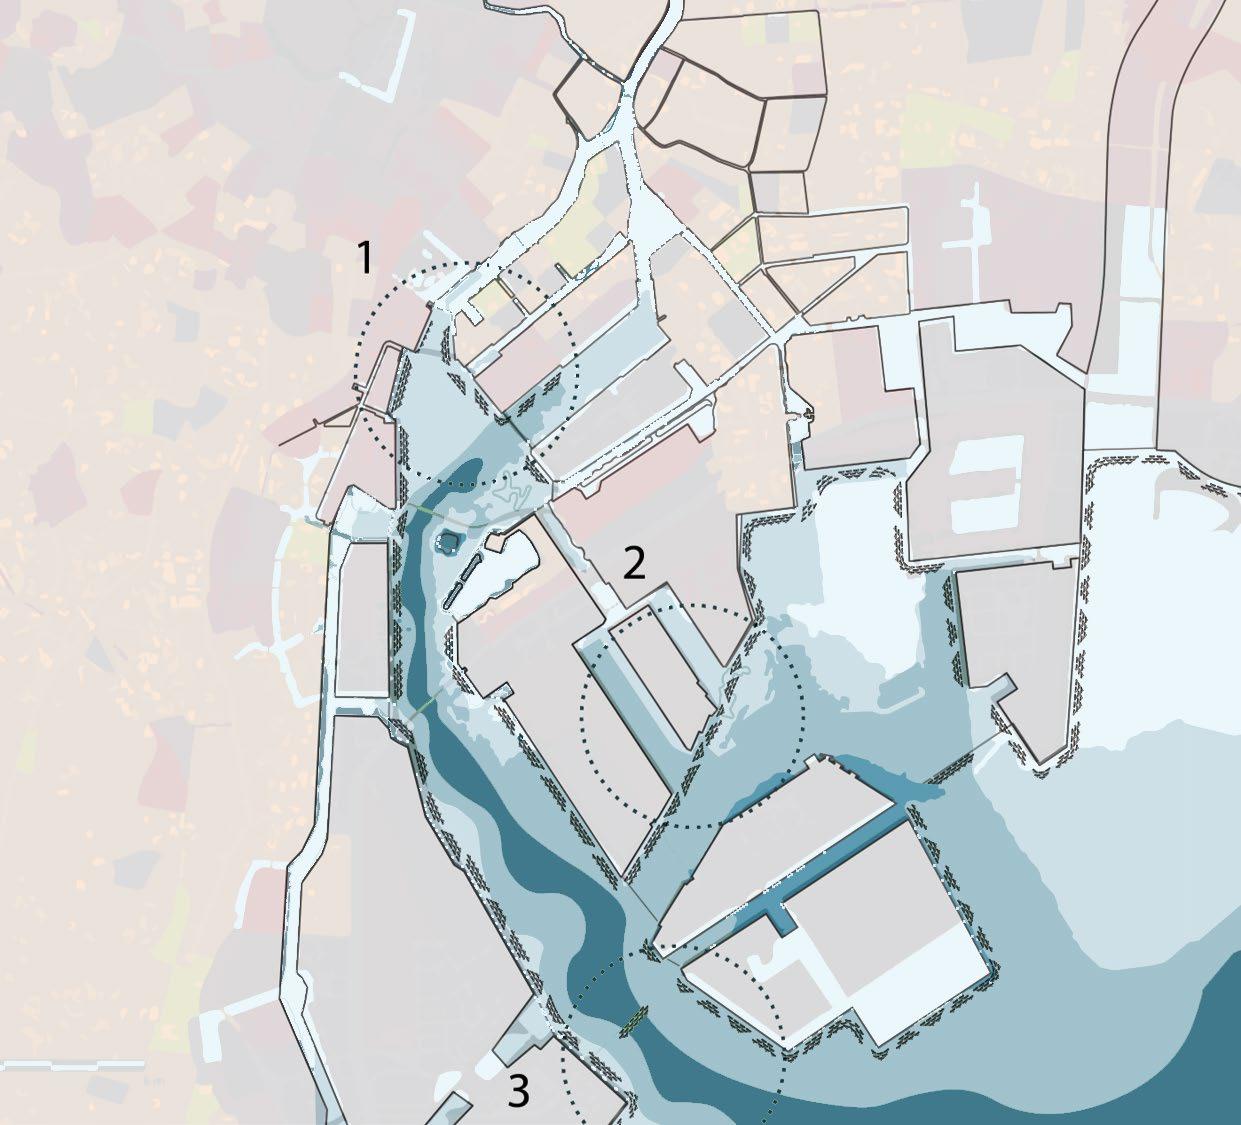
2.2.1.3 Evacuation strategies in place
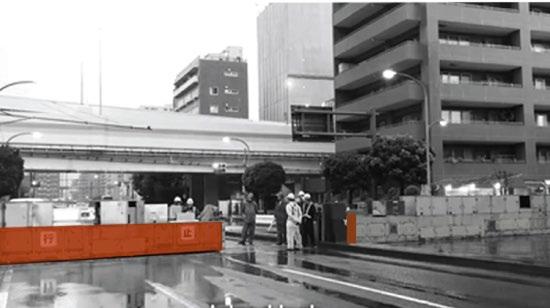
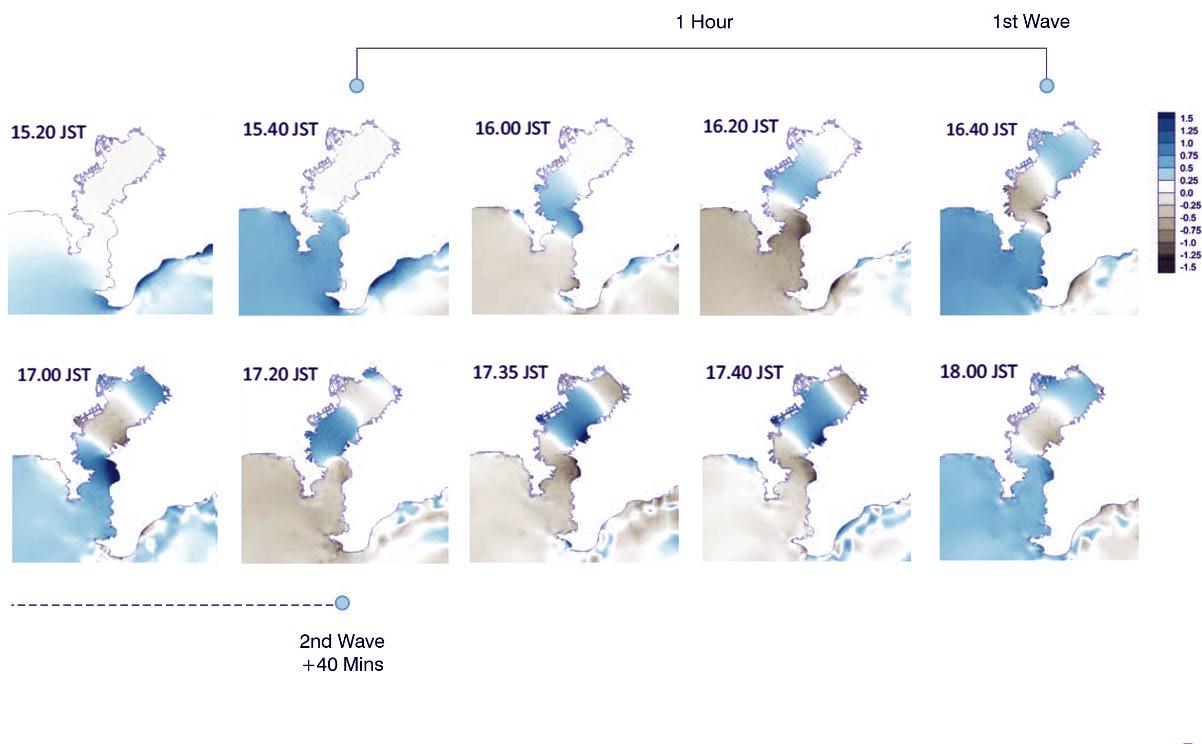
There are mitigation strategies that are laid out for areas that were severely affected by Tohoku Tsunami facing the Nankai Trough. Yet, no such evacuation strategies specifically dedicated to Tsunami risk is allocated for Tokyo Bay, as Tokyo-Metropolitan government completely relies on the existing defenses for protection. In terms of minimizing the life loss during the tsunami events, evacuation time is the primary factor. Regarding the wave propagation and reflection that happens once a tsunami enters the bay mouth, it takes about 40 minutes to an hour for a magnitude 8 wave to hit the northernmost part of the bay, and the second wave takes another 40 minutes to hit (Figure 1.2.9). If the government's emergency calls are made at the right time, life losses can be avoided in severe numbers working with the evacuation strategies. The limitations of the evacuation strategies can sometimes be the unpredicted tsunami heights and the uncertainty of the second tsunami wave propagation. [27] ( Image for propagation time)
The Tsukishima island is planned within a rigid gridded network that lacks a proper evacuation network to the closest refuge centers based on density distribution. Also, the refuge centers allocated are 4-5 storey high public buildings that do not have any special or centralised access route for it to be easily marked or distinguished from the rest of the built spaces. This could be beneficial in case of a disaster, as peope in need will try to identify and reach this place with the least amount of hassle.
2.1.1.4 Conclusion
Tokyo faces multiple marine calamities both inland and offshore leading to inundation along shoreline due to storm surge and tsunami, whereas on low lying areas more inland due to rainfall and overflow of the existing river channels. Also, the inundation map indicates that Tokyo requires an alternate approach to strengthening its defense system where it integrates more with the urban fabric and makes it feel less like a prison. This also points at the requirement of a more detailed analysis of the issues faced by these inundation prone lands along the shore in order to contextualise the solution on the site. For this very analysis, we pick Tsukishima island (of which area 6 and 7 are apart of) to study the urban issues due to population density, open urban spaces and existing land morphology.
38 39
Figure 2.2.10: Tsunami Propagation / Time Variation in Spatial Distribution
Figure 2.2.11: Evacuation Zones
2.2.2 Urban Issues

2.3.2.1 Population density and its problems
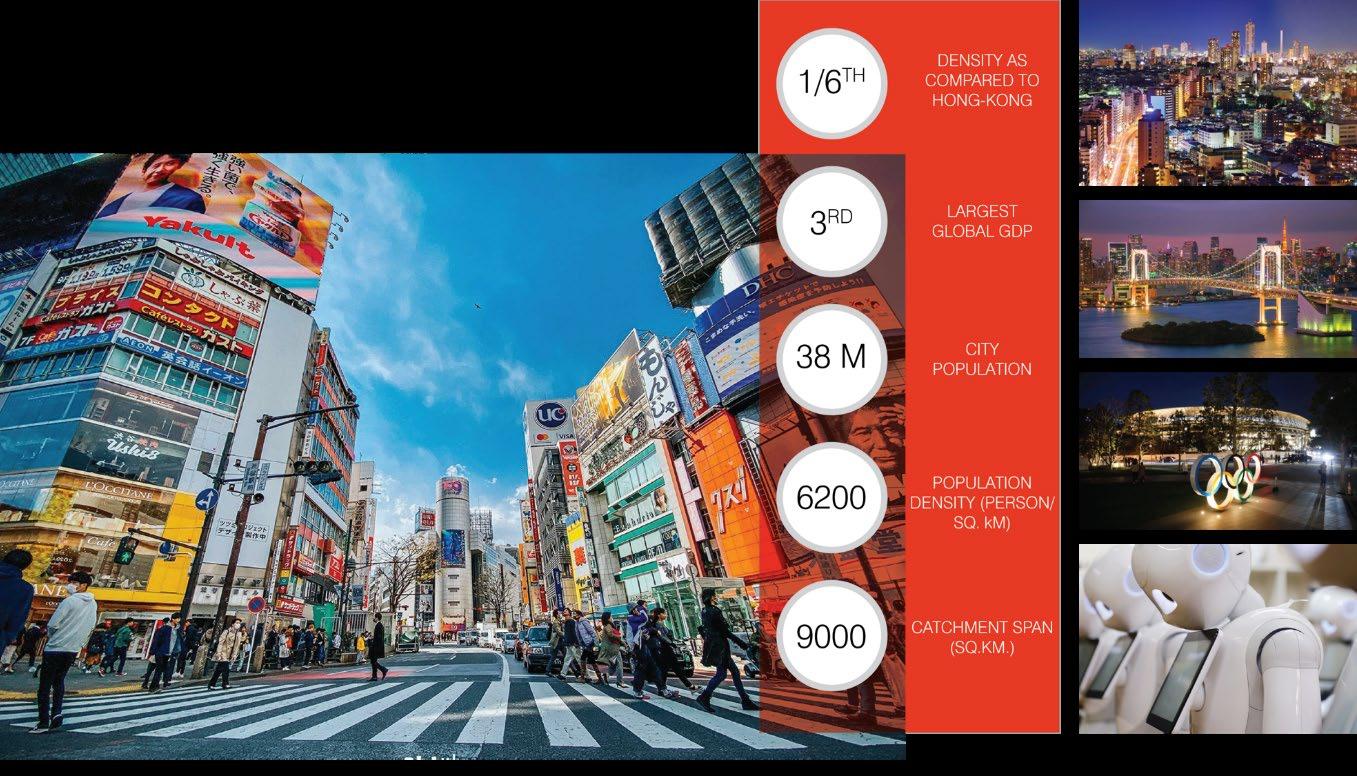
Tokyo is one of the densest cities in the world. Tokyo Bay is the largest foundation that supports the Tokyo- metropolitan area. Just 50,000 km 2 in size, the Tokyo Bay area boasts a population of 40 million and produces 40% of Japan’s GDP.[3] According to recent estimates last recorded in 2016, the 23 wards that make up the city of Tokyo had an approximate population of 9,262,046.
40 41
Figure 2.2.12: Context of Tokyo
The population density is 12,296 per square mile in Tokyo. Compared with London (13,210 per square mile), Tokyo has a slightly less population density. However, due to its early urban planning and policies, the population density problem in Tokyo shows in another way, in which the lack of green space, lack of open public space, and housing crisis are the dominant problems.
(Graphical representation of data such as GDP, population vs area, growth rate, etc)
42 43
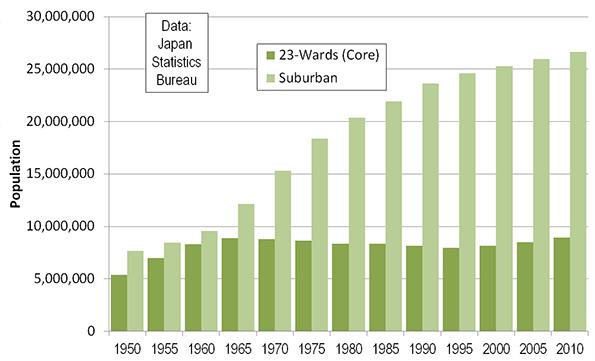
Figure 2.2.14: Tokyo Core & Suburban Population1920-2010
Figure 2.2.13: Urban Analysis / Denisty of Tsukishima Island
2.3.2.2 Lack of public and green spaces
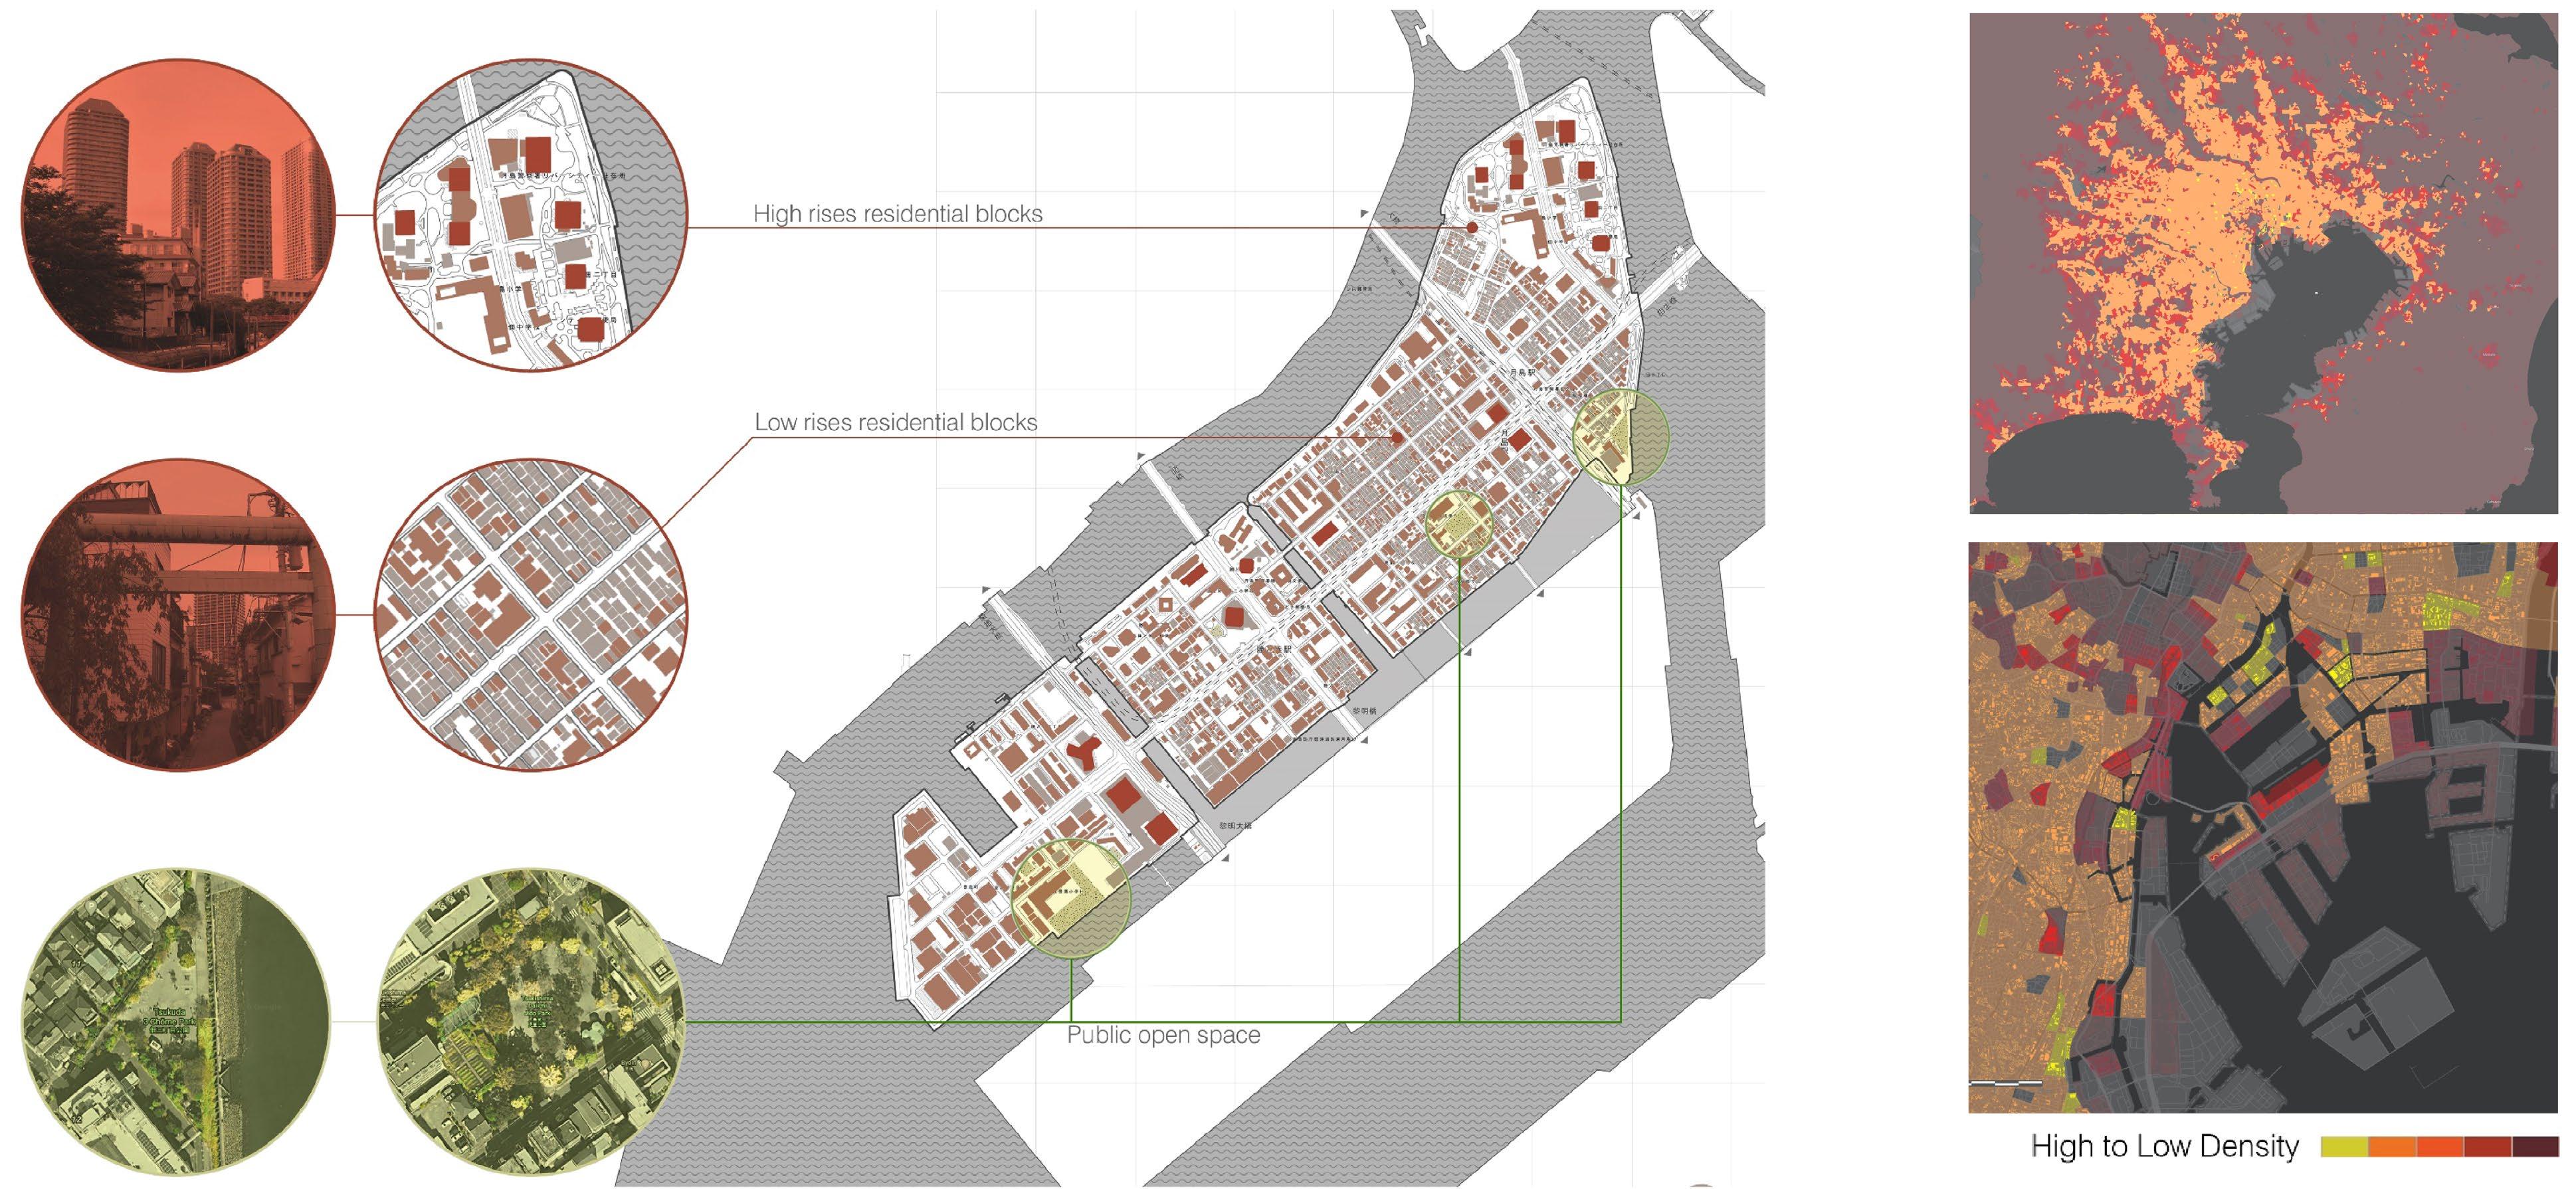
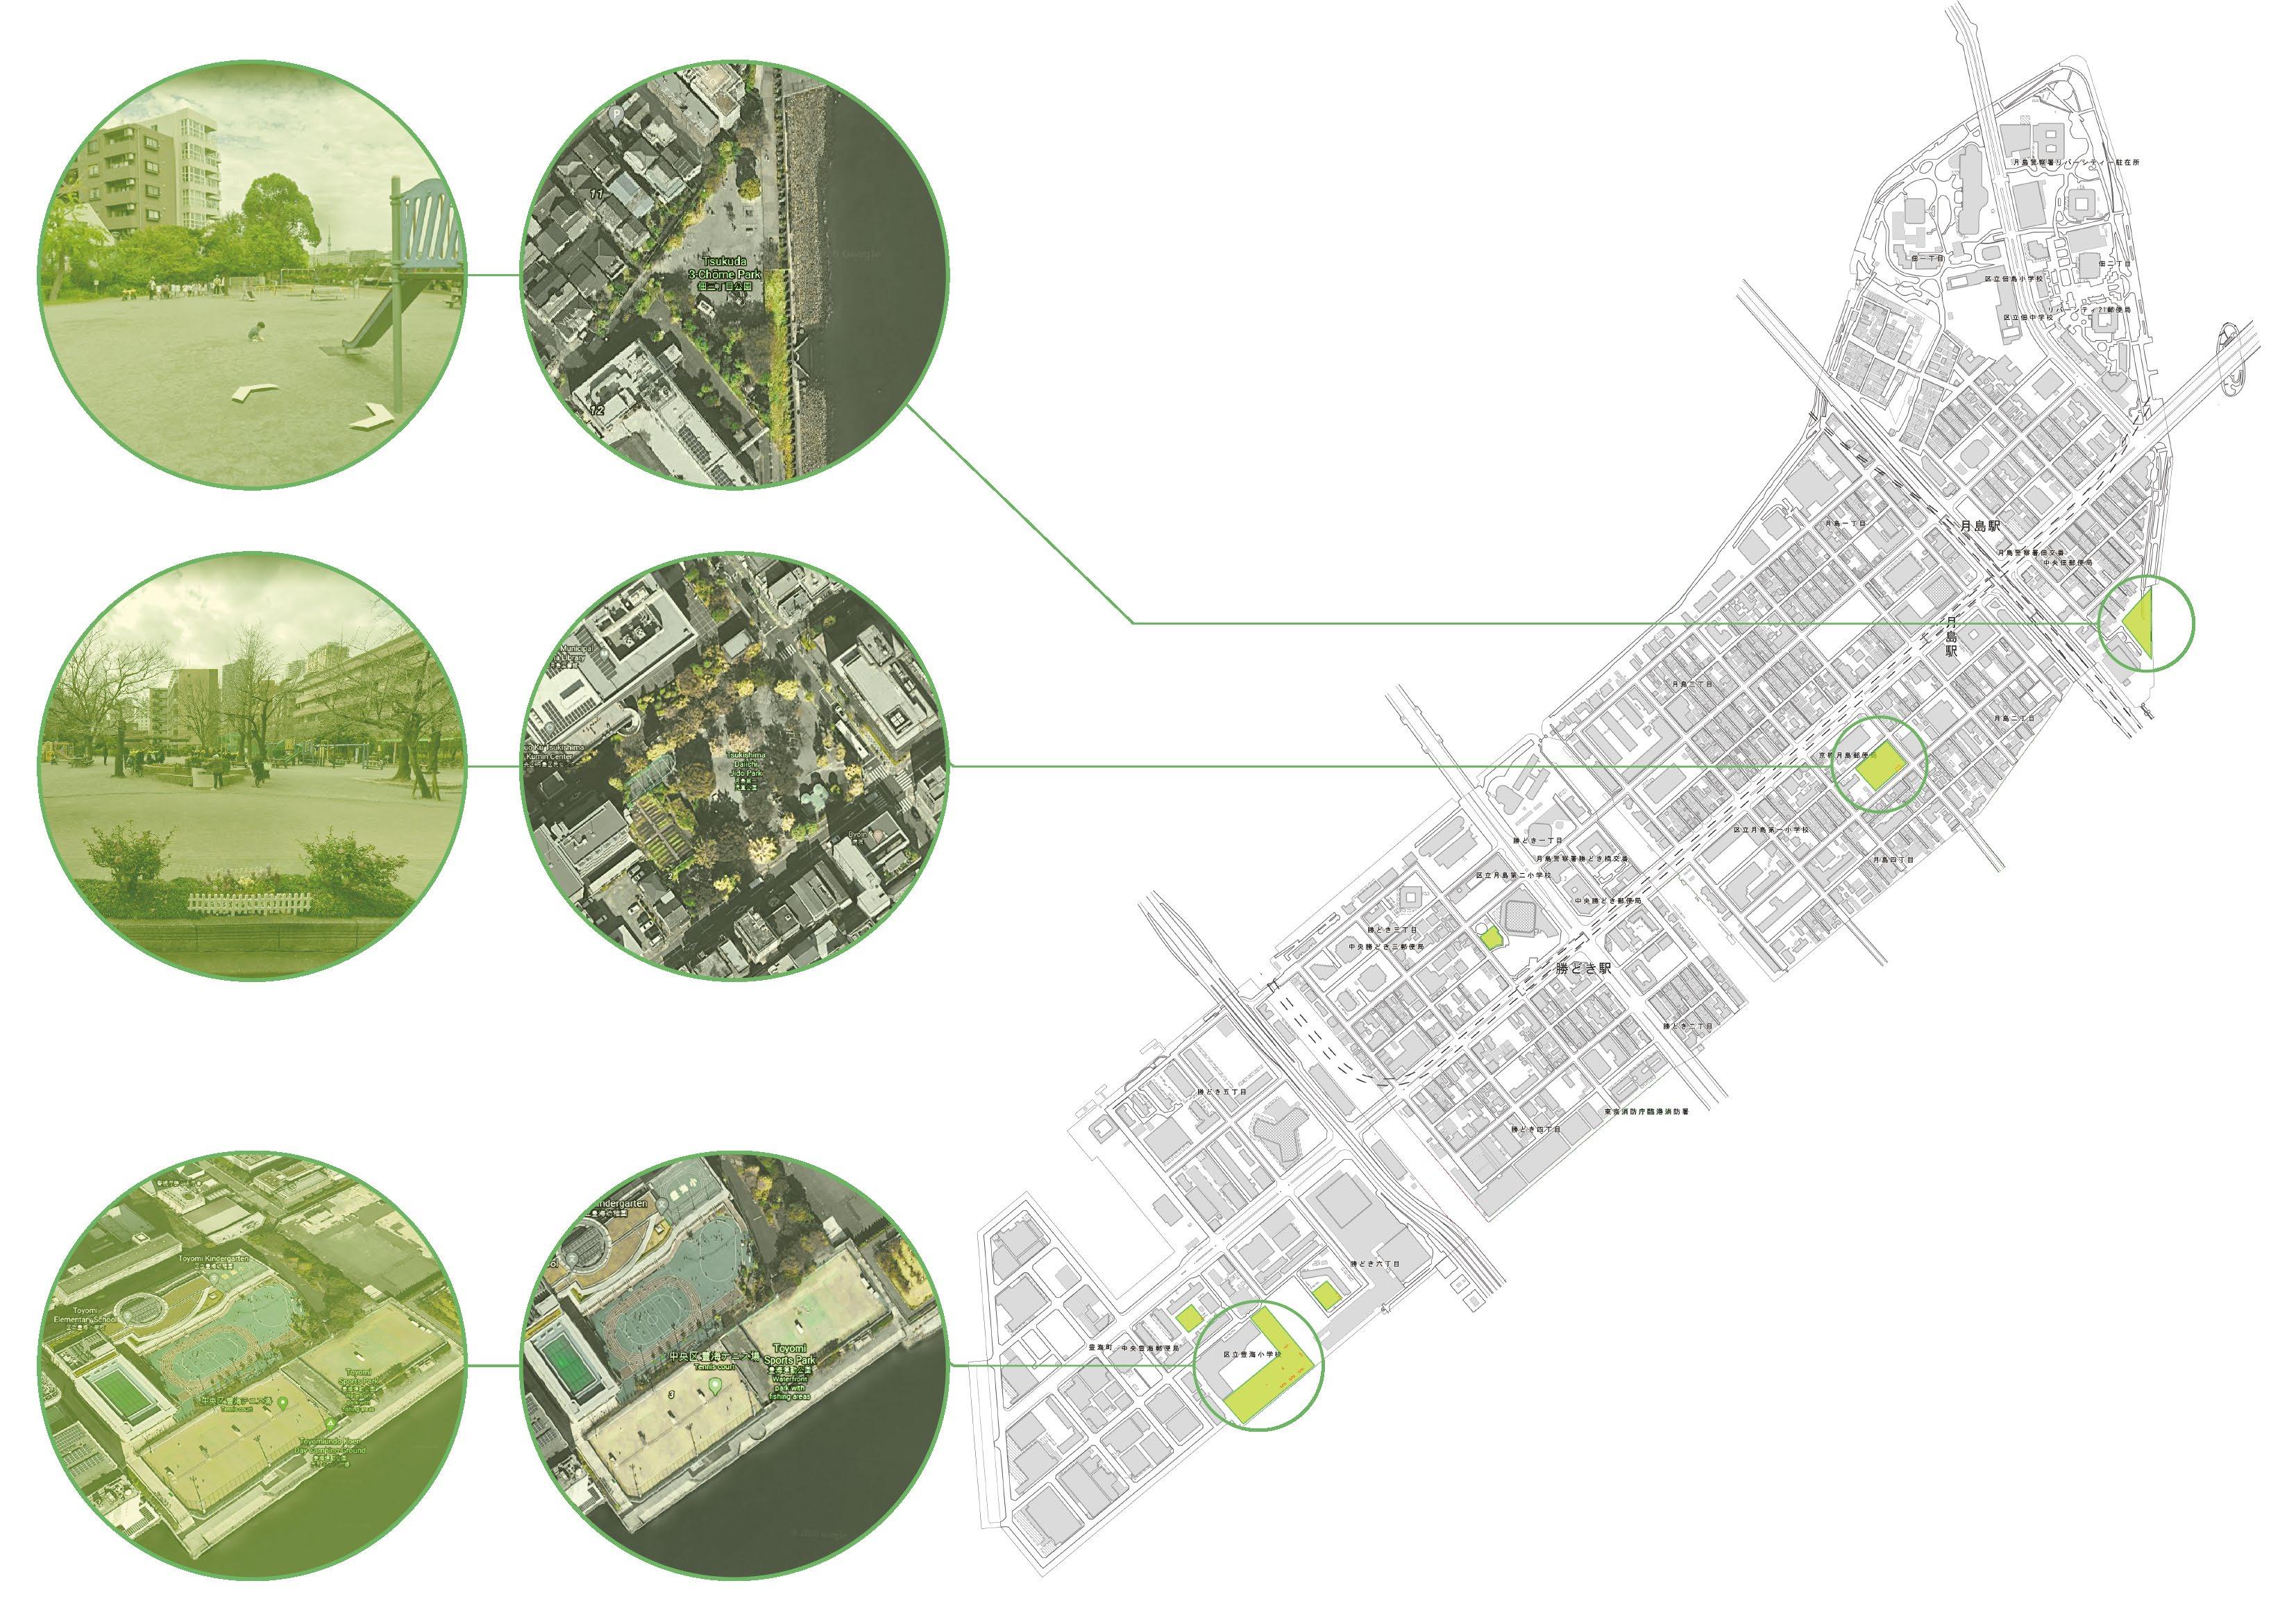
Lack of green spaces is more acute in Japan’s metropolitan areas than in those in other developed countries. According to research from Bureau of Urban Development[33], only 7.50% of Tokyo’s areas are public green space, while the number of London and New York are 33% and 27%; the per capita public green space of Tokyo is 4.5 square meter per person, while New York(23 m²/person) and London(30.4 m²/ person) largely exceed this number(Figure 1.3.2). Tokyo has suffered most of the green space depletion between 1975 to 2005, and the reasons include rapid urban growth and expansion, population pressure, and other policies. The contrast between the density crisis vs the green spaces available to the public is aptly visible in the analysis done on Tsukishima island in fig. xxx. The city fabric mainly consists of low to mid rise blocks densely packed to form square community blocks, aligned in a gridded network. On the other hand, there is a stark contrast in the building height in few patches of land, which have been developed for high rise residential towers, with green amenity and public spaces enclosed and accessible to only the residents.
44 45
Figure 2.2.15: Green Area in Tsukishima Island
City Tokyo Yokohama Osaka Koyto Kobe Nagoya m2/ person 4.5 3.7 2.9 2.8 13.5 5.3 City New York Los Angels Montreal London Paris Bon m2/ person 23.0 21.5 13.1 30.4 11.6 37.4
Figure (table) 2.2.16: The per capita public green space of large cities (1994)
2.3.2.3. Current site and Morphological limitations
Tokyo Bay, the marine hinterland of the mega-city has a long history of land reclamation going as far as the 6th century. The building of urban territory for infrastructure, industry, logistics and urban development accelerated during Japan's modernization.[6] Land reclamation in Tokyo Bay goes back as early as the 16Th century. Urban expansion relied on the ‘building’ of land on tidal flats.[6] Later the city went through continuous rebuilding of street networks and community formations due to Kanto earthquake and the second world war. These chain of reclaimed lands majority of Tokyo’s population and economy. With sea level rise and rising temperatures, these reclaimed land masses along with other low lying areas pose a threat of inundation.
The shores of the bay are lined with manufacturing industries, including steel and chemical industries, as well as tanks for oil storage and power generation and silos for food and animal feed. These industries serve as important bases for production and employment in the Tokyo metropolitan area.[3]
Upon analysing the land morphology of Tsukishima island, the central primary channel is found to be shallow that is highly prone to flooding and needs raising. Also, most of the peripheral areas facing the bay function as small yet very busy ports that have influx of small boats and ferries on a regular basis
for transporting cargo for fishery industry. In terms of building types, more industrial and temporary structures like sheds that a low in height are found in areas closer to the shoreline, slowly increasing in height and forming dense residential communities. The green patch in the topmost area in fig xxx is developed as high rises.
46 47
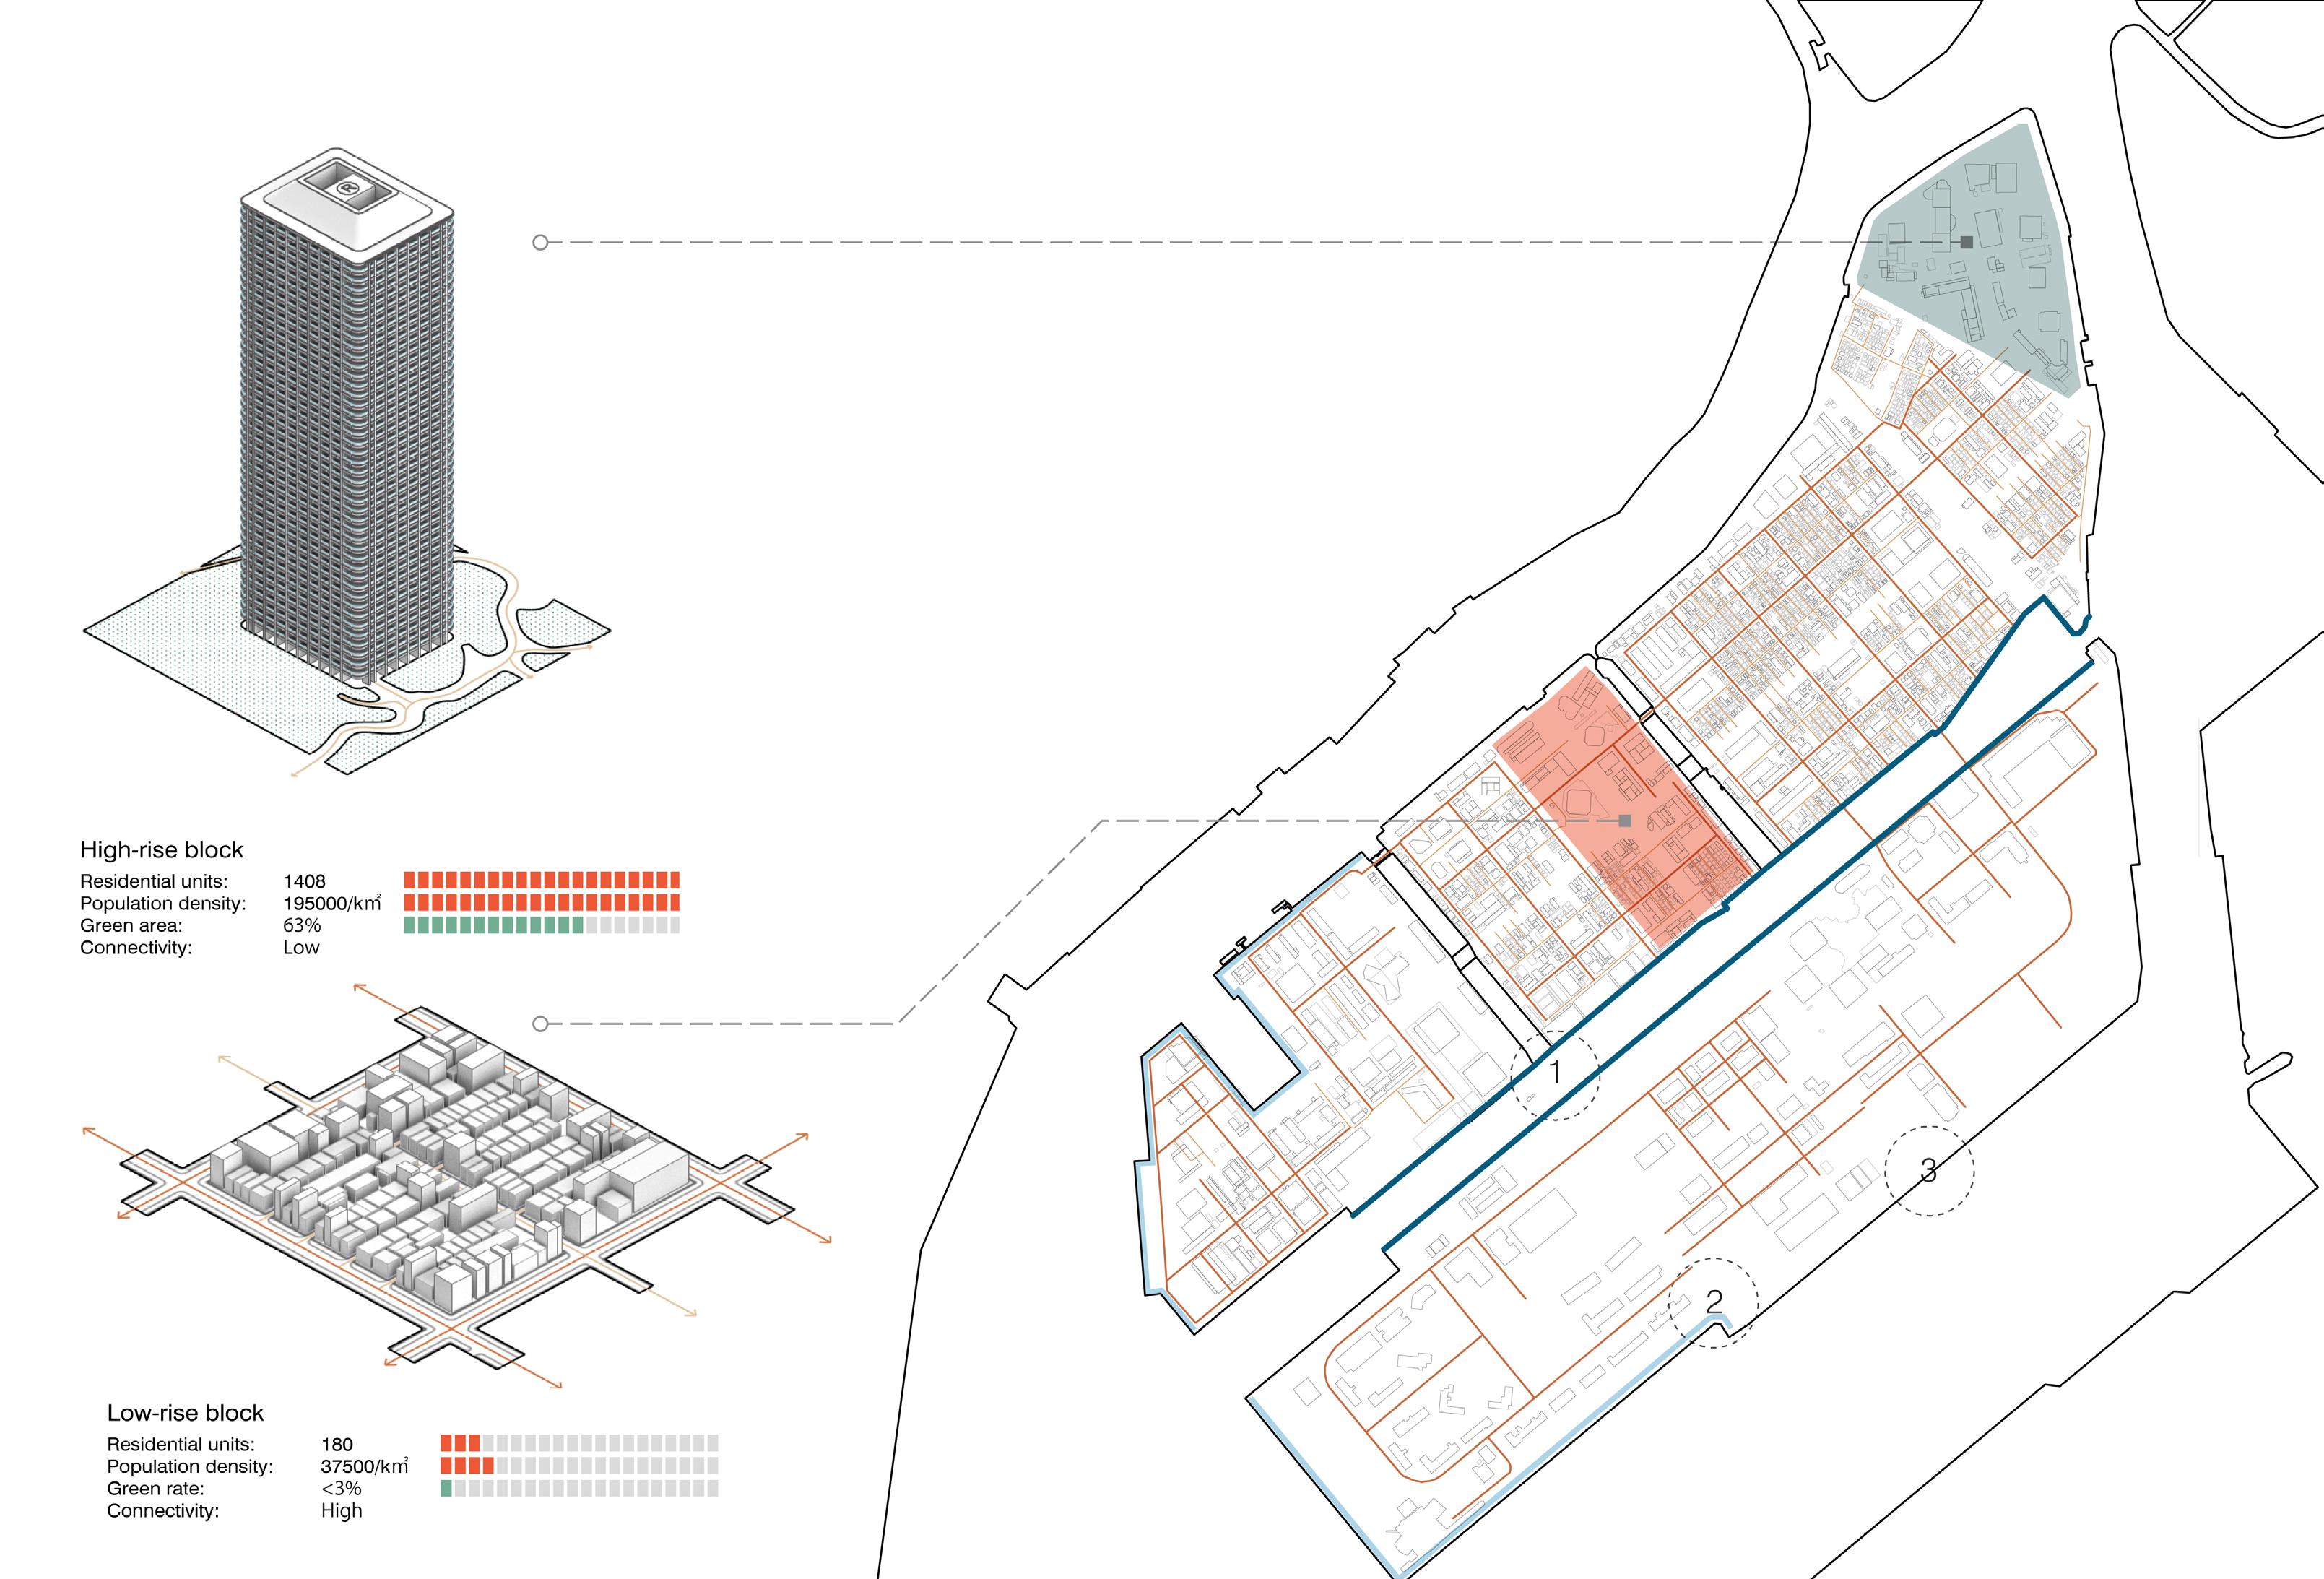
Figure 2.2.17: Low-rise and high-rise urban block analysis
2.3.3 Conclusion
On assessing Tsukishima island closely on different urban issues, the island seemed to be struggling with density spread across in a disparate fashion that had no proper evacuation route set in case of a marine disaster such as an unpredicted Tsunami. The morphology of the land also showed that it the ports and industries facing the sea were low lying without any elevated access points to escape. At the same time, density of the island being high, there were not many open green or public spaces accessible to the people. This analysis indicated us to that a new land morphology was needed that could evolve alongside a guided water network, with a zoning hierarchy to resolve the current issue of risk aversion and evacuation.
48 49
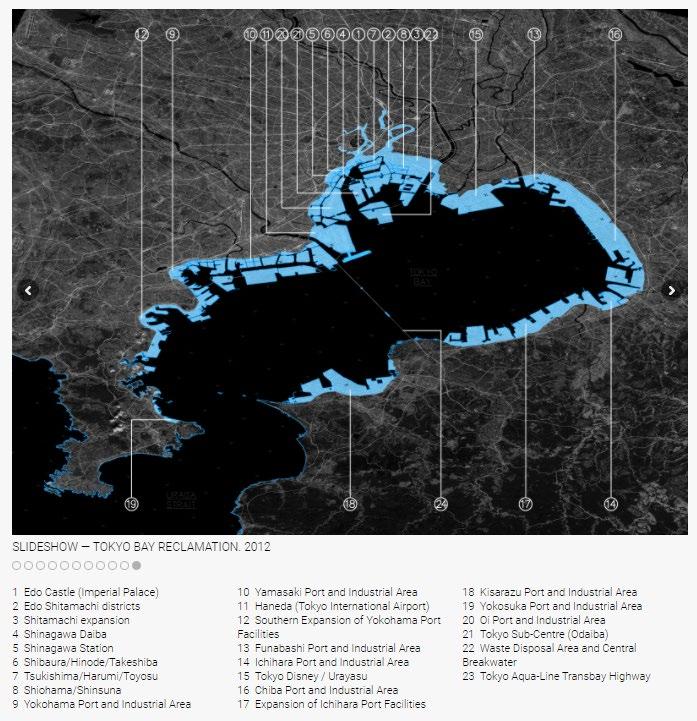
Figure 2.2.18: Tokyo Bay development
2.3 CASE STUDY
2.3.1 Types of Offshore Barriers
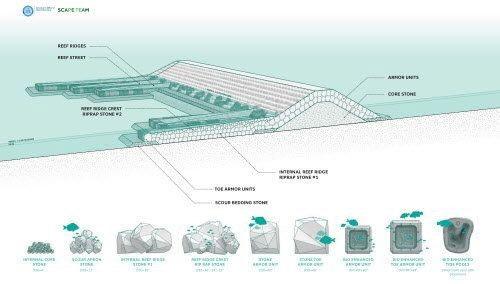
Various defense tactics are used in order to control floods and rising water levels in waterways. Enacting barriers or dams as a defense mechanism has a great impact on the environment as that have a direct influence on the existing water systems in place. At the same time, such engineering is required to help cope with unpredictable water influx from coast side and save lives. For 2011 Tohoku Tsunami, the affected areas on the northeastern side of Japan, faced lower impact due to the installation of offshore breakwaters. Furthermore, researchers have analysed through numerical results that such structural protection may have resulted in lower overall inundation heights and could avoid catastrophic destruction of the city. The local tax revenue indicated more than 30 % difference of economic impact due to offshore breakwater and that its effect continues a few years after the disaster.
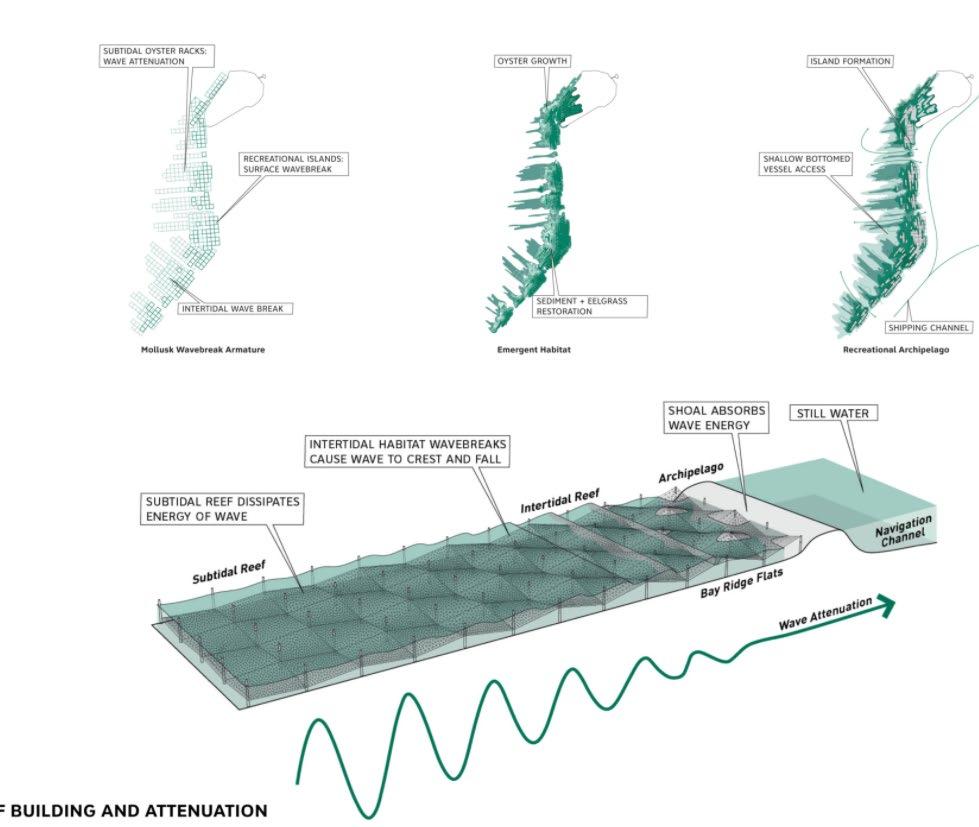
[39] Also, application of multiple modules of breakwaters with mound extensions are found to be ecologically beneficial, helping boost the oyster and crustacean habitat.
50 51
Figure 2.3.1: Reef Building and Attenuation
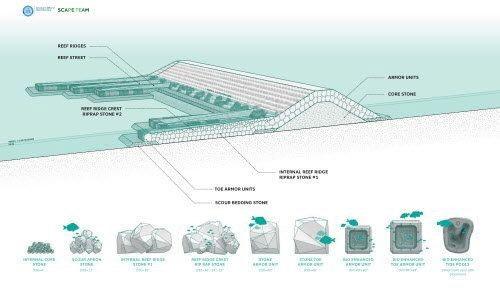
Figure 2.3.2: Barriers
The 4 main types of coastal defense strategies are dispersion, flotation, barrier and diversion. In case of coping with marine disasters such as tsunami, dispersion works the best as multiple barriers can work together in order to dissipate energy in stages, before the water reaches the coastline.
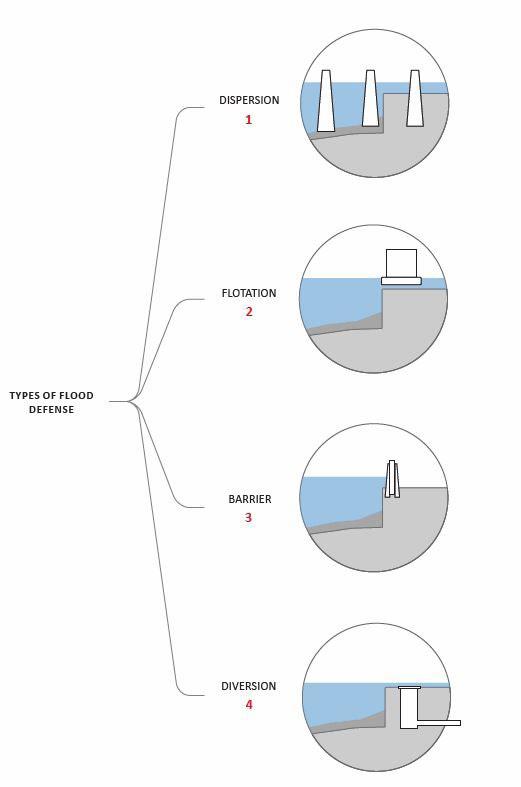
Floatation technique on the other hand reacts to the rise and fall of water level by adapting to it. This in some scenarios could be valuable option, as temporary usable space can be generated on top of it. They can serve as connectors between land and the offshore breakwaters, or land extensions for seasonal functions.
52 53
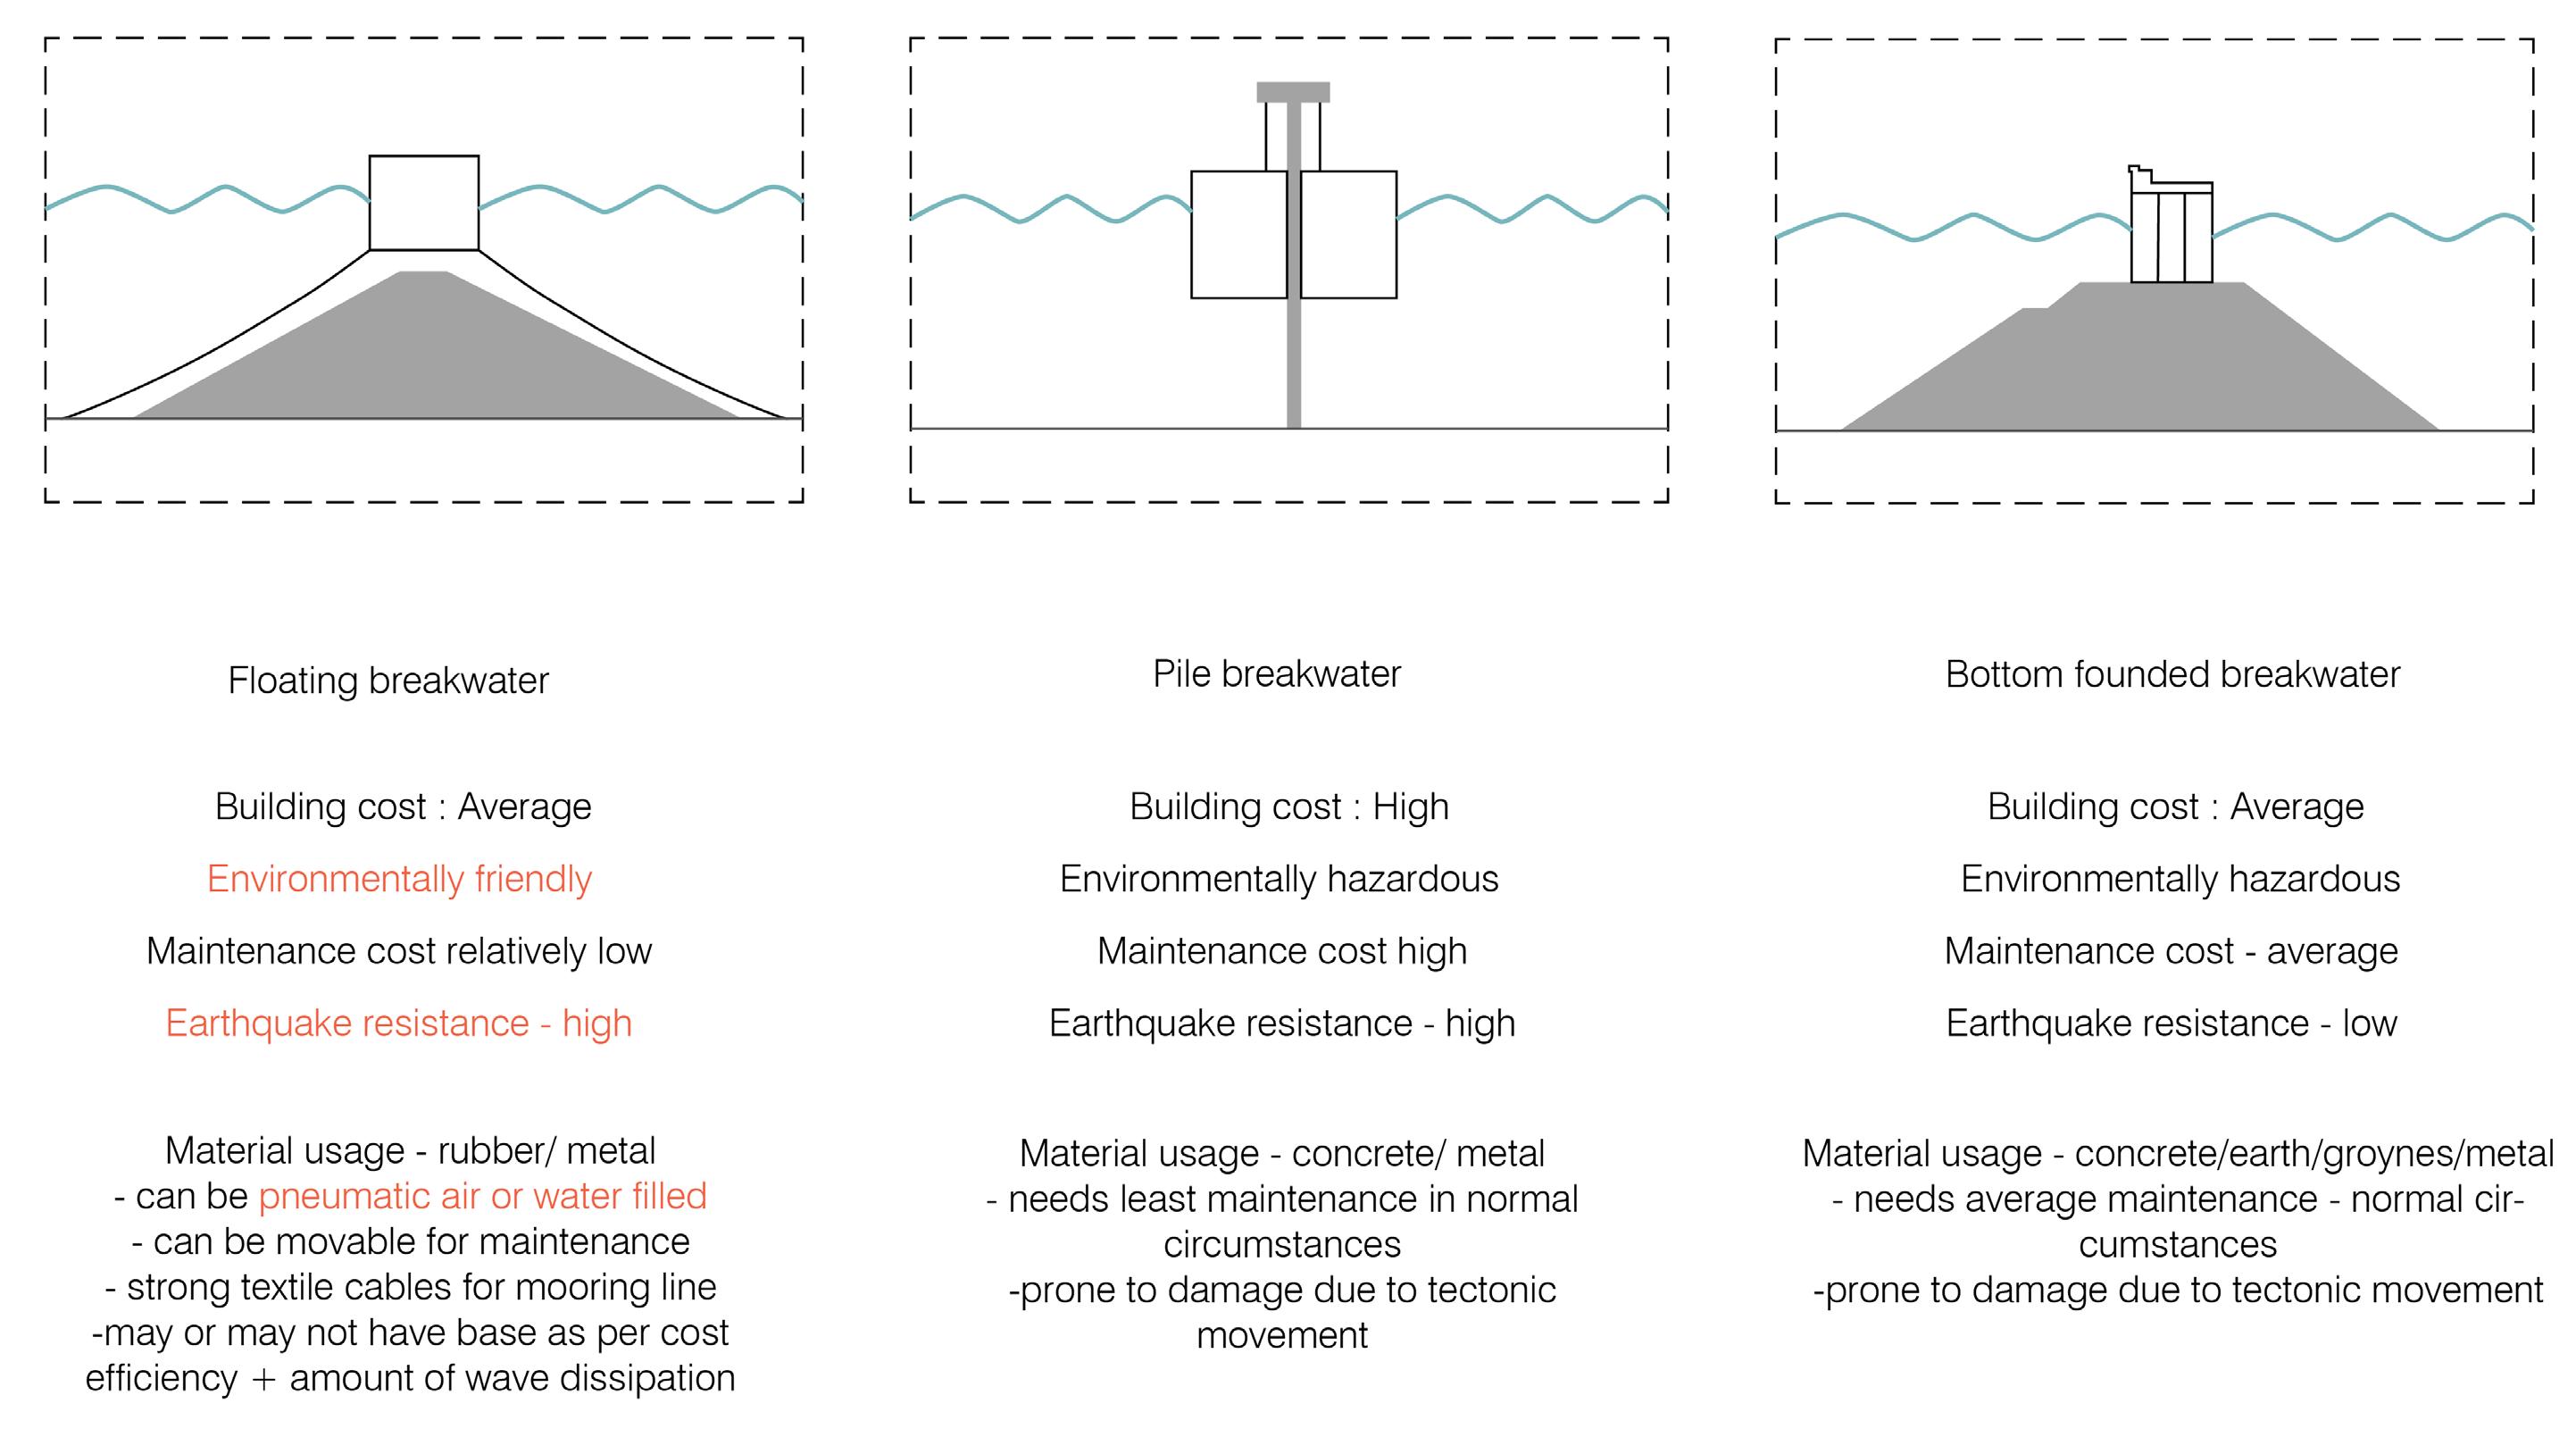
Figure 2.3.3: Types of Breakwaters Effective for Tsunami Wave Attenuation
Figure 2.3.4: Counter Flood Strategies
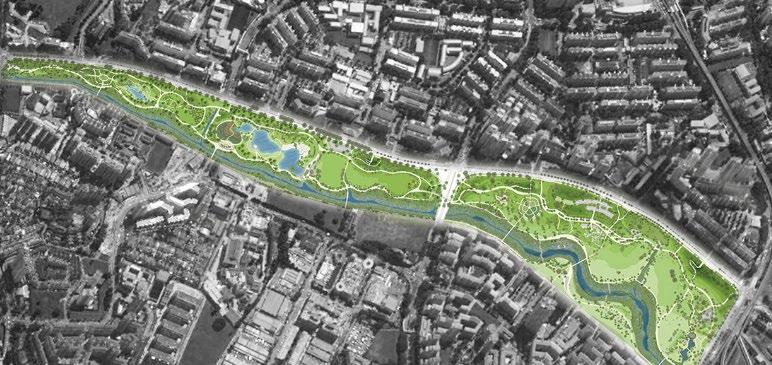
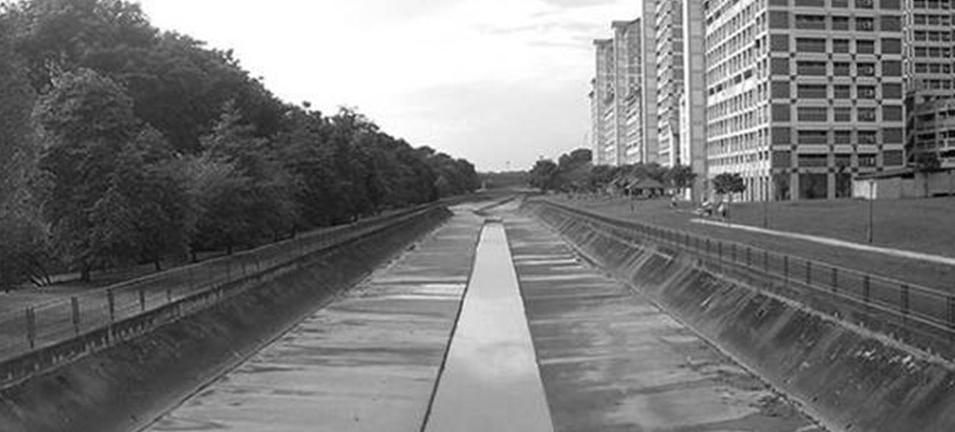
2.3.2 Soft Green Tissue as Fluid Energy Absorber
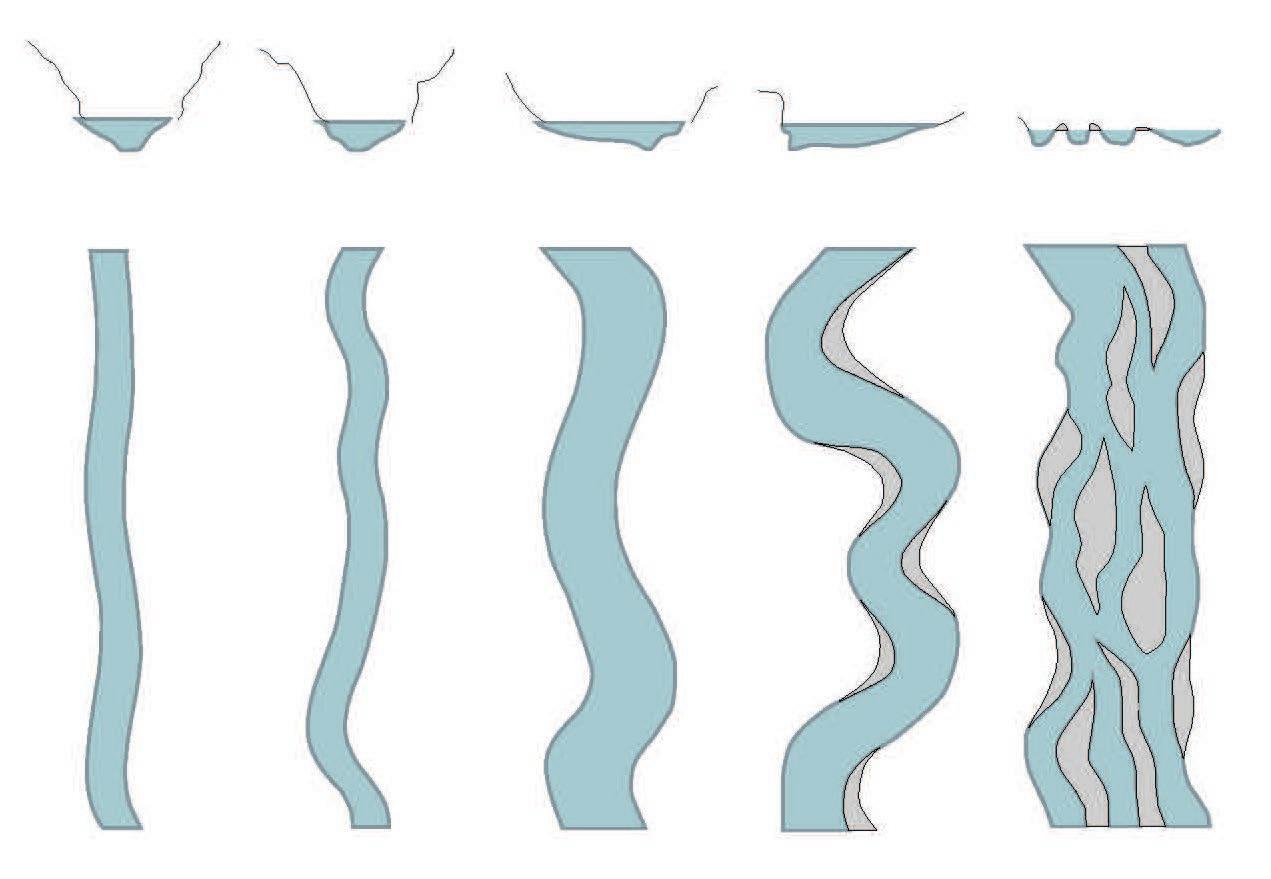
Singapore’s Bishan Ang Mo Kio park is a good example of application of river meandering technique as the canal cross-section to help cope with the flooding caused due to heavy rainfall. When designing the expansion of the Kallang River to cater for high intensity storms and rain, the canal was adapted to hold more water using green tissue in landscape form instead of concretizing the entire area. The area was transformed into a naturalized river with bioengineered river edges that meanders through the park, creating an engaging space for the people making the river front more accessible. This also served the purpose of providing a usable green space for public on one hand and an innovative drainage improvement project on the other hand.[40]
54 55
Concrete Channel (Before)
Multifunctional Green Infrastructure (After)
Figure 2.3.5: Case Study
Figure 2.3.6: Wave Dissipation by Channel Performance Figure 2.3.7: Distribution Strategies of Water Within Urban Tissue
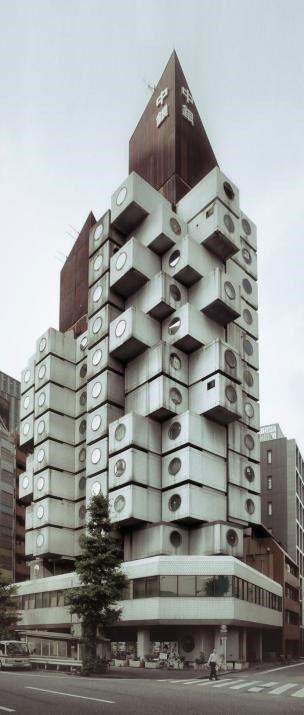
2.3.3 Metabolism Architecture
Metabolism ( 新陳代謝 , shinchintaisha) was a post-war Japanese architectural movement that fused ideas about architectural megastructures with those of organic biological growth. It had its first international exposure during CIAM's 1959 meeting and its ideas were tentatively tested by students from Kenzo Tange's MIT studio[Figxxxx1].
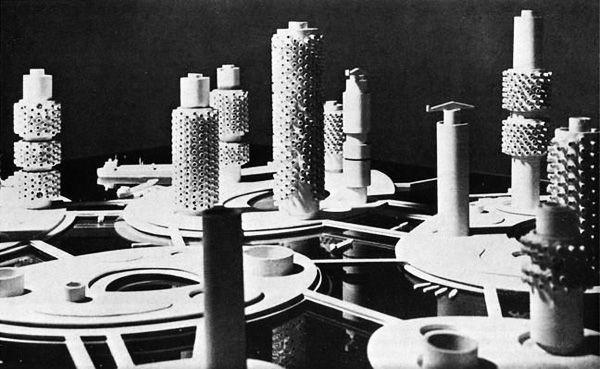
Metabolist architects, including Kiyonori Kikutake, Kisho Kurokawa, and Fumihiko Maki were influenced by a wide variety of sources including Marxist theories and biological processes. Their manifesto was a series of four essays entitled: Ocean City[Figxxxxxxx2], City in the Air[Figxxxxx3], Towards Group Form, and Material and Man, and it also included designs for vast cities that floated on the oceans and plug-in capsule towers that could incorporate organic growth.
The modularity and prefabrication embraced by the Metabolism movement are relevant to our current environmental crisis in several key ways. Prefabrication of building components in factories results in a minimization of construction waste and entire capsules or parts of them can be readily designed for reuse [Metabolism Revisited: Prefabrication and Modularity in the 21st Century Urbanism Stanley Russell University of South Florida]. Capsules also have the possibility of being regionalized with locally produced, renewable materials. This strategy would overcome the homogenizing effect of mass-produced, generic architectural elements and would reduce the carbon footprint of buildings. The inherent accessibility of individual components optimizes the potential for commissioning and controllability of building systems in modular buildings.
56 57
Figure 2.3.8: Ocean City by Kiyonori Kikutake
Figure 2.3.9: City in the Air, Arata Isozaki
2.4 DOMAIN CONCLUSION
Summarizing the domain, the following crucial points are identified, that will further guide the studies in the research development stage.
-Vulnerability to marine disasters from both shore side and in land ( inflow and outflow )
-Lack of accessibility to sea/ water body and feeling of imprisonment due to the current applied coastal defenses
-Lack of green and open public spaces
-Lack of proper zoning and housing development w.r.t proximity to high risk areas (closeness to water channels)
-Lack of an evacuation network w.r.t the refuge centers
2.4.1 Design Ambition
The ambition of this research is to maintain/improve the safety conditions of the Tokyo and its surrounding area against flooding due to typhoons and tsunamis. Therefore, the main objective of this thesis is to analyse the risk of Tokyo and its surrounding areas to the typhoons and tsunamis and design for storm surges, to reduce this risk in the future. In the process, the goal is to develop an architectural and network strategy that works hand in hand with the flood coping mechanisms applied creating an alternative urban proposal.
58 59
2.5 RESEARCH QUESTIONS
01: Can tectonic surfaces with channeling capabilities aligned with coastal protection help in creating a more resilient urban fabric to deal with Marine disasters?
02: Can mixed use modular spaces be evolved on the new urban fabric to work with the new water network and built conditions required to cope with the marine disasters?
2.6 HYPOTHESIS
Gradients of intervention integrated strategically offshore to inland can create a resilient marine defense system and built environment for future Tokyo city.
60 61
3. METHODS
62 63
3.1 OVERVIEW
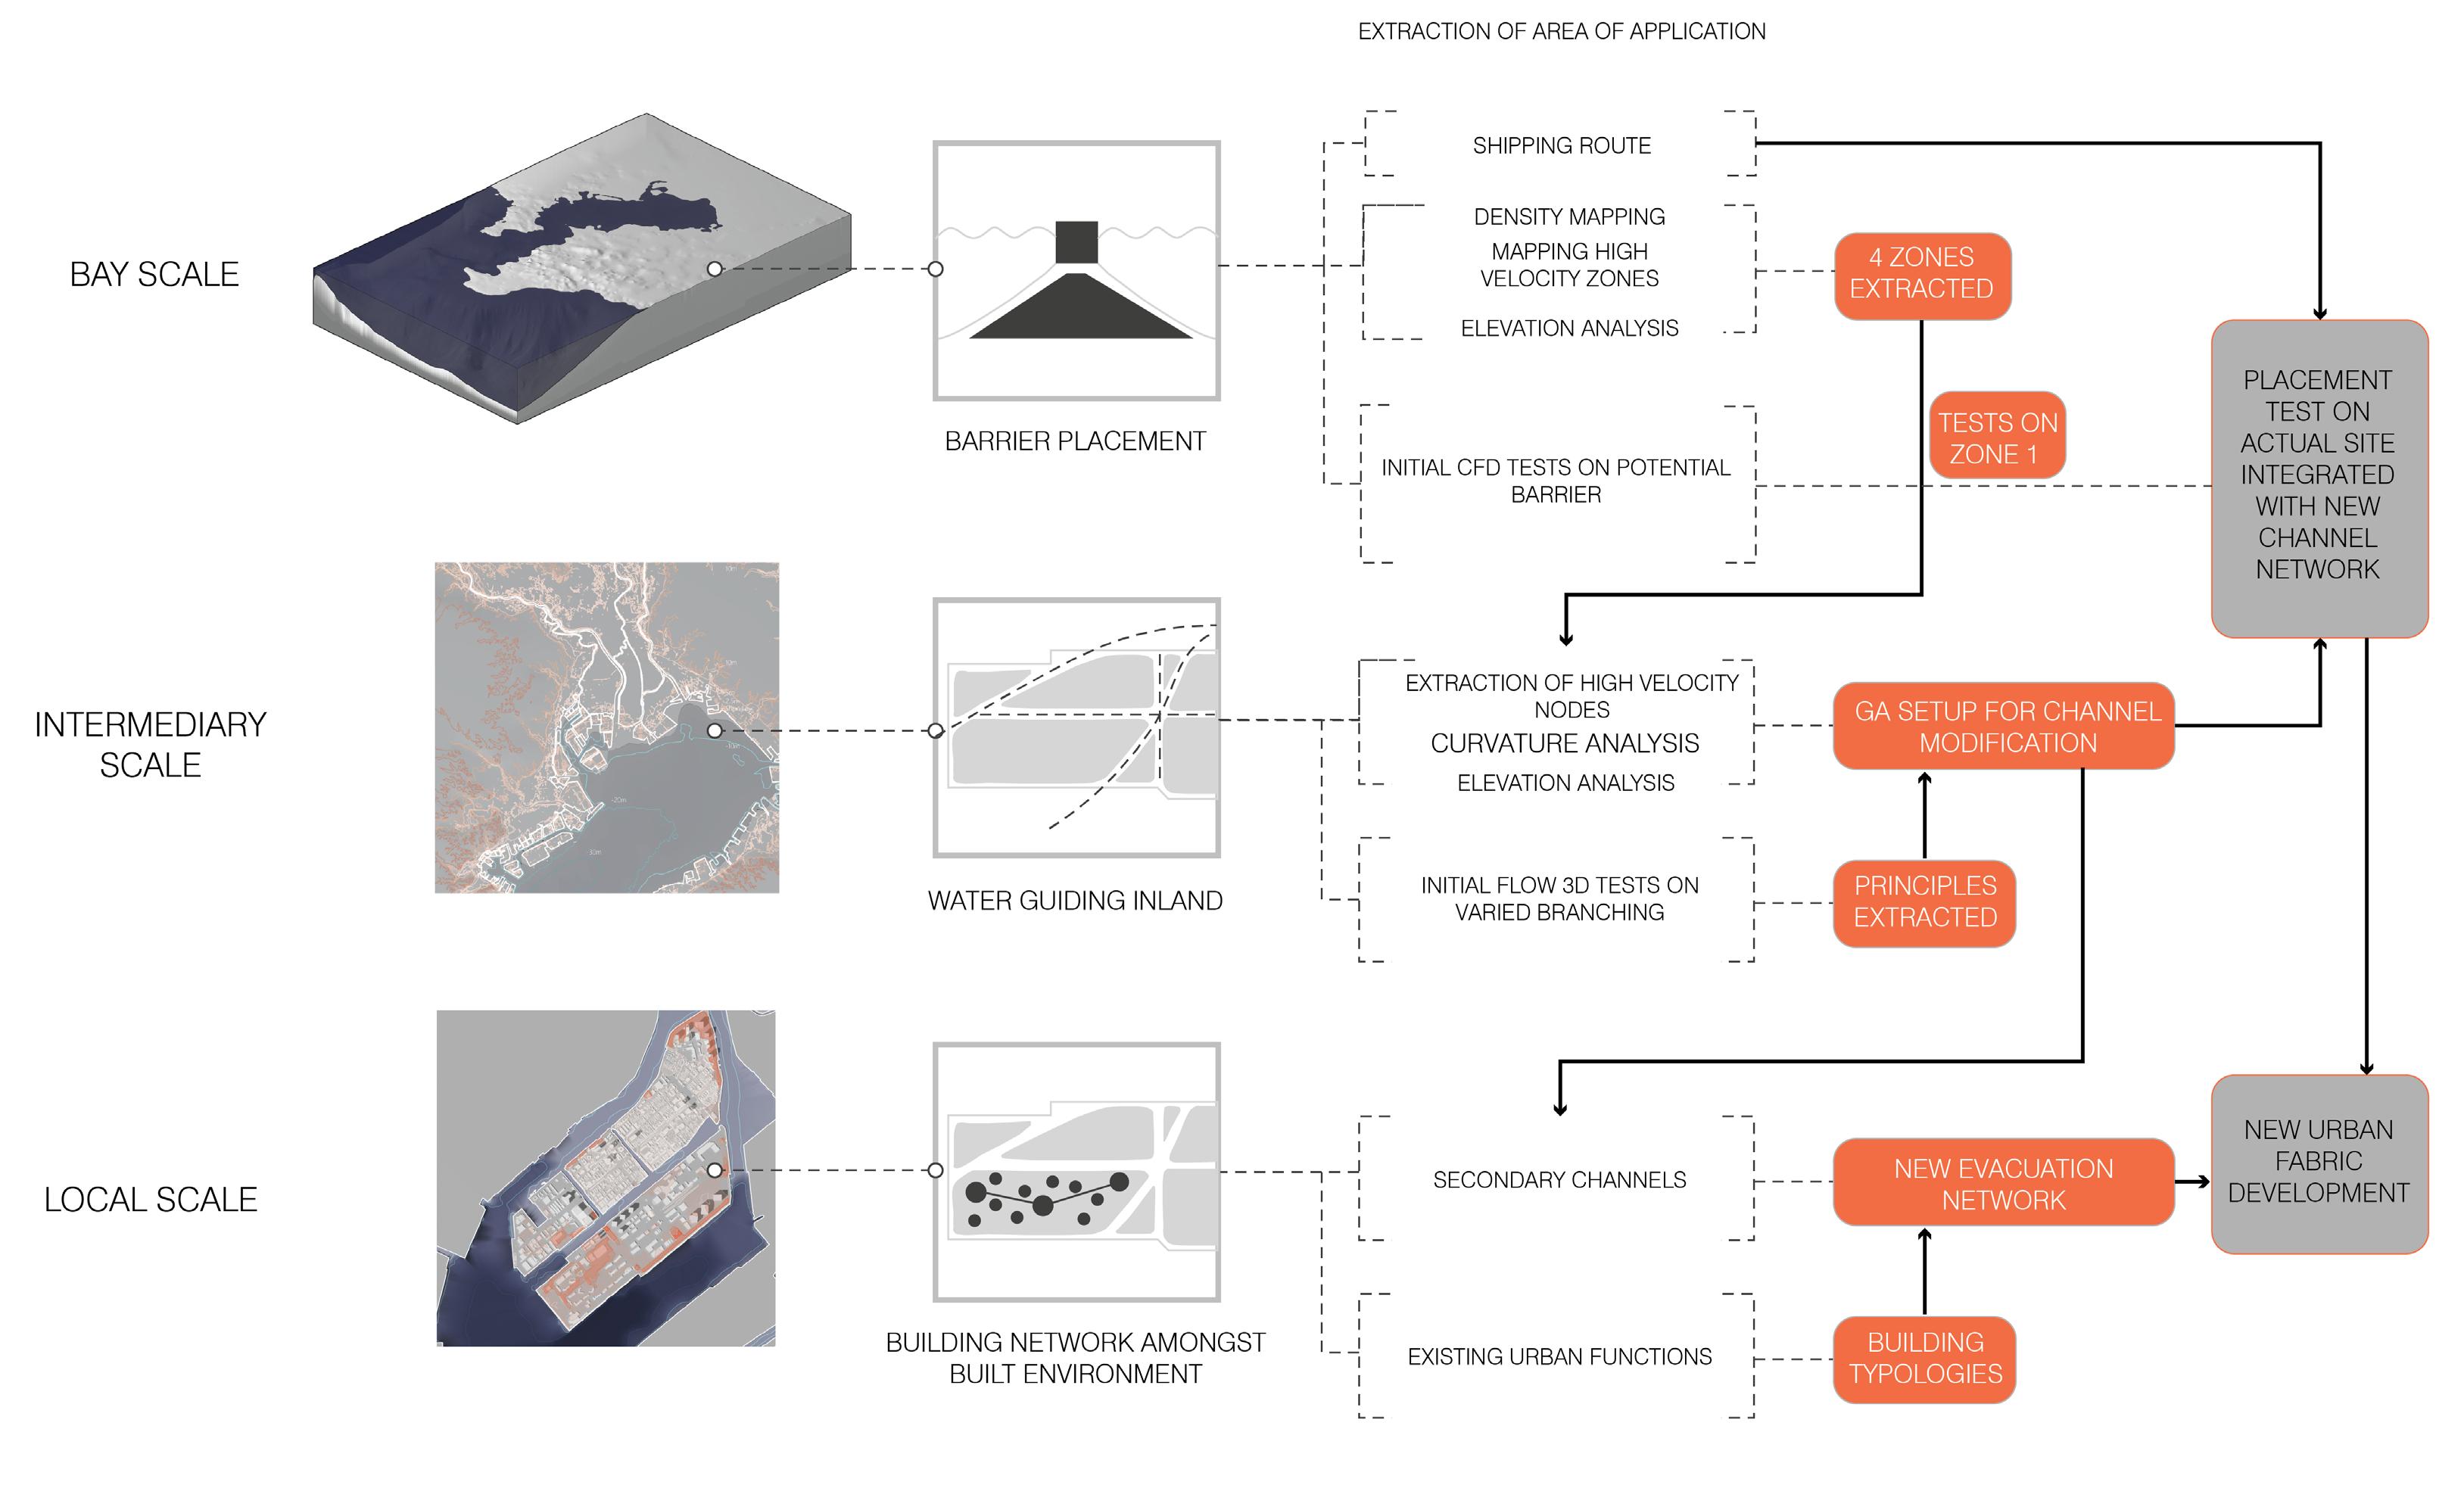
In order to explore our research emphasis, the knowledge obtained from the domain includes constructive feedback for formulating experiments. This knowledge needs to be carefully researched, evaluated and broken down to make use of its full scope. This includes both automated platforms and analysis into current activities. The complex structures in this project require many design and analysis methods to be implemented at different scales. For the process followed during our exploration, the methodologies implemented to establish a systematic design strategy were important. To get a thorough understanding of the Tsukishima Island, we believe it is imperative to develop research on a Tokyo Bay, inner Tokyo Bay and local scale.
In the Tokyo Bay scale, for the selection of the area of intervention, we followed a data remapping technique. For the channelling experiments at intermediary scale, a GA (Generative Algorithm), CFD and hydrology simulations are used. Finally, in the local scale we used pattern generation and GA. A feedback loop is the part of a system where some portion (or all) of the output of the system is used for future operations as input.
64 65
3.2 DESIGN METHOD
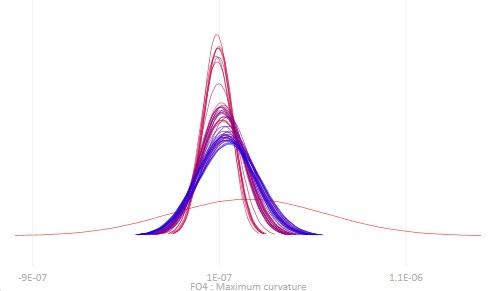
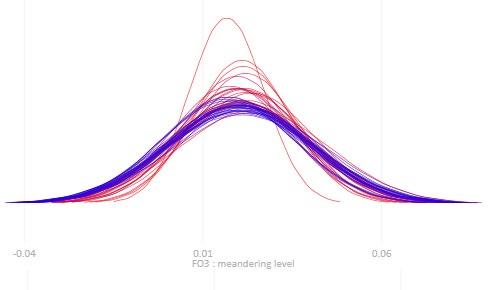
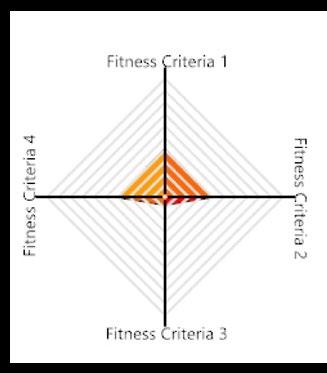
3.2.1 G. A. - multi criteria optimisation
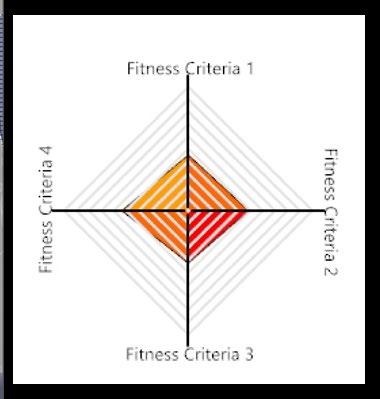
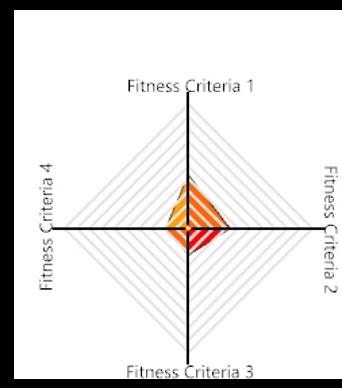
To integrate various evaluation parameters into a physical design, multi-criteria optimization is used. In a GA, assessing multiple criteria offers a variety of solutions that can be assessed and rated individually depending on the criteria. Because no single solution is the best solution, the benefit by using this method of assessment is that it allows designers the ability to determine which solution from a multitude of iterations they consider fit. These algorithms are designed to use the genetic concepts of mutation, crossover and elitism to find the best combination of variables (genes) to generate suitable solutions (phenotypes) to increase the speed of the process.
3.3 DESIGN ANALYSIS
3.3.1 Computational Fluid Dynamics (CFD)
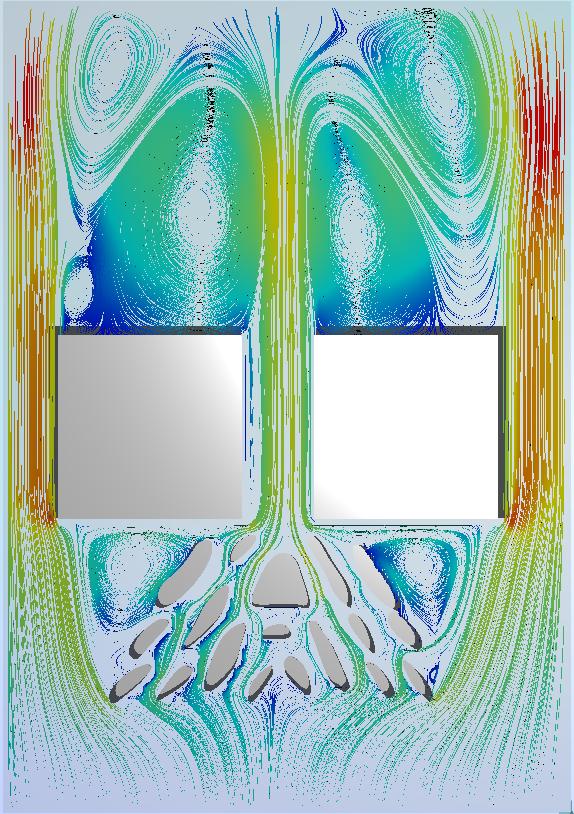
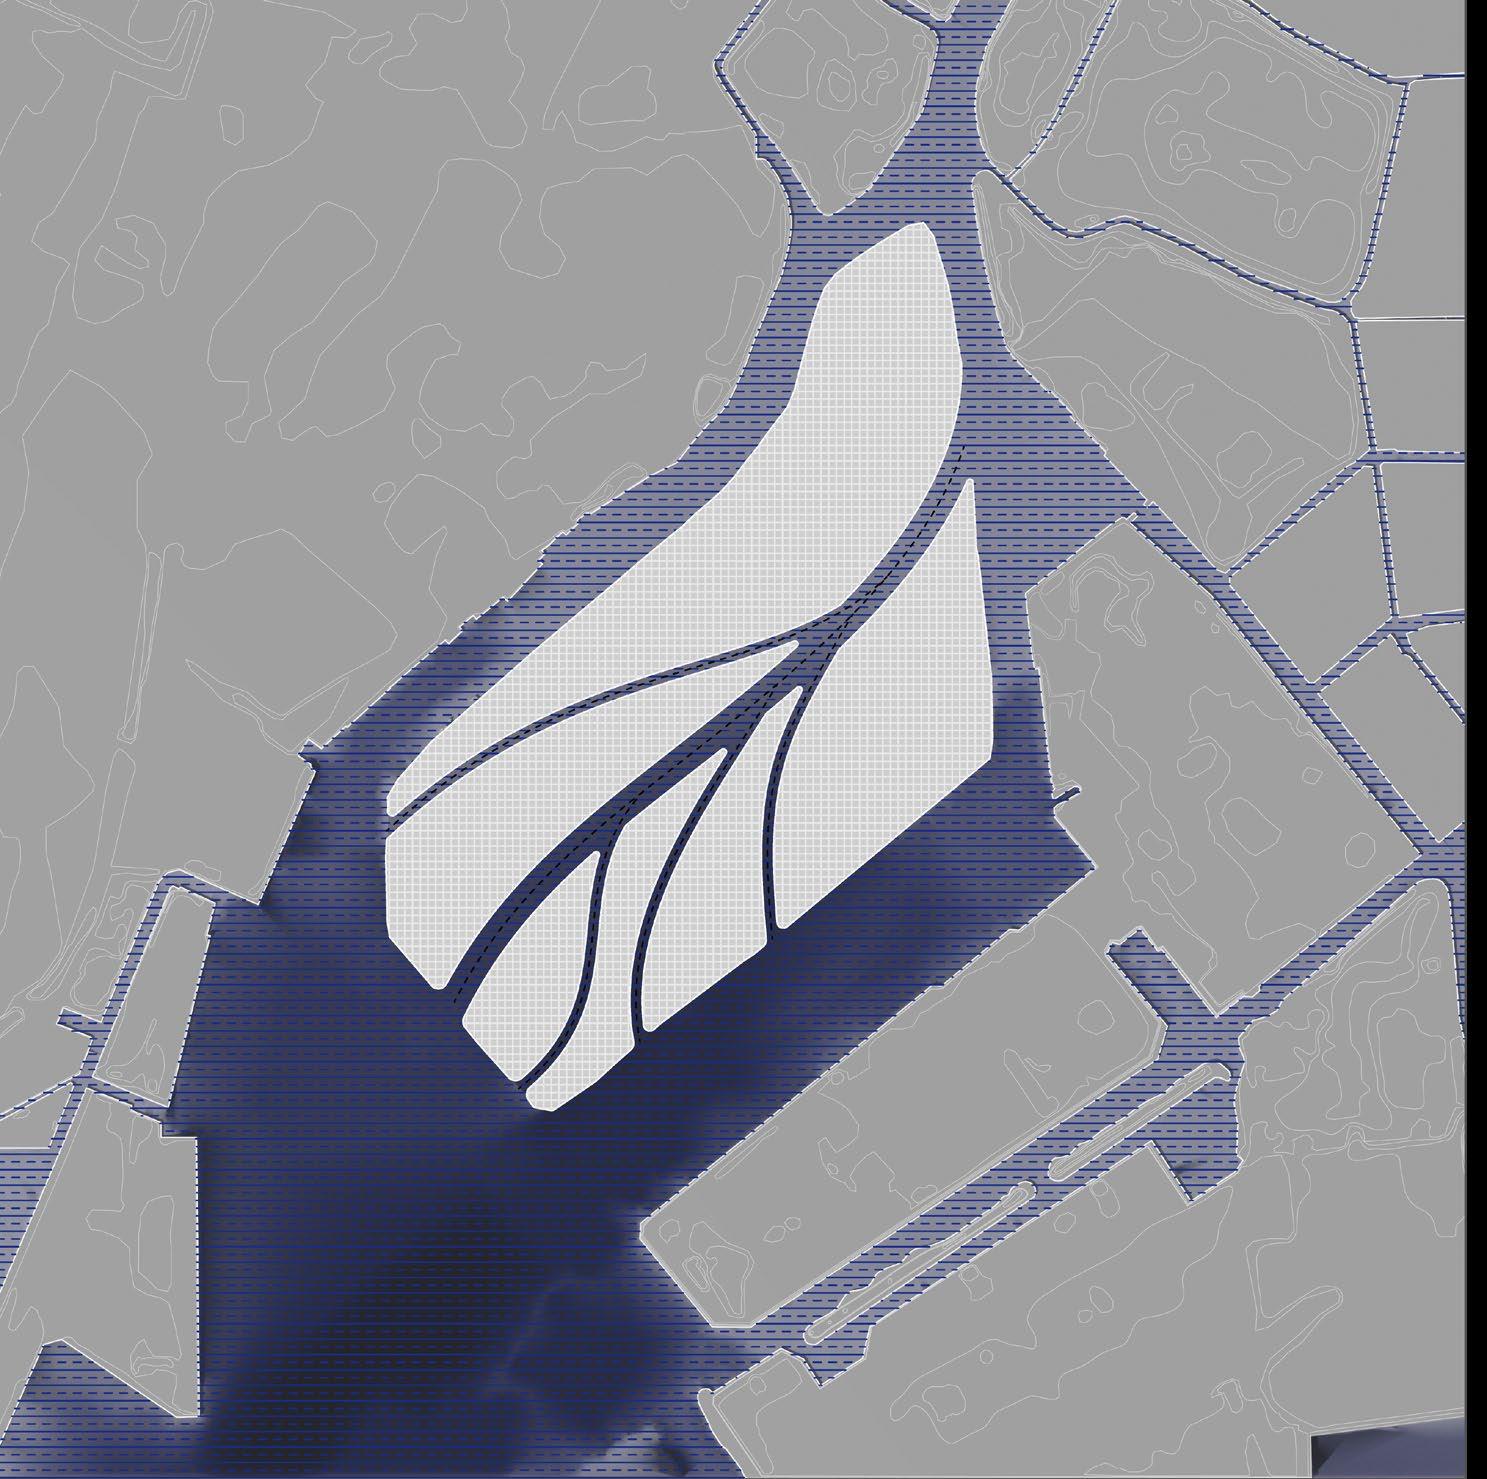
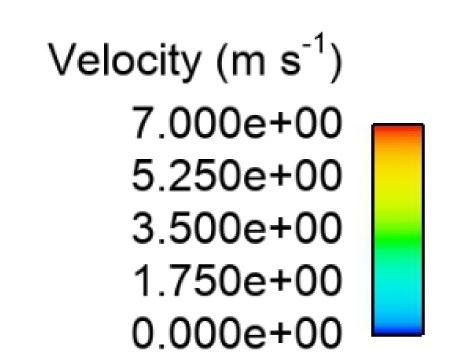
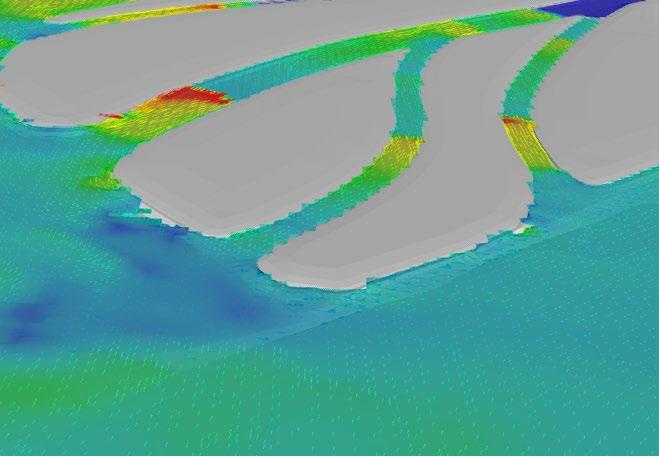
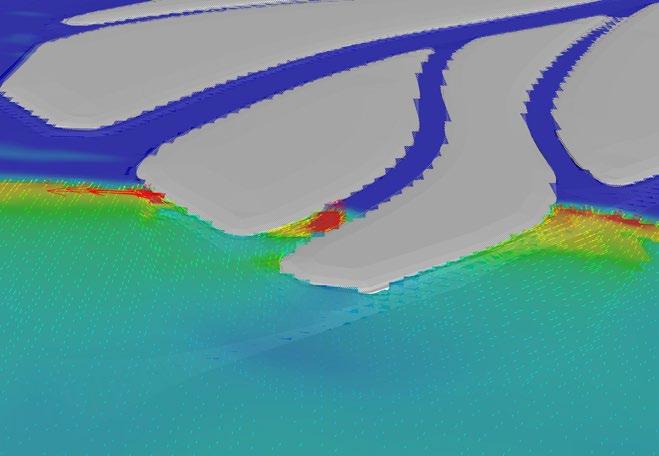
Computational Fluid Dynamics uses computers' ability to tackle finite elements rapidly and efficiently to analyze fluid flow-related issues in a particular context. Using this instrument, surface pressures and speed vectors can be measured. In this project, Autodesk Simulation CFD software is used to first evaluate the water movement at the channels, the outcome of which is compared to the design proposal. By quantitatively analysing water velocity, CFD enables us to notify the design.
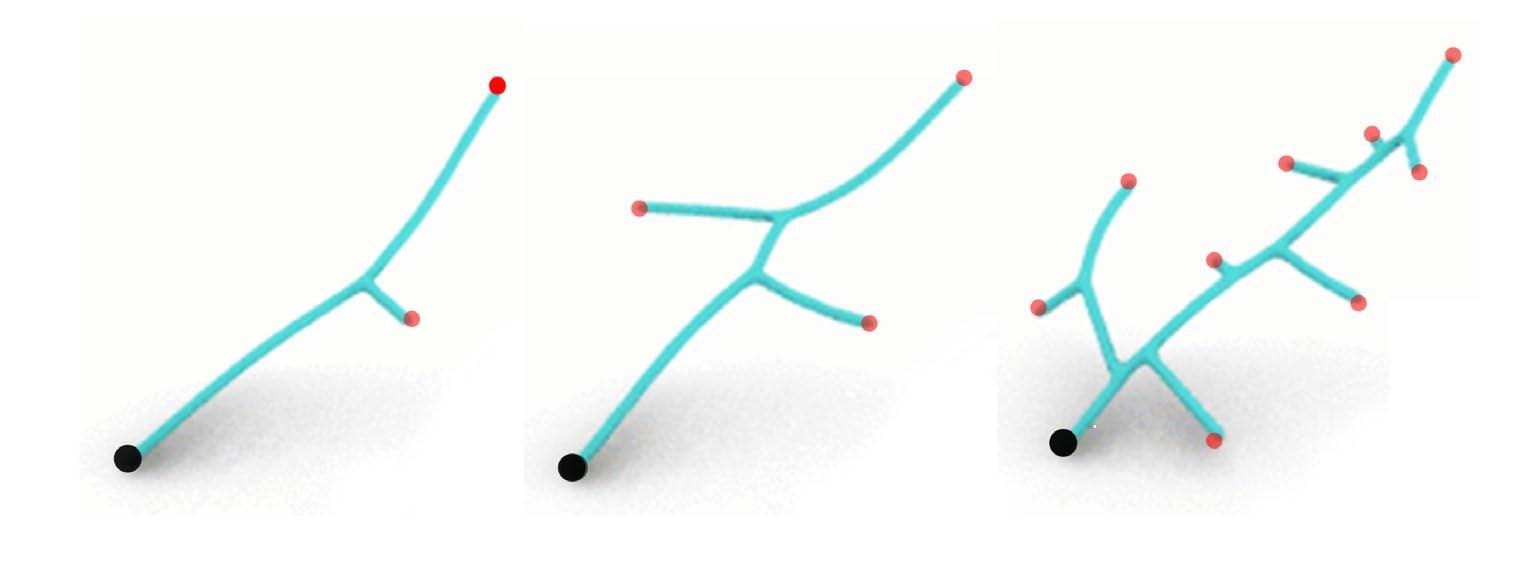
3.2.2 Modular aggregation process
Modular aggregation process using rule sets can be used to generate building types or typologies that can have space filling quality. They can be developed through procedures composed of strategies for the selection of basic aggregation rules, described as an instruction to orient one module over a selected connection of another module.
For the modular aggregation process in our dissertation, Wasp(Grasshopper plugin) has been used. The core of Wasp’s framework relies on a set of aggregation procedures, allowing the generation of specific structures from the combination of different modules. It also has field-driven aggregation procedures which allow us to use a field of value that we construct to influence and direct the aggregation process. Figure 3.2.2:
example aggregation
3.3.2 Hydrology Simulation
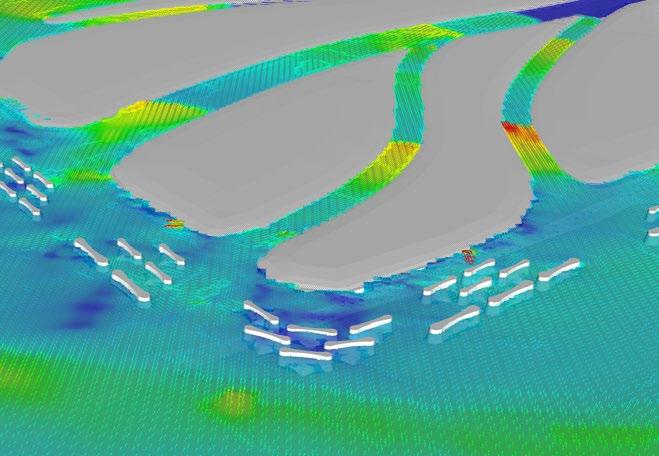
Hydrology flow simulation software allows us to generate realistic tsunami waves that can more accurately simulate a realistic tsunami condition. They specialize in solving transient, free-surface problems, especially in hydraulic simulation. It provides detailed, real-time hydraulic model and information(velocity, pressure, flow path, turbulence, friction, etc) for users to better understand and visualize the hydraulic performance.
In our tests for tsunami simulation, Flow 3D was used. It is a highly-accurate software that was mainly used in tsunami simulation on Tsukishima island, researching on branching channel experiment and post-analysis; in our dissertation.
66 67
WASP,
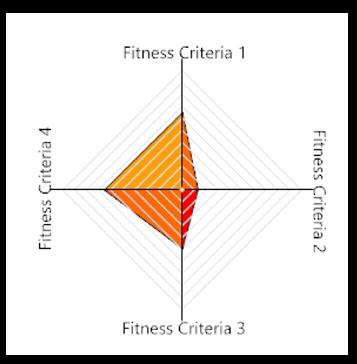
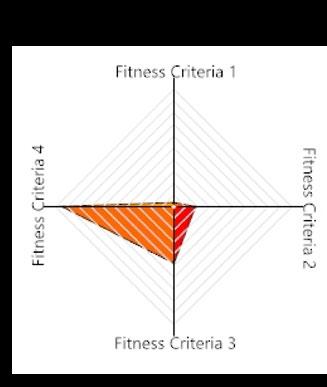
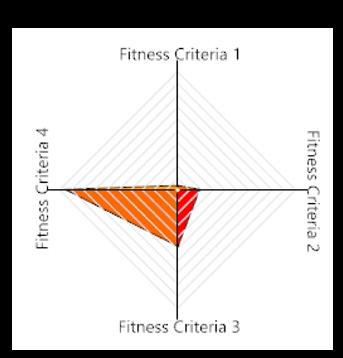
Figure 3.2.1: Fitness Objectives for given 4 criteria
Figure 3.2.3: CFD analysis
Figure 3.2.4: Water flow analysis
3.3.3 Geographic information system and data processing
A geographic information system (GIS) is a conceptualized framework that provides the ability to capture and analyze spatial and geographic data. GIS applications (or GIS apps) are computer-based tools that allow the user to create interactive queries (user-created searches), store and edit spatial and non-spatial data, analyze spatial information output, and visually share the results of these operations by presenting them as maps. [42][43][44]
3.4 NETWORK GENERATION AND ANALYSIS
3.4.1 Pattern Generation
The ArcGIS app was used in the dissertation for a part of the geographic data collection(elevation, building information, etc), and we also mapped from other geographic resources and built a geographic information system ourselves for further analysis and data processing.
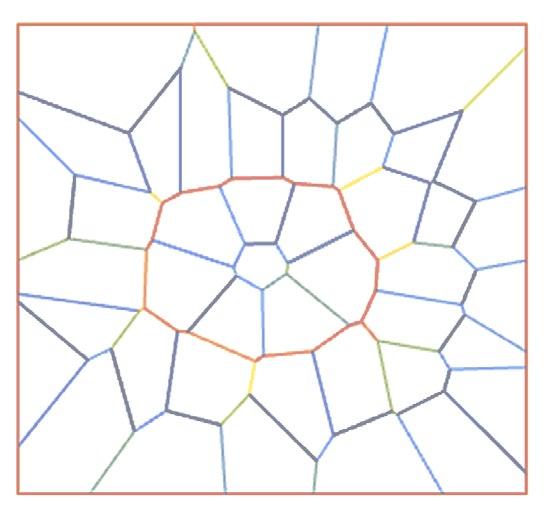
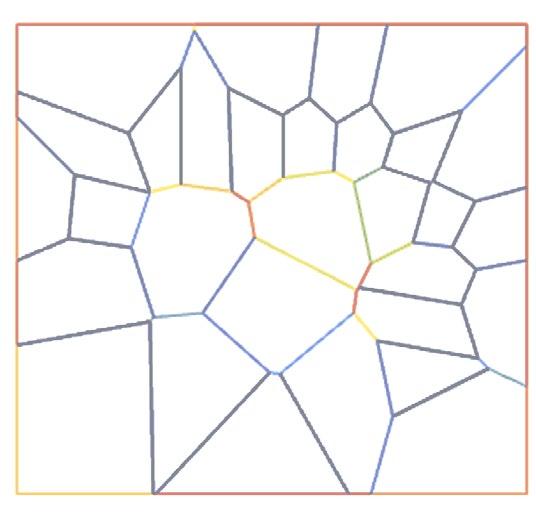
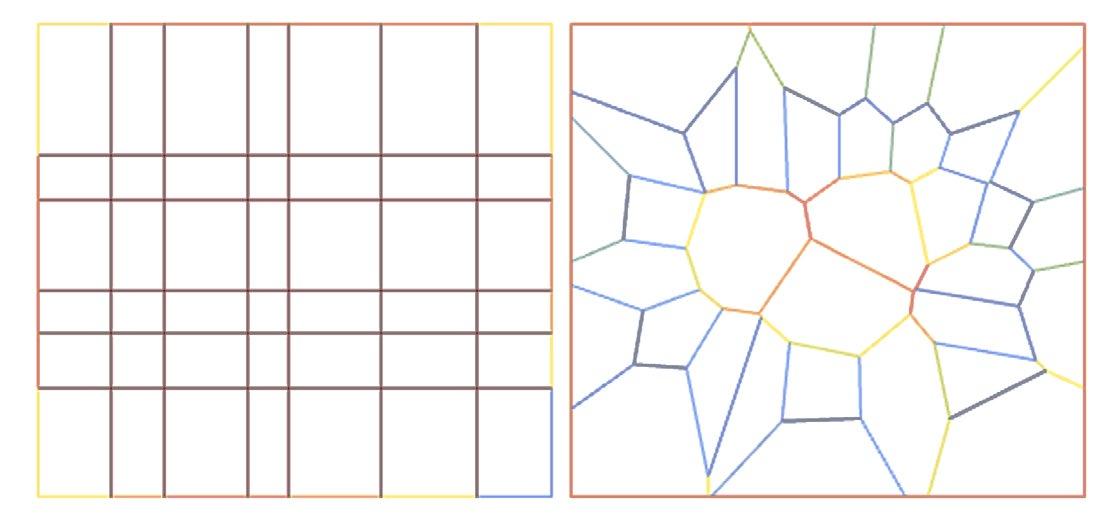
The venetian pattern generation is used to develop a transportation network that is optimized and well connected to all areas w.r.t the refuge centers. Results show that leaf- inspired models can perform similarly or better than computer-intensive optimization algorithms in terms of network cost and service performance, which could facilitate the design of engineering transportation networks. Parakeet tool in grasshopper Rhino, is utilized to construct the same.
3.4.2 Syntactical Analysis
Space syntax research has led to a fundamental understanding of the relationship between spatial design and the use of space as well as longer term social outcomes.
Betweenness centrality theory quantifies the number of times a node acts as a bridge along the shortest path between two other nodes. It was introduced as a measure for quantifying the control of a human on the communication between other humans in a social network by Linton Freeman.
We use the betweenness centrality syntactical analysis to compare amongst 5 network types that can perform best in terms of evacuation and transportation.
68 69
Figure 3.2.5: GIS diagram
Figure 3.2.6: Venetian pattern diagram
Figure 3.2.7: Space syntax diagram
4. RESEARCH
DEVELOPMENT
70 71
STRATEGY DISTRIBUTION OVER 3 SCALES
4.1 AT BAY SCALE
4.2 AT INTERMEDIARY SCALE
4.3 AT LOCAL SCALE
72 73
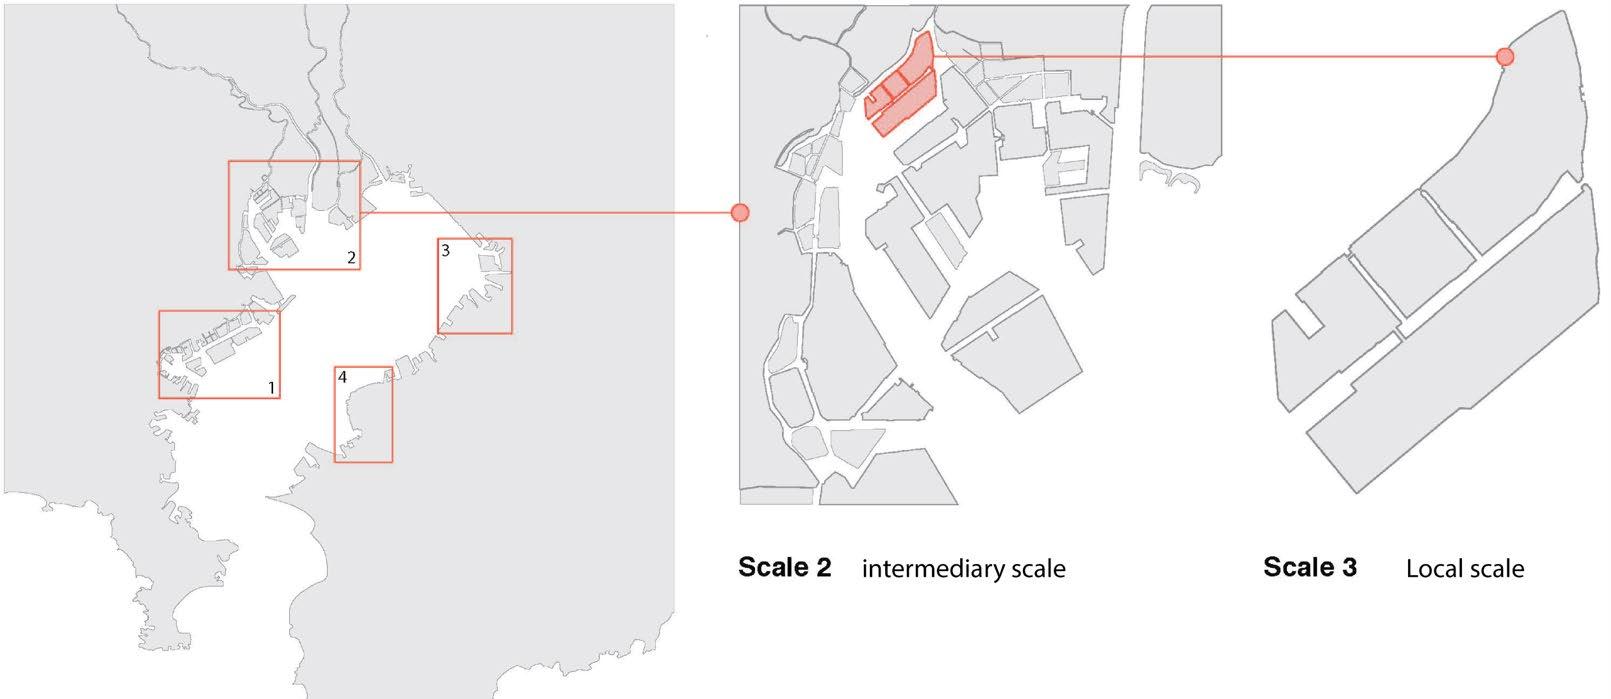
Figure 4.1.1: Scales of intervention Figure 4.1.2: Bay, intermediary and local scales
4.1 AT BAY SCALE
The first scale of intervention is the Bay Scale. The intention is to choose the areas of intervention based on multiple criteria overlapped on top of one another such as density, elevation and water velocity, to find a solution at this scale to cope with sudden influx of tsunami water.
74 75
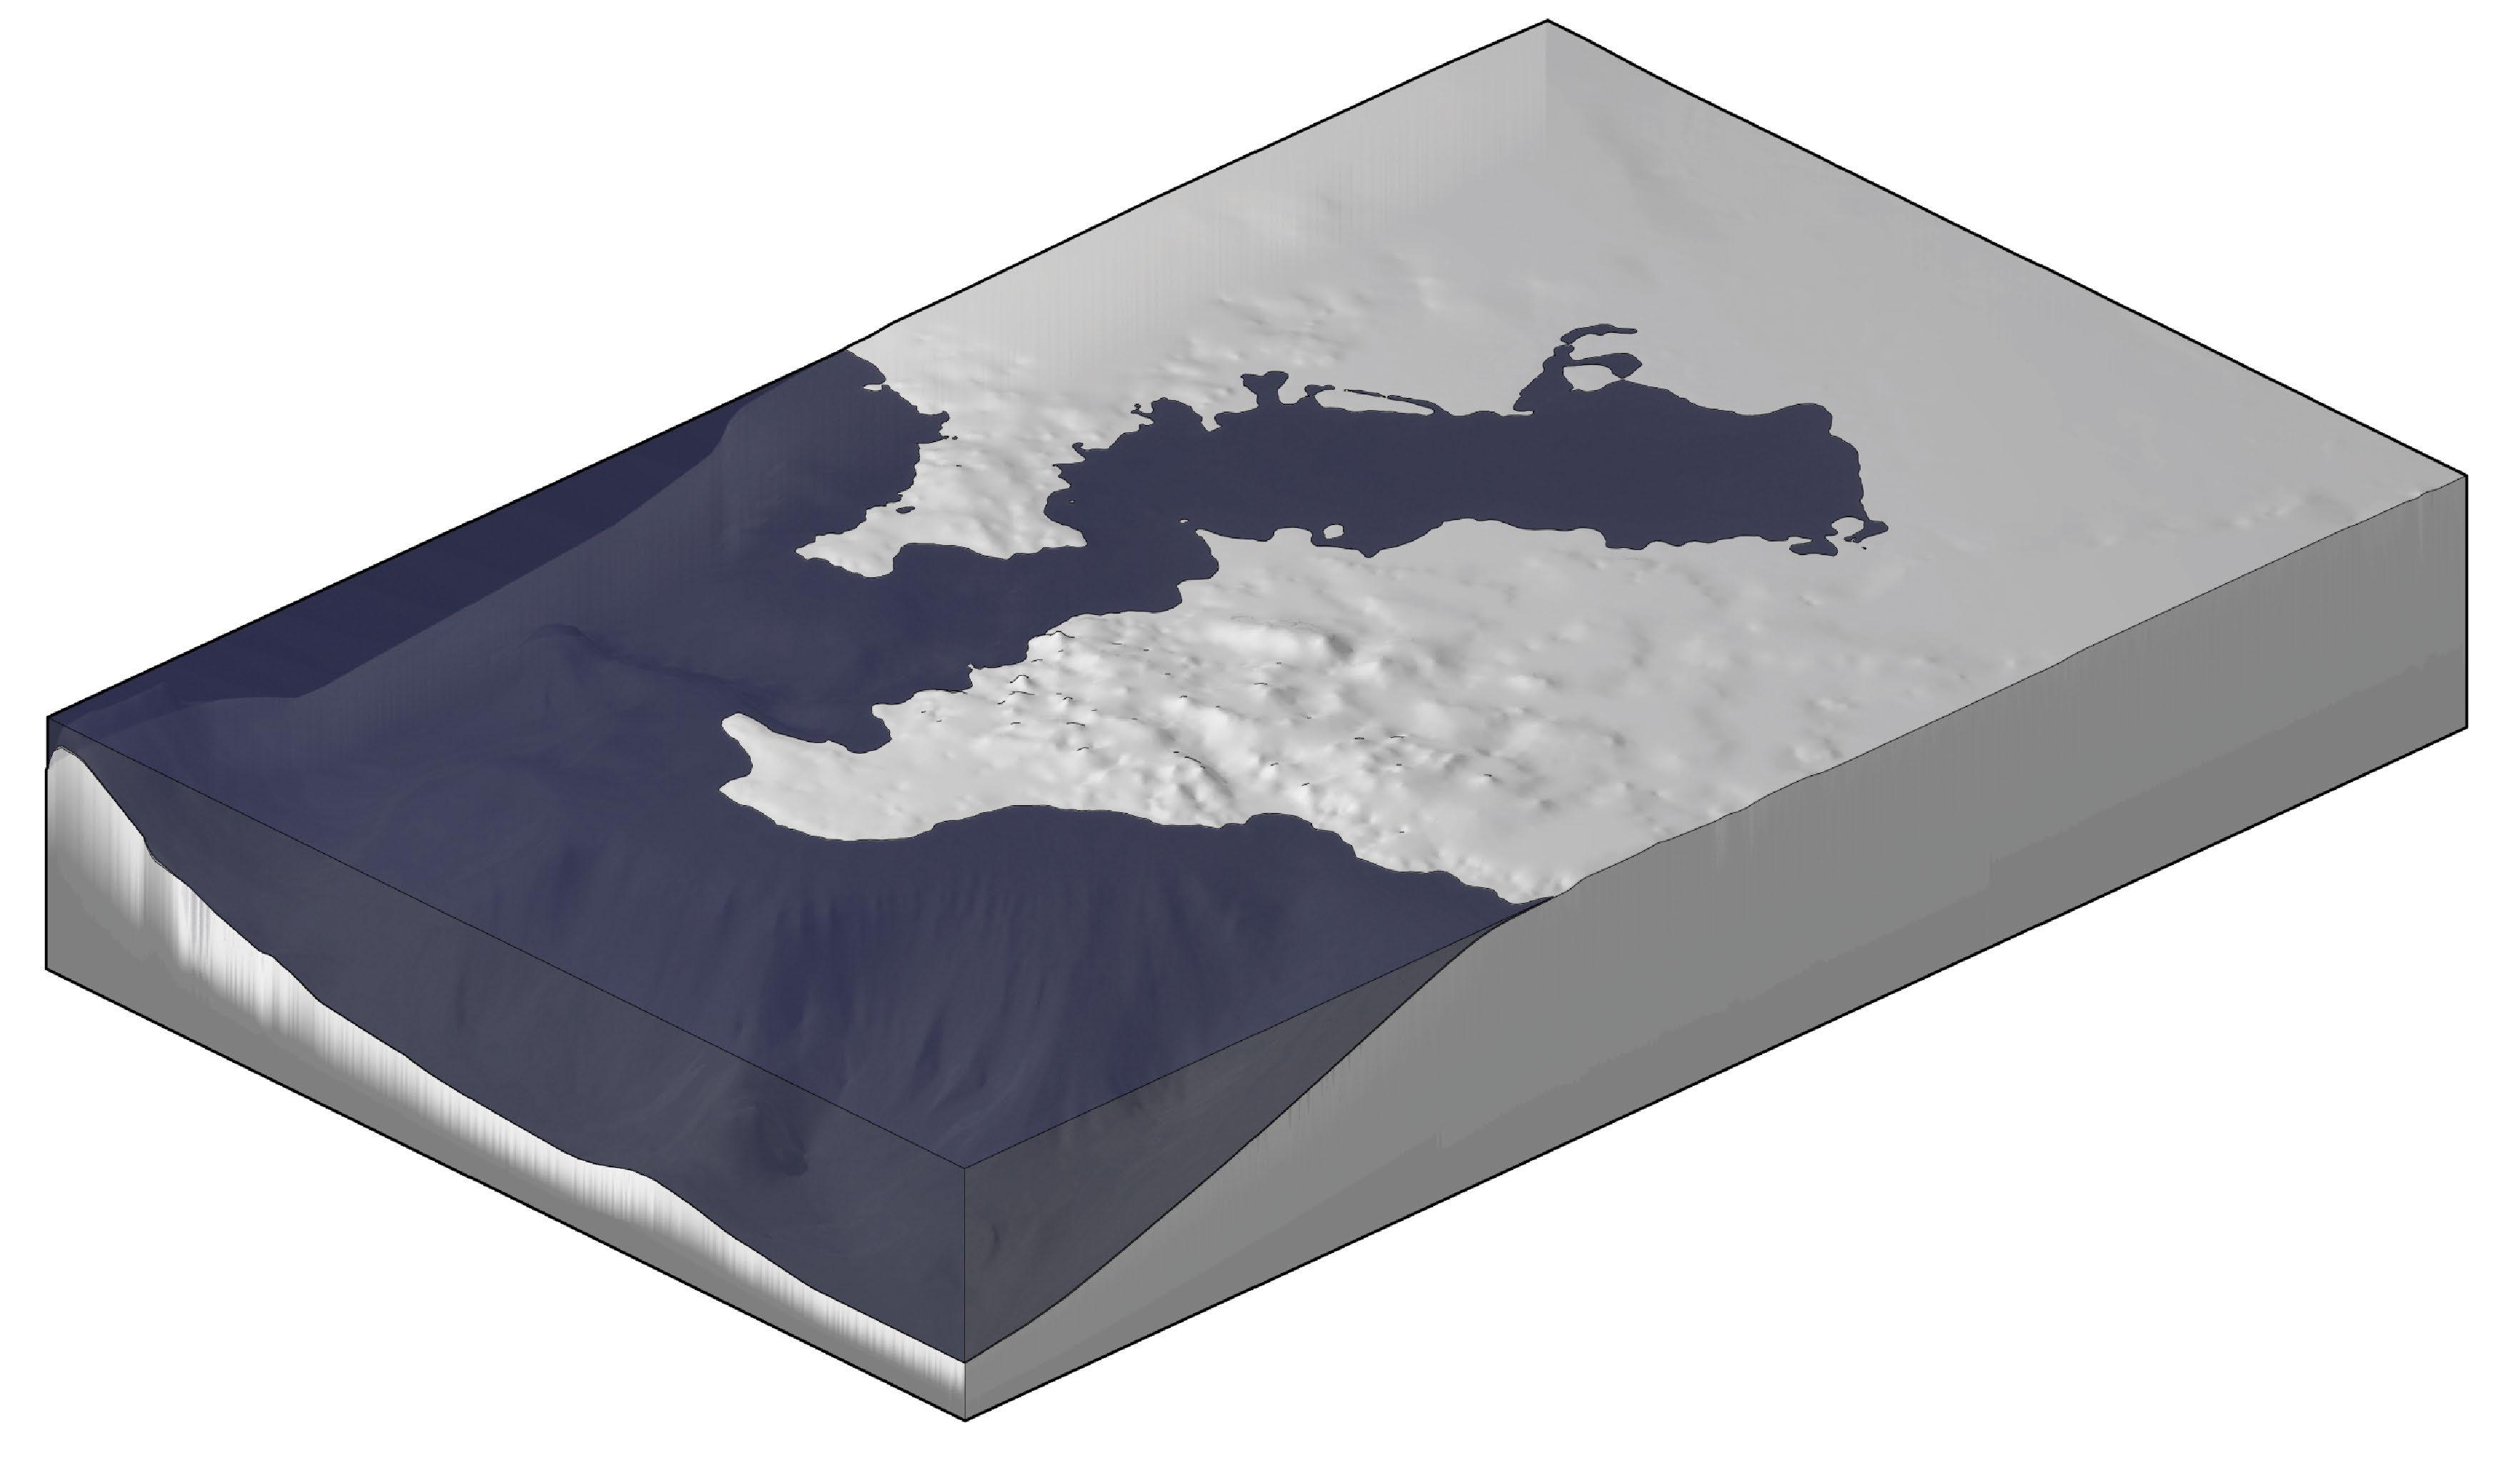
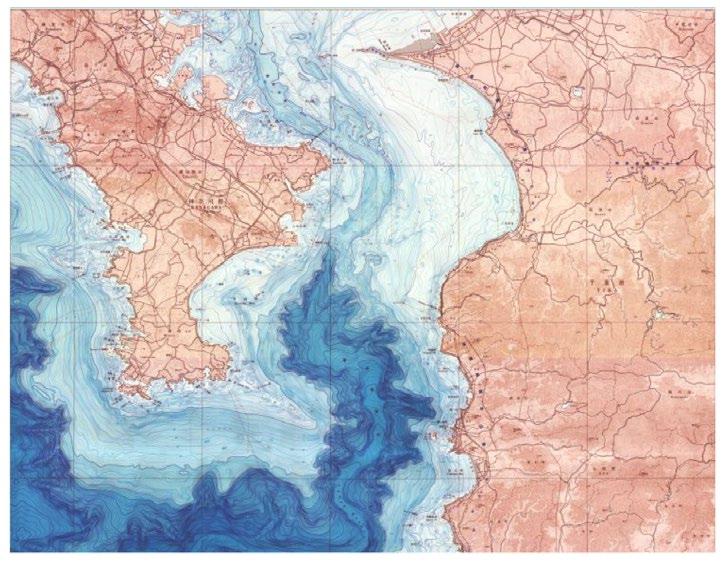
Figure 4.1.3: Bathymetry and topgraphy model of Tokyo Bay
4.1.1 Analysis
4.1.1.1 Density Analysis
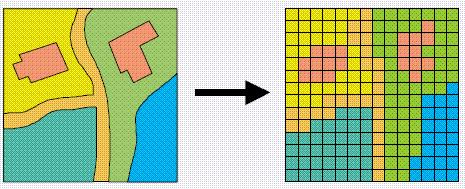
The distribution of population density in Tokyo is remapped and visualized in a 1km*1km grid. The purpose of remapping is to turn the demographic value into an information system with a unified grid, and by evaluating it with the elevation value(4.1.1.2) and water velocity value(4.1.1.2) to choose a site that is facing a threat of a tsunami and also has a density issue(4.1.1.3).
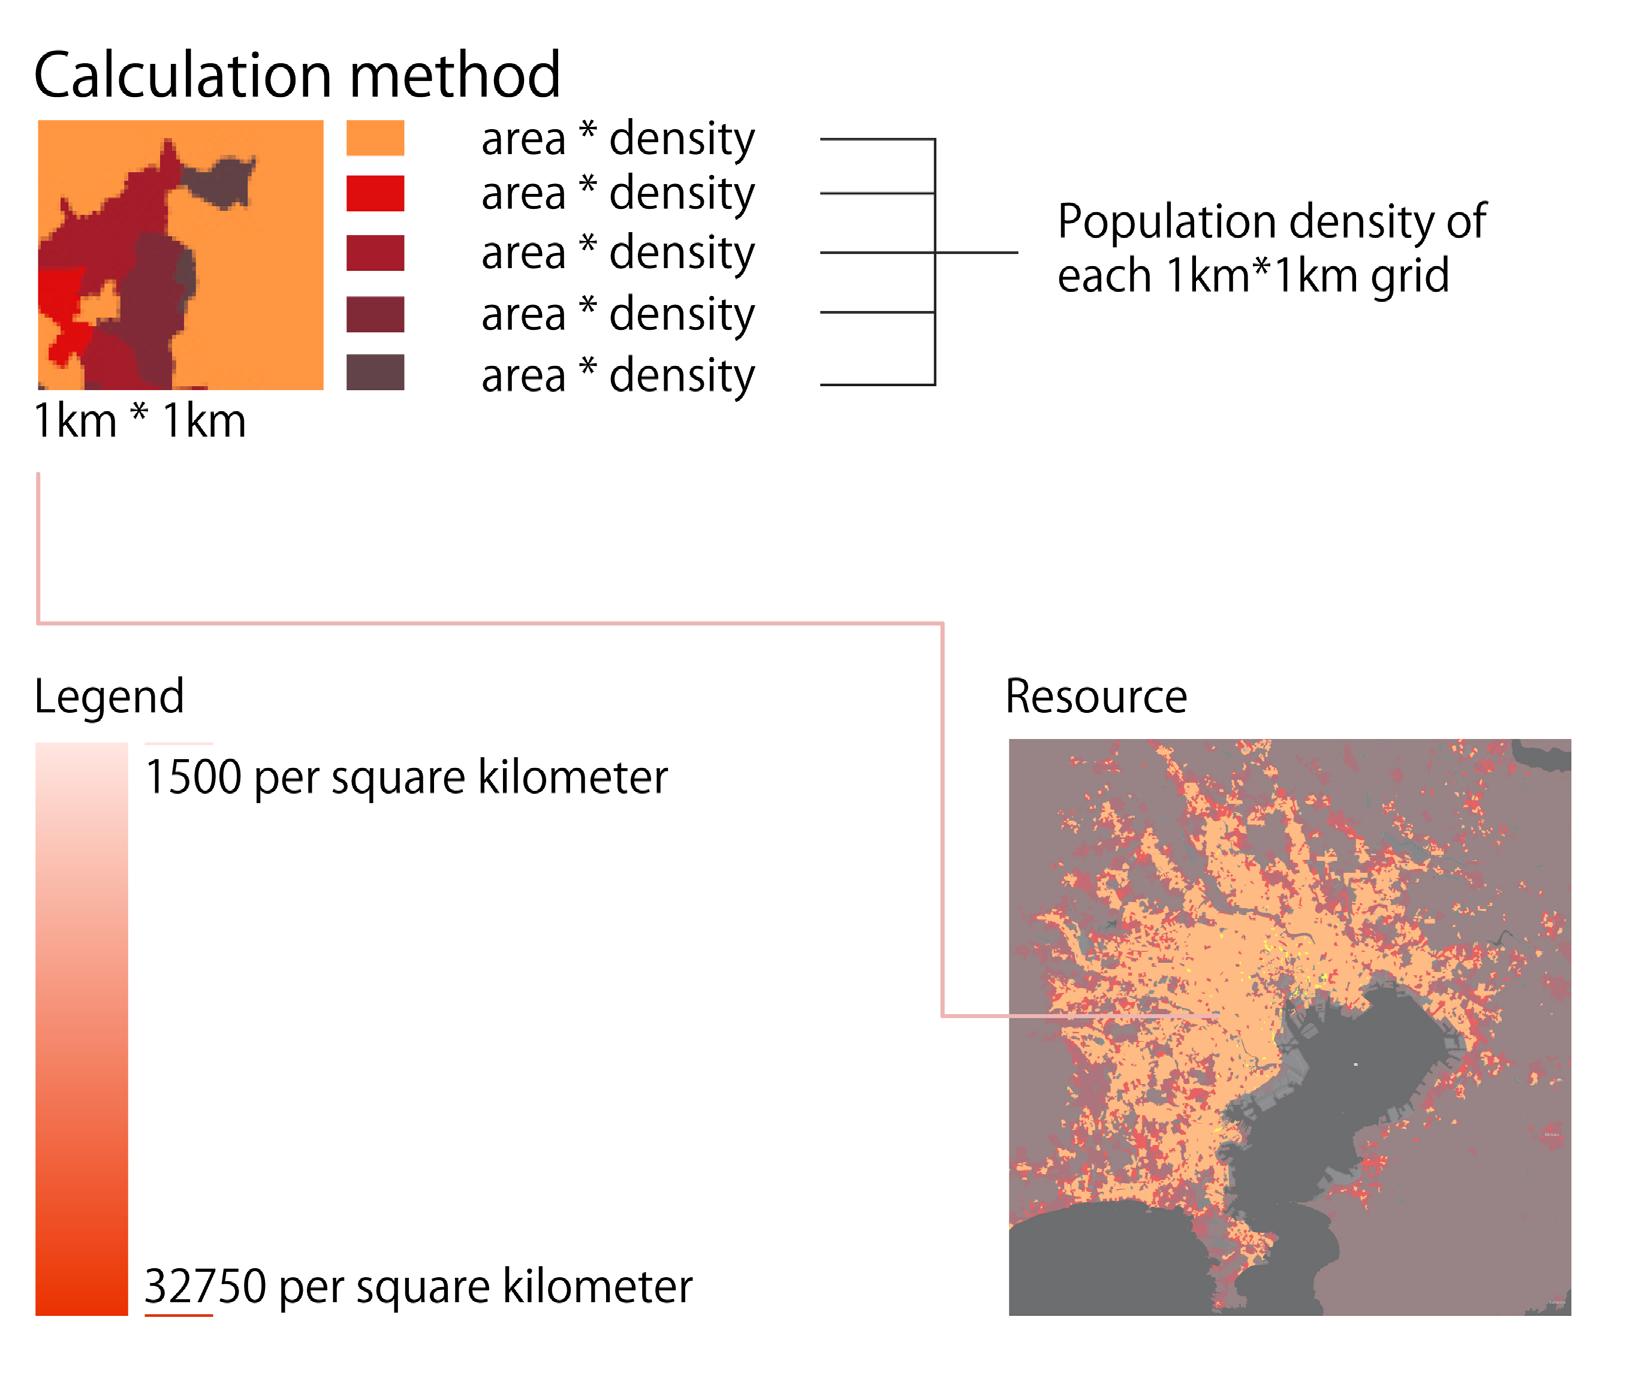
Method:
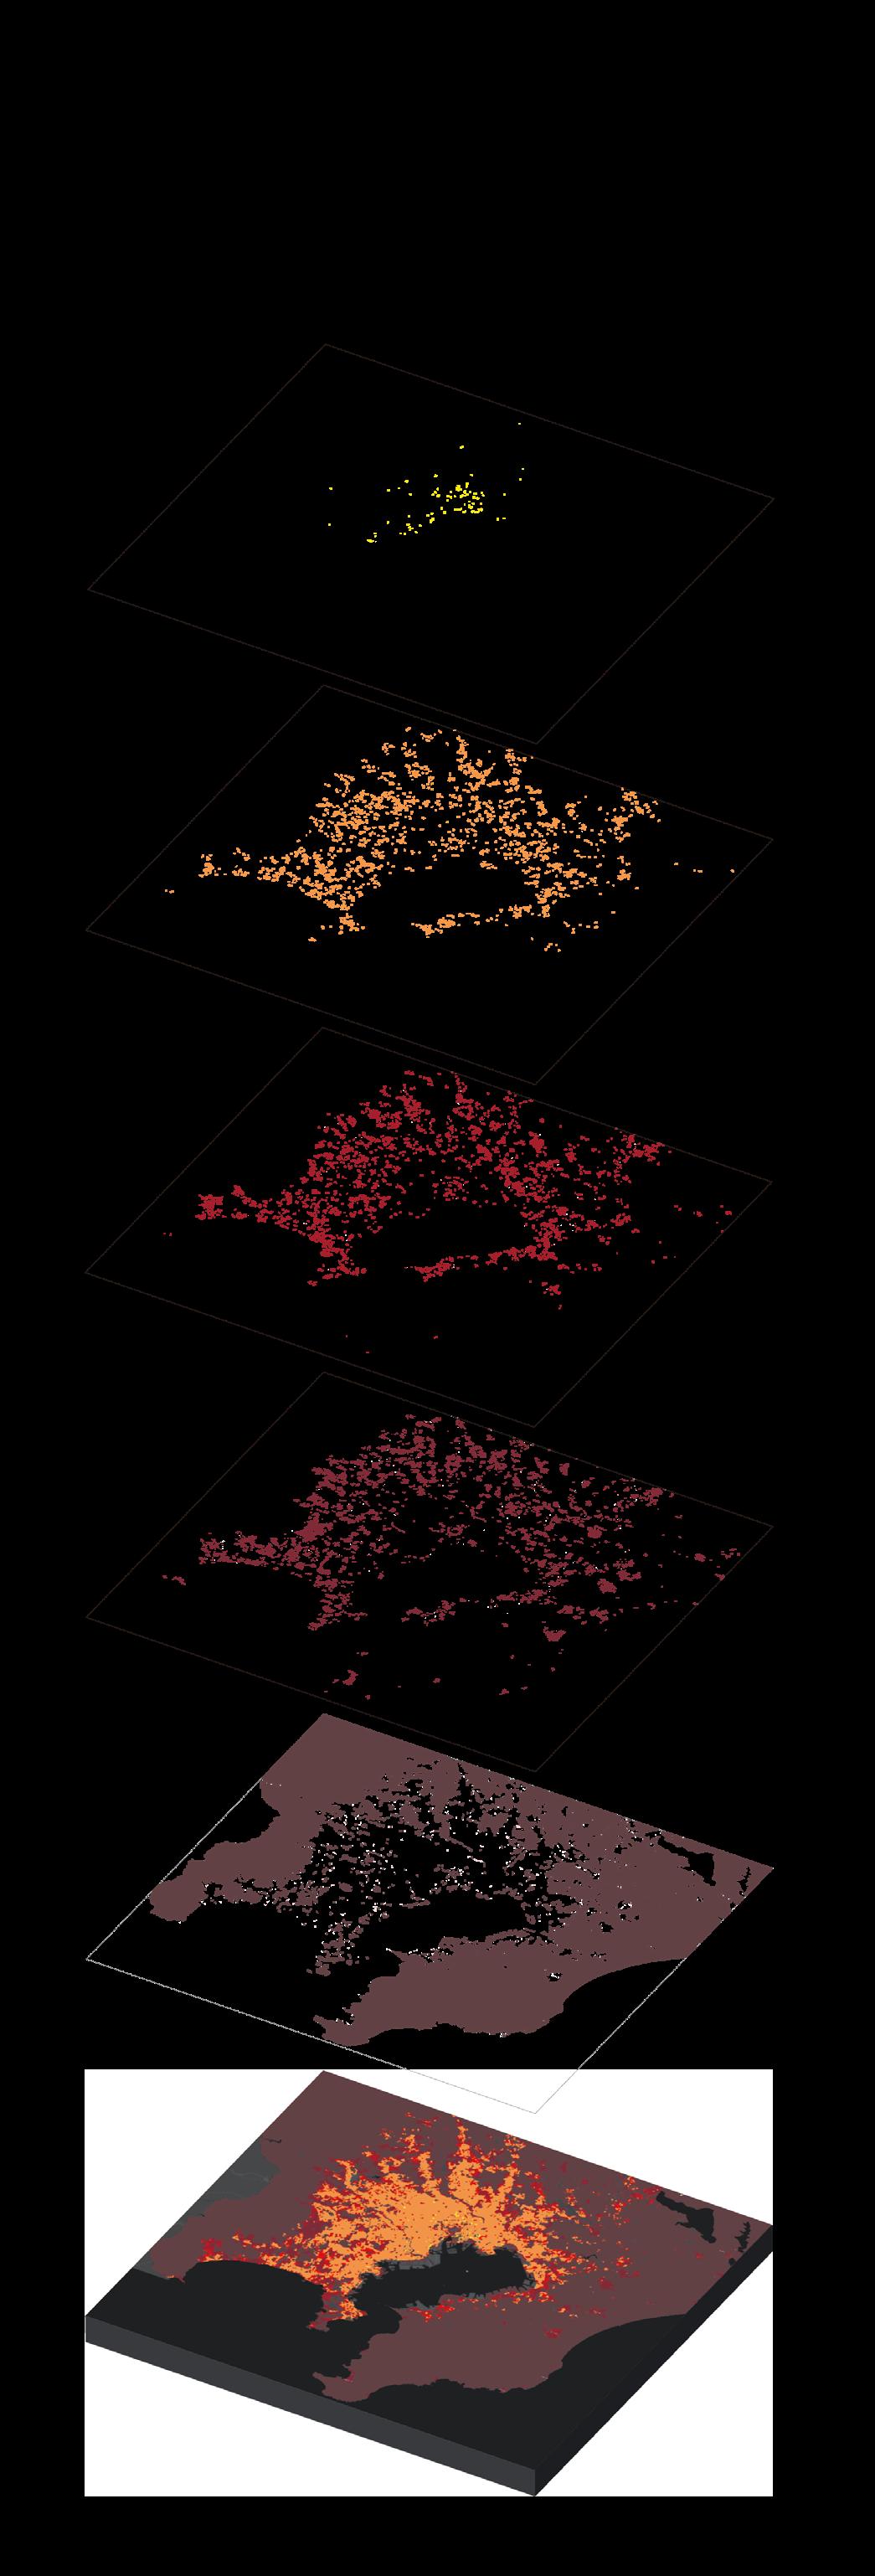
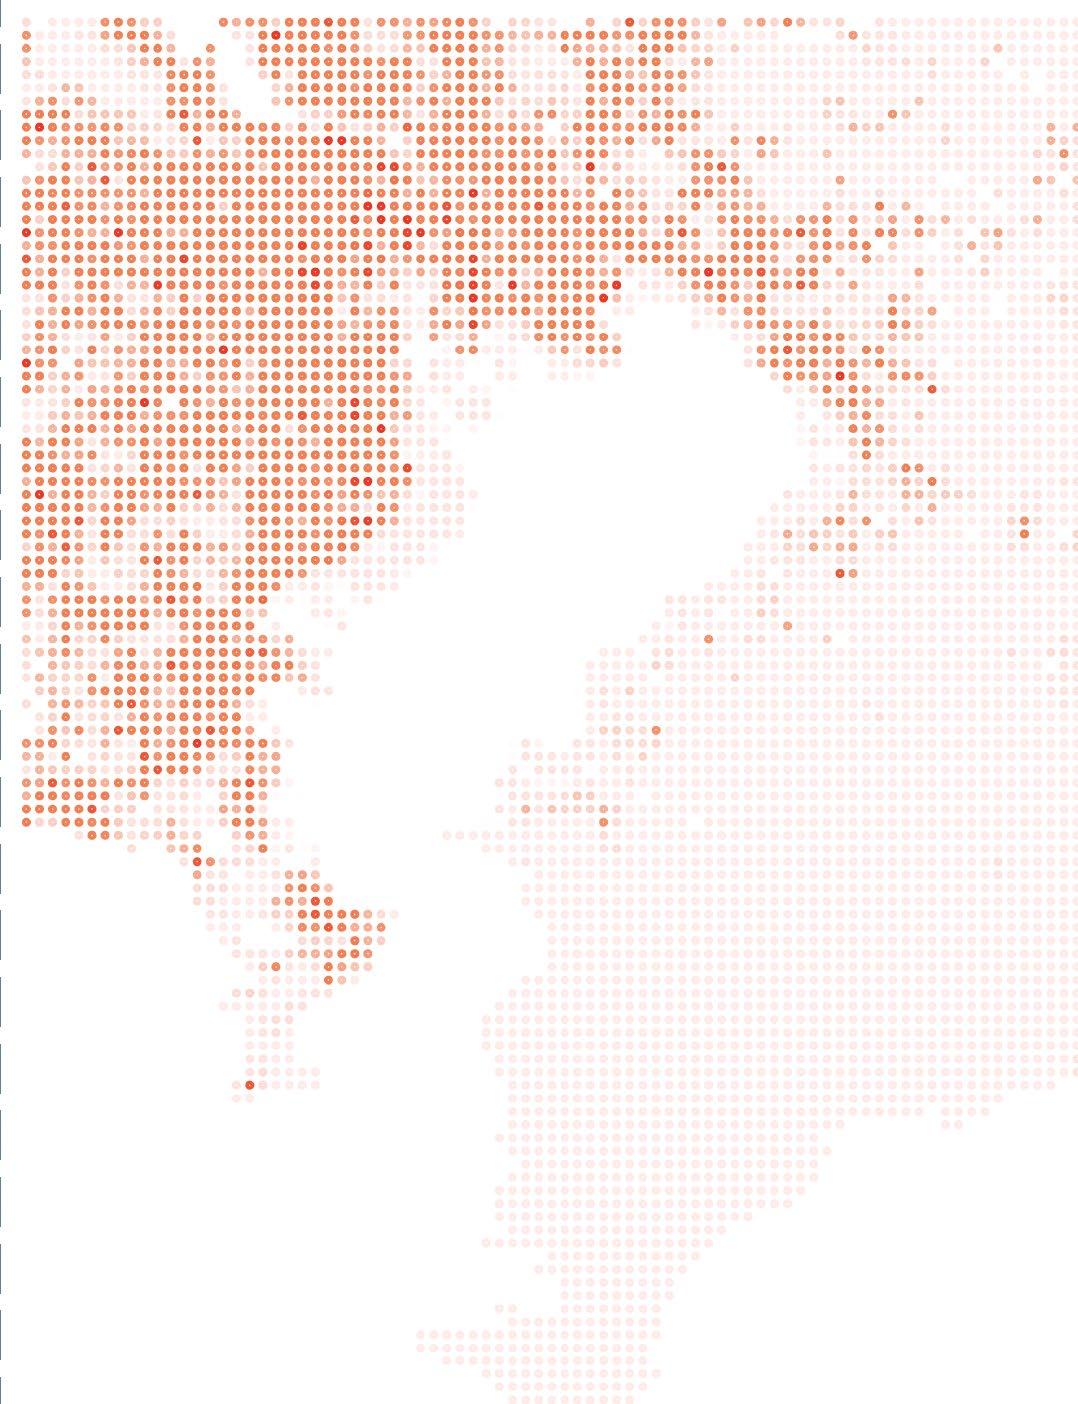
Based on the population density map of the Greater Tokyo area, regions with different density value is layered and categorized[Figure 4.1.4]. And then by dividing the whole region into a 1km*1km grid, the population density value in each grid is calculated[Figure 4.1.5]. Lastly, the density distribution in the new grid is visualized through a gradient of color based on the density value[Figure 4.1.6].
76 77
Figure 4.1.6: Density map reference
Figure 4.1.4: Density map
Figure 4.1.5: Layers of Density map
4.1.1.2 Elevation Analysis
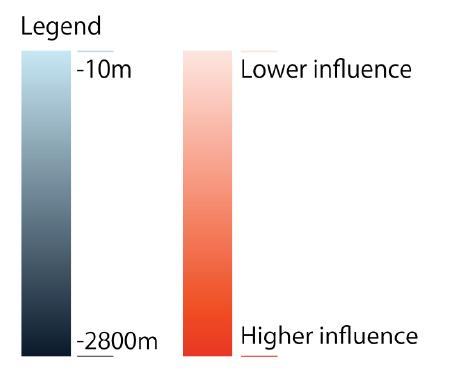
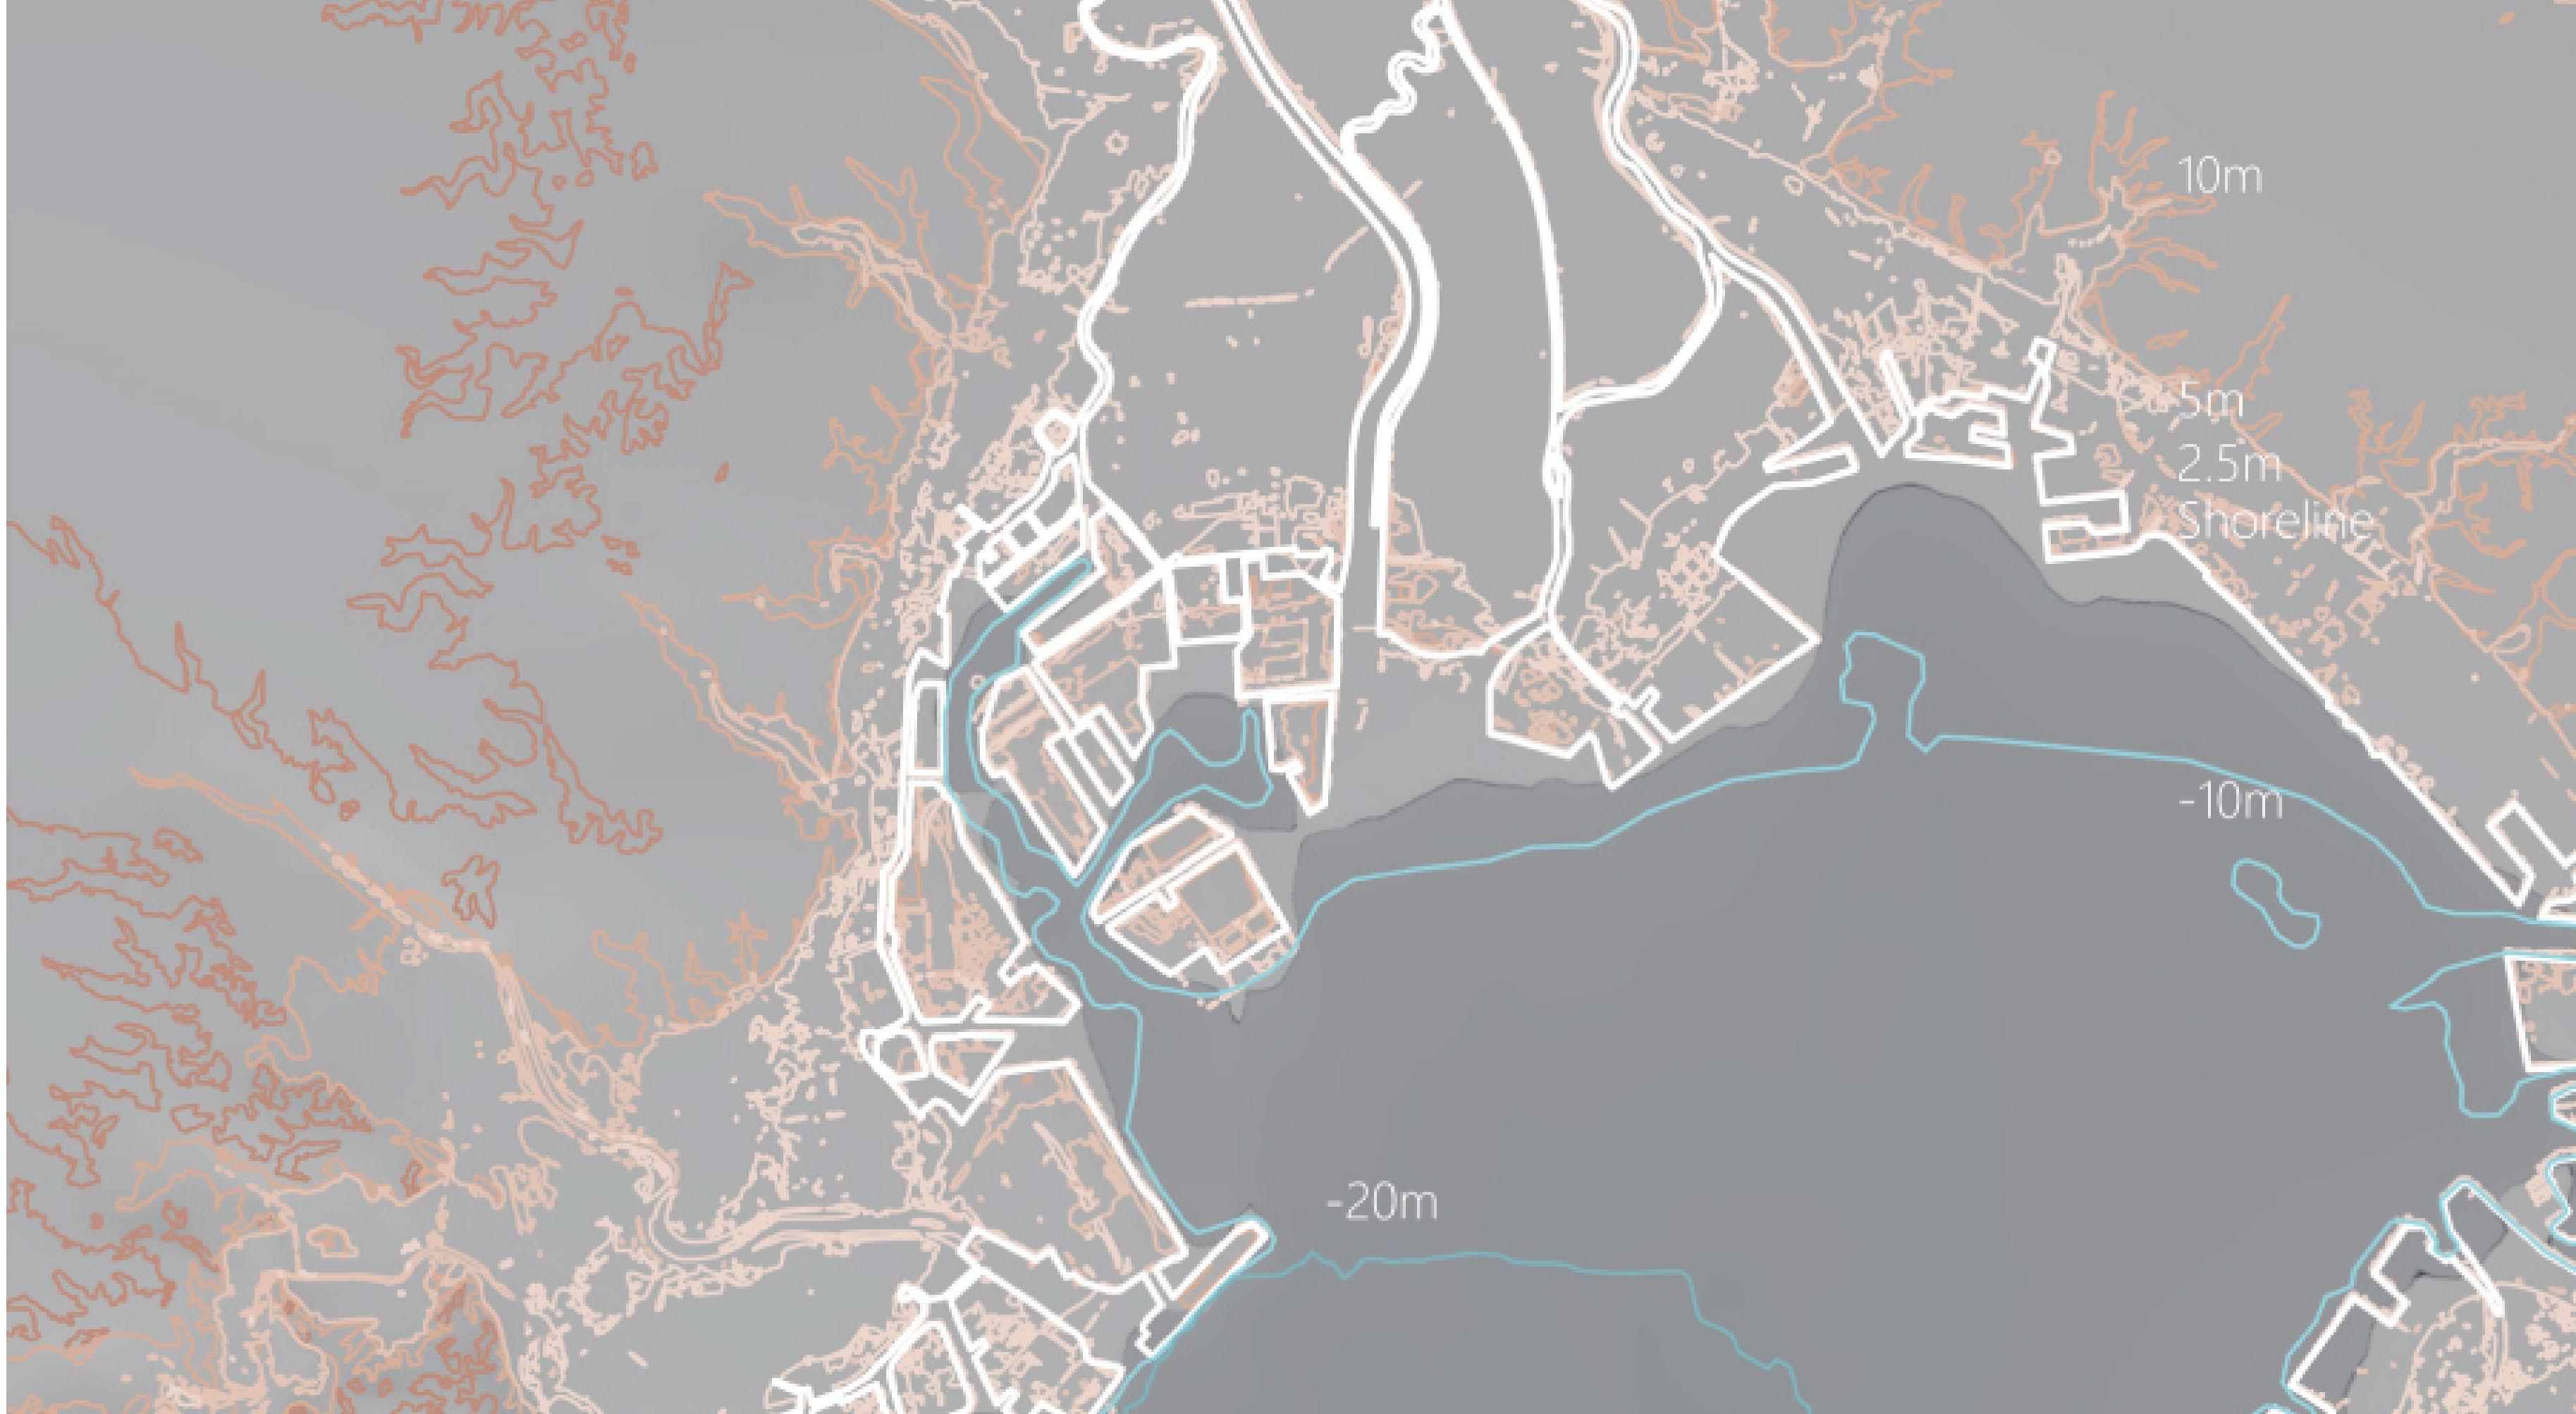
The geographic information is mapped referring to the elevation topographic map from Geospatial Information Authority of Japan(Fig 4.1.1) and bathymetric map from Japan Hydrographic Association(Fig 4.1.2). Elevation information of these two maps is emerged and remapped into a 1km*1km grid to be better evaluated with other maps of information. Regions with 0 metre to 4 metre elevation are highlighted as high-risk areas of tsunami and flooding.
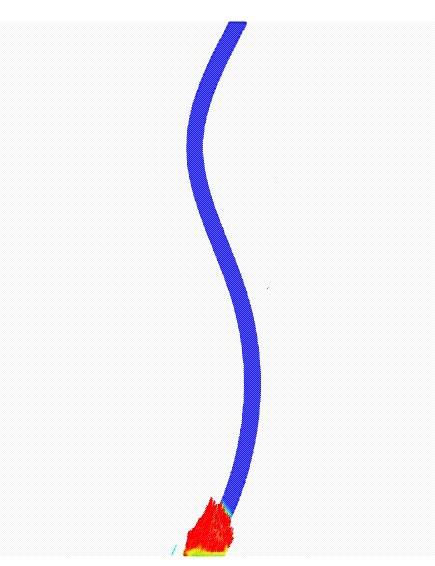
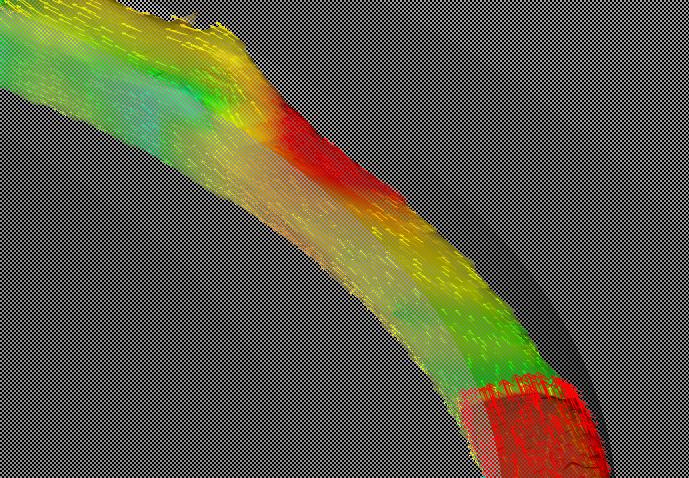
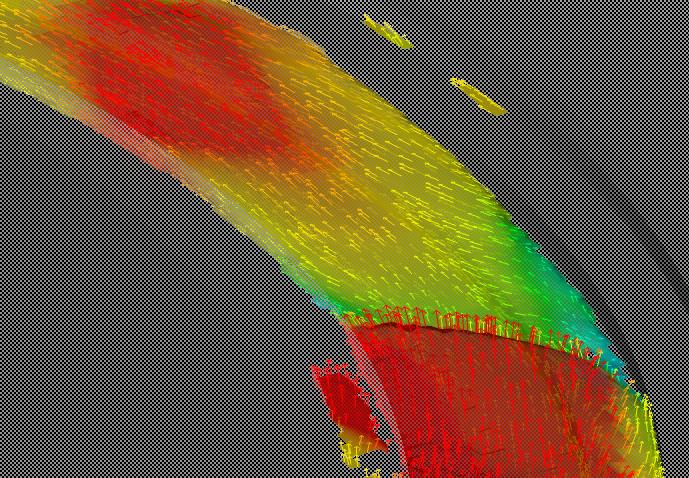
4.1.1.3 Water velocity Analysis
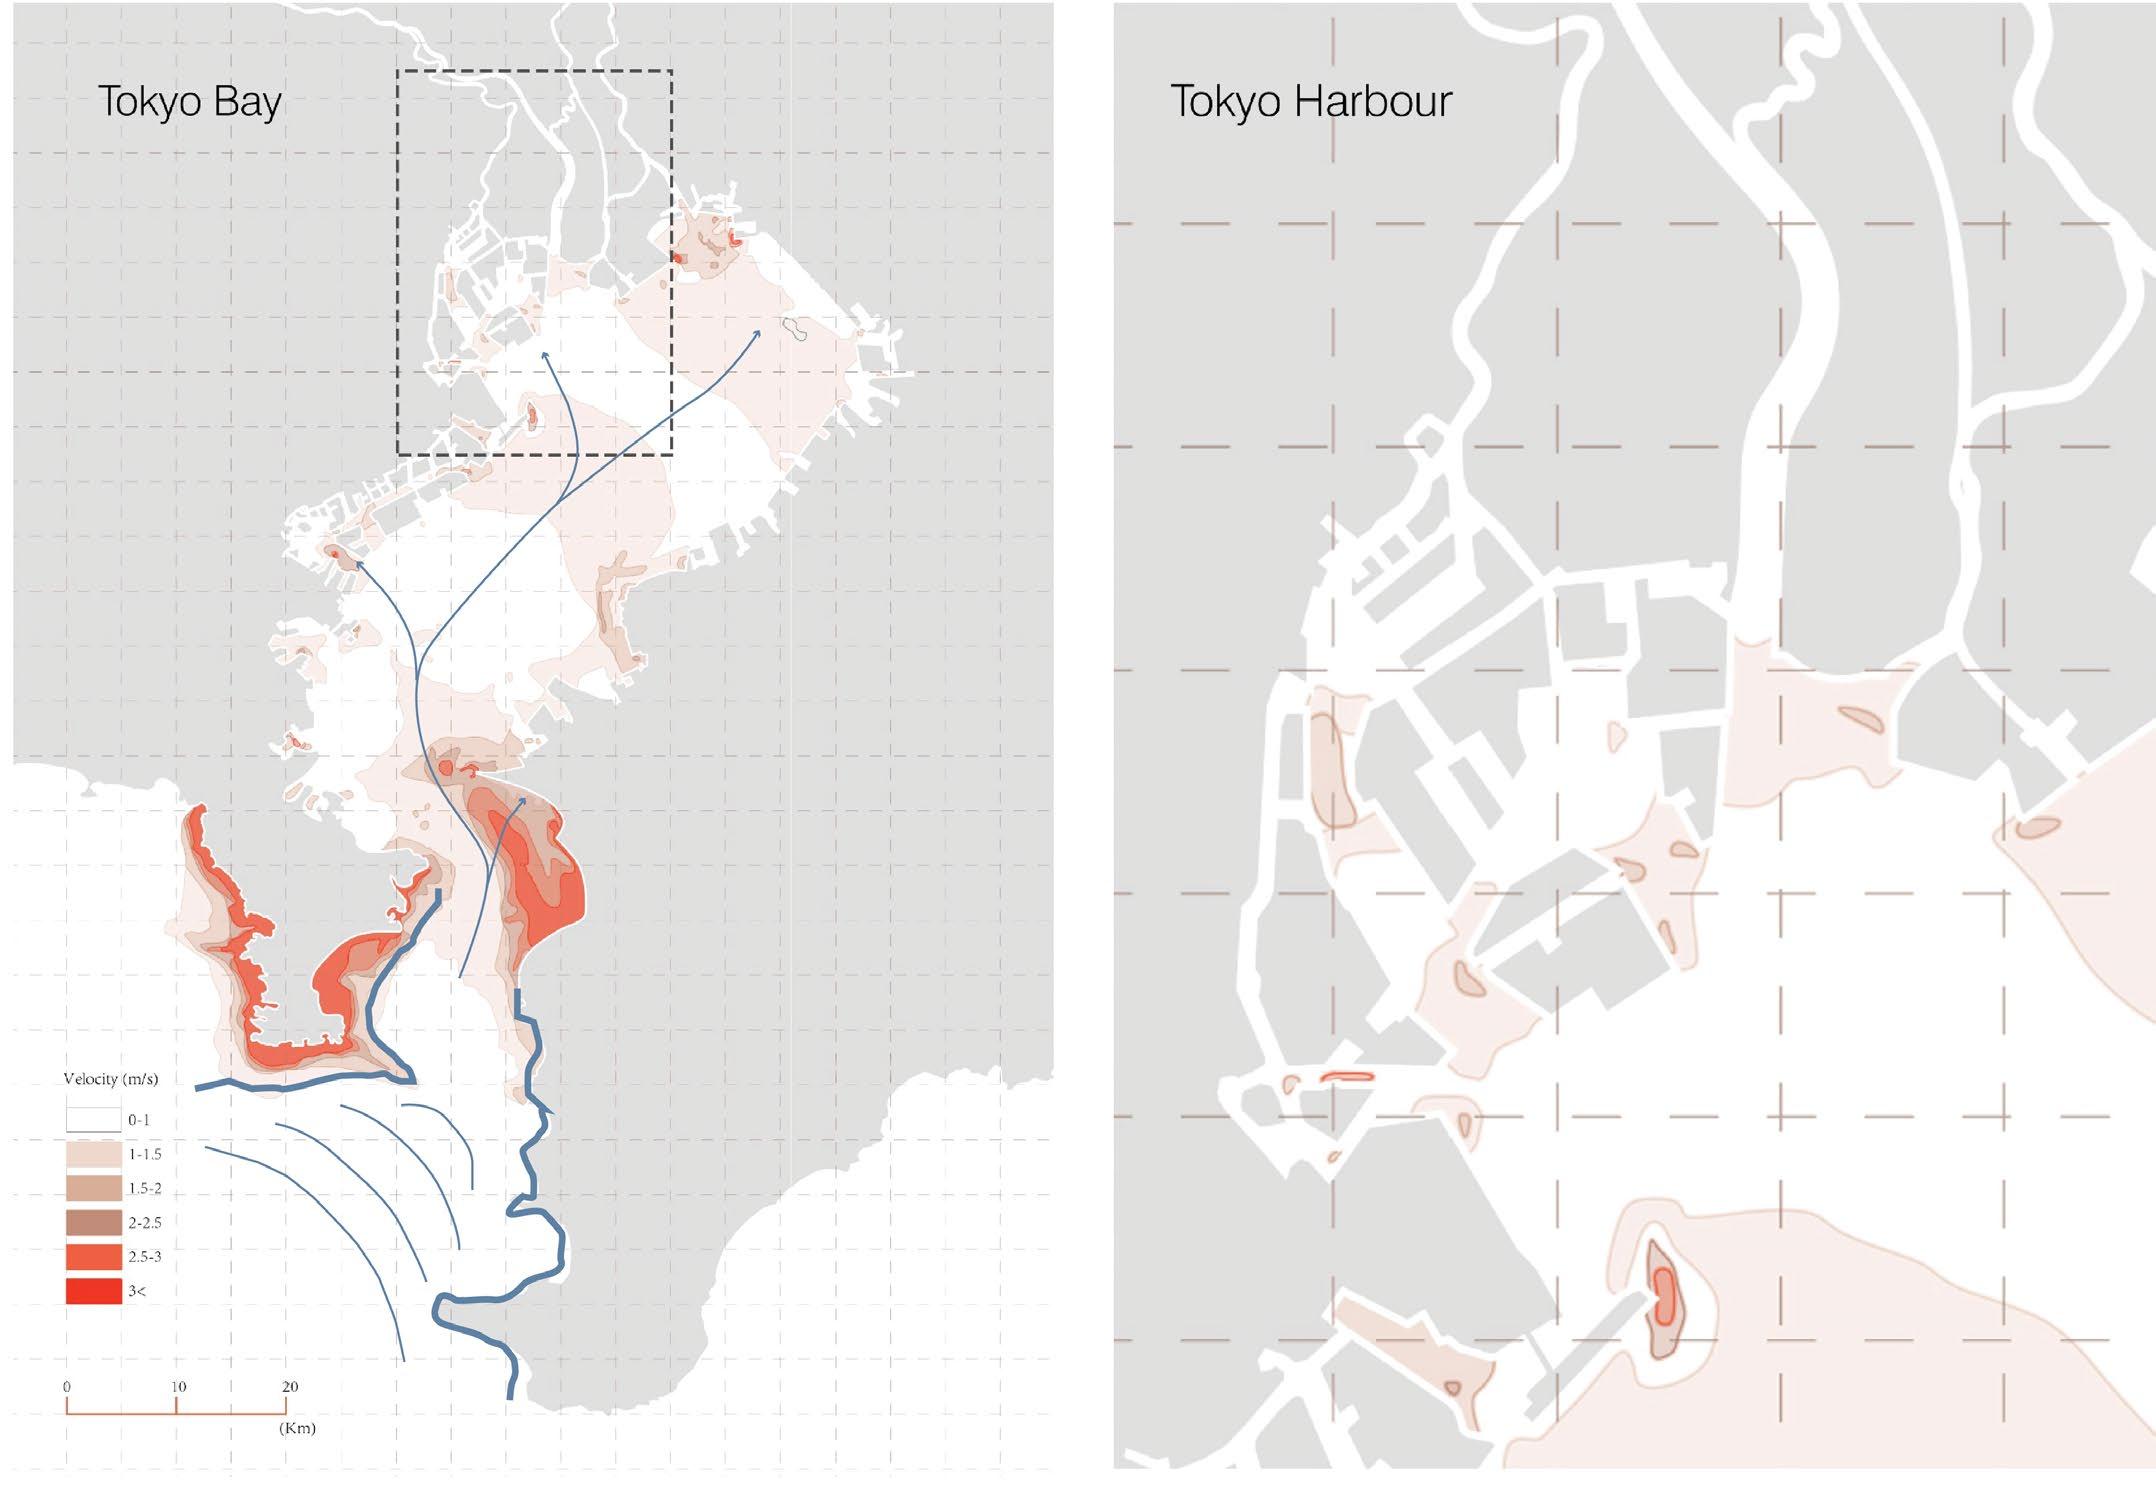
The sensing water velocity during a tsunami in Tokyo Bay and its potential area of influence is also mapped to predict the high-risk zones of a tsunami.
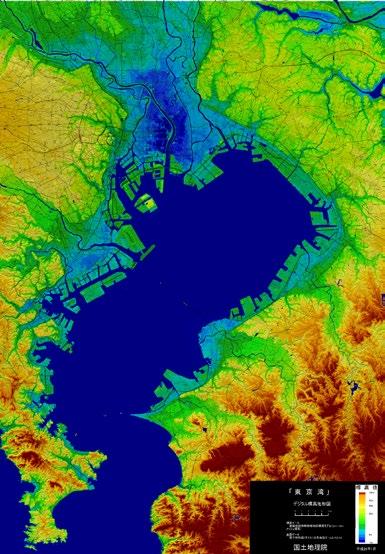
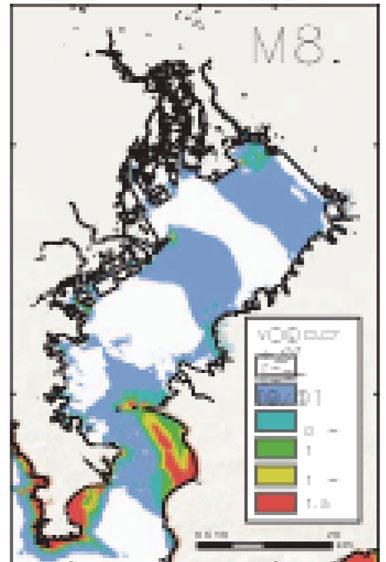
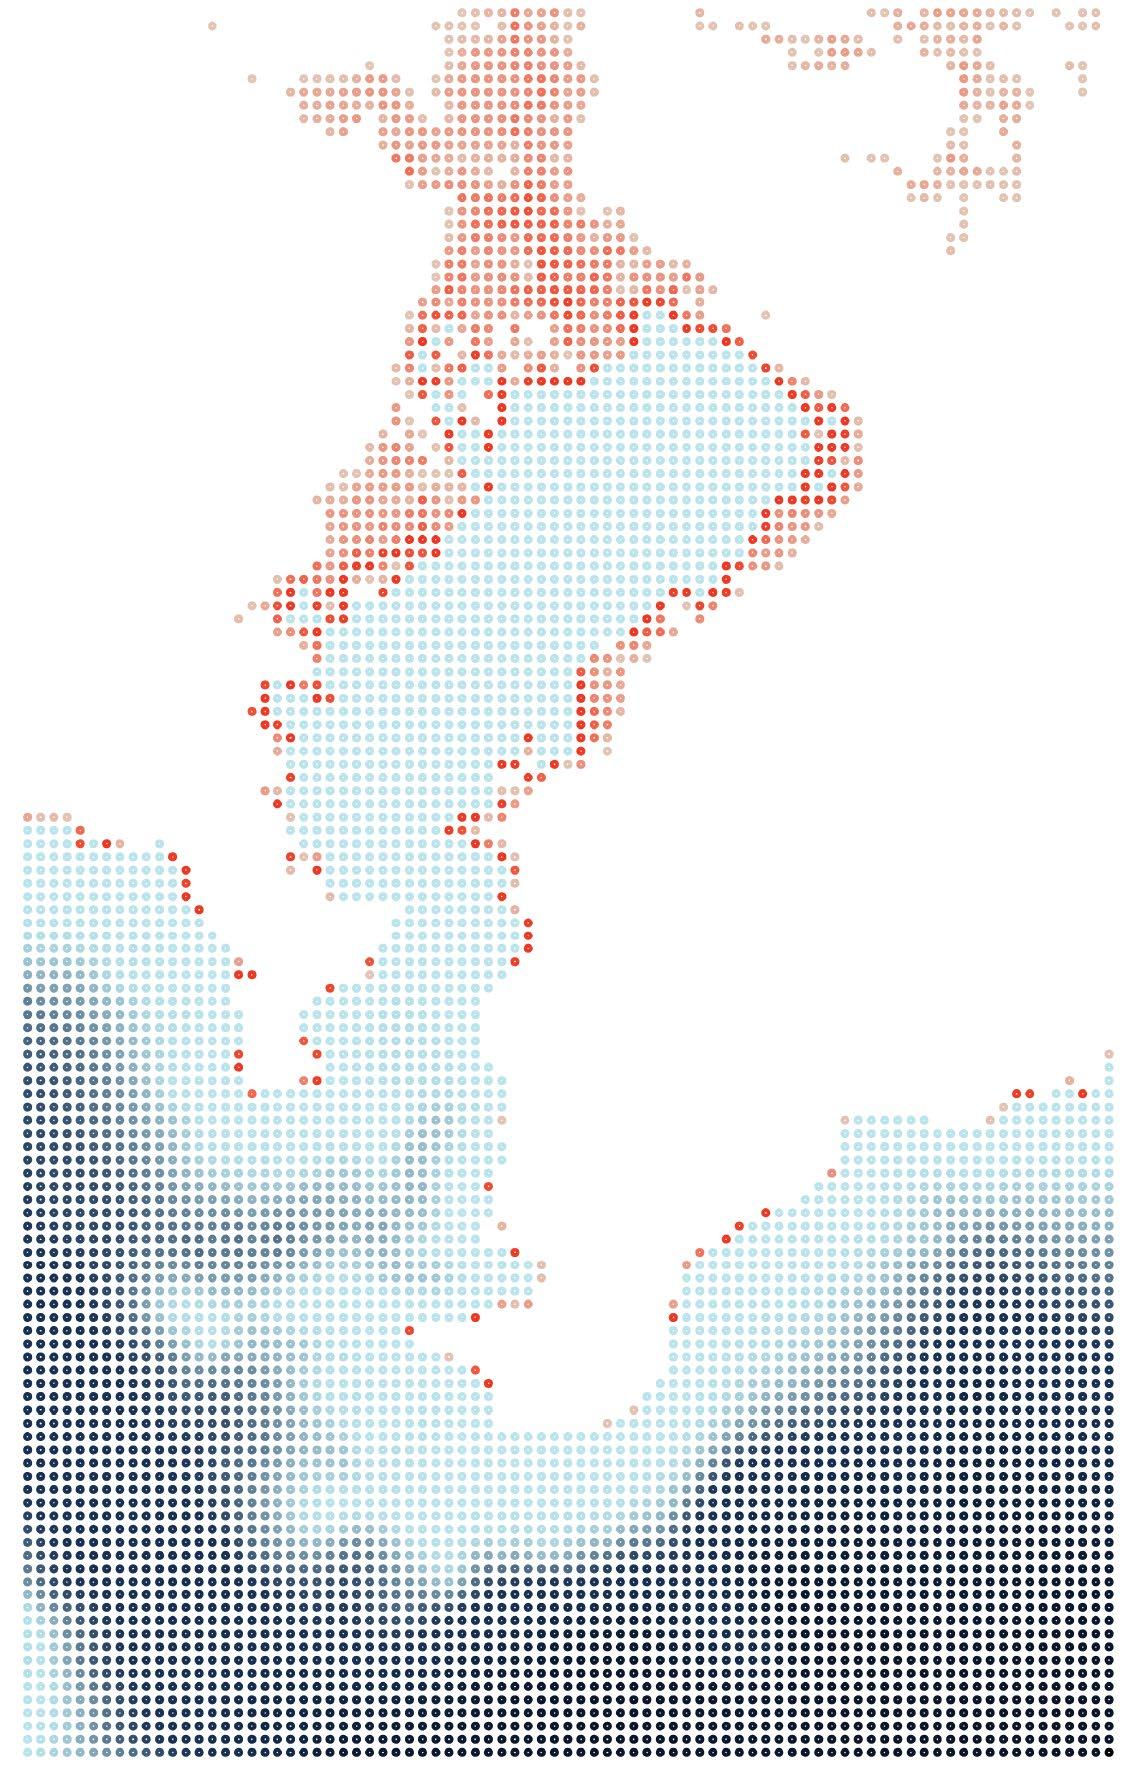
Figure 4.1.10: Elevation of Tokyo
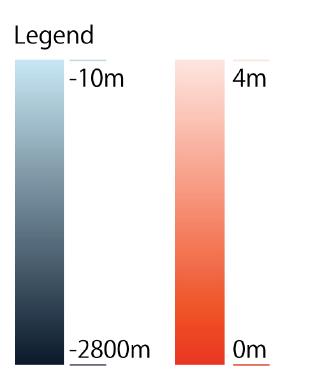
Figure 4.1.11: Water Velocity Simulation
78 79
Elevation Analysis Water velocity Analysis
Figure 4.1.9: Bathymety Map of Tokyo Bay
Figure 4.1.7: Figure 4.1.8:
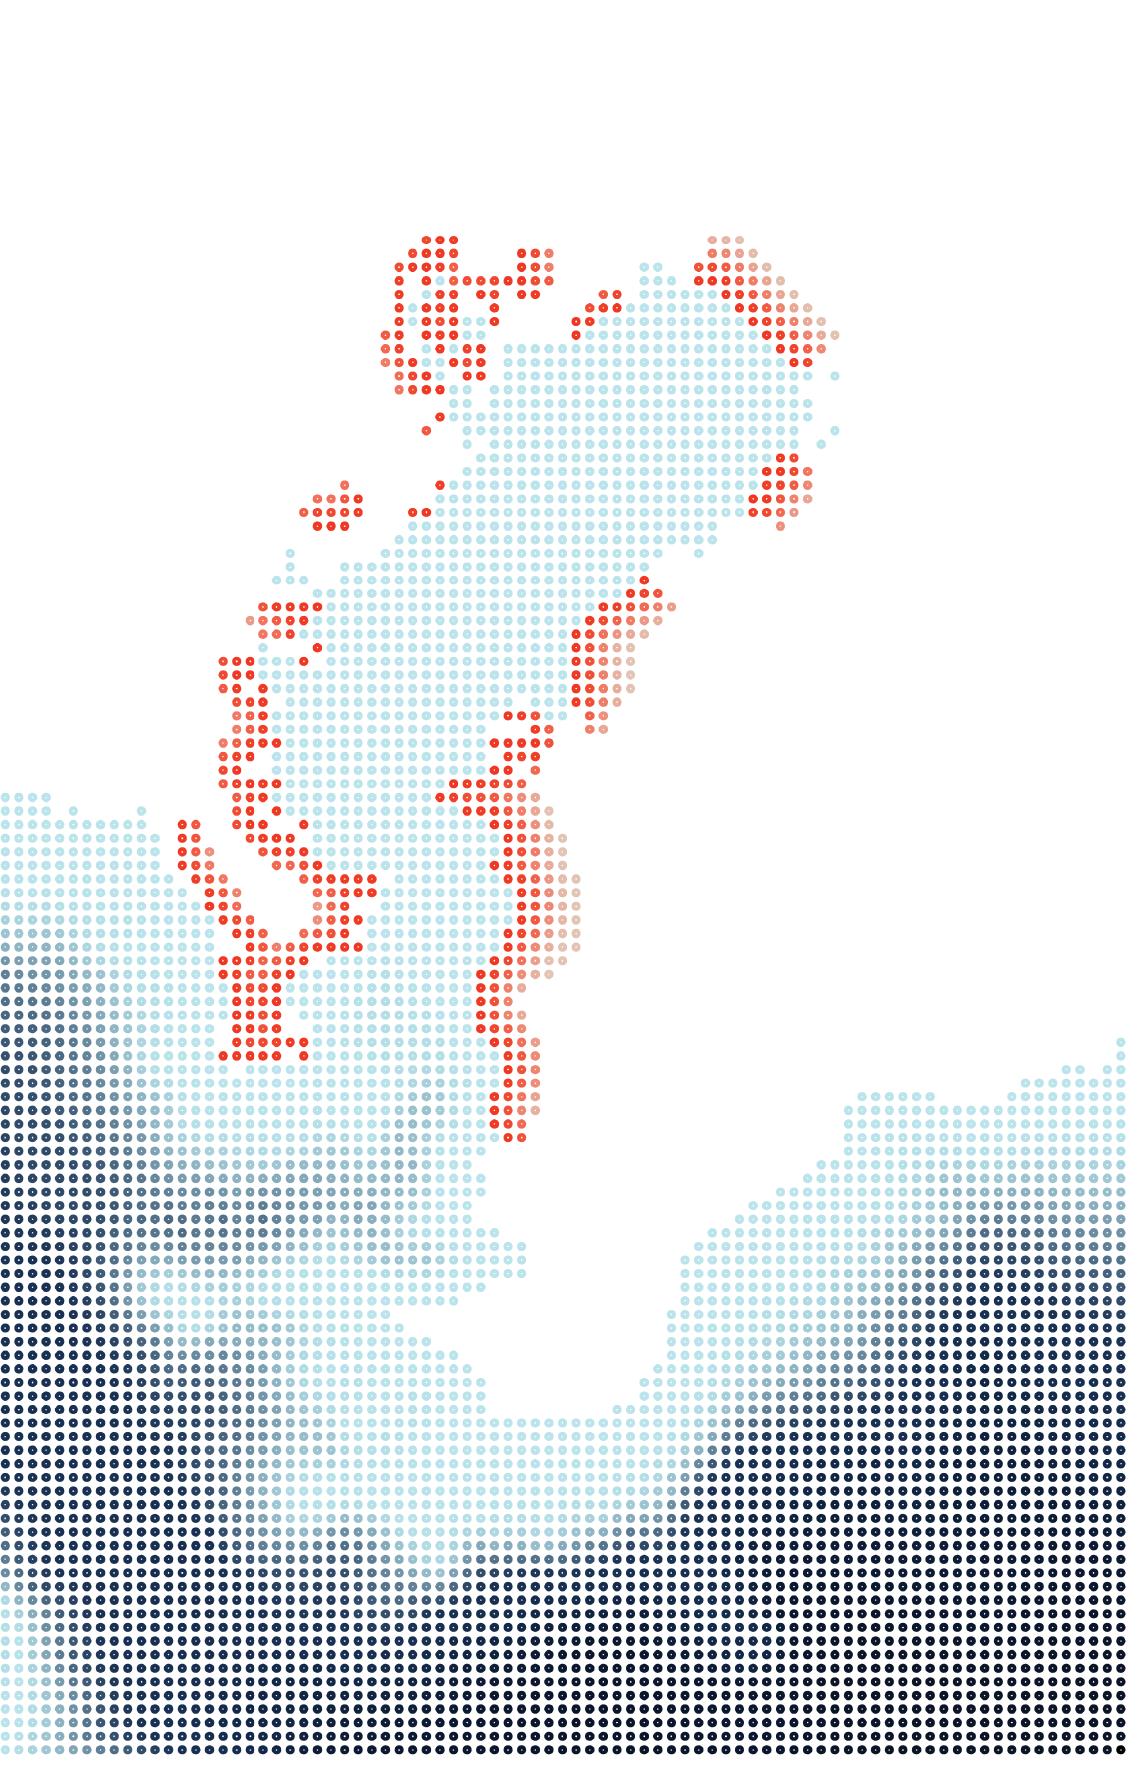
The population density map, the elevation map and the high velocity area map is given a same weight to draw the overlaping map, which indicates regions with high population density and facing the threat of tsunami and flooding.
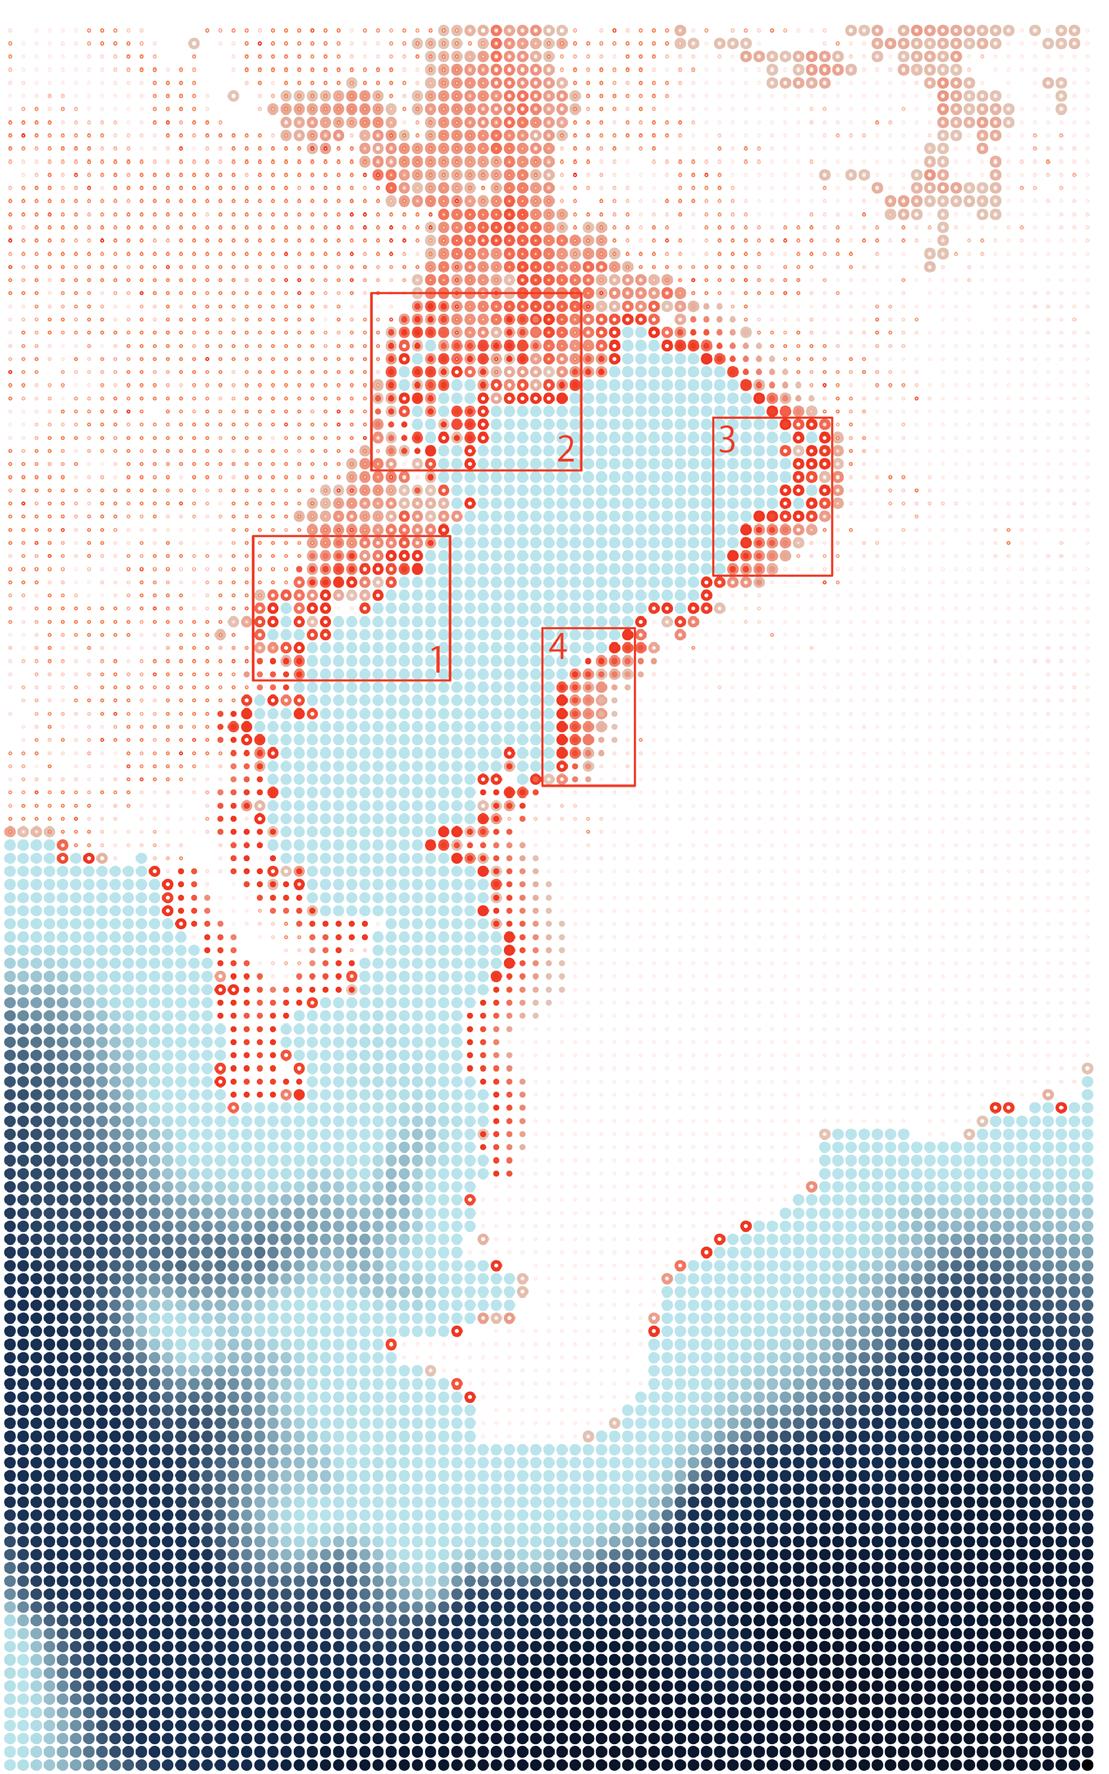
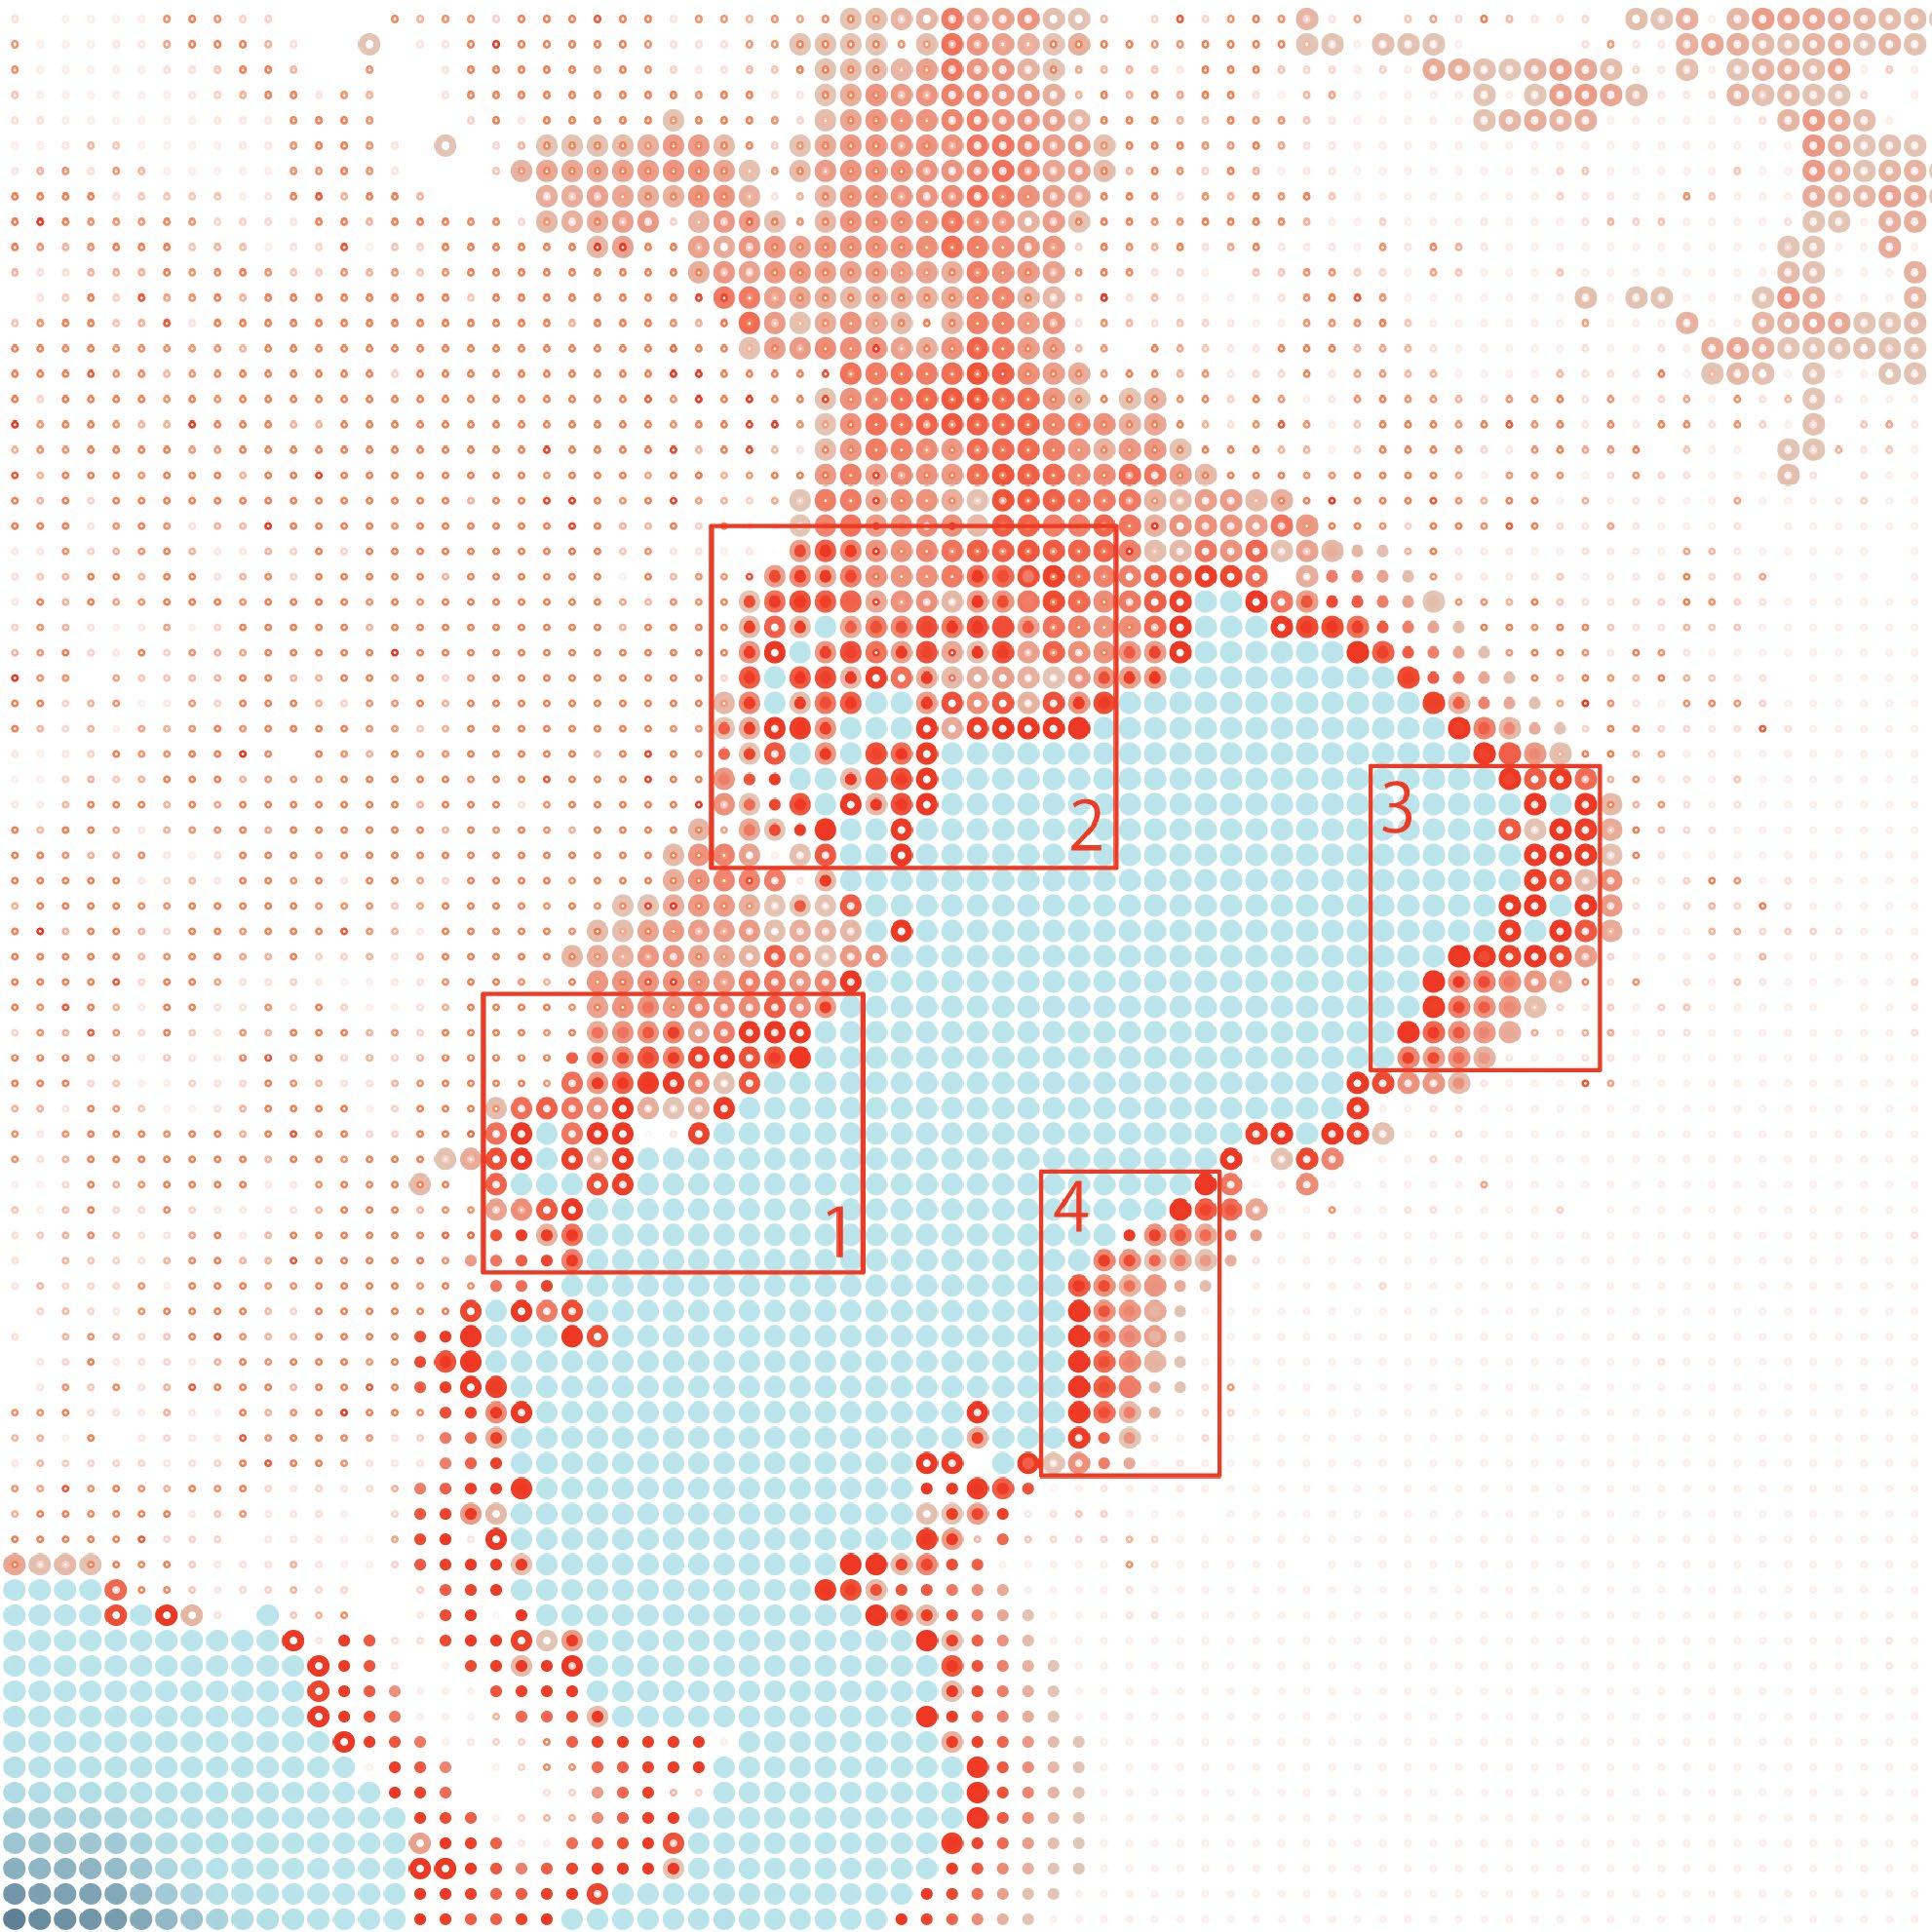
Around the Tokyo Bay, four regions are identified faing most of these issues:
1. Yokohama area
2. Chuo District, Tokyo
3. Chiba-Ken
4. Kisarazu area
Among these four area, Chuo-district of Tokyo is selected for further research, since it has the highest population density and economic value.
81
4.1.1.4 Area extraction
Figure 4.1.12:Area extraction in Tokyo Bay
4.1.2.1 CFD Tests on primitive barriers
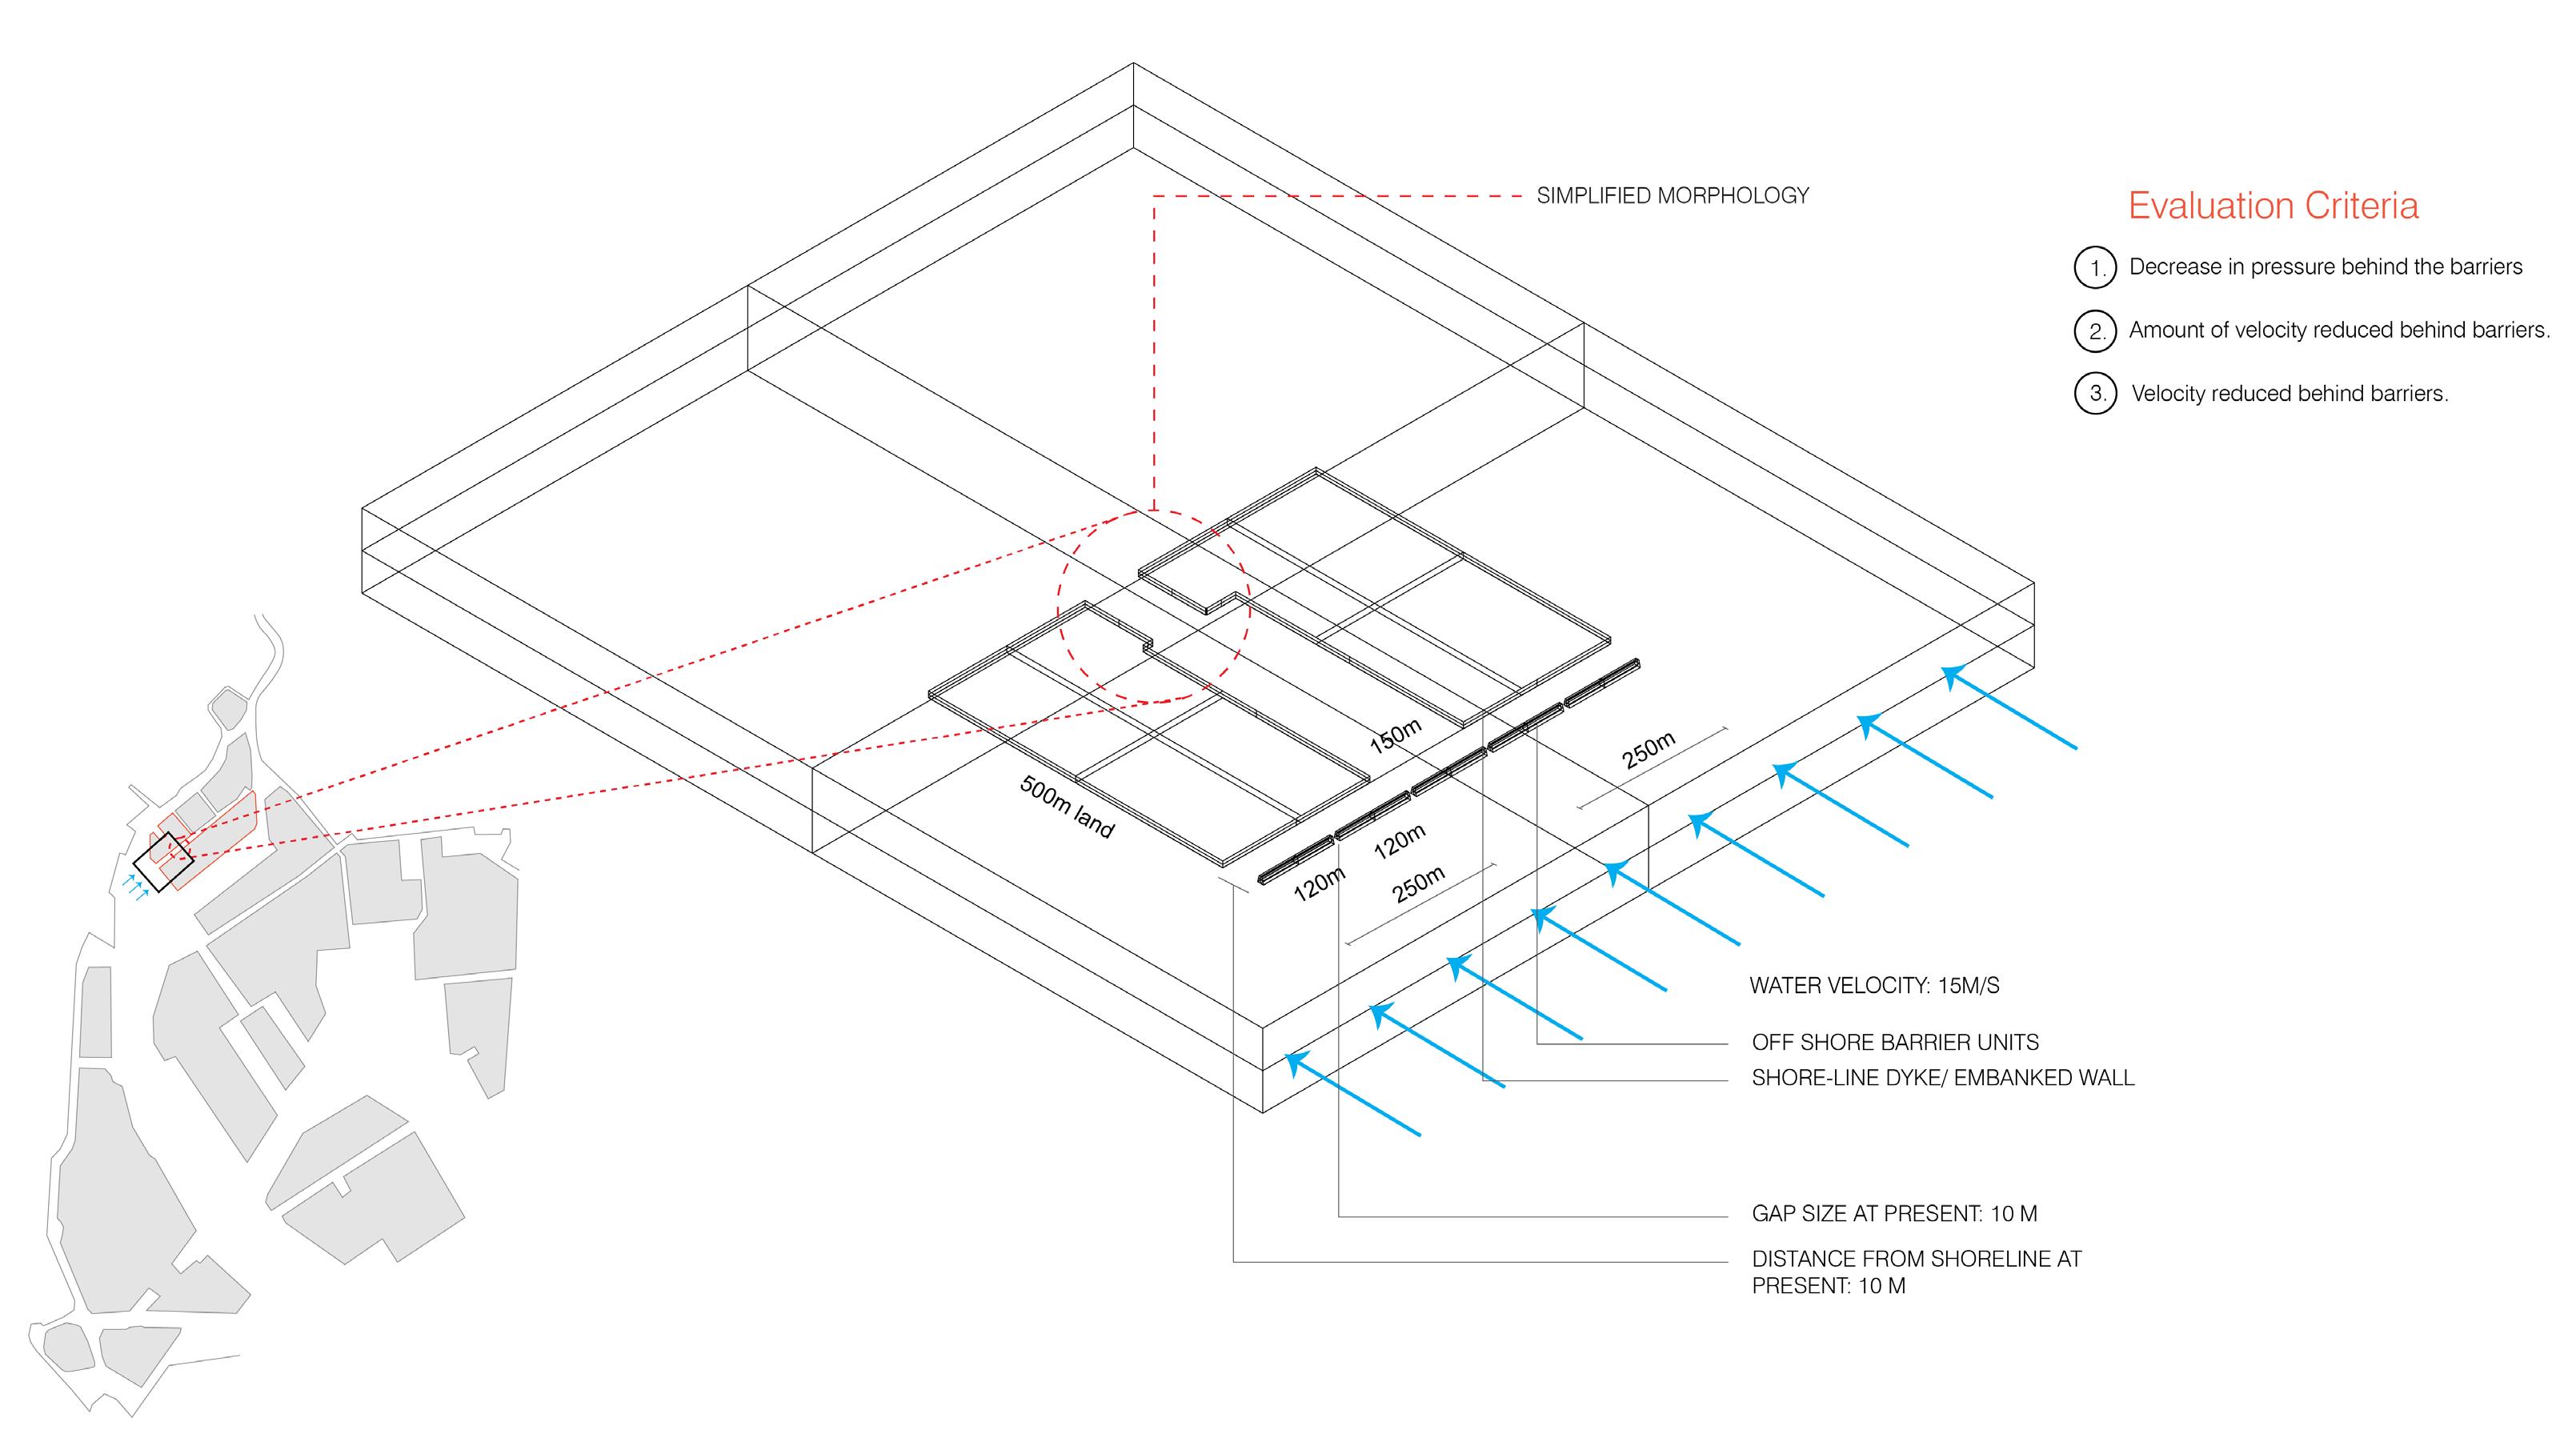
Basic Setup (scale 1:1): The test setup is done to understand the impact of the wave energy on addition of offshore breakwaters along the shoreline. To do so, two land masses are placed on either side of approximately 250m x 500m, with a channel gap in between of 150m width.
The test setup is done at 1:1 scale, with landmass height and the offshore barrier heights being 10m.
The narrowing mouth at the end of the channel is done to mimic partially the actual morphology of the existing landmass, on the site.
For the direction of the wave propagation, it has been simplified and taken as perpendicular to the shoreline.
In previous tests done by various authors, the offshore barriers have varied b/w 120m to 150m, with gap sizes varying from 10m to 50m and the offset distance from the shore b/w 50m to 200m.
Thus, the tests will be heavily dependent on the guiding values.
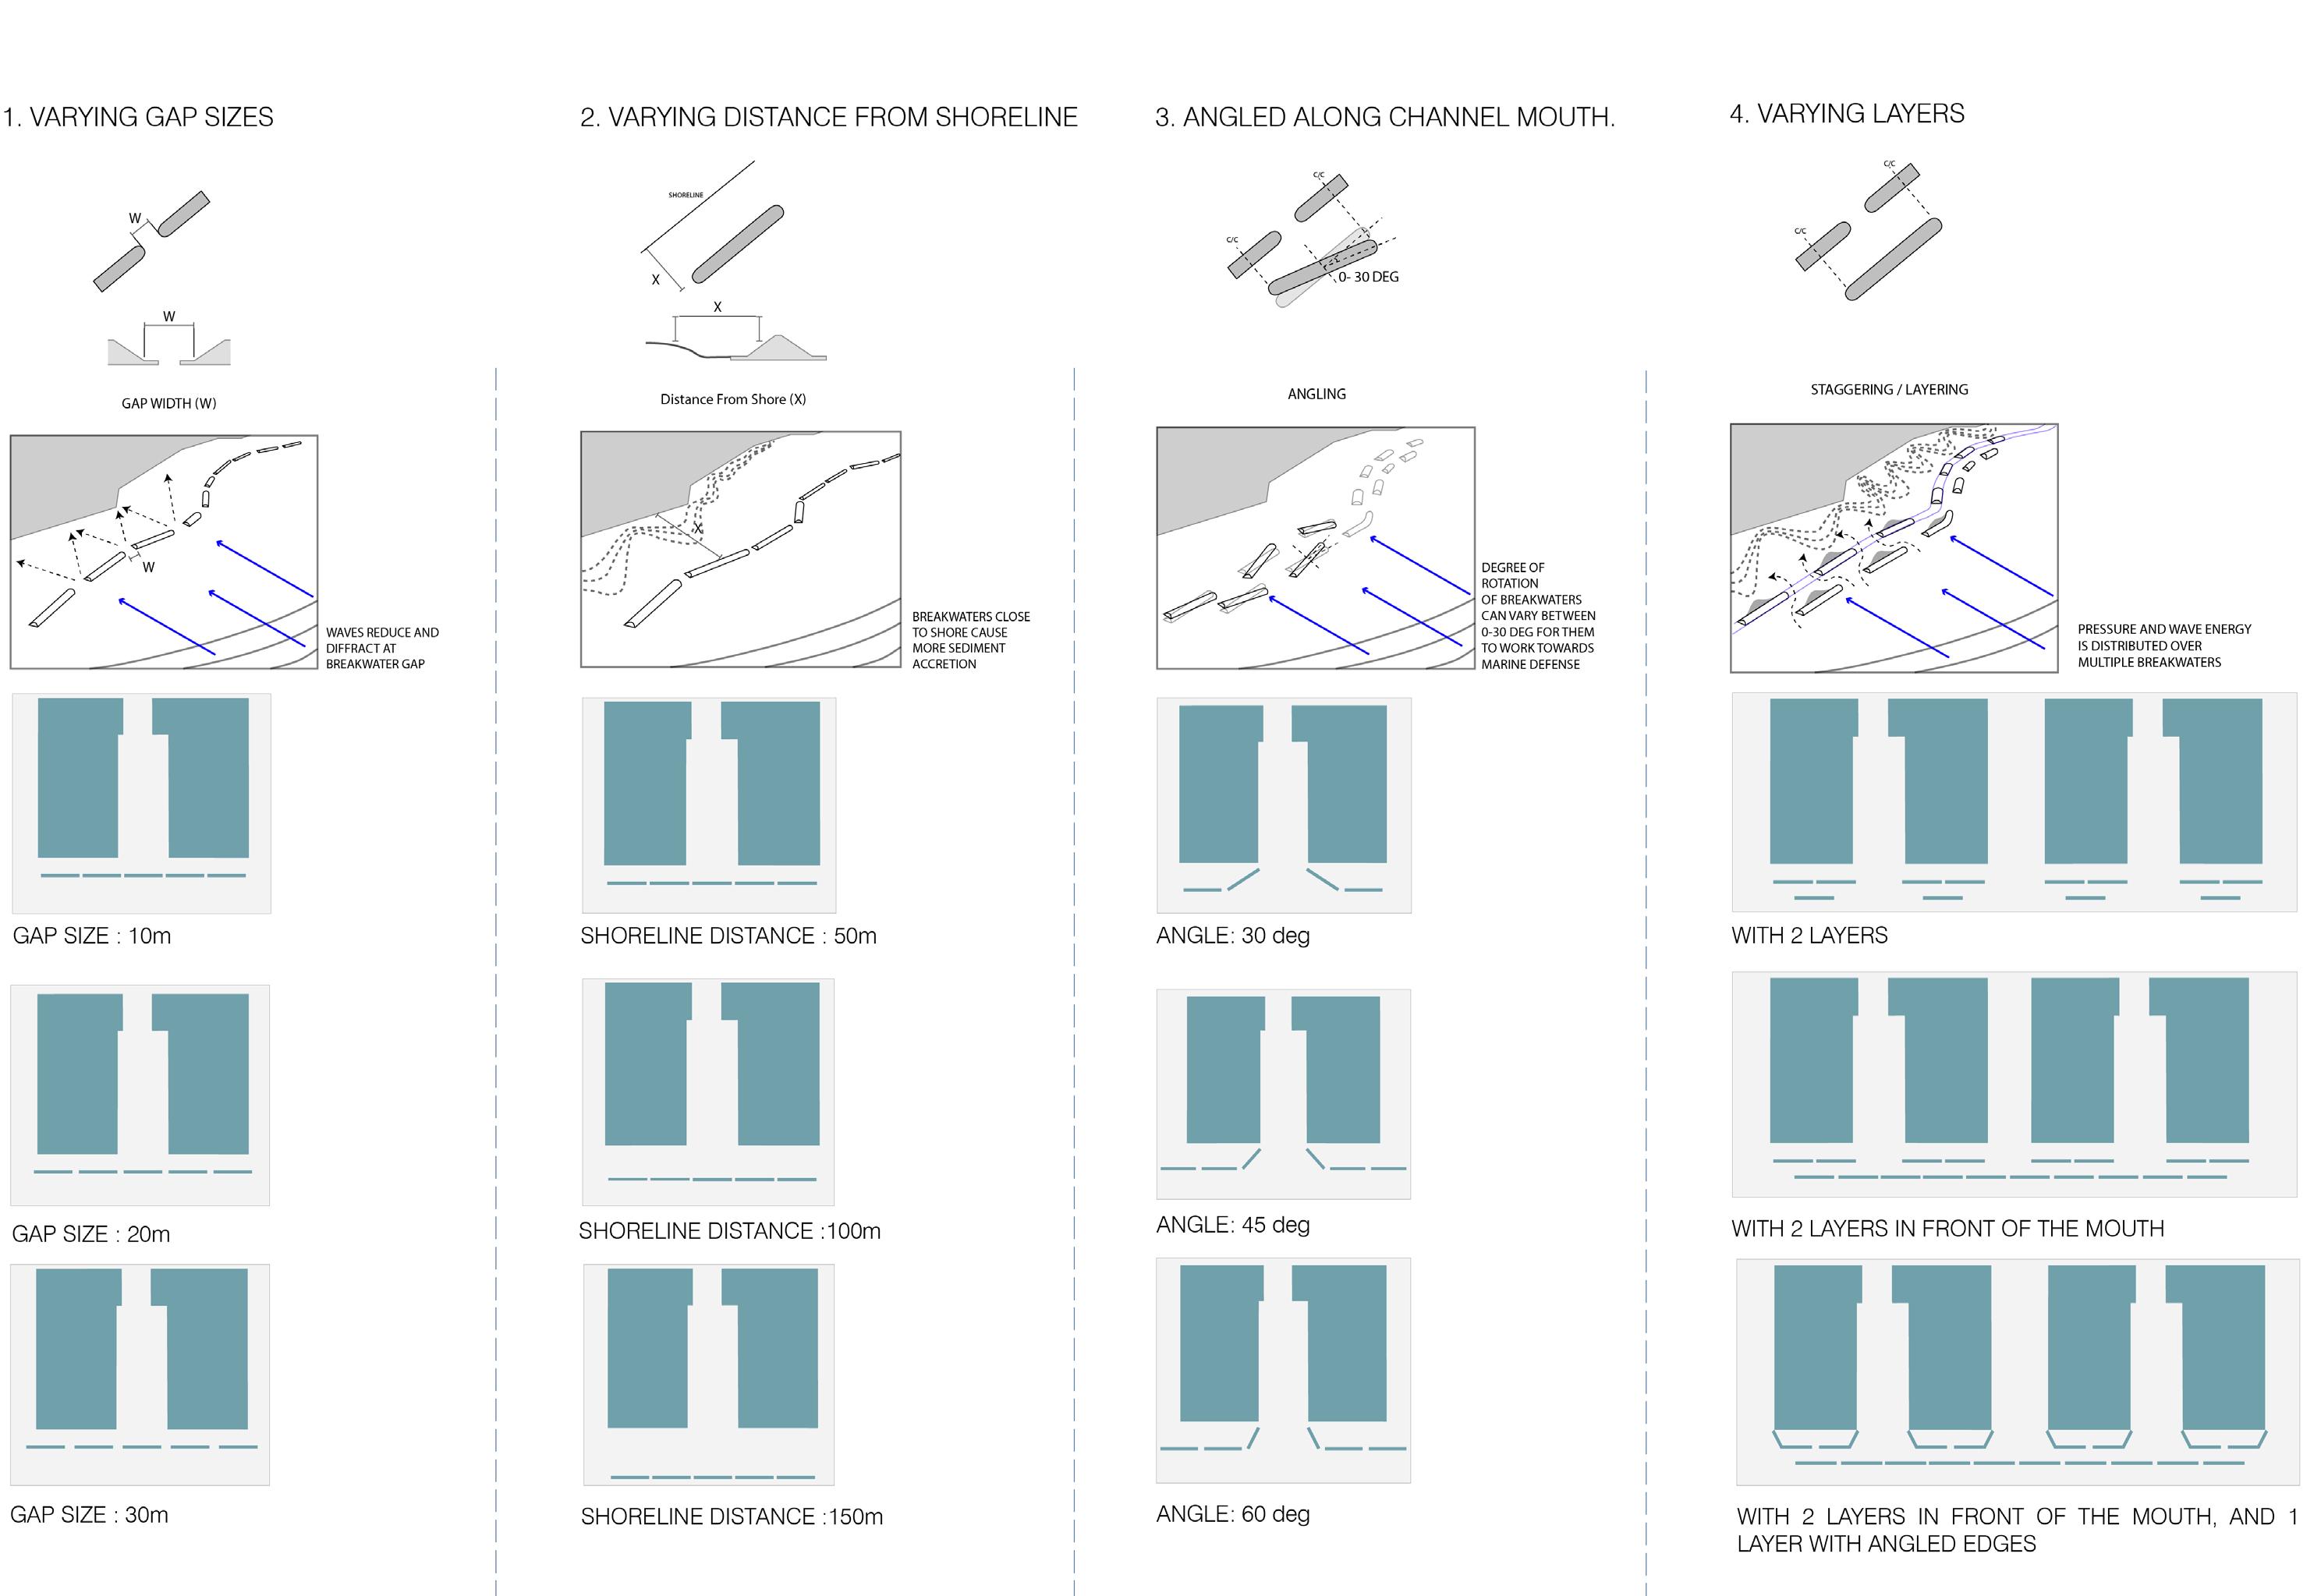
The tests are divided into 4 major parts:
1. Placement of breakwaters with varying gap sizes.
2. Placement of breakwaters with varying distance from shoreline.
3. Placement of breakwaters with angled breakwaters along the channel mouth.
4. Placement of breakwaters with varying layers.
The basic setup is analysed by the parameters as mentioned in figure xxx. Setups may vary to compare with other situations encountered by the site, specific to the test.
The parameters that remain fixed are shore land length and its width. The parameters that remain variable are barrier width, gap between units and distance from the shoreline. Evaluation criteria is velocity penetration, creation of low velocity zones and low vortexing.
Test reference: Mikami, Takahito et.al., ‘Detached Breakwaters Effects on Tsunamis around Coastal Dykes’, Science Direct, Deparment of Civil and Environmental Engineering, Waseda University, 3-4-1 Okubo, Shinjuku-ku, Tokyo 169-8555, Japan.
Conclusion: For the preferred gap sizes, 10 to 20 m gap was found beficial to let least amount of flux penetration. For the distance between shoreline and the breakwaters, 50 to 100m distance was found apt as they could generate low vortex zones and low velocity areas. For the preferred angling of breakwater along the channel mouth, an angle of 60 deg was found apt since it could guide the water in a smooth manner
83
4.1.2 Tests
Figure 4.1.13: Barrier experiment setup
Figure 4.1.14: Barrier experiment
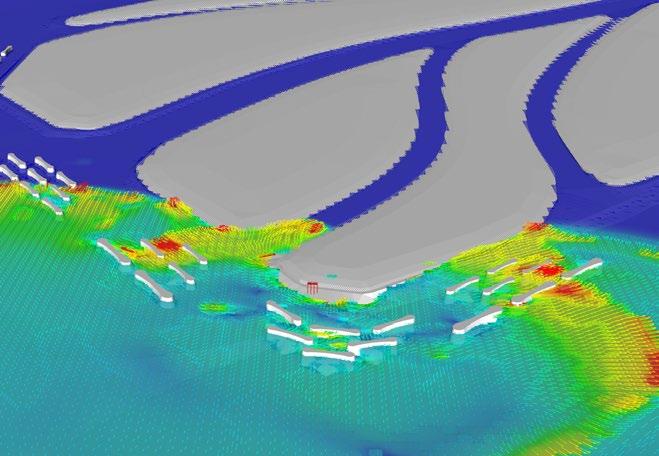
4.1.2.2 Combined tests on modified barriers
With the conclusions found on barrier gap sizes, distance from shoreline, apt angle for water flux around channel mouth and variation in layers, further combinations of geometrical modifications are done on individual modules to reduce pressure at the corner to save it from adverse impact. Simultaneously, attempts are made at reducing module sizes with the help of layering, staggering in rows. Also, modules were modified based on ecological parameters such as addition of mounds at the intertidal heights and tested to see its impact during a storm surge.
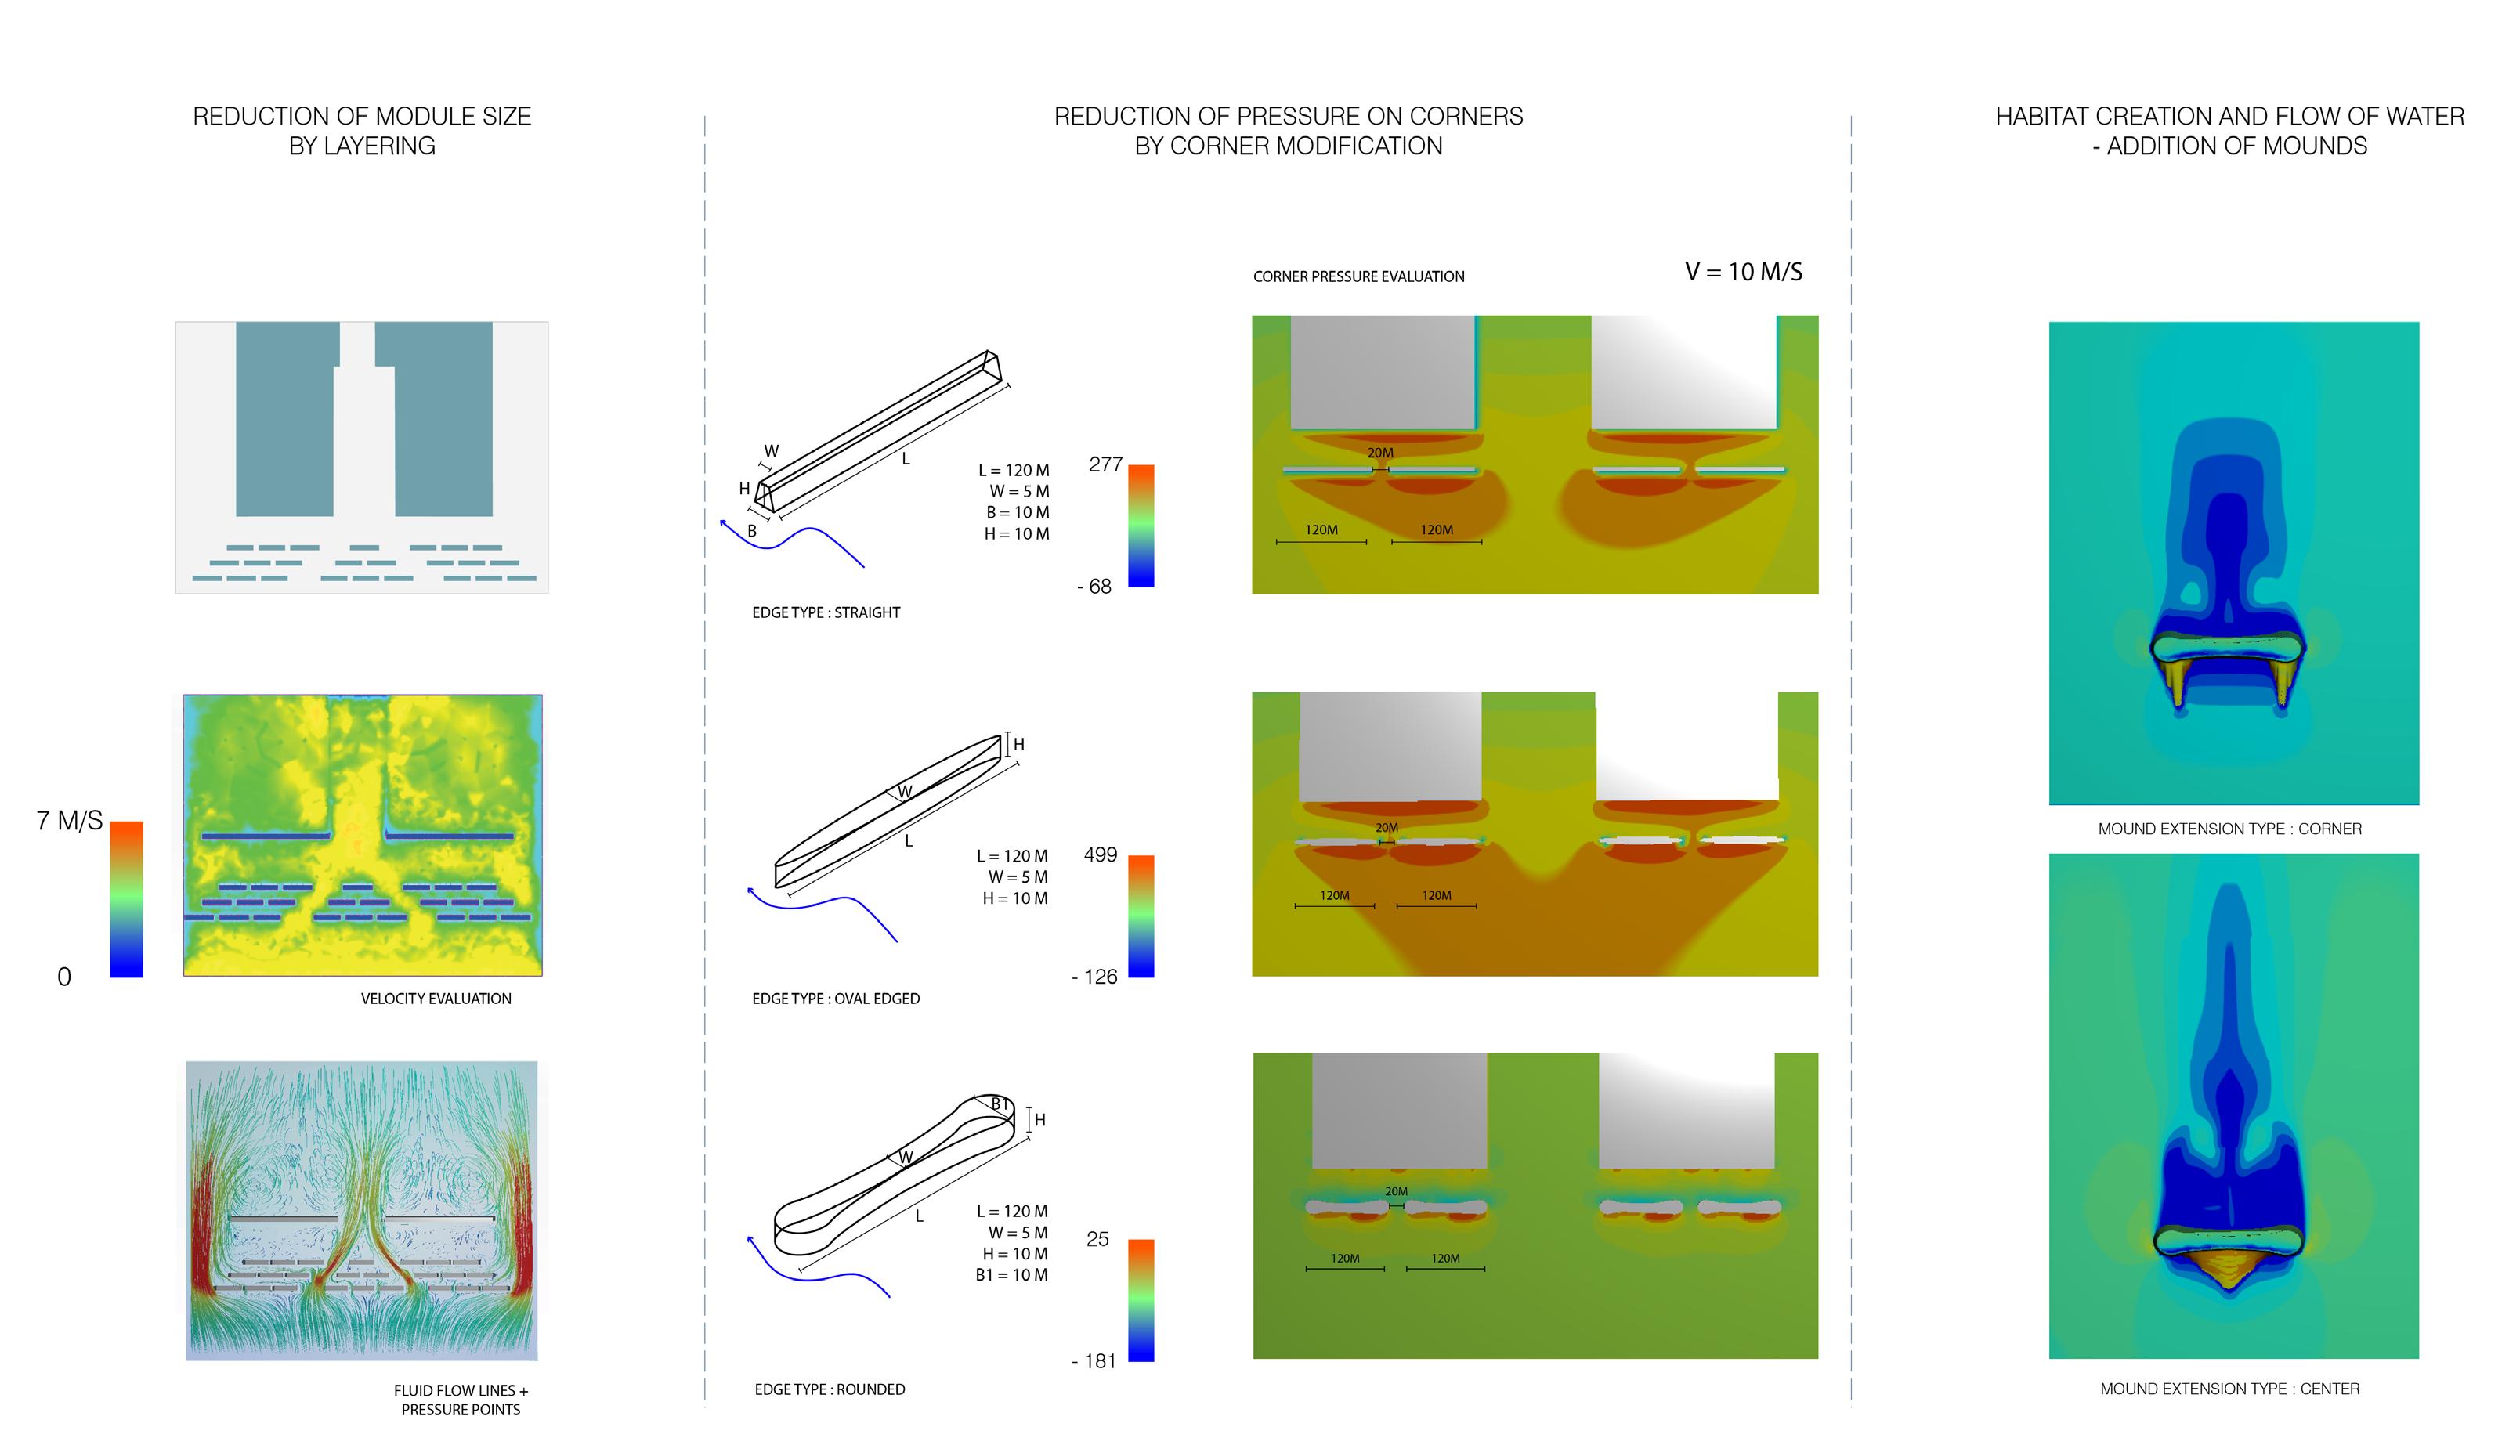
Conclusion:
Module sizes could be reduced in size from 120m to 60 m by layering them in 3 rows achieve a reduced impact and flow. For reducing pressure around the corners of a single module, the rounded edge was found to be the most efficient amongst the 3 variants tested. Lastly, out of the two module shapes evolved after applying mounds in front of them, the 2nd variant (one with the mound in the center was found to be better at keeping a smoother flow of water on a regular day, but also work in reducing water velocity due to higher surface area acting in velocity dissipation.
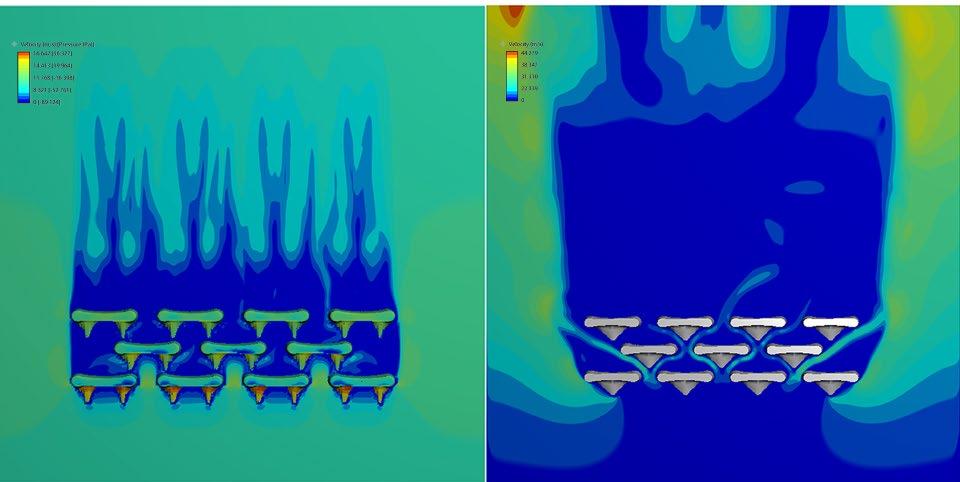 Figure 4.1.15: Barrier modules
Figure 4.1.16: Barrier modules aggregation
Figure 4.1.15: Barrier modules
Figure 4.1.16: Barrier modules aggregation
4.1.3 Conclusion
At the end of Bay scale analysis, area of intervention at the intermediary scale is achieved. Area 2 i.e the Tokyo- metropolitan area is selected due to the comparison made in terms of density, elevation and water velocity analysis.
The tests done on the mouth of tsukishima island (which is a part within Area 2) for water velocity dispersion using application barriers proves to be beneficial in lowering the intensity of the wave that passes further on into the existing channels behind.
The tests done on a single module shows that modifications made on it based on pressure, low velocity zones behind the module and habitat generation, helps indicate a tentative module shape that can be further developed along the shoreline and duplicated as per adherence to ship routes, ship types and space function along the shoreline.
The tests done on multiple staggered modules indicates that such module placement works best to divide and break the water flow. At the same time, the curved mound additions in the front of the straight barriers also helps keep a smoother flow of water and doesn’t make the areas behind the barriers a stagnated water area, making them a better addition in terms of habitat generation.
86 87
4.2 AT INTERMEDIARY SCALE
As found previously, Area 2 (TokyoKanagawa prefecture) is found out to be the area of intervention. From the previous tests done on the bay scale, it is found that water needs to be channelled in a smoother manner. This indicates to the limitations of land morphology along the existing channels which needs to be tested and modified.
88 89
Figure 4.2.1: Inner Tokyo Bay
4.2.1 Analysis
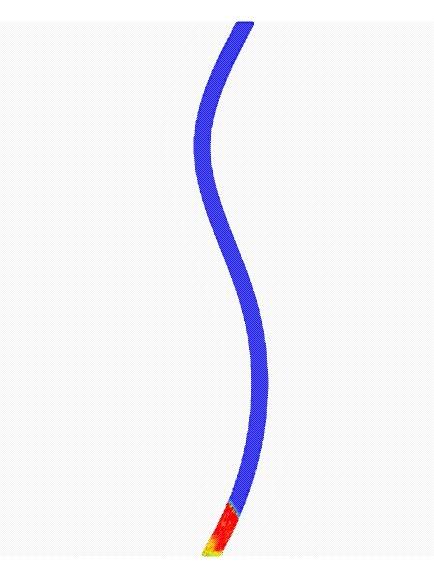
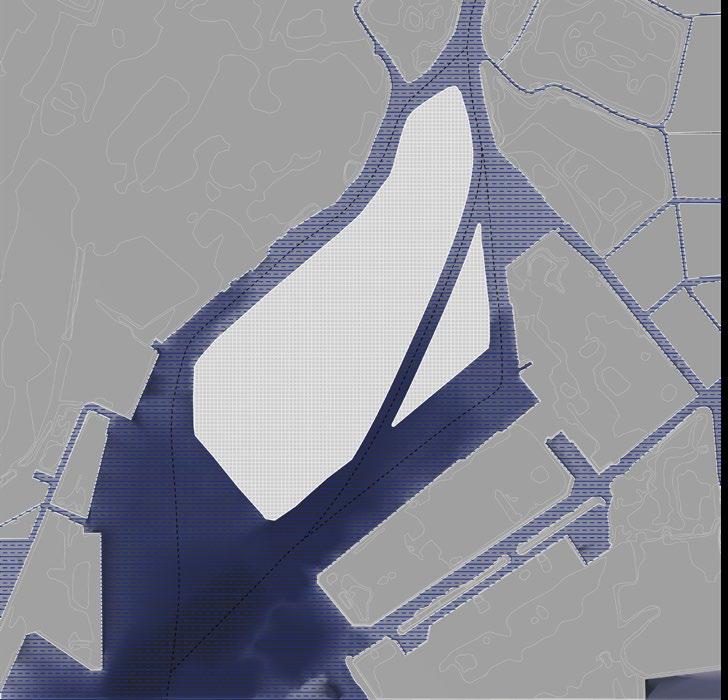
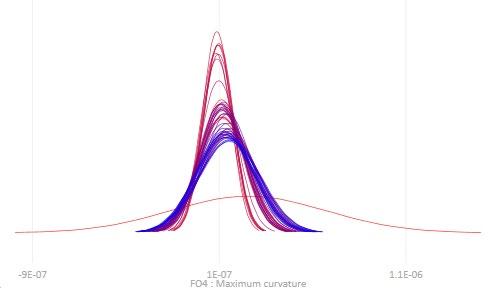
4.2.1.1 Curvature analysis
Plan curvature is an effective factor on flood potential[42]. The basic channel types CFD simulation(4.2.2.1) also indicates that channels with larger curvature are facing a larger risk of overtoppling during tsunami. Therefore a curvature study is made on the major channels in Tokyo. The result is visualized on the map to more intuitively show the large curvature channel parts.
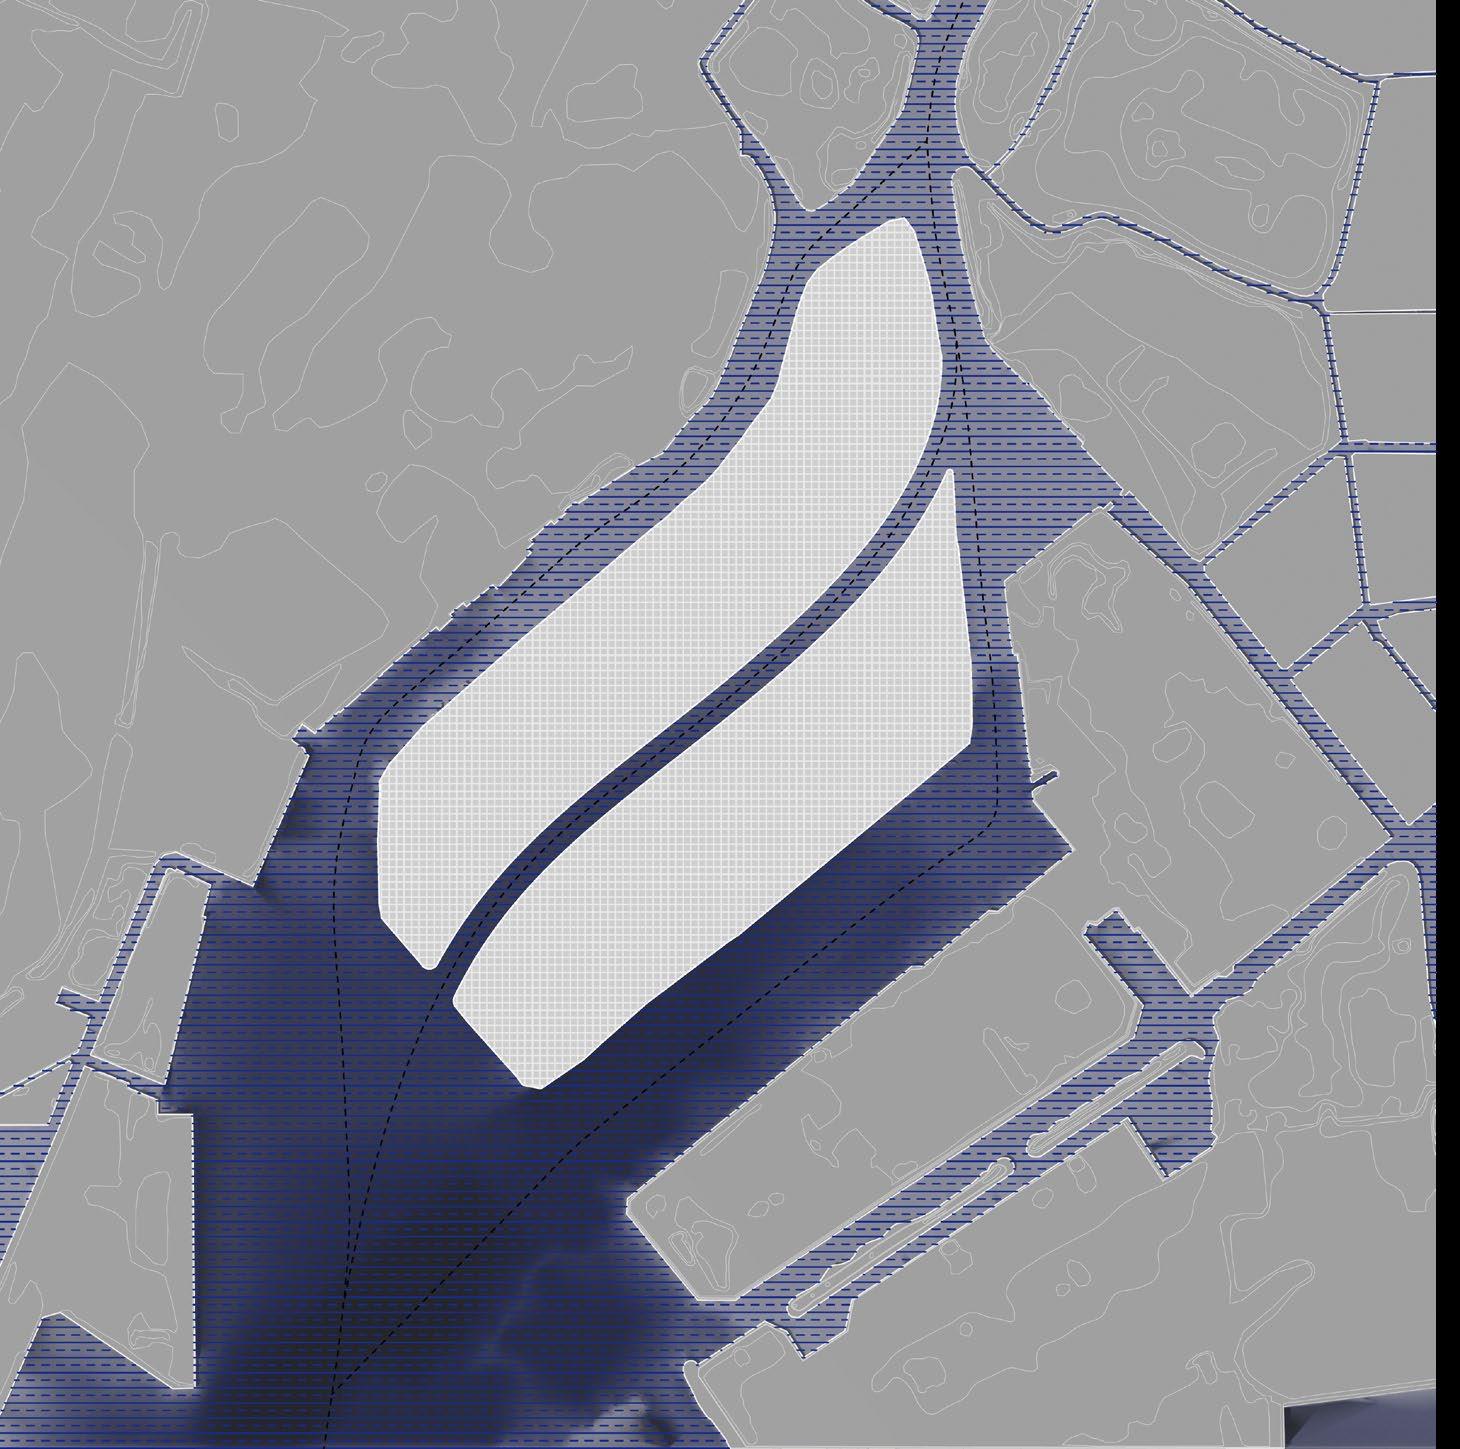
4.2.1.2 Width analysis
The change of the width is also a factor that can accelarate the water velocity. Channel areas with more than 20% width change per kilometre are mapped as potential high water velocity areas.
By analysing the curvature and width change of the major channels in Tokyo, Tsukishima island is noticed having both these two geometrical disadvantages. Therefore it is chosen to be the site for further analysis and development.
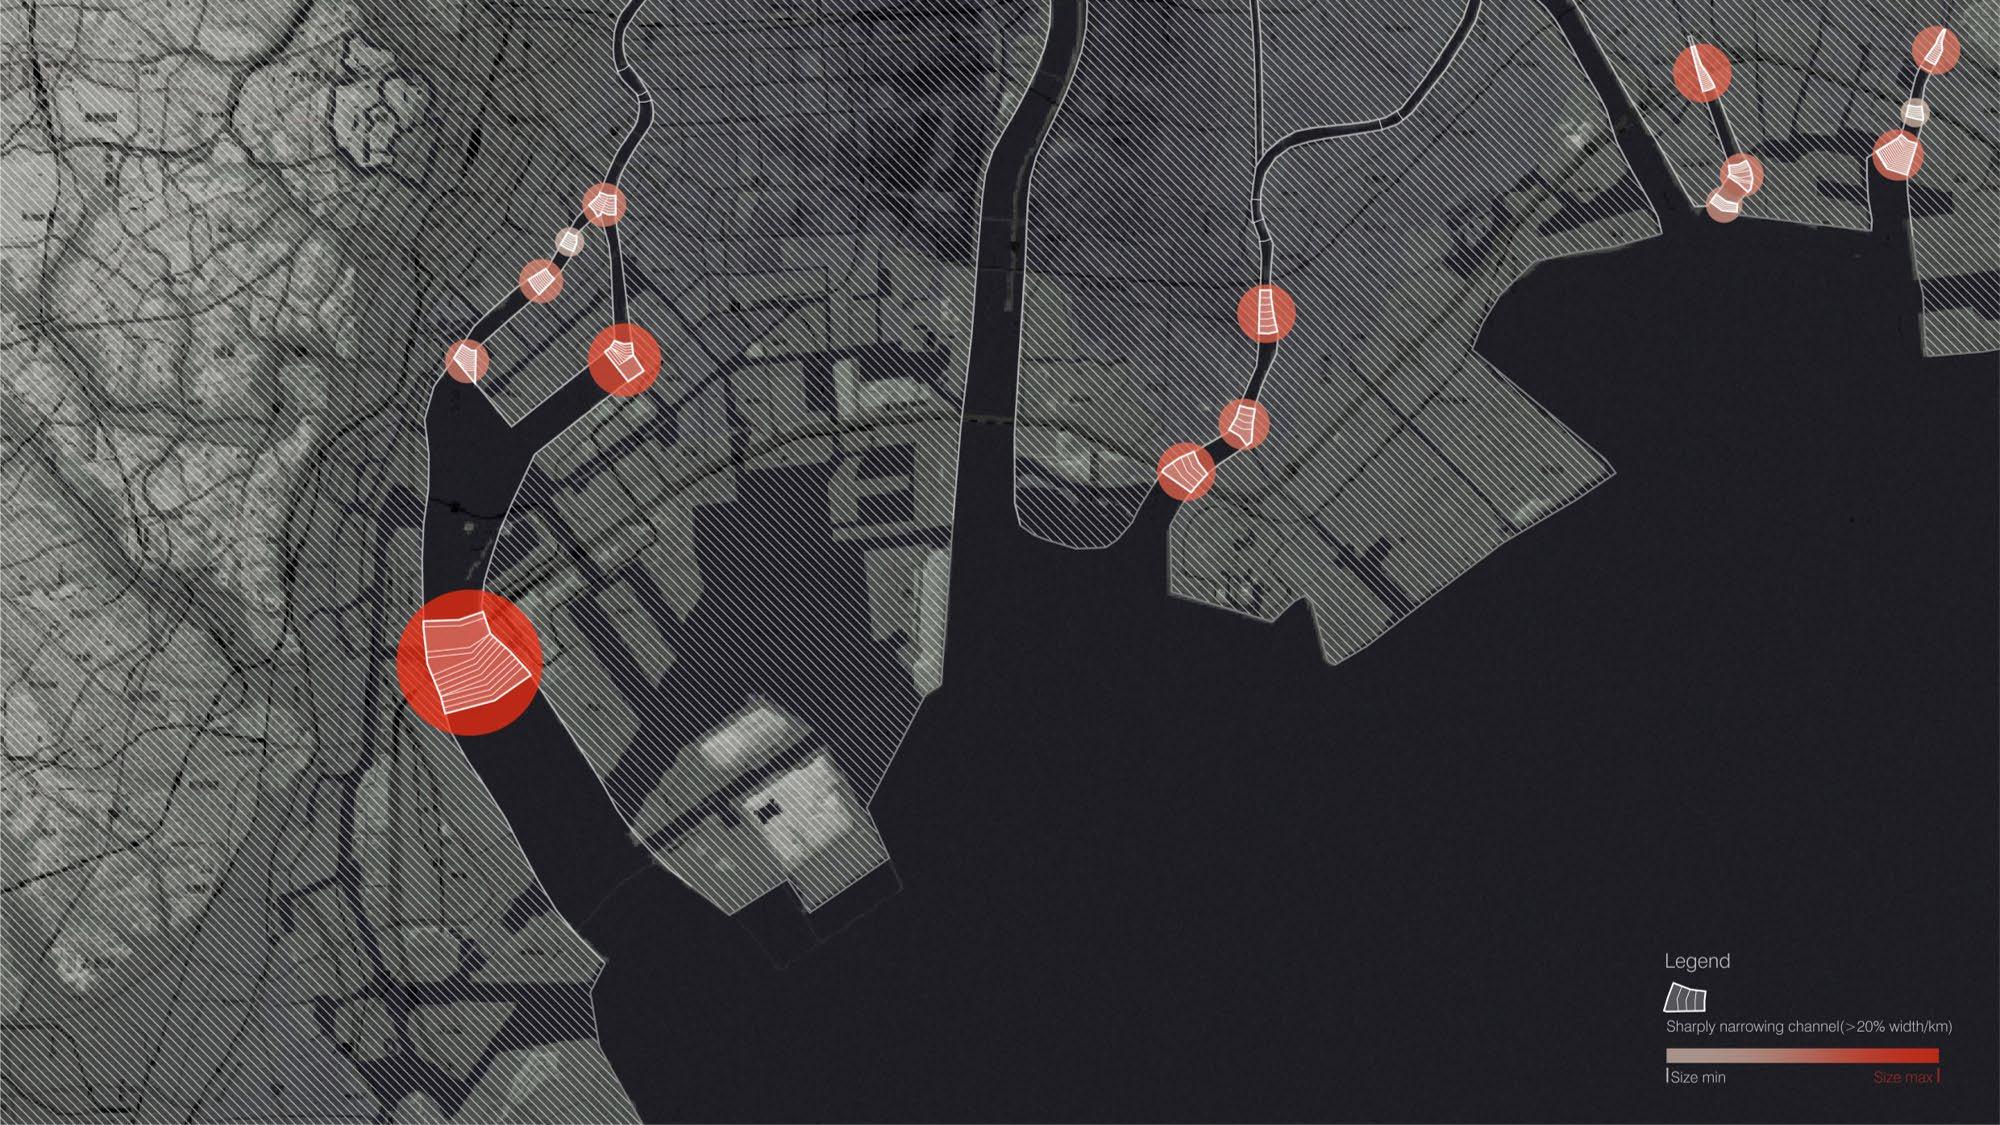
 Figure 4.2.3
Figure 4.2.2
Figure 4.2.3
Figure 4.2.2
defenses
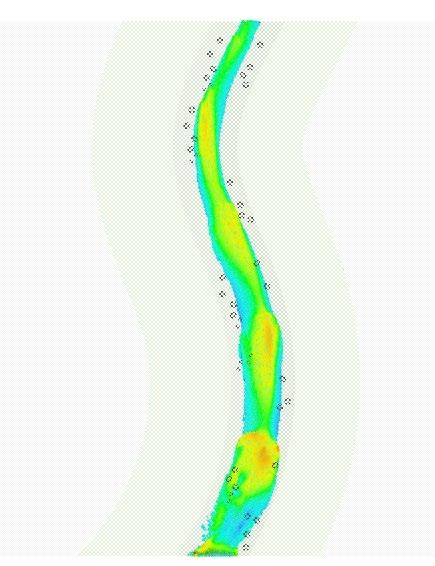
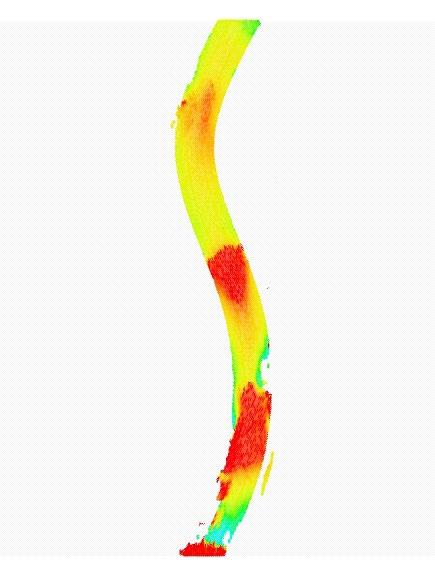
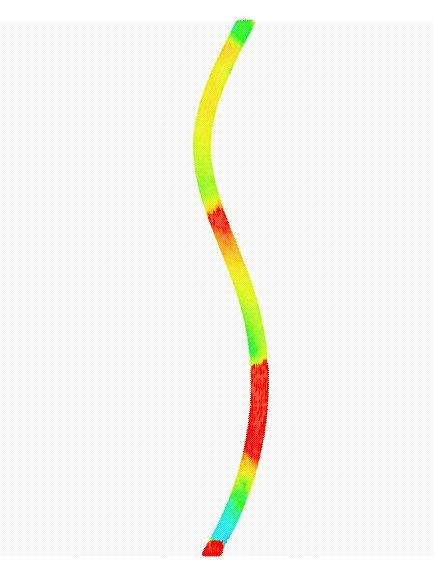
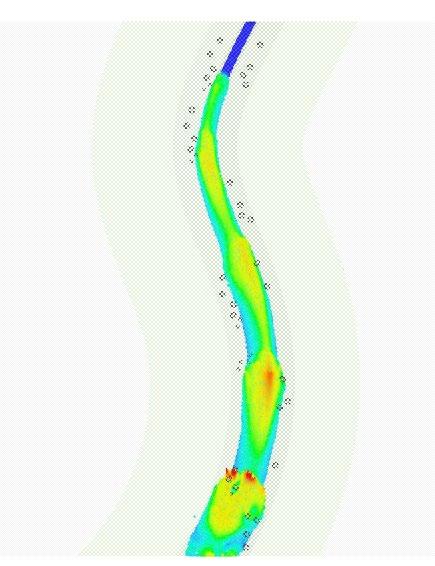
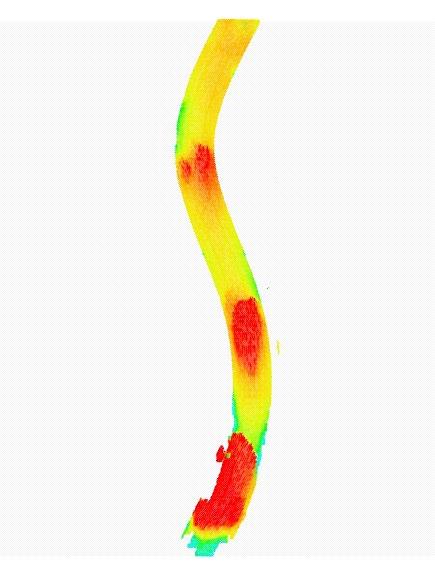
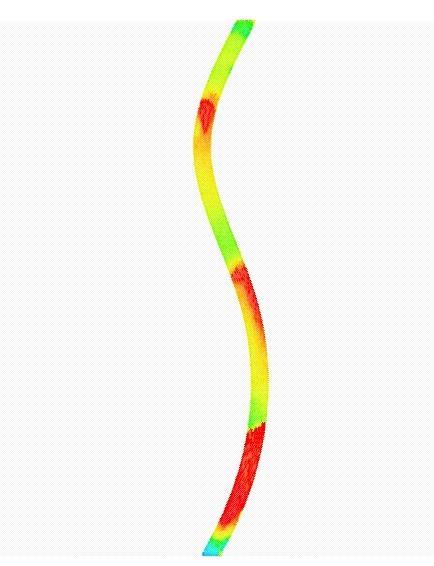
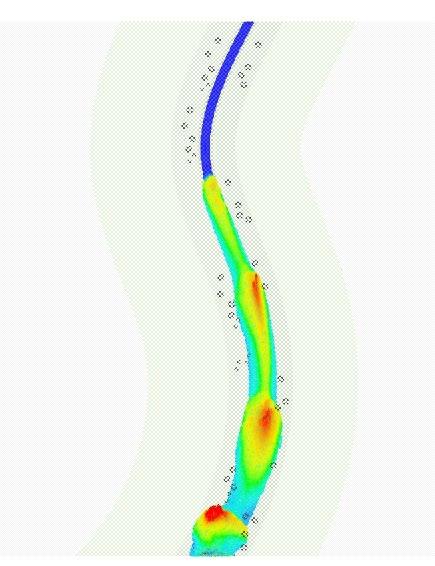
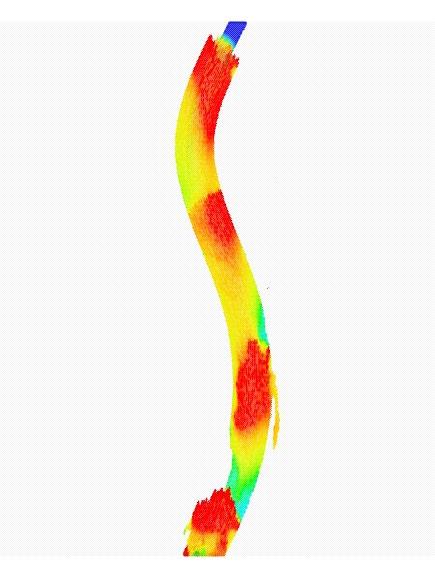
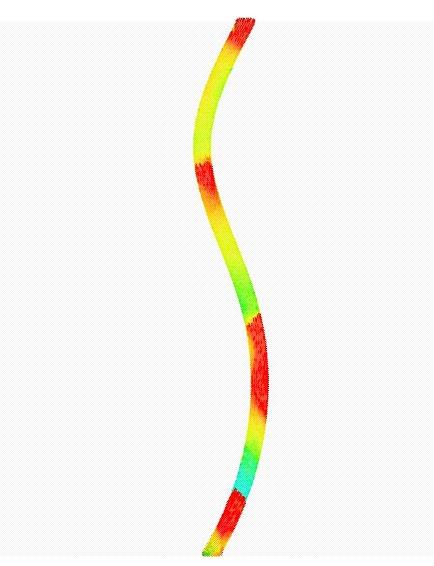
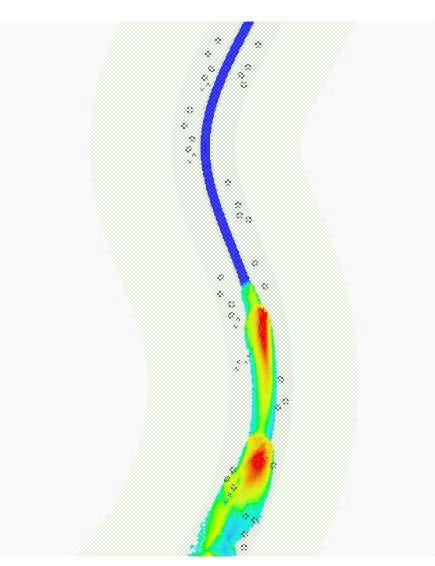
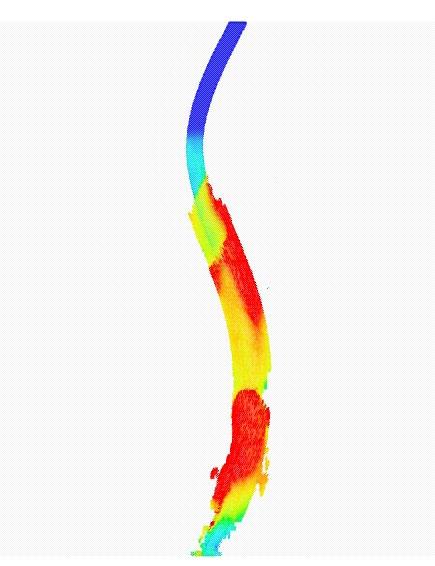
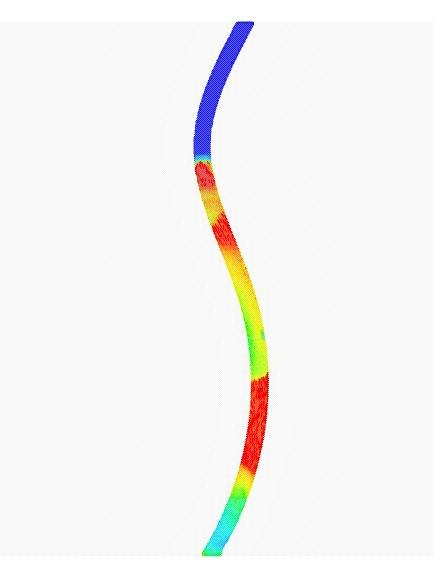
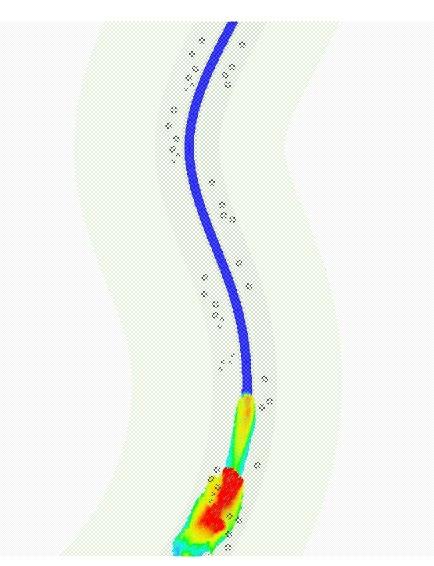
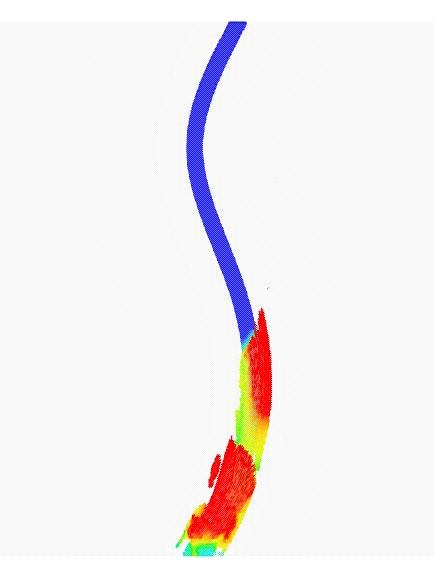
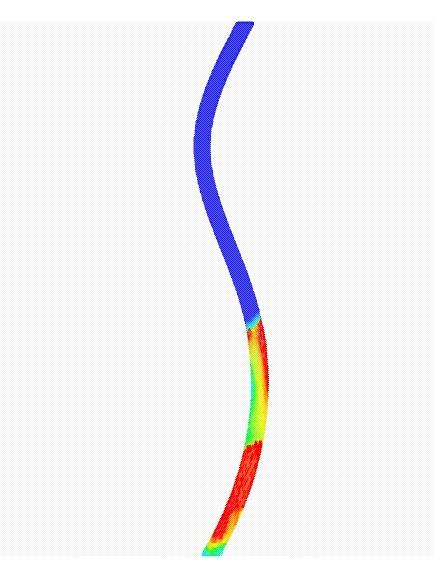
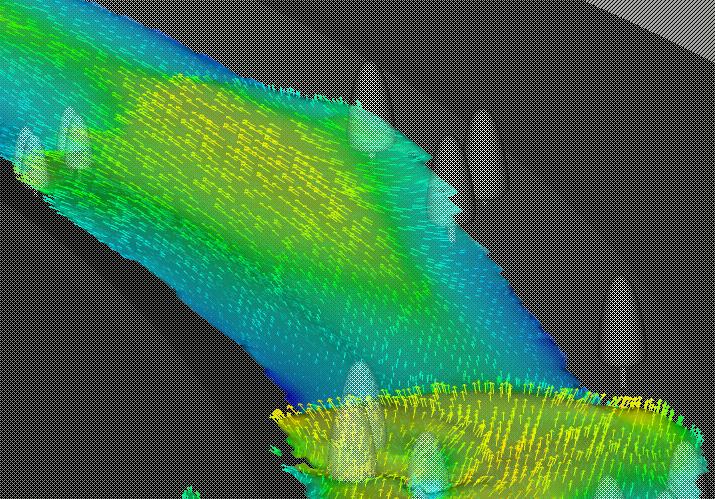
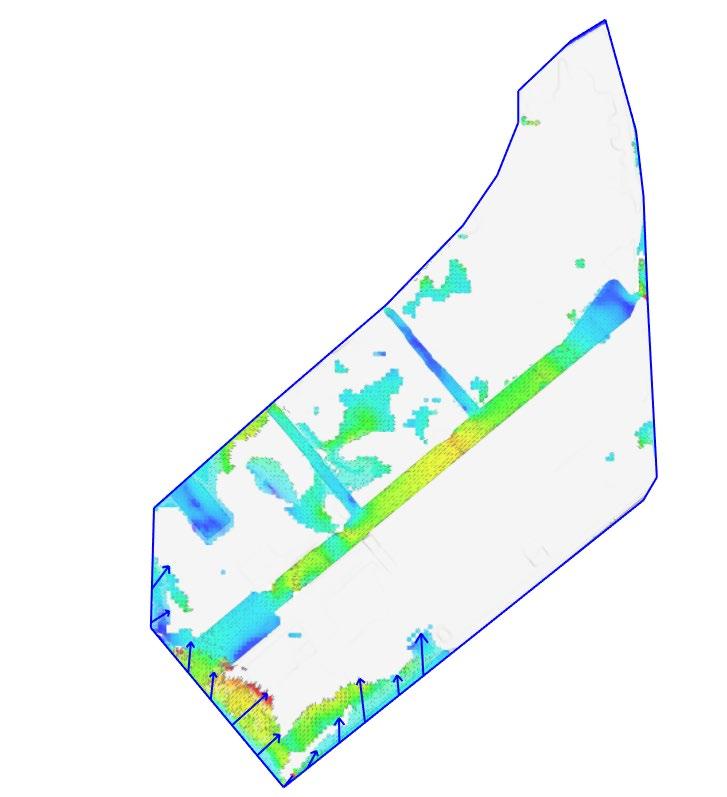
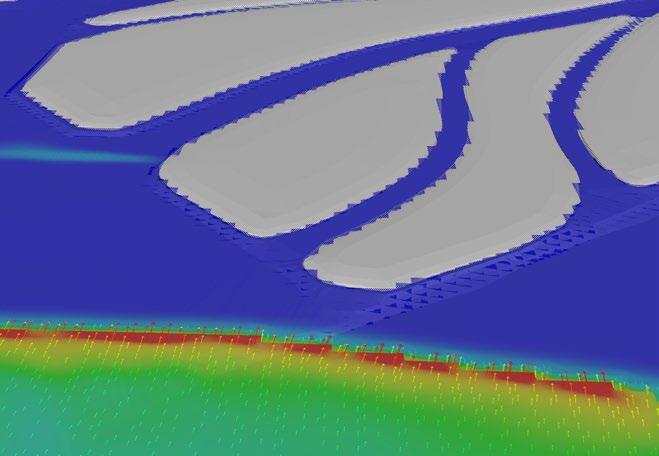
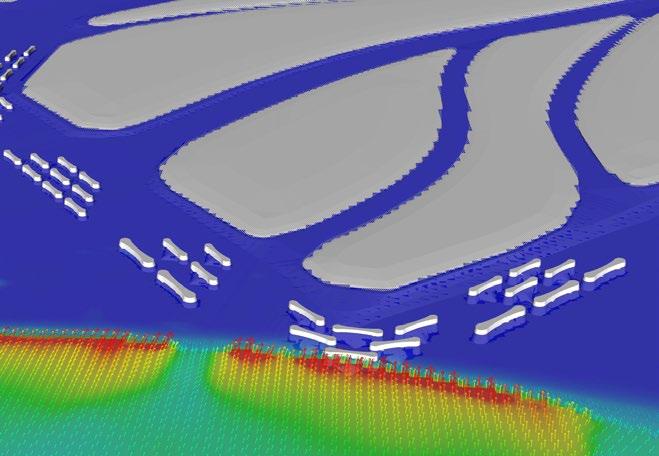
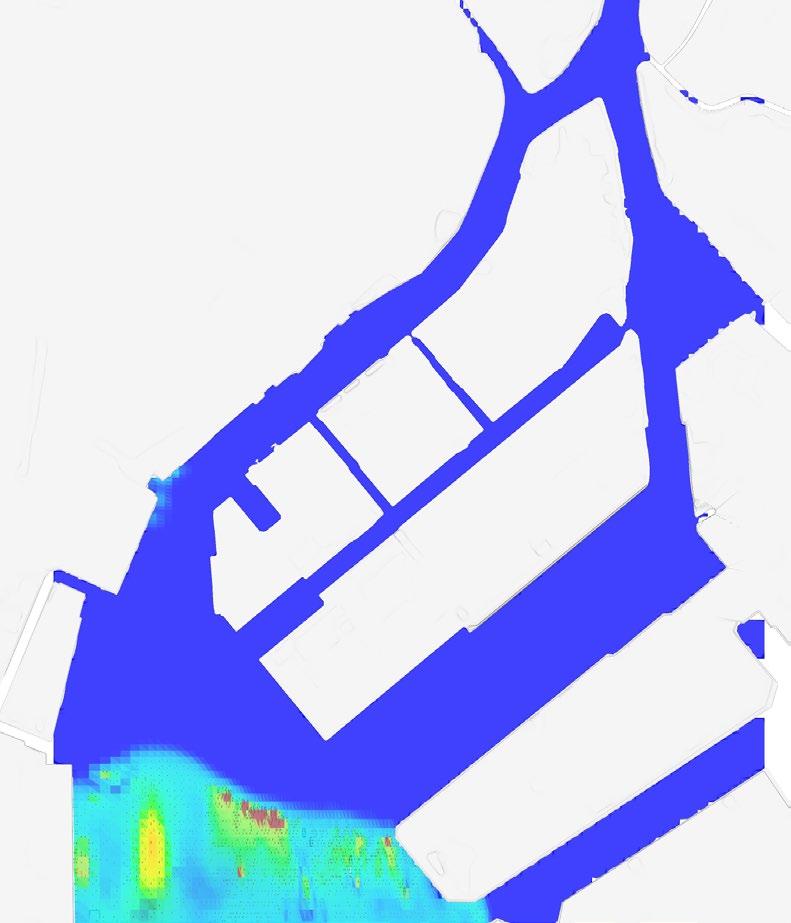
4.2.1.3 Tsunami analysis on site chosen
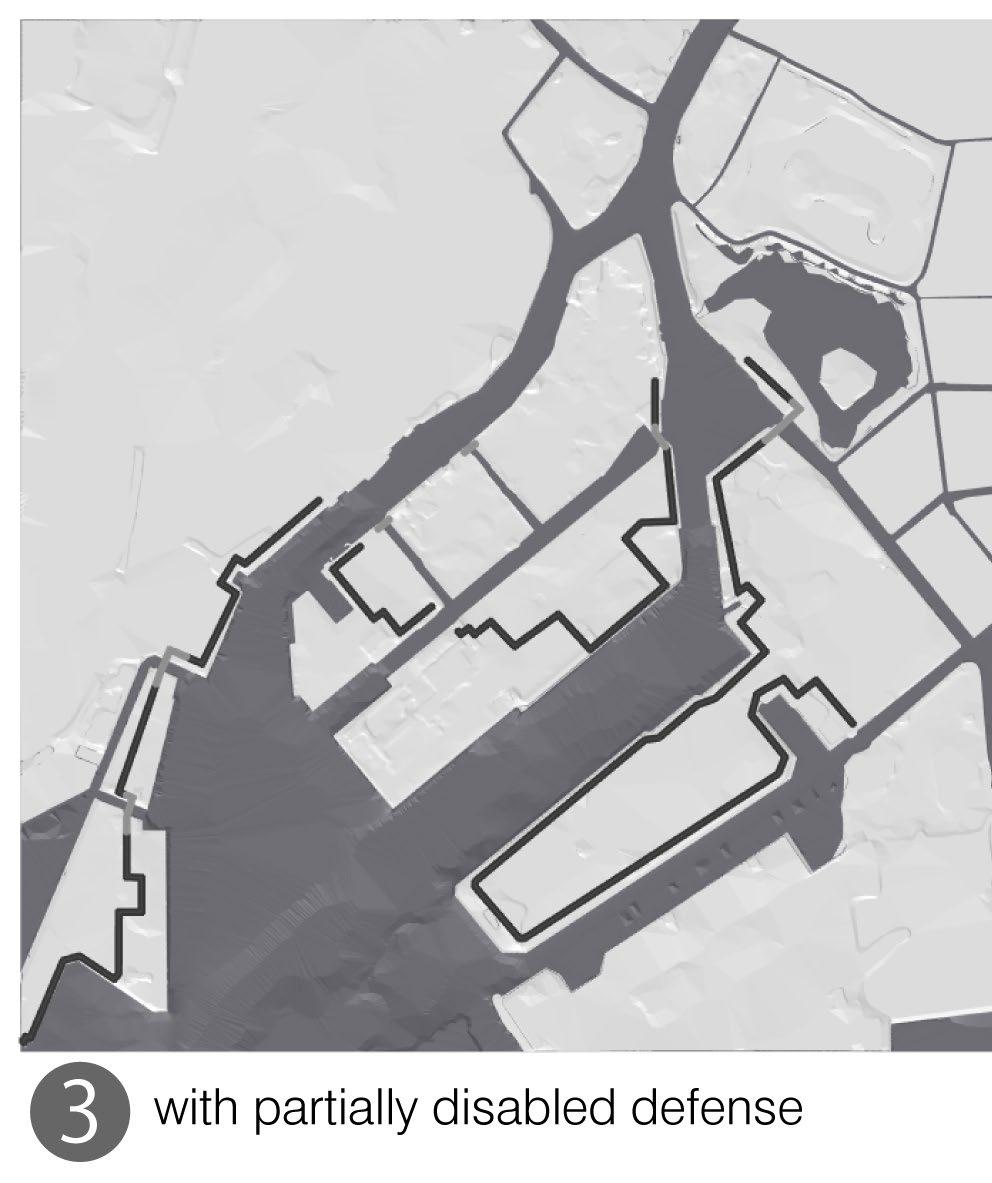
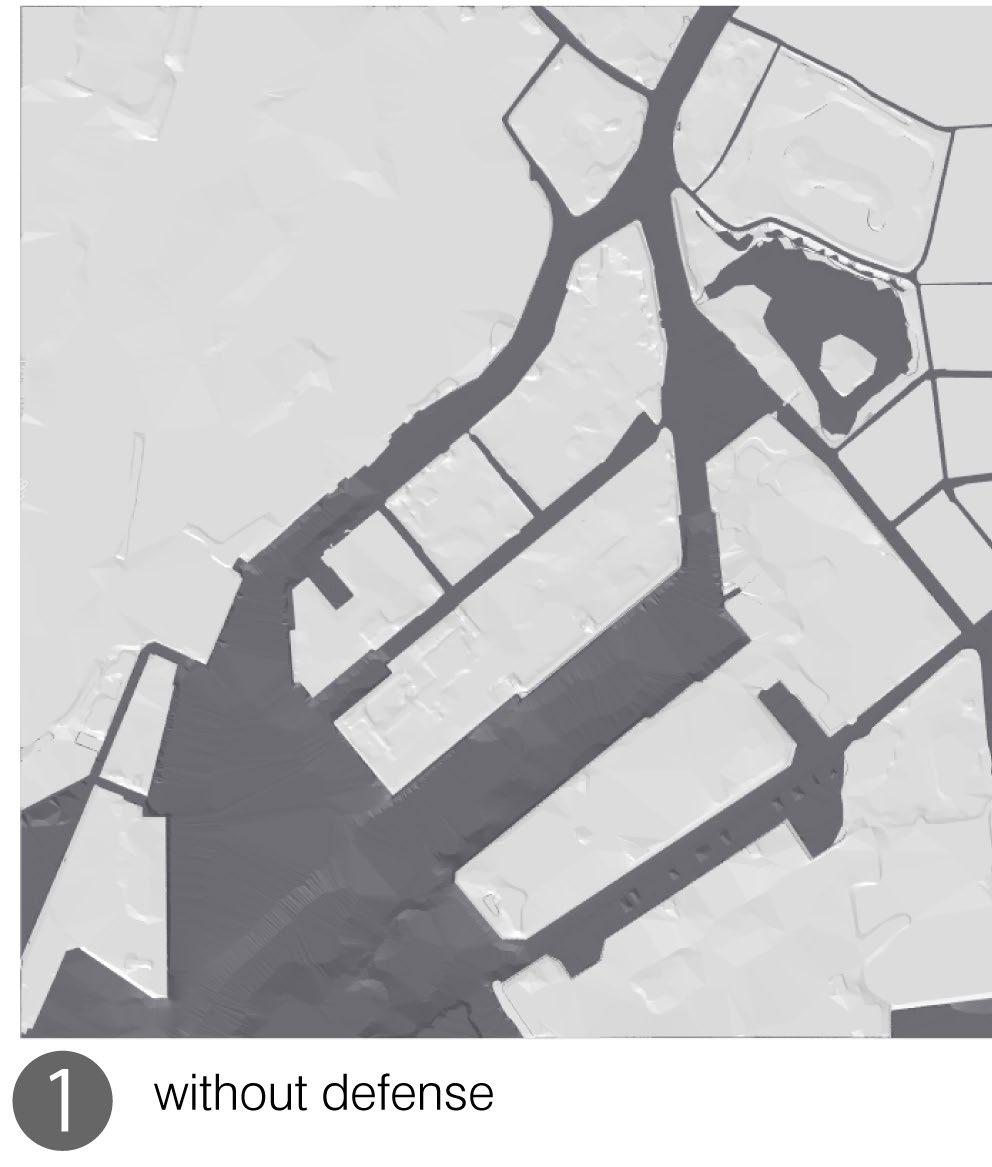
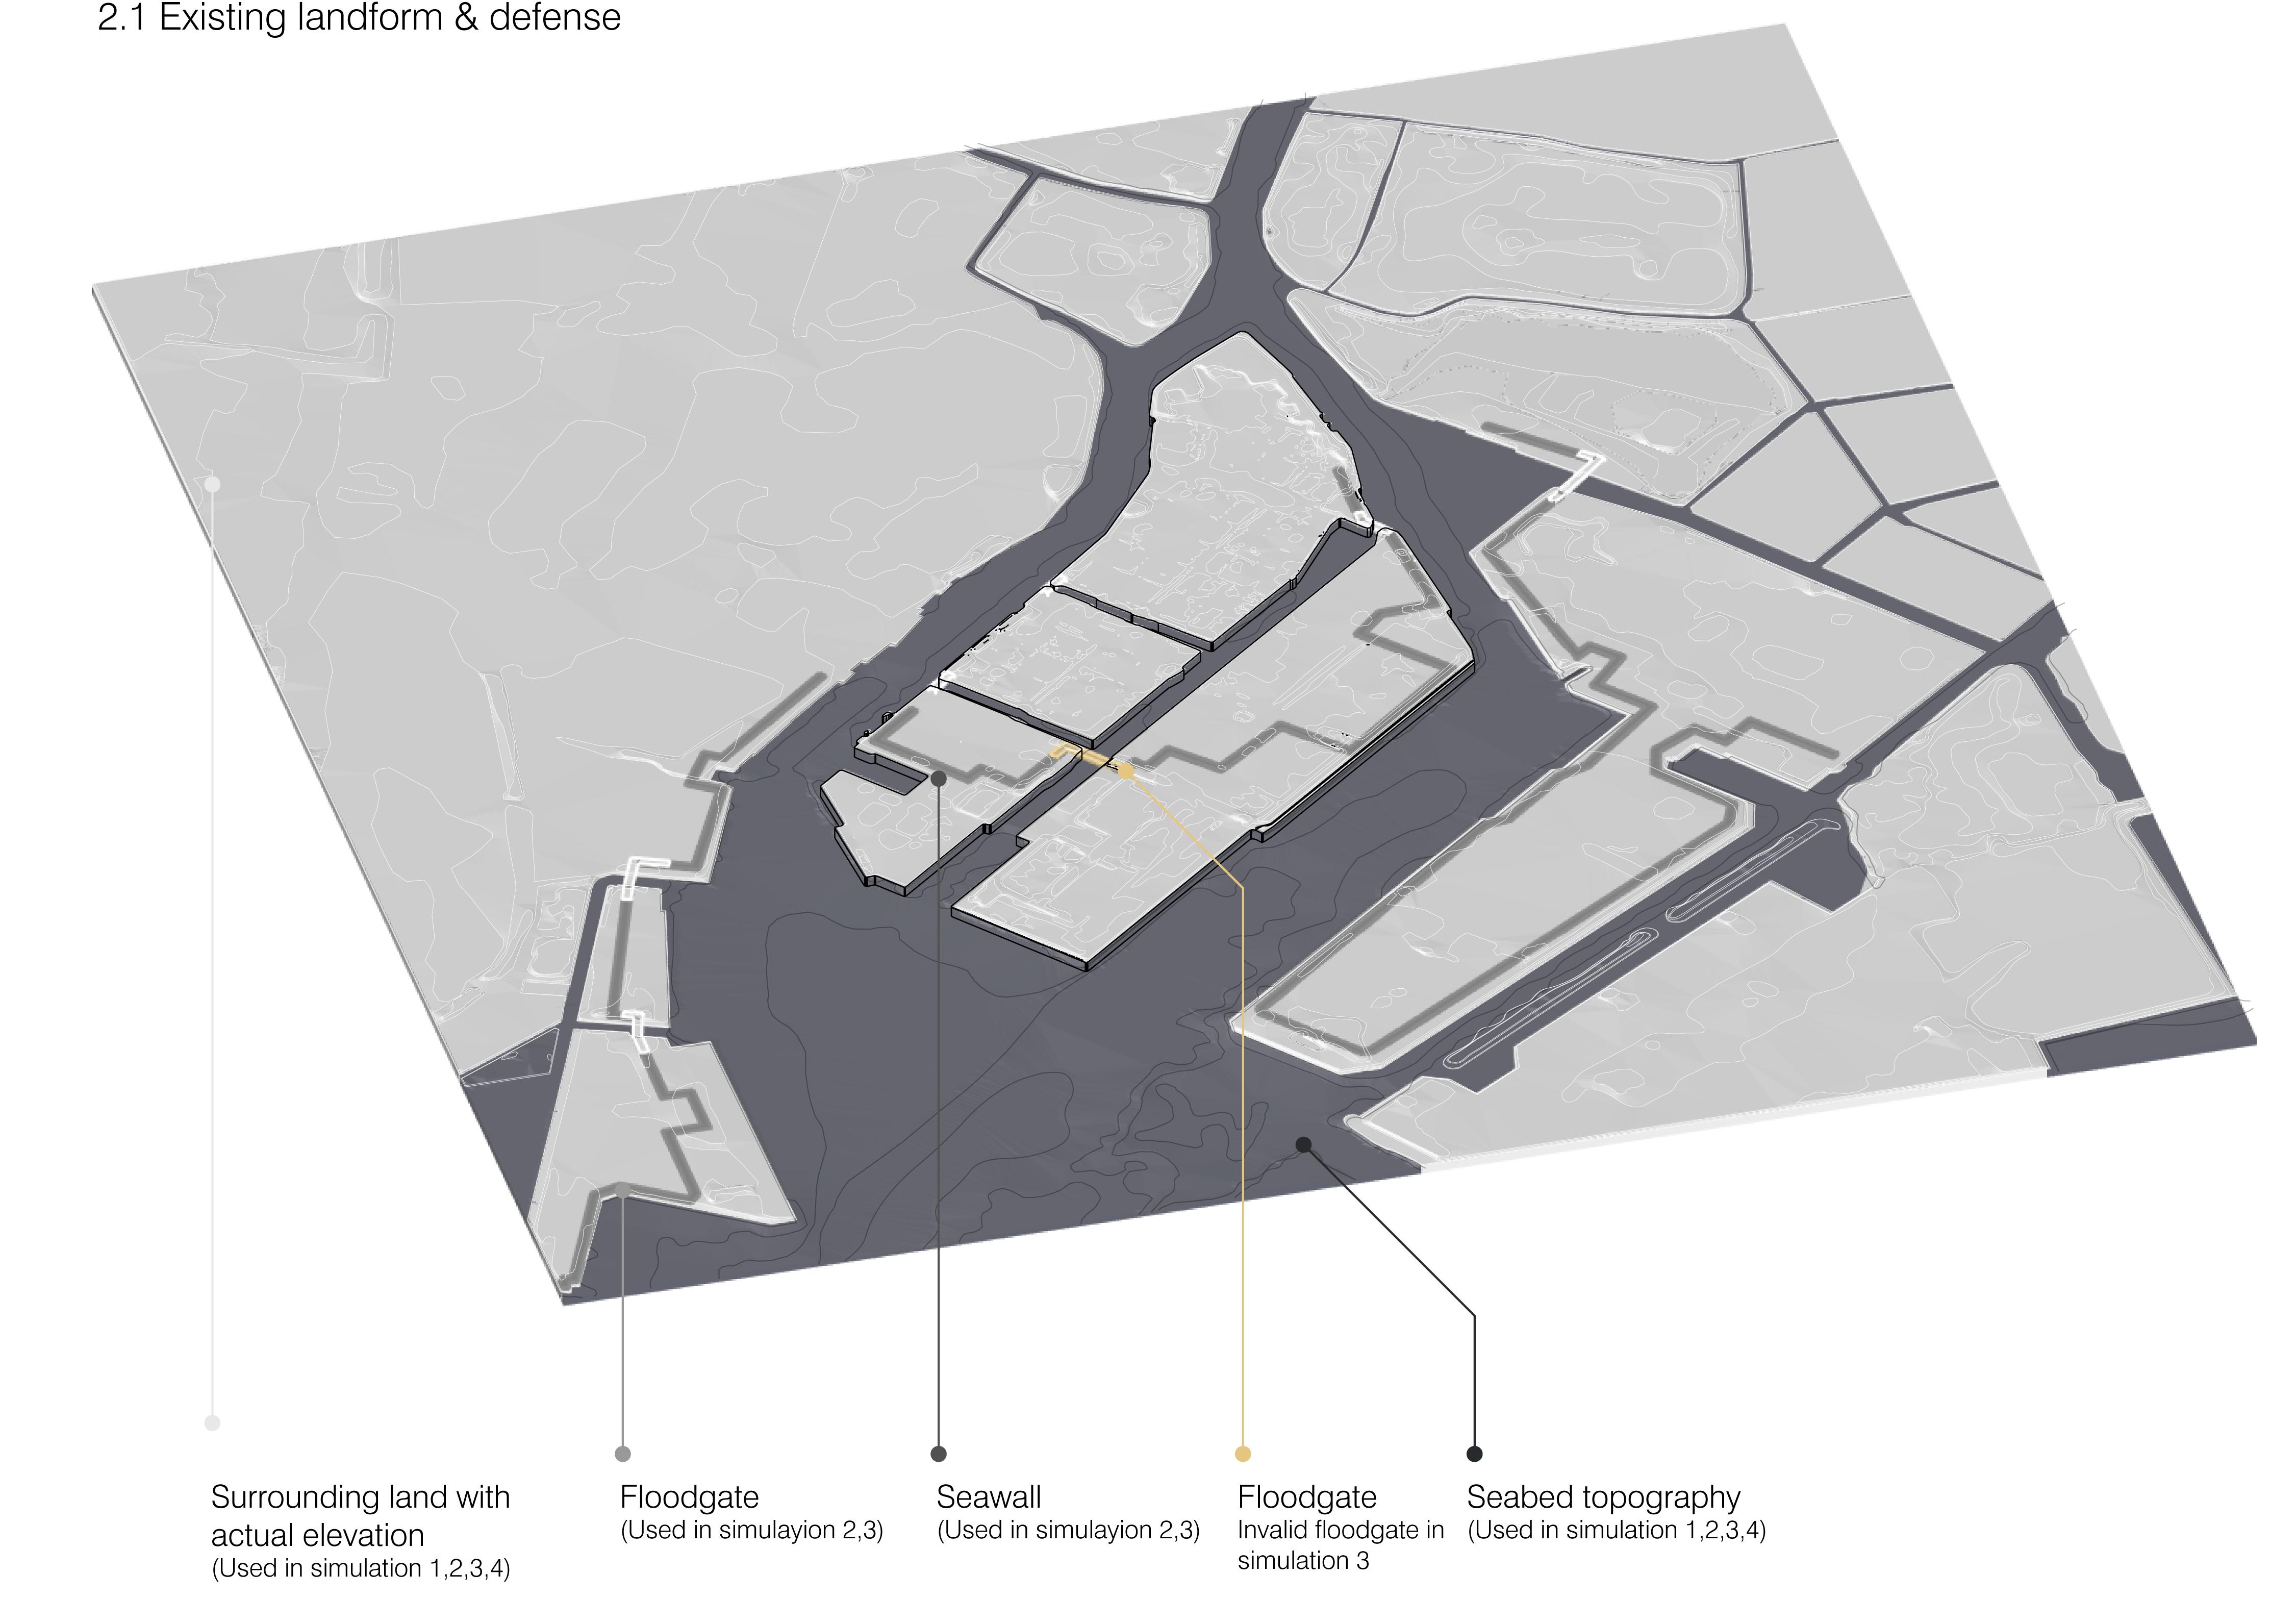
A set of CFD simulations generated using Flow-3D is made to understand the potential destruction of a 5 metre tsunami in different scenarios. The actual topography and bathymetry, as well as the existing defence are modeled as the environment of the simulation.
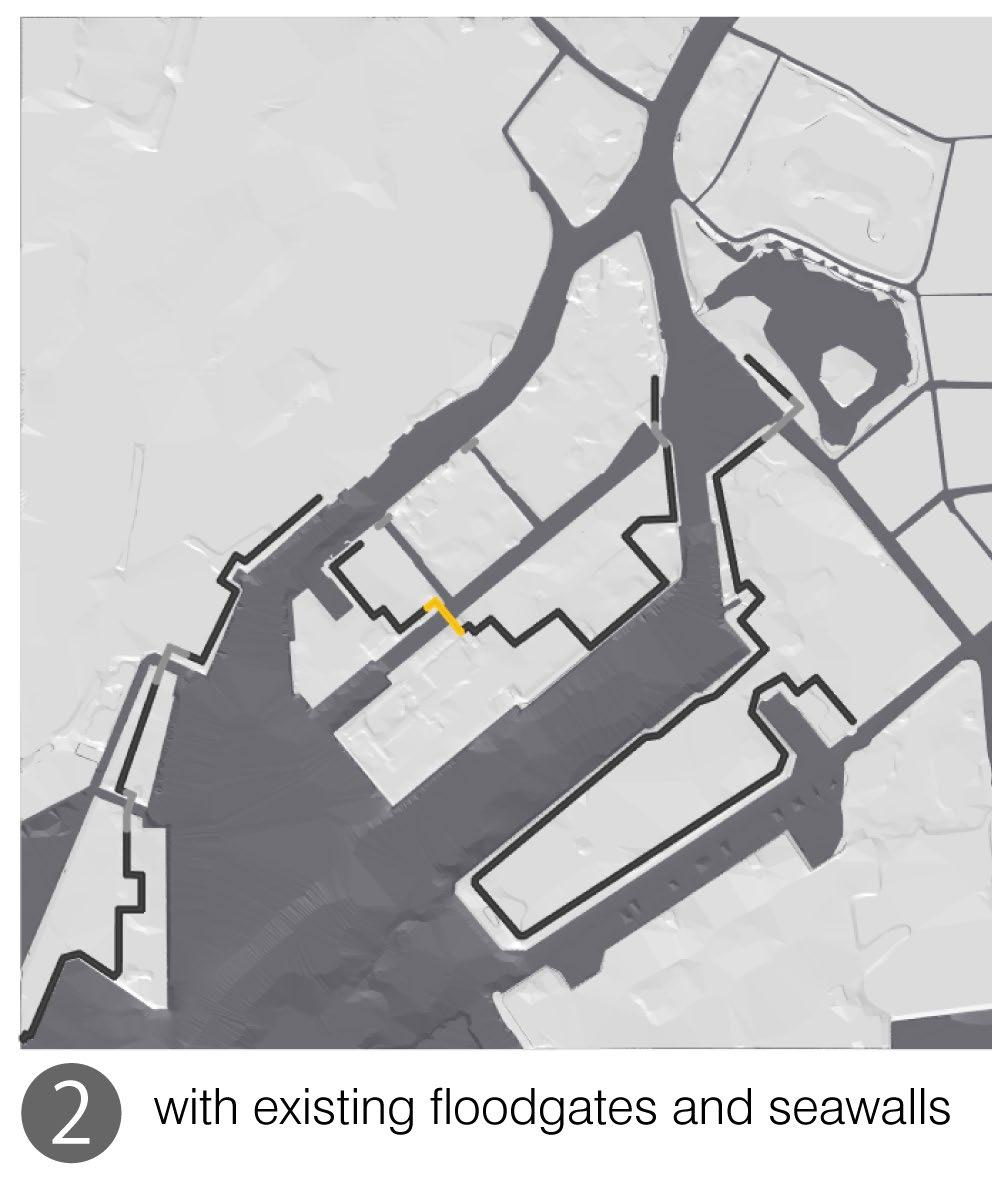
Scenario 1: Existing landform without any defence Scenario 2: Existing landform with all the defence valid Scenario 3: Existing landform with a partially broken defence(Asashio Sluice)
92 93
Figure 4.2.5: Tsunami simulation setups on Tsukishima
Figure 4.2.4: Tsukishima Island and the existing
Observation
1. Large inundation area in Tsukishima. Existing secondary channels can potentially lead to severe inundation.
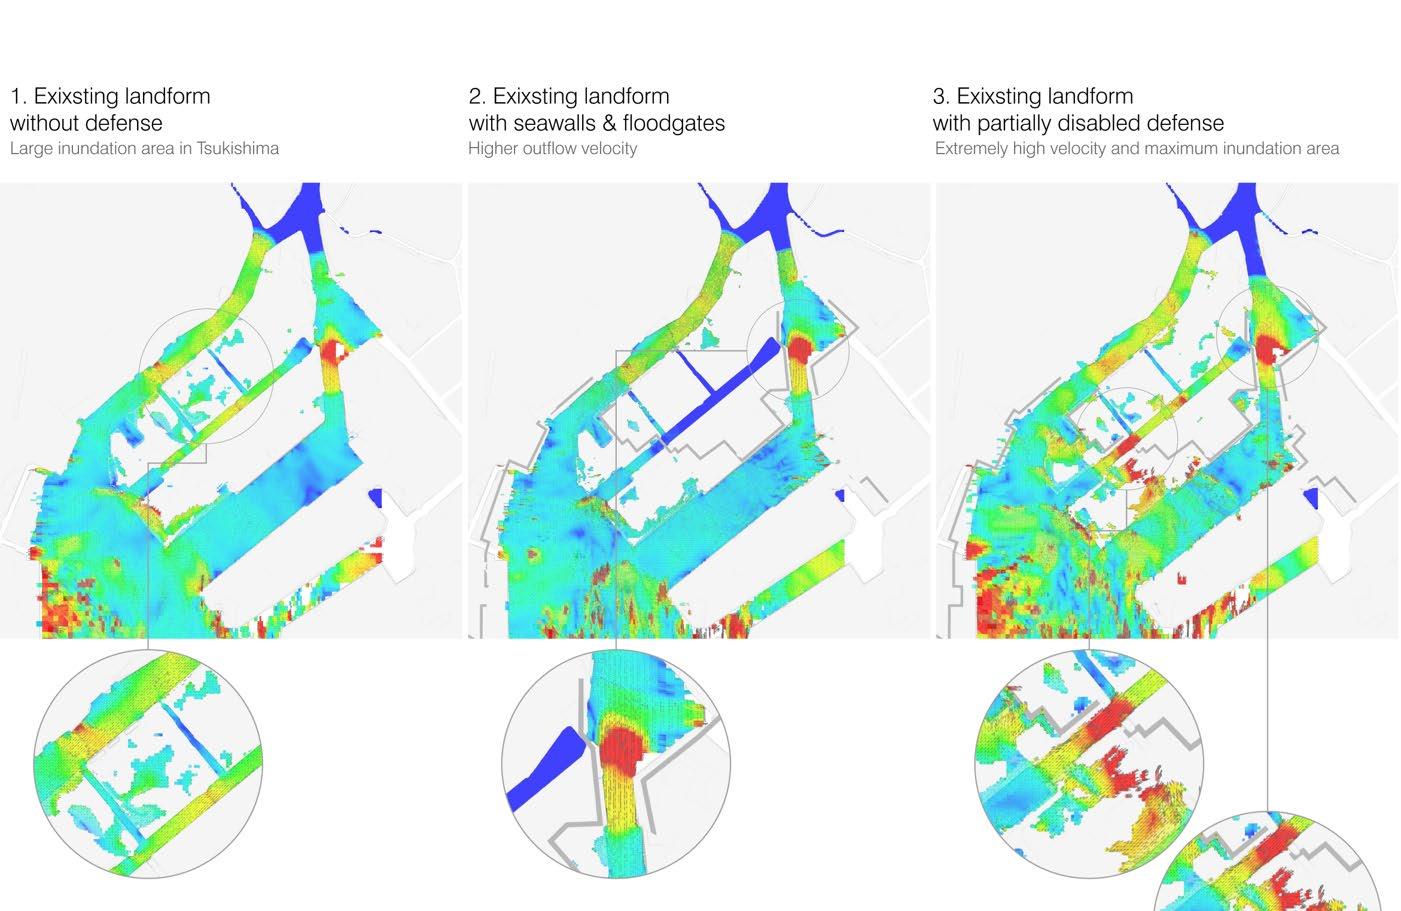
2. This simulation shows the highest outflow velocity among all. Seawall and floodgates can reduce inundation area, however, the water velocity of the upper stream region is increased.
3. Extremely high velocity and maximum inundation area are shown in this simulation. It indicates that once the defence is broken it may create the largest destruction.
Conclusion
The existing defence system can help to reduce inundation and over toppling in Tsukishinma, however, it poses a threat to the upper stream region. Besides, once the existing defence failed, it might lead to the worst scenario. Therefore, another type of defence system, which can channelize the wave better, and will not be harmful to the upper stream region needs to be developed.
94 95
Figure 4.2.6: Tsunami simulation on Tsukishima
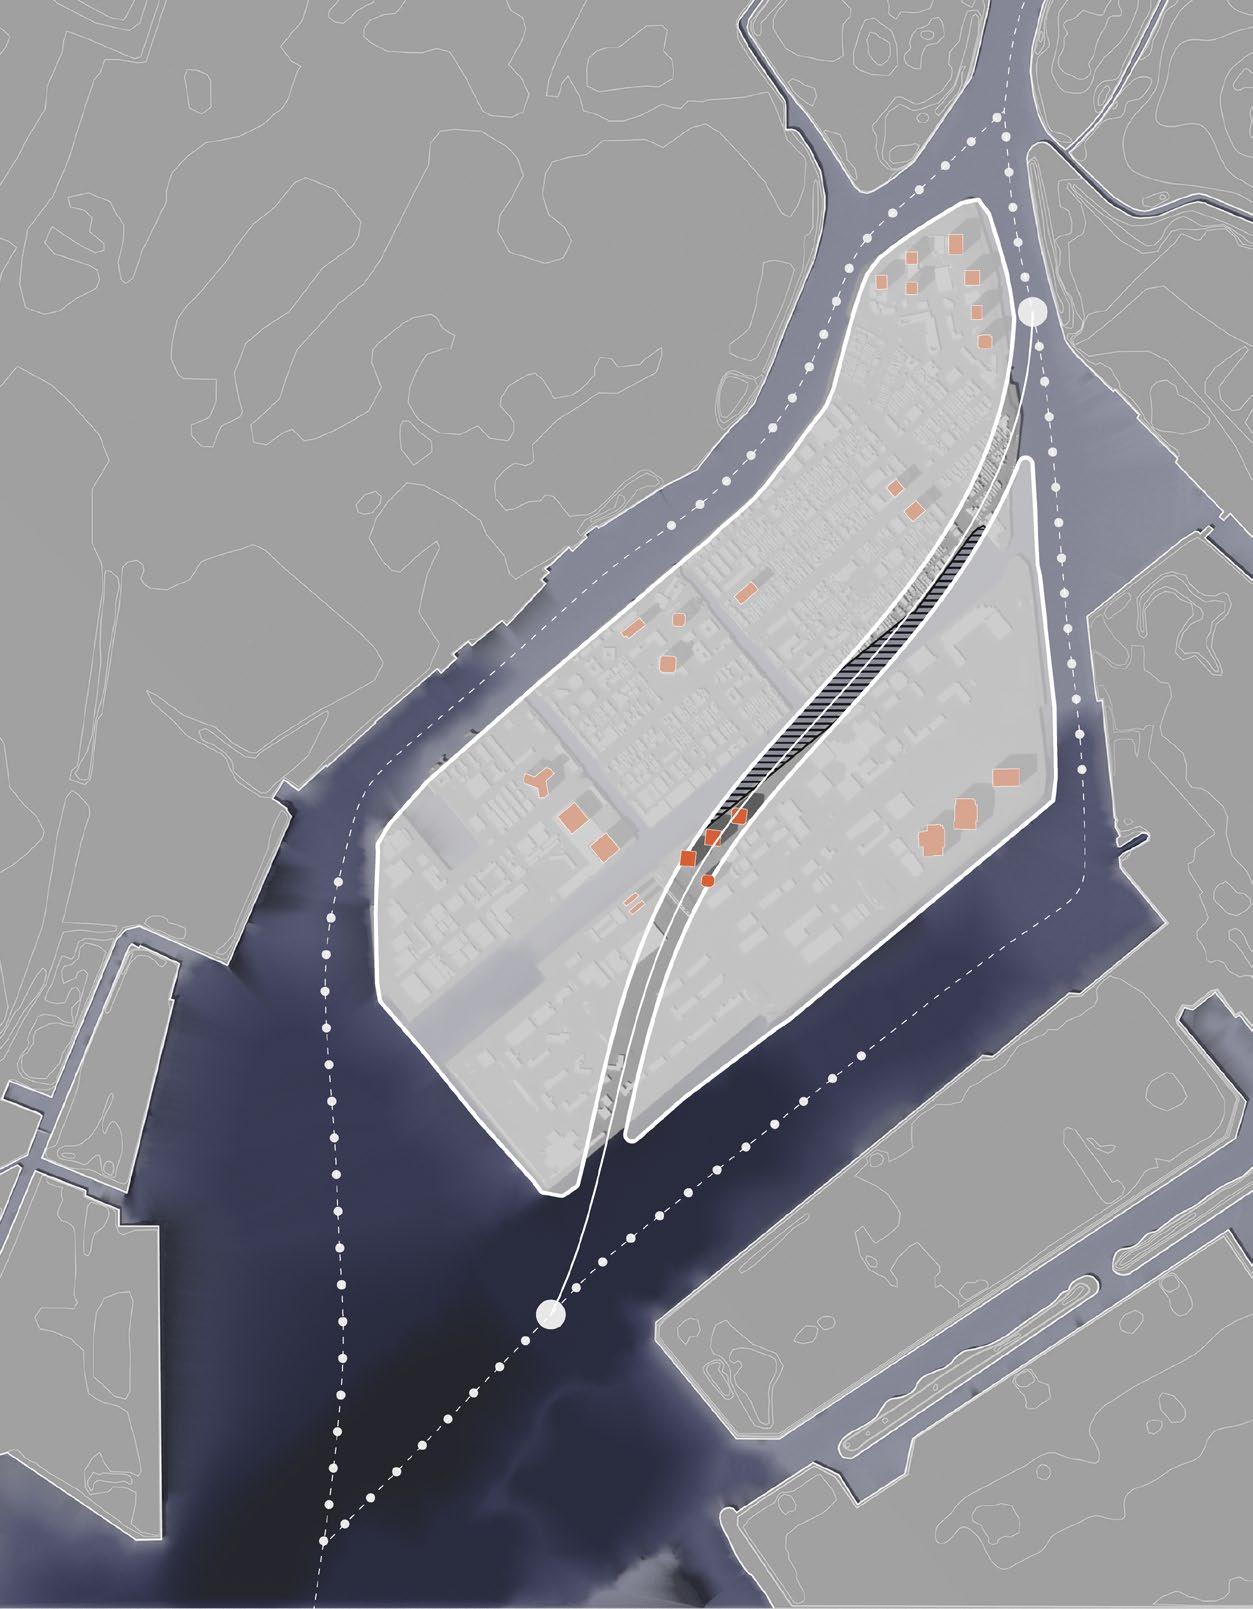
4.2.1.4 Ship route analysis
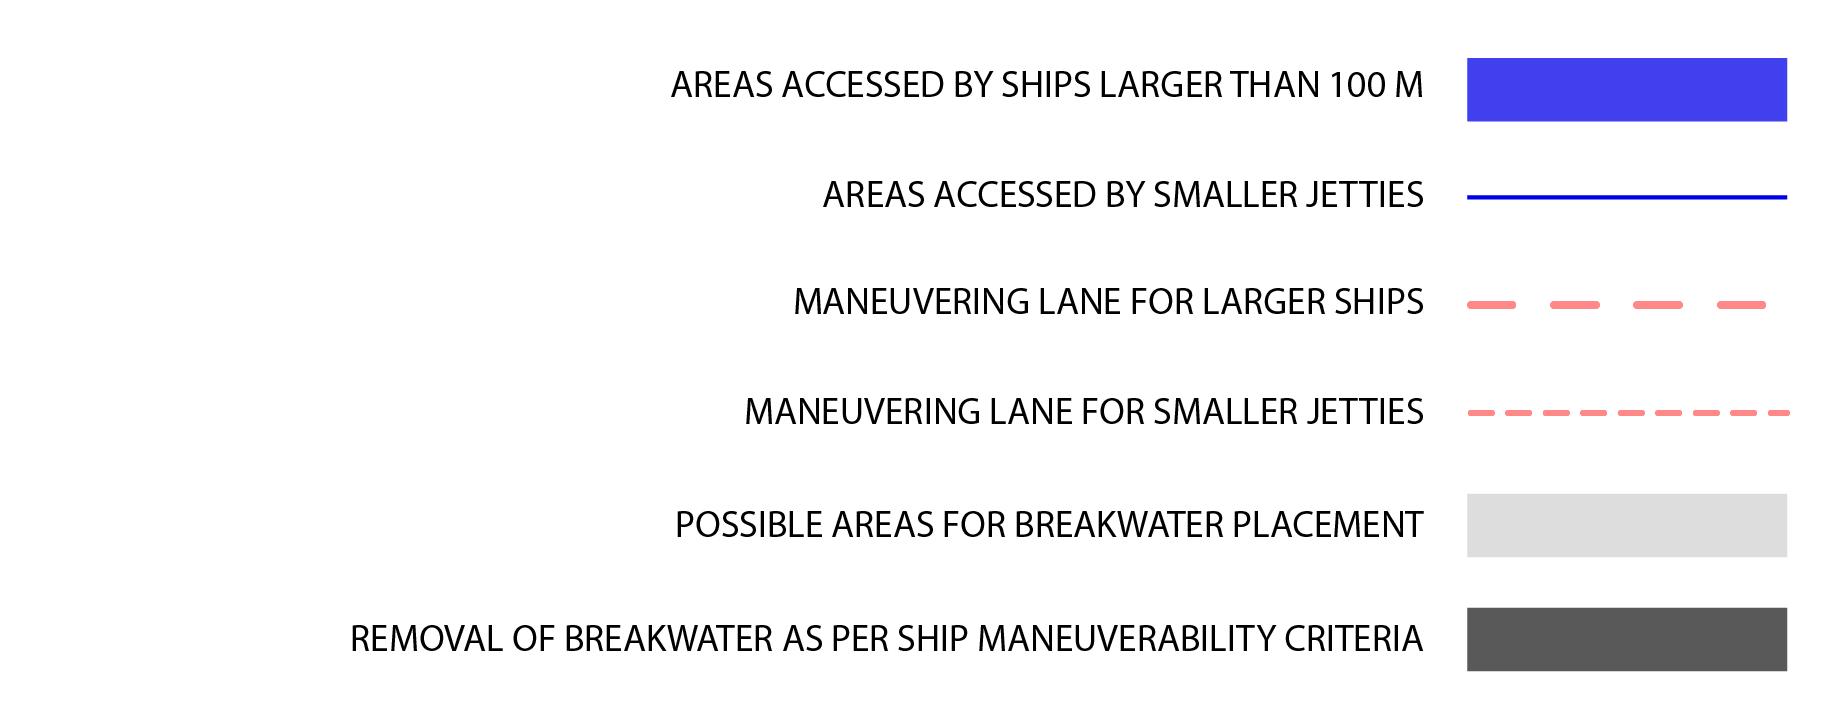
For the ship route analysis, Tsukishima’s ports were found to be always busy with small ships and ferries to deliver goods for the fisheries industry. The areas marked in thick blue lines were fully dedicated to the same, whereas the areas marked in thin blue lines allowed for small ferries with lesser travel frequencies. The average sizes for the small cargo ships were approximately 90 to 120m in length and 25 m in width. These ships require a diameter 4 times the size of the width of the ship in order to rotate and change travel direction. Also the ships require a channel width with a minimum of twice their width size to safely maneuver and move. This information and their travel maneuver routes around Tsukishima island areas helped us sum up the potential areas of the barrier module placement in and around Tsukishima island.

97
Figure 4.2.7: Existing port areas in Tsukishima Island
4.2.2 Tsunami cfd tests
4.2.2.1 Tests on basic channel types
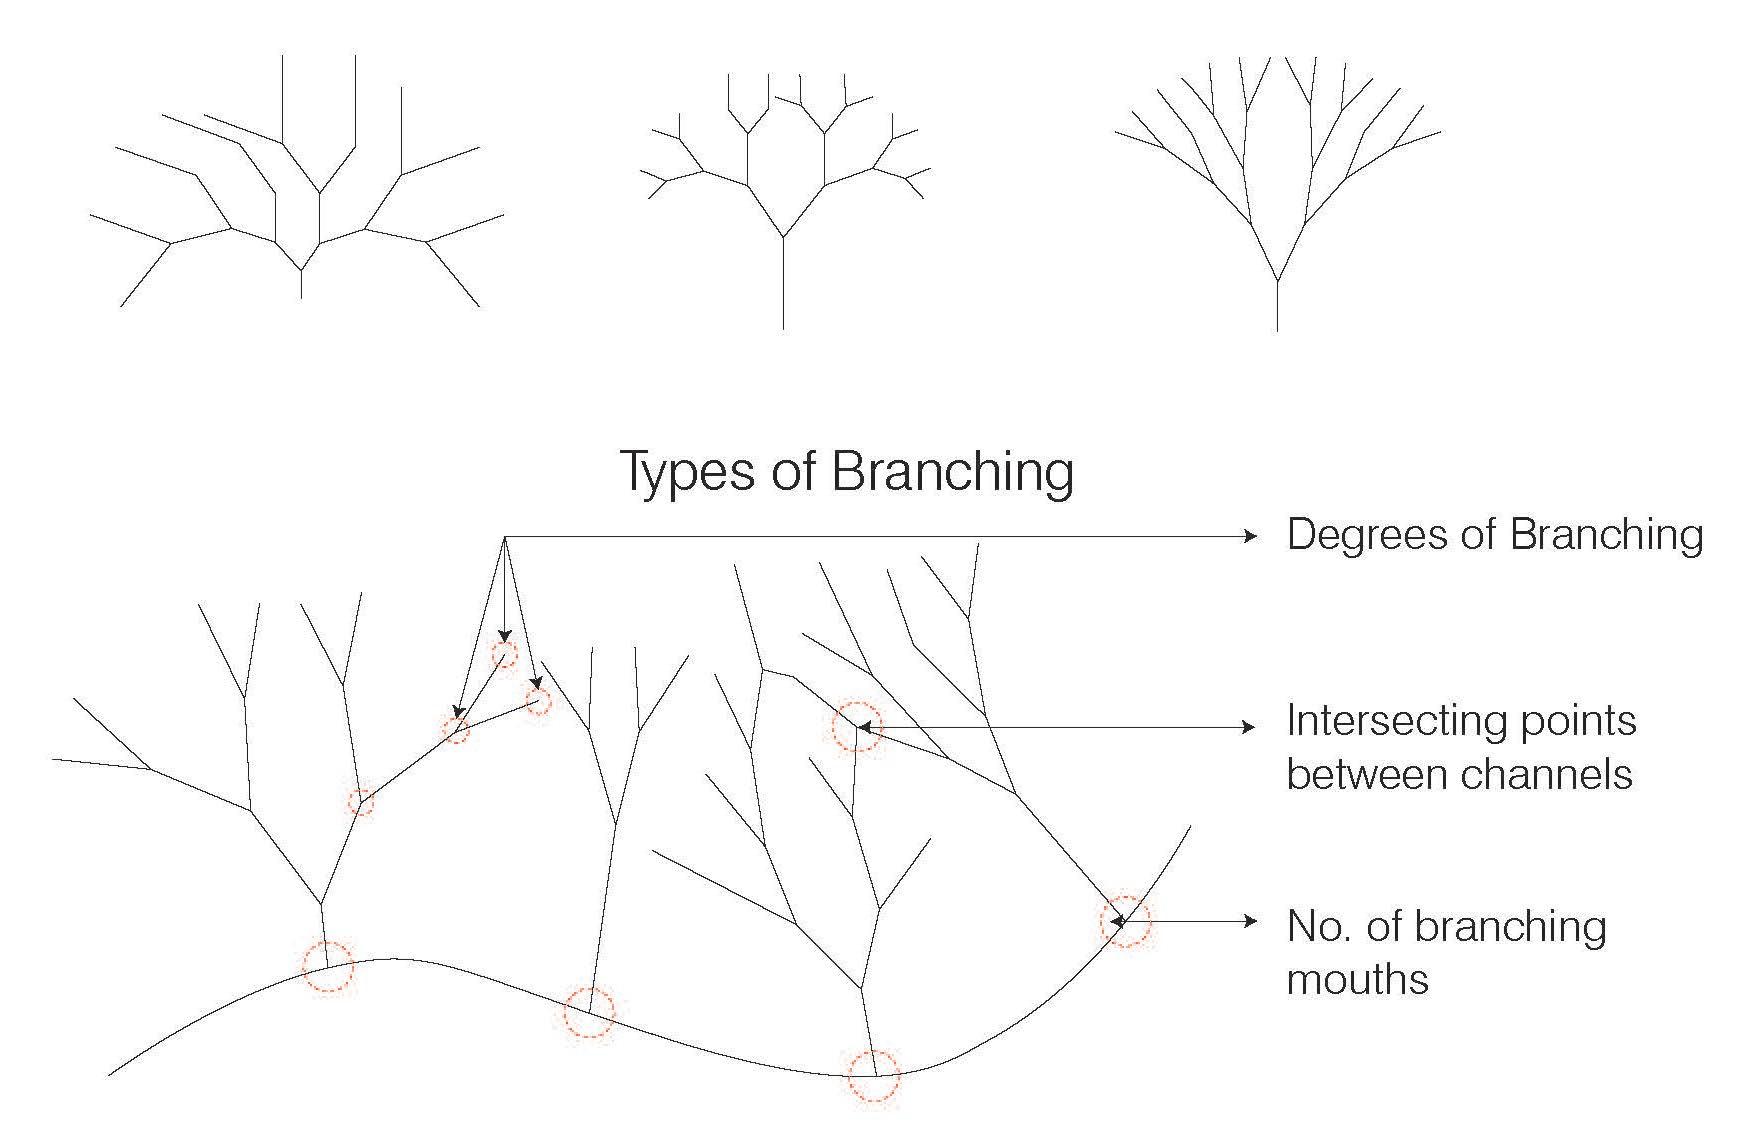
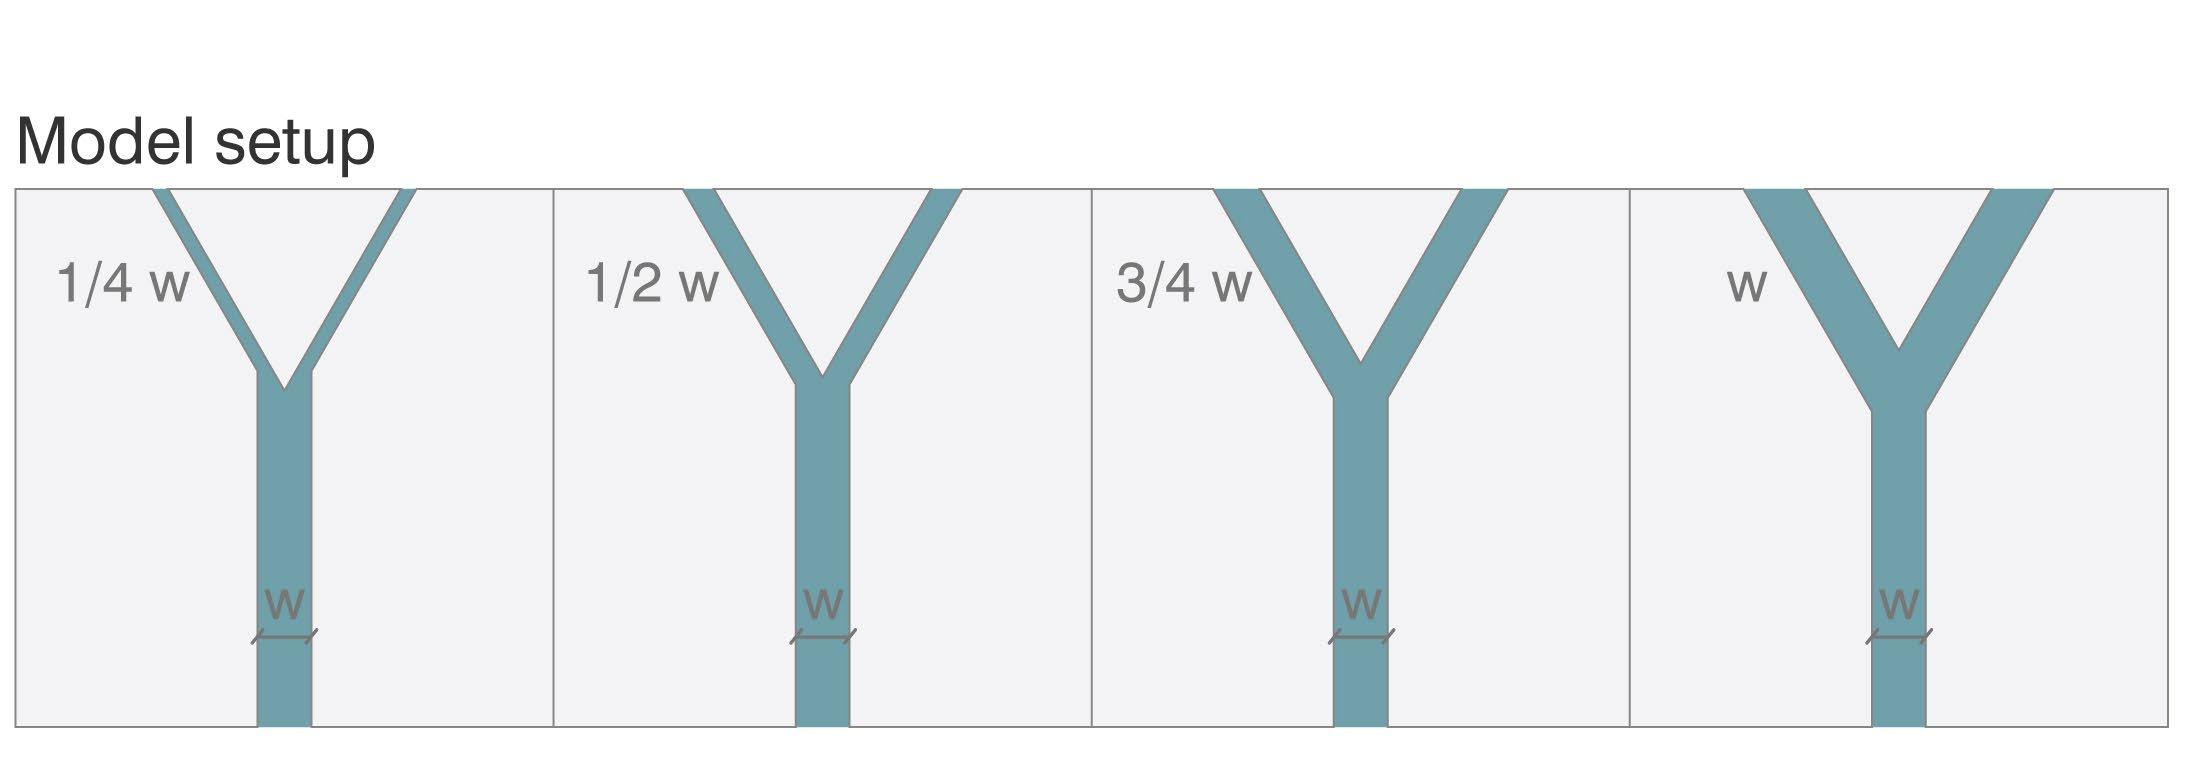
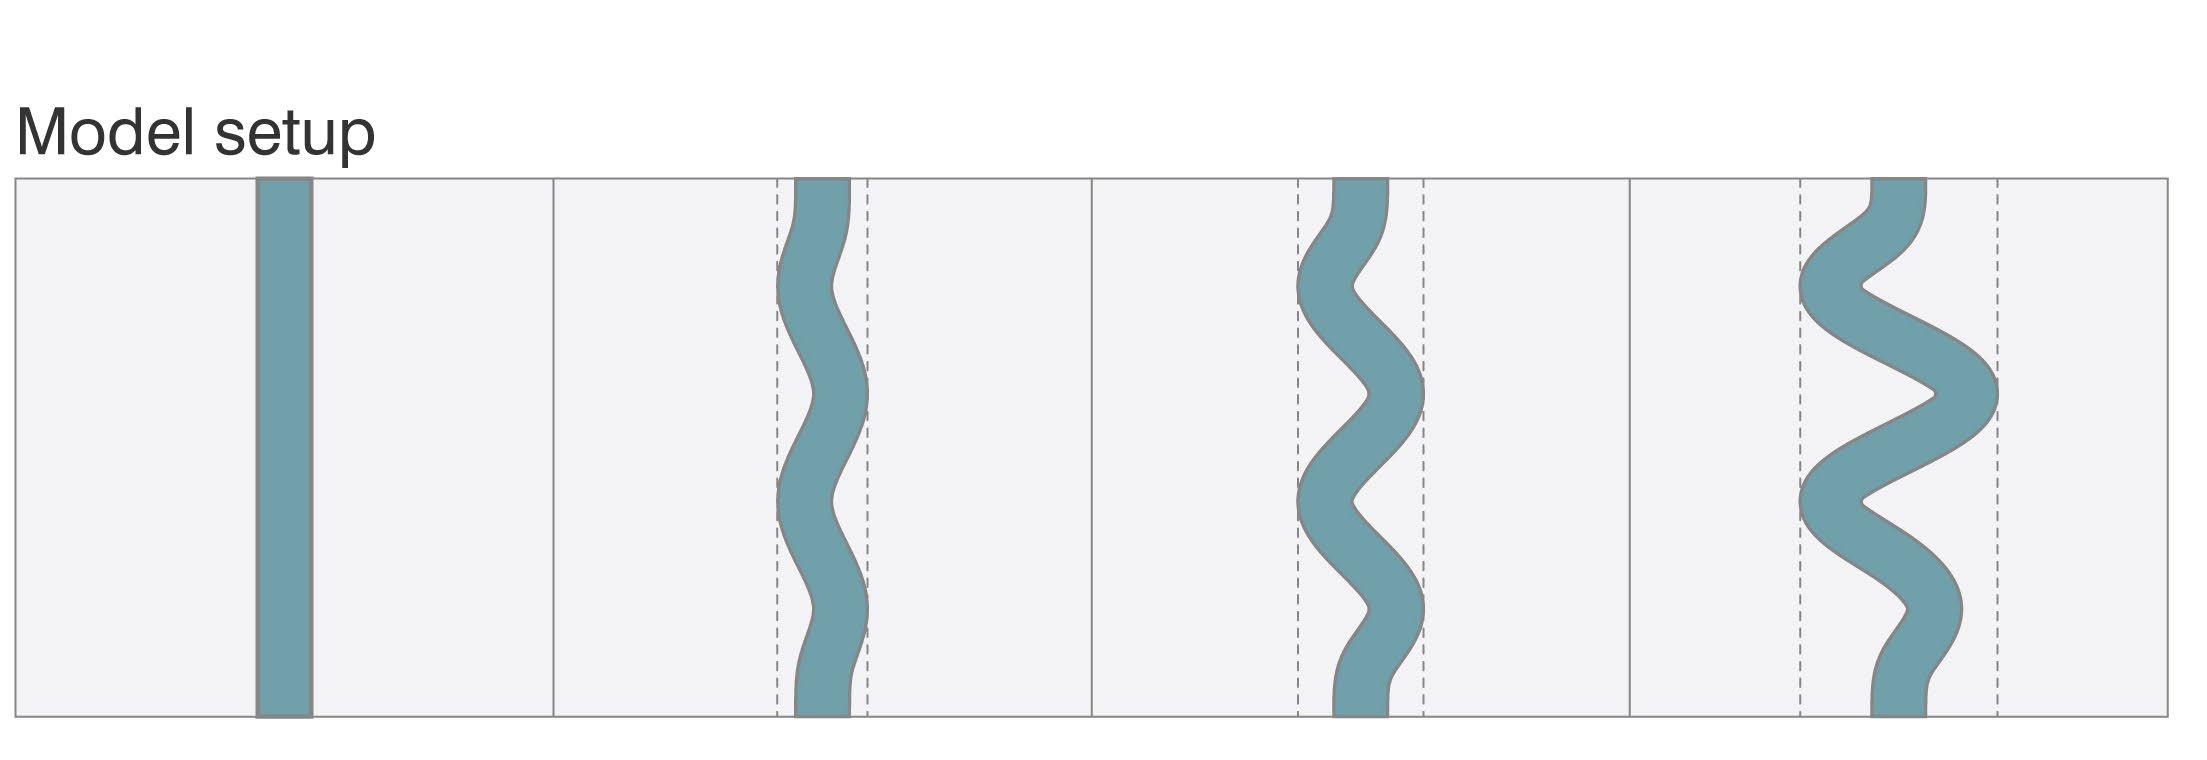
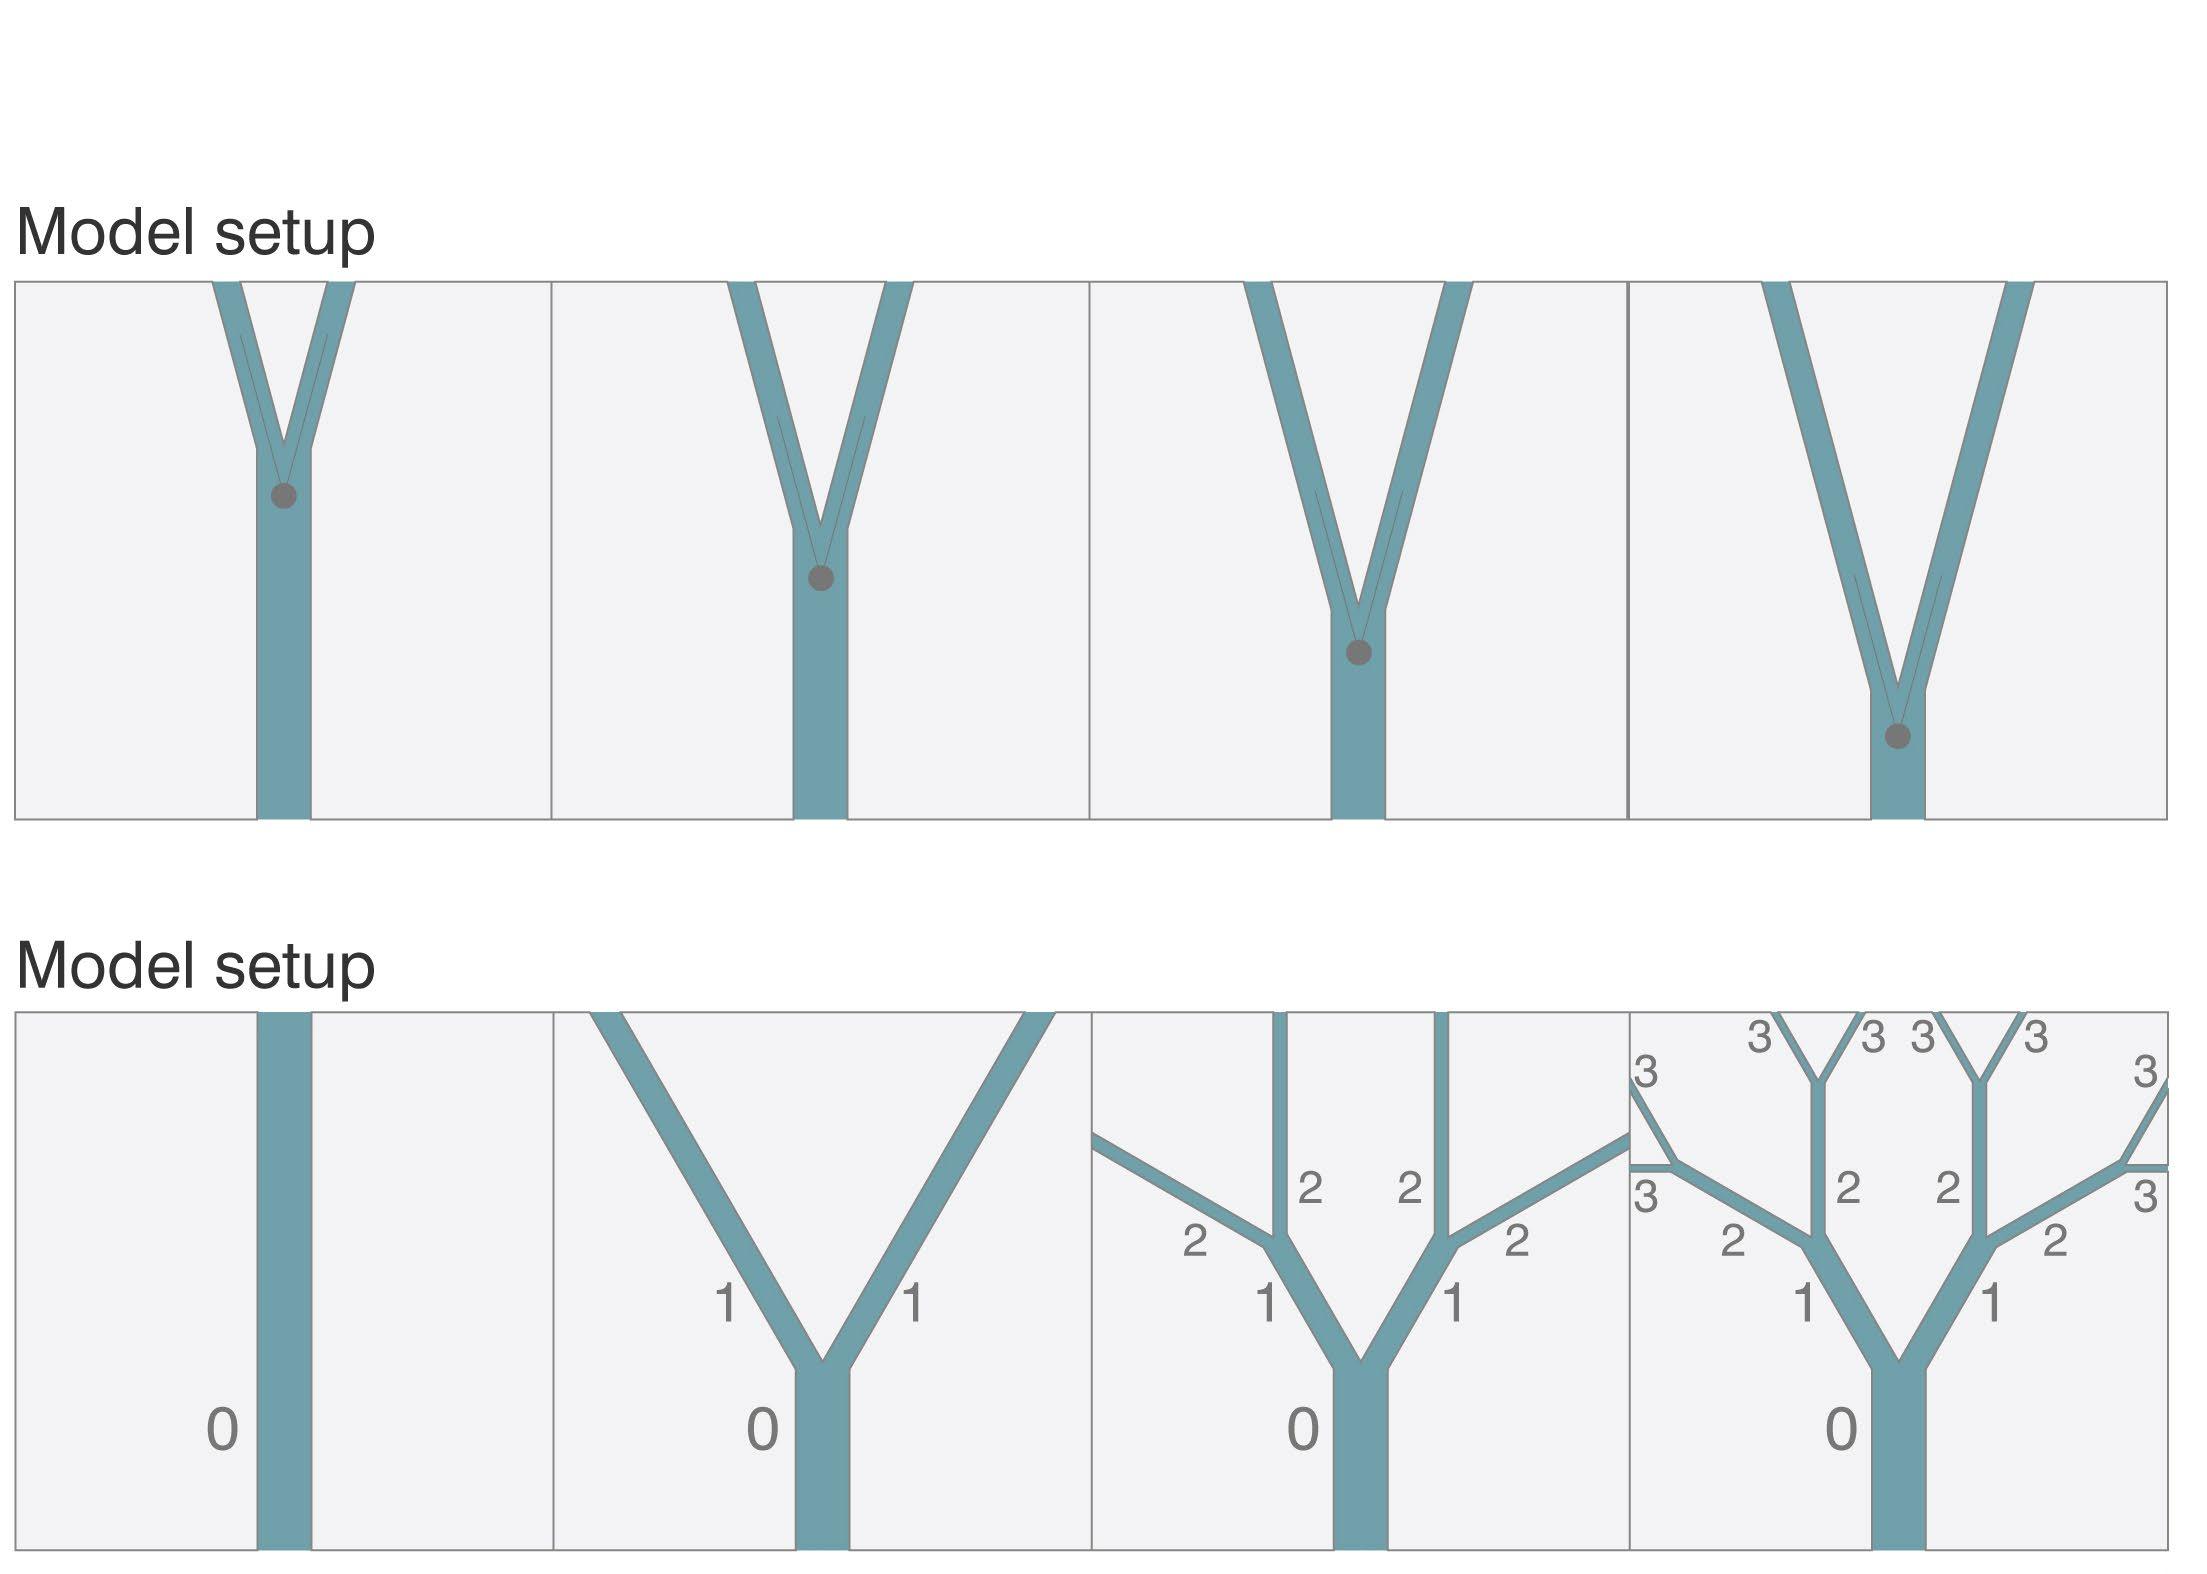
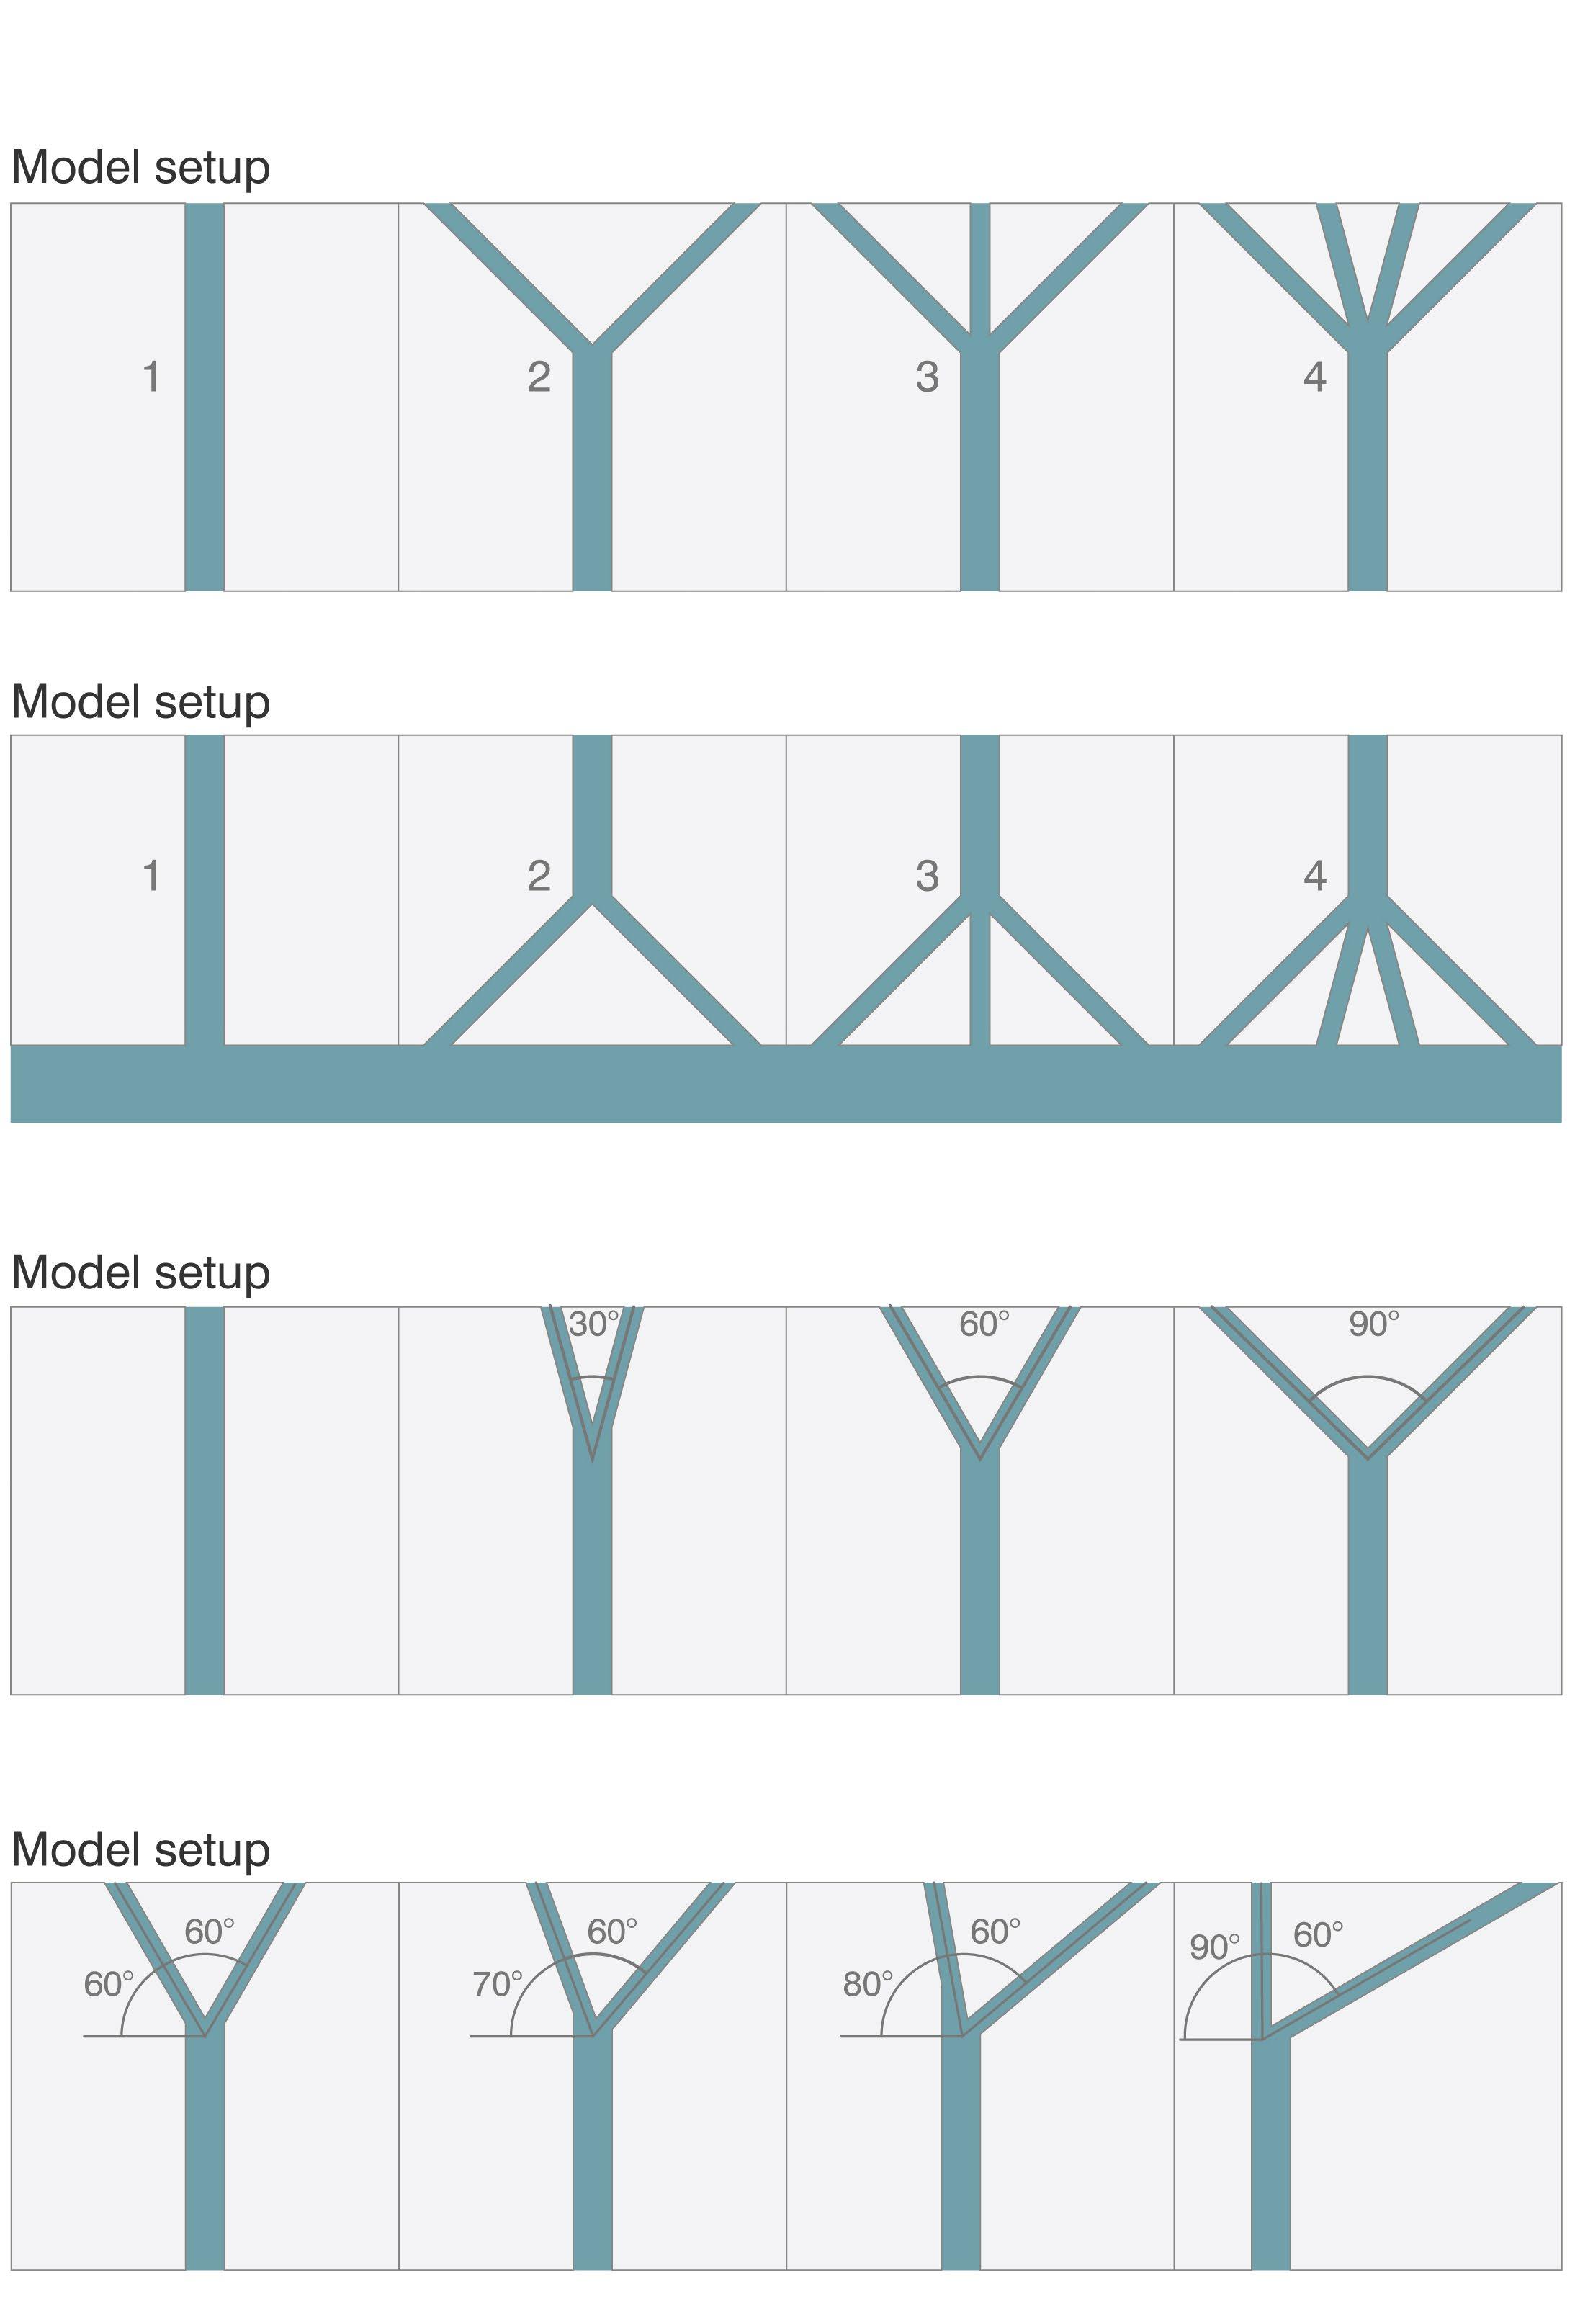
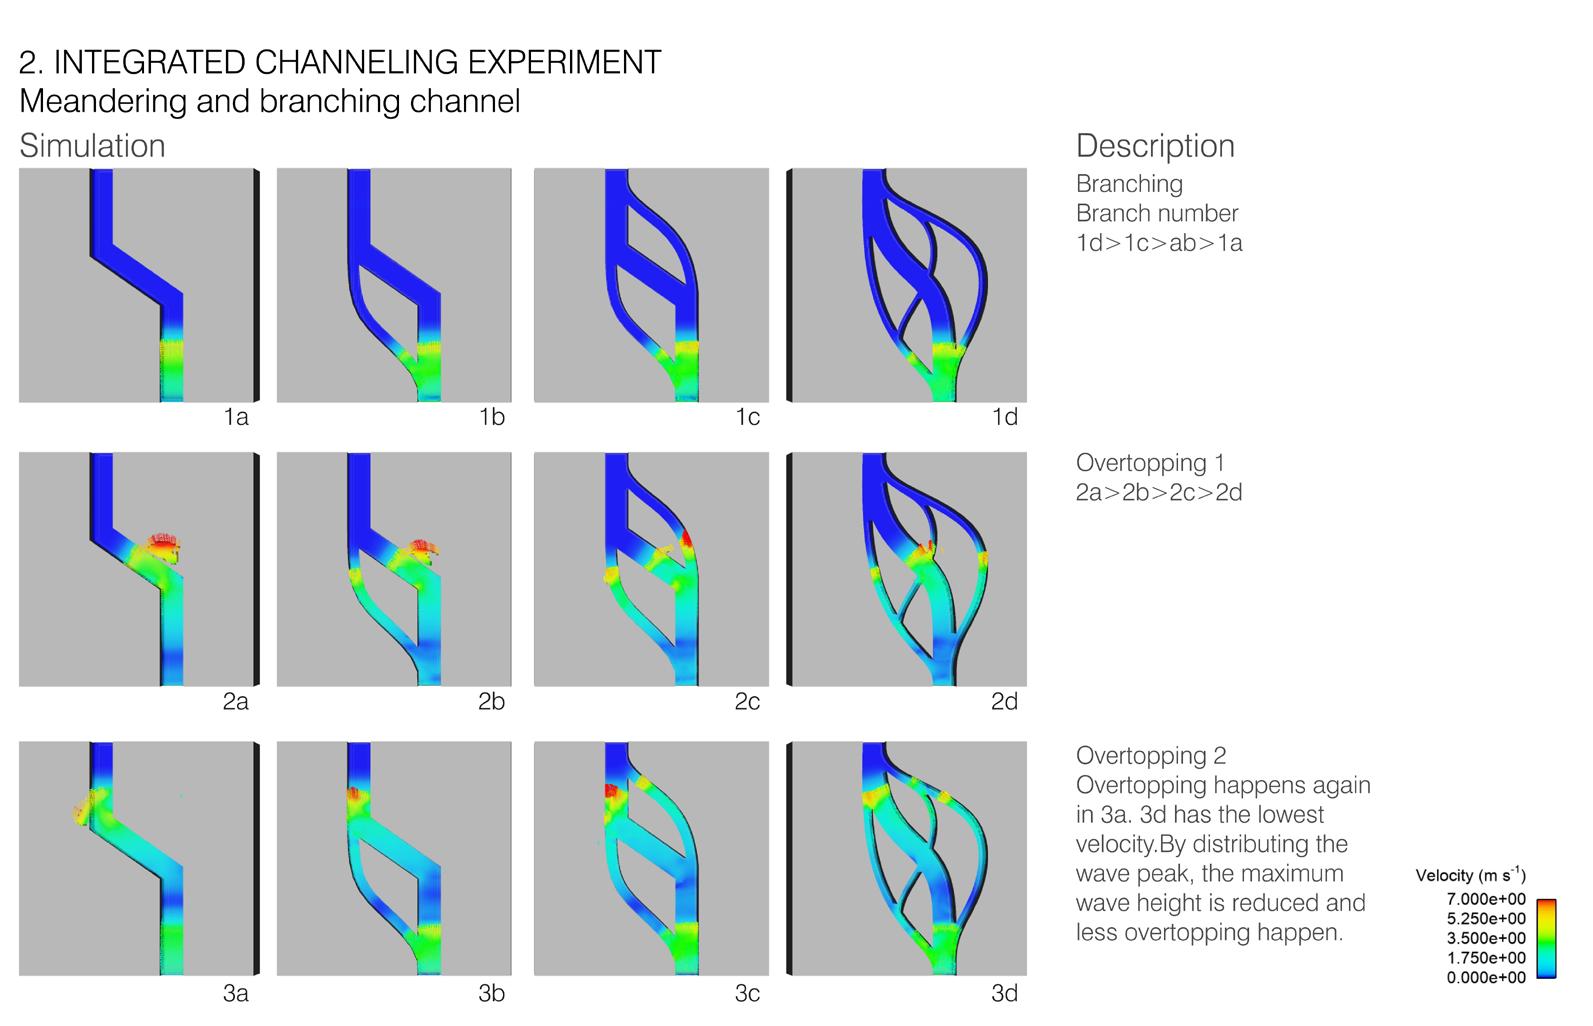
Eight sets of single-variable experiments are conducted to understand the hydraulic principles. These variables include branch number[1], branch number of river mouth[2], branching angle[3], branch relative angle[4], branch position[5], branch degree[6], branch channel width[7], and meandering angle[8].

Other settings
Size: 200m*200m
Main channel width: 20m
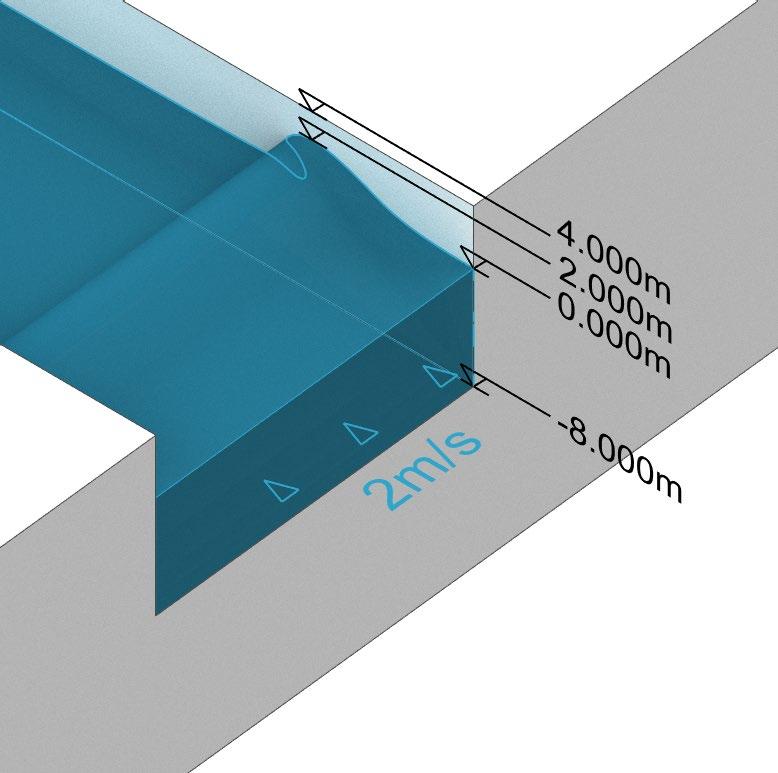
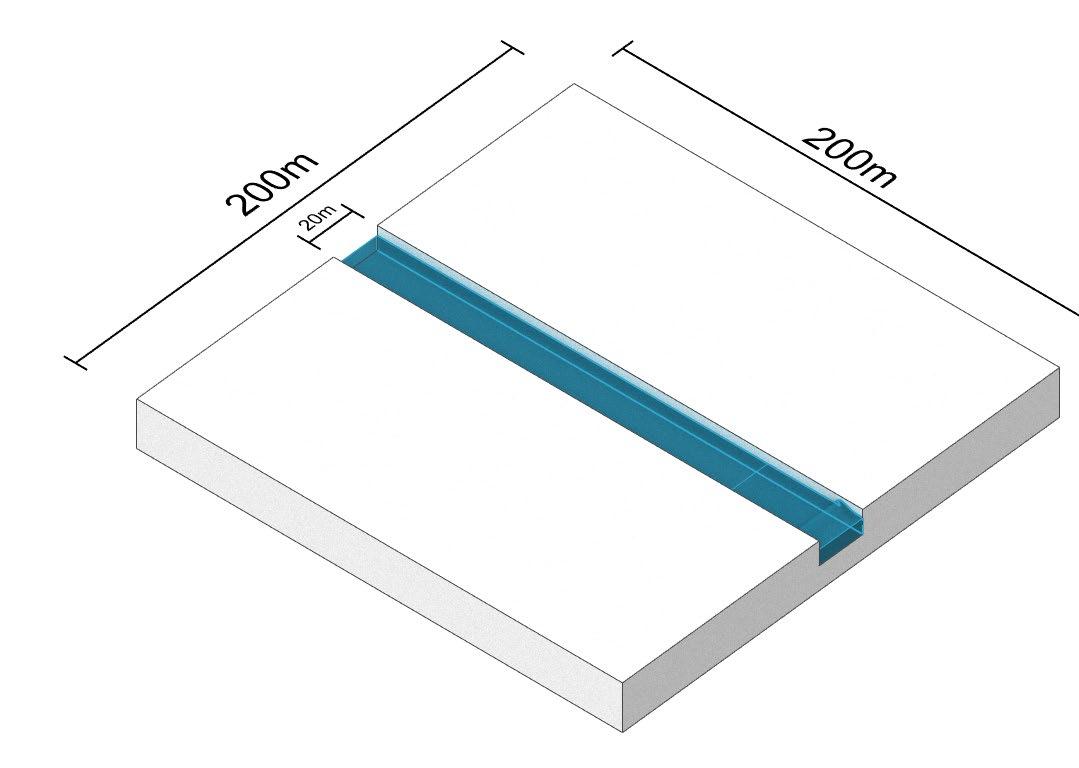
Current speed: 2m/s
Land elevation: 4m
Wave height: 2m
98 99
1. Branch number 5. Branch position
2. Branch number of river mouth 6. Branch degree
3. Branch angle
7. Branch channel width
4. Branch relative angle 8. meandering angle
Basic model setup
Figure 4.2.8: Branching experiment setup
Figure 4.2.9
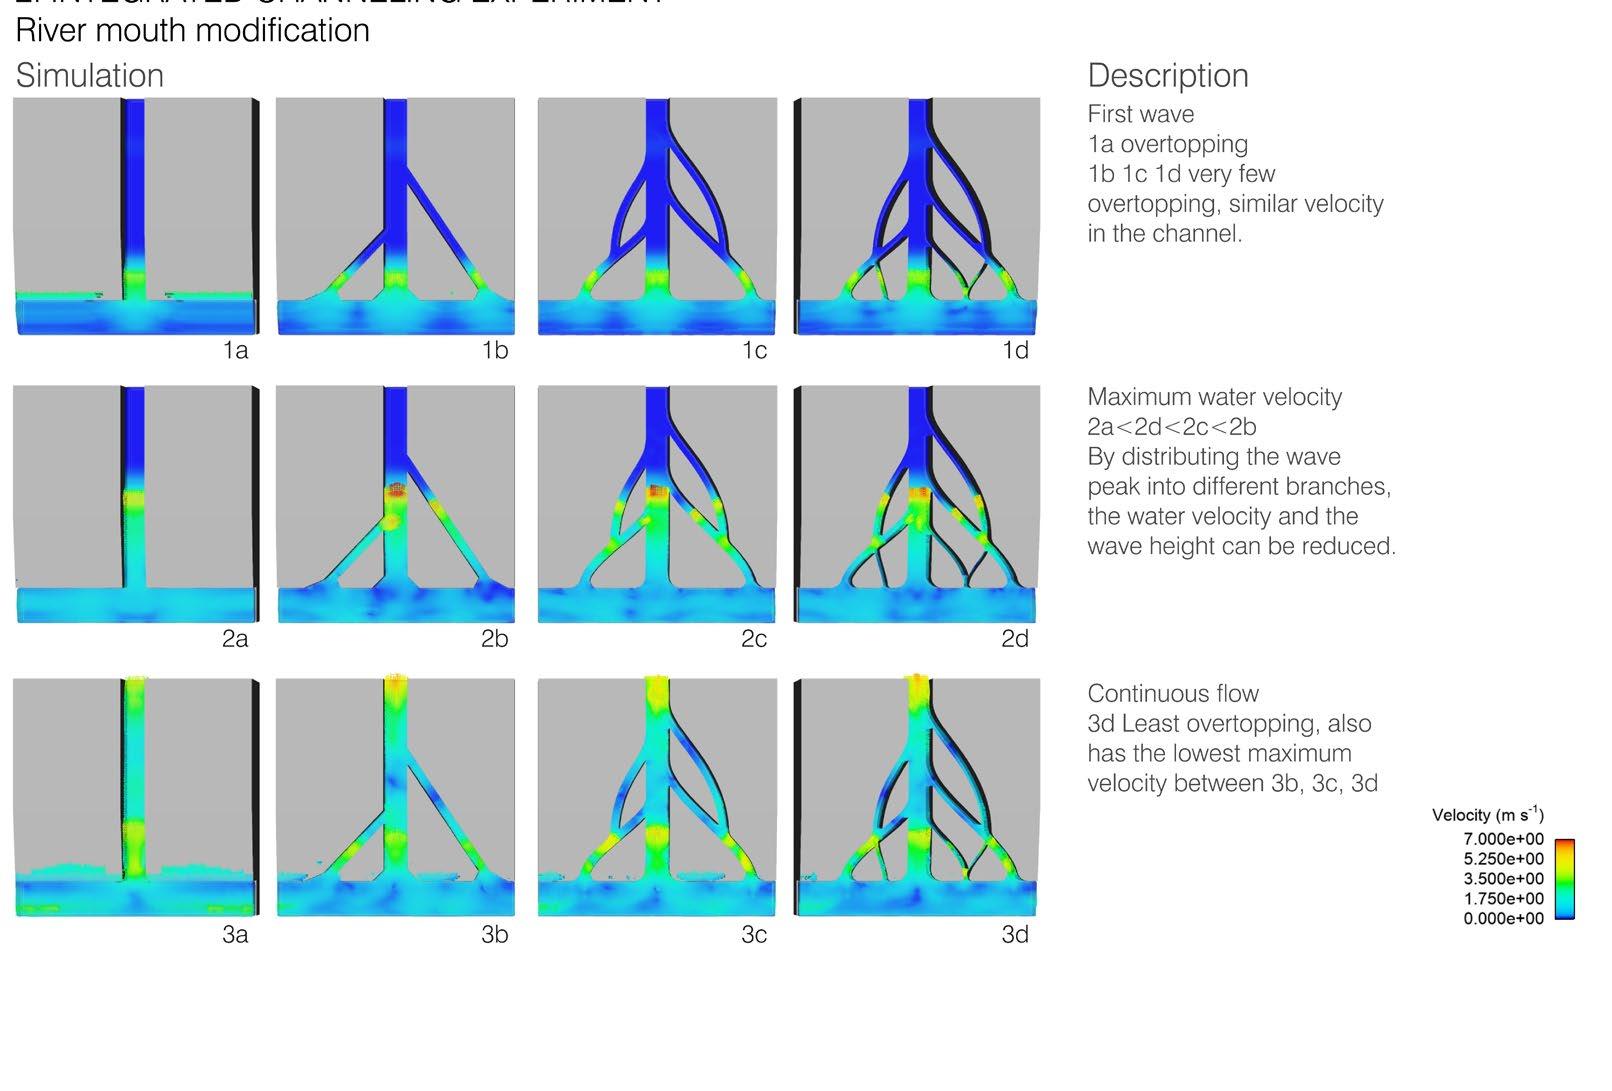
1b Overtopping
1d Most energy distribution, lowest maximum water velocity (More branching more energy distribution)
2a Largest inundation area
2d Smallest inundation area, but also has the highest velocity in the following channnel (Channelling/water intake can help to reduce shoreline inundation)
3d Most overtopping
3d Most energy dissipation (Larger angle more inundation and energy dissipation, but also has higher risk of overtopping)
4a equal energy distribution
4d most uneven energy distribution
(Angle between the stem and the branch determines the persentage of energy distribution, 0 degree = maximum energy)
5d Earlier energy dissipation (Closer branching earlier energy dissipation)
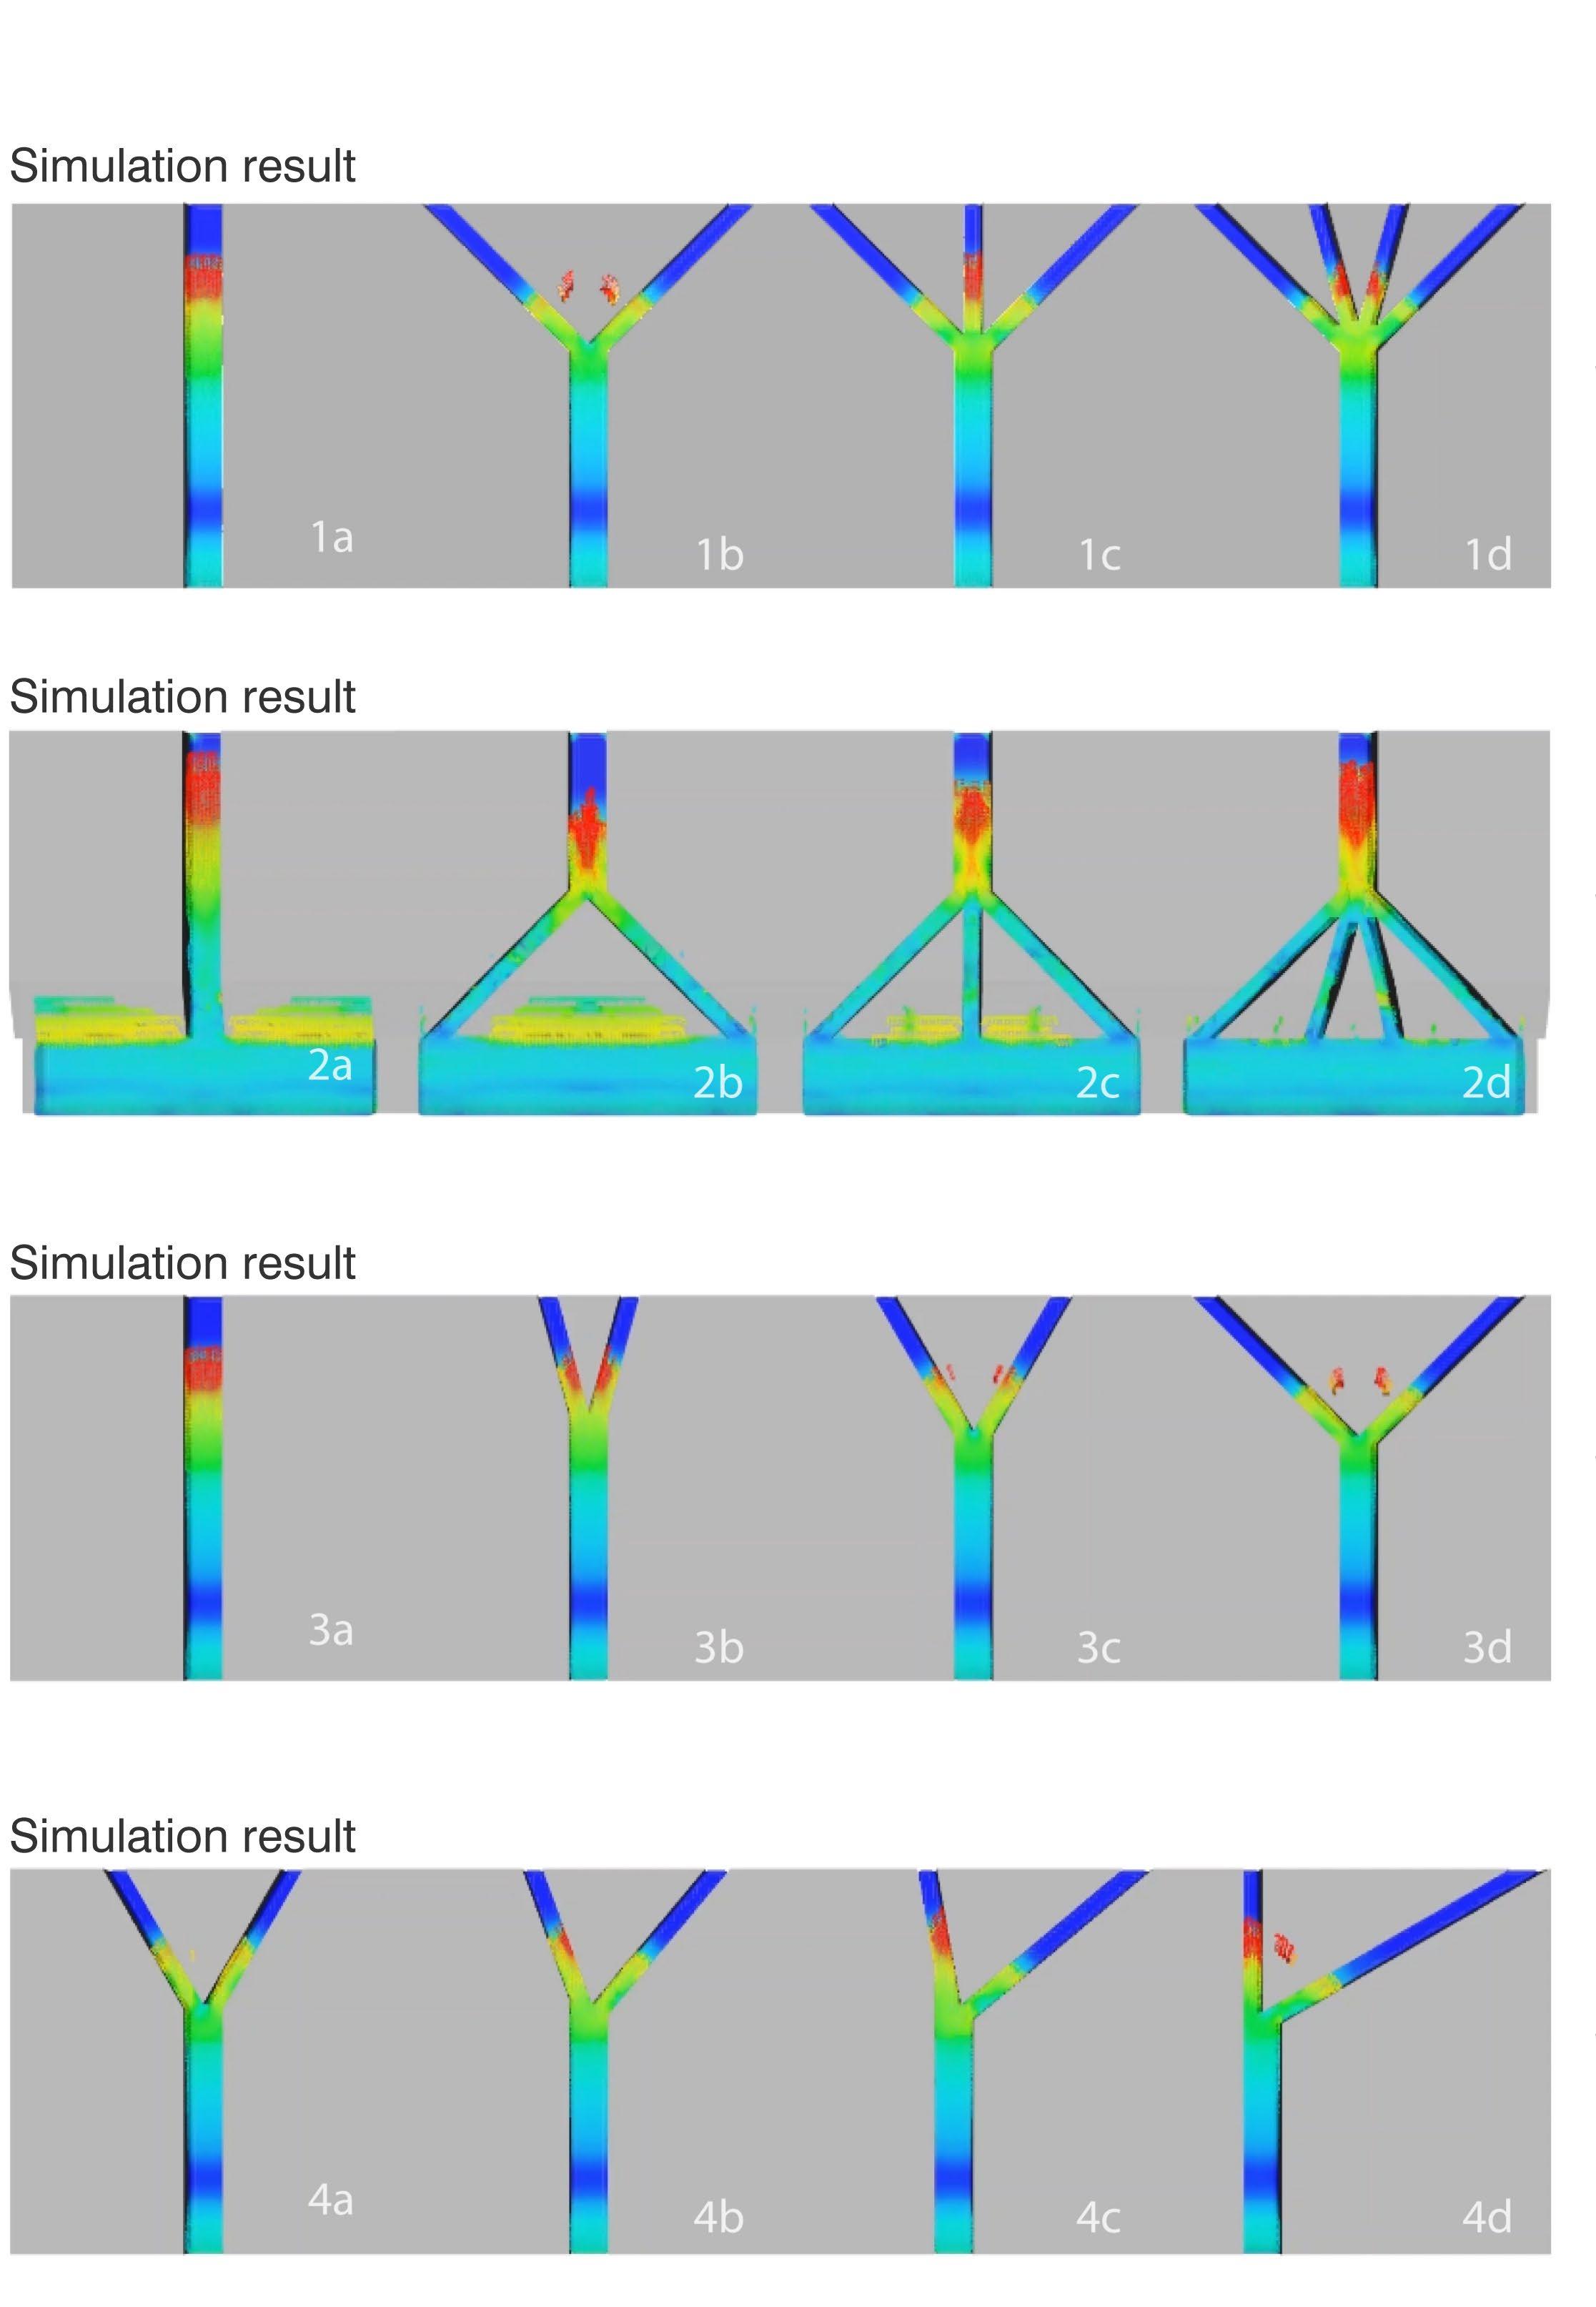
More degrees of branching more energy dissiptation / water distribution
7a Highest maximum velocity and overtopping
7d Lowest maximum velocity and lowest wave height (Wider branches less velocity and less wave height)
8d Most toppling and energy dissipation (More meandering size more energy dissipation and more toppling)
101
1. Branch number
2. Branch number of river mouth
3. Branch angle
4. Branch relative angle
5. Branch position
6. Branch degree
7. Branch channel width
8. meandering angle
Figure 4.2.11: Branching experiment iterarions
Figure 4.2.10: Branching experiment iterarions
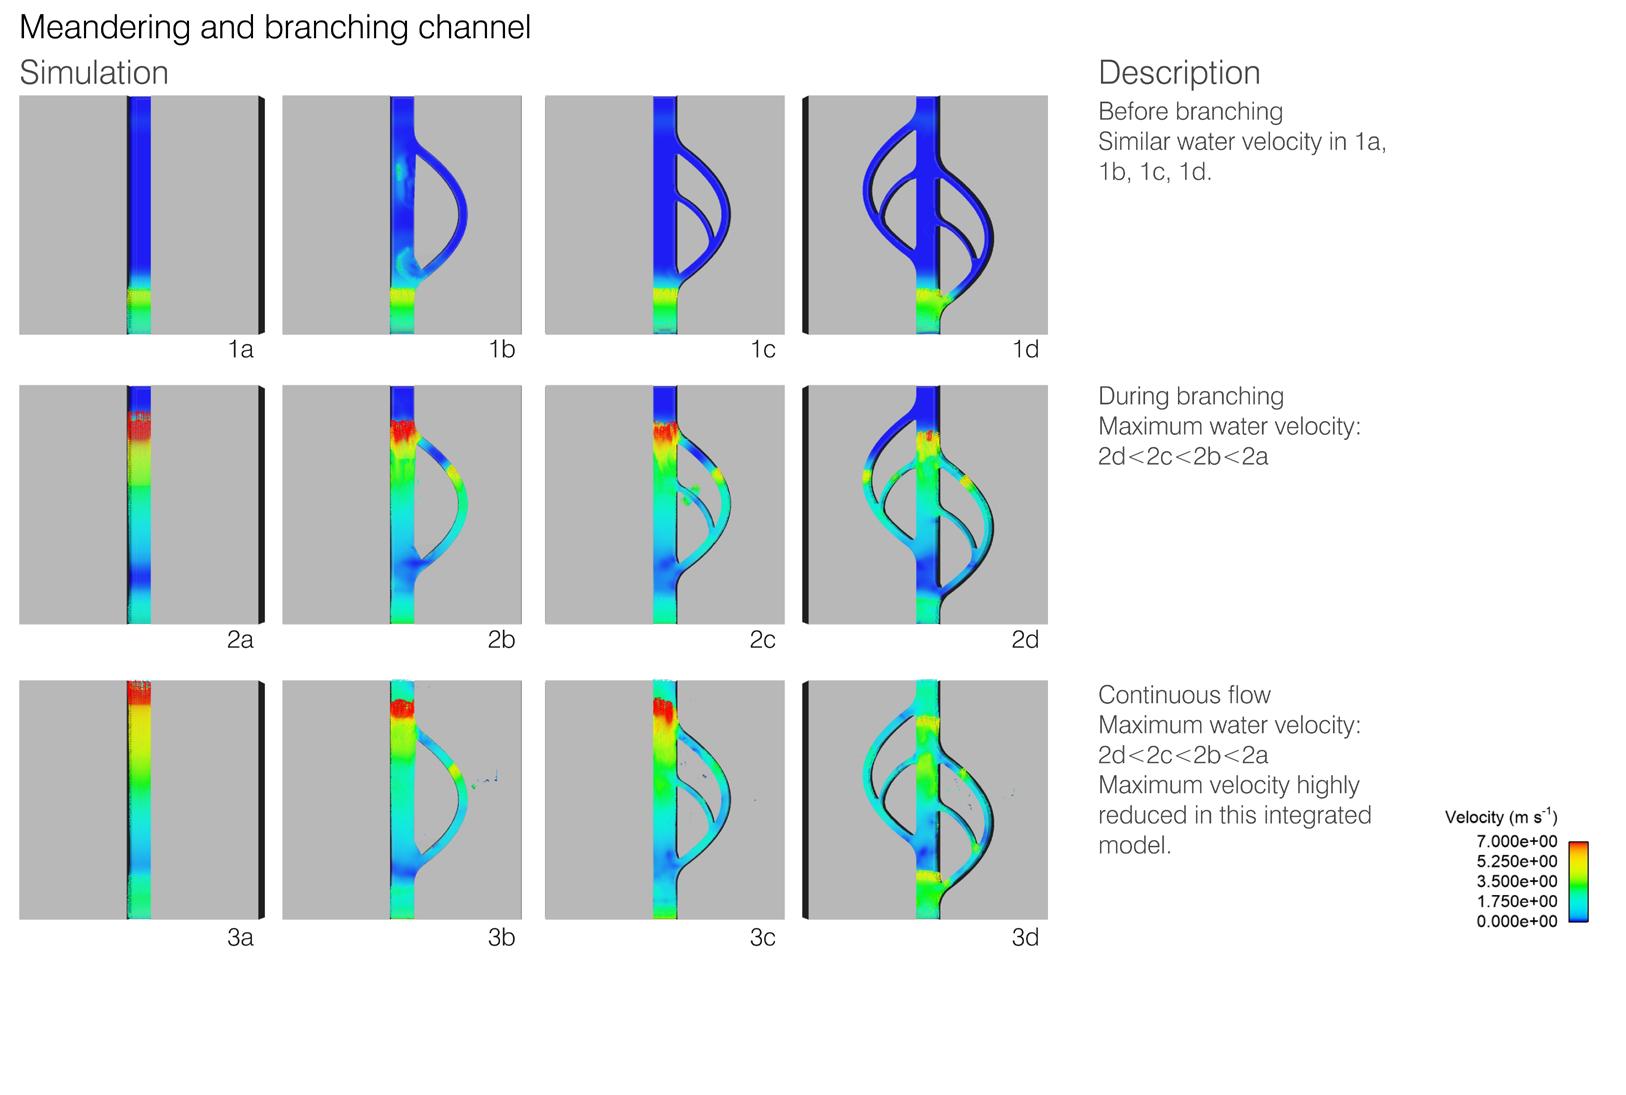
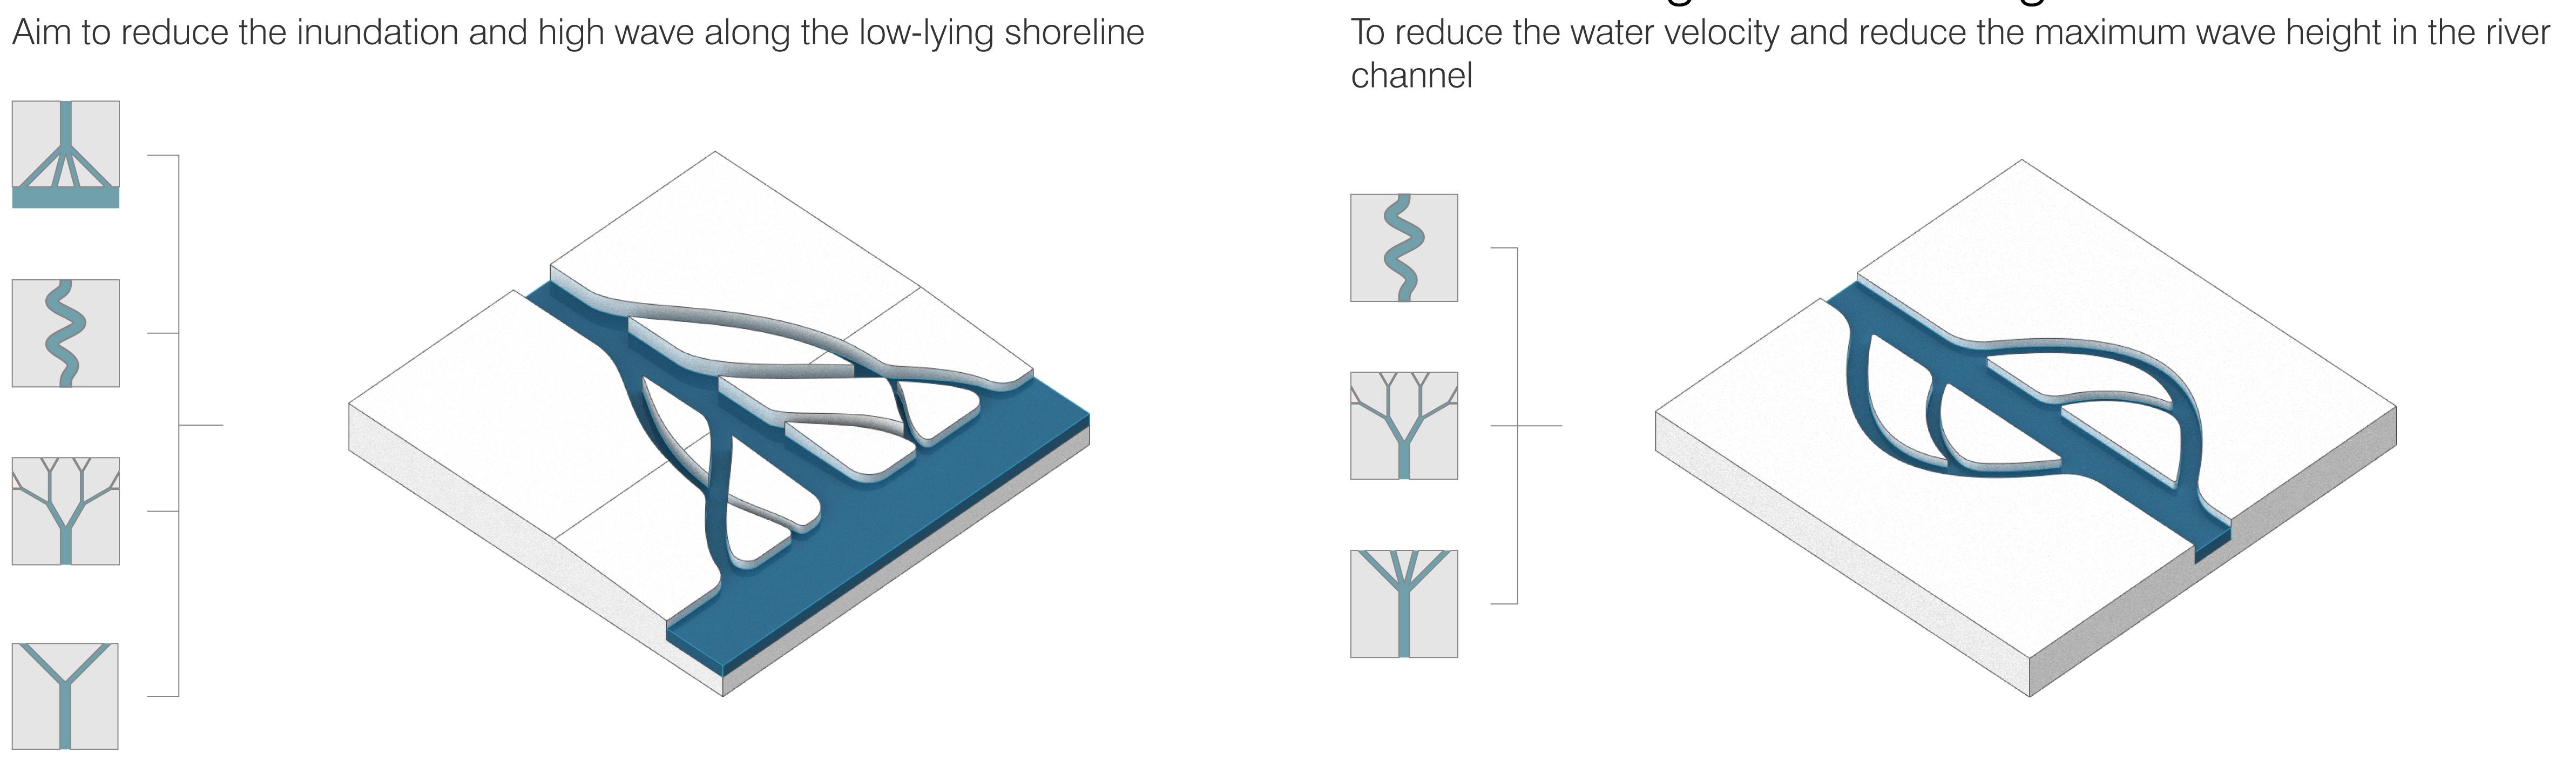
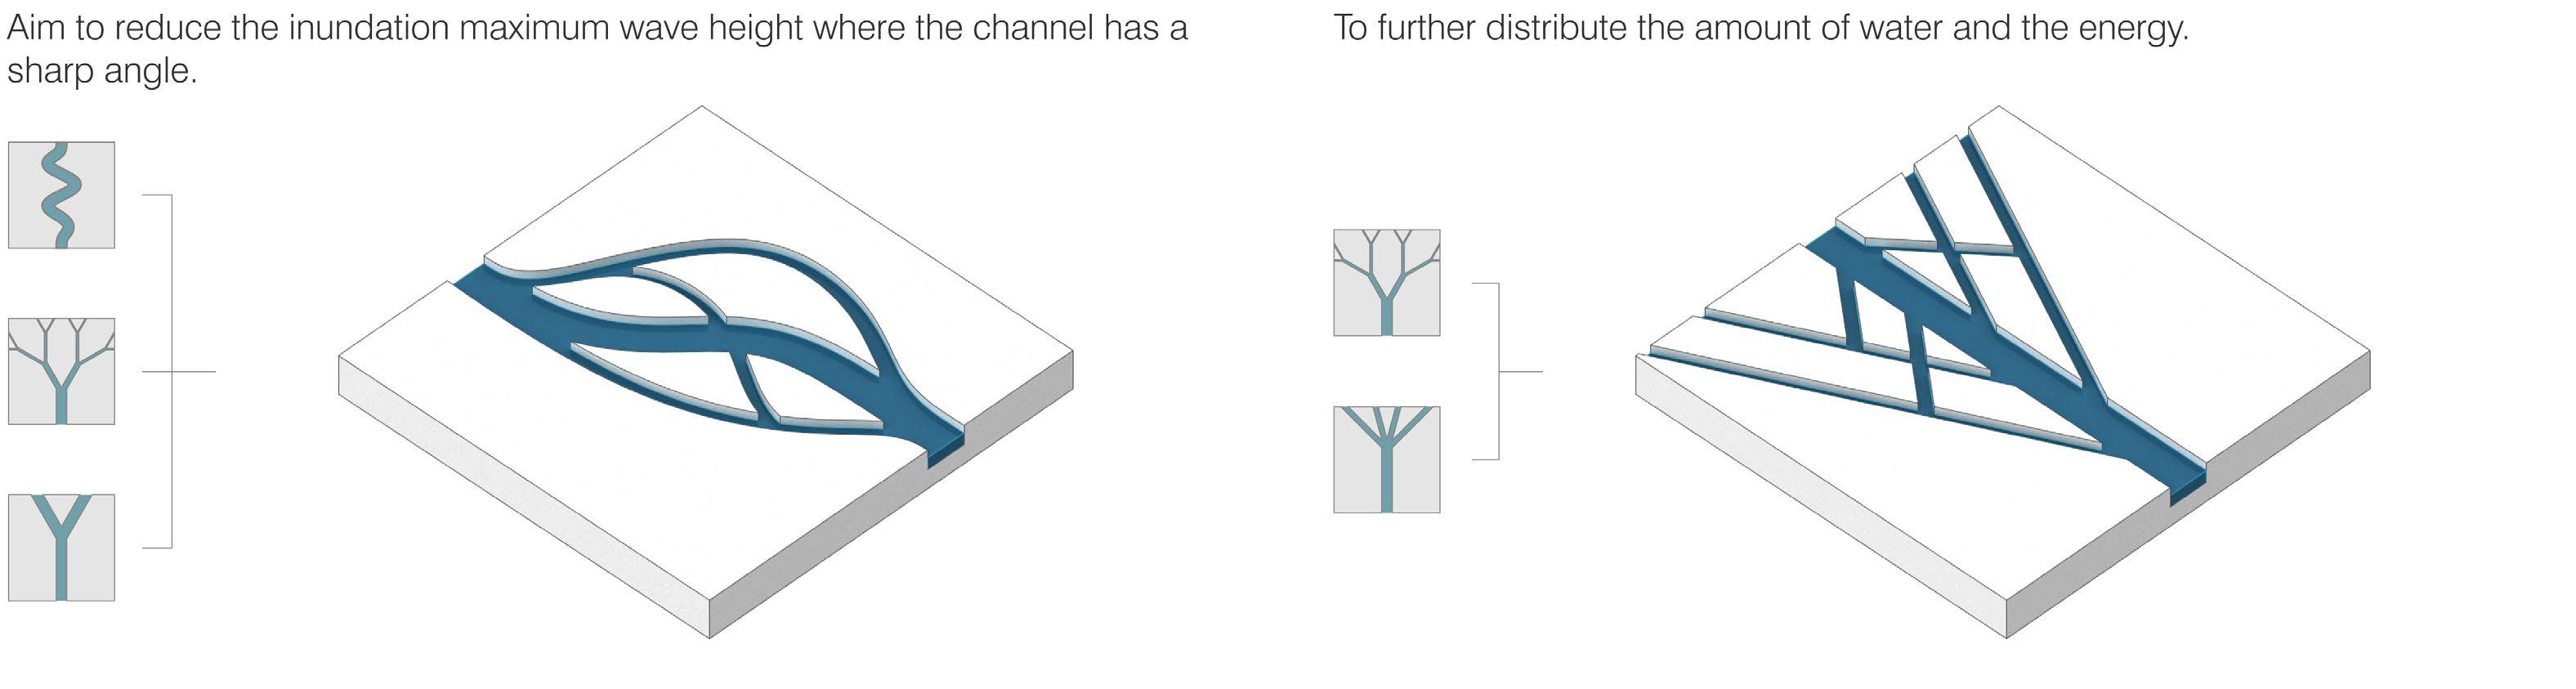
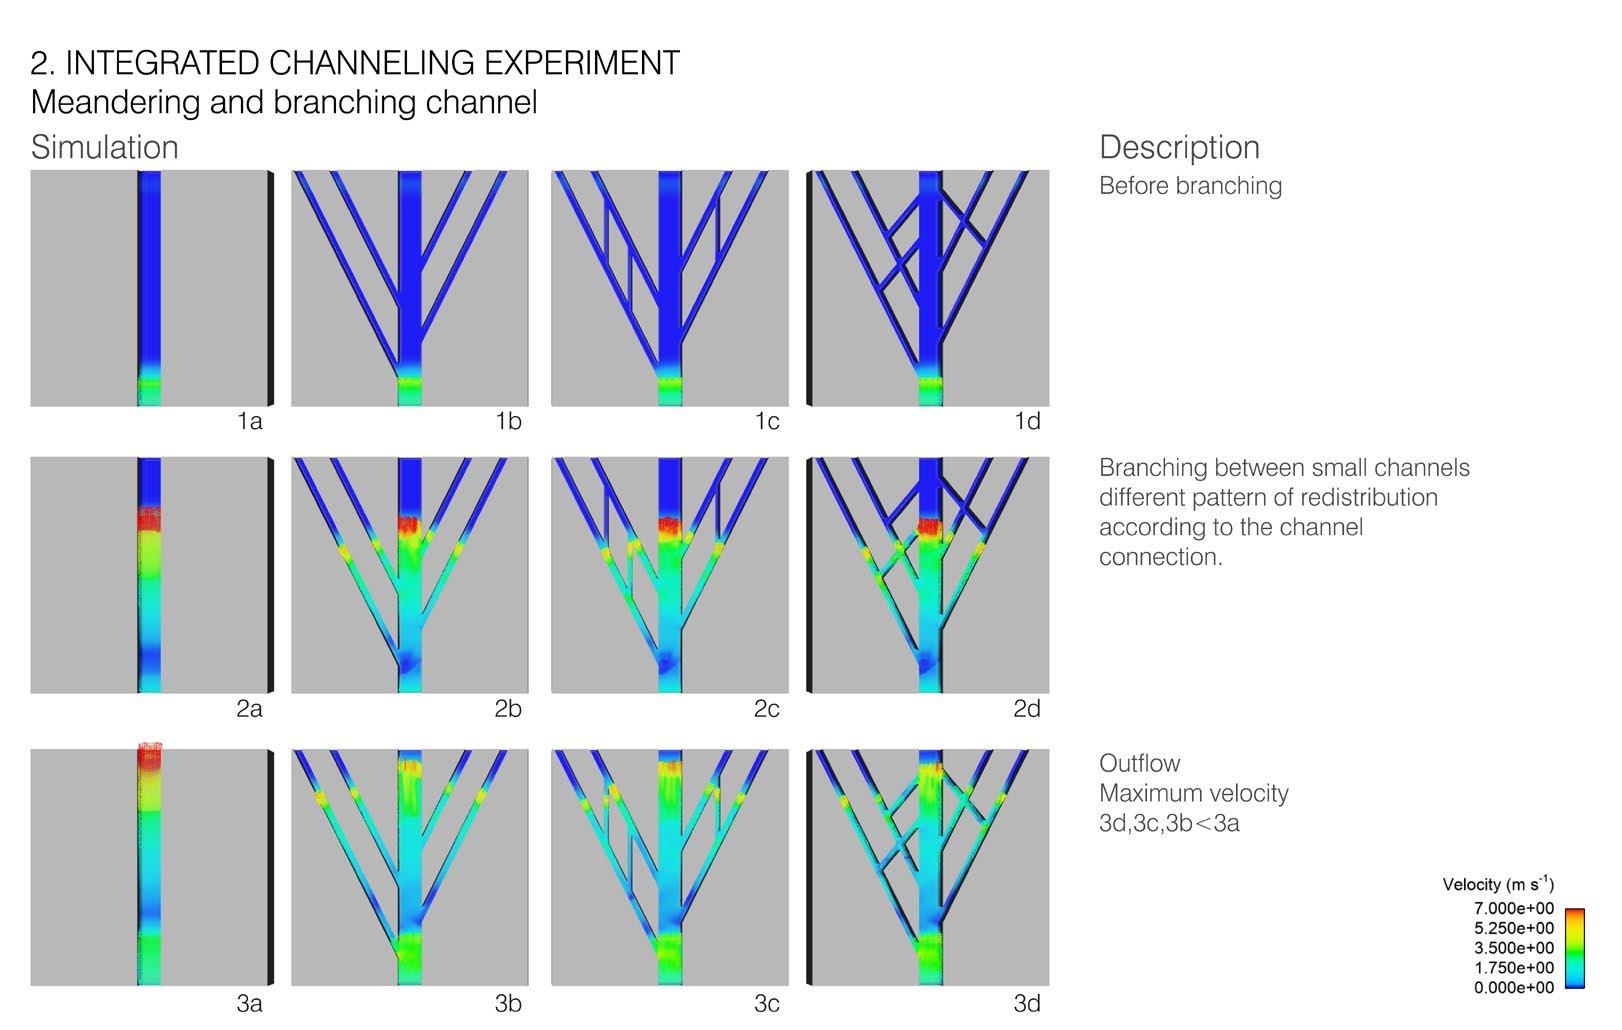
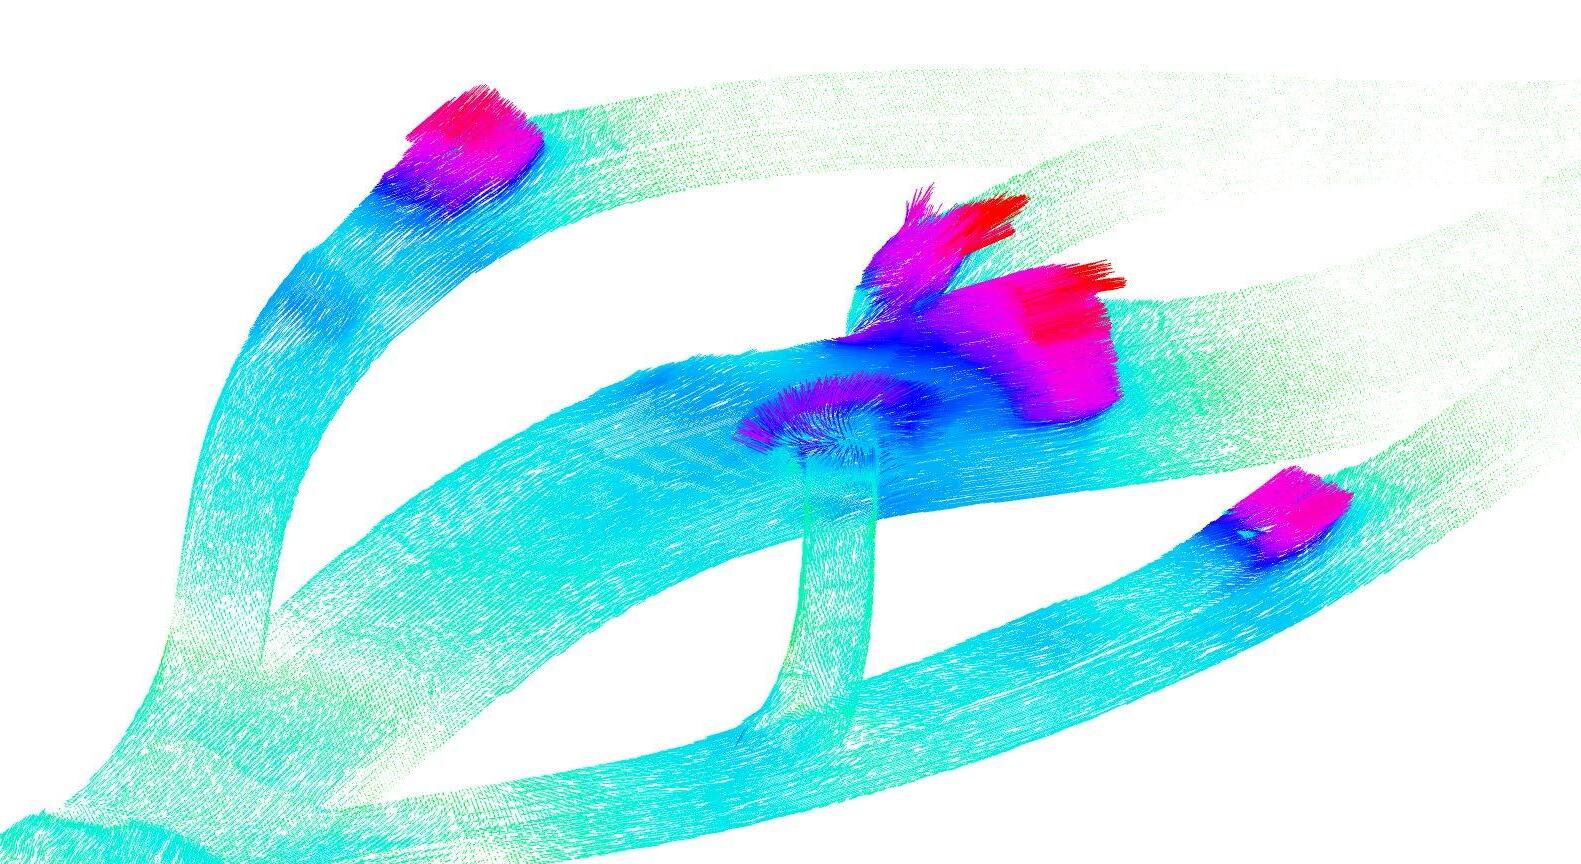
4.2.2.2 Tests on integration channel types
After observing the CFD test on basic channel models(4.2.2.1), four integrated models are proposed utilizing multiple principles from the basic channel models aiming to solve some specific tsunami and flooding problems on Tsukishima. The main goal is to find principles that can solve low-lying river mouth inundation and dissipate wave energy in channels. The effective models will be chosen and be applied to the G.A of channel modification in the later process.
102 103
Integrated Channeling Experiment
2. Meandering and Branching Channel 1. River Mouth Modification
Figure 4.2.12
4.2.3 Conclusion
At the intermediary scale, CFD Tsunami simulations were made to understand the tsunami destruction in different scenarios. Besides, analysis were made to further understand the morphological disadvantages of the existing landform. This research helps us to better identify the issues when tsunami waves hit.
Then different channel models were proposed and tested using Flow-3D, aiming to solve the issues identified. After comparison, integrated models 1 & 4 were choosen as the main channelling strategies which will be applied to land modification in a GA process in the Design Development Chapter.
104 105
Integrated Channeling Experiment
4. Channel Network
3. Sharp Angle RIver Channel Modification
Figure 4.2.13
4.2.3 Conclusion
Post analyzing the curvature and channel widths on the areas of Tokyo Kanagawa prefectures facing the bay, we find that specific areas that change drastically in both of the above criteria face higher risk of water velocity and thrust and thus needs either modification in shape or needs to be completely removed and replaced with an alternate channel pathway. This decision is backed up by the tsunami simulation that is done on the existing site in which the case with the floodgate broken shows the incapability of the central channel in handling the influx of water, leading to higher velocity and damage.
The integrated channeling experiment 1, 2, 3 and 4 indicates the channeling modifications that can be applied for different area types facing inundation such as river mouth, for meandering and branching channel, to cope with sharp angled land and a re-distribution network. It is found that out of the 4, 2 of the experiments seem more applicable at the scale of Tsukishima island i.e. river mouth modification (to reduce water velocity as the water moves in) and channel network (more inland to re distribute the water in a more tamed manner). Further on, the ship route analysis suggests the placement of the barriers in front of the shoreline at a minimum of 50m away so that the small ships and boats move with ease. It also indicates the modification required by the corner module to convert into port areas that can become a direct connection between the and the array of breakwater modules.
107
4.3 At Local Scale
4.3.1.1 Density in Tsukishima
4.3.2.1 CFD tests on tertiary channel cross section
108 109
Figure 4.3.1: Tsukishima water front
4.3 AT LOCAL SCALE
4.3.1 Analysis
4.3.1.1 Density in Tsukishima
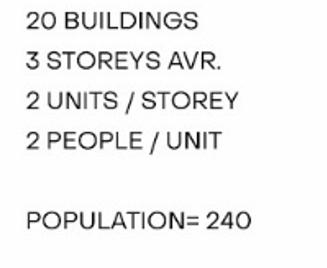
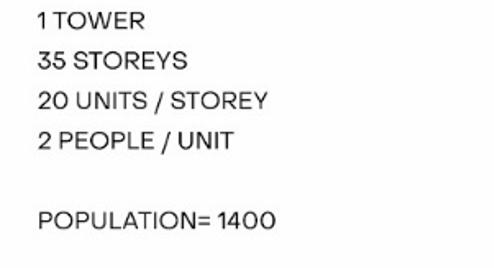
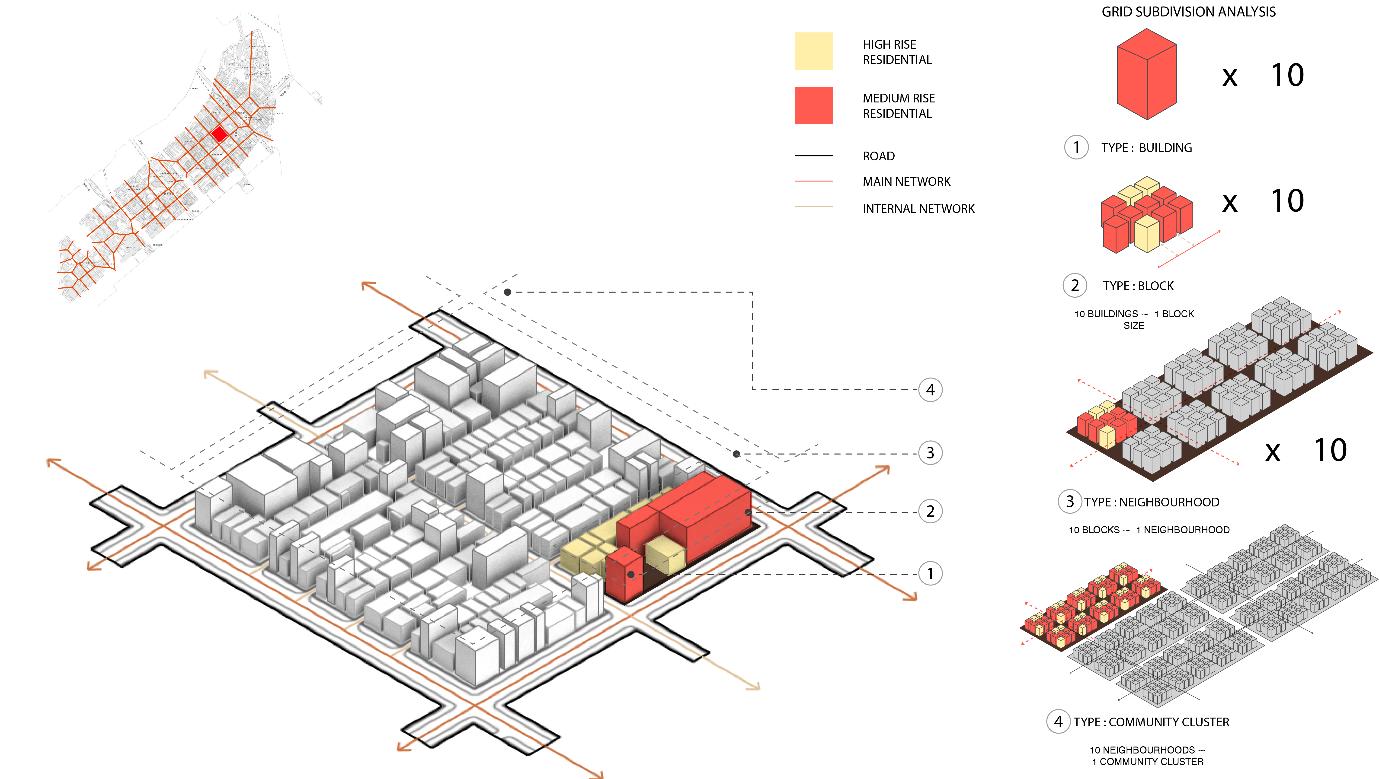
The density is analyzed in Tsukishima, considering the various scales of a building, block (10 buildings), neighbourhood (10 blocks) and a community clusters that consist of several neighbourhoods.
The main 2 types of urban bloks are the traditional lowrises and the modern high-rise buildings. When the density per area is calculated, the modern urban blocks show 5.8 times denser population compared to the traditional blocks.
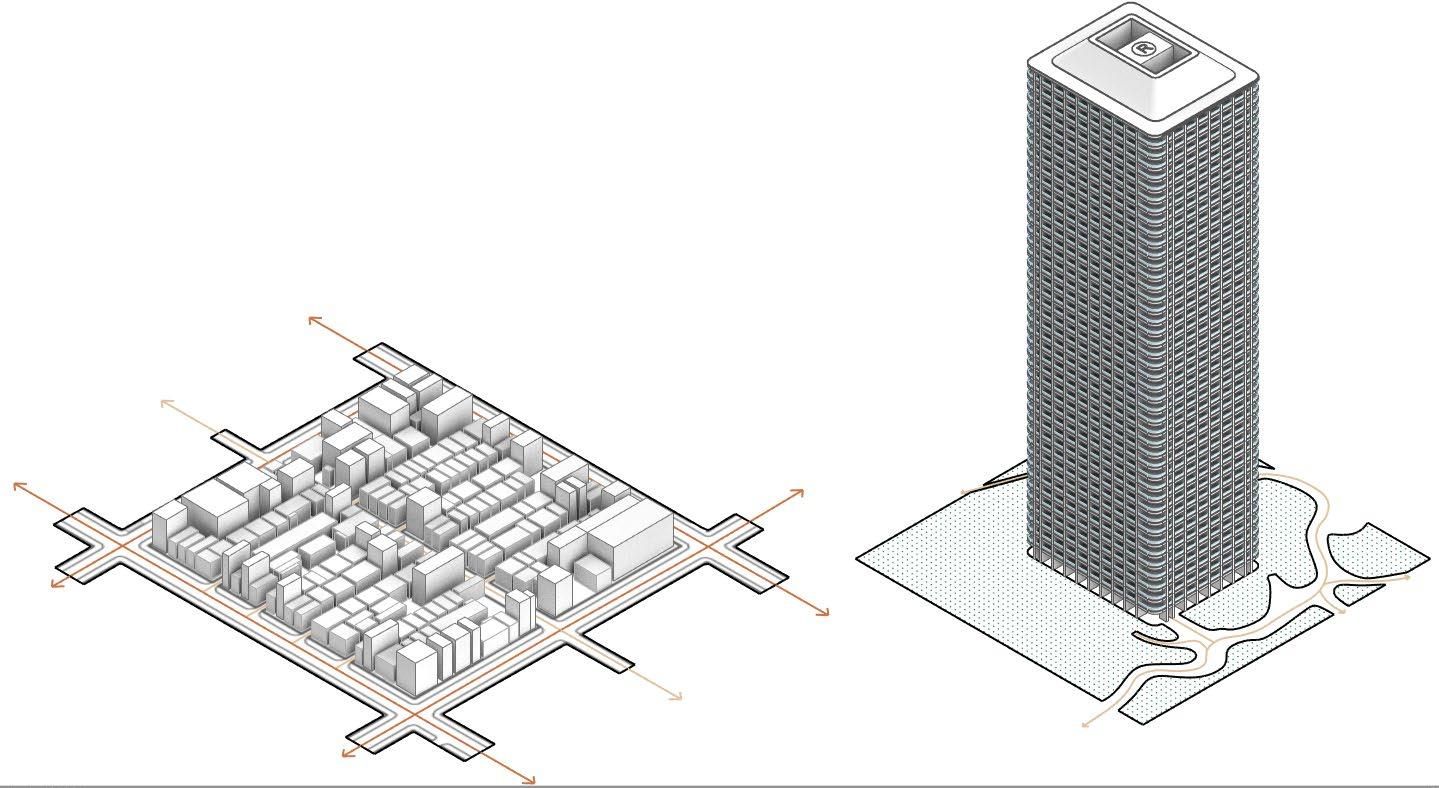
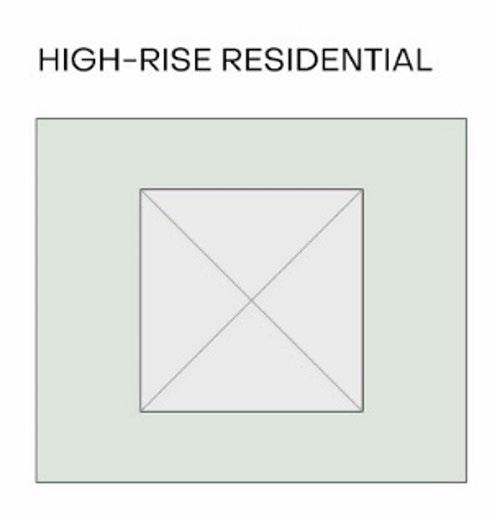
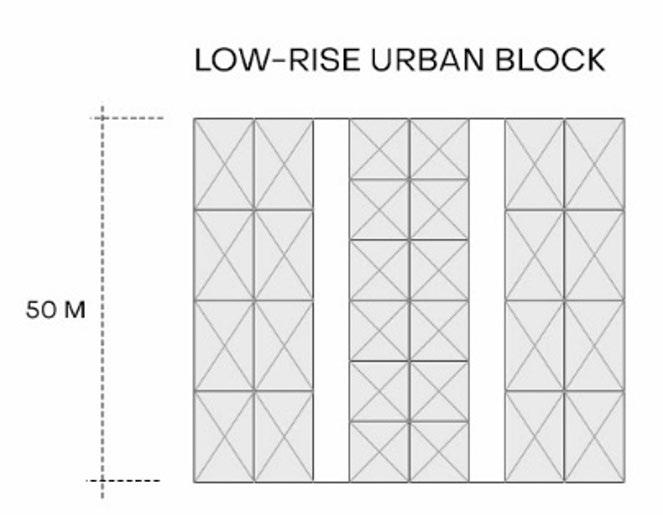
The main problem for the traditional blocks is that they are not efficient in density per area ratio and they lack of any open and public spaces. For the modern blocks, although they are efficient in terms of the density, and have a green land patch, the green is not used by the residentials and the blocks are lacking common shared spaces. In the Design Development Chapter, these problems will be handled with the new cluster proposal.
110 111
Figure 4.3.2: Population density analysis in the urban blocks
Figure 4.3.3: Population & Density Analysis
Observation
4.3.2 Tests
Although it provides the largest buildable area, the first model shows the least energy wave dissipation. Also, people don't have access to the channel in this option.
4.3.2.1 CFD tests on tertiary channel cross section
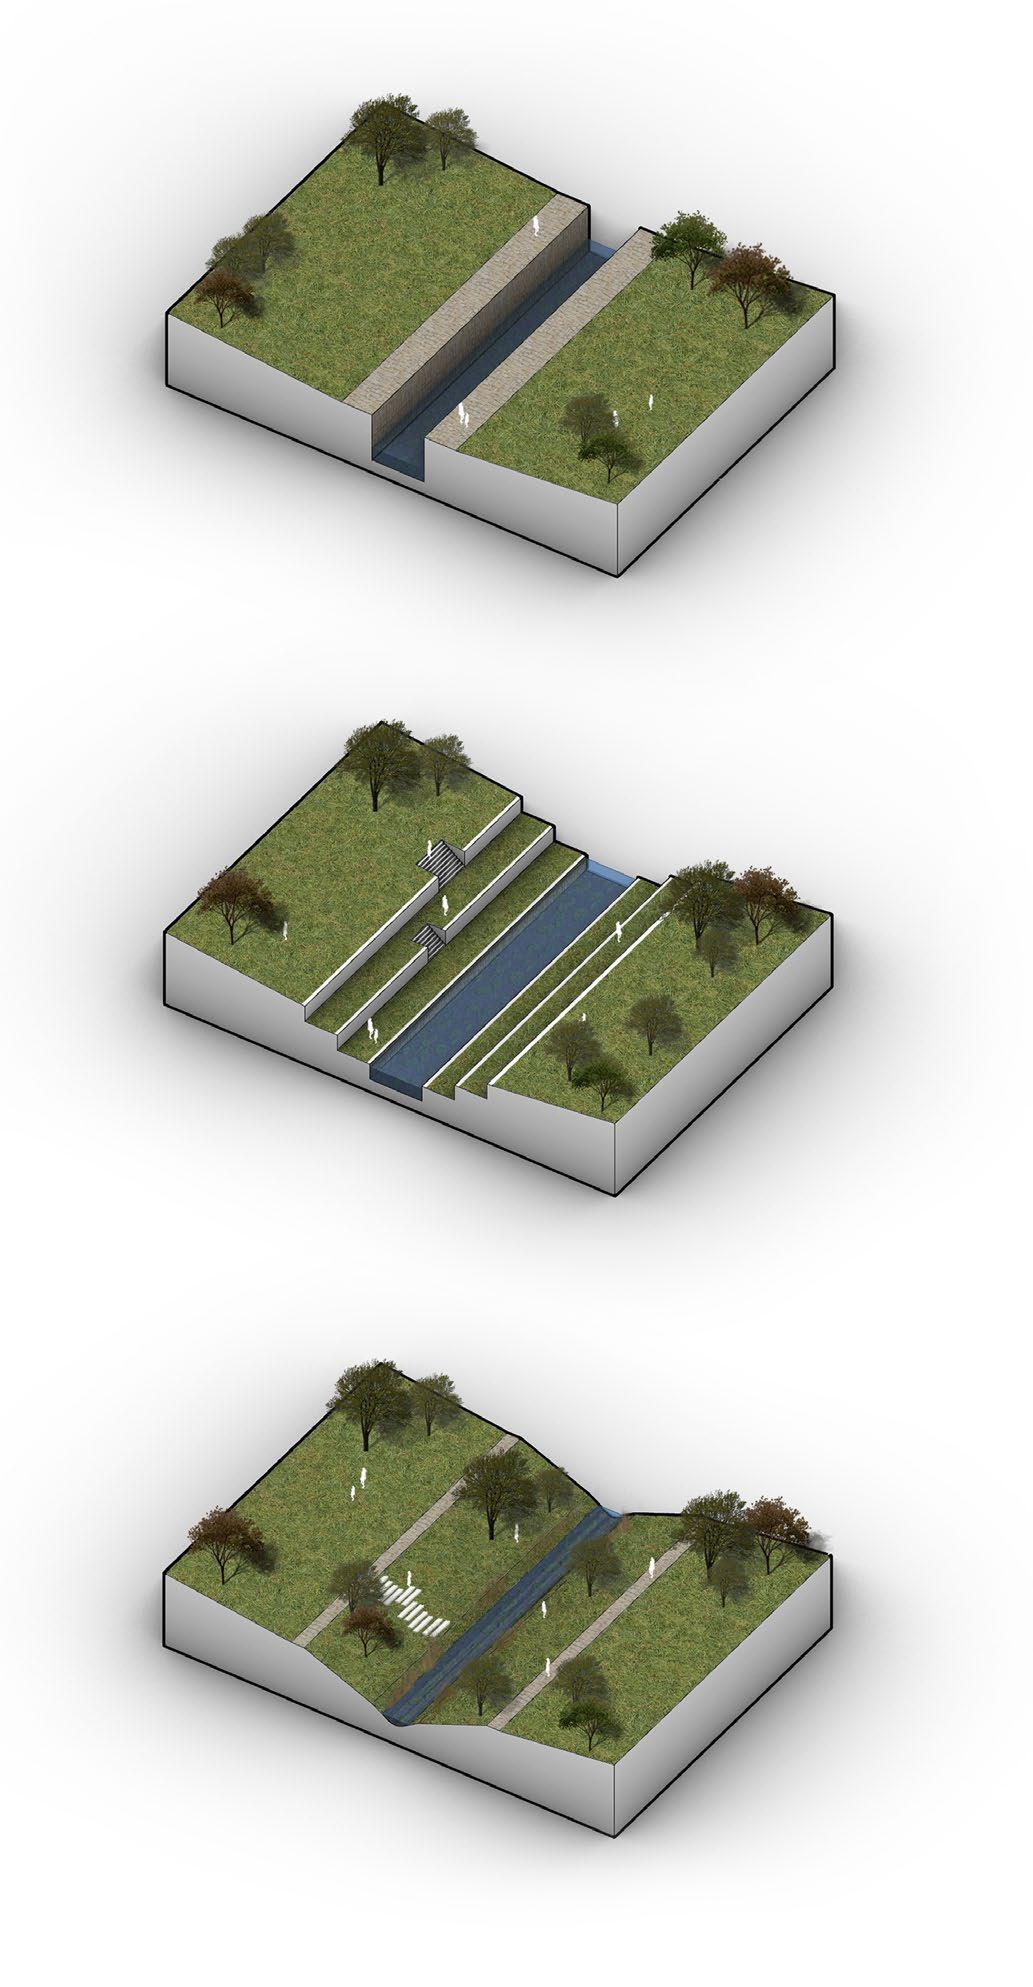
A research has been made on different types of channel cross section to evaluate their capacity in wave energy dissipation and providing urban landscape function.
A 3-metre-high tsunami is generated in three land model with same plan curvature.
In the terrace model, the velocity reduces because of more surface area, and the vegetation increases the surface roughness. Citizens can have access to the riverfront landscape.
The water velocity reduces significantly in this model since the vegetation and the rough surface create a lot of turbulence and frictional drag. It also provides an eco-friendly landscape that is easy to access.
112 113 Model Velocity 2s 2s 2s 10s 10s 10s 20s 20s 20s 30s 30s 30s
1-Traditional embankment
2-Landscape terrace
40s 40s 40s 50s 50s 50s Detail
3-Ecological embankment
Figure 4.3.4: Channel sections water velocity analysis
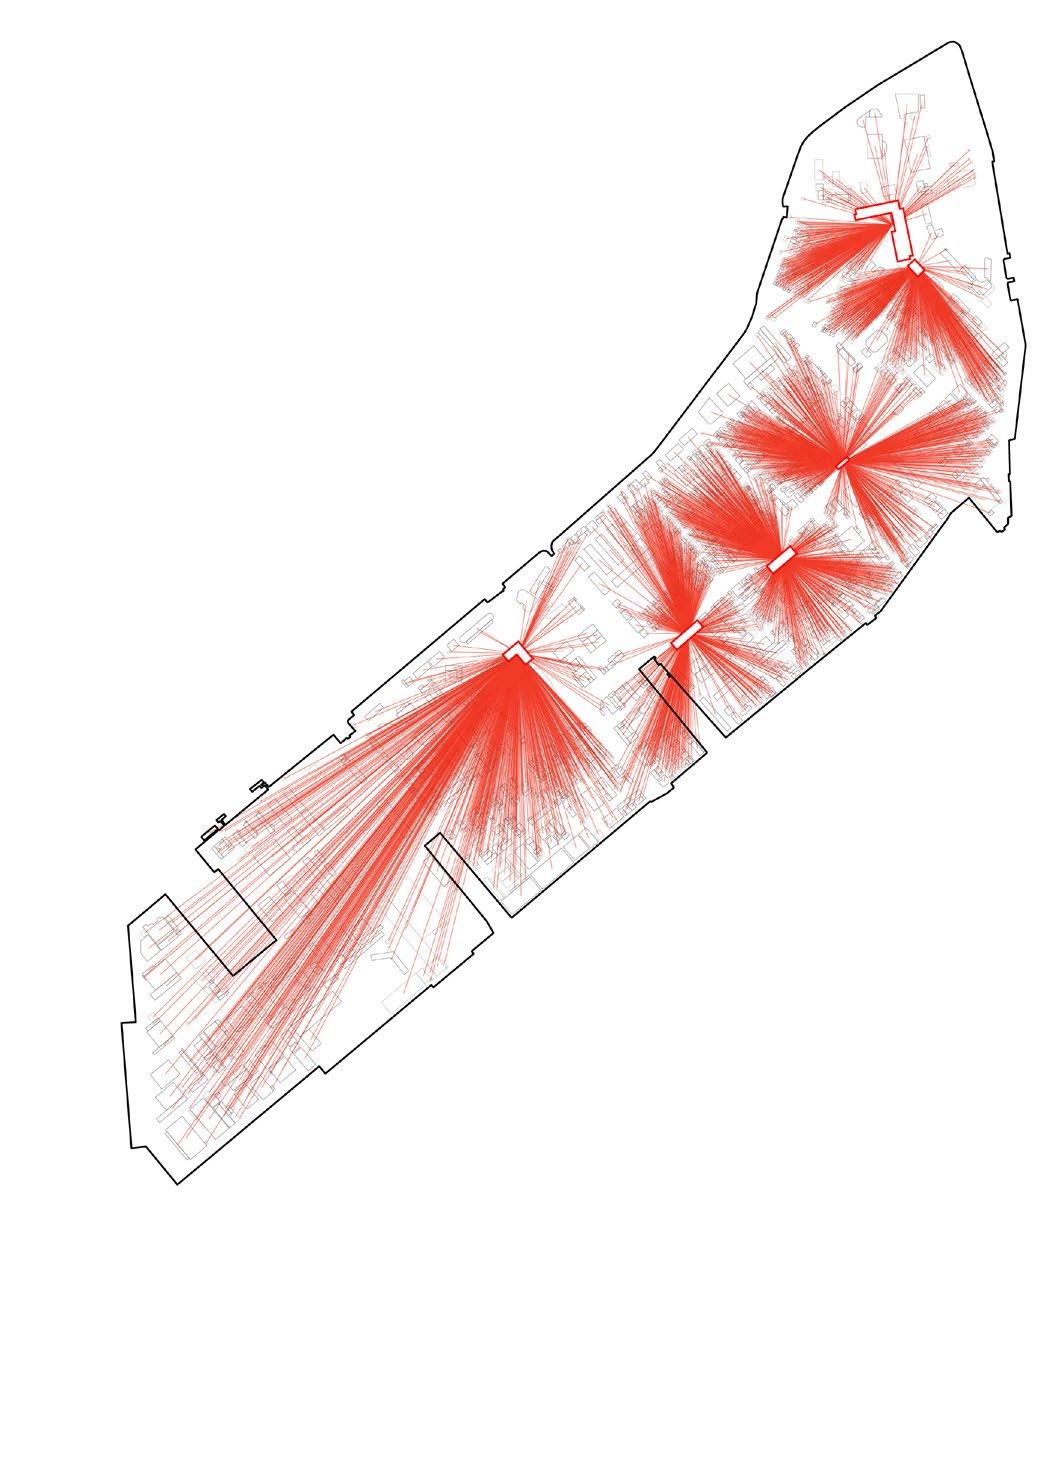
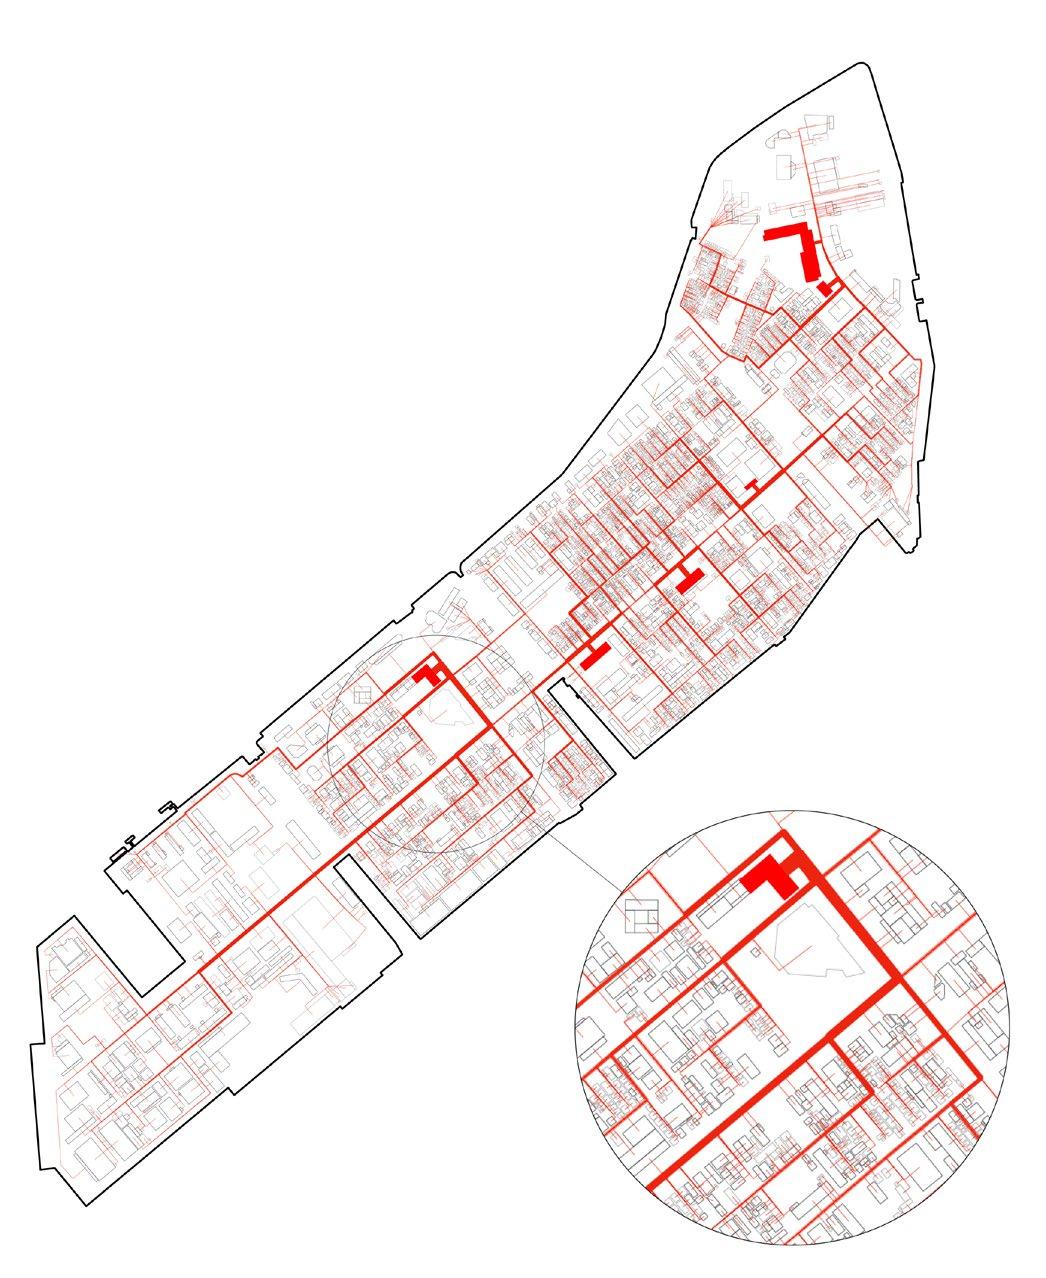
4.3.2.2 Network test using space syntax analysis
A piece of land is taken for network generation test. 5 main types of transportation networks are put to test – grid, etc. The 4th test is done using pattern generation technique of venetian networks, which proves to have a better connectivity than the rest of the networks in terms of betweenness centrality theory. For the pattern generation inputs, the points in between communities sized between 80 – 120 sqm of land and the evacuation centres as nodes are made to connect, which gives us the venetian network.
Observation: The venetian pattern generation for network building works best in terms of shortest walk between the evacuation centers and the rest of the community cluster grids.
4.3.3 Conclusion
Post the analysis of the Density in Tsukishima island, it becomes evident that any development that needs to be done in or along the new water network needs to be space saving, and one that can evolve with change in density requirements in future. Also, the morphology of the special units has to work in line with creation of ample space for light wells for penetration of radiation to the interiors and shared green spaces accessible to the public. Thus, further modular aggregation process for creation of architectural spaces and function allocation is explored in design development. The risk analysis and current zoning of the site hints us at developing a strategy of land modification work timeline. This indicates that demolition of high risk areas consisting of low-to mid rise buildings must be chosen as they prove to be more appropriate sites to cut through to build tertiary channel network whereas high rises are avoided and are set as the last spaces to be refurbished. This aspect is further set as a G.A. criteria as will be seen in chapter 5.3.2 in design development. The CFD tests on tertiary channel network prove the hypothesis of green soft tissue as a better option for coping with storm surge water influx. The green bed acts as a buffer to slow the water down further, making the buildings around it less prone to damage or inundation. The channel cross-section proven to work best amongst all tested is further applied and developed alongside the architectural built spaces as will be seen in the design development chapter.
4.4 CONCLUSION
Looking at all the experiments done under 3 scales of intervention, the information and feedbacks were found to be achieved from global to the local.
As the first conclusion, The area of intervention was narrowed down to one spot after analysis at the global scale, which was further narrowed down for 2 main experiments that had to be run simultaneously, i.e the channel experiments at the intermediary scale and barrier tests at the bay scale.
This created a feedback loop before the local level experiments could be done since barrier position with respect to modified channel was required to be tested together. These combined tests indicated that the channel types needed to be segregated where linear and deeper cross-section was required for primary and secondary channels (to comply with ship routes) that were more prone to tsunamis and storm surges, whereas tertiary channels were supposed to be more evolved as a shallower and inclined cross-section for having a better coping mechanism for slower storm surges and rainwater accumulation. To test the same, sections of tertiary channels were tested at the local scale that proved to be capable of reducing water velocity.
On the other hand, the tertiary channel guided the analysis and test types on local scale to tie it in with the urban fabric. The density analysis showed that the architectural formations in and around the channel needed to be one that could grow, densify and follow the water network. Also, this indicated a need for building height hierarchy to inform the architecture in terms of maximizing view and radiation, and to have a network of drainage functioning at a slope. It also indicated a need for a new transportation network that could have could be functional in terms of travel ease and also function as the quickest evacuation route connecting the evacuation centers.
The above conclusions helped further tests at the global scale for final barrier placements, network generation and architecture to be evolved around the tertiary channel.
114 115
Figure 4.4.1: Tsukishima Island
5. DESIGN DEVELOPMENT
116 117
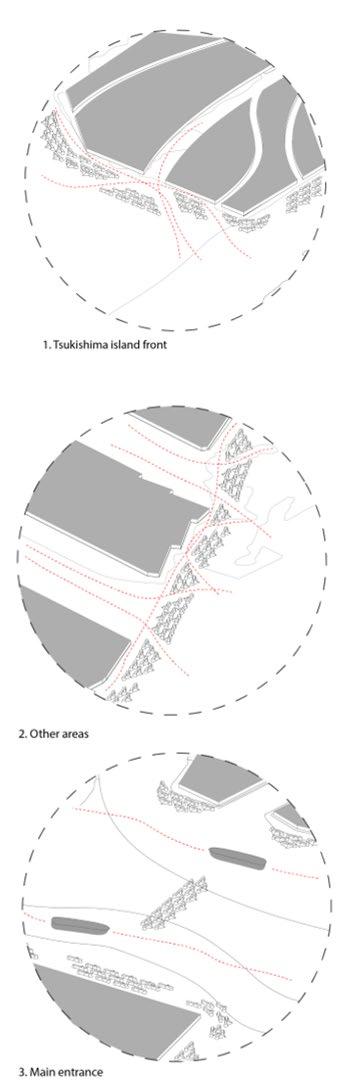
5.1 BARRIER APPLICATION IN BAY SCALE
In order to apply the barriers, an analysis is done on the existing areas of flora and fauna. Also the ship routes analyzed previously guided the placement, density and the location along the shoreline.
118 119
Figure 5.1.1: Barrier render
5.1.1 Ecology analysis
On research, the waters of inner Tokyo area consist of the tidal mud flats and shallows of Tokyo Bay that include Sanbanze, the Yatsu tidal mud flats, Kasai, Tokyo Port Wild Bird Park, Central Seaside Park, Morigasaki, and the mouth of the Tama River.
While in the past Tokyo Bay was home to expansive river mouth and tidal mud flats zones, today only a few spots remain, and these waters include those few remaining tidal mud flats and river mouth ecosystems. Numerous species of birds, in large populations, visit Sanbanze during the spring and fall migrations and winter there. Eurasian oystercatcher, black-bellied plover, lesser sand plover, grey-tailed tattler, ruddy turnstone, and sanderling visit the area seasonally.
In addition, it is home to many different species of bivalves, crustaceans and small fishes. This is taken into consideration and the placement of the barriers are positioned to connect the crucial mudflats and follow the shoreline until Tsukishima island, to help re generate the oyster beds and other flora and fauna around it in future. The same river mouth area could form one habitat in the so-called Tokyo Bay tidal mud flats network, as an important node.
120 121
Figure 5.1.2: Barrier placement and mudflat analysis on Tokyo Bay
Figure 5.1.3: Potential barrier placement map
5.1.2 Barrier development as per ship route
Considering the final barrier geometry and positioning on the previous chapter, 4.1.2.2 Combined tests on modified barriers, final barrier placement is made considering the ship routes as well.
On Tsukishima Island, currently the shorelines are utilized as ports and harbours. Thus, the barrier placement should also maintain the basic function of the ports, while keeping the connection with the land and each other for the transportation.
The design of the barrier geomerty with the triangular extension also allows a habitat generation underwater. However, this extension can potentially block the ship movement. Thus, we decided to integrate 2 types of barriers on the shoreline. The first 2 sets of barriers would allow the habitat generation, with lower current velocity, and the third set of barriers which are larger in size and excluding the triangular extension would function as ports.
122 123 Ship Routes
+ Ports Barriers + Ports
+ Habitat Generation Barriers + Habitat Generation Land 80m Offset Land
Barriers
Barriers
Figure 5.1.4: Barrier aggregation
Figure 5.1.5: 2 types of barriers
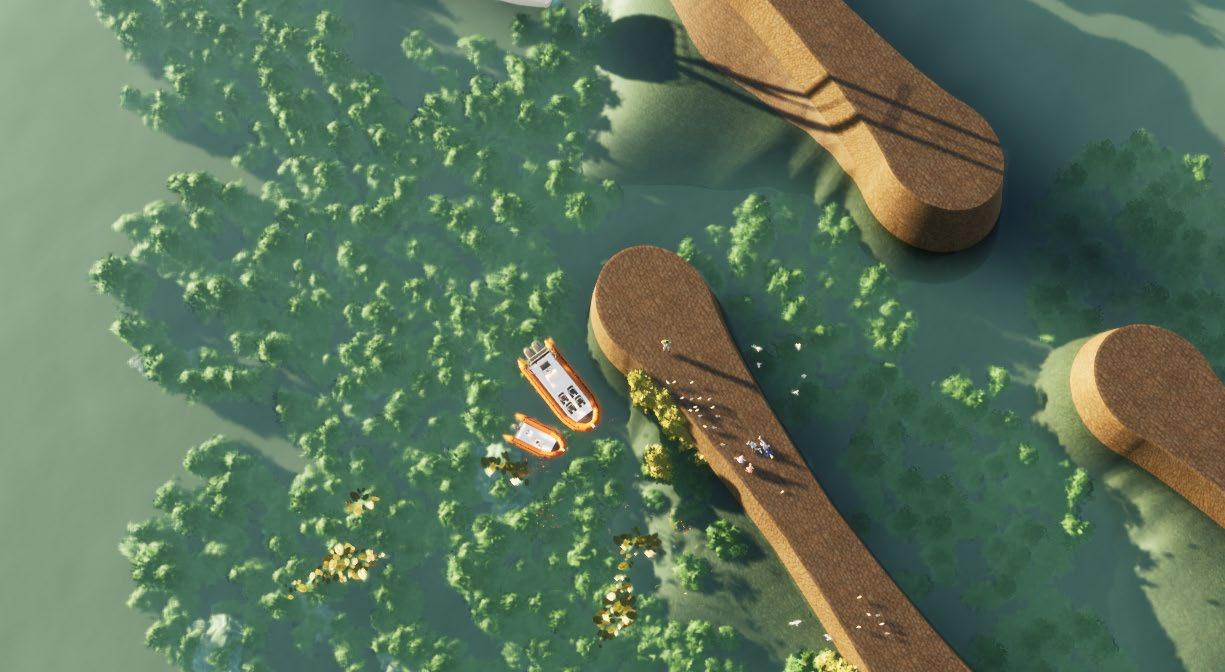
Potential place for the floating deck
Detailed plan of the floating deck
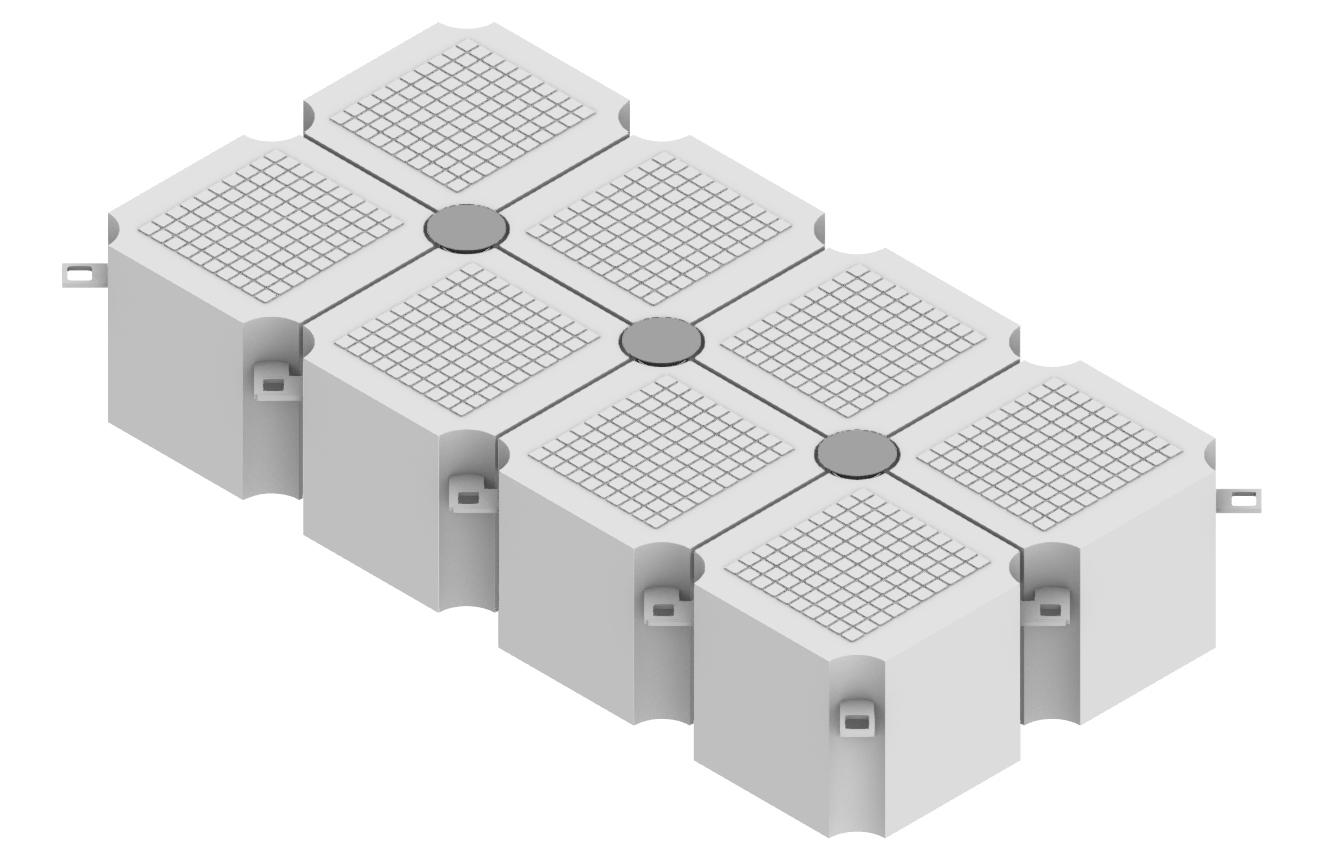
Considering the investment and the material consumption required for the barriers, it would be ideal to design them multi-functional. Besides the breakwaters having a habitat generation and port functions, they could potentially be utilzed as an extention of the land as well. This extension can be placed as floating components (4mx4m) in between the barriers for temporary functions such as fish markets.
124 125
Components of the floating deck (50*50*50cm) Components aggregation
Figure 5.1.6: Potential placement of the floating components
5.1.3 Barrier habitat generation
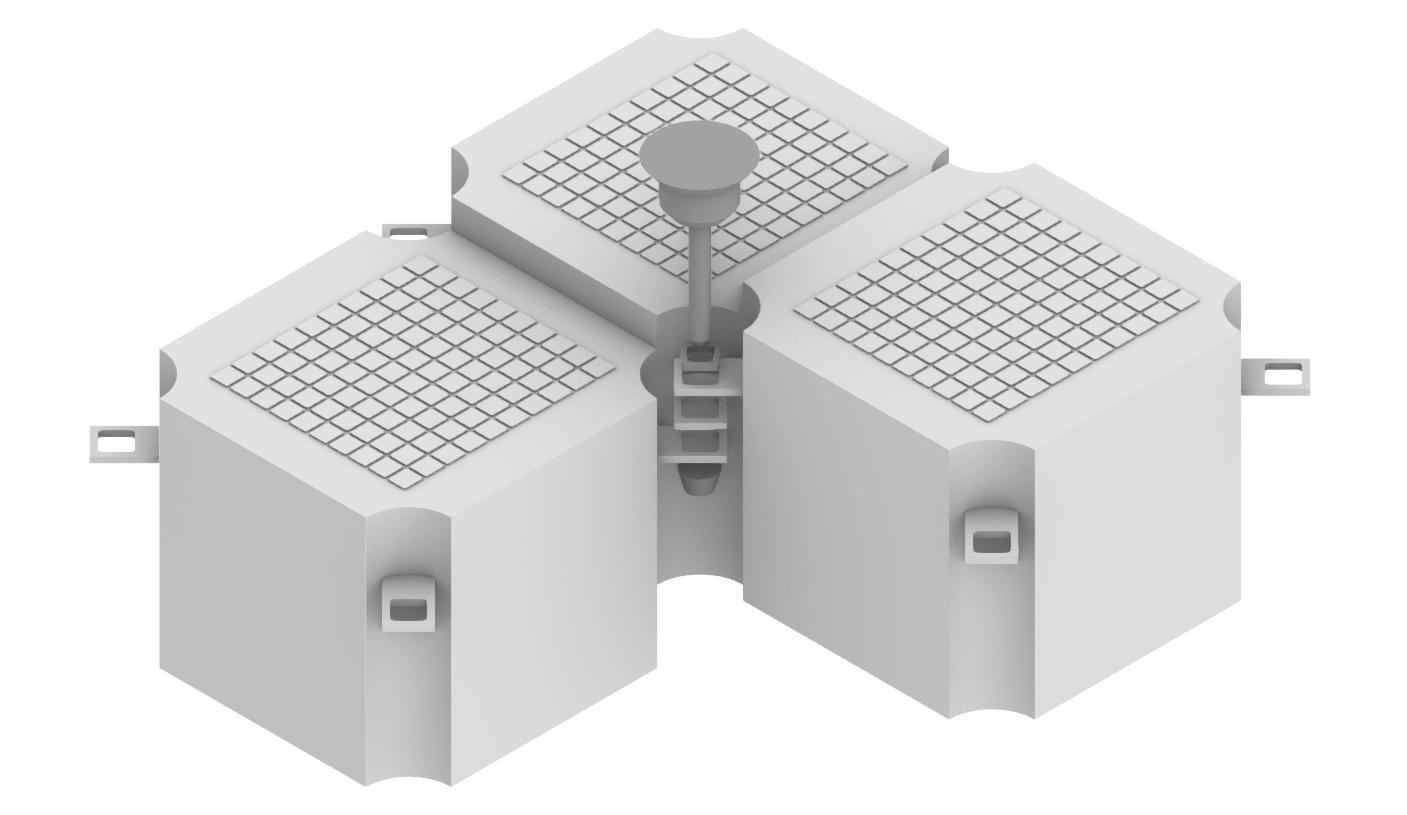
Finally, to sum up the final proposal of the barriers placed in front of the tsukishima island post different tests of single modules and as an aggregation, the barrier construction is decided to be as a rubble mound breakwater due to its stability during tsunamis. The frontal mound addition of the breakwater is imagined to hold a mesh of oyster bed to naturally help grow a habitat and start a food chain which can sustain the growth of bivalves, crustaceans, fishes and in turn be fed by migratory birds.
The floating strips help connect different barriers for human movement. The floating land masses fill the gap between the barriers, making them usable to hold temporary goods or function as a temporary fish market by the day; and also function as mariculture pods below sea level.
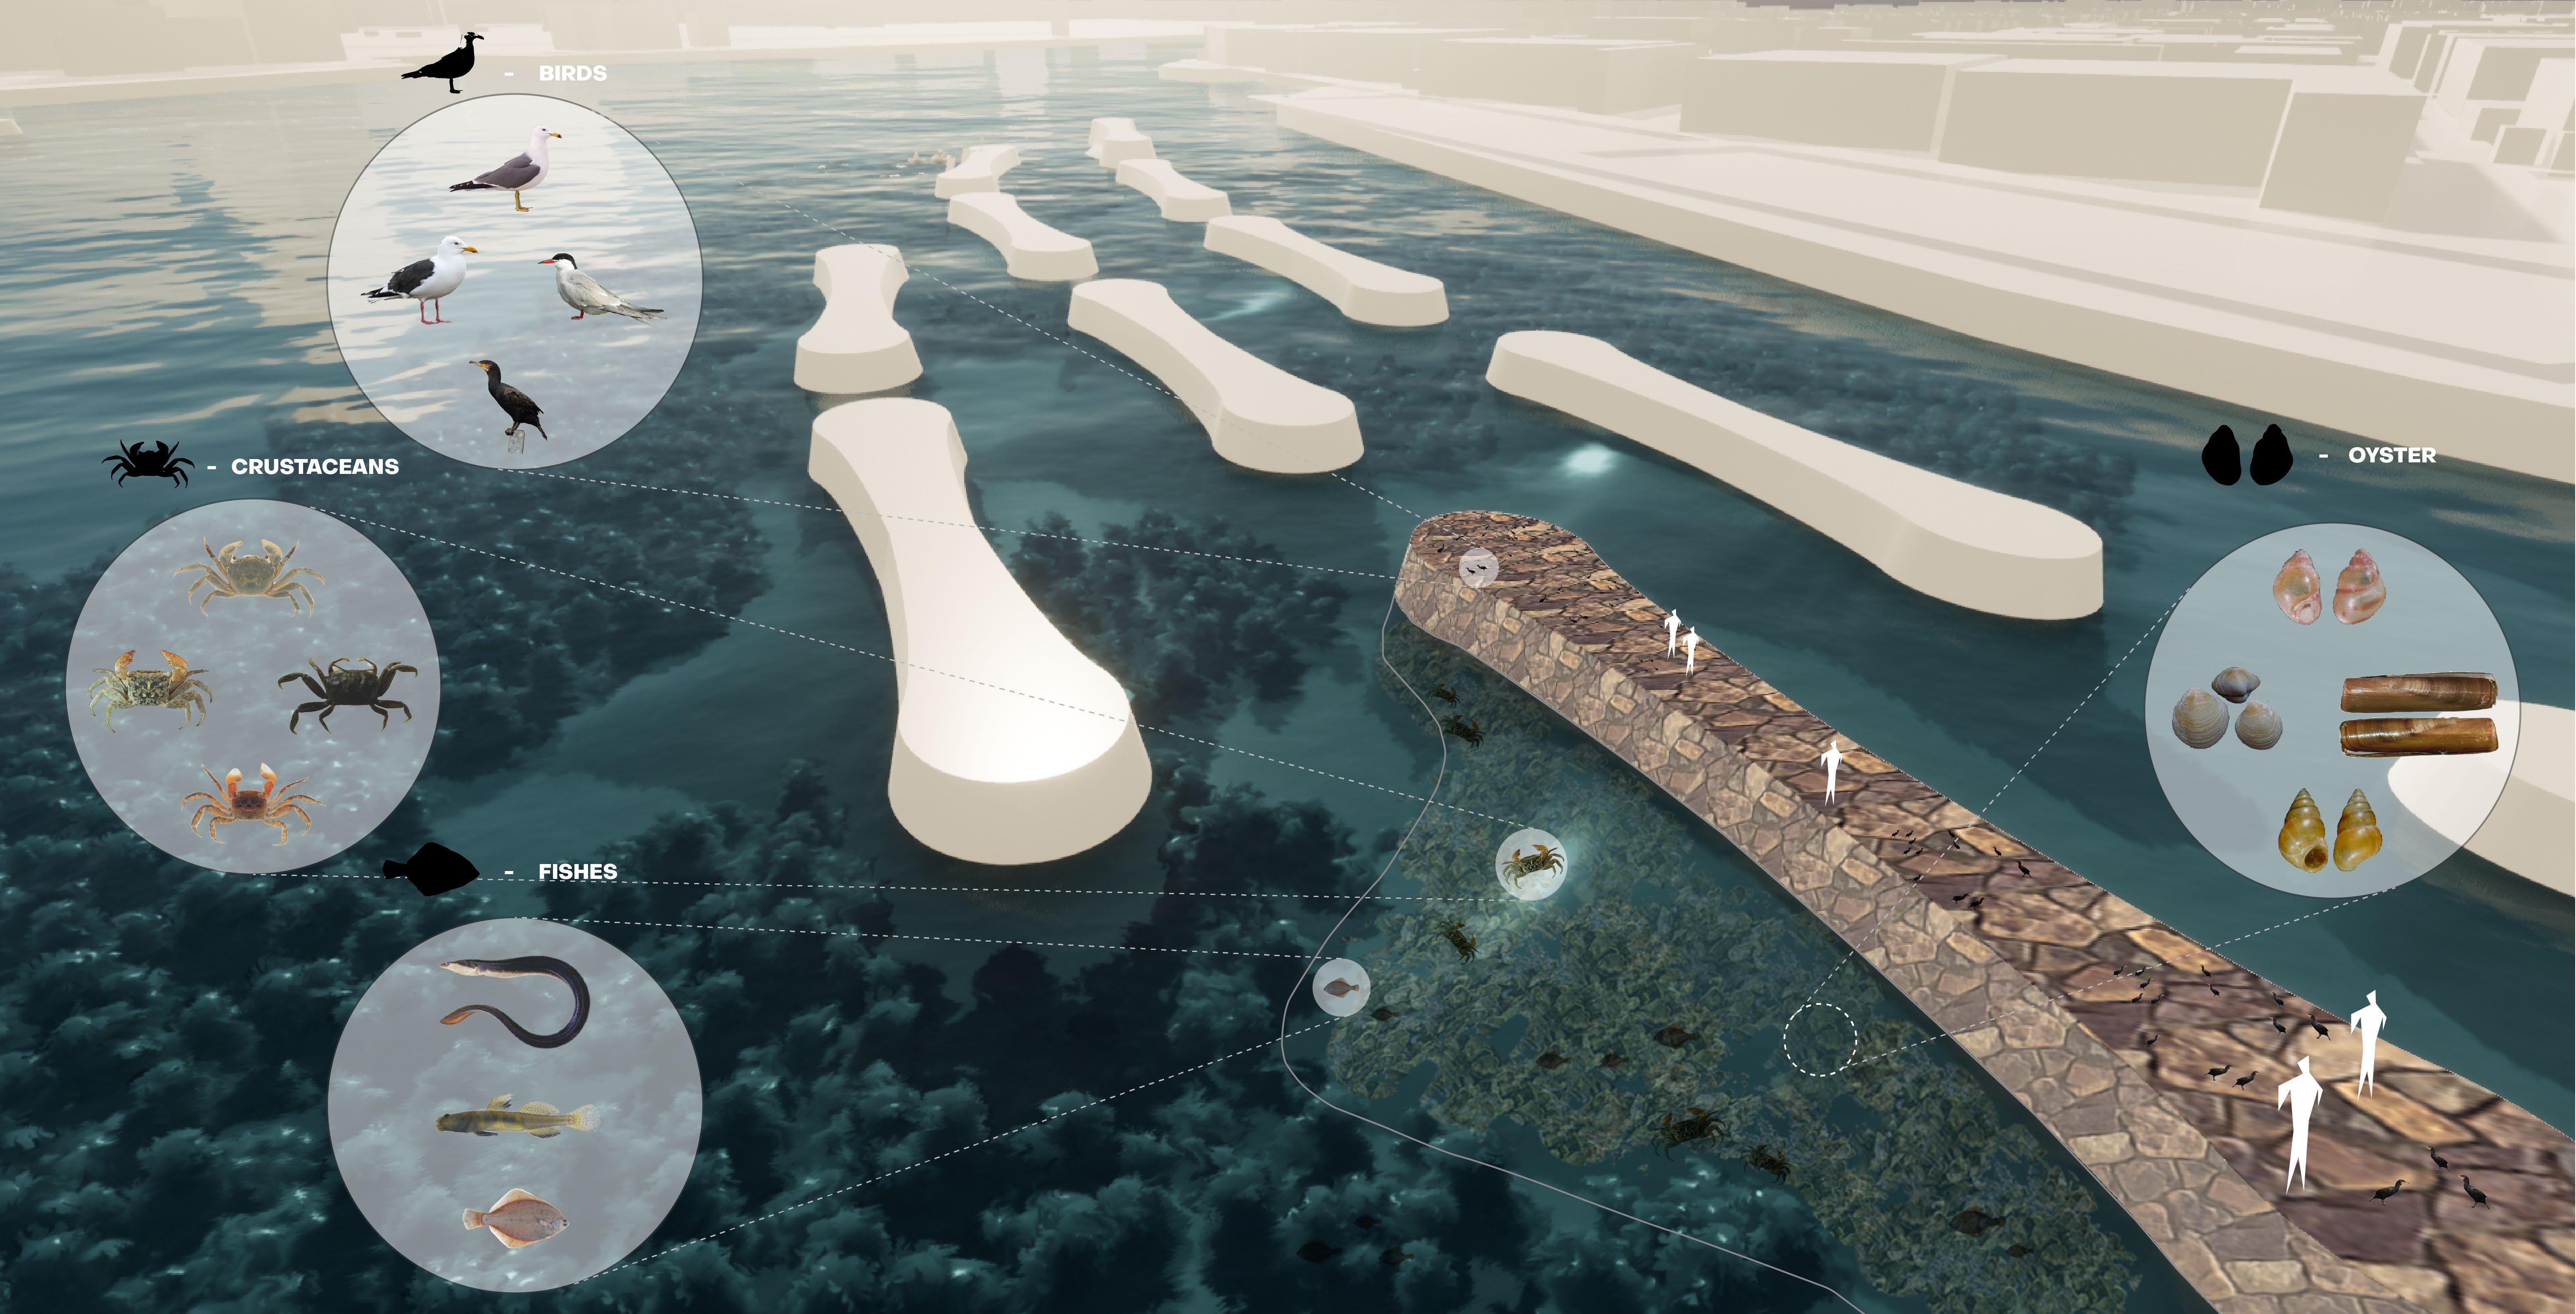
126 127
Figure 5.1.7: Habitat and species on the barriers
5.2. CHANNEL MODIFICATION AT INTERMEDIARY SCALE
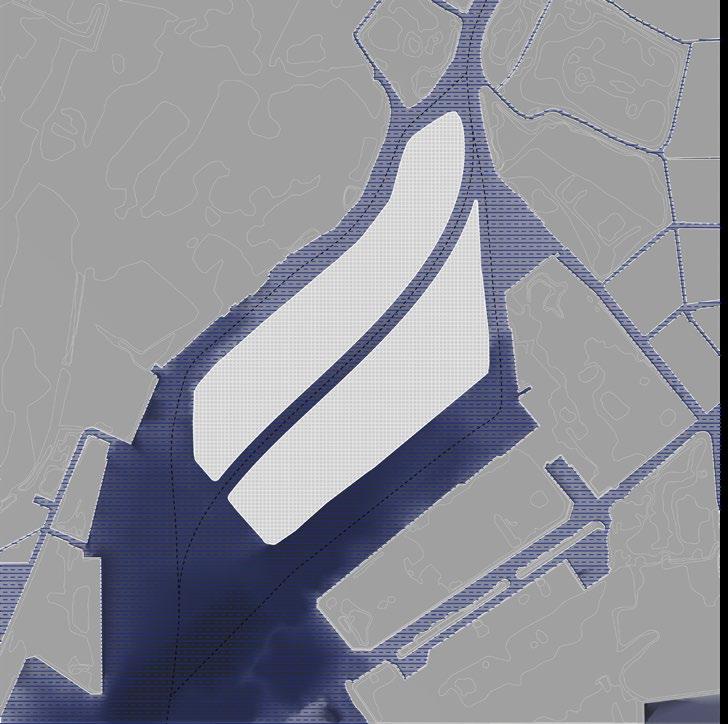
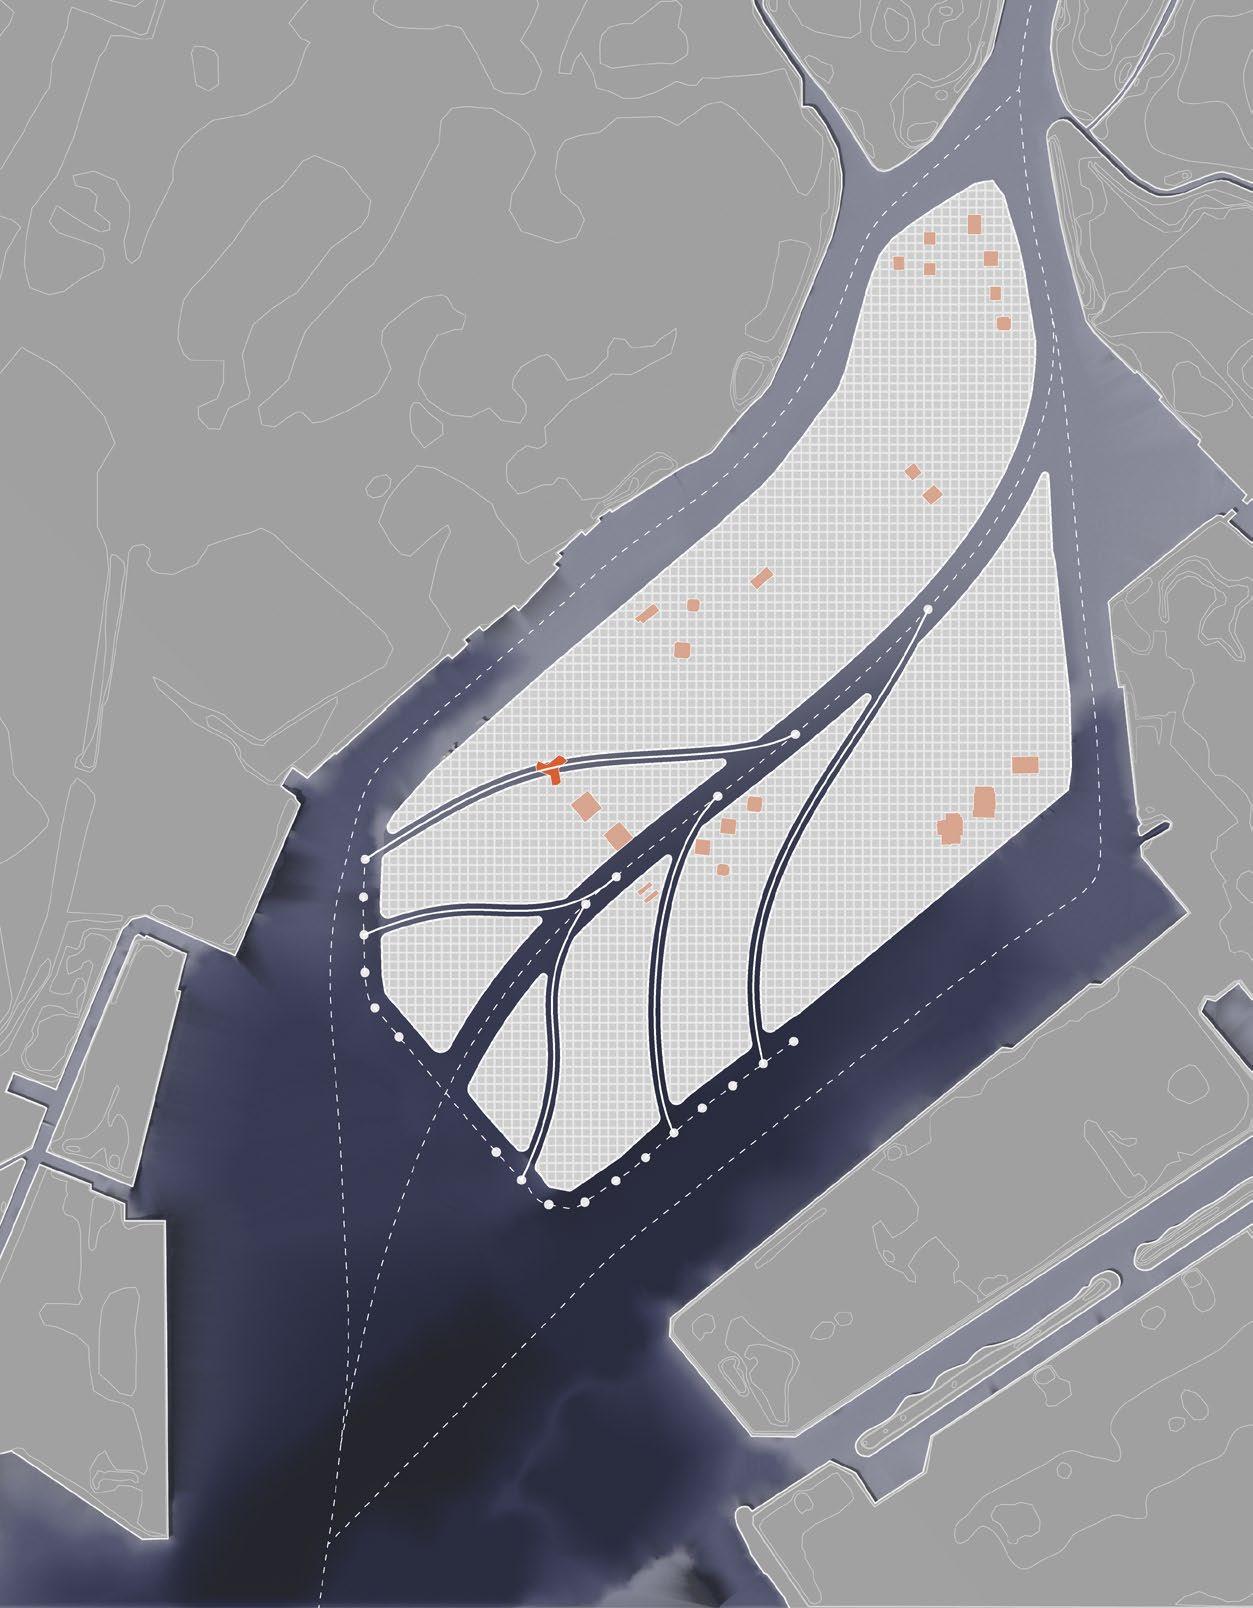
5.2.1 Primary channel allocation using G.A.
According to the simulation in chapter 4.2.1.3, the existing land form and channels are incapable to channel tsunami. It may may cause large area of inundation and create high velocity areas. Therefore a G.A is made based on the principles of channeling strategies extracted from chapter 4.2.2, to modify the existing river channel. The G.A criteria also consider the amount of area that needs to be modified and the urban context, in order to achieve the expected result with a lower cost.
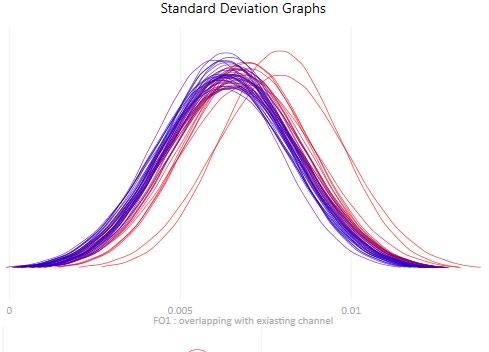
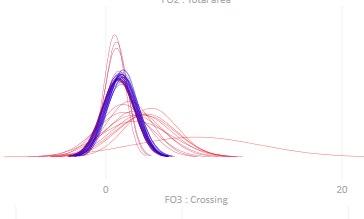
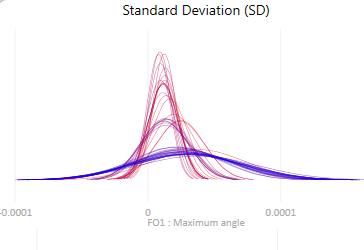
G.A statistical graphs
Parametres
1. Start points/end points the primnary channel
2. Curvature of the channel
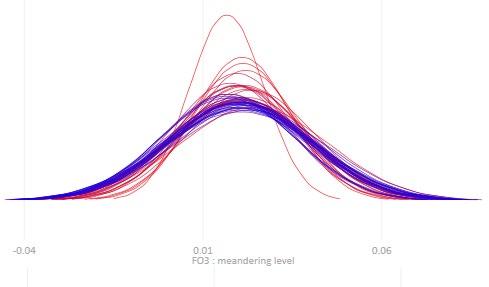
2. Meandering degree of the channel
Fitness Objective
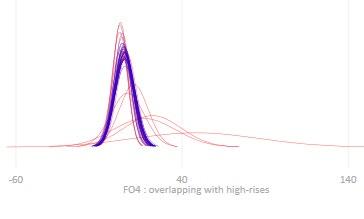
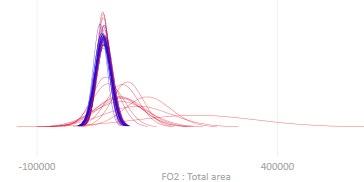
1. Minimum land modification
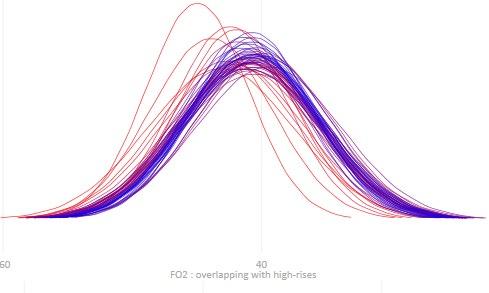
2. Minimum overlapping with high-rises
3. Minimum sharp angles
4. Maximum average curvature
Selection criteria
Average ranking of all fitness objective
 Tsunami simulation on existing land form
G.A setting
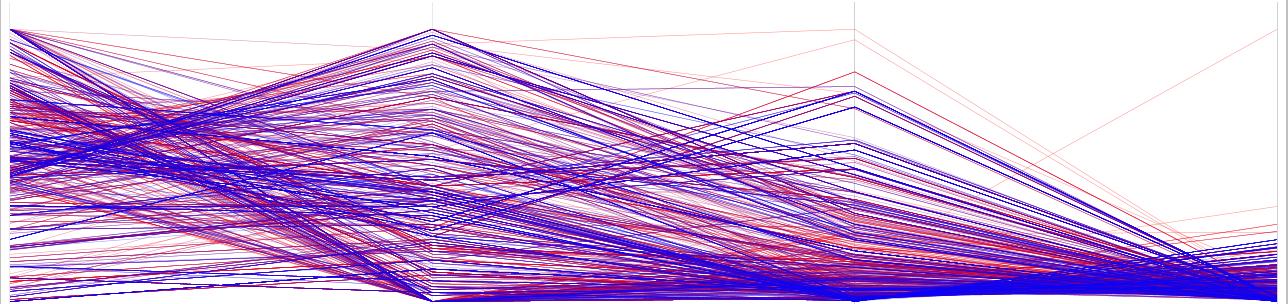
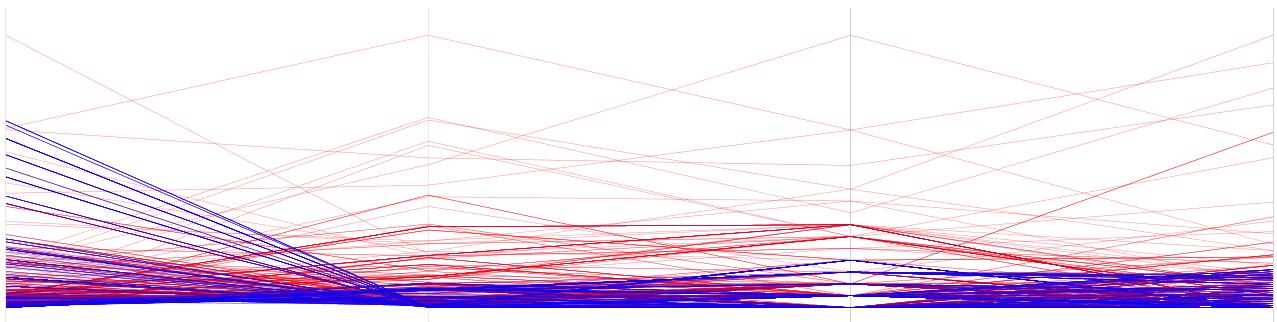
Standard Deviation F.O 1 F.O 2 F.O 3 F.O 4 F.O 2 F.O 1 F.O 3 F.O 4 Parallel Coordinate Plot G.A result selection
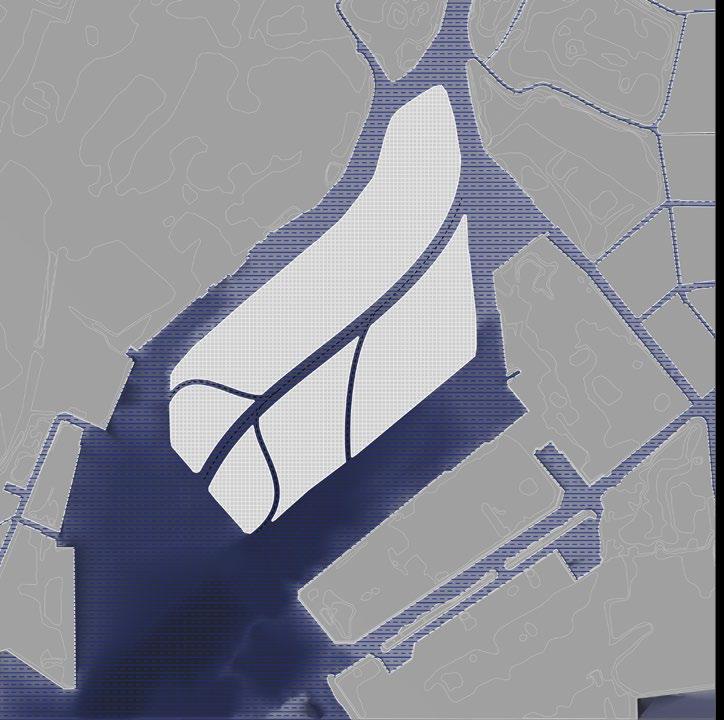
Figure 5.1.9: other candidates generated
Figure 5.1.8: Selected individual
5.2.2 Secondary channel allocation using G.A.
Based on a selected main channel result from the previous GA (5.2.1), the second phase of the GA was run. The GA allocates the secondary channels following the principle extracted from Figure 4.2.1 which suggests that by having more channels for water intake, it can reduce the inundation issue of low-lying river mouth areas.
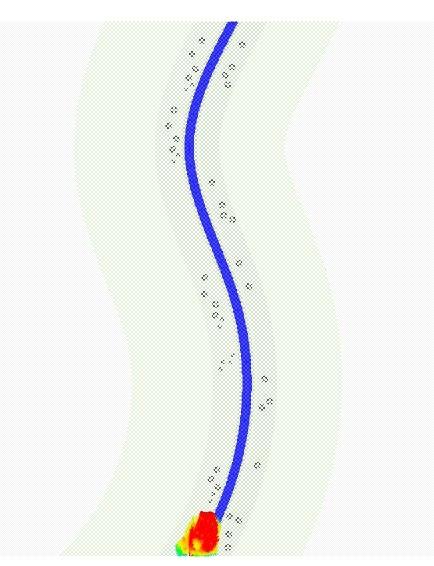
According to the GA setting, multiple (2-6) secondary channels can be generated to channel the tsunami hit. It will be generated only from the over toppling shorelines using the velocity vector (Figure 5.2.5) as initial direction. Than, the secondary channels will merge with the main channel smoothly in a meandering manner to dissipate some of the wave energy.
G.A statistical graphs
Fitness Objective
1. Min sharp angles
2. Min landuse
3. Min intersection
4. Min overlapping with existing high-rises

Parametres
1. Number of sencondary channels(from 2 to 6)
2. Start points/end points each channel
3. Curvature of each channel
4. Width of each secondary channel
Selection criteria
Average ranking of all fitness objective
result selection
G.A setting G.A
Figure 5.2.5: Over toppling direction
Parallel Coordinate Plot Standard Deviation F.O 1 F.O 2 F.O 1 F.O 2 F.O 3 F.O 3 F.O 4 F.O 4
Figure 5.1.11: other candidates generated
Figure 5.1.10: Selected individual
Tsunami simulation on existing landform without defence
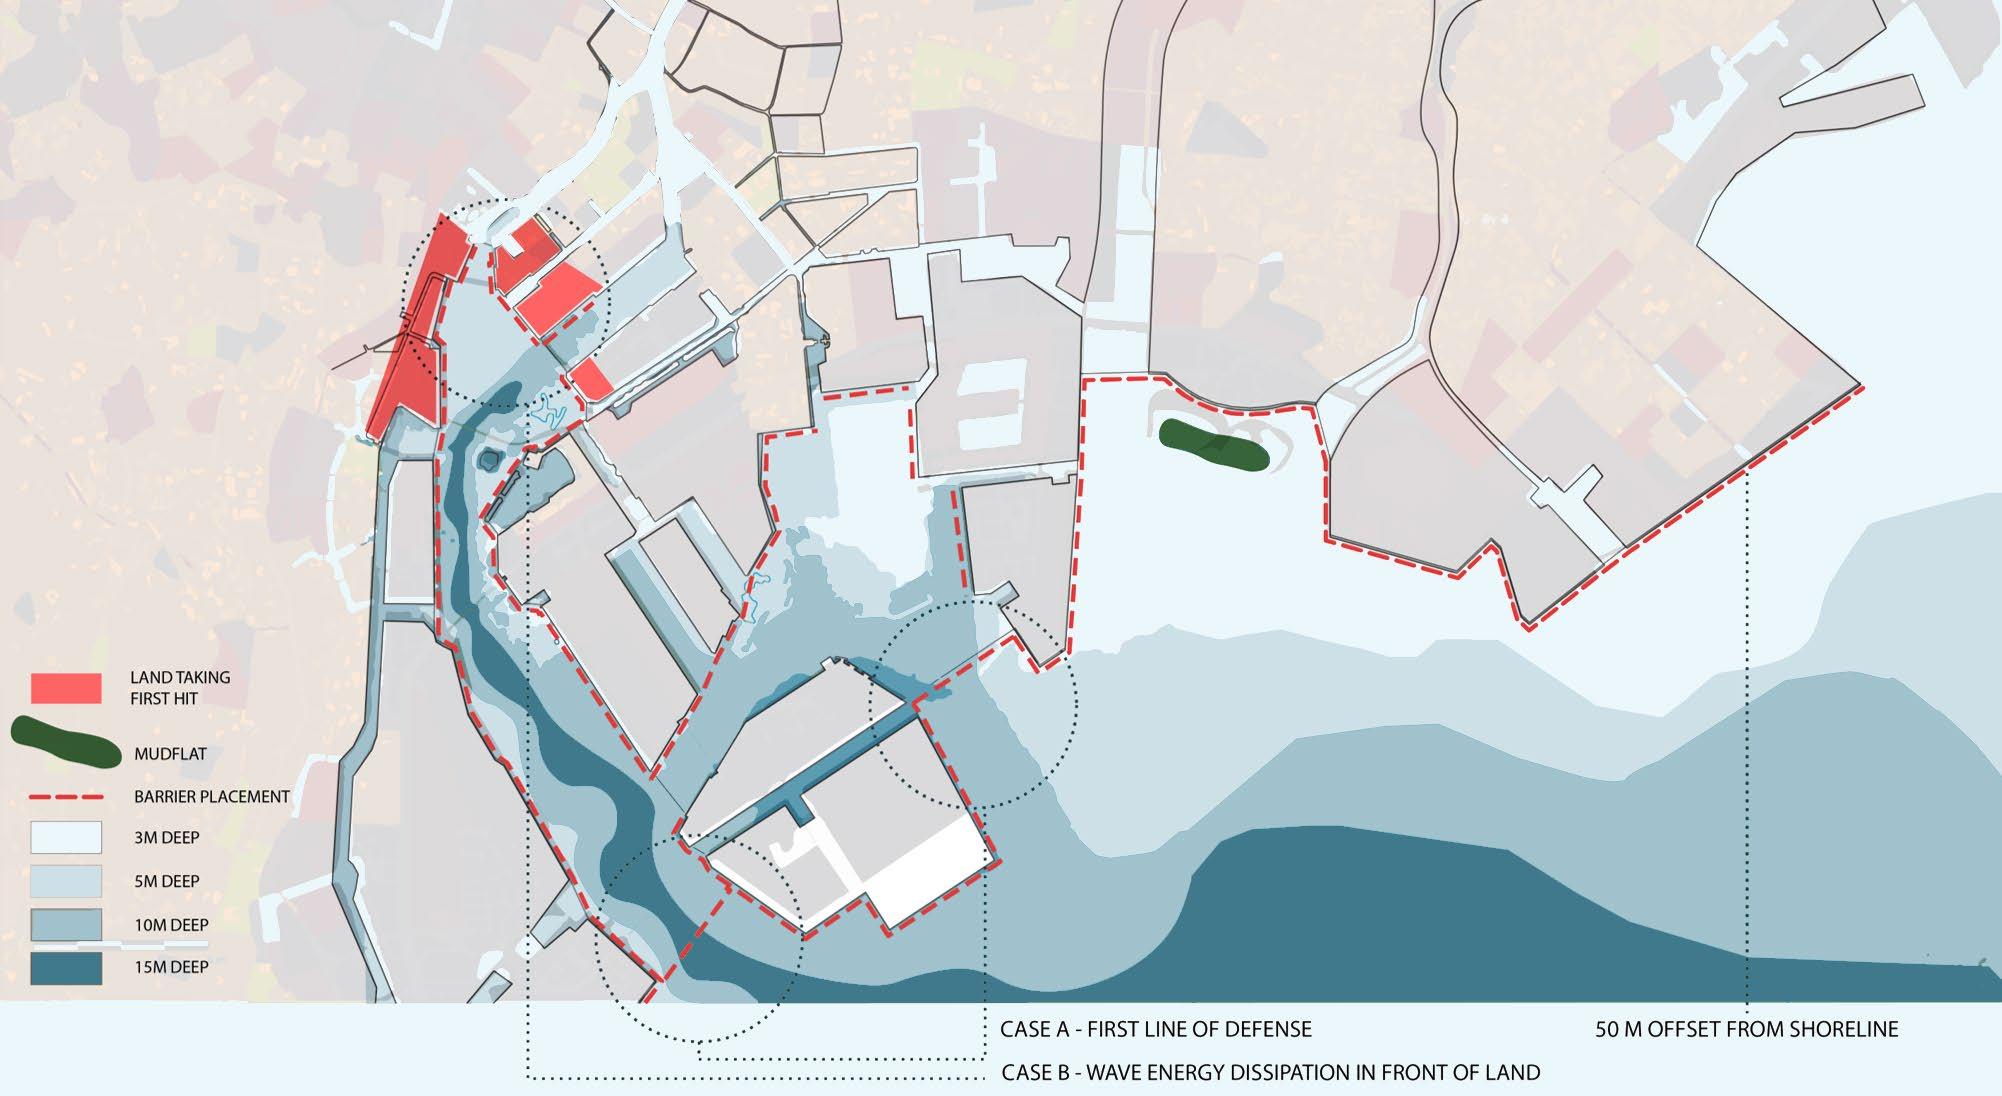
5.2.3 Post analysis with the modified channels and barrier application
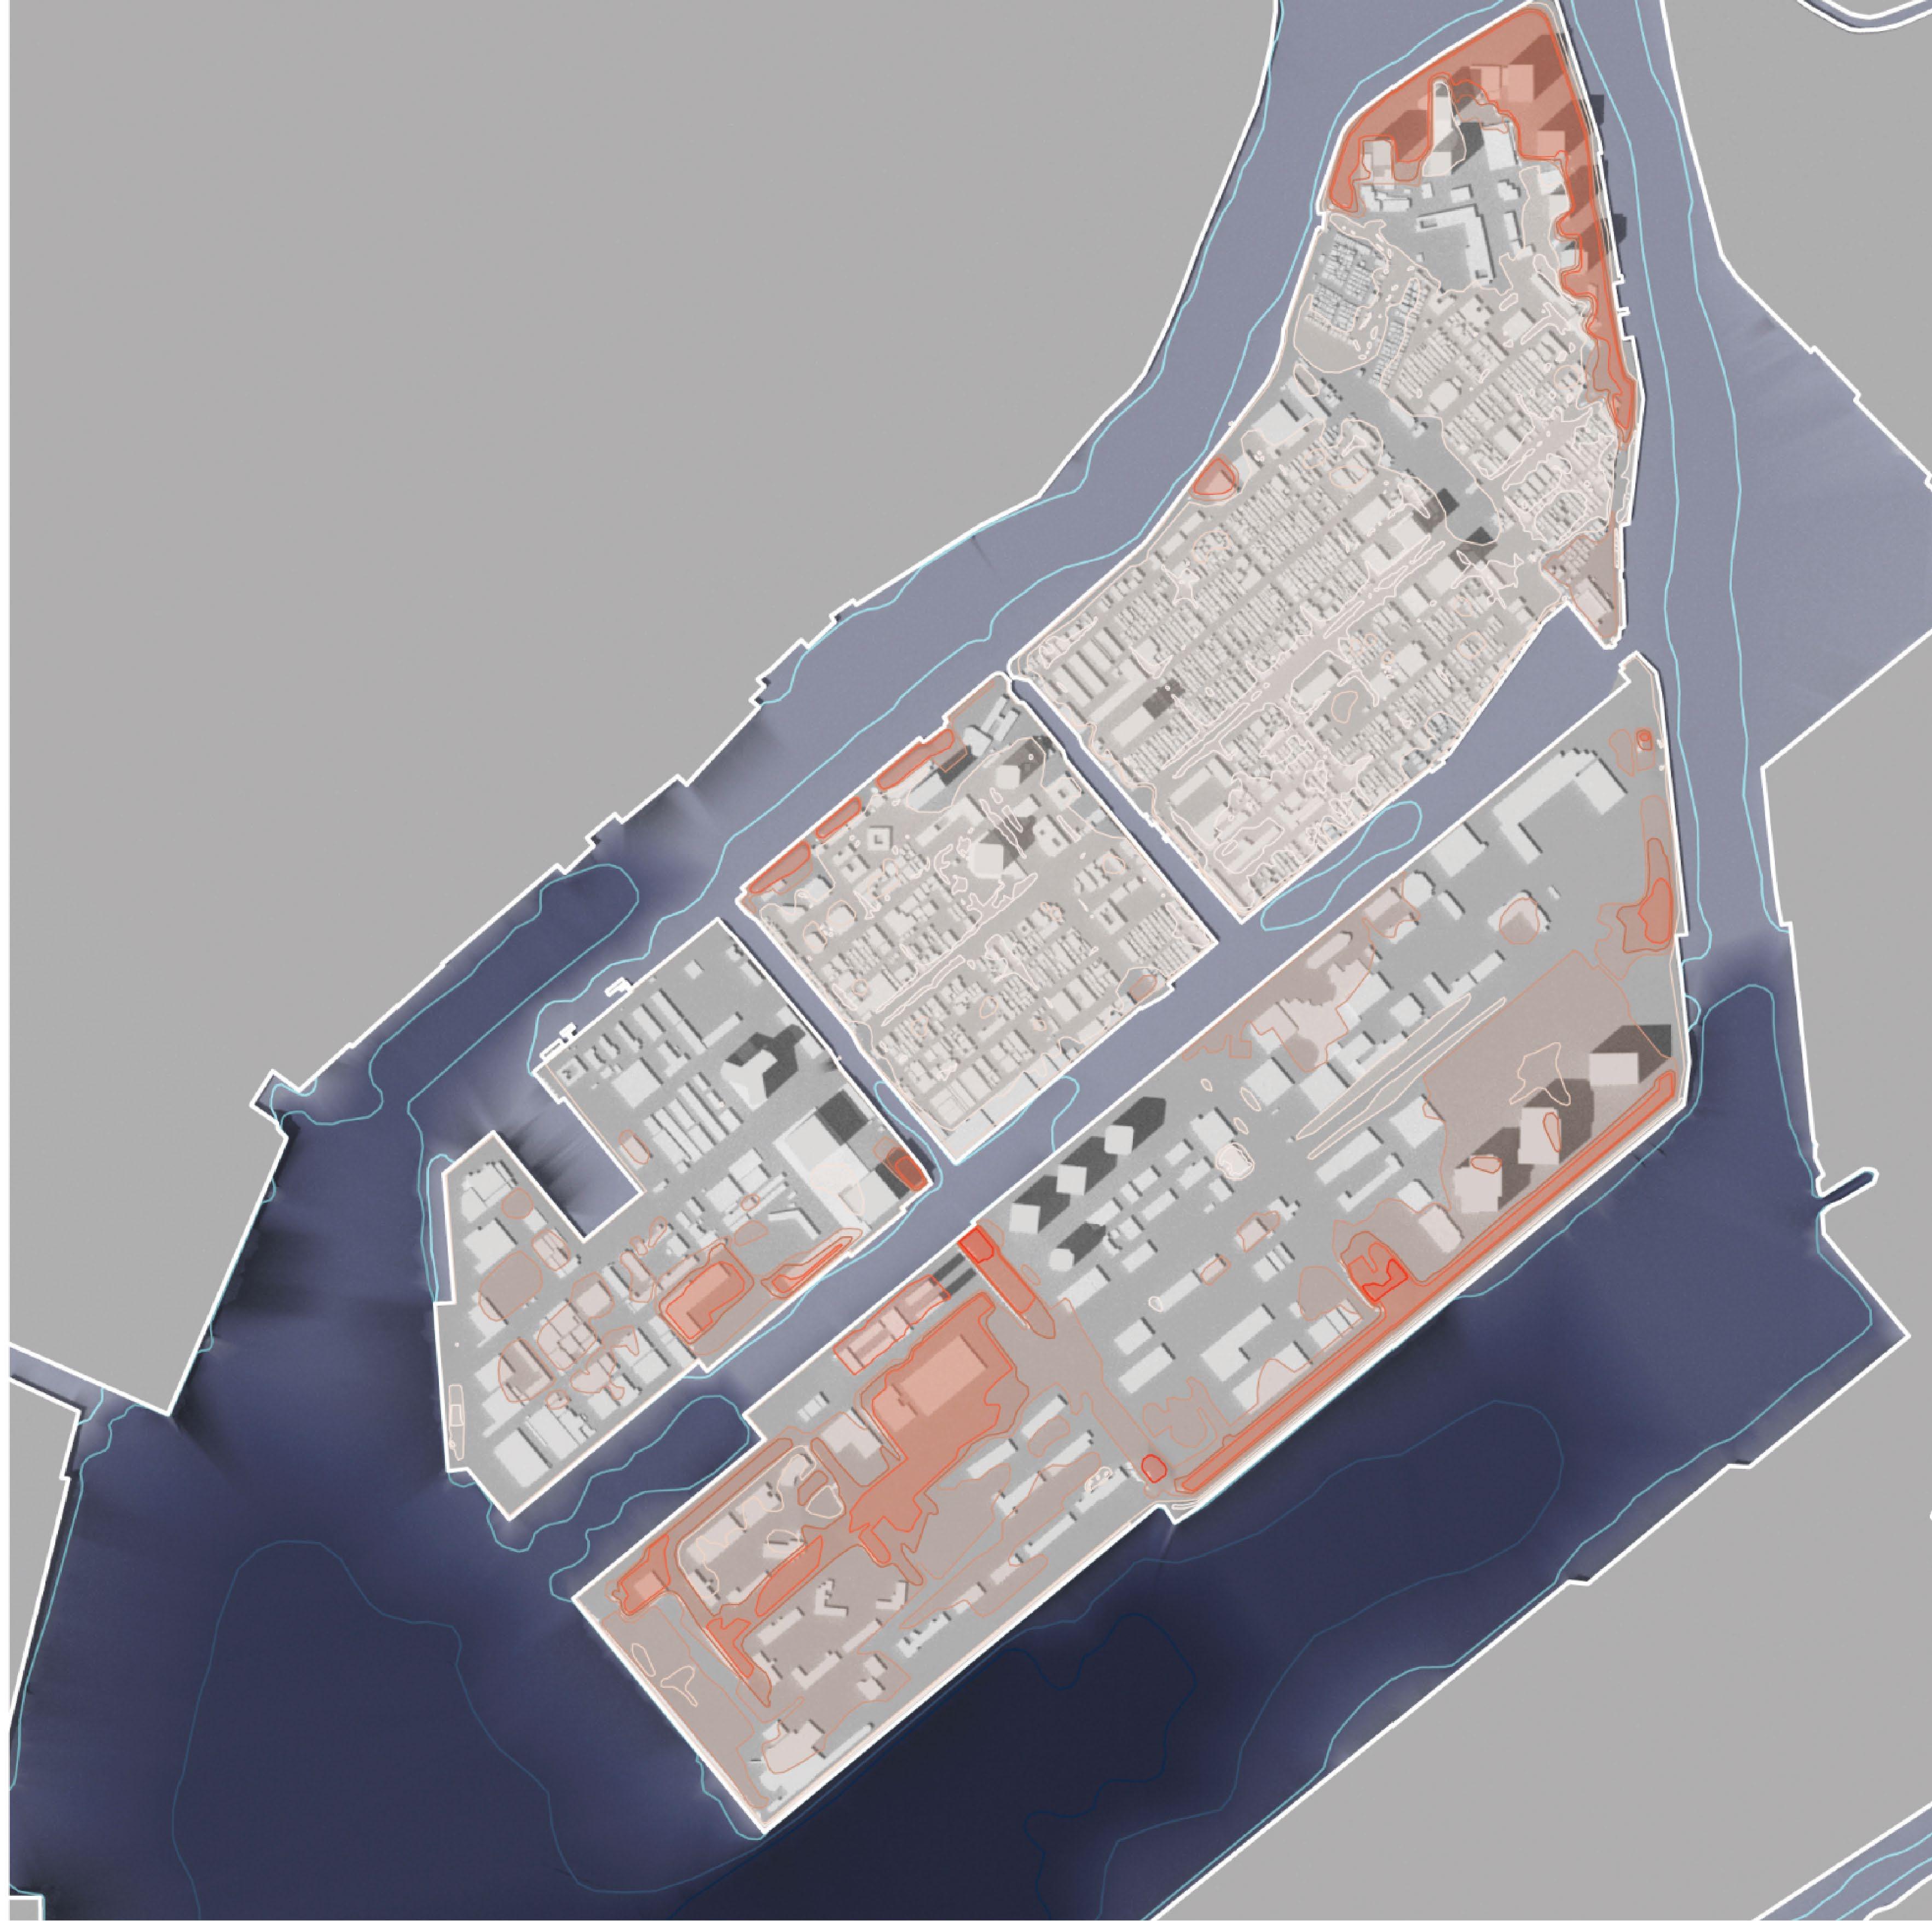
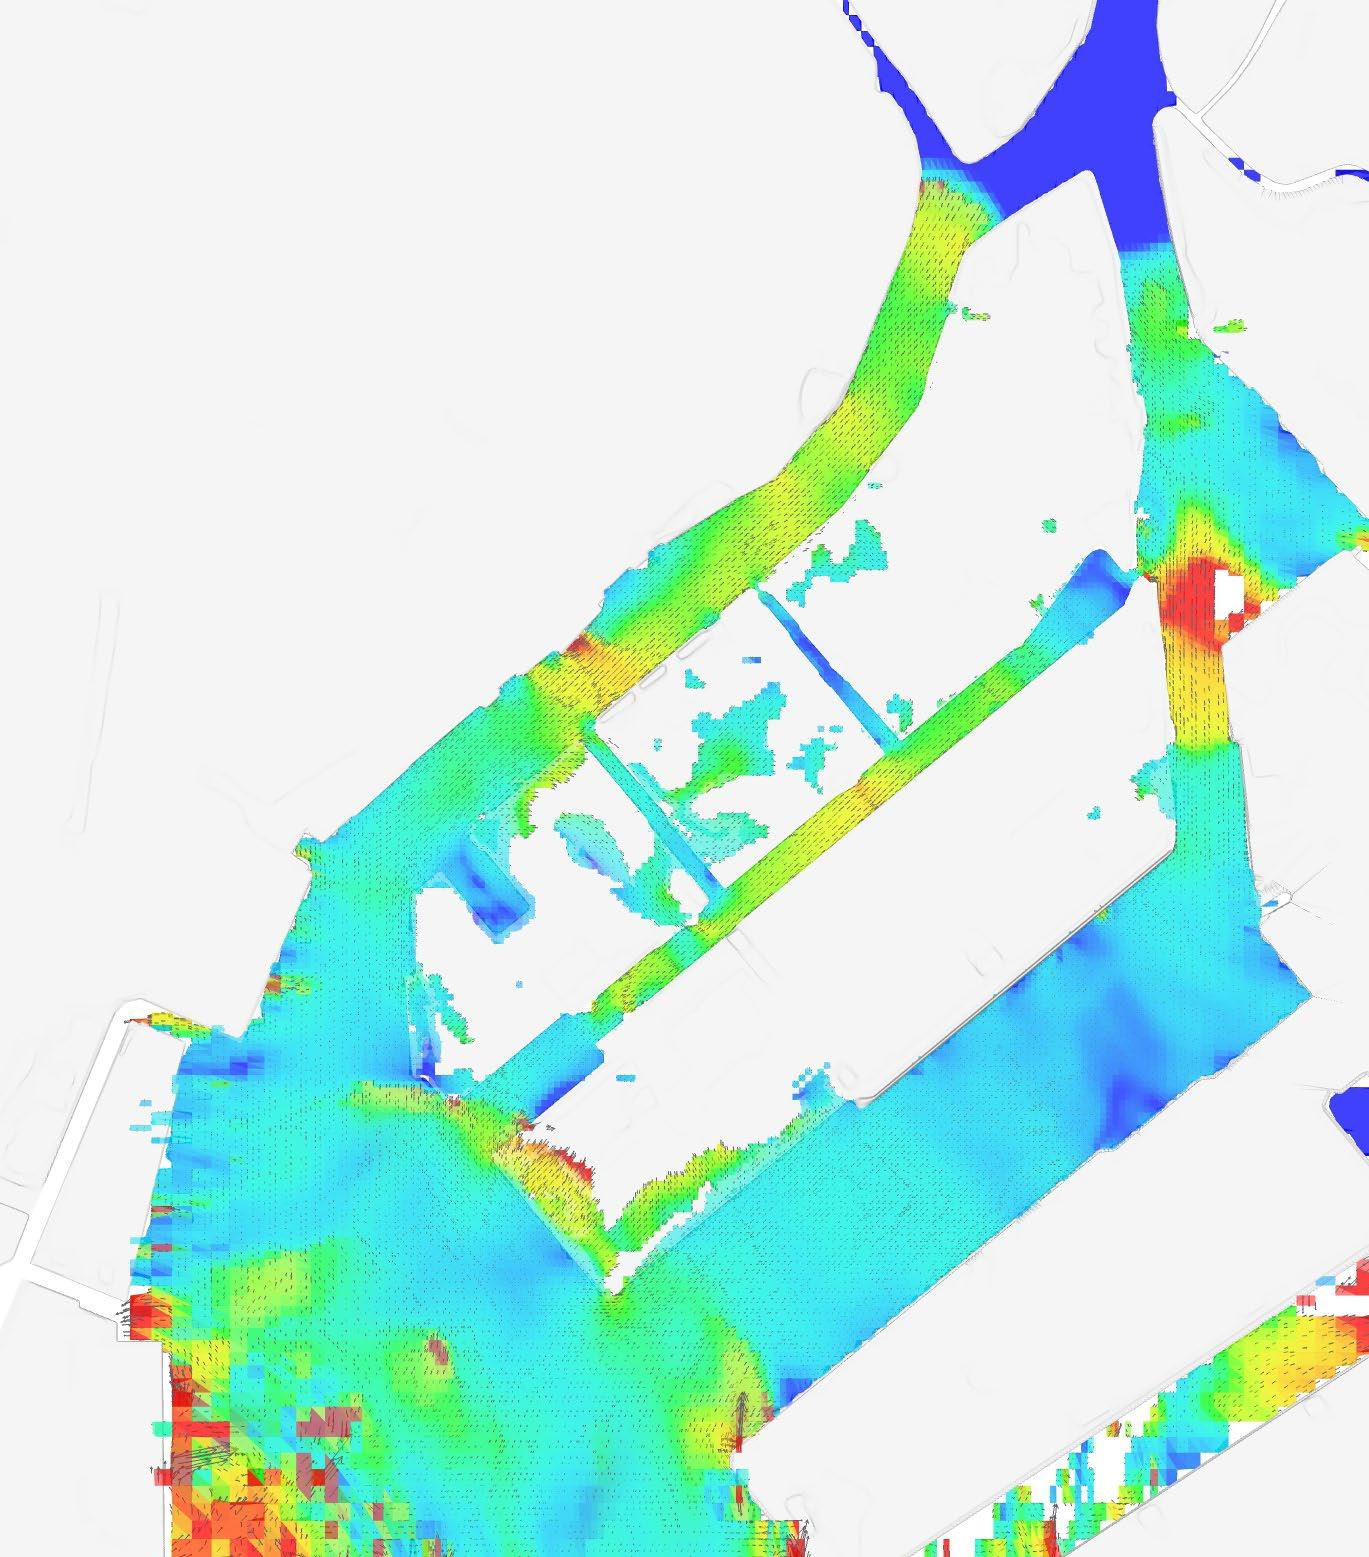
After the allocation of the barrier and the G,A for primary channel and secondary channel modification, a post analysis is run to compare the modified landform's performance with the existing landform[Figure 5.2.1]. It also shows the impact of the modification made on both the barrier and the channels.
Another post analysis is made on the modified landform, first model is with the barrier and the other is without the barrier[Figure 5.2.2]. This comparison is made to evaluate the effect of the barrier.
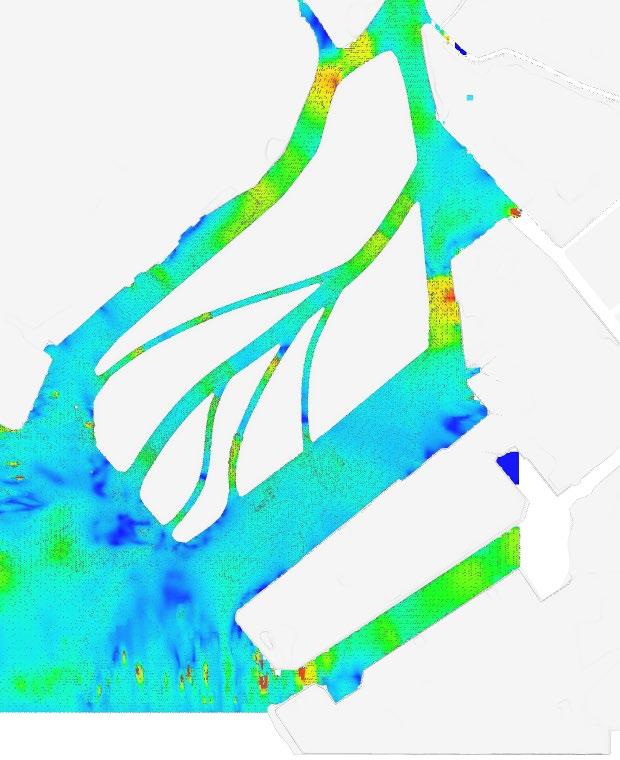
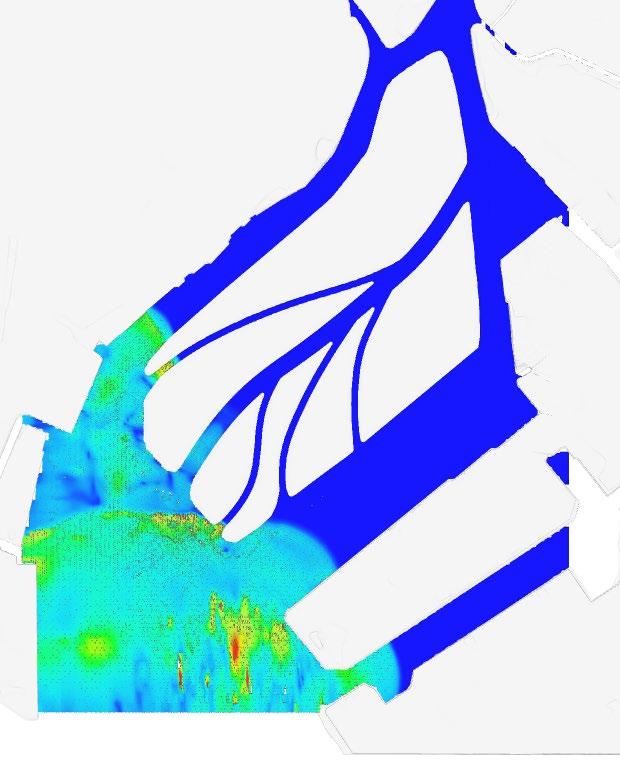
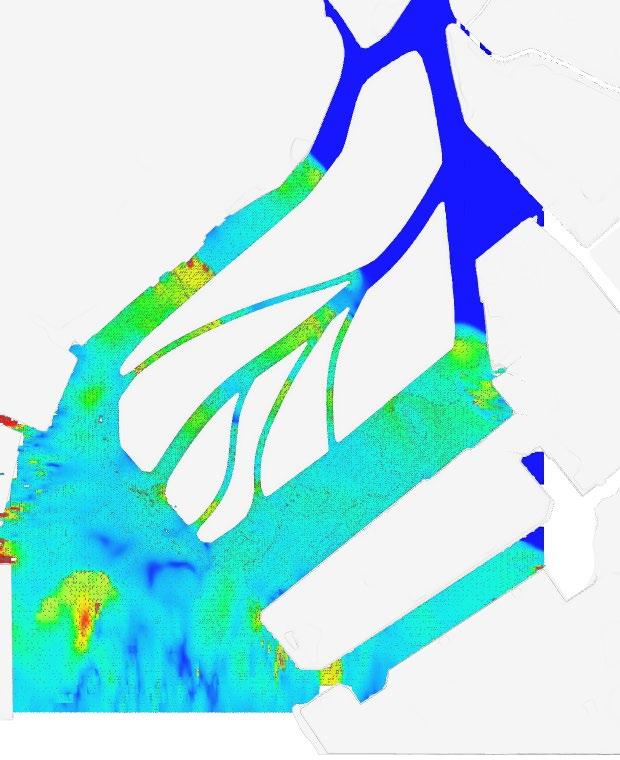
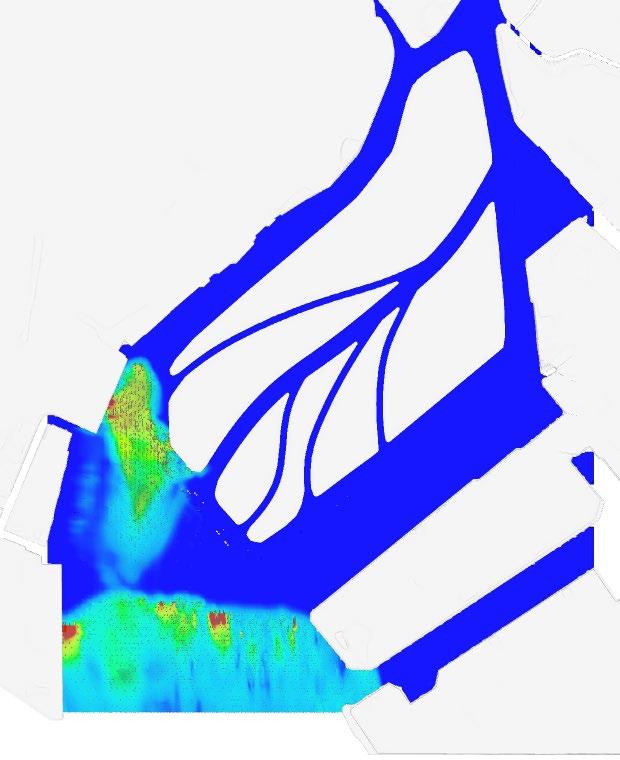
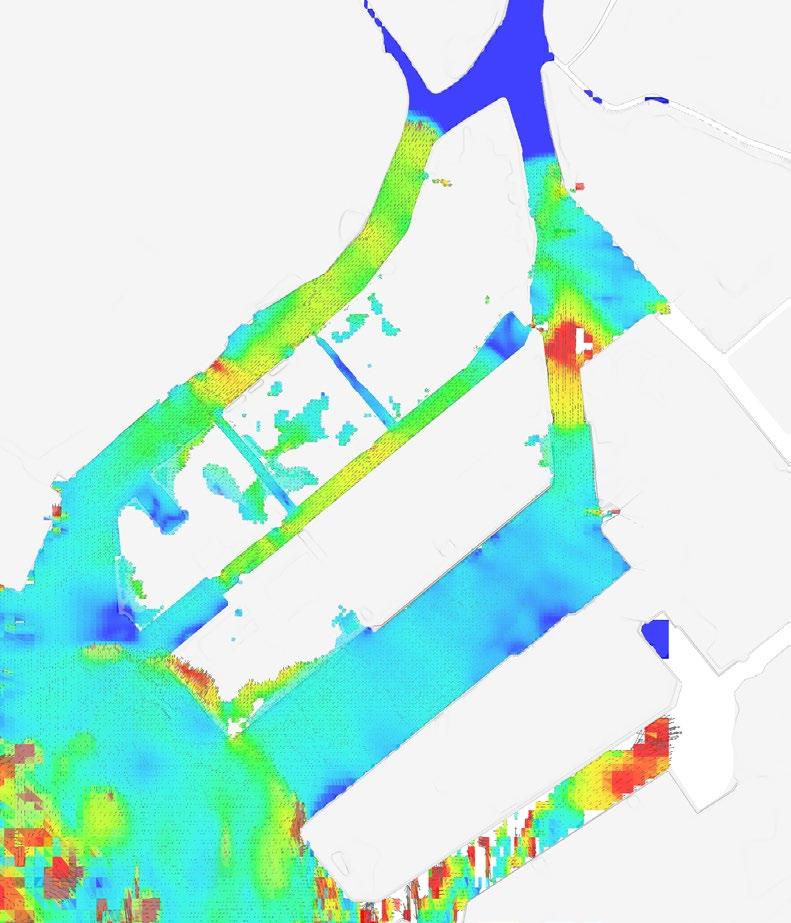
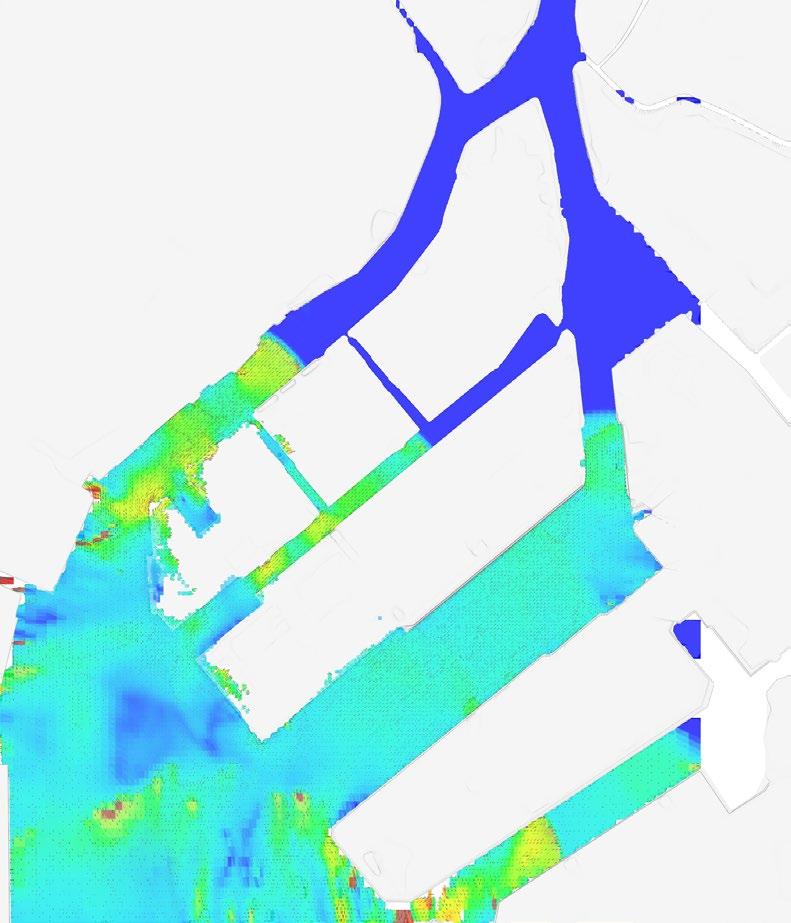
In the first set of comparison, significant difference is shown in terms of outflow velocity, inundation area, and over-toppling. It proves that the modified landform with barrier can largely solve the main issues of tsunami without posing threat to the upper stream areas. From the second set of comparison, the result shows that the placement of the barrier can create low velocity areas behind it and reduce the velocity in the main and secondary channels.
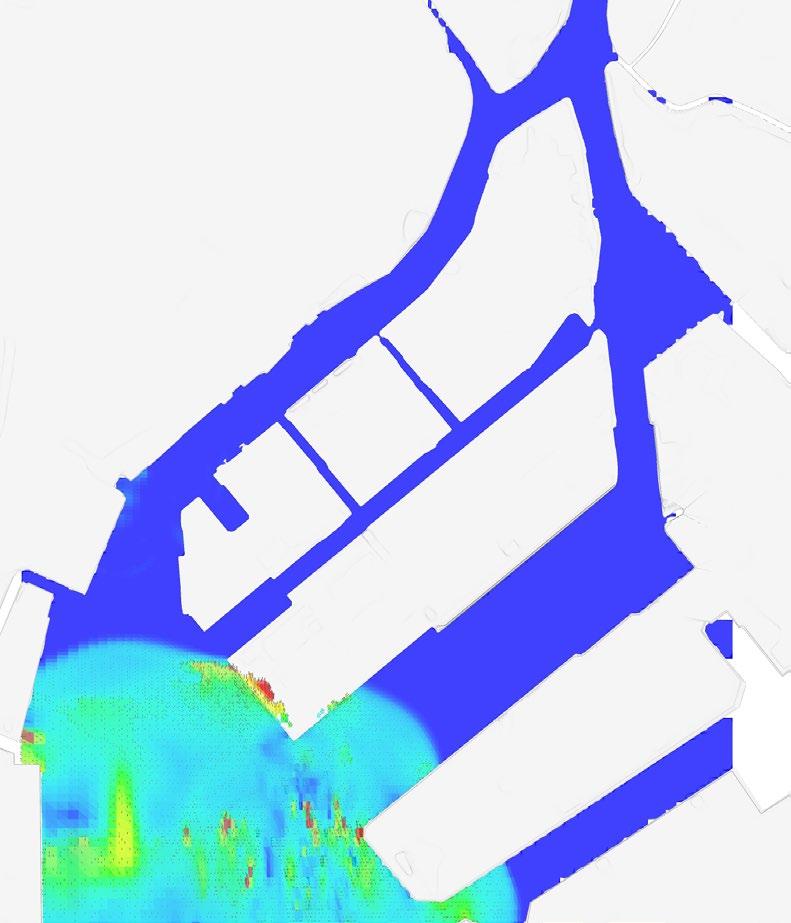
132 133
Tsunami simulation on modified landform with barrier
Figure 5.2.1: Comparison between the existing landform and modified landform with barrier
Figure 5.2.2: Comparison between the existing landform and modified landform with barrier
5.3 Zoning/Evacuation zones/Tertiary channels/Network generation in local scale
This chapter is aiming to further develop a zoning strategy[1], generate evacuation zones[2], allocate tertiary channels[3], and plan a network[4] on a local scale, based on a selected G.A landmass from chapter 5.2. The northern land piece is selected for further development since it is the largest piece of land, and a relatively high water velocity is shown in the secondary channel to its south in the post-analysis.
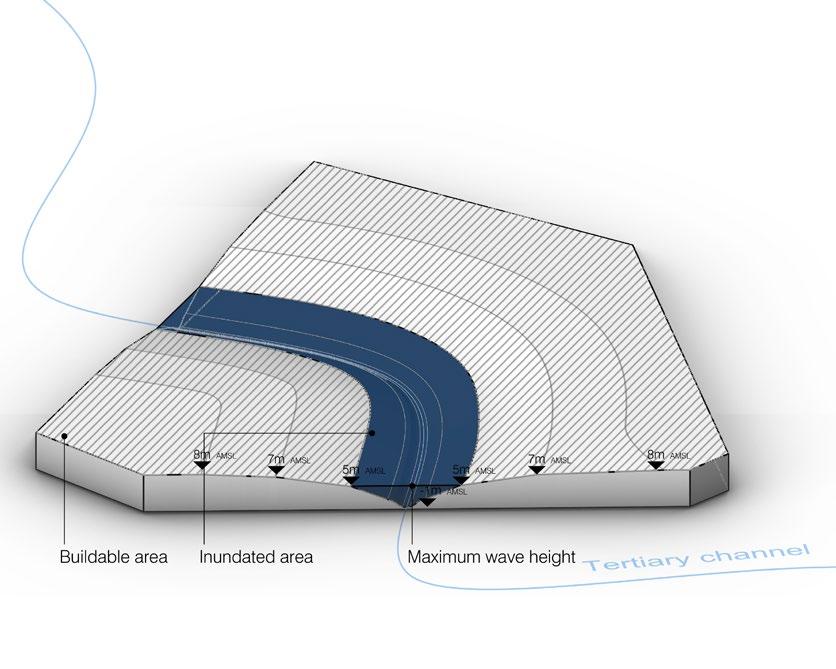
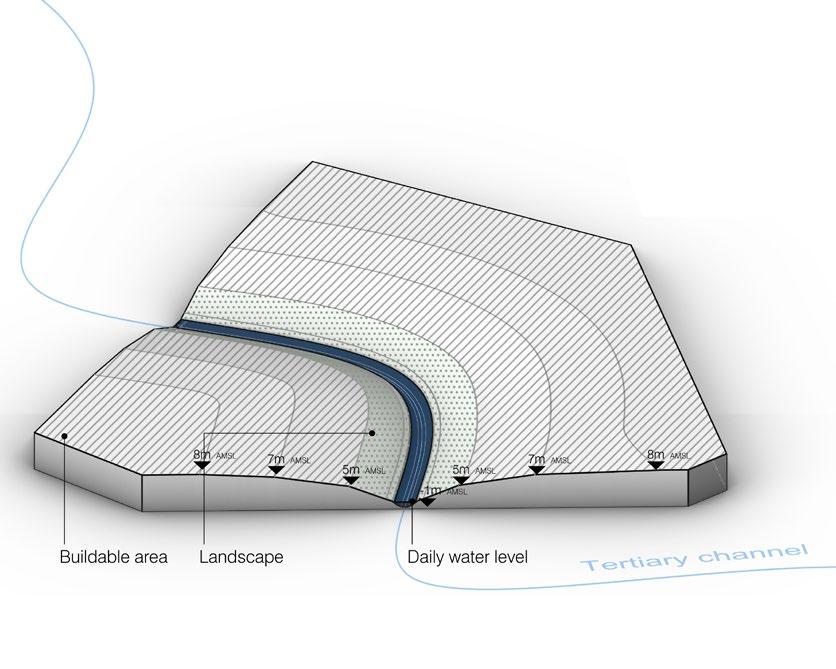
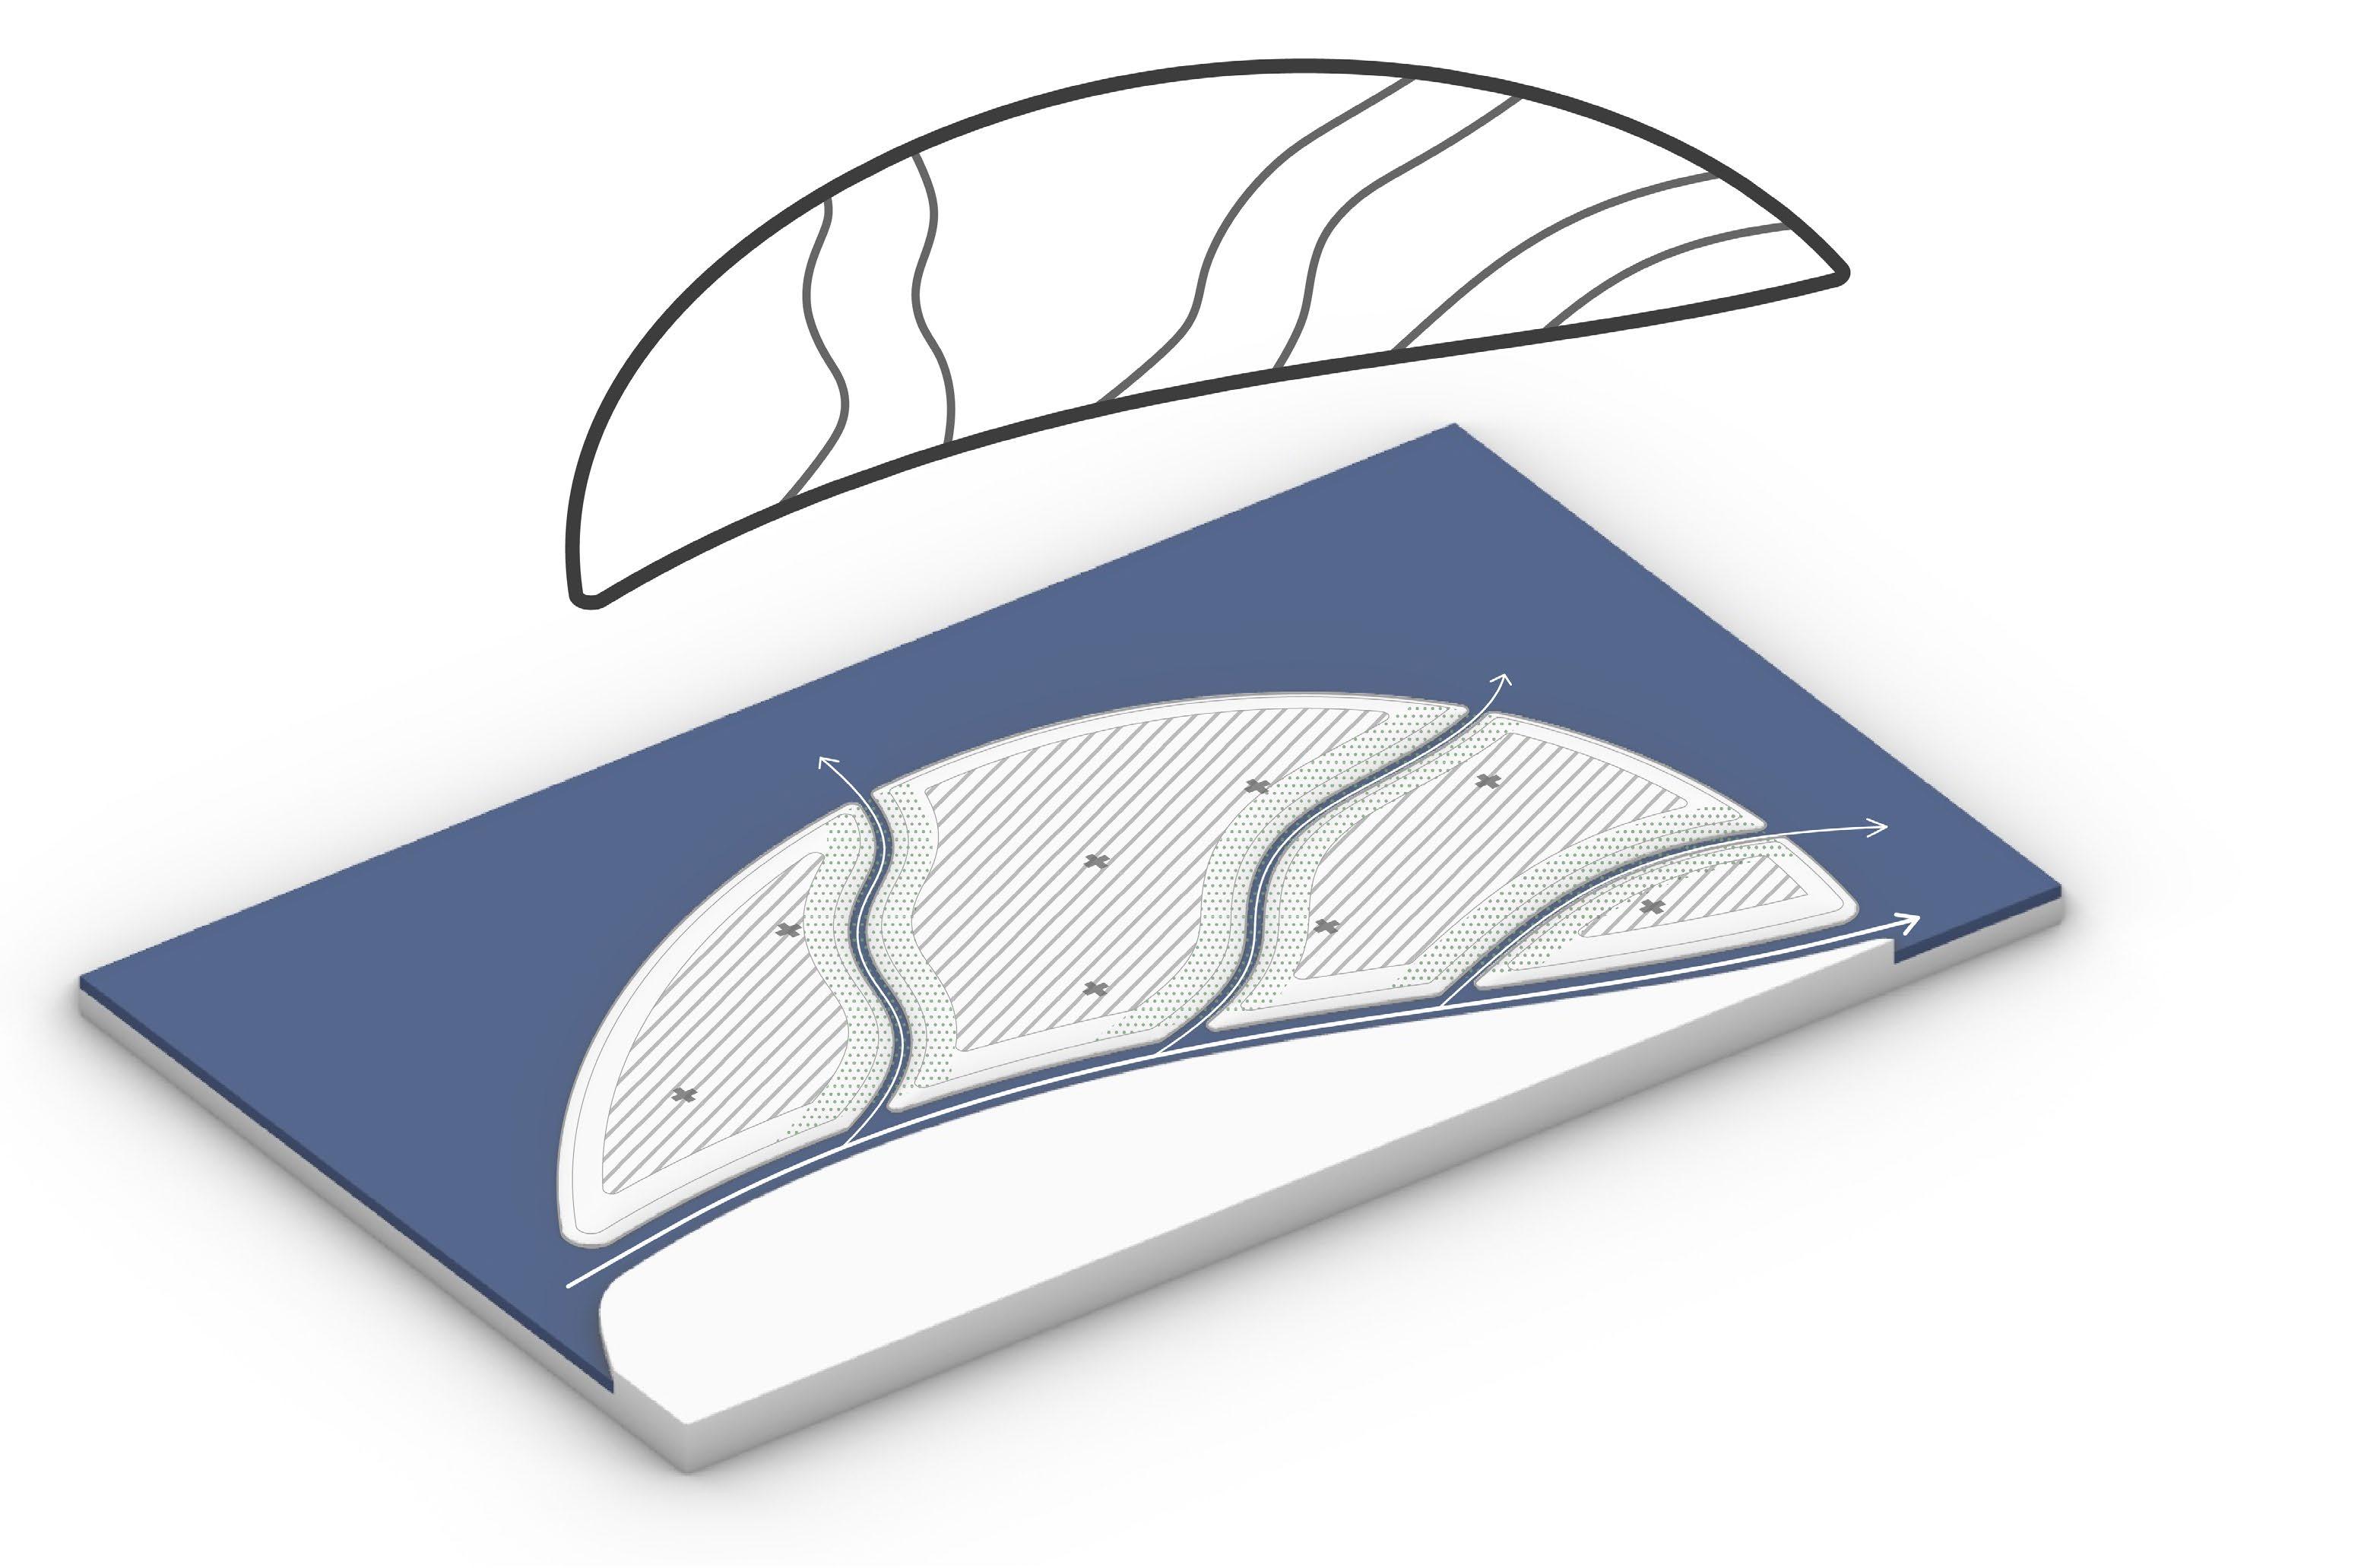
The development is divided into 3 phases. Phase 1 is to plan the zoning[1] and set evacuation zones[2] using G.A, phase 2 is to allocate tertiary channels[3] based on a selected result from phase 1 using another G.A, and phase 3 is to design a network[4] by analysis and comparison. Diagrams below are showing the sequece of development in this chapter[Fig5.3.1] [Fig5.3.2].
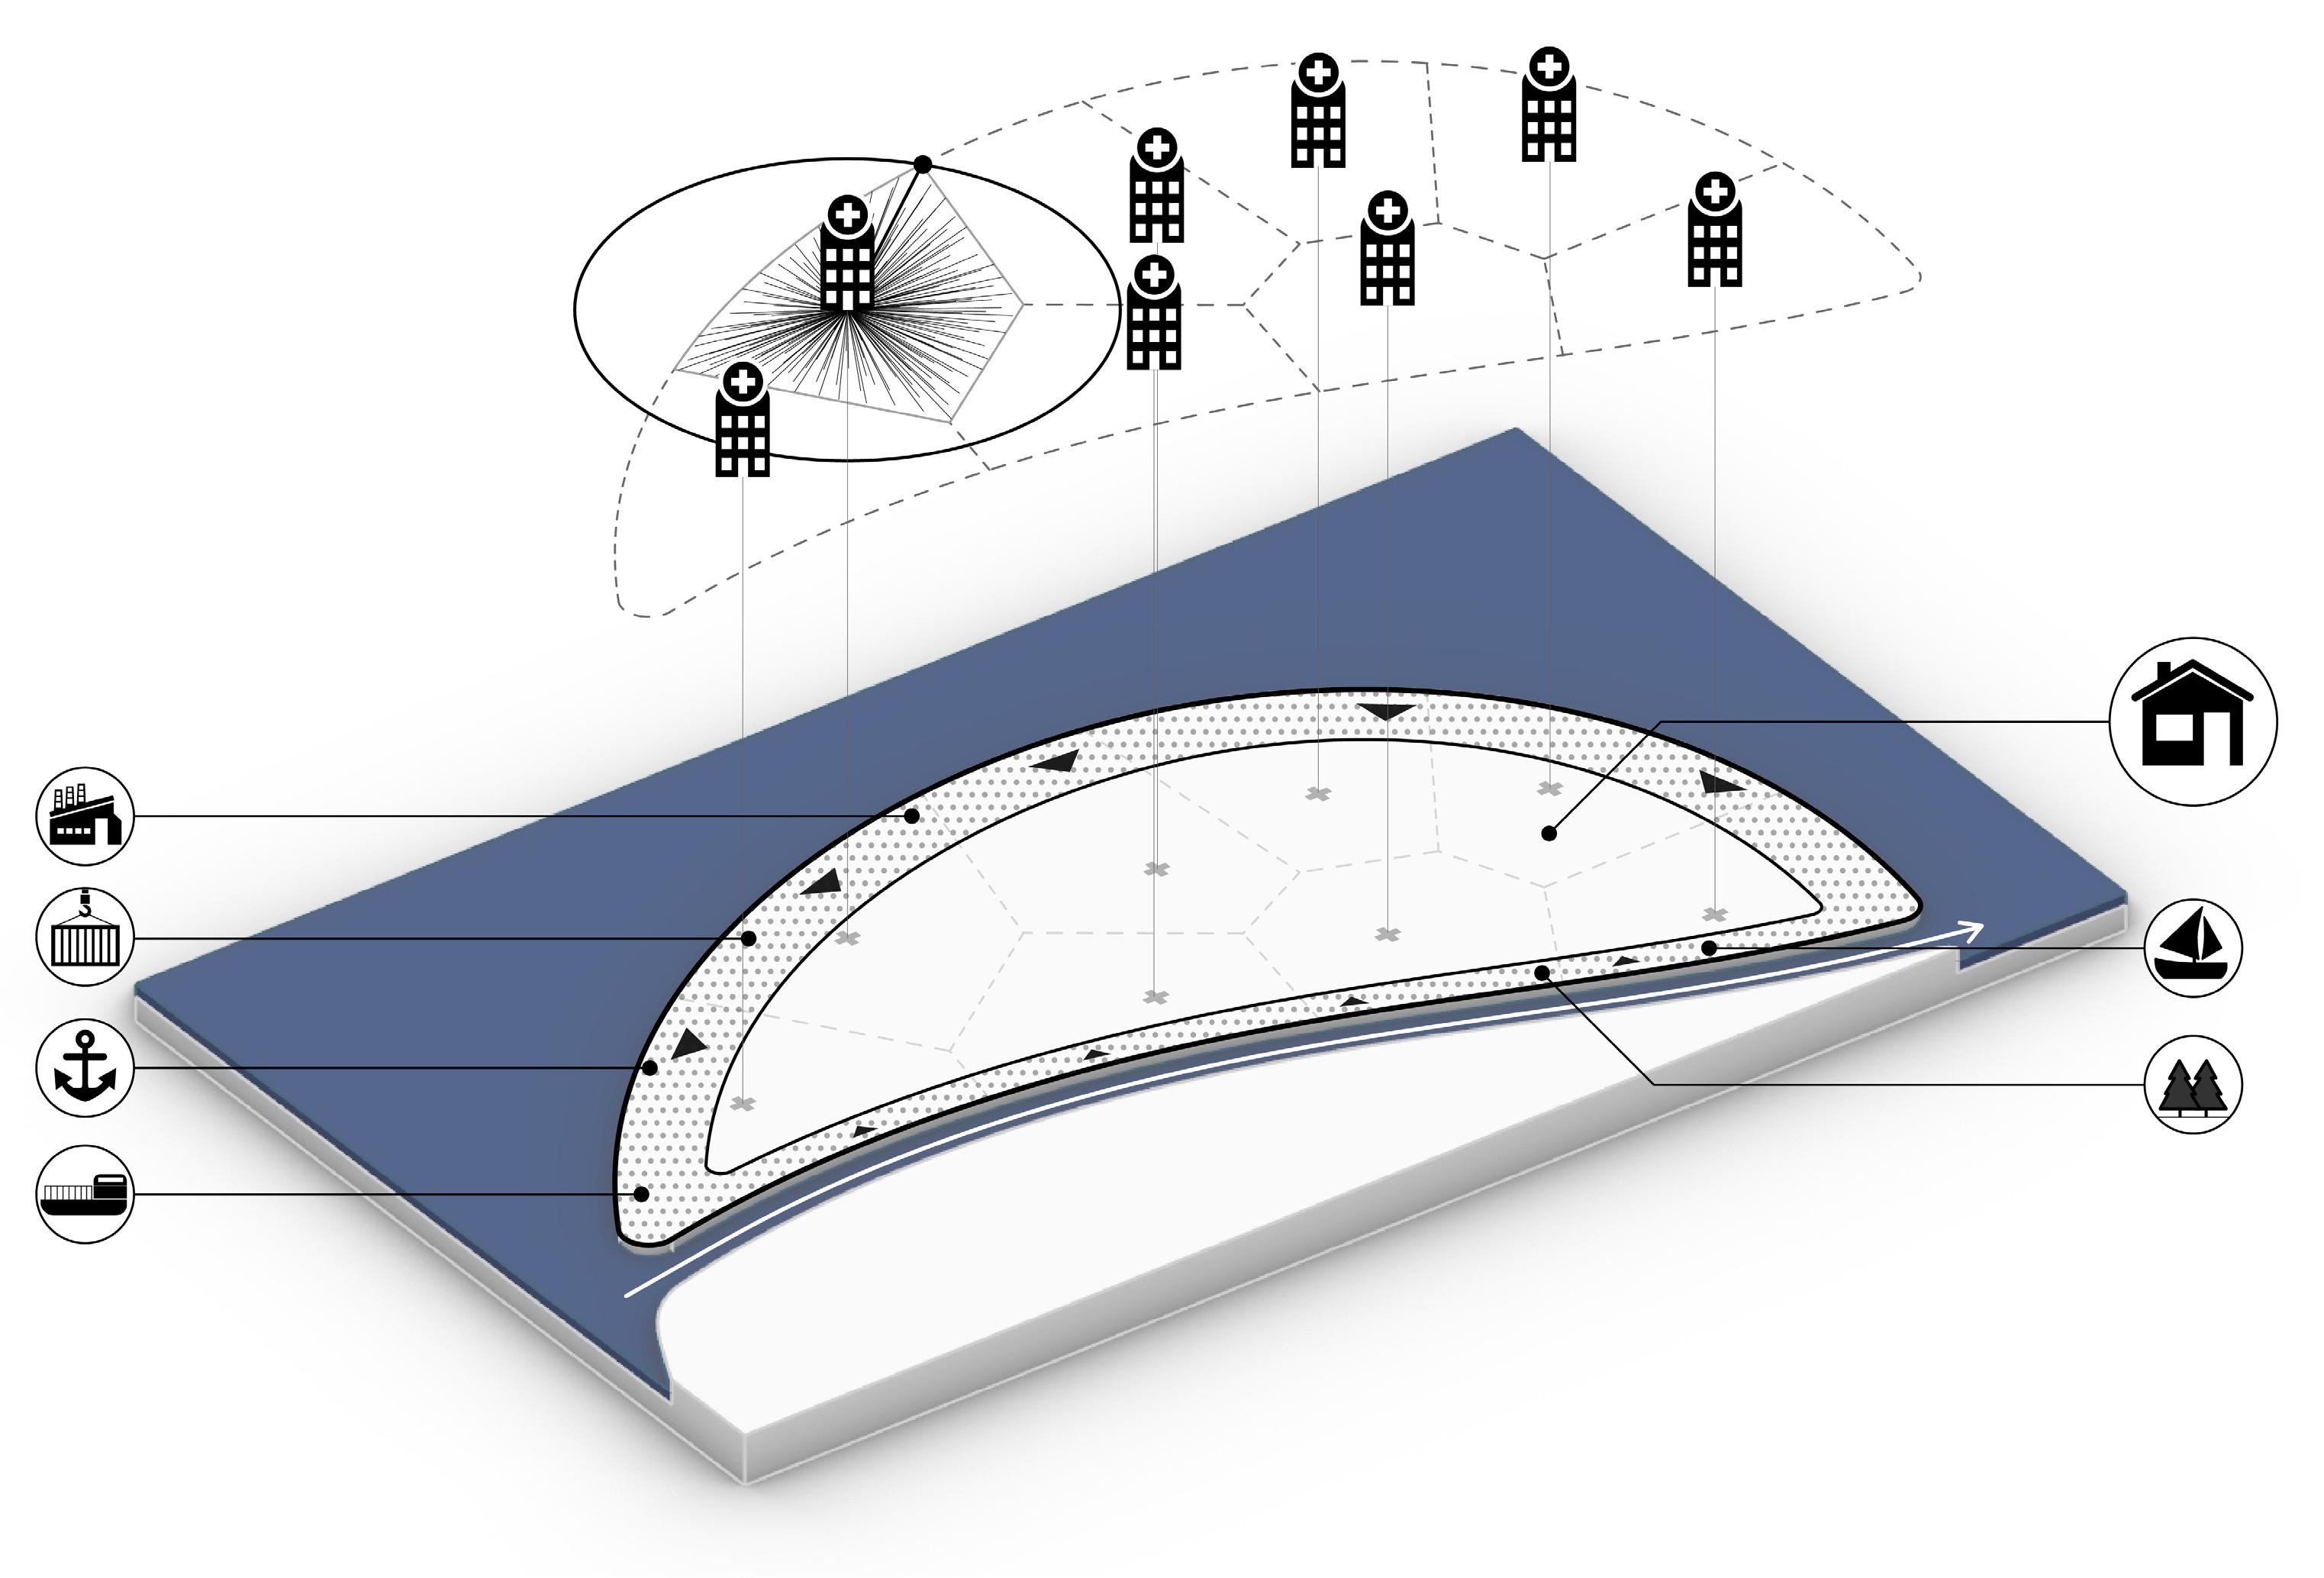
134 135
[2] Evacuation zones
[1] Zoning
[3] Tertiary channels a allocation
[4] Network development
Figure5.3.1: Zoning / Evacuation zones
Figure5.3.2: Tertiay channels / Network development
5.3.1 Zoning/evacuation zones distribution using G.A.
The main objective of this G.A is to divide the land into high-risk areas for industry/ports and lowrisk areas for residential, and set up evacuation zones for the residential area, which all the residents can have access to within 10 mins walk. The Voronoi definition is applied in the process to set evacuation zones. Multiple points will be placed as an evacuation center, and the Voronoi generated will become the evacuation zone.
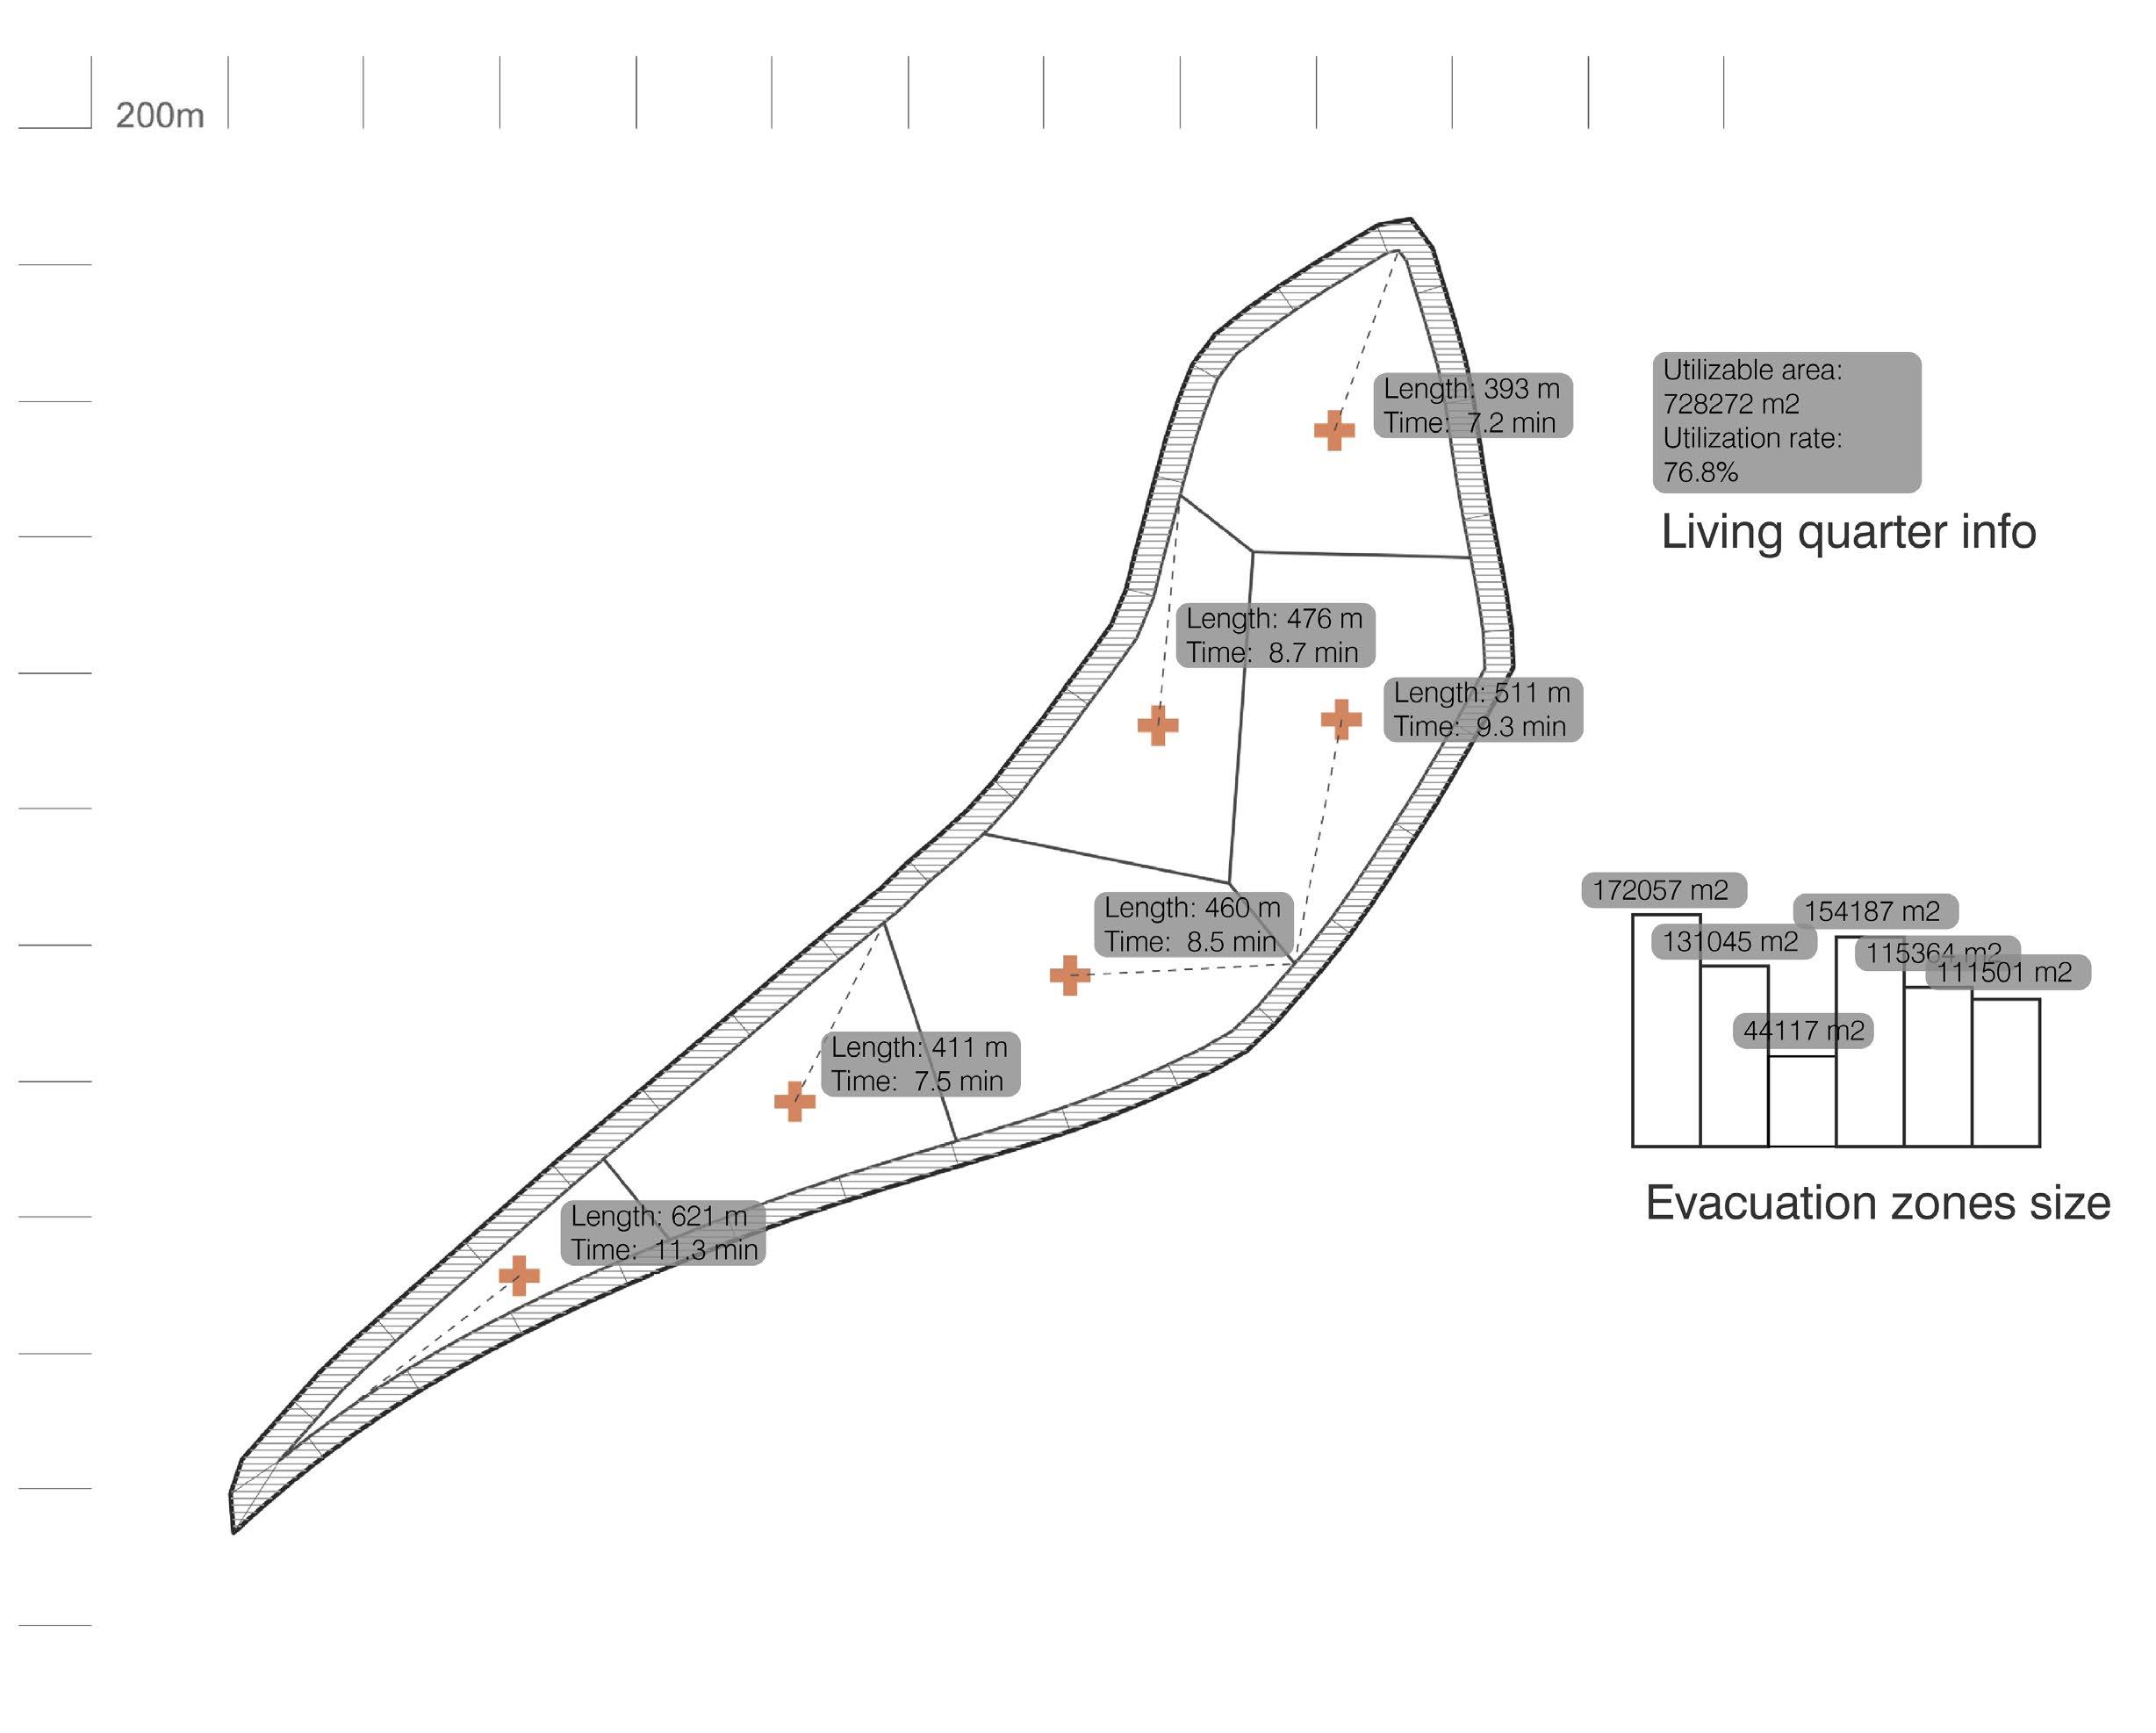
Fitness Objective
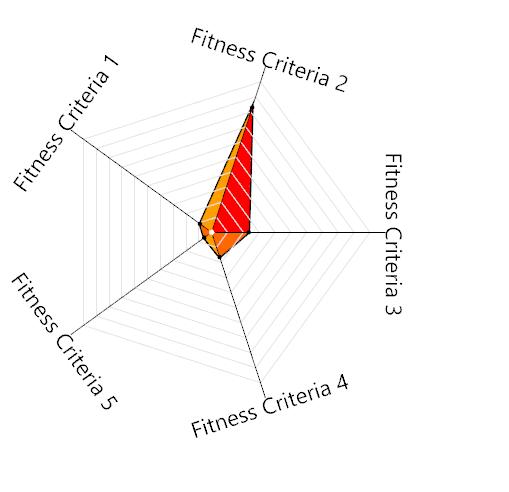
1. Approching 75% land area for residentialShorter
2. Minimum amount of evacuation zones
3. Minimum distance(<10 mins walk)
4. Even evacuation zone size (minimum standard diviation)
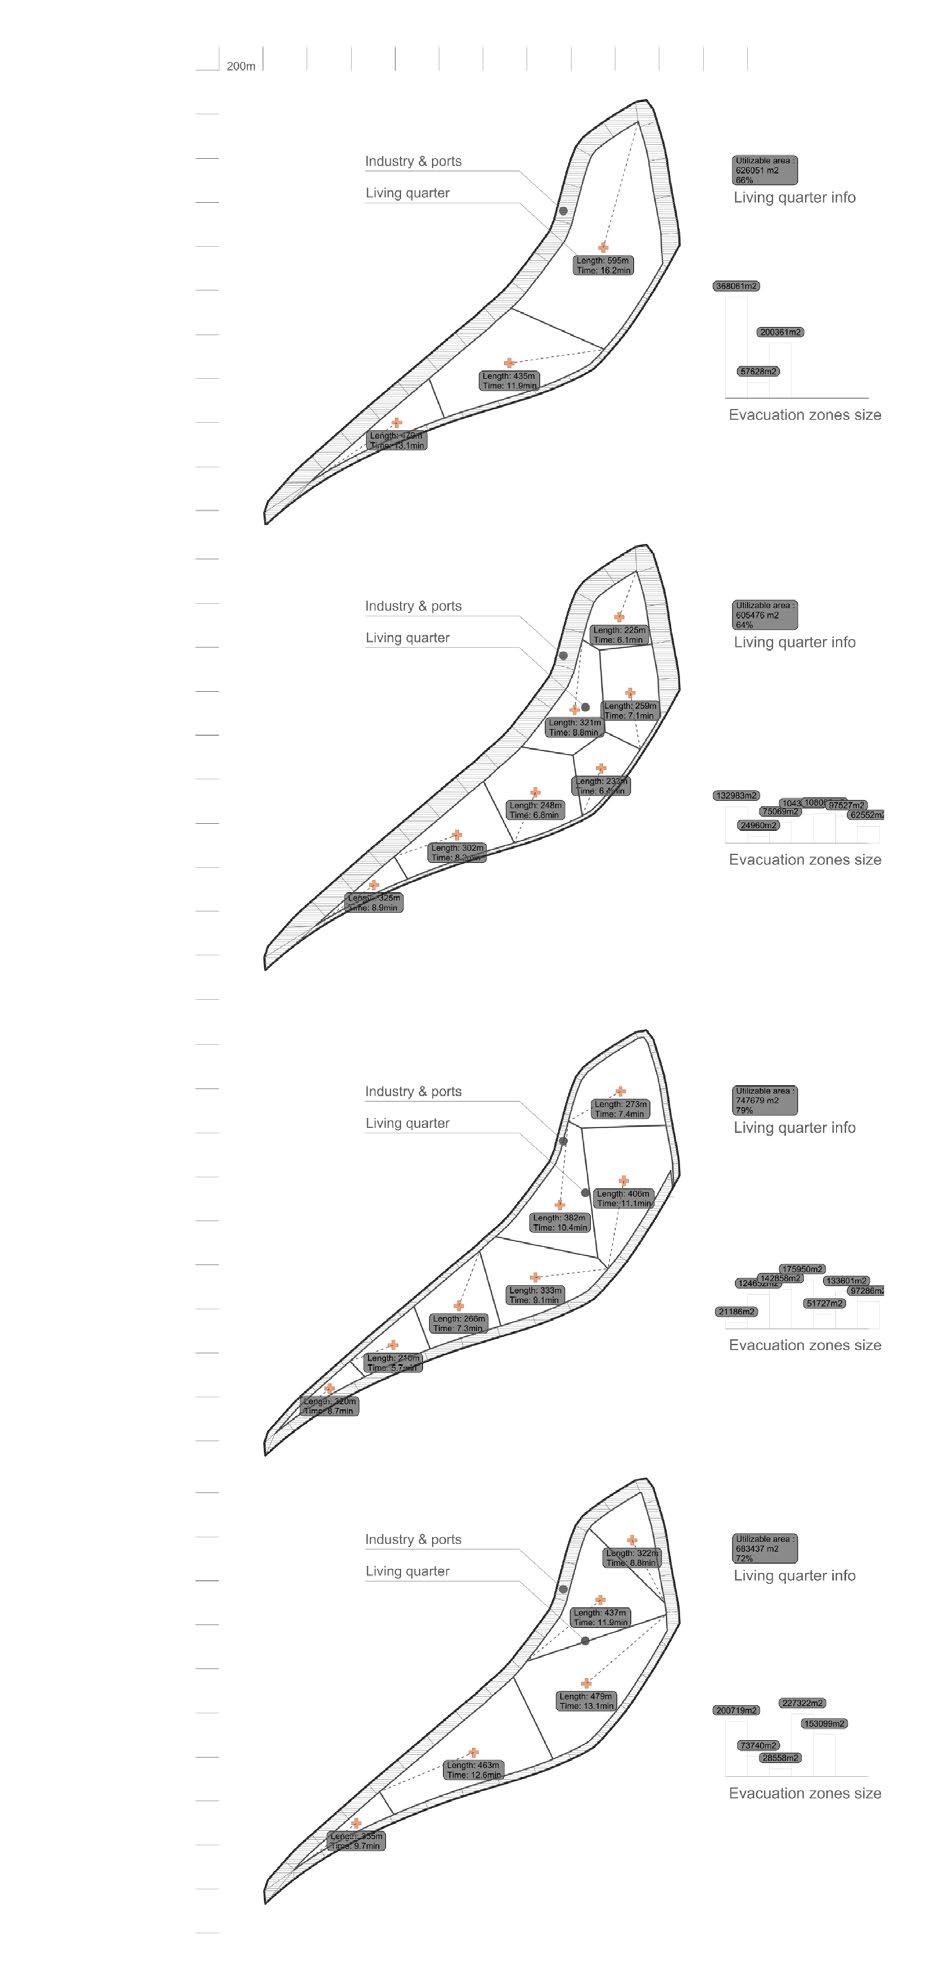
5. Minimum small size(<40000 m2) evacuation zones
Parametres
1. Offset distance for industry/port area.
2. Number of evacuation centre
3. Distribution of evacuation centre
G.A statistical graphs
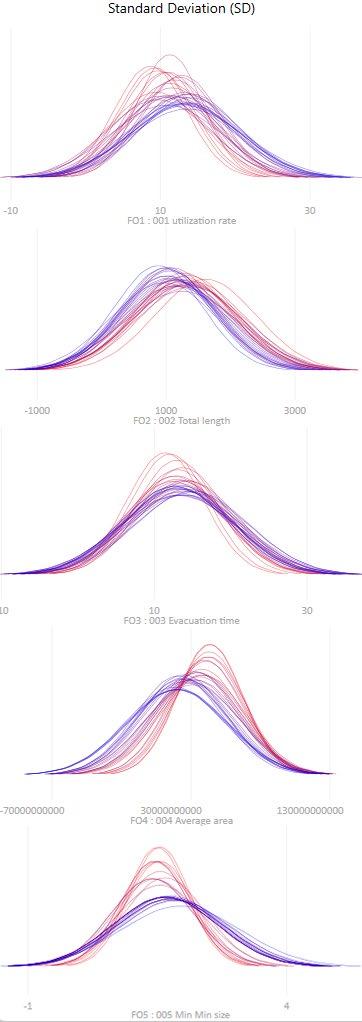

136 137
Chosen individual Other candidates Parallel Coordinate Plot Standard Deviation F.O 1 F.O 2 F.O 3 F.O 4 F.O 5 F.O 1 F.O 2 F.O 3 F.O 4 F.O 5
Figure5.3.3: GA results
Figure5.3.4: GA results
5.3.2 Allocation of tertiary channel using G.A.
The objective of the second stage of the G.A is to locate tertiary channels based on the selected option of evacuation zones and centers. Tertiary channels will be generated from the second channel to dissipate more wave energy and provide landscape and urban function for the city(F.O1), but the safety of the evacuation cente (F.O2), the geometrical property of the channel(F.O3), and the land loss(F.O4) will also be considered in the G.A.
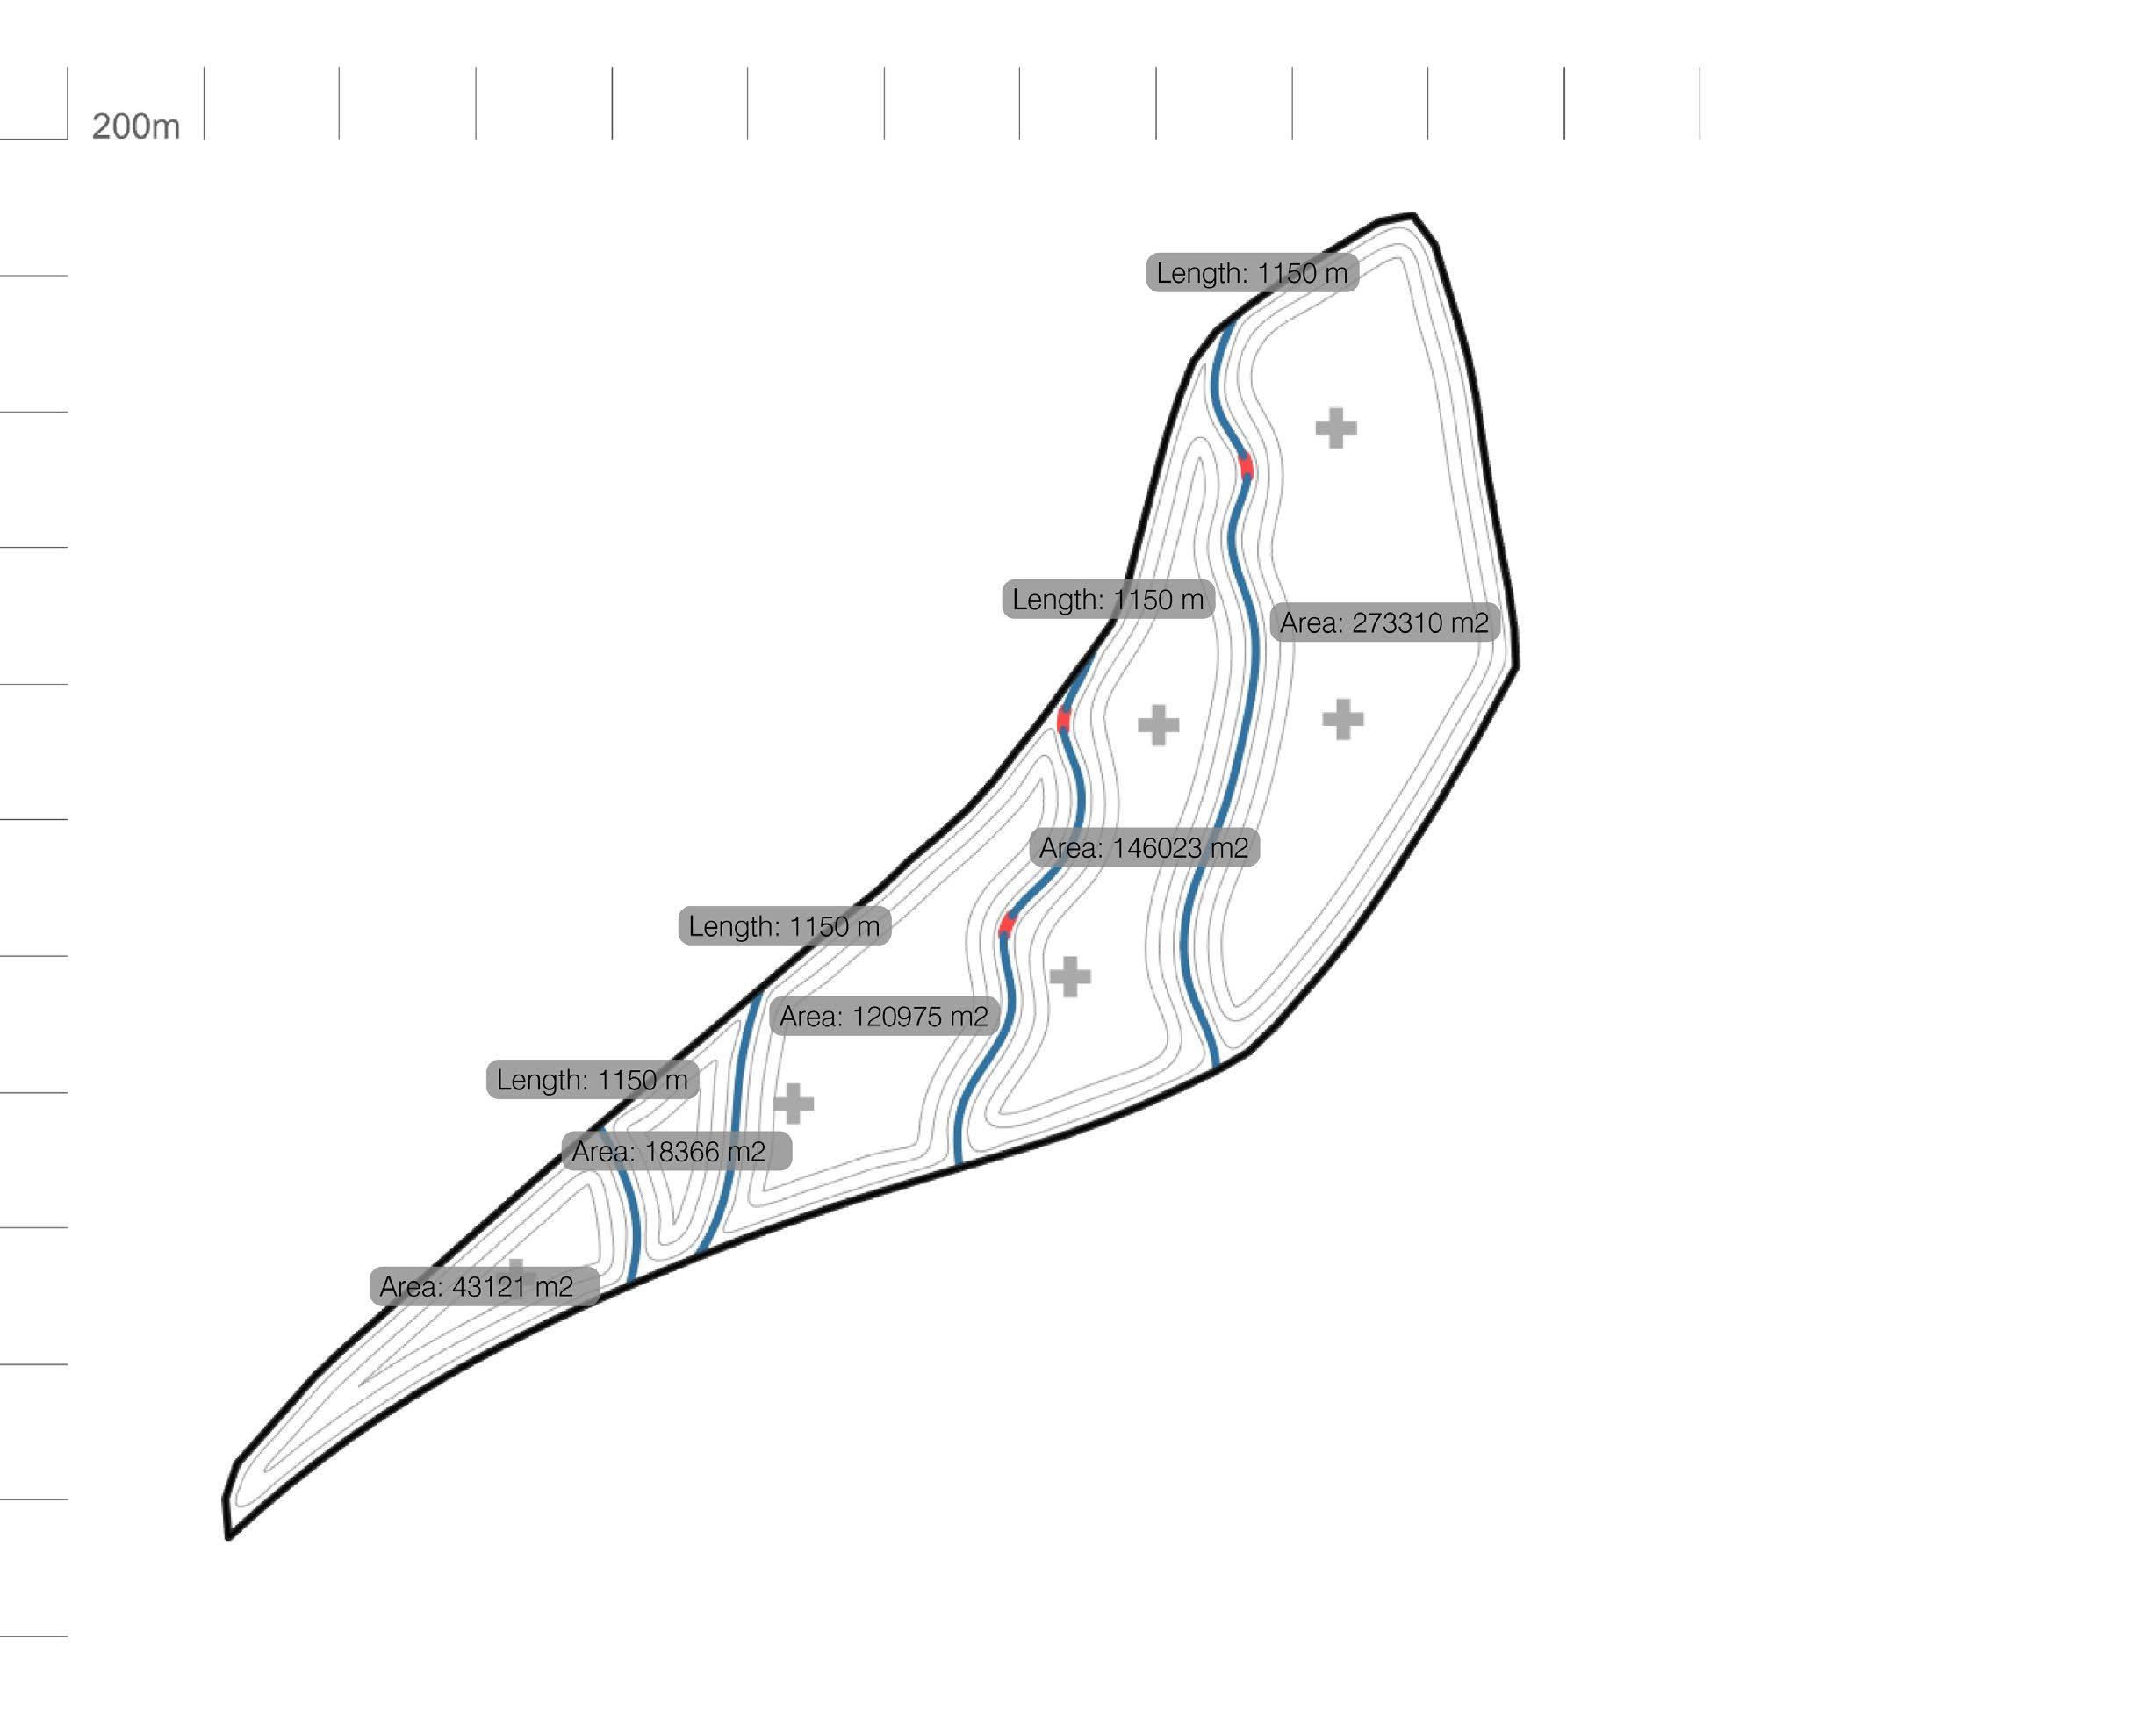
Fitness Objective
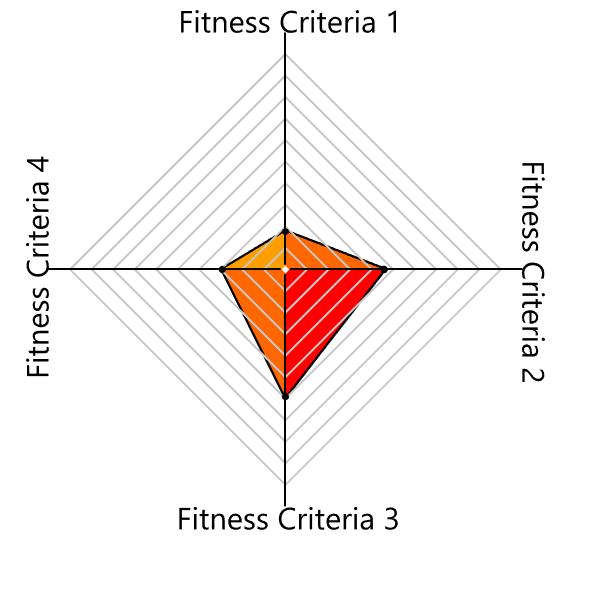
1. Max total distance
2. Max distance from evacuation centre
3. Min sharp angles
4. Max buildable area
Parametres
1. Number of tertiary channels
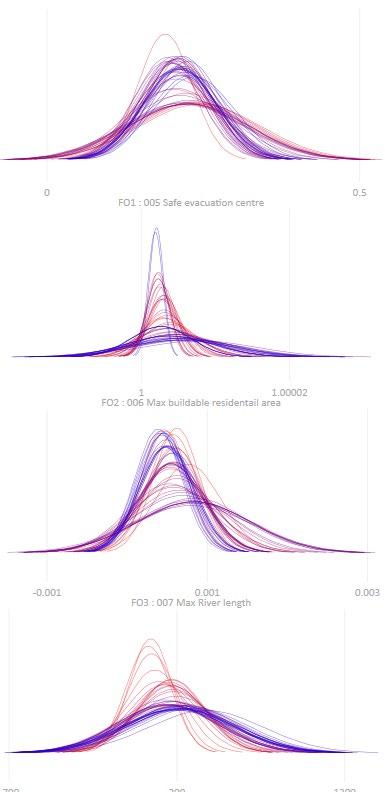
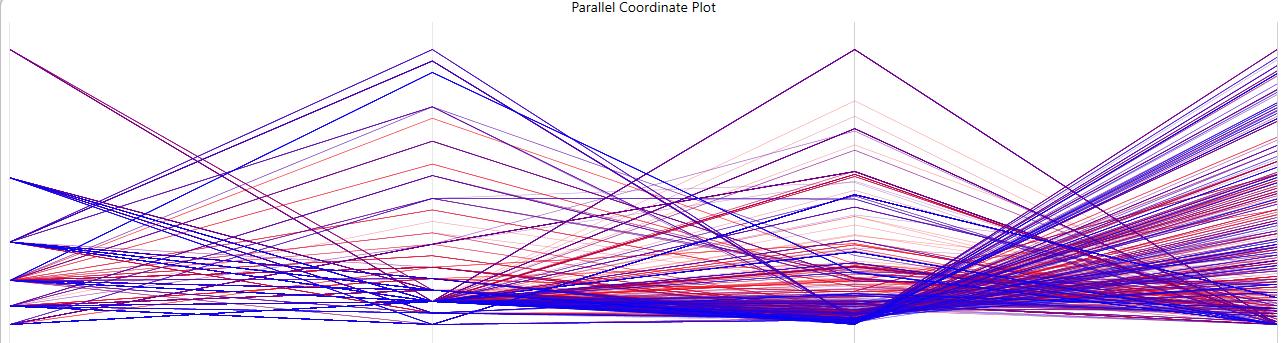
2. Start points/end points of tertiary channels
3. Meandering level of tertiary channels
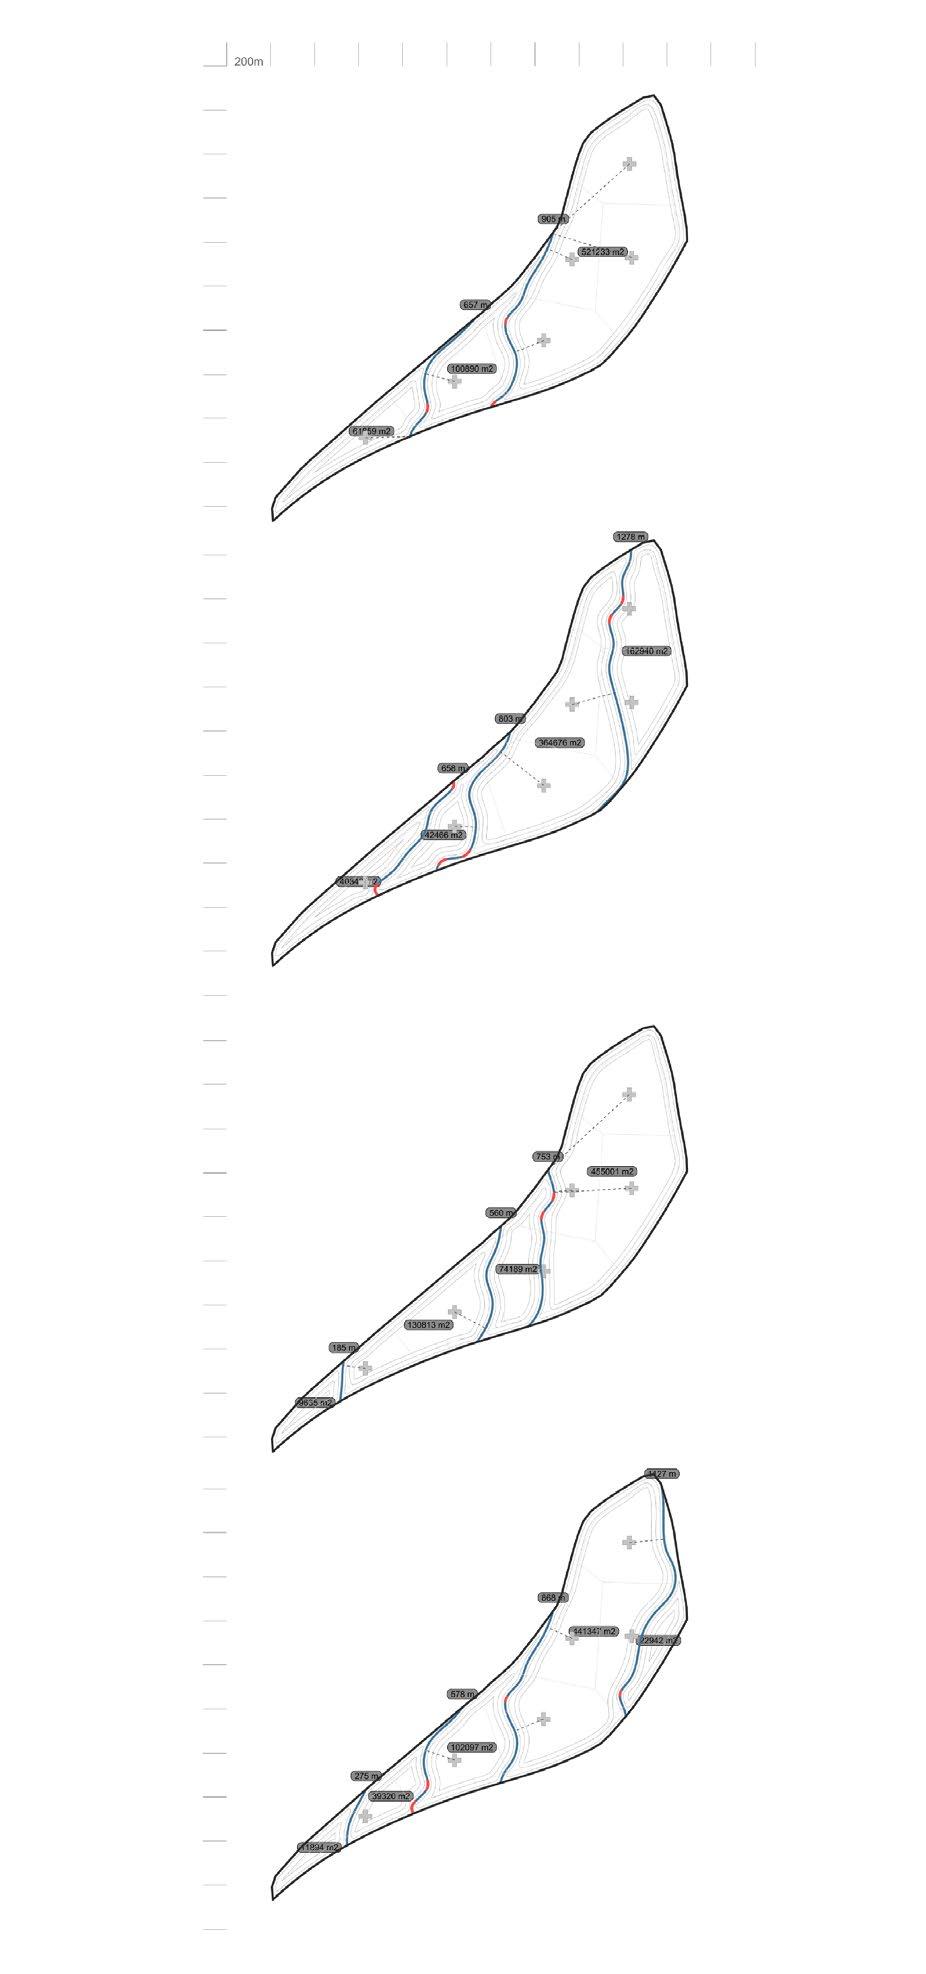
138 139 Chosen individual Other candidates
statistical
Parallel Coordinate Plot Standard Deviation F.O 1 F.O 2 F.O 3 F.O 4 F.O 1 F.O 2 F.O 3 F.O 4
G.A
graphs
Figure5.3.5: GA results
Figure5.3.6: GA results
5.3.3 Transportation/ evacuation network
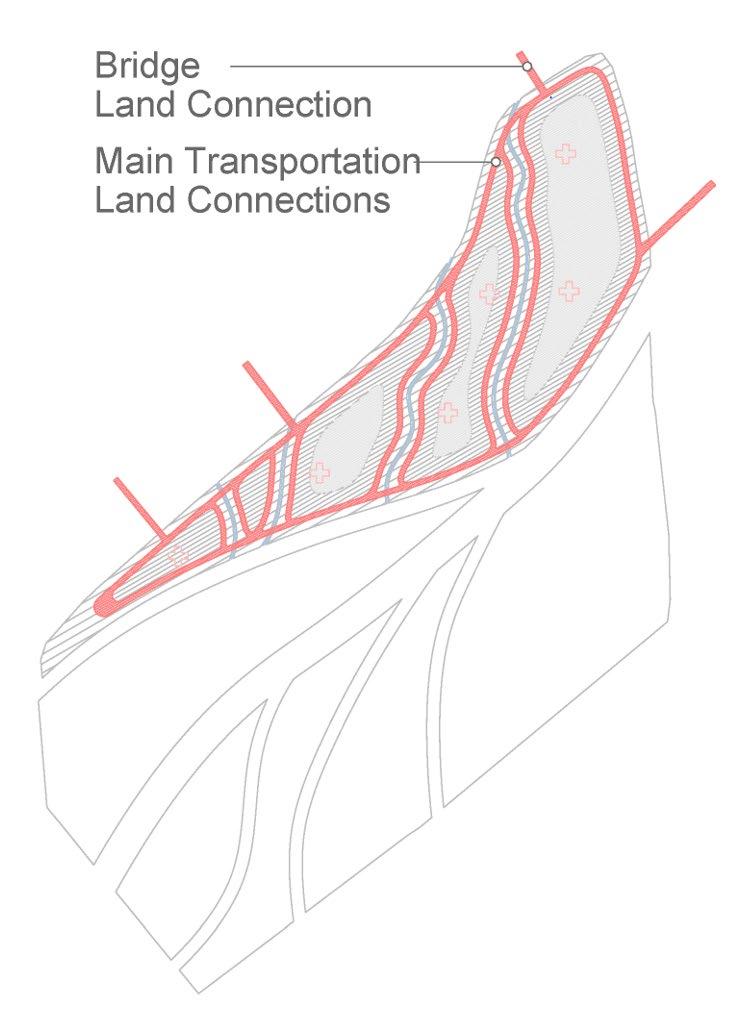
The evacuation network is taken to be the offset of the landmasses that emerge post placement of the tertiary channel on the landmass. The land around the tertiary channels are cut and inclined in order to hold the green tissue and drainage system beneath. The network generation test is implemented on all the 5 lands ,ensuring proper connectivity between allocated evacuation towers within each land mass, the ist offset vehicular network at 10m height above tertiary channel, and connections between the ring of vehicular network and the ring of pedestrian network (that lies closest to the water network) that lies at 4.5m above tertiary channel.
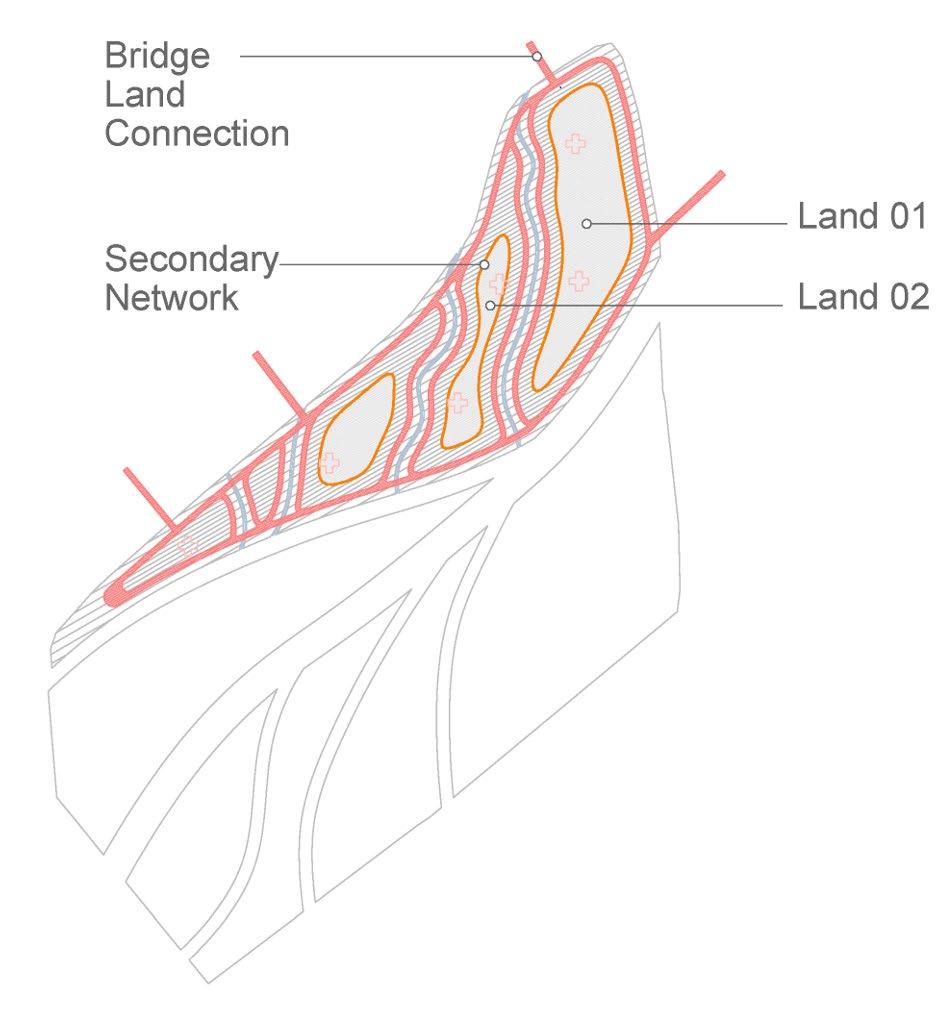
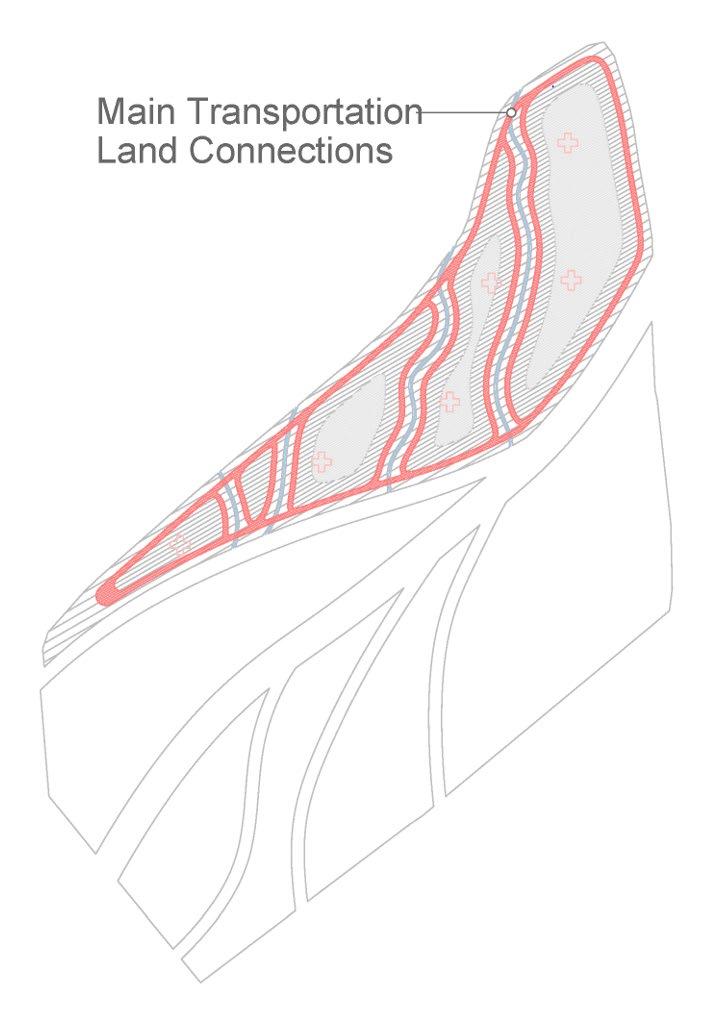
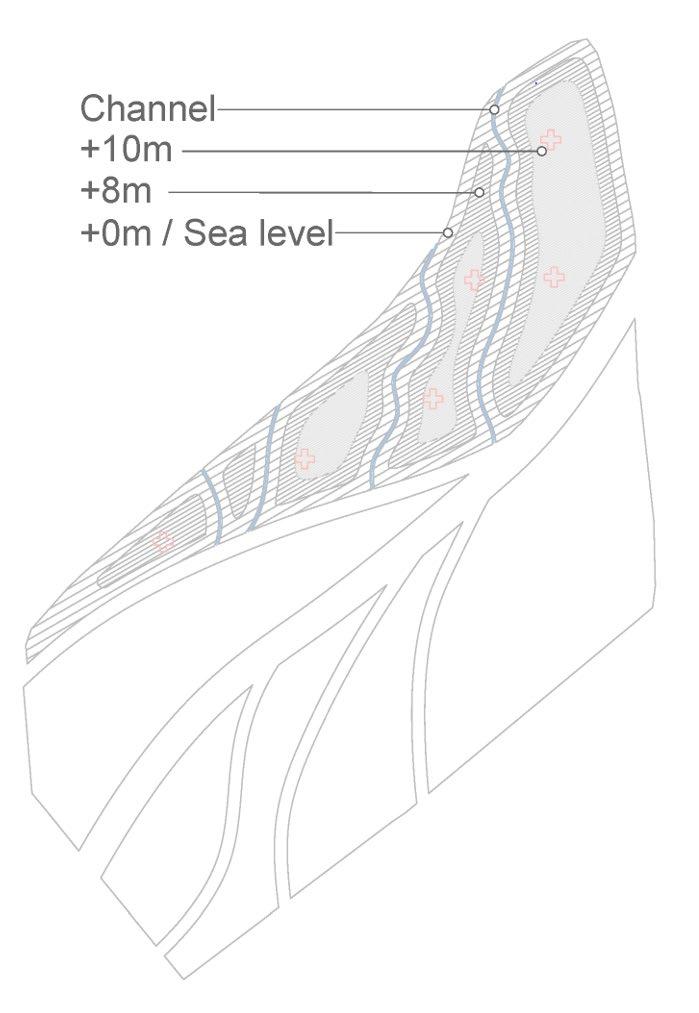
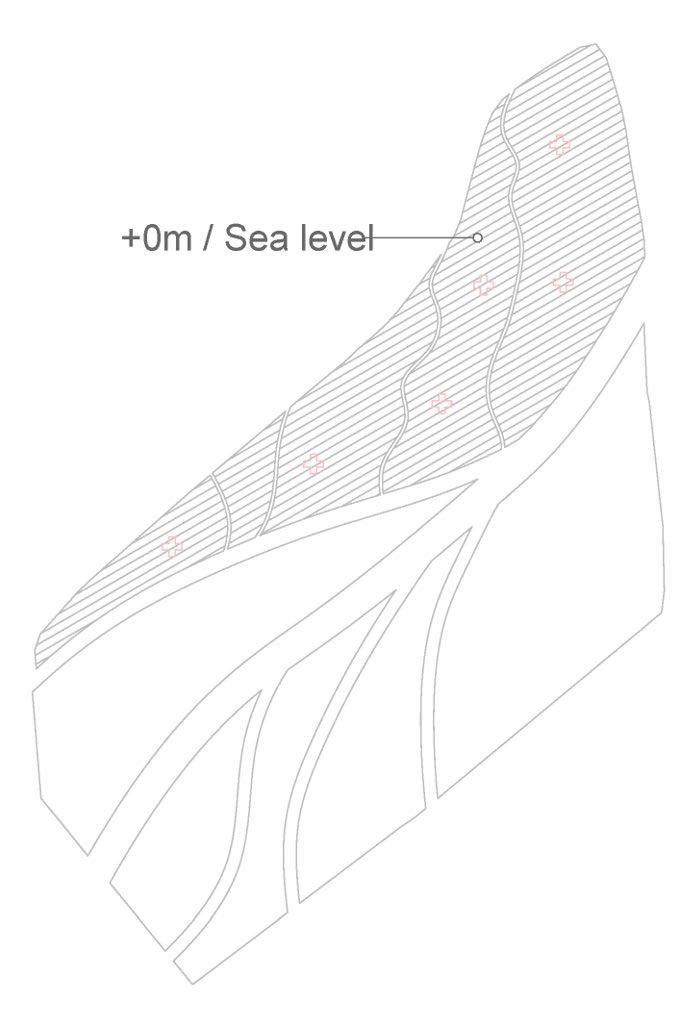
140 141
Development of network
Figure5.3.7
5.3.4 Syntactical analysis of generated networks
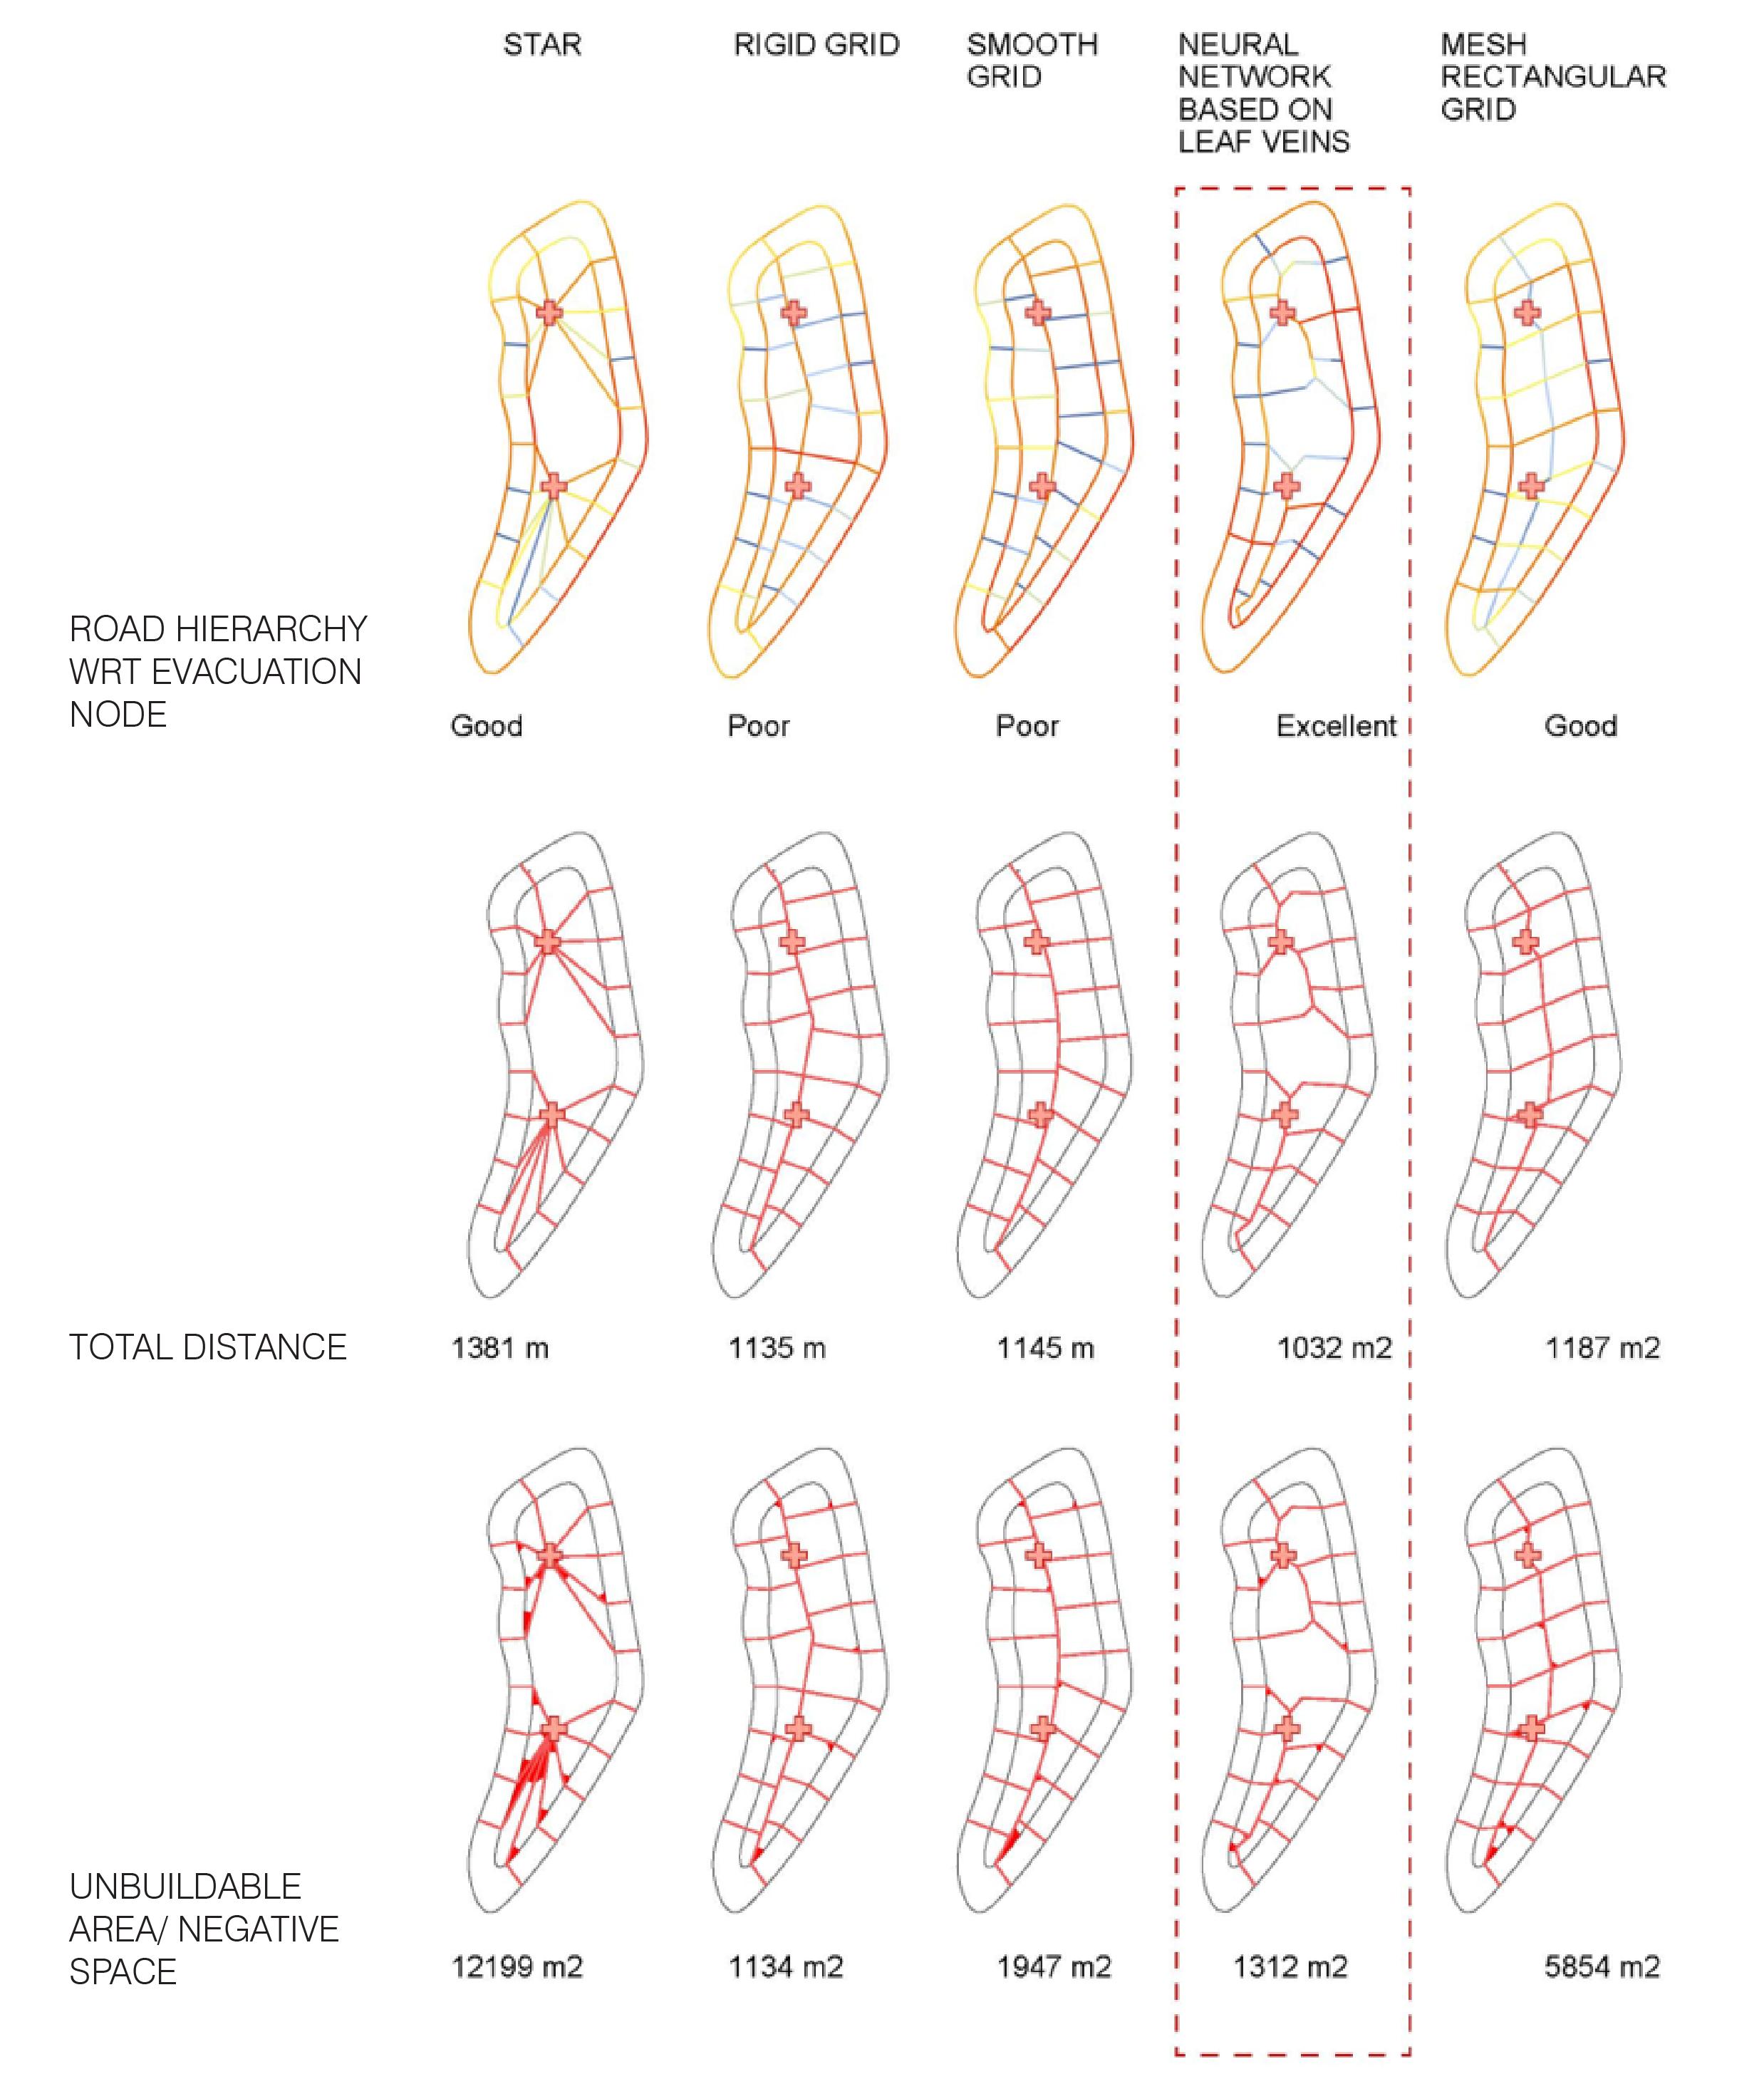
A piece of land is taken for network generation test. 5 main types of transportation networks are put to test –grid, etc. The 4th test is done using pattern generation technique of venetian networks, which proves to have a better connectivity than the rest of the networks in terms of betweenness centrality theory. For the pattern generation inputs, the points in between communities sized between 80 – 120 sqm of land and the evacuation centres as nodes are made to connect, which gives us the venetian network.
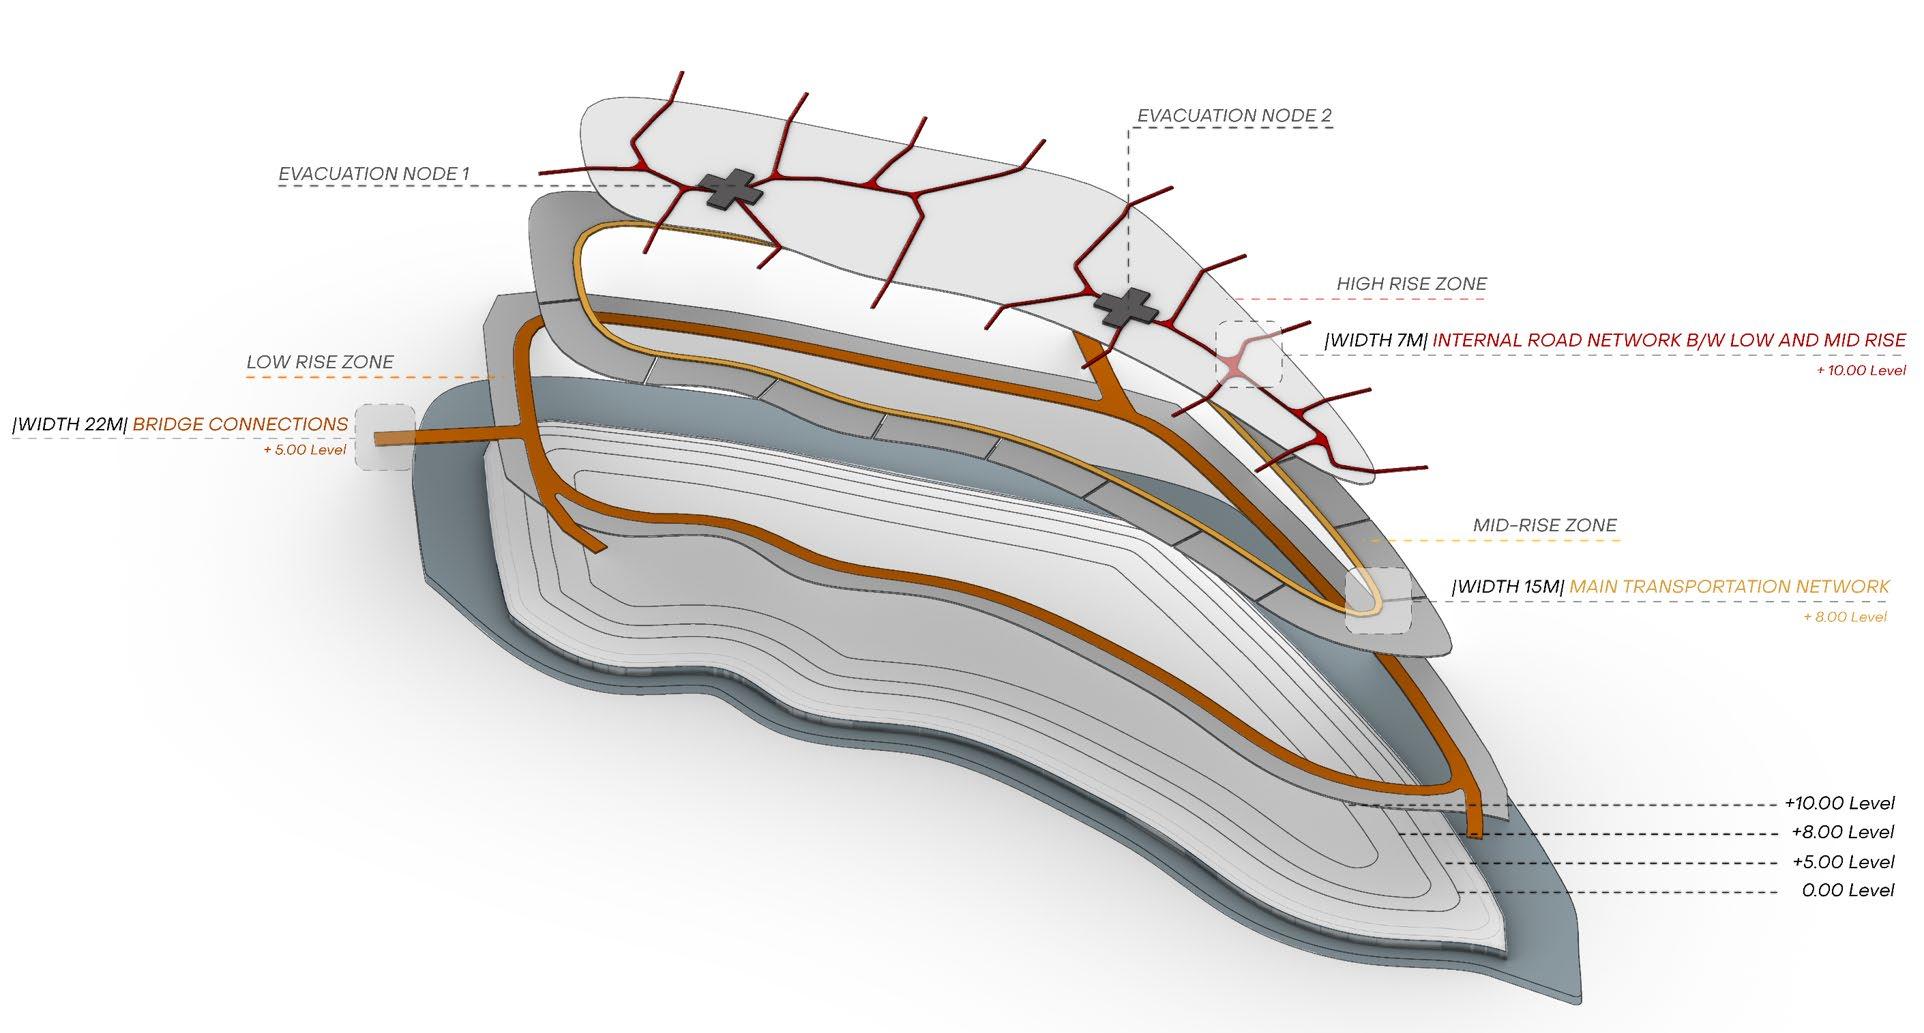
Observation: The venetian pattern generation for network building works best in terms of shortest walk between the evacuation centers and the rest of the community cluster grids.
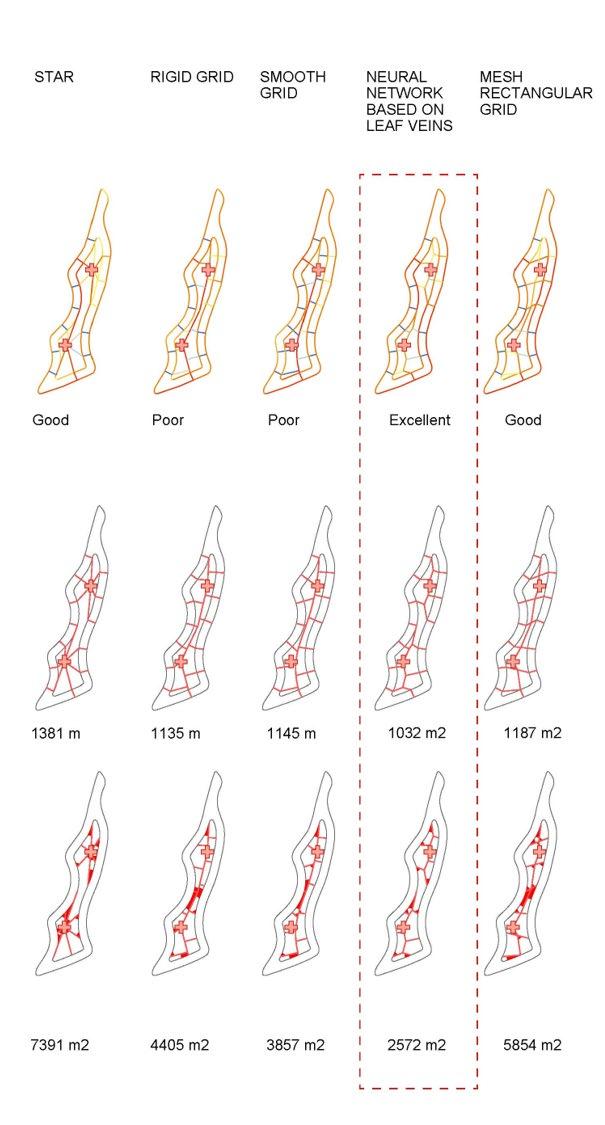
142 143
Figure5.3.8: Network type analysis on patch 5
Figure5.3.9: Exploded axonometric diagram for network
5.4 ARCHITECTURE ALONG TERTIARY CHANNEL
5.4.1 Space- filling module type
For the architecture aggregation, the module needs to have certain geometric and spatial properties. A space-filling geometry with flexibility can better occupy the complex boundary created by curvy channels; 90-degree angles within the geometry will make it efficient for compact interior layout; the variety of combination and spatial performance can be utilized for further design.
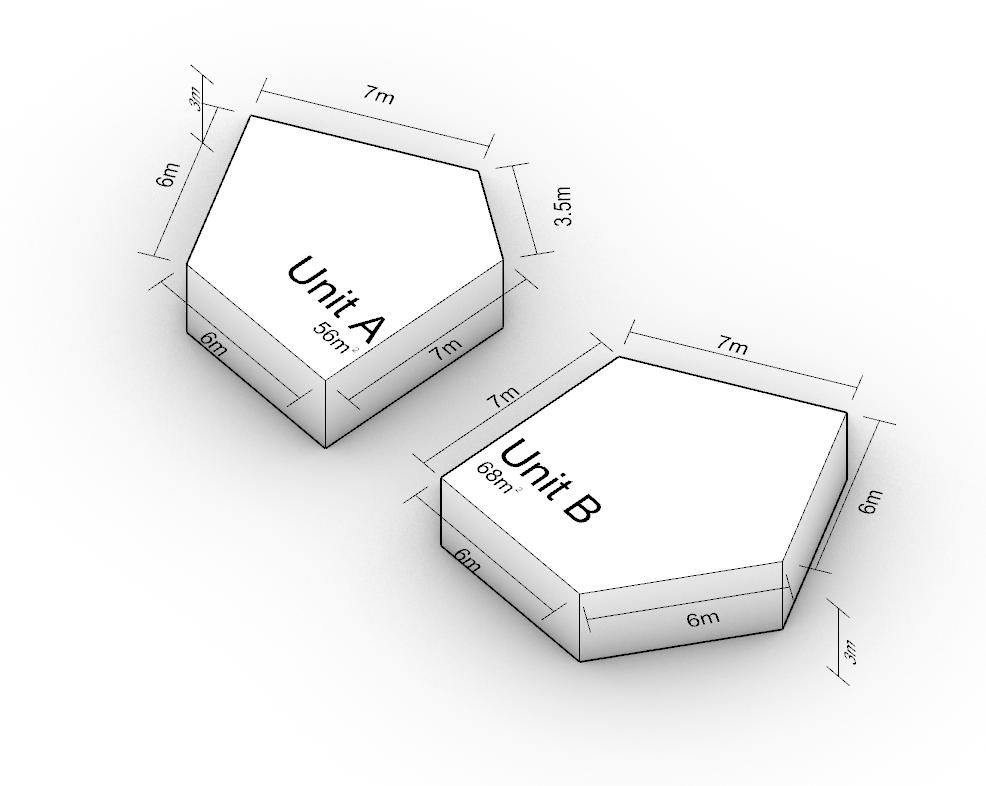
The module we selected is a combination of two pentagons which meet all the conditions mentioned[Figure5.4.1]. It is a space-filling geometry that has two 90-degree angles; it shows a variety in combination, Also it is able to generate different types of space. The dimention of the units area set considering the interior area of each housing unit[Figure5.4.2].
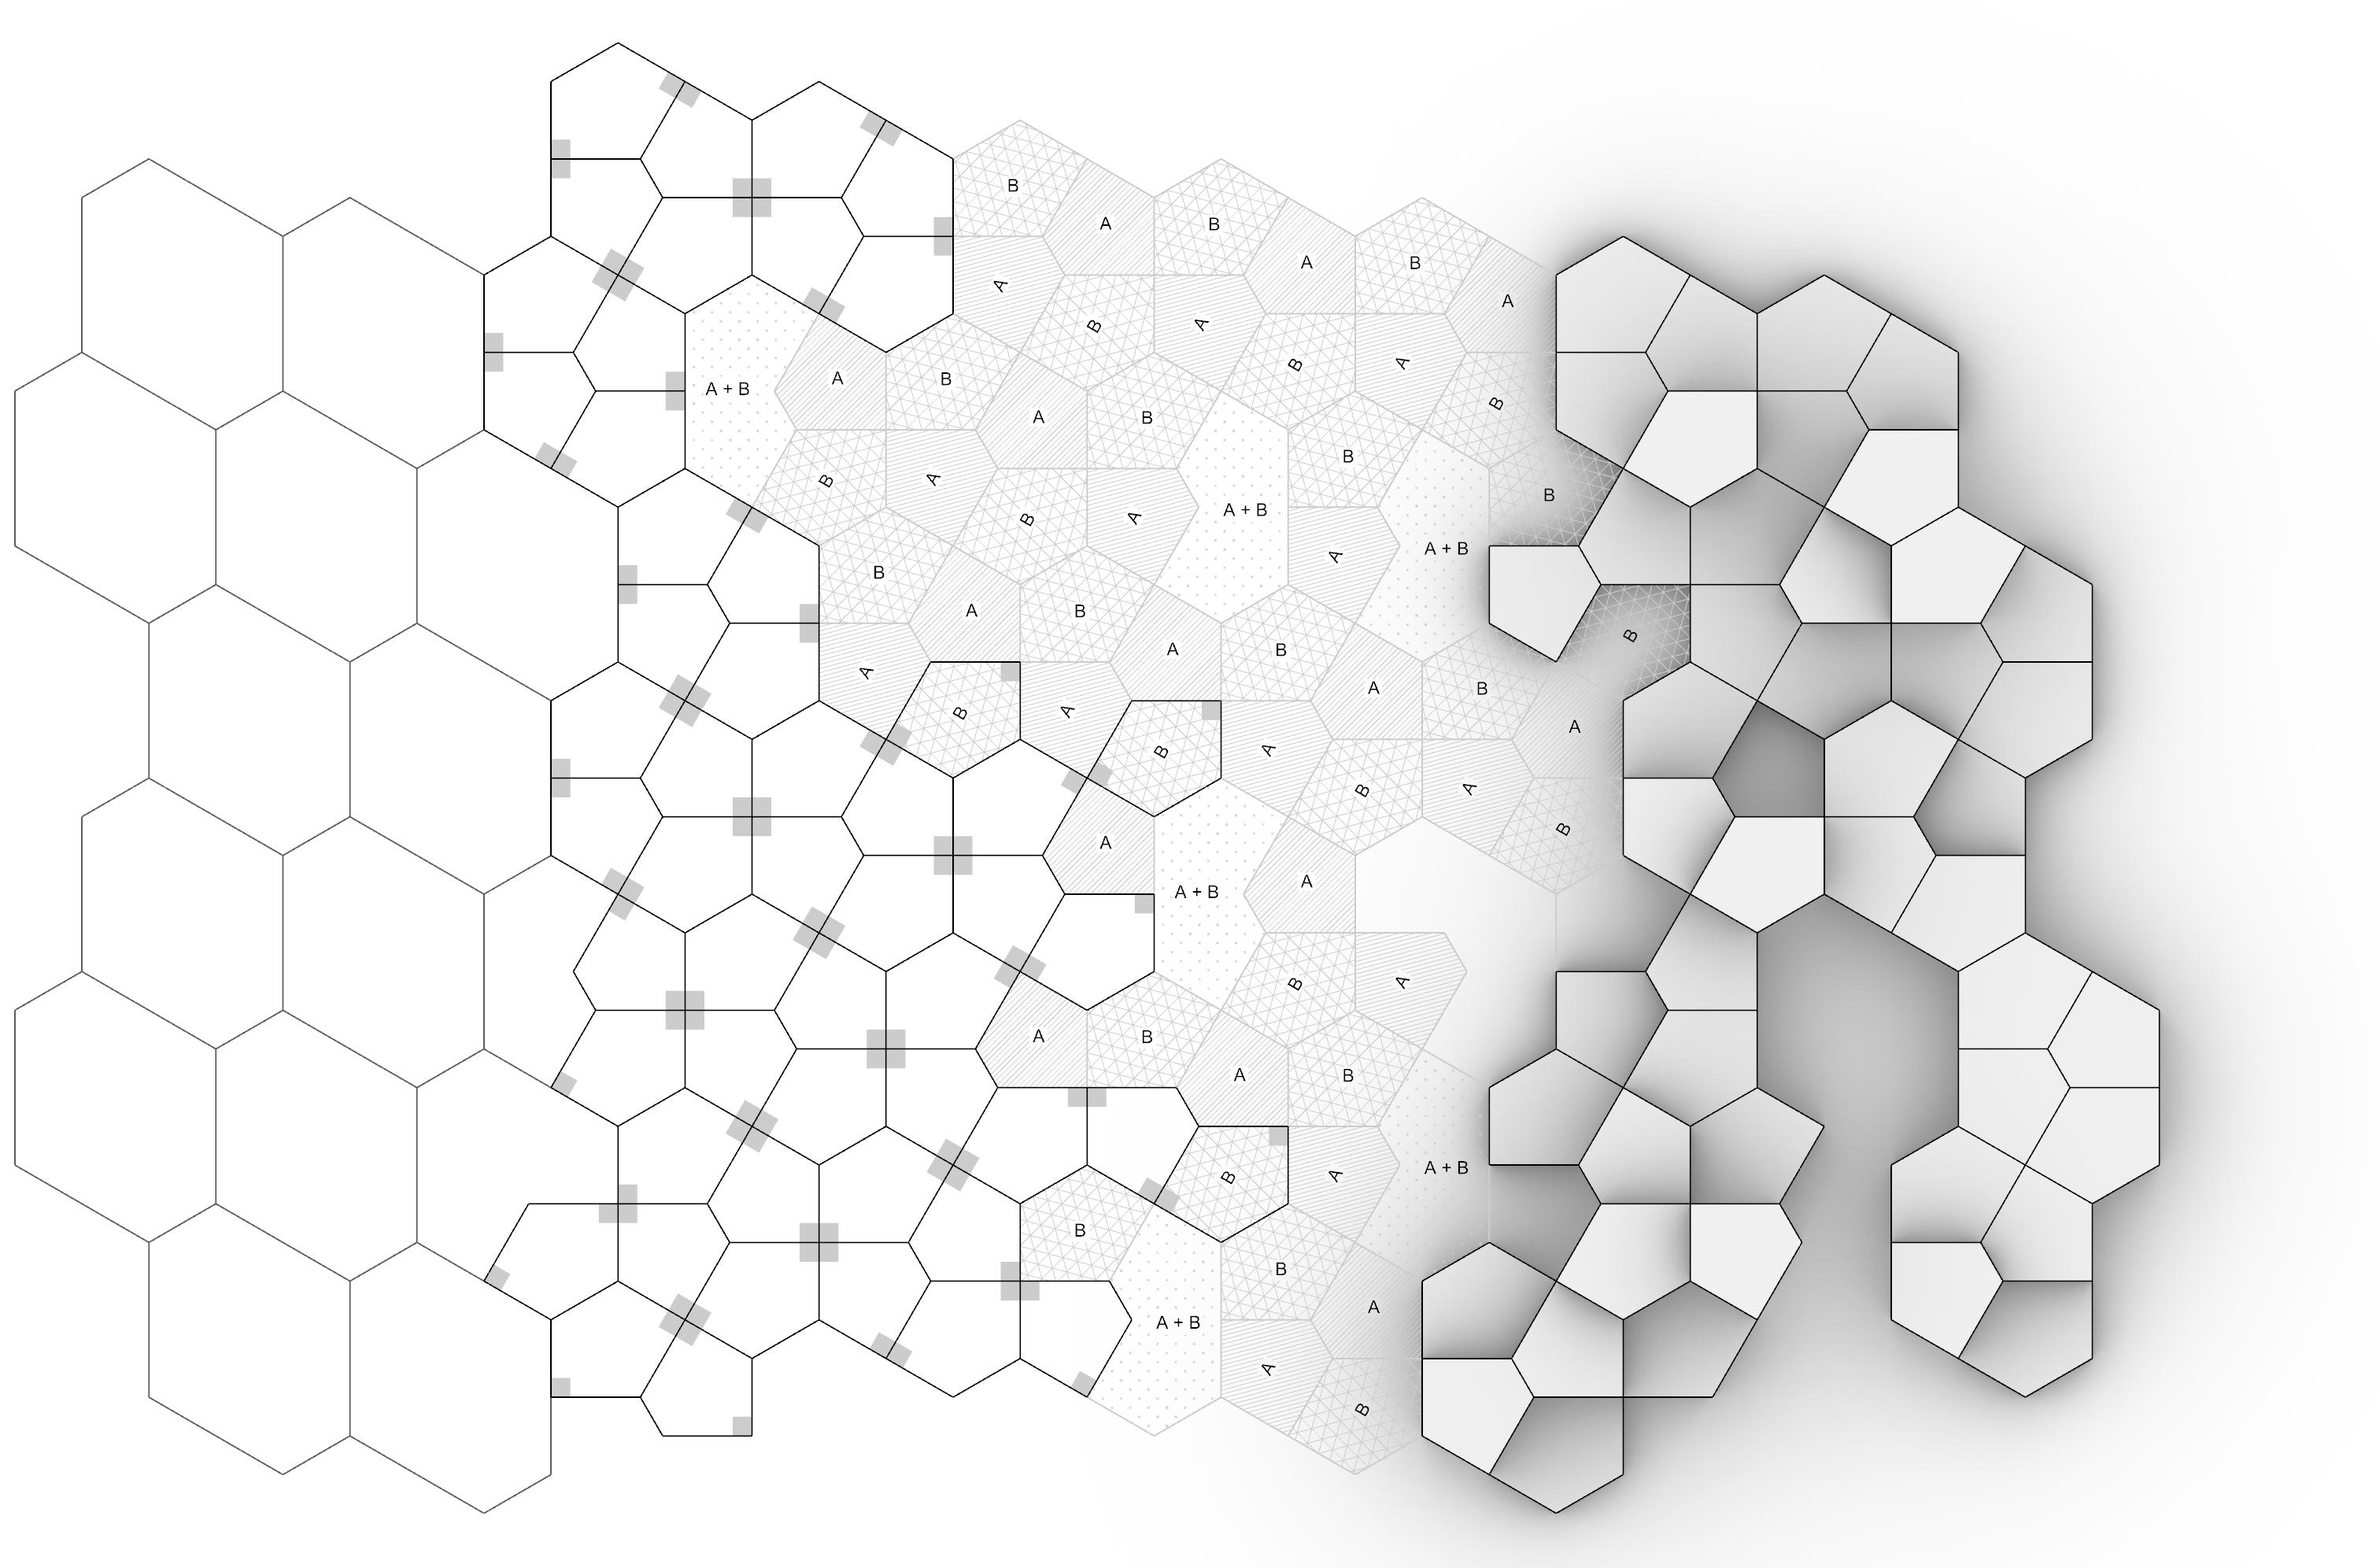
144 145
Space-filling
Figure 5.4.1
Figure 5.4.2
90 degree angle Variety of combination Spatial possibility
5.4.2 Aggregation Ruleset
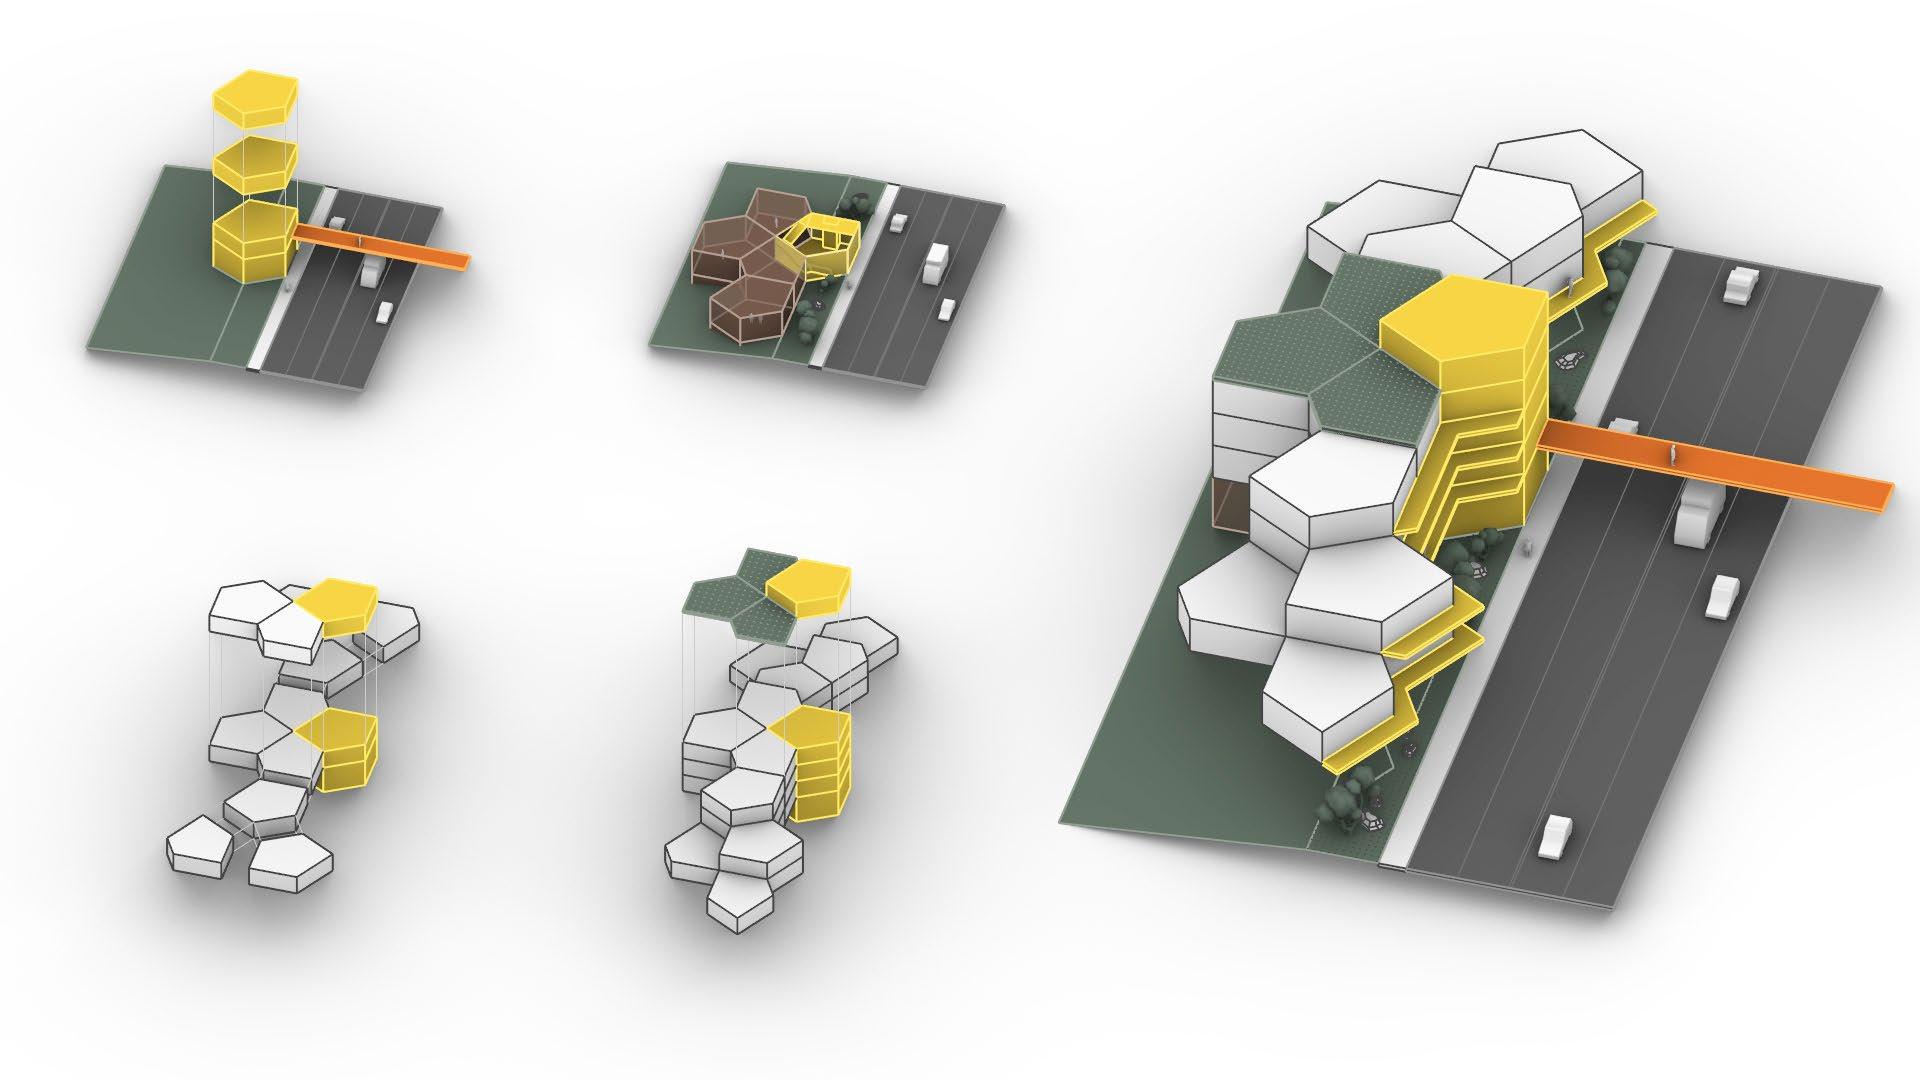
Inspired by the 'Engawa' in the traditional Japanese garden, a basic spatial relation rule is set for the lowrise aggregation. In the traditional Engawa, a corridor is used to connect and divide the living/housing space and the landscape. Residents can enjoy the view of the garden while walking through the corridor. A similar circulation will be used to connect all the residential units in our low-rise aggregation. Also, landscape area will be generated on the ground floor and the rooftop, which can both be shared by the residents.
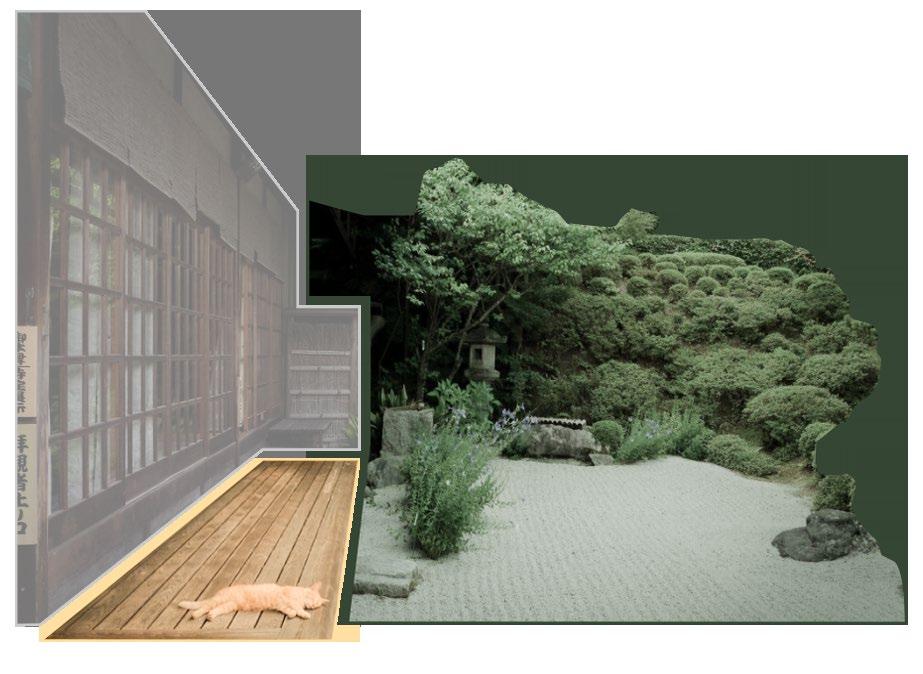
146 147
4. Roof-top garden Roof-top garden units will only be generated on the roof of the the 3rd flood, with at least 3 units(considering the size of a public space).
3. Residential units
Residential units will be generated from the circulation units and its own type, from both vertical and horizontal direction.
5. An example low-rise cluster
Figure 5.4.4: Engawa Figure 5.4.3
2. Shared and retial space Shared space units can be generated on the ground floor from the vertical circulation units.
1. Vertical circulation units
Vertical circulation units will only be located on its own type, and will difine a evacuation skywalk.
1. Vertical circulation units
Vertical circulation units will only be located on its own type.
2. Residential and shared units
Residential units can be generated from the circulation units and its own type, when all the facade faces are blocked they will turn into shared space units(patio).
5.4.2 Aggregation Ruleset
The mid-rise aggregation logic is inspired by the Azuma House by Tadao Ando. In his design, the middle part of the house is turned into a patio, which is also used for circulation and allows more sunlight to enter. In the midrise aggregation, the rule is set in a way that the dark units(without any face towards the exterior will be turned into a patio and become shared spaces for the residents.
3. Residential units and landscape units
Residential units can be generated from the circulation units and its own type, from both vertical and horizontal direction; landscape units can be generated on the roof of residential units.
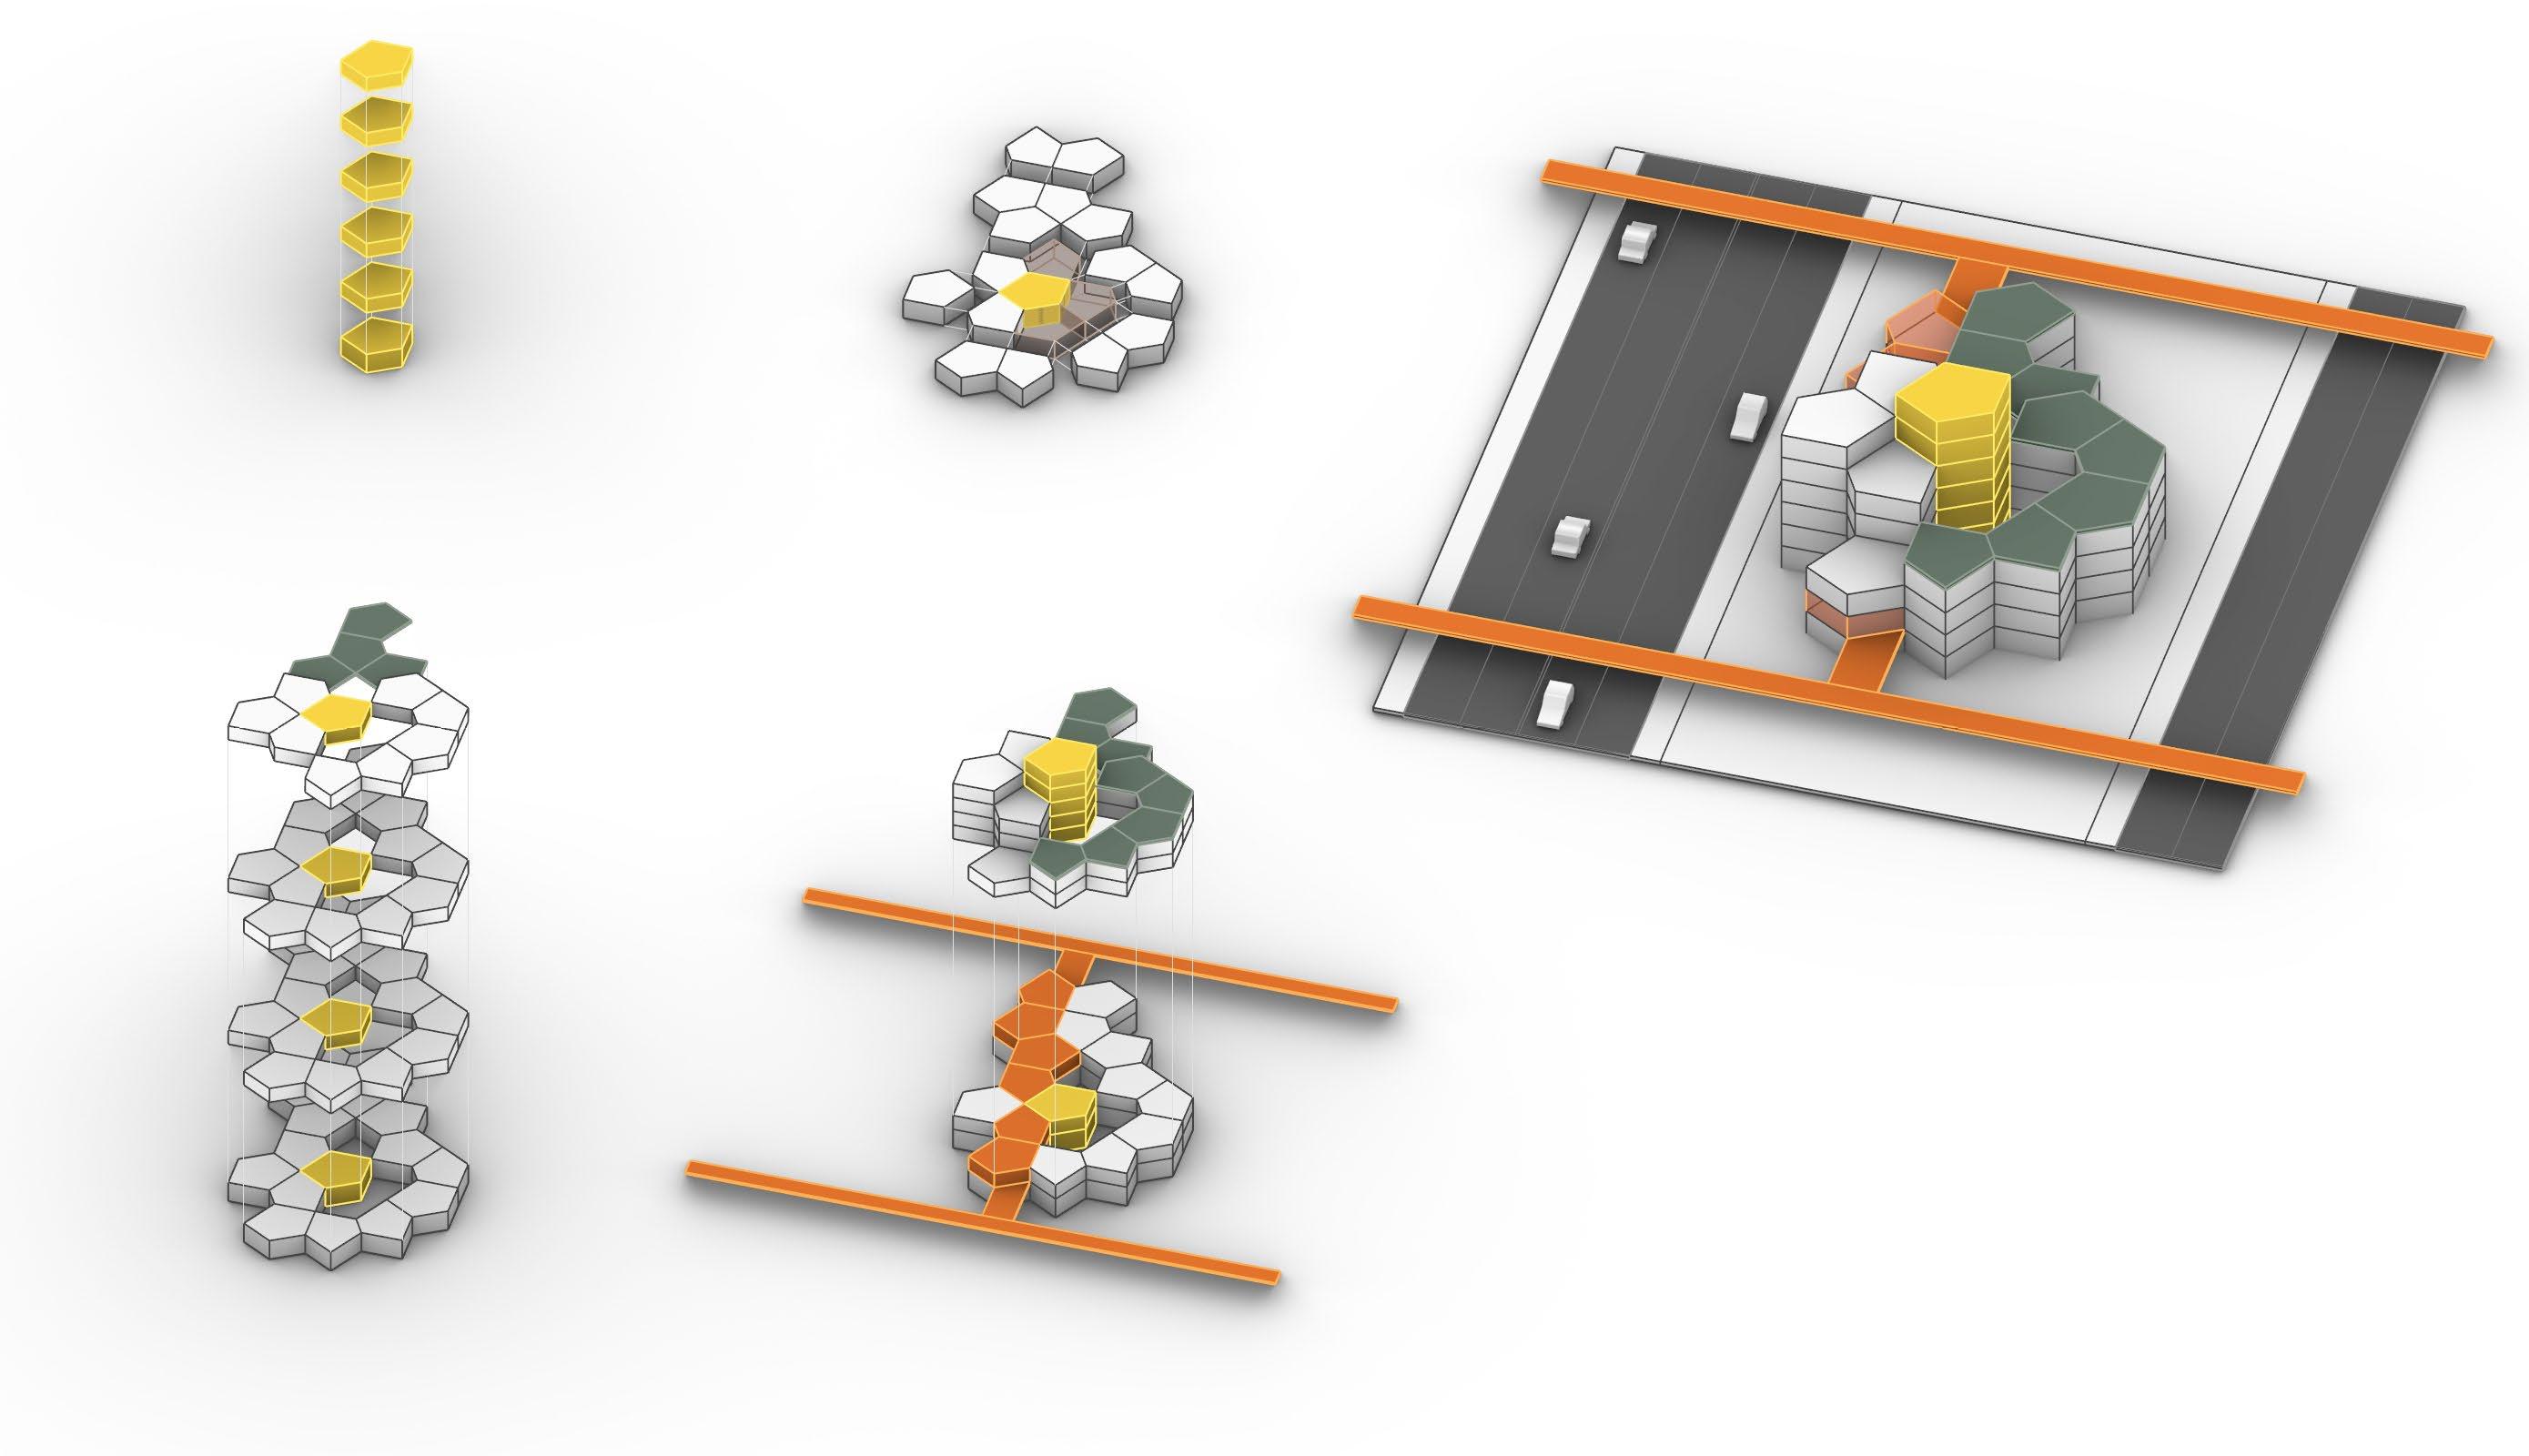
4. Roof-top garden
On the second floor, some of the residential units will be selected to be a evacuation corridor based on closest length, and connect to the evacuation network generated from low-rise aggregation.
148 149
5. An example low-rise cluster
Figure 5.3.6: Patio in the Azuma House, Japan
Figure 5.3.5
5.4.3 Low - rise aggregation
Due to the limitation of computation capacity, we couldn’t make the aggregation on the whole landmass. Therefore, we chose to further zoom in and make the aggregation on a 300m * 300m site from the landform generated, which is along the tertiary channel.
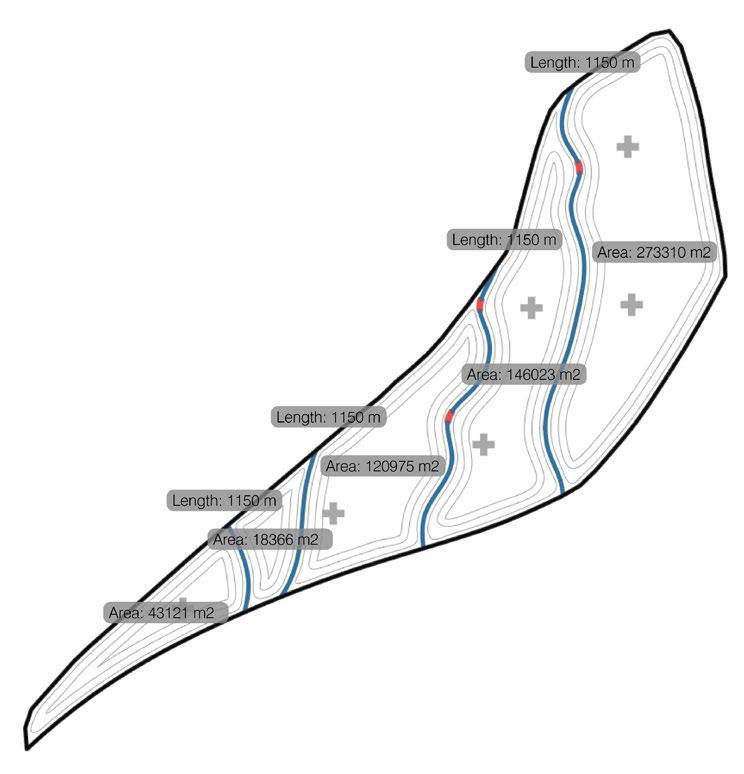

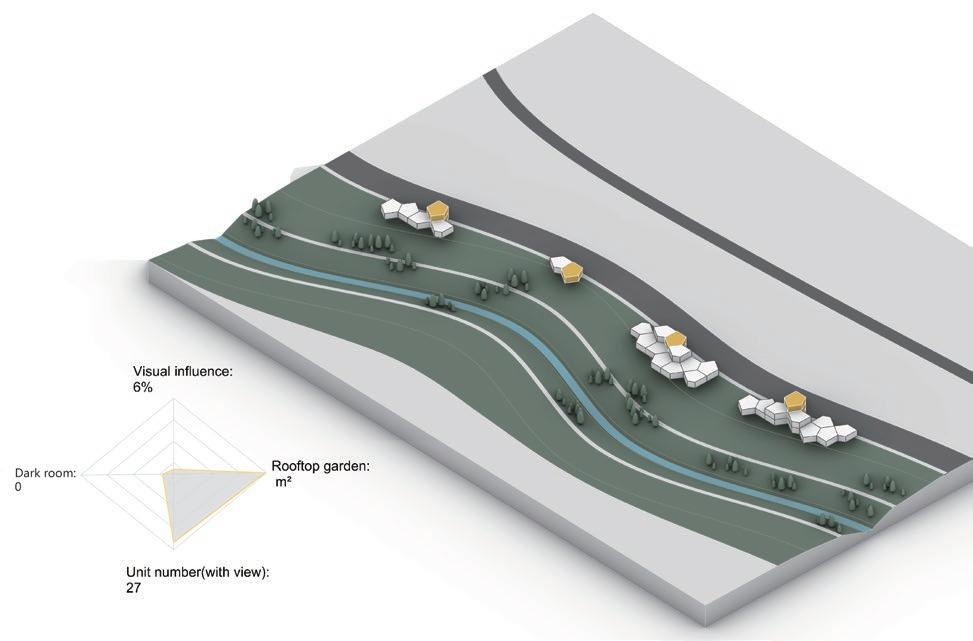
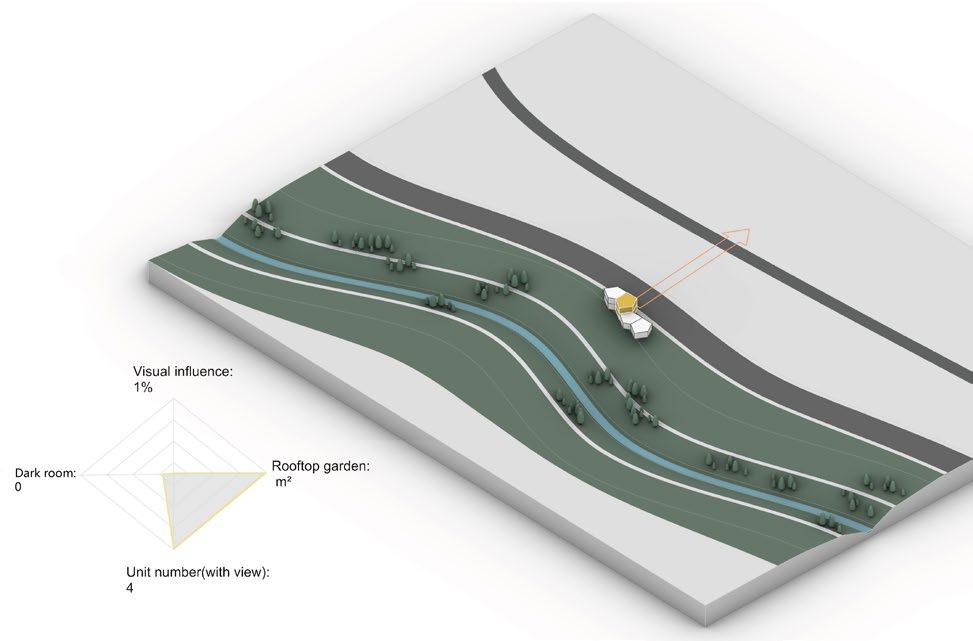
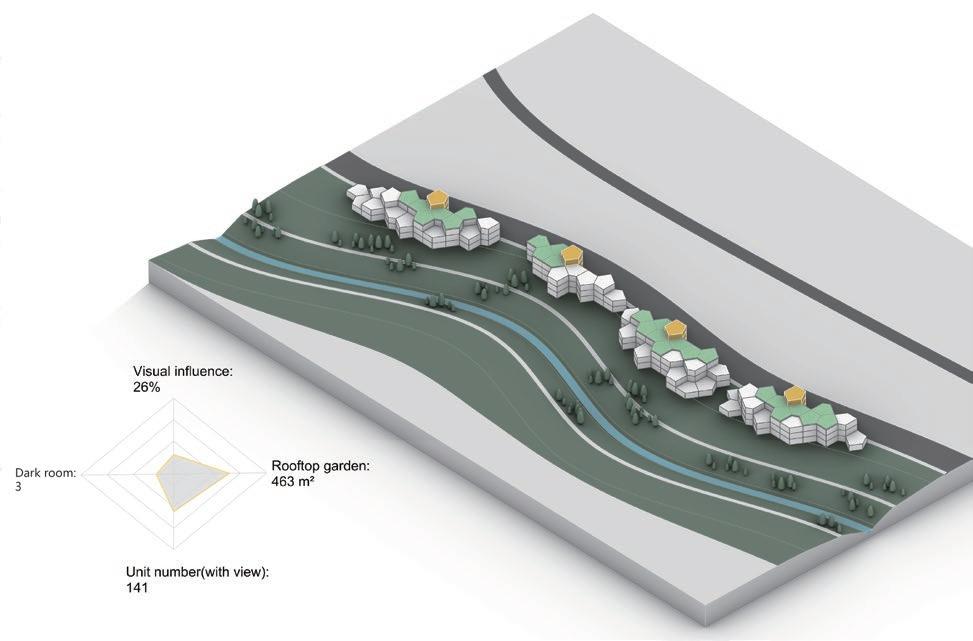
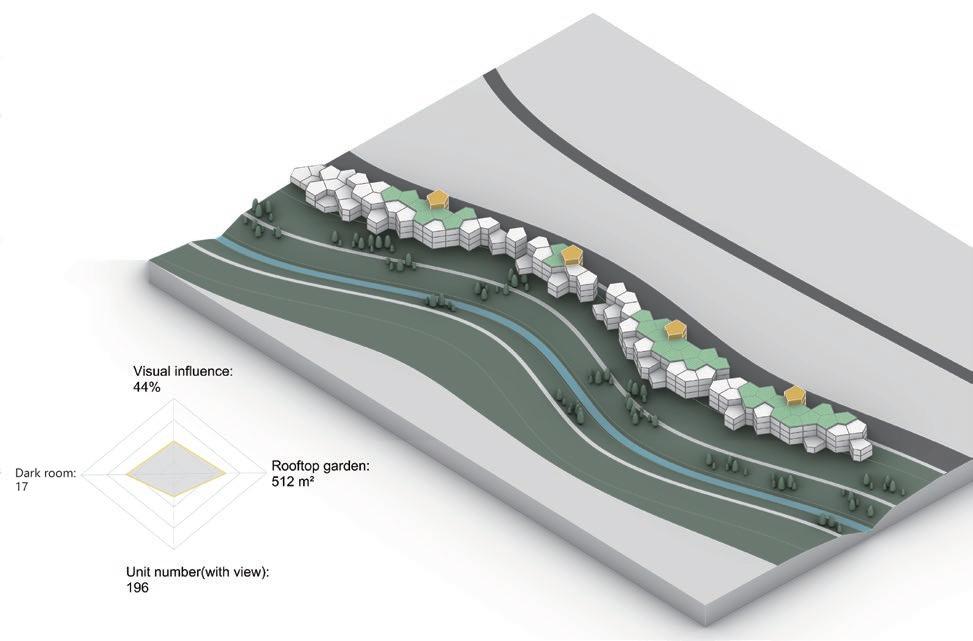
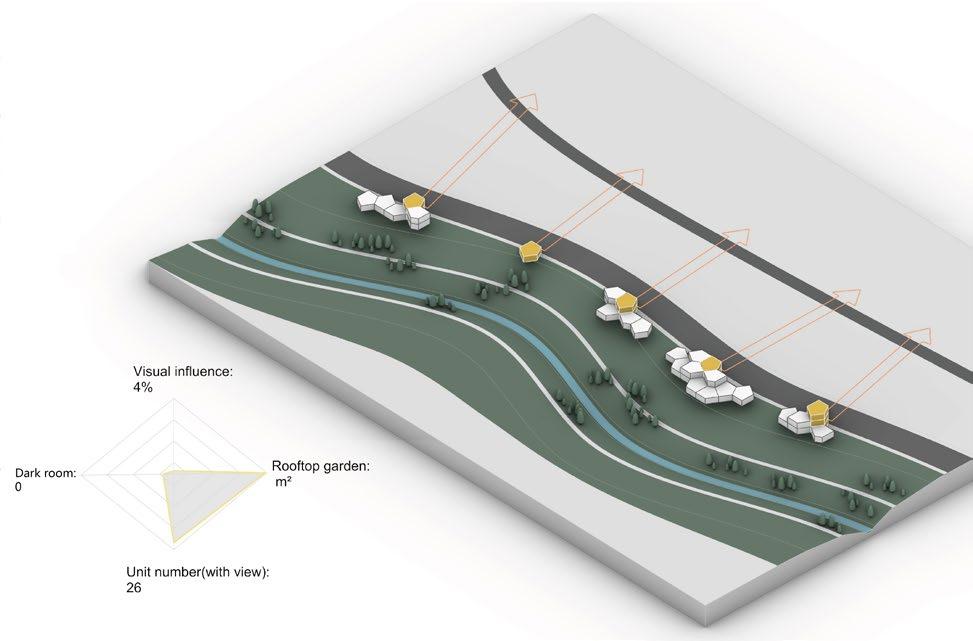

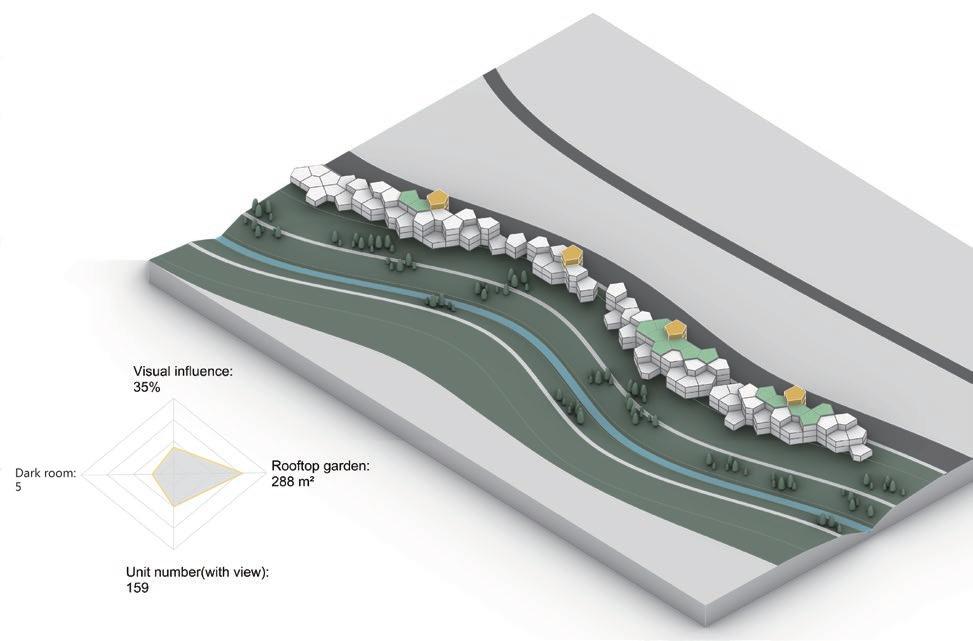
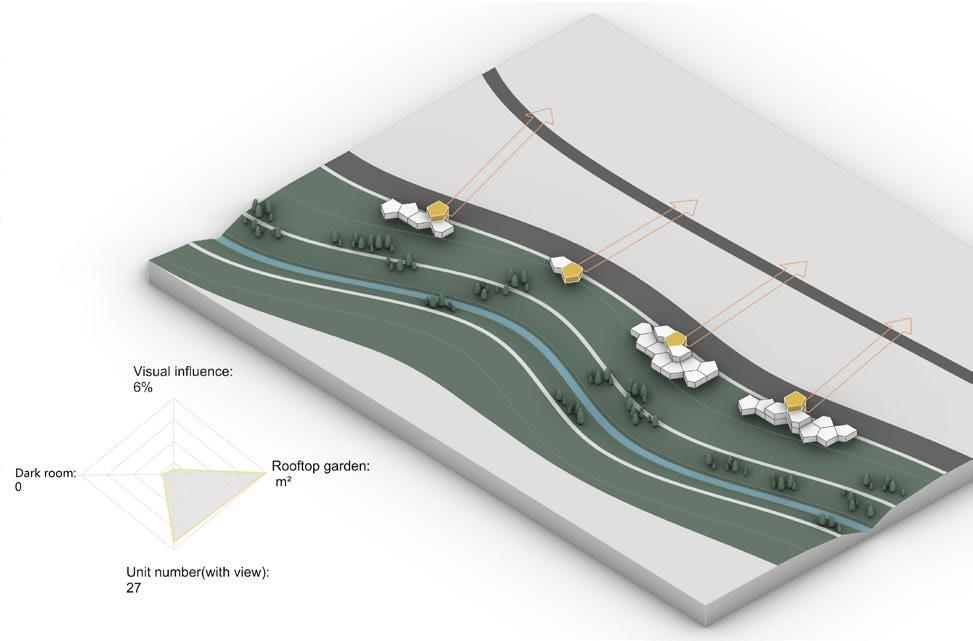
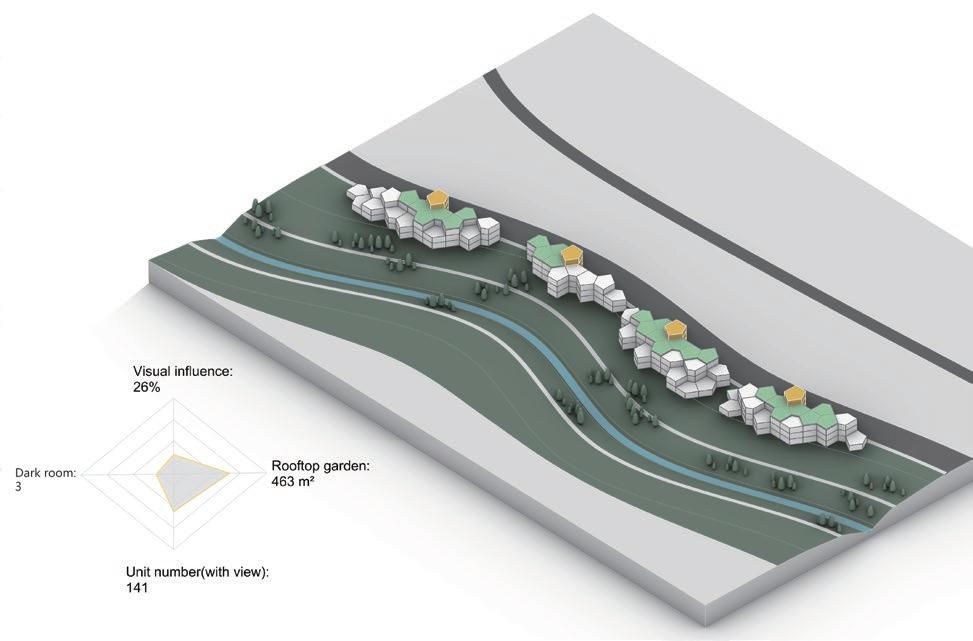
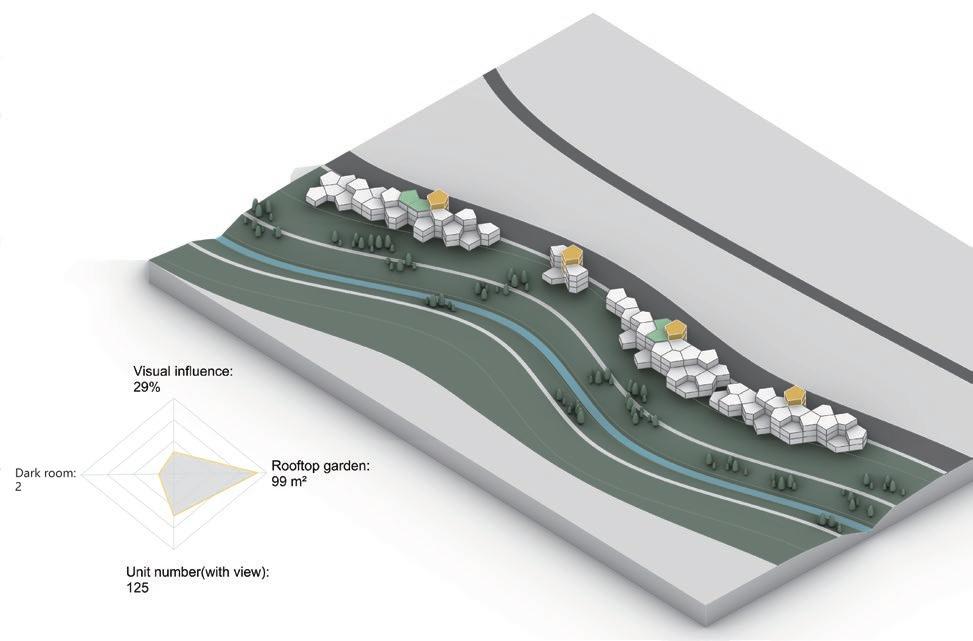
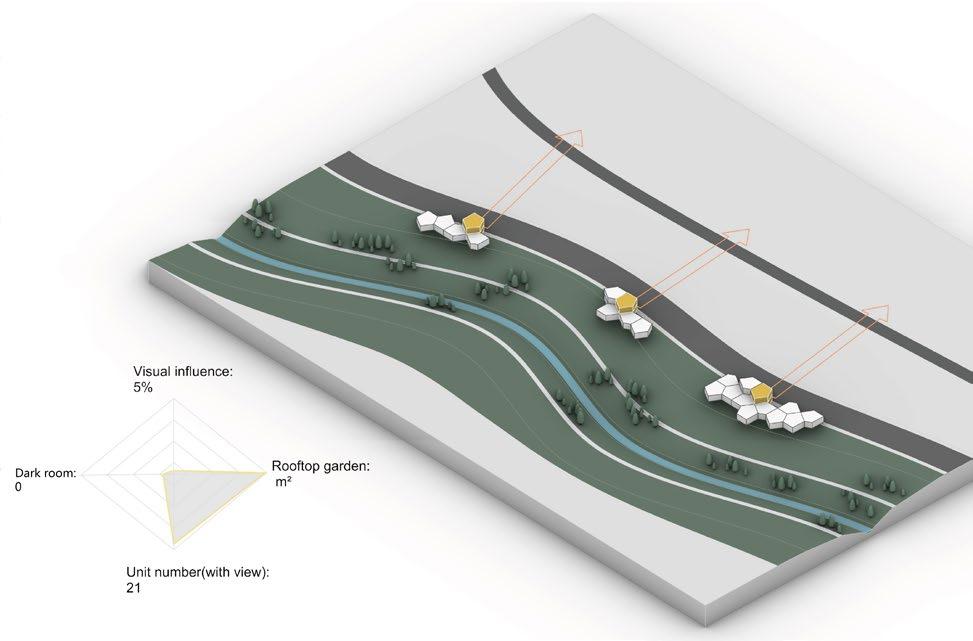
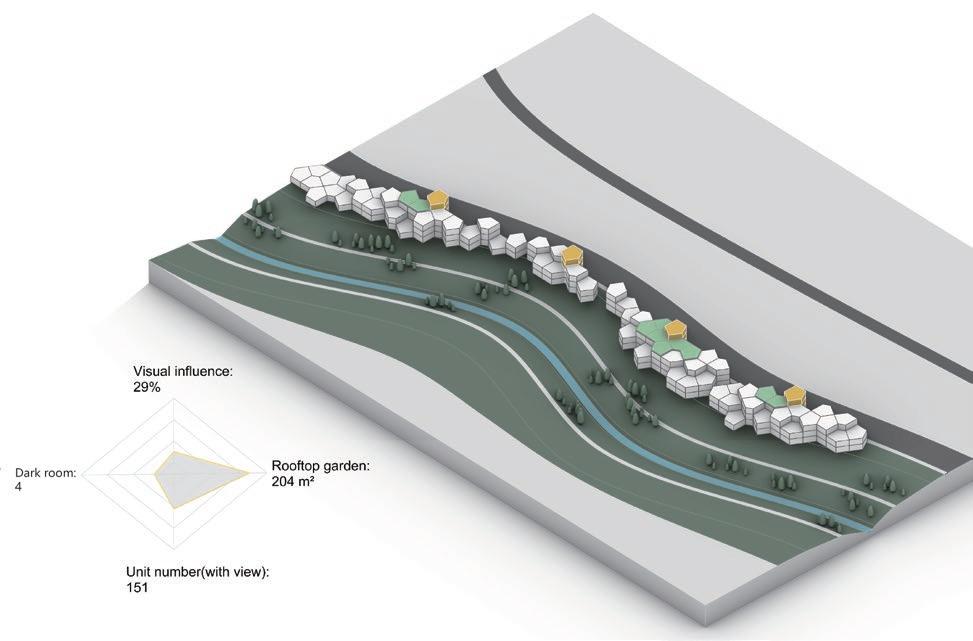
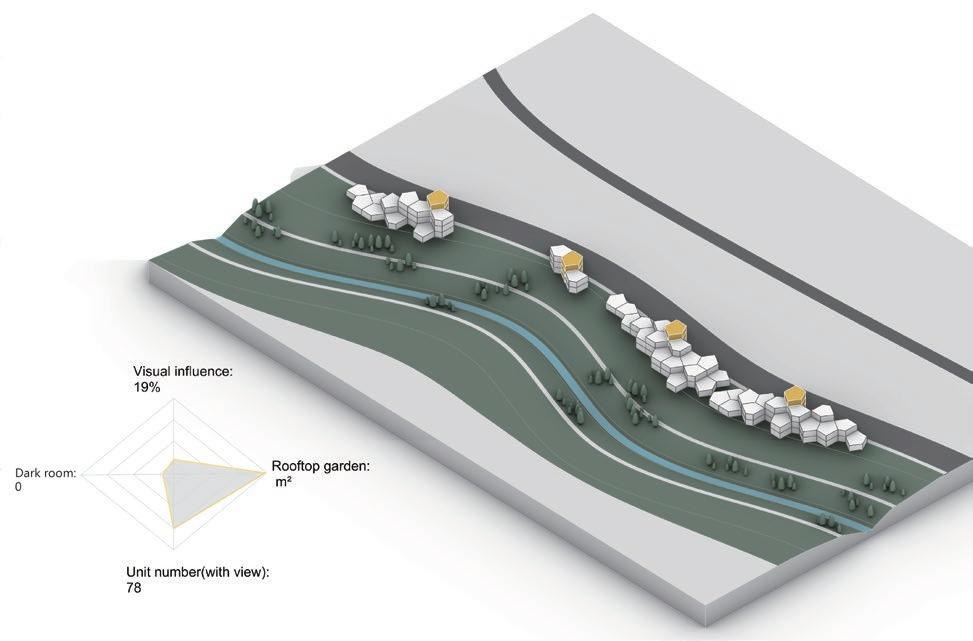
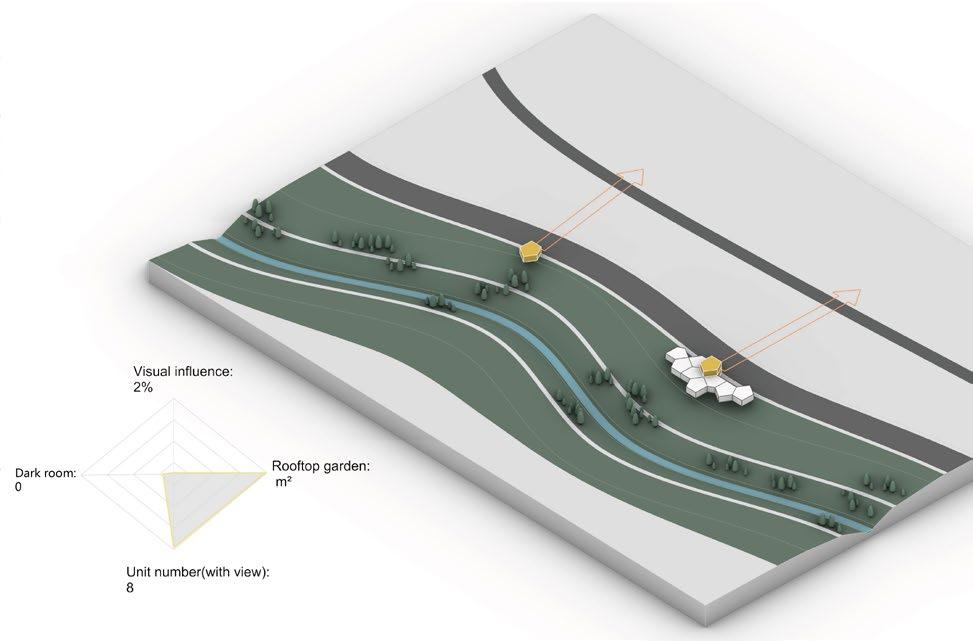
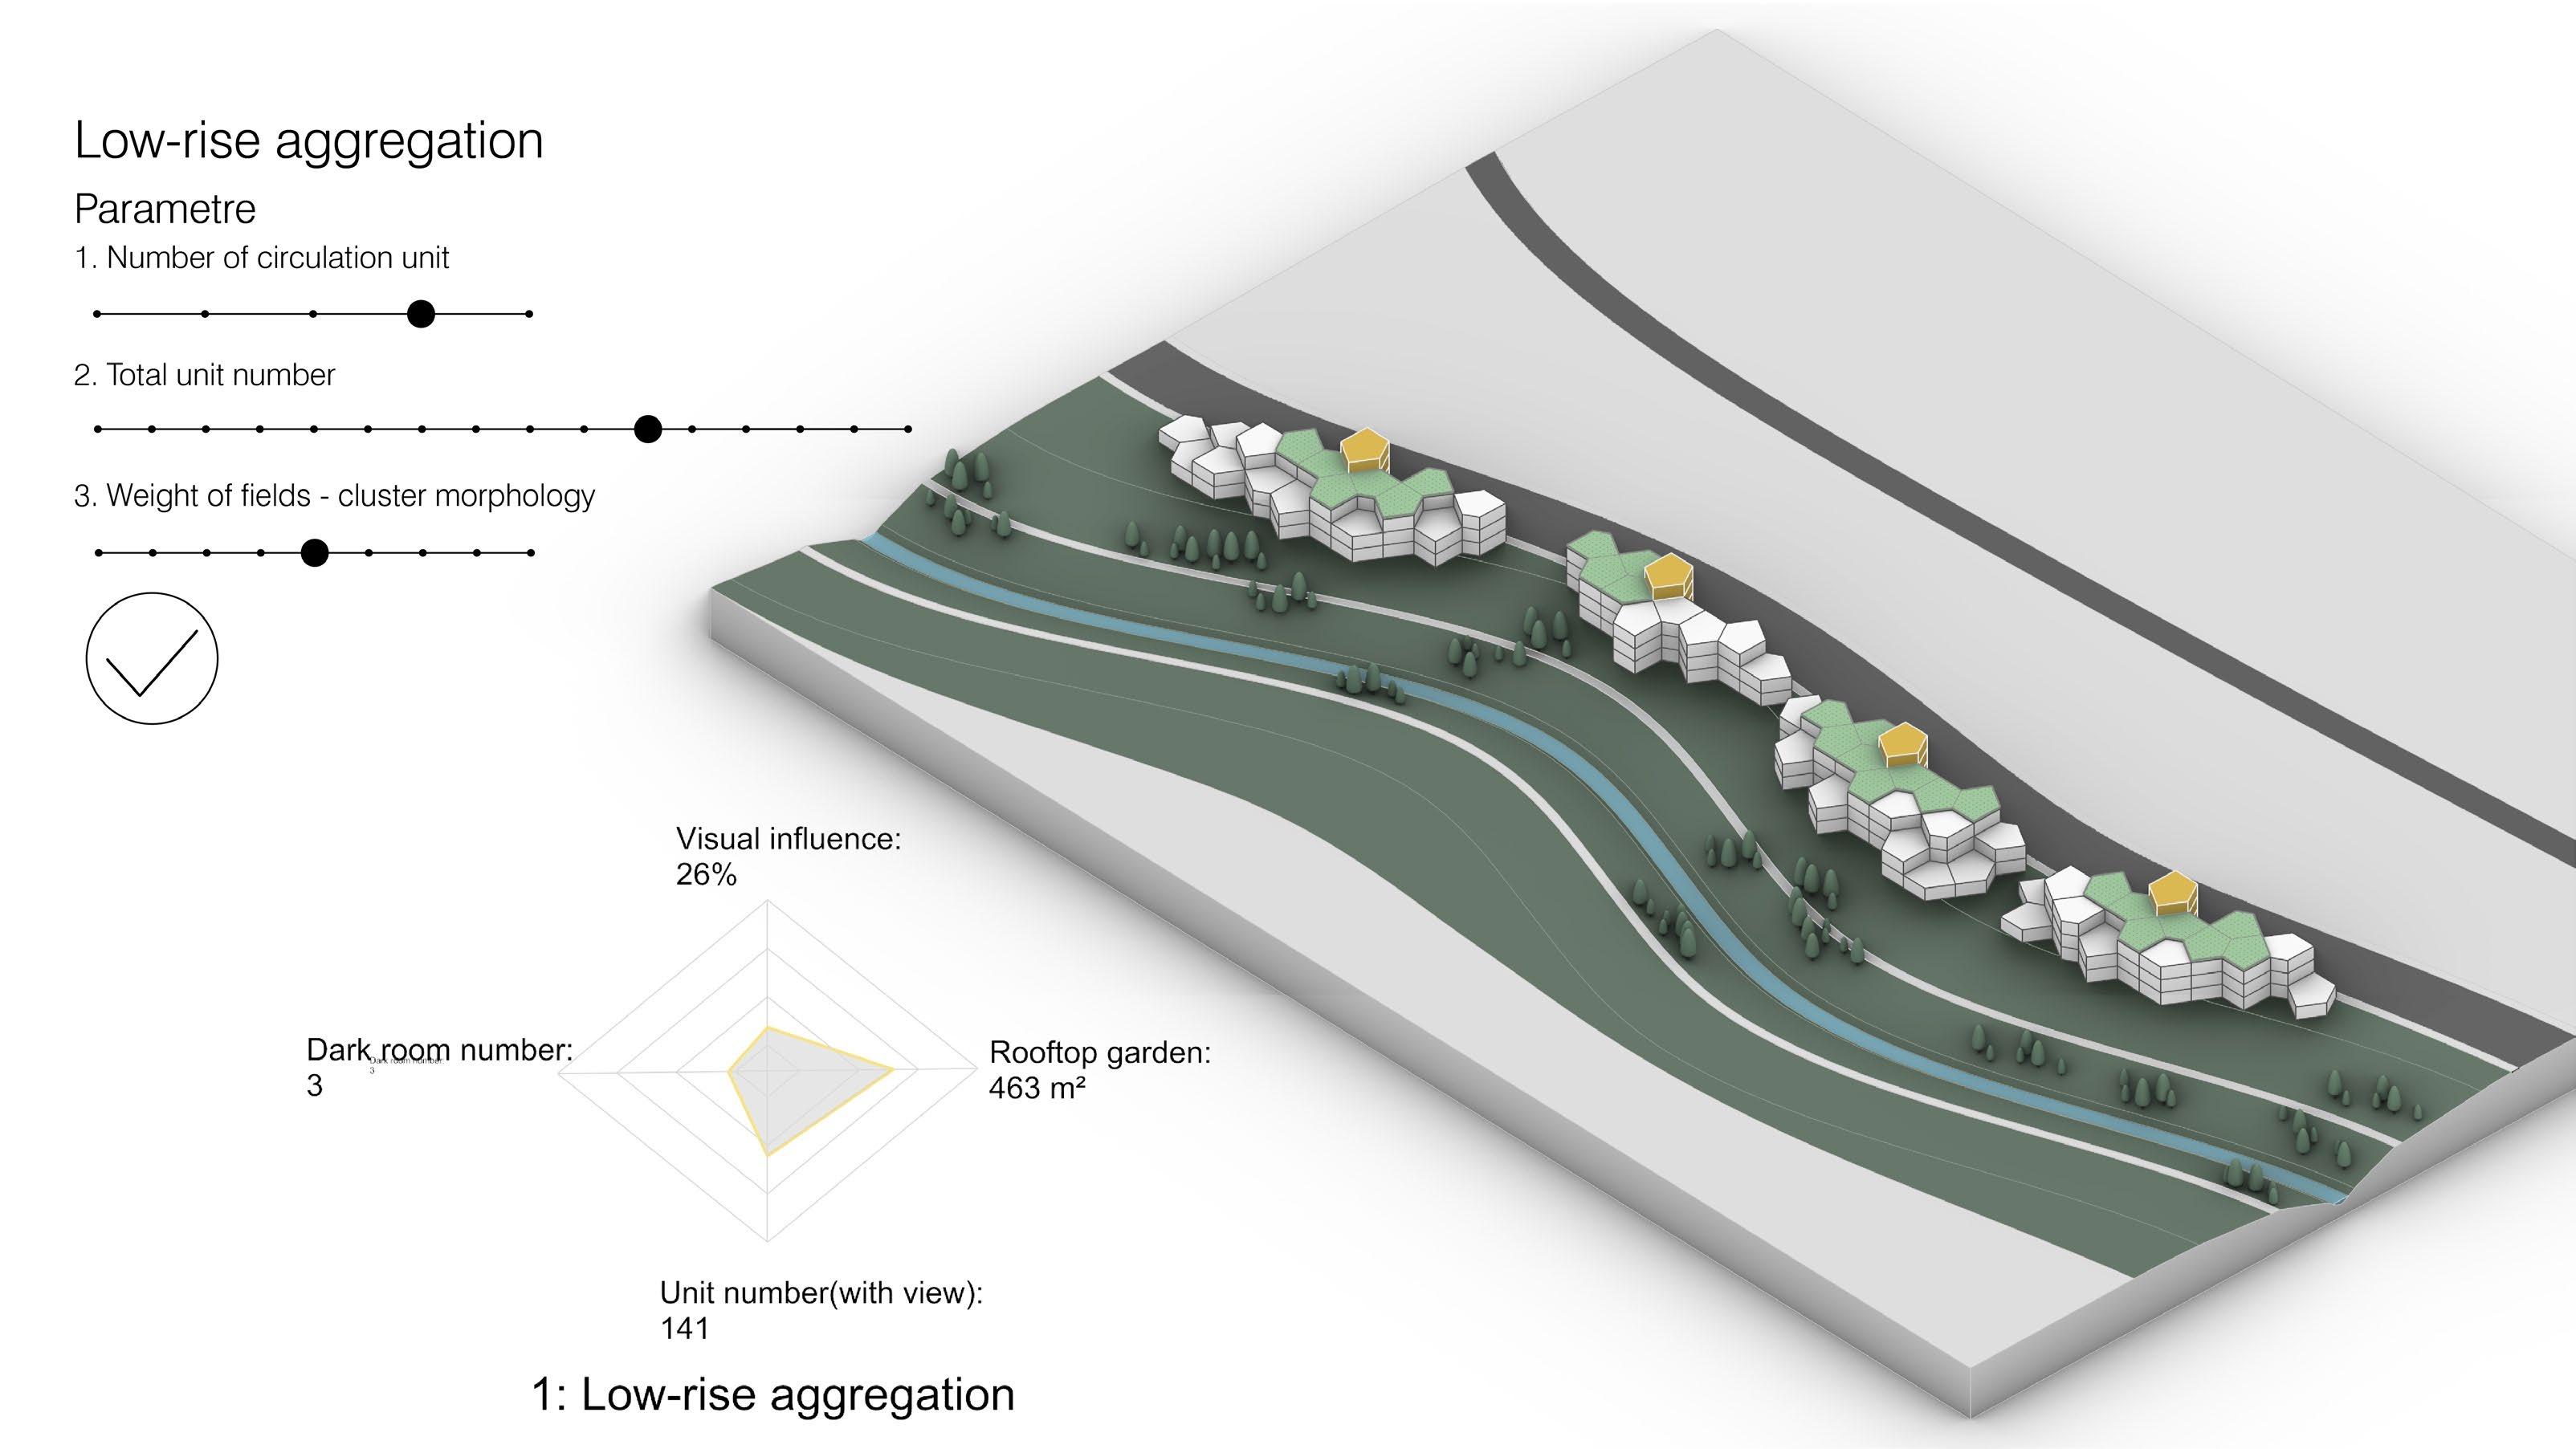
Following the rule-set[5.4.2], residential units, circulation units, shared space units, and green rooftop garden units can be generated using based on multiple parameters. The main parameters include the number of vertical circulation units(defining the cluster number and will influence the evacuation network), total unit number, and the morphology parameter of the cluster(centralized or distributed). The fitness objective is to generate low-rise clusters that have more residential units(F.O 1), fewer unusable dark rooms(F.O 2), less vision influence to the inland communities(F.O 3), and more rooftop green space(F.O 4).
An interface was made to visualize the parameter and the fitness value diamond chart. While the parameters changing, the aggregation result(building morphology) and a diamond
chart of the fitness value will be generated in real-time. The interface can help us to better understand and evaluate each aggregation result statistically and visually, turning the aggregation and selection into an interactive and dynamic process.
[Figure 5.4.7] Changing parameter: number of vertical circulation units.
[Figure 5.4.8] Changing parameter: total unit number [Figure 5.4.9] Changing parameter: cluster morphology

 Figure 5.4.7
Figure 5.4.8
Figure 5.4.9
Site locaiton
Figure 5.4.7
Figure 5.4.8
Figure 5.4.9
Site locaiton
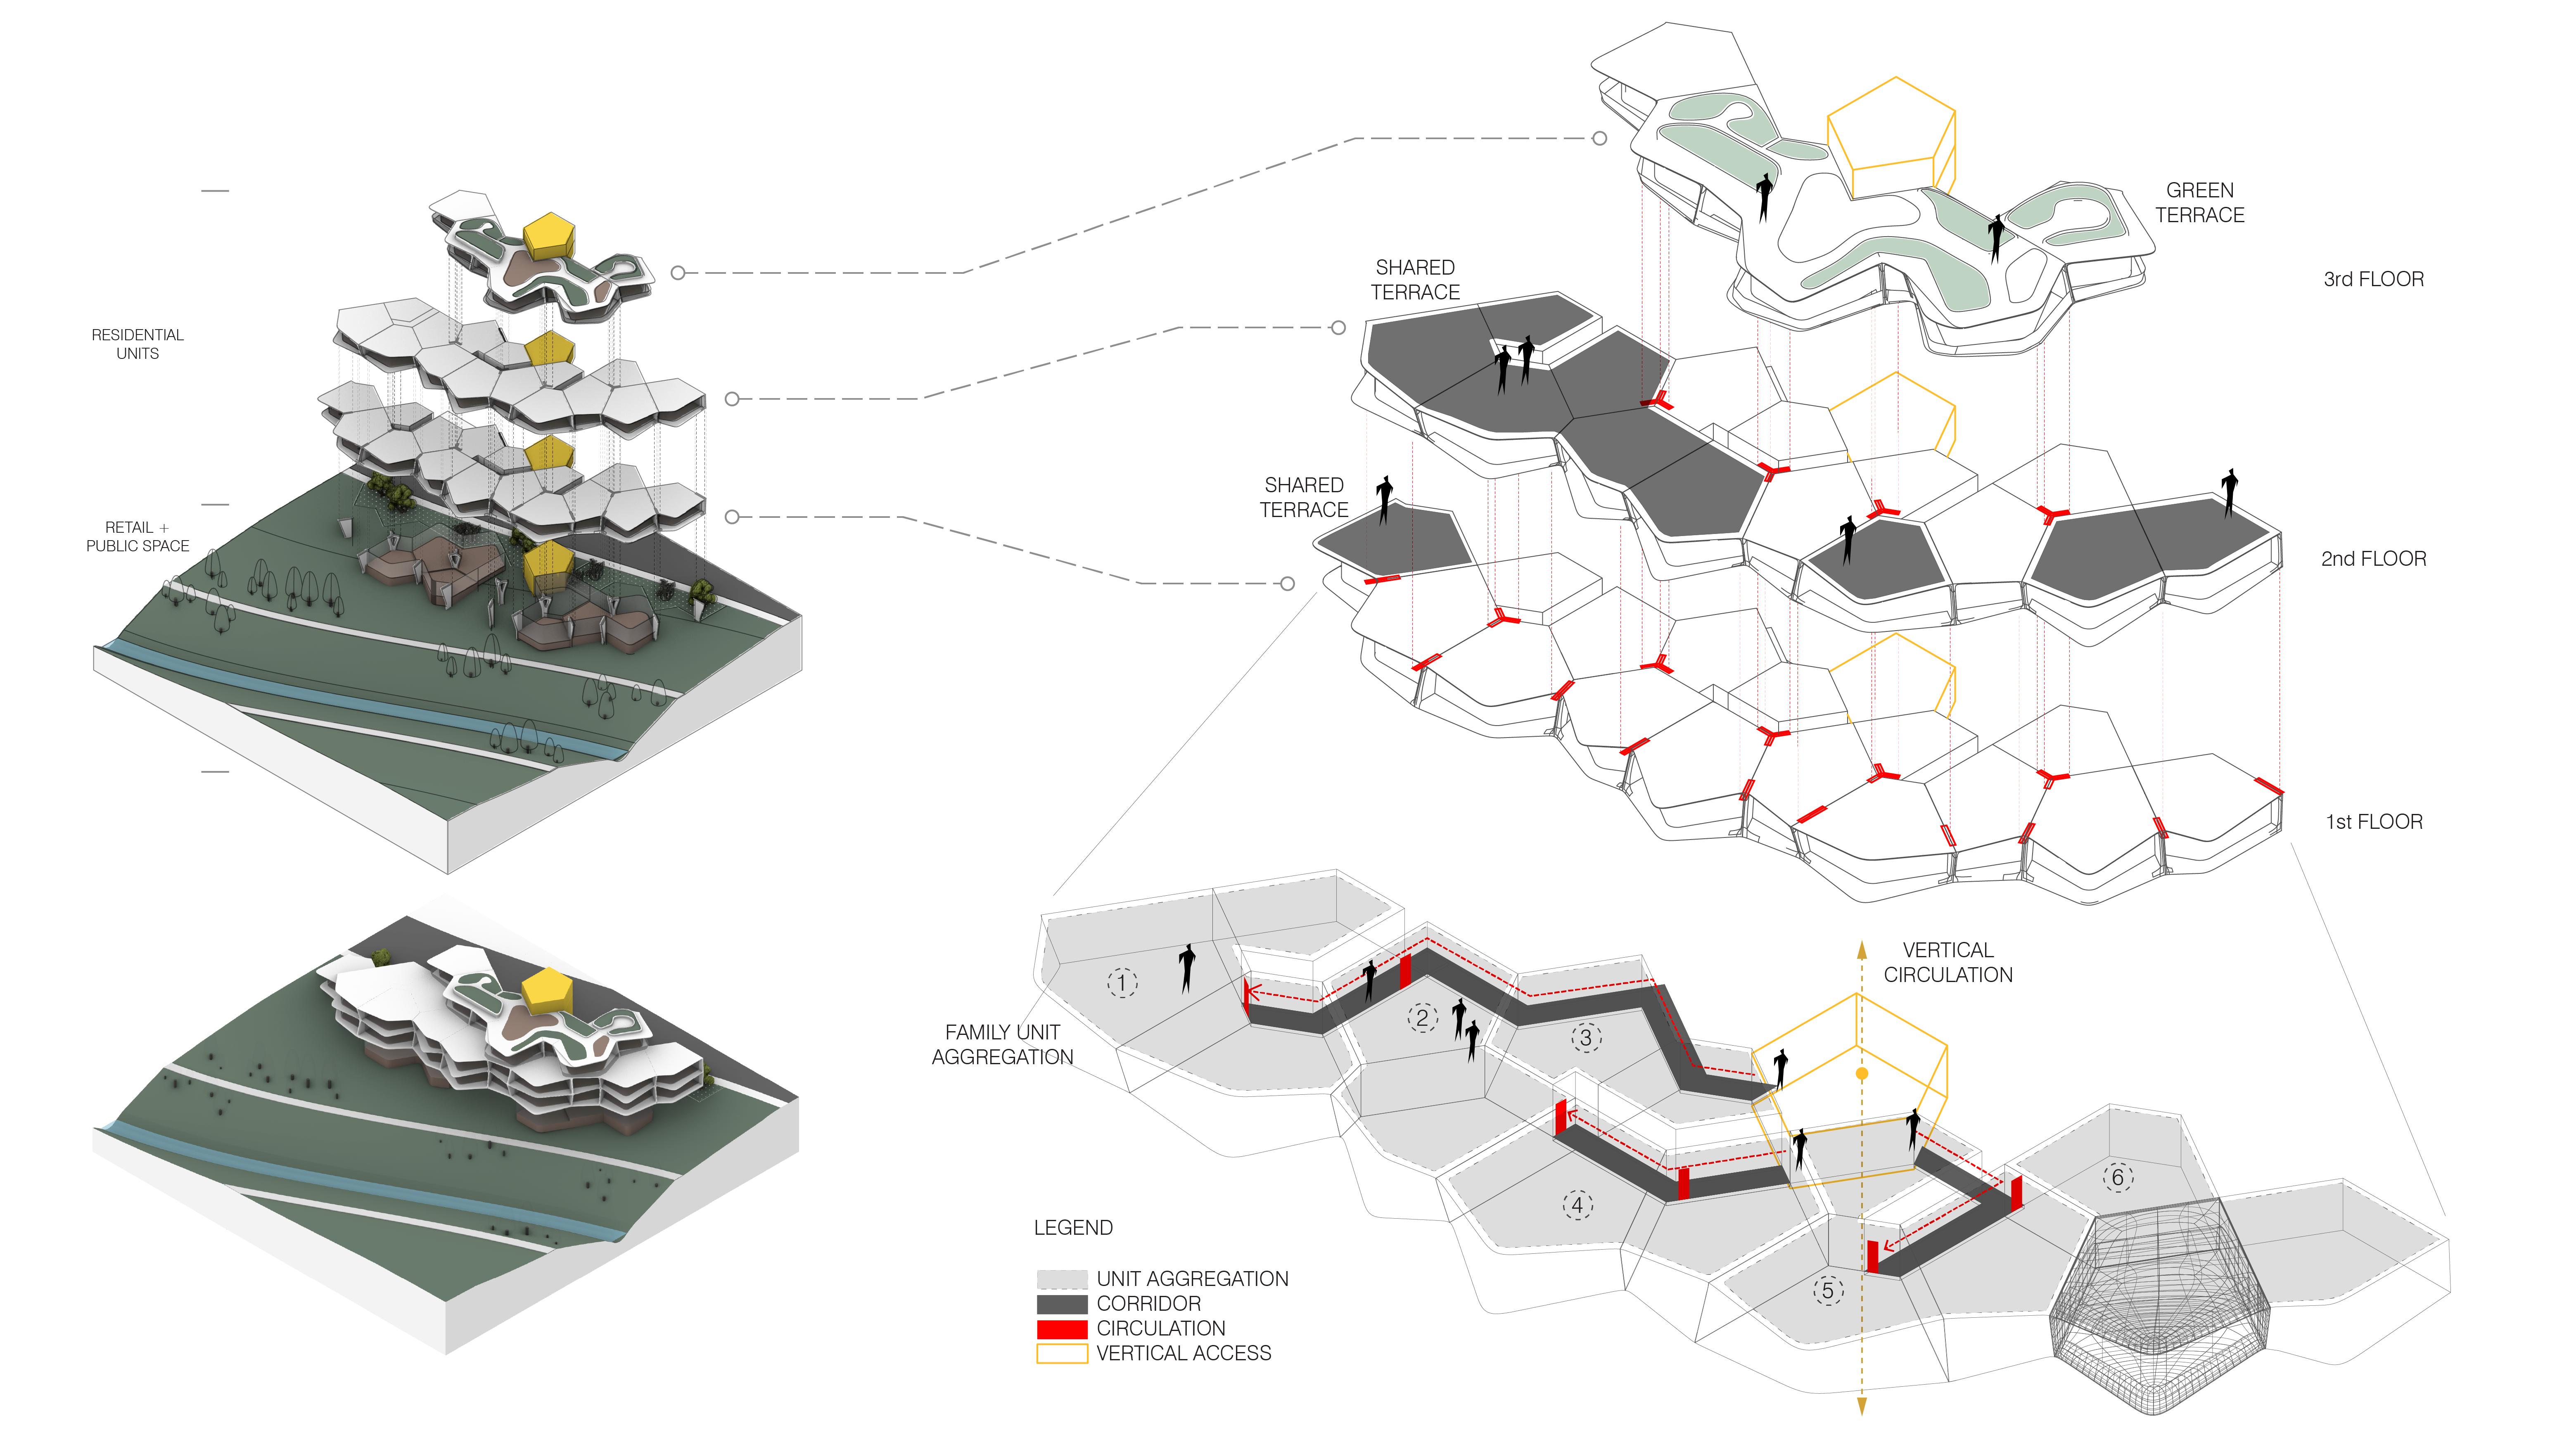
152 153
Figure 5.4.10: Exploded axonometric diagram for low-rise
5.4.4 Mid - rise aggregation
As the second stage of the aggregation, the mid-rise aggregation will be informed by the low-rise aggregation result. After the low-rise clusters are placed, a field representing the value of vision, which is depending on how much river view it has will be generated[Fig 5.4.12]. The mid-rise aggregation will start from the position with the highest value; and according to the field-driven aggregation definition, all the units will be placed at the place with a higher value in priority. Therefore this field will also influence the allocation of other units in the whole aggregation process. Besides, the evacuation path generated from the low-rise aggregation will become a boundary in the mid-rise aggregation, to make sure that the units generated will not overlap with the evacuation path.
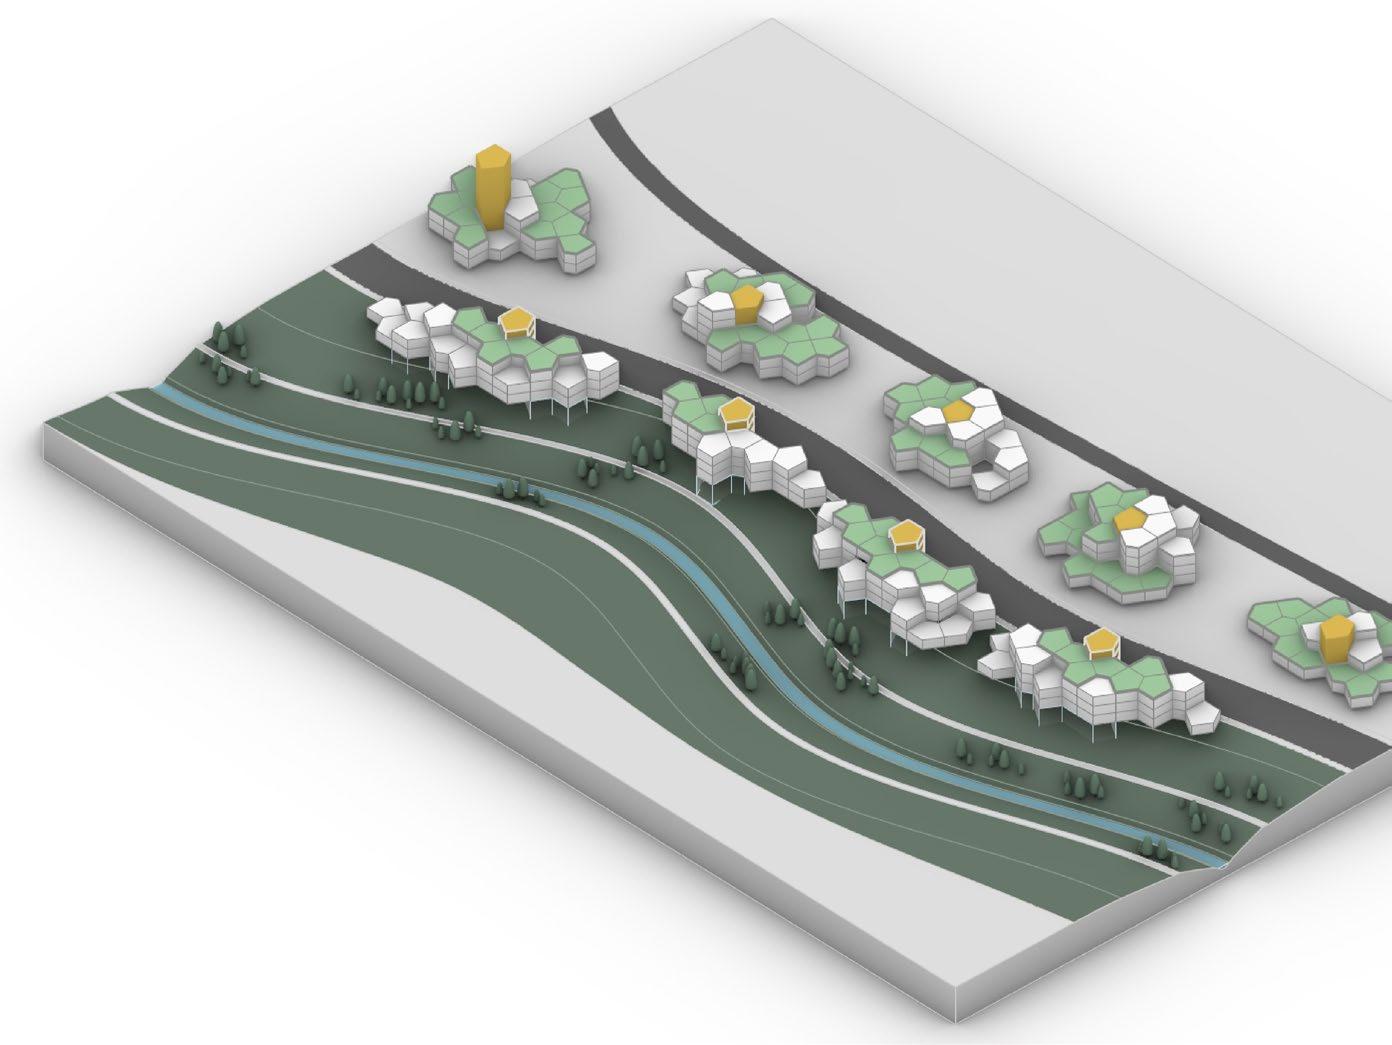
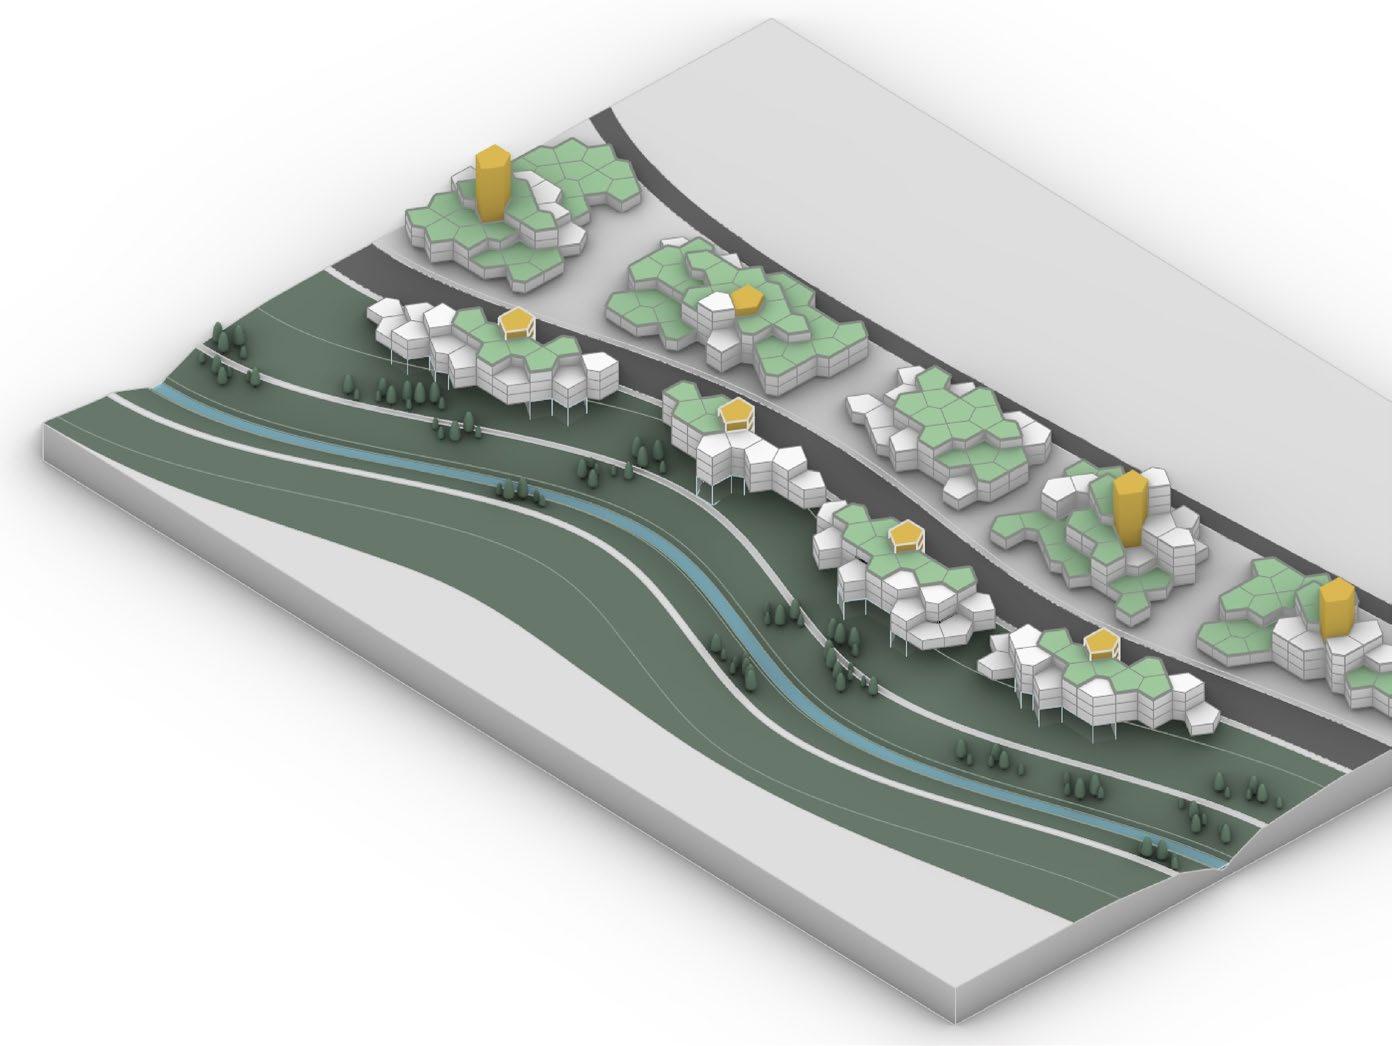
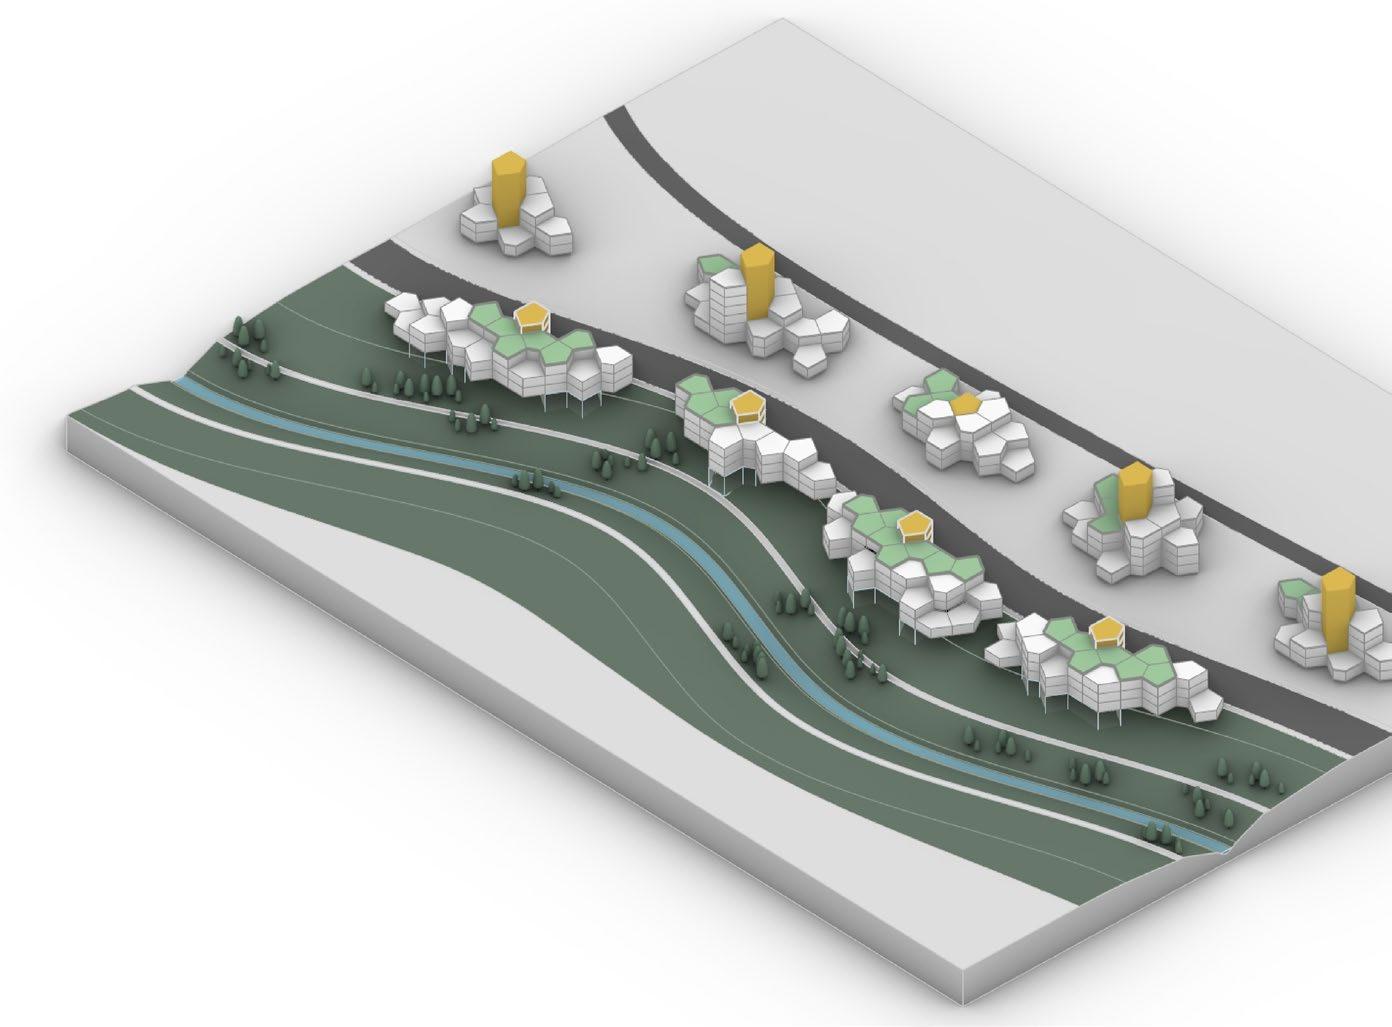
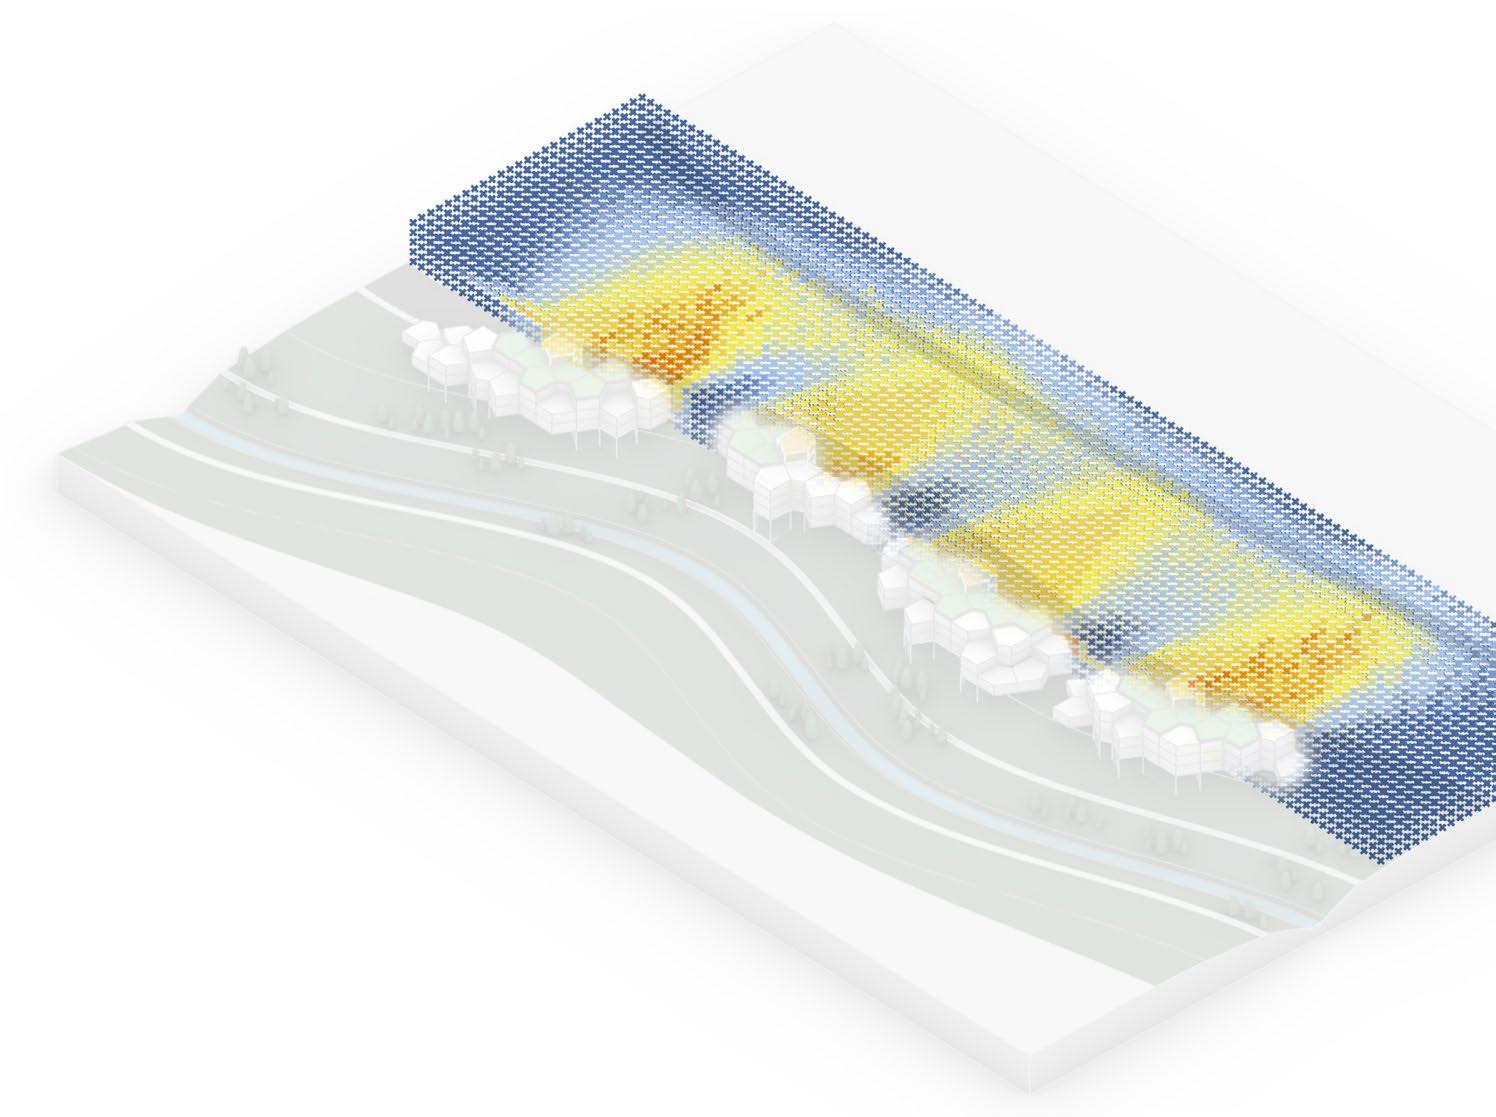
The main rule-set and parameters for the mid-rise aggregation is similar to the low-rise’. The main difference is that the darkroom units(without any faces towards the street) will be subtracted from the volume and become a shared space. Besides, the height limit is also set higher as 7 stories.
The reason the aggregation is divided into two is that we notice the building we allocate will change the urban context such as vision and circulation, thus we want to build an iterative method for architecture aggregation, and explore how one iteration can inform and influence the other. Only two iterations(low-rise and mid-rise) have been aggregated in our dissertation, but we believe that this method and be applied to further inform urban planning and building design.
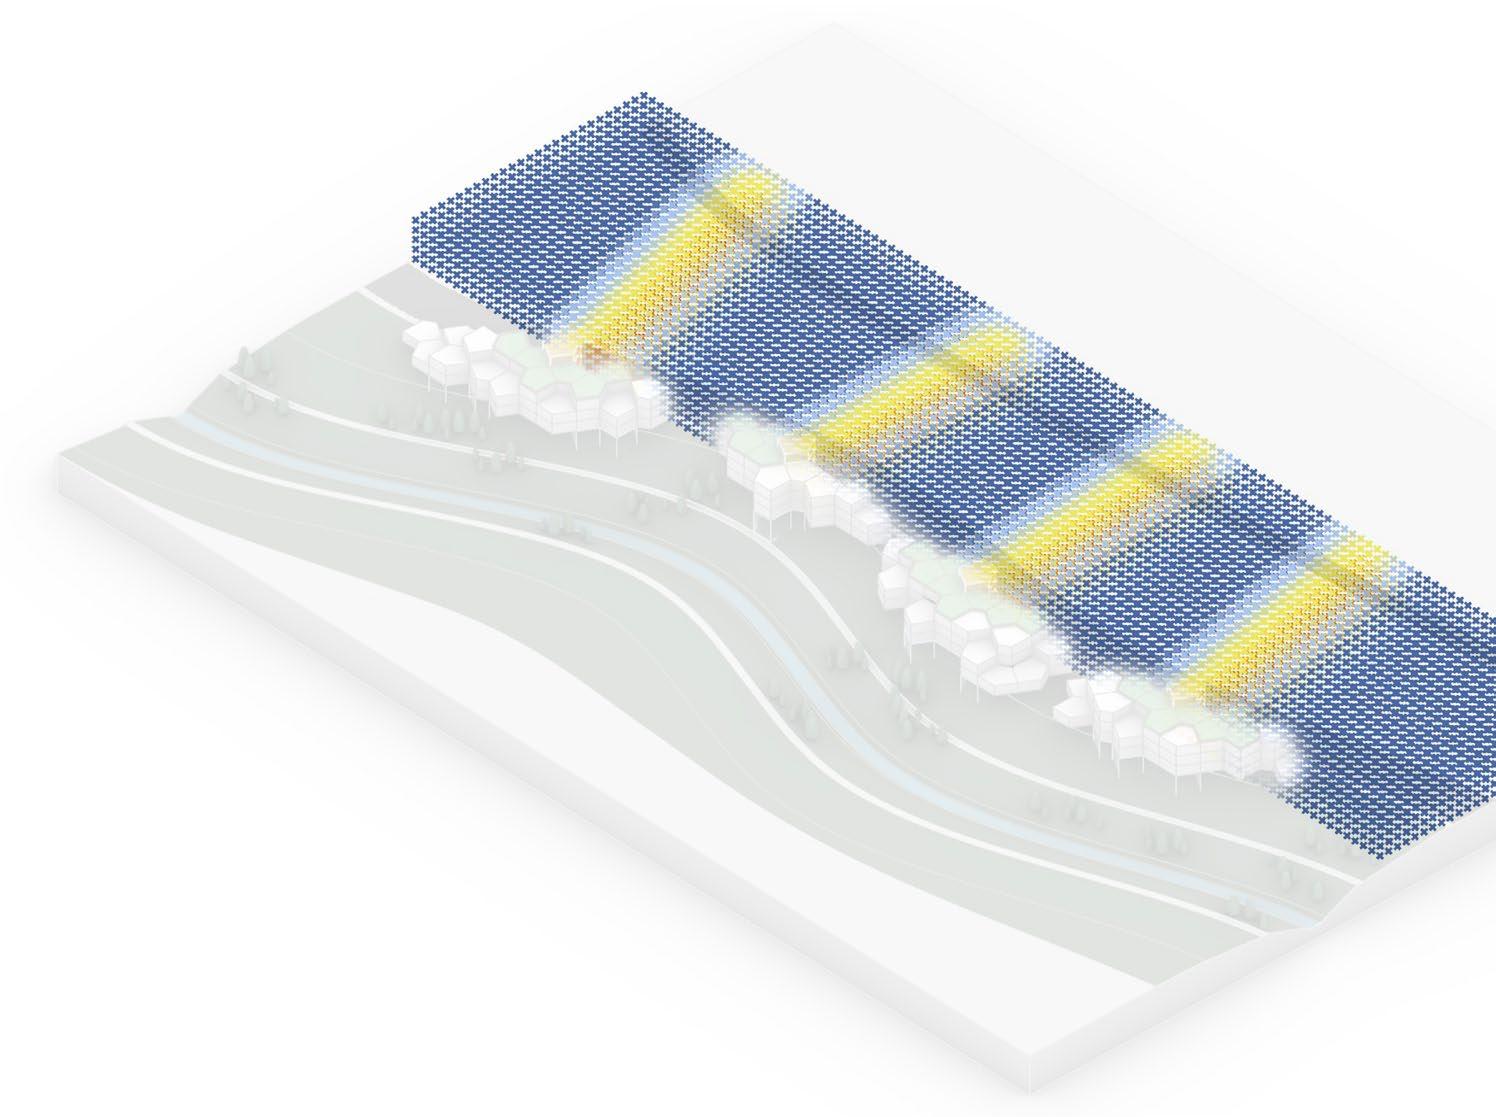
154
Low-rise aggregation result
Inform the Mid-rise aggregation
Fields of values
Figure 5.4.11
Figure 5.4.12: Mid-rise aggregation process
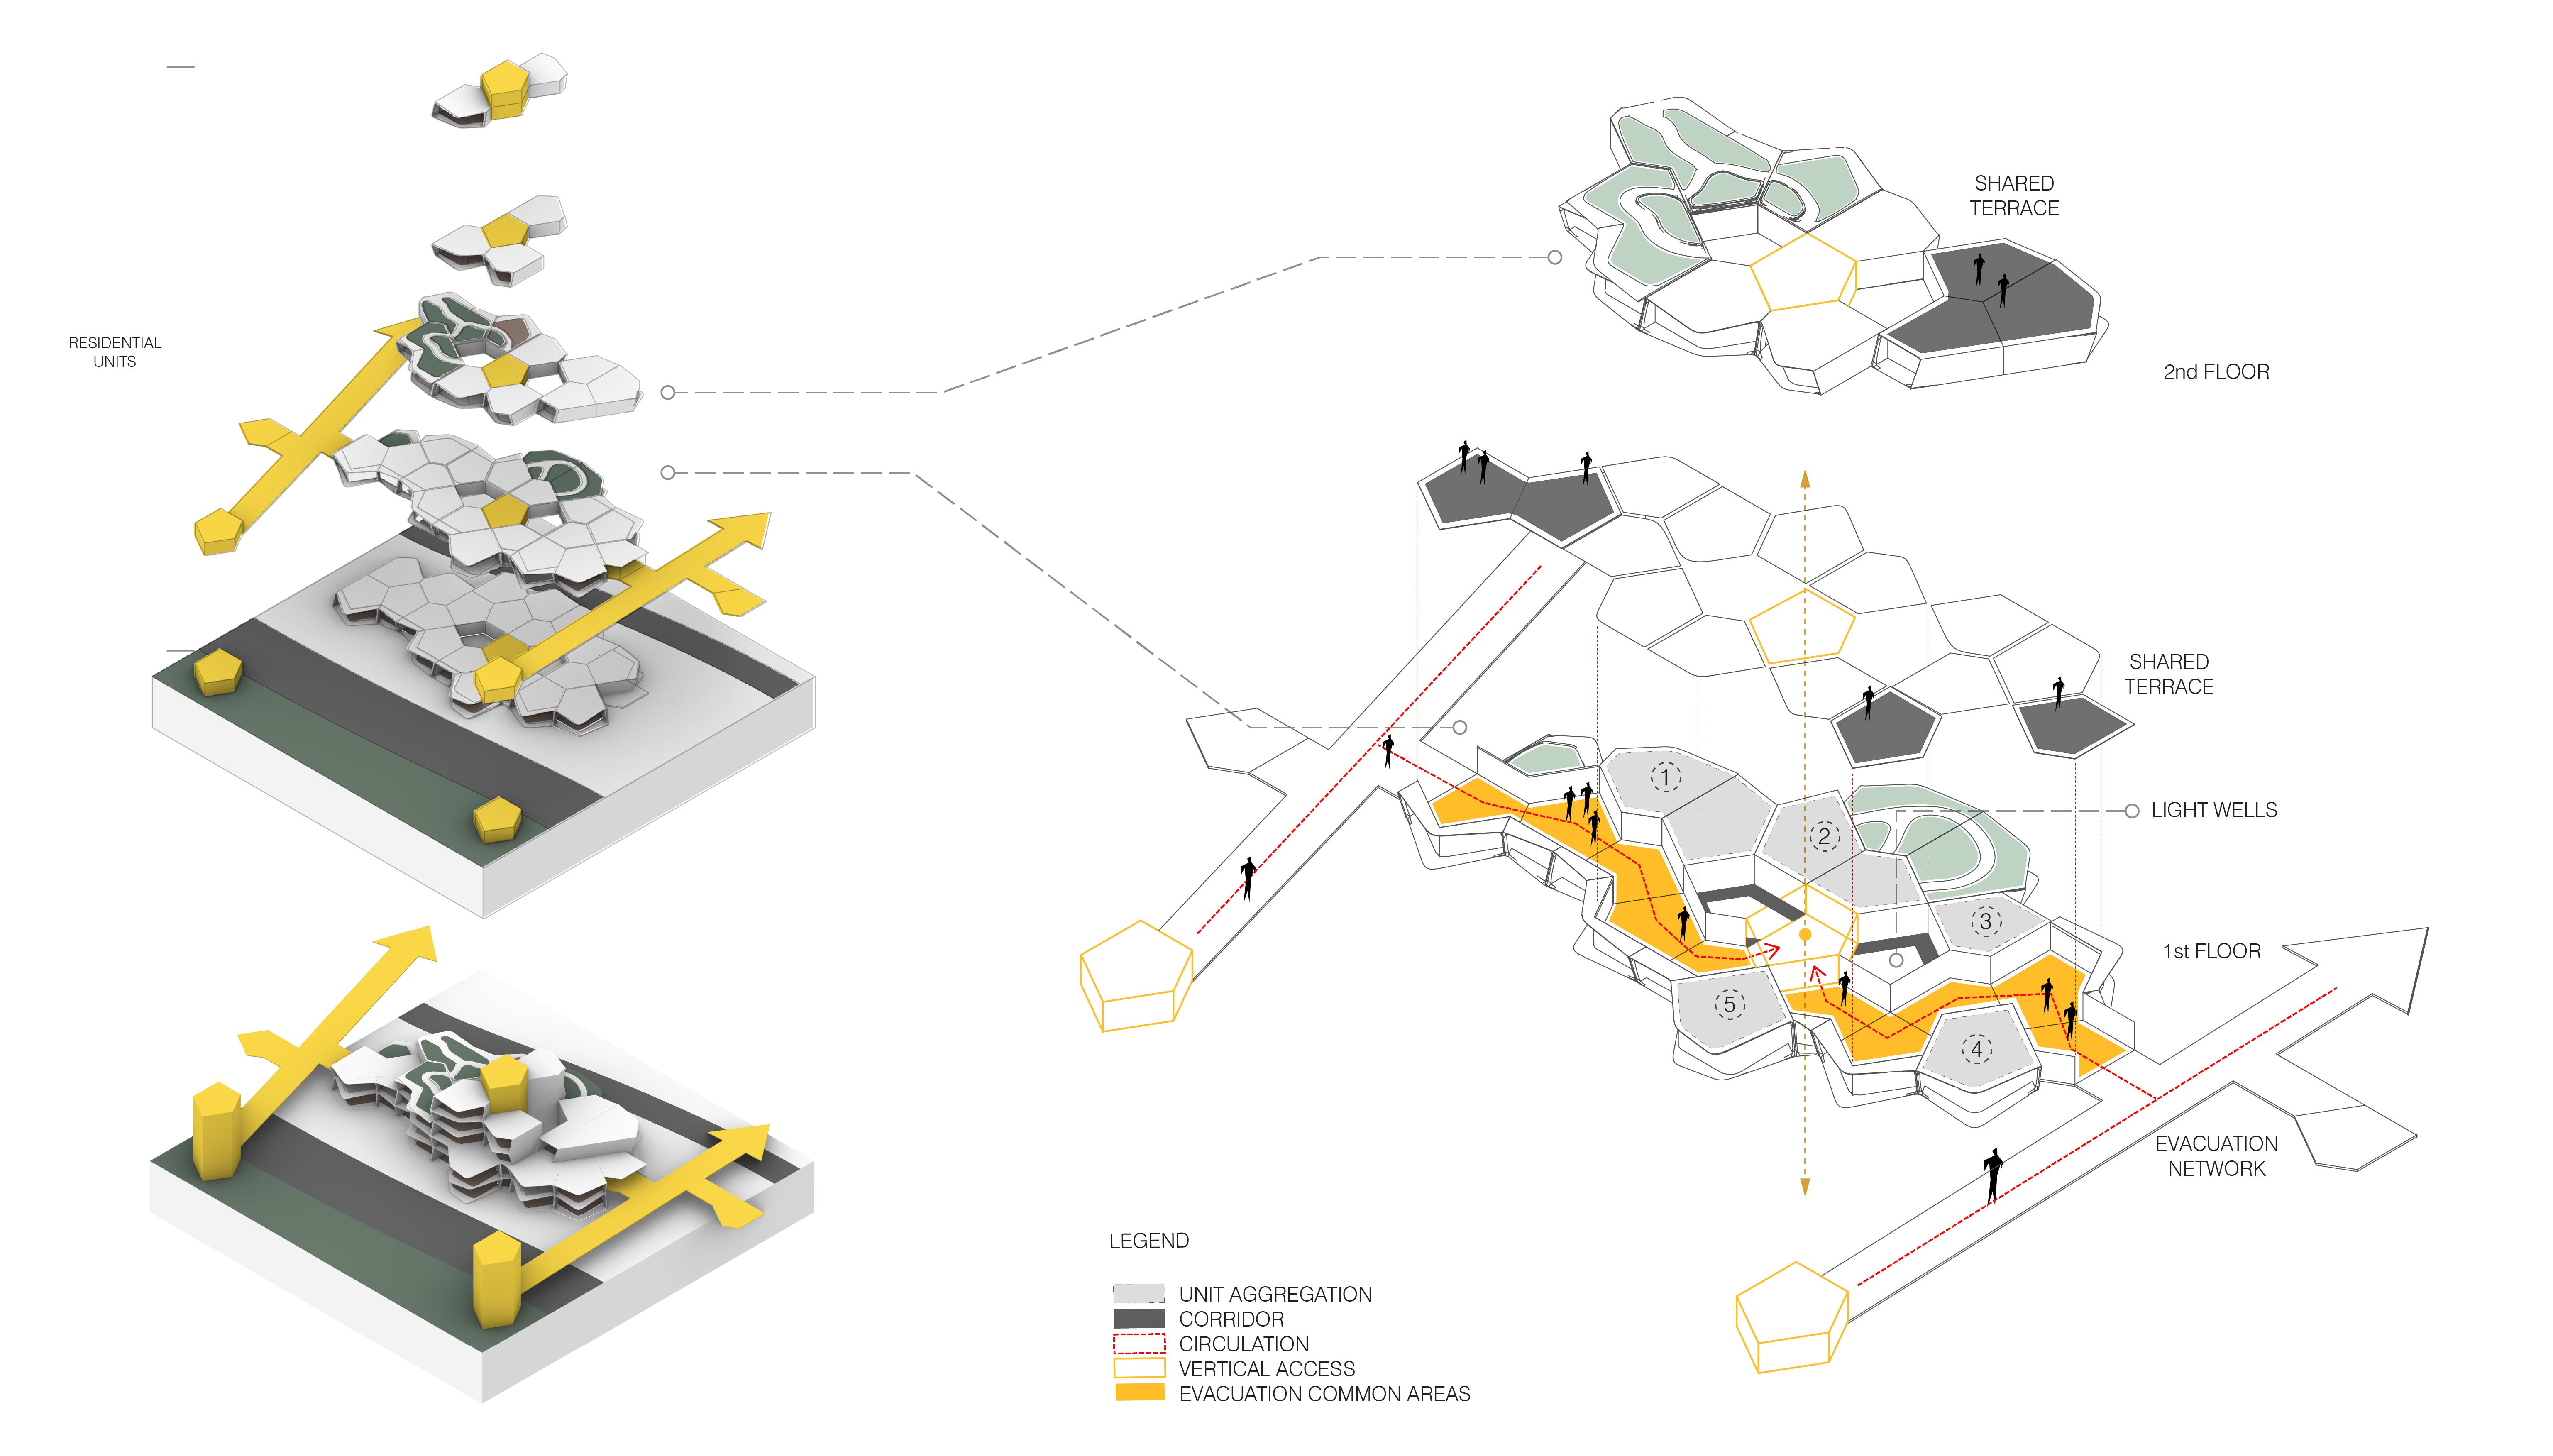
156 157
Figure 5.4.13: Exploded axonometric diagram for mid-rise

158 159
Figure 5.4.14: Exploded axonometric diagram for low-rise & mid-rise
5.4.5 Program allocation along channel
The soft tissue along the channels is utilized for public functions such as open spaces, sitting areas, playgrounds and sport areas.
The section shows the sunken area below the upper ground level which is used for gathering in daily life and act as a buffer zone in case of inundation to store the water temporarily and drain the water slowly afterwards.
The ring of pedestrian network has a bridge overlayed on top of them that act as an evacuation network passing through the high risk zone to the low risk zones.
The ground levels of the low-rises are utilized for the environmental education for kids, food and drink, cultural institutions and the retail spaces, where the residentials are placed to the upper floors for safety.
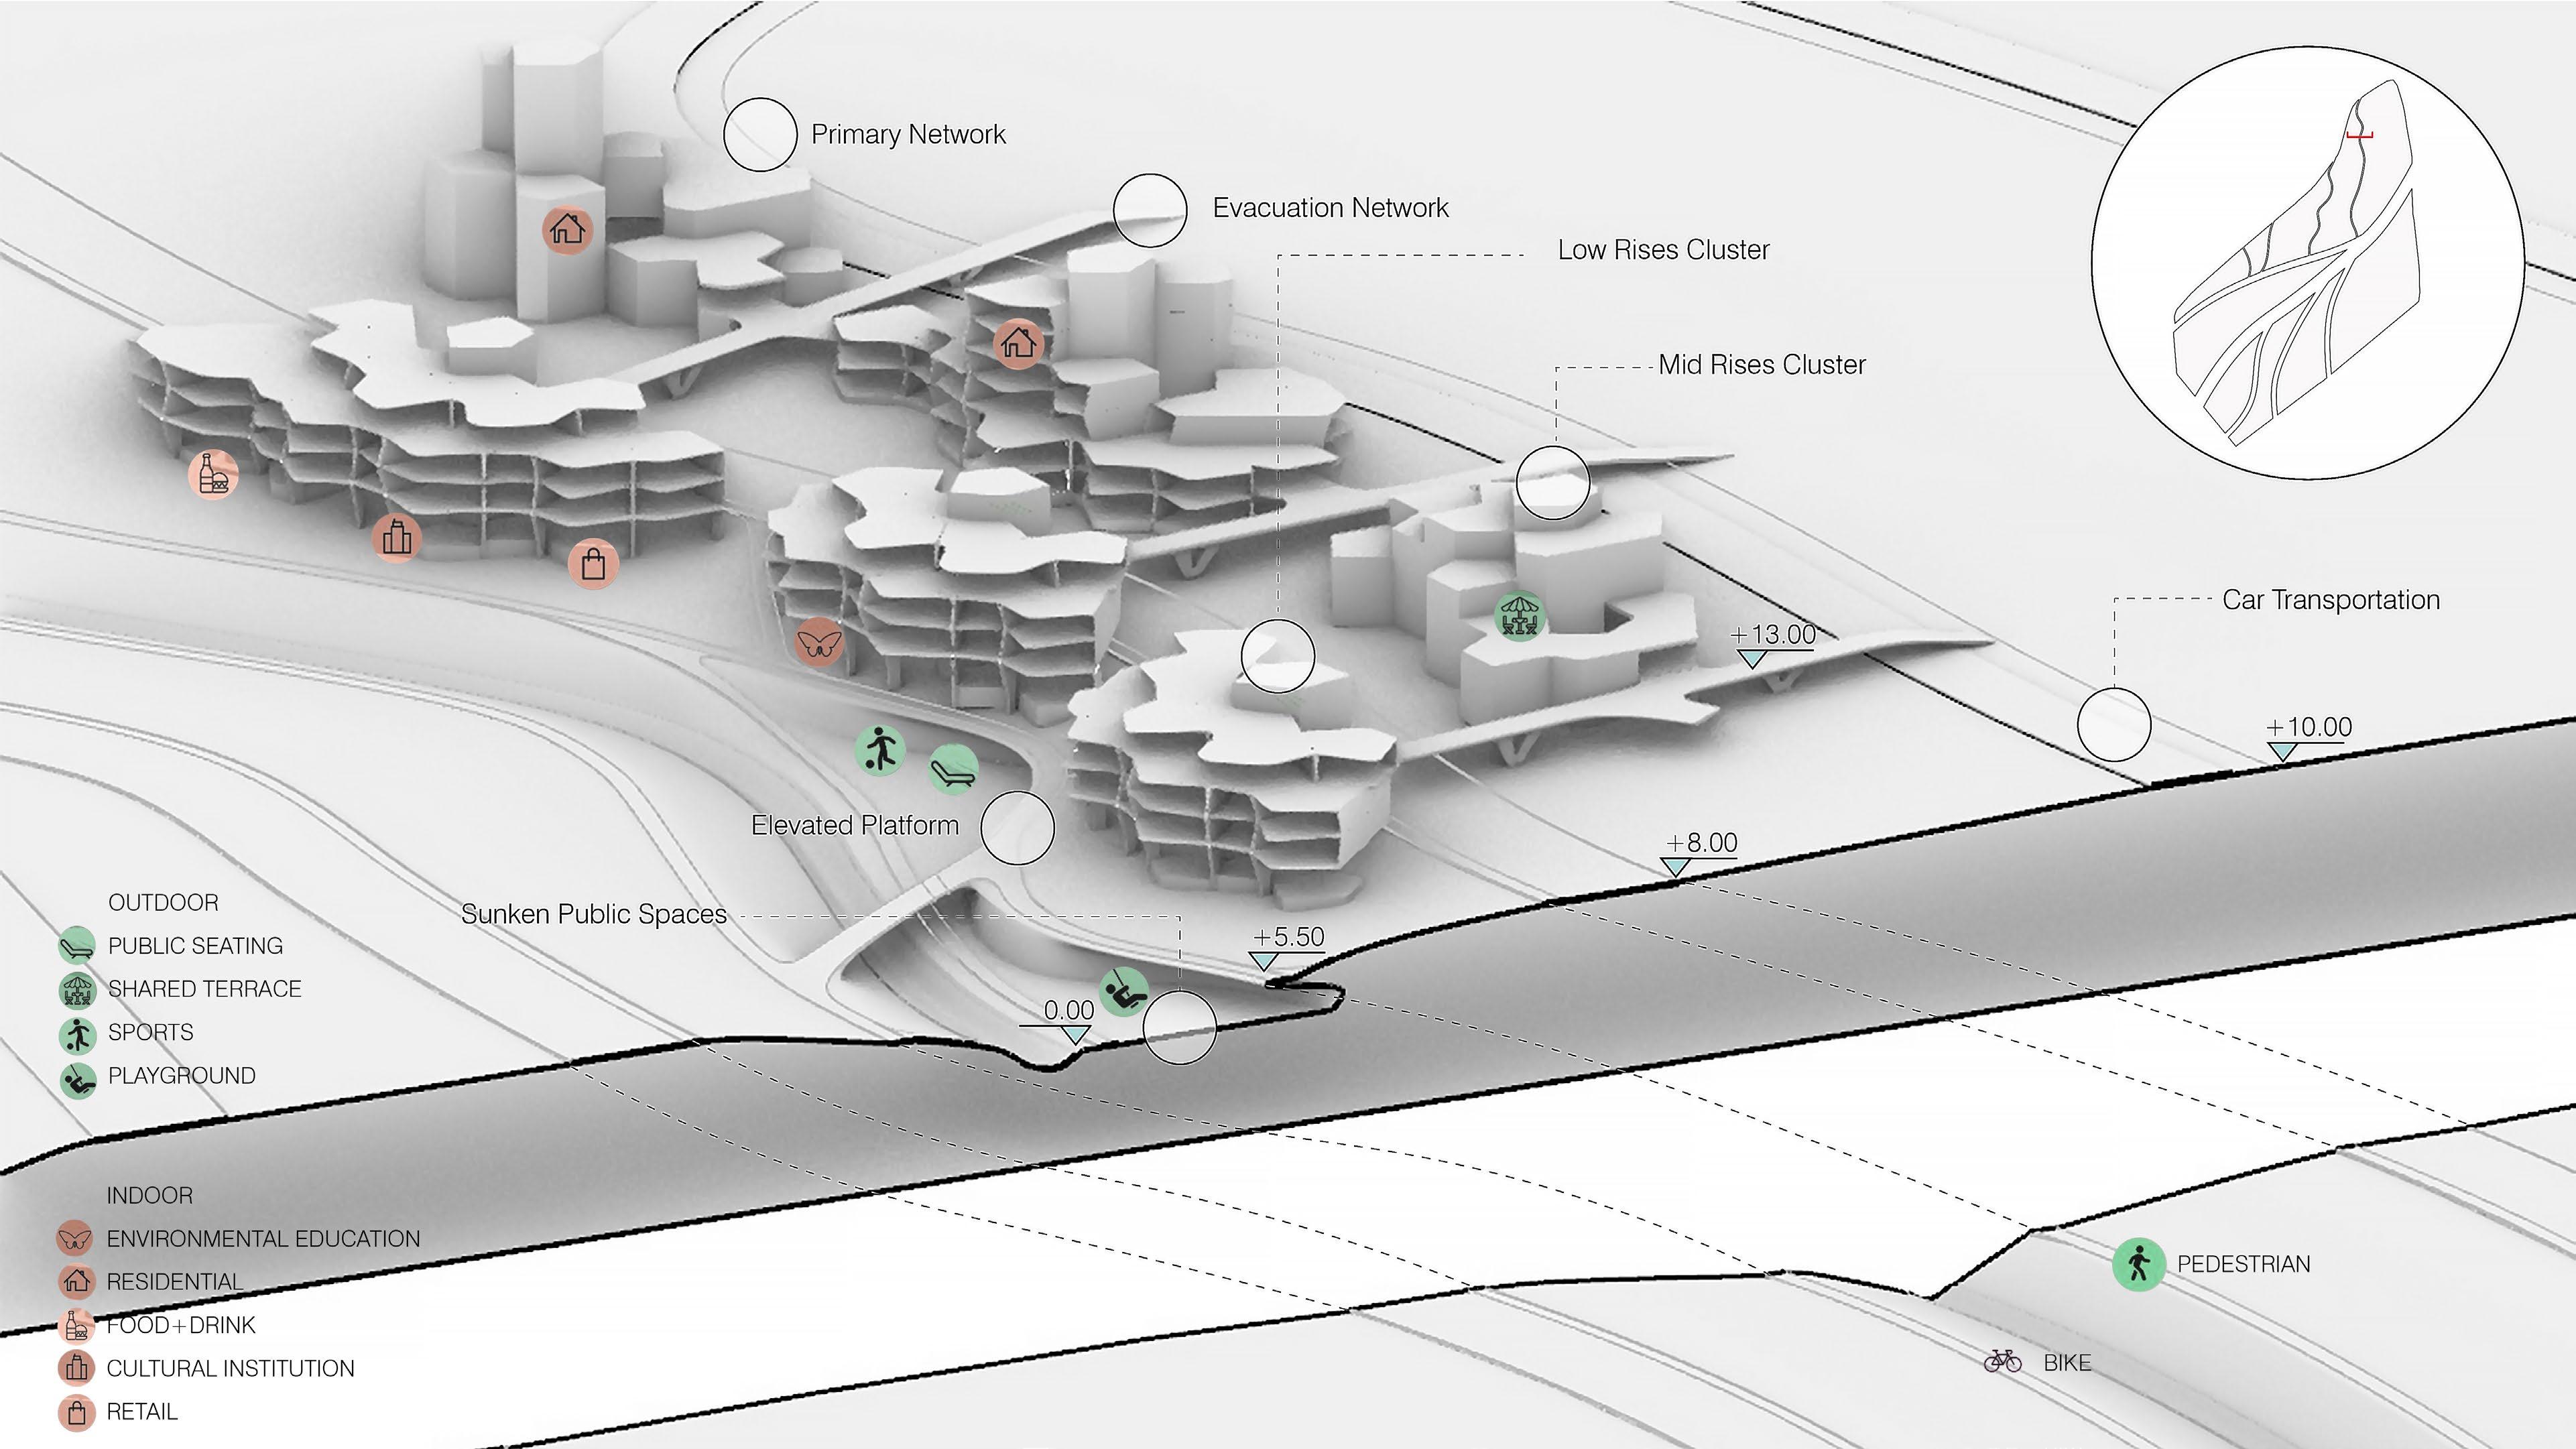
160 161
Figure 5.4.15
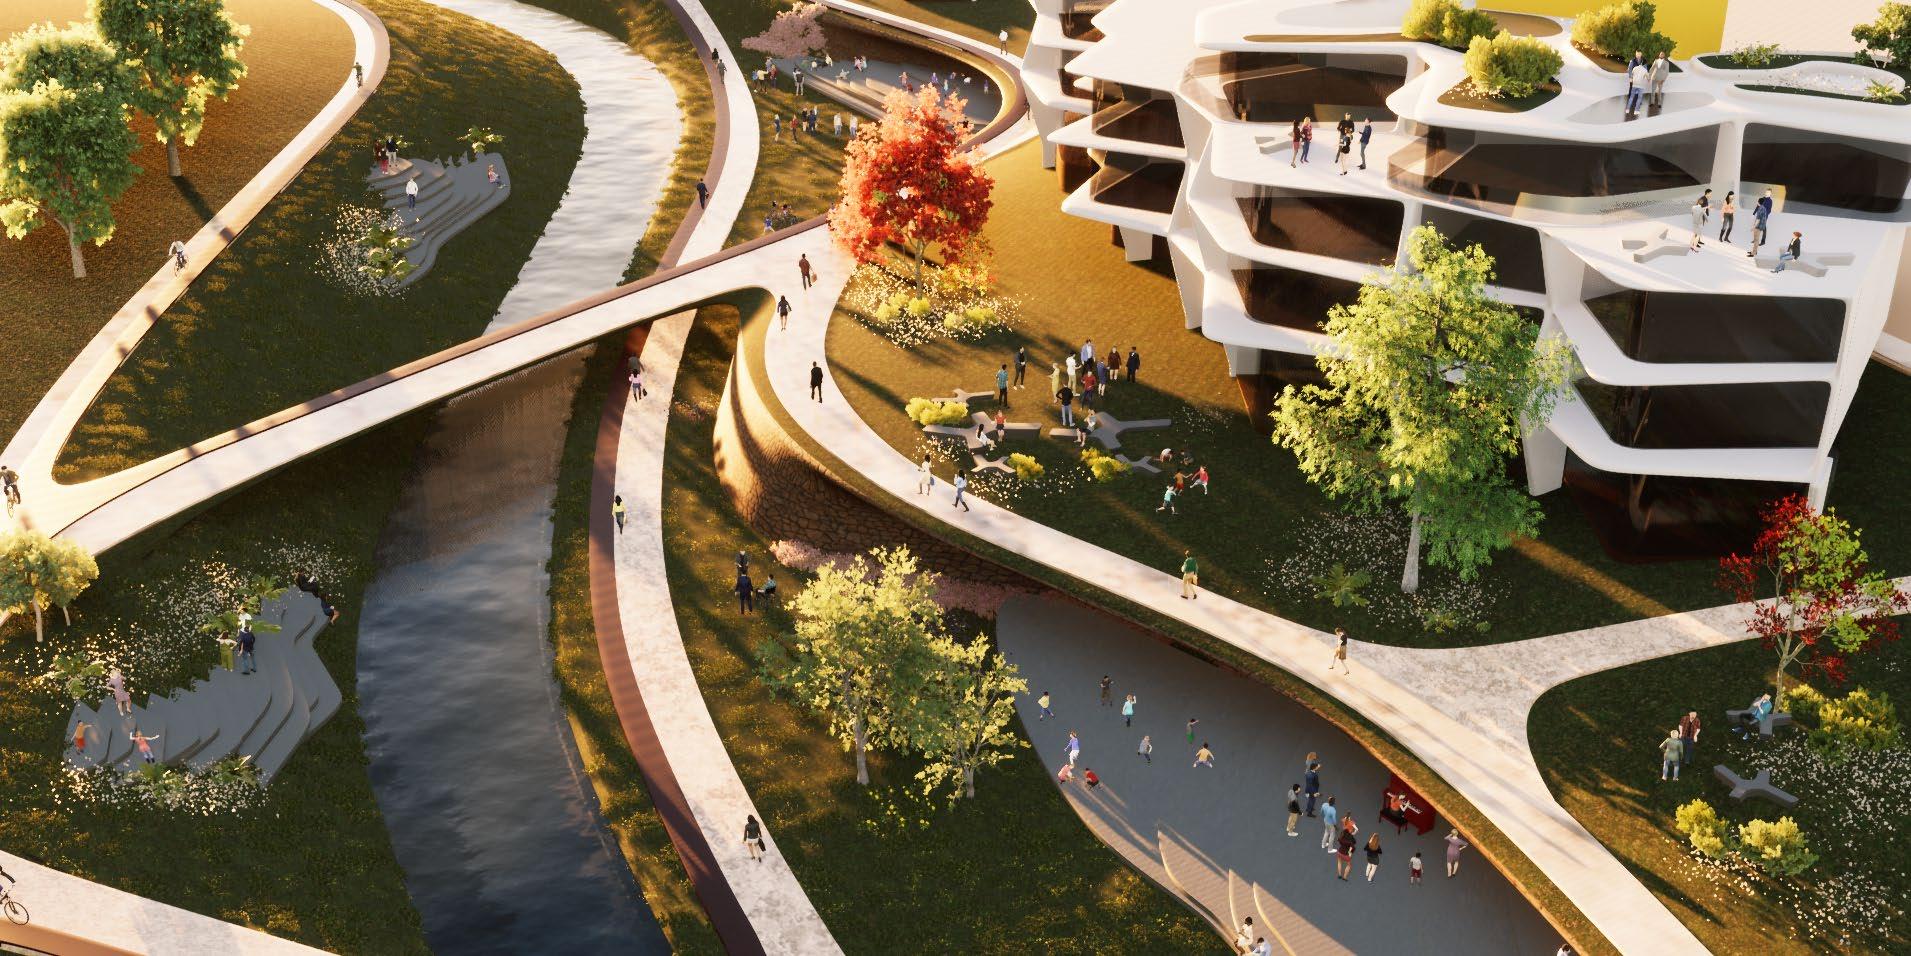
Since the the aggregation uses modular units(unitA and unitB), therefore the residential units and its facade can be prefabricated to reduce the cost of construction.
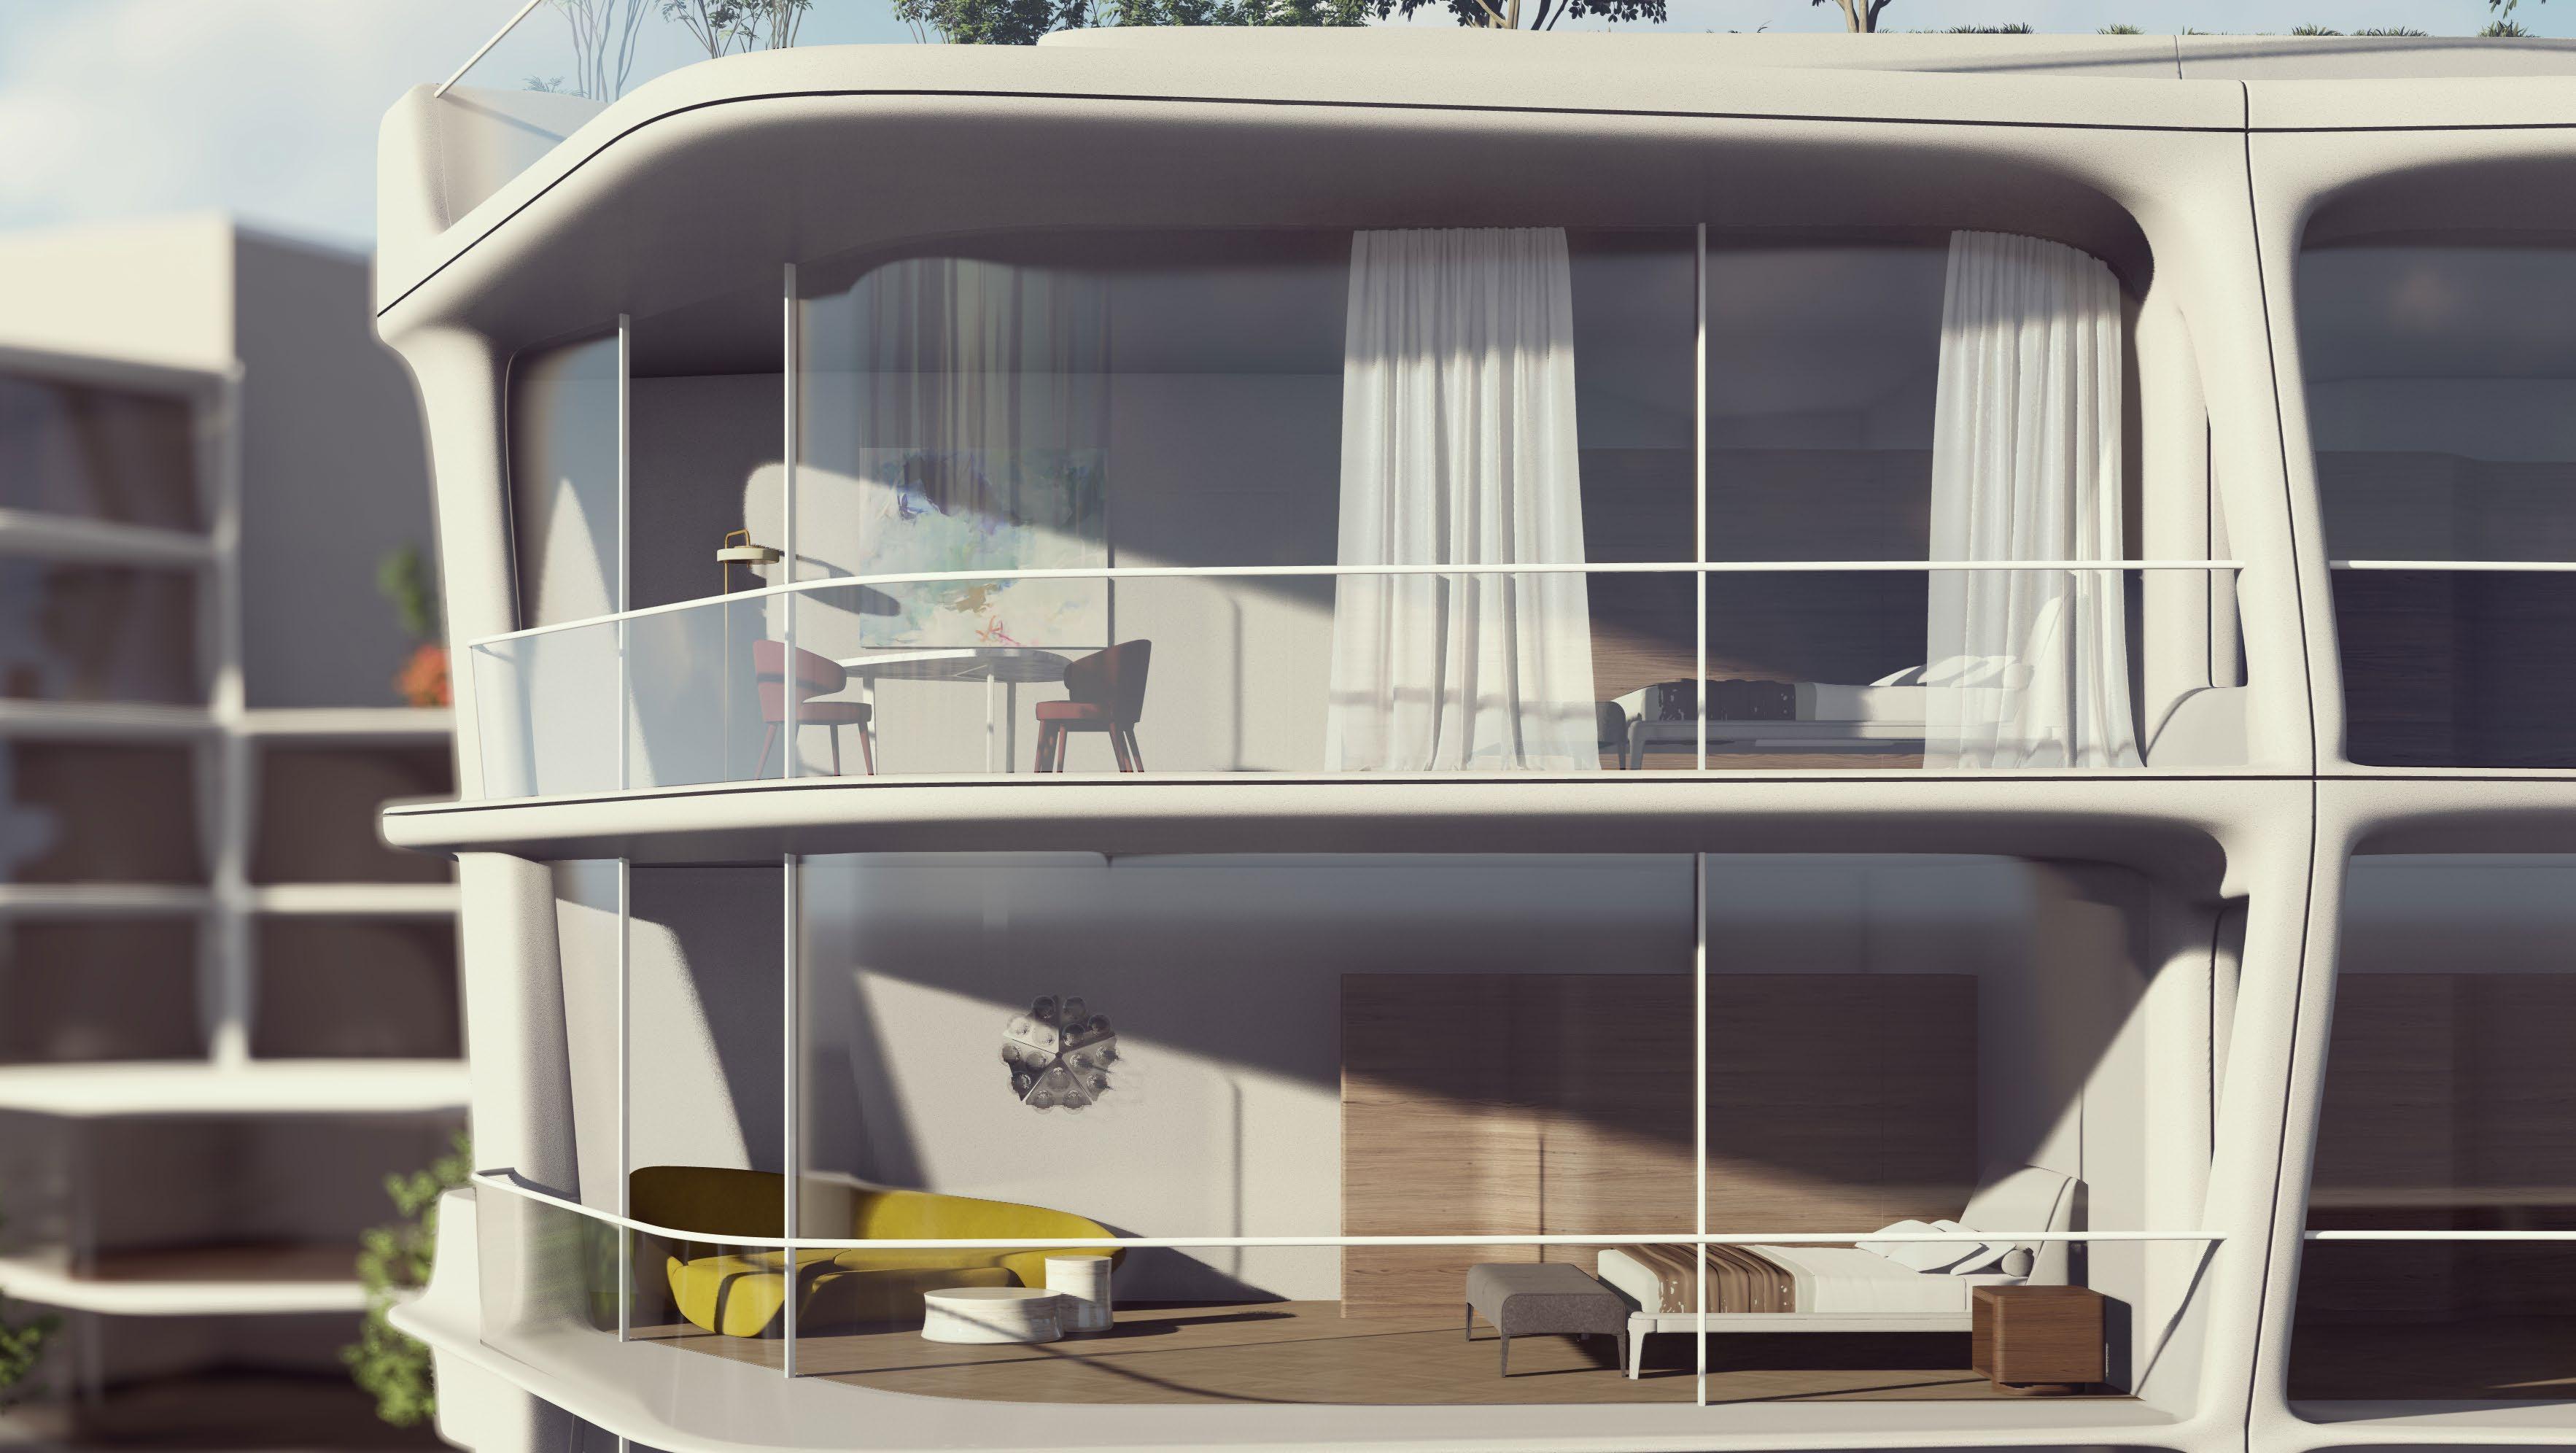
164 165 5.4.6 Modular Facade detail
An interior plan is designed and developed for residential unit module B. It shows different interior layout options and scenes of life for the modular unit system. Modular rooftop garden units can be located on the top or residential units, providing green and public space for the residents in the same cluster.
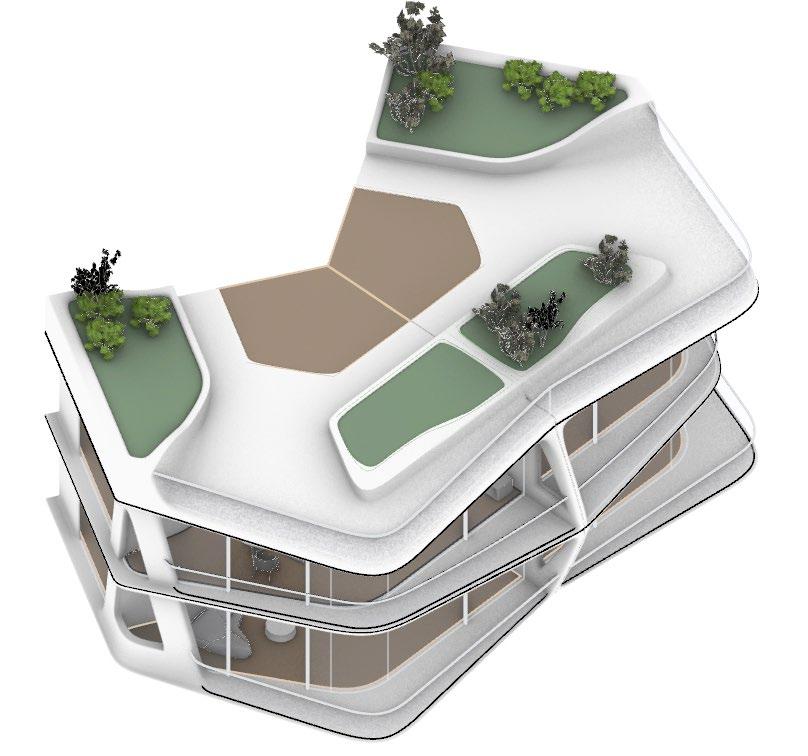
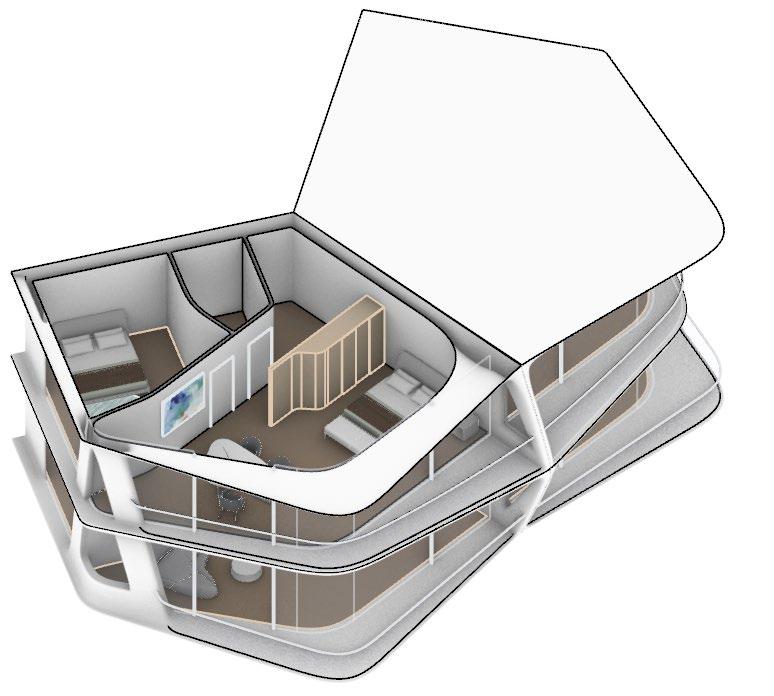
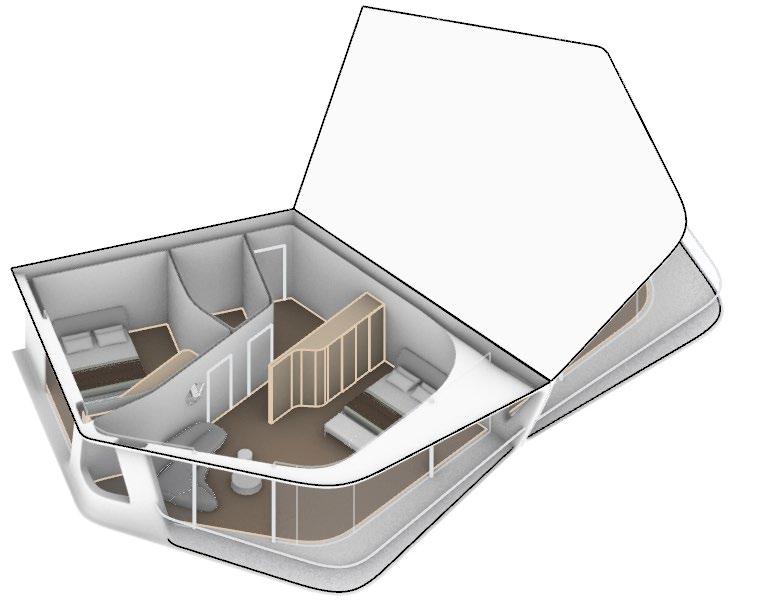
166 167 5.4.7 Single living unit detail
Figure 5.4.16: Unit details exonometric drawing
Interior model option 1
Interior model option 2
Rooftop garden unit
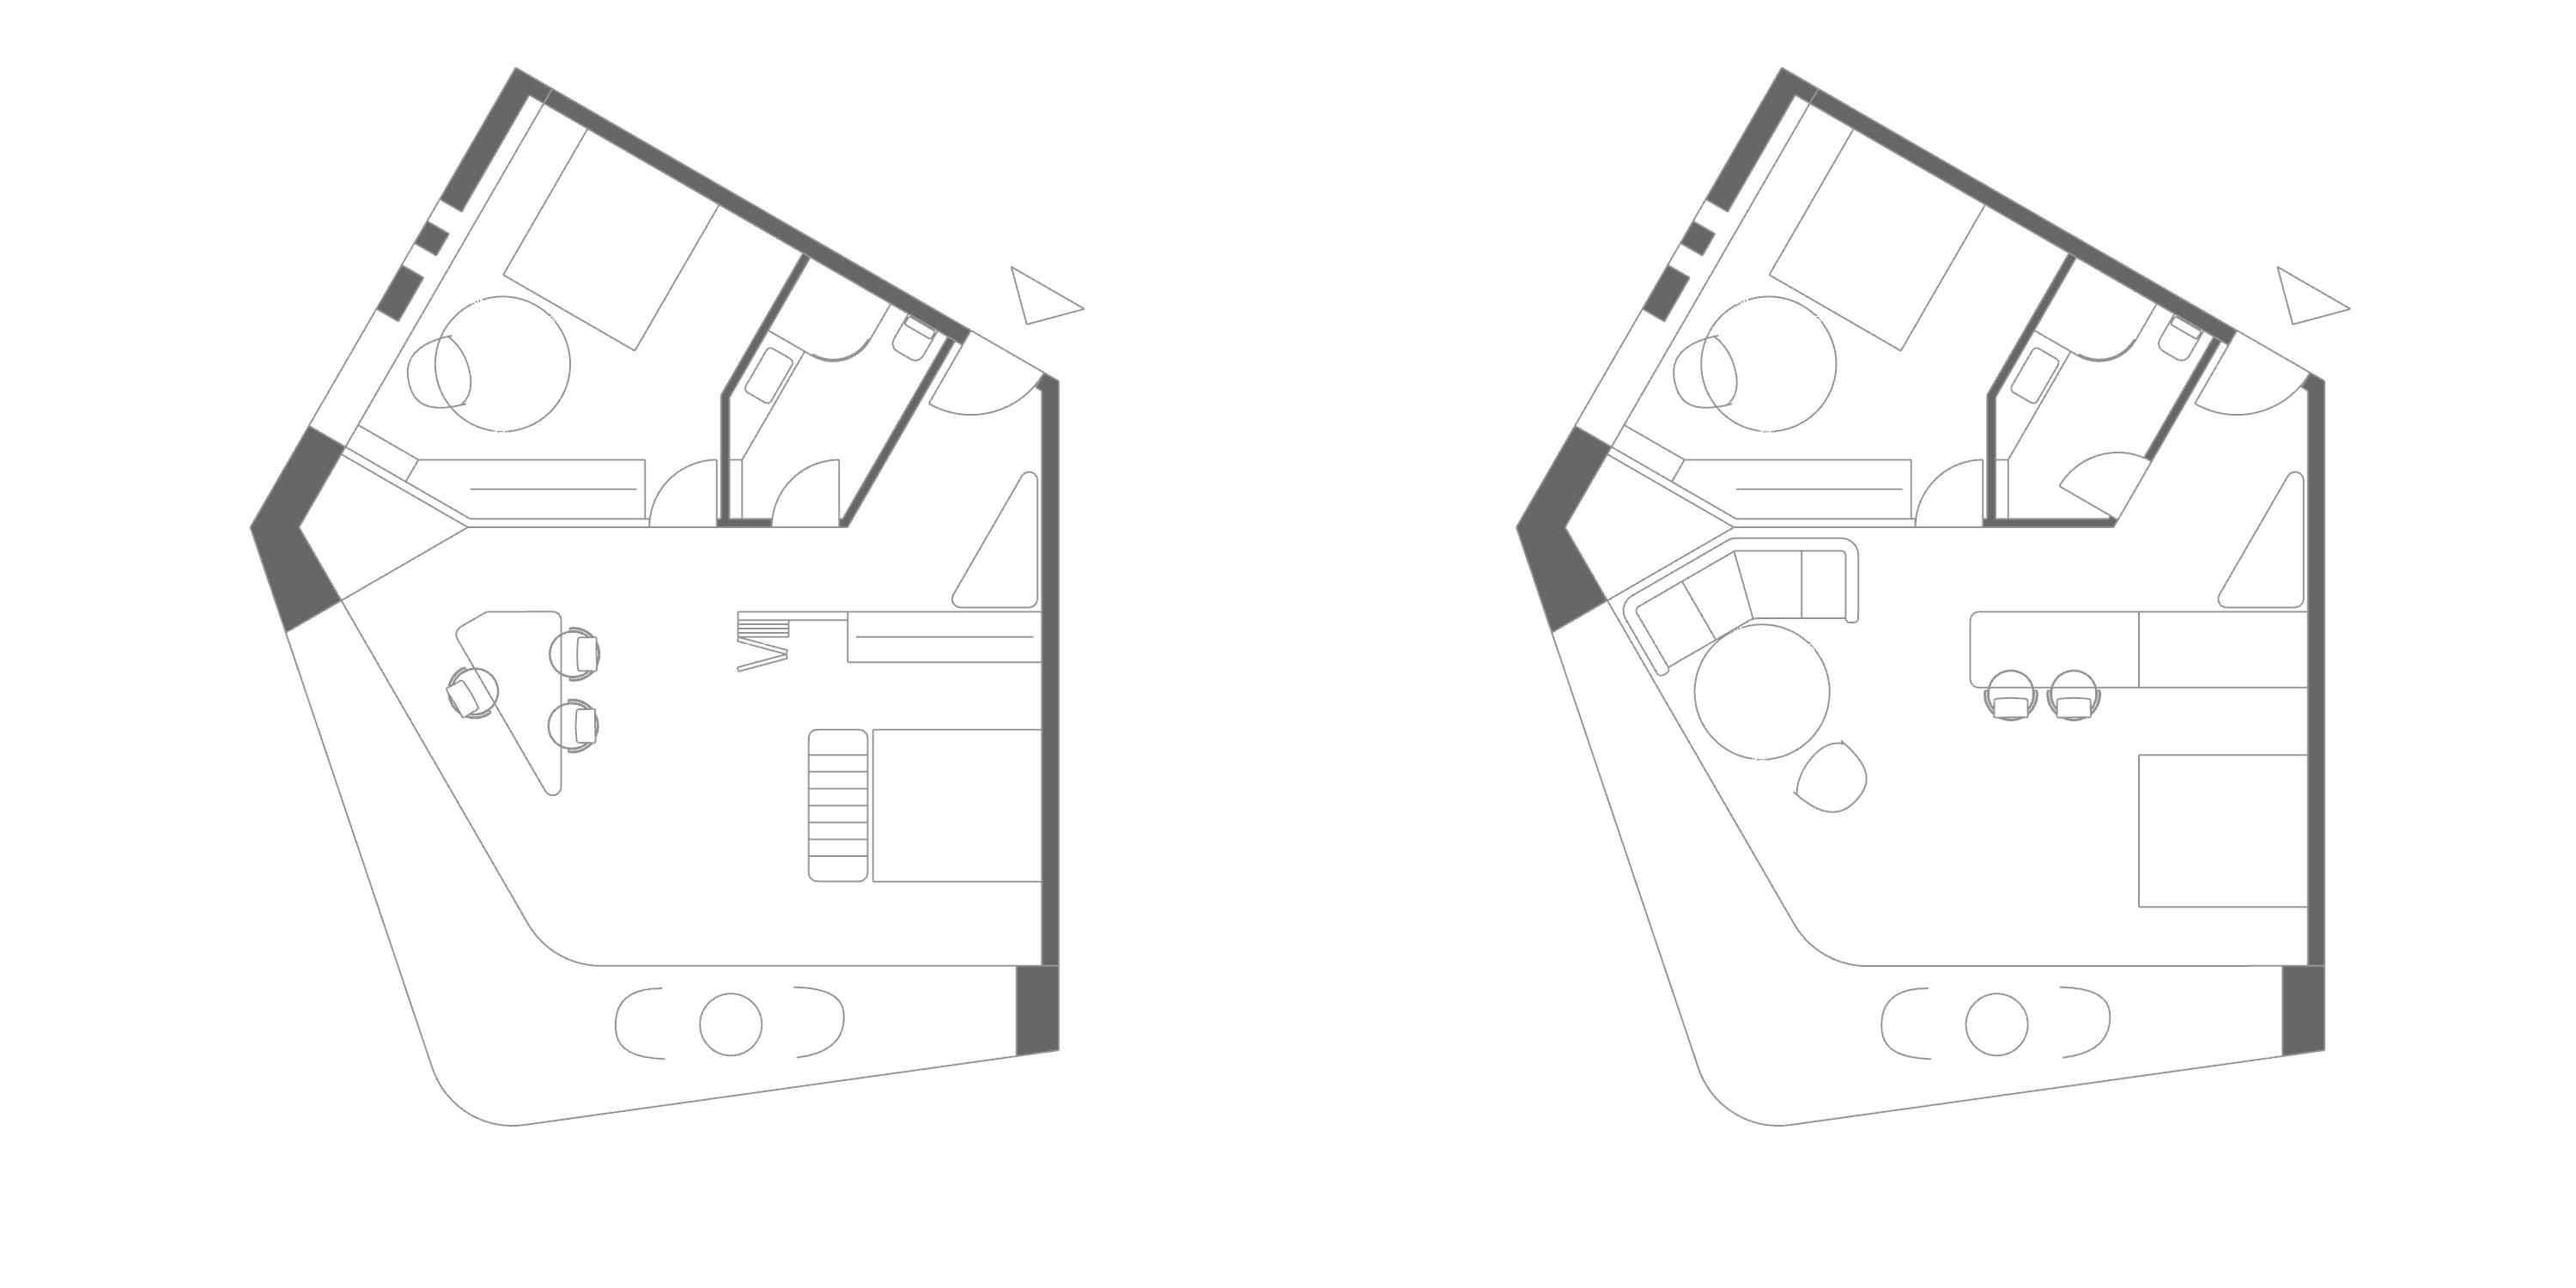
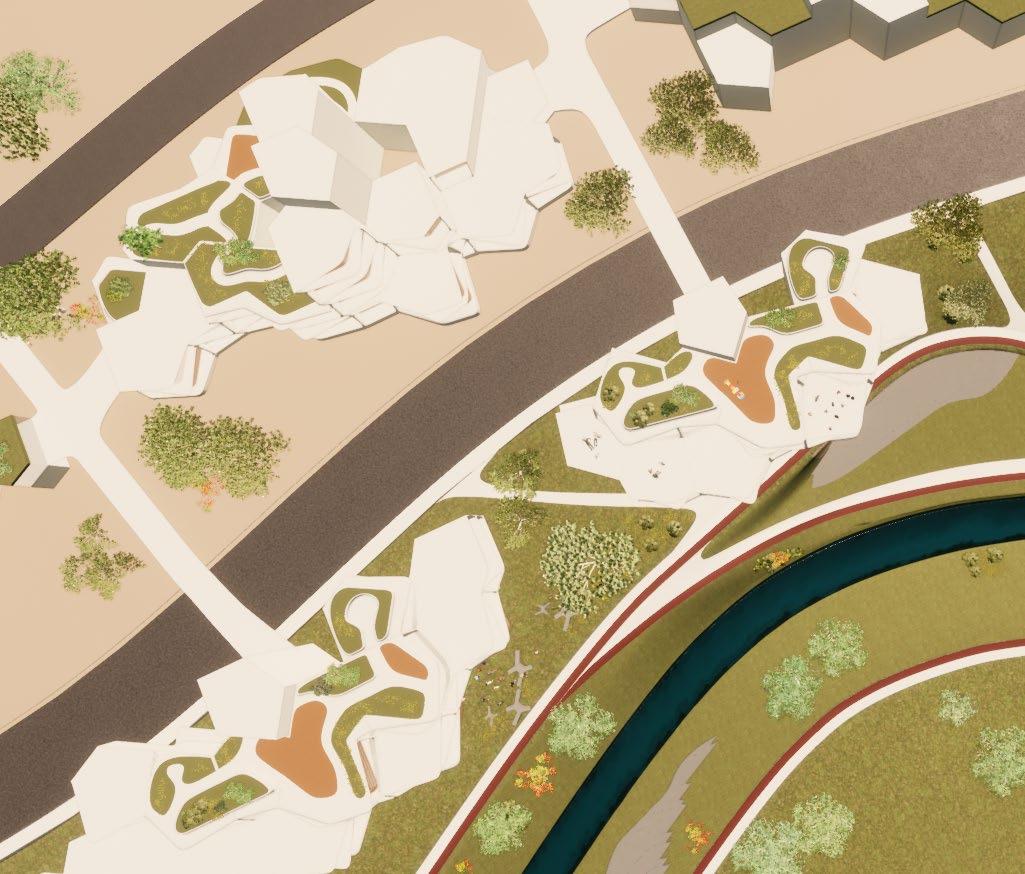
169
5.4.7 Single living unit detail
Figure 5.4.17: Unit details plan Interior layout
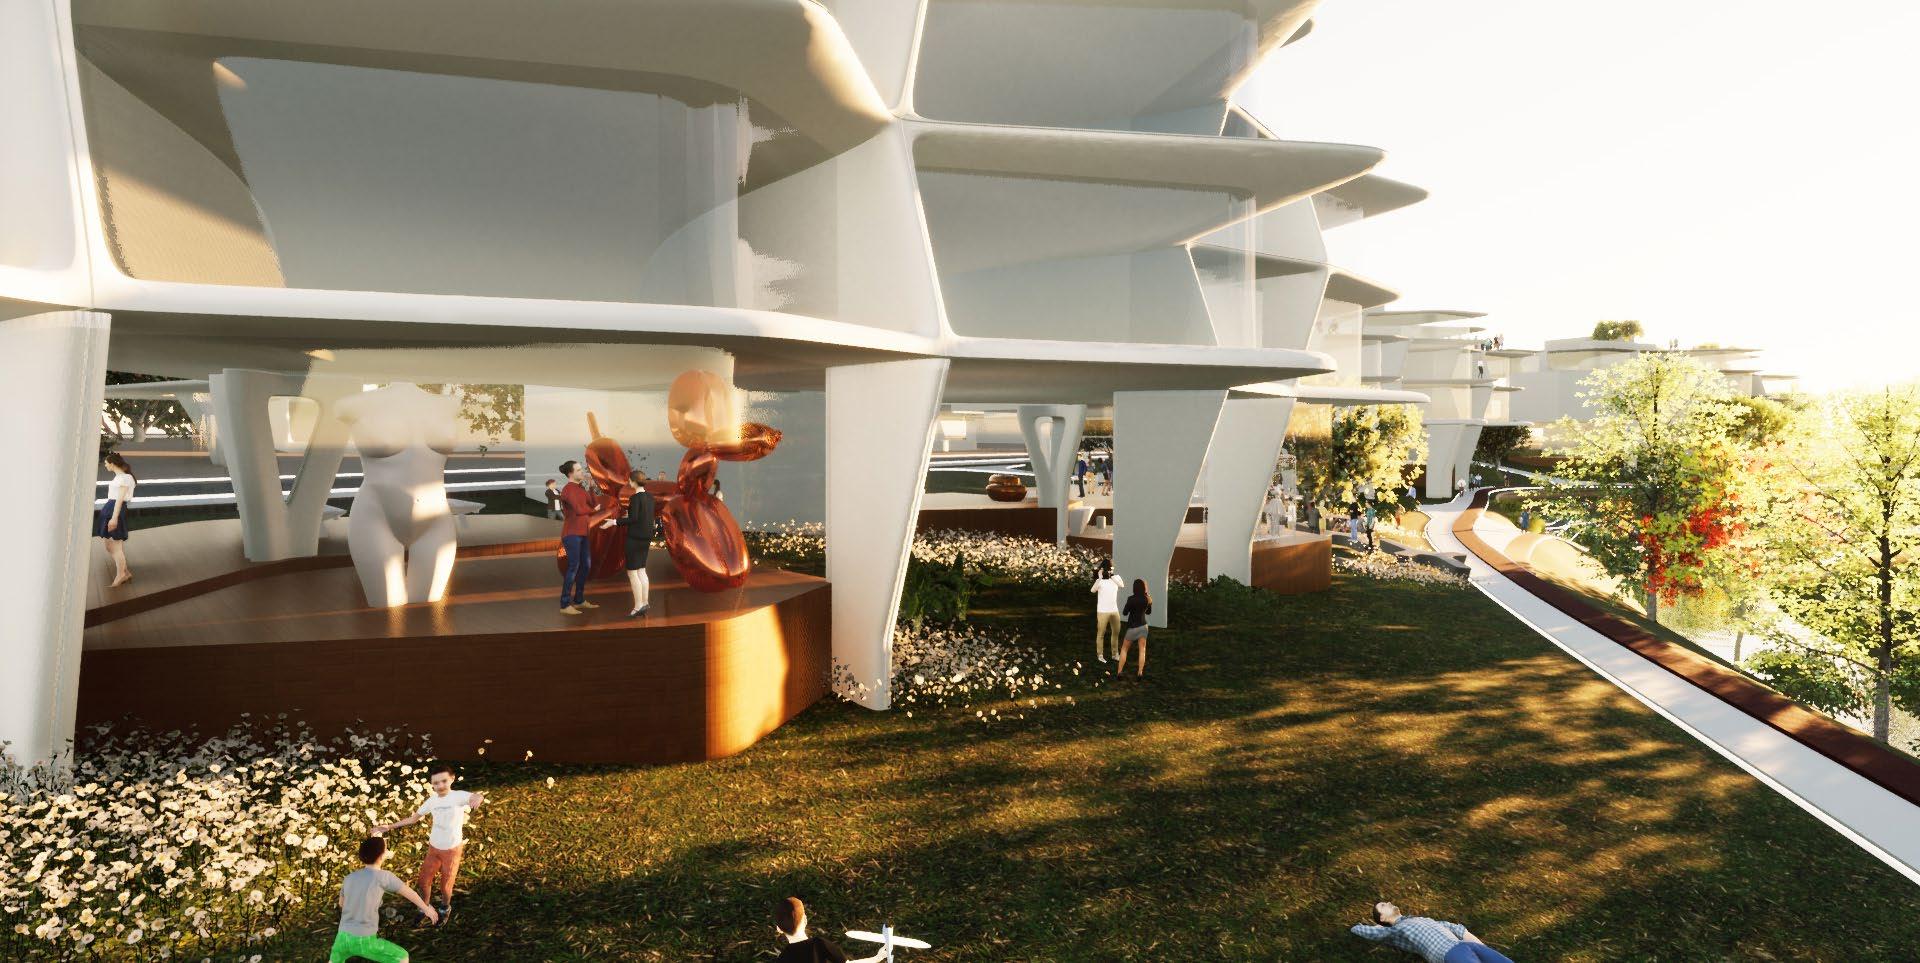
External view of low-rises
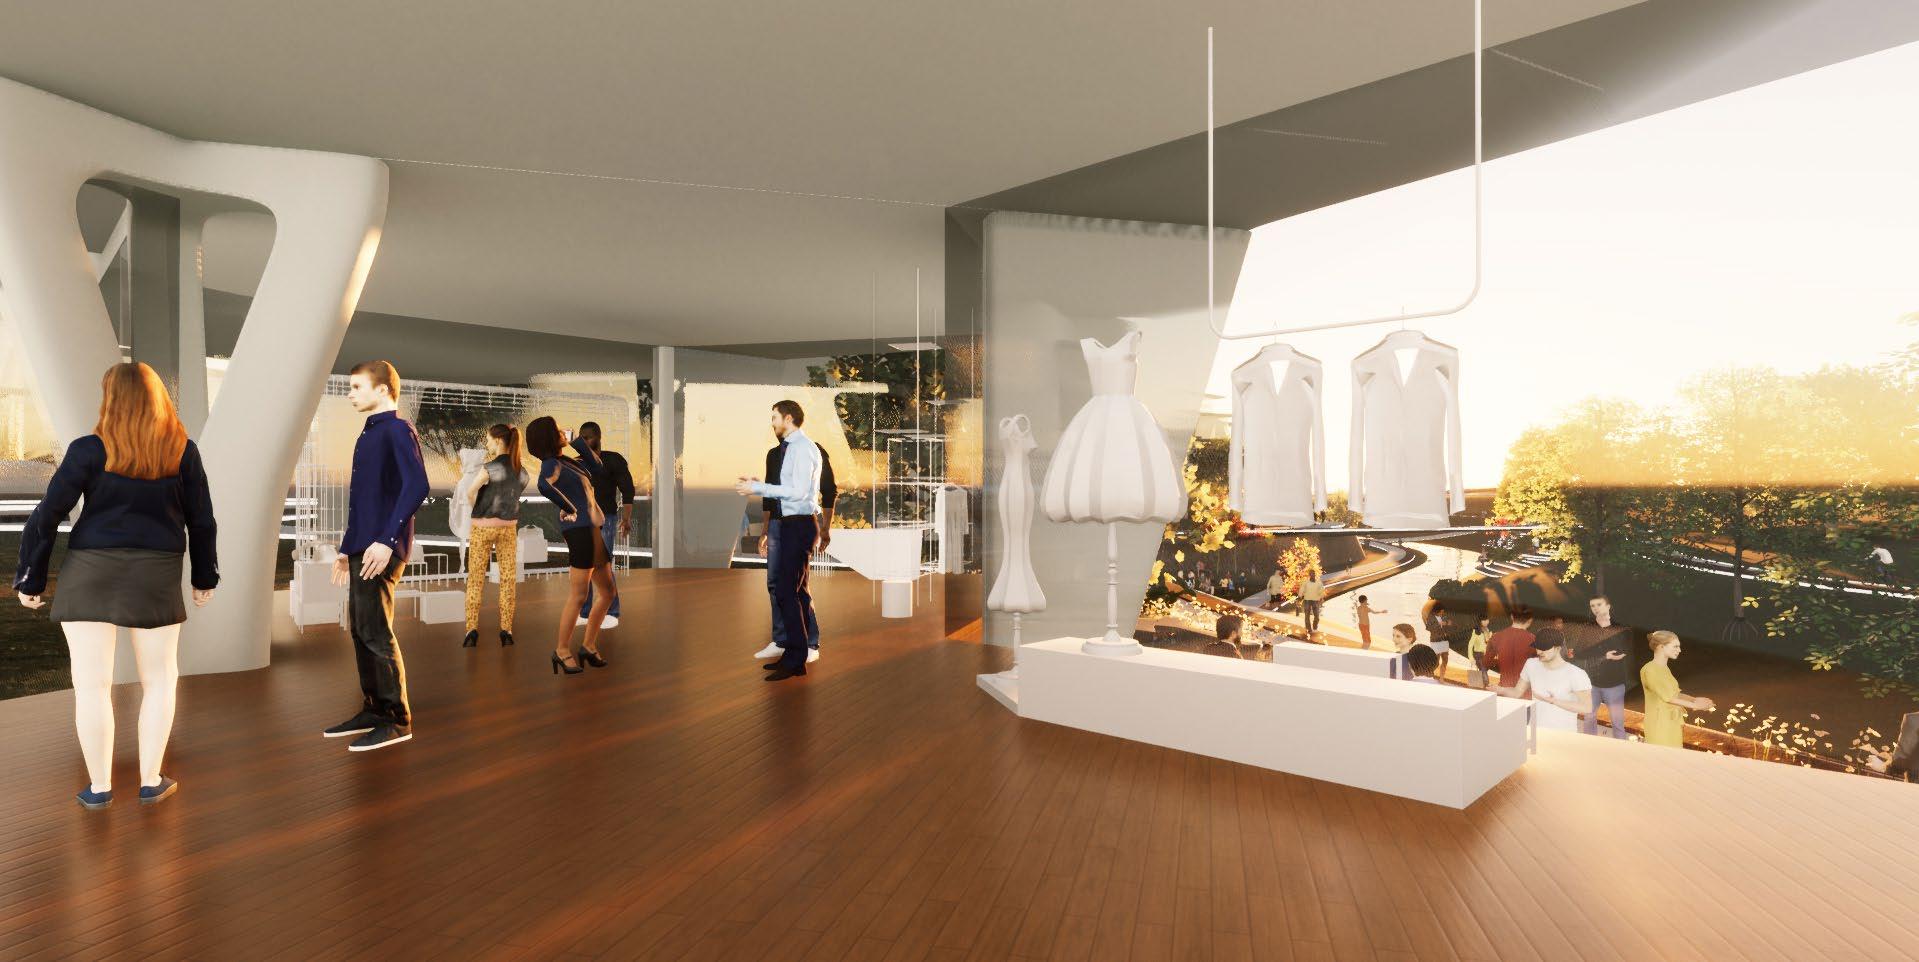 Commercial spaces below low-rises
6. DESIGN PROPOSAL
174 175
6.1 100 YEAR PROPOSAL PLAN
Figure 6.1.1
Existing Tsukishima Island, with the built environment, network and bridge connections to Tokyo
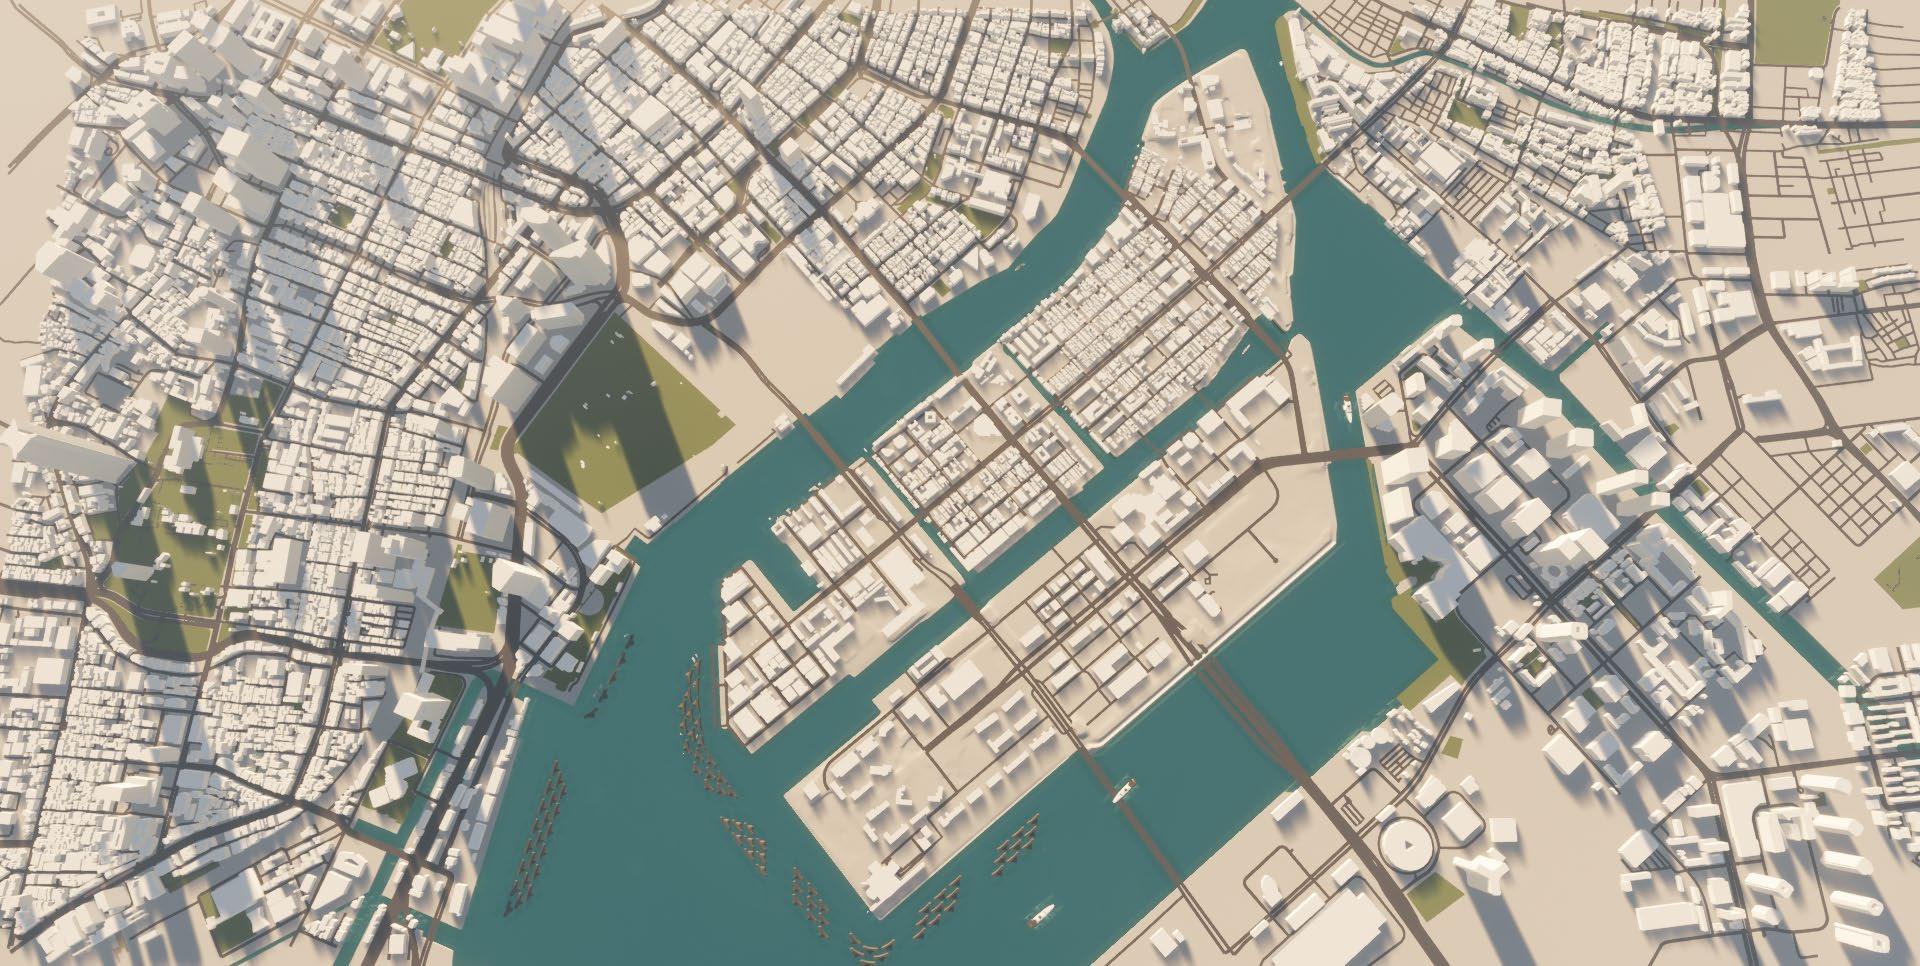

Figure 6.1.2
Barrier integration to the existing Tsukishima context
Figure 6.1.3
Modification on the built environment and the network
Figure 6.1.4
Modification on the landform and the main channel
Figure 6.1.5
Modification on the landform and the secondary channels
Figure 6.1.6
Modification on the landform and the tertiary channels
Figure 6.1.7
Integration of the new network
Figure 6.1.8
Integration of the new built environment
In the 100 year proposal plan, the first stage shall be the integration of the barriers off-shore of Tsukishima Island. The first stage is planned to be completed within 25 years, while the existing built environment is conserved.
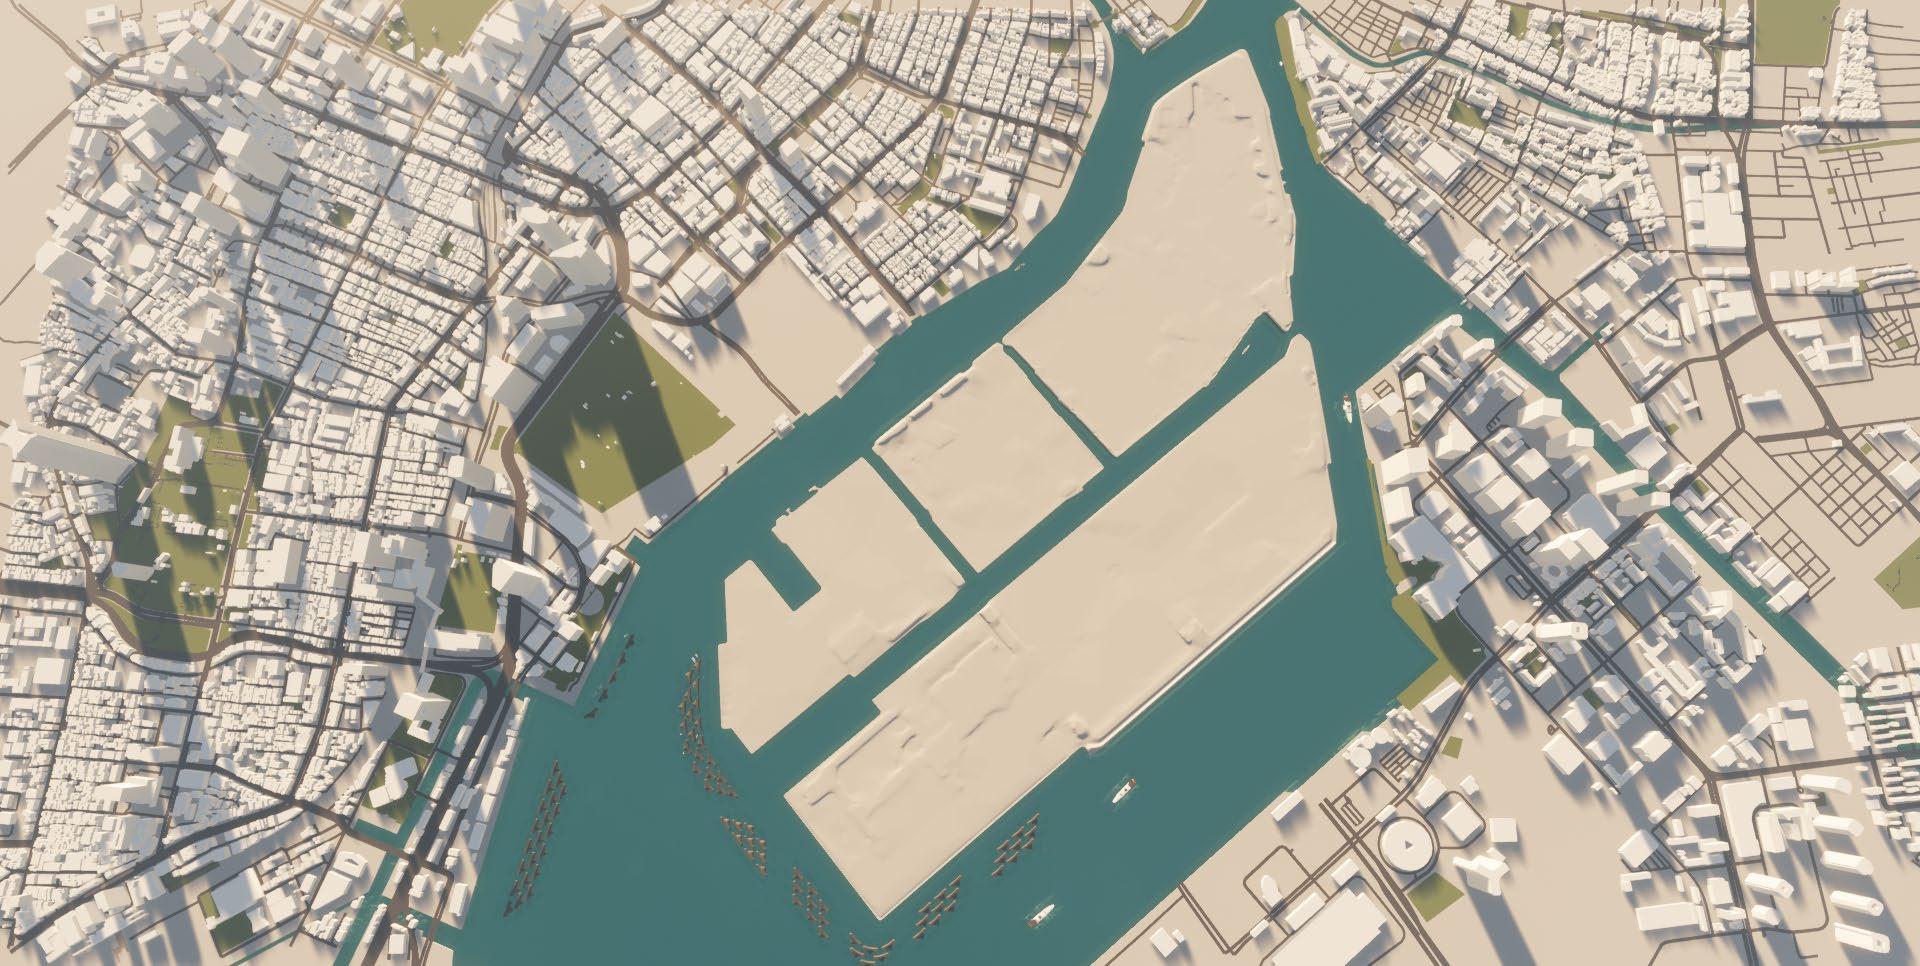
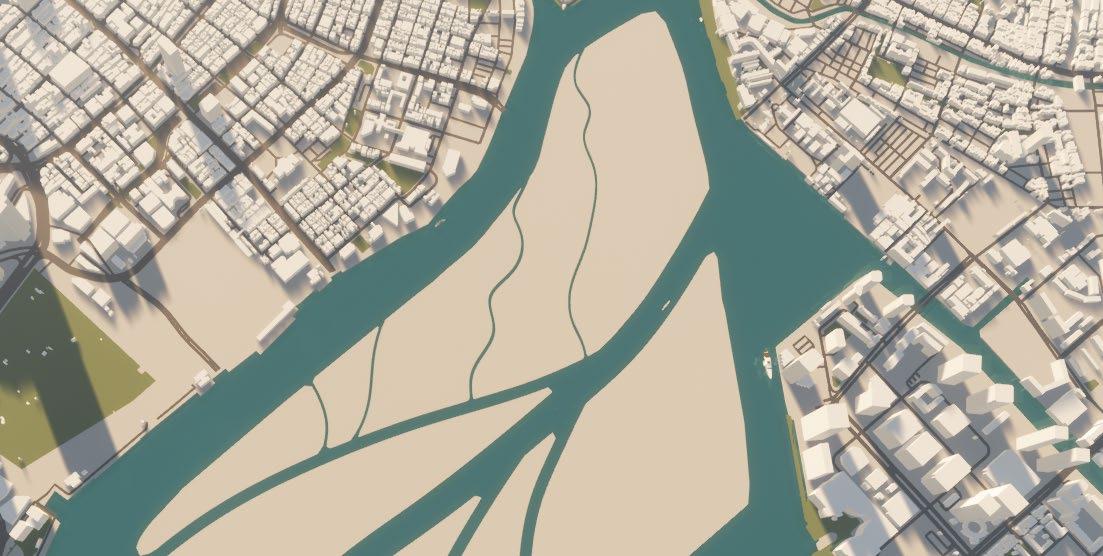
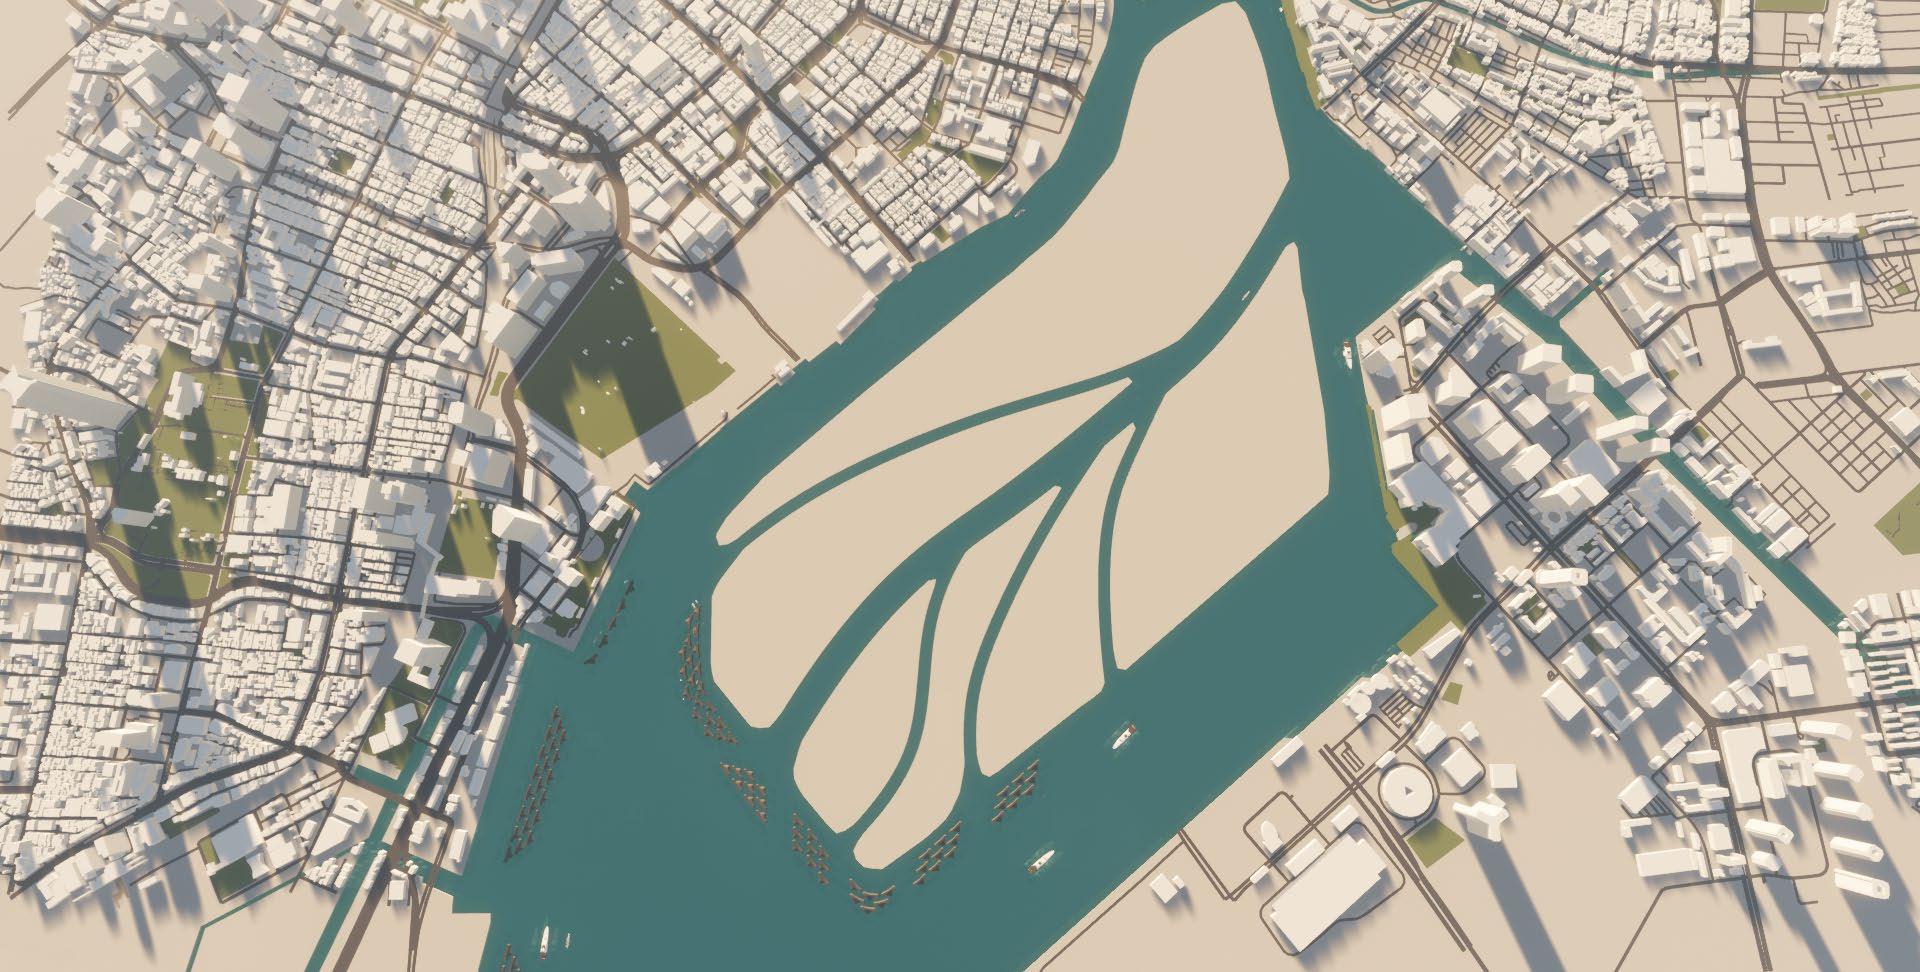
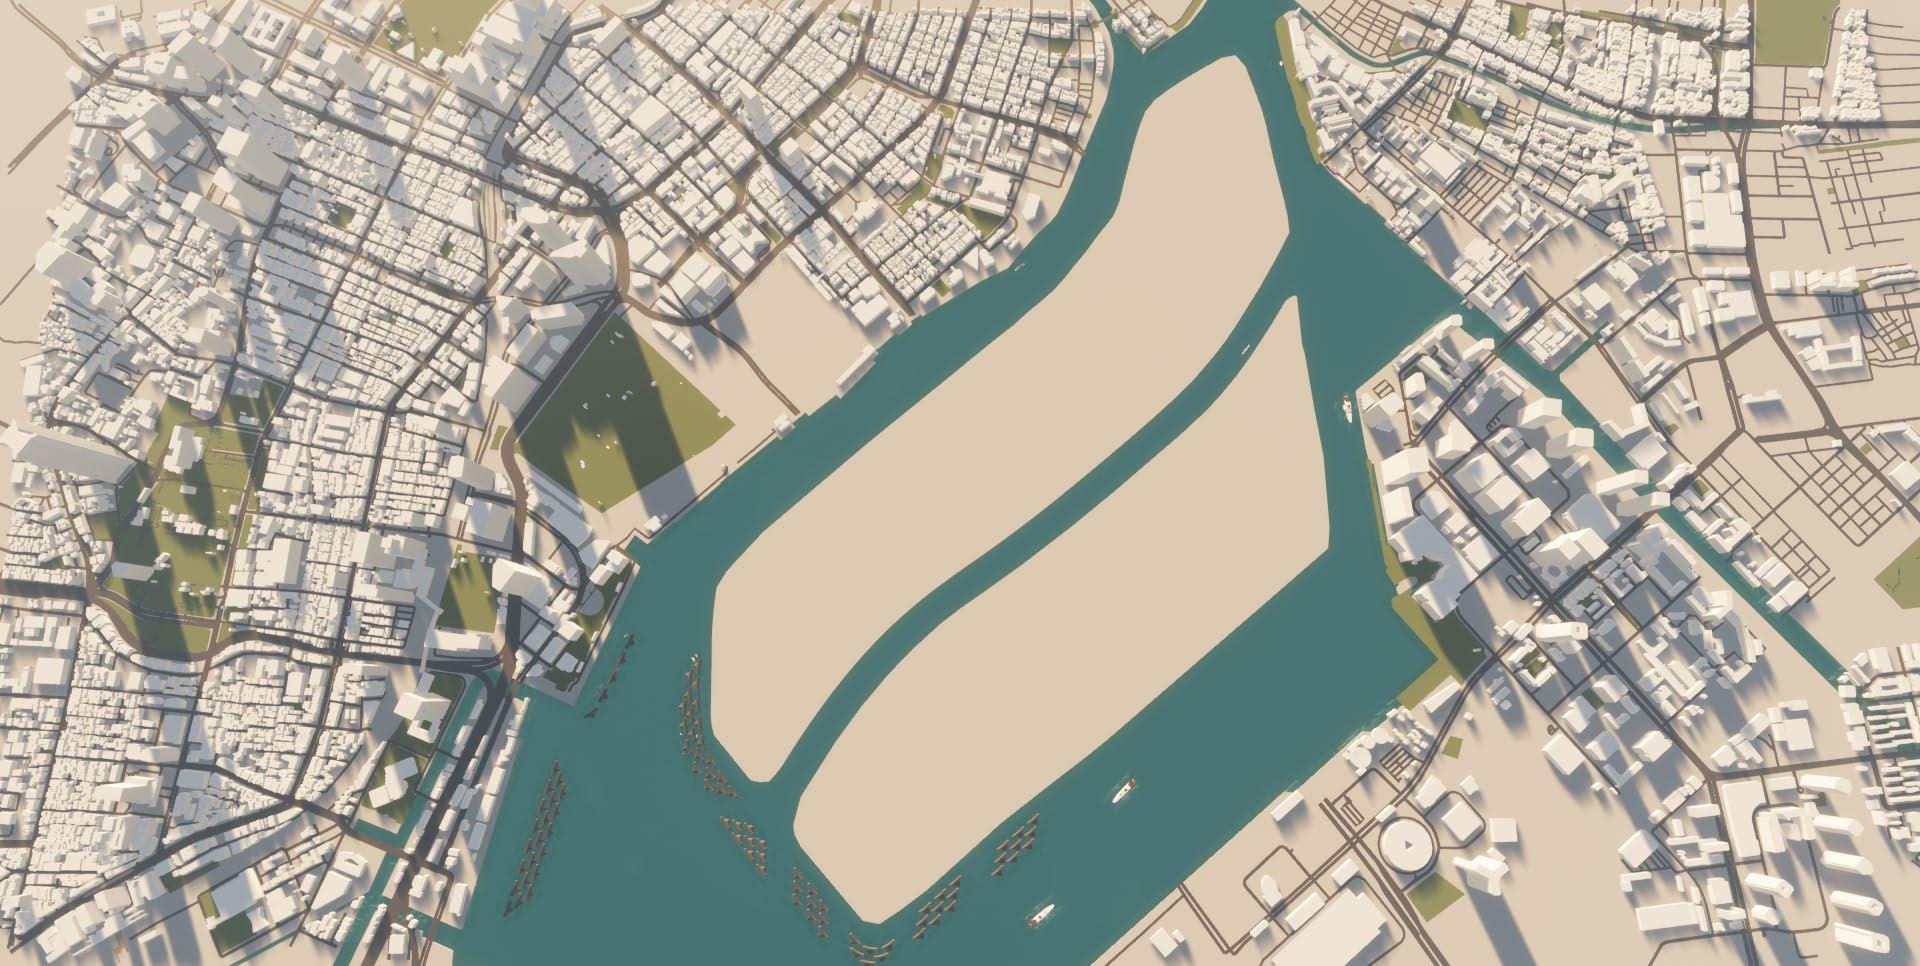
At stage 2, the old buildings and the high risk zones which are observed at the Section 5.2 ("Tsunami simulation on existing land form"), will be modified.
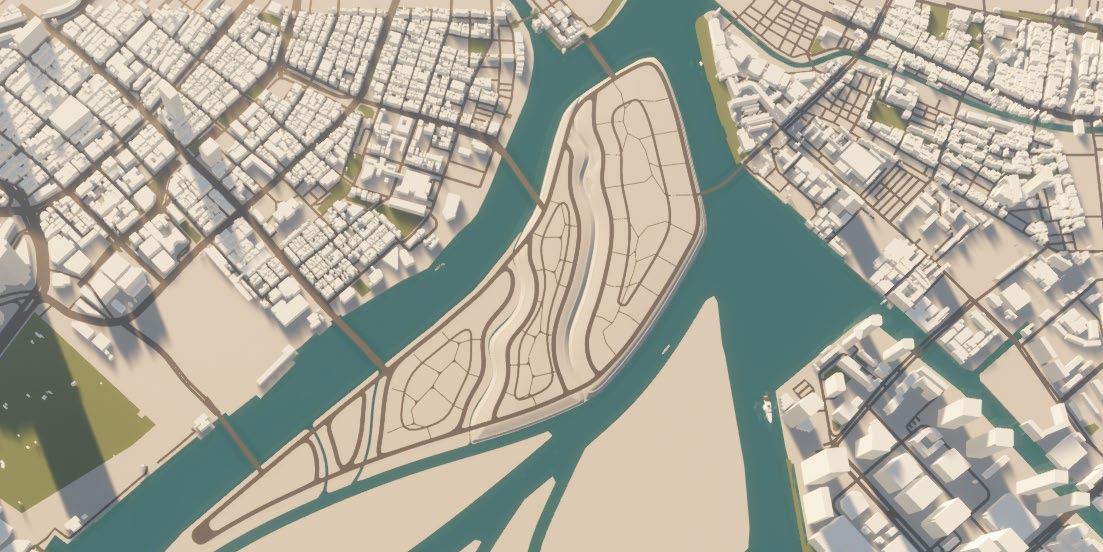
At stage 3, which corresponds with the next 50 to 75 years, as shown through the Figures 6.1.4 to Figure 6.1.6, the land modification will be completed. Simultaneously, the new transportation and evacuation network and the built environment development will start.
At the last stage of the proposal, which shall be finished in 100 years, the development of the green tertiary channel and architectural built functions around it will be finalized with the integrated network and the bridge connections to the land.
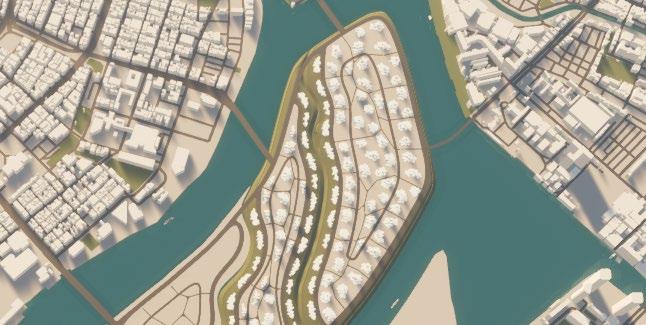
176 177
Figure 6.1.1
Figure 6.1.2
Figure 6.1.3
Figure 6.1.4
Figure 6.1.5
Figure 6.1.6
Figure 6.1.7
Figure 6.1.8
6.1.1 Urban fabric
The areas behind the breakwaters although now less vulnerable to the impact of tsunami and storm surge, is categorized to hold only industrial and temporary structures. Similarly, areas close to the primary and secondary channels are also categorized as industrial, sheds and other temporary market areas that can benefit from fisheries and ports.
With the reduced water velocity and pressure of the fluid impact on vertical surfaces now, floodgates are proposed at the mouth of tertiary channels that will be capable of handling the situation better, keeping the areas dedicated to residential and commercial areas closed or semi- closed from the rise in water levels due to a tsunami.
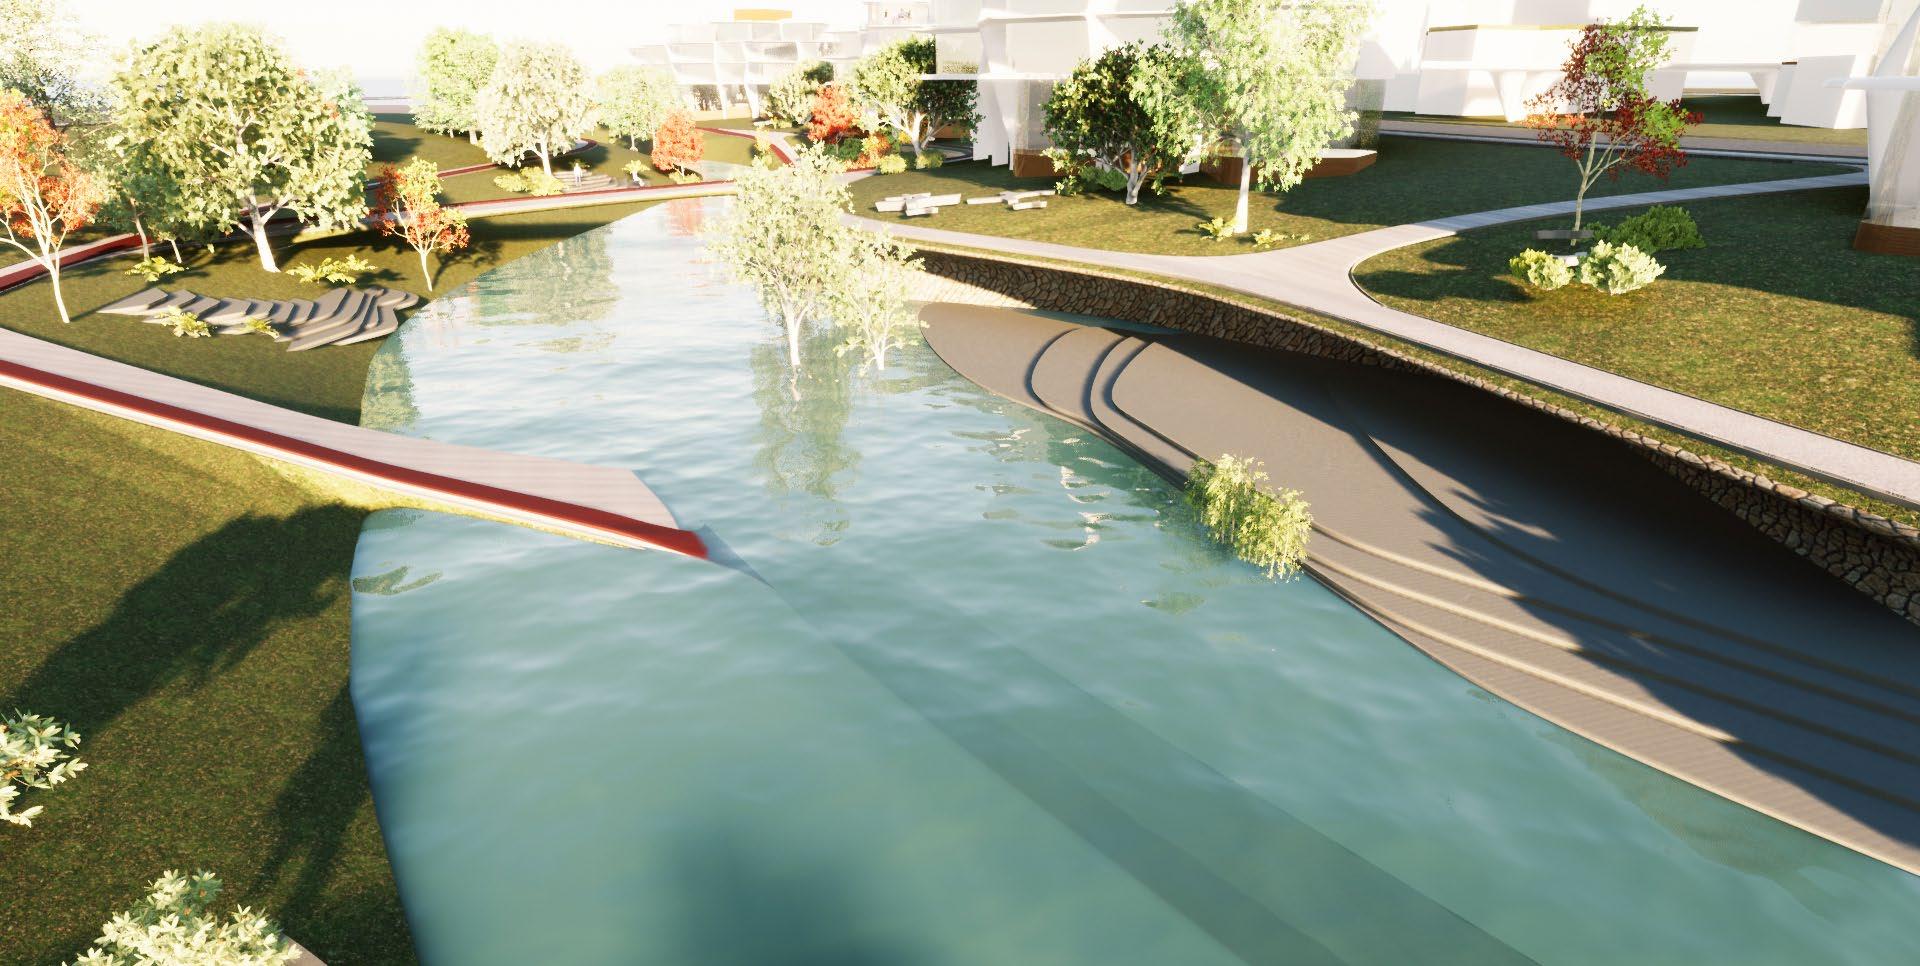
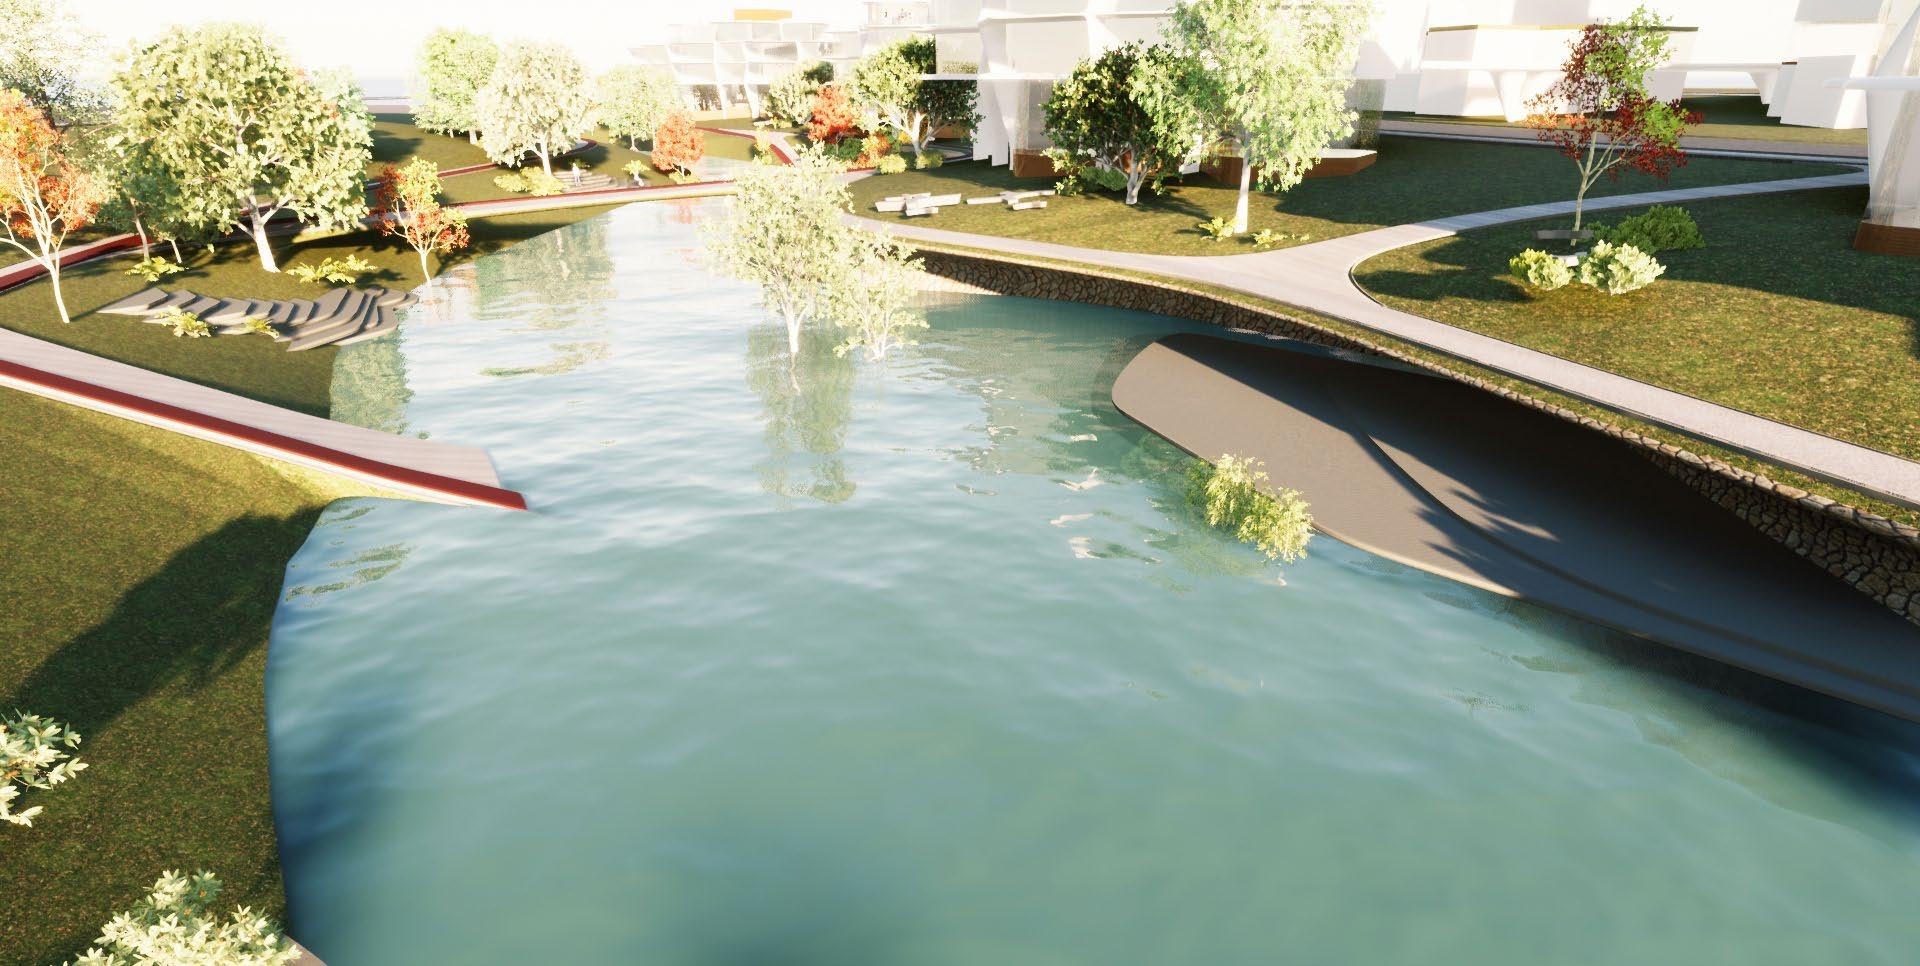
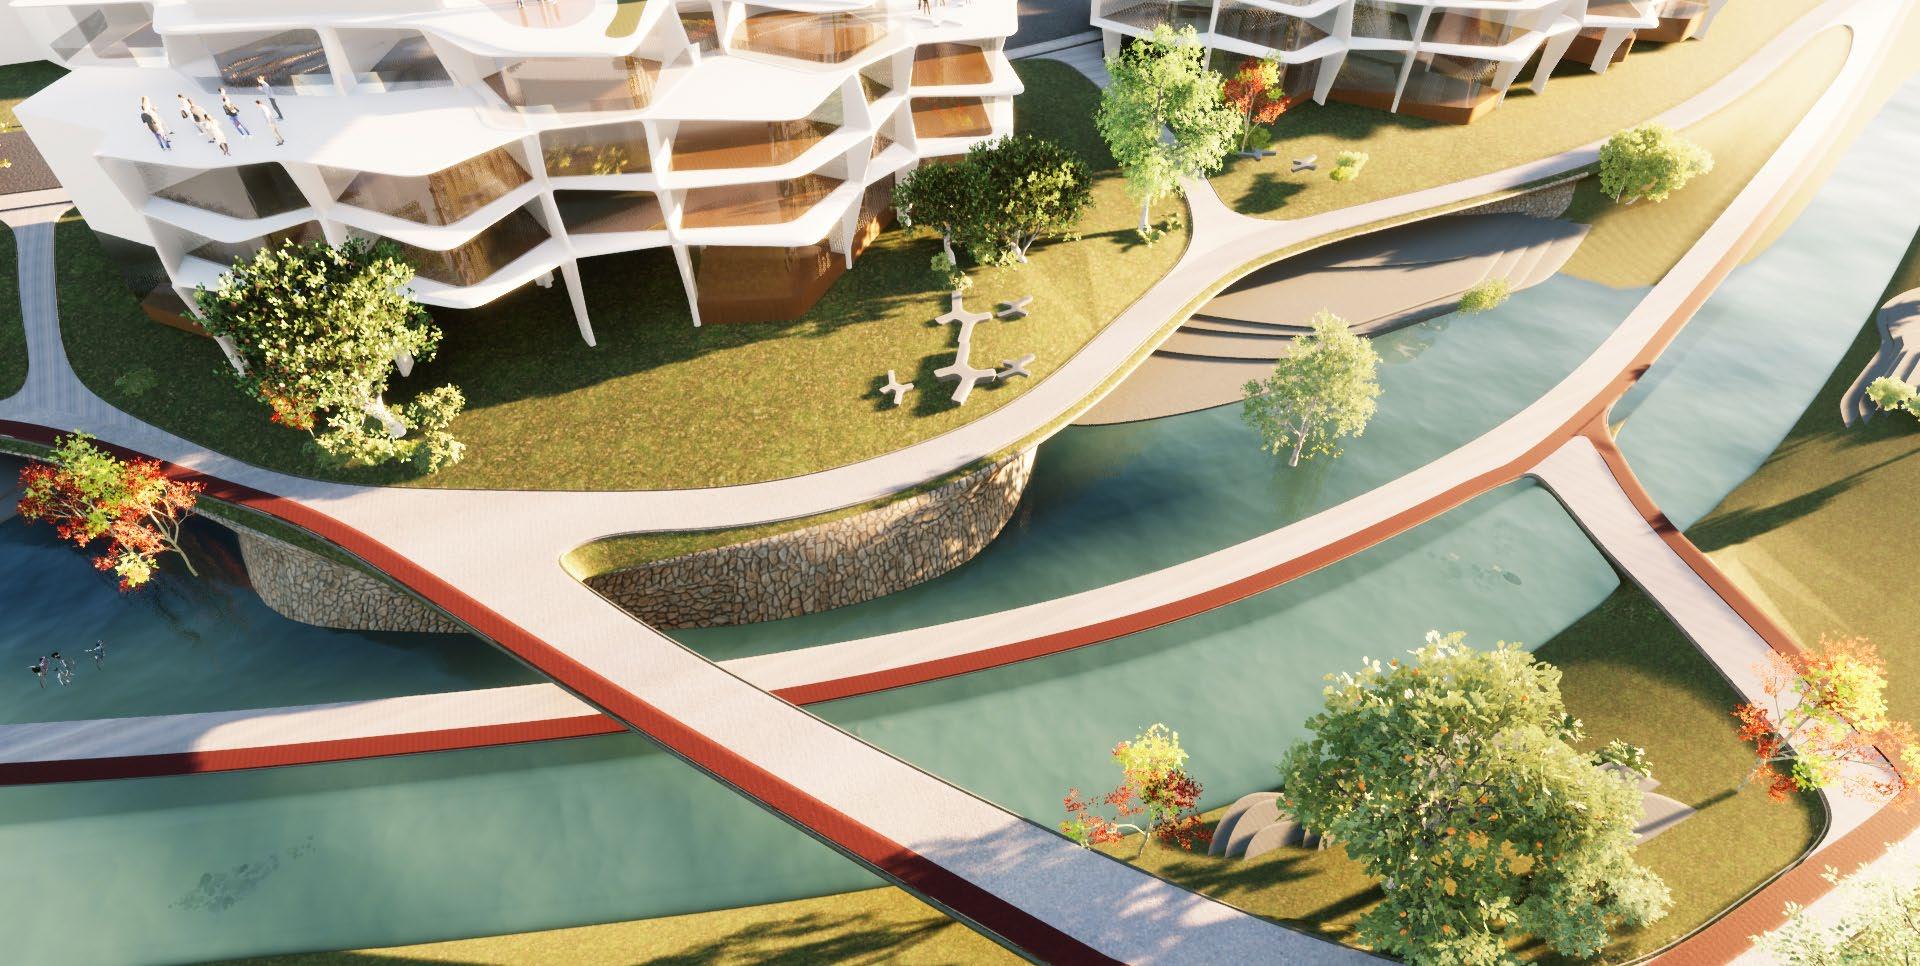
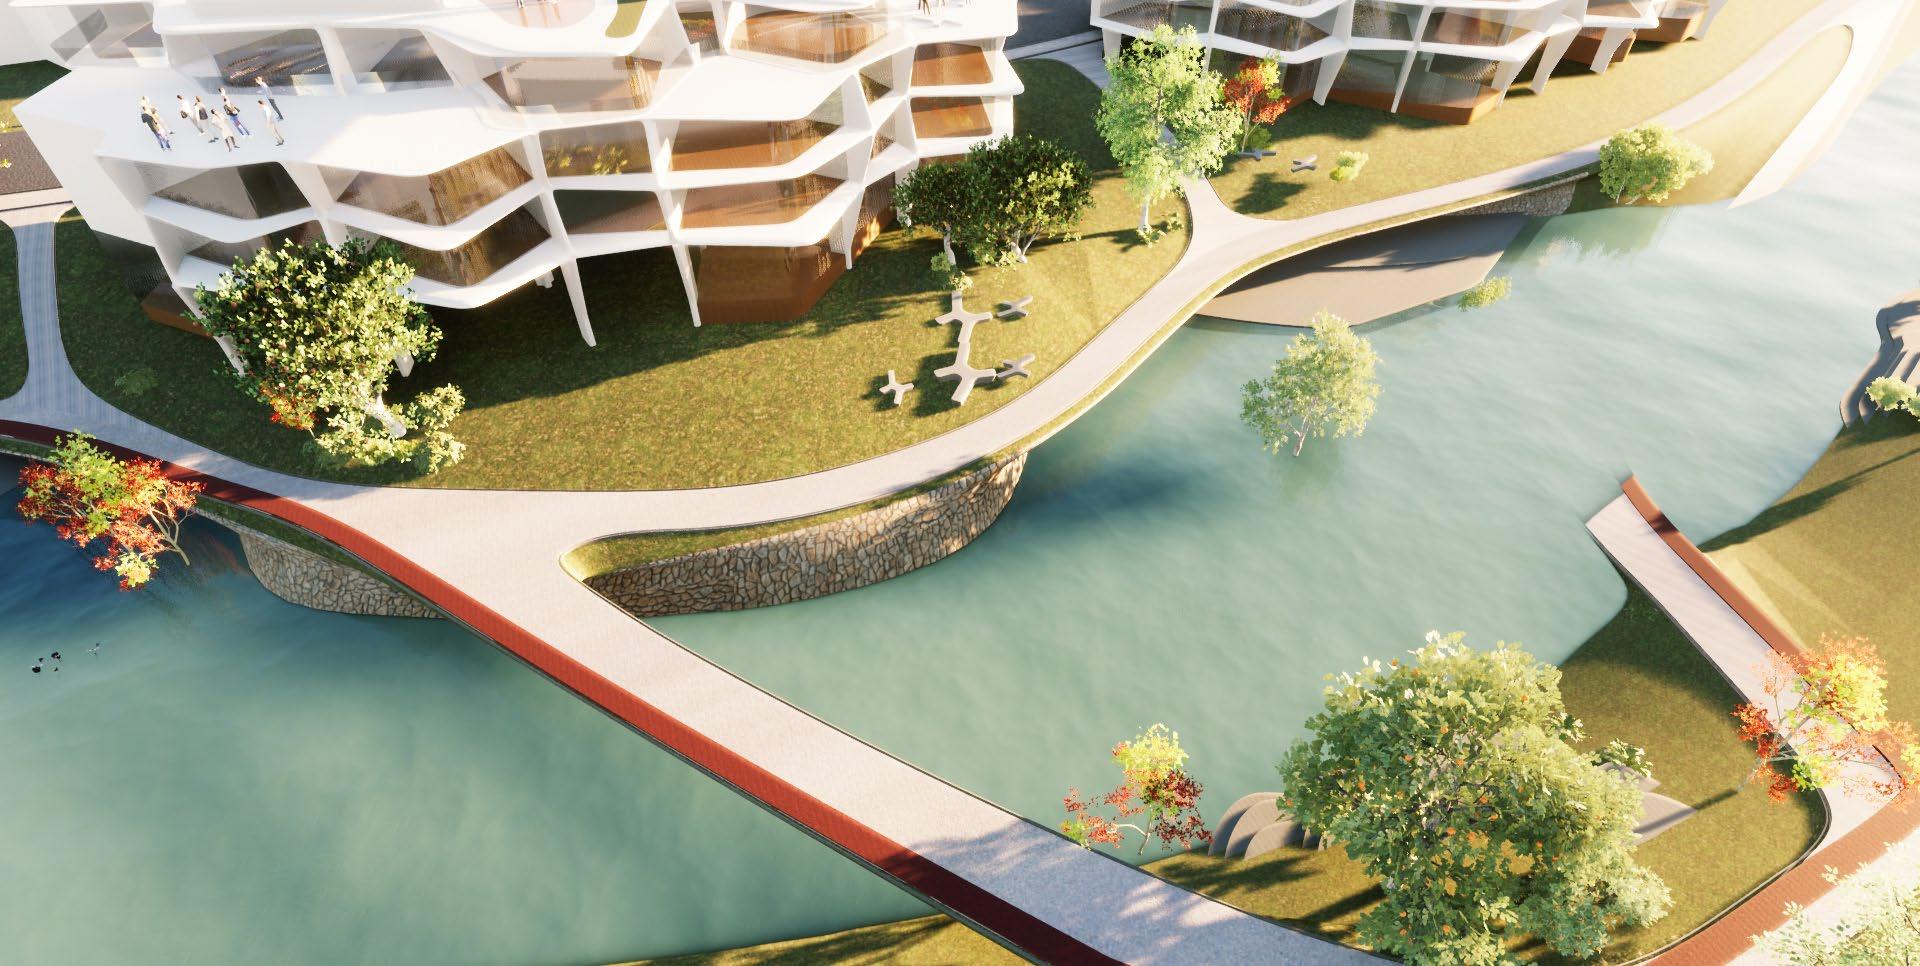
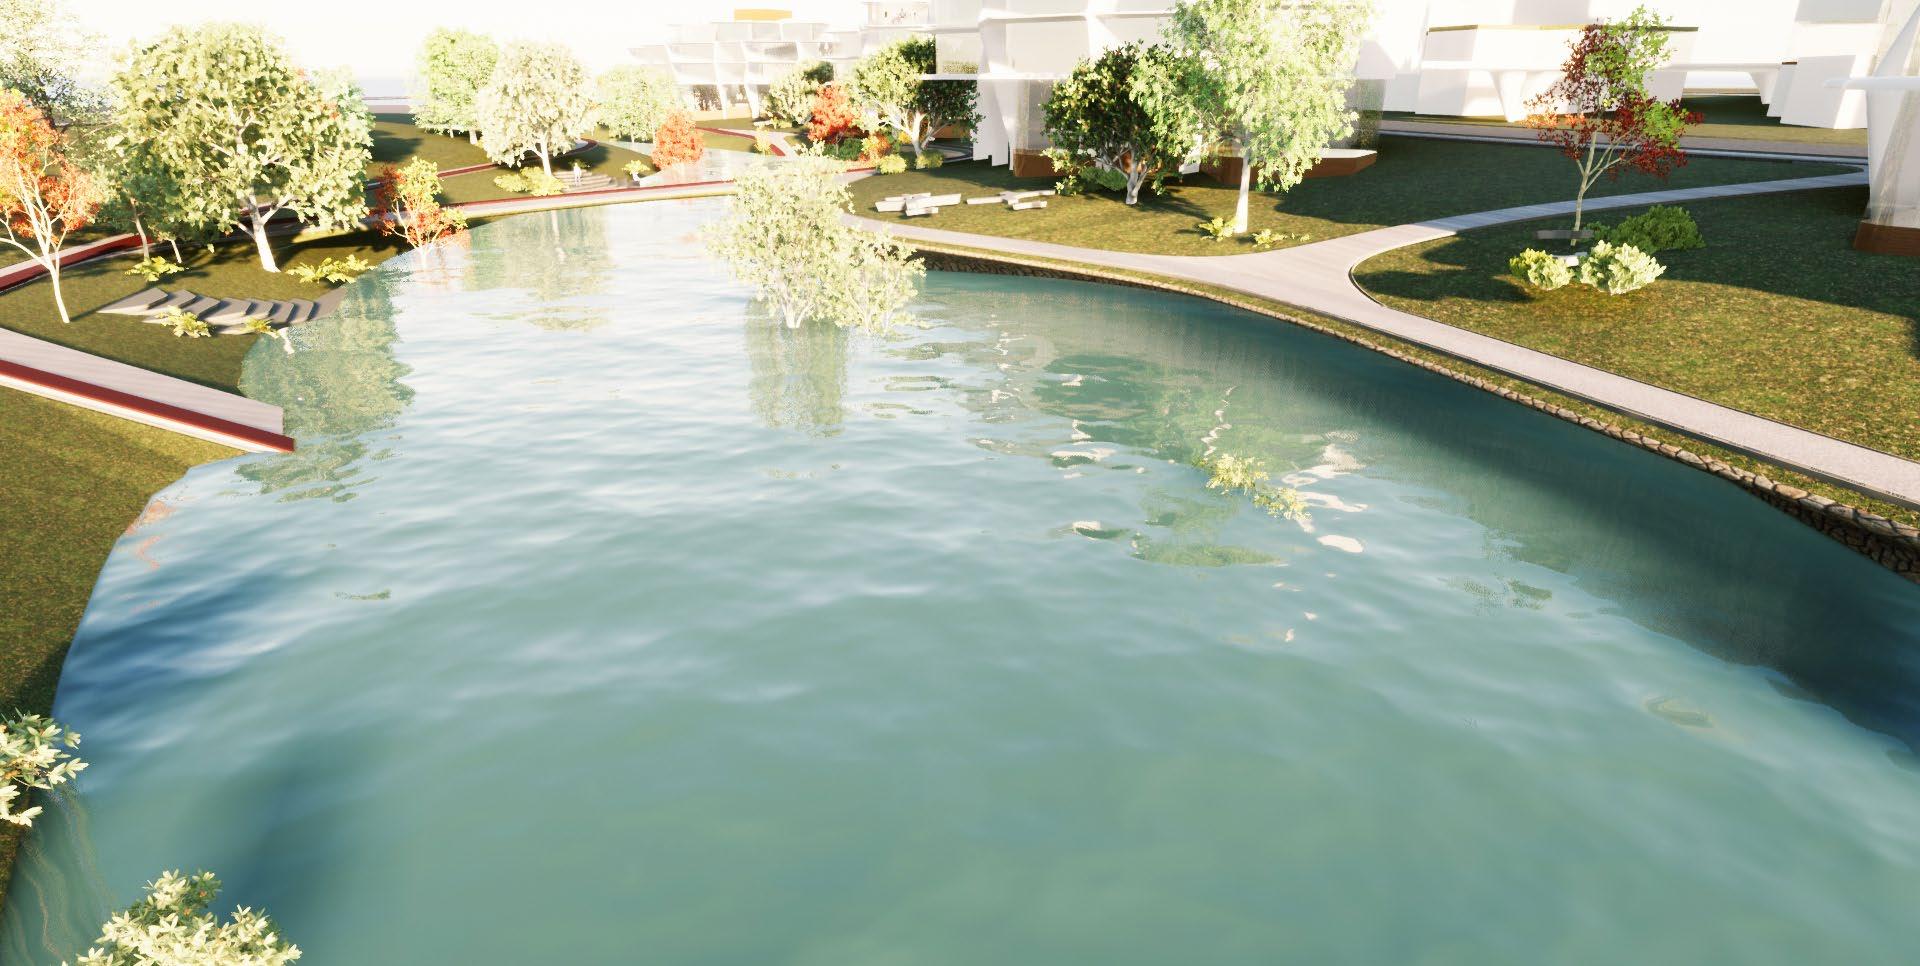
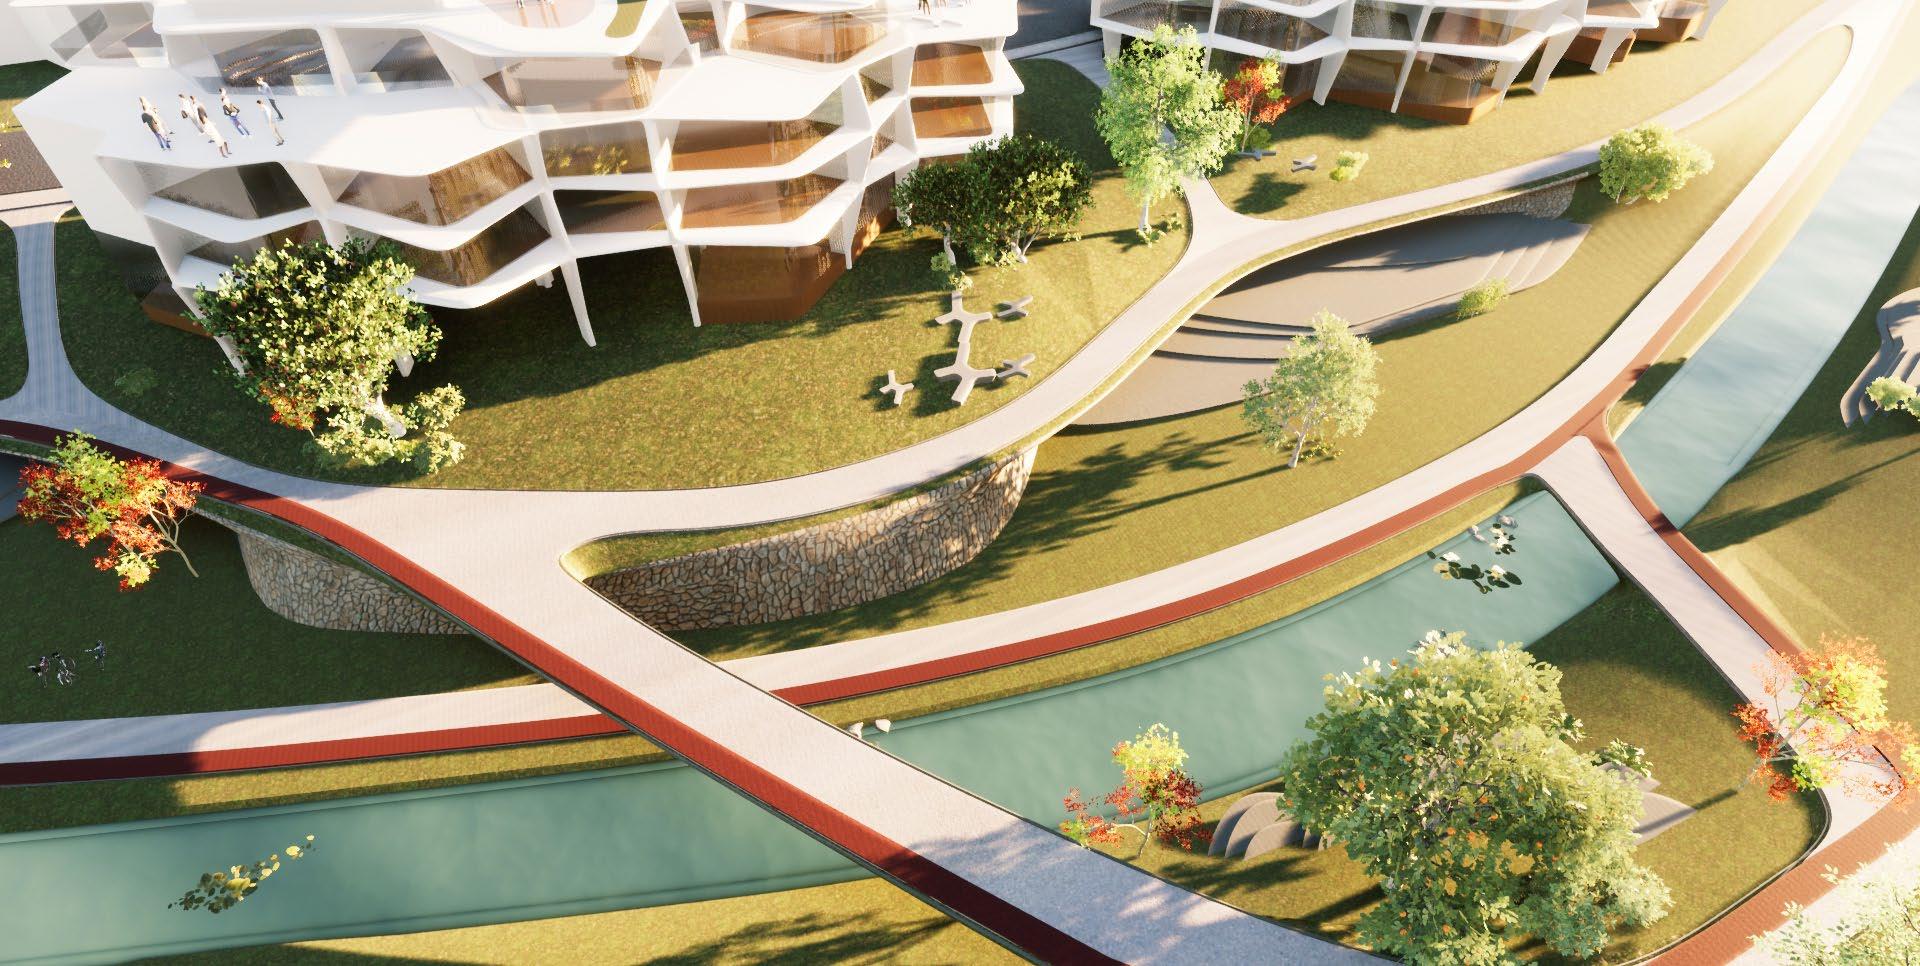
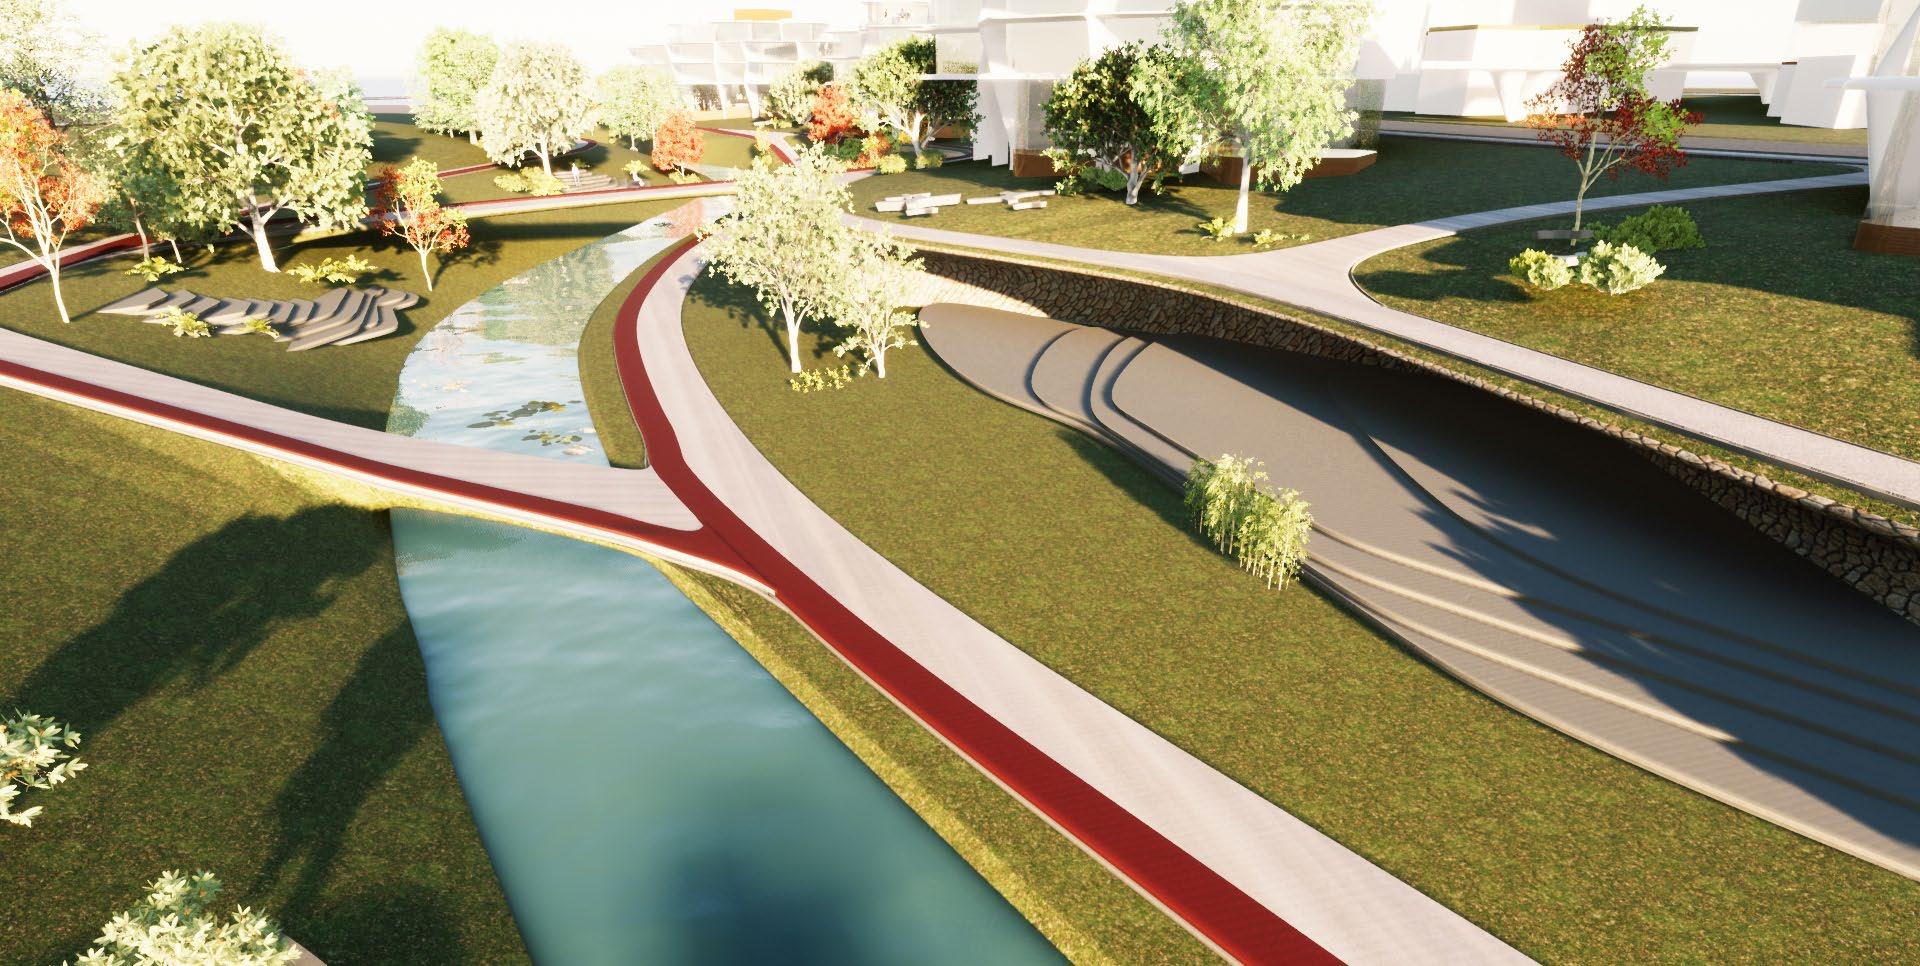
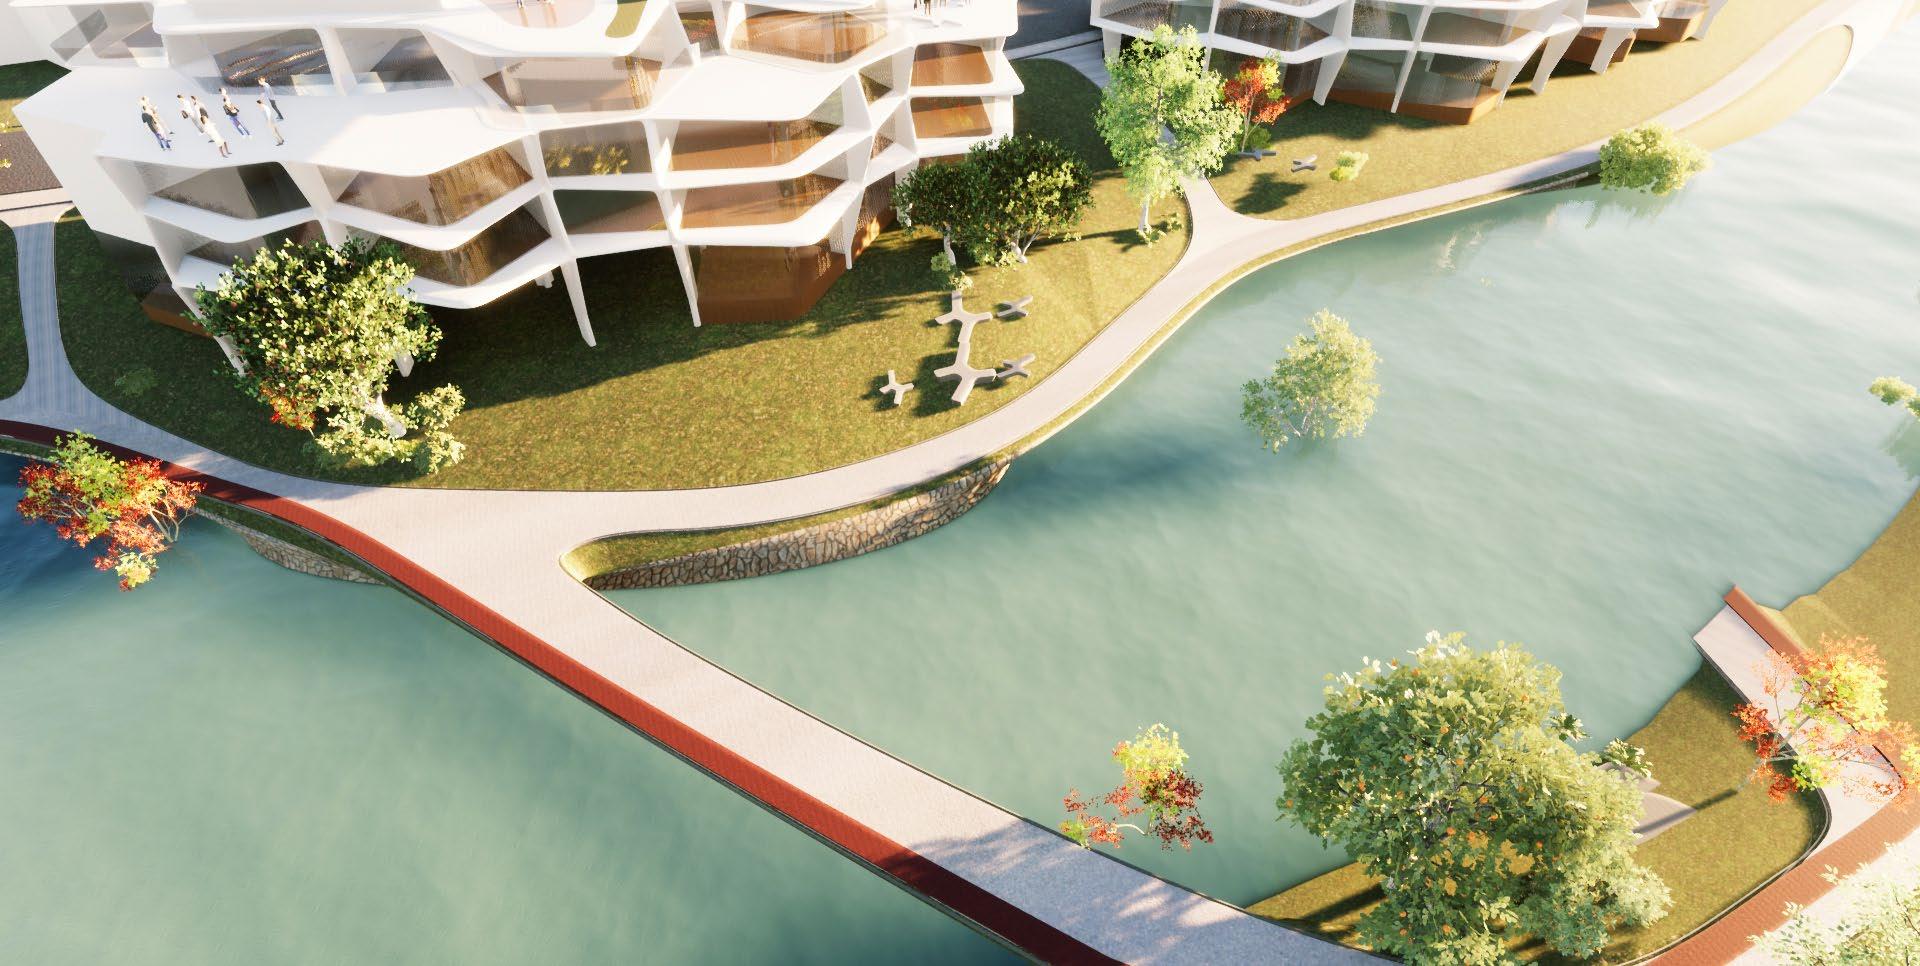
In the situation of a storm surge due to a typhoon or high tide, the tertiary channel along with the soft tissue around can act as a basin to guide and store the storm water until it gets drained to the sea within a couple of days.
6.1.2 Public spaces
On a regular day, the green tissue around the tertiary channel becomes the open green and public utility spaces that were lacking in the Tokyo’s urban fabric. This green basin makes the water network accessible to the public, removing the aspect of alienation, and the feeling of disengagement with the sea and imprisonment due to the massive floodgates and sea walls currently present. The public recessed spaces act as a buffer for the excess water entering the landscape basin in the tertiary channel during storm surge.
The storage tanks beneath the low-rise accommodations along the tertiary channels gets activated that can further pump the water out and slowly start draining it out to the bay.
Figure 6.1.9: Daily water flow
Figure 6.1.10: 1m inunation level
Figure 6.1.11: 3m inidation level
Figure 6.1.12: 5m inundation level
Figure 6.1.13: Daily water flow
Figure 6.1.14: 1m inunation level
Figure 6.1.15: 3m inidation level
Figure 6.1.16: 5m inundation level
178 179
Figure 6.1.9
Figure 6.1.10
Figure 6.1.11
Figure 6.1.12
Figure 6.1.13
Figure 6.1.14
Figure 6.1.15
Figure 6.1.16
6.1.3. Evacuation network utilisation
The transportation roads are connected to serve as a regular network for pedestrian and vehicular access on regular days. In times of storm surge or heavy rainfall, the roads connecting the green tissue area around the low-rise buildings become de activated and the bridges connecting the low-rise buildings to the mid-rise clusters towards the high clusters gets activated in the following ways:
1. Prior to the entry of storm surge in the channel, people use the vertical access points through the public access zones which leads them to the evacuation areas on the low-rise clusters. The people can use the bridges connected to these evacuation zones to move from the low-rise clusters to the mid-rise clusters to avert the highrisk zones
2. Post flooding, the same bridges get activated to help send food and essential resources from the assigned evacuation towers. These evacuation towers get accessed to by the bridges connecting the inner ring to the outer ring and then directly to the neighboring island. At the end of the day, the bridges become both the shortest route of evacuation and the space to be utilized to setup temporary shelter in times of crisis.
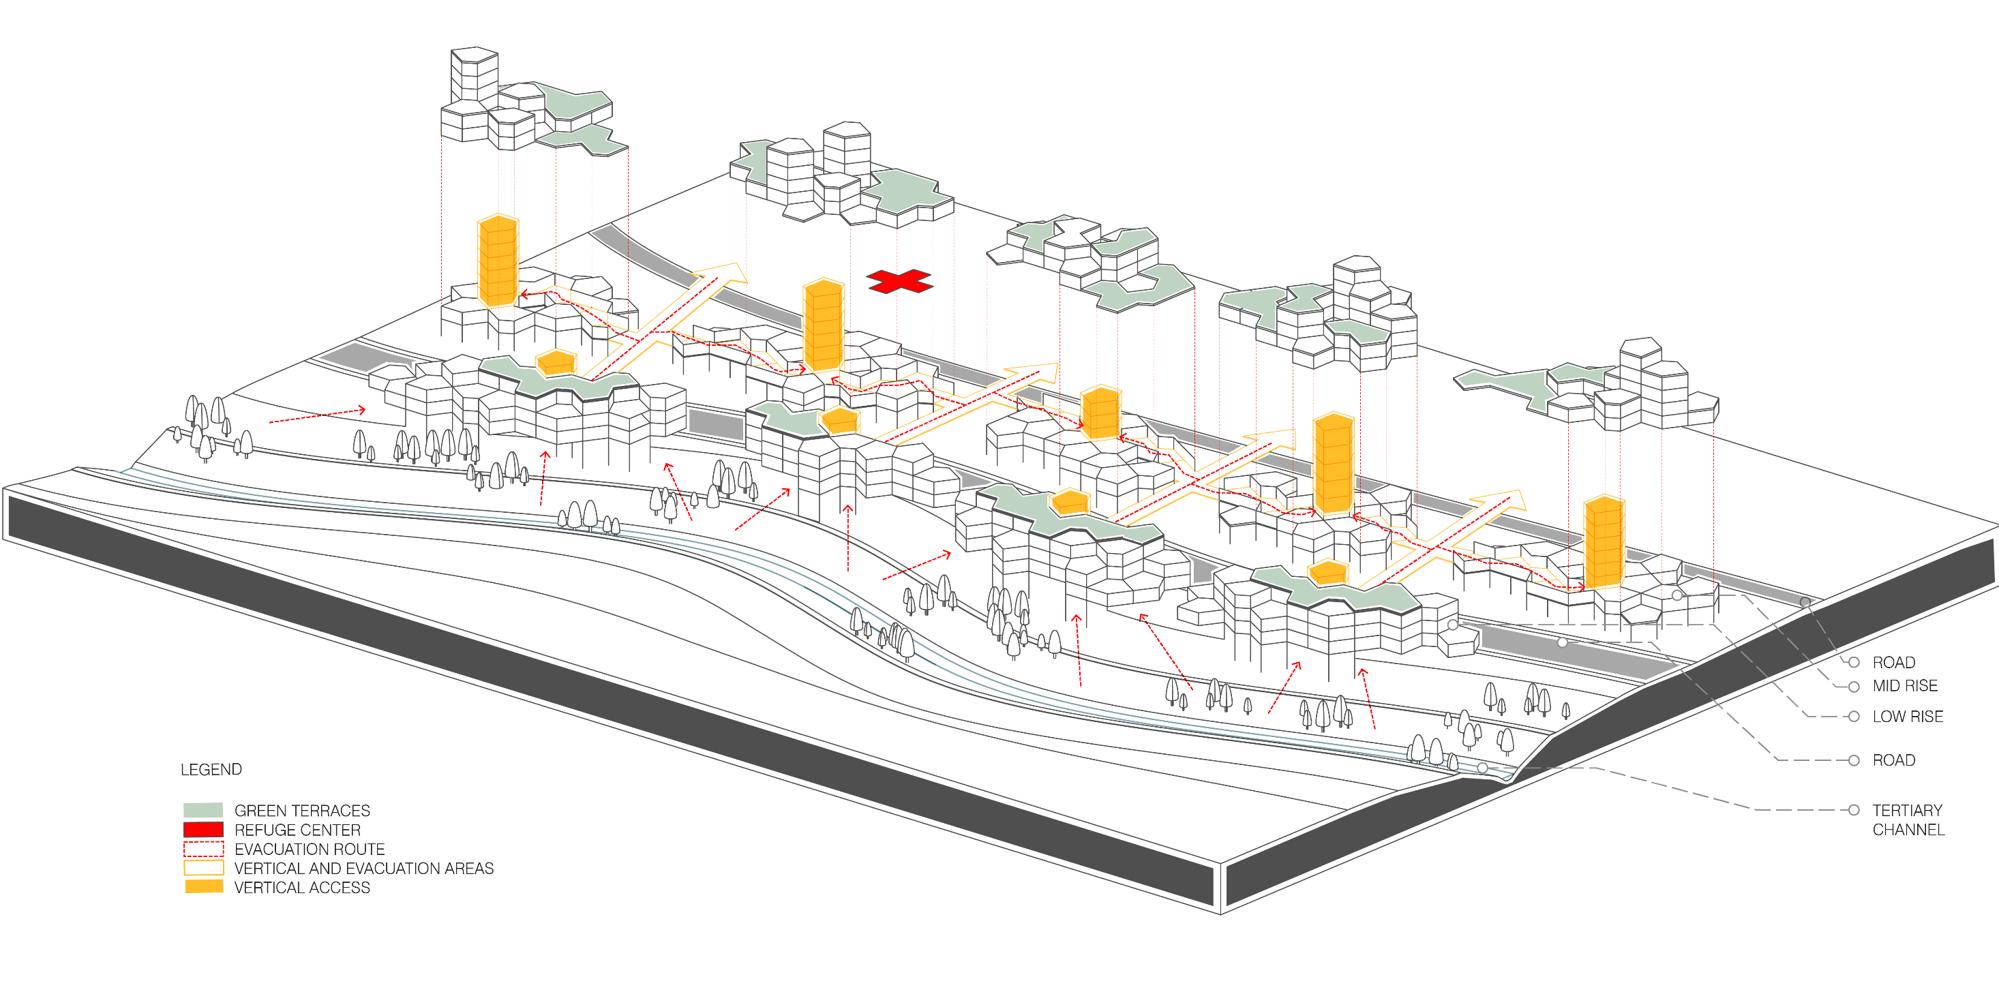
180 181
Figure 6.1.17: Exploded axonometric diagram for the aggregation and evacuation network
7. CONCLUSION
182 183
7.1 SYSTEM REFINEMENTS
The overall land morphological changes and channel improvements done on the chosen site proves beneficial in dealing with flooding of the lowest intensity to the worst case scenarios. This development proves that such systematic changes can be applied to similar land forms facing similar issues due to marine events. Yet, a backflow test of storm surge water would give a better feedback of the overall system's functionality, which could not be tested due to lack of time.
The overall network that has been developed around the new land established alongside tertiary channels seems to function aptly in terms of vehicular and pedestrian network and establishes a clear evacuation network for the people living in and around the chosen site developed. Yet, this strategy requires to be developed in line with the context of Tokyo and the city's needs and architecture.
7.2 NEXT STEP
As a next step, the urban fabric needs to be developed in a manner that can take full advantage of its accessibility to a water network. The buildings evolving around the tertiary channel needs to be developed keeping in mind the needs of the island. For eg. in the case of Tsukishima, the island is known to be the hub of fisheries, industries and ports. Yet, with the change in climatic conditions and global warming and deterioration in its natural fish culture and shell culture along the seashore, the new urban fabric could become the hub of re-inventing and structuring of a mariculture/ aquaculture industry.
The temporary spaces beneath the currently placed low rise aggregation that is prone to water influx can be developed to hold temporary fish markets and floating storage areas that can adapt to the change in water level. This could become a very important urban development that could make the communities living around it self sufficient in terms of fish production and at the same time give rise to a better fish market at the international scale.
184 185
8. REFERENCES
186 187
IMAGE REFERENCES
Figure1.1: City After Tsunami
Muirhead, Hannah. “Coastal Towns and Cities: Unique Challenges, Unique Solutions.” Go to LGIU., August 18, 2017. https://lgiu.org/coastal-towns-and-cities-unique-challengesunique-solutions/.
Figure1.2: City of Tokyo
“The Rise of Tokyo's Global Hip Hop Scene.” Here Magazine. Accessed January 29, 2021. https://www.heremagazine.com/ articles/tokyo-hip-hop-venues.
Figure2.1.1: Tsunami Wave Propogation and Shoaling Effect “Tsunami.” Encyclopædia Britannica. Encyclopædia Britannica, inc. Accessed January 29, 2021. https://www. britannica.com/science/tsunami.
Figure 2.1.2: Tsunami hit on Japan Kyung-hoon/Reuters, Kim. “After the Tsunami: Japan's Sea Walls – in Pictures.” The Guardian. Guardian News and Media, March 9, 2018. https://www.theguardian.com/world/ gallery/2018/mar/09/after-the-tsunami-japan-sea-walls-inpictures.
Figure 2.1.2: Ring of Fire
National Geographic Society. (2012, October 09). Plate Tectonics and the Ring of Fire. Retrieved January 22, 2021, from https://www.nationalgeographic.org/article/platetectonics-ring-fire/
Fang et al., “Assessment and Mapping of Potential Storm Surge Impacts on Global Population and Economy.” International Journal of Disaster Risk Science, 2014.
Figure 2.1.3: Great Earchquake Risk in Future 30 Years ch_gruetze. “" Mw9.0 Earthquake Hits Japan, Causes Tsunami (Updated – 3).” paleoseismicity.org, March 11, 2011. https:// paleoseismicity.org/mw8-9-earthquake-hits-japan-causestsunami/.
Figure 2.1.4: Velocity Echoing from the Bay Mouth Solomon, Richard. “Tokyo’s Exposure to Tsunami, Explained.” Beacon Reports, June 4, 2017. https://beaconreports.net/en/ tokyos-exposure-tokyo-bay/.
Figures 2.1.6 & 2.1.7
Tian, K. “[PDF] Tokyo Bay Storm Surge Barrier: A Conceptual Design of the Moveable Barrier: Semantic Scholar.” undefined, January 1, 1970. https://www.semanticscholar.org/paper/ Tokyo-Bay-storm-surge-barrier%3A-A-conceptual-design-Tian/7 cd57b29575d7a0ffd87b060105ac8e9440d8e98.
Figure 2.1.8: Damage Map
Tsunami and building for 2011 Tōhoku earthquake and tsunami in Japan. Accessed January 29, 2021. http://worldmap. harvard.edu/maps/2011tohokueq.
Figure 2.1.9: ch_gruetze. “" Mw9.0 Earthquake Hits Japan, Causes Tsunami (Updated – 3).” paleoseismicity.org, March 11, 2011. https:// paleoseismicity.org/mw8-9-earthquake-hits-japan-causestsunami/.
Figure 2.2.1
Parker, Clark. “Tokyo Elevation and Flood Maps 東京標高地形 図.” the tokyo files: maps マッピング東京, January 27, 2019. https://thetokyofilesmaps.wordpress.com/2018/05/19/tokyoelevation-and-flood-maps/.
Figure 2.2.2 & Figure 2.2.3 & Figure 2.2.4: Hoshino, Sayaka & Esteban, Miguel & Mikami, Takahito & Takagi, Hiroshi & Shibayama, Tomoya. (2016). Estimation of increase in storm surge damage due to climate change and sea level rise in the Greater Tokyo area. Natural Hazards. 80. 27 pages. 10.1007/s11069-015-1983-4. https://www.researchgate. net/publication/282440419_Estimation_of_increase_in_storm_ surge_damage_due_to_climate_change_and_sea_level_rise_ in_the_Greater_Tokyo_area
Figure 2.2.5: Seawall and Imprisonment Kyung-hoon/Reuters, Kim. “After the Tsunami: Japan's Sea Walls – in Pictures.” The Guardian. Guardian News and Media, March 9, 2018. https://www.theguardian.com/world/ gallery/2018/mar/09/after-the-tsunami-japan-sea-walls-inpictures.
Figure 2.2.6: Existing water storage infrastructure in Tokyo Hoshino, Sayaka & Esteban, Miguel & Mikami, Takahito & Takagi, Hiroshi & Shibayama, Tomoya. (2016). Estimation of increase in storm surge damage due to climate change and sea level rise in the Greater Tokyo area. Natural Hazards. 80. 27 pages. 10.1007/s11069-015-1983-4.https://www.researchgate. net/publication/282440419_Estimation_of_increase_in_storm_ surge_damage_due_to_climate_change_and_sea_level_rise_ in_the_Greater_Tokyo_area
Figure 2.2.8: The length of considered levees and platform surfaces can be seen in the following figure Patowary, Kaushik. “G-Cans: Tokyo’s Massive Underground Storm Drain.” Amusing Planet. Blogger, November 11, 2019. https://www.amusingplanet.com/2013/03/g-cans-tokyosmassive-underground-storm.html.
Figure 2.2.9: Existing Defenses Protecting Tokyo from Storm Surges and Tsunamis —Port of
Tokyo Coastal Protection Facilities, n.d. https://www.youtube. com/watch?v=MiwSQah546c&t=578s&ab_channel =%E6%9D%B1%E4%BA%AC%E9%83%BDTokyoMetropolitanGove rnment.
Figure 2.2.10: Tsunami Propagation / Time Variation in Spatial Distribution
Shibayama, Koichiro Ohira and Tomoya, Koichiro Ohira, Department of Creative Science and Engineering, Tomoya Shibayama, and Department of Civil and Environmental Engineering. “WAVE BEHAVIOR IN TOKYO BAY CAUSED BY A TSUNAMI OR LONG-PERIOD GROUND MOTIONS.” World Scientific. Accessed January 27, 2021. https://www. worldscientific.com/doi/abs/10.1142/9789814412216_0113.
Figure 2.2.11: Evacuation Zones “月岛附近的应急避难/支援.”
月岛附近的应急避难/支援 (第1页)
| Japan Travel by NAVITIME - 日本旅游指南、公交搜索和路线规
划. Accessed January 29, 2021. https://japantravel.navitime. com/zh-cn/area/jp/around/category/0511/?spot=0201100002071&page=1.
Figure 2.2.13: Urban Analysis / Denisty of Tsukishima Island arcgis.com. Accessed January 29, 2021. https://www.arcgis. com/home/item.html?id=d8807b7572c144459f6e72ee238f933.
Figure 2.2.14: Tokyo Core & Suburban Population1920-2010
“The Evolving Urban Form: Tokyo.” The Evolving Urban Form: Tokyo | Newgeography.com. Accessed January 29, 2021. http://www.newgeography.com/content/002923-theevolving-urban-form-tokyo.
Figure (table) 2.2.16: The per capita public green space of large cities (1994)
Data quoted from Tokyo city White paper (1994)[18].
Figure 2.2.18: Tokyo Bay development Nmurphy, and Nmurphy. Migrating Coastlines, March 11, 2016. http://www.noel-murphy.com/rotch/category/landreclamation/page/2/.
Figure 2.3.1: Reef Building and Attenuation
“Living Breakwaters Rebuild By Design Competition.” SCAPE, October 12, 2017. https://www.scapestudio.com/projects/ living-breakwaters-competition/.
Figure 2.3.2: Barriers “Oyster-Tecture.” SCAPE, January 16, 2019. https://www. scapestudio.com/projects/oyster-tecture/.
Figure 2.3.4: Counter Flood Strategies
Doshi Viral, Tabassum Mehnaj. “Collective Morphogenesis”
Page 16, Master of Architecture Dissertation. 2014
Figure 2.3.5: Case Study
“Singapore: Bio-Engineering Works at Bishan-Ang Mo Kio Park to Prevent Urban Flooding.” C40, September 28, 2018. https:// www.c40cities.org/case_studies/singapore-bio-engineeringworks-at-bishan-ang-mo-kio-park-to-prevent-urban-flooding.
Figure 2.3.6 & Figure 2.3.7:
Doshi Viral, Tabassum Mehnaj. “Collective Morphogenesis” Page 16, Master of Architecture Dissertation. 2014
Figure 3.2.2: WASP, example aggregation “Wasp++.” Food4Rhino, May 11, 2020. https://www.food4rhino. com/app/wasp-0.
Figure 4.1.6: Density map reference arcgis.com. Accessed January 29, 2021. https://www.arcgis. com/home/item.html?id=d8807b7572c144459f6e72ee230 8f933.
Figure 4.1.9: Bathymety Map of Tokyo Bay “6363-1 浦賀水道 (海底地形図)うらがすいどう.” 浦賀水道 (海 底地形図) [6363-1C] | 海図ネットショップ | 日本水路協会. Accessed January 29, 2021. https://www.jha.or.jp/shop/index. php?main_page=product_info_js2&products_id=246.
Figure 4.1.10: Elevation of Tokyo 地理院地図 / GSI Maps |国土地理院 . Accessed January 29, 2021. https://maps.gsi.go.jp/#11/35.583618/139.954147/& ls=d1-no865&disp=1&lcd=d1-no865&vs=c1j0h0 k0l0u0t0z0r0s0m0f1.
Figure 4.1.11: Water Velocity Simulation 津波来襲時における船舶避難リスクマップの提案と東京湾への適用, [土木学会論文集B2(海岸工学),Vol. 73, No. 2, I_415─I_420, 2017.] 鴫原 良典1繁? 隆範2范嗵? 毅3钒四? 宏4
Figure 5.4.4: Engawa
Matsuyama, Hiroko, Hiroko MatsuyamaView all posts, and View all posts. “Traditional Style of Engawa.” Japanese Patterns of Design, July 11, 2017. https://www.patternz.jp/ japanese-architecture-overview/traditional-style-of-engawa/.
Figure 5.3.6: Patio in the Azuma House, Japan “Azuma House,” November 5, 2020. https://www.artstation. com/?sort_by=community.
188 189 8.1
[1] Rene, Kolman, "New Land in the water: Economically and Socially, Land Reclamation Pays," International Association of Dredging Companies, Terra et Aqua, September 2012. https:// www.iadc-dredging.com/wp-content/uploads/2017/02/ article-new-land-in-the-water-economically-and-socially-landreclamation-pays-128-1.pdf
[2] Murphy, Noel, “Tokyo Bay and the Economics of Floating Cities”, Land Reclamation, Rotch, Tokyo, March 2016. http:// www.noel-murphy.com/rotch/2016/03/11/tokyo-bay-and-theeconomics-of-floating-cities/
[3] Oktem, Caner, “Urban Archipelago Reconsidered: A new Metabolism in Tokyo Bay for Contemporary Coastal Urbanism”, Thesis, Master of Science in Architecture Studies, MIT, June 2016.https://dspace.mit.edu/handle/1721.1/106422
[4] Jose, Maria, and Abby Yuting Li., “Storm Surge Barrier Tokyo Bay: analysis on a system level and conceptual design”, Msc Thesis, Delft University of Technology, June 2014,
[5] Masunaga, Eiji & Yamazaki, Hidekatsu, ”A new tow-yo instrument to observe high resolution coastal phenomena”, Journal of Marine Systems, 2013. https://www.researchgate. net/publication/259135669_A_new_tow-yo_instrument_to_ observe_high-resolution_coastal_phenomena/figures?lo=1
[6] Oktem, Caner, “Urban Archipelago Reconsidered: A new Metabolism in Tokyo Bay for Contemporary Coastal Urbanism”, Thesis, Master of Science in Architecture Studies, MIT, June 2016.https://dspace.mit.edu/handle/1721.1/106422
[7] “Japan’s Earthquake & Tectonic Setting: Why is the tectonic setting around Japan so complicated?”, Incorporated Research Institutions for Seismology, June 2017. https://www. iris.edu/hq/inclass/animation/japans_earthquakes__tectonic_ setting
[8] Grossi, Patricia, et al., “The M9.0 Tohoku, Earthquake: ShortTerm Changes in Seismic Risk”, October 2016. https://www. researchgate.net/publication/309173507_The_M90_Tohoku_ Earthquake_Short-Term_Changes_in_Seismic_Risk
[9] Dr. Mahdyiar, Mehrdad, Zalisk, Robert, “Reforming a seismicity model for Japan”, AIR Currents publications, 2013. https://www.air-worldwide.com/publications/aircurrents/2013/Reformulating-a-Seismicity-Model-for-Japan/
[10] Soloman, Richard,” Tokyo Bay at Risk to Tsunami”, Beacon Reports – Lighthouse for japan’s Thought Leaders, August 2016. https://beaconreports.net/en/tokyo-bay-tsunami-risk/
[11] ‘Ring of Fire [This Dynamic Earth, USGS]’. n.d. Accessed 22 July 2020. https://pubs.usgs.gov /gip/dynamic/fire.html.
[12] ‘Tsunami Facts and Information’. n.d. Accessed 22 July 2020. https://www.nationalgeographic.com/environment/ natural-disasters/tsunamis/.
[13] Röbke, B. R., and A. Vött. 2017. ‘The Tsunami Phenomenon.’ Progress in Oceanography 159 (December): 296–322. https://doi.org/10.1016/j.pocean.2017.09.003.
[14] ‘Japan Experts Warn of Future Risk of Giant Tsunami’. n.d. Accessed 22 July 2020. https://phys.org/news/2012-04-japanexperts-future-giant-tsunami.html.
[15] ‘Phys.Org - News and Articles on Science and Technology’. n.d. Accessed 22 July 2020. https://phys.org/ tags/government+website/.
[16] Resource from Global Historical Tsunami Database. doi:10.7289/V5TD9V7K
[24] Roland Buerk (11 March 2011). "Japan earthquake: Tsunami hits north-east". BBC. Archived from the original on 12 March 2011. Retrieved 12 March 2011.
[25] https://www.npa.go.jp/news/other/earthquake2011/pdf/ higaijokyo_e.pdf – National Police Agency of Japan. Retrieved 10 September 2018.
[26] Saira Syed – "Japan quake: Infrastructure damage will delay recovery" – 16 March 2011 – BBC News – Retrieved 18 March 2011. Archived 17 March 2011 at the Wayback Machine
[27] japaneese source
[28] Oktem, Caner. Urban Archipelago Reconsidered: a New Metabolism in Tokyo Bay for Contemporary Coastal Urbanism, 2016.
[29] ‘Coastal Defense - an Overview | ScienceDirect Topics’. n.d. Accessed 22 July 2020.
[30] [HD] The 40m (131ft) Japanese Tsunami Wave NHK Documentary. 2020. https://www.youtube.com/ watch?v=HHu8NRkW7T0.
publications/ranking-of-the-worlds-cities-to-coastalflooding/11240357
[37] Nagai Ryutaro, et al, ”Tsunami risk hazard in Tokyo Bay: The challenge of future sea level rise”
[38] “Tsunamis: the Shoaling Process.” Tsunami. Accessed January 24, 2021. https://www.sms-tsunami-warning.com/ pages/wave-shoaling-process.
[39] Mori Nobuhito et al, Effects of the Offshore Barrier Against the 2011 Off the Pacific Coast of Tohoku Earthquake Tsunami and Lessons Learned. Available from: https://www. researchgate.net/publication/264555521_Effects_of_the_ Offshore_Barrier_Against_the_2011_Off_the_Pacific_Coast_of_ Tohoku_Earthquake_Tsunami_and_Lessons_Learned [accessed Jan 23 2021].
[40] “Singapore: Bio-Engineering Works at Bishan-Ang Mo Kio Park to Prevent Urban Flooding.” C40, September 28, 2018. https://www.c40cities.org/case_studies/singapore-bioengineering-works-at-bishan-ang-mo-kio-park-to-preventurban-flooding.
[18] "New USGS number puts Japan quake at 4th largest". CBS News. Associated Press. 14 March 2011. Archived from the original on 7 April 2011. Retrieved 15 March 2011.
[19] Branigan, Tania (13 March 2011). "Tsunami, earthquake, nuclear crisis – now Japan faces power cuts". The Guardian. London. Archived from the original on 15 March 2011. Retrieved 15 March 2011.
[20] "Japan quake – 7th largest in recorded history". 11 March 2011. Archived from the original on 31 March 2011. Retrieved 11 March 2011.
[21] "March 11th tsunami a record 40.5 metres high NHK". .nhk. or.jp. 13 August 2011. Archived from the original on 28 July 2011. Retrieved 7 September 2011.
[22] Yomiuri Shimbun evening edition 2-11-04-15 page 15, nearby Aneyoshi fishery port (姉姉姉姉)(Google map E39 31 57.8, N 142 3 7.6) 2011-04-15, 姉姉姉姉姉姉姉姉姉姉38.9 m…姉姉姉姉姉姉姉 by okayasu Akio (姉姉 姉姉) Archived 18 April 2011 at the Wayback Machine
[23] Richard A. Clarke; R.P. Eddy (2017). Warnings: Finding Cassandras to stop catastrophe. Harper Collins. p. 77.
[31] Edogawa-Ku Hazard Map – Flood Disaster (English Version), Indo Japan Pulse: India japan Infohub. https:// indojapanpulse.com/2019/06/edogawa-ku-hazard-mapflood-disaster-english-version
[32] "The World's Cities in 2018" (PDF). United Nations. Retrieved May 5, 2020.
[33] Bureau of Urban Development , Survey of City Planning Park and Green Space in Tokyo
[34] Broughten, Janet,“Tectonic sites: structuring the landscape with textile-derived construction techniques”, Thesis, Master of Landscape Architecture in Landscape Architecture in the Graduate College of the University of Illinois at Urbana-Champaign, Urbana, Illinois, 2012. https://core. ac.uk/download/pdf/10201029.pdf
[35] Baliński, Grzegorz; Januszkiewicz, Krystyna, “Digital tectonics Design as a New Approach to Architectural Design Methodology”, Procedia Engineering Volume: 161 Issues: 1504—1508, 2016.
[36] Nicholls, R.J, et al, “RANKING OF THE WORLD'S CITIES MOST EXPOSED TO COASTAL FLOODING TODAY AND IN THE FUTURE”, university of Southampton, OECD, 2007 https://climate-adapt.eea.europa.eu/metadata/
[41] Hoshino, Sayaka & Esteban, Miguel & Mikami, Takahito & Takagi, Hiroshi & Shibayama, Tomoya. (2016). Estimation of increase in storm surge damage due to climate change and sea level rise in the Greater Tokyo area. Natural Hazards. 80. 27 pages. 10.1007/s11069-015-1983-4. https://www.researchgate. net/publication/282440419_Estimation_of_increase_in_storm_ surge_damage_due_to_climate_change_and_sea_level_rise_ in_the_Greater_Tokyo_area
[42] Forecasting flood-prone areas using Shannon’s entropy model Ali Haghizadeh1, Safoura Siahkamari, Amir Hamzeh Haghiabi and Omid Rahmati J. Earth Syst. Sci. (2017) 126: 39 c Indian Academy of Sciences DOI 10.1007/s12040-017-0819-x
190 191 8.2
BIBLIOGRAPHY
[17]
