Architectural Association School of Architecture

Master of Science Emergent Technologies and Design 2018-2019
Course Director
Studio Master
Studio Tutor
Studio Tutor
Michael Weinstock
Elif Erdine
Alican Sungur
Antiopi Koronaki

Architectural Association School of Architecture

Master of Science Emergent Technologies and Design 2018-2019
Course Director
Studio Master
Studio Tutor
Studio Tutor
Michael Weinstock
Elif Erdine
Alican Sungur
Antiopi Koronaki
MSc. Candidate
MSc. Candidate
MSc. Candidate
Sri Krishna Subramanya Bhat
Jia Wen Hu
Nikolai Vladimirov
PROGRAMME: Emergent Technologies & Design 2018-2019
STUDENT NAME(S):
Sri Krishna Subramanya Bhat (MSc. Candidate)
Jia Wen Hu (MSc. Candidate)
Nikolai Vladimirov (MSc. Candidate)
DISSERTATION TITLE:
COURSE TITLE:
COURSE TUTORS:
HygroModules
MSc. Dissertation
Dr. Michael Weinstock, Dr. Elif Erdine, Dr George Jeronimidis Alican Sungur, and Antiopi Koronaki
DECLARATION:
“I certify that this piece of work is entirely my/our own and that any quotation or paraphrase from the published or unpublished work of others is duly acknowledged.”
SIGNATURE OF STUDENT(S):
DATE:
September 20th 2019
(Sri Krishna Subramanya Bhat) (Jia Wen Hu) (Nikolai Vladimirov)We would like to thank Michael Weinstock, George Jeronimidis, and Elif Erdine for their support and guidance in this project and during our time at the Architectural Association. We would like to express our gratitude to Alican Sungur and Antiopi Koronaki for their helpful feedback. Finally, we would like to acknowledge the support of our friends and colleagues at the Emergent Technologies and Design programme.
This research project investigates how wood’s inherent properties can be a key factor for a more efficient approach to fabricate curved sections of timber.
This thesis documents an approach for generating effective fabrication solutions that capitalize on the research and investigation of timber’s inherent properties. The techniques and results produced in this work aims to present a modular building system which priorities the material property to enhance the relationship between material, construction, and geometry.
The process considers the proceeds derived from the physical and digital experiments enabling efficient manufacturing and fabrication of timber panels which can be articulated into a coherent building system. Experiments on the material systems’ structural performance on different levels of the projects will follow, we combine the results to develop a dynamic model which can be programmed create a range of curvature within the system’s structural limitations.
At the final stage, the material system is applied at a component and cluster level to design timber housing units in Santiago, Chile. Research and innovation present an opportunity for new architectural spaces and geometries to be produced with timber.
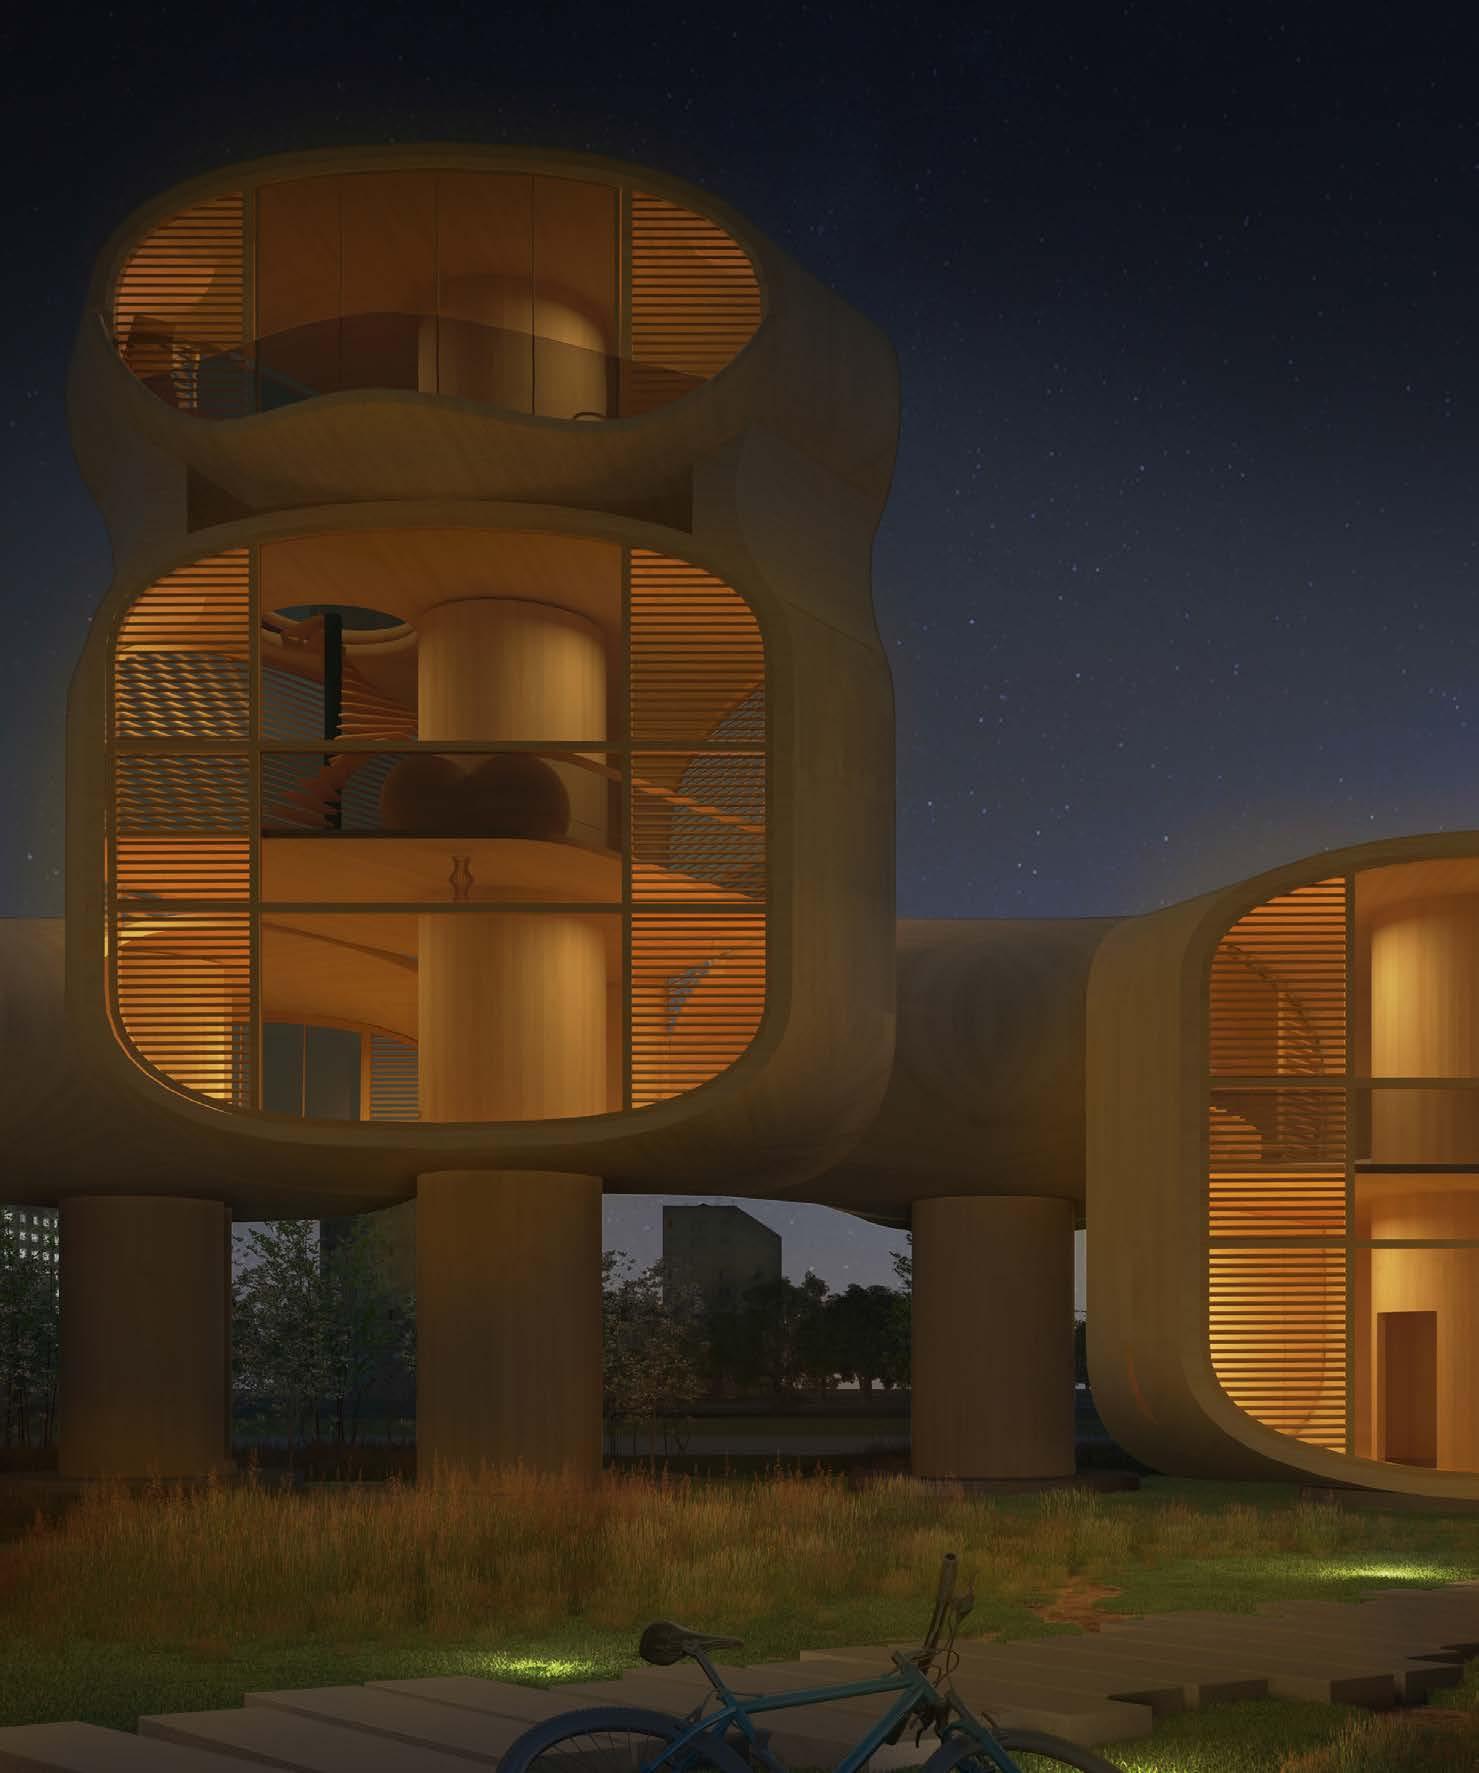

The construction industry contributes to approximately 47% of greenhouse gas emissions, and it is becoming more and more necessary to find alternative building materials which have a comparatively lower carbon footprint compared to steel and concrete. As a natural and renewable building material, timber has excellent ecological attributes. It serves as a carbon sink and has low embodied energy. The energy needed to convert trees into wood and hence into structural timber consumes less energy than that demanded by other structural materials such as steel and concrete. This research project aspires to explore the potential of timber to create a comprehensive building system built upon the relationship between material property, fabrication, structure, and geometry.
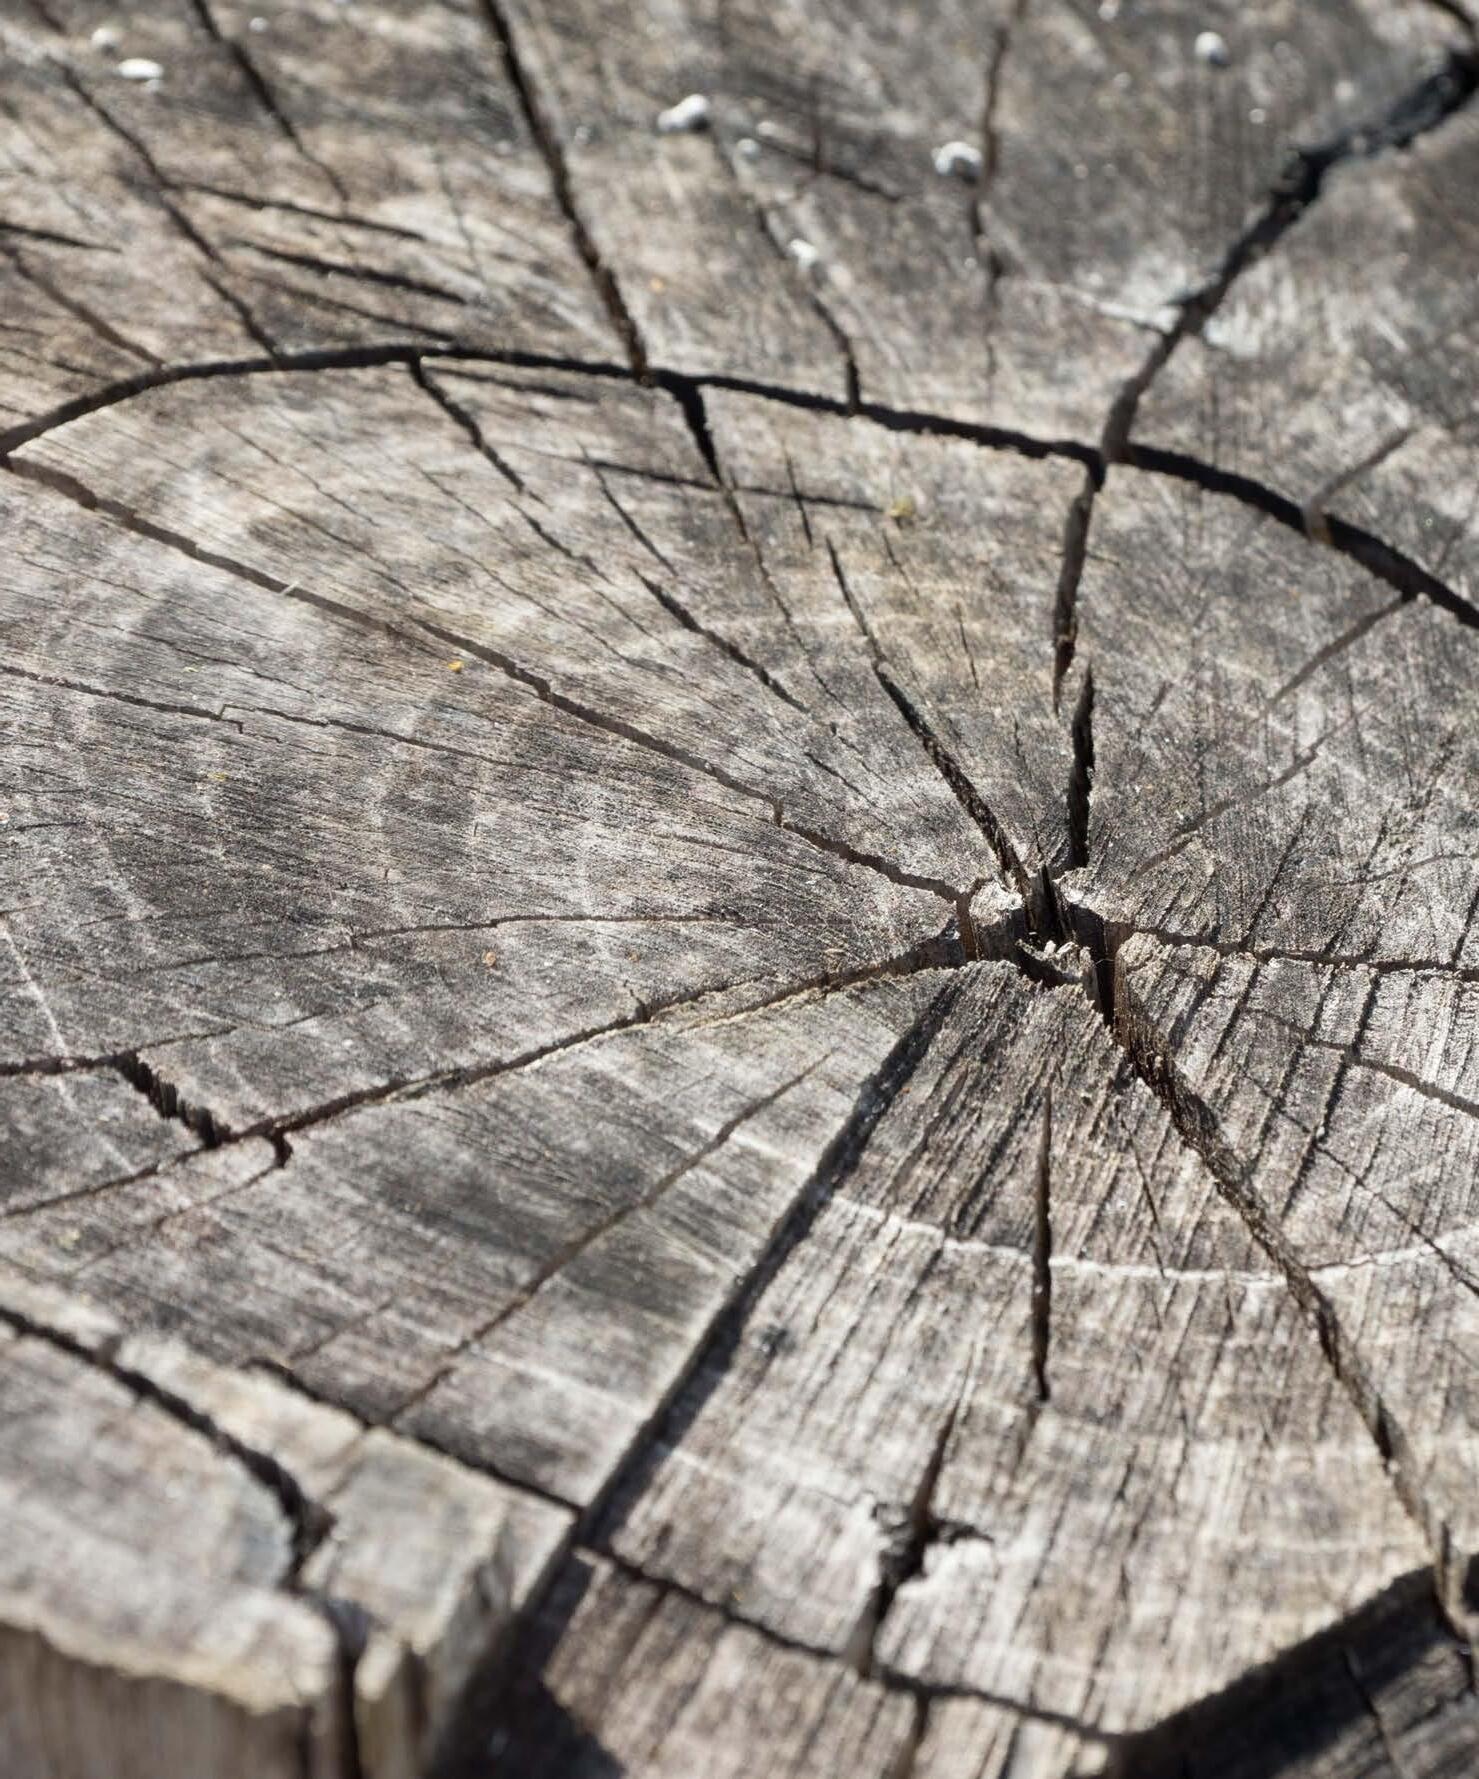
Like many other natural materials, wood is hygroscopic (ability to absorb moisture), thereby it gains or loses moisture from its surrounding environment which leads to swelling or shrinkage in its size according to the magnitude of the change. Wood contracts and expands in different ways with respect to the direction of the growth rings and in the grain’s direction (Anisotropic property). These inherent properties of wood are studied as an intent to develop an efficient fabrication technique for manufacturing curved pieces of timber.
The research initially explores the theory behind bi-metallic strips, where metals of two different coefficients of thermal expansion are used to convert the change in temperature into mechanical displacement. This theory is transposed into a digital model to test how two strips of veneers with different levels of moisture can induce curvature, various parameters are extracted from these digital experiments which are then carried forward to physical experiments to determine which parameters influence the fabrication process and which are workable, these are crucial for determining the potentials and limitations of this method of fabrication. The findings show that the strips of veneers curve the most when they are oriented tangentially to the grain direction and thinner layers produce tighter curvature compared to thicker ones which produce a limited range of curvature.
The material system is then evaluated for its structural performance and how it can be fabricated and implemented at the building scale. The material system is integrated into the design of modular housing units, the design explores the various range of curved timber panels that can be achieved and articulated into interesting morphologies. A comprehensive structural analysis indicates the suitability of the curved panels to be used as various load-bearing elements within the building system. Further geometric studies investigate how the curved timber modules can be aggregated to define well-connected spaces while emphasizing the structural logic
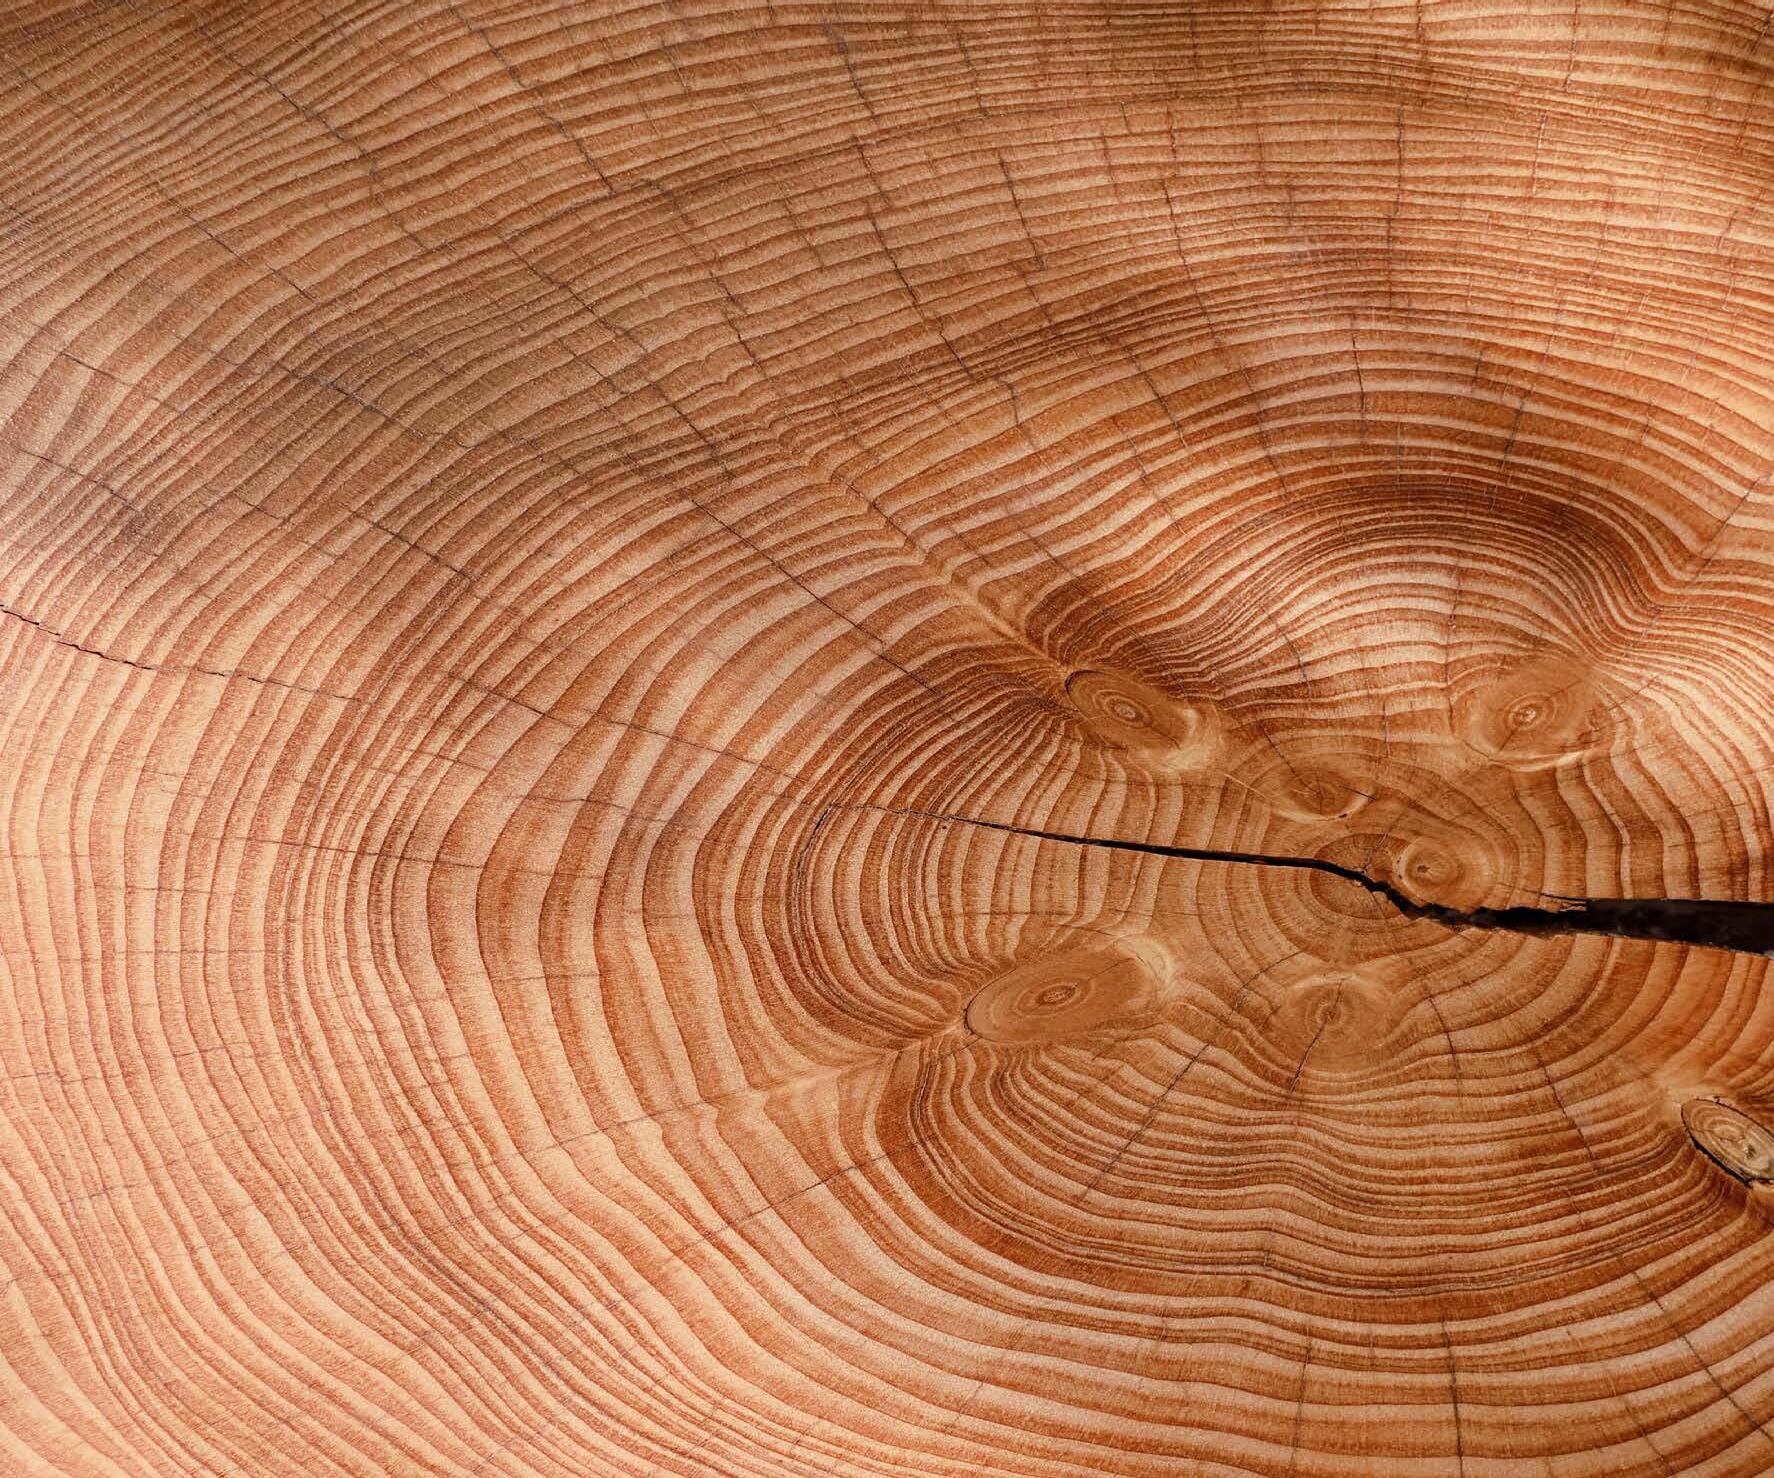
The domain chapter begins with a discussion on why timber, a sustainable natural building material that displays superior performance and extreme flexibility, can be reapplied as an innovative building material with tremendous potential for technological advancement. Wood, like any other natural material, takes on water from the surrounding environment. Much of the challenge of using timber arises from its intrinsic property such as anisotropy and hygroscopy. Recent empirical experiments demonstrate that these properties once considered a drawback, can be used as a cost-effective driver to produce non-rectilinear geometries with timber. Precedent studies show the potential of using the properties of timber to produce small scale building skins to large scale self-formed structures capable of containing both lateral and torsion loads. This chapter also talks about the architectural ambition to embed material knowledge into the fabrication of modular and prefab housing units as a potential solution for the housing problem in Santiago, Chile.
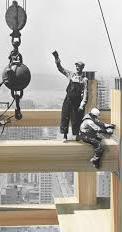
18th Century witnessed many low-rise stone or brick buildings being built, whereas in the 19th Century, the industrial revolution triggered the erection of multifamily steel buildings and reinforced concrete in the 20th Century. The production of the latter materials exhausts an immense amount of natural resources which resulted in massive deforestation in Europe and North America, and in South America and Asia in smaller scales. Today, there are a lot of materials to choose from. However, an environmental-conscious choice is the adoption of engineered timber which allows for use of young wood, usually 5- to 8-year-old, and thus stimulates reforestation.
Timber is not only a sustainable and flexible material, but it is highly cost-efficient too. In terms of strength, it is comparable to materials such as reinforced concrete and steel whereas its thermal and acoustic insulation properties even outperform the latter. It is a common misconception that timber is a vulnerable building material.
Finally, with accentuated technological development, engineered timber could be applied just anywhere from construction, through cladding to decoration. It is popular for its versatility and aesthetics.
Before 18th Century
19th Century
20th Century
21st Century
low-rise housing
stone/brick/timber
Industrial Revolution, population increase multi-family housing

steel/ reinforced concrete

Rapid development
high-rise
New era
high-rise mixed-use
small amount of forestry
deforestation
engineered timber
allow use of 5-8 year old wood
reforestation
The
Table
Wood is not only of the sustainable natural resource, but also an integral part of the indispensable valuable ecosystem, such as the forest. Wood is a natural substance produced by trees as they grow. This is done by breaking down carbon dioxide and water into chemically bound energy through photosynthesis, with the aid of solar energy. This makes forests both stores of carbon and energy and a natural resource, producing wood for construction.
The proper management of woodland through forestry can turn forest into an economic factor. The owners of these forest can derive most of their income from timber revenue. although this depends on the forest type, management strategy and production goals. The total yield of wood in the European union is 420 million cubic meters, value adding up to fifteen billion euros. (1). There are other secondary jobs and incomes of all those involved in the industry and other industries affiliated to forestry. A more sustainable timber harvesting industry is required to ensure forests can continue as carbon dioxide sinks. Producing timber requires very little energy compared to others, this is mainly due to the short average transport distance and optimized logistics.
The
Table
The life of timber material commences with the harvesting process. While the “clear-cutting” method is very well-known it concentrates on monetizing the material and does not consider the environmental impacts. On the other hand, silviculture is an eco-conscious practice of controlled growth and content of the wood. One of the popular methods among foresters is called “shelter-wood cutting” where forests are being sequentially cut throughout a period of up to two decades following a strict plan as a result of a survey taken at the very beginning of the entire process. Once harvested, the timber is left to dry for several days until the free water which is stored in the capillaries, evaporates which reduces the timber’s weight and therefore cuts down on transportation costs. After which, it is debarked and processed in a sawmill. Before going on the market all timber goes through a simple yet essential process of treatment and seasoning. The life span depends on several factors, some of which include climatic conditions, maintenance, and application. At the very end, the timber material can be recycled which makes it Carbon Dioxide neutral or even negative depending on the scale of labor and transportation involved.
FIG.2 Timber life cycle diagram (Building with timber. Kaufmann)
FIG.3 Concrete vs. timber carbon emission (MH. Wang Architects and Associates)
FIG.4 Carbon footprint and uptake for building products (VTT Technology)
The following table shows the carbon footprint and carbon uptake information for insulation materials.
Carbon footprint and carbon uptake information for insulation materials.

The following table shows the carbon footprint and carbon uptake information for wood products.
The following table shows the carbon footprint and carbon uptake information for flooring materials.
Table 7. Carbon footprint and carbon uptake information for flooring materials.
Using timber or timber-based products to replace nonsustainable or fossil based raw materials that are presently not active in binding carbon dioxide and their production and eventual disposal produces excess carbon dioxide (concrete, steel, aluminum). The low energy expenditure associated with timber based products contributes to active climate protection.
The following table shows the carbon footprint and carbon uptake information for wood products.
8. Carbon footprint and carbon uptake information for wood products.
Timber as a construction material is part of a cycle. Several uses exist for its production and end of life cycle by-products and waste products. For instance, re-use of timber beam into a new item of a furniture joinery or as an insulation or into energy producing fuel. Thereby turning a no longer usable product into secondary raw material. Ultimately wood is also biodegradable, this process returns its component substance to natural cycle of exchange. No other product as a construction material is as energy efficient as wood. Therefore, these products are technically known as “energy positive”.
In recent times, there has been an abundance of engineered timber products and these products have specific properties which are a direct result of their manufacturing processes. The most widely used industry-standard products are:
Glue Laminated Timber (GLT)
GLT is known for its ability of spanning long distances through arched-shaped beams.
Cross Laminated Timber (CLT)

CLT is the most common specification for shear walls due to its two-way oriented layers.
Laminated Veneer Lumber (LVL)
LVL can be scaled to a large proportion, this allows for configuring a wide variety of member geometries.
Nail Laminated Timber (NLT)
NLT which is more than a 100-year-old fabrication method, has a variety of different applications and is still relevant for the current construction industry.
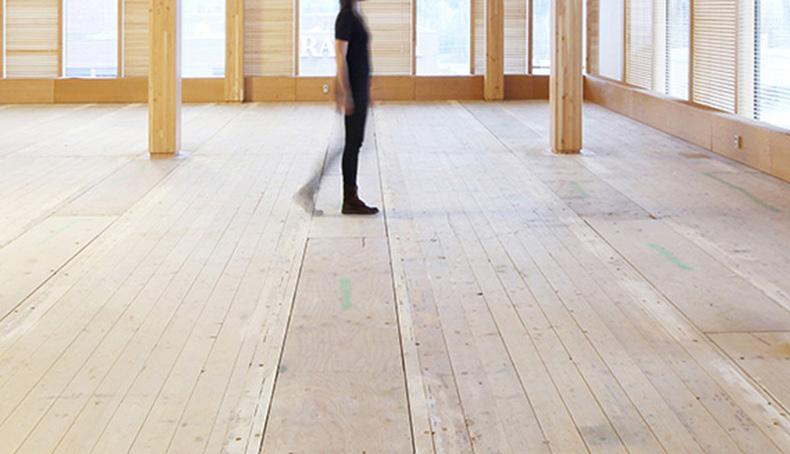
Contrary to other engineered timber products, NLT does not require a dedicated manufacturing facility as it can be produced based on available board sizes. The strength of this composite comes from the num¬ber of nails that hold each of the two elements togeth¬er. NLT can be used anywhere from elevator shafts and walls to cantilever support members. [01]
GLT is manufactured from parallel lamellae, mostly softwood, and occasionally from hardwood as well. “Pieces of sawn timber is graded for strength, before being glued together under pressure with the grain in the laminates running parallel to the longitudinal axis of the section”. The random distribution of defects such as knots and sloping grain allows for GLT to be designed for higher stress than solid timber of the same quality grade. [02]
A single CLT component is usually made of a number of layers with each consecutive layer oriented at 90 de-grees to the previous layer. The layers are usually an uneven number, very rarely an even layer, in order to al¬low for the top and the bottom ones to be oriented in the same direction. These layers are connected to one another with an adhesive. Due to its orientation along both the grain direction, CLT members benefit from in¬creased structural rigidity in both directions. [03]


LVL is composed of a large number of very thin wood¬en layers (veneers) which are then connected together using adhesives. Since it is a factory-made material it is comparatively resistant to shrinking and warping caused by non-uniform grains or changes in its mois¬ture content. Compared to GLT, LVL can withstand high¬er stresses. [04]

Combustibility of wood has become a consideration in adopting wood as a building material, extensive research and testing have shown that wood performs better than steel. Wood burns approximately 0.5mm per minute and the char layer created on the outside protects and insulates the unburnt wood and can retain 85 to 90 percent the structural integrity of the building. In contrary metal starts to melt when it reaches its critical temperature and will fail catastrophically.

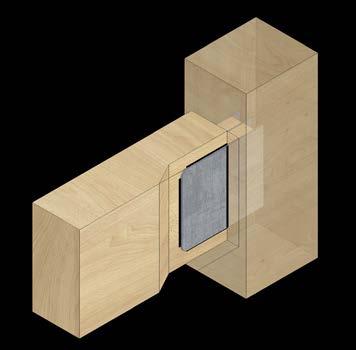
Additional fire safety can be achieved by installing the steel joints at least 100 mm inside the timber members so that the fire takes longer to reach the steel joints. They are also insulated with fire retardant intumescent strips, which swells to and protects the steel from fire. The strips usually last for about 60 minutes which gives ample time for the fire to be extinguished. Alternatively, Fire-resistant linings, such as plasterboards, can be used to protect the timber. The spread of flame on exposed timber can be reduced by surface coating or impregnating chemical treatments. [05]
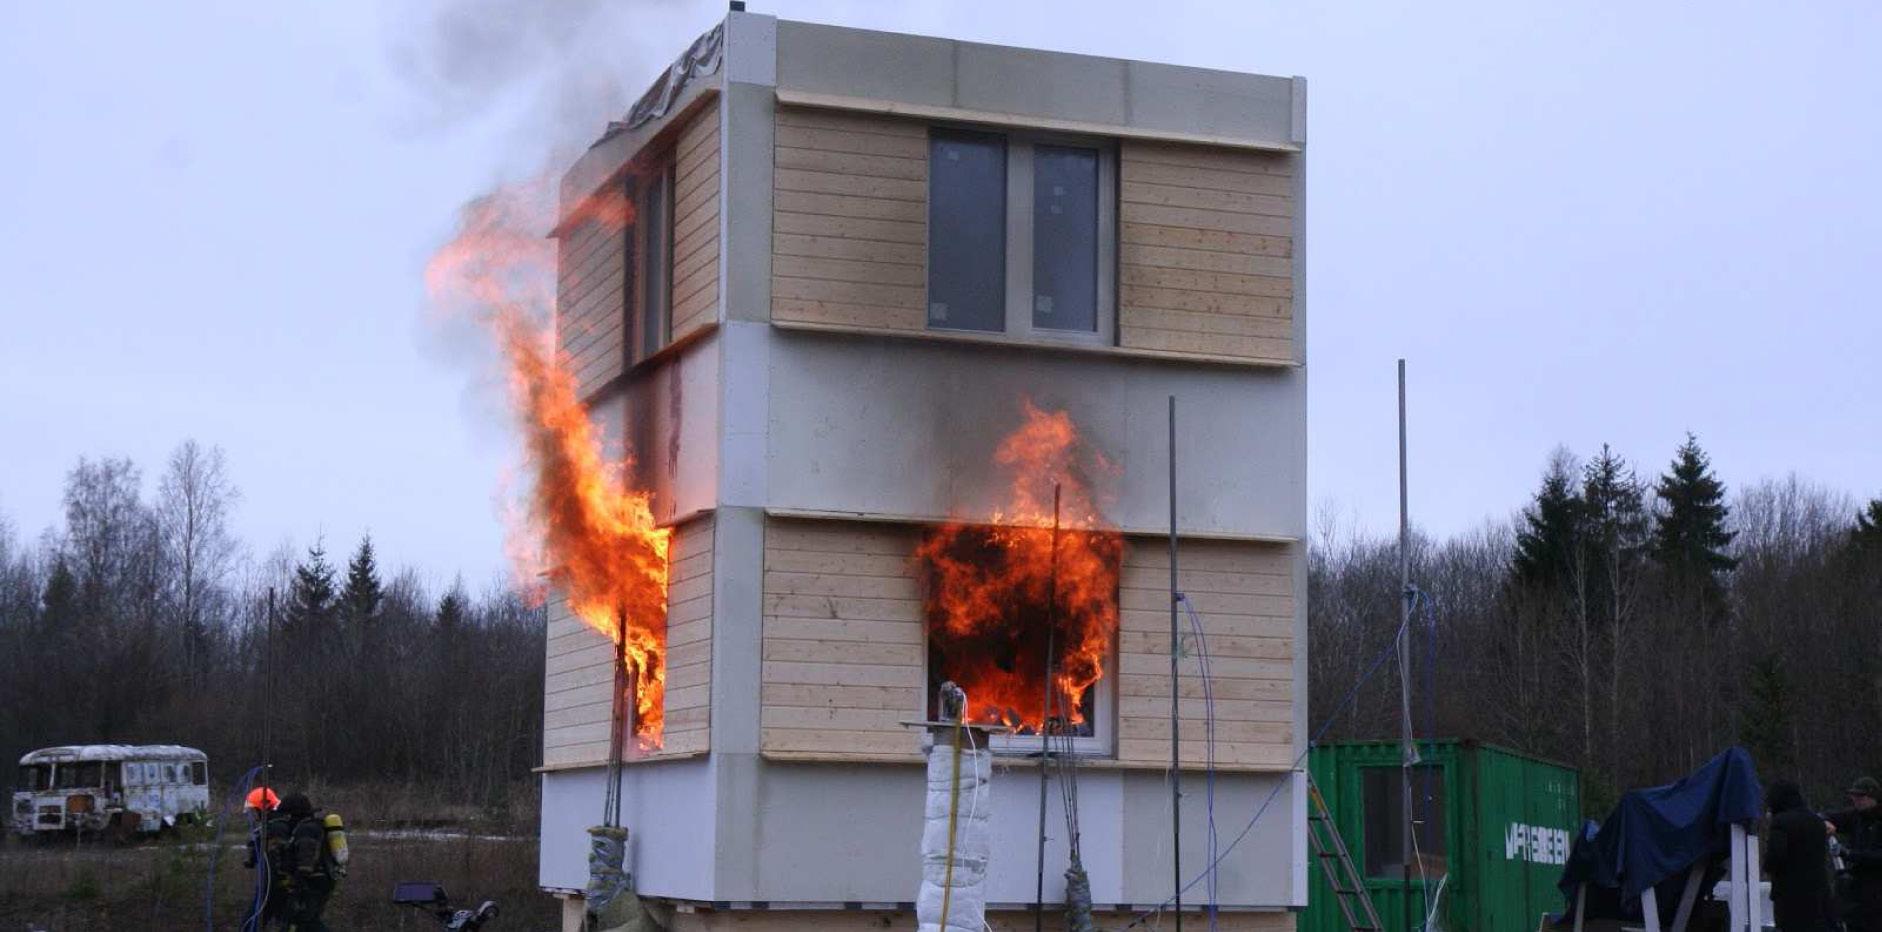
FIG.6 Fire resistance of timber
FIG.7 Table of Thermal conductivity of selected hardwoods and softwoods (General Technical Report FPL-GTR-190)
PIC.8Large-scale compartment fire test conducted by the Institute of Civil Engineering and Architecture-Tallinn University of Technology demonstrates the self-extinguishment of a twostorey CLT house. Different joints and new fire resistant products were tested in the experiment.
Thermal performance of building material is measured by its thermal conductivity. The lower the thermal conductivity the better the material will insulate. The values stated below briefly compare a few widely used building materials with wood.
Construction timber - 0.13 W/(mK)
Reinforced concrete - 2.30 W/(mK)
Brick - 0.62 W/(mk)
Cellulose insulation - 0.039 W/(mK)
Timber, a naturally insulating material, performs better compared to other widely used construction materials. Air pockets within the timber cellular structure act as an effective barrier to heat and cold. The natural thermal properties of timber maximize the efficiency of secondary insulating material as timber does not dissipate heat or become cold, does reducing the energy required for insulation. The conductivity of timber increases with the increase in its density. In the grain’s direction, the conductivity of wood is twice as much compared to the conductivity perpendicular to the grain. [06]

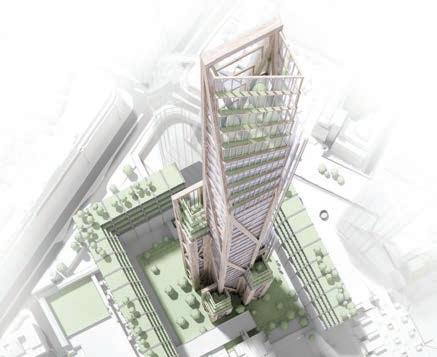
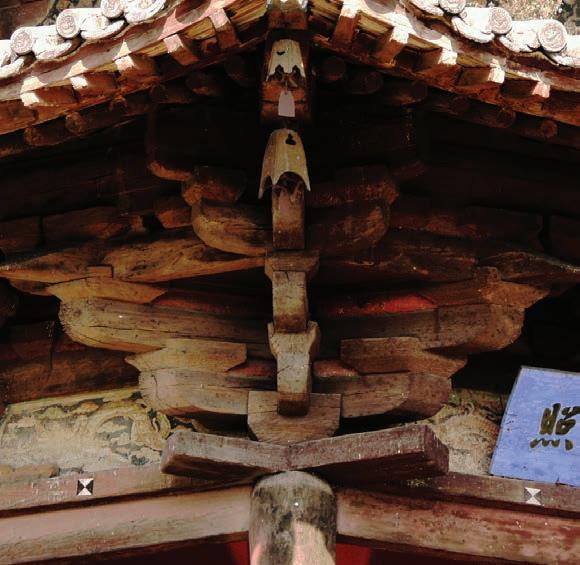
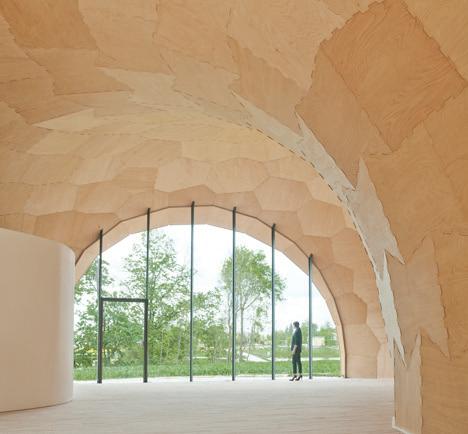
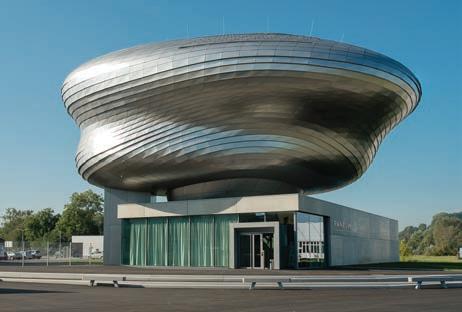
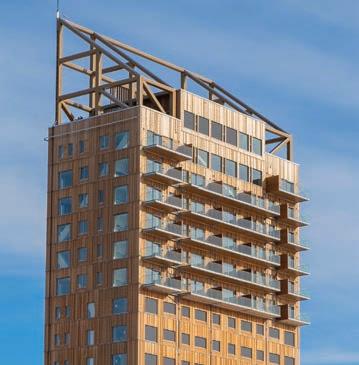
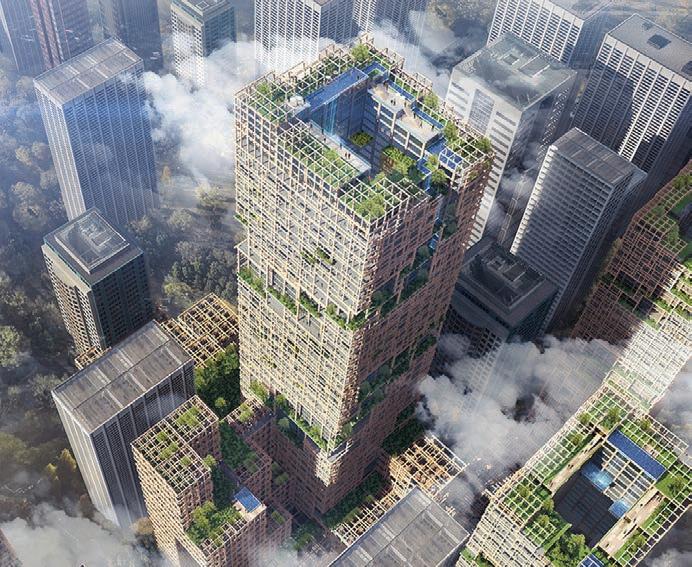
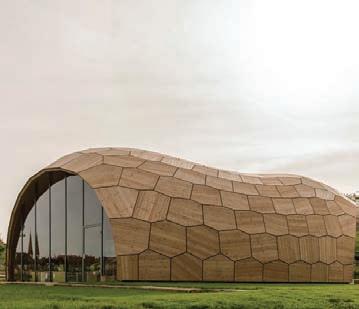
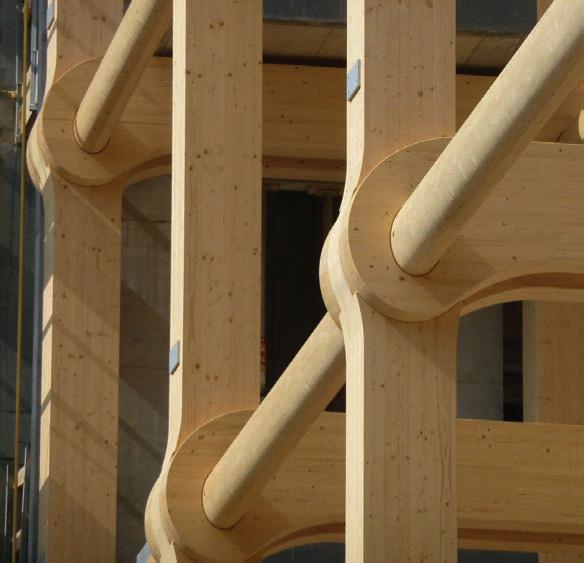

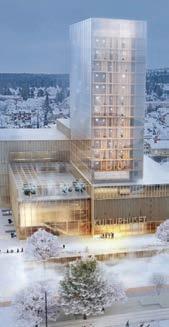
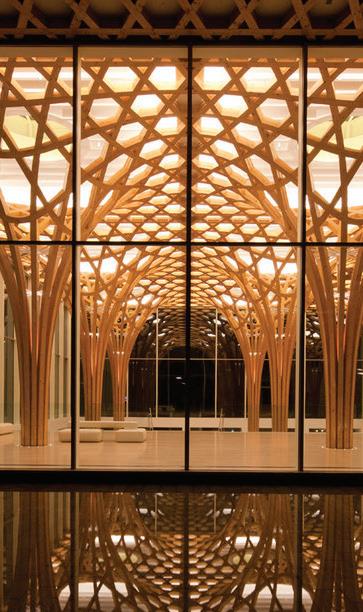
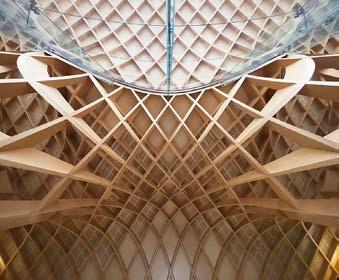

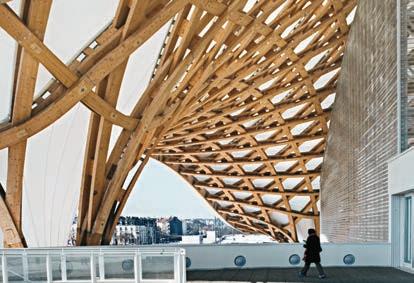


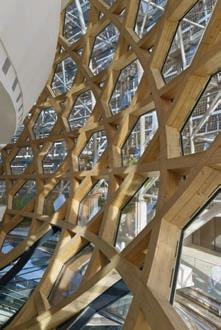

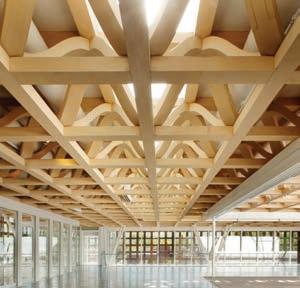

The approach towards gathering information about timber buildings is split into various stages. At the first stage, preliminary research is conducted, in terms of morphology, precedents, and uses of timber in construction. Engineered timber is investigated based on the building trends in the past few years. Finally, research is done on the structures proposed by leading design companies and their vision of what ought to be built in the near future.
Once the data is consolidated, these buildings are sorted according to the type of engineered timber used in them, the percentage of timber involved in comparison to other materials, their height and several other factors.
All the above-mentioned buildings are then arranged in a matrix which allowed for a better understanding of each of the building’s properties. As an extension to the matrix on the right, a shape grammar study was developed, which outlines the visual language of each building. All of the precedent’s drawings are in scale to one another.
Skelleftea Cultural Centre, Stockholm, Sweden
The Farmhouse
Nine Bridges, South Korea Bunjil Place, Melbourne, Australia
Omega HQ , Biel, Switzerland Toronto, Canada
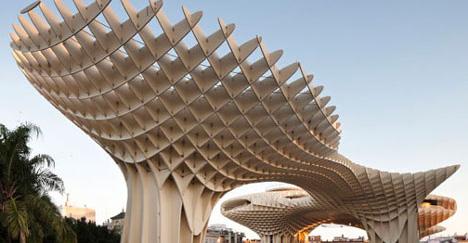
Metropol Parasol, Seville, Spain
La Seine Musicale, Boulogne-Billancourt, France Centre Pompidou, Metz, France
Landesgartenschau exhibition hall, Germany
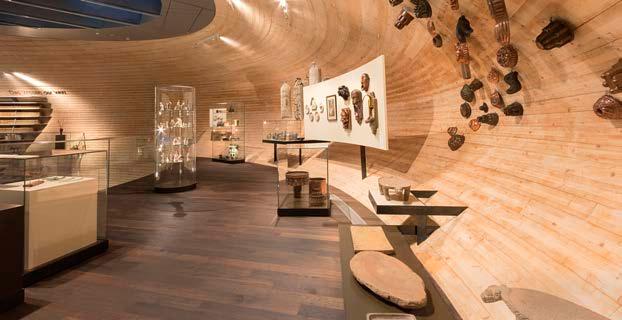
Paneum Wunderkammer des Brotes, Asten, Austria
Pagoda of Fogong Temple, Shanxi, China Camp Adventure park, Næstved, Denmark
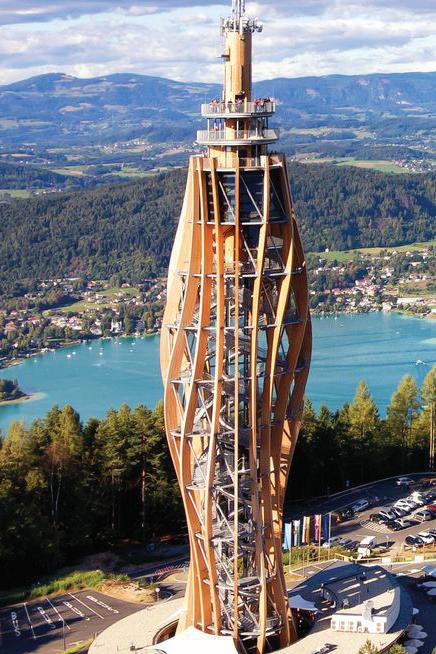
Pyramidenkogel tower, Carinthia, Austria
Mjøstårnet, Brumunddal, Norway
Hoho, Vienna, Austria
W350, Tokyo, Japan Oakwood Tower, London, UK
Dalston Works, London, UK River Beech Tower, Chicago, US
A list of over 20 case studies is created and compared according to different criteria, various morphological variations are then thoroughly studied. This shape grammar study allows for exploring key elements that make all these buildings stand out.
The precedents covered in this study are mostly contemporary buildings from recent years, there is also a millennium-old pagoda which has withstood the test of time and a futuristic tower, the erection of which will start no earlier than 2030. Many of these have nothing in common, however, they are timber-based structures, therefore they share similar structural properties and face the same limitations.
Fabricating complex geometry with timber has always been a challenge, technology has made the manufacturing more accessible. These three examples document some of the manufacturing standards alongside their limitations and drawbacks.
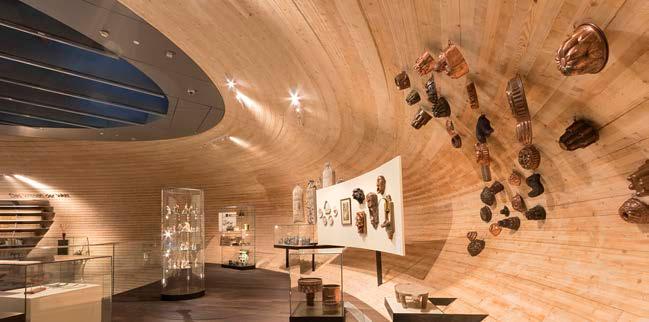
PANEUM CENTER
CNC Milling GLT
Coop Himmelbau | 2017 PANEUM CENTER
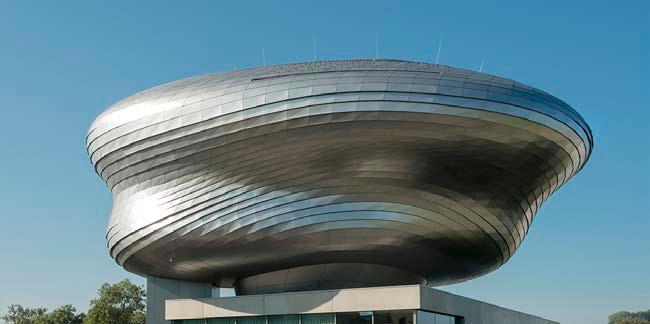
CNC Milling GLT
Coop Himmelbau | 2017
Paneum by Coop Himmelb(l)au approximates a complex self-supporting wood shell construction, the components for the free-forming structure were manufactured with CLT using CNC milling method which formulates the appearance of doubly curved surface. The drawback of this method is that it generates much waste and neglects the properties of the material which can be used to the advantage.[07]
ASPEN ART MUSEUM ROOF STRUCTURE
ASPEN ART MUSEUM ROOF STRUCTURE
Birch Plywood Lamination
SAWMILL SHELTER
SAWMILL SHELTER
Large-scale Steam Bending of entire tree
ASPEN ART MUSEUM ROOF STRUCTURE
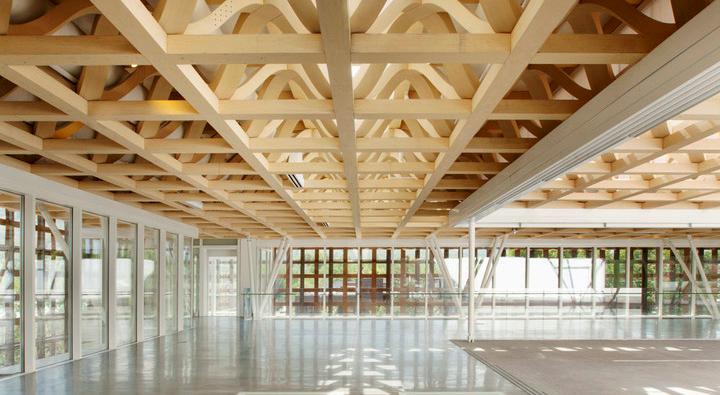
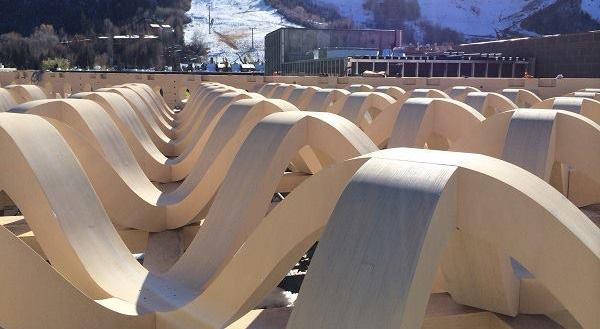
Shigeru Ban | 2014
Birch Plywood Lamination
Birch Plywood Lamination
Shigeru Ban | 2014
Shigeru Ban | 2014
Shigeru Ban’s approach of fabricating a sinuous geometry is lamination of multiple thin lamellae using adhesives. The studio claims that this method cuts costs as it significantly reduces the amount of material needed. One major issue of fabricating multi-layer composites is that they have to be clamped together so that the excessive amount of adhesive gets out. Securing together such complex geometry comprising a vast number of layers hides the risk of an imperfect result. The company fabricating these member’s solution was to put a vacuum blanket which perfectly holds all the separate layers in place.[08]
Large-scale Steam Bending of entire tree
large-scale
Design and Make, AA | 2017
SAWMILL SHELTER
Design and Make, AA | 2017
Large-scale Steam Bending of entire tree
Design and Make, AA | 2017
large-scale steam
large-scale
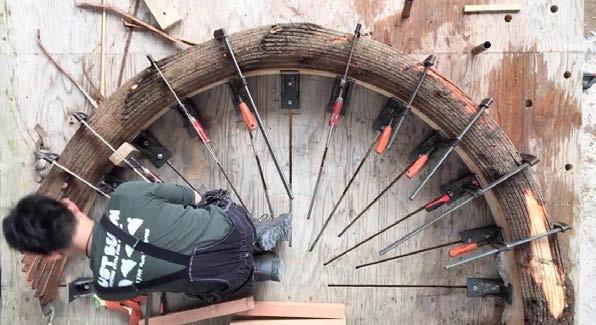
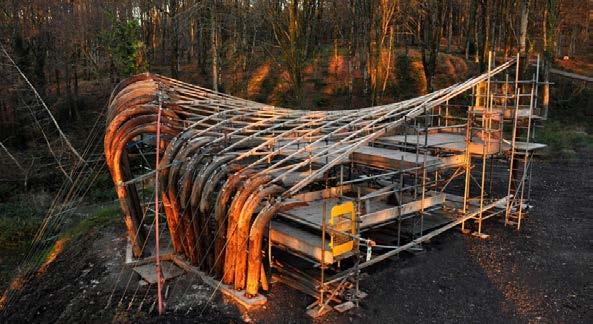
Sawmill Shelter by AA Hookpark explores the potential for large scale steam bending of whole trees. In this method the wood is placed in a steam box where the moisture and heat make the wood more pliable and allow the timber to be easily bent using a jig. This technique is limited by the degree of curvatures the timber can achieve before it fails, this procedure also requires heavy equipment and is labour-intensive. [09]
Further research is carried out on alternative ways of manufacturing curved sections on timber
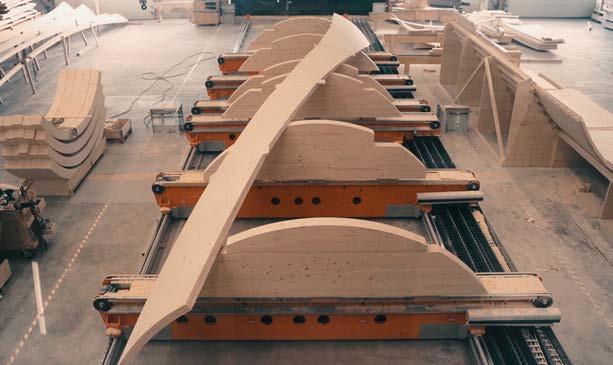
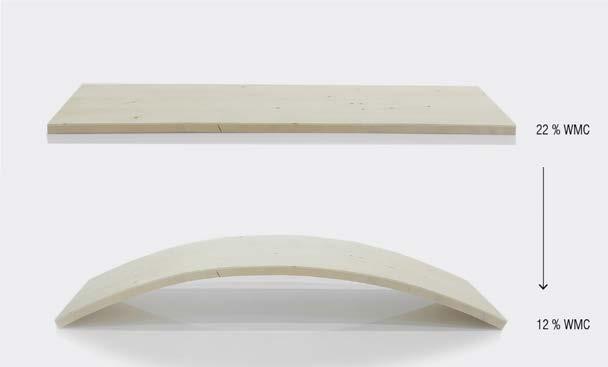
The timber tower designed by ICD provides an insight into an alternative approach to manufacturing complex shapes in timber that don’t require intensive mechanical processes. This development establishes a paradigm shift in timber manufacturing. The shape changes of the timber panels is driven by wood’s inherent property of shrinkage during a decrease in moisture content. The components are manufactured into flat pieces and are autonomously shaped during-standard technical drying. This tower marks as one of the very first novel timber structures made with self-shaped building scale components.
The curved cross-laminated timber(CLT) panels for the tower’s structure are produced as flat panels that deform into the predicted shape when dried. Primarily, the panels constitute of 5.0m x 1.2m spruce wood bilayers are manufactured with high wood moisture content and dried in an industry-standard drying process. Once removed from the drying chamber the panels are curved into the predicted shape. Parts are then laminated together to lock the geometry in shape, forming large scale CLT panels. Material specific computational models have been developed to model and predict the curvature of the panels.
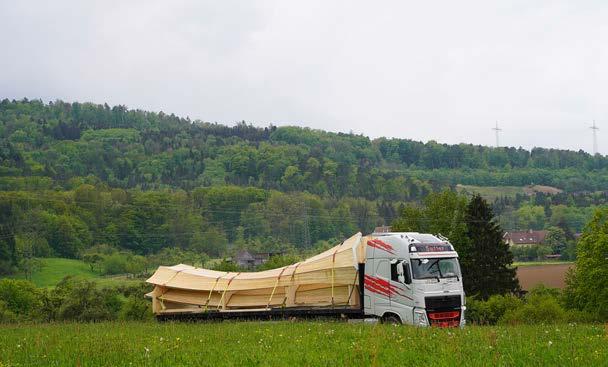
Urbach tower consists of an overall of 12 CLT components, the towers load-bearing panels have a total thickness of 90mm while cantilevering 14 meters resulting in a span thickness ratio of 160/1. the tower is just 38 kg per square meter, which makes it a lightweight structure. All 12 panels are articulated by crossing screws, the alignment of the panels to specific angles are optimized to have minimum utilization through the structure. The structure was erected on-site in a single day by a team of four craftsmen without the demand of extensive formwork and scaffolding. [10]
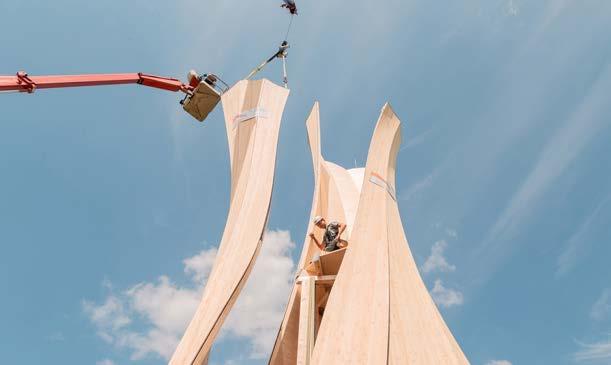
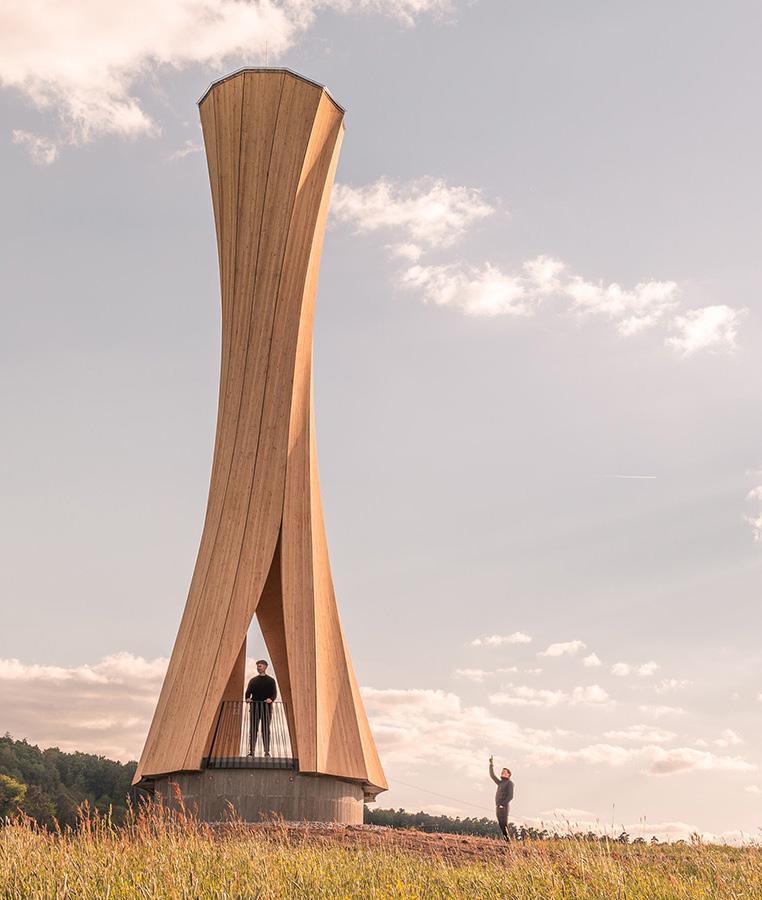
 URBACH TOWER
The introduction of active and responsive materials in architecture allows for the replacement of mechanical systems. Inherent properties of natural materials can be harnessed to compute and execute behavioral responses. However, these systems require an in-depth understanding of the material. The programming of such complex systems requires material-driven computational tools and fabrication strategies. The projects mentioned in these studies show the techniques and technology required to effectively harness and upscale the hygroscopic property of timber. The presented work shows a paradigm shift in the way timber is fabricated and used as a building material.
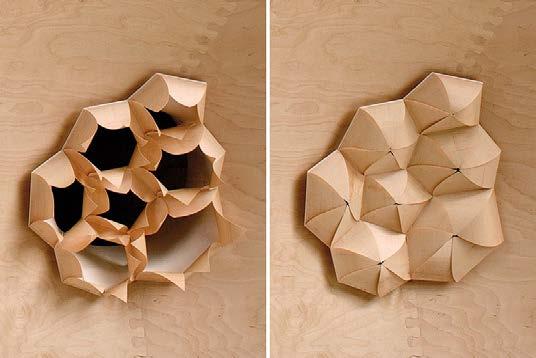
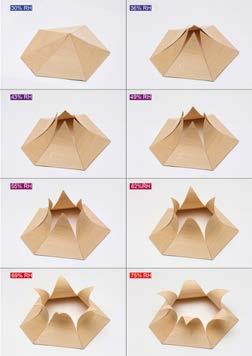
Meteorosensitive Pavilion explores a novel mode of climate-responsive architecture
ICD, University of Stuttgart | 2013 Achim Menges
A novel mode for climate responsive architecture is introduced through the project HygroSkin-Meteorosesnitive Pavilion. This project utilises the responsive capacity of the material itself unlike other attempts towards environmental responsiveness that rely heavily on elaborate technical equipment superimposed on otherwise inert material constructs.
The project dives into the tension between archetypical architecture volume, the box and a deep undulating skin imbedded clusters of intricate, climate responsive apertures. The pavilion’s envelope is also a load bearing structure and metereosensitive skin has been computationally derived from the elastic bending behavior displayed by thin plywood sheets. The material’s inherent capacity to form conical surfaces has been employed in a combination with seven axis robotic manufacturing processes to construct twenty eight geometrically components hosting 1100 humidity responsive apertures. There is a unique convergence of environmental and spatial experience due to the hygroscopic actuation of the surface. Also, the perception of the delicate, locally varied and ever changing environmental dynamics is intensified due to the subtle and silent movement of meteorosensitive architectural skin. The capacity to sense, actuate and react is embodied by the changing surface of all within the material itself.
Physical programming results in the developed material to take computed shapes in various forms in response to change in relative humidity. A combination of controlled laboratory conditions and outdoor applications over the long run has verified the reversibility and reliability of the developed material. Therefore, this project has tapped into robotic prefabrication, component based construction and elastically self forming structures based on several years of research. [11]
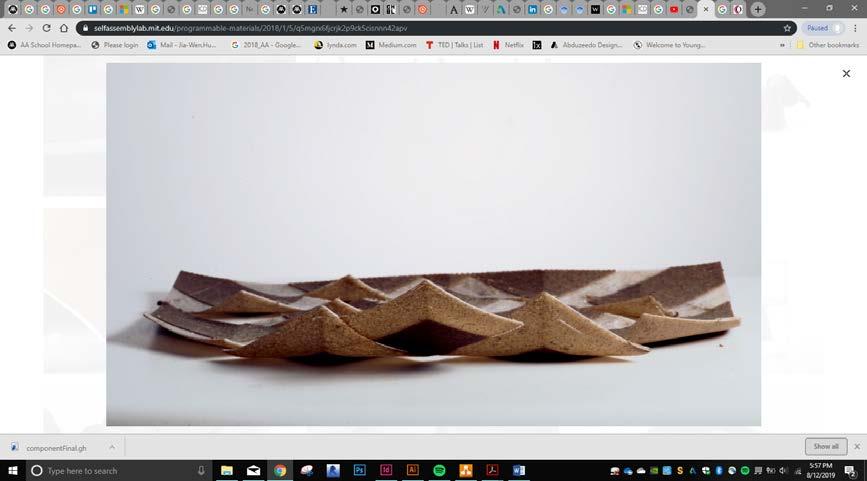
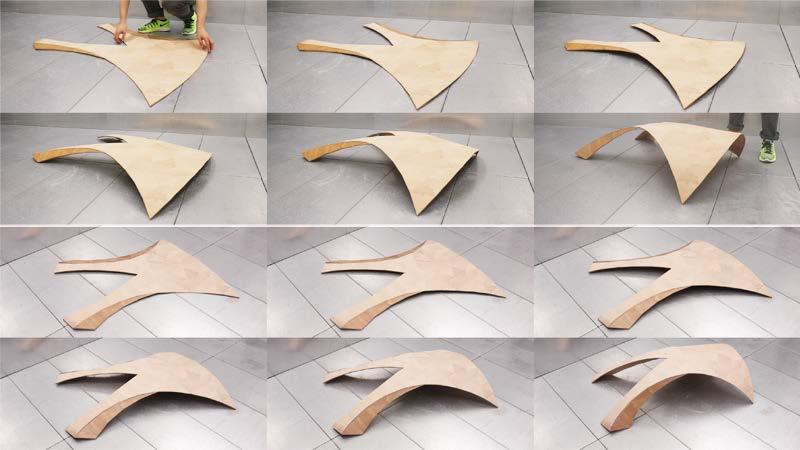
Self Assembly Lab, MIT | 2014
Competing performance criteria is resolved by nature by means of making use of structured material organizations and differentiation strategies. Complex and multi-layer structured assemblies help biological systems address performance challenges with limited resources. Biological systems rely on differentiated materials and structured material systems that are simultaneously time sensor, actuator and regulator; as compared to conventional engineering systems that rely on discreet functional components.
The research conducted in this report aims to expand these investigations through the possibility of numerically controlled, additive layer manufacturing technologies in order to engage design challenges at a material level. It also focuses on well utilising the dimensional change of hygroscopic components of 3D printed material system to be triggered to change shape in response to fluctuations of external relative humidity. Complex interaction between various programmable and functional parameters of the material structured are designed by computational tools resulting in a feasibility to manage complex four dimensional articulations. The result is therefore a Bio-inspired 3D Printed Hygroscopic Programmable Material Systems embodying the capacity to sense, actuate and react to climatic changes, all within the limits of the material itself. Hence, these systems provide an iconic conceptual and practical framework for fundamentally programmable, environmentally responsive architectural systems. [12]
Behavior tailoring in naturally responsive surfaces
ITECH, University of Stuttgart | 2014
M.Sc Thesis, Dylan Wood
Augmented Grain investigates the use of naturally responsive materials in bespoke self-forming surfaces. The project explores the potentials of augmenting the existing properties (expansion and contraction) of wood in regard to selection, fabrication, and assembly, in order to program surfaces with variable responsive characteristics. A mix of traditional woodworking techniques and sophisticated computational fabrication methods are used to create functional variation in relation to orientation, intensity, and speed of actuation. Augmented Grain represents a methodological shift in construction technique from designing and fabricating static parts, which are then manually assembled to fit a specific geometry, to designing active material systems encoded to form in response to changes in environmental conditions. This change from static to specified active material properties could fundamentally change how architectural scale structures are designed, built, and transform over time.
Principles regard to thickness and orientation of bi-layer composites were done in relation to the effects of material specific manipulations. Each surface was designed in 2D form which when subjected to higher humidity conditions transforms to a specified 3D geometry. Each surface is later tested through various cycles of transformation, and 3D scanned throughout the entire process in order to compare the actual physical form to the digitally designed target surface. This data is then used to more accurately quantitate and design future surfaces. Further development is ongoing to increase the scalability and resolution of variation within large scale self-forming building elements [13]
“4D printing wood grain”
Hygroscopy can be defined as the process whereby a material absorbs(absorption) and releases (desorption) moisture from its surrounding atmosphere to continuously maintain a relative equilibrium with its surrounding environment. Water molecules are predominantly absorbed in the cellulose and hemicellulose tissues of wood also known as bound water. The moisture content of wood is calculated as a function of its weight of water along with wood substance and has a Fiber Saturation Point (FSP) approximately at 27%-30%. At this rate, bound water is absorbed to the maximum capability so as to maintain equilibrium and any additional water is stored as ‘free water’ in its cell cavities. However, free water has minimal influence in the overall mechanical properties of wood unlike bound water. A reduction in bound water decreases the distance between the micro-fibrils of the cell tissue leading to a significant dimensional change and an increase of mechanical strength due to interfibrillar bonding. [14]
Therefore, there are three different coefficients as a result of the physical changes in the anisotropic material: Longitudinal shrinkage (parallel to grain) which is considered negligible
Tangential to the growth which is considered to be significant shrinkage
Radial Shrinking which extends from center towards the bark
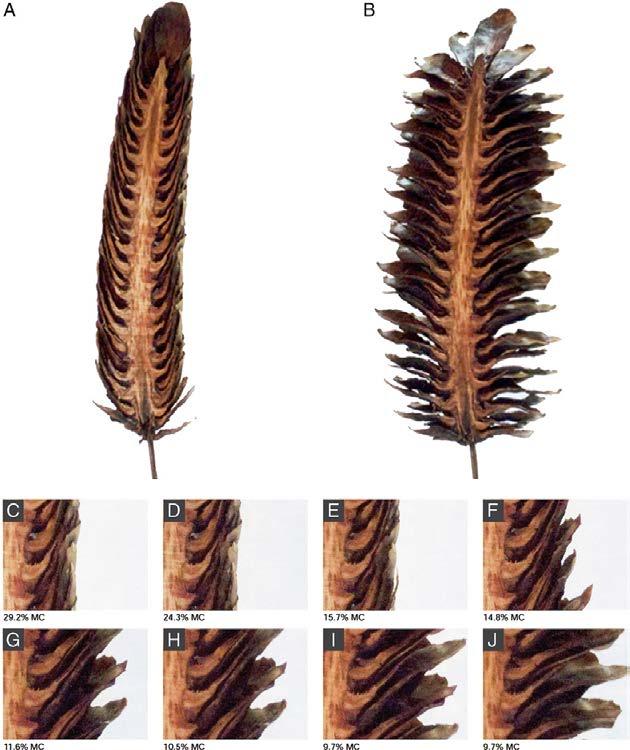
FIG.11 Tree trunk section (Timber Construction Manual, Herzog)
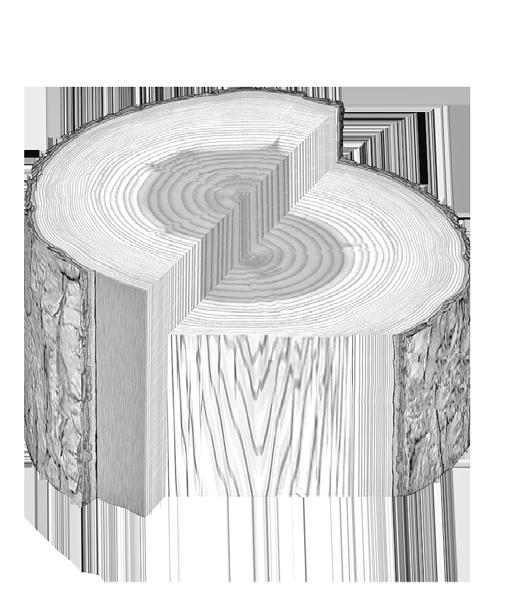
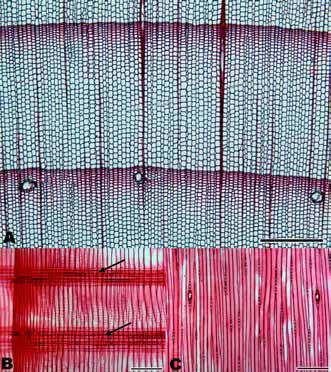
FIG.12 Section through cell wall layers (Timber Construction Manual, Herzog)
FIG.13 Longitudinal section through cell wall structure (Timber Construction Manual, Herzog)
Longitudinal Direction
Radial Direction
Tangential Direction
FIG.11
Domain 30
Wood is an orthotropic and anisotropic material. Due to the orientation of the wood fibers and the manner in which a tree increases in diameter as it grows, properties vary along three mutually perpendicular axes: longitudinal, radial, and tangential. “The longitudinal axis is parallel to the fiber (grain) direction, the radial axis is perpendicular to the grain direction and normal to the growth rings, and the tangential axis is perpendicular to the grain direction and tangent to the growth rings”. Although most wood properties vary in each of these three axis directions, differences between the radial and tangential axes are relatively minor when compared to differences between the radial or tangential axis and the longitudinal axis. Property values tabulated for structural applications are often given only for axis directions parallel to groin (longitudinal) and perpendicular to grain (radial or tangential) [15]
The ability of the cells to accommodate different directions of growth under the same conditions is known as anisotropy. The consequence of anisotropy is the completely different appearance of the various sections (transverse, tangential, radial) and the equally diverse behaviour of the wood parallel or perpendicular to the grain. [16]
Deformations of solid timber sections
Deformations of solid timber sections
mm
Board tangential
mm
Board tangential
Parallel-grain plywood perpendicular to grain
Parallel-grain plywood perpendicular to grain
Board radial
Board radial
OSB and particleboard both directions
OSB and particleboard both directions
3-ply core plywood both directions
3-ply core plywood both directions
Plywood both directions
Plywood both directions
200 + 51015
200 + 51015
02-3.3
Shrinkage is reduction, and swelling is an increase in the dimensions of wood due to changes of its moisture content. Such dimensional changes are a result of moisture of wood fluctuating below the fiber saturation point.
Wood is anisotropic with regard to shrinkage and swelling – the reduction or increase of its dimensions is different in the different directions of the tree growth. This change of dimension is least effected in the longitudinal direction (along the tree trunk), much higher in the radial direction (from pith to bark), and highest in a direction tangential to growth rings. The small axial (longitudinal) shrinkage is due to the orientation of microfibrils in the wood’s layer. If these microfibrils were accurately parallel, longitudinal shrinkage would be null. The small magnitude is due to its deviations from parallelism.
Amount of swelling and shrinkage for boards, planks and wood-base products for a moisture different of 20%
Amount of swelling and shrinkage for boards, planks and wood-base products for a moisture different of 20%
As mentioned above the magnitude of shrinkage and swelling is affected by the amount of moisture. The relation is practically linear and applied to all growth directions. The magnitude of shrinkage and swelling is greater with increased density due to the larger amount of wood substance (greater cell-wall thickness).
Dimensional changes associated with shrinkage and swelling may cause degradation of products. This may result from a simple reduction or increase of dimensions, anisotropy, or differential shrinkage or swelling in the mass of wood due to differences in the distribution of moisture or density. [17]
Based on the key studies from the domain chapter, the architectural ambition of this thesis lies in developing a material system that guides the geometrical complexity through rules set by the material’s inherent property. The material system will be designed as a kit of modular parts which can be articulated to form dwelling units. This will ensure faster production and assembly of the building, catering to the need for social housing in Santiago, Chile. The inputs for the design will be taken from the study of the demographic condition of Chile and the precedent study of social housing projects.
The material properties extracted from local wood species will be used for the material system, due to its local availability.
The basic principles and logic for the building system will be extracted from the site context and the demographic structure of Chile. The components will be analyzed for their structural and environmental performance.
In conclusion, the goal is to explore the potential of timber to fabricate a comprehensive modular building system which is built upon the relationship between material property, structure, and geometry. The variation in the assembly of the dwelling units will create spatial variation, improving spatial quality and environmental performance.
Santiago, the capital city is the largest and the most populated city of Chile, having one of the densest populations. It is also part of a conurbation by the name of Santiago Metropolitan Region, whose total population is 7 million. The participation of the rural population is ever less, going from 16,7% of the total population of the country to 10,4% a year between 1990 and 2013 (UN DESA, 201315).The city, spread over an area of 641km², is located in the country’s central valley at 570m above mean sea level.
Chile is located in a high seismic zone between the Nazca Plate and the South American Plate and has been experiencing very high magnitude earthquakes as a result of the same. Building codes regulate the mandatory earthquake standards, however, the 2010 major earthquake has caused damage to both old and contemporary buildings.
During the last 60 years, Chile started a process of forest recovery and soil improvement. [18]
It was in the early 20th century when the city started expanding at an unexpectedly fast pace due to people from other cities migrating into Santiago for better job opportunities, education and amenities. Back then the population expansion was mostly experienced on the outskirts. However, Santiago started to face a series of issues accumulated by the uncontrollable spurt in population.
In the past decades, urban growth was so strong that people started settling on the slopes of the surrounding mountains at altitudes of more than 1000m above sea level.
While the results of urban migration may have been similar throughout Latin America, migration to cities occurred at a dramatic rate in Chile that significantly outpaced its neighbors. Poor migrants new to Chile’s cities, in most cases accustomed to generations of living in isolated or remote areas and unfamiliar with the conventions of modern western finance and land ownership encountered a lack of affordable dwellings. [20]

Wind-Rose
Jan 1 -Dec 31, 2018
Hourly Data: Wind Speed
*Calm for 31.19% of the time = 2732 hours
*Each closed polyline shows frequency of 0.8% = 69 hours

FIG.17 2015 - current relative humidity of Santiago, Chile (worldweatheronline.com)
FIG.18 Wind rose diagram, Jan-Dec 2018, Chile
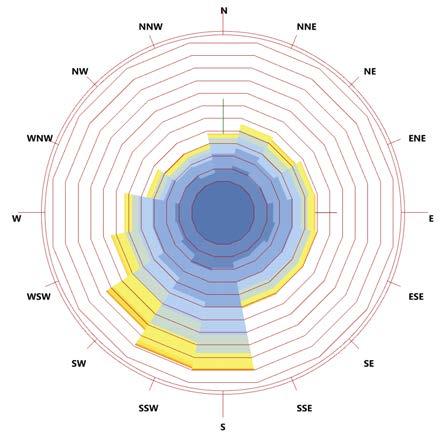
FIG.19 Total Radiation diagram, Jan-Dec 2018, Chile
PIC.39Santiago, Chile skyline
Radiation Jan 1 -Dec 31, 2018
The climate in Santiago is categorised as semi-arid. The city sees warm dry summers throughout the summer (October to March) with temperatures of up to 35° C and cool humid winters (April to September) and it gets as cold as 0° C. The average precipitation measured in Santiago is 341.8mm/year, 80% of which occurs during fall and winter.
The city experiences snowfall occasionally. The average relative humidity is 71% with its lowest in the summer month of January (57%) and the highest in the winter months of June and July (84%). The predominant wind direction is south-west with an average velocity of 15km/h (4.2m/s). [19]
The forest area, including indigenous forest and plantation forest has been increasing by 18,5 % between 1997 and 2014, reaching 15,9 million hectares representing 21 % of Chile total area. Today’s forest economy is based on private plantations that grew in 17 years from 1,9 million hectares to 2,4 million hectares. Approximately 30% of the native forest belongs to the state and the rest to private estate holders.
The Chilean state has invested continuously encouraging afforestation reaching an investment of $565 million. State incentives are responsible for more than half of the plantations which has helped almost tripling the industrial Roundwood production within a frame of fewer than 25 years since 1990. Chile is a major timber product exporter, and the number of imported goods is negligible because of its vast supply of resources and its contemporary industry.
The forest wood market mainstay comes from exotic species plantations. Less than 1 % of the volume and export products are made with native timbers. [18]
Species
Out of the many local species available in Chile three are among the prevailing ones with two of them being softwood and one hardwood. Those are the pinus radiata (softwood), eucalyptus globulus (hardwood), douglas fir (softwood).
While hardwood has a lot of advantages such as bigger strength and better fire resistance the proposed design is more inclined towards exploring and utilising softwood species as they are less expensive, more sustainable for softwood forests growing at a faster rate and they also provide easier workability which makes them a wiser material choice in this case.
Applications
weatherboards, posts, beams or plywood, boat building
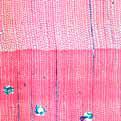
28%_Eucalyptus globulus and Eucalyptus nitens
highly stressed internal uses, floor cloverings, shipbuilding, veneer for plywood, staves
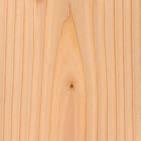
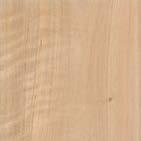
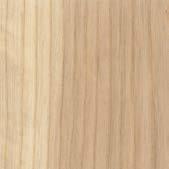

Utility lumber, pallets, paper (pulpwood), fenceposts, flooring, veneer, and turned objects.
Flooring, millwork, boxes/crates, baseball bats, and other turned objects such as tool handles.
Tensile strength parallel to grain
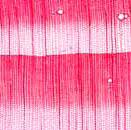
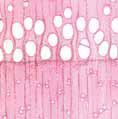
radial shrinkdage
tangential shrinkdage
elastic modulus
(GPa)
fungal

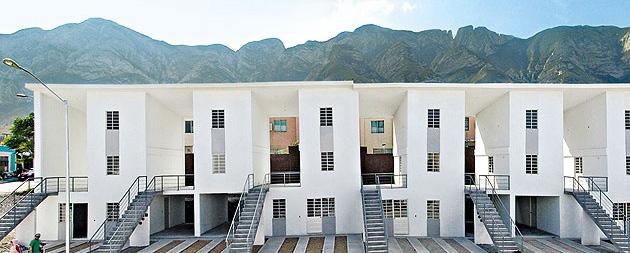


Social housing is the term used to define accommodations which are provided at affordable rates, on a secure basis to people on low incomes or with particular needs. Social housing properties are usually owned by the state, in the form of councils, or by non-profit organizations such as housing associations.
In 2001, the United Nations estimated that 9% of Chile’s urban population were living in poor settlements, compared with 40% in 1990. This is largely due to the high scaled social housing projects taken up in the country. These projects include construction of new houses, emergency houses as well as progressive houses; the installation of the tools and materials bank; the assembly of tool kits for isolated locations and vulnerable families; and the provision of participatory diagnoses, training and technical assistance to help families recover from disasters.
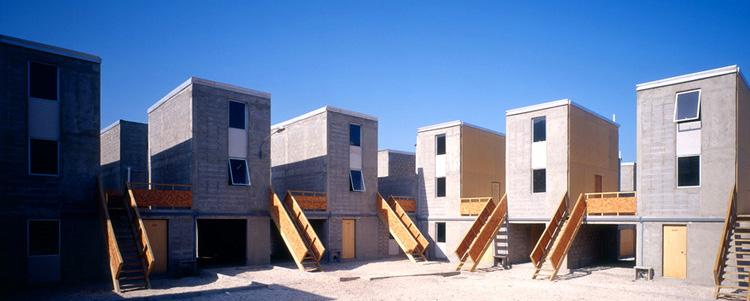
In 2010, an 8.8 magnitude earthquake hit Constitución, Chile, being the second largest earthquake the world had witnessed in half a century. The disaster had completely destroyed the town and about 80% of Constitutions buildings were ruined. However, as a part of the relief effort, an architectural firm called Elemental was brought on board in order to create a plan for the city which included new housing for the people displaced by the disaster. The structures designed by Elemental were radical in nature as they gave people ‘half a house’. Elemental provided the residents with just enough to meet the Chilean legal requirements for lowincome housing, allowing them to expand the rest. In Constitución, the plans for Villa Verde, an entire area populated by two-story half houses, the visual design of the buildings are different, but the concept is the
same, half of the houses are identical and the other halves are completely unique. The first floor of the finished half is made up of unfinished concrete floors, and the second is covered in unfinished plywood. The houses were simple, two-story homes, each with a wall running down the middle, thereby splitting the house into two. One side of the house was ready to be moved into and the other side is just a frame around empty spaces which could be built out by the occupants. Residents can take part in building workshops facilitated by Elemental, and every house comes with a manual covering possible ways to expand using standard building materials, avoiding the need for anyone to buy expensive custom resources. The vision is that residents end up with a much more pleasant house than what they could have built completely on their own or received from ordinary state funding. In 2016, the firm’s founder, Alejandro Aravena, was awarded the Pritzker Prize, one of the top prizes in the field. [21][22]
Building upon the investigation of Chile’s social housing models, modular housing could be a potential solution to explore new models of inhabitation.
Conventionally in “site-built” construction, a building is erected on the construction site after the design phase, this approach has been a widely accepted construction method since the late 19th century and accounts for most of the construction in the present time.
Industrialization has exposed the construction industry to different methods of construction, off-site construction came into practice as a substitute for the on-site method. Off-site construction involves the process of manufacturing and assembling of building components prior to the installation on site.
Modular construction is one of the offsite construction methods which is rapidly evolving as an effective alternative to traditional on-site construction.
Modular buildings can be built off-site fabrication centers, assembled and delivered to the construction site, assembled and placed on a permanent foundation. All the mechanical, electrical and plumbing work is done in the factory before being delivered to the site. About 90% of the work is done offsite and the remaining work which is the foundation is done much like the off-site construction. There are several benefits of modular construction compared to the traditional methods of construction, some significant advances are discussed below.
One of the significant benefits of modular construction is that building assembly and site preparation takes place simultaneously, as a result, time-saving can substantially cut down the cost of a project. Some literature study shows that when the number of stories of the building goes up, the time required can go down subsequently.
Controlled manufacturing facilities in which the components are built lead to better quality compared to the on-site construction where there might be constant exposure to harsh weather. Repetitive processes and automated assembly lines can result in increased precision and better finished building quality. Modular construction can be environmentally beneficial as less waste is produced due to precise planning and purchasing of materials and appropriate recycling. Also, at the end of the building cycle modules can be disassembled and reused in other projects instead of disposal. On-site reduction of greenhouse gas is added benefits as reduced construction time leads to less energy consumption. [23]
The Futuro House celebrated 50 years in 2018 and was built to revolutionise the way people lived. Unlike the other staples of a ‘better future’, this architectural oddity was designed with a purpose. A colorful pod in the shape of an ellipse, Futuro was a sci-fi vision offering the masses a living space very different from what most were used to.
Designed by Matti Suuronen, an architect from Finland, Futuro was designed as a cabin meant to be built on a ski slope. The cabin was held aloft by steel legs and the curved shape meant the snow would not settle. It also consisted of fixed seats, a kitchen, bathroom, bedrooms and a central table. As it measured a mere eight meters, the pod could be transported on a flat bed lorry or hoisted into position by a helicopter. Suuronen pioneered the usage of reinforced plastic and manmade materials such as polyesters resin, fiber glass and acrylic. [24]

[Digital Experiment]
- Bimetallic Beam Curvature equation
[Physical Experiment]
- Hygroscopic behavior of material
[Digital Simulation]
- Bimetallic Beam Curvature equation
[Multi-Criteria Optimisation]
- Genetic Algorithm
- Structural Performance
- Structural Performance
-
03-0
The research from the domain chapter establishes a constructive knowledge of the material system. The method chapter seeks to integrate the knowledge from digital and physical experiments into computational design experiments.
-
At the local building scale, digital and physical experiments carried out in the studio helped to extract various parameters leading to the design of the complex relationship between the material behavior, performance and the morphology of the building.
At the global scale, the goal was to simulate the expansion of the cluster that takes into account the demographic changes of the context. Both social and environmental criteria act as drivers for the expansion of the cluster.
-Environmental Performance
The first step to understanding material behavior is the digital extraction of the material properties. The digital simulation is based on the Timoshenko’s model for bilayer bending. The manipulation of the parameters in the equation is investigated. These experiments provide useful insights into the different factors that can be manipulated to achieve variation in material bending.
A series of physical experiments are conducted with two different wood species of veneer with a material thickness of o.5mm and 2.5mm. The goal for these experiments is to examine how the physical material behaves when compared to the parameters extracted from the digital experiments. These experiments play a crucial role in material systems development. At the same time, it provides insightful information on the limitations of the material system. The wood adhesive used in the experiment is polyurethane based waterproof adhesive and the instrument used to measure the moisture content of the specimens is called PROSTER digital moisture meter.
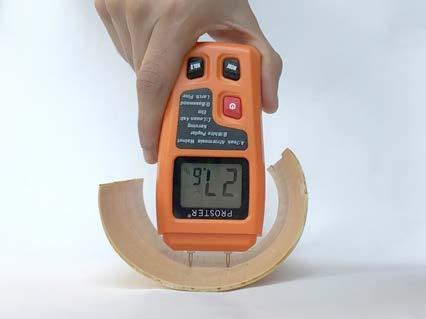
The parameters extracted from the digital and physical experiments are primarily the basis for the design of module geometry. The mechanical and physical properties of wood are embedded within the definition in order to construct the module geometry. Genetic algorithms are used to optimize geometry. The result of these experiments provides the knowledge of the component behavior and the quantifiable information required to fabricate the module.
(San�ago, Dec 1 -Mar 31, 2012 sunlight hour)
2. maximum ventilation
(Southwest wind at 6.2 m/s)
3. minimum distance to courtyard
(shortest path length)
1.maximum sunlight on modules
1.maximum sunlight on modules ENVIRONMENTAL SOCIAL
In order to perform structurally, the module needs to withstand both live load and dead loads as well as the lateral loads from the wind. These loads are digitally applied to the single module and also to the vertical stack up of multiple modules.
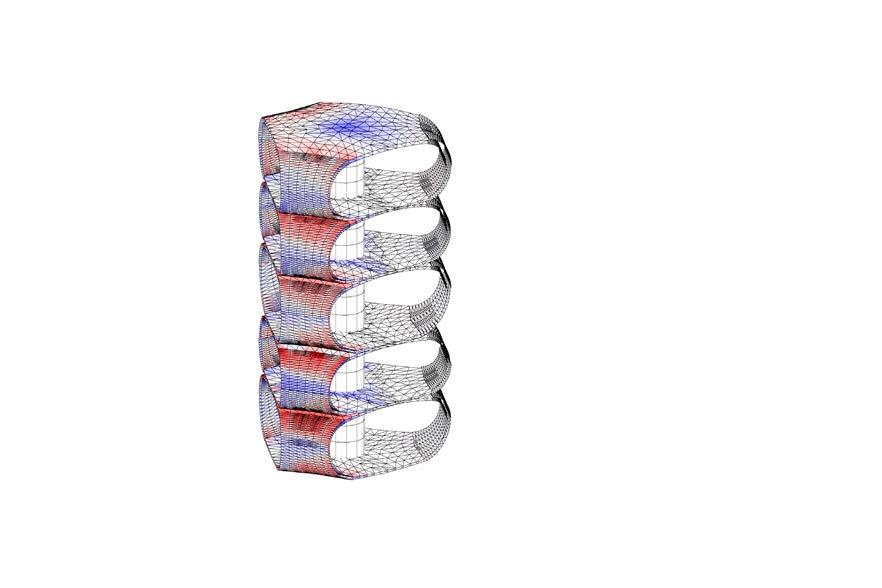
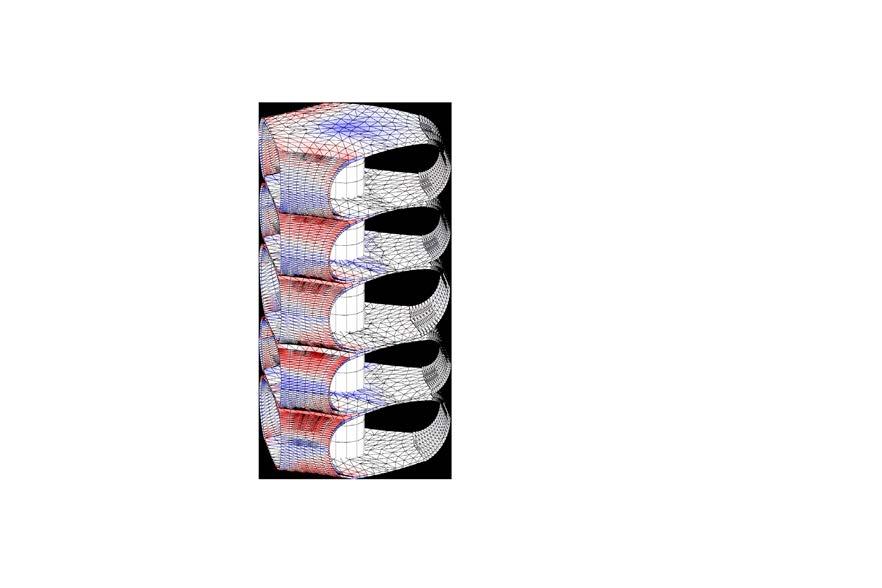
Finite Element Analysis(FEA) is used for digital analysis of the deformation within the system with an allowable range of values. The results from these experiments give an understanding of stress-induced in the local parts of the structure, which will enable a deep understanding of the material and geometry performance and indicates the parts which would require further reinforcement.
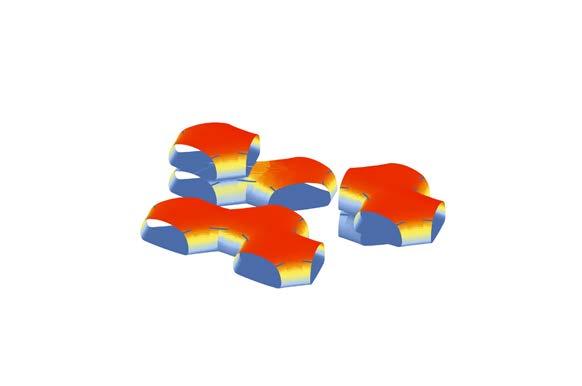
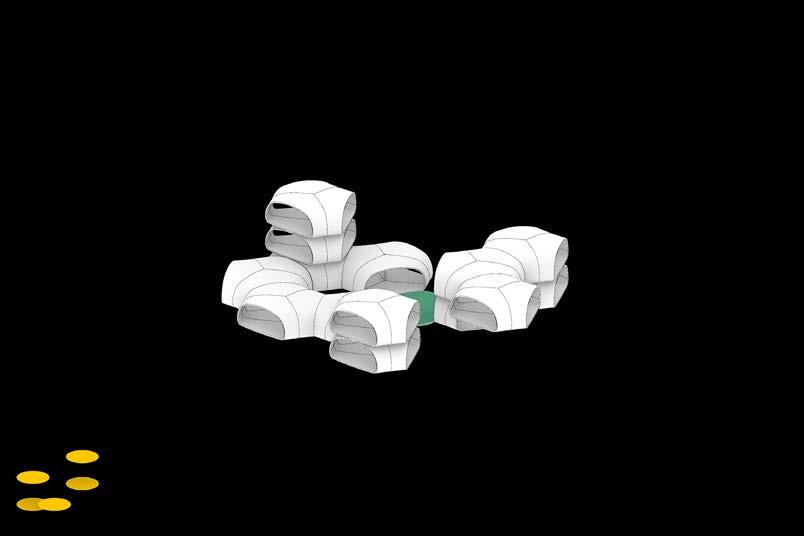


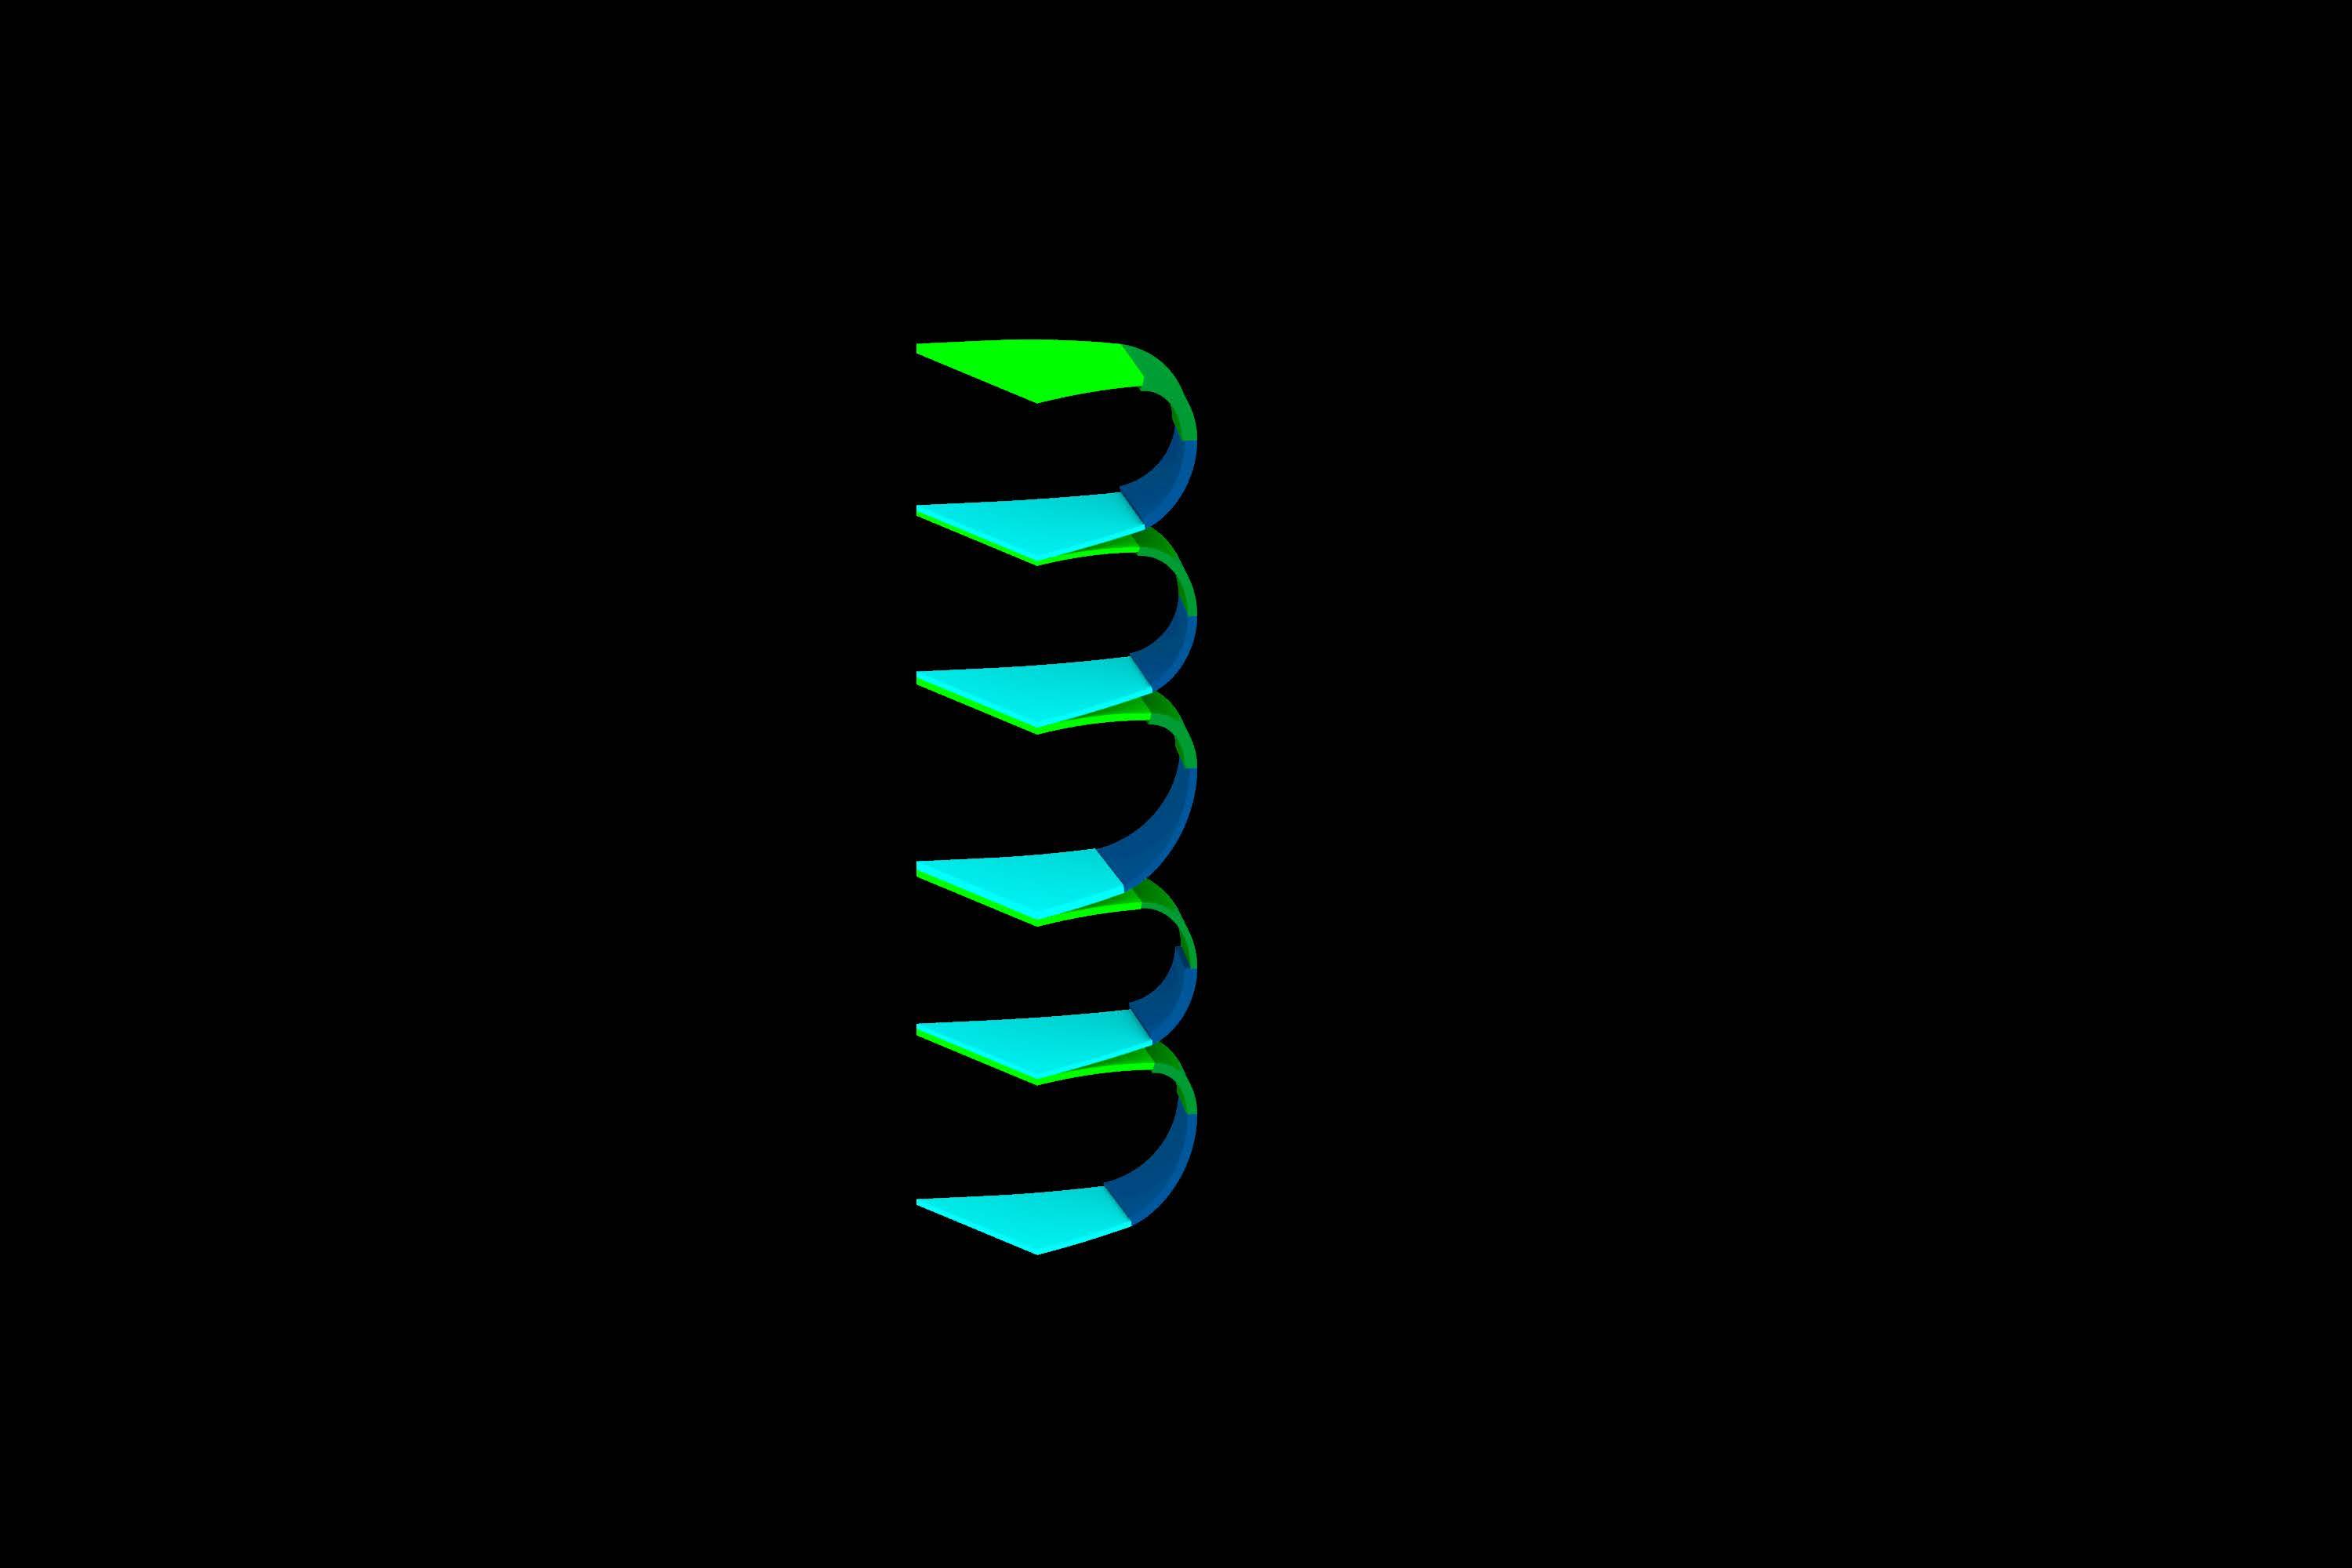
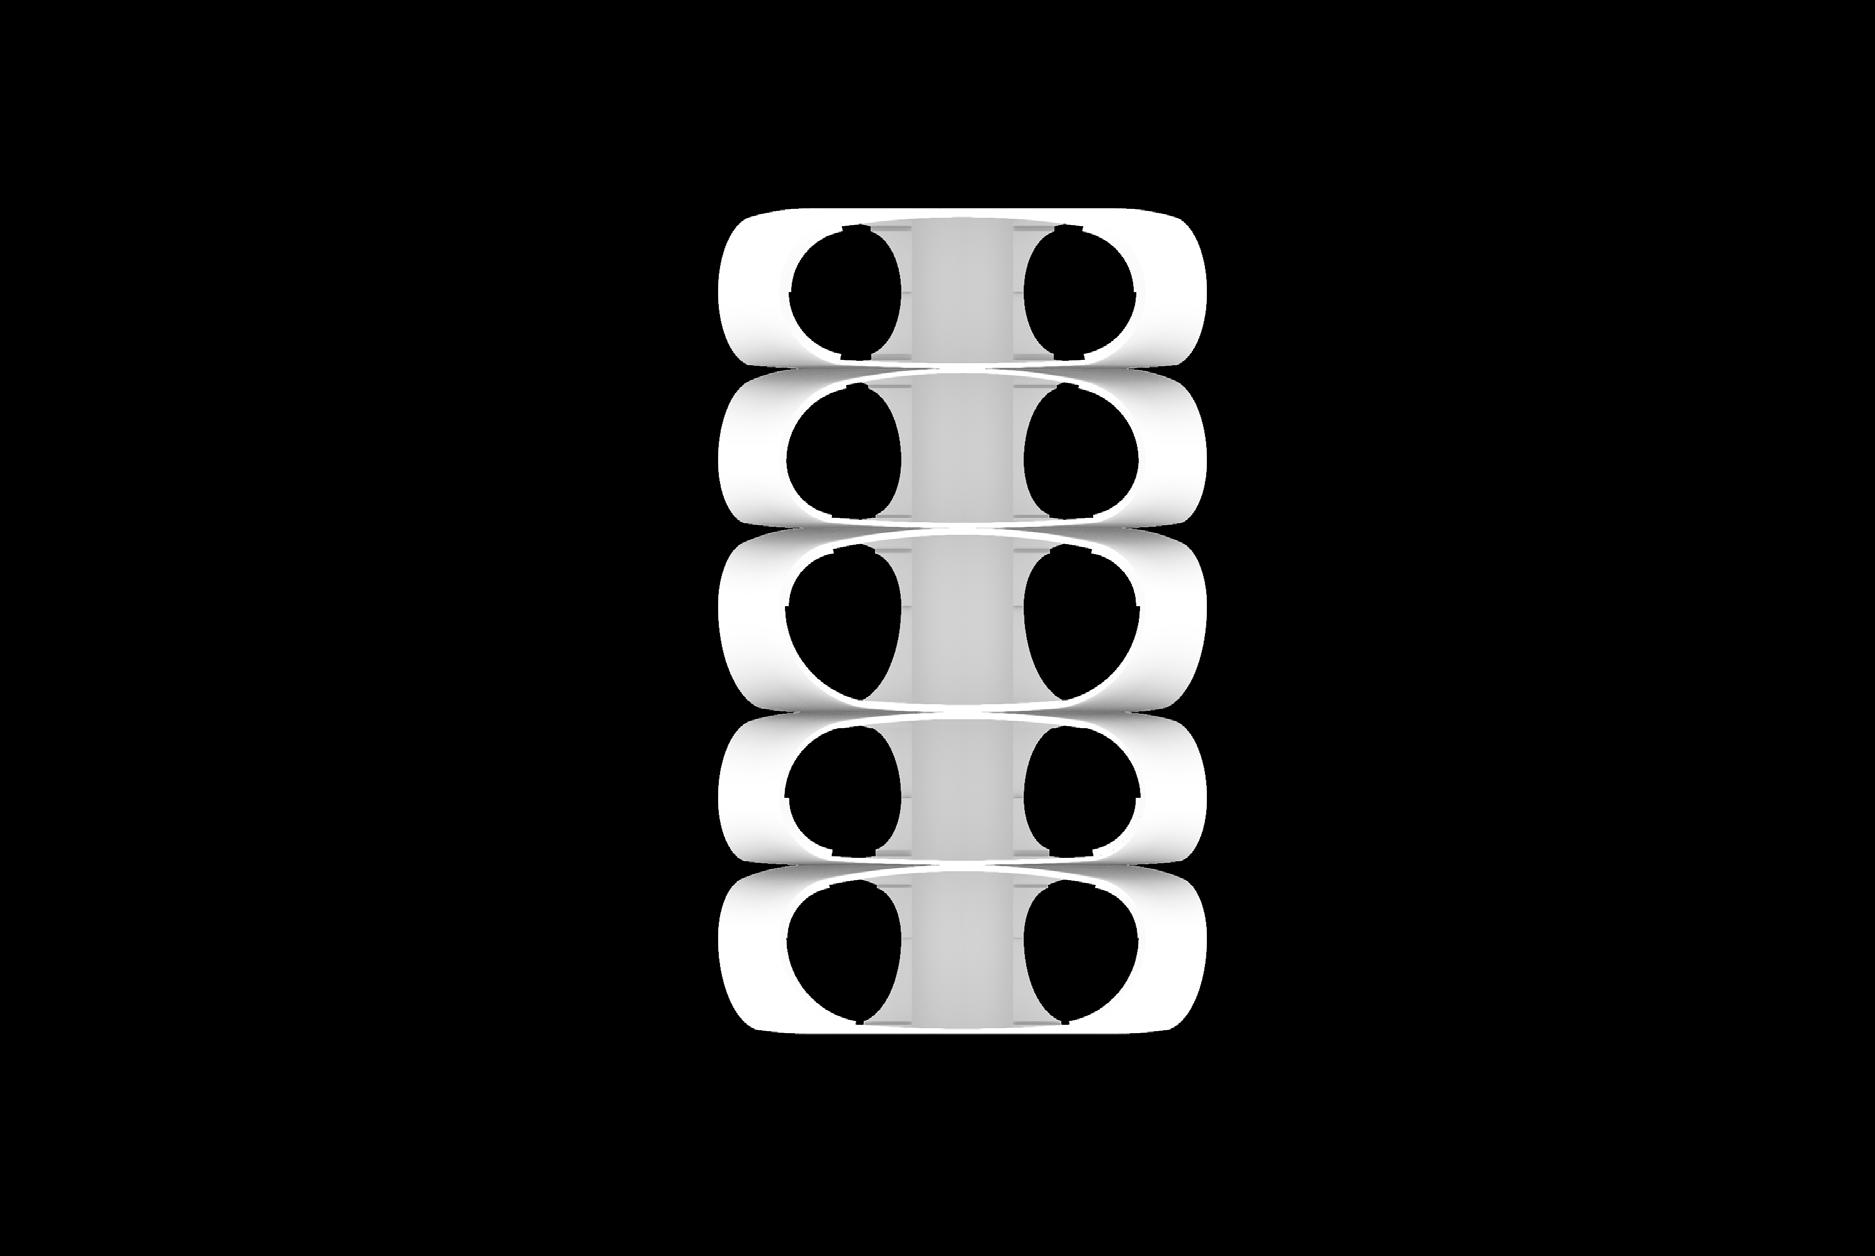
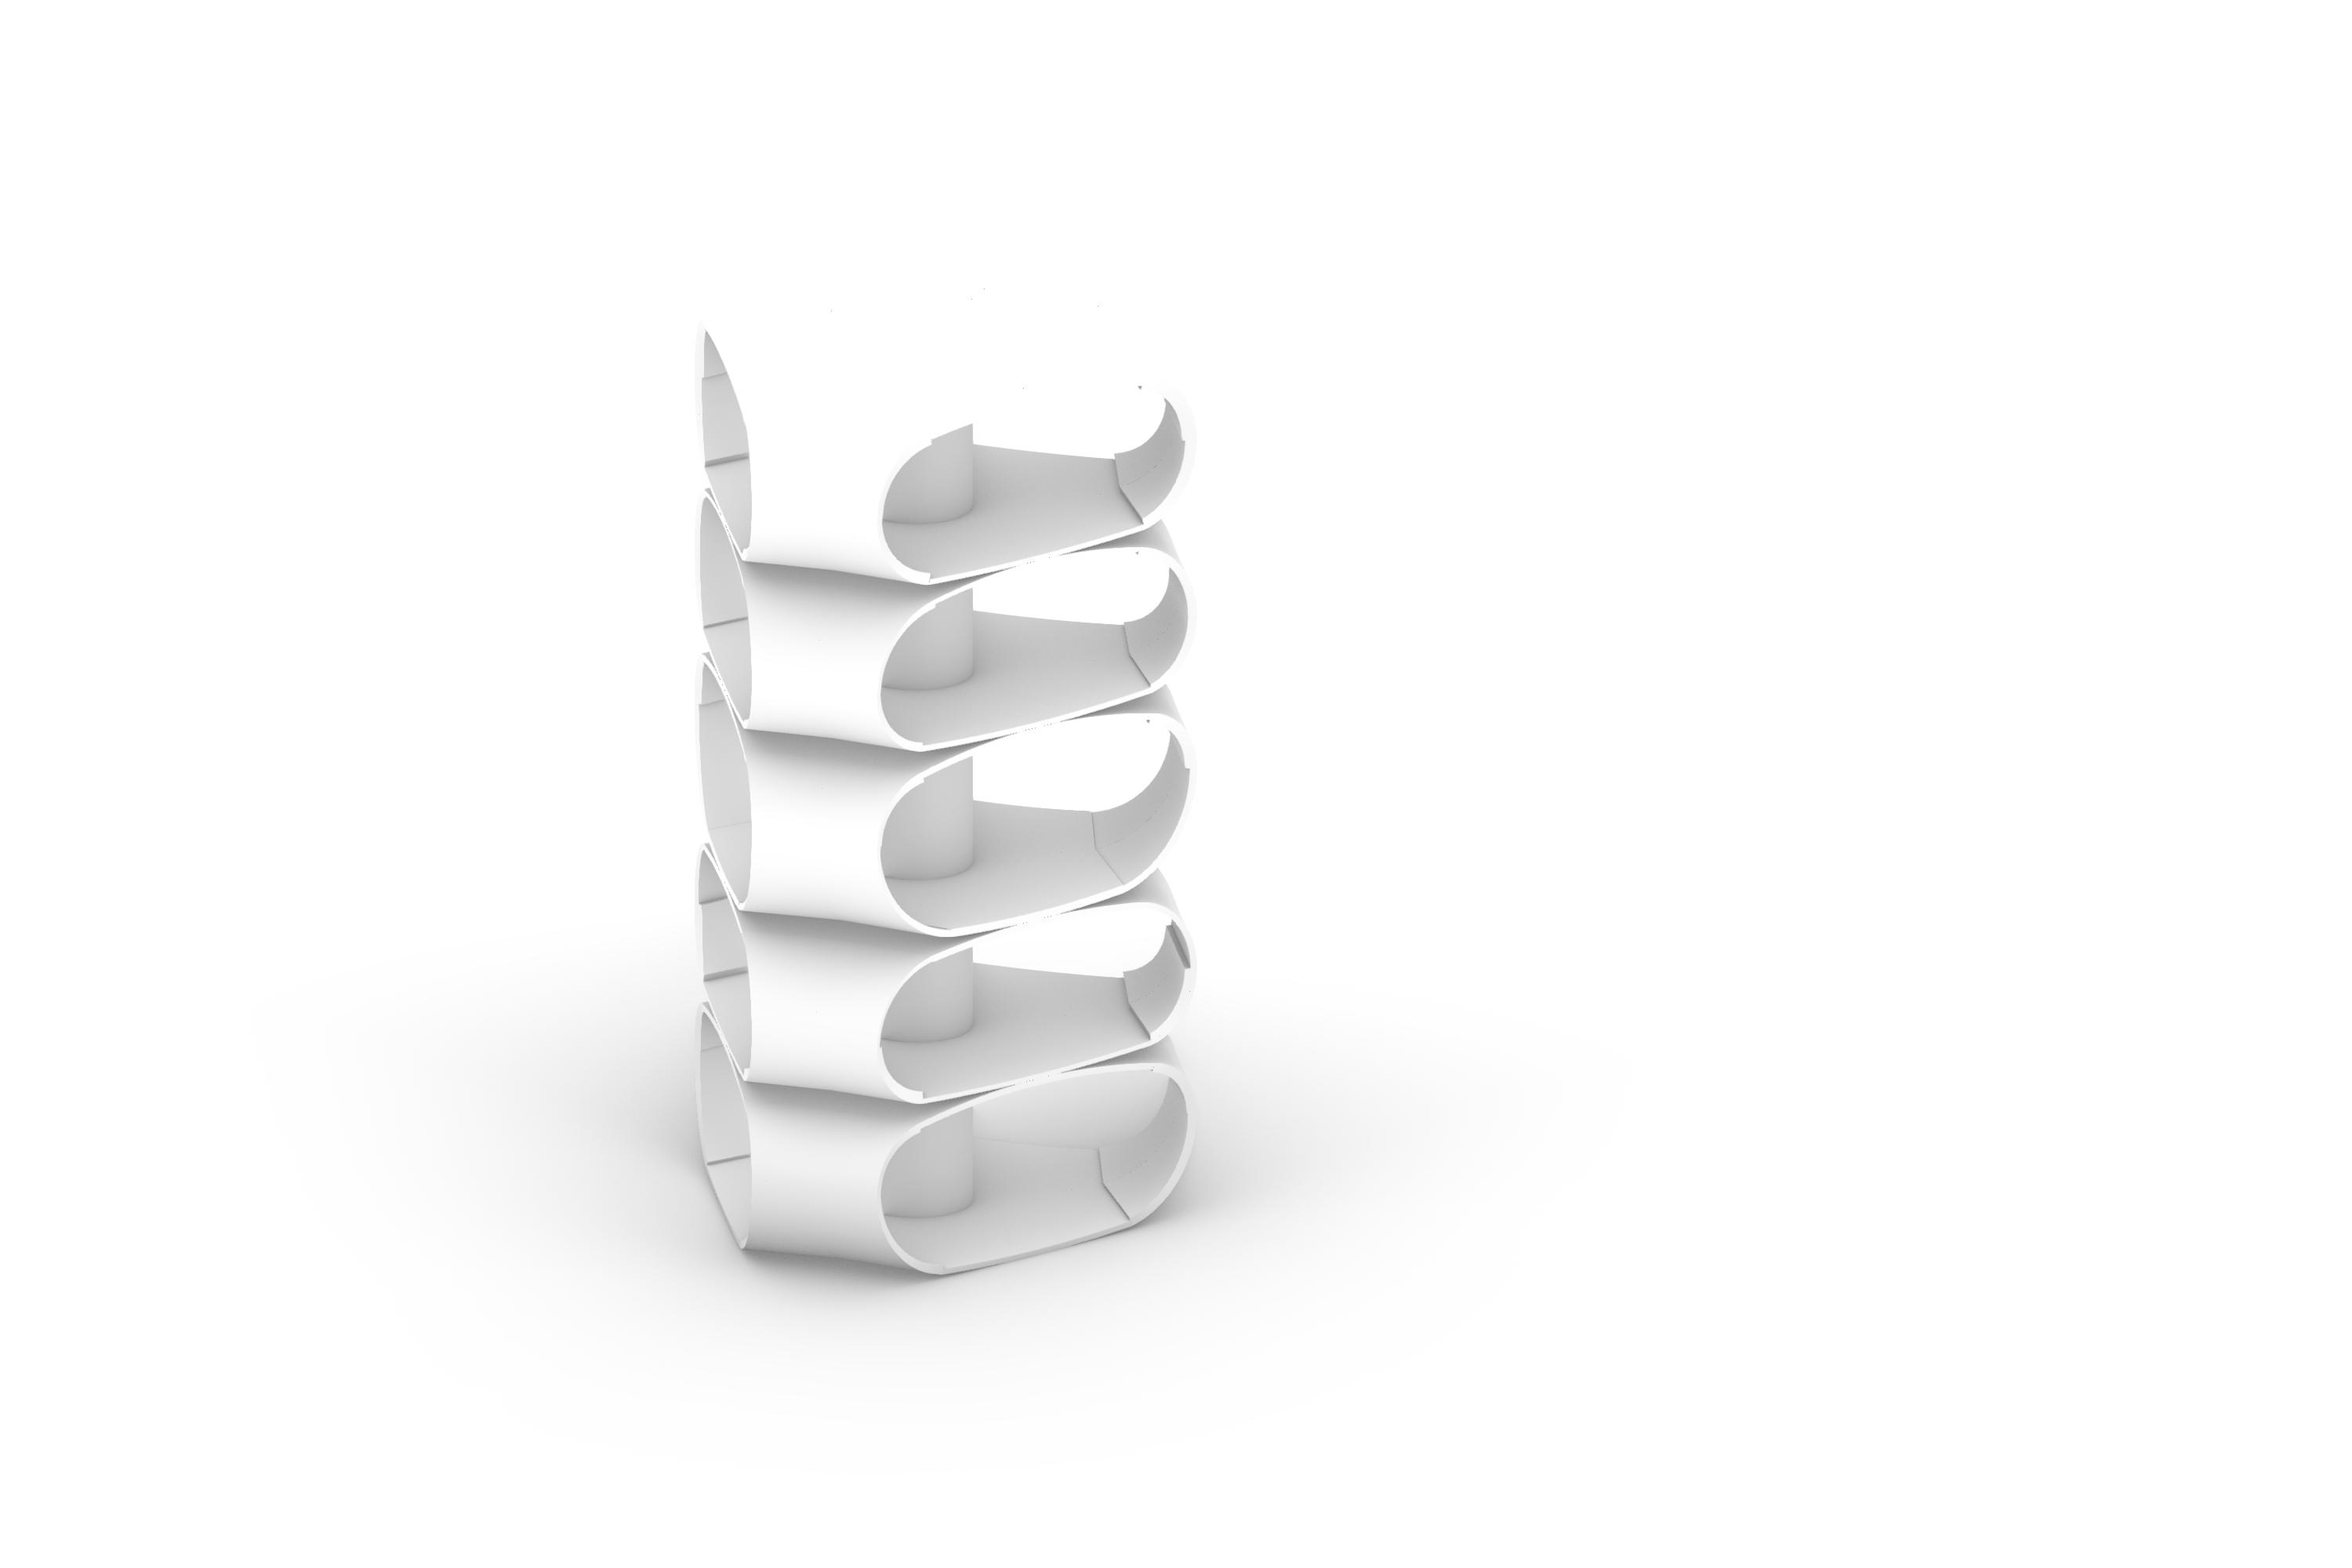
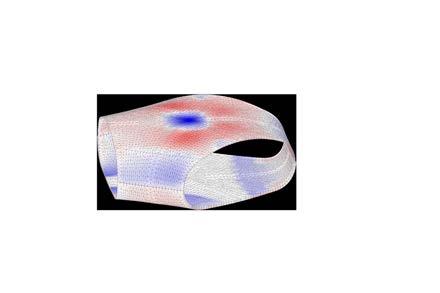
The cluster aggregation of modules will be simulated using genetic algorithms which take into consideration the social structure and environmental factors from the site context. The results extracted from these experiments are expressed in spatial relationships within the cluster.
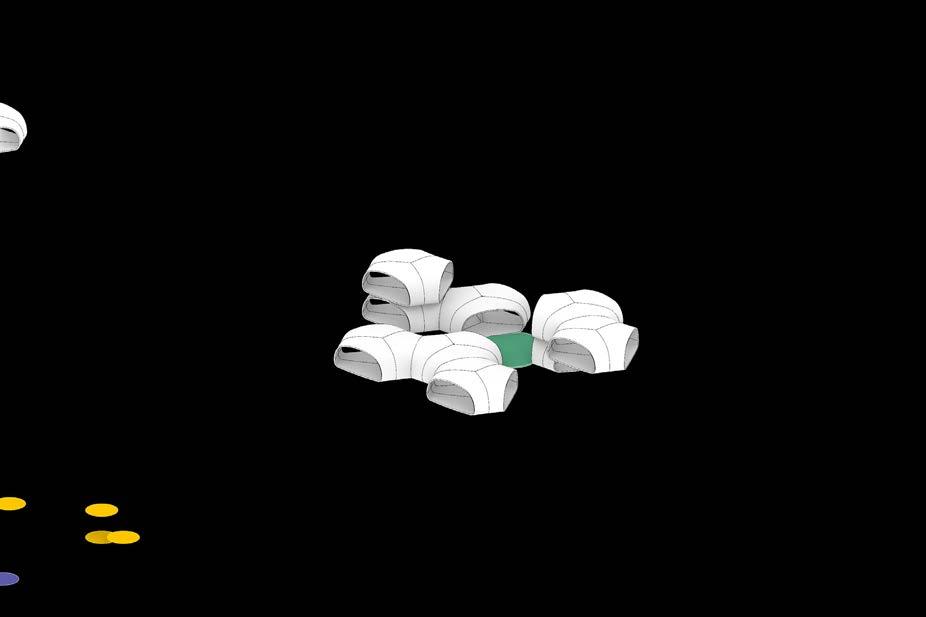


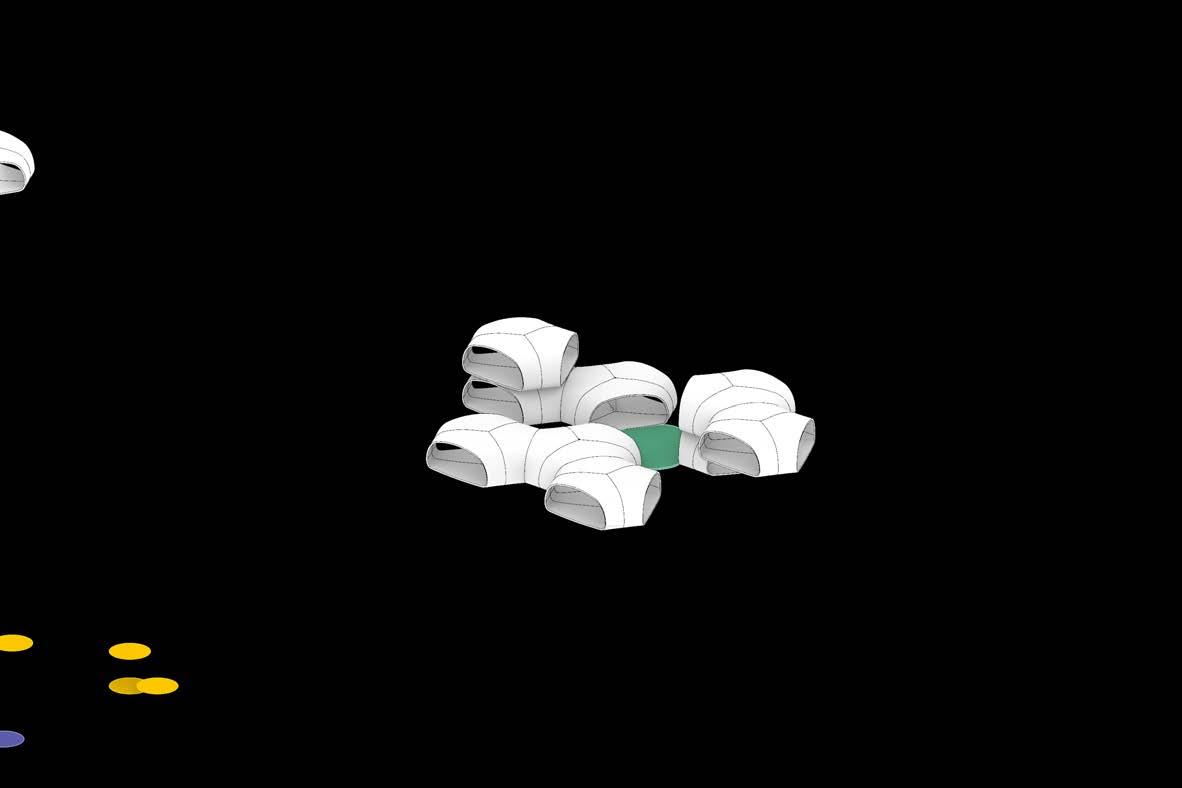
4.maximum shared space
(between each two families)
(San�ago, Dec 1 -Mar 31, 2012 sunlight hour)
The environmental performance of the cluster aggregation will be evaluated based on the amount of radiation the geometry receives. The results are used to evaluate how different configurations of the geometry produce differentiated effects. The tool used for radiation analysis is Ladybug.
2. maximum ventilation
(Southwest wind at 6.2 m/s)
3. minimum distance to courtyard
(shortest path length)

RESEARCH DEVELOPMENT
MATERIAL STUDY
Hygroscopic Design Parameters
Digital Experiment
Physical Experiment
Calibration
04-0
The research development is separated into several stages with each of them informing the consecutive one. It begins with the material exploration studying how bilayers are manufactured and conditioned. Further, it is analyzed what effect the material’s hygroscopic parameters have on the different scales of the design. A digital simulation of the bilayer modules is set up which is followed by a physical experiment which recreates, to a certain extent, the results achieved within the digital one. Once both experiments are completed they are calibrated based on their shared parameters. Finally, a critical estimation is conducted in regard to the influence that each parameter has on the design.
Bilayer theory, developed for thermally responsive bimetallic thermostats which relies on the logic that two metals with different coefficients of thermal expansion expand at a different rate when they are heated. The metal with a lower thermal coefficient of expansion is overcome by metal with a higher coefficient of expansion which in turn induces curvature to the inside. Inspired by the bi-metallic strip logic, the initial experiments show the potential of combining two layers of wood, the system employs securing an active wood layer which has a relatively higher moisture content to a passive wood layer with the same fiber orientation as the active layer and a lower moisture content, the difference in the response behavior of each layer causes one layer to expand more than the other, causing the overall bending motion that does not require any additional mechanical force, but rather relies on the inherent properties of wood.
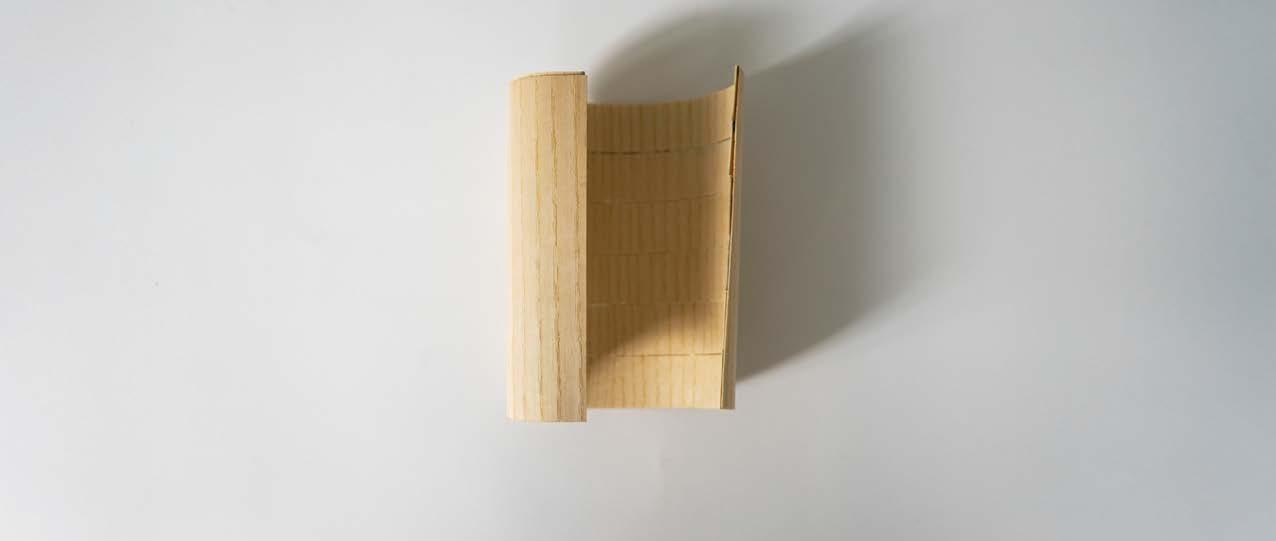

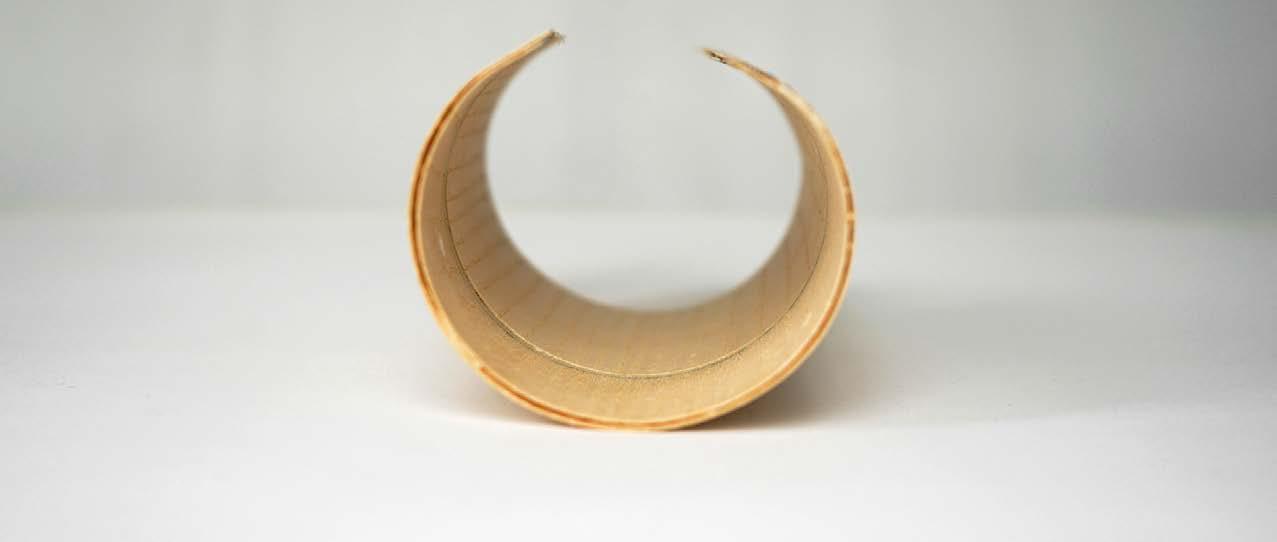
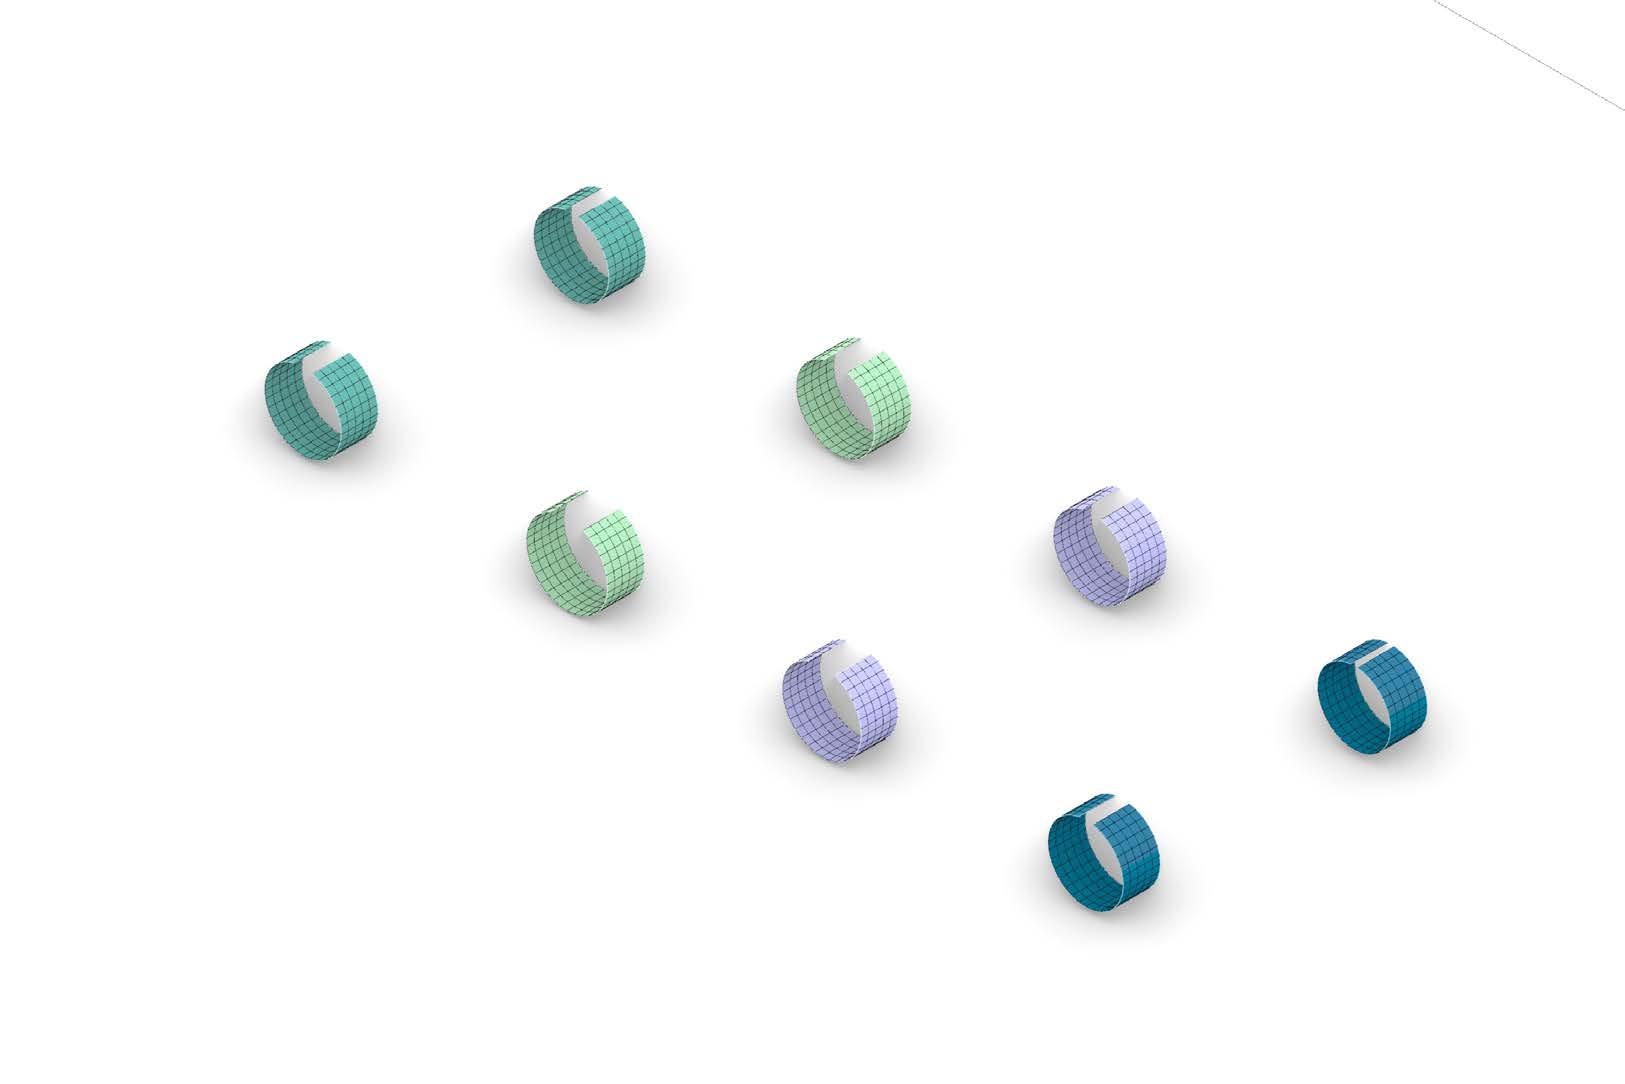
In order to precisely bend engineered timber pieces based on their hygroscopic properties, there are certain parameters which have to be calibrated accordingly. Firstly, the moisture content of both the active and the passive layers have to be considered since these are the main parameters that trigger the self-shaping mechanism. The fiber-directionality is the second main driver as timber is anisotropic material, literature study suggests that anisotropic contraction is different in all the three fiber directions. The thickness of both the active and passive layer is also one of the crucial parameters which determine the degree of curvature to be achieved.
Other parameters which are relatively less significant to the result are the aspect ratio of short to long edge, tessellation pattern and frequency, lamination technique and the wood species.
The aim of this research is to extract different information from the digital and the physical experiments and provide a better understanding of how these could inform the design.

Moisture content
Wood species
Fibre directionality
Thickness
Aspect ratio
Tessellation
Lamination
explore & analyse hygroscopic behavior explore & analyse material response

04-2

Wood species
All wood species can produce bilayer components, however, close attention should be paid at the swelling and shrinking properties of the latter.
The digital simulation of the bilayer components is affected by several variables. The first one is the wood species, since the workability depends purely on the choice of material. Further, the directionality could be radial or tangential which affects the components’ strength. Varying the moisture content and the thickness of the layers has a notable influence on the bending radius.
The calculation of the curvature and the entire computational experiment is only possible relying on the bimetal thermostats of Timoshenko.
Fibre directionality
radiata pine douglas-fir eucalyptus globulus ash radial direc�on in ac�ve layer
tangen�al direc�on in ac�ve layer
2% changes
Moisture Content
varying ac�ve layer thickness
Thickness
varying ac�ve layer thickness

The logic used to digitally simulate the bending behavior of timber is based on Timoshenko’s formula for bilayer bending, the logic which was formulated a century ago, relies on the properties of materials such as Young’s modulus of elasticity and the coefficient of thermal expansion. ‘’The result is purely geometric and holds for beams of any combination of materials and for bending due to either external forces or actuationinduced curvature’’. The material properties of the local species are used in Timoshenko’s equation to digitally simulate the curvature of the wooden strips. [1]
RADIUS OF CURVATURE
Young’s
Young’s
Active
Passive
Coefficient
radial direction in active layer
tangential direction in active layer thickness [active] = 0.5mm thickness [passive] = 0.5mm length = 300mm width = 50mm


radiata pine douglas-fir eucalyptus globulusash
Specie: radiata pine
Fibre Directionality: radial
The following set of experiments has the aim to outline the bending properties of three wooden species in Chile and White Ash which is a specie that is relatively easy to source in the UK.
The table Fig. 26 shows that eucalyptus globulus bends the most followed by White Ash, however, both are hardwood species which is less workable. The selected specie for the proposed design is Douglas fir which bends almost as much as the previous two and is also a softwood specie.
The order of bending remains the same in both the tangential and the radial directions. The strips used for both the active and the passive layers in the computational experiment measure 300mm length, 50mm width and 0.5mm thickness.
Specie: douglas-fir
Fibre Directionality: radial
Specie: radiata pine
Fibre Directionality: tangential
Specie: douglas-fir
Fibre Directionality: tangential
Specie: eucalyptus globulus
Fibre Directionality: radial
Specie: eucalyptus globulus
Fibre Directionality: tangential
Specie: white ash
Fibre Directionality: radial
Specie: white ash
Fibre Directionality: tangential
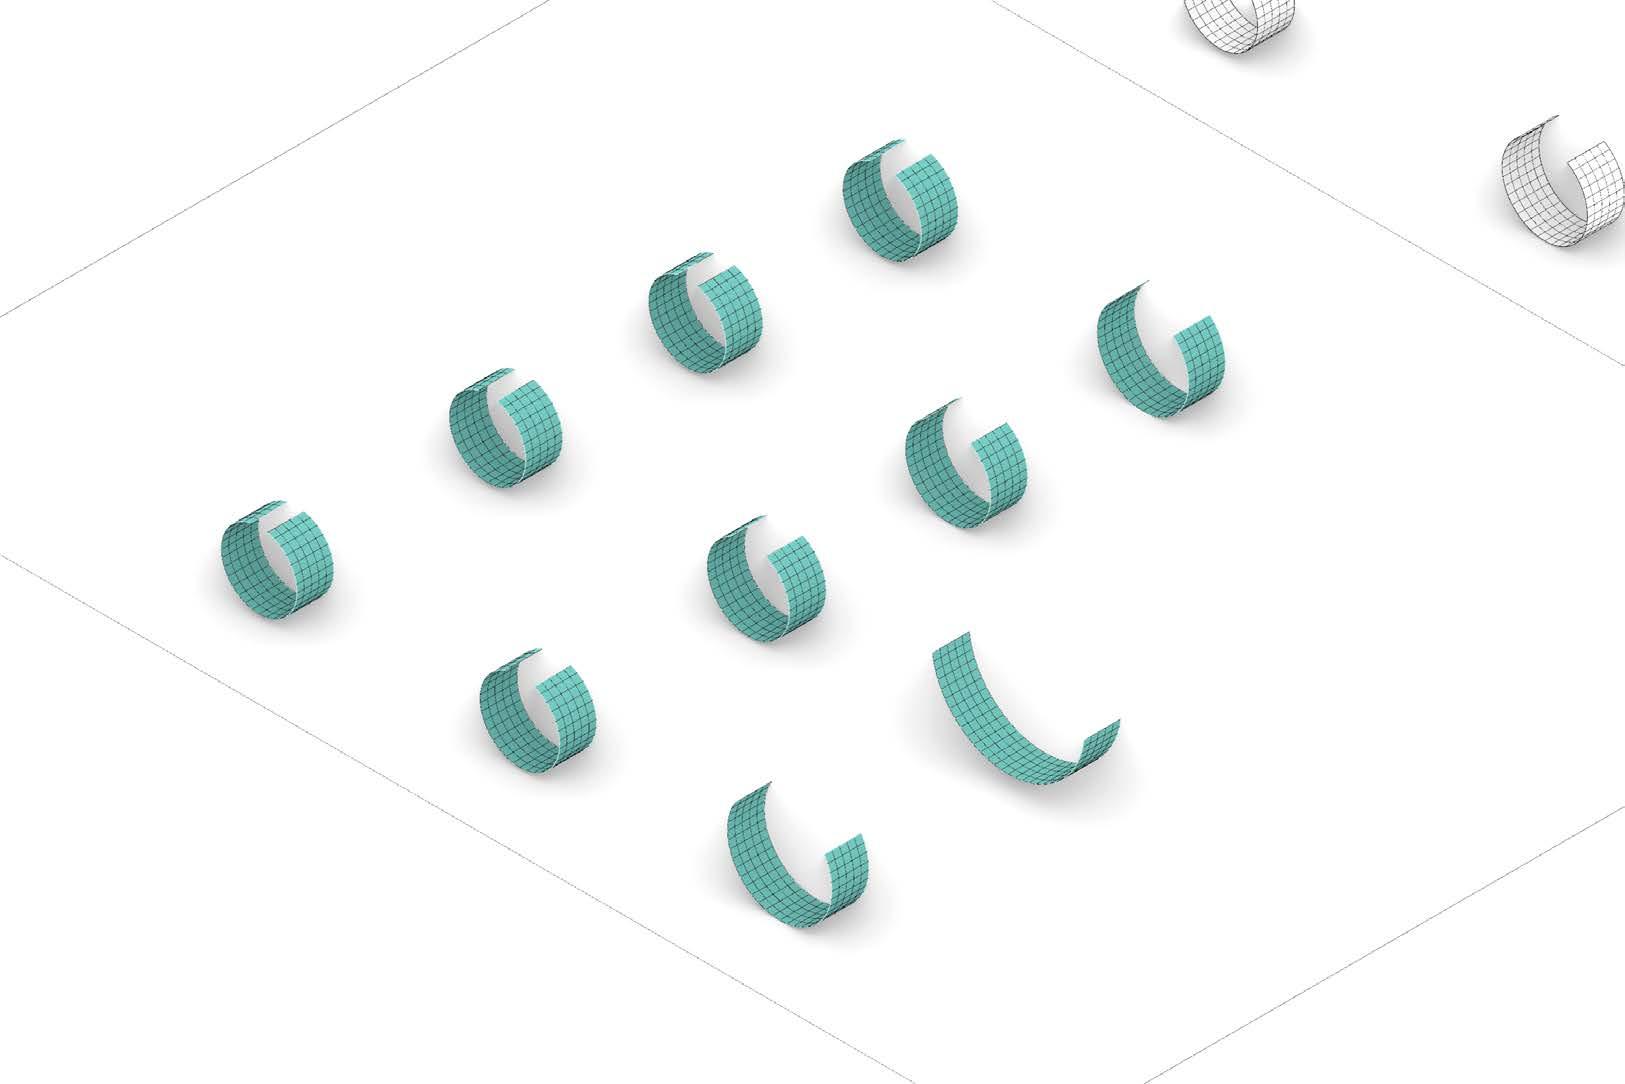


This experiment shows how the relative moisture content difference between the active and the passive layers affects the bending curvature. The rate of bending changes throughout the experiment. Fig. 27 shows that between 30% MC and 20% MC the component bending radii rapidly decline which means that the bending properties increase at a fast pace within the given percentage frame.

FIG.28 Graph showing different thickness of active/passive layers vs radius of curvature
04-2.5 THICKNESS
The last comparison is split into two sections. In the first one the passive layer remains constant while the active is gradually increased at a pace/increment of 0.5mm. In the second part of the experiment the active layer is constant and the thickness of the passive varies.
active = 0.5mm passive = thickness stated on x-axis passive = 0.5mm active = thickness stated on x-axis THICKNESS VS CURVATURE AL = 1.5mm PL = 0.5mm
FIG.28
AL = 0.5mm PL = 0.5mm AL = 2.0mm PL = 0.5mm
AL = 1.0mm PL = 0.5mm AL = 3.5mm PL = 0.5mm
AL = 2.5mm PL = 0.5mm AL = 4.0mm PL = 0.5mm AL = 4.5mm PL = 0.5mm AL = 5.0mm PL = 0.5mm
AL = 3.0mm PL = 0.5mm
0 100 200 300 400 500 600 700 800 900 1000 01234567 Research Development 63
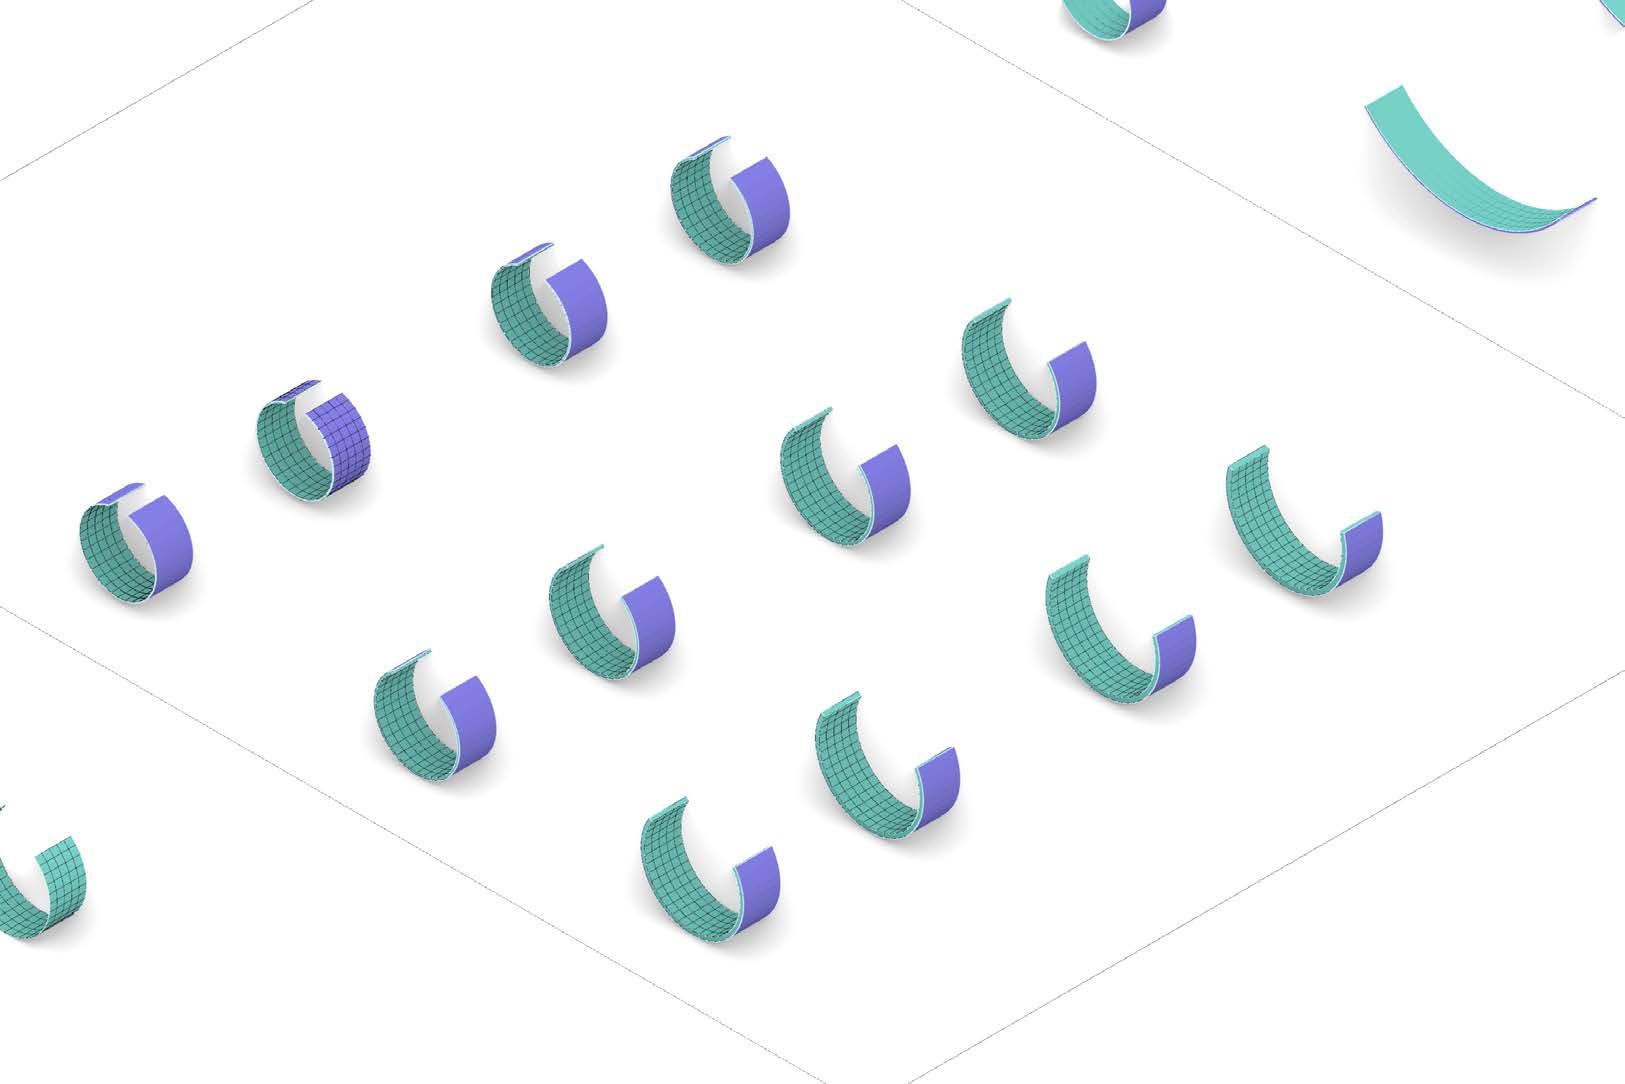


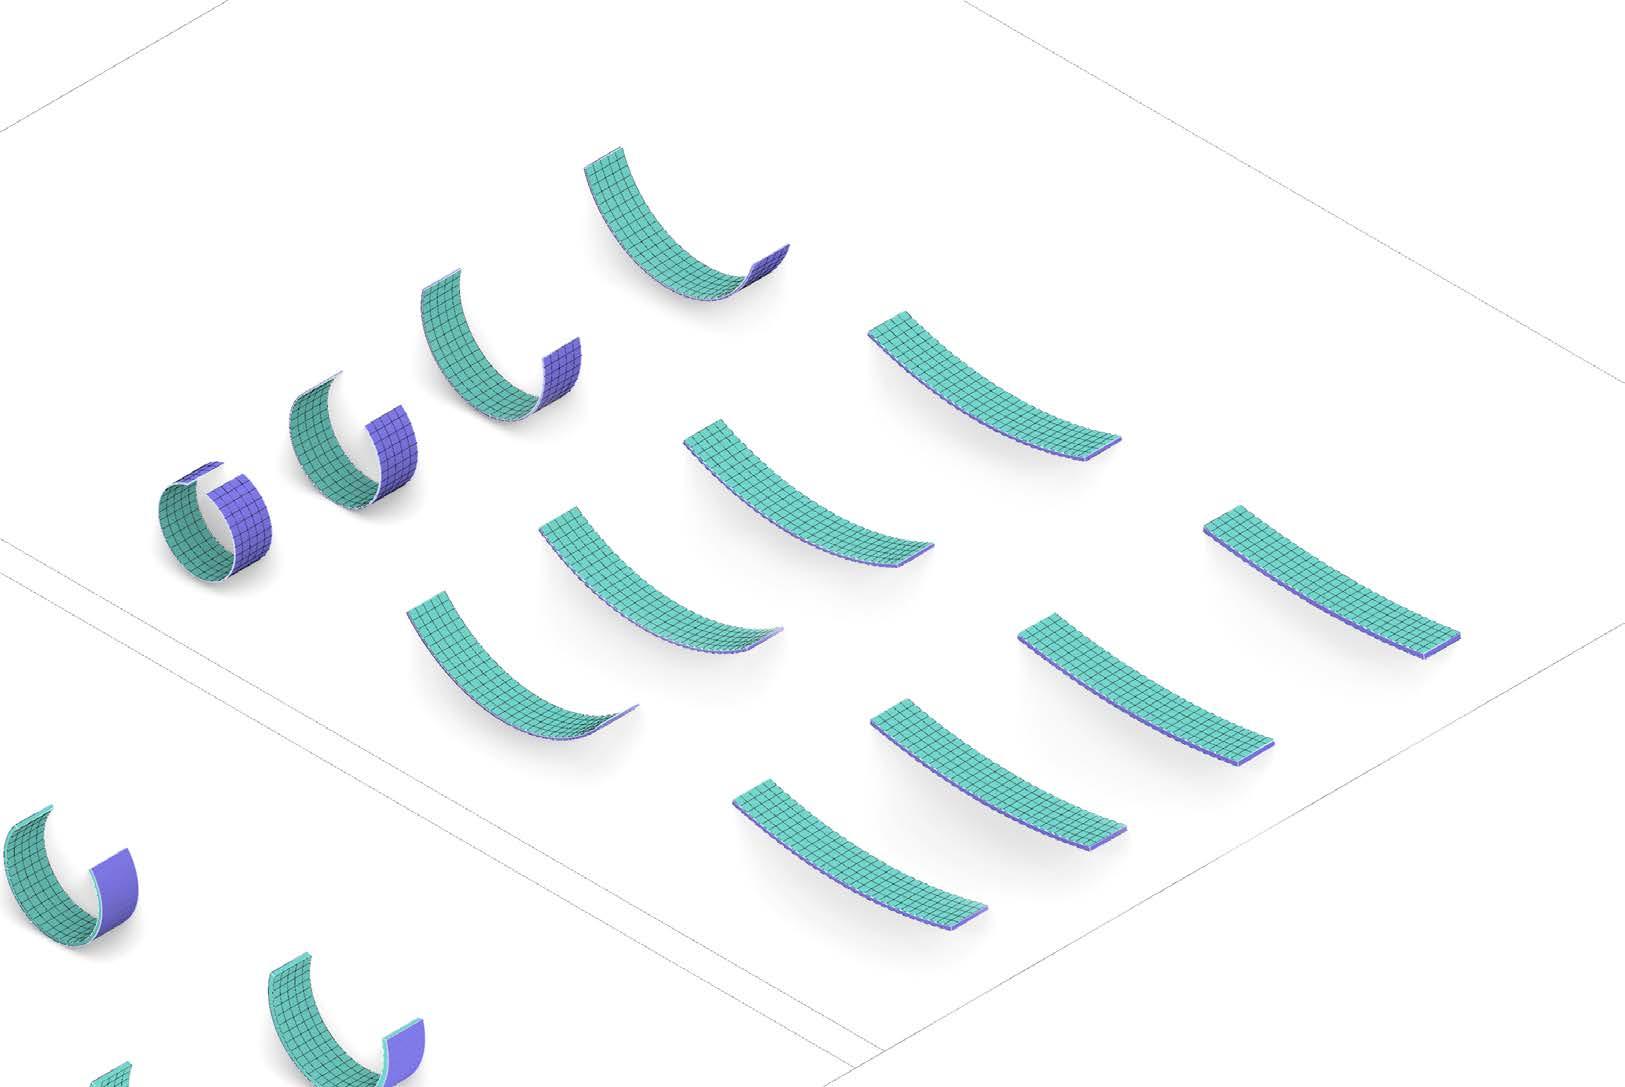


04-3.1
The following sets of physical experiments have several goals. The most important one is to study how accurate the results from the physical experiments can be compared to the digital ones. The second one was to study the scalability of the bending process. The research also looks into the drawbacks of conducting the experiment in an uncontrolled environment.
The following experiments are conducted in a few stages, in each of the experiments there is only one variable while the rest of the parameters remain constant. The parameters that are considered in these experiments are:
fibre directionality (laminate or cross laminate)

thickness (0.5mm or 2.5mm)
aspect ratio (width:length)
tessellation (division and position)
lamination
Fibre directionality
laminate
cross laminate
Thickness
layers of 0.5mm
layers of 2.5mm
Aspect ratio
varying width
varying length
Tessellation
division
posi�on
polyurethane glue
Lamination

The bilayer components are manufactured using adhesives. The weight of the layers is measured prior to applying glue and after that to estimate the amount of adhesive used. Prior to any application, however, the material has to be brought to equilibrium to the relative humidity at the chamber/kiln. Although in our experiment the weight of glue was neglected to simplify the study, we were able to select a species, adjust the thickness of both the active and the passive layers, fine-tune the moisture content and decide the grain direction. All these are key factors which simultaneously impact/affect the curvature radius of the timber piece. The calculation of the curvature and the entire computational experiment was possible, relying on the bi-metal thermostats of Timoshenko.
bilayer starts to curve during the drying process





 2. moisture is applied to the the active layer, which then expand to the same length as the passive layer
4. pressure is applied until the glue is dried
6. bilayer stops curving once reached equilibrium moisture content
1. active and passive layers with grain oriented in the tangential direction
3. both the layers are secured using a polyurethane wood adhesive
direction: 90°
active: 1 x 0.5mm
passive: 1 x 0.5mm
aspect ratio: 2 : 3
tessellation: 40/40/40mm
direction: 0°
active: 1 x 0.5mm
passive: 1 x 0.5mm

aspect ratio: 2 : 3
tessellation division: 40/40/40mm
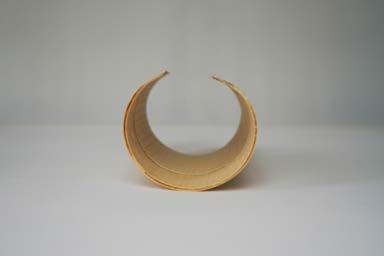
Comparing the radius of curvature of veneer layers oriented in opposite grain direction and layers oriented in the same grain direction it is observed that the layers with the same grain direction curve more compared to the latter one.
 r=76.50mm
Direction: 0°
active: 1 x 0.5mm
passive: 1 x 0.5mm
aspect ratio: 2 : 3 tessellation division: 30/30/30/30mm
direction: 0°
1:2 scale2D
active: 1 x 0.5mm
passive: 1 x 0.5mm
aspect ratio: 2 : 3 tessellation division: 15/15/15/15mm
direction: 0°
1:2 scale2D
active: 1 x 0.5mm
passive: 1 x 0.5mm

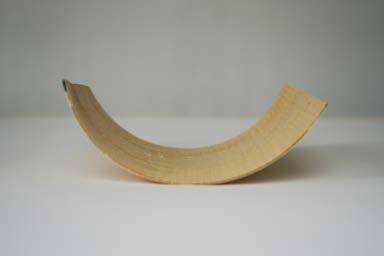
aspect ratio: 1 : 3 tessellation division: 15/15mm
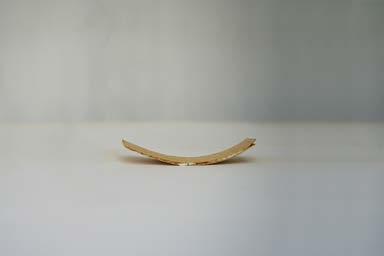
In this set, two simultaneous experiments were conducted. The first one shows how a two-dimensional scale (preserving the thickness as its original) affects the bending properties of the bilayer. The second comparison highlights the difference made by the aspect ratio. Unproportional (two-dimensional) scaling more than doubles the curvature radius, in this particular case.
direction: 0°
active: 1 x 0.5mm
passive: 1 x 0.5mm
aspect ratio: 2 : 3
tessellation division: 30/30/30/30mm
The given three pieces have the same tessellation pattern, however they differ in their active layer and passive layer thicknesses. While [4] has one layer of both passive and active layers, [6] has one passive and two active layers and [5] has an irregular build comprising 1 passive and 1.5 active. The piece with a higher number of active layers bends more than the piece with a lower number of active layers. Irregular stack-up results in unexpected deformations such as twisting and producing double curvature.
direction: 0°
active: 1,2x 0.5mm
passive: 1x 0.5mm
aspect ratio: 2 : 3
tessellation division: 30/30/30/30mm
direction: 0°
active: 2x 0.5mm
passive: 2x 0.5mm
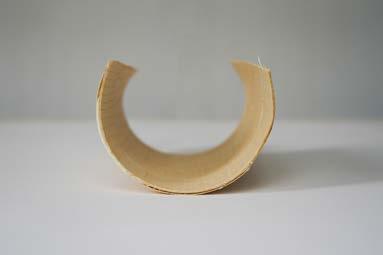
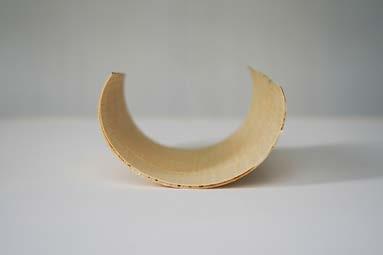

aspect ratio: 2 : 3
tessellation division: 30/30/30/30mm
EXPERIMENT r=87.41mm r=43.90mmdirection: 0° active: 1 x 0.5mm
passive: 1 x 0.5mm
aspect ratio: 2 : 3 tessellation division: 30/30/30/30mm
direction: 0° active: 1 x 2.5mm
passive: 1 x 0.5mm
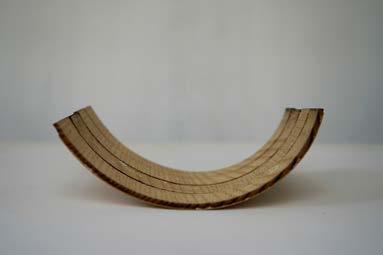
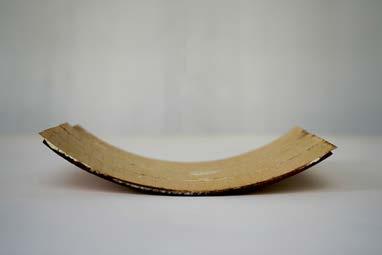
aspect ratio: 2 : 3 tessellation division: 30/30/30mm
direction: 0°
active: 1 x 0.5mm
passive: 1 x 2.5mm
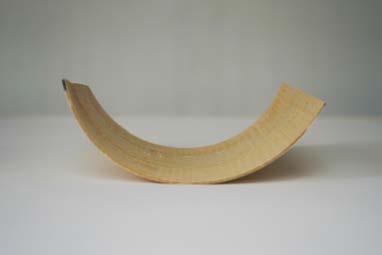
aspect ratio: 2 : 3 tessellation division: 30/30/30/30mm
The comparison between these three pieces aims to show how varying the passive layer and active layer thicknesses affect the radius of curvature. All three pieces share exactly the same tessellation pattern. [4] has both layers in 0.5mm thickness, [9] has a thicker active layer [2.5mm] and a thinner passive [0.5mm] whereas [10] has a thicker passive [2.5mm] and a thinner active [0.5mm]. The piece with a thick active and thin passive layers curves the most, whereas the one with the thin active and thick passive layers curves the least. However, the piece with equal layer thicknesses almost matches the bending curvature of the one with the thick active layer.
direction: 0°
active: 1 x 0.5mm
passive: 1 x 0.5mm
aspect ratio: 2 : 3
tessellation division: 40/40/40mm
direction: 0°
active: 1 x 0.5mm
passive: 1 x 0.5mm
aspect ratio: 2 : 3
tessellation division: 20/20/20/20/20/20mm
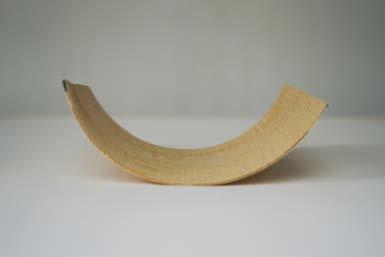
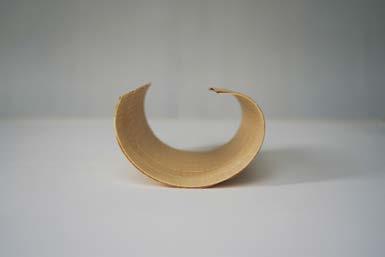
The three pieces that are being compared in this set have a 2.5-layer build as a result of the top-most active layer which covers only half of the surface of the bottom-most active layer. The goal is to explore how the tessellation pattern affects the bending properties of the whole piece. The one that curves the most [17] has its 0.5 layers aligned in the middle of the piece, whereas the one that bends the less [16] has the 0.5 layers aligned to the borders of the piece. The irregular build of [15] induces an unintended double curvature and twisting. Active layers concentrated in the middle of the piece induce more curvature. Irregularities in the stack-up result in unwanted deformation.
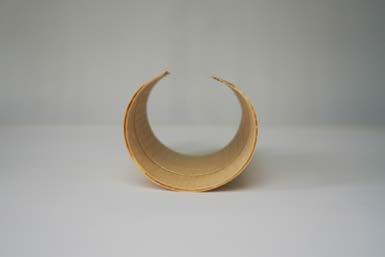
direction: 0°
active: 1 x 0.5mm
passive: 1 x 0.5mm
aspect ratio: 2 : 3
tessellation division: 30/30/30/30mm
direction: 0°
active: 1 x 2.5mm
passive: 1 x 2.5mm
aspect ratio: 2 : 3 tessellation division: 50/10/50/10mm
direction: 0°
active: 1 x 2.5mm
passive: 1 x 2.5mm
aspect ratio: 2 : 3 tessellation division: 40/20/40/20mm
direction: 0°
active: 1 x 2.5mm
passive: 1 x 2.5mm
aspect ratio: 2 : 3 tessellation division: 50/40/20/10mm
direction: 0°
active: 1 x 2.5mm
passive: 1 x 2.5mm
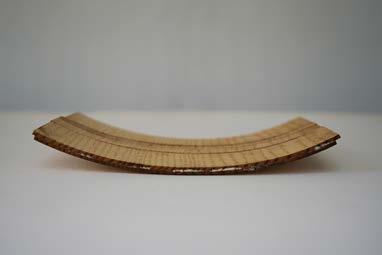
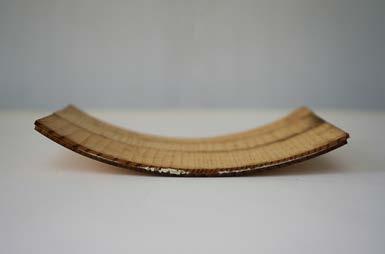

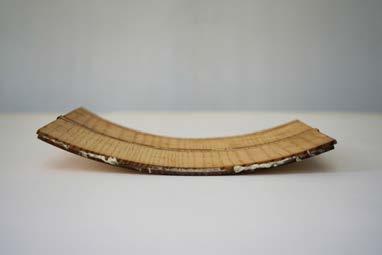
aspect ratio: 2 : 3 tessellation division: 50/10/20/40mm
The focus of the following experiment is to investigate how preserving the same passive and active layers’ thicknesses, At the same time introducing different tessellation configuration impacts the curvature of the pieces. Following the logic from the previously conducted tests, the irregularly tessellated active layer of [14] performs worse compared to the regularly tessellated ones, it has also commenced curving unevenly on both long edges. The gradient tessellation of [13] performs slightly better than [14], however, it still produces an unwanted transformation in the bilayer. The more equal width of the active layer tessellations of [12] results in it outperforming [11] by adding approximately 20% more curvature.
direction: 0°
active: 1,5 x 2.5mm
passive: 1 x 2.5mm
aspect ratio: 2 : 3
tessellation division: 30/30/30/30mm
Three different pieces of the same active and passive layer thickness are compared in this experiment. They differ in the position of the tessellation of the active layer. Based on the previous experiments it is clear that the lesser the number of tessellations in the active layer the more the induced curvature. It should be noted that in an uncontrolled environment, the more tessellations the bigger chance of mis-aligning while gluing the active layer pieces to the active layer which eventually produces imperfections in the bilayer that lead to unexpected deformations.
direction: 0°
active: 1,5 x 2.5mm
passive: 1 x 2.5mm
aspect ratio: 2 : 3
tessellation division: 30/30/30/30mm
direction: 0°
active: 1,5 x 2.5mm
passive: 1 x 2.5mm
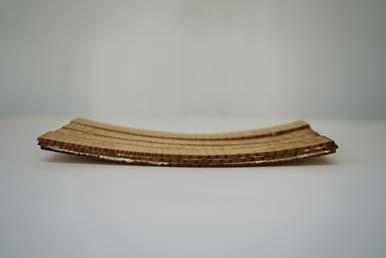
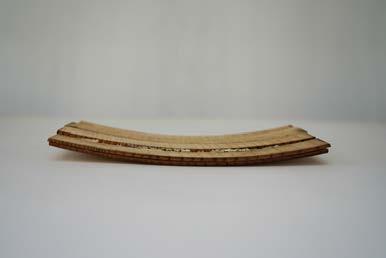

aspect ratio: 2 : 3
tessellation division: 30/30/30/30mm
04-4.1 04-3.10
Although the experiments were considered to be successful there was a certain degree of imprecision due to the lack of a controlled environment to conduct the experiments. Furthermore, the veneer used for the experiments is pre-dried and the increase in the moisture content is achieved through soaking of the specimen in water. Finally, the condition of the delivered veneer, which had plenty of cracks and the fibers were not perfectly oriented along the long material edge. The above-mentioned factors made a considerable impact on our attempts as the misalignment of the grain led to some noticeable distortions in the composite pieces.
The physical and the digital experiments show similar results, however, each of them works within a certain degree of tolerance. In order to extract more precise data which could inform the design at a later stage, both experiments have to be matched. The latter share certain input parameters, however, due to a lack of a controlled environment the physical experiment could not keep up with the level of precision of the digital one.
The physical experiment is conducted with timber material which is already kiln-dried, therefore it is soaked in water to increase its moisture content. Moreover, the drying process is not conducted in a kiln, but rather at a room temperature. The equipment informing about the moisture content is a hobby device which only measures the moisture at a node but not along the entire surface. Finally, the entire experiment is conducted to a scale which is a prerequisite for further imprecisions when calibrating both studies.
The digital experiment lacks the functionality of adjusting the tessellation pattern, aspect ratio and lamination technique, however, it is elaborate enough to inform about the bending curvature in an isolated environment.
Although there are certain challenges the design could move forward due to the versatility of the digital experiment set-up which allows for fine adjustments of all variables and therefore compensates for the inconsistency of the physical experiment.
FIG.29 2015 - current relative humidity of Santiago, Chile (worldweatheronline.com)
FIG.30 Equilibrium moisture content of wood (Timber Handbook, Wood as an Engineering Material)
PIC.42Santiago, Chile Skyline
direction: 90°
active: 1 x 0.5mm
passive: 1 x 0.5mm
aspect ratio: 2 : 3
tessellation: 40/40/40mm
difference in radius of curvature: NA
percentage difference : NA
REMOISTURIZE CURVED VENEER
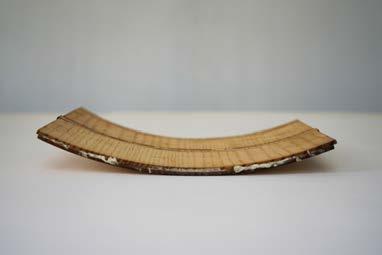


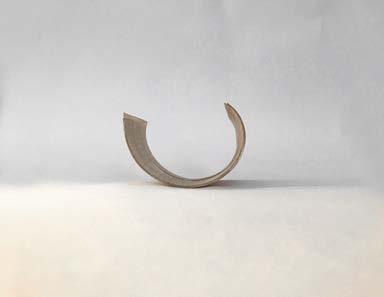


prpcess: dip in water for 3 hours. MC-
observation:
-90 degree lamination(cross lam) bilayer failed in retaining curved shaped. bilayer goes flat
-0 degree lamination alters from -7.18% to+34.13% difference in curvature of radius.
-only1 out of 5 test shows a decrease of curvature, other shoes increase . bilayer do flatten out due to increase of moisture content.
- thinckeer bilayer shows bigger difference while thinner bilyaers shoes less change in curvature.
The goal of this experiment is to observe and study the curvature change when a few selected specimens from the physical experiments are reintroduced to moisture. Three different specimens are immersed in water for about 3 hours, the first specimen with the passive layer grain direction oriented 90 degrees in respect to the active layers (cross-laminated) deforms into a twisted piece (Figure). The second specimen with the grain direction of the passive layer oriented in the same direction as the active layer has an increased curvature difference of 11.24% (Figure). The third specimen with thicker bilayer and the grain direction of both the layers oriented in the same direction has an increased curvature difference of 17.59% (Figure)
Conclusions from this experiment are that the thicker bilayers deformed to have higher curvature compared to the thinner bilayers. Further research can be conducted to precisely study the effect of reintroducing moisture to the bilayers.
direction: 0°
active: 1 x 0.5mm
passive: 1 x 0.5mm
aspect ratio: 2 : 3
tessellation division: 40/40/40mm
difference in radius of curvature: 4.03mm
percentage difference : +11.24%
direction: 0°
active: 1 x 2.5mm
passive: 1 x 2.5mm
aspect ratio: 2 : 3
tessellation division: 50/10/50/10mm
difference in radius of curvature: -39.39mm
percentage difference : +17.59%
r=263.39mm r=39.87mm r=76.50mm r=35.84mm r= 224mmThe dimensional change of wood in respect to the relative humidity of Chile is negligible, the graph (figure) shows the average humidity from 2015 to 2019, the lowest humidity is 28% and the highest is 37%, based on these changes the moisture content in wood will vary between 6% to 10%. The conclusions drawn from the digital experiments show that there will be no significant changes in dimension when the moisture content drops from 6% to 10%. Further preventive methods like coating the timber with moisture protective layer and designing the joints with tolerance to allow shrinkage and swelling. [3]

MATERIAL
Hygroscopic Design Parameters Digital
05-0
The development of the proposed design begins at a unit scale which in the context of the project is a single module. The unit is then detailed while the most attention is paid on the module to module structural connections in vertical direction and the adjacency in horizontal direction.
Further, a stacking strategy is developed. A Finite Element Analysis is embedded in the iterative process of the modules’ aggregation which informs the building’s structural stability considering material type, grain direction and timber species’ inherent properties.
The following design step takes place at cluster scale where, based on the stacking strategy, a comprehensive spatial logic is developed which is more inclined towards enhancing the quality of the habitants’ lifestyle. Once completed a Genetic Algorithm with four fitness criteria searches for possible optimal solutions.
To conclude, the results of the GA are evaluated, if needed the GA logic is revisited and the solver is run again. The design is then carried forward to the fabrication stage.
The lately explored by ICD Stuttgart new contrivances of bending wood based on its inherent properties suggest that the process of controlling the hygroscopic properties of timber materials could lead to achieving twists, folds and other simple transformations which produce monoclastic or even anticlastic curvatures.
The proposed method, due to time limitations and lack of controlled environment, is based solely on exploring how to achieve single curved surfaces by calibrating certain variables of the bilayer panels.
The self-shaping panels rely mainly on the difference between the active and passive layers’ moisture content, however the resulting curvature also depends on the number and thickness of layers and fibre directionality. Given that timber buildings are lightweight and Chile is a high seismic zone an important part is to select a three-dimensional geometric shape, to apply the bent bilayer strips on, which is as strong as possible by itself. The selected geometry, a dome, in order to resemble better a conventional habitable space undergoes certain morphological changes. A three-sided connection and a four-sided connection domes are compared in which the latter shows significantly more deflection exposed to gravity load which is the reason for the experiment to continue developing the threesided one.

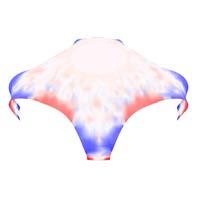
FIG.32 Pseudocode logic of simulating variations of surface panel through changing active/ passive layers thickness
As previous experiments suggest, smaller bending curvature radii result in more curved pieces whereas bigger radii correspond to flatter, or less curved, pieces. In general terms, in conventional living spaces, the floor surface should be as flat as possible in order to allow for maximum usable area. Reflecting this rule in the computational logic means that the Genetic Algorithm should be optimising the modules to have flatter horizontal surfaces.
There are few ways to achieve a straight bilayer component. One is to decrease the active layer thickness which hinders the self-shaping ability of the component, another is to increase the passive layer thickness, by doing that, it is more capable of counteracting the bending force of the active one. According to these two rules the GA, programmed to optimise for flatter horizontal surfaces, produces relative thick floors and ceilings while keeping the straight panels rather thin to allow for more bending.
SIMULATION SETUP
Active Layer Thickness
Passive Layer Thickness
[hygroscopic design parameters] [bilayer
Digital Simulation
Curvature Value
[single curved surface]
R1: 0.8m
AL thickness:25mm
PL thickness:15mm
R2: 62.6m
AL thickness:4mm
PL thickness:60mm
R1: 1.1m
AL thickness:25mm
PL thickness:20mm
R2: 62.6m
active layer thickness:4mm
PL thickness:60mm
R1: 1.6m
AL thickness:25mm
PL thickness:25mm
R2: 62.6m
active layer thickness:4mm
PL thickness:60mm
R1: 1.8m
AL thickness:20mm
PL thickness:25mm
R2: 62.6m
AL thickness:4mm
PL thickness:60mm
R1: 2.4m
AL thickness:15mm
passive layer thickness:25mm
R2: 62.6m
AL thickness:4mm
PL thickness:60mm
R1: 2.4m
AL thickness:15mm
PL thickness:25mm
R2: 6.4m
AL thickness:11mm
PL thickness:34mm
R1: 1.6m
AL thickness:15mm
PL thickness:20mm
R2: 11.1m
AL thickness:15mm
PL thickness:52mm
R1: 0.6m
AL thickness:25mm
PL thickness:10mm
R2: 4.8m
AL thickness:30mm
PL thickness:50mm
R1: 0.6m
AL thickness:25mm
PL thickness:10mm
R2: 7m
AL thickness:30mm
PL thickness:60mm
R1: 0.6m
AL thickness:25mm
PL thickness:10mm
R2: 10.9m
AL thickness:20mm
PL thickness:60mm
PSEUDOCODE LOGIC
Bottom Panels x 2
[comprises 2 unique radii values]
The fabrication of a single unit takes a total of 12 components which form the dome-like structure alongside fastening elements such as bolts.
The bottom and the top panels are produced simultaneously. Each of them comprises several layers. The number of active and passive layers vary depending on the desired curvature. Both the top and the bottom panels have 2 unique bending curvature radii each adding up to 4 radii for an entire top-to-bottom strip.
Due to the symmetry of the design the module consists of 6 pieces of the same strip keeping the degree of variety negligible and which leads to reducing the fabrication cost in the long run.
Top Panels x 2
[comprises 2 unique radii values]
Bottom Panels x 2 +
Top Panels x 2
[comprises 4 unique radii values]
Complete Geometry | Panels x 12
[comprises 4 unique radii values]

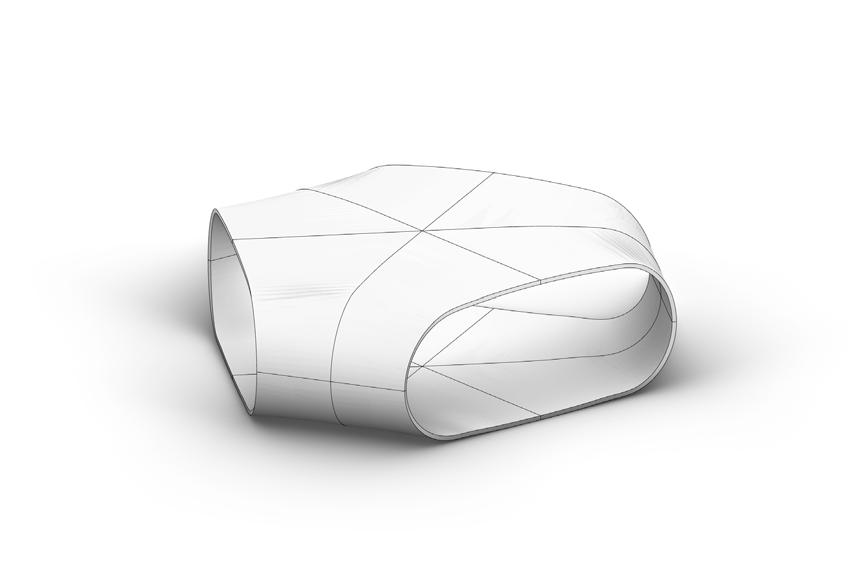

The aim of this digital experiment is to optimize the module geometry, its logic is built upon the geometrical explorations from the previous chapter. The primary goal of the study is to optimize the individual panels based on their structural and geometric capacities while considering the material limitation. Genetic algorithms solver, Wallacei, is used in this simulation to iterate through a large number of options, FEA software Karamba is integrated into the definition for structural analysis.
The fitness objectives of the experiment are to minimize the total weight of the module to reduce the material required for fabrication, at the same time keeping the utilization and displacement under considerable values.
Dead loads and live loads are introduced for the structural evaluation of the module.
The resultant geometry has an optimized number of active and passive layers of veneer required to achieve radii R1, R2, R3, and R4 of the individual panels which make up the module geometry and the total number of these combined layers to achieve the total thickness of each panel to be load-bearing.
SIMULATION SETUP
Active Layer Thickness
Passive Layer Thickness
[hygroscopic design parameters]
Digital Simulation
Curvature Value
Panel Scale
Module Scale
Structural Analysis
[weight, utilisation, displacement]
BODY PLAN
GENE POOL
OBJECTIVE
1. Minimum Weight
2. Minimum Utilisation
3. Minimum Displacement
[Gen 1, Ind 39]
Raking 4999 of Min. utilisation
Min. utilisation
Rank : 4999/5000
Total value: 911.1 %
Min Weight Rank : 4155/5000
Total value: 10.16 ton
Min. Displacement
Rank : 4999/5000
Total value:3796.3 mm
05-3.3 VARIATIONS
[Gen 95, Ind 18]
Raking 4999 of Min. weight
Min. utilisation
Rank : 129/5000
Total value: 15.7 %
Min Weight
Rank : 4999/5000
Total value: 17.90 ton
Min. Displacement
Rank : 5/5000
Total value:14.51 mm
[Gen 1, Ind 39]
Raking 4999 of Min. Displacement
Min. utilisation
Rank : 4999/5000
Total value: 911.1 %
Min Weight Rank : 4155/5000
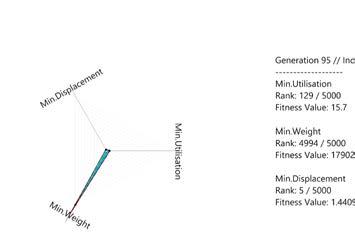
Total value: 10.16 ton
Min. Displacement
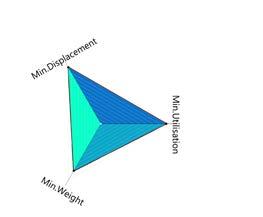
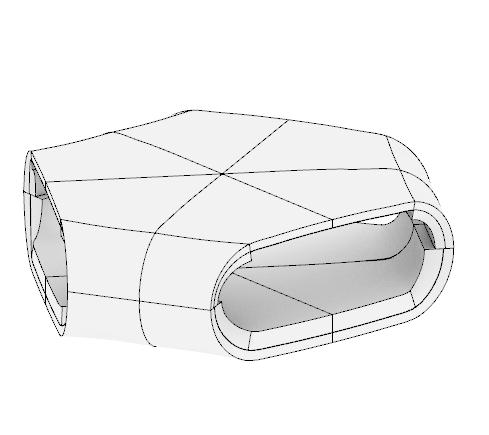
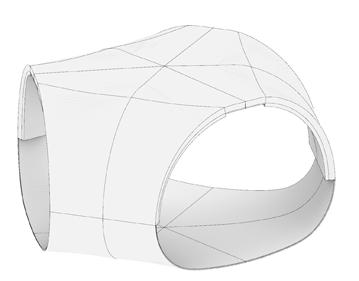

Rank : 4999/5000
Total value:3796.3 mm
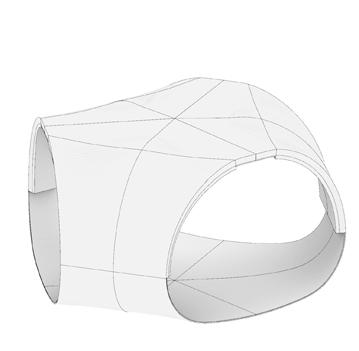
[Gen 75, Ind 37]
Raking 0 of Min. utilisation
Min. utilisation Rank : 0/5000
Total value: 14 %
Min Weight Rank : 4894/5000
Total value: 15.70 ton
Min. Displacement Rank : 85000
Total value: 17.0 mm
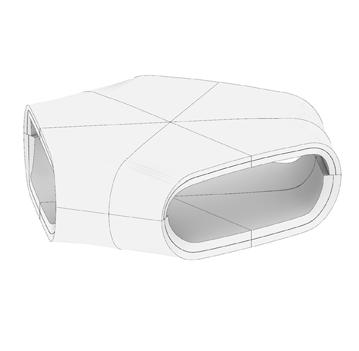
Min. utilisation
[Gen 83, Ind 15]
Raking 0 of Min. weight
Rank : 4759/5000

Total value: 254.3 %
Min Weight Rank : 0/5000
Total value: 1.74 ton
Min. Displacement
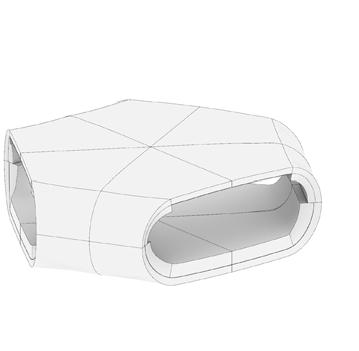
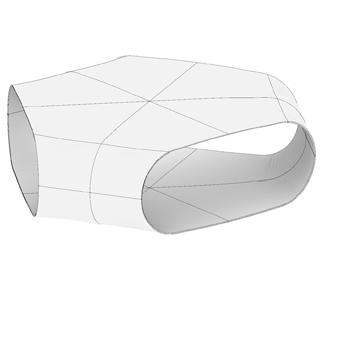
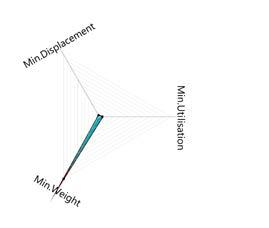
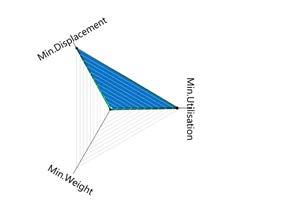

Rank : 4971/5000
Total value: 923.74 mm
[Gen 85, Ind 13]
Raking 0 of Min. Displacement
Min. utilisation
Rank : 116/5000
Total value: 15.7 %
Min Weight Rank : 4996/5000
Total value: 17.90 ton
Min. Displacement Rank : 0/5000
Total value: 14.41 mm
E1:
E2:
G12:
nue12:
G31:
G32:
gamma:
alphaT1:
alphaT2:
16400 [MPA]
900 [MPA]
910 [MPA]
0.37
1180 [MPA]
79 [MPA]
580 [kg/m3]
3.7 [1/C°]
3.7 [1/C°]
*
E1=Young’s modulus in longitudinal direction
E2=Young’s modulus in tangential direction
G12 = in-plane shear modulus
nue 12= in-plane lateral contraction coefficient
G31=transverse shear modulus longitudinal direction
G32= transverse shear modulus tangential direction
gamma =material density
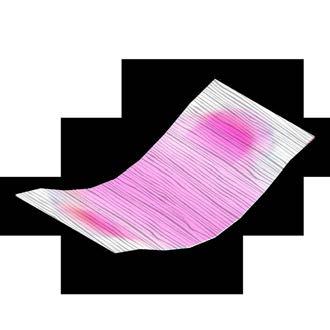

alpha= coefficient of thermal expansion
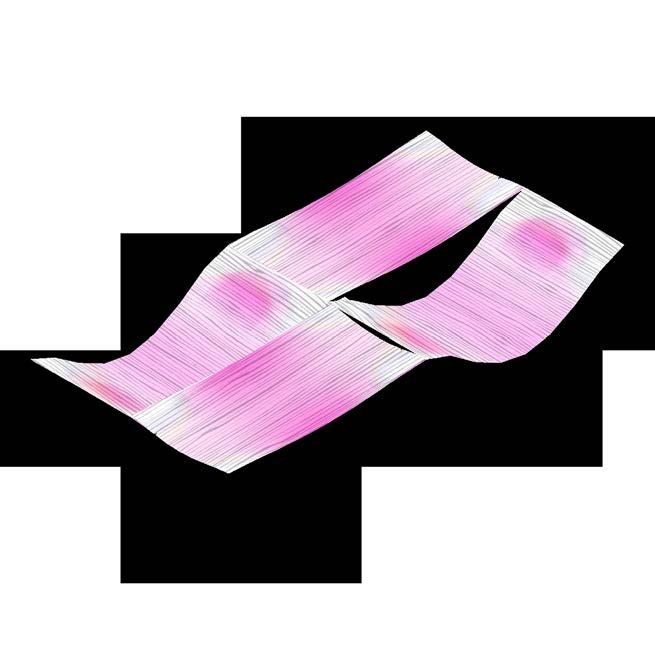
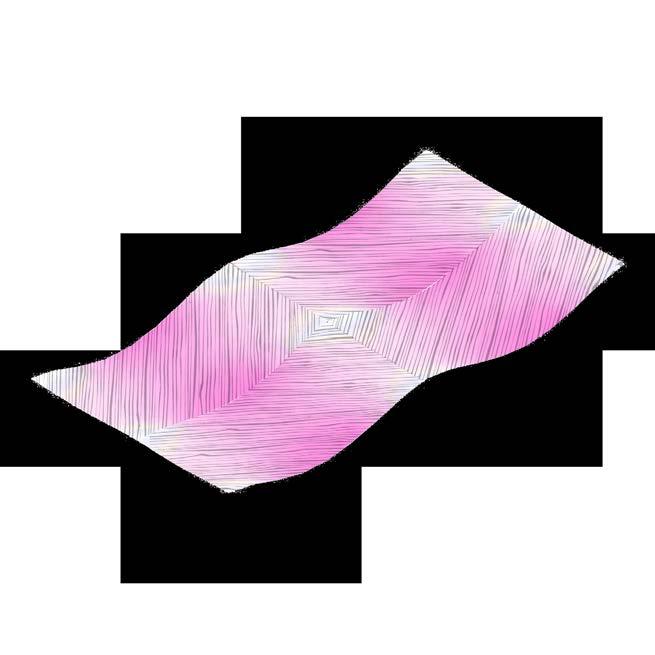
Wood is an orthotropic material which has a different strength in all three directions. The selected wooden specie, Douglas fir, receives a 3mm displacement under gravity and dead load with its grains oriented along the long panel edge it, however when the fibre directionality is changed the panel resistance becomes weaker therefore the displacement increases 5 times to 15mm.
Since the panels of the modules ought not to be too stiff or too flexible, it is important to investigate the impact that the grain orientation has on them. These experiments are carried forward to the next stage of the design.
FIG.35 Orthogonal property of Douglas-Fir
FIG.36 Deformation of single Douglas-Fir panel under self load at different fiber orientation
FIG.37 Deformation of multiple DouglasFir panels under self load at different fiber orientation
FIG.38 FEA setup on single module
FIG.39 Utilization and displacement value on single module FEA

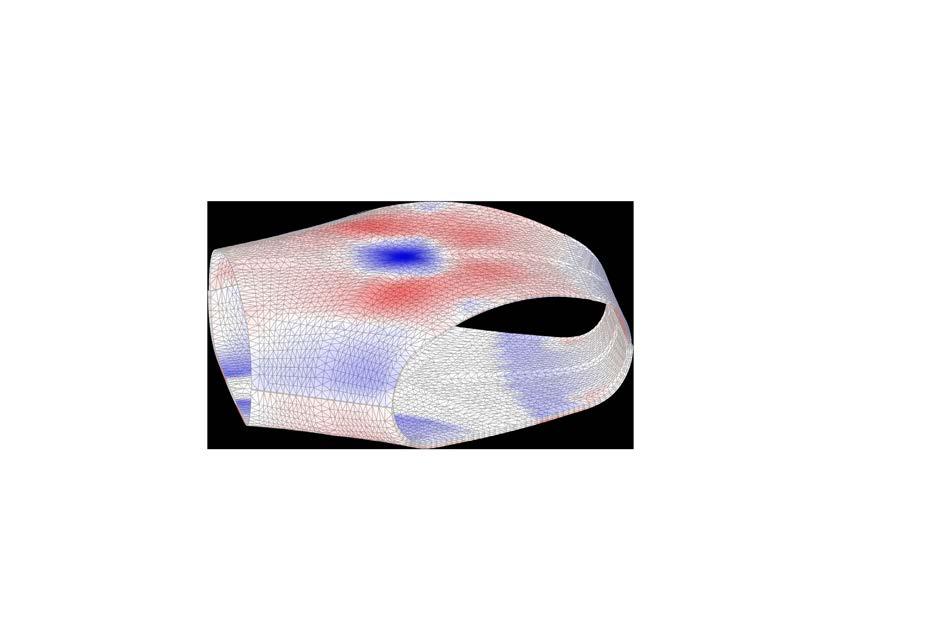
gravity load applied
maximum displacement: 32mm
maximum utilization: 3.9%
maximum utilisation: 11.8%
total weight: 9.88 ton
The geometry, being a shape closed in itself, allows for the otherwise relatively fragile panels to merge into a stronger structure. Although a single module is rendered stable under gravity load according to a Finite Element Analysis the structure has to be supported by a central element, a pillar, which separates the module span into two. The central pillar, support the dome exactly in the middle allowing for more direct transfer of the vertical loads. Including this feature in the design allows for a reduction of the layer thicknesses which simultaneously results in lowering the material costs and environmental footprint.
With a central pillar measuring 200mm in diameter the biggest displacement the module experiences is 32mm in the middle of the top bilayer. The utilisation is below 4% which indicates for the good stability of the module.
*gravity load applied
The geometry of the module is a truncated equilateral triangle. Its dimensions of 6000mm on the long edge and 3070 on the short, remain the same in plan, however, the height of the module changes according to the panel bending curvature.
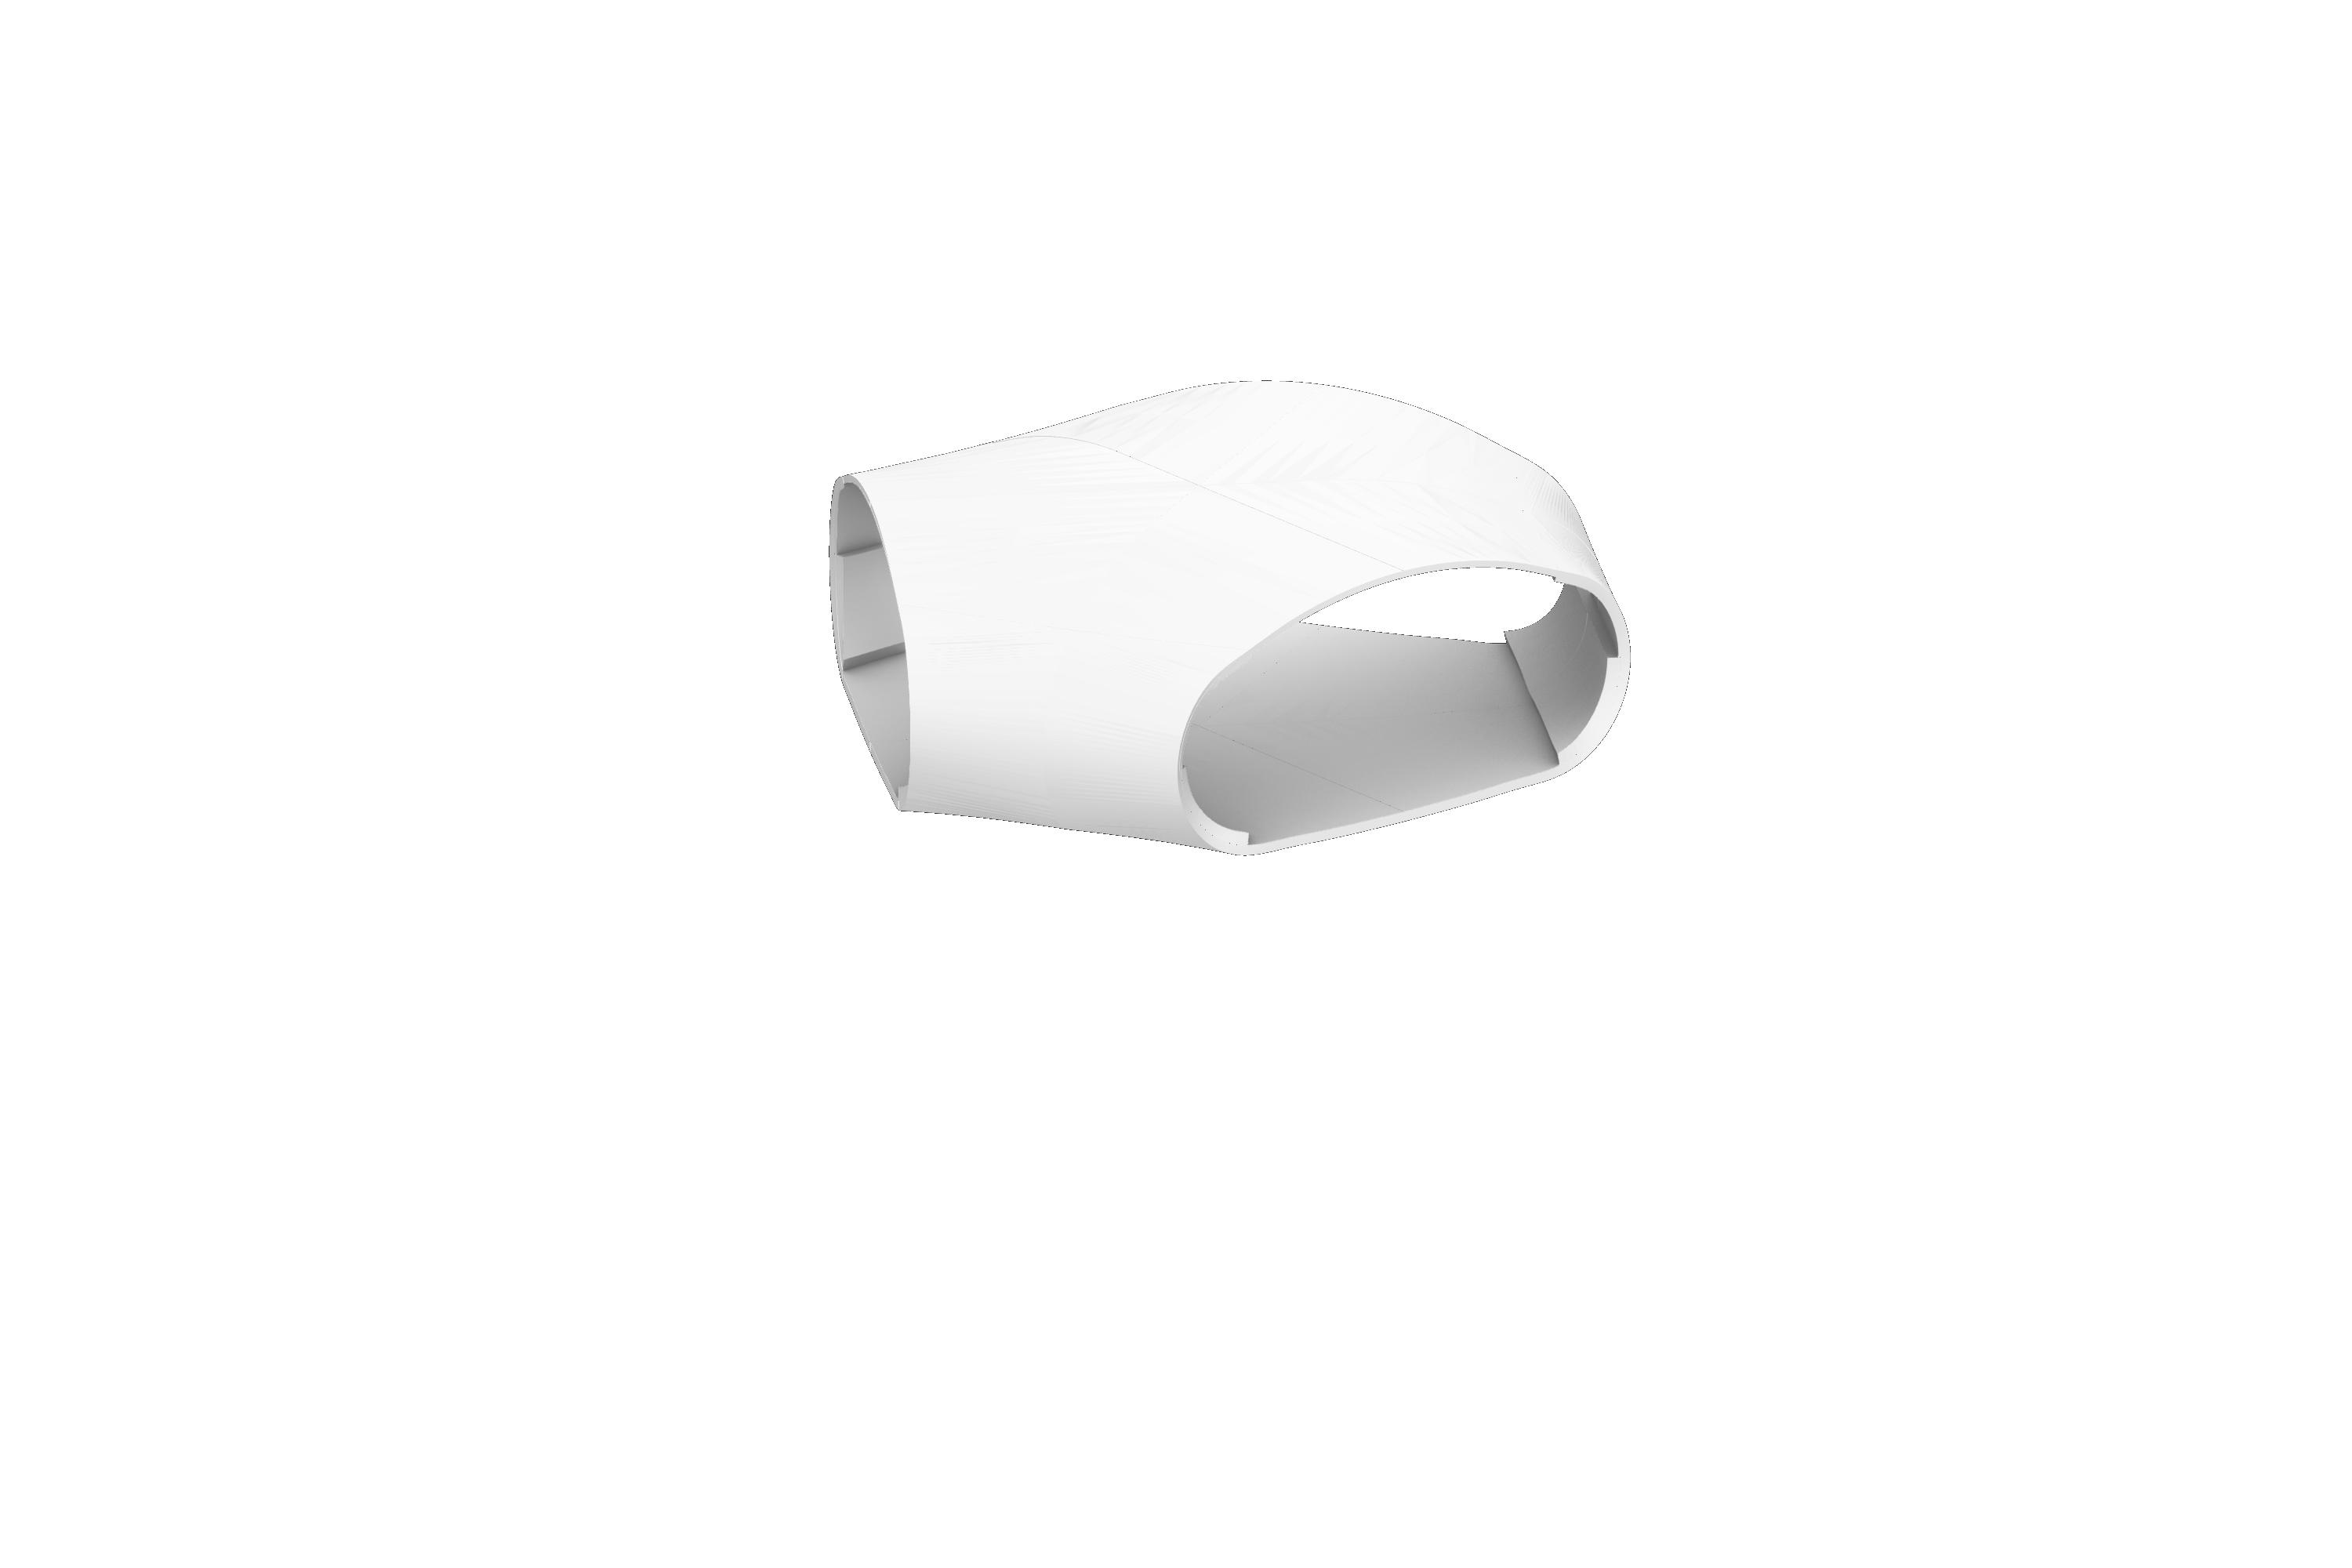

Each module comprises 6 same pieces and each of the latter consists of 4 bilayers with different radii.
In the selected module with an active layer thickness of 15mm and passive layer thickness of 56mm the T_1 bilayer is relatively thin and measures a radius (R4) of 5.01m. Its neighbouring bilayer, T_2, has a radius (R3) of 1.17m. The smaller tighter radius indicates the bigger curvature. Although the passive layers of both panels are almost equal, it is the 4 times thicker active layer of T_2 which leads to the bigger curvature.
In the bottom part of the module bilayer B_1 having an active layer with 5mm thickness, almost negligible, measures a radius (R2) of 31.1m which leads to an almost flat floor. Bilayer B_2 is the most curved one within the module due to its tight radius of 1.13m (R1). This curvature is only possible as a result of the very thick active layer (140mm) which outperforms the strength of the relative thick passive layer (105mm).
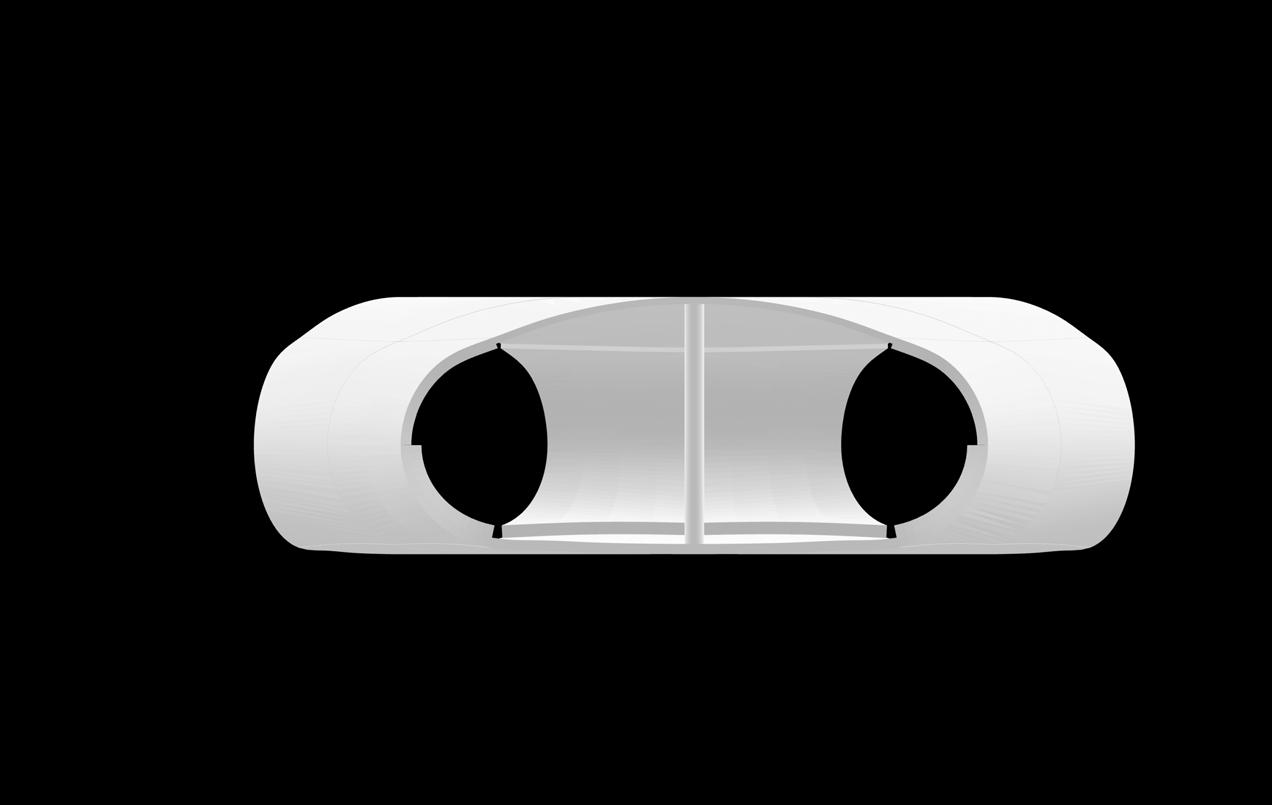
T_1
R4: 5.01m
Active Layer Thickness: 15mm
Passive Layer Thickness: 56mm

B_1
R2: 31.1m
Active Layer Thickness: 5mm
Passive Layer Thickness: 98mm
T_2
R3: 1.17m
Active Layer Thickness: 66mm
Passive Layer Thickness: 60mm
B_2
R1: 1.13m
Active Layer Thickness: 140mm
Passive Layer Thickness: 105mm
SIMULATION SETUP
Active Layer Thickness
Passive Layer Thickness
[hygroscopic design parameters]
Numbers of Stack-up Modules
[vertical direction]
Digital Simulation
[bilayer theory]
fabricating single surface
The logic of this experiment is built upon the previous GA experiment of the single module, the primary goal is to determine the maximum number of modules that can be stacked vertically with allowable displacement values. Wind load is introduced into the structural evaluation along with the dead and live loads.
The outcome of this experiment is the R1, R2, R3, and R4 radii values of the stacked up modules and their respective thickness in relation to the load that they receive.
Curvature Value
[(4x n stack-up units) Rs]
Panel Scale
Module Scale
Multi-Module Scale
Structural Analysis
[weight, utilisation, displacement]
1. Minimum Weight
2. Minimum utilisation
Minimum
[Gen 0, Ind 3]
Raking 9999 of Min. weight
05-4.2 VARIATIONS
[Gen 125, Ind 23]
Raking 9999 of Min. Utilisation and Min. Displacement
Min. Utilisation
Rank : 5507/10000
Total value: 117.2 %
Min Weight
Rank : 4155/10000
Total value: 78.2 ton
Min. Displacement
Rank : 3304/10000
Total value: 74.5 mm
Min. Utilisation
Rank : 9999/10000
Total value: 3312 %
Min Weight
Rank : 259/10000
Total value: 28.5 ton
Min. Displacement
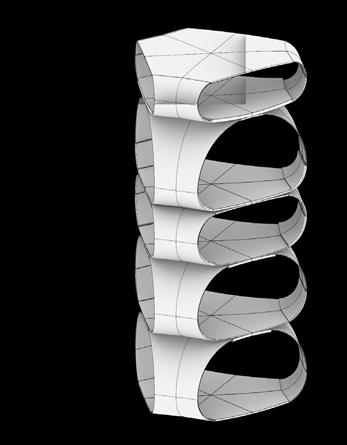
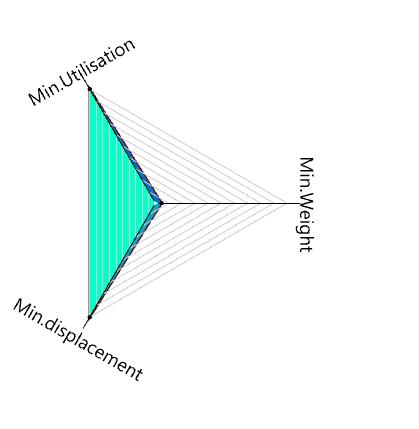

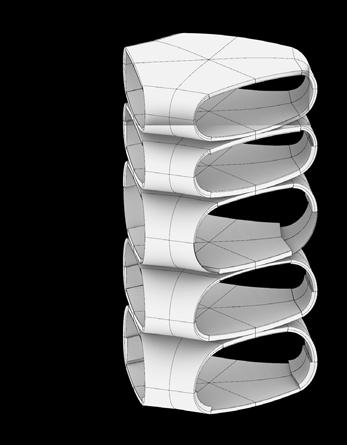
Rank : 9999/10000
Total value: 1726.2 mm
[Gen 185, Ind 33]
Min. Utilisation
Rank : 7419/10000
Total value: 97%
Min Weight
Rank : 0/10000
Total value: 16.5 ton
Min. Displacement
Rank : 9158/10000
Total value: 145 mm
[Gen 158, Ind 25]
Raking 0 of Min. Displacement
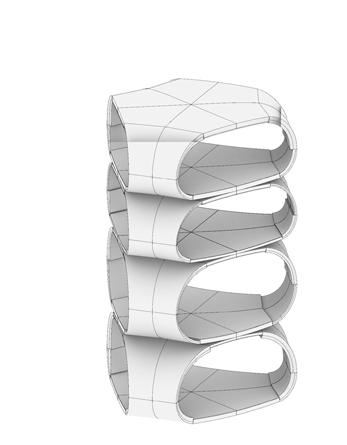
Min. Utilisation
Rank : 102/10000
Total value: 24.5%
Min Weight Rank : 9948/10000
Total value: 55.2 ton
Min. Displacement
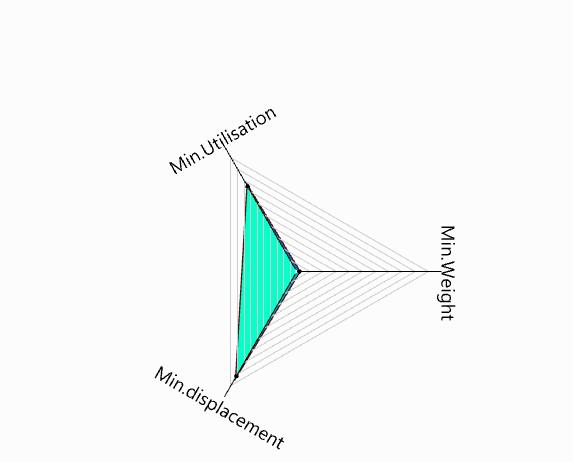
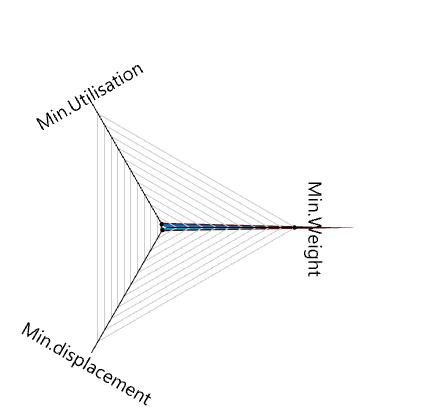
Rank : 0/10000
Total value: 20.0 mm

FIG.45
FIG.46
FIG.47
gravity load, dead load, wind load applied
displacement: 176mm
utilisation: 20.8%
weight: 48.10 ton


In order to support the horizontal spans within the modules, two options are proposed. These options are tested for their contribution to the structural performance as the modules are stacked up.
First one being the use of a central solid wood pillar which is beneficial to achieve a greater usable space within the modules. The structural member transmits loads in the vertical direction while reducing the loads in the side panels of the module. The structural tests with the central wooden pillar indicate that the utilisation is only 35%, although the high displacement could be a concern as the structure is prone to swaying under seismic and wind loads.
A central core within the module is introduced. This helps in a better distribution of vertical loads compared to that of a central pillar which leads to accumulated point loads. The larger footprint of the core also enables better structural performance for lateral loads on the stacked modules.
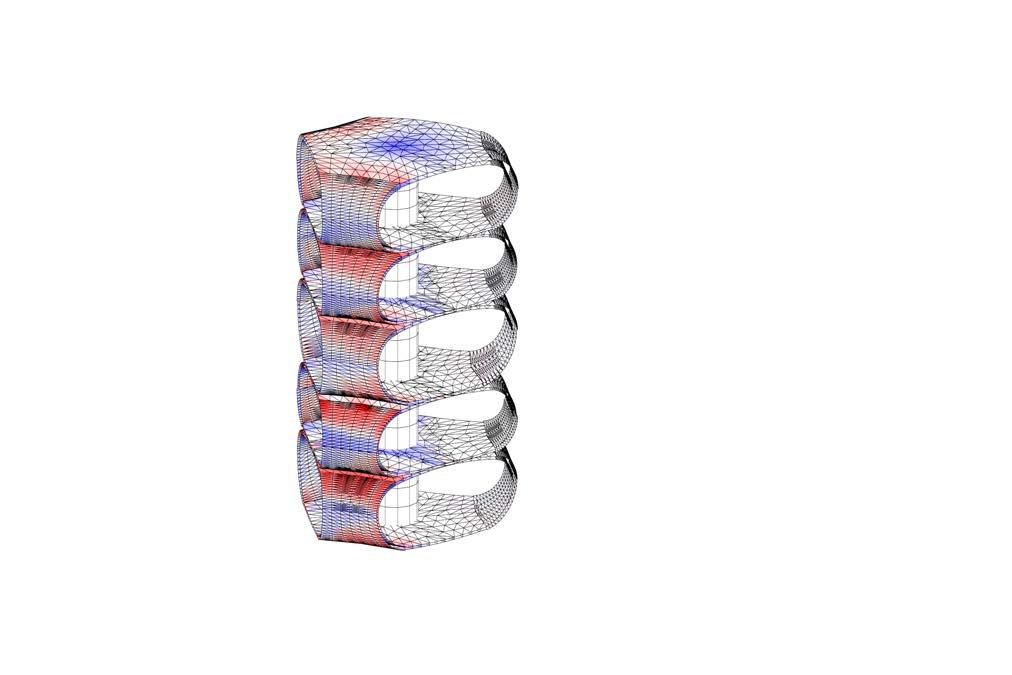
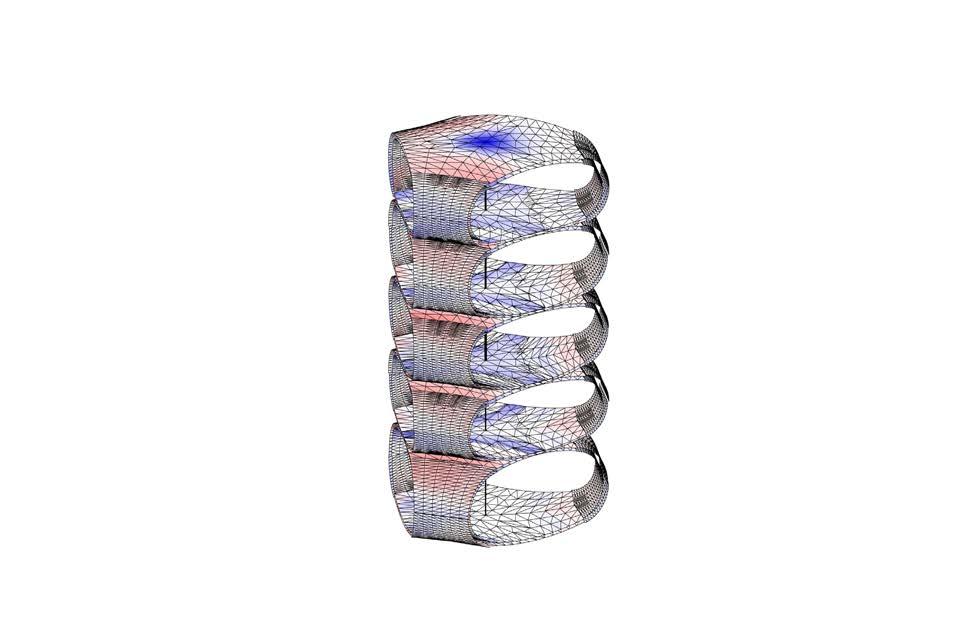

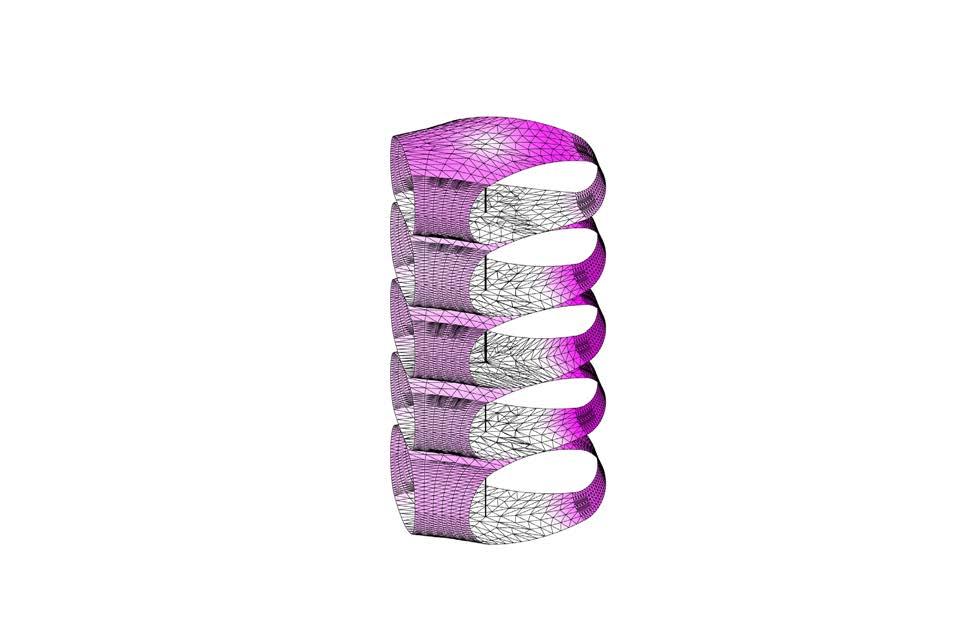

gravity load, dead load, wind load applied
maximum displacement: 13.1mm
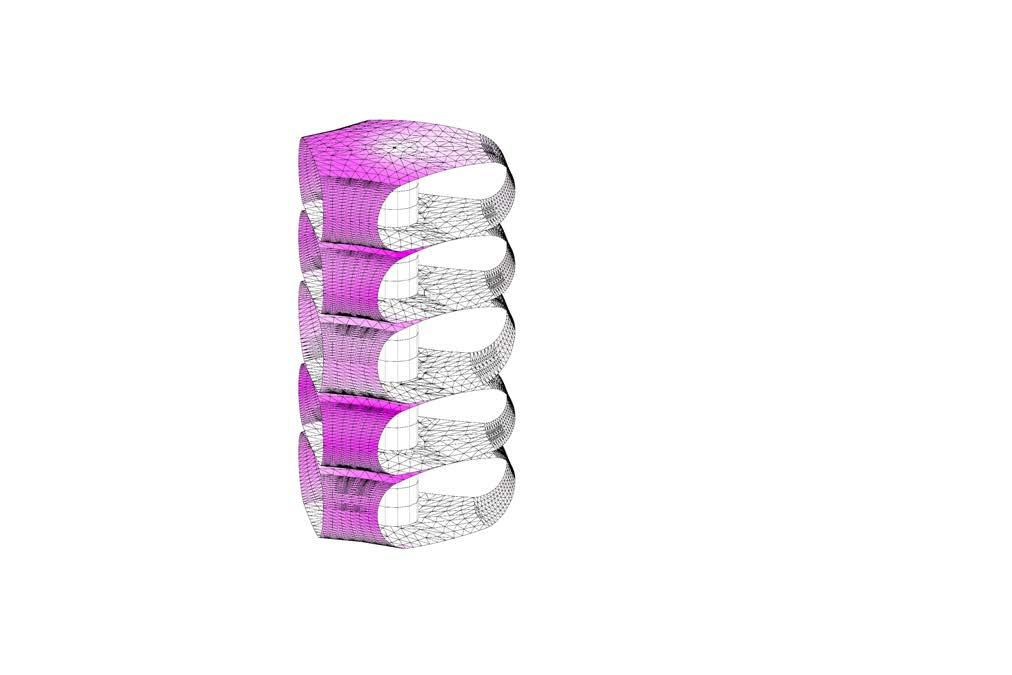


maximum utilisation: 6.3%
total weight: 55.13 ton
core added fabriting with same self-shaping technique, 1000mm radius, active23, passive 14, total thickness 125mm
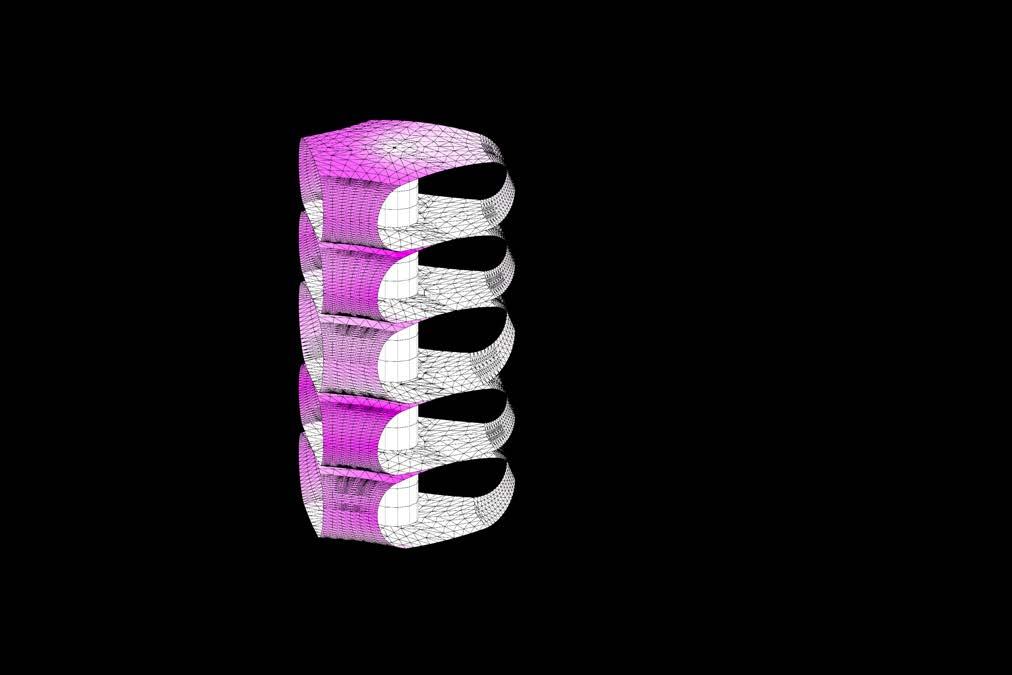
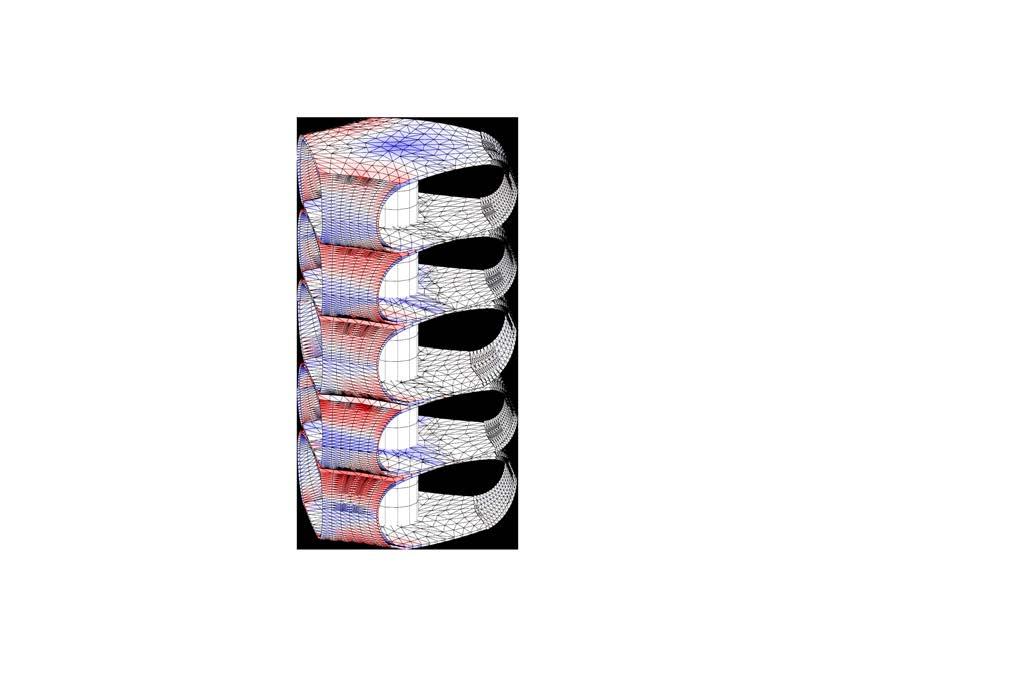

Fig. 49 represents an in-depth catalogue with all numeric parameters needed for both the fabrication and assembly of an entire cluster.

The naming comprises capital letters and follows a simple convention: floor number (0 to 4), position within the module (top or bottom) and position within the panel (1 or 2).

The diagram also gives information on the curvature radius where small numbers (4 or less digits) mean well curved panels and big numbers (5 or more digits) mean less curved, almost flat panel. Along with the curvature is given the thickness and the number of bilayers and multiplying them results in the panel thickness. Finally, the weight per piece of each component is provided. The latter, multiplied by the number of same pieces per floor (6), gives the floor weight.
Component Name [Floor_Position_Layer Type_Layer Number] Curvature Radius[mm] Number of Primary Bilayers
Component Name [Floor_Position_Layer Type_Layer Number] Curvature


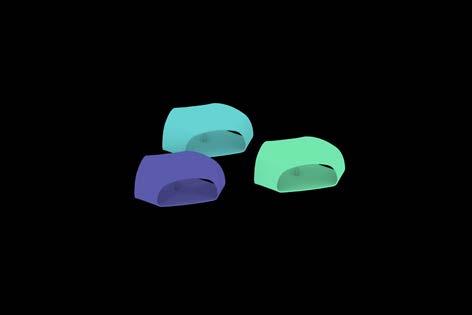
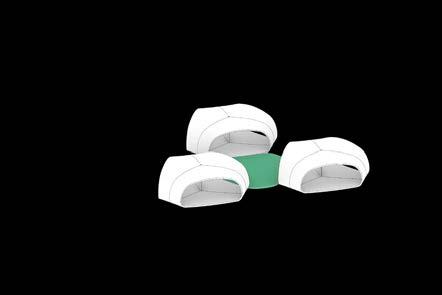
The modules are disconnected and aggregate around an open courtyard at the first stage of any cluster formation. New modules can be attached to any of the free sides of these module if they comply with the environmental and social constraints set within the system. If while doing so a module is connected to modules belonging to two different families, its state is updated to a “shared space module” consisting of function enabling interaction amongst users.

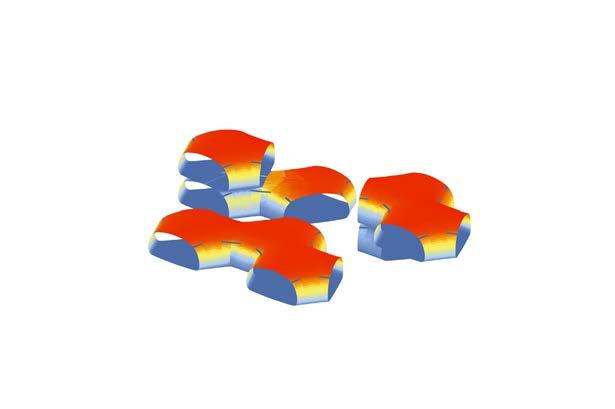
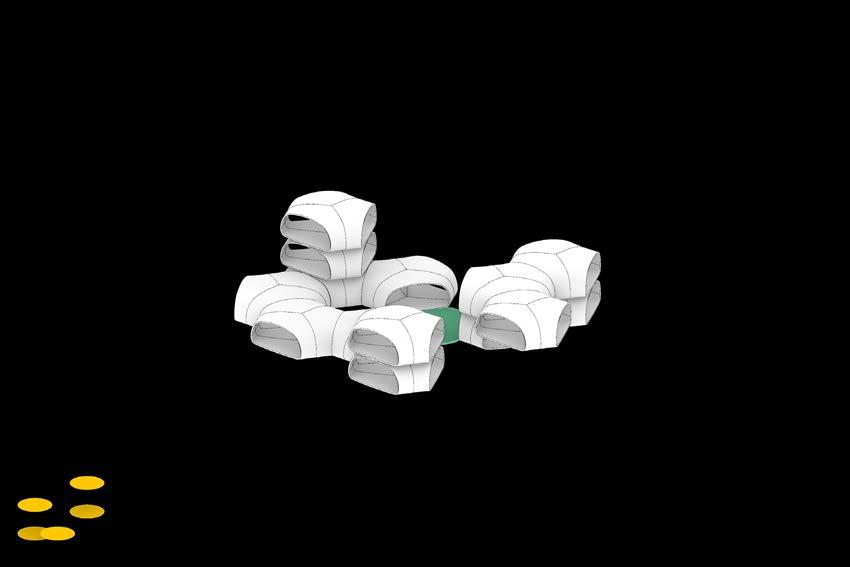
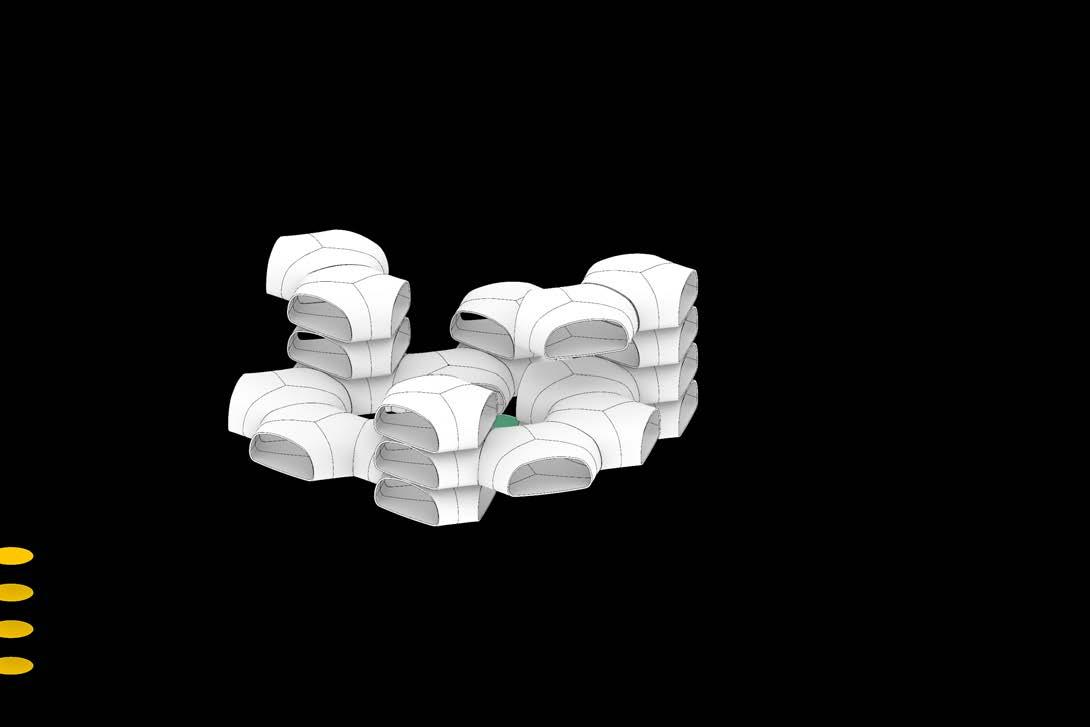
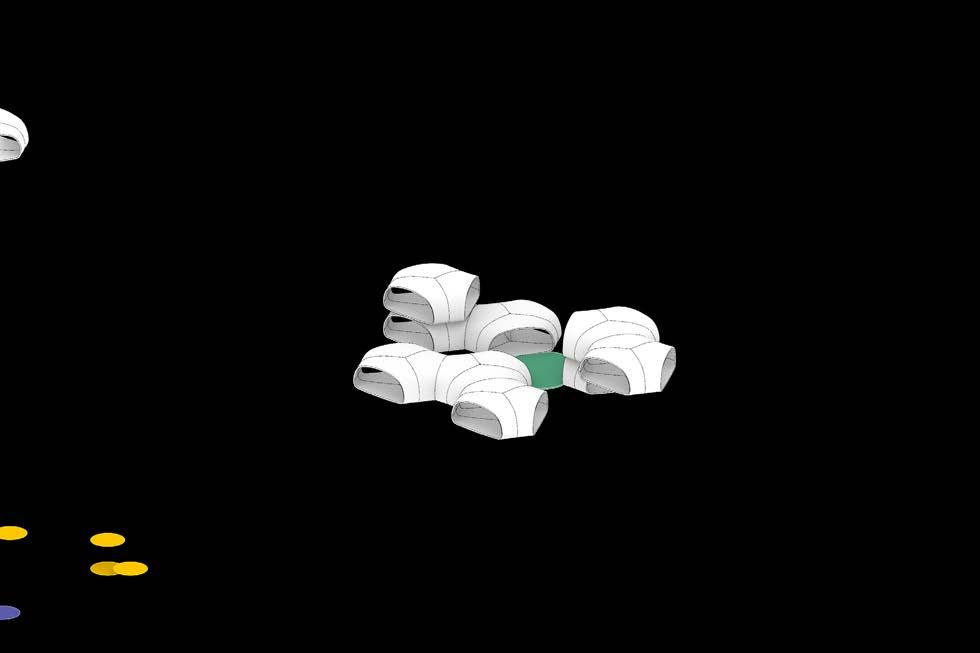


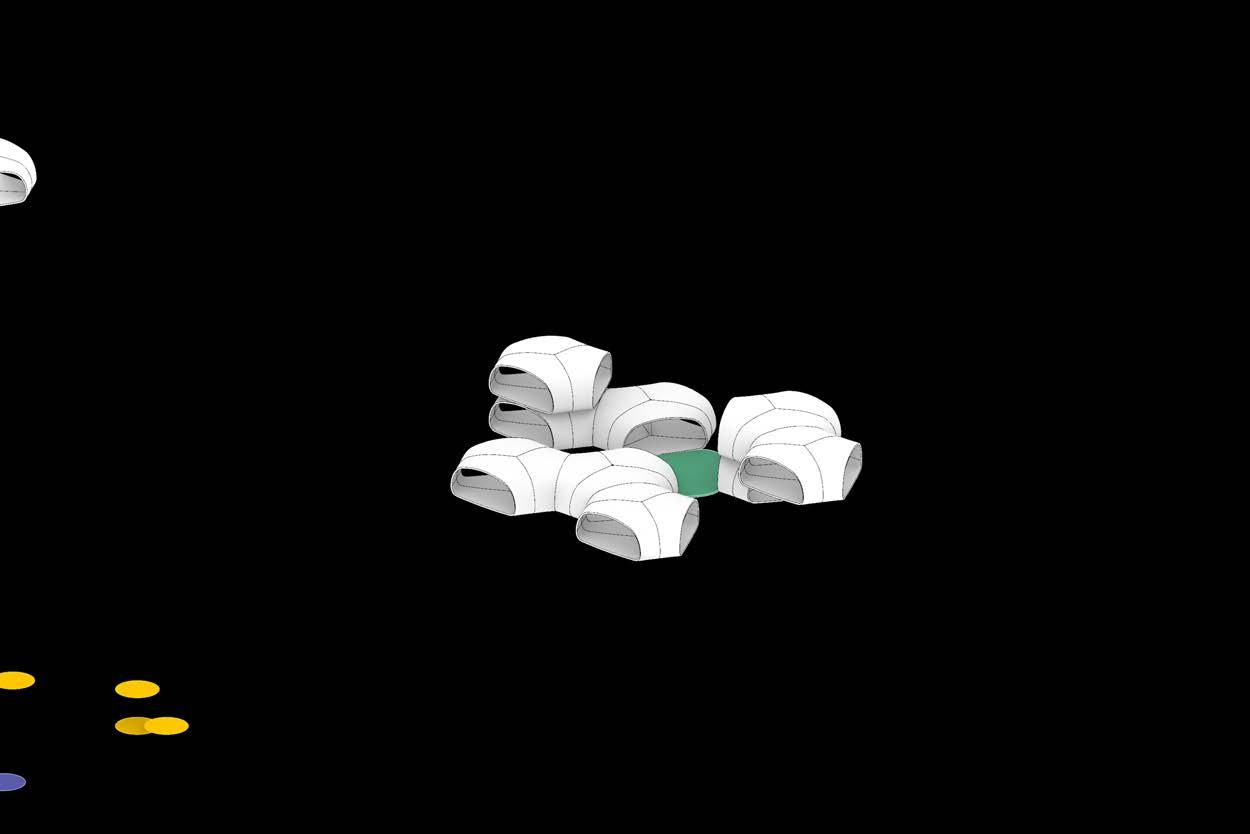
Through a GA experiment, different aggregations of modules within a cluster are analysed for various fitness objectives which are based on environmental and social parameters. The Environmental ones being to maximize the surface area of the aggregation exposed to solar radiation in winters and to the winds which blow from the south-west through the year. This was done to facilitate thermal comfort and help the wood help maintain its low moisture content. The objective filtering planar growth by minimizing the proximity of the modules from the nearest courtyard, directly contributes to the possible number of shared space modules within a cluster. This strategy helps in enabling interaction amongst the occupants.
FCs categorized into two types, environemtnal/ social.
2. maximum ventilationFIG.51
Three simulations each with a population count of 1500 individuals (20 x 75 generation) are run to define the primitive geometry for each of the successive simulation. In order to cater to the needs of a growing family, each simulation leads to addition of the modules to the previous selected aggregation that performed the best for the set environmental and social parameters. The distribution of functional spaces within the modules is proportionate to the needs of a family i.e. addition of new modules does not necessarily mean incrementation of all functions.


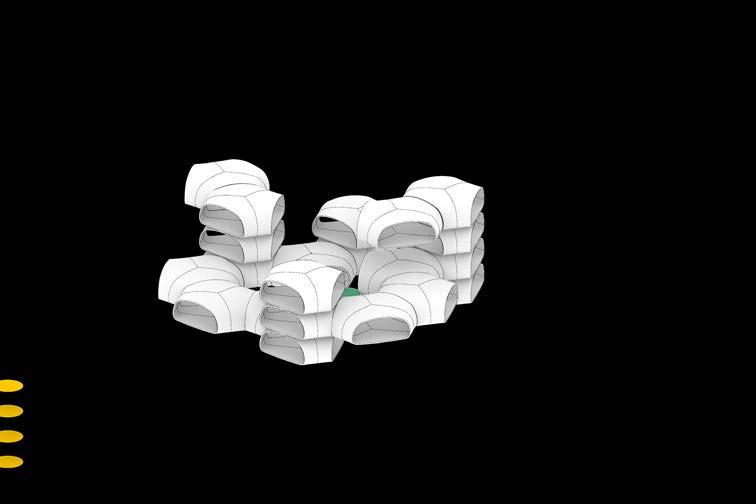
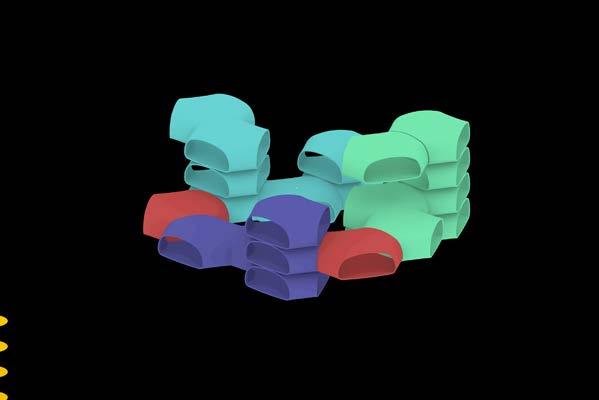
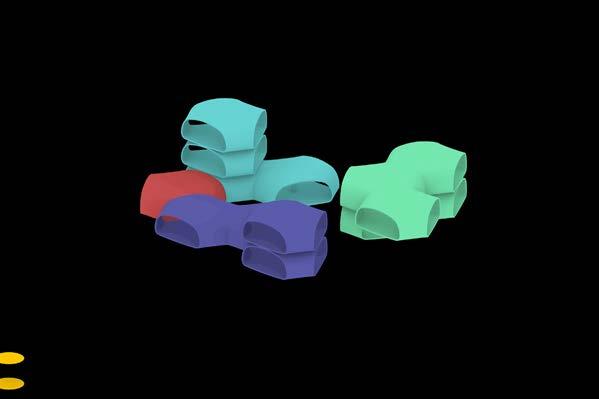

DETAIL CIRCULATION
1.
[Gen 03; Ind 01]
CIRCULATION GRAPH LEGEND
courtyard
horizontal connection of family 1
horizontal connection of family 2
horizontal connection of family 3
vertical connection ( bigger radius = higher)
2. Design Development 109
[Gen 39; Ind 13]
ranking _ 0 of FC1 module counts: 9
[Gen 46; Ind 16]
ranking _ 0 of FC1 module count: 9
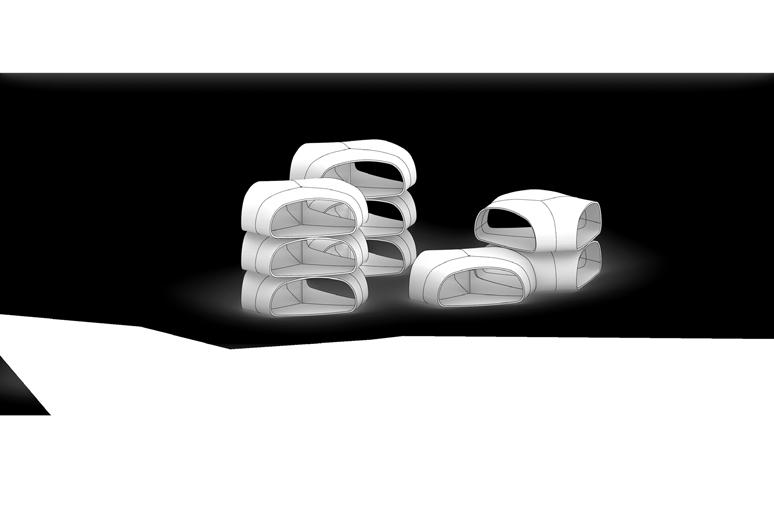
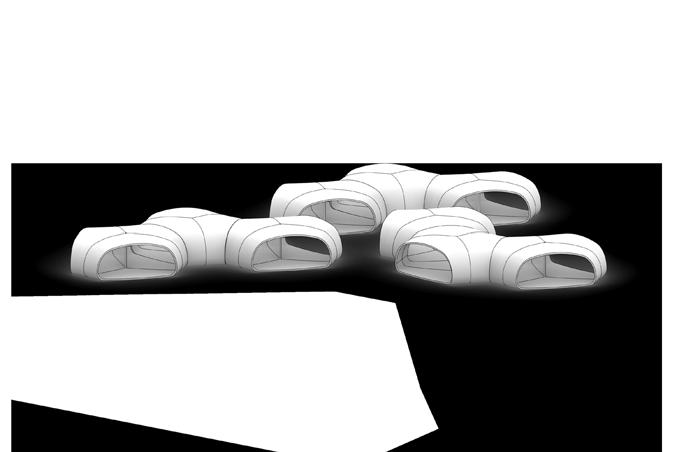


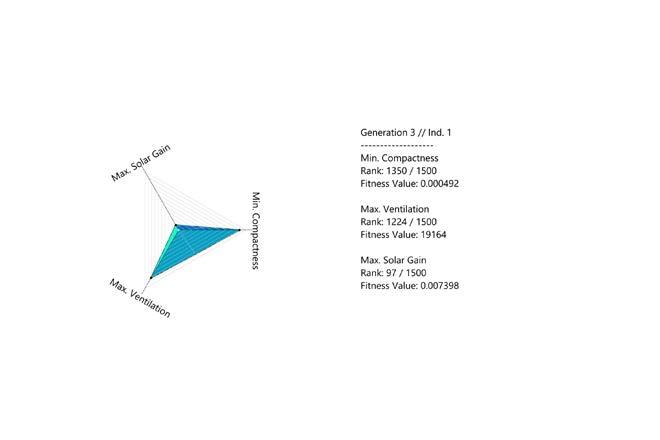
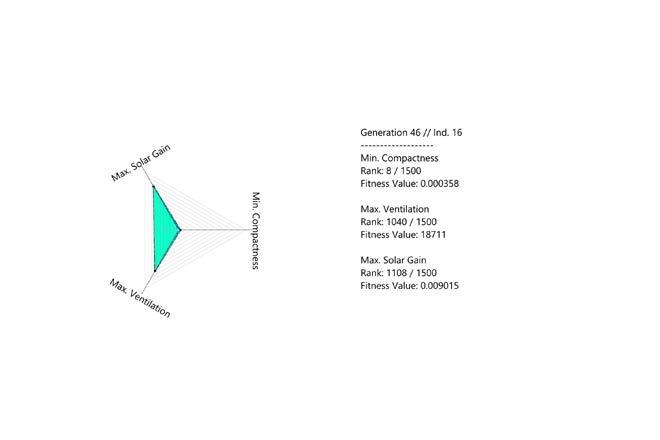
1.1.
[Gen 74; Ind 07]
ranking_0 of social evaluation module counts : 9 + 3
1.2.
[Gen 68; Ind 10]
ranking_0 of environmental evaluation module counts : 9 + 4
2.1.
[Gen 74; Ind 13]
ranking_0 of social evaluation module counts: 9 + 4
2.2.
[Gen 74; Ind 14]
ranking_0 of environmental evaluation module counts : 9 + 6
3.1.
[Gen 67; Ind 17]
ranking_0 of social evaluation module counts: 9 + 5
3.2.
[Gen 63; Ind 05]
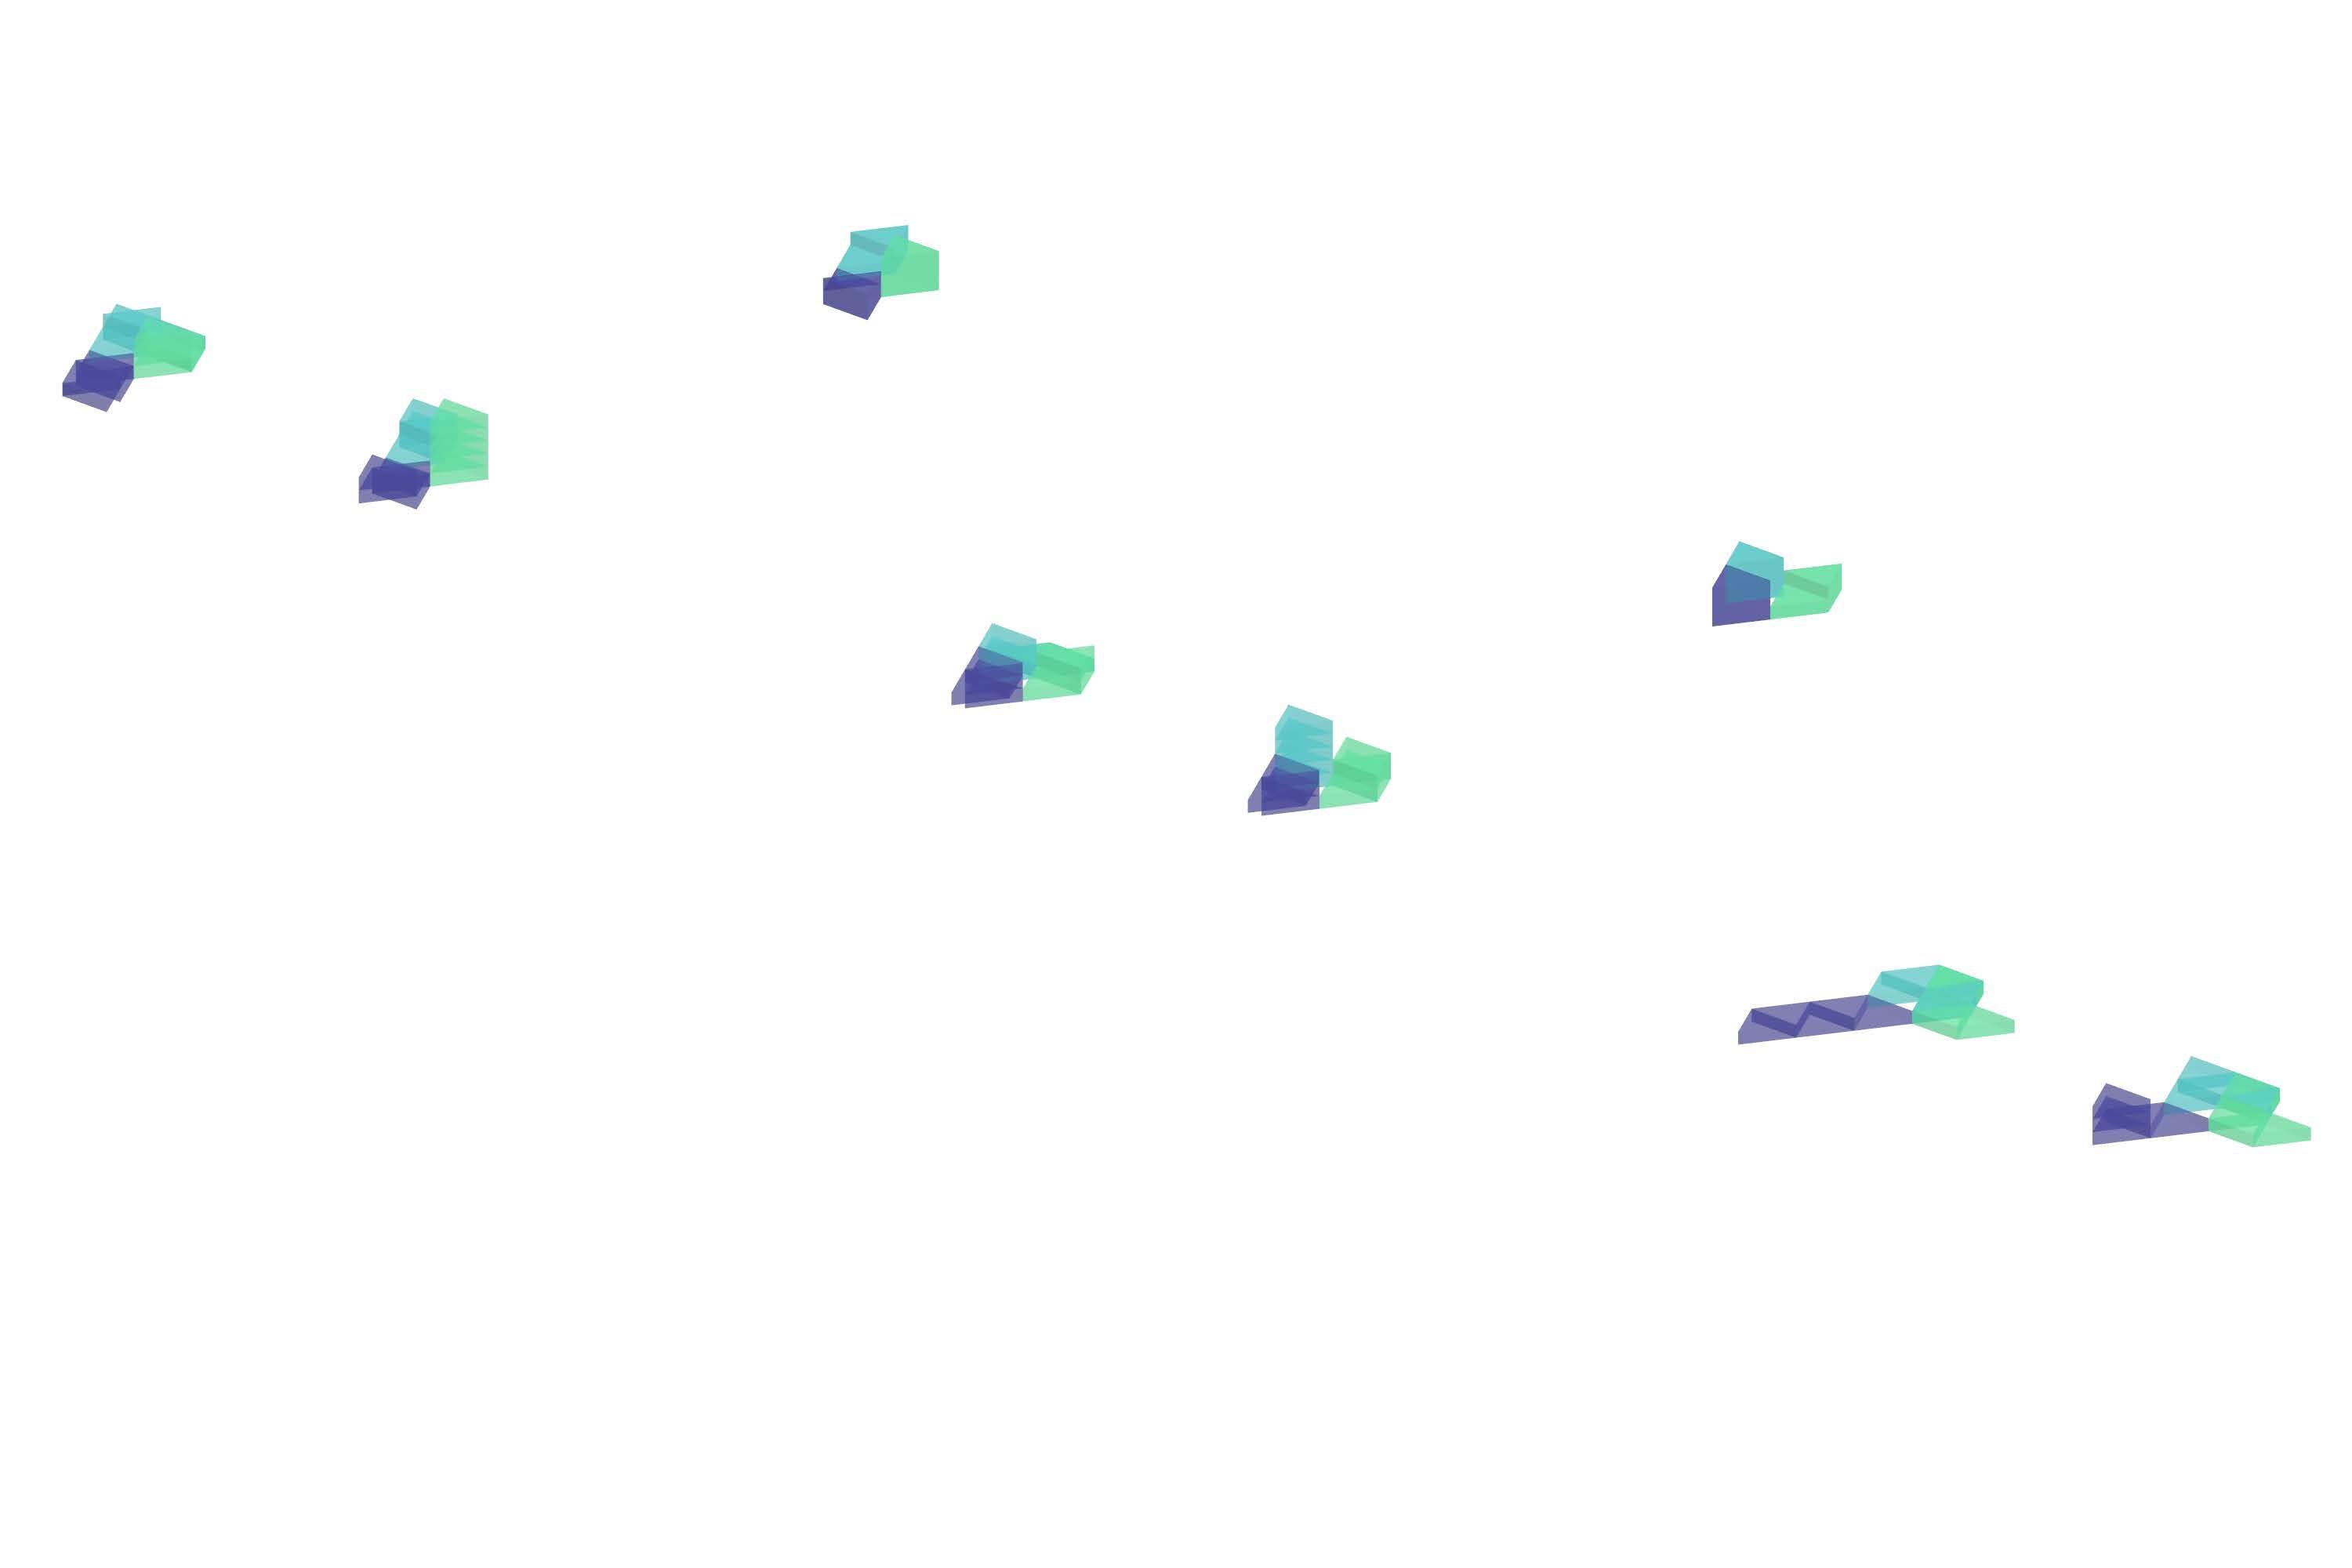
ranking_0 of environmental evaluation module counts: 9 + 6

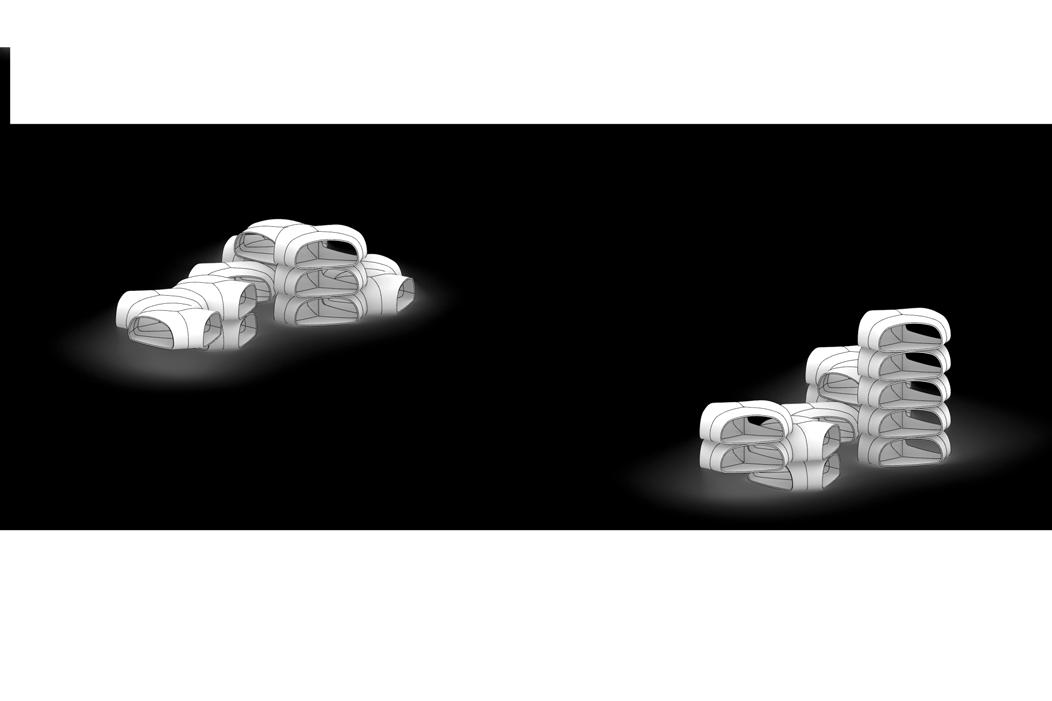
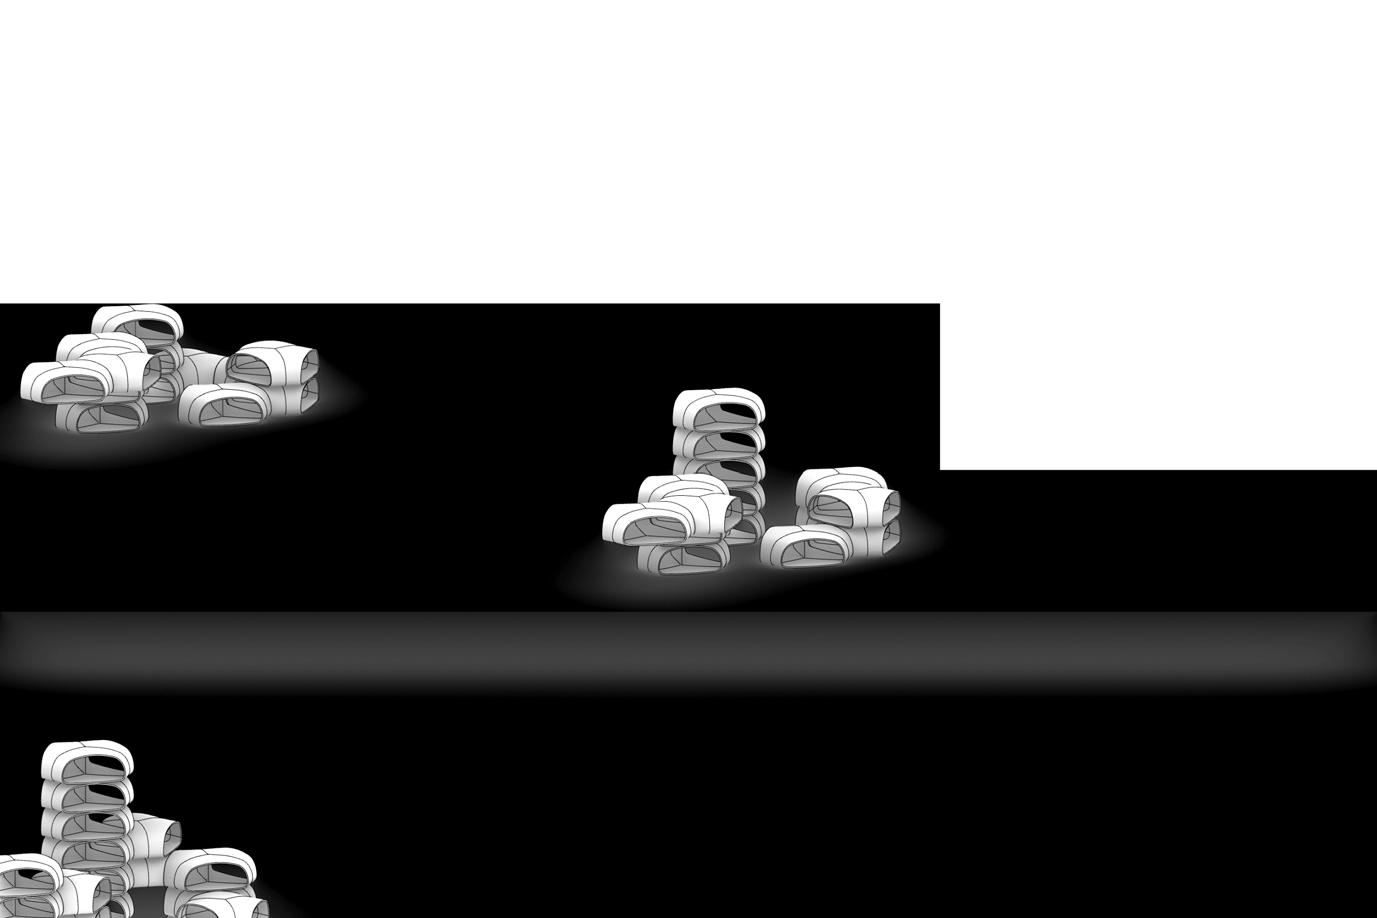

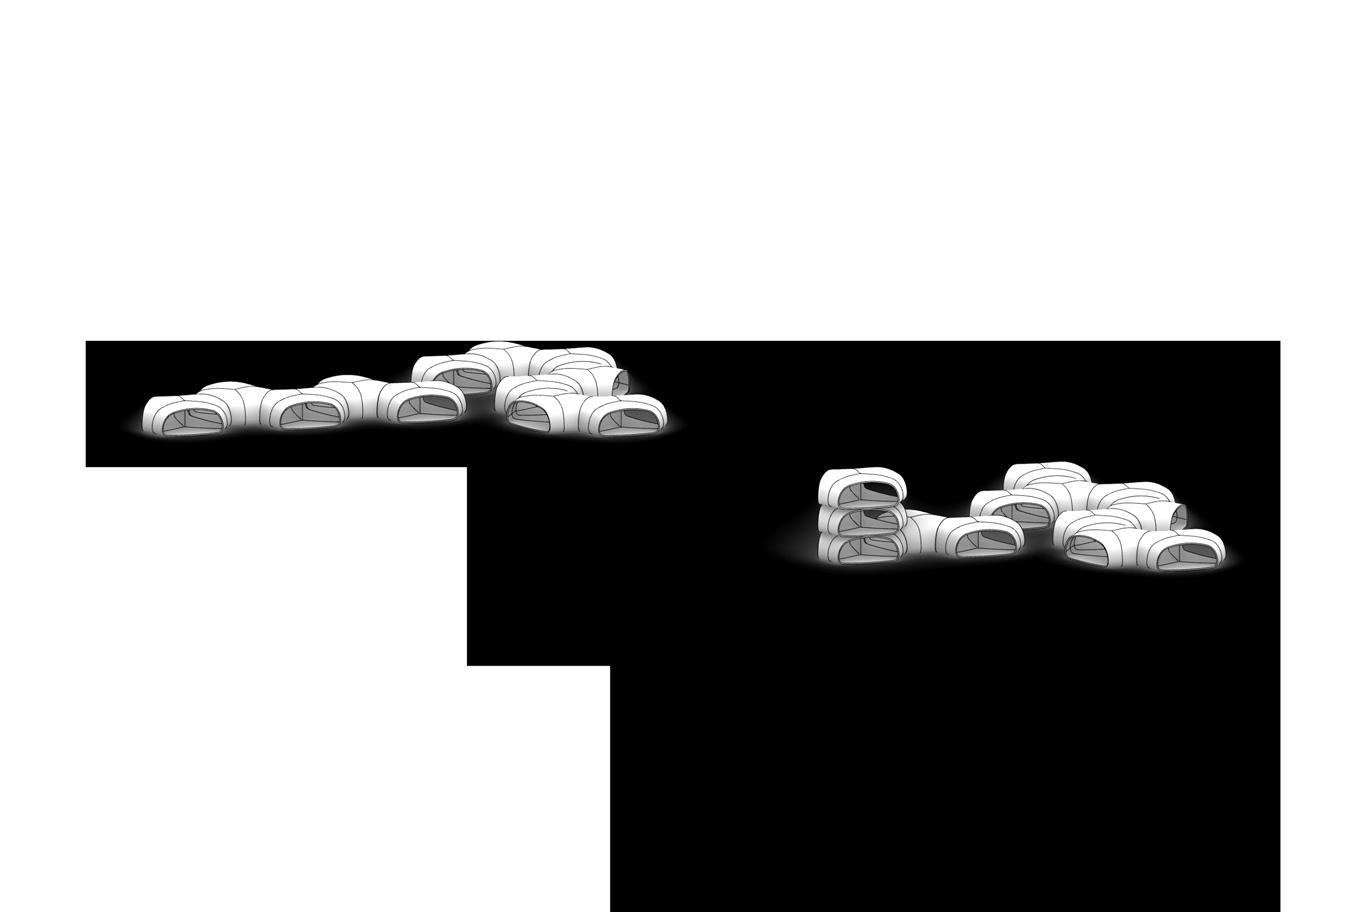


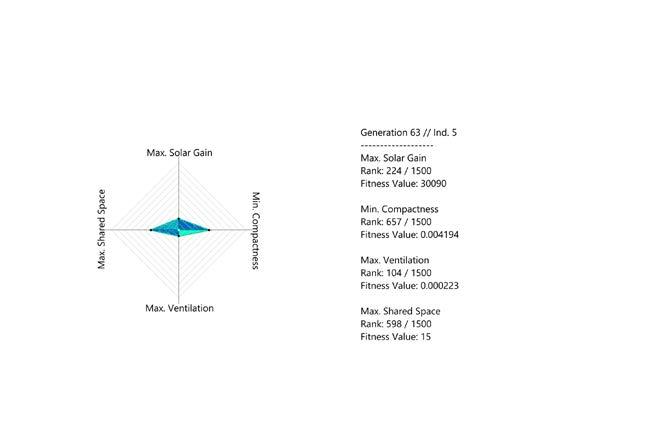
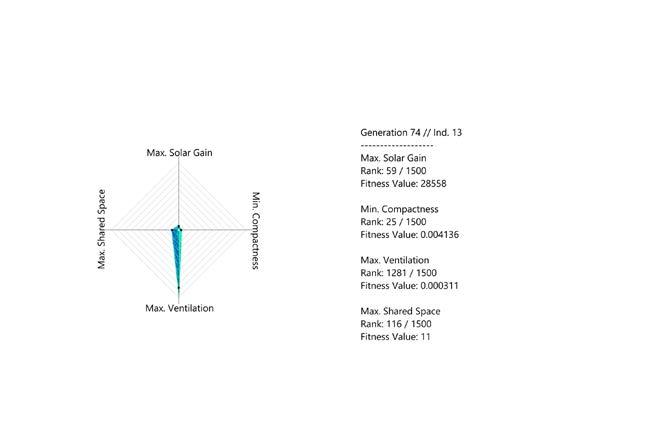

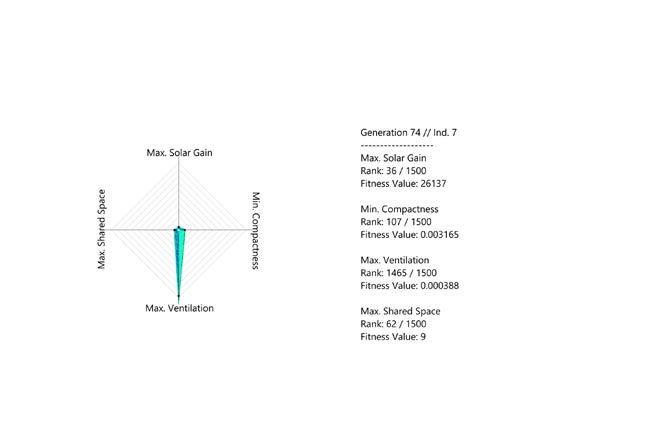
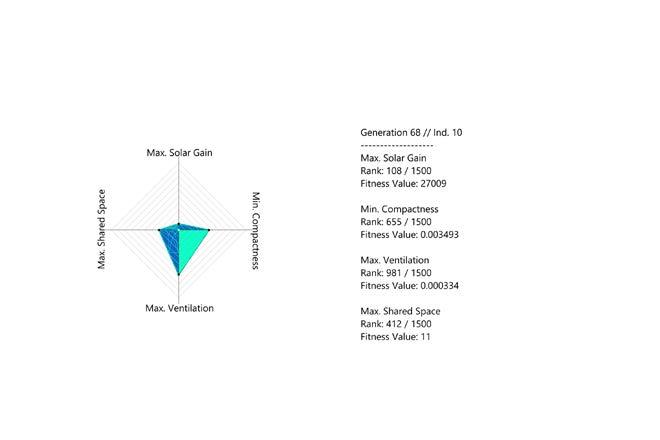
DETAIL
1.1.1
[Gen 70; Ind 15]
ranking_0 of social evaluation module counts : 9 + 3 + 7
1.1.2
[Gen 31; Ind 12]
ranking_0 of environmental evaluation module counts : 9 + 3 + 9
05-5.6 SIMULATION 3
SIMULATION 3
1.2.1
[Gen 40; Ind 11]
ranking_0 of social evaluation module counts: 9 + 4 + 7
1.2.2
[Gen 57; Ind 05]
ranking_0 of environmental evaluation module counts : 9 + 4 + 5
2.1.1
[Gen 36; Ind 14]
ranking_0 of social evaluation module counts: 9 + 4 + 4
2.1.2
[Gen 59; Ind 05]
ranking_0 of environmental evaluation module counts: 9 + 4 + 6
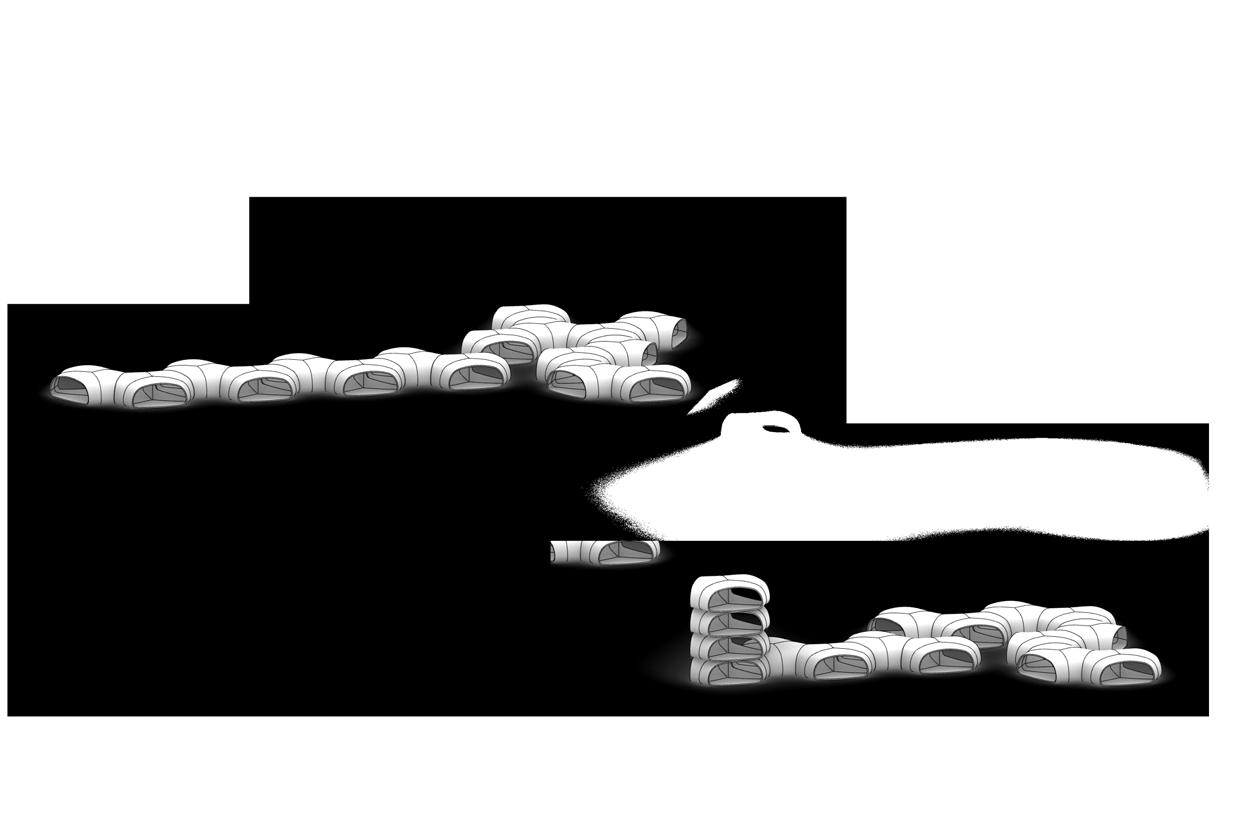

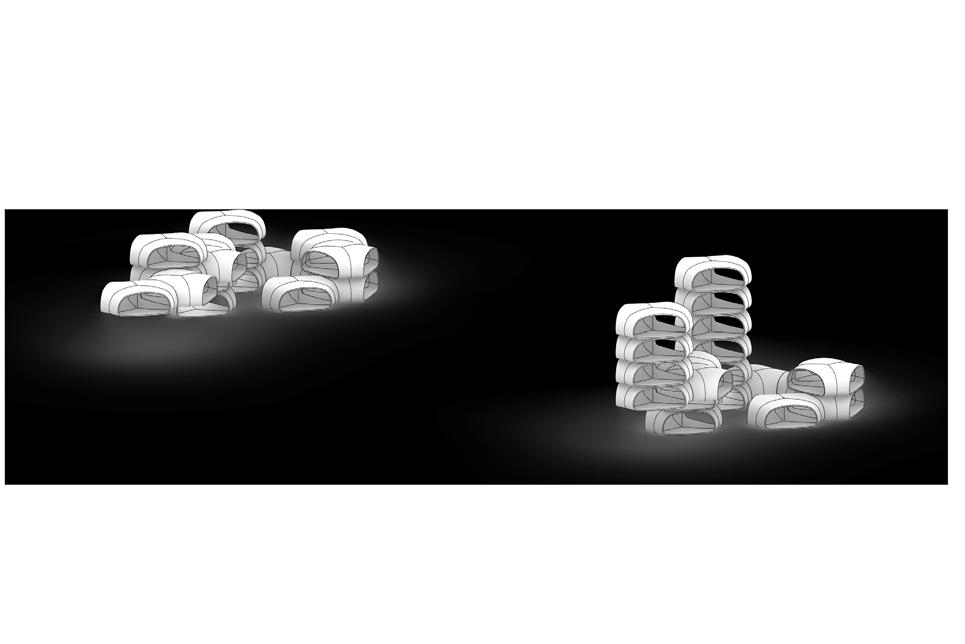

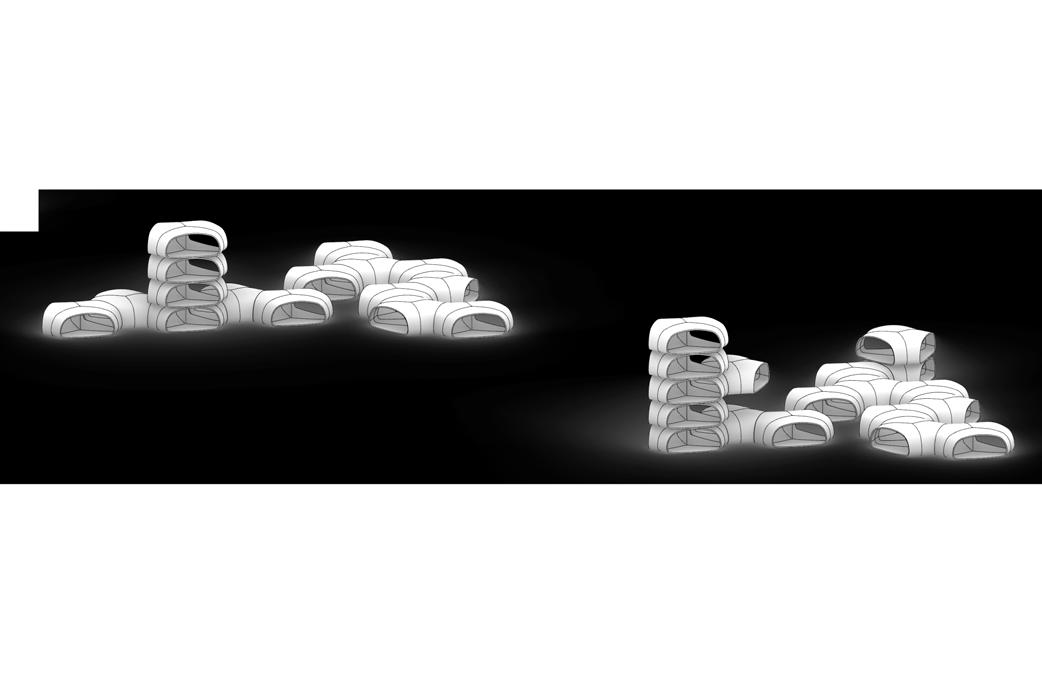


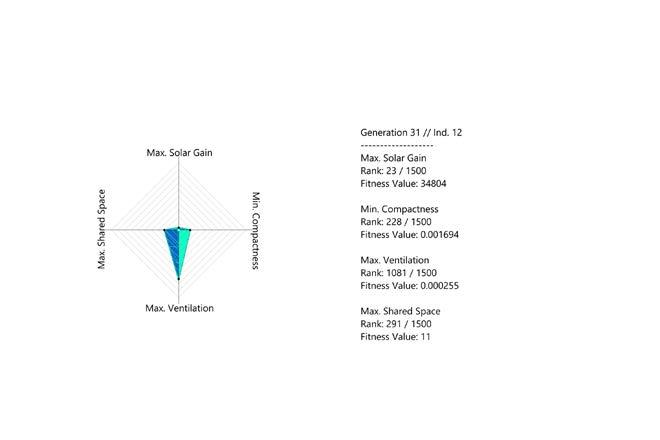
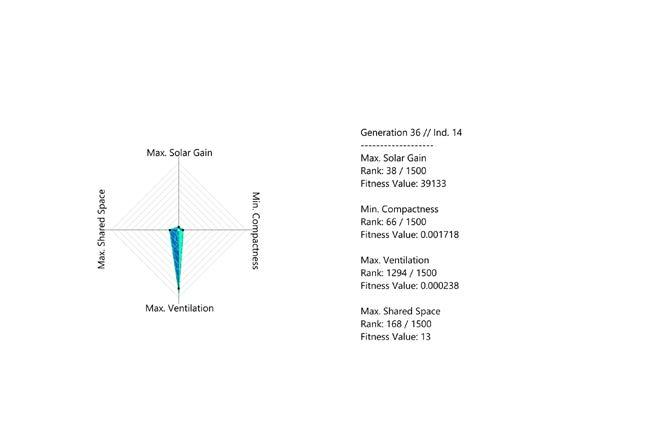
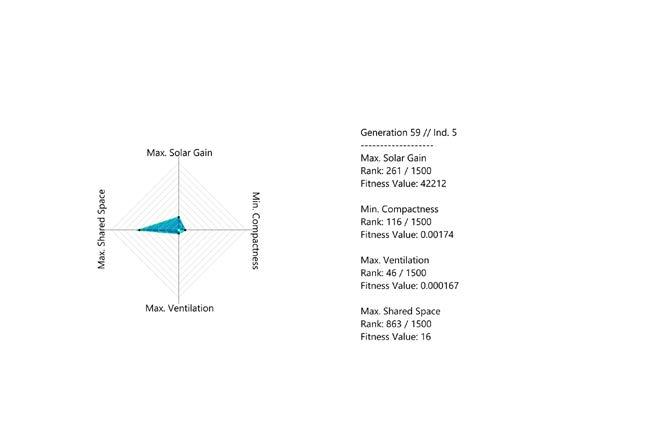
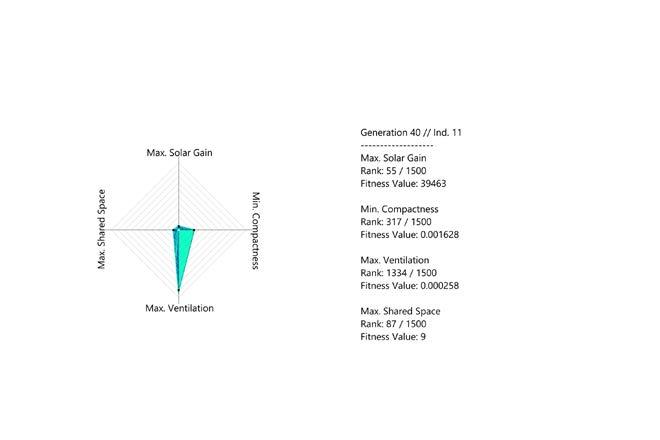
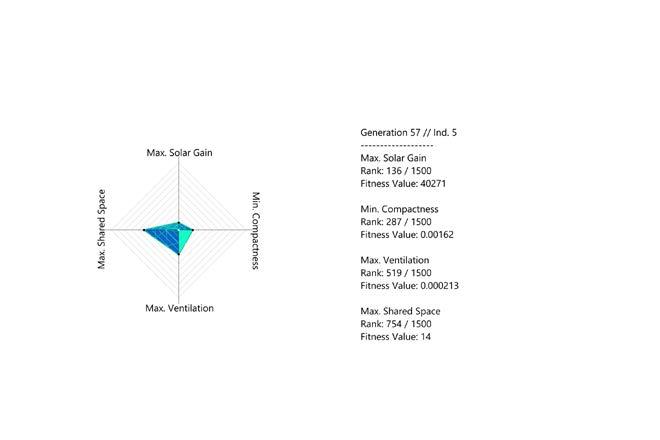
[Gen 70; Ind 17]
ranking_0 of social evaluation module counts : 9 + 6 + 6
[Gen 54; Ind 16]
ranking_0 of environmental evaluation module counts : 9 + 6 + 6
05-5.7 SIMULATION 3
[Gen 22; Ind 09]
ranking_0 of social evaluation module counts: 9 + 5 + 7
[Gen 73; Ind 02]
ranking_0 of environmental evaluation module counts : 9 + 5 + 7
3.2.1
[Gen 72; Ind 06]
ranking_0 of social evaluation module counts: 9 + 6 + 6
3.2.2
[Gen 61; Ind 16]
ranking_0 of environmental evaluation module counts: 9 + 6 + 8
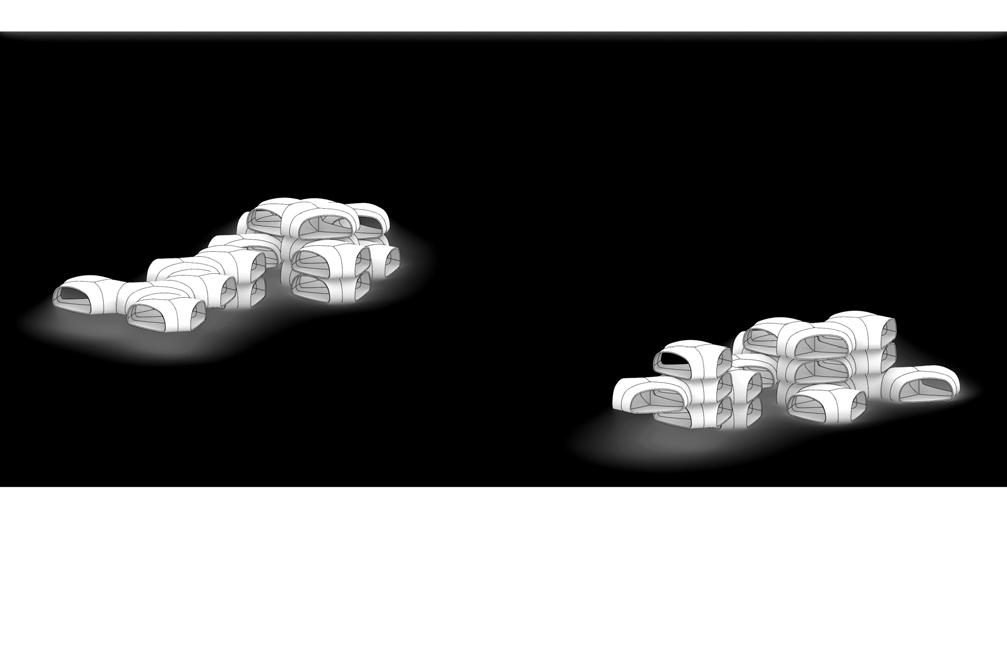
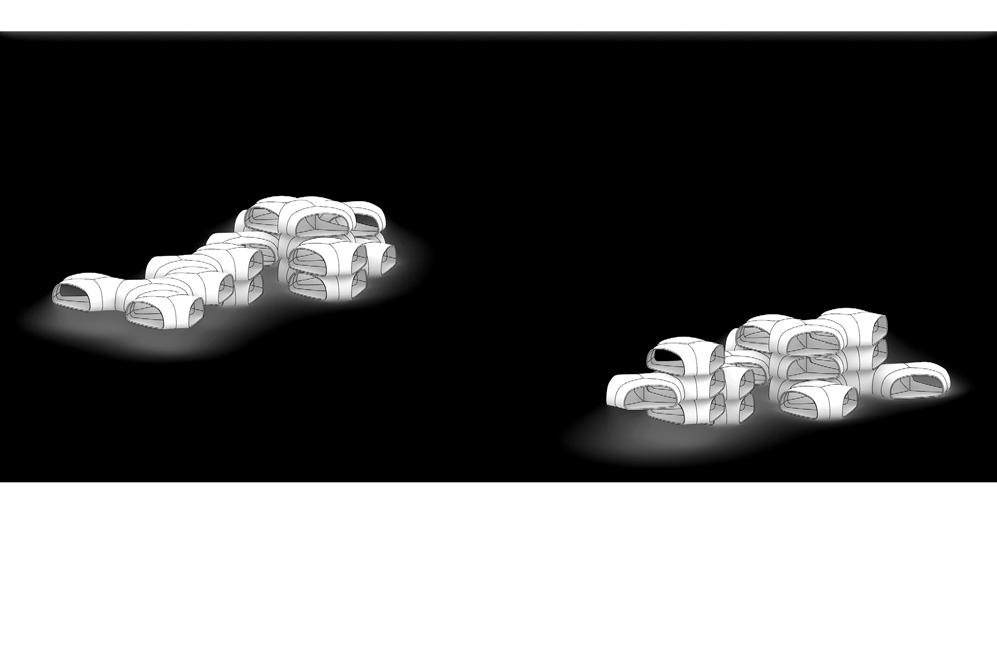
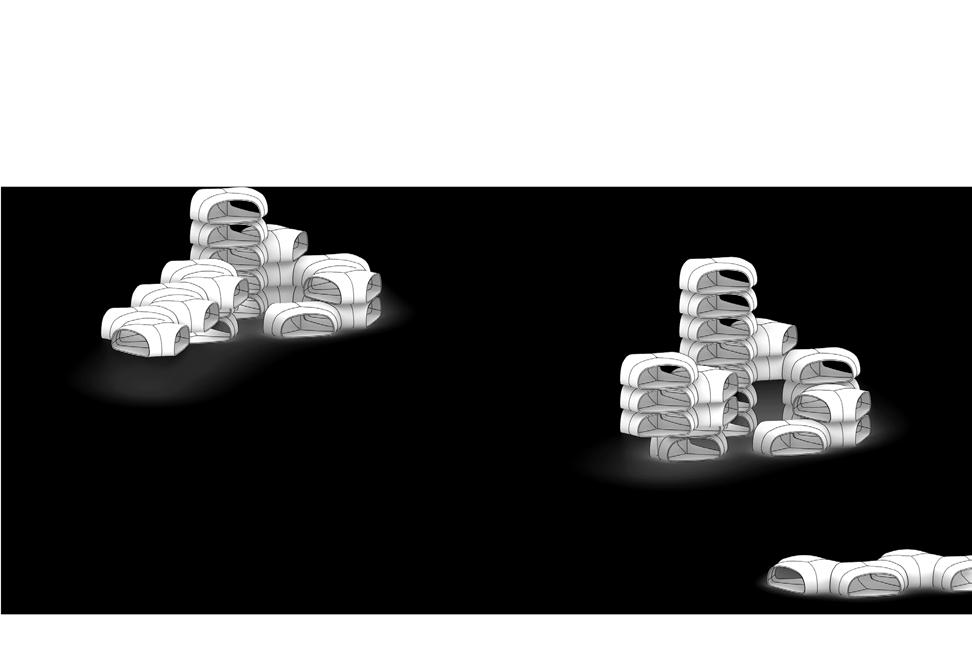
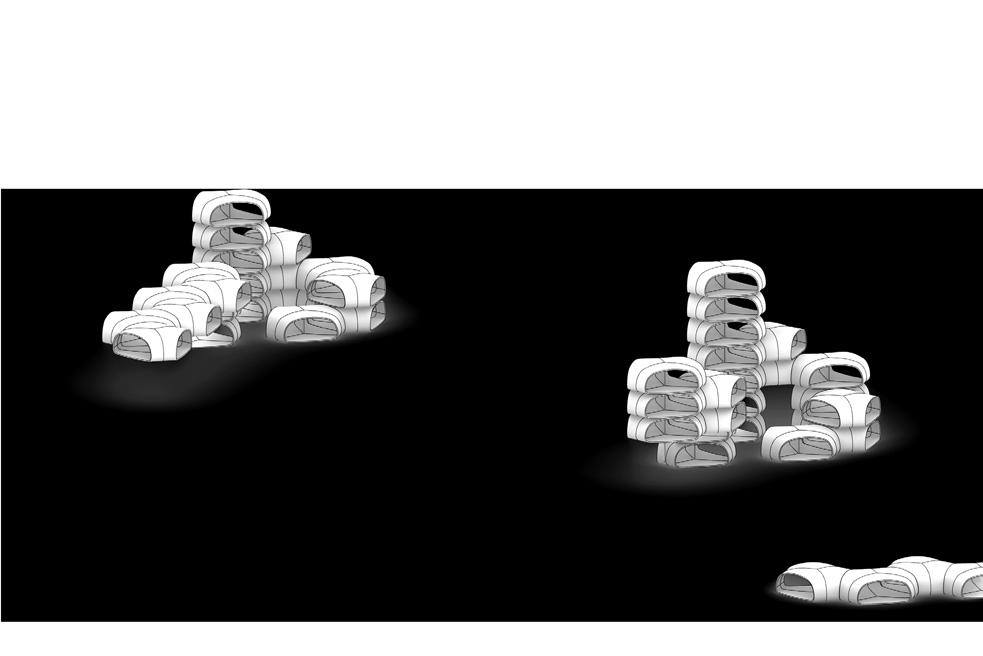
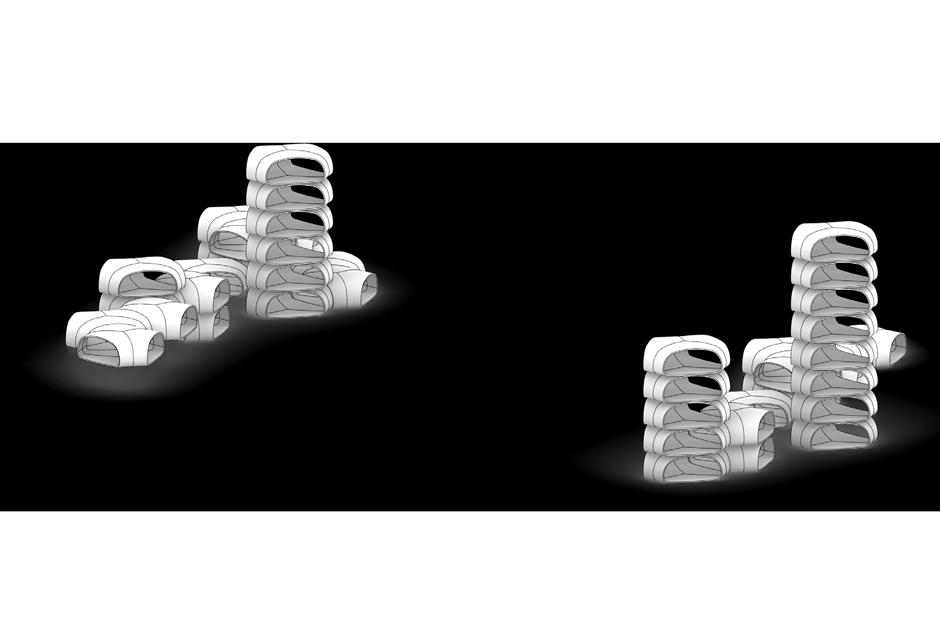
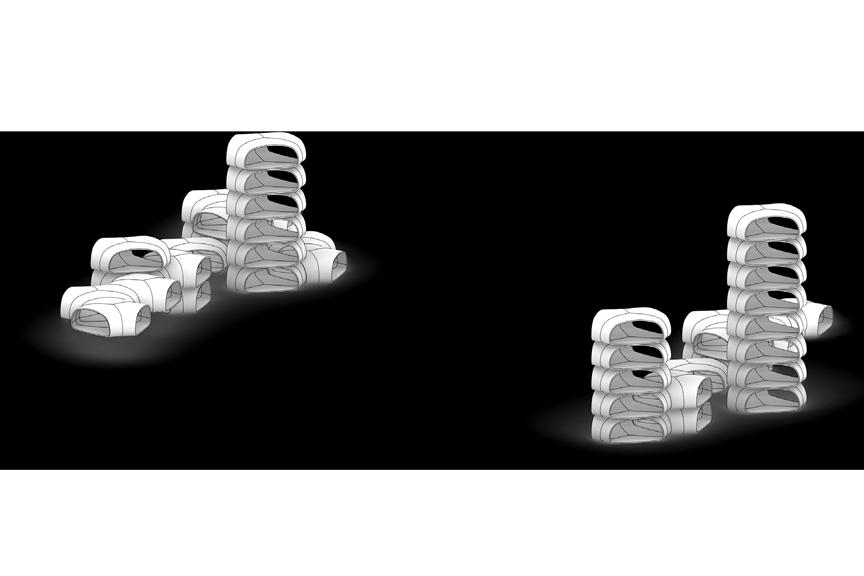
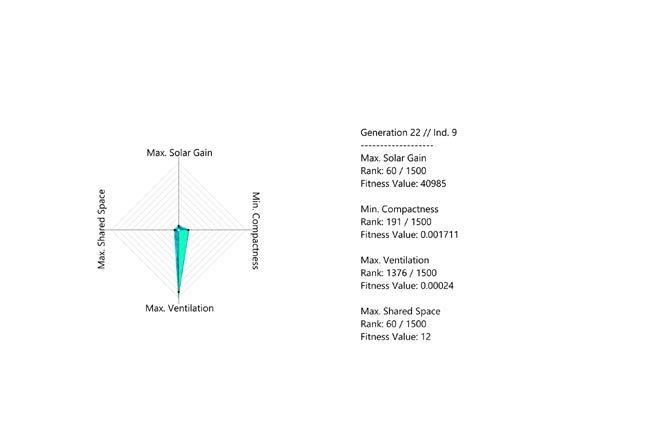
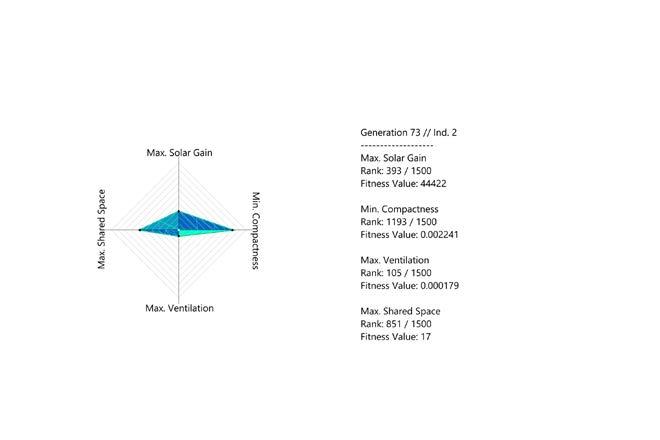
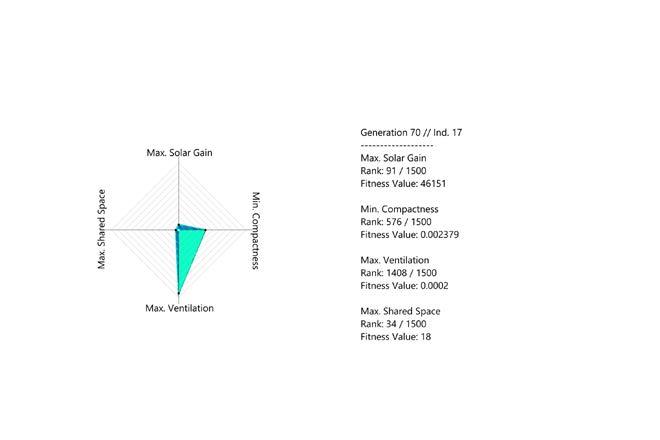
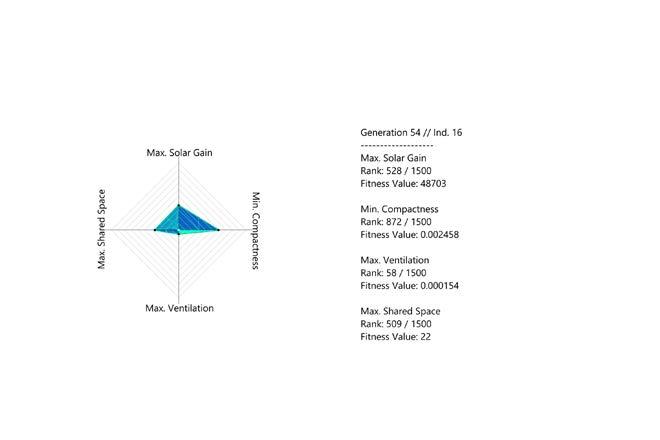
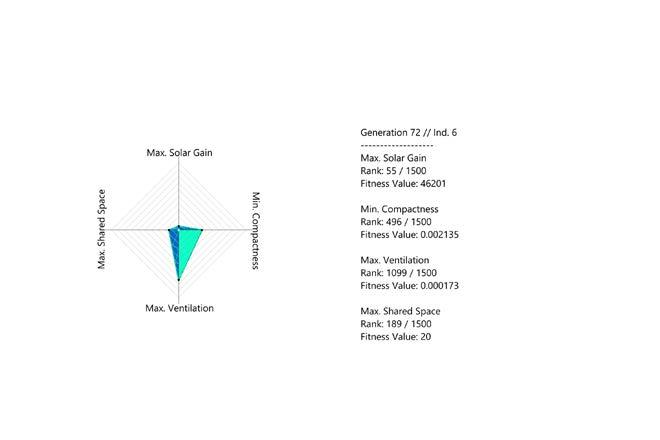
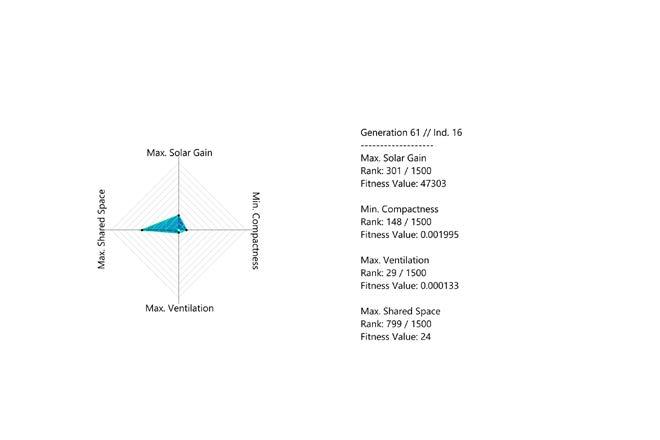
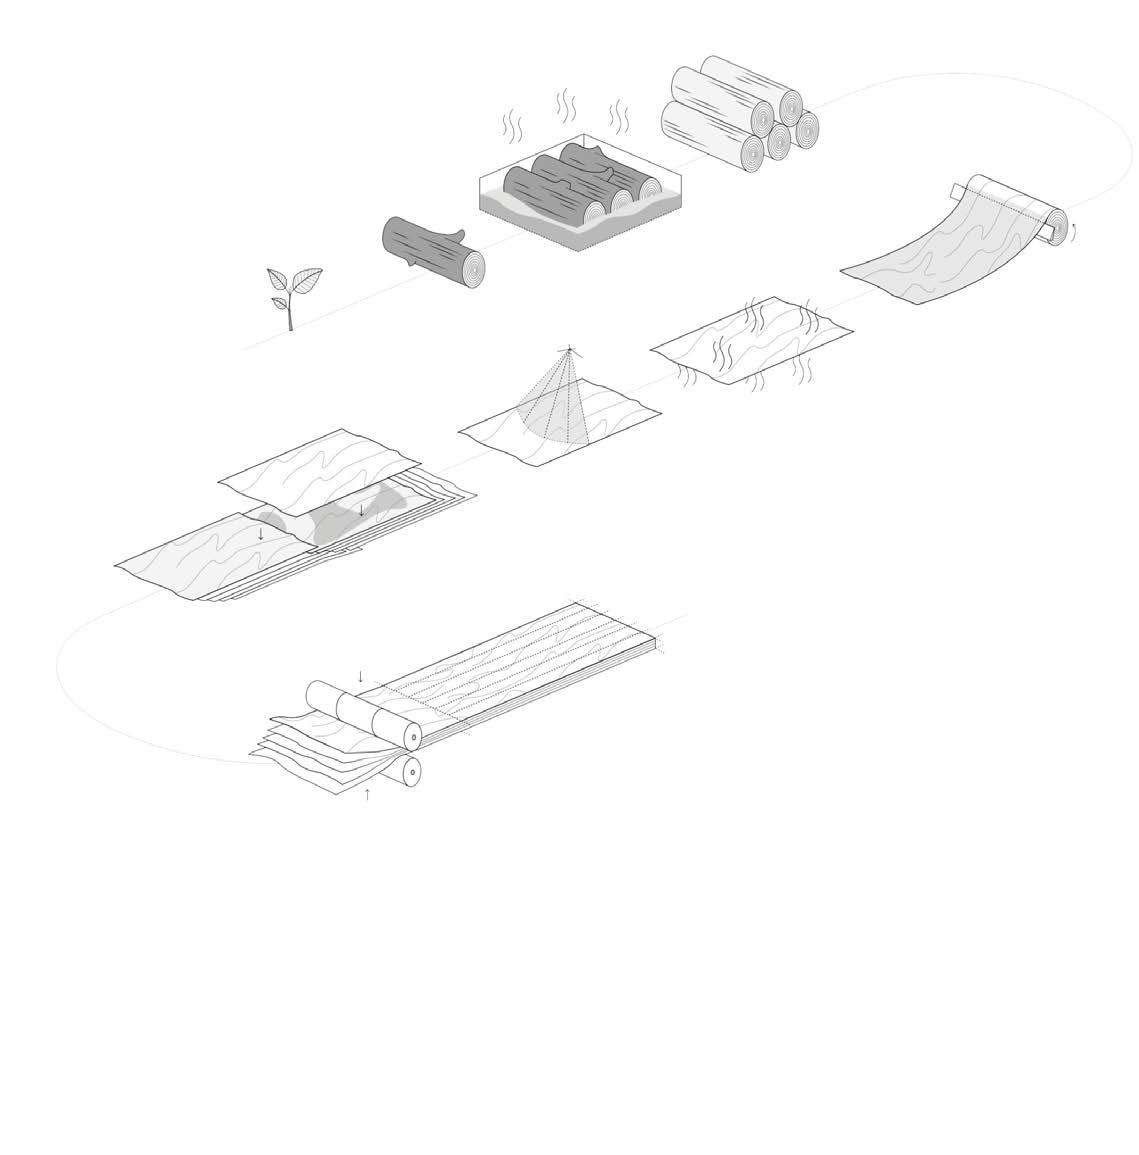

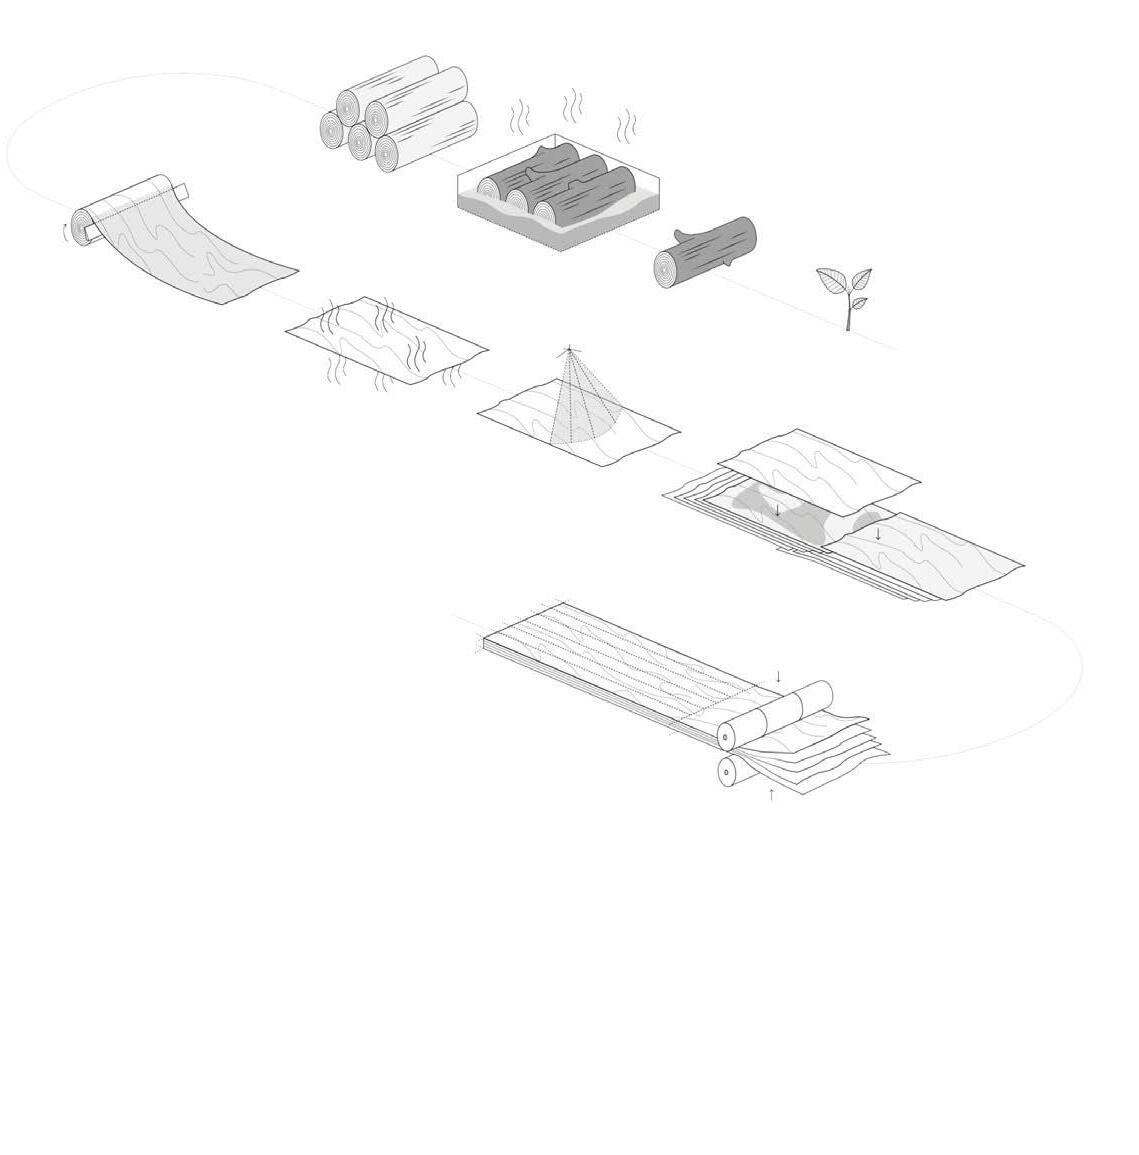


The entire process of fabrication is relatively simple, however, it requires some controlled environment. It all starts with taking the raw material to a sawmill, then the wood is steamed and debarked. Further it is cut, dried and sorted into quality classes with the aid of specialised scanners.
Once distributed into classes the cuts are further split into two groups. The active layer group comprises sheets with 30% moisture content (green wood moisture) whereas the members of the passive layer group are dried in a kiln until they reach 12% moisture content. Further, these are trimmed to the shape of a digitally unrolled bent piece.


Once the veneers are steamed and debarked, they are cut into shapes of the unrolled geometries. Since the veneers are very thin, multiple pieces of the same geometry must be cut to suffice for both the active and the passive layer stack-ups. The batch is then split into two groups, one to be used for the active layers and the other for the passive layers in the module.
As seen in Fig. 53, the corresponding active and passive layers have the exact same geometry, however their moisture content is different.
For the assembly of 1/6 of the given module are required:


9 T_1 layers (approx. 2000mm x 3500mm) of which 3 active (T_A1) and 6 passive (T_P1)
21 T_2 layers (approx. 1500mm x 1500mm) of which 11 active (T_A2) and 10 passive (T_P2)
31 B_1 layers (approx. 1500mm x 1500mm) of which 23 active (B_A1) and 8 passive (B_P1)
20 B_2 layers (approx. 2000mm x 3500mm) of which 2 active (B_A2) and 18 passive (B_P2)
When glued together these form 4 bilayers of various thicknesses: T_1, T_2, B_1, B_2.


* All active layers are cut as green wood, passive layers are dried to 12% moisture content.




 Fabrication drawing based on using 6mm rotary cut douglas-fir veneer
05-6.3
The process of fabricating self-shaped panels is carried out in multiple steps. The passive layer batch is kiln-dried until it reaches a moisture content of 12% whereas the moisture content of the active layer batch is maintained at 30%.
The multiple bilayers are stacked up to achieve the desired thickness. The component is then kiln-dried until the active layer has exactly 8% moisture content which makes the component bend. The latter are assembled in sizes not exceeding either the width or the length of a semi-truck and are then transported to the given site. The last step is the on-site assembly which could be executed by non-professionals following a provided manual.
The next step is to glue and secure the passive and active layers together. Firstly, the adhesive is applied then the layers are secured to one another and finally these are precisely clamped together so that any excessive adhesive is extracted aside of the adjacent surface. Being just a fractal of the entire process, this last step is a crucial one. Keeping the precise amount of glue between both layers does not allow for the adhesive to transform into a foam mass with occasional air bubbles compromising the bilayer’s strength.
The thickness of the active and the passive layers is determined by the radius of curvature that the panels need to achieve. The bilayer panels are finally dried inside a kiln until they reach 8% moisture content which is the point when should have achieved the desired curvature


B_A1 x 6 (green wood)
B_A2 x1 (green wood)
B_P2 x 3 (12%MC)
B_P2 x 2 (12%MC)
calculated amount of the active and passive layers which make up the
passive layers
Active/passive layers are glued together as primary bilayers and sent to industry- standard drying
4. as drying, bilayers deformed to the desired curvature.


5. A calculated number of the curved bilayers are secured together to make up the total panel thickness.

6.
Once layered up, panels are done
FIG.57 Biscuit joint detail
FIG.58 Groove and tongue joint detail for panel to panel horizontal connection
FIG.59 Groove and tongue joint detail for panel to panel vertical connection
FIG.60 Panel to panel connection detail drawing
FIG.61 Panels to central post connection detail drawing
The individual panels that constitute the module are held together with three different joints. Biscuit joints are used where elements should be connected along the panel’s smaller side, which is the thickness of the panels, bolts are used to secure the perpendicular elements. Tongue and groove joints connect the panels along the longer side, this particular joint preserves a continuous connection along the edge for a homogeneous load transfer. All the joints are further secured with code-compliant fasteners and glue
Active layer (bending)
Passive layer (bent)
Void with glue / (female part of tongue and groove joint)
Biscuit joint
DETAIL B
Bolt
Spacer beam with embeded voids for a biscuit joint and a groove and tongue joint
Thin finishing layer (evening out the thickness difference)
DETAIL C
Thick finishing layer (evening out the thickness difference)
Void with glue
Embeded board / (male part of tongue and groove joint)
Window frame
Steel Nut
Steel Threaded Bolt
Steel Pin
Central Timber Pillar
Curved Timber Panels
drawing
Each module is secured to its neighbours in vertical direction through a central core which allows for a smoother transition of the vertical loads. To assure maximum human comfort while decreasing swaying of the modules side supports, which partially unload the dome-like modules and allow for vertical transition of loads along the perimeter of the units, are introduced.
central core (R=1000mm) added when needed for supporting load. fabricated with same method as module curved panels. during process, core wall gets divded into 3 parts vertically, with each panel size 2mm x module heigh length)m before curving.
The cylindrical core has a radius of 1000mm. Its comprises 6 active and passive layers with respectively 14mm and 23mm thickness. The side support is milled on a CNC-router.
Primary Bilayer consists of 14mm Passive Layer with 23mm Active Layer (see table FIG.62)
Core Wall divided into 3 panels
Side Support done by CNC Milling
FIG.63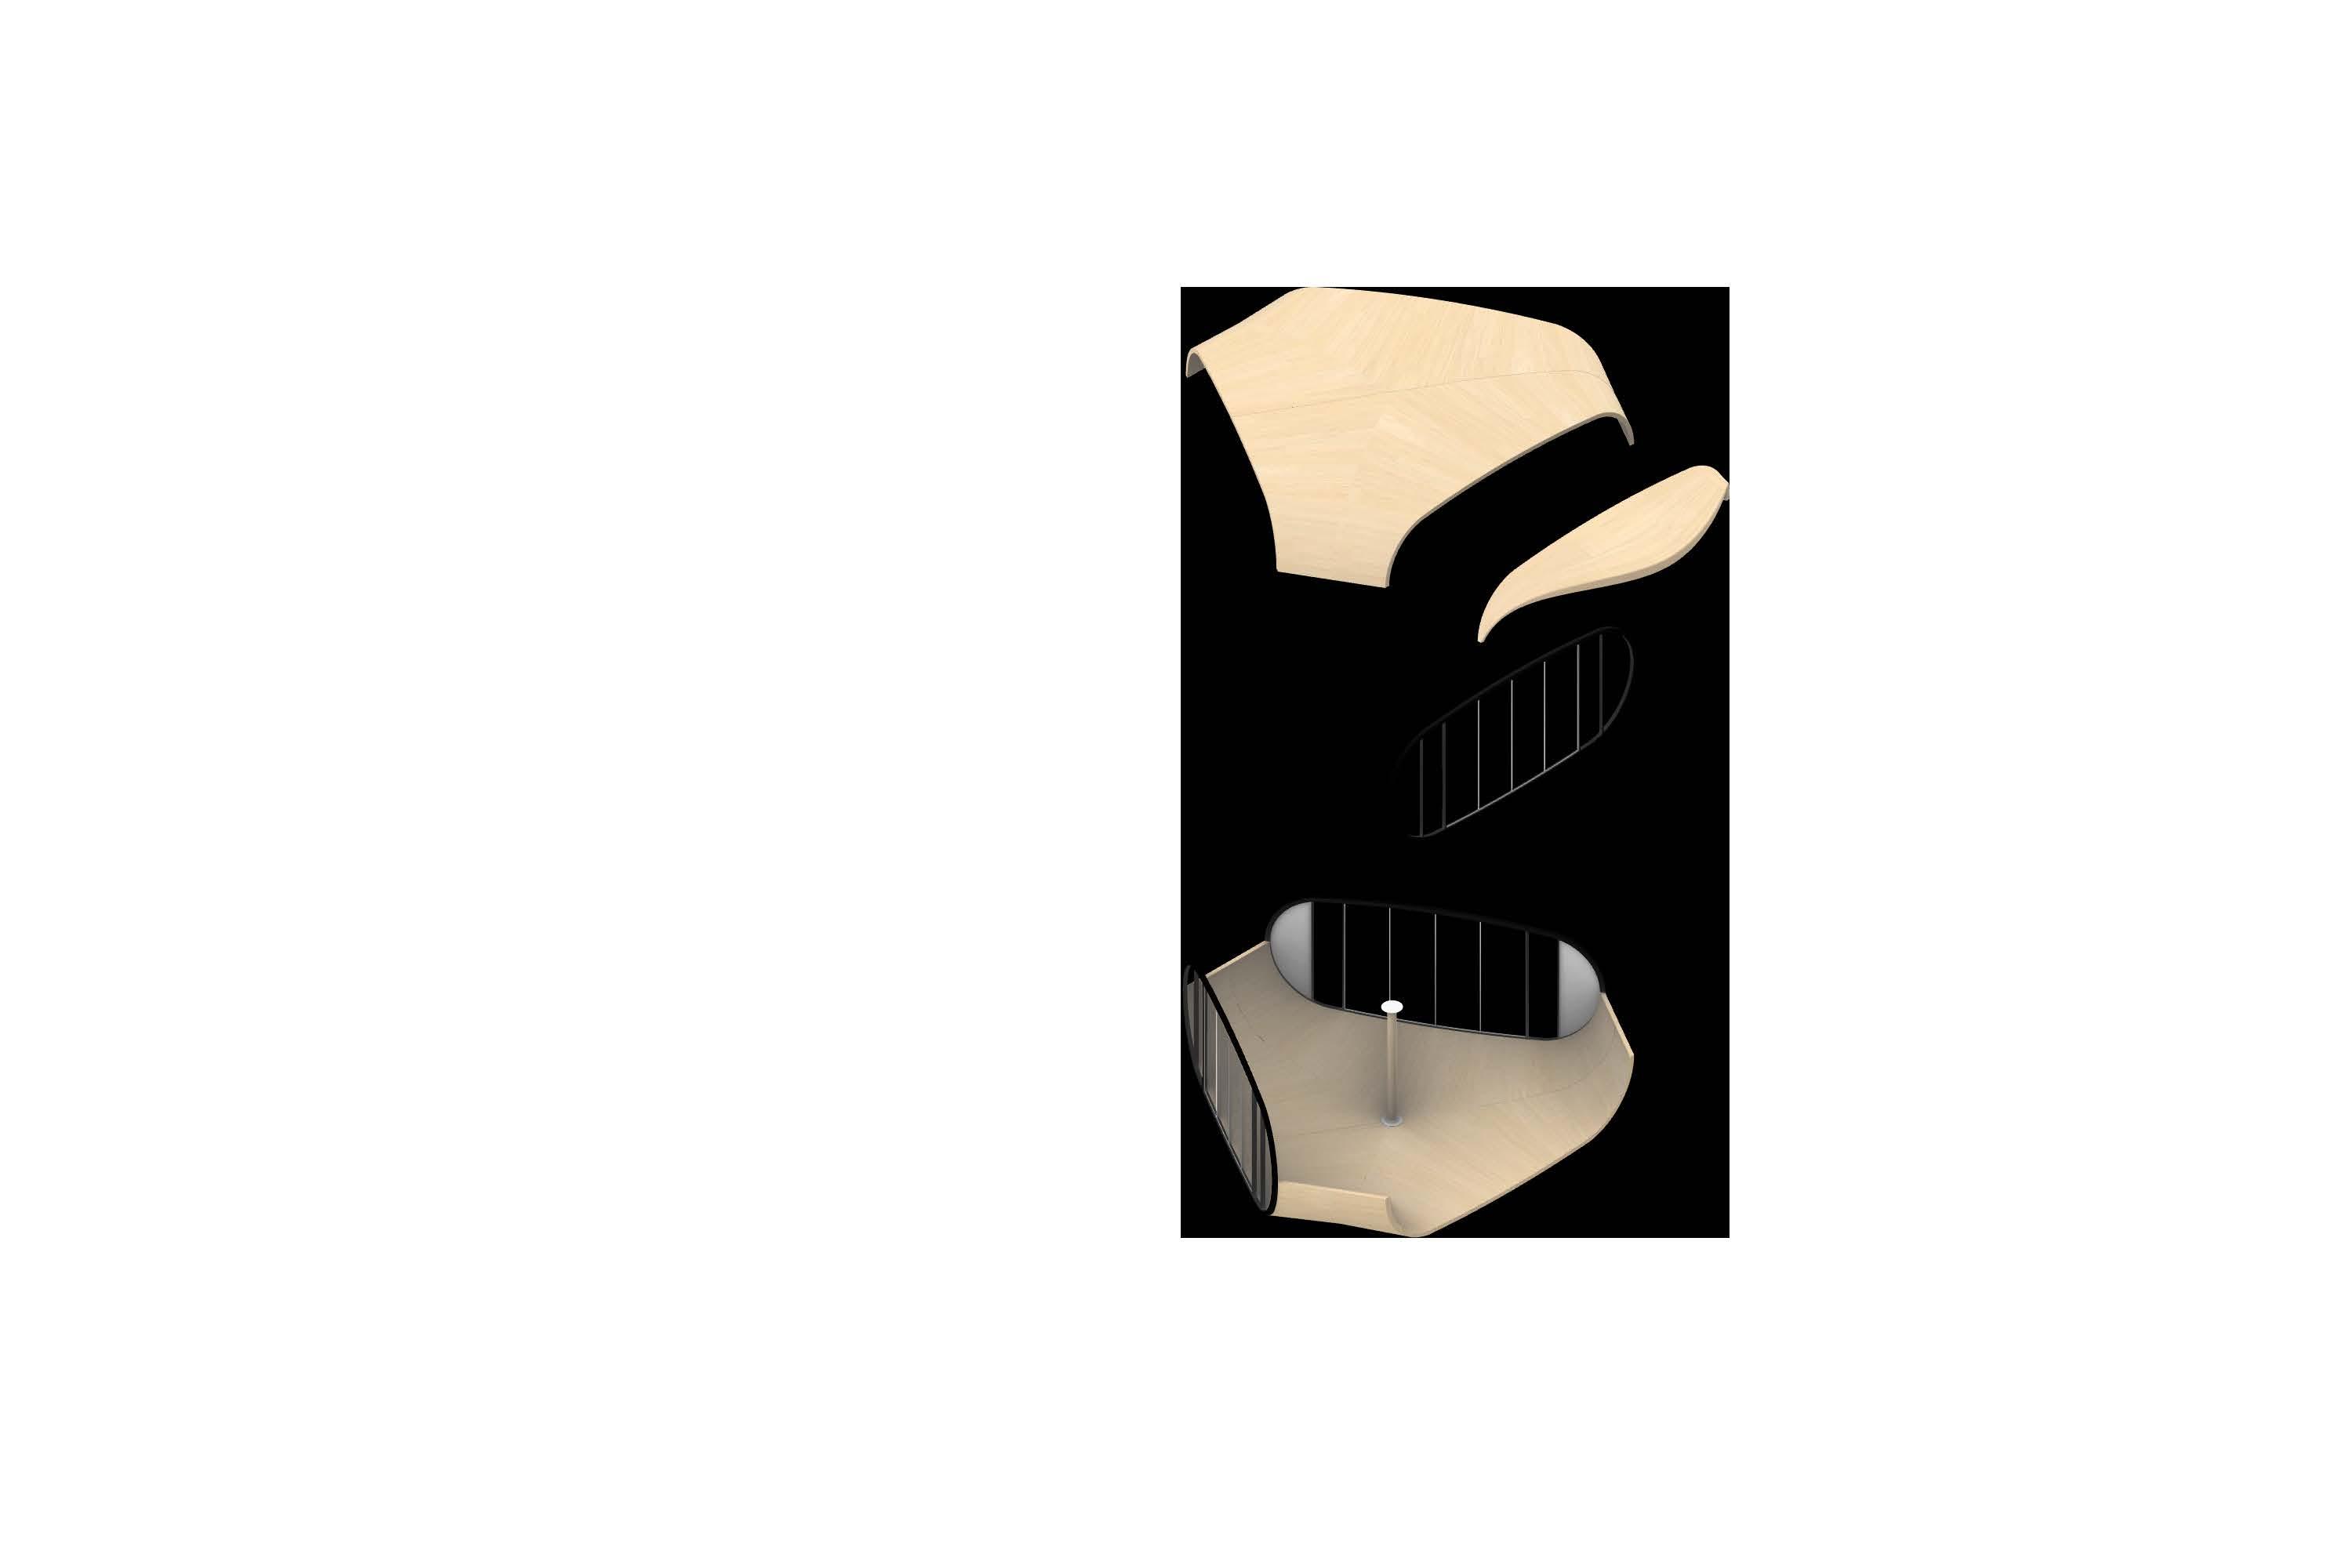
The single-storey module design could expand into multi-family aggregation with the time and demographic changes. The smallest number of modules sufficient to set up a livable area is 3. The number of interconnected modules can expand in proportion to the increase in family size. While there is no upper limit which constitutes one household, the circulation in more than 10 attached units might be time-wise inefficient.
To reduce fabrication costs and human labour work, uniformity is maintained within the size and shape of all components. The bent timber panels only differ in their curvature radius and thickness. The timber window frames follow the same curvature of the panels. All the interconnected units share a circular central core. a secondary flooring system is introduced to even out the primary curved flooring panels. The secondary flooring is also used to conceal all the service lines. Modules also have the flexibility to accommodate a balcony or a deck on the ground floor.
While most aggregations are formed of stack-ups of single-story modules are distributed in a rather horizontal arrangement, double-story and split-level ones are also available in order to align with the needs of the occupants.
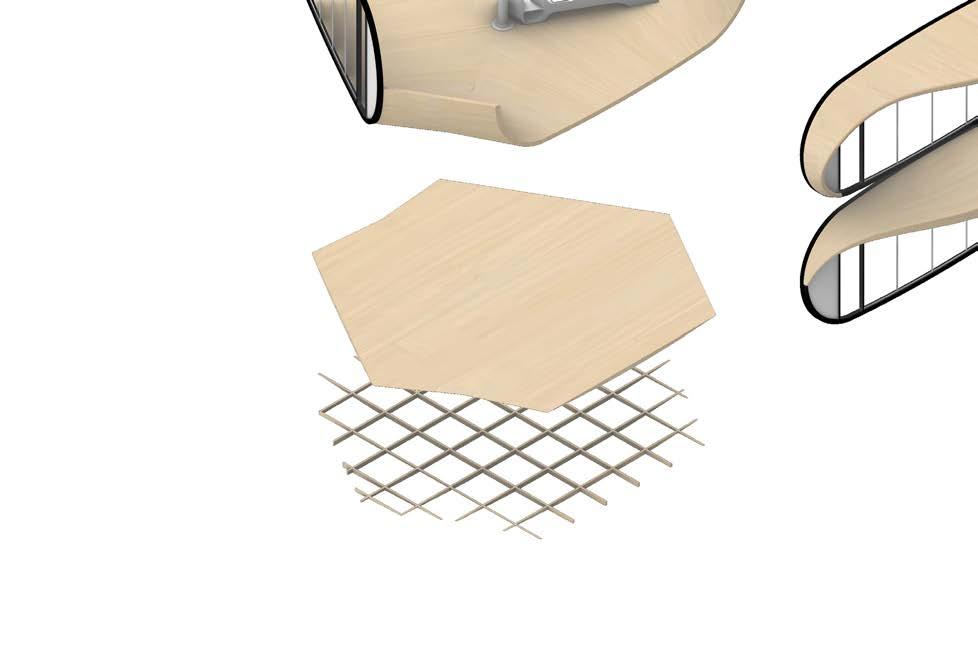
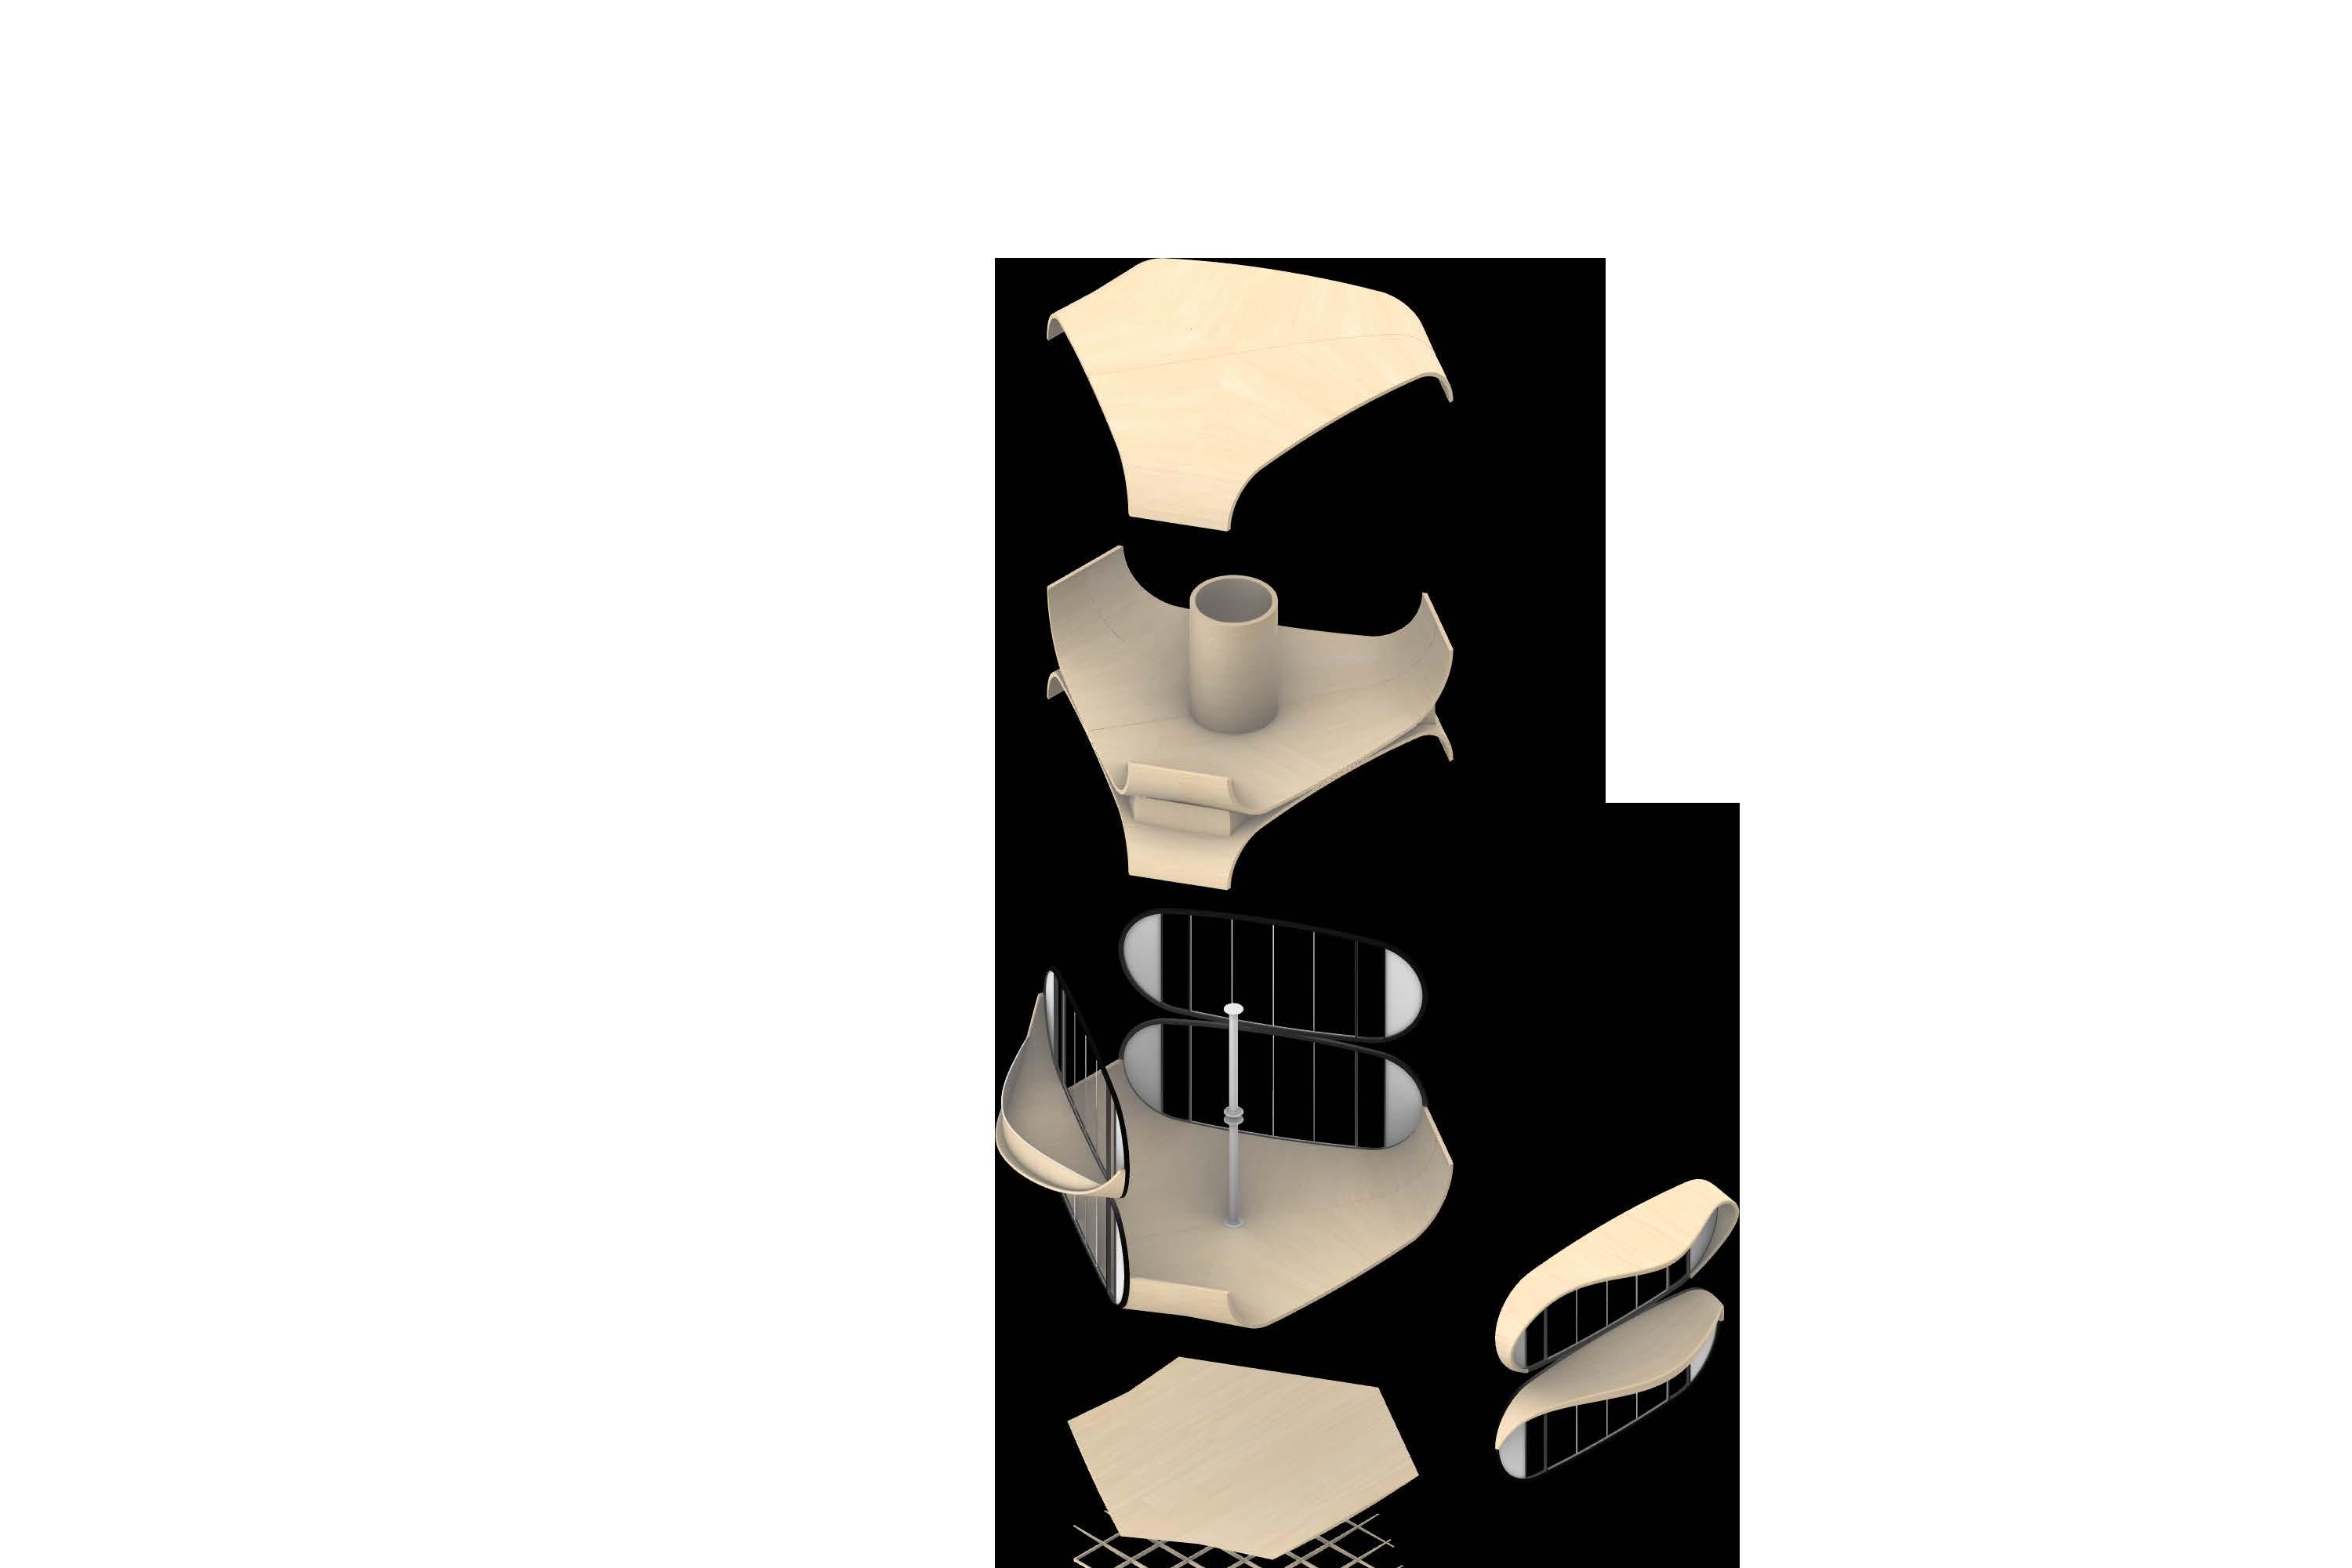
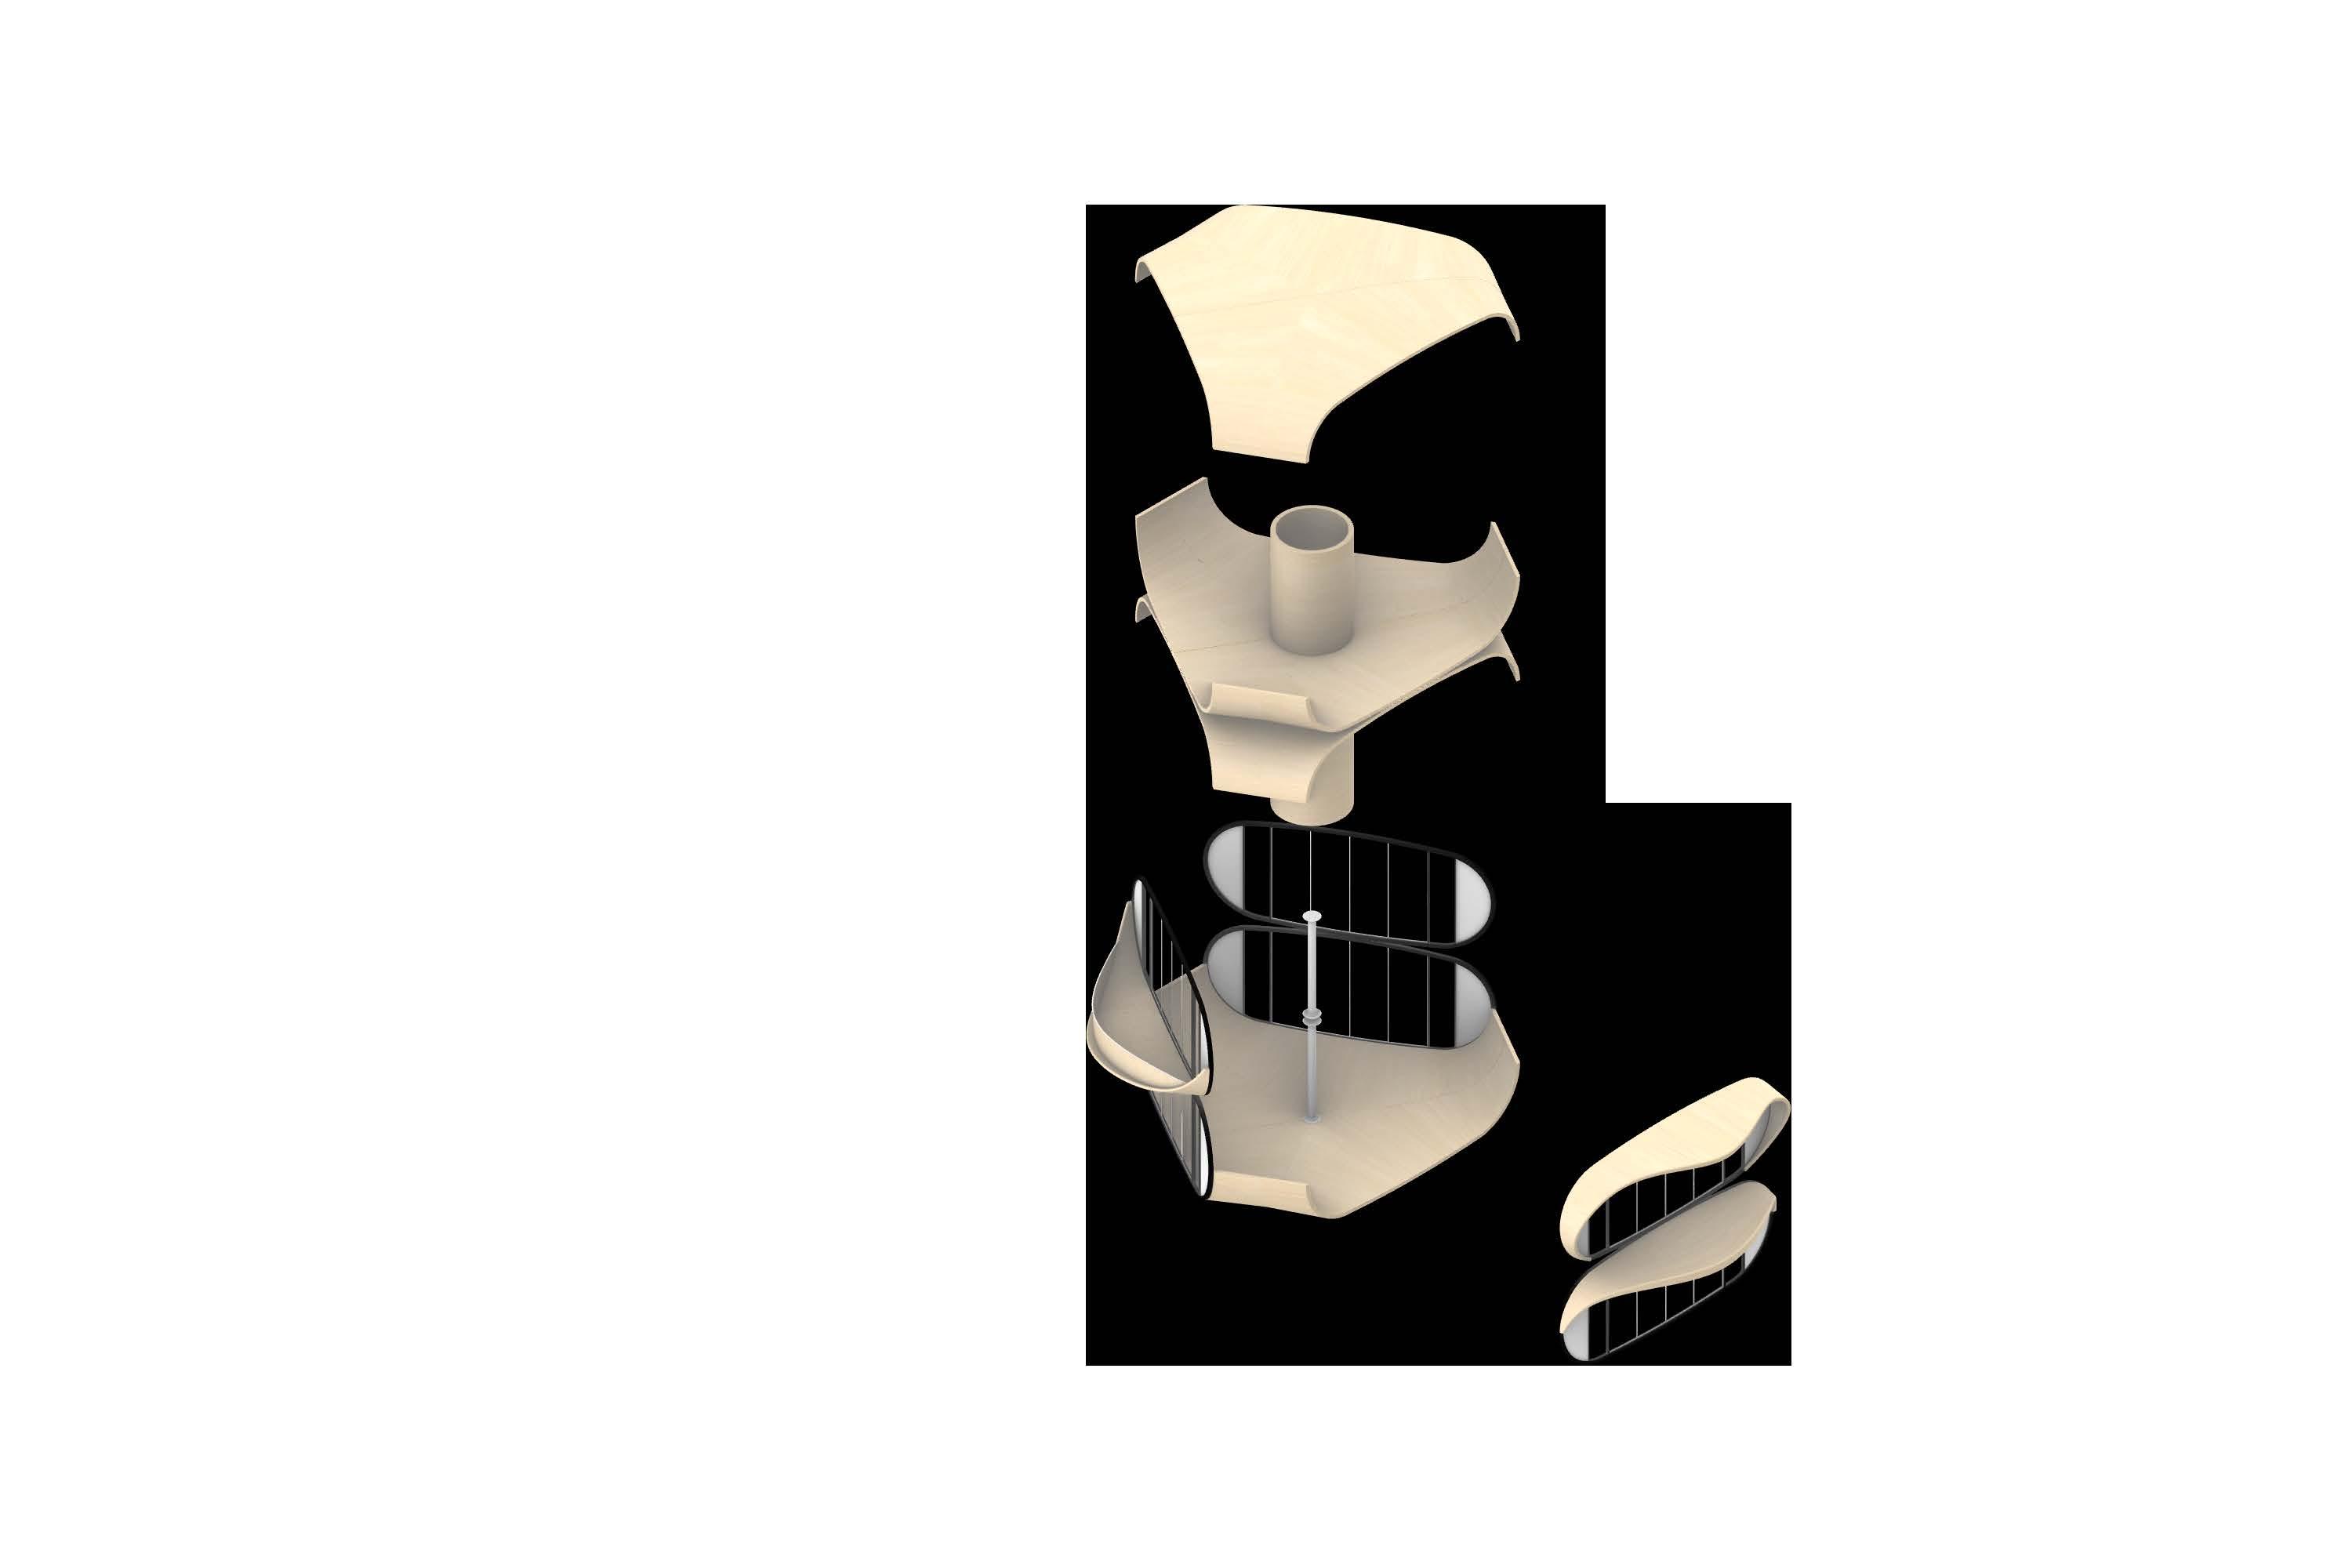


Connected through a spiral staircase, the two-story module allows for vertical expansion of the household. Essentially, the double-story unit has fewer differences compared to the single-story modules. It incorporates a circular central core which houses the vertical circulation system. The core is designed to transfer the vertical loads to the foundation, the top floor can accommodate a balcony that serves as an extension to the interior, and also provides natural shading to the bottom floor.


Providing for gallery spaces within the interior, the splitlevel module features a two thirds - size open plan top floor. The upper level is suitable for a bedroom as it is set back from the facade on one side, which allows for more privacy. Separated by a staircase in the middle, the space could double as a home office if needed. For the creation of a smooth room continuum, one additional structural part is implemented - the straight vertical wall separating the top from the bottom part of the dome. Including this single piece allows for a bigger room height and it also makes 6 bent panels redundant, reducing the fabrication cost and accommodating more usable space.
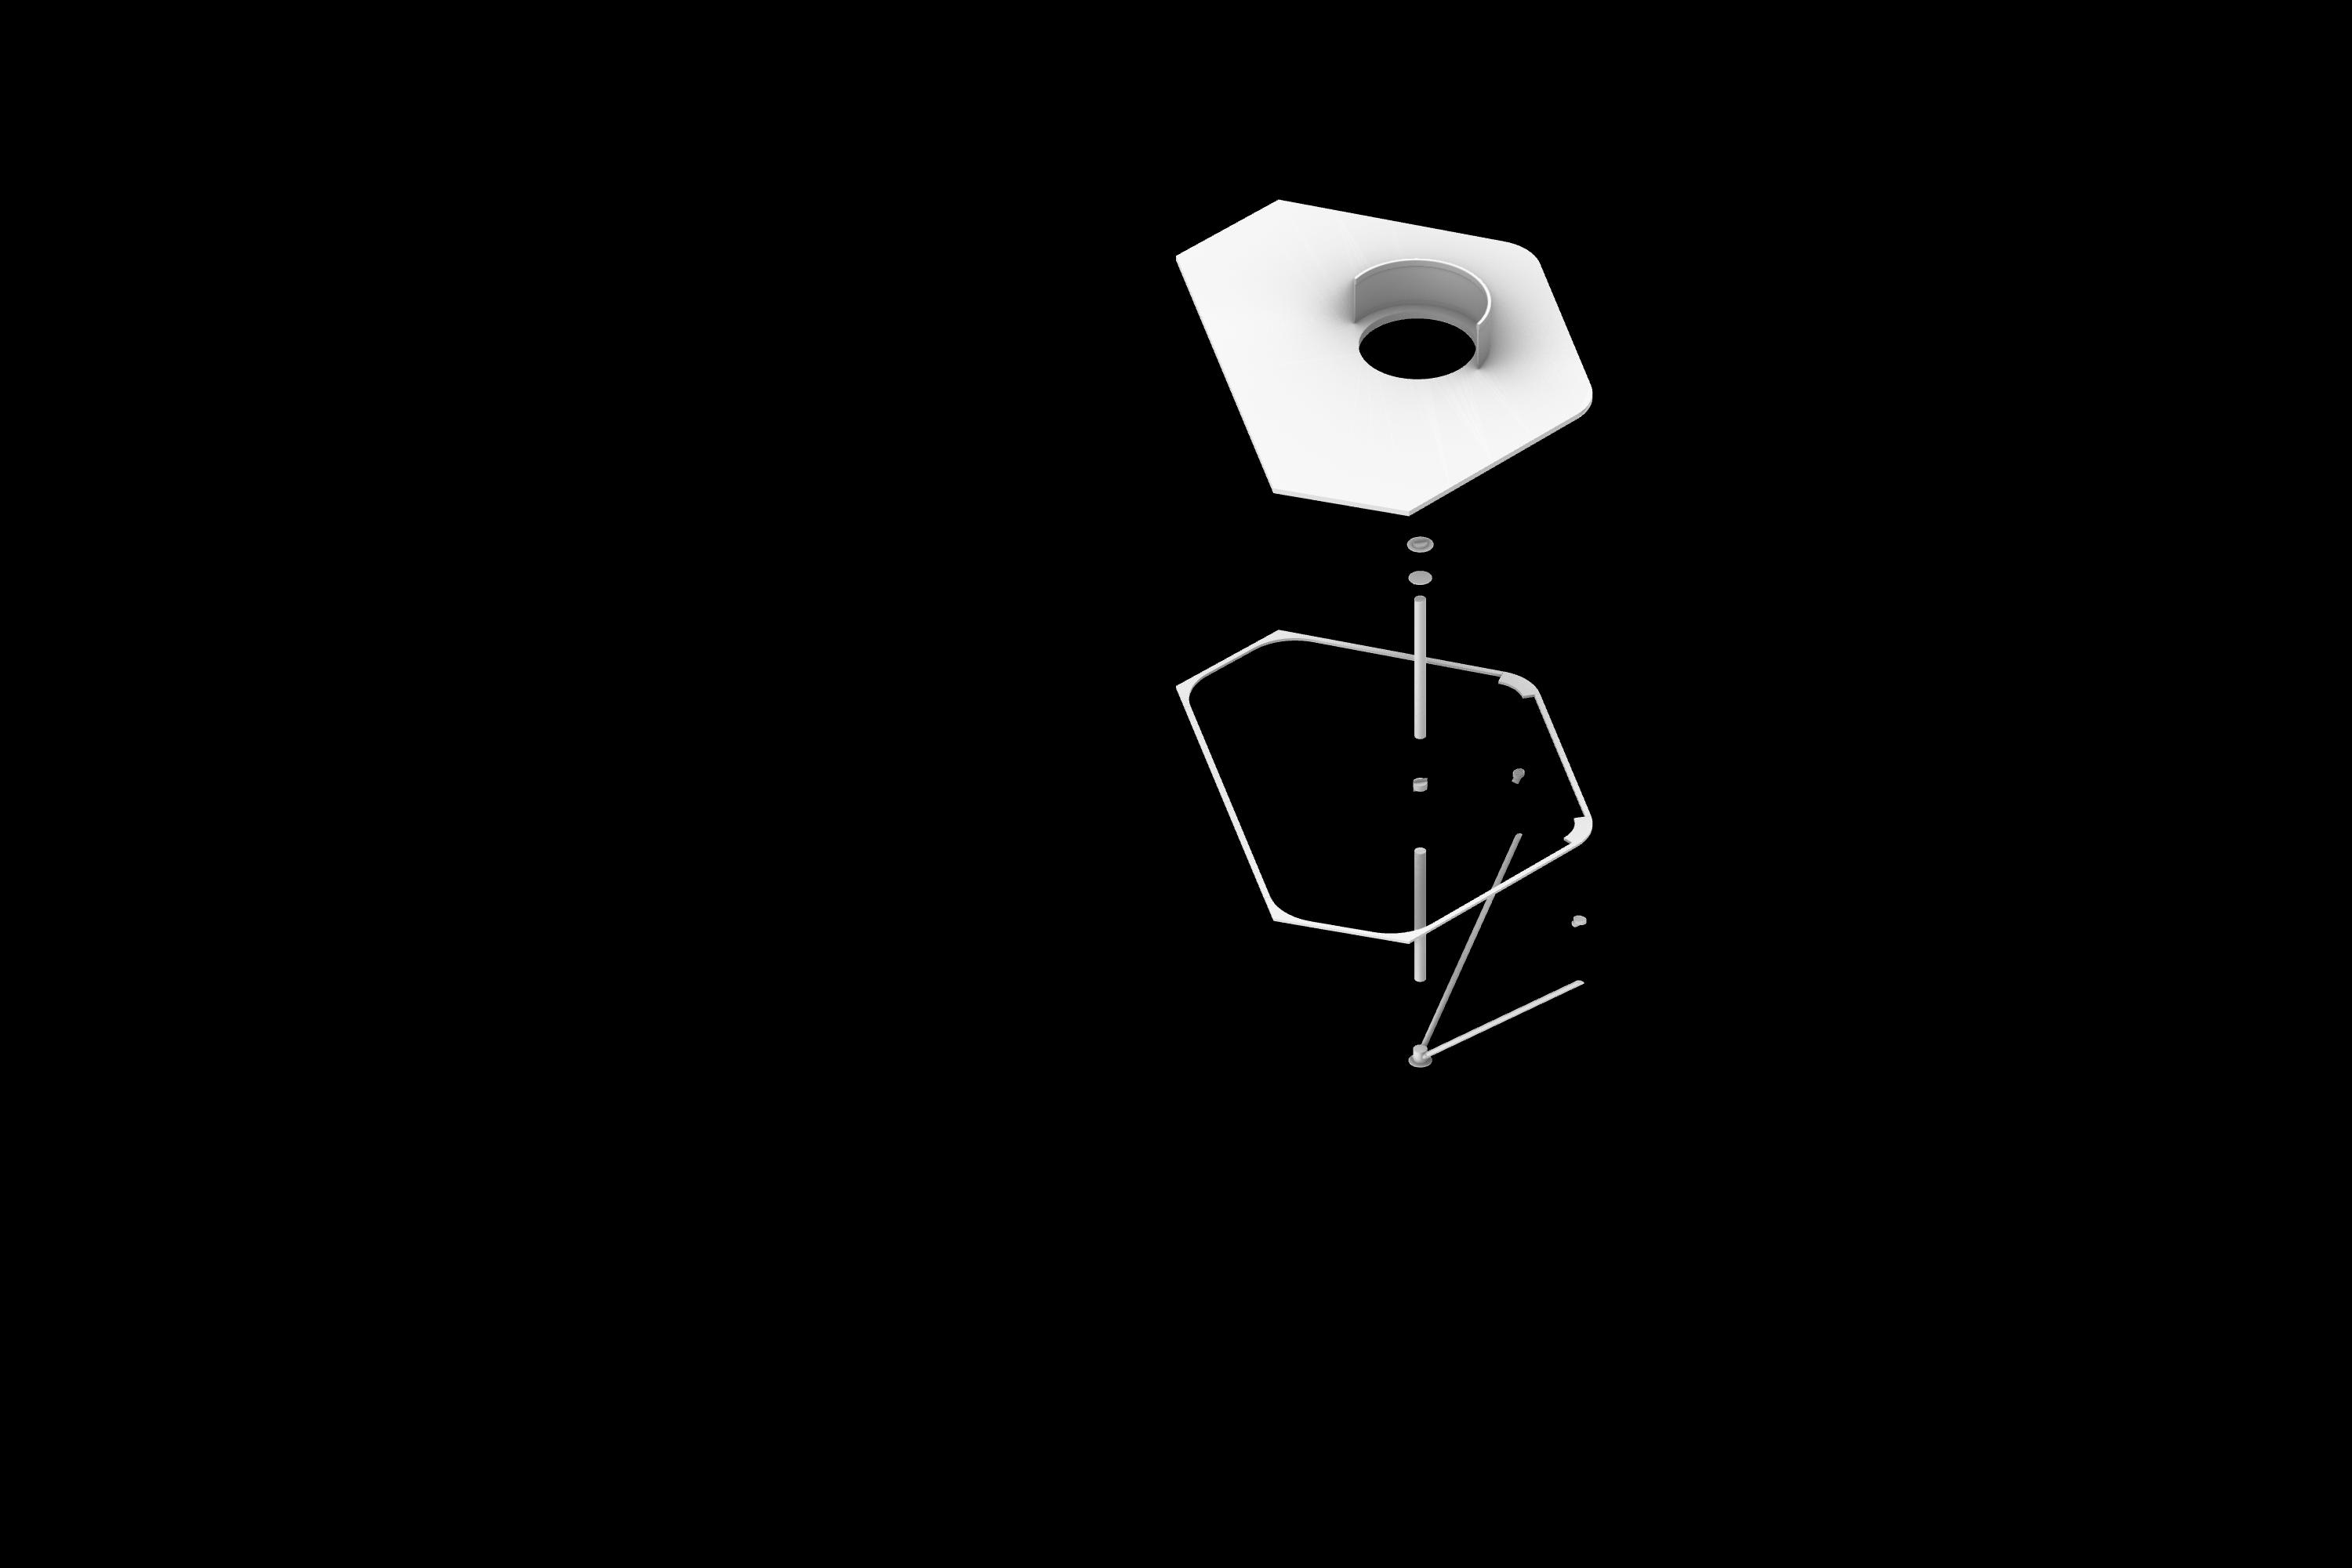

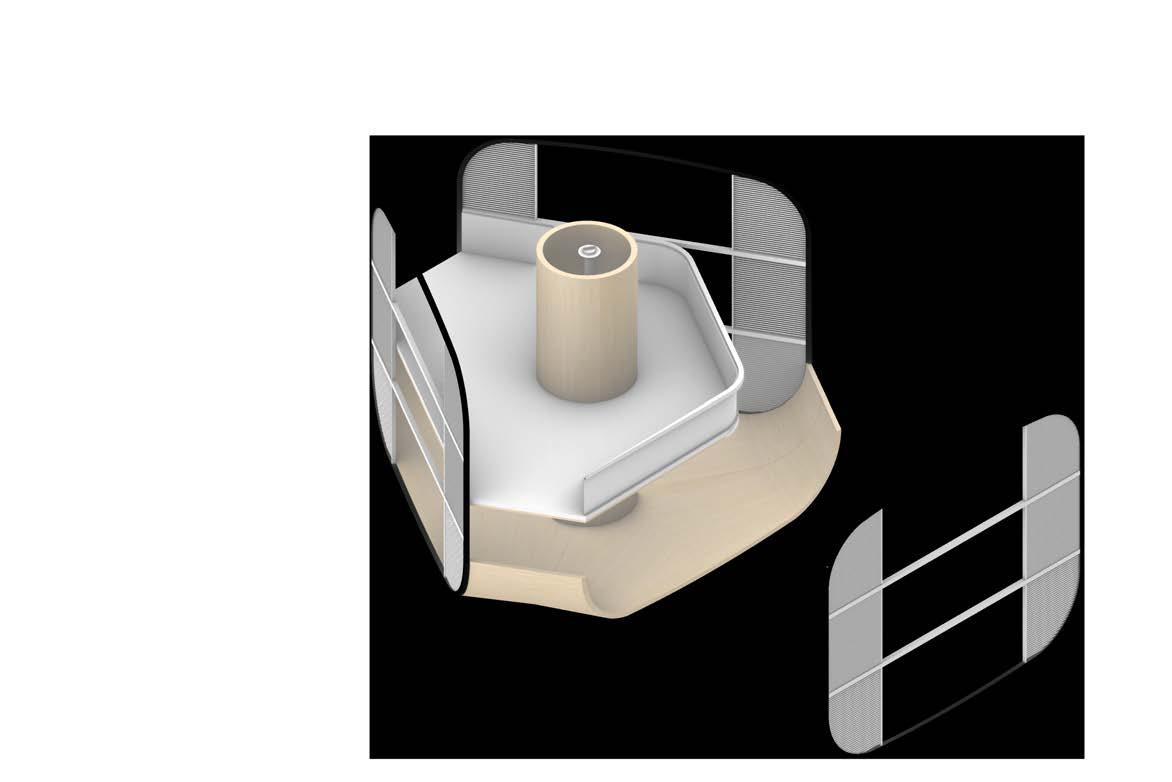


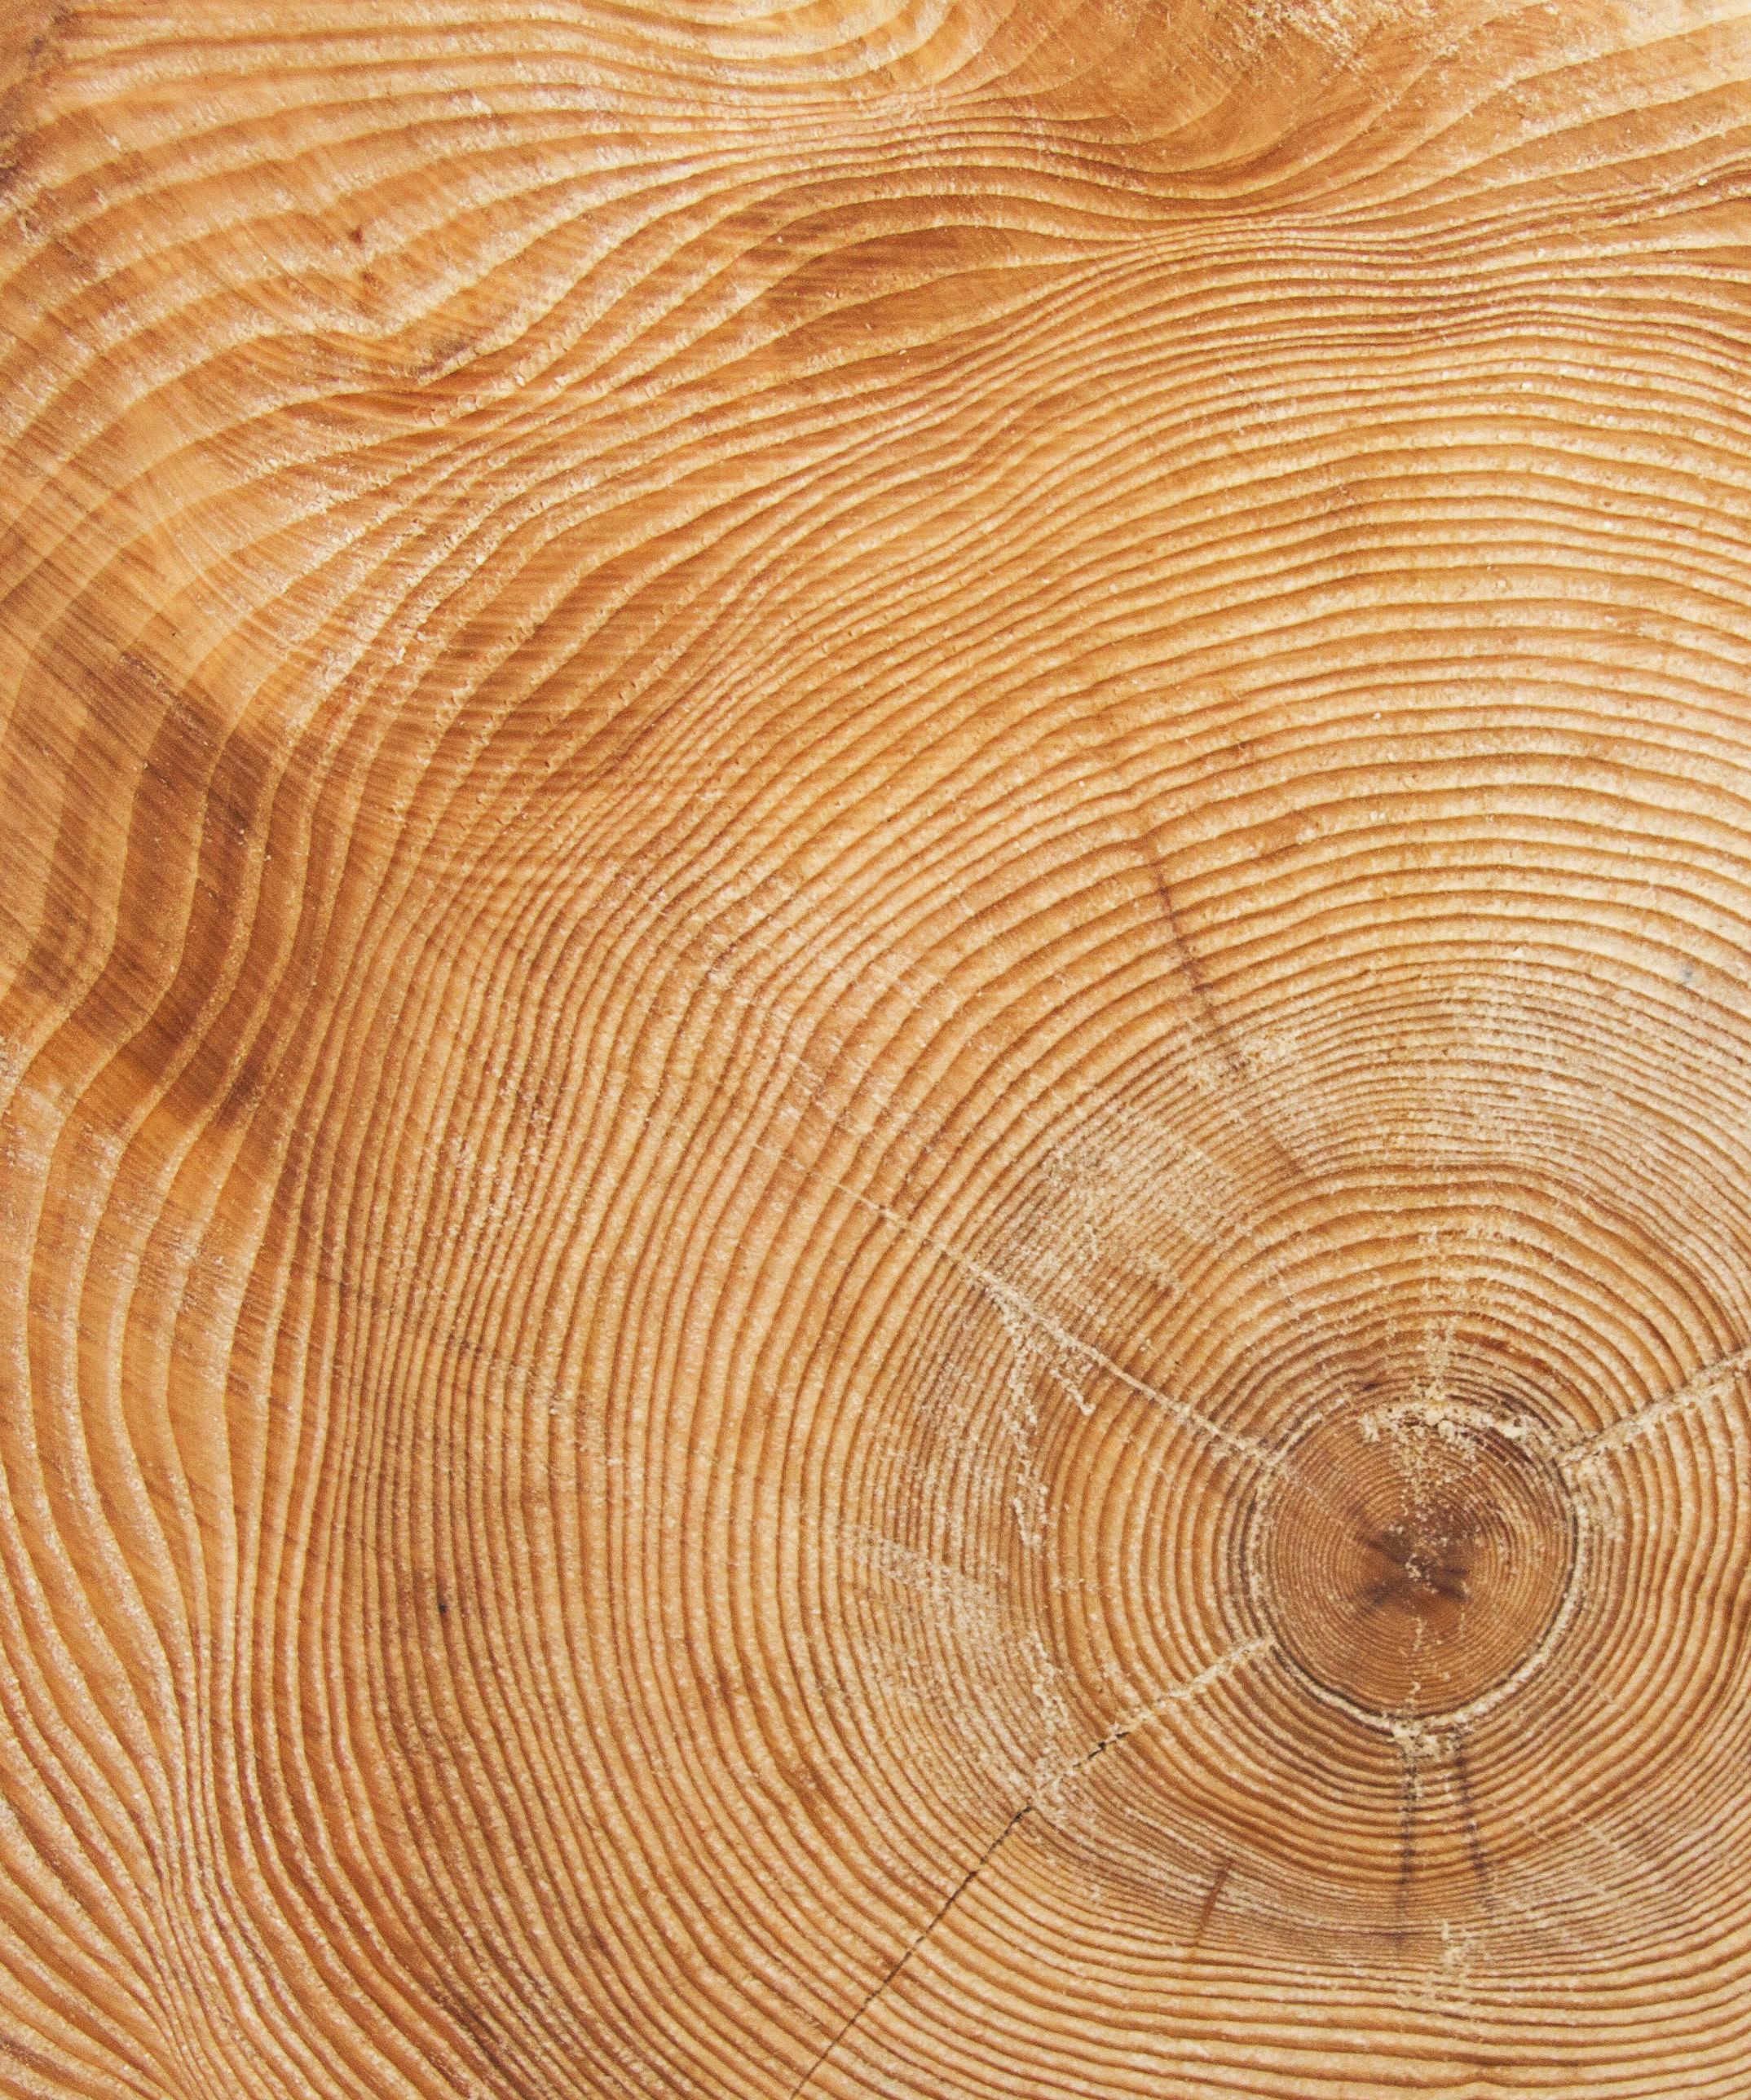
RESEARCH DEVELOPMENT
MATERIAL
Hygroscopic Design Parameters
Digital
Physical Experiment
DESIGN PROPOSAL
CLUSTER SCALE
06-0
Design Evaluation
Design Detail
Fabrication Drawing
This chapter discusses about the evaluation of the selected cluster design from the GA experiment taken from the design development stage. It documents the expansion sequence of the proposed design, and the circulation within the housing cluster.
A comprehensive fabrication drawing documenting all the different components of the proposed design and the sequence for the assembly process on site is documented.
At the end, renders of the proposed design is presented for a better visualization of the spatial quality.
On-Site Assembly
Visuals
FIG.72 Diamond Chart showing GA result
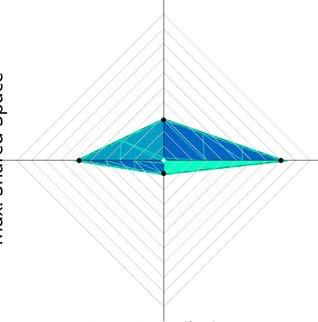
06-1
06-1.1
The selected phenotype does not excel in any of the 4 fitness criteria, however, it is the one that has the best combined ranking of the two contradicting environmental criteria - maximum solar gain and maximum ventilation. It ranks among the last 20% in the compactness criteria and just below the average in the shared space one.
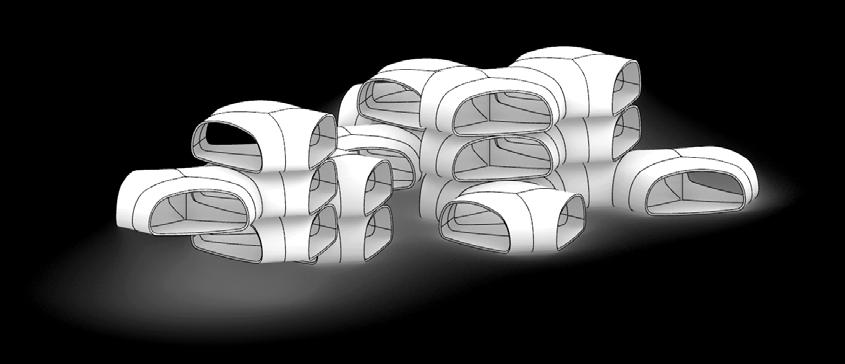
3.1.2
Generation 73, Individual 2
Module Counts: 9 (stage 1) + 5 (stage 2) + 2 (stage 3)
(Rank 0 in Environmental evaluation in simulation 3)
Max. Solar Gain Rank : 393/1500
Environmental
Social
Max. Ventilation Rank : 105/1500
Max. Solar Gain
Min. Distance to Courtyard Rank : 1193/1500
Max. Common Space Rank : 851/1500
Min. Distance to
Max. Ventilation
FIG.73 Circulation showing path to central courtyard from 3 families
FIG.74 Shared space with limited access
FIG.75 Comparative solar analysis with typical low cost housing

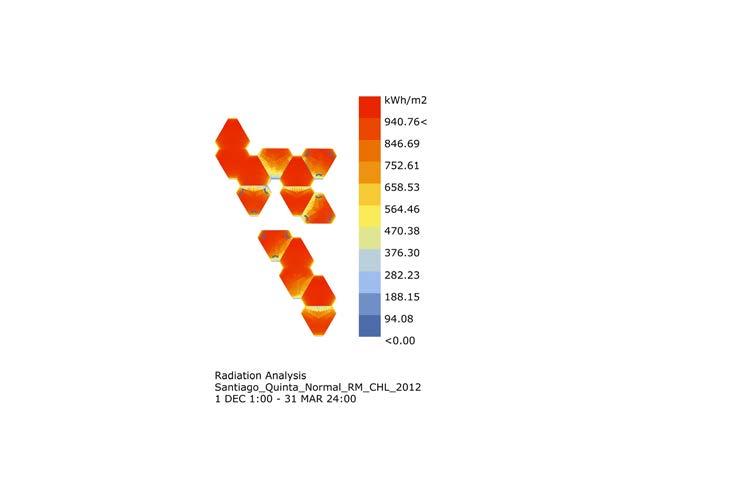
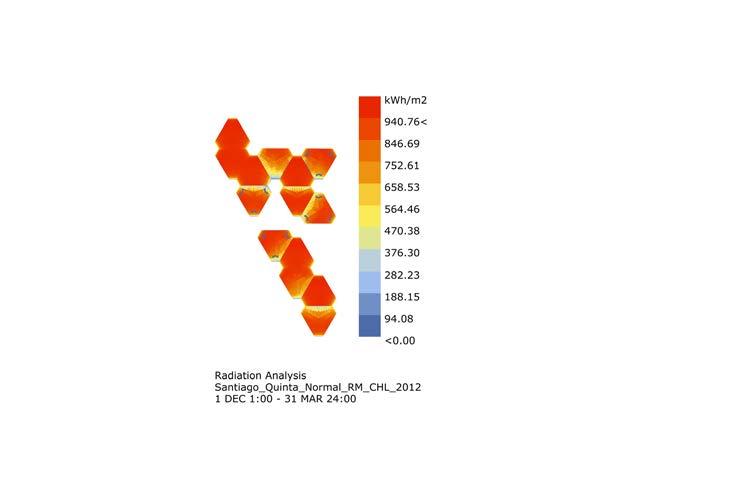

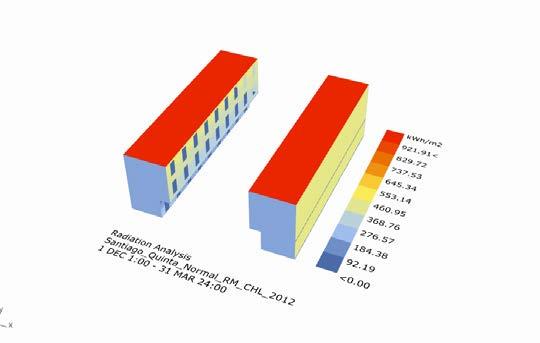
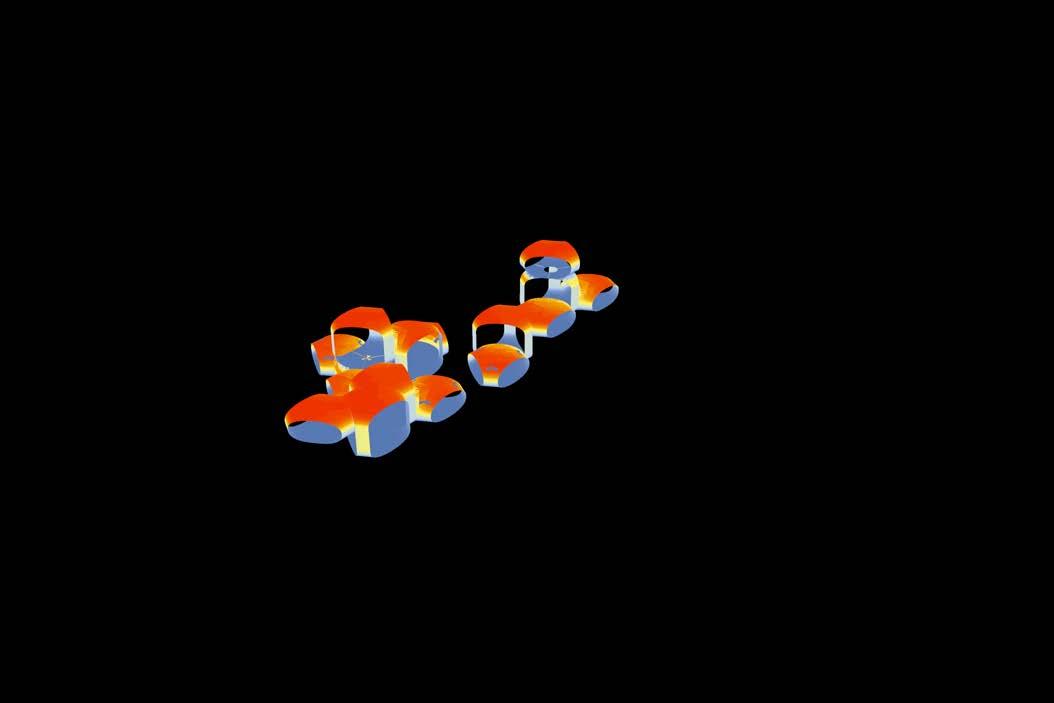
One of the aims of this proposed design is to tackle the social housing issue and the fast-paced urbanisation of Santiago. In the recent years Alejandro Aravena, a Pritzker Prize Laureate, released his ideas about incremental housing, which is built in stages depending on the owner’s financial resources.
Inspired by ELEMENTAL’s approach, and also considering that people with a lower income should not suffer from living in a closed community with low quality social housing units, the proposal offers affordable social housing design which has the flexibility to expand based on the needs of the occupants.
Each single-family home, comprising a few modules, is independent from its neighbours within the cluster they share. The expansion takes place in several phases depending on each family’s needs. Each home consists of a minimum 3 modules, however, by the addition of new units at each stage, these homes could reach 10 or more units. As a result of the uniformity of the design, stacking of modules is possible in all directions. However, in order to keep the spatial qualities of the entire aggregation intact certain expansion rules have to be complied with.
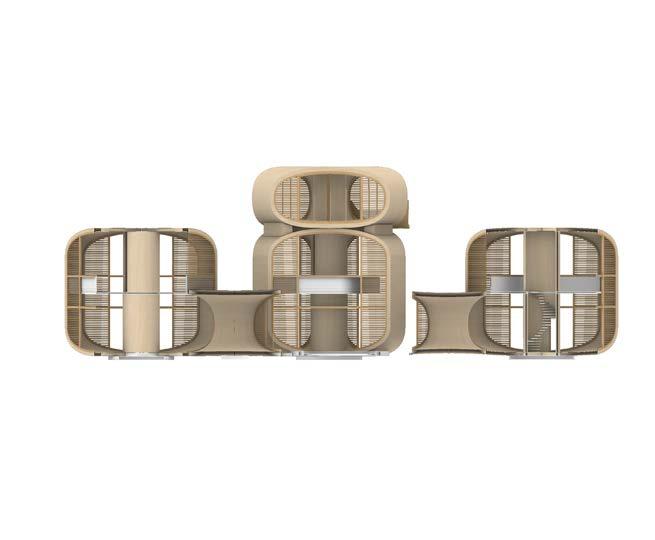
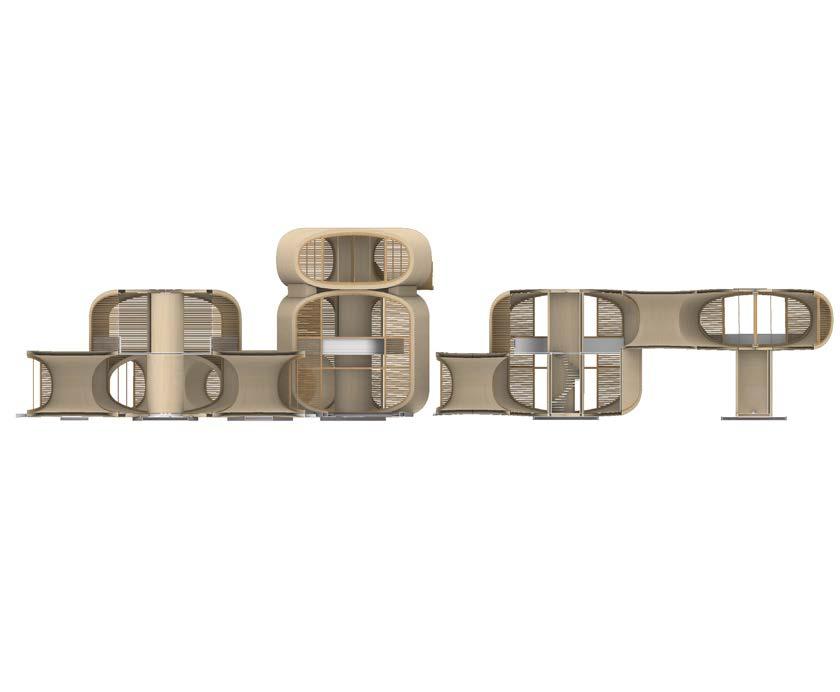
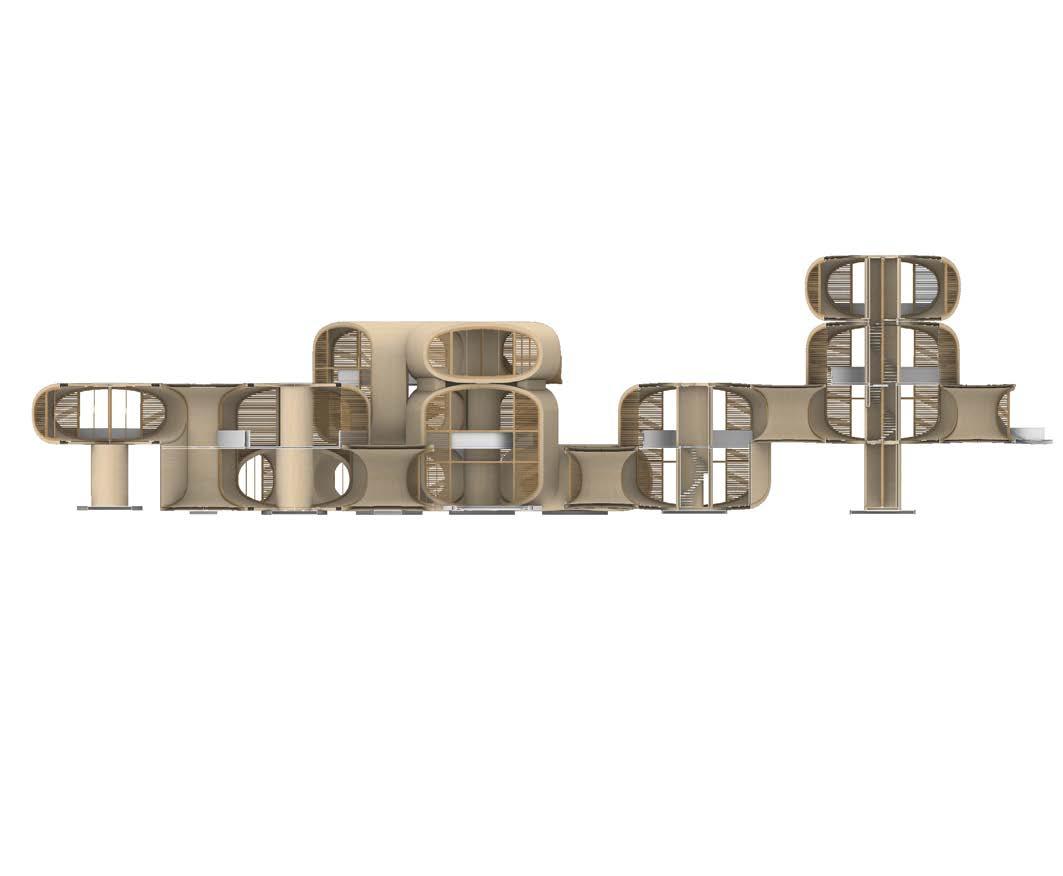


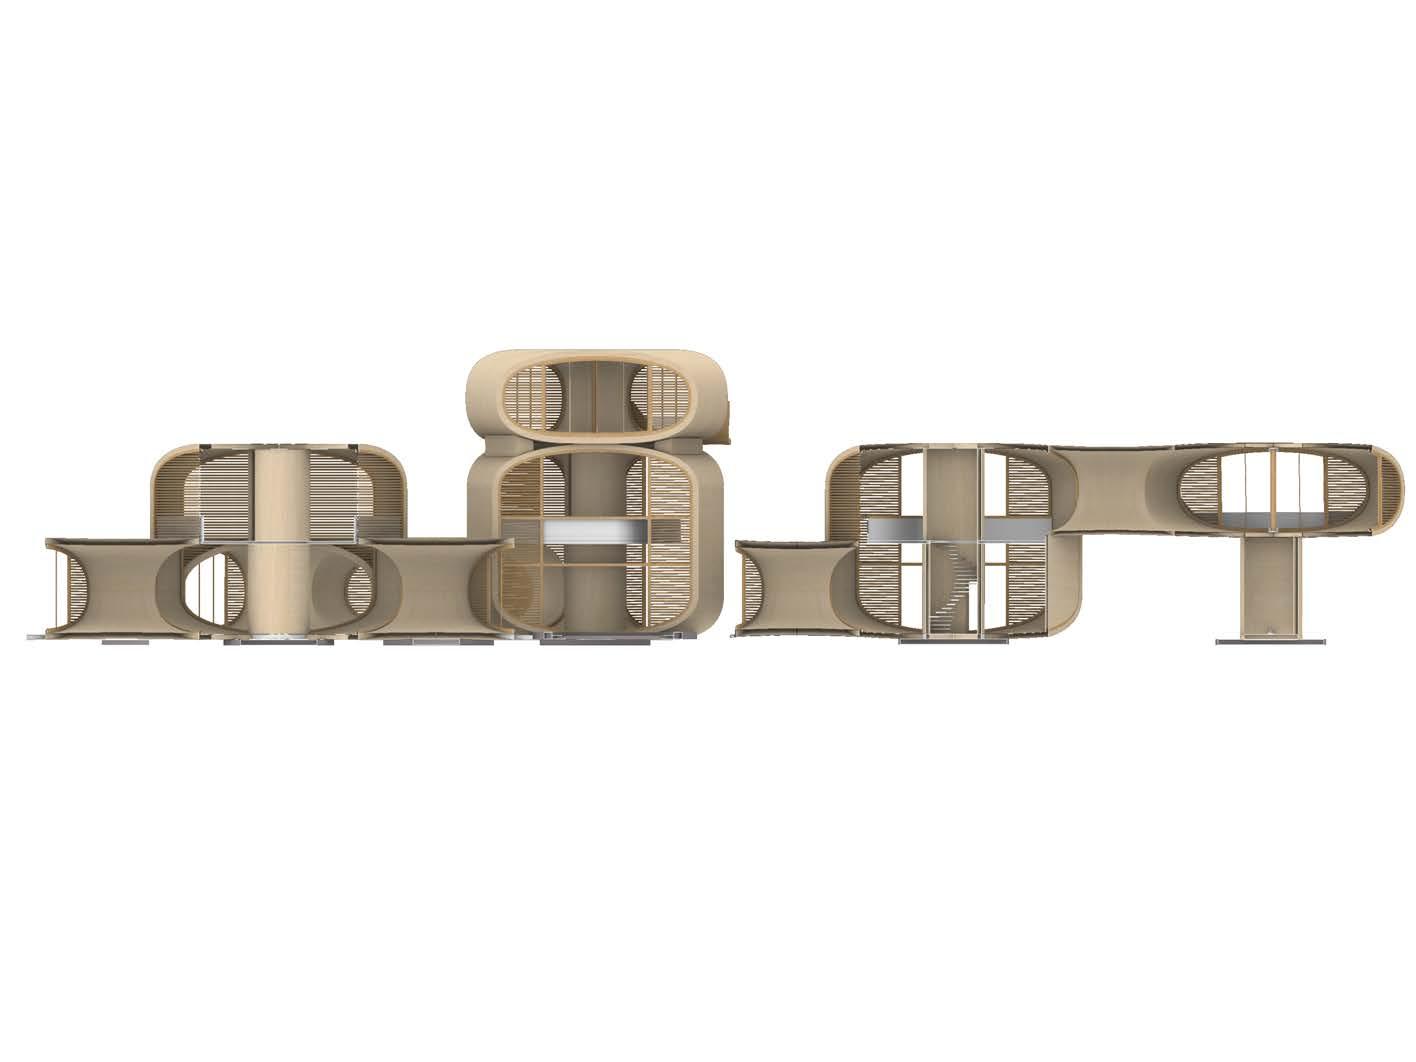
Each home consists of a minimum 3 modules, however, by the addition of new units at each stage, these homes could reach 10 or more units. As a result of the uniformity of the design, stacking of modules is possible in all directions. However, in order to keep the spatial qualities of the entire aggregation intact certain expansion rules have to be complied with.
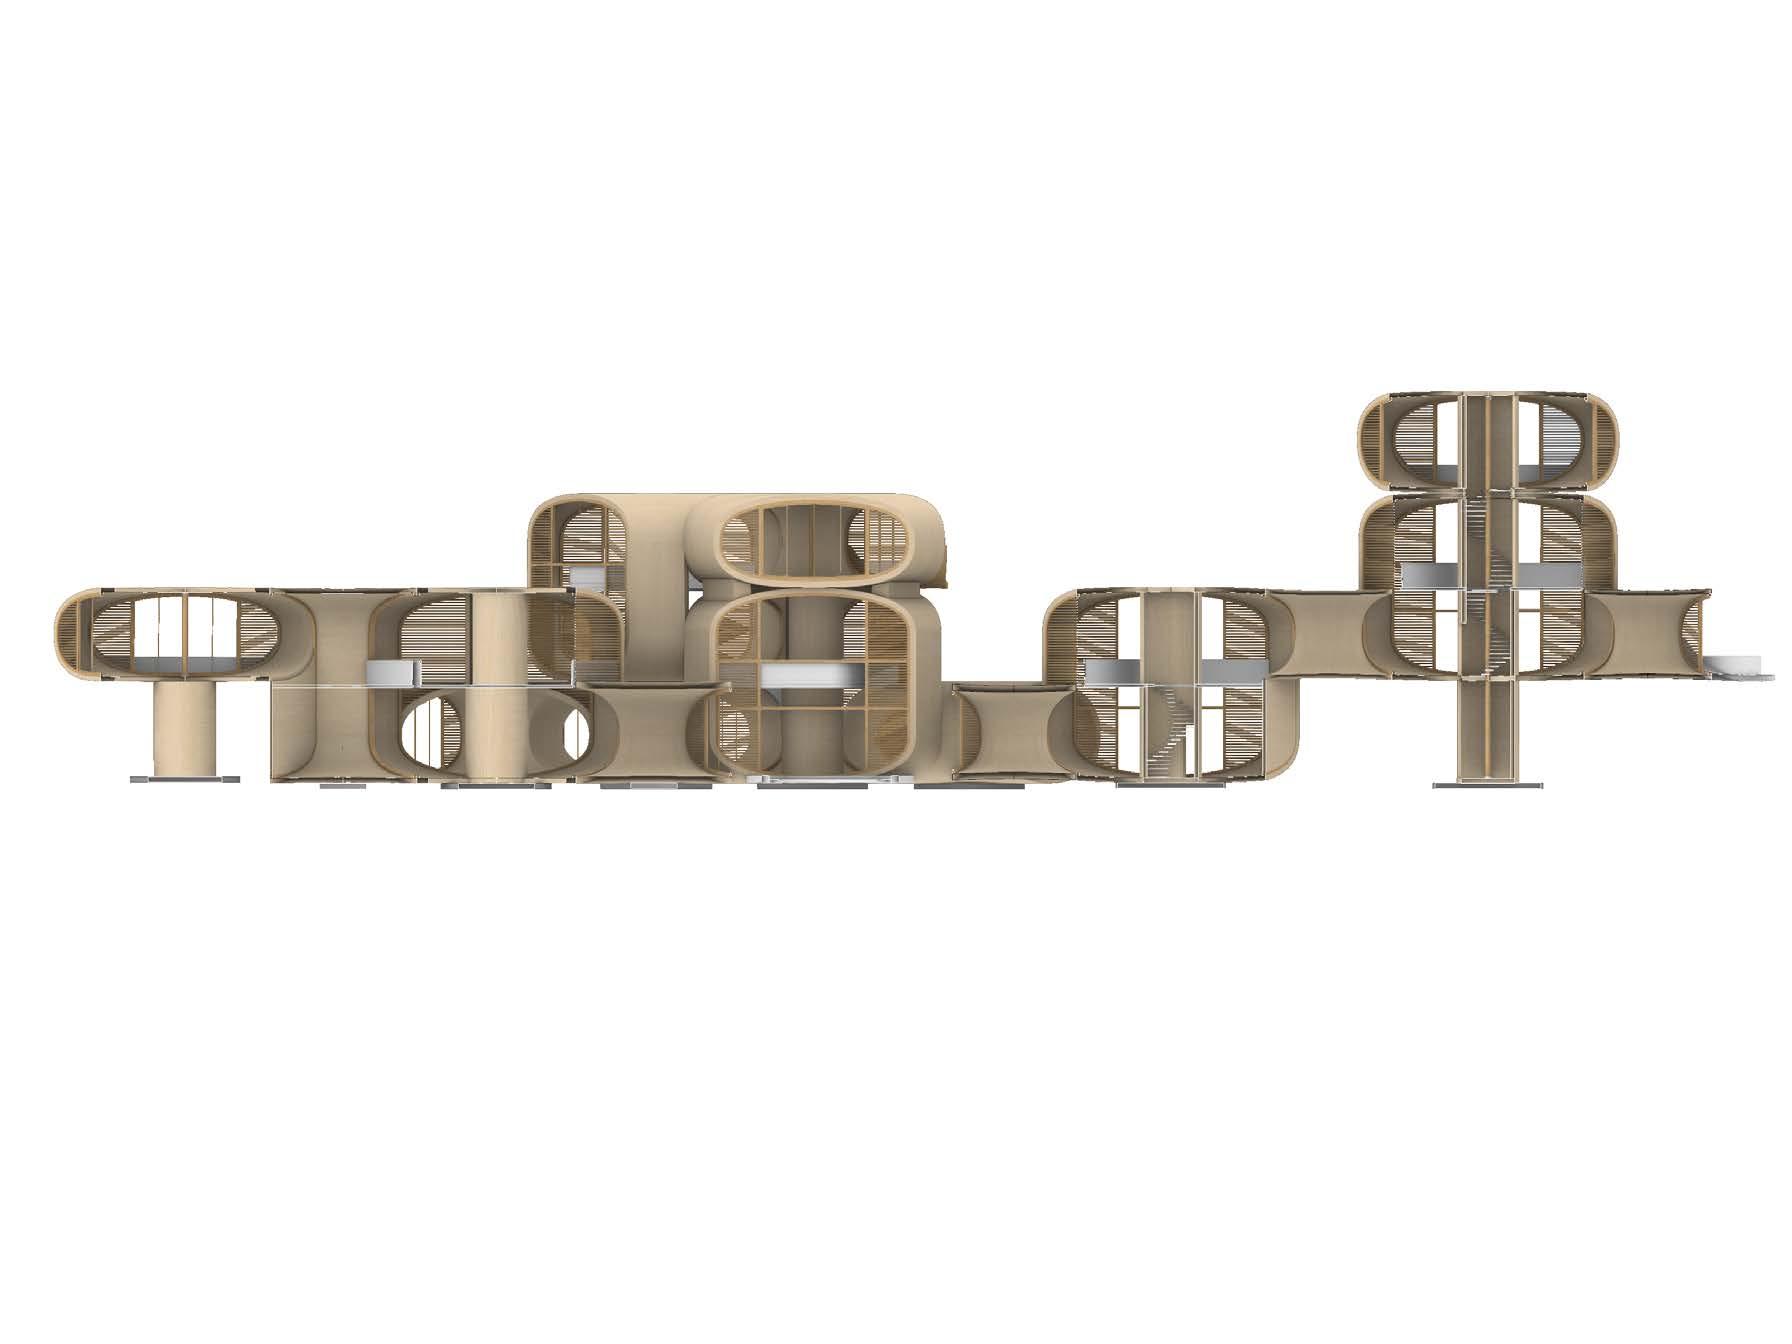


The circulation within the modules flow both in horizontal and vertical directions. The entrance to the units is located on the ground floor and serves as a separator between public, semi-public and private spaces.

The modules located on the ground floor can be used for living, cooking and dining. The modules on the upper levels are primarily used as bedrooms. The kitchen area and the bathrooms are placed next to the core which houses the service lines.
While the transition from module to module on the same level is seamless as a result of the adherent edges of each two neighbouring modules, the circulation in vertical direction takes place through a compact spiral staircase fits within the core.
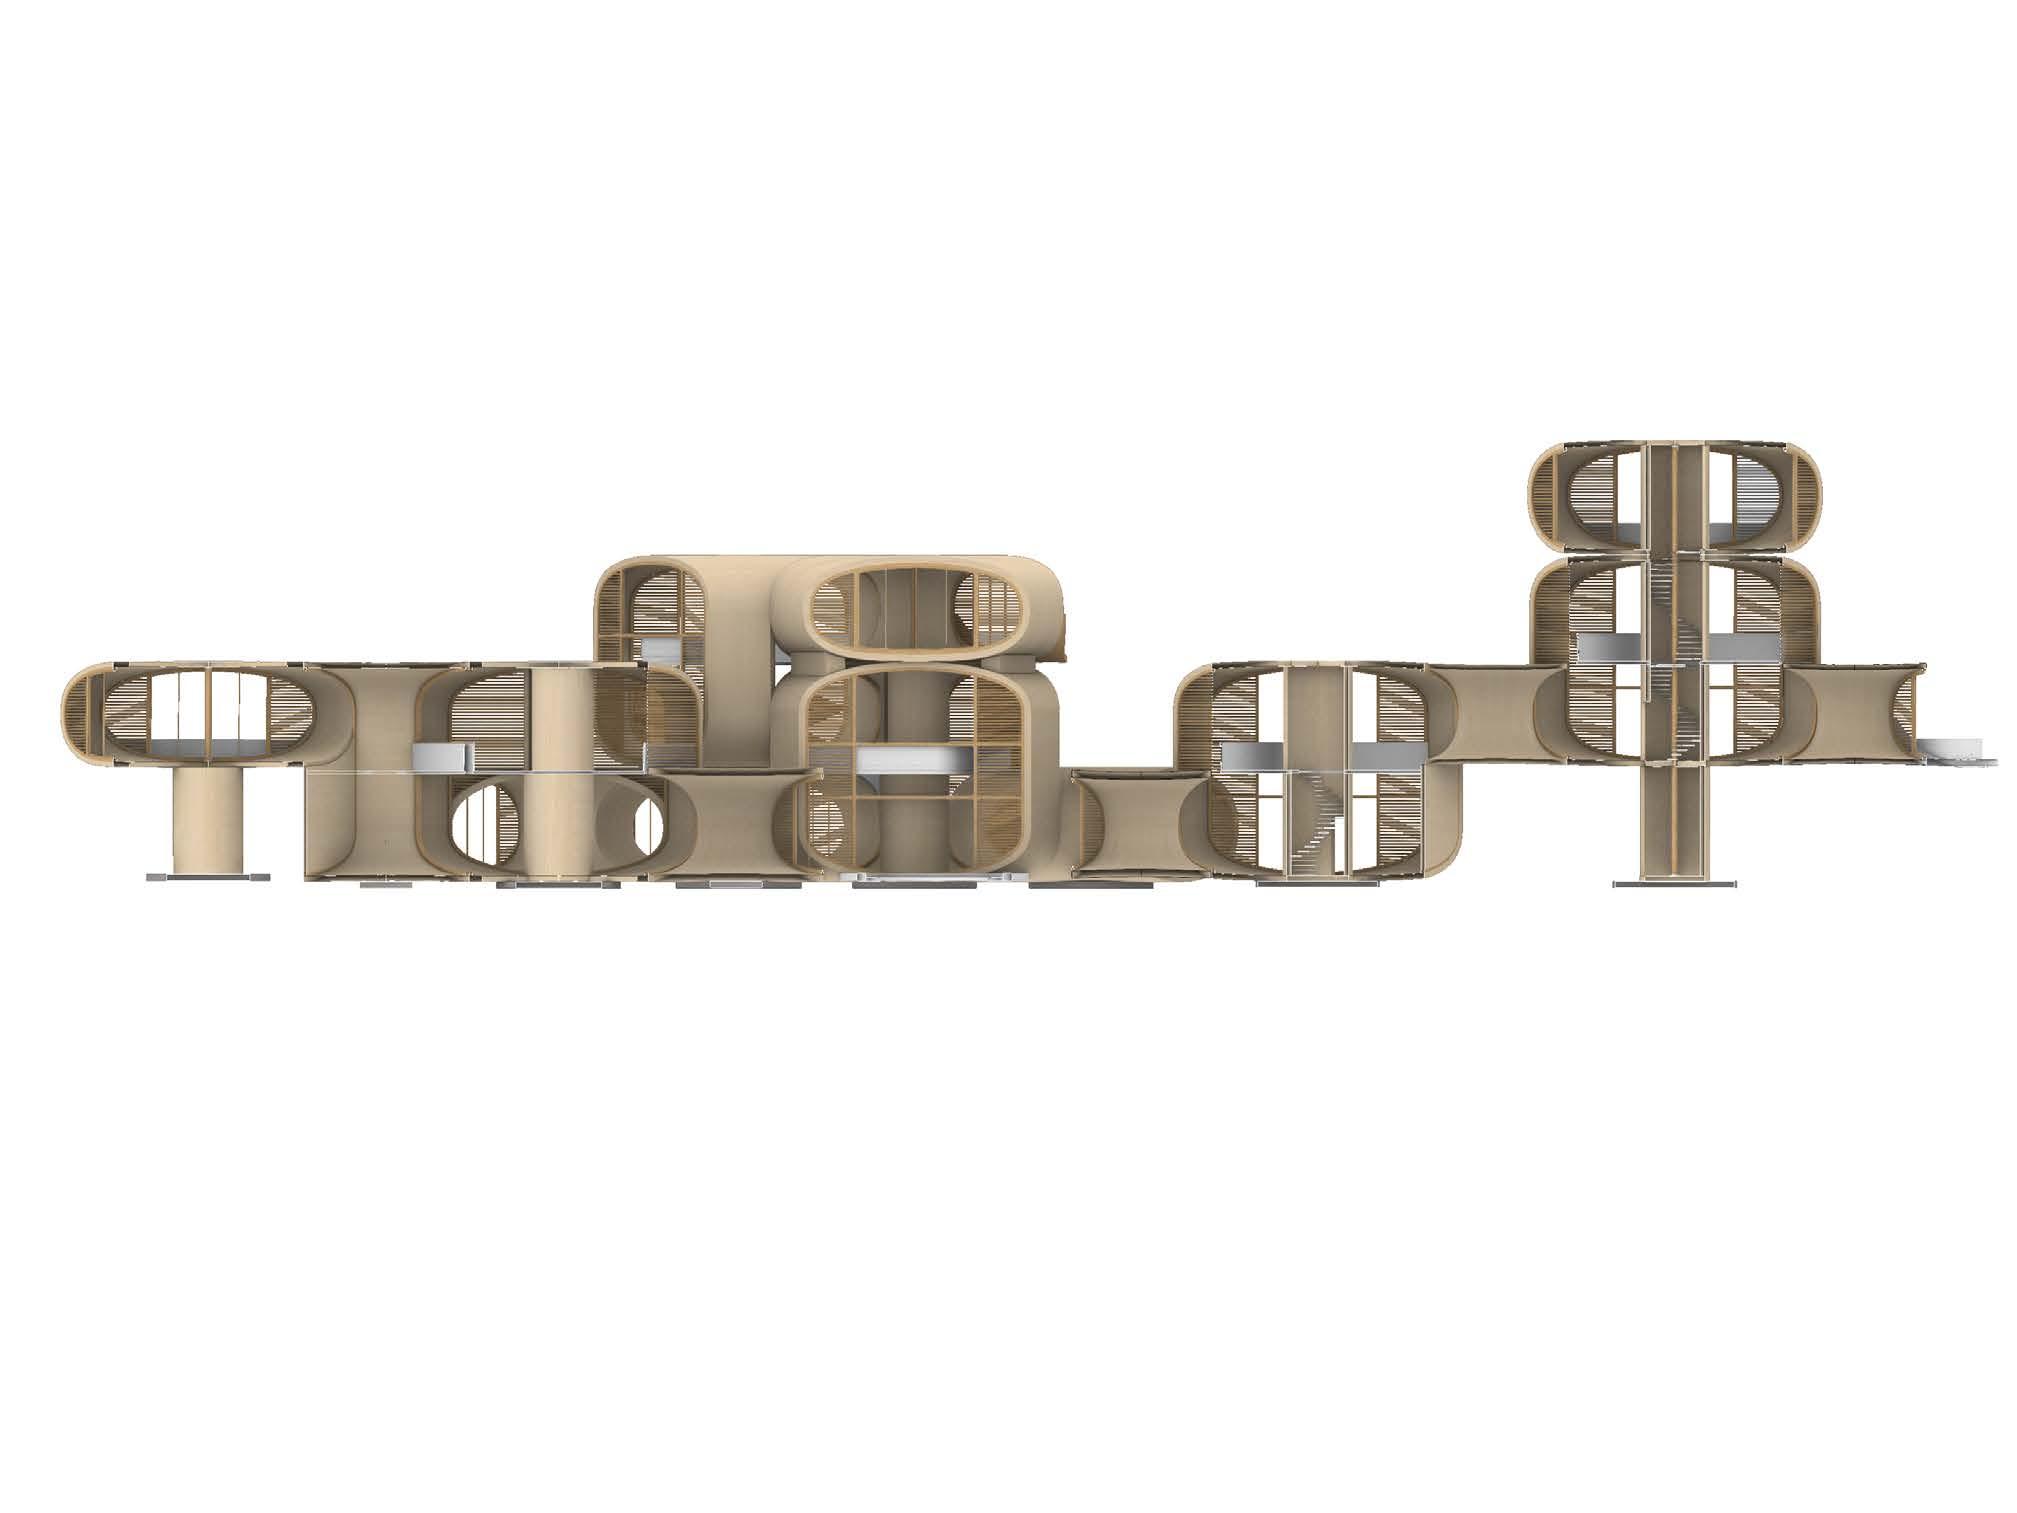
Chile, located on the borders of two plates – Nazca and South American, is a high seismic zone. The main trigger of seismic activities taking place in Chile is due to the difference in motion of the plates. Due to the devastating earthquakes throughout the history of the country, current building regulations have high requirements on new developments.
One of the most preferred measures against earthquakes is base isolation which is a relatively new invention from the 1970s. In comparison to conventional structures, the base-isolated ones are far more stable as the isolation reduces the forces transmitted from the ground and therefore reduces the structure’s deflection.
The main principle is separation of the bottom and the top parts of the building. The most common place for installing the friction pendulum dampers (FPD) is between the foundation or the basement and the ground floor. Base isolation does not absorb the earthquake energy, instead it dissipates it into the ground. This is achieved by increasing the natural period of the upper layers of the structure to exceed the period of both the earthquake and the bottom part. While the isolation interface takes most of the deformations caused by an earthquake, the structure above the foundation moves as a rigid body and therefore remains intact.
In addition to the base isolation, the central core provides for additional stability. It serves as a shear wall
aiding the structure to resist axial and lateral loads. The presence of a core makes many of the central columns within the aggregation redundant, however, in cases of one-storey-units located on the ground a more cost-effective and eco-conscious solution is a central pillar. [1]
Base of Module
Base Plate
Friction Pendulum System
Raft
Piles
06-3


Type2 Window Frame w/ glazing
Slab
Type1 Window Frame w/ glazing Central Core Staircase Side Support Base Foundation




06-4
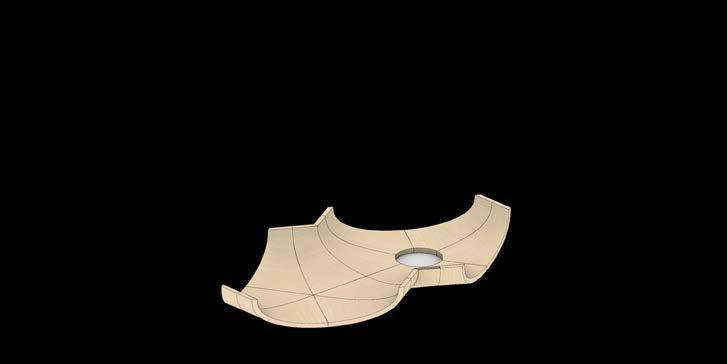
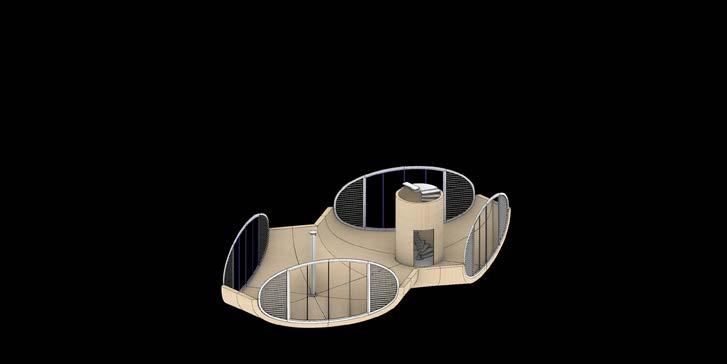
Once delivered on site the pre-fabricated pieces are ready to be assembled. The erection commences with preparing the foundation and the base isolation to which the bottom panels of the ground floor are later attached. Depending on the spatial configuration, the pillars and the cores are put into place followed by the window frames including glazing. The ground floor modules are then capped by their top panels. After each floor is completed, wedge-shaped side supports are secured so that they provide additional vertical load flow between the floors. Next, the bottom panels of the first floor are attached to ground floor module, depending on the typology of the first-floor modules the sequence continues either as a repetition of the previous floor or with straight panels shaping the split-level module. In the case of a split-level typology the two-thirds-sized split-level slab is the next part assembled followed by the its railing, the extension of the central core, the windows and finally the top panels. Disregarding the height or configuration of the aggregation the assembly sequence is always the same by virtue of the design uniformity.
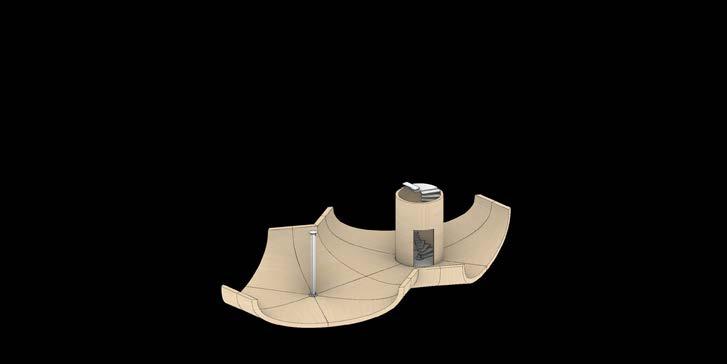 1. Foundation
2. Ground Bottom Panels
3. Central Core and Pillars
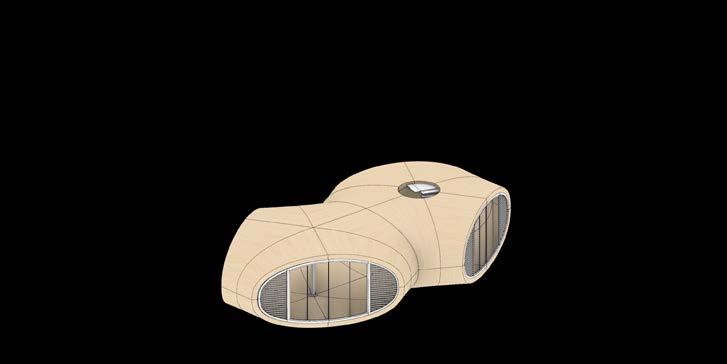
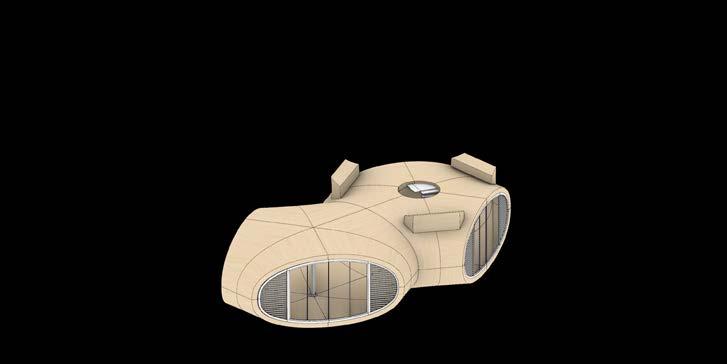
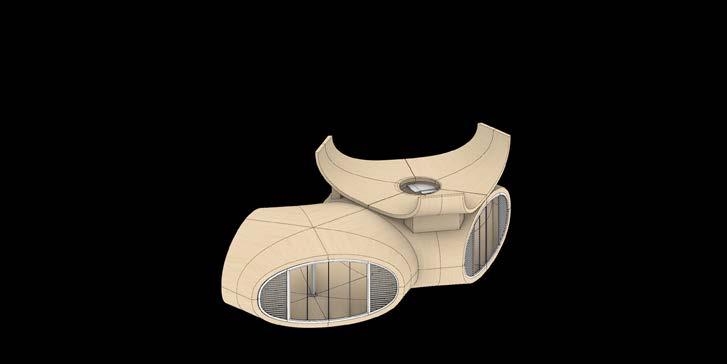
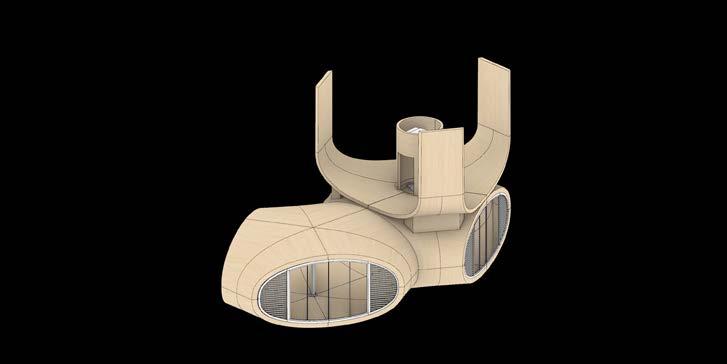


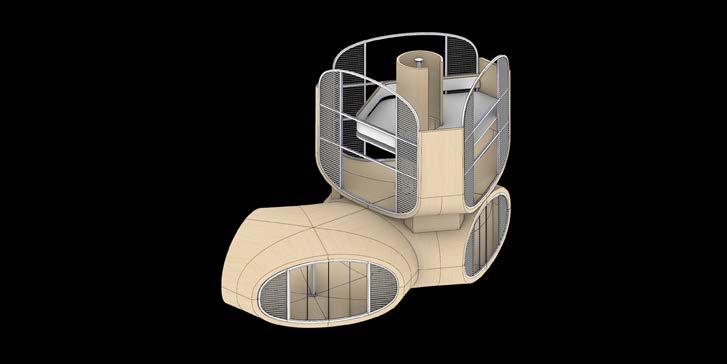
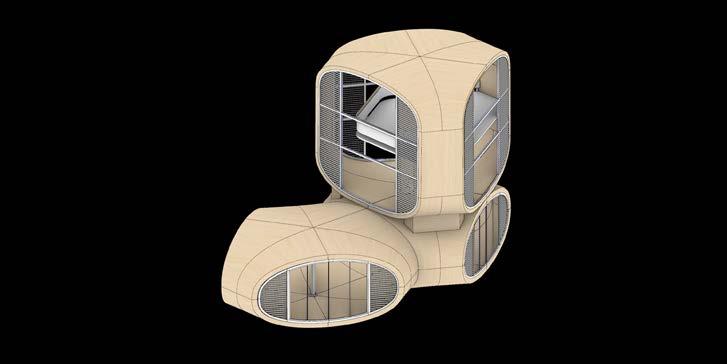 5. Ground Floor Top Panels
6. Side Supports
7. First Floor Bottom Panels
8. First Floor Straight Panels
9. First Floor Split Level Slab
10. Core Extension
11. Window Frame
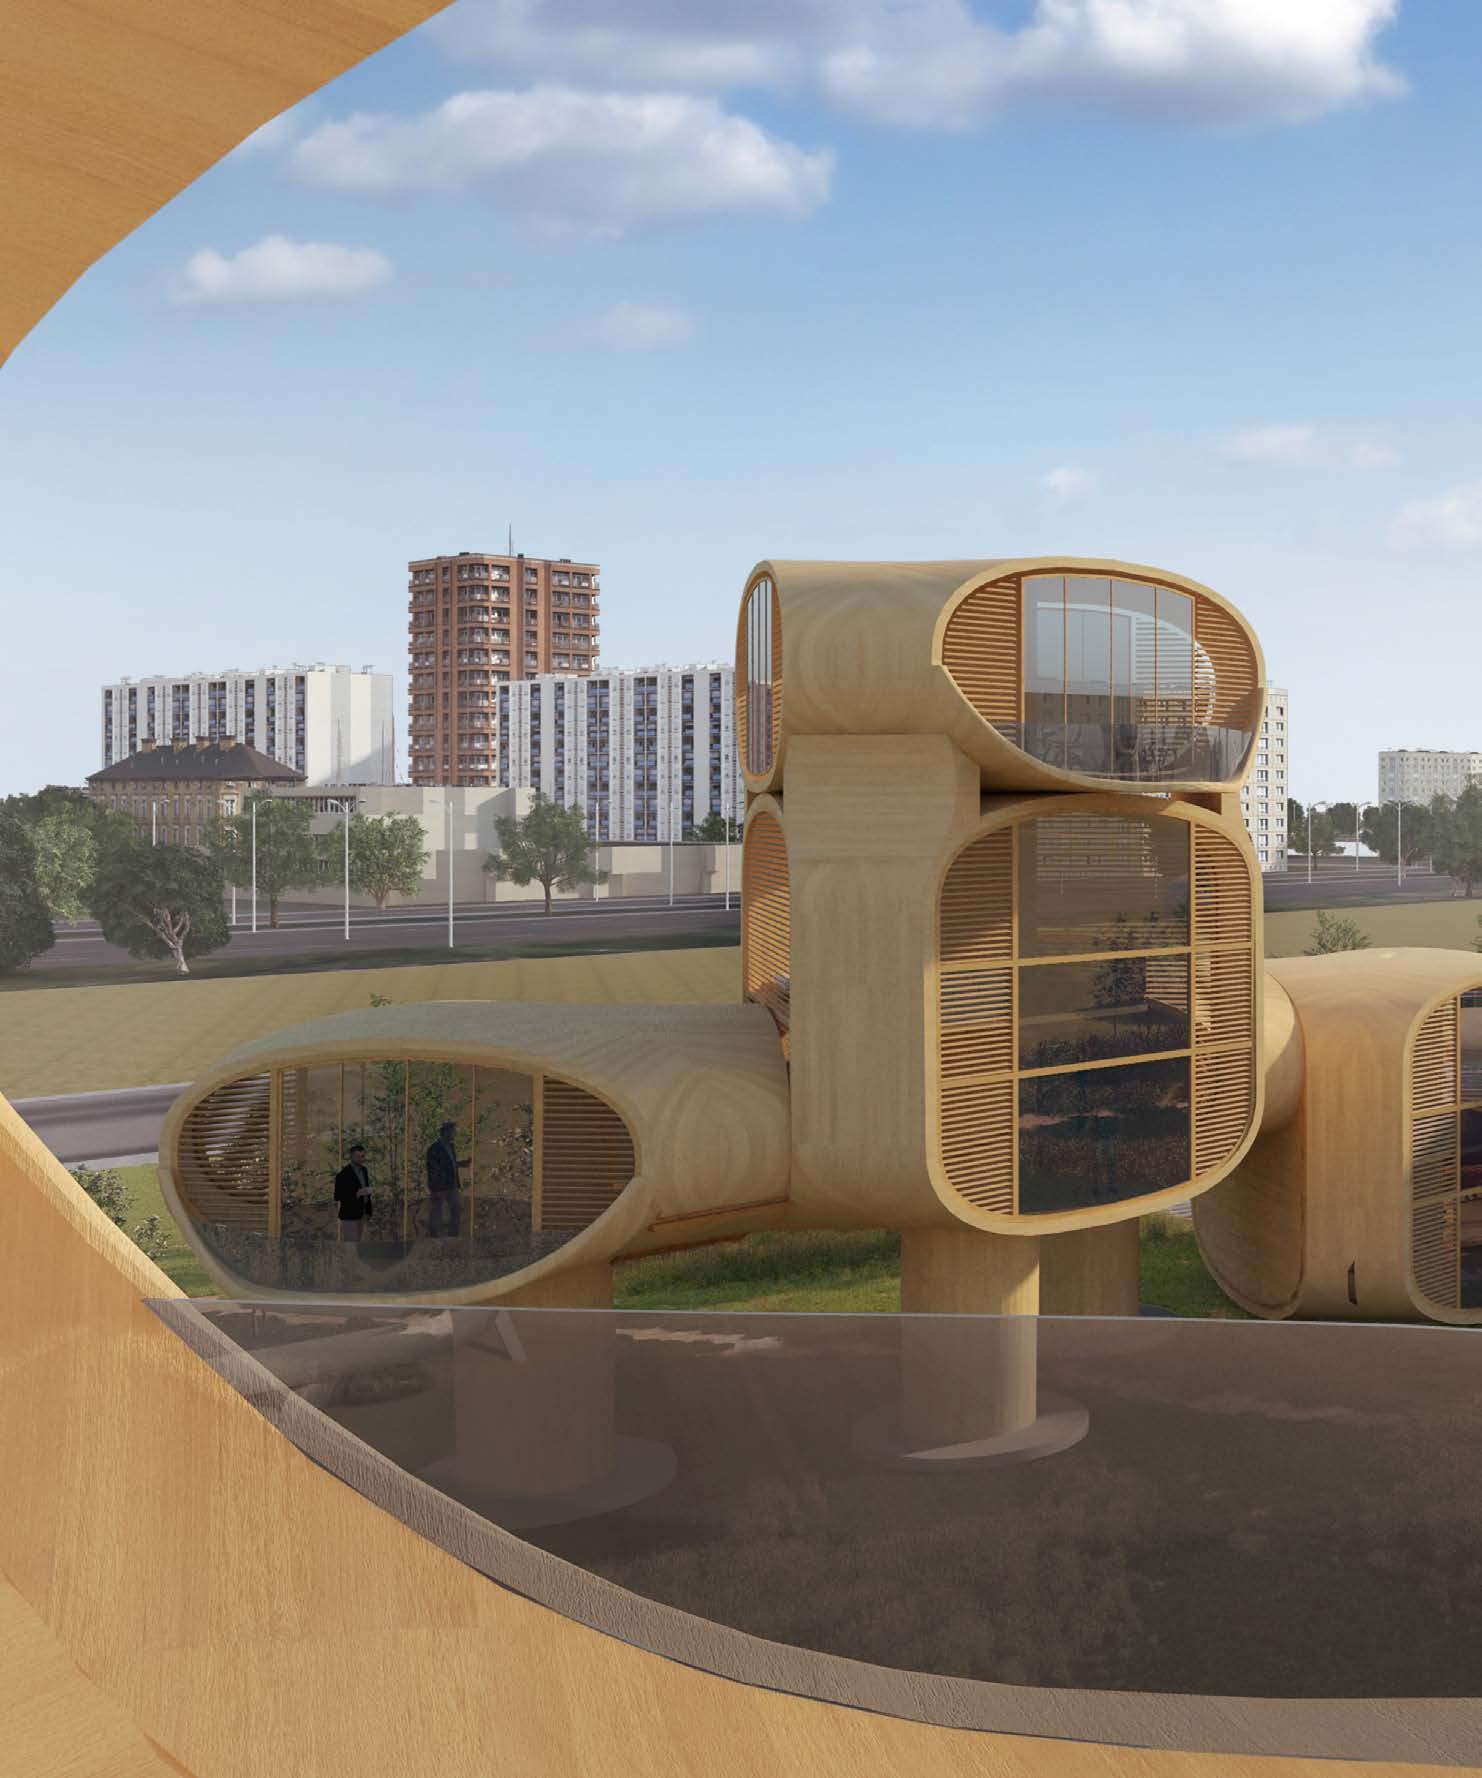
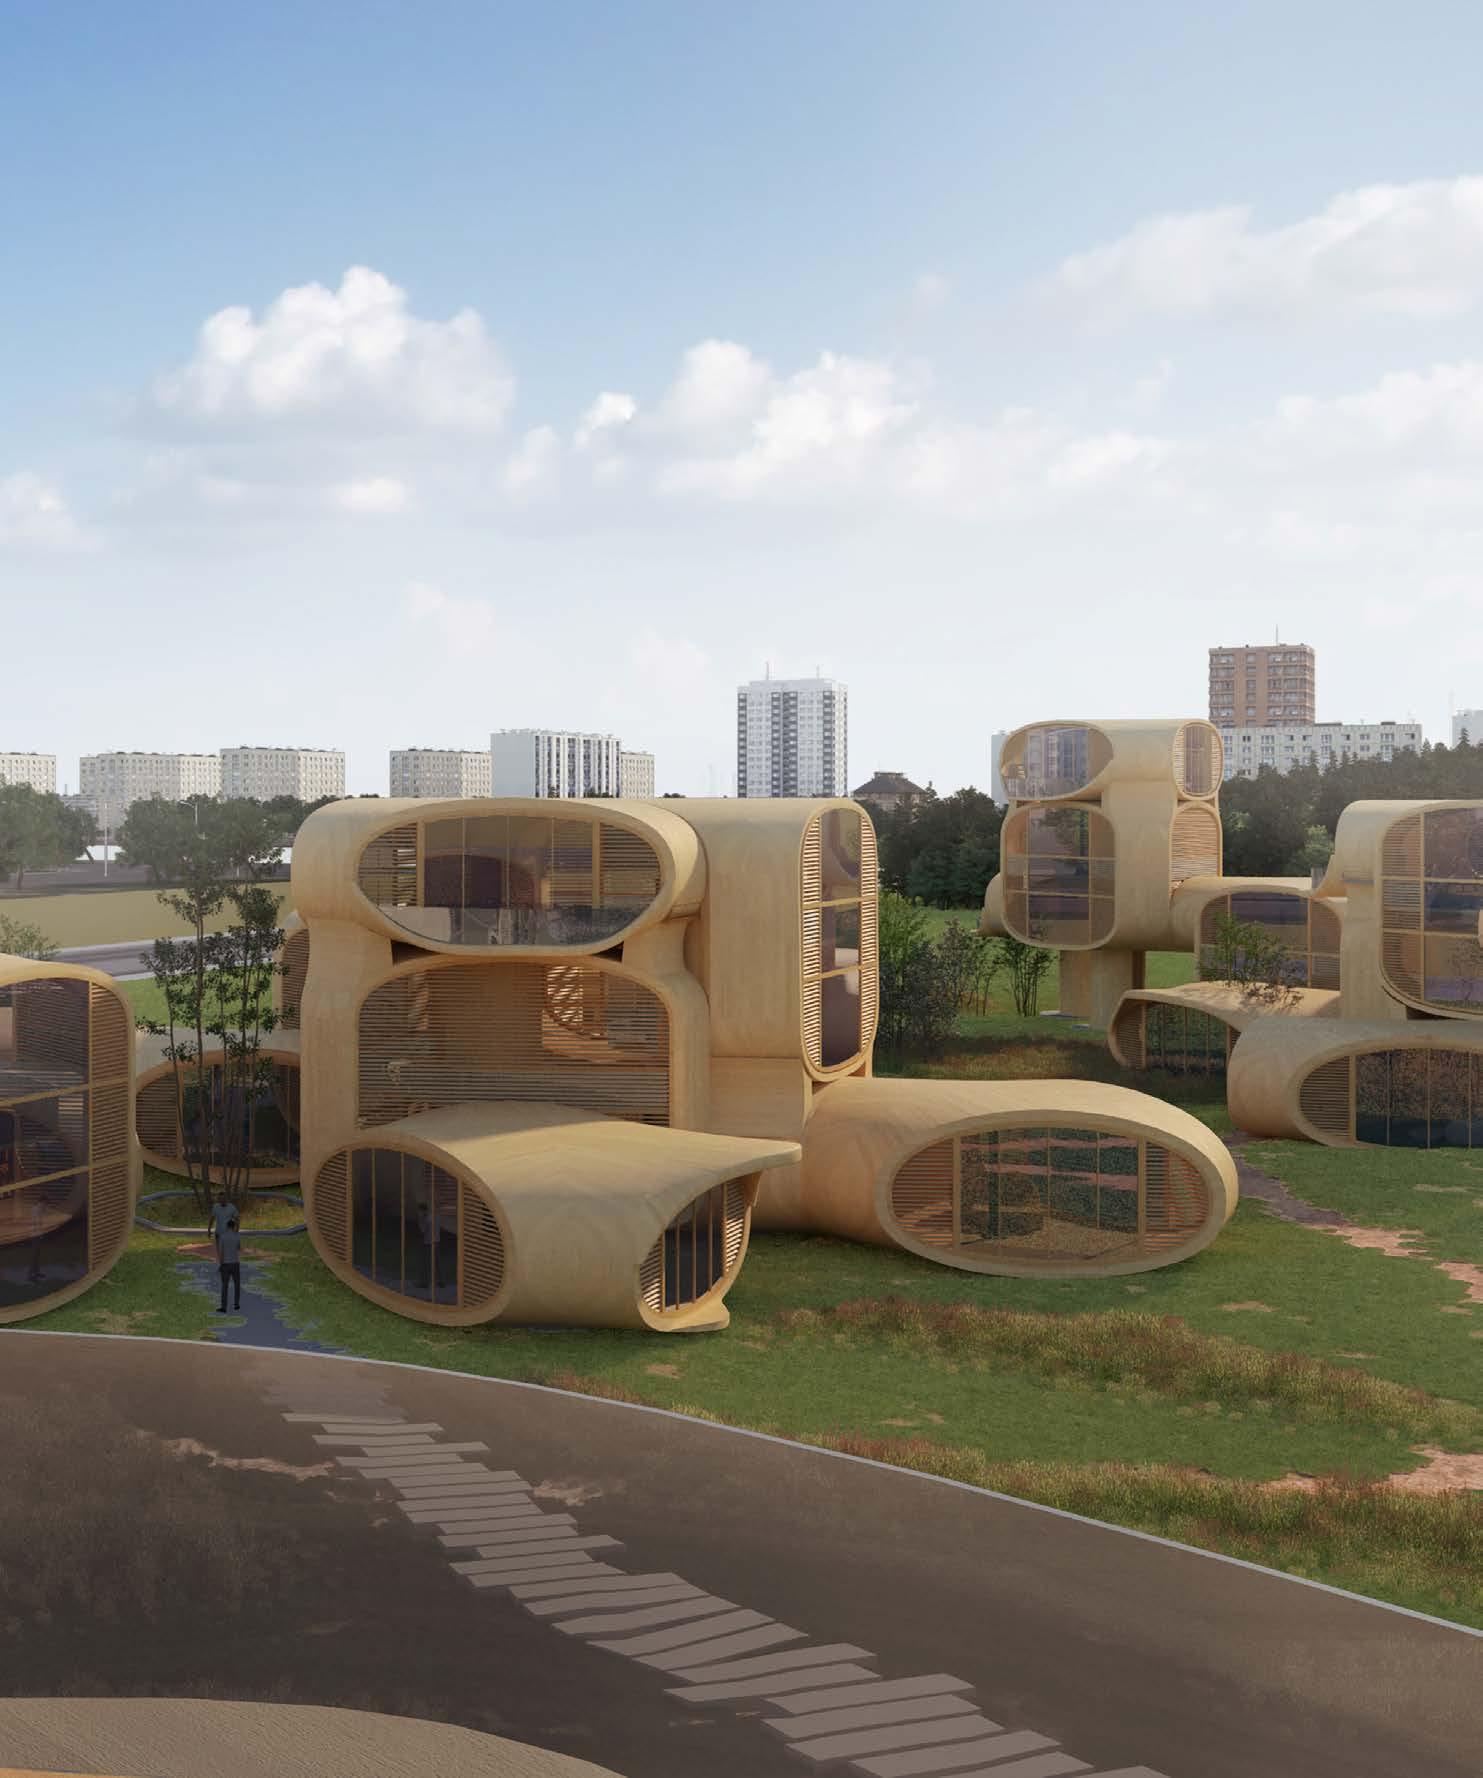
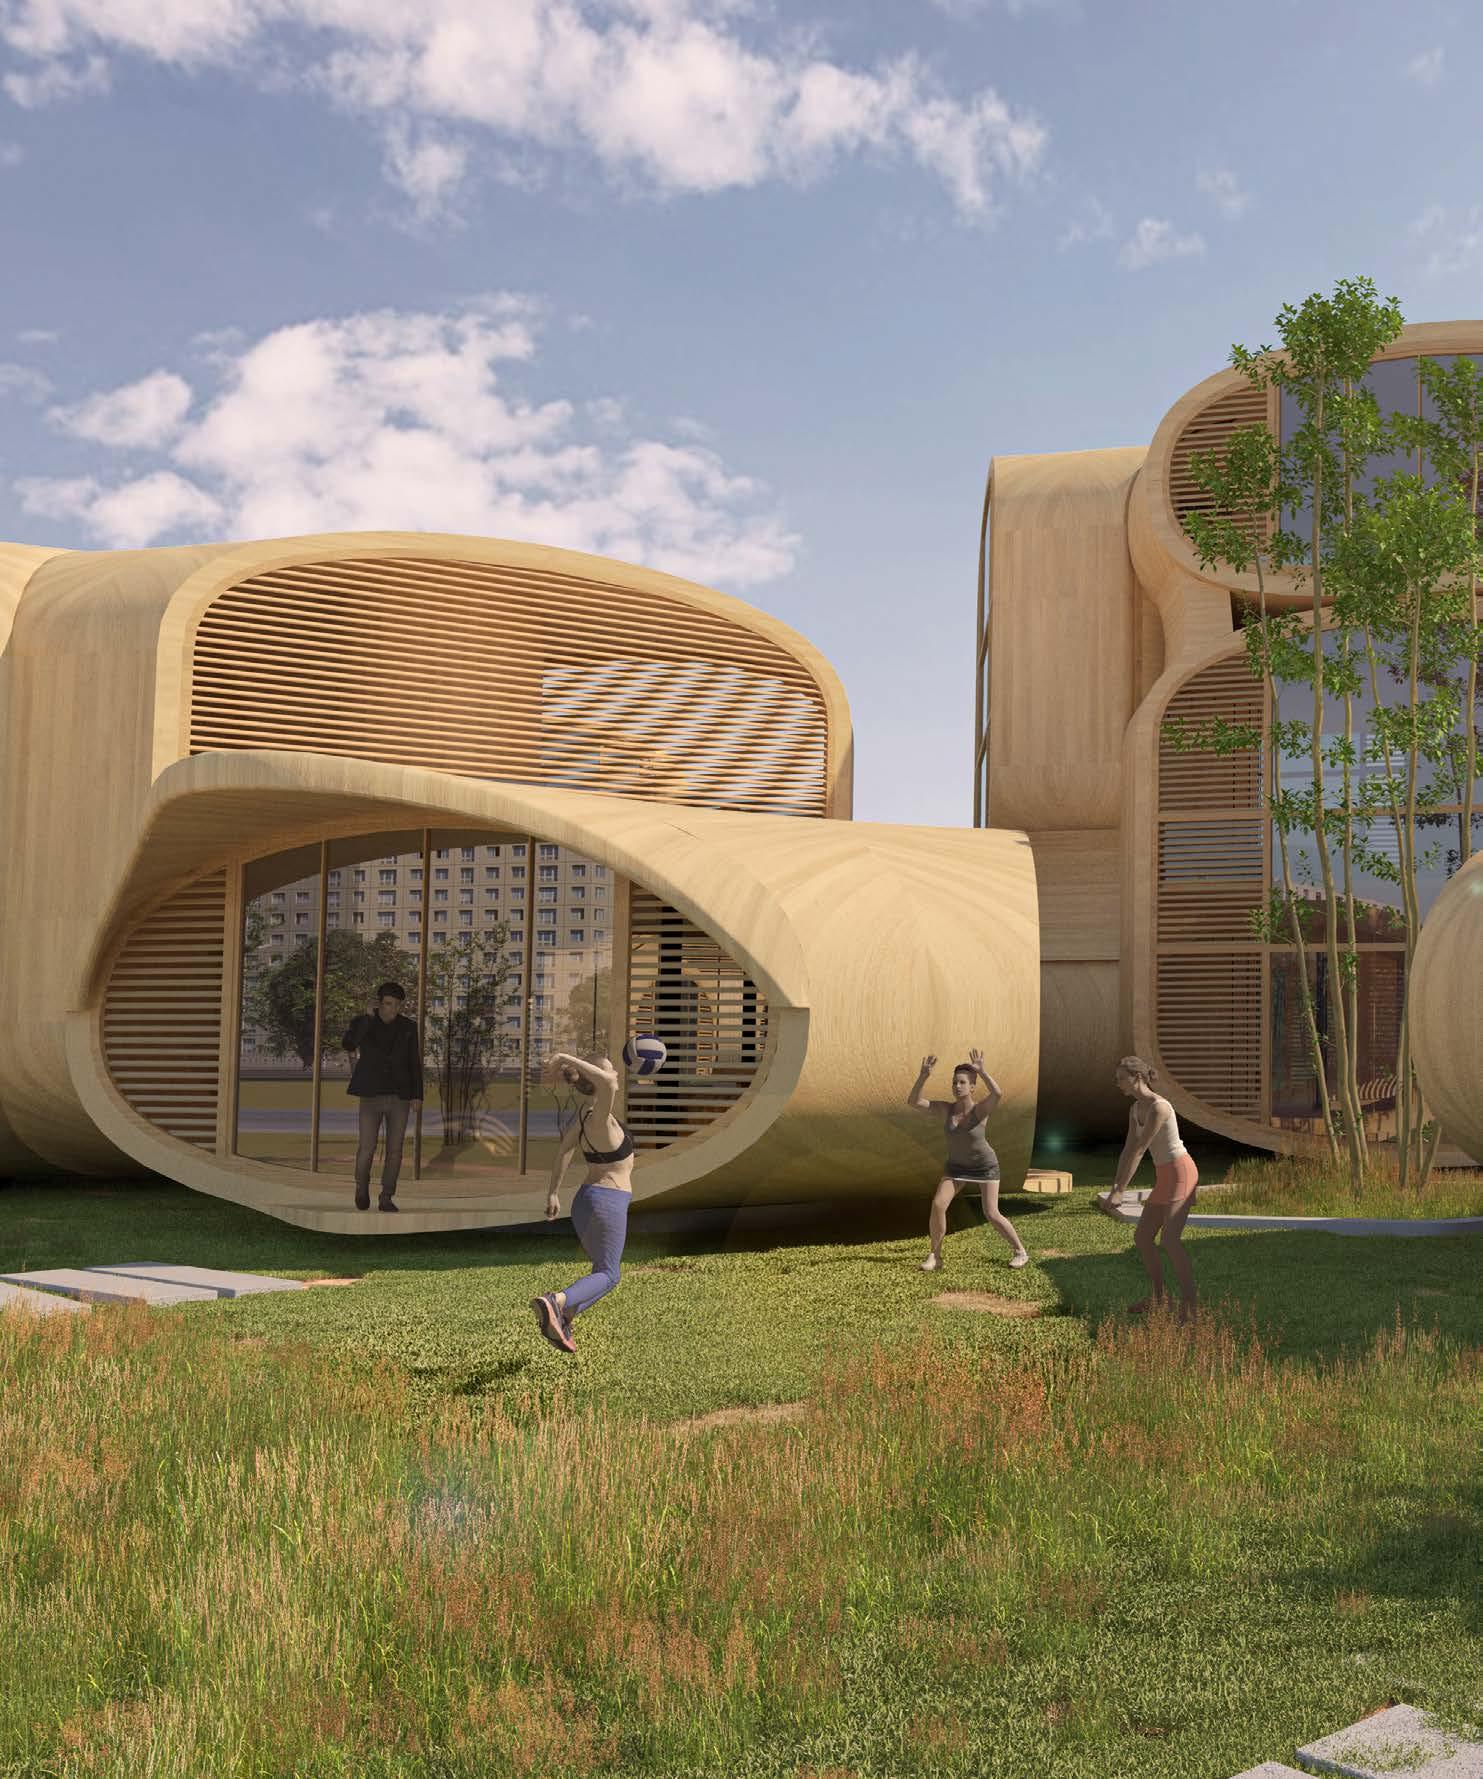
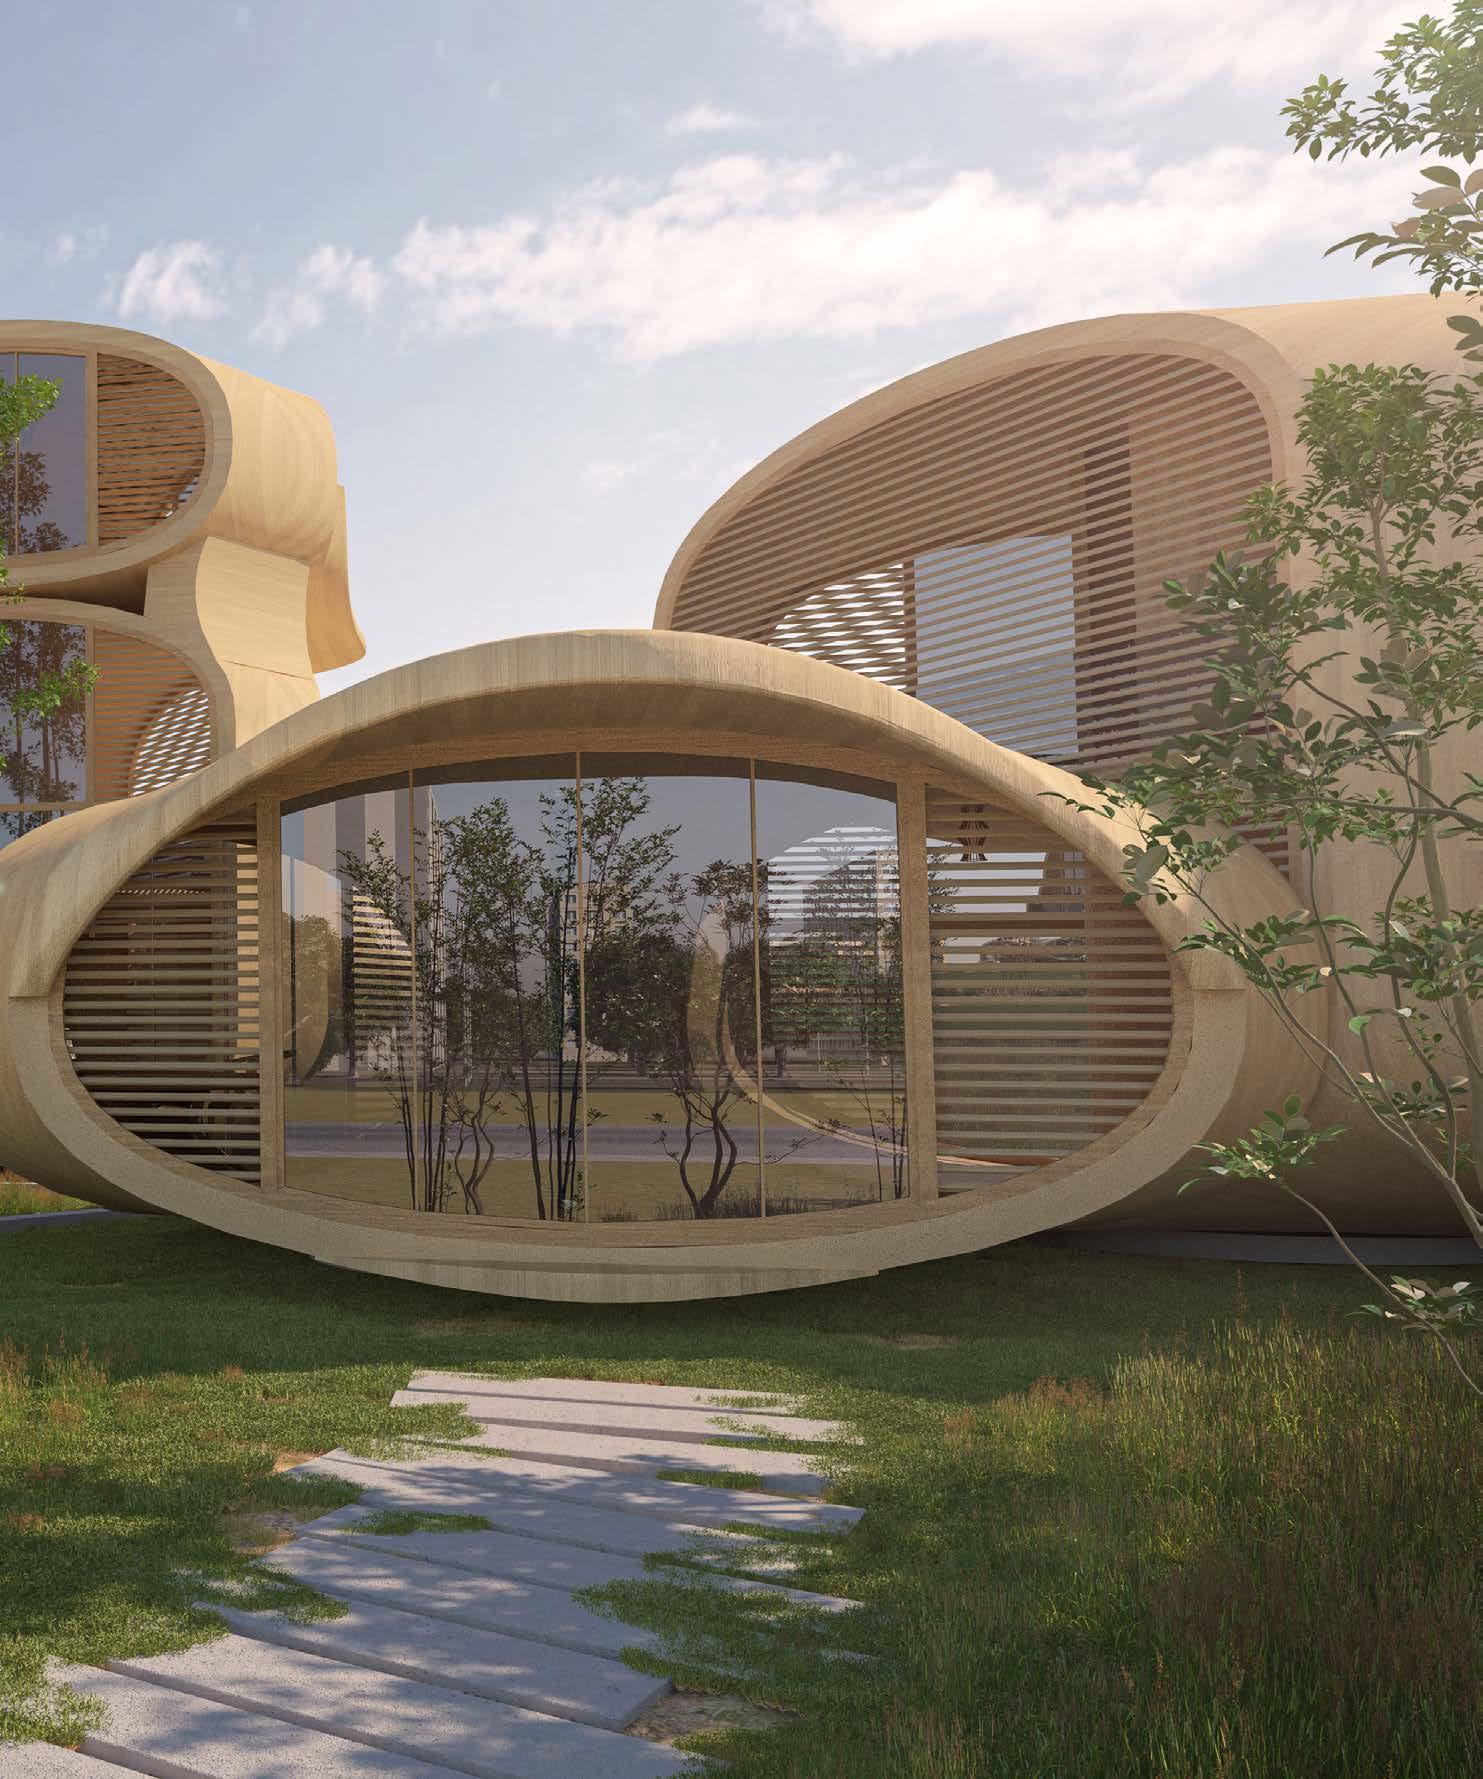
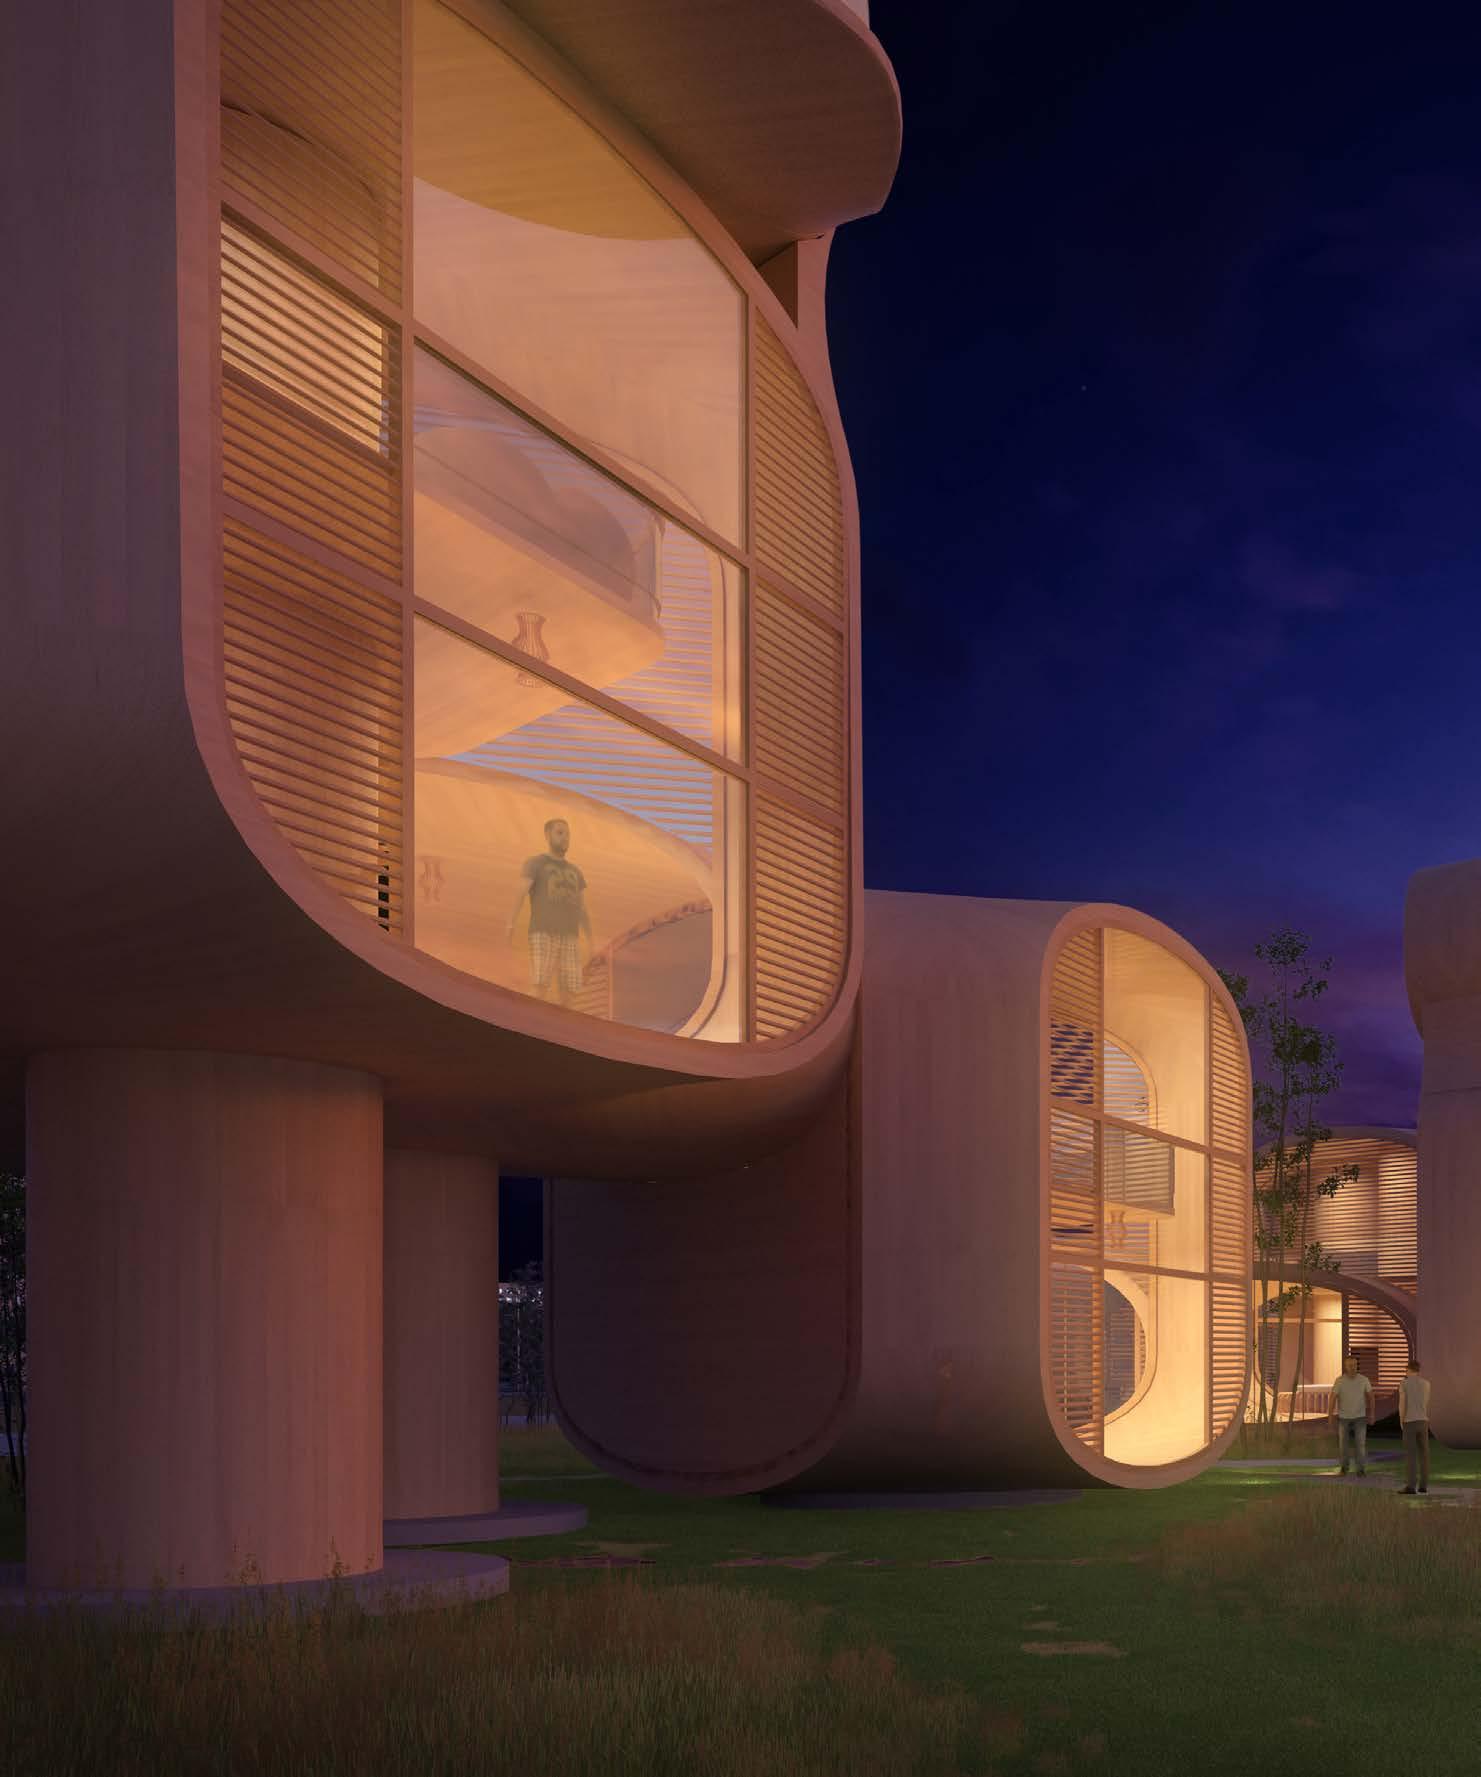
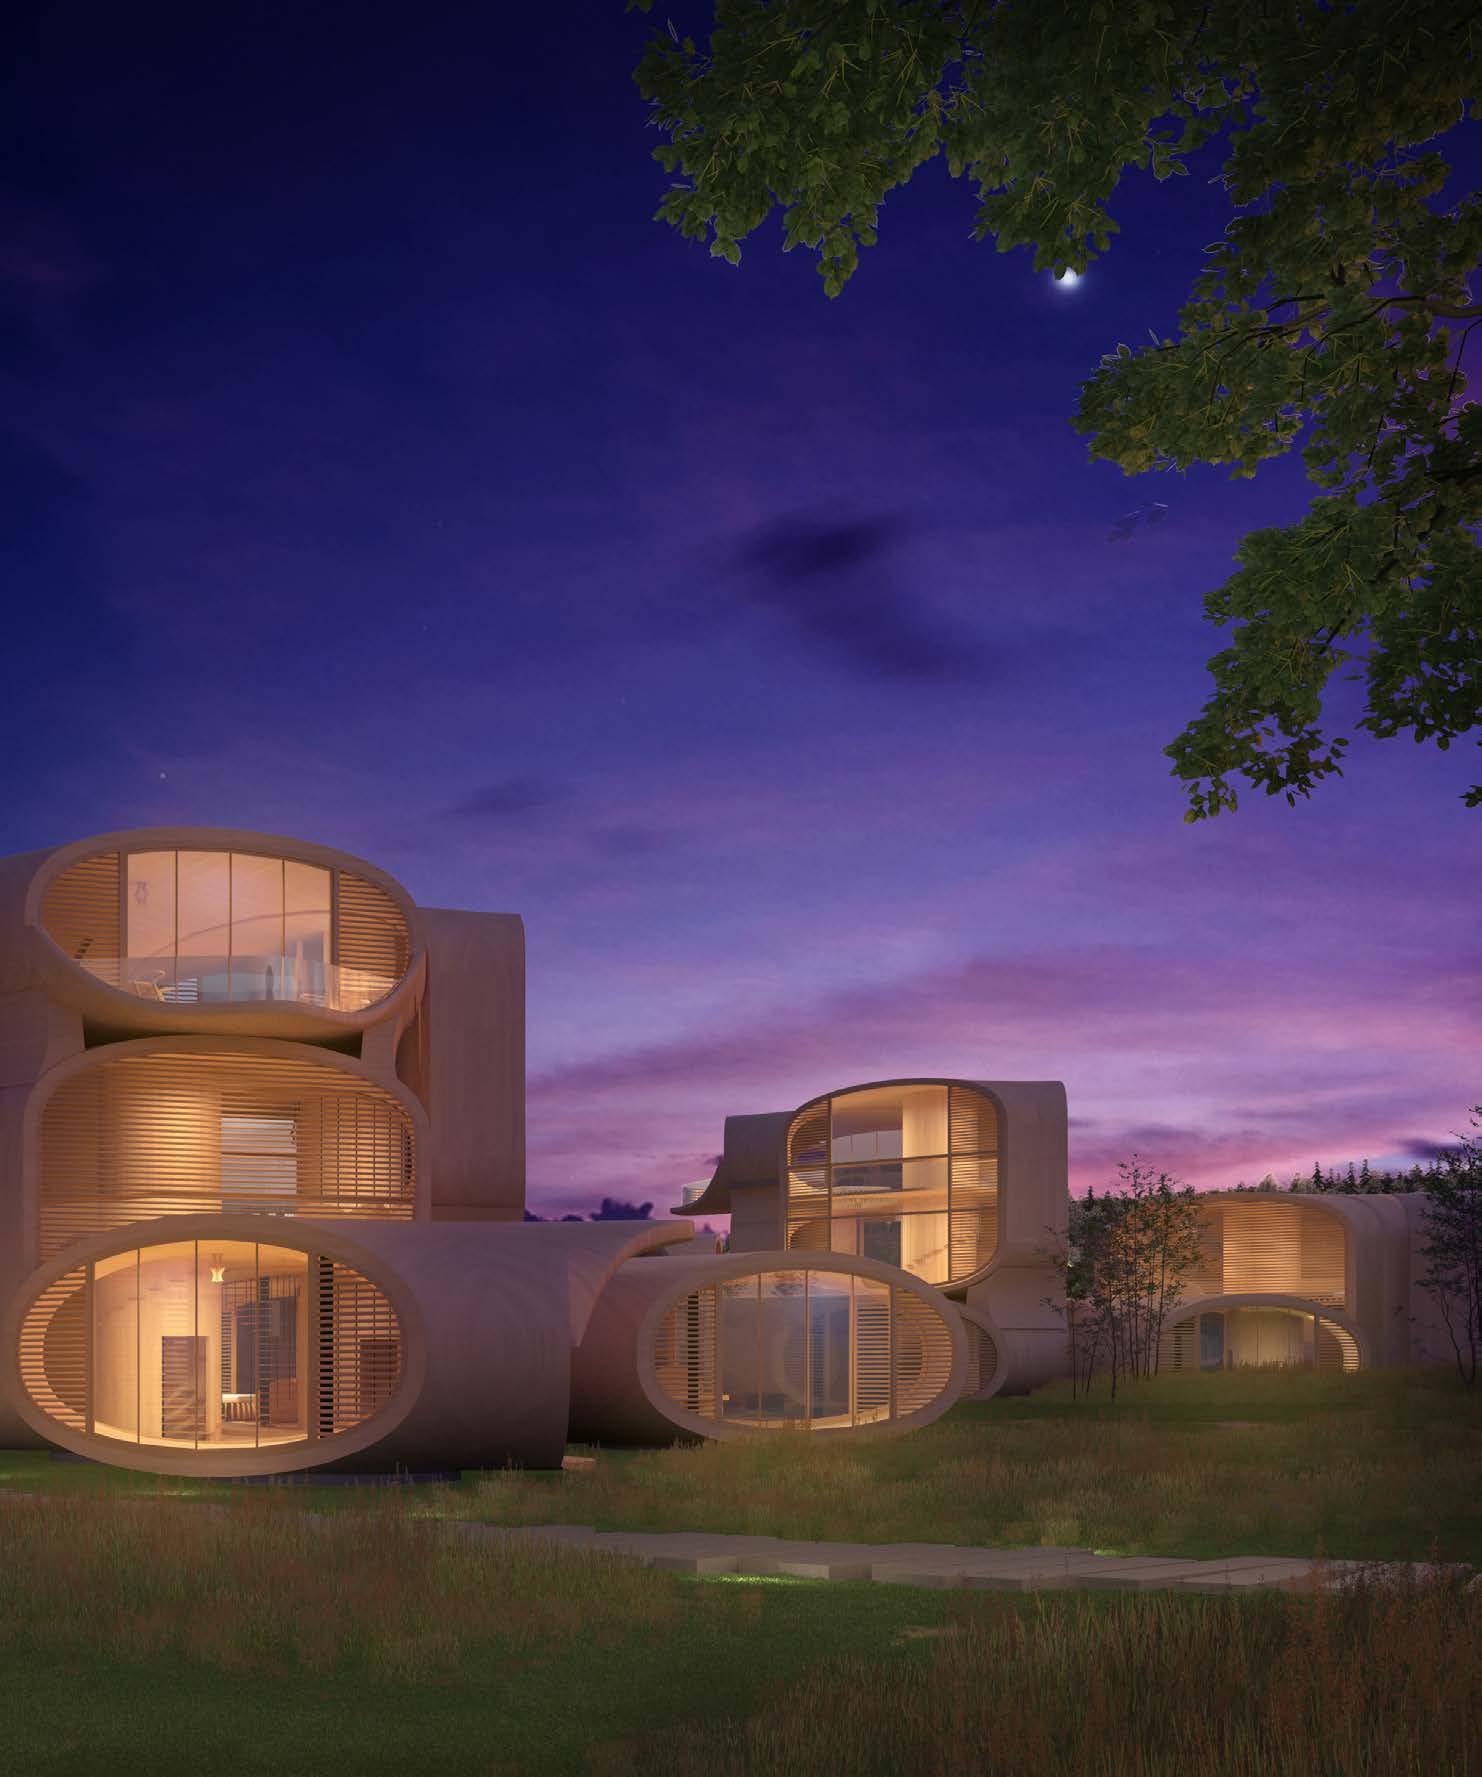
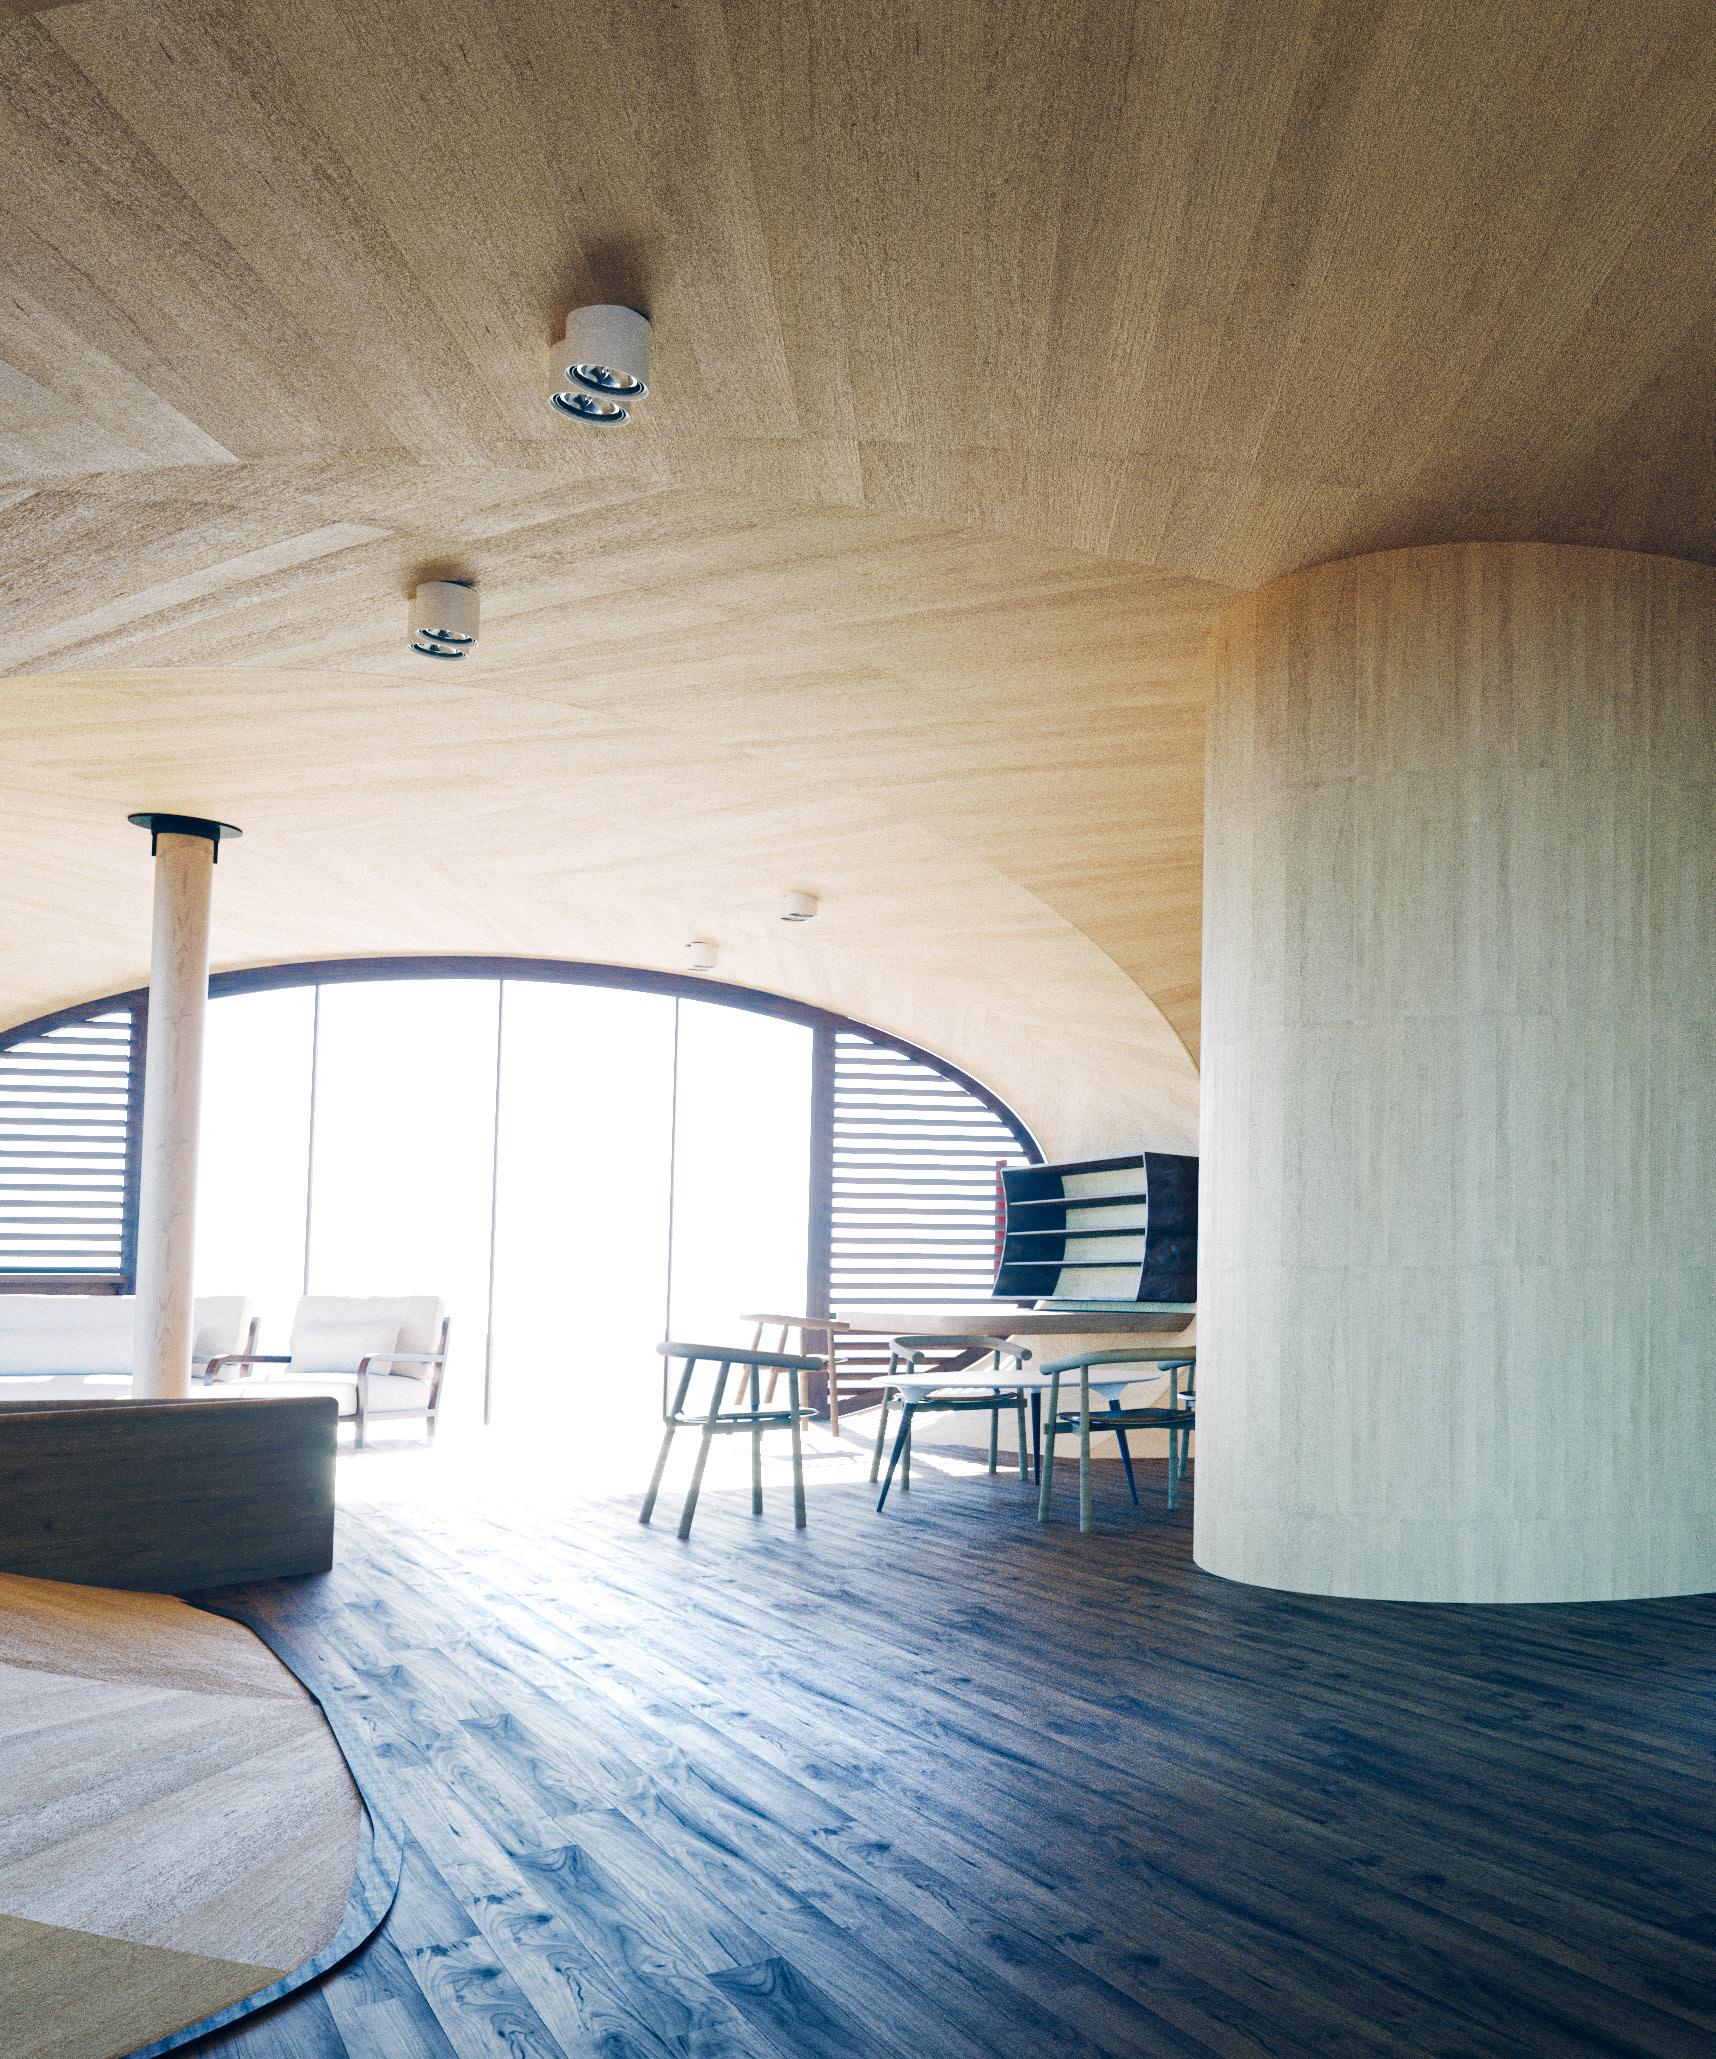
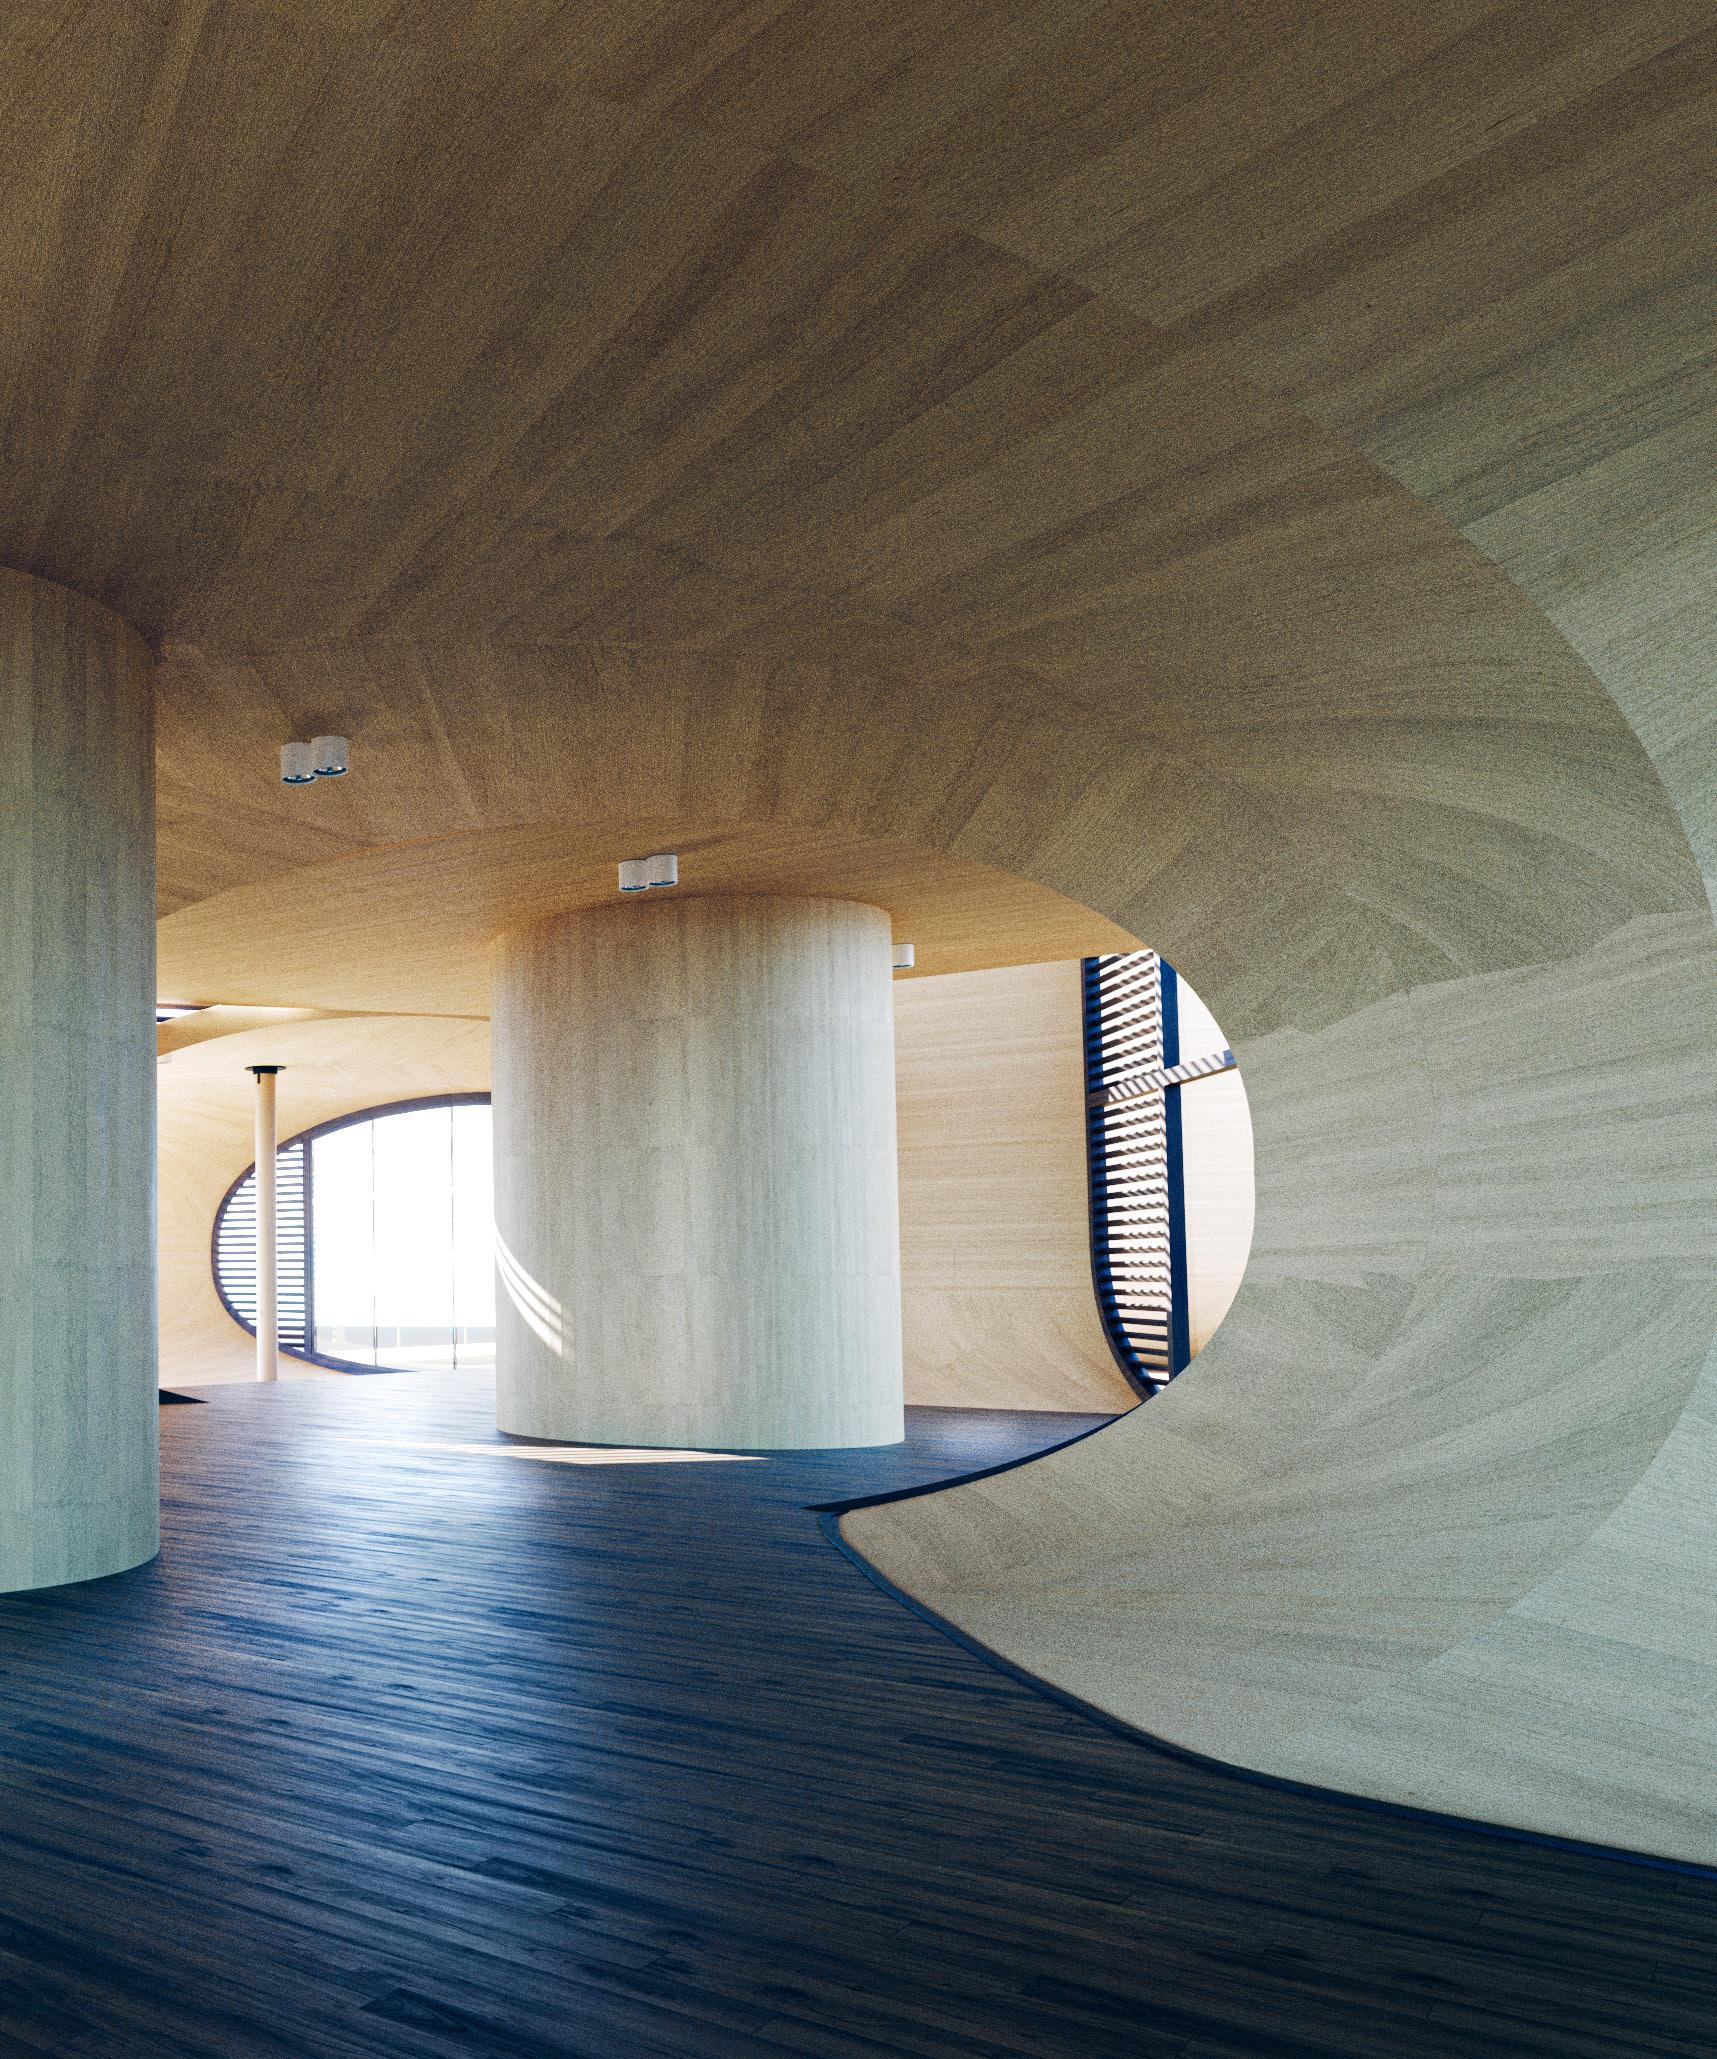
Through the study of wood and its intrinsic properties, we have managed to understand and capitalize on its behavior. This has led us to propose an effective fabrication technique making use of wood’s ability to change its dimension due to moisture exchange. This has been achieved by computationally simulating and manipulating the behavior of the material, an effective material system has been designed which enhances the performance relationship between the material, structure, and geometry. The design proposal explores how the material system can be a modular solution for efficient fabrication, a rapid and relatively simple assembly process for the building system. The proposed design solution is a framework which can be reapplied and evaluated based on any given site context. The project only documents initial conceptual ideas undertaken over a fivemonth period, and if further developments were to be undertaken, we think the investigation could focus on the following topics listed below:
Large scale physical tests can be undertaken on a full-scale laminated veneer piece, these tests will provide an opportunity to look into how the veneer layers can be glued together with alternative glues and using a vacuum pressure to keep the layers in place during the curing time. Live loading and pressure tests can be applied to understand the performance of the panels.
Aware that the inherent properties of wood can cause the component to move and react to the change in moisture, the joints for the panels can be further developed to allow for this movement. Restricting this natural movement may lead to deformations or even cracks in the components. The precedent studies documented in this thesis prove that with the right equipment and digital tools it is possible to calculate and predict the hygroscopic bending of timber. We were unsuccessful in our attempt to calibrate the digital experiments to the physical experiments due to the lack of resources; the physical experiments require precise equipment to measure the moisture content and also to dry the pieces to the required moisture content.
Facade systems for the dwelling modules can be incorporated into the aggregation logic for better environmental performance.
Further studies can be undertaken to achieve large scale doubly curved timber piece through the same fabrication technique.
1. http://www.wbdg.org/FFC/ARMYCOE/TECHNOTE/technote30.pdf
2. http://www.structuraltimber.co.uk/assets/InformationCentre/eb8.pdf (accessed September 2019)
3. Jelec, M., Rajcic, V., Varevac, D., (2018). Cross-laminated timber (CLT) - A state of the art report
4. [04] Buschow, K., (2001). Encyclopedia of materials. Amsterdam
5. Structural Timber Engineering Bulletin 7, (2014), Structural Timber Association
6.G., Samuel, Z., Samuel, (2010), Wood Handbook: Wood as an Engineering Material
7. https://www.archdaily.com/881743/paneum-center-coop-himmelb-l-au (accessed August 2019)
8. http://designandmake.aaschool.ac.uk/project/sawmill-shelter/ (accessed August 2019)
9.G. R. Kingsley, (2014), 20. Internationales Holzbau-Forum IHF 2014 Aspen Art Museum Roof Structure
10.https://icd.uni-stuttgart.de/?p=23336 (accessed August 2019)
11. Meteorosensitive Pavilion explores a novel mode of climate-responsive architecture, (2013), ICD, University of Stuttgart
12.https://selfassemblylab.mit.edu/programmable-materials (accessed September 2019)
13. 2. W., Dylan, (2014), ITECH 2014: Augmented Grain | Institute For Computational Design And Construction
14.C., Carll, C. W., Alex, (2009), Moisture-Related Properties of Wood and the Effects of Moisture on Wood and Wood Products
15. W., Jerold, (1994), Wood Properties 4th Edition
16. Timber Construction Manual, (2012), H., Thomas, N., Julius, S., Roland, V., Michael, W., Wolfgang
17. https://is.mendelu.cz/eknihovna/opory/zobraz_cast.pl?cast=19372 (Accessed August 2019)
18. C., P., Jorge, G. W., Hans, (2016), Chile Case Study
19.L., Federico, P., Pliscoff, (2017), Sinopsis bioclimática y vegetacional de Chile (in Spanish)
20.Peaklist, (2007), Argentina and Chile Central, Ultra-Prominences
21.https://www.archdaily.com/797779/half-a-house-builds-a-whole-community-elementals-controversial-social-housing (accessed September 2019)
22.https://www.habitatforhumanity.org.uk/country/chile/ (accessed September 2019)
23. K., Mohammad, H., Kasun, (2016), Life cycle performance of modular buildings: A critical review
24.https://www.theguardian.com/artanddesign/2018/aug/22/back-to-the-futuro-house-flying-saucer-mattisuuronen (accessed September 2019)
25.=18
P76 [1] G. D. Angel, G. Haritos, (2013), An Immediate Formula for the Radius of Curvature of A Bimetallic Strip
P77 [2] https://en.wikipedia.org/wiki/Bimetallic_strip (accessed August 2019)
P93 [3] = L., Federico, P., Pliscoff, (2017), Sinopsis bioclimática y vegetacional de Chile (in Spanish)
P162 [1] Y Li, J Li, (2014), Base isolator with variable stiffness and damping:design, experimental testing and modelling
1.William Le Baron Jenney, Home Insurance Building. Available at: https://upload.wikimedia.org/wikipedia/commons/3/38/Home_Insurance_Building.JPG [Accessed 10 September 2019]
2.Lewis Wickes Hine, Laying a beam, Empire State Building, New York, c 1931. Available at: https://www.gettyimages. co.uk [Accessed 10 September 2019]
3.Michael Green, EMPIRE STATE OF WOOD. Available at: http://mg-architecture.ca/work/empire-state-of-wood/ [Accessed 10 September 2019]
4.Ema Peter, Wood Innovation Design Center. Available athttps://www.archdaily.com [Accessed 1 August 2019]
5. Markus Pillhofer, PANEUM Center / Coop Himmelb(l)au. Available at https://www.archdaily.com/881743/paneum-center-coop-himmelb-l-au [Accessed 1 August 2019]
6. Didier Boy De La Tourr, Centre Pompidou-Metz / Shigeru Ban Architects. Available at https://www.archdaily.com/490141/ centre-pompidou-metz-shigeru-ban-architects [Accessed 1 August 2019]
7. Fernando Alda, Metropol Parasol by J Mayer H. Available athttps://www.dezeen.com/2011/04/26/metropol-parasol-byj-mayer-h/ [Accessed 1 August 2019]
8.Oakwood Timber Tower, London, UK. Available at http://www.plparchitecture.com/oakwood-timber-tower.html [Accessed 1 August 2019]
9. HoHo. Available at https://www.skyscrapercenter.com/building/hoho/18763 [Accessed 1 August 2019]
10. Gisling, Fogong temple corner dougong. Available at https://upload.wikimedia.org/wikipedia/commons/8/8c/ Fogong_temple_corner_dougong.JPG [Accessed 1 August 2019]
11. ICD/ITKE/IIGS University Stuttgart, Landesgartenschau Exhibition Hall. Available at https://icd.uni-stuttgart. de/?p=11173 [Accessed 1 August 2019]
12. Moelven, Mjøstårnet in Norway becomes world’s tallest timber tower. Available at https://www.dezeen. com/2019/03/19/mjostarne-worlds-tallest-timber-tower-voll-arkitekter-norway/ [Accessed 1 August 2019]
13. Moelven, Mjøstårnet in Norway becomes world’s tallest timber tower. Available at https://www.dezeen. com/2019/03/19/mjostarne-worlds-tallest-timber-tower-voll-arkitekter-norway/ [Accessed 1 August 2019]
14. Markus Pillhofer, PANEUM Center / Coop Himmelb(l)au. Available at https://www.archdaily.com/881743/paneumcenter-coop-himmelb-l-au [Accessed 1 August 2019]
15. Johann Jaritz , PYRAMIDENKOGEL OBSERVATION TOWER.Available at http://finestayslovenia.com/whattosee/pyramidenkogel-observation-tower-austria/ [Accessed 1 August 2019]
16. Didier Boy De La Tourr, Centre Pompidou-Metz / Shigeru Ban Architects. Available at https://www.archdaily. com/490141/centre-pompidou-metz-shigeru-ban-architects [Accessed 1 August 2019]
17. Sumitomo Forestry , W350.Available at https://www.dezeen.com/2018/02/19/sumitomo-forestry-w350-worlds-tallest-wooden-skyscraper-conceptual-architecture-tokyo-japan/ [Accessed 1 August 2019]
18. Michael Moran / OTTO, Derek Skalko, Aspen Art Museum / Shigeru Ban Architects. Available at https://www.archdaily.com/546446/aspen-art-museum-shigeru-ban-architects [Accessed 1 August 2019]
19. Dan Howarth, Penda proposes Toronto Tree Tower built from cross-laminated timber modules. Available at https:// www.dezeen.com/2017/08/02/toronto-tree-tower-penda-cross-laminated-timber-construction/ [Accessed 1 August 2019]
20. Didier Boy de la Tour, Tamedia Office Building. Available at https://www.archdaily.com/478633/tamedia-office-building-shigeru-ban-architects [Accessed 1 August 2019]
21. Precht, The Farmhouse Concept. Available at https://www.dezeen.com/2019/02/22/precht-farmhouse-modular-vertical-farms/ [Accessed 1 August 2019]
22. Trevor Mein, John Gollings, Glenn Hester, Nicole England, Andrew Chung, Bunjil Place / fjmt. Available at https://www. archdaily.com/897651/bunjil-place-fjmt [Accessed 1 August 2019]
23. Skellefteå Cultural Center. Available at https://www.archdaily.com/789146/white-arkitekter-designs-nordic-regionstallest-timber-building-for-skelleftea-cultural-center [Accessed 1 August 2019]
24. Eleanor Gibson , Shigeru Ban unveils interiors for “world’s tallest” hybrid timber tower in Vancouver. Available at https:// www.dezeen.com/2017/12/11/interiors-terrace-house-shigeru-ban-unveils-hyrbid-timber-tower-vancouver-port-living/ [Accessed 1 August 2019]
25. Hiroyuki Hirai , Nine Bridges Country Club / Shigeru Ban Architects. Available at https://www.archdaily.com/490241/ nine-bridges-country-club-shigeru-ban-architects [Accessed 1 August 2019]
26. Hessi , Arch formwork made of cross laminated and glued laminated timber. Available at https://www.hess-timber. com/en/references/detail/omega-formwork-switzerland/ [Accessed 1 August 2019]
27. Large Scale Fire Test of CLT – Fire Spread Through the Joints and Penetrations_Karuse
28. Markus Pillhofer, PANEUM Center / Coop Himmelb(l)au. Available at https://www.archdaily.com/881743/paneumcenter-coop-himmelb-l-au [Accessed 1 August 2019]
29. Michael Moran / OTTO, Derek Skalko, Aspen Art Museum / Shigeru Ban Architects. Available at https://www.archdaily. com/546446/aspen-art-museum-shigeru-ban-architects [Accessed 1 August 2019]
30. En-Kai Kuo, Sawmill Shelter. Available at http://designandmake.aaschool.ac.uk/project/sawmill-shelter/ [Accessed 1 August 2019]
31. ICD/ITKE, University of Stuttgart, development and assembly process of Urbach Tower. Available at https://icd.unistuttgart.de/?p=23336 [Accessed 1 August 2019]
32. ICD/ITKE, University of Stuttgart, Urbach Tower. Available at https://icd.uni-stuttgart.de/?p=23336 [Accessed 1 August 2019]
33. ICD/ITKE, University of Stuttgart, HygroSkin – Meteorosensitive Pavilion. Available at https://icd.uni-stuttgart. de/?p=9869 [Accessed 1 August 2019]
34. Self-Assembly Lab, Programmable Material. Available at https://selfassemblylab.mit.edu/programmablematerials [Accessed 1 August 2019]
35. Maria Yablonina, ITECH M.Sc 2014: Augmented Grain. Available at https://icd.uni-stuttgart.de/?m=201412&paged=2 [Accessed 1 August 2019]
36. Iva Kremsa, Kenzo Nakakoji and Etien Santiago, Programmable Material. Available at https://selfassemblylab.mit.edu/ programmable-materials [Accessed 1 August 2019]
37. Ehituse ja arhitektuuri instituut, chutiya. https://www.ttu.ee/instituut/ehituse-ja-arhitektuuri-instituut/[Accessed 23 September 2019]
40. Cristobal Palma / Estudio Palma, Tadeuz Jalocha, Quinta Monroy / ELEMENTAL. Available at https://www.archdaily. com/10775/quinta-monroy-elemental [Accessed 1 August 2019]
41. Amy Holt/Roger Birch Collection, ‘We caught a UFO’ … Todmorden, West Yorkshire, meets the Futuro in 1971 Available at https://www.theguardian.com [Accessed 1 August 2019]
42. Iva Kremsa, Kenzo Nakakoji and Etien Santiago, Programmable Material. Available at https://selfassemblylab.mit.edu/ programmable-materials [Accessed 1 August 2019]
DOMAIN
C., Aygül, G., Canan, (2014), EARTHQUAKE RESISTANT DESIGN AND SUSTAINABILITY THROUGH WOODEN COMPOSITES IN MULTI-STOREY STRUCTURES
I., Matteo Izzi, F., Georg, F., Massimo, S., Gerhard Schickhofer, (2016), Experimental investigations and design provisions of steel-to-timber joints with annular-ringed shank nails for Cross-Laminated Timber structures
L., Cristiano Loss, T., Thomas, T., Solomon Tesfamariam, (2018), State-of-the-art review of displacementbased seismic design of timber Buildings
D., Ershad, N., Abdoullah, F., Xiong, G. Qi, (2016), Seismic resistance of timber structure – a state of the art design
Open Academy, Norwich, (2009), LOW IMPACT MATERIALS: CASE STUDIES, CROSS-LAMINATED TIMBER
S., Andy, B., Daniel, W. Pete, (2017), CROSS-LAMINATED TIMBER An introduction to low-impact building materials
S., Yin-Lan, S., Johannes, T. Solomon, F. S., Siegfried, M. Zai-Gen, (2013), Hysteresis behavior of bracket connection in cross-laminated-timber shear walls
H., James, J., Malcolm, S. Colin, (2006), Handbook on structural timber design to Eurocode 5 (IS EN 1995-1-1) rules including strength capacity tables for structural elements
R., Antti, H., Tarja, (2016), Efficiency in the delivery of multi-story timber buildings
P., Maria Cristina, (2017), Ductile Behavior of Timber Structures under Strong Dynamic Loads
H. C., Robert, C. Xavier, (2017), A framework for assessing the environmental benefits of mass timber construction
G. R. Kingsley, (2014), Aspen Art Museum Roof Structure
G. Mikhail, C. L. Karen, (2010), Project Report – Centre Pompidou-Metz
M.F. Robert, H.R. Michael, (2016), Briefing: Super tall timber – Oakwood Tower
L. Simon, (2018), Design Implications of Rigid Timber Gridshells – A Method for the Planning and Manufacture of Load-carrying, Rigid, Freeform Structures of Timber
S. Jeff, S. Todd, F. Alejandro, W. David, F. Rob, R. Michael, (2017), River Beech Tower: A Tall Timber Experiment
L. Felipe, A. S. Sergio, A. Maximiliano, R. Sofia, A. Pedro, R. Sergio, G. Lennar, F. Claudio, (2011), Seismic zonation of the Santiago basin, Chile
P. Cabrera, W. Hans Grosse, (2016), Chile Case Study – Prepared for FAO as part of the State of the World’s Forests 2016
L. Randolph, (2002), “Crosswalls” Instead Of Shearwalls – A Proposed Research Project for the Retrofit of Vulnerable Reinforced Concrete Buildings in Earthquake Areas based on Traditional Hımış Construction
B. Hugo, (2003), Seismic Conceptual Design of Buildings – Basic principals for engineers, architects, building owners, and authorities
L. Randolph, (2011), Armature Crosswall Project
P. Bisch, E. Carvalho, H. Degee, P. Fajfar, M. Fardis, P. Franchin, M. Kreslin, A. Pecker, P. Pinto, A. Plumier, H. Somja, G. Tsionis, (2011), Eurocode 8: Seismic Design of Buildings Worked examples
T. Guedelman, G. R. Saragoni, R. Verdugo, (2012), Chilean emergency seismic design code for building after El Maule 2010 Earthquake
R. Langenbach, (2008), Engineering Structures: Learning from the Past to Project the Future: Armature Crosswalls
W. v.d. L. John, P. Shiling, E. P. Steven, H. Shimizu, H. Isoda, (2010), Experimenal Seismic Response of a Full-Scale Six-Story Light-Frame Wood Building
Z. Miao, G. S. Bronwen, H. M. Brian, R. C. Ramesh, J. J. Bryony, J. H. Philip, (2018), Dimensional Changes of Tracheids during Drying of Radiata Pine (Pinus radiata D. Don) Compression Woods: A Study Using VariablePressure Scanning Electron Microscopy (VP-SEM)
G., Jozsef, K. Daniel, H. Stefan, Sz. Jozsef, N. Peter, (2010), Measurement of standard and off-axis elastic moduli and Poisson’s ratios of spruce and yew wood in the transverse plane
R., Steffen, M., Achim, C., David, (2014), Meteorosensitive architecture: Biomimetic building skins based on materially embedded and hygroscopically enabled responsiveness
A., Sherif, B. El-D., Rana, M. Passaint, M., Tasbeh, (2018), A Computational Method for Tracking the Hygroscopic Motion of Wood to develop Adaptive Architectural Skins
A., Sherif, B., El-D., Rana, M. Passaint, I., Aly, (2019), The Effect of Hygroscopic Design Parameters on the Programmability of Laminated Wood Composites for Adaptive Façades
D. Wood, C. Vailati, A. Menges, M. Rüggeberg, (2018), Hygroscopically actuated wood elements for weather responsive and self-forming building parts – Facilitating upscaling and complex shape changes
C., Charles, C. W., Alex, (2009), Moisture-Related Properties of Wood and the Effects of Moisture on Wood and Wood Products
M. W., Dylan, C., David, D. K., Oliver, M., Achim, (2016), Material computation—4D timber construction: Towards building-scale hygroscopic actuated, self-constructing timber surfaces
N., Tomas, (2008), Prefabrication Strategies in the Timber Housing Industry: Case studies from Swedish and Austrian markets
C. N., Nathan, (2018), Squatters, Shanties, and Technocratic Professionals: Urban Migration and Housing Shortages in Twentieth-Century Chile
Forest Products Laboratory, (2010), Wood Handbook: Wood as an Engineering Material