Architectural Association School of Architecture

Graduate School Programme
Programme
Emergent Technologies and Design
Term
2017 - 2019
Course Title
Emergent Technologies and Design
M. Arch Dissertation
Course Tutors
Dr. Mic hael Weinstock
Dr. Elif Erdine
Dr. George Jeronimidis
Dr. Lidia Badarnah
Dr. Mohamed Makki
Antiope Koronaki Alican Sungur
Submission Title
In Situ Synergy
Graduates
Rita Stella Roesch Diaz MArc h Yufeng Zhai MArch
Submission Date
Declaration
Signatures


Date
11 January 2019
“We hereby certify that this piece of work is entirely our own and that any quotation or paraphrase from the published or unpublished work of others is duly acknowledged.”
Rita Stella Roesch Diaz Yufeng Zhai
11 January 2019
th th
Architectural Association School of Architecture
Emergent Technologies and Design 2017-2018
Course Director
Studio Master
Emeritus Professor
Studio Tutors
Dr. Mic hael Weinstock
Dr. Elif Erdine
Dr. George Jeronimidis
Dr. Lidia Badarnah
Dr. Mohamed Makki
Antiope Koronaki
Alican Sungur
Word Count: 28,941
IN SITU SYNERGY
A new synthesis of living in a productive city.
Candidates Rita Stella Roesch Diaz M.Arc h Yufeng Zhai M.Arc h
Human activity and climate change have caused desertification across the globe, many of these areas spawn new architectural strategies for adaptation in the extreme climate. This research interrogates the new ‘plastic revolution’ of Almeria, to examine both advantages and disadvantages of the horticulture production model, and its economic and environmental impact.
In situ Synergetics explores the necessities in the area in various scales, to derive integrated strategies for improving current human needs, and the horticulture industry in Almeria.
By exploring the overlap between biomimetics and pneumatic architecture, the strategies will feature rapid light-weight assembly, climatically responsive hydro and thermally integrated farming system, to sustain food production in arid conditions.
Various generative design strategies such as Genetic algorithm and Fluid dynamics will be employed in the design process. Furthermore, a synthesized urban design integrates greenhouse and migrant worker settlements to address human needs. Low tech social housing fabrication strategy aims to facilitate settlements from temporary to permanent transition.
Abstract
7 Table of Contents 1. Introduction 1 2. Domain 3 2.1. Context 5 2.1.1. Desertification 5 2.1.1.1. Overview 5 2.1.1.2. Climatic Impact 9 2.1.1.3. Social Impact 11 2.1.2. ‘Mar de Plastico’ Almeria 13 2.1.2.1. Overview 15 2.1.2.2. Site Analysis 16 2.1.2.3. Population 25 2.1.2.4. History 28 2.1.2.5. Climate 30 2.1.3. Horticulture industry Inefficiency 36 2.1.3.1. Crop Analysis 37 2.1.3.2. Water Overexploitation 44 2.1.3.3. Plastic Pollution 48 2.1.3.4. Greenhouse Inefficiencies 52 2.1.4. Social Context 57 2.1.4.1. Demographic 59 2.1.4.2. Working conditions 64 2.1.4.3. Living conditions 68 2.2. Conclusion 79 2.2.1. Problems and Potentials 79 2.2.1.1.Water Overexploitation 79 2.2.1.2. Plastic Pollution 79 2.2.1.3. Greenhouse Inefficiencies 79 2.2.1.4. Human Needs 79 2.2.2. Research Questions 80 2.2.2.1. Global Scale 80 2.2.2.2. Meso Scale 80 2.2.2.2. Local Scale 80 3. Methodology 83 3.1. Generative Design Methods 86 3.2. Evaluation & Analysis Methods 88 4. Research Development 89 4.1. Spatial Organization 91 4.1.1. Overview 91 4.1.2. Housing Types 91 4.1.2.1. Moroccan Housing Types 91 4.1.2.2. Spanish Housing types 92 4.1.3. Urban Growth 95 4.1.3.1. Moroccan Urban Growth 95 4.1.3.2. Spanish Urban Growth 95 4.2. Water Circulation 97 4.2.1. Overview 97 4.2.2. Passive System 98 4.2.2.1. Davies Alpine Greenhouse 98 4.2.3. Desalination System 99 4.2.3.1. Overview 99 4.2.3.2. Double Slope Solar Still 101 4.2.3.3. Seawater Greenhouse 101 4.2.4. Hydraulic infrastructure 103 4.2.4.1. Overview 103 4.2.4.2. Dendric Patterns 103 4.2.4.3. Branching Patterns 105 4.2.4.4. Computational Logic 105 4.3. Form Finding Research 107 4.3.1. Solutions in Nature 107 4.3.1.1. Stoma 107 4.3.1.2. Burrow Ventilation of P. Dog 107 4.3.1.3. Abstracted Concept Fluid D. 108 4.3.2. Solutions in Architecture 109 4.3.2.1. Dieste Vaults 109 4.3.2.2. Foster’s Drone Port 110 4.4. Fabrication Strategy 111 4.4.1. Overview 111 4.4.2. Earth as Building Material 112 4.4.2.1. Composites 112 4.4.2.2. Water 113 4.4.2.3. Young’s Modulus 114 4.4.2.4. Earth Building Techniques 115 4.4.3. Pneumatic Structures 117 4.4.3.1. Main Material Systems Prec. 117 4.4.3.2. Frei Otto’s Pneumatic Struct.119 4.4.3.3. Single Airbeam FEA 123 4.4.3.4. Pneumatic Formwork 125 4.4.4. Material Research 127 4.4.4.1. Overview 127 4.4.4.2. ETFE Material Properties 129 4.4.5. Fabrication System 131 4.4.5.1. Plastic Pollution and Propos. 131 4.4.5.2. Greenhouse Fabrication 133 4.4.5.3. Housing Unit Fabrication 135
5. Design Development
8 6. Design proposal 189 6.1. Global Scale Proposal 191 6.2. Meso Scale Proposal 195 6.3. Local Scale Proposal 197 6.3.1. Housing Units Proposal 197 6.3.1.1. Design 199 6.3.1.2. Application Design on GA 203 6.3.1.3. Pneumatic Form-work 205 6.3.1.4. Brick Wall Styles 211 6.3.1.5. Construction Proposal 213 6.3.2. Greenhouses Proposal 215 6.3.2.1. Architectural proposal 215 6.3.2.2. System Proposal 217 6.3.2.3. Fabrication 219 6.3.2.4. Adaptation System 221 6.3.2.5. Comparative performance 223 6.3.2.6. Component Actuation 224 6.3.3. Desalination device 227 7. Conclusion 229 7.1. Post Evaluation 229 7.1.1. Settlement Post-Analysis 231 7.1.1.1. Static Pressure 231 7.1.1.2. Velocity 232 7.1.2. Greenhouse Post-Analysis 233 7.1.2.1. Ventilation Post-Analysis 233 7.1.2.2. Crop Yield Improvement 235 7.2. Evaluation of Ambition 237 7.2.1. Water Over-exploitation 237 7.2.2. Plastic Pollution 238 7.2.3. Greenhouses Inefficiencies 239 7.2.4. Human Needs 241 7.3. Further Studies 242 8. References 245 8.1. Bibliography 247 8.2. Image & Data References 255
137 5.1. Computational Design strategy 139 5.1.1. Computational Design Ambition 139 5.1.2. Strategy 139 5.2. Global Scale 141 5.2.1. Urban Experiment 143 5.2.1.1. Experimental Setup 144 5.2.1.2. Observations 144 5.2.1.3. Conclusions 144 5.3. Meso Scale 147 5.3.1. Settlement Scale GA 147 5.3.1.1. Generative Process 147 5.3.2. Experimental Setup 149 5.3.2.1. Objective 149 5.3.2.2 Results and Obser vations 151 5.3.3. Post Evaluation 153 5.3.3.1. Street Network Centrality 157 5.3.3.2. Solar Hours Analysis 157 5.3.3.3. Conclusions 157 5.4. Local Scale 159 5.4.1. Courtyard Housing GA 159 5.4.1.1. Experimental Setup 159 5.4.2 Townhouse GA 163 5.4.2.1. Observations 163 5.4.2.2. Experimental Setup 163 5.4.3. Greenhouse 167 5.4.3.1. Experimental Setup 167 5.4.3.2. Observations 168 5.4.3.3. GA Experiment 169 5.4.3.4. Observations 170 5.4.3.5. Cluster CFD 173 5.4.3.6. Hydro-thermal Laberynth 175 5.4.3.7. Beam Distribution 177 5.4.3.8. Thermal Analysis 179 5.4.3.9. Surface Rationalization 181 5.5. Physical Experiment 183 5.5.1. Plastic Experiments 183 5.5.1.2. Experimentation and Appro. 183 5.5.1.2. Pneumatic Beams Experim. 184 5.5.1.3. Pneumatic Formwork Exper. 187
9 1
10 INTRODUCTION
1. Introduction
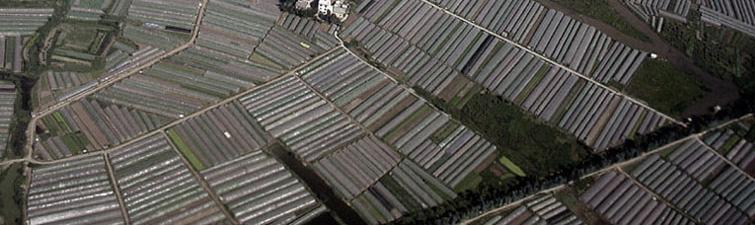
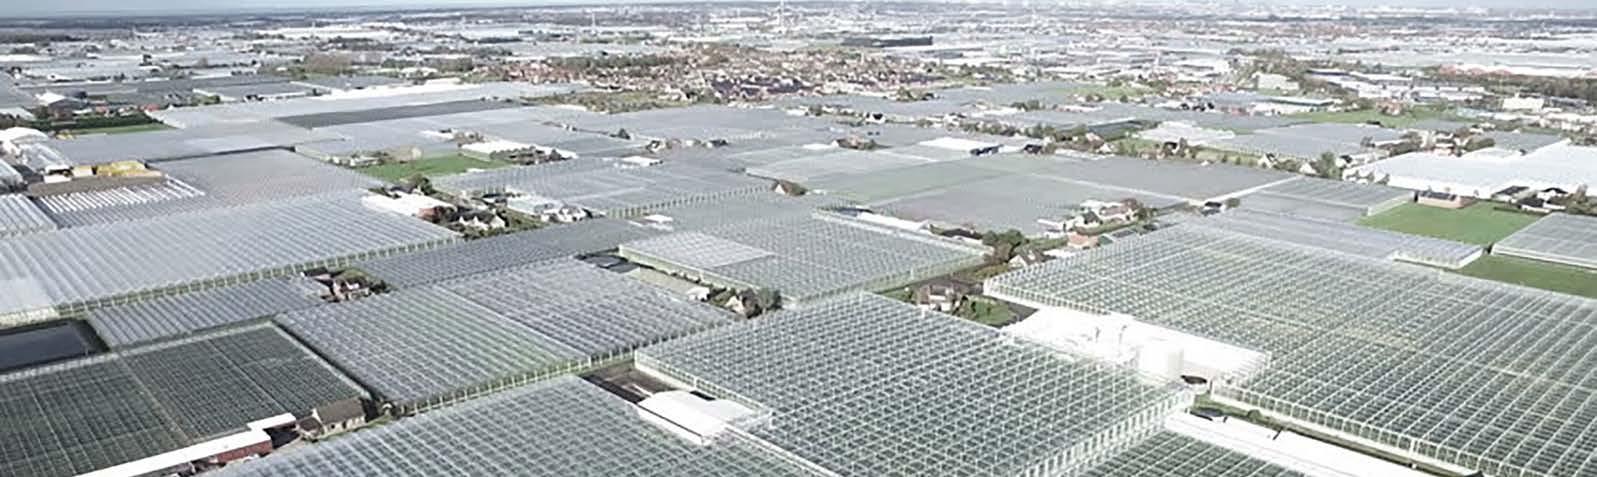
Climatic change has imposed increasing environmental pressure on agricultural production. However recent technological advances in material science and biochemical industries in the mid-twentieth century has benefited the agriculture production, as a result, industrial-scale horticulture production has emerged. Optimal human controlled indoor environment promises the maximum yield and profit of the bioengineered crops.
The production produced a booming economy and prosperity in the regions like Rotterdam, the Netherlands, South China and Palermo, Italy where greenhouses cover ample hectares of the territory. However, the ecological impact and social conflicts caused by the horticulture industry cannot be neglected. Drained local aquifer, an astonishing amount of plastic waste, pressing housing crisis all imply that this production model is not sustainable.
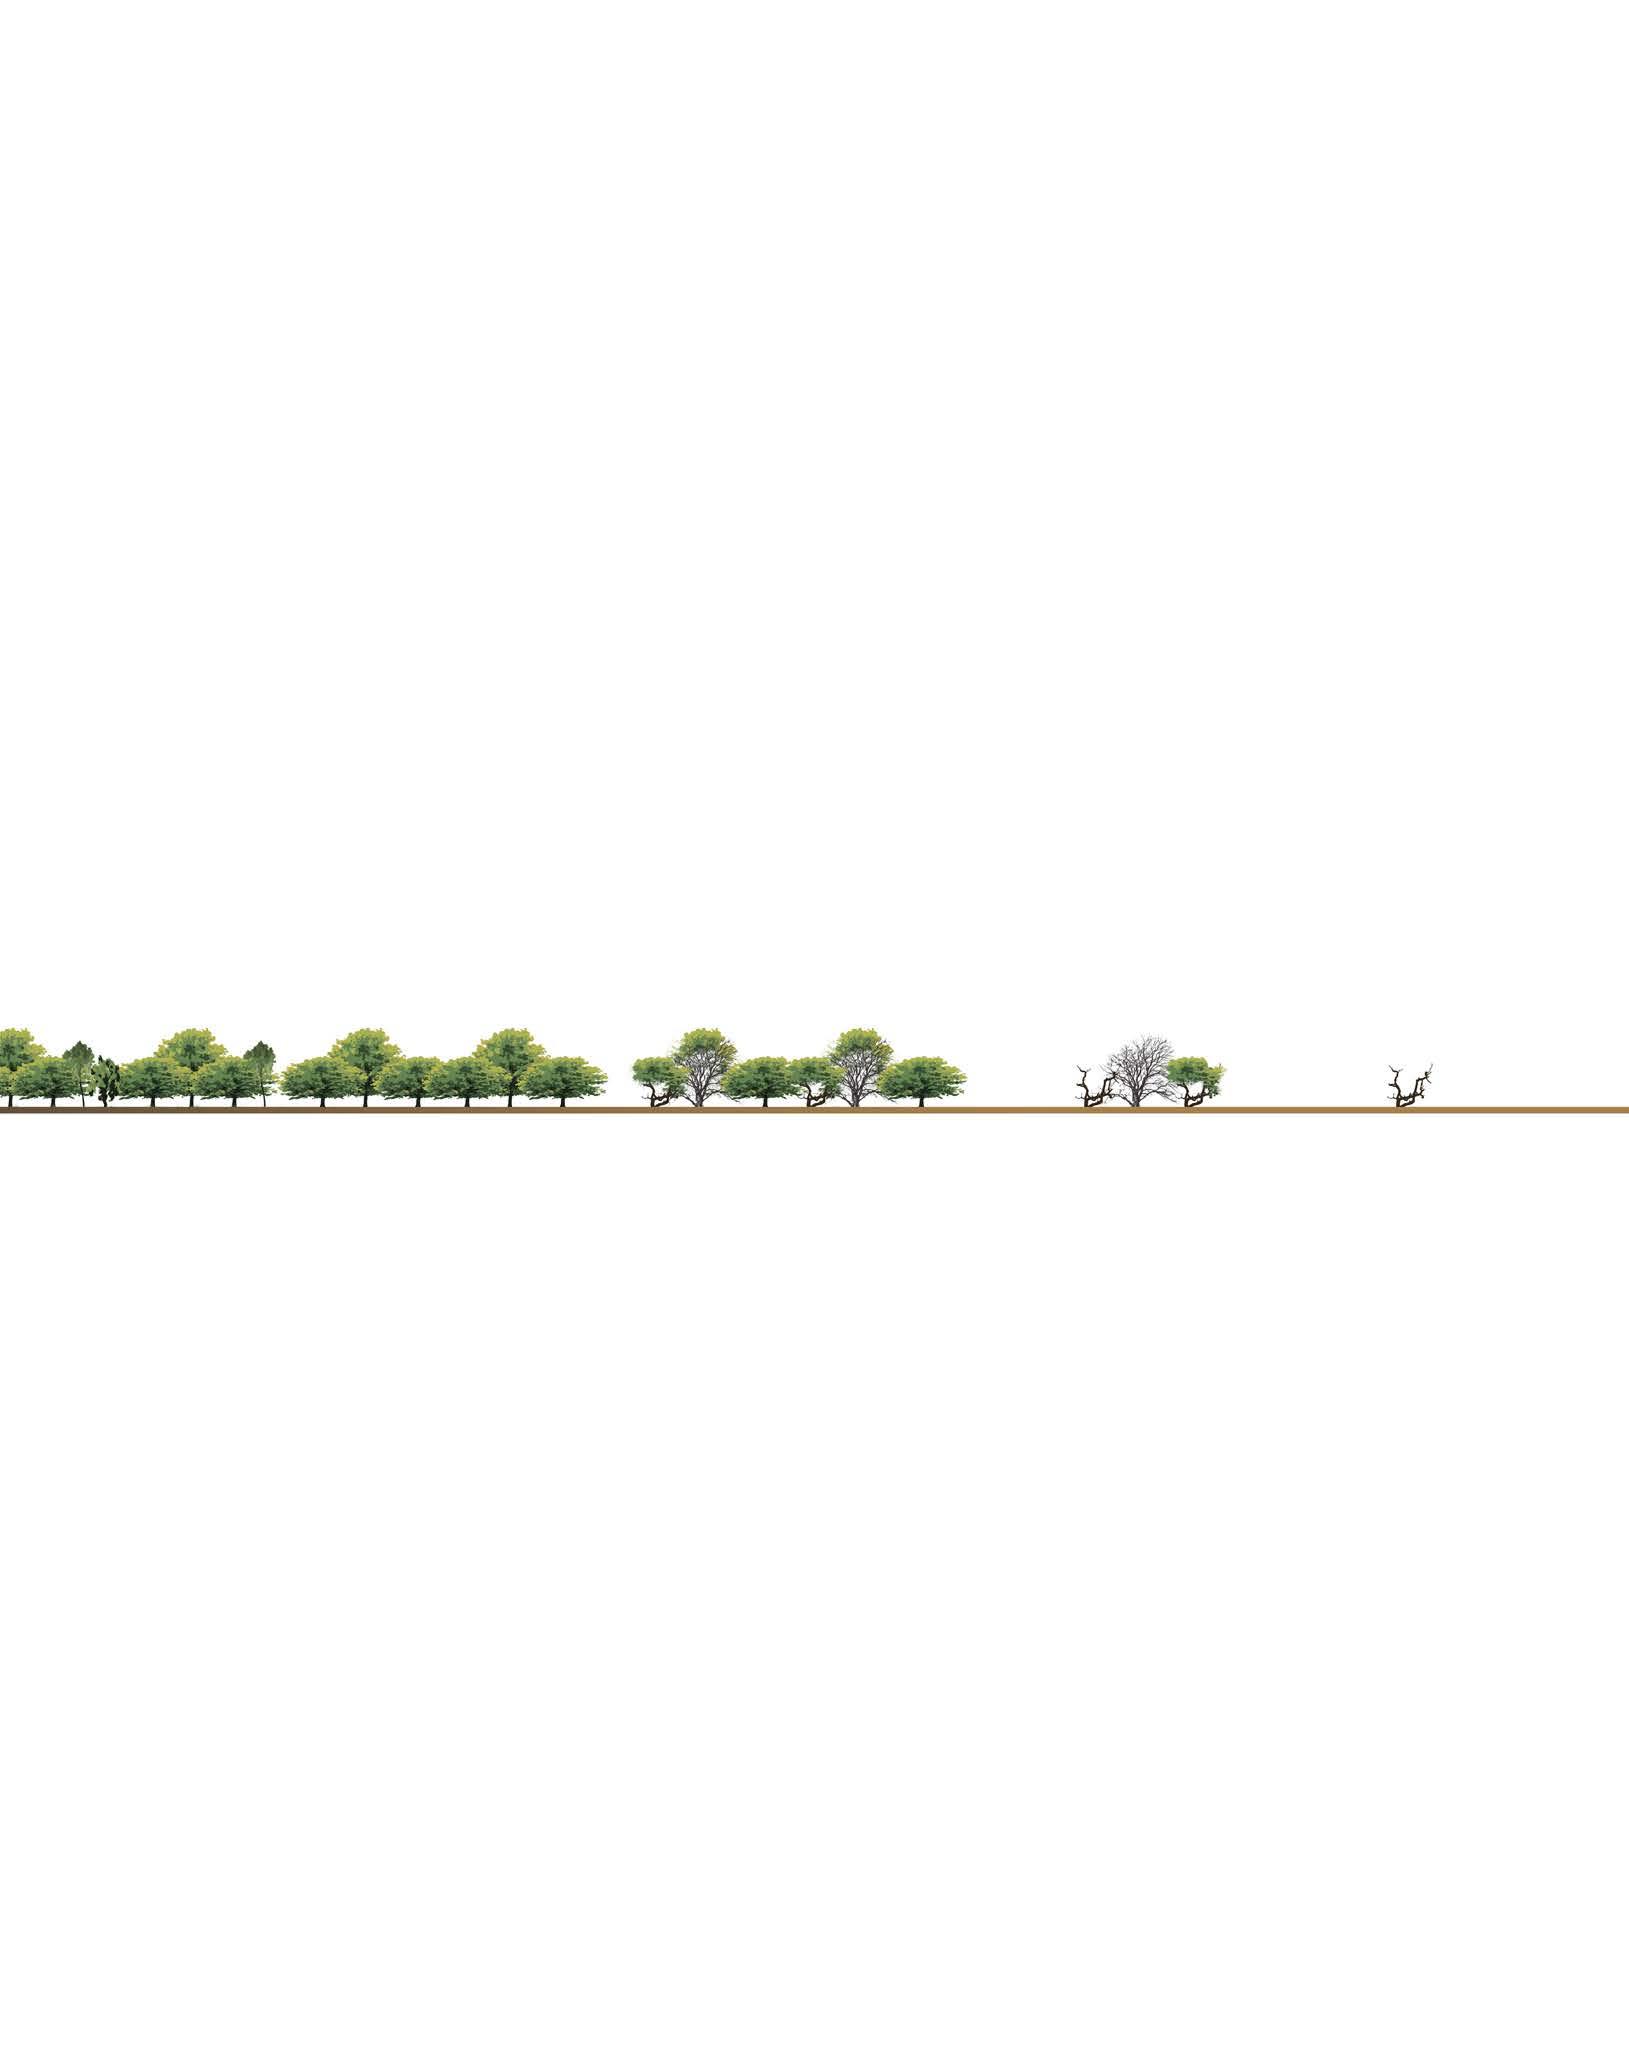
One of the most extreme cases of this issue is situated in El Ejido region in Almeria, Spain. Desertification, one of the looming consequences of global warming, has begun its permanent impact on the local biome. According to research, the South of Spain is desertifying at an alarming rate, with predictions that the area will be reduced to desert by the end of the century. Unless extreme measures are taken, the Mediterranean region will be impacted irreversibly.
International efforts have been made to implement solutions to reduce carbon emissions around the around. The Paris climate deal aims to limit the rise of temperature to 1.5 degrees at maximum. However, this is only in the ideal scenario. We must take into account all possible paths of future carbon emission, especially the worst-case scenario, when global temperatures would rise nearly 5 degrees. Deserts would expand across southern Spain. Mediterranean vegetation would soon replace deciduous forests in the ecological catastrophe.
The current horticulture production model has drained the surface water, due to this the effects of desertification would be substantially amplified. The dramatic shift in agricultural practices in the region is imperative, to ensure the survival of the crop industry of southern Spain, an economic artery of the country.
1
IMAGE SOURCES. “Europe’s Dirty Little Secret: Moroccan Slaves and a ‘Sea of Plastic.’” EcoWatch, December 18, 2015. https://www.ecowatch.com/europesdirty-little-secret-moroccan-slaves-and-a-sea-of-plastic-1882131257.html.
IMAGE SOURCES. Aerial of Greenhouses Glasshouses in Stock Footage Video (100% Royalty-Free) 32413060 | Shutterstock. Accessed December 19, 2018. https://www.shutterstock.com/video/clip-32413060-aerial-greenhouses--glasshouses-westland-aria-netherlands. “Kunming.” Accessed December 19, 2018. http://www.trekearth.com/gallery/Asia/China/South/Yunnan/Kunming/photo833293.htm.

2
3 2
4
DOMAIN
Desertification Domain
2.1. Context
2.1.1. Desertification Overview
2.1.1.1.
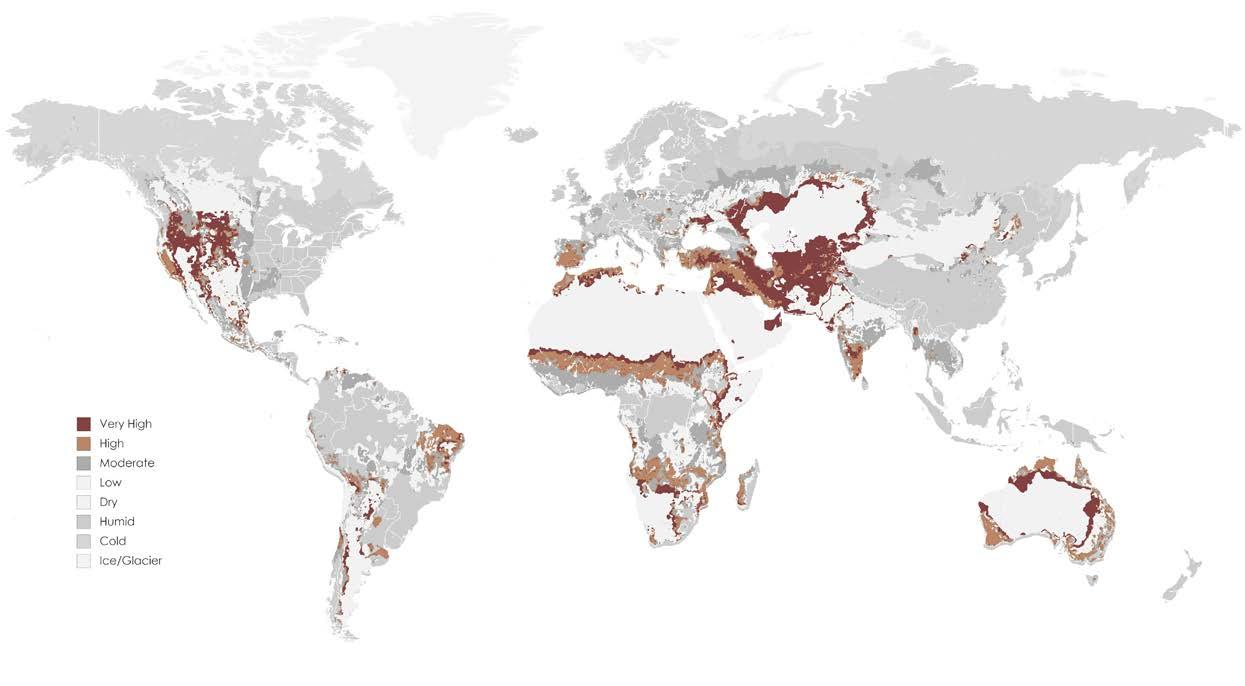
Desertification is the process of ecological degradation through which extensions of land that were fertile and productive are transformed into deserts. This can take place in different areas, but above all, it usually takes place in fertile areas that are intensively exploited for activities such as agriculture, livestock grazing, mining and deforestation, until they are exhausted.
Because of this, the soils become infertile and lose their productive capacity totally or partially. This results in them losing their vegetation cover, and being eroded even more quickly by wind and water. This process is also known as aridization. The human being is the main cause of the desertification of the soils in the planet, because with its activities it contributes or accentuates this process.
SOURCES. “Significado de Desertificación.” Significados. Accessed May 20, 2018. http://www.significados.com/desertificacion/. “Causes , Effects and Solutions of Desertification.” Conserve Energy Future (blog), August 23, 2015. https://www.conserve-energy-future.com/causes-effects-solutions-of-desertification.php.
5
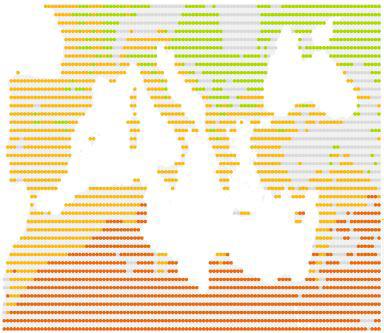
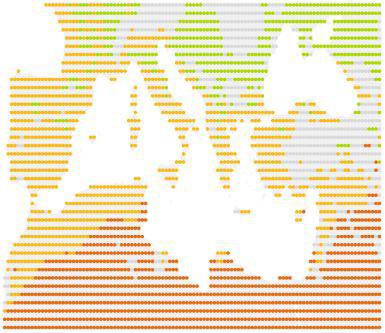
FIG. 01.1. Desertification Global Map “Miller Projection”
Non affected areas or very low sensitive areas to desertification


Low sensitive areas desertification


Medium sensitive areas to desertification
Sensitive areas to desertification
Very sensitive areas to desertification
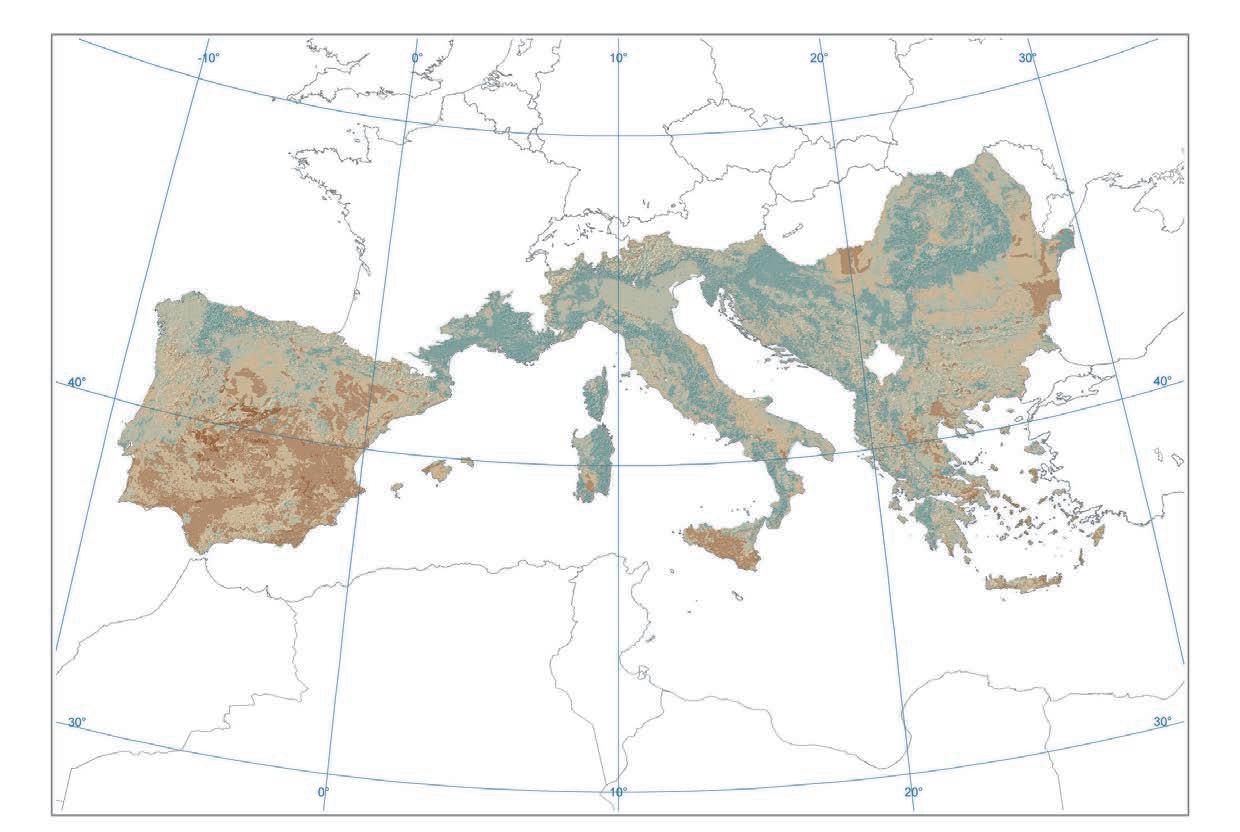
SOURCES. “Map of Sensitivity to Desertification and Drought in Southern Europe.” Accessed September 18, 2018. https://www.eea.europa.eu/themes/soil/desertification/map-of-sensitivity-to-desertification-and-draught-in-southern-europe/image_view_fullscreen.
6
FIG. 01.2. Desertification Europe Map
Desertification Domain
CAUSES
Deforestation
Farming Practices

Overgrazing
EFFECTS

Poor Water Quality
Desertification can also be a natural process in which a region passes, gradually, t o become, for different reasons, all natural, in what we know as a desert. There are other factors that can cause desertification, this includes deforestation, urbanization, over drafting of groundwater, natural disasters, and climate change.
SOURCES. “Significado de Desertificación.” Significados. Accessed May 20, 2018. http://www.significados.com/desertificacion/. “Causes, Effects and Solutions of Desertification.” Conserve Energy Future (blog), August 23, 2015. https://www.conserve-energy-future.com/causes-effects-solutions-of-desertification.php.
IMAGE SOURCES. “Free Stock Photos · Pexels.” Accessed July 15, 2018. https://www.pexels.com/.
 Difficulties in Farming
FIG. 01.3. Desertification Causes and Effects
Desertification Domain
Difficulties in Farming
FIG. 01.3. Desertification Causes and Effects
Desertification Domain
Desertification

Desertification directly affects groundwater reserves, topsoil, surface runoff, plant, animal and human populations. With this comes water scarcity, which can limit the production of crops, wood, forage and much more other services can be provided to communities.
SOURCES. “Causes, Effects and Solutions of Desertification.” Conserve Energy Future (blog), August 23, 2015. https://www.conserve-energy-future.com/causes-effects-solutions-of-desertification.php.
Urbanization Climate Change Taking Land Resources Overpopulation Flooding
Domain
2.1.1.2.
Climatic Impact
Desertification Domain
Desertification is known to be associated with biodiversity loss, which contributes to a global climate change through the loss of carbon sequestration capacity and an increase in land-surface albedo. The biological diversity is involved in most of the services provided by dry land ecosystems and is negatively affected by desertification. And something extremely relevant is that vegetation and its diversity of physical structure are an important key in soil conservation and in the regulation of surface runoff, local climate and rainfall infiltration. The variety of plant species are able to produce physically and chemically different litter components, together with a diverse community of macro and micro decomposer, which contribute to soil formation and nutrient cycling.
The diversity of vegetation species is compatible with both wildlife and livestock, and all plants support primary production, which ultimately provides firewood, fiber, food, and sequesters carbon, regulating the global climate. The excessive exploitation of vegetation leads to losses in primary production and, therefore, also to a reduction in carbon sequestration. It is the interruption of the interrelated services provided jointly by the biodiversity of dry land plants, which is a key trigger for desertification and the various manifestations,that includes the loss of habitats for biodiversity.
Desertification affects global climate change through the loss of soil and vegetation. Dry land soils contain more than a quarter of all organic carbon stocks in the world, as well as almost all inorganic carbon. Desertification without obstacles can release a significant fraction of this carbon into the global atmosphere, with important feedback consequences for the global climate system. It is estimated that 300 million tons of dry land carbon are lost in the atmosphere each year as a result of desertification (approximately 4% of total combined global emissions from all sources).
In the next diagram the relation between desertification and climate change is made including the main issue that links them which is the biodiversity loss.
“The major components of biodiversity loss (in gray) directly affect major dry land services (in blue). The inner loops connect desertification to biodiversity loss and climate change through soil erosion. The outer loop interrelates biodiversity loss and climate change. On the top section of the outer loop, reduced primary production and microbial activity reduce carbon sequestration and contribute to global warming. On the bottom section of the outer loop, global warming increases evapotranspiration, thus adversely affecting biodiversity; changes in community structure and diversity are also expected because different species will react differently to the elevated CO2 concentrations.”
SOURCES. Adeel, Zafar, Millennium Ecosystem Assessment, and World Resources Institute, eds. Ecosystems and Human Well-Being: Desertification Synthesis ; a Report of the Millennium Ecosystem Assessment. Washington, DC: World Resources Inst, 2005. “Scientific Facts on Desertification.” Accessed June 3, 2018. https://www.greenfacts.org/en/desertification/index.htm.
9
Reduced carbon sequestration into above -and below- ground carbon reserves
Increase in extreme events (floods, droughts, fires, etc.)
Domain
Desertification
DESERTIFICATION
Reduced primary production and nutrient cycling
Soil erosion
Reduced carbon reserves and increased CO2 emissions
Decreased plant and soil organisms’ species diversity
Reduced soil conservation
Reduced structural diversity of vegetation cover and diversity of microbial species in soil crust
Loss of nutrients and soil moisture
Climate change Biodiversity loss
Increases and reductions in species abundances
Change in community structure and diversity
Grey: major components of biodiversity involved in the linkages. Blue: major services impacted by biodiversity losses.
SOURCES. Adeel, Zafar, Millennium Ecosystem Assessment, and World Resources Institute, eds. Ecosystems and Human Well-Being: Desertification Synthesis ; a Report of the Millennium Ecosystem Assessment. Washington, DC: World Resources Inst, 2005. “Scientific Facts on Desertification.” Accessed June 3, 2018. https://www.greenfacts.org/en/desertification/index.htm.
10
FIG. 01.3. Linkages and Feedback Loops among Desertification, Global Climate Change, and Biodiversity Loss
2.1.1.3.
Social Impact
Desertification Domain
In the drylands, people are more dependent on ecosystem services for their basic needs than any other ecosystem. A variety of resources depend on the growth of the plants, such as firewood, crops, and construction materials, but the growth of the plants also depend on the climate that determines the availability of water.
It is normal for the supply of the ecosystem services to fluctuate, especially when it comes to the drylands, but the continuous reduction in the levels of all services over a prolonged period constitutes desertification. People in the drylands have found ways to cope with periods of shortages that last up to many years, but if the shortage lasts too long, at some point their resources and adaptation strategies may be overwhelmed with irreversible consequences.
The ability to cope with scarcity of services for large periods of time can be increased by other factors, such as demographic, and economic and political factors, in this case the ability to migrate to unaffected areas. As well as the time lapse between stress periods in the area.
Desertification can directly affect all categories of ecosystem services:
- Pr ovisioning: food, forage, fiber, and fresh water.
- R egulating: water purification and climate regulation.
- Cultural: r ecreation and cultural identity.
- Suppor ting: soil conservation.
When faced with desertification, people have responded by converting more pastures into cultivated land, or by using more and more low-productivity land for cultivation. As policies to promote alternative livelihoods are generally not in place, people often migrate to other areas, to other cities or even to other countries. These migrations sometimes exacerbate urban sprawl and can cause socio-political problems.
In the next diagram it is shown how drylands can be developed in response to changes in key human factors. The left side of the diagram shows developments that lead to a downward spiral of desertification, and the right side shows developments that can help prevent or reduce desertification. In the latter case, land users respond to tensions by improving their agricultural practices on the lands currently used. This leads to an increase in the productivity of livestock and crops, to the improvement of human welfare and to political and economic stability. Both avenues of development occur today in several dry land areas.
SOURCES. Adeel, Zafar, Millennium Ecosystem Assessment, and World Resources Institute, eds. Ecosystems and Human Well-Being: Desertification Synthesis ; a Report of the Millennium Ecosystem Assessment. Washington, DC: World Resources Inst, 2005. “Scientific Facts on Desertification.” Accessed June 3, 2018. https://www.greenfacts.org/en/desertification/index.htm.
11
Downward spiral leading to desertification
Political and economic instability
Desertification Domain
Human Factors
Demographic Economic Socio-political Science and technology
Overgrazing and expansion of cropped areas
Reduced vegetation cover
Increased soil erosion
Climatological factors
-Climate change
-Drought
Large-scale expansion of irrigation
Salinization
Reduced biological productivity
Poverty, emigration, and reduced human well-being
Approach to avoid desertification
Political stability and economic prosperity
Improved crop and livestock production
Small-scale irrigation of high-value crops
Soil, water, range conservation and imrpoved technology
Low salinization risk Reduced soil erosion
Increased biological productivity
Improved human well-being
SOURCES. Adeel, Zafar, Millennium Ecosystem Assessment, and World Resources Institute, eds. Ecosystems and Human Well-Being: Desertification Synthesis ; a Report of the Millennium Ecosystem Assessment. Washington, DC: World Resources Inst, 2005. “Scientific Facts on Desertification.” Accessed June 3, 2018. https://www.greenfacts.org/en/desertification/index.htm.
12
FIG. 01.4. Schematic Description of Development Pathways in Drylands

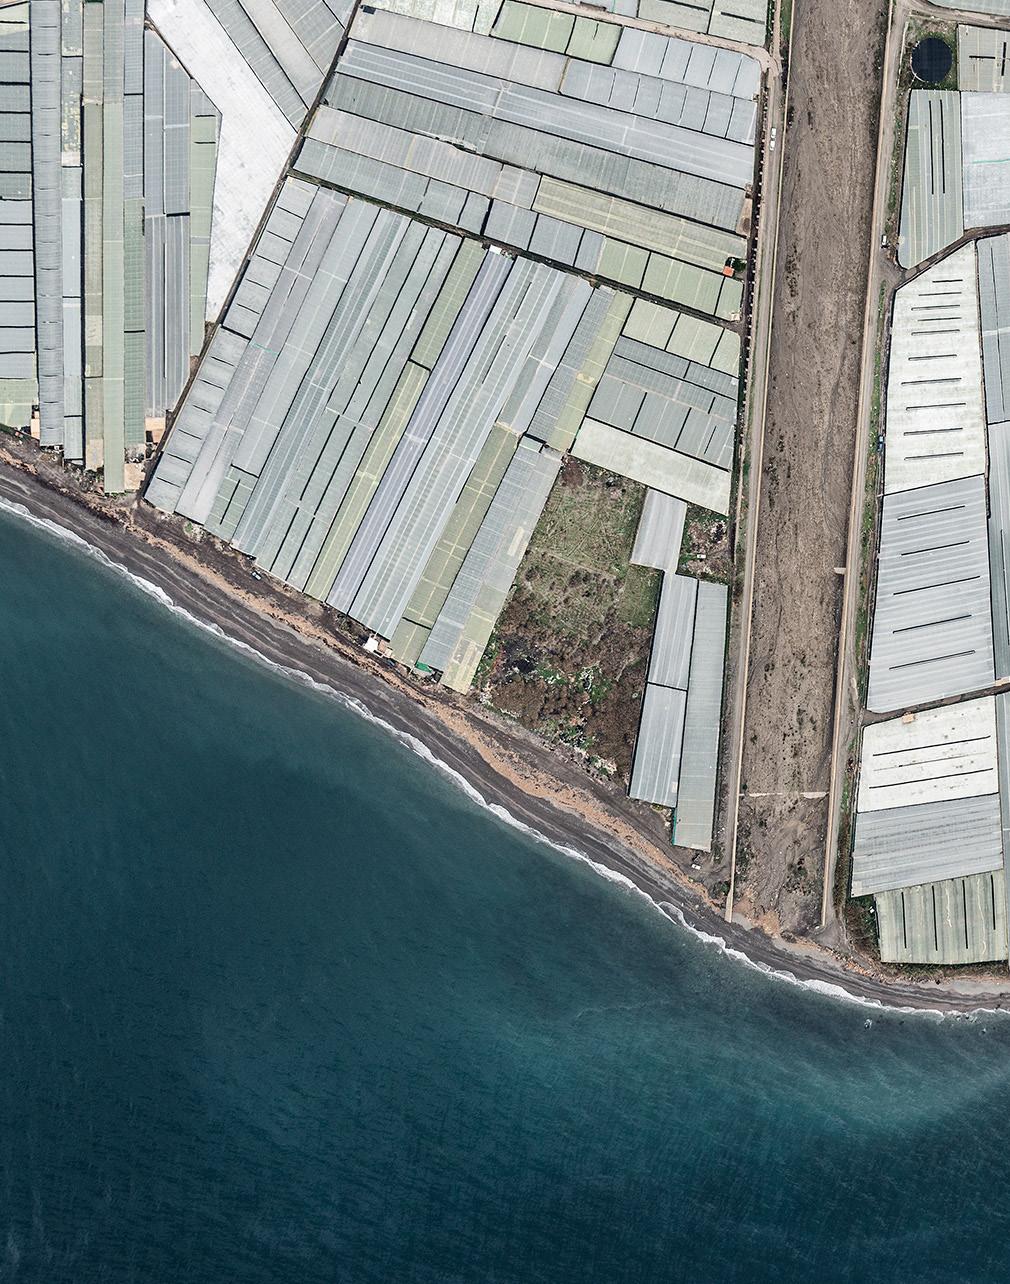
‘Mar
de plástico’ of Almeria
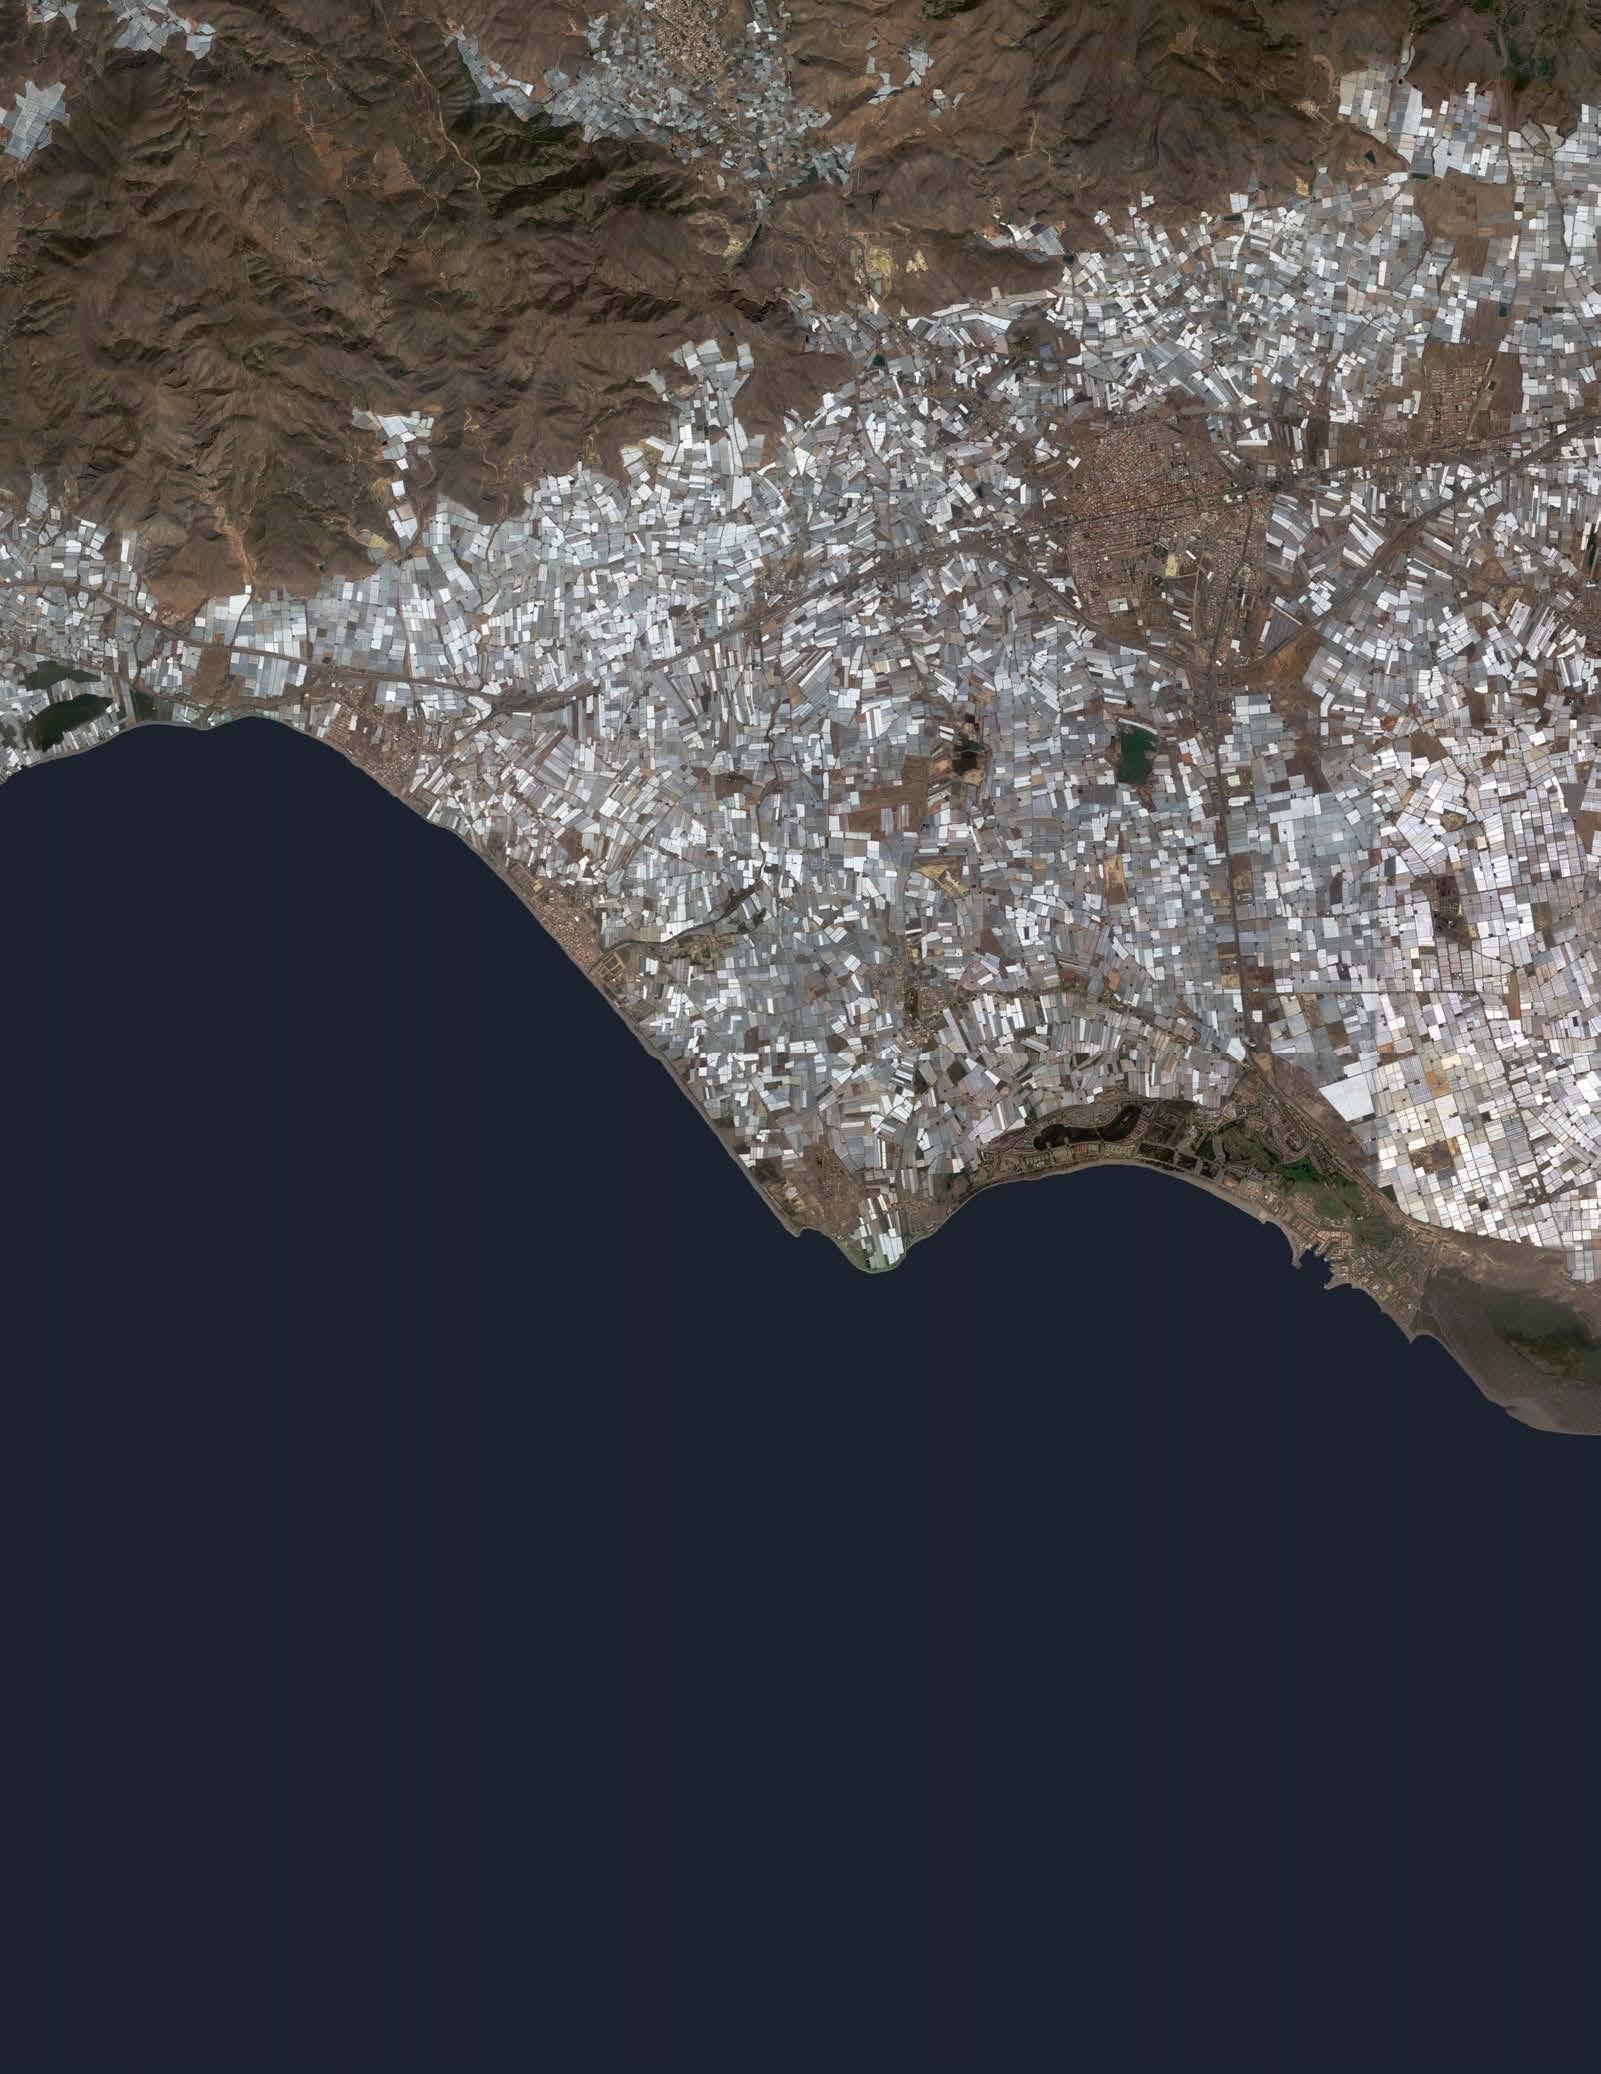
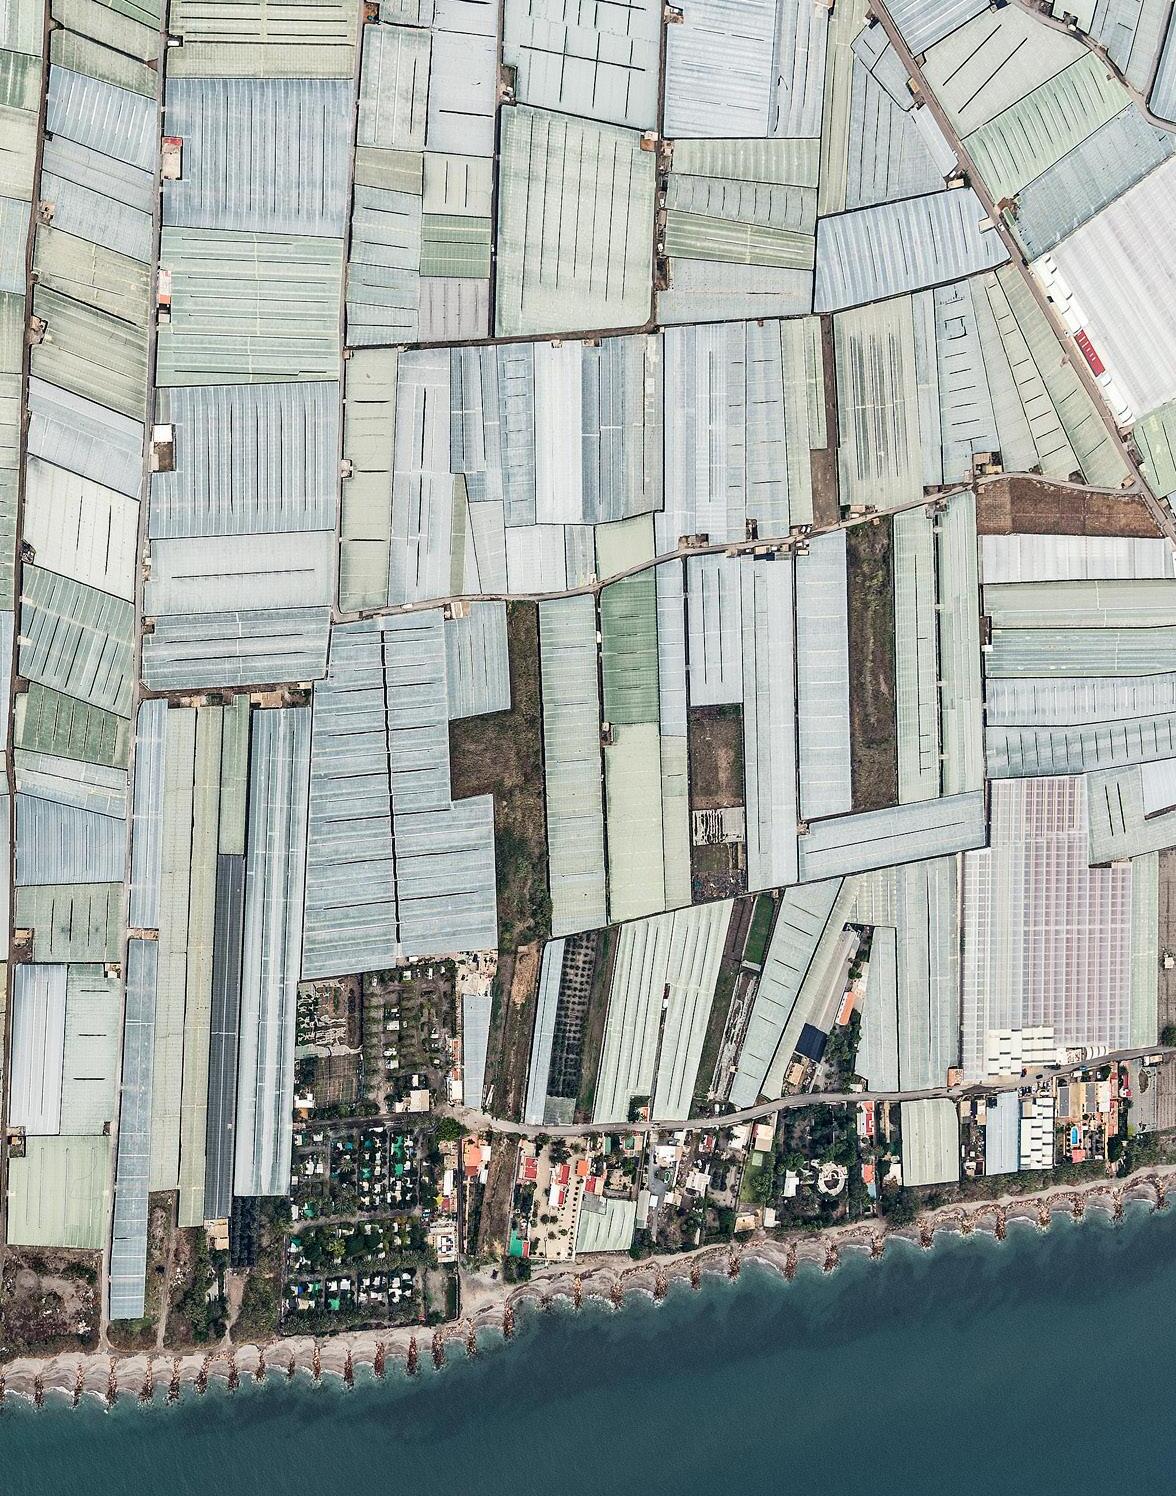
Known by many as the ‘sea of plastic’, the region of Campo de Dalías in Almeria, South Spain, features a endlessly far-reaching expanse of plastic greenhouses. The plastic roofs of these structures glisten in the southern sun and its breath-taking scale can be seen in space as a white patch on Earth’s surface.
25, 2018. https://maps.google.com/.
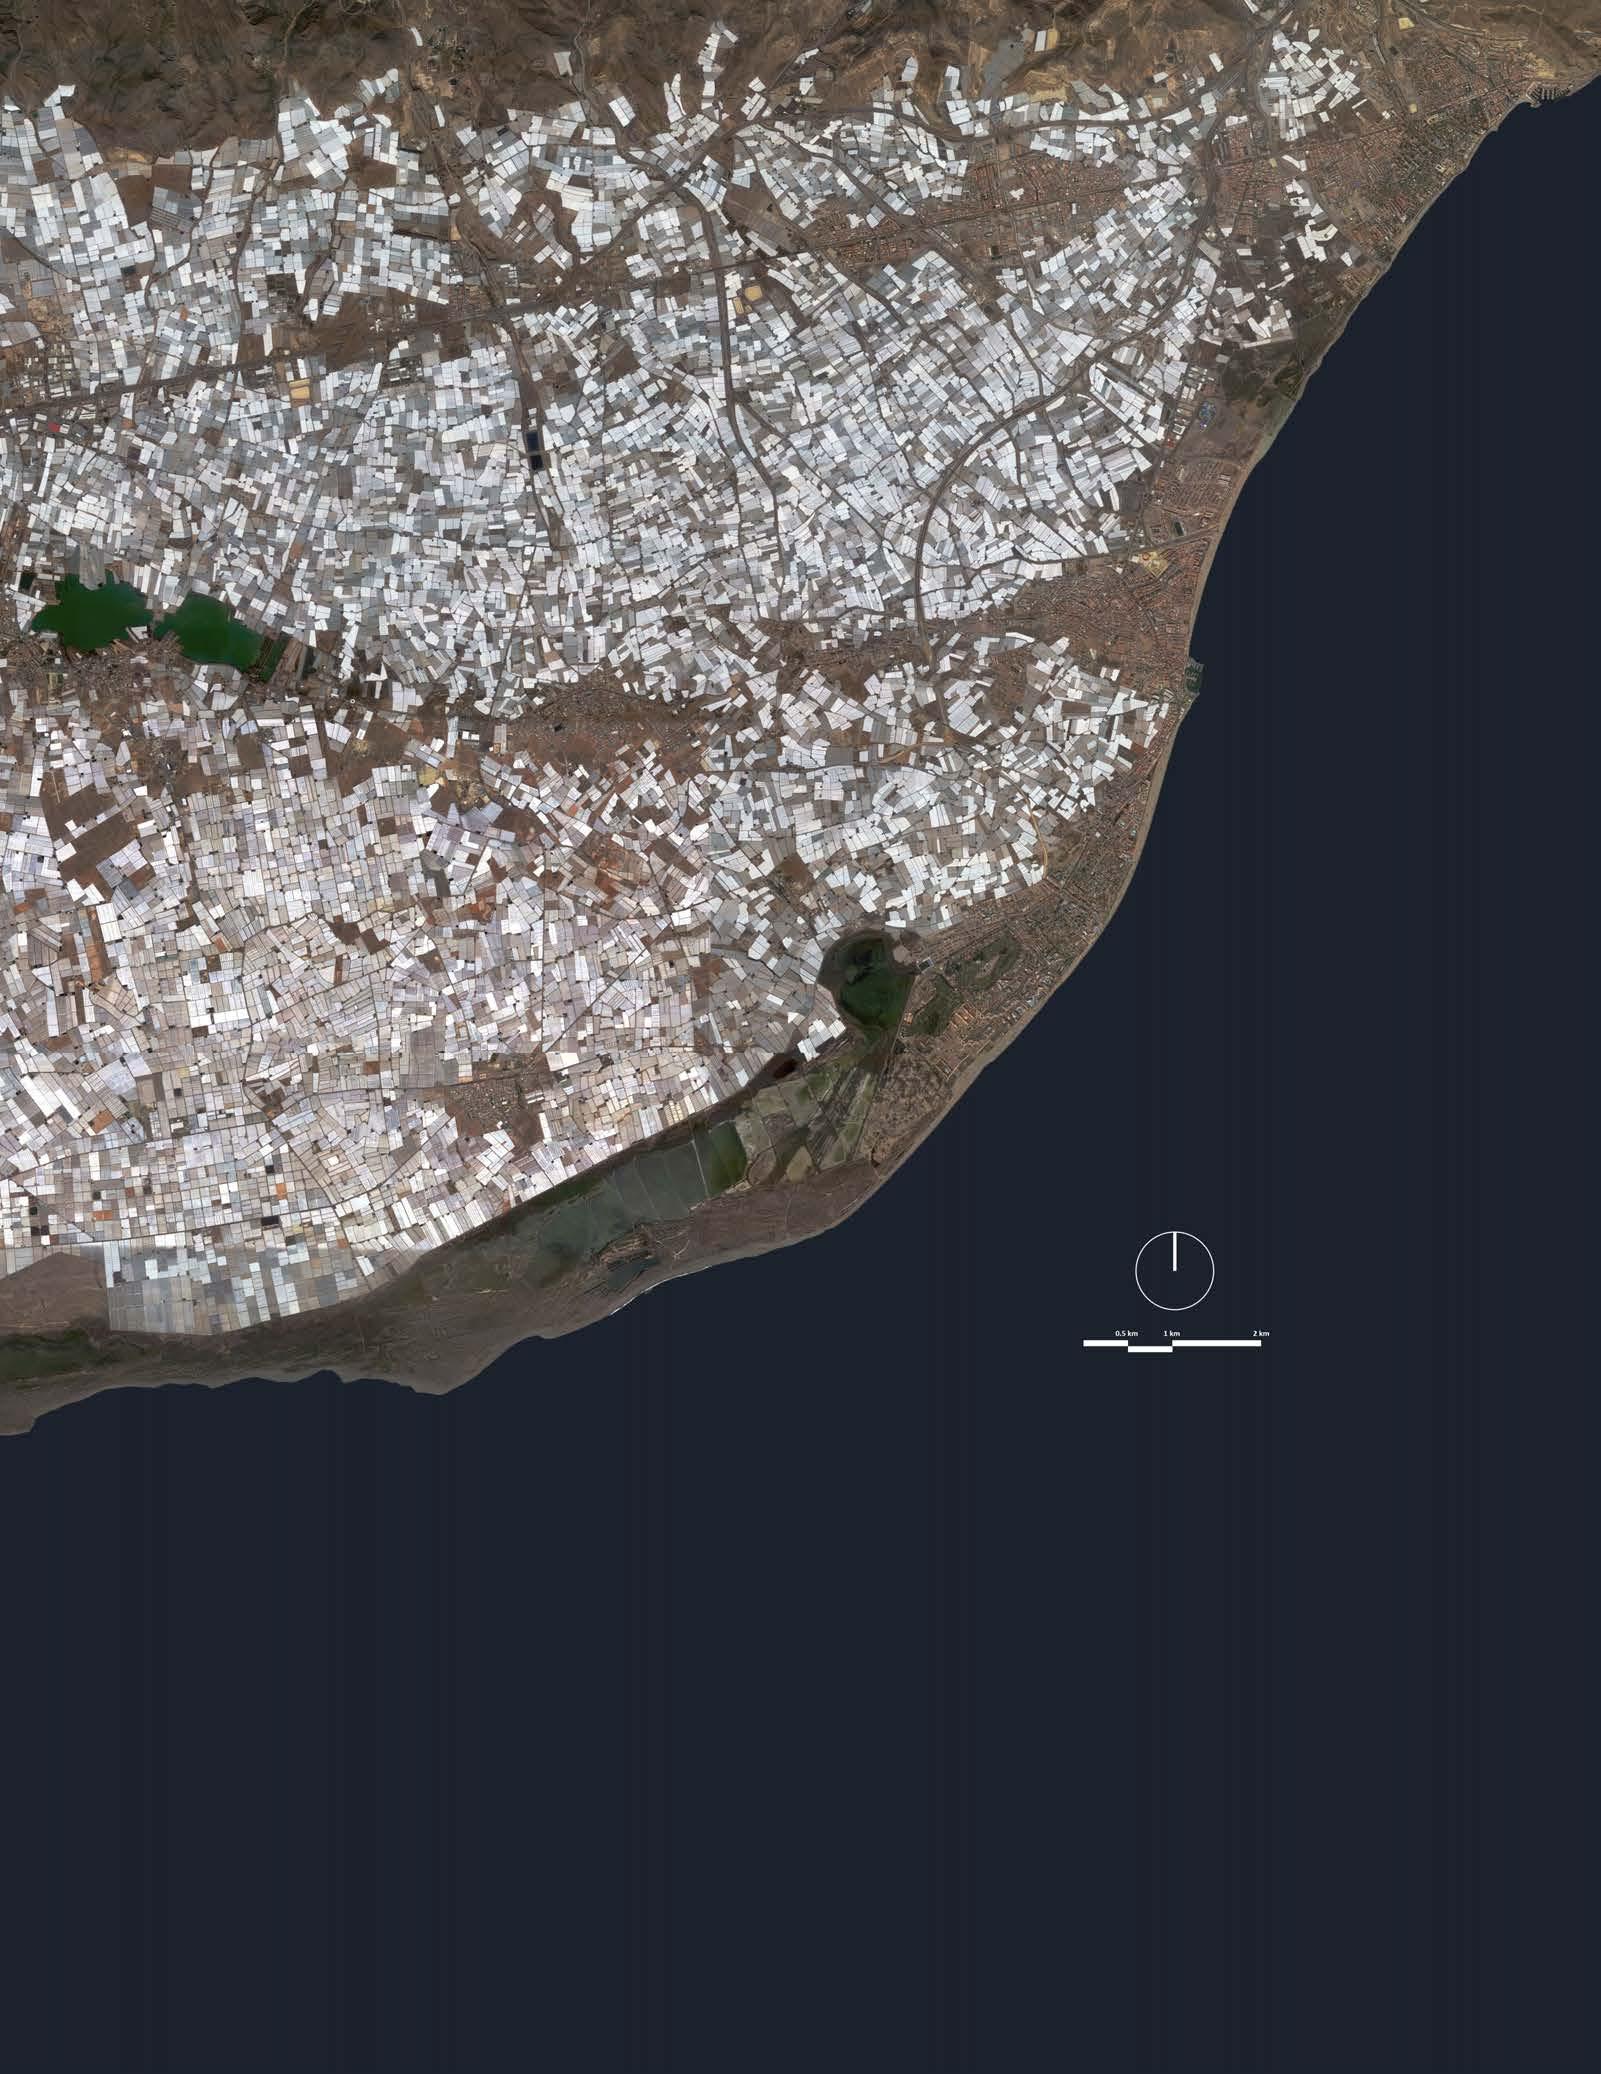 IMAGE SOURCES. Google Maps. Accessed July
Context Domain
2.1.2. ‘Mar de plástico’ of Almeria Overview
2.1.2.1. Almeria is a province in the South of Spain, that is very well known for their intensive agriculture. Agriculture has been the driving force of the economy of Almeria since the 60s, and the most representative products are: tomato, pepper, eggplant, zucchini, melon, watermelon or cucumber; roses, chrysanthemums, carnations, cut flowers, and ornamental plants.
Its main exponent is found in the so-called “Campo de Dalías”, which is the largest area of green houses in the whole world, and includes the municipalities of Dalías, Berja, El Ejido, up to Adra or in Vícar, La Mojonera and Roquetas de Mar. This model has also been called the “Campo de Nijar”.
In the 40s, El Ejido had only about twenty houses, but the growth reached such a point that now 12,000 families live in the greenhouses, which are 70% family farms. Although the first tests were made in 1963, a documentary by Cajamar explains that the true greenhouse boom came ten years later.
Almeria is a great example of a response to a desertification area, where in the 40 years they were abandoned lands and without any use, their inhabitants were resorcefull and found a way to make these lands productive with different agricultural methods. More and more inhabitants moved to the area to work in the lands, and today it is known as the orchard of Europe, when more than 50% of fruits and vegetables sold in Europe come from Almeria “Mar de Plastico”.
SOURCES. País, Ediciones El. “Por qué el Mar de Plástico se llama así.” Verne, September 2015. https://verne.elpais.com/verne/2015/09/23/articulo/1443003299_631218.html. “Agricultura intensiva de la provincia de Almería.” Wikipedia, la enciclopedia libre, August 23, 2018. https://es.wikipedia.org/w/index.php?title=Agricultura_intensiva_de_la_provincia_de_Almer%C3%ADa&oldid=110133064
IMAGE SOURCE.“Climate Change Rate to Turn Southern Spain to Desert by 2100, Report Warns | Environment | The Guardian.” Accessed September 19, 2018. https://www.theguardian.com/environment/2016/oct/27/climate-change-rate-to-turn-southern-spain-to-desert-by-2100-report-warns.
15
Almeria Present Day Almeria Worst Case Scenario Almeria Best Case Scenario Desert Temperature Deciduous forest Warm Mixed Forest
Context Domain
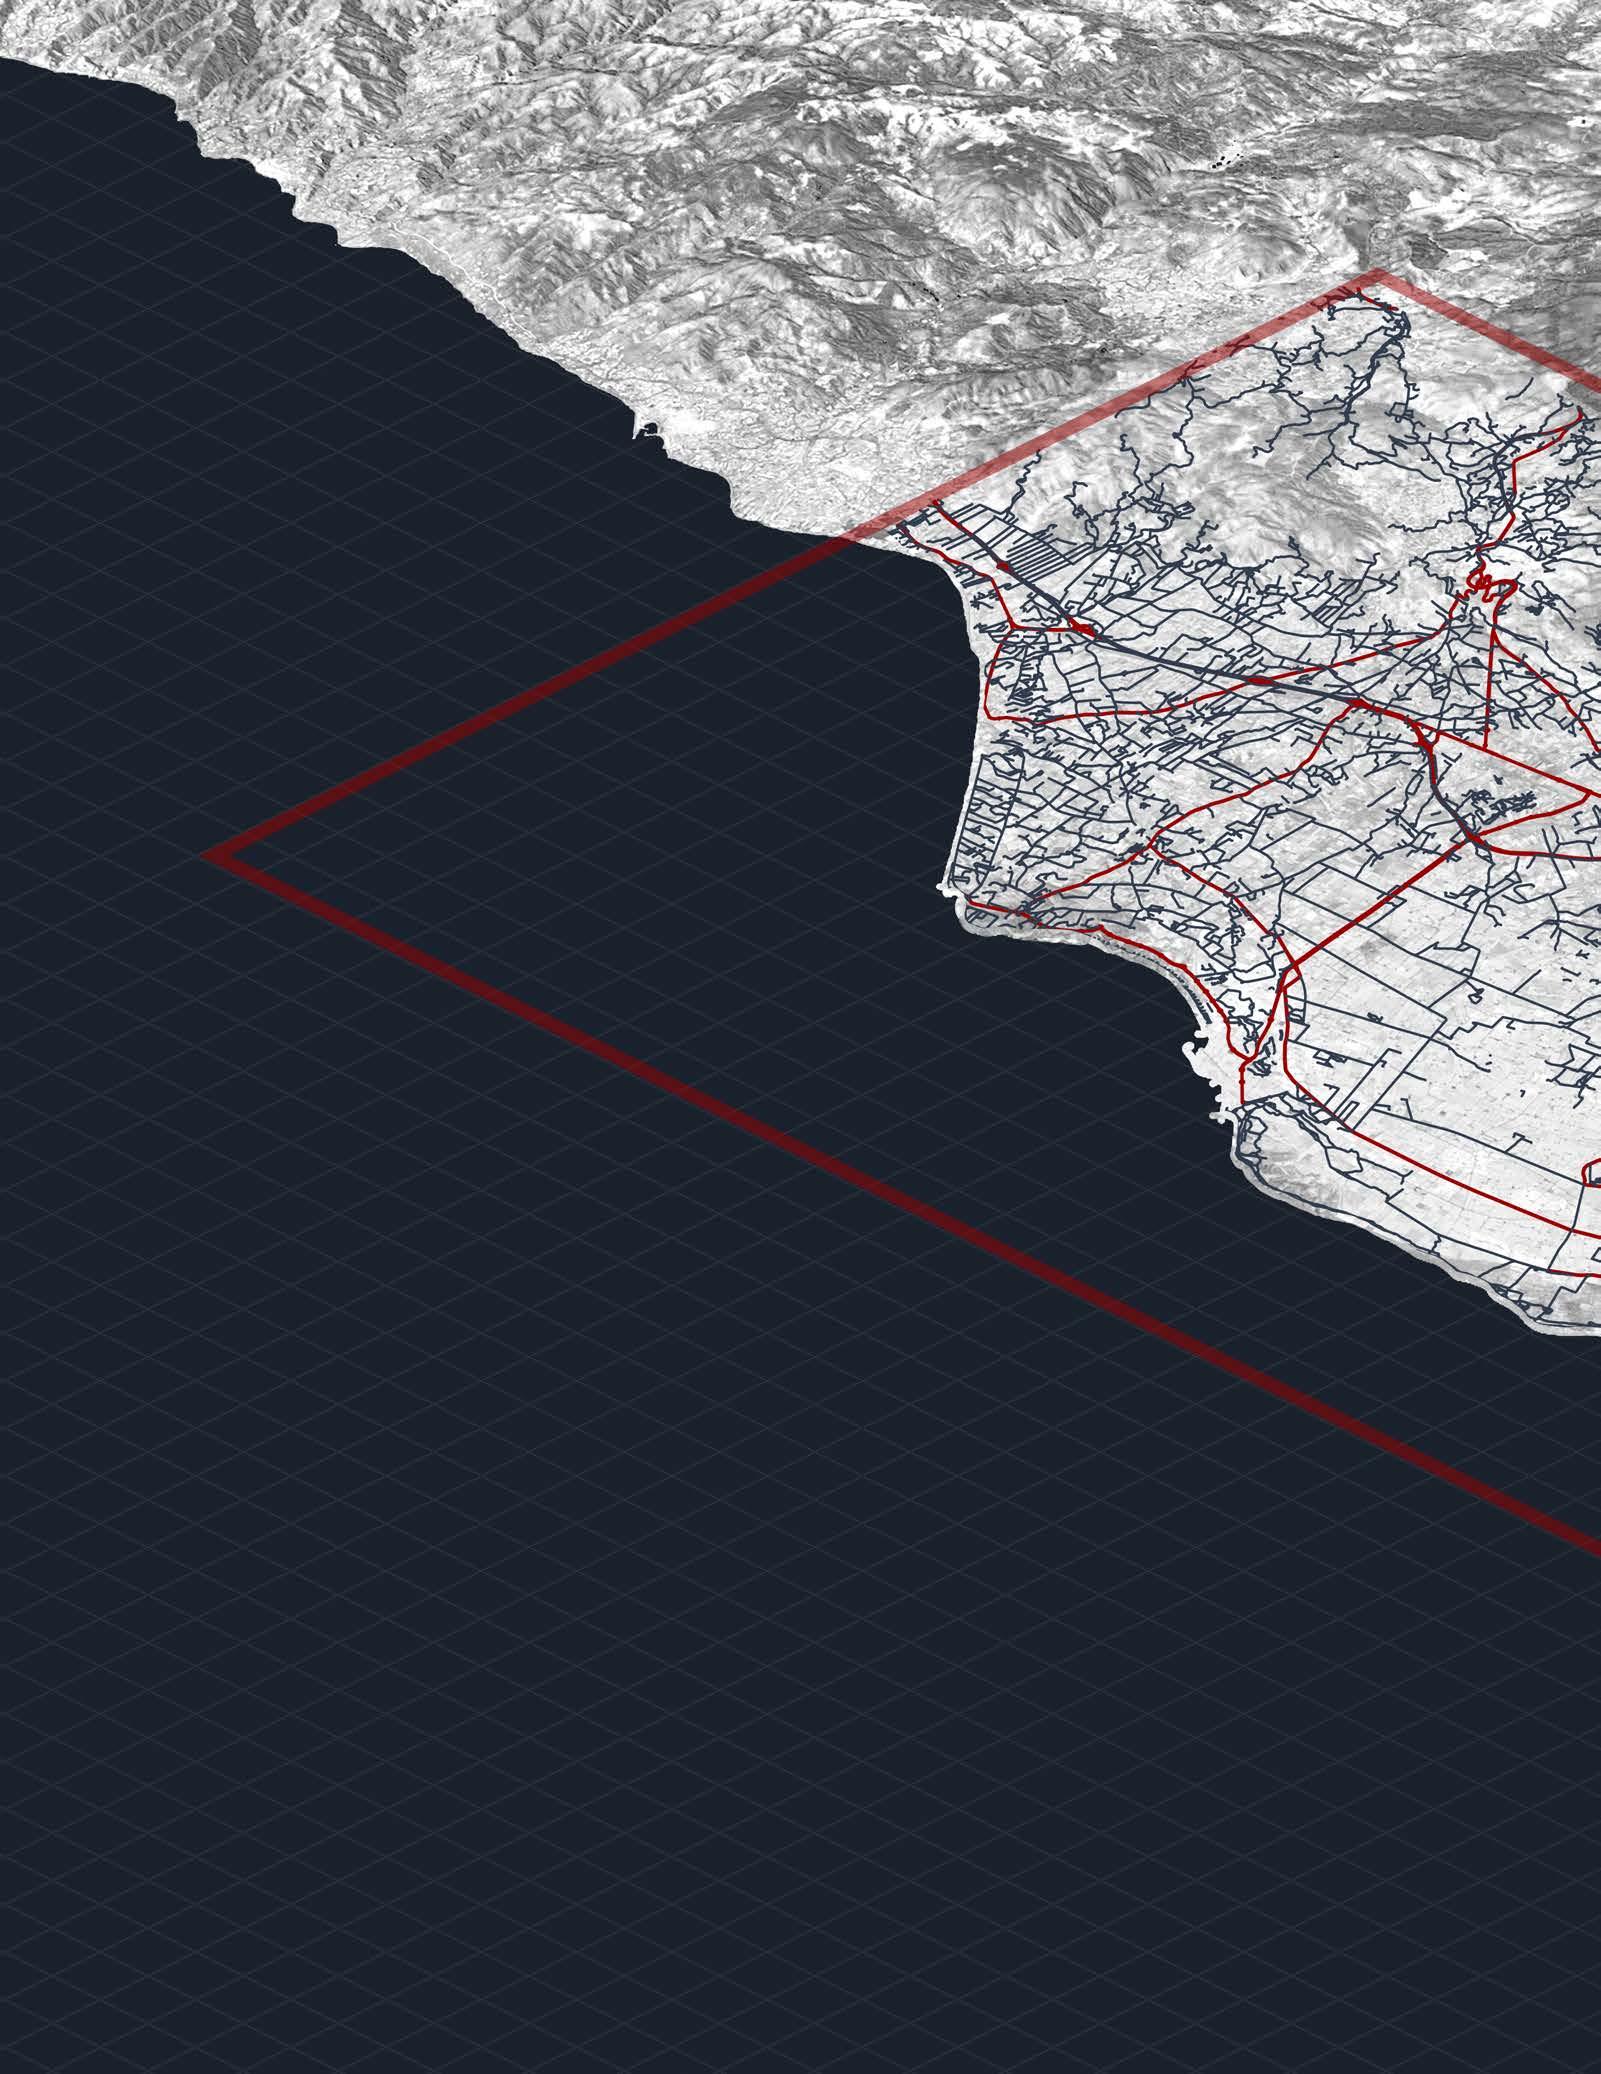
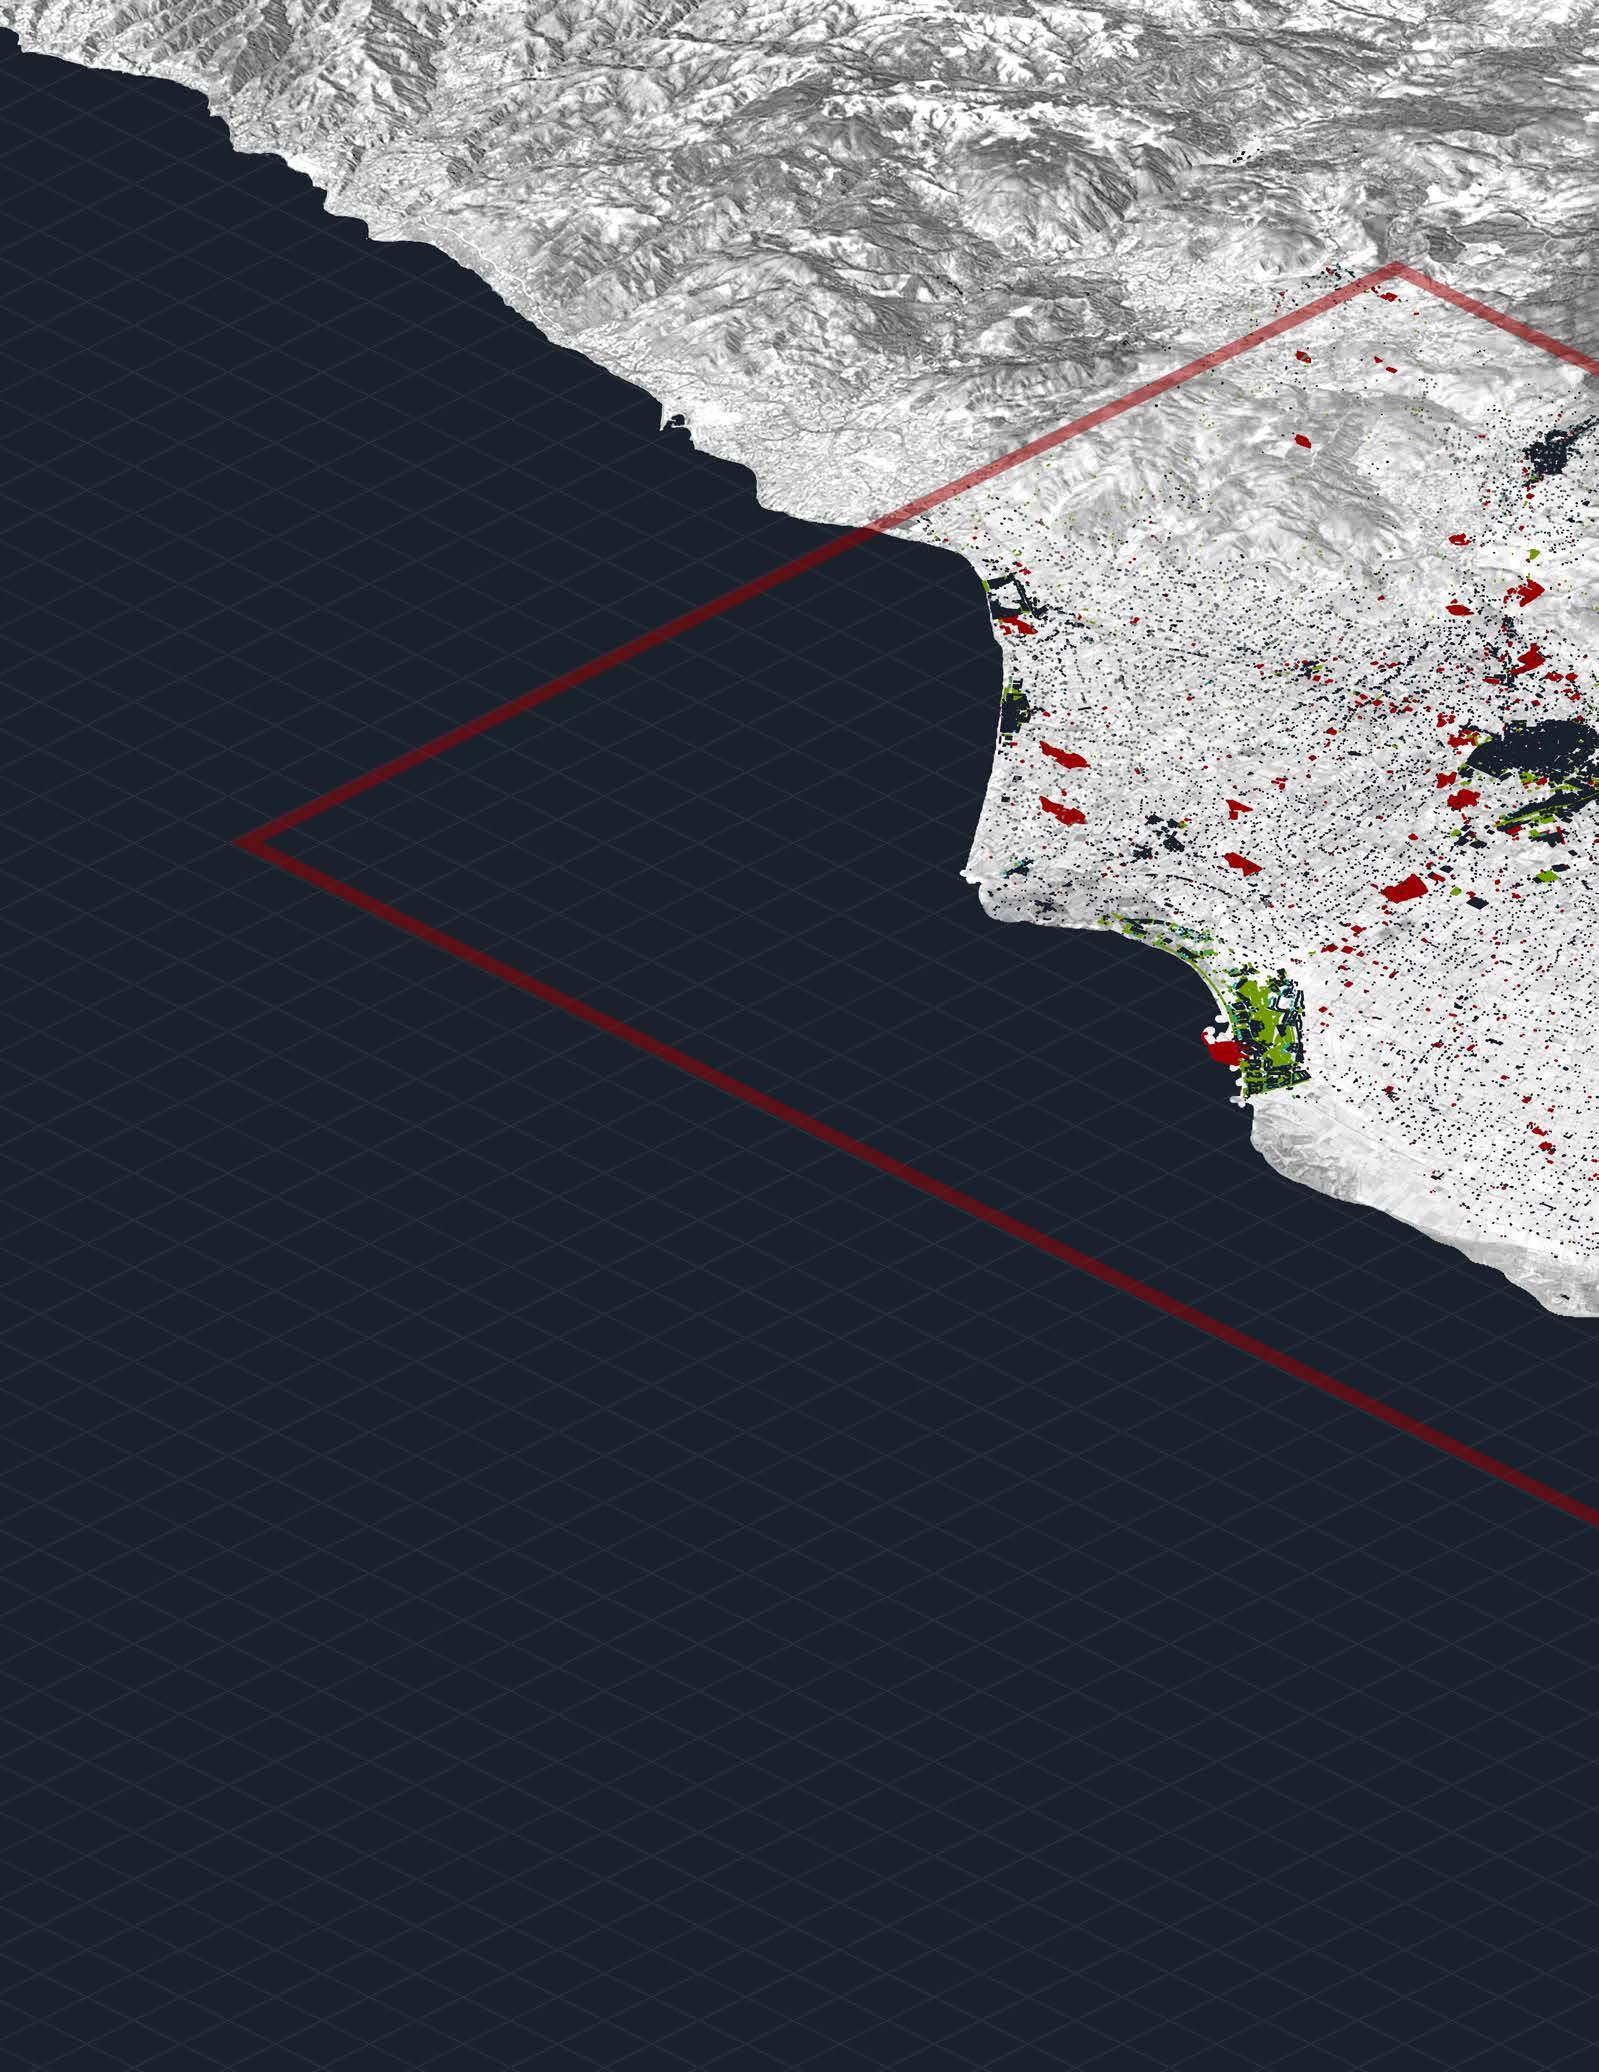
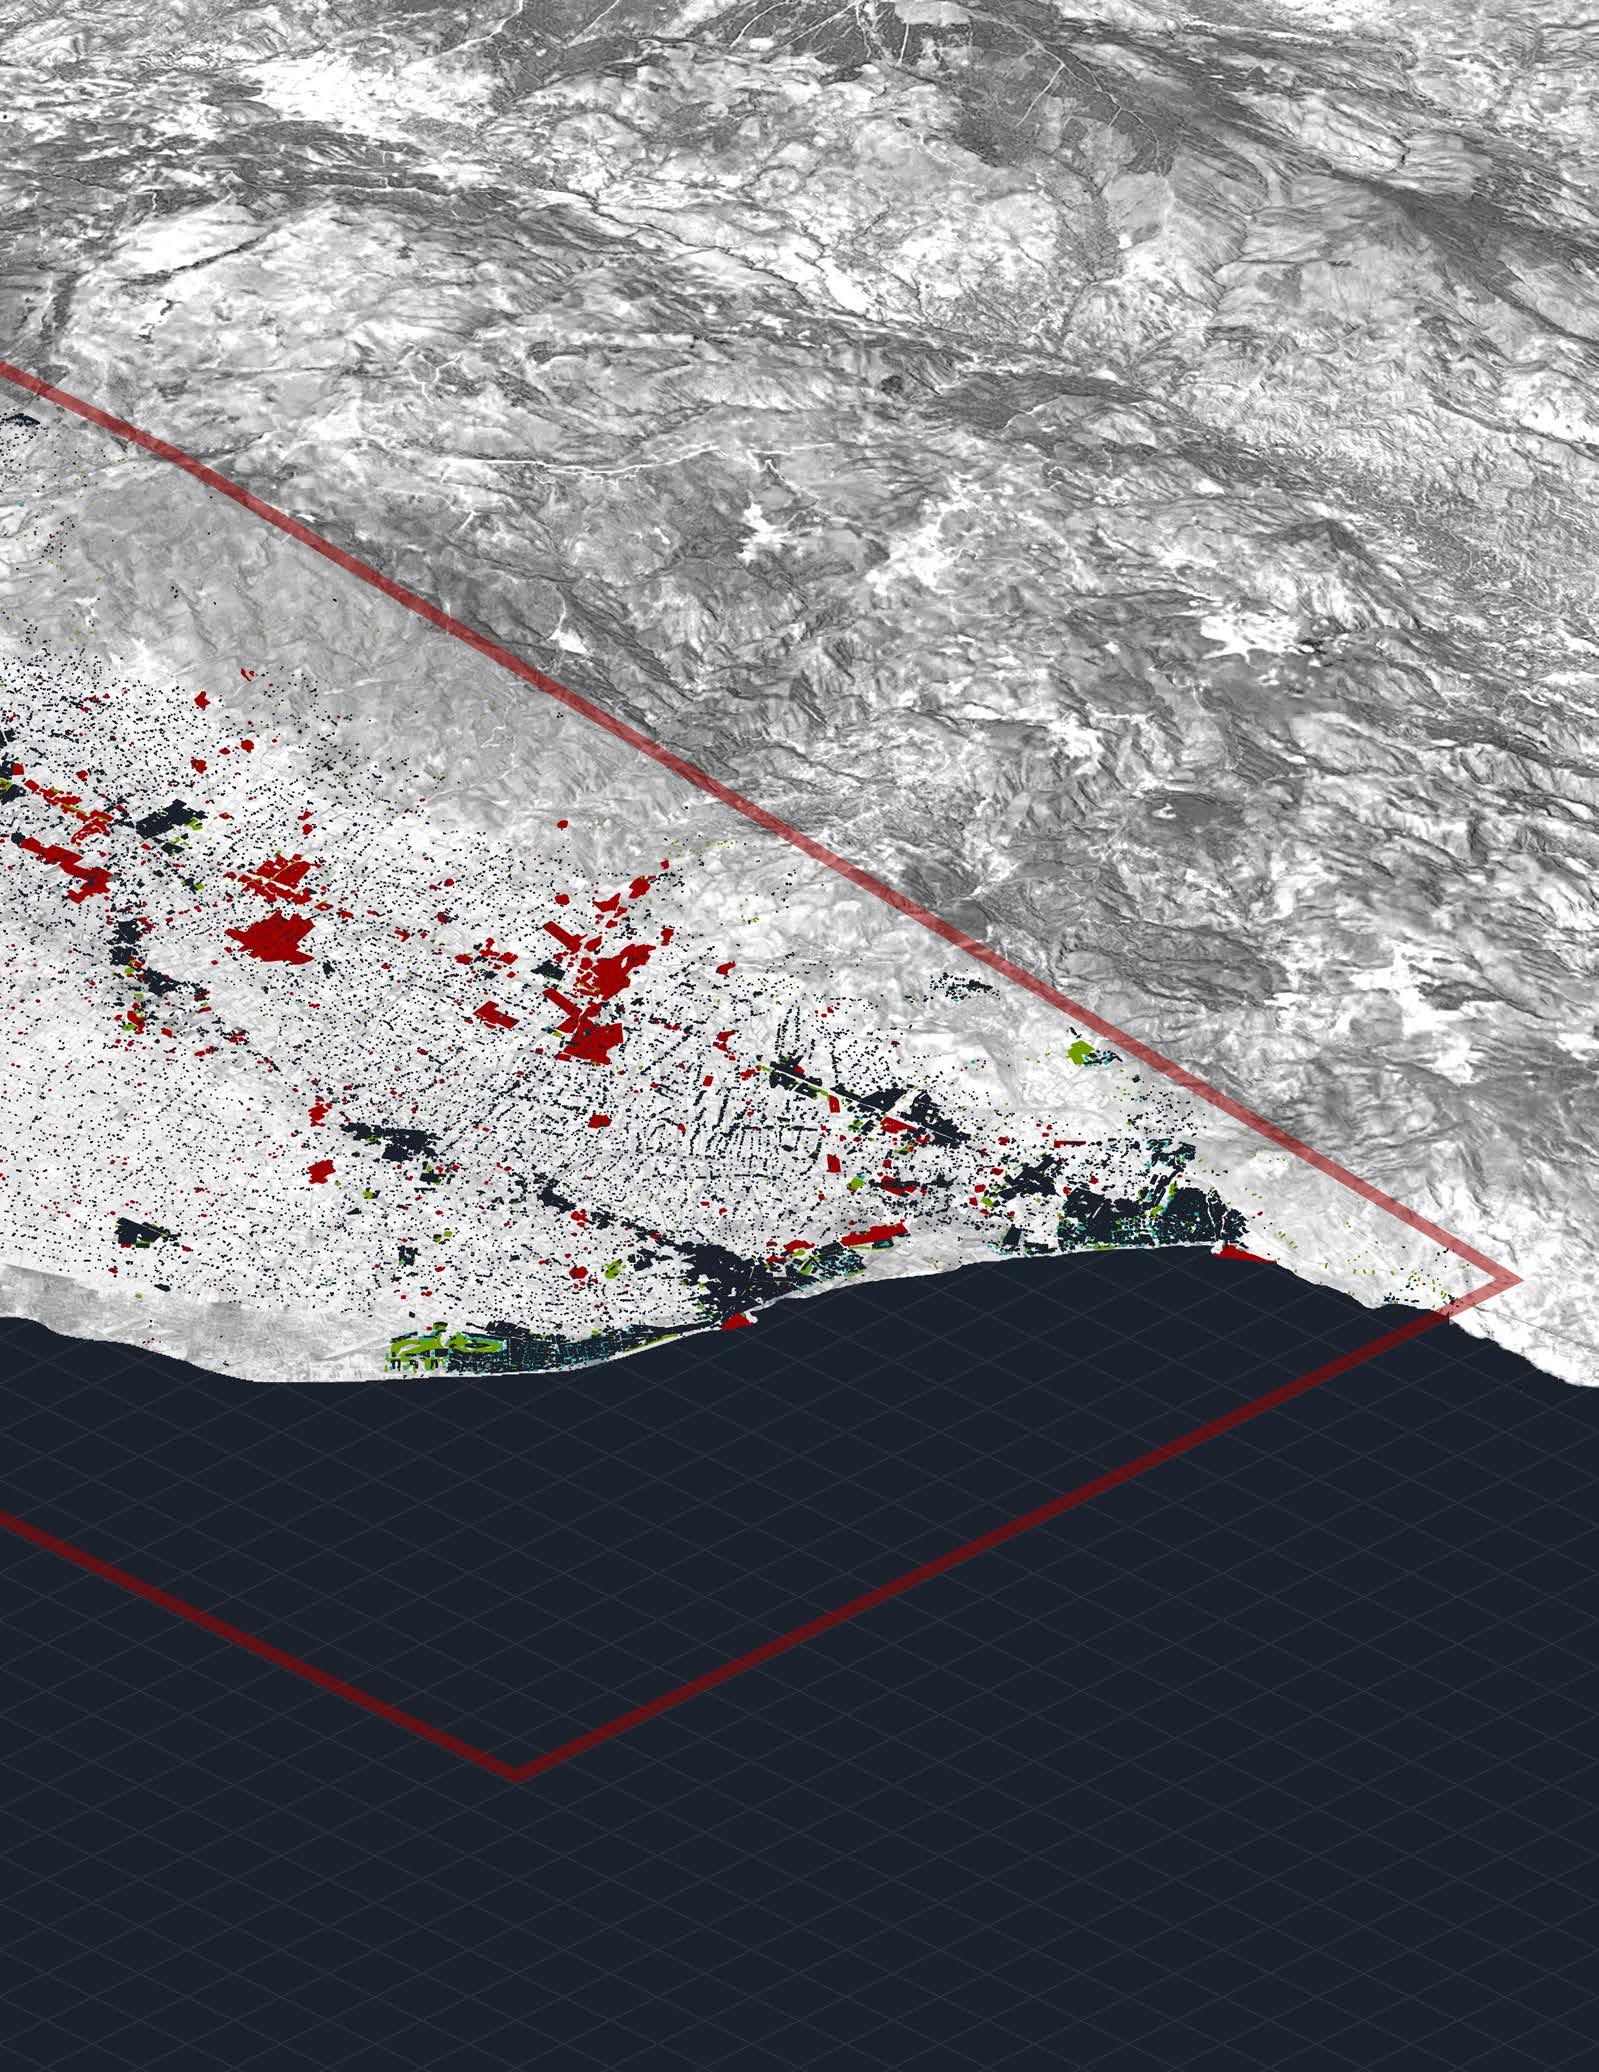
Site Analysis
2.1.2.2. Almeria is located in the southeast of the Iberian Peninsula, in the autonomous community of Andalucia, Spain. Almeria is a mountainous providence descending from the Sierra Gádor, which is a part of Sierra Nevada Mountain Range, and merges into the Mediterranean Sea with a coastline of 200 km of beaches. More than 69 percent of its area is over 300 meters and rises up to 2,519 meters above sea level.
“The mountains of Almeria provide a protective boundary against cold northerly winds and winter storms, and help provide Almeria with the warm winter months that make the horticulture industry viable(Tout 1990). Immense parts of the province are mountainous semi-desert, with arid lowlands and dry creek beds.”
Almería, due to its strategic location, open to the Mediterranean, has hosted different civilizations during its history.
Almeria Providence
Other Areas of Greenhouses Almeria City
El Ejido, Vicar, Roquetas
Almeria Province Map
SOURCES. “El Milagro de Almeria, Espa;a: A Political Ecological of Landscape Change and Greenhouse Agriculture” Robert Tyrell Wolosin.Accessed May 20, 2018. Bachelor of Science, Texas State University - San Marcos, Texas, 2006.
“Provincia de Almería - Web Oficial de Turismo de Andalucía.” Accessed May 21, 2018. http://www.andalucia.org/es/destinos/provincias/almeria/..
16
GRANADA MURCIA
MEDITERRANEAN SEA
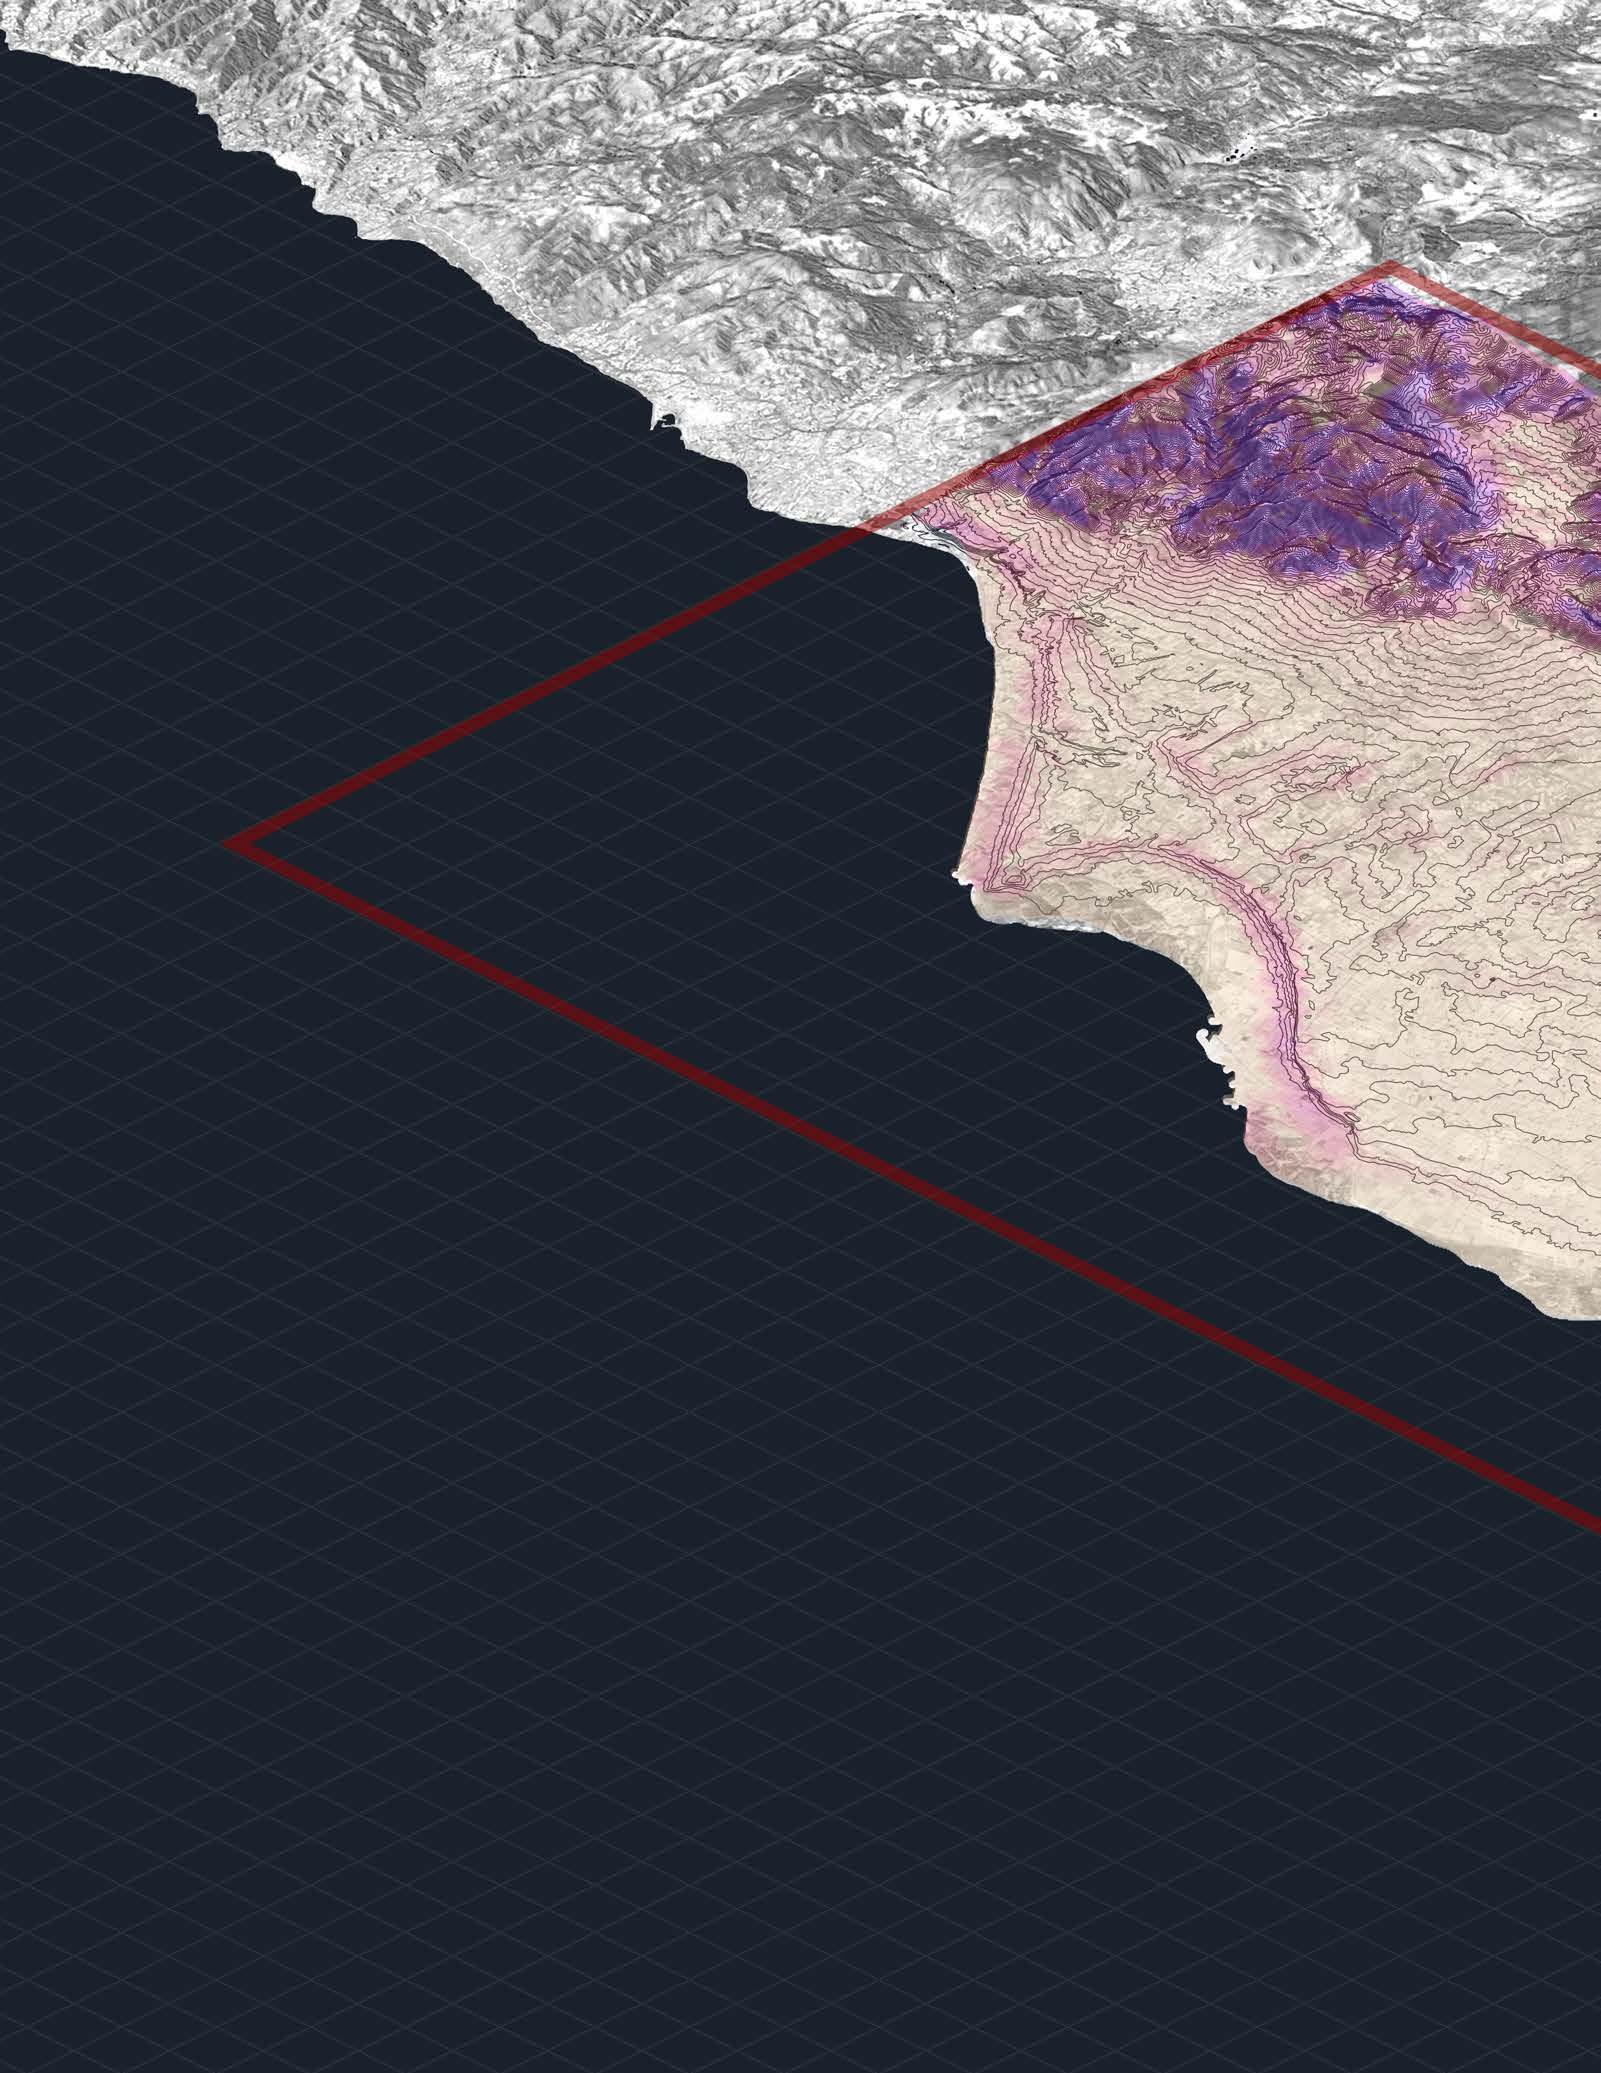
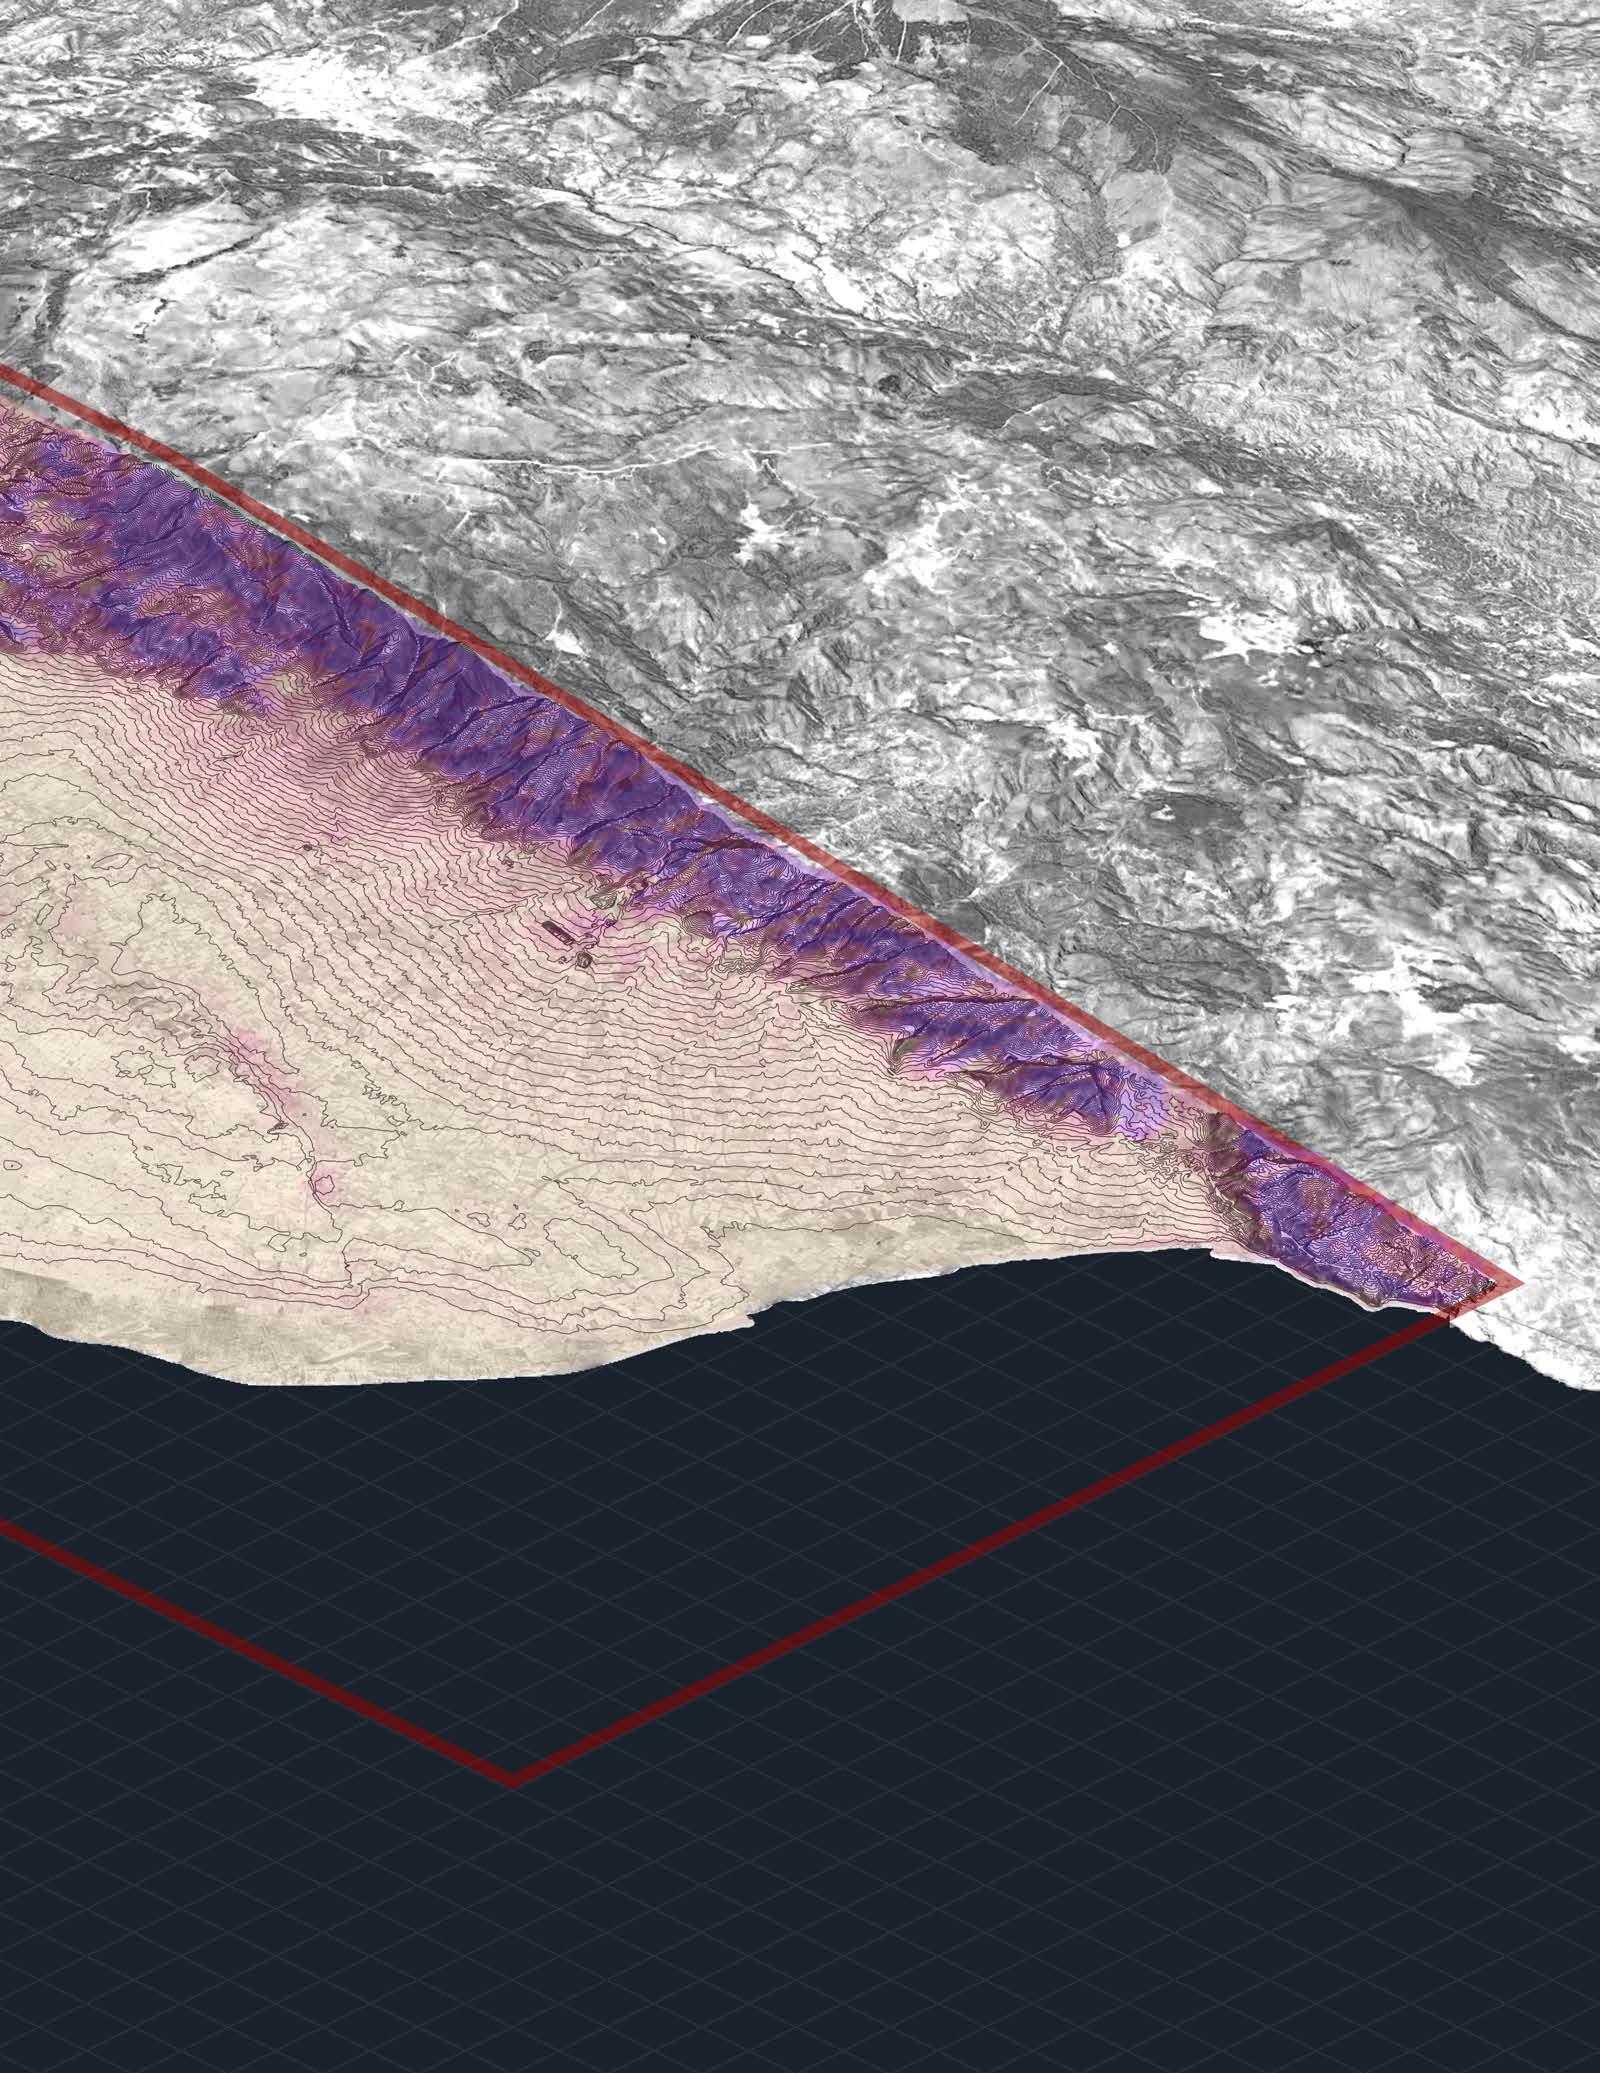
Topography Map
Almeria is a mountainousprovince with 69 percent of its area over 300 meters and rising to 2519 meters in the Sierra de Gador, part of the Sierra Nevada Mountain range.It descends from the Sierra de Gádor, to merge with the Mediterranean between extensive beaches. The formal constructions are located mostly on the planar areas, while the greenhouses occupy mostly mountainous and sloped areas.
 Montainous
Planar
Montainous
Planar
El Ejido
Sloped
SOURCES. “Base Cartográfica de Andalucía. Instituto de Estadística y Cartografía.” Accessed September 18, 2018. http://www.juntadeandalucia.es/institutodeestadisticaycartografia/bcadescargas/.
 Roquetas del Mar
Las Norias
Roquetas del Mar
Las Norias
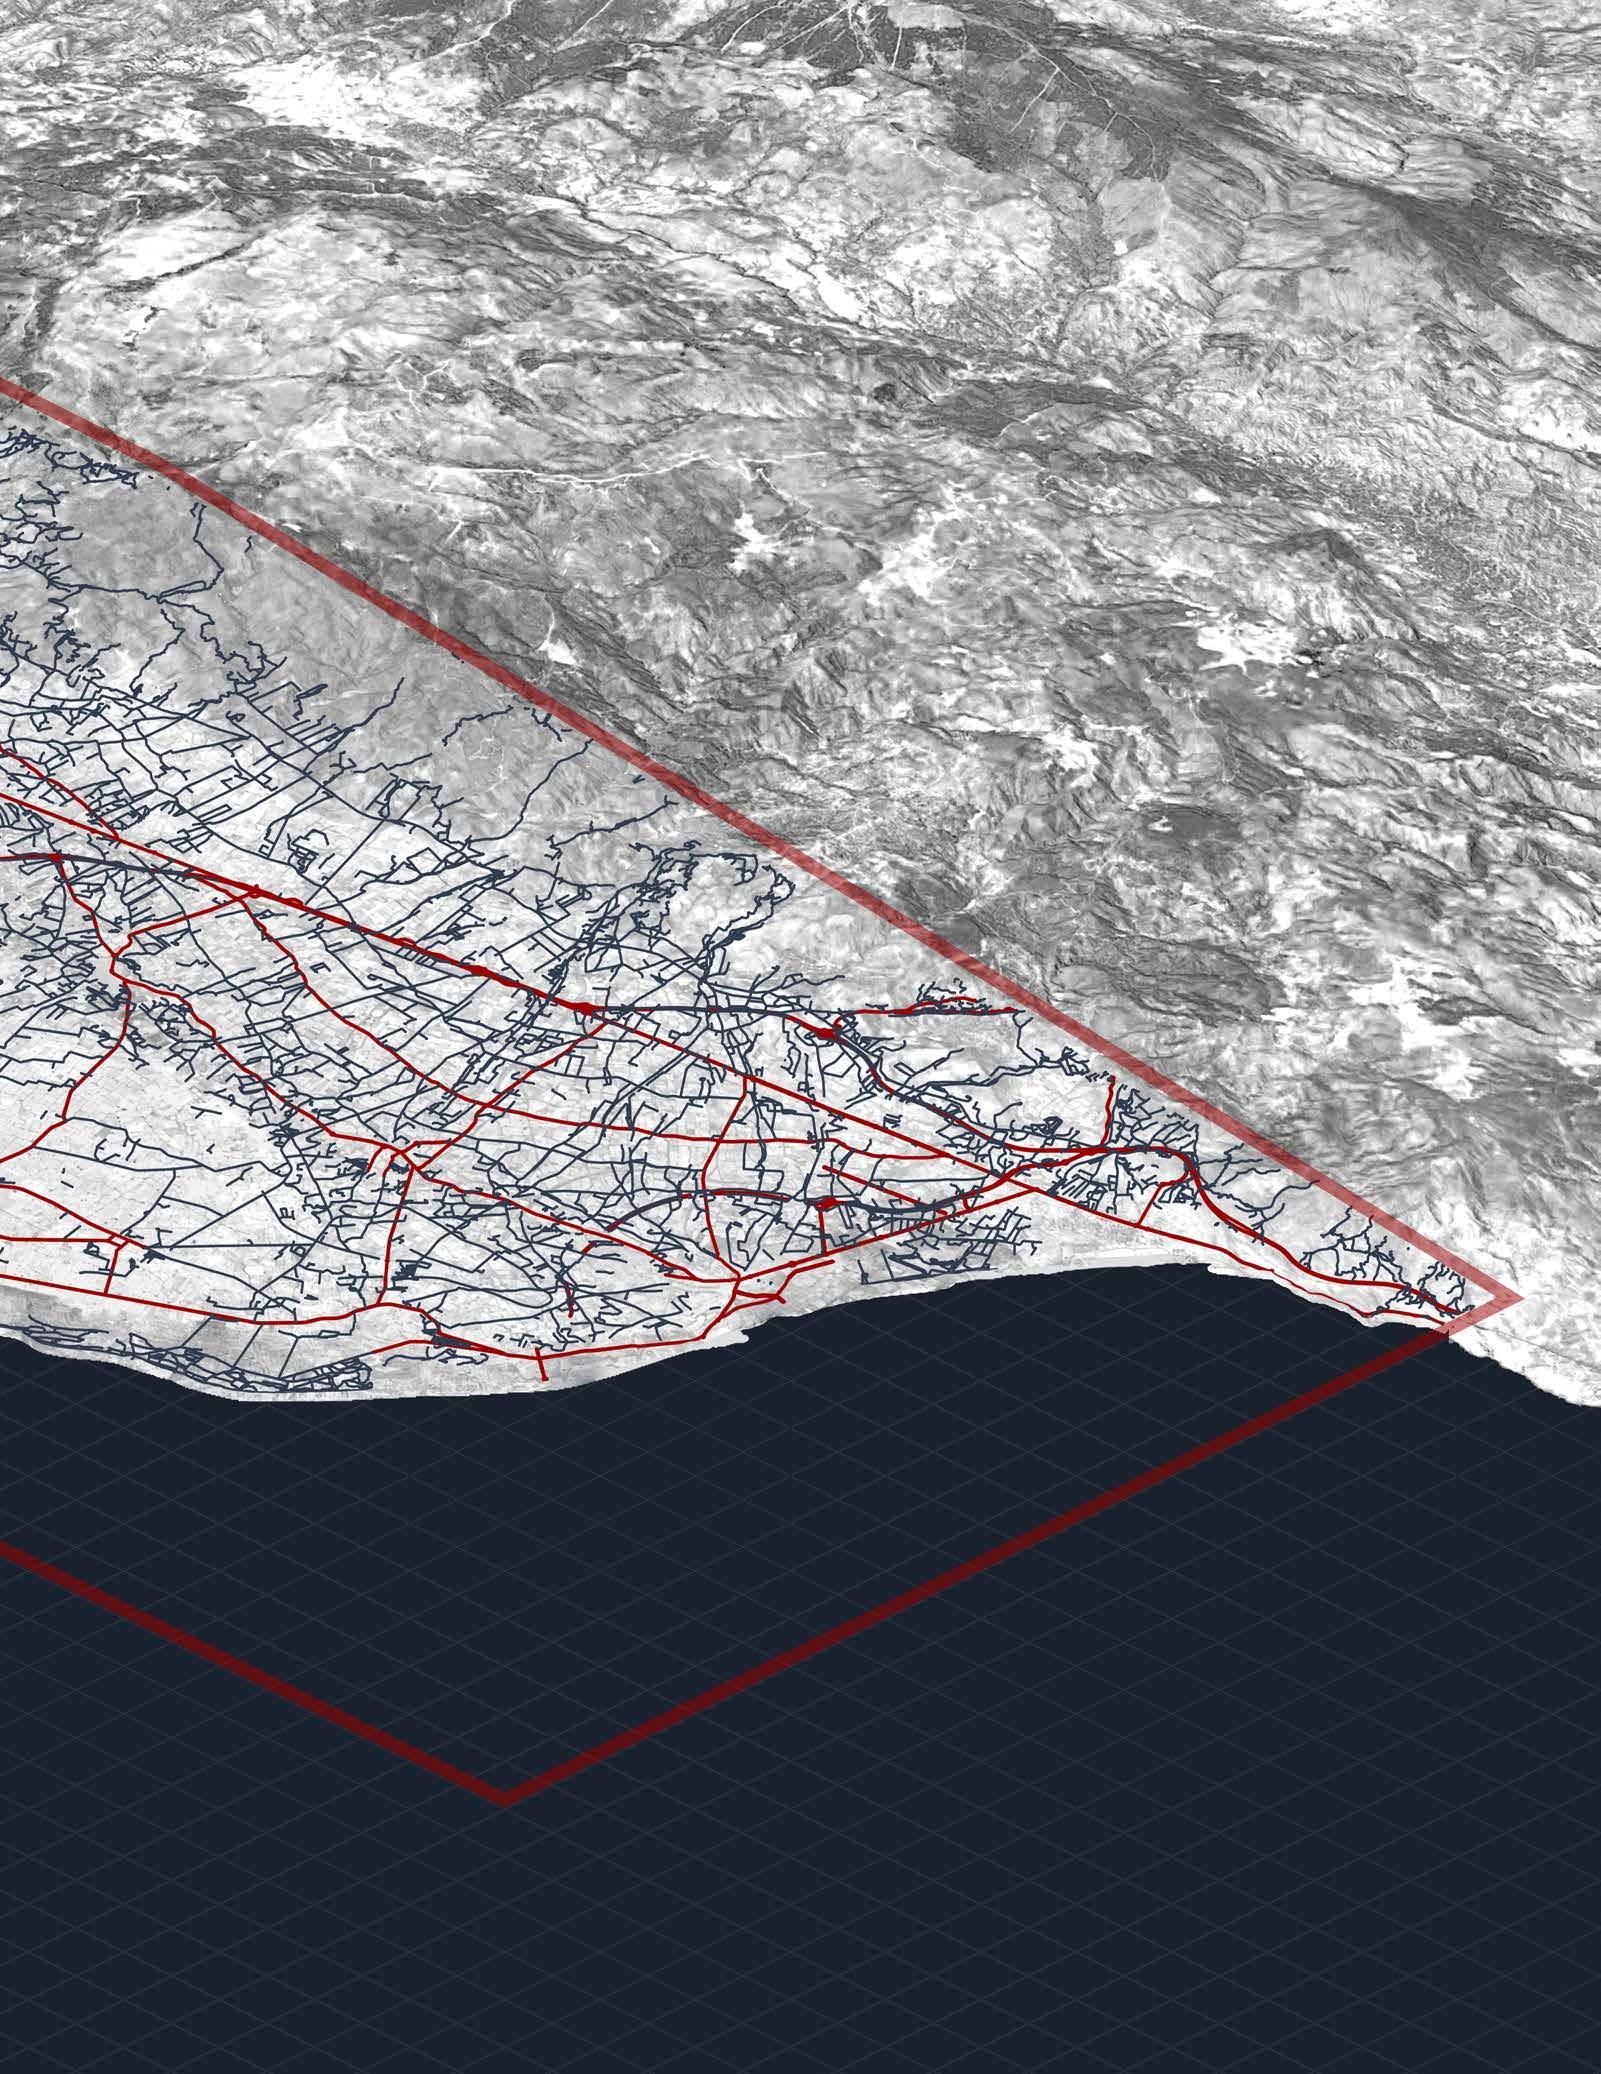
Main Road
Roads Map

Almerias roads are composed basically by main roads, and secondary roads. As it can be observed, the main roads are located in the center, and specifically in the planar areas, wheremost of the formal constructions are situated. Meanwhile the secondary roads are located all around the area, and most of them connect the main roads to the greenhouses.
Secundary Roads
El Ejido
SOURCES. “Base Cartográfica de Andalucía. Instituto de Estadística y Cartografía.” Accessed September 18, 2018. http://www.juntadeandalucia.es/institutodeestadisticaycartografia/bcadescargas/.
 Roquetas del Mar
Las Norias
Roquetas del Mar
Las Norias
Small Houses
Formal Construction
Recreational Areas (parks and pools)

The construction in Almeria is mostly located in the planar areas of the region, a good porcentage of them conecting to the main roads. The construction in Almeria is conformed by small houses, recreational areas, like sport fields, parks, and pools which most of them are private. Also includes a lot of industry which includes packing areas, ports and energy plants, like solar energy and gas. And last would be buildings in general which include residences, comerce, hotels, schools, and other public services.
Industry Buildings (residence, comerce, public services, etc.)
 El Ejido
SOURCES. “Base Cartográfica de Andalucía. Instituto de Estadística y Cartografía.” Accessed September 18, 2018. http://www.juntadeandalucia.es/institutodeestadisticaycartografia/bcadescargas/.
 Roquetas del Mar
Las Norias
Roquetas del Mar
Las Norias
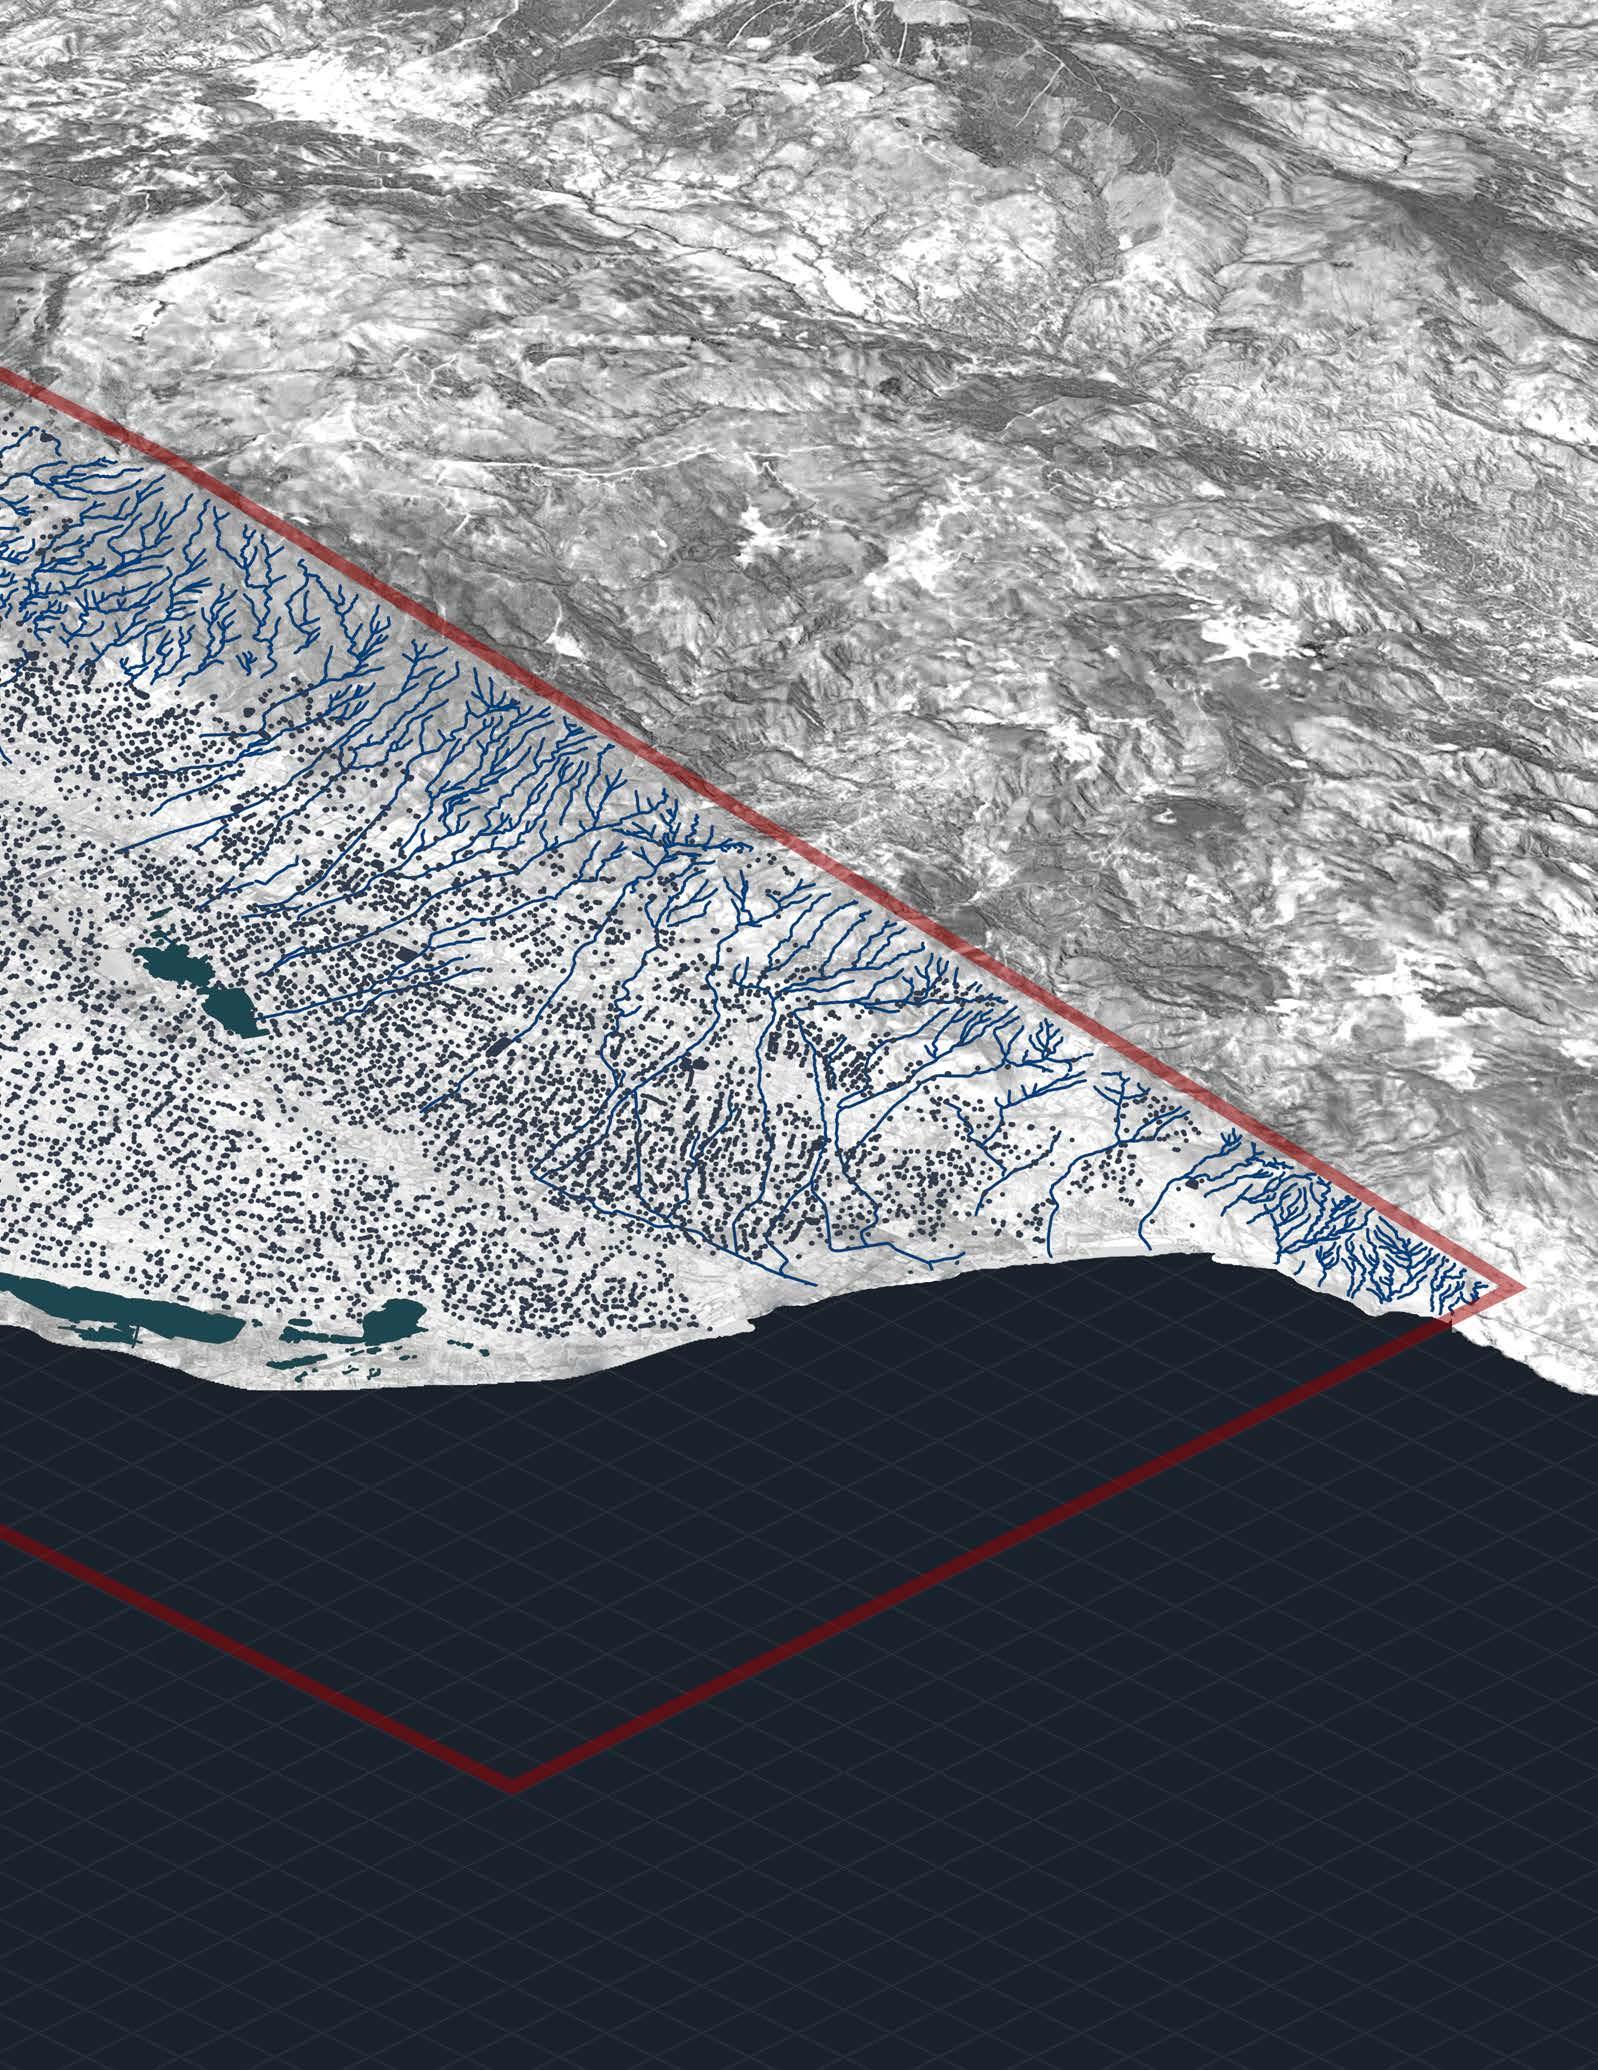
Hydrology Map
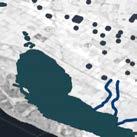
Almerias hydrology is composed by numerous natural rivers coming from the mountainous areas, lagoons which are closer to the beach side, and thousands of artificial ponds which serve as water containers for irrigation of the crops in the greenhouses.
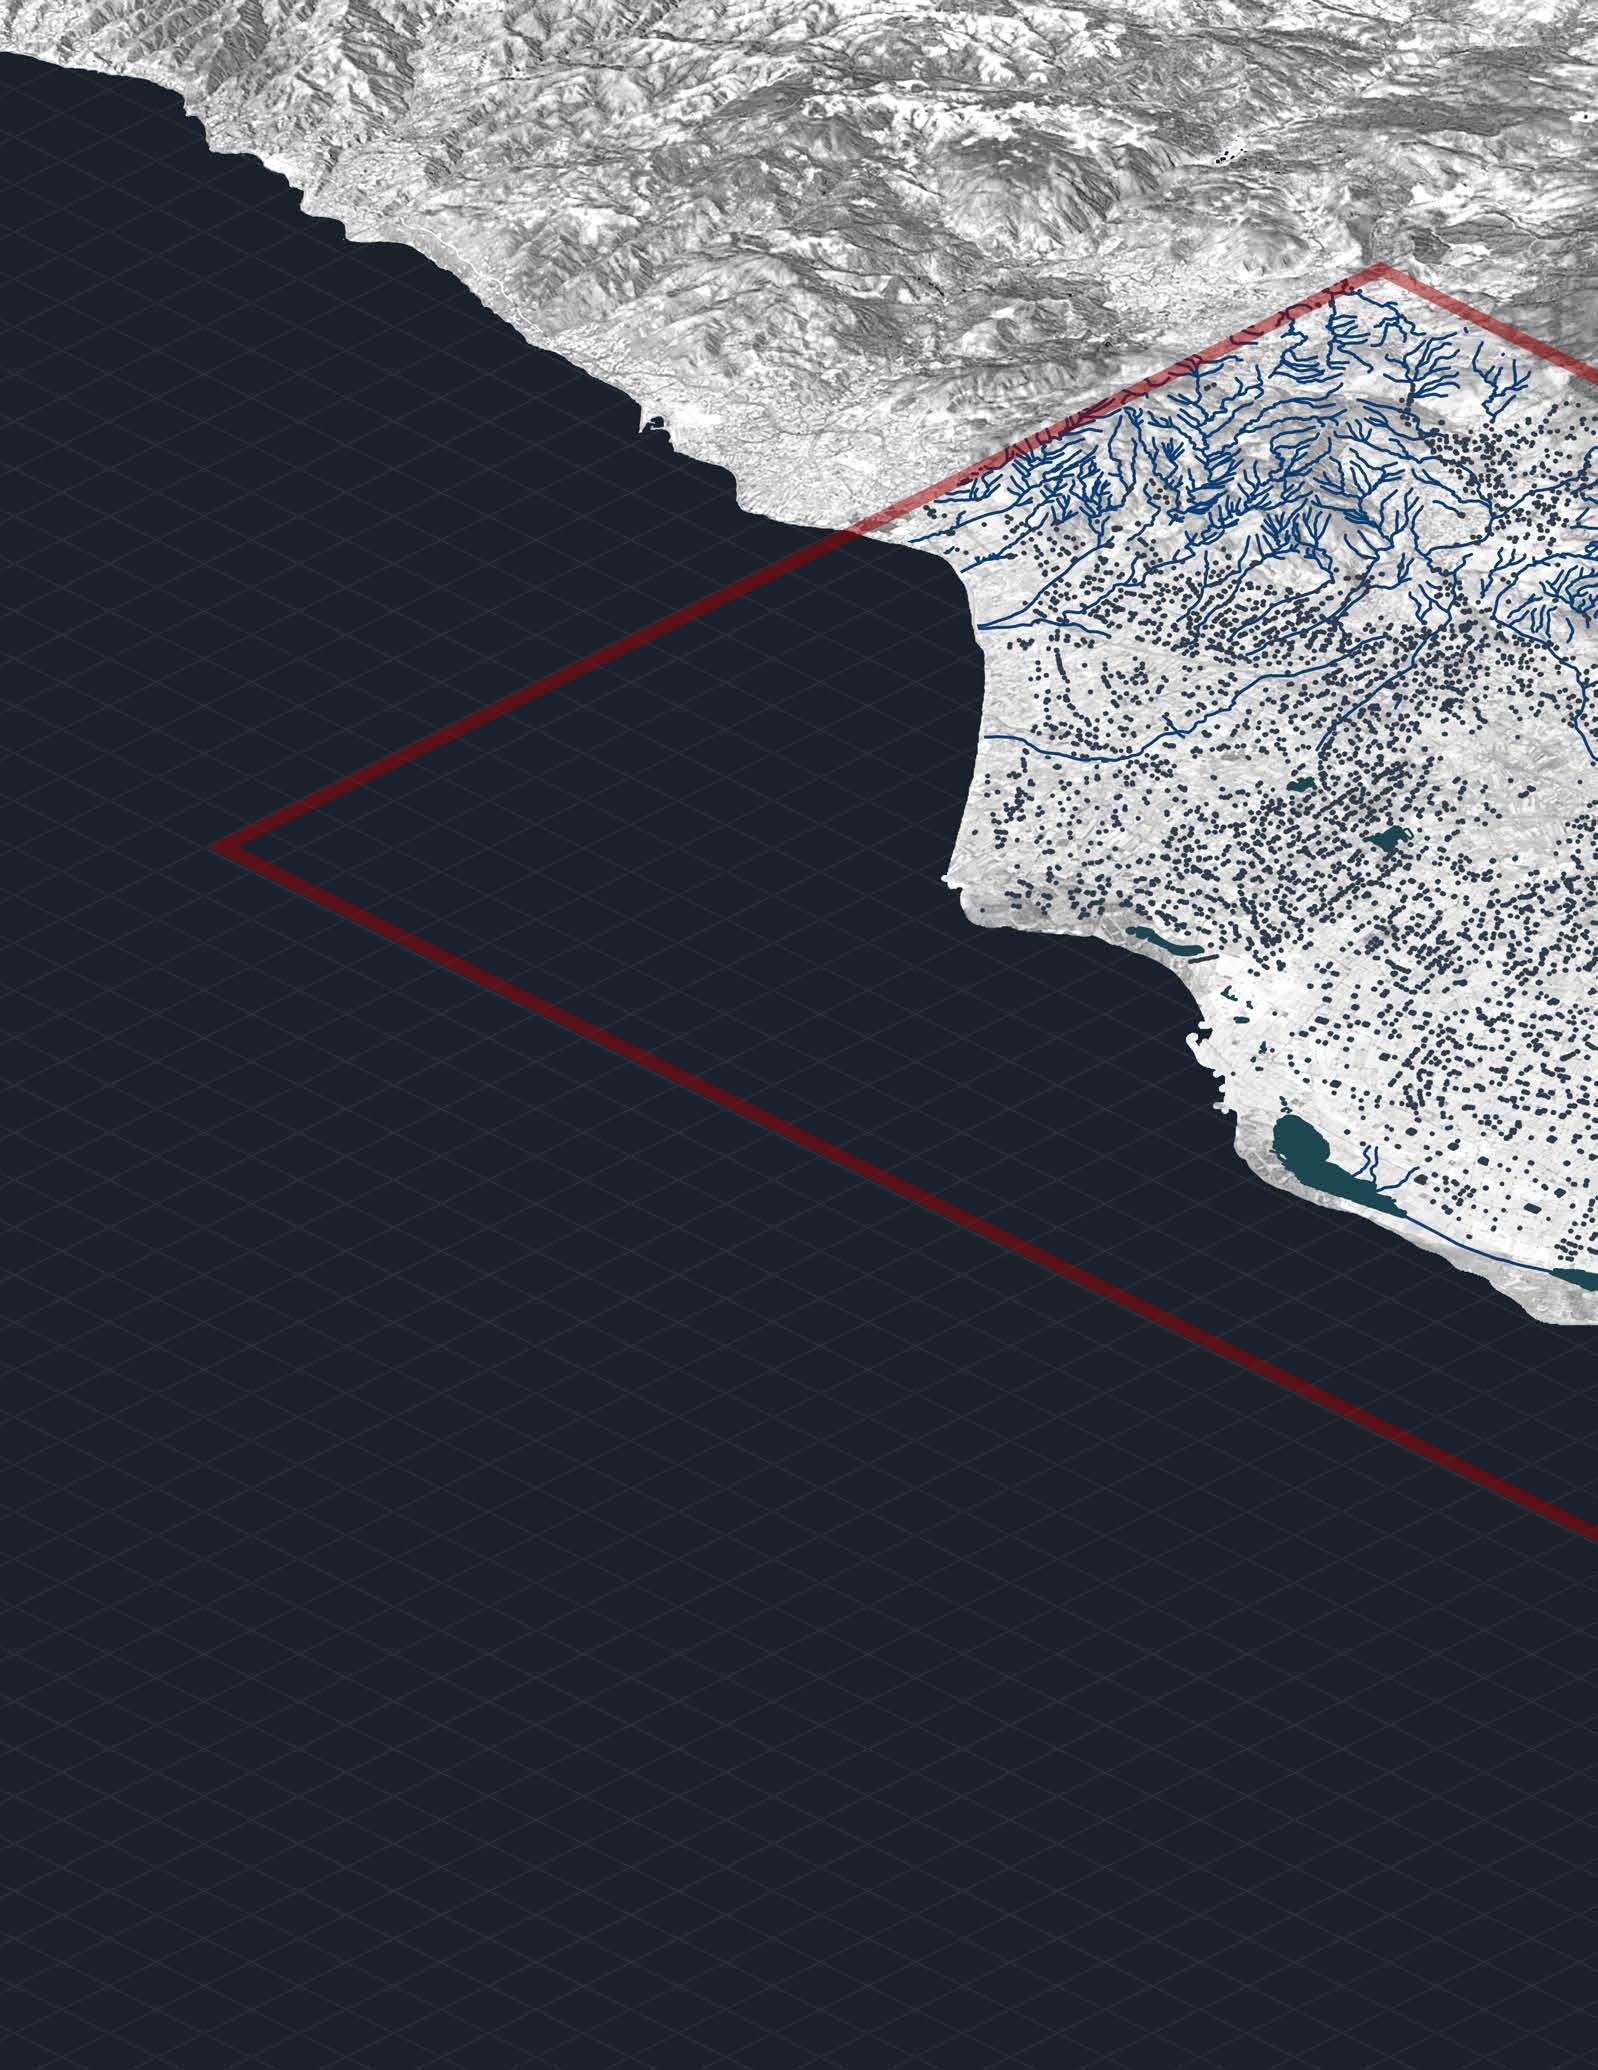
Artificial Ponds
Rivers
Lagoons
El Ejido
SOURCES. “Base Cartográfica de Andalucía. Instituto de Estadística y Cartografía.” Accessed September 18, 2018. http://www.juntadeandalucia.es/institutodeestadisticaycartografia/bcadescargas/.
 Roquetas del Mar
Las Norias
Roquetas del Mar
Las Norias
2.1.2.3.
Context
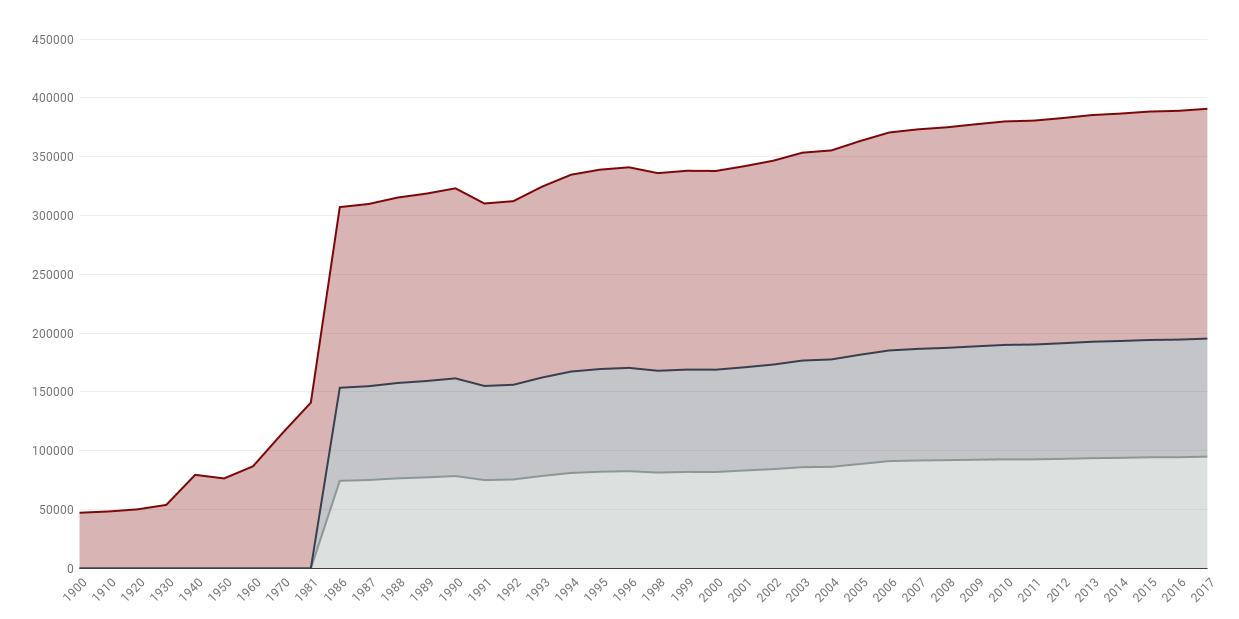
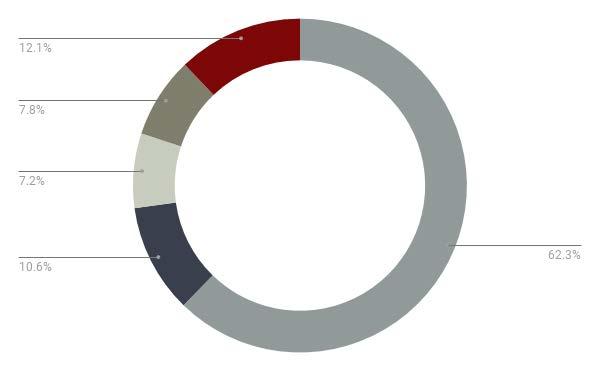
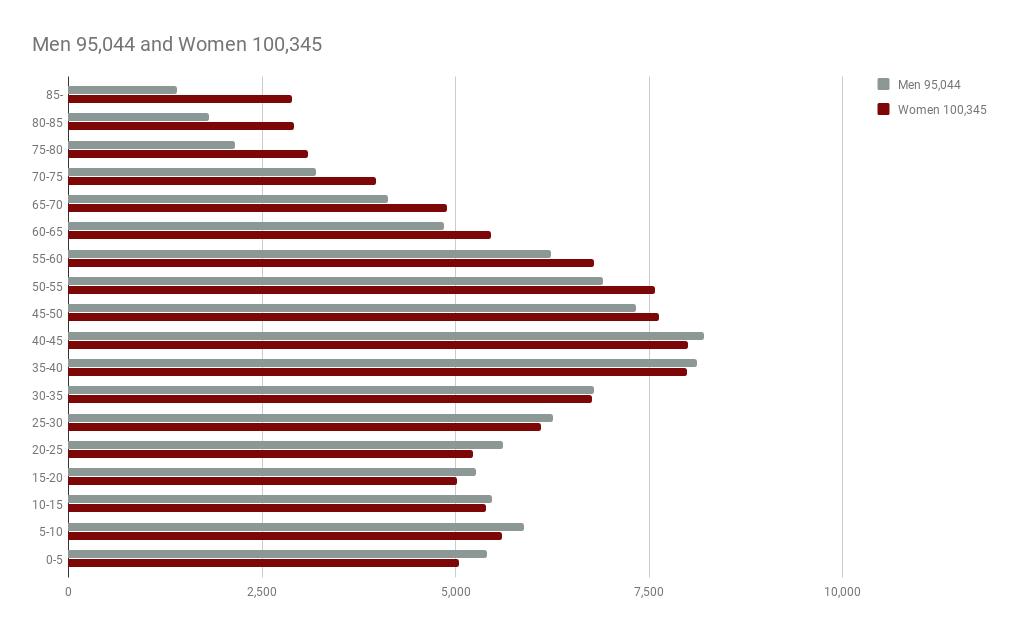
Almería is the most populated municipality in the homonymous province, with 195 389 inhabitants (95,044 men and 100,345 women) and a population density of 659.63 inhabitants / km² as of January 1, 2017. Its role as a center is noteworthy neuralgic of the metropolitan area of Almeria (with a total of 260,360 inhabitants) and as one of the poles of the conurbation that would include this area and those of El Ejido and Roquetas de Mar, to which the municipalities of Vícar, La Mojonera could be added and Enix (with a total of 476,119 inhabitants).
And the number of inhabitants keeps growing, specially in the case of inmigrants which are usually the ones working in the greenhouses. A total of 17,614 immigrants aboard 803 boats arrived on the Andalusian coast in 2017, which was an increase over 2016 of 185.2% in people and 94.5% in boats, since in the past there were 6,175 people rescued in 423 vessels.
In Almeria the Moroccans registered in the province exceed 50,000. In recent years, more than 3,000 North Africans have settled in Almería on average. Thus, in localities such as El Ejido some 18,000 reside. Other urban centers with a notable presence of Moroccan immigration are the capital, Vícar, La Mojonera, Roquetas, Adra and Níjar.
GRAPH SOURCES. “Almería, segunda provincia española con mayor porcentaje de extranjeros.” ALMERÍA HOY (blog). Accessed May 31, 2018. http://www. almeriahoy.com/2017/05/almeria-segunda-provincia-espanola-con.html. «Cifras de población referidas al 01/01/2017». Cifras Oficiales de Población de los Municipios Españoles: Revisión del Padrón Municipal - Población a 1 de enero de 2017..
25
Population
Domain
Population Growth in Almeria
Other Countries
Other places from Spain
Domain
Context
Andalucia
Almeria Province
Demography of Almeria
Almeria Municipality
Population Pyramid of Almeria
GRAPH SOURCES. “Habitantes Almería 1900-2017.” Accessed June 1, 2018. https://www.foro-ciudad.com/almeria/almeria/habitantes.html.
“El Número de Migrantes Llegados En Patera a Andalucía Aumentó Un 185% En 2017.” Accessed June 1, 2018. http://www.europapress.es/andalucia/noticia-total-17614-inmigrantes-llegan-patera-costas-andaluzas-2017-1852-mas-2016-20180102144245.html.
26
Domain
Almeria was once an area known for streams, forests, and a wide array of plant and animal life is now parched, cracked, and shade less. The environmental degradation on the landscape has very complex consequences, with changes that lasted from Roman occupation until the collapse in the table wine industry.
“One of the keys to transformations in Almería was the relationship between foreign forces controlling the province of Almería and the use of resources available and profit from the extraction of these resources. Foreigners and foreign entities took these resources to international markets and sold them without any reinvestment back into Almería.”
The history of Almeria shows a timeline of recurring modifications on the landscape either directly by powerful foreigners or indirectly through local-global markets for resources like mining, wool, silk, food etc.
The Romans and Moorish occupants subjected the land to farming and crop techniques that were unknown to Almería, so the landscape was altered to accompany these changes. Even when Almería was not directly ruled by foreign powers, Almería’s resources were in demand by international markets, and extraction of resources was kept at unsustainable levels.
The extraction of all of those resources eventually led to land degradation from open mines, soil erosion from terraced farming, the stripping of Almería’s lowland forest, and possibly causing a climatic shift to a more arid climate (Picón et al 2001, Latorre 2001). Almeria and the Mediterranean regions are “the best and most tragic example of how mankind has removed the foundations for his existence through the overexploitation of natural resources” (H. Walter quoted in Picón et al 2001).
Almeria has long been an area of resource extraction on a local-global scale. Greenhouse agriculture is the most recent phase of exploitation on the landscape and profitable industry for international and national forces.
SOURCES. “El Milagro de Almeria, Espa;a: A Political Ecological of Landscape Change and Greenhouse Agriculture” Robert Tyrell Wolosin.Accessed May 20, 2018. Bachelor of Science, Texas State University - San Marcos, Texas, 2006.
IMAGE SOURCE. “The Plastic Mosaic You Can See From Space: Spain’s Greenhouse Complex - Bloomberg.” Accessed June 1, 2018. https://www.bloomberg. com/news/features/2015-02-20/the-mosaic-you-can-see-from-space-spain-s-massive-greenhouse-complex.
28
History 2.1.2.4. Context
SOURCES.
Domain
Context
Coper and Bronze Age
4,000 BCE - 1,000 BCE
Firewood
First known historical landscape changes by humans.
Recovery Period
0500 - 0711
Environment experiences a recovery period.
Reconquista
1492 - 1850
Multiple Terraced farming, wool and silk, intensive mining. Reports of no trees in lowlands. Possible climatic shift.
Greenhouses
1950 - 2018
Agriculture
80,000 acres of greenhouses.
Roman Empire
0200 BCE - 0500
Multiple
Dry farming exportation of minerals such as lead and silver. Reports of enormus wooded surfaces and forest vegetation.
Moorish Occupation
0711 - 1492
Agriculture
Citrus fruits and almonds based on an extensive system of irrigation.
Table Grapes
1860 - 1950
Agriculture
Dry farming with limited irrigated farming.
Tourism
1990 - 2018
Construction
Technology
1998 - 2018
Multiple
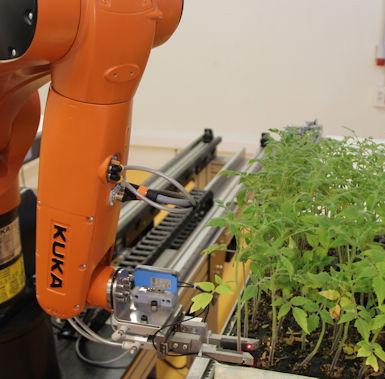
Solar and wind power for energy use. Desalisation for fresh water for crops. Robots for grafts and multiple other jobs in the crops.
“How
“The
Completition for coastal lands and water between greenhouse agriculture and tourism developers
29
“El Milagro de Almeria, Espa;a: A Political Ecological of Landscape Change and Greenhouse Agriculture” Robert Tyrell Wolosin.Accessed May 20, 2018. Bachelor of Science, Texas State University - San Marcos, Texas, 2006. IMAGE SOURCES.“Injerobots.” Accessed July 9, 2018. http://www.hortoinfo.es/index.php/6699-robot-injerto-090218.
Local Communities Are Turning Vacant Lots into Thriving Urban Farms — Stone Pier Press.” Accessed July 9, 2018. https://www.stonepierpress.org/goodfoodnews/vacantlotstourbanfarms.
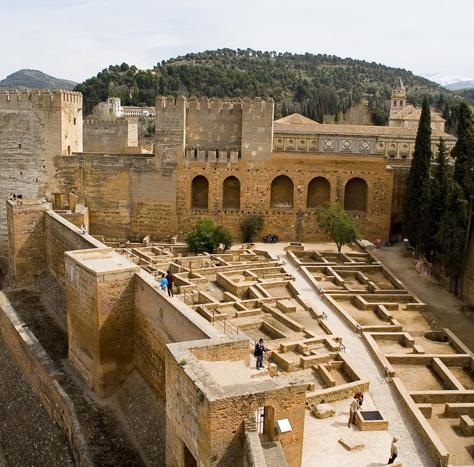
Alhambra in Granada: Photo Gallery | Spain.Info GCC.” Accessed September 19, 2018. https://www.spain.info/gcc/en/images/alhambra-generalife-granada/.
History Timeline Almeria
Domain
Almería is positioned as the most arid city in Europe and one of the most arid of the Mediterranean Basin. Almeria’s climate is a transition between the warm arid climate (BWh) and the warm semi-arid climate (BSh), according to the Köppen Climate Classification.
With an annual precipitation slightly less than 200mm, with an average of 25 days of rainfall per year, and a humidity of 65%. Also there is little monthly thermal amplitude; the temperatures oscillate between 17°C and 9°C in January and 31°C and 23°C in August.
In summer months the temperature can rise to over 40°C due to the masses of hot air coming from the Sahara, and also is the only city in Continental Europe that has never registered frost, since the historical minimum is +0.1°C.
SOURCES. “Atlas.Pdf.” Accessed May 31, 2018. http://www.aemet.es/documentos/es/divulgacion/publicaciones/Atlas-climatologico/Atlas.pdf. Meteorología, Agencia Estatal de. “Almería Aeropuerto: Almería Aeropuerto - Valores extremos absolutos - Selector - Agencia Estatal de Meteorología - AEMET. Gobierno de España.” Accessed May 31, 2018. http://www.aemet.es/es/serviciosclimaticos/datosclimatologicos/efemerides_extremos*.
30
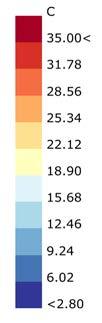
FIG. 02.2. Temperature Chart Almeria 2.1.2.5.
Climate
Context
Domain Context
IMAGE SOURCES. Google Maps. Accessed July 25, 2018. https://maps.google.com/. GRAPH SOURCES. Windfinder.com. Windfinder.com. Accessed September 18, 2018. https://www.windfinder.com/windstatistics/almeria.
31
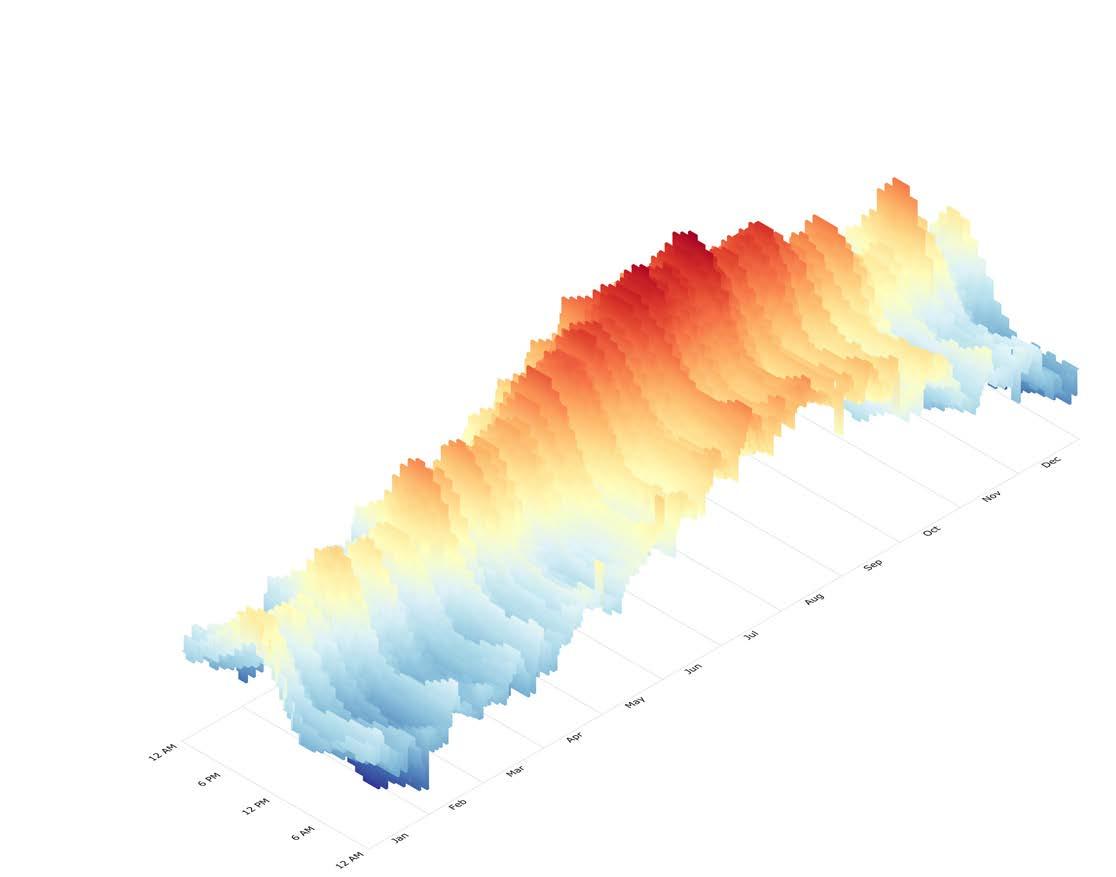
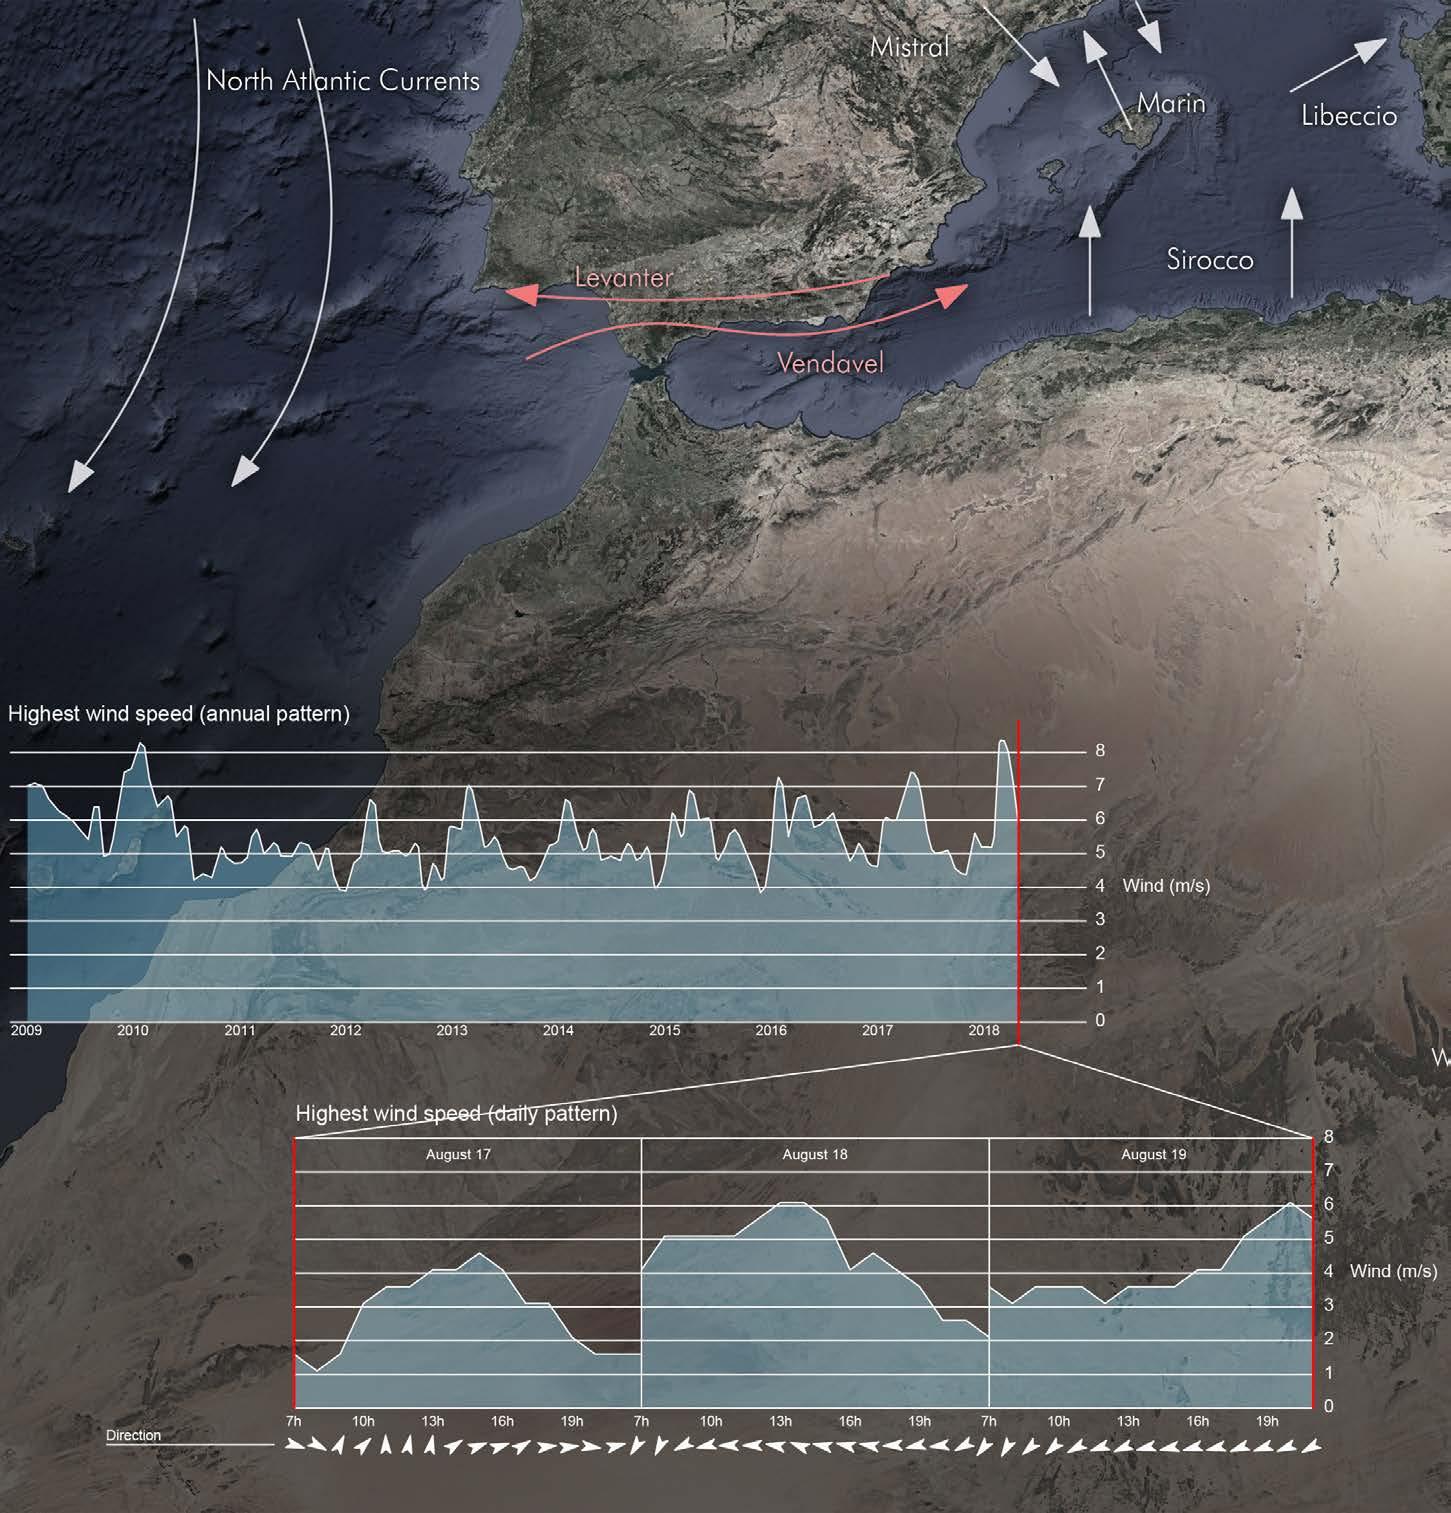
Domain Context
The wind condition of Almeria presents itself as a unique climatic condition. An analysis of the wind direction distribution reveals the predominance of eastern and western winds. The south of Spain is dominated by an East and West current called Levanter and Vendavel respectively. Such a condition has given to a predictable and constant wind condition. Looking through the wind speed records of the past 10 years, the winds usually fluctuate between 4-8 m/s, and rarely does it pass 8 m/s.
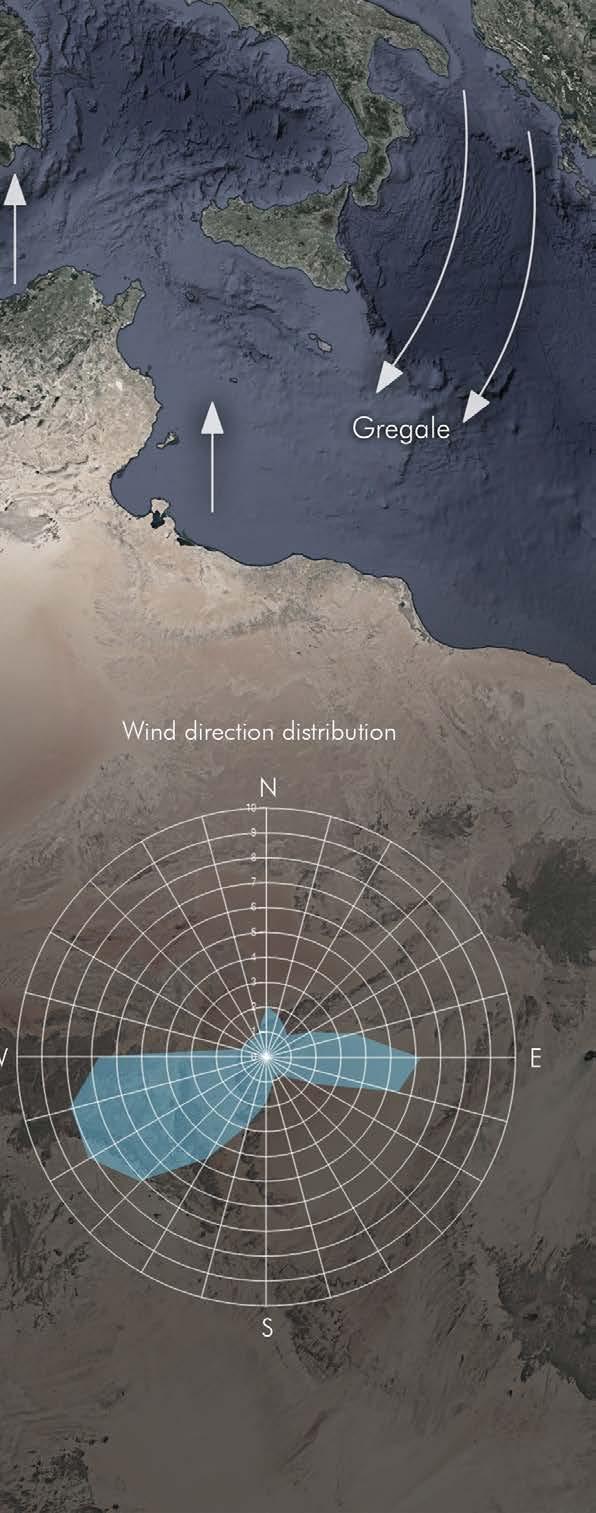
Thus such condition can be favourable to the construction of large-span structures without the high risk of wind-loads. At the same time, the contant nature of the bidirectional winds can be more easily adapted by geometric interventions, where strong winds can be addressed directly with wind-adapted geometries for both directions. Furthermore, there is a potential for shifting morphology that may only require to be adapted to 2 main directions. While it is typical for winds to be omni-directional and mercurial, rendering wind-adapted architecture rather difficult to achieve pragmatic results, the constant wind condition of Almeria posits a potential for architectural response to adaptation of wind.
To examine the validity of a long-term architectural intervention, the frequency and nature of the winds’ directional changes are analyzed, where hourly winds are plotted into a three day cycle of a chosen period during the research. The hourly winds reveals a slow shifting of directionality, while a 24-hour frame can feature up to 2-3 directional changes. As directional changes only happens 2-3 times a day, it presents an ideal setting for adaptable architectural actuation to occur , as 2-3 times a day is within a reasonable amount of energy expenditure to shift a buildings wind adapted direction.
32
Domain
Context
Climate Diagram
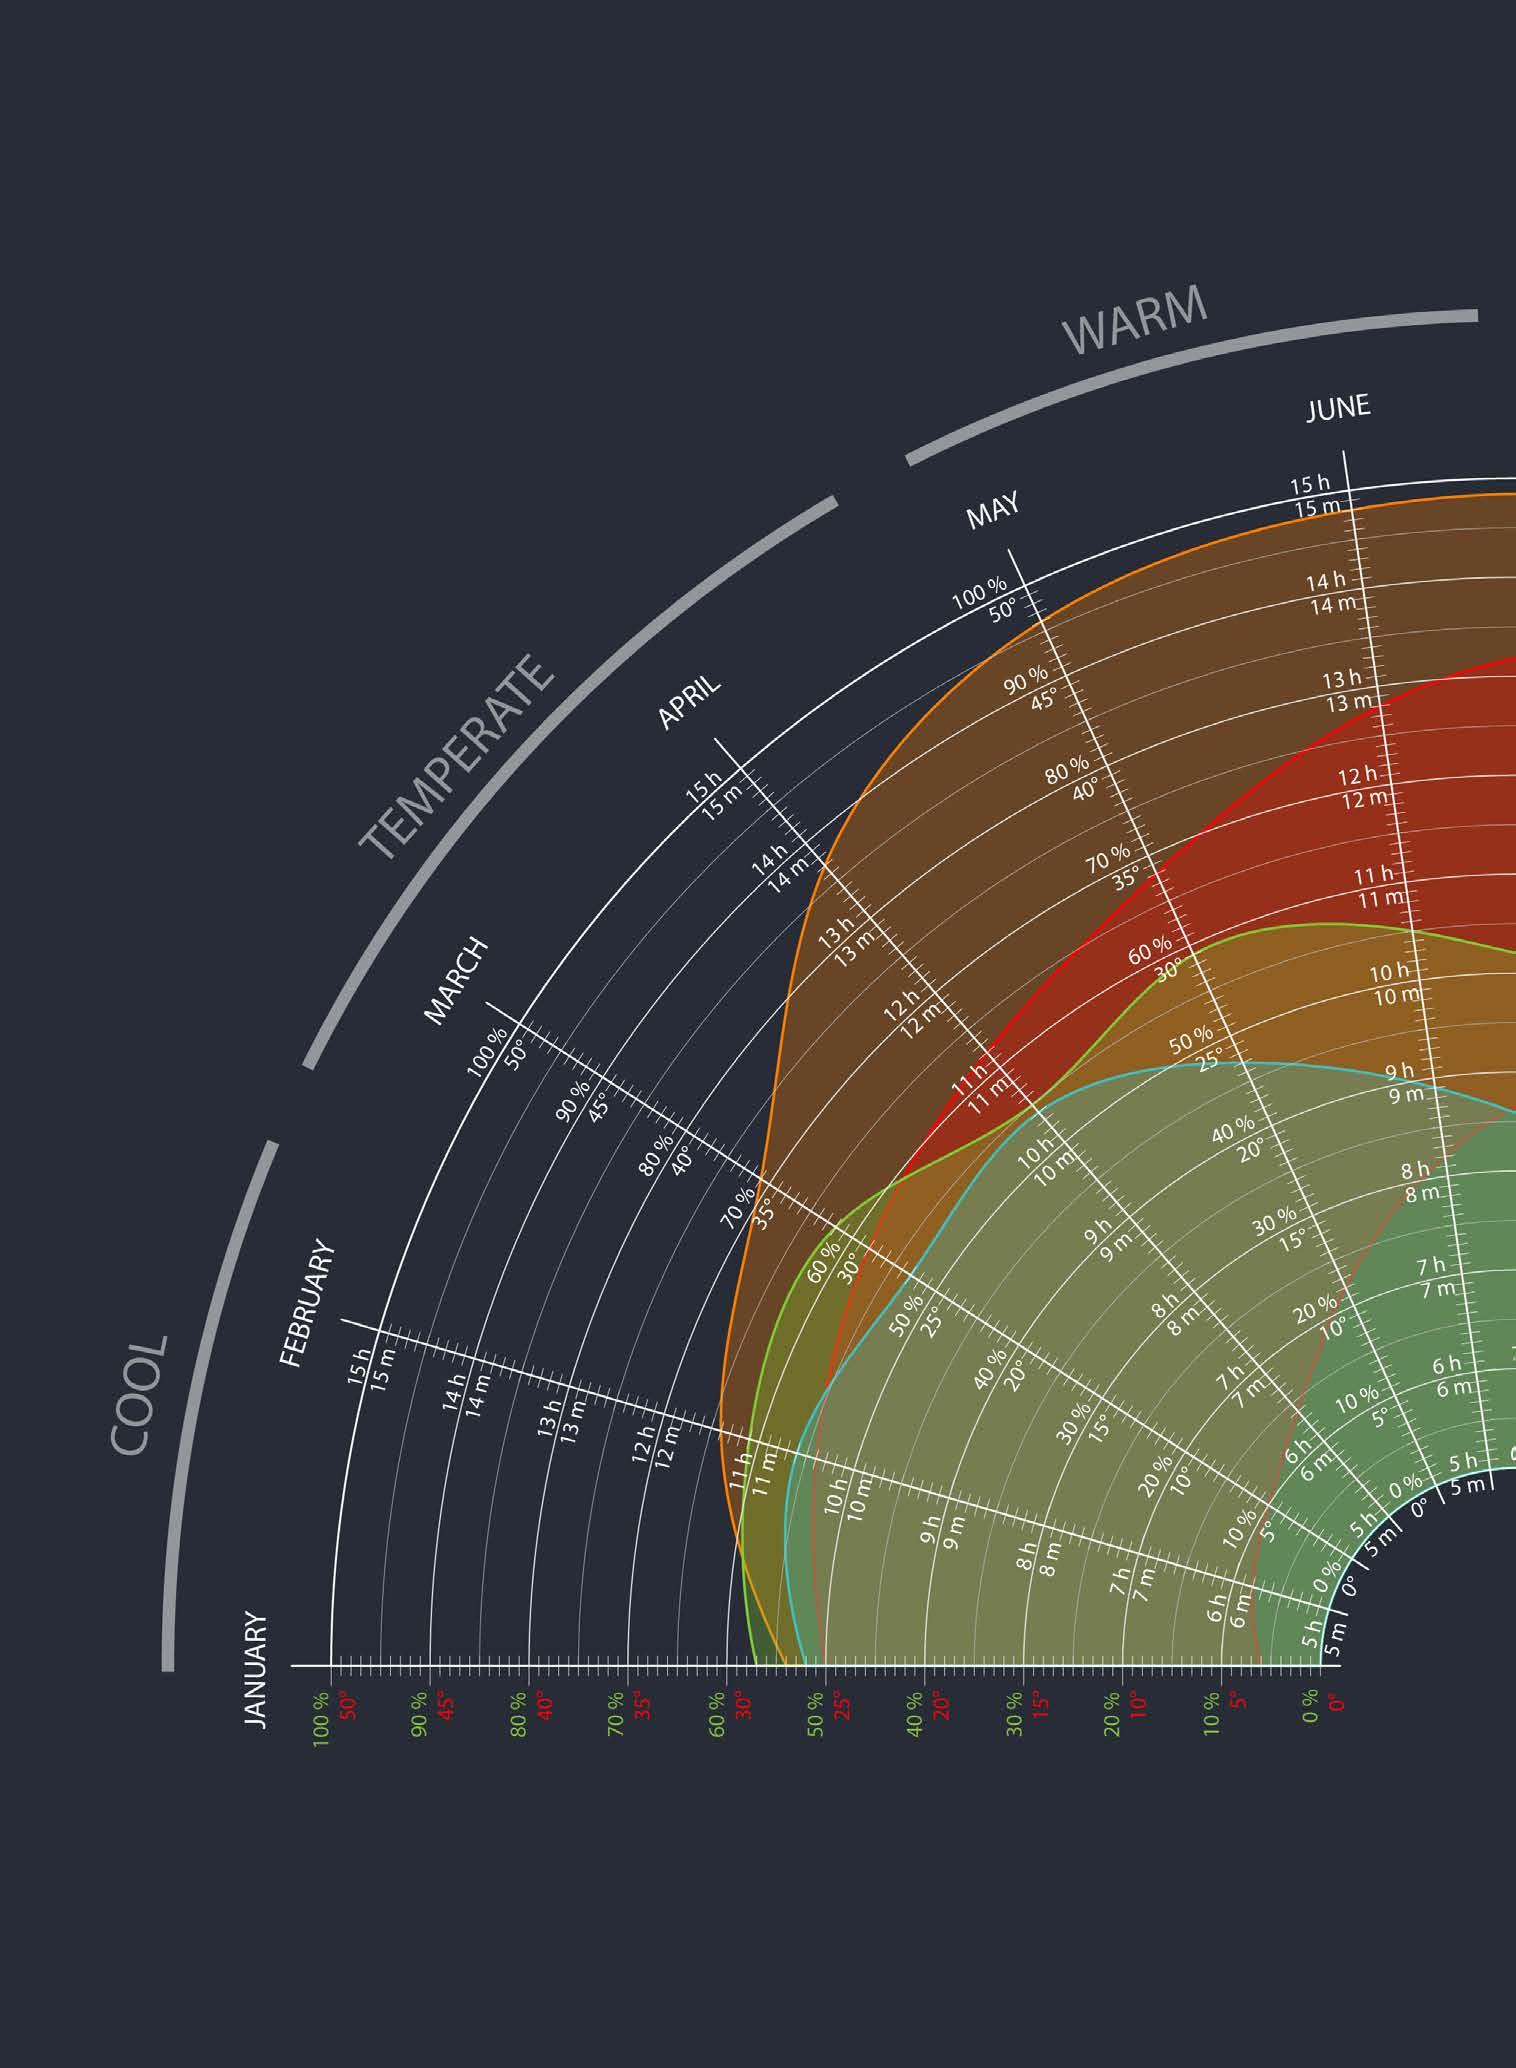
For a further analysis on the Almeria’s climate was done by overlaying four of the most important climate parameters that need to be taken into consideration for the proper growth of the crops.
SOURCES. “Clima El Ejido.” meteoblue. Accessed August 2, 2018. https://www.meteoblue.com/es/tiempo/pronostico/modelclimate/el-ejido_espa%c3%b1a_2518494 “Average Weather in El Ejido, Spain, Year Round - Weather Spark.” Accessed August 2, 2018. https://weatherspark.com/y/38210/AverageWeather-in-El-Ejido-Spain-Year-Round.
Domain
Context
As it can be seen from the diagram even though Almeria is considered to have a very hot climate, various fluctuations occuor on the temperature (red) around the year, which is directly linked to the amount of daylight hours (orange) that increase from May to August. SOURCES.
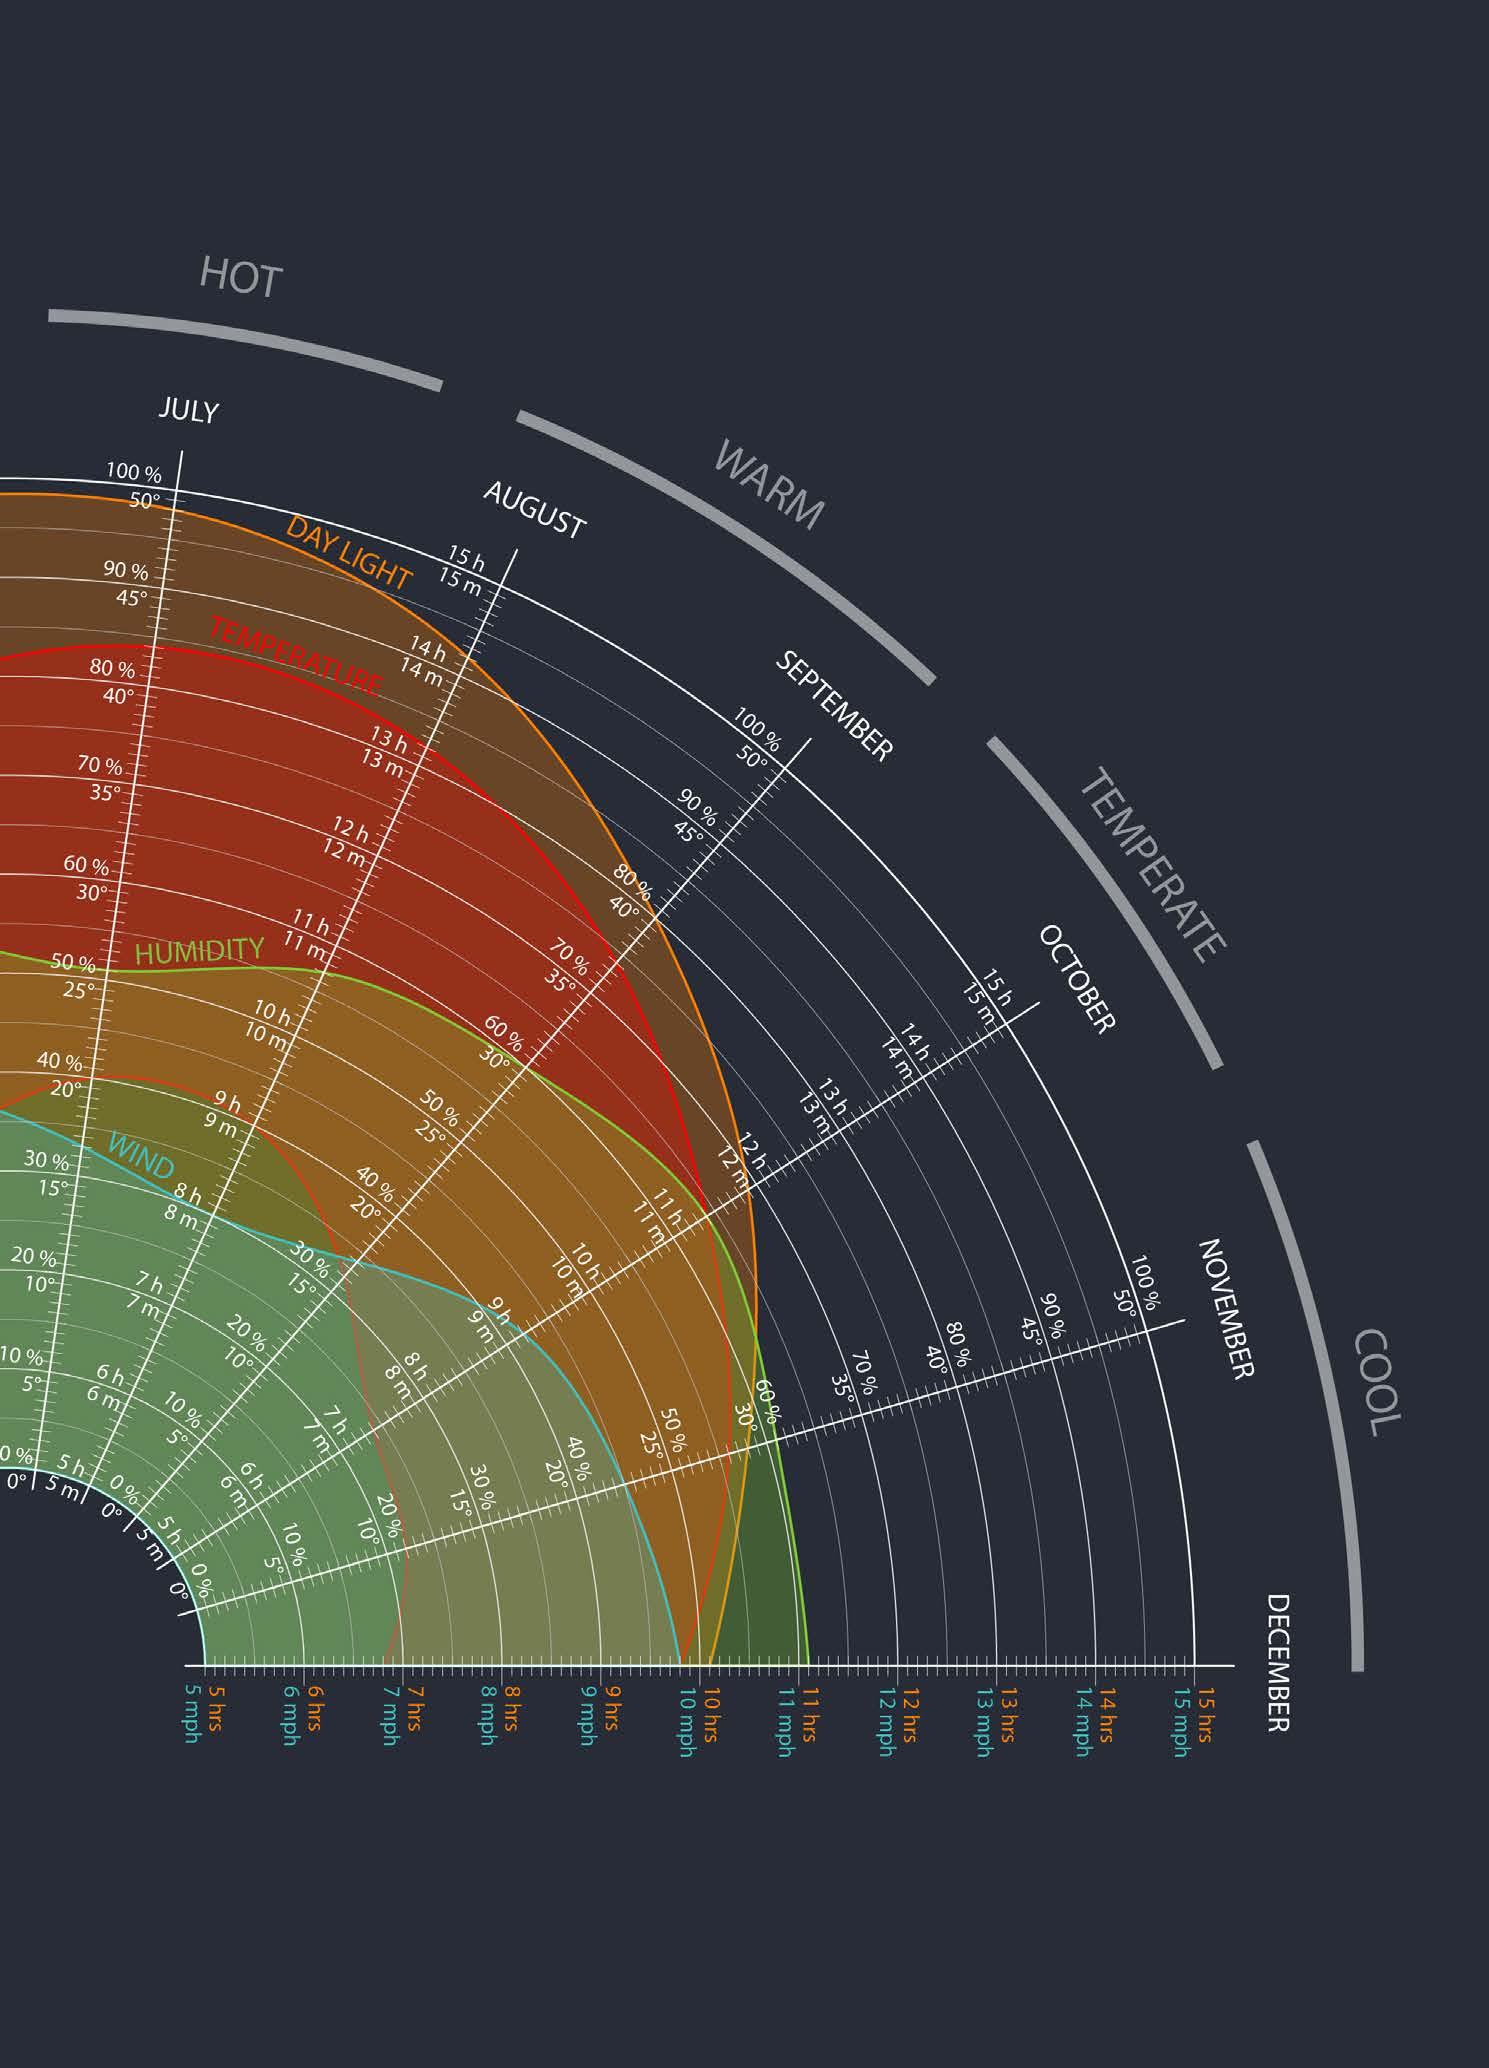
“El Ejido, Andalucia, Spain Weather Averages | Monthly Average High and Low Temperature | Average Precipitation and Rainfall Days | World Weather Online.” Accessed August 2, 2018. https://www.worldweatheronline.com/el-ejido-weather-averages/andalucia/es.aspx.
Domain Context
2.1.3. Horticulture Industry Inefficiencies
Desertification
Issue
Almeria “Mar de Plastico”
Context as a response to Issue
Water Overexploitation
Plastic Pollution
Greenhouse Inefficiencies
Human Needs
Main Problems in Context
IMAGE SOURCE. Photographer: Bernhard Lang
. “The Plastic Mosaic You Can See From Space: Spain’s Greenhouse Complex - Bloomberg.” Accessed September 19, 2018. https://www.bloomberg.com/news/ features/2015-02-20/the-mosaic-you-can-see-from-space-spain-s-massive-greenhouse-complex.
36
Domain
Context
2.1.3.1.
Crop Analysis
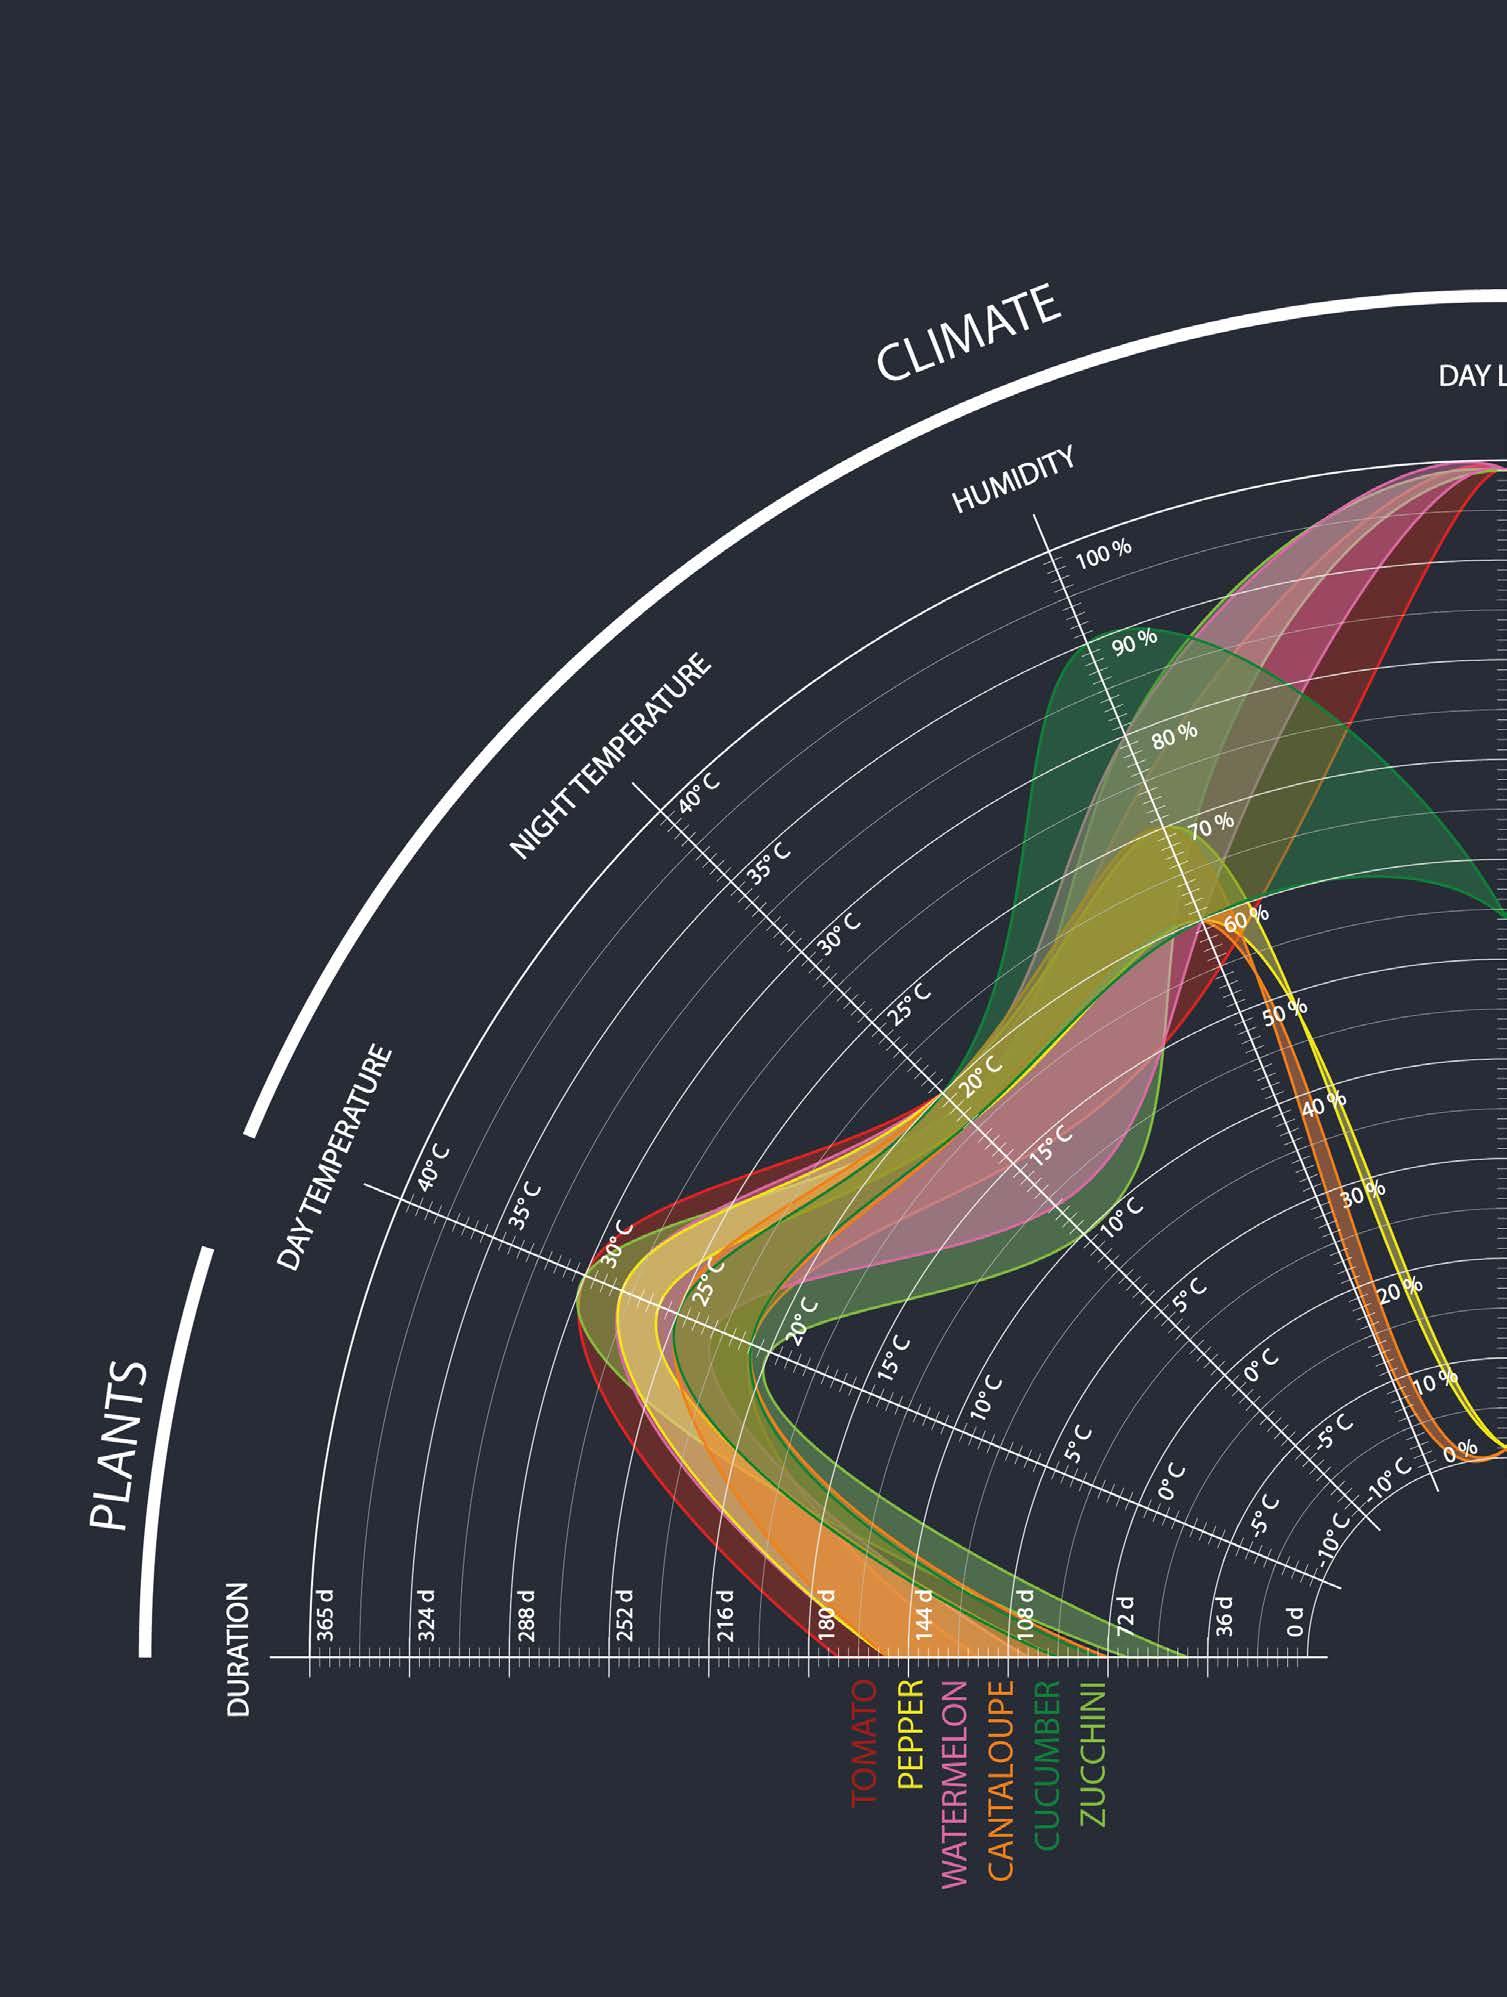
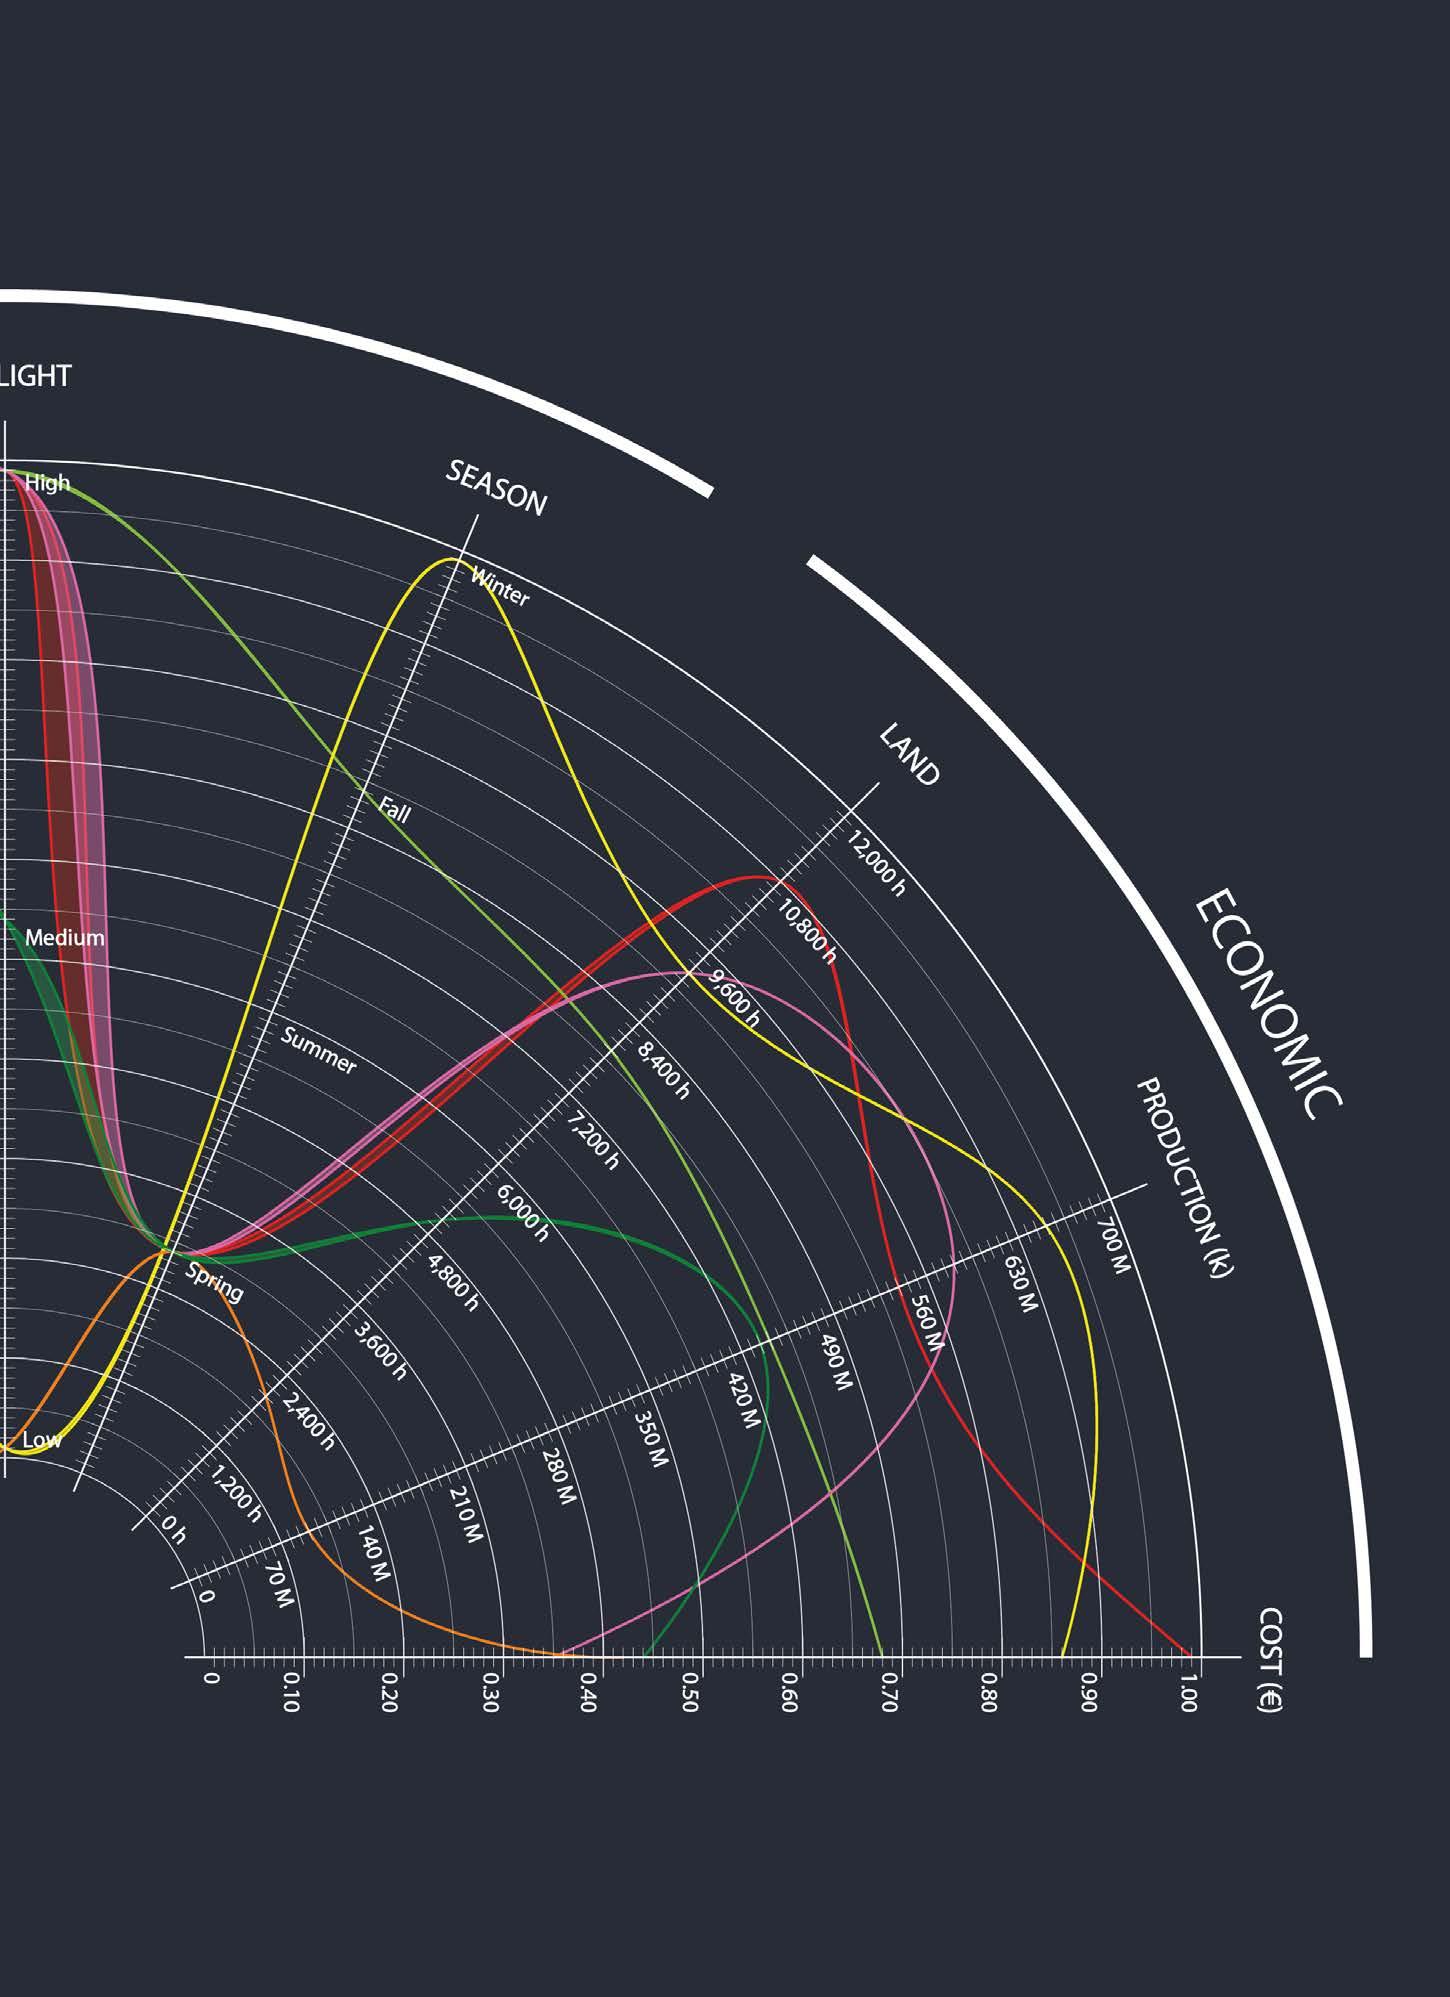
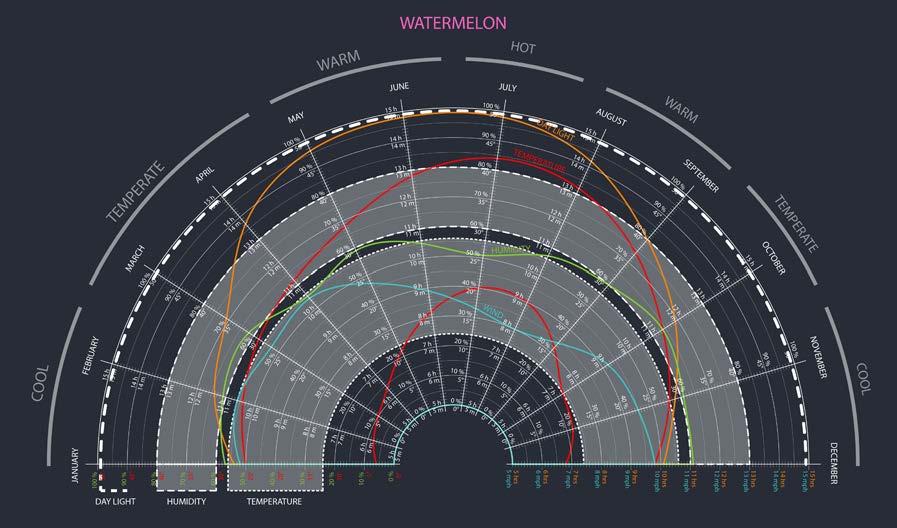
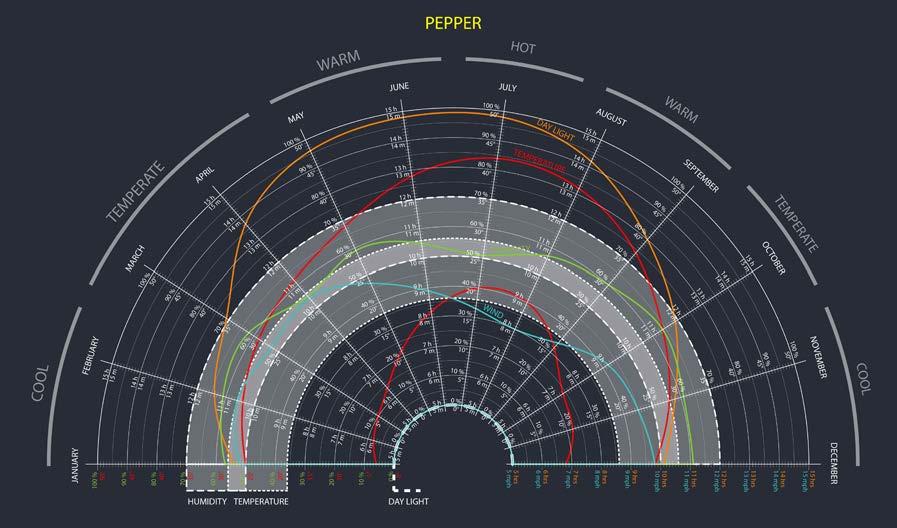
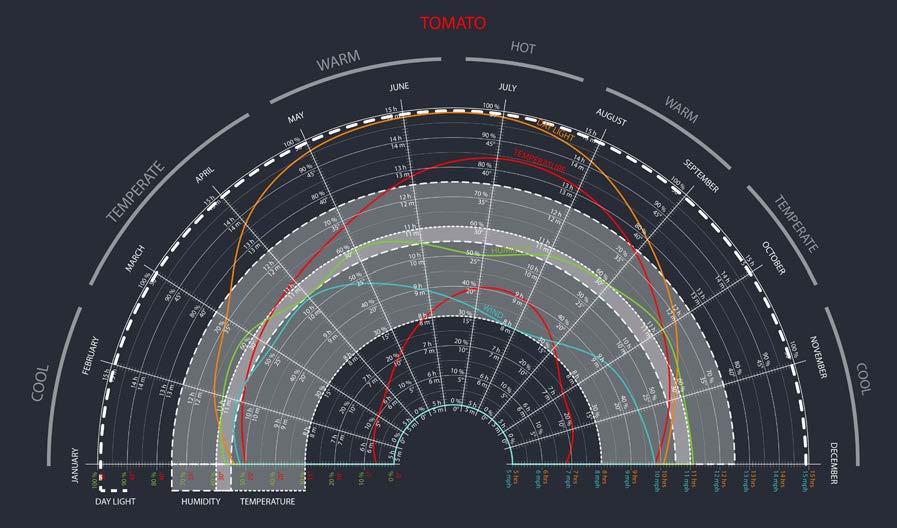
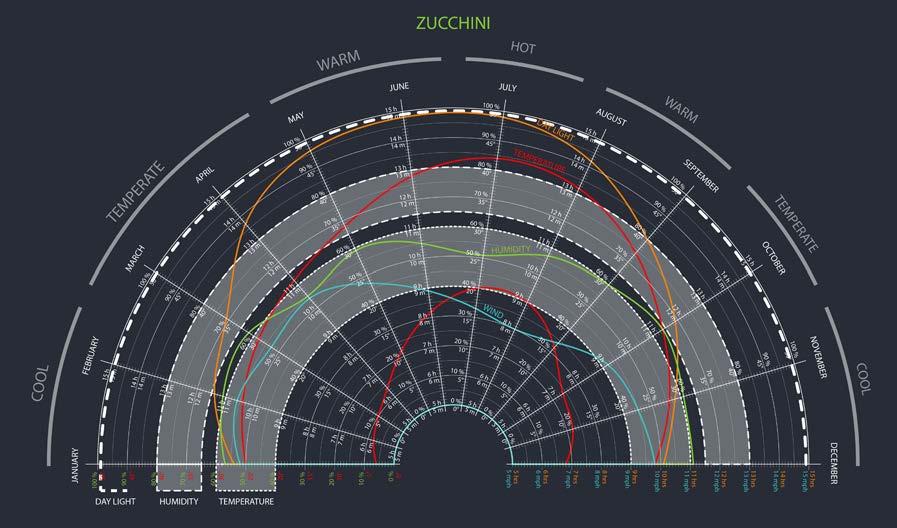
The 6 most important crops in the region were selected for a further research and analysis, which were overlaid in this diagram to compare the different plant parameters, climate parameters and economic information, for each one of the crops. As it can be seen from the diagram each one of the crops has different climate parameters to be consider for a proper growth, which means they need to be locates in different environments to create
Domain
Context
the right microclimate for each one of them. When it comes to the economic information it can be understood that there is a different amount of land being used for each crop, but that amount is not necessarily connected to the production or price. A good example is the tomato, which is the crop that is occupying the most amount of land, but is the third one with the biggest production, following pepper and watermelon, but again in the price the tomato is the most expensive by kilogram.
SOURCES. “Costes Tomate.” Accessed July 10, 2018. http://www.hortoinfo.es/index.php/5515-costes-tom-100417. Ferre, Francisco Camacho. “pimiento bajo invernadero,” n.d., 17 Food, Colaboradores Journey of. “Soy de Temporada.” Accessed July 10, 2018. https://soydetemporada.es Food, Colaboradores Journey of. “Soy de Temporada.” Accessed July 11, 2018. https://soydetemporada.es. . “Pepino.” Vegacañada, July 11, 2018. http://www.vegac.com/pepino.
38
Domain
Context
SOURCES. “Cherry_HortInt.Pdf.” Accessed July 10, 2018. http://aulavirtual.agro.unlp.edu.ar/pluginfile.php/14584/mod_resource/content/0/cherry_HortInt.pdf. “Hortoinfo Tomate.” Accessed July 10, 2018. http://www.hortoinfo.es/index.php/informes/cultivos/5897-inf-tomate-2017. “Costes Tomate.” Accessed July 10, 2018. http://www.hortoinfo.es/index.php/5515-costes-tom-100417. “Campaña de Tomate Primavera En Almería.” Seminis, July 10, 2018. https://seminis.es/ tomate-primavera-en-almeria/ “Hortoinfo Sandia.” Accessed July 10, 2018. http://www.hortoinfo.es/index.php/6900-costes-cult-sand-160418. “La sandía, ¿cómo cultivarla? Por María Pérez, técnica agrícola.” portagrano.net. Accessed July 10, 2018..
39
Tomato:
Domain
Context
There is a great variety of tomatoes such as cherry tomato, tomato beef or green tomato, and during the spring many different types of tomato are planted, especially green, which has been directed a lot more in recent years for the national market. The best season for the tomato is in spring which is a time of the year with good amount of hours of daylight and also has the right temperatures and humidity levels for this crop. The height of this plant is around 1.80m to 2.40m, and the best harvesting time is around 120 to 170 days. When it comes to the economic information in the last year more than 10,836 hectares of land were used for this crop, as well as a production of 537,602,747 kilos, and sold at €0.99 per kilo.
Pepper:
There are different types of peppers in Almeria, Italian, spicy, and the most commercial the sweet pepper, also called California, which is the most popular in the European market. The best season for the pepper is in winter which is a time of less daylight and also the right temperatures and humidity levels for this crop. The height of this plant is around 0.50m to 2.50m, and the best harvesting time is around 90 to 150 days. When it comes to the economic information in the last year more than 9,270 hectares of land were used for this crop, as well as 664,340,000 kilos of pepper were produced, and sold at €0.86 per kilo.
Watermelon:
This crop has a creeping and very branched radicular system. Currently, more than 90% of the watermelon plantations are grafted in order to avoid neck and root problems. There are different types of watermelons, white, mini, black with seeds or without, and more than 50% of the production is destined for export. The best season for watermelon is in spring which is a time of the year with good amount of hours of daylight and also has the right temperatures and humidity levels for this crop. The best harvesting time is around 100 to 150 days, and when it comes to the economic information in the last year more than 9,208 hectares of land were used for this crop, as well as a production of 558,000,000 kilos, and sold at €0.35 per kilo.
SOURCES. “Pimientos Todo El Año. Agricultores Que van a Un Solo Cultivo | Joseantonioarcos.Es.” Accessed July 10, 2018. https://joseantonioarcos. es/2016/08/19/agricultores-pimientos-almeria/ “Hortoinfo Pimiento.” Accessed July 10, 2018. http://www.hortoinfo.es/index.php/informes/cultivos/6011-inf-pim-2017. Ferre, Francisco Camacho. “pimiento bajo invernadero,” n.d., 17 “Variedades de Pimiento En Almería - Publicaciones.Poscosecha. Com.” Accessed July 10, 2018. http://publicaciones.poscosecha.com/es/pimiento-tomate/108-variedades-de-pimiento-en-almeria.html. http://www.portagrano. net/home/detallenoticia.php?idnoticia=386. Food, Colaboradores Journey of. “Soy de Temporada.” Accessed July 10, 2018. https://soydetemporada.es..
40
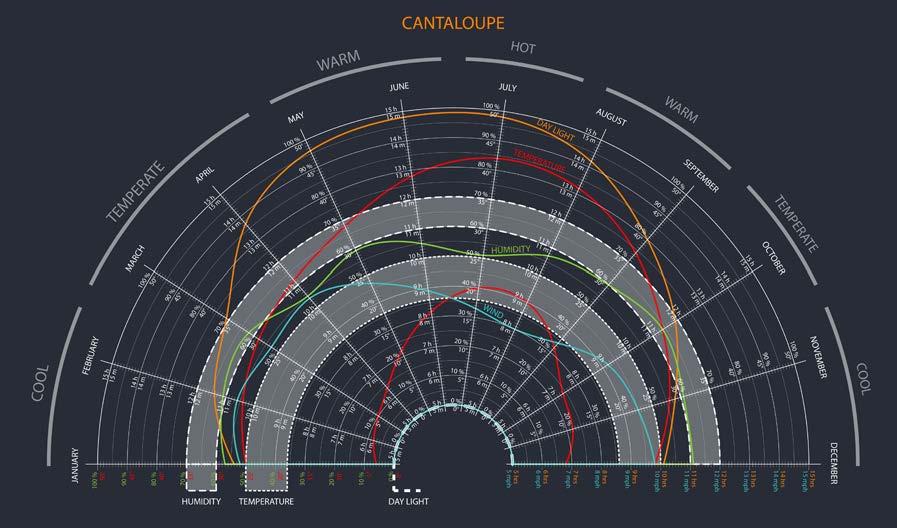
Cantaloupe:
Domain
Context
There are different types of cantaloupe depending on their place of origin and their cultivation characteristics, but in Almeria, the most common variety is toad skin, and is one of the largest types of melons, with an average weight of 2.5kg. The best season for the cantaloupe is spring which is the time of the year that has the right temperatures and humidity levels for this crop, but when it comes to the daylight spring has more hours of daylight than what is needed for the cantaloupe, so it is important take shading into consideration for this crop. The best harvesting time is around 70 to 100 days. When it comes to the economic information in the last year more than 2,042 hectares of land were used for this crop, 93,500,000 kilos of cantaloupe were produced, and were sold at €0.42 per kilo.
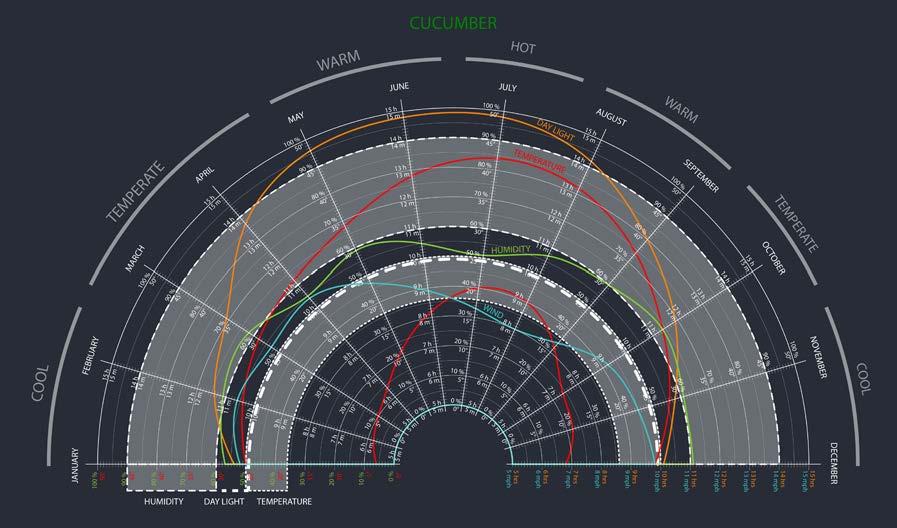
Cucumber:
There is a wide variety of cucumbers, these types are divided depending on the area where they were grown, some of the Almeria cucumbers are the Borja, Pradera or Benito. To obtain a plant whose fruits are adapted to the market and the area of cultivation, the choice of the variety is very important, some aspects to take into account are the length of the fruit and the uniformity. The best season for cucumber is in spring which is a time of the year with nice amount of hours of daylight and also has the right temperatures and humidity levels for this crop. The best harvesting time is around 75 to 90 days, and when it comes to the economic information in the last year more than 5,026 hectares of land were used for this crop, and had a production of 438,870,000 kilos, and was sold at €0.44 per kilo.
Zucchini:
Zucchini is a fleshy berry, without central cavity, and is green or yellow. The skin is smooth and very sensitive to chafing. It is elongated, cylindrical and with a very short peduncle. Usually to improve the quality of the fruit it should be guided, although there are types of zucchini that cannot be guide do to the weight of the zucchini. The best season for the zucchini is fall which is the time of the year that has the right temperatures and humidity levels for this crop, this crop also requires high daylight which during fall it is ok for the plant parameters. Summer is actually the season with more hours of sunlight but during that season the farmers usually don’t plant any crops to let the soil recuperate. The best harvesting time is around 45 to 65 days, and when it comes to the economic information in the last year more than 7,863 hectares of land were used for this crop, 445,057,000 kilos of zucchini were produced, and were sold at €0.68 per kilo.
SOURCES. “1337161080melon_baja.Pdf.” Accessed July 11, 2018. https://www.juntadeandalucia.es/export/drupaljda/1337161080melon_baja.pdf. Food, Colaboradores Journey of. “Soy de Temporada.” Accessed July 11, 2018. https://soydetemporada.es. “Hortoinfo Pepino.” Accessed July 11, 2018. http://www.hortoinfo.es/index.php/informes/cultivos/518-cultivo-del-pepino. “Costes Pepino.” Accessed July 11, 2018. http://www.hortoinfo.es/index.php/5602-costes-pep-080517. Pepino.” Vegacañada, July 11, 2018. http://www.vegac.com/pepino.
41
Domain Context
SOURCES. “Hortoinfo Calabacín.” Accessed July 11, 2018. http://www.hortoinfo.es/index.php/3462-prod-ue-calabacin-120815. “22-Cultivos-Horticolas-Al-Aire-Libre.Pdf.” Accessed July 11, 2018. http://www.publicacionescajamar.es/uploads/cultivos-horticolasal-aire-libre/22-cultivos-horticolas-al-aire-libre.pdf. “Calabacín.” Vegacañada, July 11, 2018. http://www.vegac.com/calabacin.
42
Domain Context

Domain
Context
Water Over-exploitation
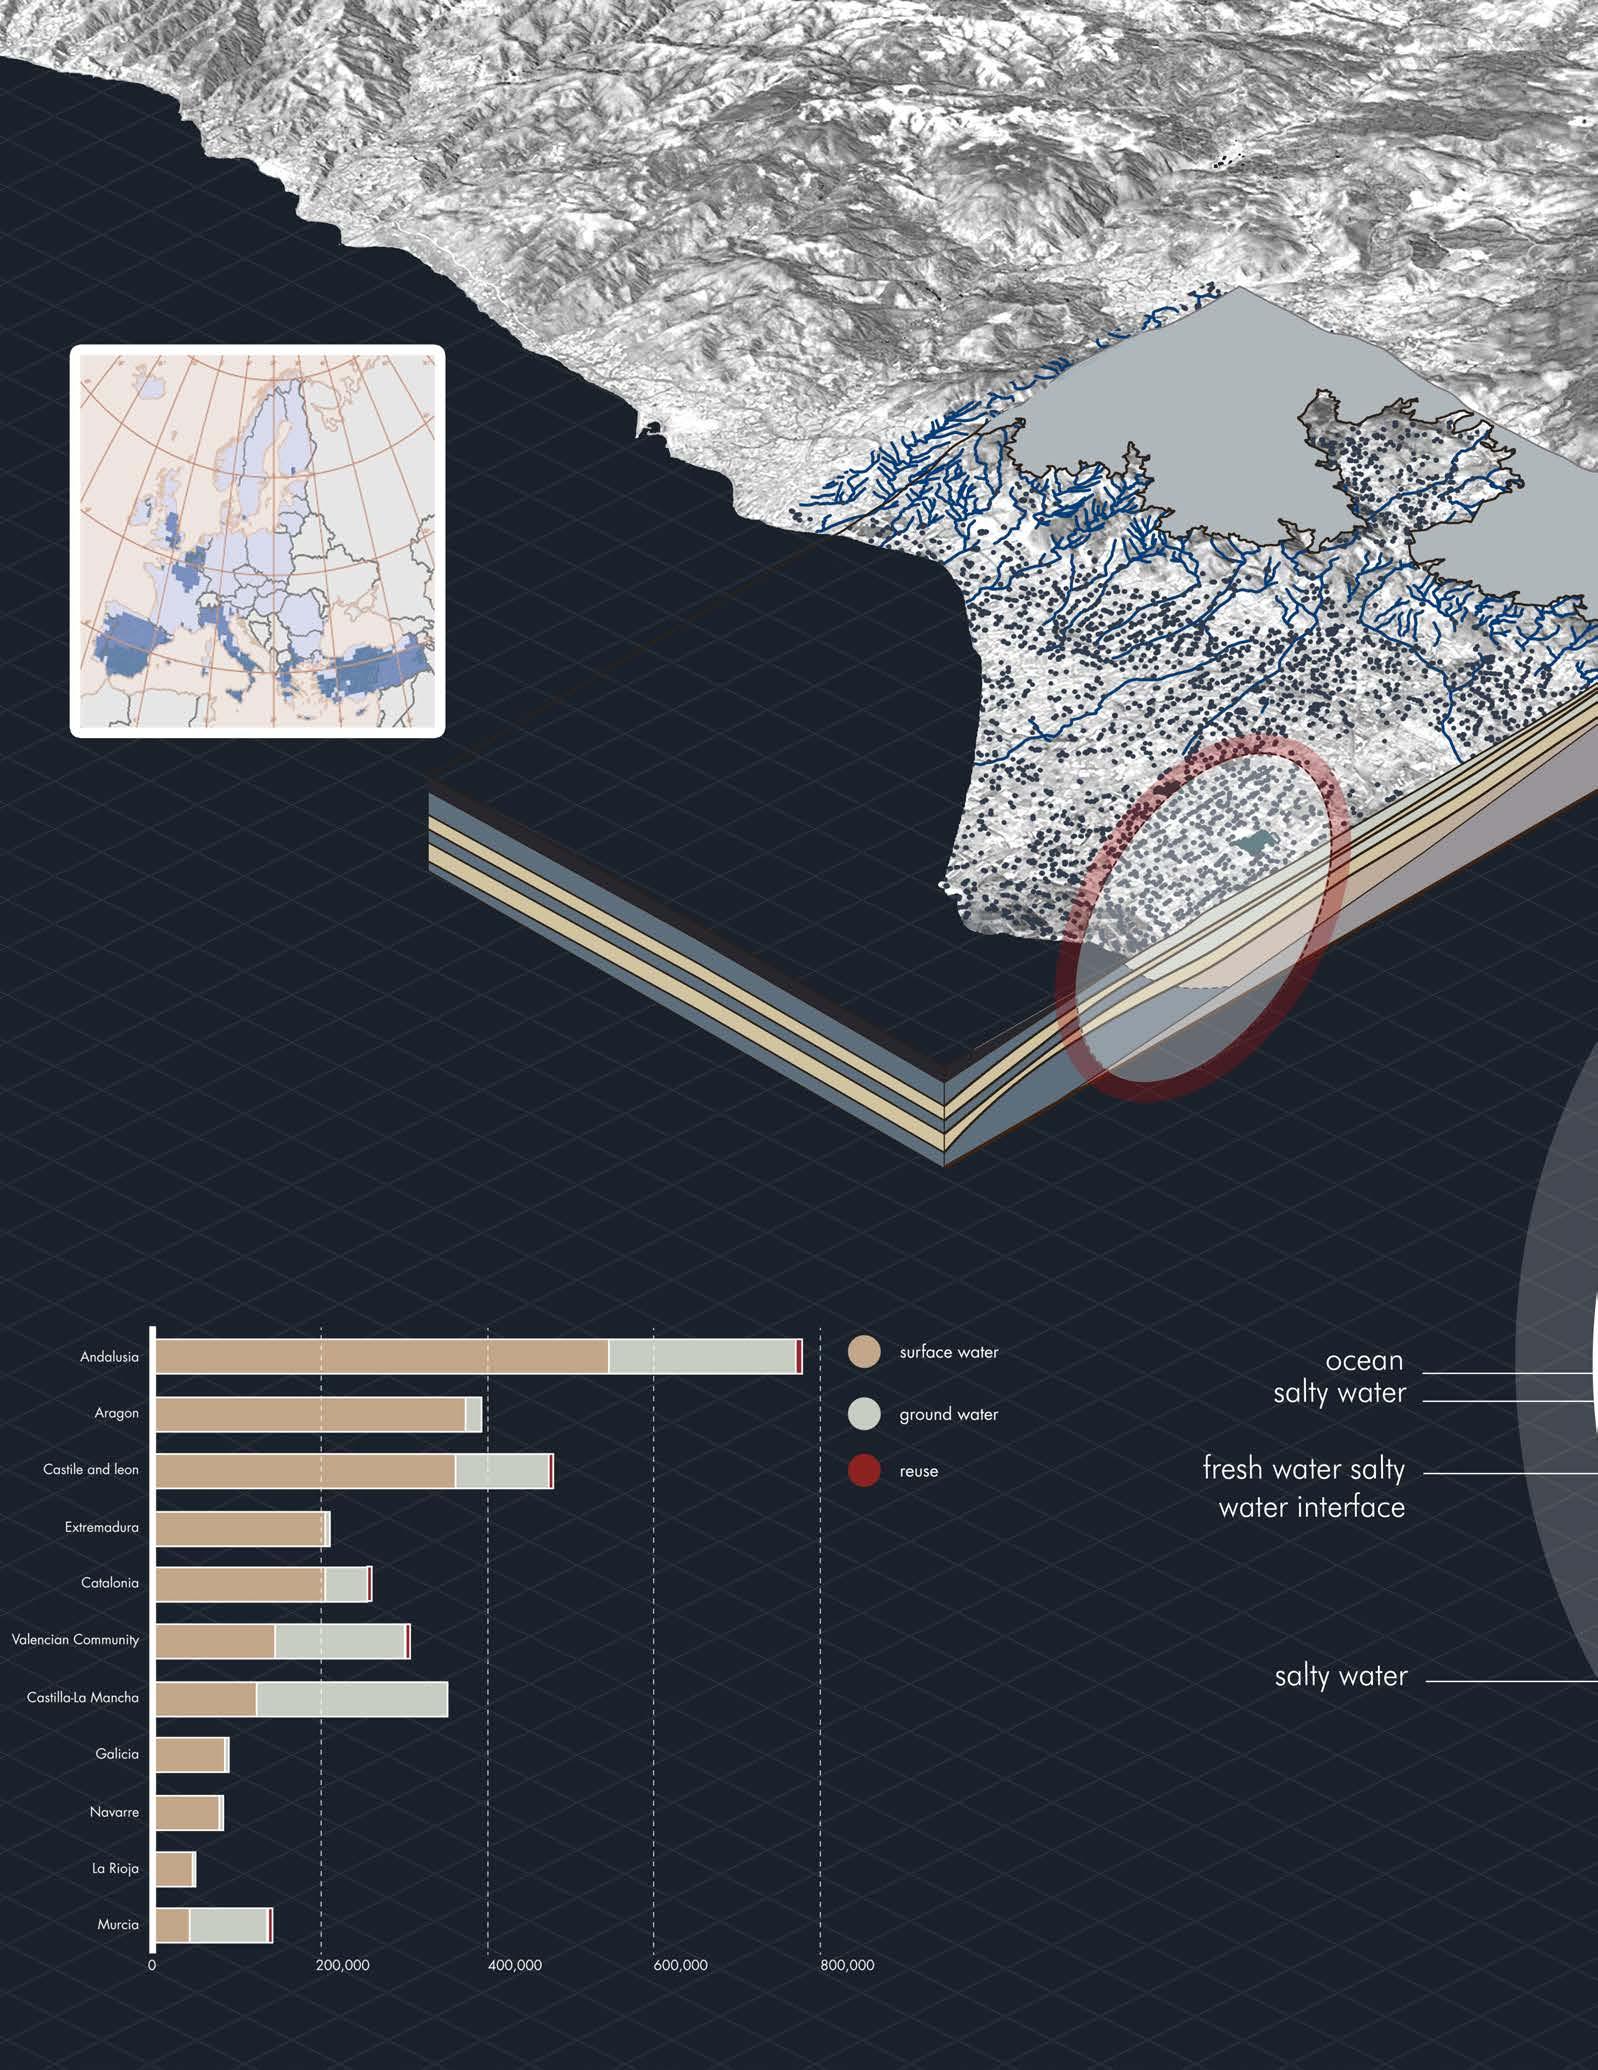
2.1.3.2. Horticulture industry is water intensive consumptive industry. In Spain, Agriculture takes up the more than 60% percent of the nation’s water usage [1] . By province, Andalusia province where the project is located, ranks the first in term of surface water and second in groundwater usage.
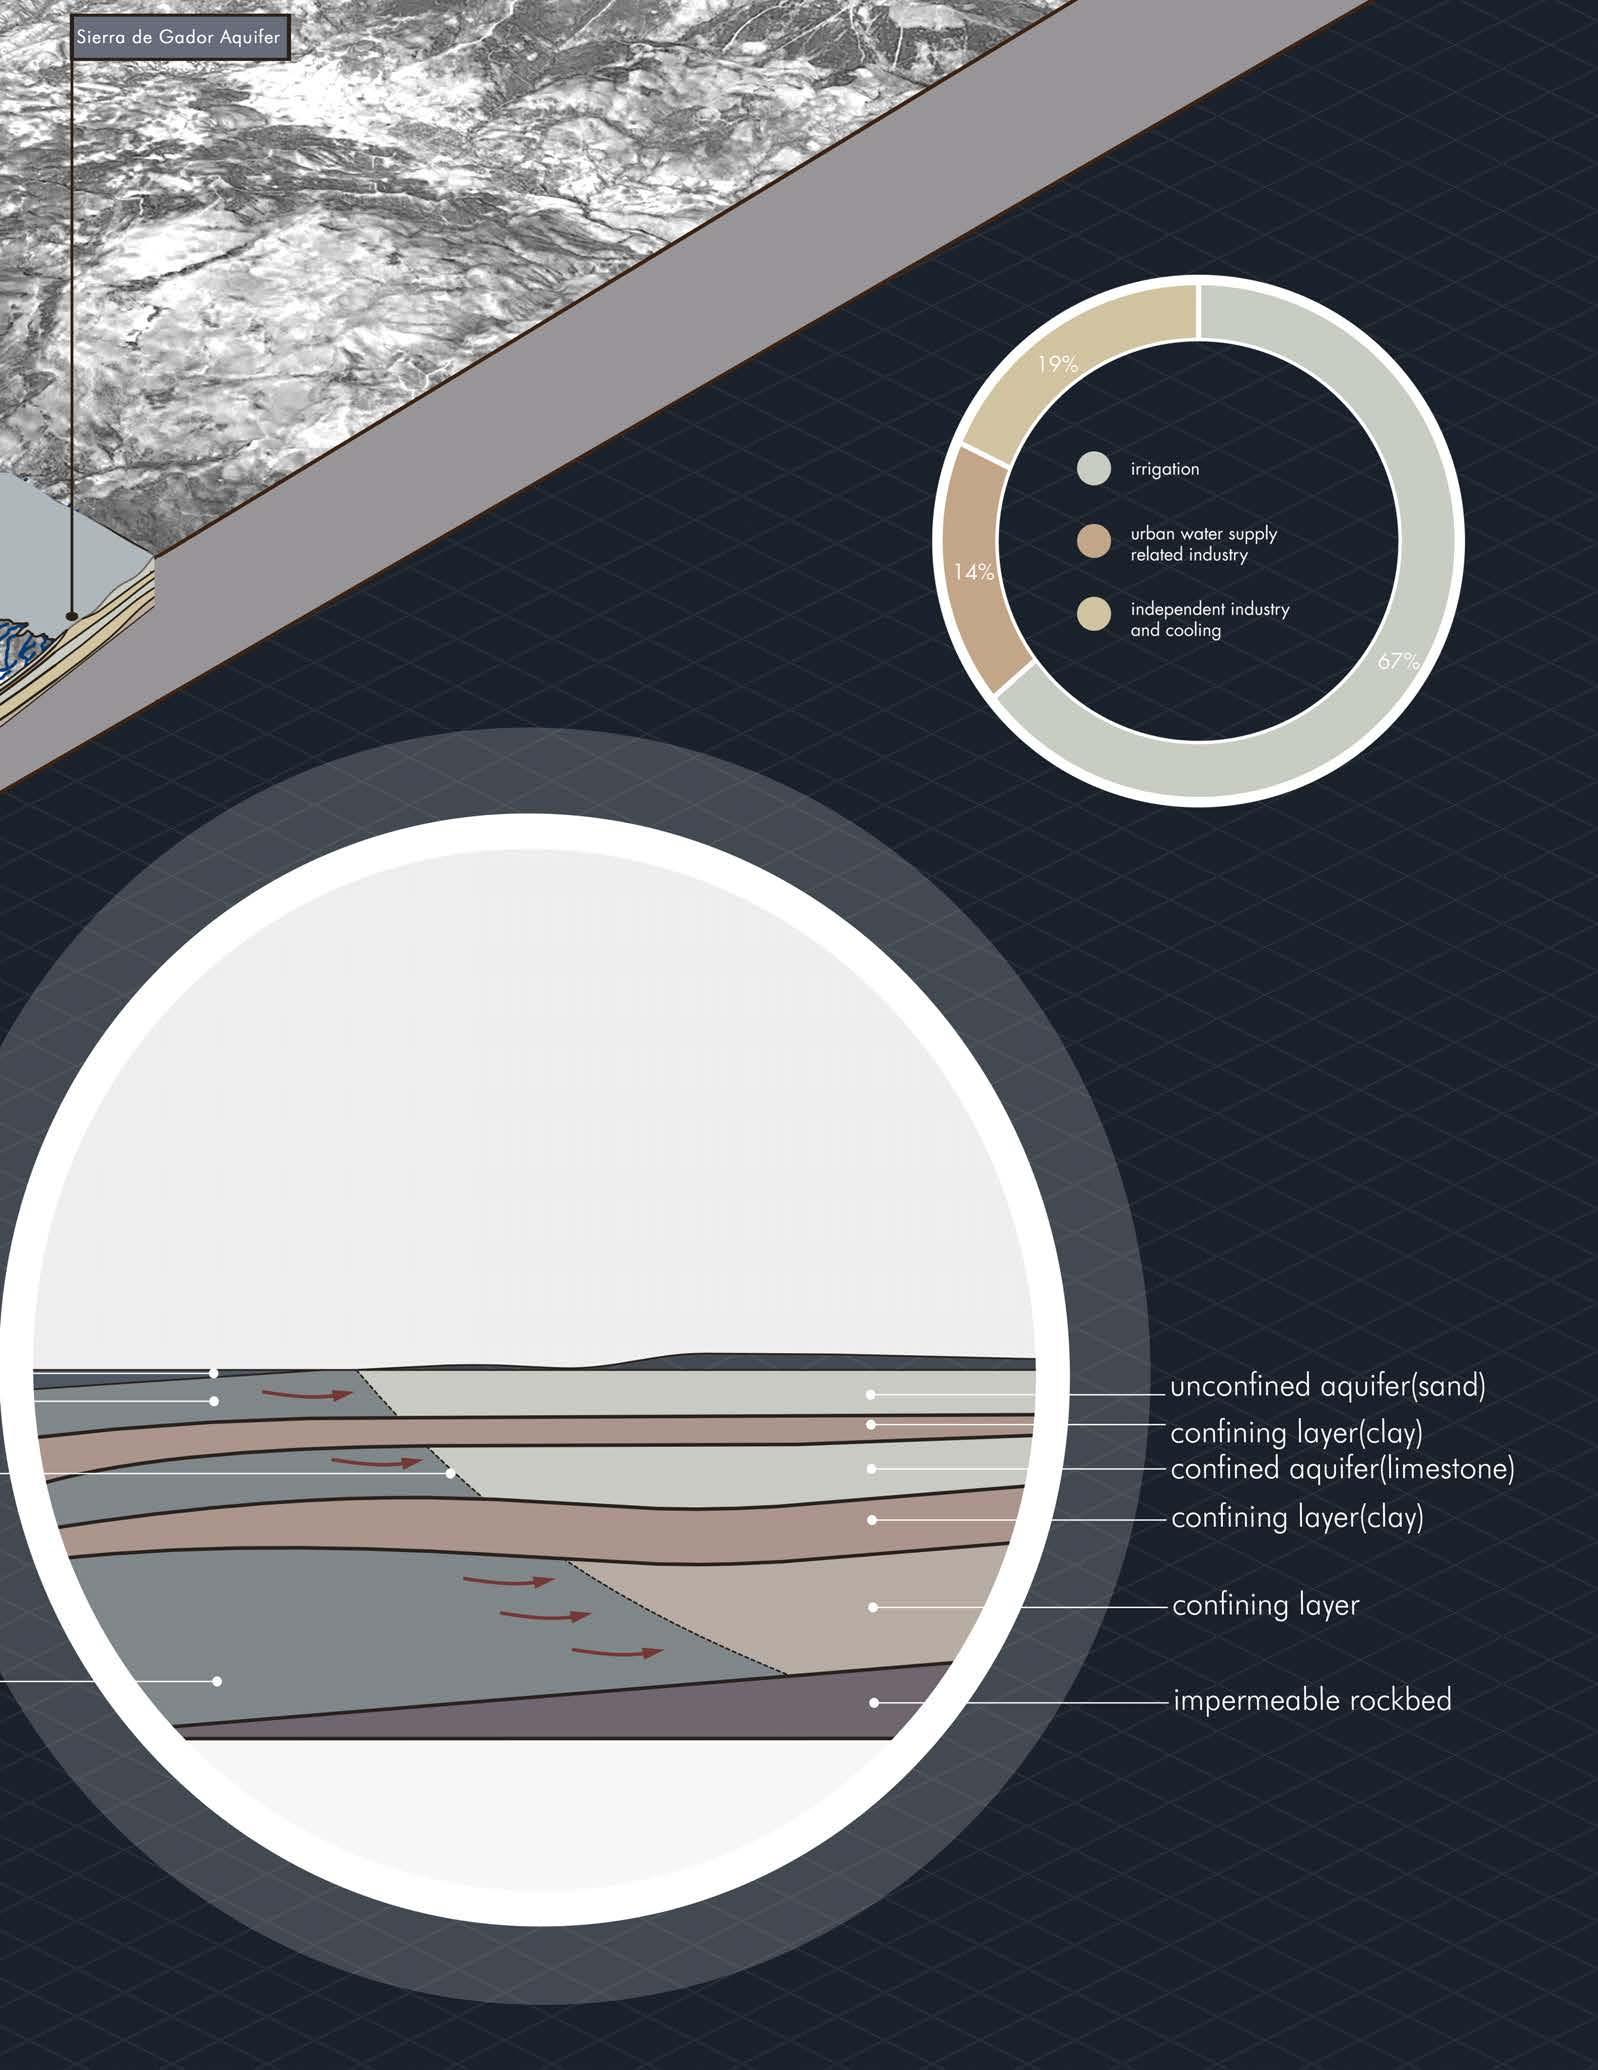
Within the desertification context, Horticulture industry in El Ejido is totally dependent on the of surface water and extraction groundwater due to the lack of precipitation. Local aquifer is fossil aquifer, which is renewable fresh water resource. The over extraction of the groundwater is so called ‘water mining’. This has imposed high water stress in the region, according to United Nation’s water survey.
According to the report by WWF [2] , The consequence of the water mining, could be summarized as following:
In the natural water cycle, healthy aquifer charges the local surface riverbed. Low water level of the local aquifer will alternate the charging direction resulting the surface water being drained thus intensifying the groundwater mining. This positive feedback accelerate the desertification.
Lower groundwater level will also induce the costal line ground brackish water infiltrating to the aquifer contamination. Quantitative relation demonstrate the extent of the issue can be described using Ghyben-Herzberg Principle,’every unit depth (m, ft) drop in the water table, there will be a corresponding 40 unit depth rise in the fresh water-sea water interface.’ [3]
SOURCES. [1] M.Ramon Llamas,Garrido,Alberto,Lessons from Intensive Groundwater Use in Spain: Economic and Social Benefits and Conflict. Department of Geodynamics, Complutense University of Madrid, Department of Agricultural Economics, Technical University of Madrid. [2] WWF(World Wildlife Fund) Adena,Illegal water use in Spain,Causes,effects and solutions, May 2006. [3] “Coastal Aquifers; Groundwater at Sea - Geological Digressions.” Accessed September 19, 2018. https://www.geological-digressions.com/coastal-aquifers-groundwater-at-sea/.
P54-55 Graph Source. Water Usage in Spain Chart redrew based on Spain’s groundwater use summary(estimated from several sources)
(Source: Llamas et al., 2001) Water Usage by Province Chart redrew based on Descriptive elements of irrigation in Spain(in hectares). (Source: MAPYA, 2001) Water stress in European river basins:European Environment Agency, http://www.eea. europa.eu/data-and-maps/ figures/water-stress-in-europe-2000and-2030 ) Section diagram redrew based on information from “Coastal Aquifers; Groundwater at Sea - Geological Digressions.” Accessed September 19, 2018. https://www.geological-digressions.com/coastal-aquifers-groundwater-at-sea/.
IMAGE SOURCES. “Daily Overview: Captivating Satellite Images of Earth.” Yatzer, April 28, 2014. https://www.yatzer.com/daily-overview-captivating-satellite-images-earth.
44
 Water Stress Index Map
Water Usage by Province
Water Stress Index Map
Water Usage by Province
 Water Usage in Spain
47
Domain

Context
Plastic Pollution
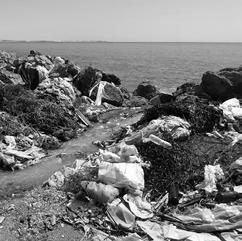
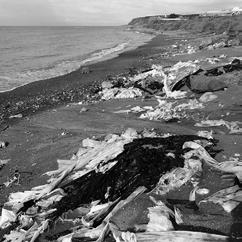
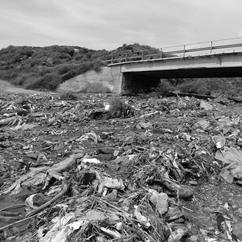
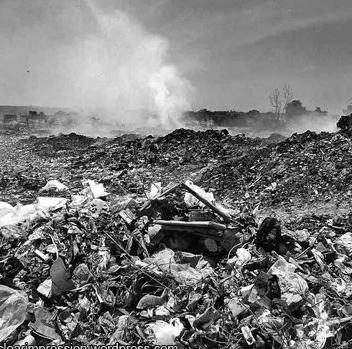
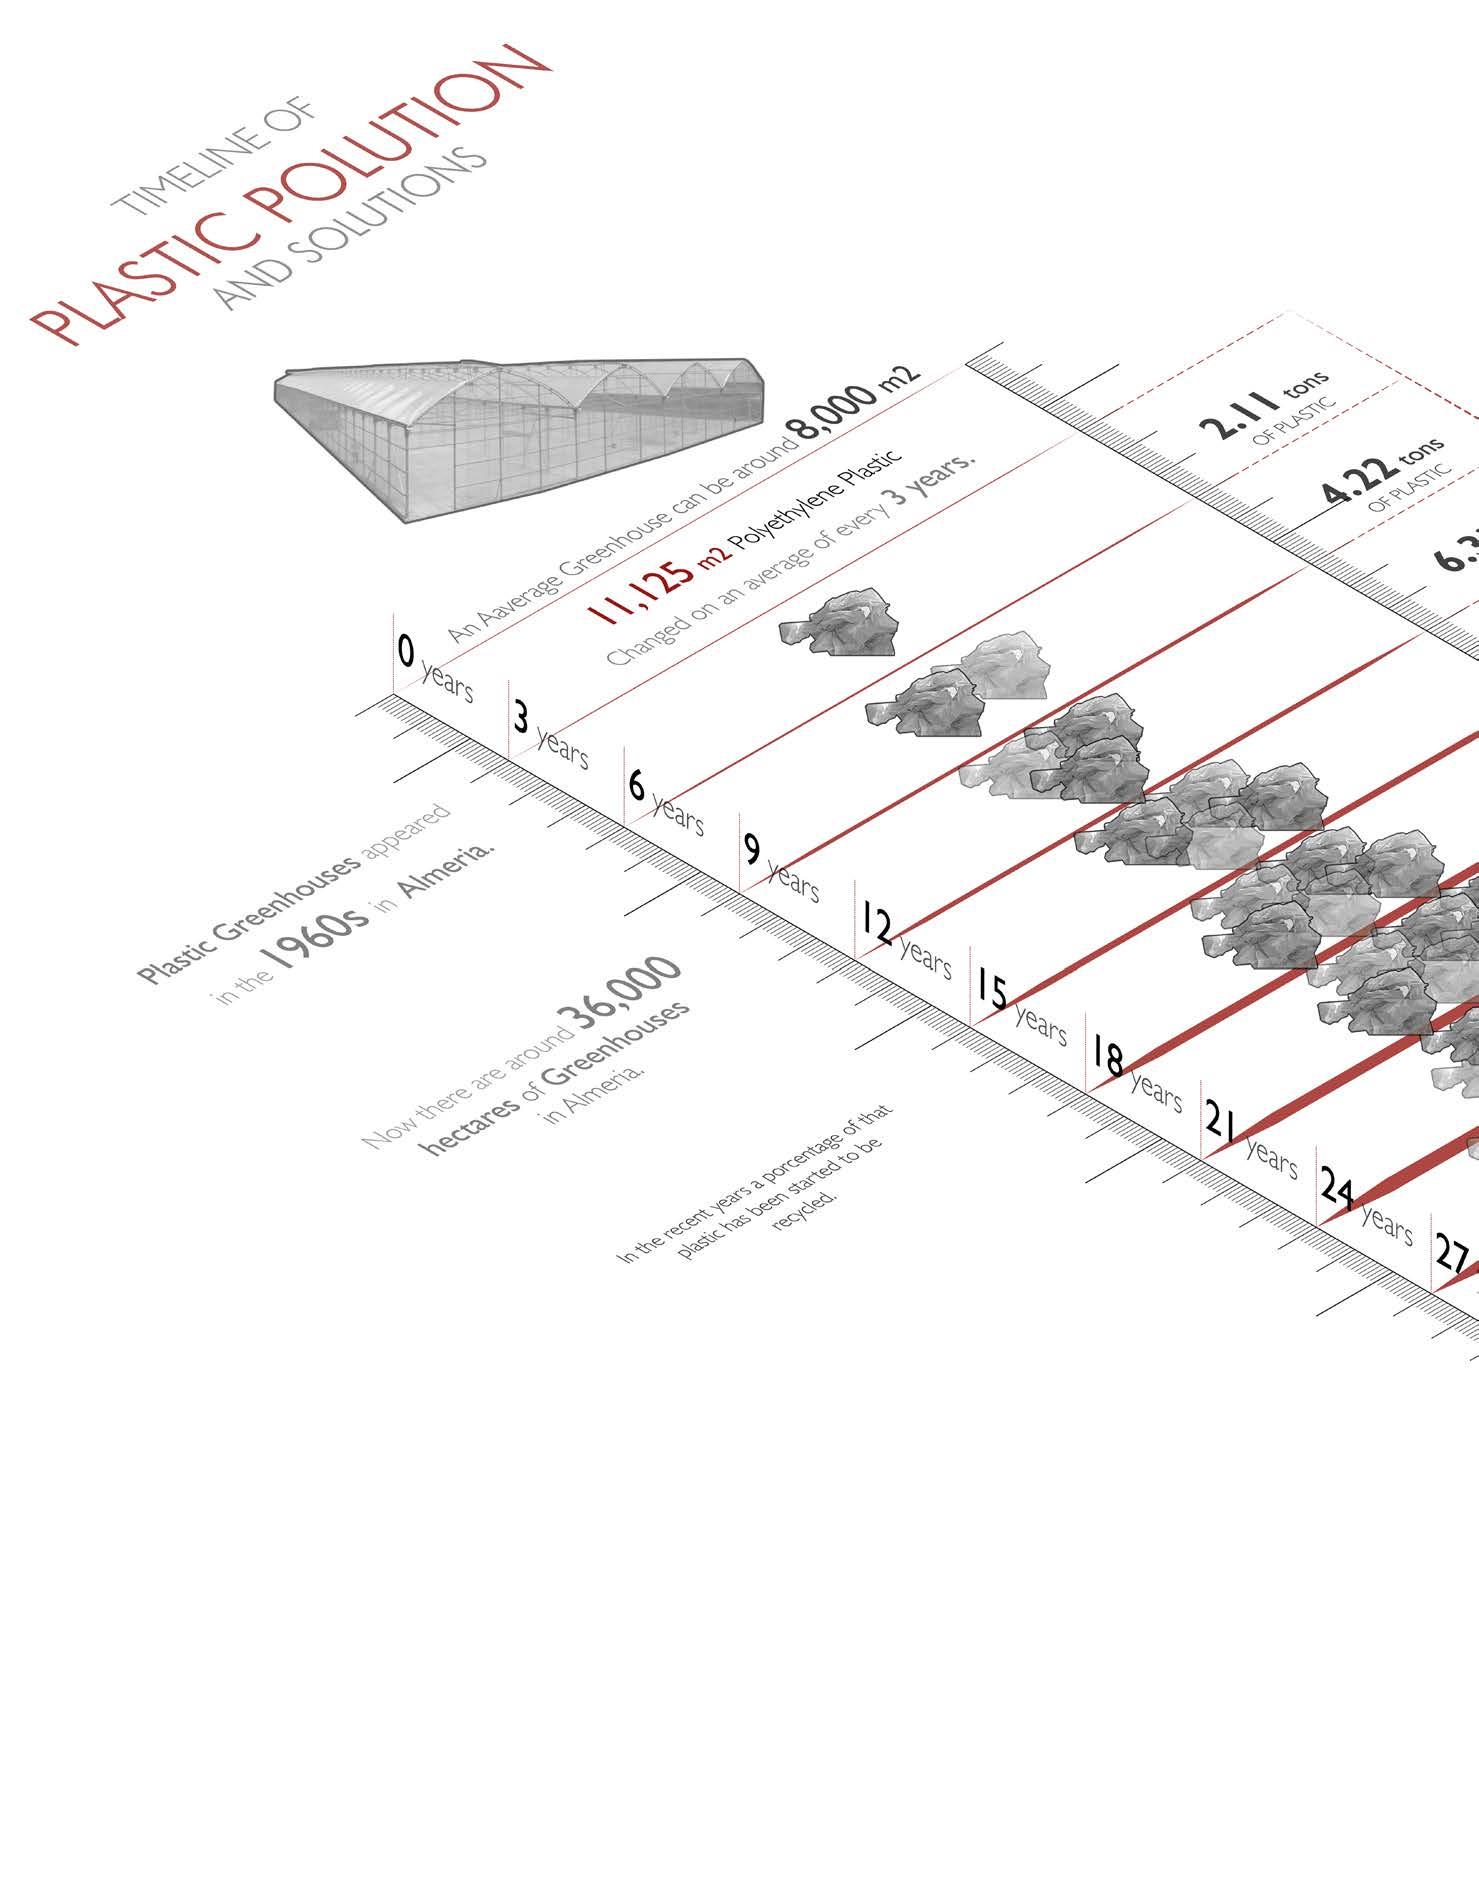
2.1.3.3. Although plastic manufacturing and recycling companies has been slowly establishing around the region, it still does not come near to address the overwhelming amount of plastic waste. The greenhouses in Almeria produce around 30,000 tons of plastic waste per year. (1) The non-recycled plastics are either piled up or burned.
Observation on the coast of El Pozuelo have been made where plastic waste piled up calf-high. Plastic waste has made an ecological impact when it blocked the riverbeds or ended up in the ocean. In 2013, The death of a sperm whale found on the south coast of spain had been linked with Almeria when it was found to have swallowed 17 kg of plastic which was dumped into the ocean.
The 80,000 acres of plastic greenhouses covering Almería’s two greenhouse growing areas, the Campo de Dalias and Campo de Nijar. Greenhouses in Almería produce 30,000 tons of plastic and one million tons of organic waste per year (The Olive Press 2007b; Webster 2001).
IMAGE SOURCES. BBC. “The Mediterranean Has a Serious Plastic Problem.Pic.Twitter.Com/0yQxNvQoNv.” Tweet. @bbc (blog), October 30, 2018. https://twitter.com/bbc/status/1057195674683535360?lang=en.
Valera, D. L., L. J. Belmonte, F. D. Molina-Aiz, and A. López. “Greenhouse agriculture in Almería.” A Comprehensive Techno-Economic Analysis, (2016). Nisen, A et al. “L’éclairement natural de serres” Edition I. (1969)
“Instalaciones agrícolas | ININSA, Invernaderos y Equipamientos de Alta Tecnología.” Accessed December 29, 2018. https://www.fabricanteinvernaderos.com/ category/blog/instalaciones-agricolas/.
“La Junta Pone En Marcha La Campaña de Retirada de Plásticos Agrícolas En Zonas de Cultivo y Cauces Fluviales — Huelva24.” Accessed December 29, 2018. http://huelva24.com/not/117415/la-junta-pone-en-marcha-la-campana-de-retirada-de-plasticos-agricolas-en-zonas-de-cultivo-y-cauces-fluviales/.
48
Domain Context
Domain Context
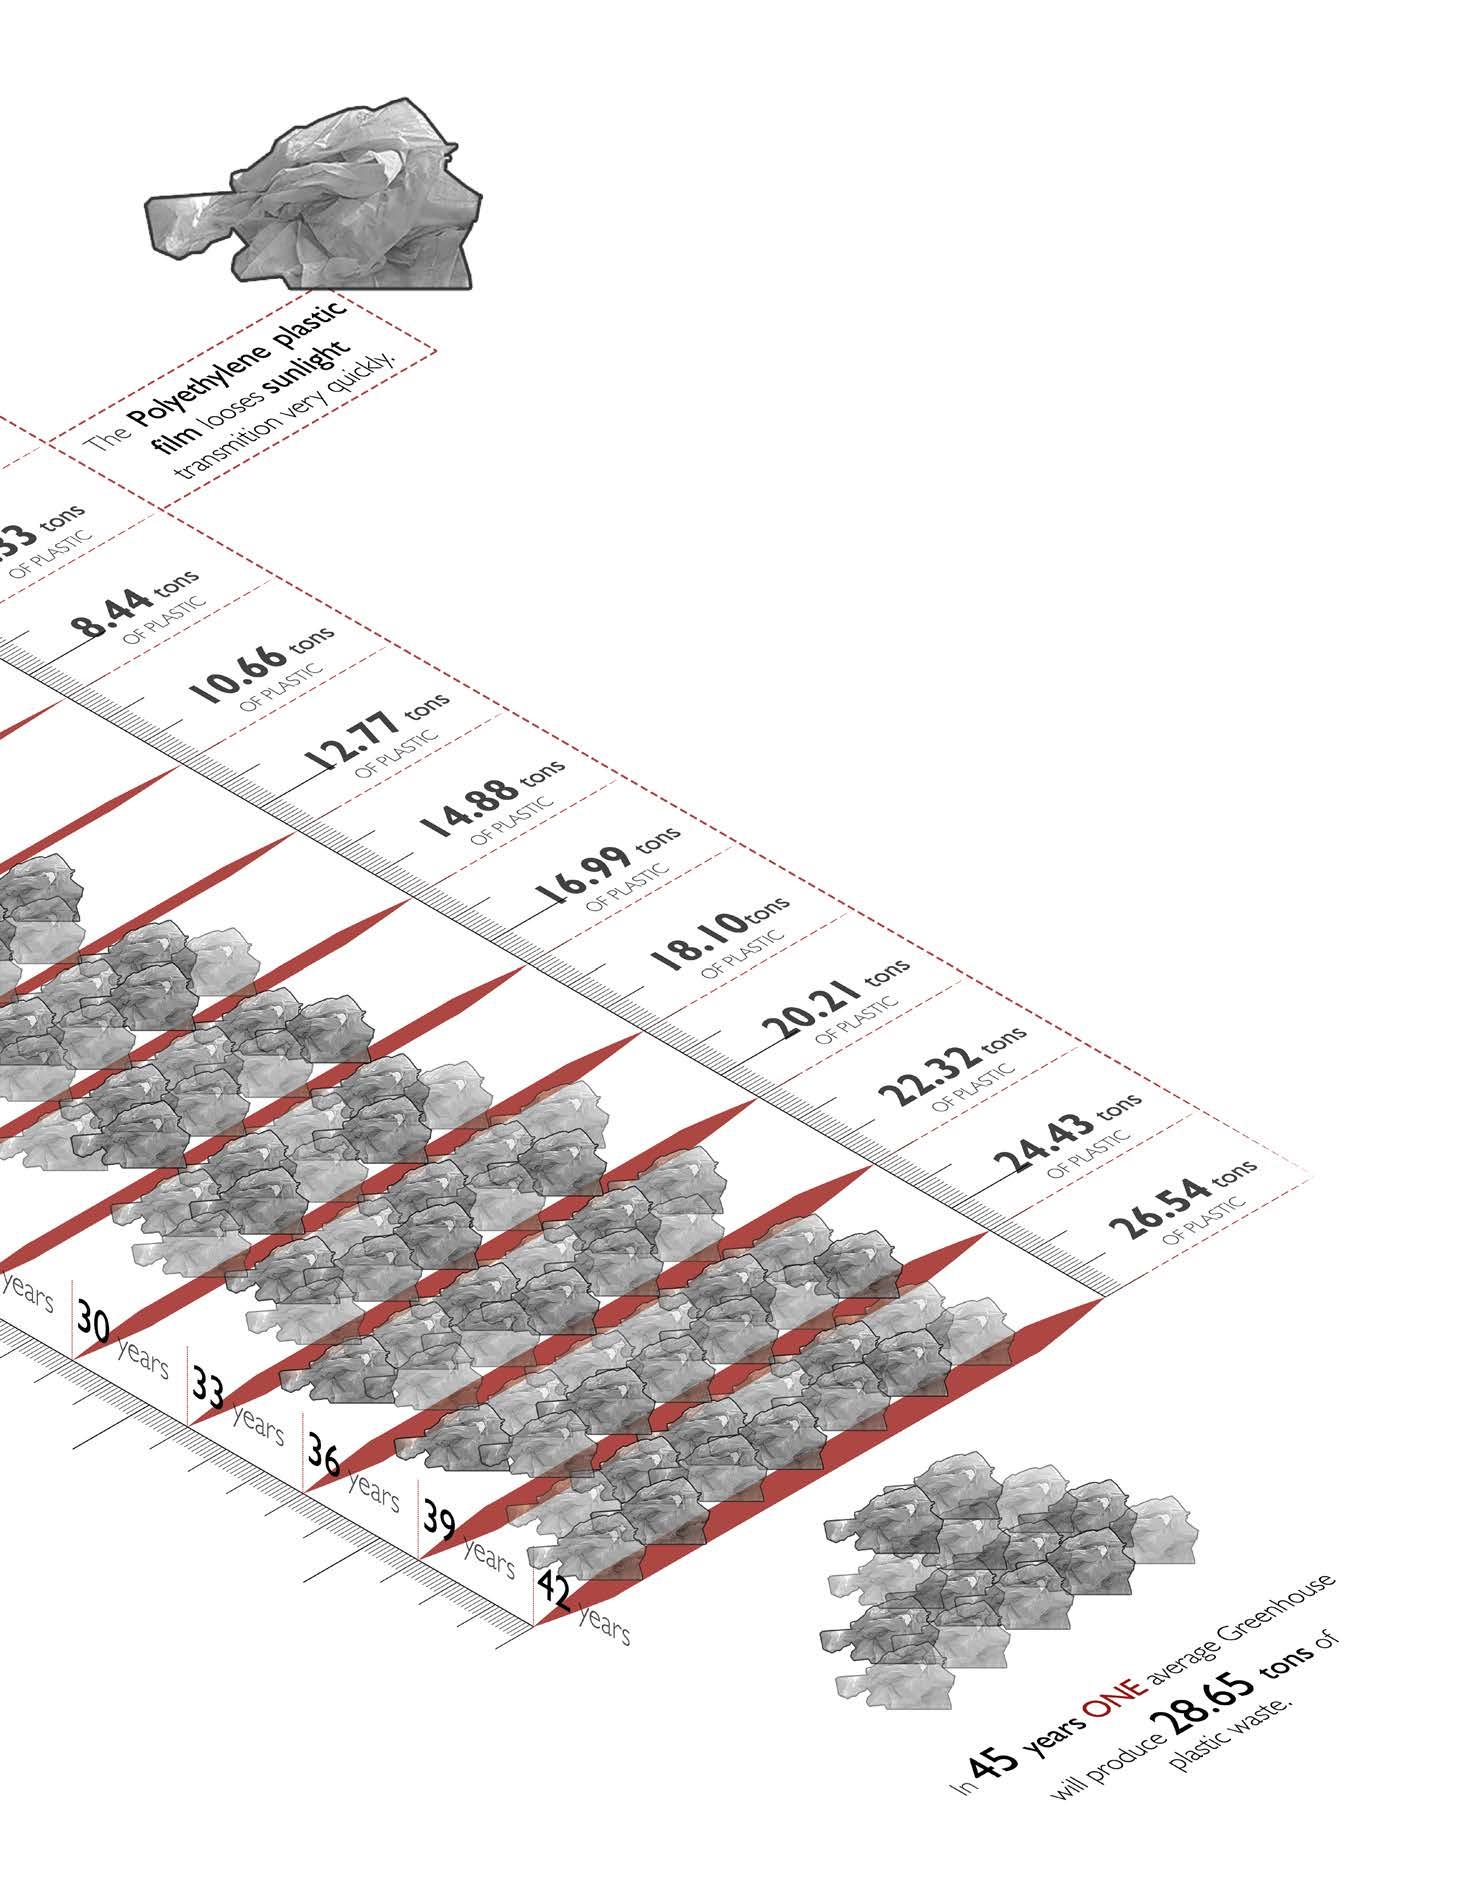
30,000 Tons of Plastic
Burned Landfield Dumped in the Ocean Recycled
Ciclogro collects 15,000 tons of plastic / year, across Andalucia.

51
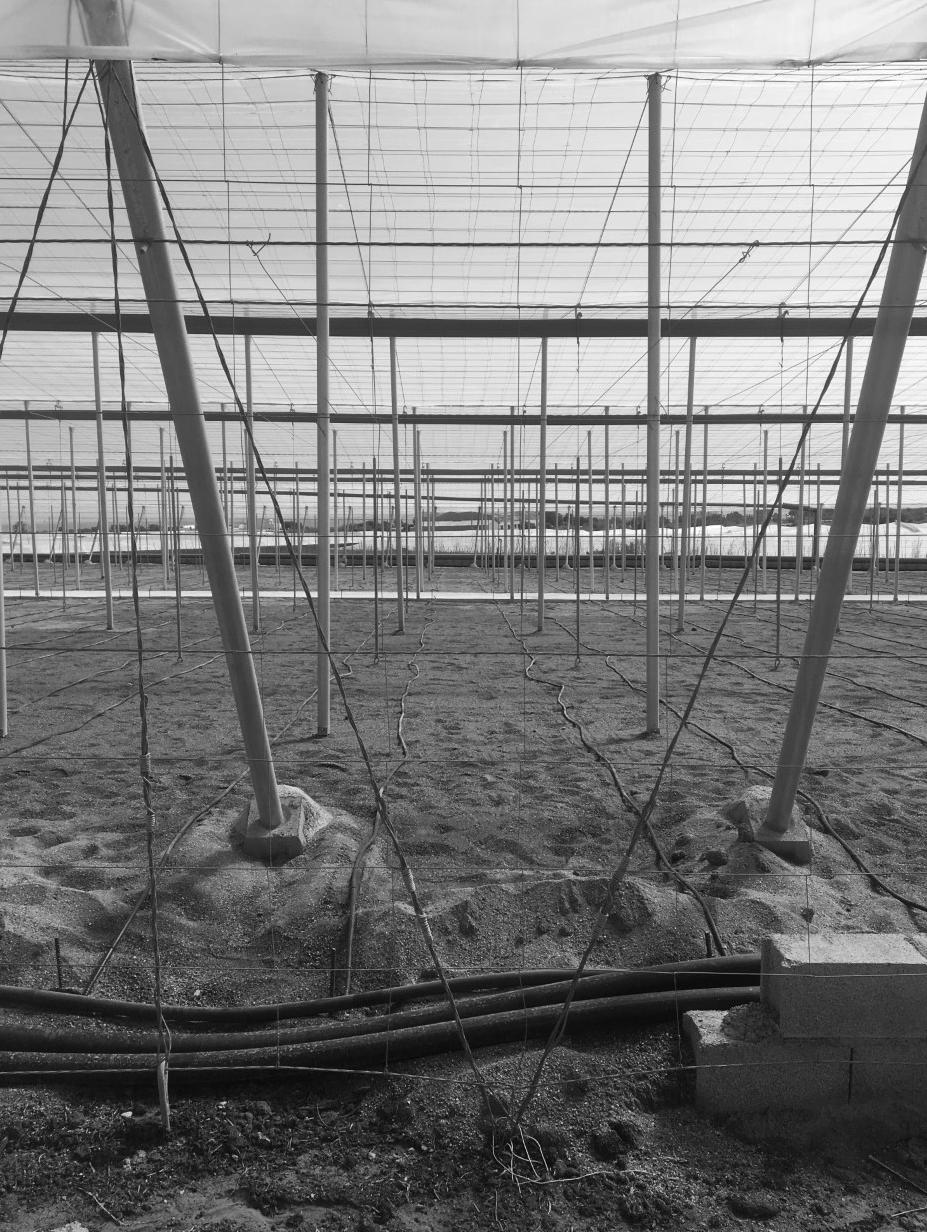
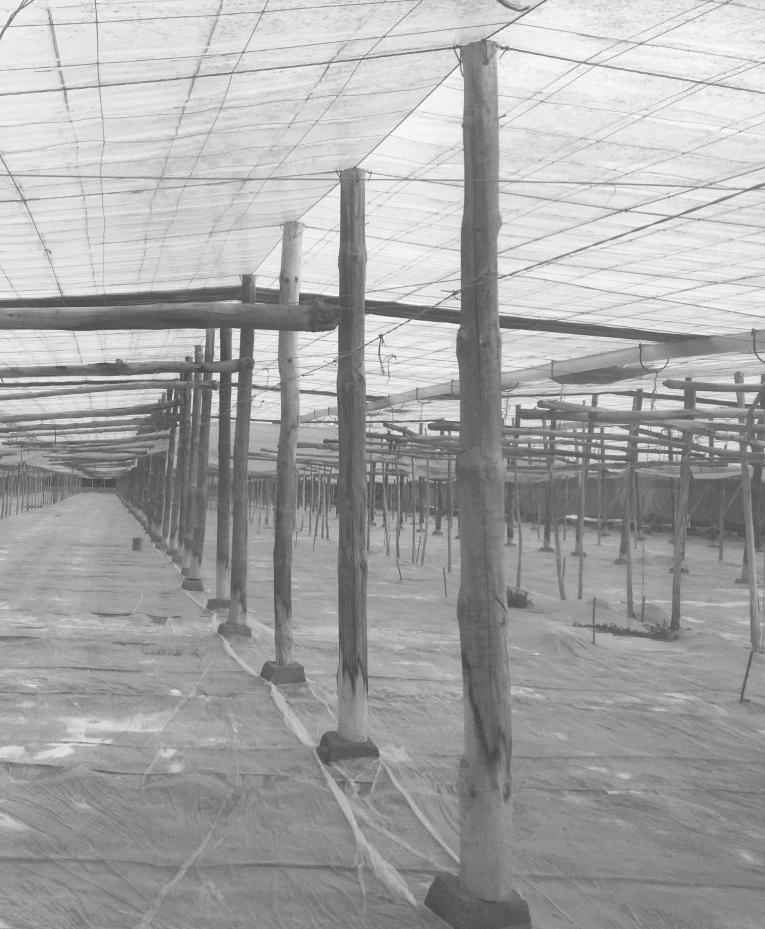
2.1.3.4. A principle geometric parameter that should be controlled is the geometry and orientation of the greenhouse. Greenhouses in Almeria are oriented to maximize solar exposure and adapt to moderate wind-speeds to enable ventilation. Transmissivity rates are affected by various greenhouse geometry and orientation. Nisen et al (1969) published findings of transmission rates of various types of greenhouses, along with different orientation. With consideration of winter seasons in Almeria, at a latitude greater than 30 degrees, East-West orientation is superior in radiation coverage than N-S. In addition, in terms of effectiveness of ventilation, roof slopes that are perpendicular to wind direction provides better ventilation than parallelly oriented ventilation. Thus, to abstract the observation, the ideal conditions for solar and ventilation performance should be provided by a geometric intervention that maximizes solar coverage of winter season, and maximizes ventilation efficiency by orienting to the wind.
52 AUTUMNWINTER SPRING/SUMMER 0.8 0.7 0.6 0.5 0.4 SPRING/SUMMER AUTUMN/WINTER 0.4 0.5 0.6 0.7 0.8 0.0 0.1 0.2 0.3 0.3 0.2 0.1 0.0 LIGHT TRANSMITION LIGHT TRANSMITION N Domain Greenhouse Inefficiencies
SOURCES. Valera, D. L., L. J. Belmonte, F. D. Molina-Aiz, and A. López. “Greenhouse agriculture in Almería.” A Comprehensive Techno-Economic Analysis, (2016). Nisen, A et al. “L’éclairement natural de serres” Edition I. (1969) IMAGE SOURCES. Rita Stella Roesch Diaz. Photographs Greenhouses Structures in “El Ejido”, June29, 2018.
Orientation Context
Height
Domain


Context
Another parameter that greatly effects greenhouse performance is the height. Almeria industry is continuously improving greenhouse prototypes to accommodate greater heights. Greater heights, due to their greater volume, can offer greater thermal inertia and chimney effect, which means better ventilation. It also allows more ceiling mounted equipment and larger range of indoor farming tools. This is greatly advantageous in the continuous effort to increase greenhouse efficiency and sustainability. At the same time, major design obstacles obstruct this ambition. A higher volume presents a higher windload, demanding better structural system to address the issue. Also, conventional green heating/cooling methods require much higher energy consumption for a much larger volume. Thus, to strive for larger height and volume, it is pertinent to address the higher structural and energy demands.
Low thermal inertia
Poor ventilation
Low Structural Stability Demand
Lower Energy Consumption
High thermal inertia
Better ventilation
Allows ceiling mounted Equipment
Higher Structural Stability Demand
Higher Energy Consumption
53
SOURCES. Valera, D. L., L. J. Belmonte, F. D. Molina-Aiz, and A. López. “Greenhouse agriculture in Almería.” A Comprehensive Techno-Economic Analysis, (2016). Nisen, A et al. “L’éclairement natural de serres” Edition I. (1969)
Greenhouse Taxonomy
Domain
Context
Currently the Horticulture industry use extensively the flat or pitched roof greenhouses with plastic film cover supported by steel frame structure.
Several iterations and improvement has been proposed and adopted during the past 50 years. The general trend of the improvement has been focusing on increasing the height and reducing the interior structural columns. Both solutions can improve interior ventilation and allowing more equipments be to installed or used inside the greenhouses
frame strucutre
building envelope
vertical
carbon-dioxide
enrichment system
greenhouse ventilation system
structural support
wire grid&rope
cover material
horizontal
flexible plastic
rigid plastic
glass
wall mounted system
steel brace
heating system
natural ventilation system
roof mounted system
insect screen
shading system
evaporative water cooling system
forced ventilation system
air heating system
floor heating system
water heating system
shade cloths
thermal screen
darkening screen
pad and fan system
fog system
agriculture in Almería.” A Comprehensive Techno-Economic Analysis, (2016). Nisen, A et al. “L’éclairement natural de serres” Edition I. (1969)
54
SOURCES. Valera, D. L., L. J. Belmonte, F. D. Molina-Aiz, and A. López. “Greenhouse
Domain Context
Pitch Roof (Raspa y Amagado):
Roof angle: 6 o ~ 20 o
Material:
• Paneling: polyethylene (PE),
• Structure: pine eucalyptus logs,galvanized iron,rolled iron, double layer galvanized wire grids
Advantages:
• Cost effective
• Good unit volume and greater thermal inertia.
• Higher height improve air circulation through stack effect.
• It’s better resistant to wind load.
• It can accommodate irregular geometry of the terrain
• It’s well adapted for non-trellised crops.
Disadvantages:
• The more increased the angle, the better the interception of solar radiation, although it requires greater structural strength.
Asymmetric Roof:
Roof angle: 6 o ~ 20 o
Material:
• Paneling: polyethylene (PE),
• Structure: pine eucalyptus logs, galvanized iron, rolled iron, double layer galvanized wire grids
Advantages:
• The sides of the cover have different inclination angles to enhance the capture of solar energy.
55 2x6m 3x4m 8x5m 12x6m 4.5m 5m 5m 6.5m
SOURCES. Valera, D. L., L. J. Belmonte, F. D. Molina-Aiz, and A. López. “Greenhouse agriculture in Almería.” A Comprehensive Techno-Economic Analysis, (2016). Nisen, A et al. “L’éclairement natural de serres” Edition I. (1969)
Height Column Grid
2.5m 3x3m 2x6m 3x4m 8x5m 12x6m 4.5m 5m 5m 6.5m
Height Column Grid
Domain Context
Pitch Roof(Raspa y Amagado):
Industrial scale Greenhouse. to stretch and hold the plastic sheets
Material:
• Paneling: polycarbonate (PC) wall, PE for roof
• Structure: galvanized steel with omega profile
Advantages:
• Increasing popularity due to the increase height to enhance lateral ventilation
• Improved micro-climate control variables ability due to water and airtight
• Large span provide space for machinery to operate
• Higher height improve air circulation
• Allow installation roof mounted ventilation.
• Barrel vault distribute brighter and even light.
• Flexible usage: some module allowed to be used as storage or receiving area.
Disadvantages:
• High cost
• Plastic cover requires mechanical opening control due to its loose attachment to the structure.
Asymmetric Roof:
Material:
• Paneling: 4mm glass x 1.125m panel length
• Structure: Steel
Roof Angle:22 o
Advantages:
• Retain heat in winter
Disadvantages:
• It’s ideal for cold areas especially the Netherlands. Not frequently used in Almeria. Because it’s not well adapted in harsh summer condition in arid area.
• High cost
56
SOURCES. Valera, D. L., L. J. Belmonte, F. D. Molina-Aiz, and A. López. “Greenhouse agriculture in Almería.” A Comprehensive Techno-Economic Analysis, (2016). Nisen, A et al. “L’éclairement natural de serres” Edition I. (1969)
Height Column Grid
3x4m 8x5m 12x6m 5m 5m 6.5m
Height Column Grid 8x5m 12x6m 5m 6.5m
2.1.4. Social Context
A total of 17,614 migrants aboard in 2017 , which was an increase in boats, since in the past there
It just have been reported, in the year 2018 Spain by sea.

803 boats arrived on the Andalusian coast over 2016 of 185.2% in people and 94.5% were 6,175 people rescued in 423 vessels.
55,200 migrants and refugees had reached

Domain Context
Demographic
2.1.4.1. Immigration from North Africa to Spain is an ever-pressing phenomenon, with statistics showing numbers increasing yearly. Reports for 2017 reveal 17,614 migrants arriving on the coasts of Spain by boat, while new reports for 2018 talk of 55,200 migrants reaching the Spanish shores.
A city like Almeria, Spain represents a chance for migrants to seek a better living standard and have more promising economic prospects. However, the trip itself is highly hazardous, with many migrants dying from the precarious travelling conditions. Eventually, for those who successfully reach their destination, it will prove equally challenging to find employment and decent housing
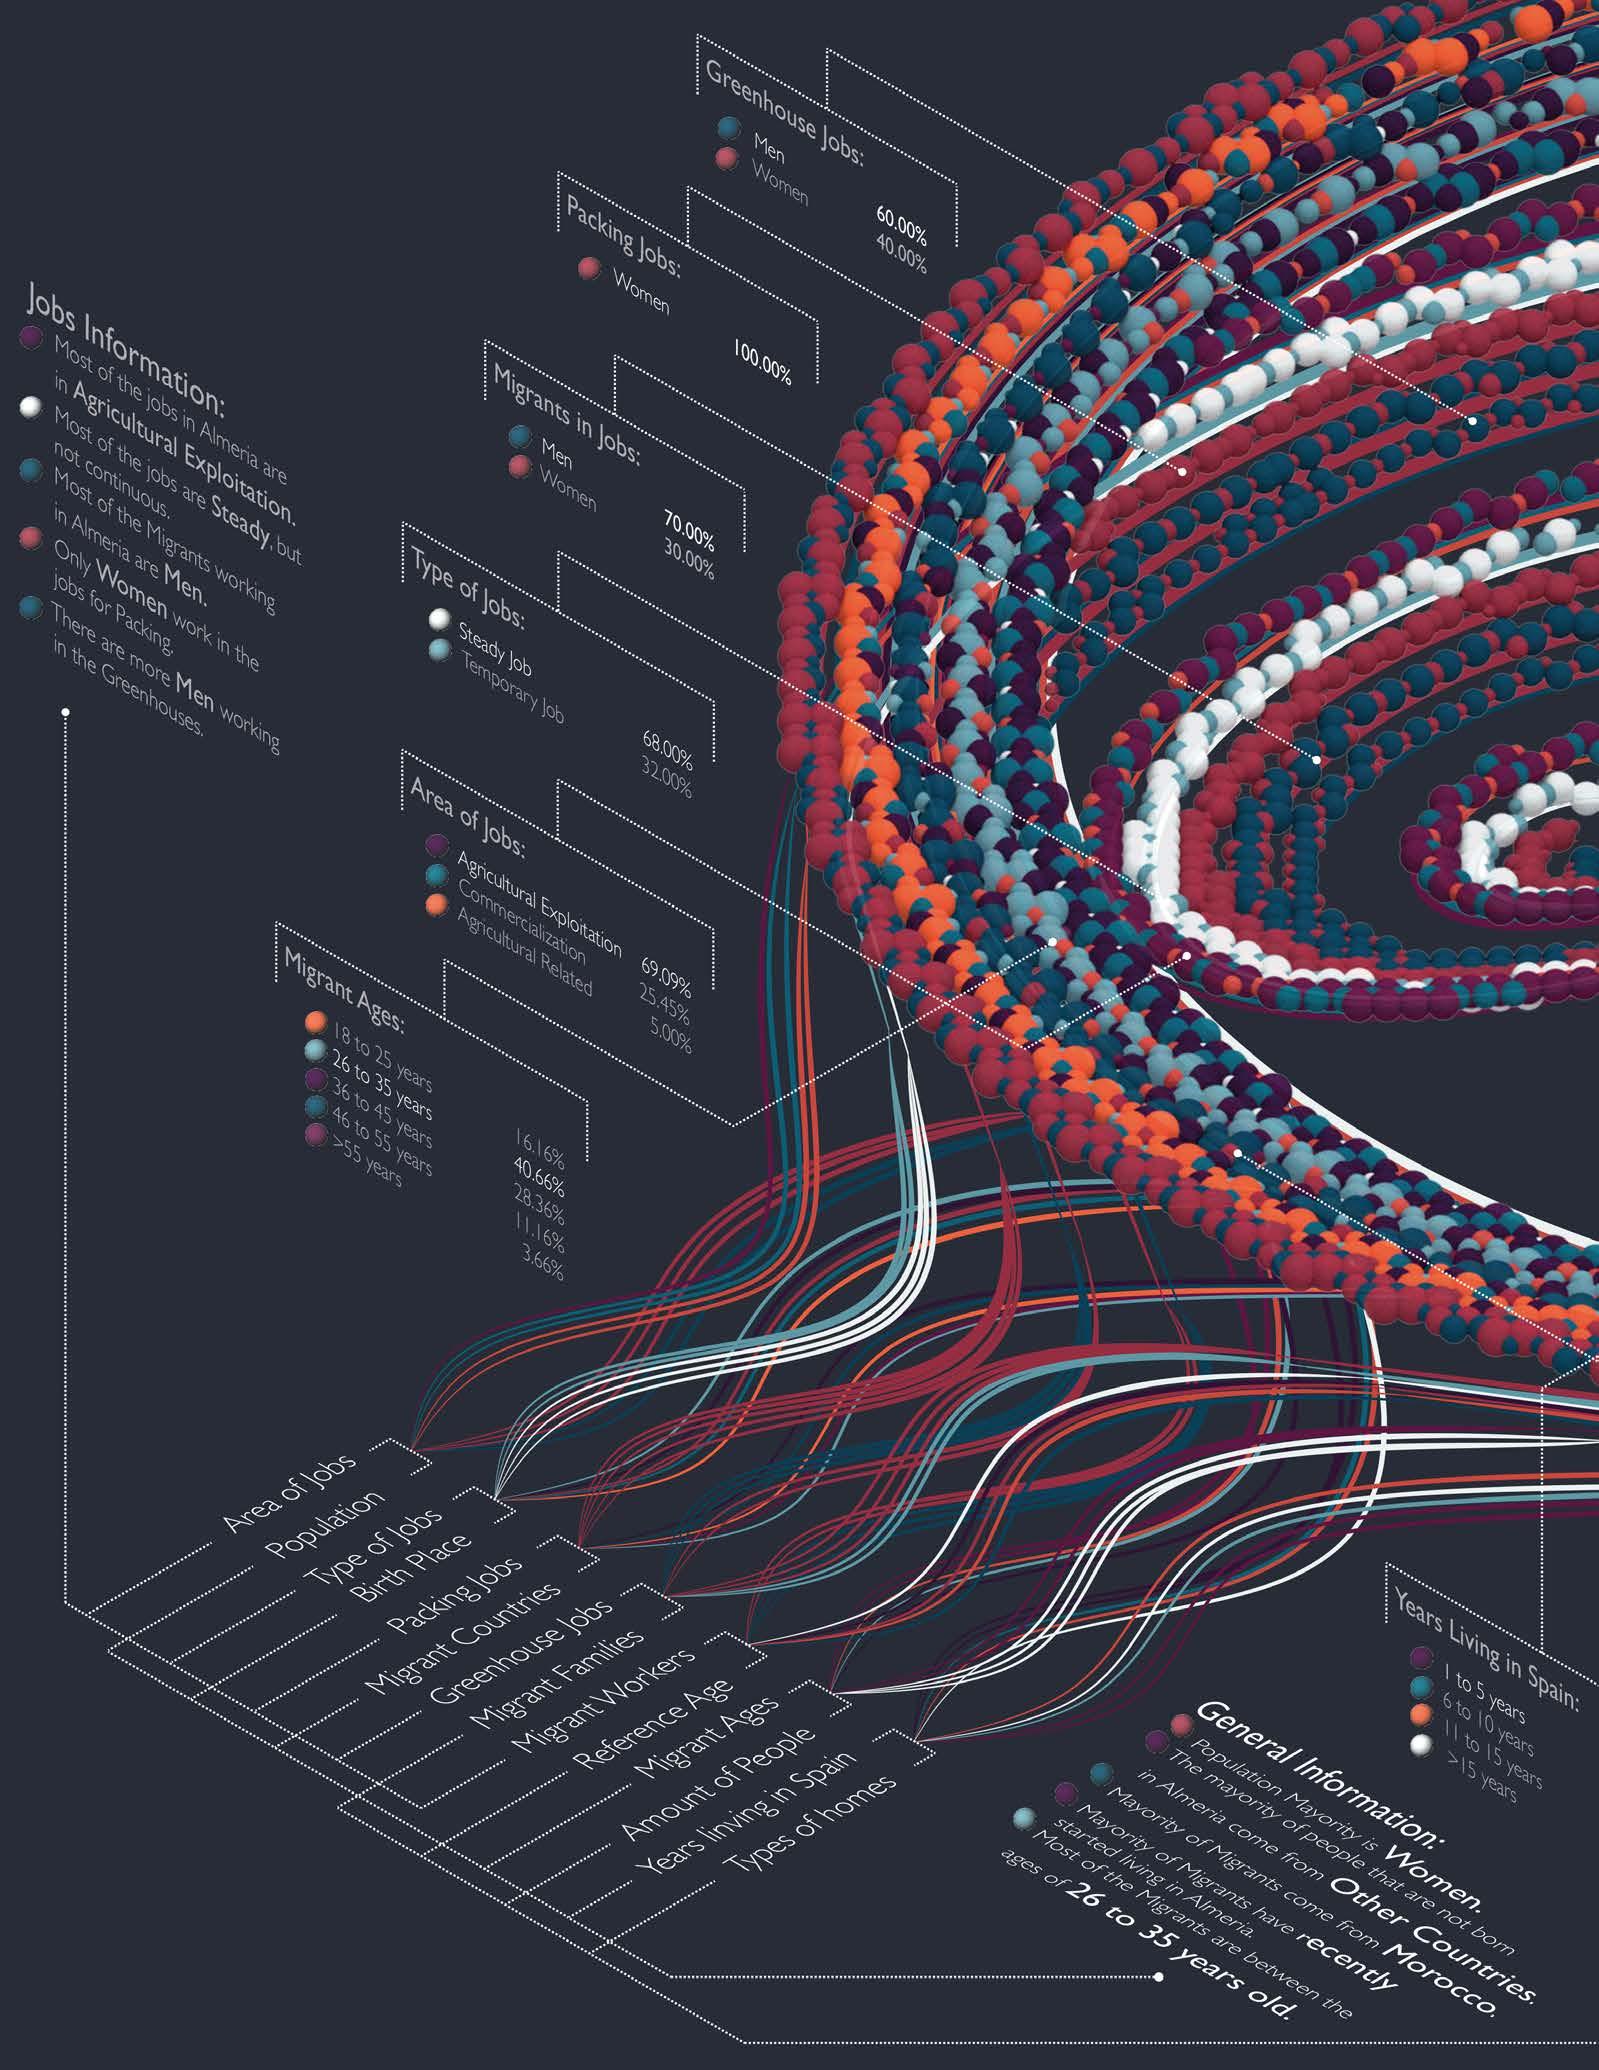
As the numbers of people fleeing to Almeria continue to increase the demographic structure of the area keeps changing every year. With an extensive research done about the area’s population, as well as job and homes information, enough data was collected to elaborate a chart of said information presented in the next spread of pages.
General Data
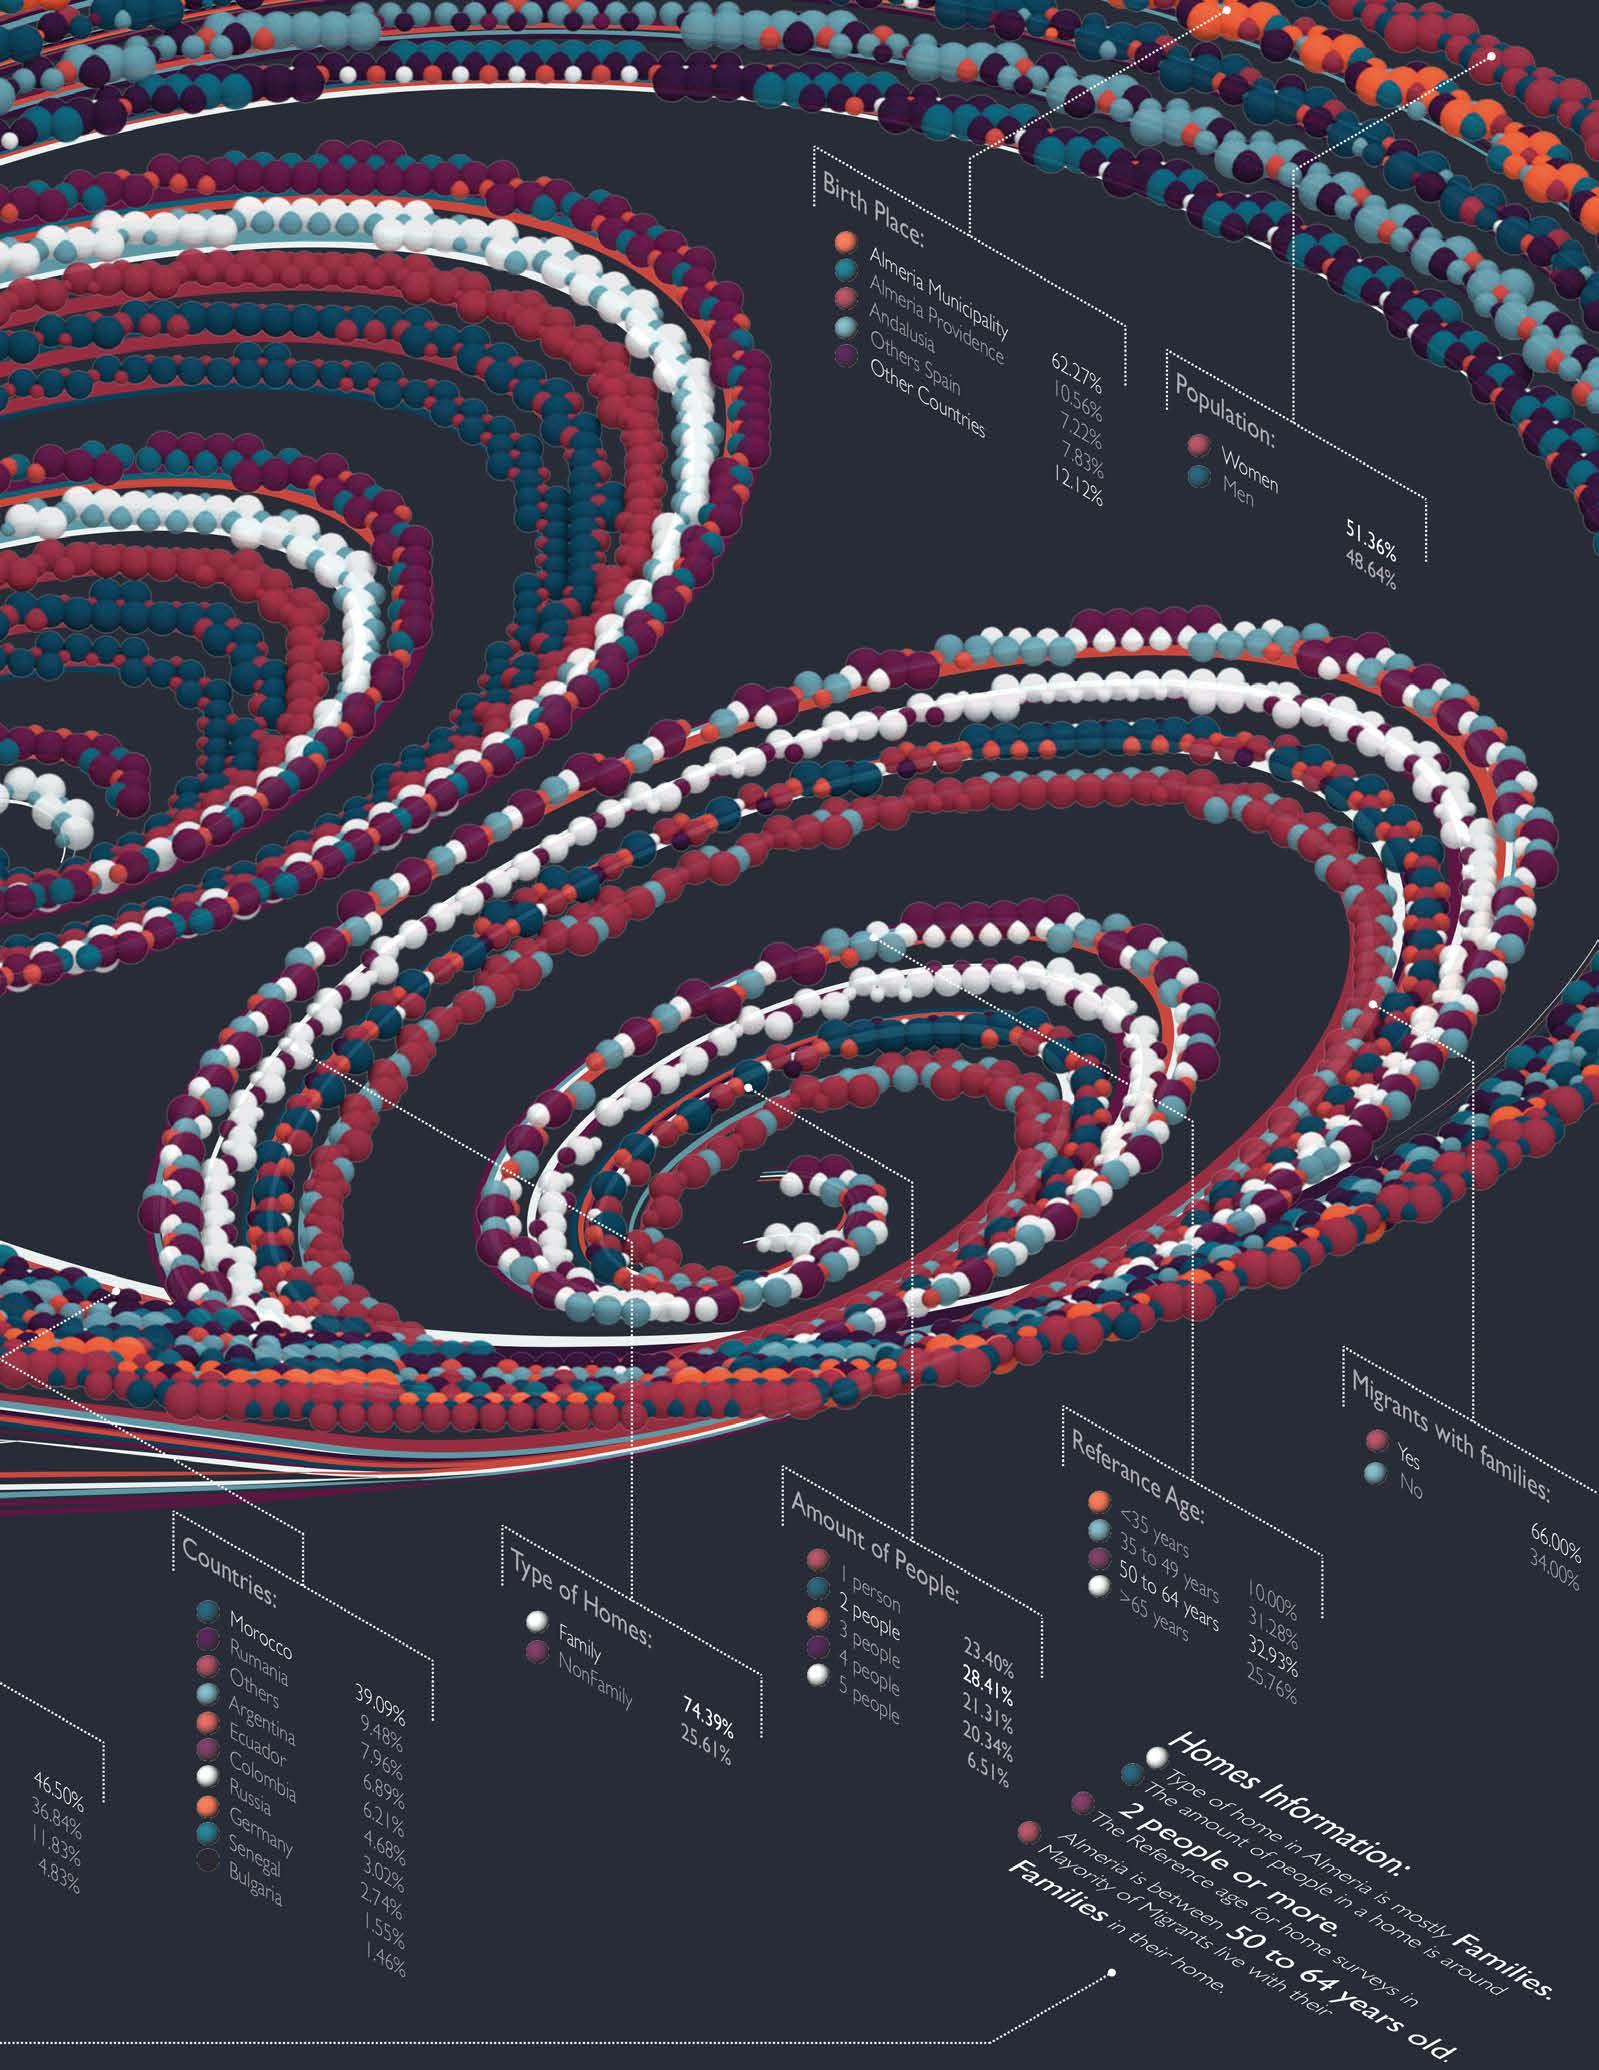
In the general information found about the population of Almeria, using “Instituto de Estadistica y Cartografia de Andalucia” as a main reference, the majority of the population is female with 100,345 registered women and only 95,044 men.
When it comes to the birthplace of the inhabitants, the majority of the people were born in the Municipality of Almeria (121, 676 people). Most interestingly, the second largest amount of residents are migrants (23,674 people), coming primarily from Morocco and Rumania. Finally, the third largest amount of people come from the province of Almeria (20,636 people).
Due to the large number of migrants in the area, our research continued centered on that specific demographic. Surveys were found with information highlighting migrants’ ages and the duration of their life in Spain. Most of the migrants were shown to be between the ages of 26 years old and 35 years old (40.66%), followed by ages 36 to 45 years old (28.36%).
Noticeably, the surveys indicated that most of the migrants arrived in Almeria within the last 5 years. Only a fraction of the migrant population has actually managed to reside in the area for 6 to 10 years.
SOURCES. Press, Europa. “El número de migrantes llegados en patera a Andalucía aumentó un 185% en 2017,” January 2, 2018. https://www.europapress.es/ andalucia/noticia-total-17614-inmigrantes-llegan-patera-costas-andaluzas-2017-1852-mas-2016-20180102144245.html
“Habitantes Almería 1900-2017.” Accessed June 1, 2018. https://www.foro-ciudad.com/almeria/almeria/habitantes.html..
IMAGE SOURCES. “Países ejercen mano más dura a la inmigración que crece pese a fatales riesgos.” 24ecuador. Accessed December 29, 2018. http://www.24ecuador.com/mundo/paises-ejercen-mano-mas-dura-a-la-inmigracion-que-crece-pese-a-fatales-riesgos/17436-noticias.
“El sur de España es un agujero de mierda.” Accessed December 30, 2018. https://www.burbuja.info/inmobiliaria/burbuja-inmobiliaria/1063115-sur-de-espana-agujero-de-mierda-15.html.
59
Family and homes Data
The data and information from “Instituto de Estadistica y Cartografia de Andalucia” also covered family and housing conditions, which prompts analysis in relation to other surveys specifically in regards to migrants working in greenhouses.
The first part of the information is based on the general population of Almeria and their types of homes. For example, most of the homes in the area are family homes (74.39%) while a small part of them are non-family homes (25.61%). The amount of people living in the homes can vary, but most of the homes were said to have less than four people The ones that have five people or more represent only 6.51%. The average person’s age for the home information was around 50 to 64 years old (32.93%), followed closely by people between the ages of 35 to 49 years old.
One important factor in this part of the research was to find information about whether migrants were living with their families or alone. Surveys clearly pointed to the former, as 66% of migrants were reported to be living with their families in Almeria.
SOURCES. Sánchez, José Ángel Aznar, Luís Jesús Belmonte Ureña, and Domingo Bonillo Muñoz. Mercado de trabajo y población extranjera en Almería. El sector en la agricultura intensiva. Universidad Almería, 2015. https://www.europapress.es/andalucia/sevilla-00357/noticia-agricultura-industria-invernadero-emplean-almeria-granada-110000-trabajadores-36-inmigrantes-20101021123726.html.
“Instituto de Estadística y Cartografía de Andalucía.” Accessed December 29, 2018. http://www.juntadeandalucia.es/institutodeestadisticaycartografia/iea/resultadosConsulta.jsp?CodOper=64&codConsulta=53975.
60
63
Domain Context
Working Conditions
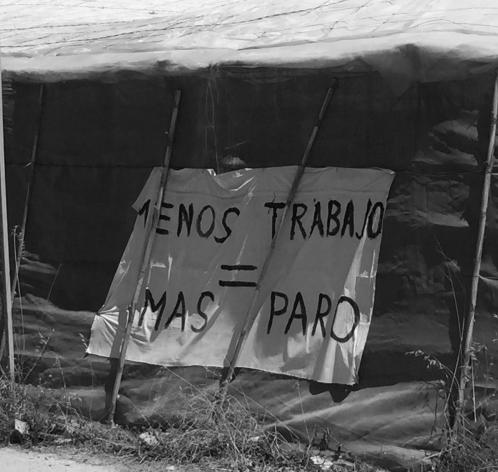
2.1.4.2. Working conditions for migrant workers in Almeria are very precarious. Migrants have no access to health care or insurance, no possibility to seek permanent employment nor to earn minimum wage.
Migrants come to Spain in the hopes of earning enough money to reach a higher living standard as well as to provide for their families back home. This self-perpetuating myth is nurtured in the migrants’ hometowns in order to encourage them to pay the high fee that is demanded to cross the sea.
The reality migrants experience once they reach Almeria is an altogether less promising one.
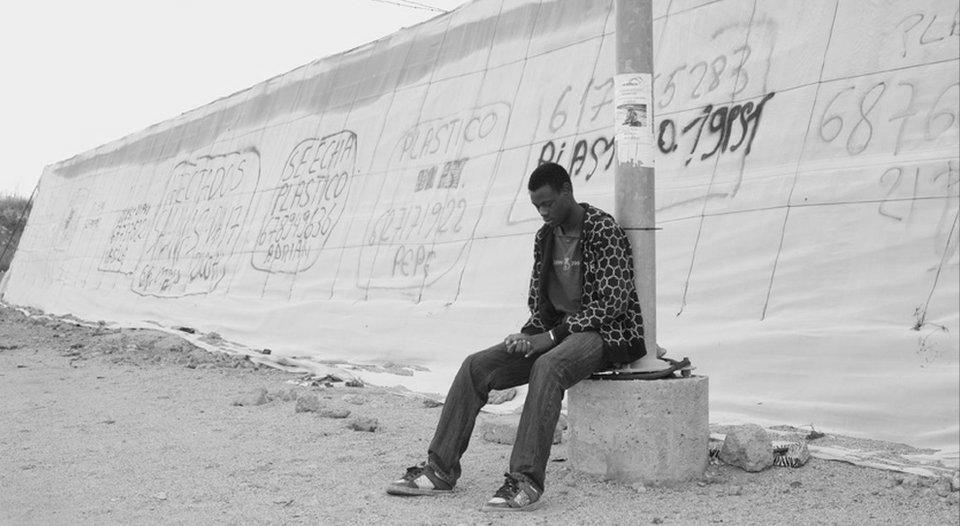
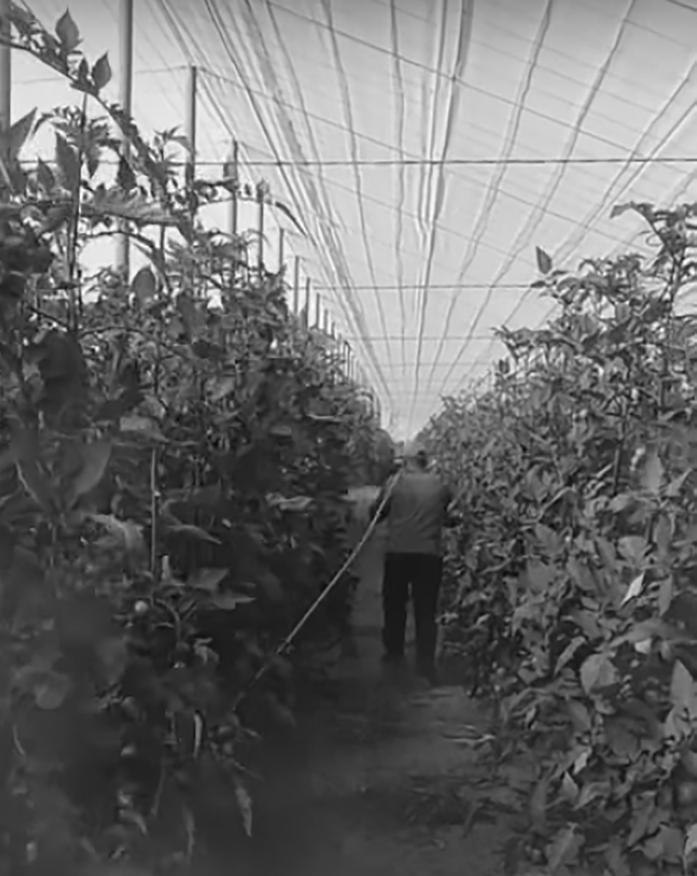
A typical day for a migrant worker is to go before dawn to a main highway or street and wait there to be picked up by a farmer in need of a worker for fruit picking, pesticide spraying, or any other plant maintenance job. This does not guarantee job safety in the slightest, as work is handed down on the day-by-day basis.
Migrants who manage to obtain work in greenhouses have to face extremely harsh working conditions, with indoors temperatures reaching upwards of 50 degrees Celsius. For those tasked with spraying pesticides, no gloves or any type of protective equipment is provided which can result in severe skin damage. This health hazard is further emphasized by the fact that migrants have no access to health care.
Finally, the fact that migrant workers constitute illegal undocumented labour, leaves freedom to the employers to fix their own rate, well below minimum wage.
SOURCES. Agencia de Gestión Agraria y Pesquera de Andalucía CONSEJERÍA DE AGRICULTURA, PESCA Y DESARROLLO RURAL. “Caracterización de los invernaderos de Andalucía” Versión 1 . Septiembre 2015.
“Salad Slaves: Who Really Provides Our Vegetables - YouTube.” Accessed December 29, 2018. https://www.youtube.com/watch?v=oZl1eBU4Qx0&t=376s&index=9&list=WL.
IMAGE SOURCES. Lawrence, Edward. “Spain’s White Coast of Greenhouses?!? Modern European Slavery.” Edward Lawrence (blog), July 9, 2018. https://edwardlawrence.net/2018/07/10/where-does-the-your-hipster-breakfast-come-from-spains-white-coast-of-greenhouses/.
“A Bitter Harvest for Spain’s Migrant Workers,” June 15, 2011. //www.bbc.co.uk/news/world-europe-13767813.
“Modern-Day Slaves: Europe’s Fruit Pickers - YouTube.” Accessed December 29, 2018. https://www.youtube.com/watch?v=PL7CHmTdrIo&t=523s&inde =13&list=WL.
64
110,000 Jobs in Almeria 76,000 Agricultural Exploitation
28,000 Commercializers
5,500 Agricultural Related
68% steady job
32% temporary job average age
26 and 45 years old
When it comes to the number of job opportunities available, a rough calculation was made from different sources by Fran Leonardo from Europa Press in Andalusia, that information was used to produce the chart above, as well as considering the data from “Instituto de Estadistica y Cartografia de Andalucia”.
The data shows there are currently 110,000 jobs in Almeria, the majority of them being in Agricultural Exploitation with 76,000 jobs. The latter are comprised of 68% permanent work and 32% temporary work. The other jobs are divided by 28,000 of them being agricultural comercializers, and the other 5,500 jobs being agriculture related or an auxiliary industry, such as manufacturers of plastic, seedbeds, agricultural machinery or packaging.
SOURCES. https://www.europapress.es/andalucia/sevilla-00357/noticia-agricultura-industria-invernadero-emplean-almeria-granada-110000-trabajadores-36-inmigrantes-20101021123726.html.
65
Domain Context
Domain Context
Migrant Workers
1 of every 3 women are owners, they are usually: 45 years old Married
38% Morocco
22% Rumania
8% Ecuador
The agricultural exploitation jobs can be divided into two groups: working in the greenhouses, and the packing and handling fruits and vegetables. The majority of the people working inside of those greenhouses are men, with a division of 60% men and 40% women, while when it comes to the packing and handling of fruits and vegetables only women are involved in this type of jobs. Interestingly 1 out of every 3 women that have jobs related to agricultural exploitation are usually the owners of the greenhouse. Furthermore the average age of people working in the greenhouses are between 26 and 45 years old, but the average age of migrant workers is 31 years old. Out of the migrant workers 70% are men and 30% are women, and most of them come from Morocco (38%), Rumania (22%) and Ecuador (8%).
https://www.europapress.es/andalucia/sevilla-00357/noticia-agricultura-industria-invernadero-emplean-almeria-granada-110000-trabajadores-36-inmigrantes-20101021123726.html
66 Work in the Greenhouses 60% 40% men women Packing and Handling 100% women
Basic Studies
30% men women average age 31 years old
70%
SOURCES. Sánchez, José Ángel Aznar, Luís Jesús Belmonte Ureña, and Domingo Bonillo Muñoz. Mercado de trabajo y población extranjera en Almería. El sector en la agricultura intensiva. Universidad Almería, 2015.
67
Domain Context
Living Conditions
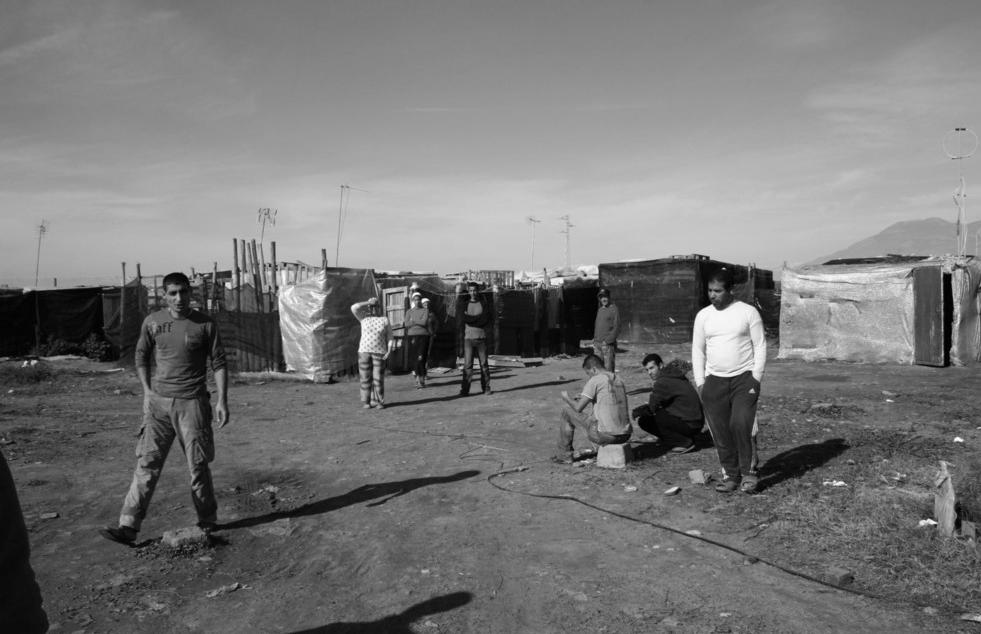
2.1.4.3. The living conditions for migrants in Almeria are similarly dire as their working conditions. When migrants reach the coasts of the South of Spain, they arrive with no money, no connections, and no papers.
Many of the migrants arrive to Almeria young and without families, but there is also a sizeable percentage that do arrive with their family for whom they have to provide. For migrants in Spain it is difficult to find a place to live. There are usually two options for them: one is to live in abandoned construction sites, and the other one is to construct their own homes.
The first option, i.e. abandoned construction sites or farm houses, is oftentimes the safest one. Those are the most popular choice and can house up to 40 people, depending on the size of the site, especially during the peak season for harvesting.
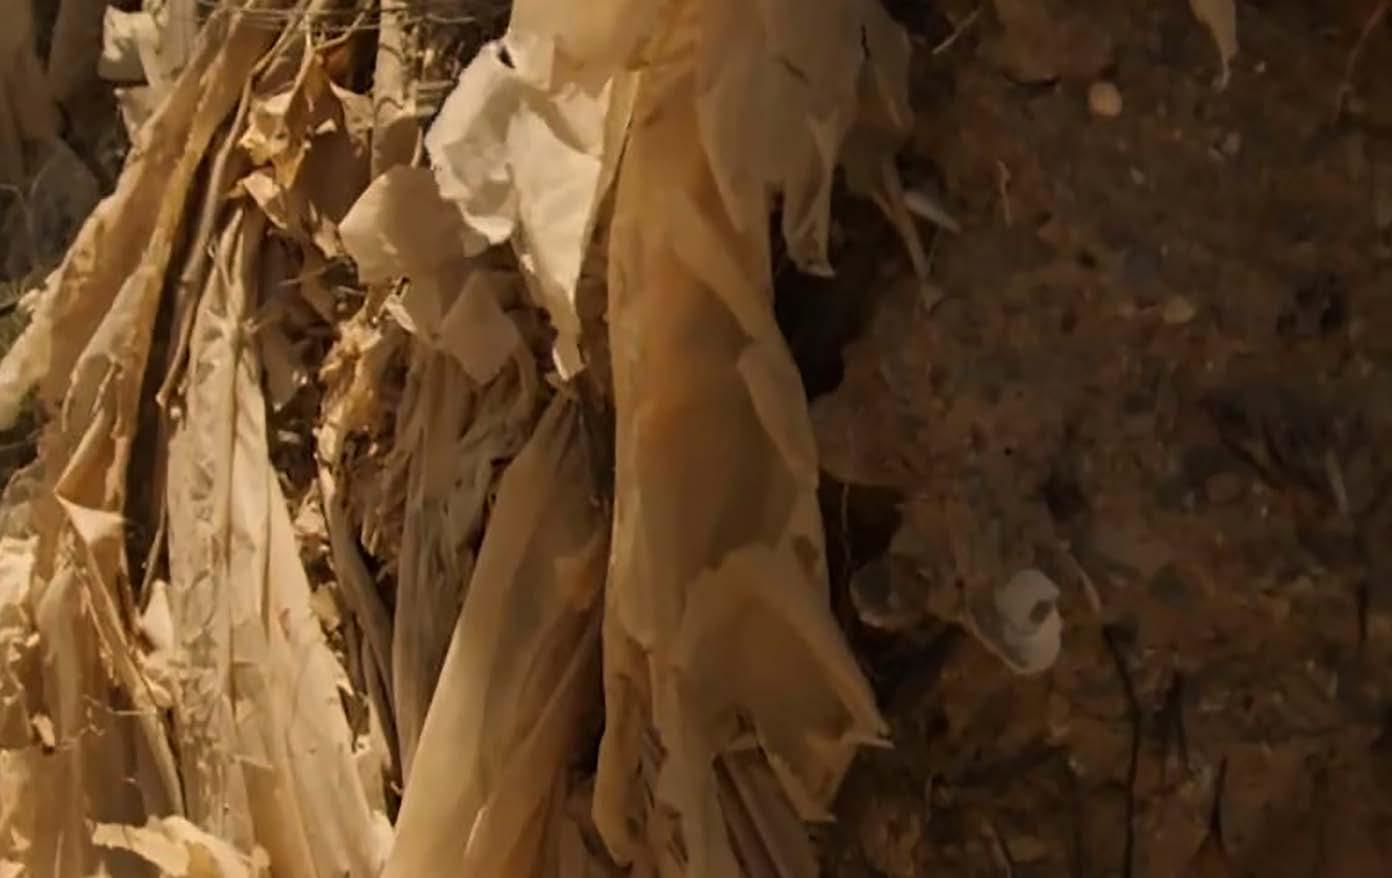
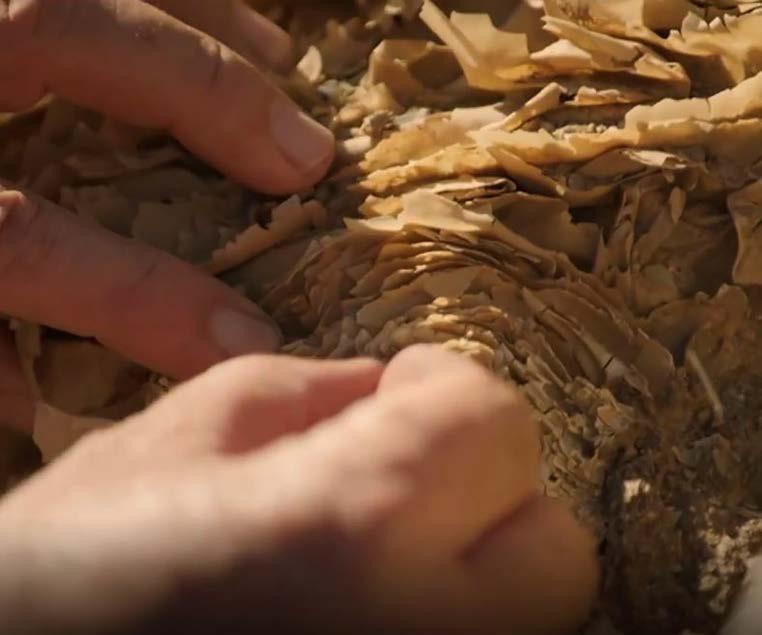
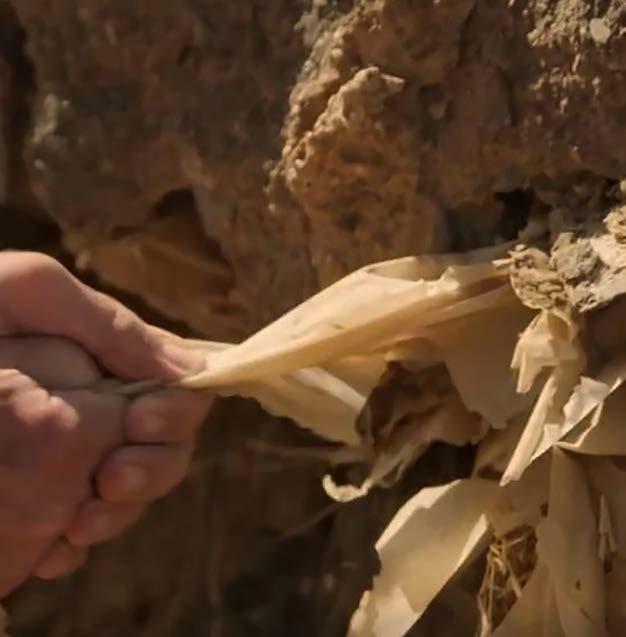
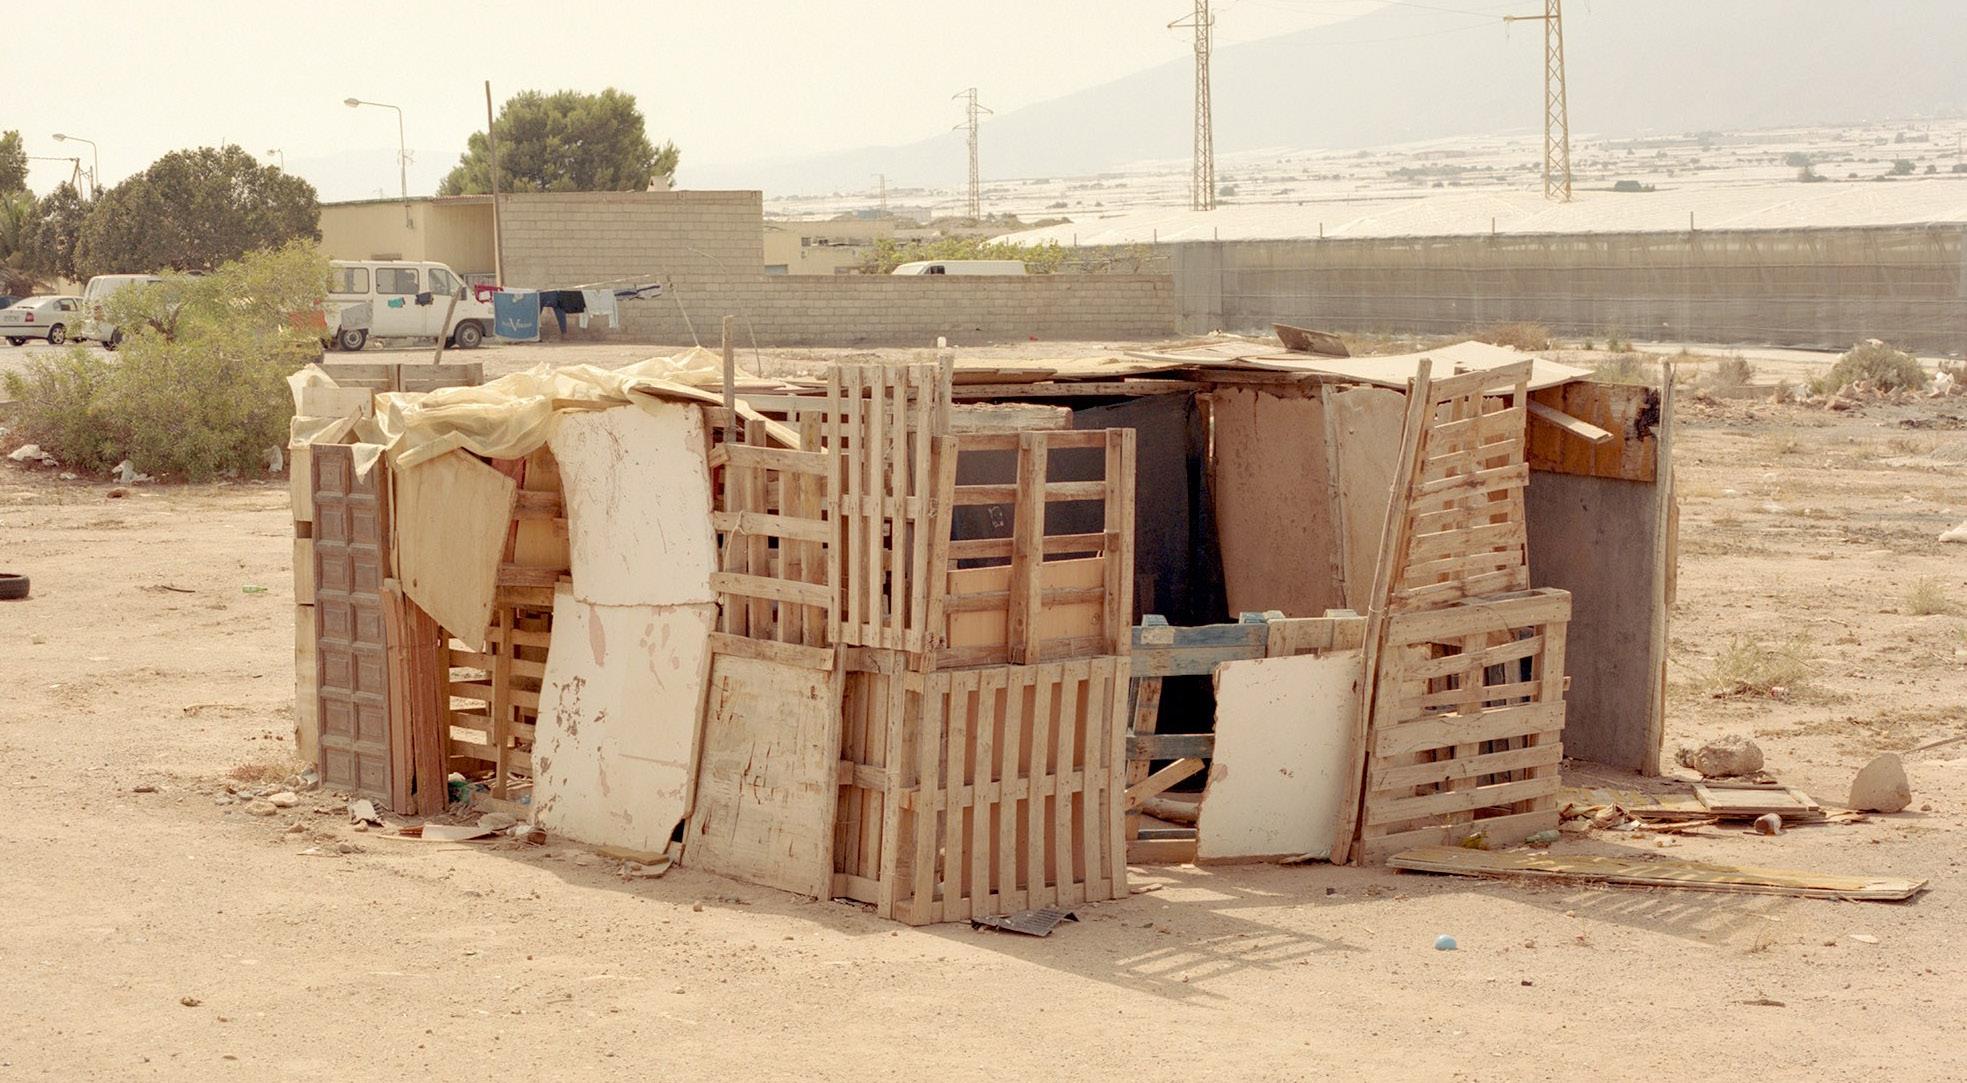
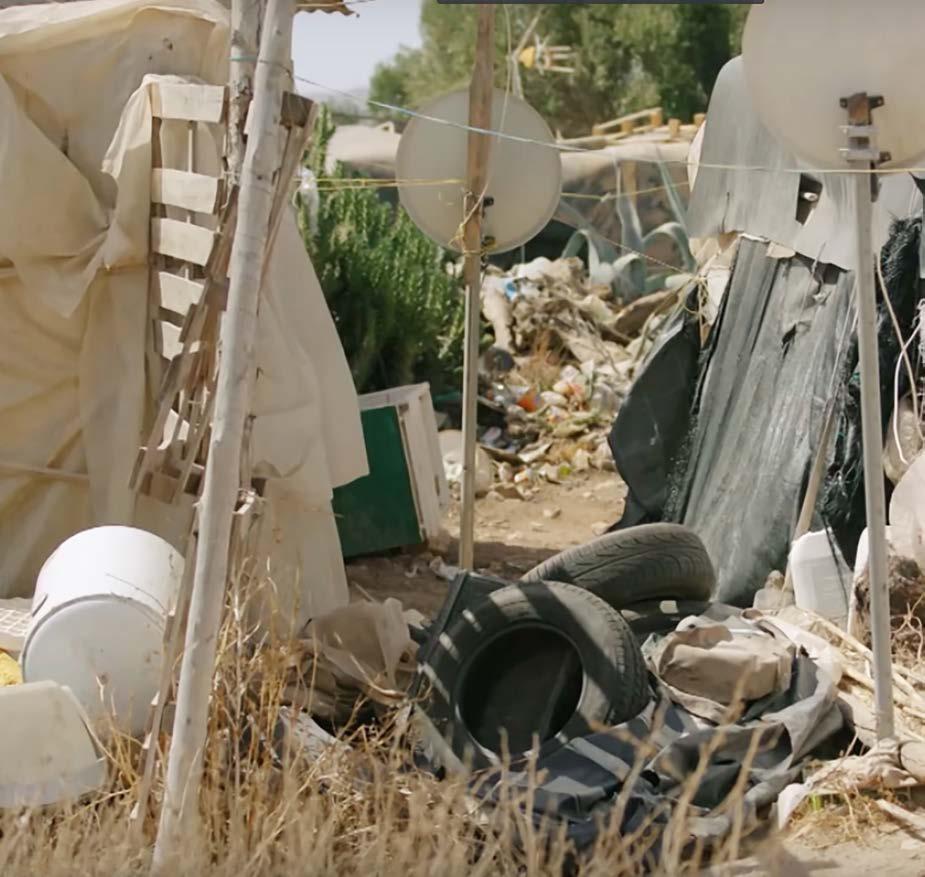
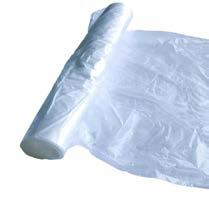
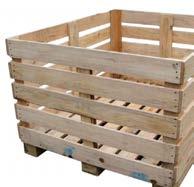
As for the second option, which is for migrants to build their own home, which they refer to as “chabolas”. It requires them to scavenge around Almeria for discarded materials. The latter are in short supply in the area and usually amount to plastic film, wooden boxes used for carrying vegetables, timber greenhouse columns and old mattresses.
Both of these options are a mere way to find shelter from the harsh climate. They lack however all basic amenities such as running water to clean oneself, potable water, waste disposal, and electricity. For instance in order to get water, migrants have to walk for miles to fill up containers and, as for toilets, a hole in the ground is the easiest solution.
SOURCES. “Salad Slaves: Who Really Provides Our Vegetables - YouTube.” Accessed December 29, 2018. https://www.youtube.com/watch?v=oZl1eBU4Qx0&t=376s&index=9&list=WL.
FRANCE 24 English. Modern-Day Slaves: Europe’s Fruit Pickers. Accessed December 30, 2018. https://www.youtube.com/watch?v=_NUvj6JSeCU&index=11&list=WL&t=1s.
Novara Media. The Bitter Fruit of Andalusia. Accessed December 30, 2018. https://www.youtube.com/watch?v=_NUvj6JSeCU&index=11&list=WL&t=1s. DW Documentary. African Immigrants Exploited in Spain - Cheap Labor for Cheap Vegetables | DW Documentary. Accessed December 30, 2018. https://www. youtube.com/watch?v=p-YAfrjvQic&index=12&t=112s&list=WL.
IMAGE SOURCES. “Almeria: Europe’s Dirty Little Secret in Southern Spain.” Huck Magazine, January 27, 2017. https://www.huckmag.com/art-and-culture/travel-diary-almeria/.
“Spain’s Sea of Plastic & Opioid Emergency: VICE News Tonight on HBO Full Episode - YouTube.” Accessed December 29, 2018. https://www.youtube.com/ watch?v=ml0EK-_H01Y&t=1222s&index=10&list=WL.,
68
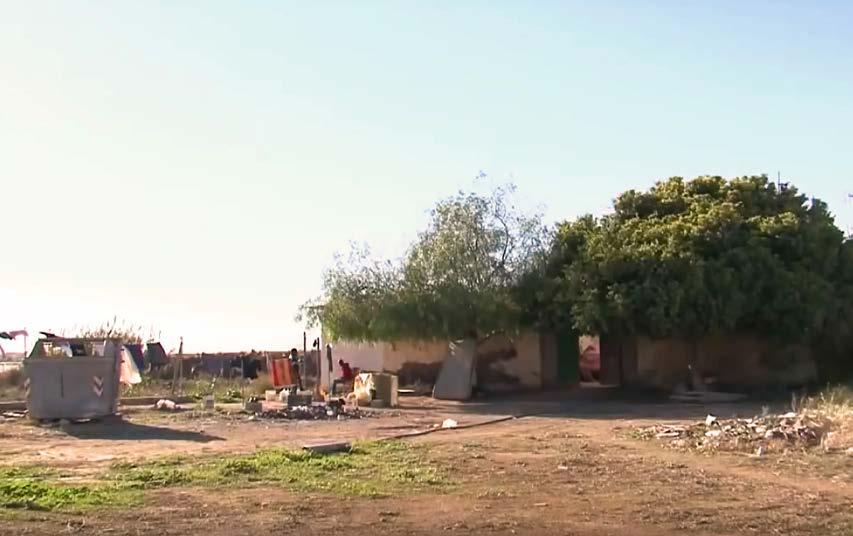
Abandoned Farm Houses: 10-40 occupants
Domain Context
Stone Sand Brick
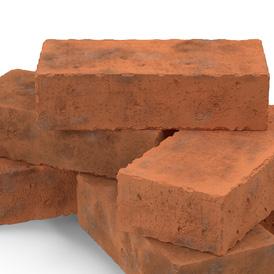
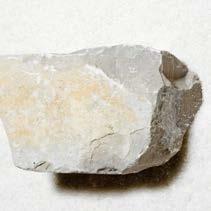
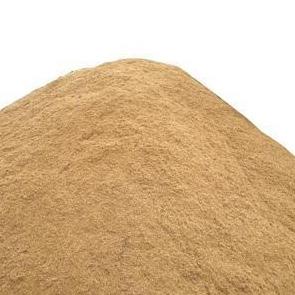
Immigrant workers are occupying abandoned farm houses as a shelter, almost 40 people occupy big abandoned constructions .They consider themselves the lucky ones, while others have to construct their shelter with disposed materials in the area.
SOURCES. “Salad Slaves: Who Really Provides Our Vegetables - YouTube.” Accessed December 29, 2018. https://www.youtube.com/watch?v=oZl1eBU4Qx0&t=376s&index=9&list=WL.
IMAGE SOURCES. “Limestone Rock.” Shutterstock.com. Accessed December 29, 2018. https://www.shutterstock.com/image-photo/limestone-rock-140817247. “Stack of Bricks PNG Images & PSDs for Download | PixelSquid - S10572023D.” Accessed December 29, 2018. https://www.pixelsquid.com/png/stack-ofbricks-1016080225924028184?image=G03.
69
Chabolas
(Hovels): 2-5 occupants
Domain Context
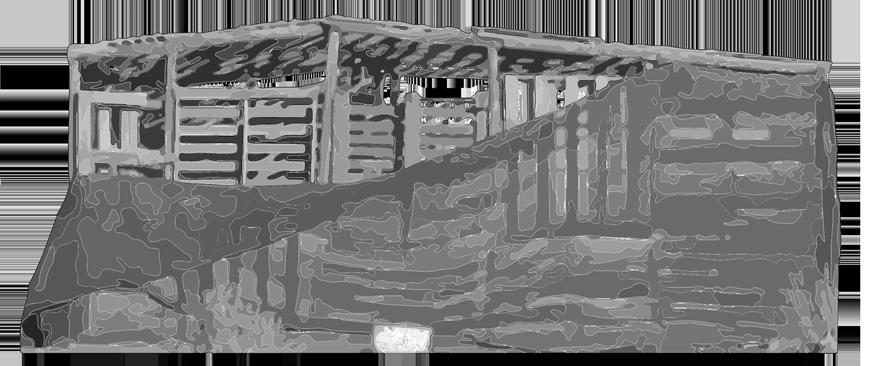
Cardboard Plastic Film Wood Boxes

Hovels or chabolas as they call them are the most common type of shelter for the immigrant workers, they are constructed by the immigrant workers with disposed material that is found in the area. Some of the most common materials used are old wood boxes for vegetables, cardboard boxes, old plastic films, old timber greenhouse columns, old fabric, and old mattresses.
IMAGE SOURCES. “Corrugated Sheets.” indiamart.com. Accessed December 29, 2018. https://www.indiamart.com/proddetail/corrugated-sheets-18936200730. html.“Jual Plastic PE ( PolyEthelene) oleh PT Tri Global Mitra di Bekasi Timur.” Accessed December 29, 2018. https://www.indonetwork.co.id/product/plastic-pe-polyethelene-5787846.
“Custom Wooden Crate.” indiamart.com. Accessed December 29, 2018. https://www.indiamart.com/proddetail/custom-wooden-crate-10648193988.html.
“Construction Aggregate and Stone Dust Wholesale Supplier | Noble Infratech, Delhi.” IndiaMART.com. Accessed December 29, 2018. https://www.indiamart. com/messrs-noble-infratech/.
70
71
IMAGE SOURCES. “Salad Slaves: Who Really Provides Our Vegetables - YouTube.” Accessed December 29, 2018. https://www.youtube.com/watch?v=oZl1eBU4Qx0&t=376s&index=9&list=WL.
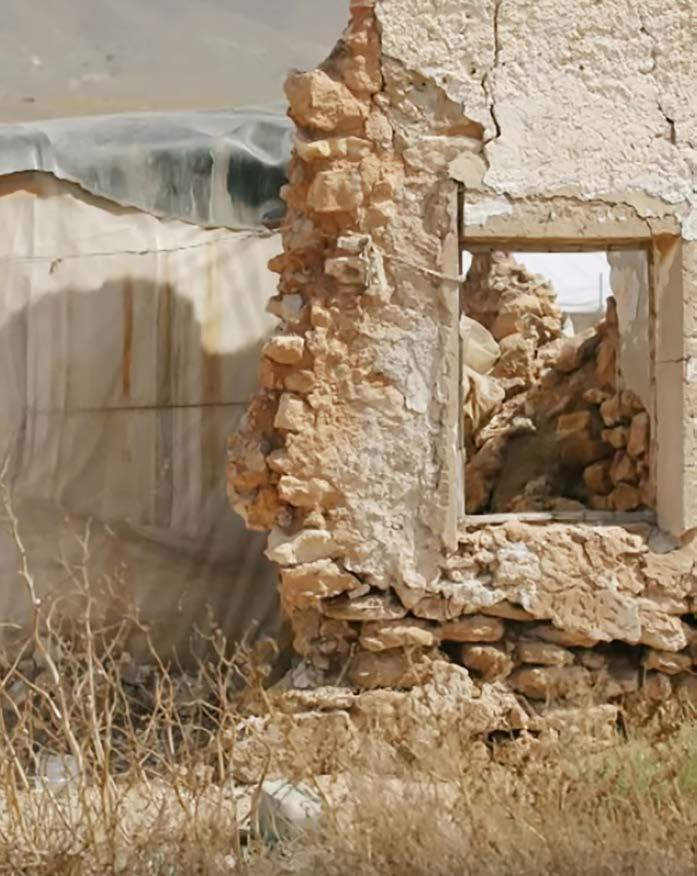
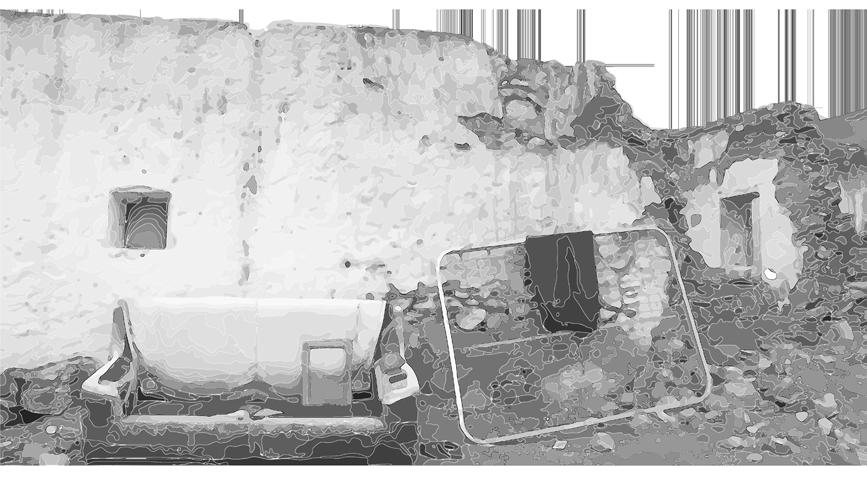
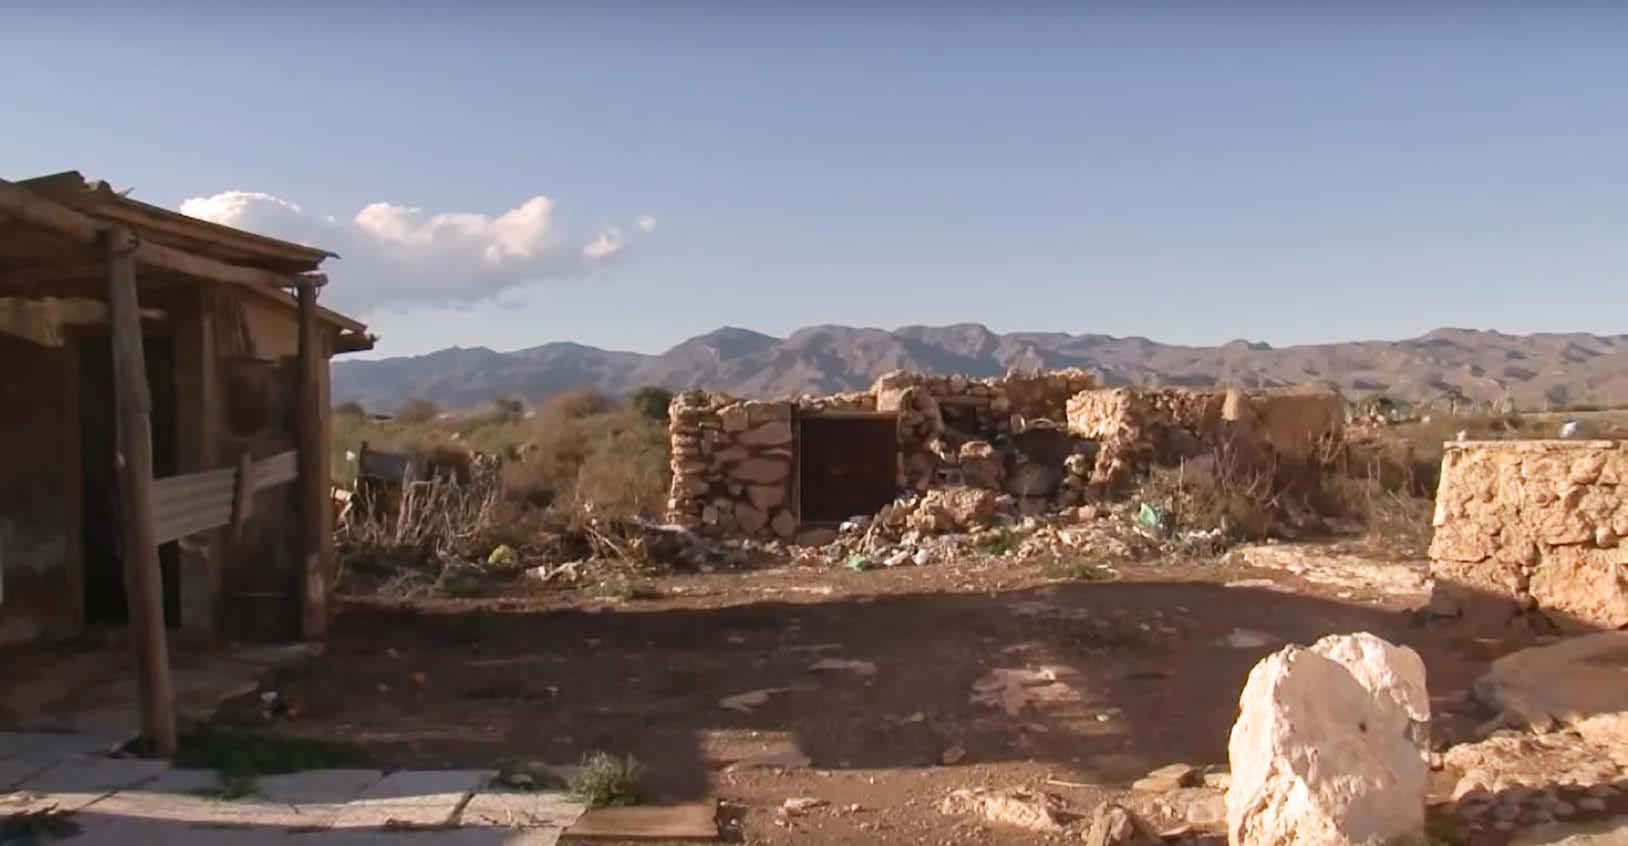
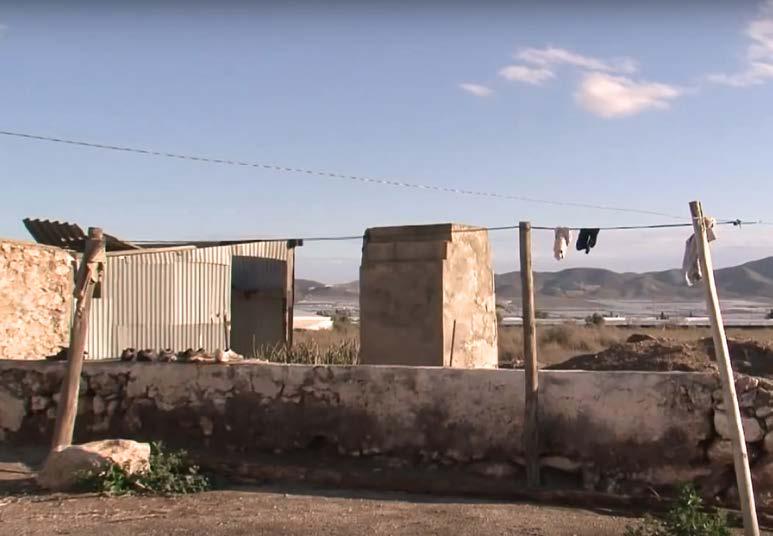
Abandoned Farm Houses
Exterior
Domain Context
The abandoned farmhouses are very old constructions that can be found in the region of Almeria. Most of them can be dated from the 1960’s to 1980’s when the boom of the greenhouses occurred in the area.

These old buildings, that are now used as houses by migrants, were completely abandoned for years. As a result they have had no maintenance and are in very precarious states.
In the peaktimes of migrants arriving to Almeria, authorities would send migrants to those houses to live, and to go to work in the greenhouses. Some of these abandoned farmhouses are located less than a mile from the touristic beaches of Almeria.
SOURCES. “Salad Slaves: Who Really Provides Our Vegetables - YouTube.” Accessed December 29, 2018. https://www.youtube.com/watch?v=oZl1eBU4Qx0&t=376s&index=9&list=WL.
“Almeria: Europe’s Dirty Little Secret in Southern Spain.” Huck Magazine, January 27, 2017. https://www.huckmag.com/art-and-culture/travel-diary-almeria/.
“Spain’s Sea of Plastic & Opioid Emergency: VICE News Tonight on HBO Full Episode - YouTube.” Accessed December 29, 2018. https://www.youtube.com/ watch?v=ml0EK-_H01Y&t=1222s&index=10&list=WL., FRANCE 24 English. Modern-Day Slaves: Europe’s Fruit Pickers. Accessed December 30, 2018. https://www.youtube.com/watch?v=_NUvj6JSeCU&index=11&list=WL&t=1s. Novara Media. The Bitter Fruit of Andalusia. Accessed December 30, 2018. https://www.youtube.com/watch?v=_NUvj6JSeCU&index=11&list=WL&t=1s.
DW Documentary. African Immigrants Exploited in Spain - Cheap Labor for Cheap Vegetables | DW Documentary. Accessed December 30, 2018. https://www. youtube.com/watch?v=p-YAfrjvQic&index=12&t=112s&list=WL.
72
Domain Context
Abandoned Farm Houses Interior
In the interior of the abandoned farmhouses people work hard to accommodate themselves, using every inch available to help receive as much people as possible.
Even though these are more formal constructions, the conditions are still very precarious. Migrants are using plastic to cover the old walls inside of the house, as well as using discarded materials and furniture found in the area in creative ways to fulfill the needs in the house.
Kitchens are improvised using concrete blocks with wood planks to support a gas stove purchased collectively by all the inhabitants of the house. The high density of resident per house means as many beds as possible have to be placed inside of a single room to maximize the house’s capacity.
SOURCES. “Salad Slaves: Who Really Provides Our Vegetables - YouTube.” Accessed December 29, 2018. https://www.youtube.com/watch?v=oZl1eBU4Qx0&t=376s&index=9&list=WL.
“Almeria: Europe’s Dirty Little Secret in Southern Spain.” Huck Magazine, January 27, 2017. https://www.huckmag.com/art-and-culture/travel-diary-almeria/.
“Spain’s Sea of Plastic & Opioid Emergency: VICE News Tonight on HBO Full Episode - YouTube.” Accessed December 29, 2018. https://www.youtube.com/ watch?v=ml0EK-_H01Y&t=1222s&index=10&list=WL., FRANCE 24 English. Modern-Day Slaves: Europe’s Fruit Pickers. Accessed December 30, 2018. https://www.youtube.com/watch?v=_NUvj6JSeCU&index=11&list=WL&t=1s. Novara Media. The Bitter Fruit of Andalusia. Accessed December 30, 2018. https://www.youtube.com/watch?v=_NUvj6JSeCU&index=11&list=WL&t=1s.
DW Documentary. African Immigrants Exploited in Spain - Cheap Labor for Cheap Vegetables | DW Documentary. Accessed December 30, 2018. https://www. youtube.com/watch?v=p-YAfrjvQic&index=12&t=112s&list=WL.
73
IMAGE SOURCES. “El sur de España es un agujero de mierda.” Accessed December 30, 2018. https://www.burbuja.info/inmobiliaria/burbuja-inmobiliaria/1063115-sur-de-espana-agujero-de-mierda-15.html.
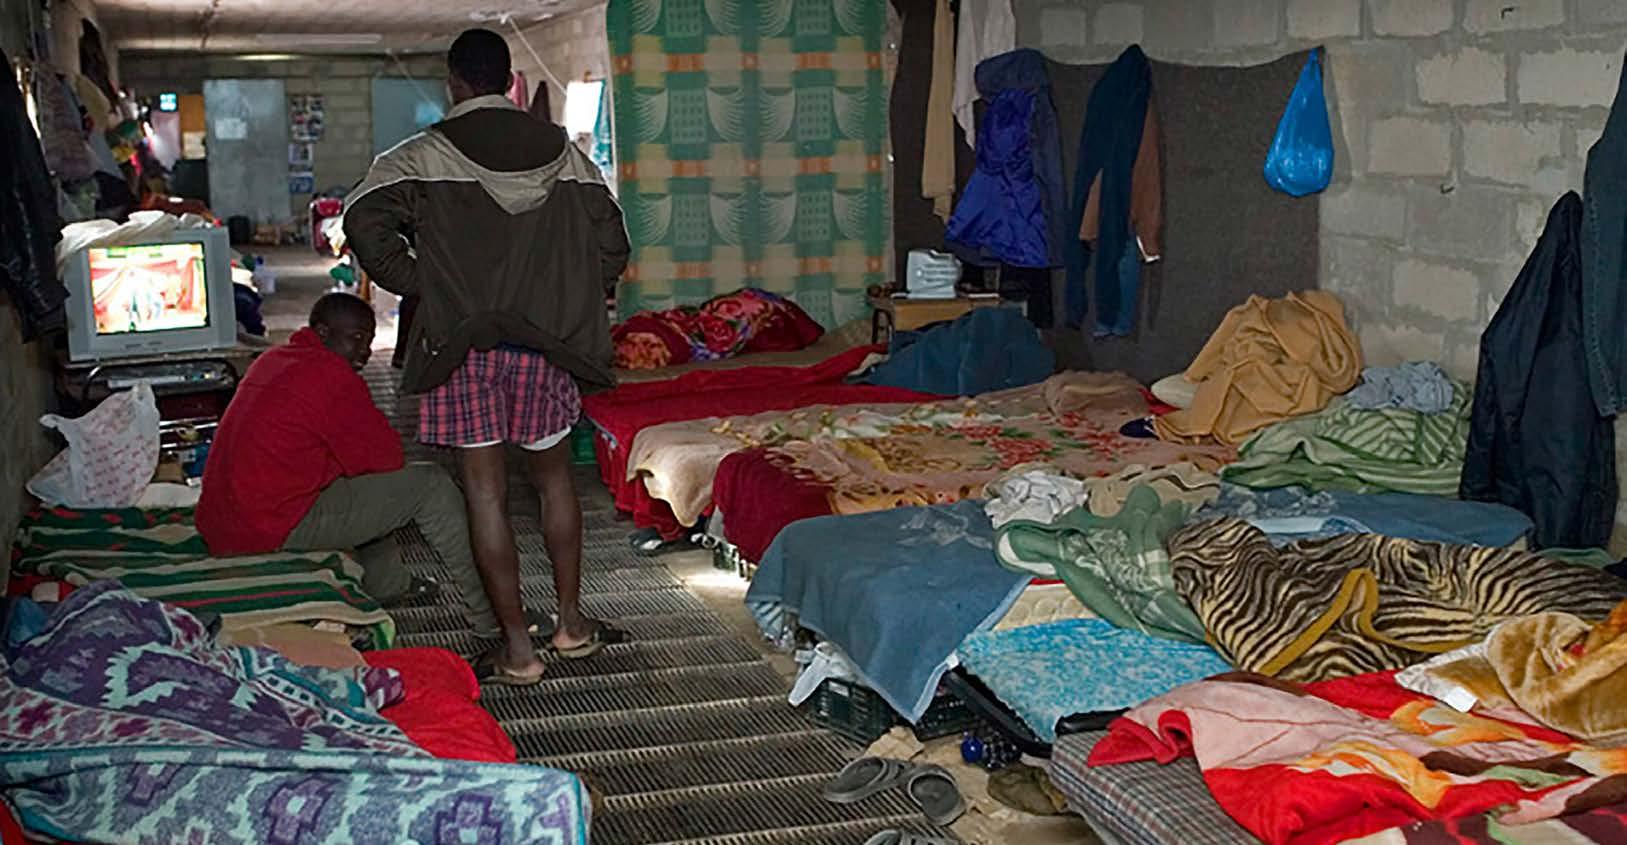
“Salad Slaves: Who Really Provides Our Vegetables - YouTube.” Accessed December 29, 2018. https://www.youtube.com/watch?v=oZl1eBU4Qx0&t=376s&index=9&list=WL.
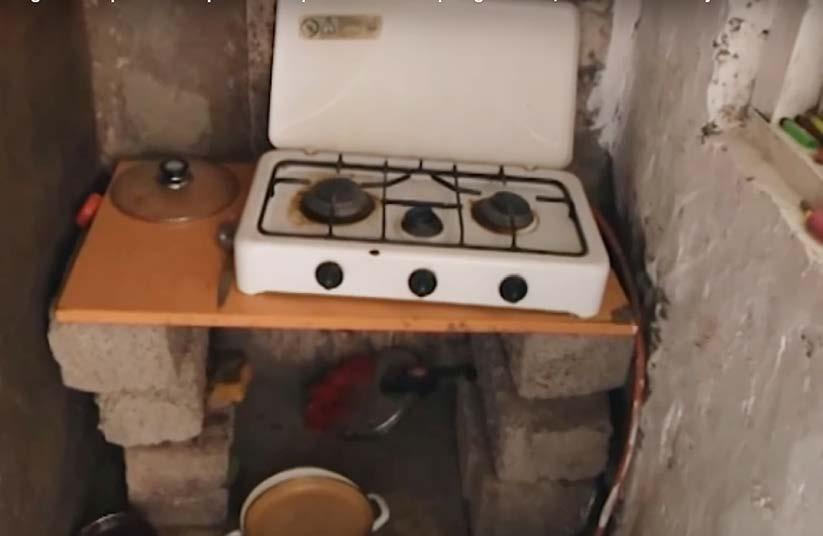
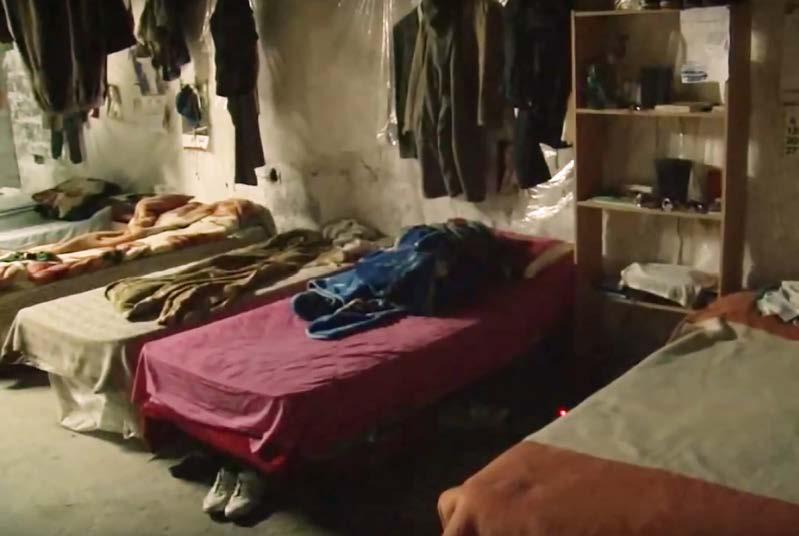
74
IMAGE SOURCES. “Salad Slaves: Who Really Provides Our Vegetables - YouTube.” Accessed December 29, 2018. https://www.youtube.com/watch?v=oZl1eBU4Qx0&t=376s&index=9&list=WL.
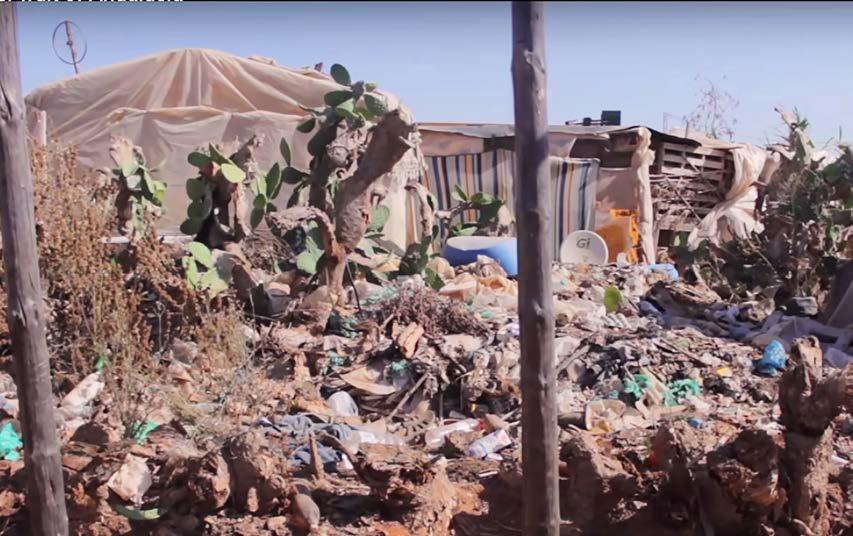
“Spain’s Sea of Plastic & Opioid Emergency: VICE News Tonight on HBO Full Episode - YouTube.” Accessed December 29, 2018. https://www.youtube.com/ watch?v=ml0EK-_H01Y&t=1222s&index=10&list=WL., Novara Media. The Bitter Fruit of Andalusia. Accessed December 30, 2018. https://www.youtube.com/watch?v=_NUvj6JSeCU&index=11&list=WL&t=1s.
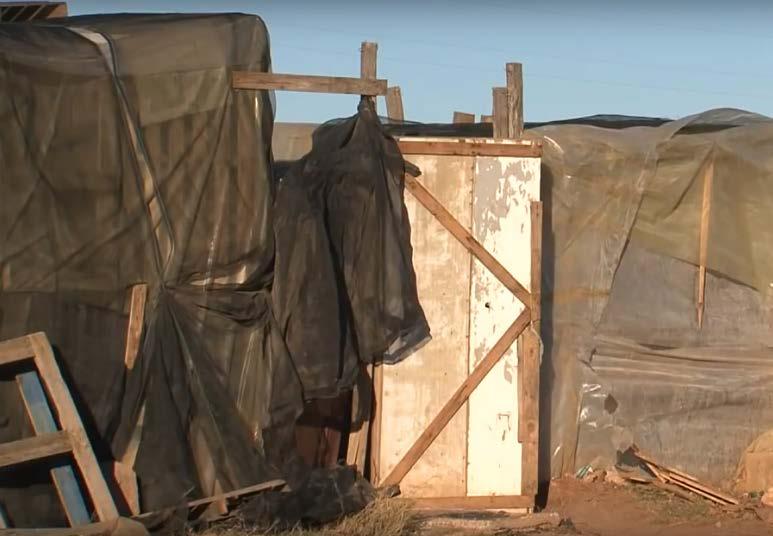
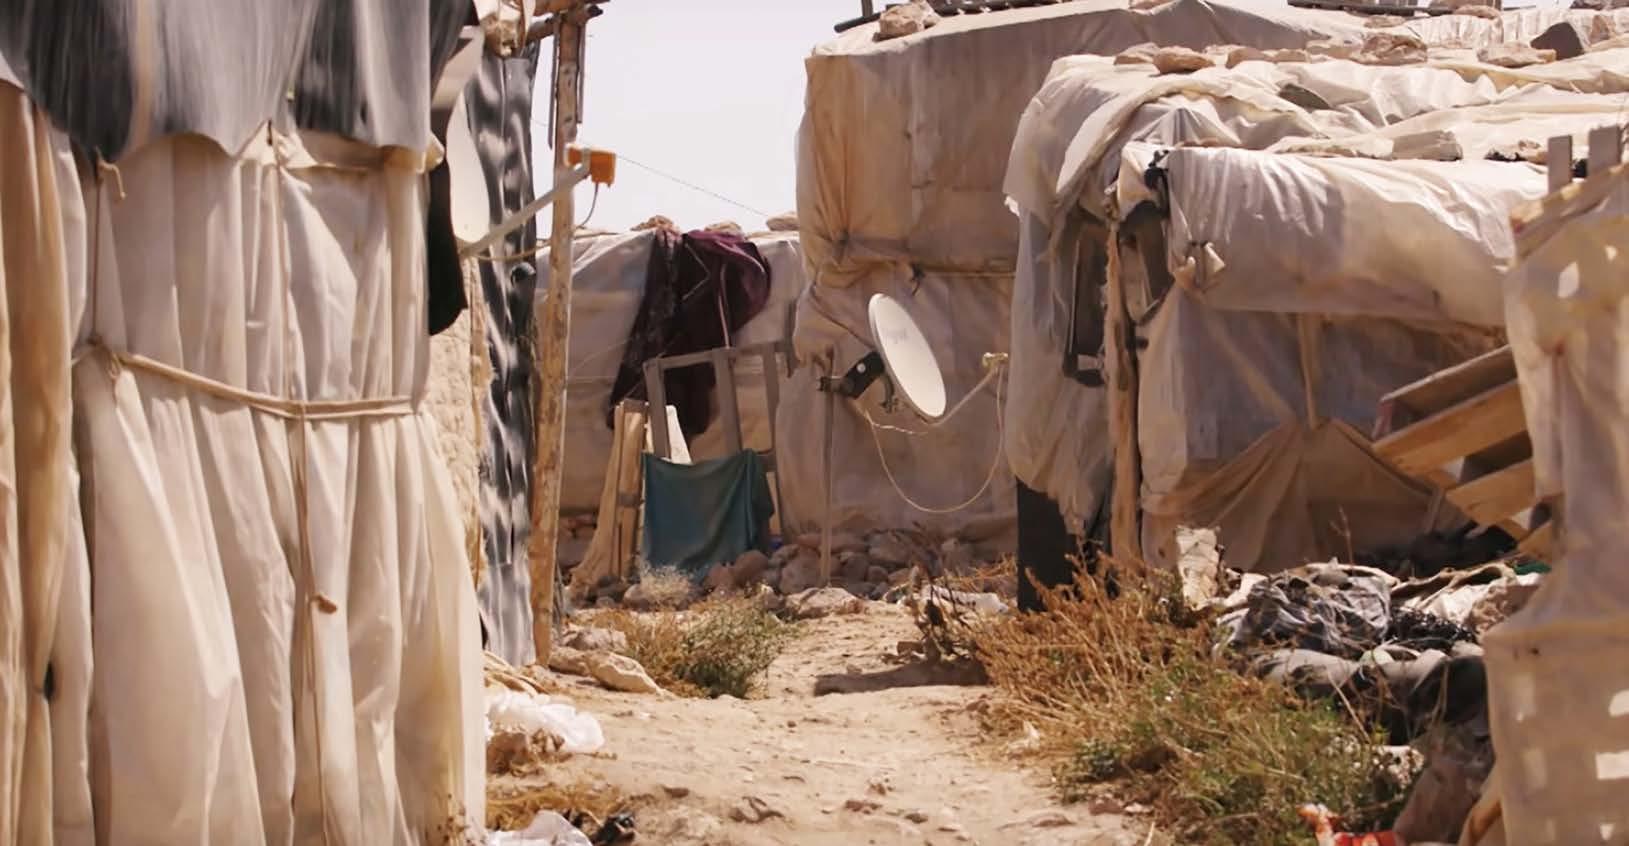
75
Chabolas (Hovels)
Exterior
Domain Context
The Chabolas or Hovels is the way the migrants call the houses that are made with any materials recycled in the area, for instance, vegetables packaging boxes, greenhouse plastic films and textiles, and in some extreme cases even cardboard boxes.

These Hovels are scattered around the whole site between the greenhouses but away from the beach. In certain empty spots that are usually surrounded by garbage. The chabolas are usually cluster in small groups accommodating less than 100 people.
“Approximately 200 workers live in the settlement in peak season. The site has no drinking water or waste removal services. Electricity is improvised with no grounding, crating a fire hazard. Toilets are 30cm holes in the ground. There are hundreds of similar settlements in the region.”
-The bitter fruit of Andalusia
SOURCES. Novara Media. The Bitter Fruit of Andalusia. Accessed December 30, 2018. https://www.youtube.com/watch?v=_NUvj6JSeCU&index=11&list=WL&t=1s.
“Salad Slaves: Who Really Provides Our Vegetables - YouTube.” Accessed December 29, 2018. https://www.youtube.com/watch?v=oZl1eBU4Qx0&t=376s&index=9&list=WL.
“Almeria: Europe’s Dirty Little Secret in Southern Spain.” Huck Magazine, January 27, 2017. https://www.huckmag.com/art-and-culture/travel-diary-almeria/.
“Spain’s Sea of Plastic & Opioid Emergency: VICE News Tonight on HBO Full Episode - YouTube.” Accessed December 29, 2018. https://www.youtube.com/ watch?v=ml0EK-_H01Y&t=1222s&index=10&list=WL., FRANCE 24 English. Modern-Day Slaves: Europe’s Fruit Pickers. Accessed December 30, 2018. https://www.youtube.com/watch?v=_NUvj6JSeCU&index=11&list=WL&t=1s.
DW Documentary. African Immigrants Exploited in Spain - Cheap Labor for Cheap Vegetables | DW Documentary. Accessed December 30, 2018. https://www. youtube.com/watch?v=p-YAfrjvQic&index=12&t=112s&list=WL.
76
Chabolas (Hovels)
Interior
In the case of the Chabolas, or hovels, cardboard and newspaper are the most common materials used as walls and ceiling. Floors are also usually made out of cardboard, with in some cases found rugs used as an additional cover (see picture left). As a consequence of not having access to running water or drainage disposal, migrants get by with makeshift bathrooms. Indeed, buckets of water are used for washing, while 30cm holes in the ground are used in lieu of lavatories.
Finally, drinking water is oftentimes procured from far-off contaminated reservoirs, which is then transported back by the migrants using pesticide containers, leading to increased health risks.
SOURCES. “Salad Slaves: Who Really Provides Our Vegetables - YouTube.” Accessed December 29, 2018. https://www.youtube.com/watch?v=oZl1eBU4Qx0&t=376s&index=9&list=WL.
“Almeria: Europe’s Dirty Little Secret in Southern Spain.” Huck Magazine, January 27, 2017. https://www.huckmag.com/art-and-culture/travel-diary-almeria/.
“Spain’s Sea of Plastic & Opioid Emergency: VICE News Tonight on HBO Full Episode - YouTube.” Accessed December 29, 2018. https://www.youtube.com/ watch?v=ml0EK-_H01Y&t=1222s&index=10&list=WL.,
FRANCE 24 English. Modern-Day Slaves: Europe’s Fruit Pickers. Accessed December 30, 2018. https://www.youtube.com/watch?v=_NUvj6JSeCU&index=11&list=WL&t=1s.
Novara Media. The Bitter Fruit of Andalusia. Accessed December 30, 2018. https://www.youtube.com/watch?v=_NUvj6JSeCU&index=11&list=WL&t=1s.
DW Documentary. African Immigrants Exploited in Spain - Cheap Labor for Cheap Vegetables | DW Documentary. Accessed December 30, 2018. https://www. youtube.com/watch?v=p-YAfrjvQic&index=12&t=112s&list=WL.
77
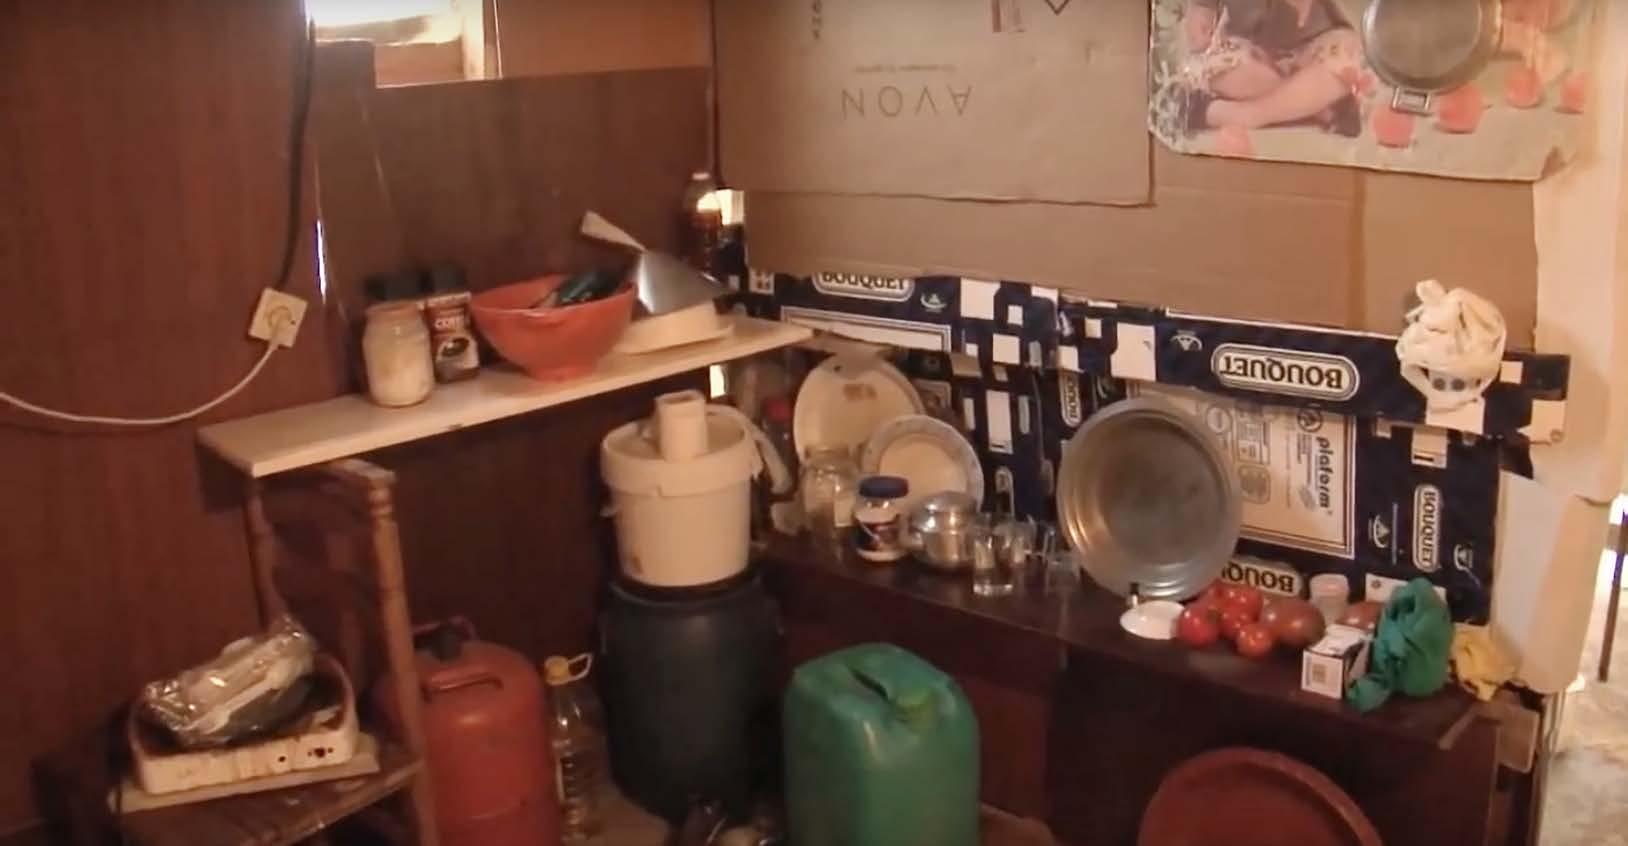
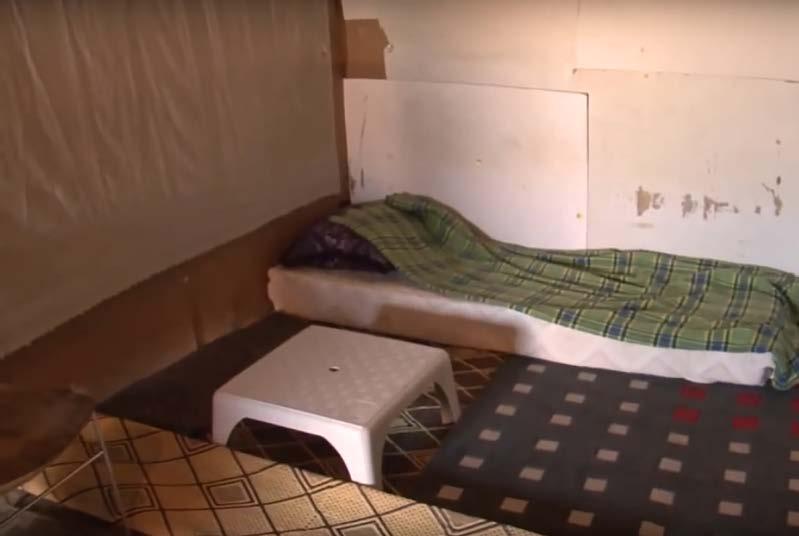
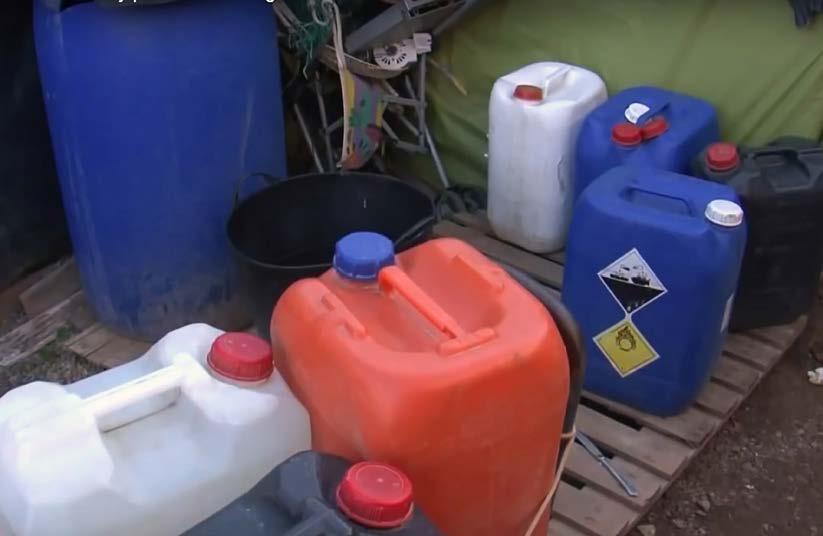
78
IMAGE SOURCES. “Salad Slaves: Who Really Provides Our Vegetables - YouTube.” Accessed December 29, 2018. https://www.youtube.com/watch?v=oZl1eBU4Qx0&t=376s&index=9&list=WL.
2.2. Conclusion
2.2.1. Problems and Solutions
The principle strategy of the research is to solve the 4 fundamental problems by creating an integrated solution of a hydrological urban network that can connect to new greenhouse system and new housing units for the migrant workers. Each solution will work in synthesis to address greenhouse inefficiencies, water over-exploitation, and plastic pollution.
Water over-exploitation
2.2.1.1. To address the increasing salination of the region, various desalination systems will be explored to be integrated with greenhouse system. Ambition will be aimed towards the net positive production of fresh-water, reversing the net consumption of the area.
Plastic pollution
2.2.1.2. A more integrated production process will be examined. Strategies to increase material longevity will be explored, with a potential to increase volume to plastic ratio through geometric strategies, and to limit multi-material joints by implementing homogeneous material construction. As well as an option to re-use plastic material that is being continuously disposed in the area.
Greenhouse Inefficiencies
2.2.1.3. The primary inefficiency to be addressed is geometric. Orientation and height will be explored to maximize chimney effect and reduce micro-climate fluctuations. As greater volume presents greater wind-loads new structural systems will be developed to address wind load and wind directional changes. A morphologically adaptable prototype will be explored.
Typical greenhouses provide singular climatic condition, while a variation of crops is produced in Almeria. Another factor to ameliorate greenhouse performance is to provide adaptability to different crop conditions. To implement control of humidity and micro-climate, systems of humidity and hydro-thermal heating/cooling control will be explored.
Human Needs
2.2.1.4. Both current working and living conditions of the migrant workers will be addressed in the area. Firstly, the new system for the greenhouses create a healthier working environment. Secondly, it will create better opportunities for migrants to find jobs by locating communities in proximity to the greenhouses.
In order to address the living conditions, a new proposal for design and construction of housing units will be put in place, taking into consideration environmental factors, the architecture and design from both Spain and the birth country of most of the migrants, and an ecologically responsible construction.
There will also be a strong focus to provide a better access to potable water for the migrant population.
IMAGE SOURCE. Photographer: Bernhard Lang
. “The Plastic Mosaic You Can See From Space: Spain’s Greenhouse Complex - Bloomberg.” Accessed September 19, 2018. https://www.bloomberg.com/news/ features/2015-02-20/the-mosaic-you-can-see-from-space-spain-s-massive-greenhouse-complex.
79
Conclusion Domain
Conclusion Domain
2.2.2. Research Questions(M.Arch)
2.2.2.1. Can a hydraulic and road network be generated to connect the greenhouses and housing units?
Global Scale
Meso Scale
2.2.2.2. Can housing units be spatially distributed to formulate residential communities which can gain access to fresh water resources and basic services as well as being integrated to existing urban networks?
2.2.2.3.
Local Scale
How fabrication and assembly logic could be devised utilizing locally sourced building material as well as material recycled from horticulture production to produce housing units for the temporary migrant workers?
80
Reduce Micro-climate Fluctuations
Greenhouse Inefficiencies
Improve Chimney Effect
Water Overexploitation
Larger Volume and Height
Control of Microclimate
Variation in Crop Requirements
Increase Volume: Plastic Ratio
Integrated Cyclical Water System
Larger Wind Load
Morphology Adapting to Changing Winds
Adaptable Ventilation System
Wind Adaptive Hydro-Thermal Farm System
Water Cooling Labyrinth
Desalinization System
Urban Network [Hydrological]
81
Generation [Road]
PROBLEMS
Socially and Ecologically Responsive Settlements
82 Plastic Polution Use Long Life Material Homogenous Material Eliminate Multimaterial Joints Increase Material Durability
Plastic Recycling Basic Services For Inhabitants Housing For Migrants
Needs Low Waste Construction Collective Settlements Plastic in Construction Process Potable Water Spacial Social Differences SOLUTIONS
Human
83 3
METHODOLOGY
84
Analysis
Methodology
85
Design Global scale Meso scale Local scale Finite Element Analysis Karamba Multi-Objective Generative Algorithm Octopus Instruction tree algorithm Decoding Space plugin Diffusion-Limited-Aggregation Model Grasshopper visual scripting environment Multi-Objective Generative Algorithm Octopus Planarize Force Driven Mesh Relaxation Kangaroo Mesh Relaxation Kangaroo Computational Fluid Dynamics(CFD) Autodesk CFD Solar hours analysis Grasshopper visual scripting environment Solar hours analysis Grasshopper visual scripting environment Centrality analysis Decoding Space plugin network analysis environmental performance evaluation structural performance evaluation Justified Gragh Analysis Decoding Space plugin Methodology Overview
& Evaluation Computational
Methodology
3. Methodology
3.1. Generative Design Methods
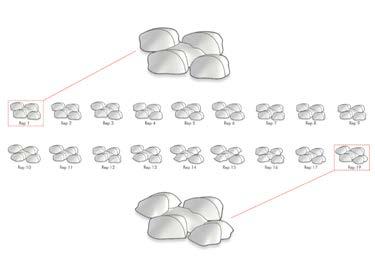
Generative Algorithm
Genetic Algorithm(GA) is a power algorithm which sorts through a large quantity of data to provide a pool of optimal solutions based on the designated objectives. In the research, a design logic based on the context situated research were implemented with GA. As the multiplicity of design objectives are needed for the basis of constructing our design, it is advantageous to utilize the multi-objective evolutionary algorithm. In this research, the algorithm was based in Octopus plugin within the Grasshopper visual scripting environment in order to be fully integrated with other modelling and analysis tools.
Instruction tree algorithm
The crucial part of the experiment was the road network generation. The instruction tree algorithm was used, It was developed by Reinhard Koenig et al. The generation logic as it has been described in their paper ‘Graphical smalltalk with my optimization system for urban planning tasks’. The algorithm was chosen for the road network generation due to the three reasons listed below,
• generate a connected hierarchical street network, as the generated morphologies are very close to the urban street in reality.
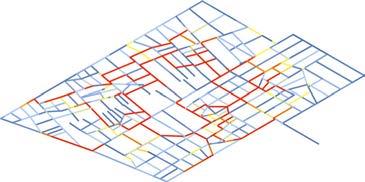
• ability to generate a diverse range of network morphologies with only a few control parameters. As such when the algorithm was integrated into the Genetic Algorithm, the GA could maintain a fine balance between exploiting local optimum solutions while exploring variations globally.
• The algorithm takes into account the existing context. In the case of this settlement experiment, the urban road network and canals from previous experiments were used as input. As a result, the generative result was coherent and related.
86
Genetic Algorithm phenotypes Street network generated by instruction tree algorithm
Methodology
Diffusion-limited aggregation
The Diffusion-limited aggregation was first proposed by IT.A. Witten Jr. and L.M. Sander in 1981. The model was first used to simulate the physical phenomenons, later several physists and urban planners has proposed its usage in the urban growth simulation.
The Mesh relaxation method was implemented using the Particle-spring engine Kangaroo in Grasshopper visual programming environment. It was used for two purposes. First, it served as a form-finding tool to generate compression only catenary adobe shell structure. Second, it was utilized as an optimization tool to test planarization using various pattern discretization.
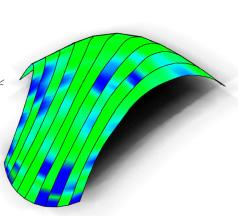
IMAGE SOURCES. THERM U-Factor Calculation: https://windows.lbl.gov/software/therm
Planarize Force Mesh Relaxation: Brütting, Jan, Axel Körner, Daniel Sonntag, and Jan Knippers. Bending-Active Segmented Shells, 2017.
87
urban simulation by DLA
Planarize Force Mesh Relaxation
Mesh
relaxation
3.1. Evaluation & Analysis Methods
Centrality analysis
In graph theory and network analysis, Centrality analysis is used to analyse the characteristic of the network and the criticality of nodes or edges within the network. In our generative design process, the centrality analysis was used to quantitatively evaluate the connectivity of the GA generated street network. The Betweenness centrality value of the street segments was used as the fitness value which also drove the GA computational process.
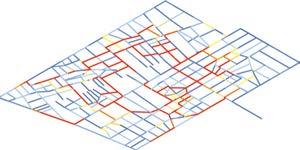
Justified graph analysis
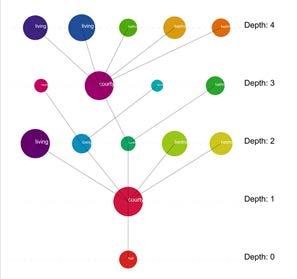
The justified graph analysis is an graph based analysis method. It was used to explicitly analyze the relationship of the spatial organization of the various domestic programmes within the vernacular housing typologies. Computational fluid dynamics (CFD)
Computational fluid dynamics (CFD) is a computational finite element simulation tool to simulate and numerically calculate the fluid flow. The tool was used to post evaluate the dynamic behavior of outdoor air movement and its impact on the local microclimate of settlement GA generated solutions.
Solar hours analysis
Solar hours analysis evaluate the amount of time that one building is exposed to the direct solar radiation within the daylight hours on a selected date. It is directly reflecting the shadows that the building morphologies cast on itself and surroundings and if the sufficient amount of sunlight requirement is met. Both Summer Solstice and Winter Solstice sun paths were used to compare the summer and winter conditions.
Finite Element Analysis
Finite Element Analysis is utilized to analyze the structure performance of the inflated pneumatic beam. In order to simulate inflation behavior of the membrane material, both internal pressure and external atmospheric pressure were applied on the surface in addition to the standard structural loads such as gravity and wind load.
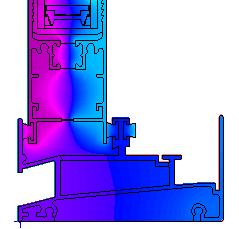
88 CFD 3D Simulation Solar Hours Analysis THERM U-Factor Calculation Methodology Centrality Analysis Justified Gragh Analysis
89 4
RESEARCH DEVELOPMENT
90
4.1. Spatial Organization
4.1.1. Overview
In order to contextualize the housing needs of migrant workers in the horticulture industry, one has to look at the demographics of the migrant labour population in El Ejido, Almeria. Moroccan migrant workers take up nearly 40% of the population, this suggests the particular spatial organization of the collective living Moroccan housing should not be neglected. Consequently, the research focus was moved to the comparative analysis of both Spanish and Moroccan housing types. The aim of the research was to understand the distinct spatial logic of the Moroccan domestic space in its vernacular housing typologies and the urban context within which it’s situated. The extracted logic then informed the residential settlement and the housing design for the low-income migrant communities.
In addition to the form and space analysis space of the Moroccan and Spanish vernacular housing types, Justified graph analysis was used to reveal the explicit topological relationships between different domestic programmes.
4.1.1. Housing Types
4.1.1.2.
Moroccan Housing Types
Courtyard house
Courtyard house and its variations are the most prevailing collective housing types which could be found in both the rural and urban parts of Morroco. Originating from the nomadic circular tent tribes, the courtyard house has been evolving and adapting to both rural pastoral needs and urban commercial mixed use. In both cases, the house accommodates one single extended family in which three generations could be commonly found.
The programs are organized around the central courtyard (in some cases covered atrium), which is also the largest space. All rooms have direct access to the courtyard. The location of the courtyard can vary in some observed regional variations.
In the case of a multi-story courtyard house it is occupied by an extended family, according to the justified graph analysis, typical single storey house contains 4 network depths.
Privacy is an important concern which defines the physical form and spatial logic of the courtyard house. The entrance of the courtyard house is typically located at the corner of the house and is indirectly linked with the courtyard by an L-shape corridor.
91 Research Development
Spatial Organization
Research Development Spatial Organization
This marks a clear boundary between the public street and the private residence. Traditionally a view to the street is least preferred.
The justified graph demonstrates the privacy level in relation to the network depth. guest accessible programmes are located on the first two depths. Private spaces are located in the deeper depth of the network.
Twinhouse
The courtyard house grows in both horizontal and vertical direction depending on the available land for expansion. Horizontal growth can be observed in the type when two adjacent courtyards merge into one. The gender segregation can be observed in this type.
4.1.1.1.
Spanish Housing Types
Townhouse
The townhouse is a typical mixed-use urban housing type in Andalucian province as well as the other regions of Spain. It features the street facing facade and private backyard. The ground floor on the street side is usually converted for commercial or production purpose.
Patio house
The patio house typically consists of multiple couryard or light wells for better natural lighting conditions. The patios could be distributed on different levels. It also creates more interesting spatial relationships.
92
house
Research Development Spatial Organization
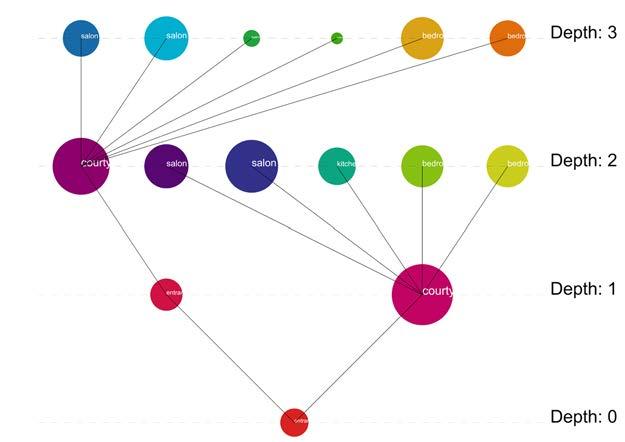
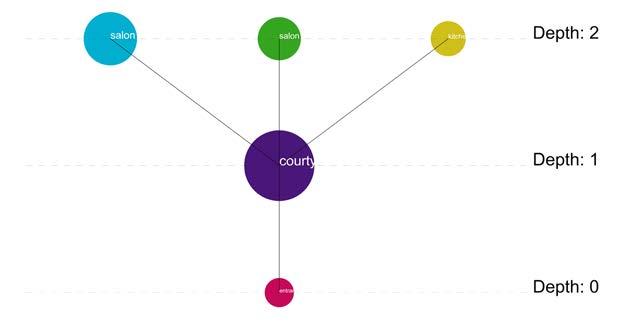
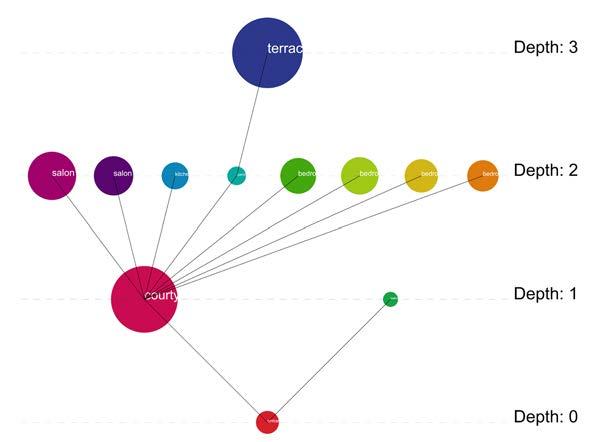
house with staircase to terrace
Two interconnected courtyard houses (separated by gender)
93
courtyard
courtyard
salon 2 salon 1 court kitchen entrance bedroom kitchen salon entrance salon bedroom salon bedroom bedroom bedroom kitchen court 2 court 1 salon bedroom toilet 1 toilet 2 entrance 2 entrance 1 bedroom bedroom salon salon bedroom bedroom
Two-story house (Morocco)
Research Development Spatial Organization
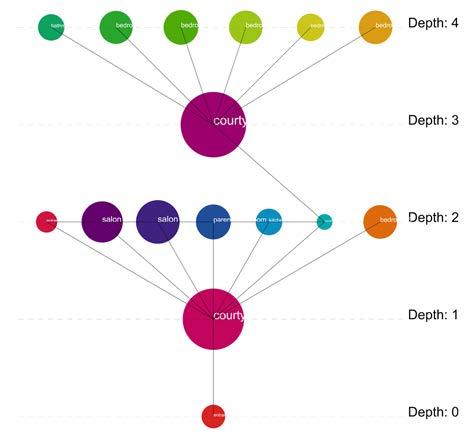
Two-story house (Spain)
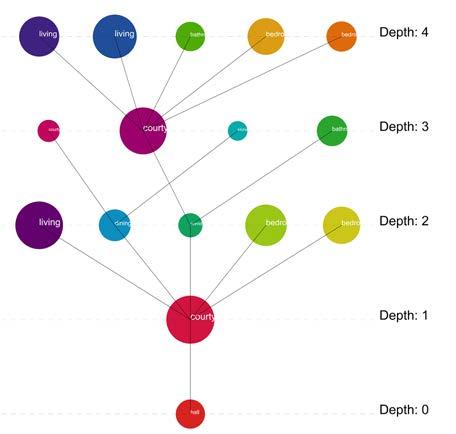
94
stairwell kitchen dining room courtyard living room court entrance bedroom bedroom bedroom Moroccan Housing Types
stairwell bathroom bedroom bedroom court living room courtyard bathroom bedroom bedroom court bedroom (parents) salon kitchen staircase entrance salon court bedroom bedroom bedroom staircase bedroom bedroom
SOURCE. Le Jardin et la Maison Arabes au Maroc, Jean Galloti Baker, Darryl. “The Traditional House and New Middle Class Housing in Morocco.” Ekistics 53, no. 318/319 (1986): 149–56.
Research Development Spatial Organization
4.1.2. Urban Growth 4.1.2.1. 4.1.2.1.
Moroccan Urban Growth Logic
The Moroccan urban growth is not controlled by a top-down master plan, it follows a self-organized logic. The urbanization started with the aggregation of individual courtyard houses. This process formulated a dense and packed urban form featuring narrow pedestrian paths. On the one hand, this was due to the limited land available, on the other hand, because the deep urban canyon of the streets was favoured in the sunny semi-arid climate. As the density increased, a hierarchy of the urban tissues could be observed from 40~60 resident Derb(cluster) to 2000 resident Houma(community). This was also reflected in the width and scale hierarchical street network.
As the complexity increased with scale, the diversity of public programmes added also increased. On the largest Houma scale, clear urban centres of the settlement can be observed. They are defined by the complex programmes like Hammam (bathhouse) and souk (market).
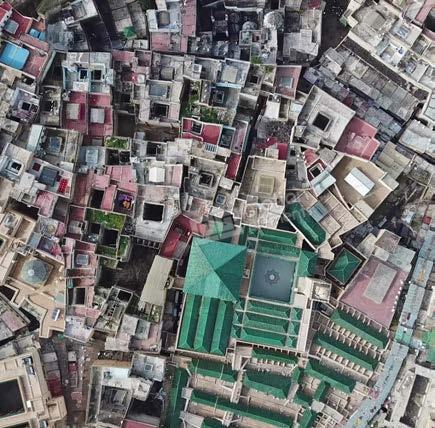
Spanish Urban Growth Logic
The Spanish urban growth featuring a clear centre, for instance, Nucleus(main plaza surrounded by religious centre and municipality building). The mixed use townhouse s started to cluster around this centre and expanded gradually. The main commercial streets were formed by these townhouses.
ch&tbs=simg:CAQSlwEJ8qcd_1kR_1_1XMaiwELEKjU2AQaBAgVCAMMCxCwjKcIGmIKYAgDEijhF40V1B7cF94ejhXdHtQL6RSVDK45kjmzOb0rlivhP7g57iL1OeI_1GjA2K3kesmVZ5e6_19a6KWwJSGDk0j-XCuhP8l1s_1oBlI4PIPaCVJFnMYDqf9vw6_1Ob0gBAwLEI6u_1ggaCgoICAESBLbXnrEM&sa=X&ved=0ahUKEwjynLG-xNzfAhV2RhUIHWfiCfcQwg4IKygA&biw=696&bih=604#imgrc=8qcd_kR__XNXVM:
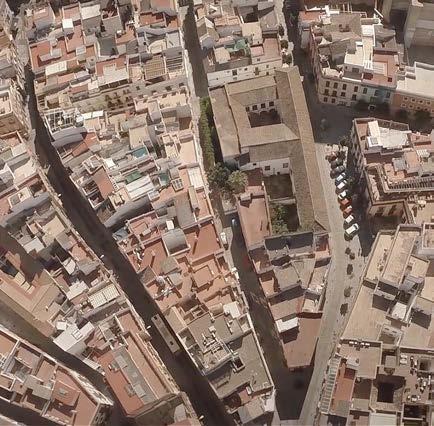
95
Fes el Bali, Morocco
Seville, Spain
IMAGE SOURCE. “Fes Medina Aerial - Google Search.” Accessed January 7, 2019. https://www.google.co.uk/search?hl=en-GB&q=fes+medina+aerial&tbm=is
Research Development
Spatial Organization
Figure-Ground Name
Population Public Programs
3-7 house Bayt (housing unit)
Derb (cluster)
40-60 cluster square
Hay (neighborhood)
200-500 neighborhood square workshops shops
Houma (community)
1800-2000
public square souk(market) mosque hammam(bath house) leisure
Urban
DIAGRAM.SOURCE.“Bayt, a Different View on Social Housing in Morocco.” Abdessamed Azarfane (blog), June 4, 2015. http://www.abdessamedazarfane. com/2015/06/bayt-a-different-view-on-social-housing-in-morocco/.
96
growth pattern in Morrocan cities
Water Circulation
4.2. Water Circulation
4.2.1. Overview
On a local scale, the research aimed to find an alternative freshwater resource as opposed to the current water mining practice. This would help reduce the ecological impact of the greenhouse farming system as well as providing fresh water access to local migrant worker communities.
The solar desalination technique promised great potential for alternative fresh water production for both greenhouse irrigation and living usage. In addition, it can be used for passive cooling. However, operating this system requires urban scale infrastructure. Each of the distributed desalination systems requires constant seawater input as well as undesalinated return water output. This suggests on a global scale, a hydraulic circulation network system is necessary for maintaining seawater flow. Research on the spatial organization of the hydraulic and drainage systems aimed to find the most efficient organizational pattern.
97
Research Development
vegetation soil
summer daytime cooling summer night cooling winter heating summer daytime cooling summer night cooling winter heating summer daytime cooling summer night cooling winter heating summer daytime cooling summer night cooling winter heating summer daytime cooling summer winter heating summer daytime cooling summer night cooling winter heating
glass façade concrete wall
concrete slab passive cooling labyrinth
Research Development
Water Circulation
4.2.2. Passive System
4.2.2.1. Project Information
Davies Alpine Greenhouse
Height: 10m
Interior floor area: 96m2
Location: London, UK
Client: Royal Botanic Gardens, Kew
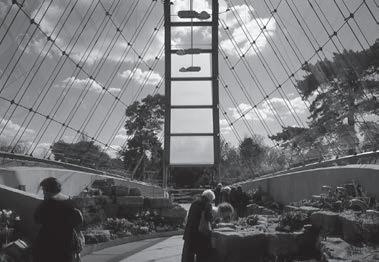
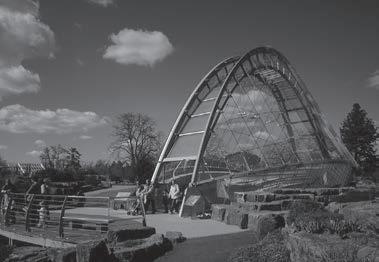
Architect: Wilkinson Eyre Architects
Structural Engineer: Michael Barclay
Partnership
Environmental Engineer: Atelier 10
Completed: March 2005
Completed in March 2005, Davies Alpine greenhouse in Kew Garden London is an innovative sustainable greenhouse project featuring natural ventilation and cooling system. It is designed by Wilkinson Eyre Architects in collaboration with environmental engineer practice Atelier 10.
In order to provide dry and bright high altitude mountainous microclimate(constant 10oC temperature) for the alpine plant species to grow and reproduce, natural ventilation is used as main microclimate mediation method.
First, the building height was design 10m tall in order to utilize the stack effect and cross ventilation effect.
Second, there’s an passive cooling strategy applied, according to Peter Davey, inspired by the principal of termite mound ventilation. An 80m long concrete block labyrinth was constructed 3m beneath the ground level. This passive cooling design could be considered as a reversed ancient Roman hypocaust. Incoming air is first drawn into the labyrinth to be cooled using thermal mass of concrete before being redistributed in the atrium. It will be exhaust through the opening on the apex using stack effect. At night time, the cooler exterior air was drawn into the labyrinth to dissipate heat accumulated in the concrete mass.
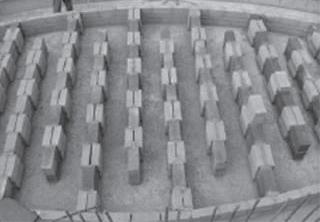
Combined with mechanical shading system, the interior temperature of the greenhouse Can be maintained around the targeted 10oC.
IMAGE
images:http://www.wilkinsoneyre.com/projects/royal-botanic-gardens-kew-masterplan labyrinth images:https://daviesalpinehouse.weebly.com/
98
SOURCES. interior exterior
Davies Alpine House Exterior Davies Alpine House Interior
Davies Alpine House Labyrinth
4.2.3. Desalination System
To provide alternative fresh water resource for local horticulture industry and reduce ecological impact of agricultural activities, research on the sea water desalination. Classification on the all the possible desalination techniques reveals that the by physical property, the techniques can be divided into phase change/non phase change techniques. An review on the major industrial scale desalination techniques indicates that Reverse osmosis is most frequently used desalination technique. Membrane technologies represent the main non phase change techniques, they are more productive than the techniques which involves in the phase change however, the phase change desalination techniques offer opportunities of co-generation(e.x. Electricity generation) or integration of other systems(cooling or heating system).
However, Current industrial scale centralized desalination plants are limited to the industrial or urban usage due to the high infrastructure investment and high energy consumption. Utilizing desalinated water for irrigation purpose is only feasible when applied on high value crops.
In terms of energy consumption, 0.7kWh/m3 is theoretically the minimum energy required to desalinate the sea water. The energy consumption of various techniques ranges between 3 to 15 kWh/m3.
As suggested by M. Schiffler, more practical approach for individual farms is to integrate small scale decentralized brackish water desalination. [1] Potential renewable energy such as wind or solar energy should be integrated into the system to minimize the energy consumption. Solar energy can be integrated into the desalination process by direct solar distillation or indirect solar desalination(coupling with RO techniques, solar energy is converted to electricity). Wind energy can be integrated into the RO technique to generate electricity.
After the initial investigation, solar distillation technique was chosen as it’s ideal for small scale decentralized desalination process using renewable energy. It’s could be integrated into the greenhouse system and being combined with cooling or heating system.
According to Kabeel et al. study, for double slope solar still with built in condenser, the theoretical daily production capacity of the system is 7 kg/m2.
SOURCES.[1]
[5]Sablani, S. S., M. F. A. Goosen, C.
and Challenges for Desalination in the 21st Century.” Desalination, Desalination Strategies in South Mediterranean Countries, 165 (August 15, 2004): 4.
[4] https://en.wikipedia.org/wiki/Seawater_greenhouse
[5] https://seawatergreenhouse.com/
H. Shayya,
Abdalla. “Solar Still with Condenser – A Detailed Review.” Renewable and Sustainable Energy Reviews 59 (June 1, 2016).
“Simulation of Fresh Water Production Using a Humidification-Dehumidification Seawater Greenhouse.” Desalination 159, no. 3 (November 5, 2003): 283–88. Kabeel,
99
[2] Schiffler, Manuel. “Perspectives
Overview 4.2.3.1.
Paton, W.
and H. Al-Hinai.
Abd Elnaby, Z.M. Omara, Fadl Essa, and Abdelkader
Research Development Water Circulation
multieffectdistillation
thermalvaporcompression chemical electrical mechanical thermal nophasechange phasechange
multi-stage flash distillation
solar distillation
freezing membrane distillation
hydrateformation
electrodialysis reverse osmosis mechanicalvapor compression
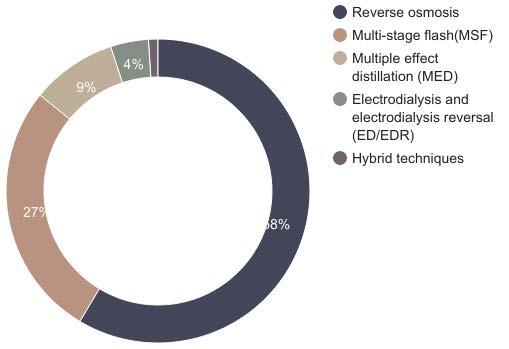
ionic exchange
evaporation
filtration
selectivecrystallization
filtration exchange
100
Desalination Techniques Market Share Desalination Techniques Overview GRAPH SOURCES.desalination Desalination Techniques Market Share chart data based on: Henthorne, Lisa. “Desalination – a Critical Element of Water Solutions for the 21st Century,” n.d.:50. Research Development Water Circulation
Research Development Water Circulation
Double Slope Solar Still
4.2.3.2. Seawater greenhouse is one type of solar distillation and micro-climate control system combined horticulture technique developed specifically for arid areas. It was first invented by the British inventor Charlie Paton in early 1990s. Several greenhouses using this techniques has been installed in Middle east and Australia.
The technique can be summarized in two phase:
1.Cool seawater is first pumped into the greenhouse to humidify and cool down the incoming air
2. The humidified air will be evaporated to vapor by solar radiation and condensed to produce fresh water. The excessive humid air will be released to the exterior crop field to mediate the exterior micro-climate.
According to Sablani S. S et al.’s study, daily fresh water productivity estimation of an 200m(width)x50m(depth) seawater greenhouse is 125m3/d with 1.16 kWh/m3 energy consumption rate.
The study also suggests that a shallow dimension is favored in order to improve fresh water productivity and reduce energy consumption. This is compared with the productivity of the same area but deeper greenhouse 50m(width)x200m(depth) 58m3/d 5.02 kWh/ m3.
SOURCE. Schiffler, Manuel. “Perspectives and Challenges for Desalination in the 21st Century.” Desalination, Desalination Strategies in South Mediterranean Countries, 165 (August 15, 2004): 4. “Seawater Greenhouse - Wikipedia.” Accessed September 19, 2018. https://en.wikipedia.org/wiki/Seawater_greenhouse. “Seawater Greenhouse.” Accessed September 19, 2018. https://seawatergreenhouse.com/. Sablani, S. S., M. F. A. Goosen, C. Paton, W. H. Shayya, and H. Al-Hinai. “Simulation of Fresh Water Production Using a Humidification-Dehumidification Seawater Greenhouse.” Desalination 159, no. 3 (November 5, 2003): 283–88. Kabeel, Abd Elnaby, Z.M. Omara, Fadl Essa, and Abdelkader Abdalla. “Solar Still with Condenser – A Detailed Review.” Renewable and Sustainable Energy Reviews 59 (June 1, 2016).
101
Seawater Greenhouse
4.2.3.3.
Research Development Water Circulation
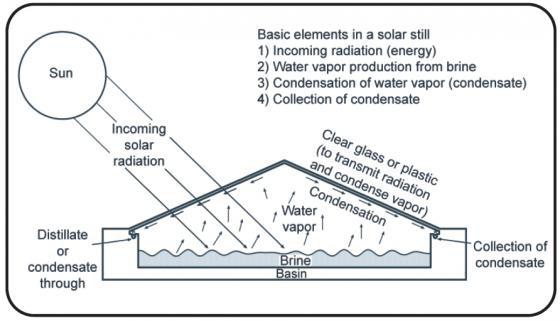
condenser evaporative wall soaked in brine
fresh water storage sea water return sea water input fresh water irrigation
– A Detailed Review.” Renewable and Sustainable
Reviews 59 (June 1, 2016).
102
Case study 2: Seawater Greenhouse
IMAGE SOURCES. Double Slope Solar Still: Kabeel, Abd Elnaby, Z.M. Omara, Fadl Essa, and Abdelkader Abdalla. “Solar Still with Condenser
Energy
Case study 1: Double Slope Solar Still
4.2.4. Hydraulic Infrastructure
4.2.4.1.
On a local scale, the research aimed to find an alternative freshwater resource as opposed to the current water mining practice. This would help reduce the ecological impact of the greenhouse farming system as well as providing fresh water access to local migrant worker communities.
The solar desalination technique promised great potential for alternative fresh water production for both greenhouse irrigation and living usage. However, operating this system requires urban scale infrastructure. Each of the distributed desalination systems requires constant seawater input as well as undesalinated return water output. This suggests on a global scale, a hydraulic circulation network system is necessary for maintaining seawater flow. Research on the spatial organization of the hydraulic and drainage systems aimed to find the most efficient organizational pattern.
Dendritic Patterns in Hydrologic System
4.2.4.2. Water distribution networks can be observed in both nature and artificially-built environments. The organizational pattern of the natural river system is governed by geological pressure: uneven terrain, impermeable rocks hindering the stream’s path, or the sediments in the estuary area. In an artificial hydrologic system, the organizational pattern is controlled by the topographic conditions and the layout of the buildings and streets.
Various branching patterns occur depends on the terrain’s lithological conditions. Among all them, the dendritic pattern is the most common form. It is formed when underlying rock terrain is homogeneous. Currently, there are no clear mathematical principles to justify the formation process of this process. (Even Greenburg, 2008). However, some quantitative measurements and numeric parameters can be used to evaluate the river system.
In the artificial hydraulic system (water supply or drainage system), two types of distribution configuration are most commonly used: 1) Branched configuration 2) grid/ looped configuration.
Branching configuration requires less piping length to cover the same amount of area, it’s commonly used in the suburban or rural area. Grid looped configuration is commonly used in a municipal environment, due to its network redundancy, water can be distributed to the building through multiple paths. It provides better water supply security especially during the break out event.
By comparing the spatial pattern of the two systems, it becomes apparent that the branching pattern exists in both systems.
103
Research Development Water Circulation
Leopold, L. 1971. Trees and Streams: The Efficiency of Branching Patterns. Journal of Theoretical Biology 31(2): 339-54..
Overview
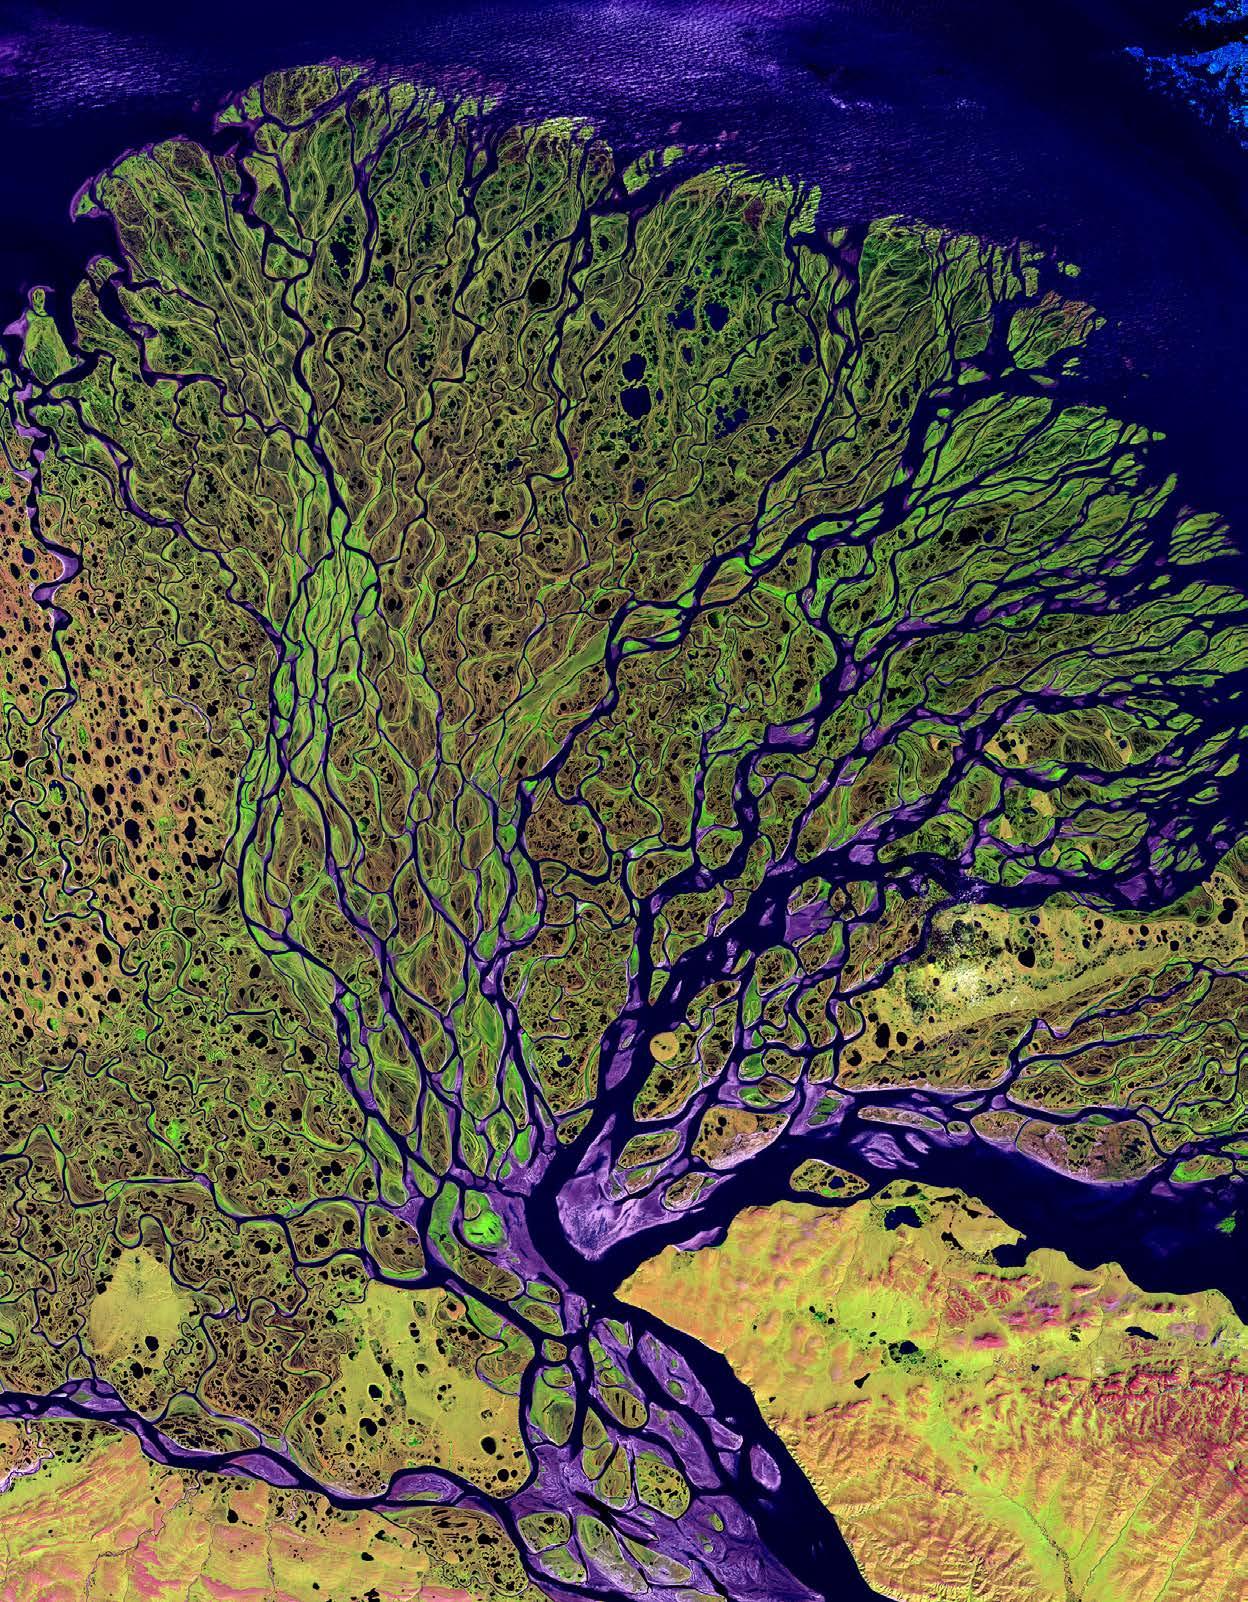
104
Research Development Water Circulation
IMAGE SOURCES. Lena Delta satellite image, USGS EROS Data Center Satellite Systems Branch
4.2.4.3.
Branching pattern
Research Development Water Circulation
It is no coincidence that in both natural river system in geomorphology and vascular systems in biology, branching patterns are a recurring scheme. In comparison to other patterns, branching patterns are a more efficient organizational pattern which contributes to fluid transportation efficiency and energy minimization. An experiment conducted by Leopold clearly demonstrates that by having more maximum orders of branches it reduces the total length of the streams serving the same amount of area. “Branching, therefore, represents an increase in efficiency in considering total stem length. It is understood that constraints are exerted limiting the bifurcation.’’(Luna
B.Leopold,1970)
Possible branching patterns to serve 64 unit areas from a central point:
(a) Separate individual stems from the centre to each unit; total length of stems & 200 units.
(b) Four principal branches, from each of these radiale 16 sterns; total length of stems & 124 units.
(c) Four principal and 16 sub-branches and radiating stems; total length of stems = 88 units
Different branching formation logics in the natural river system, the tree system and the insect tracheal system have been summarized (Even Greenburg, 2008). But one can notice that the various systems are not necessarily governed by identical formation logic. In the biological system, due to Murray’s law, the number of branching is finite and regulated by the finite cross-sectional dimensions of the fluid transporting vessels. The same logic regulates the body size and scale of the living organism. In natural or artificial drainage systems, streams could, theoretically, branch out infinitely.
Various computational logics have been developed to computationally model the branching formation. The classical L-system has been used to simulate the branching formation in biological systems like tree branching. When it comes to the large urban scale, the Diffusion-Limited Aggregation model(DLA) were used by several researchers to predict or simulate the formation of existing cities.
One of the pioneers of urban planners implemented such computation approach is Michael Batty. He argued that the cities are fractal and their fractal dimension of the cities are very similar to the one that DLA produced. According to his computational experiments have recreated very similar urban tissue distribution of the existing cities.
Physicists Herman Makse, Gene Stanley and Shlomo Havlin from Boston University also proposed a modified DLA model to simulate multicentre emergence of the cities. Morphologically, the DLA model produced bifurcated dendritic spatial organizations. This is particularly interesting as it has the potential of generating urban layout organized by dendritic hydraulical networks.
105
DIAGRAM SOURCE. Leopold, L. 1971. Trees and Streams: The Efficiency of Branching Patterns. Journal of Theoretical Biology 31(2): 339-54..
1 unit of length (a) (b) (c) 1 unit of length (a) (b) (c) 1 unit of length (a) (b) (c)
Computational Logic 4.2.4.4.
Conclusions
4.2.5. The study of both large and small-scale freshwater production techniques could offer alternative freshwater for both farming industries as well as human needs.
On the urban scale, the study of the dendritic water distribution system and its branching logic suggested that, as opposed to the generic orthogonal greenhouse grid layout, a novel urban form can be organized by a dendritic drainage pattern. This is particularly applicable in the case of the Almeria horticulture territory where an urban form is dominated by the greenhouse and water distribution network.
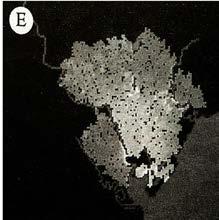
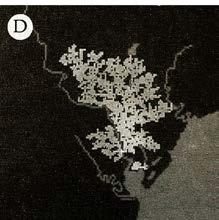
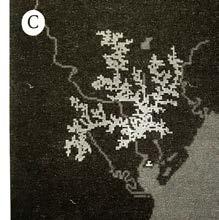
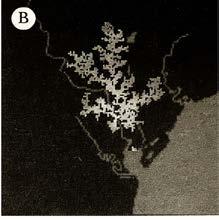
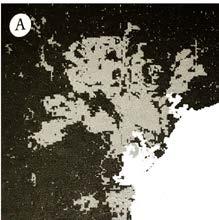
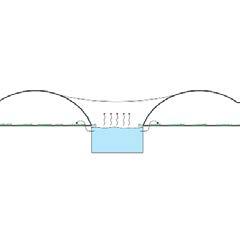
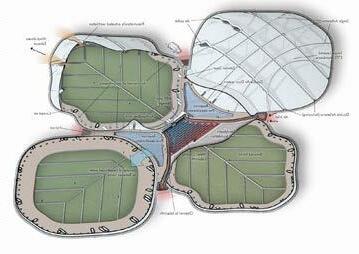
106
Research Development Water Circulation
ReturnSeawater ReturnSeawater InputSeawater FreshWater InputSeawater FreshWater FreshWater Crops Housing Units Pasive Cooling Labyrinth Desalination Seawater Canal Seawater Canal depth 1 closest street depth 2 depth 3 depth 4 depth 1 closest street depth 1 depth 2
IMAGE SOURCES. Michael Batty, University College, London
A fractal model of the growth of the city of Cardiff (a), which is constrained by the coastline (shown here in white) and two rivers. Computer simulations for different of the the coastline 1strengths of the branching instability (measured by a model parameter m) produce urban clusters that are more or less dense (b-e). The best match with reality occurs for a value of n of around 0.75 (c). In these images, earlier growth is shown as lighter.
synthesized water production and distribution system
4.3. Form Finding Research
4.3.1. Solutions in Nature
The stoma, or stomata mechanism is a plant leaf’s natural mechanism of adapting to different climatic conditions. They are microscopic openings mostly located on the bottom of leaves. When enough water is absorbed by the leaf, the stomata pressurizes and opens, and when it lacks water, the opening shrink and closes. Both the natural reaction to humidity and the actuation by pressurization yield potential in design. In strategies of actuation in adaptive architecture, typical mechanical systems require large of energy and are costly to manufacture. In the pressurized actuation system, such as the stomata, air is the primary compressional element. This allows the easy access and channeling of such element. It also holds thermal dynamic properties that can be further explored and potentially integrated with climatically adaptive elements.
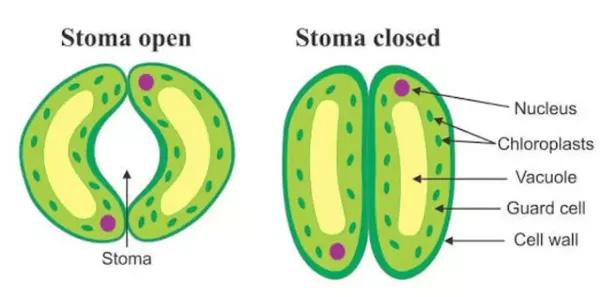
Wind-oriented design can be found throughout nature, but one of the most architecturally applicable system is the burrows of the Black-Tailed Prairie dogs (C.Ludovicaianus). It is observed that they produce intricate burrow systems of on average 14m in length, 2 meters in depth, and two to three entrances. Few researches show the CO2 levels within the burrow is within the level of survivability. The drop of CO2 level is accounted for by the natural ventilation system that the burrow creases. Burrow mount of the prairie dog ranges in form and height, from narrow to wide, from high to low. Such morphologies create a difference in pressure when the wind sweeps by. The high amount of negative pressure created then pulls the air out, effectively creating a natural ventilation system.
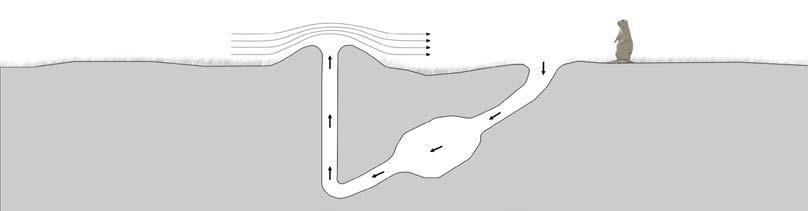
107 Form Finding Research Research Development
Sains Makmal 3. March 05, 2012. Accessed September 19, 2018.
SOURCE. “Stomata.” Anjung
https://anjungsainssmkss.wordpress.com/2012/02/14/stomata/.
Stoma 4.3.1.1. Burrow Ventilation of Prairie Dog 4.3.1.2.
Form Finding Research Research Development
4.3.1.3.
Abstracted Concept of Fluid Dynamics
To study the morphological conditions required to spawn and accentuate the negative pressures which generates natural ventilation, such as that of the prairie dog, the existing field of study of fluid dynamics holds a myriad of principles that link morphology and pressure difference. One key concept is the calculation of the drag force. In any typical study of objects traveling through wind, the drag force is the essential force which acts in inertia to the force of the traveling object. The drag force creates negative pressure. Thus, in the case of the prairie dog tunnel, the hole which creates negative pressure holds a sprouting morphology, which directs the wind upwards, and creates large drag. Car and aerospace engineering all share the same goals of reducing drag force, as it slows down the vehicle. In our circumstance, we are working in reverse. We are aiming to create and accentuate the condition of negative pressure; thus, the goal is to increase the drag force.
The drag equation is as follows:
F = 1/2Pu^2CA
Where F is the drag force, A is the area, p is the density, u is the velocity, and C is the drag coefficient. While being affected by area (A), density of fluid (p), and flow velocity(u), the form alone plays a large factor. This is where the drag coefficient proportionally affects total drag force. The drag coefficient is a unit-less measurement that differs depending on the morphology.
In the above diagram, each shape is shown to possess a different drag coefficient. But the relationship of drag force to morphology is rather complex. So this suggests the utilization of CFD to simulate wind conditions on various form would be efficient in further study.
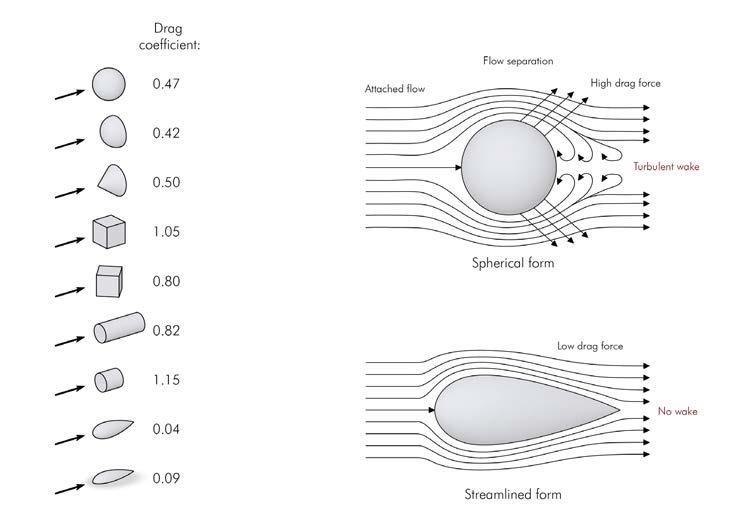
108
Form Finding Research Research Development
4.3.2. Solutions in Architecture
4.3.2.1.
Dieste vaults
Architect: Eladio Dieste

Location: Salto , Uruguay
Year: 1974
Program: Bus Station
Area: 1120 m²
Material: Brick Reinforced Concrete
The bus station project, is located in Uruguay, it offers pleasant shading for people waiting for the bus. space was also optimized for buses to maneuver. The parking lots and platforms are located on one side of the building, the offices and other services are located on the other side.
It is basically 7 self-supporting modular vaults rest on top of reinforced concrete columns located in the valleys of the middle of their 6 meter span.The reinforced concrete columns are located in only one line, which creates two cantilevers that cover an area of 1080 m2.
SOURCE. “Terminal Municipal de Ómnibus.” Accessed January 6, 2019. http://www.fadu.edu.uy/eladio-dieste/obras/terminal-municipal-de-omnibus/. IMAGE SOURCE. McKay, Graham. “Architecture Misfit #14: Eladio Dieste.” Misfits’ Architecture (blog), March 13, 2014. https://misfitsarchitecture. com/2014/03/13/architecture-misfit-14-eladio-dieste/.
109
SOURCE.
Form Finding Research Research Development
Architect: Foster + Partners
Location: Rwanda, Africa
Year: To be completed in 2020
Program: Drone Port
Material: Clay
In Africa it is estimated that less than one third of the population lives near all season roads, which makes it difficult for people to have access to medical supplies in remotes areas. Foster + Partners are now in the process of construction for a solution to this problem,drone ports, due to the lack of roads, drones are ideal solution for transporting medical supplies to this remotes places.
The proposal for the construction is modular vaulted structures which can be combined in array in order to cover larger spaces. In the future kits could be sent to the communities with the basic form-work and brick press, as the materials to make the bricks can be locally sourced. It is also proposed for this buildings to share multiple uses, not only drone ports, but also health clinics, courier room, trading hub and other activities for the communities.
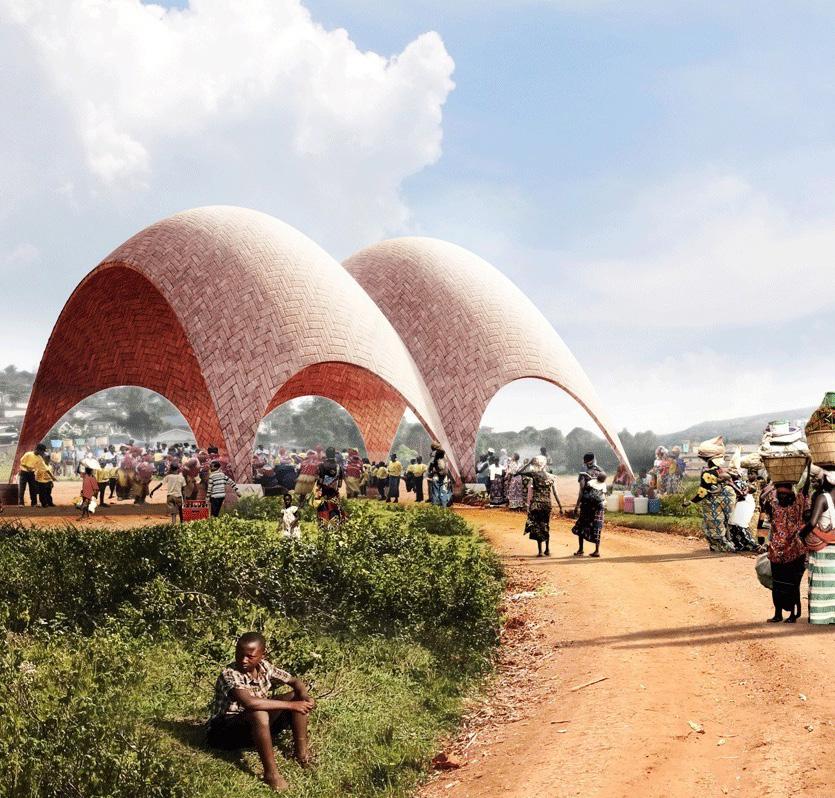
4.3.2.2.
Conclusions
In both case studies, both architects aimed to utilize furnicular shell structures and locally sourced material to create low tech construction methods. The design were both modularized in order to reuse the formwork. This reduced the construction difficulty and cost drastically. From these case study, the informed us an low tech apporach for the housing design.
110
www.fosterandpartners.com, Foster + Partners /. “Droneport | Foster + Partners.” Accessed January 6, 2019. https://www.fosterandpartners.com/projects/droneport/.
“Foster Reveals Plans for Rwandan Droneport.” Dezeen, September 16, 2015. https://www.dezeen.com/2015/09/16/foster-partners-droneport-drones-medical-supplies-rwanda/.
Fabrication Strategy Research Development
4.4. Fabrication Strategy
4.4.1. Overview
As mentioned in the previous chapter, the existing housing condition implyed the migrant worker communities have no access to modern building materials and equipment for housing construction. Locally sourced material would be a more viable approach. Traditionally, the houses were constructed using adobe bricks and timber structure. Within the desertified context of Almeria, timber was a limited option. Therefore, using unfired earth as building material for the housing construction would be an ideal and appoporiate solution.
The initial survey suggested earth is not a standard industrial material, the material property varies depending on the soil condition and construction techniques. There’s no unified consensus.
The research mainly focuses on the material property and construction specification comparison between the national design code of several countries where earth architecture is still being constructed contemporarily.
New Zealand Standard(NZL) : NZS 4297:1998, NZS 4298:1998, NZS 4299:1998
US
United States(US): New Mexico Building Code, 1991 in conjunction with Uniform Building Code
Australian national standard(AU): Bulletin 5 (Middleton, 1952) and later provisions
DIN(developed after World War II, but withdrawn after 1970)
Minke, Gernot,Building with earth : design and technology of a sustainable architecture Basel : Birkhauser, 2006 Vasilios Maniatidis & Peter Walker, A Review of Rammed Earth Construction For DTi Partners in Innovation Project ‘Developing Rammed Earth for UK Housing’, 05,2003.
111
AU DE
NZL
4.4.2. Earth as Building Material
The mixture of soils used as the building material is termed loam. It is a composite material which is formulated with a specific proportion of three constituents:
• Clay(d<0.002mm)
• Silt(0.002mm<d<0.06mm)
• Sand(0.06mm<d<2mm)
Chemical composition:
• clay :eroded grain of feldspar and other mineralsThe chemicals arrange themselves in lamellar hexagon format. This crystalline structure allows the clay to act as a binding agent.
• Sand and silt: eroded stones with irregular shapes which lack binding force and simply act as aggregates in loam.
straw
tensile strength bending strength thermal performace compressive strength erossion resistance
cement
lime
stablize expansive soil binding agent
sodium silicate

compressive strength

112
Fabrication Strategy Research Development
soil composition stablizer
Clay Silty clay Silt loam Silt Sandy loam Loamy sand Sand Clay loam Sandy clay Sandy clay loam Loam Sand(%) Silt(%) Clay(%) 10 20 30 40 50 60 70 80 90 100 100 90 80 70 60 50 40 30 20 10 100908070605040302010 gravelsandsiltclay 60mm2mm0.06mm0.02mm<0.02mm Clay Silt(%) 50 40 30 20 10 gravelsandsiltclay 60mm2mm0.06mm0.02mm<0.02mm Composites 4.4.2.1.
SOURCE. Kent Harries, Bhavna Sharma, Nonconventional and vernacular construction materials : characterisation, properties and applications, Oxford : Woodhead Publishing, 2016.
Research Development
Fabrication Strategy
In addition to the solid composites, loam also contains water. It exists in four forms: free water, absorbed water and capillary water (pore water), the water from crystallization (structural water). The water from crystallization is chemically bound, thus is only lost when the loam is heated to 400~900 o C. When loam is heated to 105 o C, pore water (absorbed and capillary water) evaporates from the gap between the lamellar structures of clay, the distance between lamellas is reduced, the electrical attraction force between them restructures the crystal into a parallel arrangement which yields binding force in clay.
Therefore, water is a significant factor contributing to the material strength as well as durability of the loam. Data indicates that the 10% increase in the water percentage contributes to the over 70% percentage compressive strength reduction of compact earth samples. Excessive free water evaporating from the loam during the drying process also introduces visible cracks which could directly lead to structural failure.
113
Mechanical Properties dry state density compressive strength(N/mm2 ) tensile strength Young’s Modulus USDENZLAU U-factor freshly dug AUMinke,2000 compressed AUNZLDEUS USDENZLAU 1.0 2.0 3.0 0 dry state density tensile strength 0.8 0.6 0.4 0.2 0 1.0 1.2 1.4 1.6 1.8 2.0 1000 800 600 400 200 Young's Modulus 0 2.0 1.8 1.6 1.4 1.2 1.0 compressive strength 0 1000 2000 1500 2500 0 0.2 0.4 0.6 0.8 USDENZLAU U-factor AUNZLDEUS USDENZLAU 1.0 2.0 3.0 dry state density tensile strength 0.8 0.6 0.4 0.2 0 1.0 1.2 1.4 1.6 1.8 2.0 1000 800 600 400 200 Young's Modulus 0 2.0 1.8 1.6 1.4 1.2 1.0 compressive strength 1000 2000 1500 2500 0 0.2 0.4 0.6 0.8 USDENZLAU U-factor AUNZLDEUS USDENZLAU 1.0 2.0 3.0 dry state density tensile strength 0.8 0.6 0.4 0.2 0 1.0 1.2 1.4 1.6 1.8 2.0 1000 800 600 400 200 Young's Modulus 0 2.0 1.8 1.6 1.4 1.2 1.0 compressive strength 2000 1500 2500 0 0.2 0.4 0.6 0.8 USDENZLAU U-factor AUNZLDEUS USDENZLAU 1.0 2.0 3.0 dry state density tensile strength 0.8 0.6 0.4 0.2 0 1.0 1.2 1.4 1.6 1.8 2.0 1000 800 600 400 200 Young's Modulus 0 2.0 1.8 1.6 1.4 1.2 1.0 compressive strength 1000 2000 1500 2500 0 0.2 0.4 0.6 0.8
Water 4.4.2.2.
Minke, Gernot,Building with earth : design and technology of a sustainable architecture Basel : Birkhauser, 2006 Vasilios Maniatidis & Peter Walker, A Review of Rammed Earth Construction For DTi Partners in Innovation Project ‘Developing Rammed Earth for UK Housing’, 05,2003.
Research Development
Fabrication Strategy
As Loam is not standardized material and Young’s modulus was mostly acquired through laboratory test which depends on the test environment and setup, four national standards offer different recommended Young’s Modulus:
• 300*characteristic compression strength (NZL)
• 500N/mm2 (AU)
• 750*compressive strength (US)
• 600 to 850 kg/mm2 (DE)
Most of the compressive strength of loam is acquired through laboratory cylindrical compression test. When applying the unconfined characteristic compressive strength to the design, a capacity reduction factor is introduced to cope with any unpredicted load condition:
f c (design compressive strength)= f uc (unconfined characteristic compressive strength)*capacity reduction factor.
In both the report and the book, the tensile strength is estimated to be 10% of characteristic compressive strength. However, in practice, tension is generally minimized or avoided by designing compression-only forms unless fibrous stabilizers added.
Currently there’s a lack of data laboratory shear strength test data, in practice, shear strength should be taken as zero.
According to Gernot, in the laboratory test, bending strength is usually taken as 10% of the compressive strength. But in design practice, the structure should avoid bending moment.
Thermal insulation property of the earth material can be evaluated by U-factor. Loam has relatively poor thermal insulation. However, the thermal comfortability that the earth buildings offer is due to the high thermal mass(heat capacity: 1830 J/m3C.). This is particularly beneficial to reduce indoor temperature fluctuation in diurnal temperature in the Mediterranean climatic zones such as South Spain and Northern Morocco. The moisture absorption ability of loam is also contributing to the user comfortability.
114
Thermal Properties USDENZLAU U-factor freshly dug AUMinke,2000 compressed AUNZLDEUS USDENZLAU 1.0 2.0 3.0 0 dry state density tensile strength 0.8 0.6 0.4 0.2 0 1.0 1.2 1.4 1.6 1.8 2.0 1000 800 600 400 200 Young's Modulus 0 2.0 1.8 1.6 1.4 1.2 1.0 compressive strength 0 1000 2000 1500 2500 0 0.2 0.4 0.6 0.8 Compressive Strength: Tensile strength: Shear strength: Bending strength: Hydrothermal property: Young’s Modulus 4.4.2.3.
Minke, Gernot,Building with earth : design and technology of a sustainable architecture Basel : Birkhauser, 2006 Vasilios Maniatidis & Peter Walker, A Review of Rammed Earth Construction For DTi Partners in Innovation Project ‘Developing Rammed Earth for UK Housing’, 05,2003.
Fabrication Strategy Research Development
Earth Building Techniques
4.4.2.4. Loam construction techniques could be observed across the various civilization and climatic zones. This justifices its easy constructability and climatic adaptability. Insitu vernacular loam construction offers a variety of techniques and predesdents.
Considering the social context of the migrant communities, a bottom-up communitybased construction technique would be more appropriate. most of the migrant workers are unskilled labour, such a construction technique should also be low tech. Precedence of Gando public school project (Kéré Architecture) construction involving the local community using adobe construction is proved to be a viable approach.
To utilize the adobe, the ideal structure form should only take compression force. Historically, the vaulting system has been used to construct adobe vernacular housing and infrastructure. An example of this is the la vadero(sheltered freshwater trench). Catalan vault and Morrish vault construction techniques were both prevailing at a certain period of time in south Spain region. However, thanks to the modern shell structure pioneers like Antonio Gaudi, Rafael Guastavino and Eladio Dieste, Catalan vaulting system was successfully modernized, the construction of this vaulting system is still common in Spain and Latin countries nowadays.
The Catalan vaulting system features thin layers of cross arranged adobe tiles. To simplify the construction, the horizontal structural elements(floor and slabs) are usually designed by repeating the subdivided shell modules. The typical tile size used in Catalan vaulting system is 200mm*65mm*12.5mm. Traditionally, to construct the vault, the fast dry mortar was used so that the tile can stay in place by an adhesive mortar during construction without the support of formwork. This reduced the cost of expensive formwork. However, this requires a skilled builder. In the case of the low tech approach, for instance, the Mapungubwe Interpretive Centre(Peter Rich et al.), the shell used curved timber formwork to decrease the construction difficulty for local untrained builders.
115
Earth
Earth Technique
Earth (Cob) Technique Adobe Technique Vernacular earth building distribution
Rammed
Rammed
Stack
formwork: not required labor requirment:non-skilled
Fabrication Strategy Research Development
formwork: not required labor requirment:non-skilled
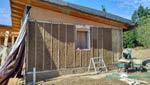
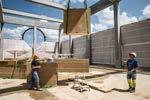
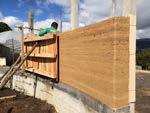
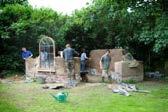
formwork: double side labor requirment:skilled equipment: industrial
formwork: double side rotational labor requirment:skilled
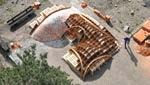
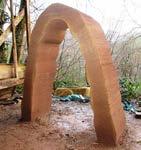
formwork: double side rotational labor requirment:skilled equipment:
formwork: double side rotational labor requirment:skilled machinary equipment
formwork: timber frame structure labor requirment:non-skilled machinary equipment: Shredder
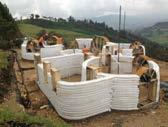
116
Modern Loam Construction Technique Classification cob house stablizer form formwork continuity materialfabrication discrete rigid formwork fabric formwork no additive earth bale timber frame structure stablizer adobe block adobe no additive earth bag Earth Architecture continuous shell planar wall rammed earth stablizer direct forming formwork
Research Development Fabrication Strategy
4.4.3. Pneumatic Structures
4.4.3.1. Main Material Systems Precedents
The main precedence selected in pneumatic architecture research is researched and integrated as a new system. The membrane type structures, such as air-dome of Duol, a Slovenian company (citation1), offers flexible and cheap membrane for covering a large span of area. The air beam type structures, such as Fuji Pavilion (citation2), offers structural support and easily programmable beam geometry. By combine the two, a new system of membrane and beam structure is proposed. In addition, some pneumatic architecture incorporates actuation, such as the Breathing Skins Project (citation3). Due to the shifting of the two prominent wind directions of the site, actuation is explored as central concept to be adapted with the membrane and air beam structure. SOURCE.
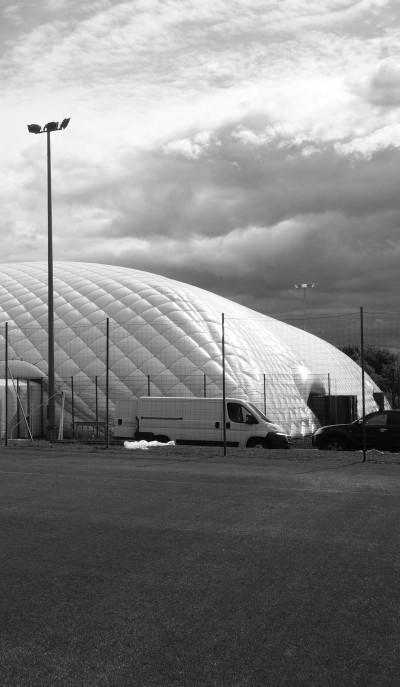
Airbeams Membranes
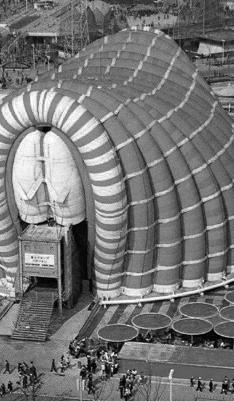
117
Airdome, Slovenia Fuji Pavilion, Osaka
“Expo 70, Fuji Group Pavilion, Air Dome.” Johnny Times (blog). Accessed September 19, 2018. http://www.johnnytimes.com/expo-70-fuji-group-pavilion-air-dome/. “Eden Project.” Wikipedia, September 8, 2018. https://en.wikipedia.org/w/index.php?title=Eden_Project&oldid=858680640. “Tensairity Solutions | Lighter, Stronger, Better!” Accessed September 19, 2018. http://www.tensairitysolutions.com/ “Breathing Skins Technology - Breathing Skins.” Accessed September 19, 2018. https://www.breathingskins.com/. “Home | DUOL - Air Supported Structure.” Accessed September 19, 2018. https://duol.eu/.
Static Structures
Research Development Fabrication Strategy
Pneumatic Architecture
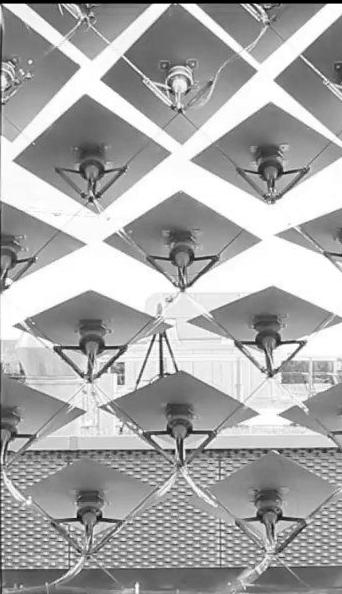
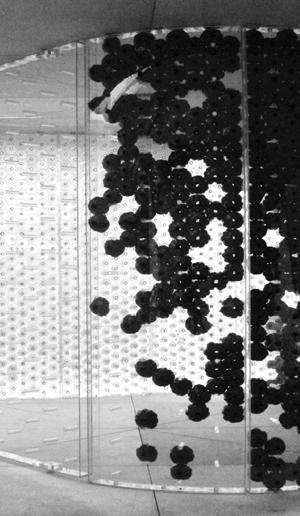
Dynamic Structures
Component Based
Tensarity
Reactive Skins
Air Muscles/Springs
Breathing
Adaptive

SOURCE. Tennis Air dome. Accessed September 18, 2018. https://duol.eu/products/tennis-air-dome.http://www.kawa-struc.com/projects/projects_0302_e.htm Breathing Skins. Accessed September 18, 2018. https://www.breathingskins.com/ “Adaptive Solar Facade (ASF).” Accessed September 19, 2018. http://www.systems.arch.ethz.ch/research/active-and-adaptive-components/asf-adaptive-solar-facade.html..
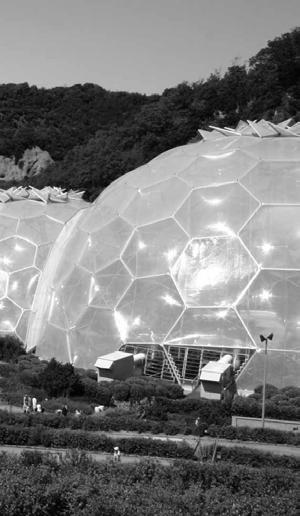
118
Eden Project, Cornwall
Tensarity Beam
Skins Project, Mandelbachtal
Solar Facade, ETH Zurich
“The air structure is the most efficient structural form available to date ... no other type of structure has the potential of providing free-span coverage for so large an area ... as the air structure is constructed if light-weight, flexible materials, it can be made easily portable and lends itself readily to the design of demountable or removable structures.”
Walter Bird, 1967
Frei Otto, one of the most prominent architect and thinker on light-weight structures, has conducted significant studies and experiments on pneumatic structures in the 1950s-60s. One of the advantages of pneumatic structures is its structural performance while being very light-weight. Otto started his first key research on pneumatic forms through investigating soap-bubble formations in a variety of boundary conditions. Plaster cast is then applied to capture the resultant forms.
Due to the light-weight feature of pneumatic architecture, Otto envisioned various large-span utopian enclosed city projects, with much influence from Buckmininster fuller.
Some calculations of the research indicates that enclosed pneumatic structure can span up to 800m. This was proven advantageous for large public spaces, with economic and stable construction. This was realized on a smaller scale, during Expo ‘70 in Osaka, as the U.S. Pavillion designed by Walter Bird and David H. Geiger. It featured a low-profile air-supported roof constrained by steel cables and a compression ring. In 1971, Frei, Arup, and Happold worked together to design a two-kilometer city in the arctic. Frei discovered that large structures required lower internal pressure than small structures. This makes pneumatic architecture suitable for large scale. The light-weight materials also makes it ideal for transportation to remote locations.
119
SOURCE. McLean, William (William F.),Air structures,London : Laurence King Pub., 2015. 4.4.3.2.
Frei Otto’s Pneumatic Structures
Research Development Fabrication Strategy
Research Development Fabrication Strategy
While it is efficient to design pneumatic architecture in the large scale, as discussed, certain restrictions of greenhouse architecture however conflict with the large-span potential of Otto’s pneumatic architecture. The height and volume restriction for harvesting economic crops disallows for the classic dome-shaped morphology. It is pertinent to adapt a new greenhouse structure that utilizes the conflicting parameters to create a comprehensive solution.
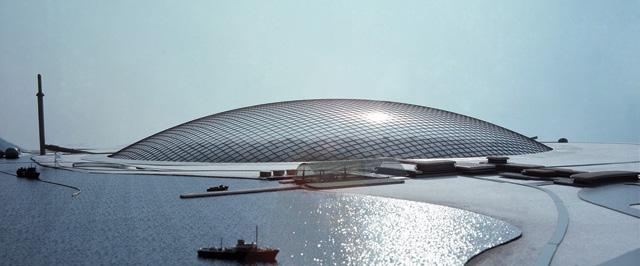
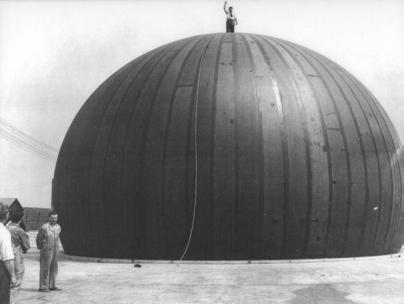
19, 2018. http://www.shouman.com/greenhouse.html.
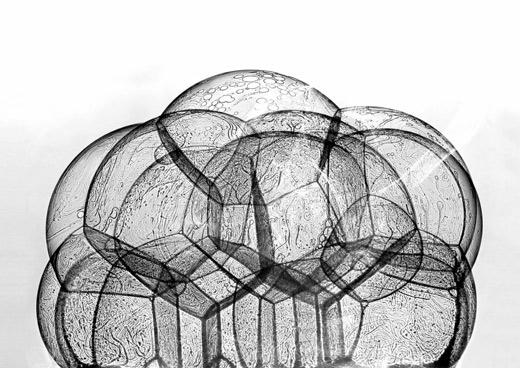
120
Frei’s soap bubbles
Present Day
Present Day
IMAGE SOURCE Roland, Conrad. Frei Otto-Structures. Longman, 1970. SOURCE. McLean, William (William F.),Air structures,London : Laurence King Pub., 2015. “GreenHouse Film SHOUMAN.” Accessed September
Fuji Pavilion
Research Development Fabrication Strategy
Architect: Yutaka Murata
Mamoru Kawaguchi
Location: Osaka, Japan
Year: 1970
Program: Fair building
Area: 3369 m²
Material: PVC neoprene vinylon
The Fuji pavillion for Expo 70 was the largest pneumatic structure of its time. It is circular in plan and 50m in diameter. Its unique architecture features 16 tubular arches with 4 m diameters each. The construction of this project used neither iron, steel, concrete nor wood, making it one of the earliest robust example of pneumatic architecture.
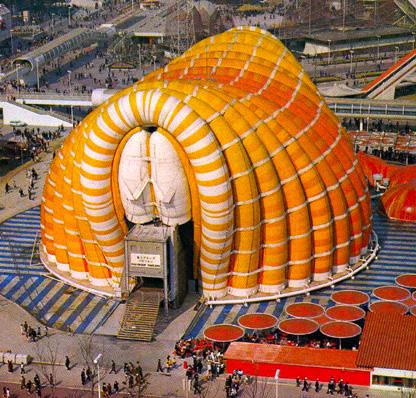
The global geometry is the result of combining multiple tubular arches of varying height and distance between footings. This aggregation method results in a fluidity in form, while keeping each component’s geometry simple and easy to manufacture.
The pneumatic structure is inflated at the pressure of 7.8kPa, it can also increase to 24.5 kPa during storm events. This ability to adapt to higher wind load requirement is especially beneficial in extreme environments. It would be worthwhile to design a self-reactive system to incorporate this shift in structural capacity, for reacting to the designated climatic conditions.
121
IMAGE SOURCE Johnny Times. (2018). Expo 70, Fuji Group Pavilion, Air
Dome - Johnny Times. http://www.johnnytimes.com/expo-70-fuji-group-pavilion-air-dome/ SOURCE. McLean, William (William F.),Air structures,London : Laurence King Pub., 2015.
Research Development Fabrication Strategy
Duol Air-supported Structure
Architect: Duol
Location: Slovenia
Year: unknown
Program: Sports facility
Area: 700 m²
Material: Polyethene
The Duol air-supported structure is a single membrane structure supported by the internal pressure. It is a unique case of pneumatic architecture, where no structural members are necessary. These structures are commonly called pressostatic balloons. The airsupported system offers a cost-effective solution, but also provides rapid deployment, ideal for temporary structures. Structure can be designed with single, double and even triple membrane, with the latter offering greater start-up cost but lower running cost due to smaller heat loss.
IMAGE SOURCE Duol Accessed September 18, 2018. https://duol.eu/products/tennis-air-dome.
SOURCE. McLean, William (William F.),Air structures,London : Laurence King Pub., 2015.
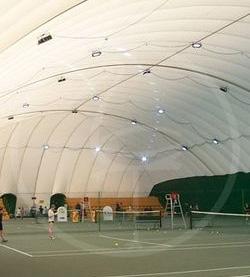
122
4.4.3.3.
Research Development Fabrication Strategy
Before proceeding to the computational form finding experiment, in order to understand the structural capability of pneumatic structure components, finite element analysis is conducted with a single arch air beam. Arc geometry was used for air beam with circular cross section. The variables are span, rise as well as polymer membrane thickness.
The main challenge for pneumatic structure is the lateral force, specifically wind and snow load. Considering the local climate condition in Almeria, only wind load is considered.
As indicated in the diagram (experiment setup), according to static Equilibrium, to keep the inflated membrane stable, the internal air pressure need to be equal to the addition of external load as well as gravity.
Atmospheric pressure(101 kN/m2) is applied to the membrane as external pressure and correspondent internal pressure is the addition of atmospheric pressure and inflation pressure(ΔP).
Both external and internal air pressure direction were set to local surface normal. Wind load were set to global X-axis, and wind load (0.1kN) is derived from the highest local wind velocity(13m/s) in El Ejido using the wind velocity-load graph.
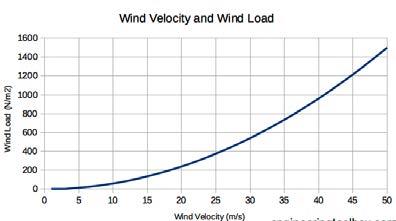
123 Wind Velocity-Wind Load Graph FIG.
Pe P F ETFE 0.5mm G SOURCES. Wind Velocity-Wind Load Graph: “Wind Velocity and Wind Load.” Accessed September 19, 2018. https://www.engineeringtoolbox.com/wind-load-d_1775.html.
01.2. FEA Set Up
Single Airbeam FEA
Research Development Fabrication Strategy
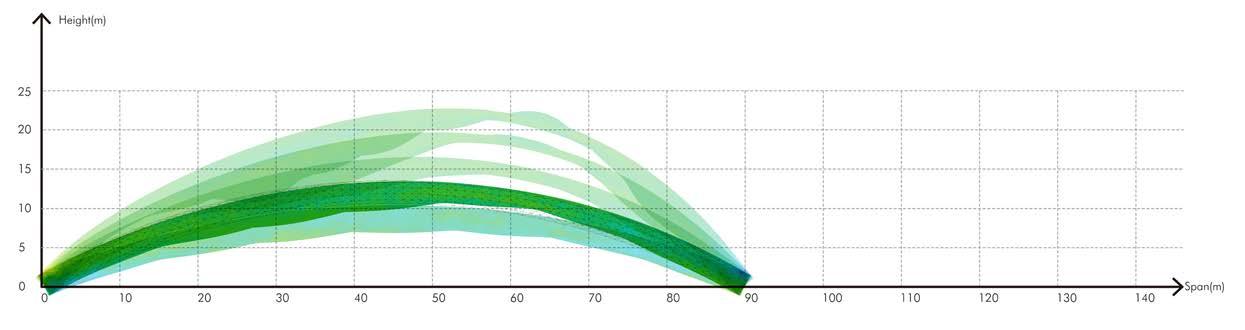
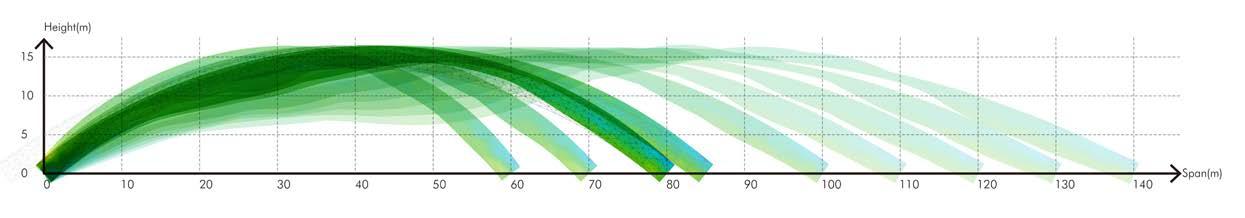
124
Experiment 1 Single Air beam Span FEA
Experiment 2 Single Air beam Rise FEA
4.4.3.4.
Research Development Fabrication Strategy
In the case of adobe building construction, the shell structure was proven to be a very efficient form to utilize this brittle compressive material. However, the geometrical complexity limited its application. This is mainly due to the cost and technical limitation of the formwork.
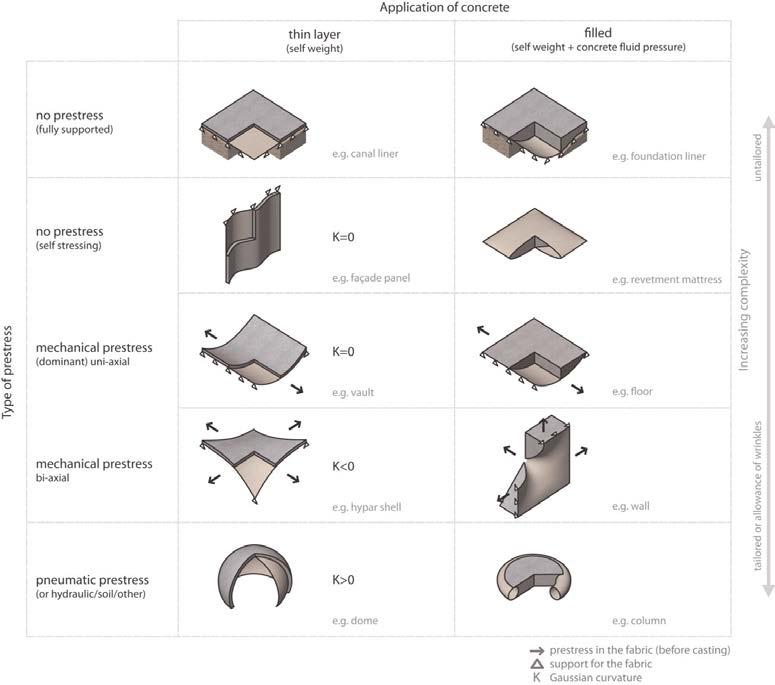
Historically, vernacular shell structure builders avoided using formwork to produce the shell structures, for instance in the Nubian vault and Catalan vault construction. Indeed, such construction required highly trained skilled labor, calibration compass as well as fast cured cement and mortar. This all limited the poor community to use adobe shell structure. In order to realize the vault structure, research on alternative low tech construction and formwork techniques were necessary.
The pneumatic formwork can be categorized under the flexible formwork technique. It consists of a closed volume of air held by fabric or plastic film. Air serves as temporary support for building structure during the construction. In principle, the minimum internal air pressure of the formwork is equivalent to or higher than the weight of the structure on top of it.
support of fresh concrete orrammed earth”. In this manner,the definition also includes soil,airorfluid pressuresupported formworkas well as the use of different types of fabrics such as non-woven membranes. It excludes the simple use of fabric as a form liner. According to Abdelgader et al. [52] fourcategories grouped by common applications can be distinguished: mattresses,sleeves,shuttering and open troughs. However,these groups do not cover all types of formworkmentioned in this paper.
ure offers an indication as to what possibilities are inherient in increasing one orboth prestress values. Of course, these stresses act relative to the chosen stiffness of the fabric and support conditions.
Similar to the pneumatic building structure, the pneumatic formwork can also be categorized by the internal pressure.
The Gaussian curvature K is also shown forsome categories,where K 0 denotes double curvature,positive values convexorconcave shapes,and negative values = saddle-like shapes. However,the type of fabric formworkdoes not necessarily dictate the expression of curvature. If the applied prestress is low,the concrete loads will govern and force the formworkto bulge outwards (forcing positive curvatures).
high-pressure system(more than 1kPa inflation pressure) only needs to be inflated once but require airtightness.
Anewtaxonomy is suggested (Fig. 29),based on how the fabric is (pre-)stressed and howthe concrete is applied, thus resulting in different geometries. The intention of this taxonomy is not to label and restrict variations within fabric formworktechnology,but ratherto invite the readerto derive novel applications by thinking about howthe fabric can be prestressed and manipulated priorto casting and howit is affected by the amount of concrete applied in the end.
The influence of mechanical prestress is explained in terms of the two prestress directions which typically correspond to the weave directions in woven fabrics. The fig-
The figure shows that highercomplexity of method and form will generally lead to eitherthe necessity of tailoring orallowing local folding. It is important to note that in each case wrinkling may be introduced intentionally to achieve some effect. Also,hybrids of all these types could be made and,indeed,this has been identified in more recent applications.
low-pressure system(usually less than 1kPa inflation pressure) requires constant inflation.
Chronological information has been added to demonstrate howthe method has developed historically
125
Pneumatic Formwork
DIAGRAM SOURCES. Veenendaal, Diederik, West,Mark, Block,Philippe. 2011. “History and Overview of Fabric Formwork: Using Fabrics for Concrete Casting.” Structural Concrete 12 (3): 164–77. https://doi.org/10.1002/suco.201100014.
174
D. Veenendaal/M. West/P. Block History and overview of fabric formwork: using fabrics for concrete casting
Structural Concrete 12 (2011), No. 3
Fig. 29. Taxonomy of fabric formwork and formwork liners
Research Development Fabrication Strategy
The pneumatic formwork is fast deployable and could be deflated and reusable after the construction. As such, it is an ideal solution for a low tech approach to shell construction. It can also be considered as a potential to the catastrophic plastic waste problem of the horticulture industry. The plastic film could be recycled and utilized as pneumatic formwork.
The pneumatic formwork was first developed by the Italian architect Dante Bini in 1960s for concrete thin shell casting. 1,600 of concrete shells structures were constructed using this formwork technique in 23 countries. A detailed construction process and iterations of technical improvement have been documented in full details in the book “Building with air” by Dante Bini.
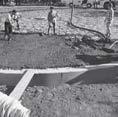
Another example of the pneumatic formwork being used for emergency shelter is a bending active gridshell project developed Gregory Quinn from Department for Structural Design and Engineering (KET), Berlin University of Arts.
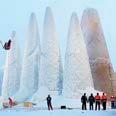
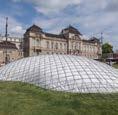
In the case studies, the construction sequence played a crucial role during the construction. This is dependent by the property of the building material. The inflation of the formwork can happen after the building materials placement If the material allows shape changing. In the case of Binishell construction, the concrete and bending active grid shells both allow shape adjustment, therefore, they were applied first on top of the formwork before the inflation. Otherwise, it’s usually inflated before the construction. The material should also be evenly distributing on the formwork to avoid wobbling movement.
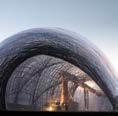
126
Ice 1.Inflation 1.Inflation
1.Inflation
bending moment 2.extrude fiber
ice
concrete
metal beams Material Construction Sequence Case Study Case Study Binishell Case Study ITECH pavillion Concrete Metal bar Carbon fiber
2.Inflation
3.apply
2.spray
2.pour
1.lay
IMAGE SOURCES. “Sagrada Familia in Ice | Structural Ice.” Accessed January 7, 2019. http://www.structuralice.com/sagrada-familia-in-ice.html. “Skill: Inflatable Concrete Domes | Thinkpiece | Architectural Review.” Accessed January 7, 2019. https://www.architectural-review.com/essays/viewpoints/skill-inflatable-concrete-domes/8641827.article “Icd Itke 2014 - Images of Home Design.” Accessed January 7, 2019. http://powerakademy.com/post/icd-itke-2014.
Research Development
Fabrication Strategy
4.4.4. Material Research Overview
Initial material research on both greenhouse and pneumatic structure suggested the materials After selecting those three materials, Polyethylene Plastic Roll, PVC (Polyvinyl Chloride), and ETFE (Ethylene tetrafluoroethylene), more research is being conducted to choose only one of them as the final material for the biopneumatic structure, that not only has great light transmittance, but also has great structural properties and durability.
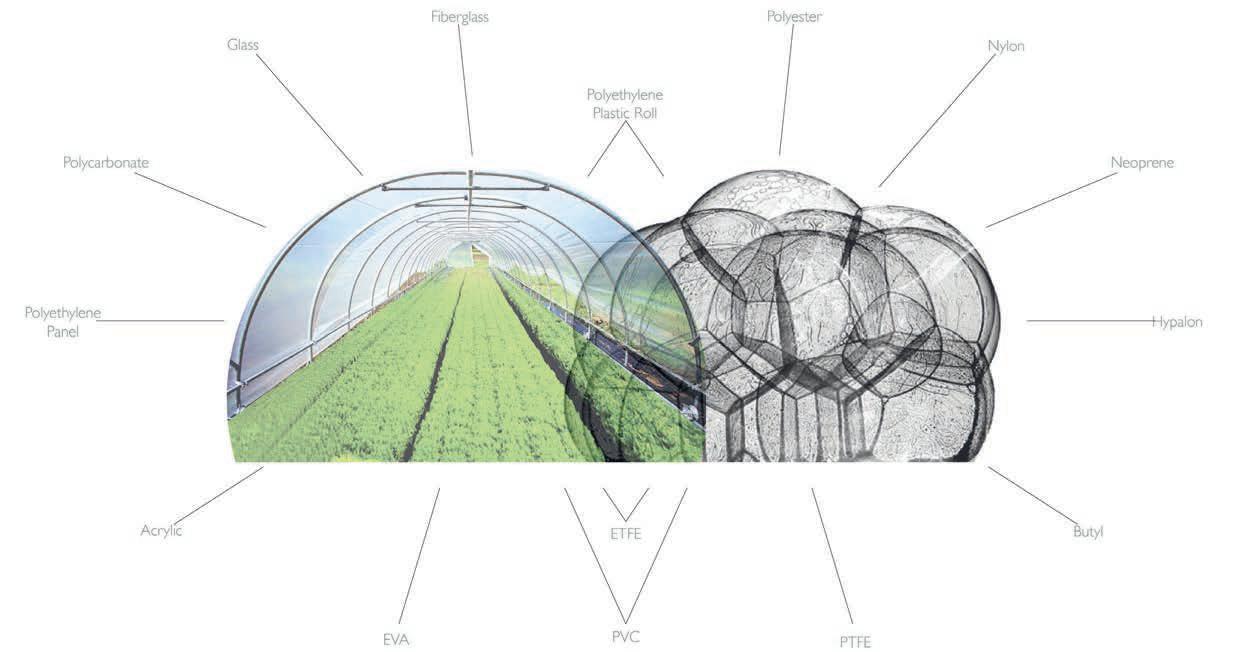
SOURCE. “Advantages of ETFE Film Structure: MakMax (Taiyo Kogyo Corporation).” Accessed September 17, 2018. https://www.makmax.com/business/etfe_ advantages.html.
127
Polyethylene Plastic Roll PVC ETFE
4.4.4.1.
Research Development
Fabrication Strategy
In the next graphic the results of a durability test of 3 materials is presented. As it can be understood for the results, PVC demostrated the least durability, followed by the Polyolefin (PE/EVA/PE), and the one with the best results is ETFE. ETFE went about 10 Mpas down in the course of 18 years, while Polyolefin and PVC went down more 15 Mpas in around 5 years.
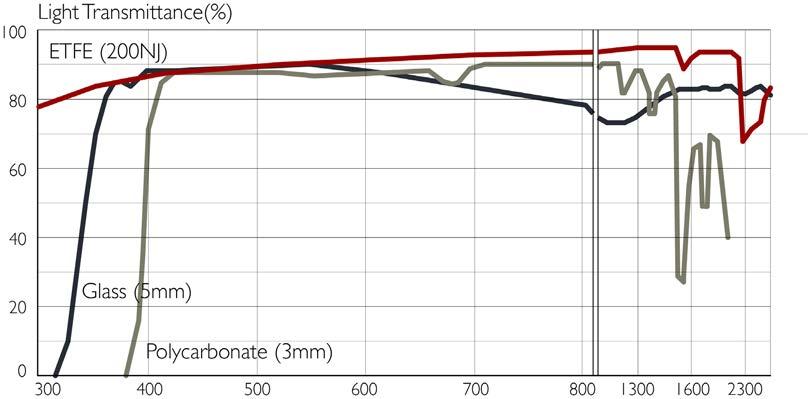
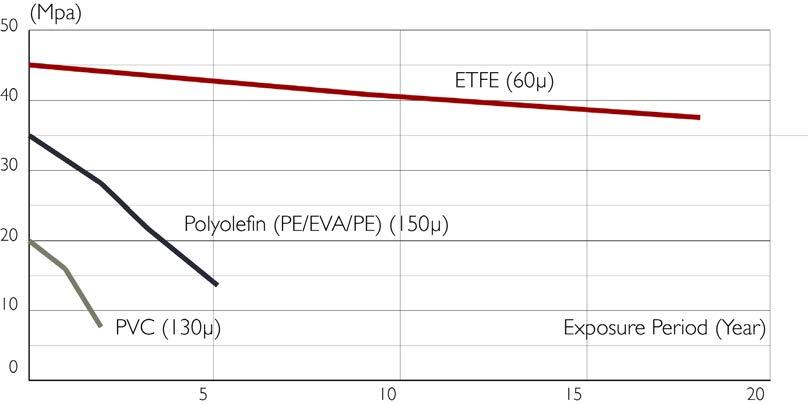
In the next graphic the results of a light transmittance test of 3 materials was presented, as it can be understood for the results, in this case ETFE was tested with two materials that are wellknown for their great light transmittance in this case glass and polycarbonate, to prove is the right material for a greenhouse.
Polycarbonate of 3mm had good results but still was the one with less light transmittance from the 3 materials, glass of course is wellknown for the best light transmittance, and had a higher result than ETFE in one part of the test results, but in the end ETFE prove to be the material with the best light transmittance.
After a lot of research ETFE proved to be the right material for the biomimetic structure, having great durability results, as well as an excelent light transmittance, which is one essential resource in greenhouses.
128
FIG. 01.4. Schematic Description of Development Pathways in Drylands
FIG. 01.4. Schematic Description of Development Pathways in Drylands
ETFE Material Properties
Research Development Fabrication Strategy
ETFE is an excellent covering material for a greenhouse, or in this case also a pneumatic structure, because not only is strong and very lightweight, it also has a great durability and great light transmittance, as it was shown in the previous graphics. When ETFE is compared with glass, it proves to be a better insulator, a lot more resistant to the weathering effects of sunlight and it weighs less than 1 percent than a piece of glass with the same volume.
A great example of this material being used for greenhouse architecture is the Eden Project, were the material used as pneumatic panels, which are composed by three layers of ETFE welded along the sides with a steel structure holding and connecting them to one another. This ETFE panels provide a great insulation without decreasing the amount of sunlight that shines through.
For the production process of the ETFE first the cutting patterns are generated from a 3D geometry, then a CNC machine cuts those patterns, and then they are pre-assembled in the right order and welded in special ETFE welding machines. Once the panels are assembled all other details are added, such as air supply valves.
When it comes to the energy consumption the pneumatic ETFE panel cushion systems are generally supplied by one or more inflation units, each unit consists of two air compressors forming a backup system to guarantee the structural stability. But the fabrication and transportation to site compared to other similar cladding material very little amount of energy is consumed. And also is easily recyclable, old elements or waste from the fabrication process can be re-moulded into new products, such as wires and tubing components.
ETFE is also very simple to repair because this material can be welded, so when it comes to tears it can be easily fixed by welding replacement patches over the affected area. And another great fact about this material is that this material doesn’t expand or shrink when heated, it can resist temperatures of up to 270°C because of its very stable molecular bonding, and is fire retardant.
SOURCE. “ETFE Film Fabric Facades & Roofs | Porte Cochere Solutions.” Accessed August 18, 2018. https://www.makmax.com.au/etfe/65. “How the Eden Project Works.” HowStuffWorks, May 3, 2001. https://science.howstuffworks.com/environmental/conservation/conservationists/eden.htm. “Structural Film.” samuel fournier. Accessed August 18, 2018. http://www.liwe.ca/structuralfilm/. “ETFE - Designing Buildings Wiki.” Accessed August 18, 2018. https://www.designingbuildings.co.uk/wiki/ETFE.
129
4.4.4.2.
Research Development Fabrication Strategy
SOURCE. “ETFE Properties.” FluorothermTM (blog). Accessed September 17, 2018. https://www.fluorotherm.com/technical-information/materials-overview/etfe-properties/. “Free Eden Project Wallpaper and Desktop Background Image Downloads.” Accessed September 18, 2018. https://www.edenproject.com/wallpaper-downloads.

130
4.4.5. Fabrication System
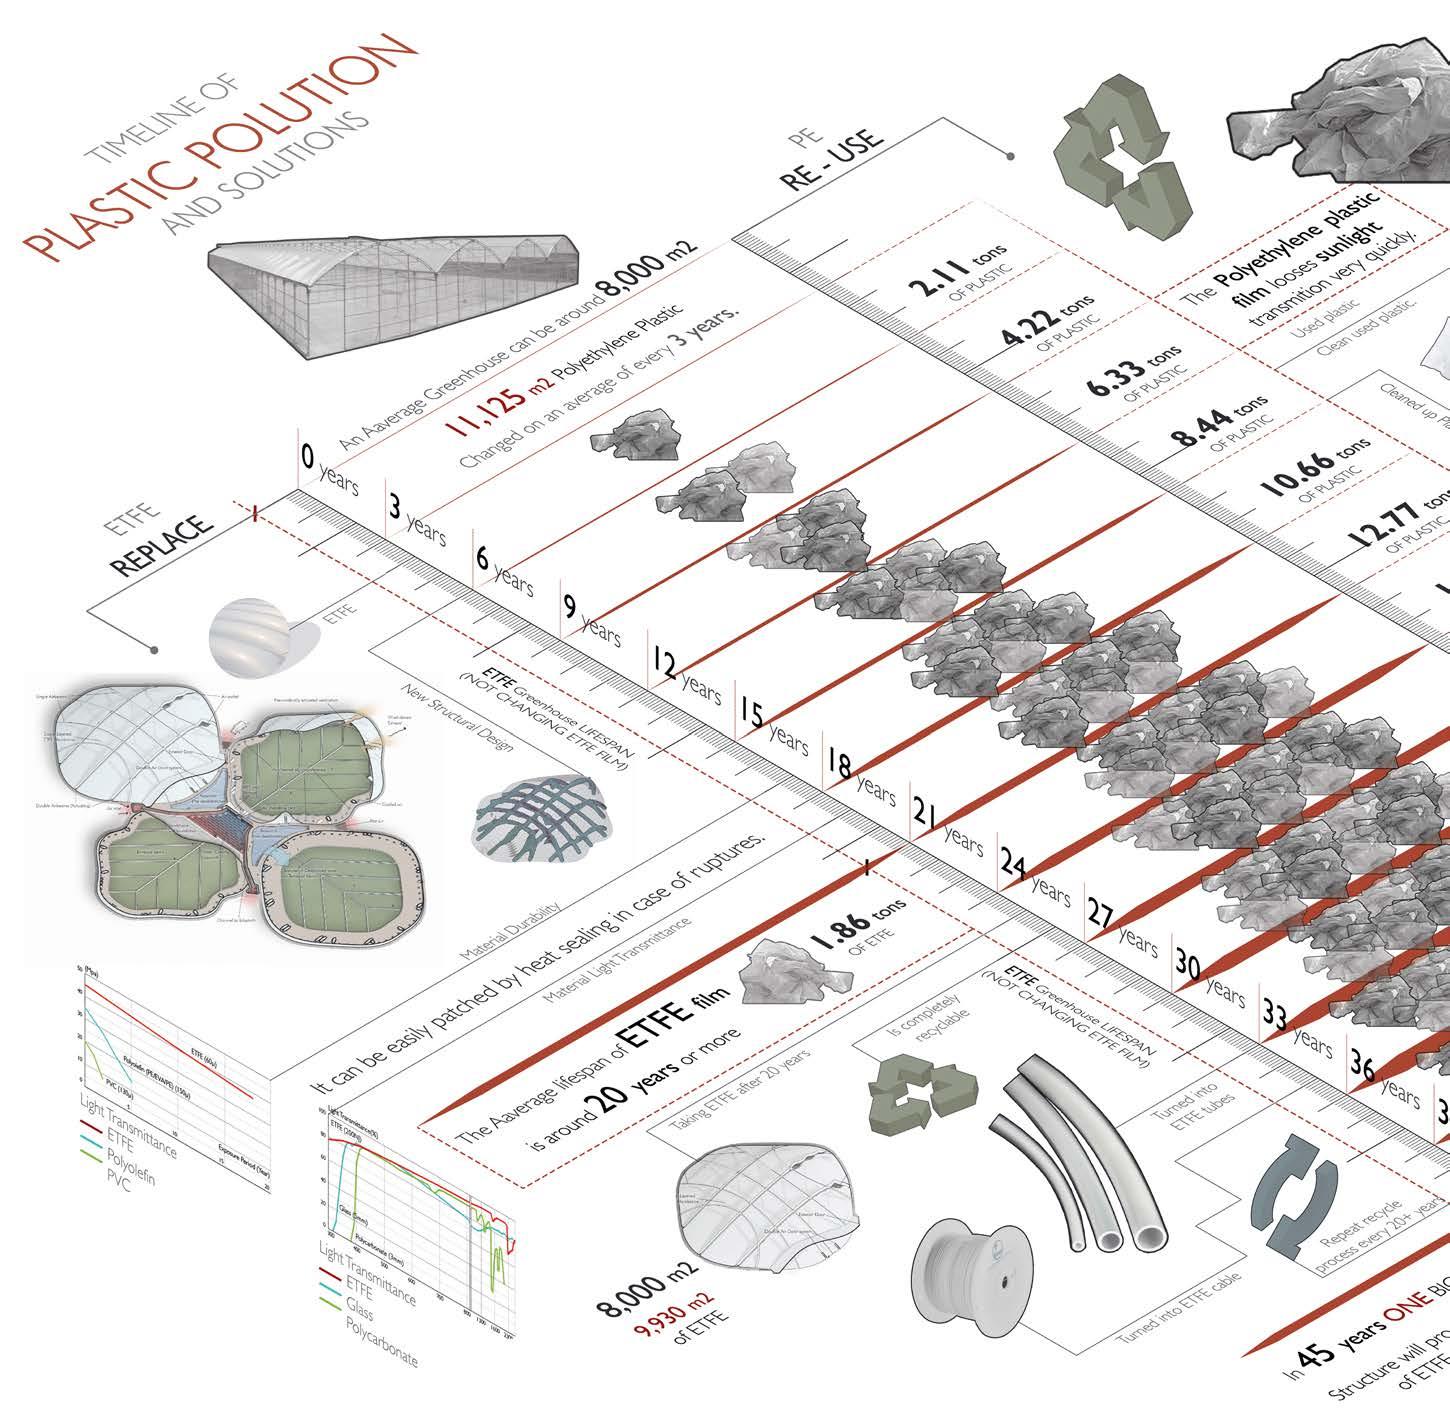
131
Research Development Fabrication Strategy
Research Development Fabrication Strategy
Plastic Pollution and Proposed Solutions
In this image a graphical representation has been made of both the amount of plastic pollution made by a greenhouse and two possible solutions for this problem.
First it starts with one average size greenhouse in Almeria, which is around 8,000m2, this size of greenhouse needs around 11,125m2 of plastic film for its construction and its proper function. The most used plastic for the greenhouses in the area is polyethylene, and depending on the type that is selected it can loose its light transmission in one to 4 years, due to this the plastic needs to be constantly changed.
For this graphic a time lapse of three years was selected for the change of the plastic, which would be consider a large amount of time taking into account that most greenhouses use the cheaper version of plastic that needs to be changed every two seasons. This greenhouse would produce 28.65 tons of plastic waste in 45 years, this amount of time was taking considering the boom of the greenhouses started in the 1960s. Now a days there are around 36,000 hectares of these plastic greenhouses which continue to change and throw away there used plastic, and only a portion of that started to get recycled in the recent years.
In this graphic to proposes are being made, one is replace and another one is to reuse this plastic.
For the proposal of replace, not only the material would change but also the design of the greenhouses. The material proposed is ETFE which can stand even more than 20 years, because of this the same size of greenhouse covering 8,000m2 would only produce 3.72 tons of plastic waste in 45 years, and that ETFE waste can be directly recycled into cables and tubes.
For the proposal of reusing the plastic, the plastic waste in not terrible conditions would be washed, disinfected, and later cut to be heat sealed into a pneumatic form-work for construction of housing units for the migrant workers.
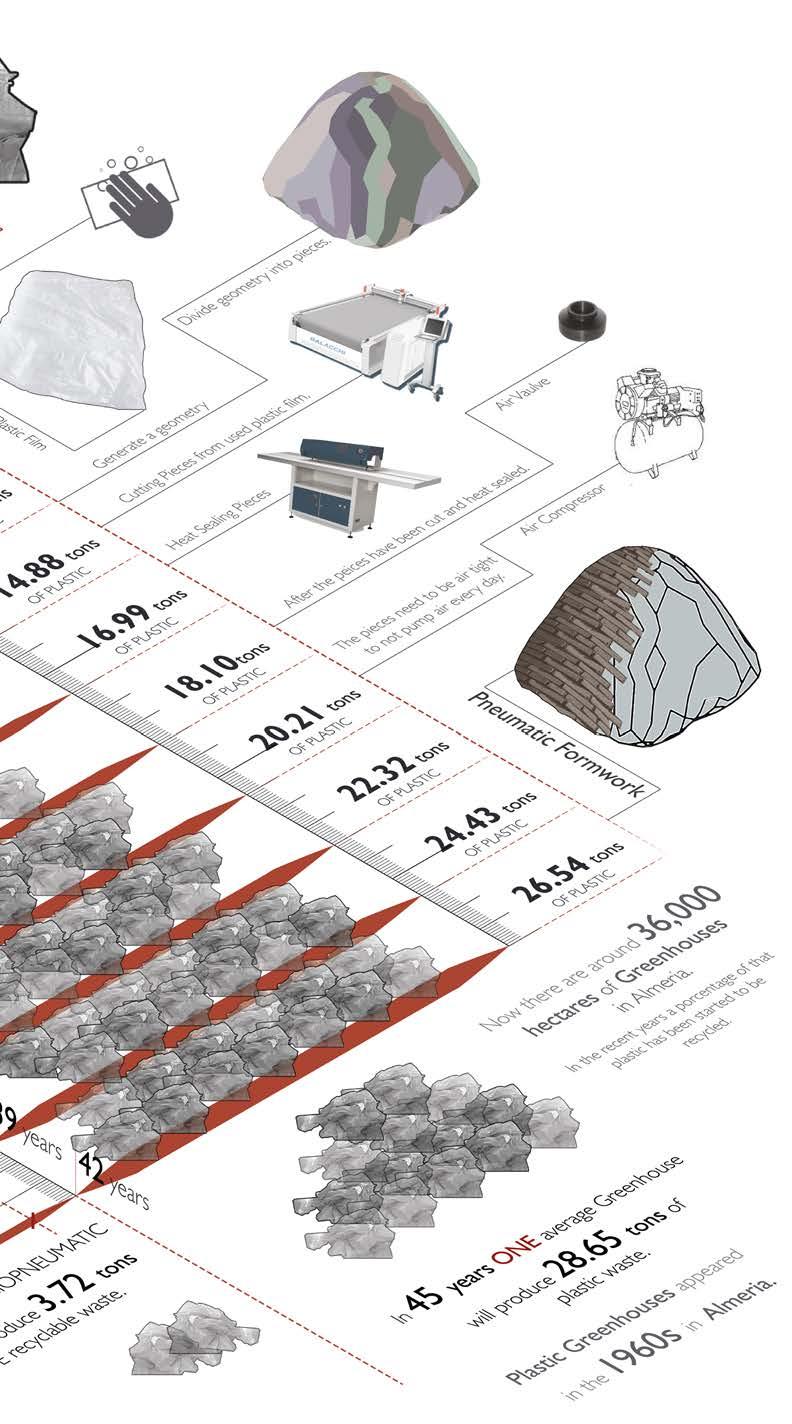
132
4.4.5.1.
Research Development
Fabrication Strategy
FABRICATION

TIMELINEOFTHE BIOPNEUMATIC STRUCTURECONSTRUCTIONPROCESS
FabricLocatedin
ElEjido,Almeria,Spain
jobWhichwillcreatebetter oportunitiesinthearea.
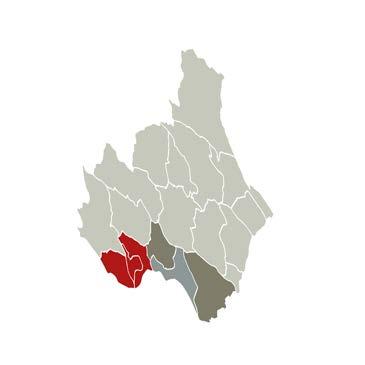
ETFEWelderMachine
fromTransportETFEMaterial Almeria.BARCELONAto
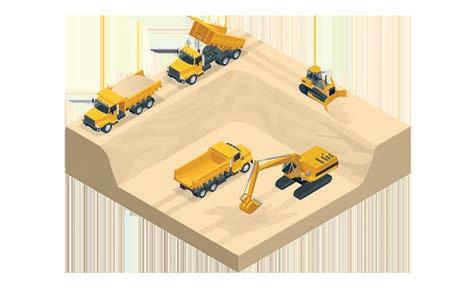


CuttingETFEbasedintheSurface RationalizationforbothMembranesandBeams,usingCNC.


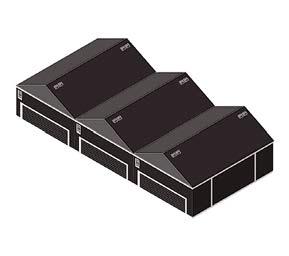
AirAirInletsand(vaulves)outlets
Tomantainthenecessaryair preassureinthestructure.
Packing
CNCMachine
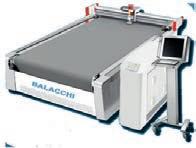
Using ETFE as the main material can decrease the use of plastic significantly in the area, plus ETFE is also a RECYCLABLE material, which means that when is time to change the greenhouses, this can be recycled into cables and tubing components among others.
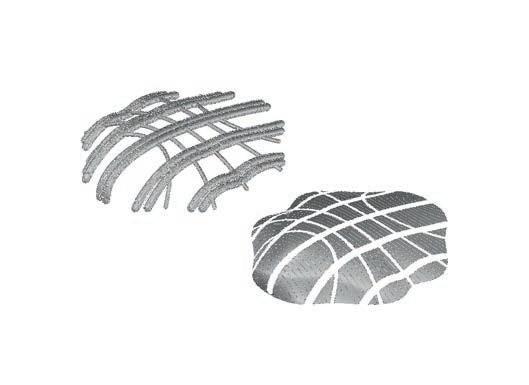


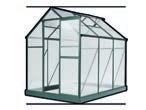
StructuresTransportETFEPneumatic totheLands.
133 ETFE PolyethyleneFilm PVC Polyester Nylon Neoprene Butyl Hypalon PTFE Glass Polycarbonate Polycarbonate Polyethelene Panel Acrylic EVA
1.
2.
3.
5.
7.
8.
Research Development Fabrication Strategy
1. ETFE is transported from Barcelona toAlmeria.
2. The fabric would be located in Almeria to c reate better job oppor tunities.
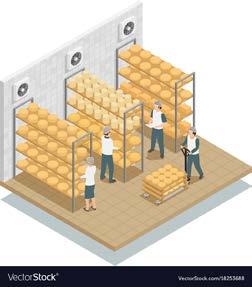
3. ETFE is cutted to pieces with CNC Mac hine.
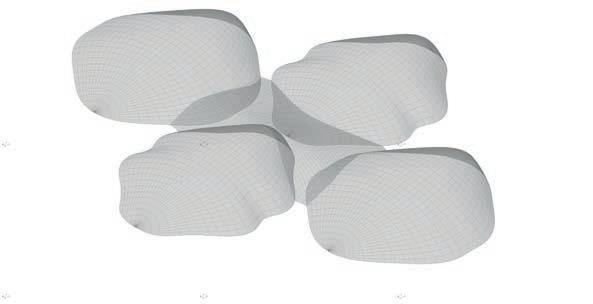
4. ETFE pieces go to the ETFE Welder Mac hine to build the structure, using a heat sealing method.
5. Other components are added to the structur e, specially air inlets and outlets , which help mantian the nec essary air pr eassure for the structure.
6. When the ETFE Structure is ready, it gets pac ked so that is ready for being transpor ted to the main land wher e the biopneumatic structur e will be located.
7. The ETFE Structure is transported to the land.
8. The land gets prepared for the c onstruction and installation of the greenhouse.
9. After the land is ready, other systems and the foundation are constructed, concrete will be use for this part of the contrsuction.
10. The biopneumatic structure gets c onected to the concrete f oundation and systems, and is inf lated.
necessaryair structure.
outletsInletsand LandPreparation
AfterLandPreparationtheconstructionofthe laberyinth,tanks,andfoundatinstarts.Tothen beconectedtothePneumaticStructure. CompletedExcavation
StructureConectingPneumatic toFoundation
Laberyinth Construction
Foundation Construction
Normal Polyethylene Plastic cover on greenhouses usually last from 2 to 3 season, even if is a good quality plastic it could last 1 to 4 years.
With ETFE material on Pneumatic Structures, even with the hard conditions and solar exposure this material con last up to 20 years, that is 5 times a good quality Polyethylene Plastic.
134
PackingETFEStructures
9.
6.
10.
Greenhouses Fabrication 4.4.5.2.
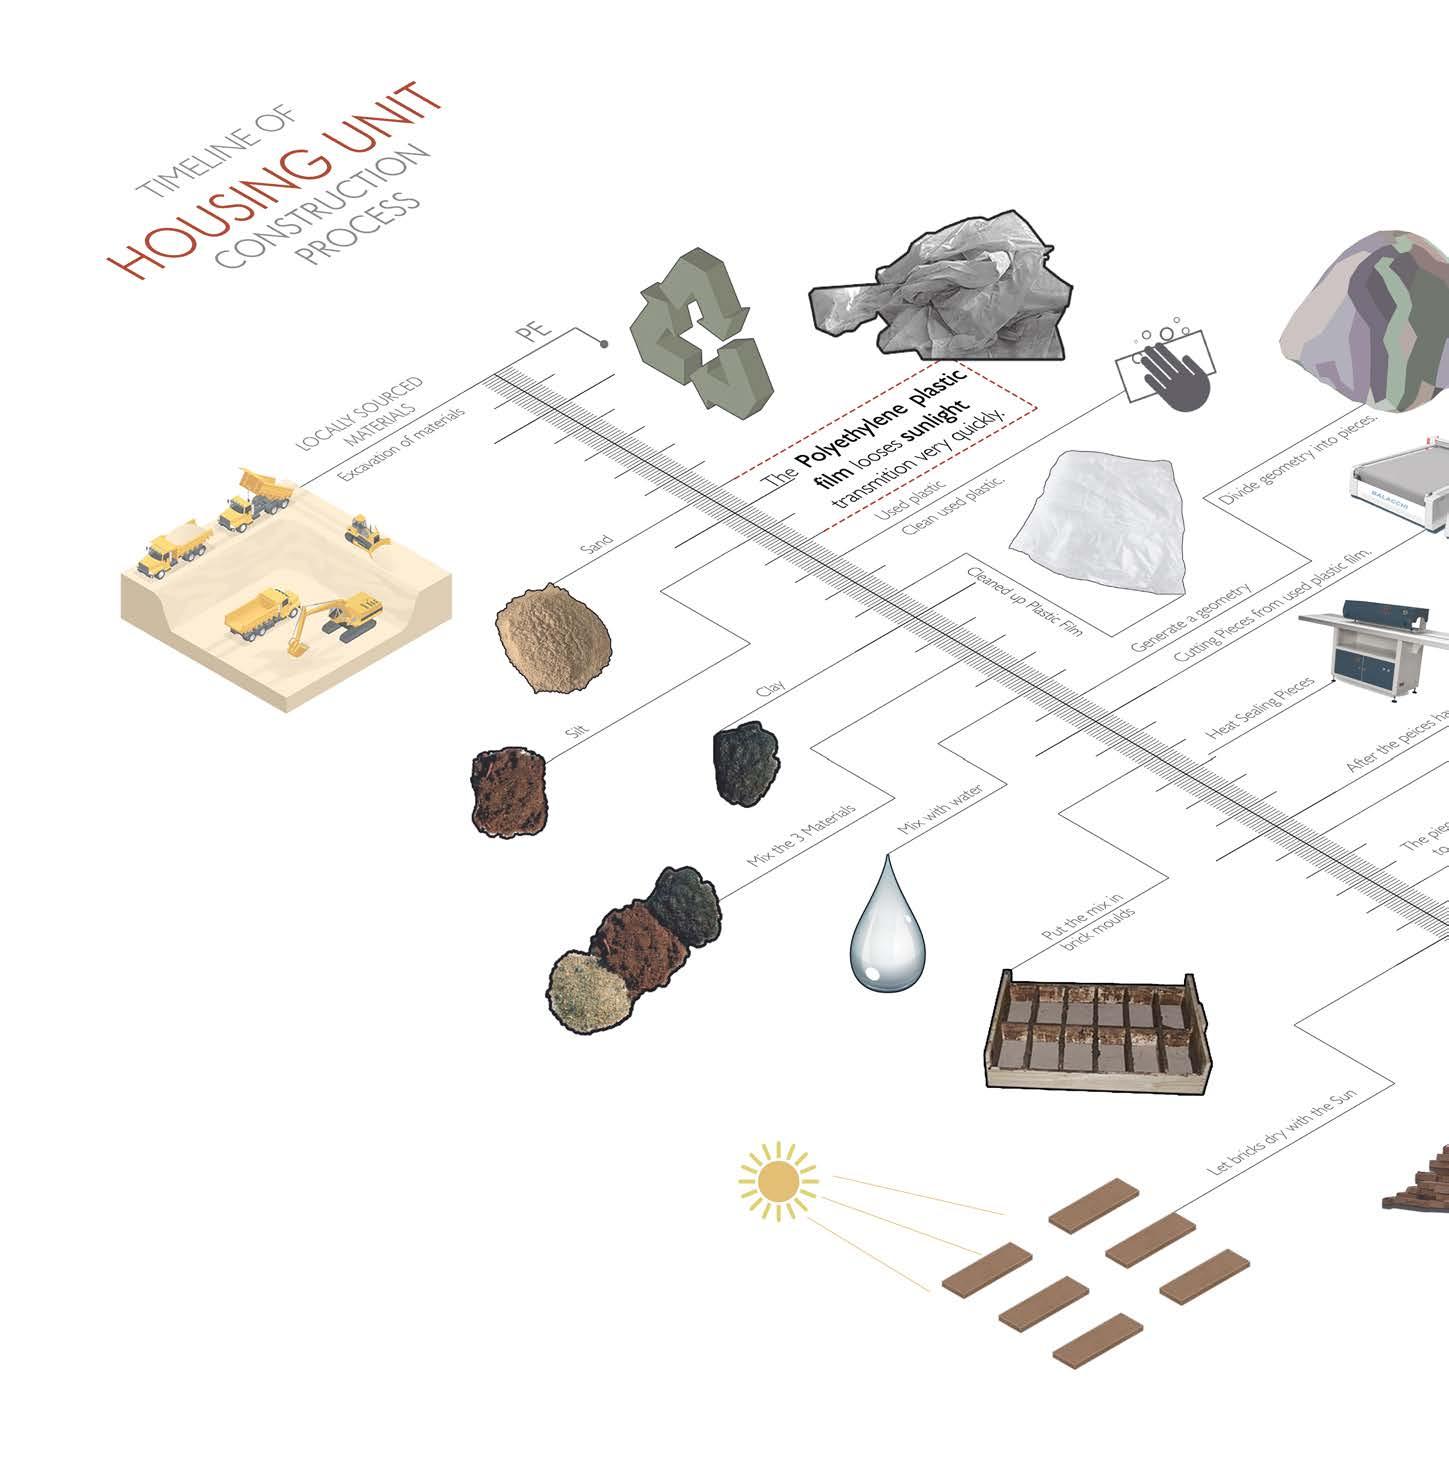
135
Housing Units
4.4.5.2. Combining the research on the adobe construction technique and pneumatic formwork, the fabrication process can be summerized as follows:
Construction Process
For the initial stages of the fabrication process of the housing units, the materials and components need to be prepared on site for the construction. For the design proposal there are two basic elements: bricks and pneumatic form-work.
The material proposed for the form-work is the disposed Polyethylene plastic films. In order to reduce the amount of plastic pollution in the area one of the approaches of this project is to reuse that plastic film in order to the pneumatic form-work for the construction of housing units for the migrant workers.
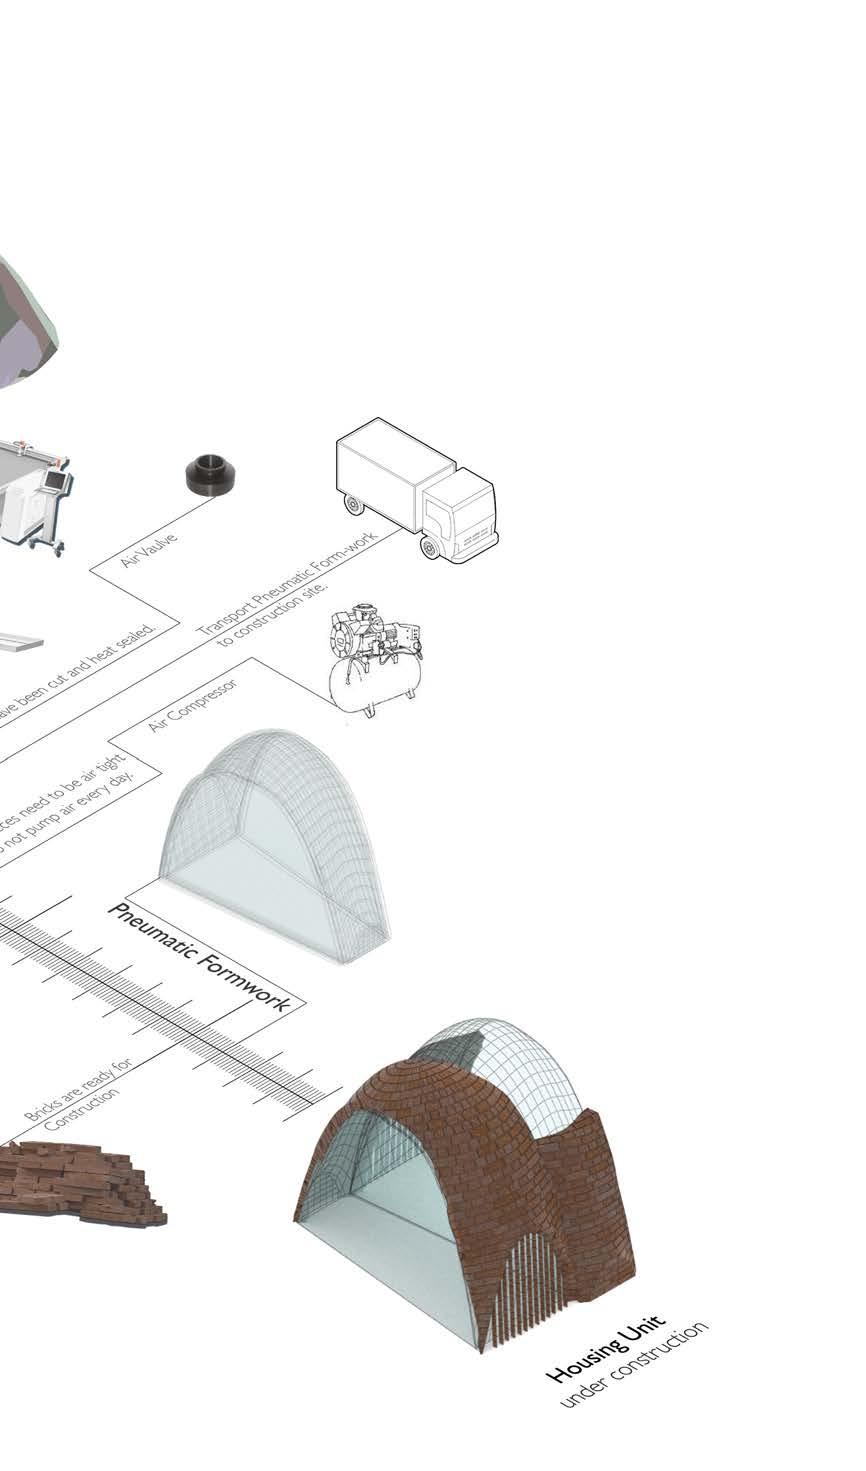
The process of constructing the pneumatic form-works starts with collecting plastic condition, which would be easy to find because the plastic is thrown aways due to their loss of sunlight transmission, in this case the sunlight transmission is not needed in the material.
Once the plastic is picked, it goes through a process of deep cleaning, to later be cut into specific pieces and heat sealing process were applied to all the pieces get attached in order to make the final form of the pneumatic structure. And to finalize an air valve is added for the inflation and deflation of the structure.
The formwork is then transported to the construction site and inflated, ready for the construction of the house unit.
The preparation of the loam happens on site. First the materials would be excavated from the area, The large gravel need to be sifted out. Next dry mass is mixed together with water, after that the mixture would be placed in brick molds and lay under the sun until they are completely dry. When enough bricks are dry and the pneumatic structure is inflated the construction is ready to start.
136
137 5
DESIGN DEVELOPMENT
138
Design Development
Computational Strategy
5.1. Computational Strategy
5.2.1. Computation Design Ambition
While each are beneficial in their respective regards, a key ambition in the computational design realm is to devise a form-finding logic that can integrate both computational fluid dynamics and genetic algorithm. In the most ideal case, CFD should be integrated directly as an objective for GA to optimize. However, due to the immense computational requirement of iterative fluid dynamic simulation on thousands of design solutions, it is currently unideal to directly apply this method. The experiments are conducted to find the most efficient strategy to synthesize the two computational design process.
5.2.1. Strategy
The two design proponents are separated strategically, with emphasis on maximizing computational design efficiency and minimizing required computational power. As the principle strategy is wind-driven design, the initial design experiment is set up as a sectional design experiment with CFD. This allows the use of 2D CFD for optimization, which is many times faster than 3D.
Next, the CFD-optimized section design is then incorporated into 3D design with GA manipulating multiple parameters in order to optimize for non-CFD related objectives. This allows fast and efficient GA computation.
As multiple fit individuals are chosen based on preferences, it is reinserted into CFD to generate a final form for a specific context. The result of this design process aims to yield design results that satisfy a multiplicity of design objectives as well as wind and thermal performance.
139
Output [Hydrological network] [Primary Road network]
Computational Strategy Design Development
[Secondary street network] [Tertiary street network] [urban blocks]
[House Programme Spatial Organization]
Methodology
Diffusion-Limited Aggregation
Urban Network Generation [Hydrological network] [Road network]
Genetic Algorithm
Settlements Layout [street network] [urban blocks]
[Wind adaptive greenhouse forms]
Experiment
Global Scale
Scale
Local Scale Meso Scale
Genetic Algorithm
Modularized Housing system [Programme Spatial Organization]
Wind Adaptive Hydro-Thermal Farm System [Wind adaptive form]
140
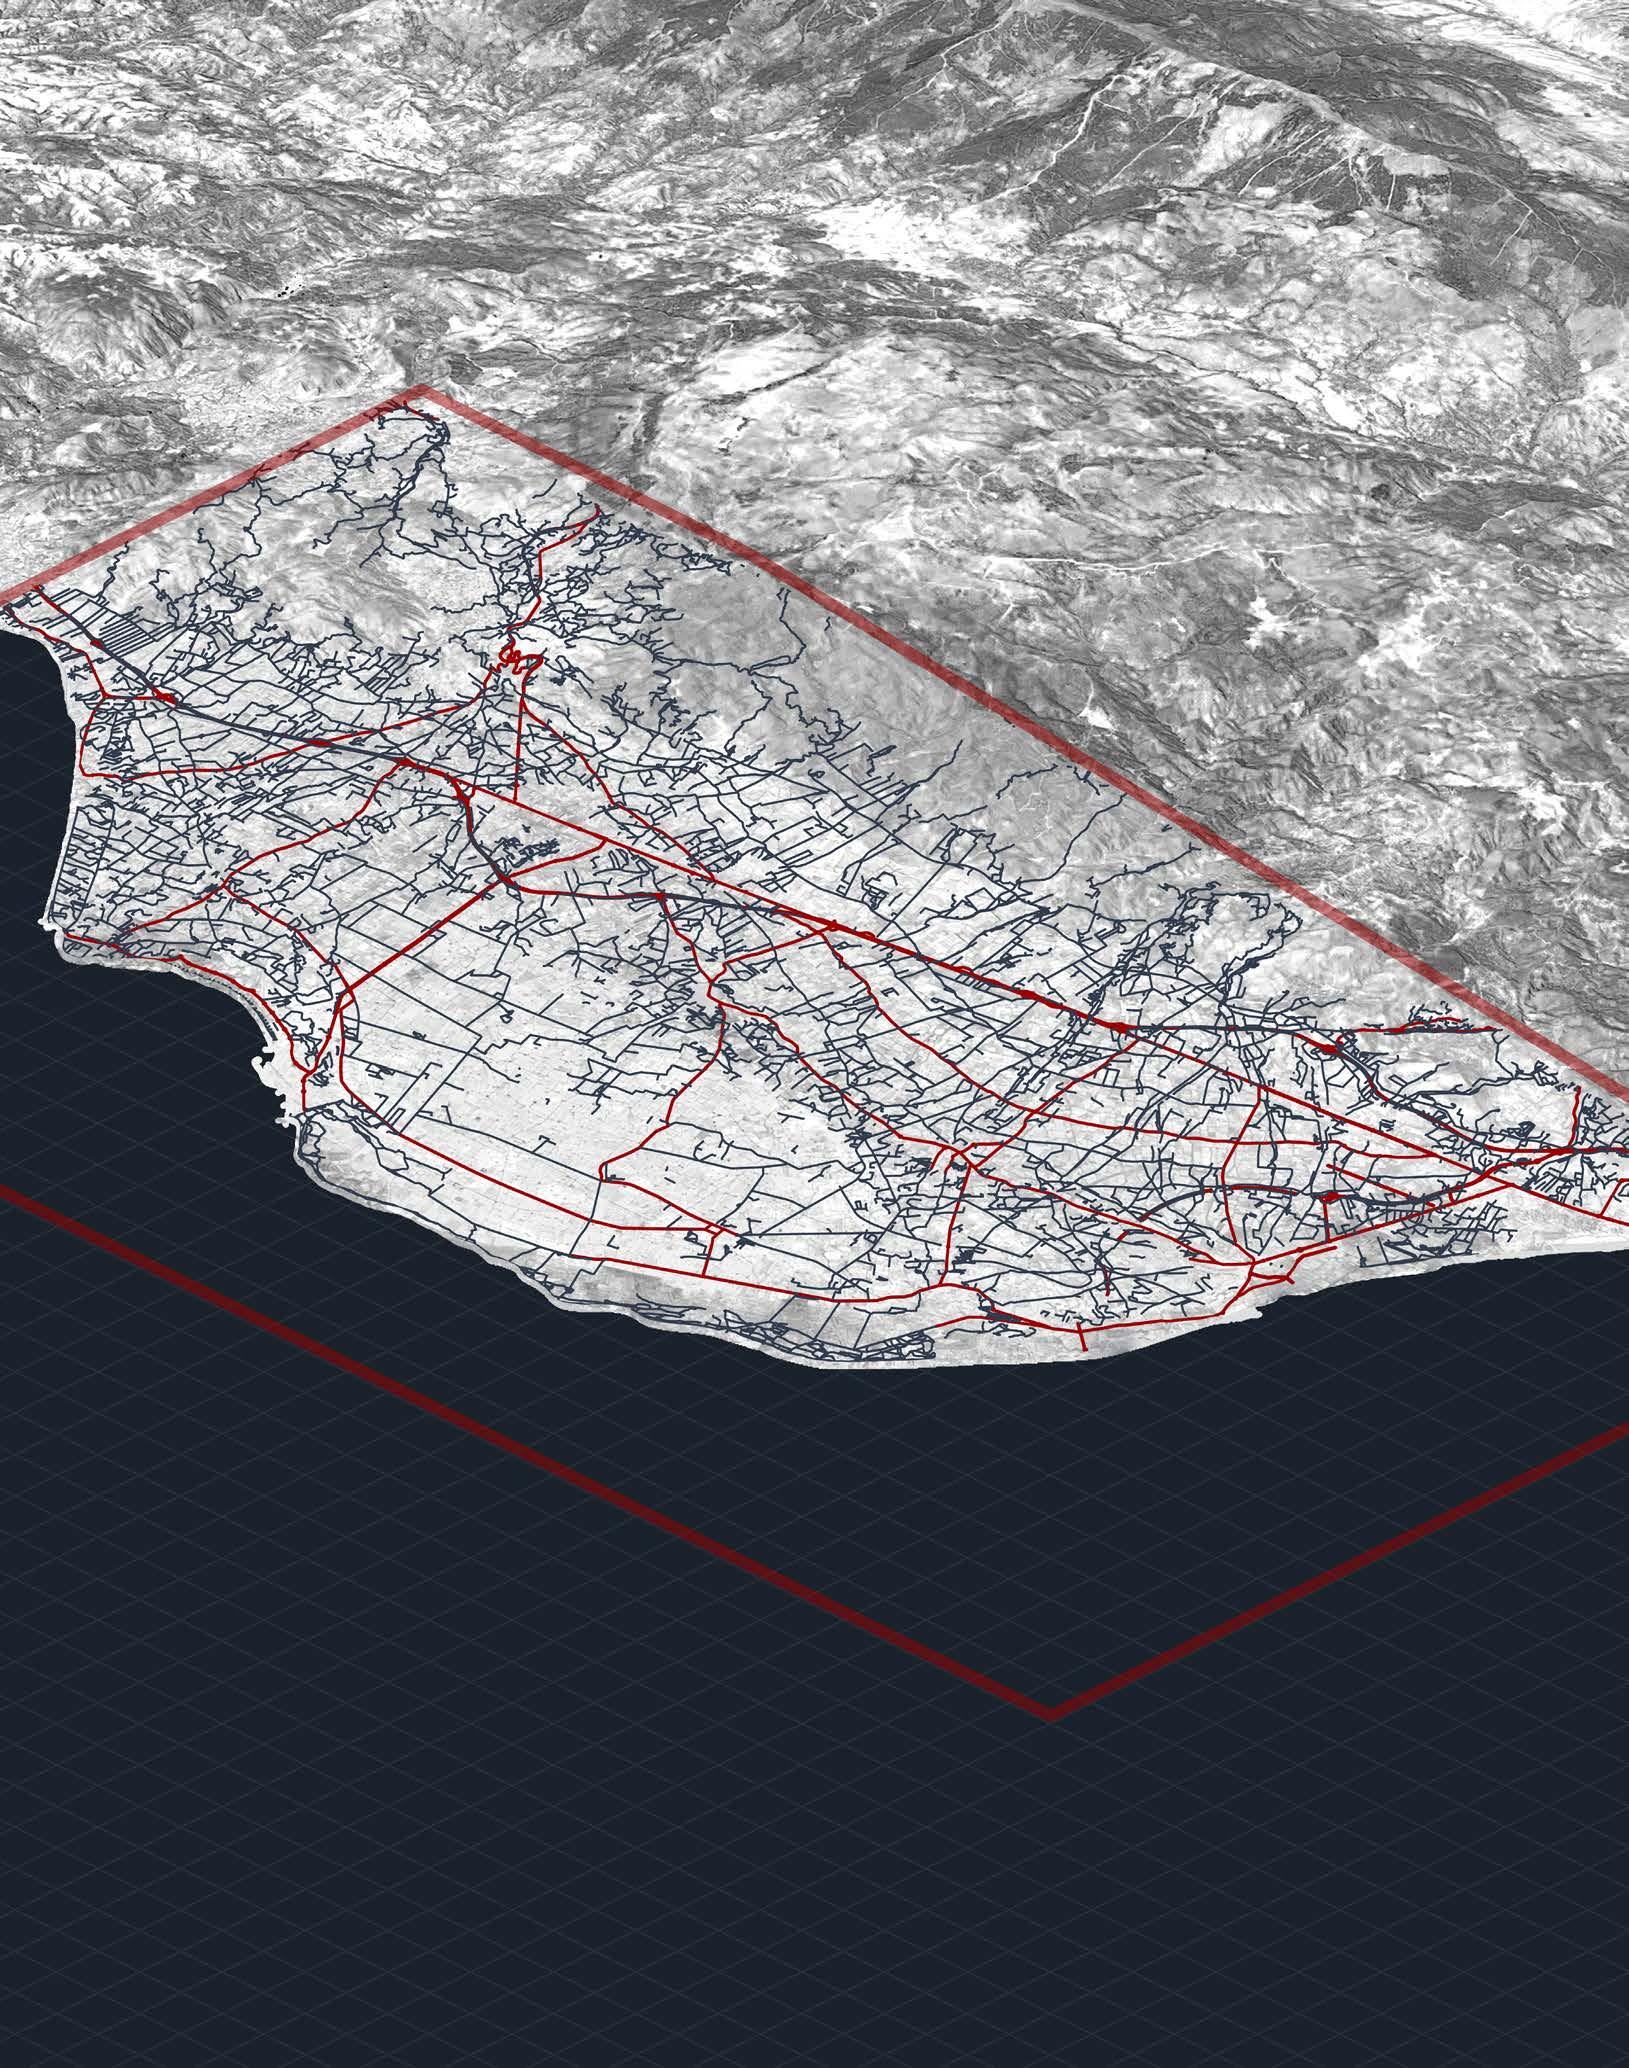
 Roquetas del Mar
El Ejido
Las Norias
Main Road Secundary Roads
1 Existing highway Network.
Global Scale Design Development
Roquetas del Mar
El Ejido
Las Norias
Main Road Secundary Roads
1 Existing highway Network.
Global Scale Design Development
Global Scale Design Development
5.2. Global Scale
The site selected for further computational expeirments were an region defined by the existing highways. Salty lakes are located near the selected site. several streams were found in the site. To create a water network, the first step was to create a overground seawater canals connecting the adacent lake to the seaside. The gental slope could main constant salt water flow through the canals.
To simulate the formation of the canals, water runoff model were used. The runoff patterns indicated the potential location of the canals.
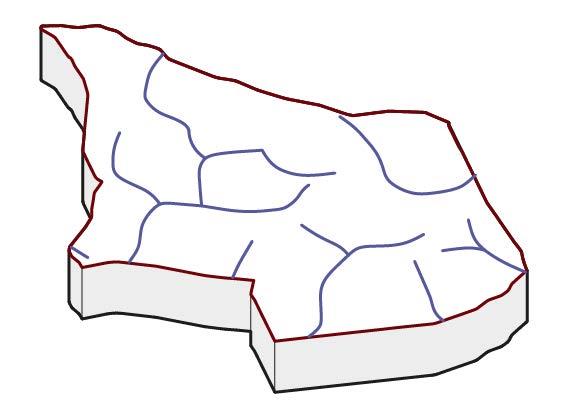
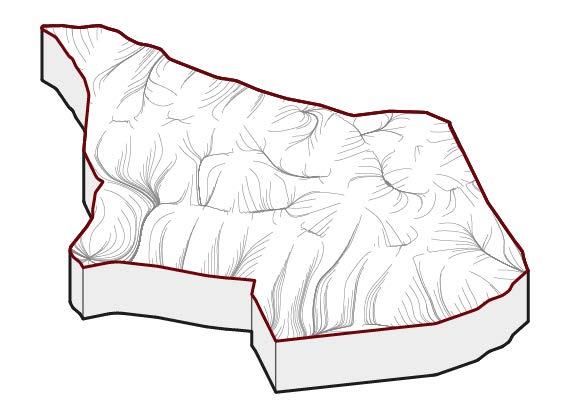
142
2 Selected Site.
3 Water Runoff Simulation.
4 Identified Canal Location.
5.2.1. Urban Design Experiment
The diffusion-limited aggregation (DLA) computational model was used to simulate the aggregation of greenhouses and formation of dendritic seawater distribution system on the urban scale. This was achieved taking into account computational time, based on the classical DLA approach (unrestricted by a lattice). Our computational model was modified to adapt the specific dimentions of building and the site. In order to execute the computation and particle movement in the Grasshopper visual coding environment, iteration steps were introduced. As such, the greenhouse was simplified as a particle. After each iteration step, the particle position was updated. Before starting the computation process, seed points were placed. Those were the points where aggregation started. In that case, equally spaced points on the seawater canals were used as seeds.
It is important to note that the computational process only simulate the aggregation of the greenhouses as they are single use. The residential settlement design requires much more complex generating logic and therefore, it was not included in the DLA computational process.
The DLA computation consisted of two processes: first, a moving particle was released from the growing domain boundary and begun a random walk (Brownian motion). Then when it approached within a certain critical range around the seed point or a branch of aggregated particles, whereupon it would stick onto the cluster and new aggregation sets were formed. A link connection was added upon the aggregation between the two particles. That connection indicated the edge within the dendritic hydraulic network. After the two processes were completed, the next particle would be released and proceed to the next iteration loop. To run the computational simulation within the finite time frame, the maximum amount of random walk steps were limited to 150 steps for each particle before it jumped into the next loop. This means the particle had the possibility not to aggregate to any branch. After each loop, the growing domain expanded to provide wider space for the DLA.
Like most of the urban growth, we limited the aggregation process started from one single centroid of the selected terrain and evenly spreading out on all directions at a steady pace.
143 Global Scale Design Development
Global Scale Design Development
5.2.1.1.
Experiment Setup
Total iteration: 9000 iterations
Among all the parameters which controlled the computational model, we selected the two most deterministic parameters. Two sets of controlled experiments were designed to compare their influence of the variables on the generated aggregation pattern.
Variables:
• Aggregation domain expansion rate
• The spacing between the seeds
Evaluation criteria:
• Greenhouse density
• Branching probability
• Total length of the hydraulic network
Observations
5.2.1.2. As the research suggested, branching pattern is efficiency spatial pattern in term of fluid transportation. The branching probability indicated within the water distribution network, how many edges of the were arranged in a branching configuration. What we have observed in the experiment that seed density and growing domain expansion rate both played an important role in influencing the branching probability. Denser initial seeds produced higher branching probability. However, this was a threshold beyond which the branching probability reduced.
Another important factor is the density which reflects the packing efficiency of the greenhouse distribution. In the aim is to generate higher density distribution. One determinist parameter was the growing domain expansion rate. The experiment with faster domain expansion rate tended to produce less density(fewer numbers of aggregated particles) scattered aggregate branches. This could be explained by the space abundance for aggregation, faster expansion created ample space for particle random movement, therefore, reducing the aggregation possibility.
5.2.1.3.
Conclusion
The controlled DLA experiments with fined tuned parameter settings provided a promising simulation of greenhouse aggregation. The greenhouse distribution pattern as well as dendritic water distribution network emerged from the simulation was an effective spacial organization pattern. From the experiment results, we have chosen the experiment 5 for further design development. It provided dense greenhouse distribution and highest branching ratio.
144
Global Scale Design Development
Experiment 1
Parameter: seed spacing:2000m growth domain expasion rate:0.0007
Result: branching probability: 16.3% network length: 143613 density: 45.1 greenhouse/km2
Experiment 2
Parameter: seed spacing:100m growth domain expasion rate:0.0007
Result:
branching probability: 15.6% network length: 89794 density: 30.5 greenhouse/km2
Experiment 3
Parameter: seed spacing:500m growth domain expasion rate:0.0014
Result: branching probability: 12.8% network length: 95385 density: 30.9 greenhouse/km2
145
Global Scale Design Development
Experiment 4
Parameter: seed spacing:500m growth domain expasion rate:0.0024
Result: branching probability: 13.4% network length: 58641 density: 19.4 greenhouse/km2
Experiment 5
Parameter: seed spacing:500m growth domain expasion rate:0.0007
Result: branching probability: 18.4% network length: 132473 density: 41.6 greenhouse/km2
146
5.3. Meso Scale
5.3.1. Settlement Scale GA
From the research on the Morrocan and Spanish housing topologies, two representative housing types from both contexts were selected: the Moroccan courtyard house and the Spanish townhouse. The aim of the generative design experiment was to create a hybrid residential settlement with both housing types and public programs for the needs of the site-specific demographics.
Previous research on the urban forms also suggested pedestrian-oriented medinas, as well as medieval centres of Spanish cities, were preferred urban scale in terms of outdoor comfortability. Through on-site observation, the main means of commuting for the migrant workers were found to be walking or biking. Taking into account both factors, the largest block scale was limited to 80m* 80m. Within this range there was a variation of block size:20m(small) 40m(medium) 80m(large)
5.3.1.1. • Settlement Street Network Generation
Generative Process
The street networks were generated using the instruction tree algorithm which has been described in Chapter 3. To evaluate the efficiency of the street network, network centrality analysis method was used. Among all types of centrality analysis, we found the betweenness centrality is the most efficient to analyze the connectivity of the street network. Higher sum betweenness value of the street network, the better connected the street network is. In this experiment, the betweenness centrality analysis has been integrated successfully as an evaluation criteria in the GA as opposed to being used commonly as post analysis. Limited by the computational time, only secondary street network centrality was calculated as GA fitness value. We considered the secondary street network was sufficient to defines overall layout and characteristics of the settlement.
• Urban Blocks generation
Once the street network was generated, it also subdivided the whole site into plots. The polymorphic plots ranging from triangle to polygons. Based on the geometric features of the plots, the programs were assigned. The detailed form operation procedure was described in the boolean condition diagram.
147
Meso Scale Design Development
Meso Scale Design Development
Road network Genes:
Road segment length range
Network starting location seed
Road segment angle range
Urban block Genes:
148
L min L max 0~A max
0F 1F 2F 3F 0F 1F 2F 3F
Courtyard houses Floors Townhouses Floors
5.3.2. Experiment Setup Objective
The conflict between sufficient urban density to accommodate as many people as possible and overshadows, poor natural light issues due to the overpopulation could be observed in most of the Medina parts of the Moroccan cities as well as the urban centres of the Spanish cities.
149 Tertiary Road Network Polygonal Plot Triangular Plot False Workshop Neighborhood Square Single Story Multiple Stories Hammam Courtyard House False Area>400m2 Largest block close to canal
5.3.2.1.
These issues could be abstracted as 3 conflicting objectives of the GA:
1. Maximize street network connectivity. The fitness value is measured by the sum of all street segments centrality value.
2. Maximize Floor area ratio(FAR). The goal is to generate a maximum amount of housing area.
3. Maximize South oriented facade ratio.
The algorithm parameters: 100 generations, 20 individuals per generation. The elitism size: 50%
Mutation rate: 50% Mutation probability: 20%. Crossover rate: 80%
150 Secondary Road Network Public Square Triangular Plot Polygonal Plot Elongated Plot Souk (Market) Place of Worship Townhouse True Neighborhood Square Single Story Multiple Stories True False True Closest to road with highest connections Closest to road with highest connections True Elongated Plot False Initial Plots Area>6,400m2 Boolean condition diagram: form operation
5.3.2.1.
Results and Observations
Meso Scale Design Development
From the 2000 individual solution, 5 individuals were selected and further post evaluated. Among all of them, 3 were elites which were fittest according to one single objective, 2 preto-front located dominant solutions were chosen as representatives for the cluster around them. It carried morphological characters of the similar solutions.
Analysis of morphological trait of the elite solutions indicated that generally, the townhouse block sizes were larger than courtyard block, it was in favor of creating higher density(FAR) and higher south facade ratio. However, due to its larger block size, it also contributed to the decrease in the street network connectivity.
It is also worth mentioning the character of the emerging urban centers defined by public programmes. Two types of urban center configurations were observed in the generated solutions:
1.Single urban centre. When all major public programmes, as well as plazas clustered at one single location. This formulated one single urban centre within the settlement.
1.Multiple urban centers. When major public programmes clustered at more than one location. This formulated multiple urban centers within the settlement.
151
Meso Scale Design Development
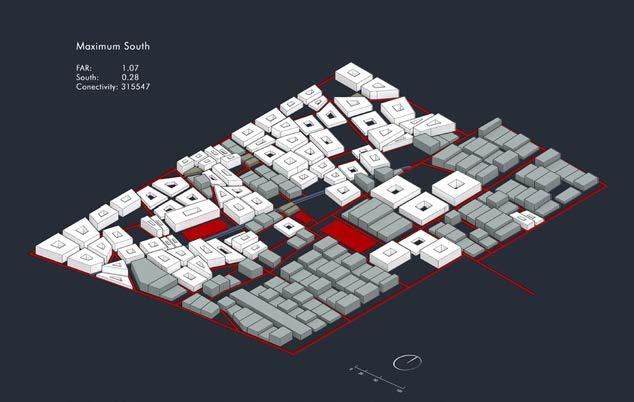
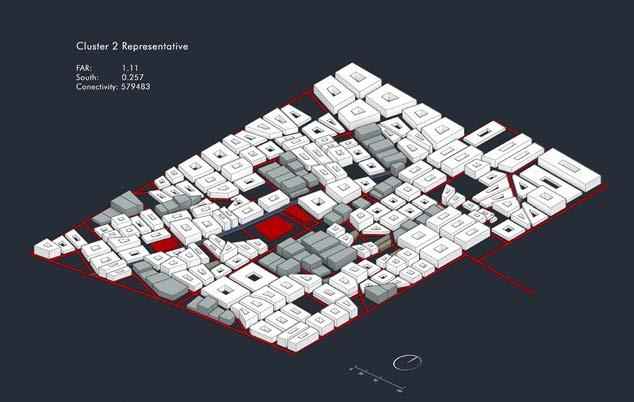

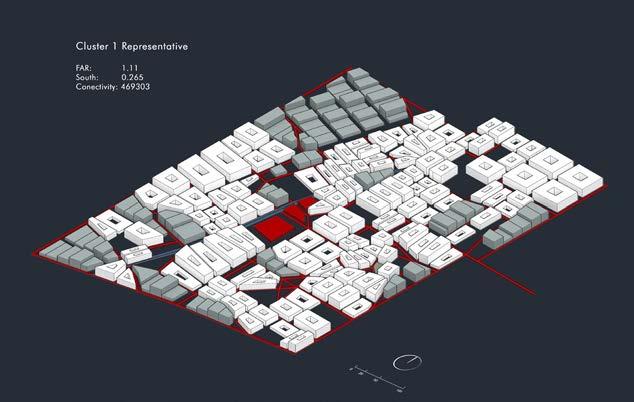
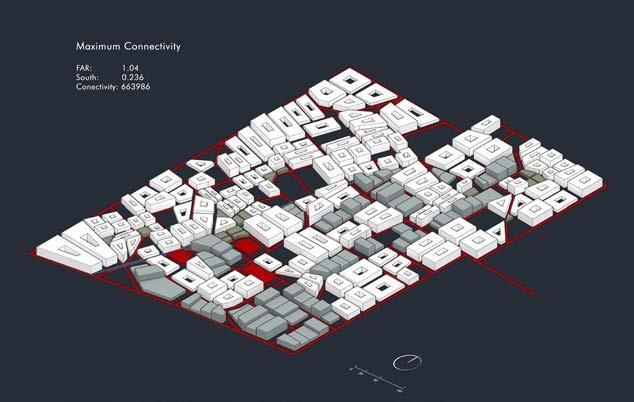
152
Elite 1
Elite 2
Elite 3
Cluster 1 Representative
Cluster 2 Representative
5.3.3. Post Evaluation
The statistic data analytical methods were used to evaluate problem-solving efficiency of the customized GA algorithm.
Standard deviation and fitness value graphs demonstrated that the fitness value of objectives 1 and 3 had been improved and that the solutions converged in the later generations. This showed that the algorithm worked well. However, there was no observed convergence after 100 generations on objective 2. In terms of the solution distribution in the objective space, the triangular truncated pareto front indicated that the objectives are conflicting. Further analysis on the distribution of the elites revealed that objective 1 elite solutions based on objective 1 and 3 were located very close in the objective space, while the elite based on objective 2 was far apart. Such distribution suggested objective 1 and 3 were optimized in pairs against objective 2.
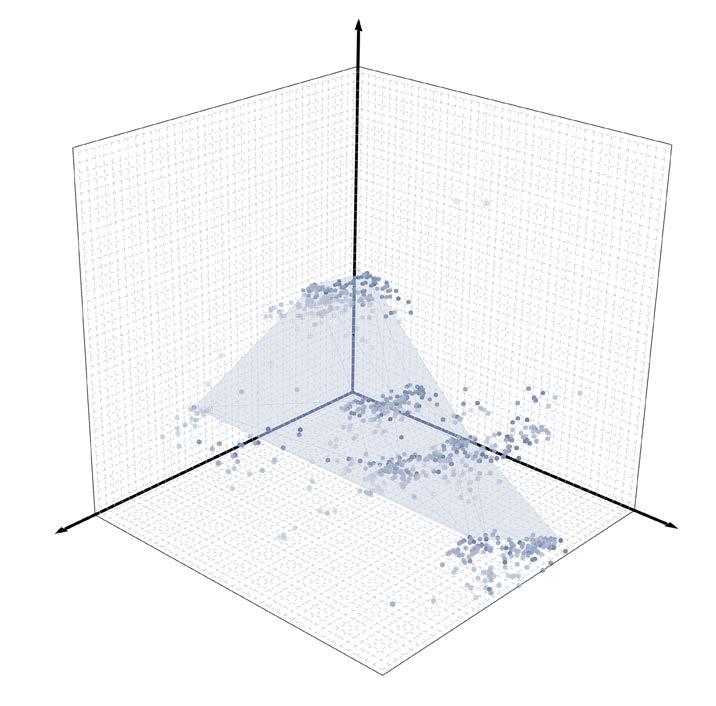
153 Meso Scale Design Development
X Maximizing FAR Z Maximizing connectivity Y Maximizing south facade ratio Elite 1 Elite 2 Elite 3 Cluster 1 representative Cluster 2 representative
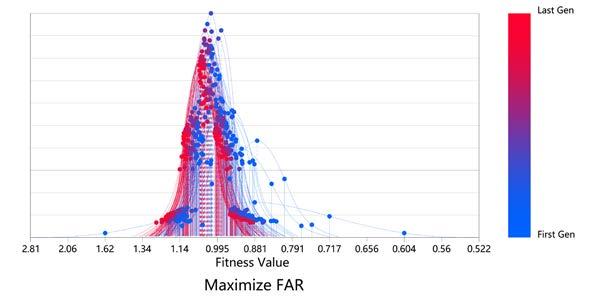
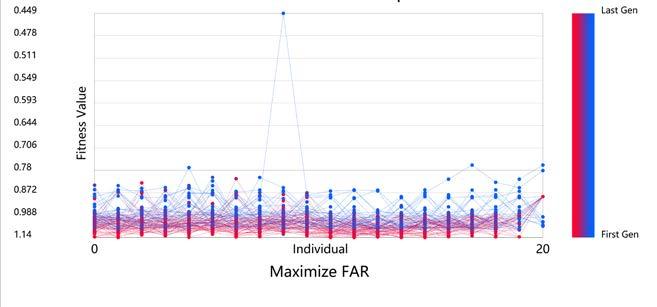
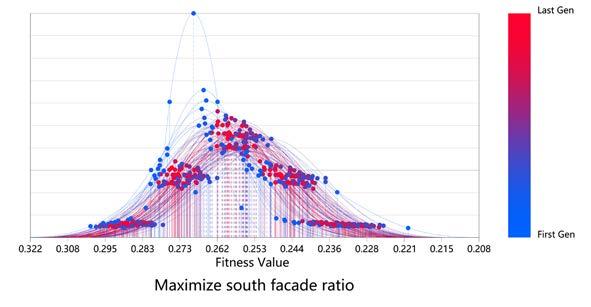
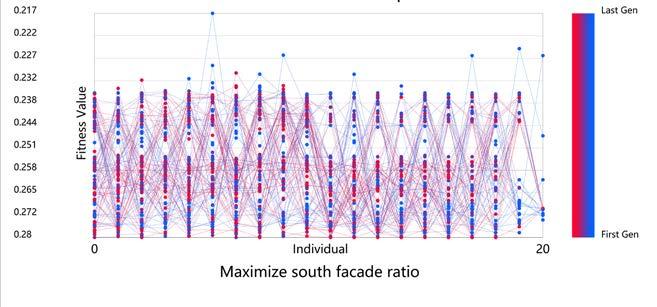
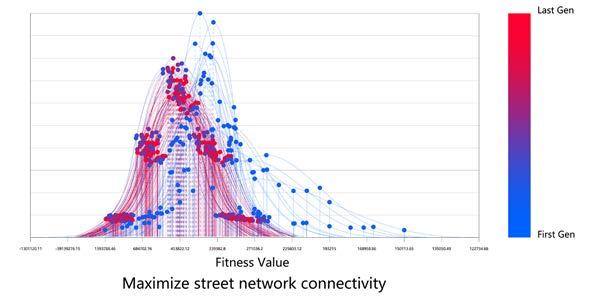
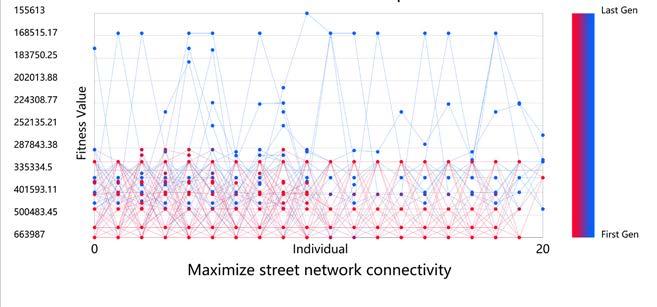
154
Meso Scale Design Development
Meso Scale Design Development
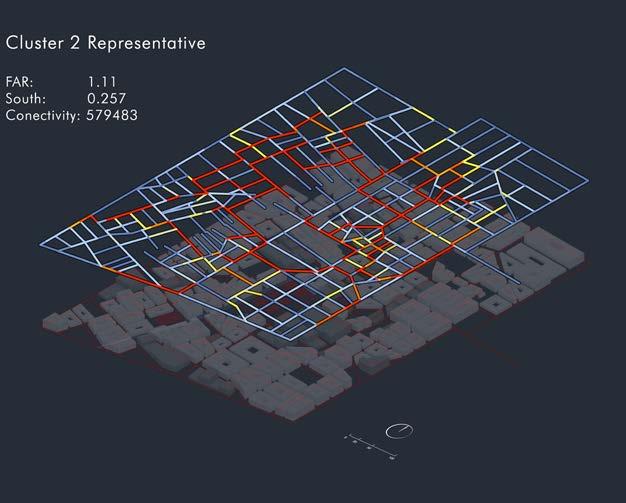
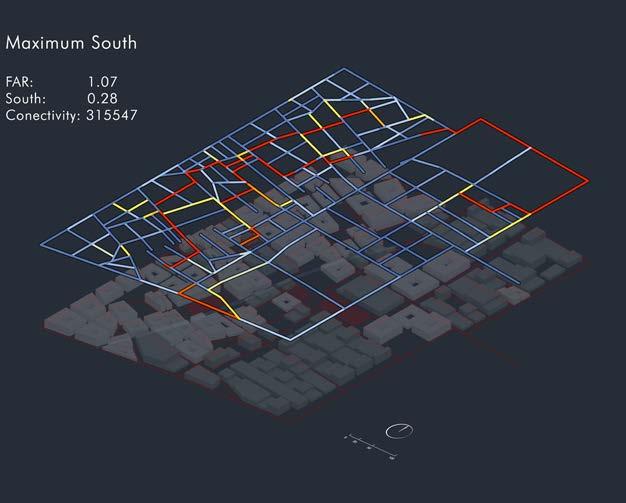
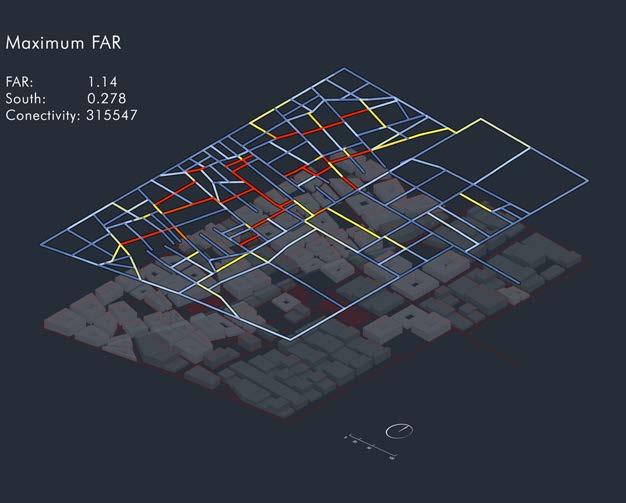
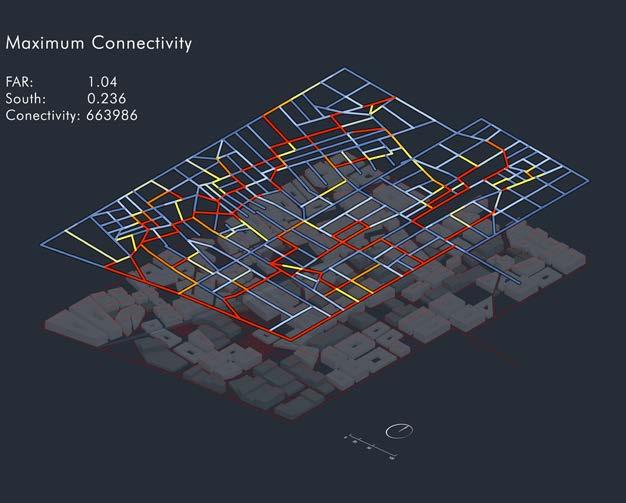
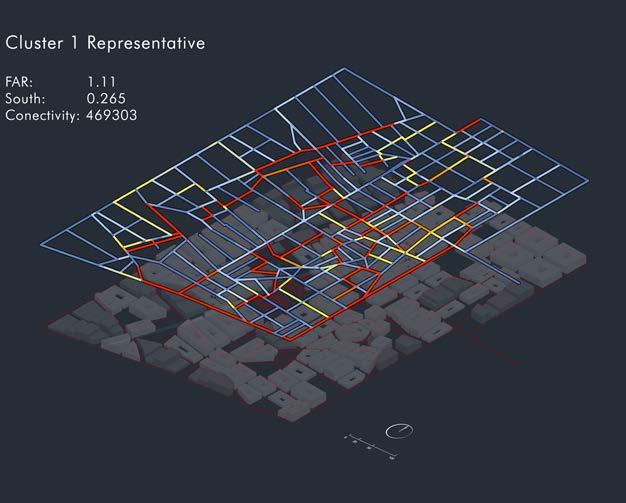
155
Elite 1
Elite 2
Elite 3
Cluster 1 Representative
Cluster 2 Representative
Meso Scale Design Development

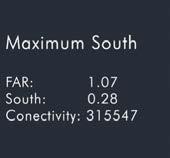
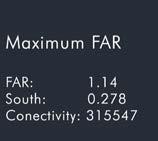


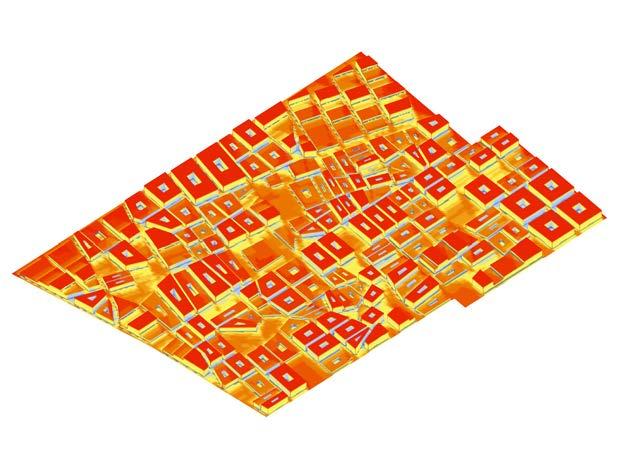
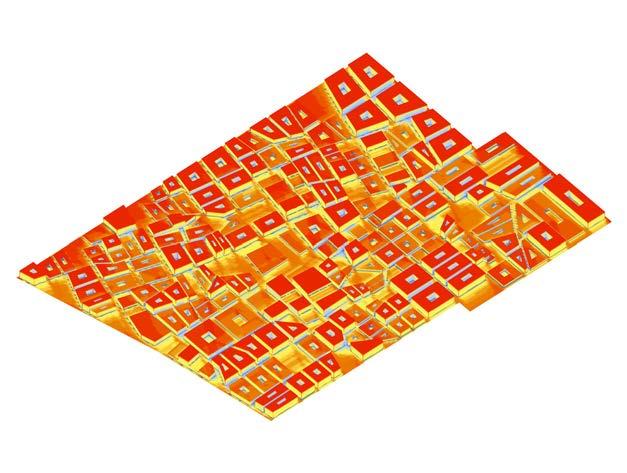
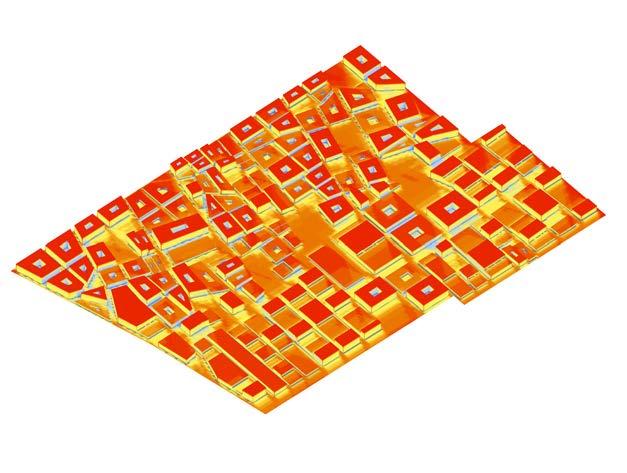
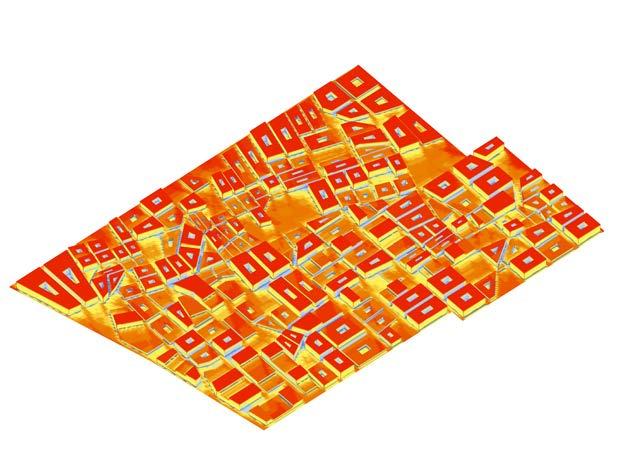
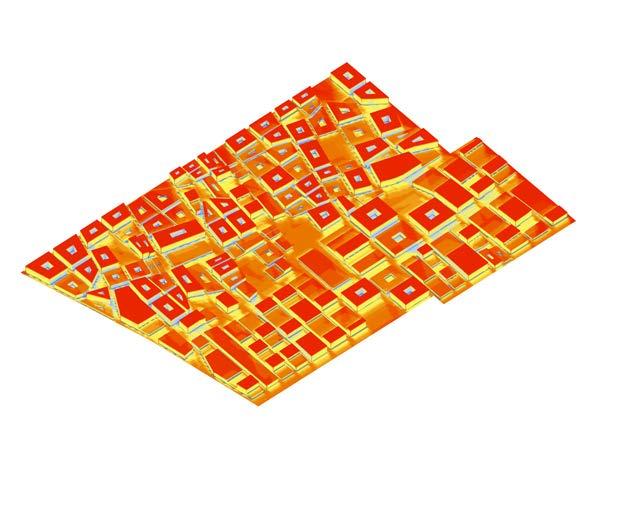
156
Elite 1
Elite 2
Elite 3
Cluster 1 Representative
Cluster 2 Representative
5.3.3.1.
Street Network Centrality Analysis
Meso Scale Design Development
5.3.3.2.
Solar Hours Analysis
Street network connectivity of 5 solutions was compared again using betweenness centrality analysis, this time secondary and tertiary street networks were both taken into account for calculation. The observation mentioned previously that courtyard blocks contributed to higher street network connectivity was proved by the post street network analysis. It is clear that the fitter solution(elite 2 and cluster representative 2) had more courtyard blocks. Moreover, high betweenness value street segments(indicated by red) were connected in closed loops.
5.3.3.3.
Conclusions
In order to evaluate the impact of the urban morphologies on the local micro-climate, solar hours analysis were performed. it took into account the solar vectors at each hour during the daytime on a given date. It indicated the long-term effect of the urban block morphologies in term of solar exposure. Winter Solstice(7 am to 5 pm) and the Summer Solstice day (6 am to 8 pm).
On Winter Solstice, there was a minor difference between all the solutions. When it comes to the summer solstice day, however, we could clearly observe that the outdoor public spaces around the smaller courtyard house blocks were exposed under direct solar exposure for less amount of time. This indicated that the courtyard house type had more effective street canyon effect to create shaded areas in the summertime. This is strongly in favour of urban outdoor comfortability.
To conclude from the post-evaluation, the settlement GA was successful in generating a sufficient amount of variations within a relatively short time. Courtyard housing block was preferred block type in the settlement GA according to multiple evaluation criteria. This also led us to the decision to choose cluster representative 2 as final soltuion. It performed best according to both street connectivity as well as environmental comfortability due to the fact that it contained more courtyard housing blocks. There’s also more variations in term of block size in this solution which offers wider options for various family sizes. This solution was chosen as output to serve for downstream housing design experiments.
157
Meso Scale Design Development

158
Townhouse
Workshop
Plaza
Streets
Hammam
Courtyard House
Religous Center
Seawater Canal
Market
Cluster 2 Representative
5.4. Local Scale
5.4.1. Courtyard Housing GA
5.4.1.1.
Experiment Setup
As the research on the Moroccan vernacular housing types suggests, the logic of its form, as well as the logic of its spatial organization, are governed by privacy. These design principles were extracted to feed into the Housing design experiment. The goal of the experiment was to use GA to find the optimized spatial organization one single house. Taking into account modular design, two unit sizes were proposed:
3m*3m service unit: this includes: kitchen, toilet, storage space and circulation (staircase and corridor)
3m*6m living unit: salon, bedroom
A 3 story courtyard house block was selected from the generative result of the settlement experiment. It served as the bounding box. Based on its proximity to the closest street, the entrance could also be identified. A grid with the cell size of 3*3m was superimposed on the plan. From the previous analysis, 4 privacy depths exist in a courtyard house. This devised the division of the grid into 4 depths. Occupation rule was developed so that certain programme units could only occupy specific privacy depth.
Occupation rule:
Depth 1 and 2: salon kitchen, storage space and circulation(staircase and corridor)
Depth 3 and 4: bedroom, toilet
The aggregation of all the programme units started around the central courtyard. The unoccupied cell would be left empty. This gave the possibility to generate the semiclosed courtyard or even unclosed house.
Objectives:
• Maximum building area
• Maximize solar exposure of the building facade (12pm solar vector on winter solstice)
159
Local Scale Design Development
3
160 depth 1 closest street entrance depth 2 depth 3 depth 4 depth 1 closest street entrance depth 2 depth 3 depth 4 depth 1 closest street entrance depth 2 depth 3 depth 4
1. Grid within the building massing
depth
entrance
depth
depth
2. Depths of the Grid Cells
1
depth 2
4
bedroom salon (living room)
storage circulation bathroom kitchen
Design
3. Program Distribution
storage
Local Scale
Development Meso Scale
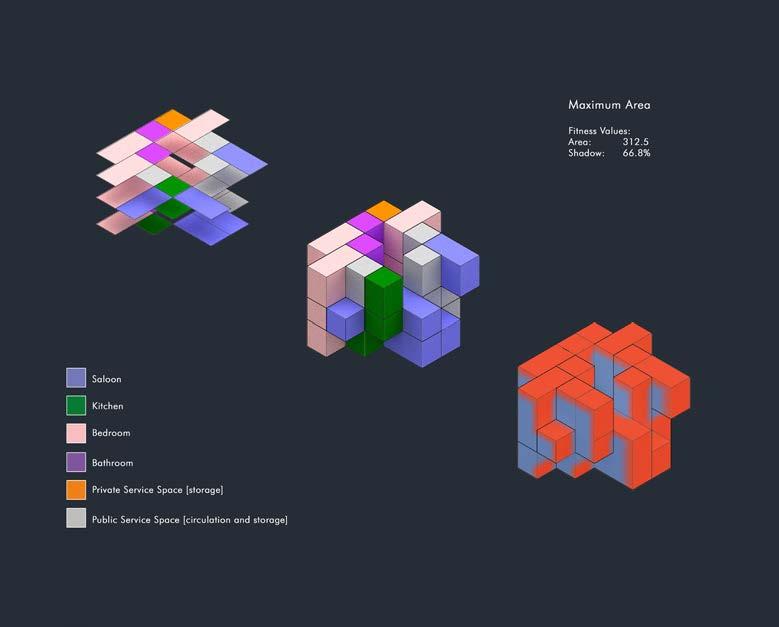
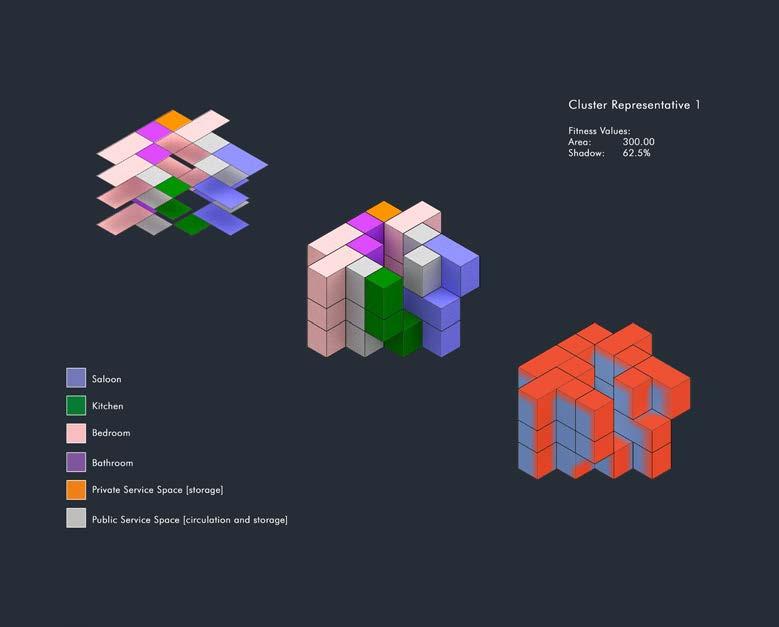
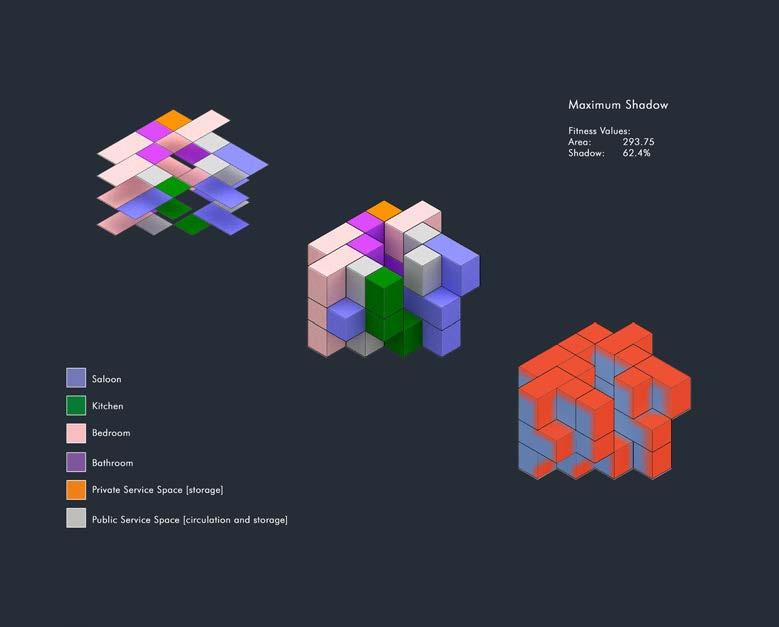
161
Local Scale Design Development
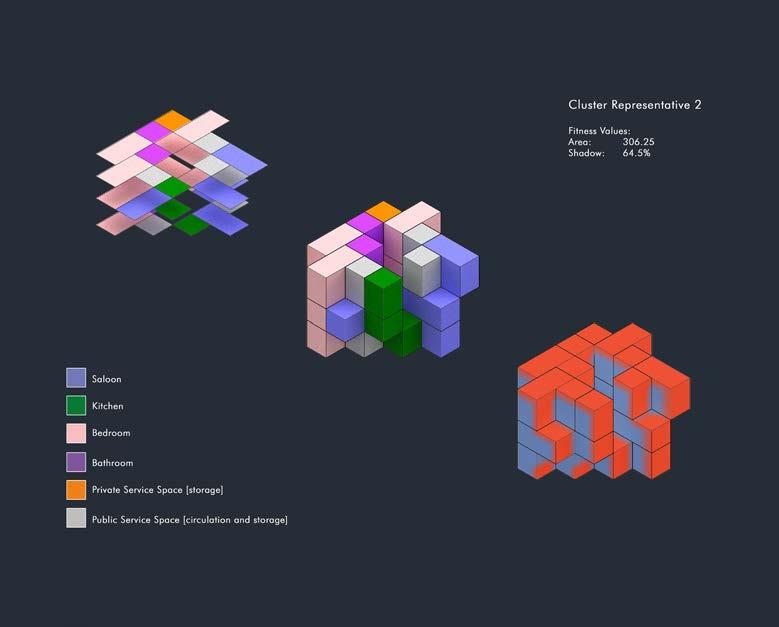
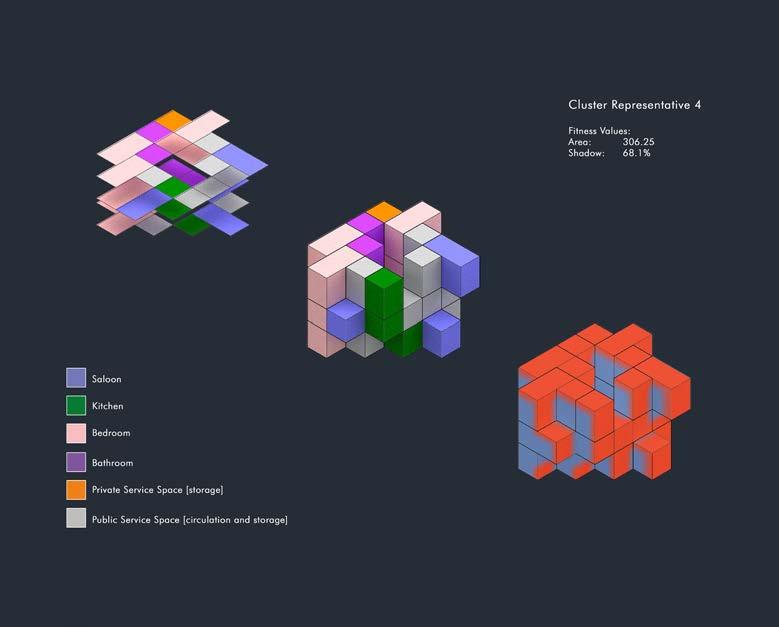

162 Local Scale Design Development Meso Scale
5.4.2.1.
5.4.2. Townhouse GA Observations
Standard deviation analysis, as well as analysis on the morphological characters of the results, suggested the converged to one similar solution and the variations between them was minus.
Room orientation, courtyard size, building height and the openings on the facade are all contributing to the second objective.
The GA the morphological features converged solution featured the ground floor typical closed courtyard house configuration, the south sides elevation were open up on the upper floors. This allows more sunlight distributed on the south side and created a better natural lighting condition for the interior space.
We think this solution is interesting in the sense that residents could enjoy private provided by the closed courtyard configuration while natural lighting in the courtyard in the winter.
5.4.2.2.
Experiment Setup
Townhouse type was successfully integrated into the previous settlement GA experiment. To develop the programme configuration of the townhouse, the second set of housing GA experiment was designed.
Similar to the townhouse design experiment setup, a grid is superimposed on a block selected building mass with 2 privacy depths from each side facing the streets. In this experiment, our focus was on the distribution of both commercial programme and residential programme.
Units on the 1 depth were designated to the commercial use and units on the depth 2 was for the residential purpose. The unoccupied grid cells remained as an open yard.
Objectives
• Maximum building area
• Maximize solar exposure of the building facade
163
Local Scale Design Development
closest street
depth 1
depth 2
depth 1
164
depth closest street closest street depth depth 1 closest street closest street depth 1 depth 2 depth 1 closest street closest street depth 1 depth 2
Local Scale Design Development Meso Scale
1. Grid within the building massing
2. Depths of the Grid Cells
residential 2 residential 1 commericial
3. Program Distribution

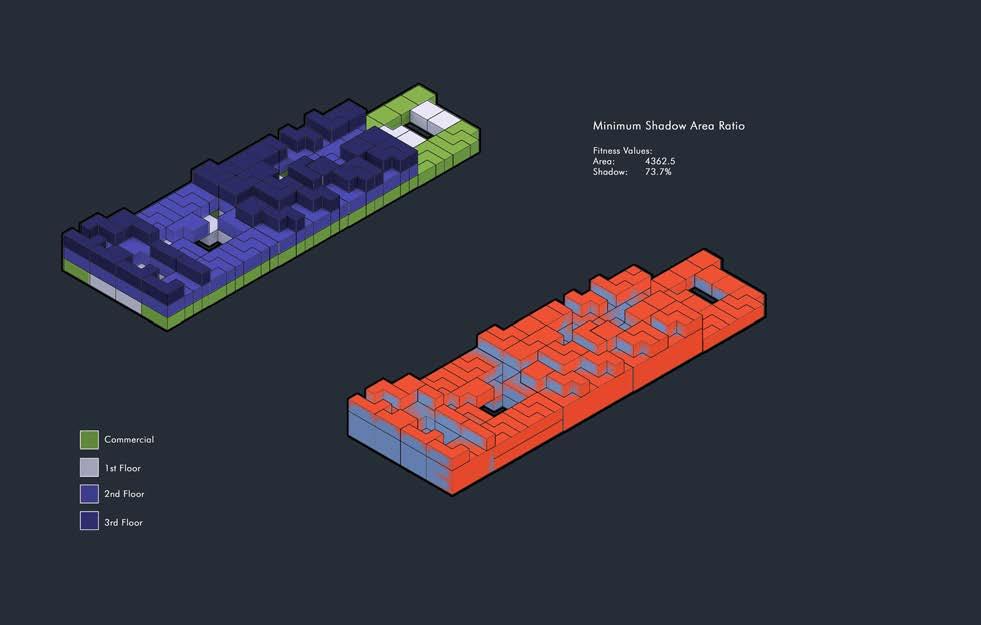

165
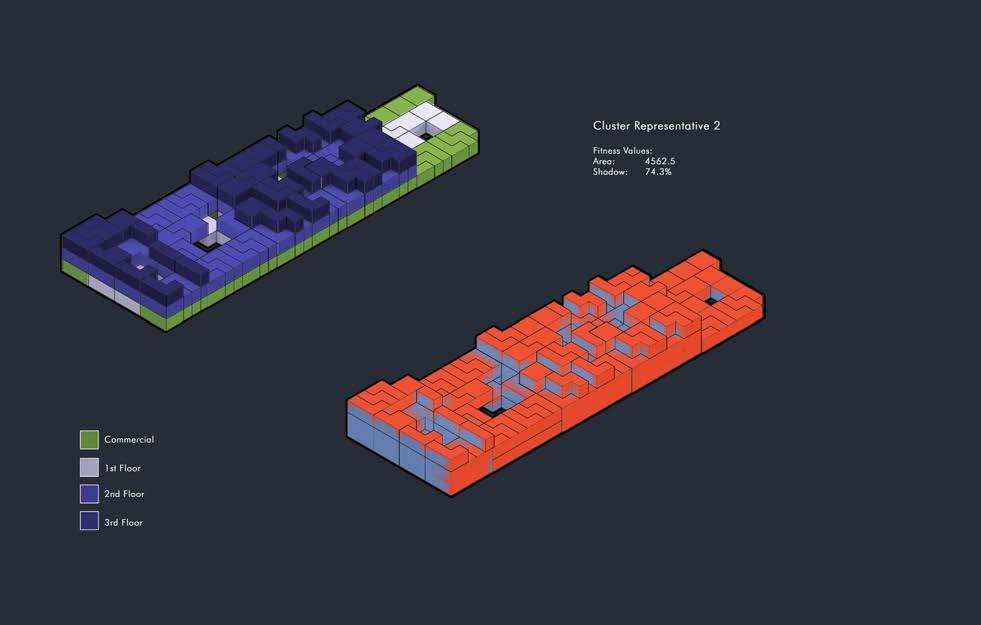
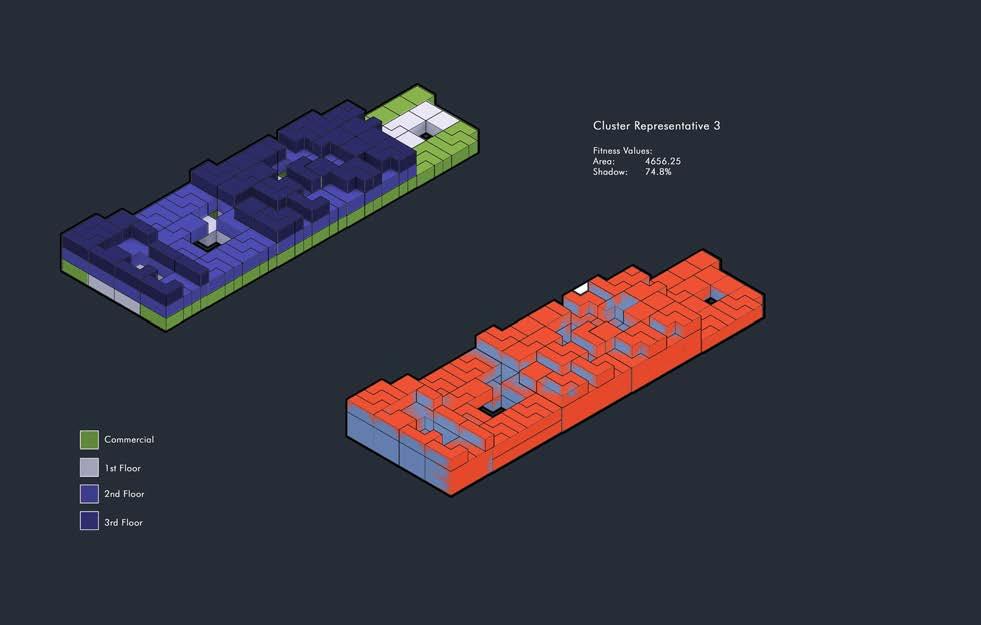

166
Local Scale Design Development
5.4.3. Greenhouses
For the main sectional design of the greenhouse, a sectional design experiment is set up. The main wind-driven objectives divide the greenhouse into two parts, where the windward side of the structure aims to minimize direct wind load, and leeward side of the structure aims to maximize ventilation effect. Thus, the previously discussed prairie dog ventilation principle as well as aerodynamic principle is employed.
In a critical light, this division of design experiment may limit the possibilities of other more complex solutions, due to the complex nature of fluid dynamics. However, since the windward side is to find the most aerodynamic form, its latter leeward side would not affect the results of the windward side. On the contrary, the leeward side may be affected by the windward side. This signifies that the design logic presents a hierarchy of priorities, where windward side is optimized first, followed by leeward side. Thus this hierarchy is set up to simply experiment and reduce unnecessary computational process. In terms of CFD objectives, the best form presents the windward side with the least positive surface pressure, thus least wind load; the leeward side with the greatest negative surface pressure, which is the “pull” of the wind that creates natural ventilation within the structure.
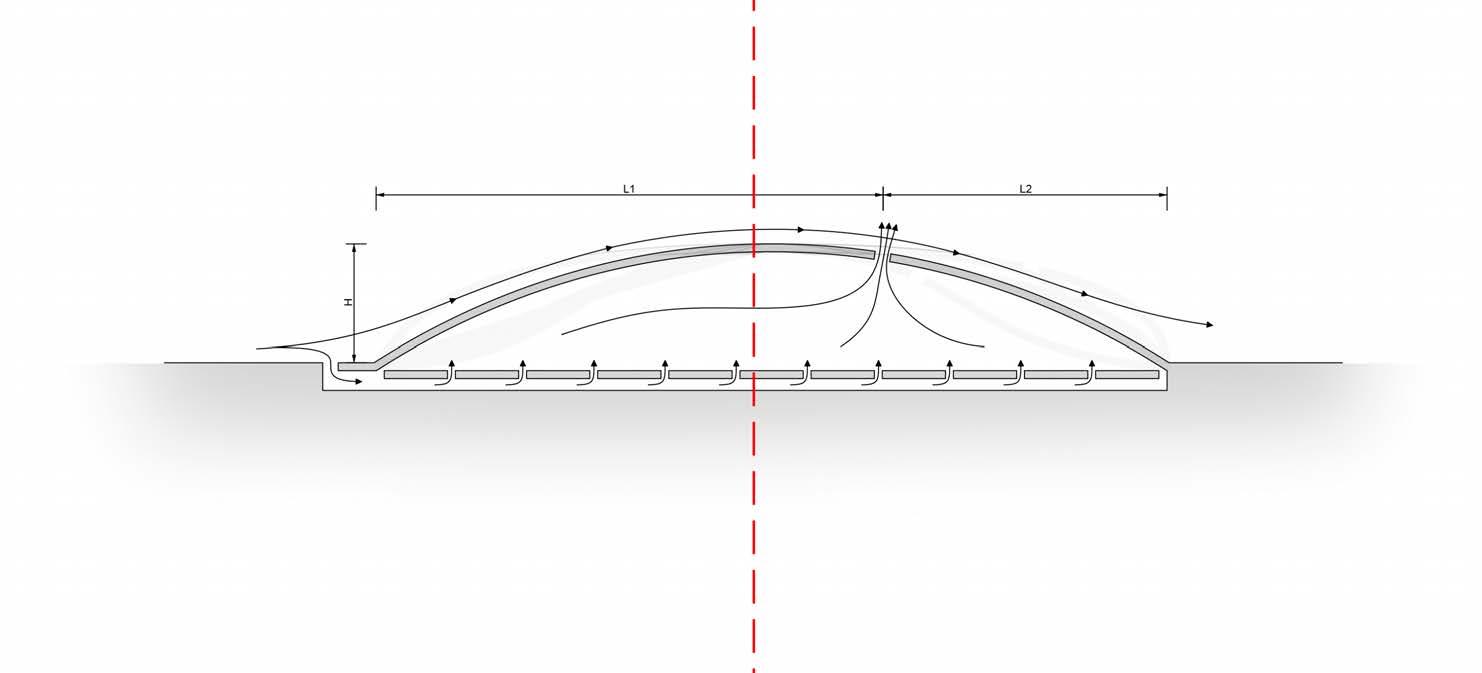
167
set up
Sectional
Experimental Set-up 5.4.3.1.
Local Scale Design Development
Observations Experimental
Utilizing the average wind of 5 m/s, a catalogue of sectional forms are evaluated based on surface pressure. The first sets of experiments fixes a standard dome section of 15 meters height and 110 meters long, but with varying degree of “lean” towards and away from the wind. As a result the most leeward leaning form yields the least windward positive pressure and most leeward negative pressure.
Next series experiments tests the height variation and its effect on wind performance. Results shows the having lower height yields much less positive pressure, while the negative pressure increasing with higher height, but at a lower rate.
Finally the last series of experiments tests a more advanced curvature variations, in order to address unpredictable potentials. In addition, wind velocity tests are run with a few optimal selections, with a crude internal labyrinth, to help identify wind distribution and ventilation efficiency.
In the end, the most optimally performing section is chosen, with a relatively low wind ward positive pressure, a relatively high leeward pressure, and additionally, a constant and even distribution of internal ventilation.
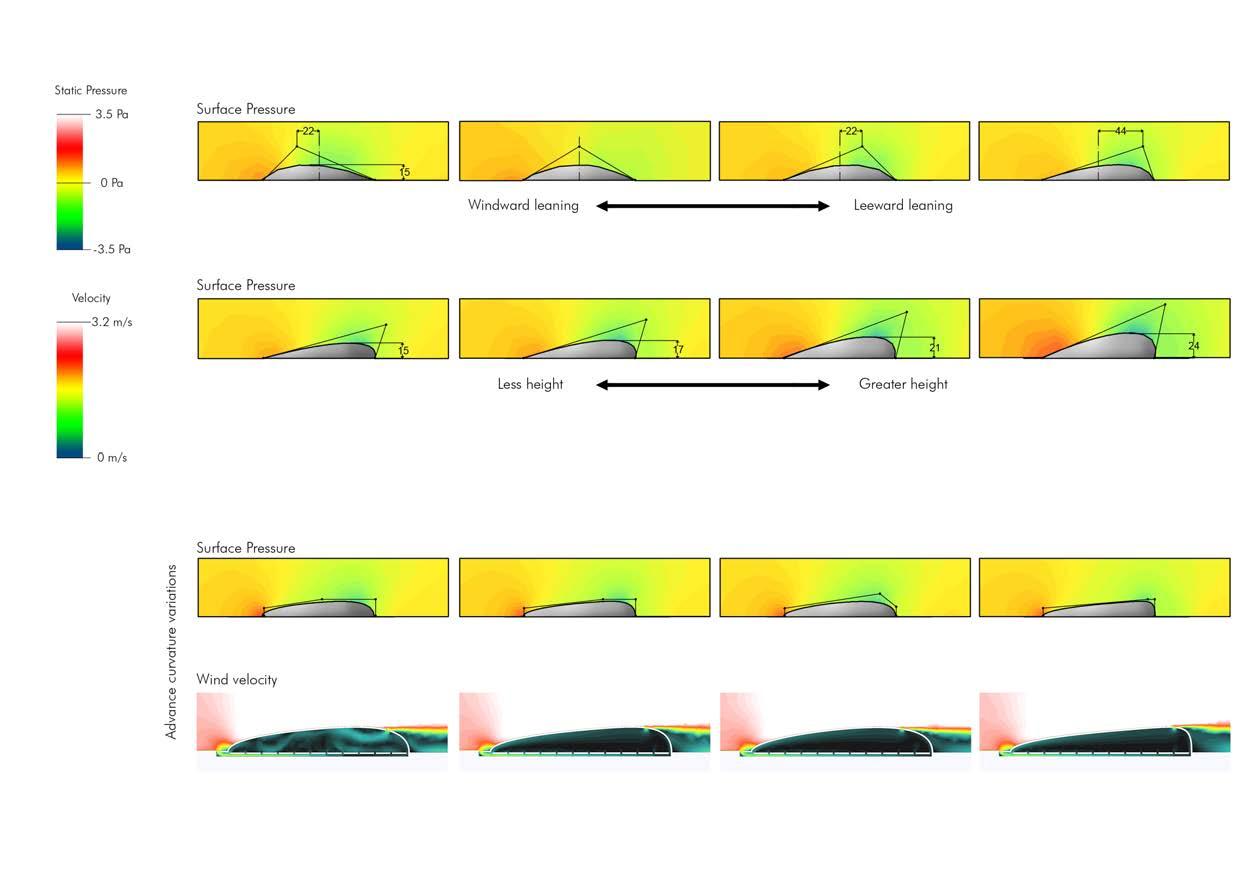
168
Sectional CFD results
Set-up 5.4.3.2.
5.4.3.3.
GA Experiment
Local Scale Design Development
GA experiment 2 body-plan
The experiment resorted to identifying two pairs greenhouses with similar wind condition: north-south pair, and East-west pair. This reduction is justified by each pair’s similar wind conditions. When predominant wind blows from east or west, the East and west morphology is aligned and experiences similar wind conditions. Similarly, the north and south morphology, experiences similar wind conditions due to its symmetrical arrangement of being the “side” unit. To ensure actuation between two directions does not affect plan, 4 genes are devised to control a quad of the entire plan, which is mirrored orthogonally to complete the plan.
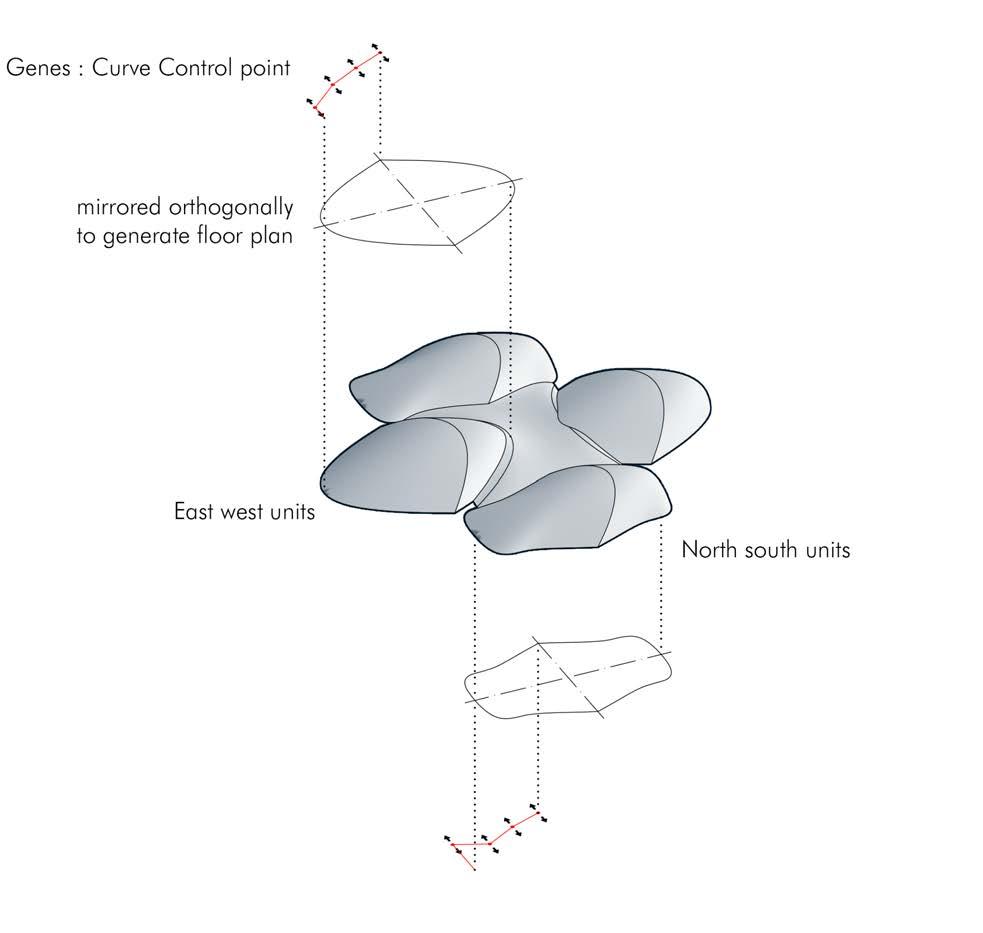
169
Local Scale Design Development
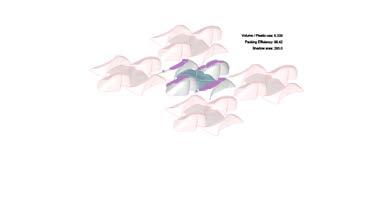
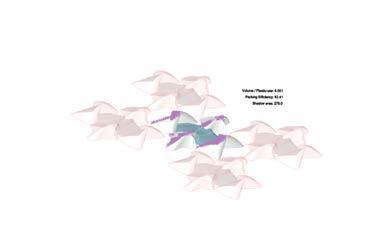
5.4.3.4.
Observations GA Experiment
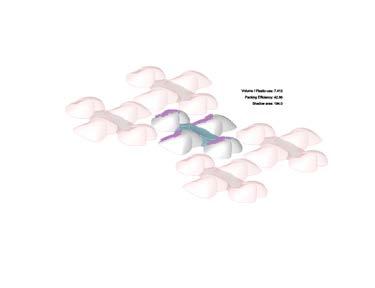
The resultant phenotypes are observed to inherit much more diverse variety, including a kink that develops along the surface. At the same time, computational process didn’t increase in operation time. The low number of genes is at a reasonable minimum, where any further reduction greatly decreases phenotypic variations.
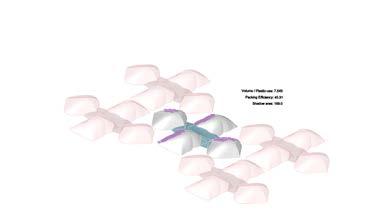
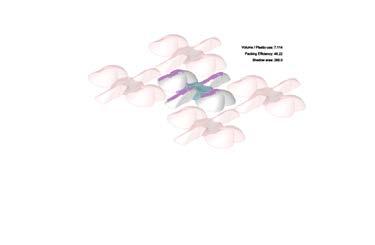
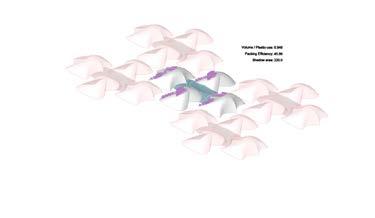
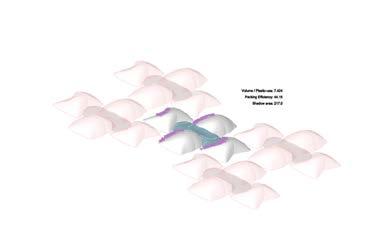
170
GA generation 5 phenotypes
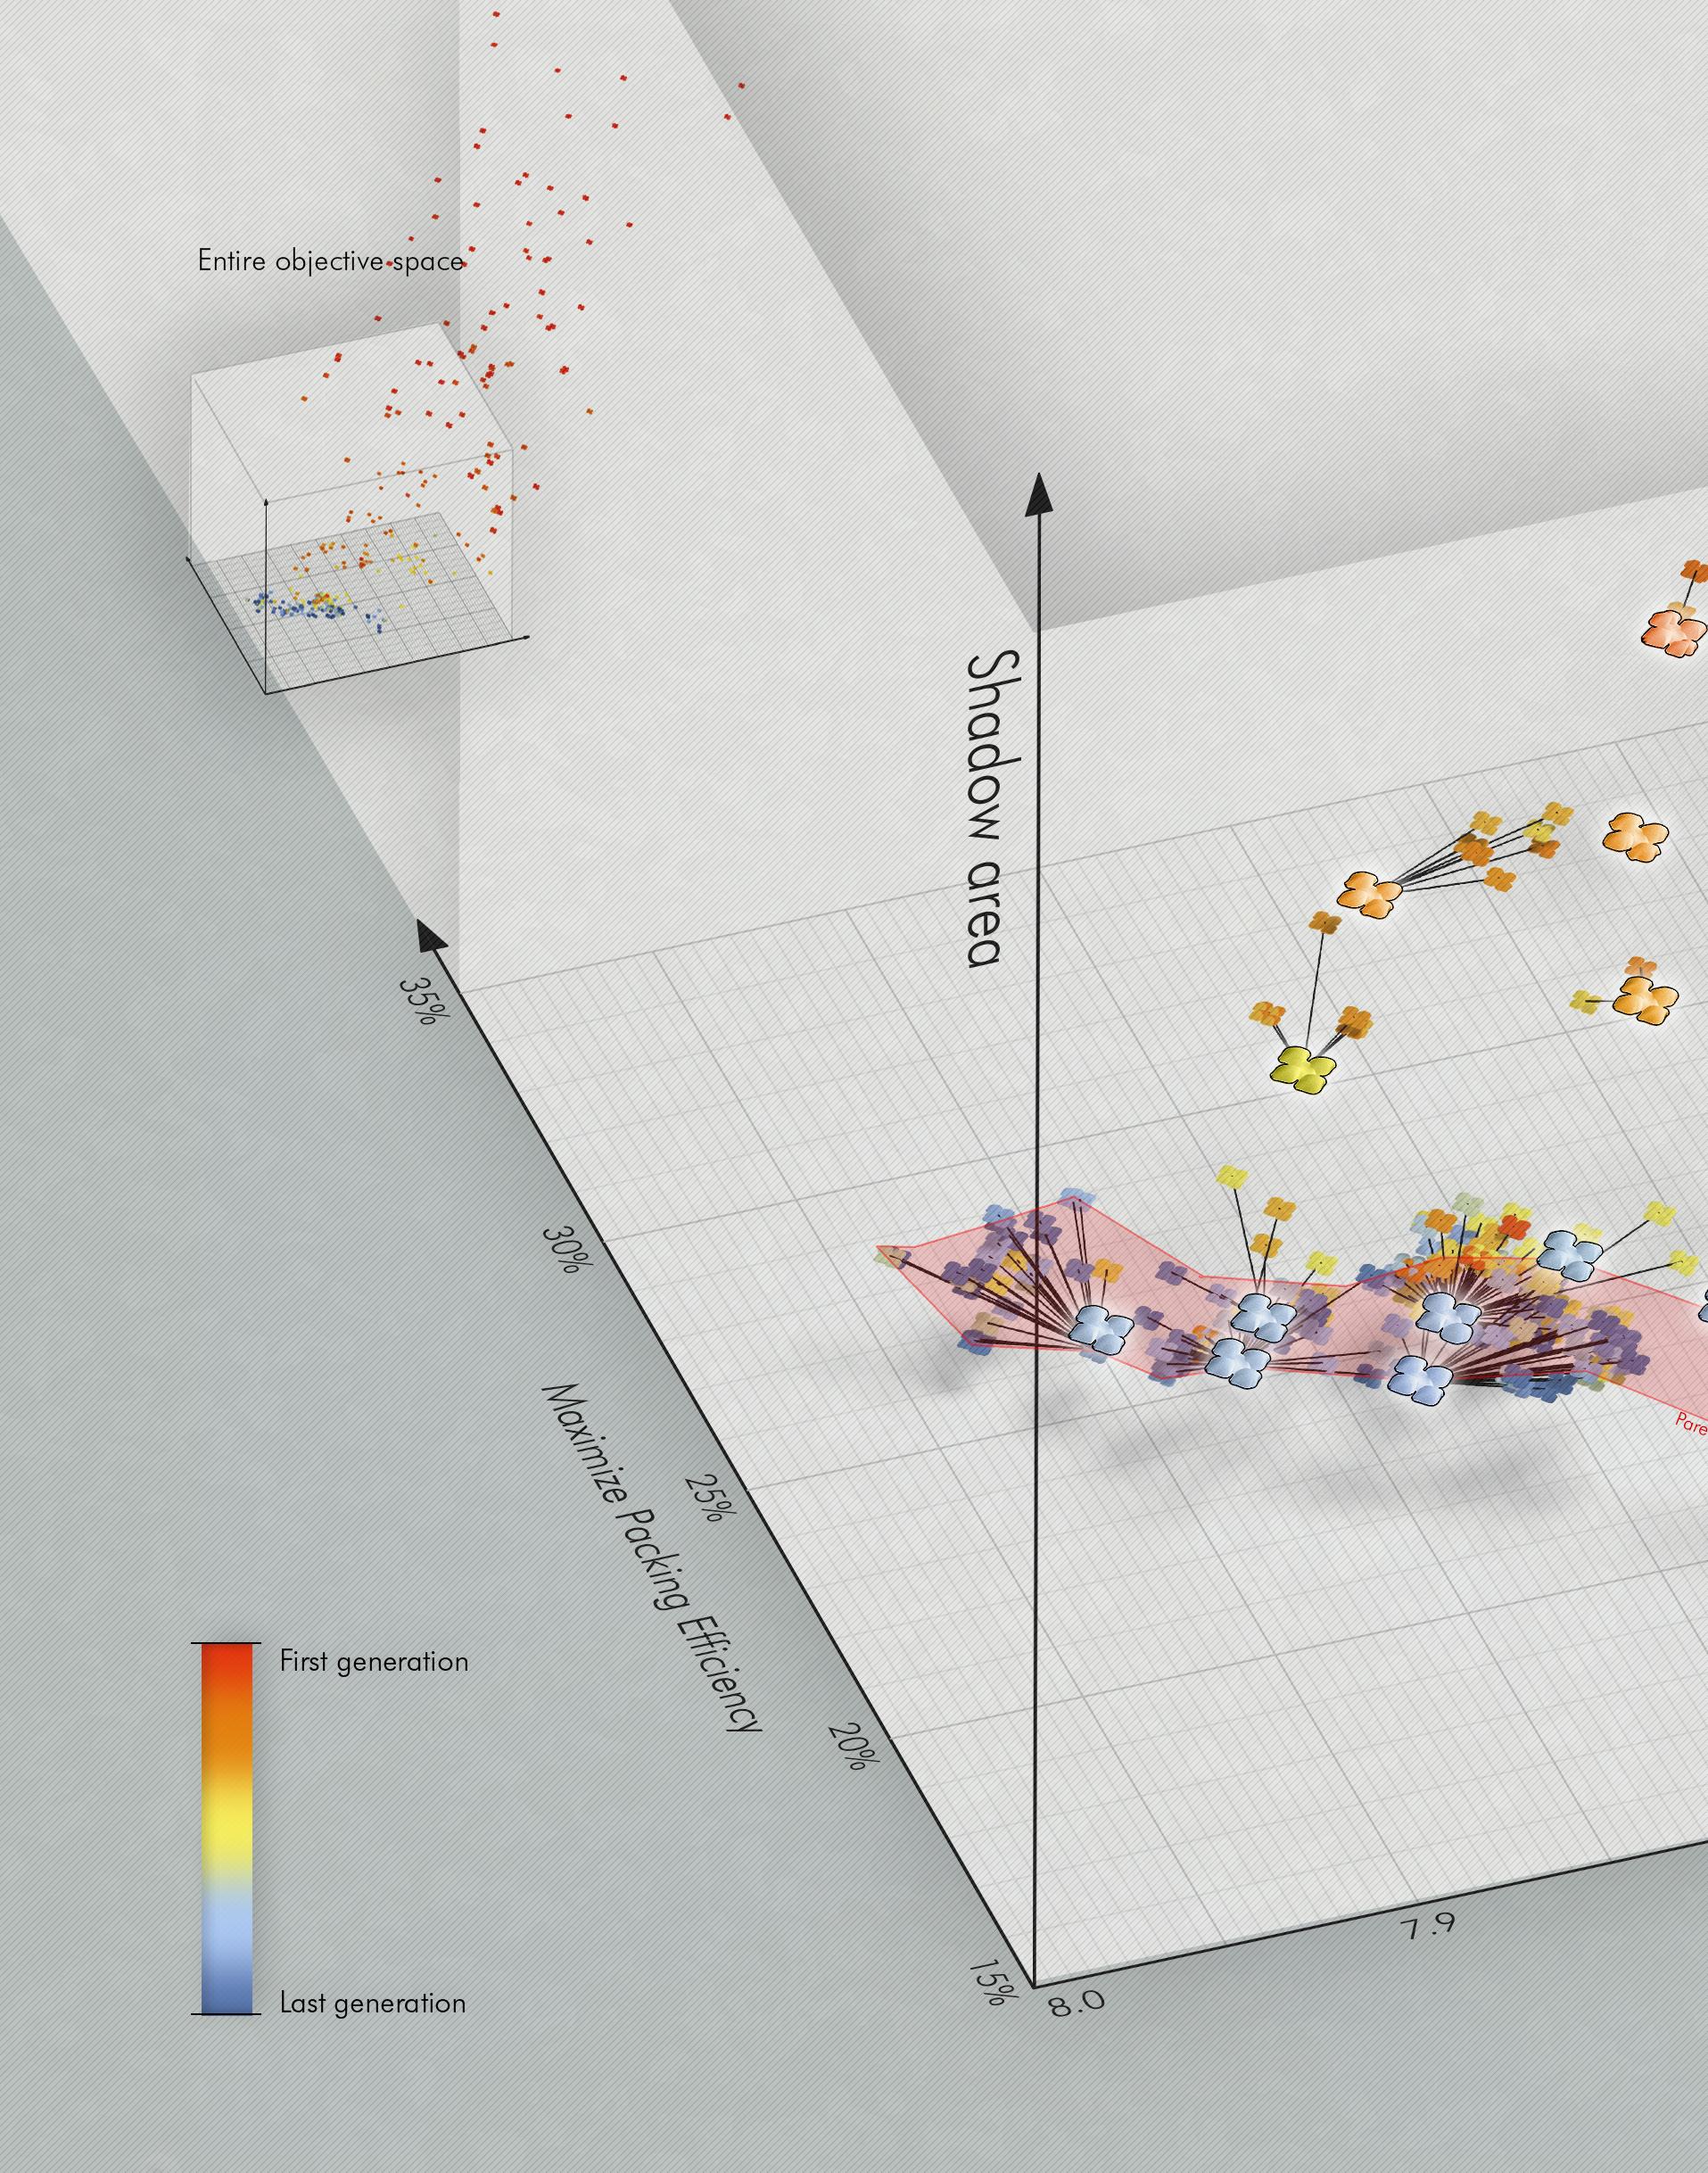
5.5.6. Elimination and Cluster logic
Following the full mapping of the solutions into the objective space, solutions are discriminated and eliminated. This is done by evenly weighing each objective to create a domain of fitness values that yields the 10th percentile solutions. A box is created by the domain and solutions outside the domain box are eliminated. This results in about 100 solutions within the box, all are relatively ideal for all 3 criteria.
As the next experiment is to re-evaluate 3D solutions with CFD, having more than 100 solutions is still quite computationally demanding, and many very similar phenotypes do not contribute to the diversity of solutions. Thus, a cluster logic is developed, where based on proximity, solutions with similar values are formed into a cluster. Then, each cluster selects a representative, the one that is the most balanced and averaged solution of the cluster. As the rest of the individuals are eliminated, the experiment concludes with 30 solutions, each sharing distinct phenotypic features that is prominent in that cluster group.
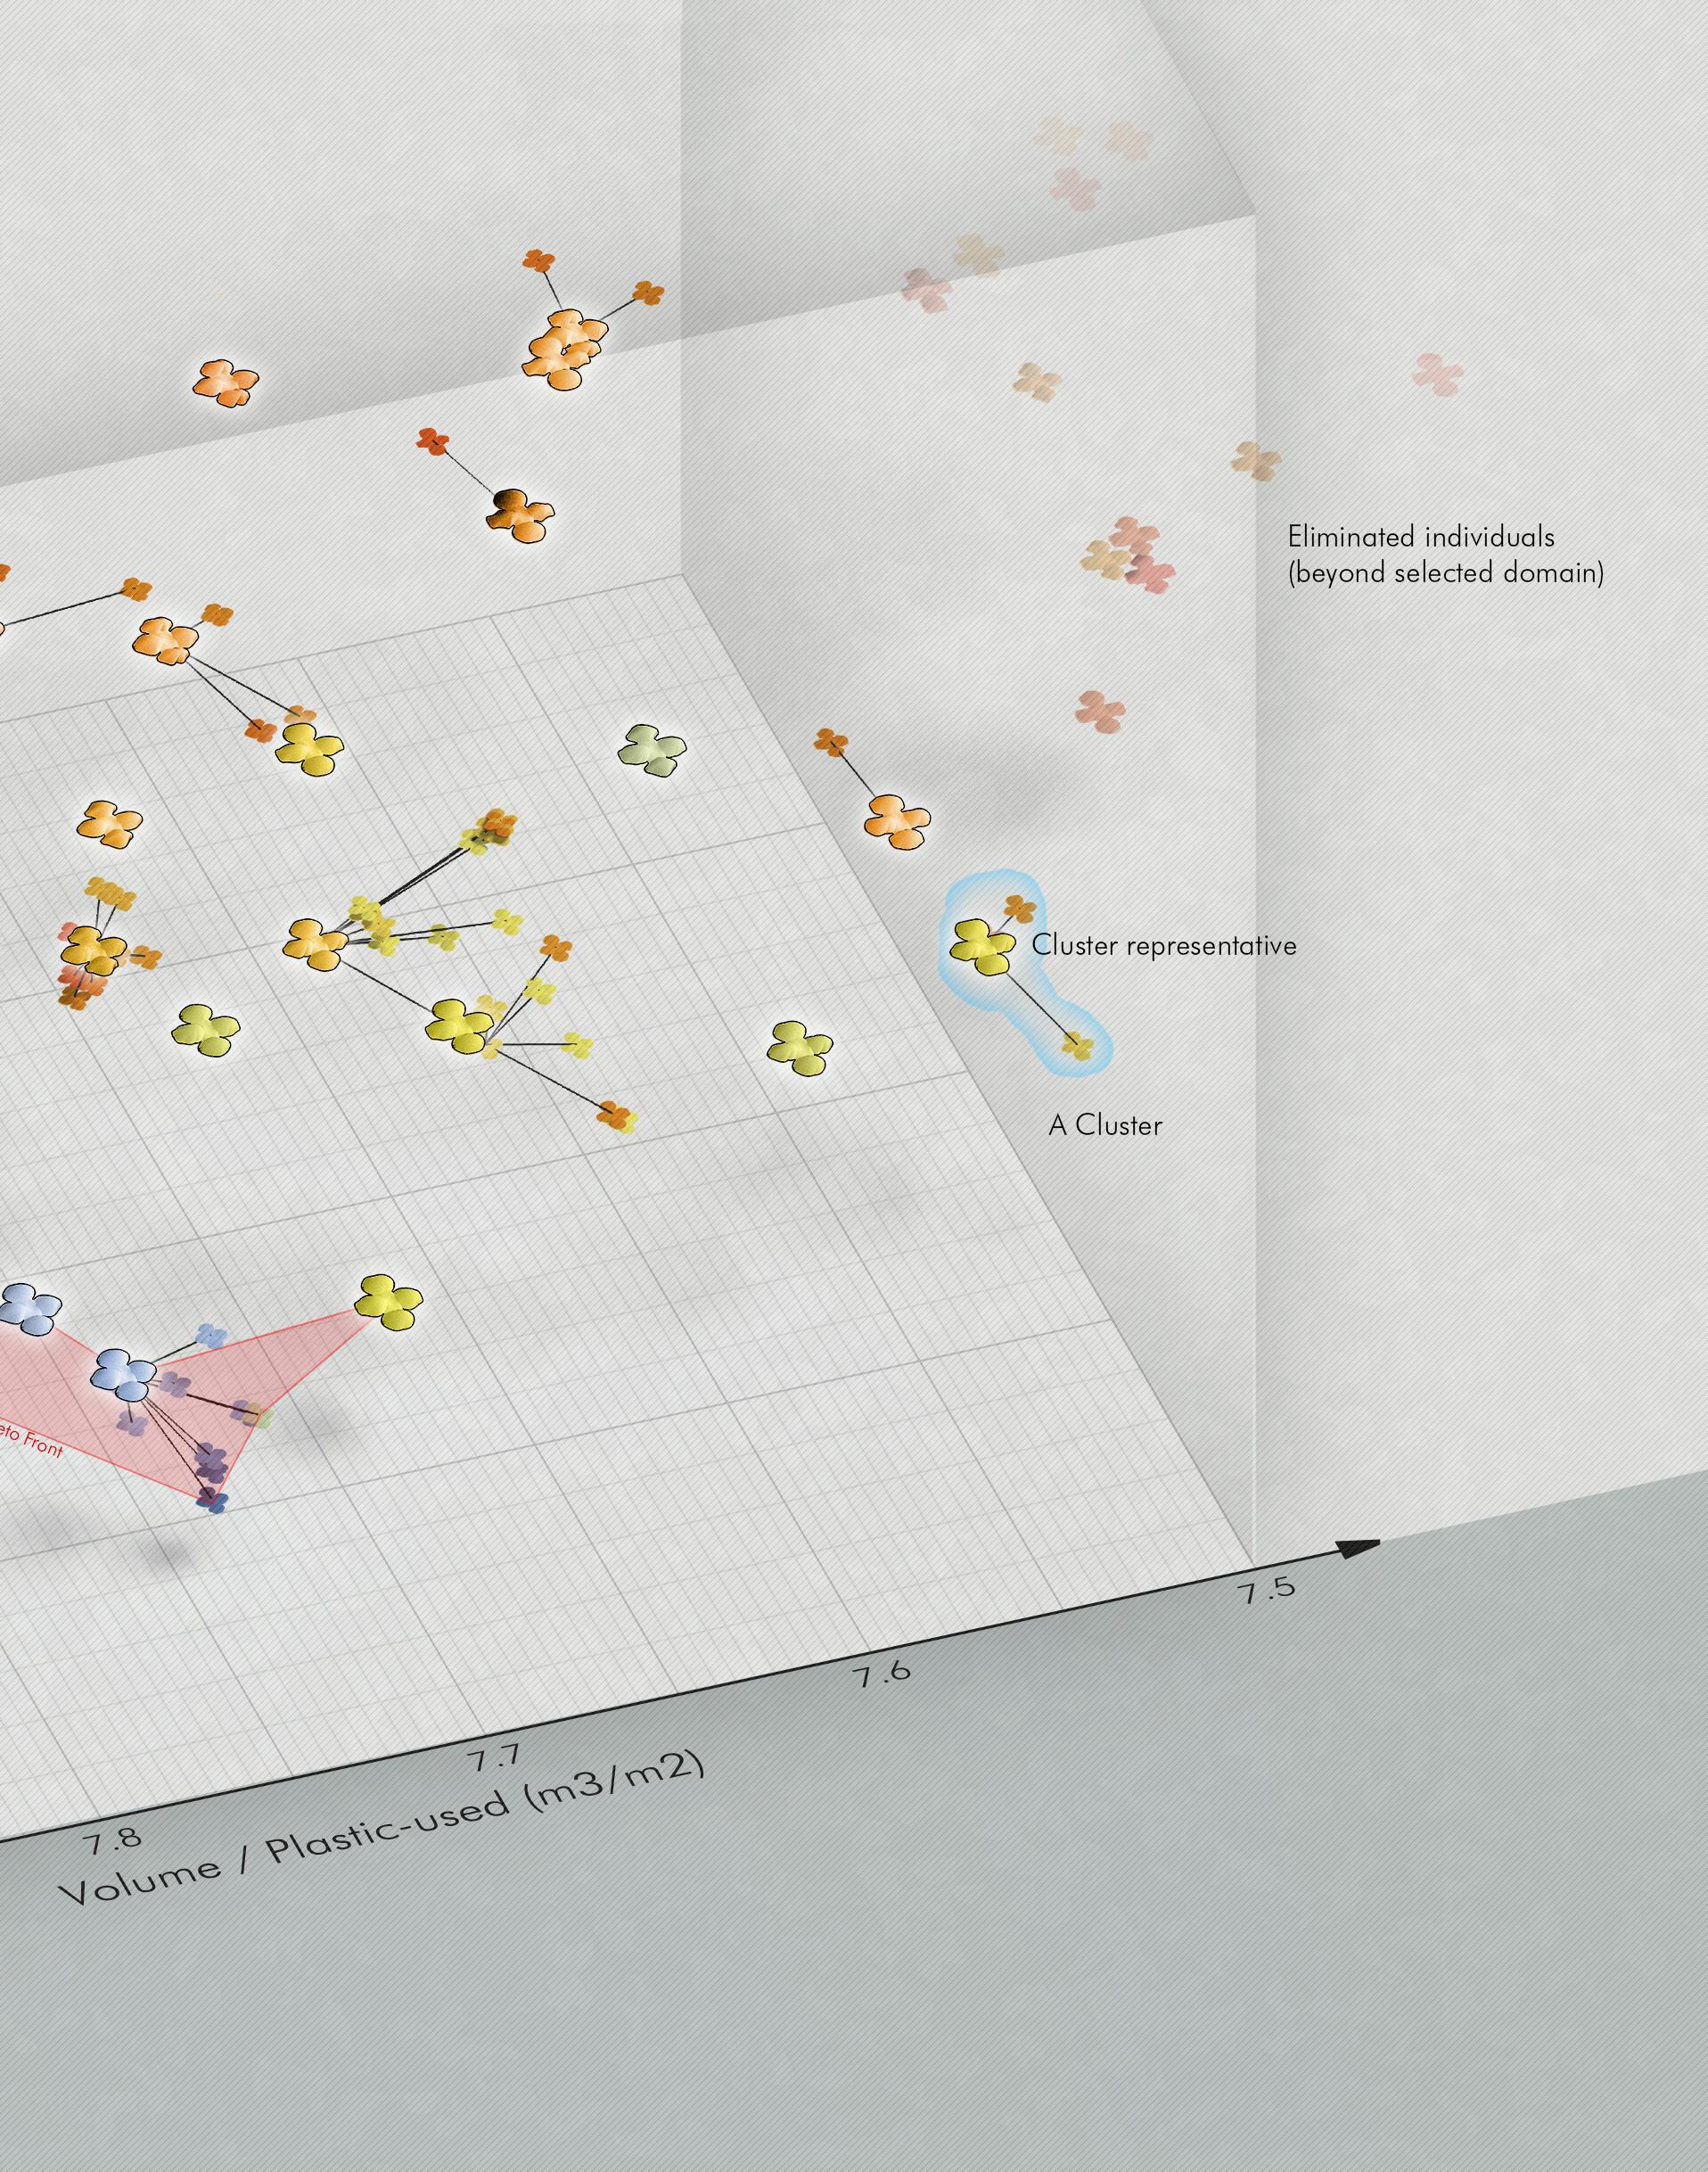
Local Scale Design Development
Since the principle parameter driving the greenhouse design logic is wind, CFD is utilized again as a final filter to the selection process, making a full circle in the design process. Out of the 30 solutions, 18 distinct representatives are chosen, to narrow down number of experiment while phenotypic diversity is kept.
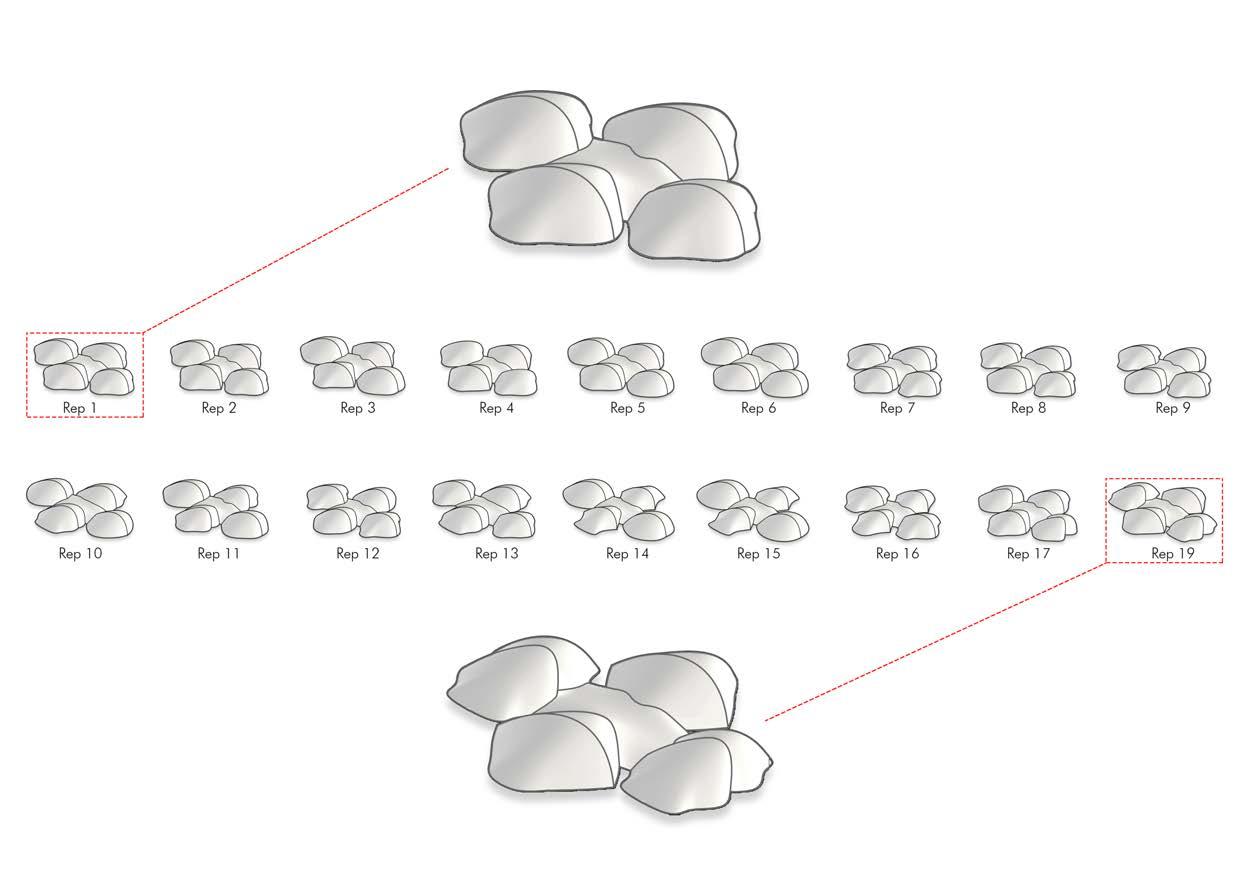
173
Cluster CFD
5.4.3.5.
Local Scale Design Development
By calculating the area of high negative and positive pressure area, the 18 solutions are mapped onto a graph. The goal is to maximize negative pressure (for ventilation) and minimize positive pressure (wind load), thus the values are summated with equivalent weighing.

Summated value = Area of negative pressure – Area of positive pressure
With this equation, individual 11, with the highest summated value, is selected. This concludes the global form-finding portion of the design, with a single geometry chosen, optimized for wind, site, and crop conditions of the designated location.
174
Hydro-thermal Labyrinth
Local Scale Design Development
Labyrinth is designed following closely to the mechanism of the Davies Alpine cooling labyrinth, but instead of geothermal, it utilizes stored hydrothermal energy. Labyrinth is placed at the underground level of the desalination plant. This provides the shortest distance between labyrinth and the water reservoir. Next, 4 air inlets are placed with ground cover at the nearest open ground space. An air channel connects the basement floor to the ground floor, with an air handling unit that can act as backup when natural ventilation is inadequate.
Labyrinth Performance
Labyrinth is designed following closely to the mechanism of the Davies Alpine cooling labyrinth, but instead of geothermal, it utilizes stored hydrothermal energy. Labyrinth is placed at the underground level of the desalination plant. This provides the shortest distance between labyrinth and the water reservoir. Next, 4 air inlets are placed with ground cover at the nearest open ground space. An air channel connects the basement floor to the ground floor, with an air handling unit that can act as backup when natural ventilation is inadequate.
Conclusions
Cooling capacity of the labyrinth is 2.8 oC while heating capacity is 3.9 oC. Between November to March, lowest dry bulb temperature could be optimized by this system to meet the minimum crop growth requirement.
The labyrinth system requires minimum 2 oC to operate. This threshold informs the annual operation period, for passive cooling, the operation period is between May to October. For passive heating, the operation period is between November to April.
Given the velocity will be accelerated as the air bottlenecked into the narrow labyrinth tunnel(17.5 times acceleration effect observed), lower air inlet velocity is preferred in order to efficiently cool down or heat up the incoming air, this is due to the fact that sufficient time is needed for heat transfer between the gas and liquid substance. According to the initial tests, most observable temperature gradient in the labyrinth when air inlet velocity was set to 0.2m/s.
175
5.4.3.6.
Local Scale Design Development
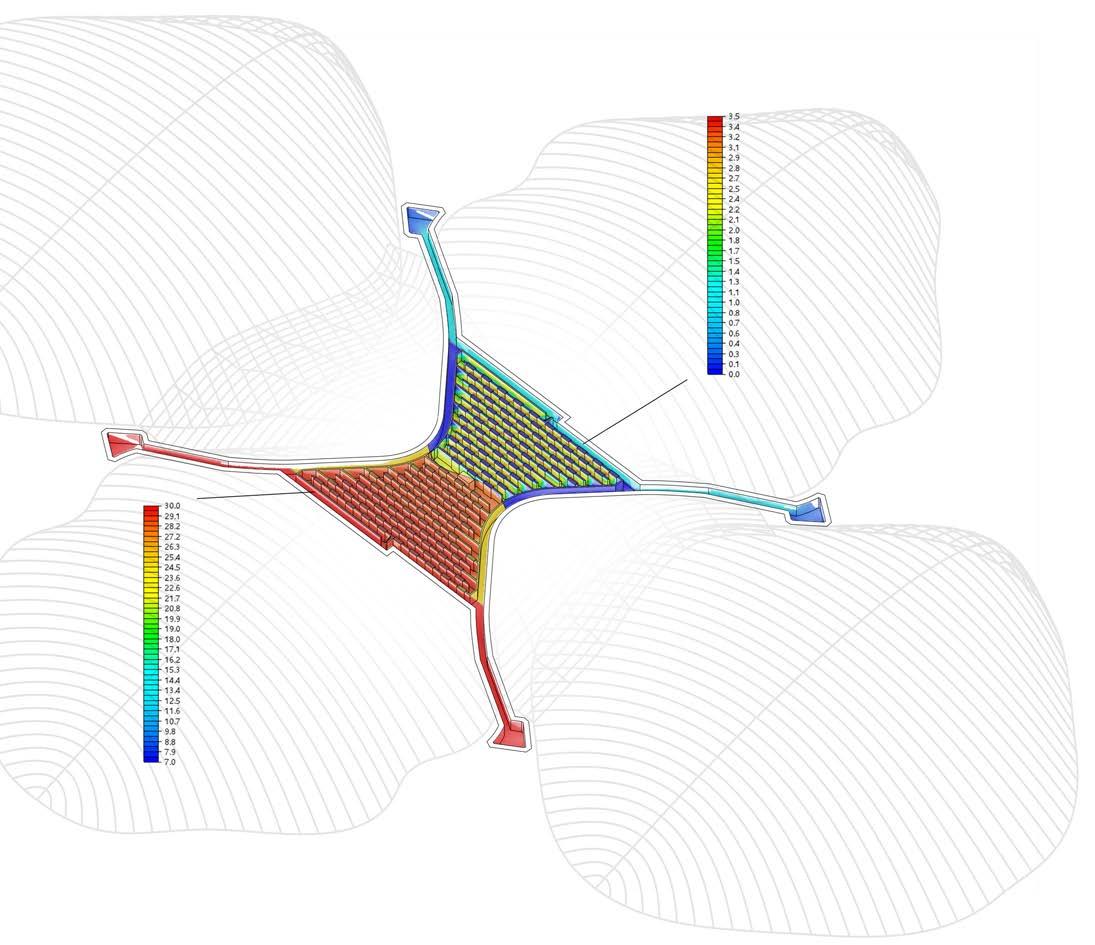
176 12 11 10 9 8 7 02.8 03.9 6 5 5 10 15 20 25 30 35 4 3 2 1 month cooling effect passive cooling operation passive heating operation passive heating operation heating effect temperature(Celsius) outdoor dry bulb temperature sea water temperature air temperature after labyrinth 7 02.8 03.9 6 5 5 10 15 20 25 4 3 2 1 passive cooling operation passive heating operation outdoor dry bulb temperature sea water temperature air temperature after labyrinth 12 11 10 9 8 7 02.8 03.9 6 5 5 10 15 20 25 30 35 4 3 2 1 month cooling effect passive cooling operation passive heating operation passive heating operation heating effect temperature(Celsius) outdoor dry bulb temperature sea water temperature air temperature after labyrinth Labyrinth 2D CFD Heat Transfer Simulation-Temperature/Velocity Labyrinth 2D CFD Heat Transfer Simulation Capacity
bulb
“Climate-Data.org.” Climate Sahara: Temperature, Climograph, Climate Table for El Ejido- Climate-Data.org. August 09, 2015. https://en.climate-data.org/location/37404/.
GRAPH SOURCES. seawater temperature data acquired from: peratures - A-Connect Ltd. “Almería Water Temperature | Spain | Sea Temperatures.” Sea Temperature, https://www.seatemperature.org/europe/spain/almera.htm. Dry
temperature data acquired from:
Conclusions
Local Scale Design Development
To distribute the air beams on the surfaces generated from genetic algorithm, Six geometrical arrangements were tested and compared using FEA. The load cases which were taken into consideration were self weight and wind load(0.1 kN). Material thickness was set to 0.5mm. Beam diameters were differentiated. 3m for east-west oriented beams, 1.5m for south-north oriented beams.
Beam arrangement
• One point radial arrangement
• Two point radial arrangement
• Orthogonal lattice arrangement
• Surface adapted lattice arrangement
• Curvature adapted arrangement: Generated based on gaussian curvature value. Ring beams were created on the boundary curve between negative and positive curvature.
• Principal stress pattern arrangement: generated based on the principal stress pattern of initial surface.
The evaluation criteria include:
• Maximum deflection on global z axis.
• Mass of the structure
• Numbers of joints
• Complexity of the joints.(numbers of connected neighbor edges)
Lattice grid beam arrangement has the least amount of deflection, and curvature-based arrangement utilizes the least amount of mass. However, these two forms are only adapted to one form, meaning beam length will change when the surface is actuated. For this reason, surface adapted arrangement is chosen.
177
https://www.engineeringtoolbox.com/heat-loss-transmission-d_748.html
SOURCES.
Beam Distribution 5.4.3.7.
Curvature Based Arrangement
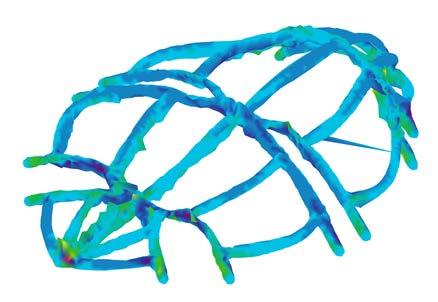
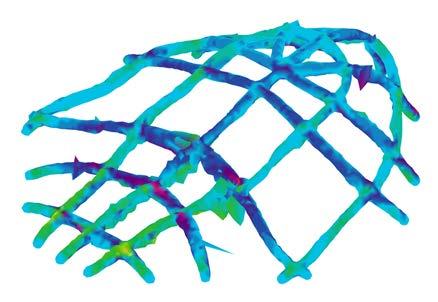
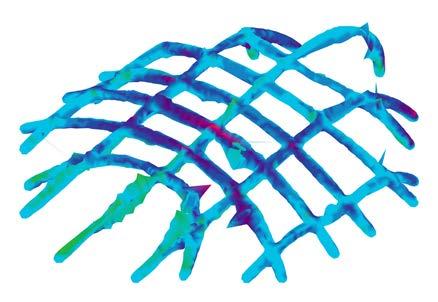
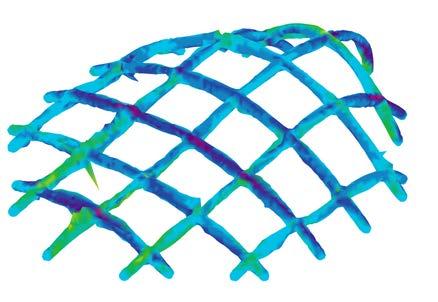
178 Local Scale Design Development Deflection Deflection Weight Weight numbers of joints numbers of joints joint complexity joint complexity 6 6 4 4 10 16 27 2 1 5513 5568 5490 3.8 2.6 2.9 2.5 3.4 3.8 6 6 4 4 10 16 26 27 2 1 5513 5568 5068 4407 3.8 2.6 2.9 2.5 3.4 3.8 10 16 26 27 27 27 2 1 5513 5568 5490 4407 3.8 2.5 3.4 3.8 6 6 4 4 10 16 26 27 27 27 2 1 5513 5568 3.4 3.8 26 27 27 27 5513 5568 5490 5068 4510 4407 3.8 2.9 2.5 3.4 3.8 26 27 27 27 2 5513 5568 5490 5068 4510 4407 2.6 3.4 3.8 5568 5490 5068 4510 4407 3.8 2.6 2.9 2.5 3.4 5513 5568 5490 5068 4510 4407 3.8 2.6 2.9 2.5 3.4 3.8 Lattice Arrangement Surface Adapted Lattice Arrangement Topological Diagram Topological Diagram Deflection Weight numbers of joints joint complexity 6 6 4 4 10 16 26 27 27 27 2 1 5513 5568 5490 5068 4510 3.8 2.6 2.9 2.5 3.4 3.8 26 27 27 27 2 1 5513 5568 5490 5068 4510 4407 2.6 2.9 2.5 3.4 3.8 5513 5568 5490 5068 4510 4407 3.8 2.6 2.9 2.5 3.4 3.8 5513 5568 5490 5068 4510 4407 3.8 2.6 2.9 2.5 3.4 3.8 Principal Stress Pattern Arrangement Topological Diagram Deflection Weight numbers of joints joint complexity 6 6 4 4 10 16 26 27 27 27 2 1 5513 5568 5490 5068 4407 3.8 2.6 2.9 2.5 3.4 3.8 26 27 27 27 2 1 5513 5568 5490 5068 4510 4407 2.9 2.5 3.4 3.8 5513 5568 5490 5068 4510 4407 3.8 2.6 2.9 2.5 3.4 3.8 3.8 2.6 2.9 2.5 3.4 3.8
Topological Diagram
5.4.3.8.
Thermal Analysis
Local Scale Design Development
In greenhouse architecture, one of the most essential consideration of the building envelope is the thermal insulation property. U factor is the overall heat transfer coefficient of building components which measures the heat loss/gain through the components due to the indoor and outdoor temperature difference. Lower U factor indicates better insulation. In the air beam experiment, single layer ETFE membrane and double layer ETFE membrane with various air channel dimensions were analyzed using Finite Element thermal analysis software THERM.
Experiment Set-up
• ETFE Material property:
• Material thickness: 0.2mm
• Conductivity: 0.24 W/m-K
• Emissivity: 0.9
• Air channel:
• Cavity model: NFRC
• Gas fill: air
• Boundary condition
• Interior temperature 30 oC
• Interior membrane film coefficient: 2.05 W/m2-K
• Exterior temperature 25 oC
• Exterior membrane film coefficient: 26.4 W/m2-K
Conclusions
Air channel has reduced the U factor, but this effect is only significant when the air channel width is within 50mm. While doubling the layer of ETFE membrane has negligible effect on reducing U factor.
Considering the material fabrication and cost efficiency, for the non-structural membrane, a 0.2mm single layer ETFE was chosen. For air beam(2m diameter) components the U-factor are estimated to be 1.39 W/(m2K). This is sufficient comparing to typical well insulated double glazing window.
179
Local Scale Design Development
180 doouble layer 0 Air Channel Width(mm) U-factor(W/(m2K)) single layer 50100200300 500 1000 1500 2000 vertical double glazed with "Low-E" coatings and heavy gas filling 50mm concrete slab 250mm solid brick wall 2.00 1.20 1.8993 1.8963 1.3919 1.4177 1.4482 1.4759 1.4783 1.4796 1.4808 1.4814 1.30 1.40 1.50 1.60 1.70 1.80 1.90 U-Factor Calculation Result SOURCES. typical building component U-factor: https://www.engineeringtoolbox.com/heat-loss-transmission-d_748.html
Due to the limitation on ETFE sheet fabrication dimensions, the surfaces need to be rationalized and segmented into smaller developable surfaces. Mesh relaxation with planarize force applied method were tested and compared.
Conclusions
South surface were chosen to test the various rationalization patterns due to its double curvature form. 5 tessellation patterns were tested:
• Hexagon
• Quadrilateral
• Rectangle
• Offset rectangle
• Triangle
Evaluation criteria:
• Deviation from original form
• Total strip edge length
Force applied:
• Spring: mesh edges were converted to springs with low stiffness value
• Planarize force: force the mesh vertices to go coplanar
• Pull to curve: mesh edge vertices remain same position
Initial double curvature surface could not be rationalized using hexagon and quadrilateral pattern with given size. Folded pleats were observed near high curvature area.
Initial surface could be rationalized using both rectangle and offset rectangle patterns. However various extent deviations were observed. For the rectangle pattern, the middle part of the rationalized surface bulged upwarded and the rear part sagged. This has altered the section curve of the original surface. For the offset rectangle pattern, only the minor deviation from the global form but there were clear gaps observed between local strips.
Among all the tested pattern, only the triangle pattern resulted in rationalization with acceptable deviation. Although it has longest edge length. Aerodynamic forms requires high accuracy to perform.
181
Surface Rationalization
Experimental Set-up
Local Scale Design Development
5.4.3.9.
Local Scale Design Development
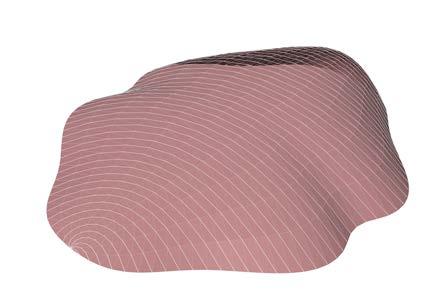
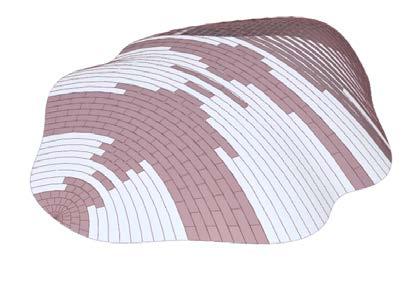

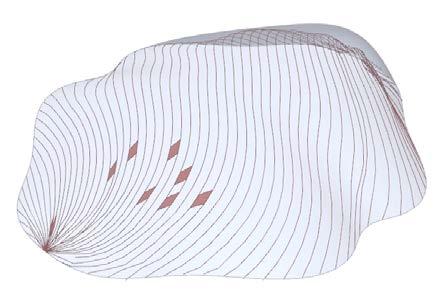
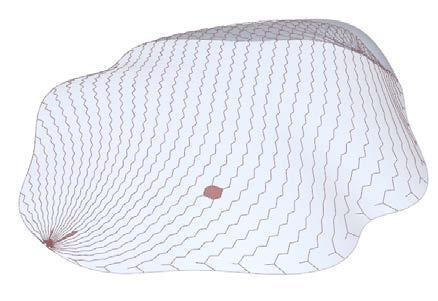
182 Total strip edge length Total strip edge length Tessellation Pattern Tessellation Pattern Quadrilateral Pattern Hexagon Pattern 4047 4712 3895 6898 4074 4047 4712 3895 6898 4074 4047 4712 6898 4074 4047 4712 6898 4074 Rectangle Pattern Total strip edge length Tessellation Pattern 4047 4074 4047 4074 Offset Rectangle Pattern Triangle Pattern Total strip edge length Tessellation Pattern 4047 4712 4074 4047 4712 4074 Total strip edge length Tessellation Pattern 4047 4712 3895 6898 4074 4047 4712 3895 6898 4074
Physical Experiments Design Development
5.5. Physical Experiments
5.5.1. Plastic Experiments
5.5.1.1.
Experimentation and Approaches
In the experimental phase of the project, both 2D and 3D form finding process are explored as viable computational outcomes. Various fabrication methods are explored as methods of achieving computational design results.
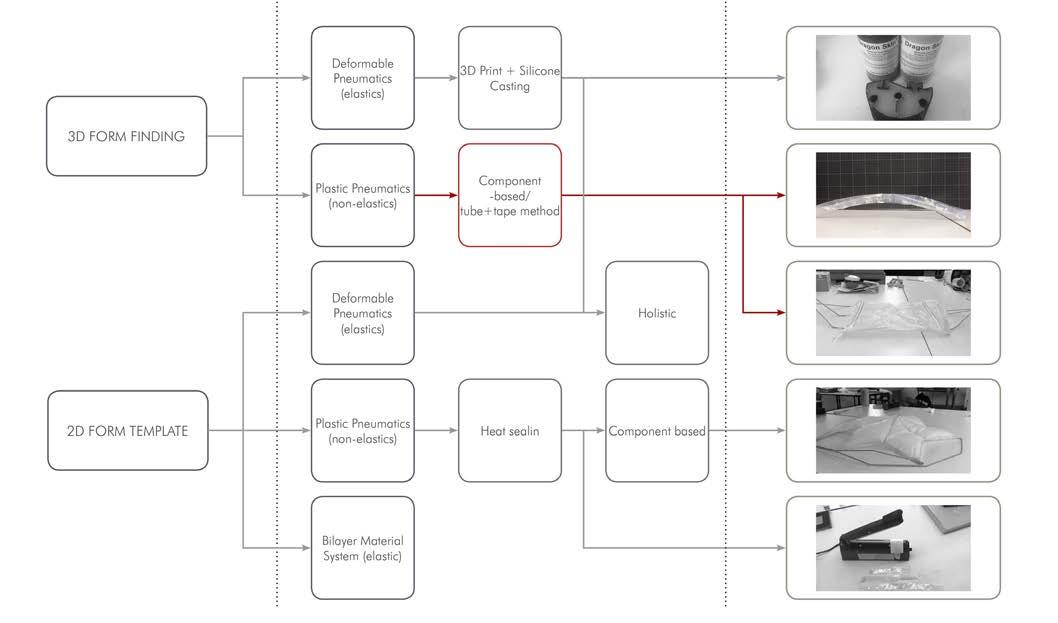
For 2D computational results, the concept is to utilize 2D patterns to create 3D components by inflation and different stiffness of surface. Heat sealing is one method to create 2D patterns on two layers of plastic, in which during inflation, different patterns and orientation can provide different 3D form and actuation results. This method holds the capability of being incorporated with robotic arm fabrication. An example of such a method is the ongoing research at MIT’s Tangible Media Group called Aeromorph.
Both 2D and 3D computational results can be divided into two major categories of pneumatic components: Deformable pneumatics and non-deformable pneumatics. Deformable pneumatics utilizes the deformation of material to create inflation results. Furthermore, arranging differential in material thickness and stiffness can be utilized to alter the deformation when inflated. An example is Furl: Soft Pneumatic Pavilion from the Interactive Architecture Lab at UCL. This example incorporates a concept called soft robotics. Non-deformable pneumatics is the utilization of predetermined geometry that is of non-elastic material. In this case, pneumatic actuation cannot occur predictably just by varying pressure. Another method of actuation, having two differently predetermined geometry entangle, can result in actuation by varying the pressure of each channel, activating one shape or the other.
“AeroMorph.” Tangible Media Group. Accessed September 19, 2018. https://tangible.media.mit.edu/project/aeromorph/. Mangion, Francois, and Becky Zhang. “Furl: Soft Pneumatic Pavilion.” Interactive Architecture Lab. October 05, 2014. Accessed September 19, 2018. http://www.interactivearchitecture.org/lab-projects/furl-soft-pneumatic-pavilion.
183
Physical Experiments Design Development
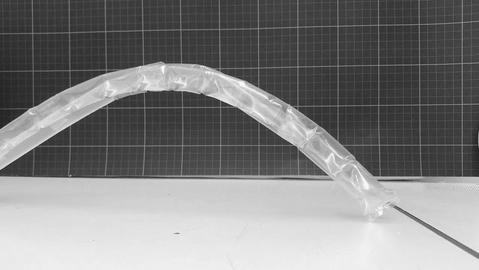
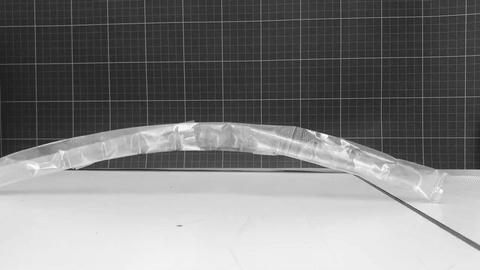
5.5.1.2.
Pneumatic Beams Experiments
The pneumatic actuation strategy is inspired by the biomimetic concept of the stomata. As mentioned in the research segment, a stomata utilizes a change in pressure in combination to geometric arrangement to perform actuation. It is hypothesized that this concept can be highly effective in pneumatic architecture, where the structural components consists of air beams of specific pressure. By providing air beams of different geometry and arrangement, manipulating the pressure can result in actuation and configuration of different geometric outcomes. A series of experiments are devised to test the actuation concept by utilizing beams and predetermined shapes, and actuating based on difference in pressure, similar to that of a stomata.
Experiment 1
2 pre-shaped beams, each with their own inflated geometry, is attached together. By varying the pressure, actuation is achieved, with a high degree of designed accuracy. Different beam arrangements are tested. Results show that top/bottom arrangement hinders movement. Parallel arrangement is ideal for actuation, minimizing deformation of neighboring components. Pressurization of one beam must be simultaneous with the depressurization of the other beam to ensure fluid motion.
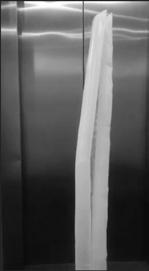
Experiment 2
Various methods are explored to actuate ventilation opening. The best and simplest result is achieved by adding a tertiary beam between the two main beams. Shaped with smaller curvatures, when the tertiary beam is pressurized, it forces small openings between the main beam to provide ventilation exhaust. As a result, the method successfully achieves a secondary actuation system of opening ventilation. It is observed that having smaller radius for the tertiary beam provides smoother actuation. Both single and double tertiary beams actuate successfully, thus the design opted for a single tertiary beam.
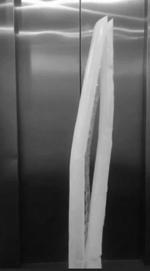
184
Physical Experiment 3
Design Development
Physical Experiments
Next, with the previous techniques, digitally designed morphology is translated into beam arrangements to test actuation and accuracy. The result showed successful actuation and yielded a reasonable degree of geometric precision from the digital model. As it produces the least deformation of membrane, parallel arrangement is applied to the beams, however this showed lateral instability. Therefore, lateral non-actuating beams are needed to combine with the main beams.
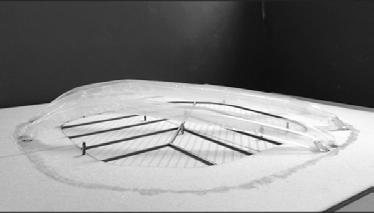
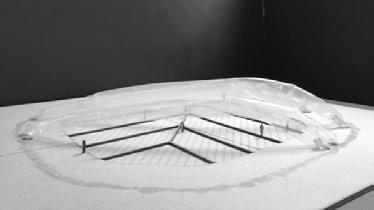
Physical Experiment 4
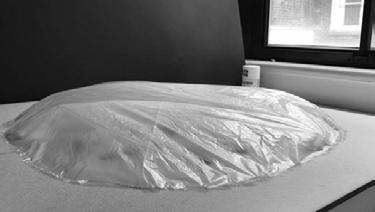
Last experiments test the viability of membrane attachment to beams. Membrane is constructed by interpolating global geometry into a single flat surface. The resultant membrane surface exhibited problems of wrinkling and tear. Therefore, a surface rationalization strategy needs to be utilized to address the problem.
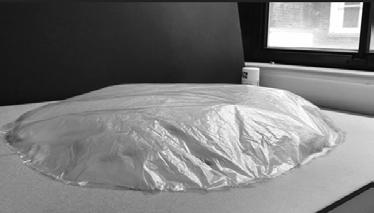
185
Design Development
Physical Experiments
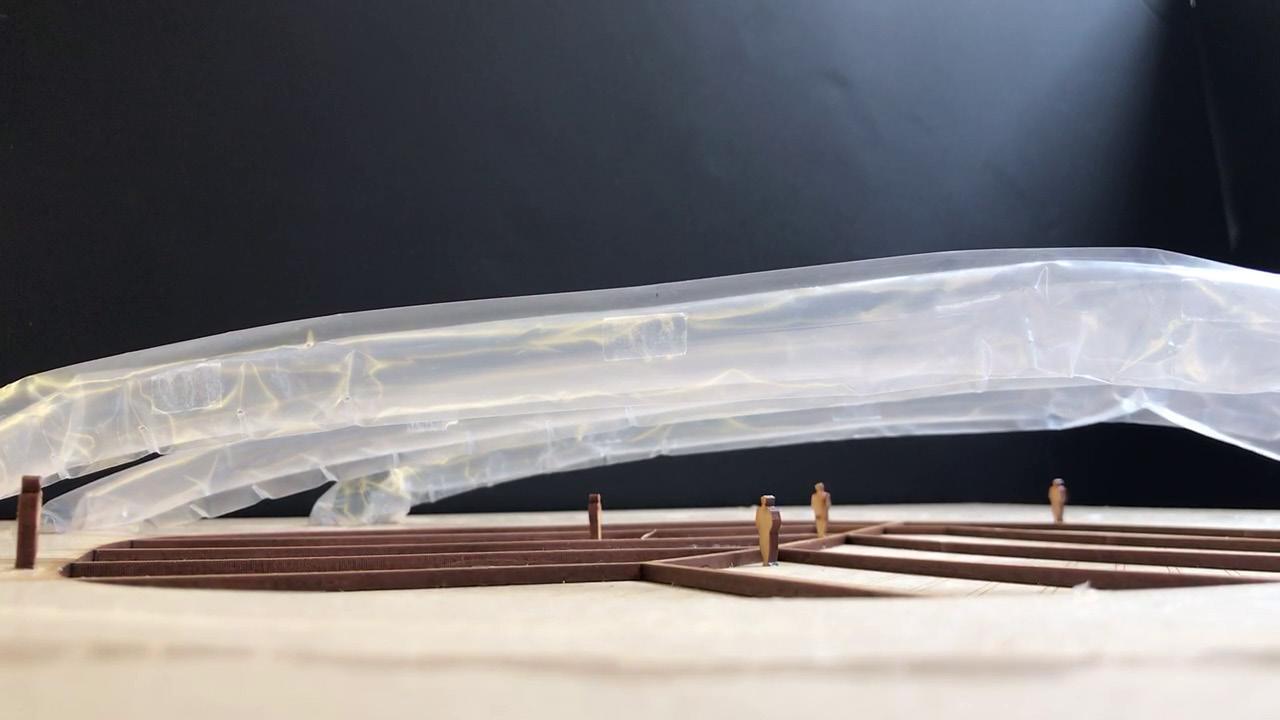
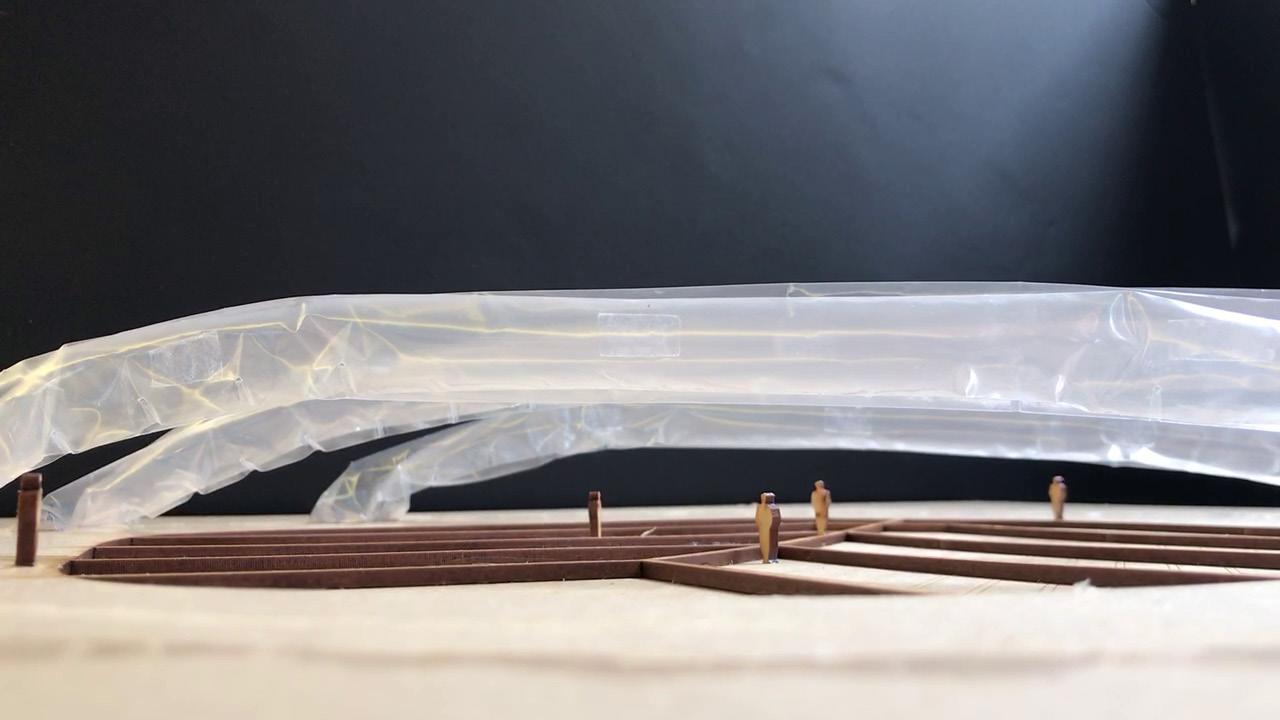
186
Physical experiment 3 -Actuating to East
Physical experiment 3 - Actuating to West
5.5.1.3.
Pneumatic Form-work Experiments
Design Development Physical Experiments
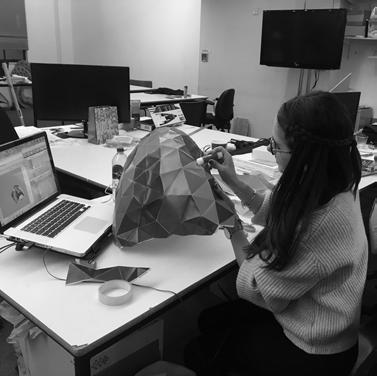
In this experiment a different approach was taken, were the initial 3D form was rationalized in order to be divided into pieces. In the first is a trial experiment in which the pieces were cut in paper with different colors, to later be paste to each other to create the final form. In this trial experiment it was noticeable that it required a large amount of time to paste together all the pieces, this was due to the fact that in the corners the pieces tend to be smaller which made it more difficult to paste as well as more time consuming.
The observations of the trial test were taken into account to continue with the pneumatic form-work experiment, in this new iteration polyethylene plastic film was used for the pieces. This experiment started with reducing the amount of pieces for the final form, printing them and cutting them in paper, the pieces were later pasted into the plastic film and cut.
All the pieces went trough a process of organization to be heat-sealed into the final form, as well as adding an air valve for the inflation. To finalize, the form was inflated, and a noticeable observation was that the heat sealing process must be done very carefully in order to have no openings in the plastic material, for the pneumatic structure to stay inflated for a longer time.
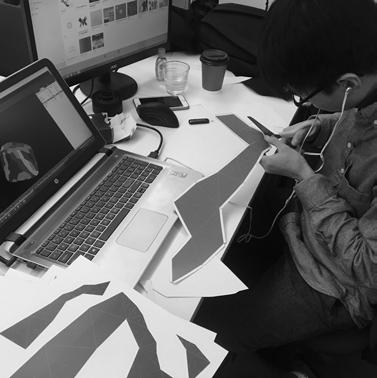
187
Cutting trial pieces
Putting together trial pieces
Design Development Physical Experiments
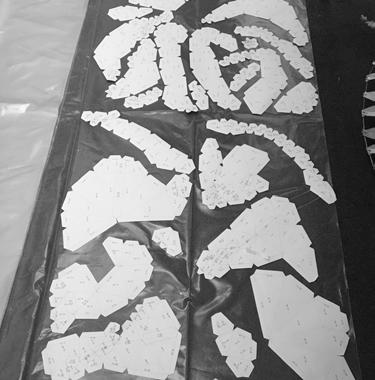
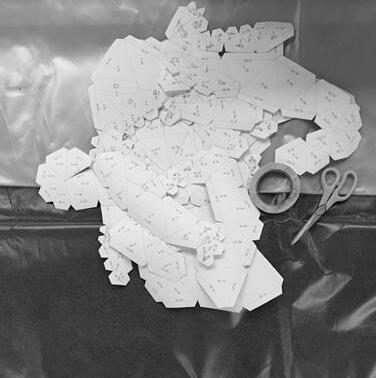
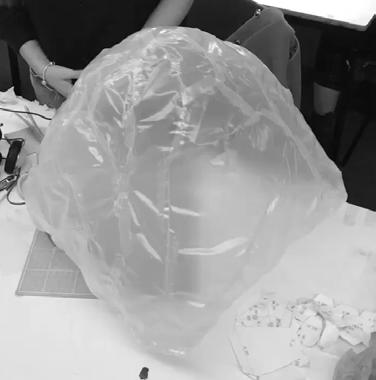
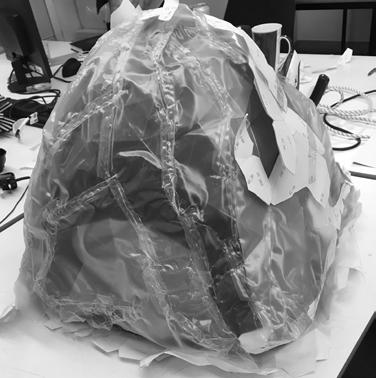
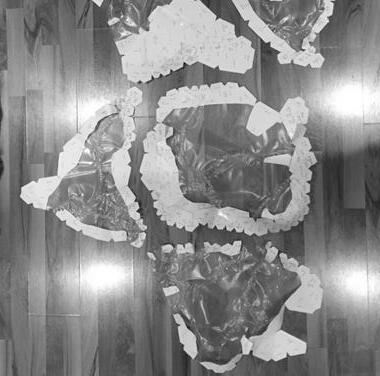
188
Final pieces cut
Pasting final pieces into plastic film
Heat sealing process
Organize pieces in order
Putting together final plastic pieces.
Inflating final pneumatic form-work.
189 6
DESIGN PROPOSAL
190
Global Scale Proposal Design Proposal
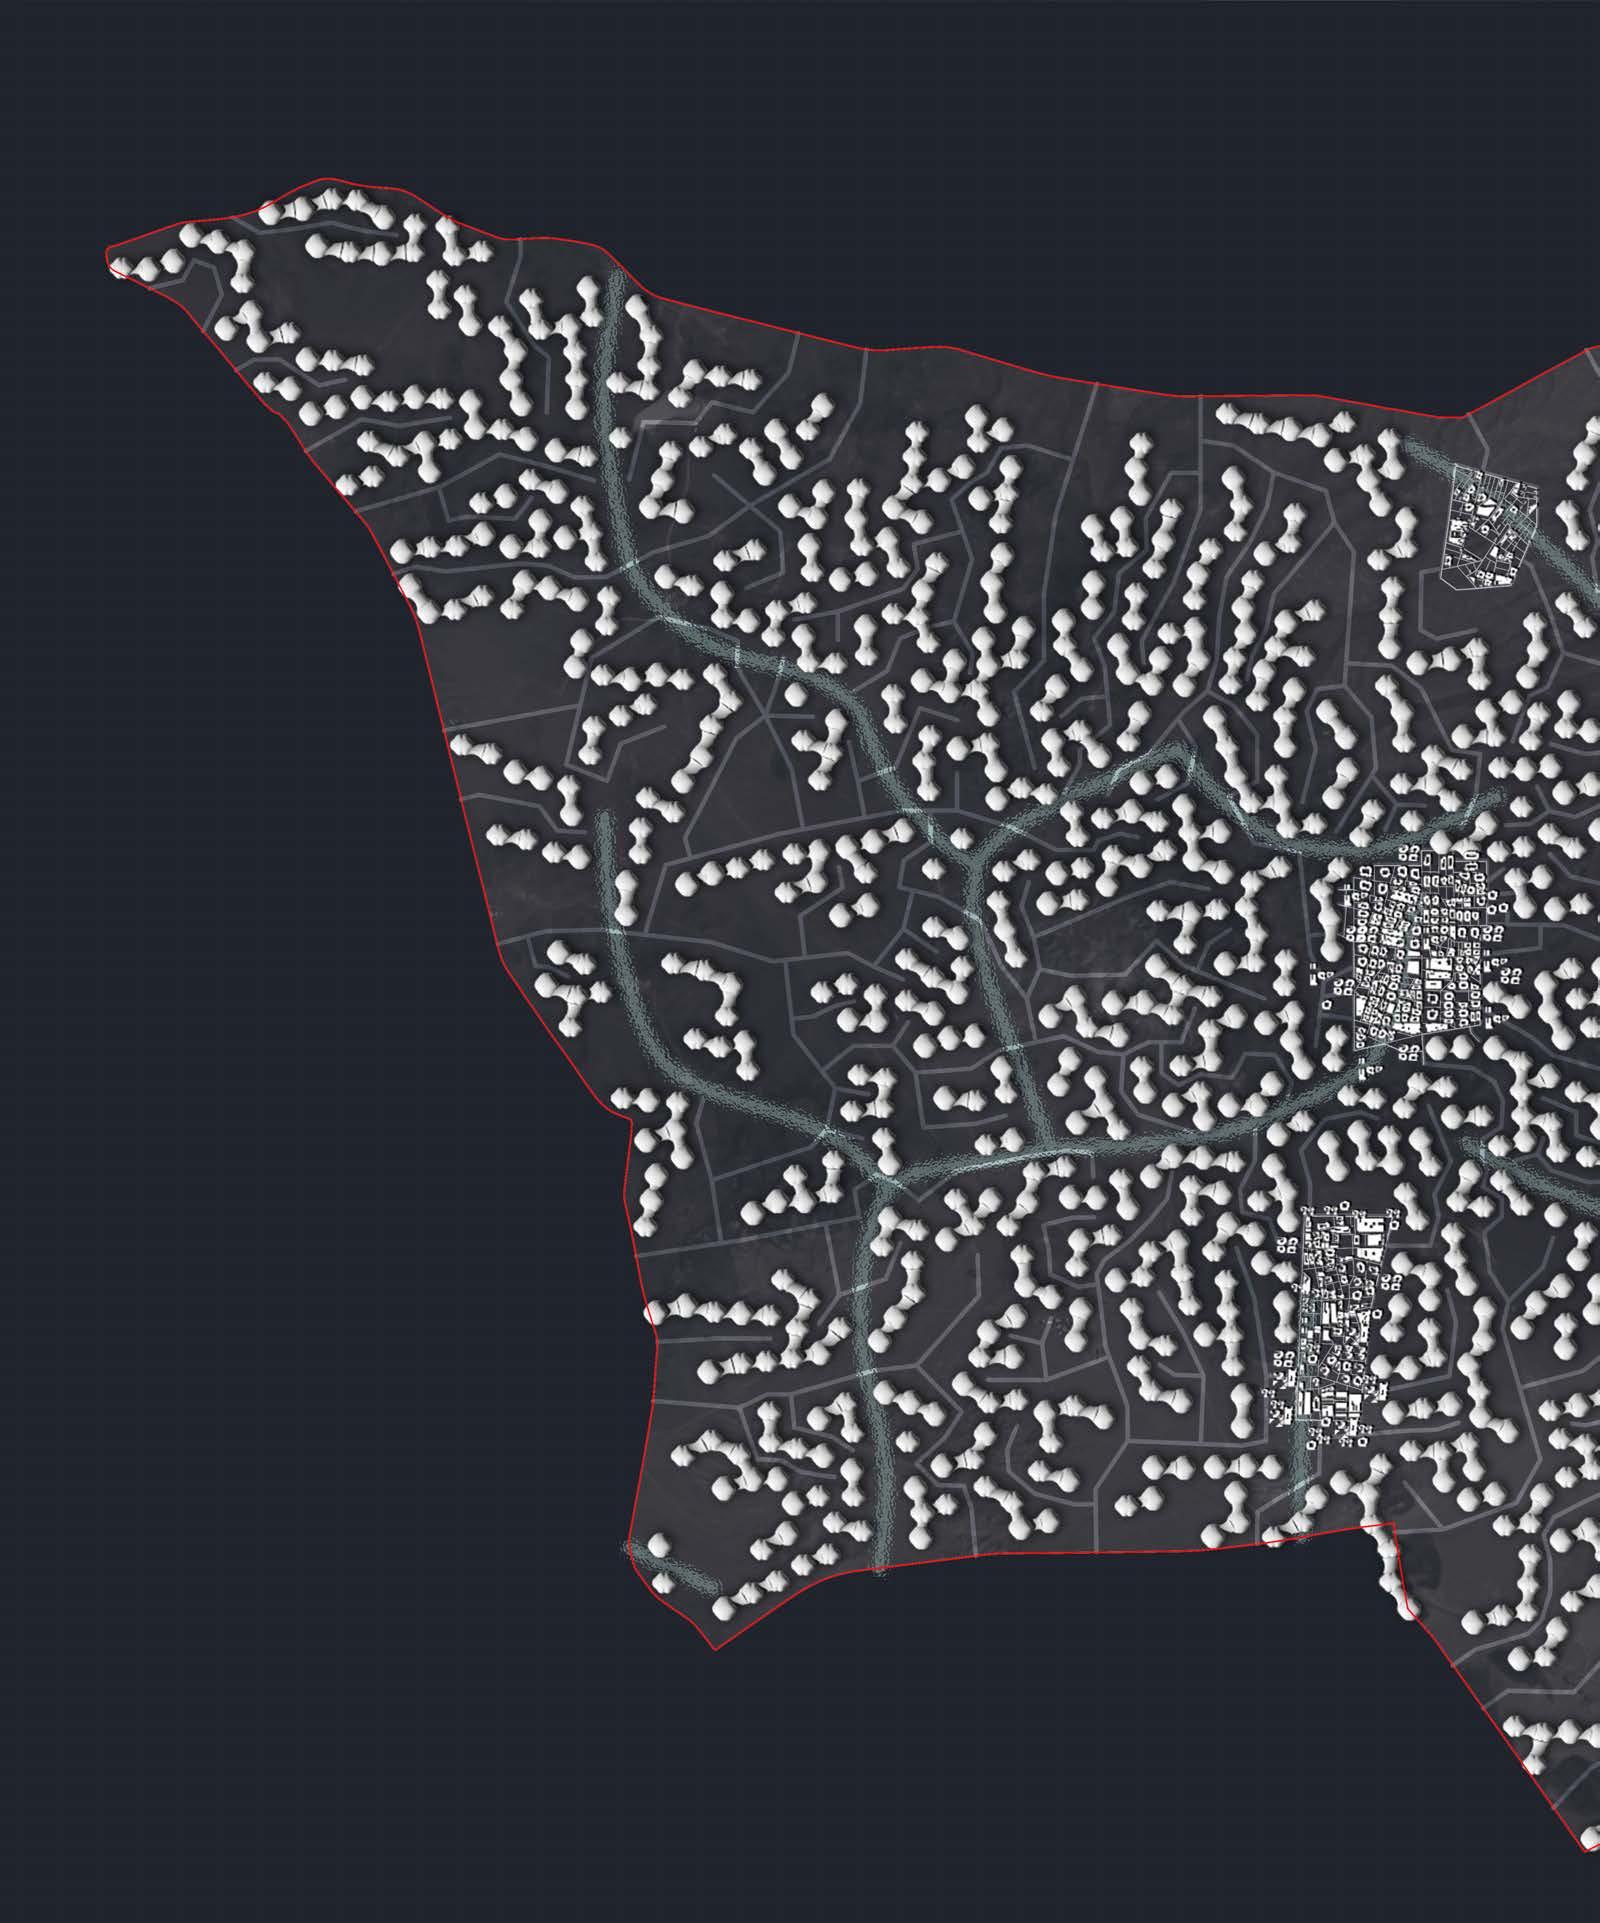
Global Scale Proposal Design Proposal
The urban scale design is organized and synthesized by the hydrological network.
The road network consists of three hierarchy:
• Existing highway(region boundary)
• Urban scale primary road(7m)
• Settlement scale secondary street(5m)
• Settlement scale tertiary street(2m)
The primary road are generated based on the logic that all the greenhouse can be direct access to the road. Both settlement street network (secondary and tertiary) and primary urban road networks were integrated and well-connected together. This ensures the migrant worker communities’ integration into the rest of the urban areas.
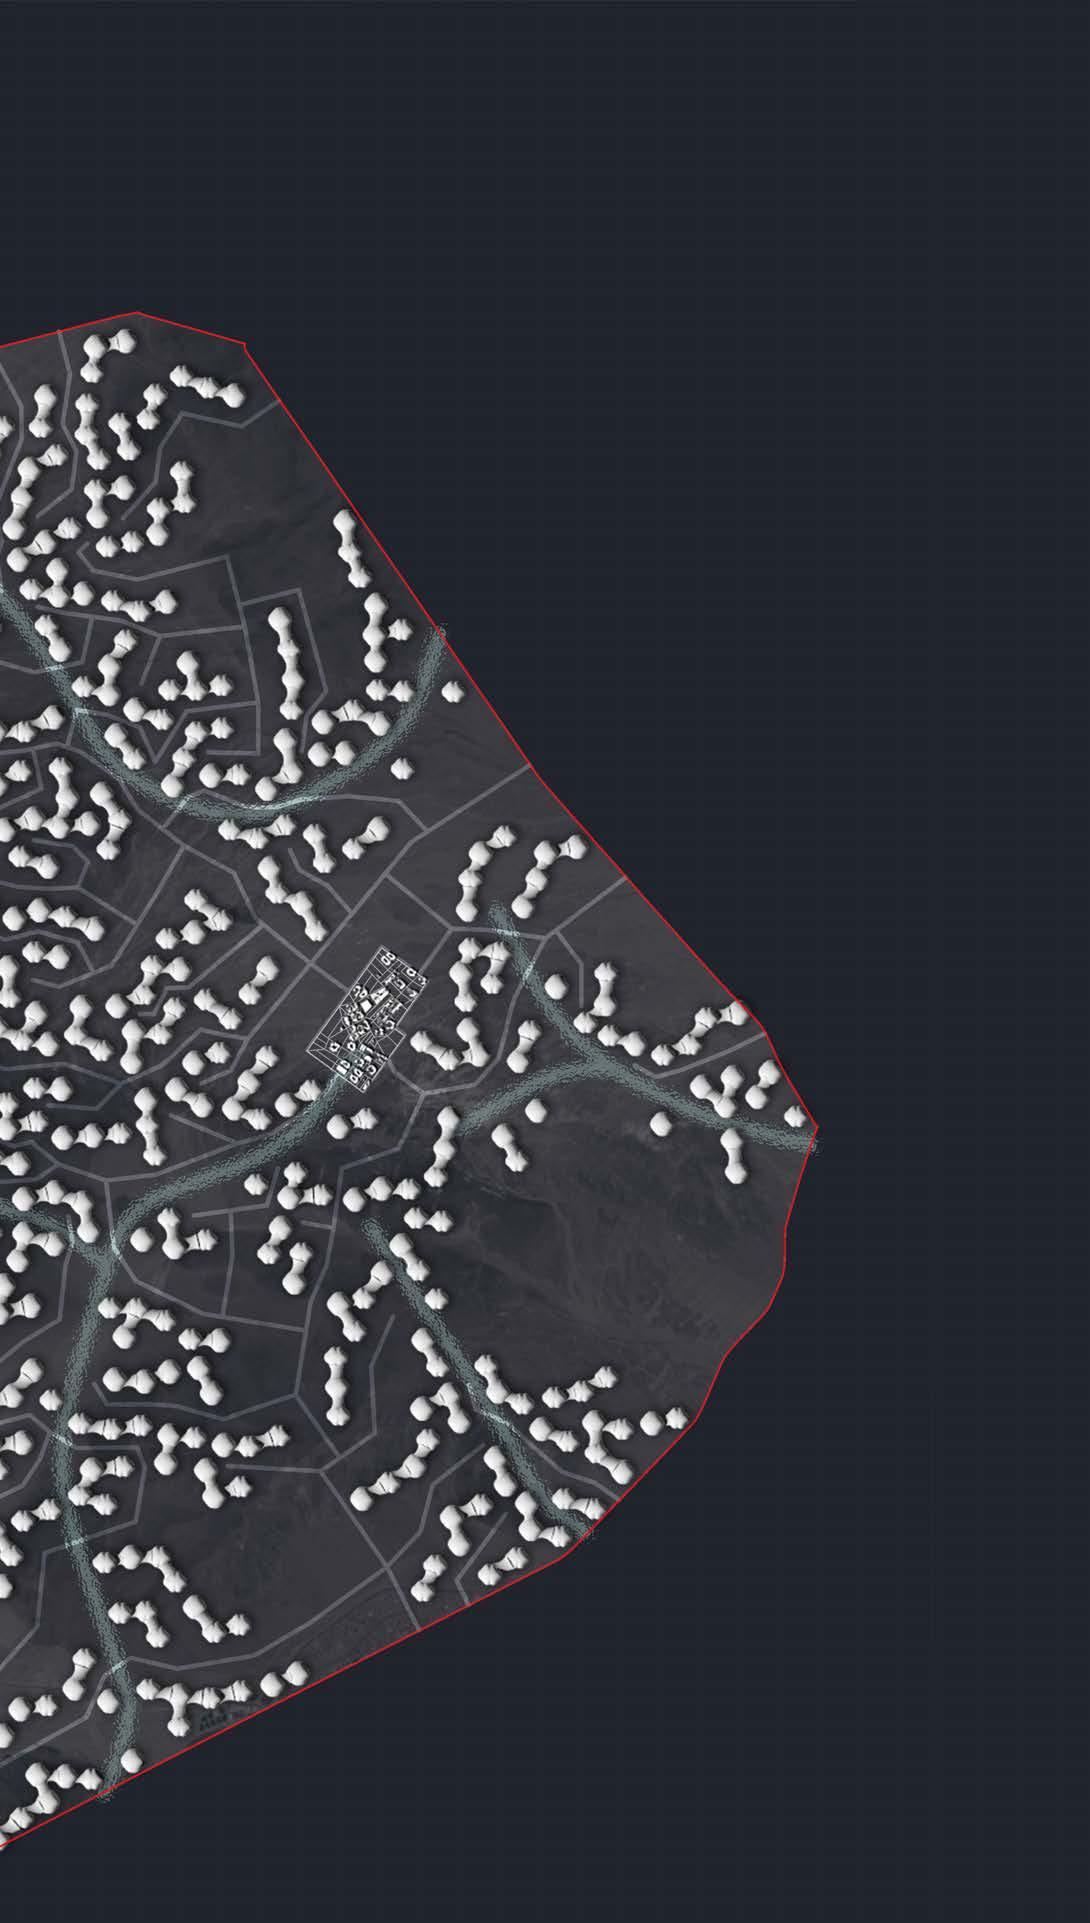
The proposed greenhouse farming system features windresponsive units facing east and west prevailing wind direction for optimum ventilation. Based on the proximity between the individual greenhouse units, clustered multi-span greenhouse systems featuring the desalination/ passive cooling chambers were formulated. The scale variations address the production requirement of various stakeholders.
The 4 settlements are situated adjacent to the seawater canals, which in total accommodate 5000 population. There is size variation between the settlements based on the land availability.
192
Global Scale Proposal Design Proposal
The proposed dendritic hydraulic network consists of overground seawater canals as well as underground water distribution networks. The holistic network covers the entire selected territory transporting and distributing the seawater to the greenhouse horticulture industry for freshwater production and passive cooling. The seawater canals bridge the existing salty lakes with to provide a constant flow of salty water for the distributed desalination purpose within the community.
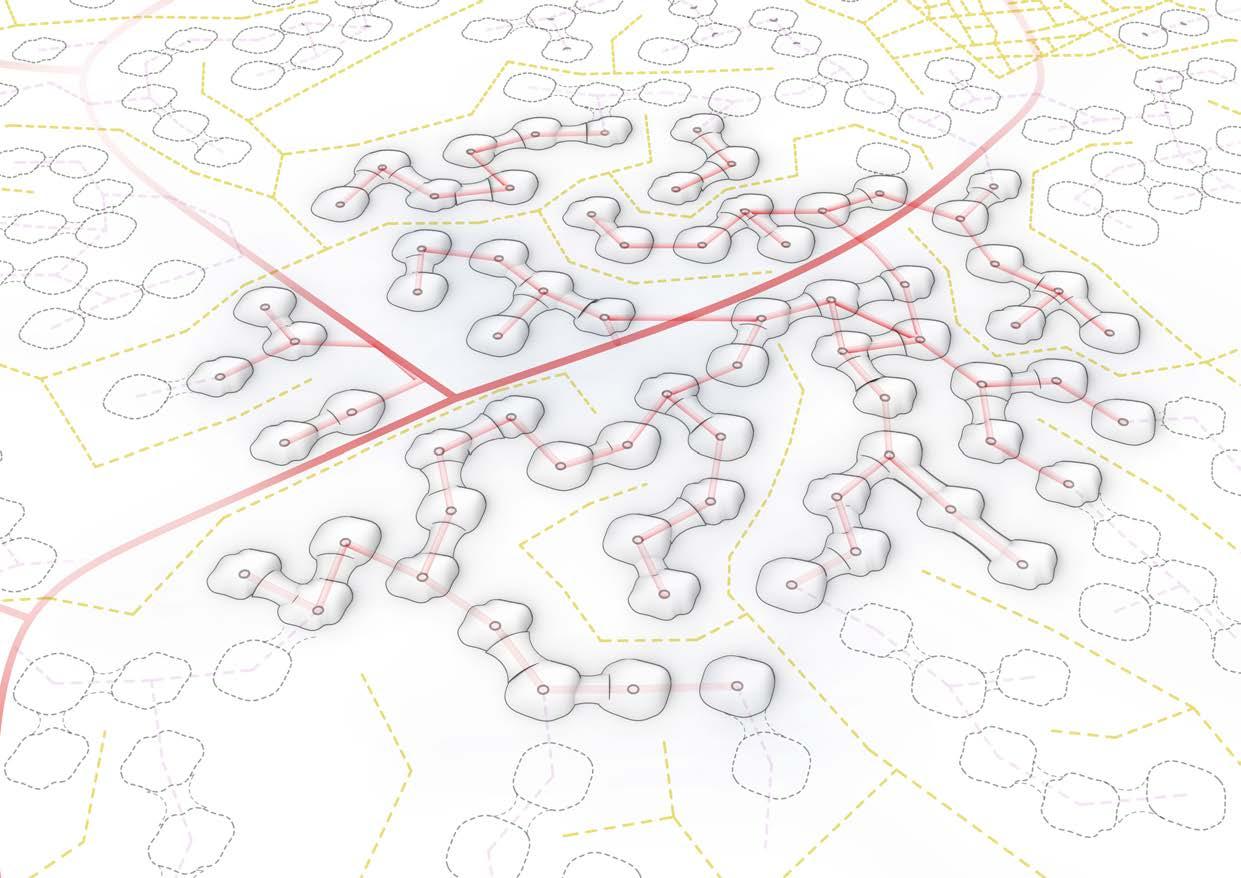
193
underground hydraulic network
desalination/passive cooling chamber greenhouse
primary road network
overground seawater canals
Global Scale Proposal Design Proposal
194
6.2. Meso Scale Proposal
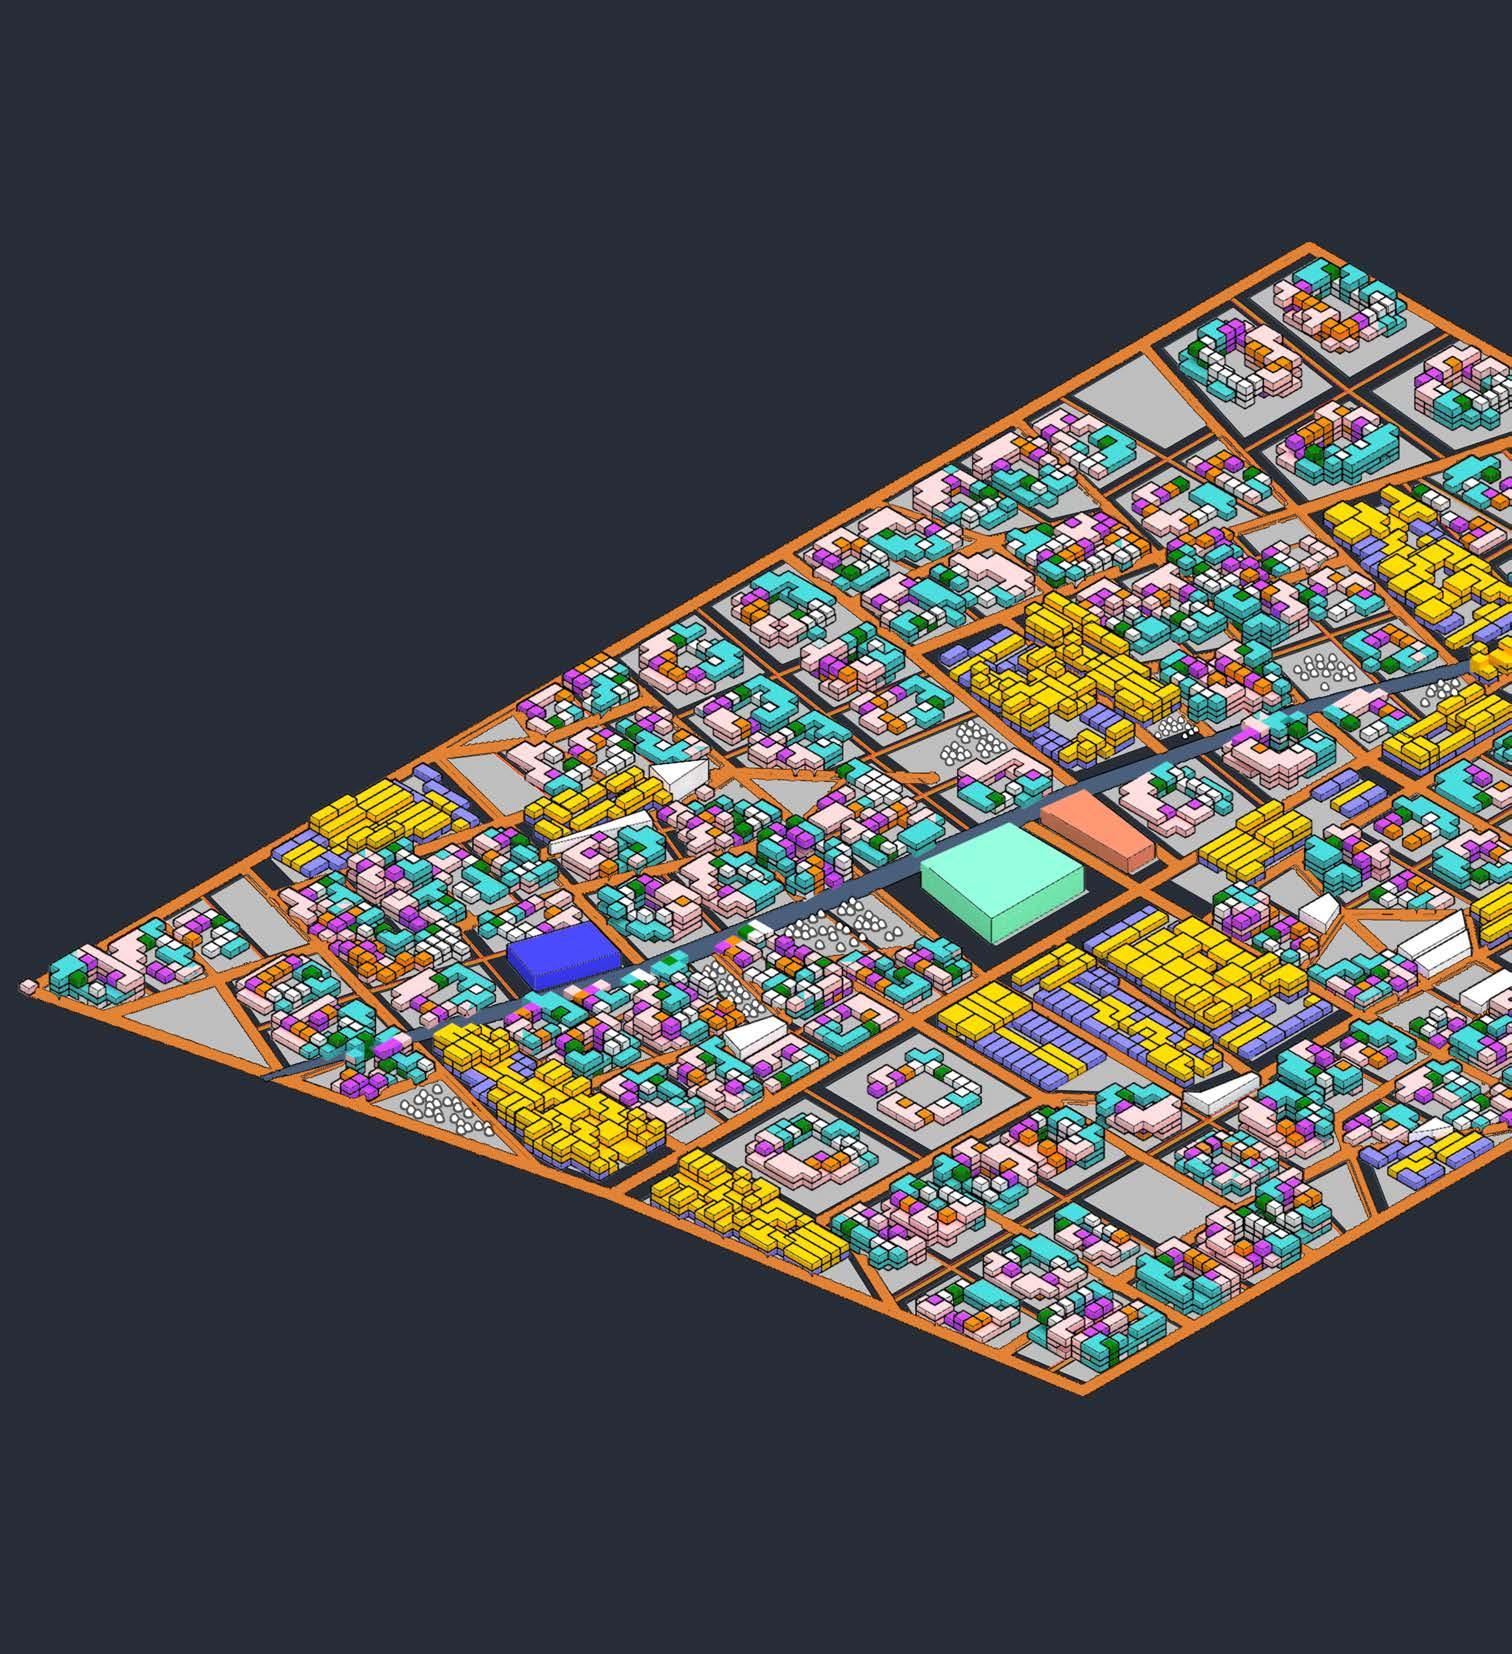
195
Meso Scale Proposal Design Proposal
Townhouse
Hammam
Religious Center
Seawater Canal
Market
Device
Desalination
Meso Scale Proposal Design Proposal
A synthesised settlement design is proposed for the migrant worker population. The FAR of the settlement is 1.2. It accomedate 3000 workers and their families. It consists of both private houses and necessitous amenities and public programmes. It features multicentre defined by hammam adjacent to the canals and clustered market and religious centre. The seawater desalination devices are located on public space within each cluster providing convenient freshwater access for the residents.
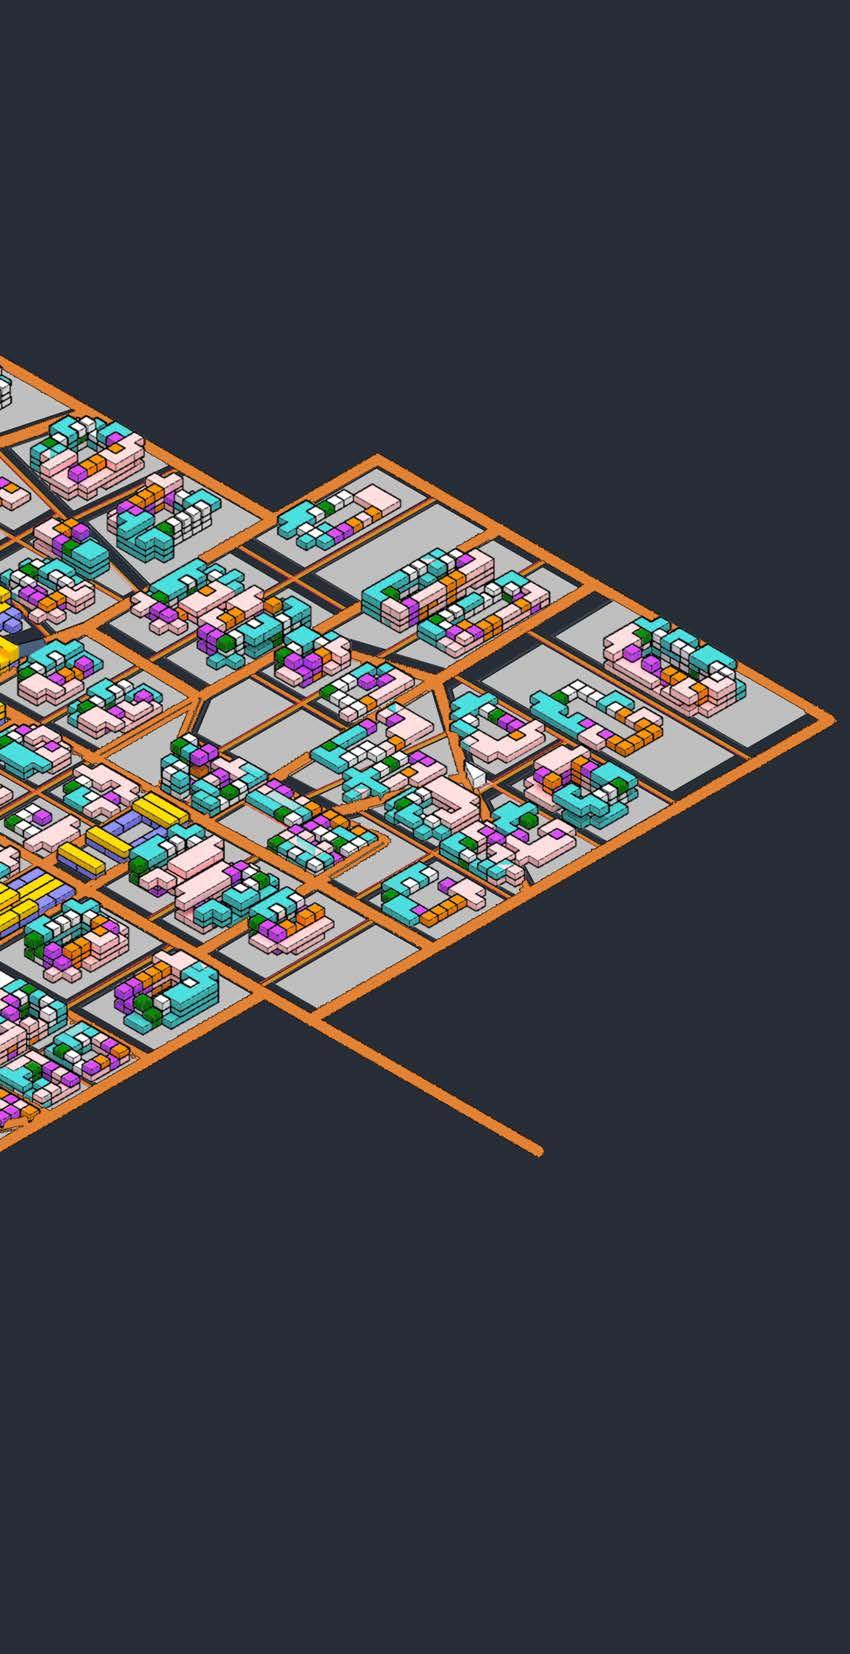
The street network of the settlement is directly well connected to the urban primary road networks. This ensures the material and job opportunities could be reached by the residents.
For the private housing, two types of houses are proposed: single family occupied courtyard house and mix-used townhouse. The courtyard house ranging from 1 to 3 floors can accommodate nuclear family to extended families.
The mix-used townhouse provides collective living spaces for individual workers. The ground floor space offers the opportunity for small business owners.
The periphery of the settlement as a material exchange zones between settlement and greenhouse farming systems. Plastic waste from the greenhouse is collected here and repurposed to be used as pneumatic formwork for housing construction. vacant lands are available for excavating earth and preparing adobe tiles.
196
Workshop
Plaza
Streets
Courtyard House
- System Proposal and Evaluation DESIGN
6.3. Local Scale Proposal
6.3.1. Housing Units Proposal
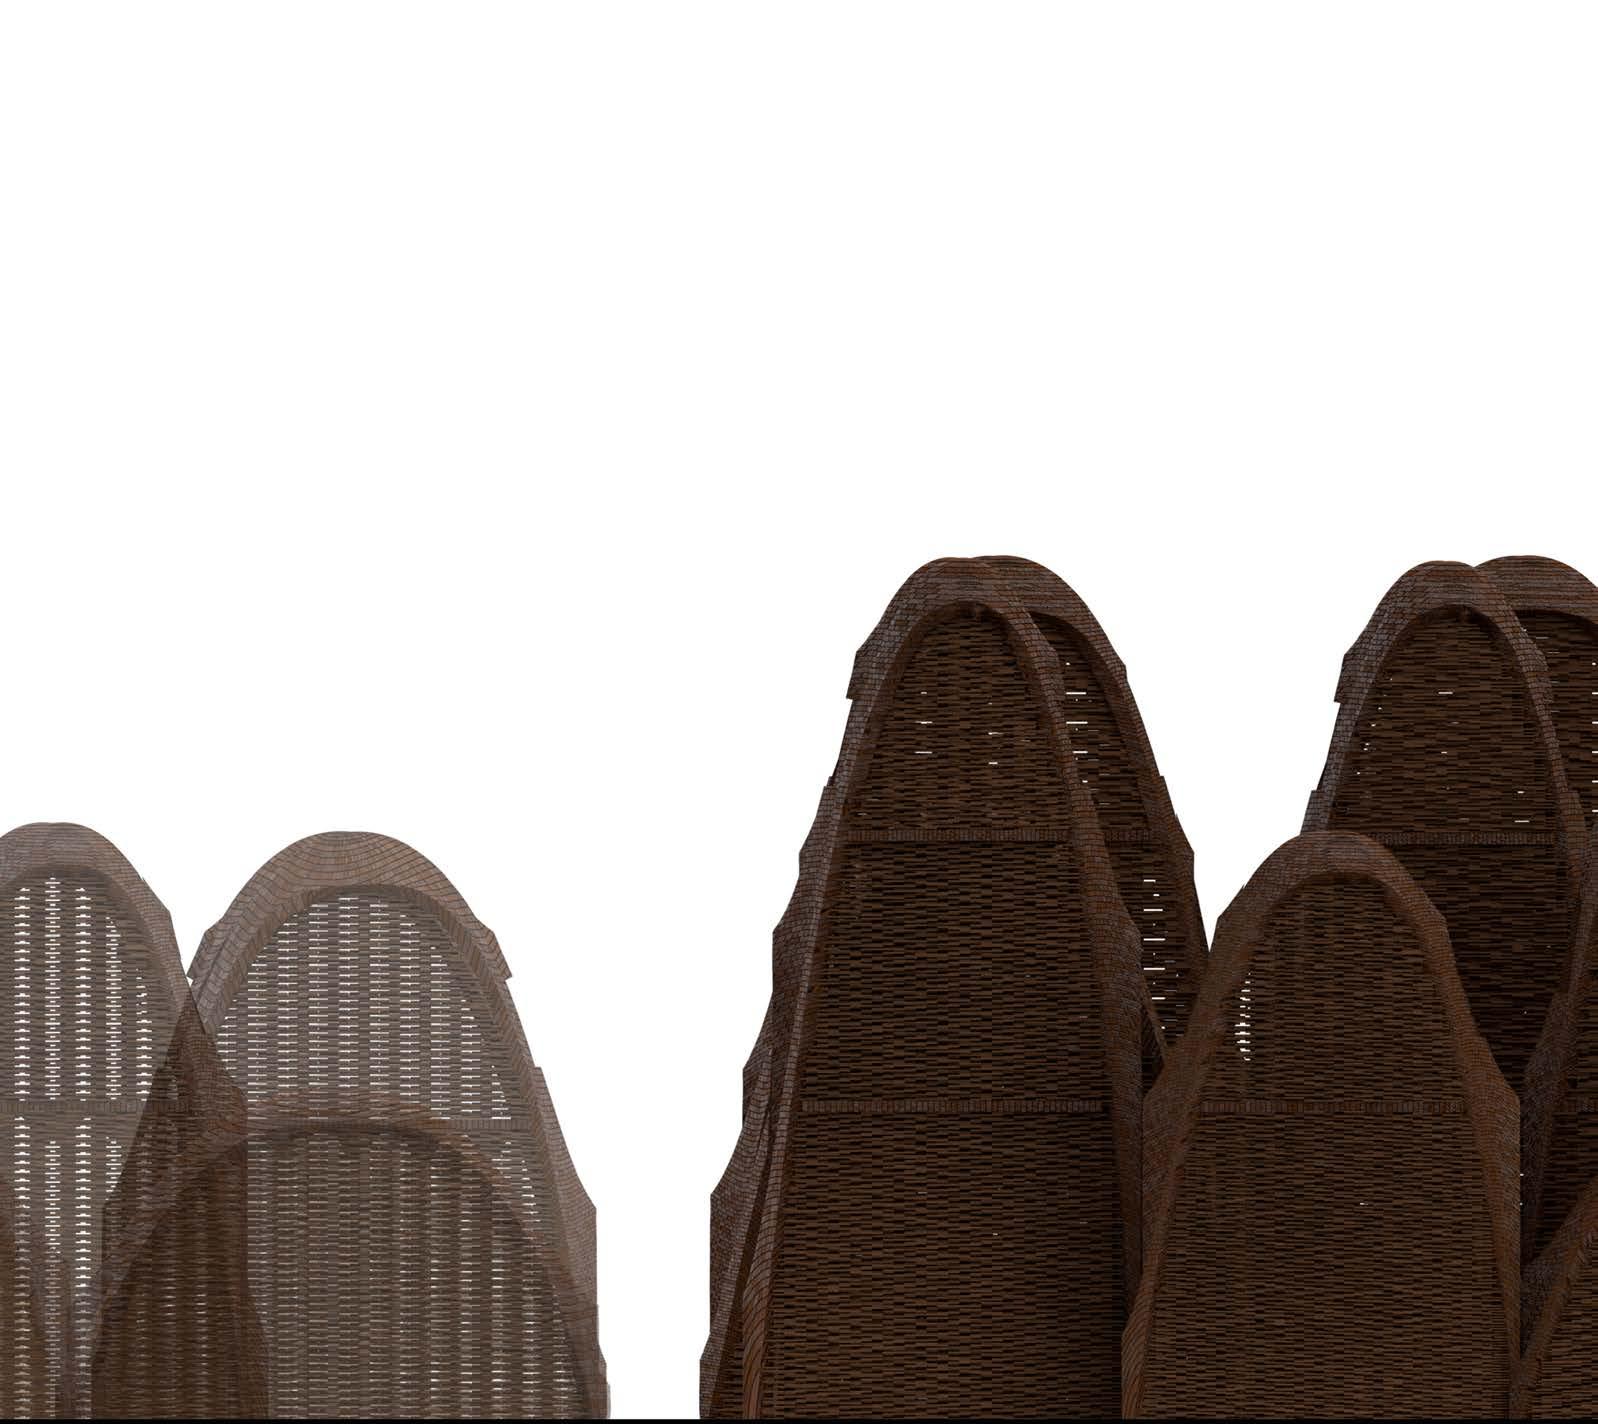
197 Local Scale Proposal Design Proposal
Local Scale Proposal Design Proposal
For the architectural proposal of the housing units, different factors were taken into account, such as traditional Spanish vault designs, earth materials, and earth construction styles. But the most important of all was a modular design style in order to facilitate the construction process, as well as give inhabitants the option to continue to enlarge their homes, which is especially needed as many migrant workers live with their families in Almeria.
The distribution of the social spaces were taken into consideration from previous research as well as experiments. Because of this, different options are given in the design in order to accommodate the space depending on its use.
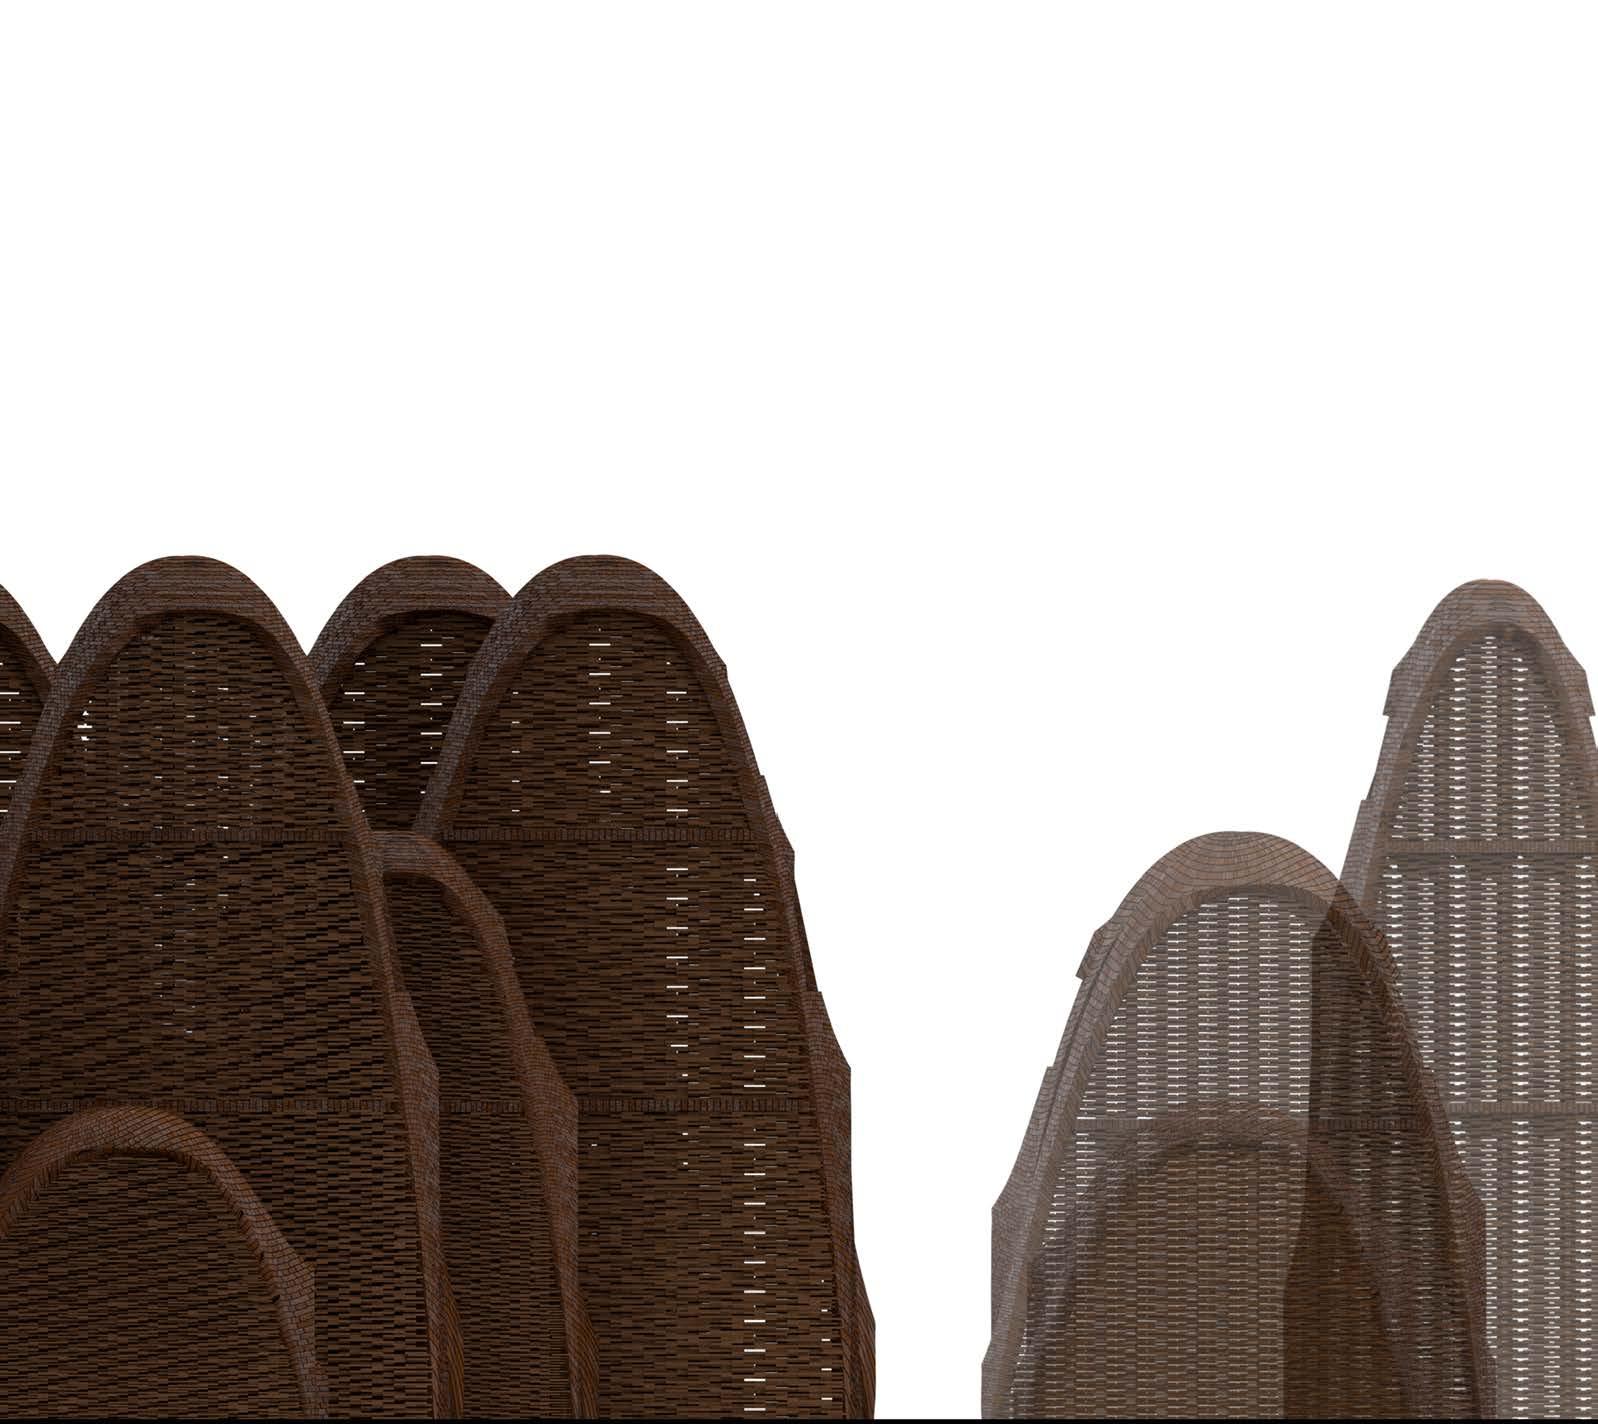
198
Local Scale Proposal Design Proposal
Design
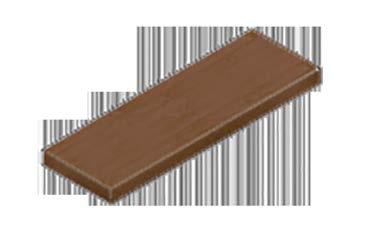
6.3.1.1. For the design of the housing units, the structural elements were of great importance. This guided the research into the Spanish traditional architecture of Catalan vaults, as not only are they considered to have a great structural strength, but also their construction materials can be sourced locally.
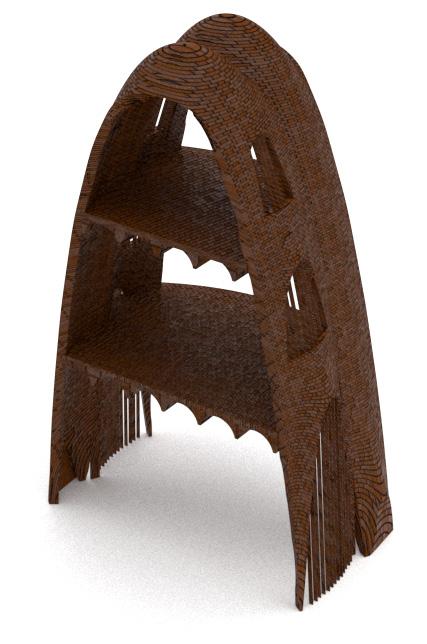
The initial modules were designed in the form of vaults, with specific dimensions to be repeated and connected to each other as it can be seen in the diagrams in this spread. As the construction of the vaults don’t need steel reinforcement, the process of construction is faster, and ecological because the bricks needed for the construction can be made from materials found in the area. The bricks’ dimensions tend to be less than normal bricks, and are made by the combination of clay, sand and water, which are later put to dry.
Differently sized vaults were taken into consideration in the design, to give the option of two to three story buildings for the migrant workers. Because of the construction of slabs, a specific structural design was needed in order to not use steel structures in the construction. For this a smaller design of Catalan vaults was created in order to take the curvature of the walls and translate it in to small Catalan vaults underneath of the slab, which are well known to be a self-supporting structural element. In the following spread, six different designs for the housing units are presented.
1.25cm Brick Dimensions 20cm 6.5cm
Local Scale Proposal
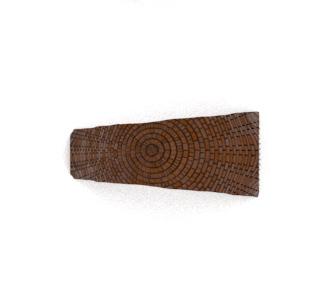
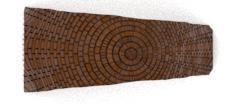
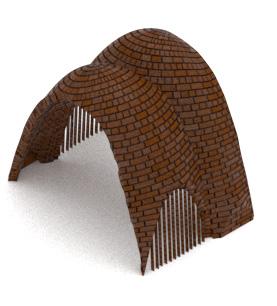
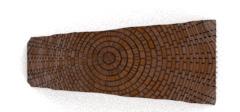
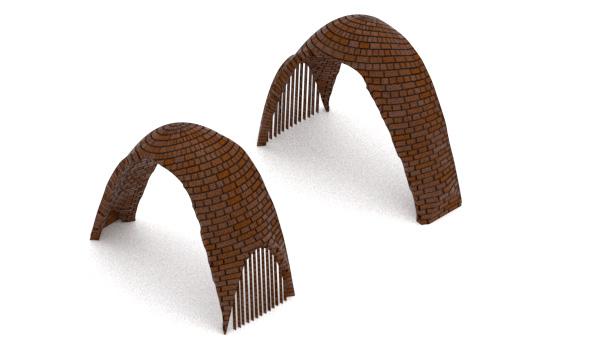
200
Single Space Vault 1 Floor
Same vault gets rotated
To get 2 connecting vaults
the 2 vaults get connected
Local Scale Proposal Design Proposal
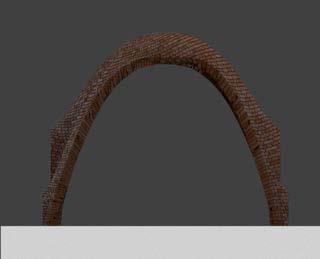
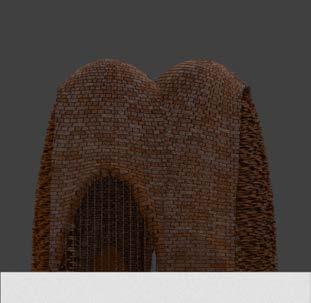
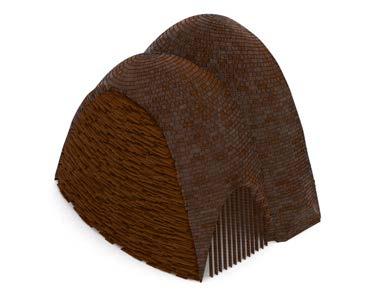

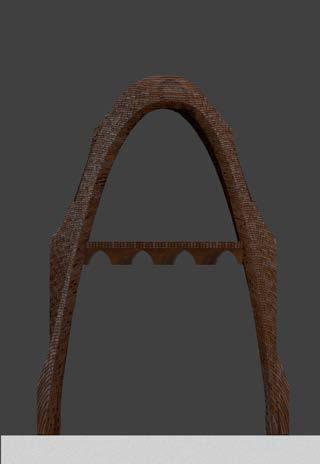
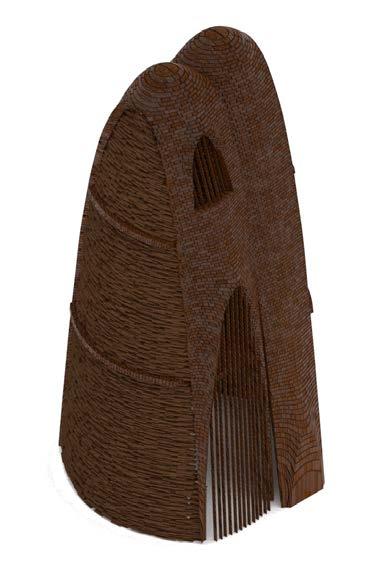
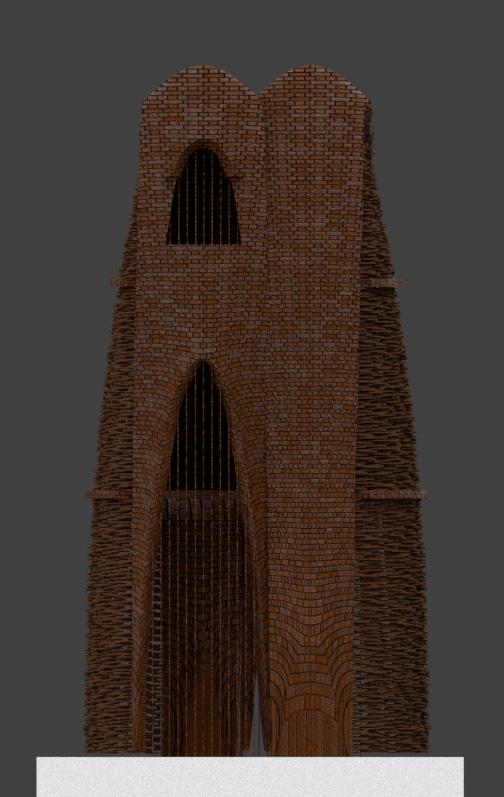
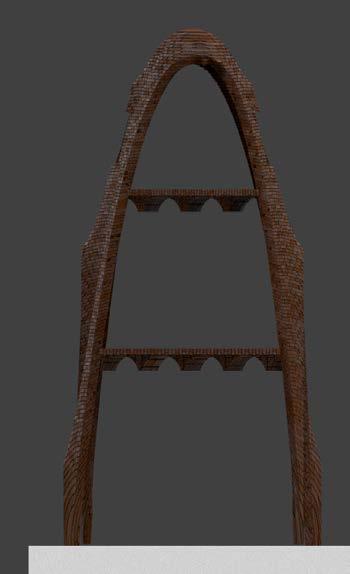
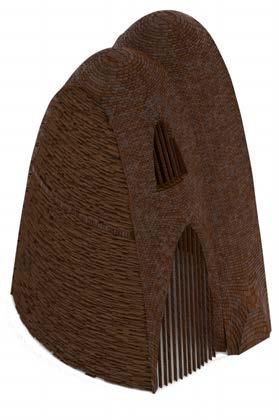
201
Vault Single Space 3 Floors: Isometric View East Elevation Frontal Elevation 3m 2.5m 2.5m 3m Vault Single Space 1 Floor: Vault Single Space 2 Floors: Isometric View East Elevation Frontal Elevation 3m 2.5m 3m Isometric View East Elevation Frontal Elevation 3m 3m
Local Scale Proposal Design Proposal
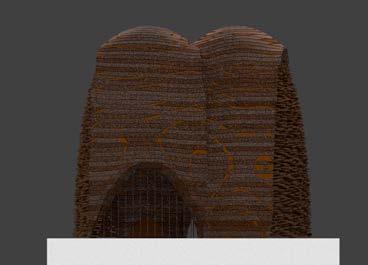
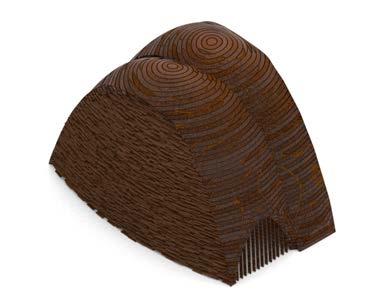
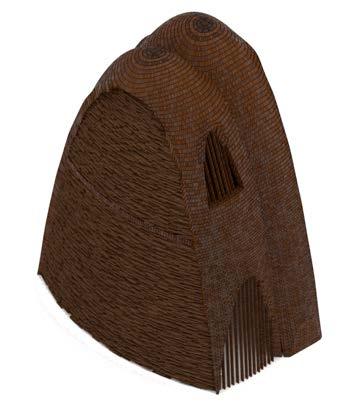
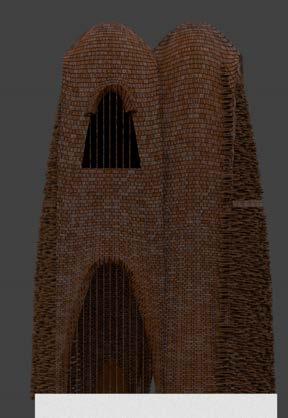
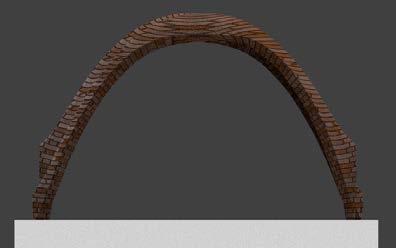
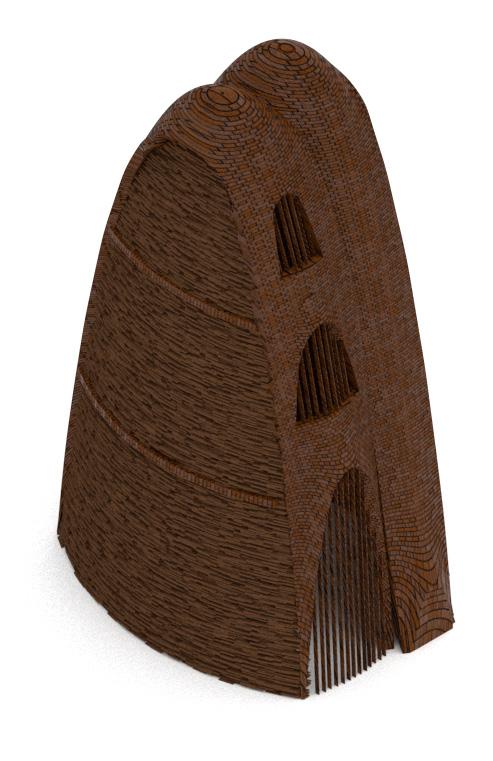
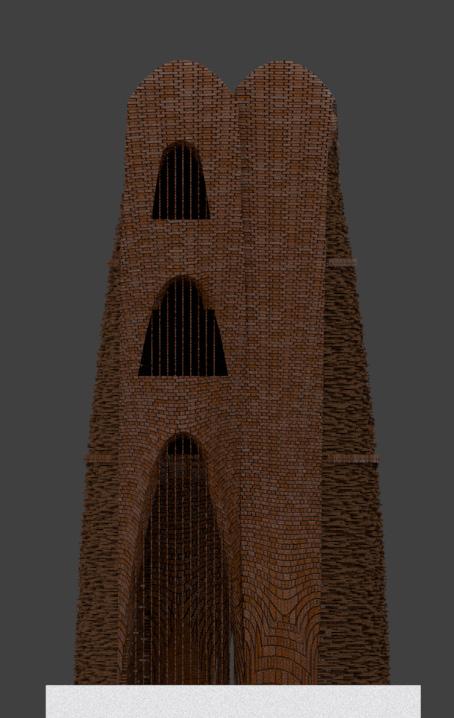
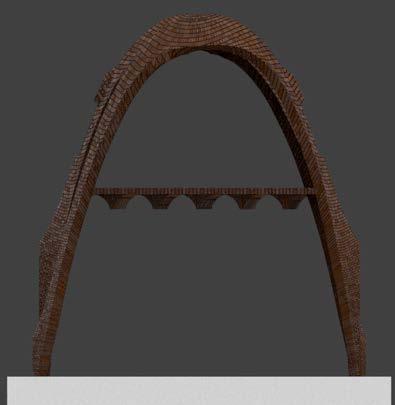
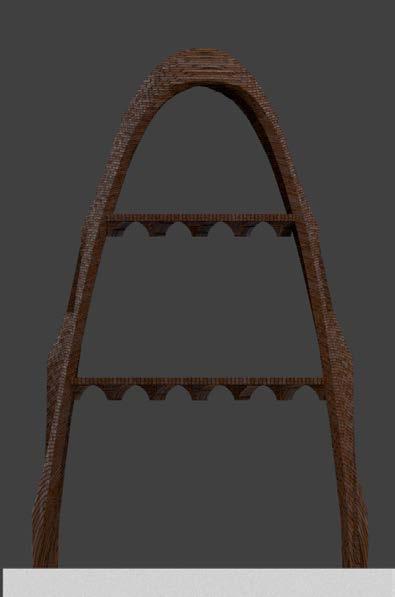
202
Vault Double Space 3 Floors: Isometric View East Elevation Frontal Elevation 3m 2.5m 2.5m 5m Vault Double Space 2 Floors: Isometric View East Elevation Frontal Elevation 3m 2.5m 5m Isometric View East Elevation Frontal Elevation 3m 5m Vault Double Space 1 Floor:
Application of Design on GA Housing Results
6.3.1.2. For the application the design into the GA results there were a series of steps to go through. The results of the GA are a series of boxes with the program of the space, as well as the dimensions, which for the first floor the height was 3 meters and for the second and third floor it was 2.5 meter each. The width and length of the boxes are 2.5m each side, but in many cases due to the boxes having the same program they merge into a dimension of 2.5m x 5m.
For the design to be directly applicable, the dimensions of the boxes were taken into consideration, making the heights of the floors 3 meters for the first floors and 2.5 meters for the second and third floors. And because of the merging of the boxes, two types of designs were made, single space vaults and double space vaults. For the double space vaults the dimensions of 2.5 meters by 5 meters were kept. For the single space vaults one of the sides was incremented to 3 meters due to the curvature of the vault which reduces the space in the higher spaces, leaving the dimensions as 3 meter x 2.5 meters.
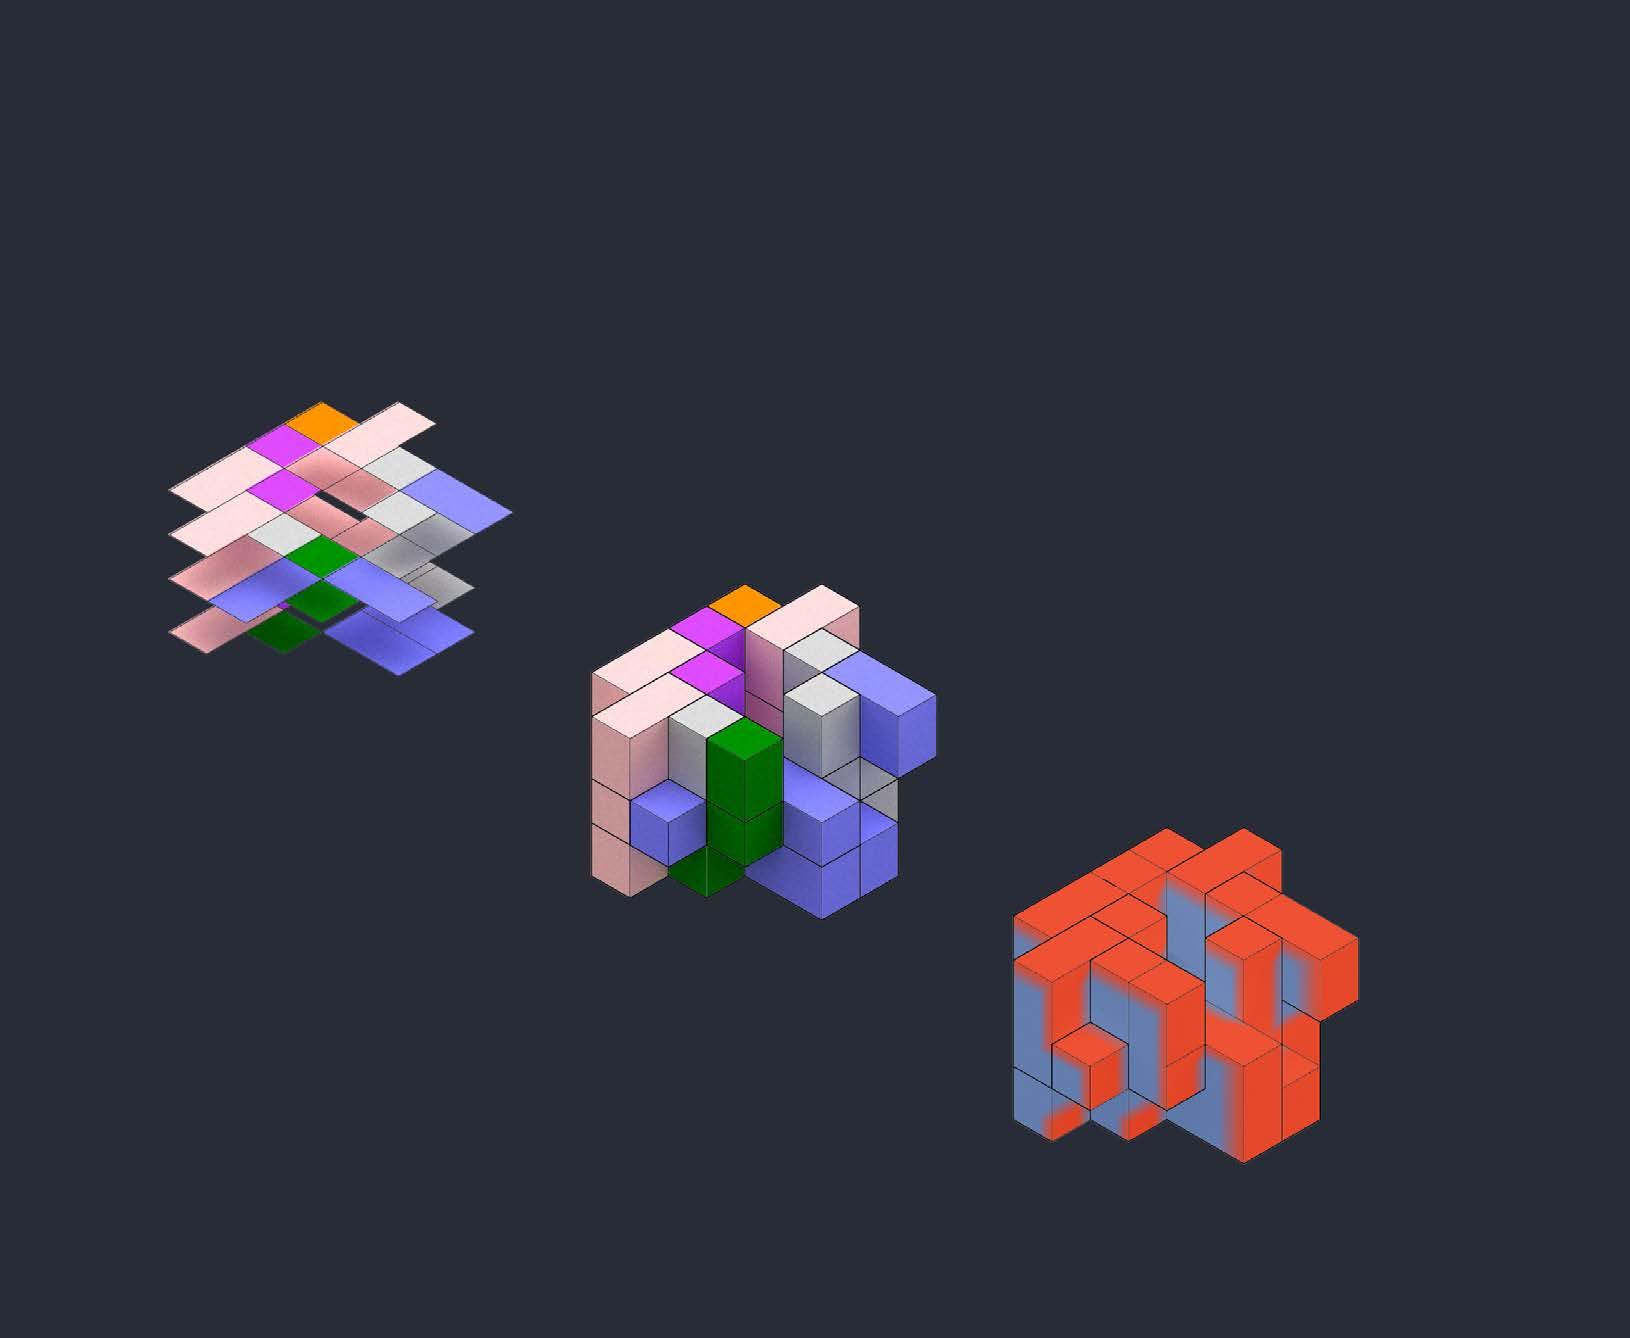
For locating the vaults in the GA Result, boxes which were in the third story without having a use in the second and first story were removed. Public service space which can be either used for storage or circulation (stairs), were examined to see if the circulation of the house and connection between spaces were adequate.
In order to locate the vaults, the anchor points of the vaults needed to be connected to each other in both directions, due to this and the slight change on the dimensions the housing design may be slightly bigger than the boxes of the GA Result.
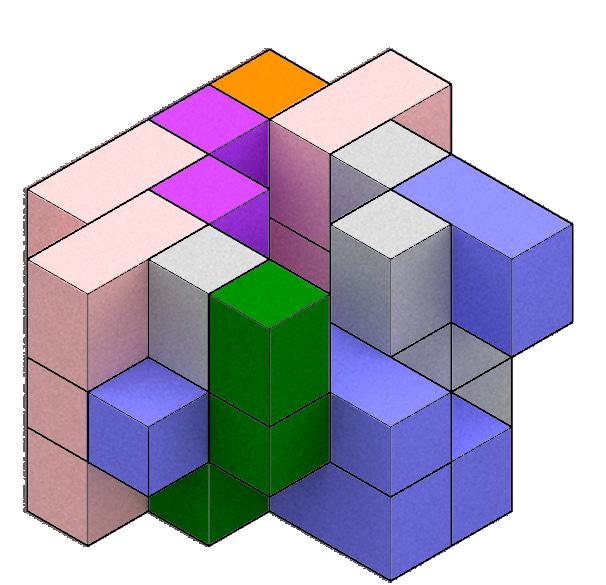
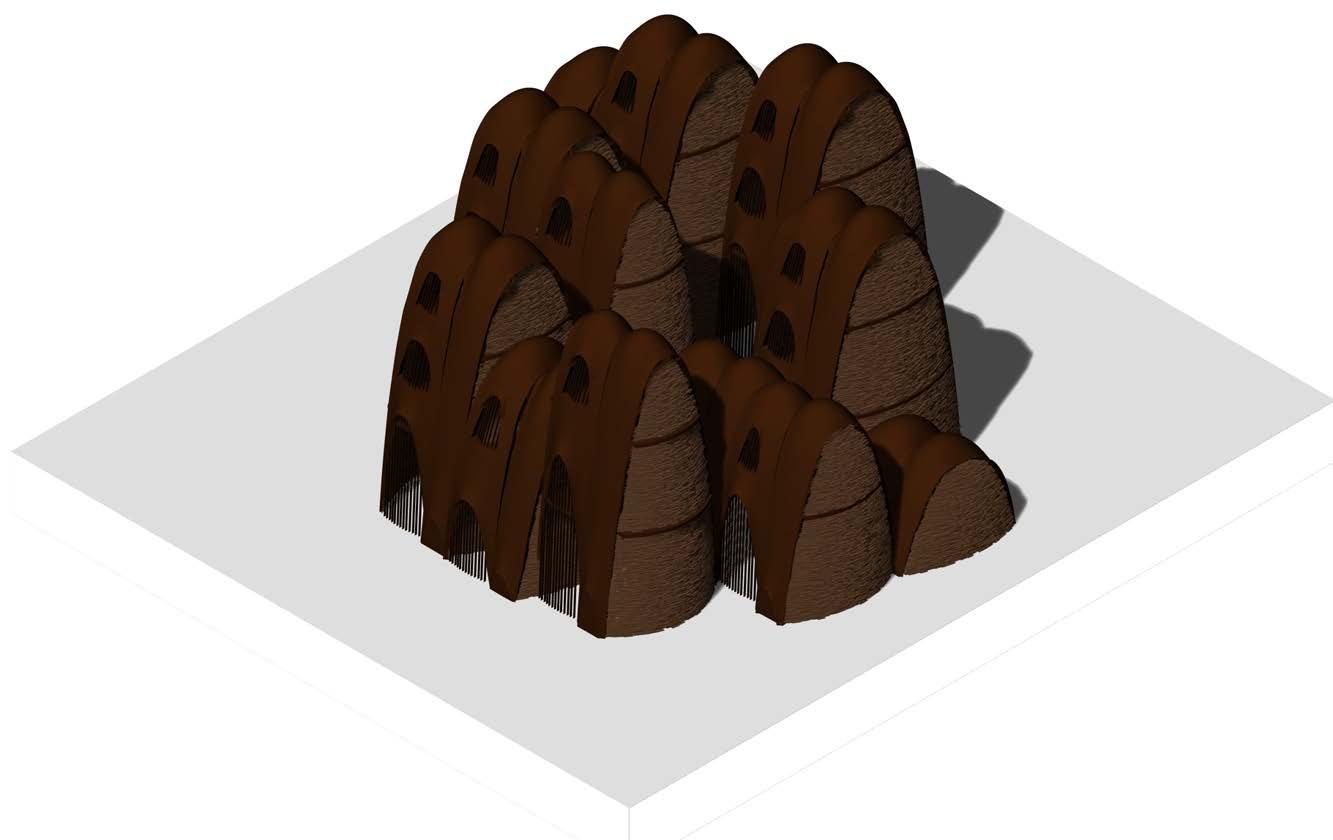
In order to address the difference between programs in the design, different brick wall patterns were designed depending on the use of the space. For this, three different wall patterns were designed, a private wall pattern, semi-private wall pattern and public wall pattern.
Also, to increase the size of the spaces the brick wall design stands out around one meter from the anchor points of the vault depending on the size of the vault, and finishes right in the top edges of the vault, giving a slight curvature to the wall and enhancing the spaces of the housing unit.
204
Pneumatic Form-work
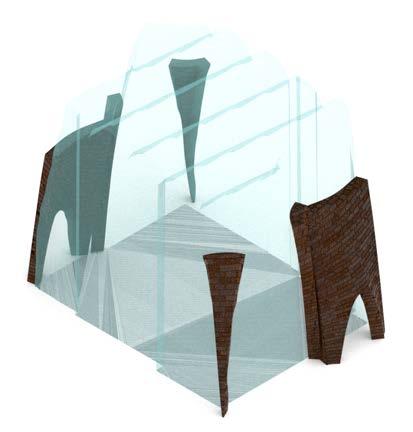
Local Scale Proposal Design Proposal
To reduce the plastic pollution in the area, one of the proposals is to reuse the disposed plastic films to make pneumatic form-work for the construction of housing units for the migrant workers. This will not only serve an ecological purpose but also help the construction of the vaults.
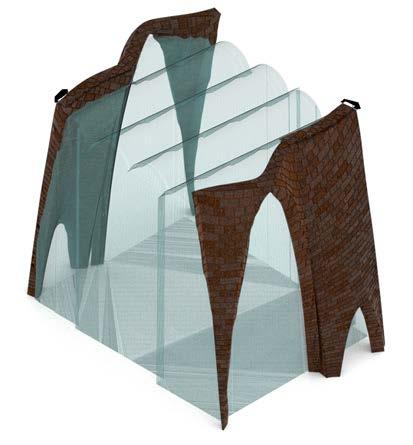
For these designs to be constructed, a series of form-work is needed to support the bricks until the vault is completely finalized. This type of form-work is usually made with wood, and due to this it can be a very slow and expensive process. Therefore, to eliminate such issues, the pneumatic form-work can be rapidly inflated to start the construction process as well as help a new purpose to the disposed plastic film in the area, which is continuously thrown away by greenhouses because of rapid loss of light transmission. These plastic films will be taken, cleaned and cut into specific pieces in order to be heat sealed to create the needed shapes for the construction. Because the housing units were designed as modules, the pneumatic form-works will also have a set of designs in order to construct the specific sizes and designs. Because there is a specific number of designs, the construction of the actual form-work can be accelerated.
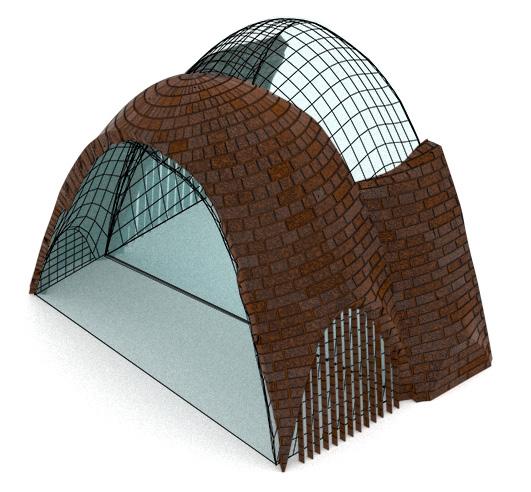
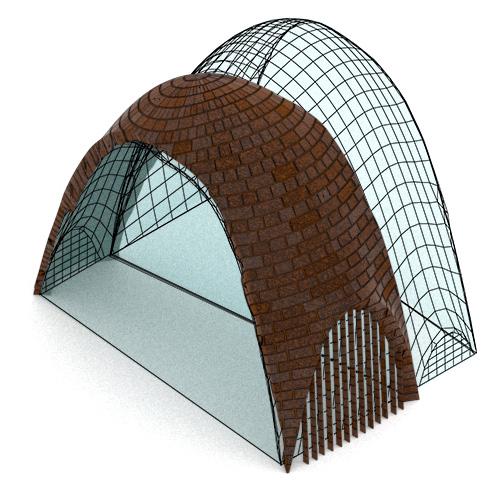
205
6.3.1.3.
formwork next to a constructed
Put
vault
Start to build walls on formwork
Local Scale Proposal Design Proposal
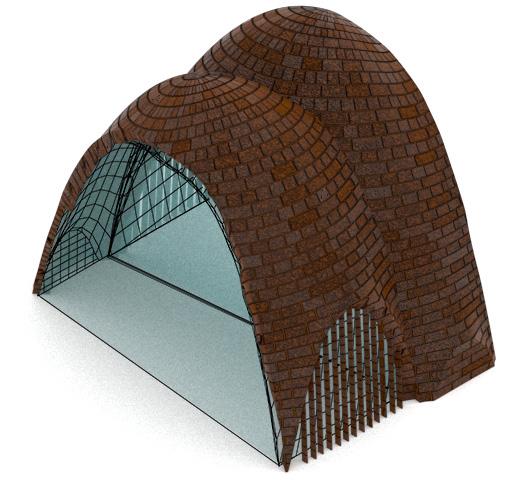
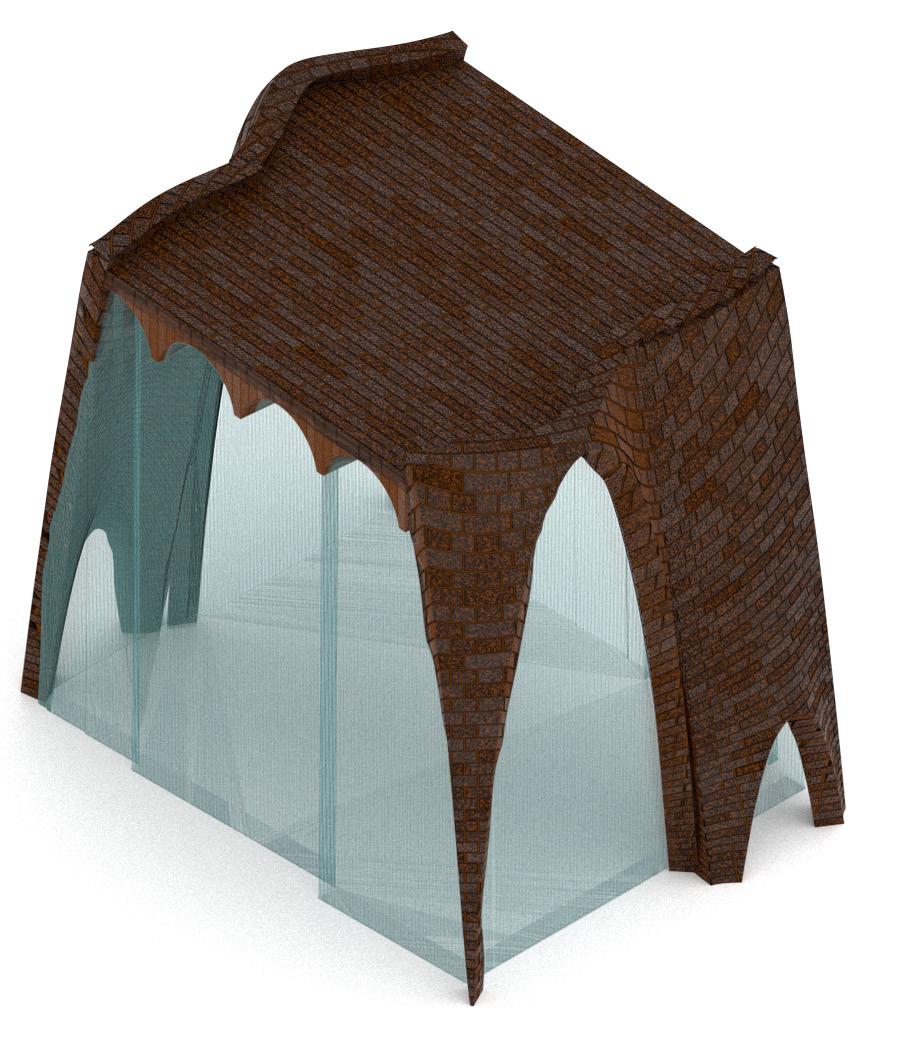
206
Formwork for Walls and Slabs
Formwork for Vaults
Finish walls and start to build small vaults and slab
Start building vault on formwork
Local Scale Proposal Design Proposal
Even though there are only 6 different vault designs, there are twelve different pneumatic form-work designs. This is because the multiple story buildings need different types of form-work for the first or second floor modules. One that has the small Catalan vaults as a structural element to hold the slabs, and the second one for the vault in the top of the module.
There are four different designs of multiple story vaulted spaces and each one has a different number of form-works depending on the number of stories.
For example, if the design of the vault is three stories high, it will require three different types of form-work: one for the first floor, one for the second floor due to size difference, and one for the third story, which will be used twice to construct the tip of the vault.
When it comes to single-story vaults, they will have just one design of pneumatic formwork. For the construction process, this formwork is set in the designated place of construction. After the it is constructed, the form-work is rotated and put next to the constructed vault in order to connect the next vault to the previous.
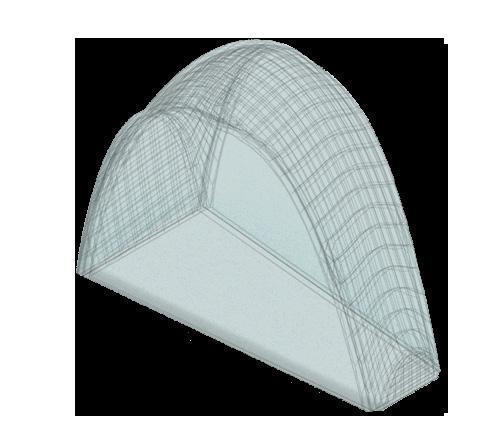
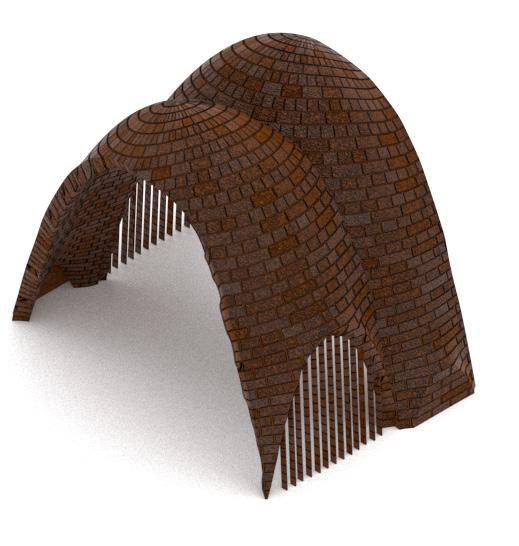
In the case of construction of the first floor with slab, the pneumatic form-work is put in place and the construction starts from the walls to the small Catalan vaults, and the slab will be directly constructed on top. If there is a second floor with slab, the pneumatic form-work is put on top of the first floor in the right direction verifying it with the direction of the vaults. Then, the walls, the vaults, and the slabs are constructed.
To finalize the construction of multiple story buildings the vault shaped pneumatic formwork is set up in one side of the constructed slab, verifying the direction with the small Catalan vaults as all of them need to be in the same direction, continuing with the curvature of the walls. The first vault is constructed, the pneumatic form-work is taken out, rotated and put next to the constructed one on top of the slab to build it connected to the first one.
207
1 Floor
Single Space Vault
1st Floor Formwork
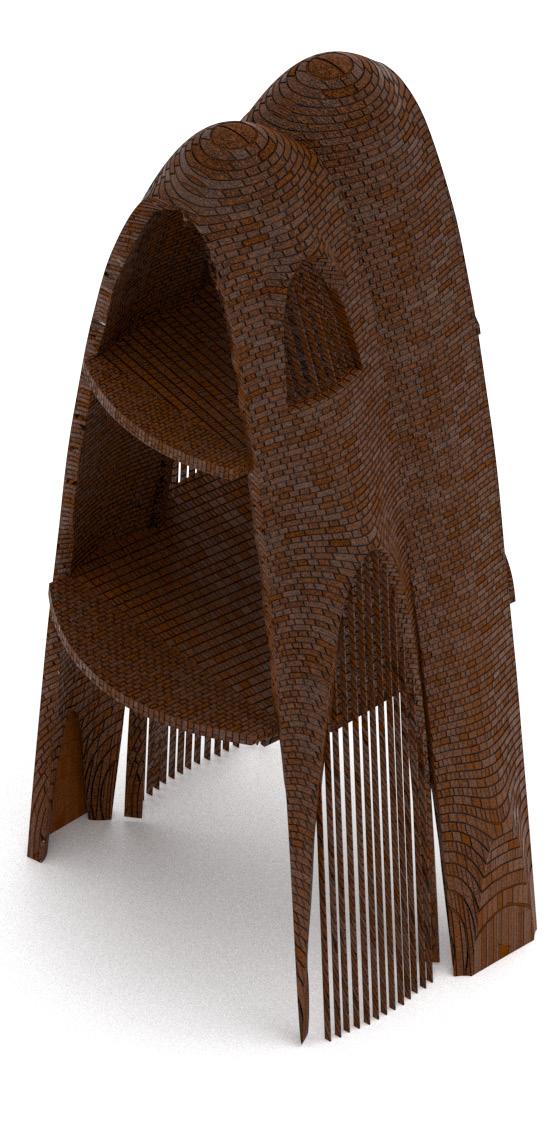
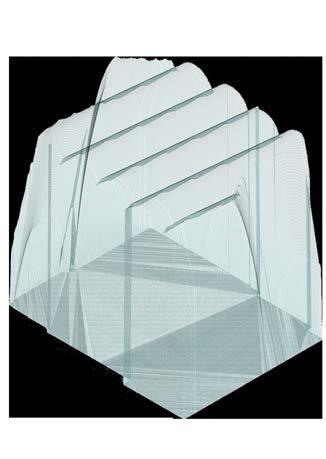
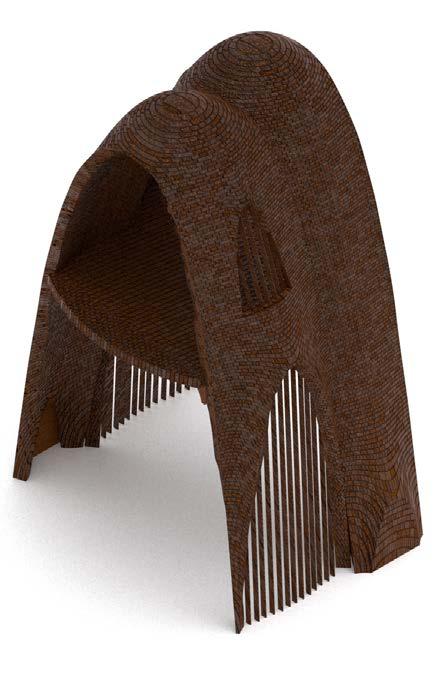
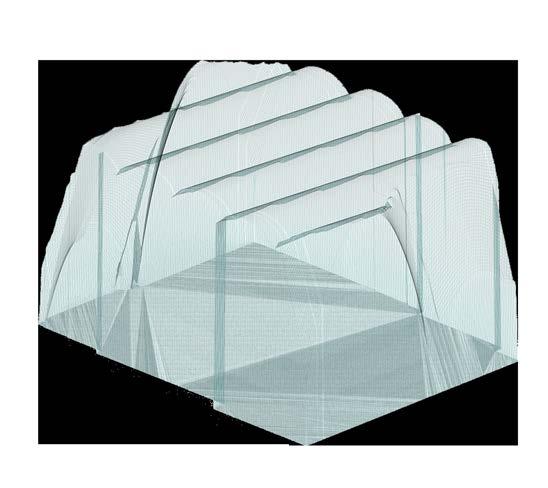
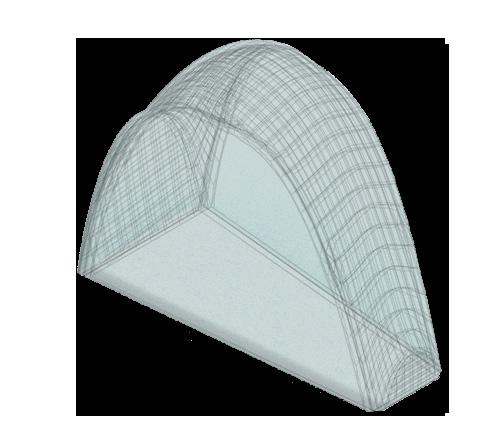
208
Scale Proposal Design Proposal 2nd Floor Formwork 3rd Floor Formwork 1st Floor Formwork 2nd Floor Formwork 1st Floor Formwork Single Space Vault 2 Floors Single Space Vault 3 Floors
Local
Local Scale Proposal Design Proposal

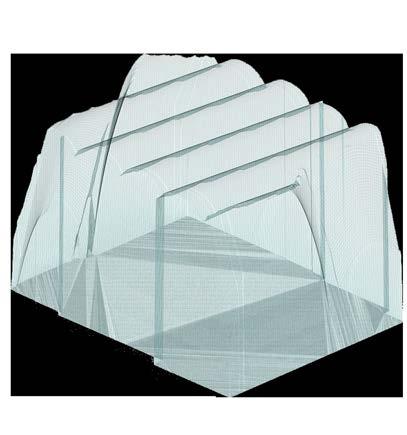
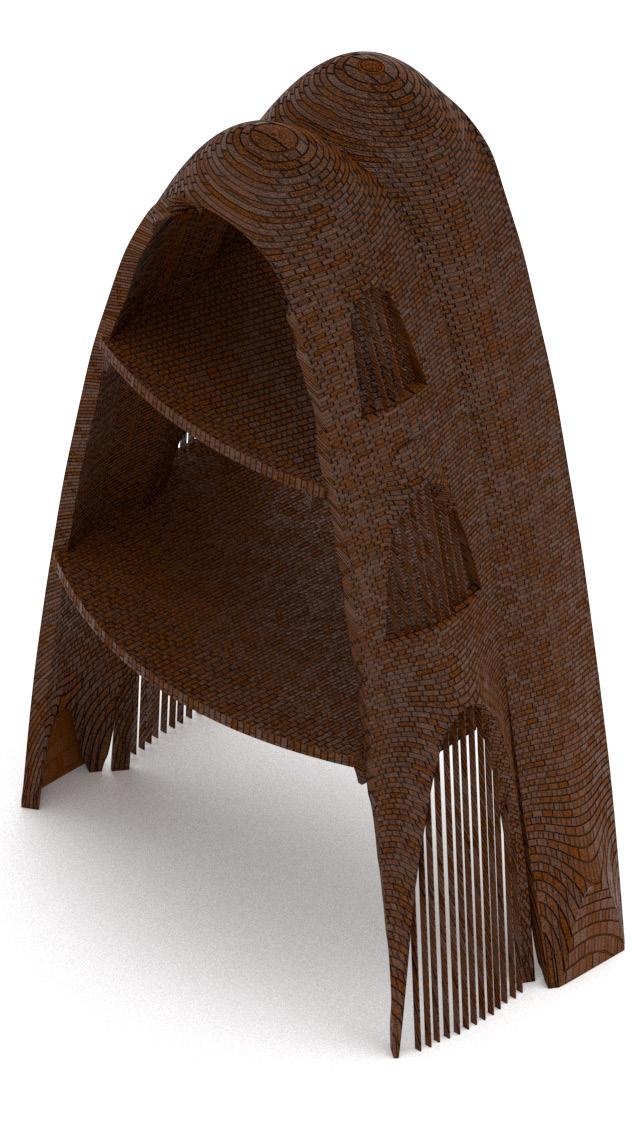
209
2nd Floor Formwork
3rd Floor Formwork
1st Floor Formwork
Double Space Vault 3 Floors
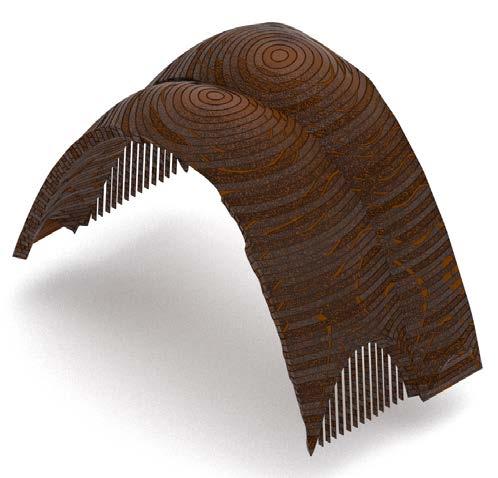
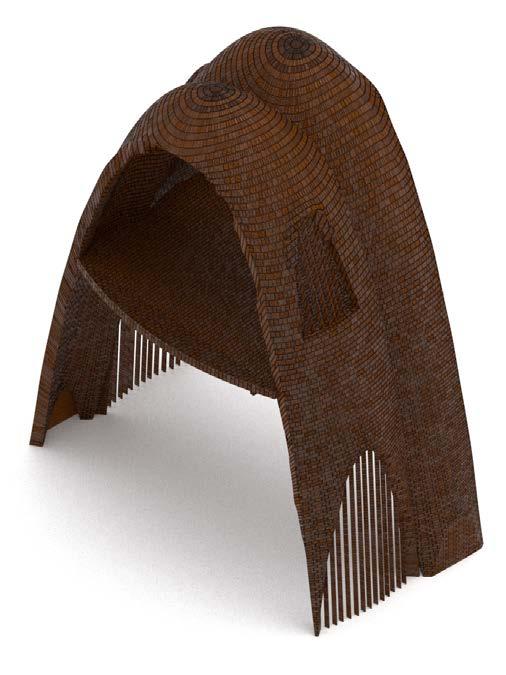
210
Local Scale Proposal Design Proposal
2nd Floor Formwork
1st Floor Formwork
1st Floor Formwork
Double Space Vault 2 Floors
Double Space Vault 1 Floor
6.3.1.4.
Brick Wall Styles
Local Scale Proposal Design Proposal
For the design of the walls, the focus was on 3 different goals: the first one being the number of resources, the second one the privacy of the inhabitants and the third one the climate of the area.
Because a large amount of bricks is needed for the construction of the vaults, it was important to reduce the amount in the walls. Due to this, a series of patterns were designed for the different spaces in the housing units. This will not only help with the limited resources but also this walls will control the interaction of the inhabitants with the exterior, as well as create opening for the ventilation of the spaces, especially in the hottest months.
Adding to the design of the patterns, the placement and sizes of bricks is a crucial element, for constructing the vaults, many bricks need to be cut in order to accommodate the right shapes in the specific spaces. Therefore, there is a fair amount of disposed bricks in the process. To respond, the walls are design with differently-sized bricks, either smaller than the normal size or added bricks to make them bigger than the normal size, which will also have an impact in the privacy and air circulation as the bricks vary in size throughout the wall.
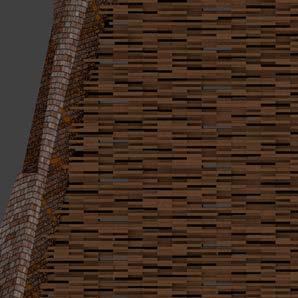
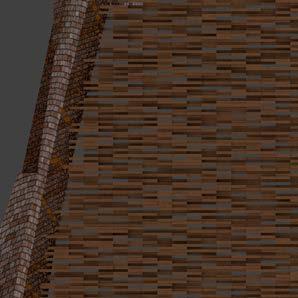
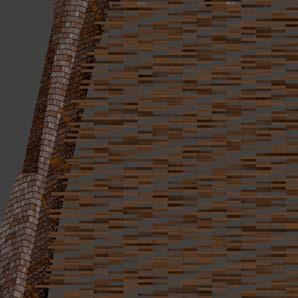
211
Front View Patterns Isometric View of Bricks Placement Private Pattern Semi Private Pattern Public Pattern
Pattern for Private Programs
This closed pattern is used in the private programs such as the bedrooms and the toilets. As private programs tend to be used by small numbers of people, it is important to not create many opening not only for protecting the user but also to keep a proper amount of warmth inside.
Pattern for Semi Private Programs
This semi-open pattern is used in the semi-private programs such as the kitchen and the living room of the housing unit.
Semi-private programs tend to be used by a fair amount of people, but to keep the privacy of inhabitants is important to create a semiopen environment, as well as keeping the area ventilated.
Pattern for Public Areas
This open pattern is used in public programs such as circulation and stairs. As public programs tend to be used often by a larger group of people, a bigger amount of ventilation is needed.
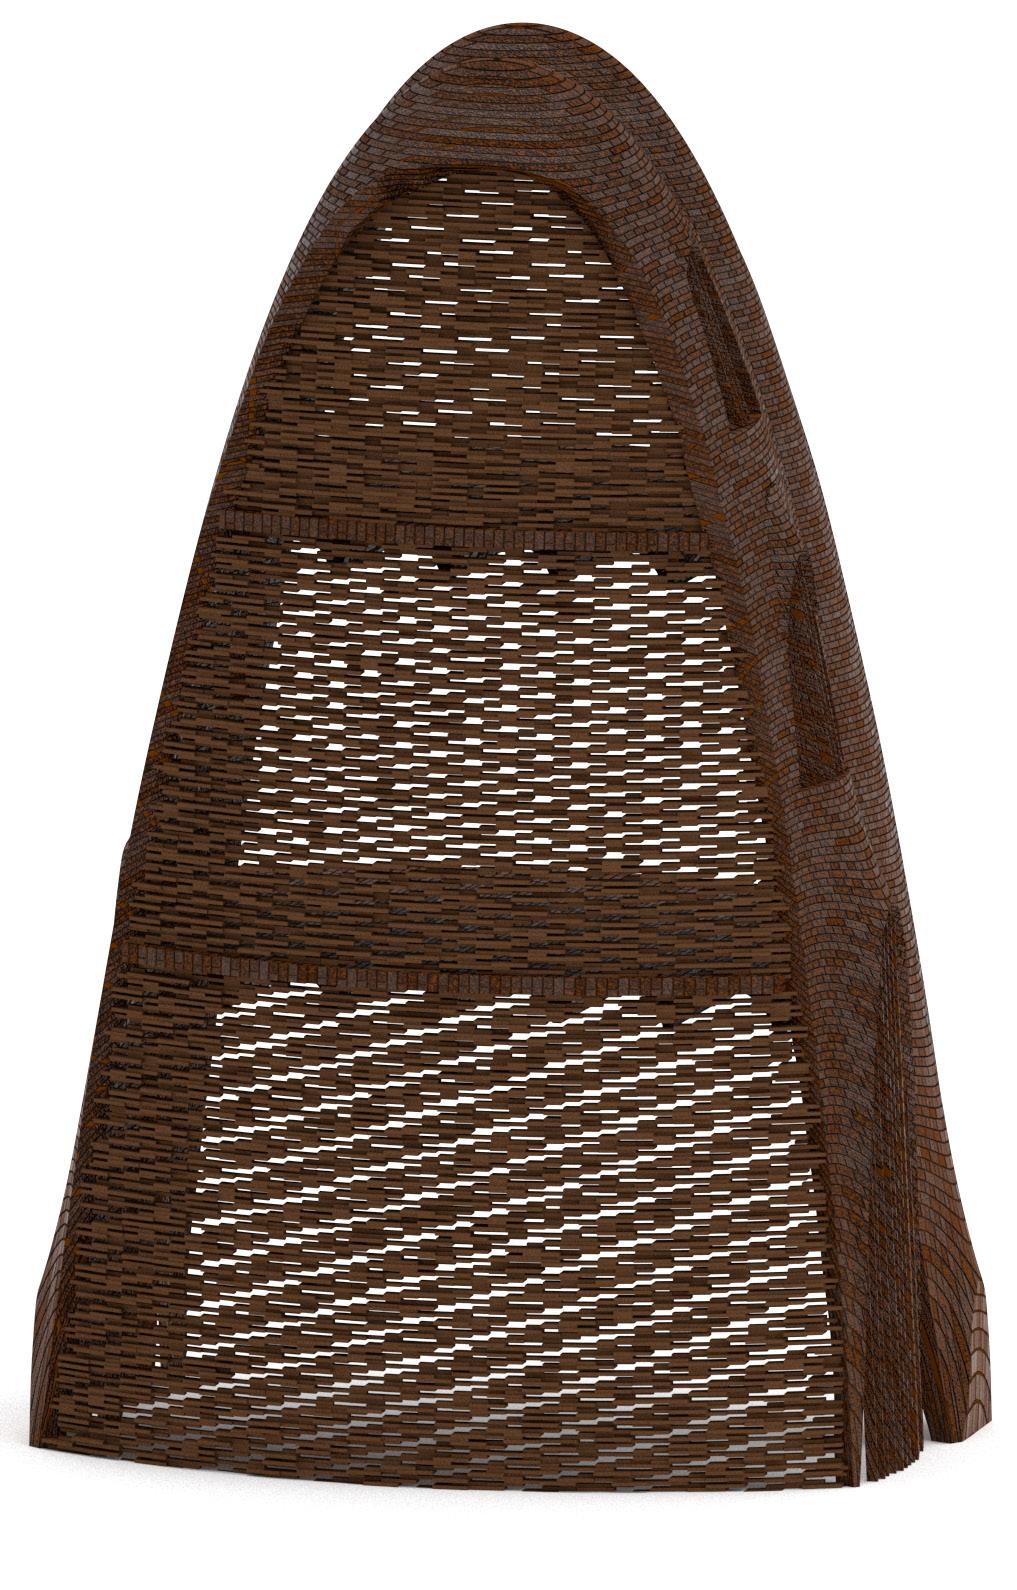
Local Scale Proposal Design Proposal
212
Local Scale Proposal Design Proposal
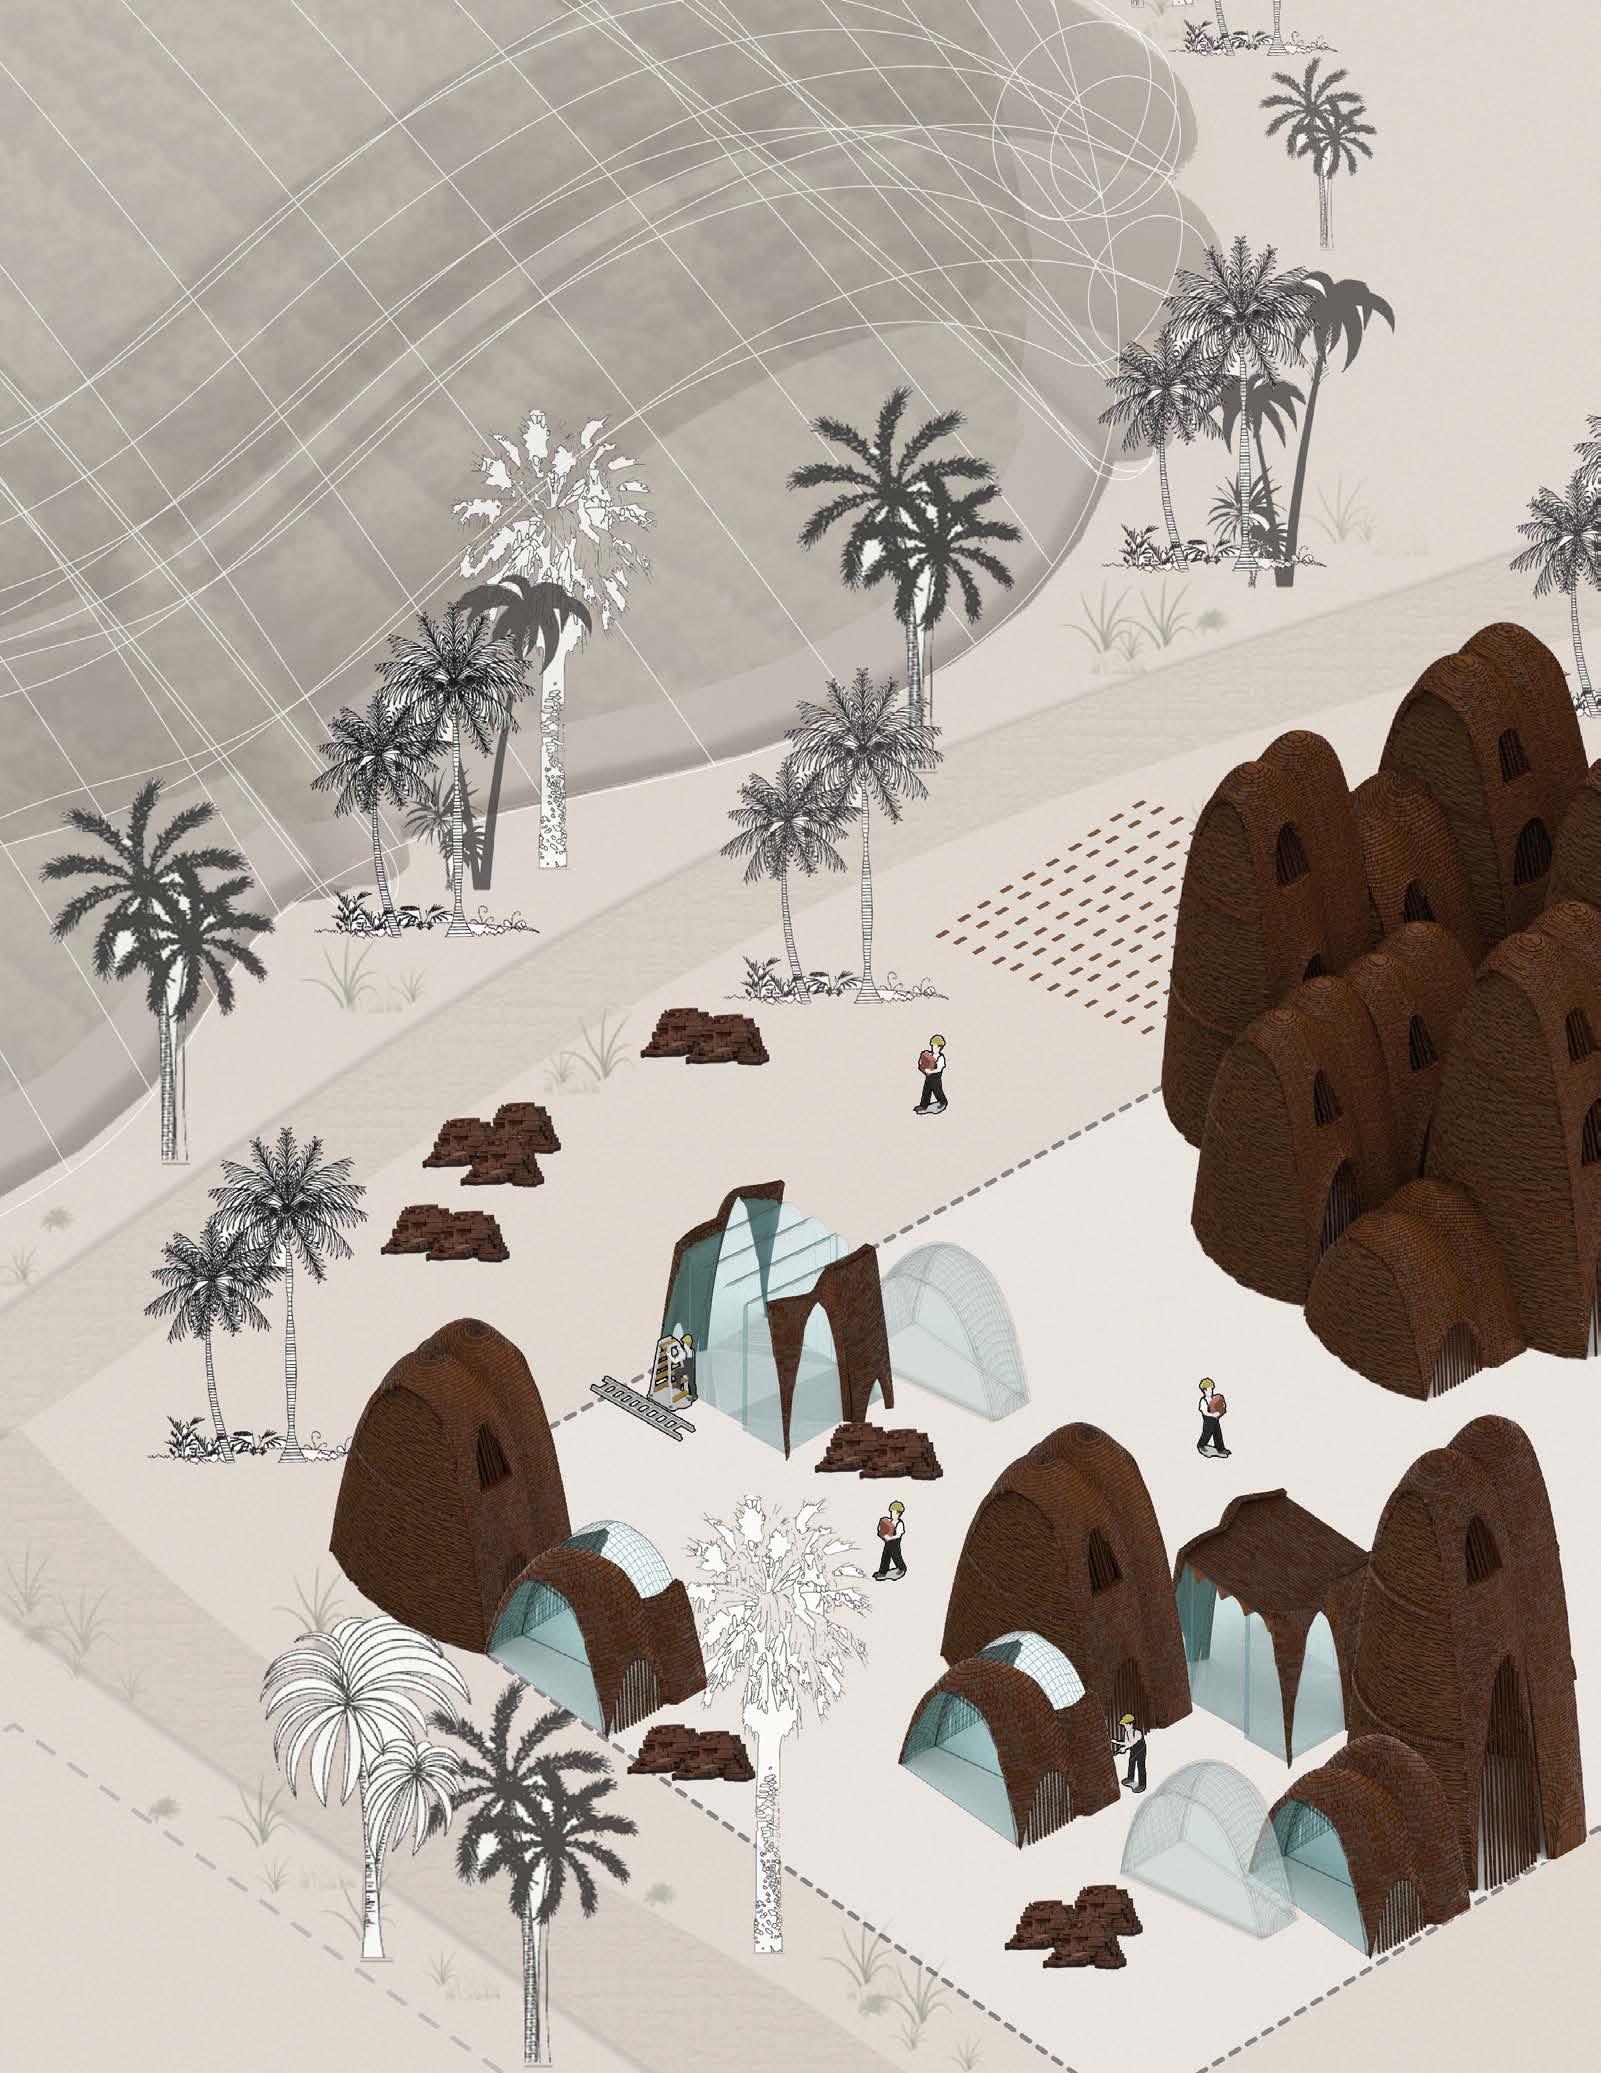
Local Scale Proposal Design Proposal
Construction Process
6.3.1.5. For the process of construction, both the pneumatic form-works and the bricks need to be made. For the process of the pneumatic formwork, the disposed of plastic in the area is the main material, which goes through a process of cleaning, cutting and heat sealing to produce the needed form-work, depending on which of the modules is going to be constructed.
After the pneumatic form-works are made, they are then transported to the site where the houses are being constructed, then they are inflated in the area with manual or battery air pumps, and then they are ready to be used for the construction of the houses.
After the vault has been constructed, the pneumatic form-work is deflated and taken out and the front and backside brick walls will start construction. The pneumatic form-work can then be reused for constructing another module.
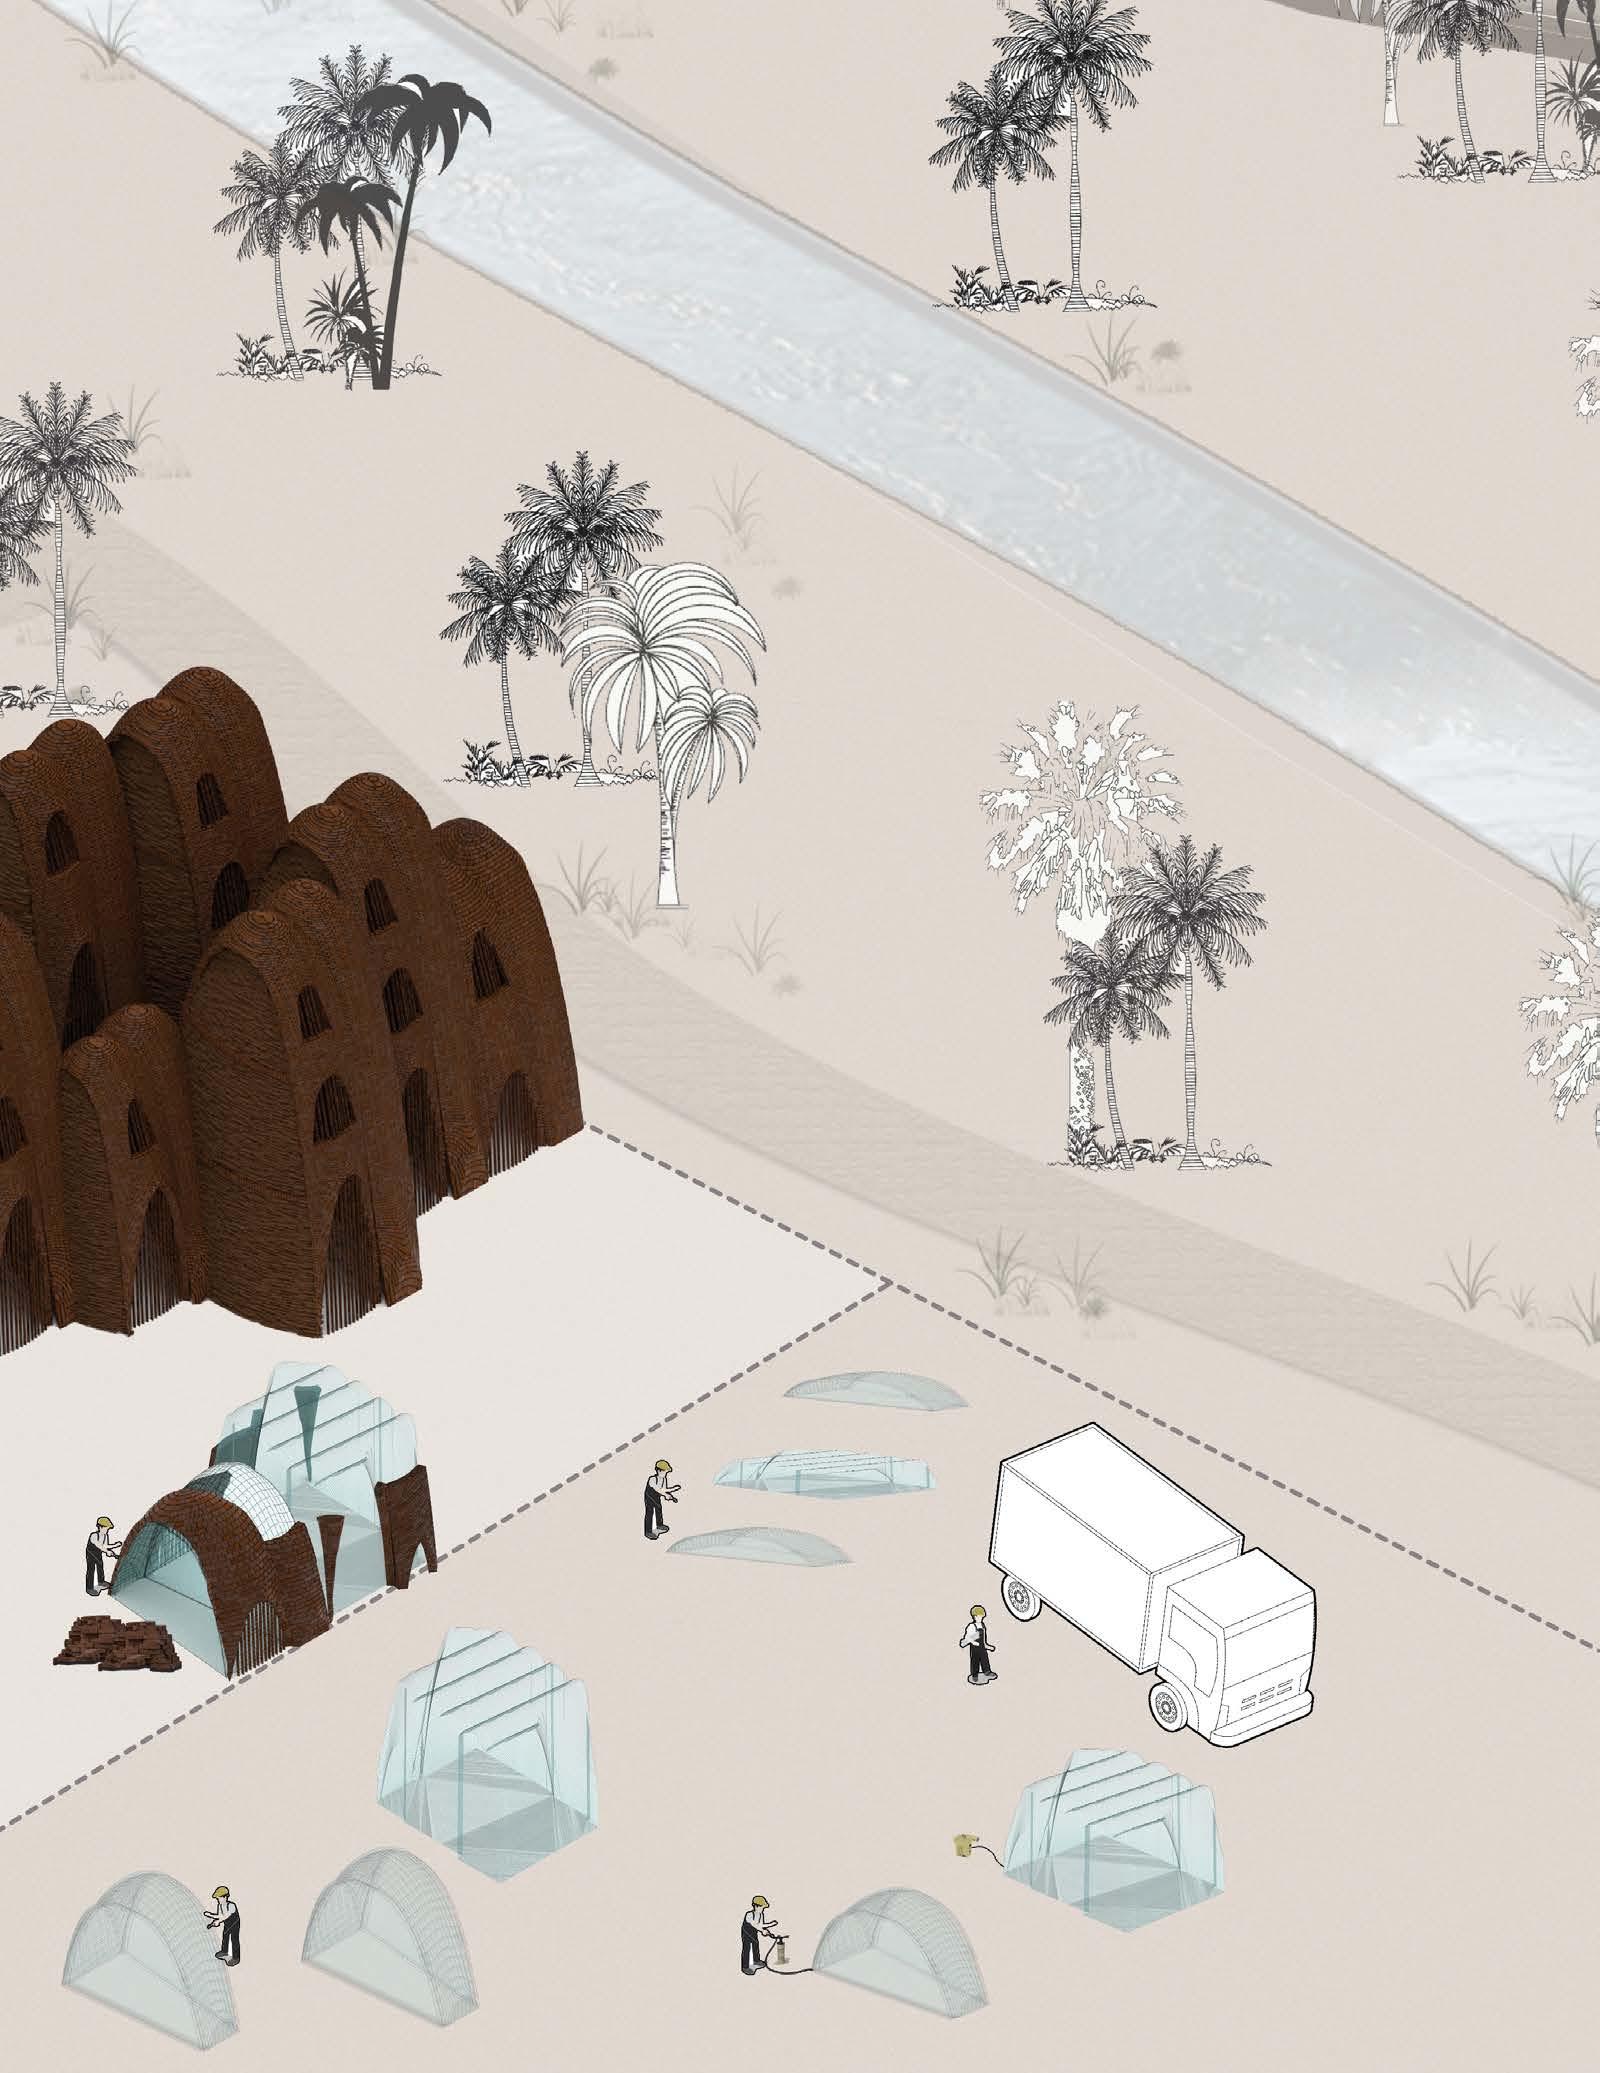
6.3.2. Greenhouses Proposal
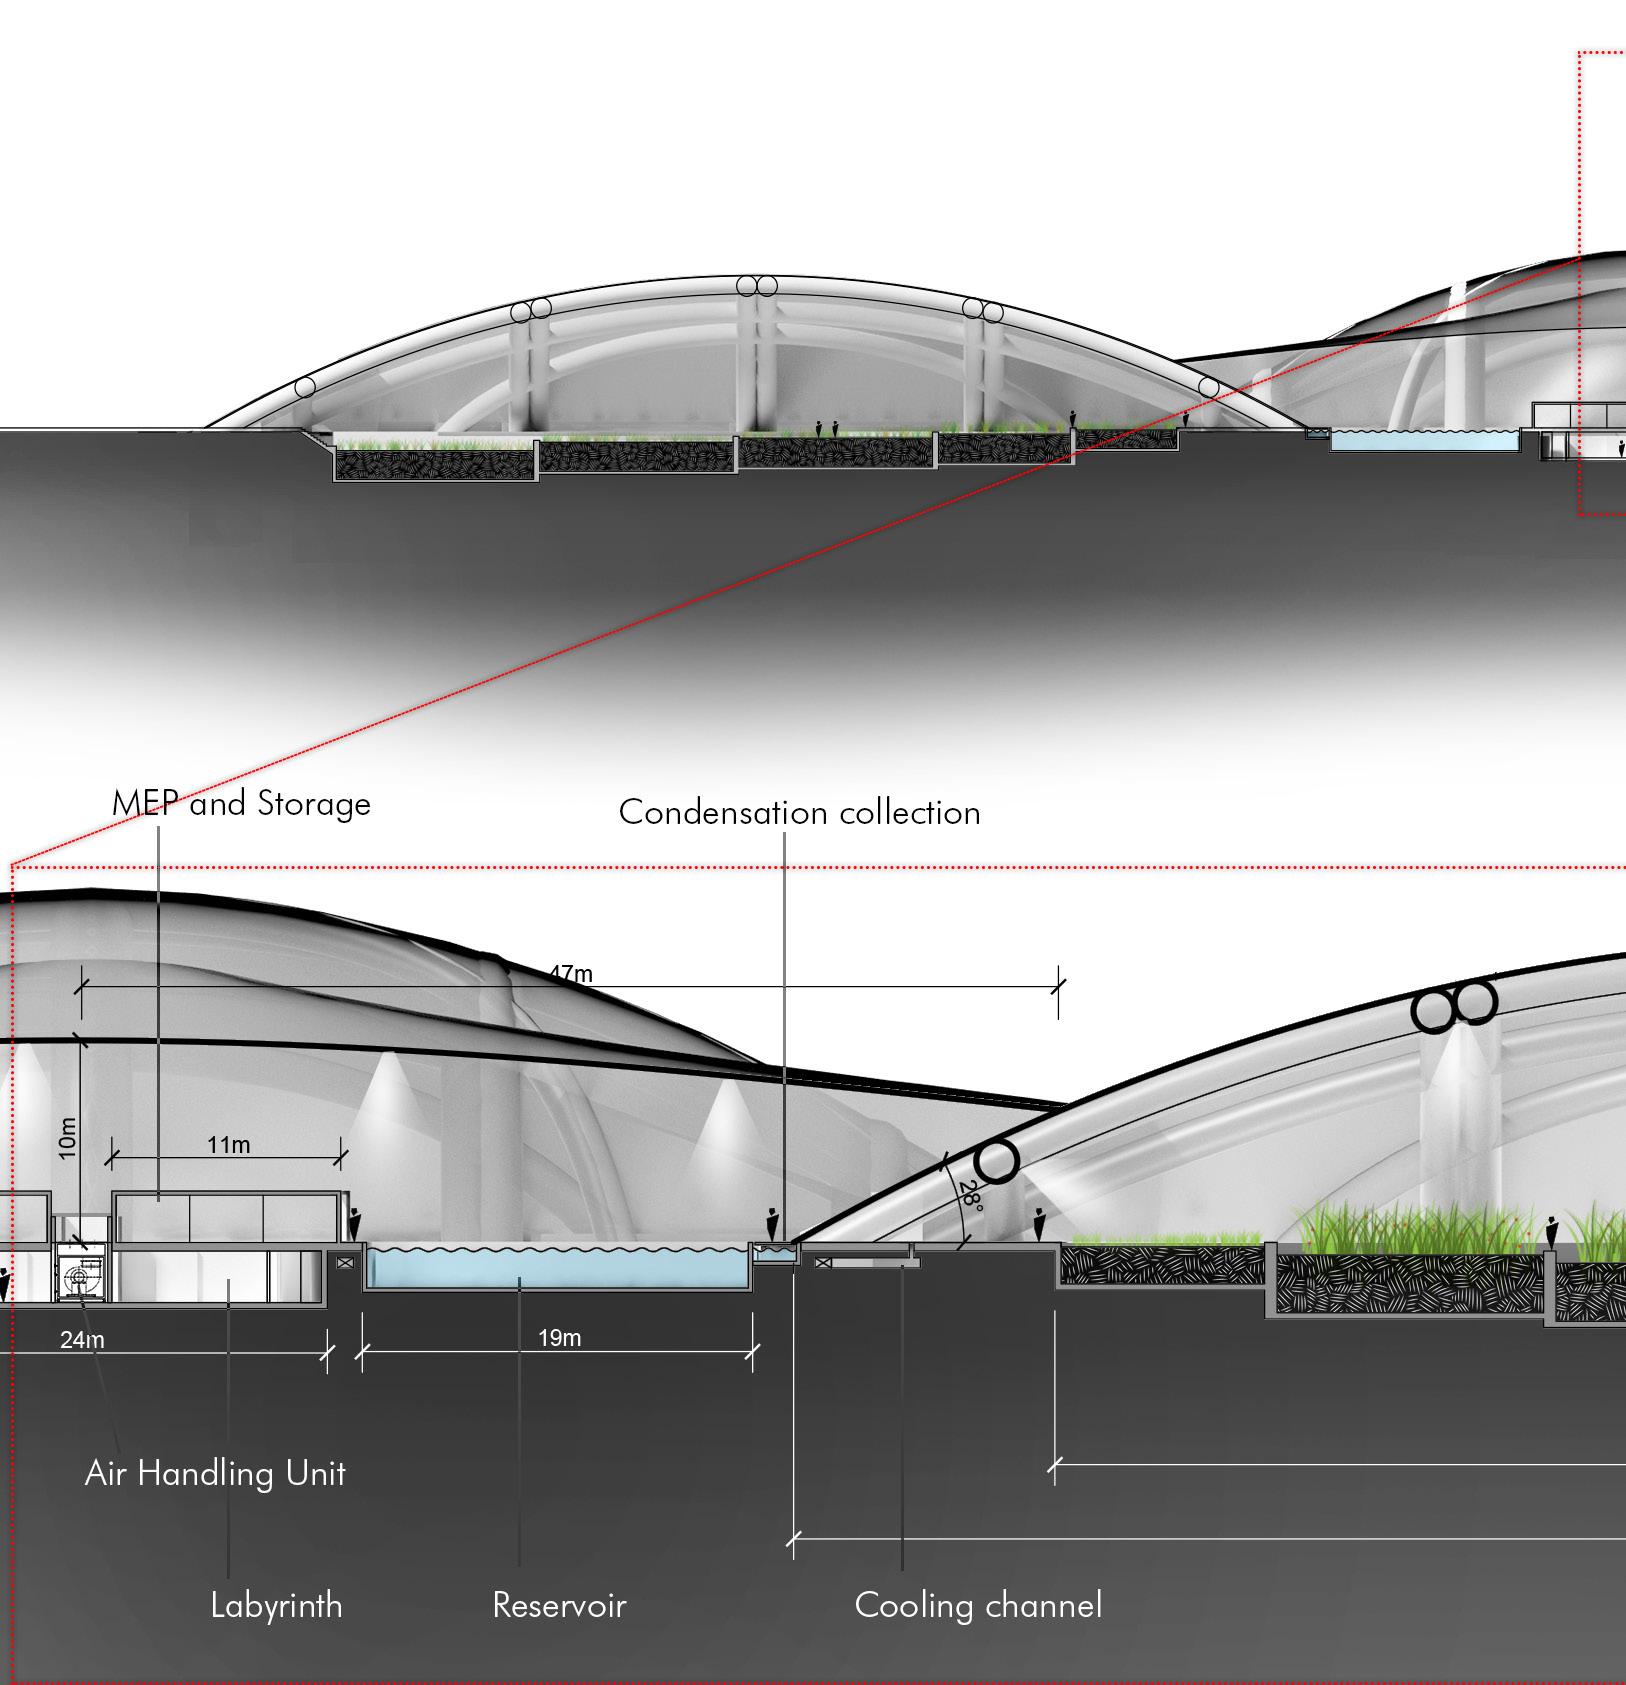
215
Architectural Proposal 6.3.2.1.
Local Scale Proposal Design Proposal
Local Scale Proposal Design Proposal
The pneumatic farmhouse features a span of 110 m, housing an area of about 700 square meters cropland per greenhouse. The peak height spans up to 15 meters, holding a volume of 28’000 meters cubed. This is significantly higher to the typical Almeria type greenhouse of the same crop size, which would be around 4000 meters cubed. This yields much greater thermal inertial than the traditional greenhouse, optimal for creating micro-climate. Furthermore, tall ceiling allows the mounting of all range of additional ceiling equipment, from mystifies to lights and climatic sensors. Tall ceiling also does not prohibit the growth of tall crops such as tomatoes, and allows various farming vehicles and tools otherwise too large to be used in traditional greenhouses. Terrace farming is incorporated, terracing downwards away from the desalination plant. As fresh water is provided to the closer crops, it natural transfers into the lower and further away crops. Double air lock door systems are established between each enclosed farmhouse, allowing movement of workers without breaking the hermitic seal of microclimates. Membrane of the desalination plant offers doubly curved surface that directs water to the side channels where condensation water is collected. This water circulates into a fresh water collection tank, to be later used for farming. An air handling unit is added to the labyrinth, as a back up when natural ventilation does not occur. MEP and
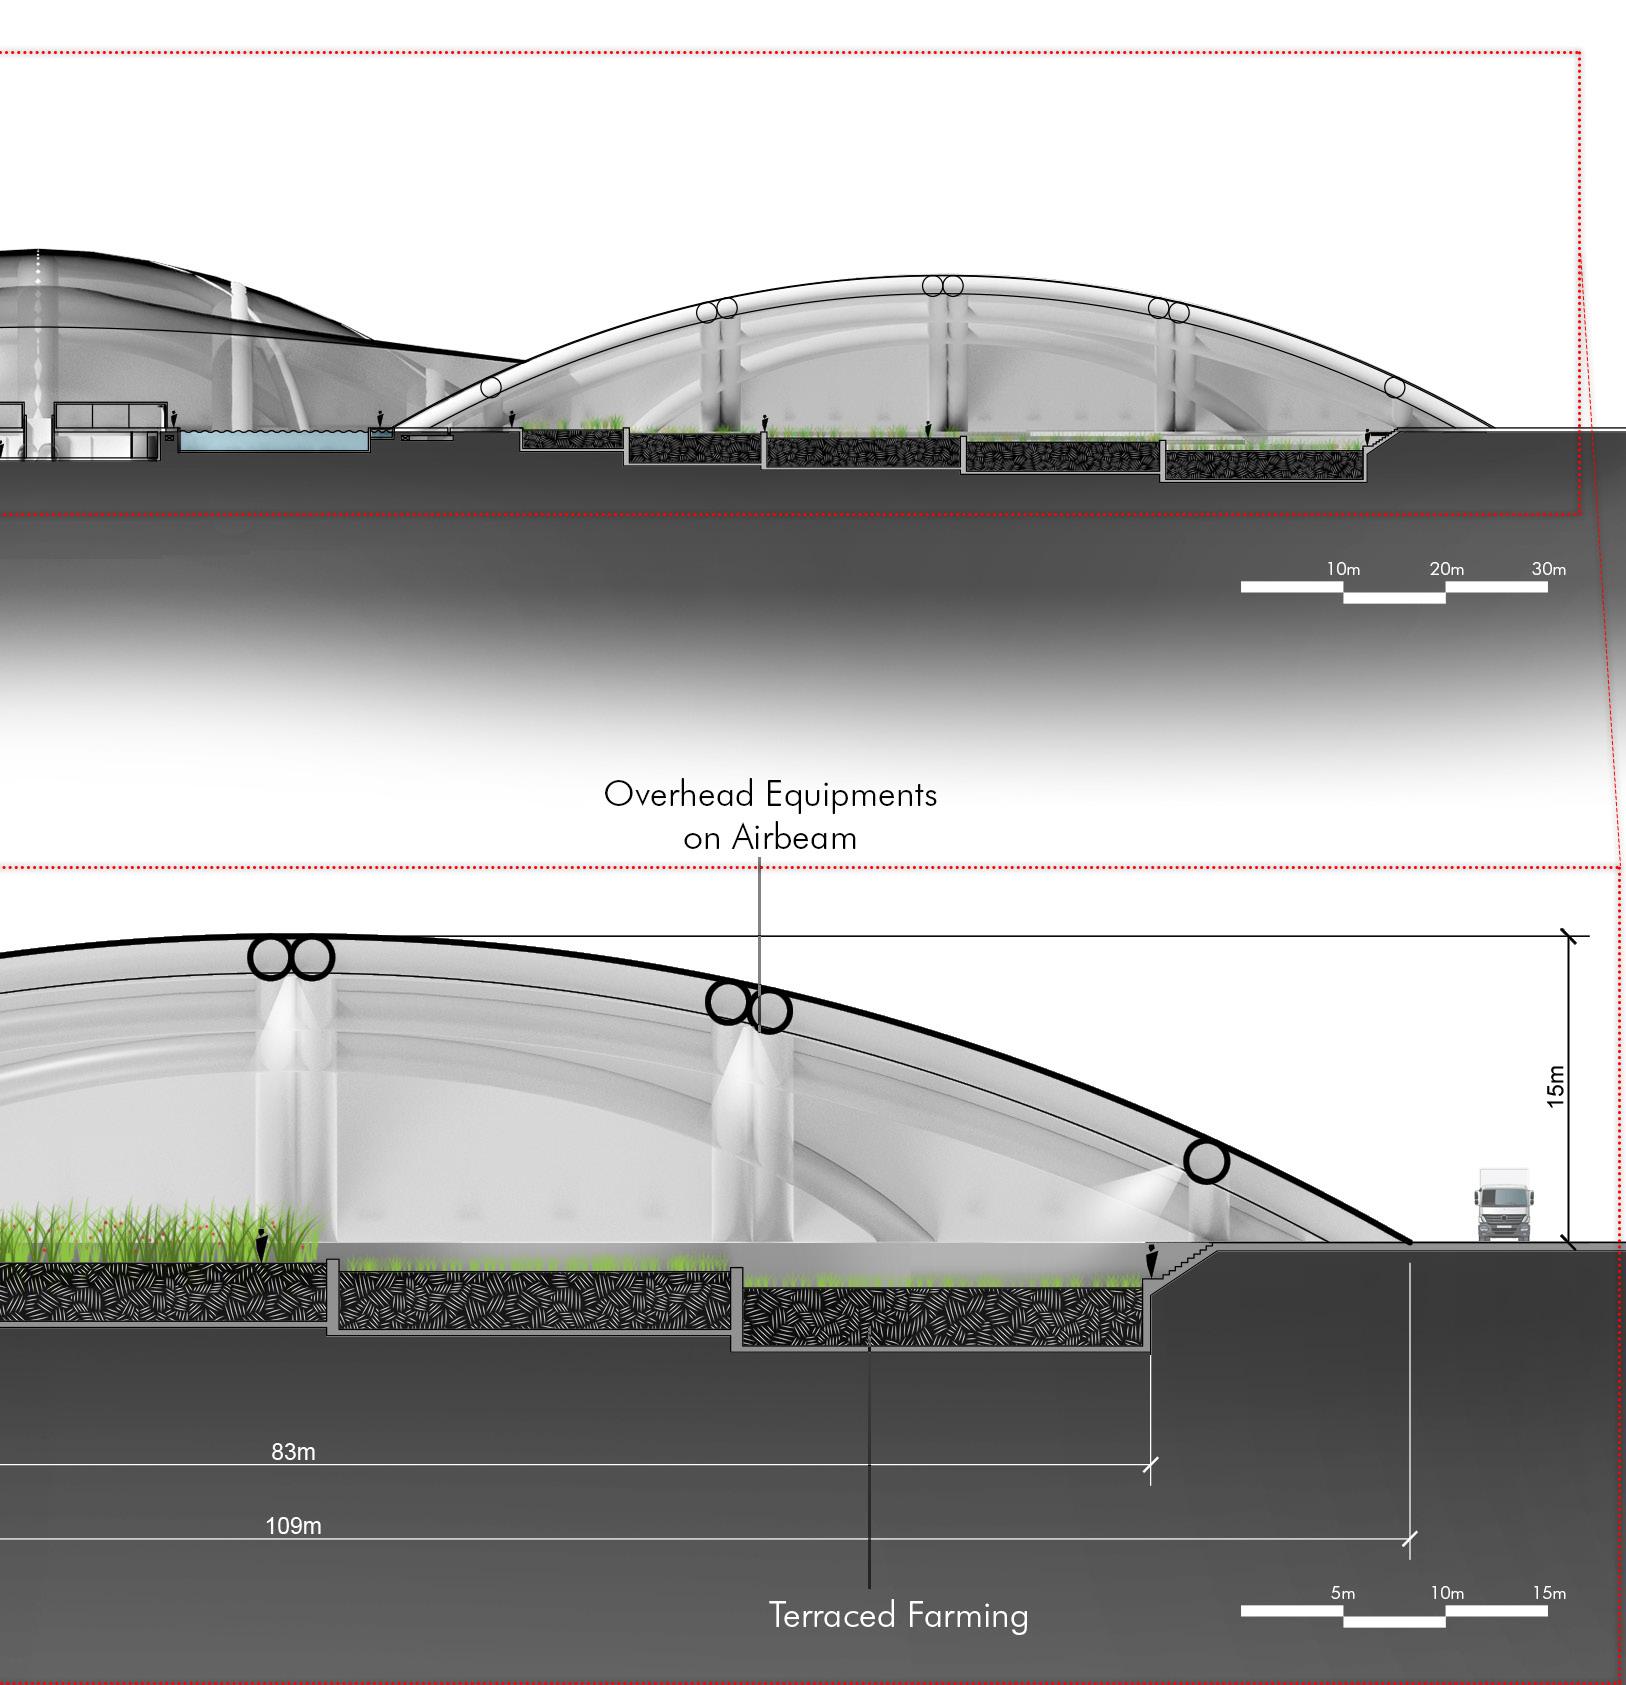
216
Local Scale Proposal Design Proposal
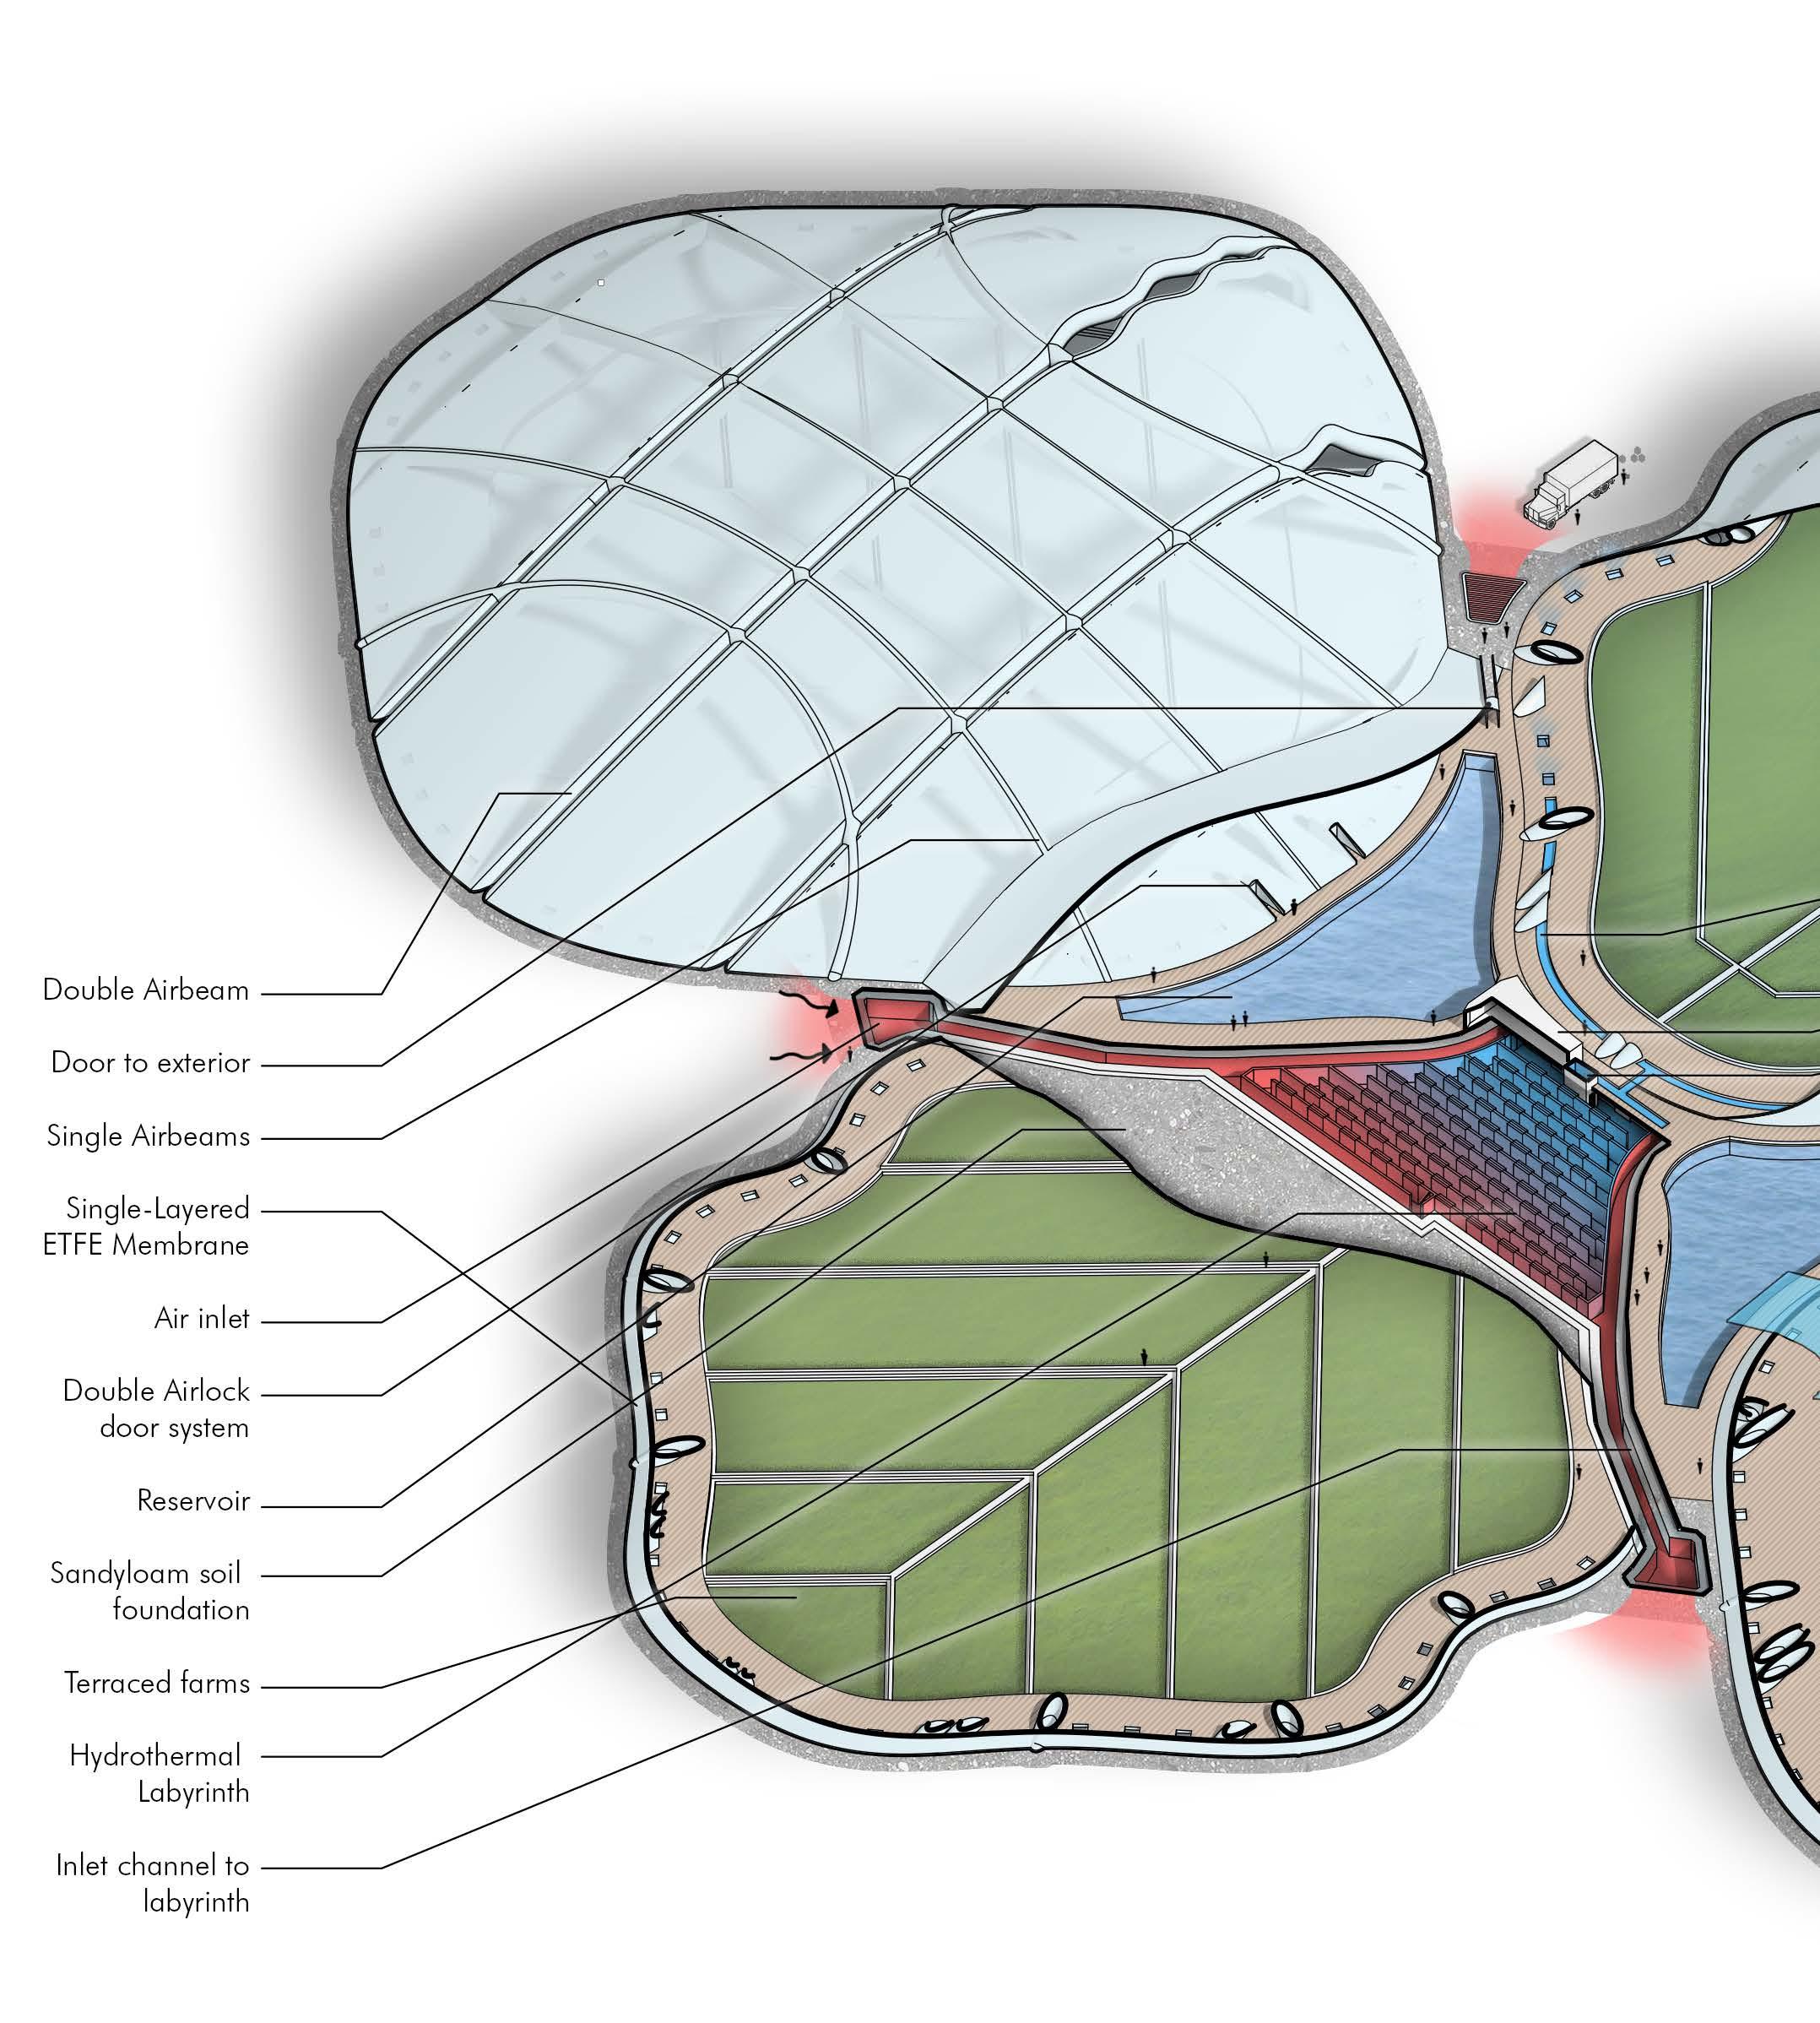
217 Systems Axonometric
Local Scale Proposal Design Proposal
6.3.2.2.
System Proposal
The architecture of the integration of hydro-thermal labyrinth and desalination system is established as an integral function of the bio-inspired greenhouse. At the center meeting point of the four greenhouses, a desalination plant is established, with saline water reservoir dominating most of the surface area. These reservoirs will be heated in the desalination plant and evaporate. Once condensed at the edge plastic membranes, the water drips down and is collected into a freshwater channel. Fresh water is then utilized for farming.
When the drawn air needs to be cooled, it travels through the cold-water channels of the labyrinth, where water is drawn directly from water streams. When the air needs to be heated, it travels through the warm—water channels of the labyrinth, where warmed water is drawn from the saline reservoir of the desalination plant. Utilizing the dichotomy of channels provide thermal control in the labyrinth.
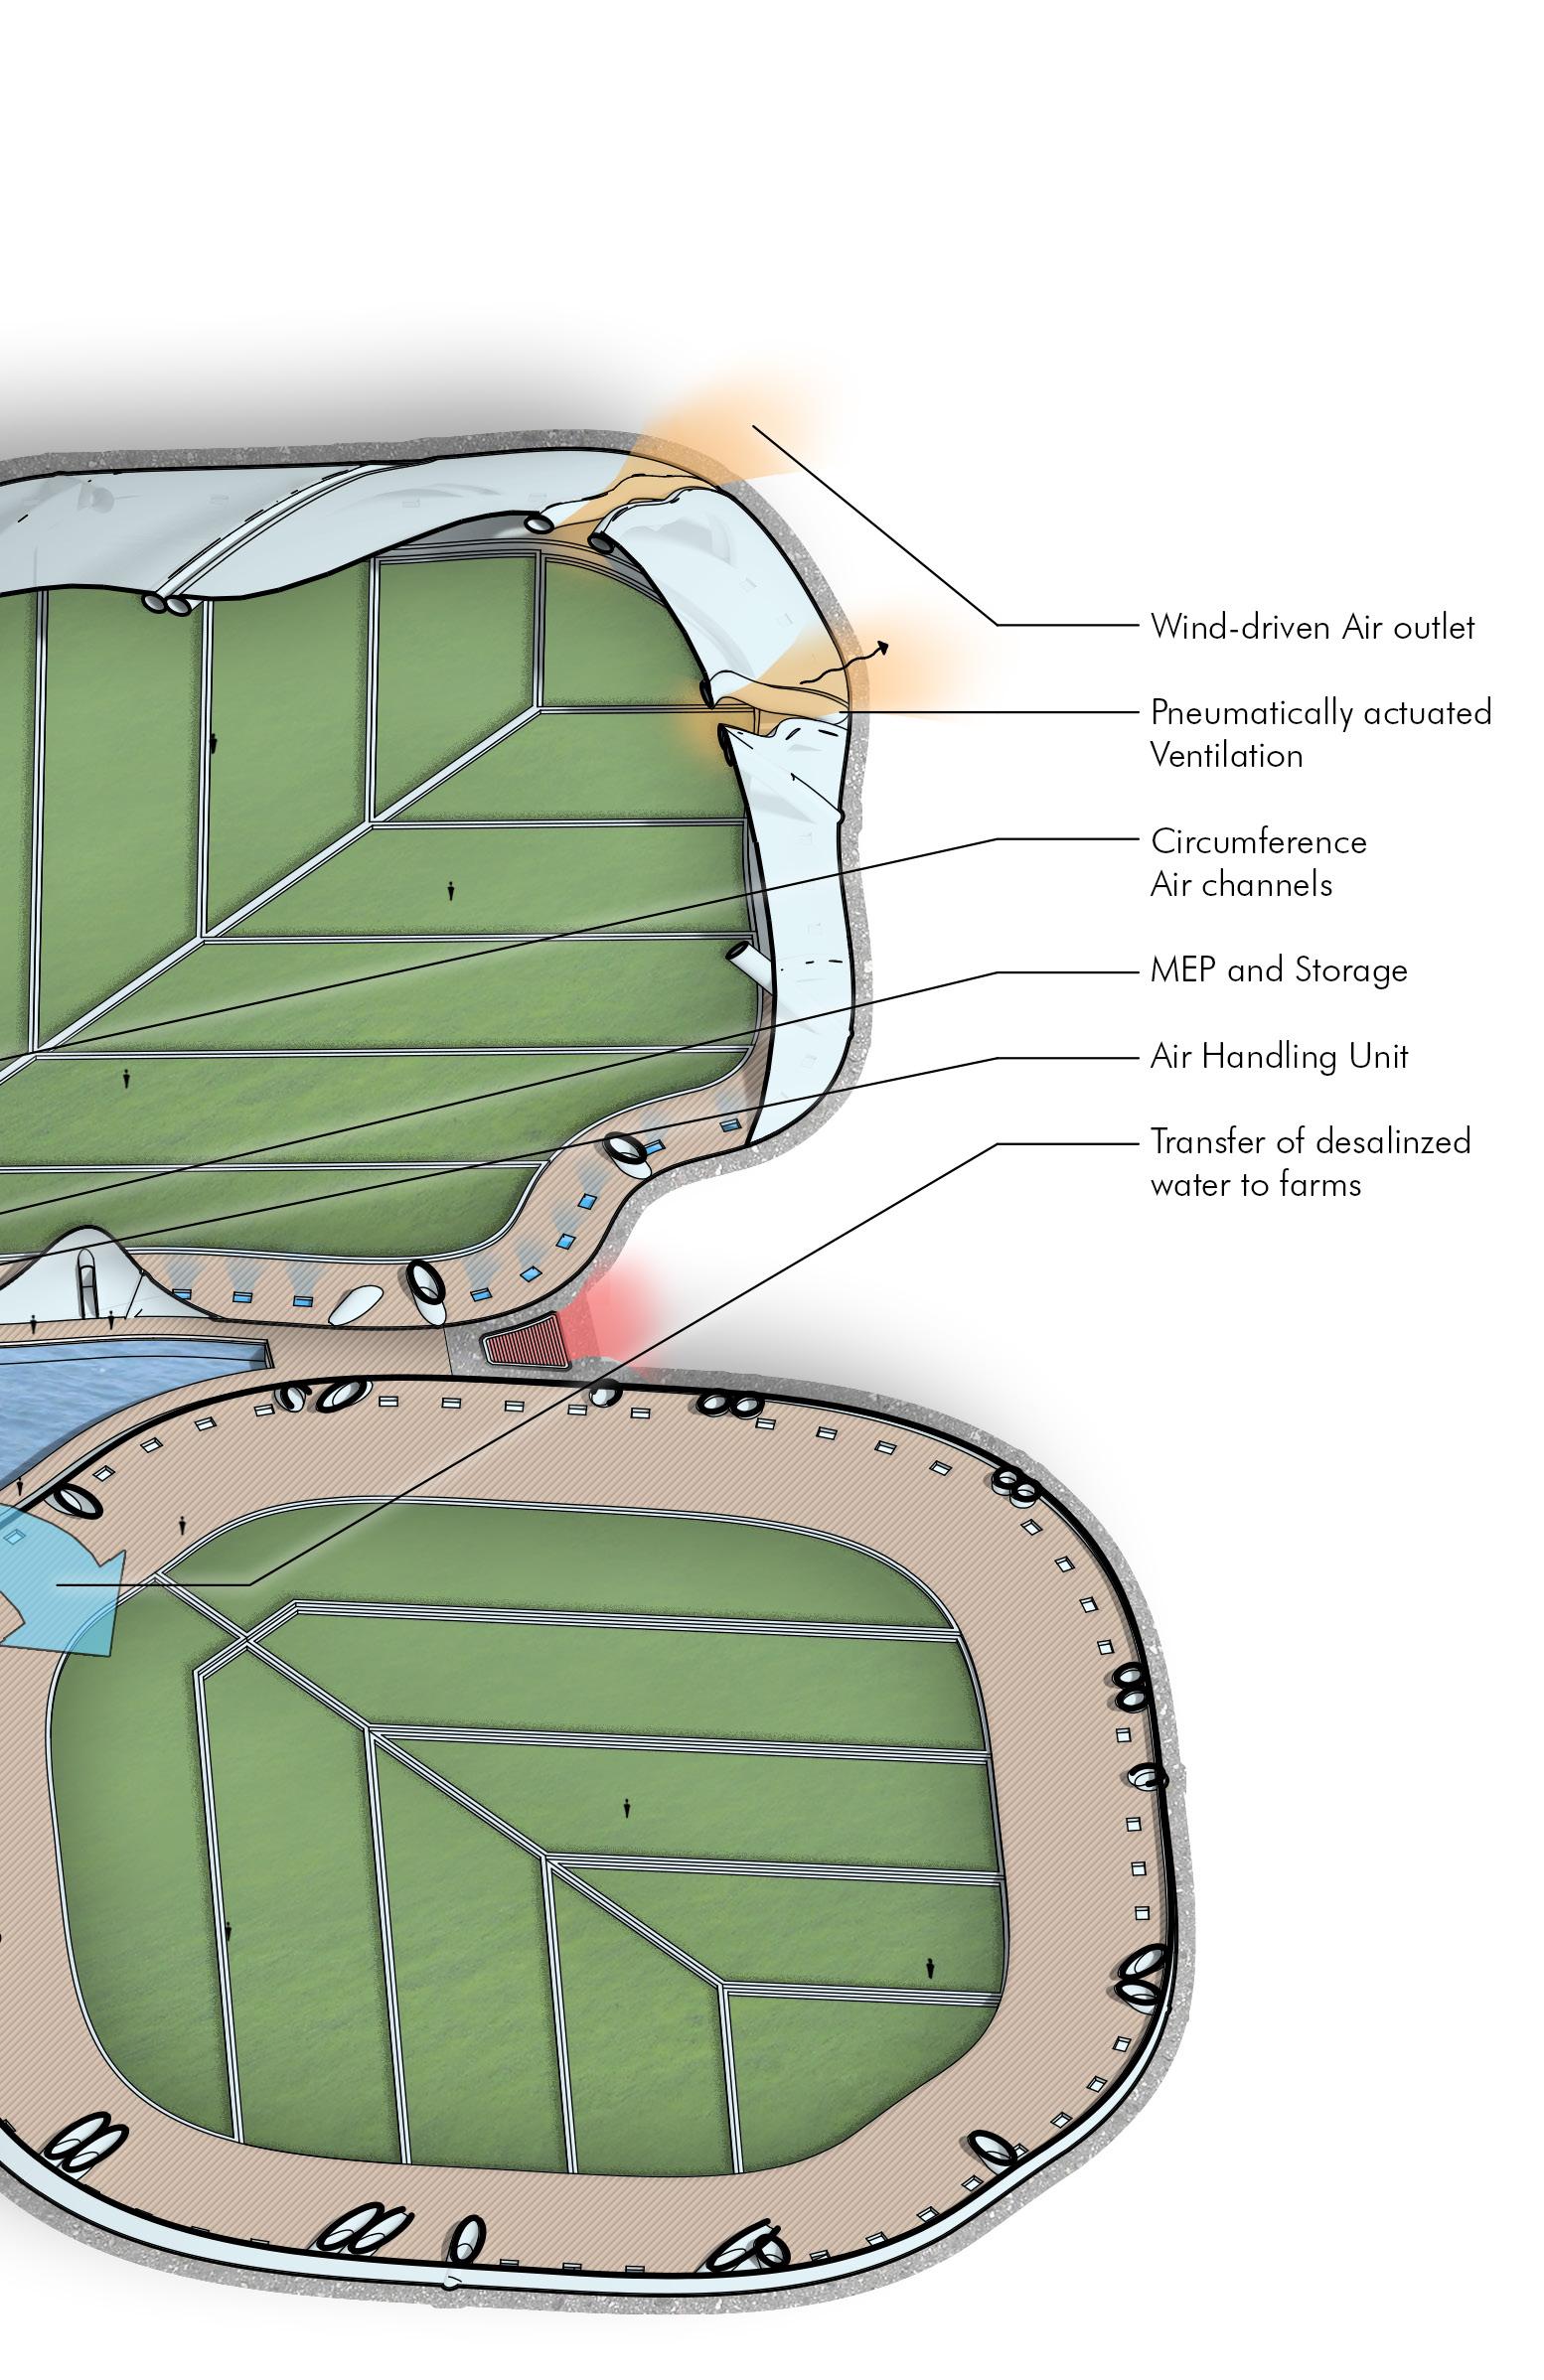
218
Local Scale Proposal Design Proposal
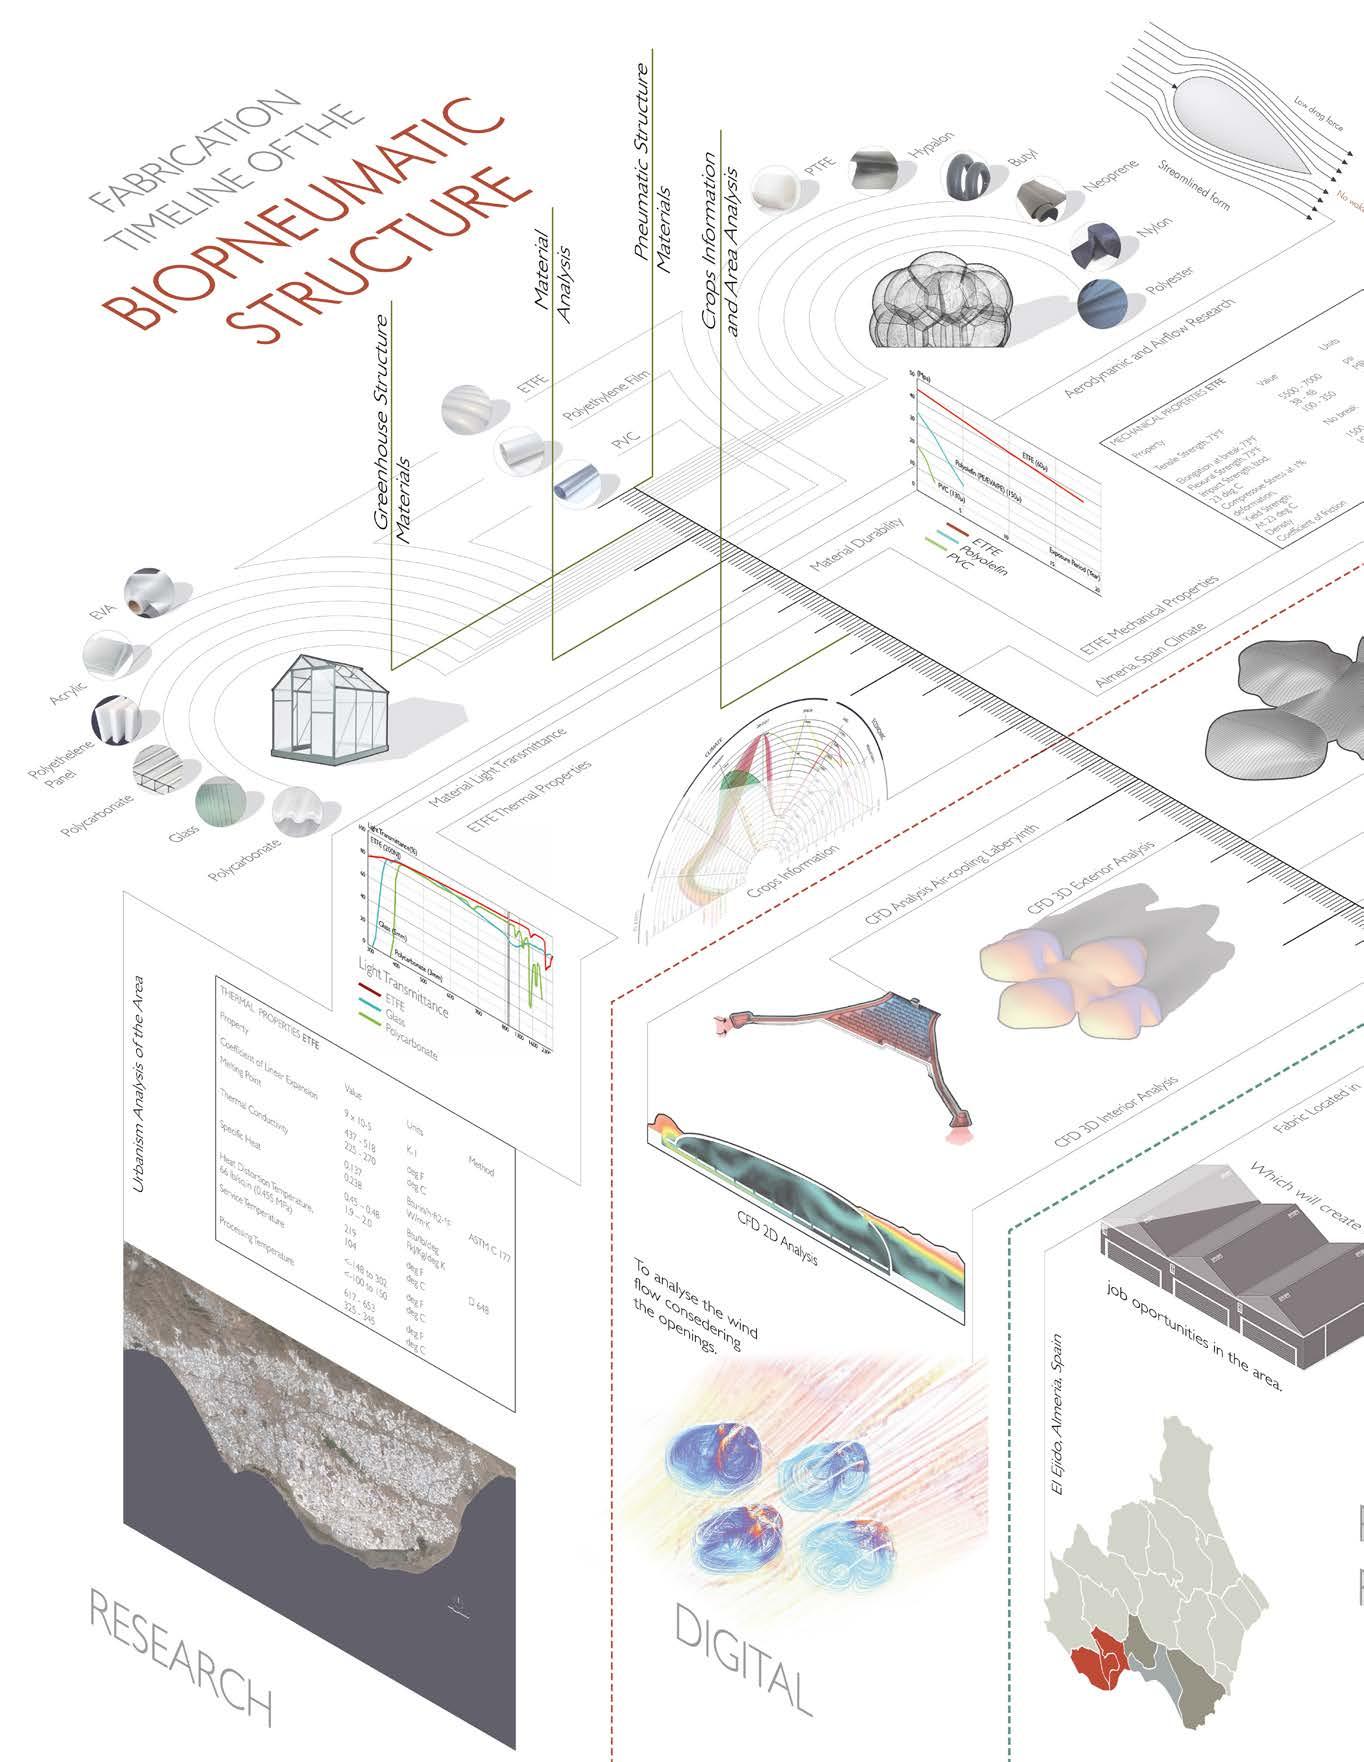
219
Local Scale Proposal Design Proposal
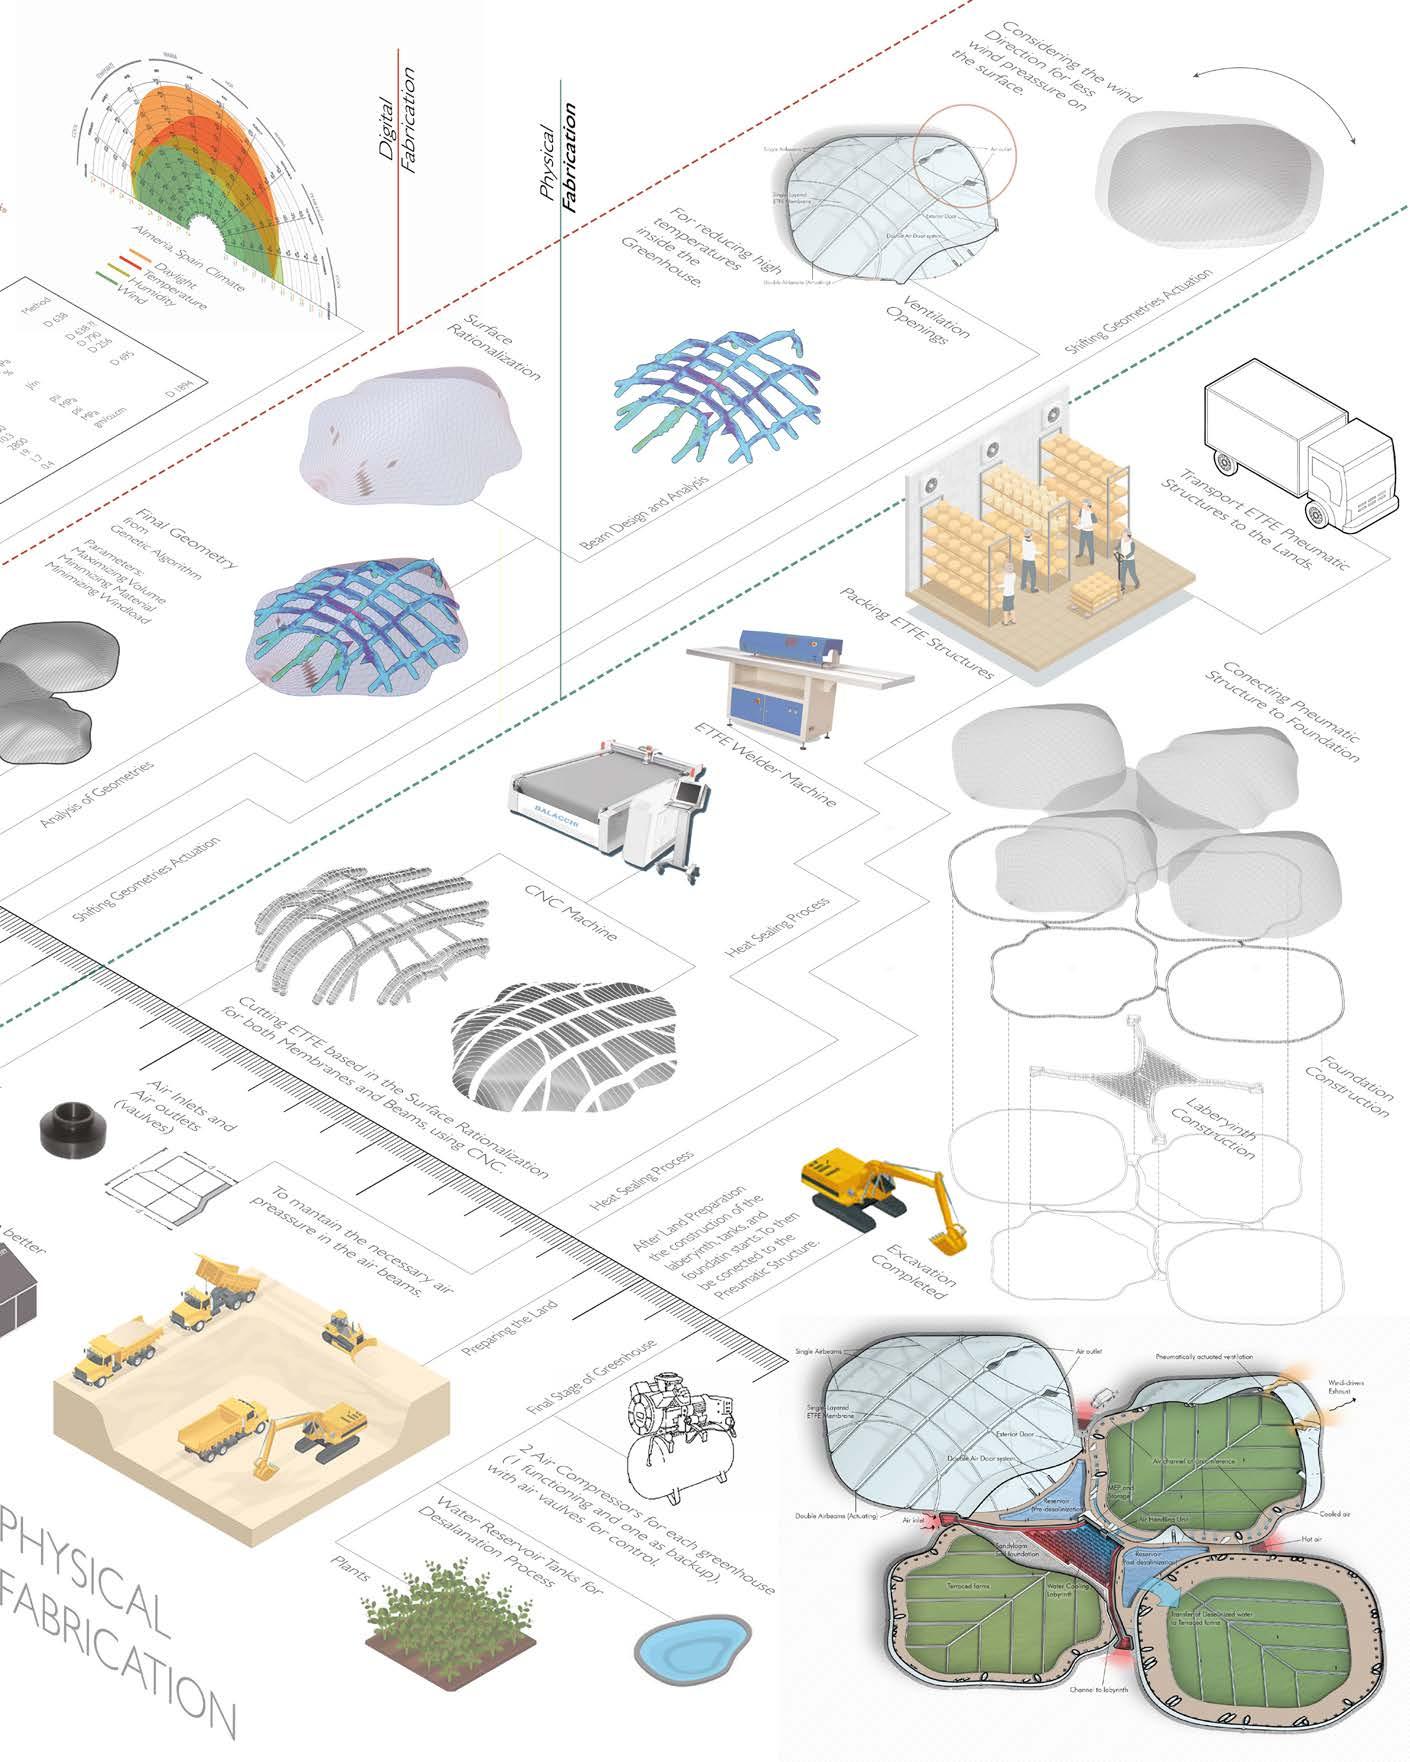
220
6.3.2.4.
Adaptation System
Local Scale Proposal Design Proposal
As one of the main ambition is to address the variation of climatic needs of crops, as well as the shifting environmental conditions of the region, various adaptation systems are integrated in the proposal.
Wind adaptation is the primary system, reacting directly to the shifting winds. The greenhouse actuates from east-wind-form to west-wind-form depending on the wind conditions. In addition, during occasional turbulent wind conditions, it retracts to neutral position: the intermediate position between the two extremes, allowing equal wind load resistance on all sides.
Temperature adaptation is achieved by the labyrinth heating/cooling system. On a typical day, within the 24-hour timefr ame, the system will typically be used as cooling from around noon to 6pm and warming during 9pm-6am. This time frame is also based on the crop requirements. Such system provides constant moderation of temperature to ensure plant’s maximum survival and quickest growth in ideal conditions.
Magnitude control of the labyrinth heating/cooling system is achieved by controlling the extent of ventilation. Varying the sizes of ventilation allows the halting, slowing, and quickening of the heating/cooling effect.
Humidity adaptation is also incorporated, to address the seasonal humidity variation to a crop’s ideal humidity range. When internal conditions are too humid, opening ventilation to maximum capacity can quickly decrease humidity, as external humidity always falls below the range of internal humidity. When internal conditions need more humidity, the airlock doors between the farm and the desalination plant is opened, transferring humid air from the desalination plant to the greenhouses. Because the desalination plant already holds high humidity from the water evaporation process and the water in the air is desalinated and ideal for crop, using it for humidifying the greenhouse is a quick and effective process.
221
Local Scale Proposal Design Proposal
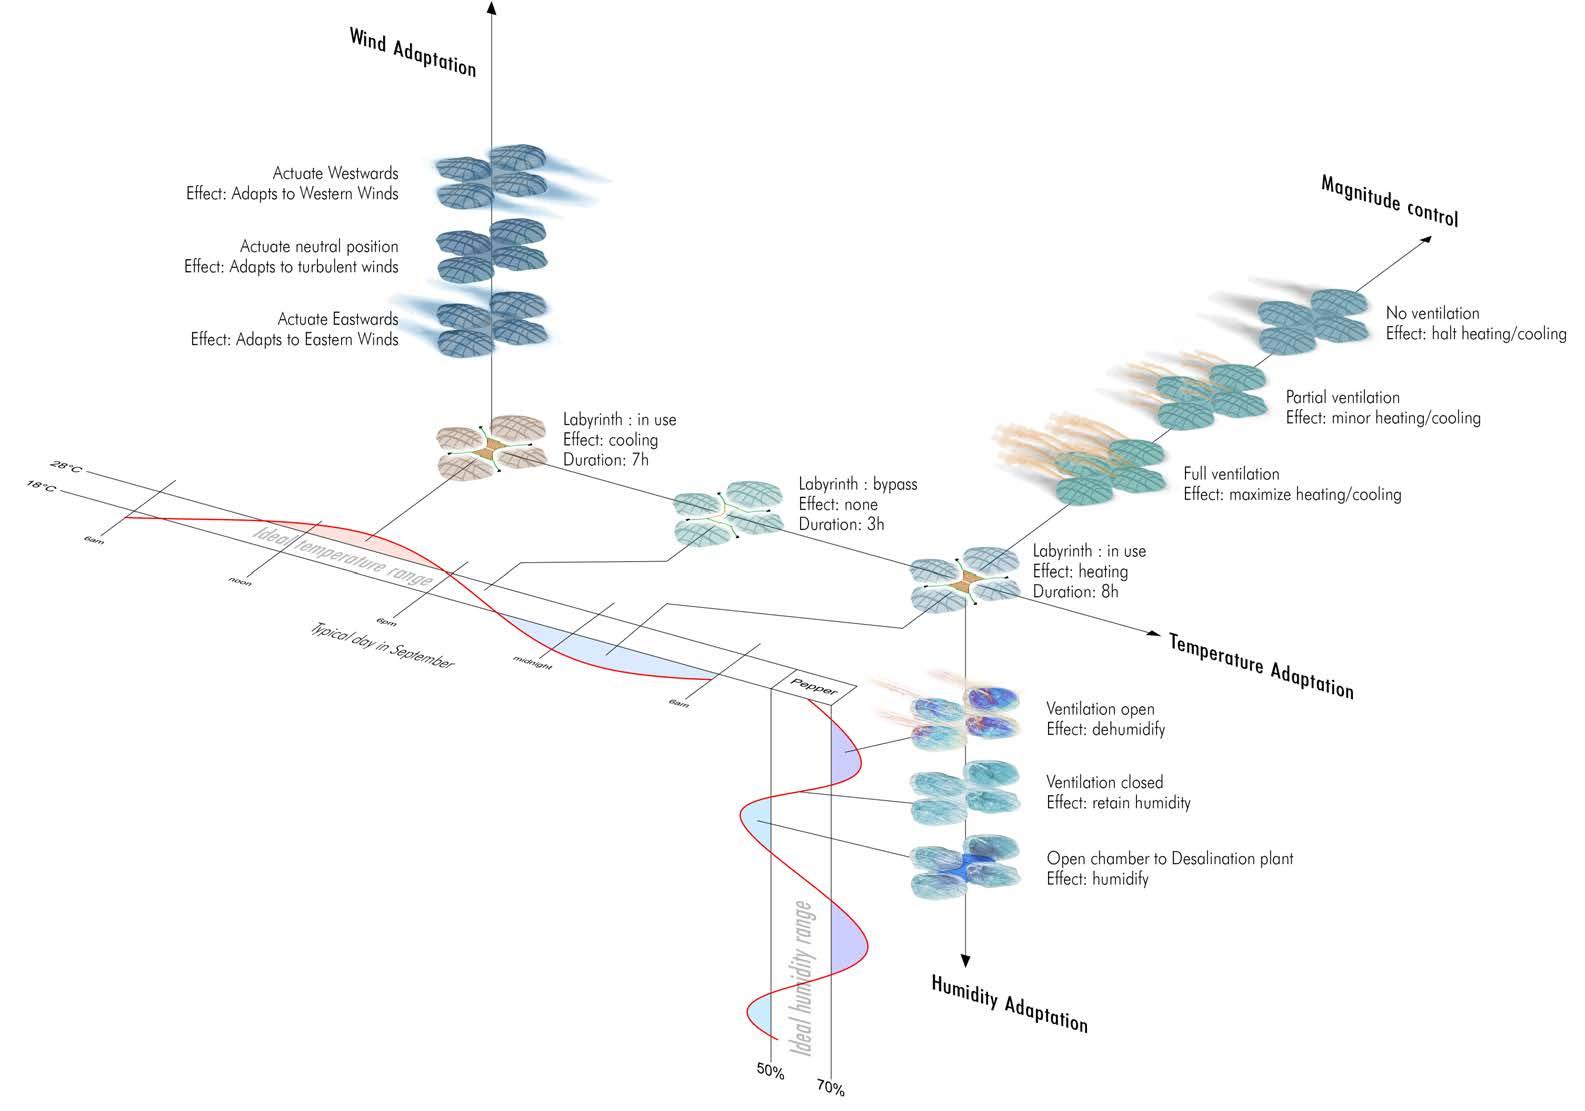
222 Systems adaptation diagram
Local Scale Proposal Design Proposal
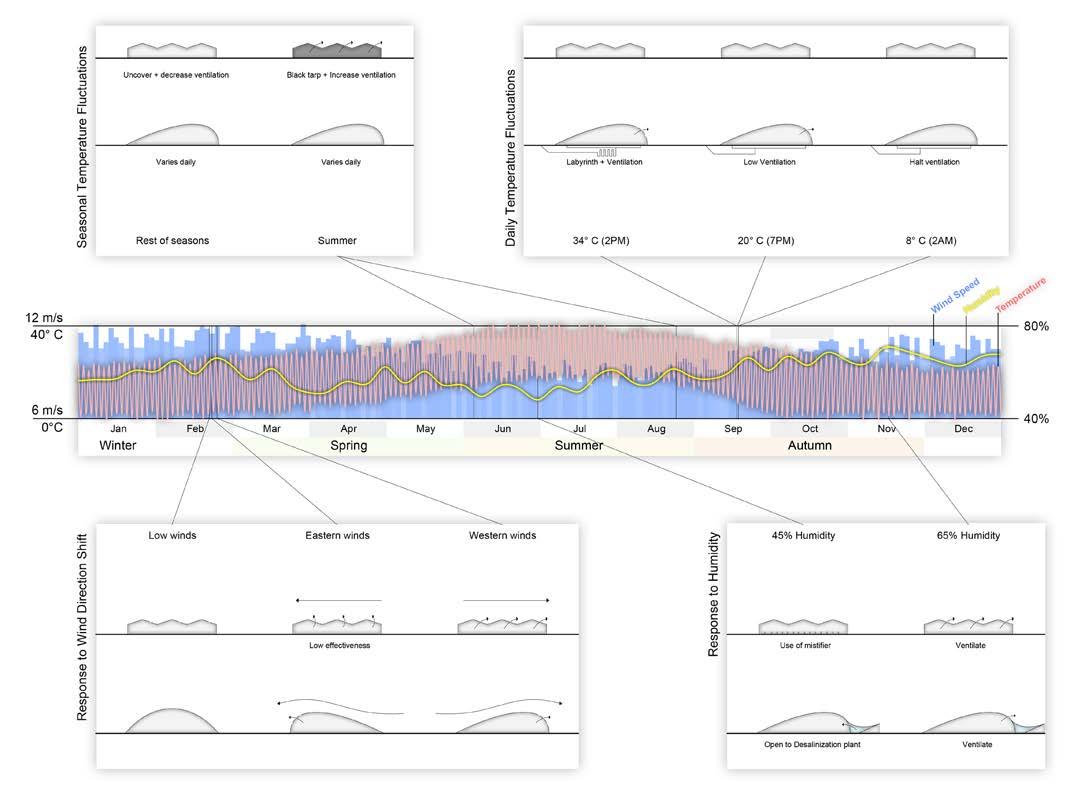
The newly proposed system features an adaptation system that is much more versatile and reacts to shorter time frame changes as opposed to the conventional system. Conventional Almeria greenhouses react to temperature requirements seasonally, where they cover greenhouse with black tarp and increase ventilation during the summer and uncover greenhouse and decrease ventilation during winter. The proposed system offers temperature adaptation that is daily rather than seasonally, providing labyrinth cooling during hot times of the day, and labyrinth cooling during cold times of the night. This adaptation can also be sensitive to extreme climate conditions.
Traditional greenhouses offer fixed orientation to wind, where ventilation efficiency completely depends on direction of wind. The proposed system offers wind optimized morphology, that can be actuated within the hour, providing more dynamic and rapid response to wind direction changes.
In response to humidity changes, traditional greenhouses use mistifiers to humidify, which uses up fresh water resource. The new system uses humidified air from desalination plant to humidify. This in turn does not use up fresh water resource, and it utilizes renewable solar energy.
223
Comparative performances Comparative Performance Timeline 6.3.2.5.
Local Scale Proposal Design Proposal
The greenhouse prototype is primarily constructed of structural air beams. A single layered ETFE membrane is attached along the exterior side of the beams. As the membrane is synclastic, it is rationalized as planar triangle components, where it is to be assembled during prefabrication and shipped to site during construction.
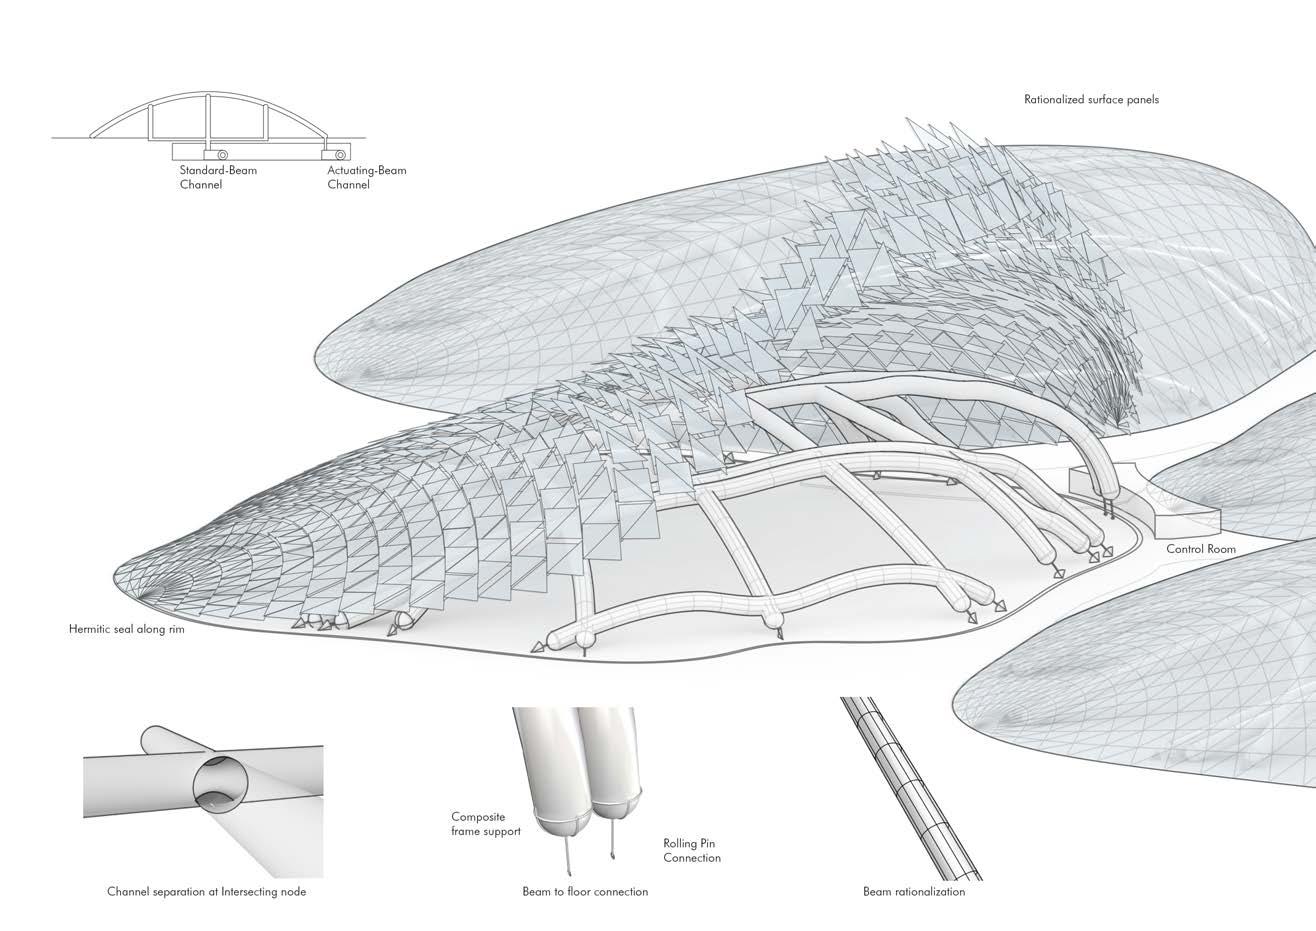
Two main air channels operate the air beams, standard-beam channel and actuatingbeam channel. The standard-beam channel is connected to the lateral beams, which do not actuate. A constant pressure is supplied to the standard-beam channel. The actuating-beam channel hosts two sub-channels, for east and west form actuation. During actuation process, the pressurization directs from one sub-channel to the other, activating different structural air beam at different wind conditions.
Since the linear and lateral beams share different air channels, they must be hermetically separated at all joints. As seen in the diagram, the node consists of two intersecting channels, and a node geometry that separates the two air channels. One channel can be activated in isolation.
Due to the actuation of the beams, beam-to-floor connections is developed to allow a degree of torsional motion. End of the beam is encased with composite frame support, which is connected to rolling pin connection to the floor.
Overall, all beams are rationalized into pieces ideal for fabrication. The air beam components will be prefabricated off-site, connected to each other at the nodes. Both the prefab air beam components and the membrane will be shipped to site during construction. Once foundation is laid, the air beams will lock onto the site at the pin connections. Membrane will be attached at joint area, and the entire assembly will be inflated. This construction process eliminates the use of cranes, and only uses pressurized air to erect the structure.
224
Components diagram
Component Specification in Actuation System 6.3.2.6.
Time: 0 min
East-form Beams: 5 kPa
West-form Beams: 0 kPa
Local Scale Proposal Design Proposal
Time: 4 min
East-form Beams: 4 kPa
West-form Beams: 1 kPa
Time: 8 min
East-form Beams: 3 kPa
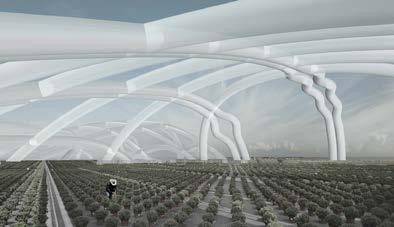
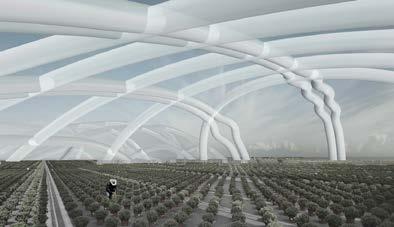
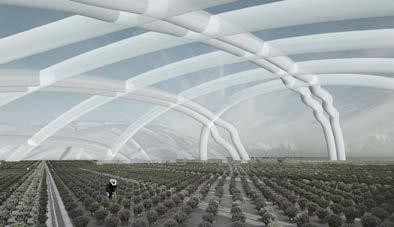
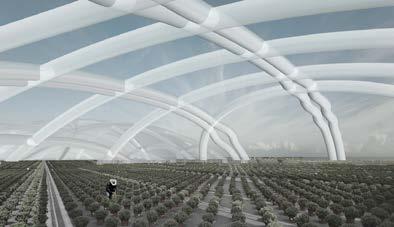
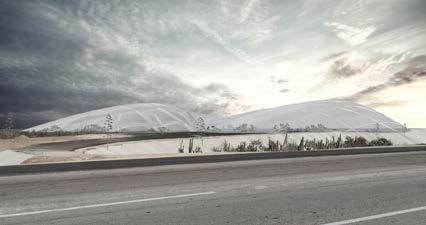
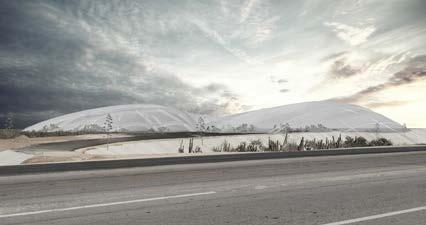
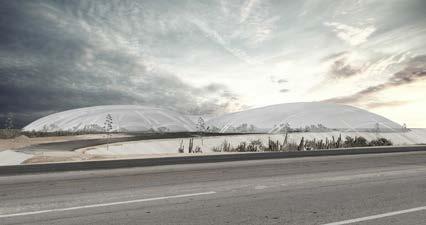
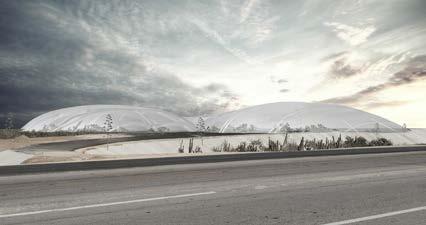
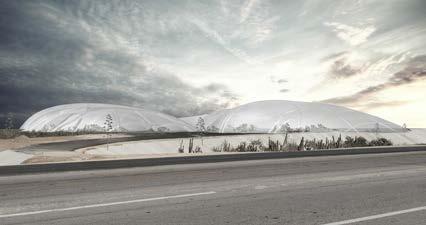
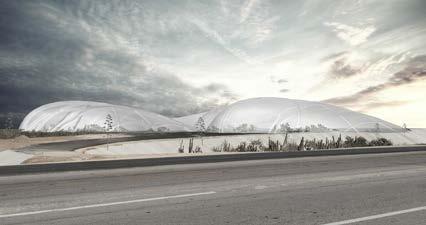
West-form Beams: 2 kPa
Time: 12 min
East-form Beams: 2 kPa
West-form Beams: 3 kPa
Time: 16 min
East-form Beams: 1 kPa
West-form Beams: 4 kPa
Time: 20 min
East-form Beams: 0 kPa
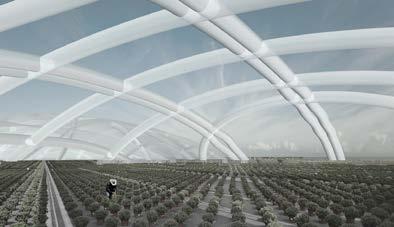
West-form Beams: 5 kPa
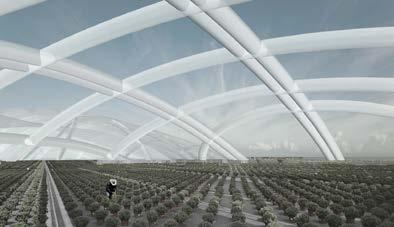
225
Actuation Time Frame 6.3.2.7.
Local Scale Proposal Design Proposal
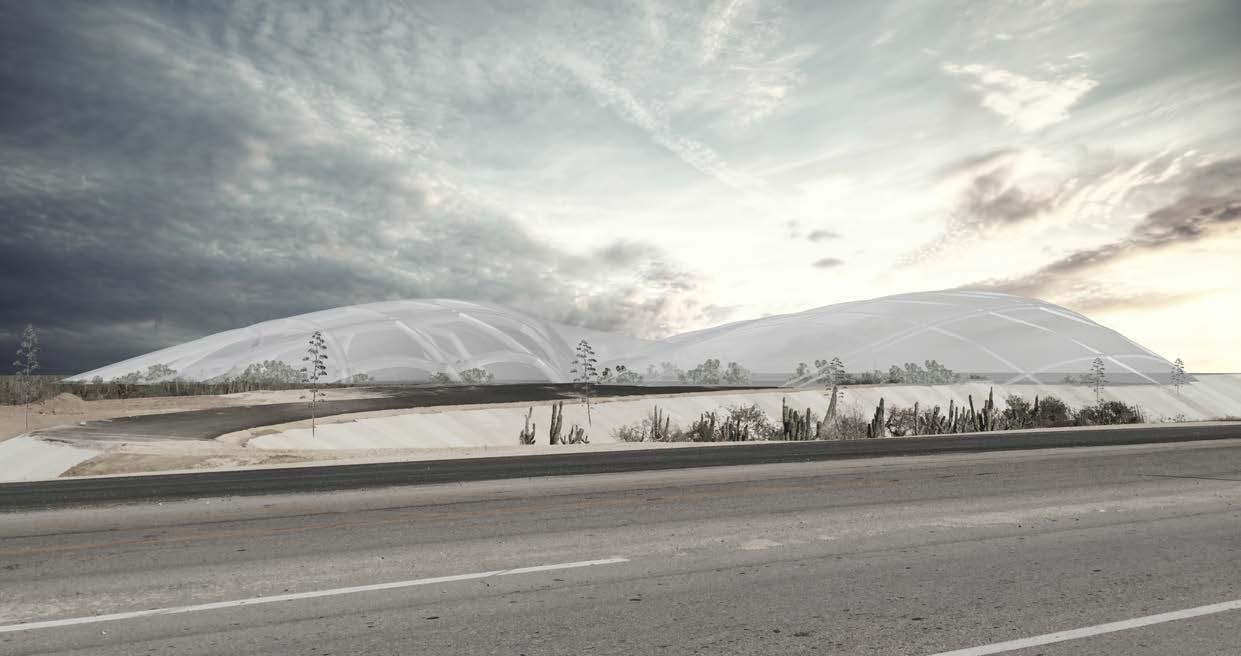
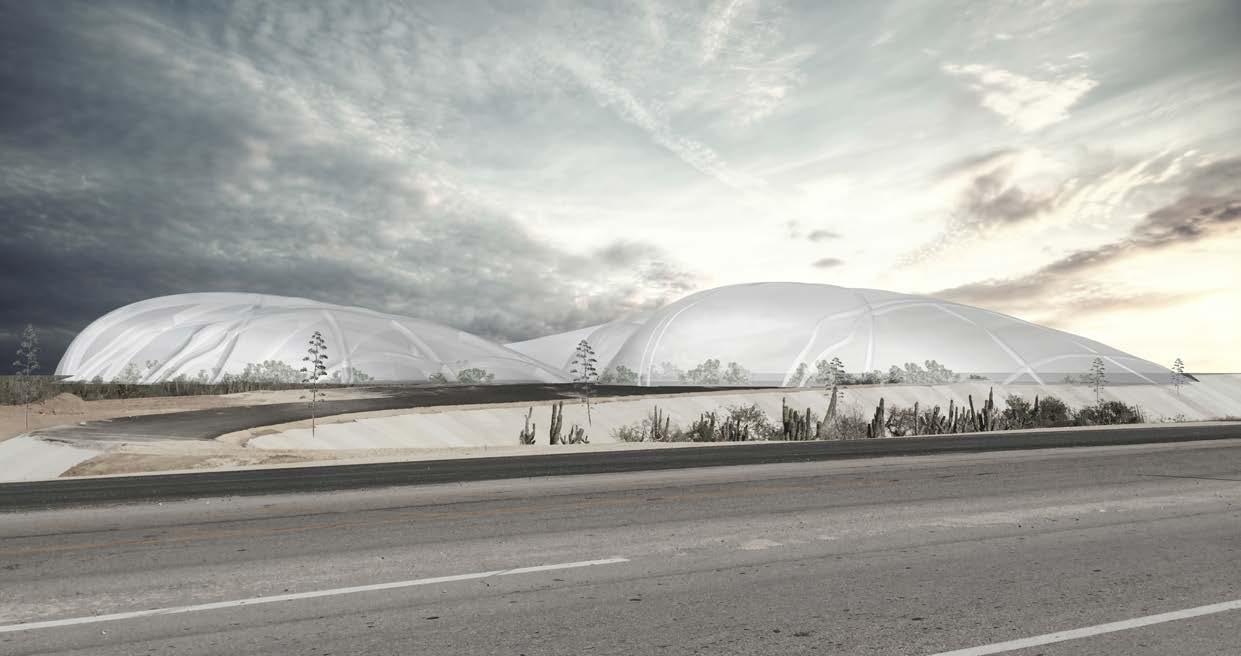
226
Actuating West-wind form
Actuating East-wind form
Local Scale Proposal Design Proposal
6.3.3. Desalination Device
The desalination device design aims to address the freshwater scarcity issue within the migrant communities. It is a closed pneumatic structure with two parts.
The upper transparent part which collects solar energy. The surface curvature also allows condensation recollected to the base. The lower part is two separate water tanks: one for seawater input and one for freshwater output. The massing is optimized to increase the south and west surface area to harness more solar energy.
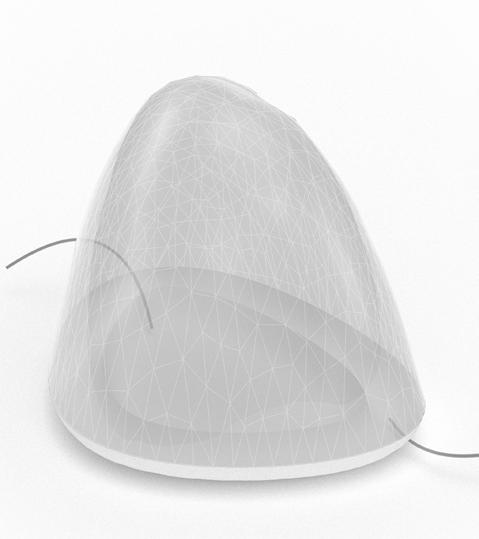
The proposed material for fabrication is ETFE recycled from the greenhouse material. After the films are recycled and cleaned from the greenhouse, they will be reshaped with guiding paper mould and heat sealed.
Such device will be distributed on the settlement plazas near seawater canals.
227
freshwater output 2500 mm 500 mm 3800 mm seawater output
Local Scale Proposal Design Proposal
228
229 7
230
CONCLUSION
7.1. Post-Analysis
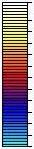
7.1.1. Settlement Post-Analysis
In this experiment the wind direction was from West to East (the prevalent wind direction in Almeria), as the wind tends to go further the pressure tends to get stronger, which not only it will help for the ventilation of the housing units , but also it helps to have a continuous airflow for the ventilation of the greenhouses, surrounding the settlement.

231 Post-Analysis Conclusion
100 76 60 44 28 12 -4 -20 -36 -52 -68 -84 -100 Pa West East 10 m/s Static Pressure 7.1.1.1.
In this experiment the wind direction was from West to East (the prevalent wind direction in Almeria), the velocity of the wind tends to go faster when it passes between the taller housing units (3 stories), but when it encounters smaller ones the velocity tends to decrease. Because the settlement has a big variation of taller and smaller housing units it helps to create a nice airflow for the ventilation of the housing units, as well as the ventilation of the greenhouses surrounding the settlement.
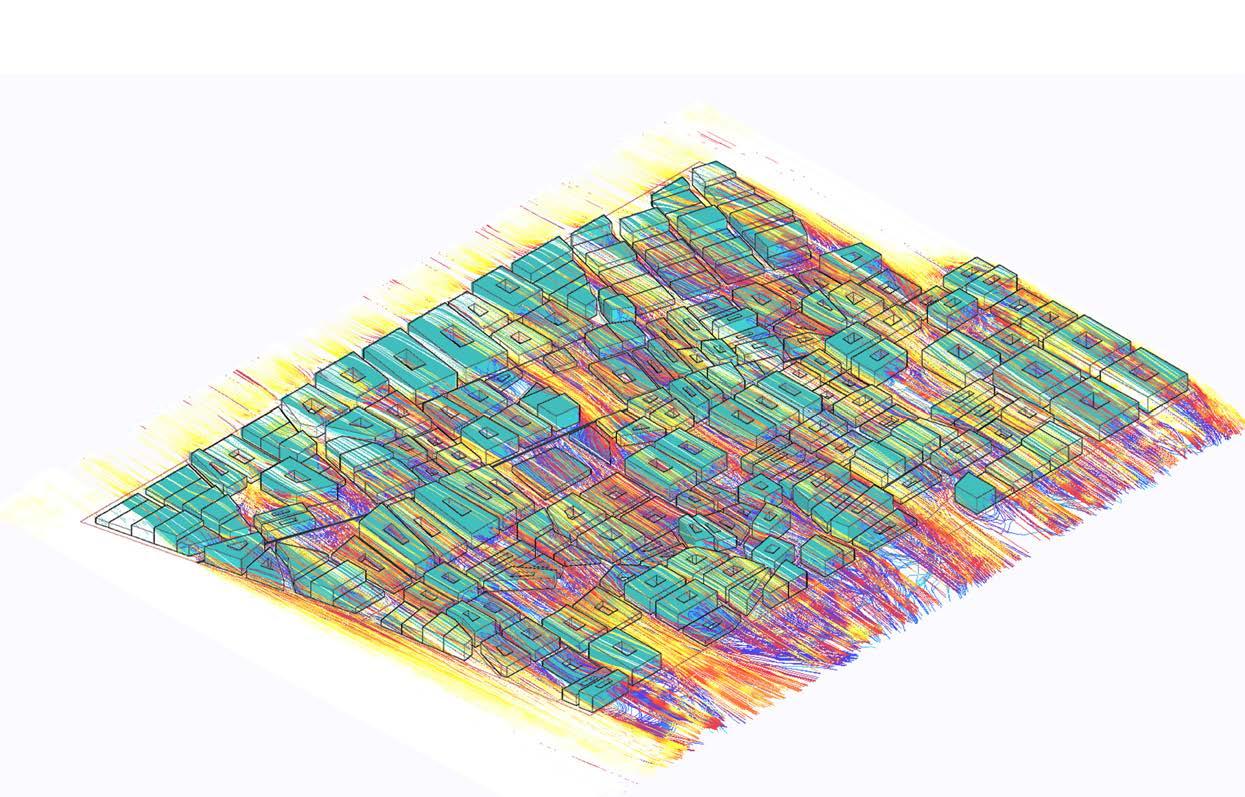
232 Post-Analysis Conclusion 10 8.8 8 7.2 6.4 5.6 4.8 4 3.2 2.4 1.6 0.8 0 m/s
West East 10m/s Velocity 7.1.1.2.
7.1.2. Greenhouse Post-Analysis
Ventilation Post-Analysis
A 3D CFD analysis is conducted as a post-analysis with the full resultant geometry including internal space and labyrinth. The experiment is set up with a eastward wind at 4 m/s, and without neighbouring quads. The resultant airflow diagram allows the analysis of air flow distribution, which in this case is relative circulated, with averaging 1 m/s wind drawn in circular motion within the structure. A calculation of air change can be conducted. Air change calculation is standard in determining the quality of ventilation in a building. The total exhaust/ minute can be calculated by multiplying the speed of exhausting air per minute with the area of ventilation. Then exhaust is divided by the room volume to obtain air change value, which in this experiment resulted to 0.236 room / min. There recommended air change for greenhouse is 1 room / min. This figure renders our experiment results significantly lower than recommended. To test viability at different conditions, a calculation is done by varying wind speeds and temperature. The result is mapped onto the graph. In conclusion, the distribution of airflow yields positive results even with optimal wind conditions and temperatures, the air change rate still falls below the recommended value. Therefore, there is a need to increase the amount of ventilation, as well as the size and effectiveness of the ventilation.
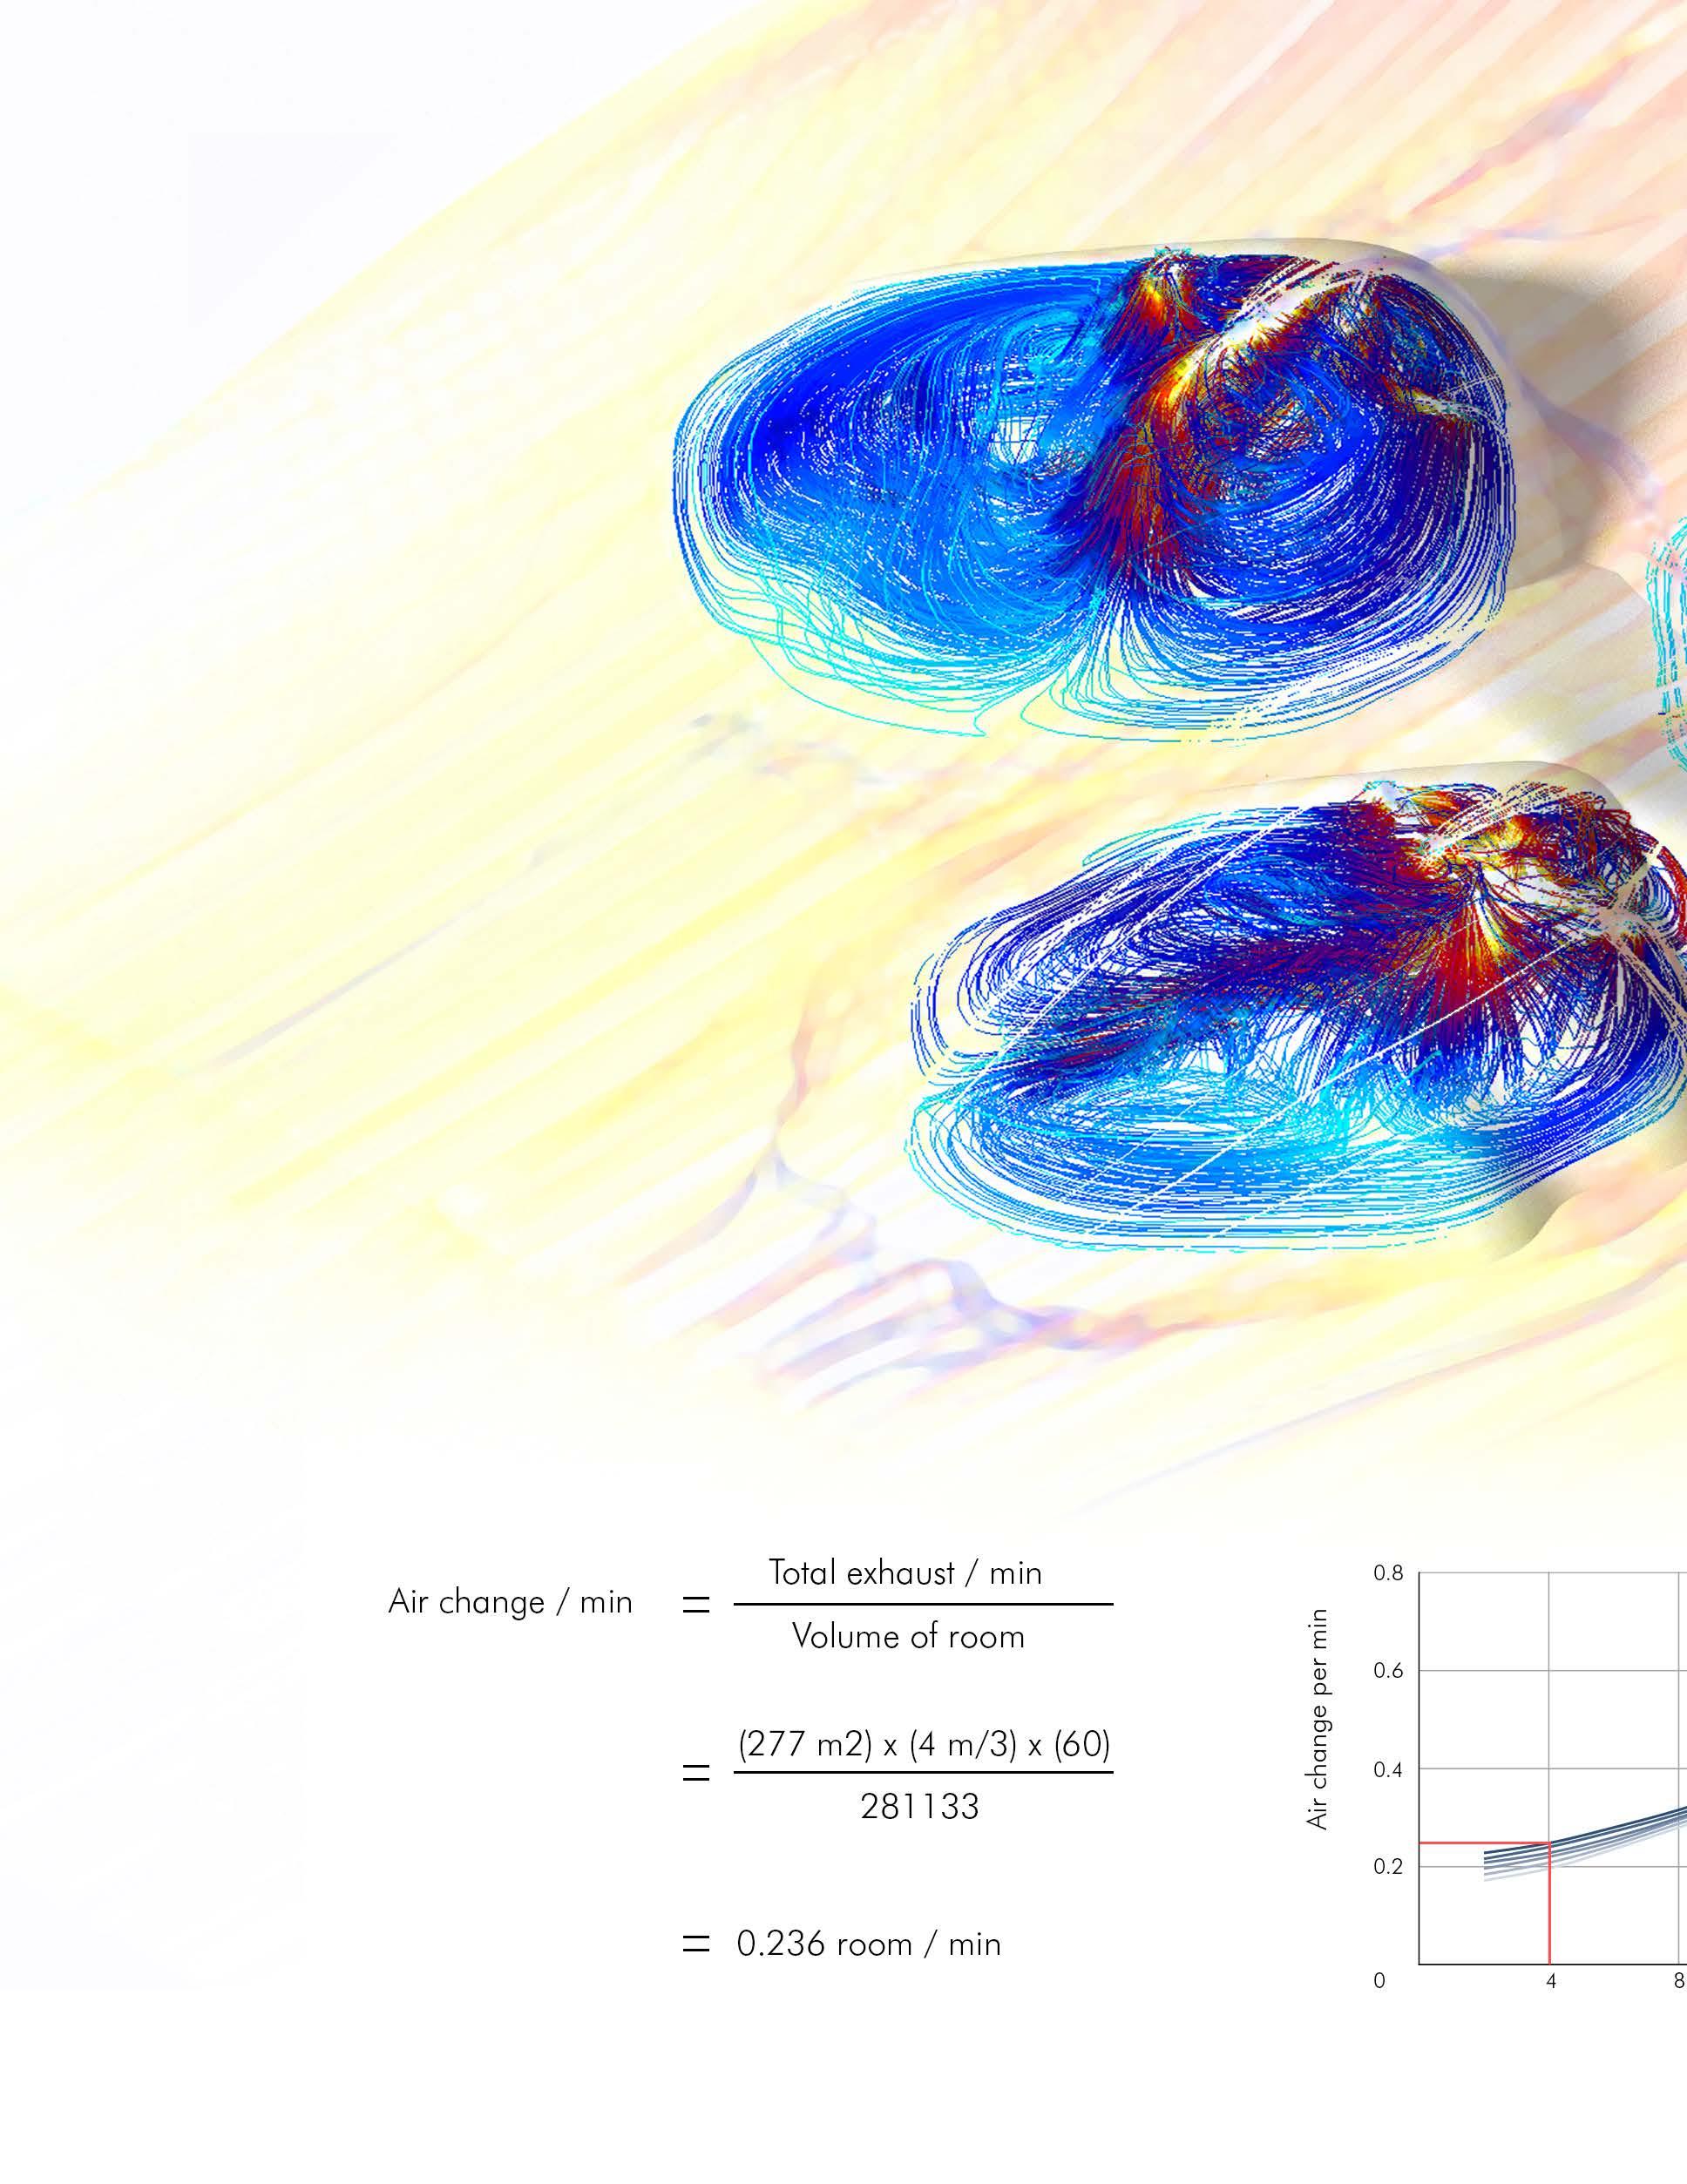
SOURCE. 13, Weldon Long | Sep. Contracting Business. September 14, 2018. Accessed September 18, 2018. https://www.contractingbusiness.com/contracting-business-success/egia-cracking-code-show-3-keys-success-tech.
Local Scale Post-Analysis Conclusion
7.1.2.1.
Local Scale Post-Analysis Conclusion
SOURCE. Garden & Greenhouse. Accessed September 18, 2018. https://www.gardenandgreenhouse.net/ articles/greenhouse-articles/the-basics-of-greenhouse-ventilation/.
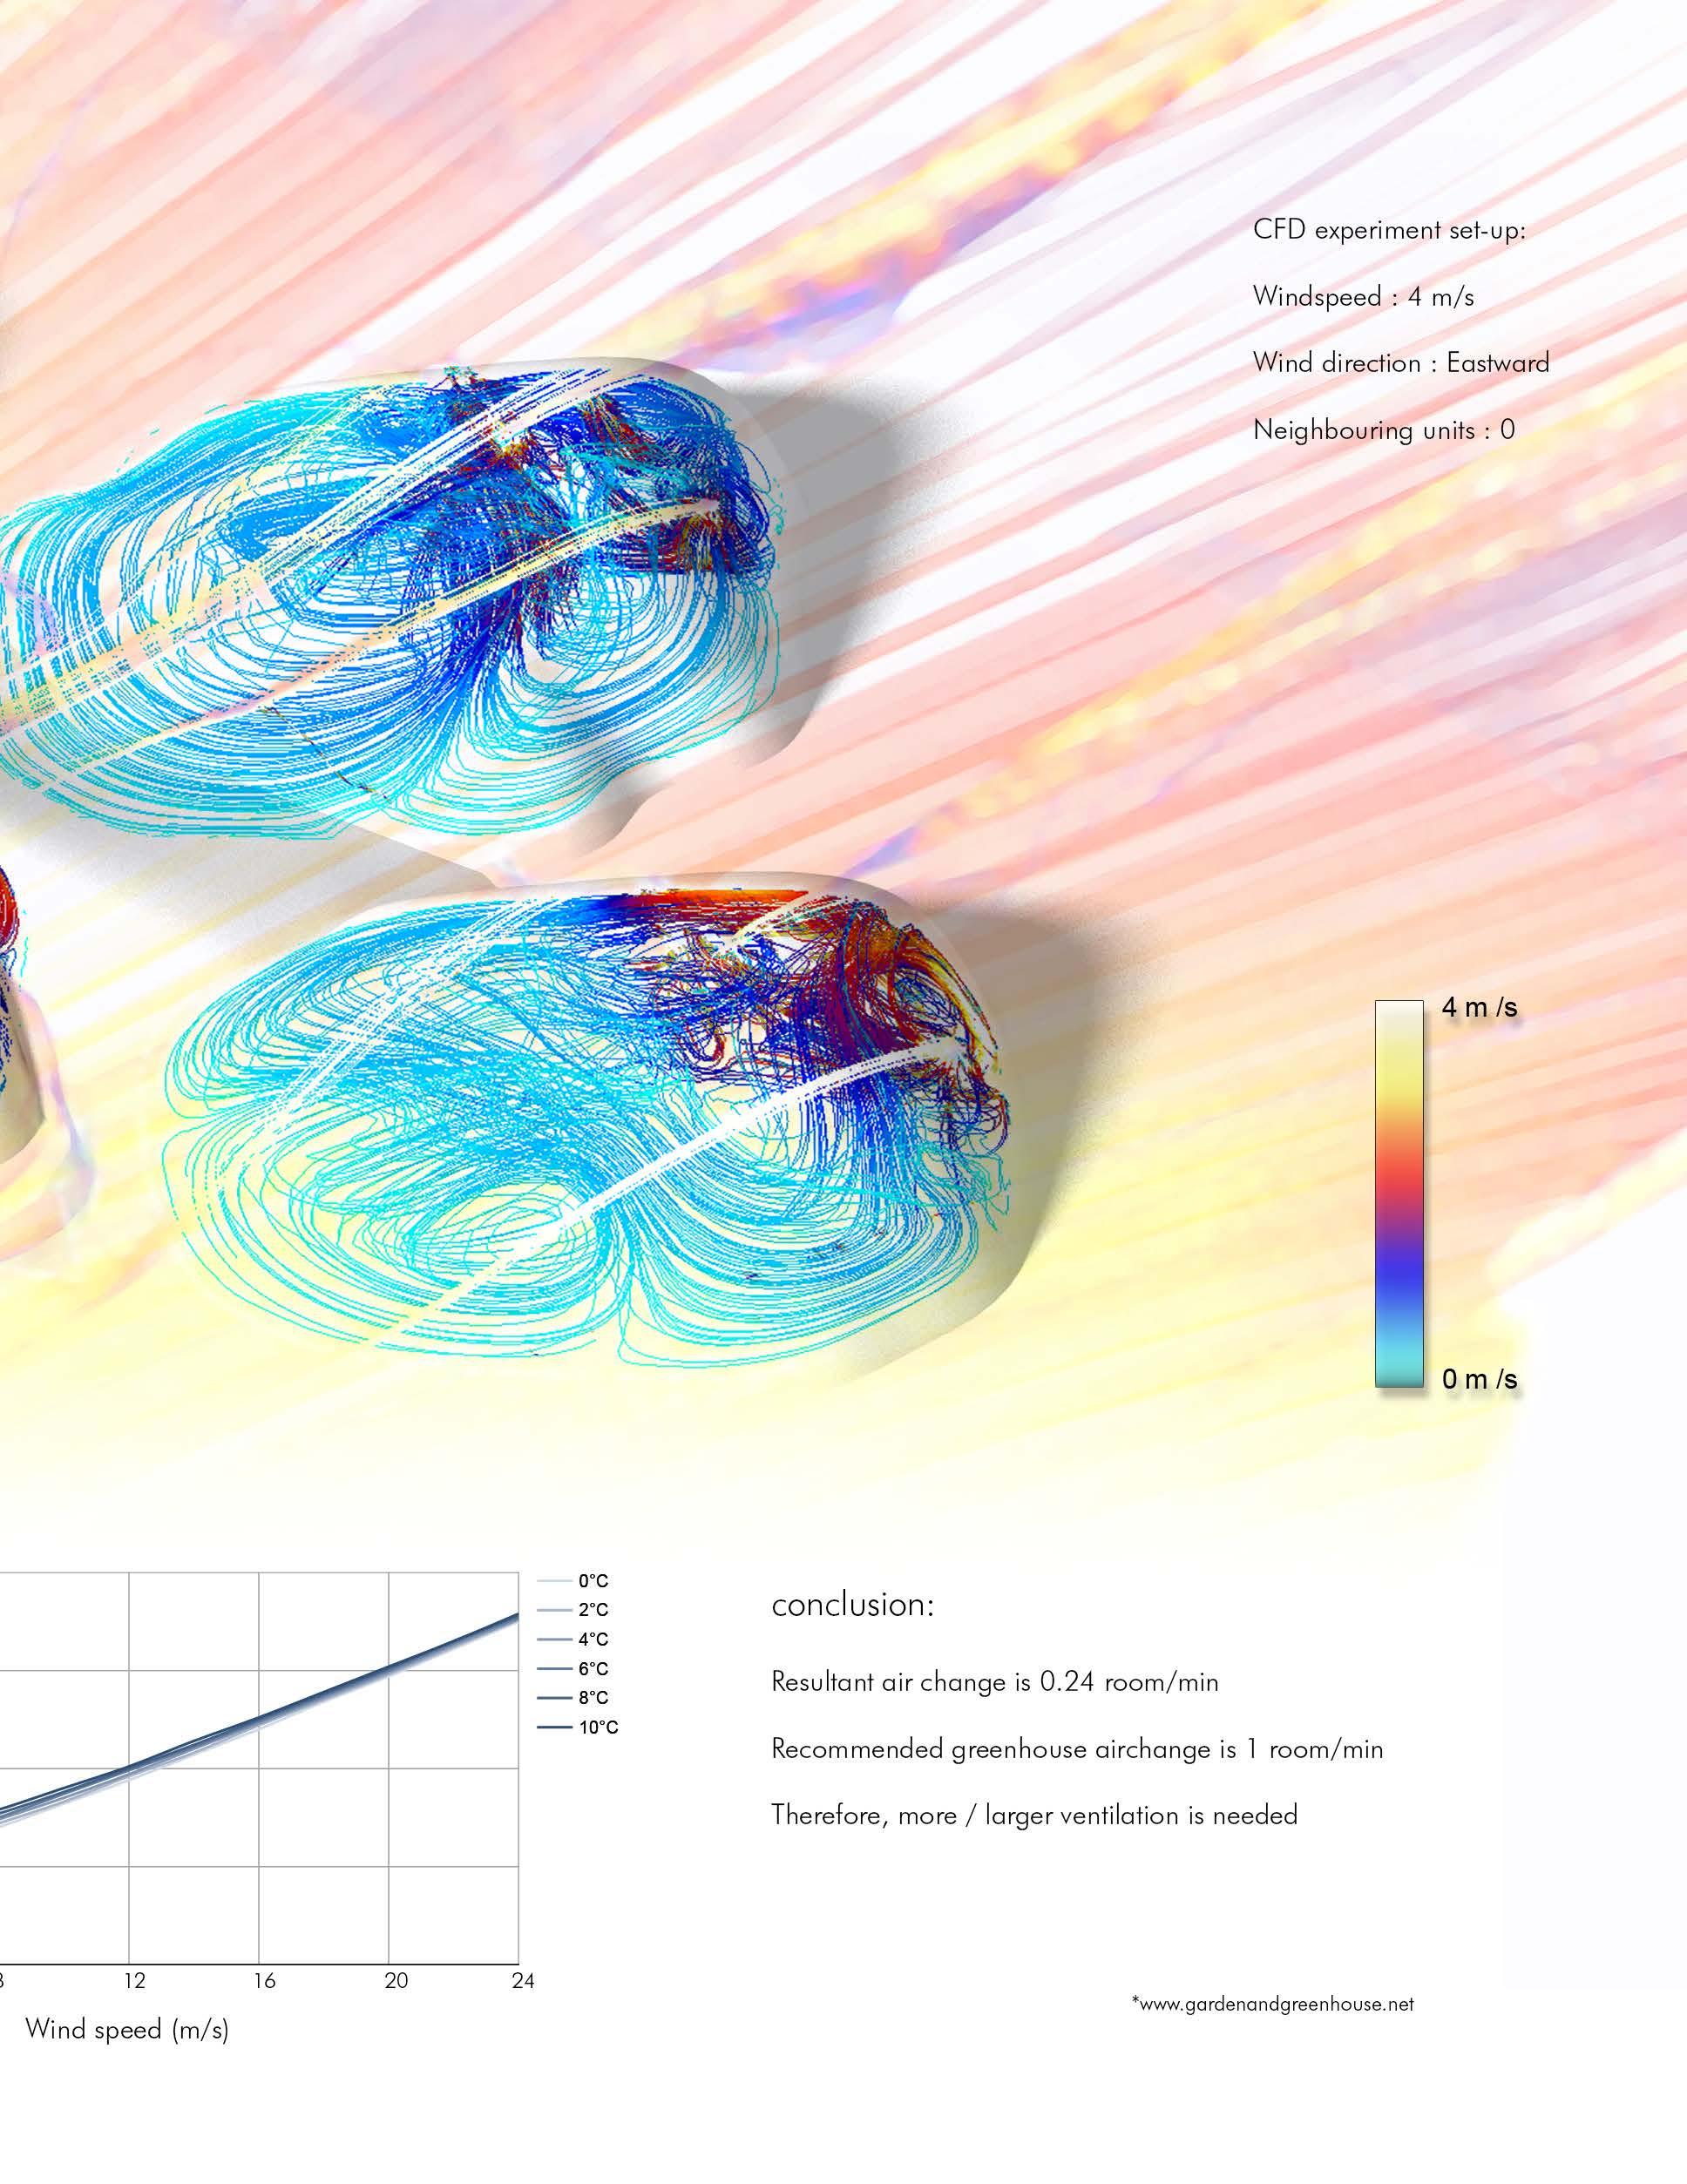
Local Scale Post-Analysis
Crop Yield
A conceptual annual harvest scheme is developed to include a new winter cycle, due to the shortening of each cycle. In Almeria, two cycles per year produces about 750 tons of tomatoes. In 3 years it would be 2250 thousand tons. The proposed system with 2.5 cycles per year, can roughly yield 2900 thousand tons of tomatoes in 3 years. Therefore using this hypothesis of crop yield, the proposed system can produce up to 217 thousand tons of tomatoes per year.
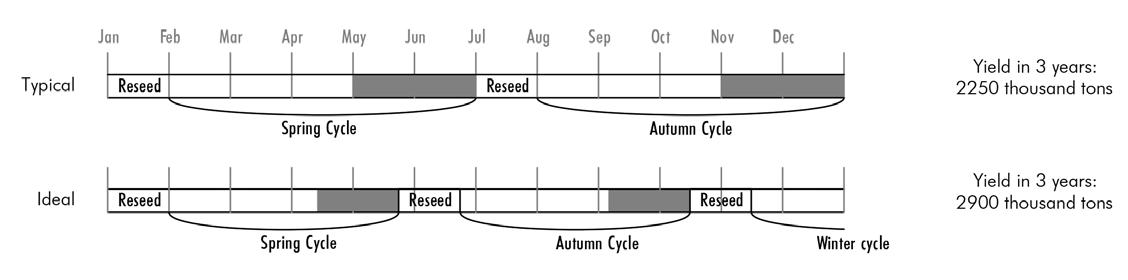
The crop yield improvement is calculated only based on shortening of harvest, without the consideration of other conditions that may benefit harvest. Some examples include: Better growth conditions decreases chance for harmful fungal development, reduces pesticide use, allows tomatoes to be planted closer together. Higher ceilings allows for better greenhouse equipment to be utilized. Overall, other methods of harvest/ economic improvement should be employed to better analyze the results of improved greenhouse farming.
Annual harvest of crops varies depending on how ideal the climatic conditions are of that year. It is hypothesized that the proposed system, if provides ideal conditions throughout the year, it can increase yield at the end of the year. A rough calculation can be made using tomato plants, the main crop of Almeria.
Each year, Almeria produces two cycles of harvest for tomatoes, a spring cycle and an autumn cycle. Each cycle goes through a series of maturing process. Starting from Germination, where seeds are planted to sprout, it can take from 5 to 12 days. The indoor sprouting can happen from 42 to 56 days. When plant reaches a certain height, they are hardened for 7 days in intermediate conditions between indoor to greenhouse. Once hardened, they are transplanted into the greenhouse, where it can take from 6585 days to reach maturity. The overall time can range from around 120 to 160 days. It is hypothesized that the 40 days can be conserved if greenhouse provided ideal conditions at all time, hastening the maturity process.
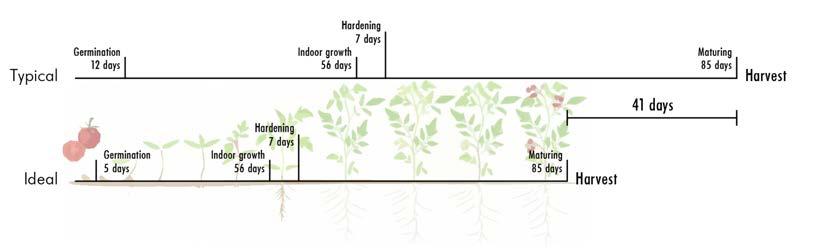
235
Improvement
7.1.2.2.
Conclusion
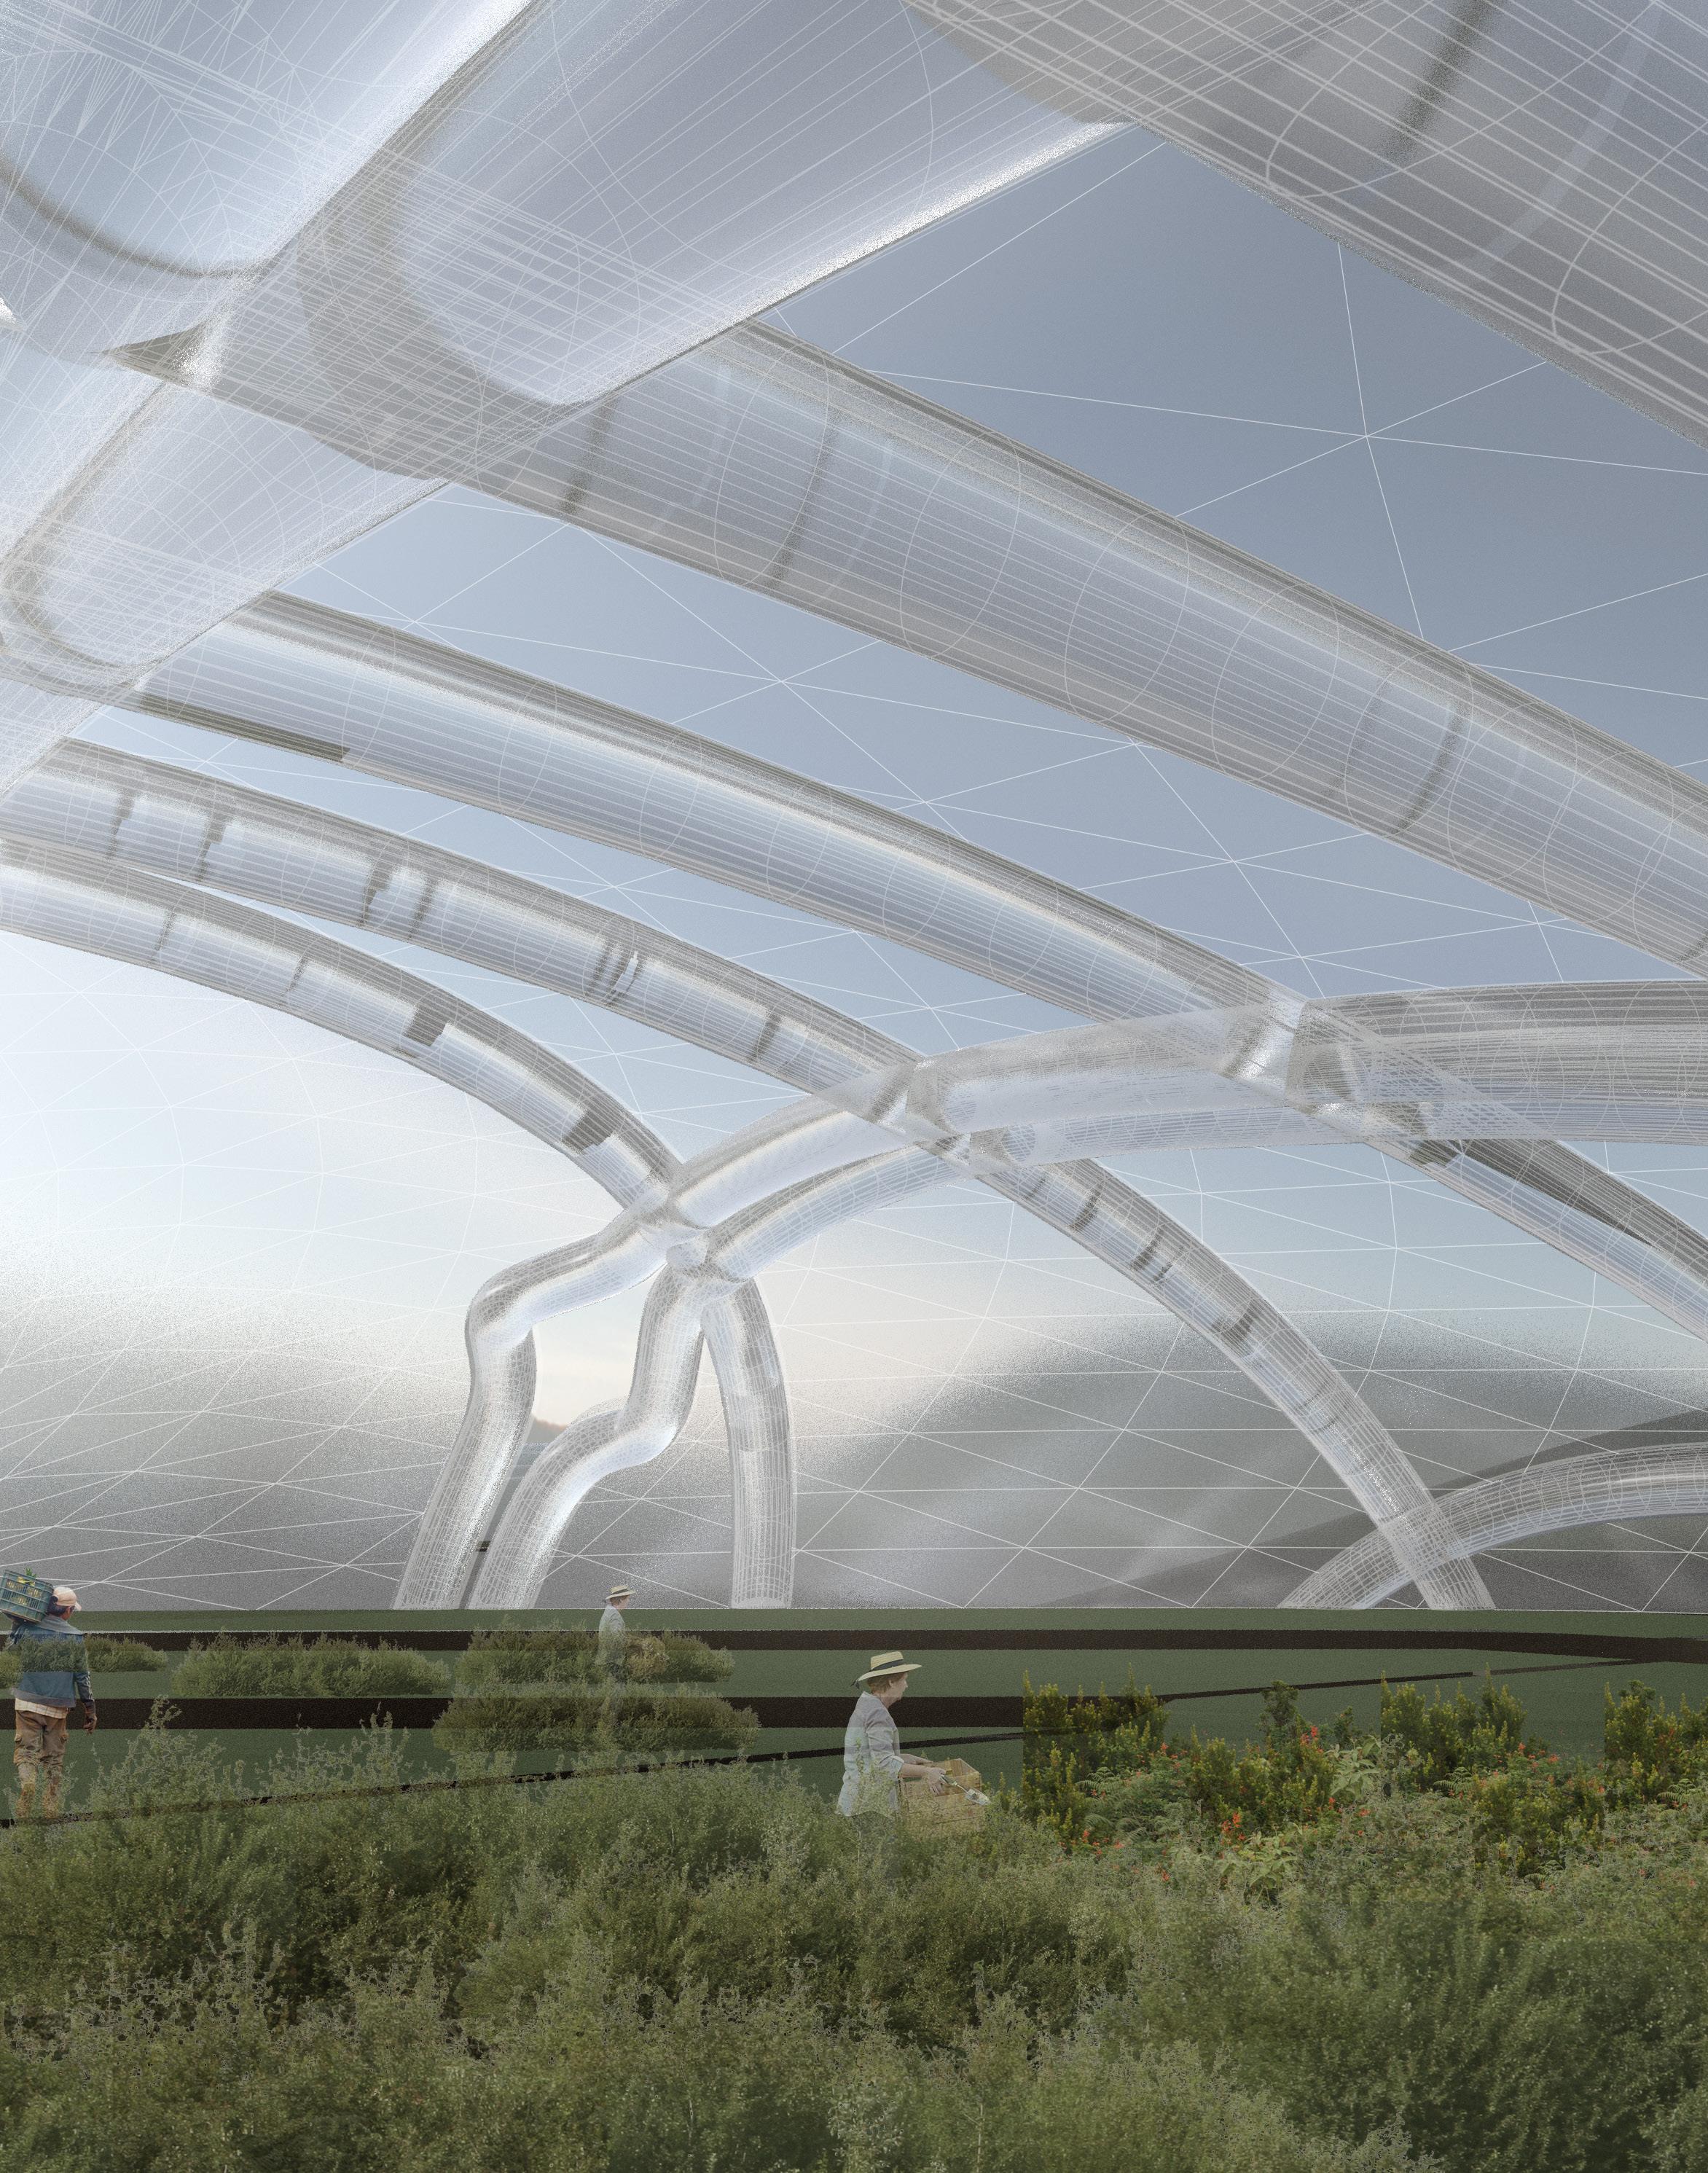
Conclusion
7.2.
Evaluation of Ambition
The design proposal is initiated by the ambition to address the 3 principle problems of existing Almeria greenhouses. In the post-analysis process, a re-evaluation is conducted on the efficiency of solution for each of the 3 principle problems.
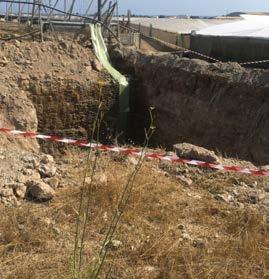
Water Overexploitation
7.2.1. Water Over-exploitation
Water over-exploitation is aimed to be addressed by inverting the net negative freshwater expenditure of farms, to a net positive freshwater gain. The quantitative achievement is directly affected by the effectiveness of the integrated desalination plants. In theory, the establishment of a suitable ratio between farmlands and desalination plants can ensure a net positive gain on freshwater. This, ideally, can be controlled by a regulating body, such as the local government or industry.
On the meso scale, the distributed the desalination devices are designed to provide freshwater production. The settlement generative design was successful in terms of generating emerging public spaces to locate the devices.
On the global scale, the established water distribution network connected horticulture desalination plants and settlement desalination devices together. This provided a global infrastructure for water transportation.
237
Evaluation of Ambition
7.2.2. Plastic Pollution
Evaluation of Ambition Conclusion
Plastic Pollution
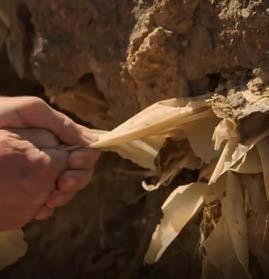
In the local scale the plastic pollution issue were addressed in the greenhouse farming system. As part of the computation, plastic usage is reduced by geometric intervention of the greenhouse. The proposed ETFE material system for the pneumatic greenhouse promises to increase lifespan but at a higher start-up cost. However, the design proposal remains a plastic-heavy project
To respond to the plastic waste issue, on the global scale, we proposed a recycling strategy of reshaping the plastic waste to serve as desalination device and pneumatic formwork. Comparing the M.se phase, this brought us a step to closer to complete the full life cycle of plastic material.
238
Greenhouse Inefficiencies
7.2.3. Greenhouse Inefficiencies
Greenhouse inefficiency is arguably the most heavily addressed issue, with various architectural and systems solution directly resulting in better greenhouse efficiency and productivity.
The harnessing of wind energy and natural ventilation decreases the cost and usage of HVAC systems, better for the environment and more cost effective. The harnessing of hydro-thermal energy from on-site streams decreases the cost and usage of cooling/ heating systems.
The added height and volume of greenhouse greatly increases thermal inertia and stack effect, allowing more efficient micro-climate maintenance. As well, it eliminates the height limitation of crop growth, yielding crop at maximum capacity. Lack of height limitation also allows the use of bigger and more efficient farm equipment and vehicles, maximizing production capacity.
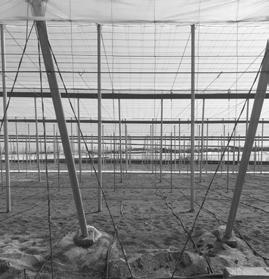
A rough calculation shows a shorter growth cycle and higher crop yield, which results in better economic output of the greenhouse prototype. In addition, with efficiency increasing, labor needs and cost decreases.
In critical light however, a new portion of the cost arises that has yet to be addressed: the startup costs and energy consumption of pressurizing air beams. With a large span of structure, the air pressure demand is high, thus potentially costly. An in-depth analysis is therefore necessary for determining the net cost value of proposed system. In addition, the actuation method requires much more pressurization, and thus energy expenditure. A further study should be conducted on the effectiveness of the same system without actuation, to evaluate the cost of actuating versus the benefit of actuating the greenhouse. There may be a potential for a static greenhouse to outperform actuating greenhouse in net costs. In such case, a more effective prototype needs to be developed as a static structure.
239
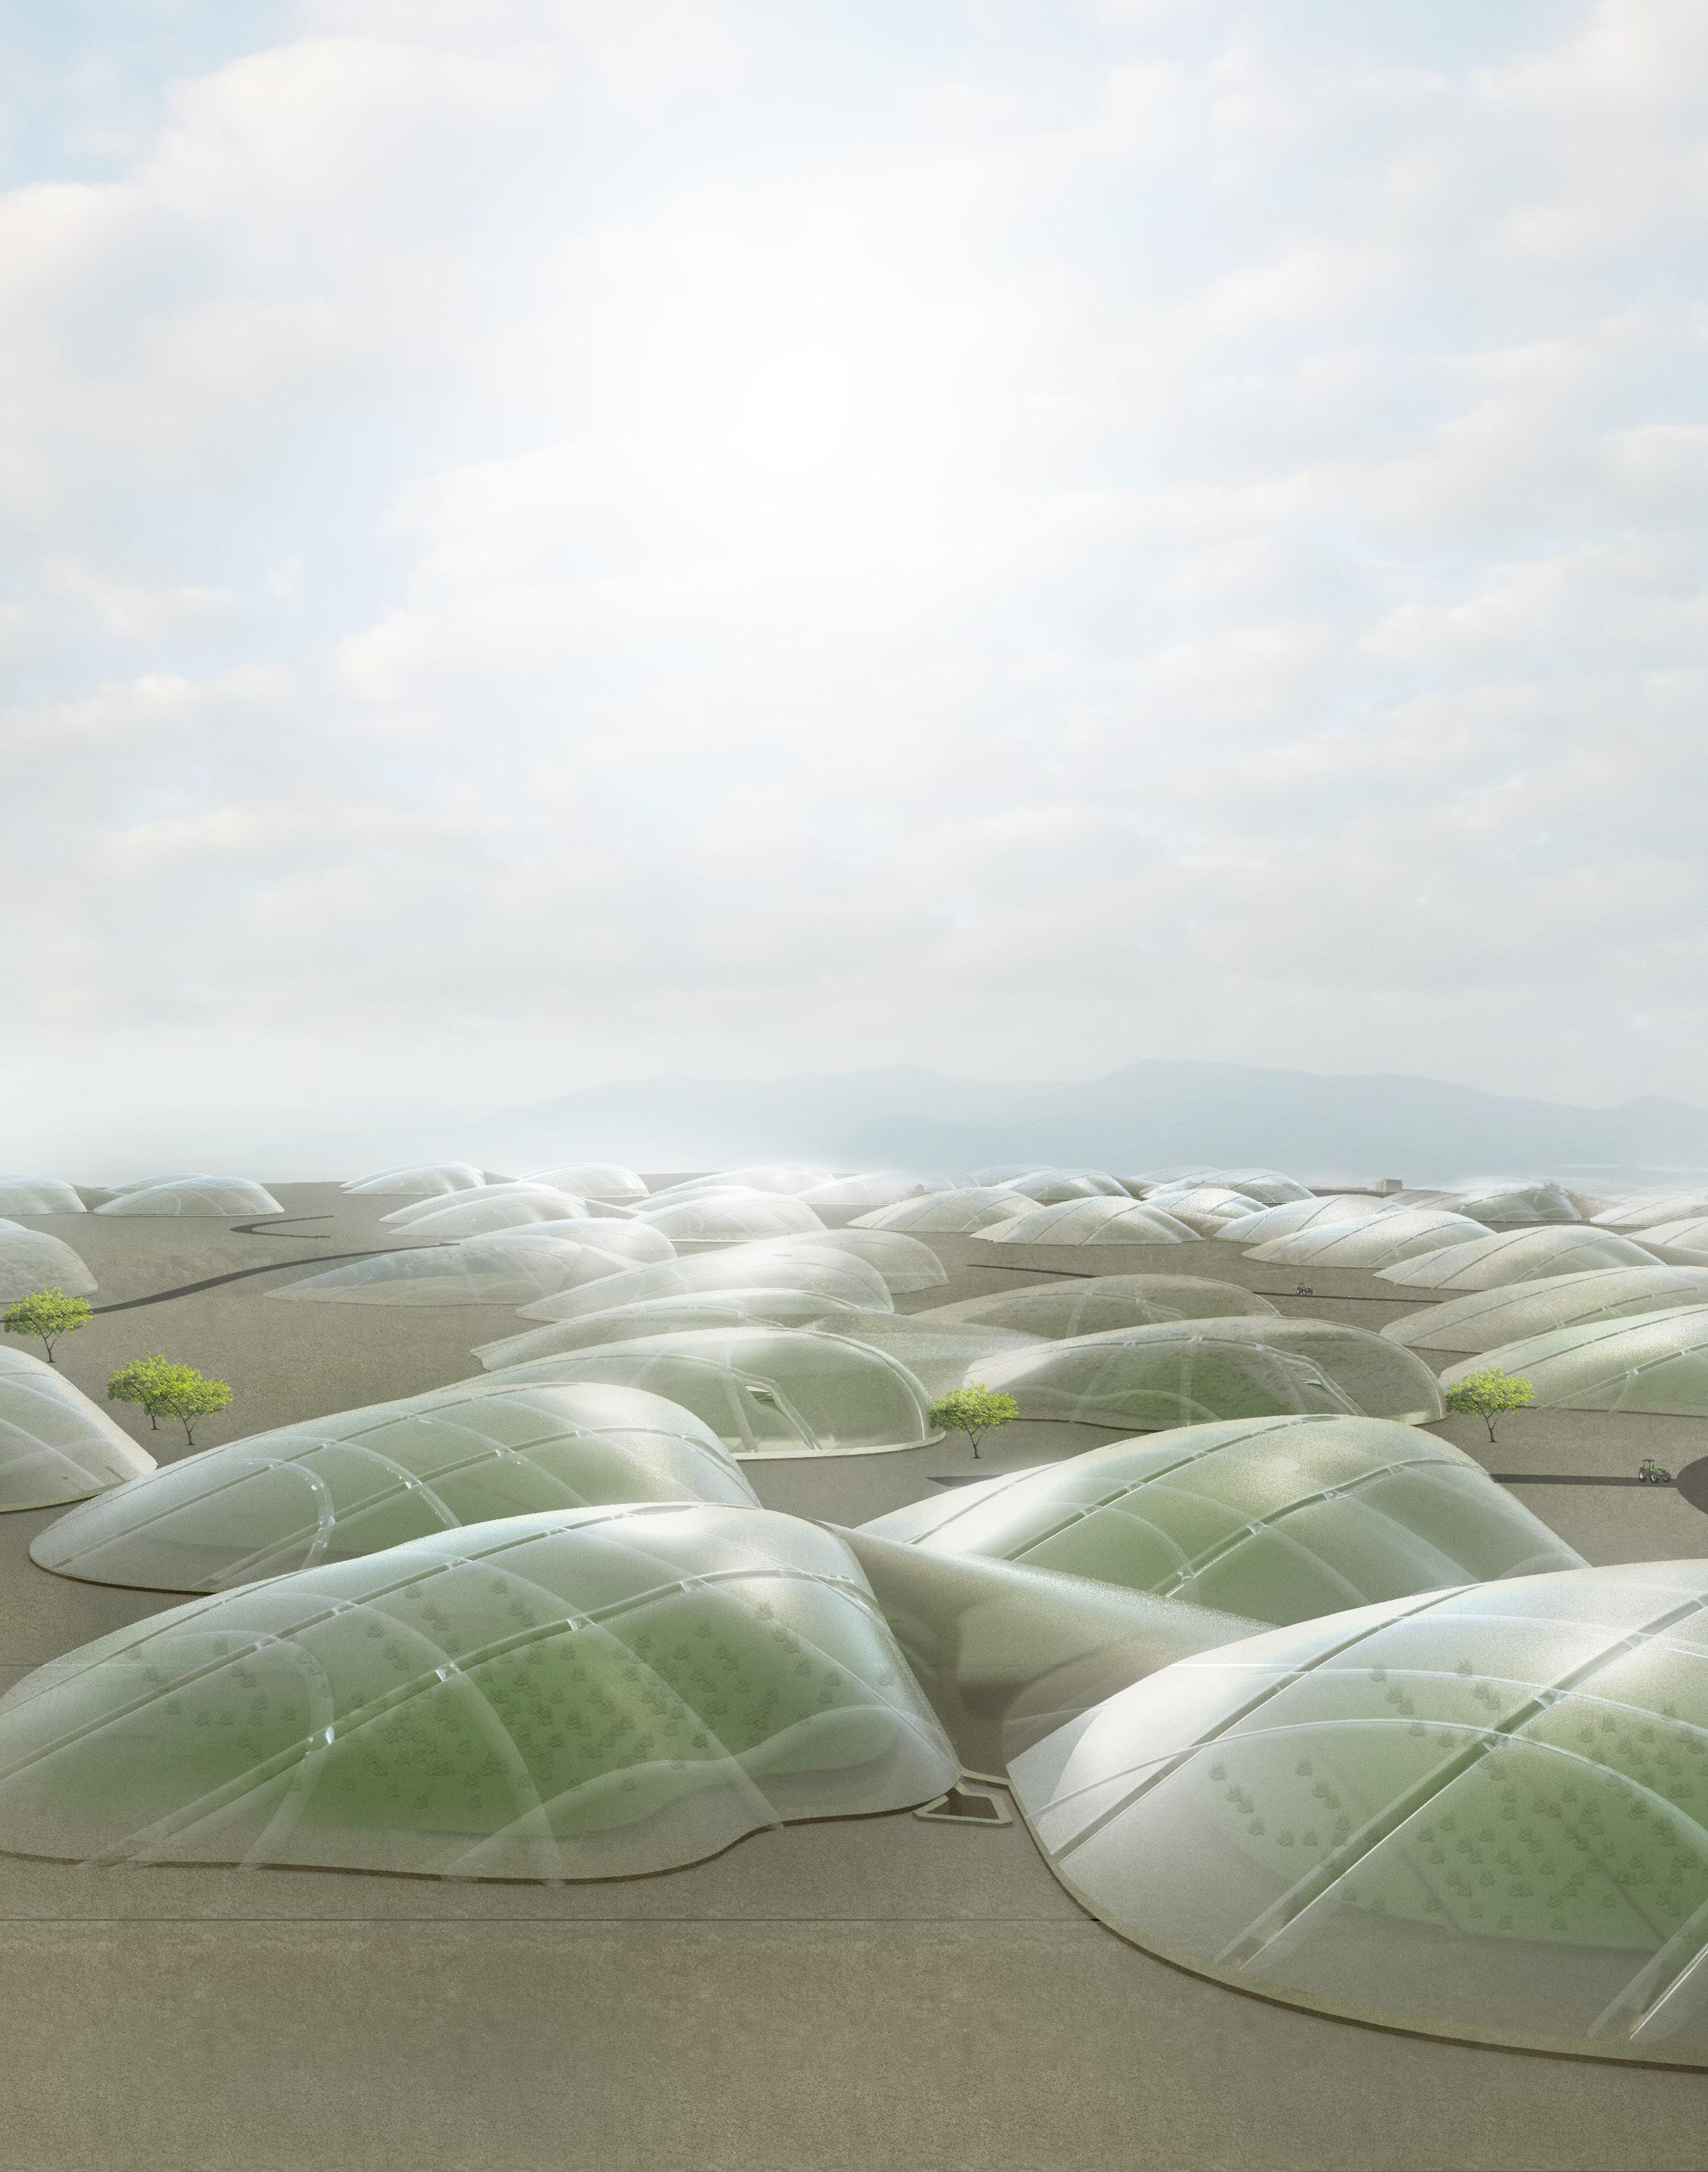
Human Needs
7.2.4. Human Needs
Reflecting the housing issues, the key focus of the M.Arch phase was addressed by design a settlement and housing , the generative process was successful in terms of achieving optimized solutions while maintaining sufficient amount of variations. The scale and morphological variations between the four generated settlements proved the adaptability of the computational model.
The extensive research of the vernacular housing typologies were fully implemented to the computational process, this promises the in situ generated solutions. proposed housing design and fabrication strategy links the locally sourced material with low tech community based construction. However, the form generation system still lacks of variations and ability to be applied across different housing types.
241
Studies Conclusion
Further
Further Studies
7.3. Futher Studies
Global scale: Current model is based on single point growth. Future study can explore the multi centre growth scenario.
Meso scale: The current street network generation is driven by the fitness value derived from unweighted centrality analysis. This connectivity fitness value of each street segment is not weight based on the adjacent type of programmes. Future research and computational strategy can link the weighted street network generations with urban block generations to create more synergetic emergence.
Local scale: research on the construction details and material property can be further extended. The potential use of stabilizer can leads to the improvement of the tensile strength of the loam material. This will potentially eliminate the limitation on the vaulting system.The production capacity of Desalination systems are based on the theoretical data source. Further physical prototype can be developed to test and improve the capacity.
242
Conclusion
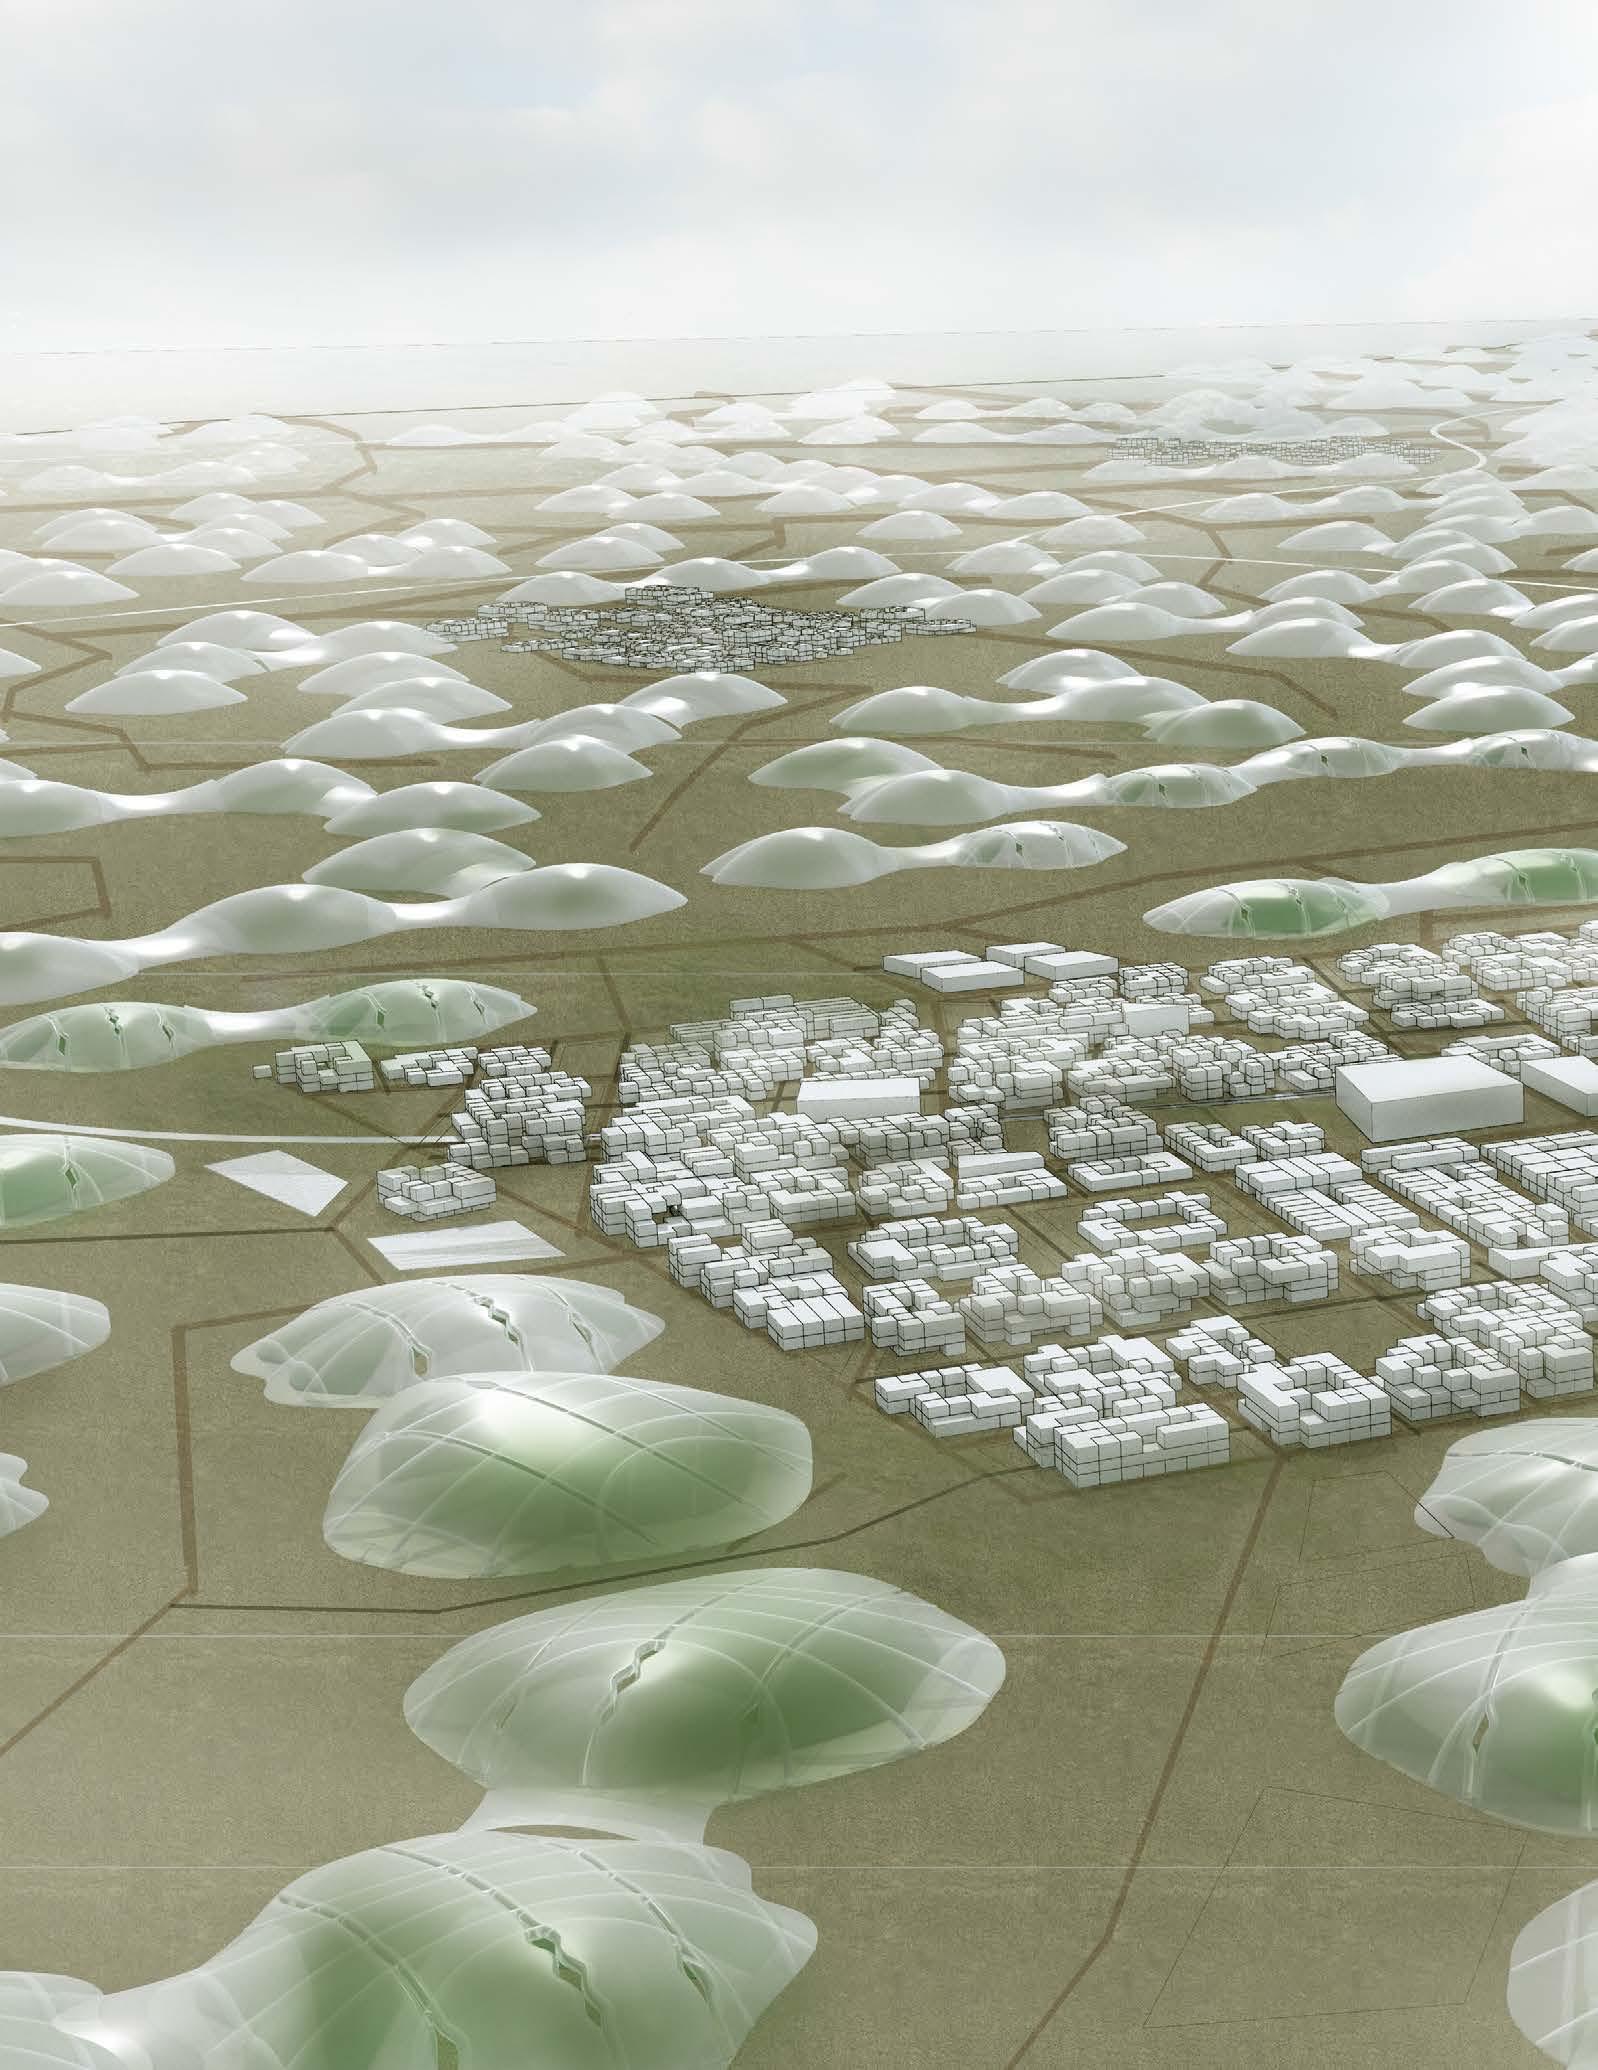
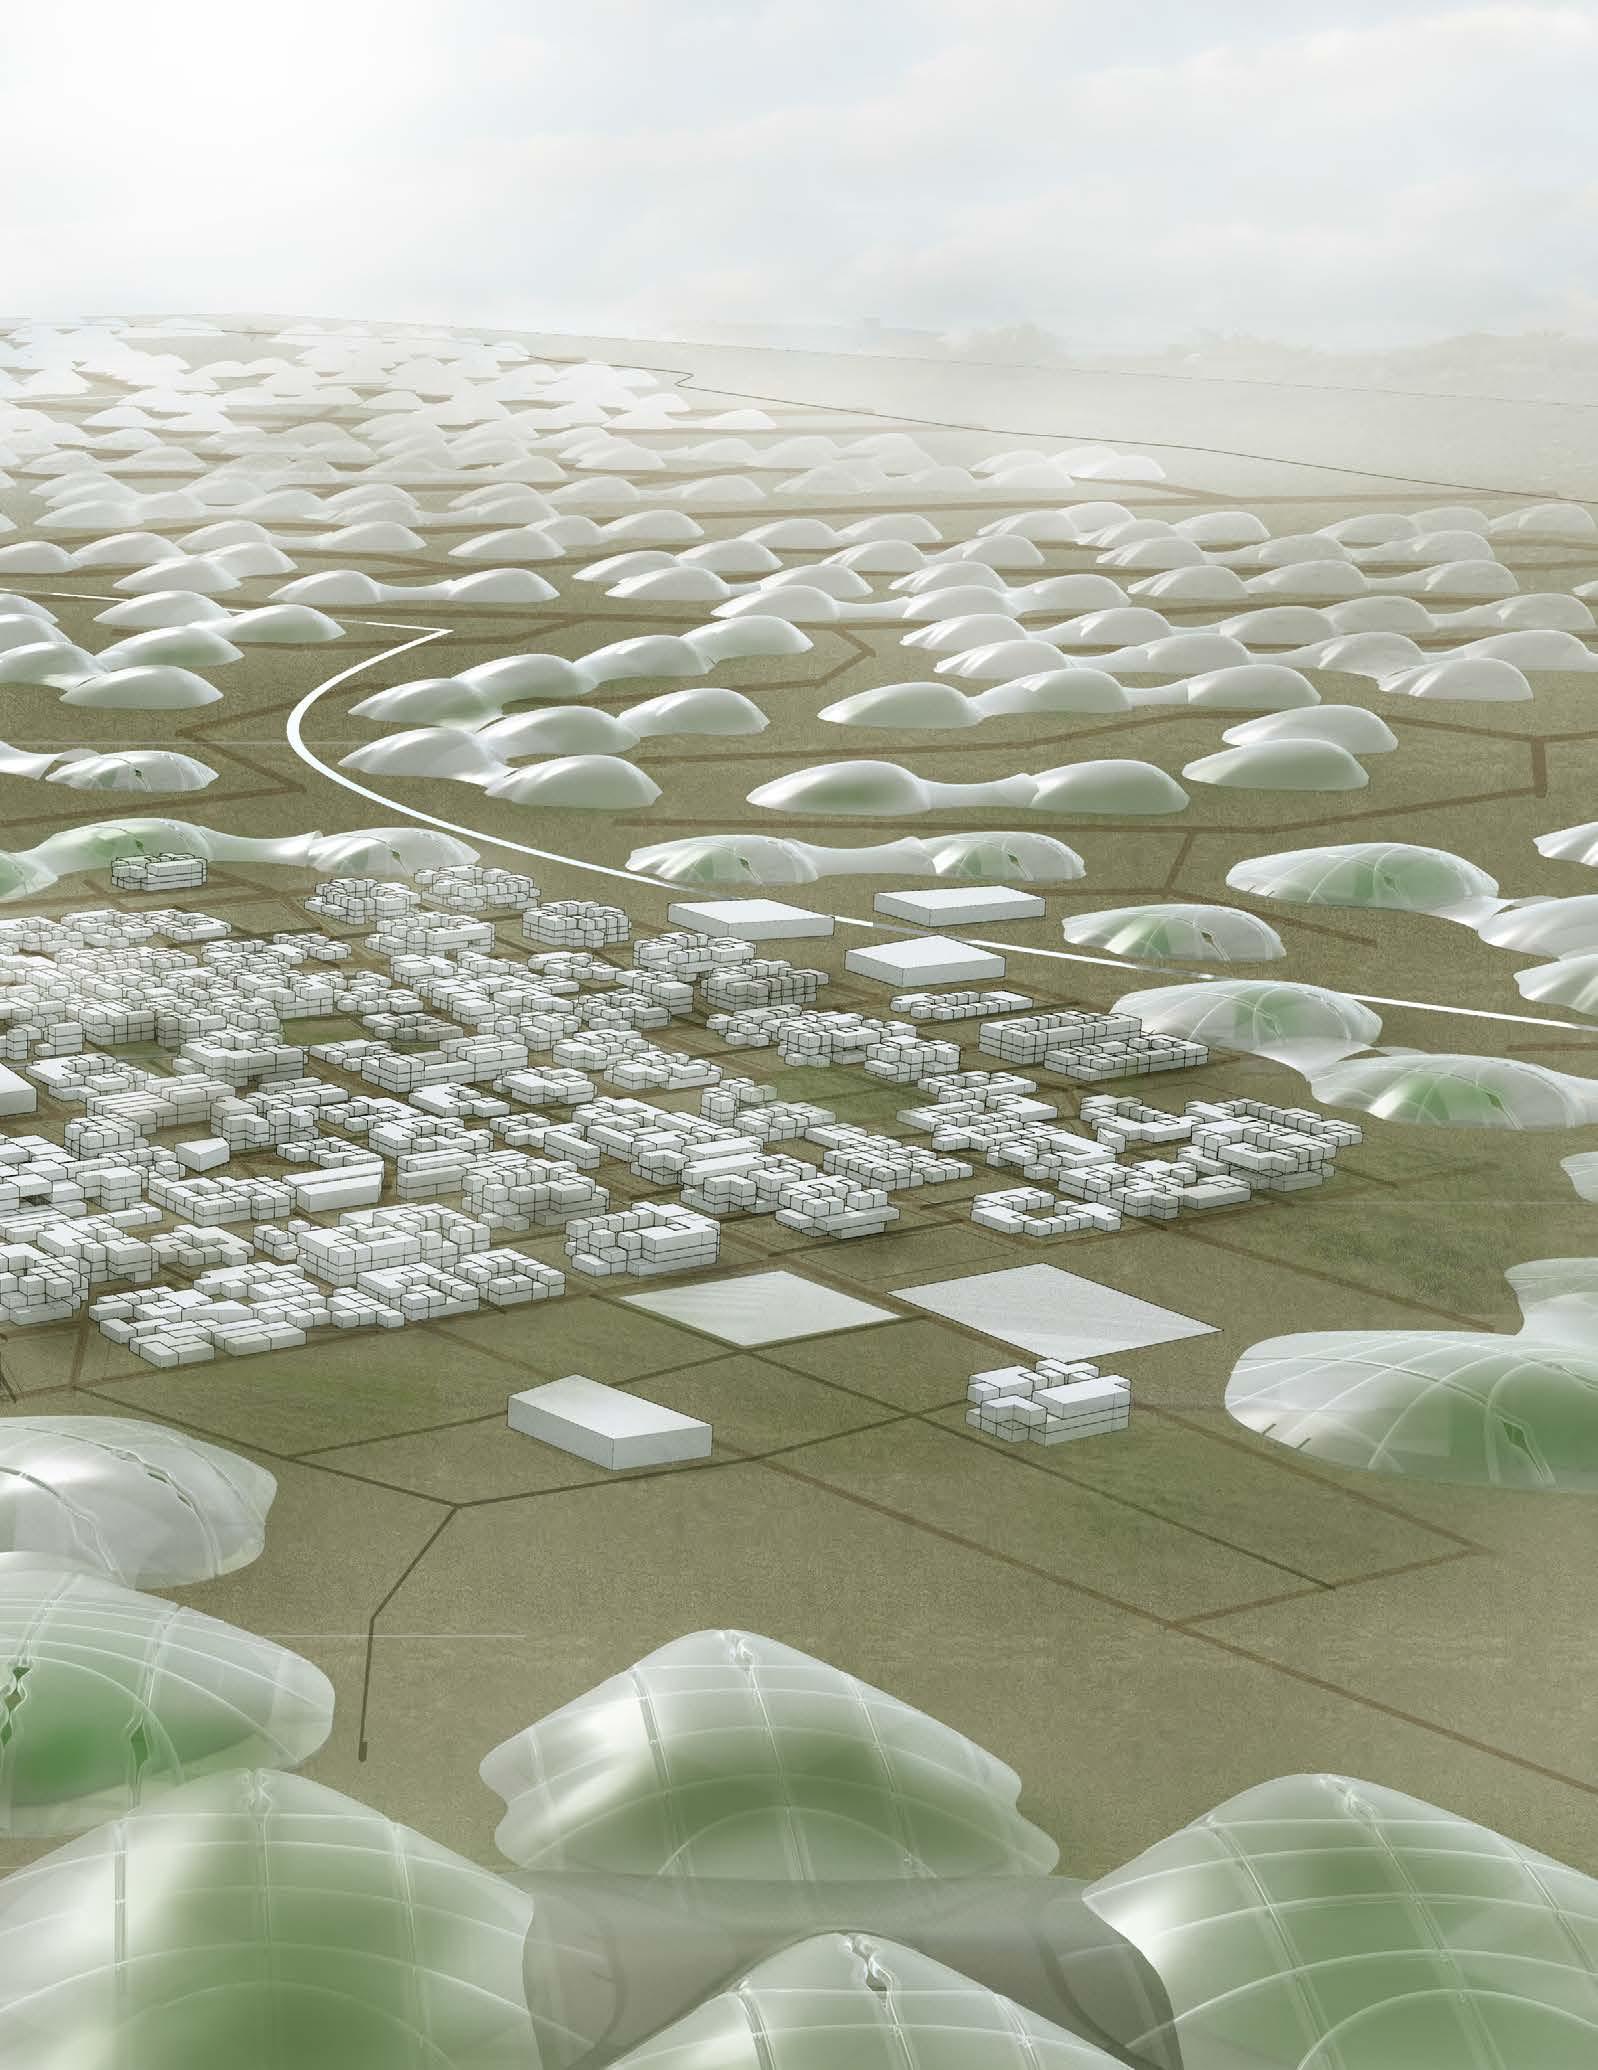
245 8
REFERENCES
246
Bibliography References
Principles of Pneumatic Architecture. Roger N. Dent. Architectural Press, 1971.
Pneumatic Structures : a handbook for the architect and engineer/ Thomas Herzog ; with contributions by Gernot Minke and Hans Eggers. St Albans, Hertfordshire : Crosbie Lockwood Staples, 1977, c1976.
Kengo Kuma : breathing architecture : the teahouse of the Museum of Applied Arts Frankfurt : Das Teehaus des Museums für Angewandte Kunst Frankfurt / Volker Fischer, Ulrich Schneider (eds.) ; [edited by the Museum of Applied Arts Frankfurt ; translation from German into English, Elizabeth Schwaiger ; editing, Volker Fischer, Thomas Menzel]. Kuma, Kengo. Basel ; Boston : Birkhäuser, c2008.
McLean, William (William F.),Air structures,London : Laurence King Pub., 2015.
Roland, Conrad. Frei Otto-Structures. Longman, 1970.
Hollis, James. The Eden project: In search of the magical other. Toronto: Inner City Books, 1998.
Dickson, M. (2003). Frei Otto Researcher, Inventor and Inspired Instigator of Architectural Solutions. AA FILES, (50), 36-49.
Hensel, Michael, and Achim Menges, eds. Morpho-ecologies. Architectural Association, 2006.
Luchsinger, Rolf H., A. Pedretti, P. Steingruber, and M. Pedretti. “The new structural concept Tensairity: Basic principles.” Progress in structural engineering, mechanics and computation (2004): 323-328.
Valera, Diego & Belmonte, Luis & Molina-Aiz, Francisco & López, A. (2016). Greenhouse Agriculture in Almeria. A comprehensive techno-economic analysis.
M.Ramon Llamas,Garrido,Alberto,Lessons from Intensive Groundwater Use in Spain: Economic and Social Benefits and Conflict. Department of Geodynamics, Complutense University of Madrid, Department of Agricultural Economics, Technical University of Madrid.
WWF(World Wildlife Fund) Adena,Illegal water use in Spain,Causes,effects and solutions, May 2006.
247
8.1 Bibliography
Bibliography References
“Coastal Aquifers; Groundwater at Sea - Geological Digressions.” Accessed September 19, 2018. https://www.geological-digressions.com/coastal-aquifers-groundwater-atsea/.
Otto, Frei, Pneu und Knochen = Pneu and bone, Stuttgart : Institut fur Leichte Flachentragwerke, 1995.
Charpentier, Victor, Hannequart, Philippe, Adriaenssens,Sigrid, Baverel, Olivier, Viglino, Emmanuel, et al.. Kinematic amplification strategies in plants and engineering. Smart Materials and Structures, IOP Publishing, 2017, 26 (6), pp.63002 - 63002.
“Davies’ Alpine House - Home.” Accessed September 19, 2018. https:// daviesalpinehouse.weebly.com/index.html.
Peter Davey, Kurt W. Forster, Exploring boundaries : the architecture of Wilkinson Eyre, Basel Birkhauser, 2007.P63
Emma Keyte, Jay Merrick,Wilkinson Eyre Architects : works, London : Thames and Hudson, 2014.
Brütting, Jan, Axel Körner, Daniel Sonntag, and Jan Knippers. Bending-Active Segmented Shells, 2017
Schiffler, Manuel. “Perspectives and Challenges for Desalination in the 21st Century.” Desalination, Desalination Strategies in South Mediterranean Countries, 165 (August 15, 2004): 4.
“Seawater Greenhouse”. Accessed September 19, 2018. https://seawatergreenhouse. com/
Sablani, S. S., M. F. A. Goosen, C. Paton, W. H. Shayya, and H. Al-Hinai. “Simulation of Fresh Water Production Using a Humidification-Dehumidification Seawater Greenhouse.” Desalination 159, no. 3 (November 5, 2003): 283–88.
Kabeel, Abd Elnaby, Z.M. Omara, Fadl Essa, and Abdelkader Abdalla. “Solar Still with Condenser – A Detailed Review.” Renewable and Sustainable Energy Reviews 59 (June 1, 2016).
248
Bibliography References
Adeel, Zafar, Millennium Ecosystem Assessment, and World Resources Institute, eds. Ecosystems and Human Well-Being: Desertification Synthesis ; a Report of the Millennium Ecosystem Assessment. Washington, DC: World Resources Inst, 2005.
Scientific Facts on Desertification. Accessed June 3, 2018. https://www.greenfacts.org/en/ desertification/index.htm.
Average Weather in Garland, Texas, United States, Year-Round - Weather Spark. Accessed September 18, 2018. https://weatherspark.com/y/38216/Average-Weather-in-AlmeríaSpain-Year-Round.
El Milagro de Almeria, Espana: A Political Ecological of Landscape Change and Greenhouse Agriculture” Robert Tyrell Wolosin. Accessed May 20, 2018. Bachelor of Science, Texas State University - San Marcos, Texas, 2006. Provincia de Almería - Web Oficial de Turismo de Andalucía.” Accessed May 21, 2018. http:// www.andalucia.org/es/destinos/provincias/almeria/.
Base Cartográfica de Andalucía. Instituto de Estadística y Cartografía.” Accessed September 18, 2018. http://www.juntadeandalucia.es/institutodeestadisticaycartografia/bcadescargas/
Almería, segunda provincia española con mayor porcentaje de extranjeros. ALMERÍA HOY (blog). Accessed May 31, 2018. http://www.almeriahoy.com/2017/05/almeria-segundaprovincia-espanola-con.html. «Cifras de población referidas al 01/01/2017». Cifras Oficiales de Población de los Municipios Españoles: Revisión del Padrón Municipal - Población a 1 de enero de 2017.
Habitantes Almería 1900-2017.” Accessed June 1, 2018. https://www.foro-ciudad.com/ almeria/almeria/habitantes.html
El Número de Migrantes Llegados En Patera a Andalucía Aumentó Un 185% En 2017. Accessed June 1, 2018. http://www.europapress.es/andalucia/noticia-total-17614-inmigrantes-lleganpatera-costas-andaluzas-2017-1852-mas-2016-20180102144245.html.
“Water Scarcity & Droughts in the European Union.” Together Against Trafficking in Human Beings. Accessed September 18, 2018. http://ec.europa.eu/environment/water/quantity/ about.htm.
The Plastic Mosaic You Can See From Space: Spain’s Greenhouse Complex - Bloomberg.” Accessed June 1, 2018. https://www.bloomberg.com/news/features/2015-02-20/themosaic-you-can-see-from-space-spain-s-massive-greenhouse-complex.
249
Bibliography References
Atlas.Pdf. Accessed May 31, 2018. http://www.aemet.es/documentos/es/divulgacion/ publicaciones/Atlas-climatologico/Atlas.pdf.
Windfinder.com. Windfinder.com. Accessed September 18, 2018. https://www. windfinder.com/windstatistics/almeria.
Meteorología, Agencia Estatal de. “Almería Aeropuerto: Almería Aeropuerto - Valores extremos absolutos - Selector - Agencia Estatal de Meteorología - AEMET. Gobierno de España.” Accessed May 31, 2018. http://www.aemet.es/es/serviciosclimaticos/ datosclimatologicos/efemerides_extremos.
Clima El Ejido. meteoblue. Accessed August 2, 2018. https://www.meteoblue.com/es/ tiempo/pronostico/modelclimate/el-ejido_espa%c3%b1a_2518494
Average Weather in El Ejido, Spain, Year Round - Weather Spark. Accessed August 2, 2018. https://weatherspark.com/y/38210/Average-Weather-in-El-Ejido-Spain-YearRound.
Costes Tomate. Accessed July 10, 2018. http://www.hortoinfo.es/index.php/5515costes-tom-100417. Ferre, Francisco Camacho.
Pimiento bajo invernadero, n.d., 17 Food, Colaboradores Journey of.
Soy de Temporada. Accessed July 10, 2018. https://soydetemporada.es Food, Colaboradores Journey of. “Soy de Temporada.” Accessed July 11, 2018. https:// soydetemporada.es.
Pepino. Vegacañada, Accessed July 11, 2018. http://www.vegac.com/pepino.
Cherry_HortInt.Pdf. Accessed July 10, 2018. http://aulavirtual.agro.unlp.edu.ar/ pluginfile.php/14584/mod_resource/content/0/cherry_HortInt.pdf.
Hortoinfo Tomate. Accessed July 10, 2018. http://www.hortoinfo.es/index.php/ informes/cultivos/5897-inf-tomate-2017.
Costes Tomate. Accessed July 10, 2018. http://www.hortoinfo.es/index.php/5515costes-tom-100417.
Campaña de Tomate Primavera En Almería. Seminis, July 10, 2018. https://seminis.es/ tomate-primavera-en-almeria/.
250
Bibliography References
“Pimientos Todo El Año. Agricultores Que van a Un Solo Cultivo | Joseantonioarcos. Es.” Accessed July 10, 2018. https://joseantonioarcos.es/2016/08/19/agricultorespimientos-almeria/
“Hortoinfo Pimiento.” Accessed July 10, 2018. http://www.hortoinfo.es/index.php/ informes/cultivos/6011-inf-pim-2017.
Ferre, Francisco Camacho. “pimiento bajo invernadero,” n.d., 17 w
Variedades de Pimiento En Almería - Publicaciones.Poscosecha.Com. Accessed July 10, 2018. http://publicaciones.poscosecha.com/es/pimiento-tomate/108-variedades-depimiento-en-almeria.html..
Hortoinfo Sandia. Accessed July 10, 2018. http://www.hortoinfo.es/index.php/6900costes-cult-sand-160418.
“La sandía, ¿cómo cultivarla? Por María Pérez, técnica agrícola.” portagrano.net. Accessed July 10, 2018. http://www.portagrano.net/home/detallenoticia.php?idnoticia=386.
Food, Colaboradores Journey of. “Soy de Temporada.” Accessed July 10, 2018. https:// soydetemporada.es.
1337161080melon_baja.Pdf. Accessed July 11, 2018. https://www.juntadeandalucia.es/ export/drupaljda/1337161080melon_baja.pdf.
Food, Colaboradores Journey of. “Soy de Temporada.” Accessed July 11, 2018. https:// soydetemporada.es.
Hortoinfo Pepino. Accessed July 11, 2018. http://www.hortoinfo.es/index.php/ informes/cultivos/518-cultivo-del-pepino.
Costes Pepino. Accessed July 11, 2018. http://www.hortoinfo.es/index.php/5602costes-pep-080517.
Pepino. Vegacañada, July 11, 2018. http://www.vegac.com/pepino.
Hortoinfo Calabacín. Accessed July 11, 2018. http://www.hortoinfo.es/index. php/3462-prod-ue-calabacin-120815.
251
Bibliography References
22-Cultivos-Horticolas-Al-Aire-Libre.Pdf. Accessed July 11, 2018. http://www. publicacionescajamar.es/uploads/cultivos-horticolasalaire-libre/22-cultivos-horticolas-al-aire-libre.pdf.
Calabacín. Vegacañada, July 11, 2018. http://www.vegac.com/calabacin.
“Almeria LGU in Biliran Hit over Open Dumpsite.” Politiko Mindanao. January 21, 2017. Accessed September 18, 2018. http://mindanao.politics.com.ph/almeria-lgu-in-biliranhit-over-open-dumpsite1/.
Bailey, Regina. ThoughtCo. Accessed September 18, 2018. https://www.thoughtco. com/plant-stomata-function-4126012.
Breathing Skins. Accessed September 18, 2018. https://www.breathingskins.com/.
Brickner-Braun, Inbal, Daniel Zucker-Milwerger, Avi Braun, J. Scott Turner, Berry Pinshow, and Pedro Berliner. Journal of Experimental Biology. December 01, 2014. Accessed September 18, 2018. http://jeb.biologists.org/content/217/23/4141.
“Climate-Data.org.” Climate Sahara: Temperature, Climograph, Climate Table for Sahara - Climate-Data.org. August 09, 2015. Accessed September 18, 2018. https:// en.climate-data.org/location/37404/.
Copyright Global Sea Temperatures - A-Connect Ltd. “Almería Water Temperature | Spain | Sea Temperatures.” Sea Temperature. Accessed September 18, 2018. https:// www.seatemperature.org/europe/spain/almera.htm.
Garden & Greenhouse. Accessed September 18, 2018. https://www. gardenandgreenhouse.net/articles/greenhouse-articles/the-basics-of-greenhouseventilation/.
Home. Accessed September 18, 2018. https://duol.eu/products/tennis-air-dome.
“Salad Slaves: Who Really Provides Our Vegetables - YouTube.” Accessed December 29, 2018. https://www.youtube.com/watch?v=oZl1eBU4Qx0&t=376s&index=9&list=WL.
“Almeria: Europe’s Dirty Little Secret in Southern Spain.” Huck Magazine, January 27, 2017. https://www.huckmag.com/art-and-culture/travel-diary-almeria/.
252
“Spain’s Sea of Plastic & Opioid Emergency: VICE News Tonight on HBO Full EpisodeYouTube.” Accessed December 29, 2018. https://www.youtube.com/watch?v=ml0EK-_ H01Y&t=1222s&index=10&list=WL.,
FRANCE 24 English. Modern-Day Slaves: Europe’s Fruit Pickers. Accessed December 30, 2018. https://www.youtube.com/watch?v=_NUvj6JSeCU&index=11&list=WL&t=1s.
Novara Media. The Bitter Fruit of Andalusia. Accessed December 30, 2018. https:// www.youtube.com/watch?v=_NUvj6JSeCU&index=11&list=WL&t=1s.
DW Documentary. African Immigrants Exploited in Spain - Cheap Labor for Cheap Vegetables | DW Documentary. Accessed December 30, 2018. https://www.youtube. com/watch?v=p-YAfrjvQic&index=12&t=112s&list=WL.
Sánchez, José Ángel Aznar, Luís Jesús Belmonte Ureña, and Domingo Bonillo Muñoz. Mercado de trabajo y población extranjera en Almería. El sector en la agricultura intensiva. Universidad Almería, 2015.
https://www.europapress.es/andalucia/sevilla-00357/noticia-agriculturaindustria-invernadero-emplean-almeria-granada-110000-trabajadores-36inmigrantes-20101021123726.html
Agencia de Gestión Agraria y Pesquera de Andalucía CONSEJERÍA DE AGRICULTURA, PESCA Y DESARROLLO RURAL.
“Caracterización de los invernaderos de Andalucía” Versión 1 . Septiembre 2015.
“Instituto de Estadística y Cartografía de Andalucía.” Accessed December 29, 2018. http://www.juntadeandalucia.es/institutodeestadisticaycartografia/iea/ resultadosConsulta.jsp?CodOper=64&codConsulta=53975.
Press, Europa. “El número de migrantes llegados en patera a Andalucía aumentó un 185% en 2017,” January 2, 2018. https://www.europapress.es/andalucia/noticia-total-17614inmigrantes-llegan-patera-costas-andaluzas-2017-1852-mas-2016-20180102144245. html
“Habitantes Almería 1900-2017.” Accessed June 1, 2018. https://www.foro-ciudad. com/almeria/almeria/habitantes.html..
“Europe’s Dirty Little Secret: Moroccan Slaves and a ‘Sea of Plastic.’” EcoWatch, December 18, 2015. https://www.ecowatch.com/europes-dirty-little-secretmoroccan-slaves-and-a-sea-of-plastic-1882131257.html.
253
Lawrence, Edward. “Spain’s White Coast of Greenhouses?!? Modern European Slavery.” Edward Lawrence (blog), July 9, 2018. https://edwardlawrence.net/2018/07/10/wheredoes-the-your-hipster-breakfast-come-from-spains-white-coast-of-greenhouses/.
“A Bitter Harvest for Spain’s Migrant Workers,” June 15, 2011. //www.bbc.co.uk/ news/world-europe-13767813.
“Modern-Day Slaves: Europe’s Fruit Pickers - YouTube.” Accessed December 29, 2018. https://www.youtube.com/watch?v=PL7CHmTdrIo&t=523s&inde =13&list=WL.
Le Jardin et la Maison Arabes au Maroc, Jean Galloti
Minke, Gernot,Building with earth : design and technology of a sustainable architecture Basel : Birkhauser, 2006.
Kent Harries, Bhavna Sharma, Nonconventional and vernacular construction materials : characterisation, properties and applications, Oxford : Woodhead Publishing, 2016.
Baker, Darryl. “The Traditional House and New Middle Class Housing in Morocco.” Ekistics 53, no. 318/319 (1986): 149–56.
Adriaenssens, Sigrid, Block, Philippe, Veenendaal, Diederik, Williams, Chris, Shell structures for architecture : form finding and optimization, Abingdon : Routledge, 2014.
Veenendaal, Diederik, West, Mark, Block, Philippe. “History and Overview of Fabric Formwork: Using Fabrics for Concrete Casting.” Structural Concrete 12, no. 3 (September 1, 2011): 164–77.
Bini, Dante. Building with air / Dante Bini.London : Bibliotheque McLean, 2014.
“Bayt, a Different View on Social Housing in Morocco • Abdessamed Azarfane.” Accessed January 7, 2019. http://www.abdessamedazarfane.com/2015/06/bayt-a-differentview-on-social-housing-in-morocco/.
254
Images & Data Reference References
8.2 Image & Data Reference
“Significado de Desertificación.” Significados. Accessed May 20, 2018. http://www. significados.com/desertificacion/.
“Causes, Effects and Solutions of Desertification.” Conserve Energy Future (blog), August 23, 2015. https://www.conserve-energy-future.com/causes-effects-solutionsof-desertification.php.
“Map of Sensitivity to Desertification and Drought in Southern Europe.” Accessed September 18, 2018. https://www.eea.europa.eu/themes/soil/desertification/map-ofsensitivity-to-desertification-and-draught-in-southern-europe/image_view_fullscreen.
Google Maps. Accessed July 25, 2018. https://maps.google.com/.
“Water Scarcity & Droughts in the European Union.” Together Against Trafficking in Human Beings. Accessed September 18, 2018. http://ec.europa.eu/environment/ water/quantity/about.htm.
Greenhouses Almeria. Accessed July 20, 2018. https://www.alamy.com/stock-photo/ greenhouses-almeria-spain.html.
North Africa. Accessed July 20, 2018. https://earthdata.nasa.gov/earth-observationdata/imagery
Mechell & Lesikar (2010)
Seawater greenhouse. Accessed July 20, 2018. seawatergreenhouse.com
WilkinsonEyre. (2018). Wilkinson Eyre Architects | WilkinsonEyre. Accessed July 20, 2018 www.wilkinsoneyre.com/
Davies Alpine House. (2018). Accessed Sept 2. 2018. Source: https://daviesalpinehouse. weebly.com/
Duol. Accessed September 18, 2018. https://duol.eu/products/tennis-air-dome.
Johnny Times. (2018). Expo 70, Fuji Group Pavilion, Air Dome - Johnny Times. [online] Available at: http://www.johnnytimes.com/expo-70-fuji-group-pavilion-air-dome/ [Accessed 18 Sep. 2018].
“Eden Project.” Wikipedia. September 08, 2018. Accessed September 18, 2018. https:// en.wikipedia.org/wiki/Eden_Project.
255
Images & Data Reference References
Rodríguez, Alberto, Eugenio Oñate, and Javier Marcipar. “Design of an Inflatable, Modular and Portable Footbridge.” Scipedia. February 01, 2018. Accessed September 18, 2018. https://www.scipedia.com/public/Rodríguez_et_al_2017a.
Breathing Skins. Accessed September 18, 2018. https://www.breathingskins.com/.
“Adaptive Solar Facade (ASF).” Adaptive Solar Facade (ASF) – Chair of Architecture and Building Systems | ETH Zurich. Accessed September 18, 2018. http://www.systems. arch.ethz.ch/research/active-and-adaptive-components/asf-adaptive-solar-facade. html.
Stomata diagram. Accessed September 18, 2018. https://www.quora.com/What-arestomata-1
GreenHouse Film || SHOUMAN. Accessed September 18, 2018. http://www.shouman. com/greenhouse.html.
“Image Analysis in Grasshopper.” BARTLETT. UNIT22. October 19, 2014. Accessed September 18, 2018. https://unit22bartlett.wordpress.com/2014/10/19/imageanalysis-in-grasshopper/.
“ETFE Properties.” Fluorotherm™. Accessed September 18, 2018. https://www. fluorotherm.com/technical-information/materials-overview/etfe-properties/.
Taiyo Kogyo Corporation. Advantages of ETFE Film Structure: MakMax (Taiyo Kogyo Corporation). Accessed September 18, 2018. https://www.makmax.com/business/ etfe_advantages.html.
“Evergreen Greenhouse 6 x 8ft Green - 6 x 8ft - Greenhouses - Gardening Trade Tested.” Accessed September 19, 2018. https://www.tradetested.co.nz/gardening/ greenhouses/6-x-8ft/greenhouse-6-x8-green.html.
“IL110 Universal Welding Machine.” Accessed September 19, 2018. https://www. ascobv.com/en/branche/sign-industry/welding-and-folding/il110-universal-weldingmachine.
“SANGIR.” Accessed September 19, 2018. http://www.sangir.com/pe-fittings.php.
StockUnlimited. “You Don’t Have To Be A Designer To Get Awesome Visuals.” StockUnlimited. Accessed September 19, 2018. https://www.stockunlimited.com/ vector-illustration/pond_2018809.html.
256
Images & Data Reference References
“A Farm Set Isometric View. Vector.” 123RF. Accessed September 19, 2018. https:// pt.123rf.com/photo_76786065_a-farm-set-isometric-view-vector.html.
“DIBUJOS OIT (63) · IMAGENES FOTOS PREVENCION.” Accessed September 19, 2018. http://www.jmcprl.net/DIB%20OIT/DIBUJOS%20OIT%20(63).html.
“Vectores de Cantera y Illustraciones Libre de Derechos - IStock.” Accessed September 19, 2018. https://www.istockphoto.com/es/ilustraciones/ cantera?mediatype=illustration&phrase=cantera&sort=mostpopular.
“Isometric Umgebaute Fabrik Und Produktion Stock Vektor Art Und Mehr Bilder von Isometrische Darstellung 166010172 | IStock.” Accessed September 19, 2018. https:// www.istockphoto.com/at/vektor/isometric-umgebaute-fabrik-und-produktiongm166010172-22955711.
“Cheese Fabric Storage Isometric Composition Vector Image on VectorStock.” VectorStock. Accessed September 19, 2018. https://www.vectorstock.com/royaltyfree-vector/cheese-fabric-storage-isometric-composition-vector-18253688.
“Isometric Truck Icon Vector Image on VectorStock.” VectorStock. Accessed September 19, 2018. https://www.vectorstock.com/royalty-free-vector/isometric-truck-iconvector-9047269.
“Cutting Machine - High Frequency Welding Machines, Cutting Plotters, PTFE Welders, Thermoforming Machine, Etfe Welding Machines.” Accessed September 19, 2018. http://www.balacchi.it/br-320-pl.html.
“Wheel - Google Search.” Accessed September 19, 2018. https://www.google.co.uk/ search?hl=en-GB&q=Wheel&tbm=isch&tbs=simg:CAQSlQEJZa-ON_1Gp4boaiQELEKj U2AQaAggVDAsQsIynCBpiCmAIAxIo8h-pHfMfqBL0H8AGvwavEvUfmQaLPsozpzajNqI 25jajM4w-yzOTPhowB91J8C724XBLl72RzrQapVQECnRl0pZXW9CmiNa6UE4WZTBn nyop-IJJId3TneOoIAQMCxCOrv4IGgoKCAgBEgQSrCKRDA&sa=X&ved=0ahUKEwjqzp y2rsfdAhXLBcAKHX6VCNkQwg4IKigA&biw=1166&bih=651#imgrc=Ih9SKsSPN8aCfM: “Hypalon.” Accessed September 19, 2018. http://rdanet.info/imgs/h/hypalon.html.
“Teflon tape & folie – Rijtech.” Accessed September 19, 2018. http://rijtech.com/shop/ algemeneindustrie/vi-teflontapes/teflon-tape-folie/.
257
Images & Data Reference References
“Jakarta ETFE Canopy - Fabritecture.” Accessed September 19, 2018. https:// fabritecture.com/project/jakarta-etfe-canopy/.
“Fnsterfilm Clas Ohlson Clas Ohlson - Hem Hyvling.” Accessed September 19, 2018. http://bestpiu.info/insynsskydd-fonster-jula-28401/fnsterfilm-clas-ohlson-clasohlson-3/.
“Emile – Des articles informatifs et des bons plans.” Accessed September 19, 2018. https://pluri-succes.com/author/emile/.
“Cut-to-Size Plastic & Acrylic Sheets : TAP Plastics.” Accessed September 19, 2018. https://www.tapplastics.com/product/plastics/cut_to_size_plastic.
“Simple Solar - High Quality Solar Cells India.” Accessed September 19, 2018. http:// simplesolar.in/photo_gallery.php.
“Crawl Space Vapor Barrier Installation & Moisture Control in VA.” Accessed September 19, 2018. https://www.baycrawlspace.com/services/vapor-barrier/.
“Fiberglass Wall Panels Fiberglass Wall Panels Canada - Deconcraft.Com/Editor.” Accessed September 19, 2018. http://deconcraft.com/editor/?
“Fiberglass Wall Panels Fiberglass Wall Panels Canada - Deconcraft.Com/Editor.” Accessed September 19, 2018. http://deconcraft.com/editor/?
“Neoprene Desk/Tabletop-Size Mat.” Accessed September 19, 2018. https://www. highspeedpc.com/Neoprene_Desk_Tabletop_size_Mat_p/neoprene24x42.htm.
“Cinta de nylon 4 cm.” Curtidos Carrasco. Accessed September 19, 2018. http://www. curtidoscarrasco.com/cintas-de-nylon-y-cintas-de-algodon-para-mochilas/1933-cintade-nylon-4-cm.html.
“Tipuri de Materiale Si Cum Le Recunosti, Alexandra Druta.” Alexandra Druta (blog), September 26, 2016. https://alexandradruta.ro/2016/09/26/tipuri-de-materiale-cumrecunosti/.
258
Images & Data Reference References
“Europe’s Dirty Little Secret: Moroccan Slaves and a ‘Sea of Plastic.’” EcoWatch, December 18, 2015. https://www.ecowatch.com/europes-dirty-little-secretmoroccan-slaves-and-a-sea-of-plastic-1882131257.html.
Aerial of Greenhouses Glasshouses in Stock Footage Video (100% Royalty-Free) 32413060 | Shutterstock. Accessed December 19, 2018. https://www.shutterstock. com/video/clip-32413060-aerial-greenhouses--glasshouses-westland-aria-netherlands.
“Kunming.” Accessed December 19, 2018. http://www.trekearth.com/gallery/Asia/ China/South/Yunnan/Kunming/photo833293.htm.
BBC. “The Mediterranean Has a Serious Plastic Problem.Pic.Twitter.Com/0yQxNvQoNv.” Tweet. @bbc (blog), October 30, 2018. https://twitter.com/bbc/status/1057195674683535360?lang=en.
Rita Stella Roesch Diaz. Photographs Greenhouses Structures in “El Ejido”, June29, 2018.
“Países ejercen mano más dura a la inmigración que crece pese a fatales riesgos.” 24ecuador. Accessed December 29, 2018. http://www.24ecuador.com/mundo/paisesejercen-mano-mas-dura-a-la-inmigracion-que-crece-pese-a-fatales-riesgos/17436noticias.
“El sur de España es un agujero de mierda.” Accessed December 30, 2018. https:// www.burbuja.info/inmobiliaria/burbuja-inmobiliaria/1063115-sur-de-espana-agujerode-mierda-15.html.
Lawrence, Edward. “Spain’s White Coast of Greenhouses?!? Modern European Slavery.” Edward Lawrence (blog), July 9, 2018. https://edwardlawrence.net/2018/07/10/wheredoes-the-your-hipster-breakfast-come-from-spains-white-coast-of-greenhouses/.
“A Bitter Harvest for Spain’s Migrant Workers,” June 15, 2011. //www.bbc.co.uk/ news/world-europe-13767813.
“Modern-Day Slaves: Europe’s Fruit Pickers - YouTube.” Accessed December 29, 2018. https://www.youtube.com/watch?v=PL7CHmTdrIo&t=523s&inde =13&list=WL.
“El sur de España es un agujero de mierda.” Accessed December 30, 2018. https:// www.burbuja.info/inmobiliaria/burbuja-inmobiliaria/1063115-sur-de-espana-agujerode-mierda-15.html.
259
References
Images & Data Reference
“Limestone Rock.” Shutterstock.com. Accessed December 29, 2018. https://www. shutterstock.com/image-photo/limestone-rock-140817247.
“Stack of Bricks PNG Images & PSDs for Download | PixelSquid - S10572023D.” Accessed December 29, 2018. https://www.pixelsquid.com/png/stack-of-bricks1016080225924028184?image=G03.
“Corrugated Sheets.” indiamart.com. Accessed December 29, 2018. https://www. indiamart.com/proddetail/corrugated-sheets-18936200730. html.
“Jual Plastic PE ( PolyEthelene) oleh PT Tri Global Mitra di Bekasi Timur.” Accessed December 29, 2018. https://www.indonetwork.co.id/product/plastic-pepolyethelene-5787846.
“Custom Wooden Crate.” indiamart.com. Accessed December 29, 2018. https://www. indiamart.com/proddetail/custom-wooden-crate-10648193988.html.
“Construction Aggregate and Stone Dust Wholesale Supplier | Noble Infratech, Delhi.” IndiaMART.com. Accessed December 29, 2018. https://www.indiamart.com/messrsnoble-infratech/.
“Salad Slaves: Who Really Provides Our Vegetables - YouTube.” Accessed December 29, 2018. https://www.youtube.com/watch?v=oZl1eBU4Qx0&t=376s&index=9&list=WL.
“Almeria: Europe’s Dirty Little Secret in Southern Spain.” Huck Magazine, January 27, 2017. https://www.huckmag.com/art-and-culture/travel-diary-almeria/.
“Spain’s Sea of Plastic & Opioid Emergency: VICE News Tonight on HBO Full EpisodeYouTube.” Accessed December 29, 2018. https://www.youtube.com/watch?v=ml0EK-_ H01Y&t=1222s&index=10&list=WL.,
FRANCE 24 English. Modern-Day Slaves: Europe’s Fruit Pickers. Accessed December 30, 2018. https://www.youtube.com/watch?v=_NUvj6JSeCU&index=11&list=WL&t=1s.
Novara Media. The Bitter Fruit of Andalusia. Accessed December 30, 2018. https://www.youtube.com/watch?v=_NUvj6JSeCU&index=11&list=WL&t=1s.
DW Documentary. African Immigrants Exploited in Spain - Cheap Labor for Cheap Vegetables | DW Documentary. Accessed December 30, 2018. https:// www.youtube.com/watch?v=p-YAfrjvQic&index=12&t=112s&list=WL.
“Almeria: Europe’s Dirty Little Secret in Southern Spain.” Huck Magazine, January 27, 2017. https://www.huckmag.com/art-and-culture/travel-diary-almeria/.
260
References
Images & Data Reference
Inc, Depositphotos. “Simple Sun Vector.” Depositphotos. Accessed January 7, 2019. https://depositphotos.com/127209548/stock-illustration-simple-sun-vector.html.
“Water Cartoon Drop Liquid Clip Art - The Screen Is a Sense of Water Droplets - Unlimited Download. Kisspng.Com.” Kisspng. com. Accessed January 7, 2019. https://www.kisspng.com/png-watercartoon-drop-liquid-clip-art-the-screen-is-a-343010/download-png.html.
“Mutiple Brick Mould by SRISTI Team.” Fair Wall - A SRISTI & ILO Initiative (blog), November 7, 2013. https://fairwallproject.wordpress.com/mutiple-brick-mould-by-sristi-team/.
“Silt - Google Search.” Accessed January 7, 2019. https://www. google.com/search?biw=1440&bih=789&tbm=isch&sa=1&ei=_ oUyXKu1FOWX1fAP6KaugA8&q=silt&oq=silt&gs_ l=img.3..35i39l2j0i67j0j0i67j0j0i67l2j0l2.21430.21999..22574...0.0..0.61.230.4......1....1.. gws-wiz-img.Z5NSMAPWH_U#imgdii=GXVxLigWaUqqM:&imgrc=FzSOGmG66EUR0M:
Leopold, L. 1971. Trees and Streams: The Efficiency of Branching Patterns. Journal of Theoretical Biology 31(2): 339-54.
Veenendaal, Diederik, West,Mark, Block,Philippe. 2011. “History and Overview of Fabric Formwork: Using Fabrics for Concrete Casting.” Structural Concrete 12 (3): 164–77. https://doi.org/10.1002/suco.201100014.
Lena Delta satellite image, USGS EROS Data Center Satellite Systems Branch
“Fes Medina Aerial - Google Search.” Accessed January 7, 2019. https://www. google.co.uk/search?hl=en-GB&q=fes+medina+aerial&tbm=isch&tbs=simg: CAQSlwEJ8qcd_1kR_1_1XMaiwELEKjU2AQaBAgVCAMMCxCwjKcIGmIKYA gDEijhF40V1B7cF94ejhXdHtQL6RSVDK45kjmzOb0rlivhP7g57iL1OeI_1GjA2 K3kesmVZ5e6_19a6KWwJSGDk0j-XCuhP8l1s_1oBlI4PIPaCVJFnMYDqf9vw6 _1Ob0gBAwLEI6u_1ggaCgoICAESBLbXnrEM&sa=X&ved=0ahUKEwjynLG-xNzfAhV2RhUIHWfiCfcQwg4IKygA&biw=696&bih=604#imgrc=8qcd_kR__XNXVM:
“Aerial Back Travelling of Seville, Spain. Slow Motion. 60fps. HD Stock Video FootageStoryblocks Video.” Accessed January 7, 2019. https://www.videoblocks.com/video/ aerial-back-travelling-of-seville-spain-slow-motion-60fps-hd-tvuc9wb.
261
Images & Data Reference References
Lena Delta satellite image, USGS EROS Data Center Satellite Systems Branch
Veenendaal, Diederik, West,Mark, Block,Philippe. 2011. “History and Overview of Fabric Formwork: Using Fabrics for Concrete Casting.” Structural Concrete 12 (3): 164–77. https://doi.org/10.1002/suco.201100014.
“Sagrada Familia in Ice | Structural Ice.” Accessed January 7, 2019. http://www.structuralice.com/sagrada-familia-in-ice.html.
“Skill: Inflatable Concrete Domes | Thinkpiece | Architectural Review.” Accessed January 7, 2019. https://www.architectural-review.com/essays/viewpoints/skill-inflatableconcrete-domes/8641827.article
“Icd Itke 2014 - Images of Home Design.” Accessed January 7, 2019. http:// powerakademy.com/post/icd-itke-2014.
“Huffington Post Spain Athena2.” Accessed October 3, 2018. http://spain1307.rssing. com/chan-25958925/all_p1130.html.
262
