
[In]dune
Saumil Nagar + Medha Bansal + Kai Yeh
[In]dune
Saumil Nagar (M.Arch)
Medha Bansal (M.Arch)
Kai Yeh (M.Arch)
PROGRAMME:
STUDENT NAMES:
ARCHITECTURAL ASSOCIATION SCHOOL OF ARCHITECTURE GRADUATE SCHOOL PROGRAMMES
Emergent Technologies & Design 2018-2020
Saumil Nagar ( M.Arch candidate)
Medha Bansal ( M.Arch candidate ) Kai Yeh ( M.Arch candidate)
In-dune
DISSERTATION TITLE:
COURSE TITLE:
COURSE TUTORS:
M.Arch Dissertation
Dr. Michael Weinstock, Dr. Elif Erdine, Dr. George Jeronimidis Alican Sungur, Antiopi Koronaki and Milad Showkatbakhsh
DECLARATION:
“I certify that this piece of work is entirely my/our own and that any quotation or paraphrase from the published or unpublished work of others is duly acknowledged.”
SIGNATURE OF STUDENTS:
DATE:
10th January, 2020
(Saumil Nagar) (Medha Bansal) (Kai Yeh)Acknowledgement
Saumil Nagar: Team:
We would like express our deepest appreciation towards Dr. Michael Weinstock. We thank you for guiding and supporting us throughout the course. You empowered us with the tools needed to think more critically at each step of this project. Dr.Elif Erdine, we thank you for your valuable feedback and lessons. We are ever so grateful to you for sharing your wisdom with us.
We would also like to thank Dr. George Jeronimidis for helping us with the material and structural research in our dissertation.
We are grateful to our studio tutors Antiopi Koronaki, Milad Showkatbakhsh and Alican Sungur for all computational aid and feedback.
I would like to extend my gratitude towards Mr. Krishnan .V , Mr. Parvez Charania, Mrs. Mridula Gudekar and Mr. Anju Gudekar for mentoring and always encouraging me to push my boundaries. Your advice in both professional and personal life has been invaluable.
I am extremely grateful to my late grandfather for all that he did for us and for being someone that I could always look up to and rely on. His work ethics and the values that he held has always motivated me to work harder and be better.
I would especially like to thank my family for all the sacrifices they made on my behalf. My grandparents for being so generous, loving and accommodating .My parents for understanding me, doing everything they could to support and guide me through all my difficulties and helping me get here today. My brother, for being my best friend and being so tolerant.
I would also like to thank Soumya for her continued love and affection. It wouldn’t have been possible without your support.
Lastly I would like to thank all my friends and colleagues at home and at Emtech. I will always cherish the moments we spent together. In your own unique way , you have inspired me and motivated me to aquire new skills.
Medha Bansal: Kai Yeh:
The past 16 months have been one of the most enriching experience of my life. This journey would not have been possible without the immense support that I got from my family, friends and team mates.
Foremost, I would like to extend my sincere gratitude to BK Gizi Pruthi for being my constant guide and a source of immense positivity. Her guidance has been invaluable in this journey.
I would not be half the person that I am without the unconditional support and love from parents and grandparents. Thank you for believing in me and encouraging me to push my boundaries with everything that I do. I am indebted to all the sacrifices that you have made.
My friends have been an integral part of this experience. They have stood by me in every challenge and opportunity and have constantly inspired me with their exceptional talent and achievements. Thank you Saloni, Abhishek, Devanshi, Rodrigo, Vyjayanti, Ekatha, Shibani, Manasi, Manasa, Sreya and Saavani.
Lastly I am thankful to the newest additions to my family- my nephews Aryavir (Aru) and Shivansh, for filling my spirit with zeal and enthusiasm
First and foremost, I am grateful for having the opportunity to work with my teammates - Saumil Nagar and Medha Bansal for this dissertation. It would not have been possible without this collaboration.
My thanks as well to my family for supporting me in this endeavour to pursue an architectural master’s degree. Their continuous encouragement and care motivated me to see everything until the end.
Lastly, I want to thank my best friend in the UK – Patrick Lawrence Monfort – for all the support, both inside and outside school. This entire journey was made even more amazing because of his good company.
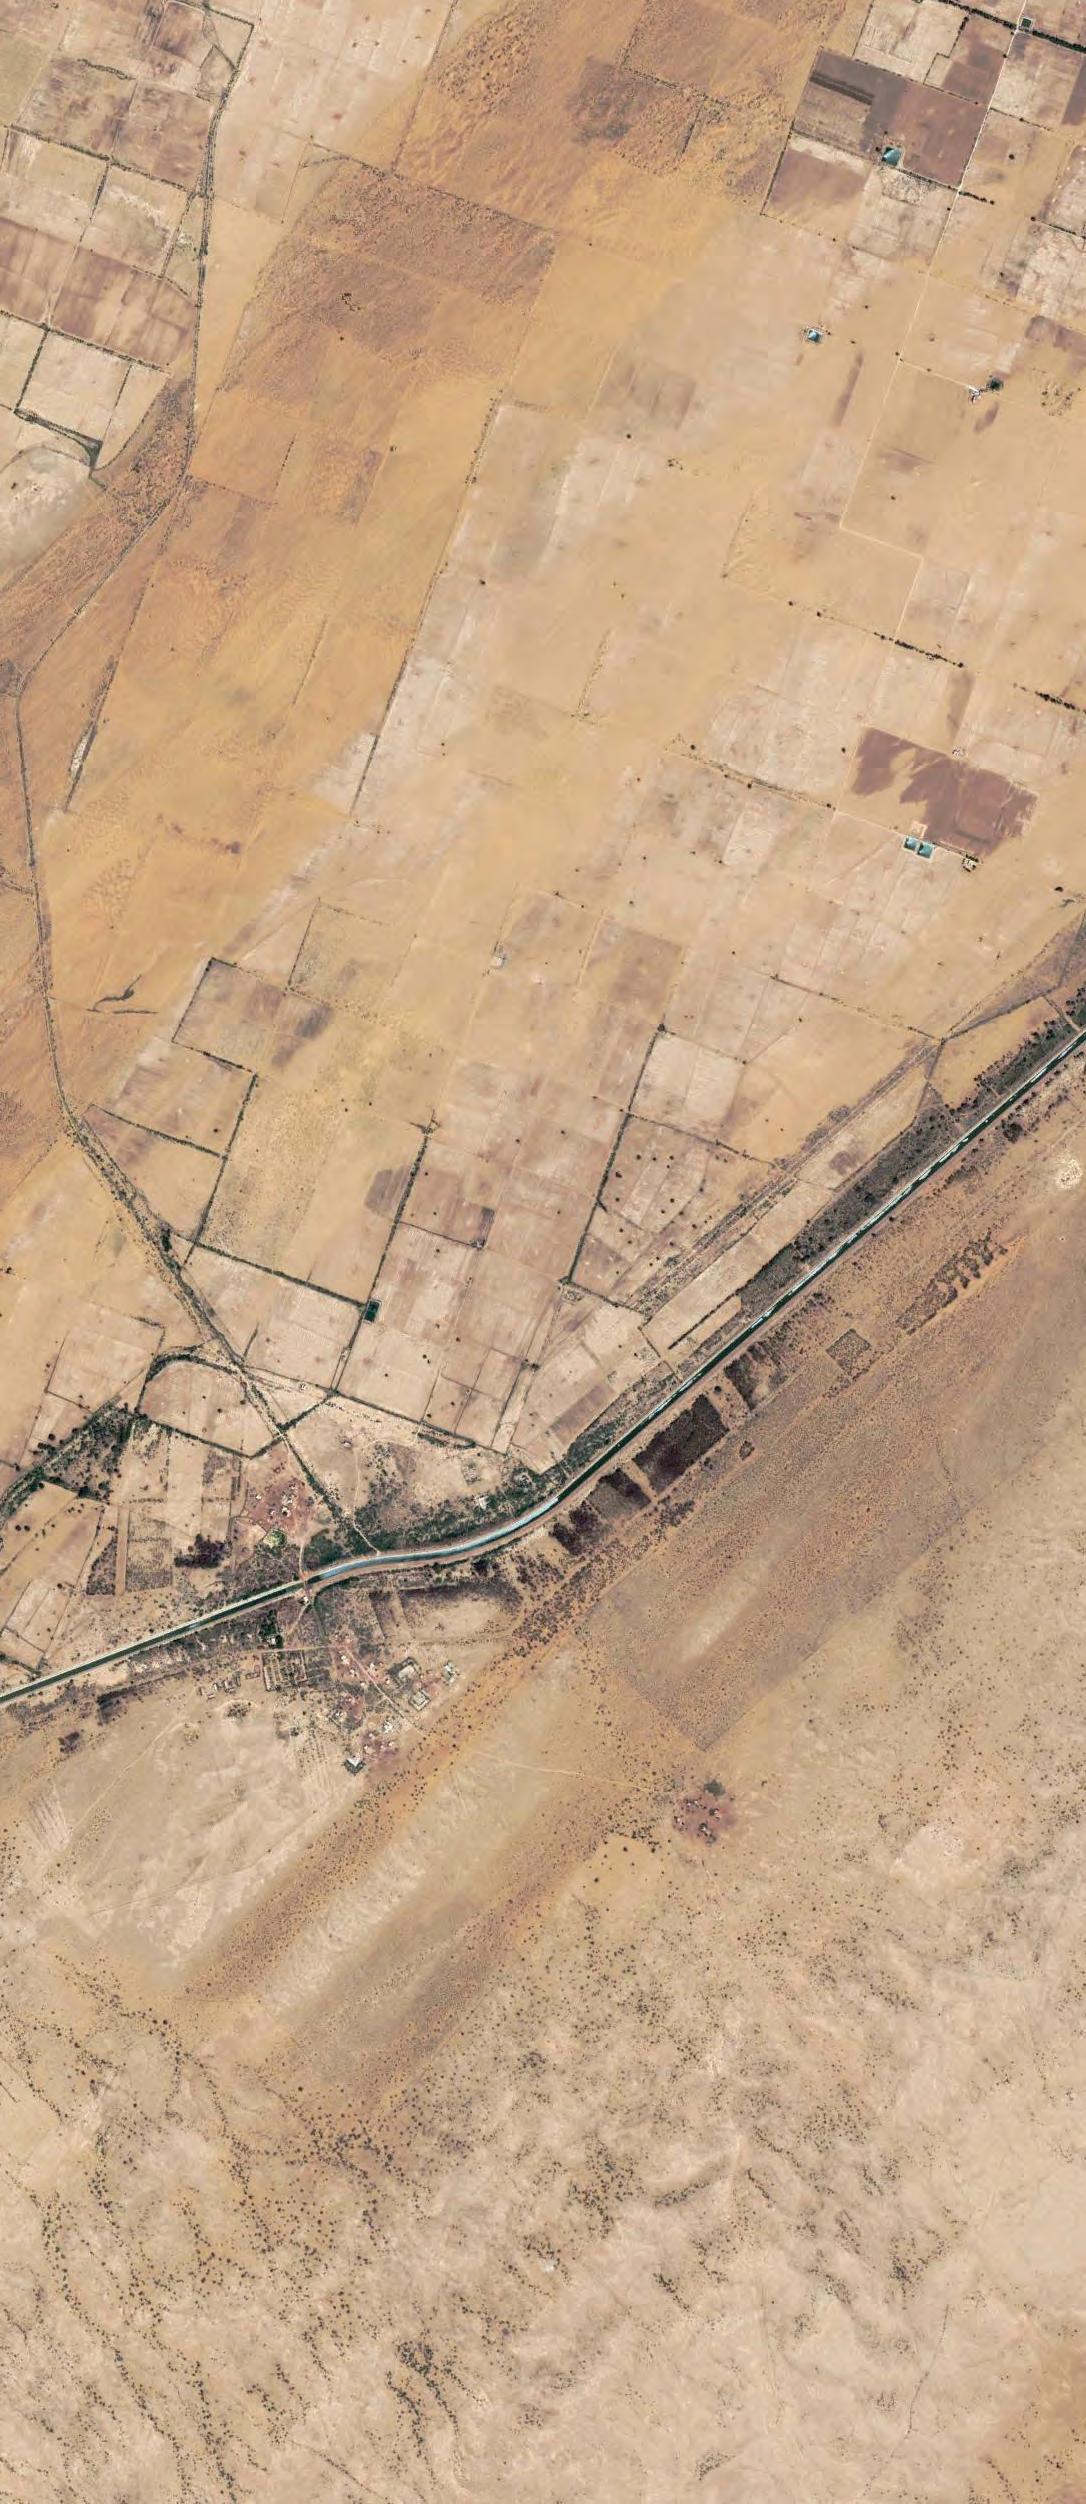
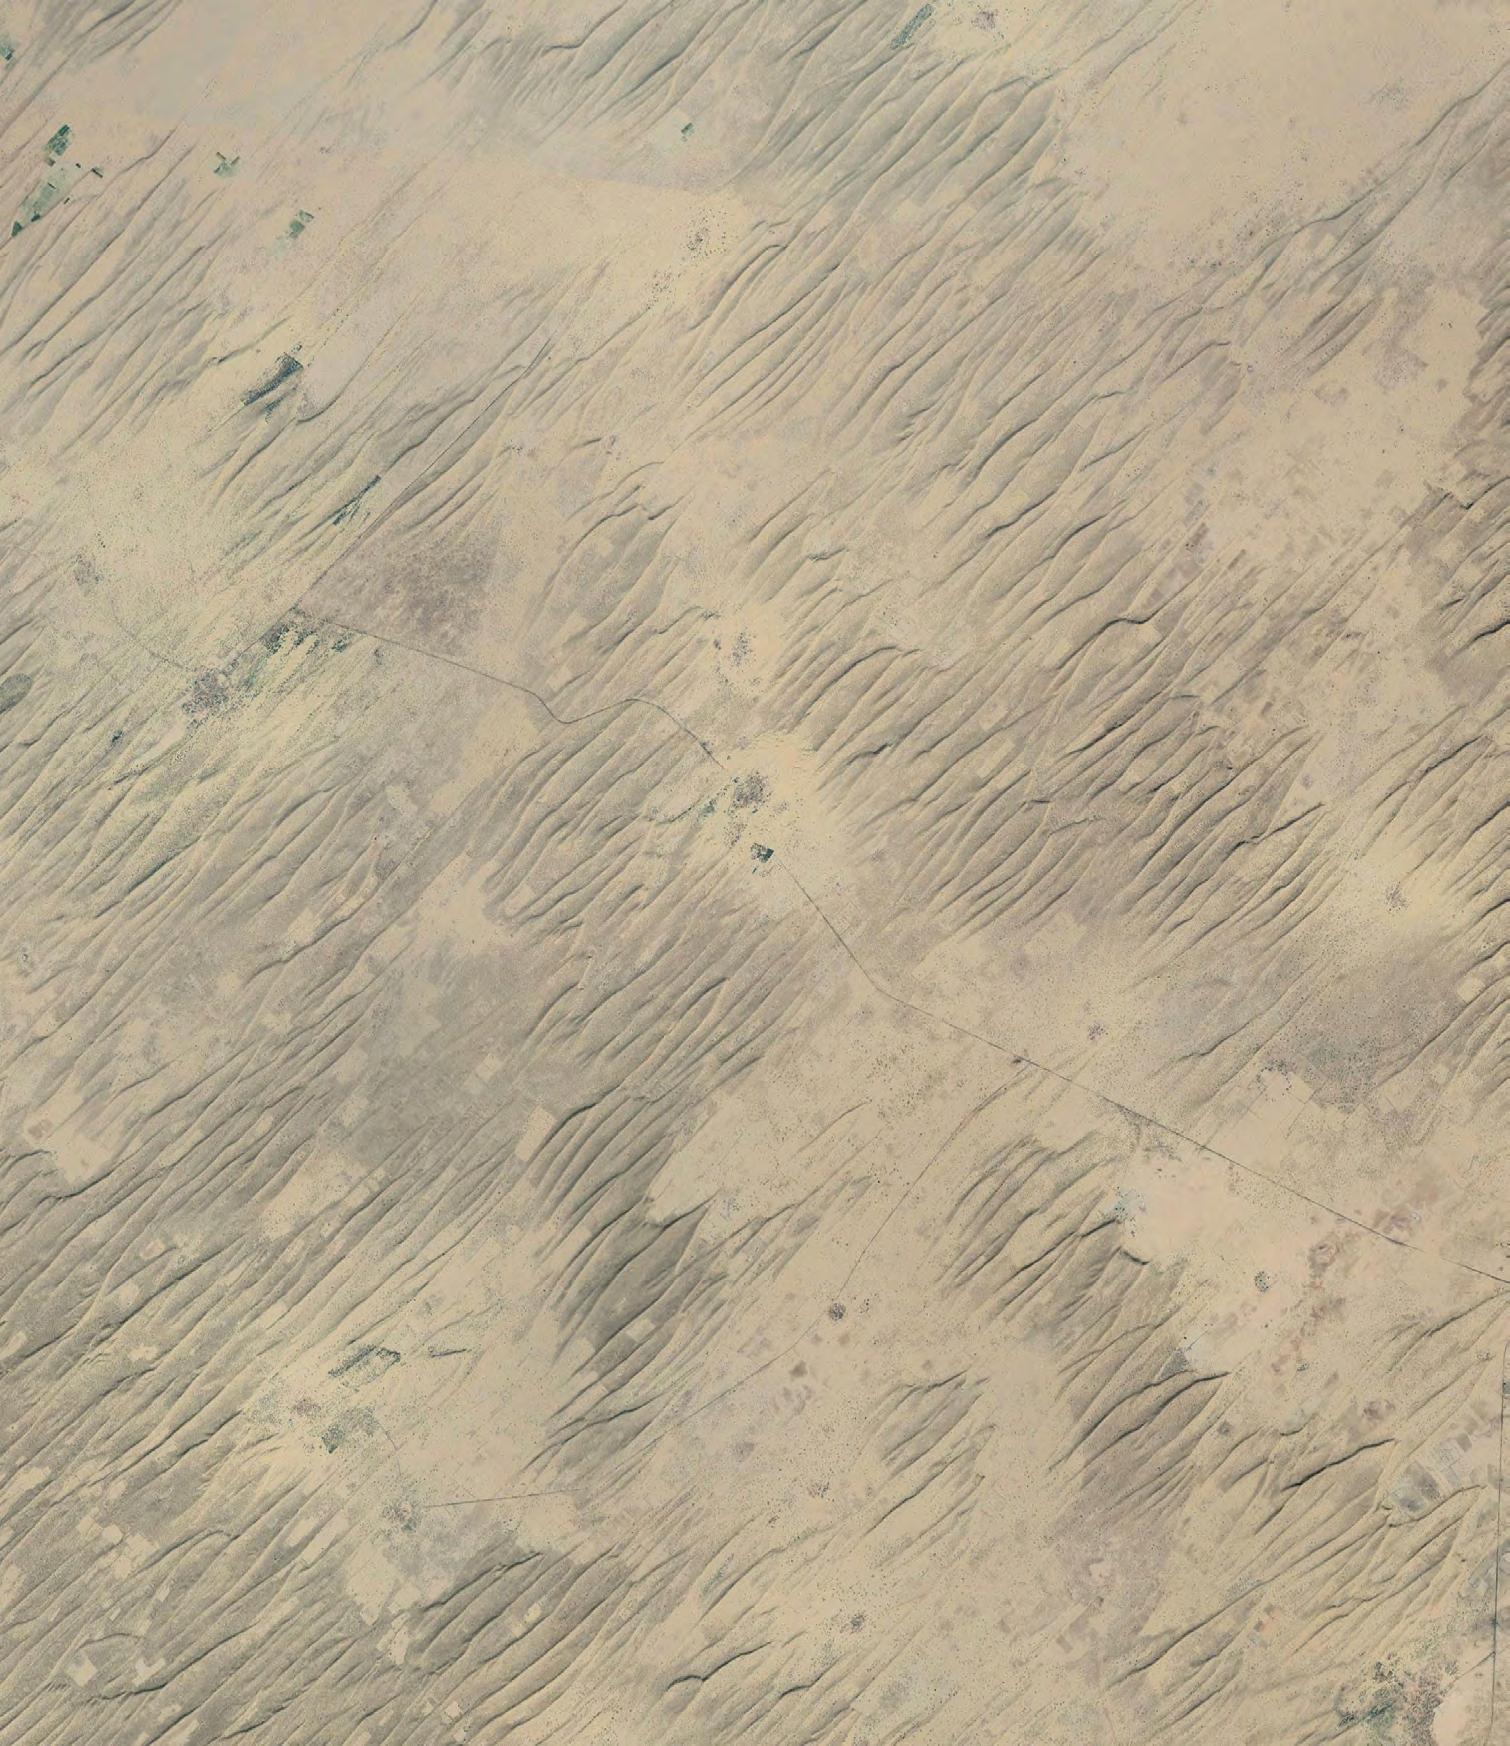
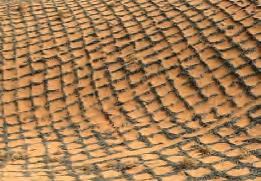
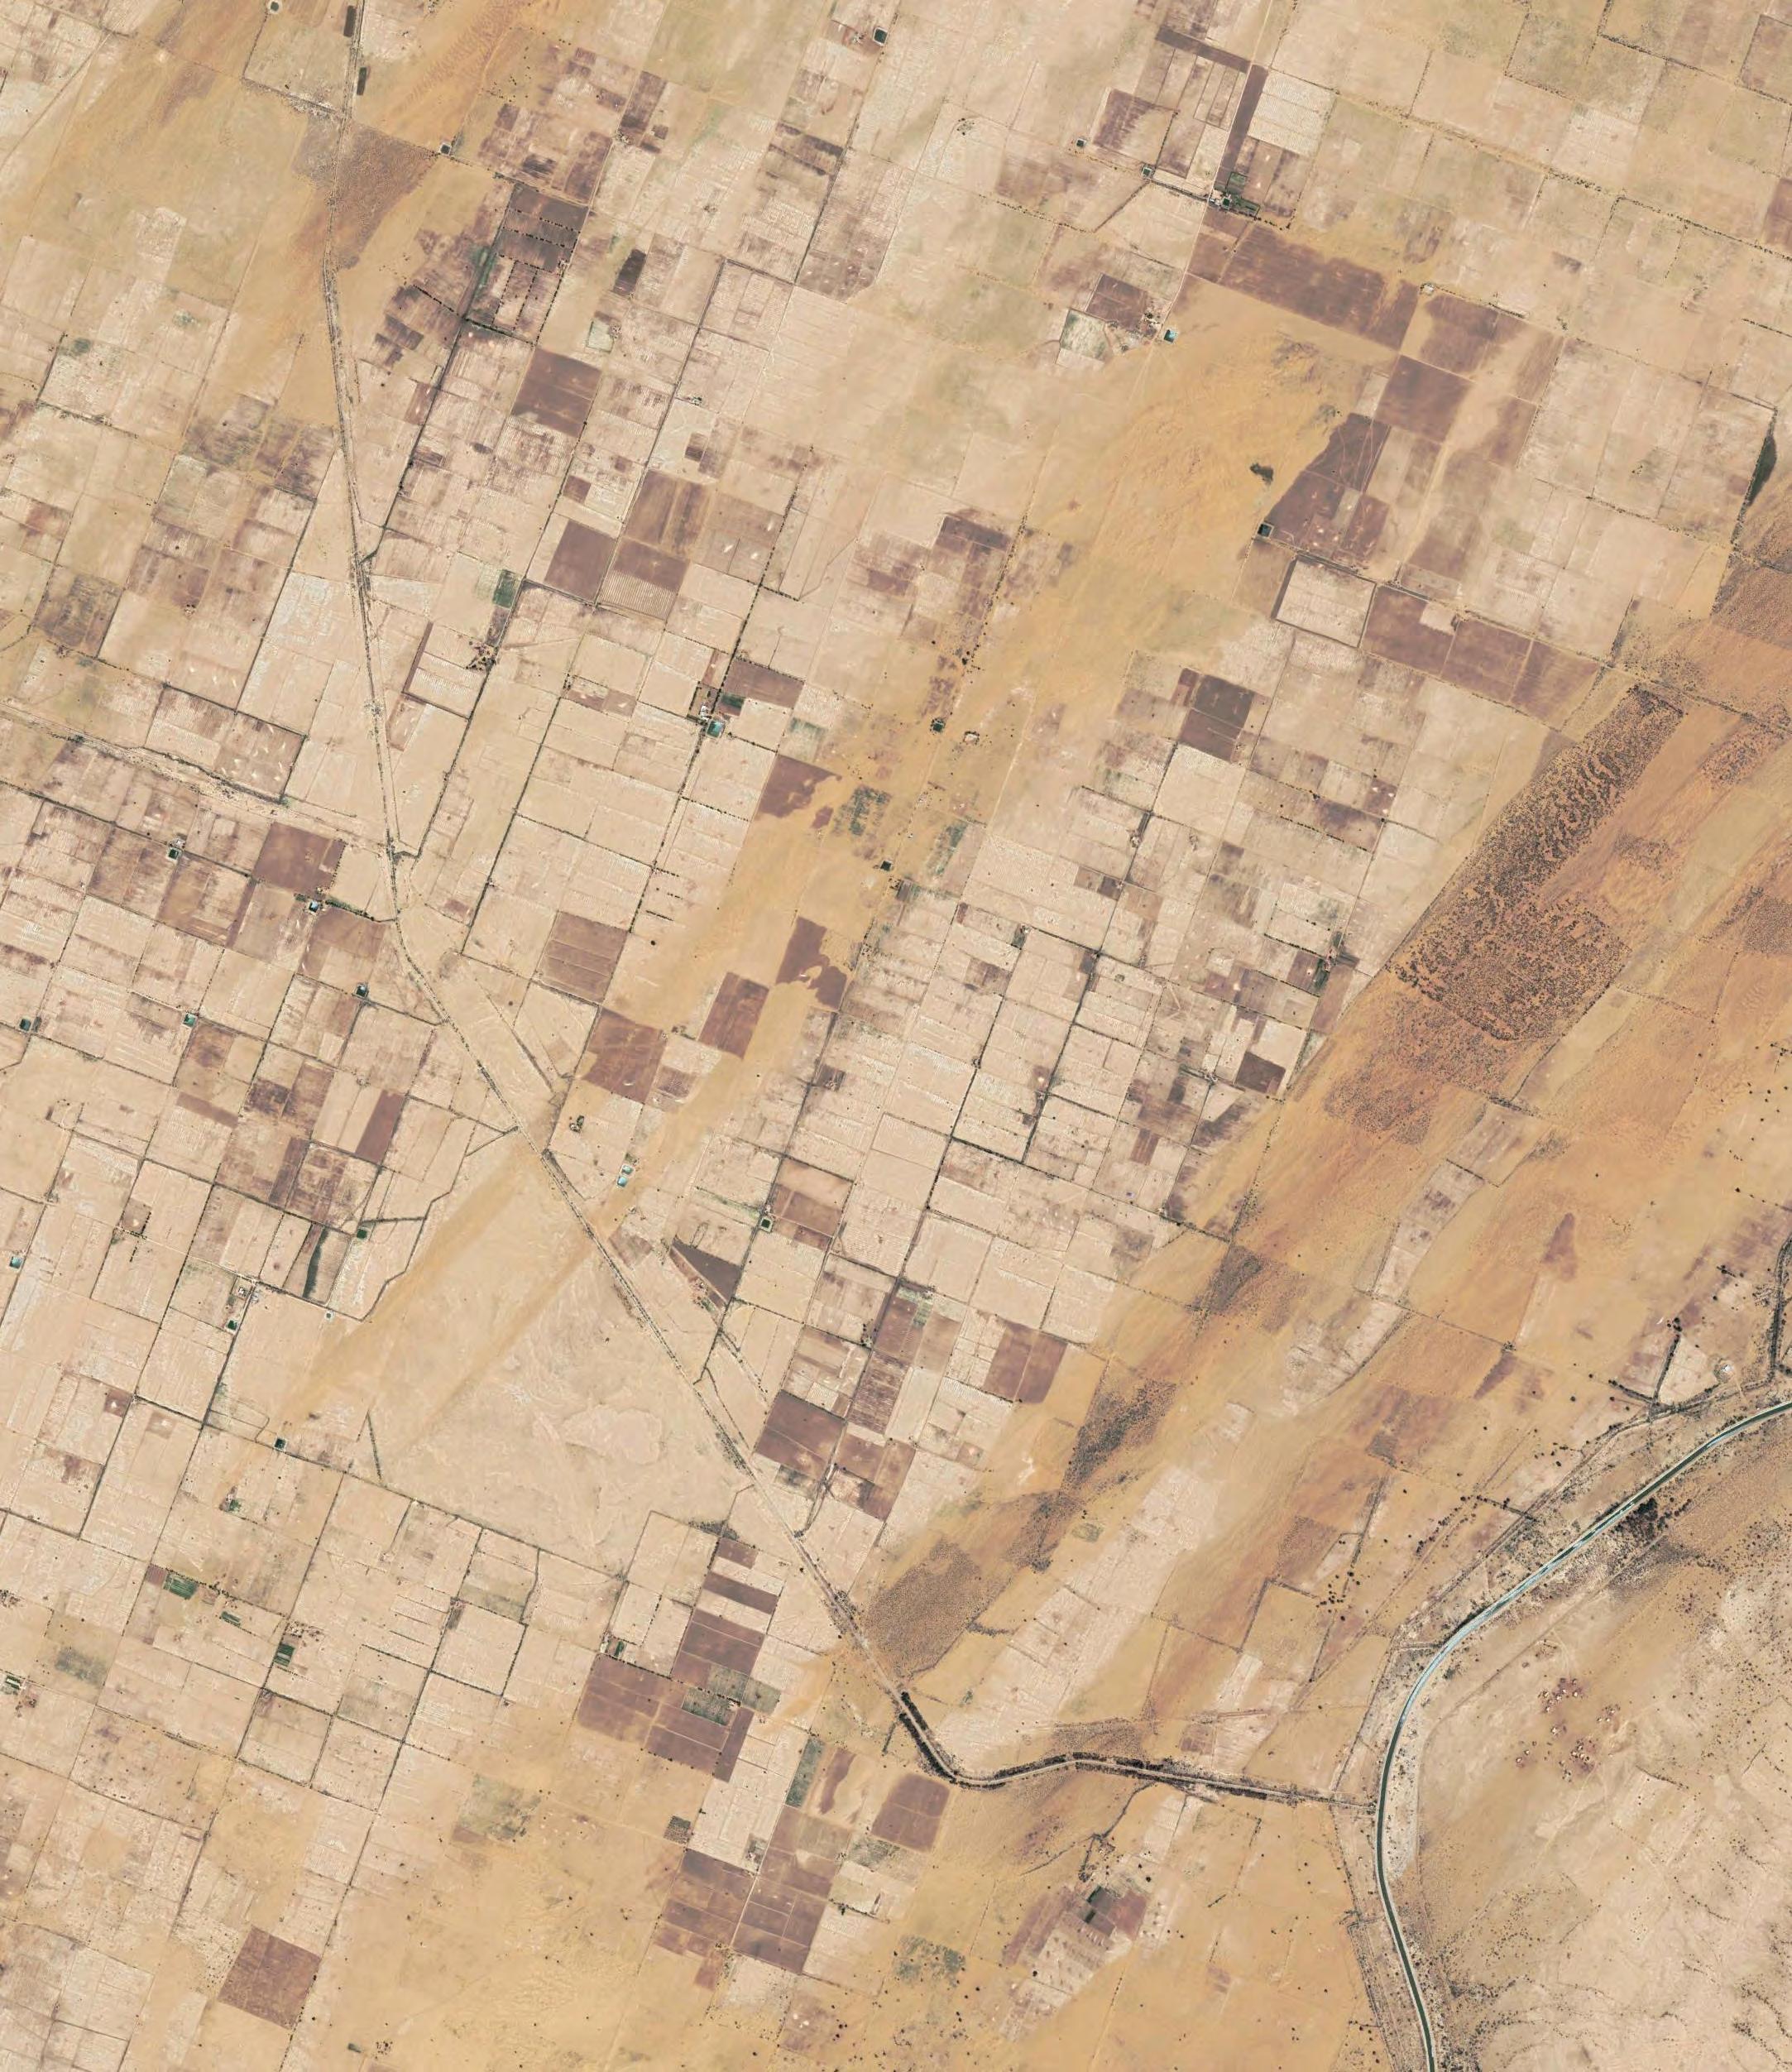 Satellite imagery of sand encroached agriculture fields in western Thar, India
Source : Google earth 2019, 24th June 2019
Satellite imagery of sand encroached agriculture fields in western Thar, India
Source : Google earth 2019, 24th June 2019
Abstract
Today desertification due to climate change and population rise has led to loss of productive landscapes more than ever before. Though the problem persists at a global level, efforts can be made at local and regional scales to design systems that are resilient to process of desertification.
The project aims to design one such system, the principles of which could be adopted to mitigate the instability of linear dunes in the Thar desert and allowing for productive landscapes and settlements to coexist.
Research is conducted in strategising the use of ecological sand stabilisation techniques to form wind deflection and building material systems that can establish a control over the sand influx in such arid biomes. As a part of the scheme, localised cementation of granular material using microbial grouts is proposed to develop underground/in-dune habitats. The morphologies of these habitats is a resultant of site study, fabrication constraints, machine tool paths and the use of environmental analysis methods. These together inform the design strategies.
The research is further extended to integrate site specific water harvesting techniques in the system to form a holistic developmental scheme. The habitable, agricultural and hydrological systems work in synergy at different scales and time steps for the transformation of the expendable landform into a productive landscape.
Contents 1. Introduction ........................................ Desertification ............................................................................ Context: Thar desert ................................................................. Research question .................................................................... 2. Domain.................................................. Western Thar................................................................................ Dune dynamics .......................................................................... Sand stabilisation techniques .............................................. Water resources in Thar............................................................ Research proposal .................................................................... 3. Methods ............................................... Overview ...................................................................................... Digital tools.................................................................................. 4. Research developments ................. Bio-mineralisation..................................................................... Stepped profile........................................................................... Sand channels............................................................................. In-dune habitable spaces........................................................ Deflection system...................................................................... 5. Design Development ....................... Habitable spaces ....................................................................... Deflection system: scalability ............................................... Resources and infrastructure ................................................ 6. Design Proposal ................................. Program distribution ............................................................... Cluster design ............................................................................ Global time-scales...................................................................... 7. Analysis and conclusion ................. 8. Appendix ............................................. 9. References ........................................... 10. Bibliography ..................................... 11. Contribution sheet.......................... 15 117 118 132 146 165 166 176 186 201 207 223 229 235 16 18 25 29 31 36 40 58 62 65 66 69 73 74 86 92 96 104
1. Introduction
Desertification


The world today witnesses rapid increase of human population and their unprecedented dependence on natural resources. The rising human pressure on land to meet these demands have subjected the resource to exploitation and redundancy. Coupled with the changing climatic patterns, degradation of dryland (arid, semi-arid and dry subhumid areas) in all its forms and levels is called Desertification (United Nations Convention to Combat Desertification (UNCCD 2014)). Implying that the two dominant reasons causing desertification -climate change and human activities have subjected 3 billion of world’s population housing in these areas to reducing vegetation covers, shrinking water bodies and loss of wildlife. 1
Climatic changes in its form and behavior modulate the exchange of energy and material between all other systems.2 Changing climatic patterns have altered the terrestrial biomes and have imposed a direct impact on physical processes like water cycle and functioning of ecosystems. In terms of global populations, these changes also mean that food-production zones are shifting, and in many regions crops and livestock are failing . The drought creating climatic trends and land degradation form a complex synergic input to create pressure on environment that has escalated Desertification, transforming it into a global phenomenon .3 As quoted by UNCCD in 2014, Desertification is a silent, invisible crisis that is destabilizing communities on a global scale.

16 I Emergent technologies and design 83 people / km2 9 people / km 2 0.5people / km 2 3 people / km 2 0.5 people / km 2 15 people / km 2 0.2 people / km 2 25 people / km 2 4 people / km 2 2 people / km 2 Sahara desert Kalahari desert Arabian desert karakum desert Great basin Atacama Desert Patagonai Thar desert Gobi desert Great Victorain Low Very low Moderate High Very High Dry
Population Total land coverage Livestock Global crop production 33% 41% 50% 44% 1.1
Top left : Desertification vulnerability based on soil and climate data climate data
Source : Zdruli, Pandi & Cherlet, M & Zucca, Claudio. (2016). Mapping desertification: constraints and challenges. Encyclopaedia of Soil Science, Third edition, (Ed. R. Lal). 10.1081/E-ESS3-120052917
Source : https://www.un.org/en/events/ desertification_decade/whynow.shtml
Top right: Continental land degradation and population density
Source : Zdruli, Pandi & Cherlet, M & Zucca, Claudio. (2016). Mapping desertification: constraints and challenges. Encyclopaedia of Soil Science, Third edition, (Ed. R. Lal). 10.1081/E-ESS3-120052917.
The global population has already reached 7 billion and it is projected that the sum will reach to 8.3 billion in next decade. The growing population account to practice unsustainable human activities and put land to risk. Human activities like expansion and intensive use of agricultural lands, poor irrigation practices, deforestation, and overgrazing have contributed to desertification. As these unsustainable practices put immense pressure on the land, they also alter the soil chemistry and hydrology of that area. These activities result in overexploited drylands suffering from erosion, soil salinization, loss of productivity, and decreased resilience to climatic variations.4
Increasing human pressures on land combined with climate change will reduce the resilience of dryland populations and constrain their adaptive capacities.. In rural areas where people depend on scarce productive land resources, land degradation is a driver of forced migration. It is estimated that desertification can cause displacement of 135 million people. By 2050, 200 million people may be permanently displaced environmental migrants . The combination of pressures coming from climate variability, anthropogenic climate change and desertification will contribute to poverty, food insecurity, increased disease burden and potentially to conflicts.
17 In-dune I
Bottom left : Dryland statistics
Chemical degradation Population densityperson/km2 Physical degradation Wind erosion Water erosion SouthAmerica 14% North America 58% Europe10% Ocenia12% Africa 17% Asia24% World15% 226 87 8 188 57 57
Figure 1.3 : Continental land degradation and poulation density Source : Zdruli, Pandi & Cherlet, M & Zucca, Claudio. (2016). Mapping deserti cation: constraints and challenges. Encyclopaedia of Soil Science, Third edition, (Ed. R. Lal). 10.1081/E-ESS3-120052917.
Context : Thar desert, Rajasthan
The arid zone of the northwestern part of the Indian sub-continent houses the world’s most populated desert- Thar Desert. In India, most of Thar is located in western Rajasthan. Climatologically it lies in the region of dry, subsiding air masses of sub-tropical anticyclone. These diverging airmasses create unfavorable conditions for conventional showers despite of the great heat. The desert is slammed by large, shifting sand dunes and frequent dust storms. (Refer to Appendix Section
8.1 for dune morphologies across Thar)
The extreme climatic conditions and anthropogenic disturbances caused to land in this part of the world has led India to face the heat of Desertification and imperil 120 m ha of its land to depletion .6 The ecological imbalance between humans, plants and climate have abated the stability of the terrain and subjected Thar to expansion. At present the desert is expanding at the rate of half a mile per year and has accelerated the subsidence of productive landscapes in north India .7
Dominated by strong winds from South-west, about 76% area has been mapped under wind erosion and deposition form of land degradation.8 Living in between the shifting sands of western Rajasthan formulate unfavorable existential conditions. The current scenario poses a threat to the future population and to the existing 40% of Rajasthan’s total population living in Thar.
18 I Emergent technologies and design Total population Agriculture Labourers Others Cultivators Total : 68,548,437 Rural 51,500,352 Urban : 17,048,085 Total : 68,548,437 Rural 51,500,352 Urban : 17,048,085 Total 68,548,437 Rural 51,500,352 Urban : 17,048,085 Total 68,548,437 Rural 51,500,352 Urban : 17,048,085 Rural Urban 98% 68% 2% 32% 75% 96.5% 25% 3.5%
1.2
Graph
Source : http://animalhusbandry.rajasthan.gov.in/livestock_census.aspx
Rajasthan livestock population 2012 Rajasthan livestock population 2007
Rajasthan annual mean temperature Rajasthan population
Source : http://berkeleyearth.lbl.gov/regions/rajasthan
https://www.census2011.co.in/census/state/rajasthan.html
Problems 1.2.1
Top
The vicissitudes of climate change and human activities have majorly effected socio-economic fabric of the settlements housing Thar. Characterised by the scarcity of water, vegetation and fragility of the soil, the region has faced frequent and severe spells of drought than any other region in the country. It is likely that the region will suffer from greater water shortage due to the impact of global warming in the form of reduced rainfall and increased evapotranspiration.9 Degraded water resources and terranean conditions have subjected the area to the loss of productive landscapes and accelerated desertification.
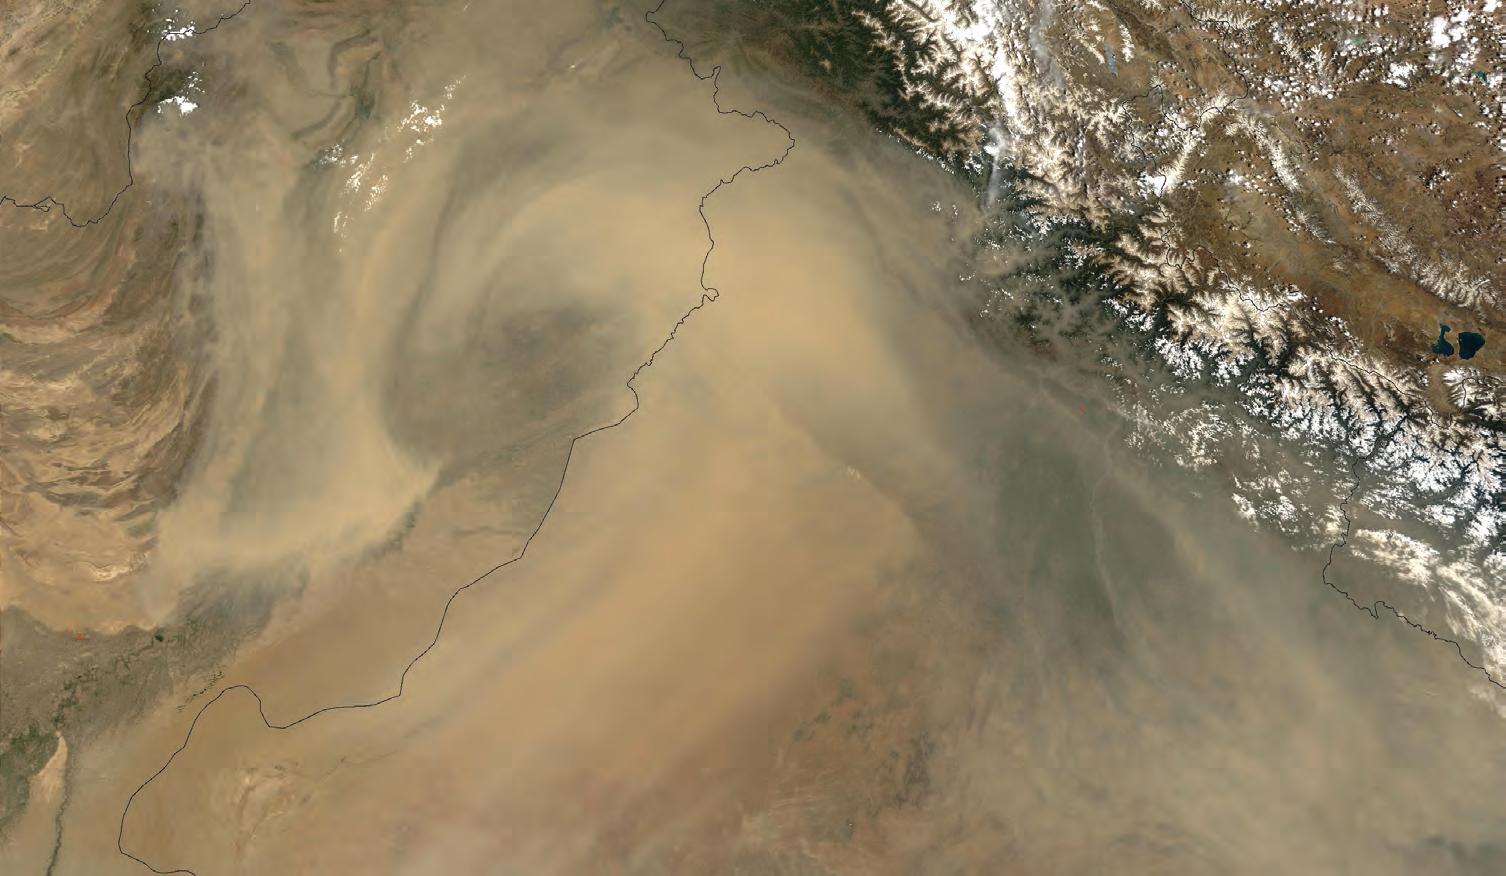
Source : https://earthobservatory.nasa. gov/images/11543/massive-dust-storm-inpakistan
Bottom left : Rajasthan Demographics
Source : https://www.census2011.co.in/ census/state/rajasthan.html
Top right : Trends of population growth , temperature and land lost due to degradation in Rajasthan T
Source : http://berkeleyearth.lbl.gov/regions/ rajasthan AND https://www.census2011.co.in/ census/state/rajasthan.html
The region shows high percentage of rural population and their economy majorly driven by agriculture and pastoralism. The increasing human population pose a serious threat to meagre vegetal resources of the arid lands. The trees and shrubs and even their roots are indiscriminately cut by them for domestic fuel. As these people are still dependent on rainfed yields, changing rainfall patterns have made agriculture a non-dependable proposition. Studies have shown failure of atleast 33% of crops due to thin soil covers and high percentage of soil salinity, inculcated by aridity.
19 In-dune I
Graph 1.2 : Trends of population growth , temperature and land lost due to degradation in Rajasthan
1.1 : Livestock population trend ( 2007 - 2012)
Horses Mules Donkeys Camels +48.5% +280.93% -20.23% -22.79% 35.0 30.0 45.0 30.0 55.0 50.0 65.0 70.0 60.0 25.0 20.0 15.0 27.0 28.0 27.5 10.0 28.5 5.0 15% 20% 25% 30% 35% 10% 5 % 1970 1965 1960 Years Population in millions Temperature in .C 1955 1975 1980 1985 1990 1995 2000 2005 2010
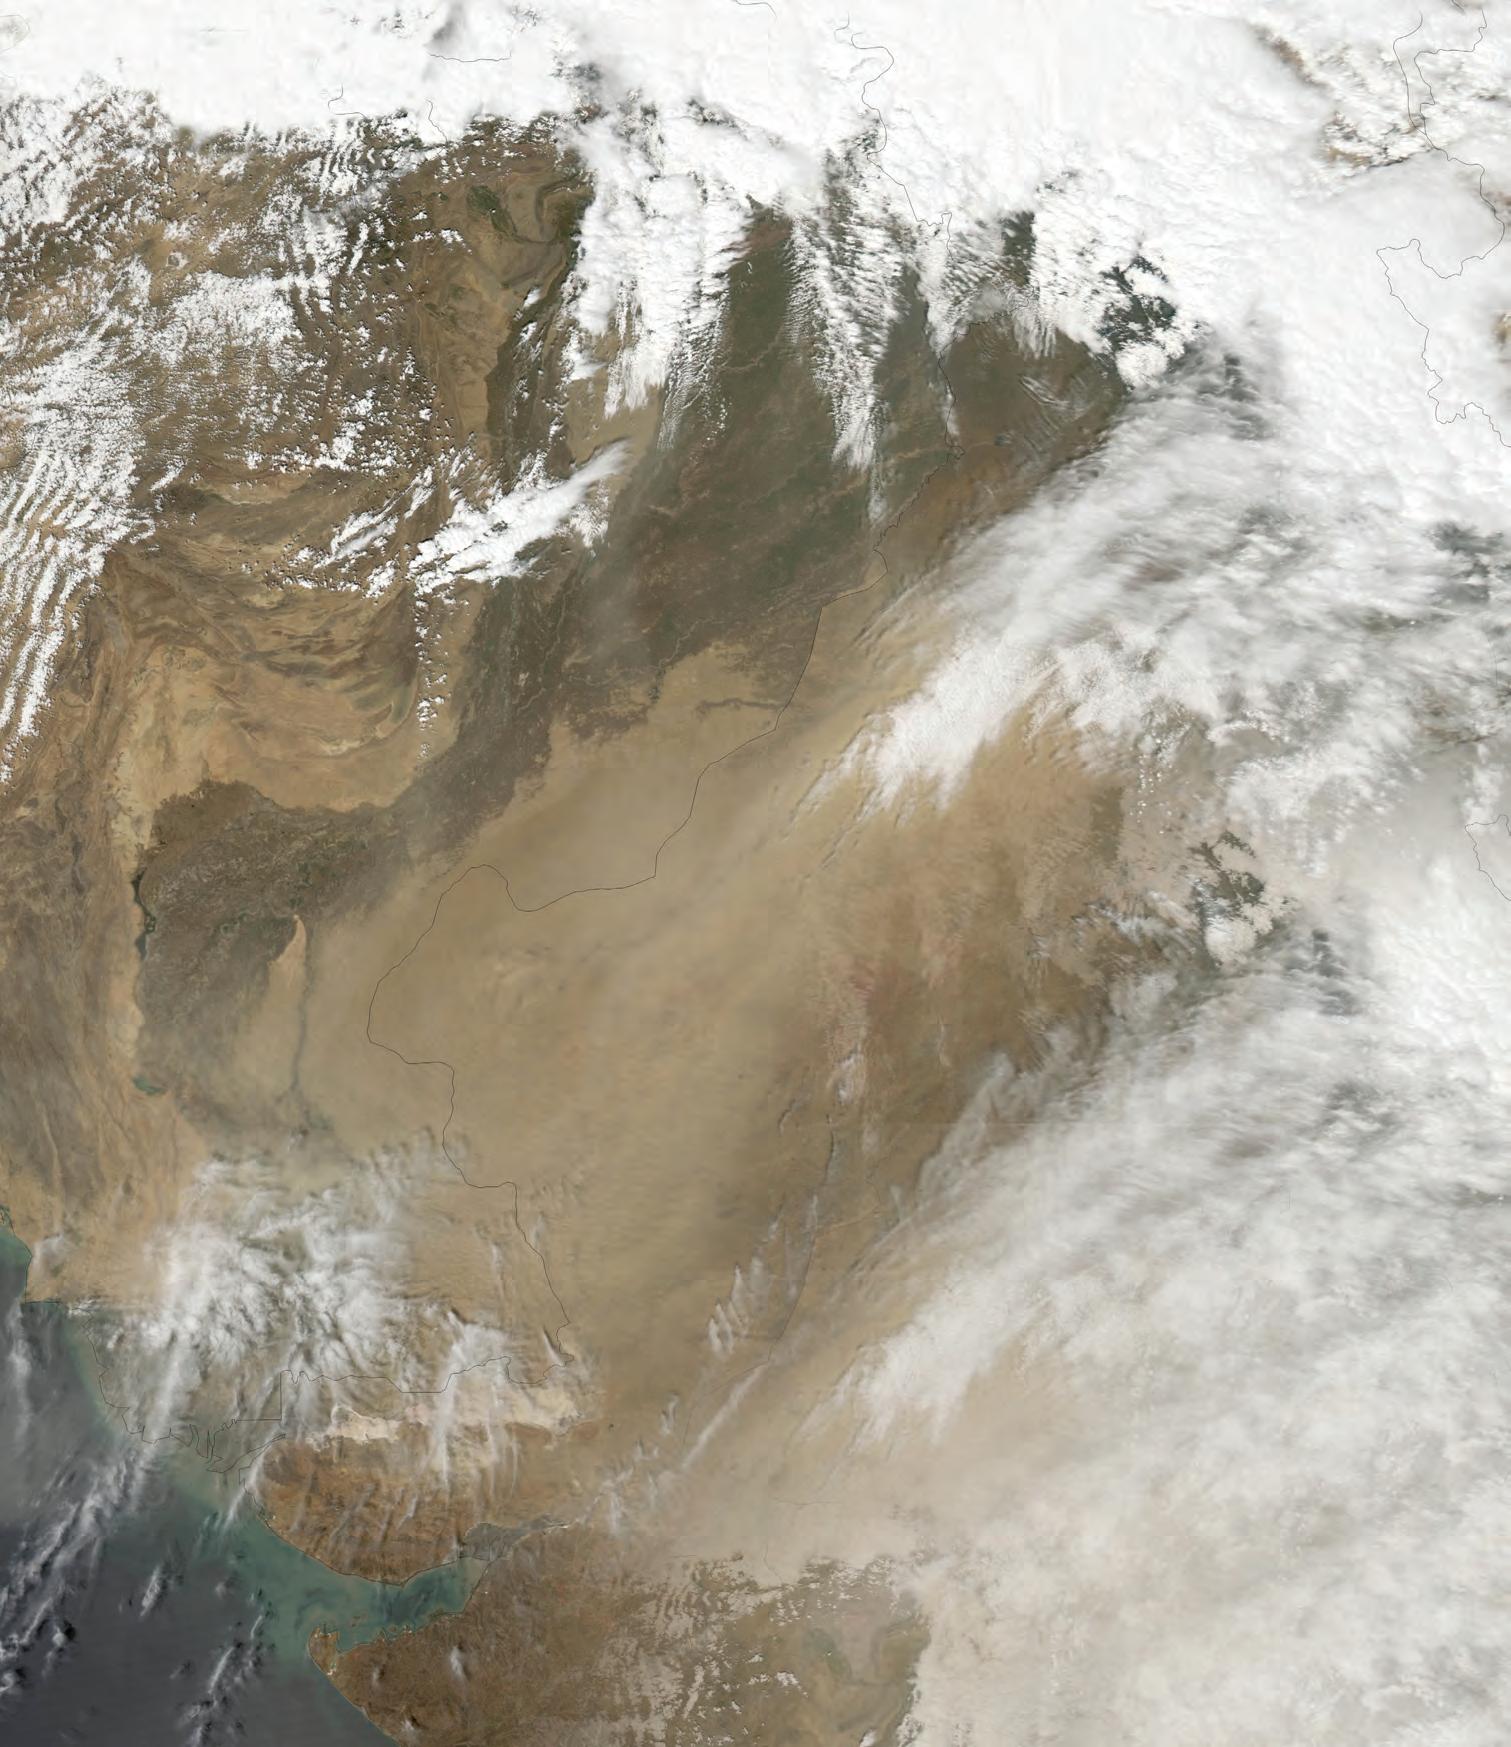
left : A dust-storm over India originated from the Thar region, captured by the Moderate Resolution Imaging Spectroradiometer on the Terra satellite.
Reduced yields have created a shift of dependence to animal husbandry, mining and other serious activities 10 (Refer to Appendix Section 8.2 for livestock population trend). The increased dependence on pastoralism has resulted in over-grazing of sparse vegetative resource, implying further degradation of land and its exploitation in the form of wind and water erosion. Thus, creating a vicious cycle of causes and problems. Decreasing hectarage of culturable lands, unfavorable climatic conditions and lack of economic growth opportunities have marginalised the locals and subjected them to migration. The situation demands for redevelopment of this region focused primarily on reinstating productive landscapes and human settlement.
Changing morphology of the dunes across Thar are an account of varying wind patterns, wind speeds, ground condition (vegetative cover and built fabric) and demographics. These factors vary at a local scale for each region and demand for a region specific strategy to mitigate Desertification.
20 I Emergent technologies and design
CAUSES
Lackofdiverseoccupationalbase
Traditionfarmingmethods
Lackofurbanplanning
Loss
PROBLEMS
21 In-dune I Va r iation in rainfallpatternsduetoclimate change
Va r iation in temperatureduetoclimate change
loitationonnaturalresources
Winderosion Exp
Humaninduced factors
Lack of resilienceandhumancomfortin sette lmen t s Reduced soilfertilityandagriculturalp roductiv ity Occasional ooding Lack ofwaterresources Sand coveredagricultural e l ds Increasedfrequency&intensity o fdust s to r m s Sandcoveredinfrastructure
Enviornmentalfactors
of green cover Climate change Land degradation Deserti cation
The Desertification feedback loop, Causes and Problems
Population rise Poverty Above:
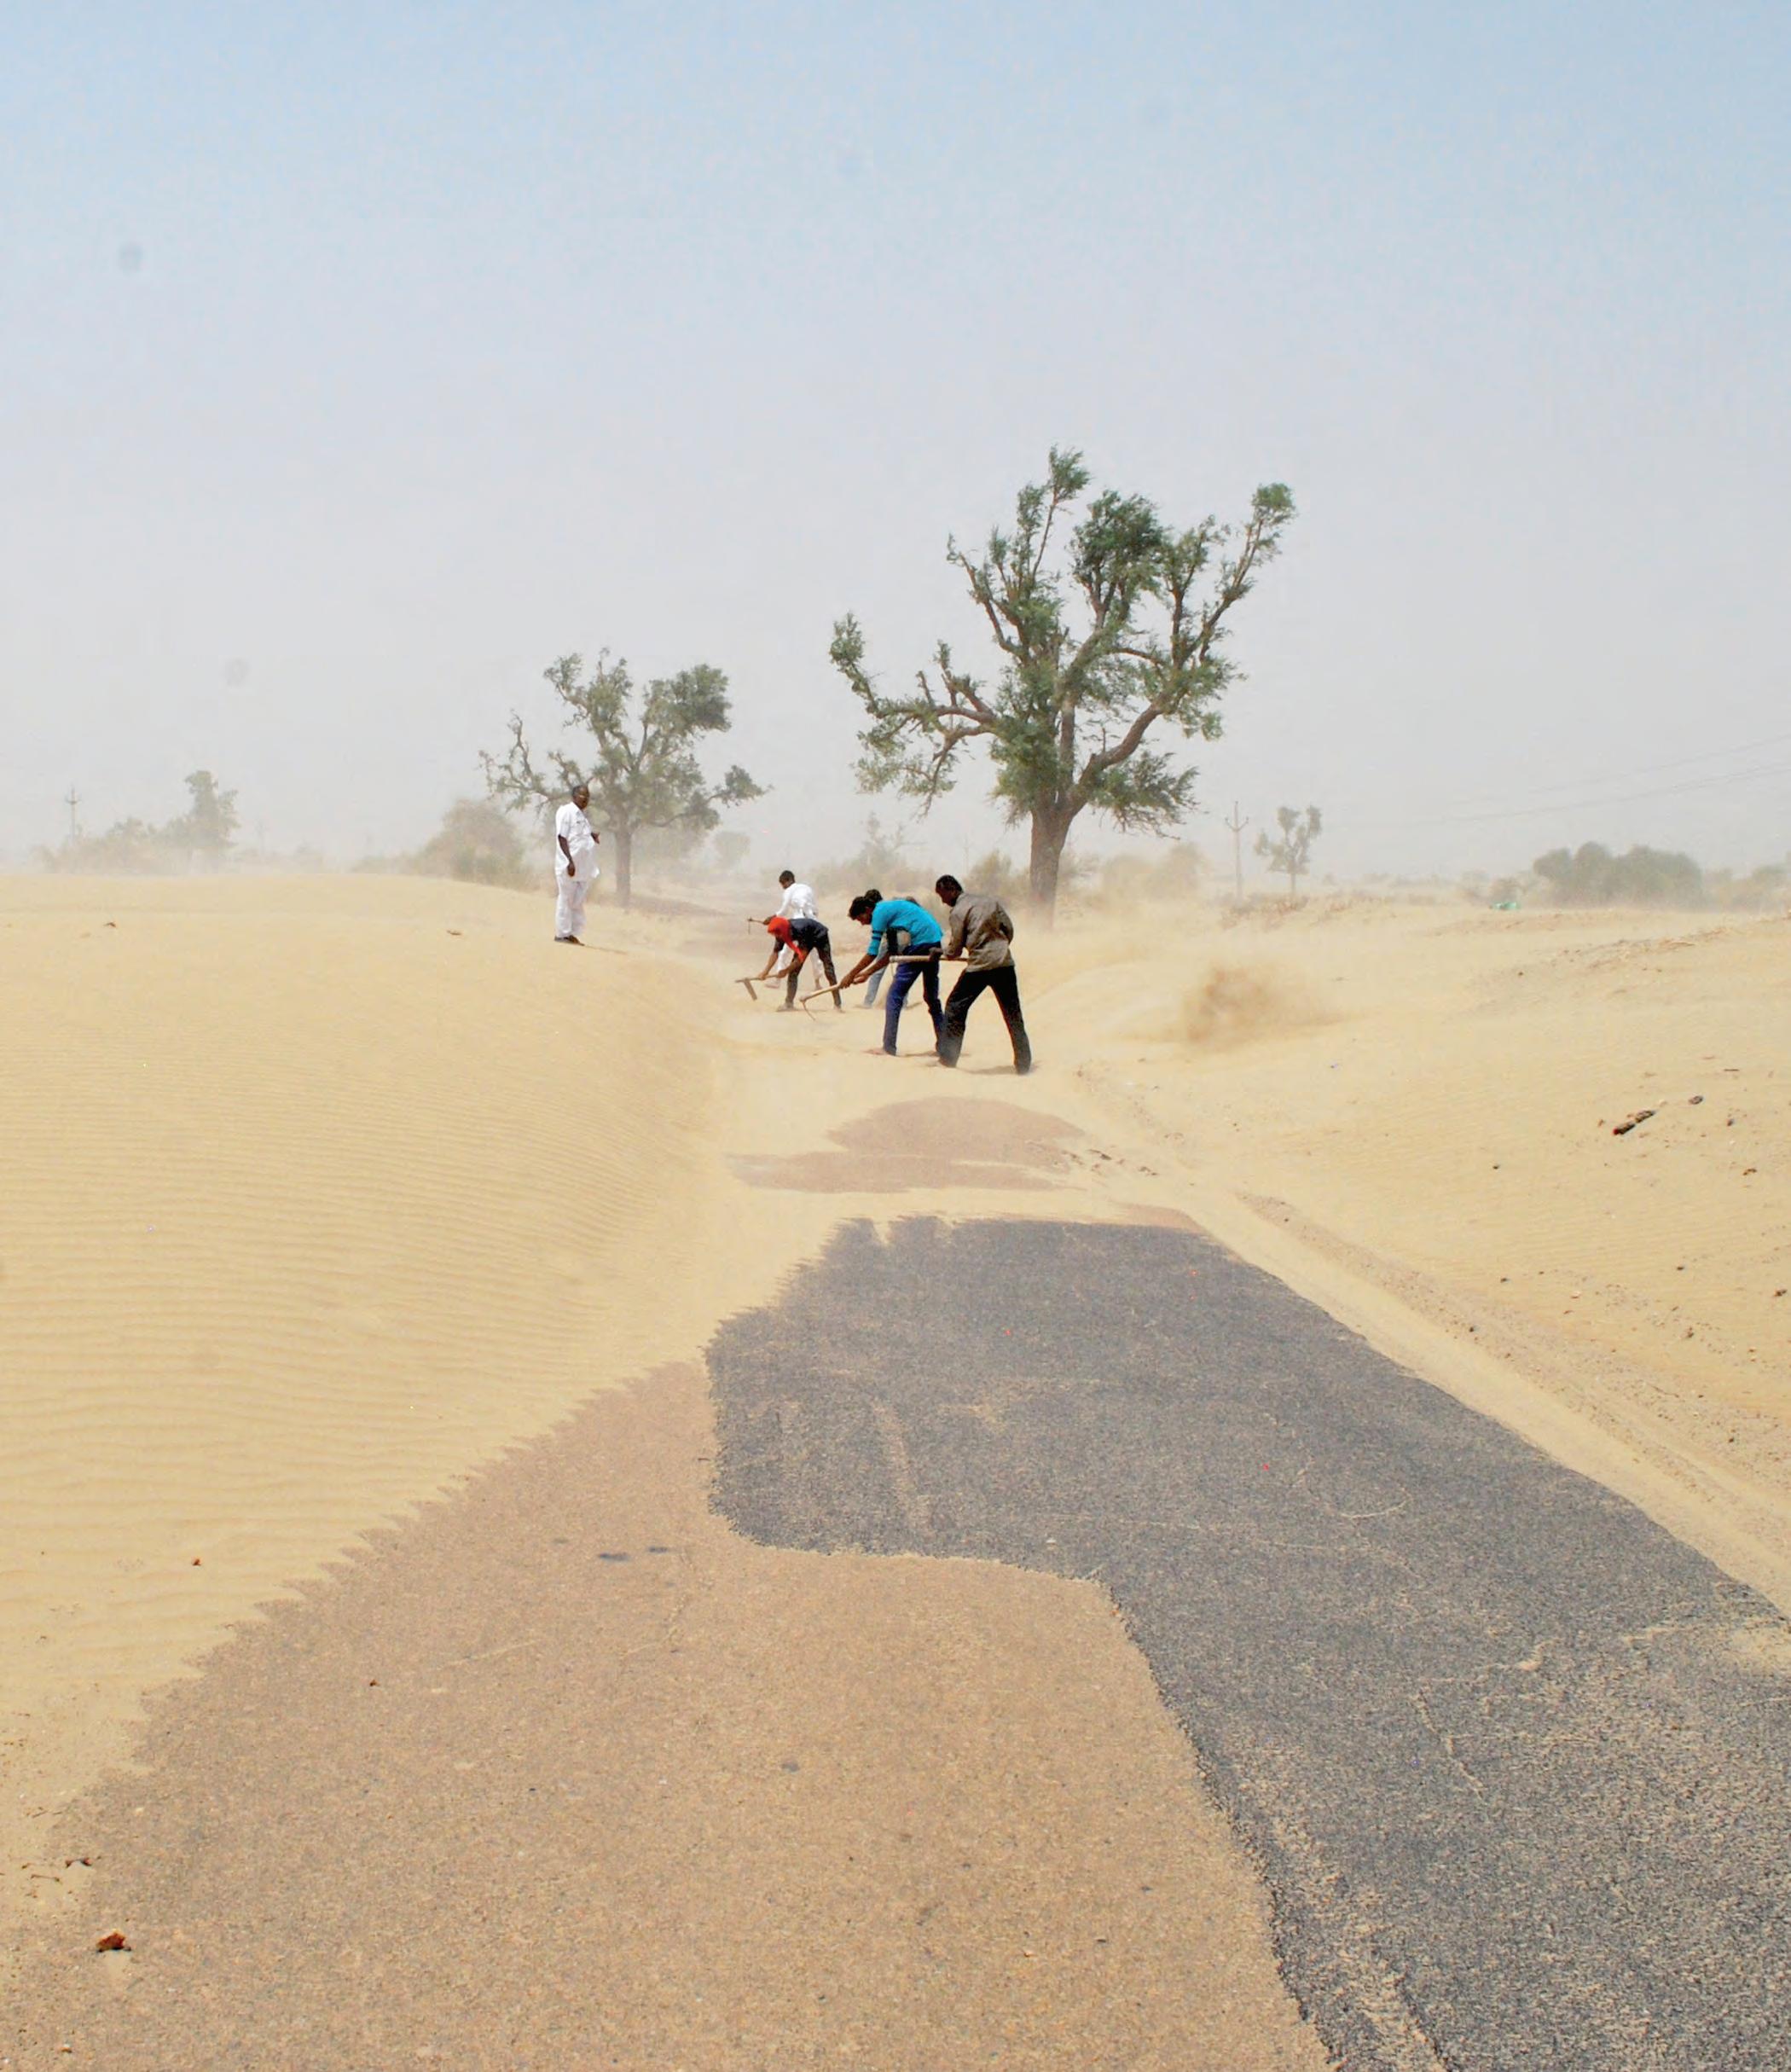 Image from site visit: The only accesses road to an urbanized village being cleared of windblown sand.
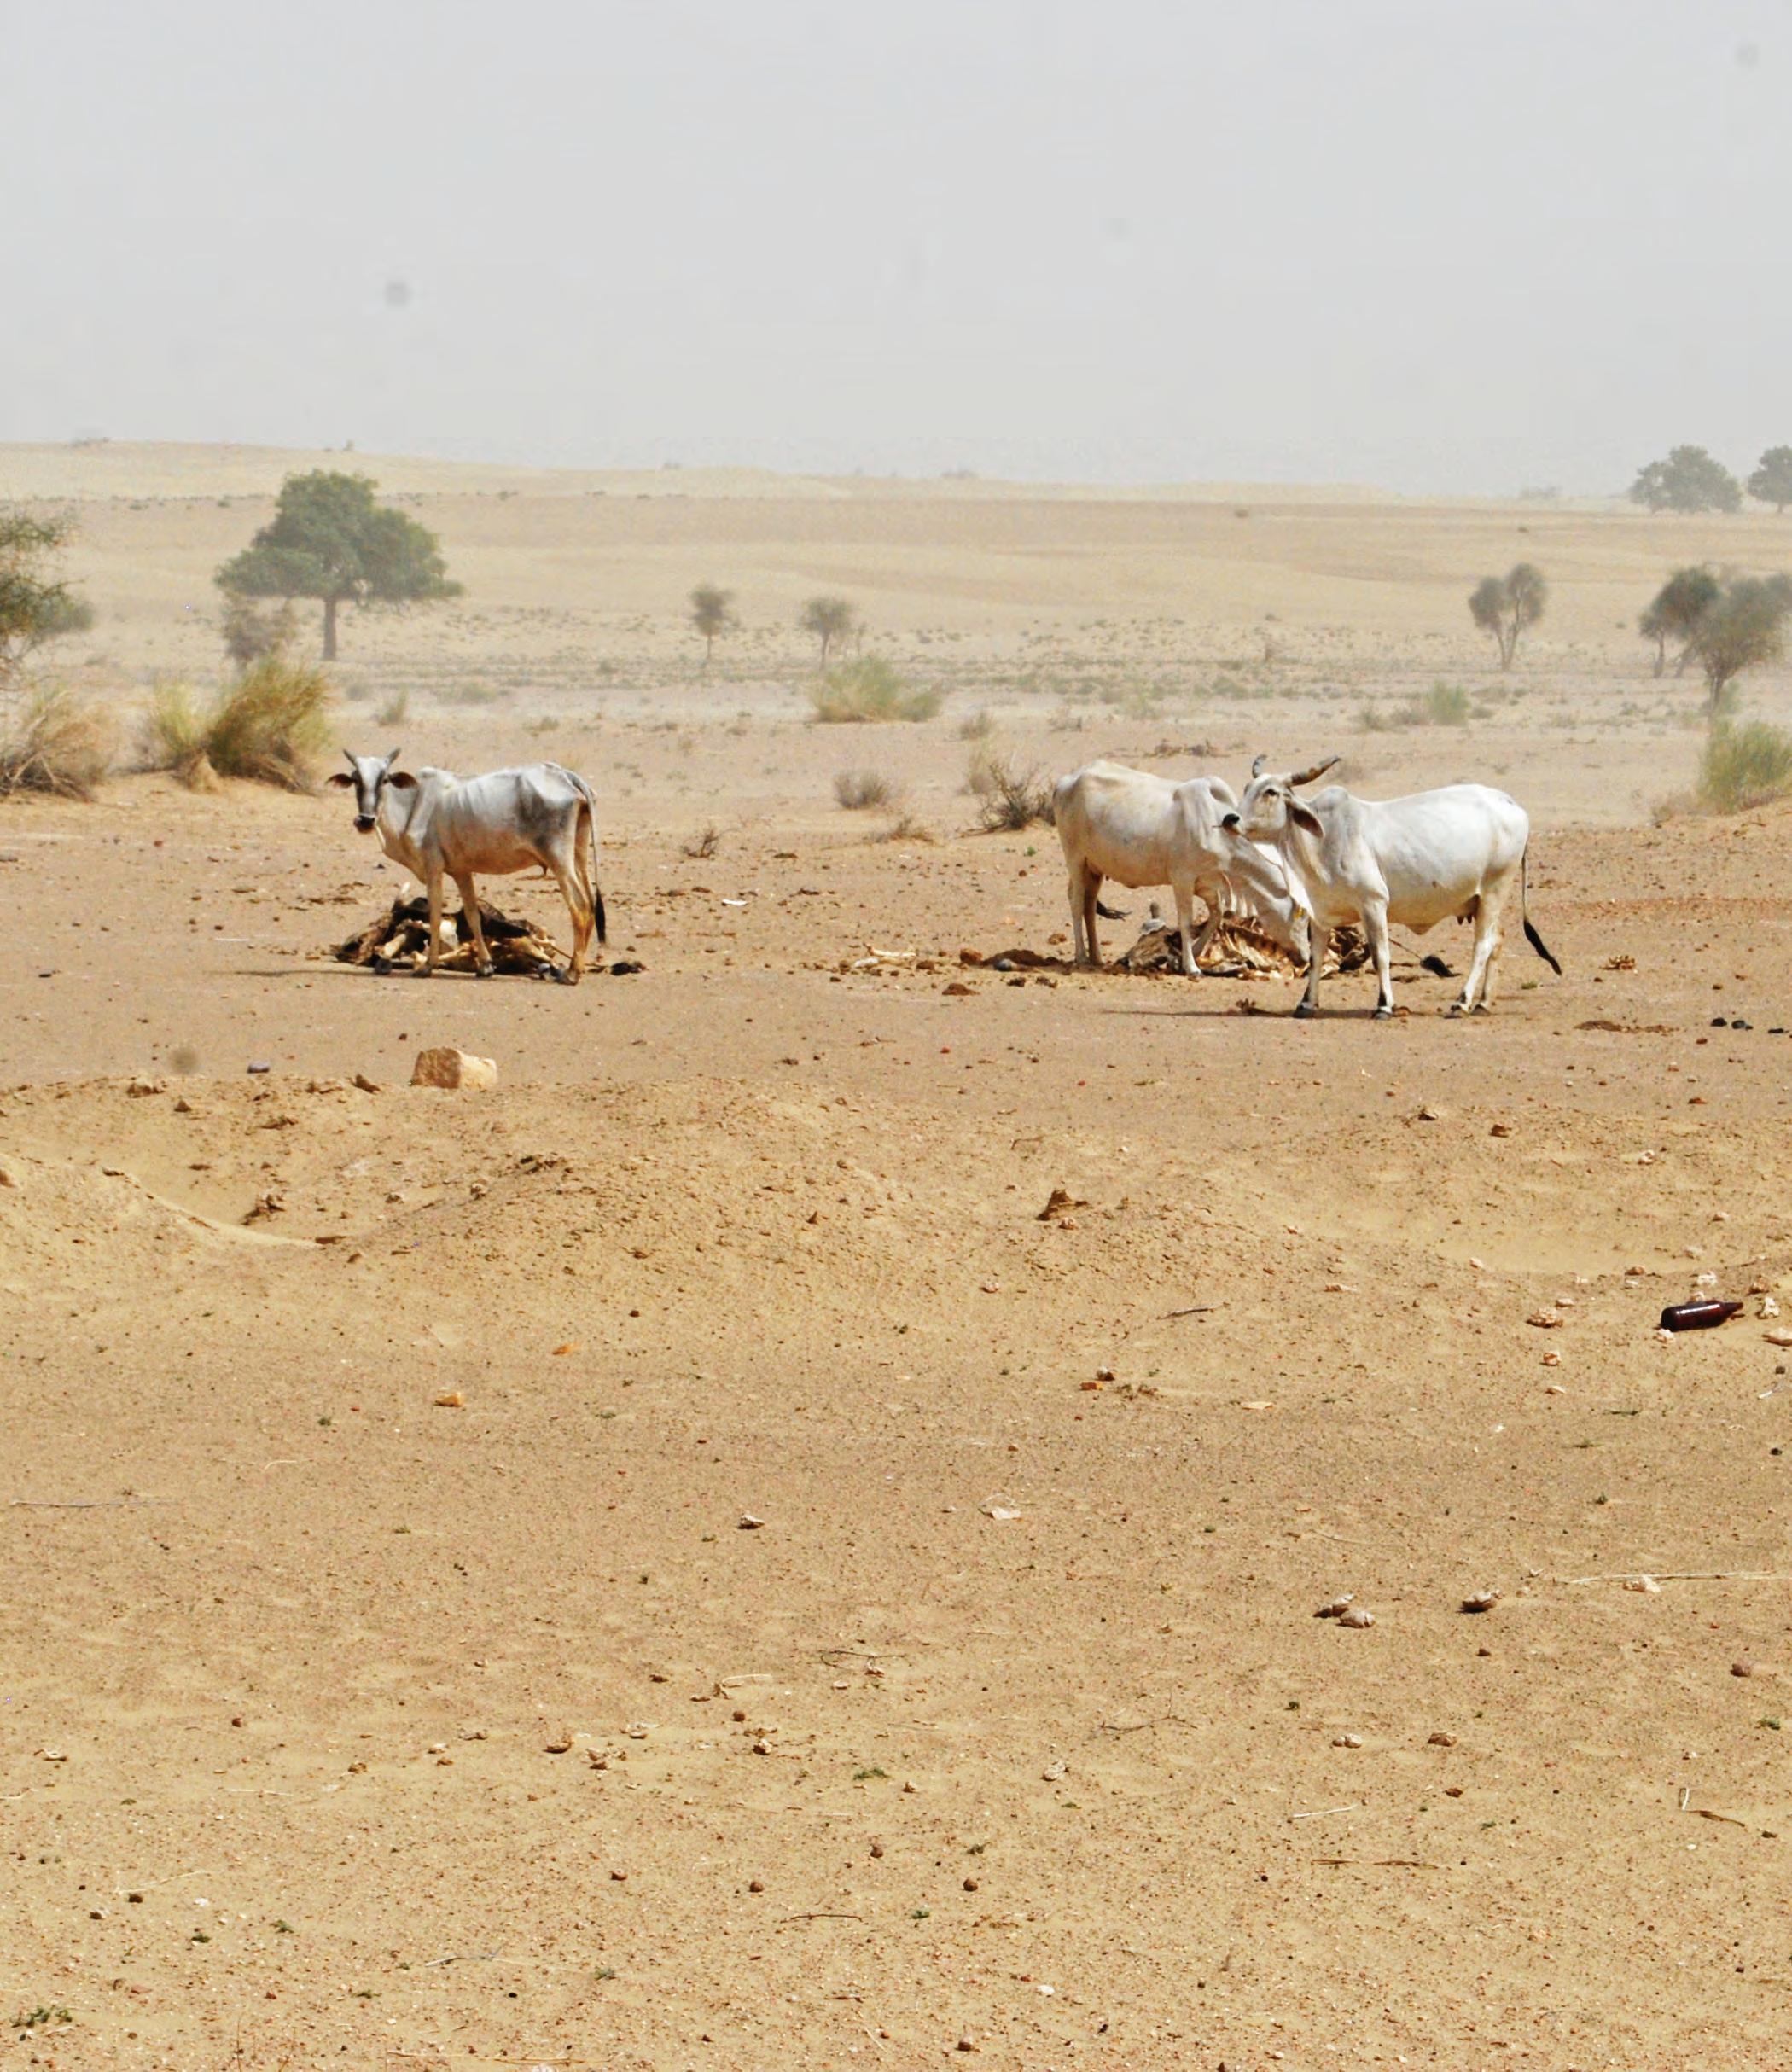 Image from site visit: The lack of fodder and extreme climatic has led to the depletion of livestock.
How can ecological sand stabilisation techniques be used to design settlements and productive landscapes resilient to desertification in Rajasthan ?
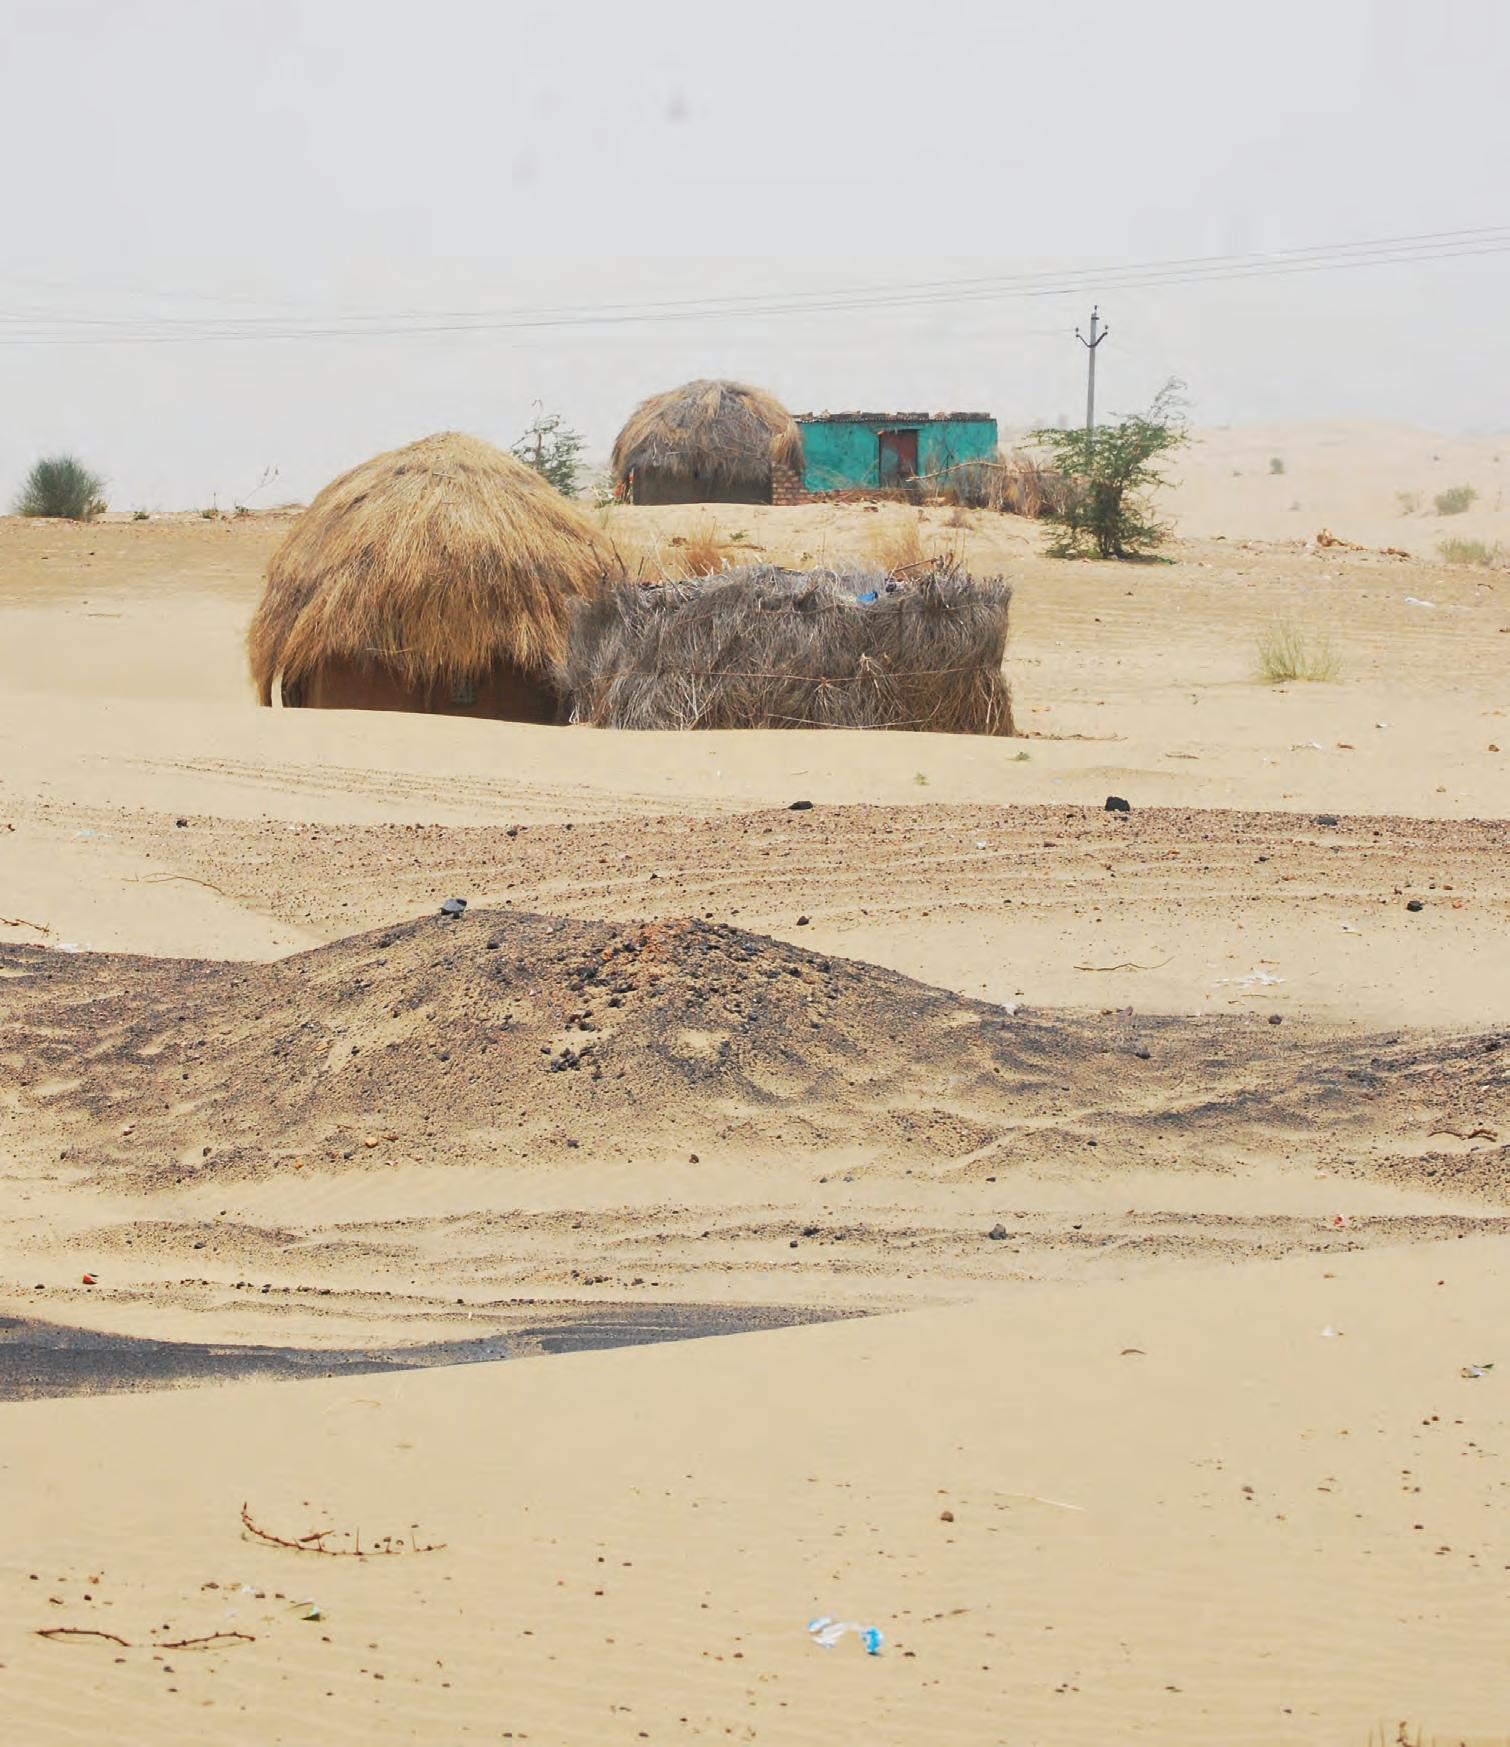
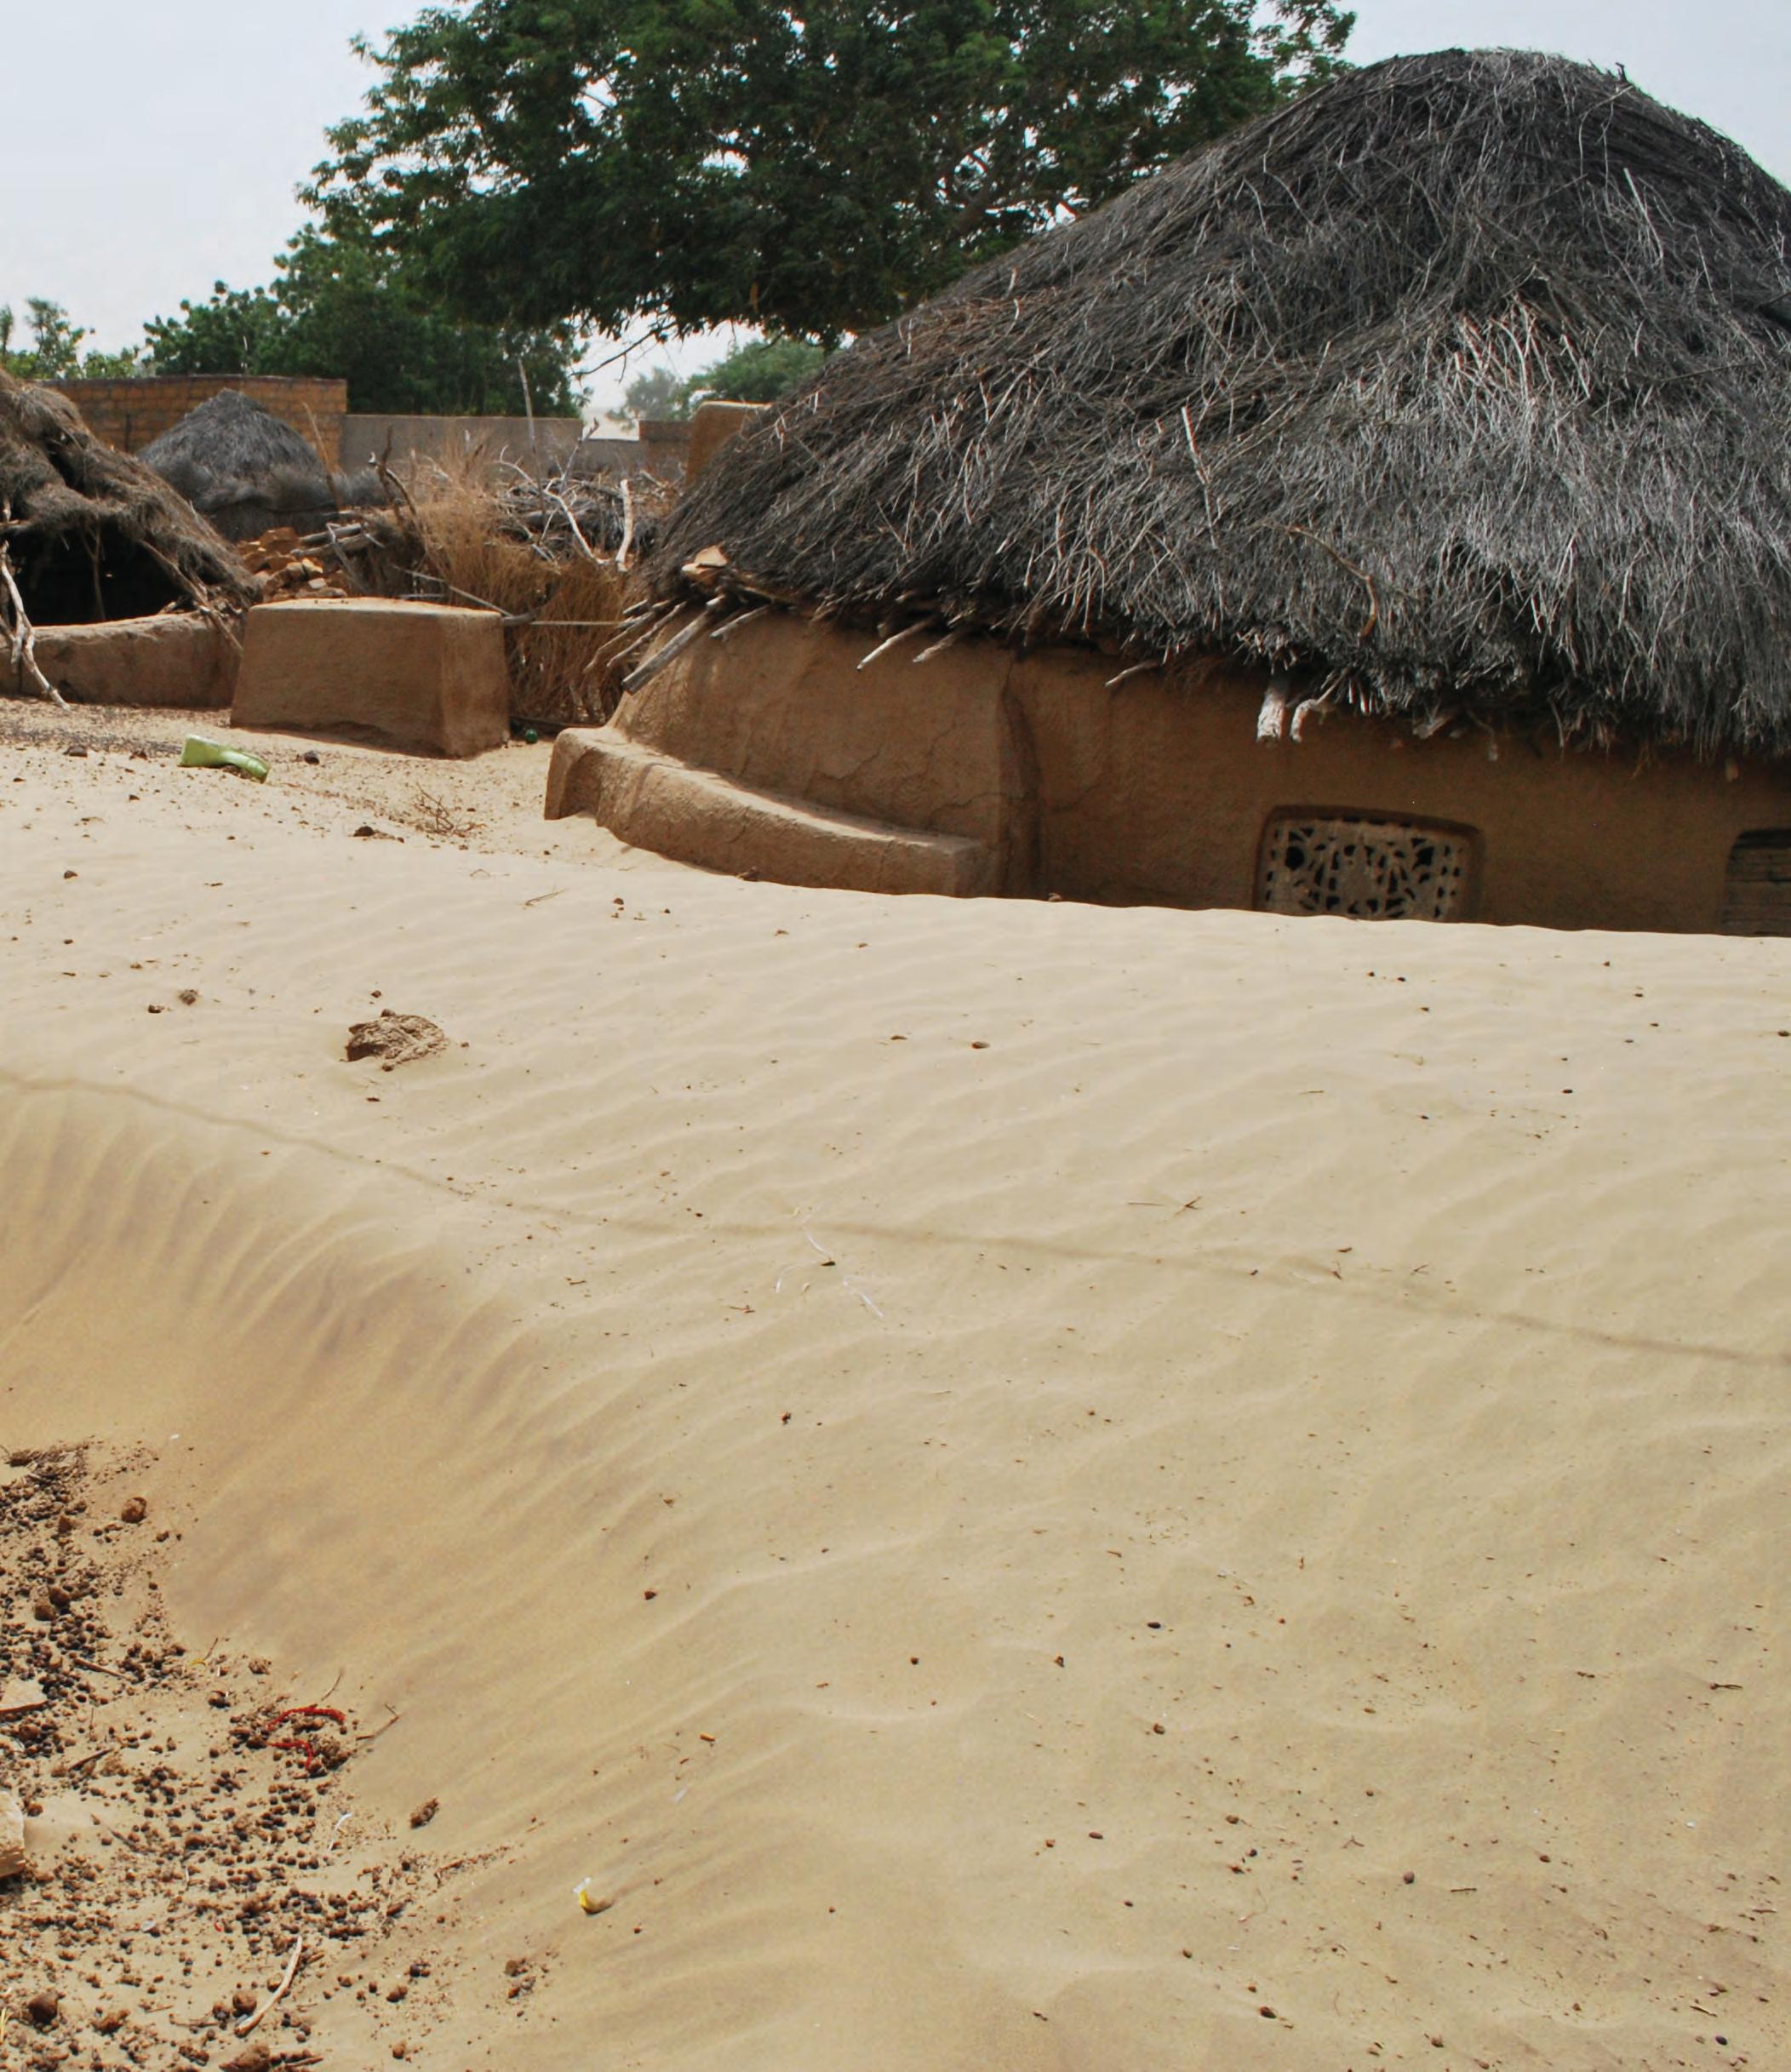 Image from site visit: Isolated houses in the interdunal plain covered in unstablized sand
Problems
Solutions
Research area
Sand stabilization techniques
Wind erosion
Extreme temperature Variation in rainfall pattern
Dependancy on livestock
Sand covered infrastructure
Thermal discomfort
Land degradation
Over exploitation of resources
Sediment free region
Thermal resistance
Erosion control
Water retention
Agricultural economy
Wind de ection
Material and fabrication system
Erosion measures
Agronomics
Water resource management
27 In-dune I
2. Domain
Desertification being a global problem, has made large productive landscapes redundant and subjected people living in these areas to migration. Amidst the adversities, there are opportunities to procure the abundant resources in a desert and combine them with traditional and modern mitigating interventions.
The following section is a study of physics of dune formation and their mobility in context to the test region. The chapter also documents various sand stabilisation and deflection measures which can be adopted and adapted to the test region at different scales. Some of these techniques need to be complimented with infrastructural support of ensured water supply and its treatment measures. The chapter outlines the tools needed for developing spatial and conceptual interventions that can sustain survival in an arid biome.
15 30 2010 450 450 150 150 150 250 550 550 250 240 480 Barmer 180 120 Scale index Wind erosion index (%) Average Annual Rainfall (mm) Result Wind Major Barchan & Barchanoid fields Localized Barchans Major Megabranchanoid Fields 60 30 15 Pokaran Jodhpur Jaisalmer Bikaner Churu 60 120 350 350 DOMINANTLY OLD DUNES NEW DUNES LINEAR DUNES NETWORK: SINUOUS DUNES BARCHANS & BARCHANOIDS MEGABARCHANOIDS SAND STREAKS AND ZIBARS TRANSVERSE PARABOLIC STAR DUNES NETWORK: LINEAR DUNES WITH TRANSVERSALS NETWORK: TRANSITIONAL PARABOLIC DUNES LEGEND Barchans and Barchanoids Megabarchanoids Active dunes fields Wind erosion index (%) Average annual rainfall (mm) Resultant wind direction 50 km 100km 200km 2010 km/ 180 120 Extremely High Scale of wind erosion index ( %) (%) Rainfall (mm) Barchanoid Megabranchanoid Fields Very High High Moderate Low Very Low 60 30 15 2010 km/ 180 120 Extremely High Scale of wind erosion index ( %) (%) Rainfall (mm) Barchanoid Megabranchanoid Fields Very High High Moderate Low Very Low 60 30 15 Scale of wind erosion index (%) Test region
2.1
Climatic conditions 2.1.1
The Thar desert is the easternmost extension of the vast SaharaArabian deserts in the horse latitudes. The desert is dominated by the south-west monsoon, which controls both the wind vector and the vegetation cover. Despite the presence of considerable precipitable moisture in the atmosphere, dearth of rain in this region is a result of configuration of atmospheric dynamics and sinking air masses in the region. The sinking air increases the surface pressure and temperature significantly. Atmospheric circulation thus becomes a key to bring amplifying changes in rainfall, winds and aeolian dynamism.11
The present study is carried out for Jaisalmer district which falls within the arid region of India and cover maximum area of Thar Desert. The district can be best described as unstable dunal terrain, dominated by climatically dry atmosphere, high temperature (reaching maximum 50°C in summers) and a low rainfall (32-78mm). Subjected to increasing frequency of dust storms over past 22 years, 12
Vulnerability to sand movement through erosion and depositional processes has increased for the region due to absence of any substantial vegetation cover and agricultural activities, coupled with
31 In-dune I
0 200 400 600 800 1000 1200 1400 1600 1800 2000 0 JanuaryFebruaryMarchAprilMayJuneJulyAugustSeptemberOctoberNovemberDecember 5 10 15 20 25 30 35 40 45 50 Temperature Solar radiation
Top right : Figure: Annual temperature and radiation data
Bottom right : Sunpath and summer solstice dry bulb temperature
2.1.2
Settlement pattern
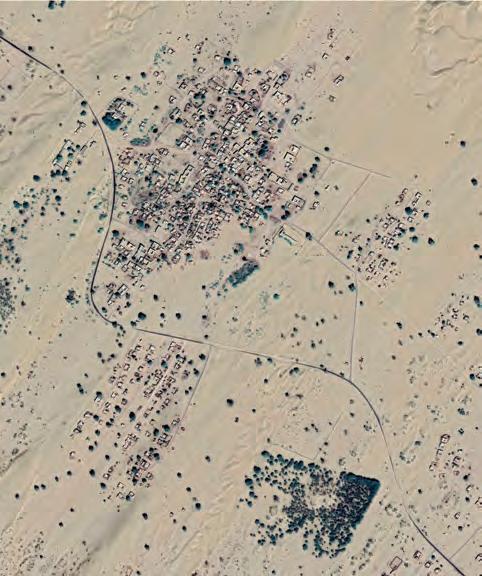
Housing a total population of approximately 670,000 people, the western and the southern parts of Jaisalmer district are made up of wind-heaped sand-dunes, where there is little opportunity for settlements to flourish. These settlements amidst shifting linear dunes are located mostly in the inter-dunal planes. Lower wind speeds in this area subject the planes to heavy sedimentation and limit the people to grow their crops close to the settlements.
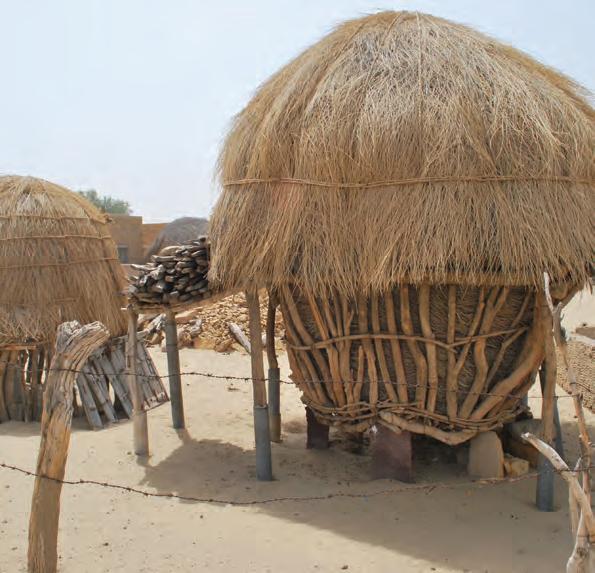
The population in this region can be divided into two broad categories- sedentary and semi-nomadic or nomadic .13 Since the area provides best bases for pastoralists and nomadic activities, people mostly live in rural setting of villages, scattered houses and wandhs (Campsites). Most of these units are built of locally procured wooden material and thatches .14 These settlements are thinly populated and scattered all across the dunal planes. Apart from the climatic adversities, the skeletal nature of the route network causes isolation to this area . The lack of public utilities with no direct access to centralised services retard the rural-urban relationships and interdependence for this region. These settlements are thus a medley of houses and streets with no defined morphological pattern.15
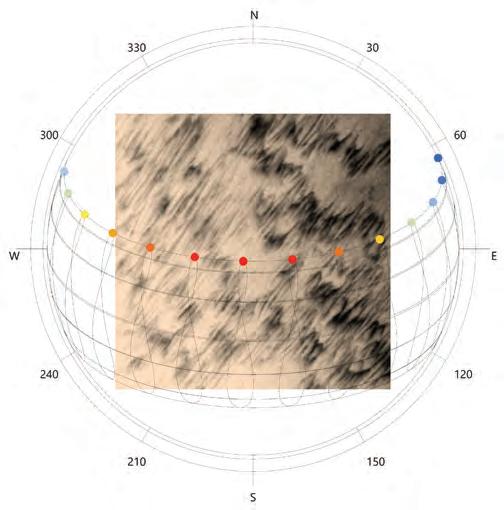
Top : Topography and wind pattern in the text region
Right: Satellite imagery of the Sam district in Jaisalmer Source : Google earth 2019, 24th June 2019
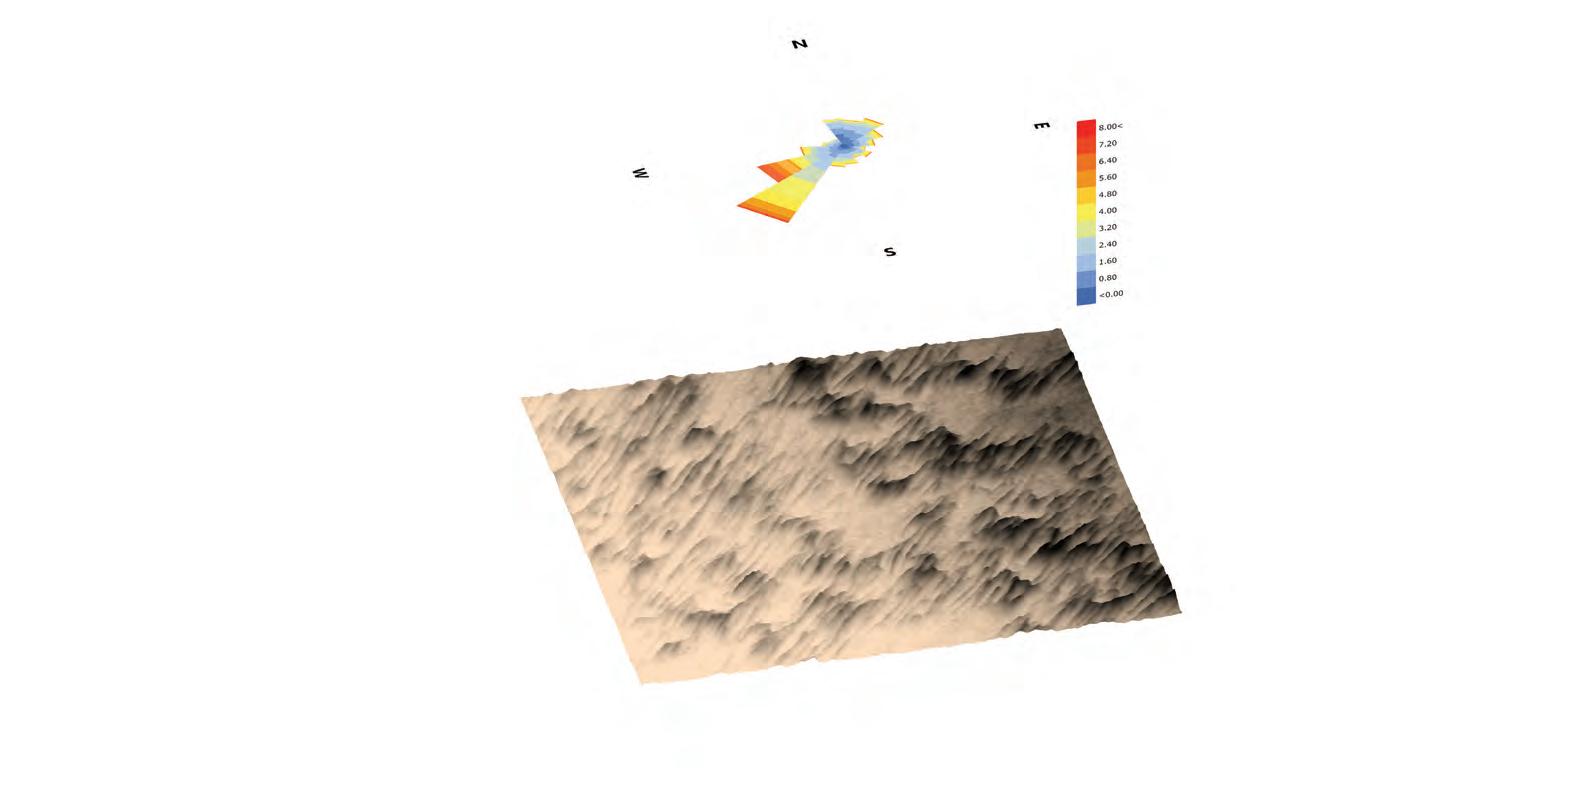
Myajlar Phuiya Satto Bachiya Punraj ka par Tejrawa Urbanized village Central village Non-central village 0.5 km 1.0 km 2.0 km 3500 1050 600 450 300 700 2700 600 2100

Despite having organic pattern of settlements, the layout of individual houses are strictly governed by the economic and social status within communities. The effectiveness of this discrepancy creates a variety of materials that can be afforded to build the houses. Building materials used for roofs and walls form the main criteria for classification .16 The average family size within these social classes is 6.2 persons .17
The low income groups usually house in a simple layout, single room house with thatched roofs. The layout is generally circular or rectangular. The walls are usually made up of muds and periphery of the plot is guarded by thorny bushes. There is generally no provision of bath or toilets. The main function is shelter for man and livestock. The thorny enclosure associated with it is multi-purpose and keeps out stray animals, provides a sleeping place during summer nights and space for livestock and storage for fodder.
Medium and High income groups usually house in more elaborate houses made of stronger materials like unburnt and burnt bricks walls or stones walls with titled roofs (made of local clay). Most of these houses are usually more than 1-storey high with a central and open courtyard, allowing for more air circulation. Massive in their appearance, these houses provide better living conditions- Room for residents and guests, Verandah as a semi-open sitting space, 2-3 living rooms, covered store and kitchen and baths and toilets.
The socio-economic conditions thus define the outcome of rural housings- thick mud walls, narrow windows, conical or flat roof oriented against the prevailing winds to lesson sand blast effect. The use of these locally available materials make the dwellings rudimentary and structurally primitive and less durable to face the impact of strong winds.
35 In-dune I
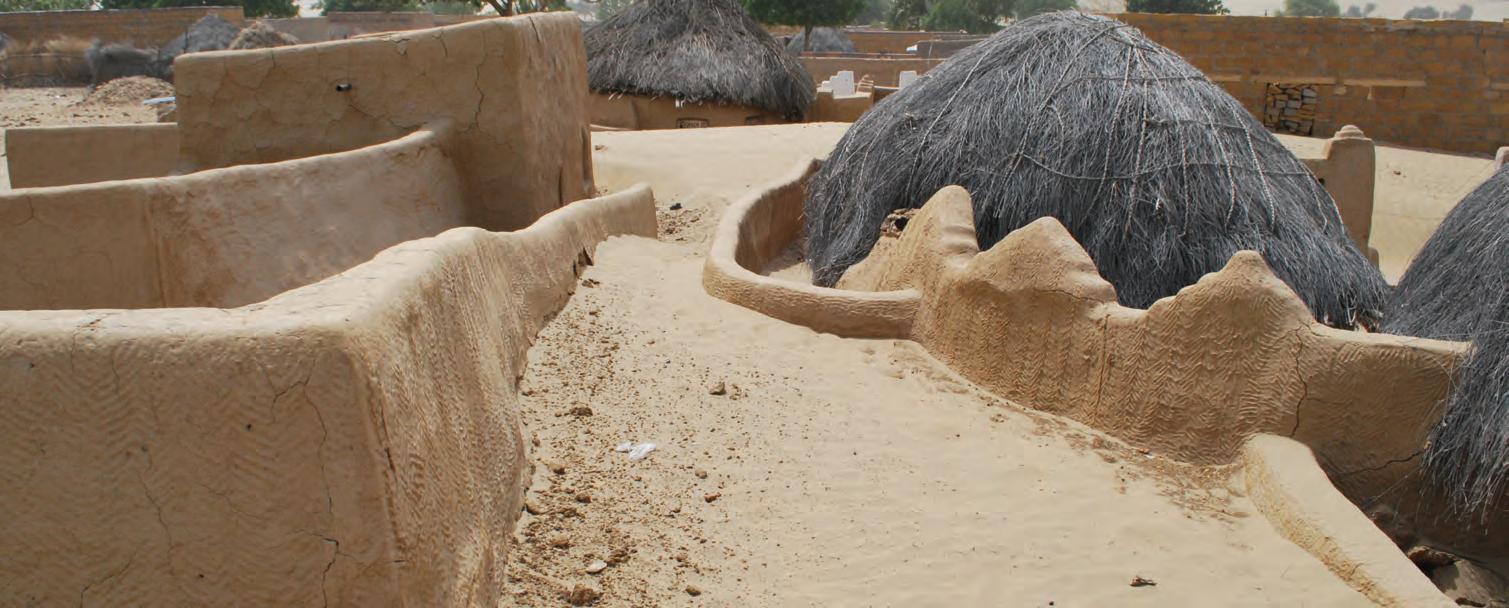
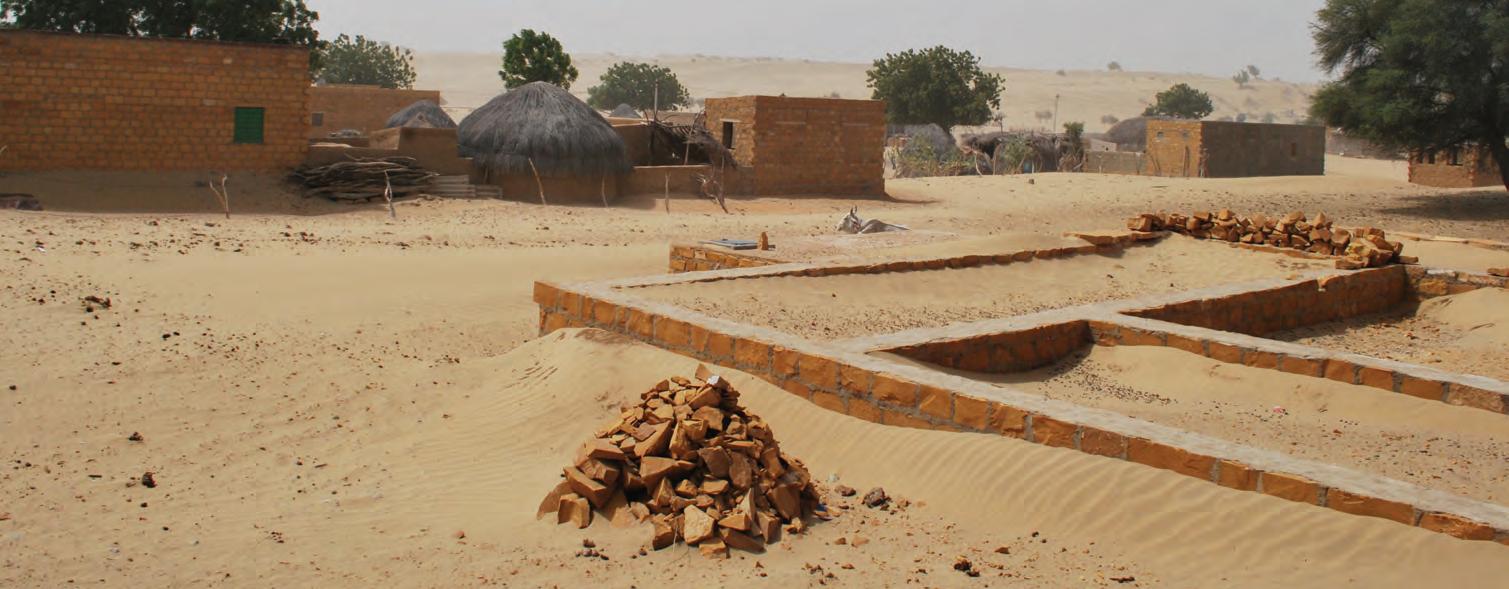
Top left: Stone and mortar house Centre left: Sand covered mud house
Documented on site visit C V V T T T K S K K CCourtyard Verandah Living Bedroom Kitchen Store Toilet V L B K S T B B B B L L V C 3m 6m 0m
Bottom left: Abandoned construction site Images form site visit
Above:
Typical house layouts
2.2
2.2.1
Dune dynamics
Aeolian processes
“Exchanges of energy and material animate the morphological processes within differing climatic regimes, acting on small particles or grains at a very small scale but producing large forms and complex behaviour over much larger dimension”.18 The emergence and temporal variability of deserts are an interplay between aeolian processes acting as an external force onto the landforms that are a resultant of tectonic and volcanic activities.
The shearing force of the wind moves the sand particles in three distinct ways: saltation , surface creep and suspension. While blowing wind velocity determines the mobility and volume of the sand particles, the size of the sand grain determines the way it is transported. Of all the modes, saltation is the most dominant process of sand transport. However, up to 25% of all wind-transported sand is moved by surface creep .19
As wind moves over a sand deposit, it is able to pick up grains from the surface and give them a forward momentum, but the weight of the sand grains soon bring the grains back to the surface. If the surface is composed of coarse grains, the saltated grain is bounced back into the air and the progression continues. However, if the surface is composed of fine grains, the saltated grain buries itself into the ground upon striking it. The effect however splashes another particle into the air and subjects it to transportation. The saltated grain can attain a maximum height of upto 2m .20
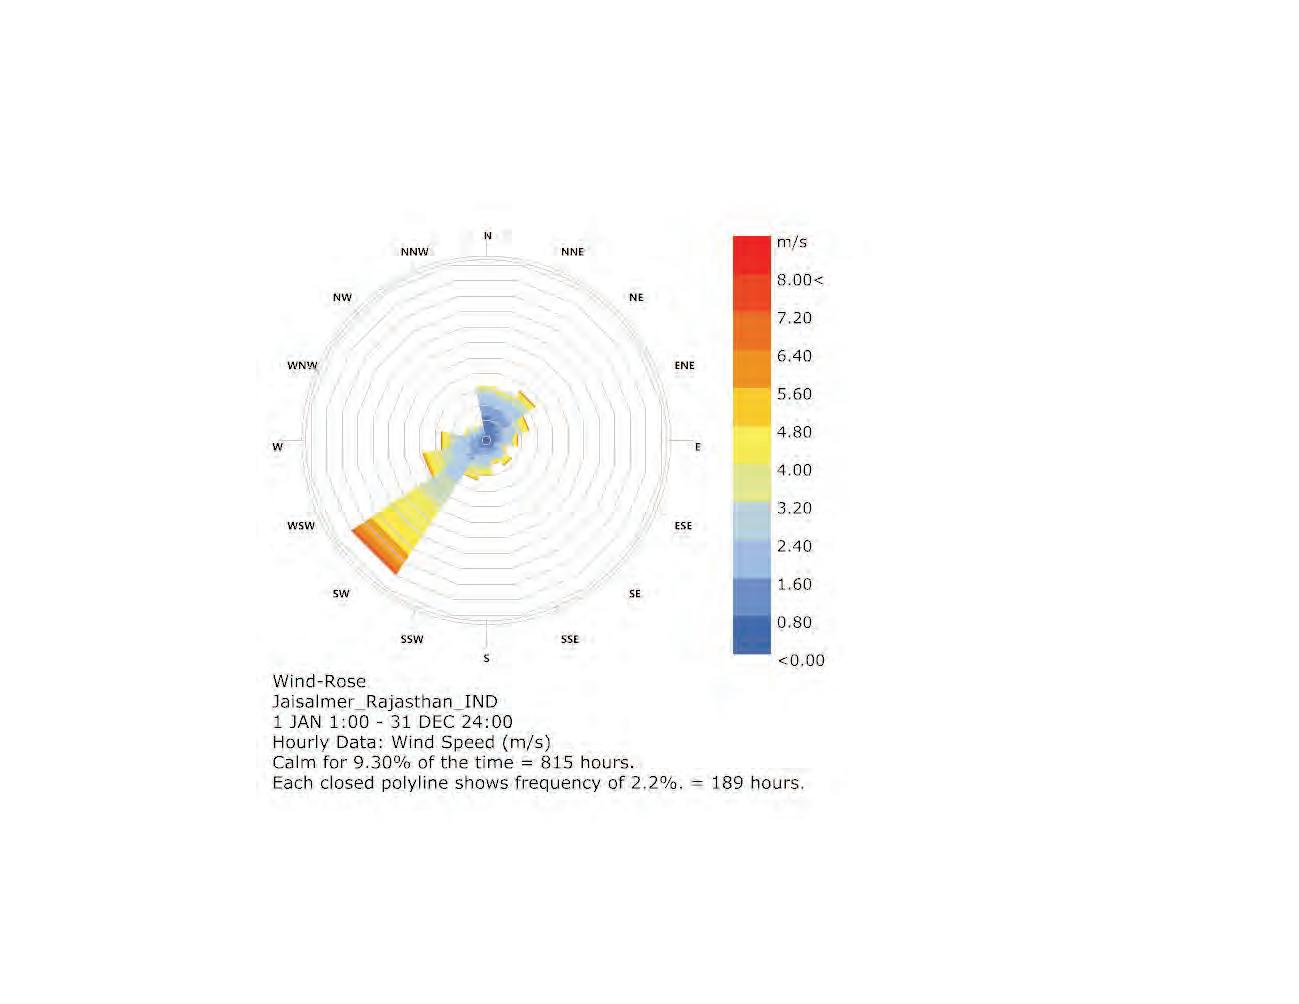
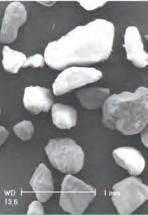
26871 km2 (71.0%) of the area in Jaisalmer is occupied by coarse sand which has poor water retention and nutrient status .21 Coarse sand texture, low soil moisture content and high wind velocity ( 8 m/s) for most of the year, subject the site terrain to instability and constant saltation.
<20 µm diameter- long term suspension
20-63 µm diameter- short term suspension
63-500 µm diameter- saltation
> 500 µm diameter- repetation and creep
Critical wind speed for 0% moisture
(260 µm)- 6 m/s Davidson-Arnott et al. (2007)
Angle of repose for fine sand ----- 36o
Angle of repose for coarse sand - 40o
36 I Emergent technologies and design
120 140° 120 140°
longer leeward shelterd ground height 1 to 1.5m porosity 30 to 40%
Fig: porous barrier
Fig: non-porous barrier
shedding
Fig: de ection dunes
greater voxtex
Top: Modes of wind blown transport of sediment
Source: Lancaster, Nicholas. (2005). Aeolian erosion, transport and deposition.
Top: Critical shear velocity and critical wind velocity of dry, loose sand particles.
Source: Leo C. van Rijn, Aeolian transport over a flat sediment surface
Bottom: Dune migration
Source: Zhiwei XU, A. MASON Joseph, Huayu LU, Shuangwen YI, Yali ZHOU, Jiang WU, Zhiyong HAN. Crescentic dune migration and stabilisation: Implications for interpreting paleo-dune deposits as paleoenvironmental records[J].Journal of Geographical Sciences, 2017
Factors
37 In-dune I 0.1 0.2 0.3 0.4 0.5 0.6 0.7 0 200 400 600 800 1000 1200 Criti ca l wi nd ve locity (m/s) Criti ca l shear ve locity (m/s) 0 2 6 8 10 12 14 4 Critical shear velocity Critical wind velocity Particle size (μm)
Saltation Sand grain size Wind speed Wind duration Moisture content Surface roughness Surface inclination 36° 36° Windward flank Leeward side Burial time of sand Old New New slip face Old slip face Dune migration in the resultant wind direction
affecting
38 I Emergent technologies and design
Linear sand dunes of Thar 2.2.2
Linear dunes form a regular and extensive landform on Earth. Subjected to two modes of migration, linear dunes can either grow by extension down wind or migrate obliquely. The two modes are not mutually exclusive and likely occur in different proportions based on the wind regime .22 Resultant of bi-modal wind directions, linear dunes align themselves in the direction of sand deposition (or dominant wind direction) and cover most of the land in the western part of Thar.
Having symmetry across shorter cross-section, active linear dunes have an array of summits and saddles along their length. Old dune fields like the one situated in the western Thar have a broad convex crest. However, the recently forming ones or the reactivating linear dunes are sharp crested like those in the Sahara and the Middle East. Loose crests and flanks create an illusion of the dune’s instability.
Plants hold the surface of the dune from all but the strongest wind direction and thus orient the dune field parallel to strong wind. Vegetation thus forms an integral part of these dunes .23 At a global scale clustering of linear dunes across the entire region, can be seen varying from un-joined and short-feathered ones to inverted Y- juncture ones to converging clusters of 5-8. The site is dominated by 10-12 kms long independent un-joined dunes that form a linear sequence of crests and valley .24 Even though these older dunes might gain stability with time they are subjected to constant degradation. Knowing the geomorphology of the dunes and dominant factors evolving it help to formulate dune and region specific sand control techniques.
Conclusions
The orientation of the dunes with respect to solar path subjects it to no self-shading and high radiation values throughout the year. While the predominant wind aligns the dunes globally, the subsidiary wind segregates the dune profile into windward and leeward flanks. The segregation locally creates variation on the dune surface in terms of slopes, sedimentation and wind velocities.
A cross-section along the shorter side of two adjacent dunes shows accelerated wind speed in the valley region due to funnelling. The decrease in wind speed from valley to crest dominates the resulting sedimentation pattern in a similar way. Heavier sedimentation at the crest makes it an obvious choice to plant the shelter belts and protect the dune valley. While the influx of sand is constant and beyond human control, these factors provide enough clues to design and induce sand stabilisation and deflection schemes into the existing dune system.
39 In-dune I
Summers Period : May-Jul Time : 6:00am to 6:00pm 0 200 400 600 800 1000 1200 1400 1600 1800 2000 Winters Period : Nov-Jan Time : 6:00am to 6:00pm Hours Sunlight hours analysis
2.3
Sand stabilisation techniques
Surface stability is fundamental to the interplay between processes and factors that determine the character of dune surfaces and spatial variation .25 Factors like wind patterns, sedimentation rates, slopes of flanks and their effectiveness on the terrain define the scope of different stabilisation measures.
Ecological imbalance is induced when sand laden strong winds blow over fertile soil, taking away the soil moisture and exposing it to erosion and degradation. The resulting action hampers the yield of agricultural land and growth of endemic plants. The principal behind stabilisation is to minimize sand influx for the period required for the initial establishment of natural or planted species on the mobile dune faces.
Influx of sand can be reduced by suppressing saltation. Wind carrying sand can either be reduced in velocity, accelerated or deflected away from the target region to control the dune mass and sedimentation rates.
Abundance of sand can cater to the development of a material system that can be used locally by hardening the sand. Successful stabilisation of mobile dunes thus involves the use of multiple techniques at different time scales. The following sub-chapters discuss these techniques and their interdependencies.
Erosion control systems
Wind deflection systems
Building material systems
Sand stabilisation techniques
Protective screens on surface
Porous and non-porous barriers
Plantation on mobile dunes
Bio-mineralisation
40 I Emergent technologies and design
Protective screens 2.3.1
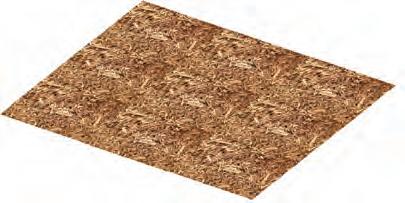
Mulch:
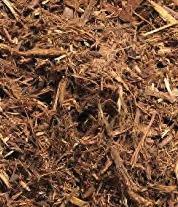
Mulch made out of materials such as straw, branches, stalks and plant waste can be uniformly distributed over the dune surface to prevent erosion. Mulching is suitable for controlling saltation in the areas with low wind velocity and gentle slopes. Hence, they are placed on leeward flanks and places that are less steep. It has an added advantage to increase the organic content and water retention properties of the dune sand.
Geo-textiles:
Geo-textile sand fixation measures combine engineering and biological sand fixation measures by using plant fabrics as the carrier of seeds (of trees, shrubs, and grass) and nutrients for soil. These natural carriers are fixed by a fabric net.
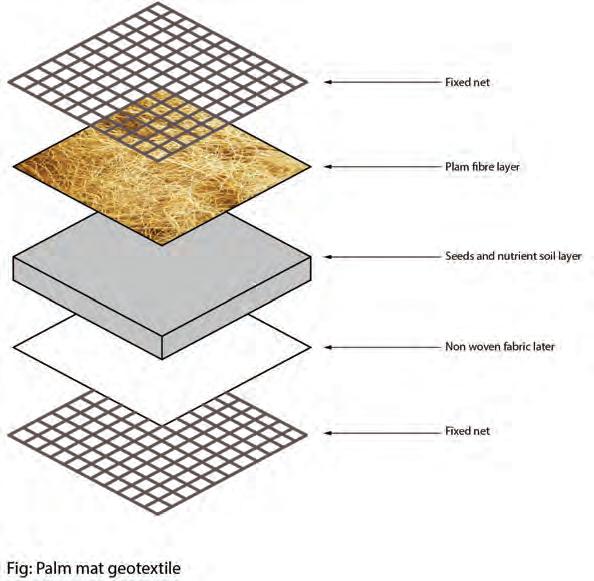
Natural fibre like jute geotextiles degrade to form an organic mulch and help in quick establishment of vegetation. Different fibres degrade at different rates. While coir geotextiles degrade in 2-3 years, jute degrades in 1-2 years. Coir is therefore useful in situations where vegetation will take longer to establish. The hairiness of Jute fibre makes it useful to absorb more moisture and control dust, making them suitable for low rainfall areas. 26
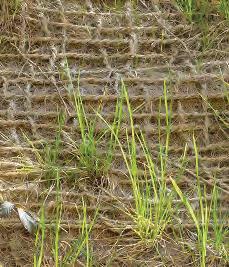
The short life-span of these protective screens find their use in shielding the initial growth period of saplings before they degrade naturally.
Wind can be accelerated to maintain the critical threshold by placing obstacles that funnel the wind and take away the build-ups of sand, thus creating larger sediment free areas. This method is applied to streamlining the streets and any other obstacle around it in desert settlements.
Alternatively placing obstacle such as fences reduce the velocity below the critical threshold and trap the sand before it reaches the target region .27 The accumulated sand can then further be used as a mound or deflection system to change the dynamics of the wind. Images
source : https://www.ecplaza.net/products/jute-soil-saver-jute-geo-textile_4228811, December 17th 2019
41 In-dune I
Mulch : covering 20% to 30% uniformly over the total surface census
Jute geo-textile : covering entire surface. Textile surface is porous to enable growth of saplings reinforcement
Palm mat Fixed net Palm fibre layer Seeds and nutrient soil layer Non woven fabric layer Fixed net
geotextile
: Natural + synthetic material ; also suitable for sub-soil
Aerodynamic method 2.3.2
Aerodynamic Method focuses on altering the speed of wind and its sand carrying capacity to control the sedimentation pattern on the terrain.
Fig: arti cial check dunes for multi-directional winds
Porous barrier: Sand Accumulation
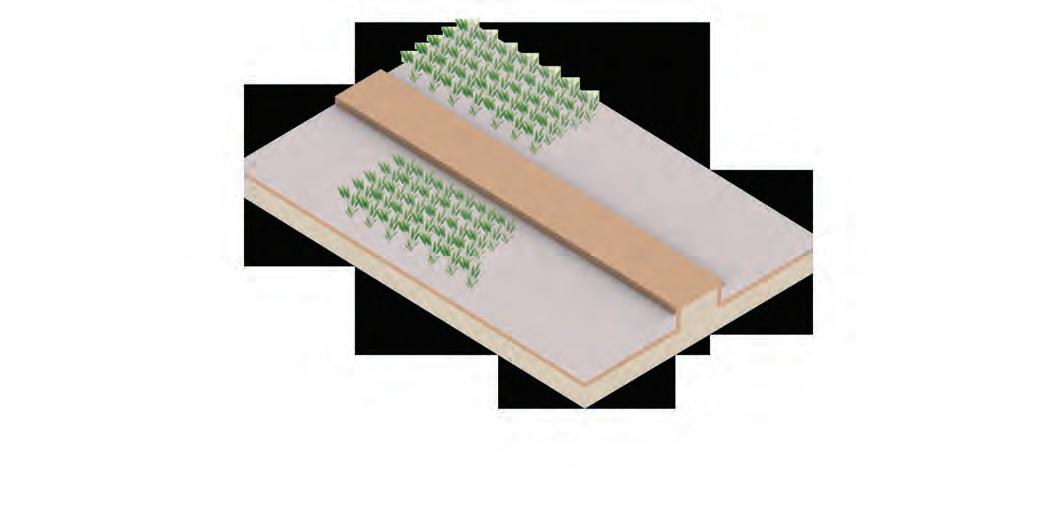
Porous Barriers/Fences can be used to trap sand and promote its lateral and vertical growth in a controlled predictable manner. The success of fences are subjected to three factors- a) volume of blown sand, b) number, position and height of the fence and c) porosity of the fence screen.
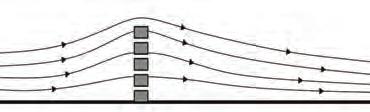
Fence with porosity less than 20% acts as a solid obstacle for sand deposition and the sand is deflected/ accumulated in front of the obstacle. Fences with porosity 30-50% create optimum condition for sand accumulation without causing any turbulence in the lee. The height of the fence is maintained between 1.5-2m to match the vertical saltation limit .28
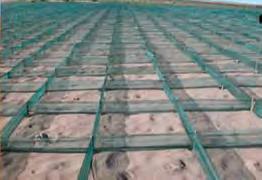
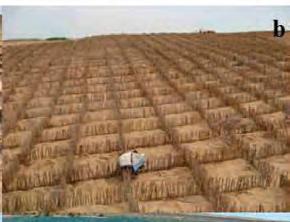
The bimodal nature of wind direction on the site suggests the placement of fences not just directly across the path of the prevailing wind but in a checkboard grid. The accumulation of sand in grids leads to formation of smaller check dunes. The size of the mesh in the grid is determined by the intensity of the winds and the slopes and shapes of the dune. The more complex the dune model, the denser the grid (fences and interior wattling ), which can range from 600 to 1200 linear metres per hectare. To keep this system more effective, the accumulated sand shall be removed at least 30 cm below the fence height.29
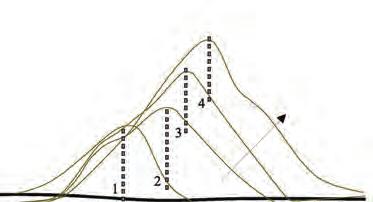
A permanent deflection system can be evolved by creating a system of stabilised artificial dunes. Placing the dune fences at an angle of 120-140° to the average prevailing wind direction can accumulate sand over the years and evolve as deflection dunes with addition of fences over it in phases. The volume of sand trapped by a fence varies as a function of the square of its height. The positioning of sequential fences will determine the dune form. 30

For a terrain like our test site where total loose sand area is vast, wind deflection system is a more viable option.
Wind flow around non-porous barrier
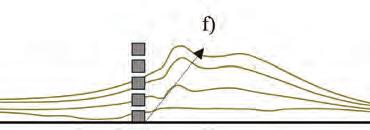
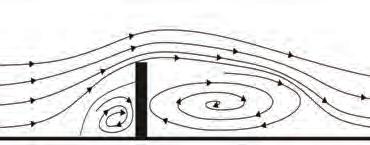
Fig: arti cal check dunes for unidirectional winds
Fig: arti cial check dunes for multi-directional winds
Resultant sedimentation around non-porous barrier
Wind flow through porous barrier
Fig: arti cial check dunes for multi-directional winds
Fig: arti cal check dunes for unidirectional winds
Resultant sedimentation around porous barrier
Fig: arti cal check dunes for unidirectional winds
Artificial dune growing process over 4 years
Images source : Bruno L,Horvata M, Raffaele L” Windblown sand along railway infrastructures: A review of challenges and mitigation measures, Journal of Wind Engineering & Industrial Aerodynamics” 2018
42 I Emergent technologies and design 120 140° 120 140°
porous barrier longer leeward shelterd ground height 1 to 1.5m porosity 30 to 40%
Fig:
barrier greater deposititon rate lesser deposititon rate
Fig: non-porous
Fig: de ection dunes
greater voxtex shedding 120 140°
porous barrier longer leeward shelterd ground height 1 to 1.5m porosity 30 to 40%
barrier
Fig:
Fig: non-porous
Fig: de ection dunes
greater voxtex shedding 120 140° 120 140°
porous barrier longer leeward shelterd ground height 1 to 1.5m porosity 30 to 40%
Fig:
greater deposititon rate lesser deposititon rate
Fig:
non-porous barrier
Fig:
de ection dunes
greater voxtex shedding
3.5m 3.5m
3.5m
Arrangement Material
Arrangement of artificial check dunes for uni-directional winds

Arrangement of artificial check dunes for multi-directional winds
Arrangement of deflection dunes
Images source : Guo, Z.; Huang, N.; Dong, Z.; Van Pelt, R.S.; Zobeck, T.M. Wind Erosion Induced Soil Degradation in Northern China: Status, Measures and Perspective. Sustainability 2014, 6, 8951-8966.
43 In-dune I 120 140° 120 - 140° greater deposititon rate lesser deposititon rate
dunes
Fig: de ection
120 140° 120 140°
porous barrier longer leeward shelterd ground height - 1 to 1.5m porosity 30 to 40%
Fig: arti cial check dunes for multi-directional winds
Fig:
greater deposititon rate lesser deposititon rate
Fig: non-porous barrier
Fig:
arti cal check dunes for unidirectional winds
Fig: de ection dunes
greater voxtex shedding 120 - 140° 120 - 140° greater deposititon rate lesser deposititon rate
Fig: arti cial check dunes for multi-directional winds
Fig: de ection dunes
Fig: arti cial check dunes for multi-directional winds
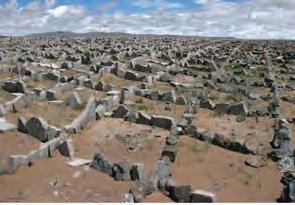
Plastic Stone
Tree stalks
Plantation of dune grasses, shrubs & trees 2.3.3
Psammophytes:
Psammophytes are plants that survive in shifting sands. A number of adaptive features such as resilience to extreme temperatures, high salinity and low water requirement enable them to survive in barbarous desert conditions.
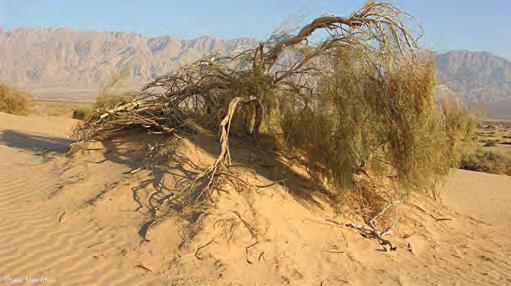
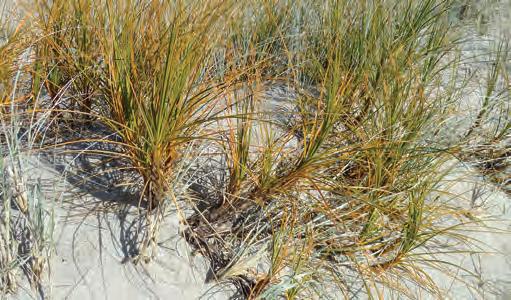
Psammophytic trees and shrubs form strong organic roots on those parts of their trunks buried in the sand. Adventitious buds followed by shoots arise on the exposed roots. These roots sprout through the sand and grip it tight. Perennial Psammophytes have small leaves or no leaves at all. This further reduces their dependence on limited water available. The fruits have appendages in the shape of wings or parachutes that enable them to move with the sand and to remain on the sand’s surface. After seed germination (usually in early spring), the roots grow very quickly, soon reaching a depth of approximately 0.5 m. At this depth, the sand remains moist until the onset of summer. 31
Despite the difficulty of establishing the vegetative cover, it forms an efficient dune arresting mechanism.
Espacement:
Within the availability of limited resources in the region, distribution of these resources becomes extremely critical. In arid and semi-arid zones, density of seedling will depend on the richness of the soil, depth of residual moisture, and rainfall. The lower the rainfall, the greater the spacing along and between planting lines, in order to avoid competition between seedlings and exhaustion of the soil’s water reserves.
Seedling production and planting period:
Battered by unfavourable growing conditions, protection and sustenance of plant species is extremely important. Since the period of optimal moisture content is very short, it is desirable to raise seedlings in nurseries where a regular water supply of water is maintained. Seedlings can be raised in earthen tubes or beds. The sowing should be such that the saplings reach a desired age/height by the transplanting period.
Planting depth
Deep plantation ensures tapping of moisture within the depths of soil. However, research has shown that in arid region of Rajasthan it is economical to resort to shallower planting depths in depressions (50-70 cm) and deep plantation in high dunes. For example, planting depths can range from 80 to 120 to 150 cm from dune slope to crest.32
To protect seedlings from the abrasive effect of the wind, plants are planted deep into the soil in 3:1 or 2.5:1 ratio to give them a good chance of taking root. It is also to be ensured that the aerial part should be at least 30 or 45 cm above the soil. 33
Source: https://www.wildflowers.co.il/hebrew/picture.asp?ID=6992
Source: http://www.terrain.net.nz/friends-of-te-henui-group/plants-grasses-sedgesrushes-nz-natives/ficinia-spiralis-pingao.html
10m X 10m (staggered)
150 seedlings/ hectare 11mm
10m X 10m
100 seedlings/ hectare
100mm
7m X 7m (staggered)
235 seedlings/ hectare
7m X 7m
200 seedlings/ hectare
5m X 5m (staggered)
462 seedlings/ hectare
5m X 5m
400 seedlings/ hectare
Plantation spacing based on rainfall pattern adapted in Mauritania
Source: http://www.fao.org/3/i1488e/i1488e04.pdf
235mm
200mm
400mm
462mm
44 I Emergent technologies and design
Calligonum polygonoides, a shrub locally known as phog
Marram Grass or Ammophila arenaria
Nursery
Specifications and yield of a plant nursery
Source: Embedded Morphophonemics, AA Emtech
Setting Capacity Seedlings grown per year - 1000 20 L /m2/ watering
up porous barriers Water requirement
Preparation of nursery beds
Sowing in nursery beds
Direct sowing of slow growing woody and grass species on dunes
Raising nursery seedlings
Transplantation form nursery
Casualty replacement
Calender of activities of planting tree seedlings and grass slips on shifting sand dunes
Predominantly shaded: Morning and evening sunlight intake
Source: R.N. Kaul, Sand Dune Stabilisation in the Thar Desert of India: A Synthesis, Annals of Arid Zone 35(3) : 225-240, 1996
45 In-dune I
Jan Feb Mar Apr Jun May Jul Aug Sep Oct Nov Dec Mulching on dune
Subsequent watering size 10 m2 ( 10m x 1m)
Plantation of crops ( Agronomics ) 2.3.4
Water retention :
Adoption of soil and water conservation practises such as peripheral bunding, contour bunding, water retaining pits and vegetative barrier individually and in combination can help reduce run-off, recharge soil profile moisture and reduce soil loss.34 Water-retaining pits like half and full moon pits and ridges act both as buns and fence. They collect the flowing water into deep undulations, trigger percolation and reduce evaporation.
Addition of chemically carbonised organic matter from harvested crops (Biochar) to the soil conceals the carbon content and improves the water retention property. It further facilitates the growth of bacteria and fungi which in return enriches the nitrogen content of the soil.
Soil improvement:
Desert soils are naturally devoid of organic matter. Adoption of specialised techniques like Dryland Cultivation can help conserve natural moisture and nutrient content in the soil. Adoption of drought resistant crops as a part of this method can further reduce the pressure on water requirements and help these plants to restore the lost nutrients in the soil.
Strategic plant selection and distribution when coupled with supply of soil and vermi-compost inside water retaining pits, can significantly improve the organic content of the soil. These organisms can rebuild the soil structure and improve fertility. Increase of organic content can further be accelerated by adopting organic mulching on dune field thus giving a robust foundation for plants to grow.
Crop rotation, inter cropping & agroforestry
While agronomic practice of inter-cropping increases the diversity of crops within the same field, crop-rotation alters the nutrient content and distribution of organic matter across the field. Agroforestry shares its principles with inter-cropping and thus improves diversity by addition of trees with crops. The trees having deeper roots pump out the nutrients deep from the soil and make them available to the neighbouring crops. These trees have an added advantage of controlling soil erosion.
Frequent droughts in the region make pearl millet a better choice than legumes to plant for they can resist the extremities better. However, rapid growth of leguminous plants along with other crops can replenish the nutrients in the fallow soils.
Above: Planting methods to improve water retention
46 I Emergent technologies and design
Half moon pits .2 - .6 m .2 - .3m 27% 27% 27% 55% 65% 65% 65% 44% 8% 5% 5% 1% .3 - .4 m .75 m Runoff Runoff 30m 30m .45 - .6 m 30m 30m 30m Runoff
Ridges and deep tillage
Mulch of surface with slopes less than 3%
Bunding around plots witn slopes less than 1%
Monsoon crops
Sowing - June
Harvesting - November
6-8 months crops harvested and replaced at the end of cropping season
Winter crops
Sowing - November
Harvesting - March
2-3 year period
Image: Inter-cropping and crop rotation methods integrated with agroforestry Cereal crops replaced with legumes in one cropping season after fallow period for soil nutrient enrichment Barley Sorghum / Millets Tomatoes Marram grass + Gum arabic tree Marram grass + Gum arabic tree Moth beanBio-mineralisation : Infrastructure system 2.3.5
Sand being the most abundant resource can be easily procured and subjected to soil treatment and improvement to be used for engineering purposes. Properties like compressive strength, hydraulic conductivity and durability against wetting and drying and environmental revitalisation of a particular engineered soil starts to define its use at different scales. While within the realm of geotechnical engineering conventional production methods are not economical, alternative biological approaches including microbial injection and by-product precipitation are being investigated. [In] Dune specifically details and adopts the application of microbial induced polymers or biopolymers as a new type of construction binder.
Biopolymers are the most viable environment friendly option. Once added to the soil, they form a stable gel matrix that synergies with ecosystem locally and does not damage it. Combined with their water retaining properties in soil, biopolymers are thought to be capable of promoting vegetation growth.
The most advantageous way of introducing biopolymer into the soil is by externally cultivating it. Exo-cultivation and then direct application overcomes shortcomings of other approaches- need for nutrient injection, cultivation time and excrement precipitation. Apart from injecting directly into the soil, biopolymers can be introduced by various practical modes of application including mixing, spraying, and grouting.35
+ Water Chemically synthesized polymers
Graph 1.1 : Overview of ground improvement methods
Source : Introduction of Microbial Biopolymers in Soil treatment.
Top right : Growth rate of CO2 emission
Graph 1.1 : Growth rate of CO2 emission
Graph 1.1 : Overview of ground improvement methods
Bottom : Overview of ground improvement methods
Source Introduction of Microbial Biopolymers in Soil treatment.
Source Introduction of Microbial Biopolymers in Soil treatment.
Source Ilhan Chang ,Jooyoung Im and Gye-Chun Cho, Introduction of Microbial Biopolymers in Soil Treatment for Future Environmentally-Friendly and Sustainable Geotechnical Engineering.
Microbial Biopolymers in Soil treatment.
48 I Emergent technologies and design
Cement + Water Chemically synthesized polymers (Acrylic polymer) Fly ash-geopolmer B- glucan Various synthesized materials Pozzolanic materials + water + cement Micro-organisms urea + starch Biopolymers + water 1 kg 2.35 kg .4 kg Nil Nil 6 kg 2 Mpa 10 Mpa 1.8 Mpa 4.3 Mpa 0.8 Mpa (Acrylic polymer) Cement Main Materials ChemicalsGeosyntheticsGeopolymerMICPBiopolymers Soil Competitiveness ne grain course grain Production of 1kg Carbon Footprint Contamination of Treated Soil Compressive Strength 1980 1990 2000 2010 Year 0 5 10 15 Annual growth rate (%) Cement related CO2 emission Global CO2 emission Graph 1.1 : Growth rate of CO2 emission Source : Introduction of
Cement
(Acrylic polymer) Fly ash-geopolmer B- glucan Various synthesized materials Pozzolanic materials + water + cement Micro-organisms urea + starch Biopolymers + water 1 kg 2.35 kg .4 kg Nil Nil 6 kg 2 Mpa 10 Mpa 1.8 Mpa 4.3 Mpa 0.8 Mpa (Acrylic polymer) Cement Main Materials ChemicalsGeosyntheticsGeopolymerMICPBiopolymers
Competitiveness ne grain course grain Production of 1kg Carbon Footprint Contamination of Treated Soil Compressive Strength 1980 1990 2000 2010 Year 0 5 10 15 Annual growth rate (%) Cement related CO2 emission Global CO2 emission
Soil
Source : https://www.archdaily.com/472905/bricks-grown-from-
Current applications:
In the past two decades the research conducted and technology developed for application of bio-mineralized earth materials in the construction industry has shown significant progress. Various models have been tested and proposed at different scales. Biopolymers can display structural stability and durability unless they are subjected to conditions that trigger their degradation. These may include certain combinations of high temperature (80-90 °C), high pressure, moisture content and biological activity over some time interval .36 Biopolymers can be used in the form of viscous pastes, solid blocks or aerosols depending on the application.
Adhesives: Adhesives primarily contain inorganic hydraulic setting binders and carbonate containing raw materials. Hydraulic setting binders can further be added to adhesives to improve its technical and physical properties. In order to improve the water retention property and consistency of adhesives, hydrophilic and water retaining biopolymer like ether can be added .37
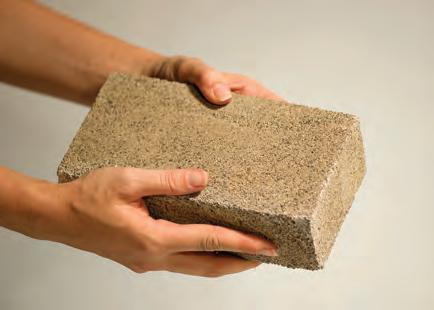
Biobricks: As an input to create solid blocks, biopolymers can be mixed with sand and water to cast bricks. Addition of natural fibres for reinforcement can further enhance the structural property of the mass. Apart from being cast, the composition can be 3D printed, as tested by BioMason. The printing process is however more expensive and time consuming.
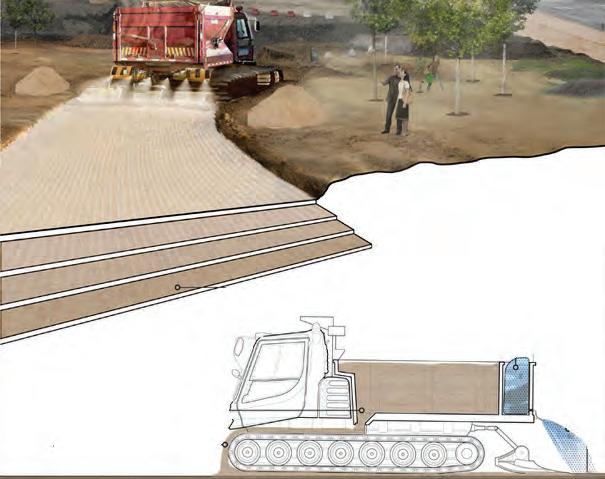
Roadworks: Thomas Kosbau and Andrew Wetzler and proposed simultaneous laying of sand and srparying of natural cementationin multiple layers as an alternative method of road construction.
Source
49 In-dune I
Casting and printing ;Biobricks
bacteria
Spraying; Road works
: https://inhabitat.com/creating-roads-from-sand-and-bacteriainstead-of-oil/
Ground improvement : Microbially Induced Calcite Precipitation (MICP), also known as “bio-grout” is the most commonly adopted process to achieve soil stability. This technique utilises the metabolic pathways of bacteria to form calcite (CaCO3) that binds the soil particles together, leading to increased soil strength and stiffness .38
There are several methods by which bio-grouts can be injected into the soil. For sandy soil, the method of permeation grouting is most suitable. The technique ensures least displacement of sand and maximum, uniform spread of the grout. This technique performs best for sand with low fine content. Structurally, the grout transforms granular soil into sandstone like masses by filling the voids with itself as a less viscous and non-particulate entity.


The grout is added to the soil through a sleeve port pipe into a predrilled hole. The grout is injected under pressure through the ports. The grout permeates the soil and hardens, creating a sandstone-like mass. A common application of chemical grouting is to provide both excavation support and underpinning of existing structures adjacent to an excavation. 39
Permeation grouting procedure

Source : https://vibromenard.co.uk/technique/controlled-modulus-columns/
Compaction grouting (radial displacement of earth)
Compaction grouting (radial displacement of earth)
Jet/ Pressure grouting (Partial replacement /mix in place)
Jet/ Pressure grouting (Partial replacement /mix in place)
Permeation grouting (Flow into existing pores)
Permeation grouting (Flow into existing pores)
50 I Emergent technologies and design
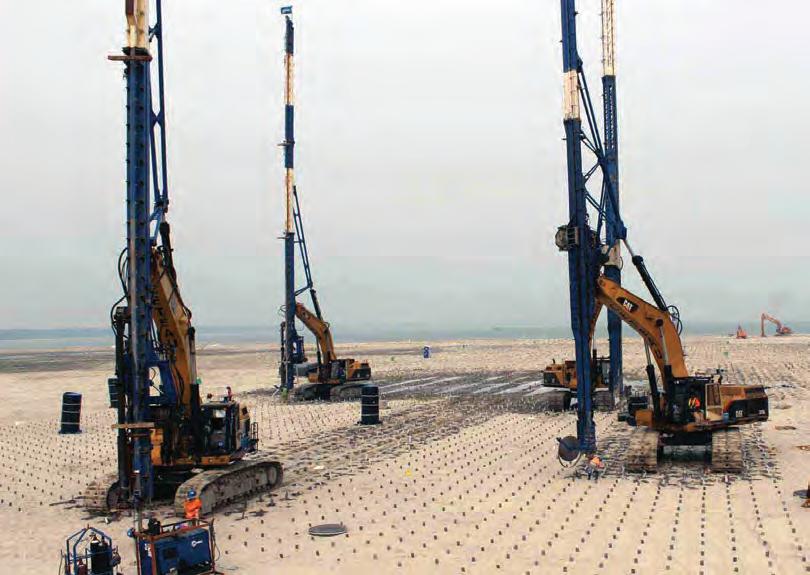
Matrix of injections depending on the purpose ( Wick drains in this case)
Source : https://gzzhaohua.en.made-in-china.com/product/wyLEKNnUElWb/China-36-Meters-Wick-Drain-Installation-Machine.html
Injection; Large scale application of bigrout for borewell stability
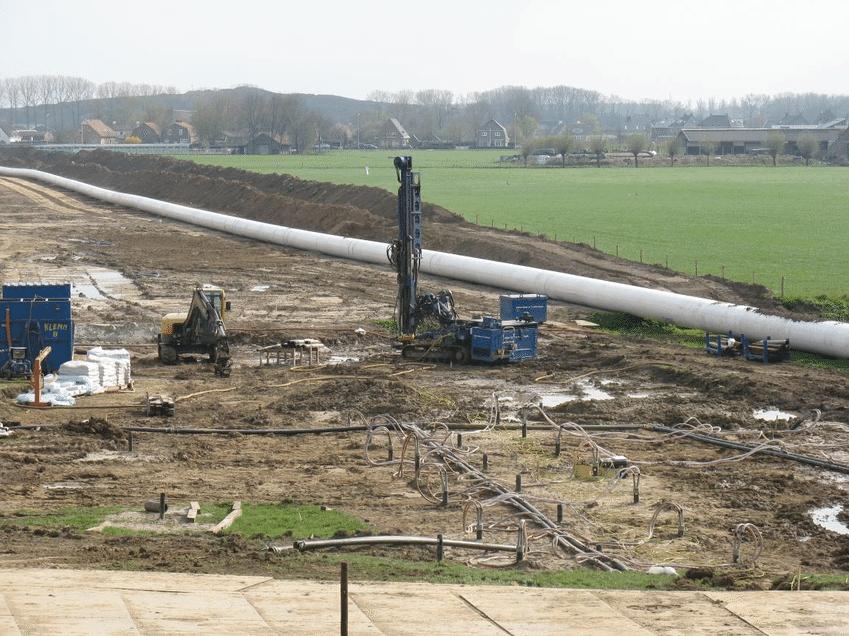
Source : van Paassen, Leon. (2011). Bio-Mediated Ground Improvement: From Laboratory Experiment to Pilot Applications.
51 In-dune I
Alginate
Alginate is a natural polysaccharide generally obtained from brown seaweed and forms a viscous gum by binding with water. Readily available in the country, the biopolymer is relatively cheaper, highly bio-compatible and less toxic. This makes it an obvious choice to be applied in food industry, biomedical uses, paper and textile. 40

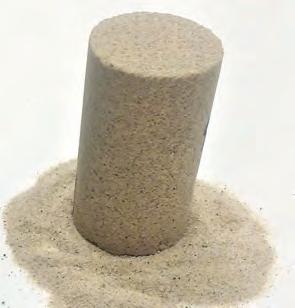
Like most biopolymers, Alginate exhibits high sensitivity to water. This limits its use to effectively treat soil for ground improvement and stability. The use of cross-linking for biopolymers may provide a more powerful soil stabilizing method. Cross-linking is a technique used to greatly improve the properties of a specific material by introducing an agent that promotes interactions between separate polymer chains, thereby enhancing their overall strength .41 Addition of calcium to the biopolymer and sand makes the composition gain strength and repel water solubility. About 5% Sodium Alginate and sand mixture can attain an unconfined compressive strength of 1550 KPa, 96 % of which is attained in 14 days .
Above: : Compressive strength of sand treated with different biopolymers
Right : Properties of alginate treated sand
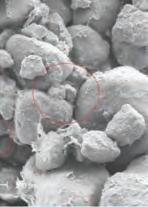
Bottom left : Biomineralisation and calcification process
Source : Zdruli, Pandi & Cherlet, M & Zucca, Claudio. (2016). Mapping desertification: constraints and challenges. Encyclopaedia of Soil Science, Third edition, (Ed. R. Lal). 10.1081/E-ESS3-120052917
52 I Emergent technologies and design 0 UntreatedXanthum 1%Agar 1%Gellan 1%Alganite 5%Cement 10% 500 1000 2000 1500 UCS (Kpa) Biopolymer content in sand
Graph 1.1 : Comparison of uncon ned compressive strength of sand hardened with various biopolymers
Source : Chang, Ilhan & Im, Jooyoung & Cho, Gye-Chun. (2016). Introduction of Microbial Biopolymers in Soil Treatment for Future Environmentally-Friendly and Sustainable Geotechnical Engineering. Sustainability. 8. No. 251. 10.3390/su8030251.
Step 1 Ca 5% Sodium alginate
2+ Ca + Sodium chloride + Sand Hardened sand mixture ( water soluble) Calcium chloride (crosslinking agent) Calcium alginate (insoluble in water) Ca + (Biopolymer) Step 2
Brown seaweed
2.3.6
In uence of temperature on the compressive strength of sodium alginate( 2%) treated sand treated sample
53 In-dune I 0 020406080100120 200 400 600 800 UCS (Kpa) Temperature ( °C) 0 051015202530 100 200 300 400 500 600 700 800 900 UCS (Kpa) Curing time ( days) 0 0123456 200 400 600 800 1000 1200 1400 1600 1800 UCS (Kpa) Sodium Alginate content (%) Site temperature range 96 % strength attained in 14 days 100 % strength attained in 14 days UCS - 1550 Kpa 5% Alginate UCS variation
Curing time e ect on the UCS of
alginate(
of sodium alginate treated dune sand by using the di erent amounts of biopolymer
sodium
2%) treated sand
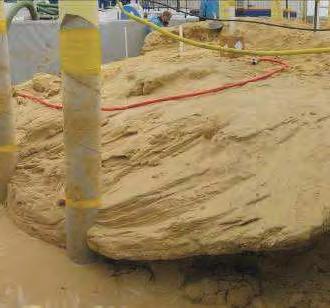
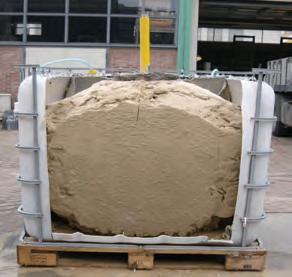
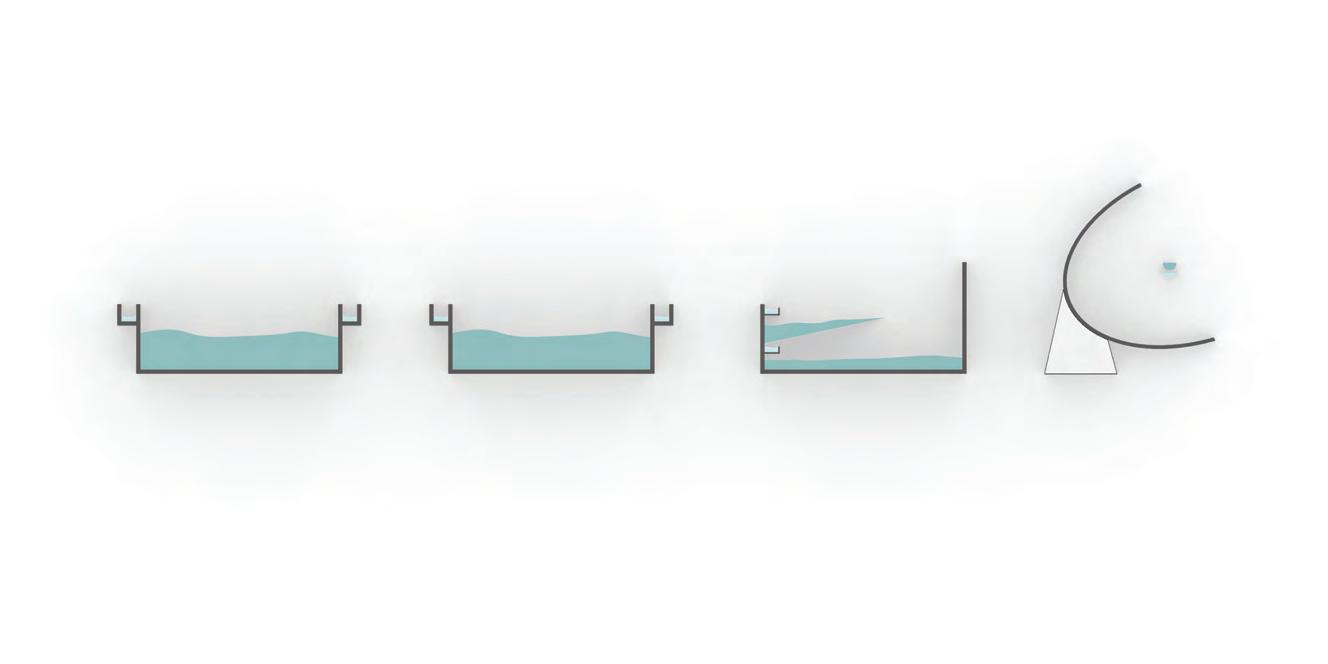
Case study: Biogrout experiments at TU Delft
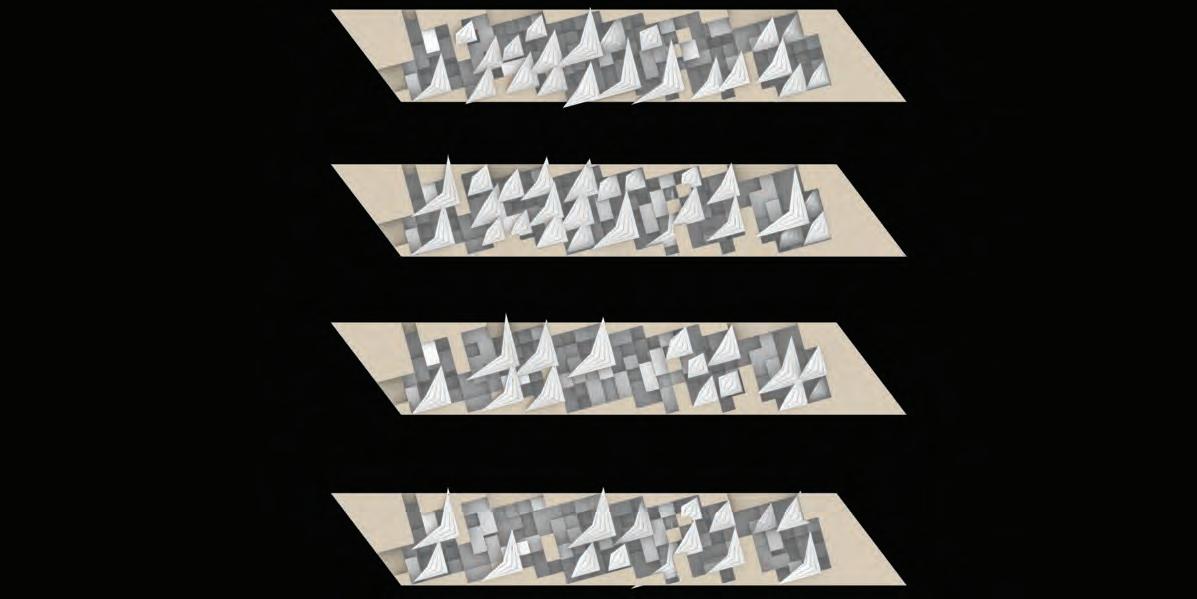
A study was carried out to test the scalability of bio-grouting to check the potential of the method in ground improvement. As an ex-situ experiment inside a laboratory, biopolymers are mixed with sand and water and cast in a mould. In another ex-situ experiment set-up bio grouts are injected to containers filled with soil of volumes 1 m3 and 100 m3 through injection wells.
Progression from casting 10 cm3 of sand to injecting 1 m3 and 100 m3 of sand as single point and grid of injections has directed the research to study the flow lines of the bio grout fluids, control the forms and pattern generated along these lines, control inlet and outlet locations of injection and observe pressure difference inside the sand.
The current experiment thus in turn also focuses on controlling the uniformity and structural properties of the hardened mass. The experiment resulted in achieving unconfined compressive strength from 0-15 MPa. The increase of stiffness from precipitation of carbonate in subsurface can also be quantified as function of the volume of injected grouting agents and its dry-density.
Conclusions
While bio-grouting is a scalable technique, the mode of its application creates the difference in varying compressive strengths within the same hardened mass. While the method of casting bricks creates uniform hardened mass with higher compressive strength, the method of injecting the grout directly into the soil creates lesser uniform hardened masses with increasing scale. However, the latter method shall always be preferred for faster larger scale application. The grout should be injected in low speed so that bio-polymer does not get washed away by calcifying agents.
The scaled up hardened mass is uniform along injection flow lines. This indicates that an increase in density of injections can increase the homogeneity. Thus, for a large scale ‘uniform’ application deployment of a matrix injection system is ideal.
Since for any given pressure the spread of grout inside sand cannot be digitally simulated, the limits of the spread can only be tested on the site. For the sake of experiments conducted during this research it is assumed that the grout spread is uniform inside sand.
54 I Emergent technologies and design
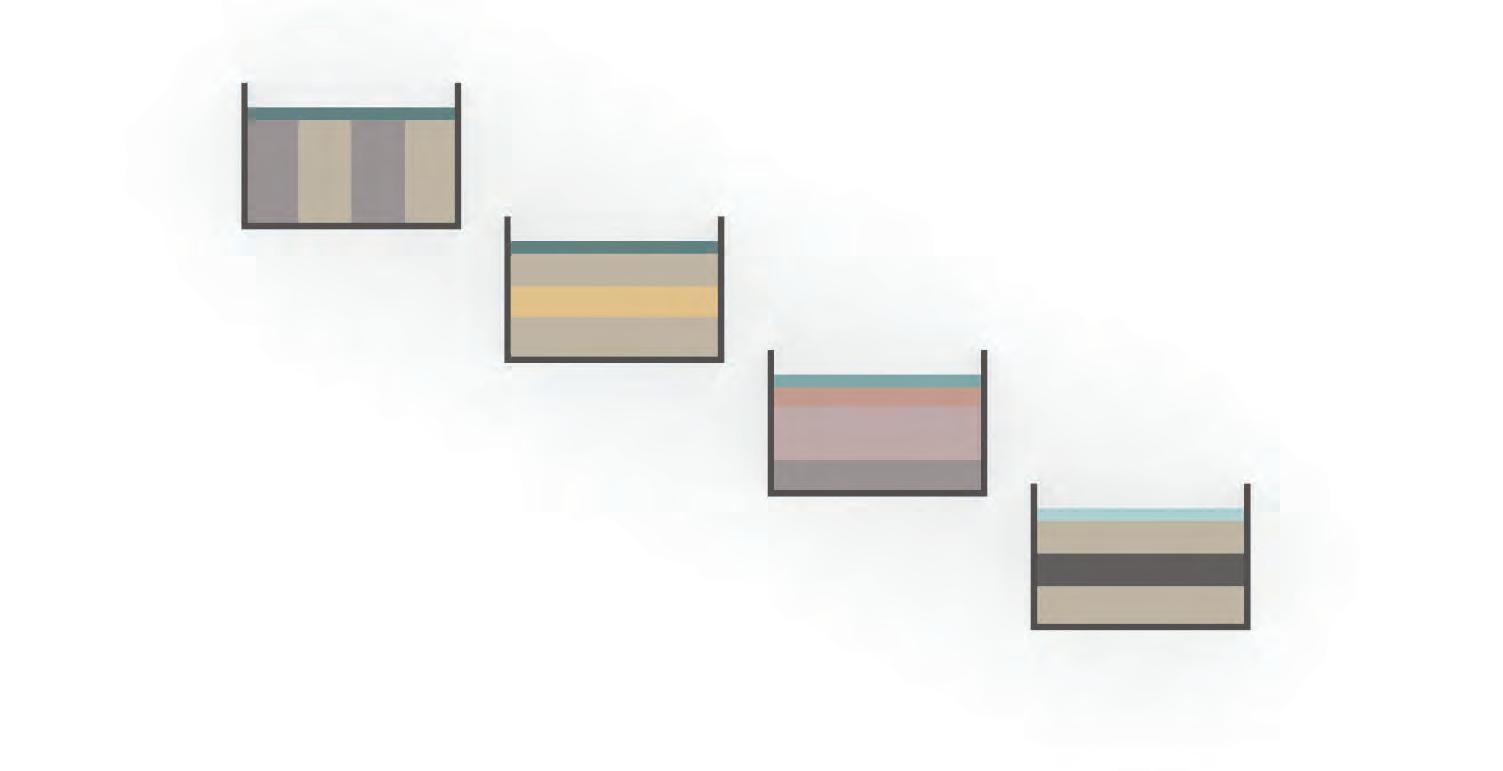
Grout Spread
Dry mix and mould casting Regular throughout the cast Uniform
Single point injection grouting
-Regular flow of grout -Spherical cemented pattern
Varied hardening towards the corners and walls
Matrix injection grouting
Clogging of grout near injection point
Cemented pattern related to flow path
Non-uniform grout spread Uniform grout spread
>15 % <1%
Homogeneous along injection flow lines.
Varies across perpendicular section to flow lines
55 In-dune I
10cm3 2003 1m3 2007 100m3 2008 Fabrication method Experiment scale
Source: Scale up of Biogrout: a biological ground reinforcement method, LA Van Paassen
Homogeneity Calcium carbonate content (% of dry weight)
56 I Emergent technologies and design
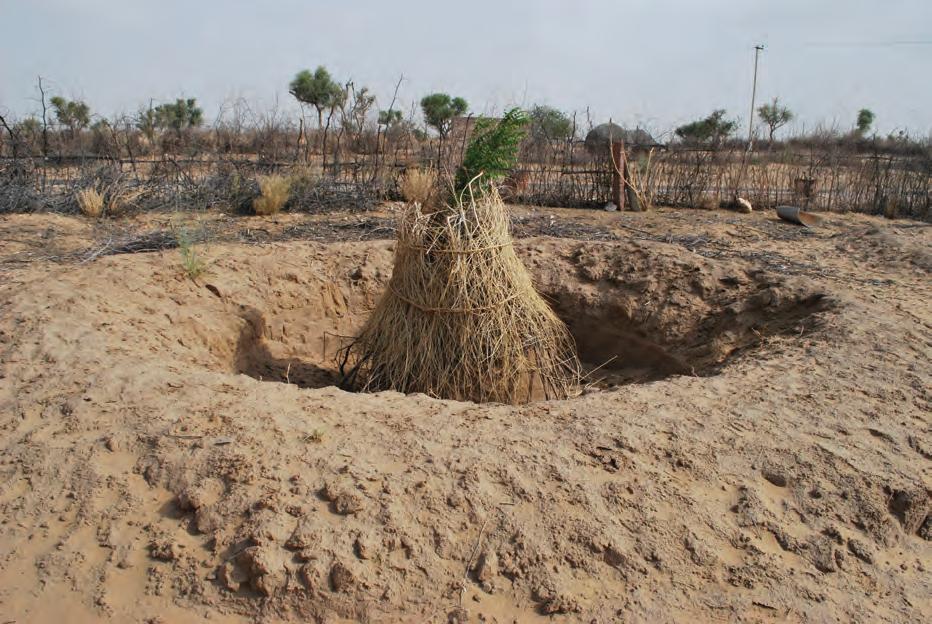
Planting technique adopted on site : 60 cm deep pit for water retention pit + support and protection from wind using twigs and branches
Source : Site visit
2.3.7
Conclusion: Sand stabilisation techniques
The techniques discussed in this section as either sand stabilisers or sand deflectors due to varying sedimentation pattern alter the immediate ground conditions and decide for the succeeding functions to occur. While techniques like porous barriers and biomineralised sand accelerate the wind speed and shield the affected area from sedimentation, establishment of vegetation cover reduce the effective wind speed to less than 6m/s and protect the top fertile soil layer from saltation. Increased moisture content in the soil can make it less susceptible to erosion and plants to thrive.
Durability
The effectiveness of all the techniques depend on their life spans. Similar to porous barriers, reducing wind speeds can submerge the plants or trees inside the sand over time and increase the dune’s height over and above the vegetation height. Vegetation covers and porous barriers do not form a permanent solution to shifting sands. They need to be continuously replaced. The initial growth and replacement of plants, other than Psammophytes is not easy for low soil quality.
Interdependence on other systems and technologies
Unlike erection of porous barriers and placement of geo-mats, plantation and microbial injection need other resources such as constant supply of water to support their growth and progression. Dependence on water makes them rely on its ready availability and quality. Considering the unfavourable environmental conditions to procure the resource, these techniques indicate adoption of rain water harvesting and micro-irrigation measures.
For smaller plants and grasses which are most vulnerable to heaping saltated grains, dependence of deflection mechanism is equally critical. Deflection mechanism made of hardened sand needs major machine, material and labour support. Hardened sand gets fully activated only after the material gains full strength and maturity post curing period.
57 In-dune I
Water resources in Thar 2.4
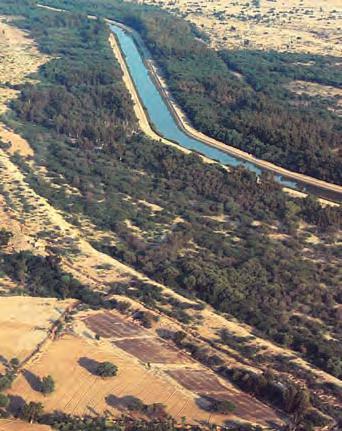
Scanty rainfall, high evaporation and remote location of the site drive the need for water catchment, treatment and circulation techniques. In order to support the water requirement, water can be procured onto the site using three sources- extraction of ground water, collection of rain water/ surface run-off and connection to existing artificial irrigation canal (Indira Gandhi Canal). While availability of ground water is an existing resource, establishment of rain water collection system and connection to Indira Gandhi Canal are proposed interventions.
Indira Gandhi Canal Project was proposed in 1958 with the purpose of bringing water from northern Himalayan rivers deep into the Thar desert. At present the canal stretches 650 kms and facilitates irrigation of 6770 km2 area in the district of Jaisalmer alone .42
The three potential sources of water inherently carry contaminants of different chemical properties. These differences subject water from each source to be treated separately and used for different purposes.
Treatment
Rhizo-filtration
Rhizofiltration is an in-situ, passive bioremediation technique that involves filtering contaminated groundwater, surface water and wastewater through a mass of roots to remove toxic substances or excess nutrients. A few examples of rhizofiltration plants are sunflower, tobacco, spinach, rye and Indian mustard.
Rhizofiltration is adopted for aquatic environment. So either the roots are extended to the contaminants or the contaminated water is brought to roots. Once the contact between the stable roots and water is made, the process of acclimation starts. A series of natural filters such as sand , gravels , coir , etc alongside the use of rhizomatous grasses start to absorb contaminants through their roots and store them in root biomass or transport them to stems and leaves. The plants absorb contaminants until harvested.
The yield from bioremediation field is dependent on factors such as growing time, climate, root depth, soil chemistry, and level of contamination. However, the roots significantly limit the application of the technique. Roots are unable to extract any contaminant below their rooting depths. Restricted to sites with shallow contamination falling within rooting zone of remediating plants, ground surface at the site may have to be modified to prevent flooding or erosion. 43
58 I Emergent technologies and design
Resources 2.4.2 2.4.1
:
Top right: Potential sources of water in Jaiselmer
Bottom left : Indira Gandhi water canal Source : https://www.indiatoday.in/india/north/story/narendra-modi-for-indira-gandhicanal-shield-against-pakistan-111529-2012-07-29
Bottom right : Continuous vertical flow based on constructed wetland system Source : Chithra, Rengaraj & Nirmaladevi, Dhamodaran & Rajendran, Viji. (2017).
International Journal of Advances in Scientific Research Study on the efficiency of continuous flow-based constructed wetland system for grey water treatment. International Journal of Advances in Scientific Research. 3. 52-57. 10.7439/ijasr.v3i5.4198.


59 In-dune I Gravel Sand Sand Coir pith Sand Rhizomatous grasses Rhizomatous grasses Humus Depth equal to the length of the roots soil/clay Sand Charcoal Sand Treated water Gravel Waste water Rhizo ltration Rhizo ltration Preliminary ltration Dechlorination Saline Jan April July Oct Jan April July Oct Jan April July Oct Heavymetal contamination Fresh with sediments Aquifer Artificial irrigation canal Surface runoff
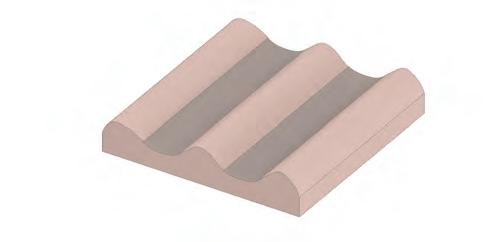
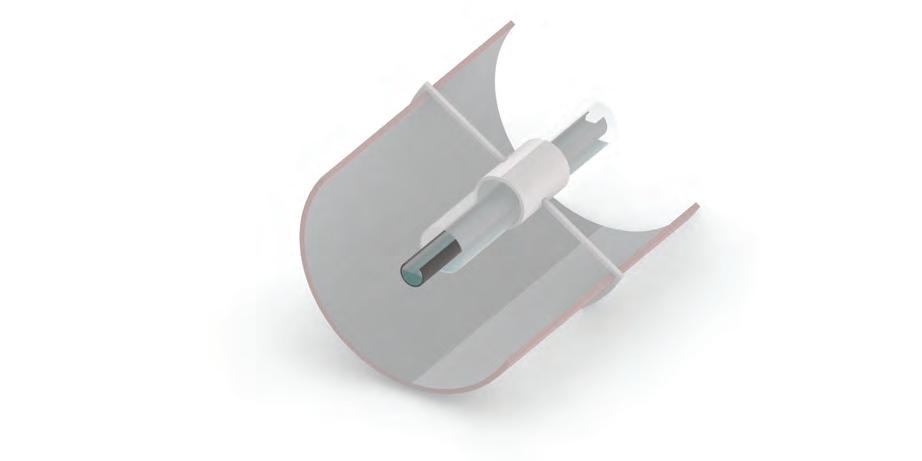
High solar radiation in the dune valley can be used to desalinate the water from underground aquifer. The yield from solar stills depends entirely on the climatic parameters, geometry of the still and increasing water temperature. The concentrator effect plays a critical role to increase the water temperature almost to its boiling point in comparison to other geometries. This leads to raise the evaporative and convective heat transfer coefficient in the solar stills. Thus, the evaporative heat transfer is higher in tubular solar stills and could relatively produce more yield.
Concentric tubular solar stills use a parabolic reflective surface to concentrate the radiation on tubular stills inside in which evaporation and condensation of the saline water takes place. A system of concentric tubular solar still has the maximum yield of about 4.5l of water per m2 per day . 43 An array of these solar stills can be deployed in the dunal region aligned to the sun-path for the maximum output.
60 I Emergent technologies and design
Solar desalination : 4000 3000 2000 1000 0 Yield (mL/m2/day)
Pyramidical solar still
Hemispherical solar still
4500 ml/m2/day Glass tube Adsober tube Saline water Fresh water Re ective surface Insulation
Double basin solar still Concentric tubular solar still
Conclusions
High radiation values in the region demands protection of water from evaporation. While, existing aquafers are naturally protected by the ground, surface run-offs and water in canal need to be shielded from evaporation. Construction of underground collection tanks and deployment of shade balls can reduce the amount of water lost to evaporation. However, the actual availability of water is also dependent on the current rate of its consumption. Since the water to canal directly comes from the endless supply from Himalayas, it is only the existing water in aquafers that face the threat of overconsumption and exploitation by current population.
Connection to Indira Gandhi Canal can significantly improve the problem of water scarcity in the region and facilitate the sustenance of population. However, construction of this connection might not be a sustainable solution for it may increase the ground water levels causing water logging and increasing salinity in the soil .45 The focus should be to control the influx of water from the canal and increase the ground water levels annually by adopting water conservation schemes.
Top left: Design of a concentric tubular solar still
Bottom left : Yield of various solar still designs
61 In-dune I
Source : Thirugnanasambantham, Arunkumar & Kandasamy, Vinoth Kumar & Ahsan, Amimul & Rajan, Jayaprakash & Kumar, Sanjay. (2012). Experimental Study on Various Solar Still Designs. ISRN Renewable Energy. 2012. 10.5402/2012/569381.
Research proposal 2.5
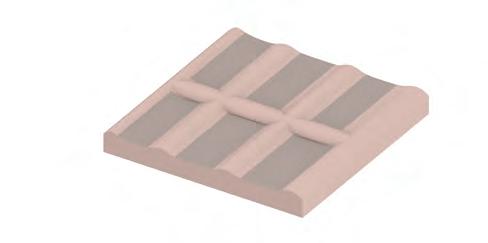
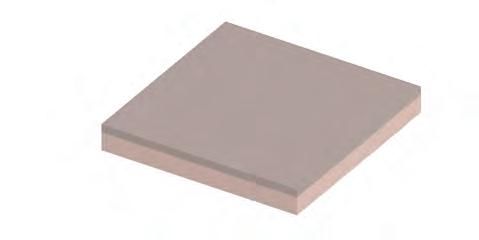
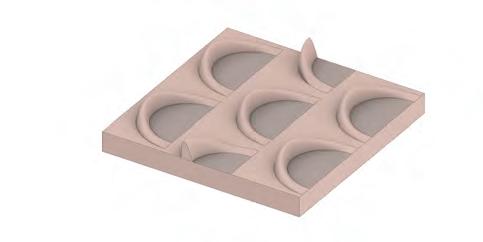
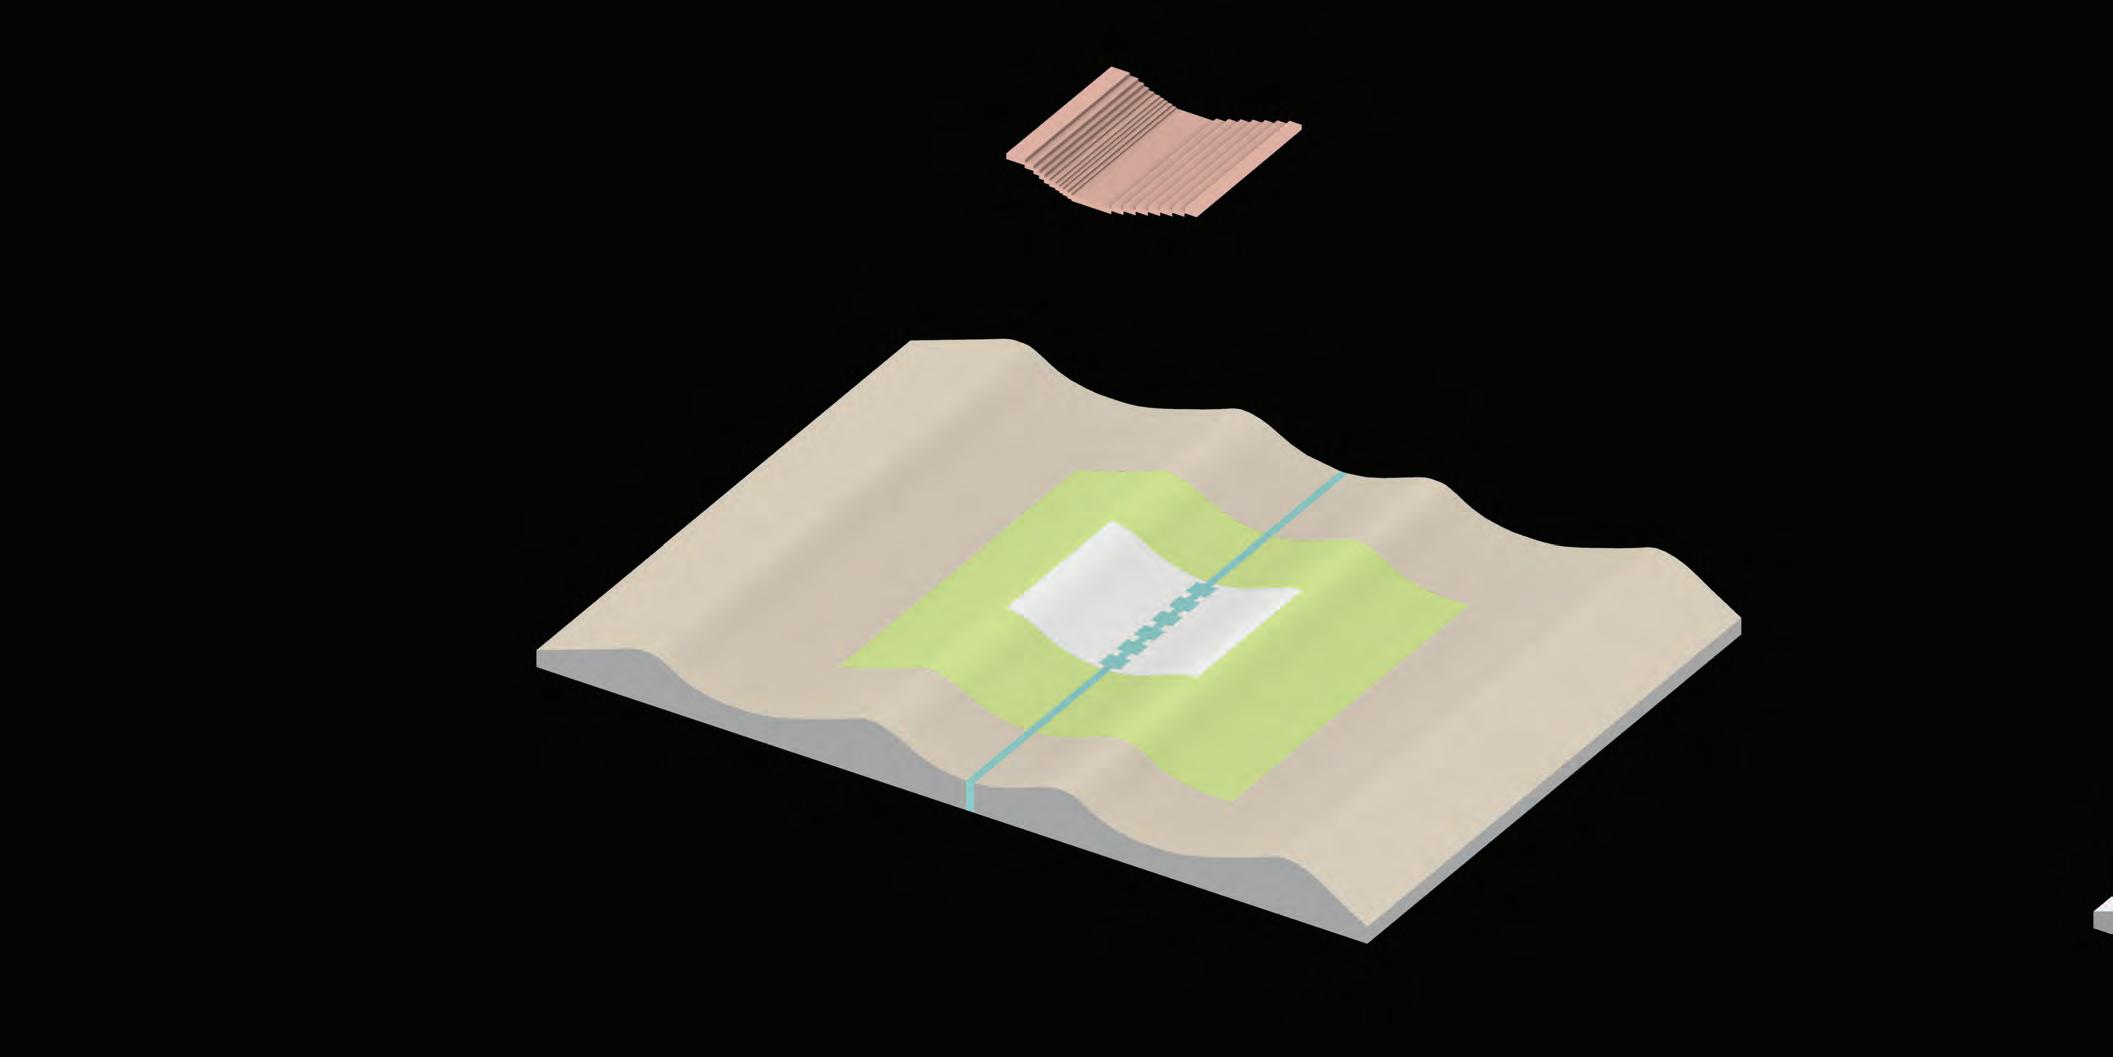
[In]Dune focuses on developing an integrated system of habitable spaces and productive landscapes amidst the unstable linear dune fields of western Thar. The two core environmental problems of continual sand influx and high radiations are mitigated by coupling traditional and proposed ecological sand stabilisation techniques at different scales. The proposal focuses on terraced development of the valley by bio-cementation of the dune slopes and plantation of trees to enhance its self-shading property. Seeking opportunity in the wind patterns of the site and deploying aerodynamic sand mitigation techniques like sand channels and deflecting surfaces, a mechanism of continual sand accumulation directly into ditches and its natural erosion is hypothesised.
Taking the advantage of sand’s low thermal transmittance and flexibility of fabricating different profiles using bio-cementation, indune habitable spaces are proposed to accommodate the growing population. All the ecological measures of sand stabilisation and deflection create an opportunity for habitable spaces and vegetation covers to thrive. To support the sustenance of both these systems, we propose to align their development with building a connection to Indira Gandhi Canal for water requirements. Procurement of water from the canal and adopting plantation and surface treatment measures lay the foundation for other succeeding techniques and resulting systems to flourish in synergy and form a holistic antidesertification scheme.
Sand stabilization strategies
Shelter belts on dune crests
Terracing in dune valley
Sand channeling on terraces
In-dune structures
Crop selection & planting techniques
Water management strategies
Bioremediation & desalination
Water collection & distribution scheme
Desired system qualities
Sediment free region
Thermal resistance
Erosion control
Water retention
Agricultural productivity
62 I Emergent technologies and design
Sand channels & wind de ection systems
In-dune structures
Agriculture terraces
Bio-mineralized dune valley
Integration of Indira Gandhi water canal
Plantation and surface treatment measures
63 In-dune I
Above: Research components
3. Methods
This section maps out the tools and systems that support various stages of design development- experiments, adaptation to design and evaluation of the adaption. Each of the computational experiment set-ups are direct or indirect adaptions from precedent studies and their translation to digital information. The digital data is evolved into series of design solutions at different scales which are then evaluated for efficiency in context to site conditions.
The global design strategies are formulated and detailed based on the evaluation of site for different environmental parameters. The input of anthropological and social data from the site visit to digital experiments make the design interventions site specific, indicating a cross medium transaction of information. Made out of local composite materials, these interventions are further detailed and evaluated for structural and environmental performances.
Fabrication logistics
Research and development Design development
Terrace development
Bio-mineralized dune valley
Fabrications of pro les and global injection strategy
Sand channel distribution
Microclimate study
Clustering and accessability
Design principals
In-dune structures
Injection matrix orientation
Planar distribution of functions
Spatial distribution of functions
Site : family sizes and functions
Design principals
De ection system
Geometric exploration
Material and structural studies
Aggregation of de ection systems
Phasing stategy
Hydrological scheme
Radiation analysis
Design principals
Plantation
Sedimentation study
Productive systems
Evaluation of exisiting resources
Treatment and distribution
Planting strategy
plant selection and planting texhniques
Design Proposal Analysis and conclusion
Bio-mineralised Sand infrastructure
Indune morphology
Sand channeling and sedimentation
Global Time Scales
Program distribution
Development of multiple settlements
Occupancy, social fabric and ancillary activities
Site
Rural character and remote location of the site enabled to get data on living conditions and problems. As desertification is a generic term, site specific issues pertaining to desertification could only be estimated by visiting it. The idea of scale of dunal fields and active traditional sand mitigation measures were documented to identify scope of interventions. (Refer to Appendix Section 8.5 for site pictures).
68 I Emergent technologies and design
visit Site visit 3.1
Genetic Algorithms
Genetic algorithms reflect the process of natural selection where the fittest/most efficient individuals are selected for reproduction in order to produce offspring of the next generation. Since criterions to develop different design elements at different stages might be contradicting to each other, genetic algorithms are used to optimise the design for these multiple objective. This technique finds its use primarily in morphology development of site.
LandSat Imaery
The Landsat program is the longest-running enterprise for acquisition of satellite imagery of Earth. Since the linear dune fields of western Thar are arranged either as array of parallel lines or converging clusters of 5-8 dunes, Landsat imagery was used to get the configuration of dunal arrangement and their land elevation specific to the test site, Satto.
69 In-dune I
3.2
Digital tools
Computational fluid dynamics

Computational fluid dynamics is a branch of fluid mechanics that uses numerical analysis and data structures to analyse and solve problems that involve fluid flows. Since wind plays a critical role in moving the sand particles, sand deposition patterns are estimated by studying the wind patterns on the site. Based on this study, aerodynamic interventions are proposed to mitigate the sand influx. The interventions are further evaluated based on CFD tests and wind simulations.
Finite element analysis
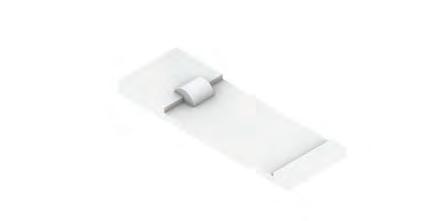
Finite element analysis (FEA) is a computerised method for predicting how a product reacts to real-world forces, vibration, heat, fluid flow and other physical effects. Any structure erected above the dune surface is subjected to high wind loads and self-weight. Sand deflection system made out of wood and sand based composite material are an outcome of constant FEA evaluations both at design and post analysis stage.


70 I Emergent technologies and design Wind Inlet 8m/s 20m Pressure outlet Width: 50-100m 50-10 Upwind Downwind Testedgeometry Velocity (m/s) 9.3 0 Utilization -54.6% 0 % 47.6% 250m- 450m Dead load Tiles : 0.001 kN/m2 + Wooden members Forces Wind lift force on lee: Dune Crest- 0.01 kN/m2 Dune valley -0.015 kN/m2 Predominant wind load: Dune crest - 0.02 kN/m2 Dune valley- 0.03kN/m2
Micro-climate analysis Solar analysis

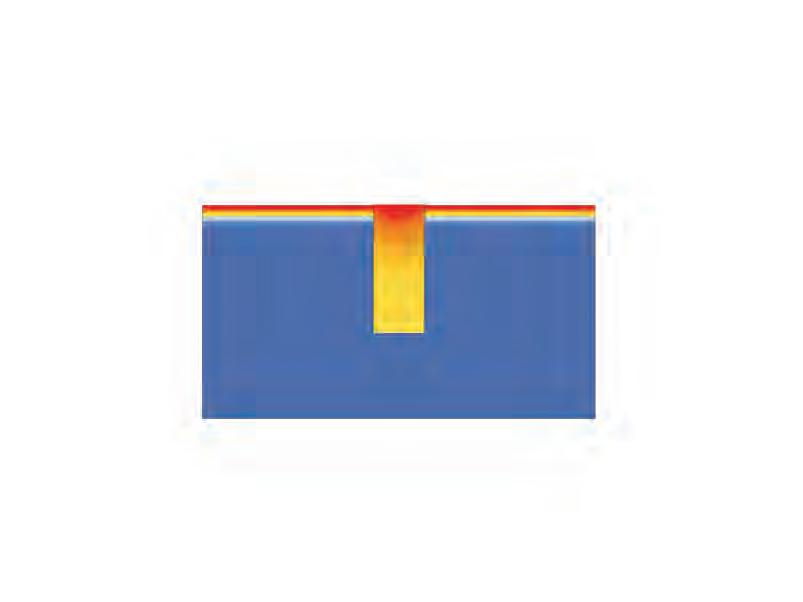
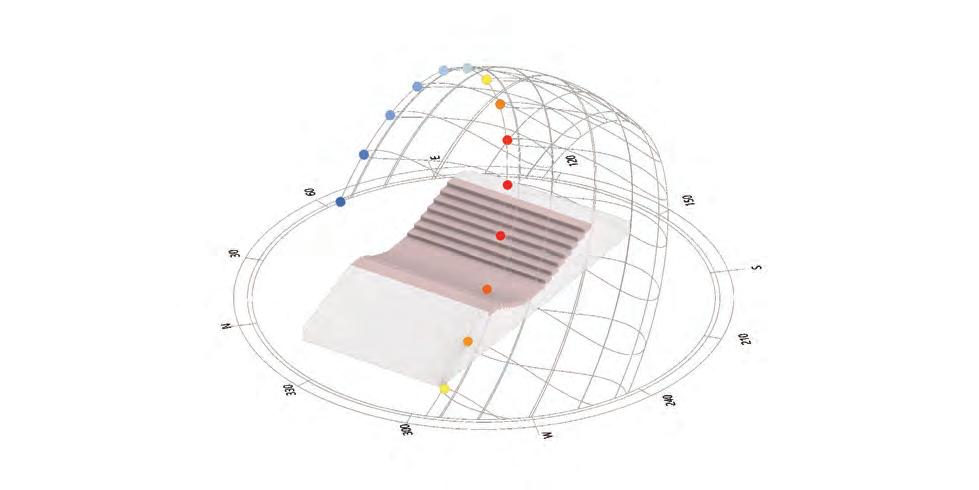
A micro-climate survey plays the special role of analysing the interaction between air and the materials, which helps control environmental aggression. In-dune habitation naturally facilitates exchange of heat between the air and subsoil. Micro-climate analysis is used to calculate the effect of thermal transmittance on the local temperature inside the pit and guide the distribution of spatial functions based on it.
Sunlight hours analysis is an evaluation of how many hours a testing surface (terrain or building) receives sunlight, which in theory is how much sun’s energy hits the surface. Vast spanning barren slopes of the site receive high radiations. Design interventions at global and local scale to induce the property of self-shading are evaluated based on solar analysis for hottest months and hours of the year.
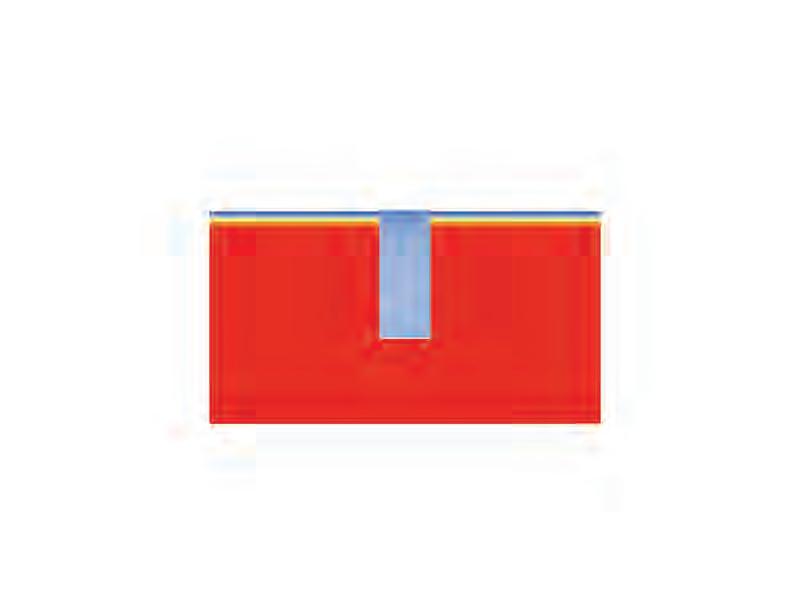

71 In-dune I Summer solstice Test periods: Summers Entire year
4. Research and Development
The section curates a series of design explorations and experiments that are interdependent to develop sand stabilisation and deflection system. Focusing primarily on development of material system, the section maps out adaptation and application of bio-mineralisation at different scales. Laconically, it lays the foundation for development of habitation system amidst shifting sands.
Based on the topographical constraints of the test site, a fabrication system is detailed for the development of selected dune valley into terraces and formulation of its global time scale. The development of the terrain is in sync with the proposed objective of introducing passive thermal technique of self-shading on the site.
Study of self-shading patterns on the terrain later inform the zoning of productive and habitable spaces across the valley. Introduction of functions onto the site demands the adoption of various aerodynamical sand mitigation techniques. Under this section, these techniques are further detailed and coupled with in-dune habitation proposal as global design strategies.
Bio-mineralisation 4.1
Scaling up fabrication : Matrix injection 4.1.1
Observations and conclusions from the bio-grouting experiments done at TU Delft suggest the scalability of the technique. In order to harden a vast dunal land mass, bio-grouting should be carried out such that large sections of the terrain are hardened at once with some local variations. While the existing technique of single point injection has shown its industrial success and ability to stabilise ground, the impact of its application is local and limited to a small area. Addressing to this short coming, we propose to extend the potential of this technique by replacing single point injection with a matrix of injections, hardening a larger portion of subsurface at once.
The customised injection grid can be mounted onto grouting machine which can freely run over the dunal fields. The density of the injections in the matrix can however only be determined on site by observing the net grout spread. The grout spread from all the injections collectively should be such that it homogeneously covers the entire surface of the hardened patch, without any traces of loose unhardened portions or overly injected portions within that patch. For the experiments, we assume that the 2.4 meters tall and 100mm thick injections are arranged such that they homogeneously harden the patch.
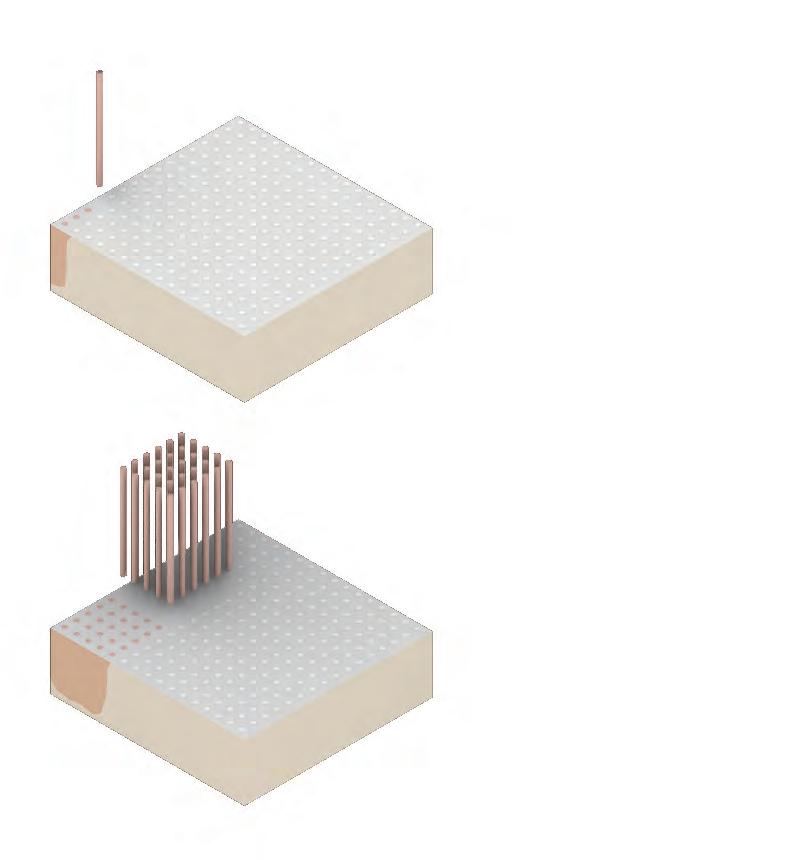
74 I Emergent technologies and design
Machine specifications
We propose to select a machine that can withstand the load of these injections, manoeuvre over the undulating field and inject upto varying depths and at different angles. Sufficing these objectives we select mobile injection grouting drill KR 807-7G by KlemmBohrtechnik. Long and heavy drilling masts are mountable and challenging drilling positions are attainable by this machine. The machine is designed with enhanced inherent stability such that its manoeuvring and setting up times are significantly less.
The machine has a mast of 7000 mm length that can be upgraded by three lattice mast extensions of 3000 mm each. However, the maximum depth the mast can travel is upto 15000mm. As per the machine’s constraints, each patch it hardens is 3m X 3m. The machine’s crawler base has an oscillating range from +12.5° to -7° and the mast automatically positions within ±5° from the vertical in all directions. These features maximise machine’s area of impact.
75 In-dune I 015 m6m + extensions 3m 3m 5.5m 360 o 360 o
76 I Emergent technologies and design 12.50 0-900 150 350 0-600 7.00 + 0 to 3.2m 2.9 m to 5.3m 2.9m to 5.3m 112 o Existing dune slope Maximum slope for injection operations
Figure: Machine injection positions
Machine positions
Having the ability to rotate the mast, the machine can inject in all the planes between two orthogonal planes. Injecting in orthogonal planes enables the machine to develop a vertical, horizontal and inclined injection system, each covering a different area of injection due to machine’s constraints.
These shifting planes of injection change the center of gravity of the machine for different positions. The machine is designed to adjust its stability for the changing center of gravity but within the limits of the slope of ground. Ground with a slope greater than 15° enables the machine to maintain stability and inject at different planes with respect to that ground plane. The test site having a slope greater than 15° demands for flattening of the dunal flange locally (only the region that needs to be hardened) for the machine to progress and inject.
77 In-dune I
Indune spaces- Multi level pro
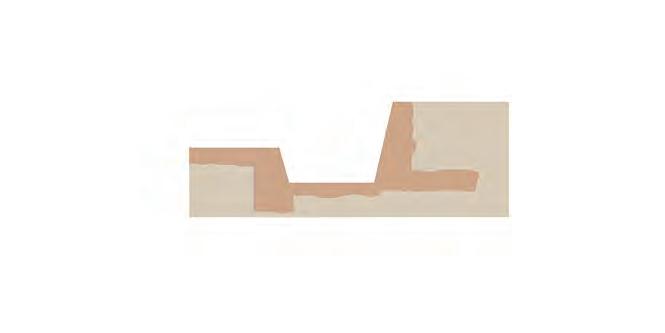
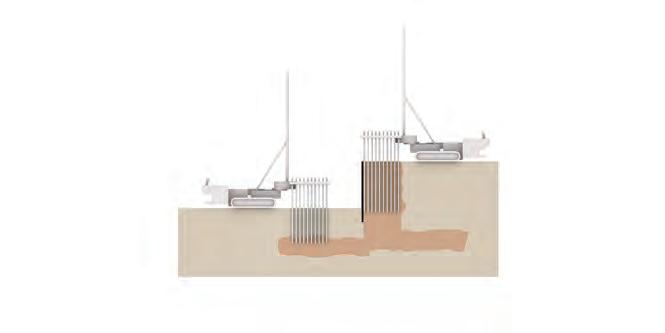
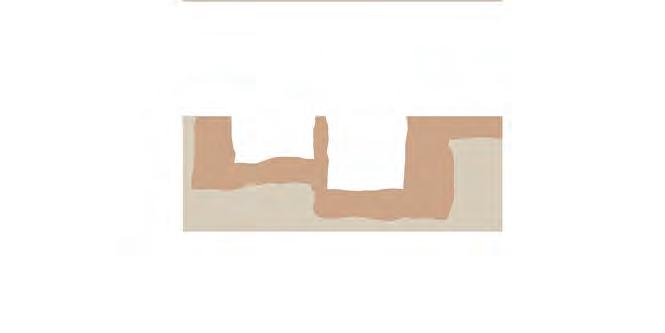
leSand channels- Inclined pro le
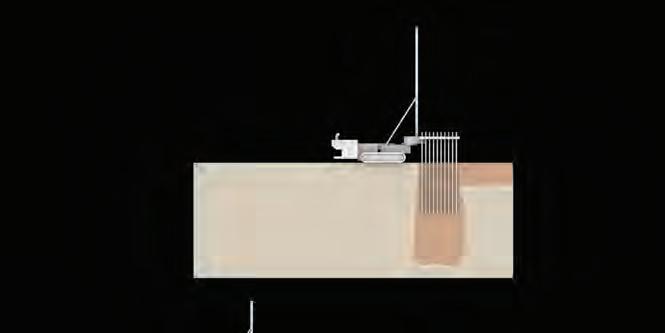
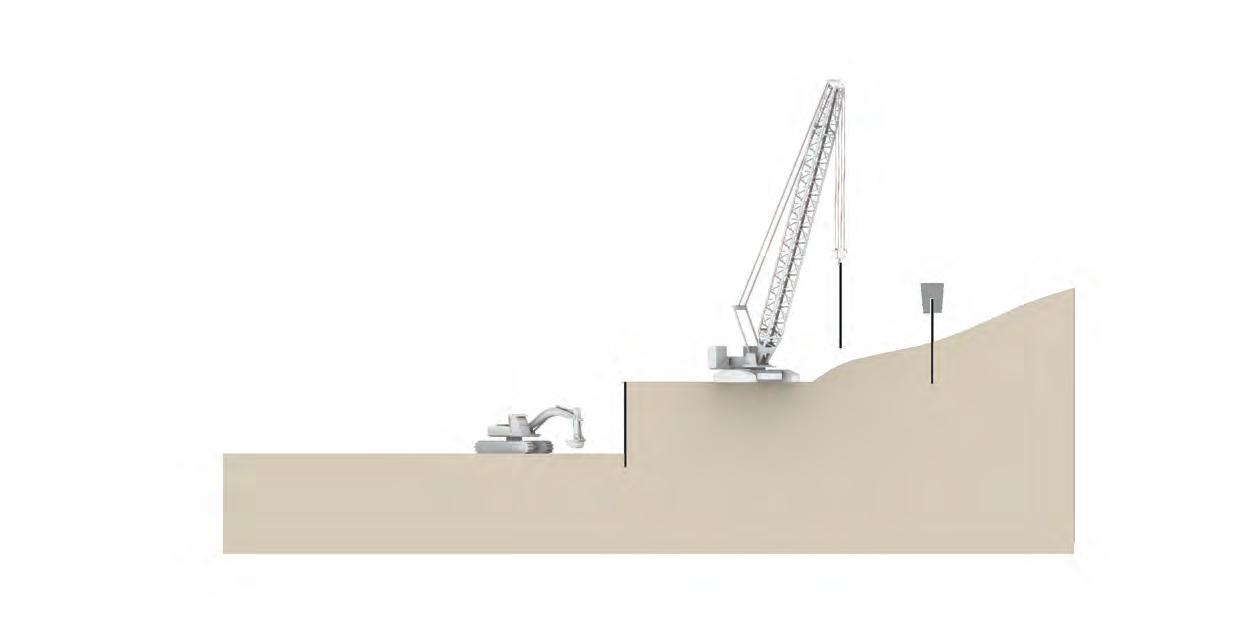
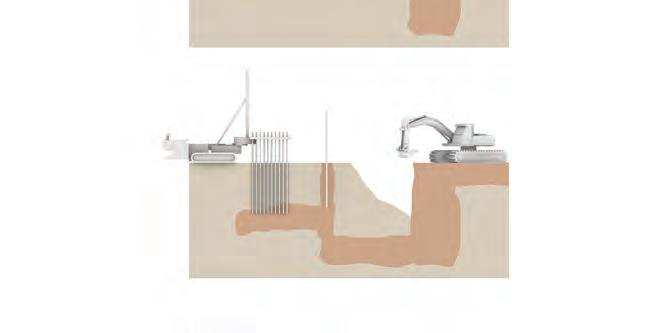
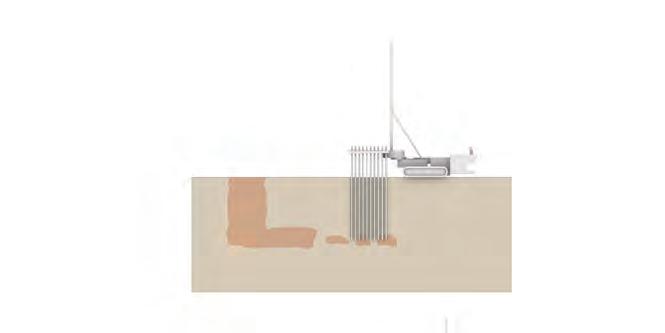
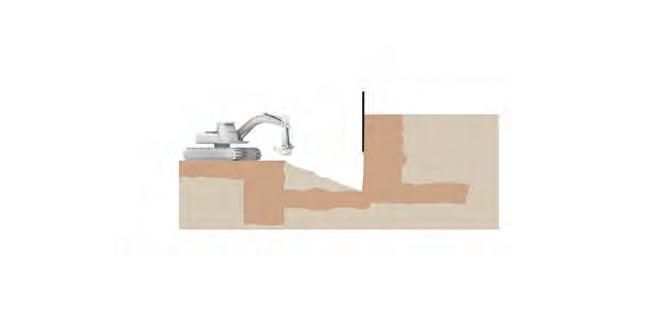
Plantation - porous pro le
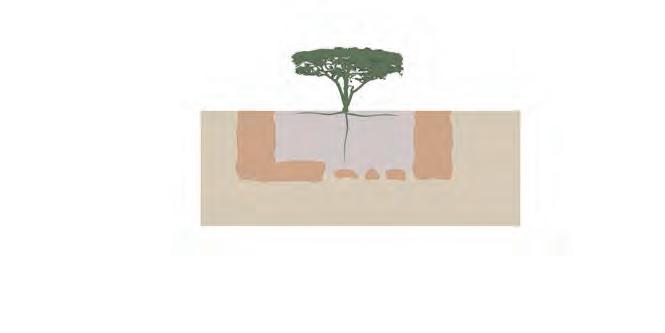
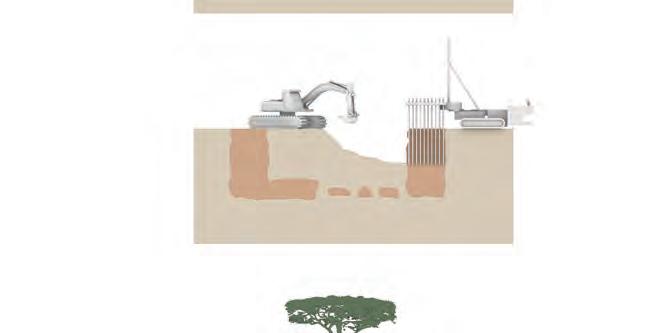
78 I Emergent technologies and design min- 3m min- 3m 0-15 m Silent piler Service crane Original dune slope 0-15 m 0-15 m 0-15 m min- 0.3m 3m 3m 3m min- 3m 3m 3m
Removal of sheet pile + Excavtion + Cutting of hardened pro le
Excavtion of loose sand + Fertile soil lling
Simultaneous injection near sheet pile
Matrix and single point injection + Excavation
4.1.2
Fabrication of different profiles
Fitness objectives
Body plan and gene pool
Assuming that the microbial grouting can produce homogeneous hardening of sand , this method is proposed to harden various sand profiles and components. Constraint of machine width and injection depths start defining the sizes of these components and determine the functions they could transform into. The shapes and sizes of these components play a critical role in developing sand stabilisation and deflection mechanism, the details of which are covered later in this chapter.
FC 1- Maximize the number of complete hardened sites
3m x 3m hardened patch
1390 m
Generation: 9 Indiviual : 9
Max available hardend sites
Leeward ank
Leeward ank- suitable for agriculture
The fabrication of these different profiles begin with piling and flattening of the sloped dune face. Similar to the terraced development in a hilly region, the dunal slopes here too are cut and filled to develop an orthogonal stepped profile. Injection on these loose stepped profiles are carried simultaneously near the sheet piles on each step to main the homogeneity of the retaining wall. Once the surfaces have attained strength (after 14 days of injection), the loose sand is excavated and the hardened mass is either shaped or filled with fertile soil based on the profile’s purpose.
2 4
79 In-dune I
sheet piling
cut and ll injection excavation
4.1.3
Machine tool path and time steps
The propagation path of the machine can define the hardening pattern of the surface. While injecting there is a possibility that the hardened patches could either overlap or be separated by a distance. Either of these cases make the resulting hardened surface inefficient for there is wastage of material in overlapping and weakening and erosion of sub-surface in separation. From the endless possibilities of how a machine could hover in free x-y plane, only the trajectories based on mathematically defined 1° curves (polynomial equations with highest power as 1) suffice to these objectives. A series of tool paths are developed based on 1° curves.
Paths developed have a dimensional constraints of machine’s body, turning radius and positions of injection. Due to crawler base’s turning capability, more than one patch can be injected from the same machine position. This could reduce the time lost in moving and parking the machine for next injection position. Running of machine or other heavy equipment over the pre-hardened patches could cause cracking due to differential settlement of sand. Thus, the tool path is propagated in one direction such that there is no crossrouting for machine.
Considering that a machine runs for 12 hours a day and takes 1 hour to inject a patch at the depth of 2m 46 , injection procedure for the terrain needs to be escalated by other inputs such as increase in number of machines deployed and selection of most efficient tool path.
80 I Emergent technologies and design 3m 0- 15m 3m 5.5m Turning radius : 2.75m Min injection distance : 2.3m Max injection distance : 6.65m Active injection Hardended site (6.65 m)
Tool path objectives for material and time e ciency Tool path trajectory
No overlappings hardened sites
No gaps between hardened sites
Maxiumum sites injected from the same position
No over-running hardened sites
81 In-dune I
1° Curve 2° Curve 3° Curve 1 2 3
Injection combinations from one position Tool paths based on 10 curves
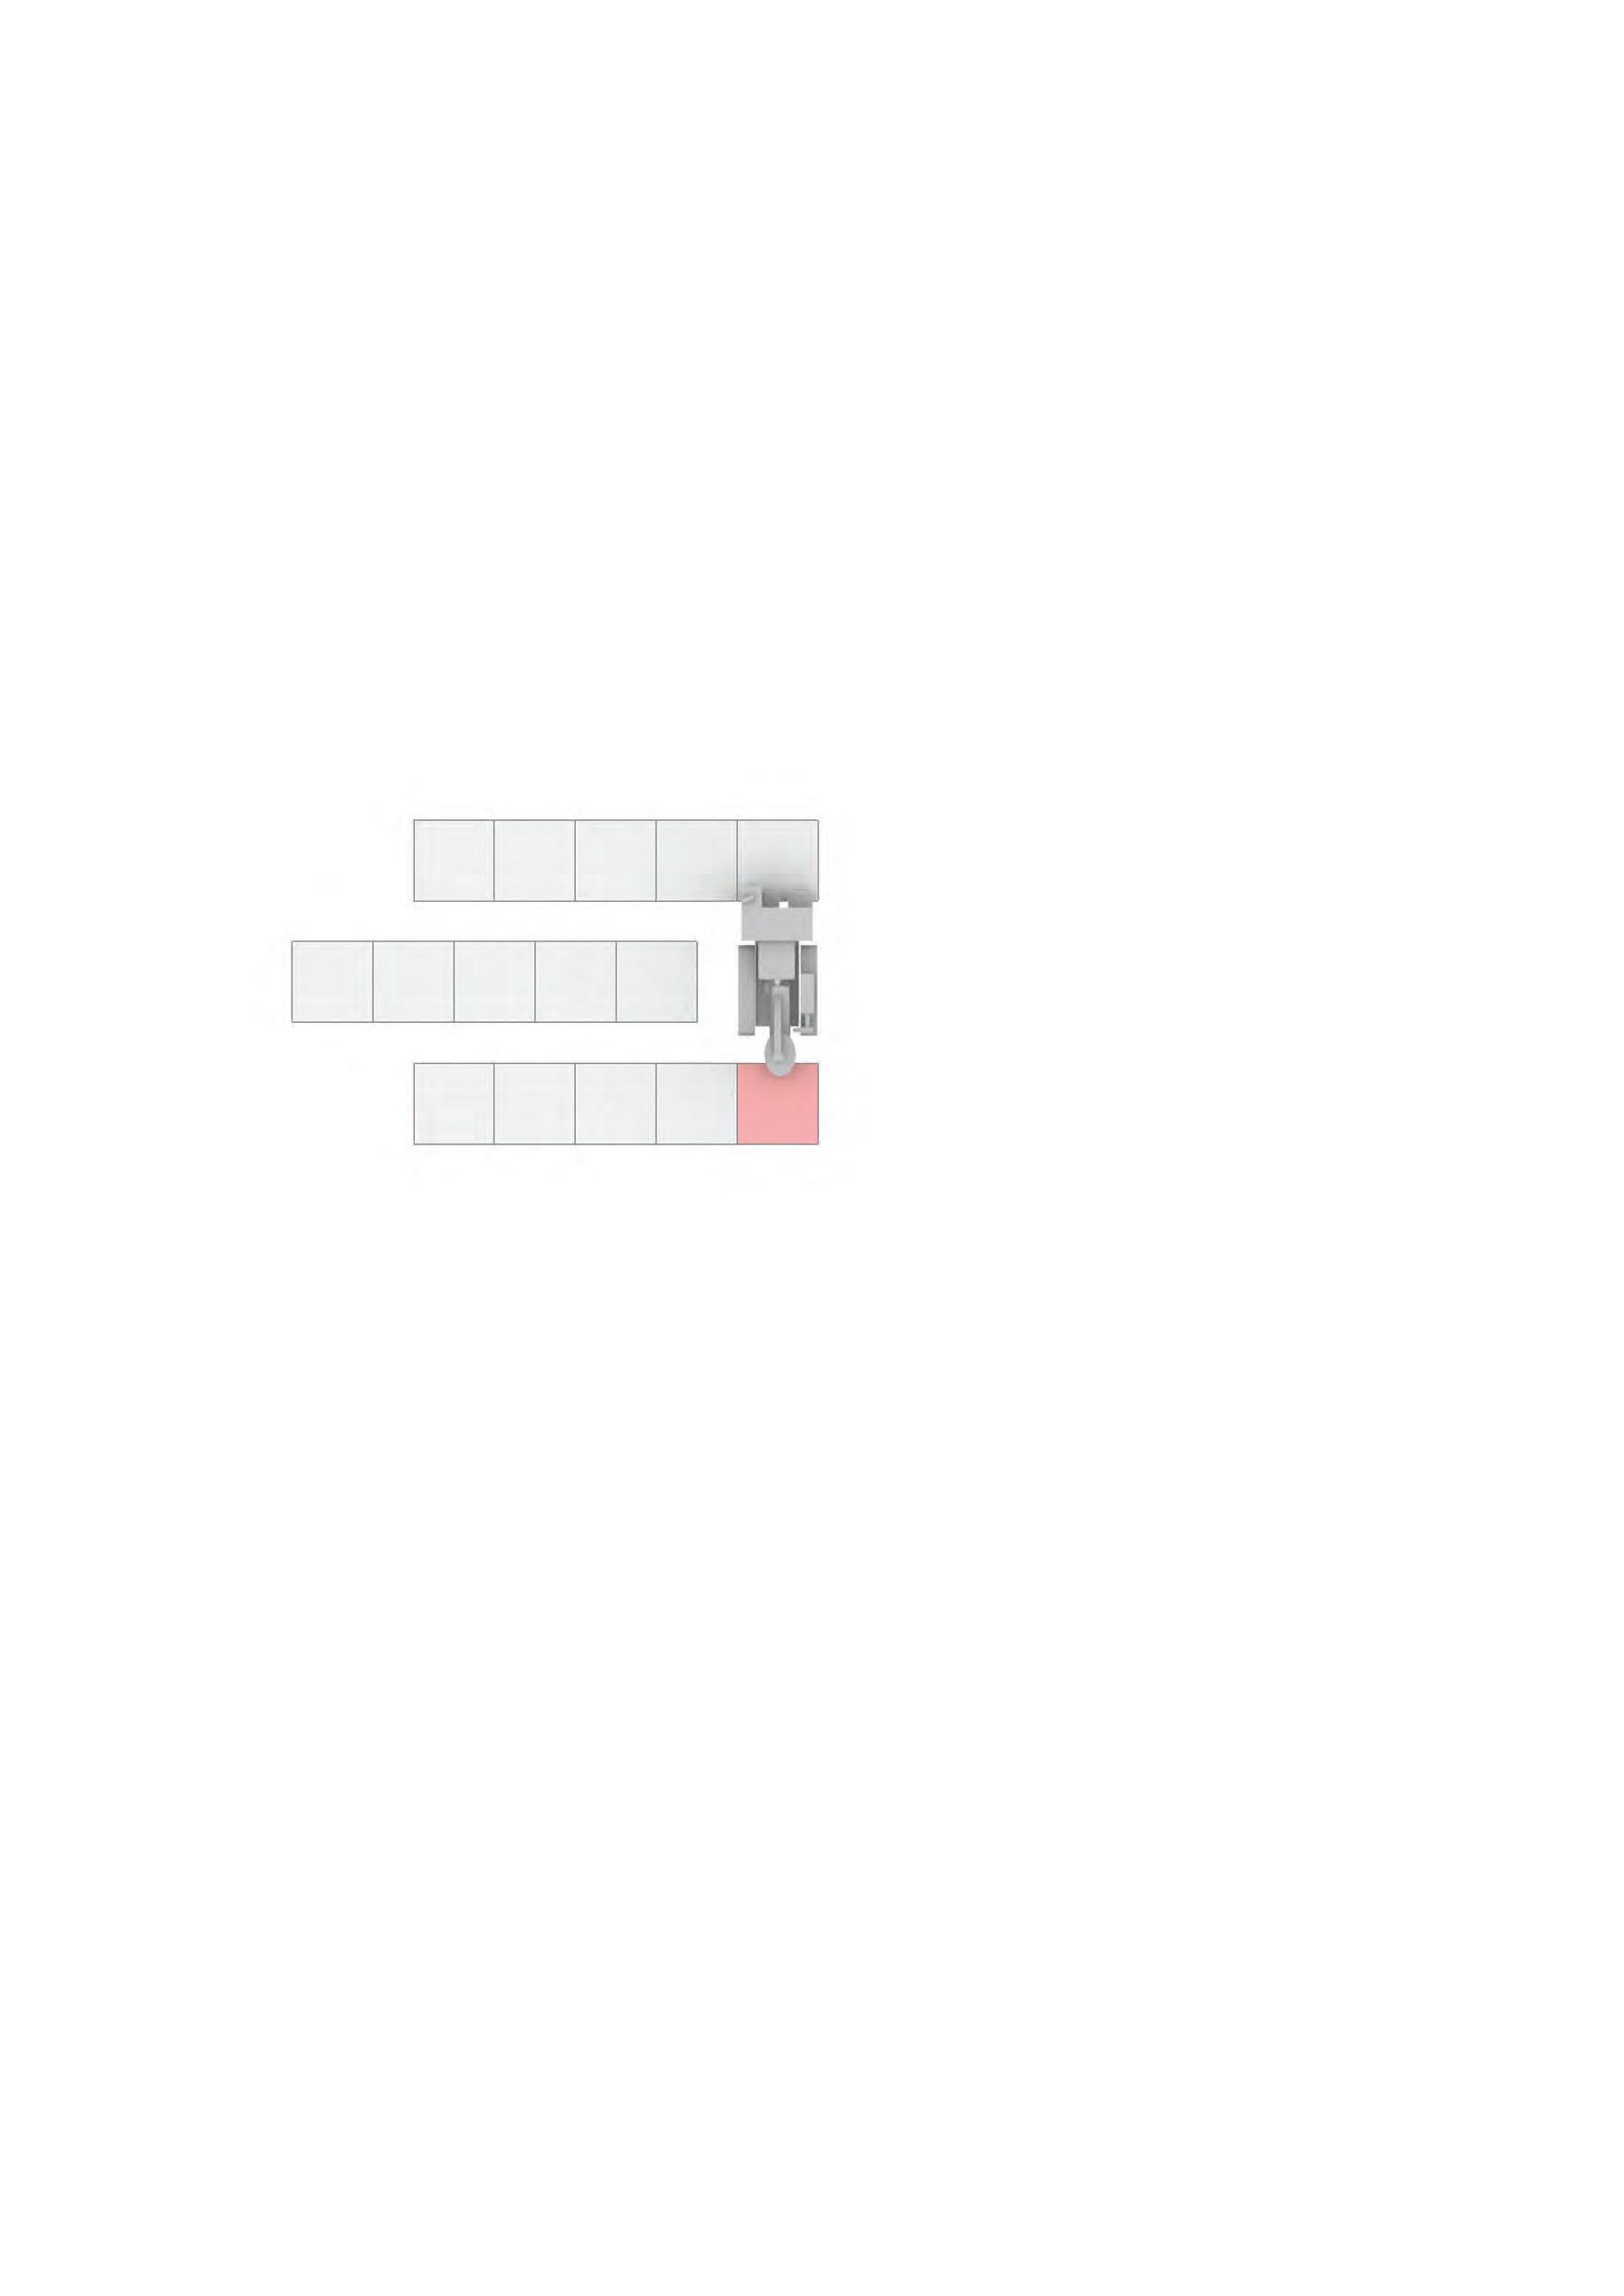
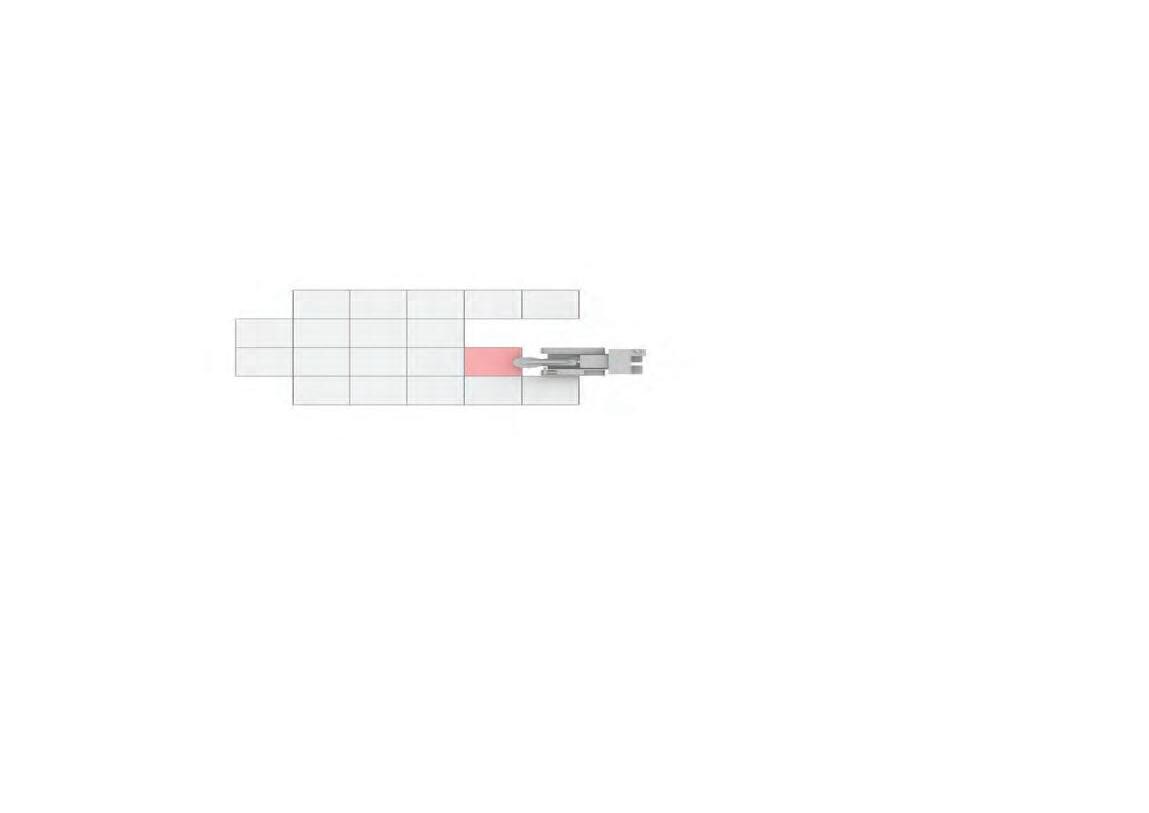
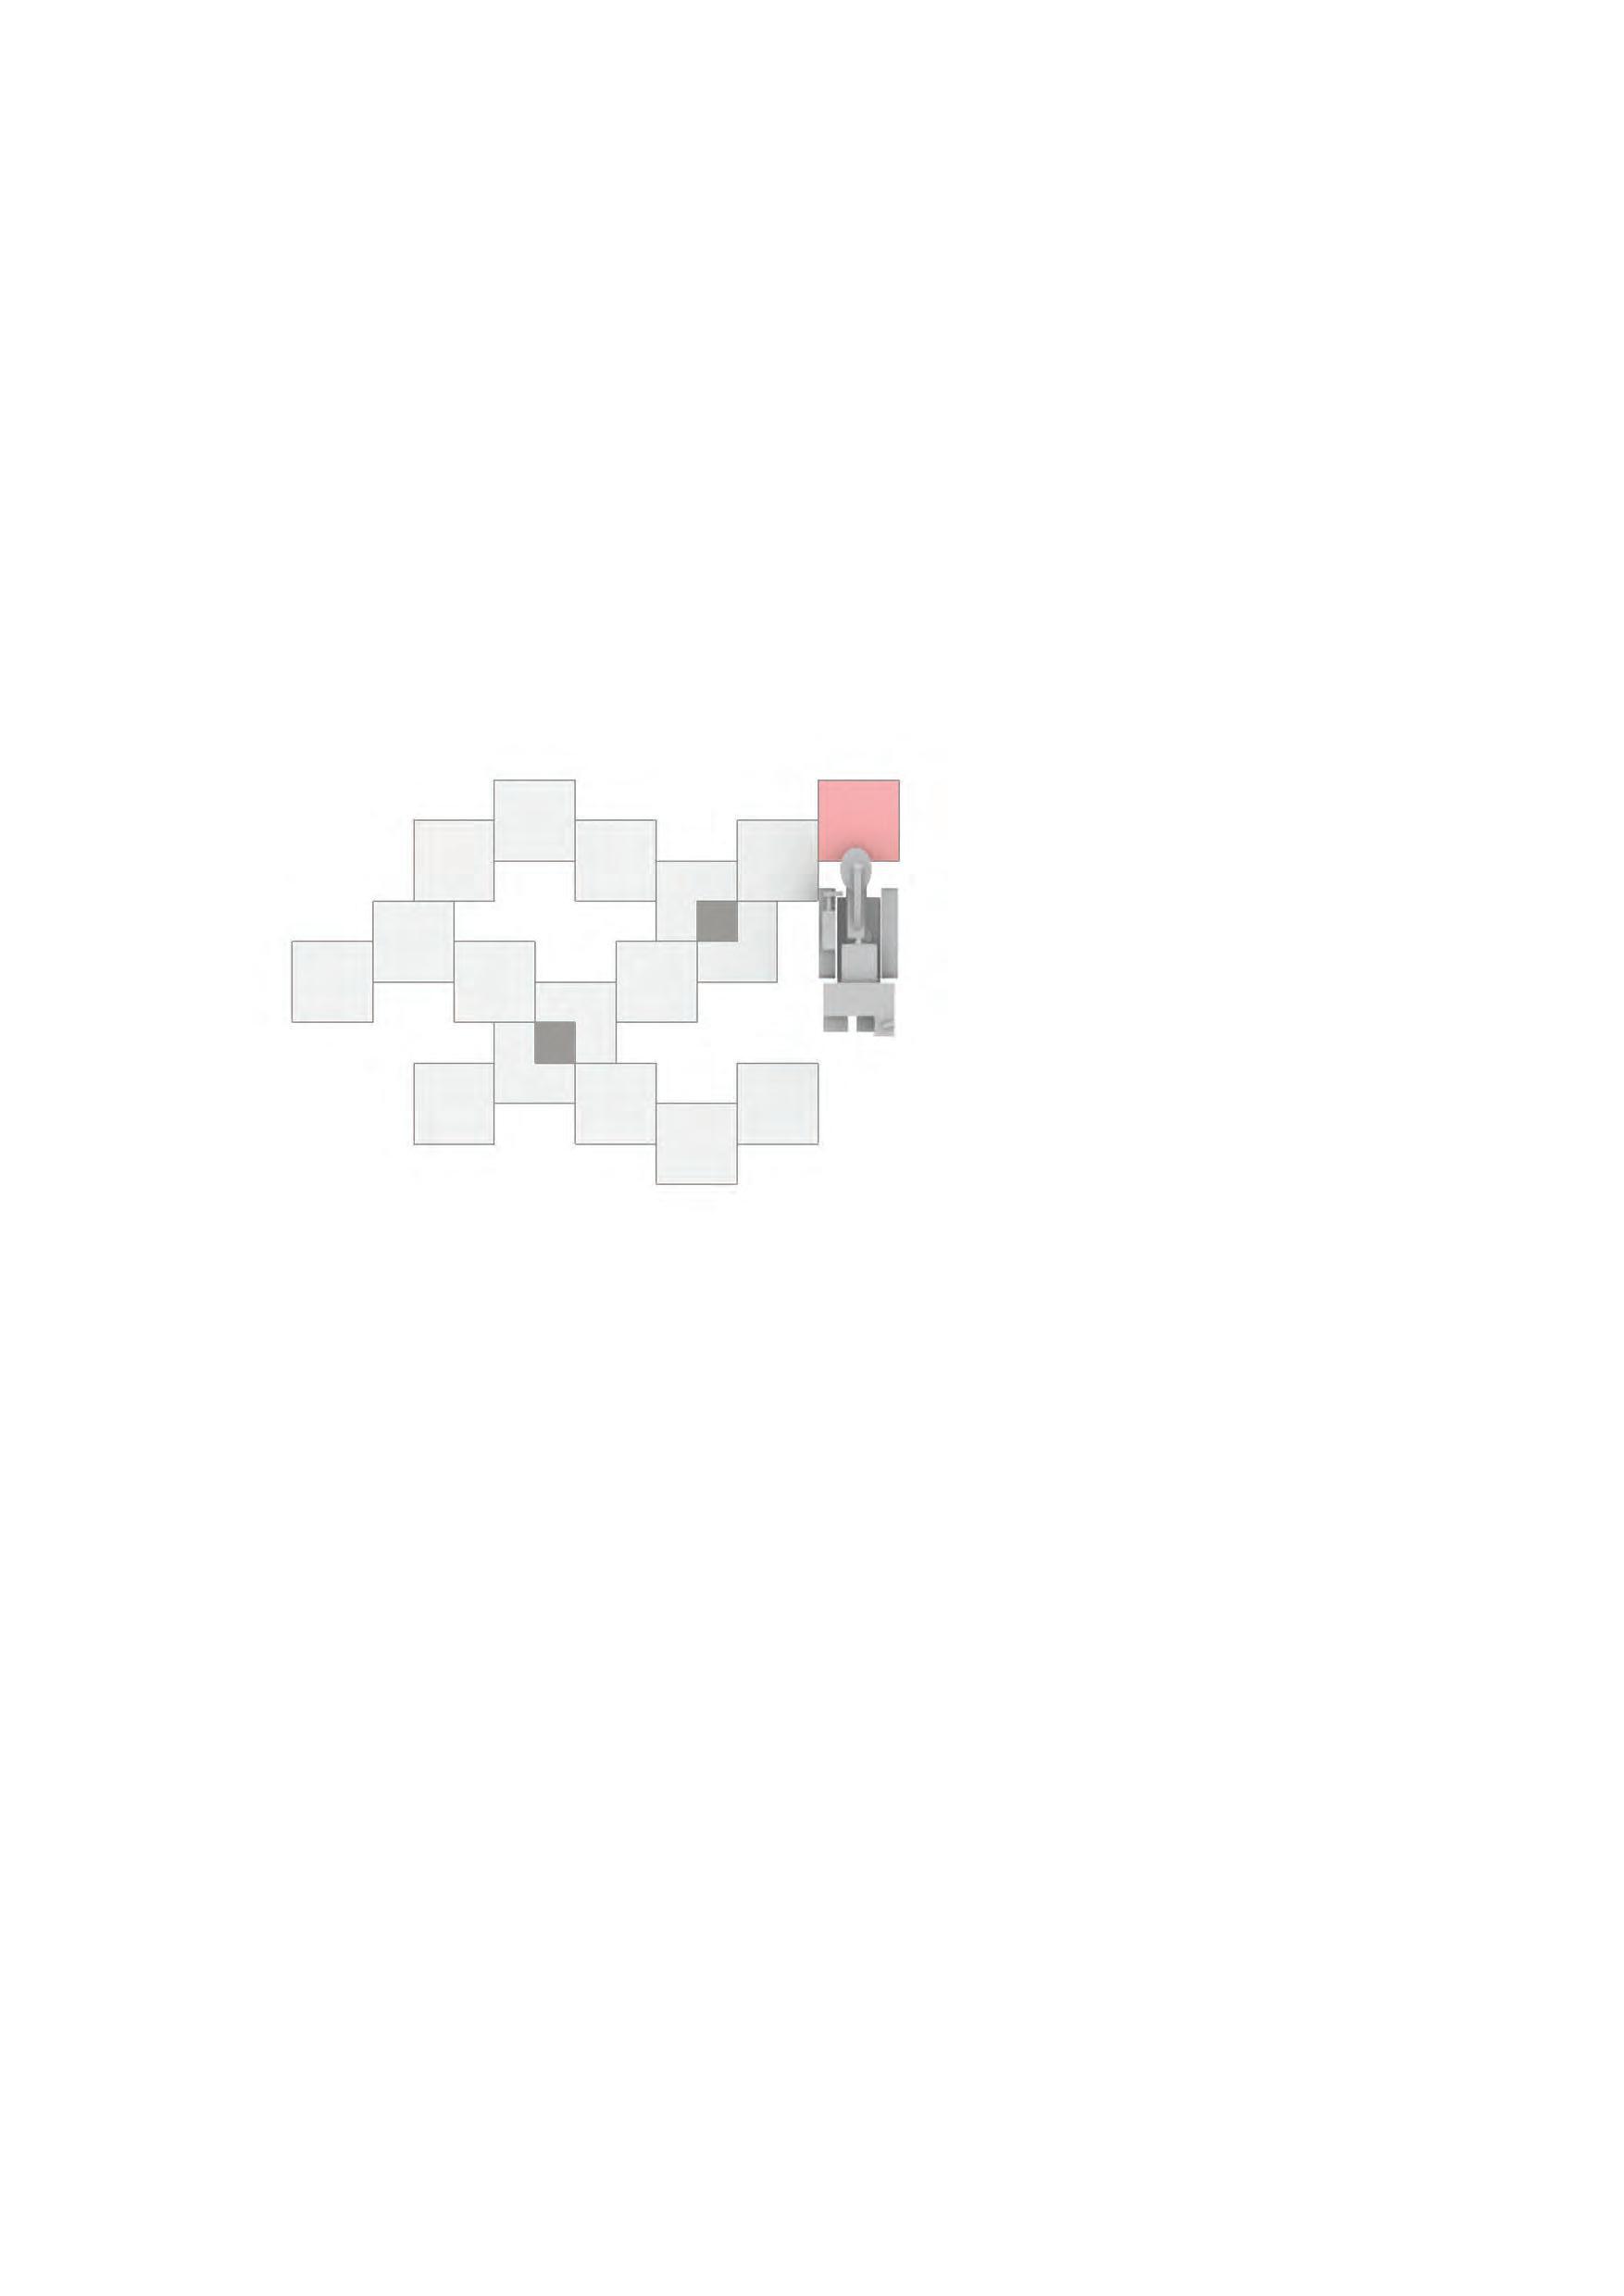
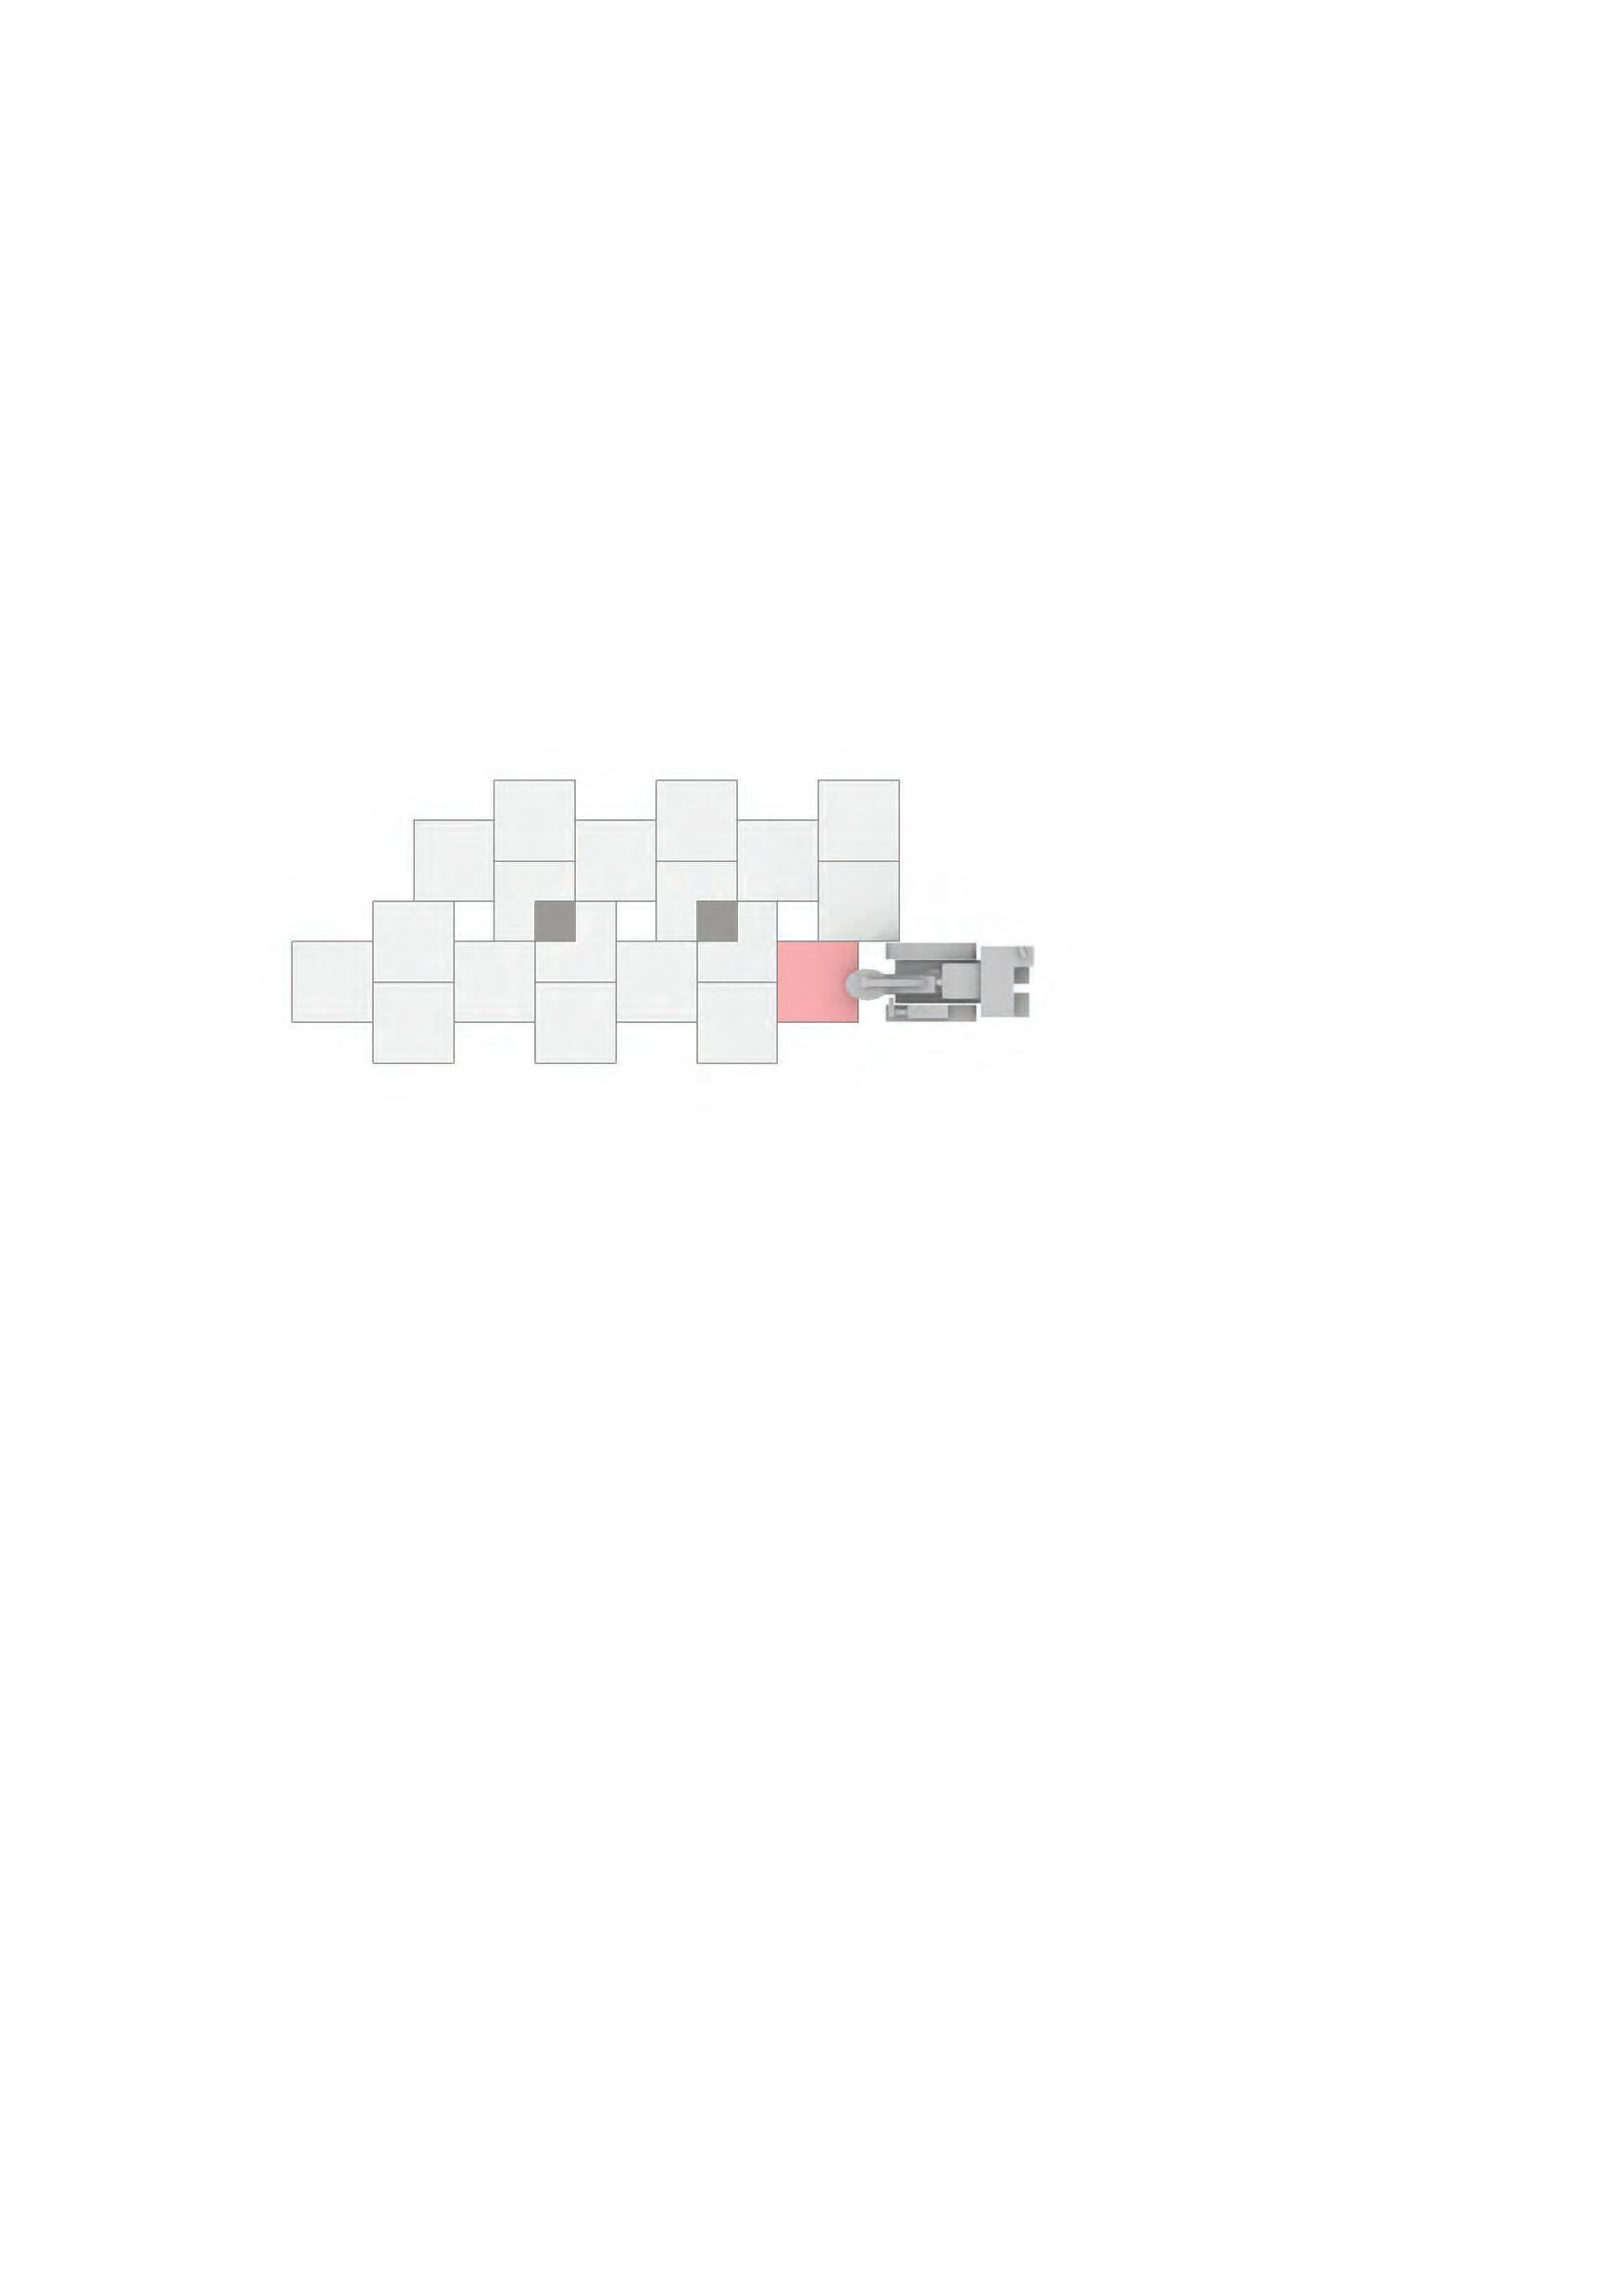
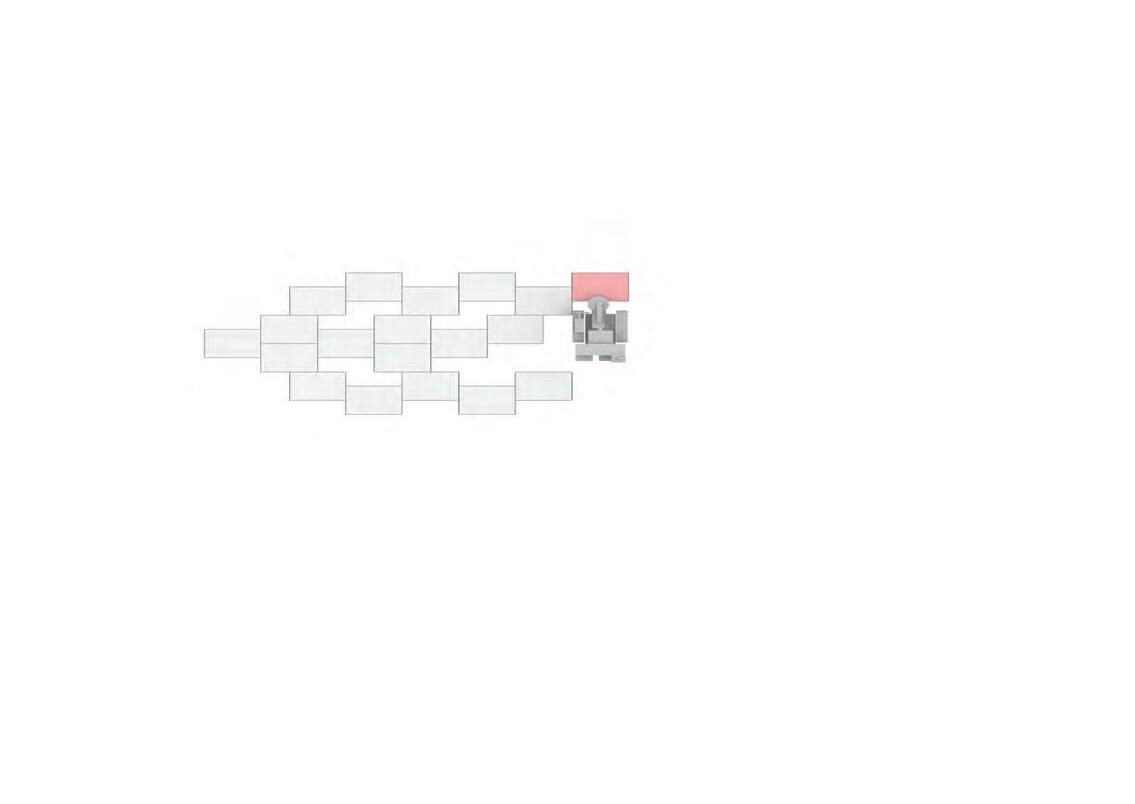
82 I Emergent technologies and design
1 2 3 1 2 1 2 1 Overlaps Gaps Overlaps Gaps Overlaps Gaps Overlaps Gaps
Overlaps Gaps
Having select this tool path which propagates uni-directionally and homogeneously packs the hardened patches, indicates sectional development of the terrain. Sectional development essentially requires deployment of several machines on different parts and steps of the dunal section. Multiple machines injecting with the same rate and at the same time could escalate the stabilisation procedure for the entire terrain and help mitigate the impact of fast shifting sand over the years.
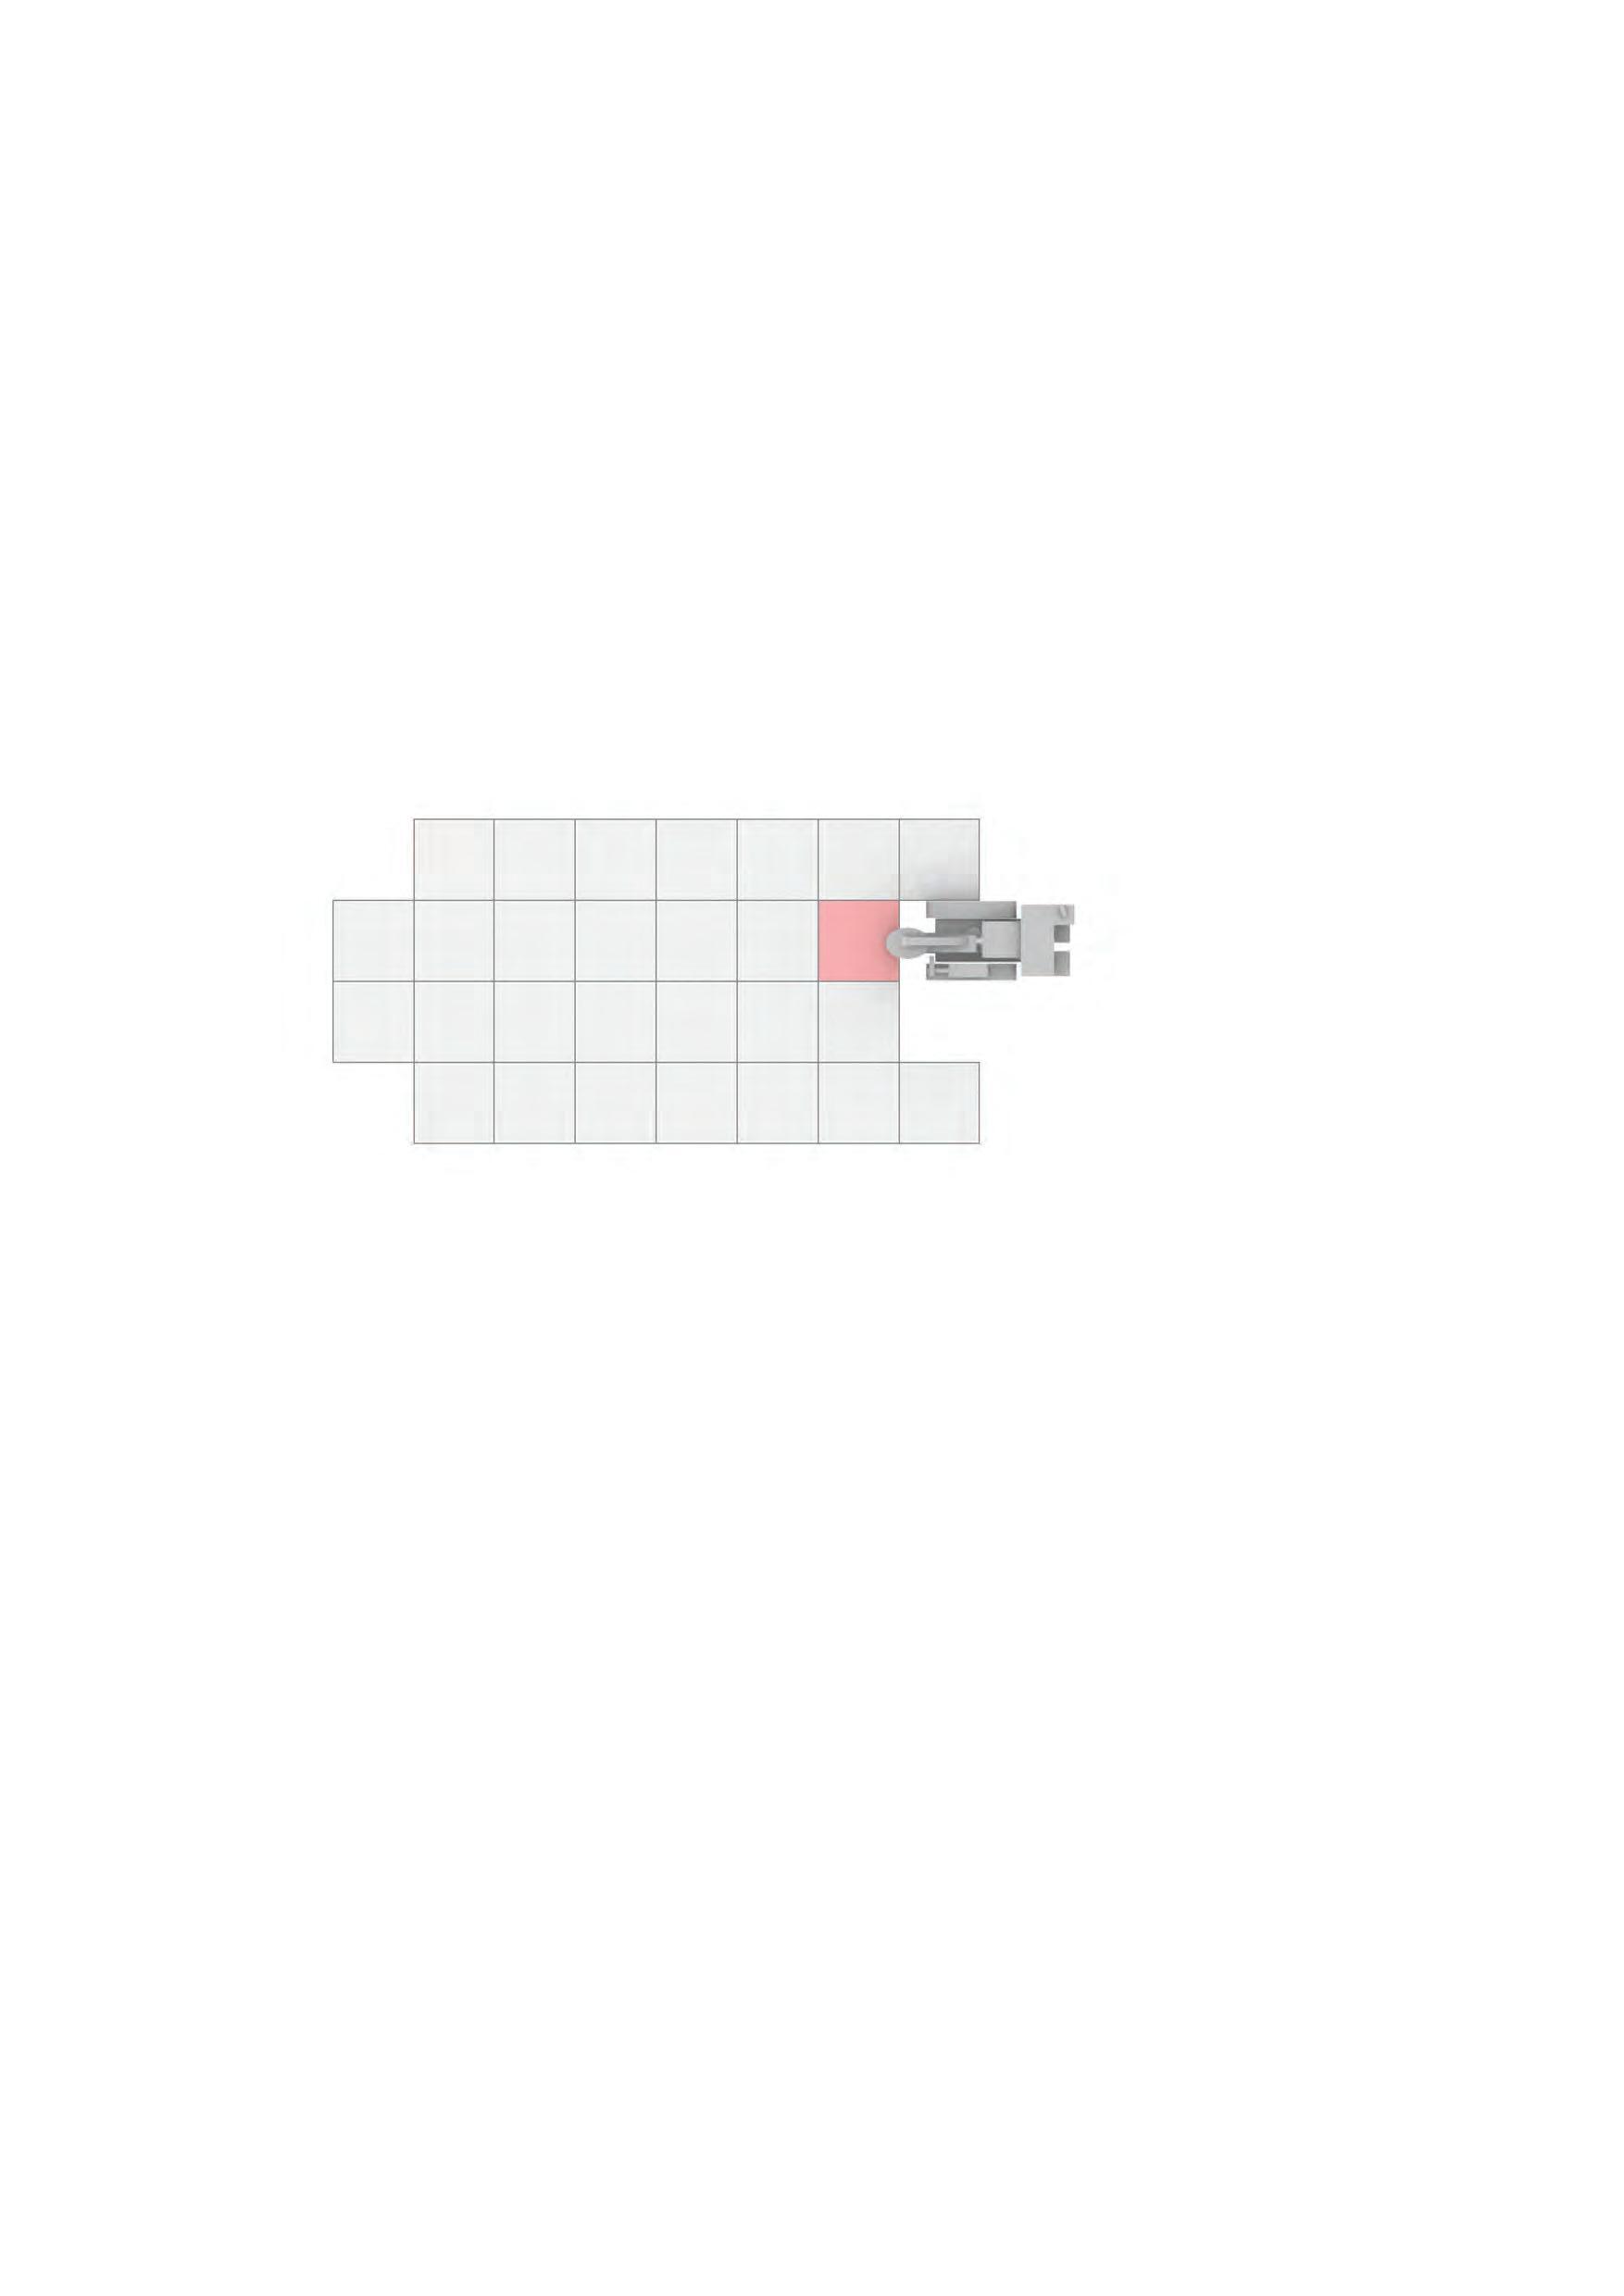
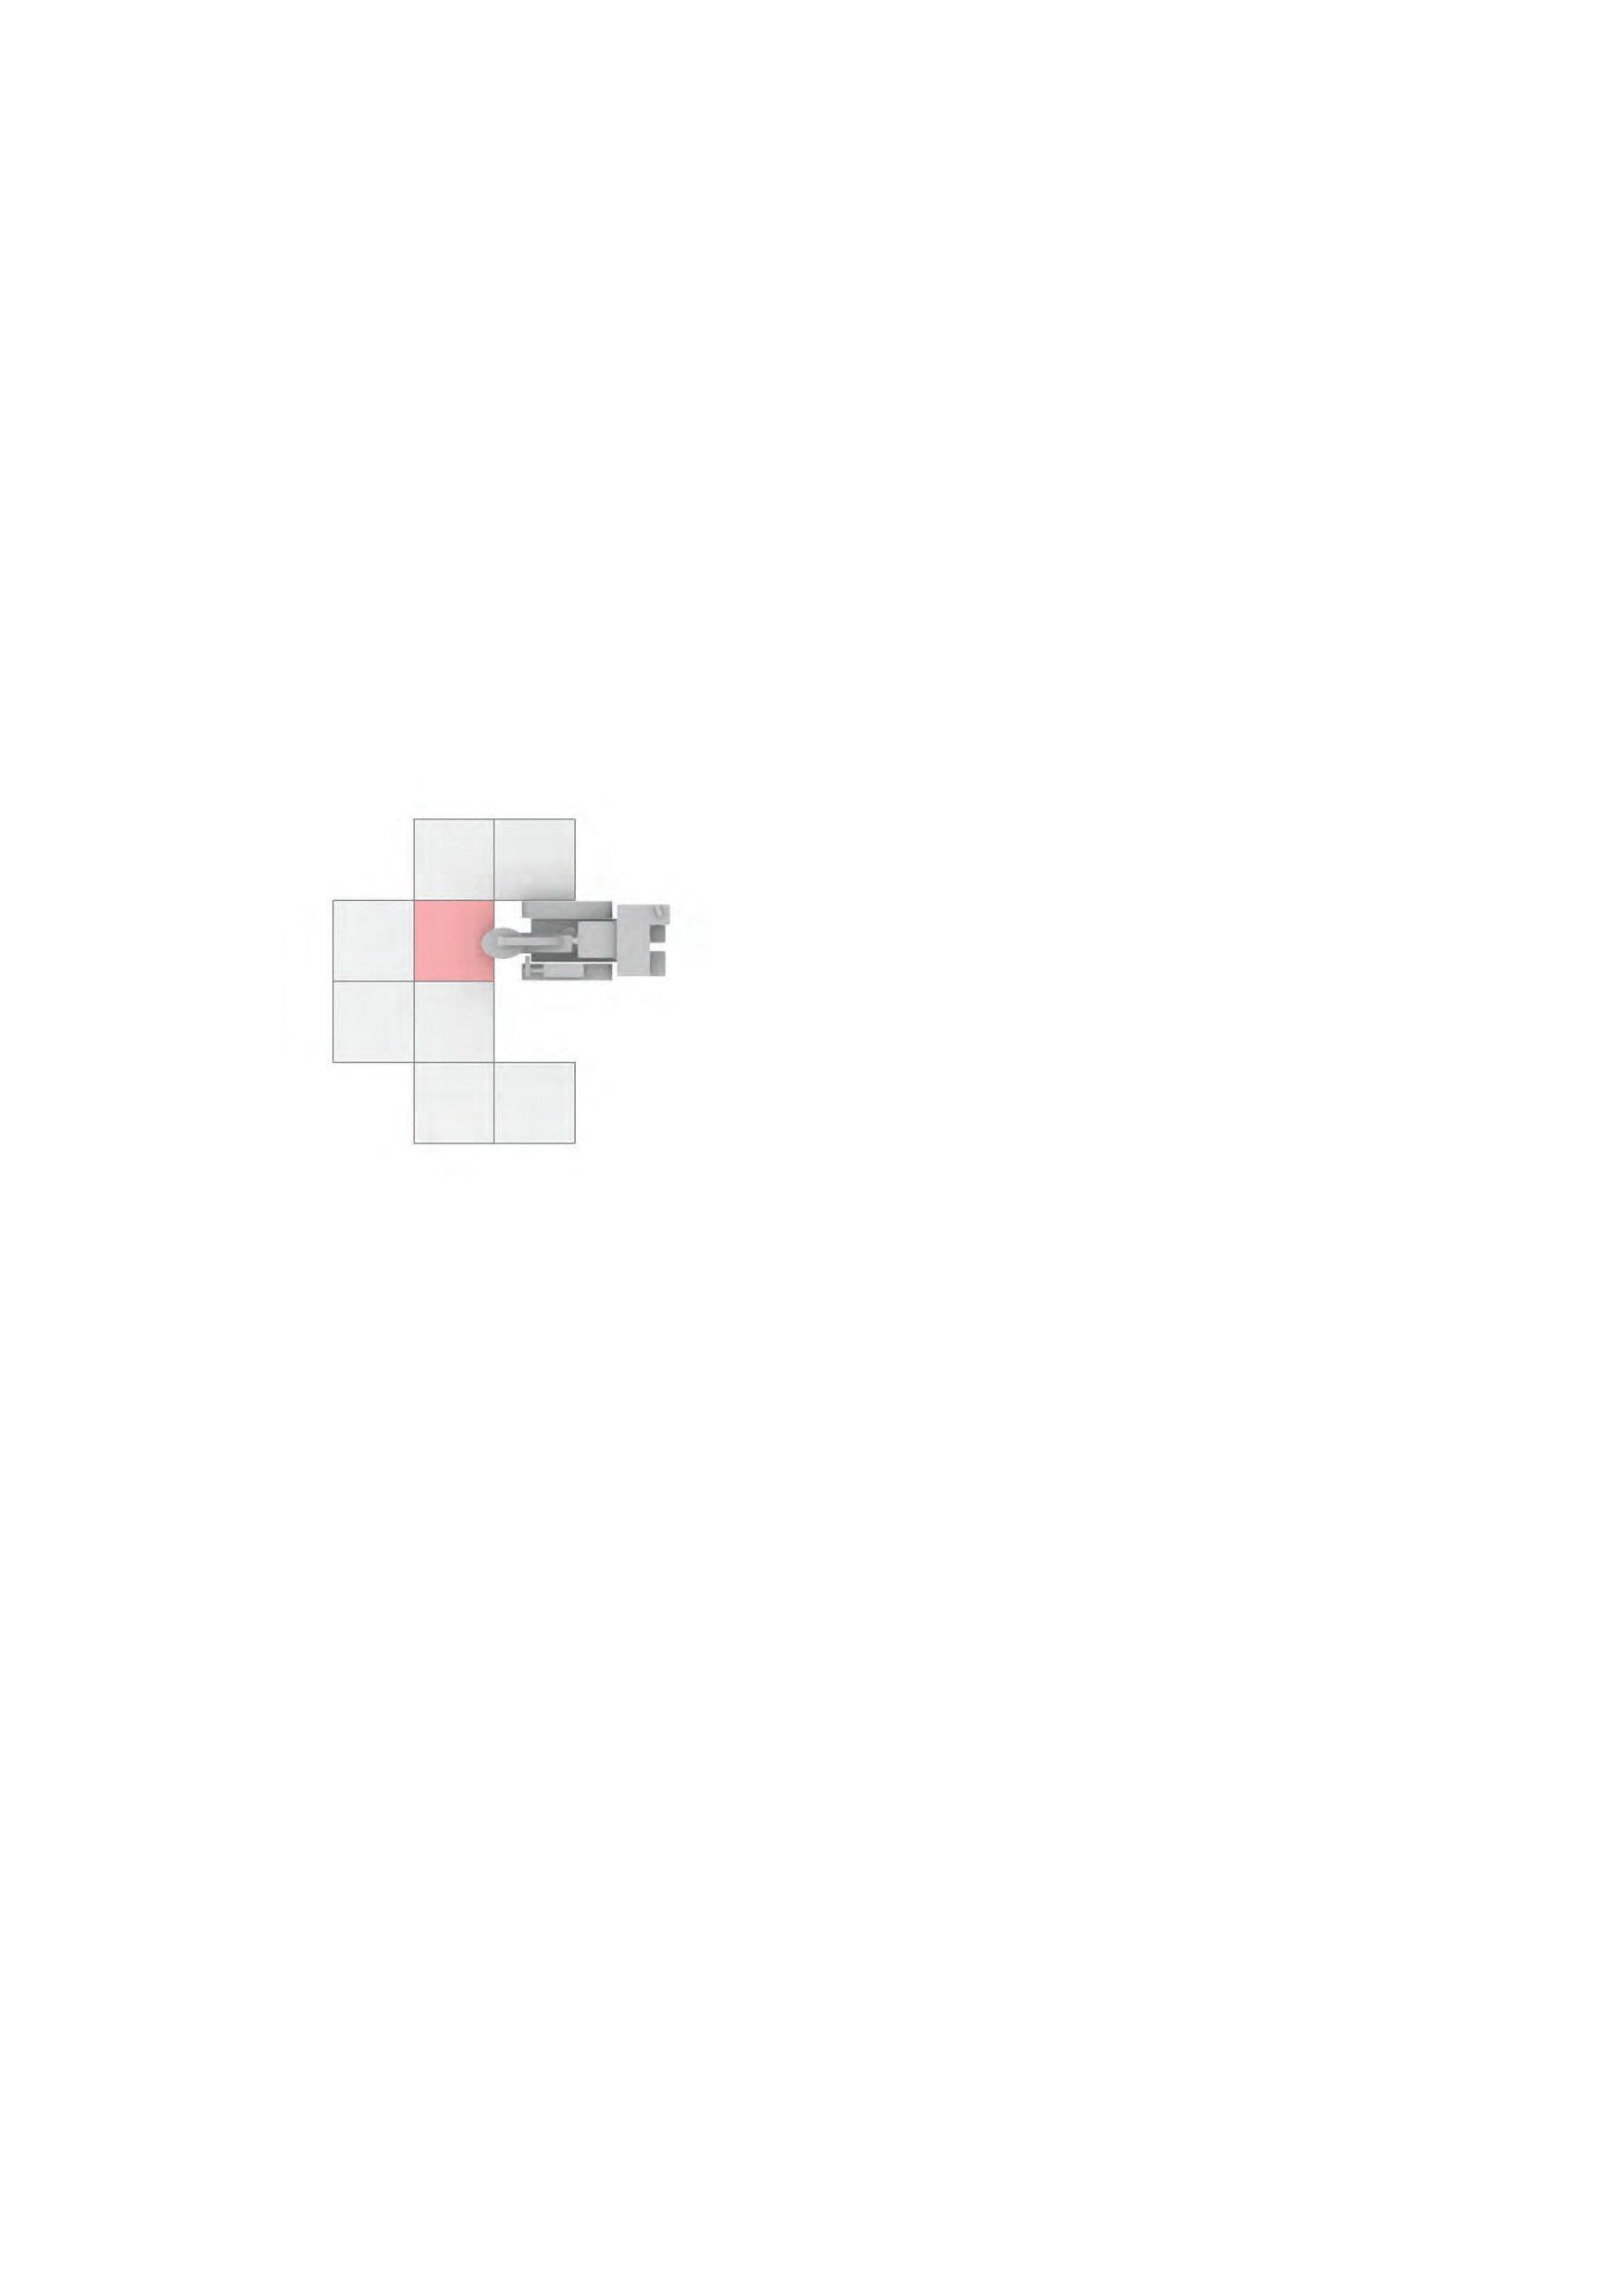
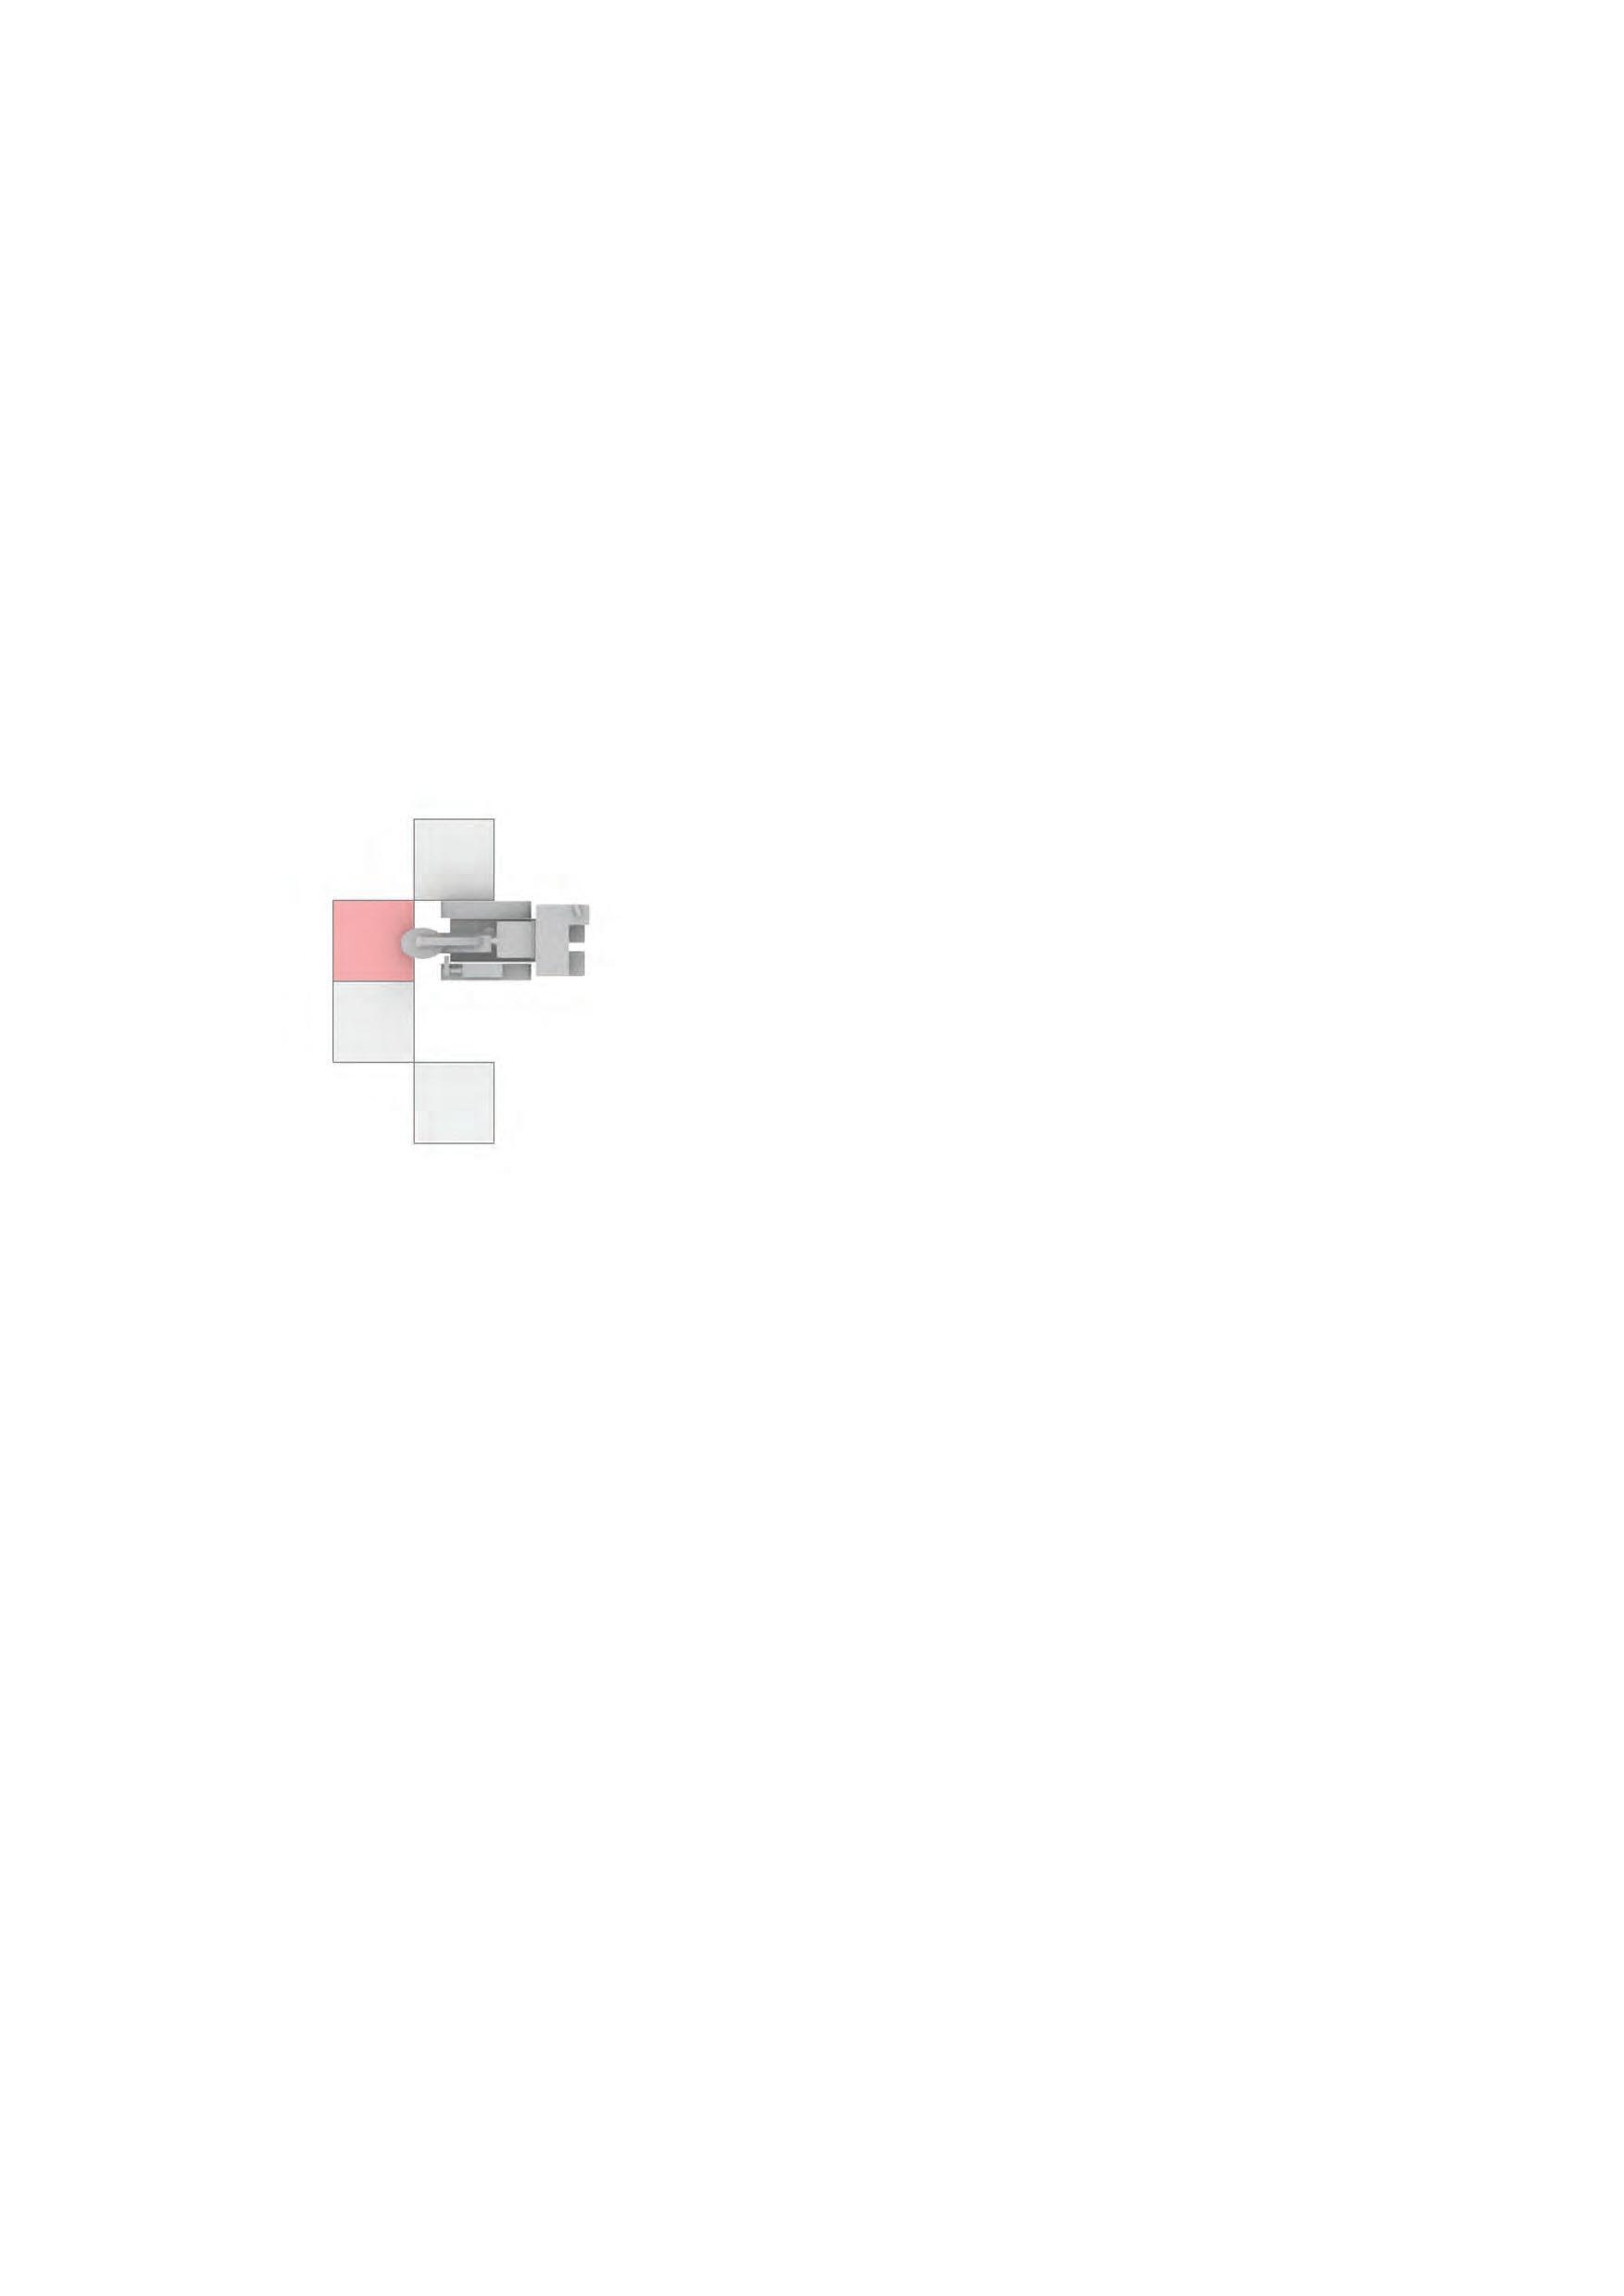
83 In-dune I
3m 3m 3m 36 sqm 72 sqm 252 sqm 3,285 sqm 12m 6 hours for 15m deep injection of alginate + 6 hours for 15m deep injection of calcifying agent + 14 days of curing 4 days Time Sinlge matrix Area injected 8 days 1 month 1 year 6m 21m 250m
4.1.4
Global injection scale : Dune valley
Fabrication of the section starts with identification of dune valley to be developed to accommodate 2250 people. Based on selected tool path and rate of injection, it is estimated that it would take 25 years to develop the entire terrain. The continual procedure of injection for over 2 decades demands for construction of pathways for machines’ circulation around the dune profile and establishment of a machine maintenance area at the centre.
Once the ramps are constructed to access the dune slopes, the sand is temporarily retained using sheet piles. The cut and fill to form the desired sectional profile does not stop the sand from saltation. Before the machines begin injecting the sand, these steps are covered with mats to give temporary support and avoid erosion. The gridded toolpath shape the interventions all through the dune. All The steps are injected simultaneously from one end so that windward and leeward flanks are available for utilization together. Due to requirements of varying injection depths across the valley, there could be some variation in time for local sectional development.
Erosion control mat( pre-hardening application)
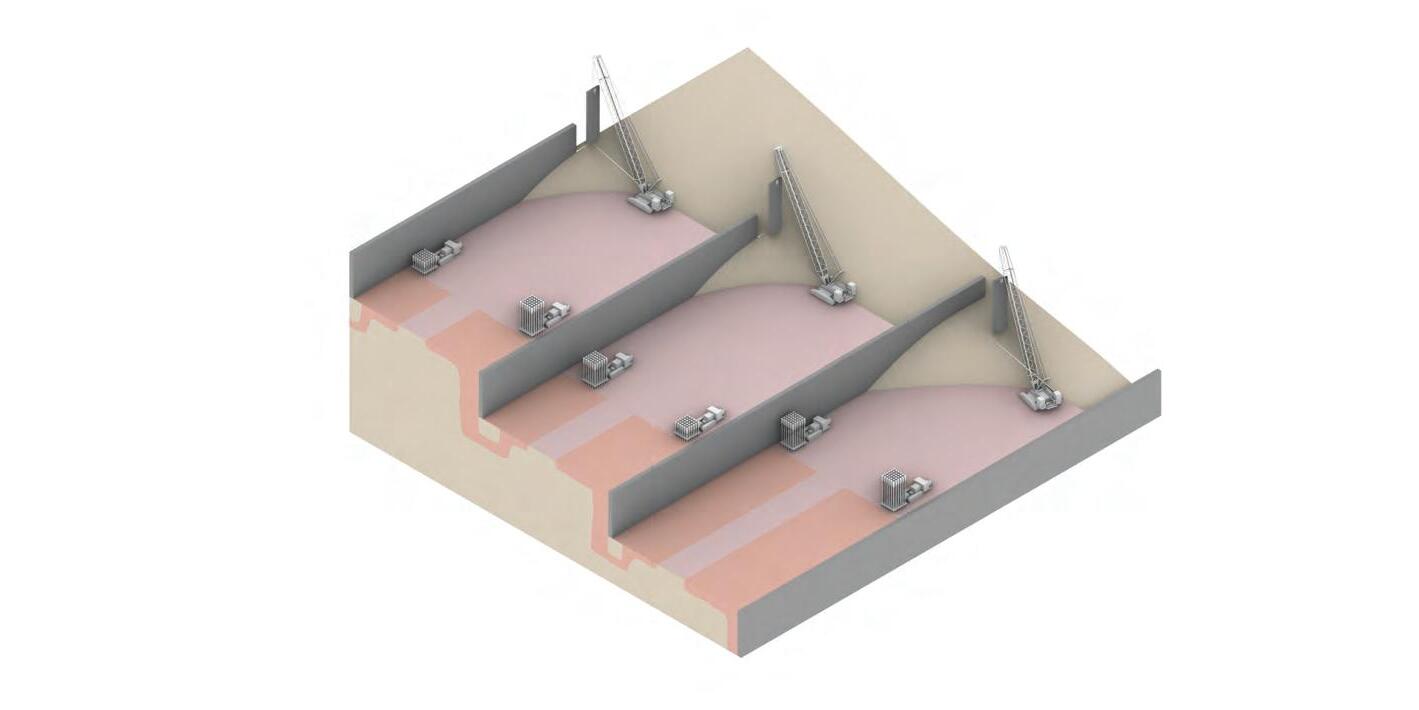
Sheet piling
Injected sites 3 x 3m
84 I Emergent technologies and design
Upto
Upto 180°
0 Years
Selected dune valley patch
Area - 1.125 km2
To sustain 2250 people
1.5km Ramps( slope 1:15 )

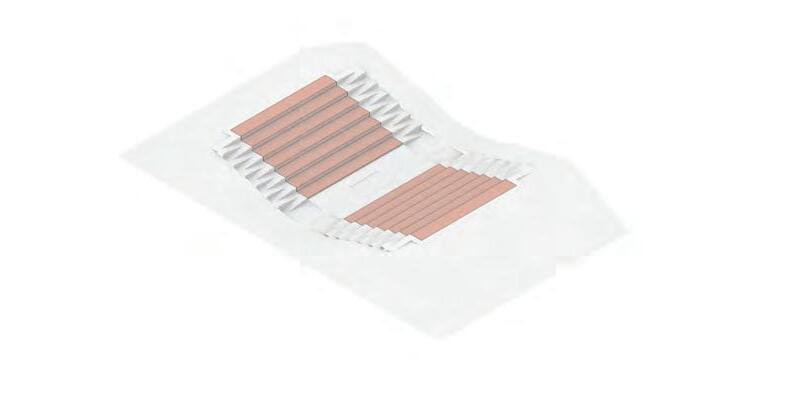
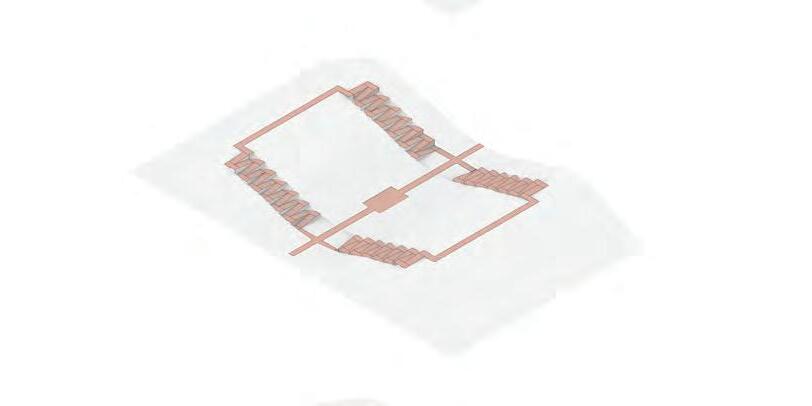
Machine maintenance
2 Years
Machine movement and maintainance
Propogation of hardened steps
5 Years
Retaing of sand and simultaneous hardening of steps across dune valley
Future expansion
20 Years25 injection machines
Hardened stepped dune valley pro le
1.5 km long

85 In-dune I Upto 180° 180°
Stepped profile 4.2 Experiment setup
Orientation of dune with respect to sun path, vast sheets of sand and plane barren surface offer no self-shading from the scorching heat throughout the year. The easiest way to introduce self-shading is by generating prominent surface texture. While the conclusions from the previous studies suggest the development of the valley in steps for easy manoeuvring of machines and escalated hardening procedure, the change from planar to stepped profile can also contribute in generating self-shading. The interplay between changing heights and widths of the steps can help control the intensity of casted shadow. Stepped terrain also facilitates easy distribution and growth of various functions across the valley.
The study is to transform valley into stepped profiles such that it collectively displays best environmental performance and spatial ability of incorporating varied functions. Variation in solution space can be generated by changing the heights and widths of each step. Machine constraints of maximum injection depths and width define the limits of these variations and total number of terraces. The results are evaluated based on the shadow casted by solutions during the recorded hottest hours of the hottest months in an year.
86 I Emergent technologies and design
Leeward ank
steps No. of Generation: 10 No. of Individuals : 100
Fitness objectives
FC 1- Maximize the number of complete hardened sites
3m x 3m hardened patch Injection sites
FC 2 - Maximize self shading
Analysed for summer solstice , 6:00 am to 6:00 pm
Windward ank
FC 3 - Maximize the width of each step for agricultural & habitation usage
FC 4 - Minimize the height of steps for ease of circulation
87 In-dune I N 750m 1500m 150m
Body plan and gene pool
1 2 3 1 2 3 4 5 Number
12 - 36m 1 - 15m 6 - 36m 1 - 15m
of
Generation: 07 Indiviual : 04Generation: 06 Indiviual : 03

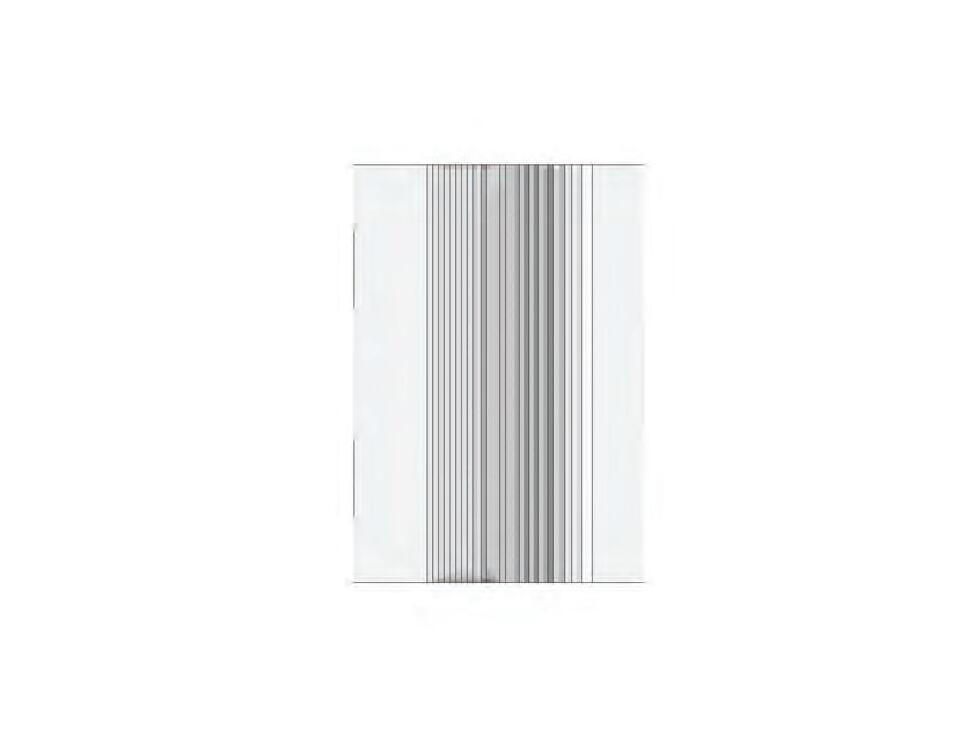
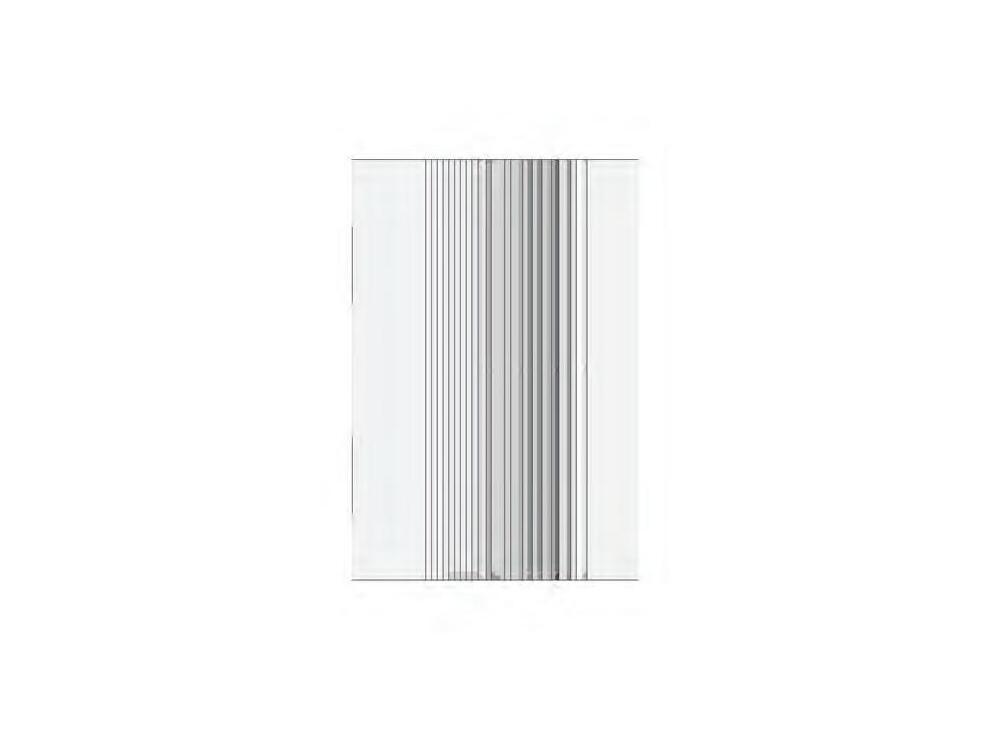
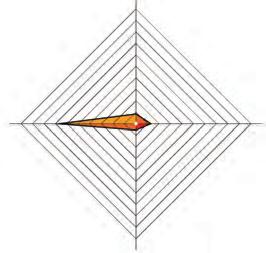
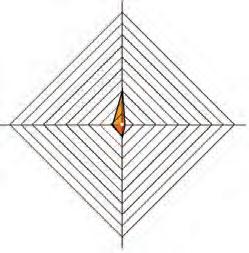
88 I Emergent technologies and design Max step width
MaxSelf-Shading Min step height Max available hardend sites Max step width MaxSelf-Shading Min step height Max available hardend sites Max step width MaxSelf-Shading Min step height Hours of shade 850 650 500 0 150 Hours of shade 850 650 500 0 150 Hours of shade 850 650 500 0 150 0.02% 10.41% 9.04% 80.5% 1.04% 11.46% 9.04% 78.43% 7.04% 9.04% 11.17% 78.37%
Observations
A notable improvement can be observed in self shading behaviour of the stepped terrain versus plane dunal valley. However, as the terrain has a fixed section running along the dunal length and the proportions of verticals and horizontals are strictly constrained by the machine, no significant variations in shading values are observed within the solution space. The intensity of shading can however be further enhanced by introducing tall trees near the edge of each step for they affect the net vertical height.

Despite having the same dimensional constraints, leeward and windward steps show spatial variations between each other. Broader steps developed on the windward phase than leeward phase show greater hours under the shade than the narrower steps developed on the leeward phase.

89 In-dune I 1500 mm 1390 m Analysis Period - May to June Time - 11:00 am to 2:00 pm Original dune Shadow analysis 0.00% 0.00% 0.00% 100% Hours of shade 850 650 500 0 150
Leeward ank
Area under shade - X
Leeward ank- suitable for agriculture
Windward ank
Net heat gain
Leeward ank > Windward ank
Area under shade - 1.5 X

Windward ank- suitable for habitable spaces
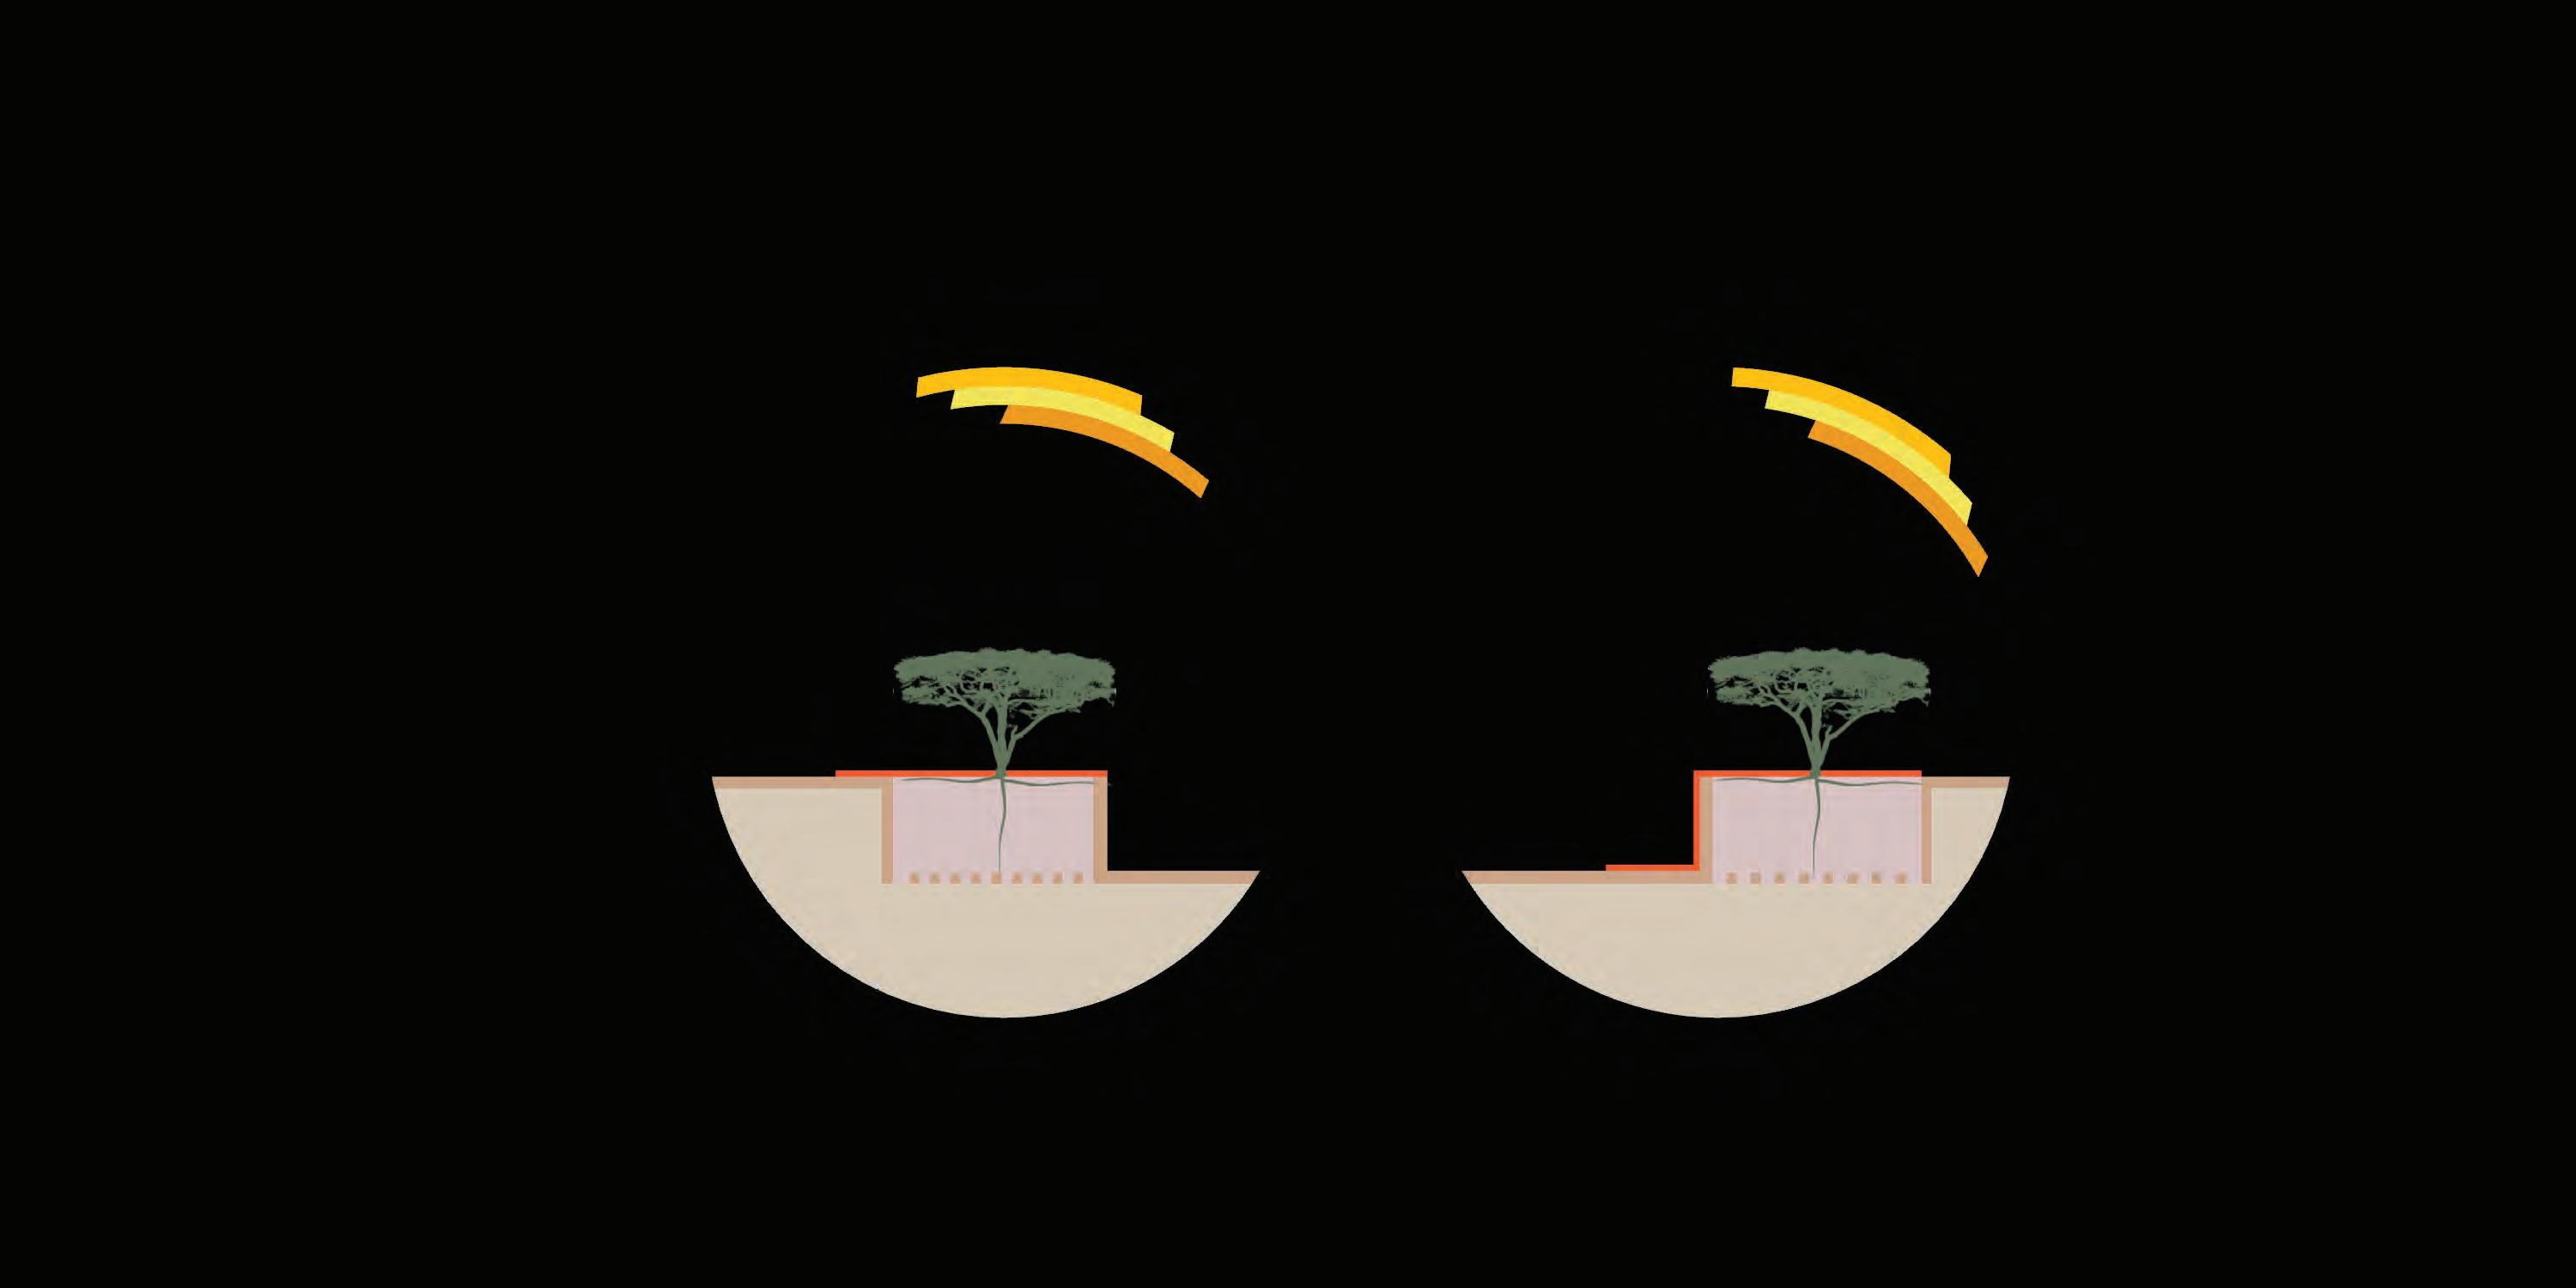
90 I Emergent technologies and design 2pm 12:30pm 11am 2pm 12:30pm 11am 21m 15 m
21m 15 m
Conclusions
Variation in spatial widths and intensity of shadow broadly suggest the zoning of agricultural fields and habitable spaces across the dune valley. Due to the angle of sun between the hottest hours of the day ( 11:00 am to 2:00 pm) greater shadow is casted by the verticals of the windward flanks onto its neighbouring steps. The selfshading during these hours makes windward steps obvious choice to populate habitable spaces. For other hours of the day when selfshading is least on this side, a shading system can be installed which could also act as sand laden wind deflecting surface.
For the agricultural fields on leeward steps a choice of species can be made which can resist high radiation value and have low water requirement.
91 In-dune I
Sand channels 4.3
The sand carrying winds across the valley cannot be harnessed but alteration of their speed and directionality can be used to guide the sediment deposition. Sand channels are one such critical sand mitigation measure for they decrease the velocity of incoming wind, induce the recirculation flow around them and promote sand sedimentation into the defined ditches . 47The bimodal wind directions can play a significant role in the mechanics of sand accumulation and their simultaneous removal. While the subsidiary wind for its low velocity can drop the sand inside these channels, the faster predominant wind can be used to saltate the deposited sand. To facilitate the saltation, these sand channels are oriented along the dominant wind direction.
Experiment : Distribution of channels
Sand accumulation and removal are dependent on geometric parameters of channel’s height, width and slope. The minimum injection width and area available after plantation on the steps define a range of geometric sizes of these channels. The selection of the appropriate cross-section is evaluated on the relationship between geometric parameters and wind behaviour inside these ditches. While any wind speed lower than critical velocity of 6 m/ sec would only cause accumulation, it is important that at least critical velocity is attained inside the channels for continual erosion of deposited sand.
Dropping wind speed from valley to crest of the dune result in higher sedimentation of sand towards the crest. This varied sedimentation pattern governs the accumulation potential of sand channels for each step and their sizes. Thus, selection of one ideal cross-section is not possible. A catalogue of cross-sections are selected that maintain the critical velocity for erosion and have the potential to withhold respective sedimentation.
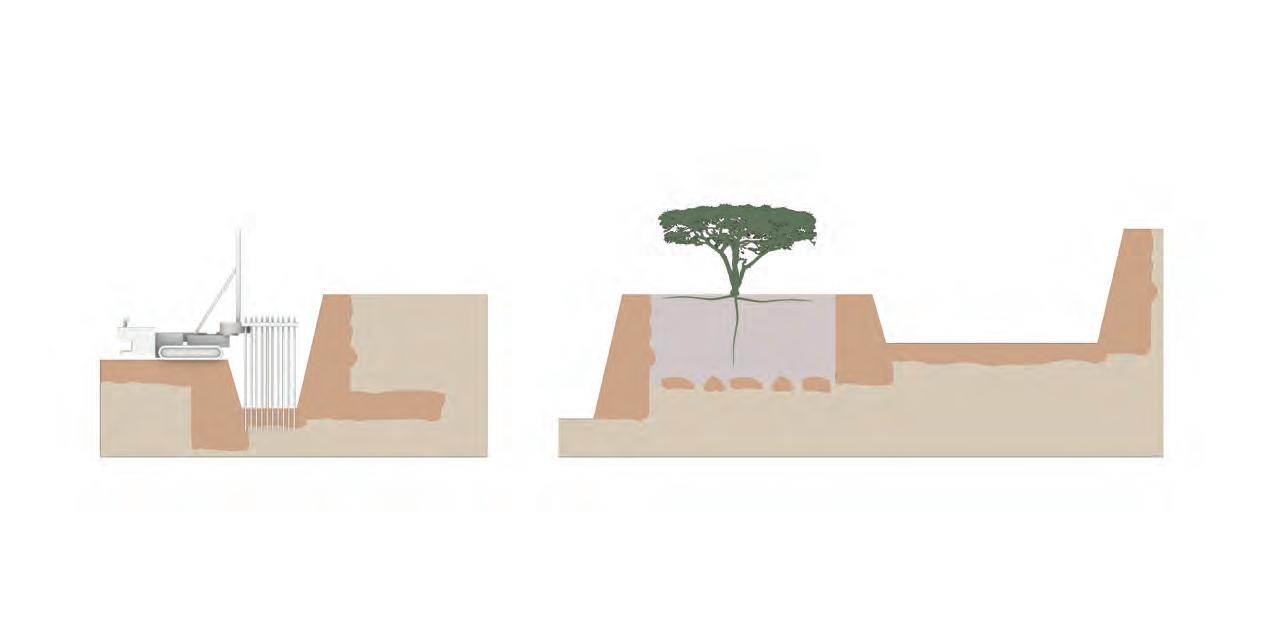
92 I Emergent technologies and design
Fig : Dimensional constraints
engineering min channel width: 3m max step width: 30m 15m ( required for roots) Trees / infrastructure de ecting sand max channel width: 15m 0-15m downwind strip ditch upwind strip
Fig : Sand accumulation in ditches Source :
Journal of wind engineering and Industrial


93 In-dune I Target wind velocity Input wind velocity 0m/s1m/s2m/s3m/s4m/s5m/s6m/s7m/s8m/s
width not suitable since target velocity is not attained
3m
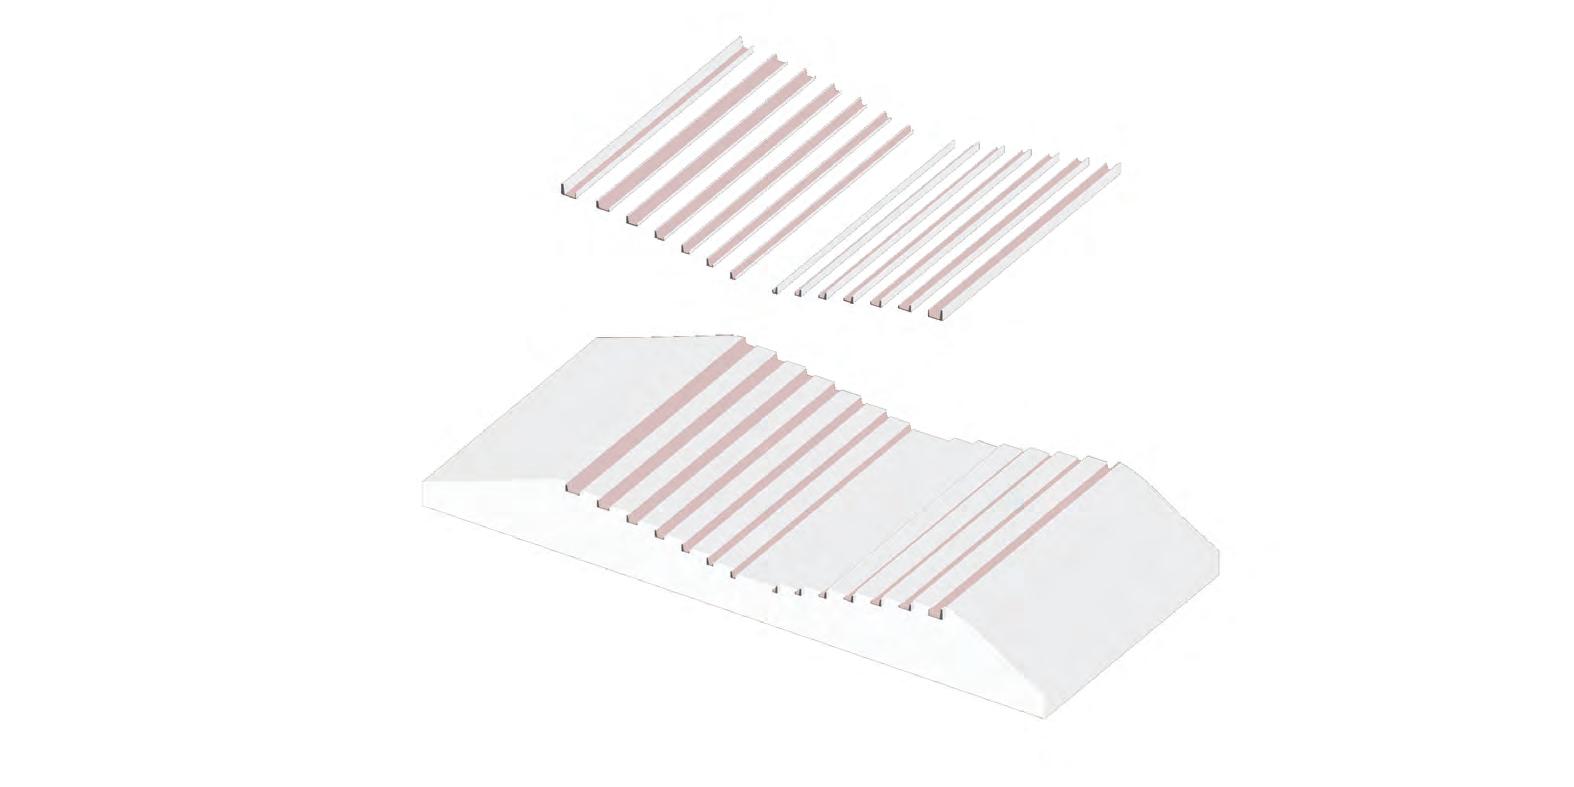
94 I Emergent technologies and design 9m10m 6m 8m WidthDepth
Conclusions
While the quantification of sand inside the channels is beyond the scope of this work, the distribution of sand channels across the dune valley is based on the qualitative assessment of sand deposition pattern. For the wind to funnel through the channel, it is important that the cross-section is properly shaped. Surface irregularity could cause generation of vortex locally, which holds for high sedimentation levels. Thus, cutting of sand channels post injection and excavation needs to be done with high precision.
Since the functioning of these sand channels are dependent on wind, they might not remain active throughout the year. For seasons when the valley receives rainfall or the air is too heavy, these channels would only function as accumulation ditches.
95 In-dune I
In-dune structures 4.4

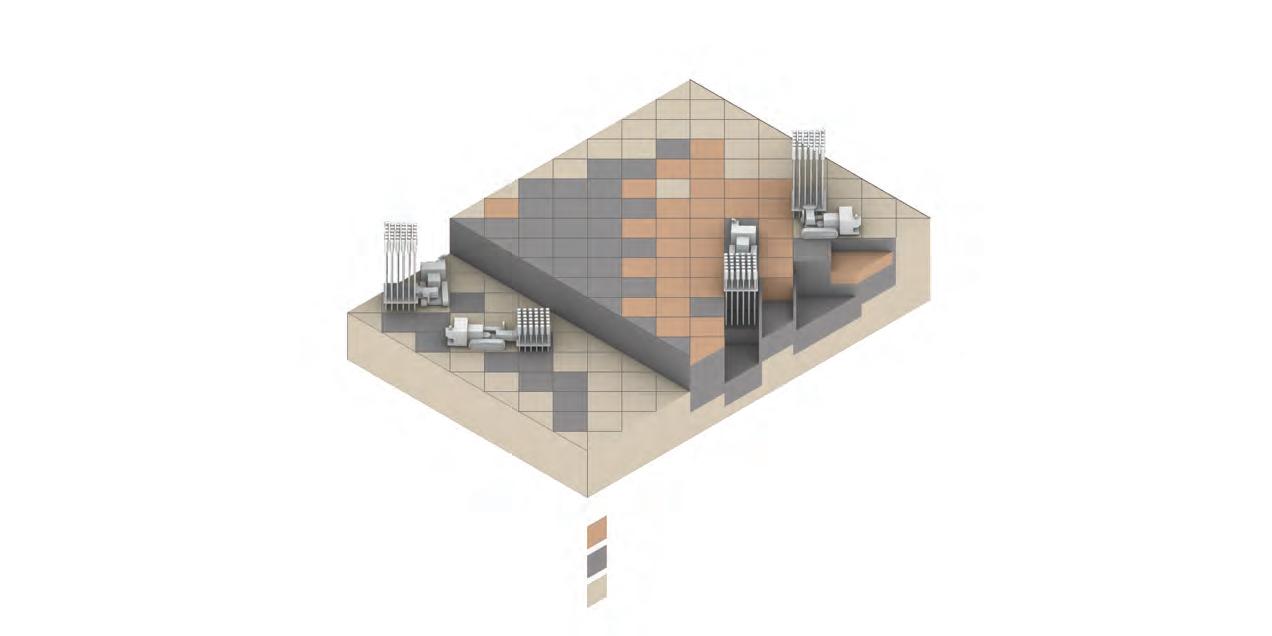
Aiming to utilise the abundant sand resource available in Thar, we propose the development of in-dune, in-situ habitable spaces. Occupying the interiors of a dune can display several environmental and functional benefits which can enhance living conditions in context to arid biome. The adaptation can facilitate heat exchange between the structure and dunal sub-soil, which in turn can significantly lower the temperature of inhabited spaces. In-dune habitation minimises the area exposed to the hot winds and sedimentation caused by their dropping velocity. Adoption of a deflection system with these spaces can help achieve a greater sediment free area between structures.
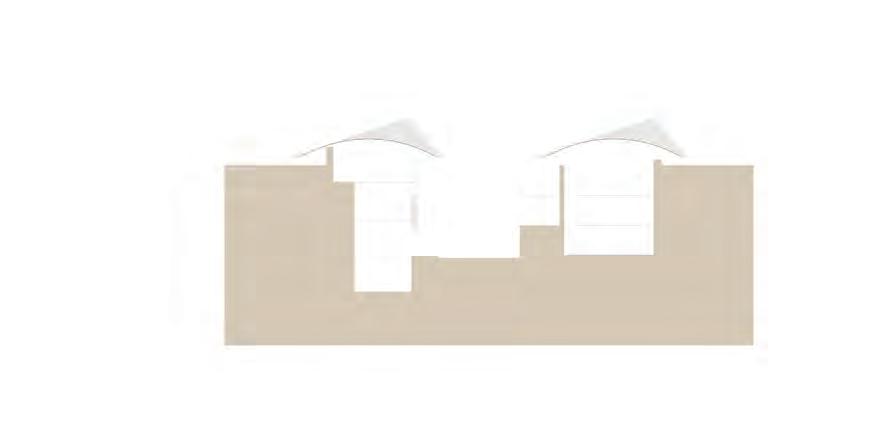
Having to occupy a dune involves heavy ground manipulation and a radical shift in structural thinking, away from pre-fabricated construction and more towards localised cementation of granular material . 48 In the adopted matrix injection system, we propose to inject at different levels within the 3m X 3m grid. For fabrication of foundations and walls we adopt application of multiple injections and single point injections at different depths respectively. Locally procured secondary material is used to stack additional floor slabs and roof over the excavated pits, details of which are discussed in later sections.
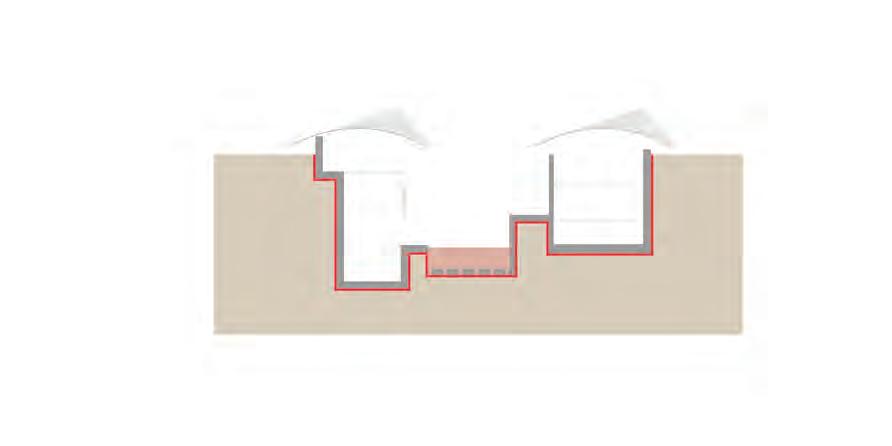
96 I Emergent technologies and design Ground level Hardened surface Ground level SW winds Courtyards and nurseries
Figure : Heat exchange through hardened walls
Windward ank
Foundation
Ground level
Matrix injection at multiple levels
Ground level
Linear array of Single point injectios
Walls
Ground level
Excavation of loose sand
Hardened pro le
Roof (alternate material)
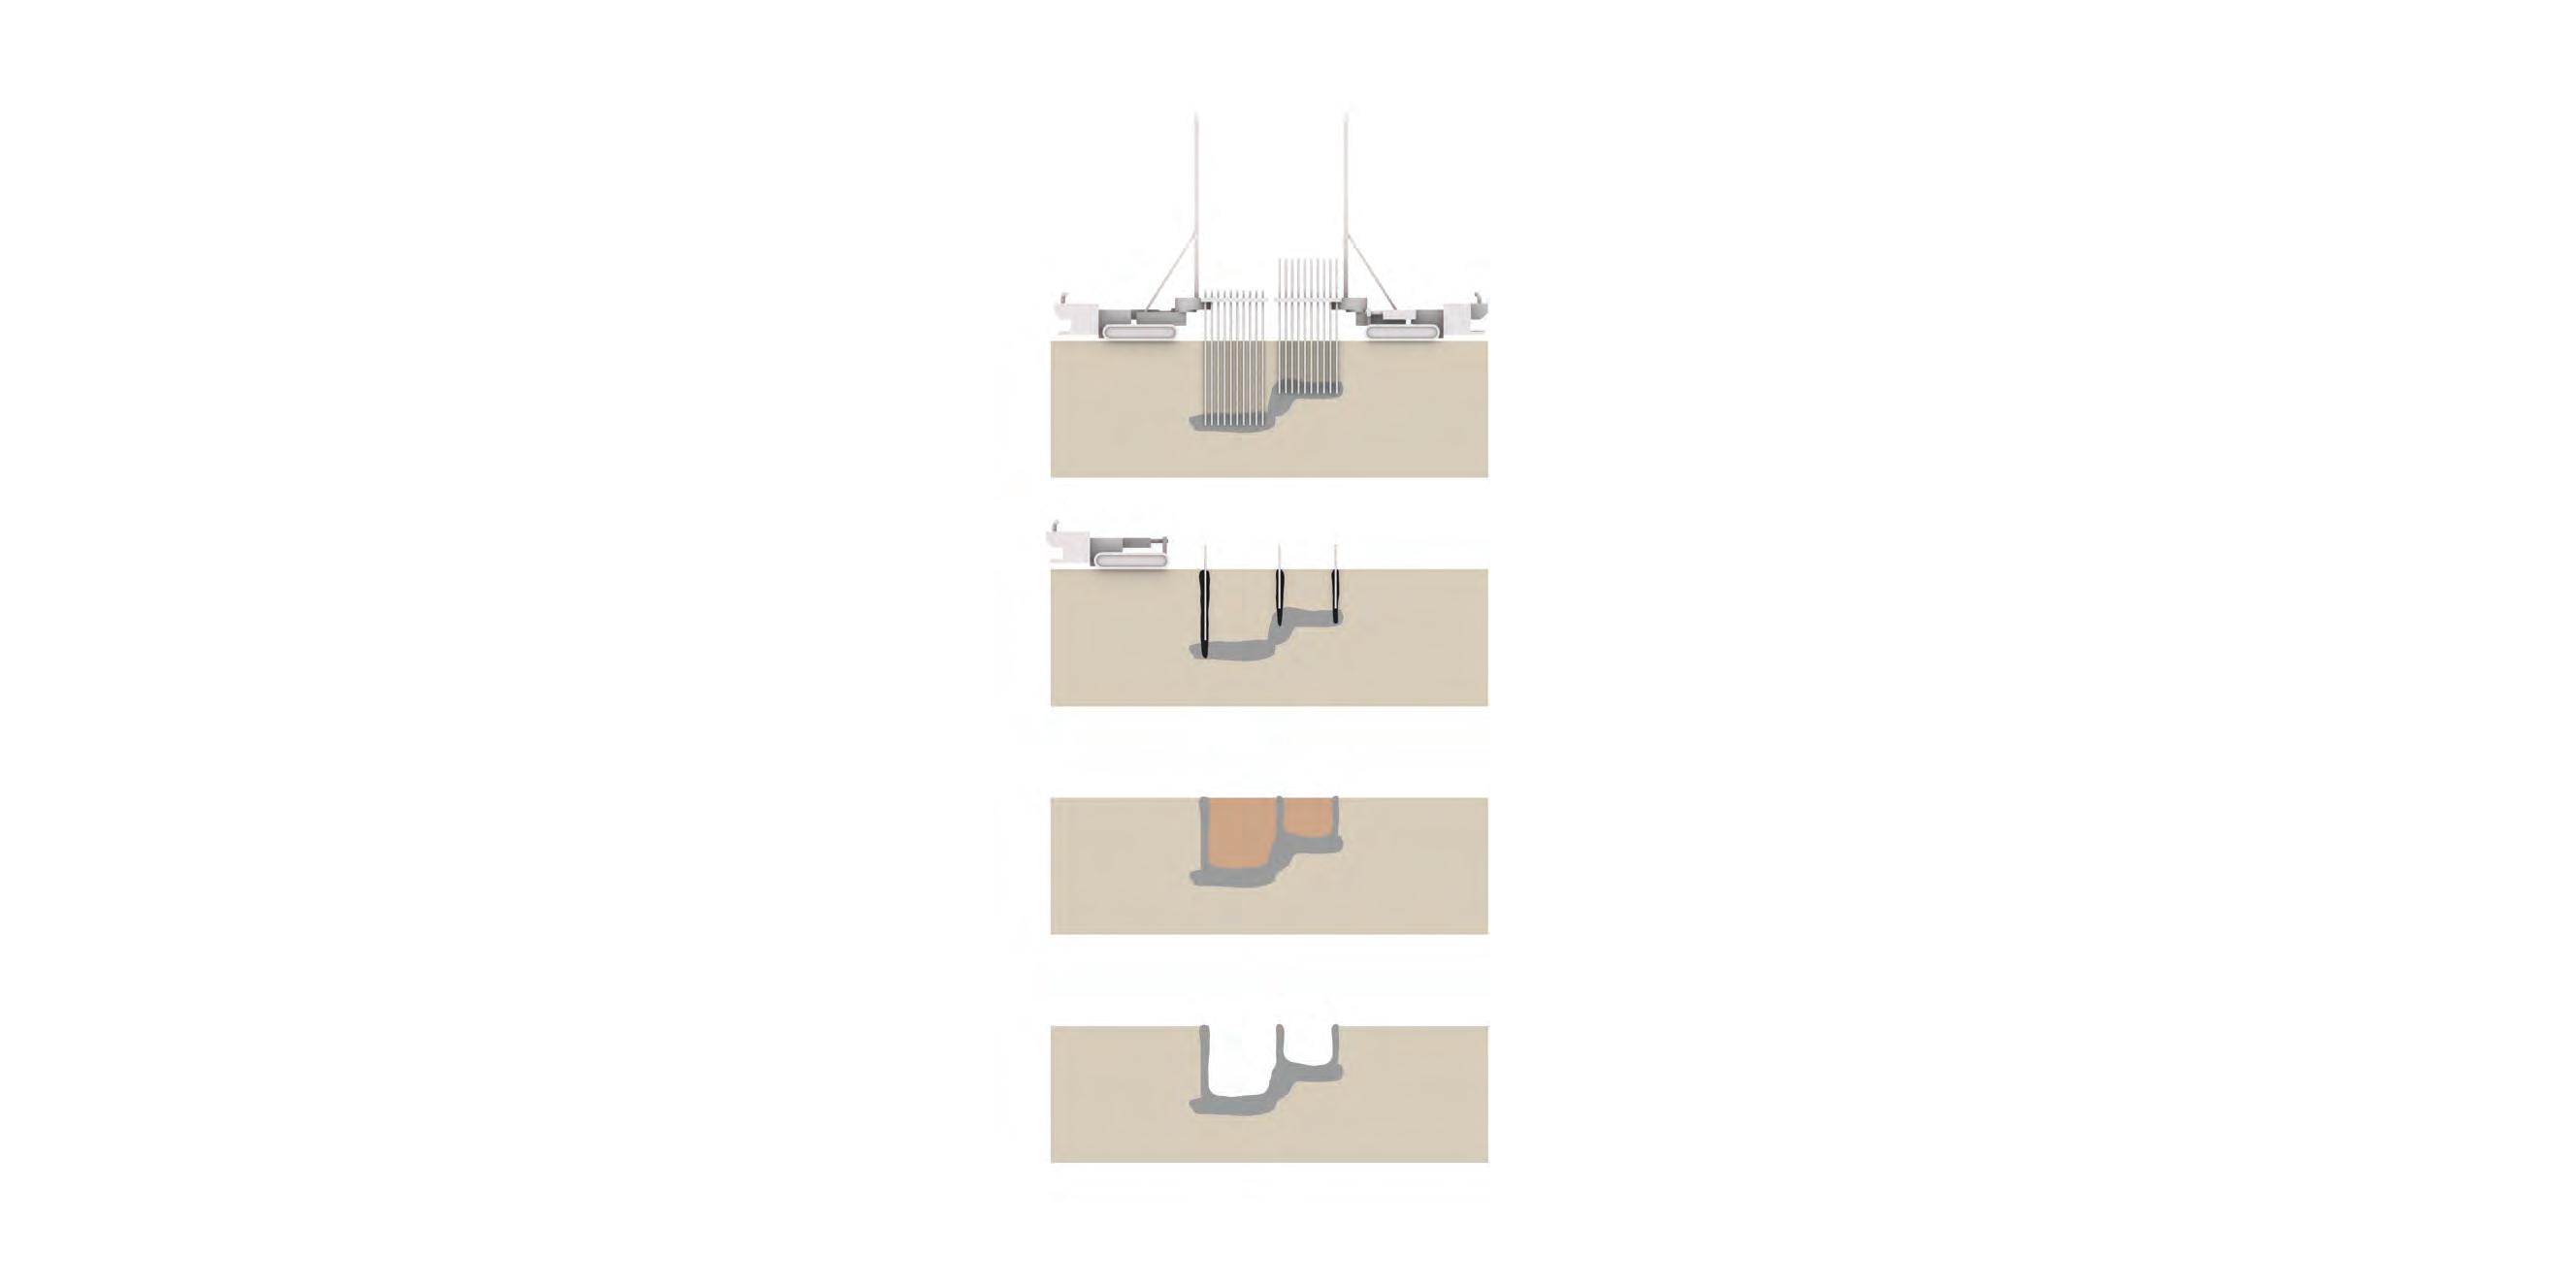
3 x 3m injection grid
Excavated sand
Hardened sand
Retained sand
Excavated pit
Ground level
Floor slab (alternate material)
97 In-dune I
Figure : Fabrication strategy and components of in-dune structure
0m 5m 10m 15m
Depth of injection 4.4.1
Micro-climate Experiment Setup
Micro-climate is a measure of surface and air temperature, humidity, wind speed and solar radiation. Microclimate analysis is ensued to simulate the liveability of excavated habitable spaces in terms of thermal comfort. The major parameters such as depth of excavation, peripheral wall thickness, soil temperature and value of subsoil’s thermal conductivity are meant to regulate the thermal performance of the spaces based on their levels of exposure to the natural environment. The opening of the pits influence the convective capacity of the space’s air volume due to its exposure to direct solar radiation. Thermal mass and opaque conductivity regulate the nature and degree of heat transmission through the peripheral wall assemblies. The same wall properties work with low U-values to inhibit high degrees of thermal exchange and permit more regulated
As the temperature variations are extremely high for the site, the comfort band for the region has higher values than any other biome. Even small thermal changes inside these pits can be significant to initiate the growth of plants and ensure human comfort.
The study aims to record the range of temperatures inside excavated pit for varying wall thickness and depth. Controlling these parameters alter the thermal transmittance or u-value of the subsoil and bring significant changes in the micro-climate. The evaluation is based on the combination of depth and wall thickness that modify the air temperature such that it falls under the comfort band of Jaisalmer for respective seasons. The machine constraint of injecting upto the depth of 15 m marks the limit to test these variations. The wall thickness is however ranging between 0.1 m to 1 m.
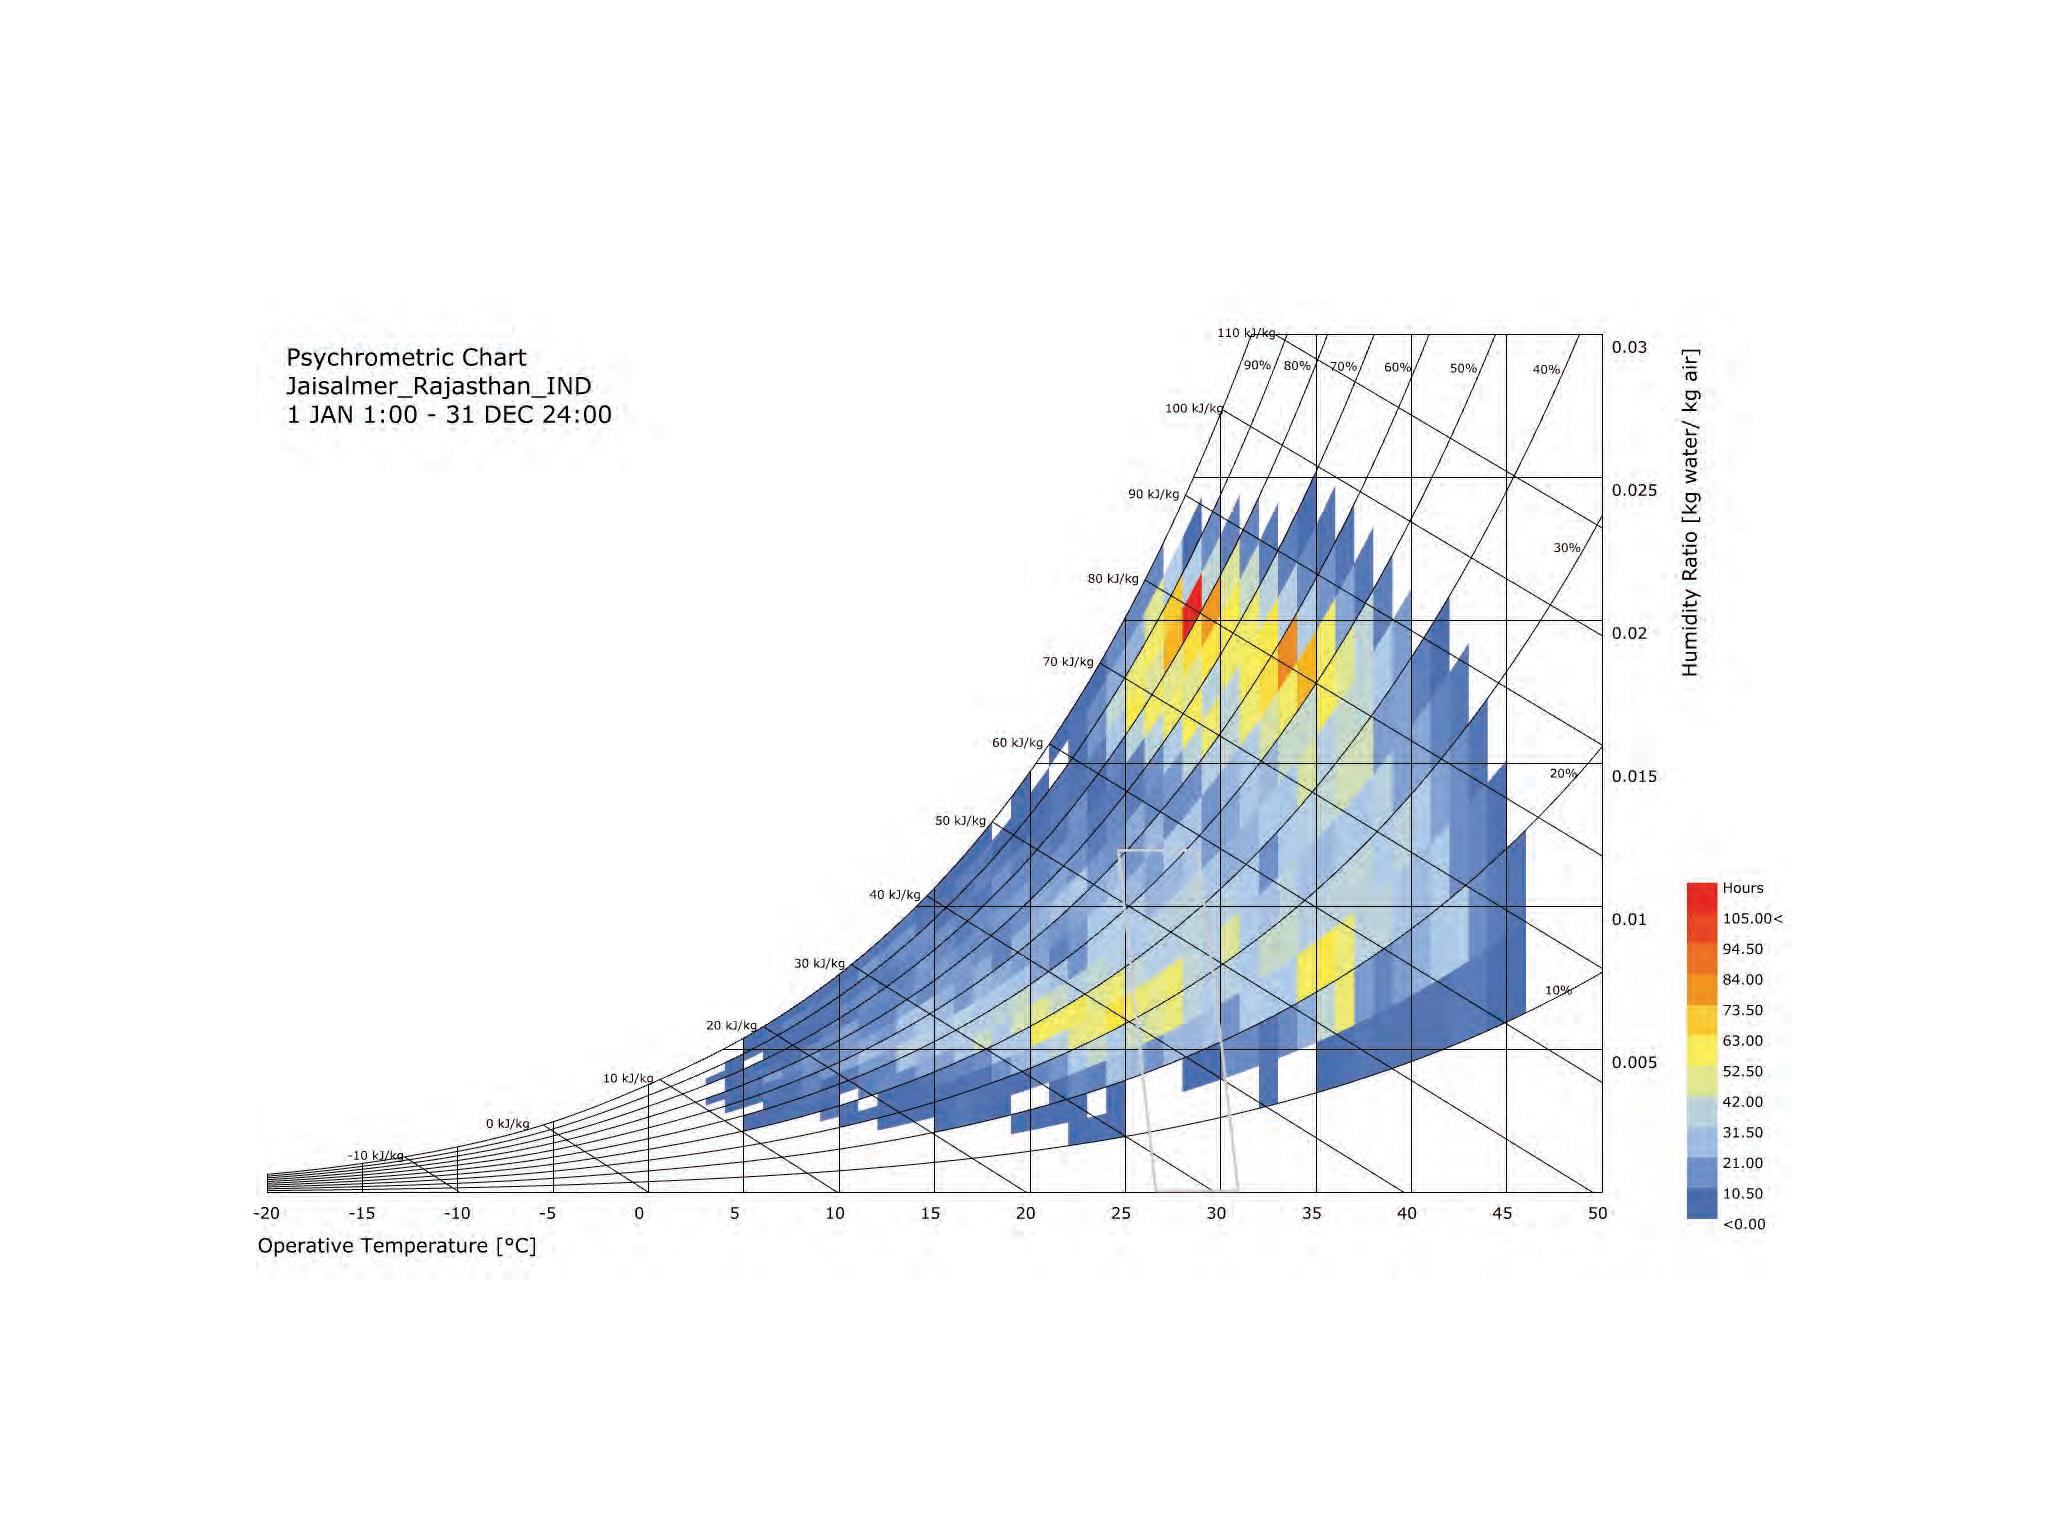
The study is conducted separately for summer and for winter season. To record the temperature variations, the surface temperature of the surrounding soil are calibrated based on precedent data 49 for both the seasons.

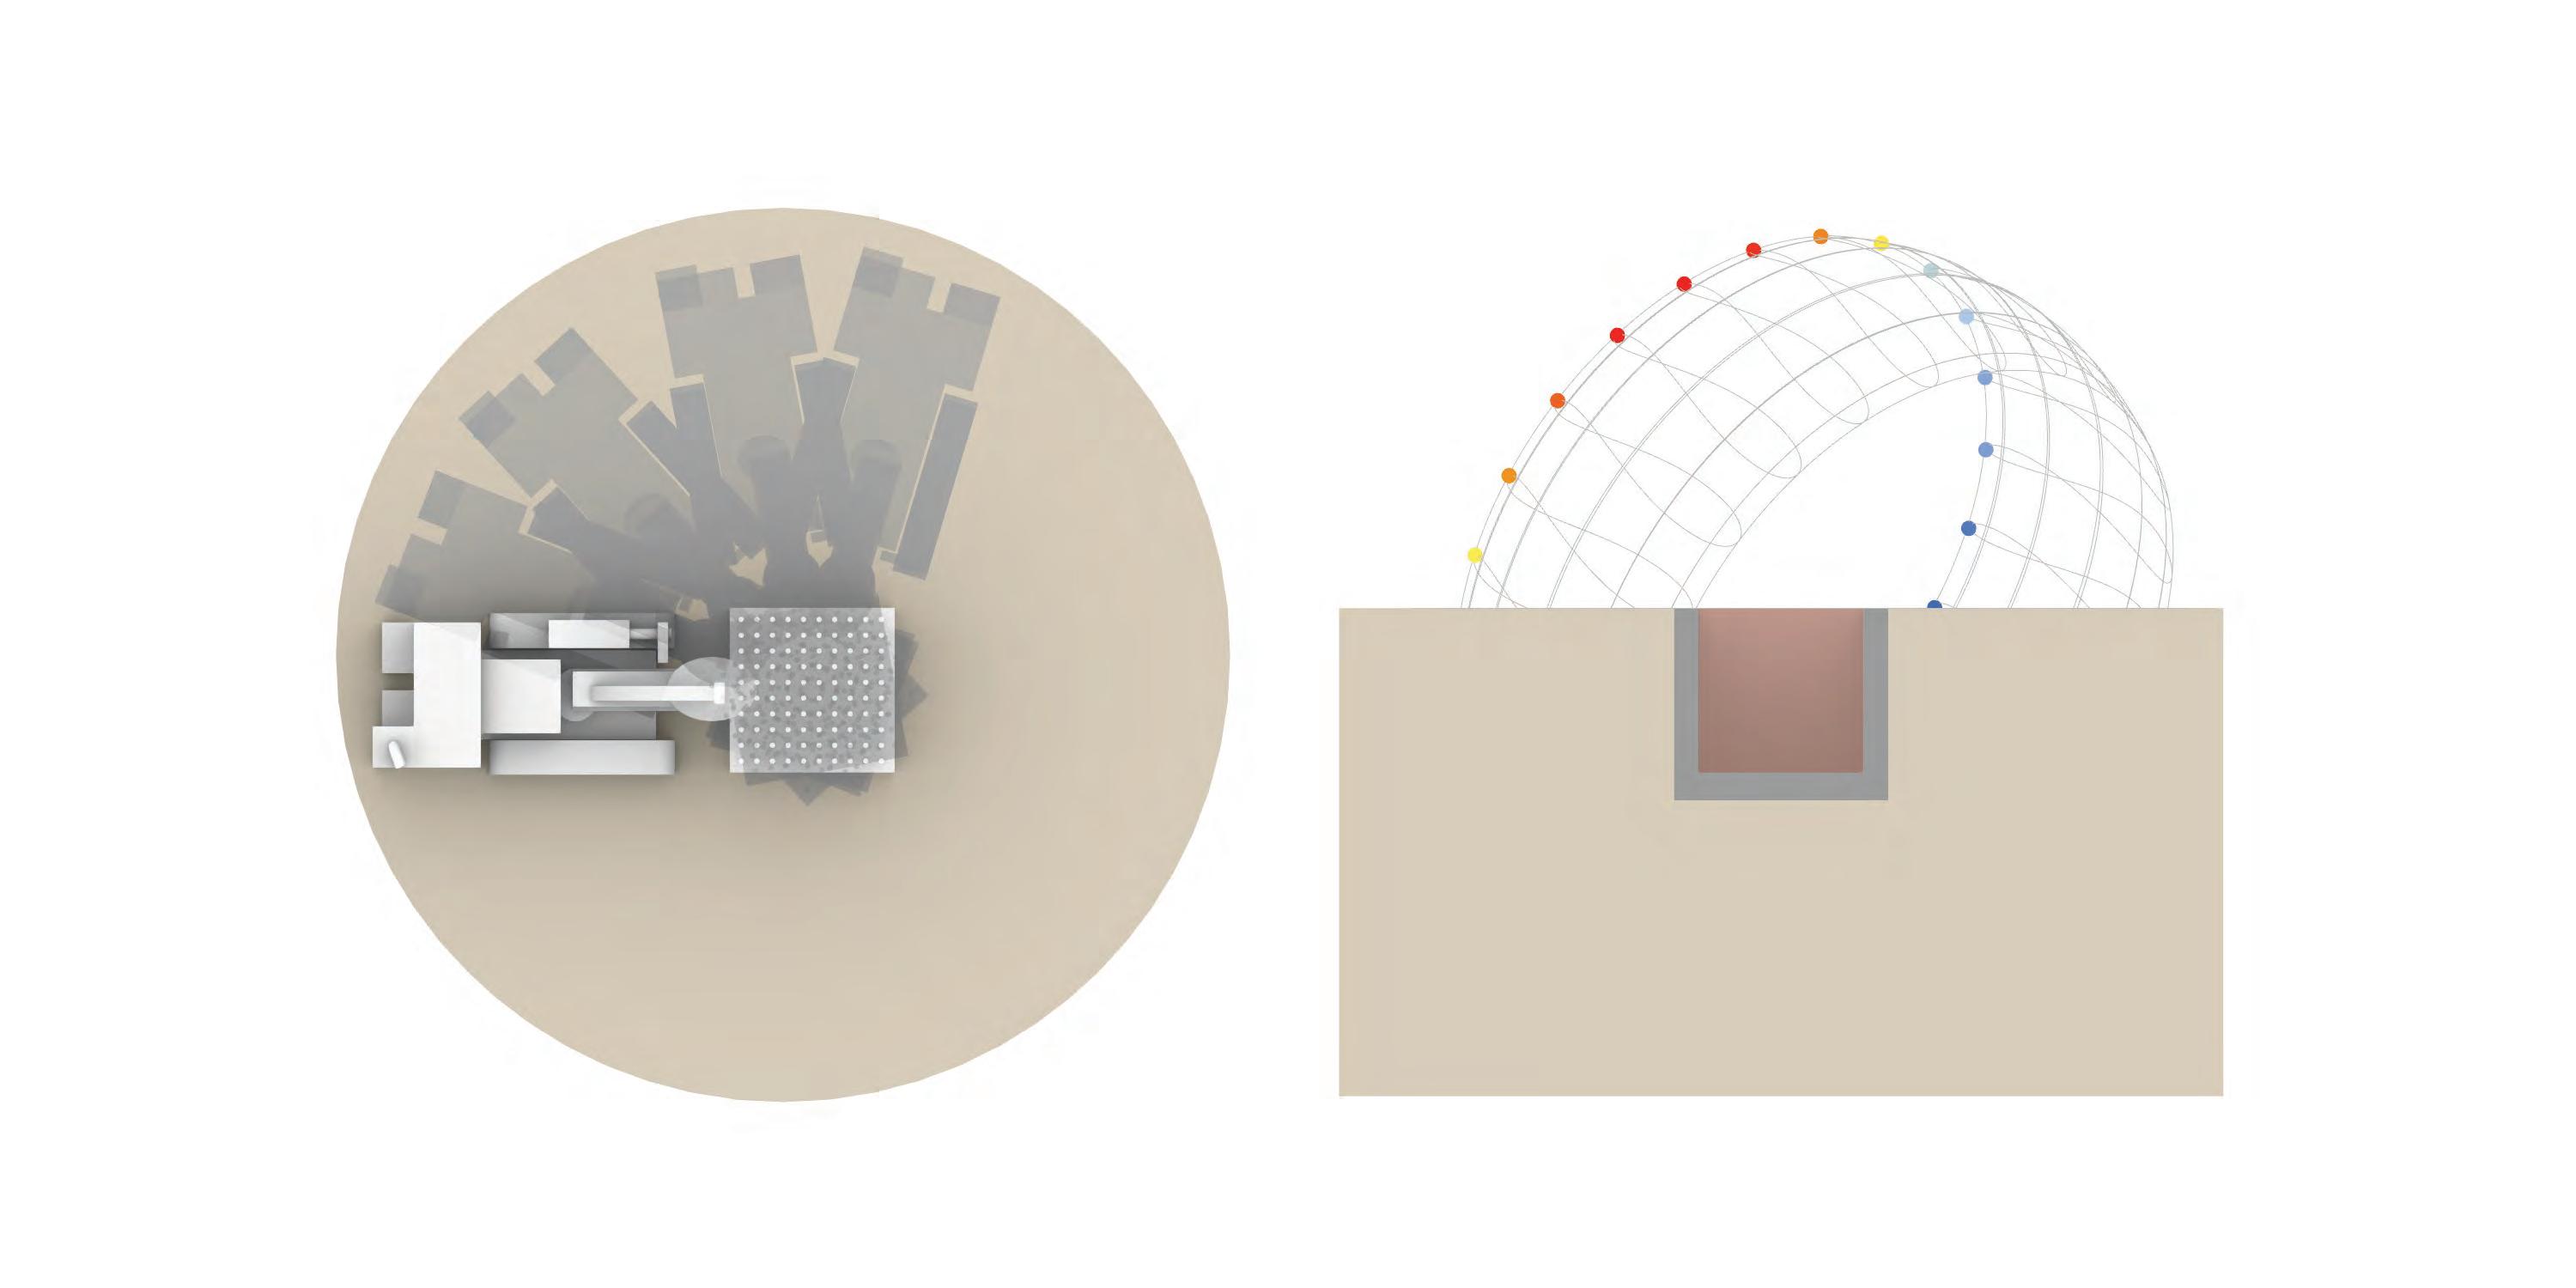


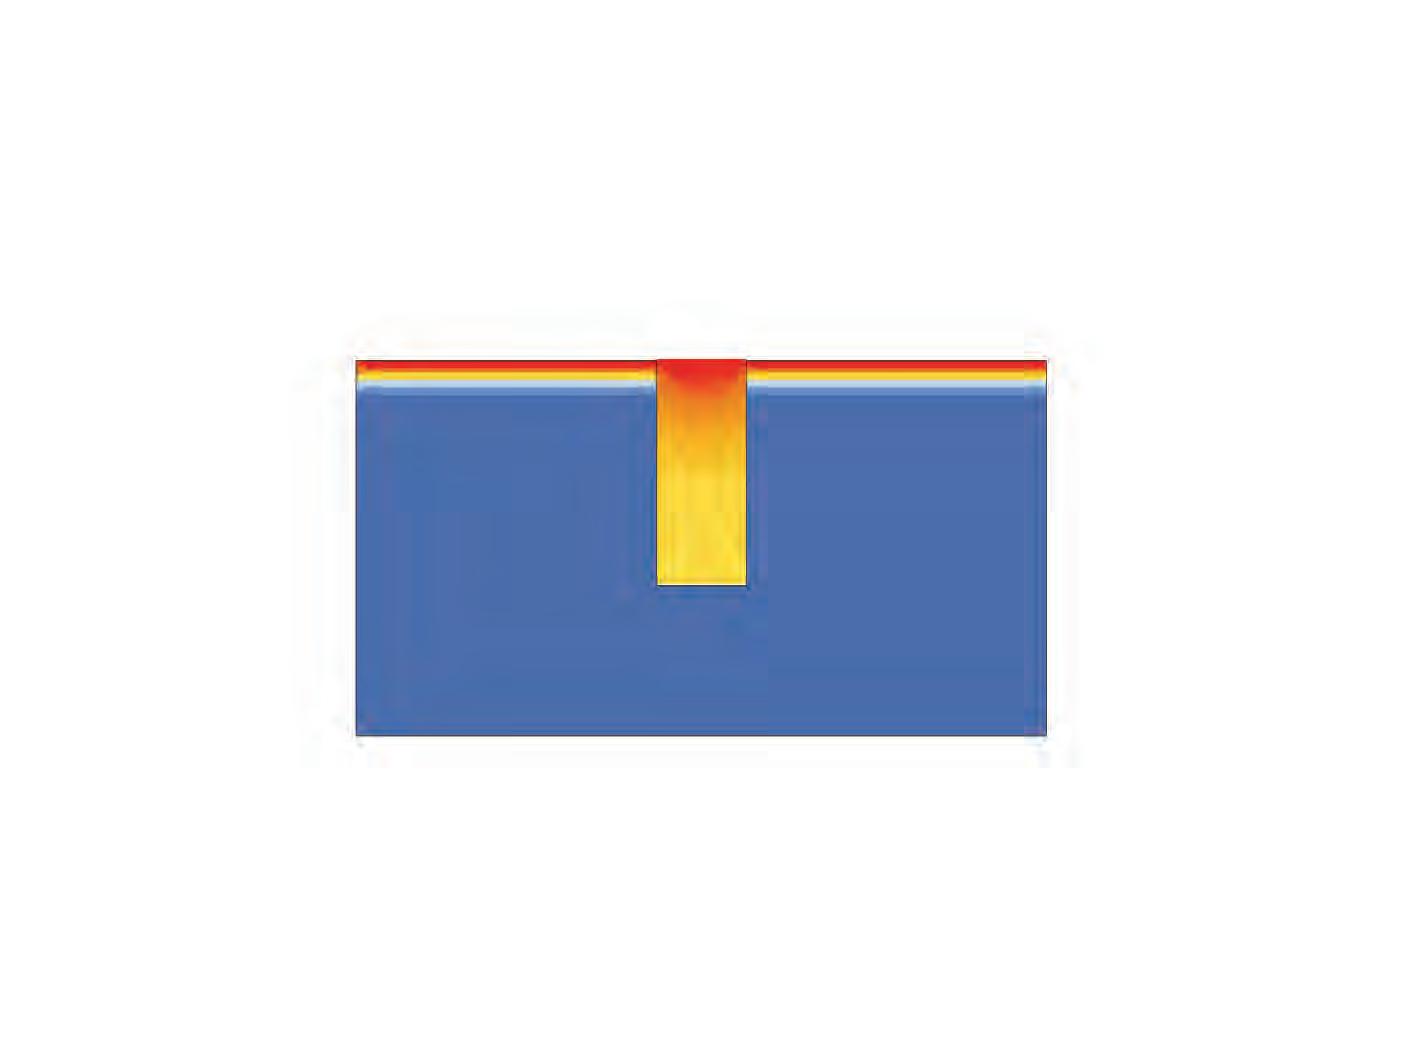


Depth (d) Thickness(t) of hardened wall Properties of hardened sand : Thermal conductivity G.L
100 I Emergent technologies and design [ Winter ] [ Summer ] Depth ( m ) Depth ( m ) Injected wall thickness: 42 12345678 101112131415 9 12345678 101112131415 9 37 32 27 15.6 15.4 15.2 15 14.8 14.6 14.4 14.2 14 0.3 m 0.6 m 0.9 m 1.2 m 1.5 m Microclimate Temperature (°C) Microclimate Temperature (°C)
Conclusions
Ground coupling serves as a proficient thermal comfort enduring technique. The technique shows significant difference for the summer season, for there is a flow of heat from interiors of the pit to subsoil. When the temperature outside during harsh summers is 50°C, a temperature drop of 20°C can be achieved inside the pit. This temperature is observed to start equalising after a depth of 9 to 12 m. Despite having greater injecting capabilities, the injection depth of grouting machine can be limited to 12m to save time and material. For winter season, there is a reverse flow of heat from subsoil to the interiors of the pit. This increases the temperature of the pit instantaneously to about 15-20°C but shows no significant variation across different depths. (Refer to Appendix Section 8.4 for experiment results).
These temperature variations for varying depths serve as an input to zone different functions inside the excavated pits based on their respective thermal requirements. The details of these functions and arrangements are discussed in succeeding chapters.
101 In-dune I
As seen in the ‘Stepped Profile’ section earlier in this chapter, selfshading is a passive thermal technique which can bring about a notable drop in temperature. Exploring this technique at a more local level, the following experiment is set to determine the orientation of the injection patch such that it casts maximum shadow after excavation. For all given intensities of radiation, there is only one unique angle for excavated pit that casts maximum self-shading. A catalogue of angles varying at an interval of 10° to the global EastWest orientation are tested for maximum value of self-shade on the base and walls of the pit.
The resulting angle of orientation in turn governs the global angle of propagation of injection machine and interior layout of different functions inside the habitable excavation.
Changing angles show variations in the overall shadow cast inside the excavated pits. While for different orientations the base of the excavated pits showed no significant difference in the shadow value, notable differences in the values were observed for the walls. Thus, excavated peripheral walls and injected interior walls become the prime mode of passively bringing in thermal comfort.
Since this angle of orientation is not parallel to the angle of predominant wind, excavated pits meet the sand channels and edge of the stepped terrain at an angle. This prohibits the injection of complete 3m X 3m patches along the edges of each step of the terrain. The patch shaping the sharp edge of these steps are hence injected separately in an injection pattern specific to its area and shape.
102 I Emergent technologies and design
4.4.2 α N 3m Plan Section 3m 3m Ground level Injection level Shadow analysis period: 1st June to 31st July 6:00 am to 6:00 pm Experiment setup
Experiment setup Observations and conclusions Orientation of injection matrix
Angle about East-West axis
Shadow on walls Shadow on base
α = 0
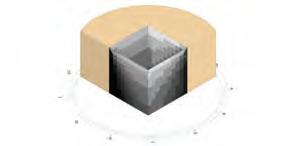
α = 10
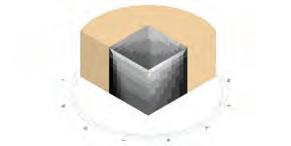
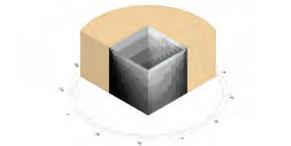
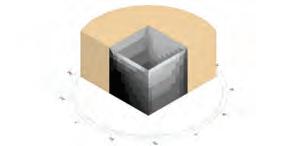
α = 20
α = 30
α = 40
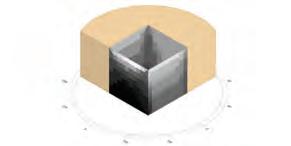
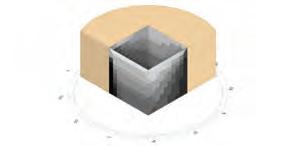
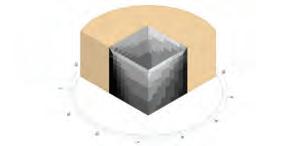
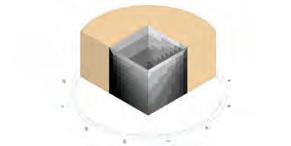
α = 50
α = 60
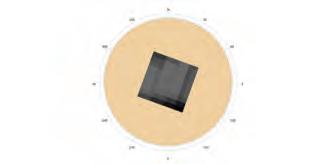
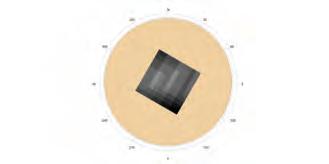
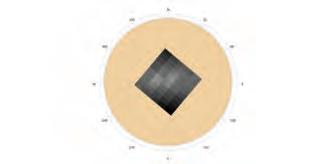
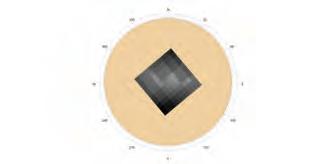
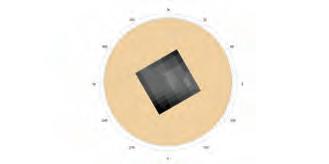
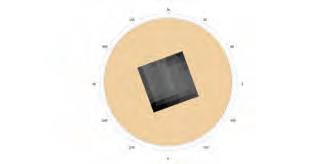
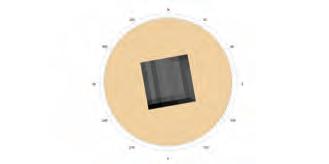
α = 70
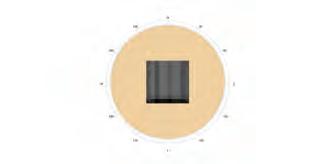
shadow
103 In-dune I
Hours of
460 Hours Total surface area 150 0 300200 61.87% 19.92%9.38% 8.81% 460 Hours Total surface area 150 0 300200 61.62% 19.24%9.77% 9.82% 460 Hours Total surface area 150 0 300200 62.23% 16.88%9.10% 11.76% 460 Hours Total surface area 150 0 300200 61.65% 16.72%9.02% 12.59% 460 Hours Total surface area 150 0 300200 59.77% 18.97%9.0% 12.45% 460 Hours Total surface area 150 0 300200 59.46% 22.56%5.16% 12.81% 460 Hours Total surface area 150 0 300200 61.43% 20.93%6.0% 11.82% 460 Hours Total surface area 150 0 300200 61.87% 19.92%9.38% 8.81%
Deflection system 4.5
Building inside a dune minimises the contact of spaces with sand laden winds and yet does not ensure complete sediment free spaces between in-dune structures. Rather, habitable excavations like sand channels act like sand accumulation ditches. Based on the concept of Jet Roof50, a deflection system is developed which acts like additional roofing system over the habitable spaces. Aerodynamic based research suggests four principles of designing these roofsacceleration of wind speed along windward slope, lifting off sand particles , deflection over the roof and deposition into sand channels. Indicating a synergic mechanism of continual sand deflection and removal within sand channels.
The effectiveness of the deflection system is based on direction and velocity of the wind and geometry of the deflecting surface- shape, width and height. The bimodal wind directions redistribute the access routes and openings to habitable spaces and suggest the anchoring of edges of the deflection surfaces facing their direct impact. The following sections are a detailed account of developing this system.
Roof Design principles
De ection of sand over habitable spaces, towards the sand channel
Openings facing away from the direction of sedimentation
Minimum direct solar exposure on spaces under the roof
Minimum wind load and lift forces on the roof
104 I Emergent technologies and design
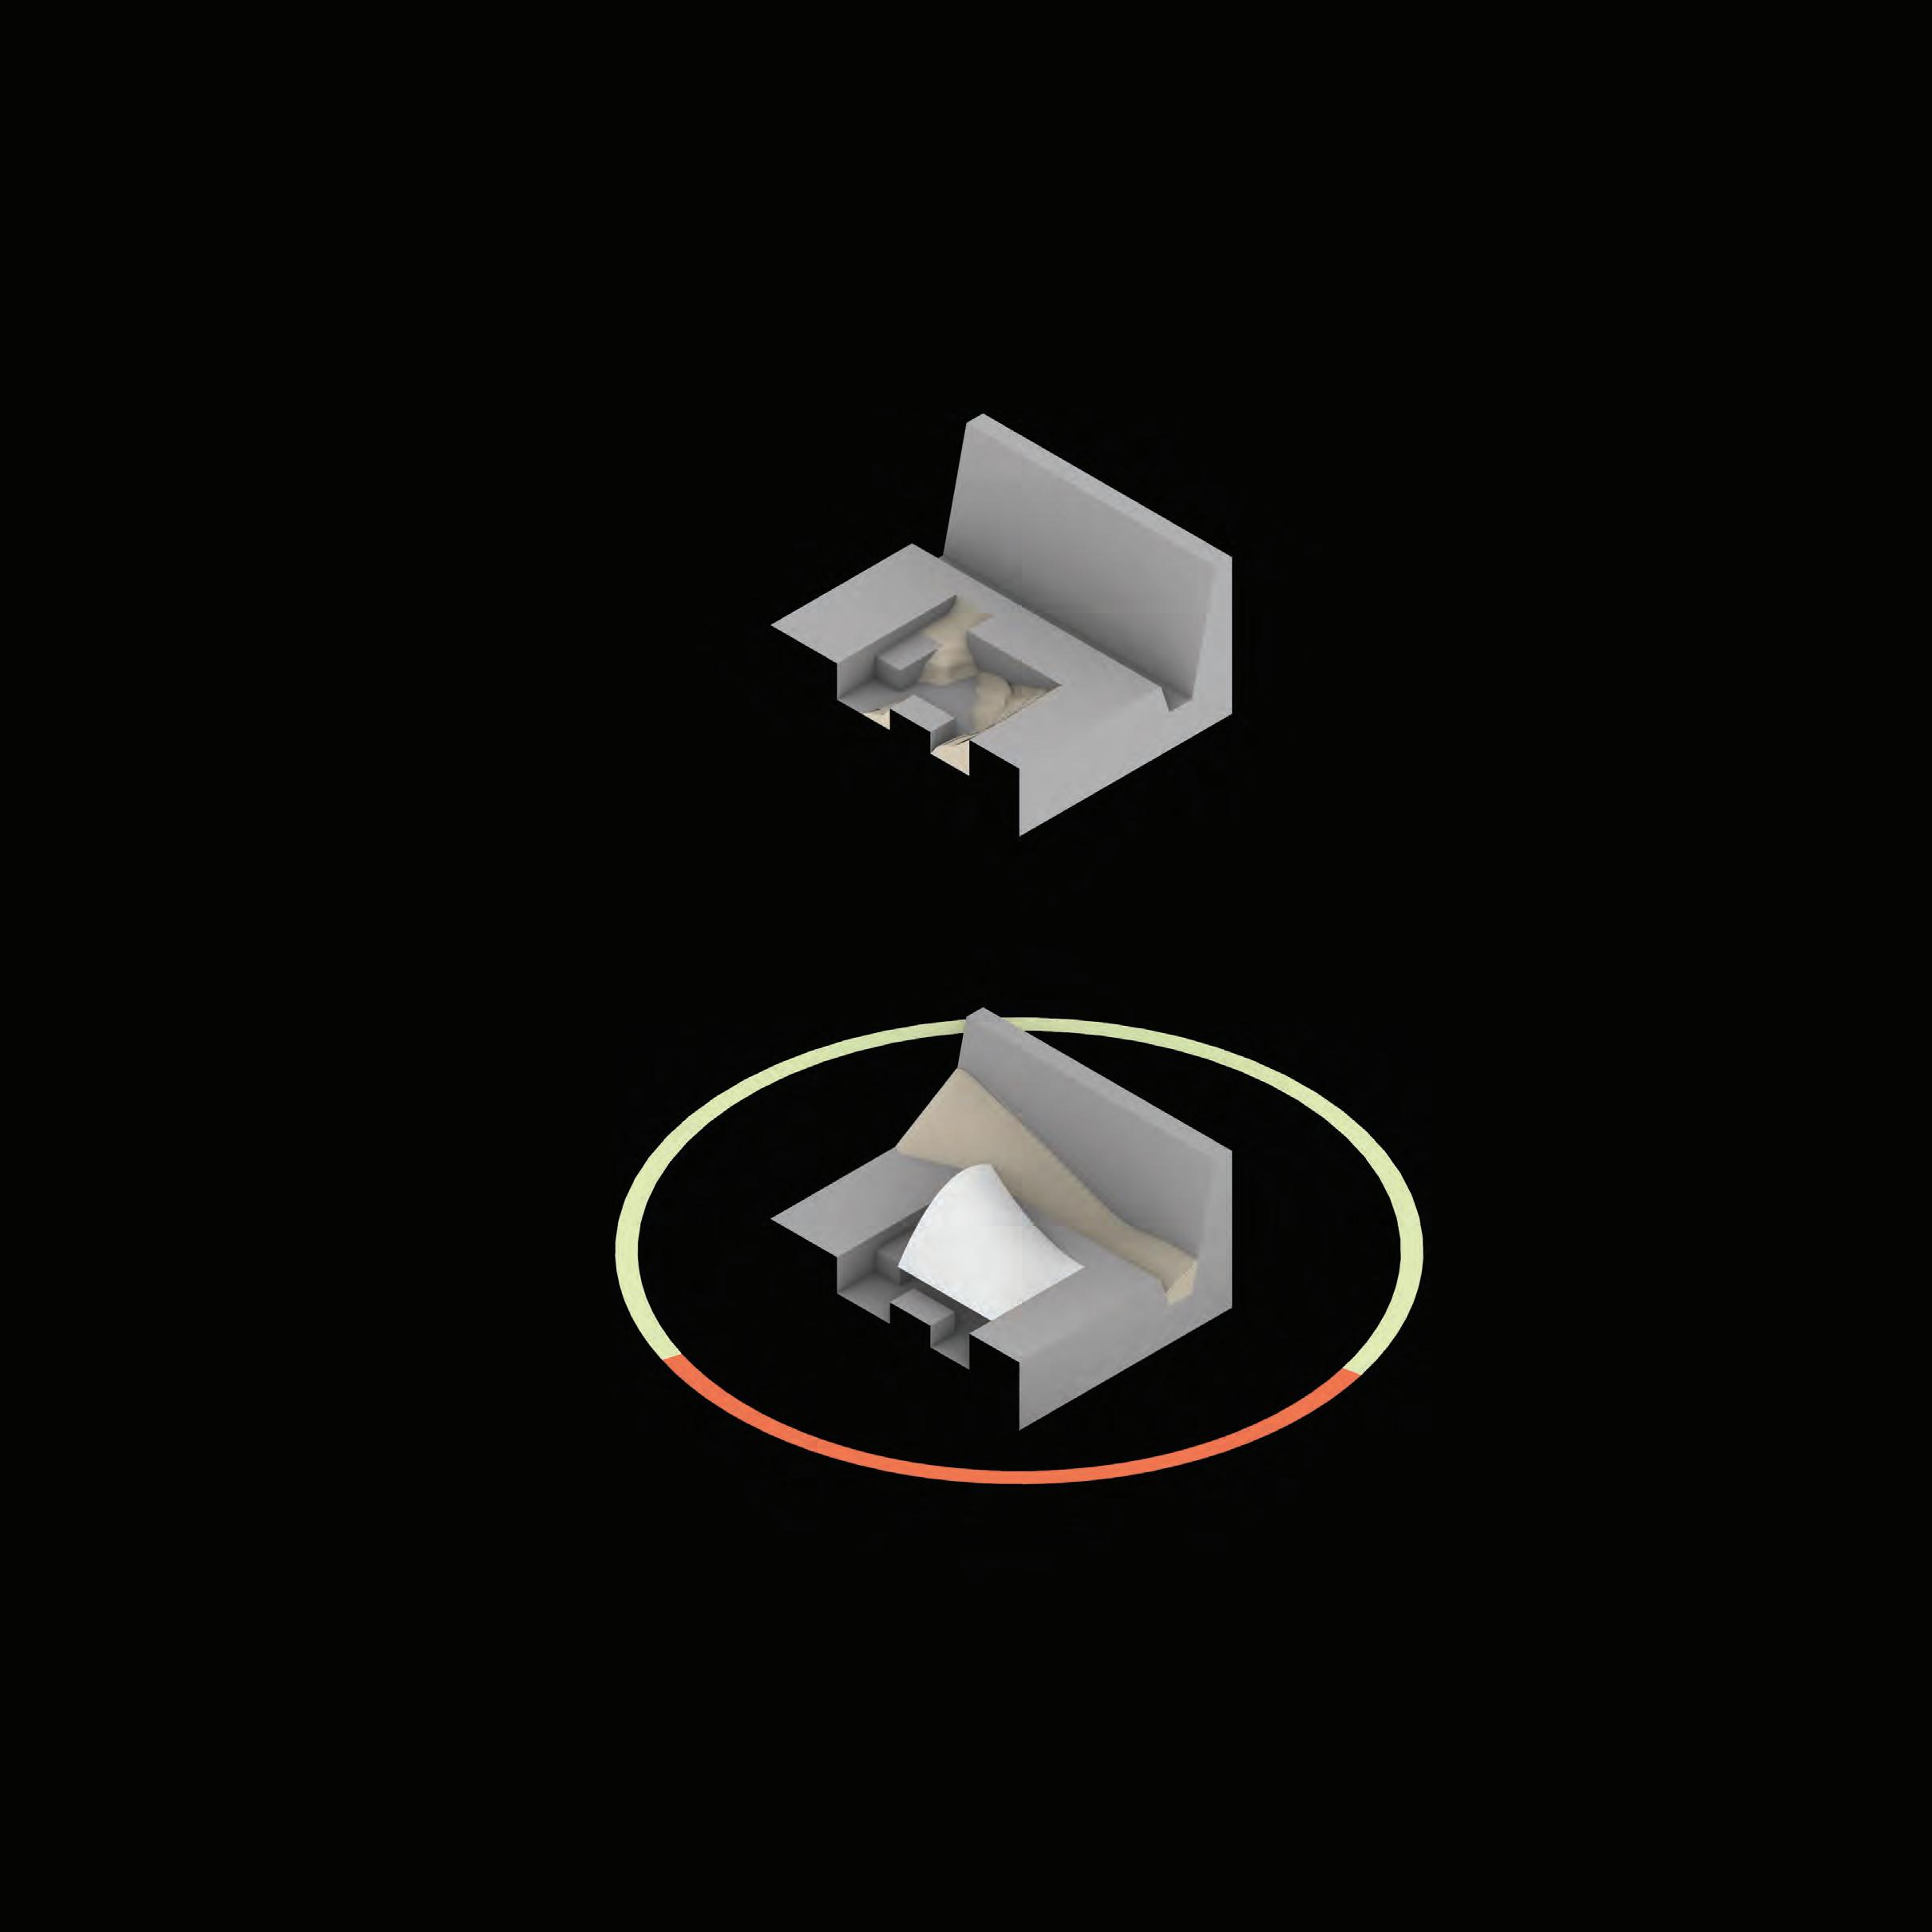
Access and openings N S W E No openings De ecting geometry SandChannel
Geometric exploration 4.5.1
Experiment 1.1
Different geometries display different behaviour when placed in the direction of dominant wind. The aim of the study is to observe the changing wind behaviour from over the surface of the roofs to the succeeding path of the wind. The evaluation of the results are based on the wind speeds attained and the lengths of the effected zones generated in proportion to the height (X) of respective testing geometries. The same geometries tested for shearing wind behaviour are also tested for surface load that the wind inculcates.
The angle of the slope is a critical factor affecting the efficiency of sand deflection. While this study helped to select roof shape based on the nature of impact zones created for respective geometries, it is the study of angle of inclination/slope of the selected shape and the resulting impact zones that start to define the details of roof geometry.
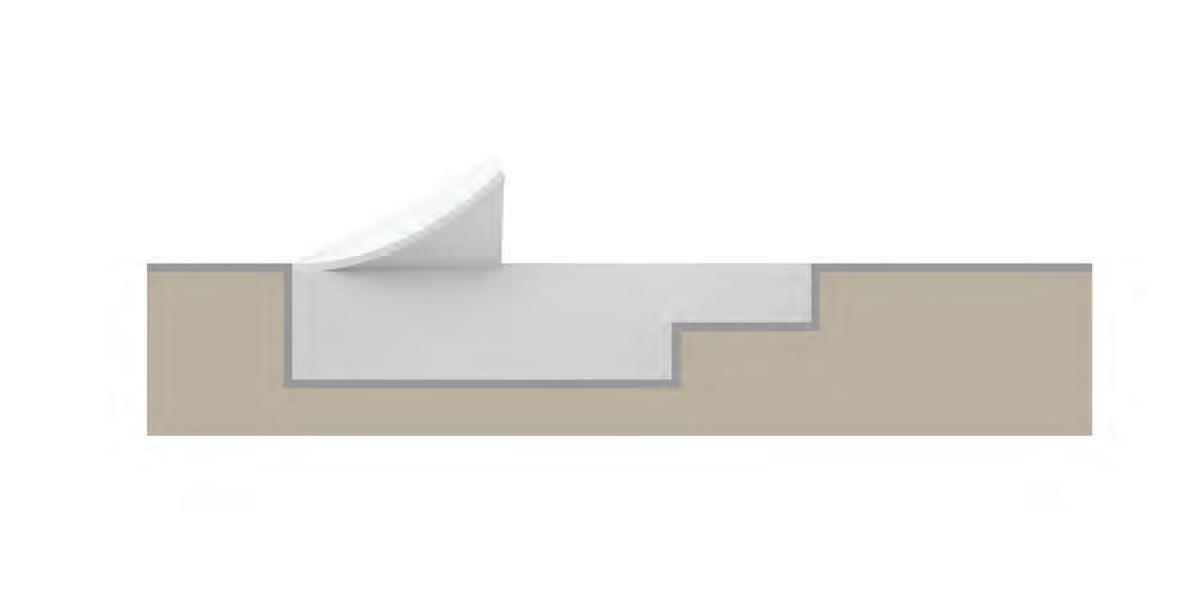
106 I Emergent technologies and design
Max height of reduced velocity zone X 2X Evaluation criteria Property / Logic Reversed eddies/ turbulent zone Wind velocity near surface of roof Maximum Human comfort, sedimentation free zone None saltation will happen in this zone. Unless wind blows from another direction Minimum Human comfort Velocity over 6m/s Least sedimentation on the roof Reduced velocity zone (velocity below 6m/s)
Upwind and downwind ow

Turbulence zone Velocity on the surface
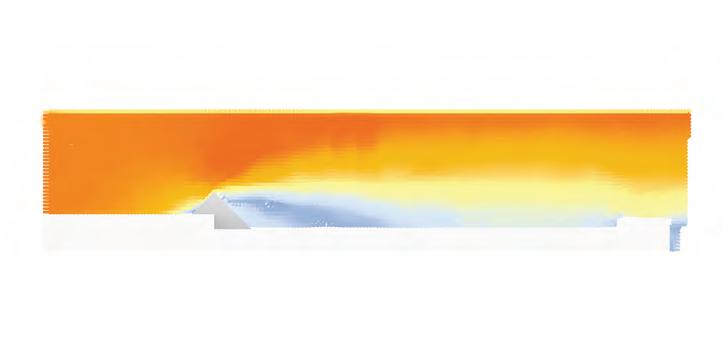
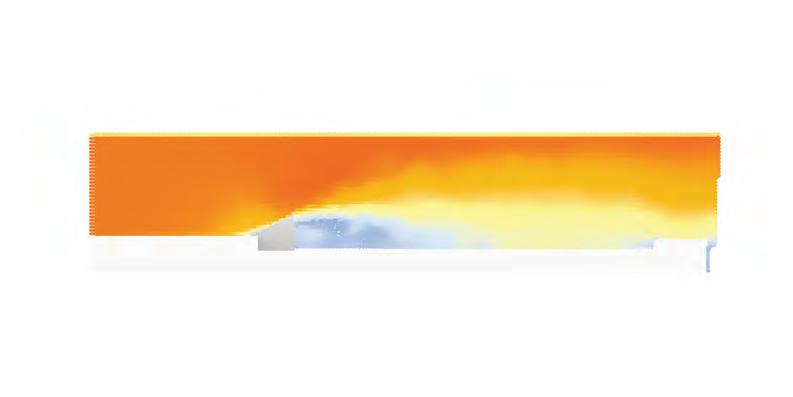
Height of reduced velocity zone Reduced velocity zone
Velocity on the surface
Turbulence zone
Reduced velocity zone
Height of reduced velocity zone
Velocity on the surface
Turbulence zone
Reduced velocity zone
Height of reduced velocity zone
Velocity on the surface
Turbulence zone
Reduced velocity zone
Height of reduced velocity zone
Velocity on the surface
Turbulence zone
Reduced velocity zone
Height of reduced velocity zone
Velocity on the surface
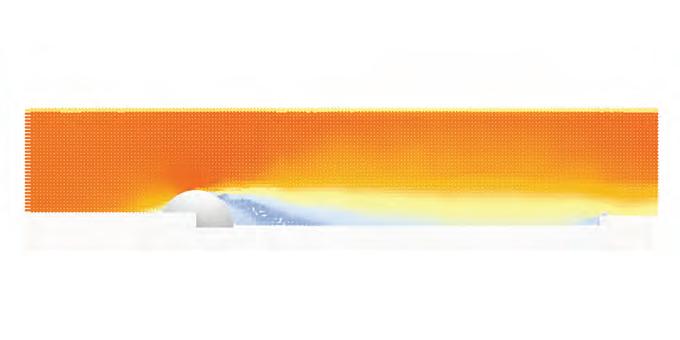

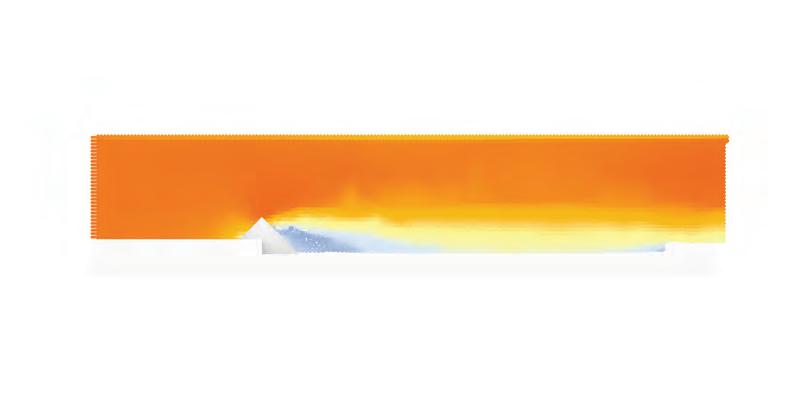

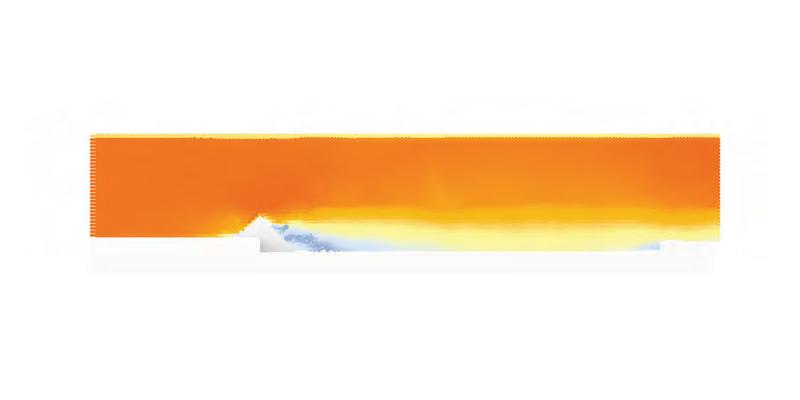
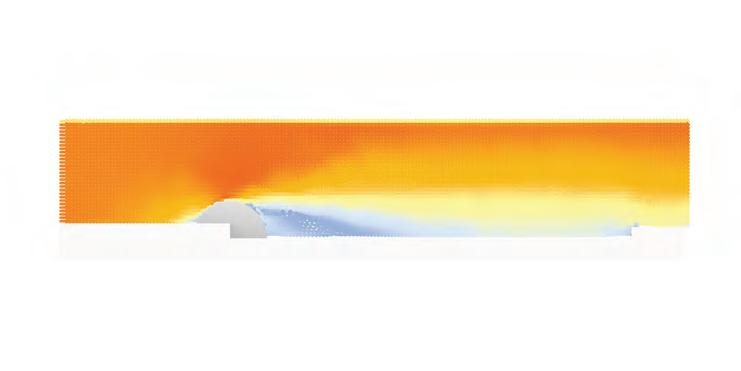
Turbulence zone
Reduced velocity zone


Height of reduced velocity zone

107 In-dune I
1.29x 2.79x 0.55x
1.74x 3.51x 0.73x .68x 1.90x 0.65x 1.29x 7.40x 0.91x .68x 1.44x 0.57x 1.29x 3.60x .92x
Legend Input velocity 9.3m/s 6m/s 0 m/s
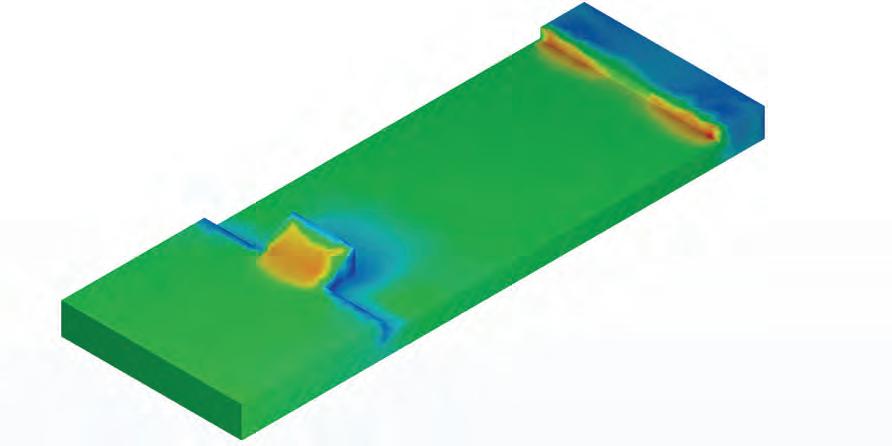
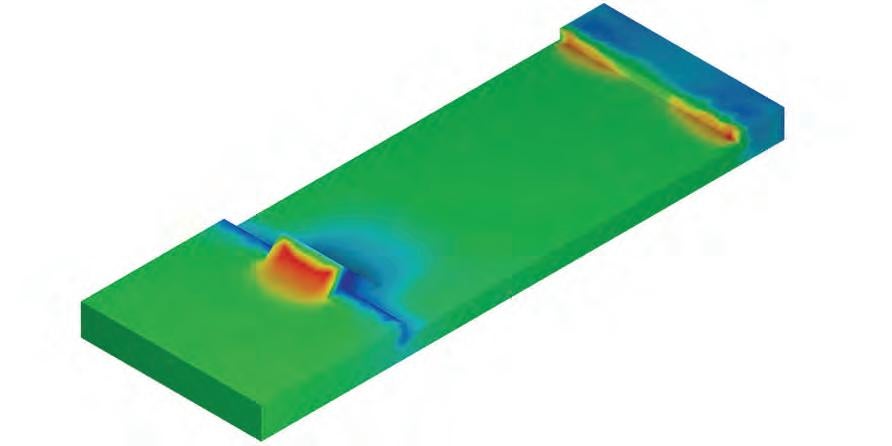
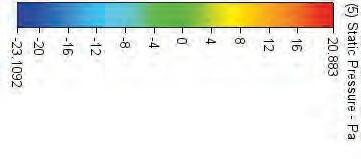
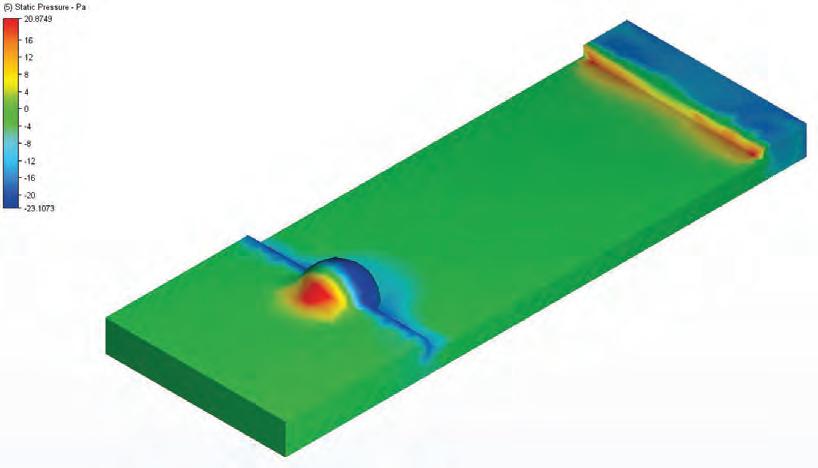

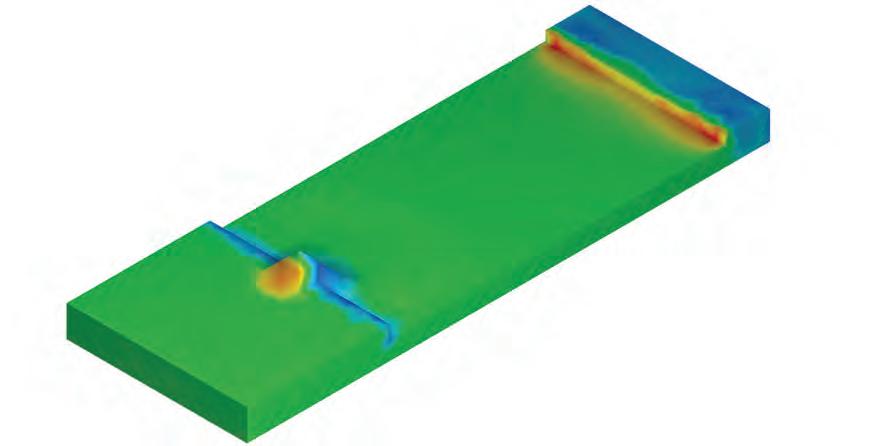
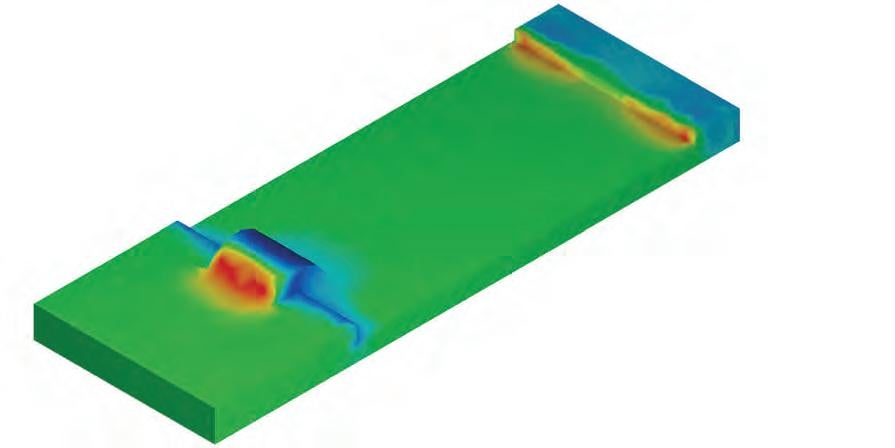
108 I Emergent technologies and design Pressure (pa) 20.88 Pressure (pa) 27.61 -28.56 Pressure (pa) 28.70 -25.13 Pressure (pa) 19.45 -22.93
Inclination of pyramidal geometry

Turbulence zone
Velocity on the surface
Turbulence zone
Reduced velocity zone
Height of reduced velocity zone
Velocity on the surface
Turbulence zone
Turbulence zone
Velocity on the surface


Turbulence zone
Reduced velocity zone
Height of reduced velocity zone
Turbulence zone
Height of reduced velocity zone Reduced velocity zone Velocity on the surface Height of reduced velocity zone Reduced velocity zone
109 In-dune I
10° 20° 30° 40° 50° 60°
0.2x 0.29x 0.73x Velocity
Height
Reduced
.47x .43x 0.73x 0.59x 0.63x 0.17x 0.80x 0.67x 0.21x 0.94x 0.87x 0.29x 0.54x 0.76x 0.59x
Legend Input velocity 9.3m/s 6m/s 0 m/s
on the surface
of reduced velocity zone
velocity zone
Velocity on the surface Height of reduced velocity zone Reduced velocity zone
Conclusions
Amongst all the testing geometries pyramidal form is an ideal choice for it is extremely aerodynamic (due to equal sloping of the surface) and can withstand powerful winds in comparison to others. For a pyramidal roof, alteration of base angle significantly and specifically can change the velocity and pressure field. Such alterations directly affect the characteristics of wind loading on the surface. Furthermore, it was also observed that the changes in flow field are more pronounced for base angle variations of shallow or medium steep pyramids than for steep pyramids51. Variation of inclination angle between 20° and 30° has the ability to create least turbulence and ensure maximum human comfort. The angle of inclination thus determines the effect of wind on the ground and range of sand deflection.
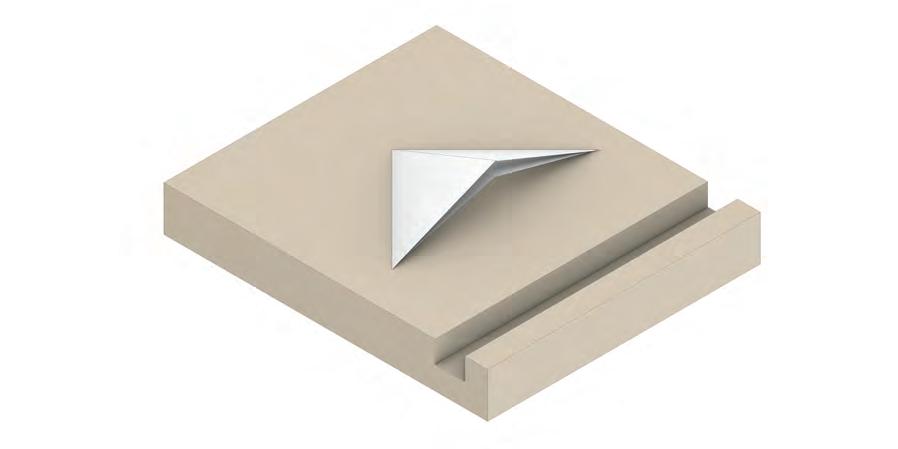
110 I Emergent technologies and design
20° 30°
Sand channel
4.5.2
Orientation of deflection geometry


Precedent studies suggest orthogonal orientation of deflection systems in the direction of prevailing wind52. However, the dual directions of the blowing wind on the site cannot support orthogonal orientation of roof to the predominant wind, for it would facilitate sedimentation in the shielded spaces. The circulation of wind demands a roofing system oriented at such an angle that it effectively deflects the sand from both the directions. The orientation angle together with the angle of inclination determines the deflection and accumulation of sand.
Experiment setup
The study aims at determining the orientation angle of roof such that it deflects the blowing dual winds. Deflection system is not studied independently for both the directions, rather a resulting vector of dominant and subsidiary wind vectors is used as an input to conduct the experiment. Since the quantitative assessment of deflected sand cannot be made, a qualitative judgement is made by observing the net deflected vectors in the direction of sand channels. The angle of orientation of roof is measured with respect to the global x-axis. The roofs are tested for orientation angles from 90° to 180°.
111 In-dune I
De ection e ciency : Cumulattion of angles between SW wind and de ected wind vectors Sand channel S.W wind N α

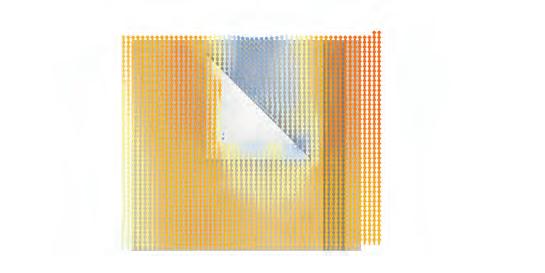


112 I Emergent technologies and design 145° 135° 155° De ection E ciency De ection E ciency De ection E ciency De ection E ciency De ection E ciency De ection E ciency
Observations and conclusions
Since the input dual winds can vary locally due to environmental reasons, a range of orientation angles are taken into account to develop the roofing cum deflection system. It is observed that roofs oriented between 130 to 135° to the global x-axis deflect most of the wind vectors towards sand channels.

Geometric parameters of shape, angle of inclination and orientation can define an efficient deflection system in computational realm. However, other parameters existing in real world such as material and texture of deflecting surface, atmospheric temperature and moisture content of the air can significantly alter the deflection procedure. While these can only be tested physically, the values from digital experiments give a foundation to formulate the physical tests.
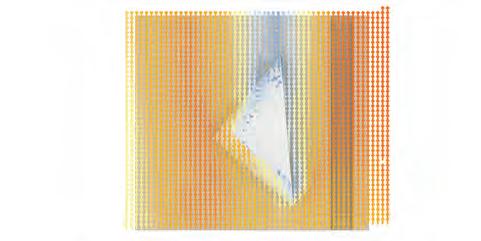
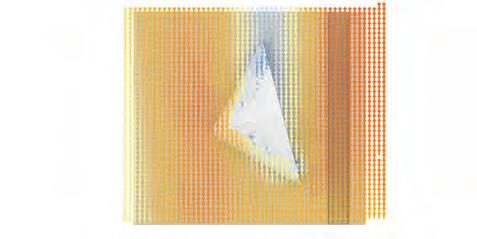

113 In-dune I
180° De ection E ciency De ection E ciency De ection E ciency Legend Input velocity 20m/s 6m/s 0 m/s
4.5.3Wind lift mitigation
Air flow over a building creates a positive pressure zone on the upstream side and negative pressure zones (cavities or eddy zones) on the roof. This pressure difference causes the roof to face an uplifting force. In places where the wind speeds are close to or greater than 17 m/s these uplifting forces can cause immediate damage to the roof. Despite the fact that pyramidal shapes are found with least uplift in comparison to other shapes53, any internal pressure would make the anchoring and sustenance of even pyramidal roof difficult. However, creating openings on the surface can lower the pressure difference significantly and mitigate the uplift.
Experiment setup
The study aims at determining the configuration of openings on the roof surface such that pressure difference between the upstream and downstream is minimised and the uplift is mitigated. The size of the openings and surface area of each roof slit is informed by the roof material. At this stage only the pressure impact of overall distribution of openings are tested. Inclination angle and orientation of each subpart of the roof even after introducing openings does not change.
Conclusions
Introduction of openings have significantly lowered the internal pressure on monolithic roof. Irrespective of having greater openings on windward or leeward side of the roof, internal pressure is reduced the most in equal distribution of the openings. Generation of openings have an added advantage of introducing light and ventilation inside excavated the habitable spaces.
Building of a roof in parts narrows down the fabrication choices for roof installation. Instead of having a monolithic material spanning over the entire excavation, part by part construction with fixing mechanism needs to be adopted. The details of roof material and fabrication are covered in succeeding chapters.
114 I Emergent technologies and design


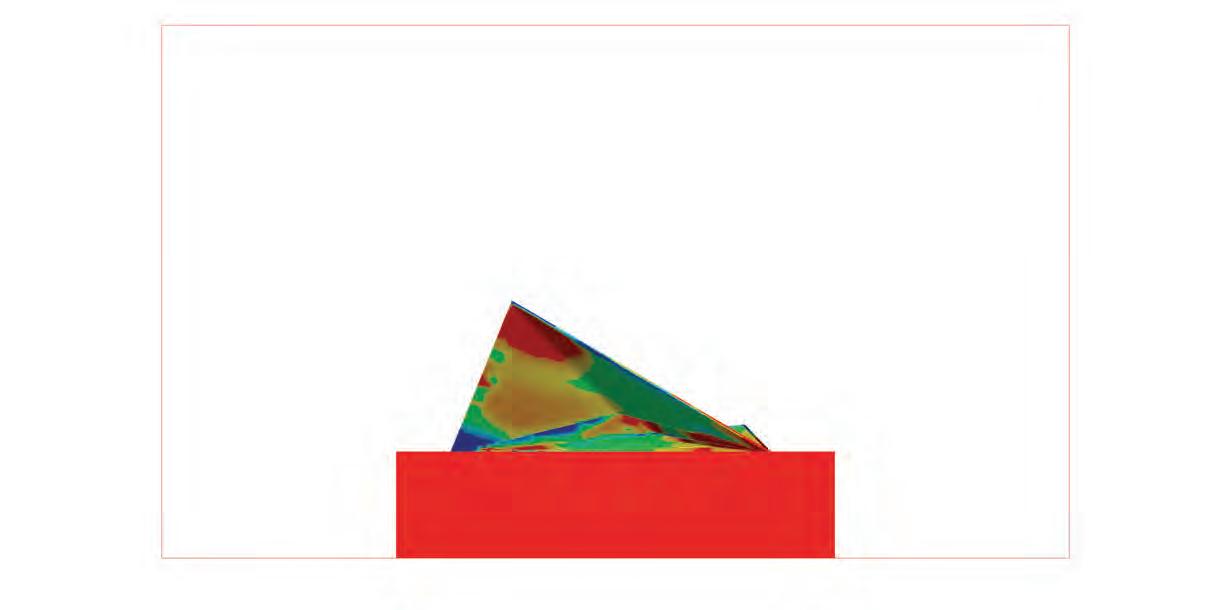
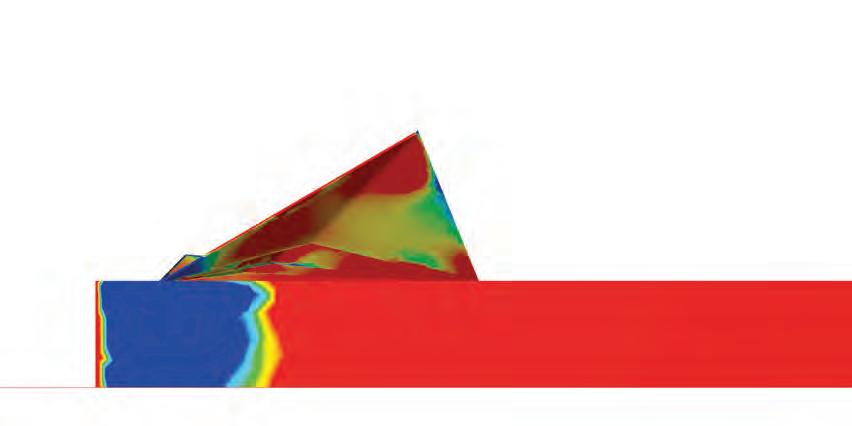
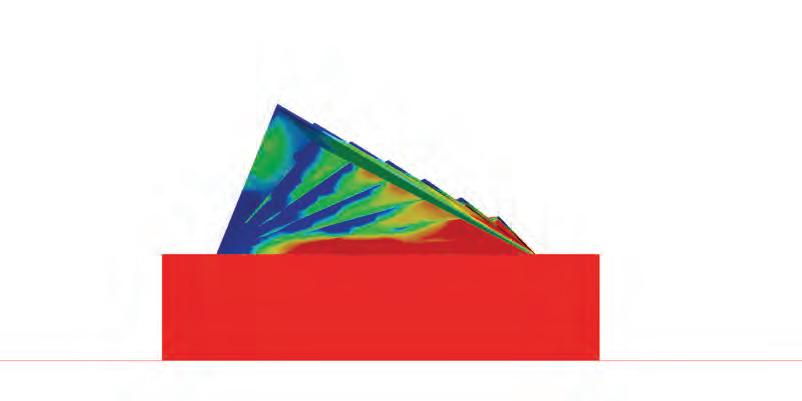
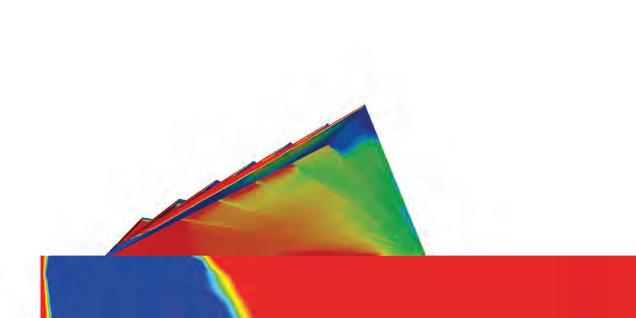
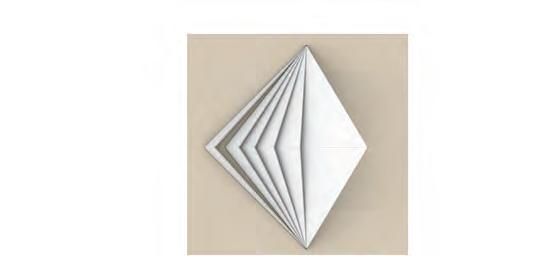


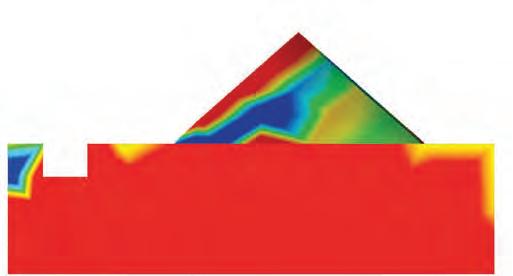

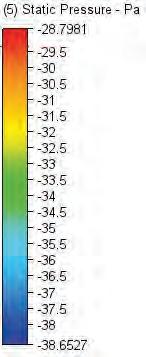
115 In-dune I Density of openings No openings Density of openings Wind lift on lee De ection geometryd with varying porosity 8m/s -38.6 -28.7 Static Pressure -(Pa) -25 -15 Static Pressure -(Pa) -25 -15 Static Pressure -(Pa) -15 -11 Static Pressure -(Pa) Wind lift reduction : 61% Wind lift reduction : 35% Wind lift reduction : 35%
116 I Emergent technologies and design
5. Design Development
This chapter is an adoption of principles derived from the experiments done in the previous chapter and adapting their applicability in the designing process. The section particularly focuses on detailing the new in-dune habitable system and its supporting sand deflecting roofing mechanism, which is optimised for least material input and maximum structural performance. The section overviews the phased development of the terrain based on correlative calculations of productive yields (agricultural and hydrological) and area requirements of the target population. Lastly, it is a detailed account of agricultural system and its dependency on proposed hydrological scheme.
The new habitation system is an adaption of site-specific settlement pattern coupled with principles that are derived from previous section for displaying best environmental performance. The sustenance of the habitable spaces is critically dependent on development of hydrological and agricultural system. Each of these systems have challenges pertaining to adaptation to the site and distribution across the dunal valley.
117 In-dune I
5.1
Habitable spaces
5.1.1Clustering and accessibility
Post zoning the habitable spaces and agricultural fields on windward and leeward sides respectively, accessibility routes are laid on each step of the terrain. While planar walking routes help in intra-step circulation, ramps are laid for inter-step circulation. On the windward side, for intra-step movement access routes are oriented along the subsidiary wind direction. This orientation helps the sand deposited by dominant wind in the access routes to get saltated directly into the sand channels by the force of subsidiary wind when it attains the critical velocity (6 m/sec).
These access routes divide each step into sub-plots where habitable spaces can populate in clusters. Division and sizes of these subplots are dependent on the inter-step walkability. Average walkable distance for a neighbourhood under favourable environmental conditions is considered to be 400-500 m. High radiation and fast blowing winds of the site make walkability tedious and suggest its reduction. We propose a 200m inter-step walkability, which also defines dividing distance between sub-plots (or distance between intra-step access routes). As the intra-step access routes are subjected to sand accumulation due to deposition by predominant wind, they are redistributed along the valley based on qualitative assessment of sedimentation pattern. Higher sedimentation volume requires greater number of ‘channels’ for accumulation. The redistribution causes a change in the sizes of sub-plots, making them range from 200m to 75m from valley to crest.
118 I Emergent technologies and design
Maxium cluster plot size derived by minimum walking distance between two steps
Step height: 15m
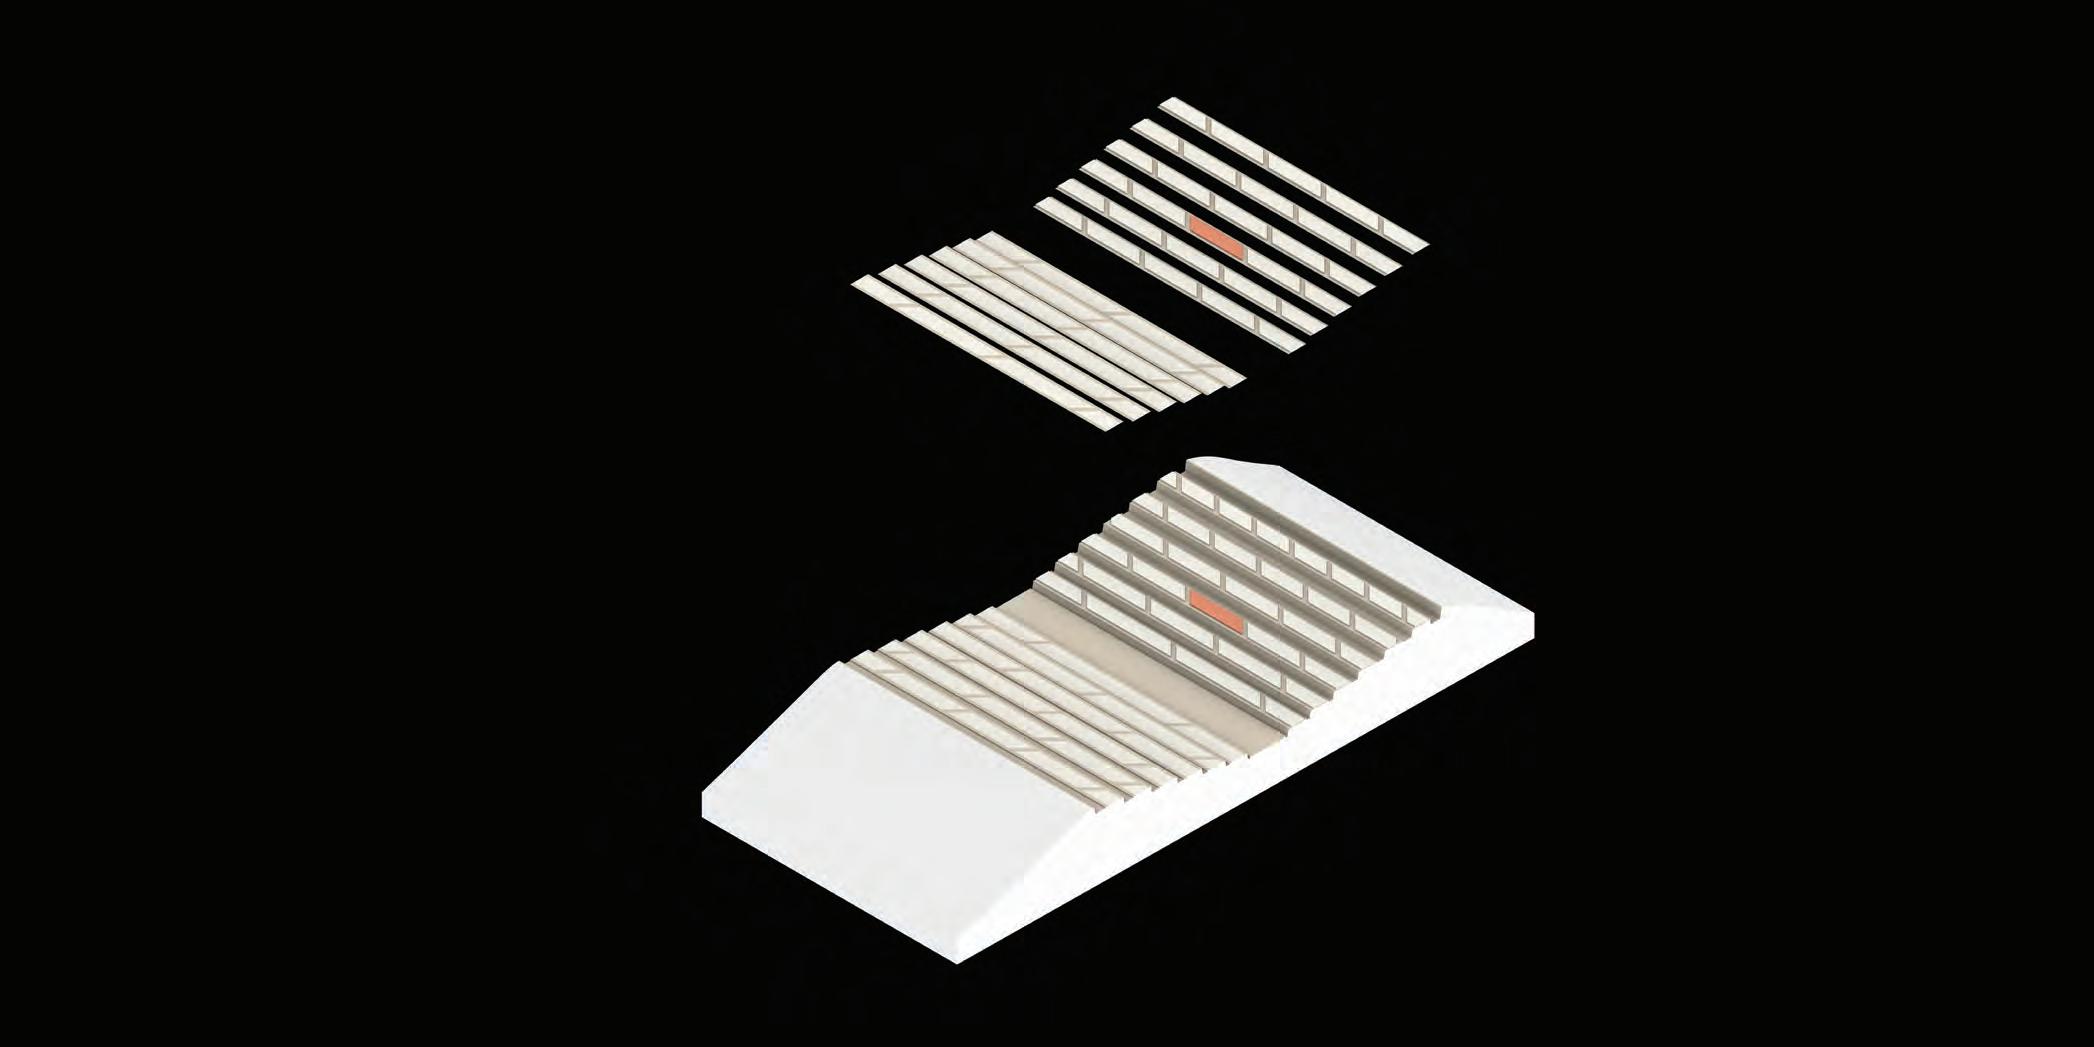
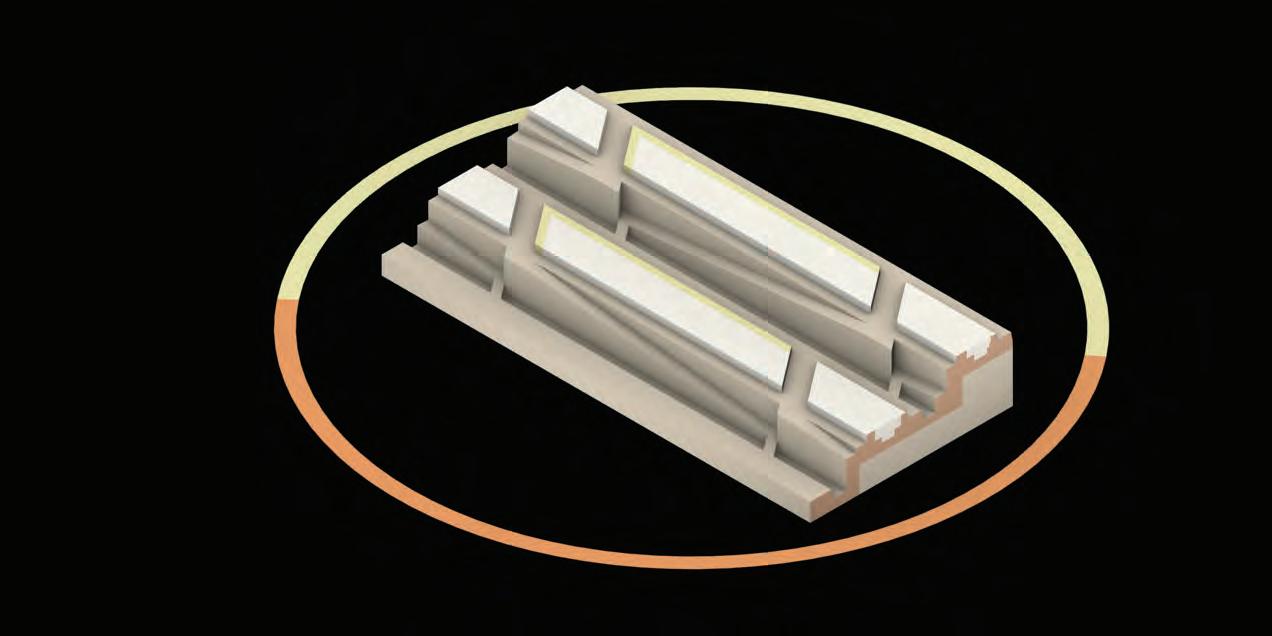
119 In-dune I N
Access from leeward faces
5.1.2Programmatic adjacencies
Each sub-plot accommodates multiple housing units in clusters. Each of these units are an aggregation of different programs specific to the site. Based on the observations made on spatial arrangements from the site visit, these programs can be categorised into Primary, Secondary and Tertiary functions. As courtyard housing is typical to the site, they are categorised as primary function around which other secondary and tertiary functions are spatially arranged directly and indirectly respectively. Courtyards play a significant role for being a benefactor of social gatherings and other outdoor activities. Based on the family sizes (average family size- 6.2) the courtyards are categorised as small, medium and large. Each of these have corresponding list of functions, their numbers and sizes.
In order to support growing family size within one unit we introduce Expansion Units as a part of programmatic strategy which can be brought to use as and when the area requirements increase. The walls and floor slabs of these are injected along with the other active functions of that unit. However, these spaces remain unexcavated till spatially not required. As the injection of all the spaces are carried out in patches of 3m X 3m, the area of each space is determined in multiples of 9 m2. Translating the above information into computational realm, each of the injection patch is referred to as ‘Cell’. Computationally each cell stores information of its order and size corresponding to its function. As an input to the further experiments on spatial arrangement, an aggregation hierarchy and a few programmatic adjacencies of these functions are defined in the table shown.
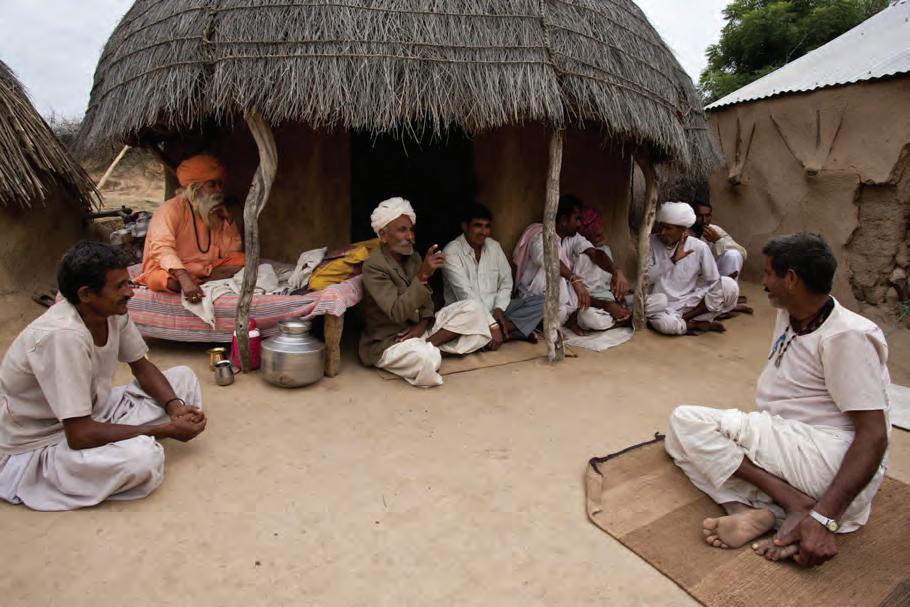
120 I Emergent technologies and design
Communal spaces outside units
Image copyrights : Nick Fleming
Table: Distribution of functions based on di erent family sizes
Family Sizes


Unit expansion strategy
( Transition of spaces as families expand )
121 In-dune I
Treated Surface Unexcavated sand Hardened walls and oor slabs Area excavated for use Area excavated for use Hierarchy of Functions Selected Cell Varying range of selected cells 4-6 cells: 36-54 sqm7-9 cells: 63-81 sqm 10-12 cells: 90-108 sqm Verandah/Semi-open public space 1 1 2 1 small 2 to 3 4 to 5 6 to 8 1large 1 large 1 1 2 1 large, 1 small 2 large, 2 small 3 large, 2 small 1 1 2 1 1 1 large 1 large, 1 small 1 large, 2 small 1 large, 1 small 1 2 2-3 1 1 1
Functions Cell size = 3x3m = injection matrix Courtyard Living Room Toilet Store Plant Nurseries Secondary Connection Large BedroomSmall Bedroom Large Kitchen Expansion Units Small Kitchen Adjacency 01 Adjacency 02 open spacePrimary Closed spacessecondary Semi-open spaces-tertiary
5.1.3Planar aggregation of programs
Arrangement of programs locally within each unit and arrangement of these units into clusters collectively form the global aggregation mechanism within each sub-plot. Semi-open spaces, specifically Verandah form the inter-unit connections. Hierarchy of functions and spatial adjacencies coupled with rules related to zoning, orientation, stacking and connections form global aggregation logic. While the Units are an adaption of traditional courtyard housing, the spatial arrangements of functions around courtyards are aimed at adapting to the environmental conditions of a desert to display best performance.
Experiment setup
From the varying plot sizes of lengths 75-200m across the valley, the study aims to develop local and global programmatic arrangements of medium and large courtyards on a 100m long plot. The rule based aggregation at both the levels happen simultaneously to form a network of open, semi-open and close spaces. While rules and objectives let the aggregation solutions inherently display different degree of performance for generic environmental conditions in a desert, the solutions are further evaluated for site specific environmental constraints.
cell size 3 x 3m
Area available 2,400 sqm
Area per person 67sqm
Population 34 pax
Family sizes 5 to 8
Large-Medium Courtyards |Pareto front solution
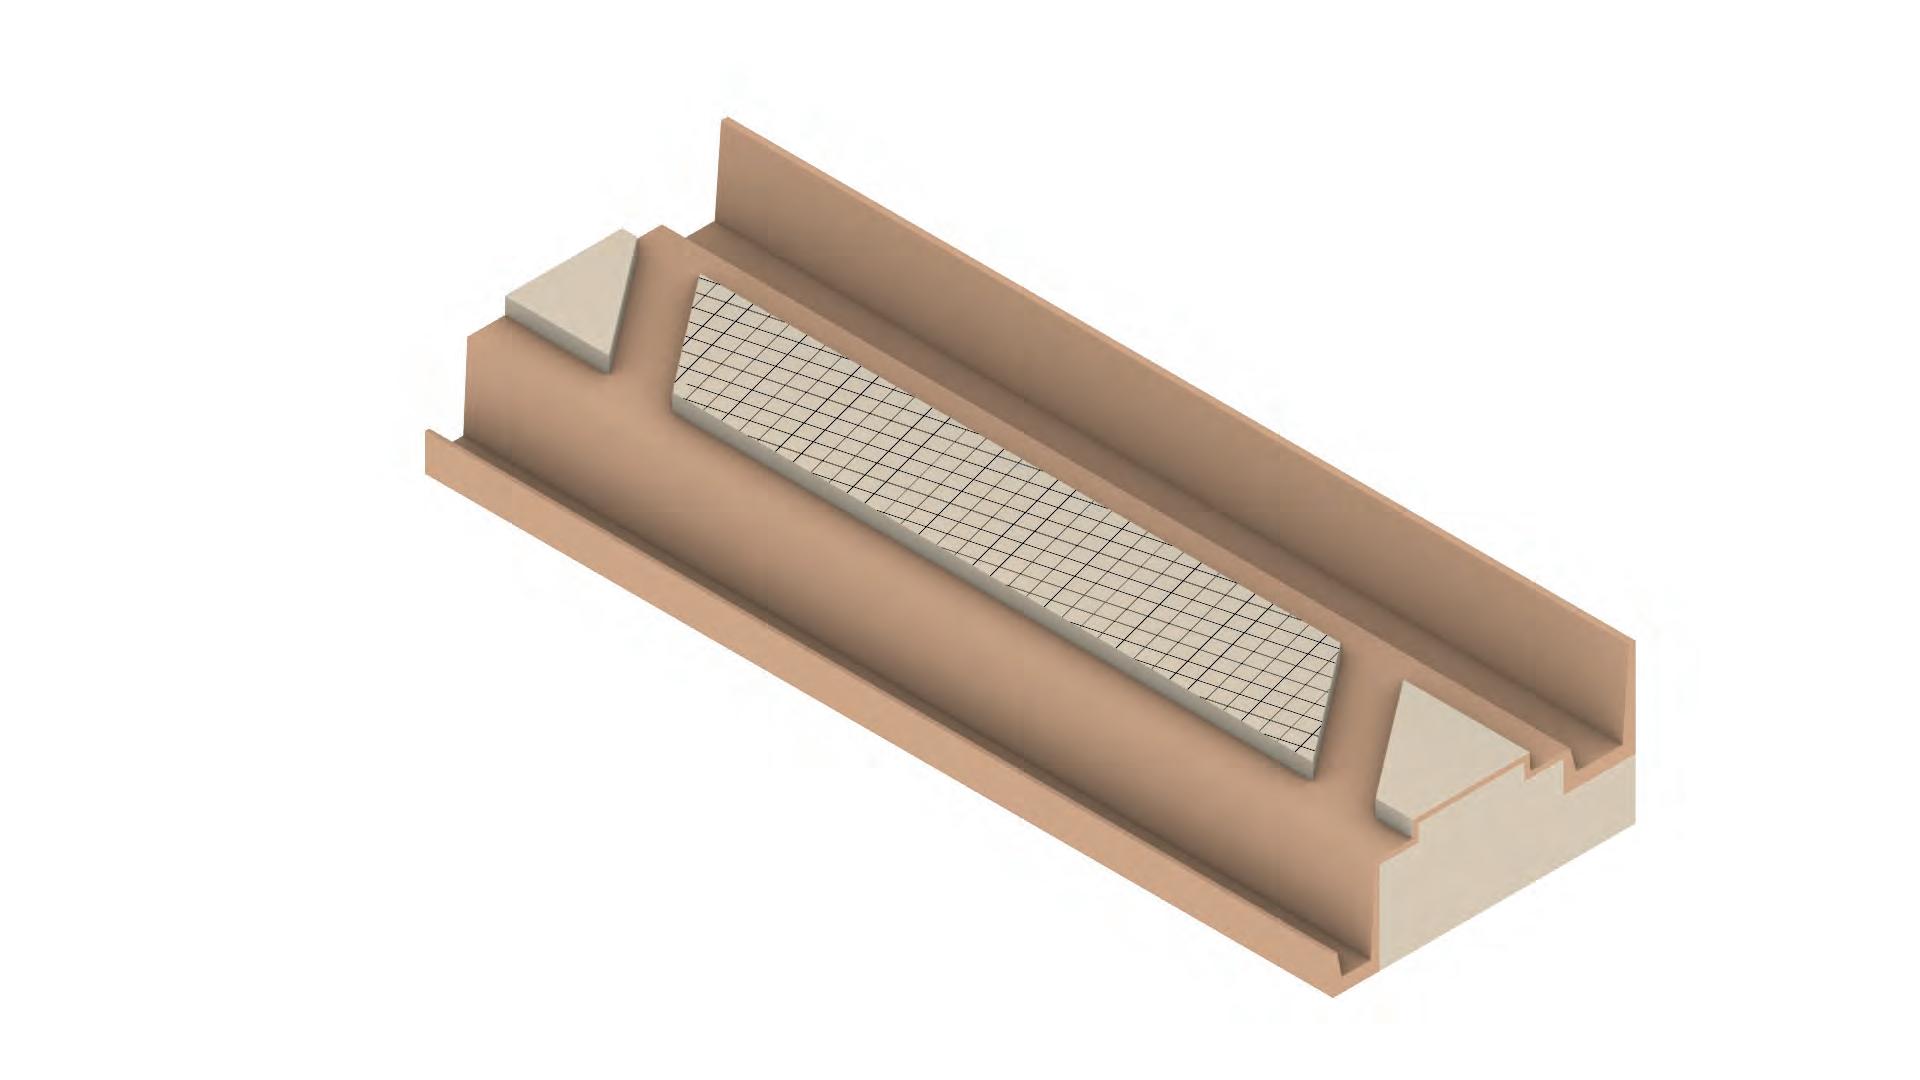
122 I Emergent technologies and design
Aggregation rule / Gene pool
Rule 01: Zoning
Cells can only be selected in zones that are based on the distance from the courtyard
I: Primary (Courtyard)
-Aggregation Point for other functions
II: Secondary functions
-Direct access to Primary function
III: Tertiary functions
-No direct access to Primary function
Rule 02: Orientation
Preference to oreint along the longest side to enable more natural light into spaces
Fitness objectives
FC 1- Maximize perimeter
This would result in a greater sufaces area available for the heat exchange between the spaces and subsoil
FC 2- Maximize closed spaces located towards north
To reduce solar heat gain
Rule 03: Stacking Stacking of secondary functions on non-availability of cells
Rule 04: Connections Courtyads can be connected only through semi-open spaces
Common social space between two
FC 3- Maximize plan nurseries located towards north
To reduce solar heat gain
FC 4- Maximize connectivity between courtyards
To reduce solar heat gain
Open Space (courtyard)
Closed Space Semi- Open Space
Selected Phenotype
123 In-dune I
N N
Pareto front solutions
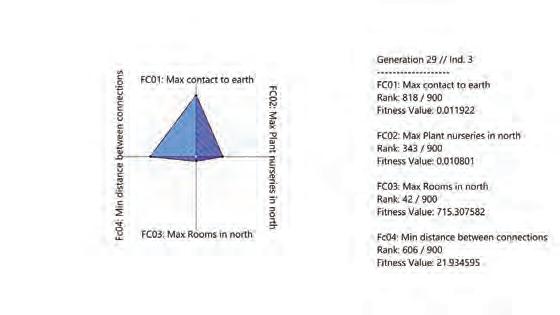
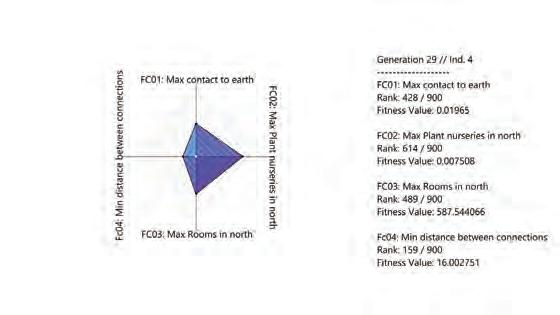
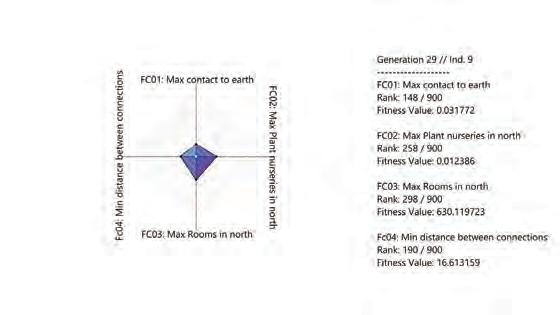
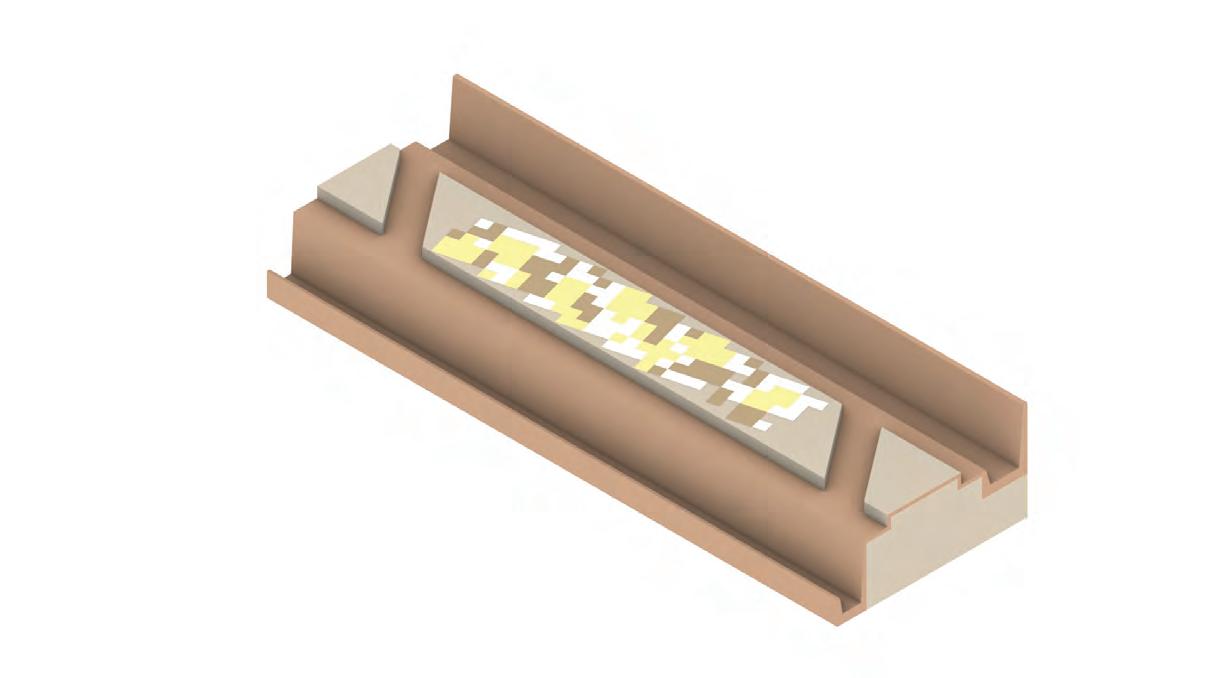


124 I Emergent technologies and design
Selected Phenotype No. of Generation: 30 No. of Individuals : 900 FC1 FC4 FC2 FC3 FC1 FC4 FC2 FC3 FC1 FC4 FC2 FC3
Selected phenotype
Best of FC 4: Maximum connectivity between courtyards
Coherency of units
Conclusion
Maximum number of courtyards protected from pre-dominant wind
Pareto front soultions
Over the generations, the adaptation to the objectives have resulted into a coherency of different spatial arrangements and functions. Each of the emerged solutions have ‘coded’ potential to respond to the environmental needs at different intensities. The selection of final solution is however based on sand influx pattern on the site and value addition of increased social interactions. The selected solution has maximum number of courtyards that are naturally shielded from sand laden bimodal winds by the assembly of closed secondary and tertiary functions on its periphery. Having maximum number of connected units, the selected solution forms a coherent aggregated mass with opportunity for increased social scheme.
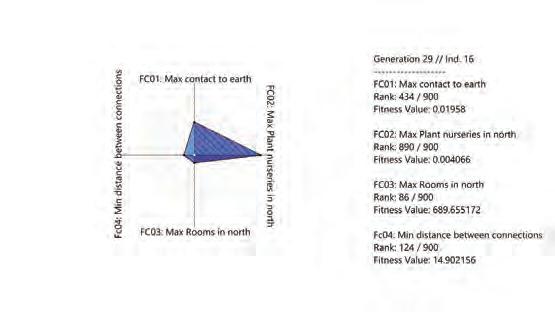
While the spatial aggregation addresses to planning of spaces, a volumetric assembly of these functions is needed to detail and define relationship and circulation between these spaces.

125 In-dune I
FC1 FC4 FC2 FC3
Selected solutions from all aggregation types
5.1.4Volumetric aggregation of programs
Stacking and configuration of planar functions from the previous experiments demand for volumetric arrangement of spaces for human inhabitation. Every space demands a unique thermal condition and spatial quality. Based on the data from microclimatic studies at varying depths, these spaces are placed for their corresponding temperature/ thermal requirements. While function like courtyard which serves as central space to other functions are injected in parts and at different levels to connect all other spaces, functions like unexcavated expansion units and bedrooms are placed at the bottom of excavation pit to provide most thermal comfort. The configuration and changing volumes of these functions play a significant role in creating buffer spaces like balconies and shaded pathways.
Experiment setup
The changing volumes and their arrangement determine the extent of excavation of each sub-plot and the circulation within it. At both local and global level for the sub-plots the study aims to derive most suited configuration that provide thermal comfort to the inhabitants by activity based placement of functions and selfshading respectively. Since the maximum heat gain happens from the roof in a structure, the evaluation is based on the heat gain value of the spaces directly exposed to the sun.
126 I Emergent technologies and design
Gene group : Levels
Fitness objectives
FC 1- Minimum excavation
For material and time e ciency
FC 2- Min. level di erence
For ease of ciculation
Gene group: Scaling
FC 3- Max. surfacea area in contact with earth
To enable heat exchange
FC 4- Max. self-shading
127 In-dune I
-12 m -09 m -06 m -03 m 00 m Expansion units Toilets Kitchen & store Living -6 to -12 m -9 to -12 m -3 to -9 m Bedrooms Courtyards -Verandah -Plant nurseries -Secondary Connection Semi-Open Spaces 3 - 4.5 m 2.5 - 3.5m 3 - 4.5 m 3 - 4.5 m 3 - 4.5 m 5 - 7.5 m
Pareto front solutions


Avg radiation : 560 kwh/sqm
Total radiation: 1.43 x 10⁶ kwh
No. of Generation: 20
No. of Individuals : 400
Avg radiation : 570 kwh/sqm
Total radiation: 1.44 x 10⁶ kwh

Avg radiation : 565 kwh/sqm
Total radiation: 1.35 x 10⁶ kwh
Radiation analysis
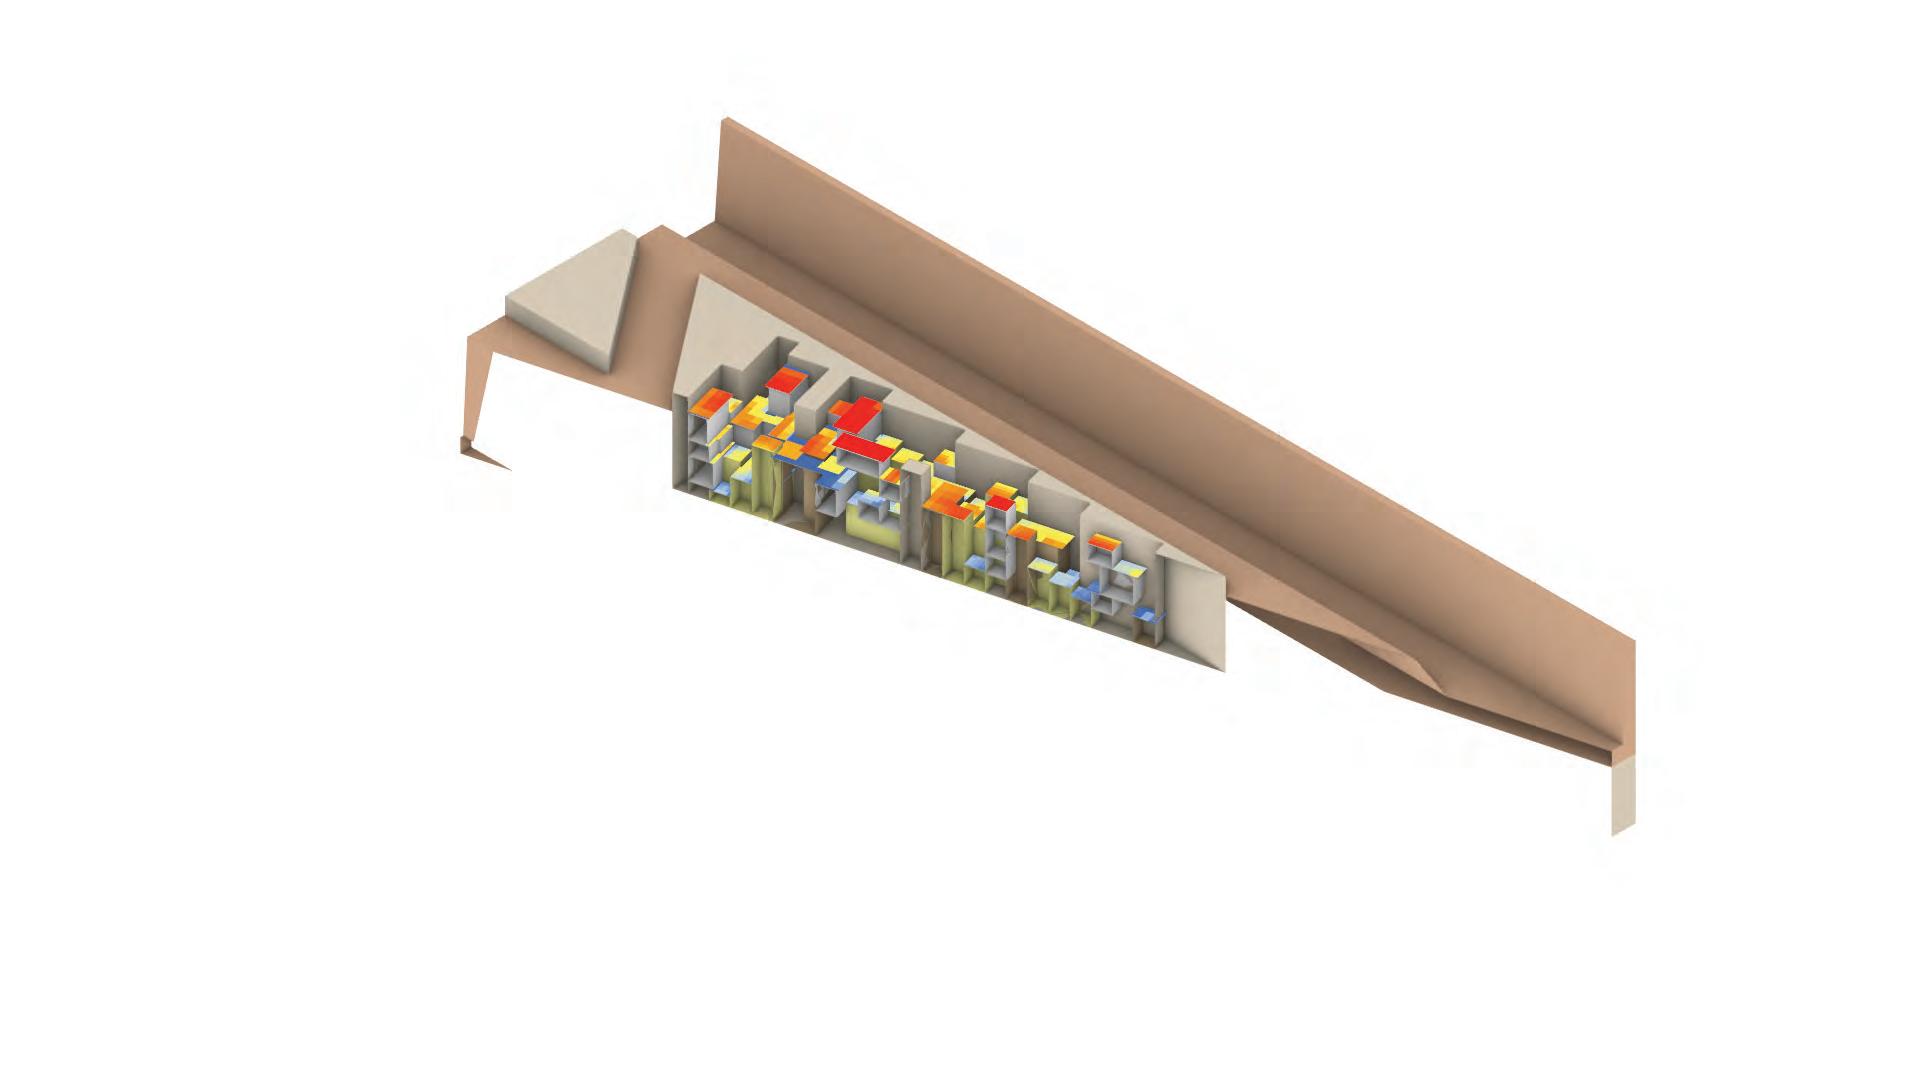
6 FC1 FC4 FC2 FC3 FC1 FC4 FC2 FC3 FC1 FC4 FC2 FC3
Avg radiation : 535 kwh/sqm
Total radiation: 1.28 x 10⁶ kwh
Avg radiation : 572 kwh/sqm
Total radiation: 1.40 x 10⁶ kwh
Avg radiation : 545 kwh/sqm
Total radiation: 1.30 x 10⁶ kwh
Radiation analysis


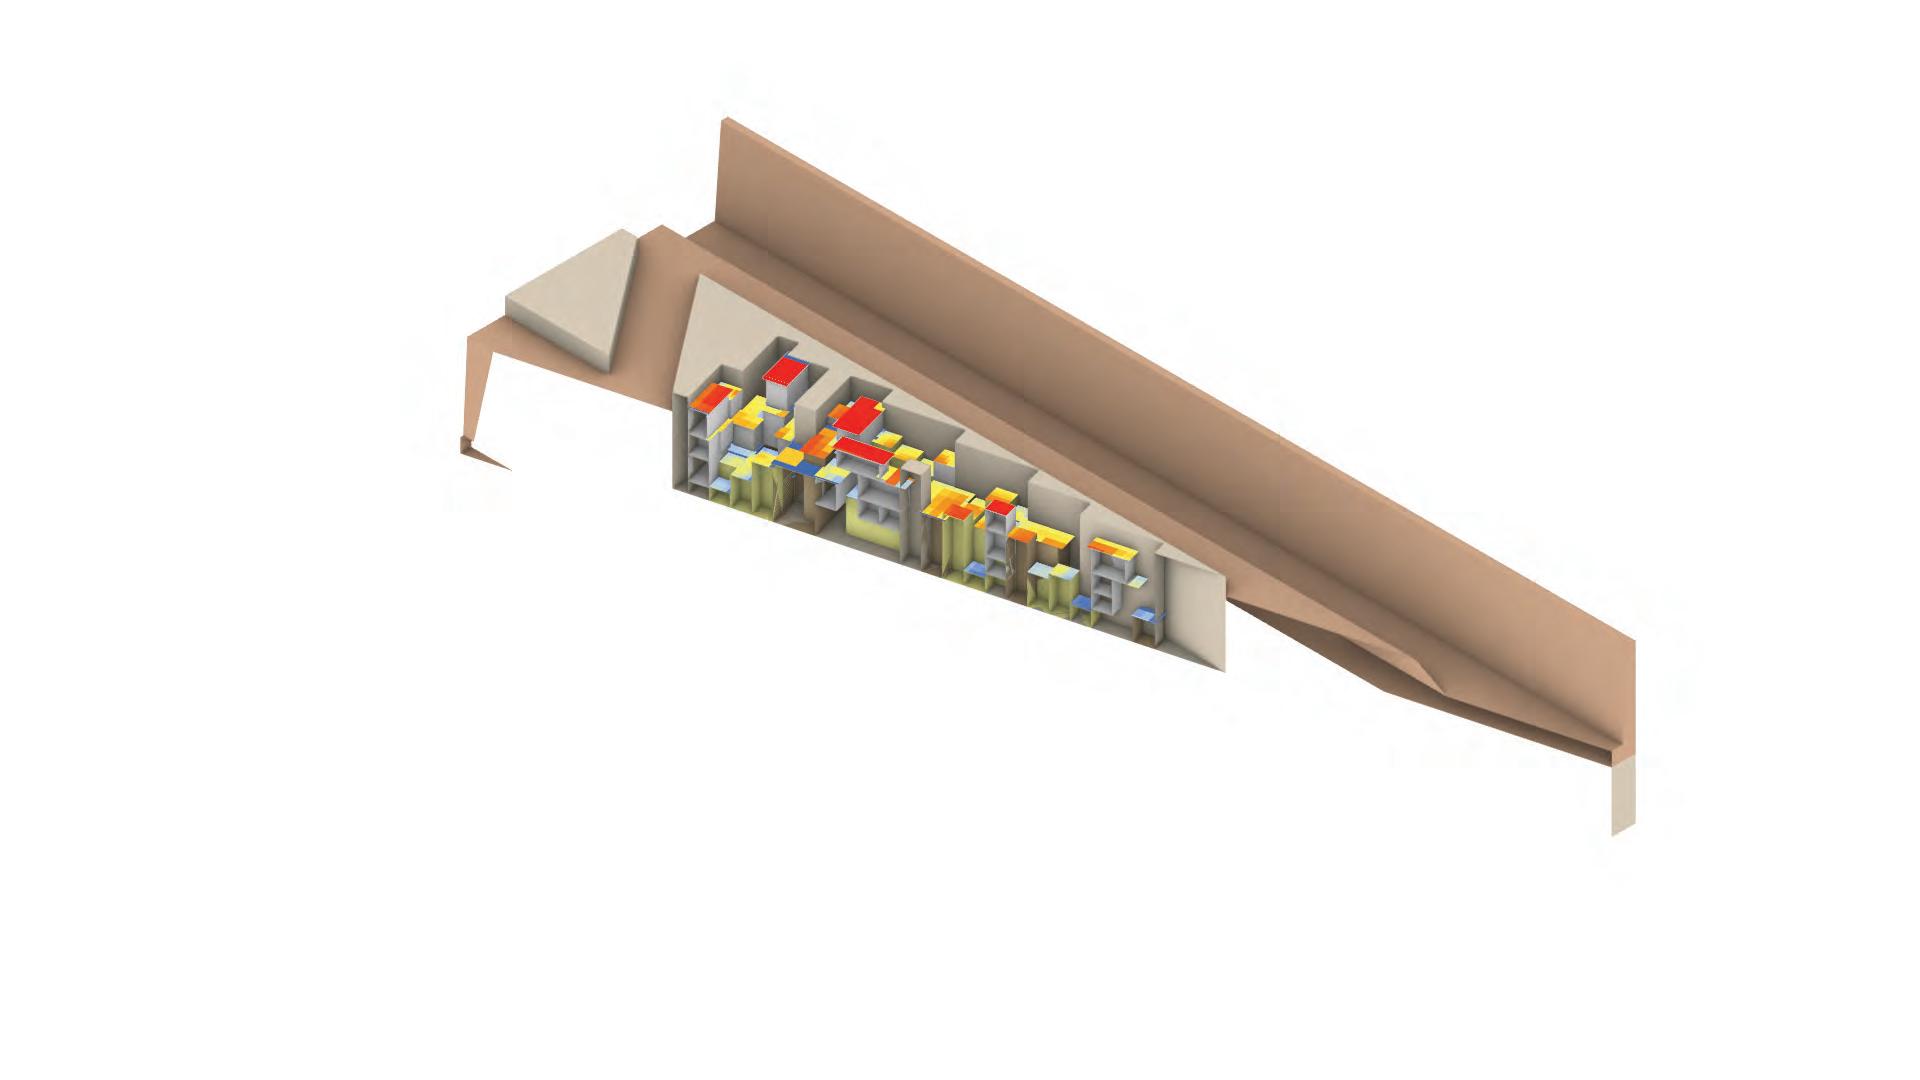
FC1 FC4 FC2 FC3 FC1 FC4 FC2 FC3 FC1 FC4 FC2 FC3
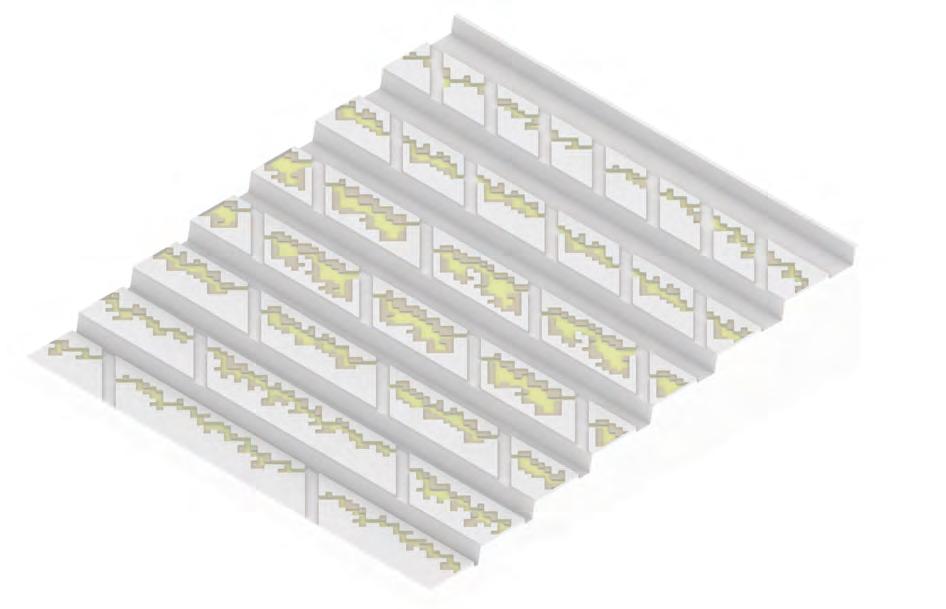

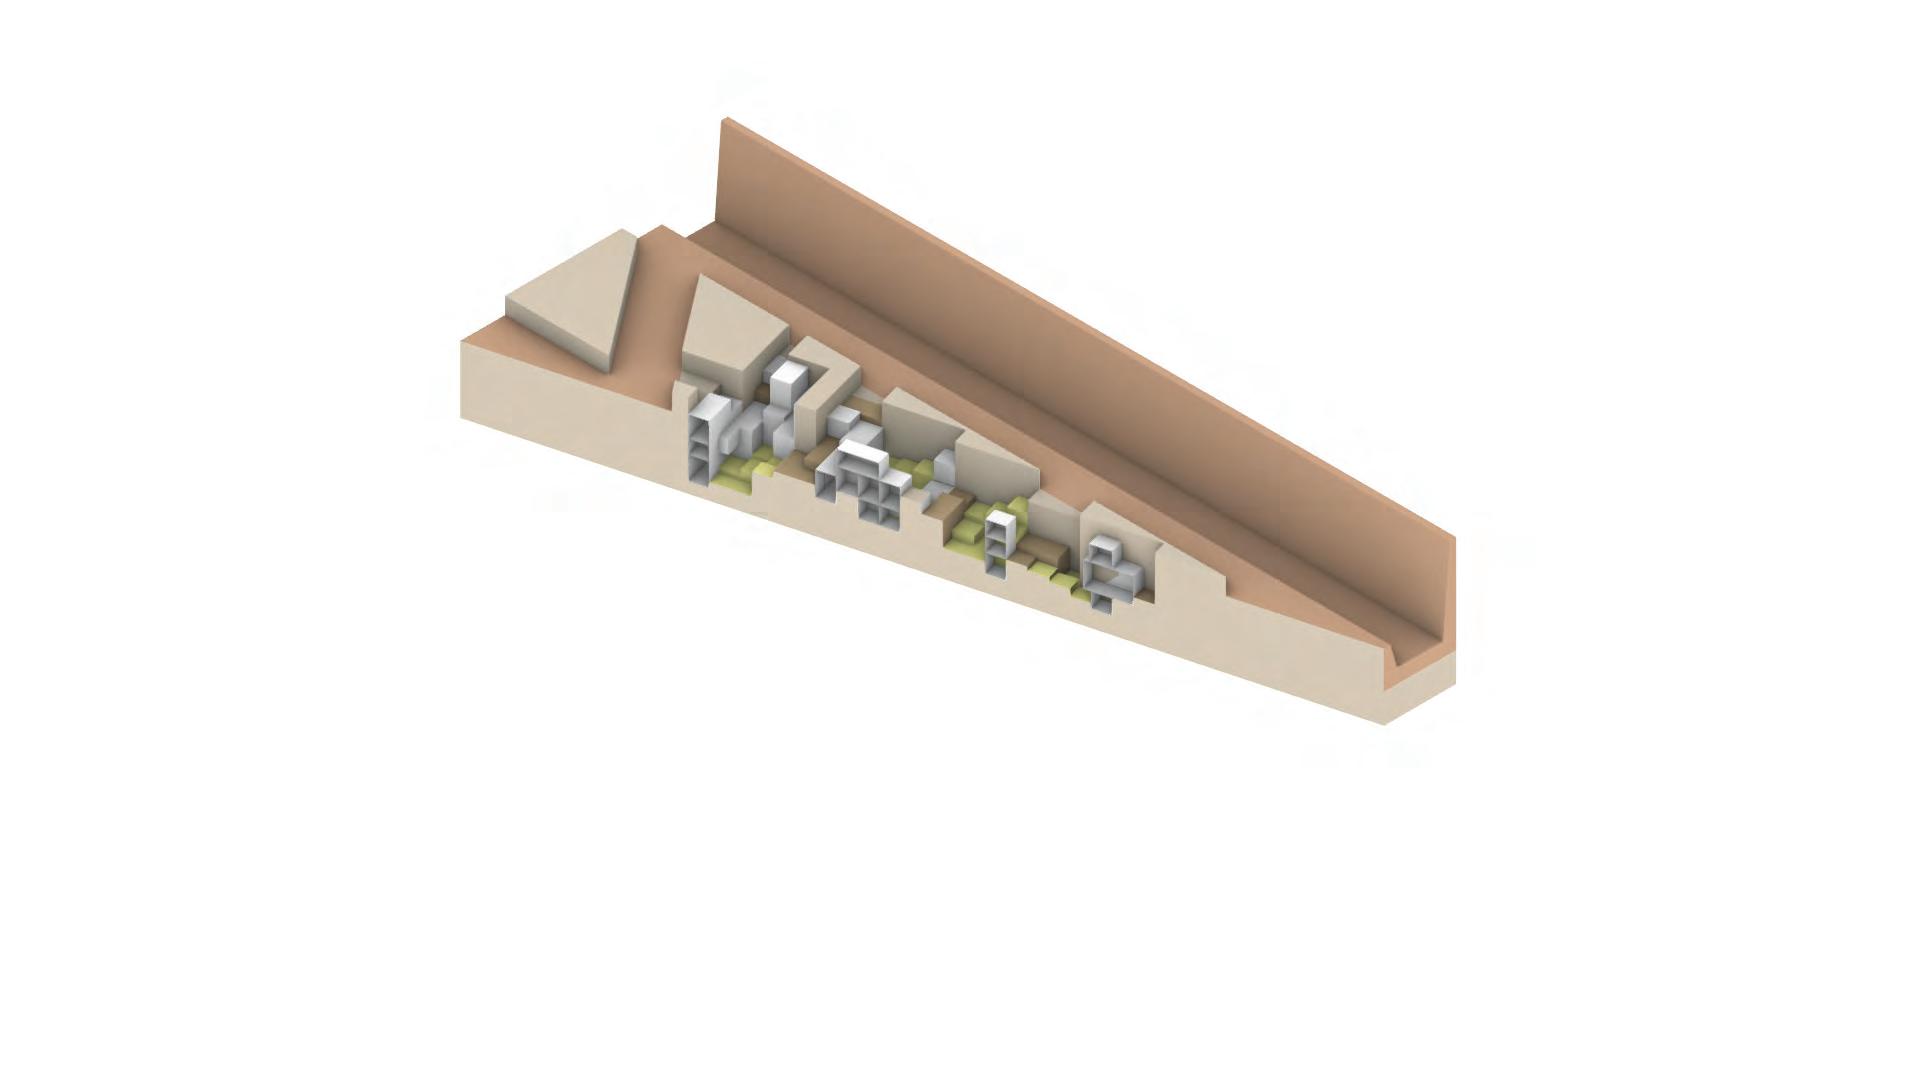
130 I Emergent technologies and design -04m -08m -12m 00m
Conclusion
The peripheral volumetric assemblies around a courtyard cast shadow on the it and makes the space usable for social activities. However, the size of courtyard also plays a significant role in determining the amount of heat that the space can gain when exposed to solar radiation. Smaller courtyards are better shaded by peripheral spaces for the spaces are not elaborately spread like those in larger courtyards. As the radiation value varies across the windward slope, the distribution of small, medium and large courtyards along with their corresponding peripheral spaces are governed by this concept. By controlling the heat gain through adopting passive self-shading technique, functions like plant nurseries can be given a suitable environment for saplings to thrive.
The variation in distribution of courtyard types also generates variation in population density on each step. This variation further governs the yield requirements from agricultural plots and distribution and density of different tanks involved in forming hydrological system on the site.
131 In-dune I
Structural frame
Deflection system: scalability 5.2
5.2.1Materiality
The part by part construction of roofing system as suggested for mitigating uplifting wind force demands for strong structural and material system. Existing use of locally produced material by the locals imply the applicability and durability of these materials in combating adverse weather conditions for over the years. The roofing mechanism has two main components- structure and cladding system. Each of these components are proposed to be developed using locally produced composite material.
Based on the material study, we opt to develop sand and biopolymer based cladding system with wooden structure. From the noted success of getting uniform compressive strength by casting sand composite in moulds, we propose dry-mixing mould casting of the composite into tiles. As these tiles will be directly exposed to blaring heat, they need to be durable and provide thermal insulation. To enhance the durability only desalinated water shall be added to the composite while fabrication. Addition of natural fibres into the composite increases the thermal insulating ability of the material.
For the development of structure, we propose to use wood from tress which are planted specially to support the fabrication procedures on the site. Since everything is fabricated on the site and there is no shortage of skilled labour for wood work, we propose to increase community participation by involving the locals in the process of development.
Cladding components
Gum arabic tree/ Babul
Vachellia nilotica
It is strong, hard and tough and locally used for bodies and wheels of bullock cart, agricultural instruments, tool handles, and well curbs
Fine sand
Fine in texture and low cost building material. Used to add bulk strength, stability, binding and levelling of dry surface

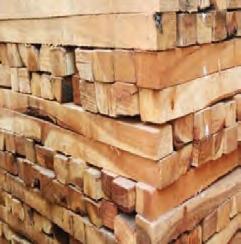
Coconut fibres
Adds toughness and tensile strength, resists cracking and spalling
5% Sodium alginate sol.

Binding agent .Imparts insulation from fire and resistance to heat.
Insulation
Natural jute fibre

Natural insulator

132 I Emergent technologies and design
Material combinations

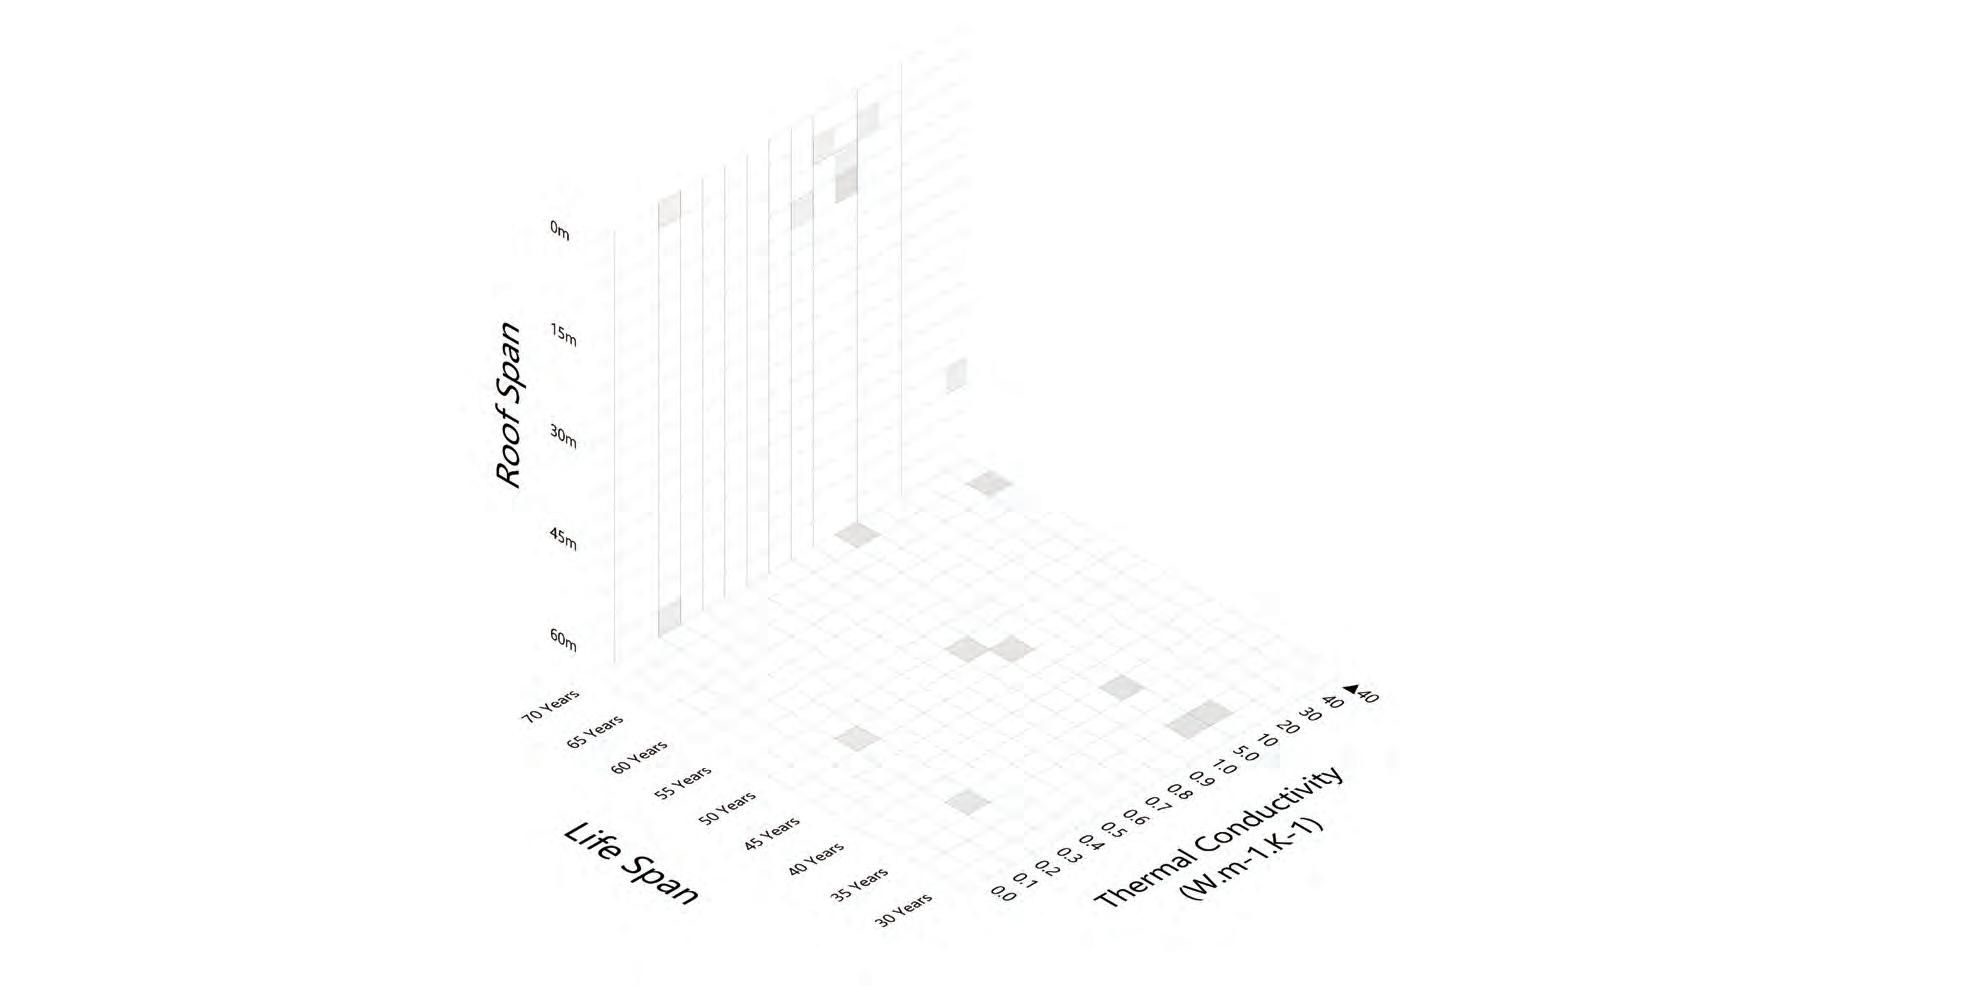
Sand & biopolymer components ( bre reinforced), interlocking self-supporting roof
Hessian + sand & biopolymer bre reinforced plaster, supported by wooden posts and tension cables.
Sand & Biopolymer tiles( bre reinforced) + wooden structure
Sandstone
Clay tiles & Wooden structure system
Tatched roof + wooden structure
Metal frame and sheets
Concrete
ETFE single layer
133 In-dune I
0 km 7091km Small cube size Large cube size Distance of production from site
5.2.2Structure
Primary structure comparative study
Spanning over atleast a distance of 3m (Minimum planar dimension of injected space), the roof is subjected to three types of loads- Wind load, Wind Lift load and Dead load or self-weight of wooden structural members and cladding tiles collectively. These loads subject the roof to torsion and shear forces for which the roof is anchored in the directions of prominent and subsidiary winds. The roof demands for a strong structural system which can withstand these loads. Three different structural systems are tested for the same loads and evaluated for least utilisation values. While it is observed that there is no significant difference in how these systems behave under these loads, the selection is based on least material requirement.
Dead load of tiles : 0.001 kN/m2 + Dead load of structure
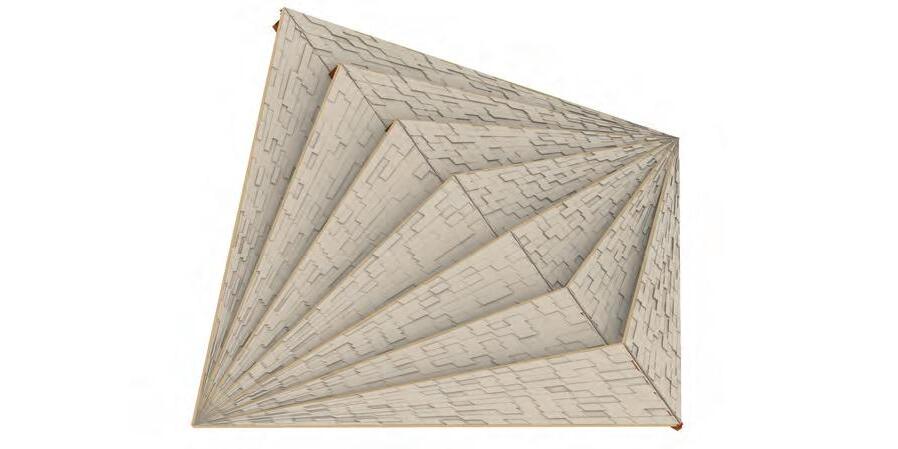
Anchored edge
Wind lift Load : 0.02 kN/m2
Force Force Force
Wind Load : 0.02 kN/m2
134 I Emergent technologies and design
Multiple trusses + supports
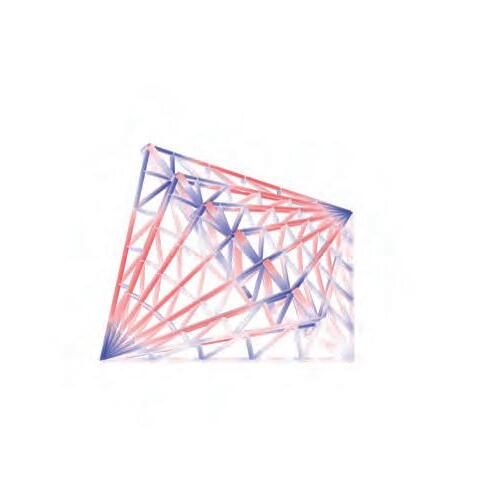
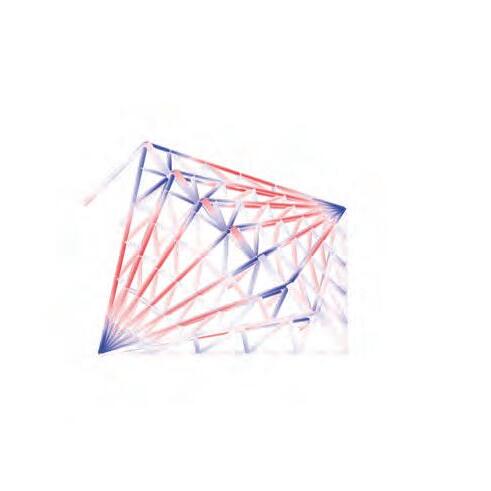
Vertical supports only
Single cantilevered truss
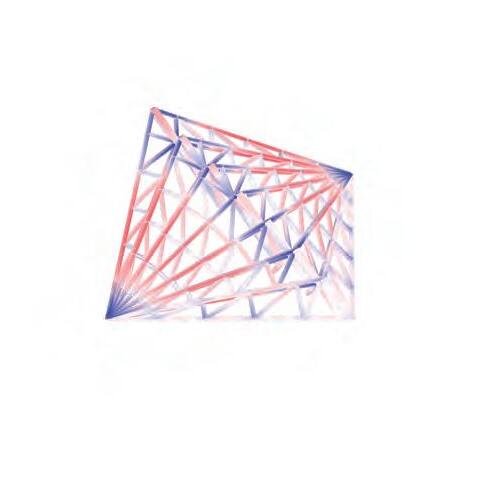
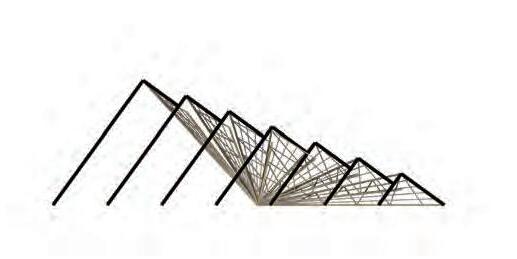
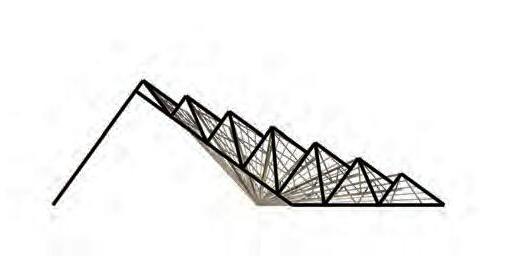
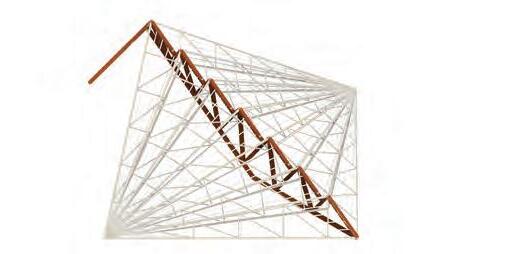
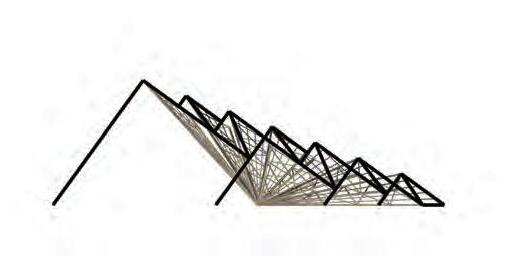
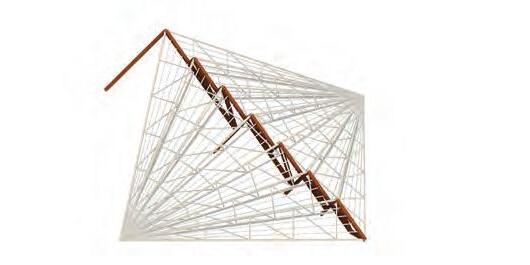
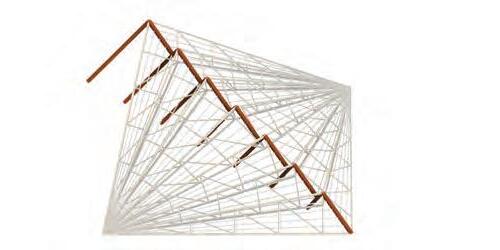
135 In-dune I
-54.6% 0 % 47.6% -51.4% 0 % 48.1% -53.9% 0 % 47.2% Structure utilization : 53.9% Material mass : 24276 kg Structure utilization : 51.4% Material mass : 23627 kg Structure utilization : 54.6% Material mass : 25028 kg
5.2.3Material optimization

The forces acting on the roof are either exerted by the nature or are self-inculcated. These forces increase with increasing wind speeds and increasing roof spans. Wind speed decreases across the dunal crosssection from valley to crest, indicating a similar trend of decrease in wind loads. Amongst all the exerting forces, the deadloads can be controlled by material optimisation. Material optimisation demands that based on the available material thicknesses in the market, the structure is assembled in such a way that each sub-structural element withstands maximum load for least material input.
Experiment setup
The study aims to optimise the material input required for construction of sub-structural elements such that they display best structural performance for changing spans between 3m to 21m. Changing the value of loads from valley to crest and anchoring the roof in the direction of bimodal winds, The results are evaluated based on mass of the structure.
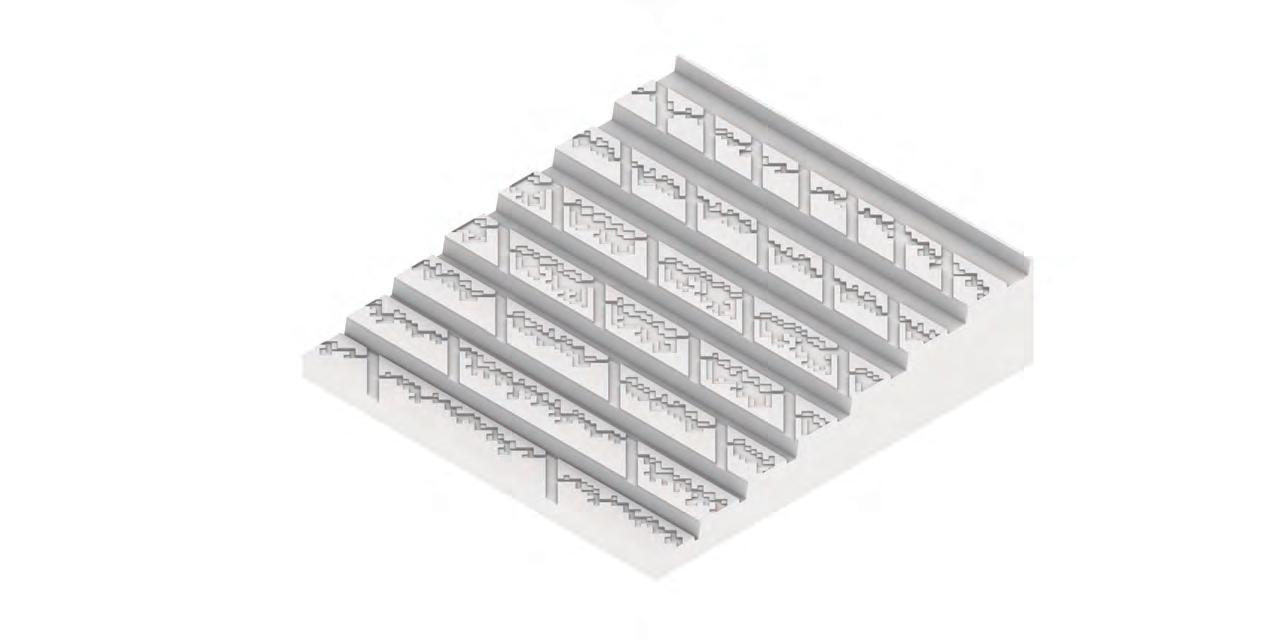
136 I Emergent technologies and design
Windward ank
Available wooden member sizes Forces
Primary truss principal rafter:
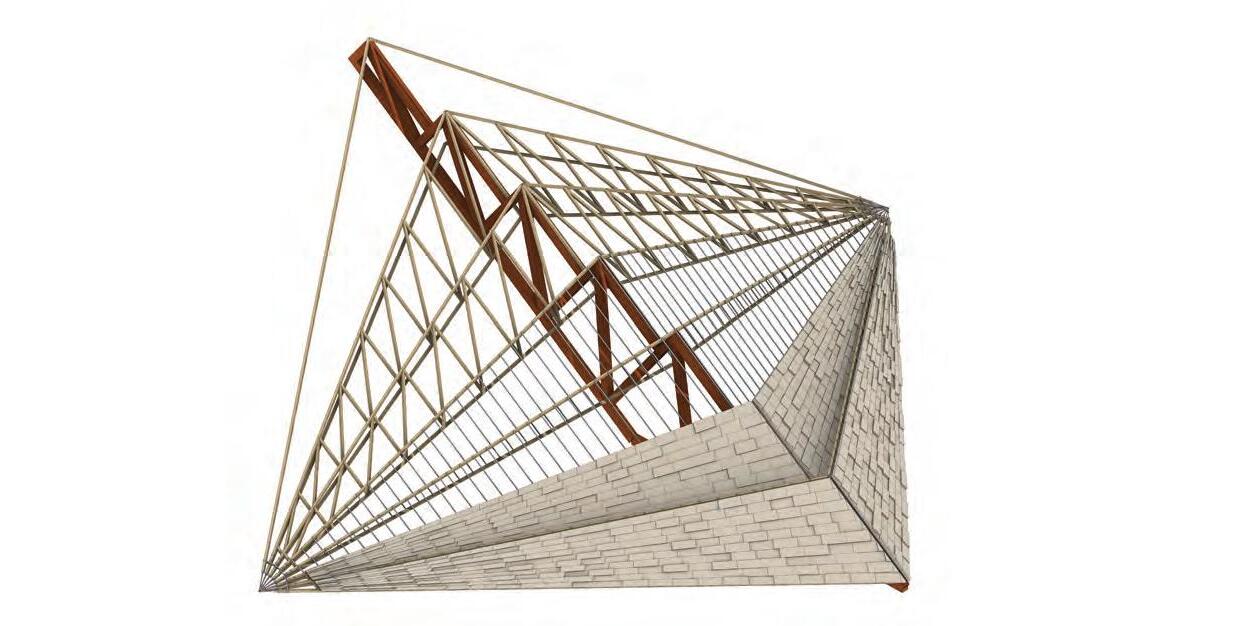
Primary truss strut:
Secondary truss principal rafter:
Secondary truss strut:
Battens for tiles:
Fitness objectives
FC1 : Minimize material mass
FC2 : Minimize utilizatiion
FC3 : Minimize displacement
Simulation run for each span from 3 to 21m
Dead load
Tiles : 0.001 kN/m2 + Wooden members
Wind lift force on lee:
Dune Crest- 0.01 kN/m2
Dune valley -0.015 kN/m2
Predominant wind load:
Dune crest - 0.02 kN/m2
Dune valley- 0.03kN/m2
Phenotypes for each simulation 100 (10 Gens 10 ind/Gen)
137 In-dune I
20 to 30 cm 20 to 25 cm 10 to 20 cm 10 to 15 cm 5 cm
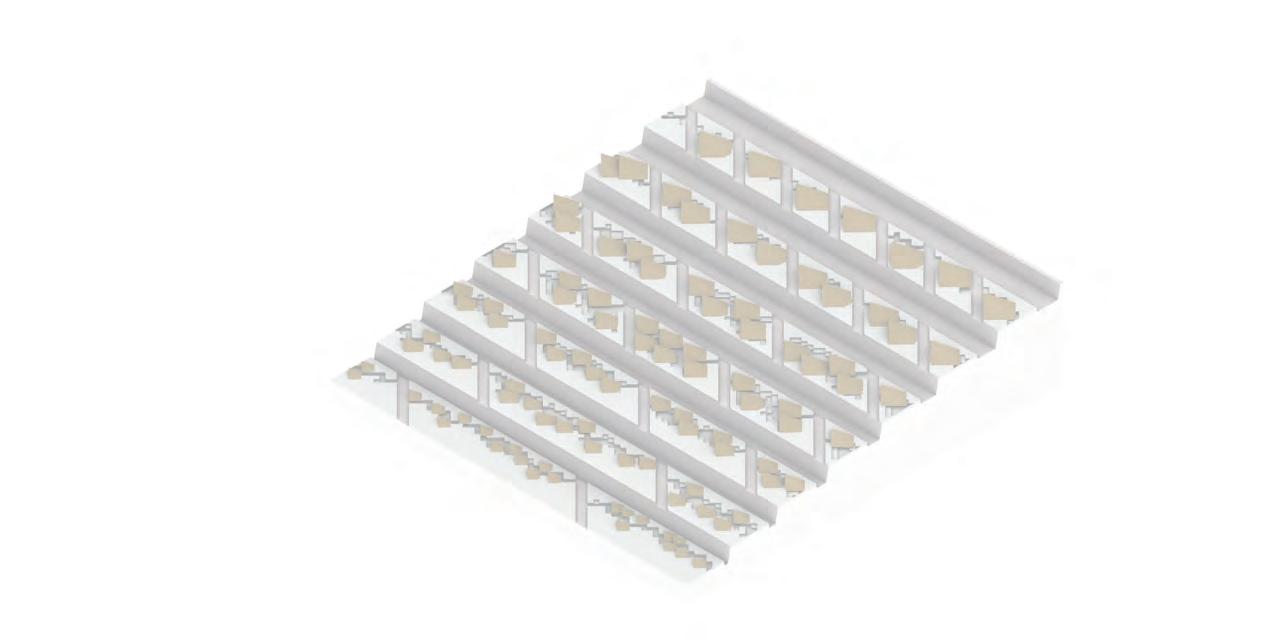
138 I Emergent technologies and design
Windward ank
Roof spans

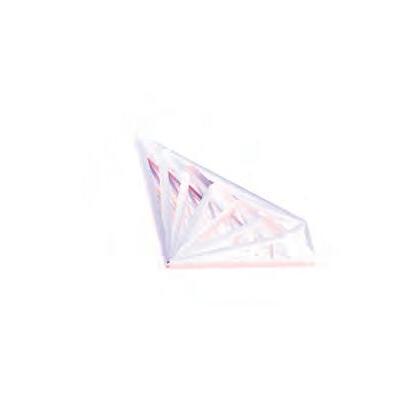
Conclusions
Based on the qualitative assessment of sedimentation pattern across the valley, the volume of saltated grains hitting the roof surface increase from valley to crest. The increasing volume demand for larger surface areas to deflect the sand grains into the sand channels. As the roof spans increase from valley to crest their material requirement and resulting dead load values also increase. These increased loads increase the stress percentage (Utilisation) in each sub-structural member. Utilisation greater than 100% indicate high breaking probability of these component when subjected to testing forces.
Utilisation value overs 100% for roof spans larger than 18m marks the upper limit of feasible roof spans for the available material cross-sections in the market.
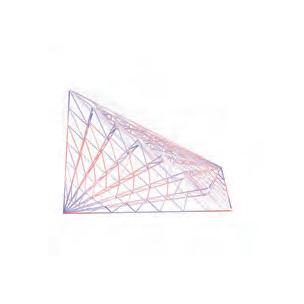

The total number of roofs populating over a cluster are dependent on the cluster size and the roof spans corresponding to that cluster. The details of these populating roofs and the rules of their aggregation area discussed in the next section.
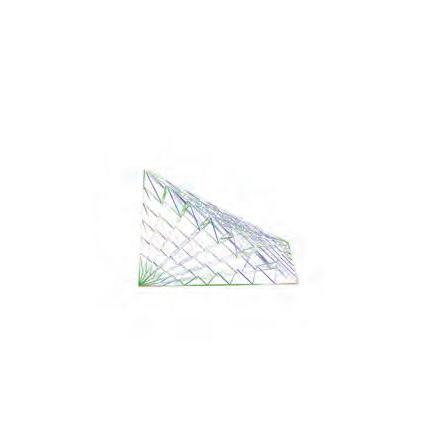
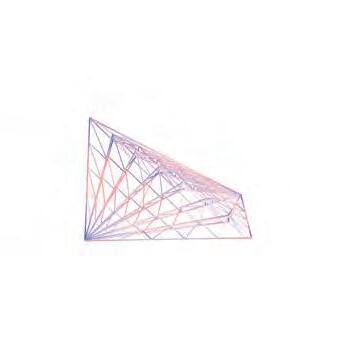
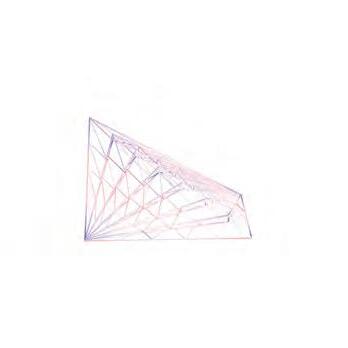
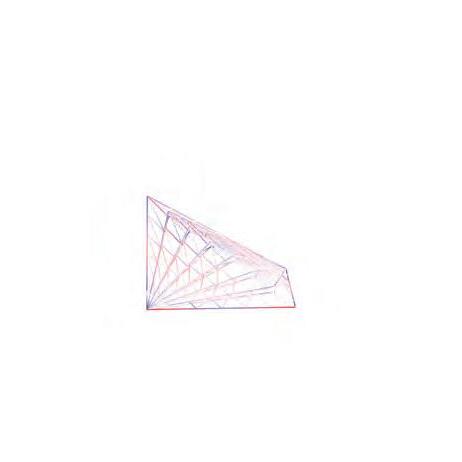
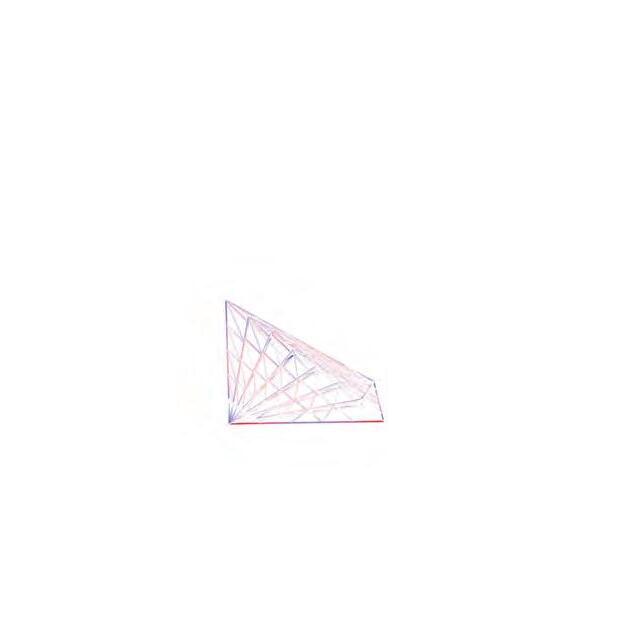

139 In-dune I 24.1 % 27.6 % 42 % 37.2 % 45 % 57 % 55 % 70 % 125 % 138 % 138 % -138 % -70% 70% 13 % 26 % 6 % 11% Roof spans more than 18m not suitable with the available member sizes Wind load Target utilization Loads for 8m/s at dune crest Loads for 11m/s at dune valley 3m 6m 9m 12m 15m 18m 21m
5.2.4Aggregation of deflecting geometries
The roofing system plays a dual role as a wind deflecting mechanism and as thermal insulator. Each of the cluster corresponding to its size, location and sedimentation pattern on the windward side has a unique range of spans for these roofs. While all the geometric explorations of the roof done so far (angle of inclination, orientation and density of openings) make roof efficient to deflect the wind and withstand its pressure, their arrangement in a group over a cluster plays a significant role in determining the state of sedimentation and heat gain inside the excavated pits. Irrespective of the arrangement of roofs on the downwind side, it is critical that windward sides are completely sheltered by deflecting roofs.
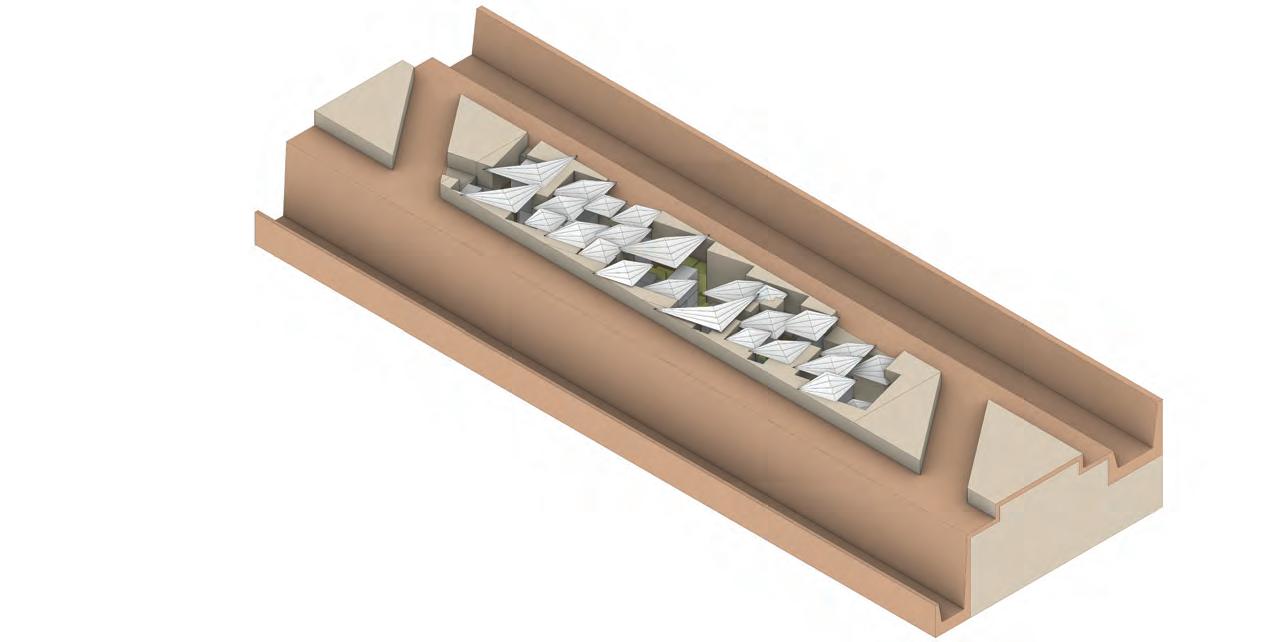
Experiment setup
The study aims to aggregate roofs over the developed cluster such that they comply to their primary objectives of deflection and insulation. The location of the sub-plot on the terrain and corresponding sand influx suggest roof spans between 6m- 9m. Since we propose to build in-dune structures upto the depth of 12m, it is also important to bring in light inside the excavations in a controlled manner by making geometric variations in size and number of openings. The final aggregations are evaluated for reduced wind velocities on leeward side, ensuring sand accumulation inside sand channels.
Plan
140 I Emergent technologies and design
sandchannel
Body
9x9m : max roof span 6 x 6m : min roof span
100m
Gene pool
FC 2- Maximize shadow on open
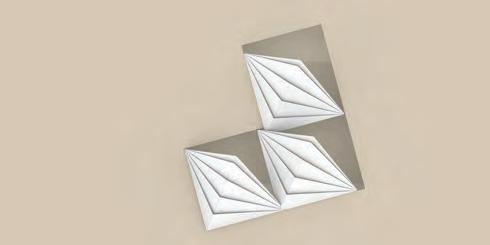
Scaling in along the grid axis
FC 4- Maximize morning sunlight on nurseries on courtyards
Analysed for the entire year 6:00 am to 6:00 pm
FC 5- Minimize intersection of roof geometries

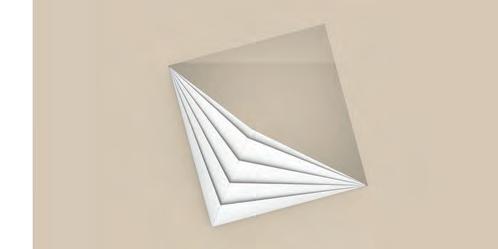

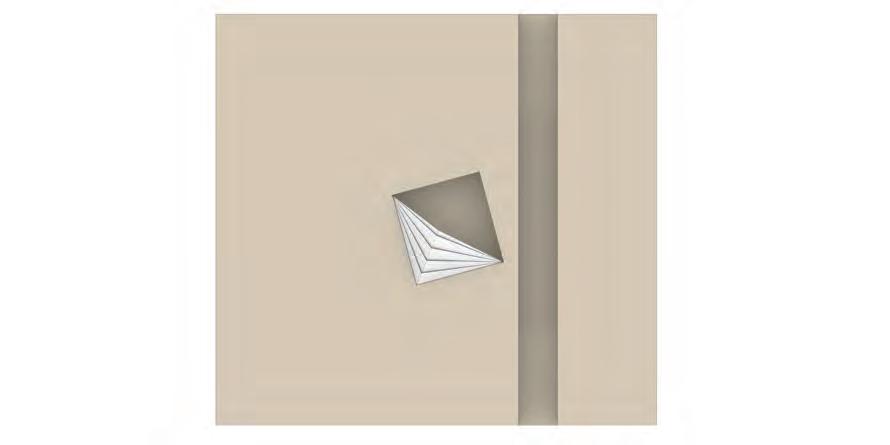
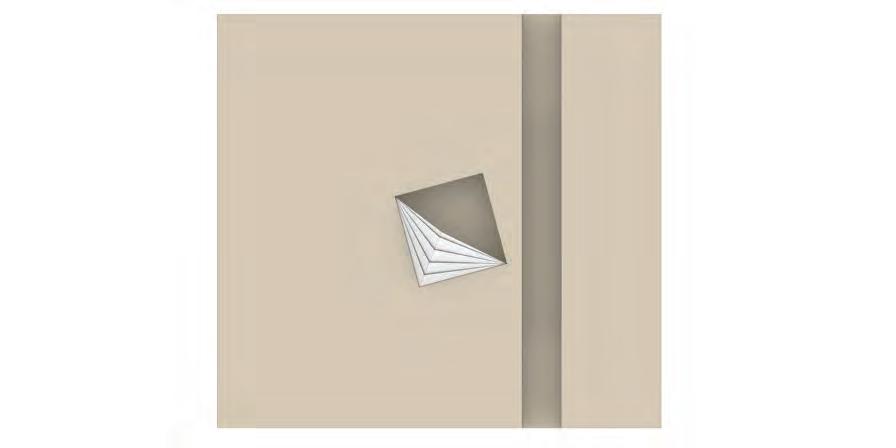
141 In-dune I
0
6m
No. of opeings in the roof Movement in -Z direcetion
to
20
Inclination of the roof
to 30 degrees
0.75
to 1.5 times
Selection of grid cells of aggregation of roof
α N N
Pareto front solutions
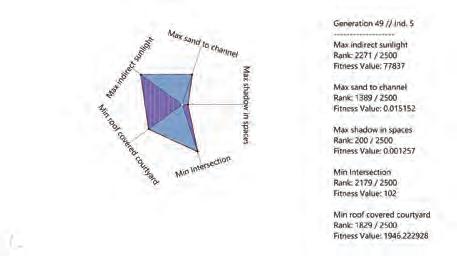
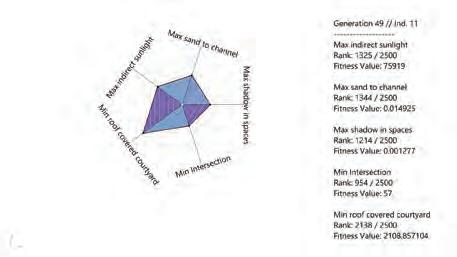
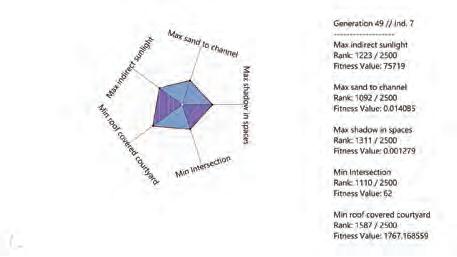
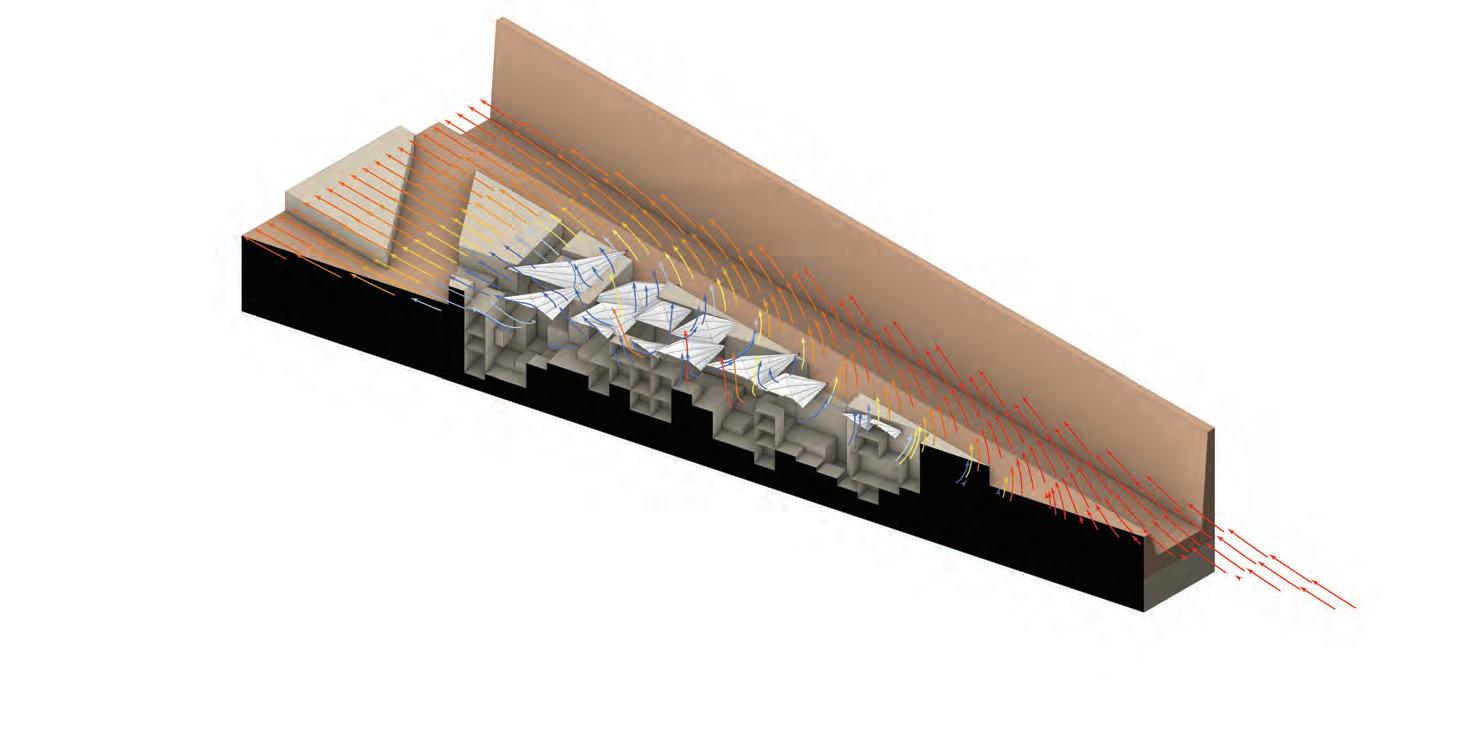


12m/s Gen 49 Ind 06 Gen 49 Ind 011 Gen 49 Ind 05 FC1 FC4 FC5 FC2 FC3 FC1 FC4 FC5 FC2 FC3 FC1 FC4 FC5 FC2 FC3 No. of Generation: 50 No. of Individuals : 2500
50m Reduced velocity zone 60m Reduced velocity zone 70m Reduced velocity zone
Selected phenotype
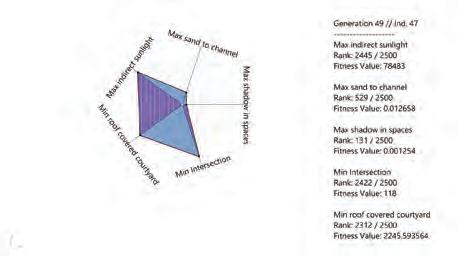
Conclusions
While all the aggregations deflect the wind towards the sand channels, the speed and spread of deflected wind vectors determine accumulation of deflected sand either on peripheral access routes or into the sand channels. The selected solution having maximum span or range of deflected vectors ensure unhindered circulation for pedestrians and sand accumulation directly into ditches. In reality, the actual results of reduced speeds and deflection are dependent on roof material and texture. Since deflection could not be tested with material, there will be a discrepancy in the computational results and actual deflection.
The arrangement of multiple roofs demand for a supporting structural system that can transfer the exerted loads on the roof surfaces directly into the ground.
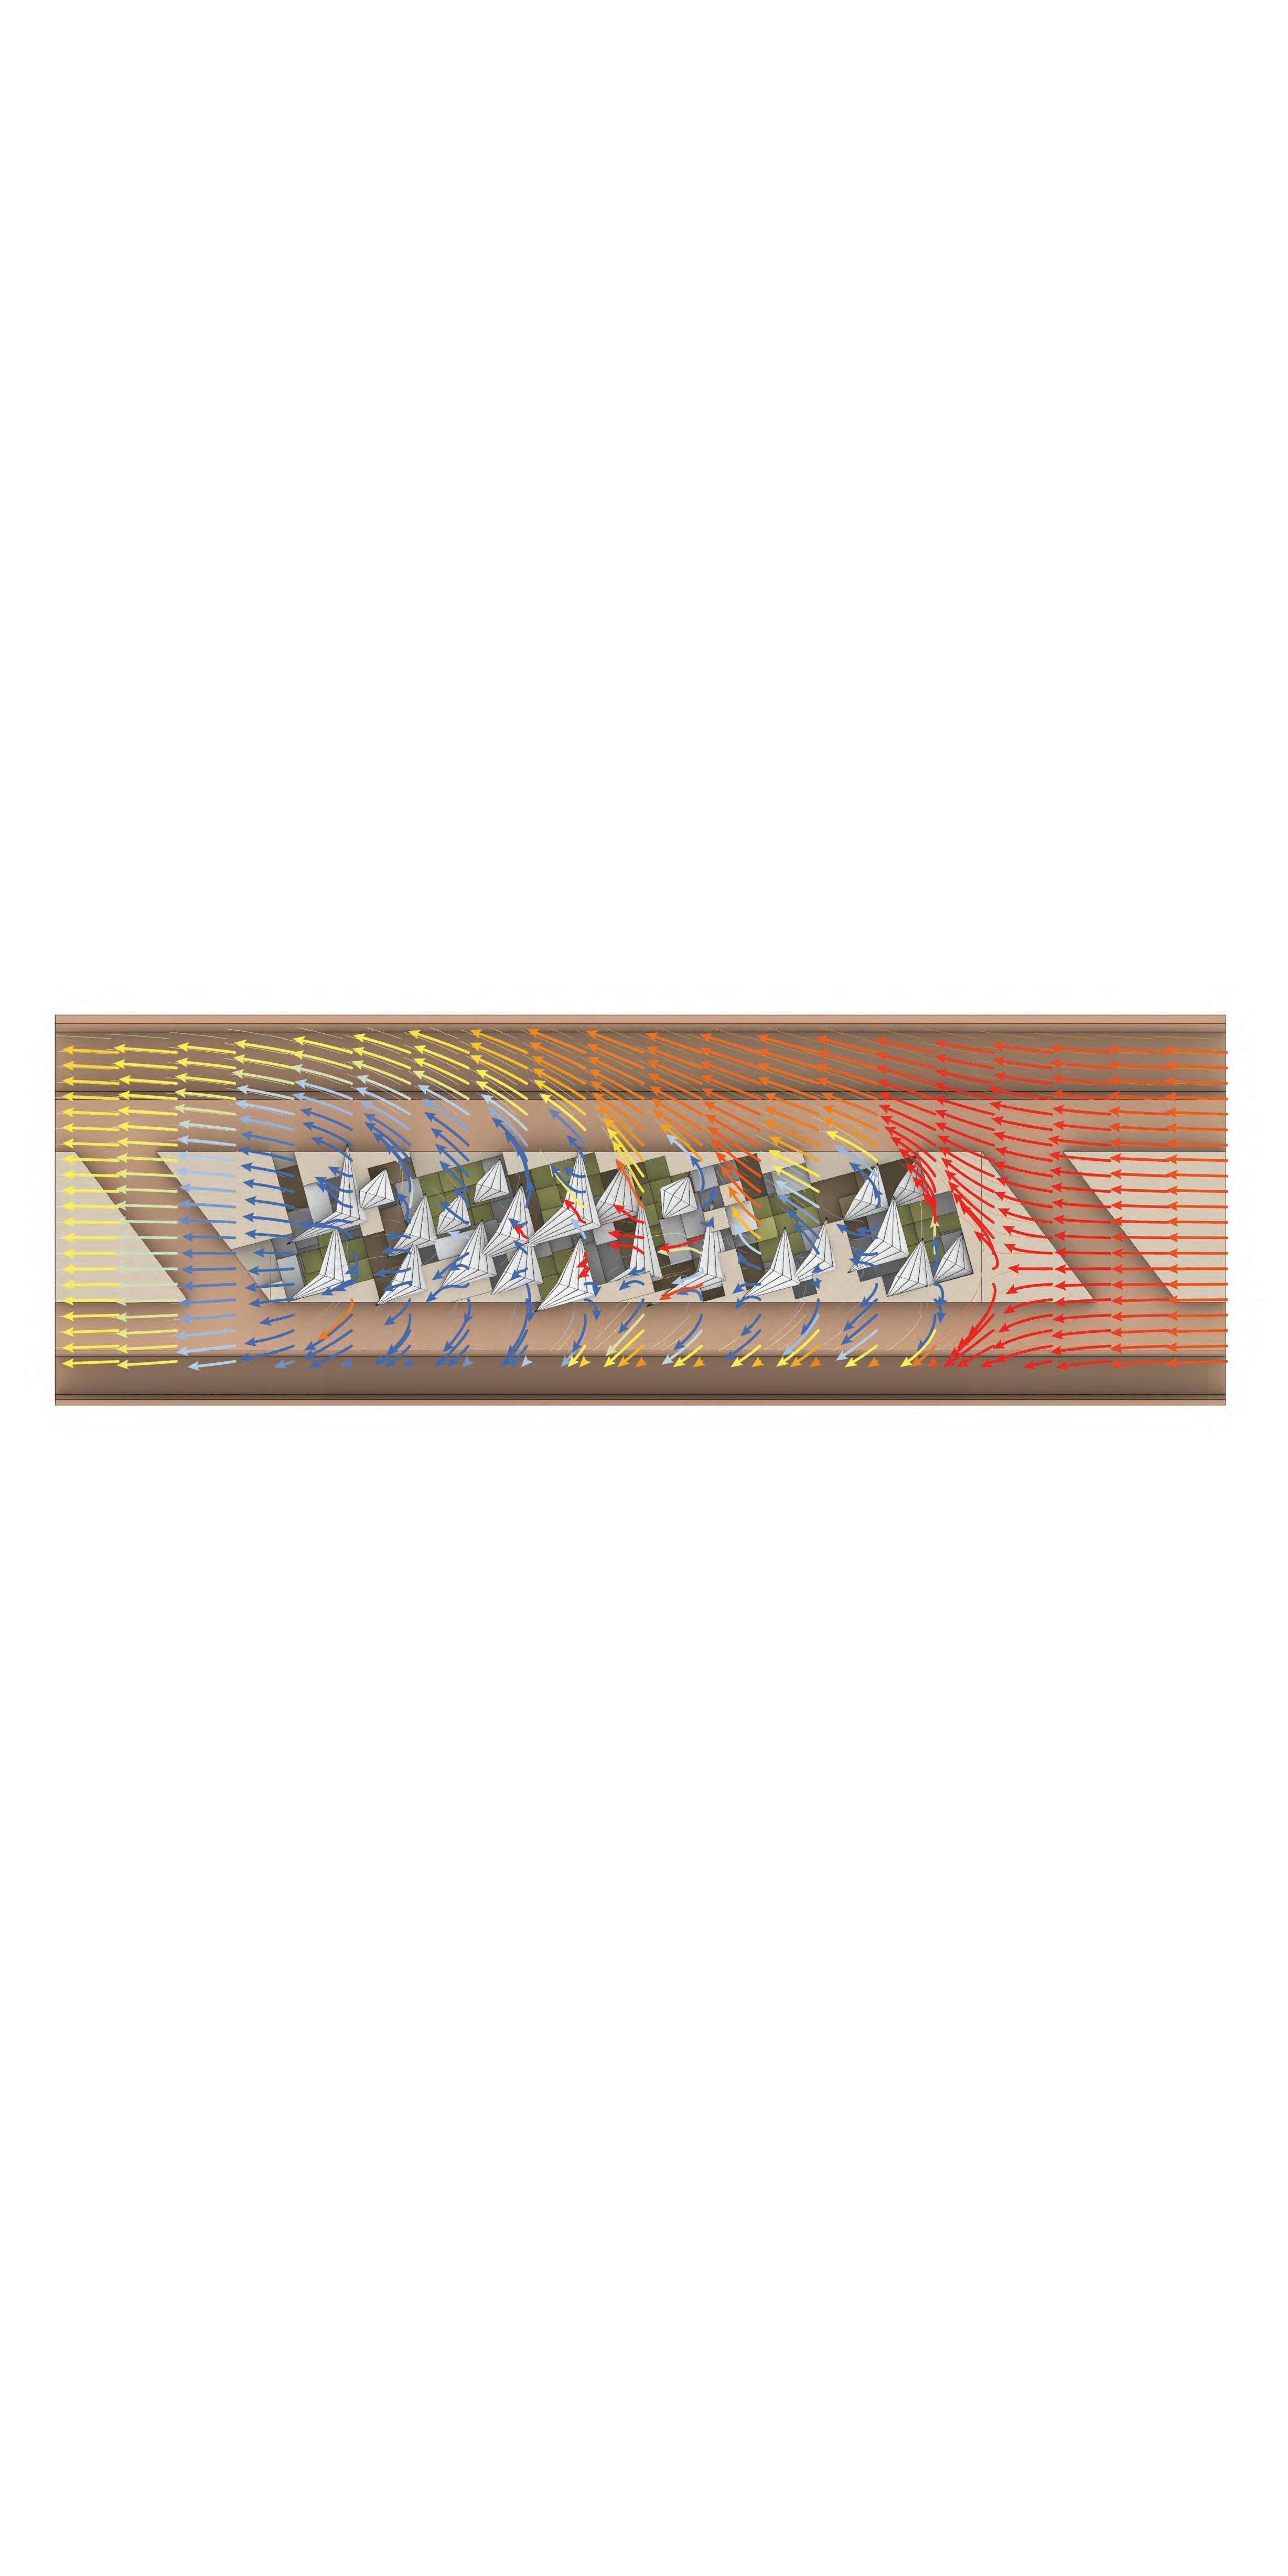
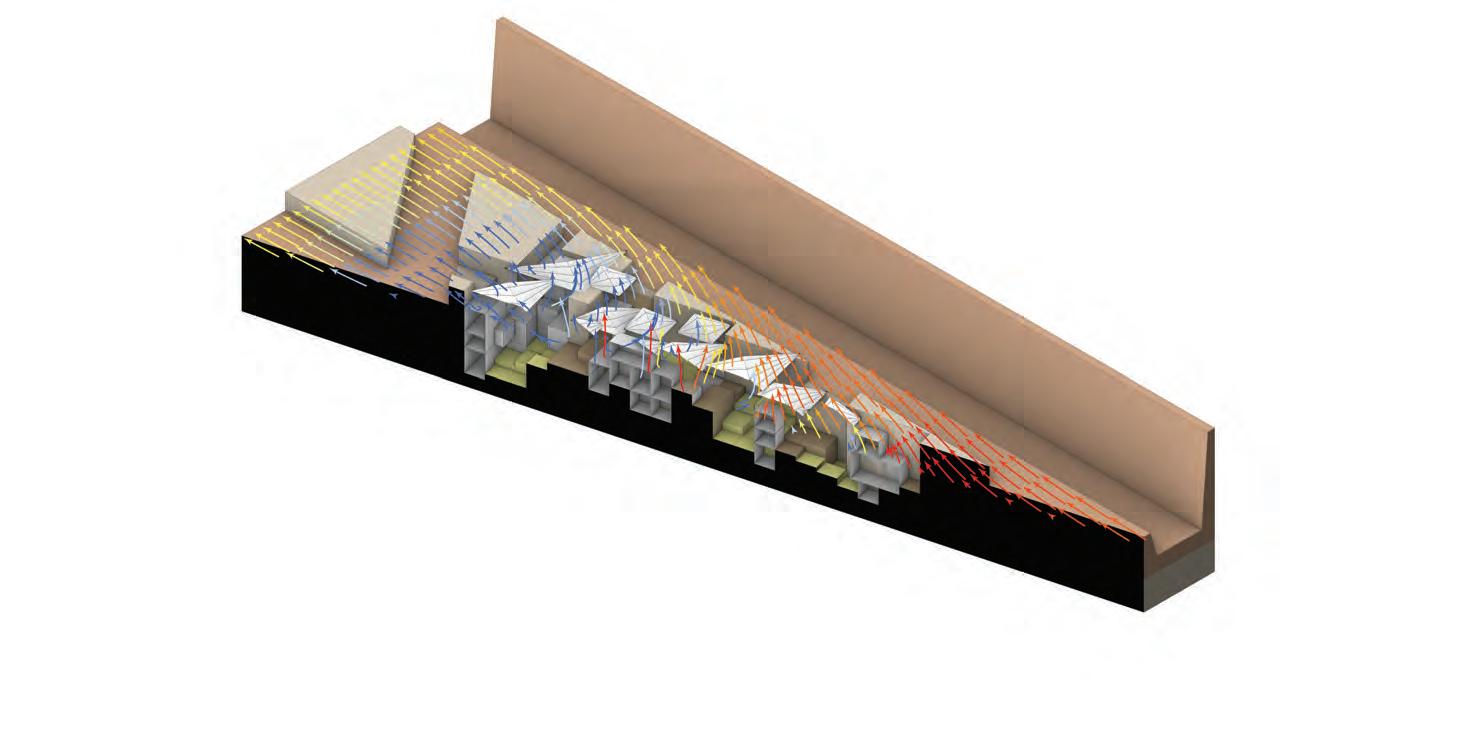
12m/s
Gen 49 Ind 46 FC1 FC4 FC5 FC2 FC3 Best of FC 1 + FC 2 : Max de ection and max shading Maximum reduced wind velocity zone in lee Pareto front soultions 75-80m Reduced velocity zone
Typical roof detail 5.2.5
The roof sits on a wooden frame work which directly transfers the load to the ground bio-cemented by multiple injections , avoiding any of it getting transferred to the walls injected by single point injection. The stone seat and concrete pedestal help in reducing the point loads. The shearing force of the wind is combated by wooden rafters by joining them to pin joints and customised metal joints. This allows for some degree of movement at critical junctions.
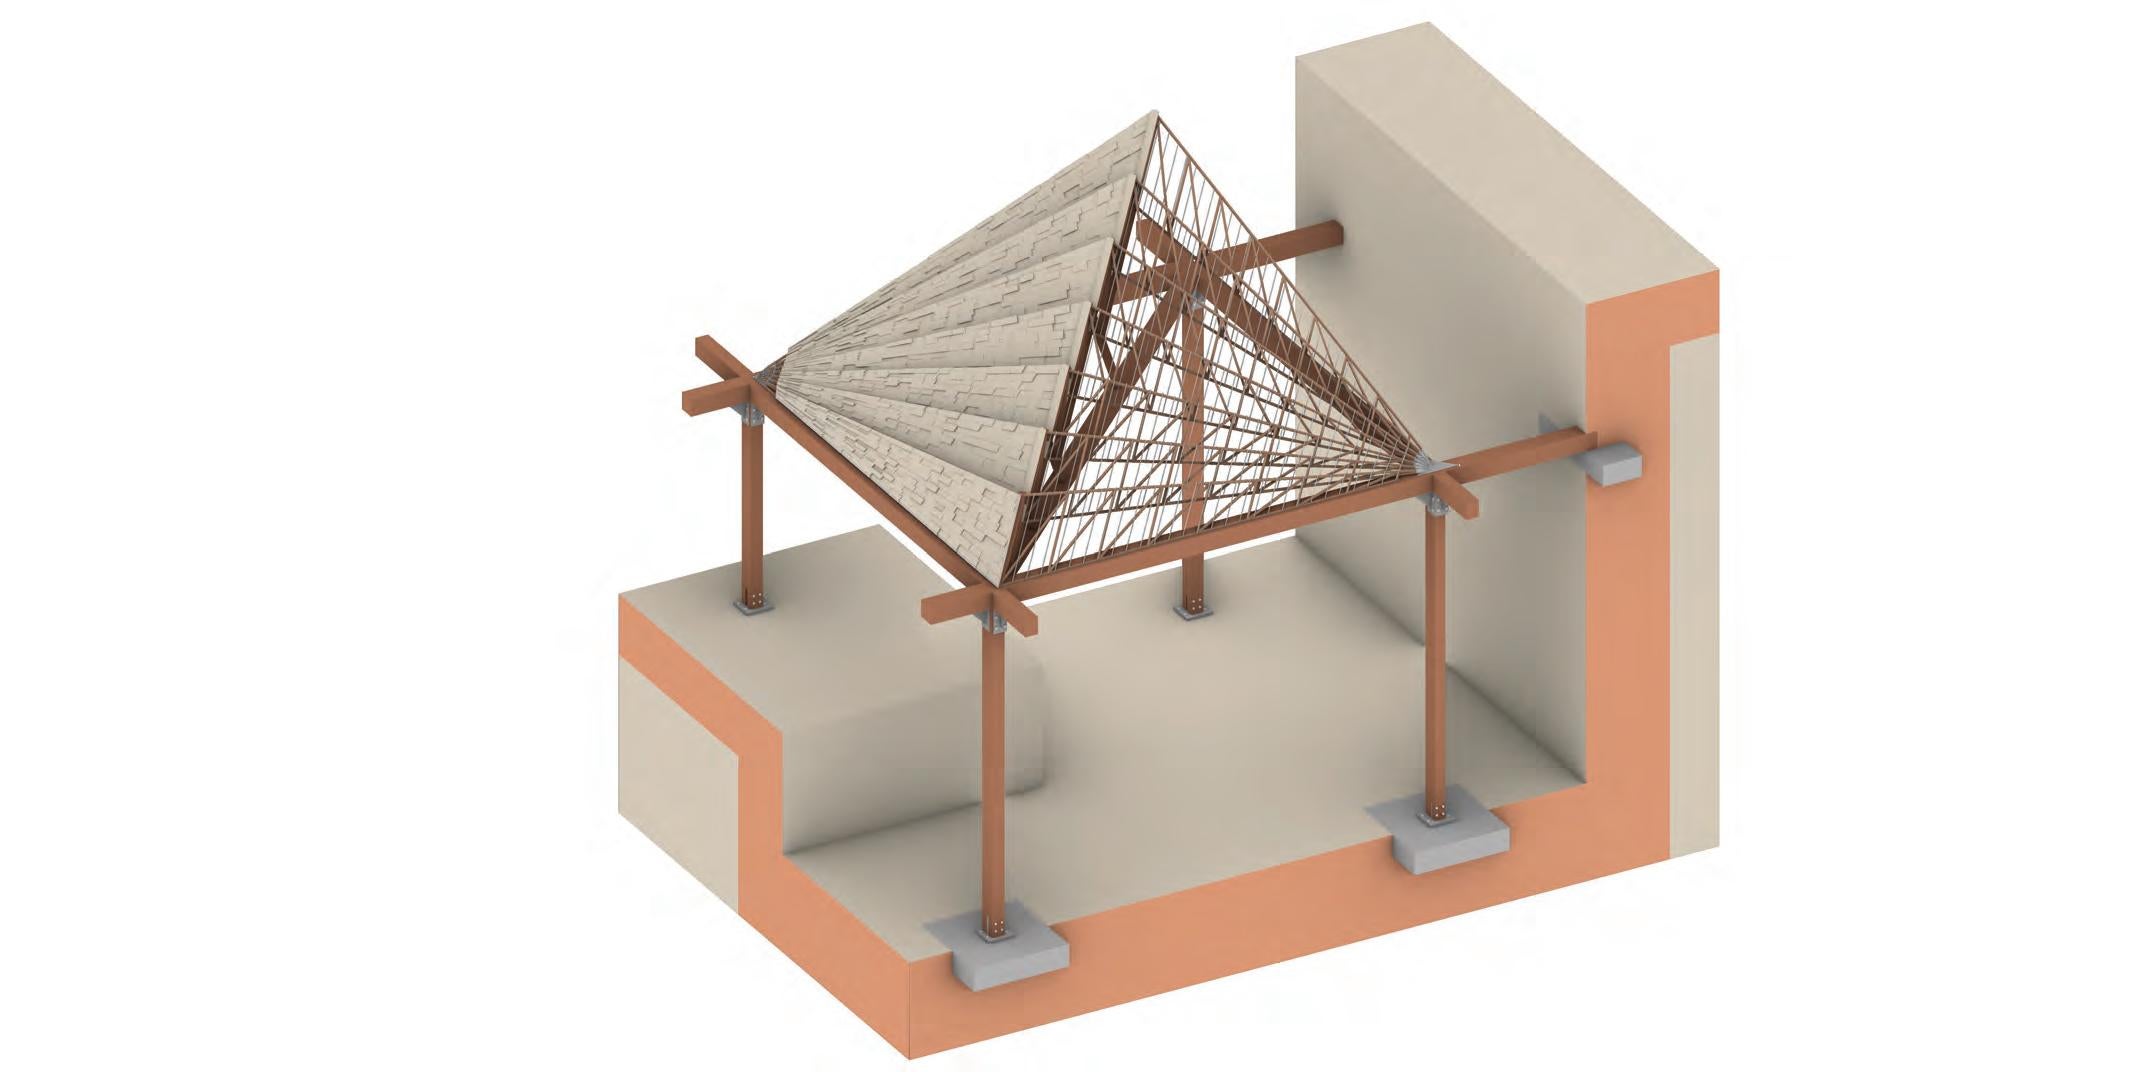
Stone seat (450 X 200mm)
Wooden beam ( 300 x 450mm)
Metal base plate ( 8mm thk)
Rcc pedestal (600mm thk)
Wooden post ( 300 x 300mm )
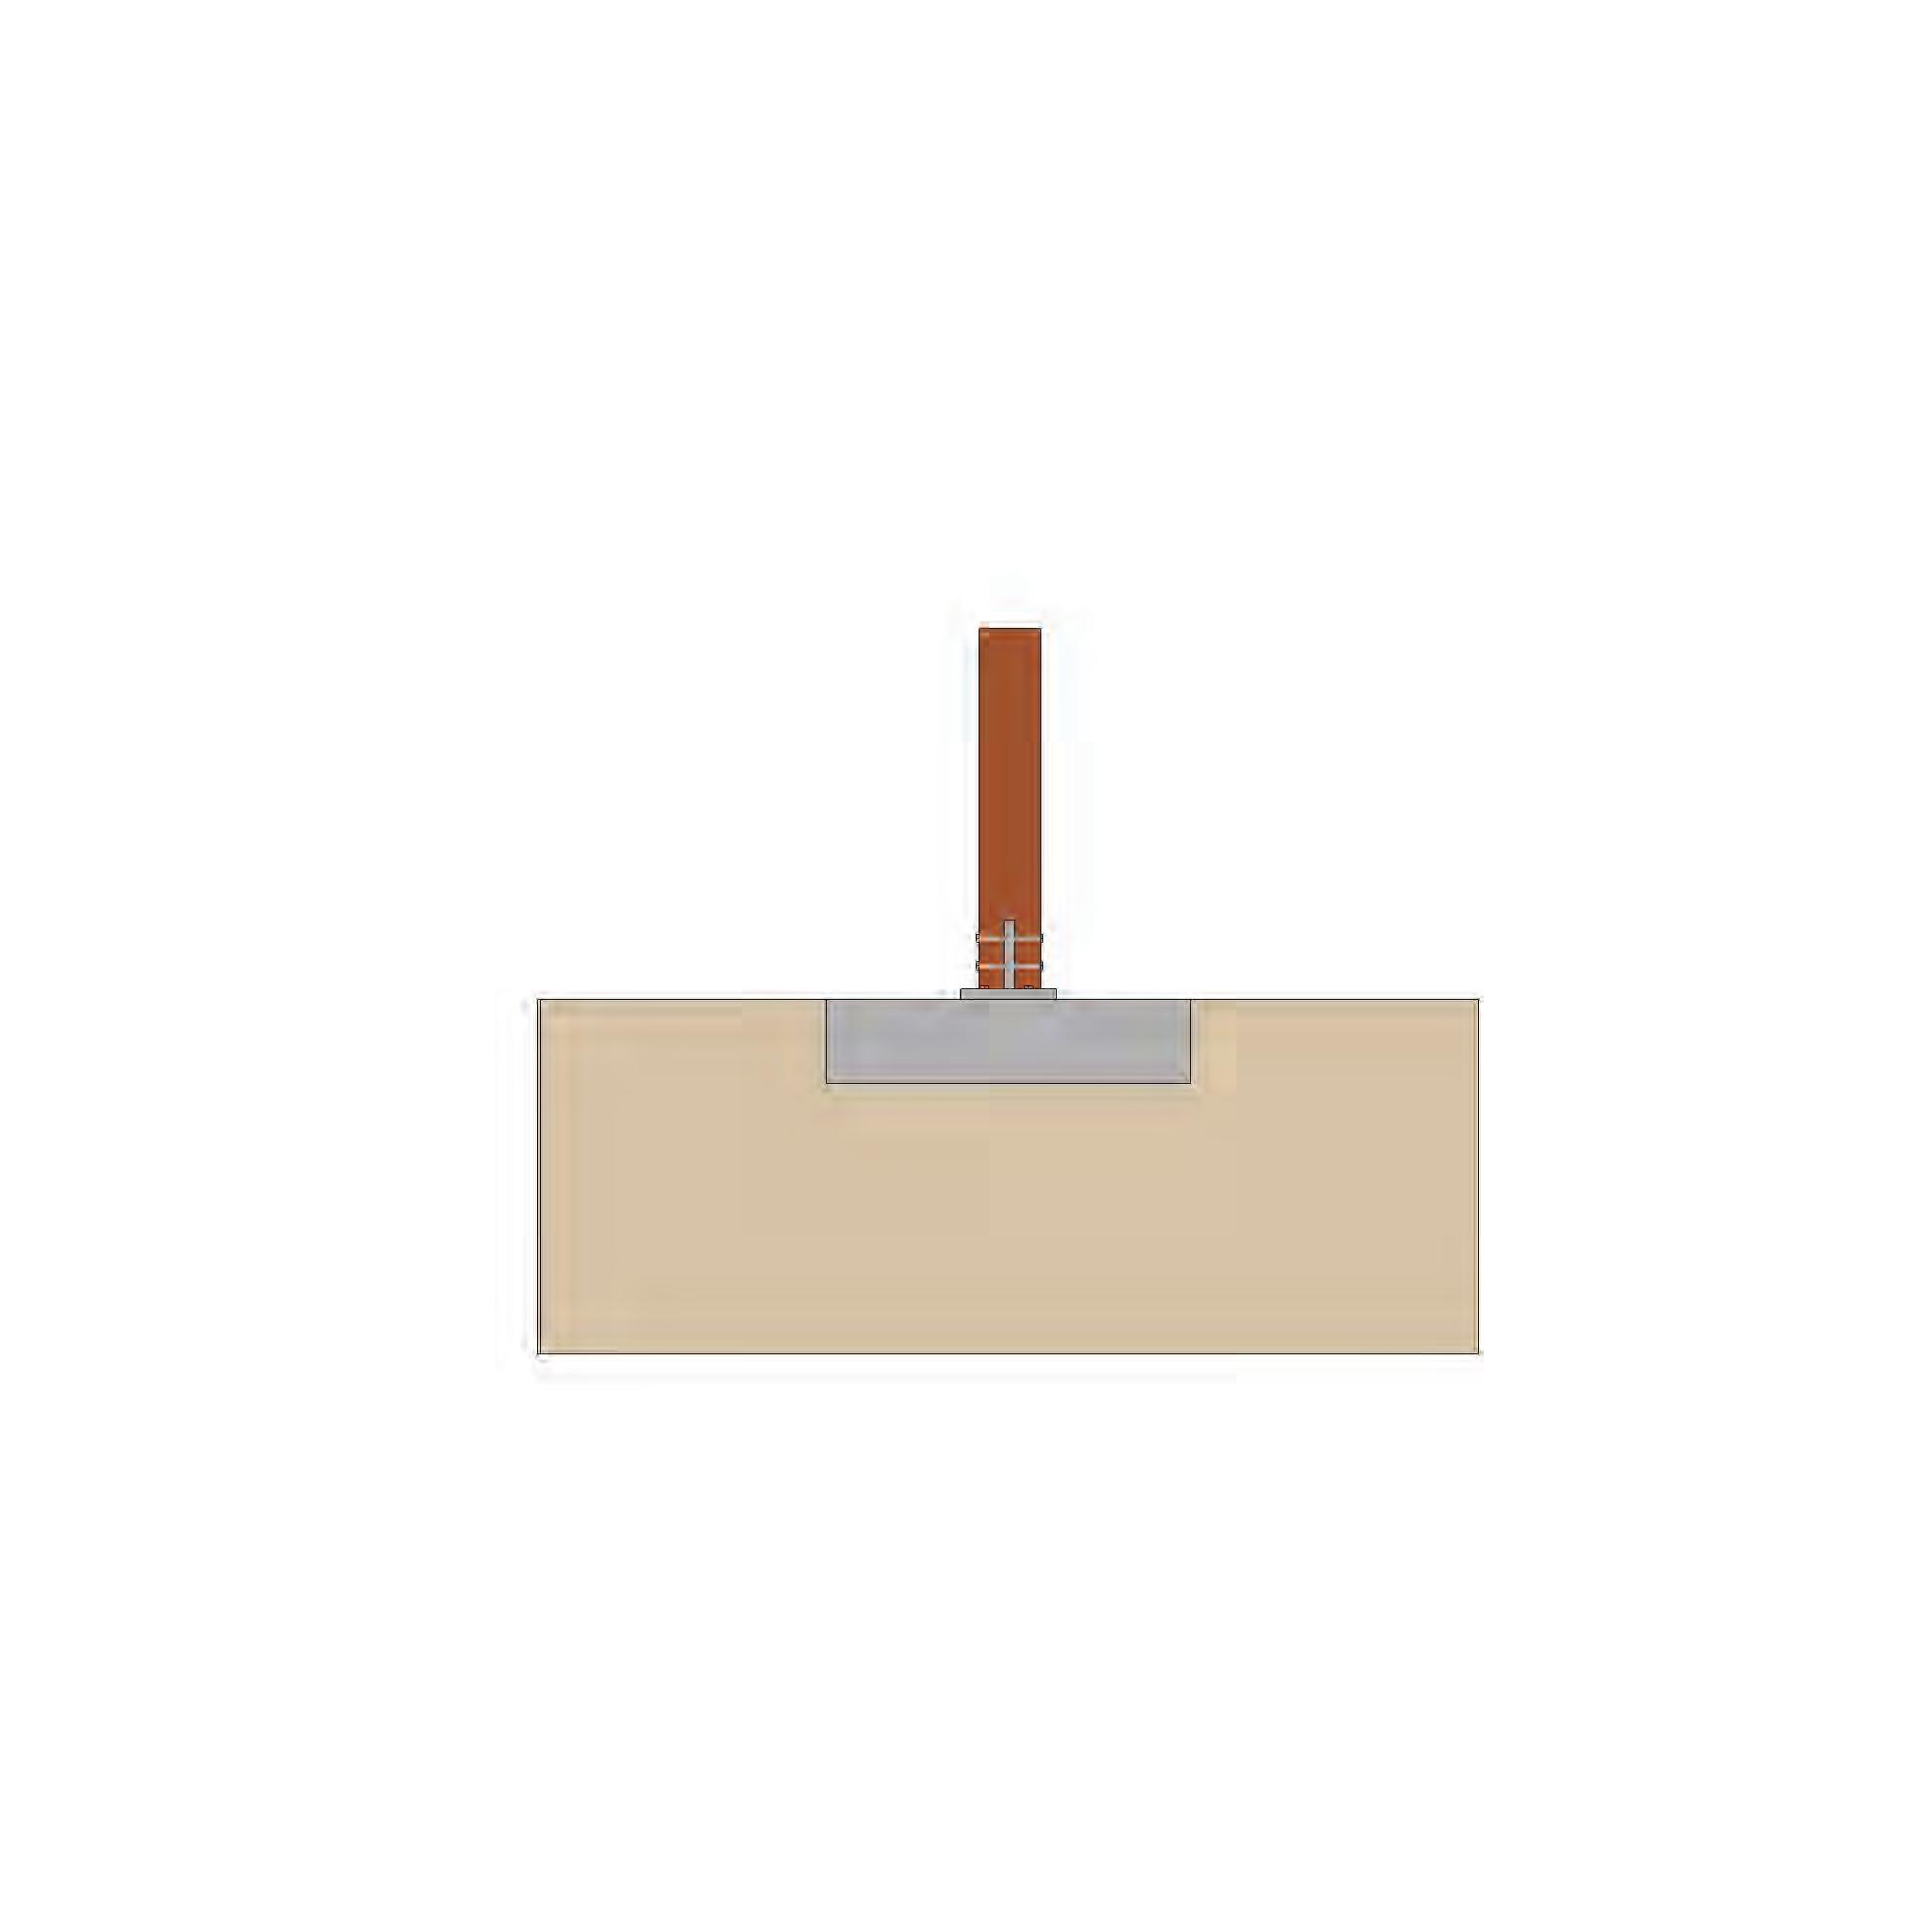
144 I Emergent technologies and design
Detail A
Detail C
Resources and infrastructure 5.3
Heavy influx of sand and extreme climatic conditions of the site subject the land and vegetation to a state of redundancy. The proposed design targets sustenance of a growing population of 2250 people. Survival of the target population is directly dependent on production of high agricultural yield and development of a hydrological system. Adoption of traditional and proposed interventions of sandstabilisation techniques can help formulate a scheme for transforming the expendable landforms into productive landscape.
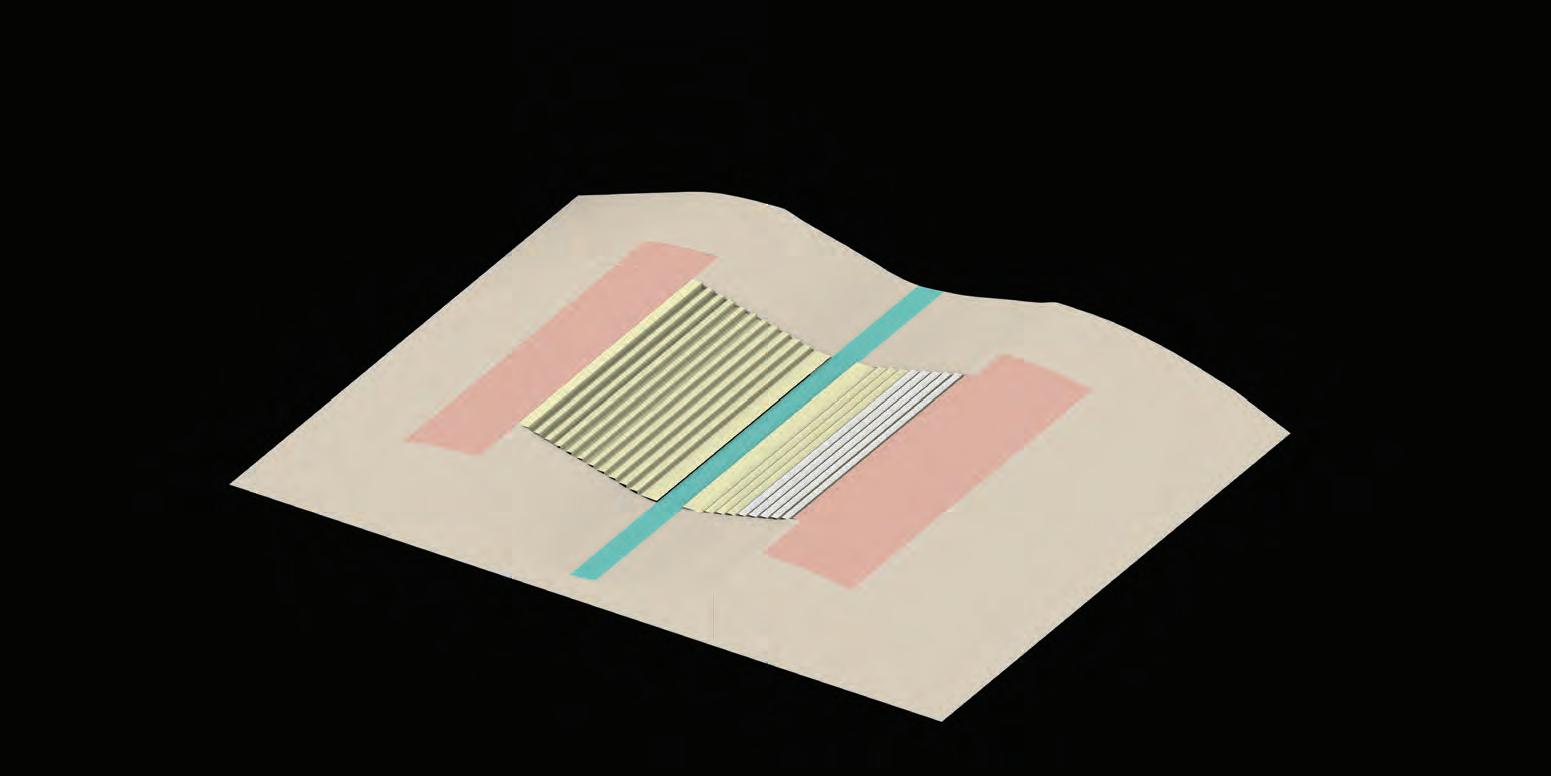
146 I Emergent technologies and design
1500m 250m 2500m 250m
Geotextile + Dune grass and shrubs Shelter belt : Large trees
Population : 2250
Habitable space area
Area per person [ 50 sqm + 35% Ciculation space ] : 67 sqm
Area for 2250 people : 150,750 sqm
Agriculture yield and area
Average human energy requirement (2700 Cal/day) : 1,000,000 Cal/year

Average calories (Sorghum, Castor seeds, Peanuts) : 5200 Cal/kg
Average yield in Rajasthan(Sorghum, Castor seeds, Peanuts) : 0.14 kg / sqm/year or 806 Cal/ sqm
Area of crop land required per person : 1,000,000/806 m2 = 1240 sqm
Total Area of cropland for 2250 people : 2,790,000 sqm
Assuming that with the help of strategic agricultural practices the yield can be increased by 300%
Total Area of cropland with improved yield for 2250 people : 929,250 m2
147 In-dune I
4 % 24.1 % Total area: 3.75 sqm Right : Stabilizated area proportions Left : Intervention region Area: 1.13 sqm Area: 2.62 sqm 10.6 % 59.3 %
Stage 1 Year 5
Irrigation canal and Bioremediation system
Stage 2 Year 5 - 7
Simultaneous plantation of shelter belt and dune grass with geotextiles
Stage 3 Year7- 27
Biomineralization of terraces for agriculture and habitable spaces
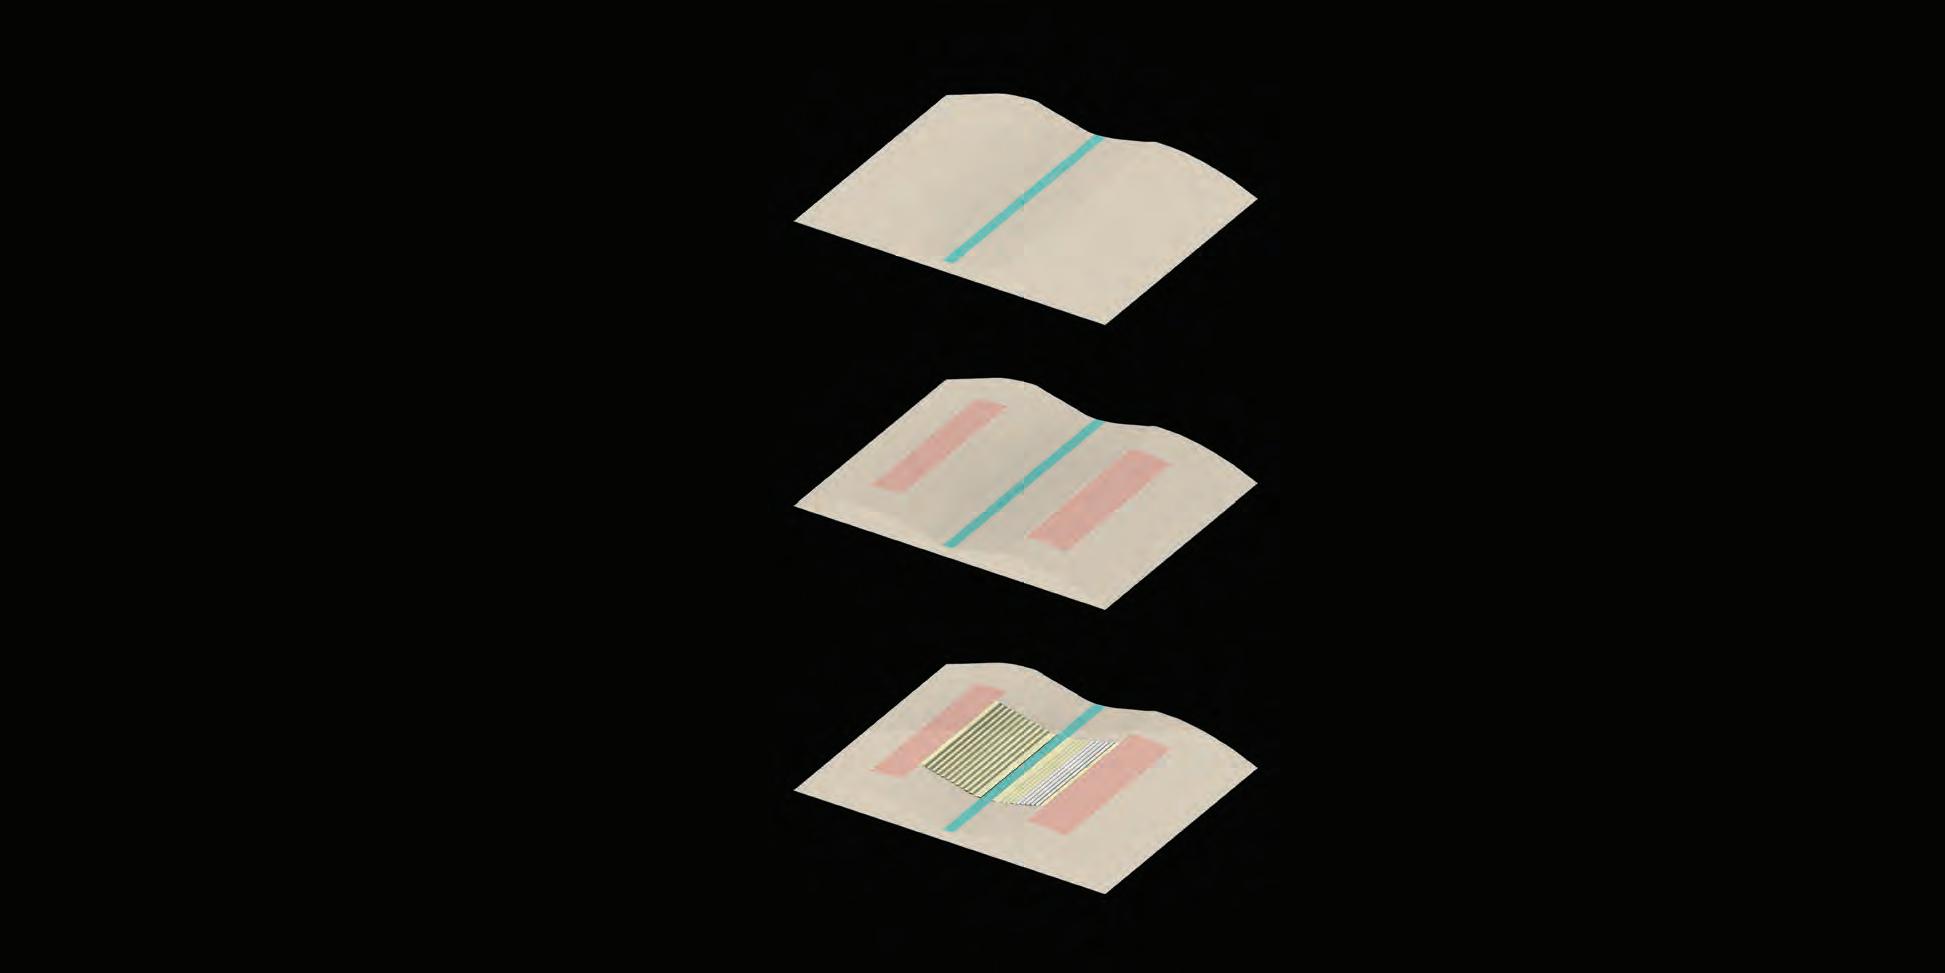
148 I Emergent technologies and design
Area requirement for each phase
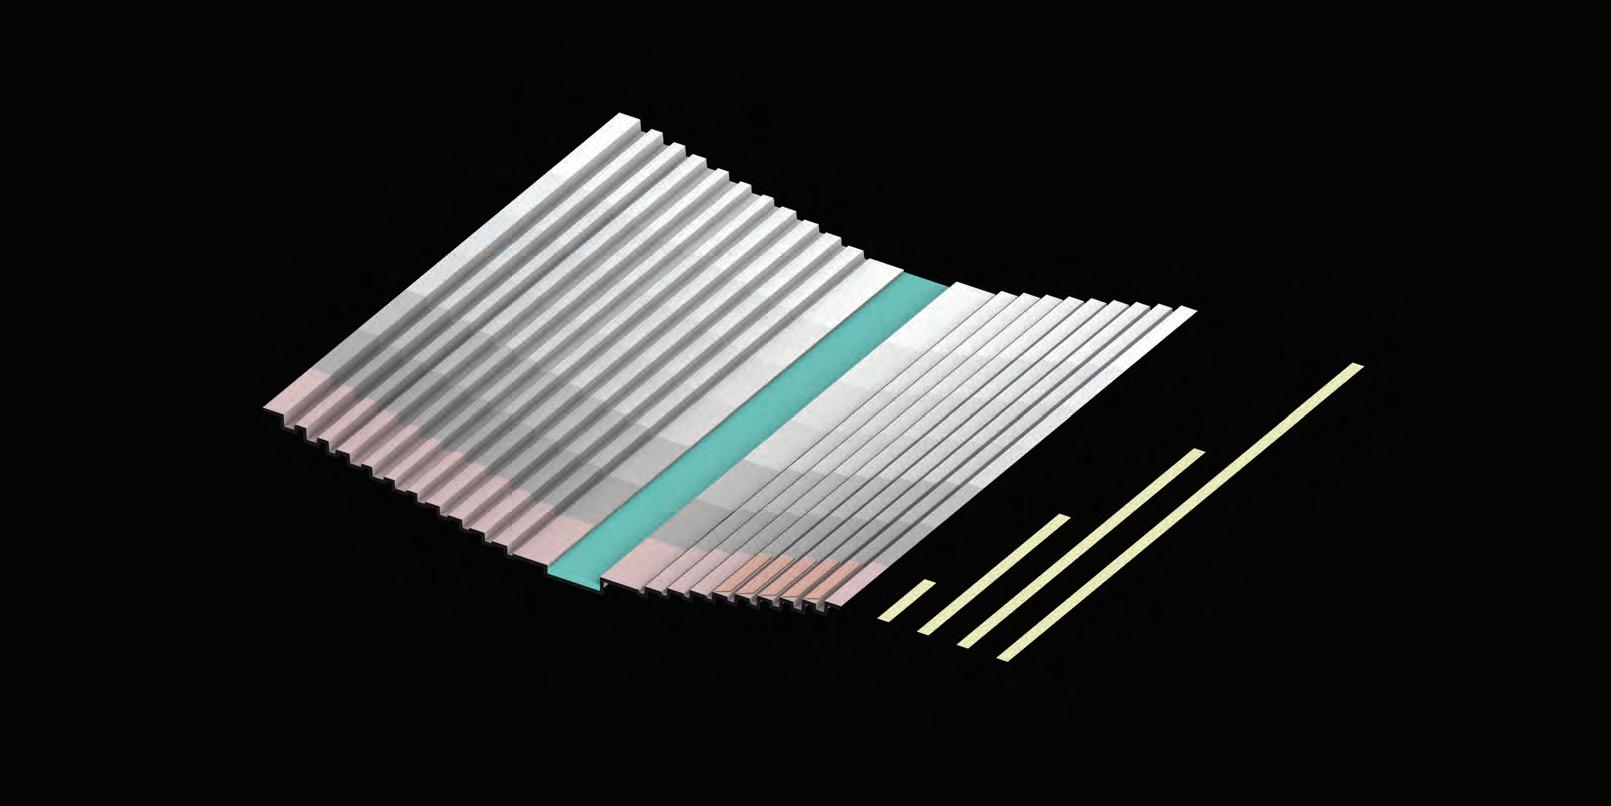
Population : 300
Total habitable space area : 10,050 sqm
Total number of cluster : ---------------------------------------------------------------------------------------------------------5
Total number of families :------------------------ ----------------------------------------------------------------------50 to 70
Total Area of cropland : 124,000 sqm
149 In-dune I
1500m 200 m 200 m 200 m 200 m 200 m 200 m 300 m Biomineralization of terraces for agriculture and habitable spaces Stage 3 -phasing Year7- 27
5.3.2Hydrological system
The three possible sources of water for the site have the potential to collectively cater to the annual water requirement. The availability is however also dependent on the current water consumption percentage in the neighbourhood, ground fabric and supporting infrastructure required to procure water from these sources.
The current data of availability and consumption of water from aquifer show over exploitation of the resource and hence limits the scope of its use. This source can however be tapped into if there is surplus ground water after being recharged by monsoon showers. The water collected from surface runoff in the dunal valley during short monsoon season can only cater to <1% of the net annual requirement. The storage of surface run-off over the years can however create an increase in the net stored volume of water. Currently, the difference between annual requirement and harvested water is significant. This dearth of water availability can only be balanced by procuring it from another rich source. The tail of Indira Gandhi Canal ends approximately 300 km from the site. Establishment of a connection from the site to the canal can overcome the deficit of water requirements of the site.
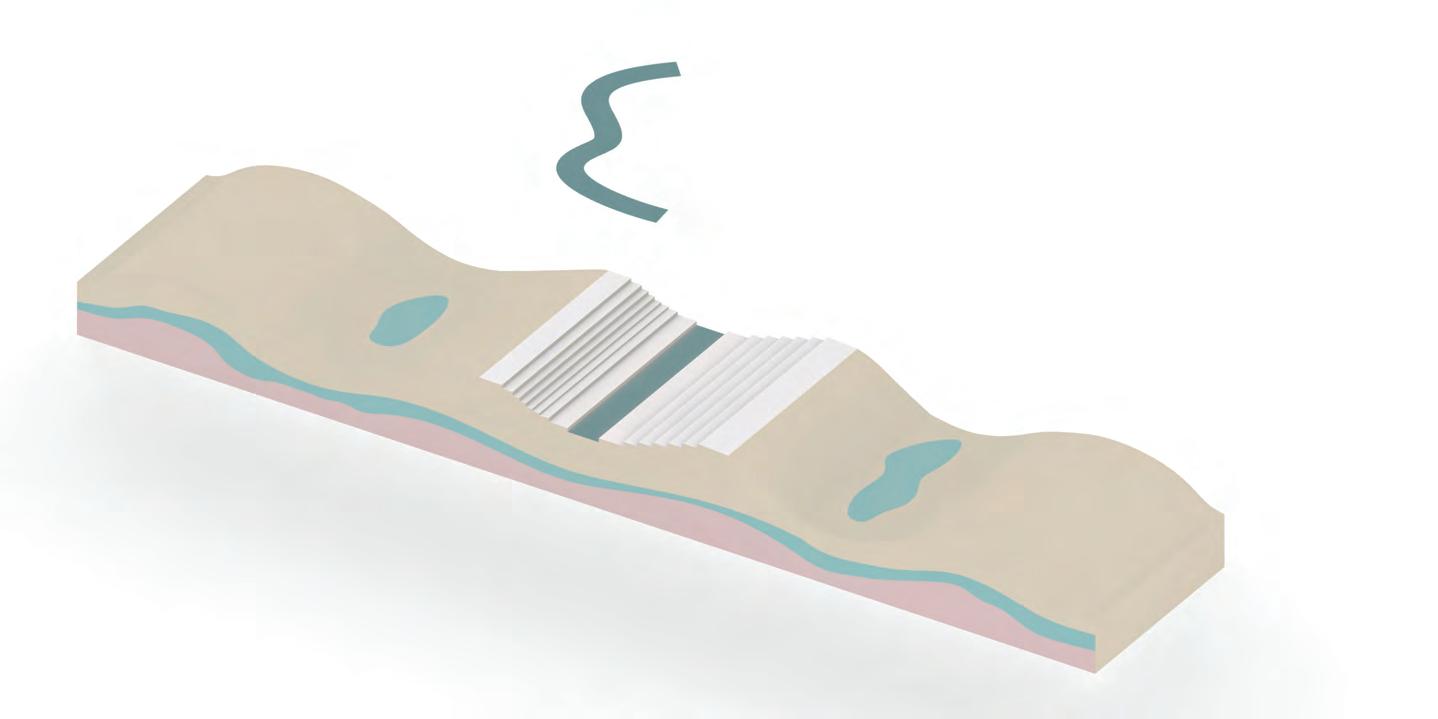
150 I Emergent technologies and design Saline Jan April July Oct Jan April July Oct Jan April July Oct
Aquifer ( 60-80m below GL)
Arti cial irrigation canal ( 300km away)
Indira Gandhi canal project
Catchment areas (adjacent dune valleys)
Heavymetal contamination
Fresh with sediments
Total water annual water requirement ( all phases completed )
Tree belt : 2460 l/m2/ year
Annual requirement for tree belt [200,000 sqm ] :---------------------------------------------- 984,000,000 l/year
Agricultural belt : 4000 l/m2/ year
Annual requirement for agriculture [ 929, 250 sqm] :--------------------------------------- 3,717,000,000 l/year
Consumption per person : 49275 l/year (135 l/day)
Annual water consumption by 2250 people : 98,550,000 l/year
Total Annual water requirement fot the system : 4,799,550,000 l/year
Water avalibility from various sources
Ground water
Annual availability in Rajasthan 256,347 x 106 L
Existing Annual consumption : ------------------------------------------------------------------------- ---321,271 x 106 L
Total ground water availabe for use : - 64,924 x 106L
Surface run-o
Annual
Irrigation canal
151 In-dune I
coe cient = 0.98 , area = 1,125,00 sqm) : 110, 250, 000 L / year Unvegetated terrain ( coe cient = 0.68, area =1,875,000 sqm ) : 127, 500, 000 L / year Vegetated terrain ( coe cient = 0.49 , area = 2,620,000 sqm) : 128, 380 , 000 L / year
366,130,000
4843
rainfall : :---------------------------------------------------------------------------------------100mm or 100 L / sqm Hardened sand surface (
Total potential of runo collection :
L/ year Discharge rate of canal : -------------------------------------------------------------------
ft3/sec or 137,988 L/sec Annual availability of water : ---------------------------------------------------------------- 4,350,000,000,000 L/ year
Agriculture terrace
Water collection
Reservoir
Normal water level
Water level 0.0 m
Bio-remediation ponds
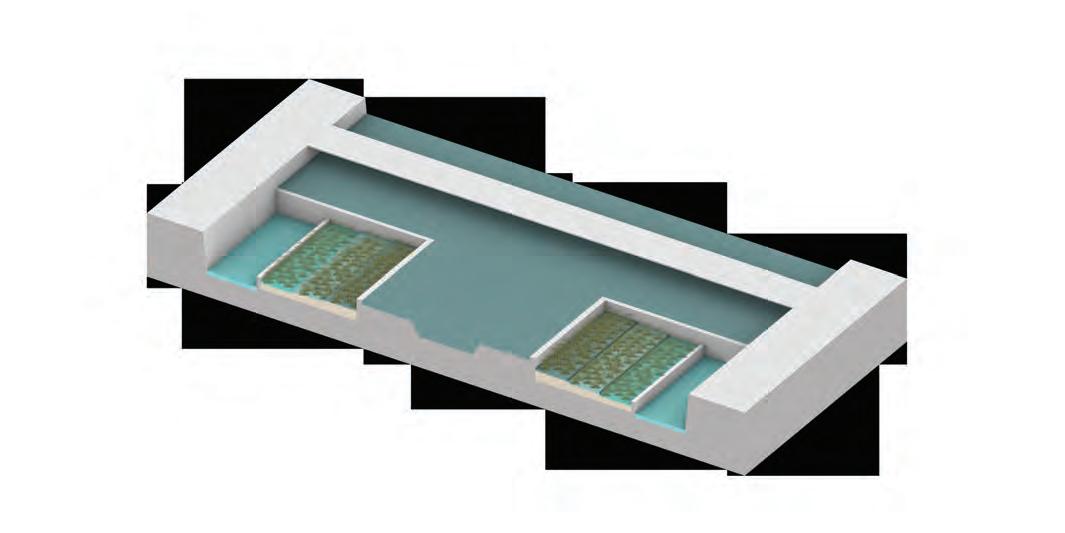
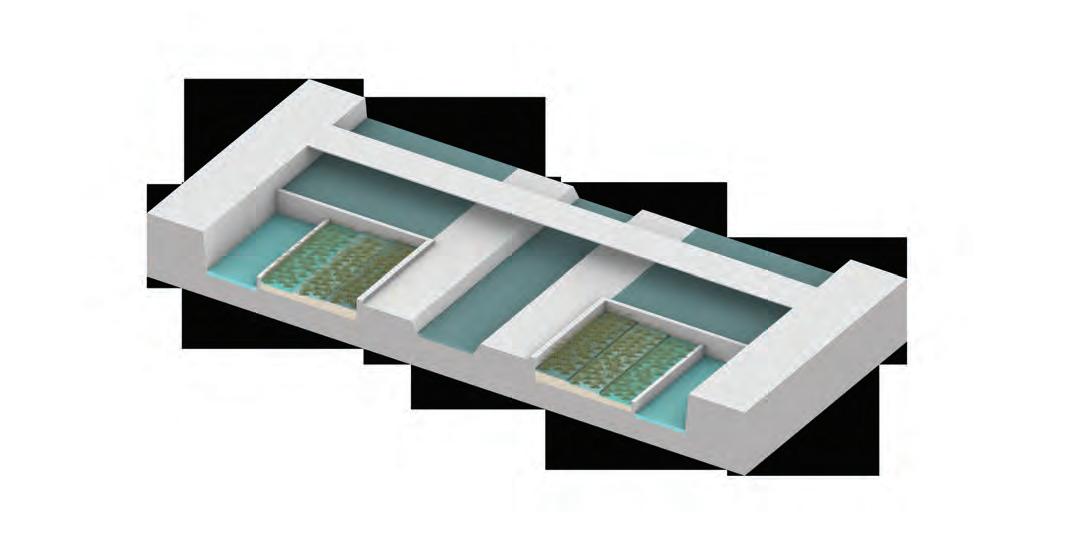

Canal water shortage
Water level - 3.5m
Reserved supply to bio-remedation ponds
Agriculture terrace
Flood condition
Water level + 3.5m
Elevated walkway
Replenishment of water in reservoir
Treated water
152 I Emergent technologies and design
Surface run-o
Surface run-o
Source: https://www.dailymail.co.uk/news/article-3204873/How-100-million-shade-balls-brought-protectLA-s-reservoir-evaporating-fact-bacterial-nightmare.html, accessed on 29/12/2019
As discussed earlier, water from Indira Gandhi Canal can rapidly increase the ground water levels and cause water logging and salination of the soil. This makes collection and building of surface run-off very critical. The water from surface run-off are collected in a reservoir. While this resource is building up, water from the canal can primarily be used by treating it with bio-remediation. Once there is sufficient collection of water in the reservoir, the dependence on canal water can be reduced by controlling the influx of water with the help of dams and weirs. In the years of drought when the water level in canal is reduced, the reserve from reservoir can be brought to use. In the rare case of flooding, the water in the reservoir is recharged by surface run-off and canal water. Water treatment is not affected by overflow of the canal. Post treatment, the water is supplied to the agricultural fields for micro-irrigation. Based on the canal’s water levels certain spaces are available which are transformed into public spaces. These are mostly located near canal and bioremediation fields.
High evaporative rates on the site and desalination of soil due to seepage from canal pose a serious threat to the whole hydrological mechanism of the site. While the continual flow of water inside the canal can help reduce its evaporation, water collected in the reservoir is subjected to evaporative loss. Deploying of shade balls or float balls floating on top of the reservoir can slow the evaporation and prevent sunlight from causing reactions among chemical compounds present in the water. Increased salinity in the soil and loss of water from the canal can be a result of its cracked concrete lining. Spread of geo-membranes are an economical solution for being flexible and impervious to cover the porous biomineralised sand surface that can reduce loss of water over time and ensure streamlined flow.
Source: https://www.geosynthetica.com/headrace-canal-hdpe-geomembrane-project/, 29/12/2019
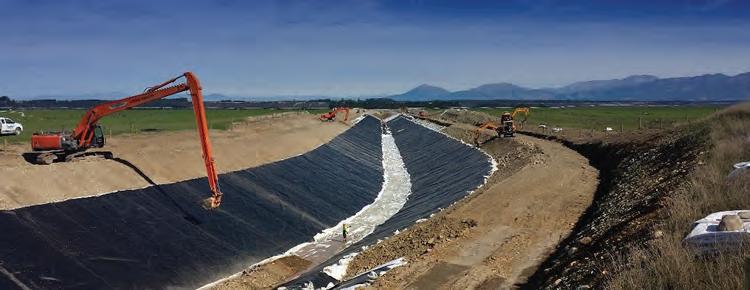
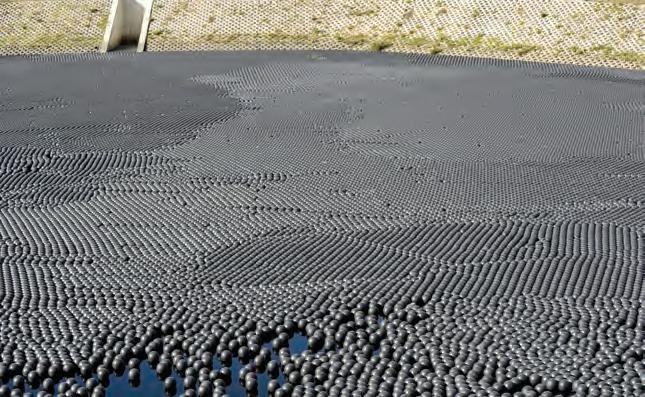
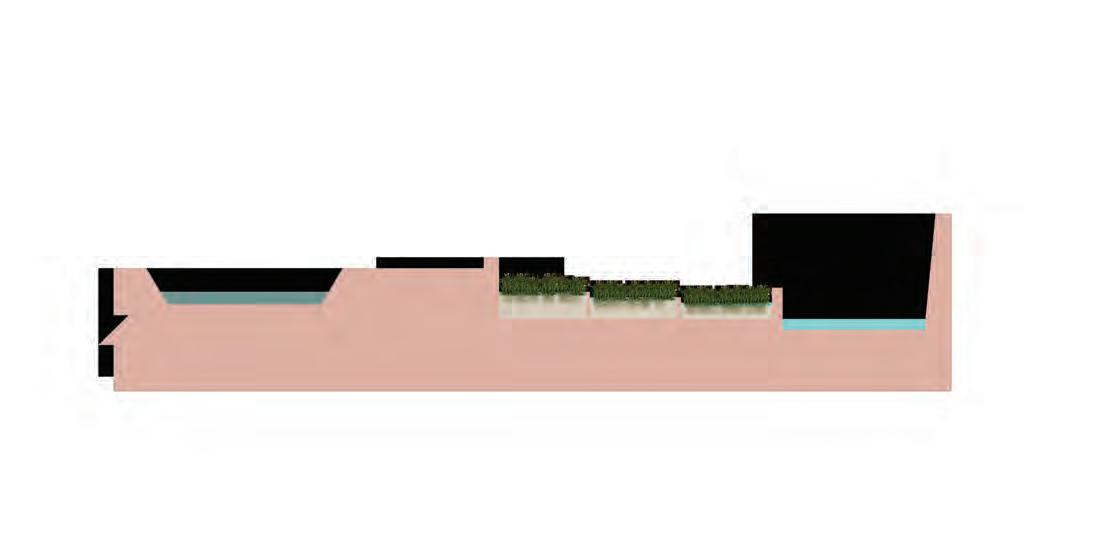
153 In-dune I 40 m wide35m wide 55 m wide + 3 m ( ood condition) + 0 m ( normal condition) - 3.5 m ( scarce canal water supply) - 7 m Weir Weir
Water channelPublic space Bio-remediation pondTreated water
Shade balls used over water bodies to reduce the loss of water due to evaporation
Geo-membrane lining optimize the canal’s flow and prevent loss of water to seepage
Water management
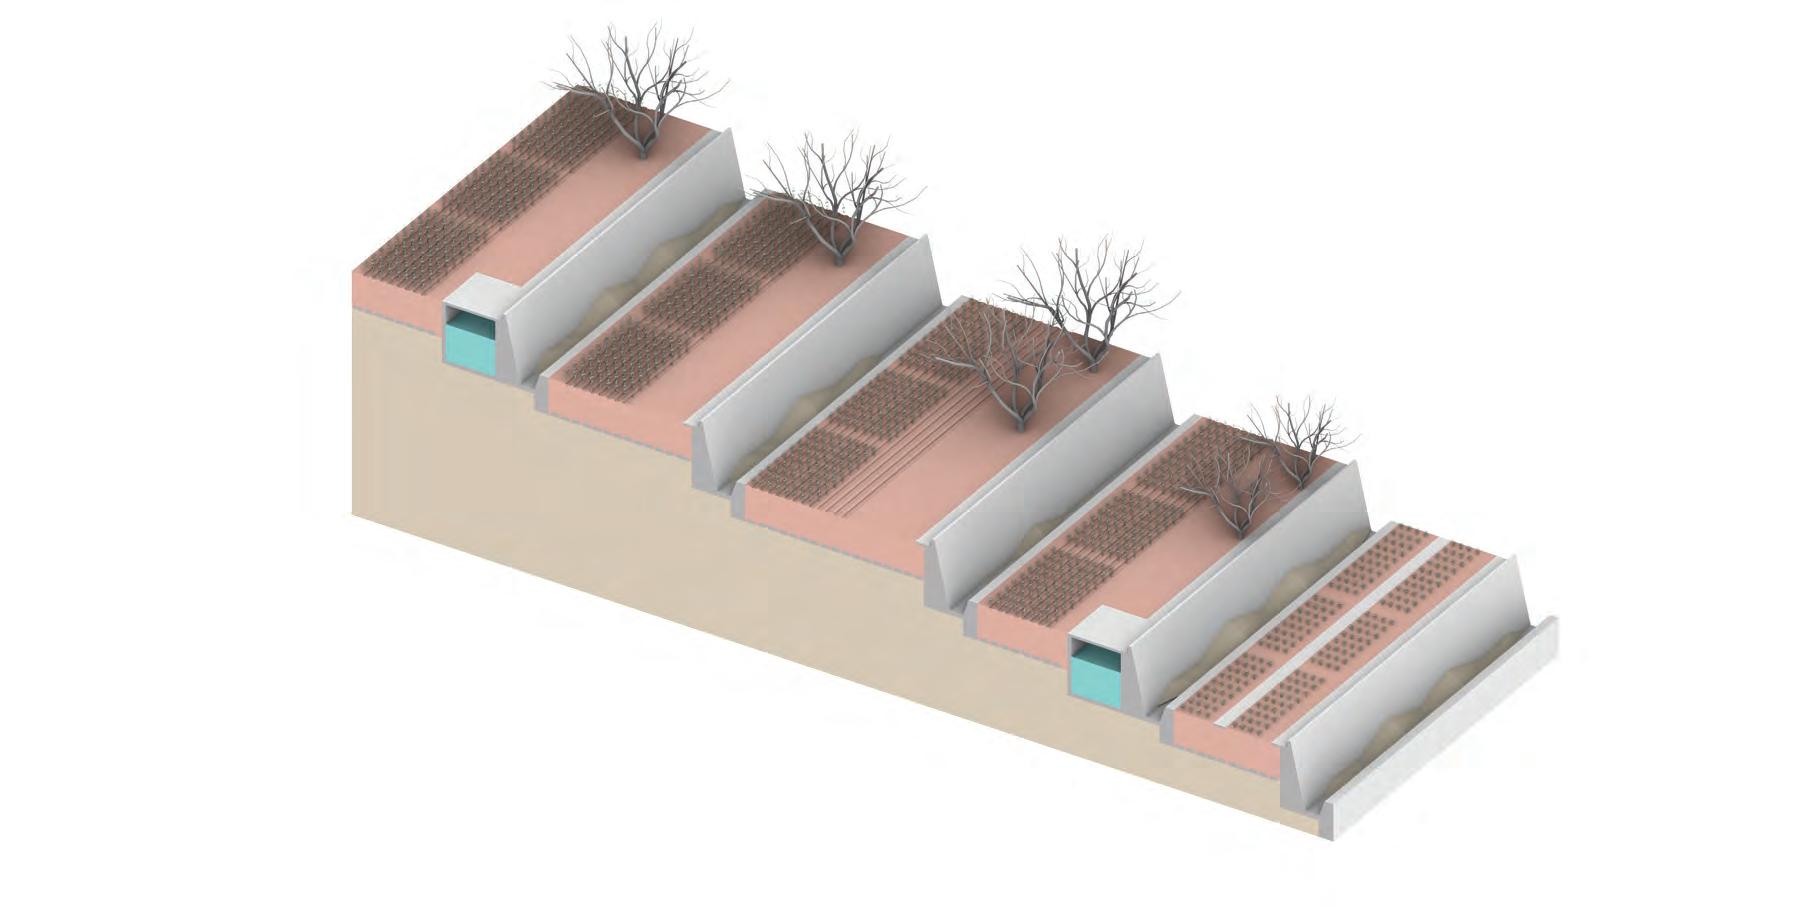
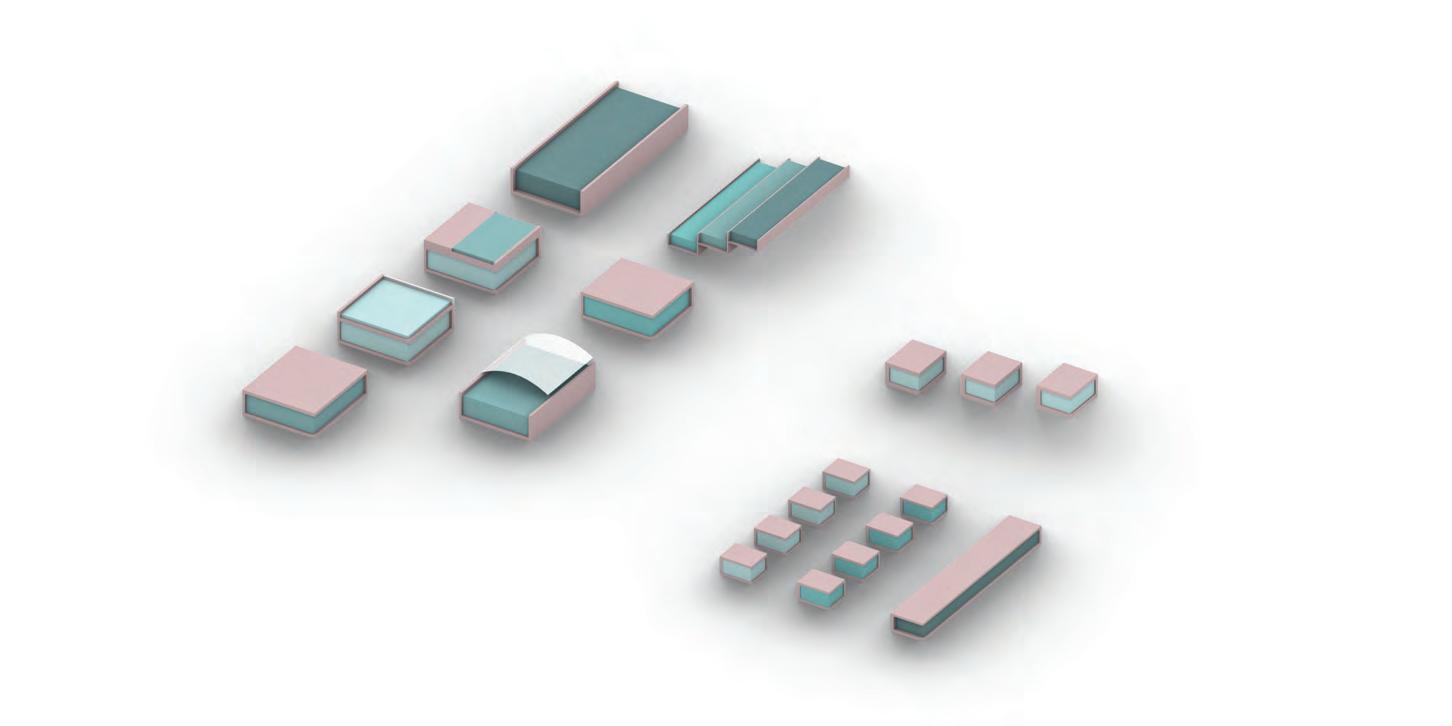

154 I Emergent technologies and design
Water tank sizes and quantities for each phase
Domestic water tanks ( 10 days holding capacity)
Daily water requirement for 300 peopl( 135 /d) 40, 500L
Water required for 10 days: 400, 500L or 400.5 m3
Asuming depth of tank =1.2m for saftey and Length x width= 3x3m based on injection grid size
Volume of one domestic tank : 10.8 m3
Total no of tanks required in one phase : 37 nos
Total of no of tanks required in each cluster: 7 nos
Micro-irrigation water tanks ( 10 days holding capacity)
Daily water requirement for agriculture( 11L/m2)---------------------------------------------------.-------1,364,000L
Daily water requirement for 10 days: 13,640,000L or 13,640m3
Asuming depth of tank =15 m ( max injection depth to maximize area available for agriculture)
Width = 3m (minmum injection width to maximize area available for agriculture)
Length = 21m
Volume of one domestic tank : 945 m3
Total no of tanks required in one phase : 16 nos
Total of no of tanks required on each step: 1 nos
Total capacity of 16 tanks: 15,120m3
Surplus capacity of 1480 m3 is su cient to water the plant nursuries inside the cluster
The water from the three sources are distributed across the site with a network of collection and underground storage tanks. The water in these tanks are mechanically aerated to stabilise bacterial growth. Water post treatment are used for different purposes depending on the source of treatment. The extreme climatic conditions of the site cannot be changed and hence adaption of water conservation techniques is critical. While practise of irrigation techniques like microirrigation and water retaining pits can significantly reduce the water requirement for agriculture, recycling and reuse of grey water can reduce water requirement for habitable spaces.
155 In-dune I
5.3.3Shelter belt
When vegetative barriers like trees are placed in the path of wind, they reduce the velocity near ground by exerting a drag on wind and deflecting wind stream. The deflection of sand laden winds can shield the leeward area from sedimentation. The effectiveness of shelterbelt in reducing wind velocity depends on direction and velocity of wind, shape, height and density of trees and width of shelterbelts. 54
While direction and velocity of the wind cannot be controlled, the geometric variation in shelterbelts can be made to shelter the leeward area.
Height: Plantation at regular intervals of 8-10 times the height of the tree can shelter greater distance than 6-8 times the height .55 The shelter belts on the crests of dunal section are designed to be at least 5 trees thick.
Length: Turbulence or tunnelling effect is generated at the end of short belt lengths which can facilitate wind borne hazards. Belts with lengths 10-12 times the height of the tree do not show any signs of turbulence. The shelter belts are planted along the crests of dunal valley of length greater than the selected patch.
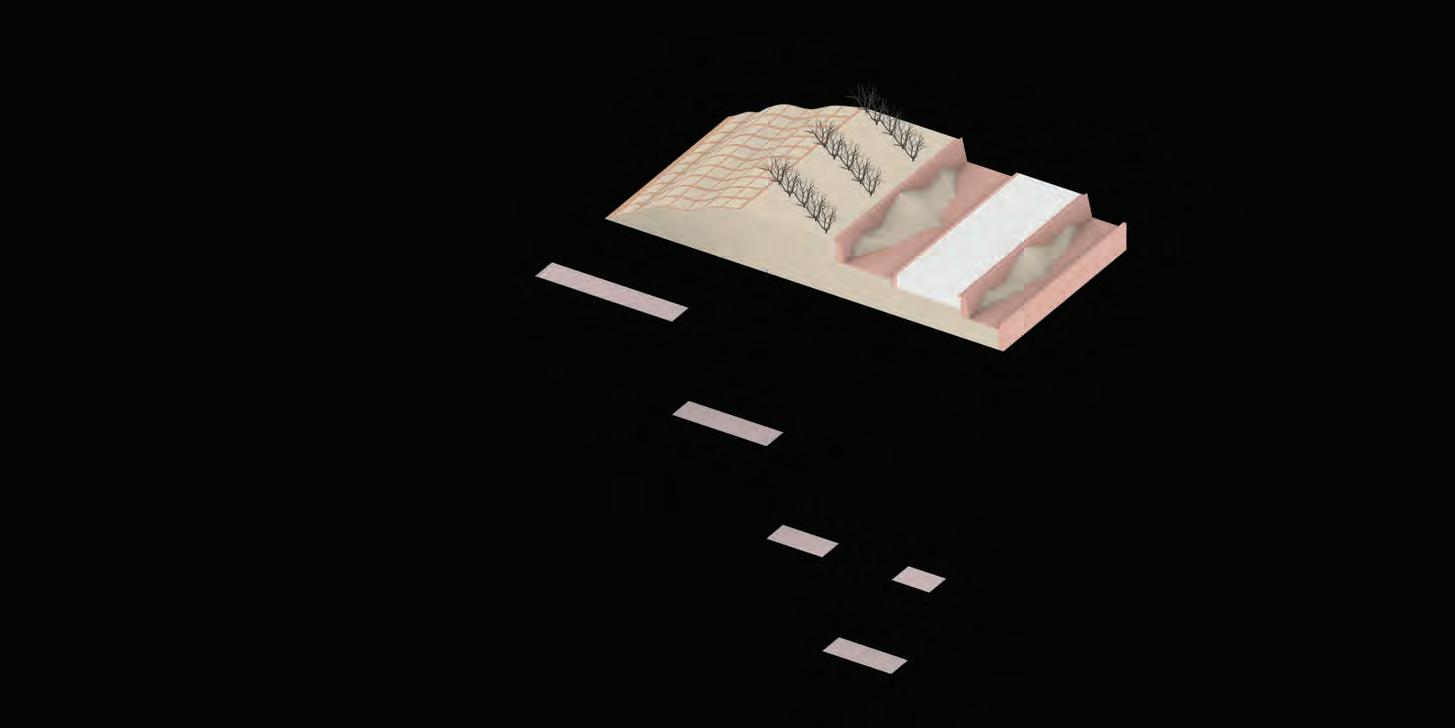
Density: Uninterrupted and uniform shelterbelt plantations are more effective than those with interruption or gaps. These gaps provide space for passage of wind with higher speed and turbulence causing more soil erosion. Dense alignment of trees creates opportunity to design shaded walkways.
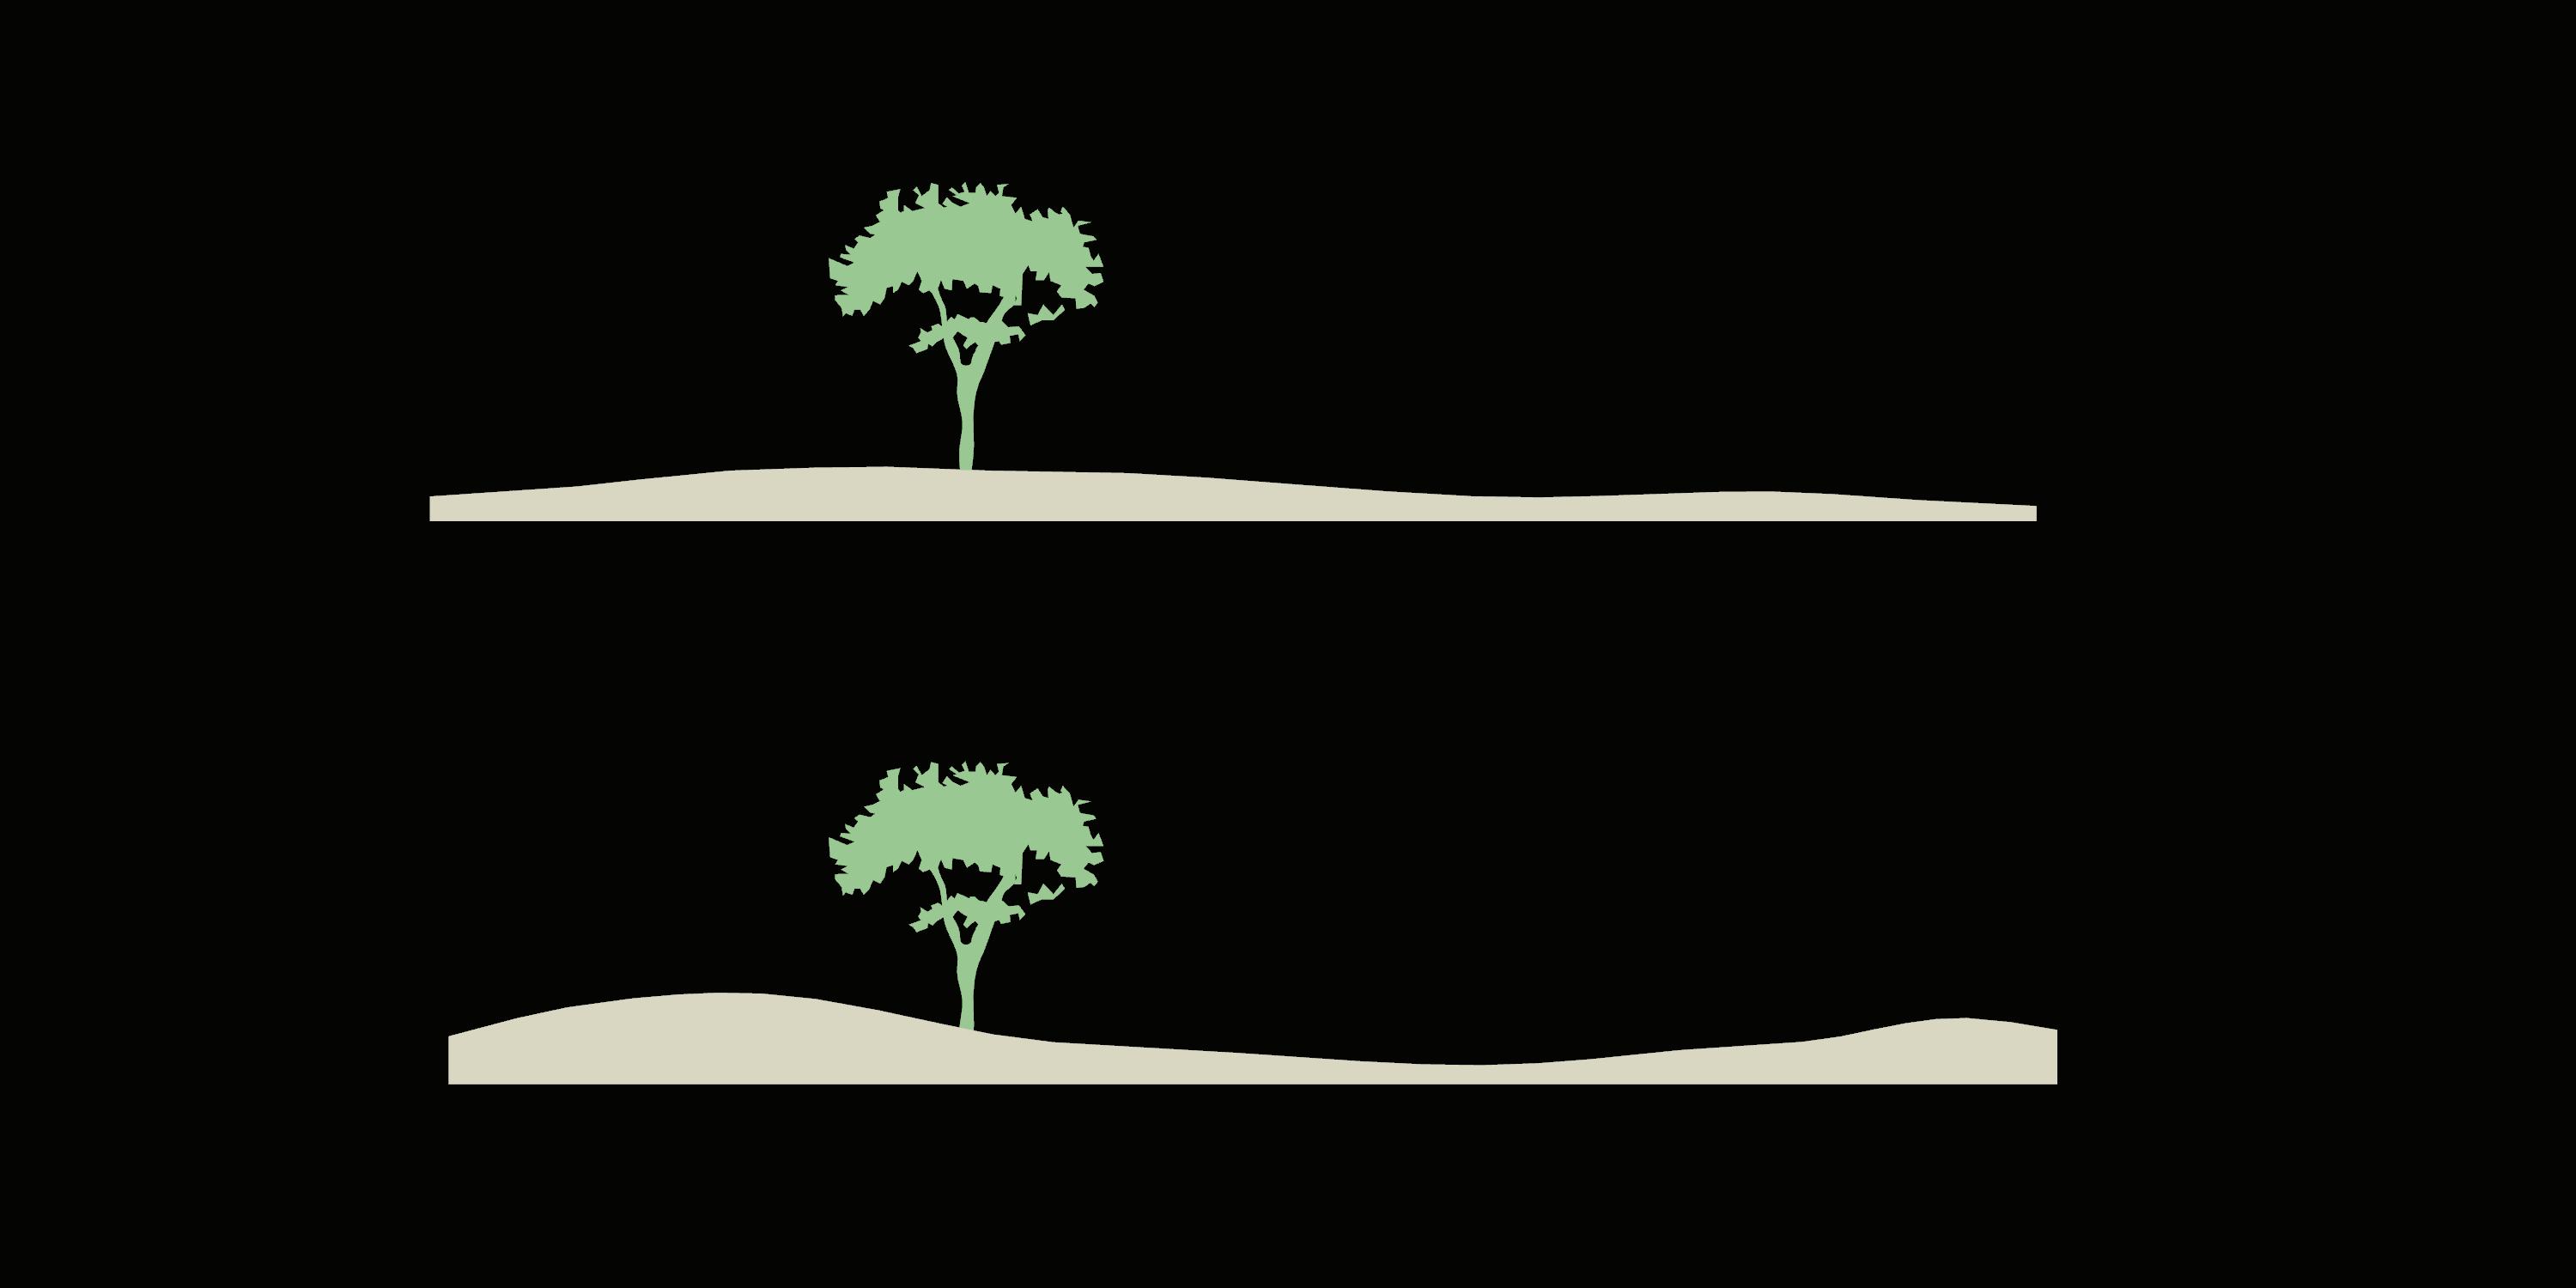
156 I Emergent technologies and design
Height : H 6H - 8H 2-3H Upwind sedimentation
Downwind sedimentation Initial stage Sedimentation over time
Tree covered in sand overtime unless saltation occurs due to wind blowing from a di erent direction
Sand accumulation downwind due to action of secondary wind
Predominant wind errodes accumulated sand along the sand channel
Sand accumulation downwind due to action of predominant wind
Funneled secondary wind errodes accumulated sand into adjacent valley
South-west wind (predominant)
De ected south-west wind
Secondary wind

Shelter belts apart from deflecting the sand like
Sand accumulation increases in adjacent valley
Increased sedimentation due to de ected sand accumulation
Saltation reduced due to plantation of dune grass.
Sand accumulation downwind due to action of predominant wind
De ected predominant wind errodes accumulated sand into adjacent valley
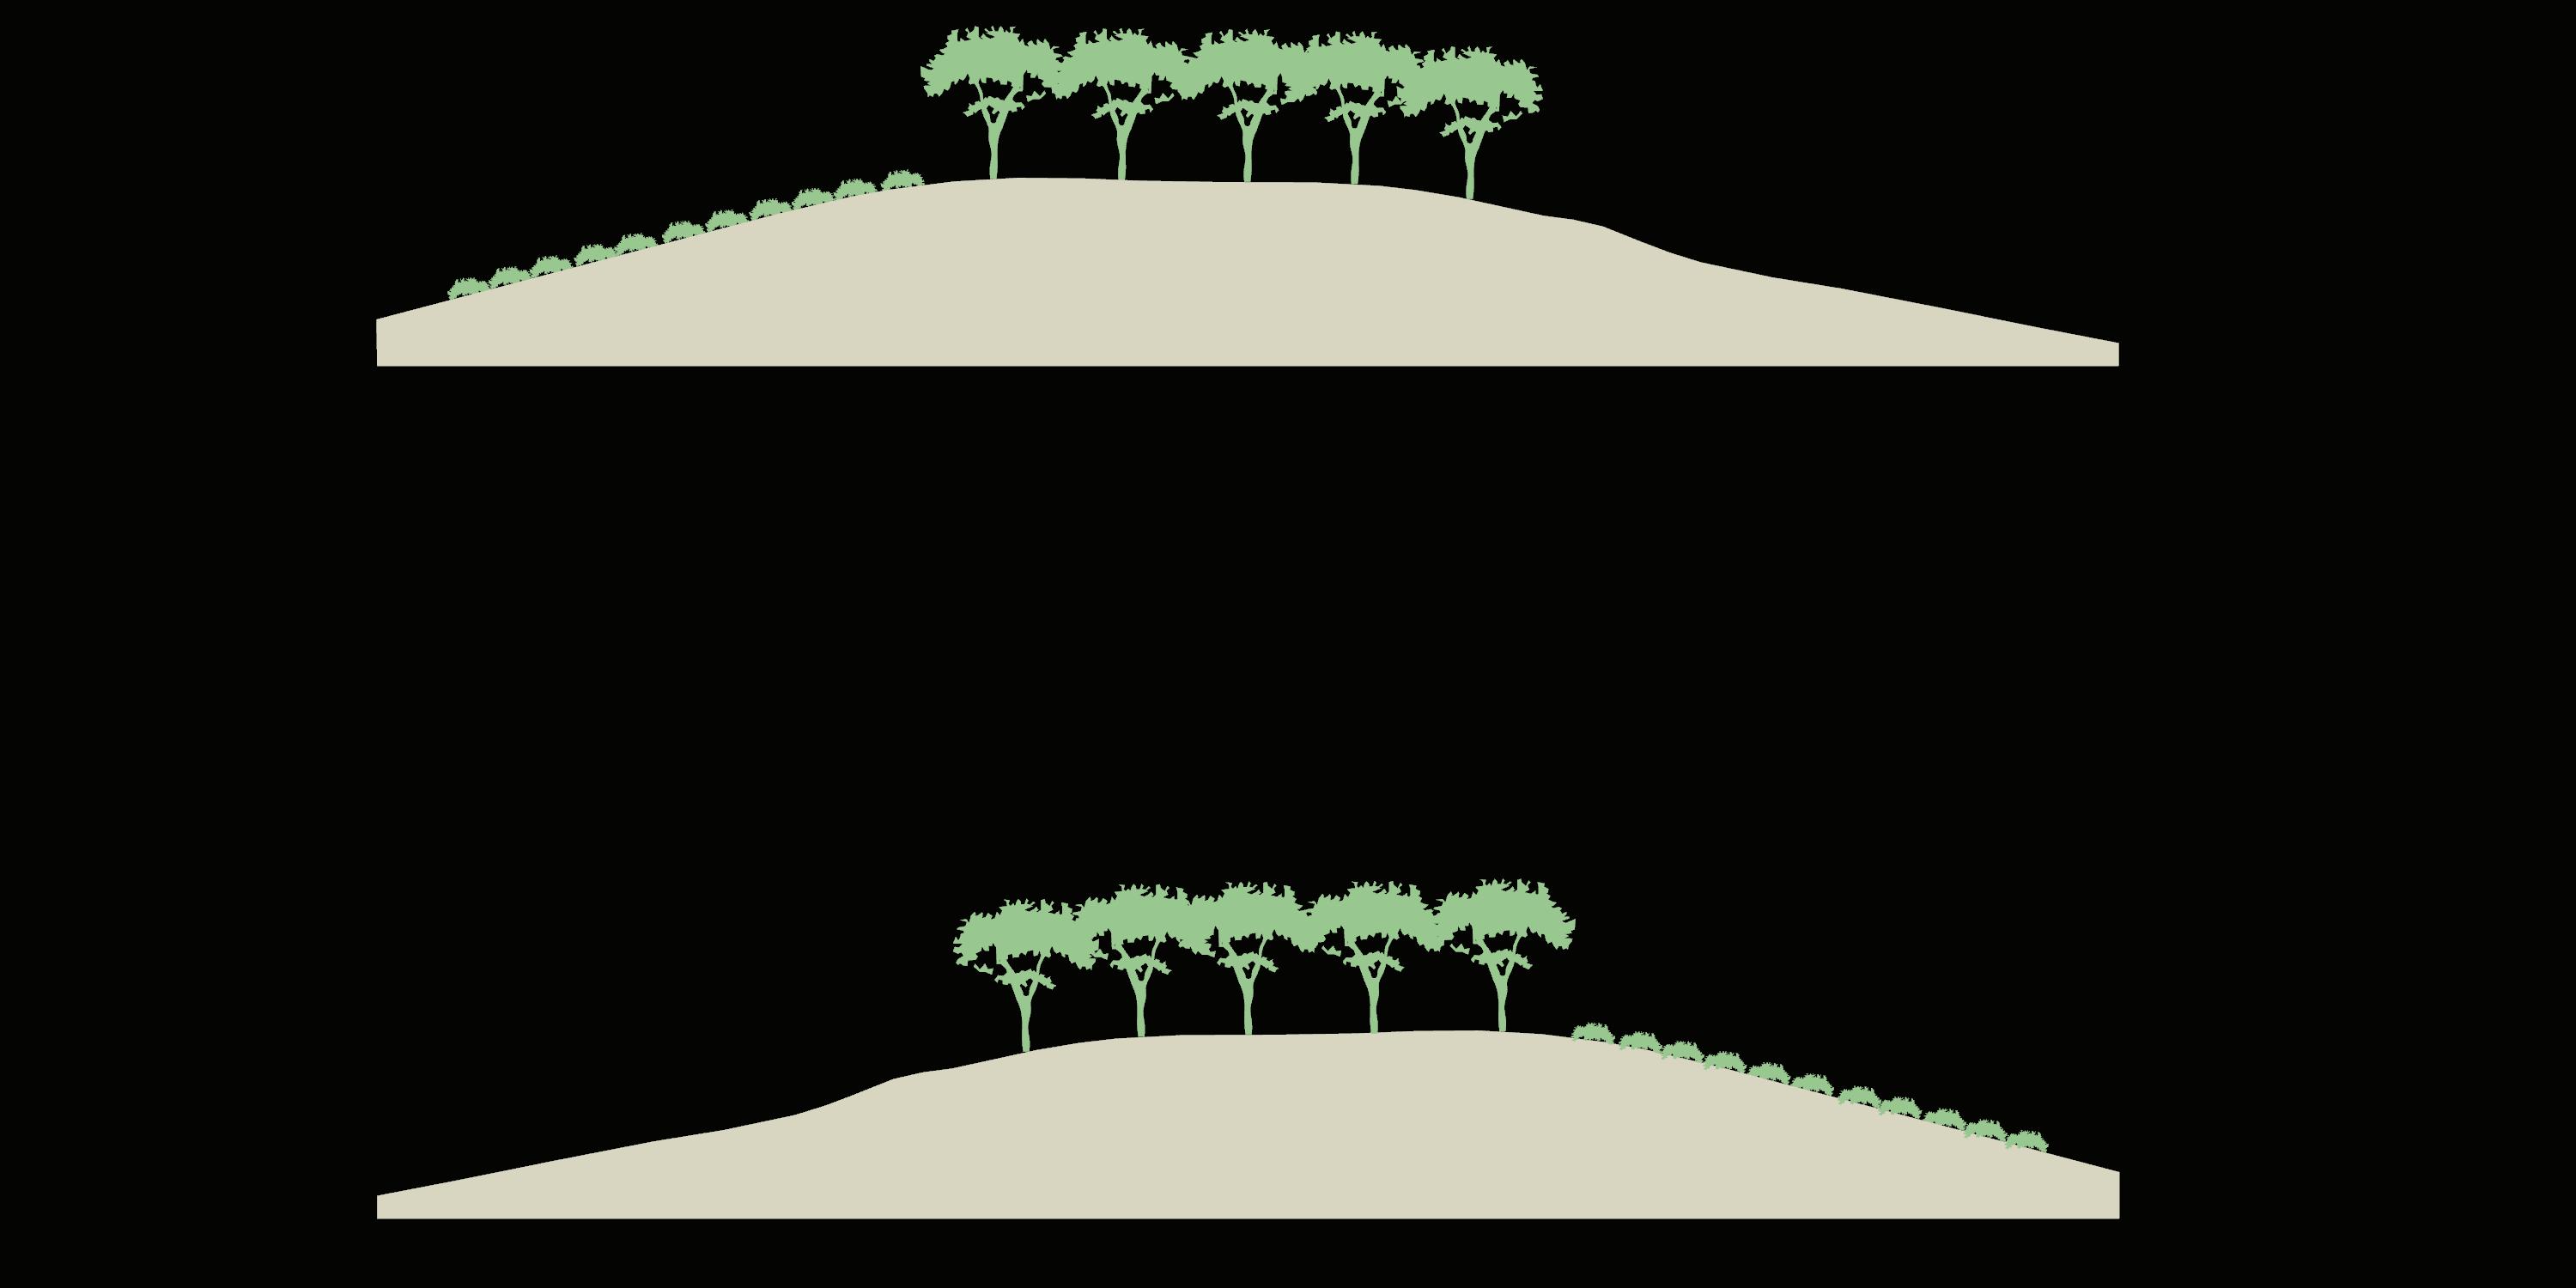
Sand accumulation downwind due to action of secondary wind
Predominant wind errodes accumulated sand along the sand channel
90 m 90 m
Selected plants for erosion control and de ection
Trees
Uses
Animal fence
Di used light
Shade
Food/Fodder
Wood
Bird habitat

Jujube/chinese date (Ziziphus mauritiana)
Chilean Mesquite (Prosopis chilensis)
Khejri (Prosopis cineraria)
Umbrella thorn (Acacia tortilis)
Gum arabic tree (Acacia nilotica )
Time period of e ectiveness
Maturity period
Life span
Water requirement
E ectiveness on slopes <10*
E ectiveness on slopes >10*
Acacia nilotica grows quickly, coppices readily and is a source of fixing nitrogen, improving soil fertility and its leaves and pods are widely used as fodder.
158 I Emergent technologies and design
15-21m 12-15m 3.5 - 4m
40 years 30 years 50 -70 years 100 years 70 years 55 -60 years 4015 m3/ha 3500 m3/ha
Dune grass
Phog (C. polygonoidess)
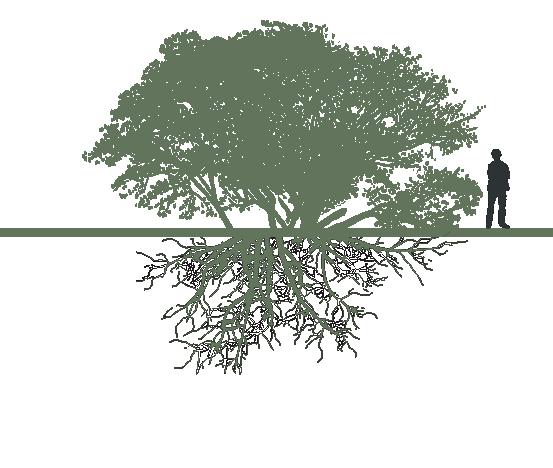
Lana (H. salicornicum)
Sewan grass (Lasiurus scindicus)
Buari (A. pseudotomentosa)
Succulents/shrubs
Lea ess Milk Hedge (Euphorbia caducifolia)
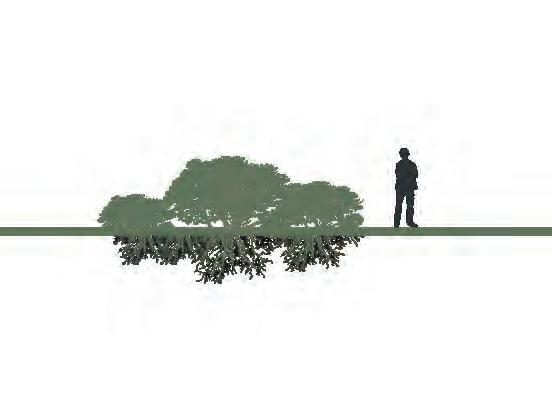
True aloe (Aloe vera)
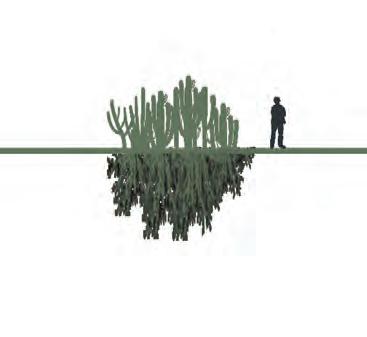
Pricky pear (Opuntia)
Caper/ karira (Capparis decidua)
159 In-dune I
3-5M 1-2M .3-2m .6 - .9m 1.5 -2m 2.5 - 3m
5 years 20 years 20 - 25 years 20 - 25 years 20 years 4 months 12 months 18 years 15 years 700 m3/ha 1250 m3/ha 1500 m3/ha
5.3.4Agronomics
The injected steps shielded by shelter belts and supported by supply of water from the canal and surface-offs support the growth of crops for all the seasons. However, the distribution of the crops over these steps are largely governed by varying radiation values on each step and proximity to water resource. Availability of land to plant on the terraced steps depends on different water levels during flooding and drought. During the period of drought, crops are planted closer to the valley for low radiation value and higher proximity to the water. On the contrary, flood conditions compel plantation above the flood level. The receding floods increase the deposition of fertile soil on each step, supporting the agronomic growth. Perennial fruit trees shade the ground and help in replenish more nutrients in the soil than crops.
Seasonal cropping gives the opportunity to the soil to regain its lost nutrients. Coupled with intercropping, agroforestry and crop rotation, these crops can also act as a barrier to the speedy winds. Thus, ensuring retention of fertile soil and its moisture.
Selected plants
Selection of the crops are mainly based on the resistance to drought, aridity and high temperature coupled with their potential to produce high yield. Sometimes there might be competition between tress and crops particularly closer to the shelter belt for nutrients and other resources. Proper selection of both the components are essential to take the benefits of sheltering from trees and high yield from crops. Giving a protective environment in the plant nurseries during initial growth years can significantly improve the chances of plant survival post plantation on the steps. (Refer to Appendix Section 8.3 for details on crops cultivated in Rajasthan)
Spatial requirement for nurseries in each phase
Number of sapling required per year : ---------------------------------------------------------------------------40,000
Total area requirement for plant nurseries (60,000 saplings per 1500 sqm) : -----------------------1000 sqm
Area of plant nursery per cluster : 200 sqm
160 I Emergent technologies and design
Perennial fruit trees
Sorghum
Millets
Pigeon Pea
Moth bean
Marama bean
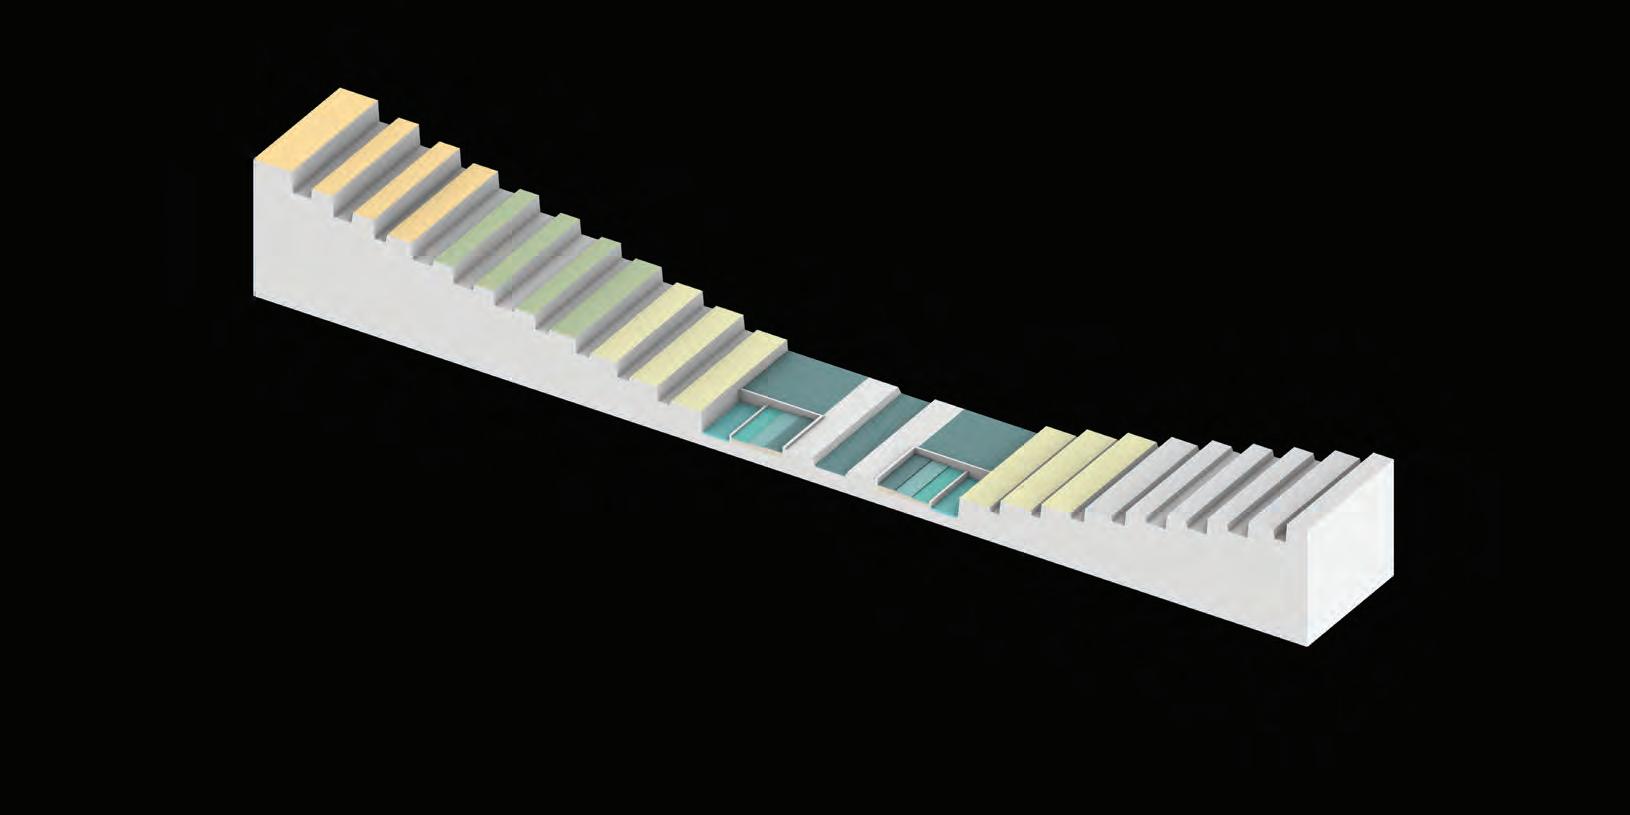
Pricky pear
Date palm
Gemsbok cucumber
Aloe vera
161 In-dune I Jan Feb Mar Apr May JunJul Aug Sep Oct Nov Dec
Dry season Wet season
Selected plants for food resources

Fruit trees

Date Palms can survive over 100 years and produce anything from food to bio-fuel.


162 I Emergent technologies and design
Prickly pear Date palm Gemsbok cucumber Aloe vera
Harvesting period Temp. resilience Water requirement Height of Plant Yield (kg/hectare) Calories per kg 4100 3690 100 530 9071 kg/ha 8271 kg/ha 7480 kg/ha 15000kg/ha 8 months 6 months 2 months 2-3 years Nursery period 1 month 1 month 1 month 2 month 45 -113 °F 5 -132 °F 65 - 75 °F 55 - 80 °F 3419 m3/ha 2559 m3/ha 2.1m 21- 23 m 1.1-1.3 m 1m 3432 m3/ha 1100 m3/ha 0.6 - 1 m 2.53 m2.53 m 3 -5 m 0.30.9 m 0.30.9 m 1 -1.5m 2.53 m 0.6 - 1 m 2.53 m 0.3 - 0.6 m 0.20.6 m
(
Opuntia) (Phoenix dactylifera) (Acanthosicyos naudinianus) (Aloe barbadensis miller)
Cereal grains

Grain Legumes
Pearl millets are less susceptible to drought than legumes.
Amongst all the legumes, tolerance to drought is highest in varieties of moth bean

163 In-dune I Sorghum Pearl millet
Piegon pea Mat bean Morama bean 181 kg/ha 4700 3780 3430 3430 3650 131 kg/ha 169 kg/ha 400 kg/ha 240 kg/ha 75 - 90 °F 3 months 4 months 3 months 3 months 2 months 1 month 1 month 1 month 1 month 20 days 75 -90 °F 77 -95 °F 77 -113 °F 77 -113 °F 2321 m3/ha 1.5 - 2 m 1.5 - 2.4 m 5m 1.5m 3m 1920 m3/ha 1830 m3/ha 1960 m3/ha 2060 m3/ha 12 m 12 m 1 -2m 1 -2m 23.5 m 13 m 11.5 m 1 -1.5 m 1.5 -3 m 0.30.5 m 11.5 m 1.52 m 0.3 - 0.6 m 0.3 - 0.6 m 0.3 - 0.5 m
(Sorghum bicolor) (Pennisetum glaucum) (Cajanus cajan) (Vigna aconitifolia) (Tylosema esculentum)
164 I Emergent technologies and design
6. Design Proposal
The chapter is a synergic integration of all the three systemshabitable, agricultural and hydrological and their sub systems. It details time based application of techniques and its corresponding impact on environmental and system changes. The section documents architectural details of proposed interventions and visualisation of the design ambition in context to the site.
6.1
Program distribution
The distribution of varied programs across the intervened dunal valley generates different spatial qualities, each supporting unique activities that contribute in building improved lifestyle of the locals. Virtually marking the boundaries of the section, the shelter belts along with stepped terraces near the water canal form public spaces. Shade from the shelter belt trees and lowered micro-climate due to water in the canal make these public spaces active even during the hottest months of the year. A strategic selection of tree species is made such that the variation in height, canopy spread and density of foliage create differing qualities of filtered light in these spaces. Qualities such as shade and diffused light from these trees help to transform the area into ecological park and demarcate public, semi-public and private zones.
While distribution of habitable spaces remain the same, agricultural terraces are active based on the season and water level in the canal. Flood condition in the region make the public spaces and agricultural plots closer to canal unusable. To avoid this condition, habitable spaces are zoned closer to the crest, along with elevated corridors and pathways.
166 I Emergent technologies and design
167 In-dune I
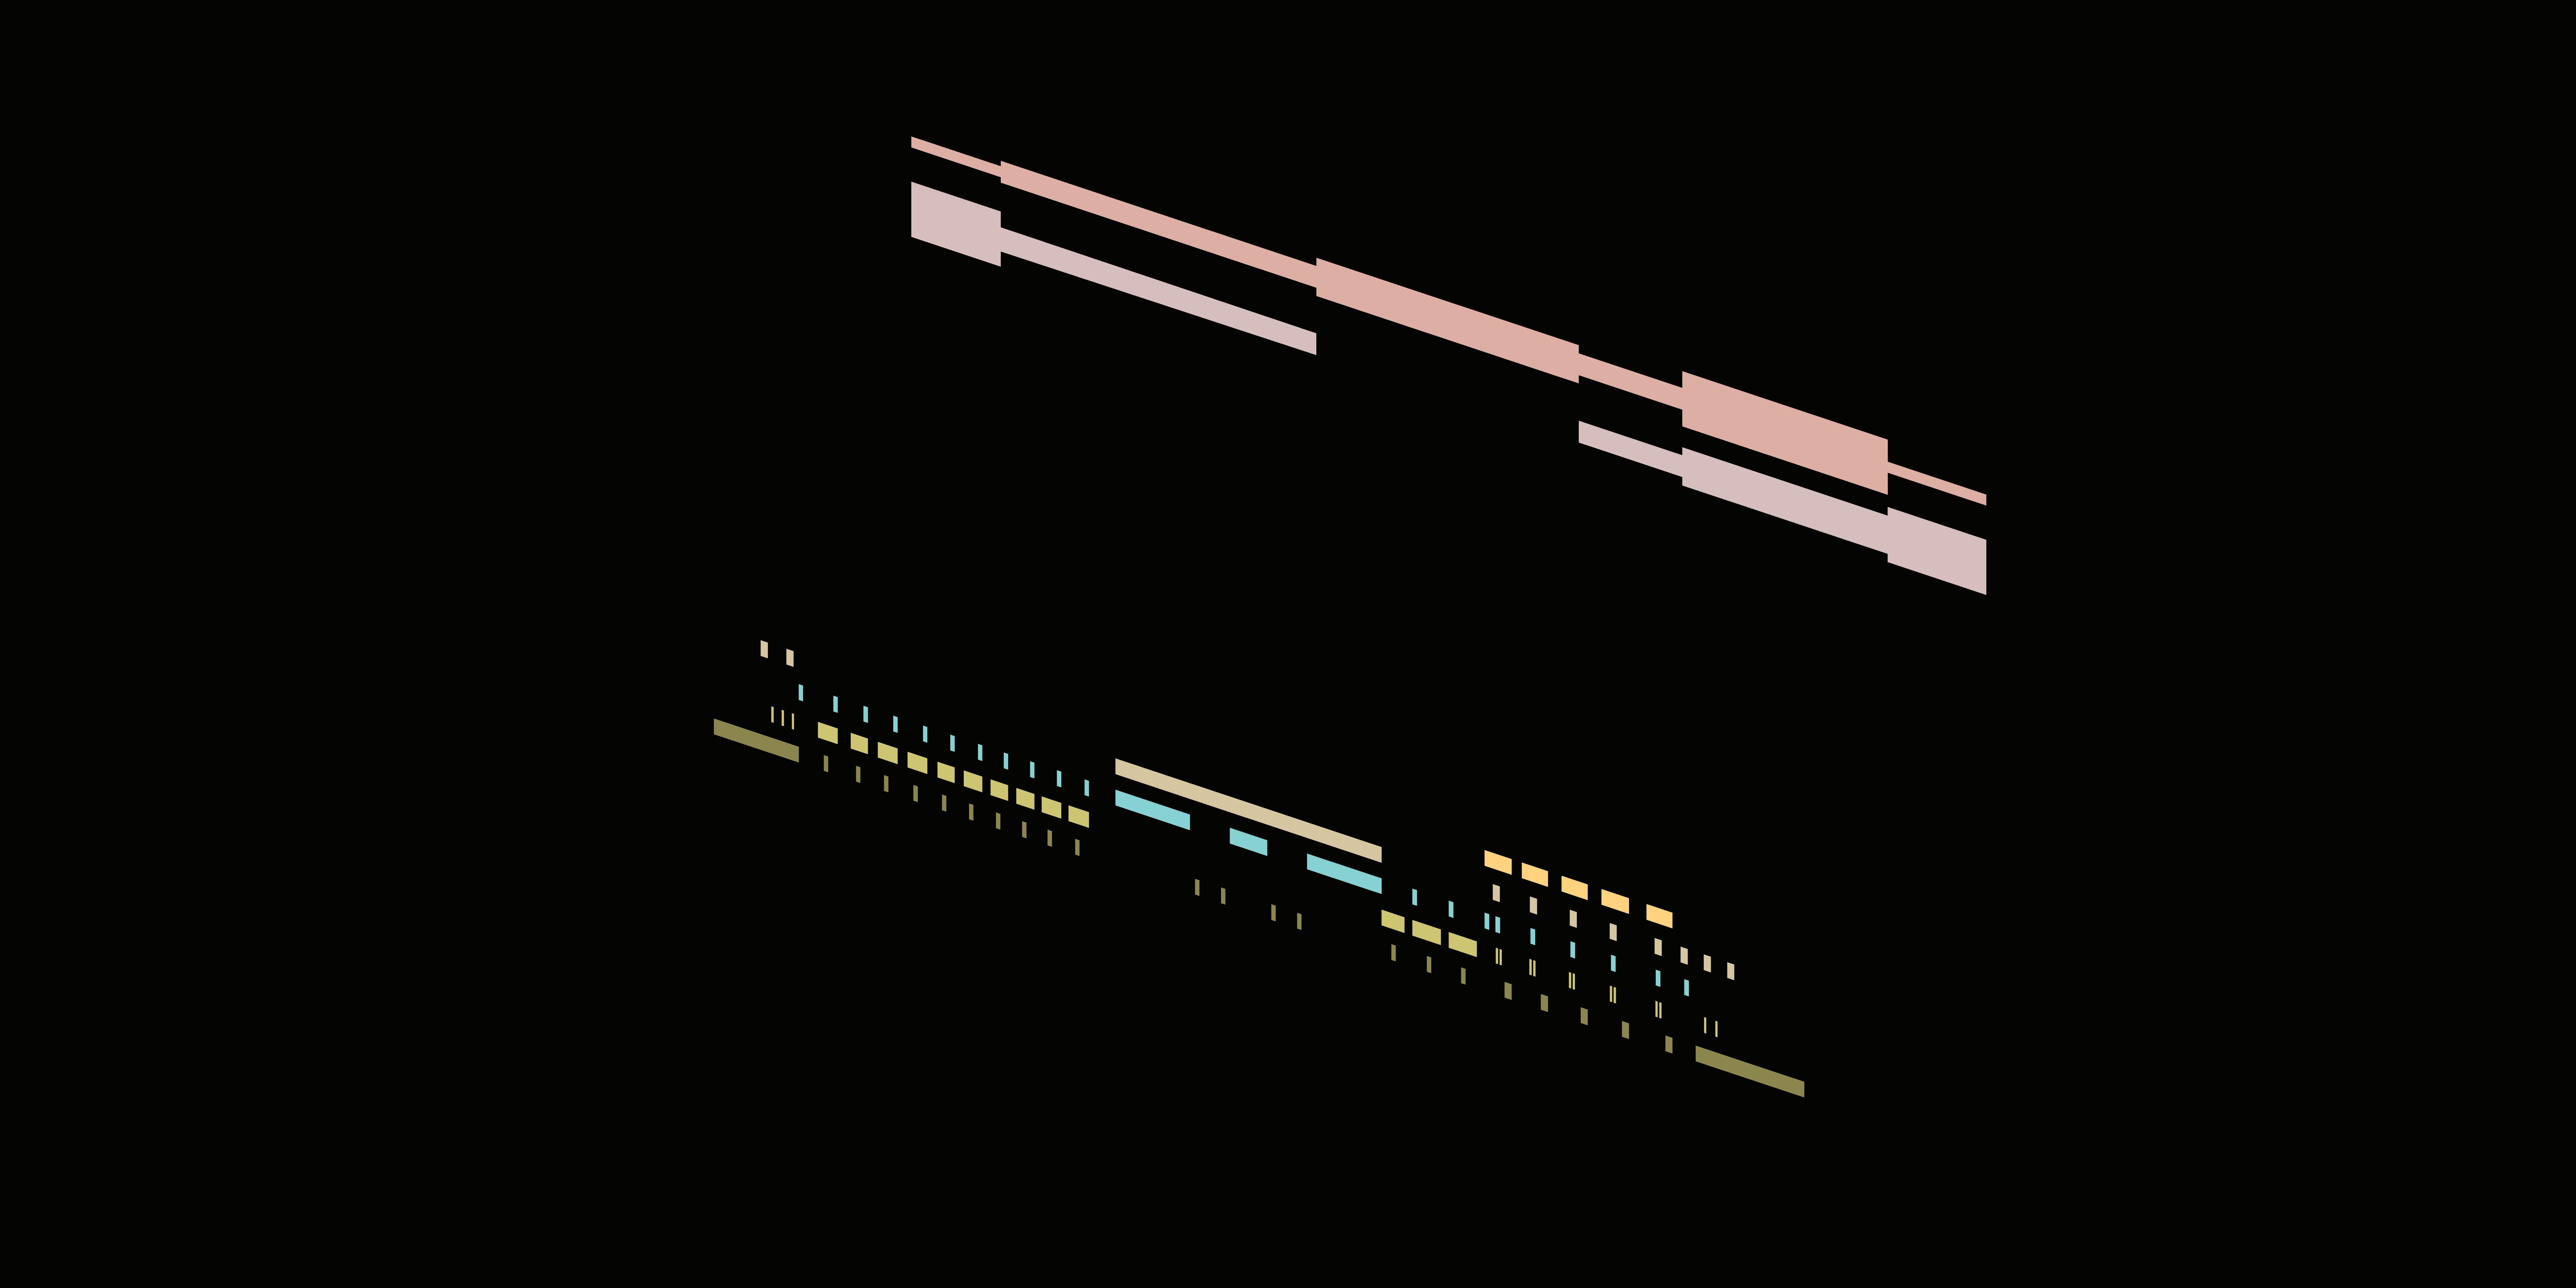
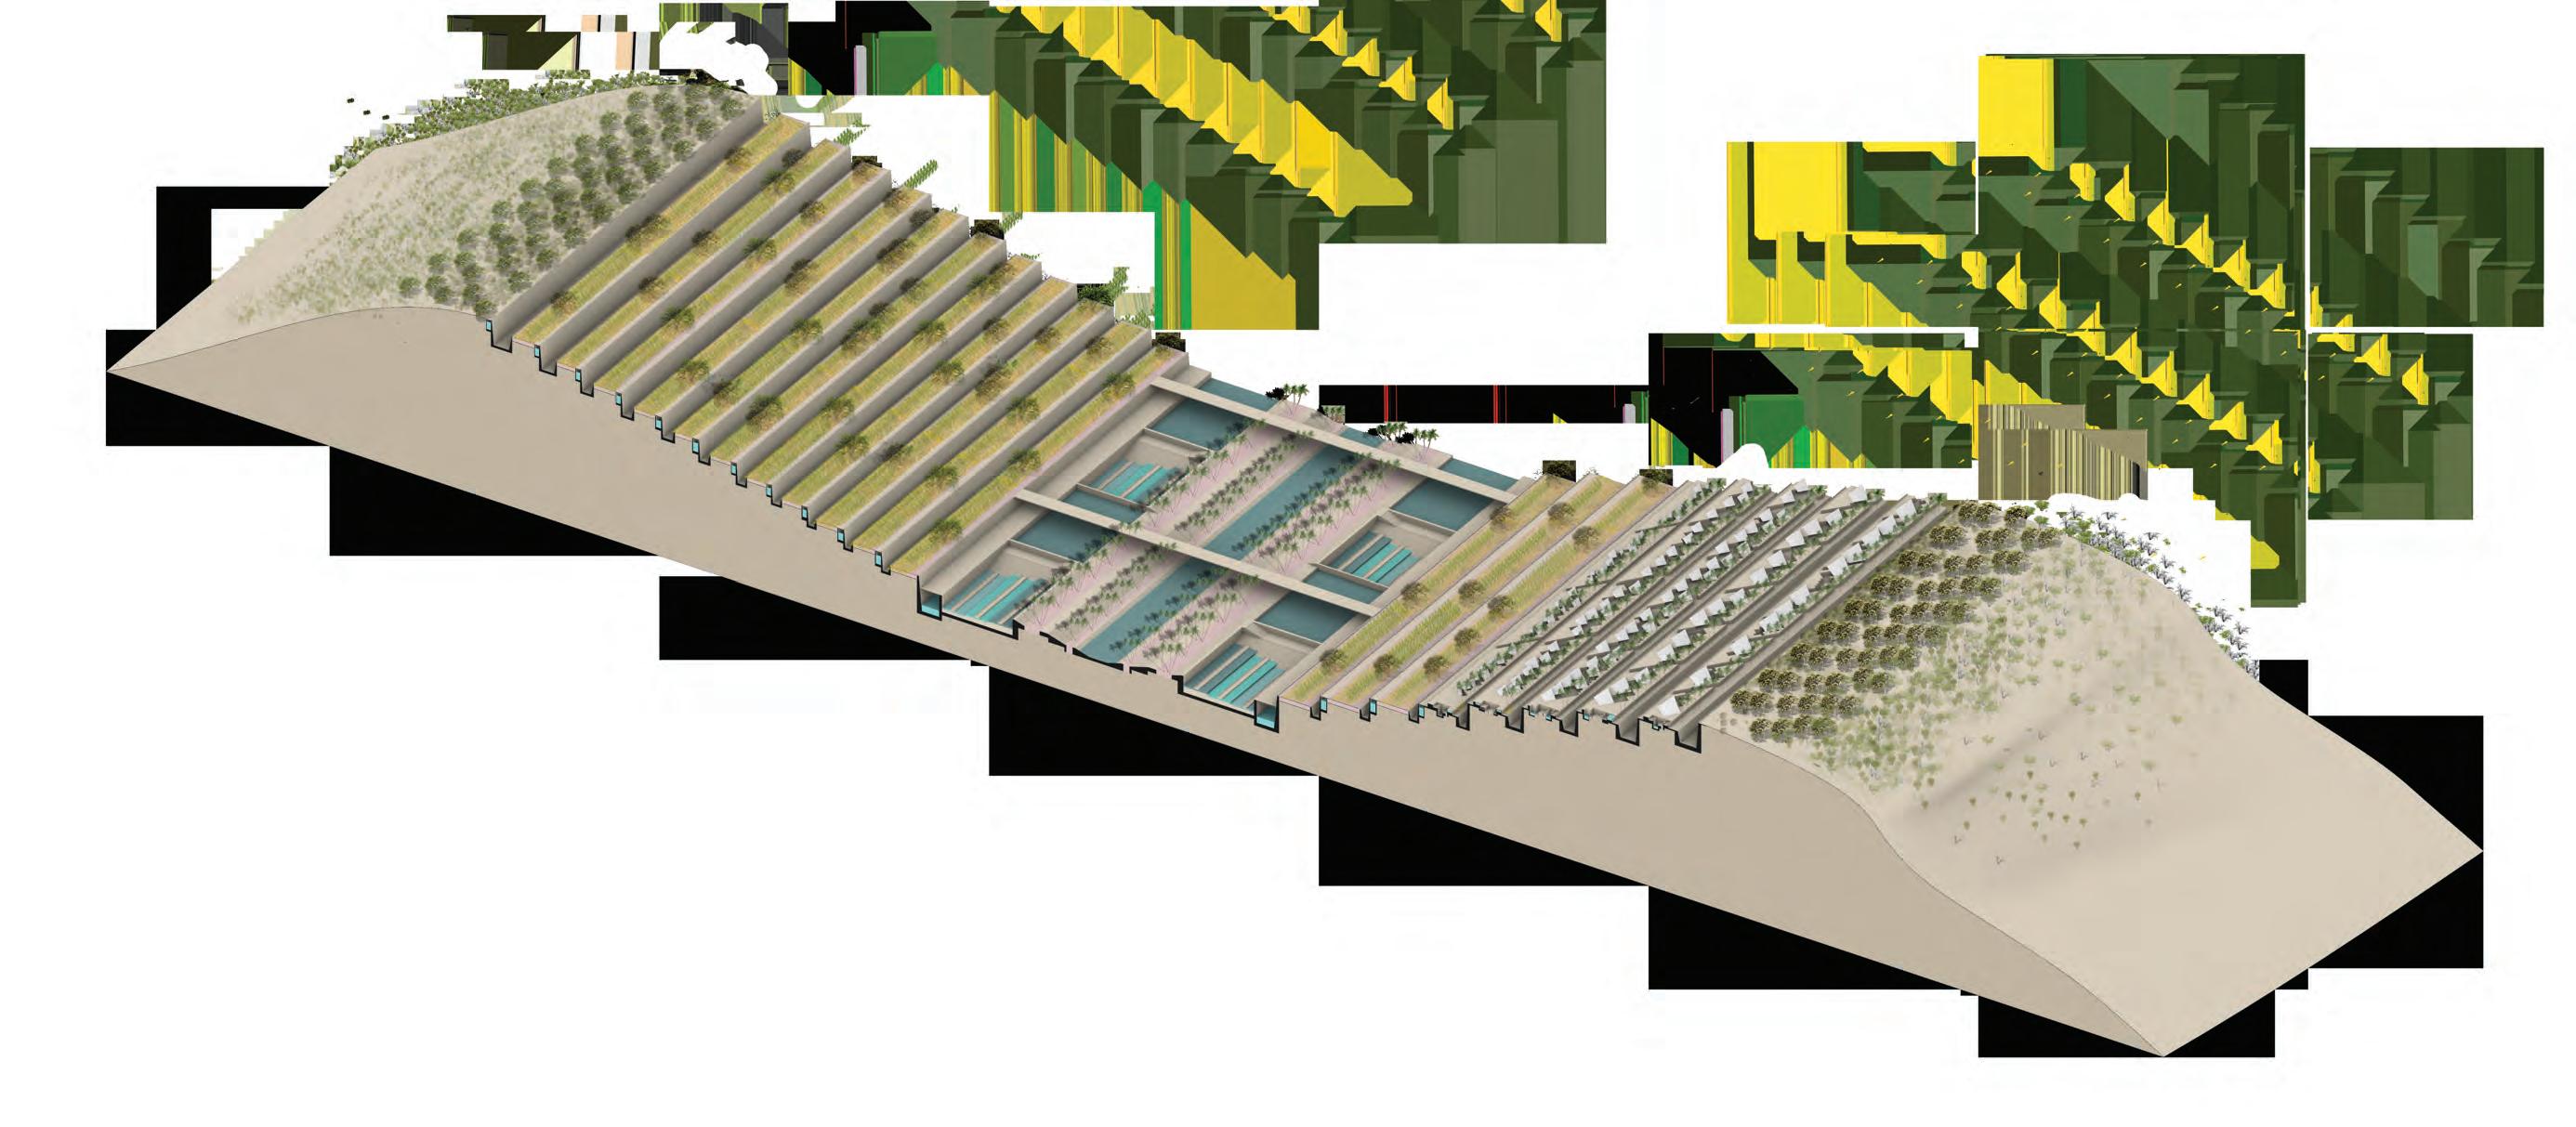
- 15 m + 75 m + 45 m + 15 m
6.1.4
Public spaces and shelter belt
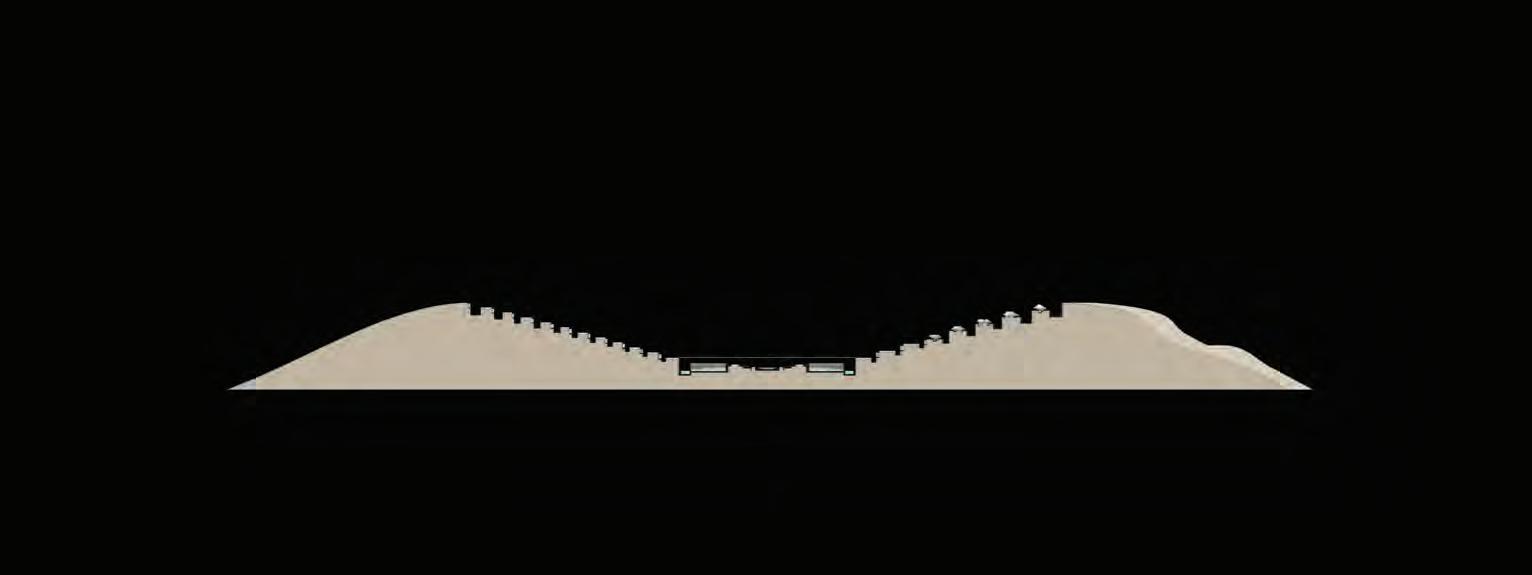
Windward ank


Key section
Elevated walkway
Alternate material
Agriculture terraces
Donum palm (Hyphaene thebaica)


Shading Low wind resistance
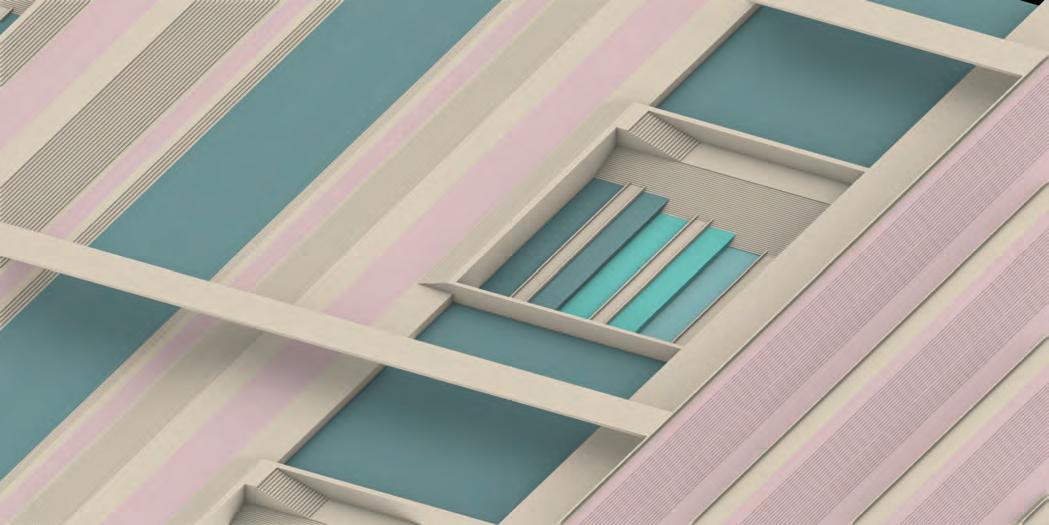
Flood water level
Normal water level
Drought
40m
Irrigation canal
170 I Emergent technologies and design
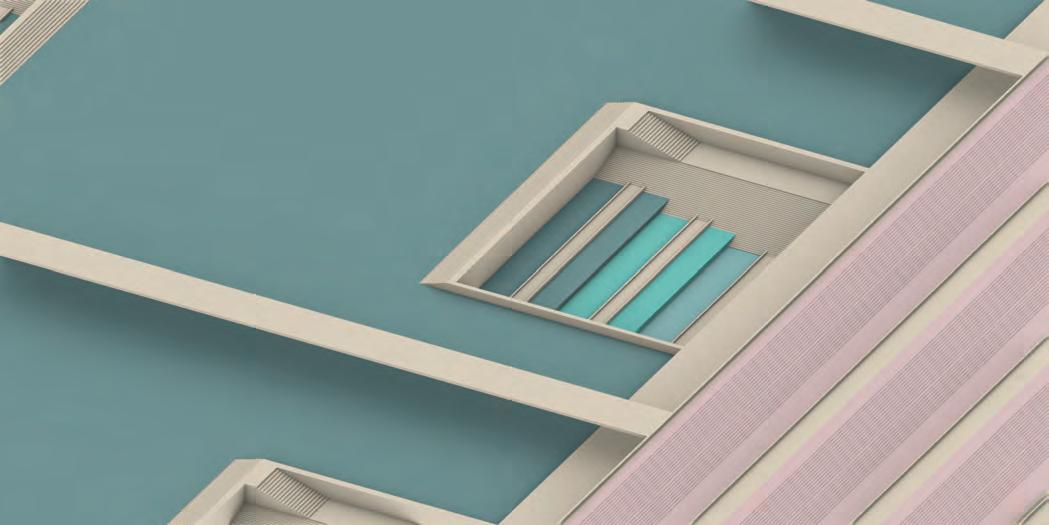
171 In-dune I Original dune pro le 0m + 1.4m + 4.5m + 10m + 10m + 20m - 15 m 75m 150m Bioremediation ponds Zone protected from ooding 15m Remediated & terrace run-o collection tank Public space Rhizo ltration Vehicular roadway (Opuntia) Rushes (Juncus spp.) Normal canal water level Flood condition Bioremediation pond Vehicular access Elevated walkway sacri cial public space Agriculture terraces
6.1.2 Site section
Key section
Date palm (Phoenix dactylifera)

Leeward
Gemsbok cucumber (Acanthosicyos naudinianus)
Piegon pea
(Cajanus cajan)
(Pennisetum glaucum)
Terrace for perennial fruit trees
Terrace for Winter crops
172 I Emergent technologies and design
Nitogen xation
Shading
3m Water tank 6m (8% slope) Ramp 9m Sand channel 20m 2m 9m Sand channel
ank
Pearl millet surface run-o to sedimentation tank and bioremediation ponds Bioemediated water
Terrace for Winter crops
Terrace for Summer crops
173 In-dune I 00 m Original dune pro le - 10 m - 20 m - 30 m - 38 m Shading Shading
9m 6m (8% slope) Sand channel Ramp 25m 9m Sand channel
Umbrella thorn (Acacia tortilis)
Umbrella thorn (Acacia tortilis)
Sorghum (Sorghum bicolor)
Pearl millet
Morama bean
Micro-irrigation 4m (fertile soil)
(Pennisetum glaucum)
(Tylosema esculentum)
6.1.3 Shelter belt
Key section
Windward
10m (3% slope)
Reverse graded terrace
10m (3% slope)
Reverse graded terrace


10m (3% slope)

Reverse graded
100m
Tree shelter belt on dune
Dune ank stabilized with dunes and shrubs along with geotextiles
174 I Emergent technologies and design
Caper/ karira (Capparis decidua)
Phog (C. polygonoidess)
10m (3% slope)
Reverse graded terrace 100m belt on dune crest
10m (3% slope)
Reverse graded terrace
10m (3% slope)
Reverse graded terrace
3m
Sand channel
175 In-dune I Original dune pro le 0 m - 10 m - 15 m
Water tank 15m
Pricky pear (Opuntia)
Khejri (Prosopis cineraria)
6.1.4 Habitable terraces


176 I Emergent technologies and design
and medium sized family cluster Access to cluster Sand channel Sand channel Primary inter-step circulation Water tank for irrigation
Small
Terrace for summer crops
section
ank
Shading Shading 6m 24m
9m
Key
Windward
Umbrella thorn (Acacia tortilis)
Collected rain water to sedimentation tank and bioremediation ponds Bioemediated water Micro-irrigation Bioemediated water Domestic use
Donum palm (Hyphaene thebaica)


177 In-dune I 00 m Original dune pro le - 15 m - 30 m - 50 m - 11.5 m - 34.5 m channel Primary inter-step circulation Di used light 6m 30m 6m 13m Sand channel Access to cluster Medium and large sized family cluster Plant nursery palm thebaica) Bioemediated water Domestic use Khejri (Prosopis cineraria)
Cluster time-scales 6.2
The fabrication of the cluster commences with the ground preparation for injection. Deployment of heavy machinery, material procurement, injecting and hardening of the composite suggest a time bound development of each structural component. Based on that foundations are injected first followed by the walls. After curing, larger pits are excavated sequentially to minimize the lateral loads of the loose sand on the walls. New roofs are fabricated and installed over these spaces and plants and trees are planted in the defined areas.
The whole process for a cluster of 6 families to become suitable for occupancy takes about three years. As the family size increases with time, the reserved spaces (Expansion Units) are brought to use.
178 I Emergent technologies and design
179 In-dune I
6.1.2 Cluster section 0-3 years
Key section
0 year
Area 2400 m2
Ground leveling + Deployment of sand mats Sheet piling to retain the sand
Multi-level 3 x 3m injections for foundation
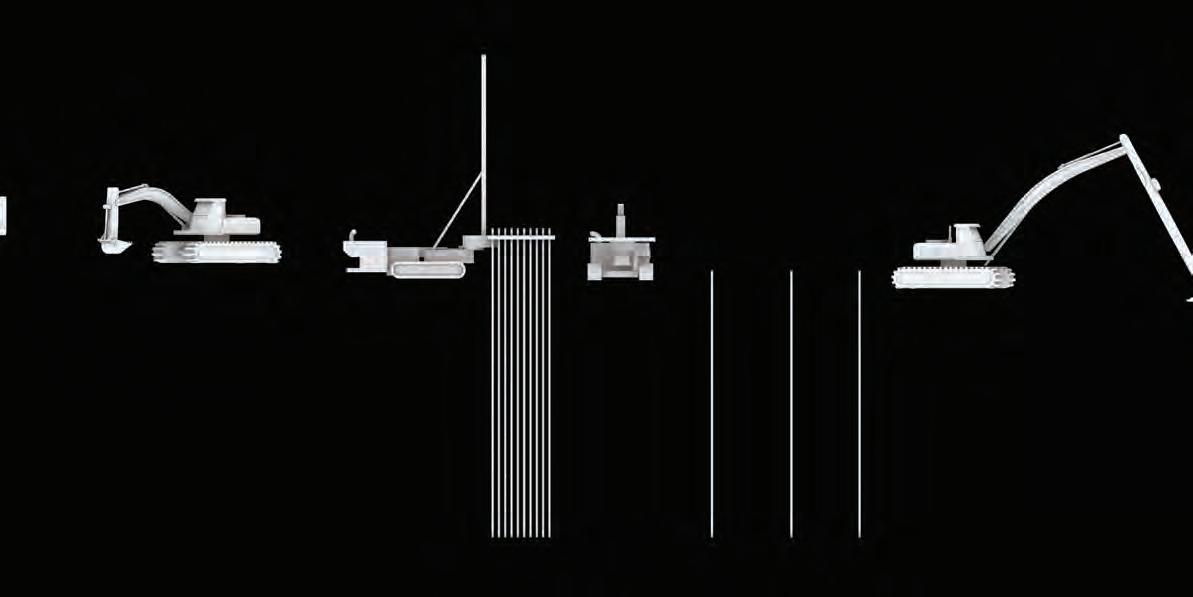

2 days ( 4m per/hr)
3 days ( 4m per/hr) 45 days
180 I Emergent technologies and design
100 m ( cluster length )
Multi-level 3 x 3m matrix injections for foundation Multiple single point injections for walls


Excavation of larger pit rst to reduce lateral load on hardened walls
Addition of oors slabs , roof , cutting openings, soil lling
45 days ( 162 sqm/day + 15 days curing)
45 days ( 1000 m3/day)
24-26 months
181 In-dune I 00 m + 15 m
- 04 m - 08 m - 12 m
6.1.3 Cluster section 3-20years
Key


Cluster becomes habitable 3 years
Population 34 pax
Family sizes 5,5,8,8 & 8
Excavation of reserved spaces and addition of new roof structures
10 - 20 years
Population 55 pax
Family sizes 8,8,13,13 & 13
182 I Emergent technologies and design
Primary access corridor Primary access
Small family unit Shading 9m 15m 3m 9m
corridor Nursuries and courtyards
section
Umbrella thorn (Acacia tortilis)

183 In-dune I 00 m - 04 m - 08 m - 12 m 00 m - 04 m - 08 m - 12 m Large family unit 3m 6m Sand channel New excavated spaces New excavated spaces 9m 9m Small family unit 3m 30m Animal pen Medium sized family unit
palm
Donum
(Hyphaene thebaica)
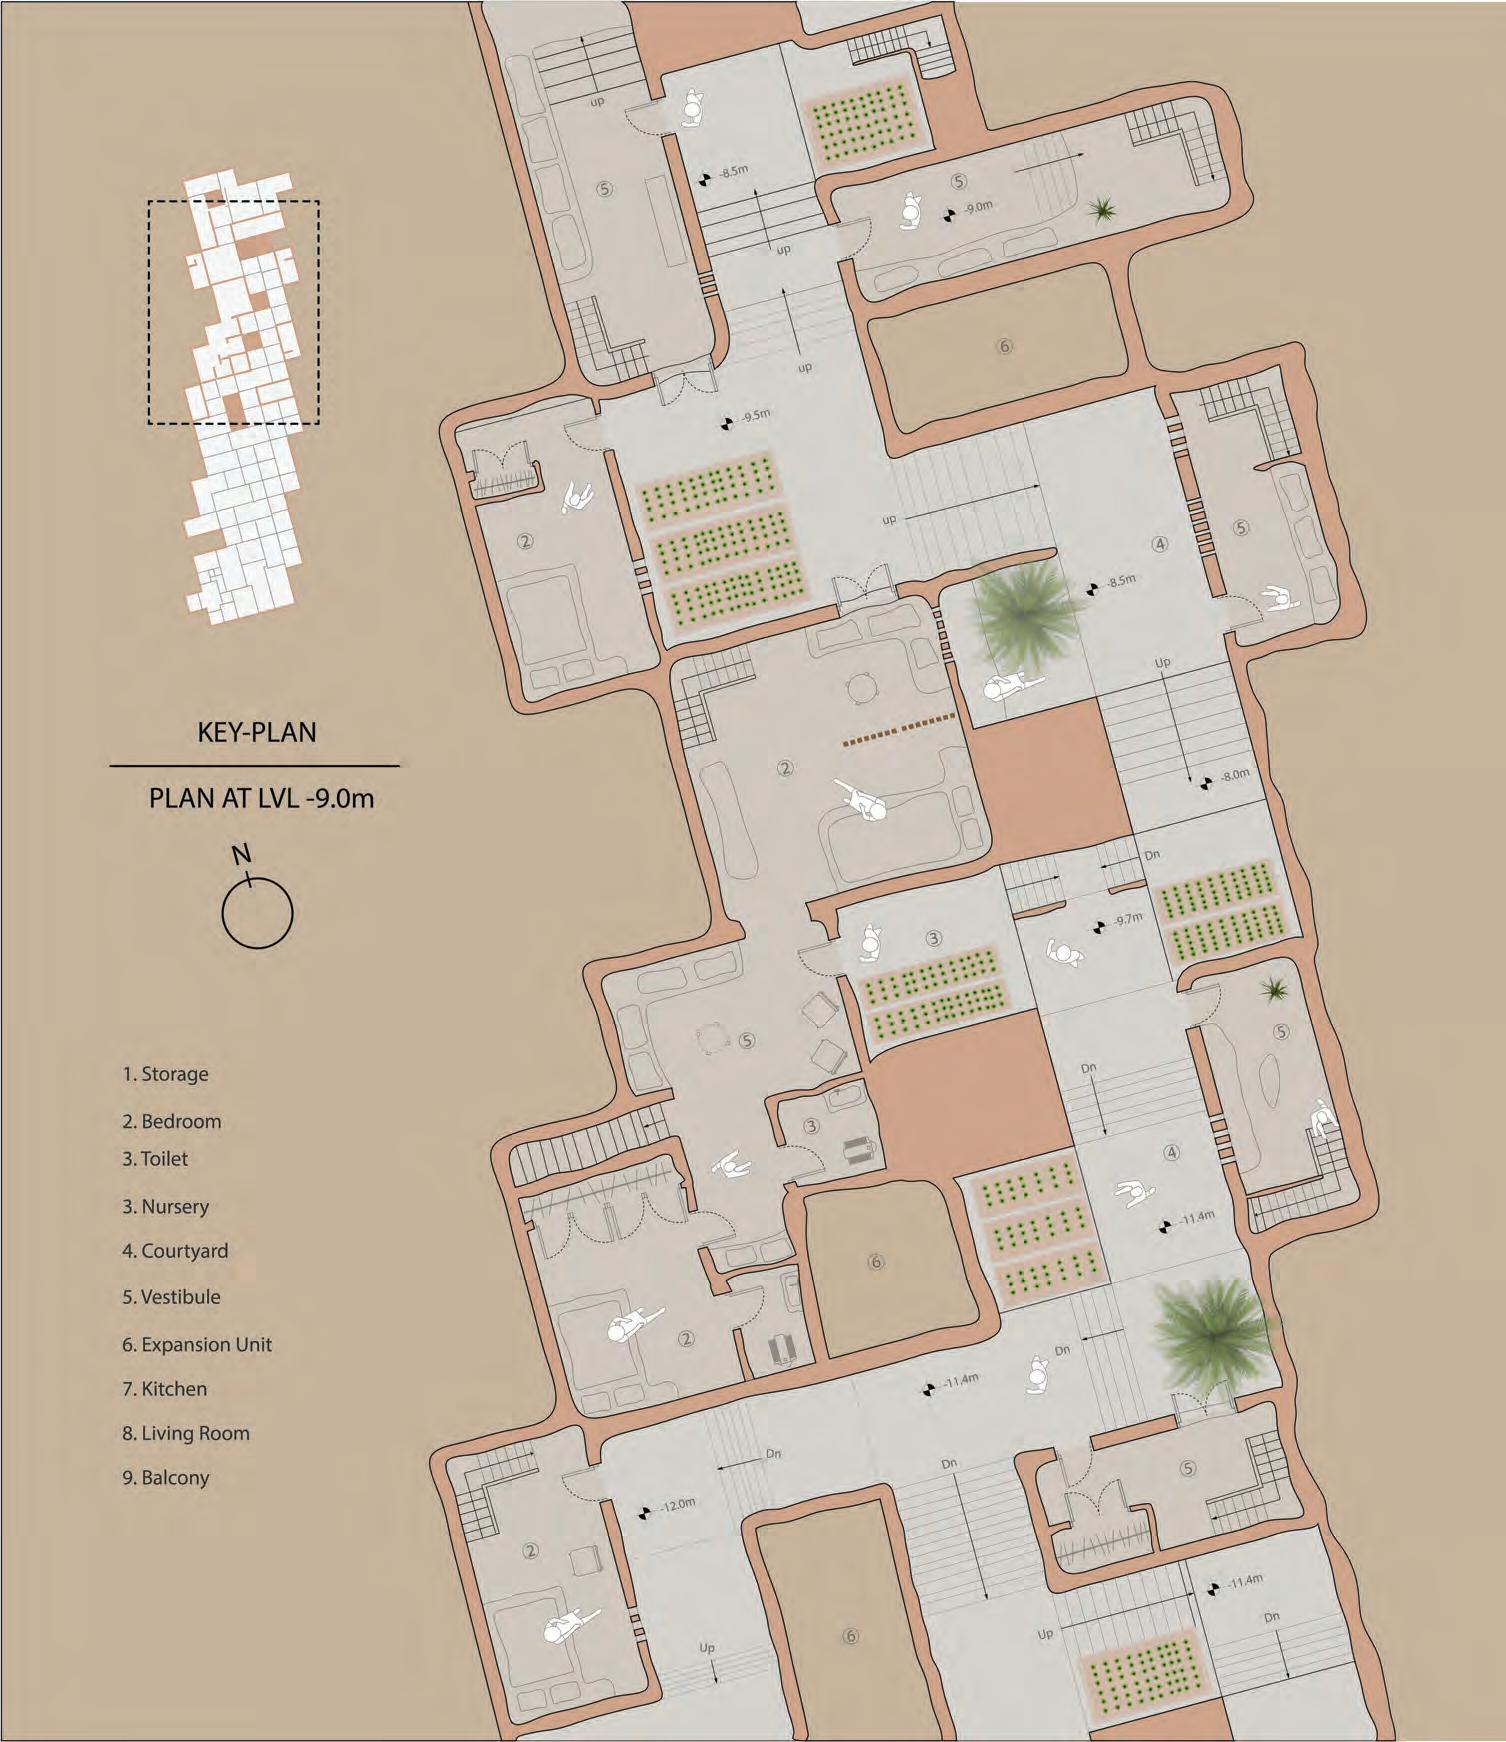
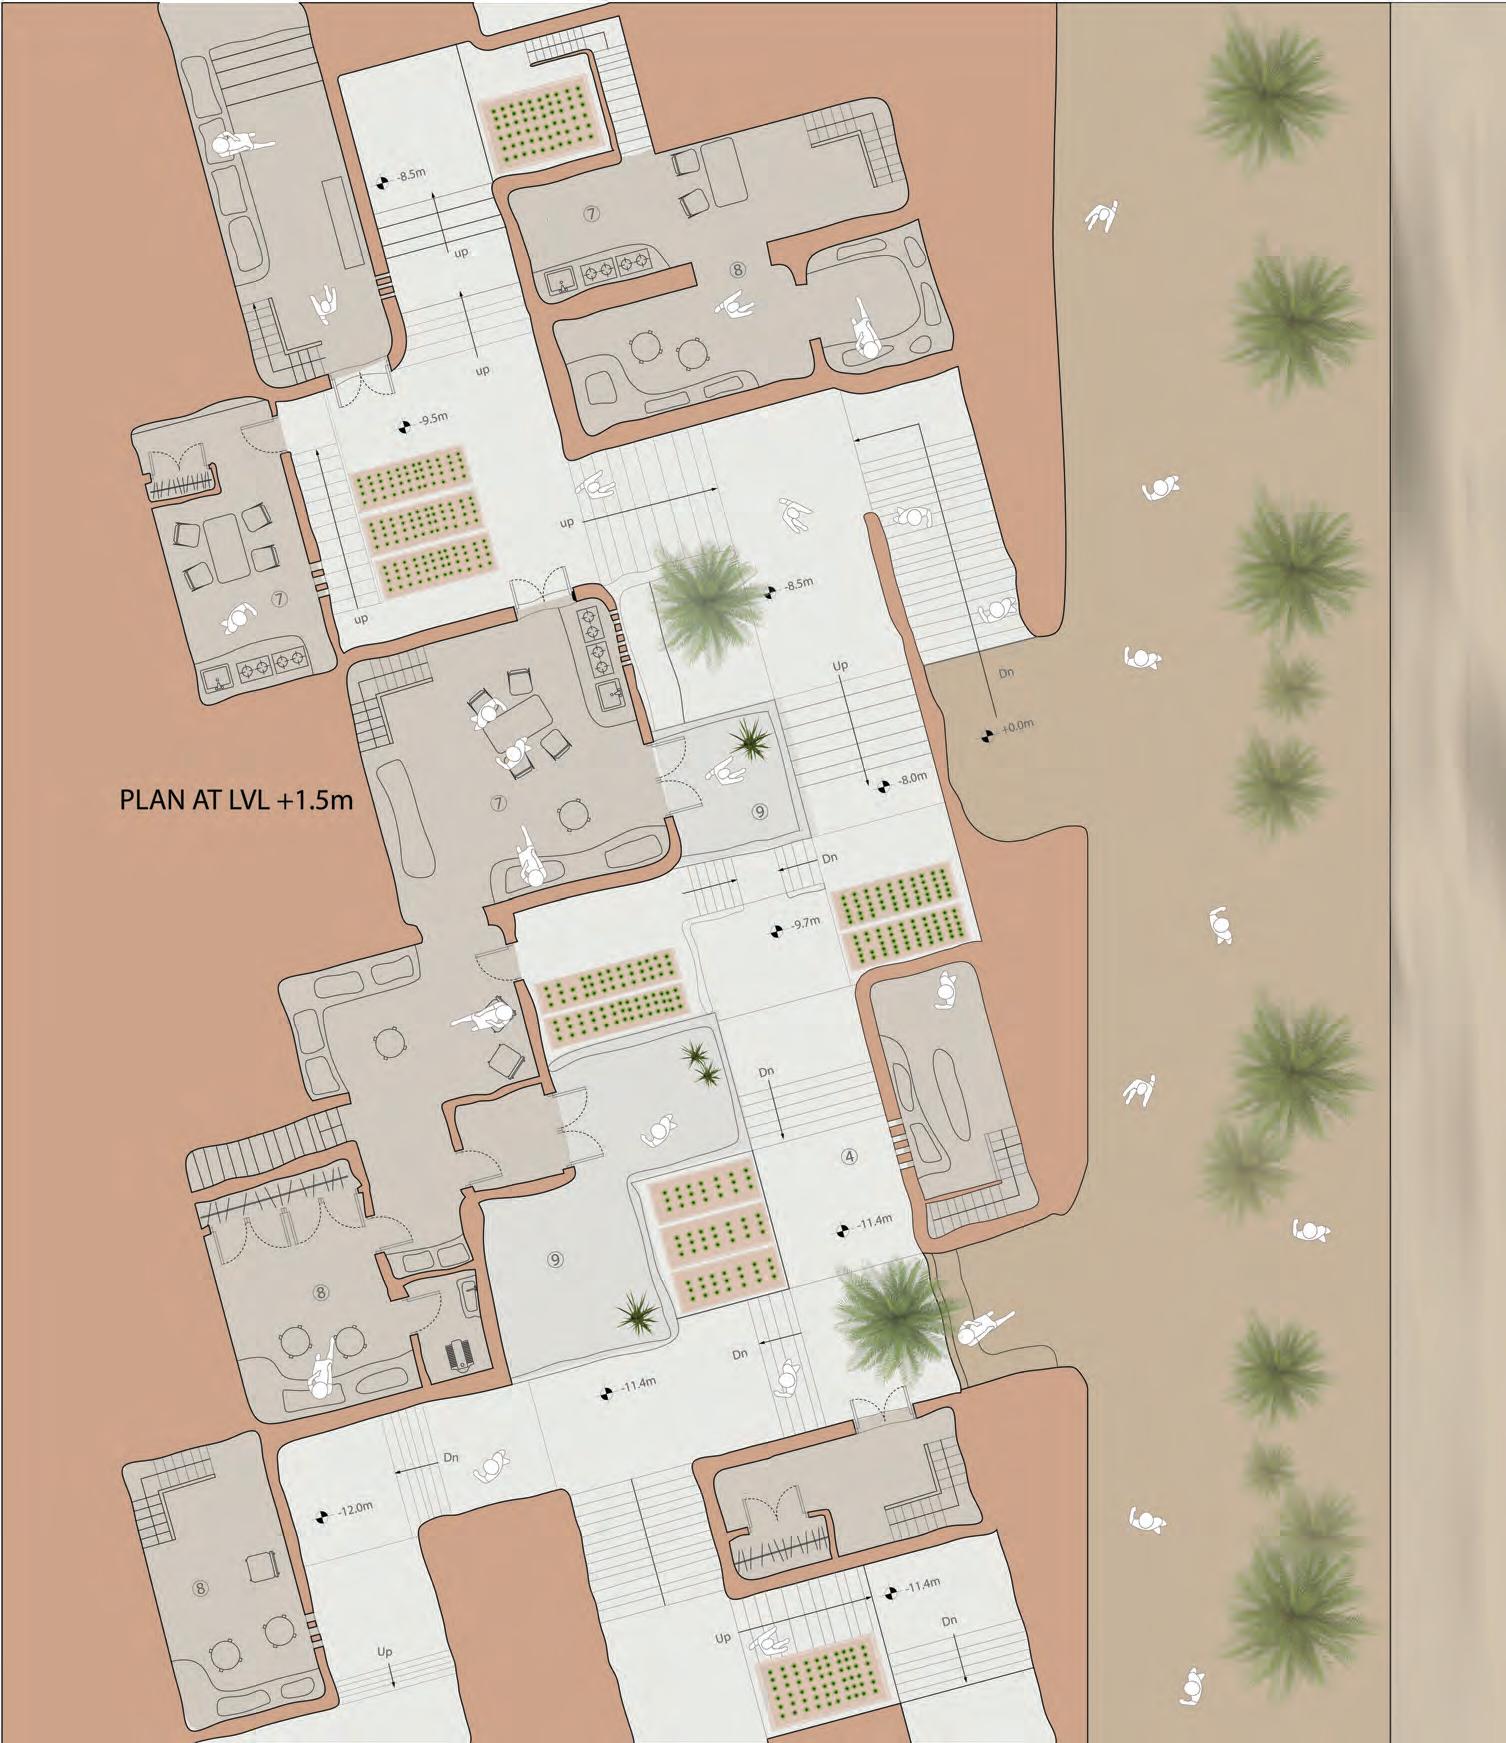
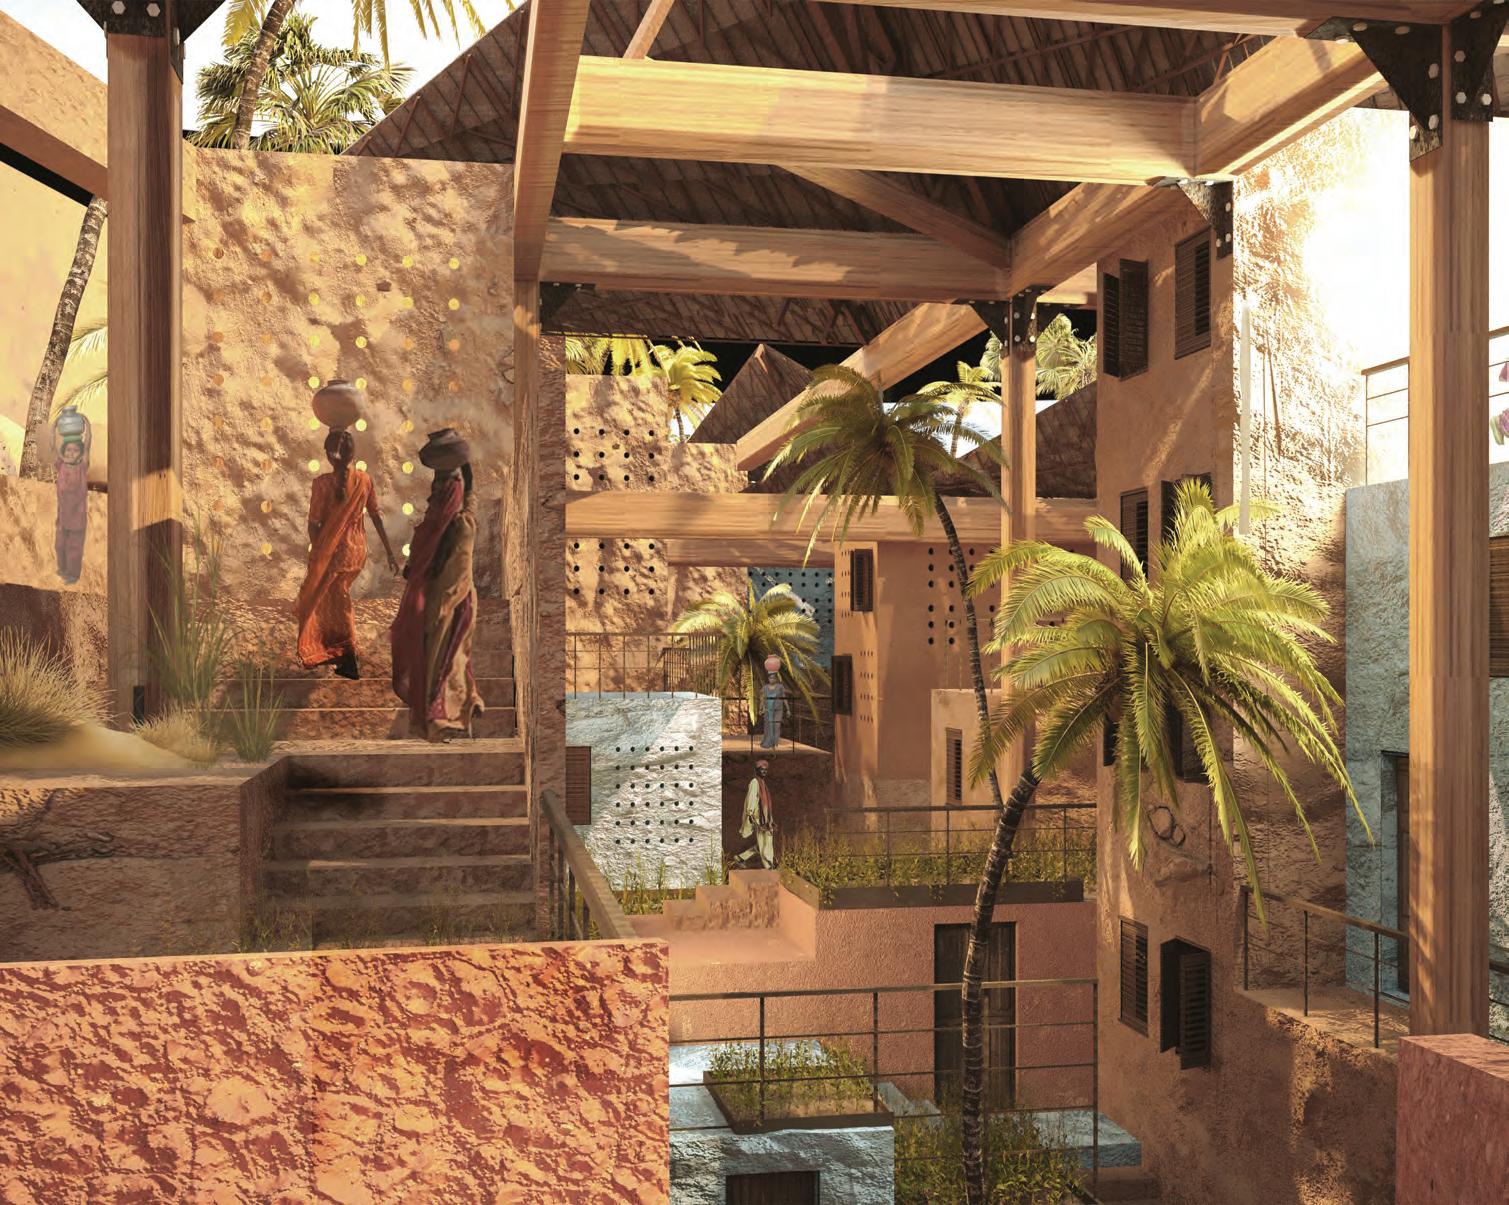
186 I Emergent technologies and design
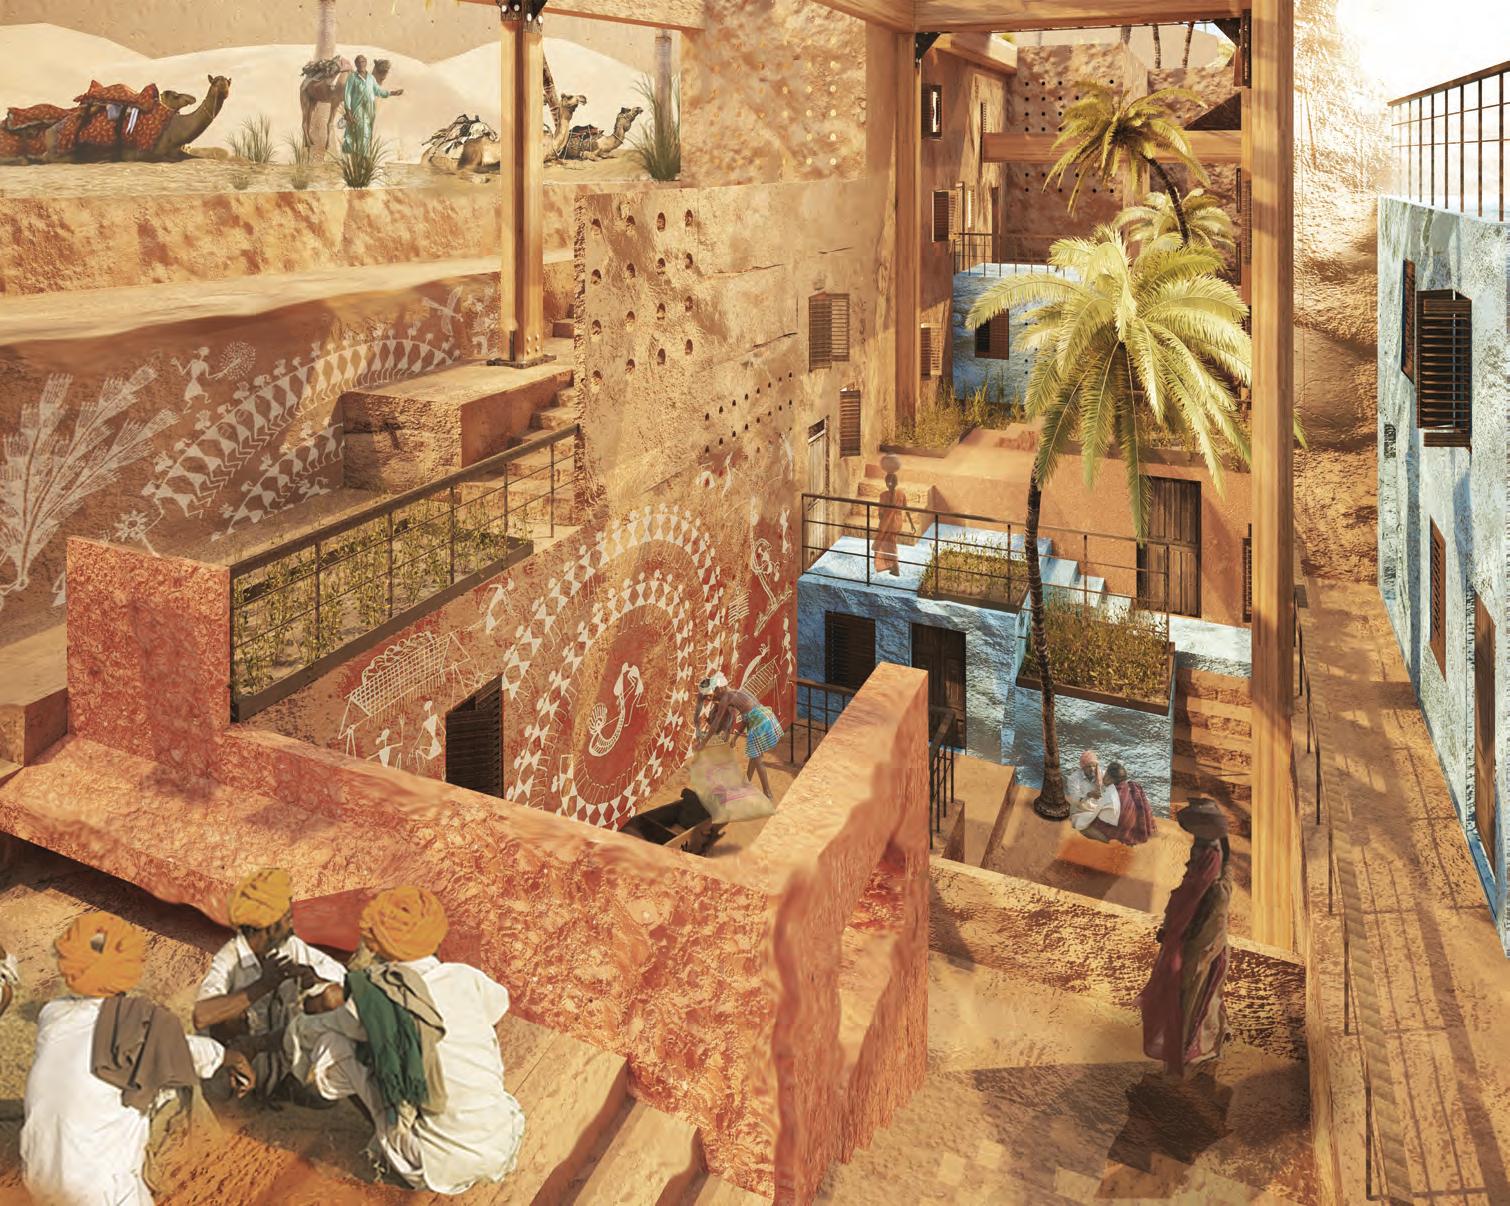
187 In-dune I
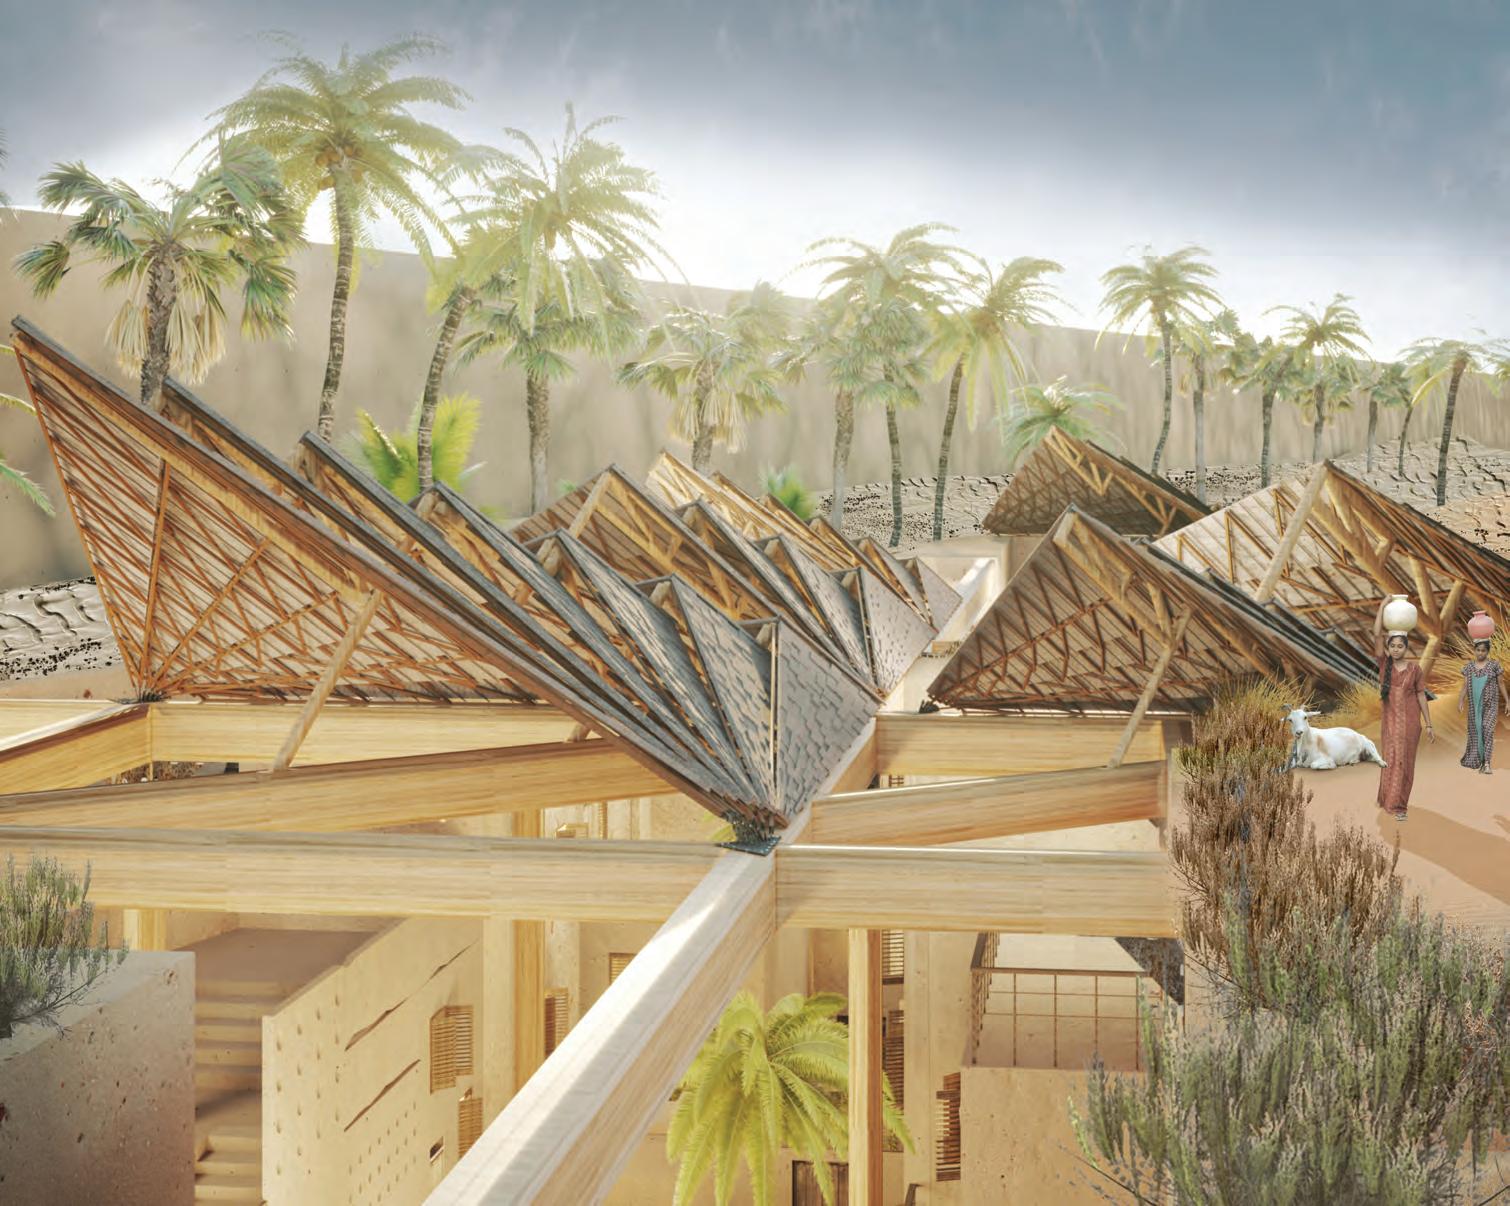
188 I Emergent technologies and design
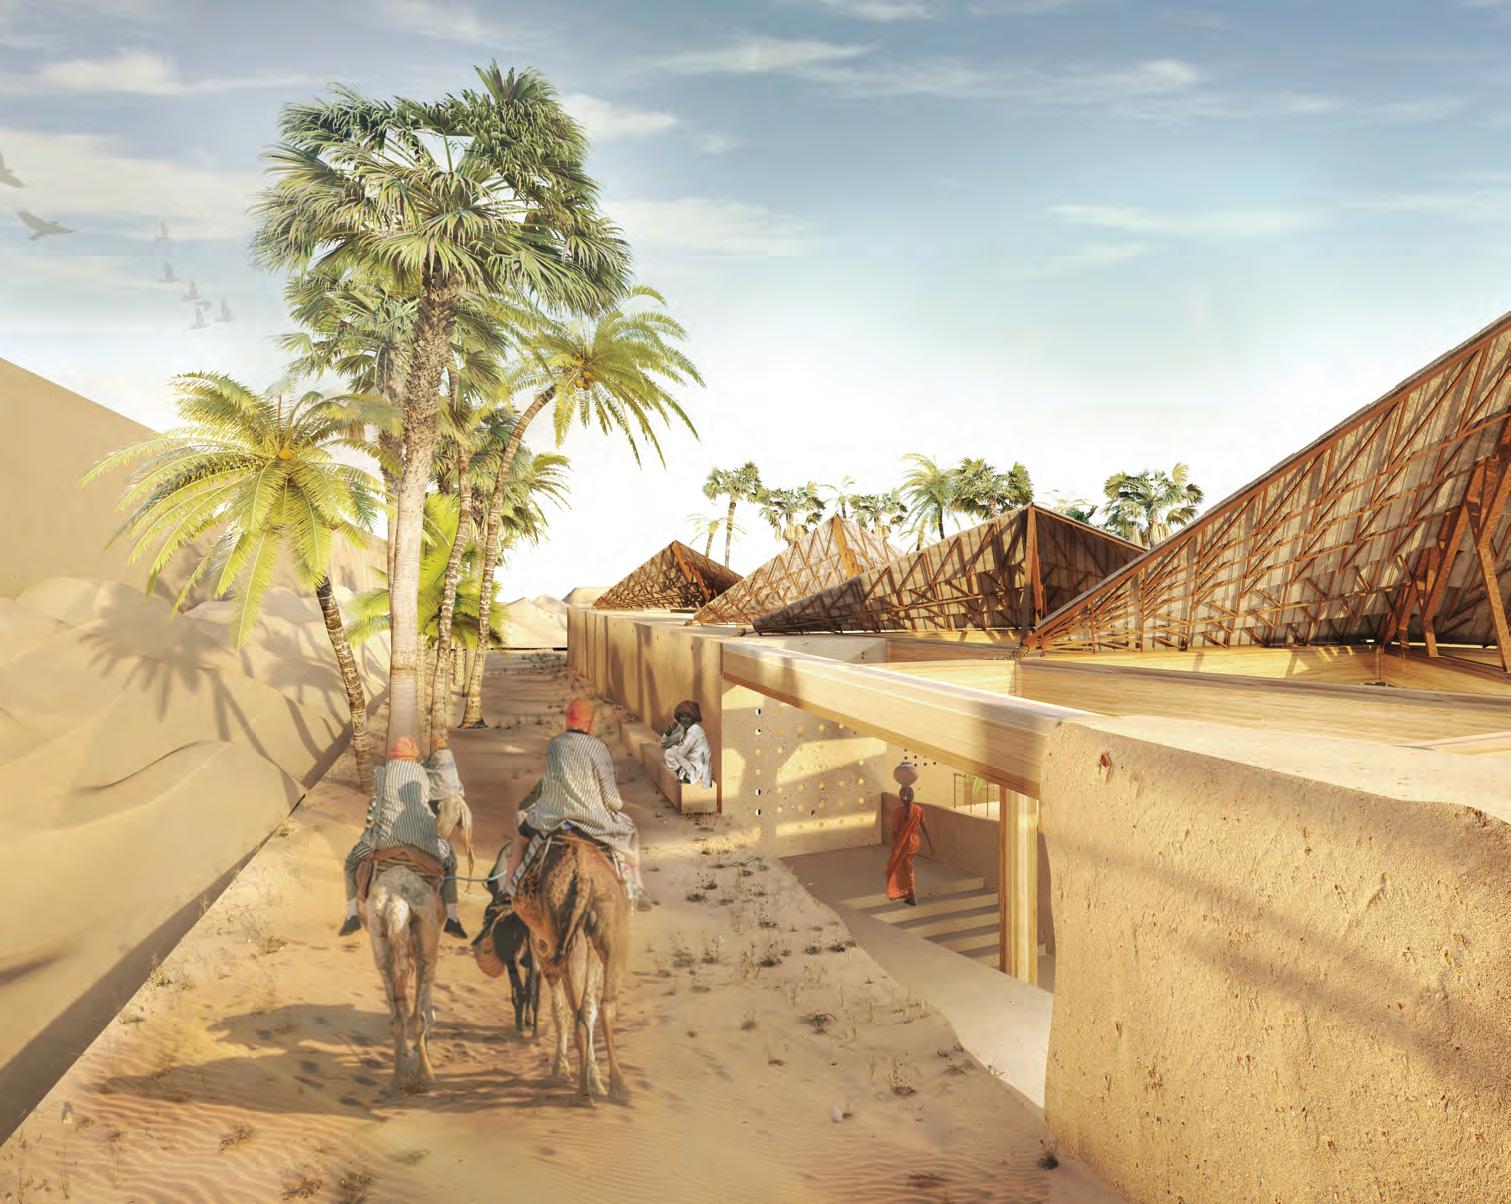
189 In-dune I
Global time-scales 6.3
Synthesising the habitable and productive system, the site is planned in a series of spatial and programmatic interventions. The execution of these interventions are based on priority and interdependence. Post selection of dunal valley for transformation, the most critical entity- water is brought to site by constructing a connecting channel to Indira Gandhi canal. To avoid the hinderance of sand influx in the initial construction process of the canal, temporary porous barriers are deployed simultaneously to deflect the sand away from it and form check posts to plant trees. Estimating the completion of fully functional canal in 5 years, initiation of all other schemes are scheduled post this time frame.
Construction of supporting infrastructure- ramps and maintenance centre are planned such that their completion is complimented with that of the canal to facilitate the next step of stepped transformation of dunal slopes. Both windward and leeward sides are retained by temporary surface treatment techniques like geo-mats, dunal shrubs and grasses and plantation of shelter belts. The short life spans of mats and shrubs suggest their constant replacement throughout the developmental phase. As shelter belt trees last over 100 years and act as wind breaks, their plantation is carried all throughout the selected patch and beyond. To channelise the incoming and deflected sand into ditches, machine cutting of injected sand channels are carried simultaneously with the development of each agricultural and habitable step.
Before the habitable spaces are available for occupation, shelter belts and dunal shrubs and grasses grow to their full potential. It is only after the habitable pits are excavated that in-situ fabricated roofing system is established over them. Corresponding to the number of occupants and seasons, suitable number of saplings are grown in the plant nurseries. However, for the first yield, external inputs of saplings are needed. Injection of underground tanks and distribution network for agricultural and domestic uses happens simultaneously with development of terraces on both the flanks. Water tanks are centrally injected to all the room, as it brings down the room temperature further. The water for these tanks is purified and stored prior to the plantation and habitation of the excavated pits. Once both these systems are ready to be used, water is circulated around the valley. Over the years the terrain can see the growth of vegetation covers and reduction of dependence on artificially procured water from the canal. Building up of its own reservoir of water from rainfall and conservation techniques, the site is aimed to achieve a state of self-sufficiency with time. Phasing activates different parts of the site differently. Minor variations in the spatial application of techniques could occur due to bio-grouting at different levels and excavation of unhardened sand
190 I Emergent technologies and design
Year 50
Simultaneous development across multile dune valleys
Multiple across alternate dune valleys
Families
Population
Phases Completed Injected Area Planted Area
Canal Water Available
Surface runo available
Agricultural Yield
450 x no. of settelments
3150 x no. of settelments
930,000 m2 x no of settelments
215,000 m2 x no of settelments
4.35 x 10¹² litres -
130,200 kg x no of settelments
0Year5101520253035404550
De ection system: Porous barriers
Water Canal
Geo-mats
Shelter belt :grasses and shrubs
Shelter belt: trees
Infrastructure for machines
Agricultural terraces
Underground water storage
Injection and excavation of spaces
Installation of roof and oor slabs
Micro-Irrigation
Crop Plantation
Plant nurseries
191 In-dune I

192 I Emergent technologies and design
De ection system: Porous barriers
Water Canal
Geo-mats
Shelter belt :grasses and shrubs
Shelter belt: trees
Infrastructure for machines
Agricultural terraces
Underground water storage
Injection and excavation of spaces
Installation of roof and oor slabs
Micro-Irrigation
Crop Plantation
Plant nurseries
193 In-dune I Phases Completed Injected Area Planted Area Canal Water Available Surface runo available Agricultural Yield Families Population 0 0 m2 0 m2 0 litres 0 litres 0 kg 0 0 0Year5101520253035404550 Year 0-2

194 I Emergent technologies and design
Phases
De ection system: Porous barriers
Water Canal
Geo-mats
Shelter belt :grasses and shrubs
Shelter belt: trees
Infrastructure for machines
Agricultural terraces
Underground water storage
Injection and excavation of spaces
Installation of roof and oor slabs
Micro-Irrigation
Crop Plantation
Plant
195 In-dune I
0Year5101520253035404550
Completed Injected Area Planted Area Canal Water Available Surface runo available Agricultural Yield Families Population 0 0 m2 0 m2 4.35 x 10¹² litres not collected 0 kg 0 0 Year 5
nurseries
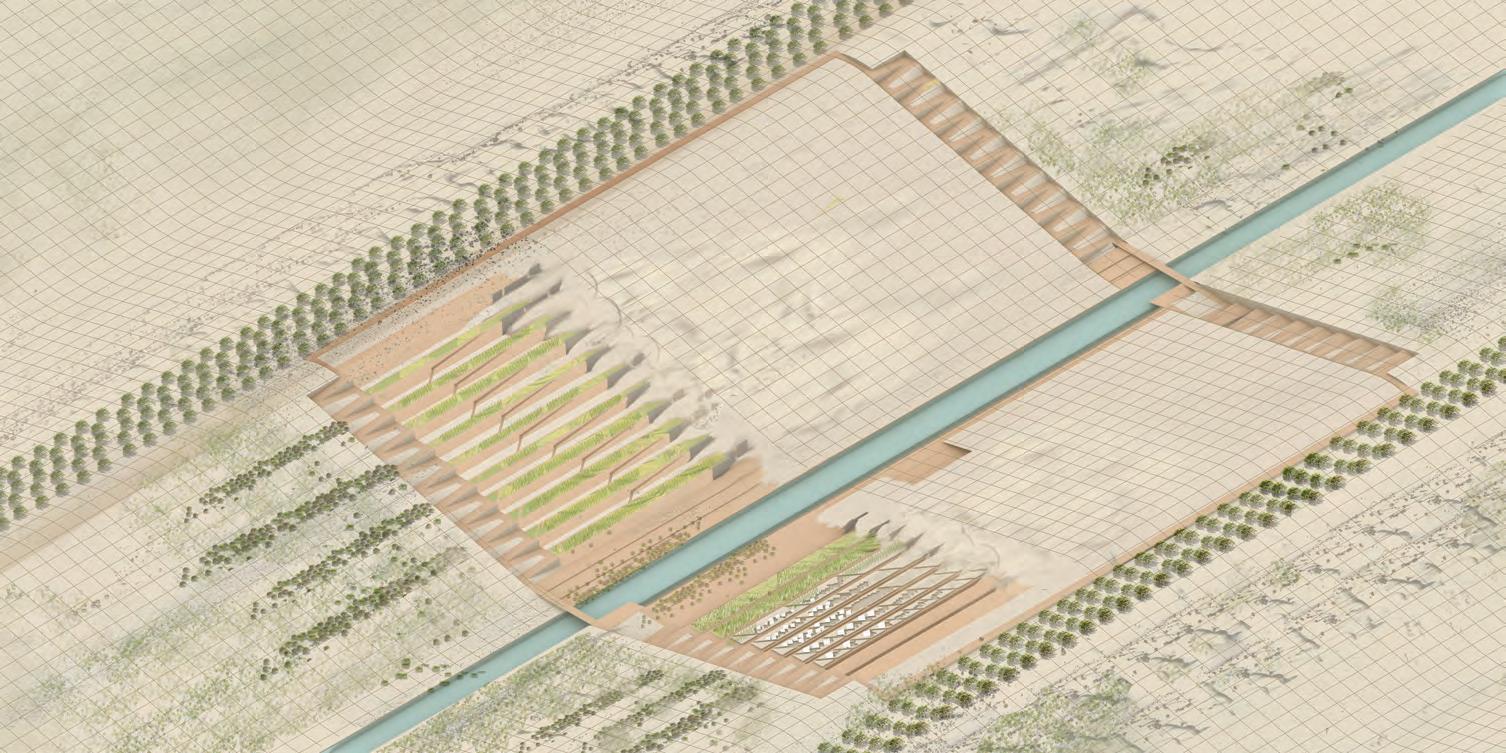
196 I Emergent technologies and design
Phases
De ection system: Porous barriers
Water Canal
Geo-mats
Shelter belt :grasses and shrubs
Shelter belt: trees
Infrastructure for machines
Agricultural terraces
Underground water storage
Injection and excavation of spaces
Installation of roof and oor slabs
Micro-Irrigation
Crop Plantation
197 In-dune I
0Year5101520253035404550
Injected Area Planted Area Canal Water Available Surface runo available Agricultural Yield Families Population 2 65,000 m2 31,000 m2 4.35 x 10¹² litres 1.70 x 10⁵ litres 4340 kg 135 750 Year 10
Completed
Plant nurseries
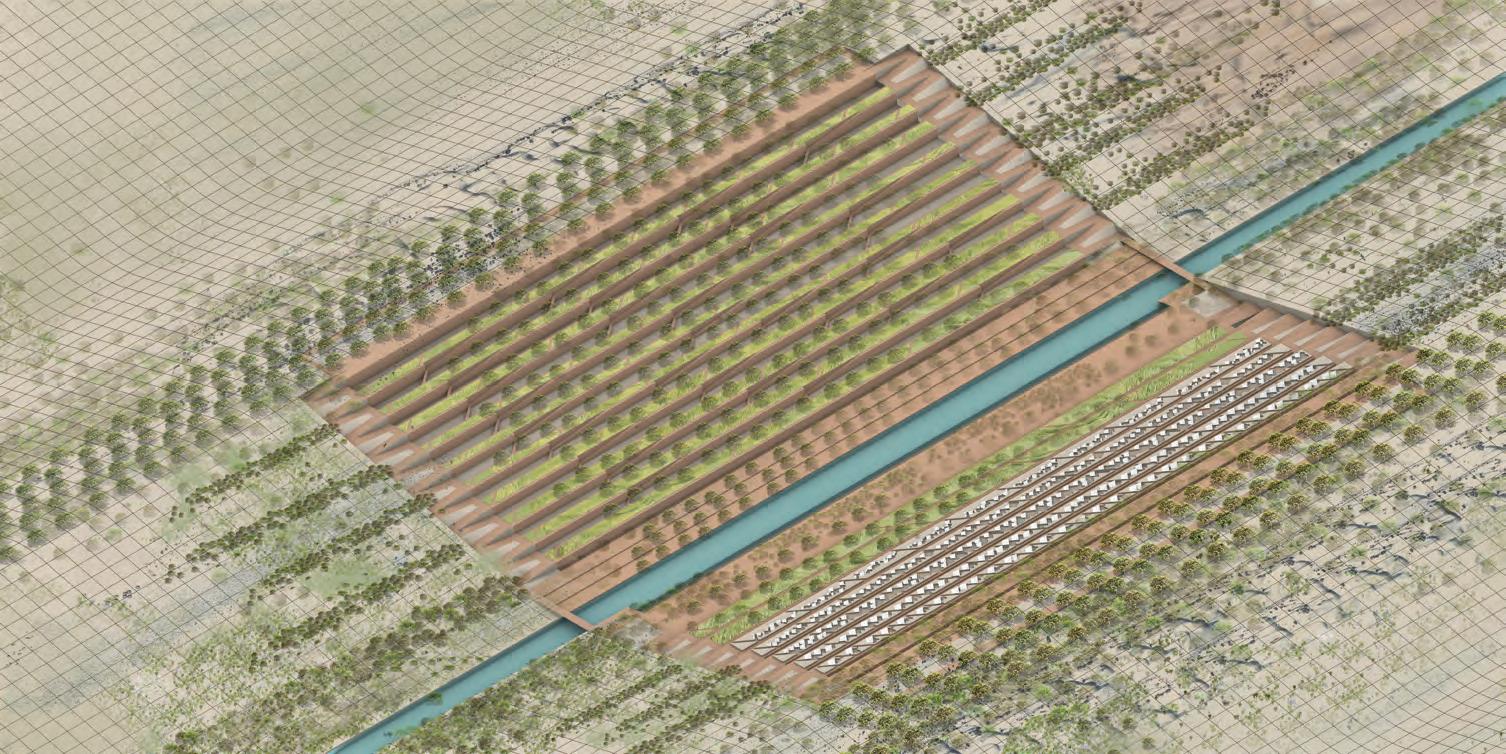
198 I Emergent technologies and design
Phases Completed
De ection system: Porous barriers
Water Canal
Geo-mats
Shelter belt :grasses and shrubs
Shelter belt: trees
Infrastructure for machines
Agricultural terraces
Underground water storage
Injection and excavation of spaces
Installation of roof and oor slabs
Micro-Irrigation
Crop Plantation
Plant nurseries
199 In-dune I
0Year5101520253035404550
Injected Area Planted Area Canal Water Available Surface runo available Agricultural Yield Families Population 7 930,000 m2 195,000 m2 4.35 x 10¹² litres 1.85 x 10⁵ litres 130,200 kg 450 2250 Year 37
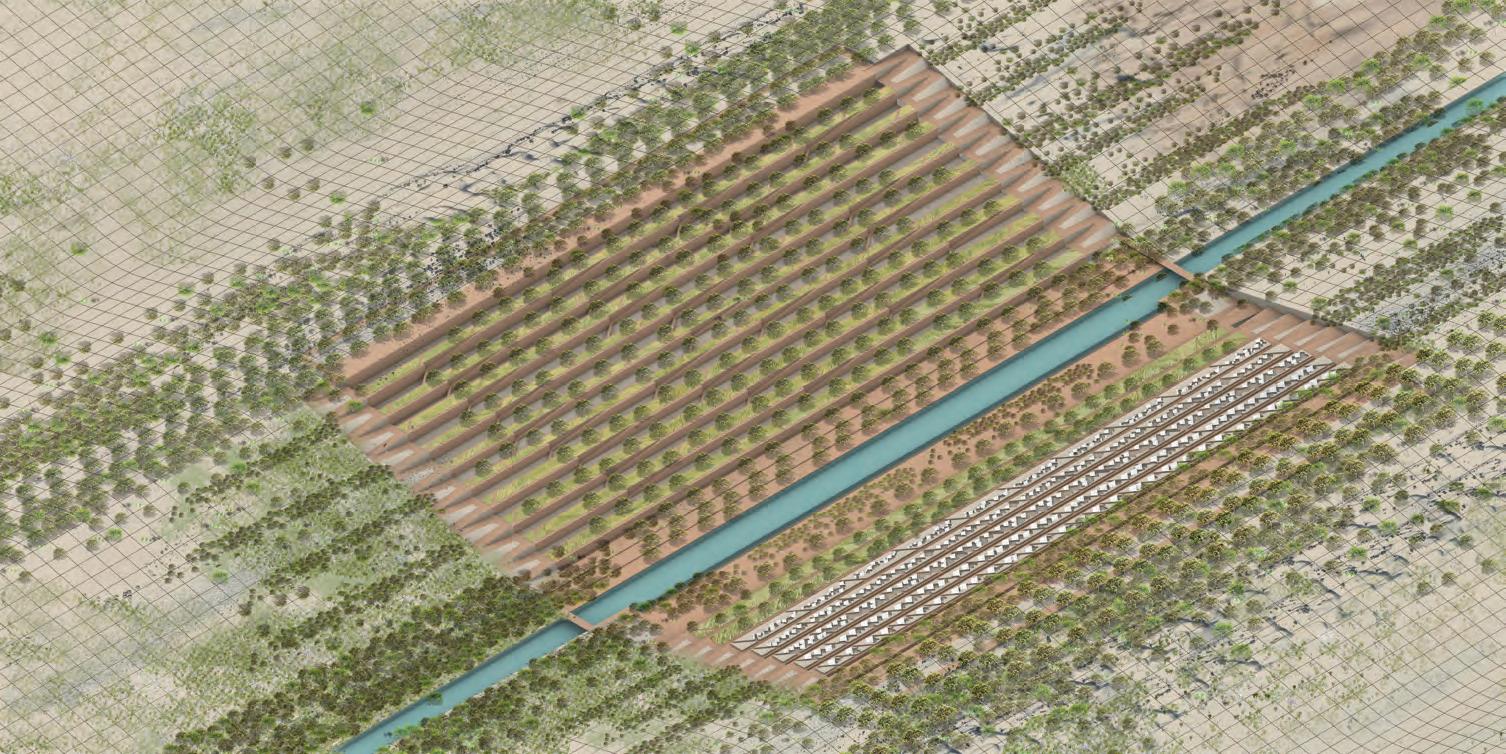
200 I Emergent technologies and design
Phases Completed
De ection system: Porous barriers
Water Canal
Geo-mats
Shelter belt :grasses and shrubs
Shelter belt: trees
Infrastructure for machines
Agricultural terraces
Underground water storage
Injection and excavation of spaces
Installation of roof and oor slabs
Micro-Irrigation
Crop Plantation
Plant nurseries
201 In-dune I
0Year5101520253035404550
Injected Area Planted Area Canal Water Available Surface runo available Agricultural Yield Families Population 7 930,000 m2 215,000 m2 4.35 x 10¹² litres 1.85 x 10⁵ litres 130,200 kg 450 3150 Year 50
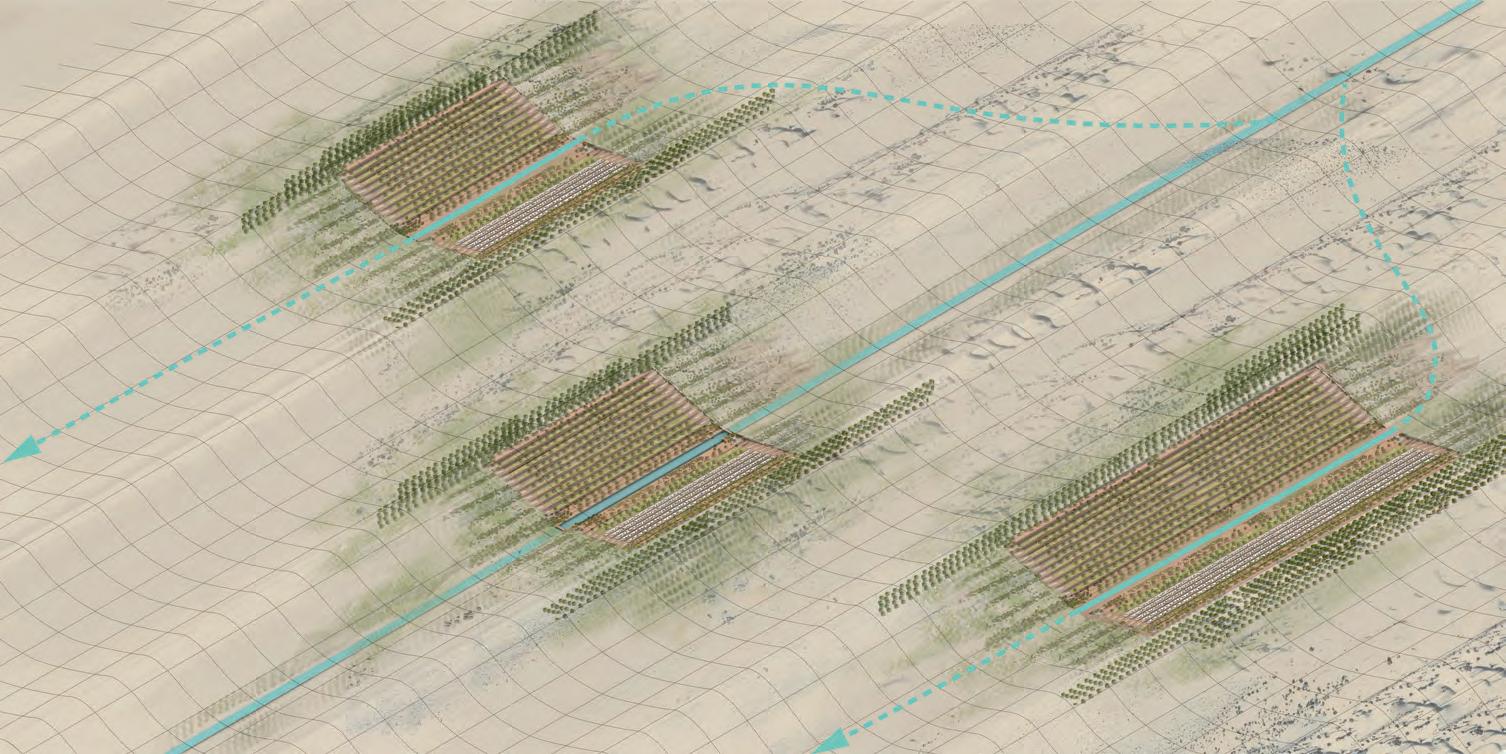
202 I Emergent technologies and design
Year 50
Simultaneous development across multile dune valleys
Multiple across alternate dune valleys
Families
Population
Phases Completed Injected Area Planted Area
Canal Water Available
Surface runo available
Agricultural Yield
450 x no. of settelments
3150 x no. of settelments
930,000 m2 x no of settelments
215,000 m2 x no of settelments
4.35 x 10¹² litres -
130,200 kg x no of settelments
0Year5101520253035404550
De ection system: Porous barriers
Water Canal
Geo-mats
Shelter belt :grasses and shrubs
Shelter belt: trees
Infrastructure for machines
Agricultural terraces
Underground water storage
Injection and excavation of spaces
Installation of roof and oor slabs
Micro-Irrigation
Crop Plantation
Plant nurseries
203 In-dune I
204 I Emergent technologies and design
7. Analysis and Critical reflection
Global time scales in the previous chapter assimilate the development of the entire terrain. Even though each of the adopted methods and techniques individually create an impact on sand mitigation at a local scale, these local changes can collectively bring significant difference in sand accumulation and deflection at a regional level. The exchange of energy and material between the evolved systems have the potential to alter the climatic system at micro or macro level for the region, depending on the scale of application of each of these systems.
205 In-dune I
De ected sand to neighbouring valley
Heavy sand deposition in intermediate valleys
Distributed sand deposition in intermediate valleys
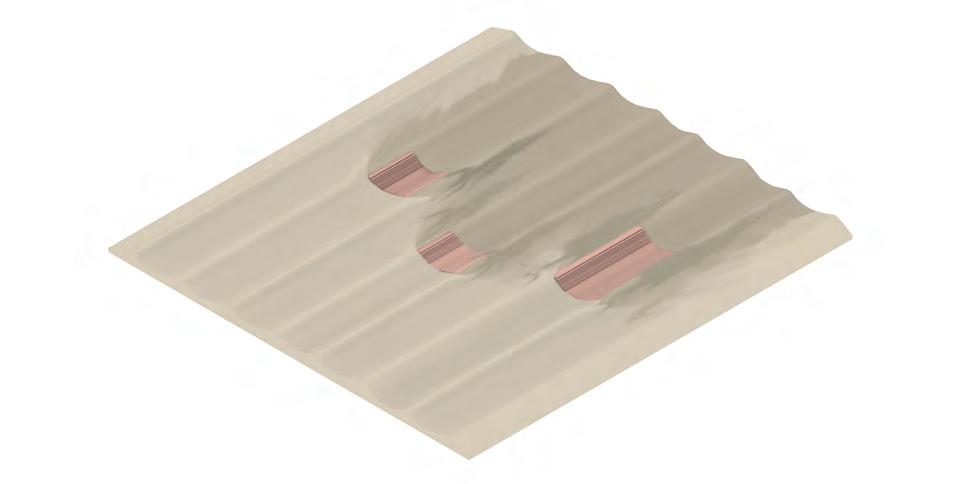
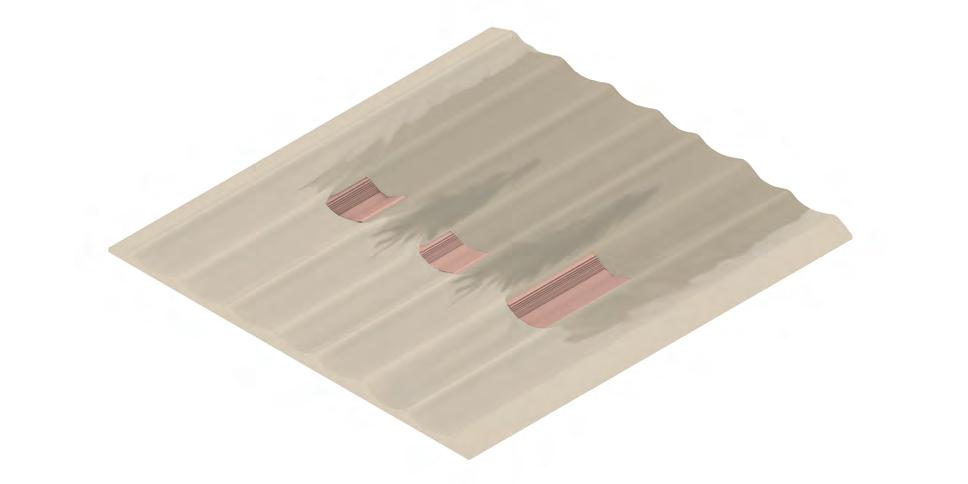
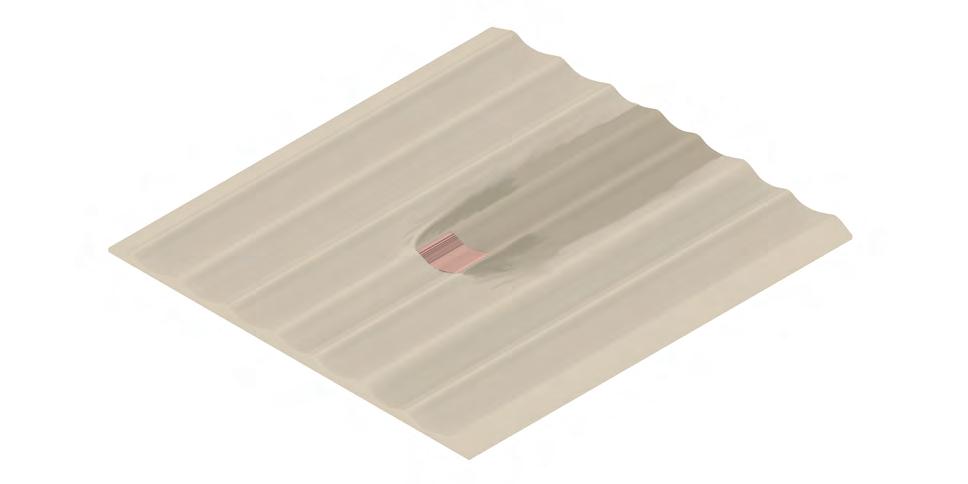
206 I Emergent technologies and design
7.1 7.2
Emergence of new landforms
Amongst the array of crests and valleys in the linear dune fields, while the incoming sand is deflected to shield the intervention area, it is accumulated in the neighbouring valley regions. As the influx of sand cannot be stopped, the deflected sand exists within the ecosystem of the region. The interplay of accumulation and deflection starts defining the land-use pattern for other regional functions and settlements to co-exist. Multiple settlements can grow in alternate parallel dunal valleys to deflect the sand towards the intermediate valleys. These regions have a greater influx of sand than natural and become unfit for any productive system to flourish. To distribute the influx from the two neighbouring deflection systems into these valleys, the settlements can be staggered. Staggering also generates differential sand accumulation zones within these regions. These inter-dunal valley regions with lesser sand deposit can be developed as catchment areas for rain water harvesting and be used for other purposes.
It is hypothesised that with time as the multiple settlements grow, collection of sand builds up due to accelerated deflection mechanism and unhardened dunes shift, a new landform of dunes and valleys would emerge. The emergent landform would define a new urban edge for neighbouring regions and cities. It might pose a threat of dunal encroachment in these areas similar to cities like Cairo and Mauritania or form an opportunity to be developed as green corridors with strategic plantation and other soil retention measures.
Sand deflection and sedimentation
Sand deflection and sedimentation works at a regional level once all the techniques are established and are working to their full potential. While the proposed techniques are still in the phase of development, the continuous influx of sand needs to be temporarily restrained by on-site measures such as fences and other membranes. The excavation of habitable spaces without roof installation makes them highly vulnerable to sand accumulation. In such scenario, the excavation of the pits should be planned for months (September-March) when the wind velocities from both the directions are least and its sand carrying capacity is the least.
Once the entire system of habitable spaces with corresponding roofs and sand channels is established for a phase, the sand deposition and simultaneous erosion starts effectively. The eroded sand as it builds up increases the volume for excavation for the succeeding phase. Increased excavation amount might subject completion of the next phase to some delay.
So far all the proposed sand mitigation interventions are investigated and designed based on pre-dominant wind directions and their flow pattern for most of the year. The proposed techniques would become redundant when the direction of the wind changes. The sedimentation due to the other wind direction would needed to be removed manually or deflected using temporary measures.
207 In-dune I
7.3
Bio-mineralised sand
Microbial injecting into sand to develop habitable spaces and other components in different profiles has been proposed based on the compressive strength that homogeneously cast composite brick attains. While it is assumed that the grout spread is uniform inside the sand, the actual spread should be tested physically. The results from the tests would start defining the attainable surface textures, wall thicknesses, undulations, permeability and load bearing capacity. The arrangement of spaces has been directed by micro-climate analysis only, the strategy should be coupled with structural tests. For the difference in hardening time of different components for varying injection depths, profiles and volume of required grout, the fabrication strategy and time estimations for development of each phase should be revisited.
Monolithically casted each wall would behave like a load bearing structure. While core-cutting is proficient to make small openings in such structures, its ability to make bigger openings for doors and windows need to be practically tested.
Sodium Chloride being the by-product of cross-linking technique would make the hardened agricultural terraces unfit for direct plantation. The terraces should to be lined with clay so that the salt does not percolate through the roots of the plants.
7.4
Occupancy, Social Fabric and Infrastructure
The proposed occupation strategy might be revisited for a new method where instead of injecting habitable spaces for each function, a matrix of walls are injected over the foundation and the occupants are given a choice to merge spaces as per their growing family sizes and requirements.
The proposed system of habitable spaces only account habitation as prime function. It lacks aggregation of functions like barns, market spaces, places of worship, shed for livestock, etc. These functions along with schemes related to infrastructure development like road networks, sewage disposal and treatment plants and institutional spaces should be a part of the aggregation algorithm and developmental scheme. At present the system lacks a social fabric.
The abundance of high solar and wind energy could be harnessed and brought to use to produce alternate source of energy. Schematic planning of solar and wind turbine farms could be done at a regional scale. A local level, the roof design should be improved to collect rain water and build water resource for the site
208 I Emergent technologies and design
Scope of application 7.5
Heavy ground manipulation needs a radical shift in adapting to fabrication mechanism and habitation of in-dune spaces. Every subsystem has its own limitation in the scope of application and some deprecated impact on the neighbouring terrain. Scaling up their applicability across the dunal field would also mean scaling up the limitations. Some of these critical observations form the next steps for future research and investigation. Inclusive of all the advantages and disadvantages, these systems can build an ecosystem which has the potential to be resilient to desertification in western Thar.
The developed climate conscious architecture finds its applicability in dunal regions which are severely affected by desertification and shifting sands. The schemes can be adopted and adapted based on the effected regions’ dune morphology, wind pattern, demographics, ground fabric, availability of resources like water and other infrastructural support.
The sustenance of the system in any context would also be largely dependent on the availability of labours and participation of the locals who are willing to be a part of the developmental scheme. Since the system is mostly self-sufficient for it requires least material input, it might need major support from the local government to provide initial inputs of plantation, surface treatment measures and bearing the cost of running the machines, its fuel requirements and their maintenance. Involvement of several stakeholders becomes critical for the success of the scheme.
209 In-dune I
210 I Emergent technologies and design
8. Appendix
211 In-dune I
Thar desert, dune morphologies
Source :Amal Kar,Morphology and evolution of sand dunes in the Thar Desert as key to sand control measures,Research-gate,1996
LEGEND
DOMINANTLY OLD DUNES
LINEAR DUNES
TRANSVERSE
PARABOLIC
NETWORK: SINUOUS DUNES
STAR DUNES
NETWORK: LINEAR DUNES WITH TRANSVERSALS
NETWORK: TRANSITIONAL PARABOLIC DUNES
NEW DUNES
BARCHANS & BARCHANOIDS
MEGABARCHANOIDS
SAND STREAKS AND ZIBARS
212 I Emergent technologies and design
JODHPUR BIKANER
POKARAN JAISALMER BARMER
8.1
Rajasthan livestock population trend 8.2
213 In-dune I
Cattle Buffalo Sheep Goat Horse Mule Donkey Camel Pigs Rabbit Dog Poultry 12119512 13324462 12976095 9079702 21665939 37776 3375 81468 325713 237674 13542 569575 8024424 11091974 11189855 21502996 25438 886 102130 421836 208556 9301 1246036 499362 +9.4% +16.99% -18.86% +0.76% 2007 2012 +48.5% +280.93 -20.23% -22.79% +13.96% +45.6% -52.29% +60.69% Cattle 2007 2012 Change % of Change Bu aloSheepGoatHorseMulesDonkeysCamelPigsRabbitsDogsPoultry 12119512 120495011884121-2110153162943 2489-20662-96123291184241-6764613030804 1332446212976095907970221665939 337581468325713237674135425695758024424 11091974 11189855 21502996 88610213042183620855693011246036499362 +9.4% +16.99% -18.86% +0.76% 12338 37776 25438 +48.5%+280.93% -20.23%-22.79% +13.96%+45.6% -52.29% +60.69%
Source : Ahmedabad, Rajasthan Agriculture,2012
Major crops cultivated in Rajasthan 8.3
Source : Mrutyunjay Swain, S. S. Kalamkar,Manishkant OjhaState of Rajasthan Agriculture, Economic Research Centre,2012
Mrutyunjay Swain,S. S. Kalamkar ,Manishkant Ojha, Rajasthan Agriculture Prosperity and Opportunity, Agro-Economic Research Centre, 2012
Main Local Agriculture Prod-


Groundnut soyabean


kidney bean, pinto bean, navy bean

214 I Emergent technologies and design Cereal Edible Oil Pulses ( Oilseed ) Horticulture Crops Pennisetum glaucum ( Pearl millets ) (Cluster Beans) Cyamopsis Psyllium ( Plantago ) ( Maize ) Zea mays Coriandrum sativum ( parsley )
Type 1961 1961 1961 1971 1971 1971 1981 1981 1981 1991 1991 1991 2001 2001 2001 2011 2011 2011 2021 2021 Year Year Year 2021 1.18Mt 1.40Mt 1.65Mt 1.91Mt 2.16Mt 2.41Mt 2.67Mt 0.53 Mt 0.02Mt 0.04Mt 0.06Mt 0.09Mt 0.11Mt 0.13Mt 0.15Mt 0.62Mt 0.71Mt 0.79Mt 0.89Mt 0.98Mt 1.07Mt
Crops


215 In-dune I Other Crops Sugarcane Wheat Primary crop Barley 40 - 55 Days 65 -75 Days 40 - 45 Days 120 Days Soil Black soil Sandy (Best) Alkali Saline Sandy Loam Clay Loam Loamy Texture Clay Loam Sandy Loam Loams Silts Gravels Alkaline Clay Loam (Best) Loamy Texture Clay Loam (Best) Clay Loam Clay Loam Time to grow Production(Mt ) Soil Time to grow Production(Mt ) 38.39 Jowar 4.20 18.74 100.72 44.23 Maize Wheat Rice Groundnuts 6.16 Oil Seeds 62.92 19.38 Pulses 90 - 110 Days 40 - 55 Days 60 Days 60 Days
8.4
Micro-climate analysis Summers

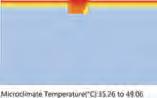


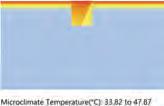
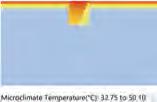
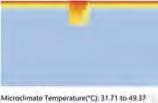

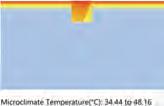
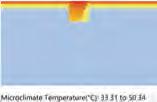
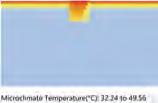
216 I Emergent technologies and design Microclimate Tem ( °C) : 14.99 - 15.68 Microclimate Tem ( °C) : 14.99 - 15.68 Microclimate Tem ( °C) : 15.11 - 15.83 Microclimate Tem ( °C) : 15.33- 16.15 Microclimate Tem ( °C) : 15.33- 16.15 Microclimate Tem ( °C) : 32.24 - 49.56 Microclimate Tem ( °C) : 33.31 - 50.34 Microclimate Tem ( °C) : 34.44 - 48.16 Microclimate Tem ( °C) : 34.44 - 48.16 Microclimate Tem ( °C) : 34.44 - 48.16 Microclimate Tem ( °C) : 33.93 - 48.15 Microclimate Tem ( °C) : 32.89 - 48.70 Microclimate Tem ( °C) : 34.13- 49.50 Microclimate Tem ( °C) : 34.94 - 47.26 Microclimate Tem ( °C) : 34.25 - 49.56 Microclimate Tem ( °C) : 34.87 - 49.34 Microclimate Tem ( °C) : 33.93 - 48.15 Microclimate Tem ( °C) : 35.89 - 47.01 Microclimate Tem ( °C) : 35.89 - 47.01 Microclimate Tem ( °C) : 35.26 - 49.06 Microclimate Tem ( °C) : 34.87 - 49.34 Microclimate Tem ( °C) : 34.87 - 49.34 Microclimate Tem ( °C) : 36.08 - 50.19 Microclimate Tem ( °C) : 36.82- 48.2 Microclimate Tem ( °C) : 36.22- 50.26 Microclimate Tem ( °C) : 36.20 - 49.88 Microclimate Tem ( °C) : 36.20 - 49.88 Microclimate Tem ( °C) : 37.39 - 50.75 Microclimate Tem ( °C) : 37.99 - 48.91 Microclimate Tem ( °C) : 37.54 - 50.84 Microclimate Tem ( °C) : 38.61 - 50.68 Microclimate Tem ( °C) : 38.61 - 50.68 Microclimate Tem ( °C) : 39.74 - 51.59 Microclimate Tem ( °C) : 40.08- 49.93 Microclimate Tem ( °C) : 39.90 - 51.71
0.3 m 0.6 m 1.2 m 1.5 m 0.9 m 6 m 7 m 1m 2 m 3m 5 m 4 m Depth
Thickness
Thickness
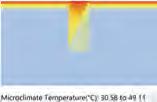
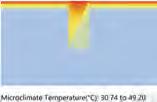
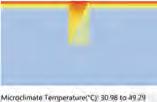
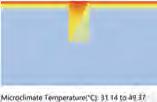
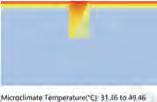
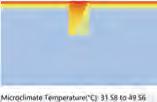
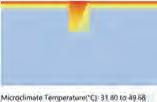
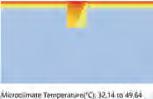
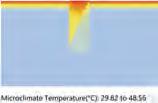
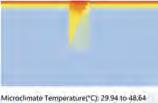
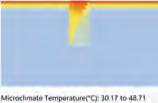
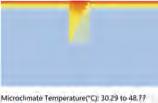
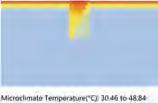
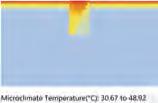
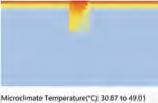
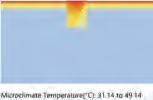
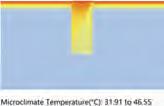
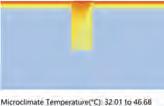
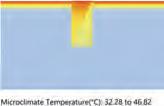
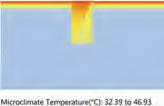
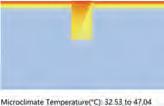
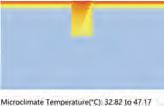
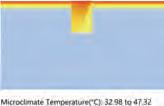
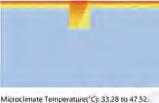
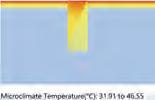
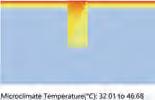
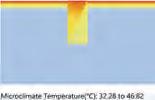

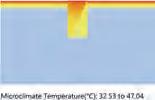

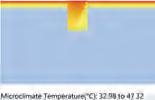
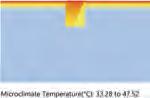
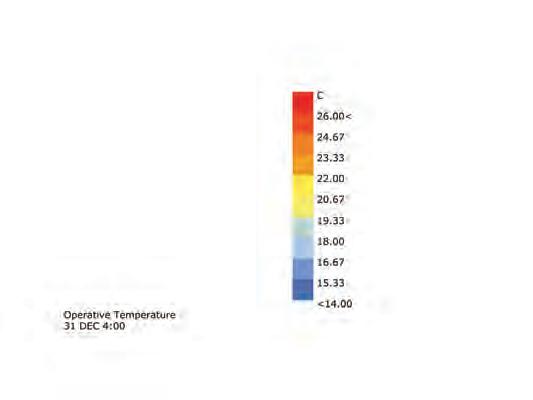
217 In-dune I Microclimate Tem ( °C) : 29.82- 48.56 Microclimate Tem ( °C) 30.58- 49.11 Microclimate Tem ( °C) : 31.91- 46.55 Microclimate Tem ( °C) : 31.91- 46.55 Microclimate Tem ( °C) : 31.14- 49.14 Microclimate Tem ( °C) 32.14 - 49.84 Microclimate Tem ( °C) : 33.28- 47.52 Microclimate Tem ( °C) : 33.28- 47.52 Microclimate Tem ( °C) 33.28- 47.52 Microclimate Tem ( °C) : 30.87- 49.01 Microclimate Tem ( °C) 31.80 - 49.68 Microclimate Tem ( °C) : 3298- 47.32 Microclimate Tem ( °C) : 33.98- 47.32 Microclimate Tem ( °C) 32.98- 47.32 Microclimate Tem ( °C) : 30.67- 48.92 Microclimate Tem ( °C) 31.58 - 49.56 Microclimate Tem ( °C) : 32.82- 47.17 Microclimate Tem ( °C) : 32.82- 47.17 Microclimate Tem ( °C) 32.82- 47.17 Microclimate Tem ( °C) : 30.46- 48.84 Microclimate Tem ( °C) 31.36 - 49.46 Microclimate Tem ( °C) : 32.53- 47.04 Microclimate Tem ( °C) : 32.53- 47.04 Microclimate Tem ( °C) 33.53- 47.04 Microclimate Tem ( °C) : 30.29- 48.77 Microclimate Tem ( °C) 31.14 - 49.37 Microclimate Tem ( °C) : 32.39- 46.93 Microclimate Tem ( °C) : 32.39- 46.93 Microclimate Tem ( °C) 32.39- 46.93 Microclimate Tem ( °C) : 30.17- 48.71 Microclimate Tem ( °C) 30.98 - 49.29 Microclimate Tem ( °C) : 32.28- 46.82 Microclimate Tem ( °C) : 32.28- 47.82 Microclimate Tem ( °C) Microclimate Tem ( °C) : 29.94- 48.64 Microclimate Tem ( °C) 30.74 - 49.20 Microclimate Tem ( °C) : 32.01- 46.68 Microclimate Tem ( °C) : 32.01- 46.68
Depth 8m 9 m 10m 11 m 12 m 13 m 14 m 15 m 1.2 m 0.9 m 1.5 m 0.3 m 0.6 m
Micro-climate analysis Winters 8.5


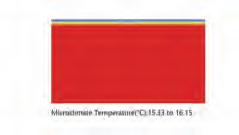


218 I Emergent technologies and design Microclimate Tem ( °C) : 14.94 - 16.07 Microclimate Tem ( °C) : 15.06 - 16.22 Microclimate Tem ( °C) : 15.20 - 16.43 Microclimate Tem ( °C) : 15.28 - 16.55 Microclimate Tem ( °C) : 15.33 - 16.62 Microclimate Tem ( °C) : 14.95 - 16.18 Microclimate Tem ( °C) : 15.06 - 16.34 Microclimate Tem ( °C) : 15.21 - 16.55 15.29 - 16.68 Microclimate Tem ( °C) : 15.35 - 16.76 Microclimate Tem ( °C) : 15.08 - 16.25 Microclimate Tem ( °C) : 15.06 - 16.34 Microclimate Tem ( °C) : 15.35 - 16.63 Microclimate Tem ( °C) : 15.29 - 16.68 Microclimate Tem ( °C) : 15.51 - 16.86 Microclimate Tem ( °C) : 15.02 - 16.35 Microclimate Tem ( °C) : 15.14 - 16.51 Microclimate Tem ( °C) : 15.28 - 16.74 Microclimate Tem ( °C) : 15.37 - 16.88 Microclimate Tem ( °C) : 15.43 - 16.97 Microclimate Tem ( °C) : 14.78 - 16.63 Microclimate Tem ( °C) : 14.95 - 16.85 Microclimate Tem ( °C) : 15.06 - 17.10 Microclimate Tem ( °C) : 15.28 - 17.31 Microclimate Tem ( °C) : 15.36 - 17.42 Microclimate Tem ( °C) : 14.75 - 16.61 Microclimate Tem ( °C) : 14.90 - 16.82 Microclimate Tem ( °C) : 15.02 - 17.07 Microclimate Tem ( °C) : 15.23 - 17.29 Microclimate Tem ( °C) : 15.31 - 17.41 Microclimate Tem ( °C) : 14.99 - 15.68 Microclimate Tem ( °C) : 14.99 - 15.68 Microclimate Tem ( °C) : 15.11 - 15.83 Microclimate Tem ( °C) : 15.33- 16.15 Microclimate Tem ( °C) : 15.33- 16.15 6 m 7 m 1m 2 m 3m 5 m 4 m Thickness 0.3 m 0.6 m 1.2 m 1.5 m 0.9 m Depth
Thickness

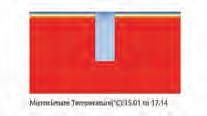


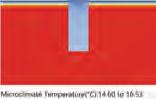


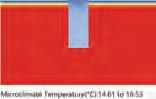

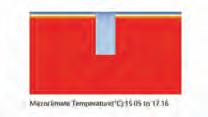
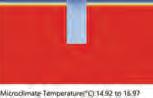

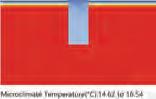


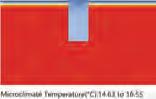


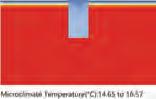


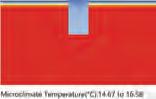


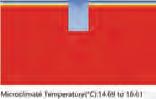


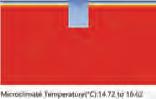
219 In-dune I Microclimate Tem ( °C) : 14.72- 16.62 Microclimate Tem ( °C) 14.87- 16.82 Microclimate Tem ( °C) : 15.15- 17.13 Microclimate Tem ( °C) : 15.19- 17.29 Microclimate Tem ( °C) 15.27- 17.41 Microclimate Tem ( °C) : 14.69- 16.61 Microclimate Tem ( °C) 14.83- 16.80 Microclimate Tem ( °C) : 15.10- 17.10 Microclimate Tem ( °C) : 15.15- 17.26 Microclimate Tem ( °C) 15.23- 17.38 Microclimate Tem ( °C) : 14.67- 16.58 Microclimate Tem ( °C) 14.80- 16.76 Microclimate Tem ( °C) : 14.99 - 17.04 Microclimate Tem ( °C) : 15.12- 17.23 Microclimate Tem ( °C) 15.20- 17.35 Microclimate Tem ( °C) : 14.65- 16.57 Microclimate Tem ( °C) 14.78- 16.74 Microclimate Tem ( °C) : 14.96- 17.01 Microclimate Tem ( °C) : 15.09- 17.20 Microclimate Tem ( °C) 15.17- 17.33 Microclimate Tem ( °C) : 14.63- 16.55 Microclimate Tem ( °C) 14.75- 16.72 Microclimate Tem ( °C) : 14.94- 16.99 Microclimate Tem ( °C) : 15.07- 17.18 Microclimate Tem ( °C) 15.17- 17.33 Microclimate Tem ( °C) : 14.62- 16.54 Microclimate Tem ( °C) 14.73- 16.70 Microclimate Tem ( °C) : 14.92- 16.97 Microclimate Tem ( °C) : 15.05- 17.16 Microclimate Tem ( °C) : 14.61- 16.53 Microclimate Tem ( °C) 14.72- 16.68 Microclimate Tem ( °C) : 14.90- 16.96 Microclimate Tem ( °C) : 15.03- 17.15 Microclimate Tem ( °C) : 14.60- 16.53 Microclimate Tem ( °C) 14.70- 16.67 Microclimate Tem ( °C) : 14.88- 16.94 Microclimate Tem ( °C) : 15.01- 17.14 8m 9 m 10m 11 m 12 m 13 m 14 m 15 m
Depth 1.2
0.9
1.5
0.3 m 0.6 m
m
m
m
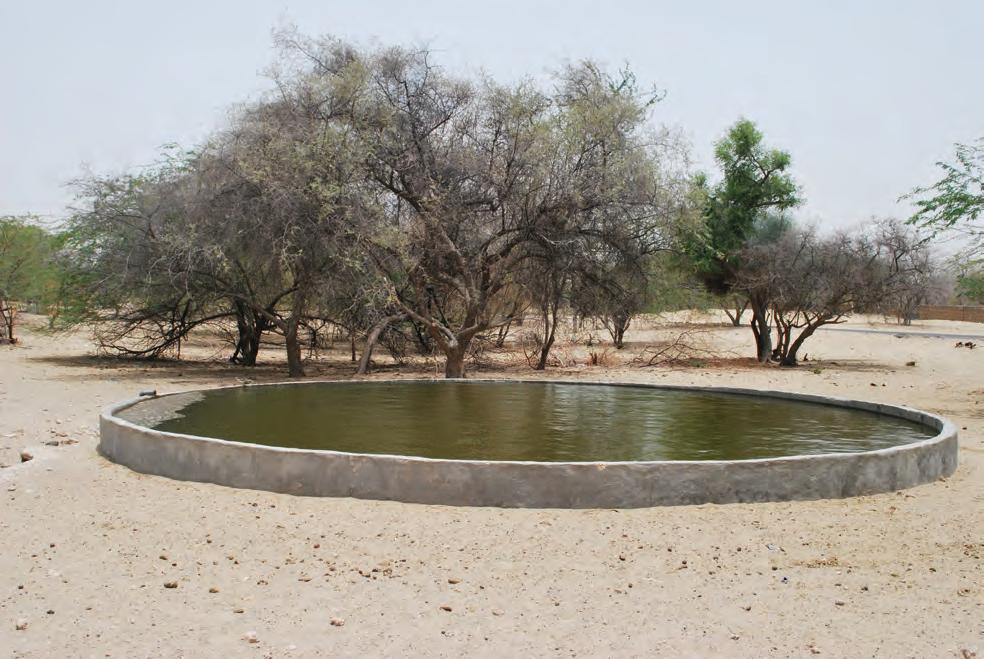
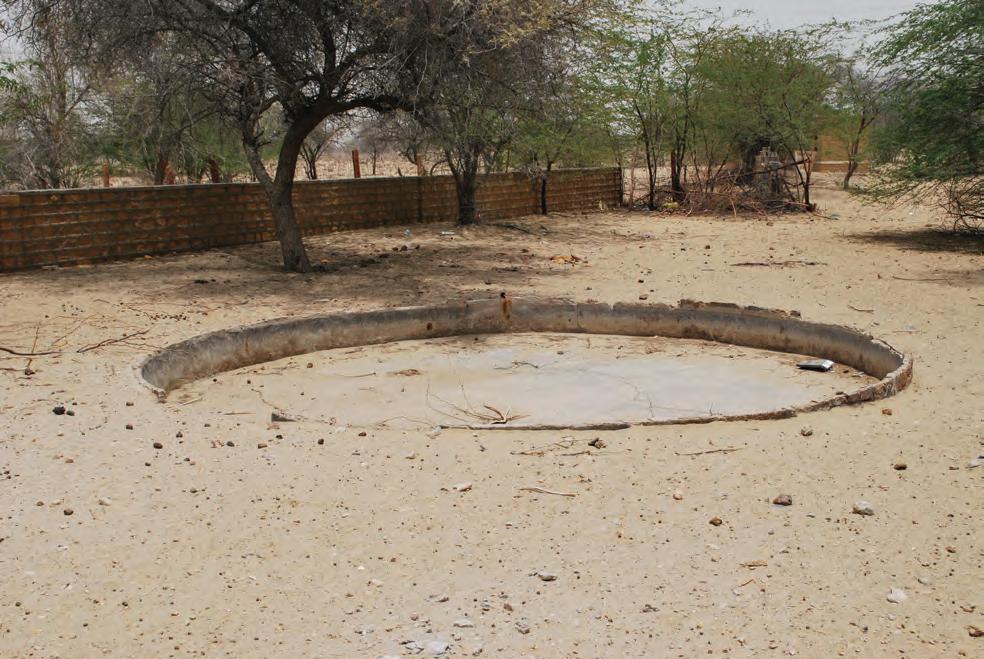
220 I Emergent technologies and design
Site visit photographs 8.5
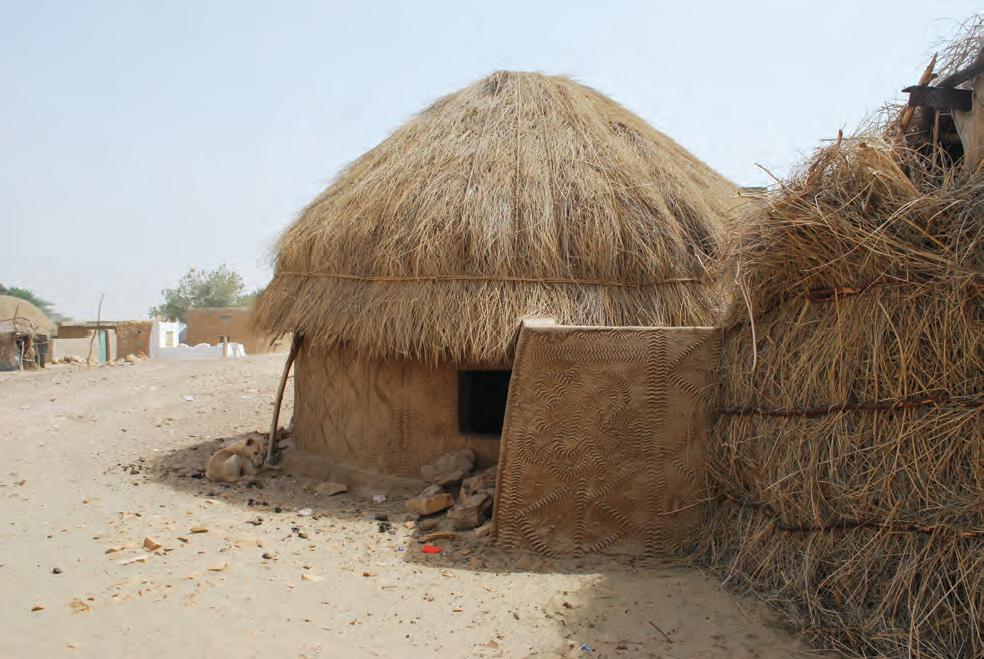
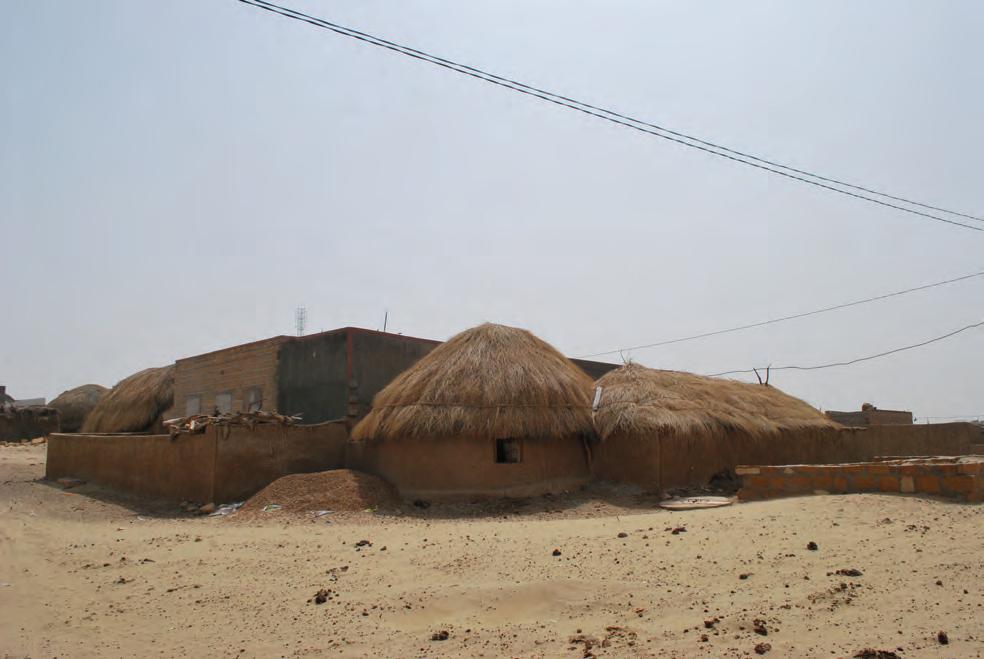
221 In-dune I
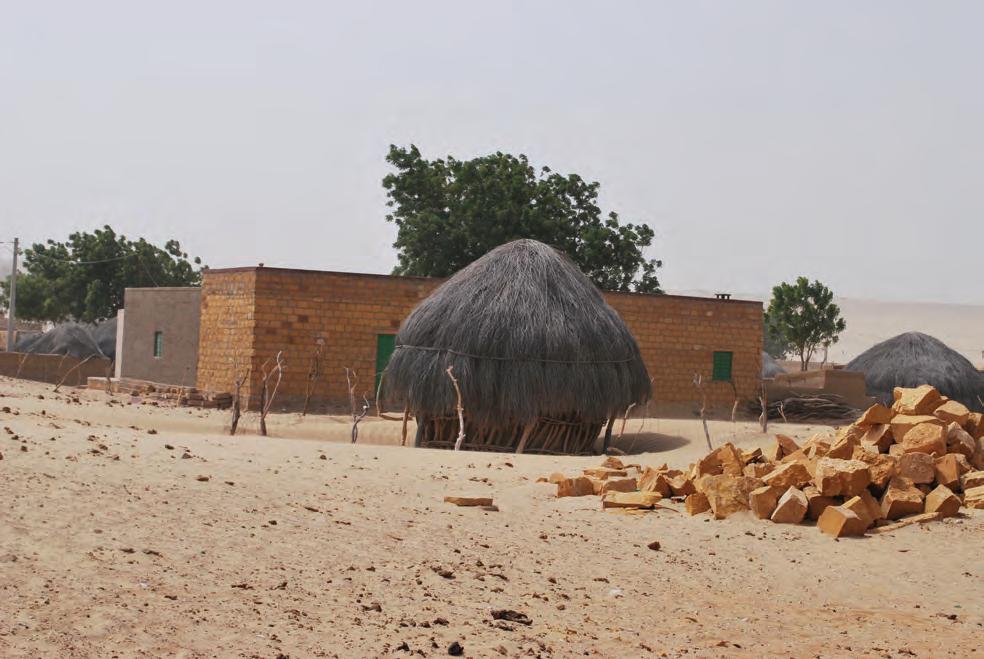
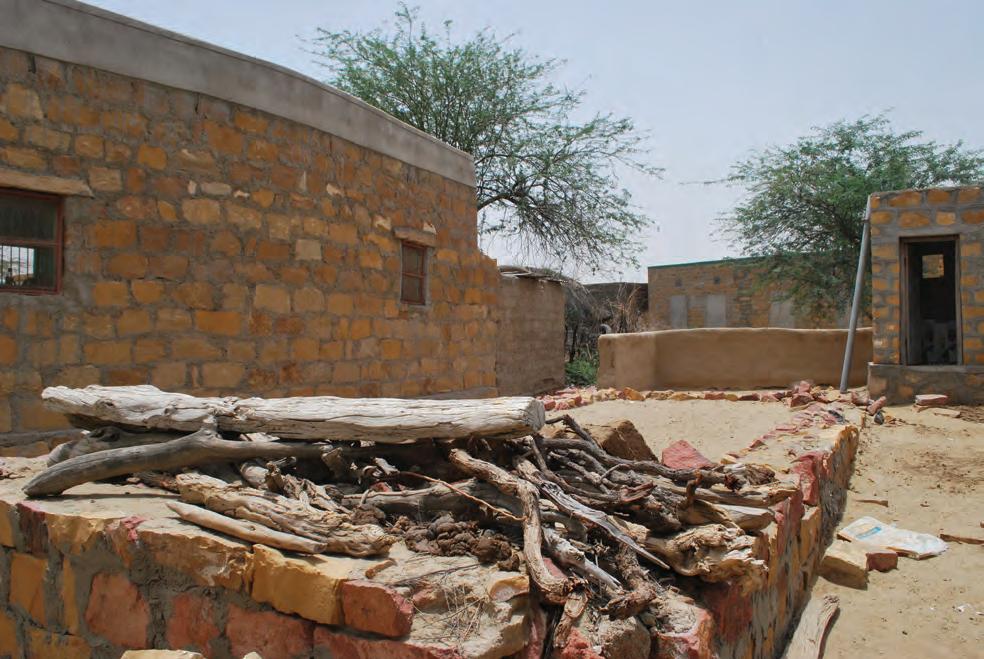
222 I Emergent technologies and design
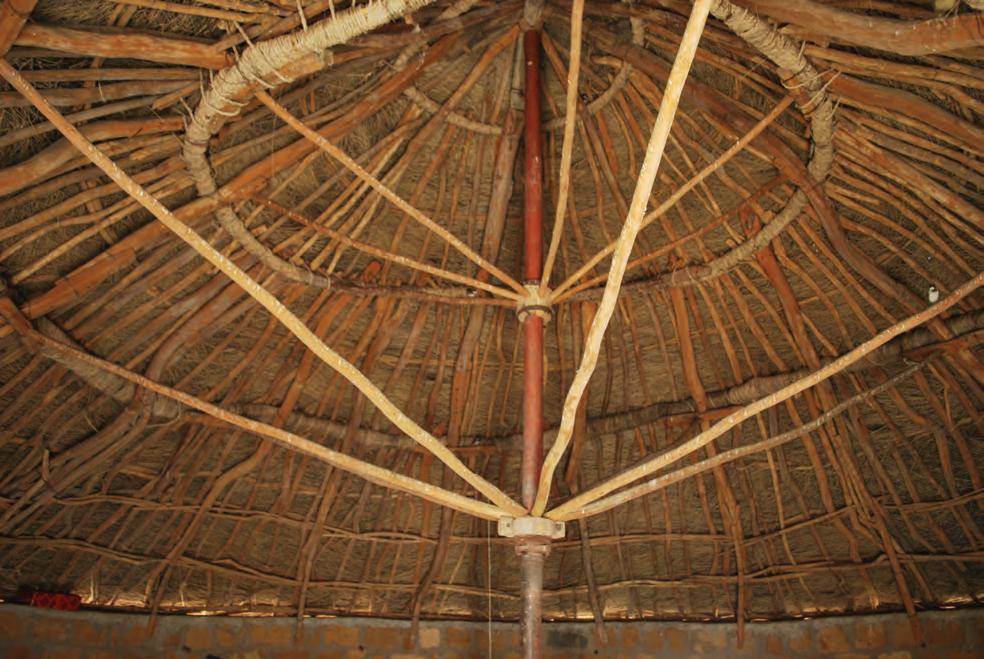
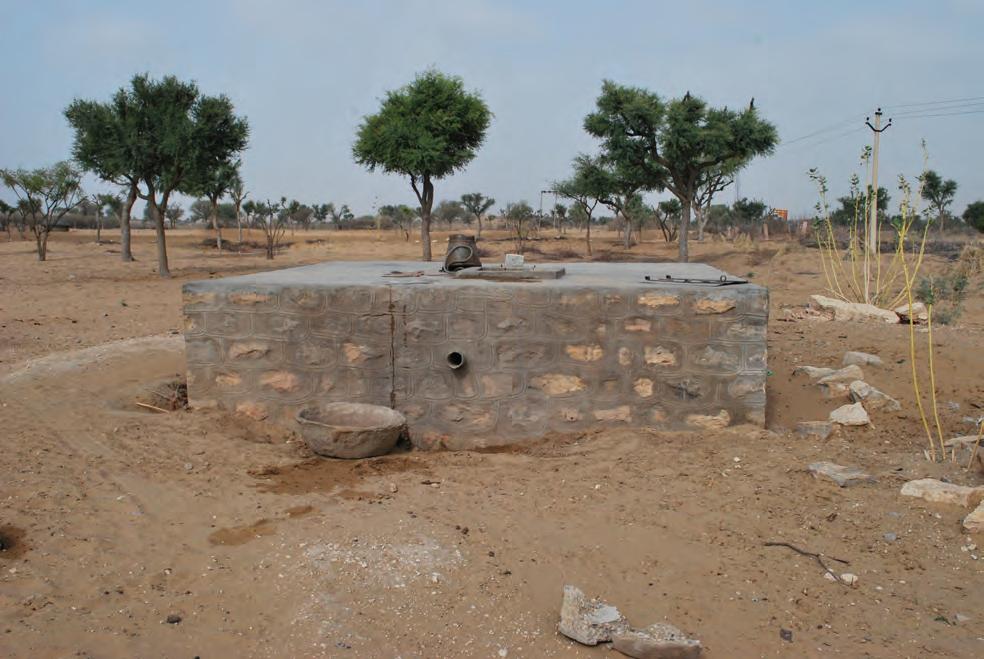
223 In-dune I
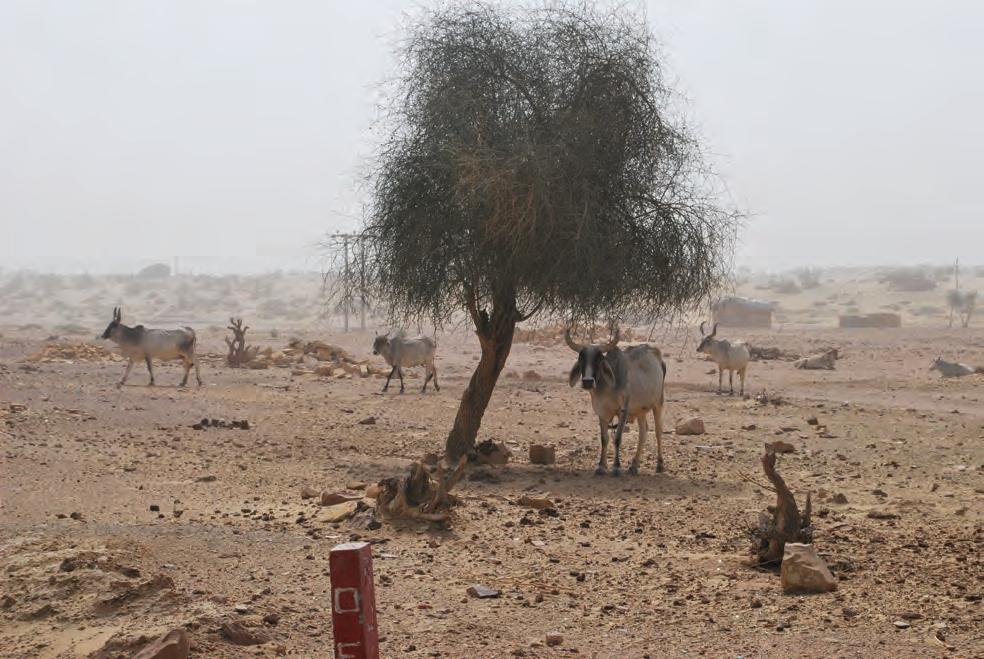
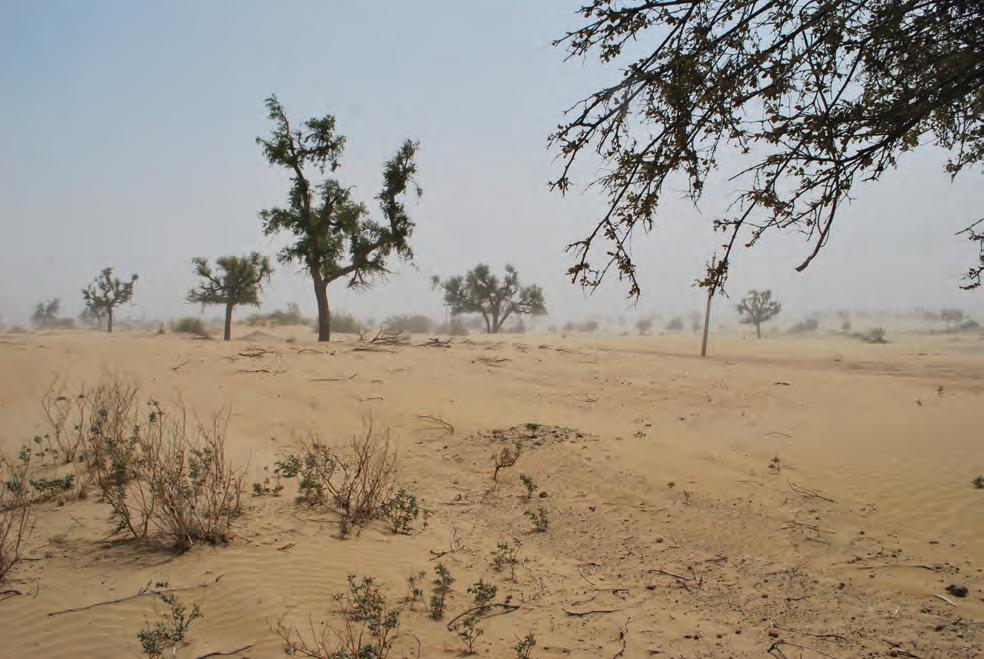
224 I Emergent technologies and design
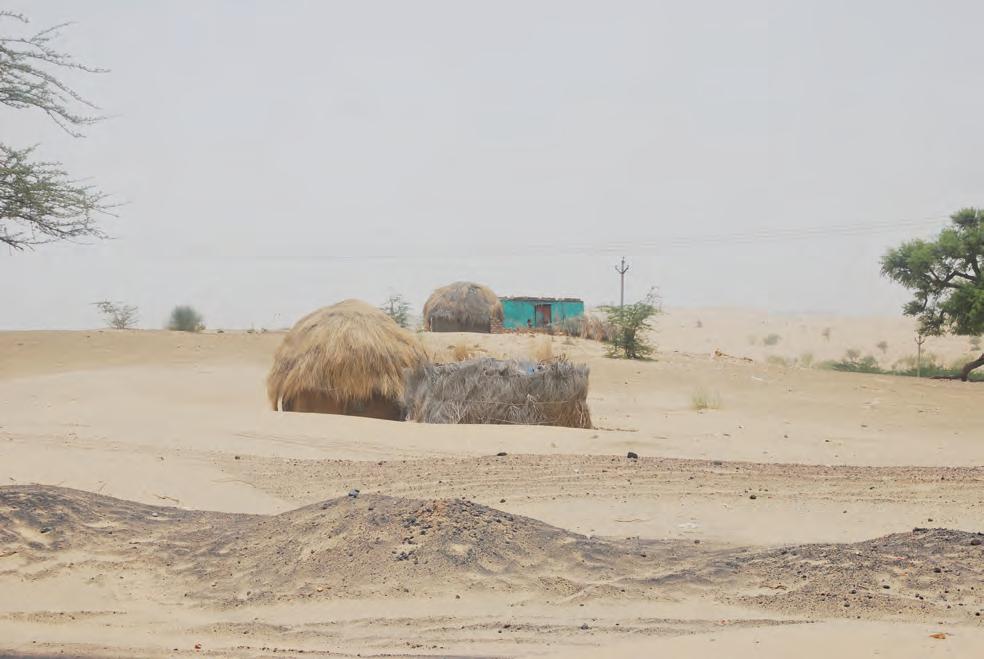
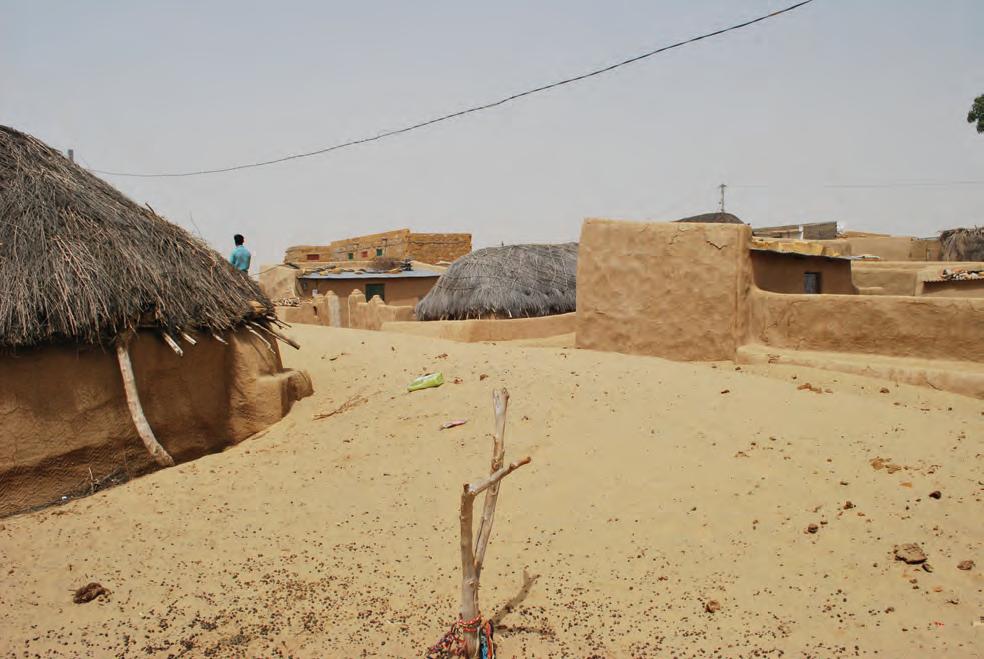
225 In-dune I
226 I Emergent technologies and design
9. References
227 In-dune I
1.Jason Evans, Felipe Garcia-Oliva, Ismail Abdel Galil Hussein, Muhammad Mohsin Iqbal, Joyce Kimutai, Tony Knowles, 6 Francisco Meza, Dalila Nedjraoui, Fasil Tena, Murat Türkeş, Ranses José Vázquez, Mark Weltz, “Chapter3: Desertification”, IPCC SRCCL, April 2019, Page 03).
2 Weinstock, Michael. “The Architecture of Emergence: the Evolution of Form in Nature and Civilisation”, John Wiley and Sons Ltd, West Sussex, 2013.
3 Cooke, Ronald U., Andrew Warren, and Andrew Goudie, “Desert Geomorphology”, UCL Press, London, 1993.
4 Population Reference Bureau, “What’s behind Desertification?”, https://www.prb.org/whatsbehinddesertification/, Accessed on January 02, 2020
5 “Migration- Free or Flee”, Desertification The Invisible Frontline, UNCCD, 2014
6 Moharana PC, Soni Shalu, Bhatt RK, “NDVI Based Assessment of Desertification in Jaisalmer District of Rajasthan in Reference to Regional Climate Variability”, XXXIII INCA International Congress, Jodhpur, September 2013, Page 01
7 Bryson RA, Baerreis DA, “Possibilities of Major Climatic Modification and their Implications: Northwest India a Case for Study”, University of Wisconsin, Madison, March 1967, Page 136-142.
8 Cooke, Ronald U., Andrew Warren, and Andrew Goudie, “Desert Geomorphology”, UCL Press, London, 1993.
9 Rathore Narpat Singh, Verma Narendra, “Impact of Climate Change in Southern Rajasthan, India”, International Journal of Water Resources and Arid Environments, 2013
10 Sharma Kriti Mohan, Singh Sarvansh, Jain Himanshu, “Reasons for the Expansion of Thar Desert & Methods to Control this Spreading”, CPUH-Research Journal, 2017
11 Singhvi A K, Kar Amal, “The aeolian sedimentation record of the Thar desert”, Journal of Earth System and Science, September 2014.
12 Sharma Kriti Mohan, Singh Sarvansh, Jain Himanshu, “Reasons for Expansion of Thar Desert and Methods to Control this Spreading”, Career Point University, Hamirpur, 2017. Page 12
13 Saha DK, “Desertification in Western Rajasthan- A Sociological View Point”, Central Arid Zone Research Institute, India, 1994, Page 01
14 Mallah Qasid Hussain, Talpur Mumtaz H, “Spatial Analysis of the Contemporary Settlement Pattern in the Thar Desert: An Ethnoarchaeological Investment”, Shah Abdul Latif University, January 2001
15 Sharma RC, “Settlement Geography of the Indian Desert”, Kumar Bros, July 2010, Page 187.
16 Sharma RC, “Settlement Geography of the Indian Desert”, Kumar Bros, July 2010.
17 Miyazaki Tadakuni, Tsunekawa Atsushi, “Remote Sensing and Social Investigation for Desertification in Western India”, National Institute for Environmental Studies, Japan, 1994
18 Weinstock, Michael. “The Architecture of Emergence: the Evolution of Form in Nature and Civilisation”, John Wiley and Sons Ltd, West Sussex, 2013.
9 “Wind Induced Sand movement”, Accessed May 07, 2019. https://digital-desert.com/natural-formations/sand-dunes-02. html
228 I Emergent technologies and design
20 Bagnold, RA. “The Physics of Blown Sand and Desert Dune”. Dover Publications,INC. New York, 1941
21 Sharma BK, Singh Nepal ,Kumar Mahesh, “Sandy Soils of Jaisalmer District: Their Morpho-genesis and Evaluation for Sustainable Land Use”. Central Arid Zone Research Institute, Jodhpur, 2006
22 Cooke, Ronald U., Andrew Warren, and Andrew Goudie, “Desert Geomorphology”, UCL Press, London, 1993.
23 Kar Amal, “Morphology and Evolution of Sand Dunes in the Thar Desert as Key to Sand Control Measures”, Indian Journal of Geomorphology, Central Arid Zone Research Institute, Jodhpur, 1997
24 Kar Amal, “Morphology and Evolution of Sand Dunes in the Thar Desert as Key to Sand Control Measures”, Indian Journal of Geomorphology, Central Arid Zone Research Institute, Jodhpur, 1997
25 Cooke, Ronald U., Andrew Warren, and Andrew Goudie, “Desert Geomorphology”, UCL Press, London, 1993.
26 Shuai Zhong , Zhiwen Han, Aimin Li and Heqiang Du, “Research on the Application of Palm Mat Geotextiles for Sand Fixation in the Hobq Desert”, MPDI, China, 2019
27 Beret Charles Jacques, Mohamed Moustapha Oula, Saleck Meimine Oula, “Fighting Sand Encroachment: Lessons from Mauritania”, Food and Argicultural Organisation of United Nations, Rome, 2010. Page 15
28 Kenneth Pye, Samantha Saye, Simon Blott,” Sand Dune Processes and Management for Flood and Coastal Defence. Part 4: Techniques for Sand Dune Management”, Joint Defra/EA Flood and Coastal Erosion Risk Management R&D Programme, May 2007, Page 08
29 Beret Charles Jacques, Mohamed Moustapha Oula, Saleck Meimine Oula, “Fighting Sand Encroachment: Lessons from Mauritania”, Food and Argicultural Organisation of United Nations, Rome, 2010
30 Kenneth Pye, Samantha Saye, Simon Blott,” Sand Dune Processes and Management for Flood and Coastal Defence. Part 4: Techniques for Sand Dune Management”, Joint Defra/EA Flood and Coastal Erosion Risk Management R&D Programme, May 2007,
31 “ Psammophytes”. Accessed on December 10, 2019, https://encyclopedia2.thefreedictionary.com/Psammophyte
32 Kaul, R.N. “Sand dune stabilisation in Thar Desert of India: A synthesis”. Annals of Arid Zone, 1996, Page 225-240
33 Beret Charles Jacques, Mohamed Moustapha Oula, Saleck Meimine Oula, “Fighting Sand Encroachment: Lessons from Mauritania”, Food and Argicultural Organisation of United Nations, Rome, 2010.
34 Khan M.A. and Narain Pratap, “Integrated Watershed Management for Sustainability”, Arid Zone Research Association of India & Scientific Publishers (India), 2003, Page 154.
35 Chang Ilhan , Im Jooyoung and Cho Gye-Chun, “Introduction of Microbial Biopolymers in Soil Treatment for Future Environmentally-Friendly and Sustainable Geotechnical Engineering”, Sustainability, 2016.
36 Niaounakis Michael, “Building and construction applications, Biopolymer: Application and trends”, William Andrew Publications, 2015.
37 Niaounakis Michael, “Building and construction applications, Biopolymer: Application and trends”, William Andrew Publications, 2015.
38 Cheng Liang, Shahin Mohamed A, “Microbially Induced Calcite Precipitation (MICP) for Soil Stabilisation”, Ecological Wisdom Inspired Restoration Engineering, 2019.
229 In-dune I
39 “Permeation (Chemical) Grouting”, Accessed on December 24, 2019. https://www.haywardbaker.com/solutions/ techniques/permeation-chemical-grouting
40 Hadi Fatehi , Maysam Bahmani and Ali Noorzad, “Strengthening of Dune Sand with Sodium Alginate Biopolymer”, GeoCongress, 2019.
41 Chang Ilhan , Im Jooyoung and Cho Gye-Chun, “Introduction of Microbial Biopolymers in Soil Treatment for Future Environmentally-Friendly and Sustainable Geotechnical Engineering”, Sustainability, 2016.
42 Asthana Vandana, Shukla AC, “Water Security in India- Hope, Despair, and the Challenges of Human Development”, Bloomsbury Publishing, 2014
43 Tangahu Bieby Voijant, Abdullah Siti Rozaimah Sheikh, Basri Hassan,Idris Mushrifah, Anuar Nurina and Mukhlisin Muhammad, “A Review on Heavy Metals (As, Pb, and Hg) Uptake by Plants through Phytoremediation”, Internal Journal of Chemical Engineering, 2011.
44 Arunkumar T, Vinothkumar K, Ahsan Amimul, Jayaprakash R, Kumar Sanjay, “Experimental Study on Various Solar Still Designs”, ISRN Renewable Energy, 2012
45 Hussain Ajaz, Tayyab Mohammed and Asif, “Indira Gandhi canal project environment and changing scenario of western Rajasthan: A case Study”, Department of Geography, Jamia Millia Islamia, July 2018, Page 18
46 Krishnan Amritha, Rajakumar Balamurugan, “Embedded Morphodynamics”, AA Emergent Technologies and Design, 2014, London, Page 129.
47 Burno Luca, Horvat Marko, Raffaele Lorenzo, “Wind Blown Sand along Railway Infrastructures: A review of Challenges and Mitigation Measures”, Journal of Wind Engineering and Industrial Aerodynamics, 2018, Page 357.
48 Larrson Magnus, “Dune: Arenaceous Anti-Desertification Architecture”, Springer Verlag Berlin Heidelberg, 2011, Page 431
49 Gupta P, “ Moisture and thermal regimes of the desert soils of Rajasthan, India, and their Management for Higher Plant Production”, Hydrological Sciences Journal, 2009.
50 Rahim M, “Behaviour of Drift Sand and Method of Dealing with it”, Pakistan Engineering Conference, 1945
51 Ikhwan M and Ruck B, “The Flow and Pressure Field Characteristics around Pyramidal Buildings”, Laboratory of Building and Environmental Aerodynamics, Germany
52 Burno Luca, Horvat Marko, Raffaele Lorenzo, “Wind Blown Sand along Railway Infrastructures: A review of Challenges and Mitigation Measures”, Journal of Wind Engineering and Industrial Aerodynamics, 2018, Page 353.
53 Singh Jagbir and Roy Amrit Kumar, “Effects of roof slope and wind direction on wind pressure distribution on the roof of a square plan pyramidal low-rise building using CFD simulation”, International Journal of Advanced Structural Engineering, 2019.
54 Gupta JP and Narain Pratap, “Sustainable Crop Production in Arid Region: Strategies and Research Priorities”, Arid Zone Research Association of India and Scientific Publishers (India), Jodhpur, 2003
55 Mertja RS, Prasad Rajendra, Gajja B.L., Samra J.S., Narain Pratap, “Impact Of Shelter Belt In Arid Region Of Rajasthan”, Arid Zone Research Association of India and Scientific Publishers (India), Jodhpur, 2006
230 I Emergent technologies and design
231 In-dune I
232 I Emergent technologies and design
233 In-dune I 10. Bibliography
Albugami, Sarah, Steven Palmer, Jonathan Cinnamon, and Jeroen Meersmans. 2019. “Spatial and Temporal Variations in the Incidence of Dust Storms in Saudi Arabia Revealed from in Situ Observations.” Geosciences (Switzerland) 9 (4). https://doi. org/10.3390/geosciences9040162.
amadas, Sendhil & Balaji, S.J. & Ramasundaram, P & Kumar, Anuj & Singh, Satyavir & Chatrath, Ravish & Singh. 2018. “Doubling Farmers Income by 2022: Trends, Challenges, Pathway and Strategies.” 2018. https://doi.org/10.13140/ RG.2.2.24608.28169.
Arunkumar, T, K Vinothkumar, Amimul Ahsan, R Jayaprakash, and Sanjay Kumar. 2012. “Experimental Study on Various Solar Still Designs.” ISRN Renewable Energy 2012: 1–10. https://doi.org/10.5402/2012/569381.
Autologon. 2001. “INDIA NATION ACTION PROGRAMME TO COMBAT DESERTIFICATION In the Context of UNITED NATIONS CONVENTION TO COMBAT DESERTIFICATION (UNCCD) Status of Desertification MINISTRY OF ENVIRONMENT & FORESTS GOVERNMENT OF INDIA NEW DELHI.”
Banasthali Vidyapith. 2013. “Hydrogeological Atlas of Rajasthan Jaisalmer District.” Rolta India Limited. 2013. https://www. coursehero.com/file/piuoukm/This-publication-Hydrogeological-Atlas-of-Rajasthan-is-the-culmination-of-a/.
Barrio, G. del, M.E. Sanjuán, A. Ruiz, and J. Martínez Valderrama, J. Puigdefábregas. 2018. “Case Study: Land Condition Surveillance Using Geospatial Data (Iberian Peninsula and Maghreb).” In World Atlas of Desertification, edited by G. Cherlet, M., Hutchinson, C., Reynolds, J., Hill, J., Sommer, S., von Maltitz, 194–97. Publication Office of the European Union. https:// doi.org/10.2760/9205.
Bashan, Y, A E Carrillo, G J Bethlenfalvay, A Rojas, and Puente. n.d. “PREVENTION OF DESERT SOIL EROSION AND ENHANCING SOIL Stabilisation BY MYCORRHIZAL FUNGI AND BY CACTUS PLANTS INOCULATED WITH AZOSPIRILLUM BRASILENSE.”
Bel, Golan, and Yosef Ashkenazy. 2014. “The Effects of Psammophilous Plants on Sand Dune Dynamics.” Journal of Geophysical Research: Earth Surface 119 (7): 1636–50. https://doi.org/10.1002/2014JF003170.
Bhadra, B. K., Sushilkumar B. Rehpade, Hansraj Meena, and S. Srinivasa Rao. 2019. “Analysis of Parabolic Dune Morphometry and Its Migration in Thar Desert Area, India, Using High-Resolution Satellite Data and Temporal DEM.” Journal of the Indian Society of Remote Sensing 47 (12): 2097–2111. https://doi.org/10.1007/s12524-019-01050-1.
Bhardwaj, Dr. Vinod Kumar. n.d. “Micro-Climatic Changes in Thar Desert: Development and Challenges.”
Bhatt, Kanishk. n.d. “THERMAL COMFORT IN HOT-DRY CLIMATE.”
Bryson, Reid A. 1977. “THE HOW AND WHY OF CLIMATIC CHANGE.” Annals of the New York Academy of Sciences 300 (1): 40–53. https://doi.org/10.1111/j.1749-6632.1977.tb19301.x.
Chatterji, PC, Amal KAR mw, and S PC Kathju Pande MS Yadav RK Abichandani MS Khan A Kar Gyanchand DL Vyas HC Pathak. 1992. “INTEGRATED NATURAL AND HUMAN RESOURCES APPRAISAL OF JAISALMER DISTRICT.”
Creswell, Randy, D R Franklin, W Martin, and E C Ho. 1993. “ECHO.” http://www.echonet.org/.
Dahy, H. 2017. “Biocomposite Materials Based on Annual Natural Fibres and Biopolymers – Design, Fabrication and Customized Applications in Architecture.” Construction and Building Materials 147 (August): 212–20. https://doi. org/10.1016/j.conbuildmat.2017.04.079.
Dakir, D., H. Rhinane, O. Saddiqi, E. El Arabi, and L. Baidder. 2016. “Automatic Extraction of Dunes from Google Earth Images New Approach to Study the Dunes Migration in the Laâyoune City of Morocco.” In International Archives of the Photogrammetry, Remote Sensing and Spatial Information Sciences - ISPRS Archives, 42:53–59. International Society for Photogrammetry and Remote Sensing. https://doi.org/10.5194/isprs-archives-XLII-2-W1-53-2016.
234 I Emergent technologies and design
“Development Of Index To Assess Drought Conditions Using Geospatial Data A Case Study Of Jaisalmer District, Rajasthan, India*.” 2015. Geoinformatica Polonica 2015 (1): 29–39. https://doi.org/10.1515/gein-2015-0003.
Dr. Kirti Mohan Sharma, Sarvansh Singh, Himanshu Jain. 2017. “Reasons for the Expansion of Thar Desert & Methods to Control This Spreading.” 2017. http://www.cpuh.in/academics/academic_journals.php.
Felix, Mary, and Eslam Elsamahy. 2017. “The Efficiency of Using Different Outer Wall Construction Materials to Achieve Thermal Comfort in Various Climatic Zones.” In Energy Procedia, 115:321–31. Elsevier Ltd. https://doi.org/10.1016/j. egypro.2017.05.029.
Florides, Georgios, and Soteris Kalogirou. n.d. “Measurements of Ground Temperature at Various Depths.”
Gaur, Mahesh K., and Hemlata Gaur. 2004. “Combating Desertification: Building on Traditional Knowledge Systems of the Thar Desert Communities.” Environmental Monitoring and Assessment 99 (1–3): 89–103. https://doi.org/10.1007/s10661004-4005-7.
Geomorphology of Desert Environments. 1994. Geomorphology of Desert Environments. Springer Netherlands. https://doi. org/10.1007/978-94-015-8254-4.
Harsh, L N, and J C Tewari. 1989. “Sand Dune Stabilisation and Desert Afforestation The Success of Fish Breeding in Floating Cages View Project TATA-ICRISAT-ICAR-BAIF Project on Paticipatory Development of Degraded Watersheds in Eastern Rajasthan View Project.” https://www.researchgate.net/publication/318921725.
Kaur, Rupinder, Amandeep Kaur, Ram Chand Bhatti, C. Nirmala, and A.N. Singh. 2018. “Differential Responses of β-Glucosidase, SOC and MBC of Degraded Soil under Various Treatments in a North-Western Arid Region, India.” Applied Ecology and Environmental Sciences 6 (4): 99–108. https://doi.org/10.12691/AEES-6-4-1.
Kilaru, Suman, Bandaru Karunakar Goud, and Vijay Kumar Rao. 2013. “Crustal Structure of the Western Indian Shield: Model Based on Regional Gravity and Magnetic Data.” Geoscience Frontiers 4 (6): 717–28. https://doi.org/10.1016/j. gsf.2013.02.006.
Lancaster, Nicholas, and William G. Nickling. 1994. “Aeolian Sediment Transport.” In Geomorphology of Desert Environments, 447–73. Springer Netherlands. https://doi.org/10.1007/978-94-015-8254-4_17.
Laoubi, Hamza, Madani Bederina, Amina Djoudi, Adeline Goullieux, Rose Marie Dheilly, and Michele Queneudec. 2018. “Study of a New Plaster Composite Based on Dune Sand and Expanded Polystyrene as Aggregates.” The Open Civil Engineering Journal 12 (1): 401–12. https://doi.org/10.2174/1874149501812010401.
Larsson, Magnus. 2011. “Dune: Arenaceous Anti-Desertification Architecture.” Environmental Science and Engineering (Subseries: Environmental Science), no. 9783642147784: 431–63. https://doi.org/10.1007/978-3-642-14779-1_20.
Li, Xiaobo, and B S Beijing. 2004. “Physical, Chemical, and Mechanical Properties of Bamboo and Its Utilization Potential for Fiberboard Manufacturing.” https://digitalcommons.lsu.edu/gradschool_theses.
Liddle, M. J., and K. G. Moore. 1974. “The Microclimate of Sand Dune Tracks: The Relative Contribution of Vegetation Removal and Soil Compression.” The Journal of Applied Ecology 11 (3): 1057. https://doi.org/10.2307/2401765.
Liu, Z, B Liu, and J Qian. 2014. “Some Mechanisms in Reproduction of Psammophyte to Adapt to Wind Erosion on the Active Sand Dune.” Adv. Geosci 1: 1–8. https://doi.org/10.5194/adgeo-1-1-2014.
Lü, Ping, Clément Narteau, Zhibao Dong, Olivier Rozier, and Sylvain Courrech Du Pont. 2017. “Unravelling Raked Linear Dunes to Explain the Coexistence of Bedforms in Complex Dunefields.” Nature Communications 8 (January). https://doi. org/10.1038/ncomms14239.
235 In-dune I
Maggi, Alejandro & Abraham, & Elena, & Frédéric, Achard & Frédéric, & Ajai, & Ahmedabad, & Akça, Erhan & Erhan, & Archibald. 2018. “WORLD ATLAS OF DESERTIFICATION Third Edition Rethinking Land Degradation and Sustainable Land Management.” Joint Research Center. 2018. https://www.researchgate.net/publication/326731546_WORLD_ATLAS_OF_ DESERTIFICATION_Third_Edition_Rethinking_land_degradation_and_sustainable_land_management.
Marasco, Ramona, María J. Mosqueira, Marco Fusi, Jean-Baptiste Ramond, Giuseppe Merlino, Jenny M. Booth, Gillian Maggs-Kölling, Don A. Cowan, and Daniele Daffonchio. 2018. “Rhizosheath Microbial Community Assembly of Sympatric Desert Speargrasses Is Independent of the Plant Host.” Microbiome 6 (1): 215. https://doi.org/10.1186/s40168-018-0597-y.
Mazdiyasni, Omid, Amir AghaKouchak, Steven J. Davis, Shahrbanou Madadgar, Ali Mehran, Elisa Ragno, Mojtaba Sadegh, et al. 2017. “Increasing Probability of Mortality during Indian Heat Waves.” Science Advances 3 (6). https://doi.org/10.1126/ sciadv.1700066.
McGlynn, Ian O., Christopher M. Fedo, and Harry Y. McSween. 2011. “Origin of Basaltic Soils at Gusev Crater, Mars, by Aeolian Modification of Impact-Generated Sediment.” Journal of Geophysical Research E: Planets 116 (4). https://doi. org/10.1029/2010JE003712.
Middleton, N. J. 1986. “A Geography of Dust Storms in South‐West Asia.” Journal of Climatology 6 (2): 183–96. https://doi. org/10.1002/joc.3370060207.
Midha, Rachna. n.d. “EVALUATION OF HEAVY METAL CONTAMINATION IN INDIRA GANDHI CANAL WATER, SRIGANGANAGAR, INDIA.” Vol. 4. Accessed January 3, 2020. www.srjis.com.
Mishra, V. 1967. Geography of Rajasthan. New Delhi: National Book Trust.
Moharana, P C, P Santra, D V Singh, Suresh Kumar, R K Goyal, Deepesh Machiwal, and O P Yadav. n.d. “ICAR-Central Arid Zone Research Institute, Jodhpur: Erosion Processes and
Desertification in the Thar Desert of India.” Proc Indian Natn Sci Acad 82 (3): 1117–40. https://doi.org/10.16943/ ptinsa/2016/48507.
Ould Mohamed, M. 2010. Mechanical Dune Stabilisation: Installing Plant Matter. P. Koteswaram. 1978. “Meteorology and Climatology of the Rajasthan Desert.” 1978. https://www.researchgate.net/ publication/285914017_Meteorology_and_Climatology_of_the_Rajasthan_Desert.
P.C.Moharana, Shalu Soni and R.K.Bhatt. 2013. “NDVI BASED ASSESSMENT OF DESERTIFICATION IN JAISALMER DISTRICT OF RAJASTHAN IN REFERENCE TO REGIONAL CLIMATE VARIABILITY.” 2013. https://www.researchgate.net/ publication/311708161_NDVI_BASED_ASSESSMENT_OF_DESERTIFICATION_IN_JAISALMER_DISTRICT_OF_RAJASTHAN_ IN_REFERENCE_TO_REGIONAL_CLIMATE_VARIABILITY.
Padmakumar, G. P., K. Srinivas, K. V. Uday, K. R. Iyer, Pankaj Pathak, S. M. Keshava, and D. N. Singh. 2012. “Characterization of Aeolian Sands from Indian Desert.” Engineering Geology 139–140 (June): 38–49. https://doi.org/10.1016/j. enggeo.2012.04.005.
PRATAP NARAIN, AMAL KAR. 2005. “Desertification.” 2005. https://www.researchgate.net/publication/302905222_ Desertification.
Publication, IAEME. n.d. “BEARING CAPACITY OF STRIP FOOTING RESTING ON DUNE SANDS STABILIZED BY GROUTING WITH LIME–SILICA FUME MIX.”
Pye, Kenneth, and Haim Tsoar. 2009. Aeolian Sand and Sand Dunes Aeolian Sand and Sand Dunes. Springer Berlin Heidelberg. https://doi.org/10.1007/978-3-540-85910-9.
236 I Emergent technologies and design
Qian, Chun Xiang, Hui Rong, Xiao Niu Yu, and Xin Wang. 2016. “Experiments on and Predictions about Properties of Sand Bonded by Microbe Cement.” Science China Technological Sciences 59 (8): 1186–93. https://doi.org/10.1007/s11431-0166077-3.
Raichle, Brian W, Max C Poole Dean, and Cratis D Williams. 2016. “ON-SITE BIOREMEDIATION: A SOLUTION TO TREATMENT OF GREYWATER.”
Rajawat, A. , Prof, Ajai , Arya, A.s , Dhinwa, Dr. Dasgupta, Ms. Sur, Koyel , Sastry, Shri, Bhanderi. 2016. “Desertification and Land Degradation Atlas of India.”
Rathore, Mansingh, Sanjay Sharma, and Vimal Preet. 2018. “Analysis of Traditional and Existing Construction Practices for Sustainable Rural Houses in the Southern Western Part of Rajasthan.”
Robbins, Paul. 1998. “Nomadization in Rajasthan, India: Migration, Institutions, and Economy.” Human Ecology 26 (1): 87–112. https://doi.org/10.1023/A:1018748917722.
Santosh Kumar, T., B. Abraham, A. Sridharan, and Babu Jose. 2011. “Determination of Cement Content of Grouted Sandy Soils.” International Journal of Earth Sciences and Engineering 4 (6): 169–72.
Shahid, Munazzam Jawad, Muhammad Arslan, Shafaqat Ali, Muhammad Siddique, and Muhammad Afzal. 2018. “Floating Wetlands: A Sustainable Tool for Wastewater Treatment.” Clean - Soil, Air, Water. Wiley-VCH Verlag. https://doi.org/10.1002/ clen.201800120.
Sharma, K. D. 1998. “The Hydrological Indicators of Desertification.” In Journal of Arid Environments, 39:121–32. Academic Press. https://doi.org/10.1006/jare.1998.0403.
Singh, Madan & Bhojvaid, P & Reddy, Santhosh & Ashraf, Jawaid. 2014. “ISSN EVIDENCES AND ASPECTS OF FOREST TRANSITION IN INDIA.” 2014. https://www.researchgate.net/publication/281391864_httpwwwindianforestercoin_ISSN_ EVIDENCES_AND_ASPECTS_OF_FOREST_TRANSITION_IN_INDIA.
Singh Rathore, Narpat, and Narendra Verma. 2013. “Impact of Climate Change in the Southern Rajasthan, India.” International Journal of Water Resources and Arid Environments 2 (1): 45–50.
Singhvi, A. K., and Amal Kar. 2004. “The Aeolian Sedimentation Record of the Thar Desert.” Proceedings of the Indian Academy of Sciences, Earth and Planetary Sciences 113 (3): 371–401. https://doi.org/10.1007/BF02716733.
Syranidou, Evdokia, Stavros Christofilopoulos, and Nicolas Kalogerakis. 2017. “Juncus Spp.—The Helophyte for All (Phyto) Remediation Purposes?” New Biotechnology. Elsevier B.V. https://doi.org/10.1016/j.nbt.2016.12.005.
The Energy and Resources Institute, and (TERI). 2014. “Rajasthan State Action Plan on Climate Change Government of Rajasthan.”
Vogel, Richard M. 2005. “Regional Calibration of Watershed Models.” In Watershed Models, 47–71. CRC Press. https://doi. org/10.1201/9781420037432.ch3.
Vries, S. De, J. S.M. van Thiel de Vries, L. C. van Rijn, S. M. Arens, and R. Ranasinghe. 2014. “Aeolian Sediment Transport in Supply Limited Situations.” Aeolian Research 12 (March): 75–85. https://doi.org/10.1016/j.aeolia.2013.11.005.
Whitford, Walter G., and Benjamin D. Duval. 2020. “Desertification.” In Ecology of Desert Systems, 371–95. Elsevier. https:// doi.org/10.1016/B978-0-12-815055-9.00012-6.
Zdruli, Pandi, Michael Cherlet, and Claudio Zucca. 2016. “Desertification: Mapping Constraints and Challenges.” In Encyclopedia of Soil Science, Third Edition, 633–41. CRC Press. https://doi.org/10.1081/e-ess3-120052917.
237 In-dune I
10. Contribution
Saumil Nagar:
Contributed in formulating research background, core design ambitions and ideas, design of the settlement, strategizing background and set-up for computational experiments, developing site drawings, design drawings ,diagrams, details and designing and formatting the research book. The critical contributions being critical in analysing and redeveloping computational strategies and design interventions at all the stages of the research and synthesising all the proposals into a holistic scheme.
Medha Bansal:
Contributed in formulating research background, performing a field survey on the site, conducting computational experiments at various Research and Design Development stages and documenting the entire research in text. The critical contributions being material study and development of tool paths, scripting planar and volumetric aggregation algorithms, resource calculations for phasing strategy and formulating global time steps of the proposed scheme.
Kai Yeh:
Contributed in conducting computational experiments at Research Development and Design Development stages. The critical contributions were in conducting micro-climate analysis, FEA structural analysis, CFD tests for design investigation and post analysis and scripting roof aggregation algorithm based on material studies. Also contributed in developing detailed plan drawings of habitable clusters and renders.
240 I Emergent technologies and design 1.1 Deserti cation 1.2 Context: Thar desert, Rajasthan 1.2.1 Problems 2.1 Western Thar 2.1.1 Climate conditions 2.1.2 Settlement patterns 2.2 Dune dynamics 2.2.1 Aeolian processes 2.2.2 Linear sand dunes of Thar
Sand stabalisation techniques
Protective screens
Aerodynamic method
Plantation of dune grasses, shrubs & trees
Plantation of crops ( Agronomics ) 2.3.5 Bio-mineralisation : Infrastructure system 2.3.6 Alginate
Conclusion: Sand stabilization techniques 2.4 Water resources in Thar 2.4.1 Sources 2.4.2 Treatment 2.5 Research proposal 3.1 Site visit 3.2 Digital tools
Methods
Domain
Medha
Kai
ResearchDesign Logic Experiment Logic
2.3
2.3.1
2.3.2
2.3.3
2.3.4
2.3.7
1.Introduction 3.
2.
Saumil Nagar
Bansal
Yeh [
241 In-dune I Content and analysis Scripting Diagram Design Design Drawings Text editing
242 I Emergent technologies and design
Bio-mineralization
4.1
4. Research & Development
Scaling up fabrication : Matrix injection 4.1.2 Fabrication of di erent pro les 4.1.3 Machine tool path and time steps 4.1.4 Global injection scale : Dune valley 4.2 Stepped pro le 4.3 Sand channels 4.4 In-dune structures 4.4.1 Depth of injection 4.4.2 Orientation of injection matrix 4.5 De ection system 5.1 Habitable spaces 5.1.1 Clustering and accessibility 5.1.2 Programmatic adjacencies 5.1.3 Planar aggregation of programs 5.1.4 Volumetric aggregation of programs 5.2 De ection system: scalability 5.2.1 Materiality 5.2.2 Structure 5.2.3 Material optimization 5.2.4 Aggregation of de ecting geometries 5.2.5 Typical roof detail 5.3 Resources and infrastructure 5.3.1 Phasing 5.3.2 Hydrological system 5.3.3 Shelter belt 5.3.4 Agronomics 4.5.1 Geometric exploration 4.5.2 Orientation of de ection geometry 4.5.3 Wind lift mitigation ResearchDesign Logic Experiment Logic
Saumil Nagar Medha Bansal Kai Yeh 5. Design Development
4.1.1
243 In-dune I Content and analysis Text editing Scripting Diagram Design Design Drawings
6. Design Proposal
244 I Emergent technologies and design 6.1 Program distribution 6.1.2 Isometric site section 6.1.3 Public space and bioremediation 6.1.4 Shelter belt 6.1.5 Agriculture 6.1.6 Habitable terraces 6.2 Cluster time-scales 6.2.1 Cluster sections 6.2.2 Cluster plan 6.2.3 cluster renderings 6.3 Global time-scales 7.1 Multiple Settlements 7.2 Sand de ection and sedimentation 7.3 Biomineralised sand 7.4 Social fabric and infrastructure 7.5 Scope of application 8.1 Thar desert, dune morphologies 8.2 Rajasthan livestock population trend 8.3 Major crops cultivated in Rajasthan 8.4 Micro-climate analysis
Appendix
Conclusion
8.
7.
Saumil Nagar Medha
Kai Yeh ResearchDesign Logic Experiment Logic
Bansal
245 In-dune I Content and analysis Text editing Scripting Diagram Design Design Drawings