INFRASONIC
a material resonant system
ABHINAV RANJAN CHAUDHARY, India
MIGUEL ESCALLON SALAZAR, Colombia
NEIL DEEP SINGH GREWAL, USA
INFRASONIC
a material resonant system
M.ARCH CANDIDATES:
ABHINAV RANJAN CHAUDHARY, India
MIGUEL ESCALLON SALAZAR, Colombia
NEIL DEEP SINGH GREWAL, USA
ARCHITECTURAL ASSOCIATION SCHOOL OF ARCHITECTURE
GRADUATE SCHOOL PROGRAMMES
PROGRAMME:
TERM:
COURSE TITLE:
COURSE TUTORS:
Emergent Technologies and Design [EmTech]
2017-2019
MArch, Dissertation
Michael Weinstock, Elif Erdine, George Jeronimidis, Alican Sungur, Antiopi Koronaki
SUBMISSION DATE:
SUBMISSION TITLE:
STUDENT NAME (S):
DECLARATION:
11 January 2019
INFRASONIC a material resonant system
Abhinav Ranjan Chaudhary, Miguel Escallón Salazar, Neil Deep Singh Grewal
“I certify that this piece of work is entirely my/our own and that any quotation or paraphrase from the published or unpublished work of others is duly acknowledged”
SIGNATURE OF STUDENTS:
DATE:
Abhinav Ranjan Chaudhary Miguel Escallón Salazar Neil Deep Singh Grewal
11 January 2019
12.623 words
We would like to express our sincere gratitude to Michael Weinstock and George Jeronimidis for their invaluable support and guidance throughout the project.
We would also like to express our gratitude to Elif Erdine, Antiopi Koronaki, Mohammad Makki, Milad Showkatbakhsh, and Alican Sungur for their critical feedback and sharing their computational knowledge.
We would like to acknowledge the support of our friends and colleagues whom have become our family at the Emergent Technologies and Design programme, for their encouragement and constructive criticism throughout the year.
Finally, we would like to thank our families and friends at home for their continuous love and support.
The dissertation aims to achieve an ecological design and construction process for earthquakeprone residential settlements and landscapes.
The goal is to fabricate a composite material system that can aggregate and deploy as habitable infrastructure produced by readily available materials, in Kathmandu, Nepal.
The study will focus on the relationships between material resonance, earthquake resistant structures, and fabrication processes.
8 9
ABSTRACT
In 2015, an earthquake of 7.8 magnitude displaced over 6.6 million in Kathmandu, Nepal. Three years later, the country struggles to rebuild its capital. The aim of this study was to investigate a construction system, produced from locally sourced materials, that can aggregate and deploy as self-built, habitable infrastructure. The study focused on the relationships between material resonance, earthquake-resistant structures, and fabrication processes.
An agent-based form-finding algorithm was developed using knowledge acquired through physical prototyping of mycelium-based composites to generate complex geometries that increase earthquake-resistance, optimise material usage, and enhance spatial occupation. The results show compelling evidence for a construction methodology to design and construct a 3-4 storey building. The scope of work contributes to advancements in bioengineering, confirming easy-to-grow, light-weight mycelium-composites as viable structural materials for construction.
12 CONTENTS 1. INTRODUCTION 15 2. DOMAIN 16 2.1 2015 NEPAL EARTHQUAKE 2.2 KATHMANDU, NEPAL 2.3 EARTHQUAKE RESISTANT STRATEGIES 2.4 BIO-MATERIALS FOR CONSTRUCTION 2.5 TRANSFORMATIVE FORMWORK 2.6 AUGMENTED REALITY TOOLS FOR ASSEMBLY 3. RESEARCH QUESTION 37 4. METHODS 38 4.1 OVERVIEW AND TOOLS FOR DESIGN 4.2 EARTHQUAKE-RESPONSIVE URBAN PLAN 4.3 EARTHQUAKE RESISTANT BUILDING 4.4 SPATIAL CONFIGURATION 4.5 FABRICATION 5. EXPERIMENTS AND RESULTS 66 5.1 URBAN 5.2 SPATIAL CONFIGURATION 5.3 AGENT-BASED FORM FINDING 5.4 MATERIAL OPTIMISATION 5.5 BRANCHING 5.6 FLOOR SLAB 5.7 MYCELIUM GROWTH 6. DESIGN PROPOSAL 120 6.1 NEIGHBOURHOOD PATCH 6.2 EARTHQUAKE-RESISTANT BUILDING 6.3 ROOF/WALL DETAIL 6.4 FOUNDATION DETAIL 6.5 WINDOW DETAIL 6.6 SURFACE FINISH DETAIL 6.7 FORMWORK AND ASSEMBLY 7. CONCLUSION 135 8. REFERENCES 136 9. APPENDIX 138 13
INTRODUCTION
On 25 April 2015, almost 9,000 people were killed in a devastating earthquake in Nepal of 7.8-magnitude [1]. 1200 adobe-constructed buildings in the heart of the Kathmandu Valley were completely destroyed [2]. The damage cost the country an estimated 10 billion dollars, where the government offered homeowners $3,000 each to rebuild their homes. Unfortunately, that only covered a quarter of the cost of rebuilding a typical family dwelling, leaving many Nepalese stranded and without a place to live [3].
Three years later, buildings are still applying construction techniques used prior to the earthquake, which has been proven inefficient for a city susceptible to natural disasters. Hence, the desire for inexpensive, self-built infrastructure is drastically growing [4]. One way of lowering construction cost is by using locally sourced bio-materials. For example, MOMA PS1 in New York City showed that four-story structures built of bio-materials, can be grown and assembled by local communities [5]. However, although low-cost, little attention has been paid to using bio-materials for earthquake-resistant structures.
The research presents a state-of-the-art construction process that allows the affected victims to grow, construct, and assemble their own earthquake-resistant home. By using strategies to dissipate seismic energy while maintaining and improving the efficiency of spatial relationships in Nepalese architecture, the study proposes a 3-4 storey new building
14
15
DOMAIN 16 2.1 2015 NEPAL EARTHQUAKE 18 2.2 KATHMANDU, NEPAL 20 2.3 EARTHQUAKE RESISTANT STRATEGIES 24 2.4 BIO-MATERIALS FOR CONSTRUCTION 28 2.5 TRANSFORMATIVE FORMWORK 34 2.6 TOOLS FOR ASSEMBLY 37
2.1_2015 NEPAL EARTHQUAKE
2.1.1_IMPACT
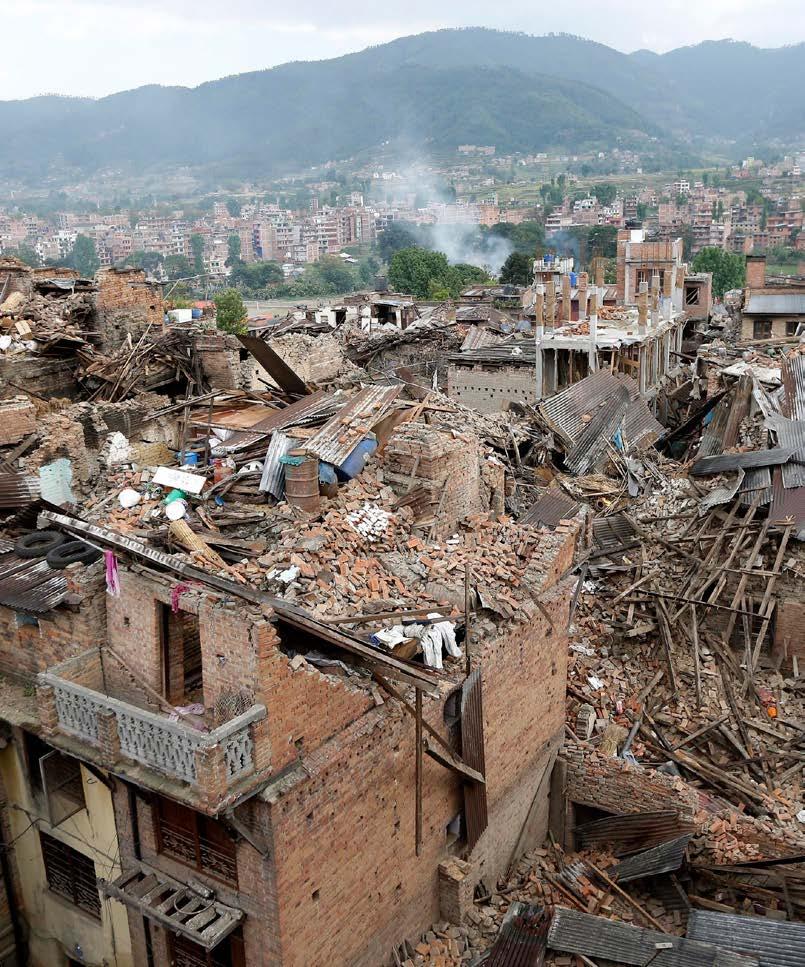
On 25 April 2015, an earthquake of 7.8 magnitude hit central Nepal, followed by an aftershock of 7.3 magnitude on 12 May 2015. The earthquake was highly destructive due to its proximity to Nepal’s capital, Kathmandu. 35 out of the 75 districts were affected where 600,000 houses were destroyed and over 6.6 million people were displaced from their homes [6]. (Figure 2.1.1)
Three years after the devastating earthquake, Nepal is still struggling to rebuild its capital. Nearly 70% of the affected people live in temporary shelters, and it is still common to see damaged houses, temples without roofs, and earthquake debris within the Kathmandu city limits [7]. International non-profit organisations have been working with local communities to educate architects and engineers on earthquake resistant strategies, but these methods still require public funding, impossible to acquire in an absent local government. Donors have pledged more than US $10 billion to the National Reconstruction Authority, but only 10% of that money has been allocated towards recovering approximately 500,000 damaged homes [8].
Given the persistent seismic risks in the valley, there is a need to create a coherent regional structure for disaster recovery. Having the money is insufficient; if major resources are invested into housing without improving people’s ability to re-establish productive lives, they will remain susceptible to future natural disasters. Therefore, recovery strategies need to strengthen local capacity for redevelopment in affected areas [9].
18 DOMAIN 2015 NEPAL EARTHQUAKE
CHINA
KATHMANDU
NEPAL INDIA
7.8 M
MOST AFFECTED ZONES
fig. 2.1.2 (right) Map of Nepal showing areas that were most affected by the earthquake DOMAIN 2015 NEPAL EARTHQUAKE 19
fig. 2.1.1 (right) Observed damage three days after initial 2015 Nepal Earthquake
2.2_KATHMANDU, NEPAL
2.2.1_SITE
The Kathmandu Valley also known as the Nepal Valley has been the centre of attraction and dominating power of the Himalayas for the past 2000 years [10]. It measures about 20 km x 25 km, and sits about 1350 meters above sea level, surrounded by steep wooded mountains measuring over 3000 meters high [11]. The terrain within the valley is relatively flat, interrupted only by shallow streams. It is this continuation of the land that keeps the Kathmandu Valley as the controlling and organising power of trade between China and India.
Unlike other small states in Nepal, the Kathmandu Valley has had continuous development attracting immigrants to some of the most important Hindu and Buddhist sanctuaries and monuments in Nepal. In turn, Kathmandu is highly populated and extremely dense. Roughly 1.4 million people live within 400 km2 which equals approximately 20,288 people per km². According to the United States Central Intelligence Agency, this makes Kathmandu the third most dense city in the world [12].
2.2.2_VERNACULAR ARCHITECTURE
Since the opening of Nepal to the outside world promoted by King Tribhuvan in 1951, western architecture has significantly influenced Nepalese architecture, however, elements from vernacular Newari architecture are still deeply embedded within Nepalese culture. Understanding and abstracting these principles provides a strong foundation for new architecture that stems from culture.
A unique characteristic of Newari residential architecture is the vertical home arrangement [13], (regardless of home size) a result of economic and security requirements. Historically, as density within the valley increased, the need to free up irrigable land for food encouraged vertical home arrangement. Residents could also prevent intruders from accessing the first floor by installing a trapdoor on the staircases leading to the ground floor.
Gradually, family homes in rural villages clustered around courtyards known as Chowks, usually accessible through the ground floor of one house or a narrow alley that could be closed. A large part of the Newari community and family life traditionally takes place around these open spaces. In turn, courtyards have shaped urban growth in Kathmandu and use Chowks as centres for community life in modern day Nepalese living.
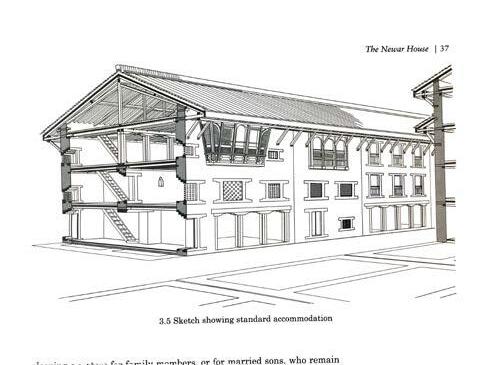
Privacy is determined by the vertical arrangement of spaces in the home [14], where public spaces occur on street level and become more private higher up (Figure 2.2.1). Commercial activity takes place on the ground floor, or chhyadi and depending on the building height, sleeping quarters and social spaces on the intermediate levels culminating in the kitchen and prayer spaces on the top-most floor.
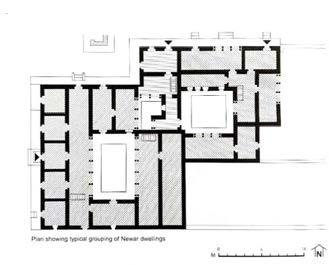
The ground floor plan is divided by a central wall, or duãga, parallel to the façade facing the main road (Figure 2.2.2). Of the resulting spaces, the room facing the road or courtyard with the most commercial activity becomes either a store or workshop, leaving the back room for storage. This division is traditionally used across each floor as load bearing walls for structural stability.
Following the ground floor is the mãtã, or middle section of the house, where there are living quarters of family members or married sons whom remain in the home with their family [15].
The 2011 Nepal census calculates an average household size of 4 individuals per home [16], a
‘HOLY’ [PRIVATE]
LIVE [PRIVATE]
SLEEP [SEMI-PUBLIC]
WORK [PUBLIC]
NEWAR GROUND FLOOR PLAN
20 DOMAIN KATHMANDU, NEPAL
fig. 2.2.2 (bottom)
Newar Plan
fig. 2.2.1 (top)
DOMAIN KATHMANDU, NEPAL 21
Newar Section
NEWAR SECTION
DUÃGA
2.2.3_ADOBE CONSTRUCTION


high figure by western standards, especially when compared to London’s 2.5 individuals [17].
The second floor in a four-storey house, known as the chwata, is where the main living and family areas are located. A row of twin columns replaces the duãga generating an open floor plan overlooking the main street or courtyard. The large window, sãjhyã, allows residents to partake in frequent parades and festivals.
Lastly, the attic or baiga (half or small space) holds the highest and most private spaces of the home: the kitchen and the family shrine. This area is reserved for close family members, rarely open to visitors.
New building materials and western architecture coupled with development and urban growth have modified the way these spatial relationships are manifested in modern architecture. However, despite significant change, the fundamental cultural drivers are still present in Nepalese living.
The buildings within the dense city fabric are made up of adobe bricks. It was observed that 1200 buildings were destroyed in the heart of the historical city [18]. Consequently, adobe construction contributes to 80% of the overall pollution [19] generated by transportation and production of adobe bricks and performs poorly in earthquake-prone areas as adobe is high in mass and extremely brittle.
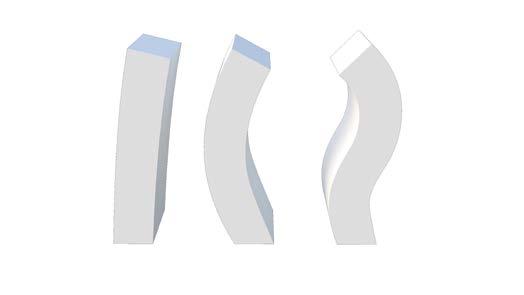
Although wall fractures occur frequently, the extent of the damage due to cracks is often not severe. Wall overturning, however, is the cause of collapse and results in out-of-plane instability. Several factors define wall stability: Thickness to slenderness ratio, connections to roofs and floors, load bearing, and the distance to intersecting walls [20]. Figure 2.2.4 outlines


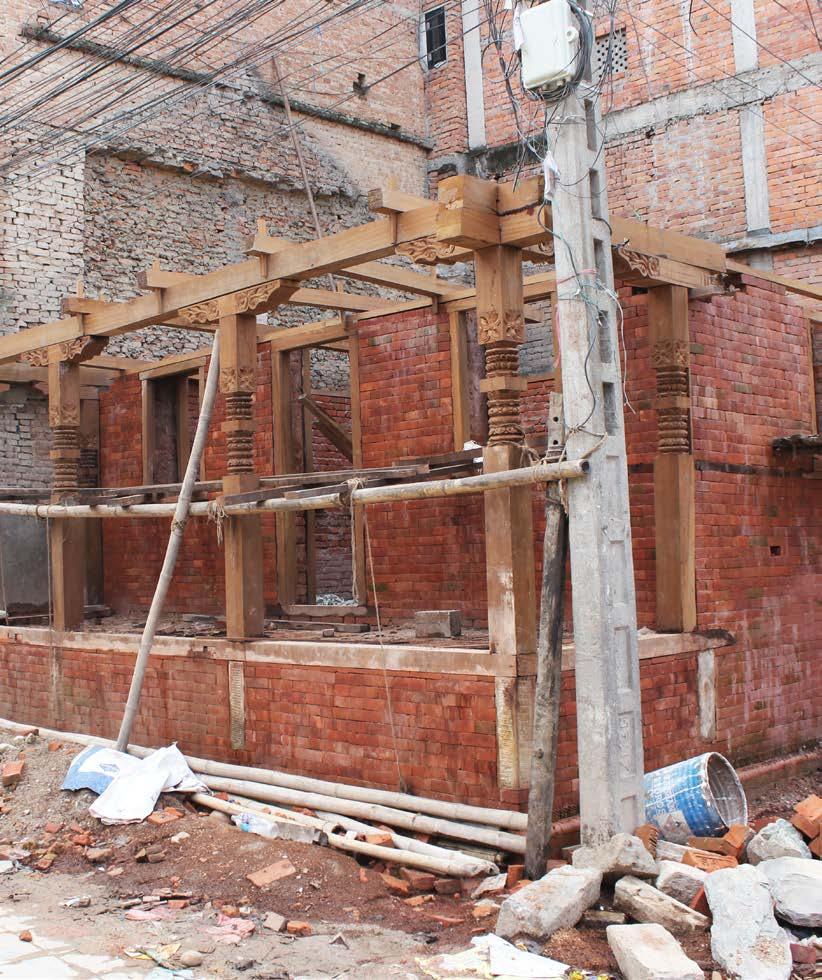
Through observation on a site visit to the Kathmandu valley, We found the initial response to earthquake damage to be undeveloped, using long wooden beams as temporary supports. evident that the city requires a cheap and effective earthquake construction strategy to combat future natural
22 DOMAIN KATHMANDU, NEPAL
OUT OF PLANE FLEXURAL CRACKS WALL COLLAPSE
fig. 2.2.3 (left) Three ways wall collapse can occur fig. 2.2.4 (right) Image taken in Darbar Square after earthquake showing 'temporary supports' that have been used for three years 23
DOMAIN
KATHMANDU, NEPAL
2.3_EARTHQUAKE RESISTANT STRATEGIES
2.3.1_OVERVIEW
“Earthquake-resistant construction greatly reduces the loss of life from a damaging quake, as well as lessening economic losses and disruption to societal activities[21].”
The three most relevant characteristics of an earthquake to consider while designing a structure:
1. The value of peak ground acceleration
2. The duration of strong shaking
3. The frequency content of shaking
By altering the materiality, weight, design and construction quality of a building, the behaviour of a building can be designed to respond efficiently to natural disasters[22].
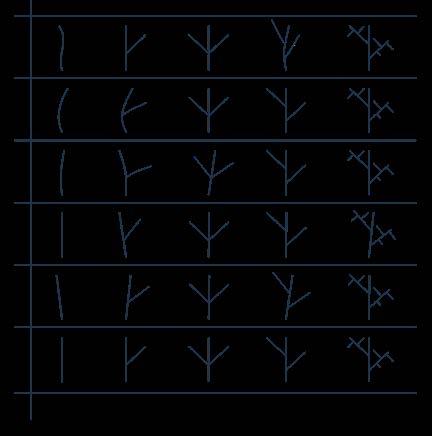
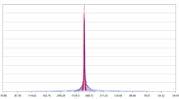
Like a ruler that is held horizontally in cantilever and is made to vibrate by a sharp vertical push, a building will oscillate from side to side when the structure is excited by an earthquake. The time for the structure to make one full cycle is known as the natural period of vibration and corresponds to its first mode of vibration [23]. A building has a set of defined frequencies [24] which, once the input force’s frequency matches them, will resonate resulting in shape deformation. The resulting shape is known as the mode and its corresponding frequency is its modal frequency [25]. As the frequency of the input force increases, higher modal frequencies can be reached resulting in higher order mode deformations (Figure 2.3.1). However, previous research suggests [26] that only the first few modes are considered during structural design, primarily Mode 1 where both the highest displacement and inertia forces occur. Moreover, where the structure is excited, the energy is gradually dissipated. This is known as damping; the structure dissipates earthquake energy and reduces resonance or the ‘build-up’ of earthquake inertia forces.
2.3.2_COST-EFFICIENT STRATEGIES
There are three main design strategies that help to achieve an earthquake resistant structure (Figure 2.3.2):
1. Increase the structures’ stiffness to a point where its natural frequency is beyond the frequency of an earthquake.
2. Use mechanical methods to dissipate earthquake energy.
3. Increase the structures’ flexibility to dissipate the energy before reaching its breaking point.
Adobe construction relies heavily on the increased stiffness approach. Thick walls are kept in place by heavy roofs that prevent overturning, however, when failure does occur, the impact can be detrimental, where heavy debris from natural disasters increase the chance of death.
fig. 2.3.1 (top)
fig. 2.3.2 (bottom)
Mechanical techniques are generally high tech, and mostly dedicated for high rise structures. Tuned mass dampers and base isolation techniques are expensive as they rely on springs, shock absorbers, sensors, and actuators to function. Passive damping accounts for less expensive techniques such as friction joint energy dissipation, where on-plane displacement between wooden elements dissipates energy and dampens the oscillatory movement of the structure [27], or branching strategies analogous to tree behaviour during seismic events. The more flexible the structure, the longer its natural period, thus higher damping properties
EARTHQUAKE RESONANCE
DISSIPATE ENERGY
INCREASE FLEXIBILITY INCREASE STIFFNESS INCREASED MASS = INCREASED RISK EXPENSIVE
DYNAMIC DAMPING HIGH TECH FOR TALL BUILDINGS
24 DOMAIN EARTHQUAKE RESISTANT STRATEGIES
Modal deformations as a result of higher modal frequencies.
DOMAIN EARTHQUAKE RESISTANT STRATEGIES 25
Diagram breaking down three main design strategies for earthquake resistant structures
2.3.3_TREES IN NATURE
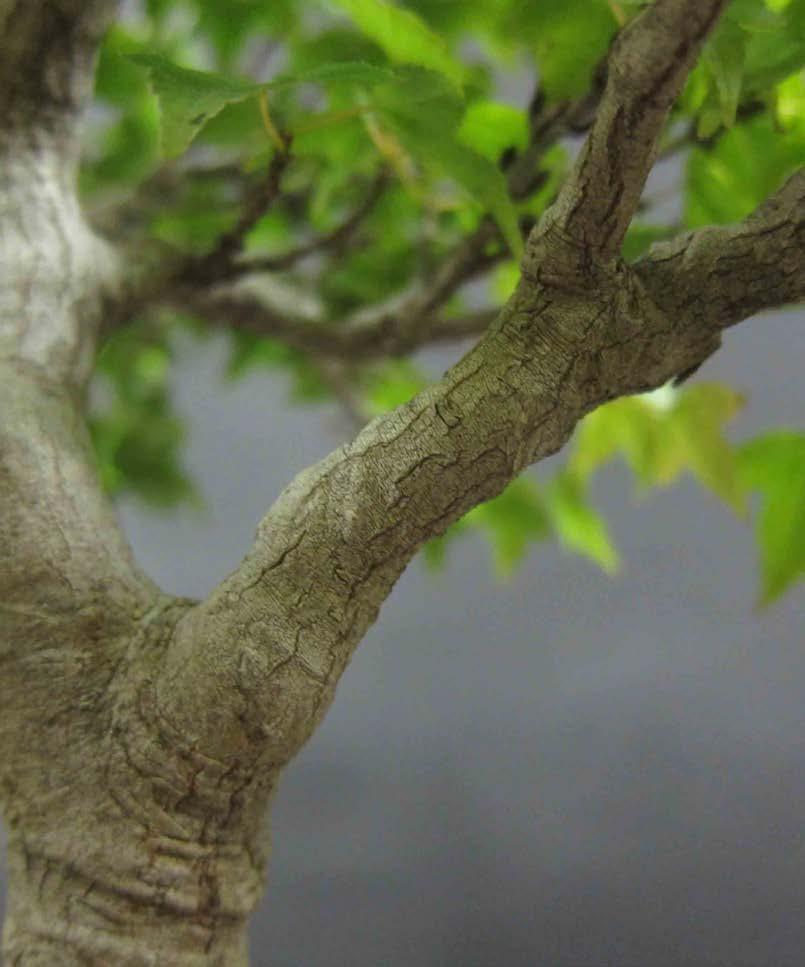
Trees in nature remain undisturbed during seismic events [29] (Figure 2.3.3.). Like building structures, trees are excited by the frequency input of either wind or seismic forces generating a state of resonance. Research on different tree species suggests that oscillation damping accounts for their ability to withstand strong periodic wind loads. Mechanical energy imposed by gusty winds can be either converted to heat by viscous damping in the material or it can be dissipated to the surrounding fluid (air) [30]. Energy dissipation in trees illustrate three principles; tuned mass damping, resonance energy transfer and damping by branching.
Tuned mass dampers are commonly used in skyscrapers where a high-mass pendulum counteracts the swaying motion induced by wind loads. Like in trees, primary and higher order branches act as tuned mass dampers [31], where shifts in oscillation frequency counteract swaying motion.
As frequency bands overlap within branches a phenomenon known as resonance energy transfer can distribute mechanical energy over the entire tree (Figure 2.3.4). Such that, the energy is dissipated effectively by engaging more branches reducing the risk of failure associated with high energy concentration. Moreover, hierarchical differentiation subdivides the forces affecting the tree by generating multiple mass dampers, known as damping by branching
In essence, there are two particular features of modal dynamics on trees that can be applied to the building scale to ensure a low-cost earthquake resistant construction method:
1. Modal frequencies of each branched hierarchy are relatively close together
2. The resulting modal shape corresponds to each hierarchy.
FREQUENCY (Hz)
26 DOMAIN TREES IN NATURE
TREE
PRIMARY BRANCH SECONDARY BRANCH
fig. 2.3.3 (right)
Trees in nature during an earthquake remain still.
fig. 2.3.4 (left)
DOMAIN TREES IN NATURE 27
Frequency bands overlap within branches and can distribute mechanical energy over the entire tree structure.
2.4_BIO-MATERIALS FOR CONSTRUCTION
2.4.1_OVERVIEW
Materials derived from biological resources can lead to create low-cost, sustainable building materials for construction [32]. Polymeric materials, such as cellulose, lignin, pectin, and fungus are biocompatible and biodegradable with a wide variety of properties. Previous research has suggested that physical and mechanical properties can be customised during the growth process [33]. Not only does utilising bacterial and fungal growth to create biomaterial composites make production ecological, where building debris is lightweight and biodegradable, but also the materials’ innate resonant properties allow for the bio-composite to effectively dissipate energy during seismic events [34].
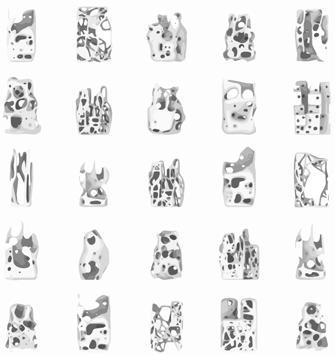
2.4.2_MYCELIUM-BASED COMPOSITES

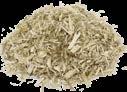
Mycelium has been identified as the largest living organism on Earth [35] (a mycelium network occupies nearly 10 km2 in Oregon’s Blue Mountains) (Figure 2.4.1). It is the vegetative lower part of fungi, where the growth process prior to the production of mushroom results in a hard sponge-like material that has a high strength to weight ratio [36]. It grows due to a symbiotic relationship with the materials that feed it, forming entangled networks of branching fibres. The filaments of the fibrous mycelium are called hyphae and consist of elongated cells. These cells are separated from each other by internal porous cross walls. The cell wall protects the hyphae, providing mechanical strength to the entire organism. It is composed of chitin, glucans and an outer layer of protein [37].
Mycelium based composites can be directly used to replace plastic and oil-based materials and has been currently used to create foam-like packaging, reinforce light-weight masonry structures, and even to make furniture. Mycelium composites may be grown using a variety of locally available mushroom spores as well as substrates making them an infinitely renewable resource [38]. Moreover, the actual production of the material requires basic knowledge and setups of a sterilised growing environment, easily learned by unskilled home-owners (prevalent in Kathmandu) [39] (Figure 2.4.2.).
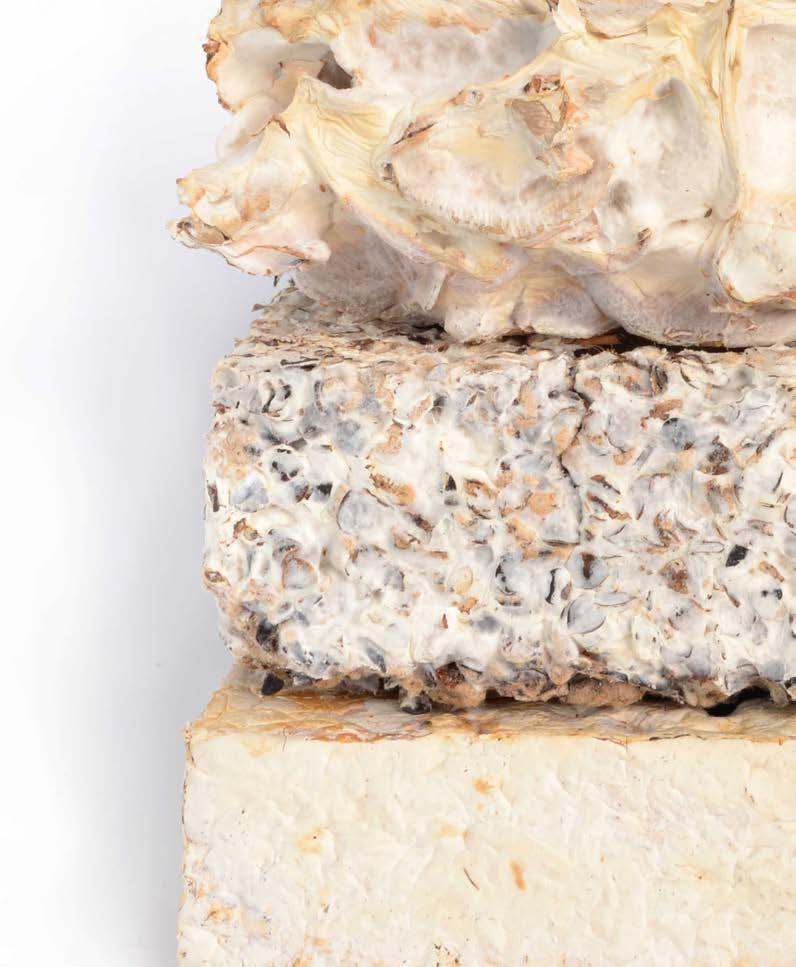
As mycelium is made up of numerous branching elements and interwoven hyphae, a dense physical matrix of hard foam-like consistency is created. Previous research has suggested that substrates that are harder to digest such as hardwoods, result in harder composites with relatively higher compressive strength when compared to substrates easier to digest; it may be possible to engineer mycelium-based materials that have varied anisotropic physical properties within a homogenous fabrication system [40].
CREATE SUBSTRATE GROW MYCELIUM

BOILING CELLULOSE-BASED

STERILIZE SUBSTRATE STOP GROWING
INOCULATE SUBSTRATE SURFACE FINISHES
HUMID DARK 14-24 oC
DRY FOR 1 WEEK
28 DOMAIN BIO-MATERIALS FOR CONSTRUCTION
fig. 2.4.1 (right)
Mycelium building components made by MOGU, an italian tile company.
fig. 2.4.2 (left)
DOMAIN BIO-MATERIALS FOR CONSTRUCTION 29
Mycelium growth process from beginning to end.
2.4.3_MATERIAL PROPERTIES

Research conducted at Utrecht University and the material lab at Delft University of Technology in the Netherlands, has proven the structural resilience and real-life applicability of mycelium-based composites. The research focused on the visual appearance, density, mechanical properties, and water-absorbing behaviour [41]. It was observed that the formation by pressing, impacted the tensile strength and elasticity modulus of myceliumbased materials. Tensile strength and elasticity modulus of heat-pressed materials were higher when compared to the corresponding cold-pressed and non-pressed materials.


A similar trend was observed during three-point bending. The flexural strain needed to break the samples was higher than those needed during tensile measurements (Figure 2.4.3). In addition, the research suggests that there is no overall relation between moisture exposure and the type of fungus, substrate, or pressing condition.
The experiment shows the structural impact of mycelium submerged in water for two hours. It was observed that each mycelium sample reached saturation in about 12 hours after moisture exposure. The final weight increase at 40oC was less than 5%. Moreover, the study performed a thermogravimetric analysis, to understand the rate at which the mycelium degrades. The experiment used an air flow of 100 mL/min and increased the temperature from 20 to 600oC at a rate of 10oC/min. It was observed that initial degradation temperature was 225oC. The high degradation temperature and moisture exposure experiments suggests mycelium as an efficient building bio-material (Figure 2.4.4).
30 DOMAIN BIO-MATERIALS FOR CONSTRUCTION Young’s Modulus (MPa) Poisson's Ratio Density (Kg/m3) Thermal Conductivity (W/mK) 206 0.3 1250 0.3 60 0.3 800 0.4 MYCELIUM ADOBE fig. 2.4.3 (right)
Bending tests conducted at Delft University of Technology under 0.2 MPa pressure indicating mycelium structures should be compression-only.
fig. 2.4.4 (left)
DOMAIN BIO-MATERIALS FOR CONSTRUCTION 31
Table comparing mechanical properties for adobe and mycelium
2.4.4_MYCELIUM IN ACTION
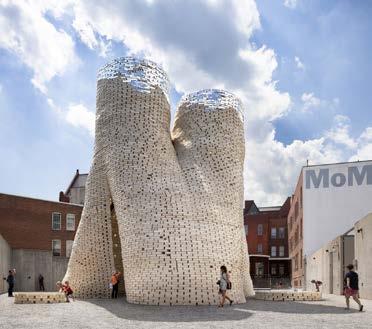
The Hy-fi Tower (2014) at Moma PS1 in New York City was a 4-storey circular tower structure made up of organic mycelium bricks and reflective plastic bricks. The organic bricks were produced through a combination of corn stalks and a specially developed mycelium composite by Ecovative Design. The reflective bricks are used as growing trays for the organic bricks, and then incorporated into the final construction before being shipped for reuse. This ‘low-tech biotech’ approach offers a new vision for built infrastructure and redefines the use of local materials [42]. (Figure 2.4.5)
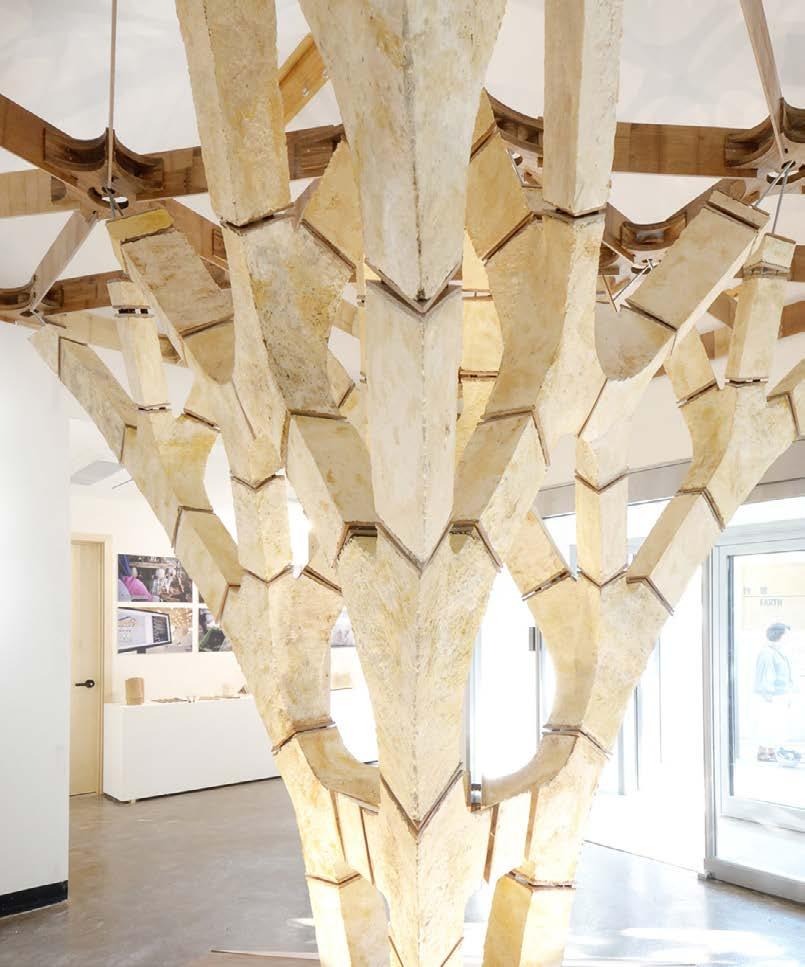
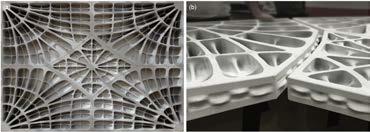
MycoTree, made for the Seoul Biennale in 2017, shows a structure using load-bearing mycelium components. Each component was designed using 3D graphic statics, making sure weak materials are kept in compression. Each node was grown within a digitally fabricated mould. Utilising only mycelium and bamboo, the structure shows how achieving stability through geometry rather than relying on material strength can change the way we build structural systems; and, ultimately, how regenerative resources in combination with informed structural design can lead to a sustainable building industry [43]. (Figure 2.4.4)
MOGU is an Italian, environmentally-conscious company that is dedicated to developing sustainable, high-performance building alternatives. They use mycelium-based bio-materials to create acoustic bricks and floor tiles. Their products show how mycelium can be moulded into complex curved geometry where small components can be aggregated and joined while the fungus is alive. The company shows that a homogenous system can be generated on site during installation [44]. (Figure 2.4.1, pg. 27 )
32 DOMAIN BIO-MATERIALS FOR CONSTRUCTION
fig. 2.4.4 (right)
MycoTree, made for Seoul Biennale in 2017. Compression-only structure where each piece was fabricated within a custom mould.
fig. 2.4.5 (left)
DOMAIN BIO-MATERIALS FOR CONSTRUCTION 33
The Hy-Fi tower at MoMA PS1. Four storey strucutre made of mycelium bricks.
2.5_TRANSFORMATIVE FORMWORK FOR FABRICATION
2.5.1_KERFING
The scope of this research uses complex geometries to tackle earthquake resistant design of a 3-4 storey building. However, buildings constructed of complex, doubly-curved elements can be expensive and labour intensive. Moreover, the formwork to produce those elements can be even more expensive and cannot be reused for future application. Research shows that custom-made milled formworks for doubly-curved precast cladding elements with moderate curvature can cost an estimated 60-75% of the total cost for mycelium-based construction.
Formwork can be constructed of hard and soft membranes that allow for mycelium to be deposited within a framework. A transformative formwork, or flexible formwork, can consist of a soft membrane (interpolation layer) that holds a desired shape temporarily, and then can be adjusted to create new curvature. Soft materials tend to easily stretch; previous research suggests that soft materials suitable for casting, only stretch in one direction. To make threedimensional forms, it is important for the stretchable layer to extend in as many directions as possible. In addition to direction, the amount of flexibility or desired rigidity is a prime factor in regulating formwork. A flexible material can easily produce desired curvature, however, the ability to keep the curvature while the load of a casting material is applied becomes more difficult.
2.5.2_TOOLS FOR ASSEMBLY
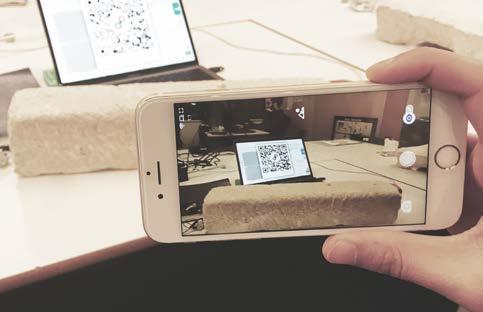
Augmented reality (AR) systems for construction of architectural structures are used by designers and researchers to improve aspects of design, construction and maintenance. Handheld devices such as smartphones can be used to track users and objects in space that provide digital information within the physical environment. Unlike virtual realities, whose virtual worlds replace the real world, AR systems enhance the real world by superimposing information onto it. The ability to track objects in space, allows for real-time structural feedback during construction.
The Nepal Telecommunications Authority has estimated the number of smart-phone users in Kathmandu is 34% higher than the total population of the entire country; there are more than 38.3 million users as of mid-July this year. As the platform to run AR systems are readily available in Nepal, this research aims to develop an interface that allows users to grow and assemble their own earthquake-resistant building.
Fologram for Android and iPhone is a tool (using a Grasshopper plug-in for Rhino 6.0), for architects, engineers, and designers to develop an interface that can help a user match, organise, and assemble discrete components in a physical environment. The single-platform is free for anyone that has a smart-phone, where a simple drag and drop command allows to begin the assembly process. A forum built-in the application allows the user to interact with the designer to make real-time adjustments. Not only can the collaborative process reduce construction costs, but also it ensures that users are using earthquake-resistant strategies to minimise impact due to natural disasters
34 DOMAIN TRANSFORMATIVE FORMWORK FOR FABRICATION
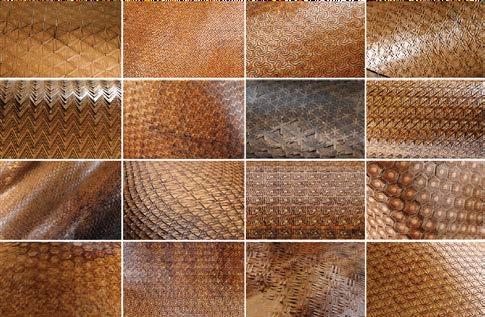
fig. 2.5.1 (top)
Kerfing patterns can create double curvature using rigid materias, such as, MDF.
fig. 2.4.2 (bottom)
DOMAIN TRANSFORMATIVE FORMWORK FOR FABRICATION 35
AR application on iPhone allows for users to match and construct pieces for construction.
Can a composite mycelium material be developed to achieve earthquake resilient behaviour through manipulation of material properties and geometric configuration while reducing pollution due to vernacular adobe construction methods in Kathmandu, Nepal?
36
37
38 METHODS 4.1 OVERVIEW AND TOOLS FOR DESIGN 40 4.2 EARTHQUAKE-RESPONSIVE URBAN PLAN 44 4.3 EARTHQUAKE-RESISTANT BUILDING 46 4.4 SPATIAL CONFIGURATION 58 4.5 FABRICATION 62
SENDAI CITY EARTHQUAKE DISASTER RECONSTRUCTION PLAN VERNACULAR SPATIAL DISTRIBUTION
The Sendai Plan is used to lay the groundwork for implementing improvements within the city for the next 30 years. The plan delineates how to assess complex damage and issues, gives suggestions to redistribute energy supply, encourages self-help and independence to reconstruct earthquake impacted regions [51].
Space configuration in the proposed 3-4 storey building is guided by vernacular space distribution of Newari architecture. Residential units are designed for families between 2-8 people where public spaces on the lower floors lead up to private, ‘holy’ units on upper floors. The research aims to maintain the cultural identity of Nepalese living while providing a solution for a growing population within a dense city fabric [53].
BRANCHING MATERIAL OPTIMISATION
Branching is used as a guiding principle to dissipate energy on a 3-4 storey structure. When a tree structure is excited, the energy is transferred through discrete hierarchical elements dividing the energy at each successive node. Friction due to oscillation of branched elements occurs, releasing heat to further dissipate energy. Altering the number, size and mass of branches can affect the rate and magnitude at which energy is dissipated [52].
Material is removed to minimise the amount of mycelium needed to grow and construct the proposed building. Additionally, minimising the mass of the structure while maintaining the structural integrity of the building increases earthquake resilience.
TRANSFORMATIVE FORMWORK
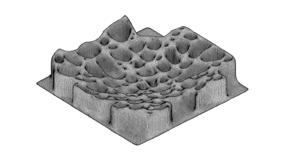
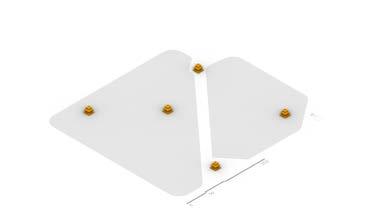
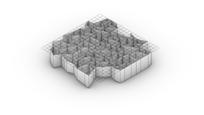
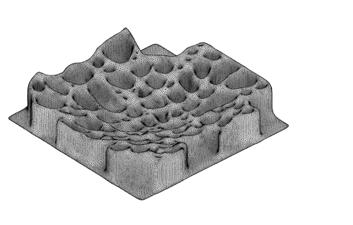
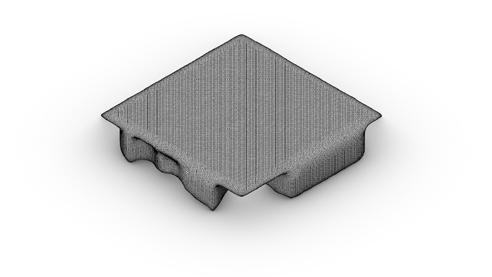
A flexible formwork is used grow discrete mycelium components. A kerfing pattern is applied on an interpolation layer in a standardised box framework. Kerfing gives rigid sheet materials, such as plywood and MDF, the freedom to bend in multiple directions to produce doublycurved geometries. By altering the pattern and distance between cut lines, desired geometries are achieved both economically and ecologically [57].
MYCELIUM GROWTH
Mycelium is grown to test the physical viability of a composite system. A 20-day growing period occurs where a cellulosebased substrate is sterilised and inoculated with mycelial spores. By controlling the moisture in a cool, dark environment, mycelium is formed. Once the desired geometry is achieved, the samples are dried in natural sunlight to stop growth. Surface finishes are then applied [56].
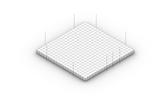
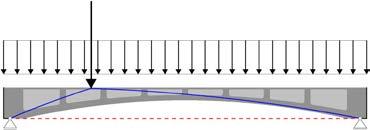
FUNICULAR STRUCTURES
Hanging chain models introduced in 17th century by Robert Hooke guide the design of floor slabs within the proposed building. Inverted funicular solutions are used to produce vaulted floor-plates to reduce horizontal forces and mass to increase earthquake resistance in the building.
METHODS OVERVIEW AND TOOLS FOR DESIGN 40 SAFE ZONE SAFE ZONE 2 SAFE ZONE SAFE ZONE SAFE ZONE 3 100 m
METHODS OVERVIEW AND TOOLS FOR DESIGN 41
AGENT BASED MATERIAL OPTIMISATION
Used to remove material by determining principal stress on building elements developed using Grasshopper Python, Quelea, and Culebra
SPACE SYNTAX
Used to perform computational analysis of street network, plots, and buildings on existing and proposed Kathmandu urban plan via DeCodingSpaces Toolbox.
GENETIC ALGORITHM
Used to optimise multi-objective design problems based on the Strength Pareto Evolutionary Algorithm – 2 used in the grasshopper add-on Octopus
FINITE ELEMENT ANALYSIS (FEA)

Used to analyse both displacement and material strength imposed by self-weight and uniform loads via engineering software, Strand7 and Karamba3d.
NATURAL FREQUENCY ANALYSIS

Used to calculate modal frequencies, modal shapes and relative displacement on structures based on material properties via Strand7 and Karamba3d
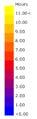
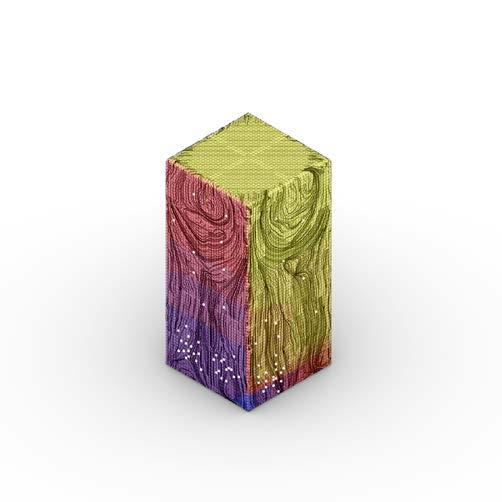
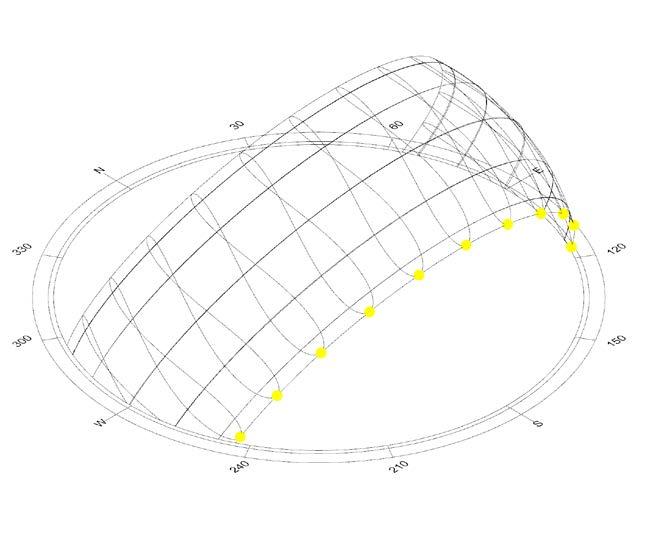
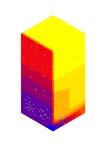
SOLAR ANALYSIS
Used to analyse solar radiation on proposed buildings to determine areas for openings using grasshopper add-on Ladybug.

Used to produce doubly-curved discrete components for proposed building structure using laser kerfing strategies within a box framework.
KERFING FOLOGRAM
Used on handheld devices to aid assembly and construction of discrete components in situ.
10 min 0 min
42 METHODS OVERVIEW AND TOOLS FOR DESIGN
43 METHODS OVERVIEW AND TOOLS FOR DESIGN
4.2_EARTHQUAKE RESPONSIVE URBAN PLAN
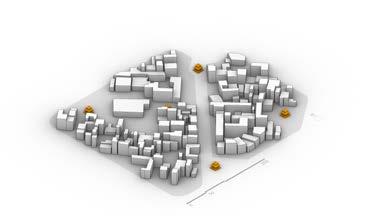
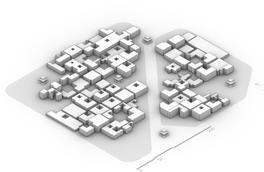
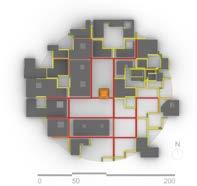
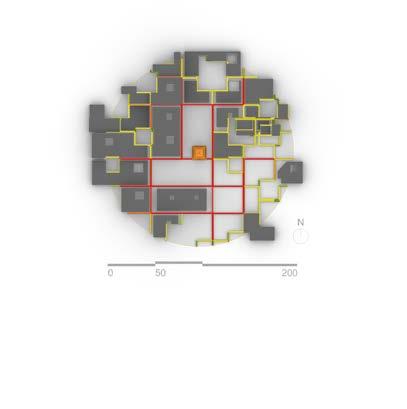
The investigation involved analysing a 300 m x 300 m patch in the existing city fabric to generate an urban plan that is more responsive to natural disasters. The plan maintains the primary street network, five historically preserved temples, and uses principles outlined in the 2015 Sendai City Earthquake Disaster Reconstruction Plan [58] where a ‘safe zone’ must be located within 100m of any constructed building and on hard bedrock (Figure 4.2.1)
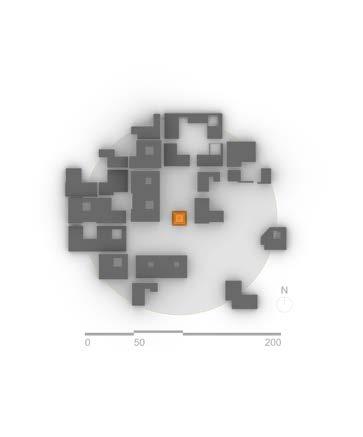
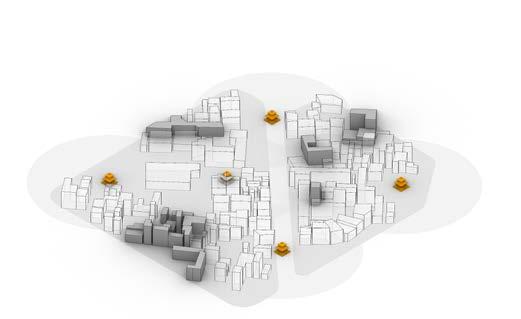
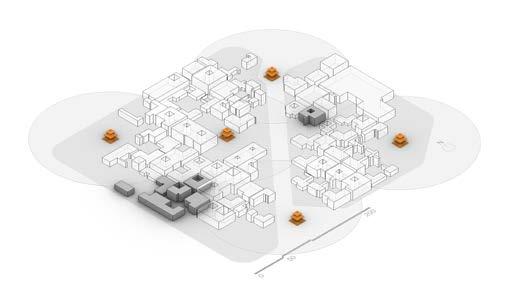
A GA was used to design a multi-objective problem that aimed to maximise building volume, maximise the number buildings around a safe zone, and minimise the walking time from each constructed building to a safe zone. The building height varied between 2 and 5 storeys, derived from vernacular Newari architecture to achieve a density of 20,000 persons/square kilometre (density of Kathmandu), and temples were used as attractor points to ensure that each building is a 10 min walk to a protected area, as outlined in the Sendai plan (Figure 4.2.2). This method obtains a set of 2000 solutions (100 generations, 20 individuals) that were further analysed and selected by a two-stage process:
1. The top 10 globally ranking individuals
2. Individuals with the most repeated fitness values
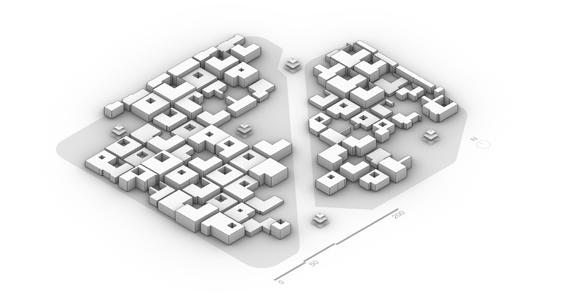
The proposed solution is then compared to the existing condition and evaluated. The algorithm generated for all experiments did not consider altering the primary street network, therefore one representative solution was used for assessment, since variation among solutions are negligible.
44 METHODS EARTHQUAKE RESPONSIVE URBAN PLAN
ATTRACTOR 2-5 STOREYS
fig. 4.2.1 (right) Top to bottom: Existing 300 m x 300 m patch; maintined primary street network and temples; application of Sendai Plan.
METHODS EARTHQUAKE RESPONSIVE URBAN PLAN 45 MAKHAN BAHAL EAST TANA BAHAL AKASH BAHAL MAKHAN BAHAL WEST TARANI BAHAL BUILDINGS OUT OF SAFE ZONE BUILDINGS IN SAFE ZONE
fig. 4.2.2 (left) Temple used as attractor point in urban evolutionary algorithm to minimise walking times in safe zone.
4.3_EARTHQUAKE RESISTANT BUILDING
4.3.1_BRANCHING
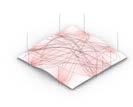
Research shows that energy dissipation in trees results from the hierarchical distribution of its branches. The combination of tuned mass damping, resonance energy transfer and damping by branching allows for efficient energy dissipation under wind loads. Arguably, the defining characteristic of branching in trees is the fact that modal frequencies are close to each other, a prerequisite for energy transfer between different modes (Figure 4.2.1).
The input energy and resulting excitation produced by wind gusts on trees is qualitatively and to an extent quantitatively similar to that of earthquakes, therefore it is assumed an extrapolation of the aforementioned branching principles to mid-rise structures can be achieved with similar results.
Earthquakes are expected to occur within a frequency range of 1 to 6 Hz. For branching to dissipate energy efficiently, it is ideal that as many modes as possible of a structure fall within this frequency range.
Figure 4.2.2. demonstrates how changing parameters such as branch number, size, mass and symmetry result in higher hierarchical differentiation, lowering modal frequencies and increasing proximity between modal shapes.
46
METHODS EARTHQUAKE RESISTANT BUILDING
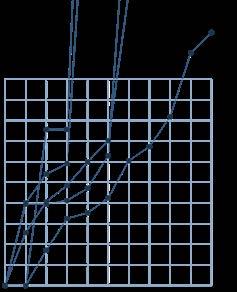
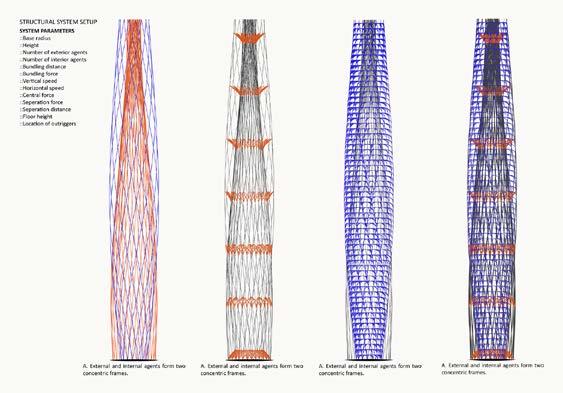
MODE NUMBER 10.0 9.0 8.0 7.0 6.0 5.0 4.0 3.0 2.0 1.0 0.0 FREQUENCY (Hz) 0 1 2 3 4 5 6 7 8 9 10 fig. 4.2.1 (right) Modal shapes per individual fig. 4.2.2 (left) Modal frequencies per individual 47 METHODS EARTHQUAKE RESISTANT BUILDING
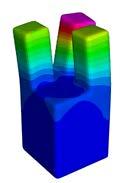
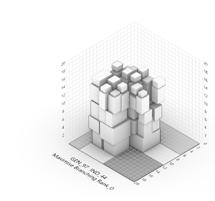
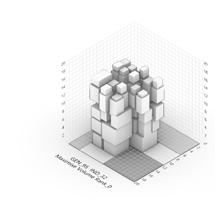
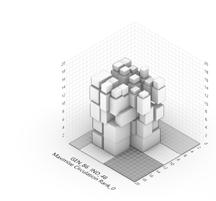
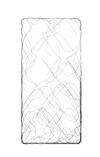
To test the effect of branching on a 1:1 scale building, an initial simplified digital model is produced with CAD software. Building dimensions are determined such that they represent the correct height and a basic internal distribution of a mid-rise building. Three branching scenarios are defined varying the number, height and symmetry of the branches.

Prior to experimentation a natural frequency analysis is performed on an individual without branching to establish a baseline. The analysis is then performed on all iterations to compare the first ten modal shapes of each individual. The iteration with the lowest modal frequencies and lowest relative difference between frequencies is selected and used to inform the design proposal.
The spatial implications of branching are to be considered both in terms of programmatic arrangement and relative displacement. Branching morphologies with extremely high performance are solutions with high displacement, making the building uninhabitable. Moreover, excessive branching may result in inefficient use of land and horizontal programmatic discontinuity. Therefore, a balance between branching performance and programmatic logic must be established

48
METHODS EARTHQUAKE RESISTANT BUILDING
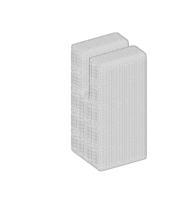
fig. 4.2.3 (left)
Simplifeid digital model to test the effect of branching
49 METHODS EARTHQUAKE RESISTANT BUILDING 18.00 M 18.00 M 18.00 M 18.00 M 8.00M 8.00M 8.00M 8.00M 8.00M 8.00M
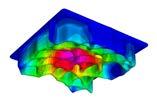
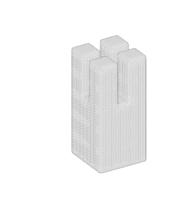
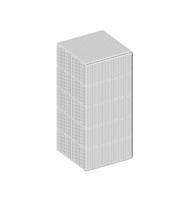
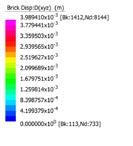
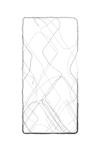
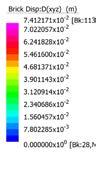
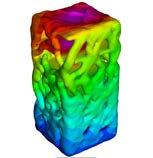
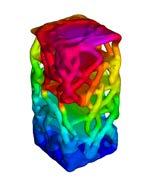
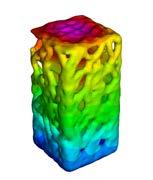
fig. 4.2.4 (right) Natural Frequency Analysis to evaluate if branched elements minimise displacement
4.3.2_AGENT BASED MATERIAL OPTIMISATION
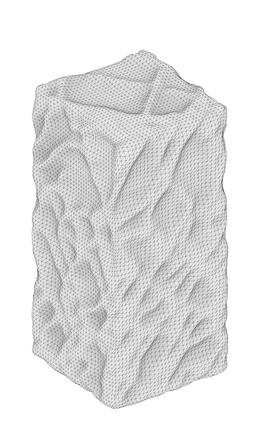
In addition to utilising branched global geometry, reducing the mass of a structure will further increase earthquake resistance. The primary objective of the proposed form-finding method is to reduce material utilization through systems that respond to structural and spatial constraints. Reflecting upon mycelium growth patterns and naturally occurring branching morphologies previously discussed, a form-finding system that results in emergent global patterns through discrete local interactions is explored [61].
“Swarm intelligence describes the behaviour exerted by natural or artificial self-organized systems, which are made up of boids/agents interacting locally with one other and their environment. These interactions lead to the emergence of complex systems demonstrating intelligent behaviour on a global level. The simulation of swarm intelligence is realized by agent-based models, which are computational algorithms created to simulate the interactions of local boids/agents to evaluate their complex behaviour.” [62]
The generative morphologies of agent paths produced are used to inform locations where material is added or removed on the base geometry. By analysing the structure and spatial implications posed by the proposed agent-based model, a feedback loop is generated between computational design, digital fabrication and material research.
The proposed agent-based model uses principles that outline flocking behaviour, described by Reynolds:
1. Cohesion – Steer to move toward the average position of local flock mates.
2. Separation – Steer to avoid crowding local flock mates.
3. Alignment – Steer towards the average heading of local flock mates.
Top: A precedence for dividing a building strucutre into sub-systems.Tower subsystem; 'Biomimetic Stragies in Tower Design'(Elif Erdine)
Bottom:
Agent-based material optimisation system using environmental inputs
4.Neighbour Vision Angle/Radius – The neighbourhood is the simulated perception characterized by the distance and the angle from the boids’ direction of flight. Flock mates outside the local neighbourhood are ignored.
5. Path following – goal seeking through corrective steering towards a path is implemented by measuring the closest point of the input polyline to the boid. Force is applied when a threshold polyline radius is crossed.
50 METHODS EARTHQUAKE RESISTANT BUILDING
51 METHODS EARTHQUAKE RESISTANT BUILDING
fig. 4.3.1 (top)
fig. 4.3.2 (left)
Experimental workflow
fig. 4.3.3 (left)
Attractors assigned to building based on solar-radiation and force lines
The proposed building structure is separated into two sub-systems:
1. Exterior/Interior Walls
2. Floor-Plates
The initial experiments were carried out on a simplified geometry to compensate for computational limitations (initial meshes produced polygon counts over one million faces), where the results are analysed and used to inform proposed building geometry. Experimentation on both sub-systems occur sequentially, where agent paths from the exterior/interior walls are used to inform the emitter points for floor supports. Both subsystems aim to minimise material usage and maximise structural performance to create a homogeneous and continuous geometry using CAD based meshing. Fabrication and material constraints inform meshing parameters. A comparative analysis of the resulting geometry against the baseline geometry is conducted to quantify the percentage difference in volume while retaining structural performance. Initial experiments are carried out in Python and C# (refer to Appendix) with the final model developed using Quelea and Culebra. FEA is conducted using Karamba 3D in the Rhino/Grasshopper environment and results are verified in Strand7.
Structural and solar analysis coupled with flocking parameters describe the bottom-up approach to generating locally optimised and globally emergent patterns, where the base geometry used for the agent based-system describes the top-down approach.
BASE GEOMETRY
FEA FORCE FLOW SOLAR ANALYSIS REPELLER POINTS
AGENT BASED SYSTEM SUBSYSTEM 01
MESH AGENT PATHS + BASE GEOMETRY
MOVE MESH VERTICES
INTERSECTION OF AGENT PATHS + SLABS EMITTER POINTS/SUPPORTS
FEA ATTRACTOR POINTS
FUNICULAR SOLUTION BOUNDING GEOMETRY
AGENT BASED SYSTEM SUBSYSTEM 02
CREATE OPENINGS
RATIONALISATION + EXTRUSION
FORCE FLOW LINES
REPELLER POINTS
POST ANALYSIS AND SELECTION
52 METHODS EARTHQUAKE RESISTANT BUILDING 53 METHODS EARTHQUAKE RESISTANT BUILDING
Sequential experimental workflow


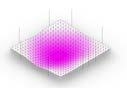
Solar radiation analysis is carried out on the façade of the building on December 21 from 6am to 6pm to determine incoming radiation at the lowest sun angle. Repeller obstacles are placed to create window-openings that correspond to those data points.
Force flow lines obtained from FEA of the base geometry are used as guiding paths for the agent; the repeller force and multi-path follow force remain constant while agent number, cohesion, separation, alignment and vision radius are varied. This is done to understand how changing the flocking patterns of an agent-based system can influence the system without changing environmental stimuli.
The agent paths describe areas on the walls where material is fully present and the resulting mesh displays a maximum thickness value defined by fabrication and material constraints. Experimentation is carried out in two steps: First, agent paths are meshed and joined with the floor slabs, with no walls present, to establish a minimum material usage condition. The model is analysed to ensure adequate structural performance. In the second step agent paths are overlaid on the base geometry and the combined mesh is thinned incrementally towards a defined minimum. The model is analysed to ensure that material usage is reduced but retains structural performance. By overlaying the agent paths on the base geometry, the combined mesh is thinned out incrementally to achieve a buildable thickness. The distances between the mesh points and agent paths are multipliers for the incremental thinning process and openings begin to emerge as points are moved beyond the minimum thickness. The resulting solution lies between the geometry described by the agent paths and the input form.
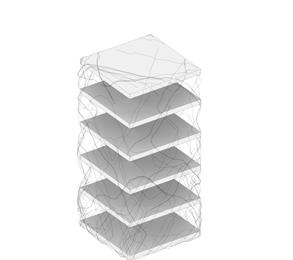
The intersections between floor-plates and agent trails define the structural support points and emitter points for the second agent sub-system. Through an iterative process, agent paths are generated on vaulted surfaces and the paths are extruded to a top plane creating a ribbed vaulting roof below, and flat floor-plate above. The resulting geometry is analysed for deformation under self-weight using FEA.
By studying the impact of agent path connectivity on the structural performance of the solution, flocking parameters are iteratively modified to generate favourable results. Structural performance and material volume of the resulting vaulted slab is compared to the baseline geometry. The slab depths and ribbing thicknesses applied during CAD meshing are derived from the material and fabrication constraints and the resultant floor-plates are combined with the interior and exterior walls generated in the previous sub-system.
As discussed previously, due to limitations posed by structural analysis of complex geometries, primary experimentation is performed on simplified forms. Moreover, even though performance of the system is verified through FEA, it is important to further develop the research towards physical prototyping and testing to verify the performance of the proposed construction system.
54 METHODS EARTHQUAKE RESISTANT BUILDING 55 METHODS EARTHQUAKE RESISTANT BUILDING
+ +
FORCE FLOW
REDUCTION
SOLAR ANALYSIS REPELLER POINTS
FEA
MESH
fig. 4.3.4
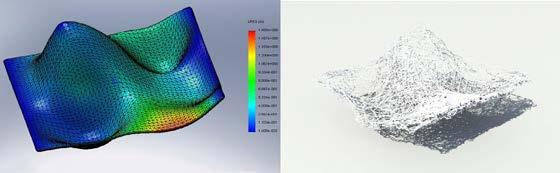
The structural support points are emitter points for the system and through an iterative process, agent paths are generated on the vaulted surface. The paths are extruded to a top plane creating a ribbed vaulting roof below, and flat floorplate above. The resulting geometry is analysed for deformation under self-weight using FEA.
By studying the impact of agent path connectivity on the structural performance of the solution, flocking parameters may be iteratively modified to generate favourable results. Structural performance and material volume of the resulting vaulted slab is compared to the baseline geometry. The slab depths and ribbing thicknesses applied during CAD meshing are derived from the material and fabrication constraints and the resultant floorplates are combined with the interior and exterior walls generated in the previous sub-system.
As discussed previously, due to limitations posed by structural analysis of complex geometries, primary experimentation is performed on simplified forms. Moreover, even though performance of the system is verified through FEA, it is important to further develop the research towards physical prototyping and testing to verify the performance of the proposed construction system.
 SLAB GEOMETRY + AGENT PATHS
DEFORMED SLAB
FUNICULAR SOLUTION + ATTRACTOR POINTS
SLAB GEOMETRY + AGENT PATHS
DEFORMED SLAB
FUNICULAR SOLUTION + ATTRACTOR POINTS
56 57
AGENT PATHS
fig. 4.3.6 (right)
Sequential experimental workflow
fig. 4.3.5 (left)
METHODS EARTHQUAKE RESISTANT BUILDING METHODS EARTHQUAKE RESISTANT BUILDING
Phillipe Block Research on funicular floor slabs
4.4_SPATIAL CONFIGURATION
In present-day Kathmandu, land availability is limited, and still favours a vertical arrangement to reduce the footprint of buildings. Current economic and ecological considerations demand efficient resource allocation by maximising floor area while minimising material usage. Moreover, as previously stressed, earthquake resistant design has become a primary concern following the 2015 earthquake.
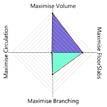
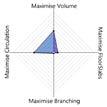
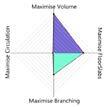
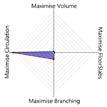
Newari spatial principles coupled with branching principles can yield new spatial relationships optimised to satisfy modern day requirements. Four conflicting fitness objectives are used in the GA:
1. Maximise the usable floor/slab area
2. Minimise material usage or volume
3. Maximise circulation
4. Maximise structural performance using branching
Variation within the GA is generated on an initial CAD model by altering parameters such as room sizes, vertical room location, and horizontal translation. The dimensions of a floor plan range based on the size of a home, guided by a 3-4 storey typical Newari vertical configuration. (Figure 4.4.1). Although these guidelines traditionally respond to construction and material constraints, they have shaped the way current homes are organized and inhabited at the urban and local scale, respectively.
The ground floor subdivision generated by the duãga, or middle wall, organises spaces to generate spatial hierarchies; larger spaces are closer to streets and courtyards, and smaller spaces are used for storage and private programme (Figure 4.4.2).
TOP FLOOR: BAIGA
MIDDLE SECTION: MÃTÃ
SECOND FLOOR: CHWATA
GROUND FLOOR CHHYADI
58
METHODS SPATIAL CONFIGURATION
fig. 4.4.1 (left)
Floor distribution of vernacular Newari space planning
fig. 4.4.2 (right)
59 METHODS SPATIAL CONFIGURATION GROUND FLOOR IF STREET > COURTYARD IF STREET > COURTYARD IF AREA > THRESHOLD IF AREA > THRESHOLD PREVIOUS FLOOR DIST. CHOWK CHOWK CHOWK CHOWK IF STREET < COURTYARD IF STREET < COURTYARD SUBDIVIDE SPACE SUBDIVIDE SPACE SCALING SCALING SCALING SCALING SCALING TRANSLATION TRANSLATION TRANSLATION TRANSLATION 1ST AND 2ND FLOOR THIRD FLOOR LAST FLOOR STREET STREET STREET STREET STREET STREET STREET STREET STREET STREET STREET STREET STREET STREET STREET STREET CHOWK CHOWK CHOWK CHOWK CHOWK CHOWK CHOWK CHOWK CHOWK CHOWK CHOWK CHOWK
Abstraction of Newari principles used to generate evolutionary alorithm.
Structural branching principles guide the developed algorithm by favouring clustering and separation among interior spaces. As a result, tower-like structures generate hierarchical differentiation. This branching effect can both lower the modal frequencies to fall within the desired range of 1 to 6 Hz (frequency of earthquakes) and reduce the relative difference between modal frequencies, improving the structures’ ability to dissipate energy. (refer to section 4.3.1. Branching).


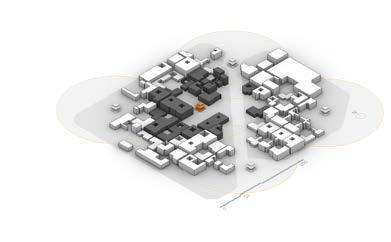
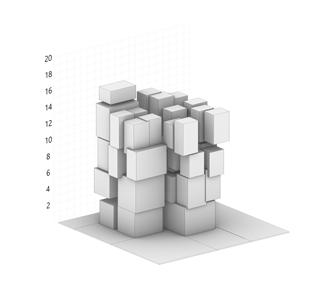
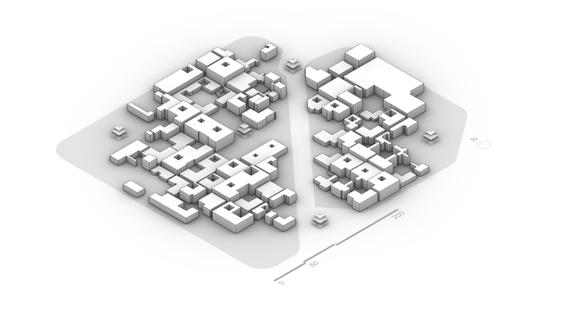
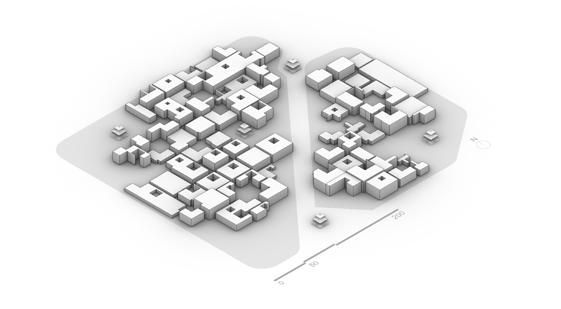
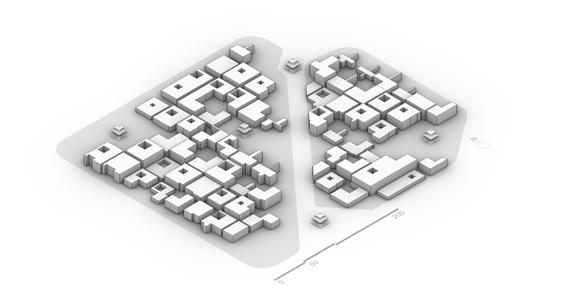
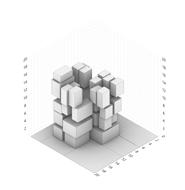
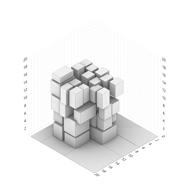
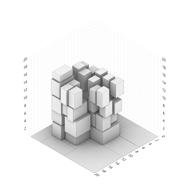
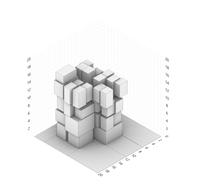
A set of 5,000 solutions is generated (100 generations, 50 individuals each generation), and 9 individuals are selected for further evaluation. Preference was given to the globally ranked individuals for two objectives; maximising floor slab area and maximising branching structure. Although all solutions show clear programmatic distribution, the experiment generated them using discrete box elements. Therefore, the resulting programmatic distribution map was rationalised to provide a circulation strategy (informed by space syntax analysis) to be used as input for form-finding experiments
Nonetheless, these GA experiments show a new way of using vernacular spatial specifications to satisfy the programmatic and structural requirements for the modern Nepalese way of living.
60
METHODS SPATIAL CONFIGURATION FLOOR PLAN DIMENSION CONSTRAINTS MINIMUM AREA MAX AREA LENGTH RANGE 8-20M WIDTH RANGE 414 M 8M 4M MINIMUM FLOOR PLAN ALLOWED IS 32 M2 70 M 70 M 15 M 15 M FLOOR PLAN DISTRIBUTION
fig.
4.4.3 (left)
Boundaries defining spatial occupation
fig. 4.4.2 (right)
61 METHODS SPATIAL CONFIGURATION
Methods to evlauate fitness objectives for evolutionary algorithm.
CIRCULATION
3. CIRCULATION AREA
% 1. VOLUME PER BOX
VOLUME
4. BRANCHING DISTANCE
2.
PER SLAB
4.5_FABRICATION
4.5.1_MYCELIUM GROWTH
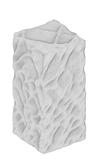
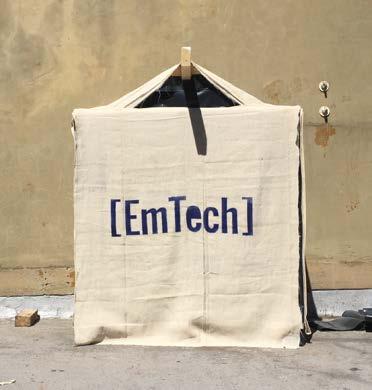
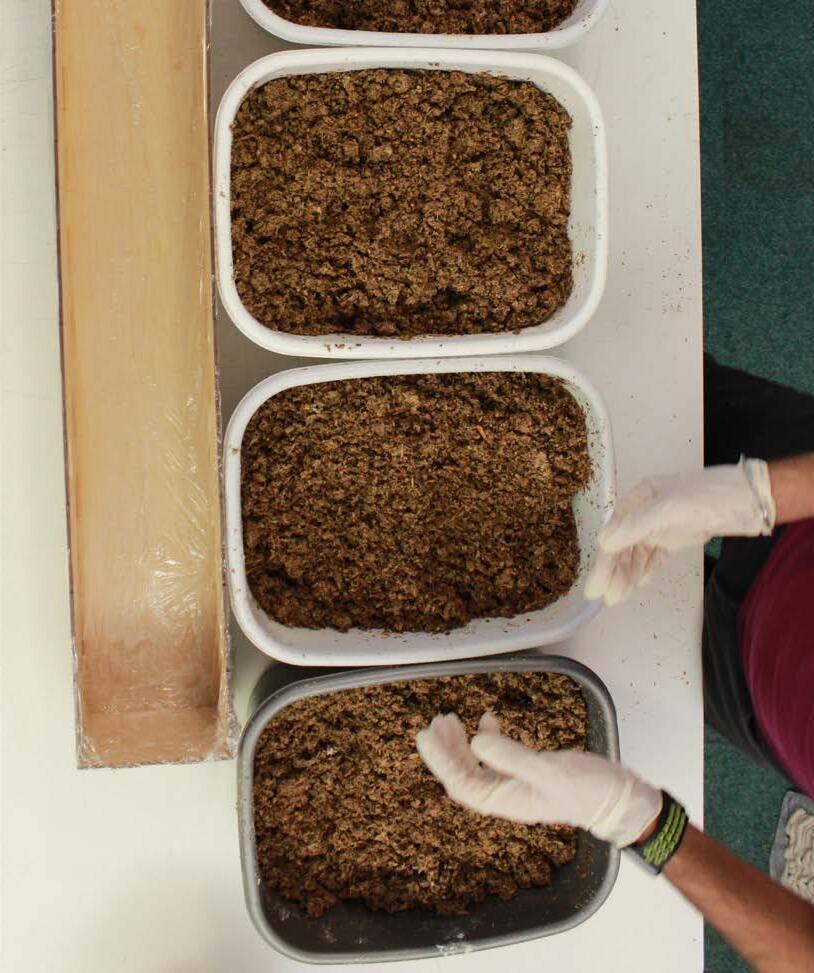
Physical prototyping to calibrate computational studies, as mentioned in section 4.3.2 AgentBased Form Finding, involved growing and analysing six samples testing two substrates and four species of fungal spores. Two of the four initial spores used were laboratory-engineered in a sterile environment using composite blends that ensure healthy growth, while the remaining two were locally sourced in London and Kathmandu, respectively. An outdoor shed was constructed to control the temperature, humidity, and amount of light for growth. All substrates were sterilised by boiling, inoculated with the spore, mixed with 3 cups of water, 2 tablespoons of flour/kg of substrate and placed in a sealed filter bag to prevent contamination. After 10 days, the mycelium was transferred to a mould for desired geometry. After 20 days, the sample was dried and exposed to the sun, completing the growth process, established by the Delft University of Technology.
This method obtains four mycelium blocks that can be stored easily. Once successful attempts of mycelium growth are observed, formwork experiments are carried out to refine geometrical outputs of the composite system. Although all experiments were performed in a sterile environment, two samples were contaminated as a result of using non-laboratoryengineered mycelial spores, nonetheless, experiments showcase mycelium composites as an efficient building material for construction.
62
METHODS FABRICATION
fig. 4.5.1
63 METHODS FABRICATION
Outdoor constructed shed lined with plastic to help regulate temperature and humidity.
4.5.2_TRANSFORMATIVE FORMWORK
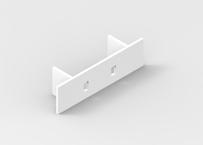
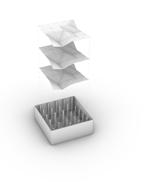
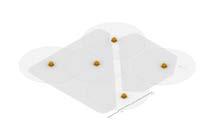
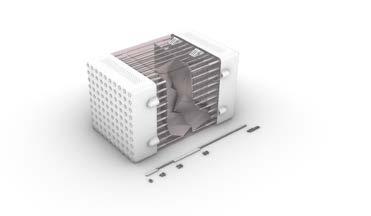
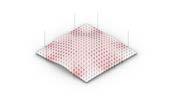
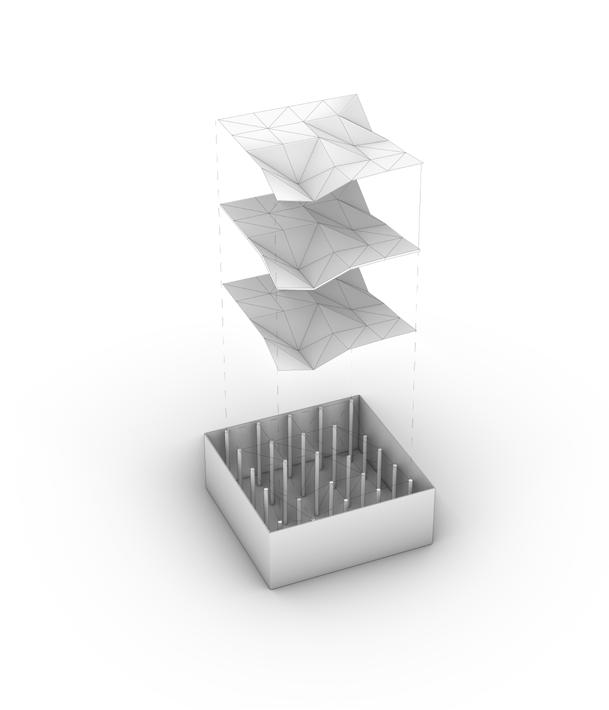
A reconfigurable mould was developed to create a formwork that is reusable and can produce custom components for construction. This process has been frequently used in the industry for concrete casting of complex elements. A five-part system is constructed in a 50 cm x 50 cm box consisting of 25 movable dowels controlling a fabric layer made of elastic fibres (see Appendix). An interpolation layer using kerfing patterns, where material is removed from MDF to allow the surface to produce double curvature, is covered by a thin plastic layer to ensure that the formwork can be reused. The density, size, and pattern of the interpolation layer allows the user to calibrate the resolution of the formwork to generate a component that is suitable for construction.
Design for a temperature/humidity-controlled formwork (based on physical prototype) is proposed to respond to material sensitivities of the growth process, like the way mycelium would grow in a laboratory. This allows for a sterile, self-build construction method that can be easily transported for mycelium growth on site.
64
METHODS FABRICATION
fig. 4.5.3 (right) Higher dowel resolution allows for precision and smoother surfaces.
65 METHODS FABRICATION PLASTIC LASER KERFING ELASTIC FABRIC MOVABLE DOWELS BOX FRAMEWORK
fig. 4.5.2 (left) Three kerfing pattern iterations were tested. Higher density allows for a higher curvature degree.
COMPUTATIONAL EXPERIMENTATION
EXPERIMENTS + RESULTS
URBAN
PHYSICAL EXPERIMENTATION
SPATIAL CONFIGURATIONS
BRANCHING
AGENT BASED EXPERIMENTATION
EXTERIOR/INTERIOR WALL FLOOR SLAB
FORM FINDING FORM FINDING
MATERIAL OPTIMIZATION
MATERIAL OPTIMIZATION
FABRICATION
66
5.1.1_EXPERIMENTAL SETUP
Kathmandu has struggled to rebuild itself after a devastating earthquake, the objective of this experiment is to generate safe zones around landmarked temples to create an urban plan more responsive to natural disasters than the current one. In our study, solutions to the multi-objective design problem were obtained by maximising building volume (to maximise population density), maximising the number of buildings around a safe zone (100 m radius according to 2015 Sendai Evacuation Plan), and minimising the walking time from each constructed building to a temple. The solution used for analysis was then selected based on the methods outlined in section 4.2 Earthquake Responsive Urban Plan
5.1.2_RESULTS
Figure 5.1.3 on the next page, shows the results obtained using the GA. As can be seen (Figure 5.1.2), the proposed solution significantly decreases the number of buildings out of the safe zone by more than 50%, where 20 buildings in the existing condition were out of a safe zone, and only 7 buildings in the proposed condition, ensuring that more people have access to safety during an emergency. Walking times from each proposed building to a temple were consistent with the results obtained in the safe zone study; no building exceeded a 10 minute walk to the centre of the protected region (15 m from the centre of a temple to a proposed building), as recommended by the Sendai plan.
5.1.3_CONCLUSION
However, the differences between the obtained solutions were negligible. Although improvements were made to the existing condition, the algorithmic setup did not allow for the primary street network to change, impacting the number of buildings that can occupy the 300 m x 300 m urban patch, ultimately capping the population density that can be achieved for a growing urban condition. Future research should consider a way to generate new street networks that still maintain landmarked buildings. Nevertheless, the results suggest that the methodology to generate an earthquake responsive urban plan can still be applied.
20 BUILDINGS OUT OF SAFE ZONE
< 10 MIN WALK TO SAFE ZONE
7 BUILDINGS OUT OF SAFE ZONE
68
5.1_URBAN EXPERIMENTS AND RESULTS URBAN
10
0
min
min
fig. 5.1.2 (top right)
Selected urban patch showing improvement relative to existing patch.
69 URBAN EXPERIMENTS AND RESULTS PROPOSED
fig. 5.1.1 (left) Shortest walking-time analysis analysis used to evaluate solutions.
EXISTING
DENSITY = 17,453 persons/km2
DENSITY = 21,320 persons/km2
DENSITY = 19,340 persons/km2
GEN 88 // IND 9
DENSITY = 21,104 persons/km2
GEN 96 // 1
GEN 96 // IND 6
GEN 95 // IND 9
EXPERIMENTS AND RESULTS URBAN
fig. 5.1.3
Representative set of indivduals selected showing morpholigacal variation.
70
URBAN EXPERIMENTS AND RESULTS
71
5.2_SPATIAL CONFIGURATION
5.2.1_OVERVIEW
Experiments combined Newari and branching principles to spatially define and structurally enhance a 4-storey building footprint derived from previous urban exploration (families up to 6 people). The plot contour (85 m²), adjacent streets and designed courtyards provided the base to solve a multi-objective design problem; to maximise floor slab area of a building, to minimise overall building volume, to maximise circulation, and to maximise a global branched geometry.
5.2.2_EXPERIMENTAL SETUP
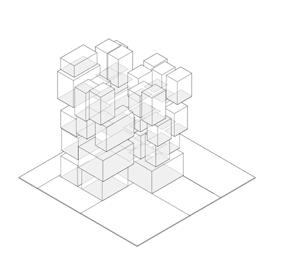
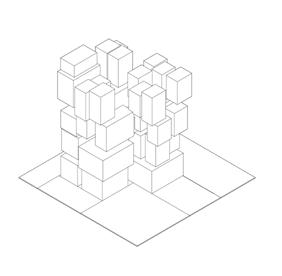
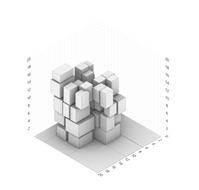
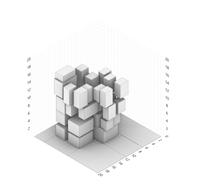
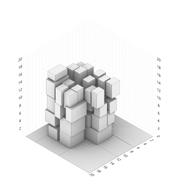
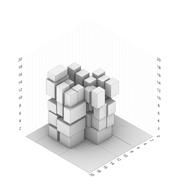
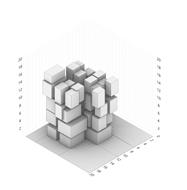
Internal spaces were represented as discrete boxes that move 1 metre in ‘x’, ‘y’, and ‘z’ direction to create differentiated space while staying within the dimensions of the initial bounding box (refer to section 5.1 Urban Experiments). Rectangular floor plans that varied 8-20 metres in length and 4-14 metres in width helped to assign programmatic occupation. Adjacent boxes less than 2 m² are joined to guarantee functional spaces, where boxes larger than 2 m² and overlap are merged to create communal spaces as observed in Newari space distribution. It is evident that maximising the floor slab area significantly lowered the probability of boxes to completely join. Moreover, a double-height space added to the upper floors accentuated the effect of branched geometry, minimising global displacement while compensating for area removed from branching.
CAD DEFINITION SETUP
FLOOR PLAN DIVISION
BOOLEAN CONDITION
- HORIZONTAL DIVISION
- VERTICAL DIVISION
AREA CONSTRAINTS
GROUND FLOOR
LENGTH 8-20M
WIDTH 4-15M
VARIABLES
XYZ DISP. -1.0 TO 1.0M
XYZ SCALING 0.9 TO 1.1
1ST AND 2ND FLOORS
fig. 5.2.1 (left) Experiment work-flow diagram.
FITNESS RANK
THIRD FLOOR
LAST FLOOR
GROUNDFLOOR SUBDIVISION
AREA CONSTRAINTS
SUBDIV. THRESHOLD - 30M2
VARIABLES
XYZ DISP. -1.0 TO 1.0M
XYZ SCALING 0.9 TO 1.1
EVALUATION CRITERIA
MAXIMISE FLOOR SLABS
MINIMISE VOLUME MAXIMISE CIRCULATION MAXIMISE BRANCHING
GROUNDFLOOR SUBDIVISION
AREA CONSTRAINTS
SUBDIV. THRESHOLD - 20M2
VARIABLES
XYZ DISP. -1.0 TO 1.0M
XYZ SCALING 0.9 TO 1.2
RESPONDS TO RESPONDS TO RESPONDS TO
PREVIOUS FLOOR GEOMETRY
VARIABLES
XYZ DISP. -0.5 TO 0.5M
XYZ SCALING 0.6 TO 0.8
MAXIMISE SLAB AREA MINIMISE VOLUME MAXIMISE CIRCULATION INITIAL GEOMETRY - EVALUATION CRITERIA HIERARCHY - AVERAGE
GENETIC
DATA
POST ANALYSIS OUTPUT INDIVIDUAL
RANKS 0-8 9 INDIVIDUALS CAD DEFINITION OBJECTIVE CRITERIA
ALGORITHM
ANALYSIS SELECTED INDIVIDUALS
EXPERIMENTS AND RESULTS SPATIAL CONFIGURATION 72 FLOOR HEIGHT 3 TO 4 FLOORS
fig. 5.2.2 (right) CAD definition setup showing variable parameters for the GA.
SPATIAL CONFIGURATION EXPERIMENTS AND RESULTS 73
5.2.3_RESULTS
Ground floor subdivision produced by the duãga, is repeated across all floors. A boolean condition defines the first spatial subdivision either as horizontal or vertical as shown in the ground floor section (refer to section 4.4 Spatial Configuration). The first and second floors corresponding to the mãtã (middle section), are programmatically similar, and replicate the same basic subdivision. Resulting spaces under a threshold of 30m² were further subdivided by varying parameters into a grid of maximum 4 cells.
On the third floor or pyeta the subdivision threshold is lowered to 20m² to increase the effect of branching. As previously stated, the upper floor further accentuates the effect of branching by replicating the same subdivision of the preceding floor. The algorithm only permits scaling parameters to operate on the utmost floor as seen previously in Figure 5.2.2.
5.2.4_CONCLUSION
The last generation of solutions, depicted in red, had a significant shift in standard deviation, indicating overall fitness improvement. In general, elongated curve distributions provide evidence of convergence towards one fittest solution; as such, all fitness objectives show preference to one individual, respectively. Although overall improvement is observed, the algorithmic setup did not allow for changes in volume in the building structure. Future research should address how to balance top-down bounding inputs with bottom-up spatial arrangements that adjust with family size.
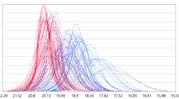
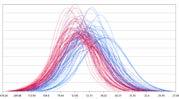
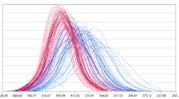
MAXIMISE FLOOR SLABS MINIMISE VOLUME MAXIMISE CIRCULATION MAXIMISE BRANCHING FIRST GEN. LAST GEN.
fig. 5.2.3 (left)
Statistical analysis of results obtained by evolutionary algorith, using Wallacie.
fig. 5.2.4 (right)
EXPERIMENTS AND RESULTS SPATIAL CONFIGURATION 74 SPATIAL CONFIGURATION EXPERIMENTS AND RESULTS 75
Top-ranking individuals for each fitness objective .
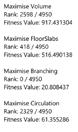
Top ranking individuals for each criterion were selected to understand the morphological implications posed by each fitness objective. Surprisingly, the top-ranking individuals for both floor slab area and branching optimization also ranked the highest for the entire generated population; indicating the parameters that influence both design problems directly correlate.
Since the scope of this research focuses on structural performance during seismic events, 9 individuals were selected given preference to solutions that ranked high in branching optimisation However, as the simulation converged quickly, variation between selected individuals were negligible.
Because of the discrete box elements, it was difficult to use as a clear programmatic distribution directly from the resulting boxes. A process of rationalization was carried out to define clear programmatic distributions. Further fine tuning of the experiment may help address this issue in the future. However, overall the experimentation was successful in improving the spatial distribution of spaces within the building and optimizing for the desired criteria. The output of this experiment allows for a clear spatial distribution map and was used as an input for the form finding experiments
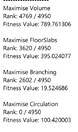
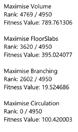
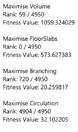
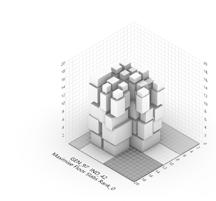
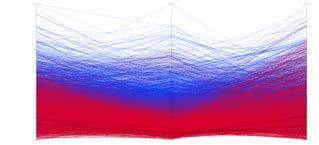
252.93 15.49 25.63 573.63 20.81 MAXIMISE BRANCHING MAXIMISE BRANCHING MAXIMISE CIRCULATION INCREASED FITNESS 100.42 PARALLEL COORDINATE PLOT 76
fig. 5.2.5 (left)
Parallel Coordinate Plot showing increased fitness over 100 generations
fig. 5.2.6 (right)
EXPERIMENTS AND RESULTS SPATIAL CONFIGURATION FIRST GEN. LAST GEN. 97-11 71-28 83-10 77-6 88-11 89-24 95-45 76-38 89-7 GEN-IND GEN-IND GEN-IND GEN-IND GEN-IND GEN-IND GEN-IND GEN-IND GEN-IND 77 SPATIAL CONFIGURATION EXPERIMENTS AND RESULTS
Representative set of indivduals selected showing morpholigacal variation.
5.3_AGENT-BASED FORM FINDING
5.3.1_OVERVIEW
5.3.2_EXPERIMENTAL SETUP

The primary objective for the experiment is to optimise material usage as a part of the design process. By intelligent removal of material from the structure it is possible to decrease the building mass while retaining structural performance, thereby increasing earthquake resiliency. This hypothesis is evaluated by comparing the material volume and maximum displacement of the initial and resultant geometries.
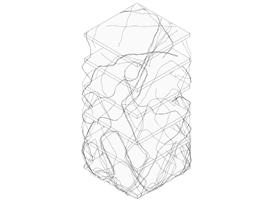
The first set of experiments are carried out on both the exterior and interior wall subsystem of the building to generate a reduced structure and produce the inputs required for further investigation. This is done using an agent-based system which result in local optimisations within a global geometry. FEA of the initial geometry results in force flow lines which are used as input curves for the multi-path follow force. Through a solar radiation analysis, repeller points are determined based on where fenestrations are required. This is done iteratively by varying the flocking parameters as well as the density of agents while maintaining a constant initial geometry along with its structural and environmental inputs. CAD based meshing through Cocoon a grasshopper plug-in, is used to generate 3D geometries from the agent paths. Nine iterations are run through FEA and the resulting displacement and volumes are compared to define settings and configurations that will be carried forward for the proposal.
MULTI-PATH

REPELLER POINTS STRESS LINES AGENT PATH LINES AGENT PATHS + SLABS AGENT PARAMETERS
BASE GEOMETRY SOLAR ANALYSIS AGENT BASED SIMULATION CAD MESHING COMPARE TO BASELINE OUTPUT FEA ANALYSIS 5 STORIES TALL BUILDING
78 EXPERIMENTS AND RESULTS AGENT-BASED FORM FINDING
fig. 5.3.1 (left) Experimental workflow diagram fig. 5.3.2 (right) Agent path generation using solar and FEA analysis
POINTS
OPENINGS
OPENINGS
DENSITY HEAVIER BOTTOM LIGHTER TOP
SOLAR ANALYSIS REPELLER
EMERGENT
PLANNED
HIGHER
AGENT PATHS FORCE FLOW LINES
AGENTS WITH SLABS
FOLLOW 79 AGENT-BASED FORM FINDING EXPERIMENTS AND RESULTS
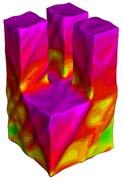
An initial geometry is setup as a 9 x 9 x 18 m building with internal partitions generating four rooms on each floor. This is done to define a simplified geometry which is representative of the proposed architectural scale while allowing for the experimental process to be tested in a speedy fashion before applying the result to the final geometry. The wall thicknesses are set to 500 mm, the dimensions derived from local adobe construction. Through an initial FEA using Karamba3D a grasshopper plug-in, force flow lines are generated, and the maximum displacement of the base geometry is defined as 0.1m. Support points are defined on the ground plane and the physical properties (refer to 2.4.3. Material Properties) for the mycelium composite are used to run the simulation.

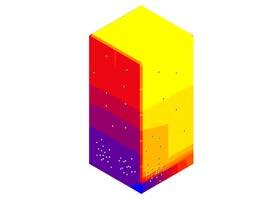
Ladybug is then used to generate a solar radiation map on the façade of the structure to determine where repeller points are needed to create openings on a building; the number of repeller points directly correlate to the size of fenestration required. Solar radiation is analysed on the 21st of December for a 12-hour period during the day, where areas least exposed to the sun are given more repeller points.
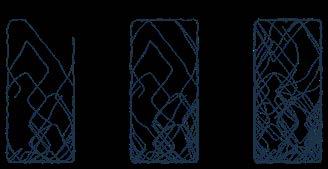
Agents are emitted from the ground plane perimeter of the building and are programmed with a Z-direction bias. This is done to generate a vertical structure that is denser closer to ground and becomes lighter as height increases. The flocking parameters of cohesion, separation, alignment and vision angle are varied across the iterations to analyse their impact on the resulting structure. Initial experiments (see Figure 5.3.4) concluded that 150 timesteps are needed to generate agent trails that extend the height of the building.
5.3.1a
Agents – 30
Vision radius – 1
Alignment – 0.09
Separation – 0.1
Cohesion – 0.3
Time steps – 150
Repulsion force – 7
Follow force – 4
5.3.1b
Agents – 40
Vision radius – 1
Alignment – 0.09
Separation – 0.1
Cohesion – 0.3
Time steps – 150
Repulsion force – 7
Follow force – 4
5.3.1c
Agents – 50
Vision radius – 1

Alignment – 0.09
Separation – 0.1
Cohesion – 0.3
Time steps – 150
Repulsion force – 7
Follow force – 4
5.3.2a
Agents 30
Vision radius – 1.6
Alignment – 0.05
Separation – 0.8
Cohesion – 0.1
Time steps – 150
Repulsion force – 7
Follow force – 4
5.3.2b
Agents 40
Vision radius – 1.6
Alignment – 0.05
Separation – 0.8
Cohesion – 0.1
Time steps – 150
Repulsion force – 7
Follow force – 4
5.3.2c
Agents - 50
Vision radius – 1.6
Alignment – 0.05
Separation – 0.8
Cohesion – 0.1
Time steps – 150
Repulsion force – 7
Follow force – 4
5.3.3a
Agents 30
Vision radius – 0.2
Alignment – 0.02
Separation – 0.5
Cohesion – 0.9
Repulsion force – 7
Follow force – 4
5.3.3b
Agents 40
Vision radius – 0.2
Alignment – 0.02
Separation – 0.5
Cohesion – 0.9
Repulsion force – 7
Follow force – 4
5.3.3c
Agents - 50
Vision radius – 0.2
Alignment – 0.02
Separation – 0.5
Cohesion – 0.9
Repulsion force – 7
Follow force – 4
80 50 100 TIMESTEPS 150
fig. 5.3.3 (right)
Experimental workflow diagram
fig. 5.3.4 (left)
EXPERIMENTS AND RESULTS AGENT-BASED FORM FINDING
Agent path generation using solar and FEA analysis
81 AGENT-BASED FORM FINDING EXPERIMENTS AND RESULTS
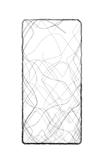
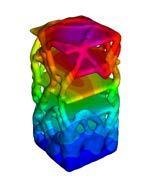
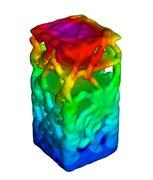
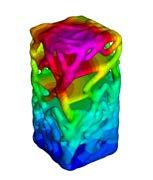
5.3.3_RESULTS
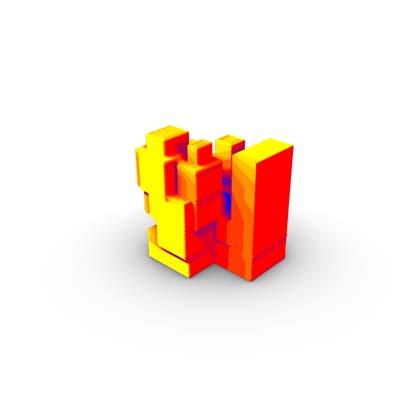
Three sets of experiments using 30, 40, and 50 agents, respectively were tested to study the effect of flocking behaviour on self-organization. In the first set of iterations 5.3.1, a bias towards alignment with moderate vision radius result in consolidated agent paths that appear to be highly responsive to repeller obstacles, producing defined openings on the building surface. The iterations with high cohesion and low vision radius 5.3.2 display similar behaviour, with increased interconnectivity resulting in locally branched morphologies. And finally, iterations with high separation and high vision radius 5.3.3 display significantly more interconnected agent paths. Based on branching principles, the likelihood of interconnected agents increasing earthquake resistance is high.
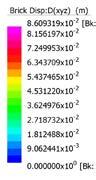
The displacement values obtained from FEA indicate that the resultant structures undergo a maximum displacement of 0.177m (5.3b) and minimum displacement of 0.059m (5.3f) across all iterations. Comparing the volume to the initial geometry (921 m³), all iterations display reduced material volume by 40-53%. In the iterations with high alignment and cohesion, the number of agents is directly proportional to the volume and inversely proportional to maximum displacement. However, this trend does not apply to iterations with high separation, where the individual with 40 agents minimised displacement having lower volume than the individual with 50 agents. It appears that iterations with 40 agents are most favourable in terms of material reduction and locally branched morphologies.
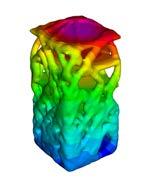
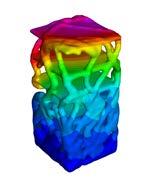
Out of the 9 iterations, 6 display a maximum displacement of 0.1m or less. 5.3.2b has the lowest displacement to volume ratio with a maximum displacement of 0.059m and volume of 731 m3. It achieved a 20% material reduction compared to the baseline model.
5.3.1a
MAX DISPLACEMENT = 0.11 M
VOLUME = 583 M3
DISP/VOL RATIO = 1.8
18.00 M
5.3.1b
MAX DISPLACEMENT = 0.18 M VOLUME = 603 M3 DISP/VOL RATIO = 2.8
18.00 M
5.3.1c
MAX DISPLACEMENT = 0.08M VOLUME = 679 M3

DISP/VOL RATIO = 1.1
18.00 M
Iteration (5.3) Iteration (5.3) VOLUME M3 400 450 500 550 600 650 700 750 800 0.35 3c 3b 3a 2c 2b 2a 1c 1b 1a 0.3 3c 3b 3a 2c 2b 2a 1c 1b 1a 0.25 0.2 0.15 0.1 0.05 0.0 DISPLACEMENT CM 0.4 82 EXPERIMENTS AND RESULTS AGENT-BASED FORM FINDING
fig. 5.3.4 (left) Comparative analysis; displacement (cm) and volume (m³) for each iteration fig. 5.3.5 (pg. 81-83) Experiments to determine least amount of material needed for sturctural performance
83 AGENT-BASED FORM FINDING EXPERIMENTS AND RESULTS
5.3.2a
MAX DISPLACEMENT = 0.10 M
VOLUME = 643 M3
5.3.3a
MAX DISPLACEMENT = 0.12M
VOLUME = 593 M3
DISP/VOL RATIO = 3.0
5.3.2b
MAX DISPLACEMENT = 0.08 M
VOLUME = 686 M3
DISP/VOL RATIO = 1.2
18.00 M
DISP/VOL RATIO = 1.5 18.00 M
5.3.2c
MAX DISPLACEMENT = 0.06 M
VOLUME = 731 M3
DISP/VOL RATIO = 0.8
18.00 M
5.3.3b
MAX DISPLACEMENT = 0.11 M
VOLUME = 648 M3
DISP/VOL RATIO = 1.5
18.00 M
5.3.3c
MAX DISPLACEMENT = 0.07 M
VOLUME = 665 M3
DISP/VOL RATIO = 1.1


18.00 M
18.00 M
84
EXPERIMENTS AND RESULTS AGENT-BASED FORM FINDING
85 AGENT-BASED FORM FINDING EXPERIMENTS AND RESULTS
5.3.4_CONCLUSION
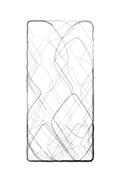
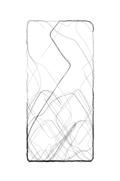
The agent paths generated are highly dispersed along the force lines closer to the ground plane with openings that occur due to repeller obstacles:
1. If height increases, then material and agent-density decreases
2. If height increases, then branching also increases.
This helps to increase earthquake resistance by making the structure bottom heavy with opportunities to dissipate energy through branched morphologies. Low displacement value provides evidence that forces are being optimally distributed through the structure.
Better geometry resolution is obtained with a higher density of agents. Although high cohesion and alignment result in higher degree of local branching continuous throughout the structure, it appears that high separation forces results local branching to occur as height increases. The vision radius plays an significant role in defining the degree of alignment, cohesion or separation that takes place within the system. Specifically in systems with high separation force, material gradually decreases with increase in height.
Although solutions displayed acceptable structural performance while reducing material usage, the feasibility and implications of applying this process should be the focus of future study.
fig. 5.3.6
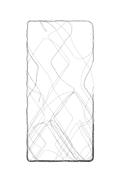
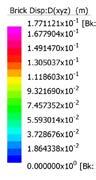
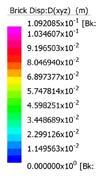
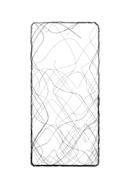
Result showing minimum use of material while maintaining desired strucutral performance
FLOOR SLABS
Thickness = 0.50m
MINIMUM DISPLACEMENT 0.07m
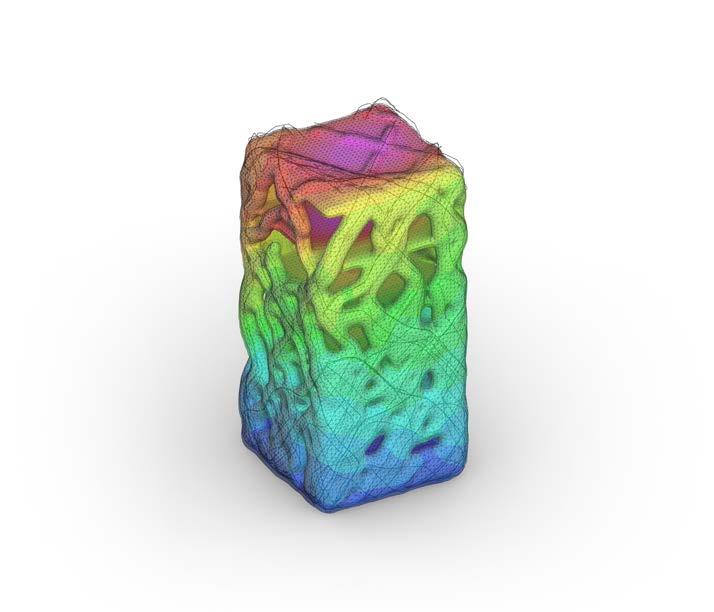
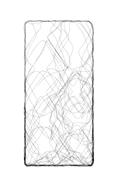
AGENT PATHS
Thickness = 0.50m
AGENT REPELLER POINTS
MAXIMUM DISPLACMENT 0.007m
86 EXPERIMENTS AND RESULTS AGENT-BASED FORM FINDING
87 AGENT-BASED FORM FINDING EXPERIMENTS AND RESULTS
5.4_AGENT-BASED
The objective of the following experiments is to develop a systematic process to control material optimisation as described in the previous experiment. This is done to rationalise the creation of openings and introduce a non-generative, designer-controlled aspect to the computational design process. As previously stated, by systematically reducing the mass of the structure, earthquake resistance increases.

The hypothesis that structural performance is maintained in the geometry created using the agent paths has been supported in the previous experiment. In this next step, agent paths and initial geometry are meshed together to a thickness of 0.5m. By culling out the mesh vertices lying on the agent paths, mesh vertices thus obtained describe the areas on the façade of the building where the structure may be thinned out to create openings. A gradual gradient of material removal is described by using the distance between the vertices and agent paths as a multiplier for moving the points. The points move towards the inner surface by a vector force between the mesh vertices on the inner and outer surfaces. Across iterations, the points are moved within a range of 0.1 m to 0.4 m inwards from their original position. In areas where walls are thinned beyond the minimum buildable thickness of 0.15 metre, mesh vertices are deleted to create openings.
AGENT LINE INPUT IND 5.3.3C DISTANCE RADIUS AROUND AGENT PATHS 0.50 METERS THINNING VALUE 0.30 METERS 88 EXPERIMENTS AND RESULTS AGENT-BASED MATERIAL OPTIMISATION
fig. 5.4.1 (left) Experimental workflow diagram fig. 5.4.2 (right) Material removal using agent-based system 89 AGENT-BASED MATERIAL OPTIMISATION EXPERIMENTS AND RESULTS AGENT TRAILS 100% VOLUME MATERIAL REMOVED 89% VOLUME
MATERIAL OPTIMISATION 5.4.1_OVERVIEW 5.4.2_EXPERIMENTAL SETUP
5.4.3_RESULTS
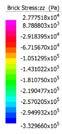
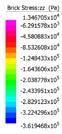
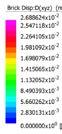
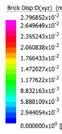
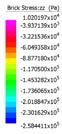
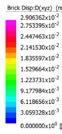
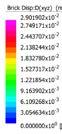
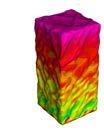
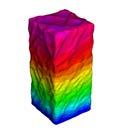

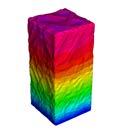
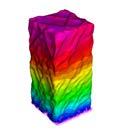
The resulting geometries are analysed through FEA to determine the maximum displacement and stress per brick, and is compared to the modified values for material volume. In this experiment, although the designer has complete control over the resulting wall thicknesses, the shapes of the openings are directly derived from the previously generated agent paths. By incrementally reducing the walls, the designer is able to control the steepness of curvature obtained between the ‘structural veins’ described by the agent paths and ‘reduced walls’ created through this process. The amount of curvature has direct implications on the fabrication constraints, thus playing an important role in the global design process.
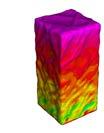
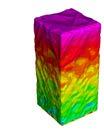
It is observed that as the mesh is thinned, the volume of the structure reduces by almost 80 m3 across all iterations. Although the resulting displacement and stress/brick values negligibly vary, displacement decreases with volume as the structure becomes lighter despite increase in stress/brick. 5.4a has the maximum volume (417 m³) and exhibits the maximum value for displacement (0.29 m) and minimum value for stress/brick (0.26 MPa). 5.4d has the minimum volume (333 m³) and exhibits the minimum value for displacement (0.26 m) and maximum stress/brick (0.362MPa). It appears that the displacement and stress values are similar between first and last two iterations, with a relatively large jump in values between 5.4b and 5.4c. This may suggest a critical threshold for the material in terms of structural performance and volume.
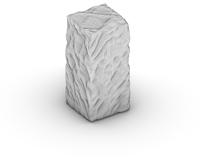
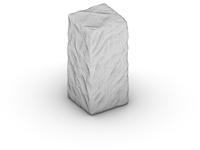
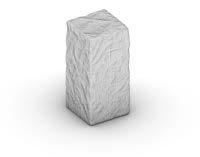
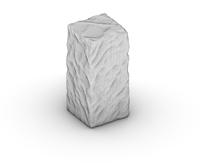
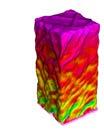
90 EXPERIMENTS AND RESULTS AGENT-BASED MATERIAL OPTIMISATION
5.4.3 Obtained results after material removal 18.00 18.00 18.00 18.00 5.4d 5.4c 5.4b 5.4a Volume
m Disp. = 2.79 cm Max Stress = 0.362 MPA Volume
m Disp. = 2.68 cm Max Stress = 0.33 MPA Volume
Disp.
Max Stress
MPA Volume
Disp.
Max Stress
MPA 91 AGENT-BASED MATERIAL OPTIMISATION EXPERIMENTS AND RESULTS
fig.
= 333.2
= 359.7
= 386.1 m
= 2.91 cm
= 0.26
= 417.8 m
= 2.90 cm
= 0.26
5.4.4_CONCLUSION
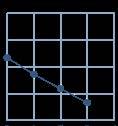
Reflecting on all 4 iterations, 5.4c exhibits the lowest value for displacement (0.268 m) under self-weight with a decrease in material volume by 11% when compared to the baseline volume of 921 m³. The minimum wall thicknesses in this iteration range between 0.15 m to 0.2 m, with a maximum of 0.52m (within the constraints of the fabrication and material properties). It is observed that areas with resulting wall thickness of 0.15 m largely coincide with the position of repeller points. The density of points that are 0.15 m from the inner surface increases with height making it possible to create larger or increased window openings on the higher floors.
Experiments 5.3 and 5.4 both aid in creating a computational framework for generating structural geometry from agent paths. As the initial goal of the agents was to optimise material usage in terms of structural performance, experiments 5.4 carry forward the results of 5.3 by introducing the possibility of non-generative architectural detailing. Hence, this becomes an important step for synthesising architectural morphologies from abstract computational models. However, future study should test this experimental process on complex base geometries. As the complexity of the base geometry increases, it is challenging to separate internal and external surface points. Nonetheless, these set of experiments offer the designer to edit, assess, and design the building system, which up to this point in the research has been created through computational generative processes an interesting opportunity to explore the role of a designer and his/her impact on a data-driven generative design system.
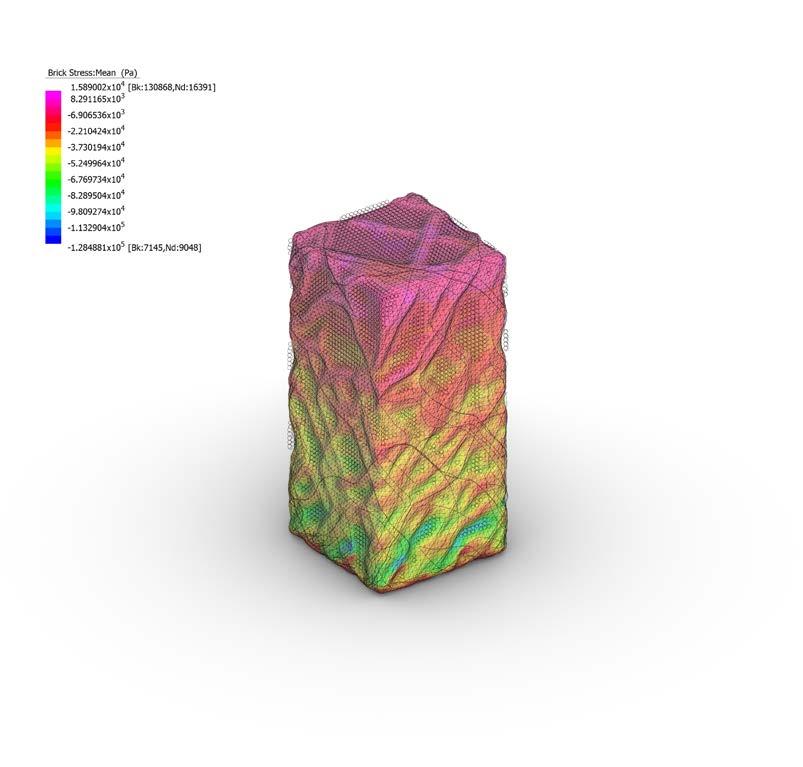
500 450 400 300 1234 individual Displacement (M) 500 450 400 300 1234 individual volume (M3) 92
fig. 5.4.3 (left) Graph showing that volume was reduced maintaining acceptable displacement fig. 5.4.4 (right) Result showing minimum use of material while maintaining desired strucutral performance EXPERIMENTS AND RESULTS AGENT-BASED MATERIAL OPTIMISATION HIGH STRESS WALLS MESH REDUCTION MINUMUM STRESS AGENT PATHS 93 AGENT-BASED MATERIAL OPTIMISATION EXPERIMENTS AND RESULTS
5.5_BRANCHING
5.5.1_OVERVIEW
As previously stated, hierarchical branching found in trees is an effective method of mechanical energy distribution through the principles of resonance energy transfer and tuned mass damping. As more localised elements participate in energy dissipation through resonant harmonic motion, the risk of failure associated with high energy concentration is reduced. This is the key principle to create earthquake resistant structures through geometrical manipulation. Thus, in this stage of experimentation, the branching principles associated with resonant damping of wind loads in trees are studied and abstracted to a building scale to produce architectural geometries. By subdividing the building volume into hierarchical ‘branches’ and disconnected floor slabs, it is possible to dissipate the mechanical energy produced in the event of an earthquake through induced resonant motion of differentiated sub-structures. Increasing the differentiated elements participating in resonant motion, subsequent modal frequencies as well relative displacement is reduced. Thus, the primary objective of the experimentation is to:
1. Lower the difference between the modal frequencies within the system
2. Lower the range of values of modal frequencies to fall within the range of 1-6Hz

BASELINE INDIVIDUAL 5.5.1 TWO BRANCHES 5.5.2 FOUR BRANCES 5.5.3 THREE BRANCHES BRANCH LENGTH BRANCH NUMBER 5.5.1a - 3.50 METERS 5.5.1b - 7.00 METERS 5.5.1c - 10.50 METERS 5.5.2a - 3.50 METERS 5.5.2b - 7.00 METERS 5.5.2c - 10.50 METERS 5.5.3a - 3.50 METERS 5.5.3b - 7.00 METERS 5.5.3c - 10.50 METERS ANALYSIS NFA VOLUME VS DISPLACEMENT 94 EXPERIMENTS AND RESULTS BRANCHING fig. 5.5.1 (left) Graph showing that volume was reduced maintaining acceptable displacement fig. 5.5.2 (right) Branched geometry allows for energy dissipation
95 BRANCHING EXPERIMENTS AND RESULTS
5.5.2_RESULTS
An initial geometry similar in dimensions to the previous experiments, is defined as the baseline for comparison. To test the impact of branching on the modal frequencies of the building three sets of morphologies are defined – two branches, four branches, and three asymmetrical branches.
By defining the third set of experiments as asymmetric, it is possible to study the effects of differentially biased branching conditions. Within each set, the depth of the branches is varied to study the impact of branch length at the building scale. The modal frequencies of 15 iterations are obtained from the natural frequency analysis in Strand7. The range of modal frequencies between modes 1 and 5 of every iteration are compared and the iteration with the lowest range is selected. Within this iteration the relative differences between each modal frequency is analysed against a flatline graph.
The base geometry of 8 x 8 x 17.5 metres is defined with each floor subdivided into 4 rooms (floor to ceiling height of 3.5 metres). Through a preliminary natural frequency analysis of this geometry the baseline modal frequencies are determined to be between 0.92Hz to 3.21Hz. Although this already falls within the acceptable range of modal frequencies, the experimental process is used to test if the value can be further reduced.
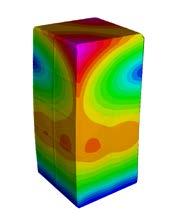
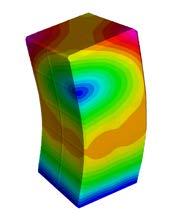
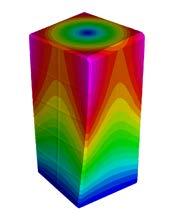
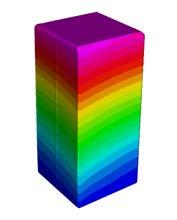
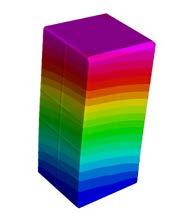
The distance between branches is kept at a constant of 2 metres and the depth is incrementally increased by 3.5 metres. Supports are defined on the ground plane and a natural frequency analysis is performed to compare across each morphological typology. The structural parameters used for the FEA input are values for the mycelium composite (see section 2.4.2. Material Properties).
fig. 5.5.3 (pg. 95-101)
Results obtained from branching experiments
96 EXPERIMENTS AND RESULTS BRANCHING
97 BRANCHING EXPERIMENTS AND RESULTS REFERENCE MORPHOLOGY 5.5.0 Mode 1 Mode 1 Mode 2 Mode 3 Mode 4 Mode 5 0.930 0.930 0.934 1.950 3.200 3.210 Hz Hz Hz Hz Hz Hz 18.00 M 18.00 M 18.00 M 18.00 M 18.00 M 18.00 M
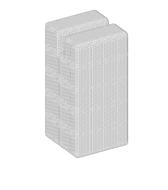
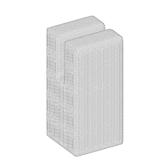
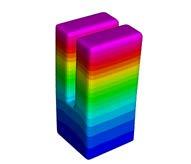
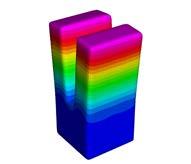
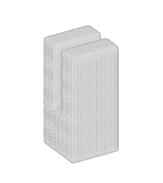
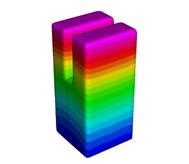
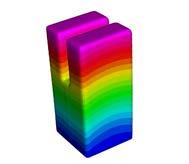
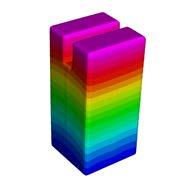
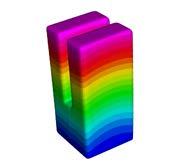
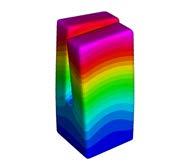
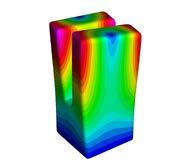
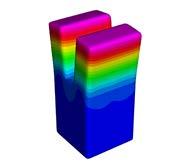
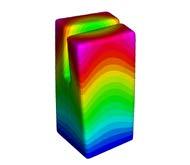
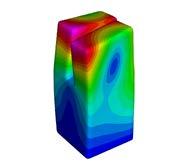
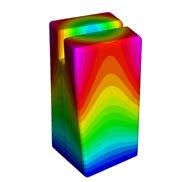
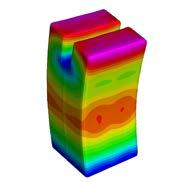
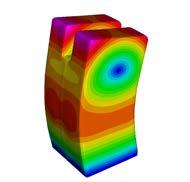
18.00 M 18.00 M 18.00 M 18.00 M 18.00 M 18.00 M Mode 1 5.5.1a 5.5.1b 5.5.1c Mode 1 Mode 1 Mode 2 Mode 2 Mode 2 0.965 0.950 0.821 0.970 1.000 0.930 Hz Hz Hz Hz Hz Hz 18.00 M 18.00 M 18.00 M 98 EXPERIMENTS AND RESULTS BRANCHING Mode 3 Mode 3 Mode 3 Mode 4 Mode 4 Mode 4 Mode 5 Mode 5 Mode 5 1.998 1.637 1.005 3.221 1.935 1.488 3.395 2.905 2.268 Hz Hz Hz Hz Hz Hz Hz Hz Hz 18.00 M 18.00 M 18.00 M 18.00 M 18.00 M 18.00 M 18.00 M 18.00 M 18.00 M 99 BRANCHING EXPERIMENTS AND RESULTS
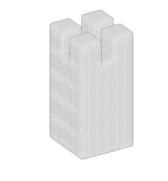
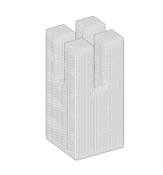
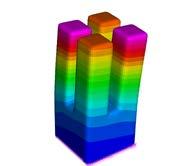
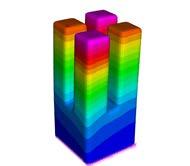
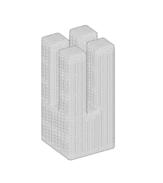
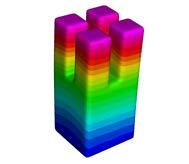
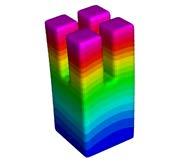
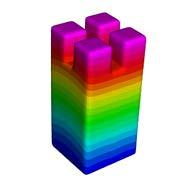
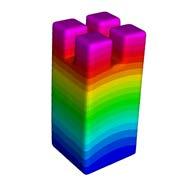
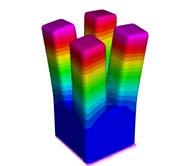
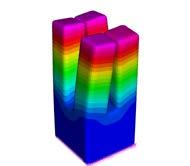
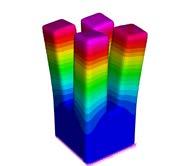
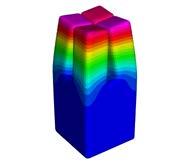
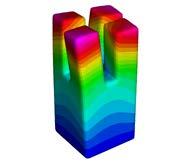
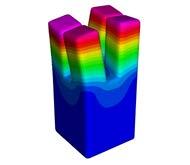
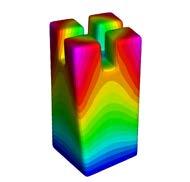
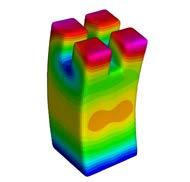
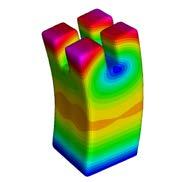
18.00 M 18.00 M 18.00 M 18.00 M 18.00 M 18.00 M Mode 1 5.5.2a 5.5.2b 5.5.2c Mode 1 Mode 1 Mode 2 Mode 2 Mode 2 1.021 1.001 0.843 1.030 1.006 0.845 Hz Hz Hz Hz Hz Hz 18.00 M 18.00 M 18.00 M 100 EXPERIMENTS AND RESULTS BRANCHING Mode 3 Mode 3 Mode 3 Mode 4 Mode 4 Mode 4 Mode 5 Mode 5 Mode 5 2.073 1.703 0.935 3.426 1.715 0.967 3.435 1.750 0.983 Hz Hz Hz Hz Hz Hz Hz Hz Hz 18.00 M 18.00 M 18.00 M 18.00 M 18.00 M 18.00 M 18.00 M 18.00 M 18.00 M 101
EXPERIMENTS AND RESULTS
BRANCHING
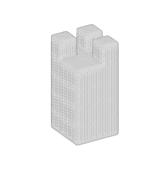
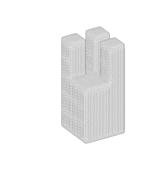
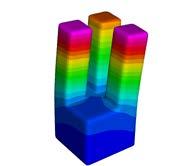
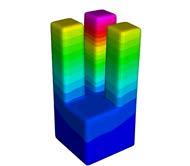
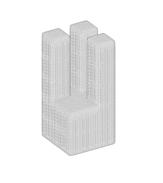
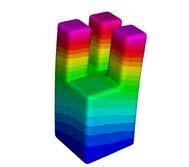
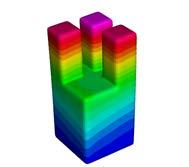
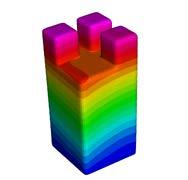
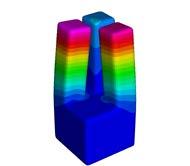
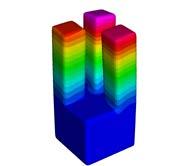
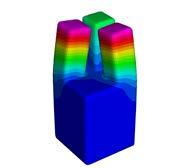
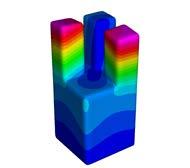
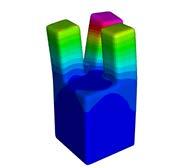
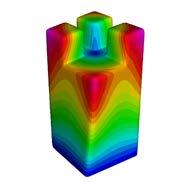
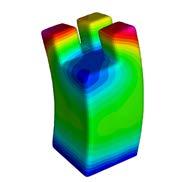
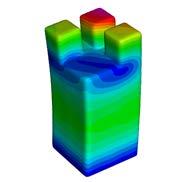
18.00 M 18.00 M 18.00 M 18.00 M 18.00 M 18.00 M Mode 1 5.5.3a 5.5.3b 5.5.3c Mode 1 Mode 1 Mode 2 Mode 2 Mode 2 1.083 1.079 0.864 1.094 1.097 0.878 Hz Hz Hz Hz Hz Hz 18.00 M 18.00 M 18.00 M 102 EXPERIMENTS AND RESULTS BRANCHING Mode 3 Mode 3 Mode 3 Mode 4 Mode 4 Mode 4 Mode 5 Mode 5 Mode 5 2.178 1.725 0.952 3.465 1.735 0.979 3.490 1.801 0.955 Hz Hz Hz Hz Hz Hz Hz Hz Hz 18.00 M 18.00 M 18.00 M 18.00 M 18.00 M 18.00 M 18.00 M 18.00 M 18.00 M 103 BRANCHING EXPERIMENTS AND RESULTS
5.5.3_CONCLUSION
Across all the 15 iterations, it is observed that as branch depth increases, the range of modal frequencies decreases with 5.5.3a having the maximum range between 0.96Hz to 3.39Hz and 5.5.3c having the minimum range between 0.86Hz and 0.87Hz. It appears that asymmetrical branching lowers the frequency of the system more than symmetrical branching. All iterations form the three asymmetrical branching experiments display a reduced relative difference between the modes with 5.5.3c having an average difference of 0.022Hz.
Iteration 5.5.3b, relative difference of 0.146Hz between modes, is selected for further analysis to address the spatial concerns of having a single-storey floor height on the ground floor that is immediately subdivided into 3 towers above.
It was observed that it is possible to reduce the modal frequency range by 2.6Hz where the depth of the branches was inversely proportional to the relative difference between modal frequencies However, the experiments show that the geometrical configuration of the branches seems to play an important role in reducing this range. Further study will use physical experiments to verify the results.
fig. 5.5.4
Comparing modal frequencies of each individual in three experiments
104 EXPERIMENTS AND RESULTS BRANCHING
0.0 2.0 3.0 4.0 5.0 6.0 7.0 8.0 10 8 7 6 5 4 3 2 1 0 10.0 9.0 8.0 7.0 6.0 5.0 4.0 3.0 2.0 1.0 0.0 9.0 10 9 8 7 6 5 4 3 10.0 0 1 2 1 10.0 9.0 8.0 7.0 6.0 5.0 4.0 3.0 2.0 1.0 0.0 10 9 7 6 5 4 3 2 1.0 Mode Number Ind 1-1 Ind 0-0 Ind 1-2 Ind 1-3 Ind 2-1 Ind 0-0 Ind 2-2 Ind 2-3 Ind 3-1 Ind 0-0 Ind 3-2 Ind 3-3 Mode Number Mode Number Frequency (Hz) Frequency (Hz) Frequency (Hz) Individals 1 Individals 2 Individals 3 5.5.0 5.5.0 5.5.0 5.5.1a 5.5.2a 5.5.3a 5.5.1b 5.5.2b 5.5.3b 5.5.1c 5.5.2c 5.5.3c RESULTS 5.5.1 RESULTS 5.5.2 RESULTS 5.5.3 105 BRANCHING
RESULTS 18.00 M Mode 2 1.097 Hz 18.00 M Mode 2 1.006 Hz 18.00 M Mode 2 1.000 Hz
EXPERIMENTS AND
5.3-5.5_CONCLUSIONS
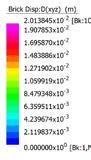
The results obtained in agent-based form finding, agent-based material optimisation, and branching experiments, help to simulate the structural implications of the building system. The computational limitations of the FEA software allowed for experimentation to occur on simple geometries, where the results are used to inform the final design.
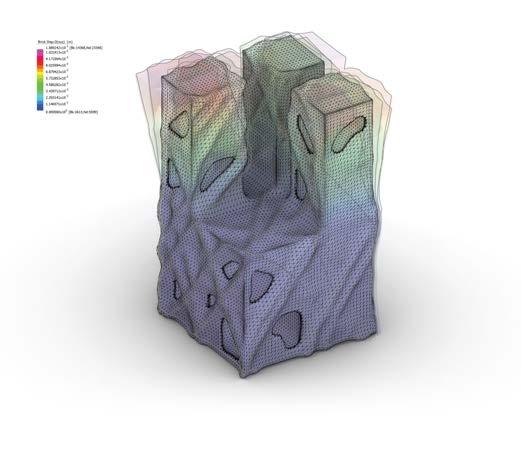
The global objectives of reducing material while maintaining structural performance and reducing the range and relative difference of modal frequencies are the drivers for every step.
Figure 5.5.5. shows the synthesized application of the last four experiments. The iteratively selected settings for the agent-based material optimisation are applied to the selected branched morphology. Namely, high density, high separation and high vision radius settings from 5.3.2bf and asymmetrical branching morphology are combined to produce a mesh where 0.3 metres of material is globally removed (from previous study).
Two building geometries are compared through FEA, with and without openings, to test displacement, stress, and natural frequency. The relative changes in modal frequencies are compared to the baseline geometry generated prior to agent-based material optimisation. The results are used to inform final building proposal.
Figure 5.5.5. shows modal frequency values for 3 selected geometries. As can be seen, the baseline geometry has the lowest modal frequency out of the three, however, the difference between the baseline geometry and the geometry without openings are negligible. Therefore, the focus shifts to the geometry with openings. The graph shows a drastic change between modes 5 and 6, versus a mild change between modes 8 and 9. As previous research has shown, the change in frequencies within the modes of a geometry occurs due to the hierarchical nature of the branched morphologies. As the number of modes increase, branches higher up in the hierarchy are excited and a shift occurs whenever subsequent branch is excited. It is evident that there is a direct correlation to the dimensional hierarchy of the branches and the number of modes at which they are excited; larger branches correlates to the lower modes, number of mode increases as branch size decreases.
fig. 5.5.5
Synthesised application of experiments 5.35.5 combining agent-based form finding, agent-based-material optimisation, and branching
Therefore, it is likely the shift in frequency between modes is gradual when modulating the sizes of the building branches to incrementally decrease with height. It is observed that the displacement and stress values between the geometries with and without openings negligibly vary, however, a significant decrease in volume by 15% shows this method is structurally feasible and optimises material usage.
106
EXPERIMENTS AND RESULTS BRANCHING 107 BRANCHING EXPERIMENTS AND RESULTS 1.0 2.0 3.0 4.0 5.0 6.0 7.0 8.0 9.0 10.0 0 1 2 3 4 Mode Number Ind 3-2 No Windows With Windows Frequency (Hz) 5 6 7 8 9 10 0.0
5.6_FLOOR SLABS
5.6.1_OVERVIEW
5.6.2_EXPERIMENTAL
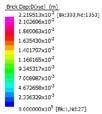
Material optimisation as an earthquake-resistant principle aims at reducing overall building mass resulting in lower moments of inertia during seismic events. Research has shown that up to 80% of a building´s mass corresponds to horizontal elements such as roofs and floor slabs. Experimentation was used to establish an agent-based model capable of optimising floor-plates of a mid-rise building by reducing material usage and minimising displacement.
Using inverted funicular solutions to generate a vaulted slab was the first step in the experimental setup used as the baseline individual to compare volume and displacement values.
From the initial vaulted slab, a shell surface was extracted and used as the base surface for an agent-based simulation. Self-weight structural analysis was performed to identify high stress areas on the surface and represented them as attractor points. Point emitters for an agentbased model were assigned based on where the slab surface meets an agent path on the façade of the building derived from previous experiments.
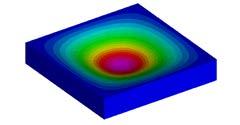
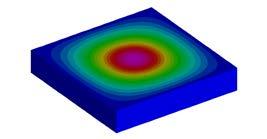
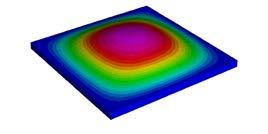
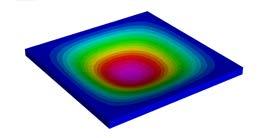
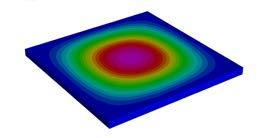
The simulation generated 10 iterations where agent paths were traced on the surface, rationalised and extruded to a top surface. The resulting surfaces were meshed using grasshopper plug-in, Cocoon, and each iteration was analysed via FEA to evaluate changes in displacement and volume.
As support points distribution on the slab varies, the resulting force flow is asymmetric and cannot be determined. The collective behaviour of agents as they respond to structural inputs facilitates the form finding process. FEA software is used to accurately evaluate the structural implications of the agent behaviour parameters on the simulation.
SLAB GEOMETRY SELF-WEIGHT DISPLACEMENT FLIP GEOMETRY OVER GROUND PLANE SELF WEIGHT ANALYSIS STRESS POINTS AS ATTRACTOR REDEFINE ANCHOR POINTS APPLY LIVE LOAD FORCES STRESS ANALYSIS VOLUME VS STRESS DISPLACEMENT REDUCTION AGENT RATIONALIZATION SLAB PROYECTION STRUCTURE ANCHOR POINTS AS EMITTERS STRUCTURE ANCHOR POINTS FUNICULAR METHOD AGENT BASED OPTIMISATION SECOND STRUCTURAL ANALEVALUATION 108 EXPERIMENTS AND RESULTS SLAB EXPERIMENTS
SETUP fig. 5.6.1 (left) Experimental workflow diagram fig. 5.6.2 (right) Using funicular principles to generate floor slabs in proposed 3-4 storey building
BOTTOM VIEW VAULTED SLAB
4. SOLID VAULTED SLAB
3. FLIPPED VAULTED SURFACE
2. SELF WEIGHT
109 SLAB EXPERIMENTS EXPERIMENTS AND RESULTS
1. INITIAL 15CM SLAB
An initial 15 cm thick slab (3 x 3 m) (refer to section 2.4.3. ) was used, representative of the typical spans in traditional Newari architecture. The target thickness for experimentation is 60cm to provide sufficient space for plumbing and electrical pipes. Through FEA, the experiment shows a 4cm displacement. This value was scaled by a factor of 17 to generate a 45cm cm slab to achieve a value closer to the target thickness. The bottom vaulted surface was then projected onto a flat surface 15 cm above, generating a solid vaulted slab.
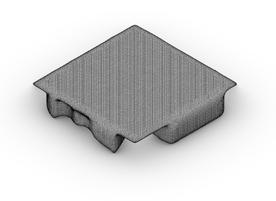
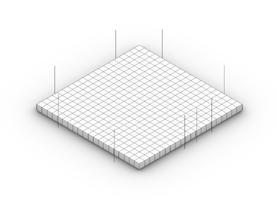
1. Boundary Condition:
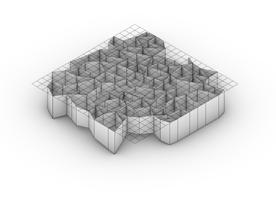
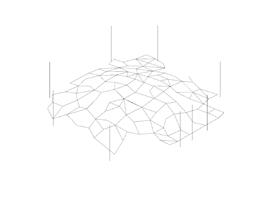
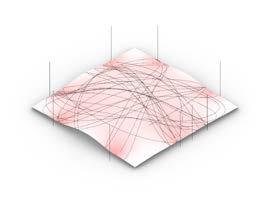
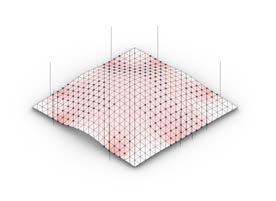
As mycelium composites work best in compression, each slab was assumed to be resting or connected to a wall on all four sides.
2. Agent Behaviour:
Agents are emitted from the resulting intersection points between the agent trails from the vertical agent system, and the vaulted shell surface. Attractor points are defined by high stress areas over the surface.
3. Loads:
Slabs are subjected to self-weight analysis as part of the funicular optimisation process. For the agent-based optimisation section all slabs are evaluated under a global area force of 800kg/m2 as the highest load scenario. Displacement among iterations is compared under the maximum load.
4. Target Displacement:
The maximum displacement tolerated is 0.1m under the specified load. This is to guarantee that no perceivable deformations occur during normal occupancy of the building.
110 EXPERIMENTS AND RESULTS SLAB EXPERIMENTS
fig. 5.6.3
Step-by-step process outlining inputs for agent-based system
1. INITIAL 0.15 M SLAB
3. AGENT TRAILS
5. TRAIL EXTRUSION
2. STRESS AREAS DEFINE ATTRACTOR POINTS
4. TRAIL RATIONALIZATION
111 SLAB EXPERIMENTS EXPERIMENTS AND RESULTS
6. MESHING
5.6.3_RESULTS
Agents were initialized to travel along a surface towards attractor points on the high stress areas. Agent behaviour is determined by each agents’ ability to perceive neighbouring agents within their vision radius. Forces of cohesion, separation and attraction affect agent behaviour only when agents fall among each other’s vision radius. Similarly, attractor points have a defined area of influence upon which they can influence the agent’s direction.
An initial simulation (5.6.a) using nine agents to generate a low-density path distribution that encompasses the surface. In subsequent iterations one parameter at a time was changed to keep track of behaviour changes in the simulation. A total of 10 iterations were analysed using the parameters highlighted in blue (see Figure 5.5.4).
Self-organisation is more apparent towards the end of the simulation, except in individual 5.6.h where the separation force is increased to 0.2, resulting in irregular behaviour.
After sub-dividing the agent lines, reducing the point count and triangulating according to distance, a structural analysis is performed to establish maximum global area load of 800 kg/ m2, exceeding Eurocode recommendations.
POINTS ATTRACTOR POINTS 112 1 Agent Mass 0.1 BODY SIZE 0.01 Max Speed 0.05 Max Force 0.01 Vision Radius 0.1 Number of Agents 2 INTERACTION FORCES Cohese Weight 0.02 Separate Weight 0.05 Align Weight 0.05 ATTRACT FORCE Weight 0.01 Mass 0.01 Distance Lower Limit 1 Distance Upper Limit 3 Agent Mass 0.1 BODY SIZE 0.01 Max Speed 0.05 Max Force 0.01 Vision Radius 0.1 Number of Agents 3 INTERACTION FORCES Cohese Weight 0.02 Separate Weight 0.05 Align Weight 0.05 ATTRACT FORCE Weight 0.01 Mass 0.01 Distance Lower Limit 1 Distance Upper Limit 3 Agent Mass 0.1 BODY SIZE 0.01 Max Speed 0.05 Max Force 0.01 Vision Radius 0.1 Number of Agents 3 INTERACTION FORCES Cohese Weight 0.02 Separate Weight 0.05 Align Weight 0.05 ATTRACT FORCE Weight 0.01 Mass 0.01 Distance Lower Limit 1 Distance Upper Limit 3 1 Distance Upper Limit 3 Agent Mass BODY SIZE 0.01 Max Speed 0.05 Max Force 0.01 Vision Radius 0.1 Number of Agents 3 INTERACTION FORCES Cohese Weight 0.05 Separate Weight 0.05 Align Weight 0.05 ATTRACT FORCE Weight 0.01 Mass 0.01 Distance Lower Limit 1 Distance Upper Limit 3 0.1 3 1 Distance Lower Limit 0.01 Mass 0.01 Weight ATTRACT FORCE 0.05 Align Weight 0.05 Separate Weight 0.1 Cohese Weight INTERACTION FORCES 3 Number of Agents 0.1 Vision Radius 0.01 Max Force 0.05 Max Speed 0.01 BODY SIZE 0.1 Agent Mass Distance Upper Limit 3 1 Distance Lower Limit 0.01 Mass 0.01 Weight ATTRACT FORCE 0.05 Align Weight 0.2 Separate Weight 0.05 Cohese Weight INTERACTION FORCES 3 Number of Agents 0.1 Vision Radius 0.01 Max Force 0.05 Max Speed 0.01 BODY SIZE 0.1 Agent Mass Distance Upper Limit
EMITTER
EXPERIMENTS AND RESULTS SLAB EXPERIMENTS
fig. 5.6.4 (pg.110-113)
Agent Mass BODY SIZE 0.01 Max Speed 0.05 Max Force 0.01 Vision Radius 0.01 Number of Agents 1 INTERACTION FORCES Cohese Weight 0.02 Separate Weight 0.05 Align Weight 0.05 ATTRACT FORCE Weight 0.01 Mass 0.01 Distance Lower Limit 1 0.1 Agent Mass BODY SIZE 0.01 Max Speed 0.05 Max Force 0.01 Vision Radius 0.01 Number of Agents 1 INTERACTION FORCES Cohese Weight 0.02 Separate Weight 0.05 Align Weight 0.05 ATTRACT FORCE Weight 0.01 Mass 0.01 Distance Lower Limit 1 0.1 Agent Mass 0.1 BODY SIZE 0.01 Max Speed 0.05 Max Force 0.01 Vision Radius 0.1 Number of Agents 2 INTERACTION FORCES Cohese Weight 0.02 Separate Weight 0.05 Align Weight 0.05 ATTRACT FORCE Weight 0.01 Mass 0.01 Distance Lower Limit 1 Distance Upper Limit 3 Agent Mass 0.1 BODY SIZE 0.01 Max Speed 0.05 Max Force 0.01 Vision Radius 0.1 Number of Agents 3 INTERACTION FORCES Cohese Weight 0.02 Separate Weight 0.05 Align Weight 0.05 ATTRACT FORCE Weight 0.01 Mass 0.01 Distance Lower Limit 1 Distance Upper Limit 3 Agent Mass 0.1 BODY SIZE 0.01 Max Speed 0.05 Max Force 0.01 Vision Radius 0.1 Number of Agents 3 INTERACTION FORCES Cohese Weight 0.02 Separate Weight 0.05 Align Weight 0.05 ATTRACT FORCE Weight 0.01 Mass 0.01 Distance Lower Limit 1 Distance Upper Limit 3 Distance Lower Limit 0.01 Mass 0.01 Weight ATTRACT FORCE 0.05 Align Weight 0.05 Separate Weight 0.02 Cohese Weight INTERACTION FORCES Number of Agents 0.1 Vision Radius 0.01 Max Force 0.05 Max Speed 0.01 BODY SIZE 0.1 Agent Mass Distance Upper Limit Agent Mass BODY SIZE 0.01 Max Speed 0.05 Max Force 0.01 Vision Radius 0.1 Number of Agents INTERACTION FORCES Cohese Weight 0.02 Separate Weight 0.05 Align Weight 0.05 ATTRACT FORCE Weight 0.01 Mass 0.01 Distance Lower Limit Distance Upper Limit 0.1 Agent Mass BODY SIZE 0.01 Max Speed 0.05 Max Force 0.01 Vision Radius 0.1 Number of Agents INTERACTION FORCES Cohese Weight 0.05 Separate Weight 0.05 Align Weight 0.05 ATTRACT FORCE Weight 0.01 Mass 0.01 Distance Lower Limit Distance Upper Limit 0.1 Distance Lower Limit 0.01 Mass 0.01 Weight ATTRACT FORCE 0.05 Align Weight 0.05 Separate Weight 0.1 Cohese Weight INTERACTION FORCES Number of Agents 0.1 Vision Radius 0.01 Max Force 0.05 Max Speed 0.01 BODY SIZE 0.1 Agent Mass Distance Upper Limit Distance Lower Limit 0.01 Mass 0.01 Weight ATTRACT FORCE 0.05 Align Weight 0.2 Separate Weight 0.05 Cohese Weight INTERACTION FORCES Number of Agents 0.1 Vision Radius 0.01 Max Force 0.05 Max Speed 0.01 BODY SIZE 0.1 Agent Mass Distance Upper Limit Agent Mass BODY SIZE 0.01 Max Speed 0.05 Max Force 0.01 Vision Radius 0.01 Number of Agents INTERACTION FORCES Cohese Weight 0.02 Separate Weight 0.05 Align Weight 0.05 ATTRACT FORCE Weight 0.01 Mass 0.01 Distance Lower Limit 0.1 Agent Mass BODY SIZE 0.01 Max Speed 0.05 Max Force 0.01 Vision Radius 0.01 Number of Agents INTERACTION FORCES Cohese Weight 0.02 Separate Weight 0.05 Align Weight 0.05 ATTRACT FORCE Weight 0.01 Mass 0.01 Distance Lower Limit 0.1 Agent Mass 0.1 BODY SIZE 0.01 Max Speed 0.05 Max Force 0.01 Vision Radius 0.1 Number of Agents INTERACTION FORCES Cohese Weight 0.02 Separate Weight 0.05 Align Weight 0.05 ATTRACT FORCE Weight 0.01 Mass 0.01 Distance Lower Limit Distance Upper Limit Agent Mass 0.1 BODY SIZE 0.01 Max Speed 0.05 Max Force 0.01 Vision Radius 0.1 Number of Agents INTERACTION FORCES Cohese Weight 0.02 Separate Weight 0.05 Align Weight 0.05 ATTRACT FORCE Weight 0.01 Mass 0.01 Distance Lower Limit Distance Upper Limit Agent Mass 0.1 BODY SIZE 0.01 Max Speed 0.05 Max Force 0.01 Vision Radius 0.1 Number of Agents INTERACTION FORCES Cohese Weight 0.02 Separate Weight 0.05 Align Weight 0.05 ATTRACT FORCE Weight 0.01 Mass 0.01 Distance Lower Limit Distance Upper Limit Distance Lower Limit 0.01 Mass 0.01 Weight ATTRACT FORCE 0.05 Align Weight 0.05 Separate Weight 0.02 Cohese Weight INTERACTION FORCES Number of Agents 0.1 Vision Radius 0.01 Max Force 0.05 Max Speed 0.01 BODY SIZE 0.1 Agent Mass Distance Upper Limit Agent Mass BODY SIZE 0.01 Max Speed 0.05 Max Force 0.01 Vision Radius 0.1 Number of Agents INTERACTION FORCES Cohese Weight 0.02 Separate Weight 0.05 Align Weight 0.05 ATTRACT FORCE Weight 0.01 Mass 0.01 Distance Lower Limit Distance Upper Limit 0.1 Agent Mass BODY SIZE 0.01 Max Speed 0.05 Max Force 0.01 Vision Radius 0.1 Number of Agents INTERACTION FORCES Cohese Weight 0.05 Separate Weight 0.05 Align Weight 0.05 ATTRACT FORCE Weight 0.01 Mass 0.01 Distance Lower Limit Distance Upper Limit 0.1 Distance Lower Limit 0.01 Mass 0.01 Weight ATTRACT FORCE 0.05 Align Weight 0.05 Separate Weight 0.1 Cohese Weight INTERACTION FORCES Number of Agents 0.1 Vision Radius 0.01 Max Force 0.05 Max Speed 0.01 BODY SIZE 0.1 Agent Mass Distance Upper Limit Distance Lower Limit 0.01 Mass 0.01 Weight ATTRACT FORCE 0.05 Align Weight 0.2 Separate Weight 0.05 Cohese Weight INTERACTION FORCES Number of Agents 0.1 Vision Radius 0.01 Max Force 0.05 Max Speed 0.01 BODY SIZE 0.1 Agent Mass Distance Upper Limit Agent Mass = 0.1 Vision Radius = 0.01 Number of Agents = 1 Cohese Weight = 0.02 Seaparate Weight = 0.05 Align Weight = 0.05 Weight = 0.01 Mass = 0.01 Lower Limit Dist = 1 Upper Limit Dist = 1 Agent Mass = 0.1 Vision Radius = 0.01 Number of Agents = 1 Cohese Weight = 0.02 Separate Weight = 0.05 Align Weight = 0.05 Weight = 0.01 Mass = 0.01 Lower Limit Dist = 1 Upper Limit Dist = 3 Agent Mass = 0.1 Vision Radius = 0.01 Number of Agents = 1 Cohese Weight = 0.02 Separate Weight = 0.05 Align Weight = 0.05 Weight = 0.01 Mass = 0.01 Lower Limit Dist = 1 Upper Limit Dist = 3 Agent Mass = 0.1 Vision Radius = 0.01 Number of Agents = 1 Cohese Weight = 0.05 Separate Weight = 0.05 Align Weight = 0.05 Weight = 0.01 Mass = 0.01 Lower Limit Dist = 1 Upper Limit Dist = 3 Agent Mass = 0.1 Vision Radius = 0.01 Number of Agents = 1 Cohese Weight = 0.1 Separate Weight = 0.05 Align Weight = 0.05 Weight = 0.01 Mass = 0.01 Lower Limit Dist = 1 Upper Limit Dist = 3 Agent Mass = 0.1 Vision Radius = 0.01 Number of Agents = 1 Cohese Weight = 0.05 Separate Weight = 0.2 Align Weight = 0.05 Weight = 0.01 Mass = 0.01 Lower Limit Dist = 1 Upper Limit Dist = 3 5.6a 5.6f 5.6b 5.6g 5.6c 5.6h 5.6d 5.6i 5.6e 5.6j Agent Mass = 0.1 Vision Radius = 0.1 Number of Agents = 1 Cohese Weight = 0.02 Separate Weight = 0.05 Align Weight = 0.05 Weight = 0.01 Mass = 0.01 Lower Limit Dist = 1 Upper Limit Dist = 3 Agent Mass = 0.1 Vision Radius = 0.01 Number of Agents = 2 Cohese Weight = 0.02 Separate Weight = 0.05 Align Weight = 0.05 Weight = 0.01 Mass = 0.01 Lower Limit Dist = 1 Upper Limit Dist = 3 Agent Mass = 0.1 Vision Radius = 0.01 Number of Agents = 3 Cohese Weight = 0.02 Separate Weight = 0.05 Align Weight = 0.05 Weight = 0.01 Mass = 0.01 Lower Limit Dist = 1 Agent Mass = 0.1 Vision Radius = 0.01 Number of Agents = 3 Cohese Weight = 0.02 Separate Weight = 0.05 Align Weight = 0.05 Weight = 0.01 Mass = 0.01 Lower Limit Dist = 1 Upper Limit Dist = 2 113
Results obtained by agent-based floor slab experiments
SLAB EXPERIMENTS EXPERIMENTS AND RESULTS
Volume = 2.89
Disp. = 0.8cm
EXPERIMENTS AND RESULTS SLAB EXPERIMENTS
Volume = 2.62 m3


Disp. = 1.1 cm
Volume = 3.36 m3
Disp. = 1.9 cm
Volume = 2.69 m3
Disp. = 0.7 cm
Volume = 2.73 m3
Disp. = 1.01 cm
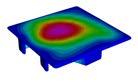
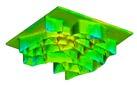


Volume = 2.53 m
Disp. = 0.8cm
Volume = 2.76 m
Disp. = 2.1 cm
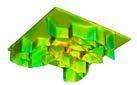
Volume = 2.59 m
Disp. = 0.9 cm
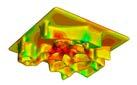
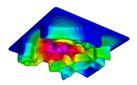
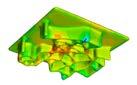
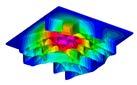
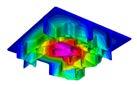
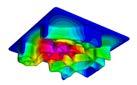
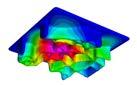
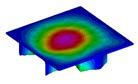
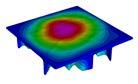
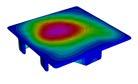
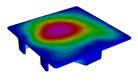
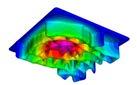
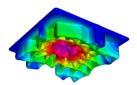
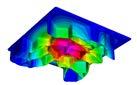
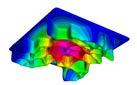

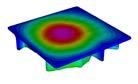

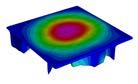
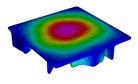
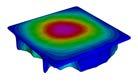
Volume = 2.08 m
Disp. = 0.8 cm
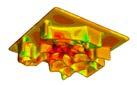
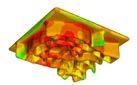
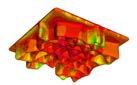
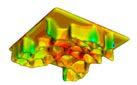
Volume = 2.75 m
Disp. = 1.3 cm
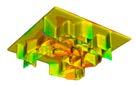
5.6a 5.6b
5.6d 5.6e
5.6c
114
5.6f 5.6g 5.6h 5.6i 5.6j
115
SLAB EXPERIMENTS EXPERIMENTS AND RESULTS
5.6.4_CONCLUSIONS
Out of the ten iterations, 6 individuals are below the maximum 0.1m accepted displacement. From these, individual 5.6i has the best displacement to volume ratio with a maximum displacement of 0.08m and volume 2.08m³. This implies a 43% material reduction compared to the baseline value of 3.67m³.
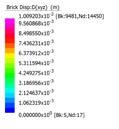
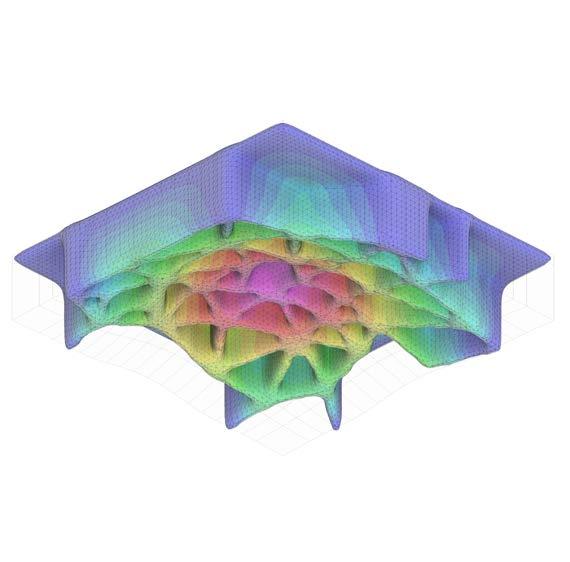
Iteration 5.6i displays the highest degree of self-organization; trails are more defined, and agents appear to cluster and redirect towards high stress areas better than any of the other iterations. Figure 5.5.5. shows the results of increasing the cohesion value from 0.05 to 0.1, where the resulting rationalised lines correlate to areas experiencing high stress. The low displacement implies forces are being successfully redirected in an efficient manner towards the vertical structural elements of the building. A higher definition in agent trail translates into more control in the rationalization process, thus increasing the efficiency of the optimisation sequence.
Agent behaviour depends heavily on the ability of agents to perceive each other within a vision radius, thus care must be taken when switching scales. As the simulation space increases so must the agent number or vision radius to guarantee meaningful flocking behaviour and agent interactions. Although structural performance of the slab is within range, future research should focus on how additional horizontal forces impact the seismic behaviour in the building.
EXPERIMENTS AND RESULTS SLAB EXPERIMENTS
fig. 5.5.5
116 ANCHOR POINTS ANCHOR POINTS EMITTER POINTS INITIAL VAULTED SLAB MAXIMUM STRESS AGENT TRAILS SLAB EXPERIMENTS EXPERIMENTS AND RESULTS 117
Results of increasing cohesion forces, lines correlate to areas experiencing high stress
5.7_MYCELIUM GROWTH


5.7.1_OVERVIEW
Data obtained in previous studies indicated that there are sensitivities to consider during the mycelium growth process. According to the Delft University of Technology, the material can grow in dark environments with temperatures between 14 and 24OC. In our study, mycelium was grown (20 days) in a humidity-controlled outdoor shed, using fungal spores that were both laboratory-engineered and locally sourced. The intention of the experiment was to test the physical properties of mycelium to verify results from computational studies, however, due to difficulties in the growing process, the experiment investigated how to generate a myceliumbased composite for self-build construction in an environment outside the laboratory. To ensure a homogenous structure, one experiment tested the ability to fuse discrete pieces before the growth process completes. The resulting samples were visually analysed and used to inform transformative formwork experimentation.
5.7.2_RESULTS
Figure 5.7.2. shows initial experiments grown in 120 mm x 120 mm acrylic boxes. As can be seen, pre-sterilised laboratory-engineered spores yielded significantly stronger samples, free of contamination. Samples that used locally sourced fungal spores, requiring in-house sterilisation through boiling substrates, were contaminated within four days of mycelium growth.
Furthermore, the sequence of growth also impacted the quality of the resulting sample. It can be observed that growing the mycelium-composite directly in the desired formwork yields contaminated samples, whereas, allowing the growth process to occur in a filter bag for 10 days and transferring the sample after to the formwork can prevent contamination. In addition, it was observed that discrete pieces do, in fact, fuse before full growth, however, the strength of the joint should be tested for structural performance.
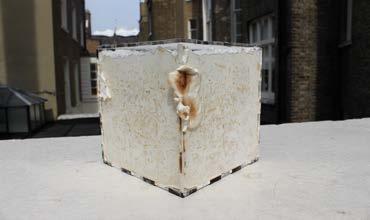
Through tactile observation, it is evident that harder substrates, such as hardwoods (aspen), correlates to stronger mycelium-composites. Although all types of substrates use a similar growing process, it is advised to use hardwoods for building construction


DAY 01
DAY 02
DAY 07 DAY 09
DAY 11
DAY 13 DAY 15
FRONT RIGHT BACK LEFT TOP
fig. 5.7.1 (left)
Growth in acrylic box using lab-engineered mycelial spore
fig. 5.7.2 (right)
118 EXPERIMENTS AND RESULTS MYCELIUM 119 MYCELIUM EXPERIMENTS AND RESULTS
Growth in acrylic box using locally sourced mycelial spore
DESIGN PROPOSAL
120
121
PROPOSED BUILDING
EMERGENCY ASSEMBLY POINT
PROPOSED WALKING PATHS
Neighbourhood blocks are planned in accordance with the Sendai Plan while considering local building protection laws. Houses within the neighbourhood block are 10 minutes walking distance from the nearest safe zone and the minimum distance between a temple and building is 15m, creating urban plazas. This further aides in creating an interconnected network of open spaces throughout the city for public use.
SAFE ZONE PERIMETER
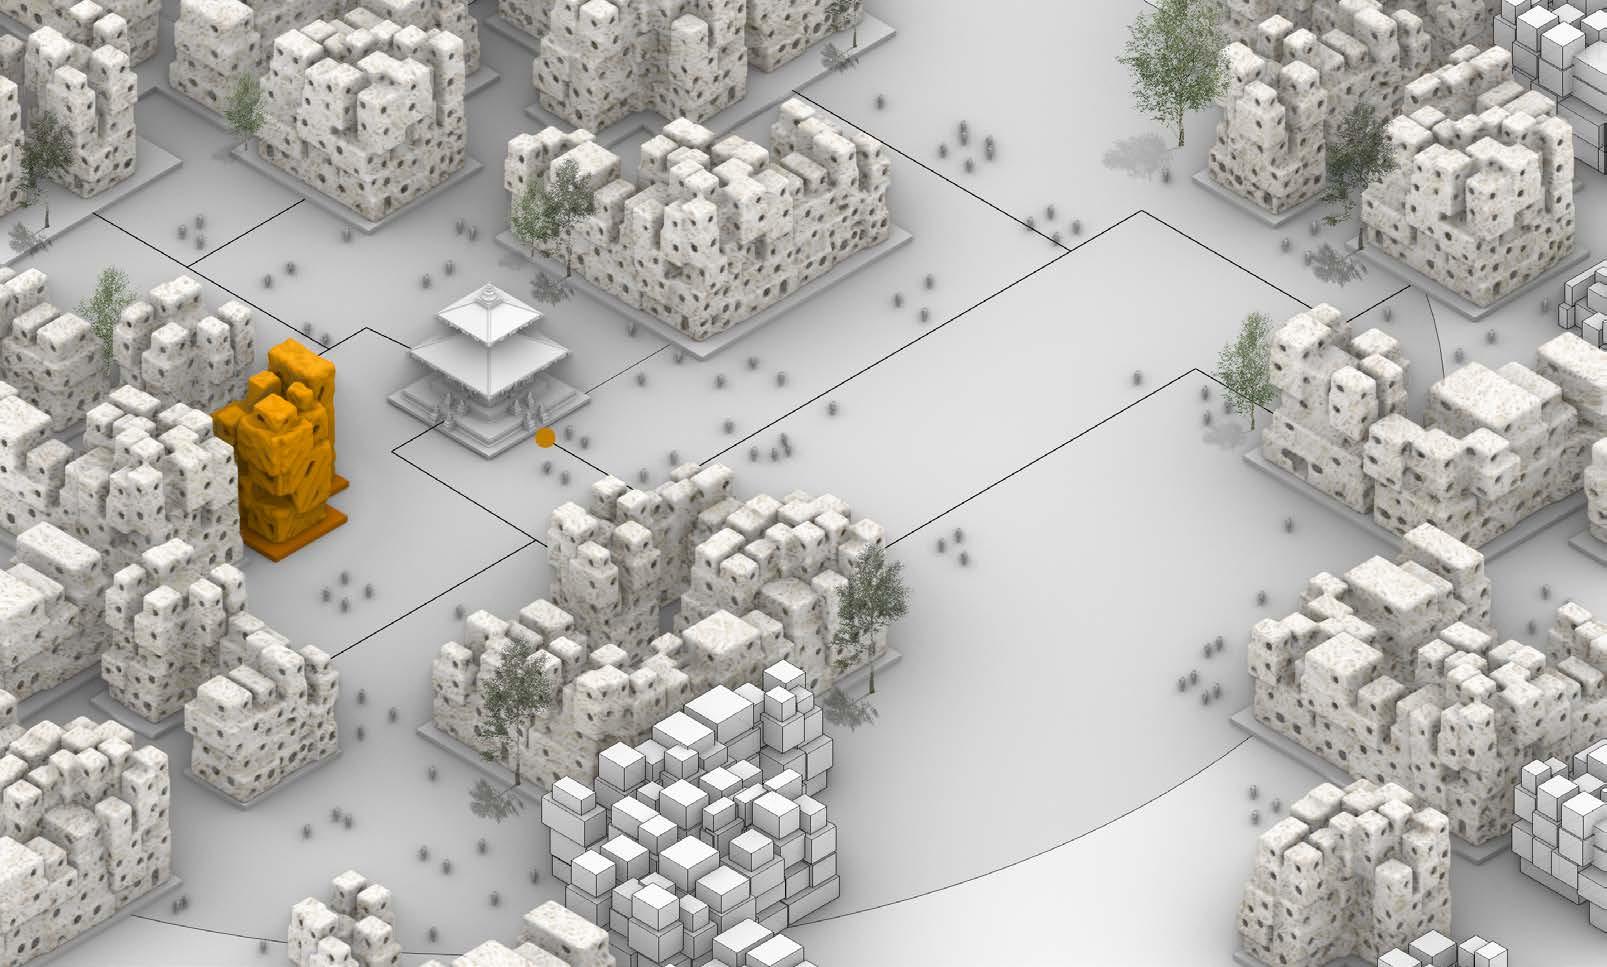
DESIGN PROPOSAL NEIGHBORHOOD PATCH 123 NEIGHBORHOOD PATCH DESIGN PROPOSAL
A neighbourhood block is selected from the iterations of the first experiment and spatial conditions are generated within the prevalent urban parameters. The geometry is rationalised and analysed to produce inputs for the next step in the process. Selected results from the agent-based material optimisation experiments are applied. The resultant geometry is rationalised for architectural detailing.
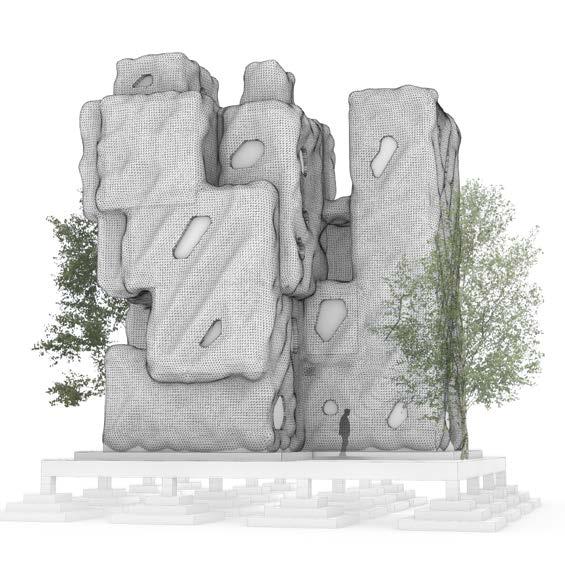
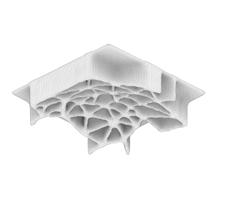
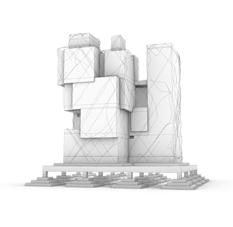
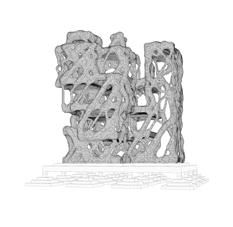
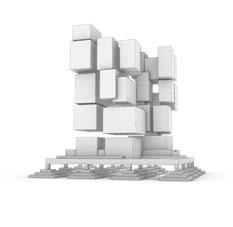
124 DESIGN PROPOSAL BUILDING DETAILS
125 BUILDING DETAILS DESIGN PROPOSAL
At areas of intersection between the walls and slabs, through the process of funicular vaulting, slab depths have been reduced while creating usable spaces for building services. At the roof condition, the vaulted roof is resolved into a parapet detail with an inclined roof finish for water drainage.
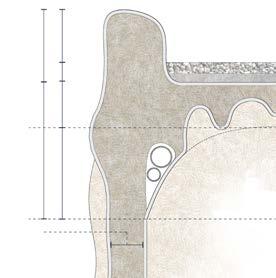
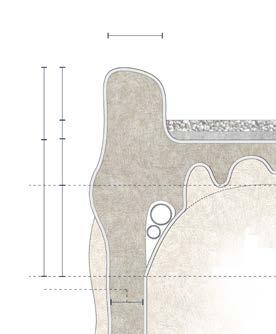
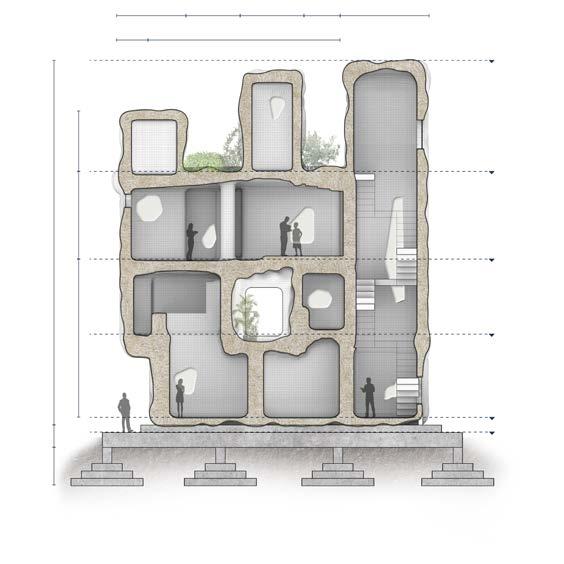
15 m 2.75 m 1.2 m 9.7 m 2.2 m 2.7 m 1.8 m 3.8 m 6.5 m 3.5 m 2.6 m 0.9 m 1.2 m GL ±0 m FL 0.55 m FL 3.9 m FL 6.7 m FL 10.6 m FL 15.3 m 126 DESIGN PROPOSAL BUILDING DETAILS GRAVEL LEVELING MORTAR WATER PROOFING PARAPET OPTIMISED SLAB PLUMBING AND ELECTRICAL EXTERNAL SURFACE FINISH 20 cm 50 cm 70 cm 40 cm 10 cm 30 cm 30 cm 15 cm MYCELIUM COMPOSITE 127 BUILDING DETAILS DESIGN PROPOSAL
NICELIUM COMPOSITE
EXTERNAL SURFACE FINISH
POROUS WOODEN FASTENER
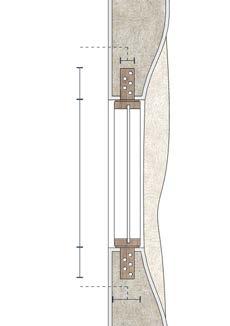
WOODEN FRAME
GLASS WINDOW
Mycelium panels connecting directly with the foundation are created through custom formwork allowing for 0.75m tall concrete half walls. These are routed with tubular holes through which mycelium is packed and fused with the superstructure.
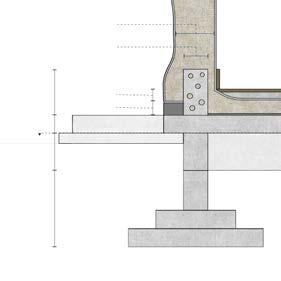
MYCELIUM COMPOSITE
WIRE MESH
PLASTER STUCCO
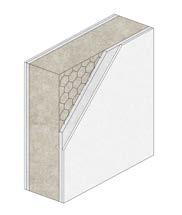
PAINT FINISH
For mycelium panels contain door and window frames, custom formwork is created allowing for customised frame dimensions. Wooden frames are routed with tubular holes through which mycelium is packed and fused to the superstructure. To increase the lifespan of the material, a constant layer of waterproofing must be applied on all surfaces before applying any finishing materials. The proposed surface finish consists of a wire-mesh followed by plastering and painting.
MYCELIUM
POROUS
FLOOR
HIDDEN MATERIAL INTERFACE RCC FOUNDATION PLINTH 120 cm 75 cm 25 cm 75 cm 15 cm 30 cm 50 cm 20 cm GL ±0 m 128 DESIGN PROPOSAL BUILDING DETAILS
COMPOSITE
CONCRETE FASTENER
FINISH
129 BUILDING DETAILS DESIGN PROPOSAL 20 cm 120 cm 20 cm 5 cm 5 cm
VENTILATION CONTROL
HUMIDITY AND TEMPERATURE CONTROL
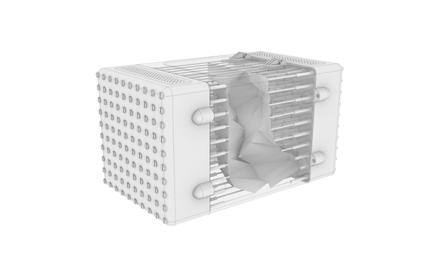
UV CONTROL COVER
ACTUATORS
ABS SIDE PANEL
TELESCOPIC DOWELS
SIDE CLIPS
FABRIC + KERFING PANEL
SUB-HEADING
TELESCOPIC DOWELS
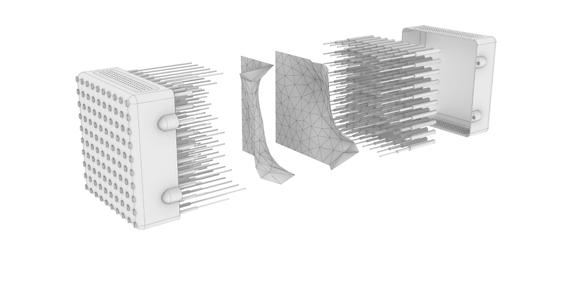
FABRIC + KERFING PANEL
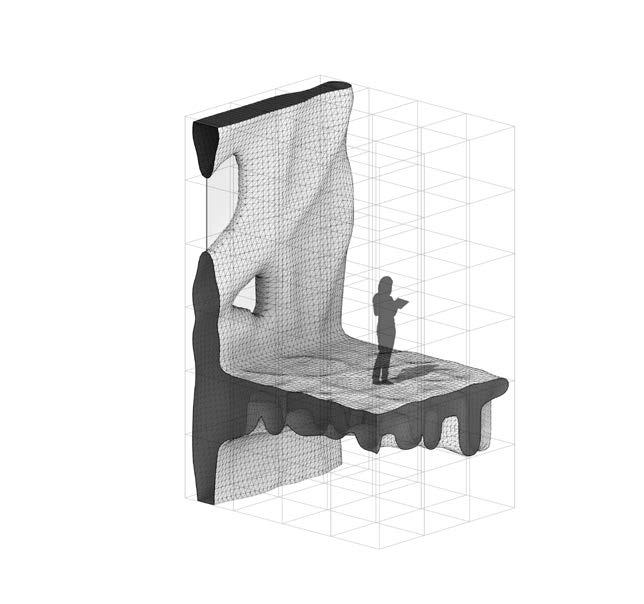
130 DESIGN PROPOSAL BUILDING DETAILS
131 BUILDING DETAILS DESIGN PROPOSAL
The building is constructed by using the proposed boxed framework in situ. Users can grow mycelium-composites in a temperature controlled environment. Before drying, the user can assemble discrete 'live' pieces using their smartphone. Once assembly has completed, the mycelium is dried and a new home is built.
133
CONCLUSION
The 2015 Nepal earthquake has displaced over 6.6 million lives in the Kathmandu valley where 600,000 homes were destroyed, largely due to outdated construction methods using adobe bricks. Kathmandu’s density and pollution has increased the demand for inexpensive, self-built infrastructure that is earthquake-resistant and ecologically produced. However, the local government has done little to find a balanced solution.
This research designed and proposed an earthquake-resistant building and earthquakeresponsive urban plan that uses mycelium-composites as locally-sourced building alternatives. We tested building geometries that increase earthquake resistance, optimise material usage, and enhance spatial occupation for victims to reconstruct their homes.
We found that 3-4 storey globally branched building structures, grown of mycelium, do, in fact, increase earthquake resistance. By generating an agent-based form-finding algorithm with knowledge acquired through physical prototyping, this research offers an ecological construction methodology.
The scope of work contributes to advancements in bioengineering, confirming easy-to-grow, light-weight mycelium-composites as viable structural materials for construction. Experiments show that the building geometry has more influence on structural performance than the material properties. The study therefore indicates that the benefits gained from agentbased simulations address earthquake-resistance. Most notably, this is the first study to our knowledge to investigate a complete architectural system using bio-materials incorporating all scales from urban planning to fabrication and assembly while tackling seismic consequence.
Our results provide compelling evidence for a methodology to design and construct a 3-4-storey building and suggest that this approach is effective for communities that are susceptible to natural disasters. However, some limitations are worth noting. Although we were able to grow 1:1 mycelium samples to produce curvature generated by agent-based simulations, the growth process is inconsistent and made it difficult to physically test the material for architectural application. Future work should therefore address engineering a mycelium- composite for complex homogeneous structures that shift the industry standard for earthquake-resistant buildings.
135
REFERENCES
1,2,3,6,18
He Lulu, Aitchison Jonathan, Hussey Karen, “Accumulation of vulnerabilities in the aftermath of the 2015 Nepal Earthquake: Household displacement, livelihood changes, recovery challenges,” (2018)
7,19
Gautam, Pitambar, “Environmental magnetic approach towards the quantification of pollution in Kathmandu urban area, Nepal” Physics and chemistry of the earth, 29 (2004)
11,12,20-24
Galetzka, J. “Slip pulse and resonance of the Kathmandu basin during the 2015 Gorkha Earthquake,” Science Magazine (2015)
32,33,34,45
Haneef Muhammad, Ceseracciu Luca, “Advanced Materials from Fungal Mycelium: Fabrication and Tuning of Physical Properties,” Scientific Reports (2017)
35,36,38,40
Jones Mitchell, “Mycelium Composites: A Review of Engineering Characteristics and Growth Kinetics,” Journal of Bionanoscience (2017)
46,47,48
Kalantar Negar, Borhani Alireza, “Informing Deformable Formworks” CAARDIA Conference 2017
41
Appels Freek, Camere Serena, Montalti Maurizio “Fabrication factors influencing mechanical, moisture-and water-related properties of mycelium-based composites (2018)
49,50
https://fologram.com/
42
https://momaps1.org/
43 http://block.arch.ethz.ch/brg/project/mycotree-seoul-architecturebiennale-2017
44 https://www.mogu.bio/
4,5,8,9
http://theconversation.com/two-years-after-the-earthquake-why-hasnepal-failed-to-recover-77552
10,13,14,15
Wolfgang Korn, The Traditional Architecture of the Kathmandu Valley, vol. 11, III (Kathmandu, Nepal: Ratna Pustak Bhandar, n.d.).
16
National Planning Comission Secretariat, “National Population and Housing Census 2011” (Central Bureau of Statistics, 2012), https:// unstats.un.org/unsd/demographic-social/census/documents/Nepal/ Nepal-Census-2011-Vol1.pdf.
51 https://www.city.sendai.jp/shinsaifukko/shise/daishinsai/fukko/kanren/ kekaku/documents/english14511_cover-p2.pdf
30,31,59
Hanns-Christof Spatz and Benoit Theckes, “Oscillation Damping in Trees,” Plant Science 207 (June 2013): 66–71, https://doi.org/10.1016/j. plantsci.2013.02.015. P.66
52,53
James Kenneth, Haritos Nicholas “Mechanical Stability of Trees under Dynamic Loads” American Journal of Botany 93 (2006)
60,61
Andrew Charleson, Seismic Design for Architects: Outwitting the Quake, 1. ed (Oxford: Elsevier/Architectural Press, 2008). P.13
62 Erdine, Elif. “Biomimetic Strategies in Tower Design,” n.d., 10. 63 Boids, Craig Reynolds, https://www.red3d.com/cwr/boids/)
136
137
APPENDIX
138
139
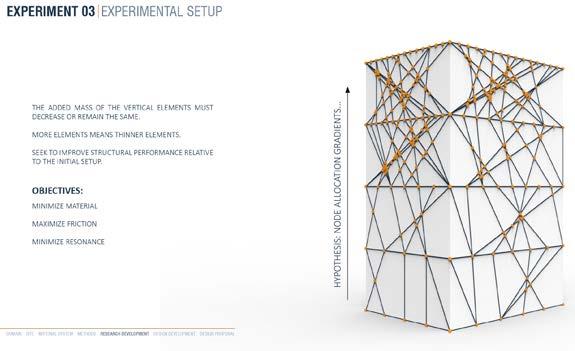
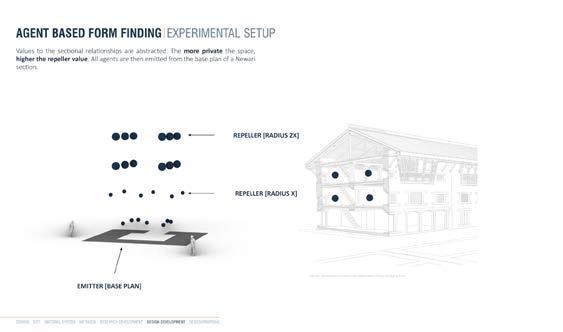
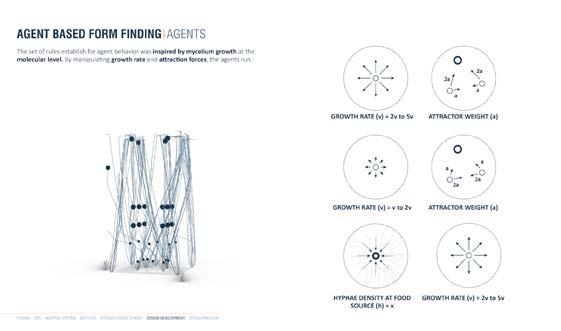
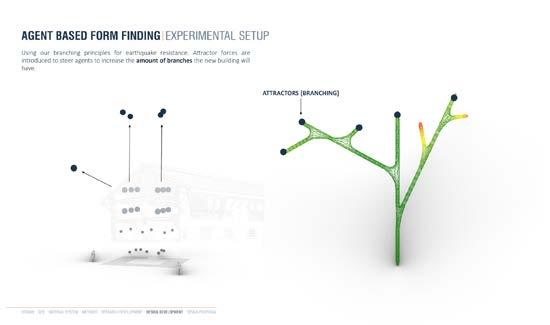
APPENDIX PRELIMINARY EXPERIMENTS PRELIMINARY EXPERIMENTS APPENDIX 140 141
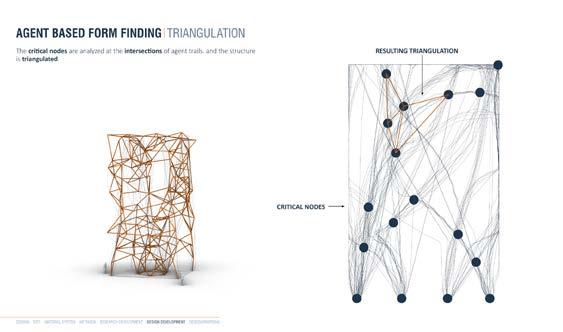
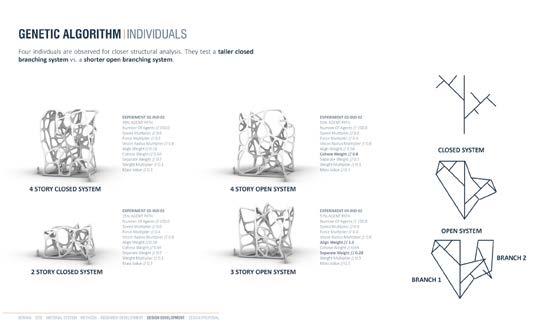
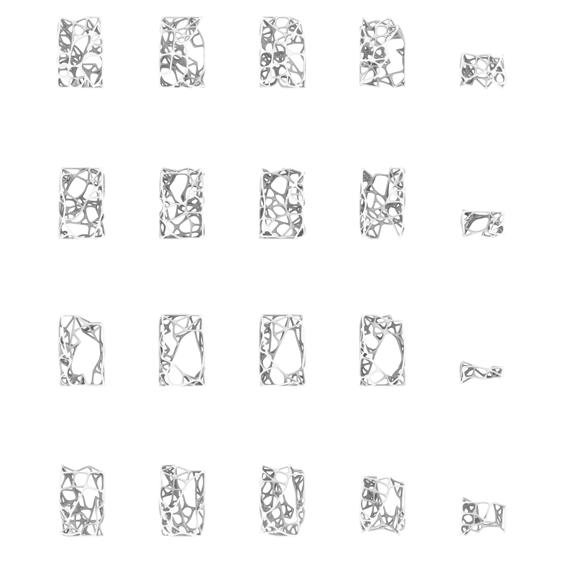
APPENDIX PRELIMINARY EXPERIMENTS PRELIMINARY EXPERIMENTS APPENDIX 142 143
import rhinoscriptsyntax as rs import Rhino as rc
from random import *
rectX = 50
rectY = 30
class Runner:
def __init__(self, p, v): #position, vel, acc
self.p = p
self.v = v
self.a = rs.VectorCreate( (0,0,0),(0,0,0) )
def ptRun(self):
self.v = rs.VectorAdd(self.v, self.a)
v = rs.VectorLength(self.v)
if v > .2:
self.v = rs.VectorScale(rs.VectorUnitize(self.v), 0.5)
self.p = rs.VectorAdd(self.p, self.v)
self.a = rs.VectorCreate( (0,0,0),(0,0,0) )
def reflect(self):
if self.p[0] >= rectX or self.p[0] < 0: self.v[0] *= 0
if self.p[1] >= rectY or self.p[1] < 0: self.v[1] *= 0
def flock(self):
self.separate(ms)
self.cohesion(mc)
self.align(ma)
self.attractor(mat)
self.repeler(mar)
def align(self, mag):
steer = rs.VectorCreate( (0,0,0) , (0,0,0) )
count = 0
for i in pts:
distance = rs.Distance(i.p, self.p)
if distance > 0 and distance < 4:
steer = rs.VectorAdd(steer, i.v)
count += 1
if count>0:
steer = rs.VectorScale(steer, 1.0/ count) #longer it runs, slower it gets
steer = rs.VectorScale(steer, mag)
self.a = rs.VectorAdd(self.a, steer)
def cohesion(self, mag):
sum = rs.VectorCreate( (0,0,0) (0,0,0) )
count = 0 for i in pts:
distance = rs.Distance(i.p, self.p)
if distance > 0 and distance < 6:
sum = rs.VectorAdd(sum, i.p)
count += 1
if count>0:
sum = rs.VectorScale(sum, 1.0/count)
steer = rs.VectorSubtract(sum, self.p)
steer = rs.VectorScale(steer, mag)
self.a = rs.VectorAdd(self.a, steer)
#print(self.a)
def separate(self, mag):
steer = rs.VectorCreate( (0,0,0) (0,0,0) )
count = 0 for i in pts:
distance = rs.Distance(i.p, self.p)
if distance > 0 and distance < 3:
diff = rs.VectorSubtract(self.p, i.p)
diff = rs.VectorUnitize(diff)
diff = rs.VectorScale(diff, 1.0/distance)
steer = rs.VectorAdd(steer diff)
count += 1
if count>0:
steer = rs.VectorScale(steer, 1.0/ count)
steer = rs.VectorScale(steer, mag)
self.a = rs.VectorAdd(self.a, steer)
#print(self.a)
def attractor(self, mag):
steer = rs.VectorCreate((0,0,0), (0,0,0)) for aPt in aPts:
distance = rs.Distance(self.p, aPt)
if distance < 10:
diff = rs.VectorSubtract(aPt, self.p)
diff = rs.VectorUnitize(diff)
steer = rs.VectorAdd(steer, diff)
steer = rs.VectorScale(steer, mag*2)
self.a = rs.VectorAdd(self.a, steer)
def repeler(self, mag):
steer = rs.VectorCreate((0,0,0), (0,0,0))
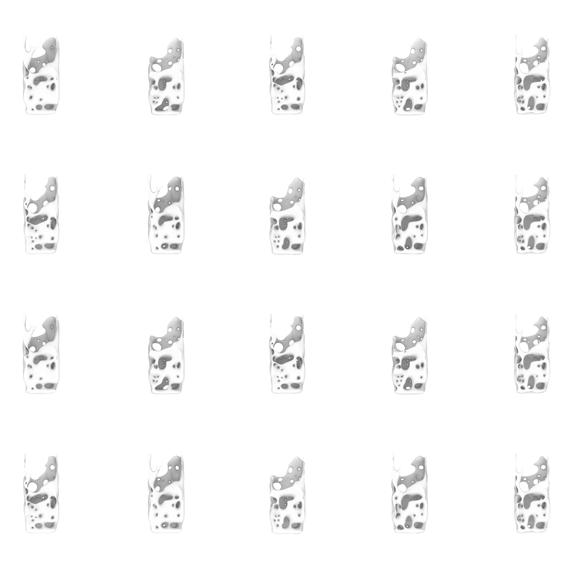
for rPt in rPts:
distance = rs.Distance(self.p, rPt) if distance < 4:
diff = rs.VectorSubtract(rPt, self.p) diff = rs.VectorUnitize(diff)
steer = rs.VectorAdd(steer, diff)
steer = rs.VectorScale(steer, -mag)
self.a = rs.VectorAdd(self.a, steer) def drawPt(self):
pt = rc.Geometry.Point3d(self.p[0], self.p[1], self.p[2])
return pt
if reset: #add vector and position to runner
class
pts = [] for pt in ePts:
for in range(Nbranch):
p = pt
v = rs.VectorCreate(rs.AddPoint( 0,0,randint(20,30)),rs.AddPoint(0,0,0))
run1 = Runner(p, v)
pts.append(run1)
else:
pos = []
vec = []
if not stop:
for in pts:
pos.append(i.drawPt())
vec.append(i.v)
for in pts:
i.reflect()
i.flock()
i.ptRun()
else:
for in pts:
pos.append(i.drawPt())
vec.append(i.v)
plane = rs.WorldXYPlane()
rect = rs.AddRectangle(plane, rectX, rectY)
APPENDIX PRELIMINARY EXPERIMENTS PRELIMINARY EXPERIMENTS APPENDIX 144 145
// if (iReset || centers == null)
centers = new List<Point3d>(iStartingPositions);
for( int c = 0; c < iterationCount; c++){
Point3dList centers3d = new Point3dList(centers);
Point3dList curvePoints3d = new Point3dList(curvePoints);
List<Vector3d> totalMoves = new List<Vector3d>();
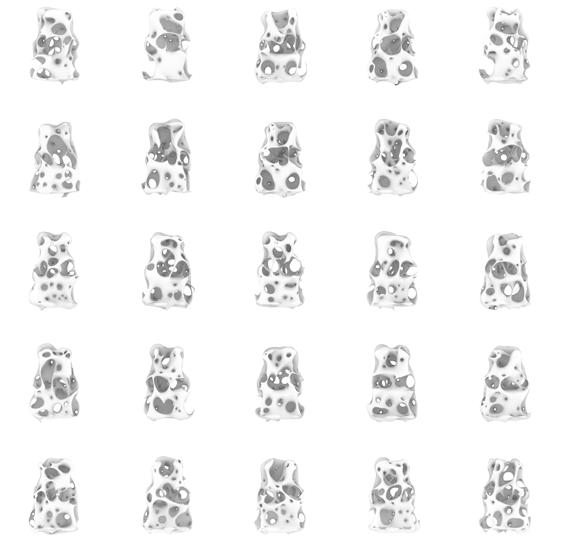
List<Vector3d> totalMovesToCurve = new List<Vector3d>();
List<double> collisionCounts = new List<double>();
List<List<double>> curveDistance = new List<List<double>>();
List<double> minDist = new List<double>();
List<Point3d> closestPointOnCurve = new List<Point3d>();
List<double> weightOfPoints = new List<double>();
//PointCloud curvePointCloud = new PointCloud(curvePoints);
for (int = 0; < centers.Count; i++)
{
totalMoves.Add(new Vector3d(0.0, 0.0, 0.0));
totalMovesToCurve.Add(new Vector3d(0.0, 0.0, 0.0));
collisionCounts.Add(0.0); minDist.Add(0.0);
closestPointOnCurve.Add(new Point3d(0, 0, 0)); weightOfPoints.Add(0.0); }
for (int = 0; < centers3d.Count; i++)
{ int closestIndex = curvePoints3d.ClosestIndex(centers3d[i]);
closestPointOnCurve[i] = curvePoints3d[closestIndex];
weightOfPoints[i] = curveWeights[clos-
estIndex]; }
oMinDist = closestPointOnCurve; //This is gonna move the circles away from the curve points for (int i = 0; i < centers.Count; i++) { double d = centers[i].DistanceTo(closestPointOnCurve[i]);
if (d > collisionDistance)
{ // move towards curve points
Vector3d move = centers[i] - closestPointOnCurve[i]; move.Unitize();
move *= 1 * (weightOfPoints[i] - d); totalMoves[i] += move; collisionCounts[i] += 1.0; } else { // move away from curve points
Vector3d move = centers[i] - closestPointOnCurve[i]; move.Unitize();
move *= -1 * (weightOfPoints[i] - d); totalMoves[i] += move; collisionCounts[i] += 1.0; } } //--------------------------------------------
//FOLLOWING CODE MOVES CIRCLES AWAY FROM EACH OTHER //--------------------------------------------
for (int i = 0; i < centers.Count; i++) for (int = + 1; < centers.Count; j++)
{ double d = centers[i].DistanceTo(centers[j]);
if (d > collisionDistance) continue;
Vector3d move = centers[i] - centers[j]; move.Unitize(); move *= 0.5 * (collisionDistance - d); totalMoves[i] += move; totalMoves[j] -= move; collisionCounts[i] += 1.0; collisionCounts[j] += 1.0; }
for (int i = 0; i < centers.Count; i++) if (collisionCounts[i] != 0.0) centers[i] += (totalMoves[i] + totalMovesToCurve[i]) / collisionCounts[i]; ;// Aca adicionamos movimiento alejandose de la curva }
oCenters = centers; //-------------------------------------------//--------------------------------------------
// <Custom additional code> List<Point3d> centers;
}
APPENDIX PRELIMINARY EXPERIMENTS PRELIMINARY EXPERIMENTS APPENDIX 146 147
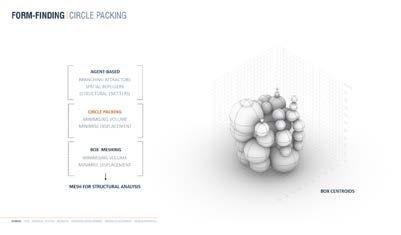
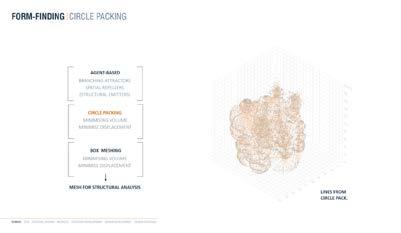
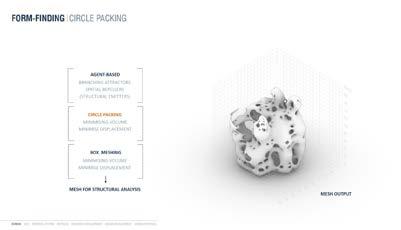
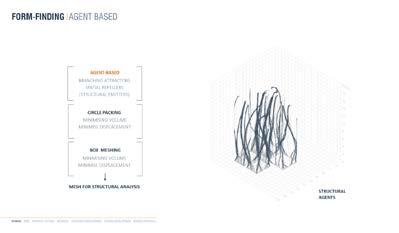
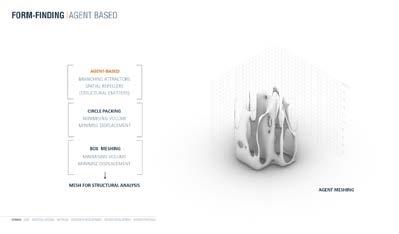

APPENDIX PRELIMINARY EXPERIMENTS PRELIMINARY EXPERIMENTS APPENDIX 148 149
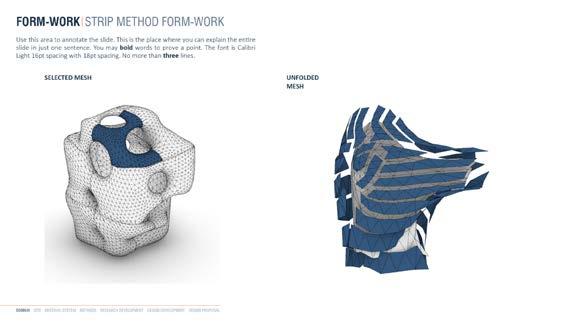
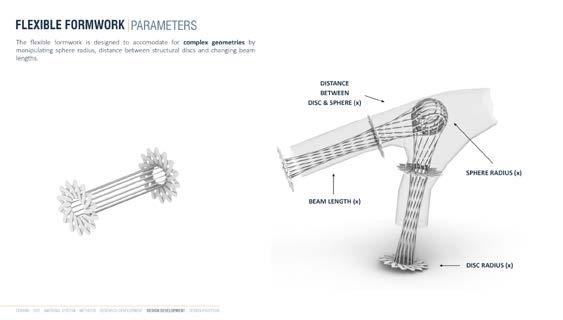
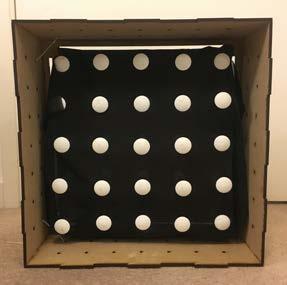
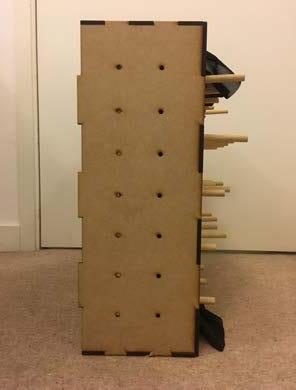
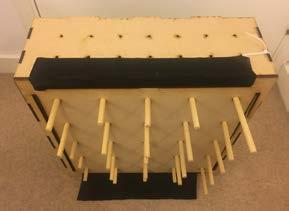
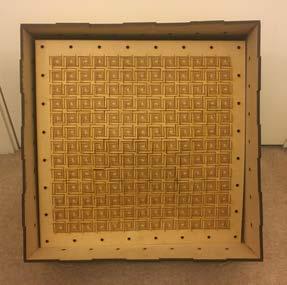
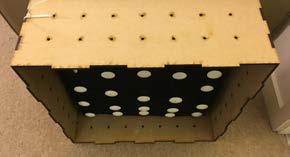
APPENDIX PRELIMINARY EXPERIMENTS PRELIMINARY EXPERIMENTS APPENDIX 150 151
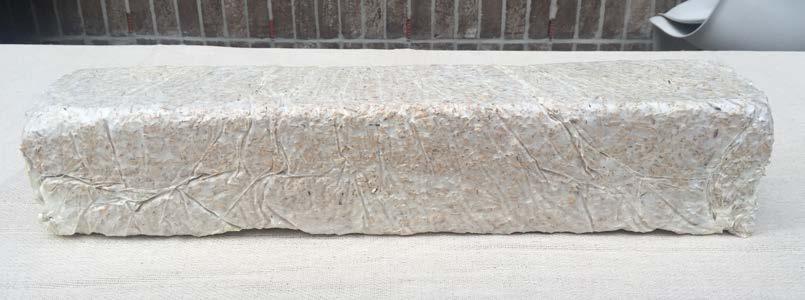
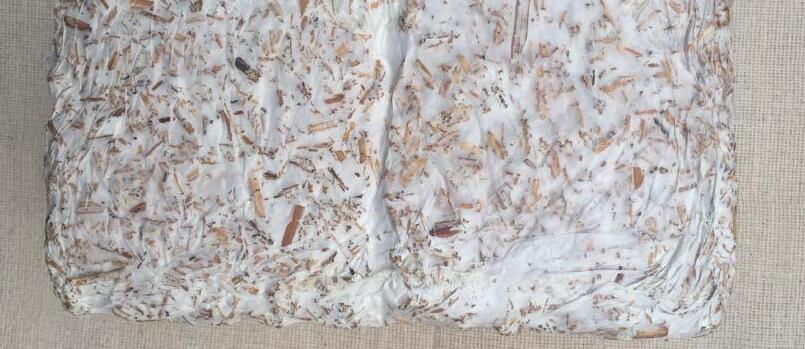
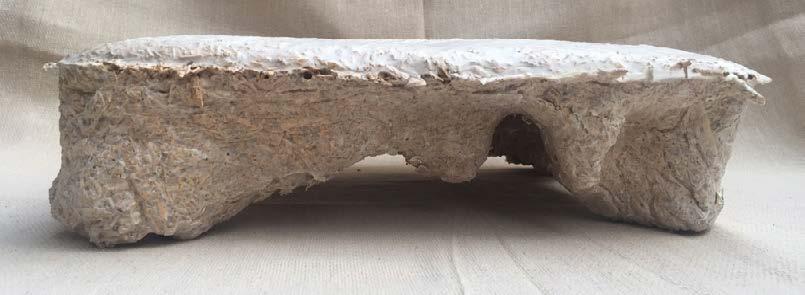
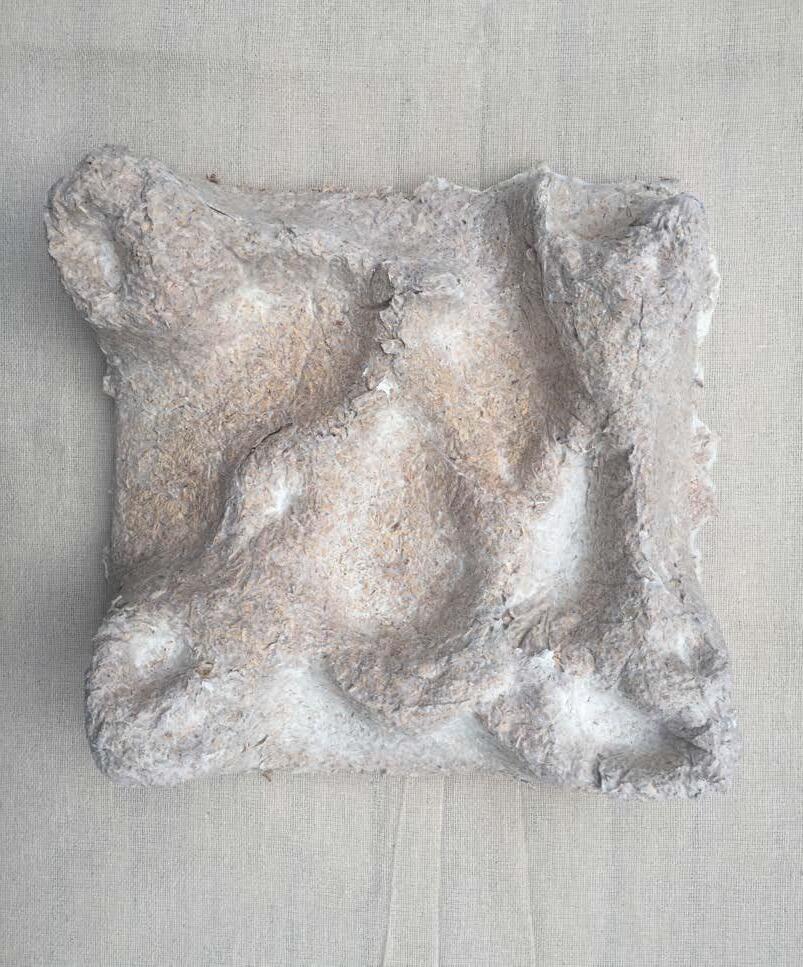
APPENDIX PRELIMINARY EXPERIMENTS PRELIMINARY EXPERIMENTS APPENDIX 152 153
a material resonant system
INFRASONIC

