INTERSTICE
AN EXPLORATION INTO LONDON’S HOUSING CRISIS
Architectural Association School of Architecture
Master of Science Emergent Technologies and Design 2021-2022

Course Director
Founding Director
Studio Master
Studio Tutors
Dr. Elif Erdine
Dr. Michael Weinstock
Dr. Milad Showkatbakhsh
Lorenzo Santelli
Studio Tutors Felipe Oeyen
Studio Tutors Eleana Polychronaki
INTERSTICE; An Exploration into London’s Housing Crisis
MSc. Candidate
MSc. Candidate
MSc. Candidate
Yael Johnson
MSc. Candidate Baris Doga Cam
Brendan O’Rourke
Zhaoheng Chen
PROGRAMME:
YEAR:
COURSE TITLE:
DISSERTATION TITLE:
ARCHITECTURAL ASSOCIATION SCHOOL OF ARCHITECTURE GRADUATE SCHOOL PROGRAMMES
Emergent Technologies and Design
2021-2022
MSc. Dissertation Interstice
STUDENT NAMES:
Baris Doga Cam, Brendan O’Rourke , Yael Johnson , Zhaoheng Chen
DECLARATION:
“I certify that this piece of work is entirely my/our and that my quotation or paraphrase from the published or unpublished work of other is duly acknowledged.”
SIGNATURE OF THE STUDENT:
DATE:
24 September 2022
(Baris Doga Cam) (Brendan O’Rourke) (Yael Johnson) (Zhaoheng Chen)ACKNOWLEDGEMENTS
We would like to express our gratitude to Michael Weinstock, Elif Erdine and Milad Showkatbaksh for their guidance and support in the development of this project and during our time at the Architectural Association. We would also like to thank Lorenzo Santelli, Eleana Polychronaki and Felipe Oeyen for their helpful feedback and suggestions. Finally, we would like to acknowledge the support of our families, friends and our colleagues at the Emergent Technologies and Design programme.

ABSTRACT
London is one of the fastest growing cities in Europe, with a current population of 9.5 million. The city’s rapid population growth is putting tremendous strain on the already overloaded housing market. Densification strategies need to be implemented in London to alleviate this housing crisis. Past strategies such as mass housing projects and urban sprawl have proven to be ineffective in many ways such as disrupting the urban fabric, overloading the existing infrastructure etc. This research therefore proposes a novel strategy of distributing affordable housing evenly throughout London, with an experiment located in the borough of Islington. This new building strategy is addressed specifically for young professionals, one of the most overlooked populations affected by the crisis.
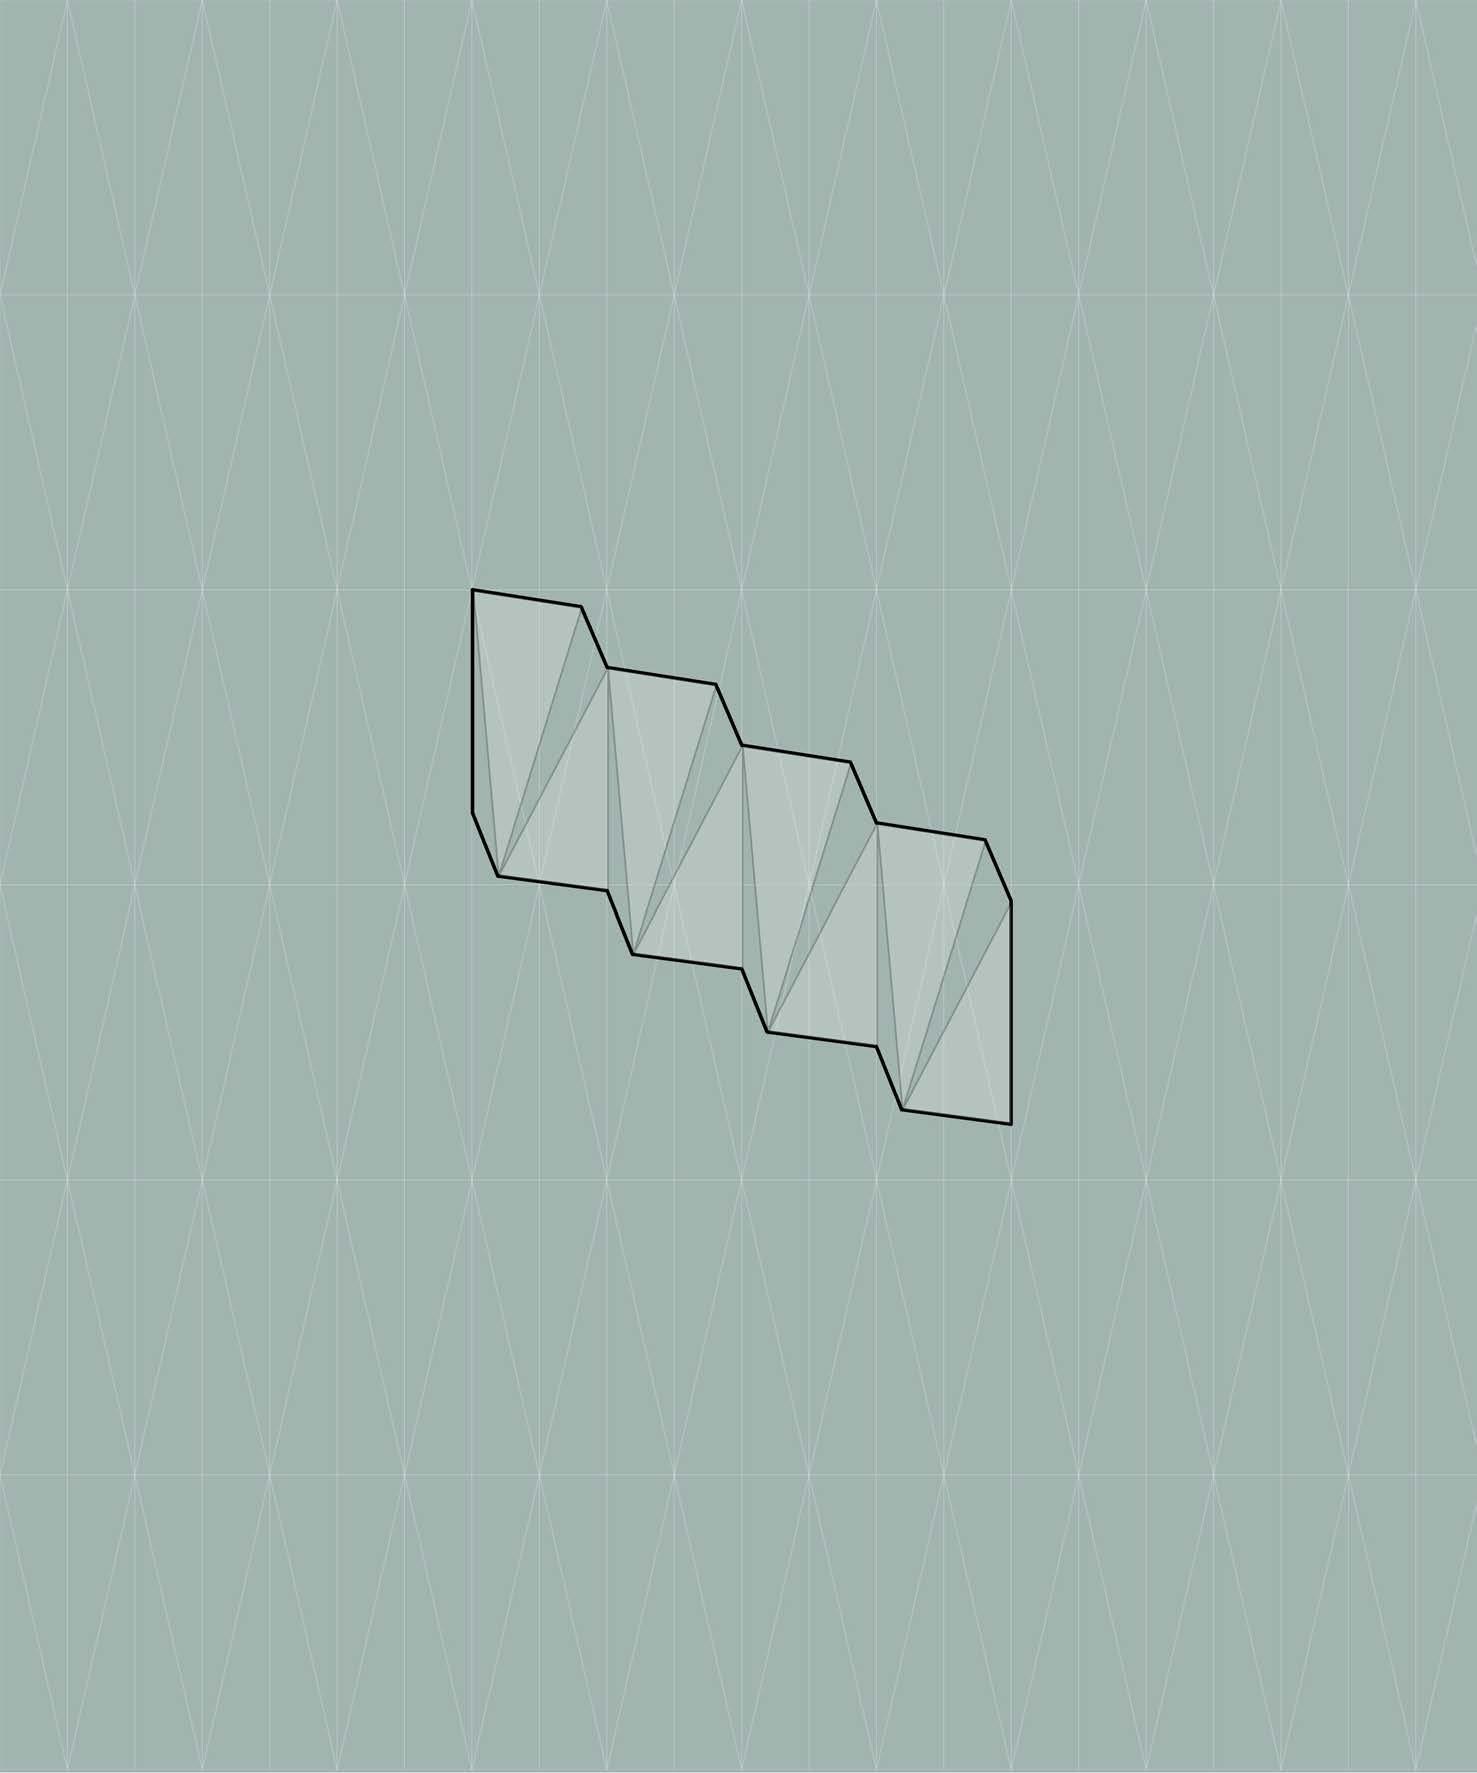
By examining London and Islington in particular, it was discovered that a vast amount of underutilized space exists between the various rooftops. The research took two paths in order to convert these spaces into affordable housing. First, a configurator was developed to analyze all rooftops in the area and generate plans based on the limitations of each rooftop and the specific needs of the individual users. Along with the configurator, a timber kit-of-parts was designed, allowing for a customizable building system on a mass scale. Due to the limitations of the sites, origami folding principles were implemented into the timber kit-of-parts system, allowing ease of portability. By creating site-specific strategies, coupled with the efficiency and scalability of a kit-of-parts approach, mass affordable housing can be implemented without destroying the urban fabric.
This research makes note that the housing crisis will not be solved by one architectural intervention only and requires the collaboration of politicians, economists, and other stakeholders. However, the contribution of this research is to offer a novel approach to solving this issue, by developing a viable solution for the overlooked demographic of young professionals.
00
CONTENT INTRODUCTION DOMAIN METHODOLOGY RESEARCH DEVELOPMENT DESIGN DEVELOPMENT
APPENDIX PROBLEM TARGET GROUP ARCHITECTURAL APPROACH METHODS ROBOTICS CONSTRUCTION STRATEGY SITE SELECTION SPATIAL CONFIGURATION MORPHOLOGY CATALOGUE PROCESS SITE PARTS & DETAILS LIFE CYCLE MATERIAL RESEARCH MORPHOLOGICAL RESEARCH 14-15 16-39 44-53 54-141 144-167 168- 173 178-195 01 02 03 04 05 06 07 14-15 16-39 44-53 54-141 144-167 168-173 178-195 18-23 24-25 26-29 48-51 30-31 32-39 56-71 72-77 78-95 96-97 98-101 102-123 146-147 148-149 150-163 164-165 170 171 RESEARCH AREAS
APPROACH
PROTOTYPING ORIGAMI FOLDING 124-135 136-139
CONCLUSION
MATERIAL
MATERIAL

INTRODUCTION
London is one of the fastest growing cities in Europe, with a current population of 9.5 million. The city’s rapid population growth is putting tremendous strain on the already overloaded housing market. This growth, combined with the inadequately slow increase in housing, has engendered a real-estate crisis in London, pushing young people and the main drivers of the capital’s economy out of the city centre. This phenomenon provokes the youth to seek employment elsewhere and can jeopardise London’s central position as a global hub for various fields.1 Therefore, it is crucial to develop a solution that can help accommodate the youth of London in the city centre and alleviate the housing crisis. Although this crisis London is facing is a multifaceted problem that greatly exceeds the scope of an architectural thesis project and requires the collaboration of experts from various fields, the architectural proposal presented in this study can be applied as a planning strategy on a much larger scale to mitigate and treat the symptoms of this issue.
15
01
DOMAIN
London is the most populated city in Western Europe, and it is experiencing immense growth, with its 9.5 million population expected to reach 10.8 million by 2041.2 This growth is resulting in an inevitable increase in demand for housing and consequently encumbering the already burdened housing market. London’s housing crisis, which has been exacerbating since the 1980s, is mainly affecting two demographics: the council housing candidates and the young professionals.3 According to a recent survey encompassing over 2000 respondents between the ages of 18-34 and living in South England and London, 59% consider moving away where housing is more affordable and almost 70% are in favour of the construction of new homes in their area.4
Around 250,000 Londoners are currently on council housing waiting lists. In addition, London has the highest rate of homelessness in the country, with 165,000 homeless people living in temporary housing provided by their local borough. A recent study suggests that the impacts of the Covid-19 pandemic could continue to be seen and that council house waiting lists could quadruple by next year.5
As for the second group, the average age of first-time buyers increased from 29 to 32 in the last 10 years, due to the difficulty of gathering a large deposit.6 Property prices have risen to roughly seven times the average annual earnings of first-time purchasers. The maximum amount that may be afforded is four times the average salary.7 Suffice it to say that the greatest challenge London is facing today is the housing crisis and therefore, the main problem that will be addressed throughout this study is the lack of housing in London.
17
02
02_1
PROBLEM
SOCIAL HOUSING IN LONDON
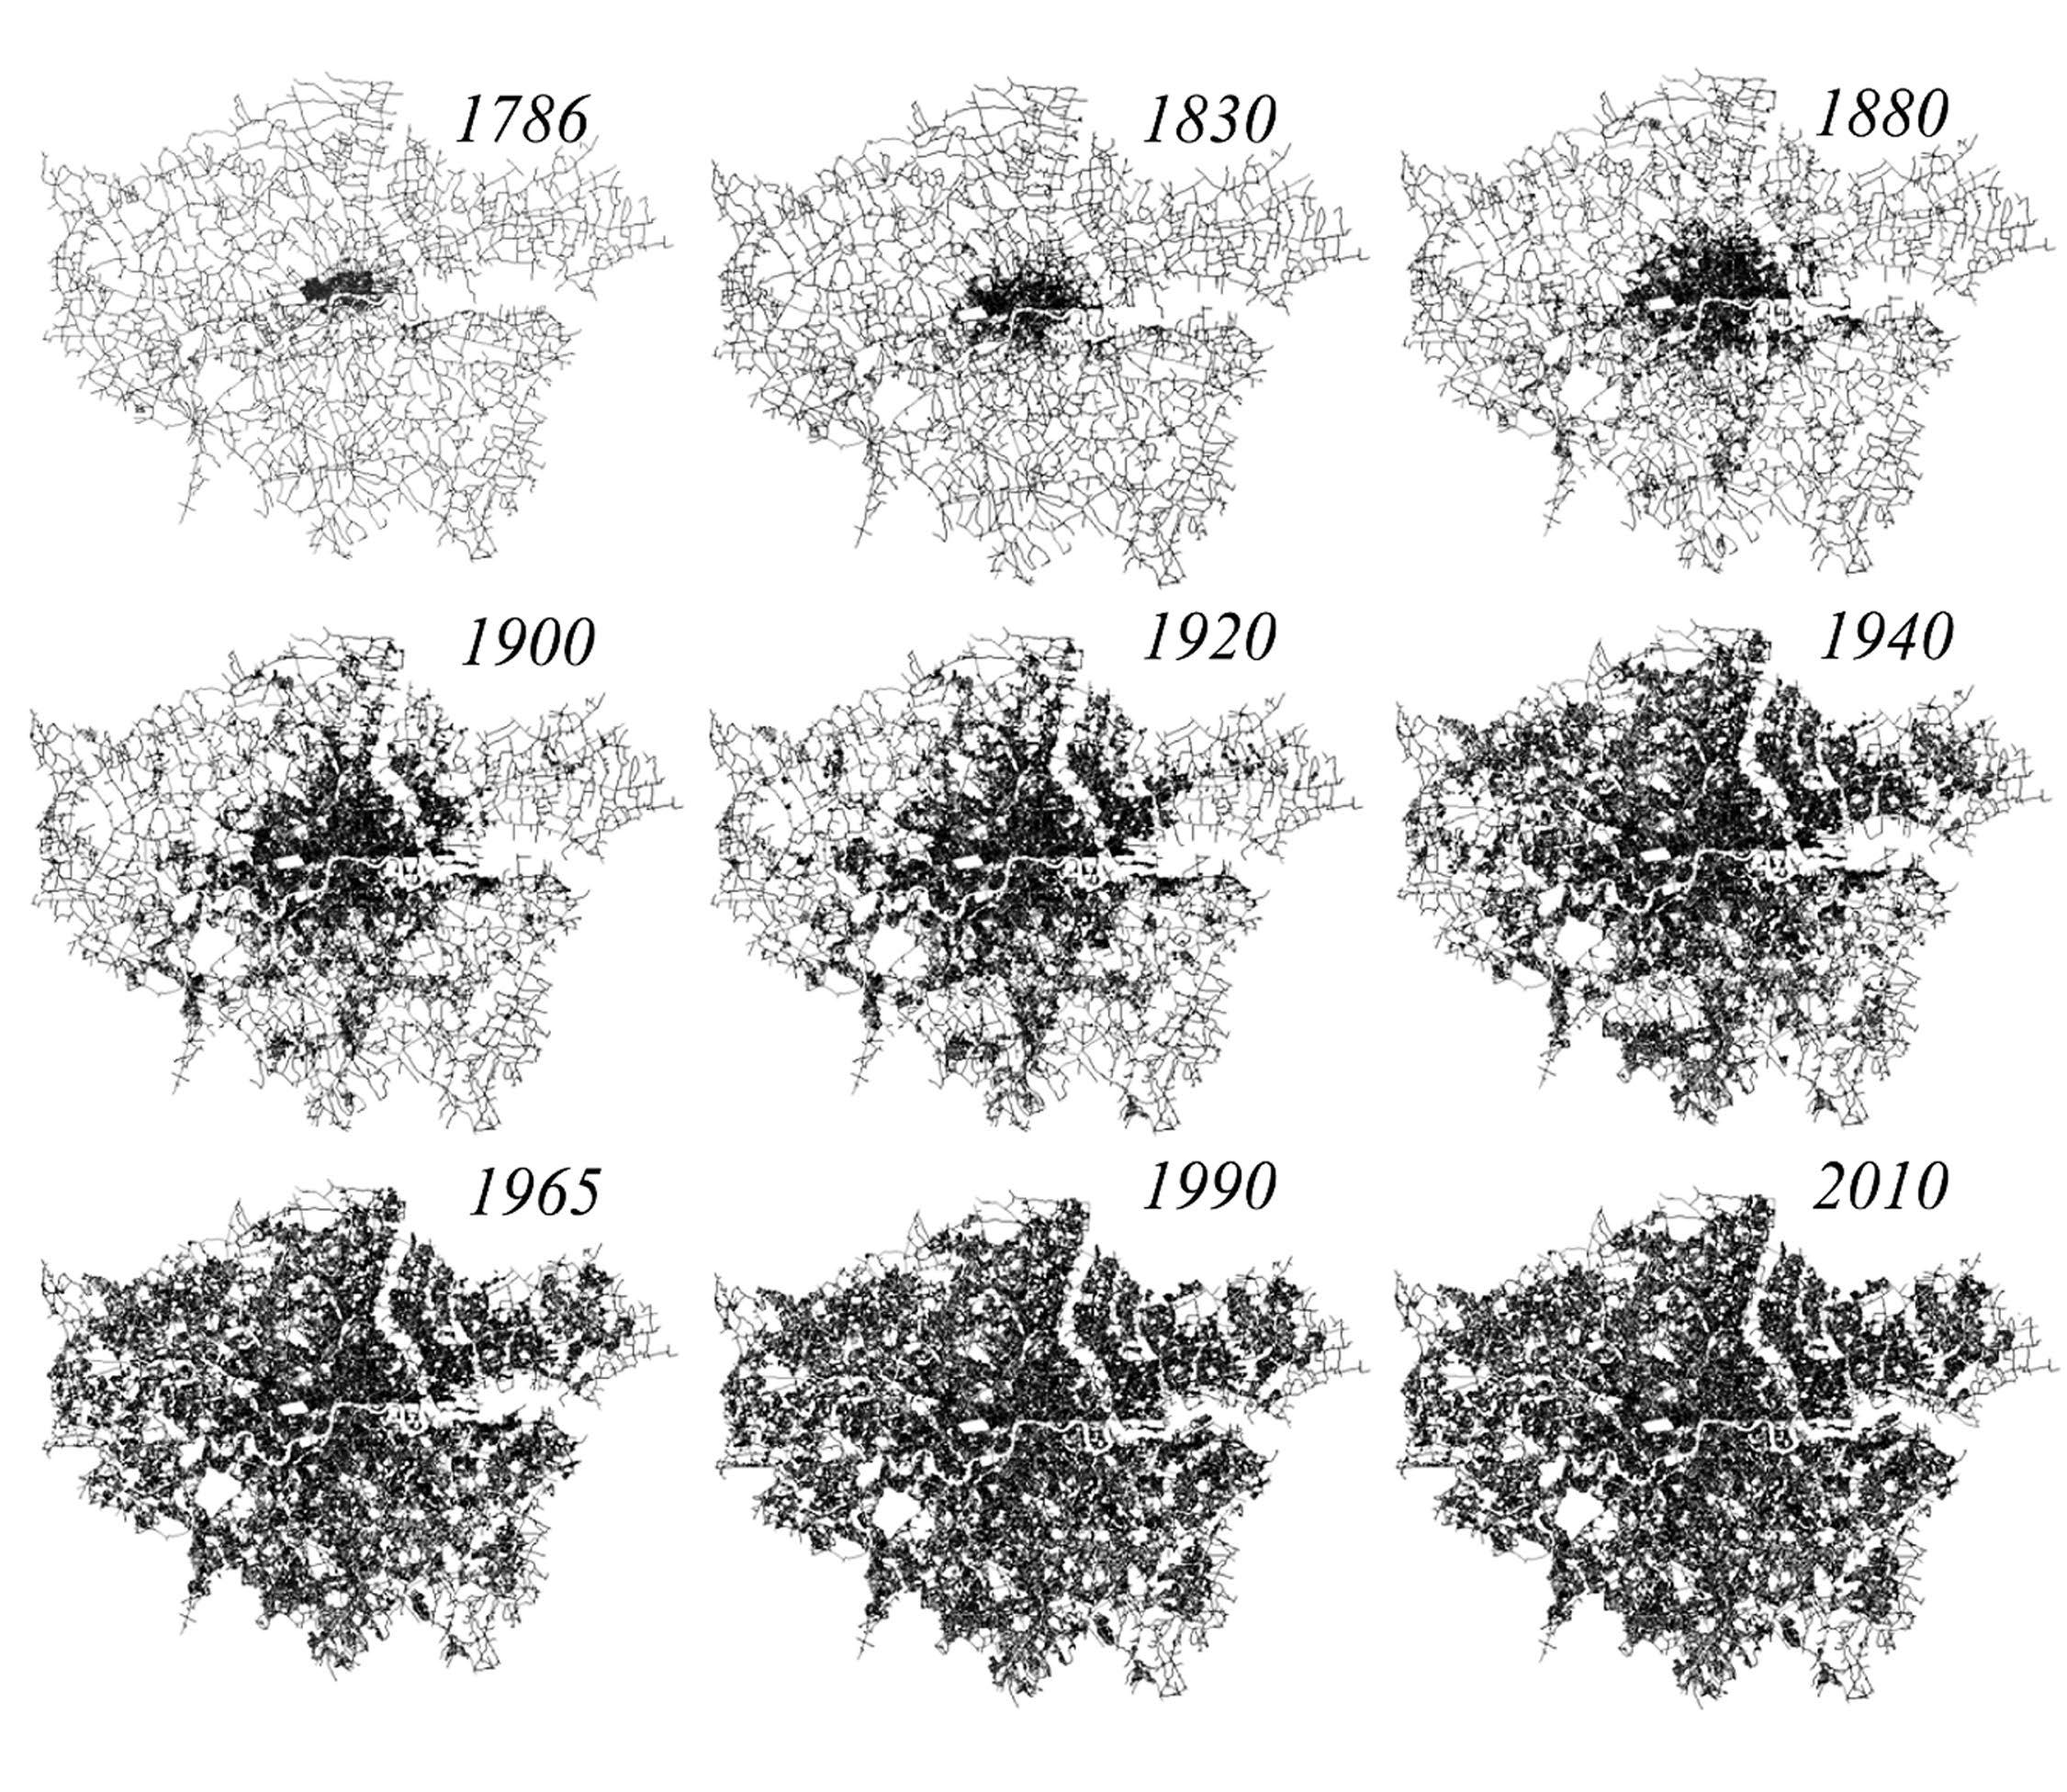
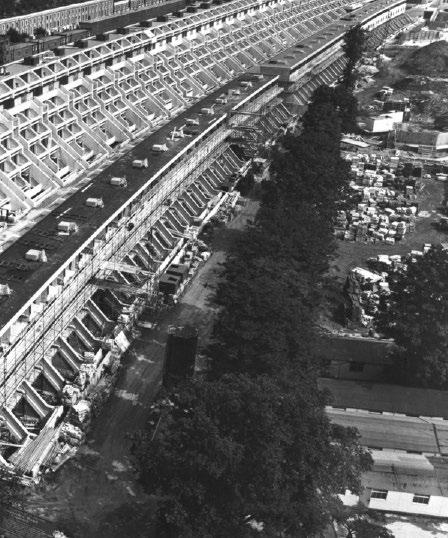
London emerged from three different centres that melted together into a single city today. The first one was the walled Roman city founded in the 1st century AD, known today as the City of London, the City or the Square Mile. The second town was across the river Thames on the southern bank, the city of Southwark or the Borough. And finally, to the west of the City of London was the City of Westminster, where the abbey and the palace formed the centre of the British empire.8 Although the City of London kept its autonomy as well as retained its size bounded by the medieval walls, the rest of the city kept growing independently and engulfed the towns and small settlements on the north of the river, merging into a single city in the early 1600s. The widening of the city’s radius would increase even more with the technological advances, the rising middle-class and the booming colonial economy of the 18th century.9 The east-to-west size of London, which was approximately 8km in the 1750s, became 24km in the 1850s and 50km in the 1950s.10
During that time, the population reached an apex as well. London already had 1 million inhabitants in 1800. In 1900, this number was 6.5 million. The last century however has seen major changes in the city’s population. The number of people in the capital reached a peak of 8.6 million, right before the Second World War in 1939. However, the war affected the city’s population, especially that of inner London and reached a lower point of 6.8 million in 1981.11 The city has grown every year since then, often exceeding official projections. For instance, the city’s Strategic Plan expected projected a growth of 51.000 people per annum between 2001-2011. However, a census done in 2011 demonstrated that the population grew by 87.000 every year during that decade.12 Currently, London’s population is expected to increase by 70.000 each year, meaning that the population will most likely exceed 11 million in the 2040s.13
19
1 Figure: The street network in London from 1786 to 2010.
1
HISTORY OF SOCIAL HOUSING IN LONDON
For years, social housing has been an important part of addressing people’s housing requirements across the country, providing millions with the quality and dignity of living that insecure and overpriced private renting could not. Today, England’s severely depleted supply of social housing continues to decline, leaving it unable to serve the same role.
Despite the existence of social housing in England since the late 19th century, there were no comprehensive government plans put in place until after the conclusion of the First World War, spurred by the inadequate health and numbers of viable recruits attributed to poor living conditions. This resulted in the legislation of the 1919 Housing and Town Planning Act and mobilised government-led construction at a large scale for the first time. Following the Second World War, a more extensive vision for social housing was outlined and implemented by various administrations in response to the destruction caused by the war. As a result, for approximately 35 years after the resolution of the war, council authorities and housing associations in England built an average of 126,000 social homes annually 14
The second half of the 20th century, however, was marked by a dramatic shift in the country’s social housing policies and saw a reduction in the number of council housing available. This is due in part to the establishment of the Right to Buy Scheme in 1980 by Margaret Thatcher’s government, which facilitated council housing tenants to purchase their homes at a large discount. The jurisdiction and resources that local governments traditionally had to create and operate social housing, were simultaneously curtailed. As a result of this and the right to buy scheme, a disproportionate number of England’s social housing was purchased by tenants and became part of the private market; local governments were therefore left with only a fraction of the social housing that had previously been available, but also without the power and means to rectify the dwindling availability of social housing.15 Up until the Right-To-Buy Scheme, over 40% of Britain’s population was living in council housing while the rate has fallen to 8% today.16 To date, over 300,000 council homes have been sold since 1980 via the Right to Buy Scheme in London alone, and the majority have not been replaced.17
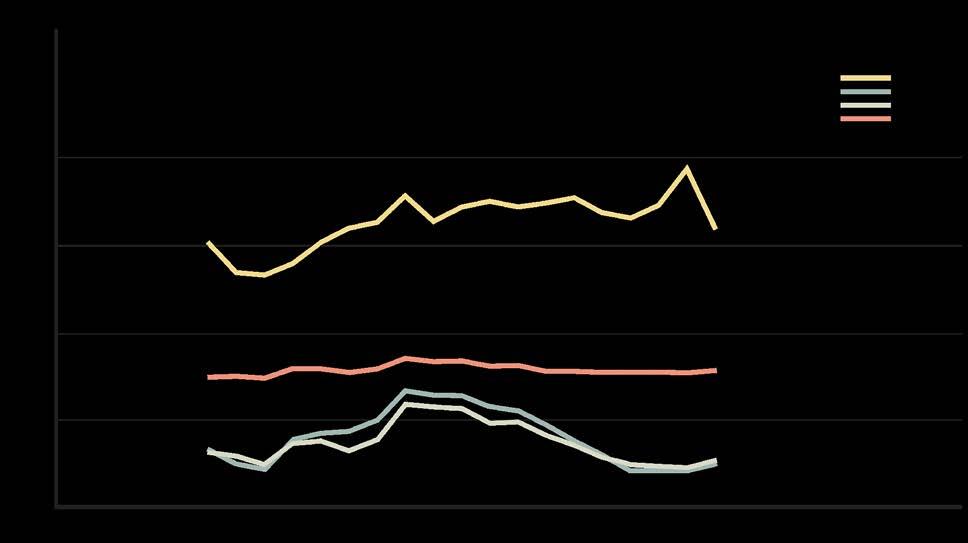
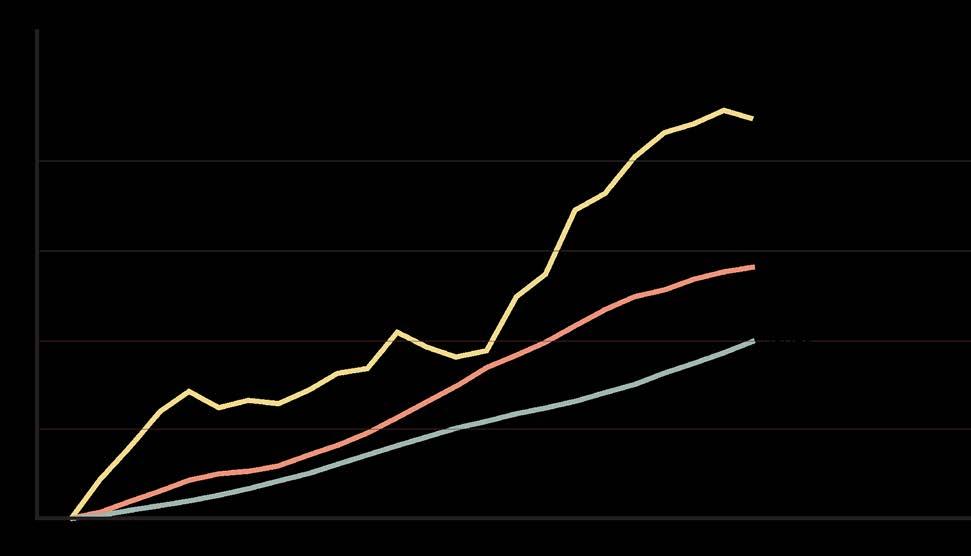
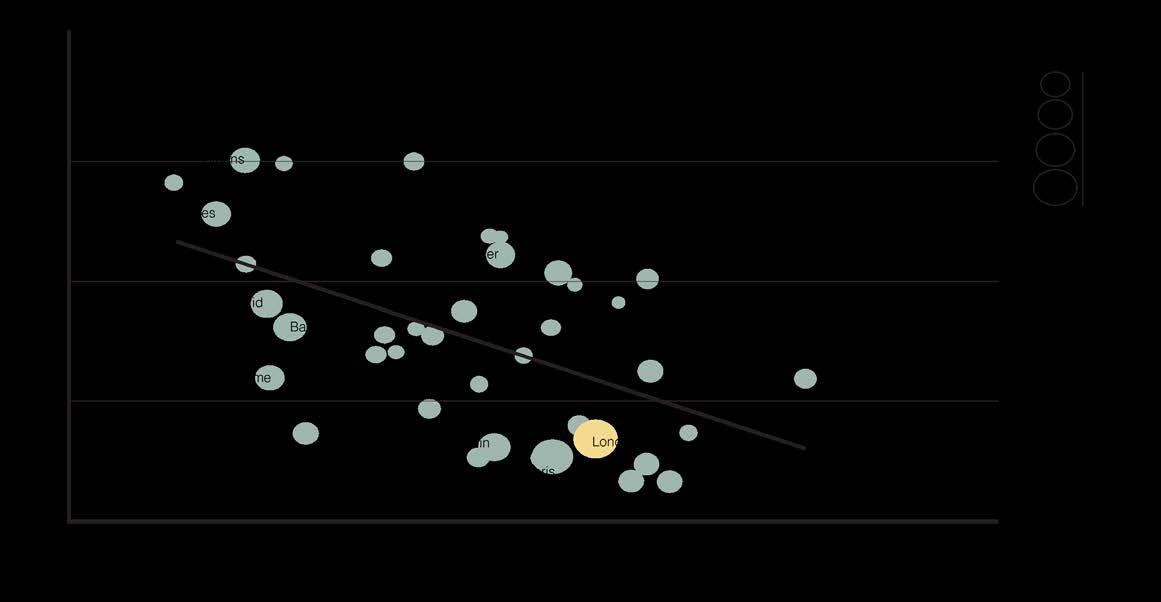
Ultimately, this has resulted in a discrepancy between the supply of homes with population and employment rates. Since 1997, the population of London has increased by 28%, and the number of jobs by 45%, while the increase in the number of homes has remained at only 20%. (figure 1) Today, it is easier to find employment than it is to buy a home, as London now demonstrably has one of the lowest housing-to-employment ratios amongst large European cities.18 (figure 2) This, when coupled with the factors described above, has compounded and subsequently engendered London’s present housing crisis, forcing the many inhabitants struggling to pay extortionate rents to either relocate outside the city or accept cramped living conditions. Suffice it to say, buying a home in London is no longer an option for most.19


21
5
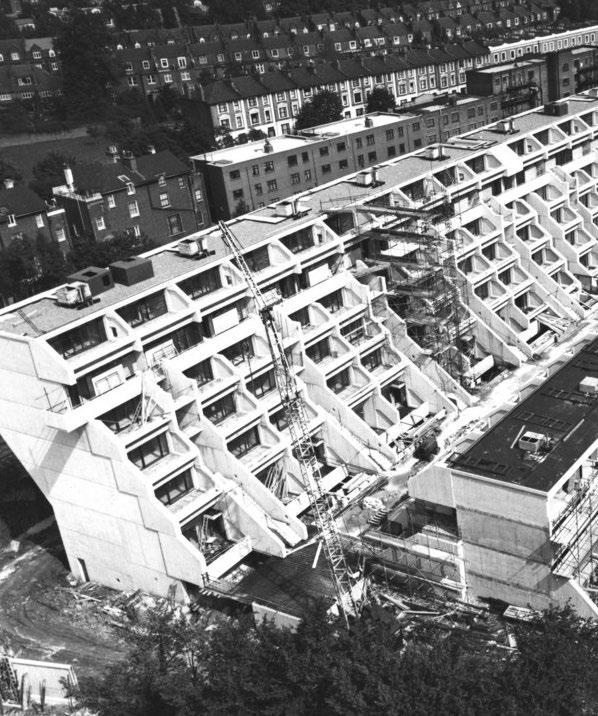
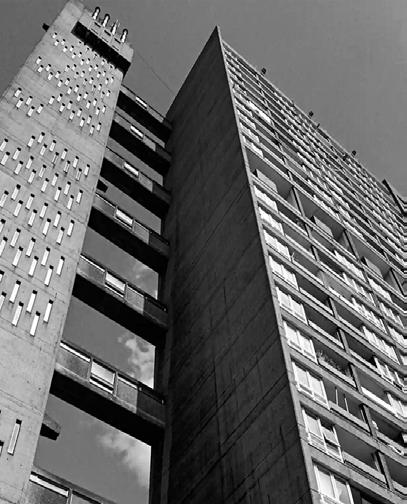
Figure: Balfron Tower, Poplar, London, a 27-storey brutalist tower block designed by Ernö Goldfinger. Photograph: Construction Photography/ Alamy
2 3 4
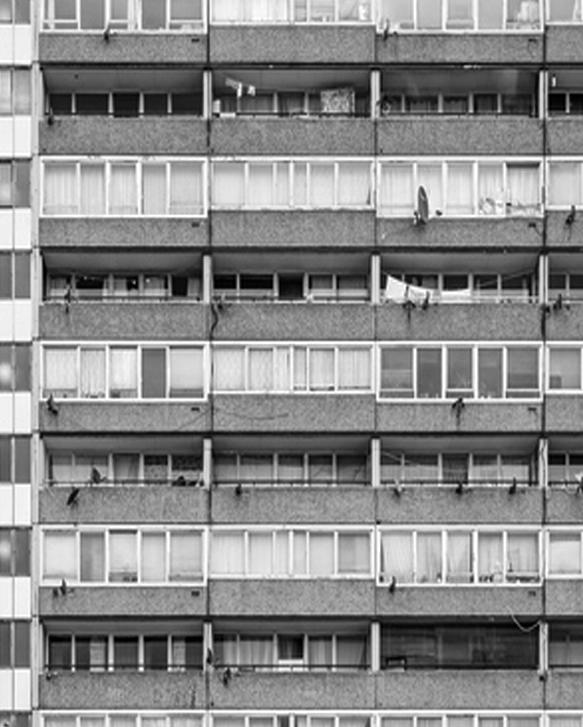
Figure: Alexandra Road estate in London. Cuts to budgets for social housing are blamed for chronic lack of housing and worsening levels of homelessness.
2 3 4 5
Figure: Source: I Wei Huan/ Shutterstock Figure: A council tower block in Walworth, southeast London Credit: iStock.
HISTORICAL SOLUTIONS
Historically, housing developments occurred either in the form of mass-housing estates or urban sprawl. Although these approaches undoubtedly responded to certain needs and reflected the urban design ideas of their time, they both fail to meet the needs of today.
Mass-housing developments have been efficient in accommodating a great number of residents within a small footprint, especially when they occurred in the form of high-rise projects. However, they have also dismantled the existing urban fabric wherever they were implemented and generated mass homogeneous populations of residents, resulting in the segregation of communities. Moreover, these projects have significantly increased the number of residents in a small area, causing an overload on the existing public services.
Urban sprawl on the other hand is the exact opposite of the above-mentioned approach and yet, has been similarly problematic. It has caused cities to expand to unforeseen sizes, swallowing former towns and transforming them into disconnected urban satellites. This sort of urban development has reinforced the formation of segregated communities alike, while greatly damaging the environment both by urbanising former green spaces and farmlands, and by leading to longer commutes and bringing about new highways. According to research, urban sprawl causes a significant increase in transport-related CO2 emissions wherever it occurs.20
It is evident that both models of urban design can no longer respond to today’s needs. Urban sprawl on one hand has pushed London’s boundaries to its limits. The restrictions introduced by the Green Belt Initiative now prevent the city from expanding any further. Mass-housing projects on the other hand have proven to be destructive and cause an overload on the existing public services such as schools, public transport etc. In addition, London councils have long lacked the resources needed to develop housing on a mass scale.21 Therefore, this research proposes an alternative urban growth model, where areas of inner London would be densified by building new homes in interstitial spaces.
CURRENT RESPONSES
The housing problem is the most crucial issue that London is facing today as stated by the current mayor of London, Sadiq Khan.22 The mayor of London created a strategic planning framework for the city to tackle the housing crisis. The strategy includes building 10,000 new council houses, which was met in March 2022, the Right-to-Buy-Back fund which would provide funding to help councils repurchase homes previously sold through the Right-to-Buy scheme23, and assisting and encouraging contractors in building 116,000 affordable homes by March 2023. The execution of the latter has seen the construction of only half of this number.24 This clearly demonstrates that the problem is real and alarming, yet the solutions proposed are insufficient or slow.
It is unmistakably clear that to address the rising housing demands while also maintaining the Green Belt and open areas, London must densify and ensure that new dwellings are distributed evenly around the city. All towns in London including the city centre must become denser.25
PROPOSED SOLUTION
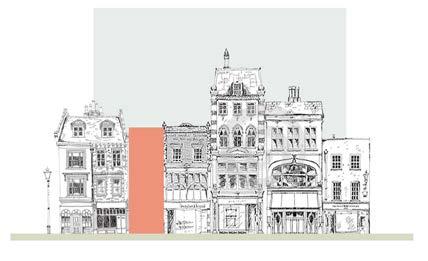
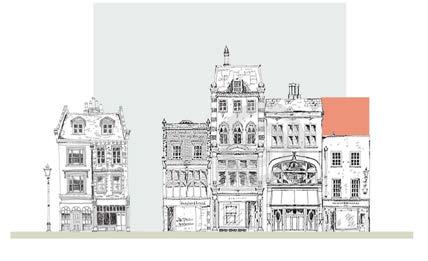
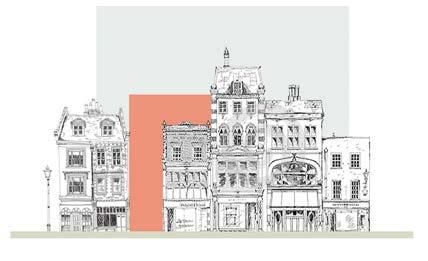
The housing crisis in London is a major issue that far exceeds the scope of an architectural thesis project. What this study proposes is an architectural solution to the problem by designing new apartments in the form of vertical expansions, in available interstitial spaces on rooftops of buildings that have a lower roofline than their adjacent neighbours. By distributing the new housing evenly across an area, this strategy offers to create a denser inner London and mitigate the housing crisis and alleviate the strain it creates on the city, without resorting to the obsolete design approaches mentioned above.
23
6 Diagram: New proposel 6
02_2
TARGET GROUP
MOST AFFECTED DEMOGRAPHIC

TARGET GROUP
This study aims to provide a viable solution to alleviate some of the strain caused by this crisis on one of the most vulnerable demographics, young professionals. Although the problems of homelessness and the astronomically long council housing waiting lists appear to be more alarming than those of young professionals, these issues are under the radar of authorities, and there are various government bodies and NGOs with vast resources being allocated to address them.26 In the meantime, the conditions of living and dwelling of young professionals, who constitute the backbone of London’s economy, are strikingly neglected. According to the findings of Forbes UK, young professionals and first-time home buyers are the two most
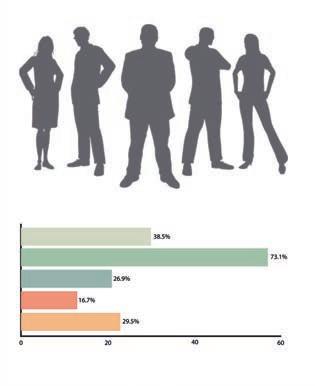
overlooked populations.27 People in their twenties constitute the largest demographic of London residents. (figure 8) Furthermore, the next highest demographic is 65+, demonstrating how the majority of homeowners are the elderly and how young people and first-time home buyers are being forced out.28 In addition, London has the highest proportion of adult children living at home in England.29 (figure 7) Finally, the average age of first-time buyers has risen from 29 to 32 since 2011.30 Based on this data it is evident that real-estaterelated conditions of young professionals are dire and need the spotlight. An architectural solution must be developed to solve this problem.
25
Graph: The trend line of people migrates to London by age group.
8 9 10 Graph: A comparison between London and other cities. Graph: The trend line of jobs, people, and homes in London from 1997 to 2020.
Graph: Proportions of parents with adult children living at home and of adult children living with the parents by region.
7
7 8 9 10
PROPOSAL
Although there are densification projects in London, the majority are high-rise developments built on brownfield lands and fall under the category of mass-scale, the disadvantages of which have been discussed above.31 Therefore, the only option to densify the city appears to be targeting existing buildings. One approach would be demolishing existing buildings and building higher ones instead to fit more apartments and house more people. However, this rebuilding approach brings about many disadvantages, namely the high cost and the long delivery time. Also, it would be environmentally detrimental and potentially disrupt the urban fabric. A large portion of central London’s housing stock consists of historical buildings that constitute the character of the area. In central boroughs such as Camden, Islington, Westminster, and Kensington and Chelsea, the percentages of houses that predate the 20th century are 48%, 37%, 46% and 65% respectively.32 In most cases, these buildings and their appearance is protected by the borough councils. Thus, demolishing and rebuilding as a densification strategy in London would present many challenges, both architectural and legal.
On the other hand, there are underutilised small spaces in central London, generated by these existing buildings, such as gaps between buildings, and the airspace above the roof. In most cases, these spaces are either left unbuilt or are developed as individual architectural projects. These underutilised spaces in urban contexts, which will henceforth be referred to as “interstitial spaces”, offer great potential for densifying London. As demonstrated above, it is imperative to develop innovative approaches to respond to London’s increasing housing demand, without resorting to mass-scale developments, urban sprawl or demolishing and rebuilding. And building in interstitial spaces throughout a large urban context can offer thousands of new homes, without overcrowding or radically transforming a certain area.
The research proposes a lightweight kit-of-parts building system that can be implemented across London, inserting new apartments for young professionals in small, underutilised interstitial spaces. Benefitting from interstitial spaces to densify the area, the strategy presented in this study has the potential to provide thousands of homes in central London without destroying the urban fabric. (figure 11)
To develop the densification strategy presented in this study, two types of interstitial spaces were taken into account. The first is flat rooftops that belong to buildings with a lower height than their adjacent neighbours. The height variation in the roofline provides an opportunity for inserting an extra storey of apartments, minimally altering the urban texture and without the need for a new plot or infrastructure. The possible applications for these types of spaces are named “vertical expansions” in this study. The second sort of interstitial space taken into consideration are the unused gaps between two neighbouring buildings that do not touch each other. In this research, the insertion of a new building into this type of interstitial space is denominated “infill”.
VERTICAL EXPANSIONS
The idea of building extra floors on top of existing buildings, or rooftop development or airspace development, is increasingly being considered a potential solution to London’s housing shortage and has been gaining government support as well. It has been stated by the city council that there are plans to support this strategy with a new permitted development right for new upward expansions when existing buildings are lower than the current roofline.33
There have been several studies investigating the possibilities of a vertical expansion strategy. One study was performed by the property consultation firm Knight Frank Cross, where a detailed 3D model of London was generated using data from the Ordnance Survey and the Land Registry. According to the study, rooftops in London’s fare zones 1 and 2 have the potential to accommodate 40,000 extra houses.34
One of the main advantages of vertical expansion strategies and what renders it a prospective densification method is the fact that owners (freeholders) can build the additional storey and gain rental income from the new apartments. Although, an important factor to consider is the reaction of the current residents of the building. Leaseholders possess the legal authority to halt such projects. One proposal to gain resident support for the project is by offering other benefits such as landscape upgrades and new facilities.35 Another challenge that can arise in congested urban areas is how daylight, sunlight, and overshadowing affect nearby structures. Setting the additional levels back from the current building’s edge can help reduce the impact of the expanded storey.36
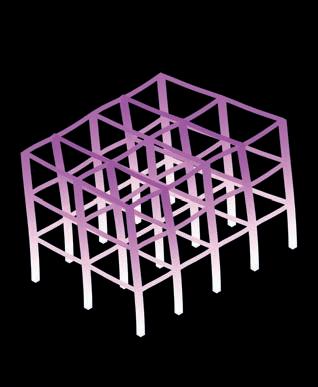
Most vertical expansions are lightweight, and therefore place less load on the existing structure and cause less disruption for the residents. A deck is often constructed on the rooftop to transfer the load of the new storey evenly. It is vital to determine whether the structure of the building is suitable. 37
INFILLS
Infill is another alternative approach for providing housing for London’s rising population and addressing the current supply gap. It refers to the strategy of building new structures in the existing urban fabric, in unutilised gaps between buildings. Residential infill sites are those that do not necessitate the demolition of existing homes, with some supporting infrastructure already in place.38
Although infills offer great potential for the scope of this study and have similar advantages to vertical expansions, they also present several important challenges. On one hand, these sites are small by definition. They are left unbuilt and unused in large part because of their size which is generally not big enough for a living space. In addition, they sometimes provide access to basements, and gardens, or serve as parking spots for the residents. On the other hand, these gap sites might belong to multiple freeholders and be legally divided. This further complicates the process and might hinder the development and execution of the project.
Therefore, although vertical expansion and infill approach both can be applied for addressing the lack of housing problem, the vertical expansion approach has been determined to be more appropriate for this study. One of the main reasons behind this decision is the fact that the number of new apartments that can be achieved through vertical expansions is much higher than that through infill. In addition, in the case of vertical expansions, the new construction will be using land that is already in use, thus it is an efficient use of land. And finally, in vertical expansion projects, there is one single owner of the land because the roof of an existing building that will be used as the base of the new construction belongs to one freeholder and not multiple as is the case for infills.
27
ARCHITECTURAL APPROACH
02_3 11 Diagram: the proposal
infill
vertical expansions or both
CASE STUDIES
of
building,
11
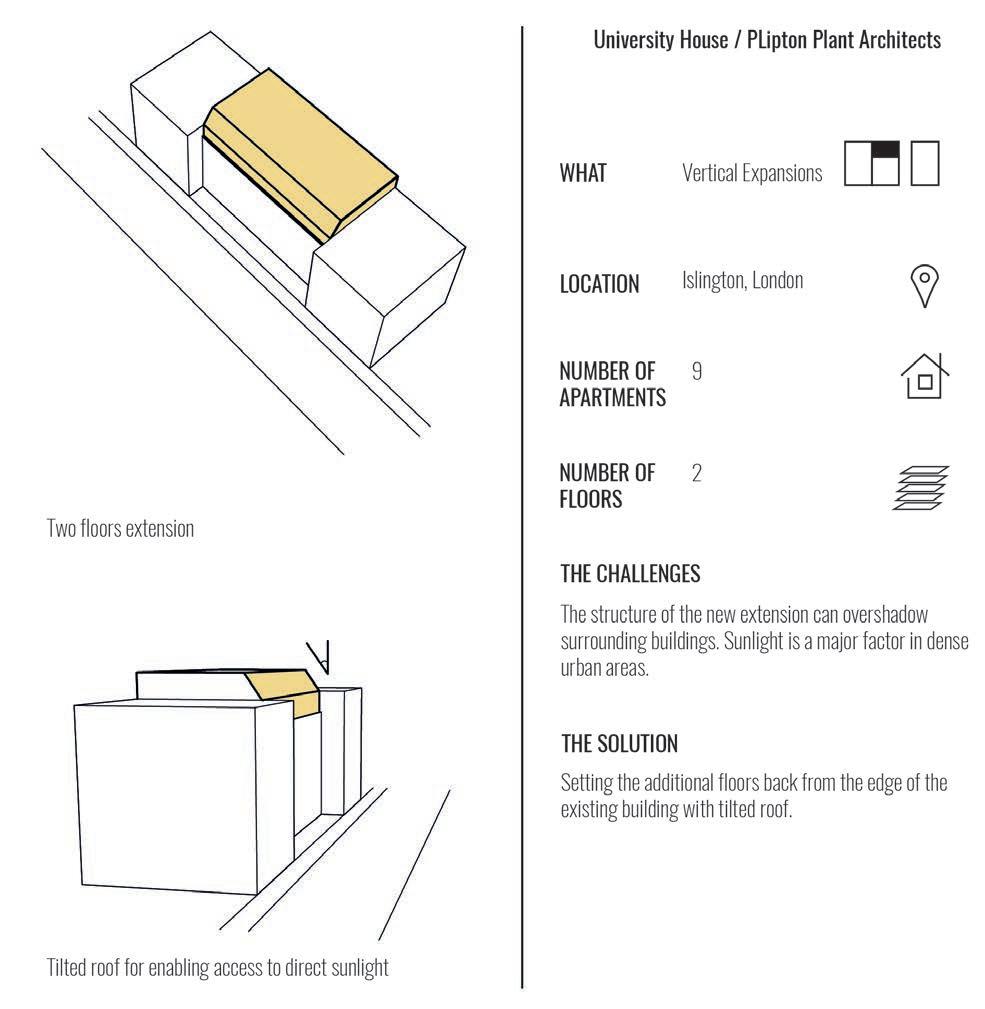
UNIVERSITY HOUSE / LIPTON PLANT ARCHITECTS
A vertical extension project on top of the University House in Islington, London The existing building covers an area of 38,000 m². The project is a multi-purpose building, containing studios and commercial offices. Its original function was as a private university. The new expansion is composed of two floors consisting of 9 new apartments of 1, 2 and 3 bedrooms, each with balcony gardens.39
The sunlight and the overshadow are major factors in these narrow urban environments as the structure of the new expansion can affect surrounding buildings. In this case study, the additional floors were set back from the edge of the existing building and a tilted roof was created.40 (figure 12)
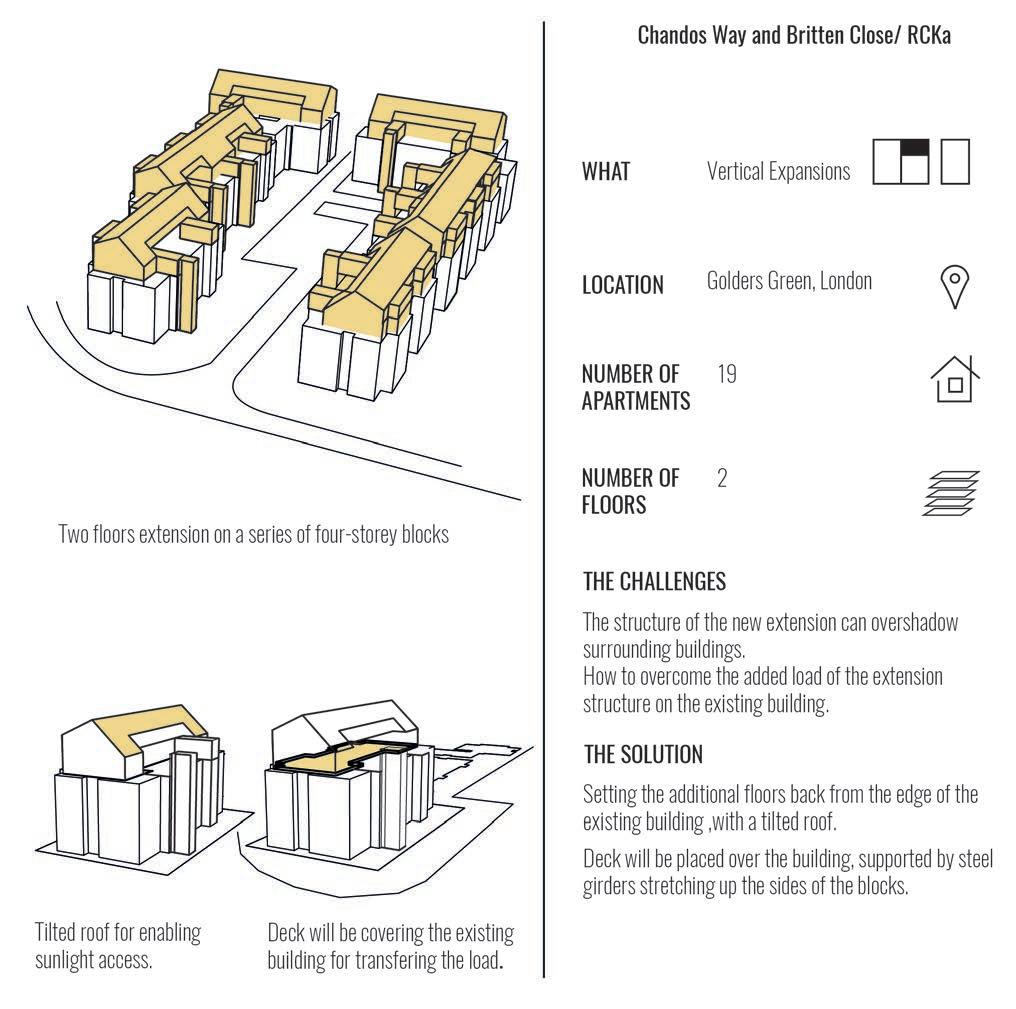
GOLDERS GREEN/ RCKA
This is one of London’s largest rooftop extension projects and offers over 30,000 square feet of new residential accommodation. Over 200 existing flats are located on the estate at Chandos Way and Britten Close in a series of ten four-story buildings. In the proposal, the project carefully places new structures on top of almost all of the old blocks, with new elevators attached to the exterior surfaces of the existing vertical circulation cores. In order to transfer the load of the expansions to the existing buildings, a deck was built that will cover the rooftop of the existing building blocks, supported by still girders. In this case study, a tilted roof was created to enable more daylight on the street level.41 (figure 13)
CASE STUDIES CONCLUSION
Figure: The case study of vertical expansion in Islington in London.
12 13
Figure: The case study of vertical expansion in Gloders Green in London
The first case study indicates the importance of a vertical expansion’s morphology and its effect on the dwelling’s sunlight gain and its impact on surrounding buildings. The second case study illustrates how a vertical expansion can be built without interfering with the structure of the existing building and how it can connect the old building with the new one. It is understood that the design and construction of a deck to transfer the load of the vertical expansion to the existing building is a crucial part of this process. Additionally, the use of a tilted roof in the vertical expansion presents itself as a beneficial solution to invite more sunlight into the newly built space and minimise the shadow cast on the street level.
29
12 13
MATERIAL APPROACH
MATERIAL REQUIREMENTS
For the material experimentation phase, the needs of the project were explored and certain requirements were determined to find a suitable material system that would serve the expansion structures in the best way. First of all, the material must be lightweight, given that a lighter structure would have less impact on the existing building on top of which the expansion is going to be built. Lightweight structures also provide ease and speed in both construction and transportation.
Secondly, the material has to be low-cost. Material costs constitute a big portion of the total cost of a building and cheaper material contributes highly to the affordability of a house. Low-cost materials also enable correcting errors in fabrication and construction since a faulty piece can be easily replaced. Furthermore, the implementation of the material system must enable rapid construction. Given that erecting a new house on top of an existing building can disturb the residents, fast construction is crucial in this project. This will also lower the total construction cost.
Moreover, maintaining a low carbon footprint is essential for the implementation of this project. The construction industry accounts for 25% of the carbon emissions in the UK42 and using a material that stores carbon rather than emits it, is manifestly much more sustainable. Finally, easy manufacturing and easy maintenance are imperative qualities for this type of project. Aside from the cost of the raw material, the labour and energy put into the manufacturing of structural and architectural elements constitute a big portion of a material’s cost and construction time. Therefore, easy manufacturing would be useful to reduce both. Ease of manufacturing also means that faulty pieces can be remanufactured. Easy maintenance, on the other hand, is important for the convenience of the end-users.
Consequently, timber was chosen as the raw material for developing this material system. Timber structures are lightweight, relatively low-cost, quickly built, low-carbon footprint, easy to manufacture and easy to maintain. When compared to other primary building materials such as concrete and steel, timber is much lighter by volume, with a compressive strength similar to that of concrete.43
MATERIAL AVAILABILITY
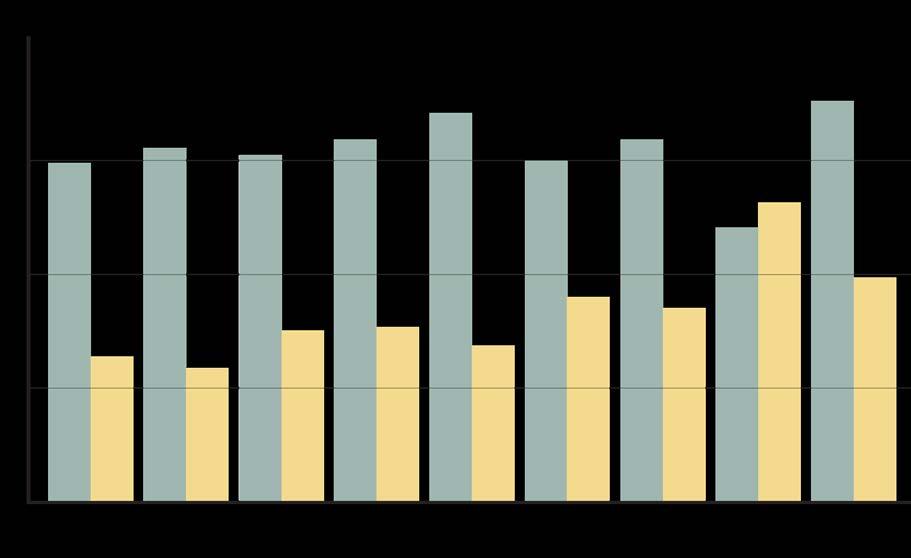
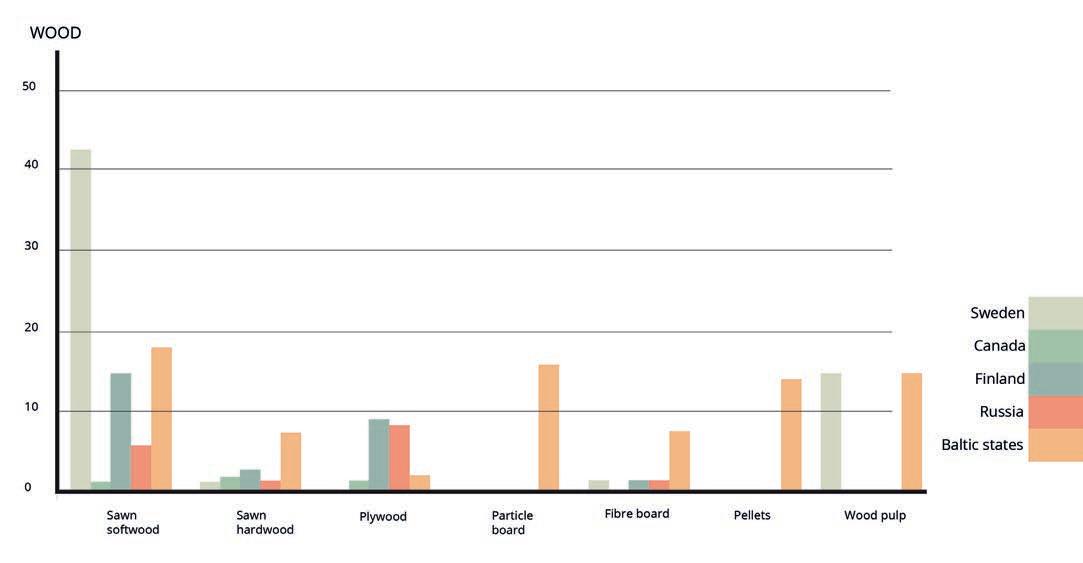
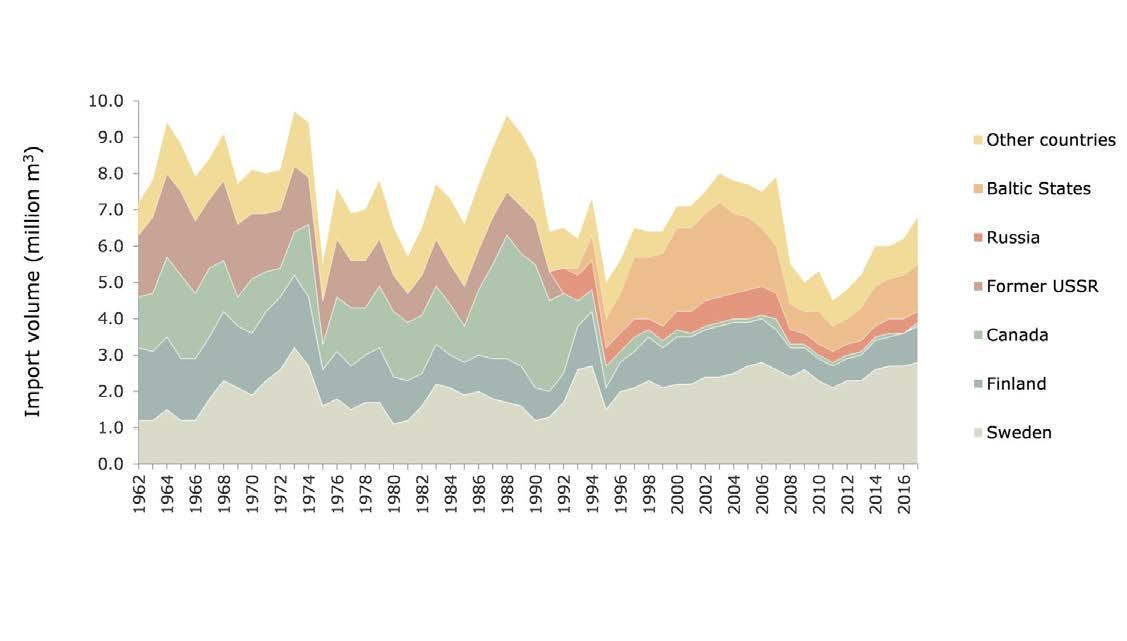
The UK imports most of its wood products. The apparent consumption was 54.8 million m3 in 2020, while 88% of it (48 million) was imported.44 In 2021, the UK imported 8.2 million cubic metres of sawn wood and 3.7 million cubic metres of wood-based panels. The country’s wood imports totalled £8.5 billion in value.45 (figure 14) Some of the significant suppliers of wood to the UK are Nordic and Baltic countries. Sweden, Latvia, and Finland formed 73% of imported sawn softwood in 2020, while China and Brazil were the principal sources of plywood imports with 60%.46 (figure 15) There has been an increase in the cost of timber and other construction materials in the past few years, suspected to be caused by high inflation, COVID-19 and conflicts in supply zones.47 Although the current conflict in East Europe was speculated to impact timber costs, Russia constitutes a very small percentage of all the wood products imported into the UK. Only 6% of sawn softwood, 2% of sawn hardwood, 7% of plywood, 1% of particle boards, and 5% of fibreboards imported into the UK are sourced from Russia.48 Therefore, it is safe to say that a direct impact on timber products used in construction in the form of shortage is not concerning for timber construction. The wood products for the project can be imported from EU suppliers such as Sweden, Latvia and Finland and nonEU suppliers such as China and Brazil. The rise in the prices due to inflation following the COVID-19 pandemic appears to be affecting all construction materials and therefore timber remains a relatively low-cost and low-carbon footprint alternative to other materials.49
31
percentage of total imports in UK in 2021
countries of origin of wood imports to
14 15 Graph: The
Graph: The
UK in 2021.
CASE STUDIES 15 14 PERCENTAGE OF TOTAL UK IMPORTS COUNTRY OF ORIGIN OF WOOD IMPORTS TO THE UK, 2021
02_4
INTENTIONS
Interstice aims to build new affordable homes in interstitial spaces, through a lightweight kitof-parts system that can be implemented across Islington as vertical expansions to existing buildings, wherever there is a height variation. Therefore, one of the main goals of the project is to propose light and low-cost structures with ease of manufacturing, with the design of a modular kit-of-parts.
3D KIT-OF-PARTS
The 3D kit-of-parts approach enables the creation of variation in the design of the houses by using the same parts. This way, the design of every single new house will be different and will suit the needs of its unique circumstances, while using the same kit of building elements. Thus, variation and customisation will be ensured while the standardised parts will reduce manufacturing costs. Furthermore, a structure designed to be built from smaller parts offers easier transportation and construction processes. This will be crucial in the implementation of the project given that the construction of the new homes proposed in this thesis will take place on rooftops of existing inhabited buildings.
DEPLOYABLE STRUCTURES
Deployable structures are designs that can be compacted into smaller volumes while maintaining the physical connections amongst their parts and can be expanded to a larger volume when needed. This approach is essential in the development of this project given that an apartment made of deployable volumes would offer much cheaper and easier transport, straightforward assembly, adaptability, and lightness.
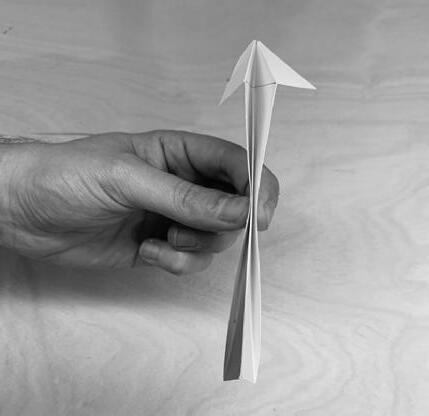
ORIGAMI FOLDING
Origami is the Japanese art of paper folding. All origami patterns consist of two types of folds: valley folds and mountain folds. Conventionally, the former is represented with blue and the latter with red. Flat sheets of paper are marked with these red and blue lines and are folded at each line in the direction that is suggested by the line’s colour.
Conventionally used mainly for artistic and entertainment purposes up until the last century, origami has now found its place in the fields of engineering and design as a powerful design tool. Its potential lies in its scalability: The small-scale paper models can be translated and scaled up into large rigid structures by replacing the folding creases and the faces of the paper model with rigid panels and hinges respectively. One of the prominent researchers in the field, Tomohiro Tachi attributes the potential of origami in architecture to three main characteristics.
1) The construction of a space’s envelope, a roof, or a facade can be realised using a watertight surface that is also the structure.
2) A rigid kinetic structure can be achieved on a large scale without using elastic materials, using solely geometrical mechanisms.
3) There are fewer degrees of freedom that can influence how the configuration changes. This makes it possible for the structure to deploy semi-automatically 50
In addition to these features, the ability to manufacture entire structural parts from smaller sheet materials and transport them to the construction site in very small volumes is one of the main reasons this technique was investigated.
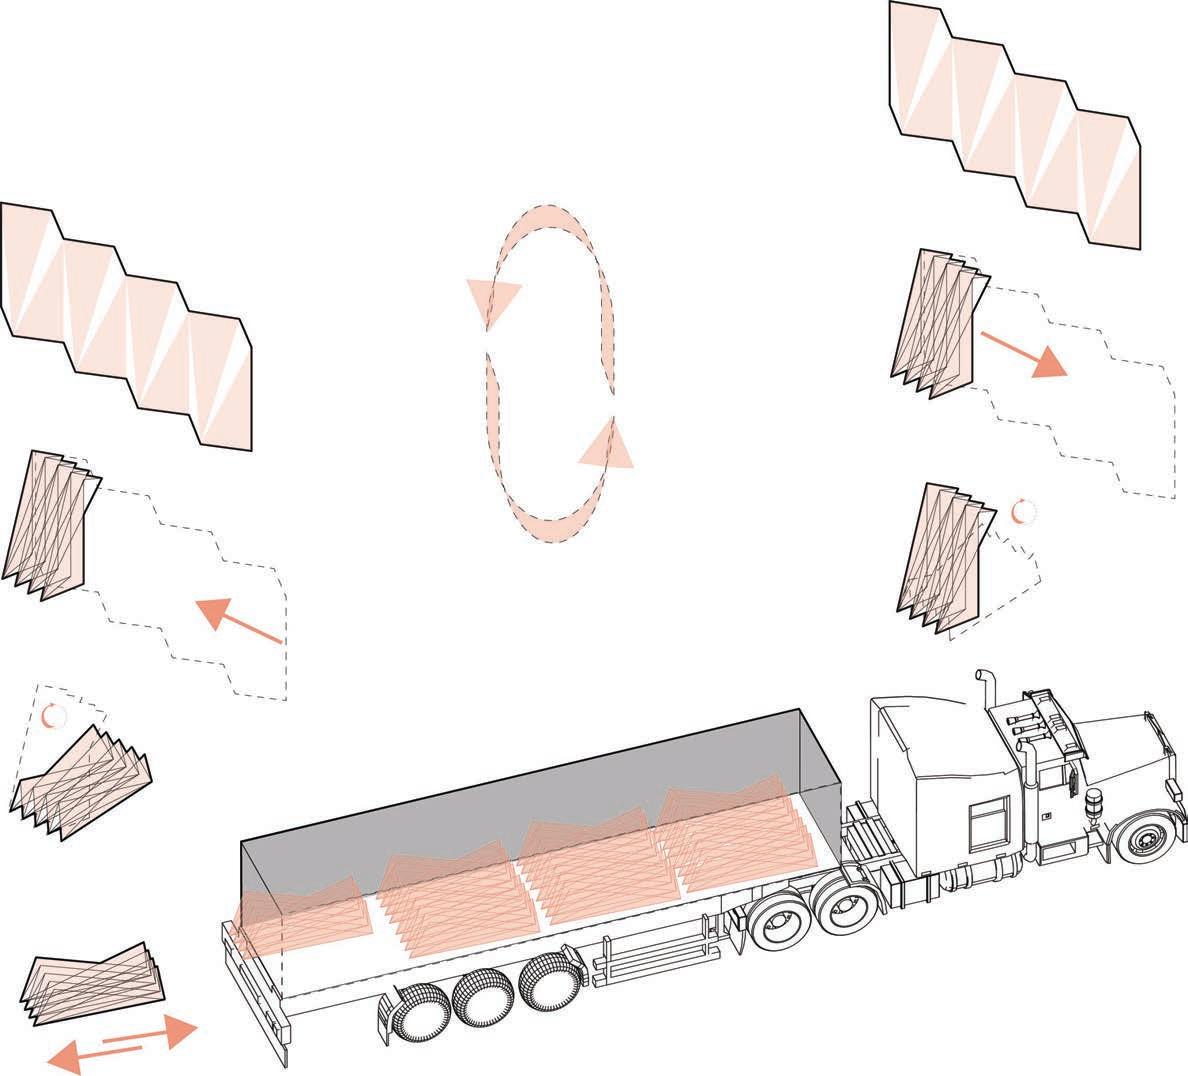
33 16 Diagram: The benefits in transportation of folded kit of part elements.
AREAS 02_5
RESEARCH
16
17
MATERIALITY CASE STUDIES
Four case studies were carried out to further investigate and expand the knowledge on the research areas listed above. Three of these studies pertain to the different applications of kit-of-parts systems and how they can be used for various architectural purposes. The last case study however is related to deployable structures and how structural optimisation can be involved in their design to improve their performance.
DESIGN AND FABRICATION OF A REUSABLE KIT OF PARTS FOR DIVERSE STRUCTURES
WIKI HOUSE
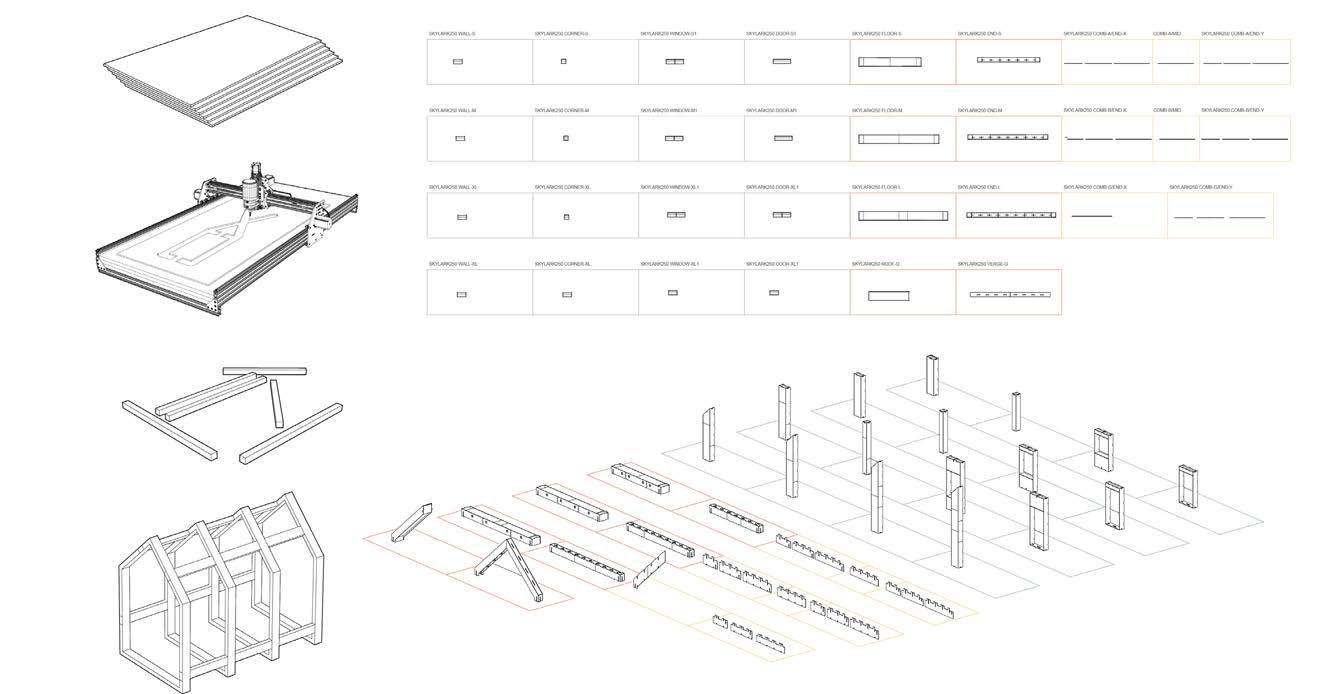
An open-source platform for planning and constructing homes, WikiHouse was founded in London in 2011 by Alastair Parvin and Nick Ierodiaconou, and aims to democratise and streamline the building of efficient and sustainable homes. The platform allows users to download designed building elements and edit them on 3D modelling software according to the user’s needs. These pieces can then be cut from thick plywood sheets with a CNC machine. The parts have finger and lap joints that give them a puzzle-like appearance and are connected with peg and wedge connections that do not require any additional material.52 (figure 18)
Diagram: The general research of kit of part system.
17 18
Diagram:The
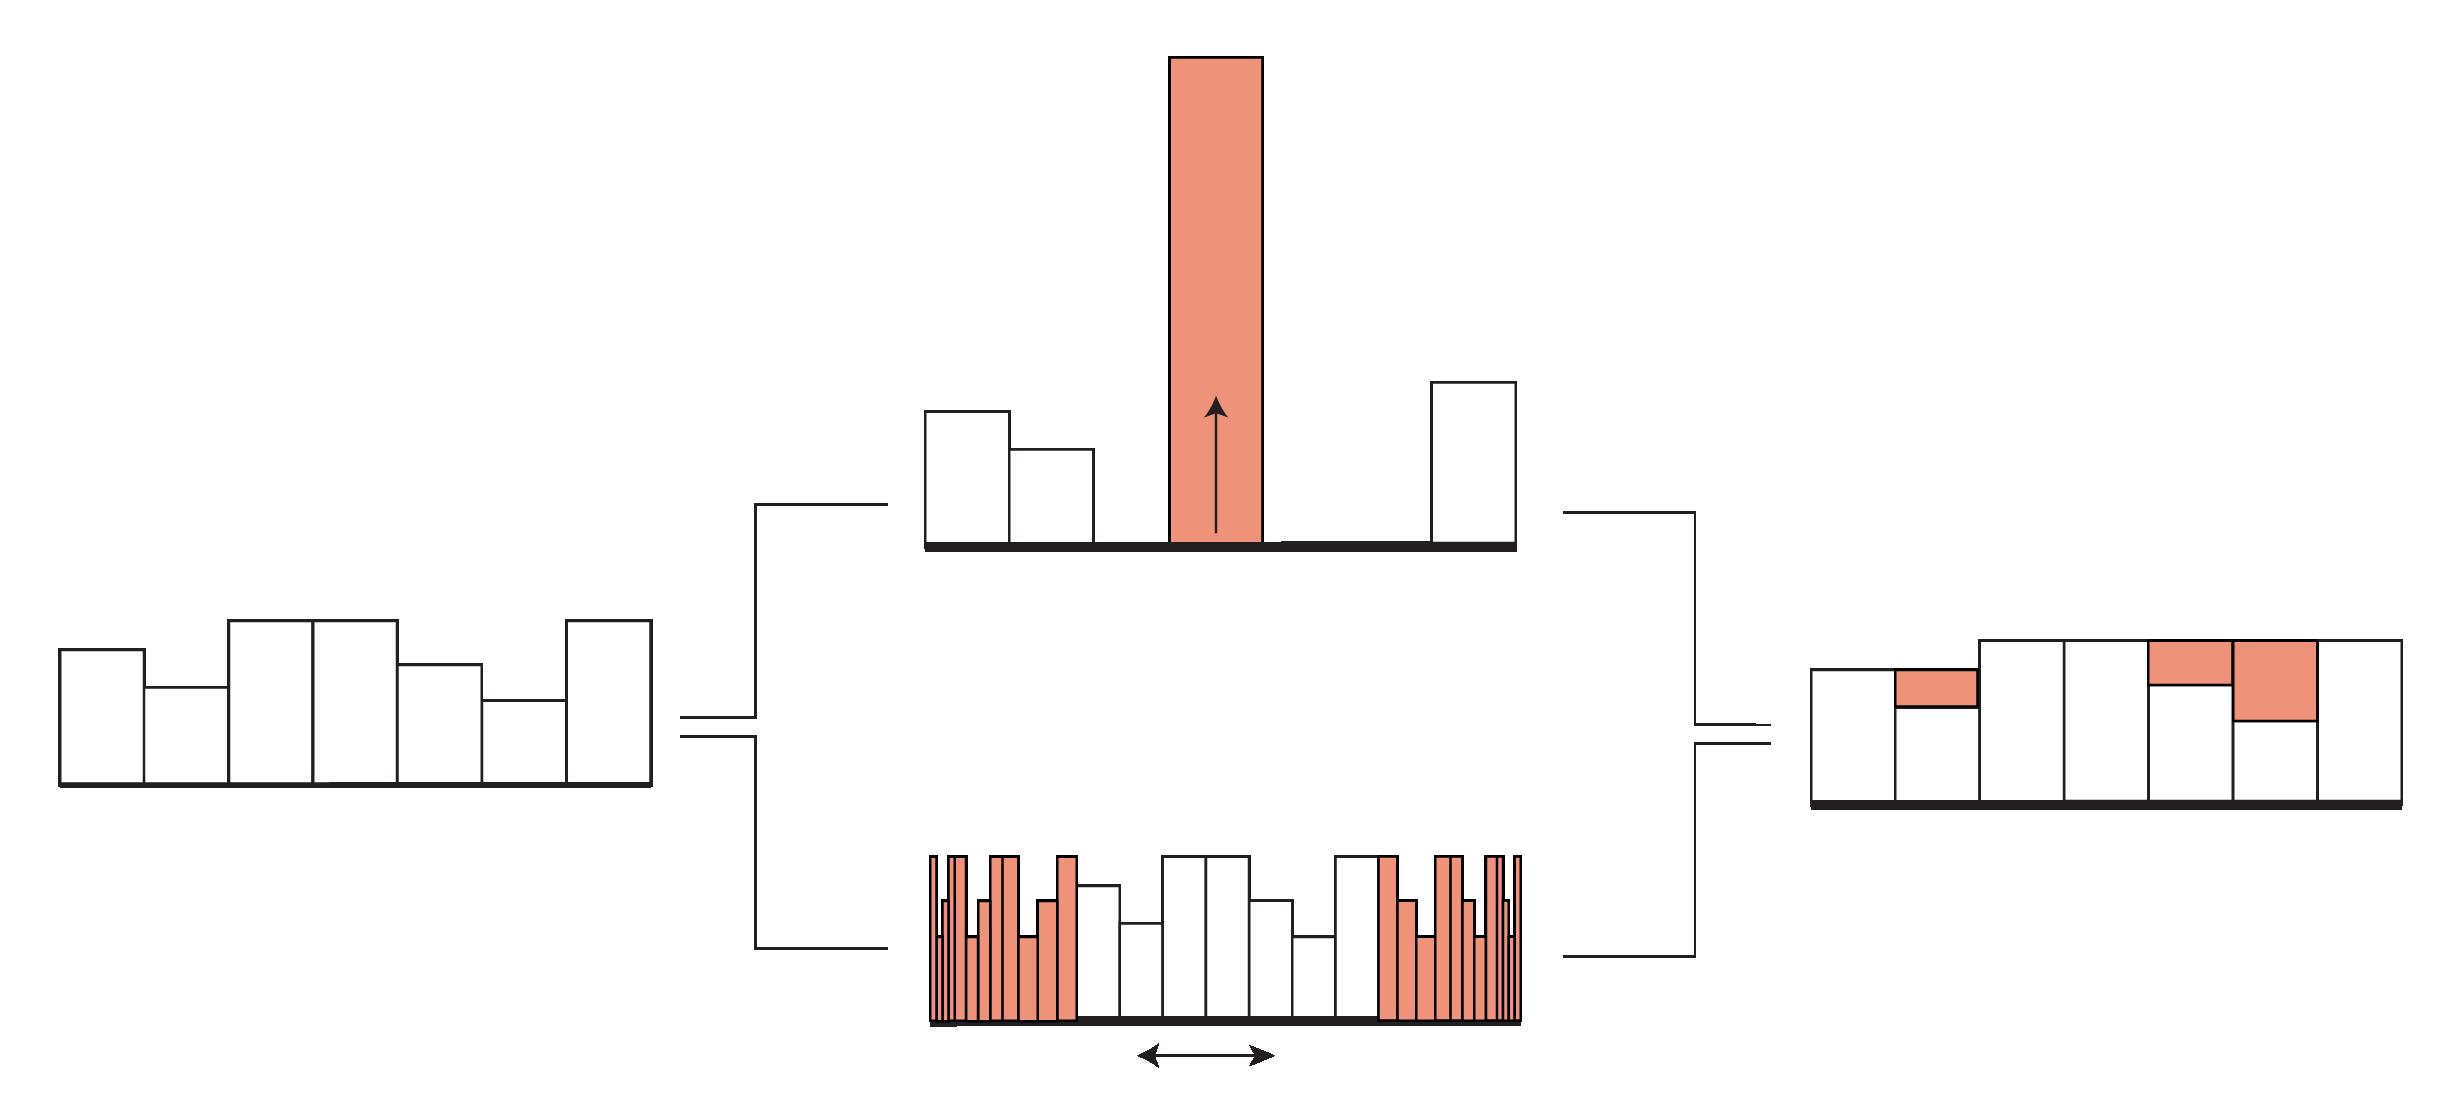
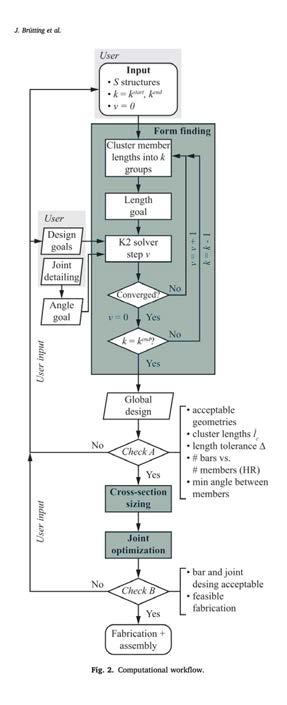
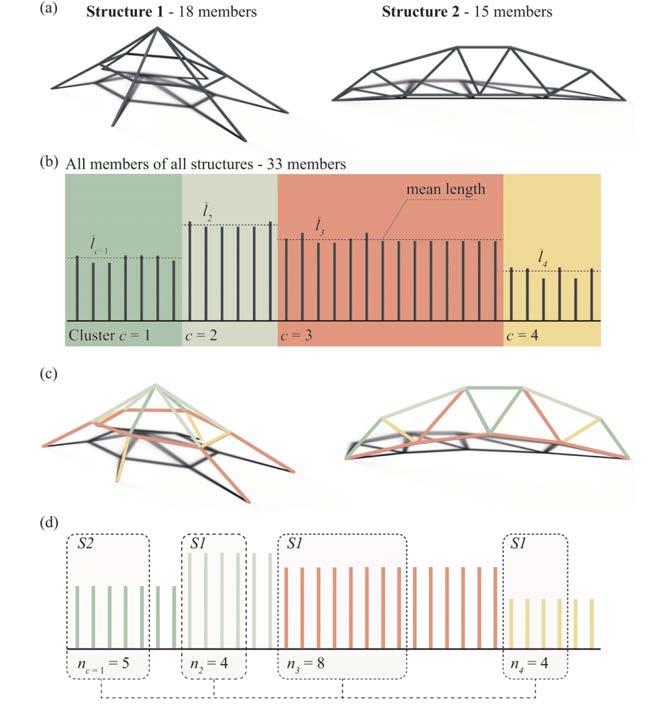
The research paper demonstrates the potential of using a kit-of-parts system for structural components. The paper proposes an efficient method of optimisation and rationalisation of the individual elements that allow for the system to assimilate into a kit-of-parts. By starting with a global form and then looking at the individual components for rationalisation, the structure can be rebuilt with the same parts without fully altering the intended initial global form. Analysing the individual elements with the k-means clustering algorithm ensures that although the elements change in length, the alterations are all relative and therefore the global form is not lost. Such clusters can then be further reduced by removing redundant elements since each cluster contains the same length elements. (figure 17) An optimisation was also employed during the manufacturing process to reduce waste material. The simultaneous use of machine learning algorithms and structural optimisation has enabled researchers to rationalise their distinct structural elements while maintaining the structural integrity and global form of their initial designs.51 The reiterative process of designing and redesigning is crucial in understanding how a global morphology and its kit-of-parts can be developed.
The success of the platform lies in its way of merging standardisation and customisation. The fact that all the pieces have predesigned connections facilitates the user’s designing and building experience, given that no design or structural knowledge is required on their part. In addition, being able to manufacture all the parts with a standard CNC machine drastically reduces the overall cost of the construction and in theory, the designs can be assembled in a day. However, WikiHouse only offers structural frames and for the users’ projects to become an actual home, the structure needs to be clad and insulated.53
35
case study of variety of kit of part system in Wiki house.
18
ROATAN PROSPERA RESIDENCES / ZHA
This housing project involves a digital architecture platform to design houses for Roatan Prospera in Honduras. The platform was developed by ZHACODE and enables homeowners to digitally design their own customised houses based on a kit-of-parts system. (figure 19) The houses use local timber as the main building material in order to achieve sustainable and lightweight structures. The design and dimensioning of the parts were determined according to the limitations of local manufacturing practices, construction techniques and transportation networks. 54
With this approach, the designers are promoting the utilisation of local materials and craftsmanship, all the while enabling the users to take part in the design of their own homes. The parts of the design are embedded into cubic volumes or voxels that are aggregated, complying with certain design rules and following an orthogonal grid. Each voxel is 4m tall and 35m2 in size. By combining up to five different types of voxels, homeowners can build their own residential units on the digital platform. The combinations offered by the kit-of-parts system allows for 15,000 different designs.55


The Lunark project (figure 20) is a habitat prototype for a lunar expedition. It was designed by SAGA space architects in 2020 and combines the ideas of biomimicry with origami folding. The prototype was tested by the designers themselves, in a location in northern Greenland with extreme weather conditions. The main goal of the design was to minimise space during transport and maximise it once expanded.
The habitat is a deployable structure that folds down and minimises its volume in order to save space during transport. When deployed, the prototype reaches up to 750% of its folded volume. The origami folding pattern and the size of the structure were algorithmically optimised for maximum efficiency. The shell is made of rigid carbon-fibre sandwich panels with a foam core serving as insulation and the panels are connected with a foldable composite rubber sheet. A lightweight aluminium frame was used as the load-bearing structure. The interior of the habitat is designed to give the space a home-like and liveable quality.56
37 19
20
The case study of kit of part system in Lunark in SAGA.
The case study of kit of part system in roatan prospera residences in ZHA. 20
LUNARK / SAGA
19
Figure:
Figure:
MATERIALITY CASE STUDIES CONCLUSION
The first case study proves the importance of having a global understanding when working with a kit-of-parts as well as the potential of optimisation through every stage of the process and not only for the individual elements. The reiterative nature of designing a global morphology and its parts simultaneously is at the core of the research development section of this study. Also, the use of machine learning algorithms was found useful for standardisation and an experiment regarding topological networks that employ this technique can be found in the Appendix. The second case of WikiHouse illustrates how simplicity in design and considerations of accessibility can be powerful tools in designing a platform for users to interact with. The success of WikiHouse is related also to its integrated approach, which can be observed in the fact that all elements including frames, wedges, pegs or mallets can be manufactured using the same material and the same process. The third example of Roatan Prospera exhibits a different sort of digital platform and how it can be used to involve users in the design of their own homes. The kit-of-parts in this case is much more elaborate and complete, enabling users to explore a myriad of design options through a well-designed interface. Furthermore, users are not involved in the construction of the project but are rather having a say in design decisions. The kit in this project consists of already designed spaces and their configuration, not structural elements as is the case with WikiHouse. Finally, the fourth case study of Lunark illustrates how deployable structures can create liveable architectural spaces while minimising transport costs and energy, and how folding techniques can be applied in their design for efficiency. It also proves that a deployable structure need not be dull or hostile as is the case with similar structures such as tents and shelters but can provide a cosy home. This conclusion constitutes one of the main design principles of this study.
SUMMARY 02_6
The architectural system that is being developed will be an integrated design and construction framework. As the outcome of the parallel research of urban scale implementation, spatial configuration, kit-of-parts and morphology, and material prototyping, the outcome will be a building framework proposal to construct affordable houses for young professionals on rooftops of existing buildings in London.
15
16
17
Dave Hill, ‘London Housing Crisis: “reverse Brain Drain” Ahead?’, The Guardian, 26 September 2014, sec. UK news, https://www.theguardian.com/uk-news/davehillblog/2014/sep/26/londonhousing-crisis-reverse-brain-drain-ahead.
Greater London Authority, ‘The London Plan’ (City Hall, The Queen’s Walk, London: Greater London Authority, March 2021), https://www.london.gov.uk/sites/default/files/the_london_ plan_2021.pdf.
‘Housing Futures: The Vital Role of Home in Young People’s Futures’ (Twickenham: MTVH Metropolitan Thames Valley Housing, 9 February 2022).
‘Housing Futures: The Vital Role of Home in Young People’s Futures’.
Joe Talora, ‘London Is “Epicentre” of Housing Crisis as 250,000 Await Council Homes’, Evening Standard, 13 October 2021, https://www.standard.co.uk/news/london/london-housing-crisissadiq-khan-council-homes-b960327.html.
Jason Clarke, Lyndsey Cheshire Willis, ‘Halifax First-Time Buyer Review 2021’, Press Release (Halifax, 22 January 2022), https://www.lloydsbankinggroup.com/assets/pdfs/media/pressreleases/2022-press-releases/halifax/20220122-halifax-annual-ftb-review-2021.pdf.
Talora, ‘London Is “Epicentre” of Housing Crisis as 250,000 Await Council Homes’.
Chris Rogers, How To Read London (London: Ivy Press, 2017).
Edward Denison, 30-Second London (London: Ivy Press, 2017).
Michael John Hebbert, Hugh D. Clout, and Blake Ehrlich, ‘London | History, Maps, Population, Area, & Facts | Britannica’, in London (Encyclopedia Britannica, 24 August 2022), https://www. britannica.com/place/London.
‘Population Of London, London Population Growth - Trust For London’, Trust for London, accessed 16 September 2022, https://www.trustforlondon.org.uk/data/population-over-time/.
Greater London Authority, ‘The London Plan 2016’ (London: Greater London Authority, March 2016), https://www.london.gov.uk//what-we-do/planning/london-plan/past-versions-andalterations-london-plan/london-plan-2016.
Greater London Authority, ‘The London Plan’.
‘London’s Social History: The History of Public Housing in London’, Londontopia (blog), accessed 22 July 2022, https://londontopia.net/culture/architecture/londons-social-history-thehistory-of-public-housing-in-london/.
‘The Story of Social Housing’, Shelter England, accessed 22 July 2022, https://england.shelter. org.uk/support_us/campaigns/story_of_social_housing.
ohn Harris, ‘The End of Council Housing’, The Guardian, 4 January 2016, sec. Society, https:// www.theguardian.com/society/2016/jan/04/end-of-council-housing-bill-secure-tenancies-pay-tostay.
‘What Is the Mayor Doing to Increase Council Housing for Londoners?’, London City Hall, 14 October 2019, https://www.london.gov.uk//what-we-do/housing-and-land/council-and-socialhousing/what-mayor-doing-increase-council-housing-londoners.
István László Bart, ‘Urban Sprawl and Climate Change: A Statistical Exploration of Cause and Effect, with Policy Options for the EU’, Land Use Policy, Forest transitions, 27, no. 2 (1 April 2010): 283–92, https://doi. org/10.1016/j.landusepol.2009.03.003.
Talora, ‘London Is “Epicentre” of Housing Crisis as 250,000 Await Council Homes’.
‘Tackling London’s Housing Crisis’, London City Hall, 30 August 2017, https://www.london.gov.uk//what-we-do/ housing-and-land/tackling-londons-housing-crisis.
22
19
Greater London Authority, ‘London Housing Strategy: Executive Summary’ (Greater London Authority, May 2018), https://www.london.gov.uk/sites/default/files/2018_lhs_exec_summary_ fa.pdf. 18
‘Housing in London - The Evidence Base for the Mayor’s Housing Strategy - London Datastore’, accessed 22 July 2022, https://data.london.gov.uk/dataset/housing-london.
‘What Is the Mayor Doing to Increase Council Housing for Londoners?’
‘Homes for Londoners: Affordable Homes Programme 2016-2023’, London City Hall, 22 November 2016, https://www.london.gov.uk//what-we-do/housing-and-land/homes-londoners-affordable-homes-programmes/ homes-londoners-affordable-homes-programme-2016-2023.
‘Mayor Vows to Protect “the Lungs of the Capital”’, London City Hall, 27 November 2017, https://www.london. gov.uk//press-releases/mayoral/london-plan-strengthens-safeguards-for-green-belt. 24 23 25
‘Tackling London’s Housing Crisis’
Laura Howard, ‘House Prices – Latest News’, Forbes Advisor UK, accessed 22 July 2022, https://www.forbes. com/uk/advisor/personal-finance/2022/07/20/house-prices-updates/
‘London’s Population Age, London Poverty - Trust For London’, Trust for London, accessed 22 July 2022, https://www.trustforlondon.org.uk/data/population-age-groups/. 26
Families and Households in the UK - Office for National Statistics’, accessed 22 July 2022, https://www.ons.gov. uk/peoplepopulationandcommunity/birthsdeathsandmarriages/families/bulletins/familiesandhouseholds/2019.
Jason Clarke, Lyndsey Cheshire Willis, ‘Halifax First-Time Buyer Review 2021’.
Savills, ‘Savills UK | Residential Sites in London at Risk as Industrial Land Values Soar, Says Savills’, 22 June 2022, https://www.savills.co.uk/insight-and-opinion/savills-news/329995-0/residential-sites-in-london-at-risk-asindustrial-land-values-soar--says-savills. 30 29 31
‘Historical Buildings & Houses in Camden - Knight Frank (UK)’, accessed 16 September 2022, https://www. knightfrank.co.uk/residential/age-of-housing-stock-in-london/camden.
Greater London Authority, ‘The London Plan’.
Knight Frank, ‘More than 40,000 New Homes Could Be Built on London’s Roofs - Knight Frank’, accessed 22 July 2022, https://www.knightfrank.co.uk/blog/2017/11/15/more-than-40000-new-homes-could-be-built-onlondons-roofs..
Colin Marrs, ‘Can Rooftop Extensions Help Solve the Housing Crisis?’, Architects’ Journal, 26 March 2018, https://www.architectsjournal.co.uk/news/can-rooftop-extensions-help-solve-the-housing-crisis.
32
33
Colin Marrs. 35 34 36
Colin Marrs. 37
Future of London 2011 Ltd, ‘Delivering Infill Development: A London 2050 Briefing Paper’ (London: Future of London 2011 Ltd, January 2015), https://www.london.gov.uk/sites/default/files/gla_migrate_files_destination/ Delivering-Infill-Development.pdf. 38
COMMERCIAL Archives’, Lipton Plant Architects, accessed 22 July 2022, https://lparchitects.co.uk/projecttype/commercial/. 39
‘COMMERCIAL Archives’. 40
‘Chandos Way and Britten Close | RCKa’, accessed 22 July 2022, https://rcka.co.uk/chandos-way-brittenclose/. 41
41
1 2 3 4 5 6 7
8 9 10 11 12 13 14
20 21
27 28
1&2 CHAPTER
ENDNOTES
45
46
47
48
Climate Change’, UKGBC - UK Green Building Council, accessed 22 July 2022, https://www. ukgbc.org/climate-change-2/.
‘Choosing between Wood, Concrete and Steel Structures’, accessed 22 July 2022, https://www. ecohome.net/guides/1010/how-wood-structures-compare-to-steel-and-concrete/.
Sheila Ward, ‘Forestry Statistics 2021, Chapter 3: Trade’ (The Research Agency of the Forestry Comission, 30 September 2021), https://cdn.forestresearch.gov.uk/2022/02/ch3_trade_fs2021-1. pdf.
Sheila Ward.
Sheila Ward.
“Timber Prices Going up Daily” in Europe Due to Ukraine War’, Dezeen, 17 June 2022, https:// www.dezeen.com/2022/06/17/timber-shortage-ukraine-war-news/.
Origin of Wood Imports’, Forest Research (blog), accessed 22 July 2022, https://www. forestresearch.gov.uk/tools-and-resources/statistics/forestry-statistics/forestry-statistics-2018/ trade-2/origin-of-wood-imports/. 42 43 44
49 50
Ella Jessel, ‘Explainer: What Construction Materials Are in Short Supply, and How Is It Affecting Architects?’, The Architects’ Journal (blog), 31 January 2022, https://www.architectsjournal. co.uk/news/explainer-what-construction-materials-will-be-in-short-supply-in-2022-and-areprices-still-going-up.
Tomohiro Tachi, ‘Geometric Considerations for the Design of Rigid Origami Structures’, in Spatial Structures - Permanent and Temporary (Proceedings of the International Association for Shell and Spatial Structures (IASS) Symposium 2010, Shangai, 2010), 13.
51
an Brütting, Gennaro Senatore, and Corentin Fivet, ‘Design and Fabrication of a Reusable Kit of Parts for Diverse Structures’, Automation in Construction 125 (1 May 2021): 103614, https://doi. org/10.1016/j.autcon.2021.103614.
52
53
WikiHouse’, accessed 22 July 2022, https://www.wikihouse.cc/.
‘Free: Download a Construction Kit to Build Your Own “WikiHouse” - Architizer Journal’, Journal, 19 February 2019, https://architizer.com/blog/practice/materials/wikihouse-the-open-source-diyhome/.
54
‘Zaha Hadid Architects Unveils Roatán Próspera Housing Complex for Honduras’, Dezeen, 29 July 2020, https://www.dezeen.com/2020/07/29/zaha-hadid-architects-roatan-prospera-housingcomplex-honduras/.
55
‘Roatán Próspera Residences – Zaha Hadid Architects’, accessed 22 July 2022, https://www. zaha-hadid.com/architecture/roatan-prospera-residences/.
56
‘LUNARK’, accessed 22 July 2022, https://saga.dk/projects/lunark.
43
1&2 CHAPTER ENDNOTES
METHODOLOGY
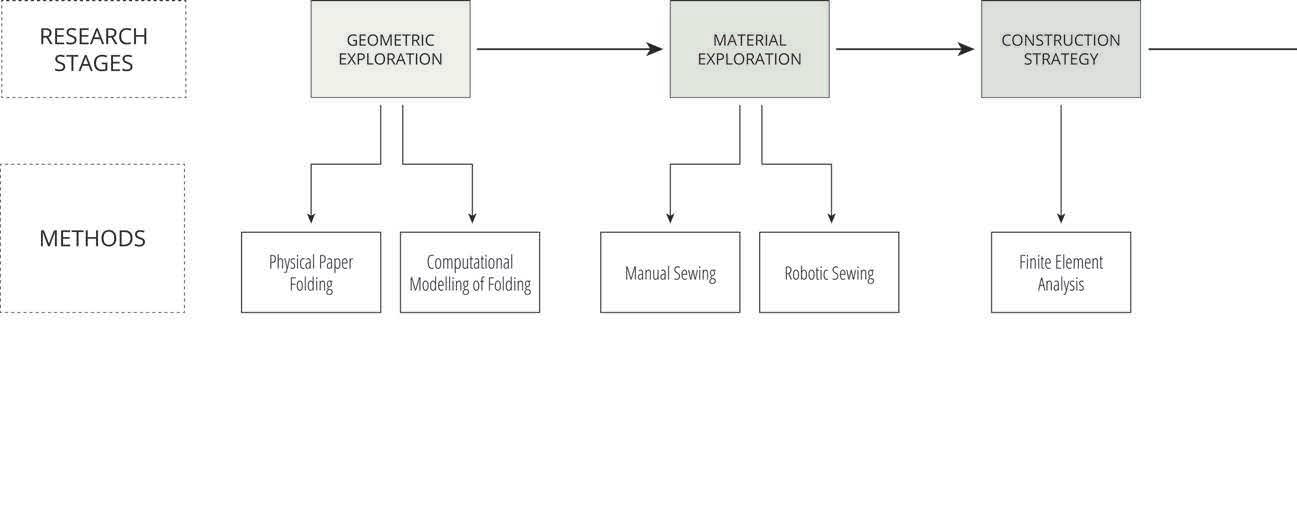
A variety of methods ranging from physical prototyping and surveying techniques to computational analysis and design tools were utilised in the development of this research. The order in which these methods are presented is organised according to the areas of research that were addressed along the development of the study.
45
03
47
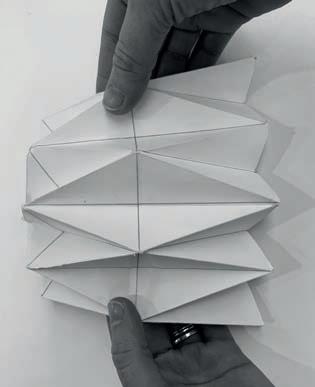
Physical Paper Folding
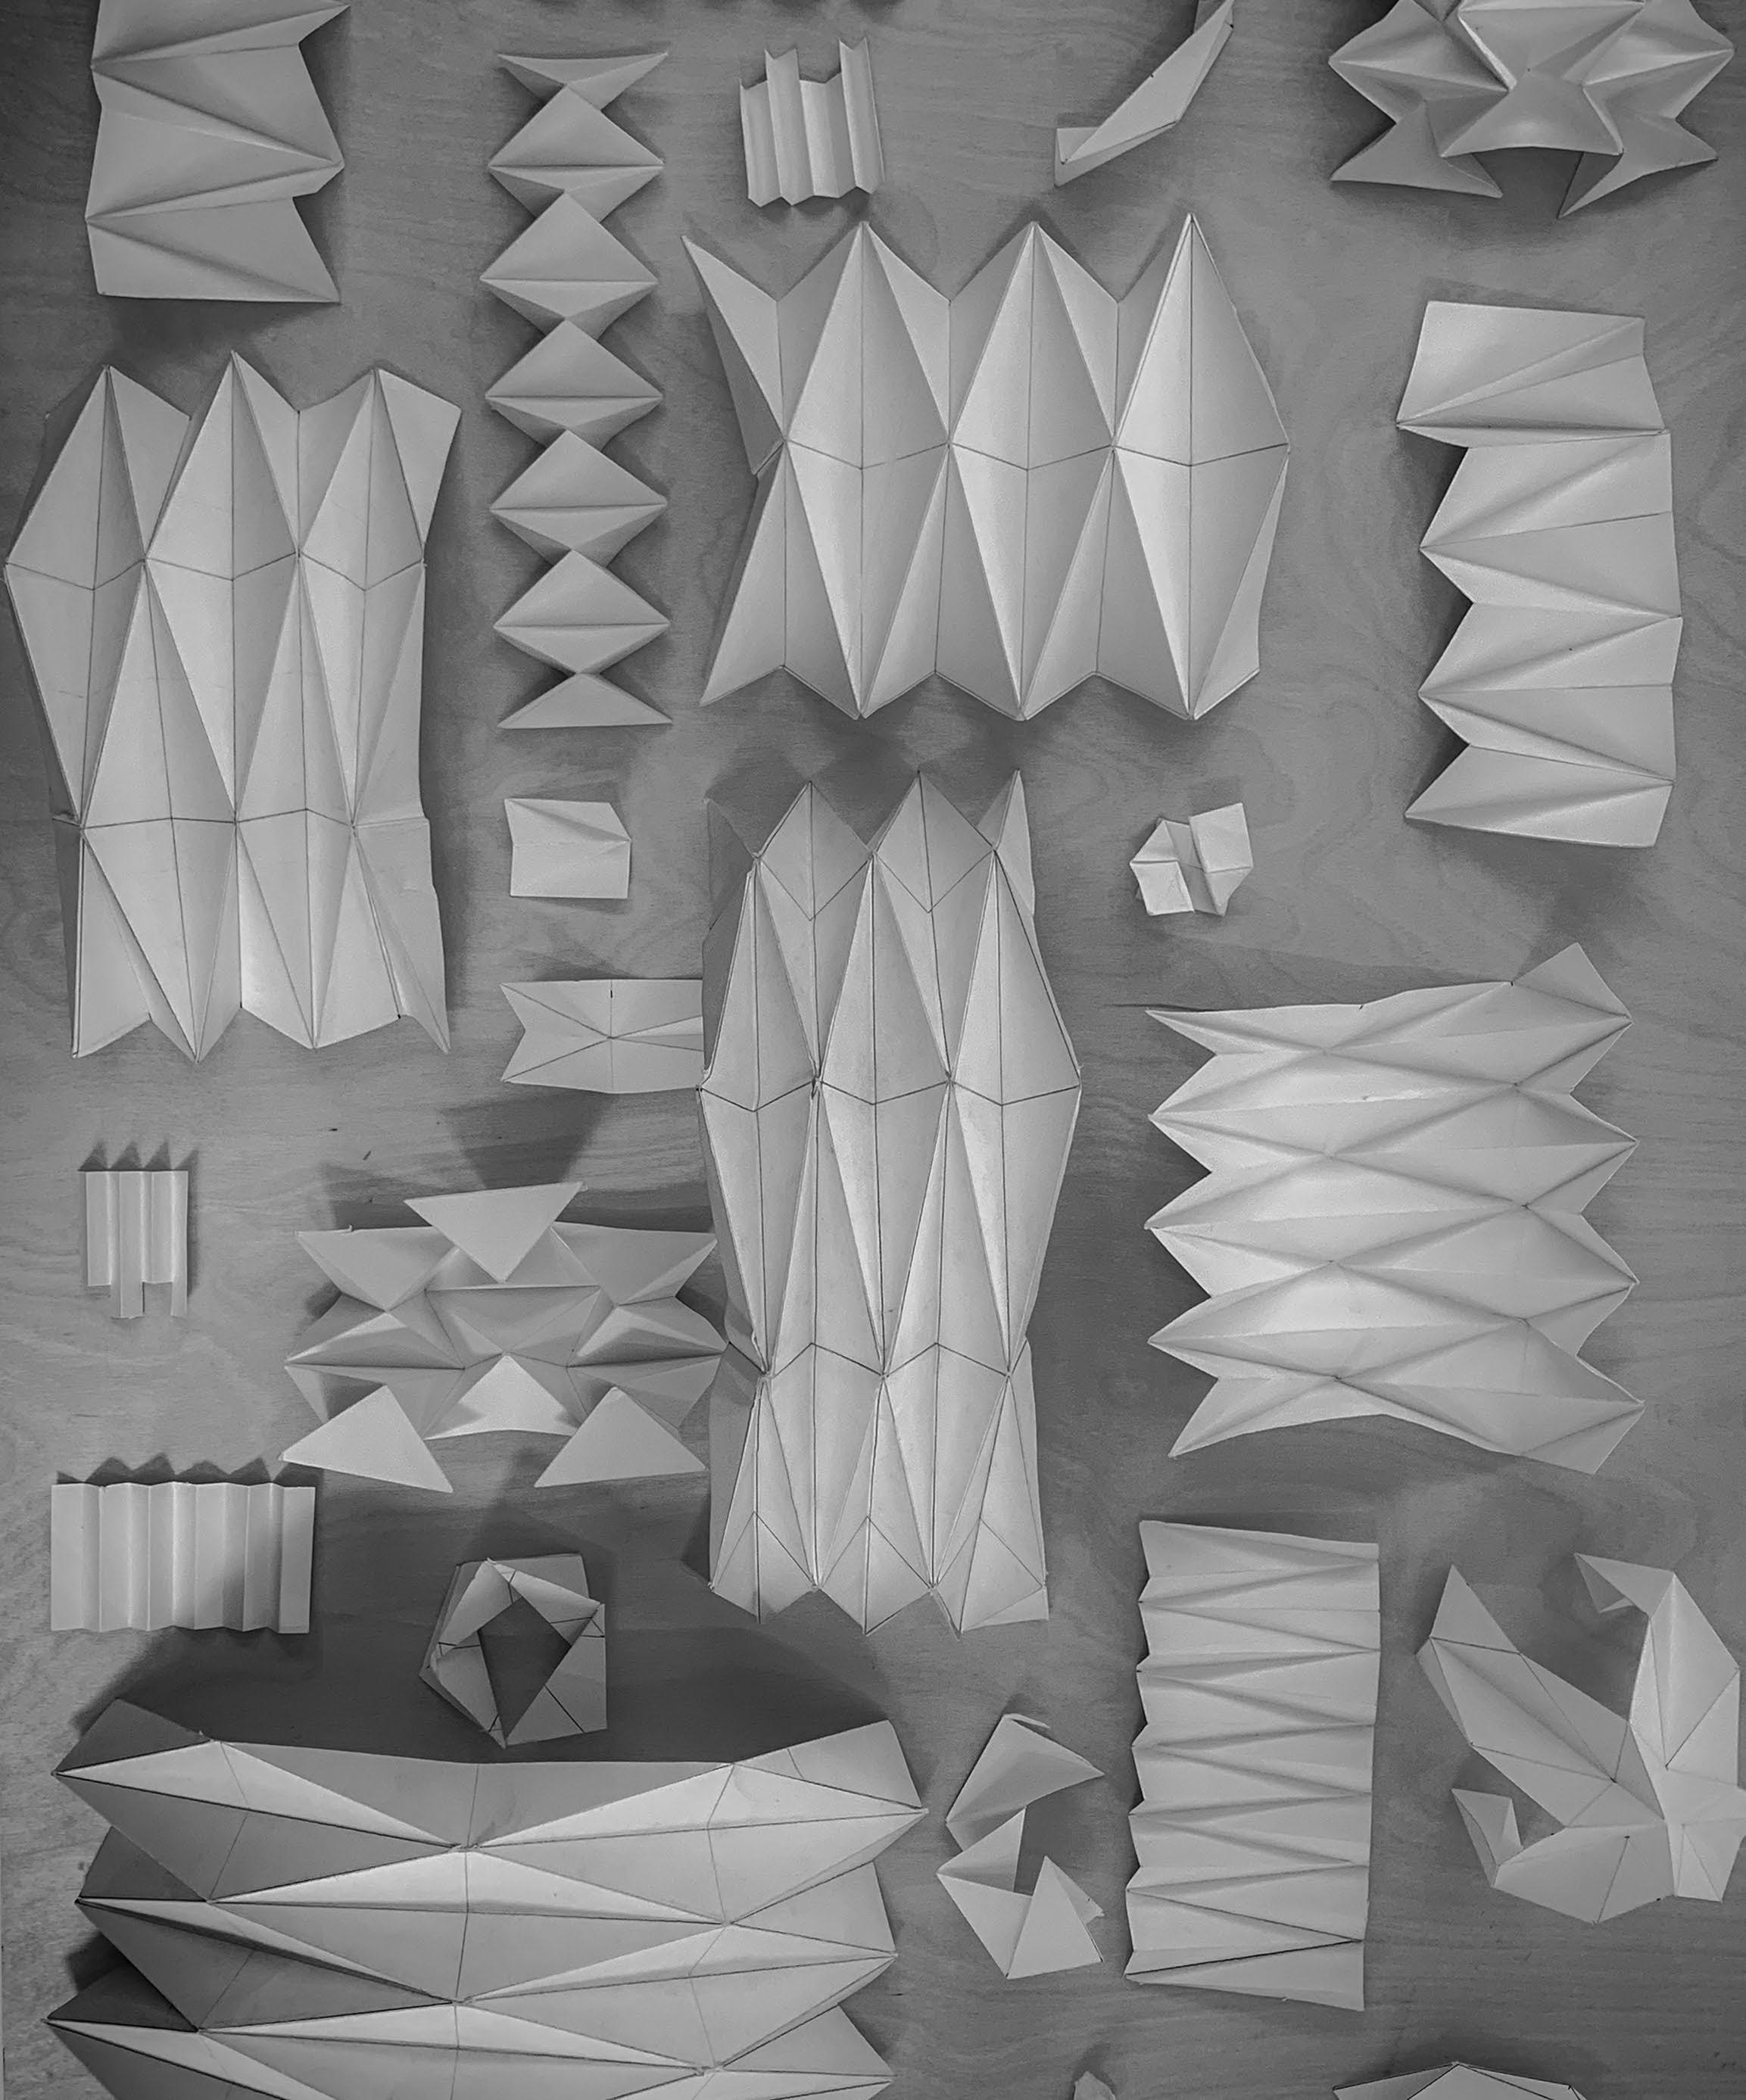
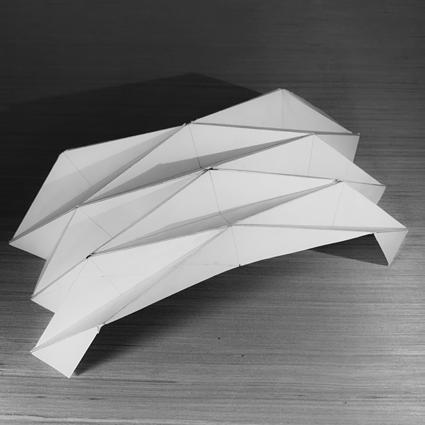
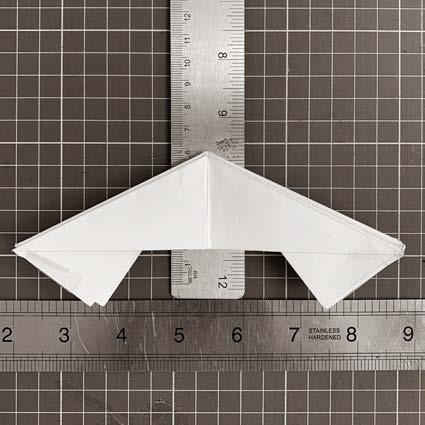
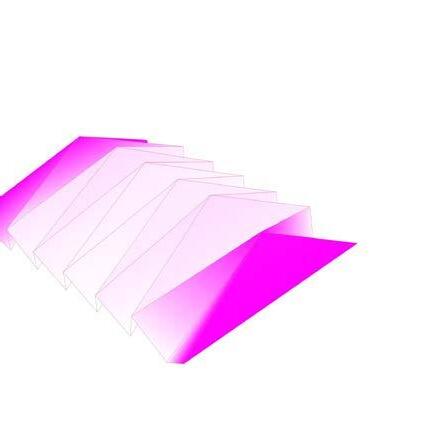
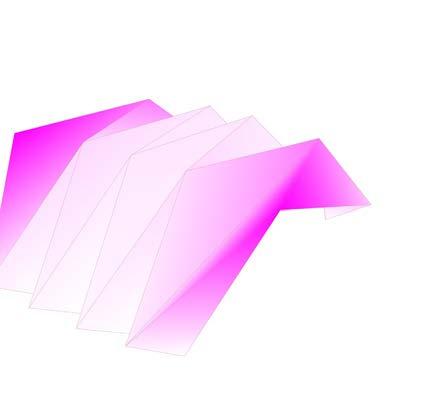
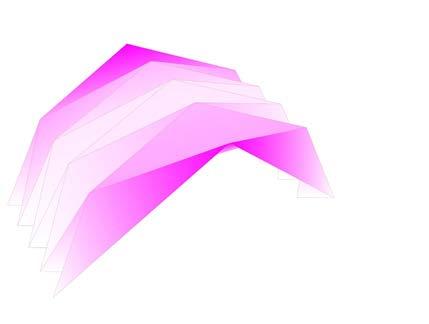
Physical folding experiments were carried out to obtain rigid shell structures with paper. Following research on different origami folding techniques and their applications in architectural design, four rigid origami patterns were chosen for further investigation and were recreated with paper. After further analysis, two of these patterns were selected for further morphological explorations. To overcome the limitations emerging from the geometry of the folded shells, these two patterns were combined in different ways to create enclosures. The mountain and valley folds of the combined patterns were extracted to be used in the digital modelling of the folded structures.
Computational Modelling of Folding
Computational design plug-in Grasshopper was used to model the folded structures. Initially, the physics engine Kangaroo was used to simulate the folding behaviour. Next, a physics engine specifically designed for origami folding called Crane was employed to simulate the two selected patterns. Both methods presented the same problem of lack of dimensional accuracy and were therefore abandoned, given that the folded shell was going to be the basis of the morphology and that accuracy was crucial. Instead, the two patterns and the combined pattern were parametrically modelled using the geometric modelling tools offered by Grasshopper. In every morphological experiment, the faces of the structure were checked for planarity, given that rigid origami requires all facets to be planar and developable.
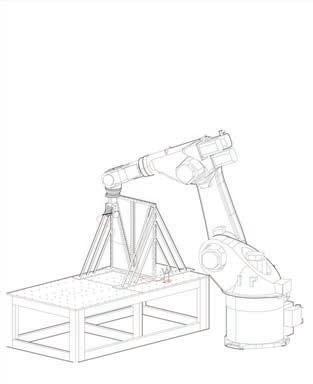
Robotic Sewing
Robotic sewing was employed as a method to test a manufacturing system. The hypothesis behind developing this technique was to increase the speed of manufacturing, decrease the cost of labour and increase manufacturing accuracy. The fabrication process was to achieve the goal of sewing automatically. During the process, several preparations needed to be done such as the development of a needle, an end effector, and the prototype materials such as panels, PVC sheets etc. The mechanism is based on the sewing process of a sewing machine and sewing manually. To this end, a script was developed with the computational design software Grasshopper, using the plug-in Robots, that would convert the commands in the visual code into a KRL script. A KUKA KR-30 robotic arm was used to replicate the sewing process.
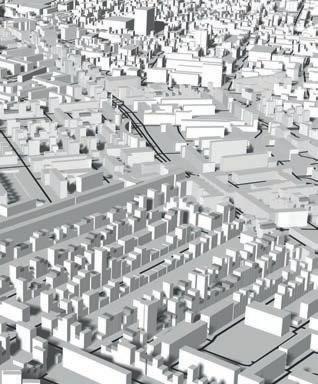

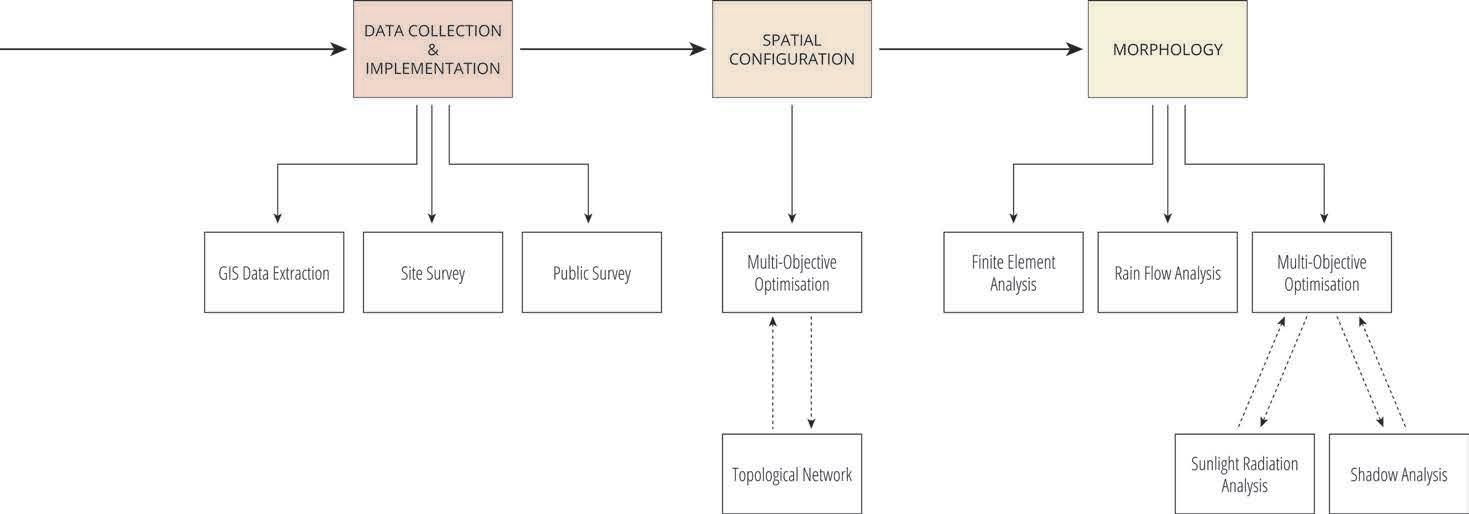
GIS Data Extraction
Elevation data from a Geographic Information System (GIS) database was used to extract height information about the buildings in central London. This data was coupled with the plan of London that lacked accurate height information about the majority of the city and an approximate 3D model of central London was generated. Every building within the boundaries of this plan was extruded as closed meshes. Then an algorithm was in Grasshopper to find all possible implementation sites within the selected area of implementation. The top faces of every closed mesh that represents a building were selected and the Z coordinate of their centre points was extracted. The same operation was done to the top faces of the two adjacent buildings. The difference between the Z coordinates was calculated to check whether the building height was enough for a rooftop expansion.
Site Survey
Studying the interior and the spatial configuration of the existing building of the selected implementation site was essential to developing the design proposal. To this end, the plans of the building were inquired. However, after corresponding with the local authorities, it was understood that it was not possible to obtain the building plans. Therefore, to collect the necessary information on the site, the building was visited several times. The site was studied as thoroughly as visitor permissions allowed. Measurements, photographs and videos of the site were taken for further study. Finally, the first-hand collected information was combined with the digitally available data such as Google Street View images and Google elevation data and was used to extract the missing information needed for creating a digital model of the site.
Public Survey
An online survey was conducted to understand the target user group’s spatial needs and preferences. This was done by creating a Google Forms document where inquiries were laid out in the form of 4 multiple choice questions, each with 5 or 3 choices and all with more than one answer possible. One of the questions also had the option of adding additional answers to the questions. Finally, a fifth open-ended question about the respondents’ spatial preferences was asked. The survey, together with an explanation about the context in which the results were going to be used and a disclaimer about the users’ data privacy, was sent to 80 people qualifying for the survey through email and messages.
49
Figure: Geographic Information System database 4 5 6 Figure: Online survey Figure: Measurements, photographs and videos of the site Figure: Robotic fabrication. 3 Figure: Physical origami folding. 1 2 Figure: Computation simulation
1 2 3 4 5 6
03_1
METHODS
Finite Element Analysis
A Finite Element Analysis (FEA) was conducted on two occasions, using the Grasshopper plug-in Karamba. The goal of the first analysis was to understand the effect a rooftop expansion would have on an existing building. To this end, the building on one of the selected implementation sites was modelled as a structure and the estimated load of the new rooftop expansion was applied as vertical loading. This informed the design of the structural deck transferring the load of the new expansion to the existing building evenly. Secondly, another FE Analysis was carried out to understand the effects of combining different rigid origami folding patterns for the creation of shell structures. The shell models were tested under the same vertical loading case and the displacement values extracted from the analysis were used as an indicator of rigidity and stability.
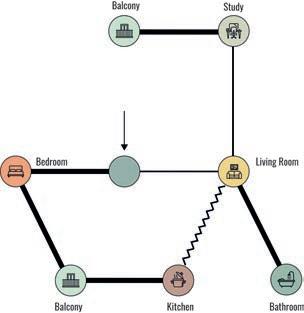
Topological Network
For the spatial configuration of the rooftop expansions, a script for generating a topological network based on Network Theory was developed in Grasshopper. Every space was represented with a node or a vertex and every link or edge in the graph represented the access from one space to the other. The network was initially developed independently of position and spatial distribution. Then, the graph was translated into a spatial distribution network by placing the nodes in predetermined locations. This process too was carried out in Grasshopper, in order to exhaust all different possibilities.
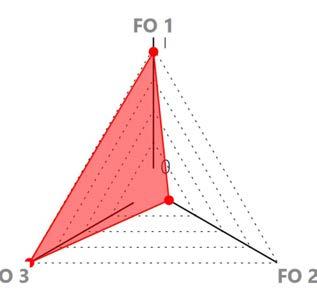
Multi-Objective Optimisation
A multi-objective optimisation was employed at several different stages of the research. For this method, the Grasshopper plugin Wallacei was used. Initially, the algorithm was developed and used for the generation and optimisation of the topological networks and spatial configurations, using the connections between spaces and the types of links as genes. Furthermore, the same method was used in the development of the morphologies on the selected implementation sites. In this case, the rotation of the building envelope, its height and the distribution of its openings were utilised as the genes of the simulation.

Rain Flow Analysis
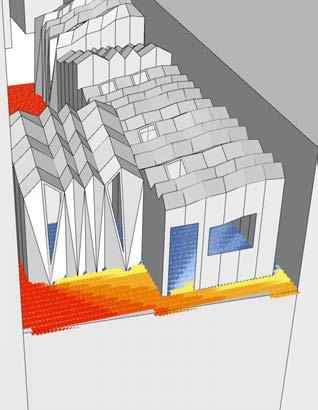
A Rain Flow Analysis was carried out on the morphology using the Grasshopper plug-in Anemone, to test if the roof was performing adequately. For the simulation, a grid of points was generated on top of the morphology and the points were projected on the surface. Then the projected points would move downwards along the Z-axis and the moved point would be projected to the surface again. This process was repeated 50 times in a loop. The resulting string of points was joined into a polyline. The length of the polylines determined the performance of the structure, given that the length of the longest polyline had to be shorter than the smallest dimension of the morphology, which proves thar the rainwater is flowing without any puddling.
Sunlight Radiation Analysis
A Sunlight Radiation Analysis was conducted on the morphologies in the Multi-Objective Optimisation process, using the Grasshopper plug-in Ladybug. For this analysis, an EnergyPlus Weather (EPW) file about London’s climate and weather data was used. The SkyMatrix generated through Ladybug was used to generate sunlight vectors over London throughout the year and these vectors were then directed onto the floor surface of the rooftop expansions. The morphologies of the designs were used as barriers for the sunray vectors and the openings on the morphology were the areas where the vector could pass through. The number of sunlight vector hits on the floor surface points was calculated and added together. The obtained value was used as an indicator of sunlight performance, i.e. the higher the number of hits, the better the morphology’s performance.
Shadow Analysis
A Shadow Analysis was carried out using the same software and technique. In this case, a planar surface was created on the ground level and divided into a grid of points. The sunlight vectors were directed towards this point grid and the entire morphology of the new rooftop expansion was used as the vector barrier. The number of sunlight vector hits on the ground surface points was calculated and added together as previously. The obtained value was used as an indicator of shadow performance, i.e. the higher the number of hits, the better the morphology’s performance.
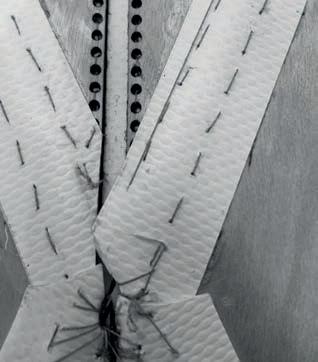
Manual sewing was used to prototype the deployable timber panel structure on a 1:100 scale. The 0.8 mm thick plywood panels were laser-cut to dimension, with a series of laser-cut holes on the edges to facilitate the sewing. Next, the panels were first glued and then sewn to a strip of PVC sheet using a conventional sewing needle and an acrylic thread.
51
Sunlight Radiation Analysis
13
Manual sewing Figure: Shadow Analysis Figure: Rain Flow Analysis
Figure: Topological Network
9
Multi- objective optimisation Figure: Finite Element Analysis
Figure:
11 12
Figure:
10
8
Figure:
7
7 8 9 10 11 12
13 Manual Sewing
SUMMARY 03_2
The methods of physical paper folding, computational modelling of folding, manual sewing, robotic sewing, finite element analysis, GIS data extraction, site survey, public survey, multiobjective optimisation, topological networks, rain flow analysis, sunlight radiation analysis and shadow analysis were employed in different sections of this study. Finite element analysis and multi-objective optimisation methods were utilised on more than one occasion, for distinct purposes and conditions.

RESEARCH DEVELOPMENT
The research developed in this study consists of two main parts: material system and computational system. The research concerning the material system comprises the sections of Origami Folding, Material Prototyping, and Robotics, while the research pertaining to the computational system consists of Location Selection, Site Selection, Spatial Configuration, Morphology and Kit-of-Parts sections.
55
04
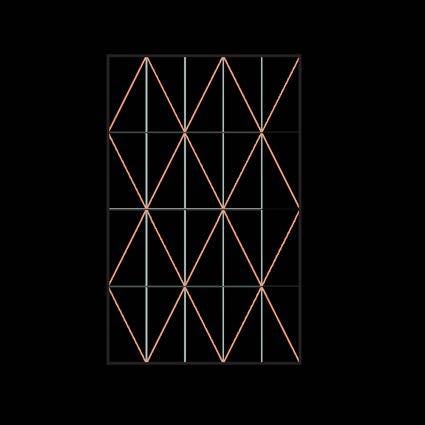
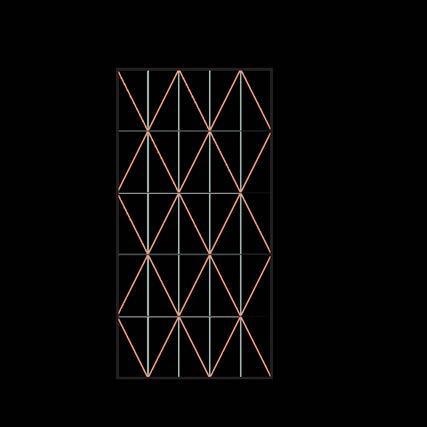
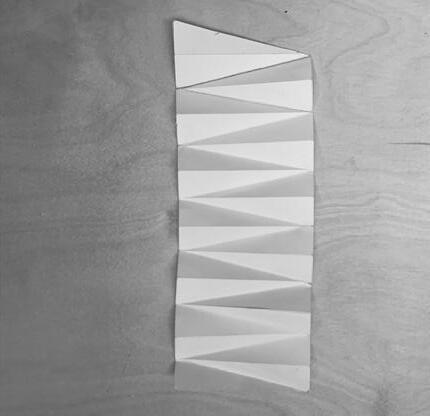
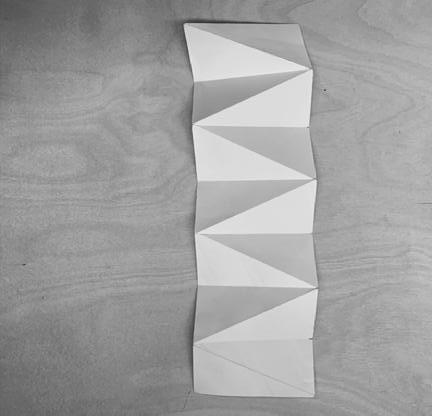
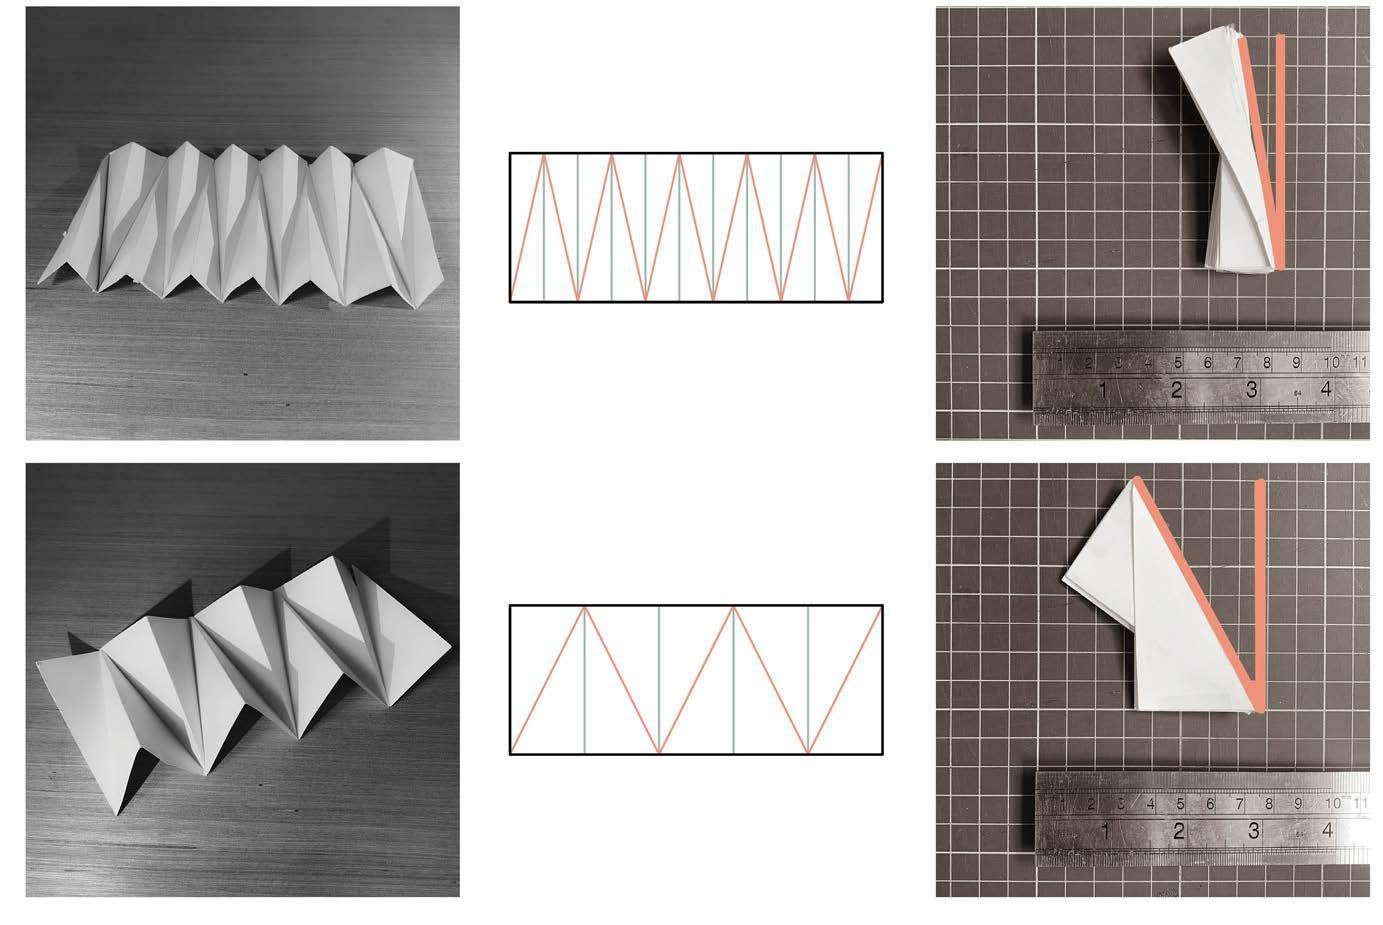
Four origami patterns were investigated for morphological research, which was particularly well researched for structural applications and architectural design.1 Yoshimura (Diamond) pattern, Miura-Ori (Herringbone) pattern, Waterbomb pattern and Diagonal pattern.
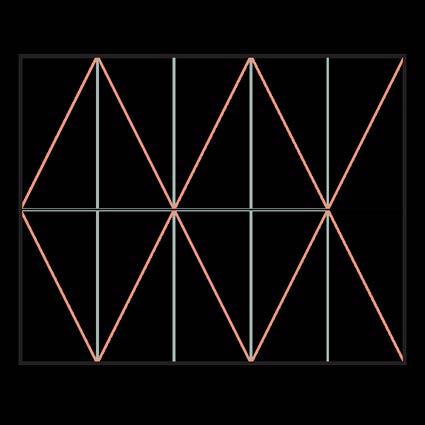
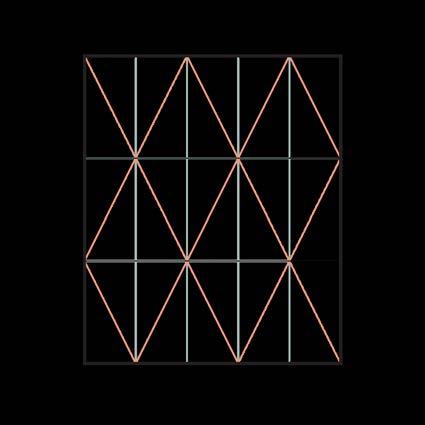
Yoshimura Pattern (Diamond Pattern)
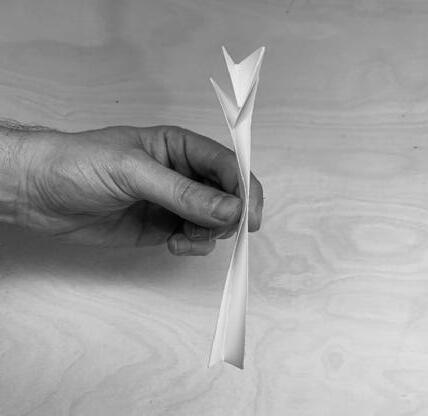
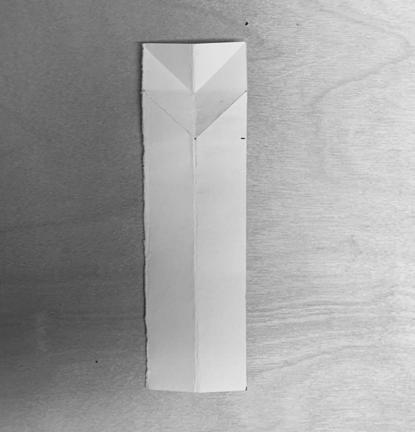
The diamond form that this pattern contains, folds in one of its diagonals. (figure 1) The diamond’s diagonal and its edge form an acute angle, which results in a flatter folded pattern. When the folding angle becomes more obtuse, it changes the morphology and generates a more inclined form (figure 10,11,12,13). The inflexion of the curve is altered by distortion from diamond to kite shape by creating a more obtuse angle. Another variation of this pattern can be accomplished by altering the number of diamonds along the Y-axis of the structure. (figure 5-9) Higher rigidity is achieved by adding more diamonds. In addition, having an even number of diamonds also contributes to the stability of the structure. The height of the structure is determined by the number of diamonds.
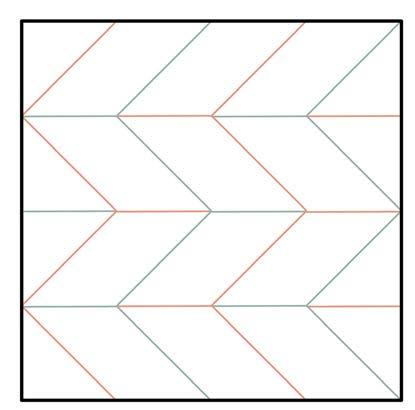
Miura-Ori Pattern (Herringbone Pattern)
Miura Ori is one of the most well-researched origami patterns. (figure 2) Its application ranges from nanotechnology and metamaterials to space engineering. It has a negative Poisson’s Ratio, meaning that when extended along the X-axis, it also extends along its Y-axis, and vice versa when compressed. This allows structures designed with the Miura-Ori pattern to be compressed into very small sizes and cover large surface areas once deployed. Furthermore, the pattern has one degree of freedom, meaning that a rigid structure can be obtained by locking one hinge or two distant points.2
The pattern is achieved by dividing a surface in U and V directions. The lines in the U direction form a zigzag on the surface plane. The lines in the V direction are folded in an alternating mountain-valley pattern, thus repeating a reverse fold. As a result, the folded pattern features a distinctive two-directional zigzag corrugation. (figure 14). This zigzag enables the pattern to be expanded and contracted in both directions simultaneously, thus the negative Poisson’s Ratio.
Waterbomb Pattern
This pattern is based on a folding logic similar to that of the Miura Ori pattern and has deployment in all directions. Waterbomb patterns have been used for advanced materials. This pattern however has several disadvantages for architectural implementation, such as its difficulty to be stabilized given that it is a non-rigid origami folding technique and the fact that it contains many acute angles, rendering its construction rather problematic. (figure 3)
Diagonal Pattern
A parallelogram folded on its diagonal serves as the foundation of this pattern. While the pattern shares many similarities with the Yoshimura pattern, the main distinction is that the valley folds in a Yoshimura pattern produce a plane polygonal line, whereas the valley folds in a Diagonal pattern to form a helical polygonal line. This generating of helical structures was determined to be unsuitable for the design ambitions of this thesis. (figure 4)


57
ORIGAMI FOLDING CATALOG OF PATTERNS 04_1
2 3 4 Figure: Diagonal Pattern Figure: Waterbomb Pattern Figure: Yoshimura pattern 1 1 2 3 4
FOLDING PATTERNS
Figure: Miura Ori Pattern


59
5 6 7
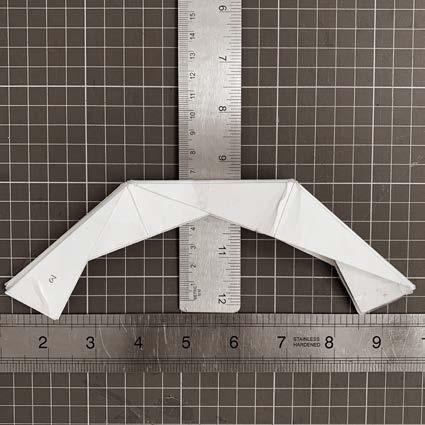
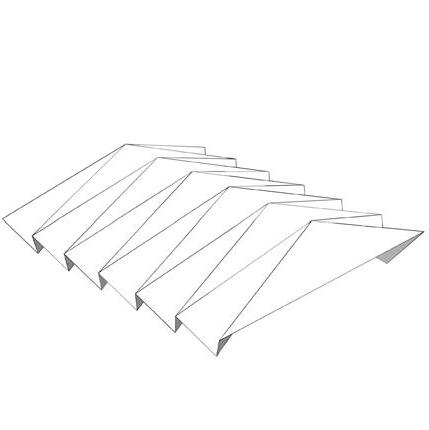
Figure: The folding results and computational analysis of structure in two triangles with Yoshimura pattern.
Figure: The folding results and computational analysis of structure in four triangles with Yoshimura pattern.
0cm 3.92e-01 0cm 8.70e-01 0cm 8.88e-01 5 6 7
Figure: The folding results and computational analysis of structure in three triangles with Yoshimura pattern.


61 8 9
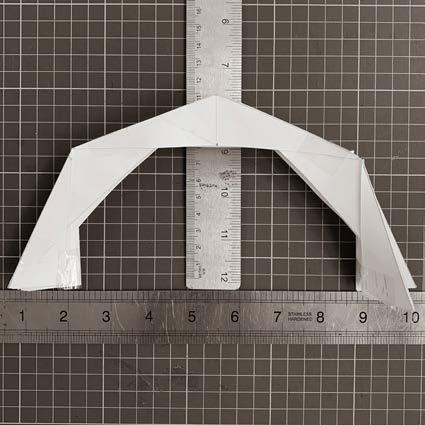
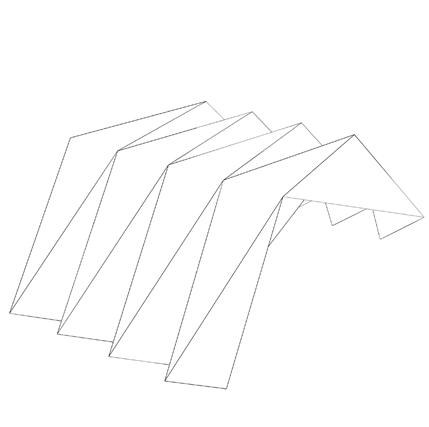
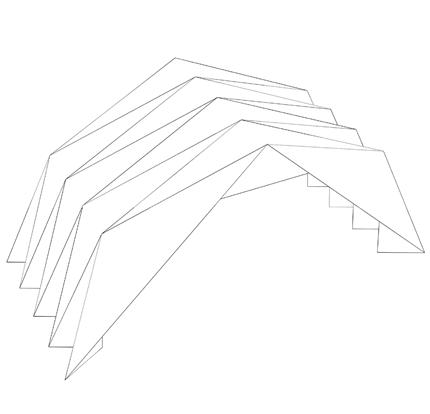
Figure: The folding results and computational analysis of structure in six triangles with Yoshimura pattern.
0cm 8.70e-01 0cm 8.88e-01 8 9
Figure: The folding results and computational analysis of structure in five triangles with Yoshimura pattern.

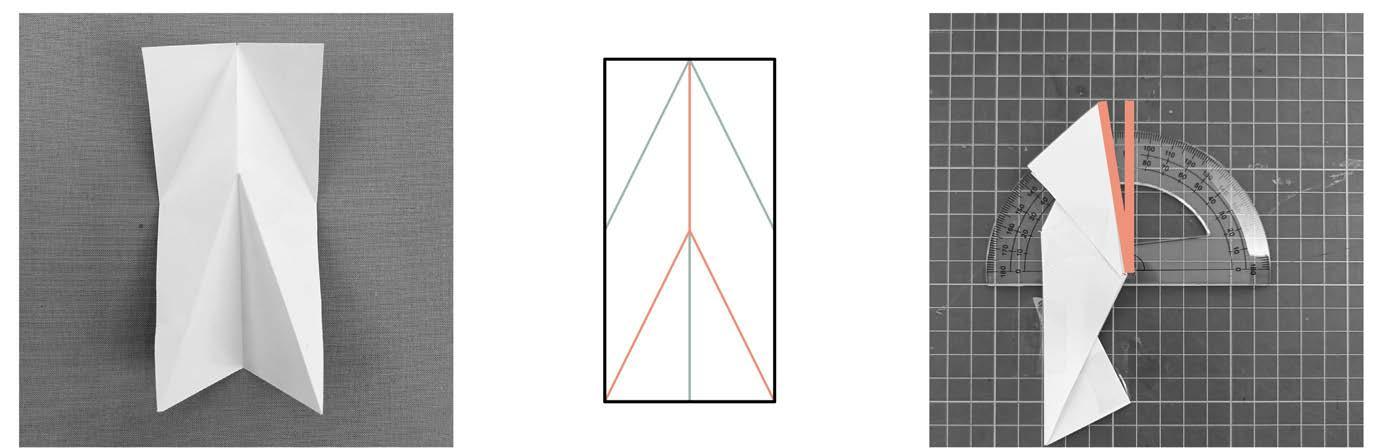
63 Figure: Acute angle of the Yoshimura Pattern 10 11 12 Figure: Acute angle of the Yoshimura Pattern 2 Figure: obtuse angle of the Yoshimura Pattern 10 11 12


CONCLUSIONS
Among the studied Origami patterns, the first two were selected for further investigation. The fact that the Yoshimura pattern can create rigid shells with rather simple folds and the bidirectional deployment feature of the Miura-Ori pattern were the main reasons for this selection. The Miura-Ori pattern in particular was chosen as a possible inspiration for the roof structure, due to its suitability for covering large spans. Furthermore, the chosen patterns lack the disadvantages of the Waterbomb and Diagonal patterns, which were deemed unfit for residential structures due to their morphology
65
14 Figure: The zigzag enables the pattern to be expanded and contracted in both directions simultaneously Figure: obtuse angle of the Yoshimura Pattern 2
13
13 14
COMBINING PATTERNS

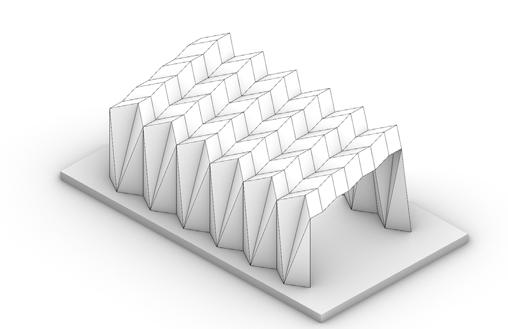
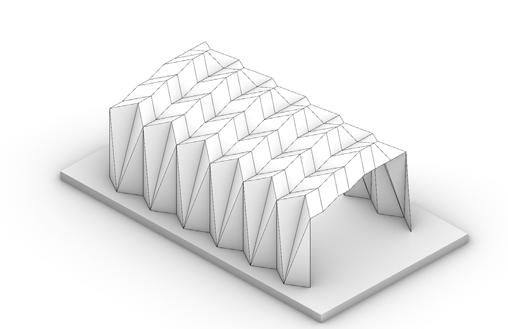
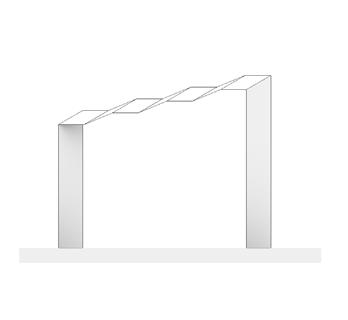
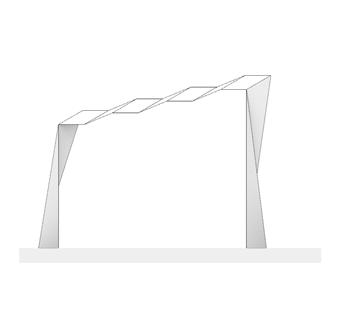
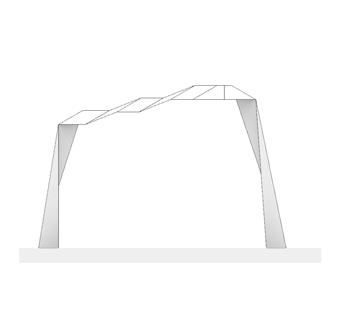
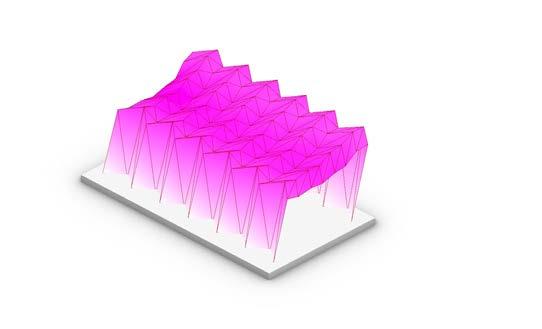
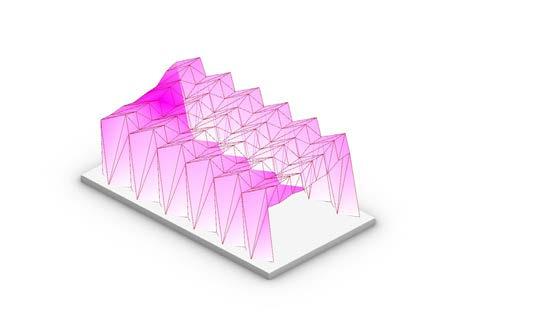
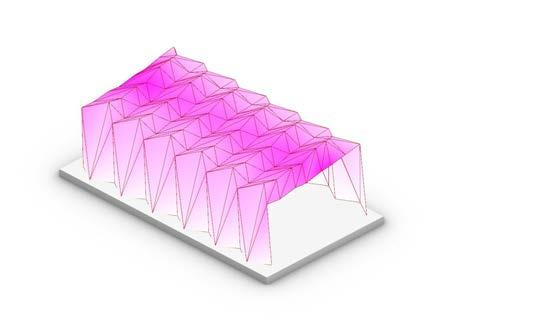
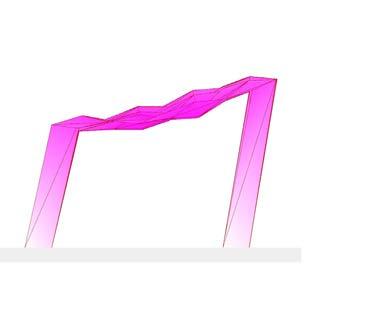
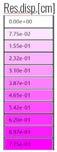
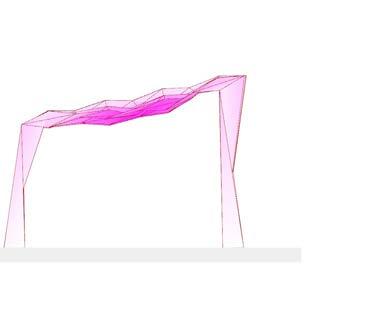
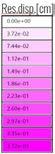
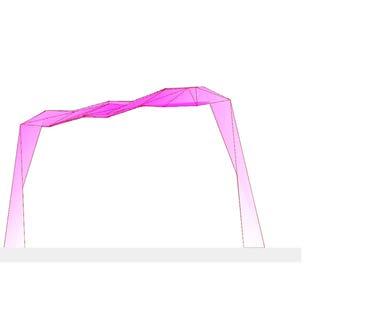
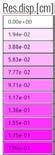
Figure: Miura Ori pattern for the walls and the roof 18 15
Upon determining the origami patterns with the highest potential for the study, their possible combinations for the design of a structure were investigated. The Yoshimura and the Miura Ori pattern were combined computationally to test the outcomes.
roof pattern were mirrored. It was hypothesised that in this way, a more stable structure would be created. It was expected that the first pattern would be the least rigid, the combined pattern would be the second most rigid, and the combined and mirrored final pattern would be the most rigid structure. (figure 17)
Figure: combining the Yoshimura and the Miura Ori pattern
Figure: combining and mirroring the Yoshimura and the Miura Ori pattern
Figure: FEA of the Miura Ori pattern
Figure: FEA of the combining patterns
19 16 20 17
Figure: FEA of the combining and mirroring patterns
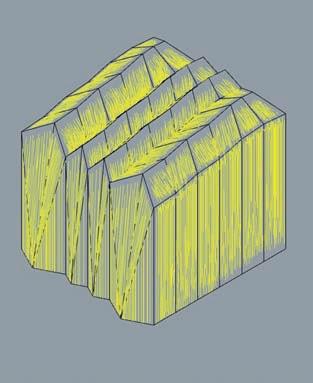
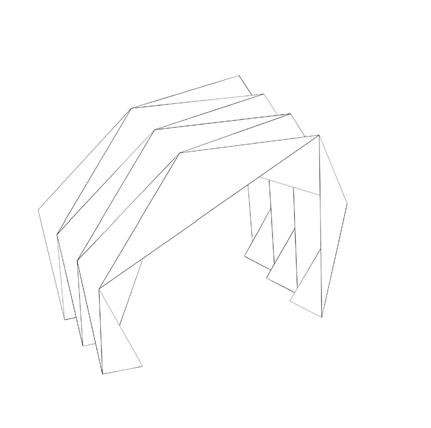
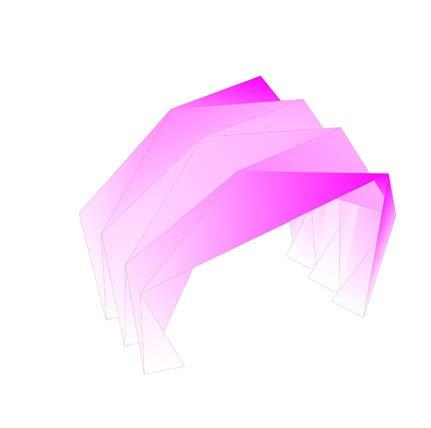
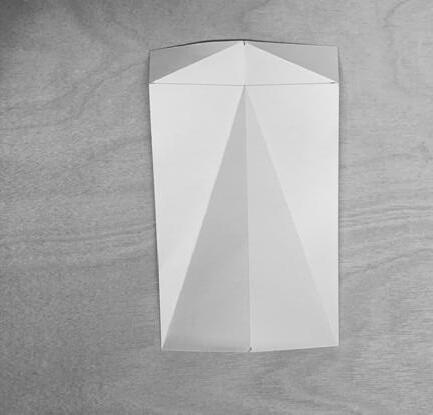
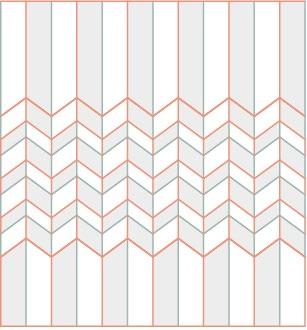
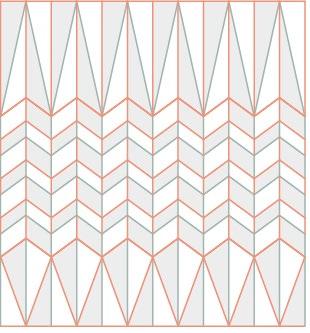
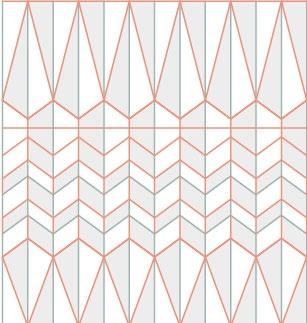
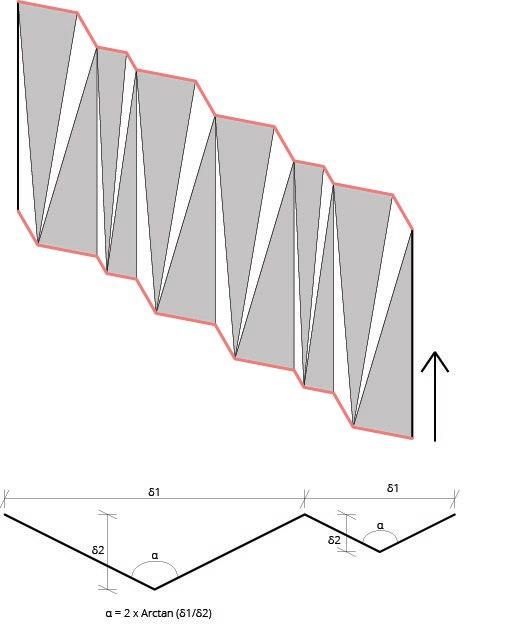
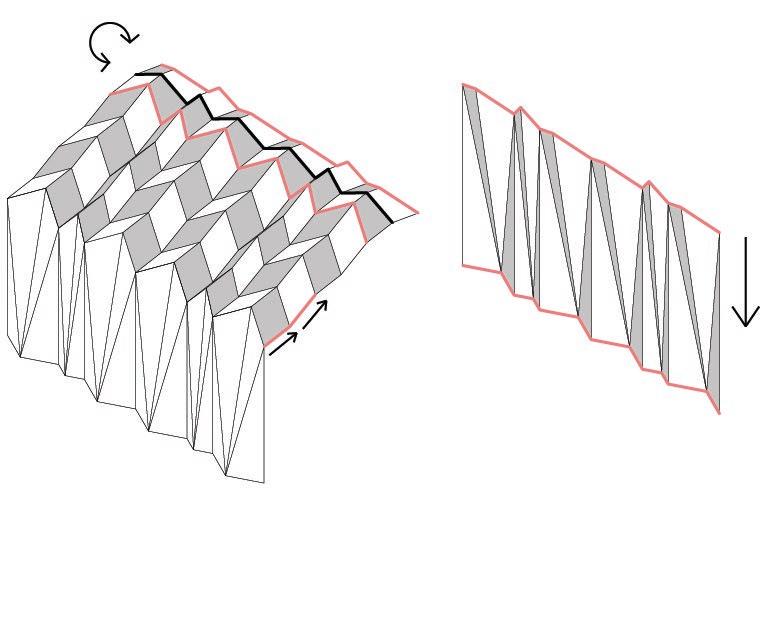
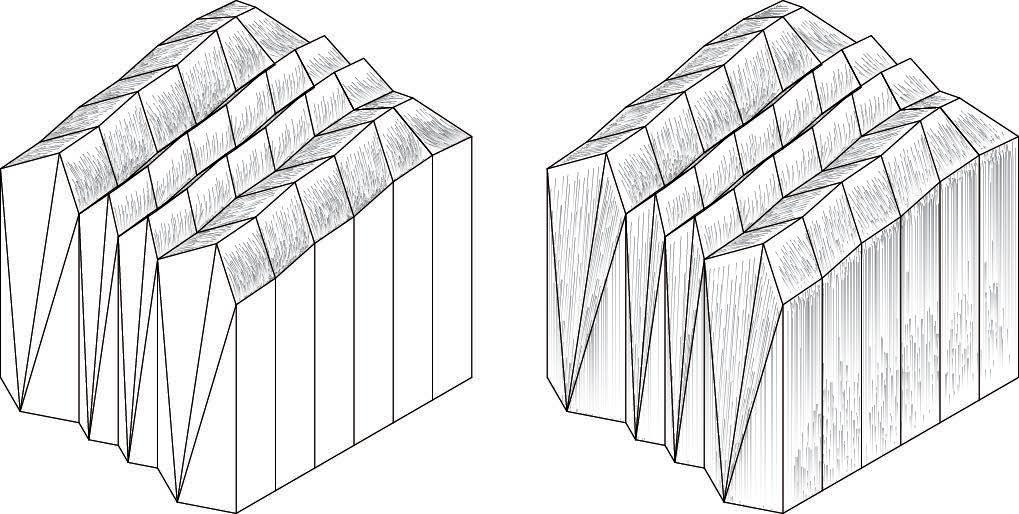
To employ the Miura-Ori pattern as a roof structure, two options were explored. The first option consists of extending the lower and higher zigzag edges of the pattern downwards by creating flat rectangular surfaces that would act as walls, thus creating a shell (figure 15). In the second option, however, the same lower and higher zigzag edges of the MiuraOri pattern are connected to a vertical diamond folding pattern. The folding angles of the zigzag determine the folding angles of the diamond pattern walls since the valley folds of the walls meet the zigzag folds of the roof. (figure 16)
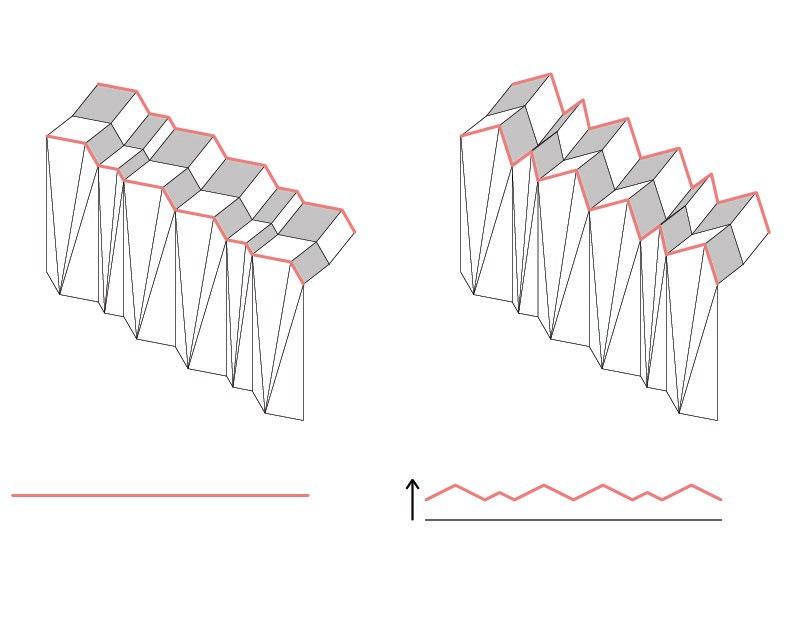
However, combining the two patterns in this way caused a morphological problem: Given that the Yoshimura pattern forming the front wall was tilted in the Y direction of the shell, it determined the fold direction of the Miura-Ori folded roof and therefore the tilting direction of the back wall. This resulted in a shell structure entirely tilted towards the Y direction. To solve this issue, the Yoshimura pattern of the back wall and the final fold of the Miura-Ori
To compare the structural performance of the three shells and to test the rigidity hypothesis, a structural analysis was carried out using the Finite Element Analysis method. To obtain reliable results from this experiment; the dimensions, folding angles, slope, and height of the Miura-Ori pattern covering the roof were kept at constant values. The material chosen for the analysis was wood, as a default material in the FEA software Karamba. The section thickness of the structure was chosen as 6cm, a value based on the material prototyping studies being carried out simultaneously
The three structures were tested under a combined load of gravity and vertical loading of 1.0 kN/m2. The results of the FE analysis confirmed the initial expectations of the experiment. The second structure with the combined pattern performed better than the first structure in both loading cases. In the first loading case consisting of only vertical loads, the first structure exhibited a 0.69 cm displacement (figure 18), the second structure displayed a 0.33 cm deflection (figure 19), and the final structure had a 0.17 cm displacement. Therefore, it was concluded that the third pattern combination is structurally more stable. (figure 20) Based on this study, further morphological explorations were carried out with the third combined and mirrored pattern.
67
15 16 17 18 19 20
21
Diagram: Computational model pseudocode
FINAL PATTERN
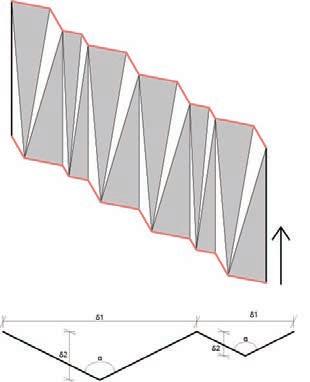
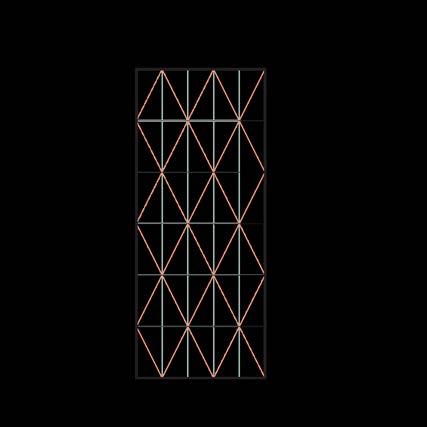
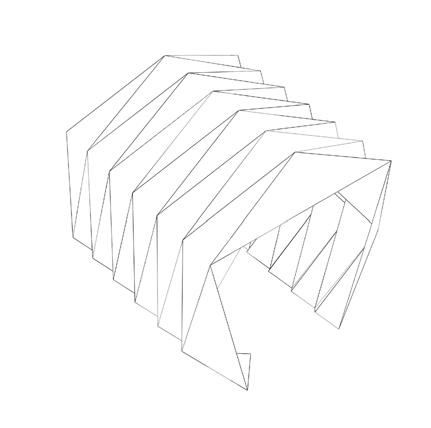
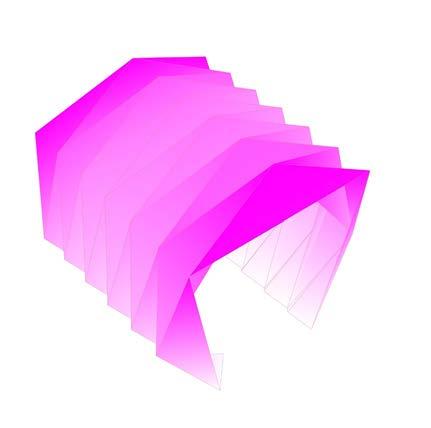
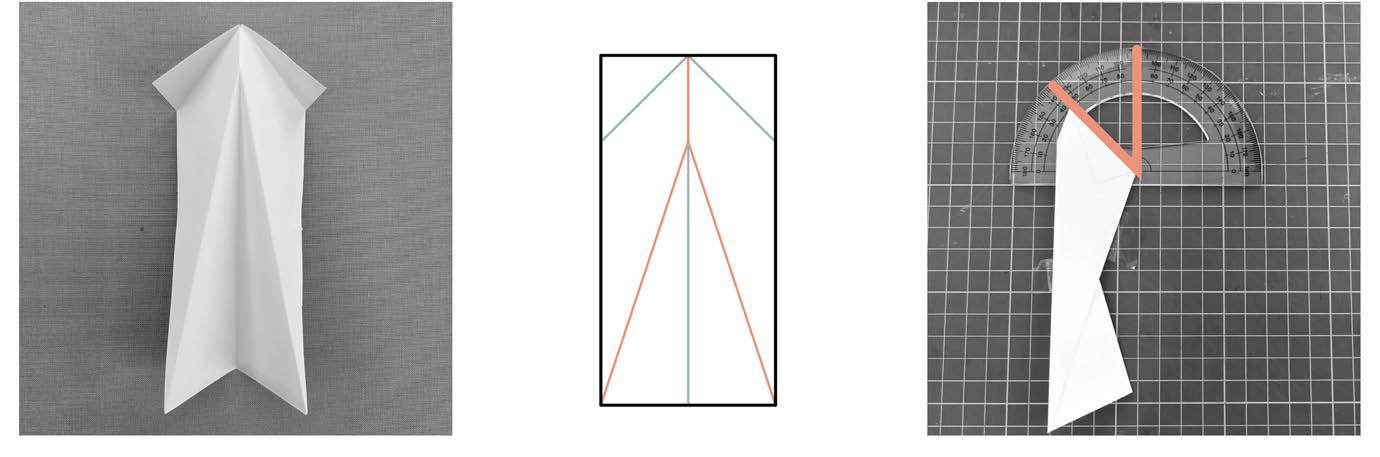
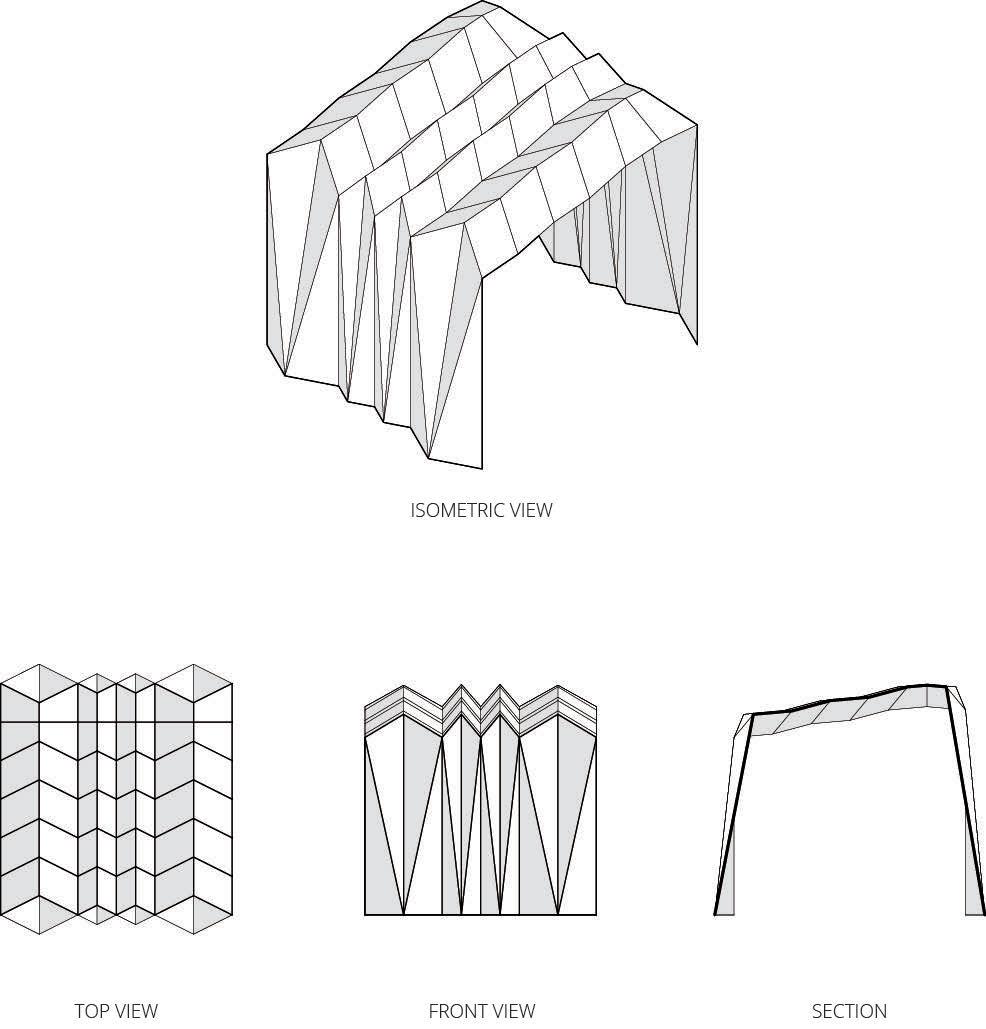
The selected shell with the combined and mirrored pattern was modelled parametrically using Grasshopper. First, the pattern of the front wall with the Yoshimura pattern was generated. In the model, the desired fold length in the X direction “δ1” was determined as the first parameter. The second parameter was the fold length in the Y direction “δ2” or the structural depth of the shell. The angle “α” required to create this fold was calculated as “α = 2 x Arctan (δ1/δ2)”. Once the fold is generated, it is repeated along the X -axis with desired parameters. Once the zigzag base for the pattern is generated, a copy of it is moved up along the Z-axis according to the desired height parameter and mirrored. The folded pattern is finalised by connecting these to polylines with triangular surfaces. (Figure 21)
In the second stage, the generated Yoshimura pattern is used as the starting point of the Miura-Ori pattern that would constitute the roof. However, given that the top edge of the wall pattern is flat, it in turn generates a roof pattern folded only in one direction. To solve this geometric issue, the top centre points of the folds on the Yoshimura wall pattern are extended along the Z-axis according to the desired extension parameter “δ3” and a zigzag
is generated on the XZ-plane. Thus, generating a Miura-Ori pattern that folds in two directions is possible. For generating the roof pattern, two parameters are needed to determine the angles “β” and “θ” of the folds in the Y direction. Another parameter controls the horizontal length “δ4 and δ5” of the folding pieces in the Y direction. Therefore, the length of the pieces “l1” and “l2” are calculated as “l1 = δ4 / Sin (β) ” and “l2 = δ5 / Sin (θ) ”. By using this method, the horizontal distance that the roof pattern spans can be controlled precisely. The polyline curve that forms the border between the Yoshimura wall and the roof is repeated along the “l1” and “l2” distances and “β” and “θ” angles. (Figure 21)
To mirror the back wall and the final row of faces on the roof, in order to generate a more rigid structure as explained previously, the penultimate roof curve is transformed and planarized in the XZ-plane. This way, the pattern that is folded in two directions comes to an end and can be mirrored from this planar edge. Finally, all the polylines forming this particular Miura-Ori pattern are used to generate rectangular planar surfaces. The mirrored fold line at the back end of the roof is then used to generate the back Yoshimura wall, in the opposite order that the front wall was generated. (Figure 21) And thus, the primitive of the envelope developed, that would be further developed in the morphology section. (Figure 22)
69
21
RAINWATER
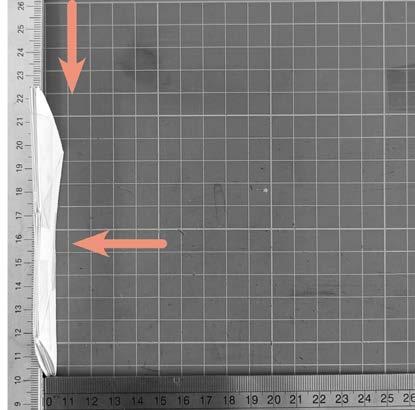
The folded shell morphology had to be tested for rainwater performance, to test if this angle with which the Miura-Ori pattern was generated provided adequate slope for water to run off. The pattern on the roof was generated using angles “β = 5°” and “θ = 15°”, using small angles to have a low slope in order for the back wall of the envelope not to be exceedingly high.
A rain simulation was carried out to test the established angles, using the Anemone plug-in in Grasshopper. A grid of 5000 points was generated and projected onto the envelope, and then these projected points were moved along the Z-axis and reprojected. This process was repeated 50 times and all the generated points were joined through a polyline. The length of these polylines was then checked against the dimensions of the envelope. It is hypothesised that if the length of these polylines far exceeds the dimensions of the envelope, this means that the rainwater is generating puddles of water on the surface. This can also be checked visually by looking at the 3D model, to see if all the polylines are flowing down. The highest point of the envelope was 300 cm and the longest polyline was calculated as 245 cm, proving that the rainwater runs off as expected. Therefore, the tested angles of β = 5° and θ = 15° were used for the roof structures in the next stages of the research. (Figure 23)
71
22 23 Diagram: Rain simulation on the primitive Diagram: Envelope primitive 22 23
PAPER TO WOOD
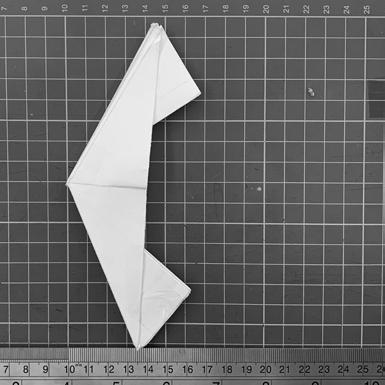
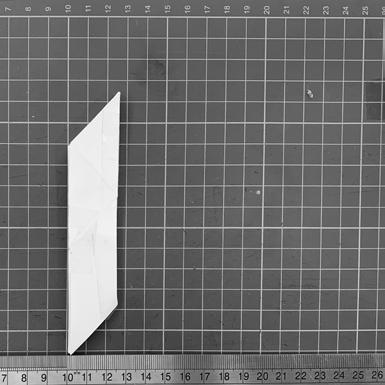
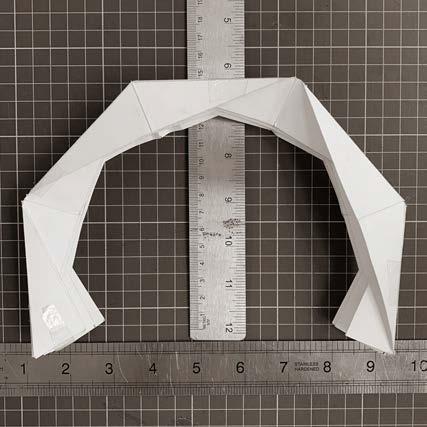
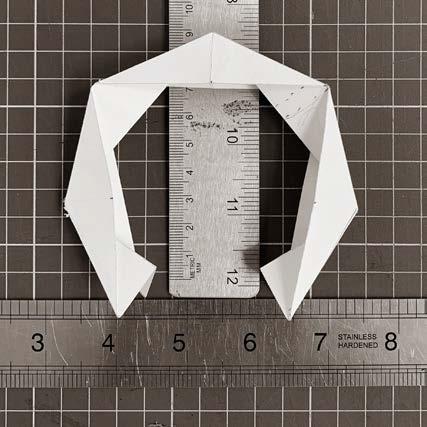
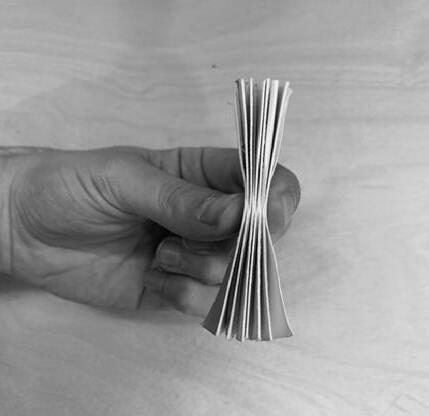
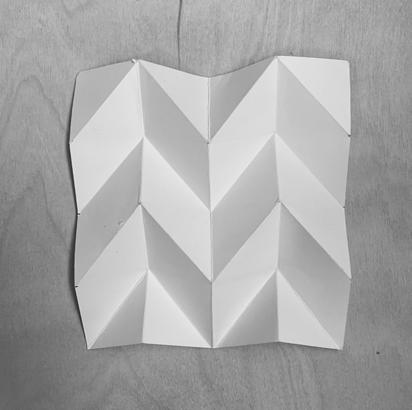
Origami is conventionally applied on paper, pliable material with insignificant thickness. Therefore, when scaling up, the rigid faces of the structure need to gain thickness for the structure to perform similarly on a large scale. Thus, the material research focused on investigating how wood panels and their connections can be designed for the final structure to perform with the same principles as folded paper.
To achieve this objective, it was hypothesised that a piece of plywood could be cut along the fold lines of an origami pattern and then reattached together with a hinge, converting a rigid sheet of plywood into a series of foldable panels. With the intent to create an enclosed structural system and not merely a series of panels, a hinge system had to be developed. Yet this hinge had to not only allow for rotation but also lock it at a certain angle and needed to be integrated with the panels into a single sheet with both rigid and pliable sections. Inspiration arose from the fashion industry; how individual pieces of fabric are sewn together to create a single article of clothing. By sewing the individual pieces of plywood back together along the fold lines with a pliable fabric, the individually cut panels become a single foldable sheet. (Figure 25)
FABRIC TYPES
Additional research was conducted on various fabrics and threads, as well as the requirements for external walls. Nylon thread was the strongest and most flexible thread that was available. Since nylon is also resistant to chemicals, abrasion, and sunlight, it was determined that nylon thread was appropriate for the sewing experiment. Several fabrics were explored and narrowed down based on recent research on deployable structures.4 (Figure 24)
Polyvinyl Chloride (PVC) and Polyethylene (HDPE) were chosen and then further analysed. Both are widely used in the construction industry. PVC is much cheaper than HDPE yet still provides high tensile strength. It is softer, meaning it is more suitable for the sewing process and was therefore chosen for use in this application. 610g Heavy Duty Fire Retardant PVC Awnings Tarpaulins were chosen as the fabric to be used as the hinge for this research.
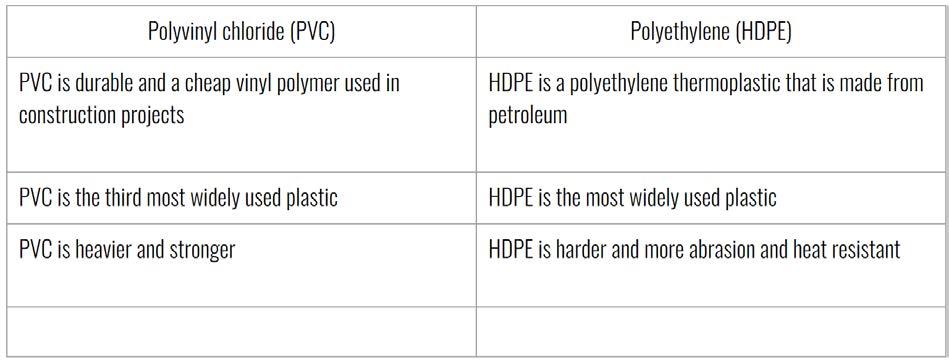
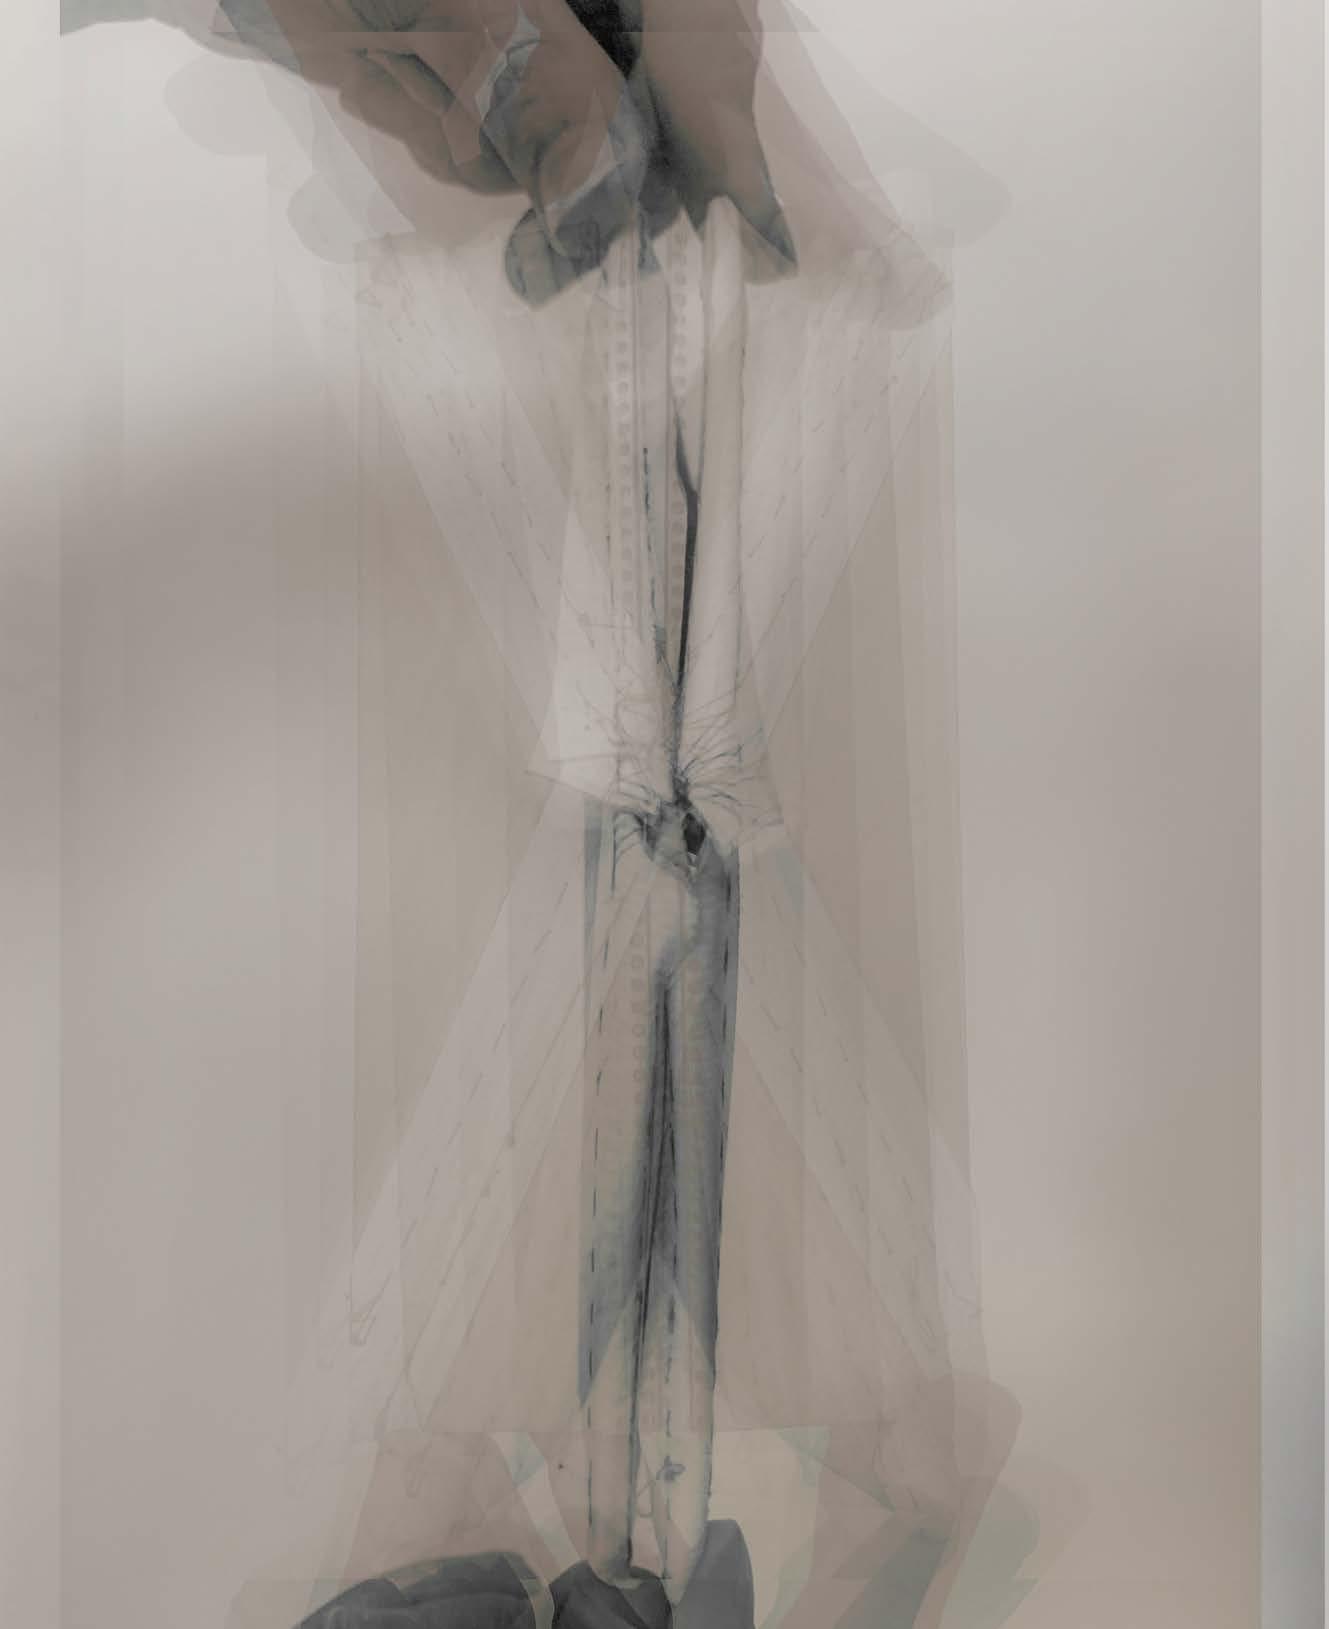
73
PROTOTYPING
04_2 24 25 Image: The folding process in small scale prototype. Chart: a table of material comparisons of difrent fabrics.
MATERIAL
EXPERIMENTATION
24 25
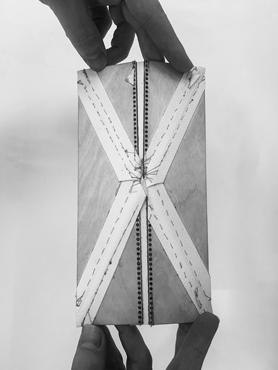


PROOF OF CONCEPT
To test this hypothesis, a single sheet of plywood of 1.5 mm thickness was cut along the fold lines of the Yoshimura pattern. Understanding that a needle could not penetrate the material, holes with a radius of 0.75 mm and a centre-to-centre separation distance of 3 mm were cut into the plywood sheet, creating a guide for the needle to follow. The pieces were positioned with an offset of 2.5 mm from the fold lines, allowing for movement when folded. The fabric was sewn by hand combining six individual panels into one sheet. The hypothesis was proven accurate with the new sheet, observing folding behaviour similar to that of paper folded with the Yoshimura pattern. (Figure 26) From this test, it was also understood that the grain of the fabric must run in parallel with the fold lines for ease of bending. The fabric also must be positioned at the mountainside of the fold to create a stronger bond and reduce the forces on the fabric. Having validated the hypothesis, acting as a proof of concept, the focus now shifted to scaling up the application.
1:1 THICKNESS
Obtaining this understanding gave way to constructing an experiment to understand how this system would work with a 1:1 scale wall thickness. An experiment was designed to demonstrate how two panels would be connected with a more realistic thickness for real-world application. A sandwich panel was built using two 1.5 cm sheets of plywood on both sides and a 2 cm sheet of rigid foam representing insulation in between the sheets, adding up to a total section thickness of 5 cm. The guide holes for the sewing were enlarged to 3 mm in diameter but the separation distance between them was maintained at the same ratio as the previous experiment. The fabric was positioned on the outside of the panels and sewn between. This method worked by combining two separate panels into one sheet with the ability to fold. However, this method created a large bulge of surplus fabric when the system unfolded, which would cause problems with construction and the addition of more panels. The technique also required an extensive amount of fabric and thread. (Figure 27, 28)
To compensate for this problem, the fabric was moved to the interior of the sandwich panel and only sewed to the exterior of the interior plywood sheet. This method allowed for the reduction of material, requiring only 15 cm in comparison to the previous 25 cm, as well as the minimization of the bulge when the panels were folded. A pocket within the insulation layer was created to contain the smaller surplus fabric when folded. This method also demonstrated the ability of the fabric hinge to act also as a locking mechanism. By changing the interior plywood thickness and subsequently changing the length of the fabric needed the angle at which the system locks could be changed and controlled. This experiment continued to validate the intended method. (Figure 29, 30)
The panel prototype was further developed, and new layers were added to model an exterior wall section accurately. Dissimilar to paper, timber panels require a certain thickness to generate surfaces of connection that can be joined and locked. It was determined that by using two 1.5 cm plywood sheets, enough thickness could be obtained for the folded panels. However, the location and thickness of the insulation needed to be changed. To prevent condensation on the insulation layer, the insulation was moved to the exterior of the wall section. Rigid rock wool insulation was chosen as the insulation material, which will provide a 0.3w/m2k U value required for code compliance with a thickness of 6cm. Furthermore, a moisture barrier and external cladding were added. The final thickness of the exterior wall is approximately 11 cm. (Figure 32).
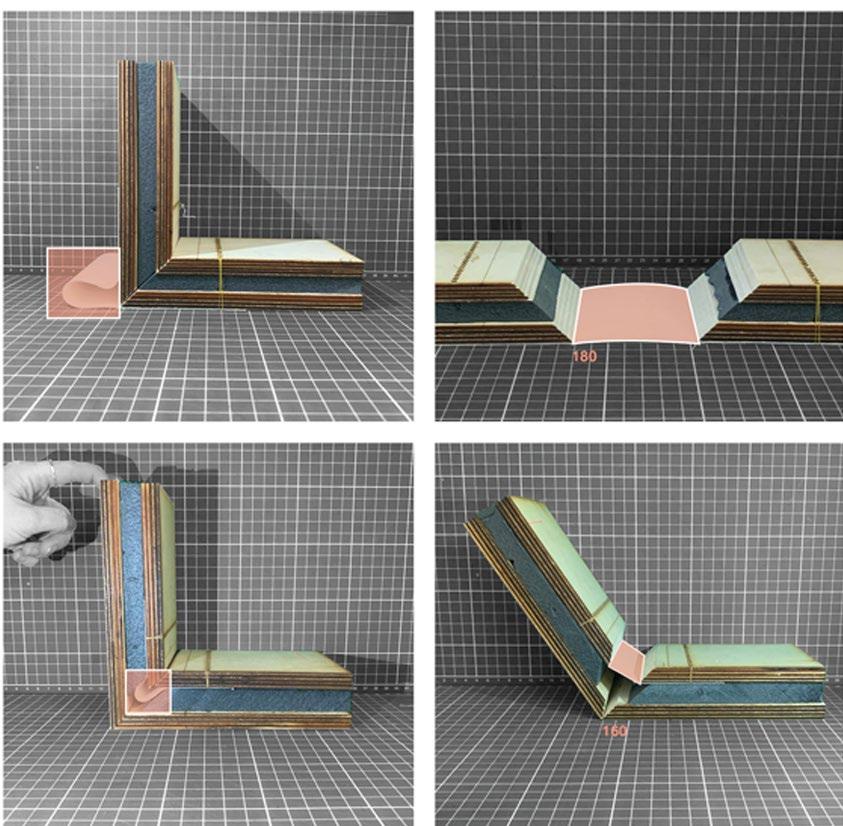
75
Modal: demonstrating how changing the fabrics location inpacts the maximun fodabal angal Modal: demonstrating how changing the fabrics location reduces the bulge caused by extrafabric
26 Modal: demenstrating that wood with fabric can act similarly to papper in relationship to origomy folding Modal: demonstrating the maximum fodabal angal 28 27 Modal: demonstrating the bulge caused by exces fabric 27 29 28 30
30
29
26
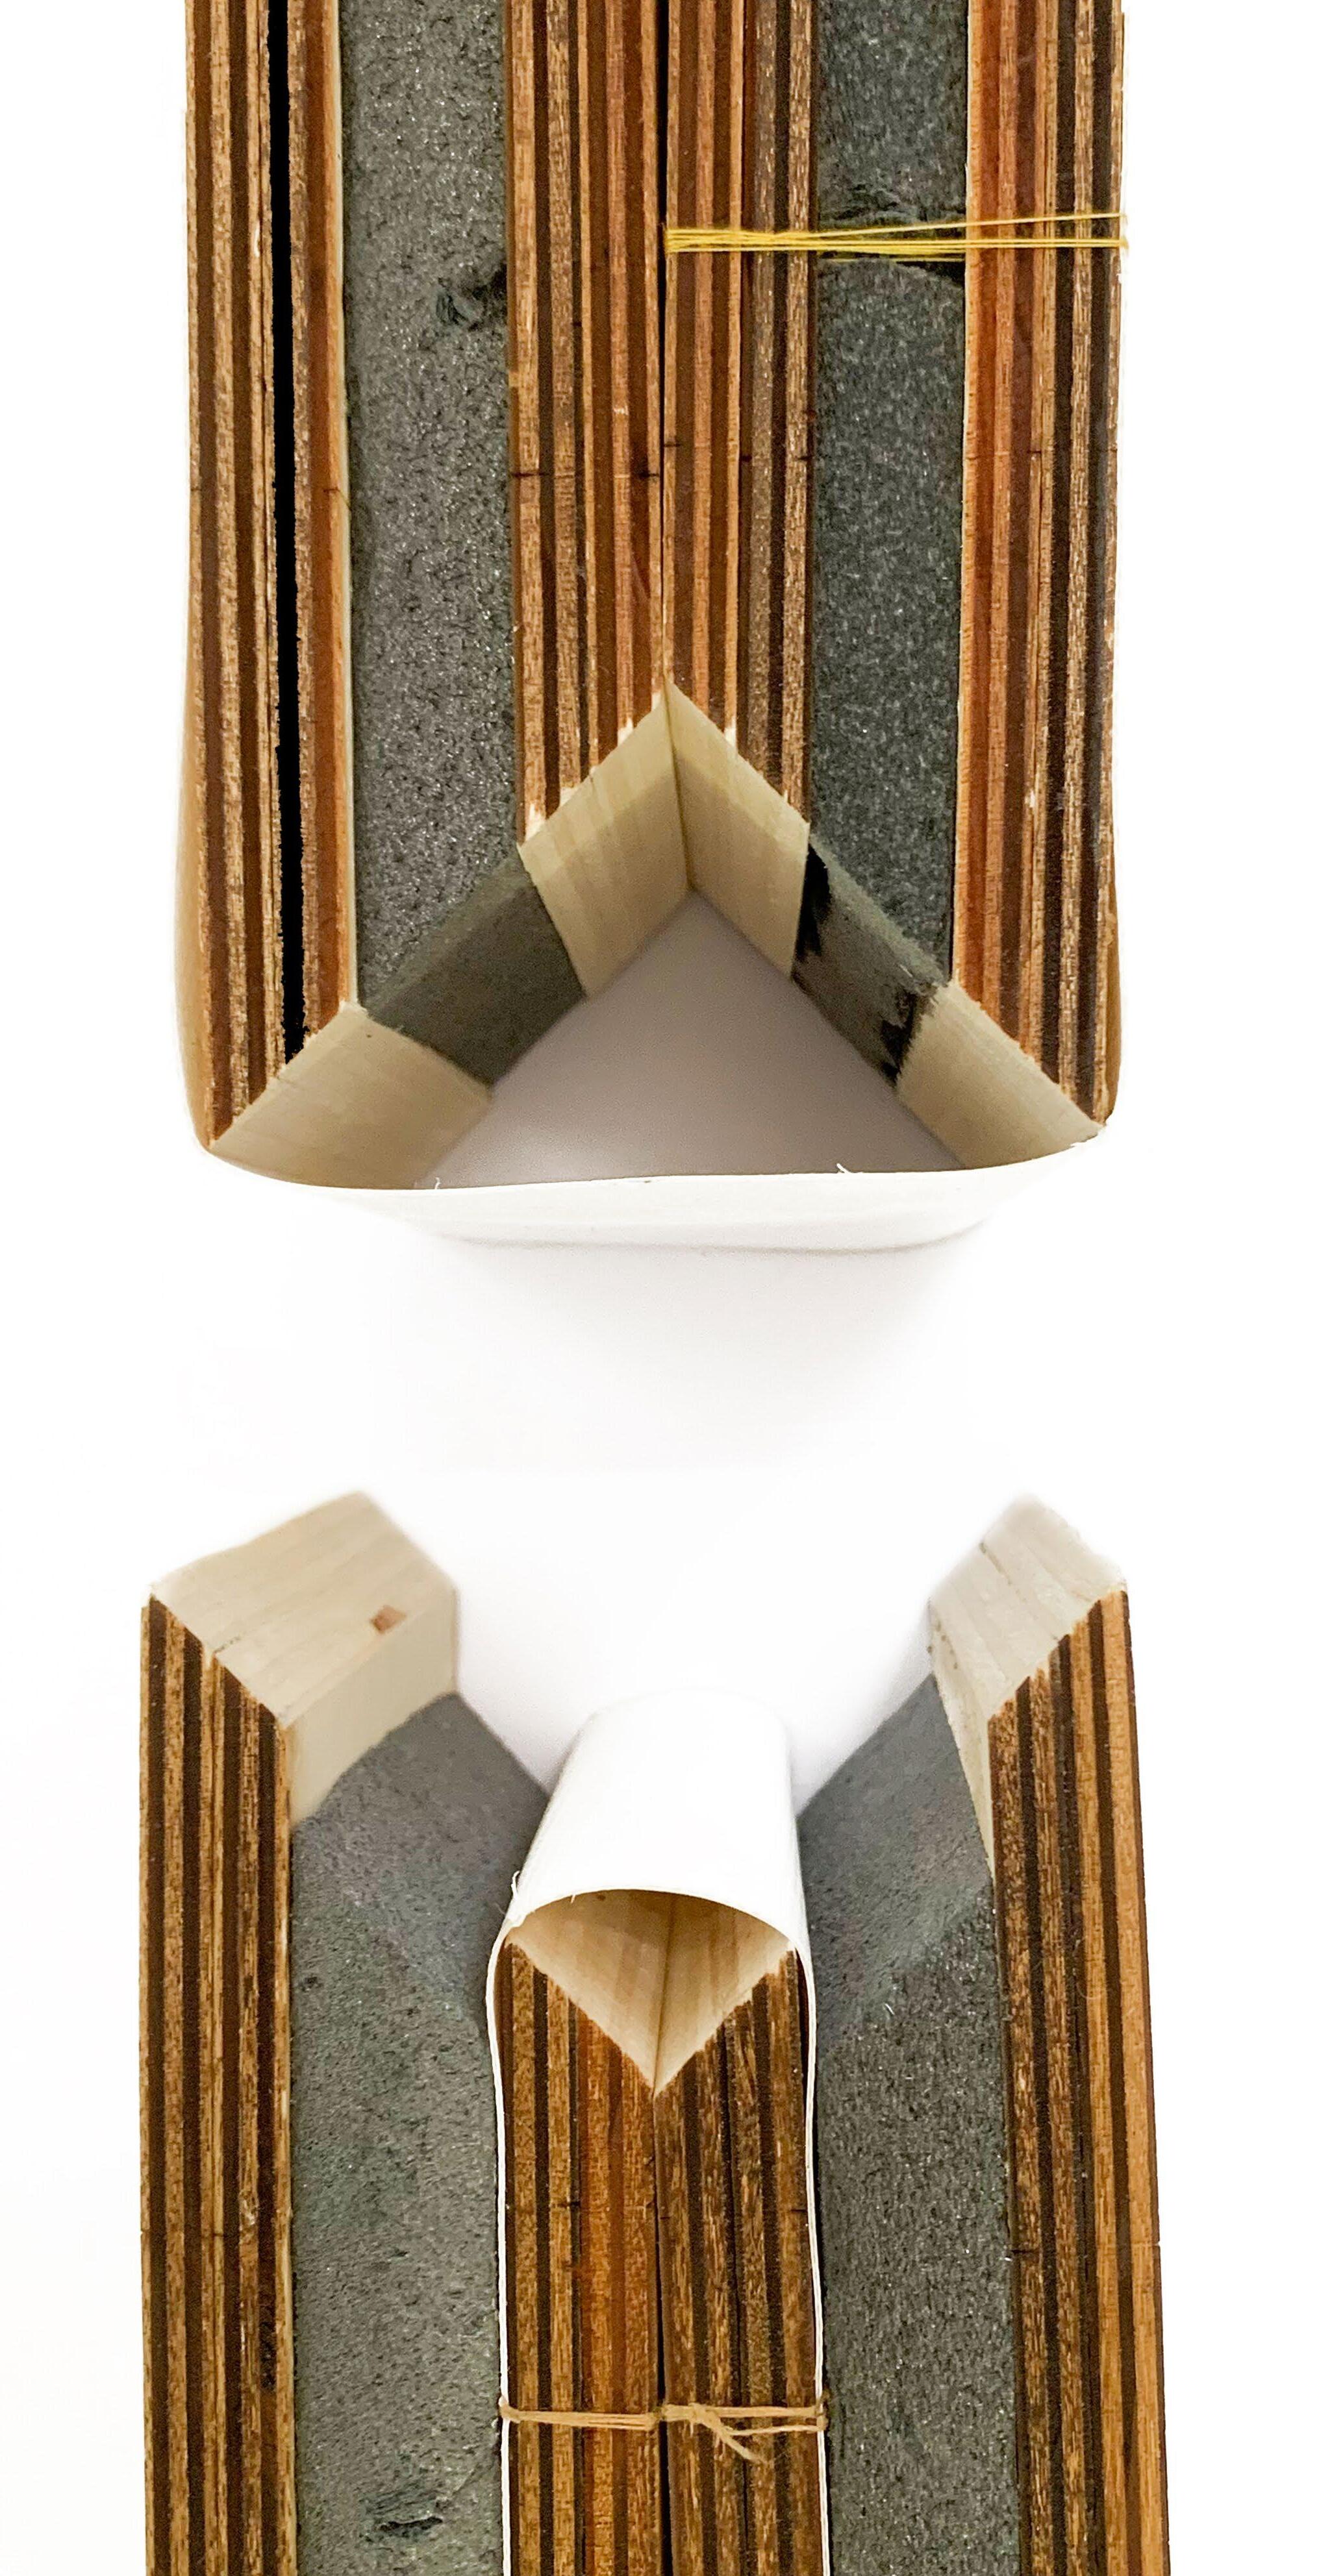
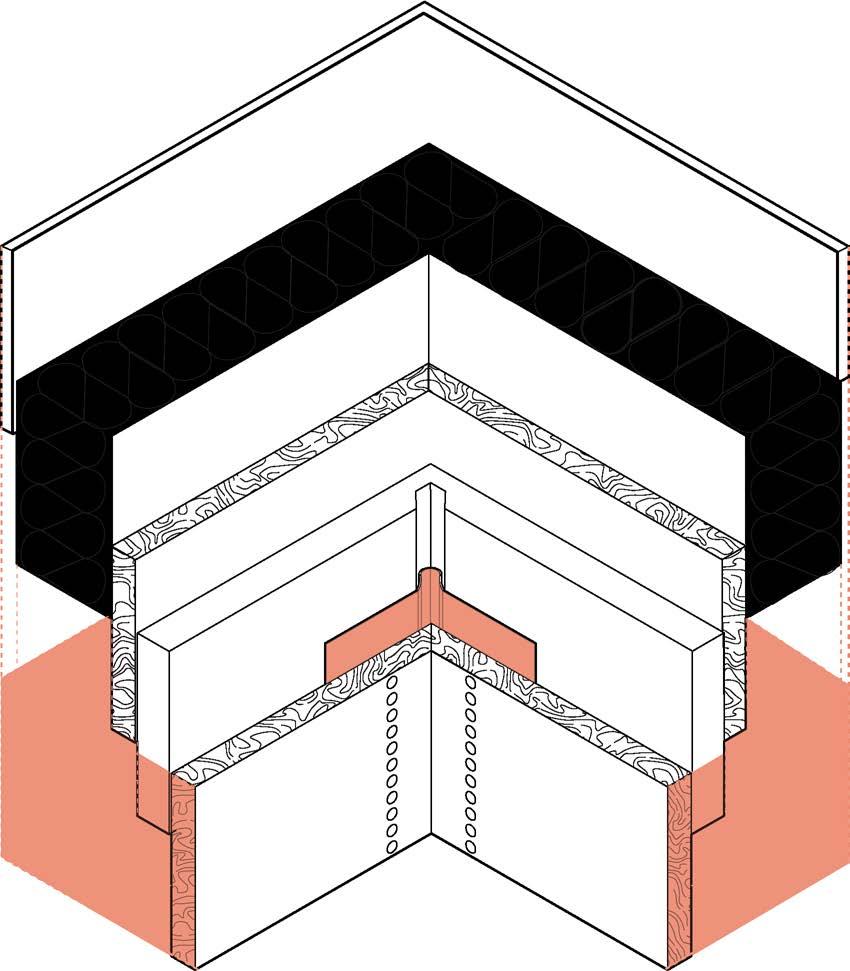
77
3cm
32
wall.
8cm 31
Modal: The explosion of the material inside the
31 32
Modal: The section of the one-to-one scale prototype.
ACCOYA BOARD 2 CM
ROCK WOOL 0.3W/M2K
PLYWOOD 1.5 CM
FOAM BOARD 2 CM
PVC SHEET 1MM
ROBOTICS
ABSTRACTING THE SEWING PROCES
WHY ROBOTS?
Due to the increased reliability, safety, efficiency, accuracy, and productivity of robotic systems, they are now widely used in many industrial manufacturing processes. Given that the production of a kit-of-parts requires repetitive tasks, a robotic manufacturing system was determined to be suitable for the kit-of-parts proposed in this thesis. The intention is to automate the sewing process, for this is the most repetitive and time-consuming part of the manufacturing process. The small-scale prototype (figure 26) took approximately 5 hours to sew by hand whereas robots have the potential to complete this task in a fraction of the time.
INITIAL IDEA
Ambition
For the first experiment, the ambition is to explore and implement an approach of combining the sewing process with robotic fabrication, understanding the limitations of this approach, and analysing the difference between the digital and the physical outcome.
Mechanism
Abstracting the principles of how the sewing machine functions and applying them in a system that utilises both the KUKA KR-60 and KUKA KR-30 and the 7th axis turntable. The KR-60 would hold the plywood panel and move it to align the guide holes to be perpendicular to the KR-30 and the turntable. The KR-30 would then grip a needle and pierce the fabric with a poking motion as it moves perpendicular through the guide holes. On the opposite side would be the turntable with a hooking system that would grab the thread and bind it to the other internal thread creating a strong bond. This process would be repeated until completion.
Limitation
Due to the limitations of space in the DPL, the current positioning would not allow for the separate robotic systems to work together as intended. In addition, the KR-60 lacks the ability to grip. Thus, the robots could not be moved in the way that was required for this method and therefore this system was not feasible for testing.
Experiment Conclusion
This experiment can only work in a digital capacity with several limitations, and the mechanism of sewing machines cannot meet the needs of the fabrication process. Therefore, we turn to another approach, extracting the mechanism of sewing manually.
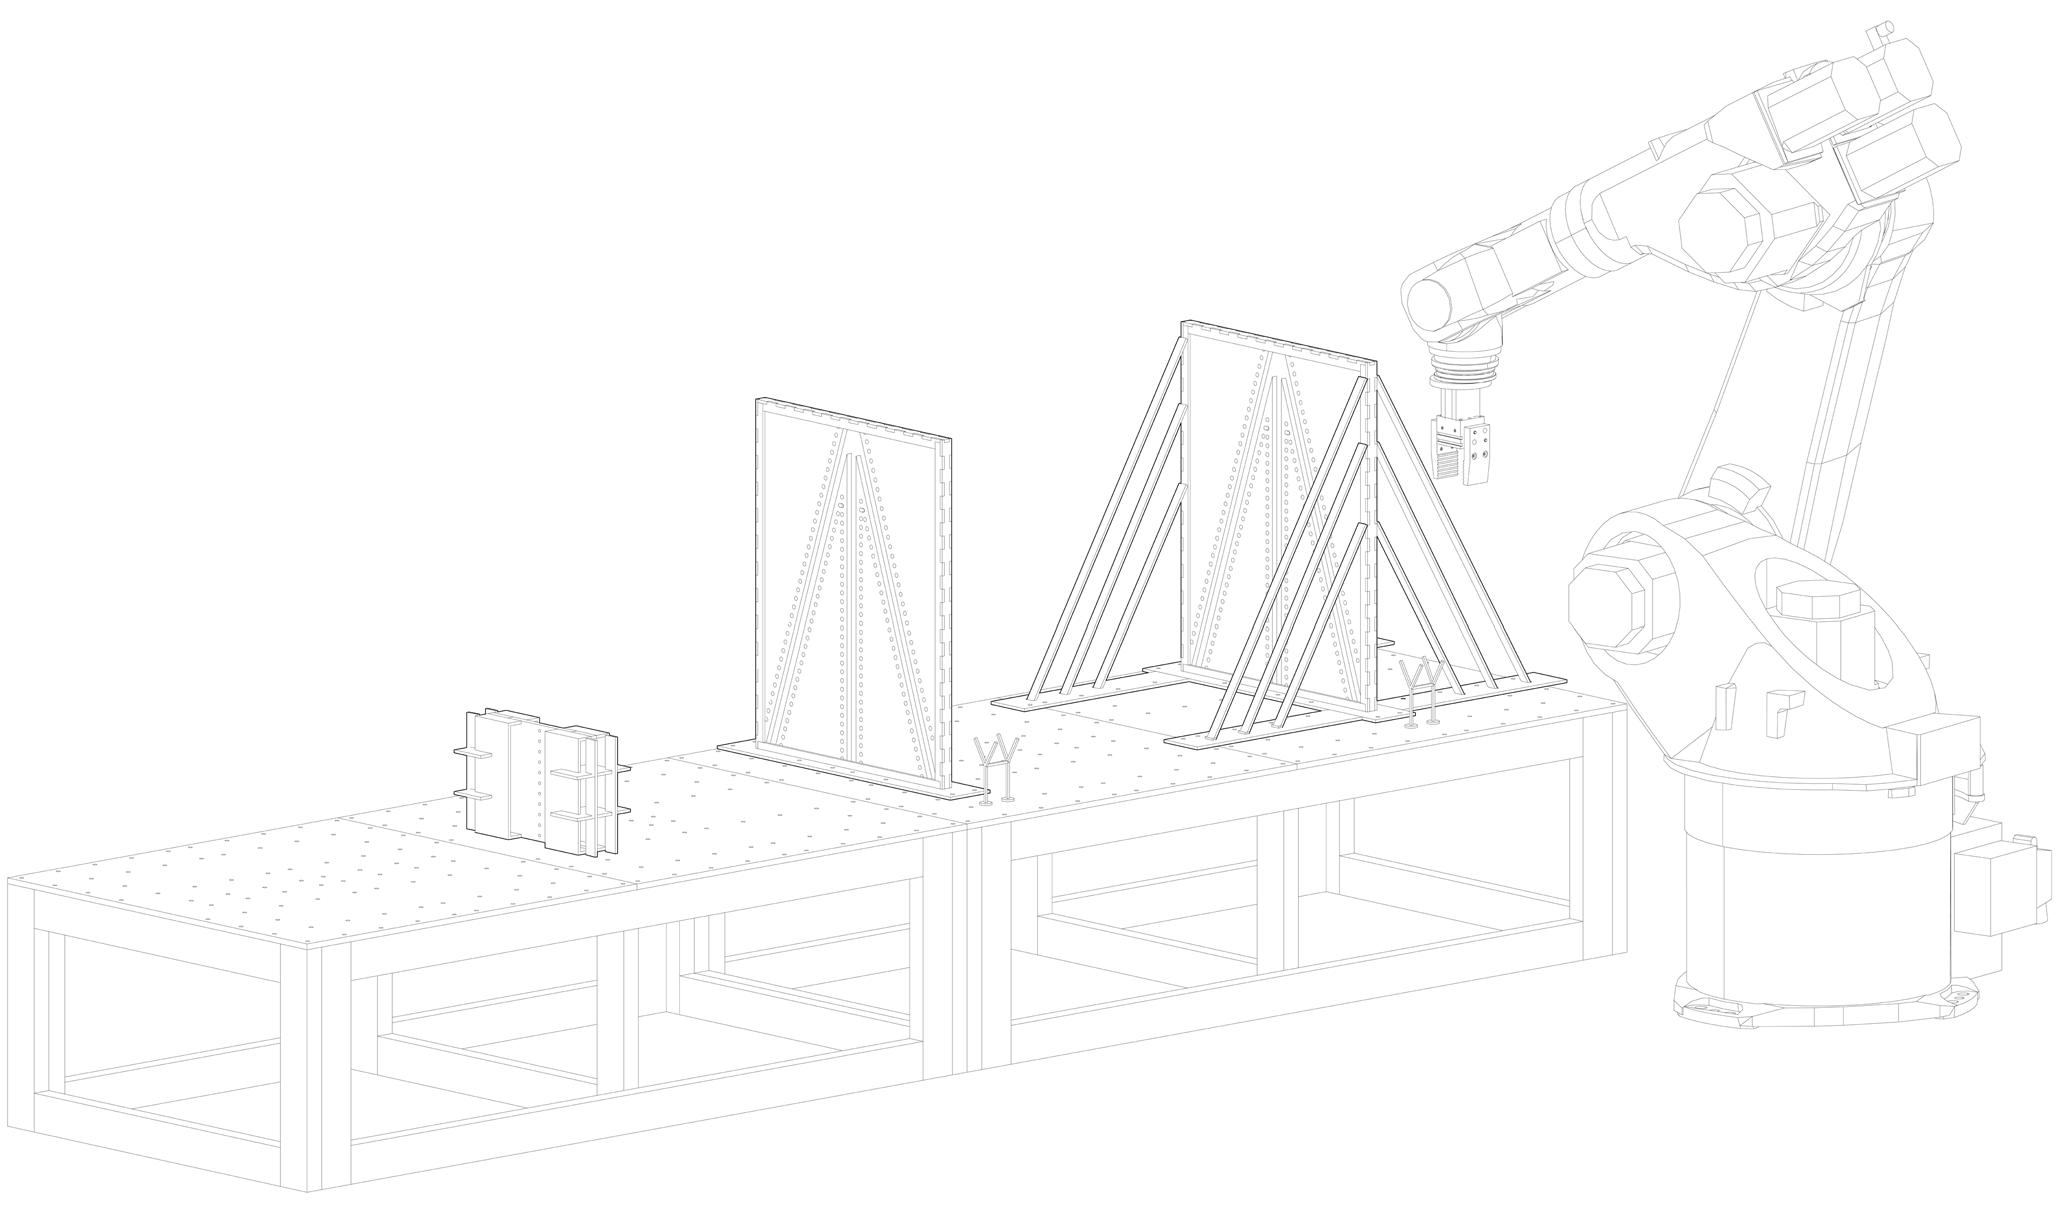
79
04_3
33 Diagram:
iterations
experiments. First one works on the small scale. Second one works on the full scale. Third one optimizes the frame of second one. 33
Three
of
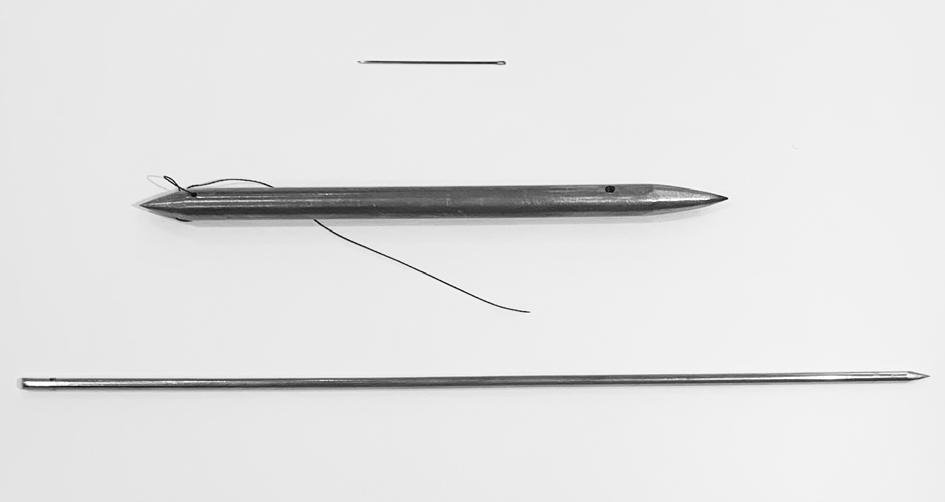
Ambition
To apply the mechanism of sewing by hand to robotic fabrication, a needle and hand first needed to be abstracted. Conventional sewing needles that were available were too small for robotic use. Among the robots at the AA school, only the KUKA KR-30 has the ability to grab, however, it needs a custom end-effector to perform this action. Therefore, the development of a bespoke needle and end effector was necessary for testing the robotic sewing process.
Preparation
For the robotic sewing experiment, the material of the needle must be metal to make sure the needle is strong enough to pierce the fabric without breaking. The form of the needle was customised in the metal workshop. (Figure 34)
For the end effector development, additive manufacturing was used. To ensure that the end effector does not crack when grabbing the needle, shock absorbers had to be implemented. The property of the shock absorber should have the ability to deform. Therefore, a rubber pipe was chosen as the material. (Figure 35, 36, 38)
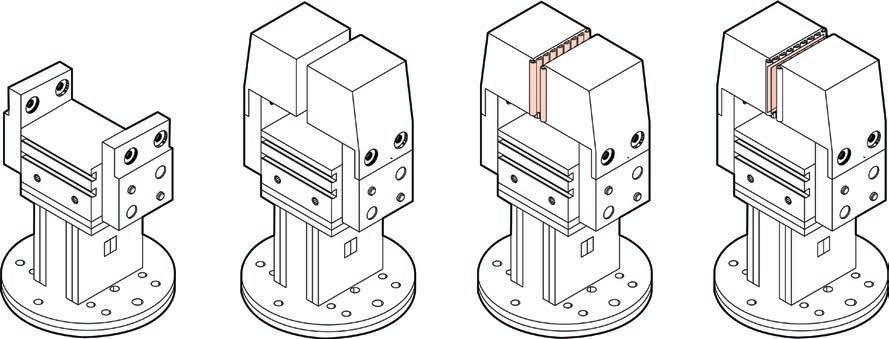
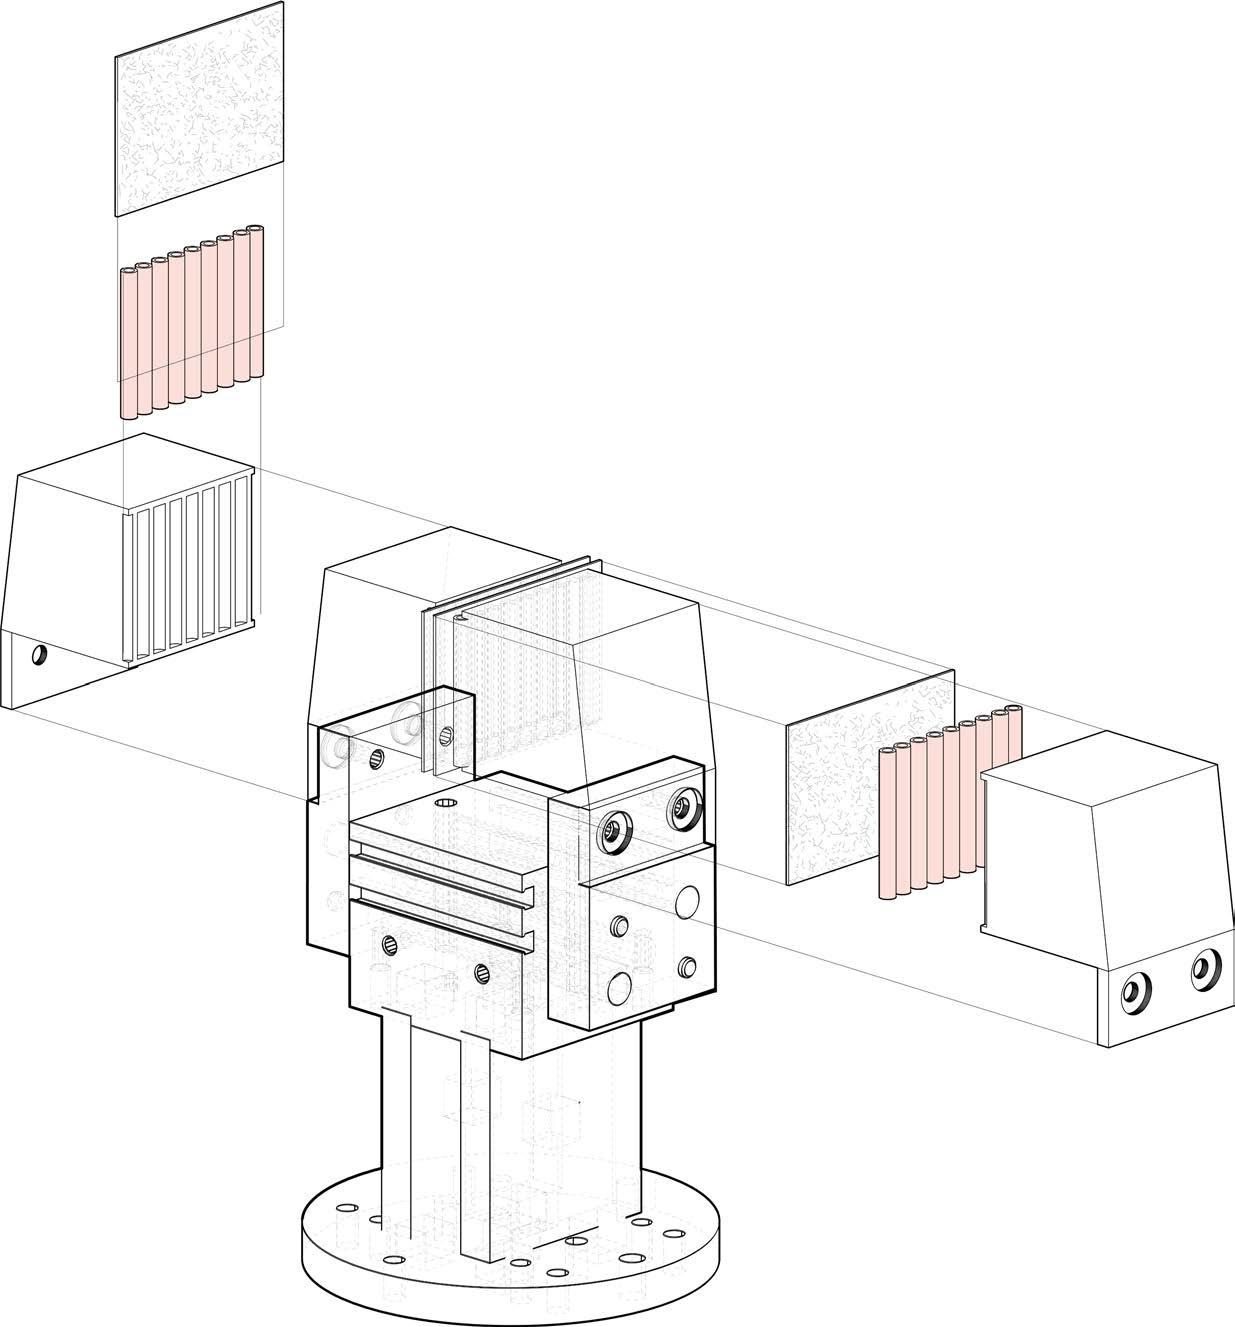
81
NEEDLE & END-EFFECTOR
34 35 36
Image: Evolution of the needle. First one is the normal needle. Second one is designed by us. Third one optimizes the designed needle.
Diagram:
Explosion of the end effector. The gripper works with the shock absorber and the abrasive sheet.
35 36 34 ABRASIVE SHEET SHOCK ABSORBERS GRIPER LINEAR NUMATIC ACTUATOR
Diagram: Evolution of the end effector.
After
each iteration, the 3D-printed gripper, the shock absorber, and abrasive sheet was added.
Experiment Process and Results
The size of a conventional needle is approximately eight centimetres, which was not long enough for a robotic sewing process, as well as the thickness of the intended panels. For the first test, the needle was manufactured out of a 7mm steel bar. The bar was sharpened on both ends with a metal sander. The holes were drilled on both ends, working as the eye of a conventional needle, to allow for the thread to pass through and be tied. The length of this needle was fifteen centimetres. Firstly, the limitation of this needle was the wide diameter, which could not be reduced due to the safety concerns of the metal workshop. Being sharpened manually, it also lacked the precision and sharpness needed to pierce the PVC fabric. Secondly, due to the short length of this needle, there were some collision conditions which could not be avoided in the robotic sewing process.
Therefore, a second needle was developed for the robot to grip that was thinner, longer and sharper. A meat skewer, normally used for cooking, provided the solution. Operations of cutting and drilling were performed on the skewer to convert the skewer into a needle. With the increased length and decreased thickness, there were no more clashes during the sewing process. Therefore, this needle was used in the following experiments. (Figure 34)
The main part of the gripper was 3D-printed. To compare two different ways to print, the PLA fibre was printed perpendicular and parallel to the tool of the robot. It was demonstrated that the perpendicular way of printing was stronger. After this, a rubber pipe was cut into several pieces and glued to the 3D-printed part creating the end-effector. During the piercing process, it was discovered that the end effector was not strong enough to hold the needle in place as PVC fabric has high tensile strength and the rubber shock absorbers had low friction. To increase grip strength, an abrasive sheet was added. Sandpaper can give more friction; therefore the 100-grit sandpaper was used as the material of an abrasive sheet.
Experiment Conclusion
The experiment showed the evolutionary development of the needle and end effector. After iterations, the needle and the end effector were made suitable for use in further experiments. The needle got longer and thinner, and the mechanism of the end effector gained rigidity. During the iterations, the parameter of the needle and end effector slightly changed, and the final version built a strong foundation for the experiments in the preceding steps. (Figure 38, 39, 40)
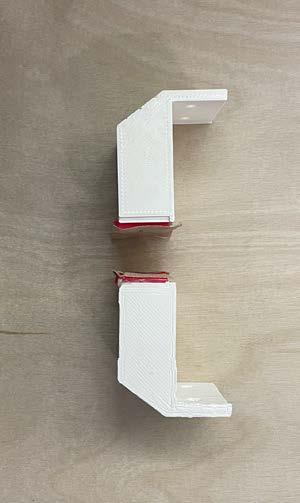
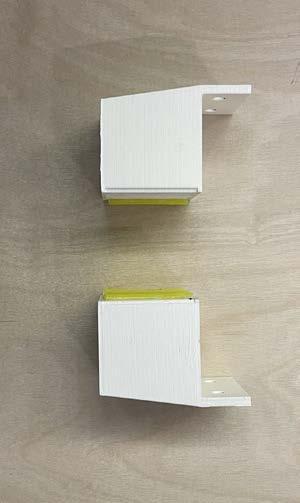
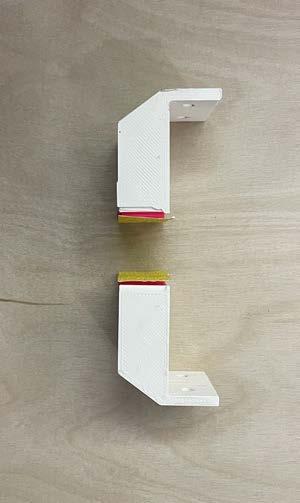
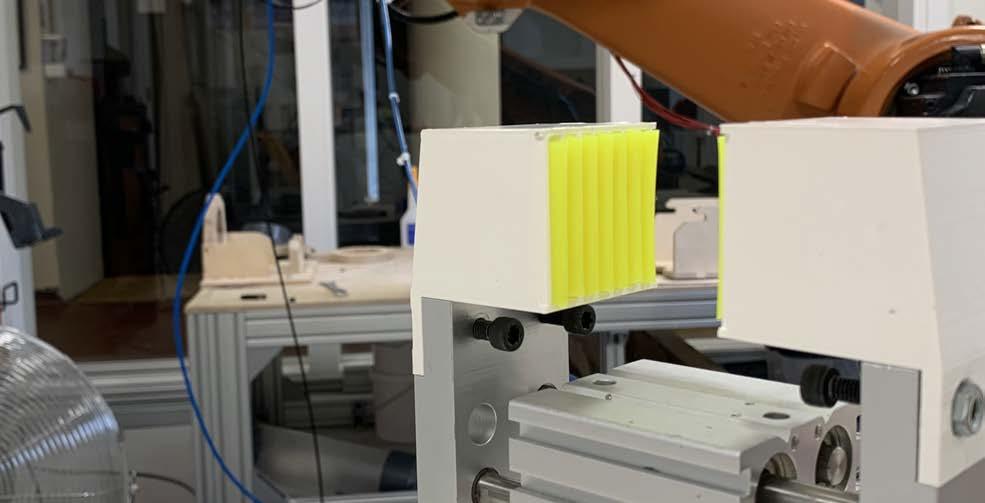
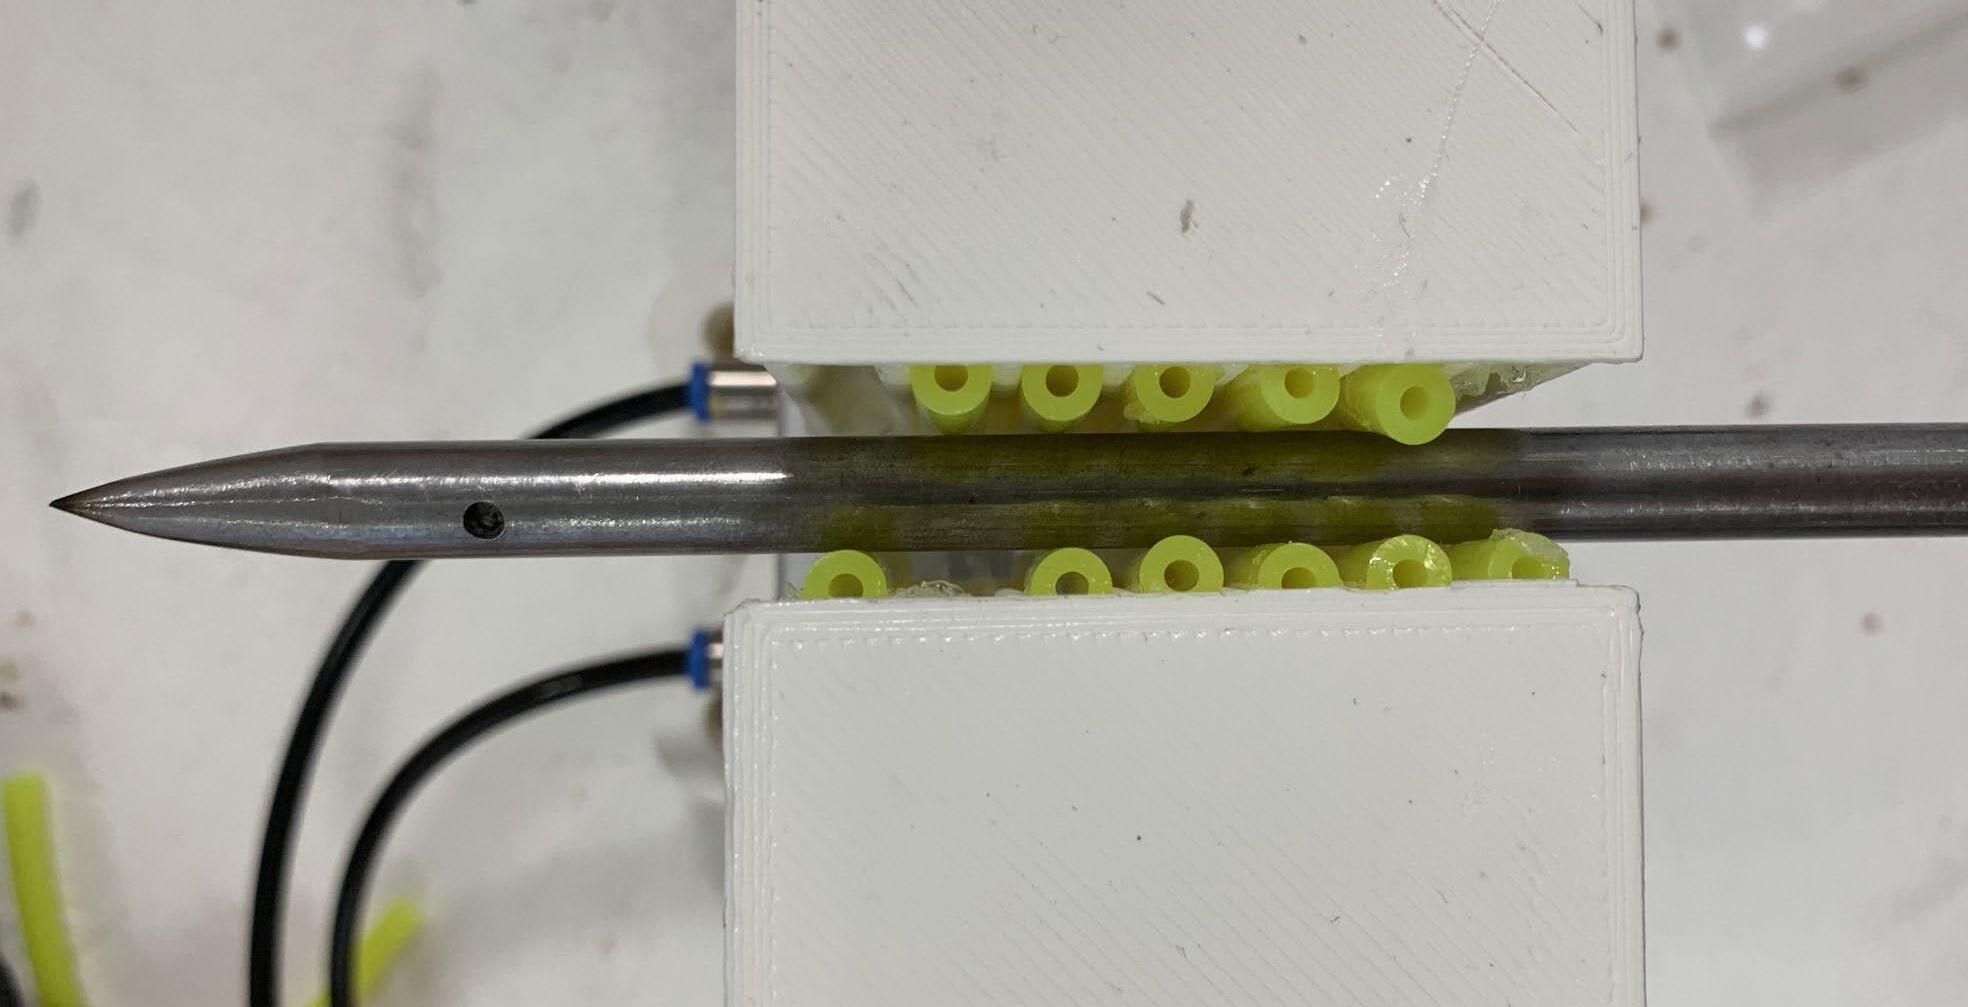
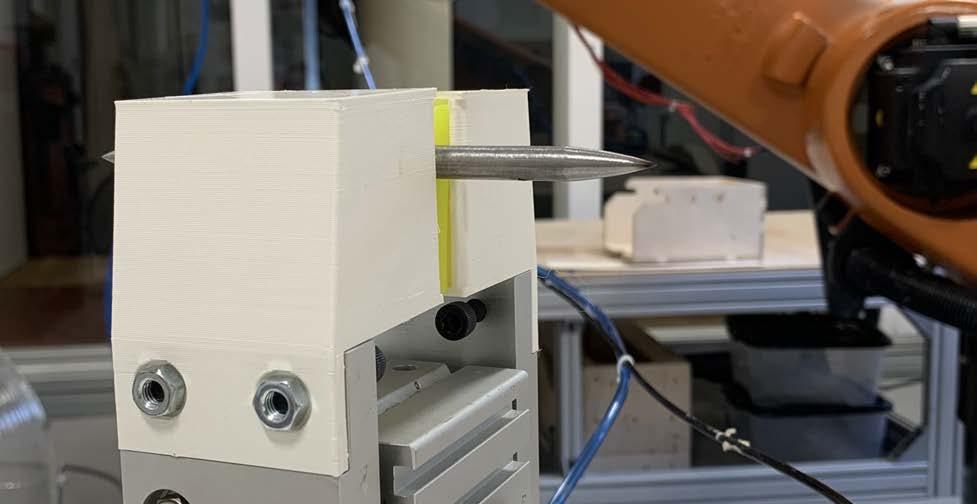
83
Image: Top view of the process of the end effector grabbing the needle.
Image:Perspective view of the process of the end effector grabbing the needle.
The shock absorber is added on the end effector.
39 40
Image:
Image: Evolution of the end effector. First one is easy to be broken. Second one glues with shock absorber. Third one glues with abrasive sheet. 37 38 39 40
38 37
Ambition
For the second experiment, our ambition was to test the basic flow of the robotic operation. As we developed the end effector, the first task was to check if the end effector could grab the needle stably during the piercing. The second task was to check if the mechanism could work with a simplified one-to-one scale version. Once these tasks were completed, an accurate one-to-one scale prototype could be fabricated.
Mechanism
The hand sewing process is not new, dating back many centuries. The person holds the needle, targets the fabric, and pushes the needle to pierce the fabric. When the needle fully goes through the fabric, the person rotates the needle, targets the next position, and pushes again. Manual sewing is relatively easy because of the flexibility and dexterity of the human hand. The only difficulty is to accurately target the position.
For the robotic experiment, we extracted the mechanism of manual sewing. There are several differences between the Kuka 30 and a human hand that had to be addressed. Firstly, the end effector is only able to grab and release the needle, the rotation mechanism is going to be done by the robotic arm which is a 6-axis KUKA KR-30, not the end effector. Secondly, the rotation angle is limited to 360 degrees. The end effector cannot rotate in one direction continually. Thirdly, the needle is supposed to be placed in a specific location for the end effector to grab. Finally, the principle of robotics is to follow the target planes in comparison to human vision. So, safety planes needed to be calculated and added to the robotic mechanisms to avoid collision during the process.
Inspired by hand sewing, robotic sewing rules were established. The robot grabs the second half of the needle from the specific location where the needle is already positioned. Then the robot holds the needle, moves to the target plane for piercing the fabric and pushes the needle. When the needle goes in the middle of the panel, the end effector releases the needle, goes over to the other side of the panel and grabs the first half of the needle again and pulls it out. After the needle fully goes through the material, the needle is placed back in the original start position. In this workflow, the robot finishes sewing one hole. For continuation of the sewing process, the robot grabs the second half of the needle again and runs the same operation as the first mechanism from the opposite side of the panel. The operations are repeated for the entirety of the sewing process. After the entire sewing process, the robot places the needle in the original start position and goes back to the home position.
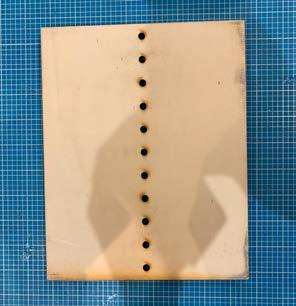
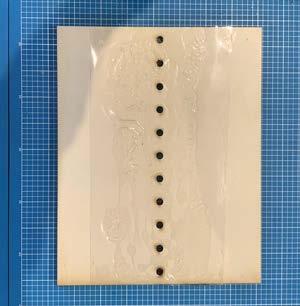

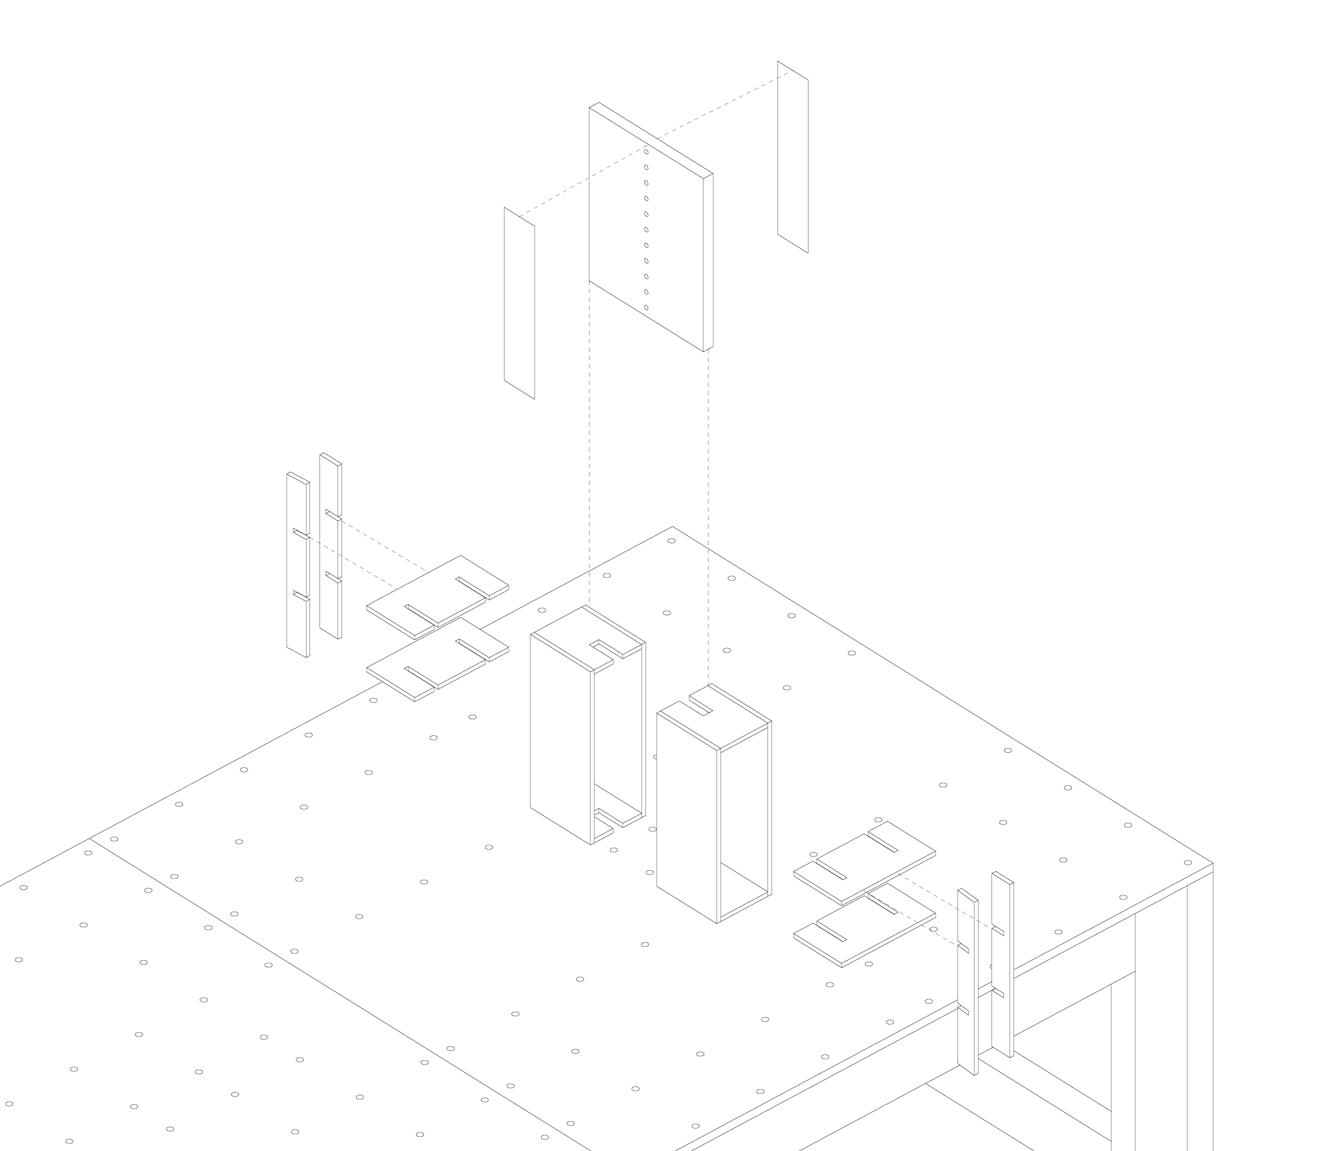
85
MATERIAL EXPERIMENT 2
41 41 42
Diagram:The explosion of the support frame on the operating table.
42
Image: The size of the plywood panel is 24cm x 19cm. The panel on the left has no fabric folowed by PVC plastic and Finaly PVC fabric
Preparation
Before the robotic process, several operations were made. Firstly, we laser-cut three panels with ten holes. (Figure 41) To test different fabrics, these three panels have a different statuses. One panel is without fabric, one panel is glued with PVC fabric, and the last Panel is glued with a PVC sheet. Secondly, a frame was designed and manufactured for fixing the panel in place through the process. (Figure 42) Thirdly, we developed a script for the robotic mechanism (see appendix). Lastly, we tied the thread to the needle manually for sewing. The alignment of the digital model and the physical model was conducted. During the process, we picked three vertices on the frame and aligned them manually. After the entire preparation, the experiment was set up and ready to be carried out.
Experiment Results
The experiment included four parts. The first part used the panel without fabric to understand how the mechanism worked, comparing the computational model with reality. It was concluded that the system works as intended therefore the next phase of the experiment was conducted.
Due to the absence of fabric, in the first part, when the end-effector released its grip on the needle between the panel, the needle was not stable and lost its intended positioning. The addition of the fabric in the next stages of the experiment resolved this stability problem, acting as glue, and holding the needle in place. The PVC fabric’s high tensile strength required a large amount of force for the needle to penetrate the fabric with the needle shifting slightly through this process. The end effector was redeveloped, resolving this problem, as stated in the end effector development stage. The PVC sheet was also tested, finding that it was easier to pierce but lacked the structural properties needed. Both the PVC fabric and the sheet were able to hold the needle in place, but the positioning was still shifting slightly. This was resolved by utilising both the PVC fabric and the PVC sheet. The sheet was placed on both sides of the pane creating a double-layered system. The results showed the double-layered system resolved the dropping problem and therefore this technique was chosen to be further developed in the next stages. (Figure 44)
Experiment Conclusion
The experiment demonstrates that the mechanism extracted from manual sewing can work with robotics. There are several preparation steps to be performed before the experiment. Based on the experiment results, the end effector and the panel were redeveloped. This experiment yielded useful insights that informed the following one-to-one scale experiment.
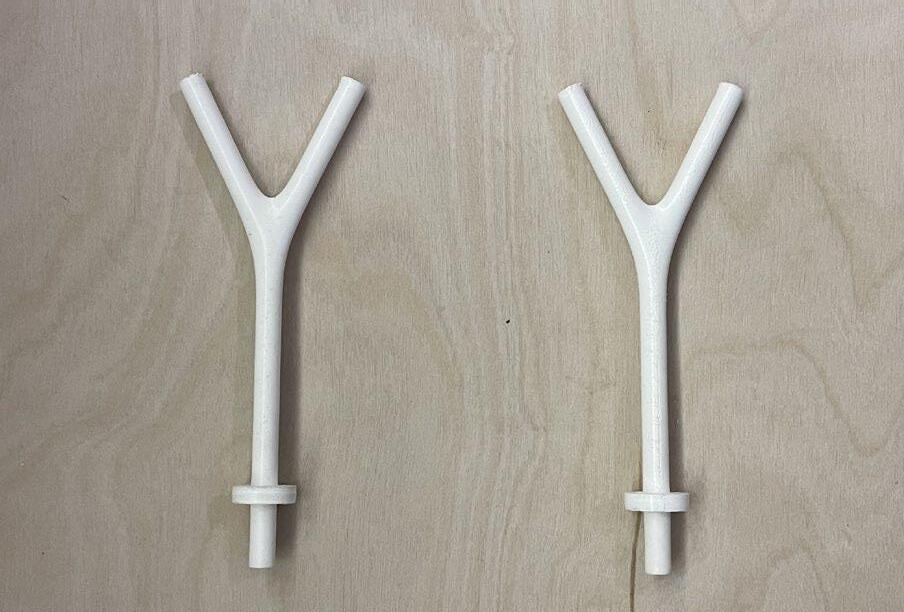
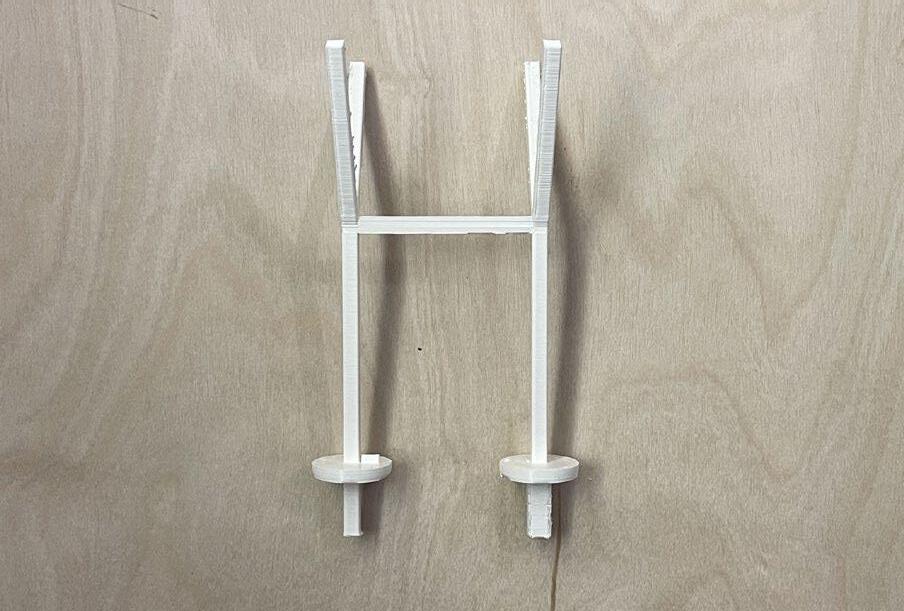
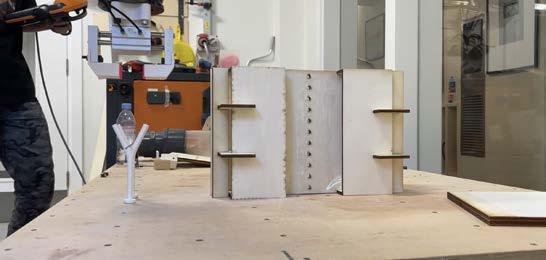
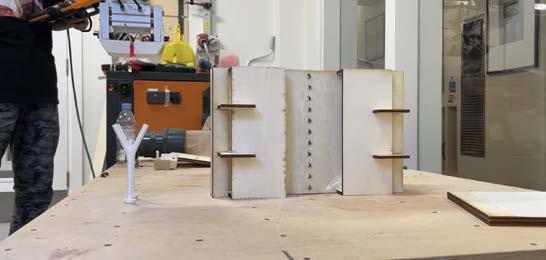
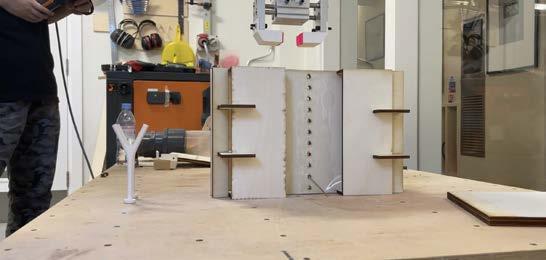
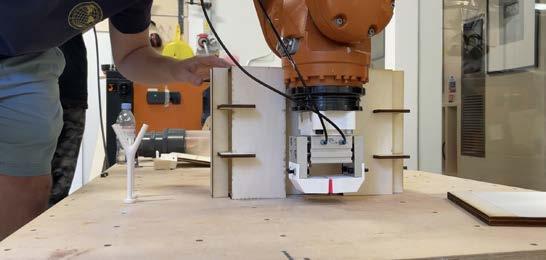
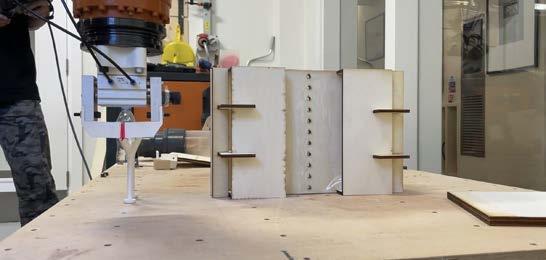
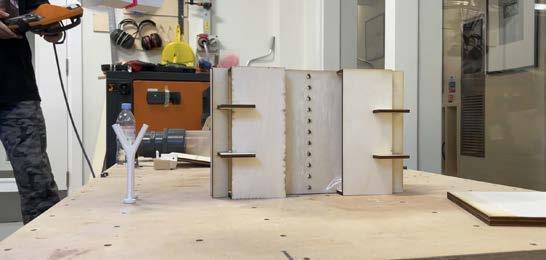
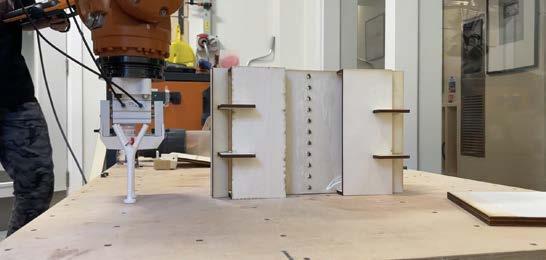
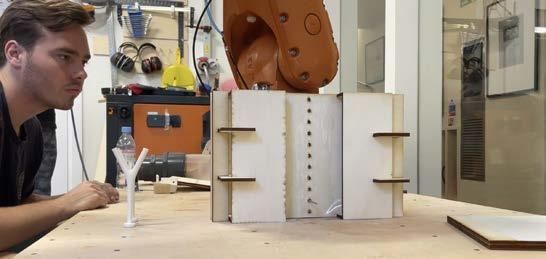
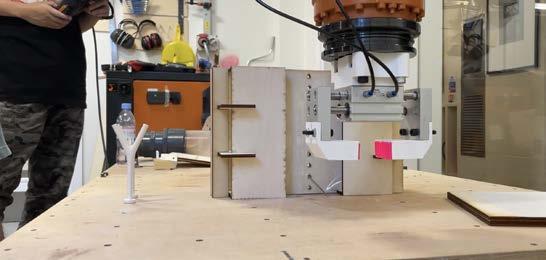
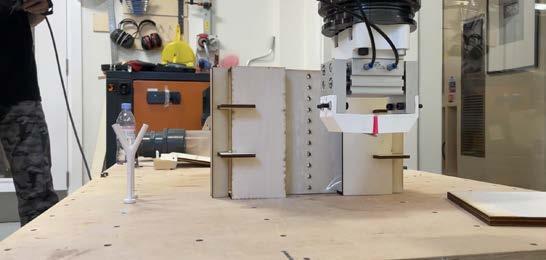
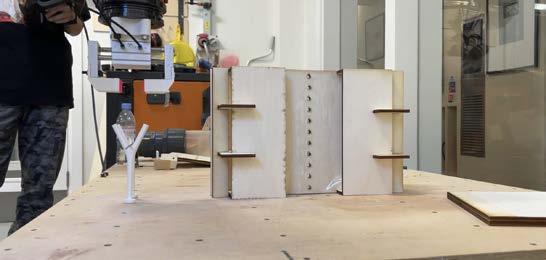
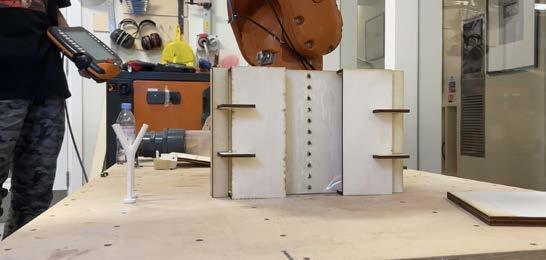
87
43 44 Image:
43 44
Image: Evolution of the support of the needle.
The process of robotic fabrication.
Ambition
For the third experiment, the goal was to develop the full version of the one-to-one scale prototype based on the knowledge obtained from the previous experiments and subsequently complete the sewing process fabrication. The mechanism functioned in previous experiments, but some details needed to be further refined. In this stage, it was important to finalise the fabrication process so that it could be repeated without setbacks.
Preparation
The second experiment was set up similar to the previous experiment in that the second experiment is a simplified version of the intended fabrication process. Therefore, the mechanism is similar to the one in the second experiment. For the digital script, we updated the new positions of the target plane and safety plane. For the alignment, an additional position was added that aligned with the first target plan (the first hole through which the needle travels) which increased the accuracy needed for the robot to repeatedly align the needle with the hole throughout the fabrication process.
With the same preparation as in the second experiment, we laser-cut the panel, glued the fabric on both sides, and tied the thread to the needle. In contrast to the other two experiments, a new frame was developed due to the change of scale. The updated frame was slenderer, allowing the robot to approach more towards the panels, reducing the possibility of a collision. Six sloped supports were added to the edge of the frame for structural support. To ensure that the frame would not break from the force of the needle piercing the fabric, a series of grooves were added to the frame that could be glued together creating a more rigid system. Lastly, the holder for the needle was too smooth and was causing inaccuracies where the end-effector would grab the needle at different placements. The support was remanufactured, ensuring that the needle would land in the same position every time for the end-effector to accurately grab the needle.
Experiment Results
The experiment completed one full row in the sewing process. Due to the limitations of the availability of robots; the sewing of more rows could not be performed. The sewing process works but still has some limitations. Firstly, the needle itself has quality problems. Since we created our own needle, the metal around the eye of the needle was not entirely smooth, causing the thread to tear. Secondly, the needle was not totally straight, therefore with the rotation it might still miss its target even when aligned. Furthermore, the slight asymmetry of the end-effector also caused alignment problems. Finally, the greatest problem was that of speed with which the end-effector closes to grab the needed. The end-effector closed too fast to grab the needle accurately. And during that time, there was a slight shaking of the needle. (Figure 46)
Experiment Conclusion
The experiment achieved the desired goal, albeit slowly. The alignment was more accurate due to the addition of the fourth target plane. With the one-to-one scale, the prototype better demonstrates the final deployable walls. This scale also demonstrated the need to better develop how all the separate panels and the PVC fabric and sheets meet at the end point of the fold pattern, as well as more accurately determining the separation space needed from each panel and how that relates to the length of the PVC fabric and sheet. The addition of the insulation layers and the angles at which they need to be cut in relation to the fold angles should also be explored in detail. The limited availability to work with the Kuka also should have been a bigger consideration when developing the experiments in order to meticulously analyse every step of the experiment.
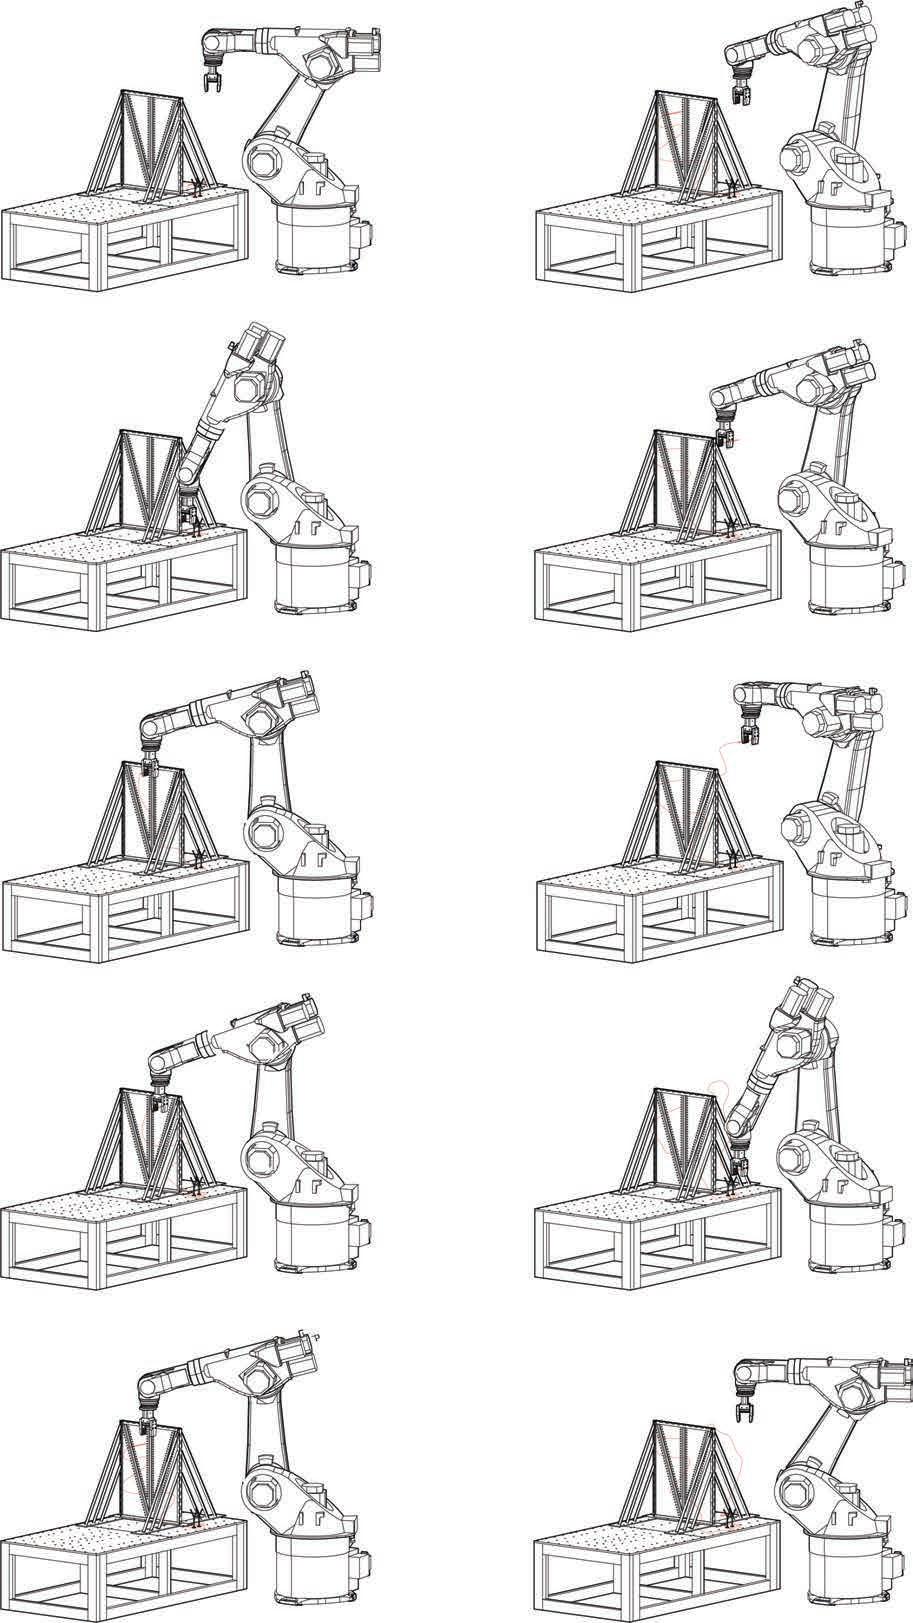
89
ONE-TO-ONE SCALE
45
Diagram: The workflow of the robotic The home position of robotic.The robotic goes to grab. The robotic get the needle. The robotic moves to the target plane with needle. The needle pierces the fabric. The robotic leaves the needle in the panel and move to another side. The robotic grabs the needle and pulls out the needle. The robotic moves to the original start position with needle. The robotic drops the needle. The robotic goes back to home position. 45
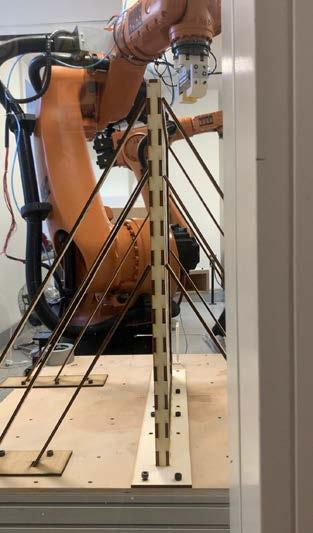
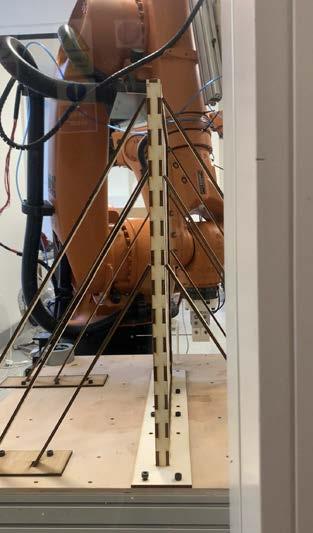
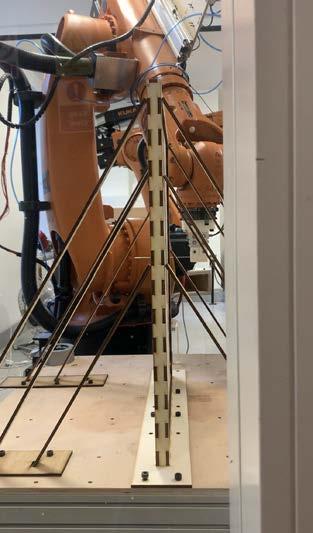
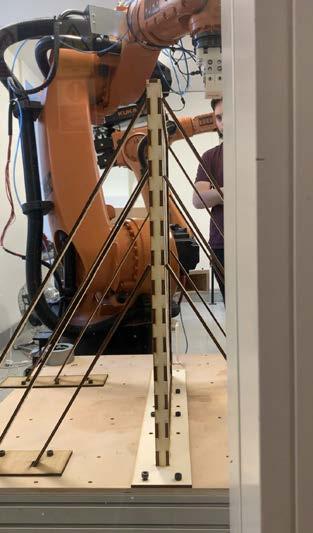
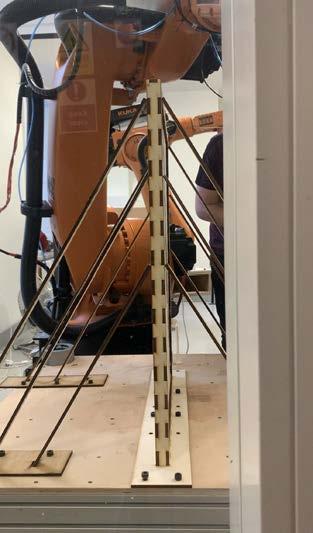
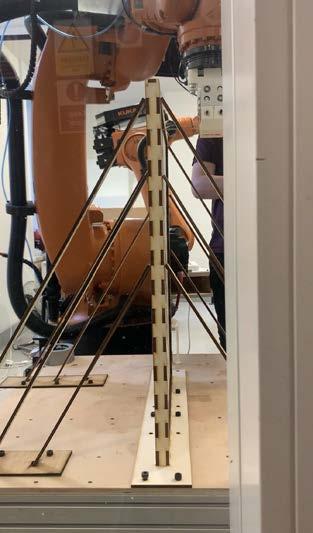
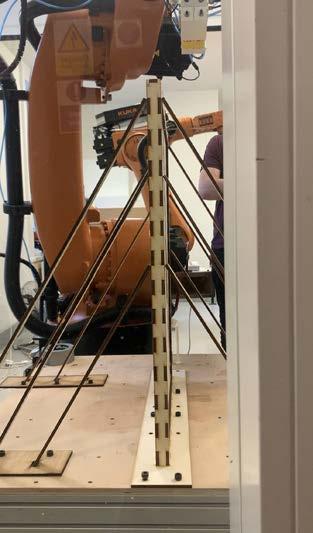
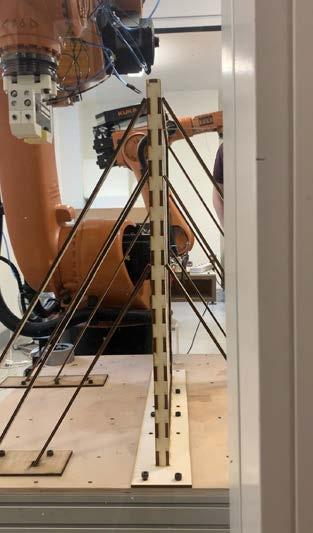
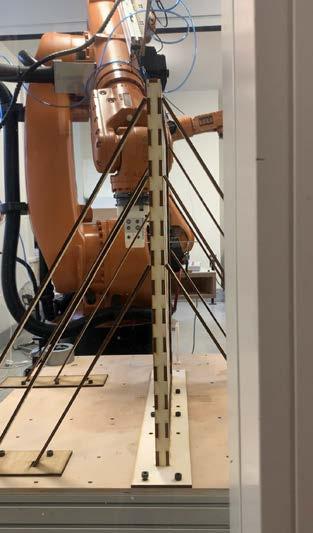
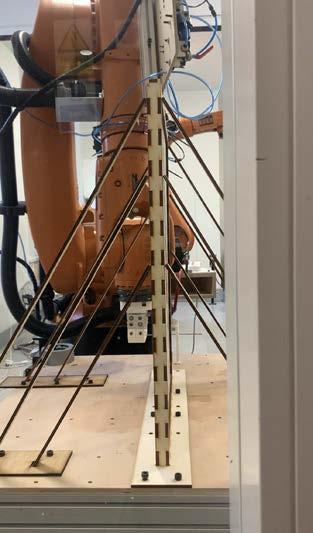
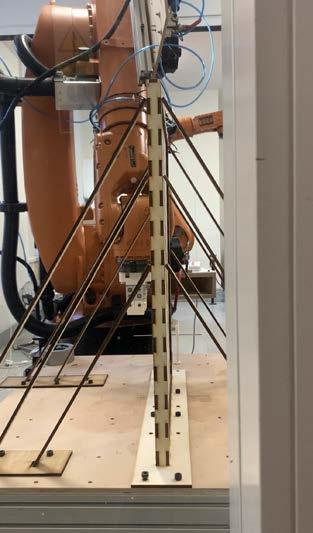
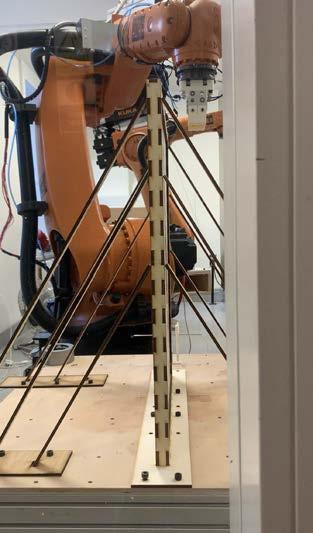
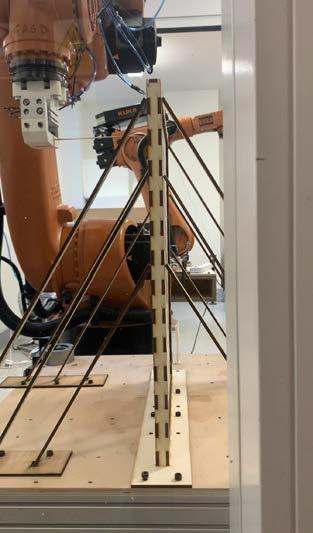
91 46 Image: The process of robotic fabrication. 46
ROBOTIC FABRICATION SUMMARY
Ambition
To increase the speed of manufacturing, decrease the cost of labour and build the elements accurately, robotic fabrication was used. The fabrication process was to achieve the goal of sewing automatically. During the process, several elements needed to be developed and manufactured such as the needle, the end-effector, panels etc. The mechanism was inspired by manual sewing. After finishing the entire sewing process, the prototype was built and achieved the folding and unfolding functions.
Mechanism
For the first experiment, the robotic mechanism was extracted from that of a sewing machine. It used two robotic arms at the same time. Based on the affordability of weight, KUKA KR60 was going to hold the frame and the panel, and the KR-30 was going to push and pull the needle at the same time. However, because of the limitation of space and the ability of the KR-60, the robots could not work together. Therefore, the mechanism shifted into one inspired by manual sewing.
For the second experiment, the mechanism of robotics was extracted from the mechanism of sewing by hand. The robot would grab the needle, pierce the fabric, place the needle, go over to the other side, grab the needle again, pull the needle out, and place it back in its original starting position. The KR-30 could grab the needle, so potentially the workflow could work.
Preparation
The preparation phase was divided into four parts: the needle, the end-effector, the frame, and the panels. The needle was developed after three iterations and finally, the needle got longer and thicker compared to the initial needle. The end-effector was developed in three parts to grab the needle stably. Based on the different sizes of the panels, the first frame was developed for solid and heavy panels and the final frame was designed for large, slender and strong frames. The panel was transformed and PVC fabric was added on both sides.
Experiments Results
The experiments developed resolving issues along the way, concluding in a one-to-one scale prototype. The mechanism worked after a timely alignment process. Due to the lack of robotic time slots, the entire sewing process could not be completed. However, it worked with one row of holes, therefore it was concluded that the system worked. The manual sewing process was able to be abstracted and applied in a robotic workflow.
Experiment Conclusion
Although the experiment worked it was still a timely process that needs to be refined moving forward. By increasing the size of the needle, it is hypothesised that collisions would be greatly reduced, increasing the overall speed of the process. The end-effector had asymmetry that should also be resolved to reduce tolerance requirements and increase speed. The experiments demonstrated a workflow that abstracted the sewing process for robotic manufacturing that can be iterated upon moving forward. (Figure 48)
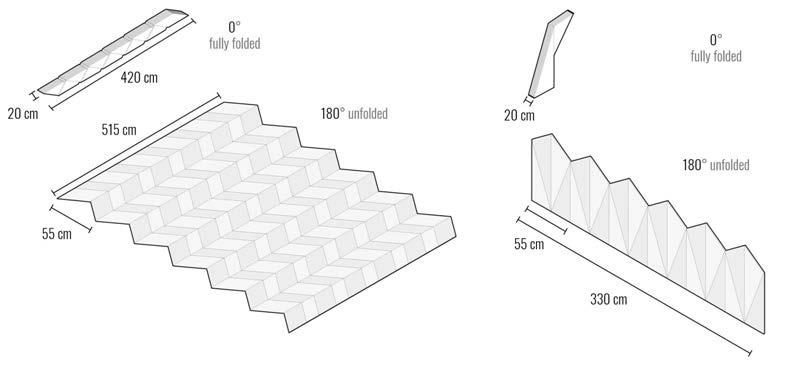

93
48 Image: The mechanism of final prototype. 47
dimension
folded status and expended status 47 48
Diagram: The
of the
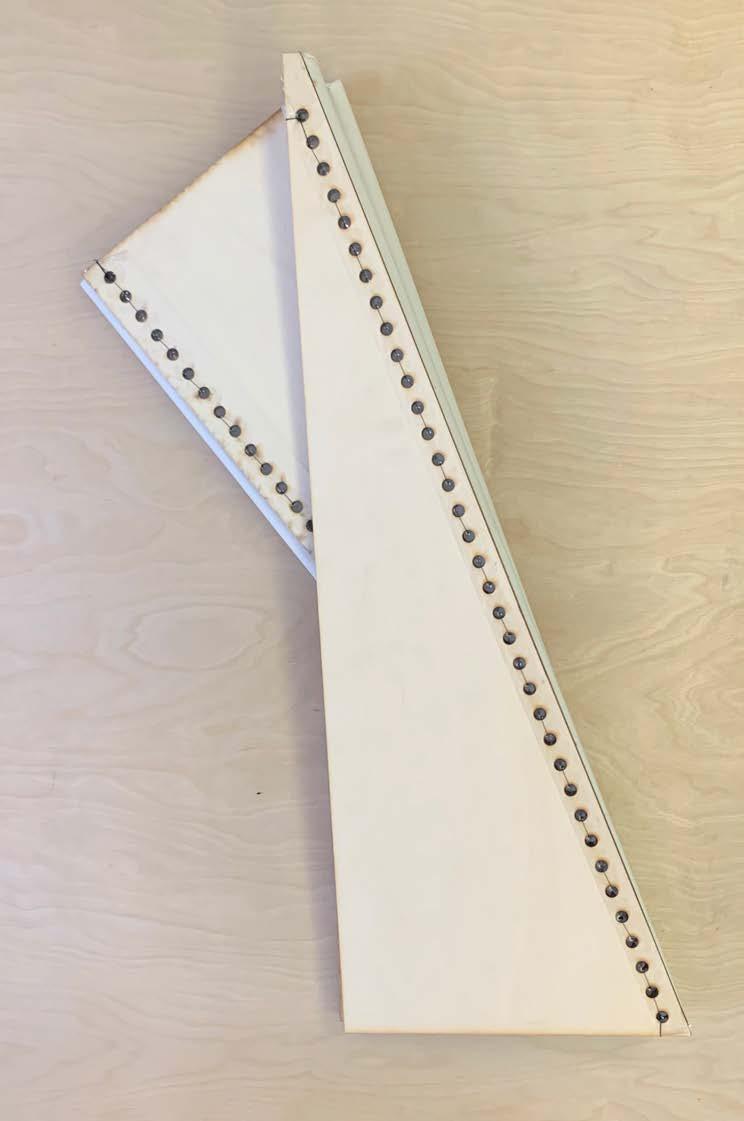
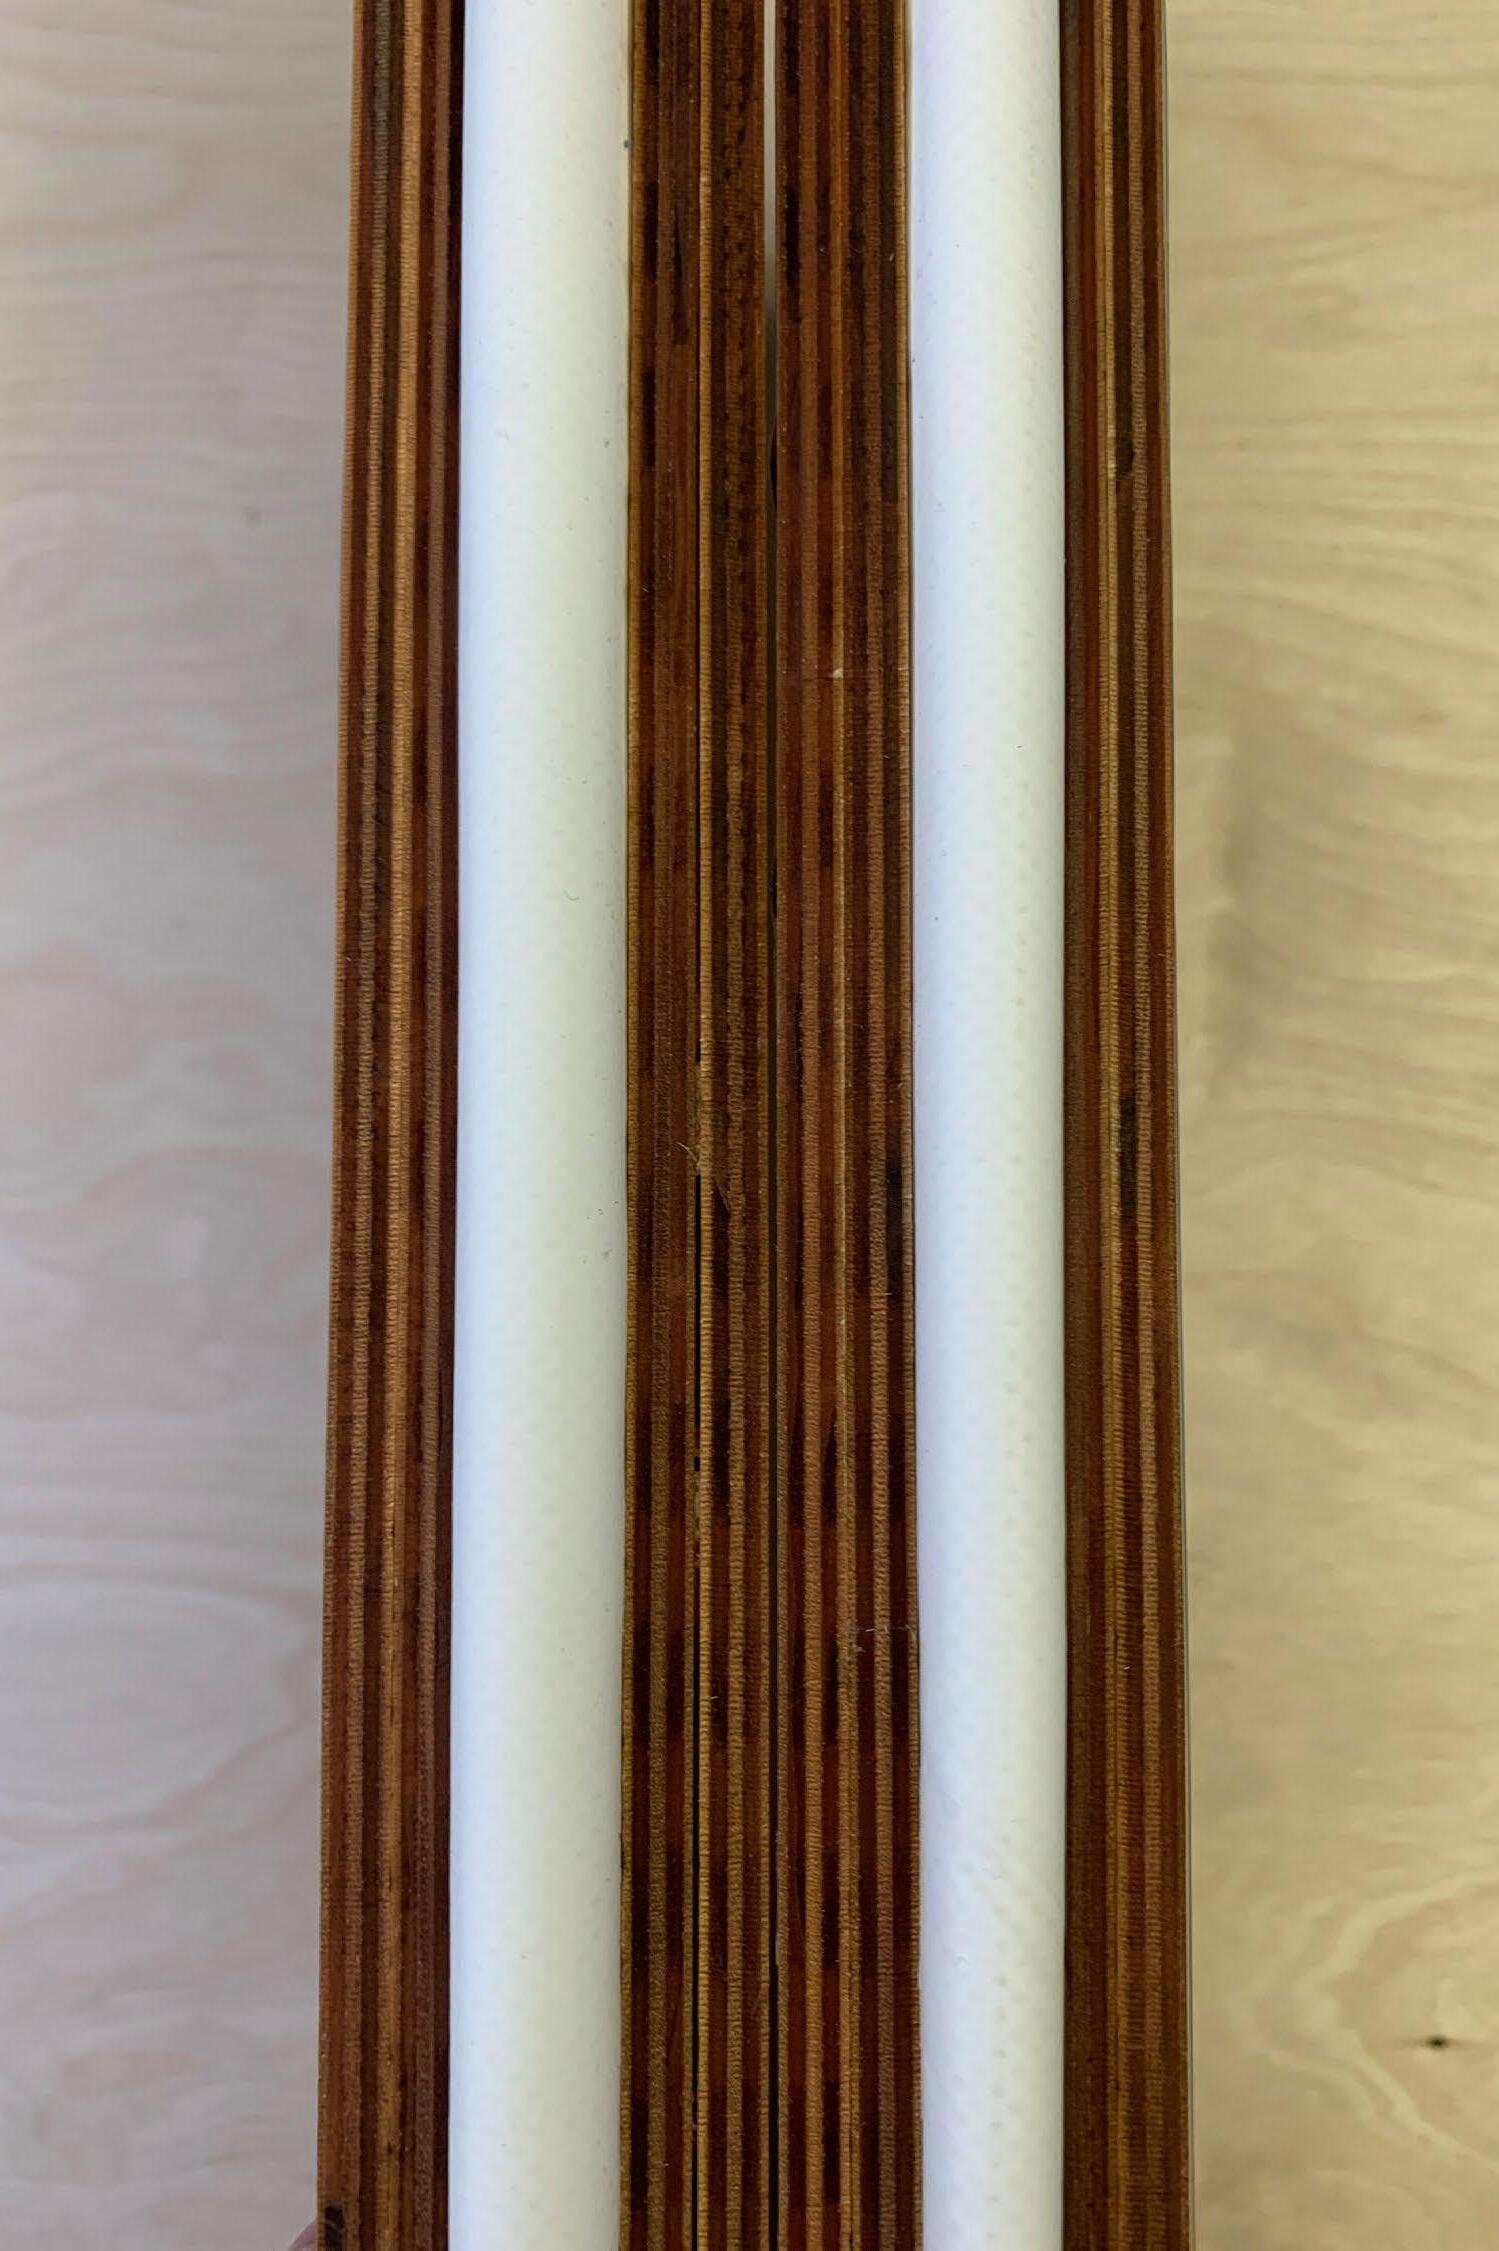
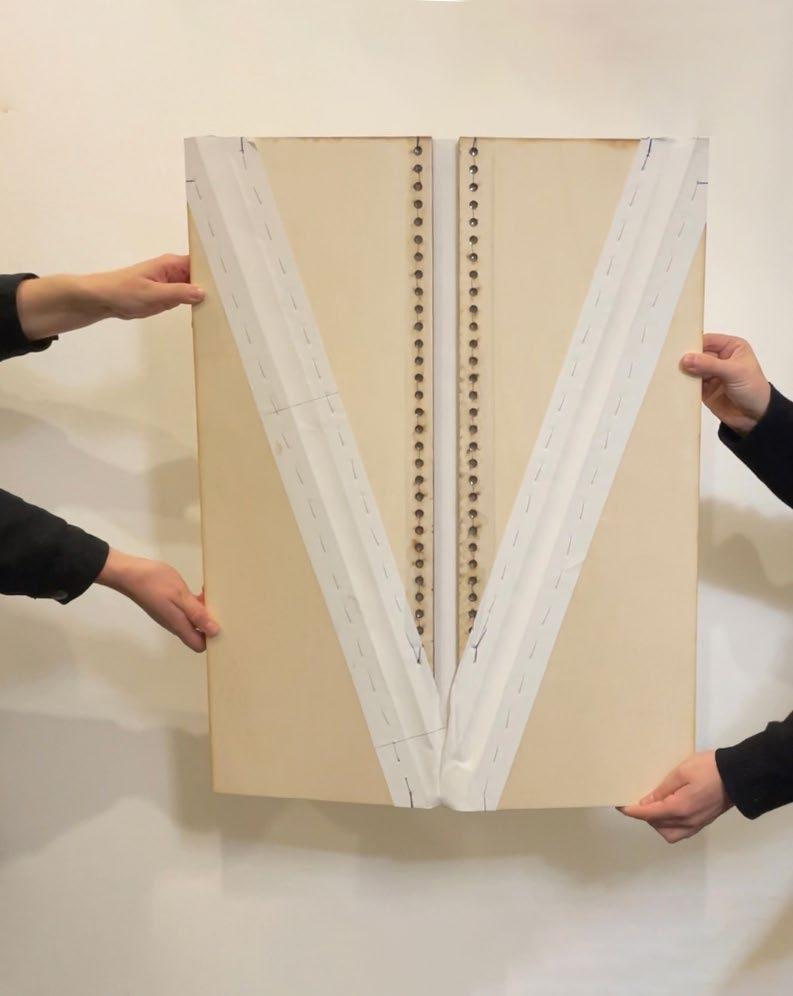
95
50 51
Image: The top view of folded prototype.
49
Image:The top view of expanded status prototype.
49 50 51
Image: The side view of folded prototype.
52
CONTRUCTION STRATEGY LIMITATIONS AND CONNECTION 04_4
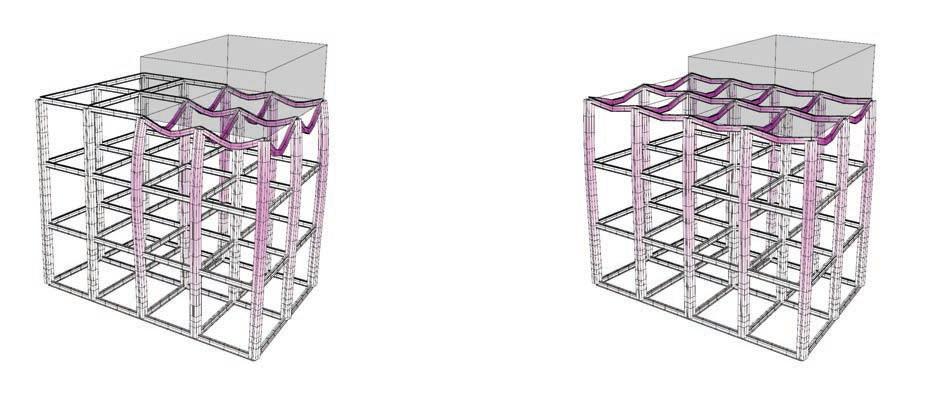
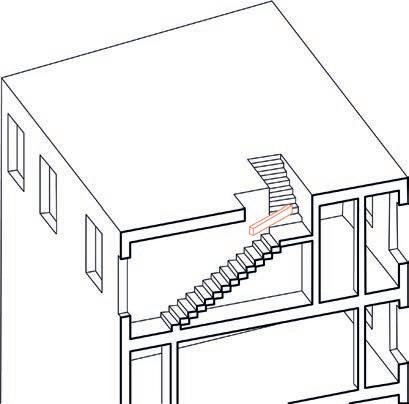
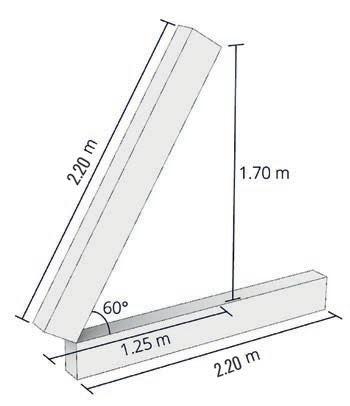
To reach the new vertical expansion positioned on the building’s rooftop, a solution regarding vertical circulation needs to be developed. There are two options at this stage: either the existing building’s circulation core should be extended until the rooftop to allow access to the new floor, or a new core should be built as a separate staircase alongside the building, following local regulations of the specific site.
The new rooftop expansion will be constructed on a deck that will distribute the load of the new building equally to the existing building. A detailed structural analysis of the existing building and an accurate calculation of the load distribution would need to be performed on each site. This process must be site-specific and should be carried out by a structural engineer. To guide the deck design process, an FE Analysis was carried out on the building in one of the selected implementation sites. The building was modelled as a structure and was deflected under a vertical loading of 600 kN/m2. This number was calculated as the approximate load of the new rooftop expansion (600 tons). The same loading case was applied again but this time with a deck separating the two structures and transferring the load of the new one evenly to the old one. It was observed that the deflection caused on the existing building changed dramatically. The vertical displacement in the structure was 15 cm when the rooftop expansion was positioned without a deck. But when the load was transferred evenly, the deflection decreased to 9 cm. This analysis proved that the construction of a structural deck is indispensable. (Figure 52)
The average staircase dimension were another limiting factor for the construction strategy. Upon analysis, it was concluded that the largest dimension for parts that can be carried from within the building is 2.20 m. (Figure 53)
The new rooftop expansion’s installations such as gas pipes, sanitary plumbing and electric cables, will be planned by relevant professionals according to the plan of the new apartments. This new network of installations is aimed to be connected to the system of the existing building with minimal disruption to the building’s existing installations or residents. The pipe and cable network of the new rooftop expansion would run in the gap between the existing building and the deck. In case the building’s existing installations are not fit for an extra floor’s overload and are therefore unable to be connected to the installation network of the rooftop expansion, a bypass alternative pathway will be built from the expansion, directly connecting to the municipal infrastructures. (Figure 54)
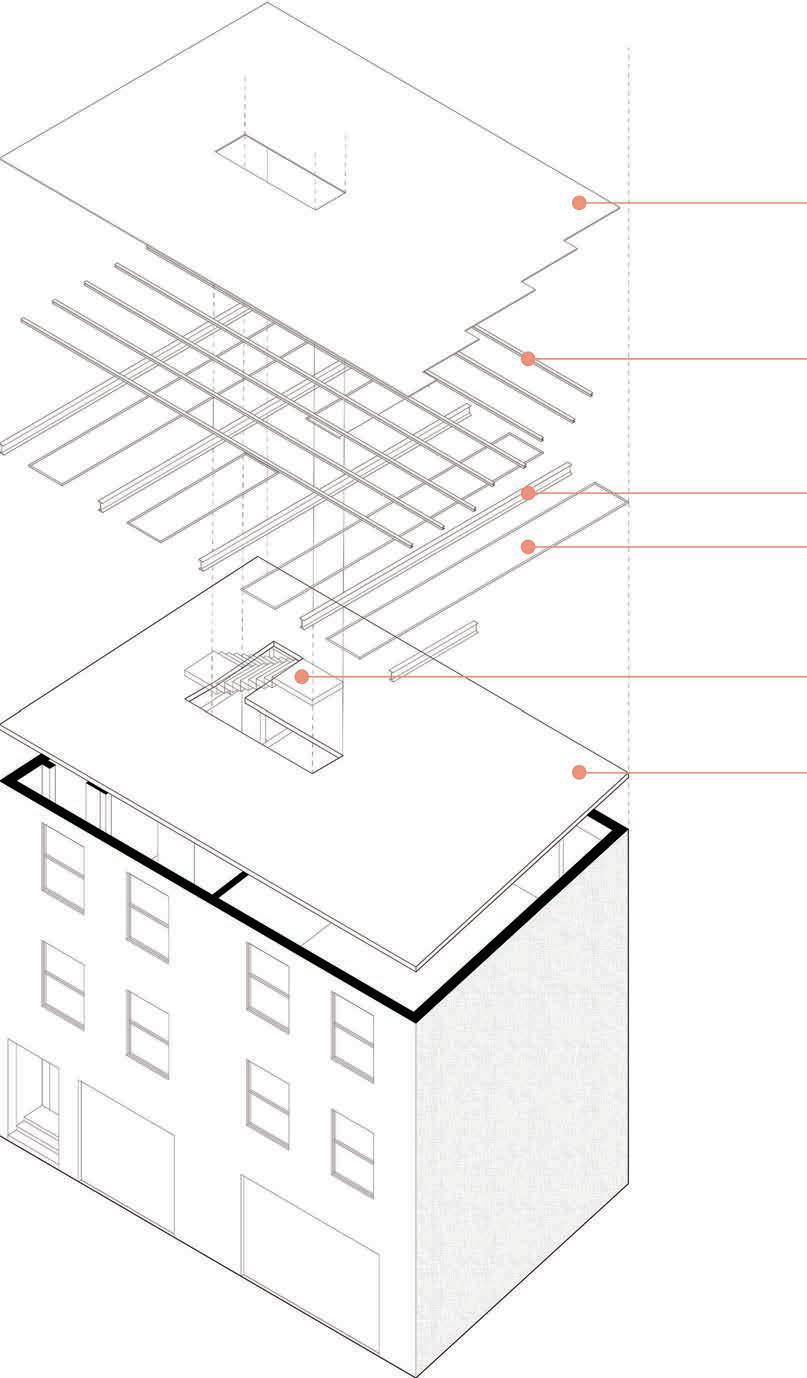

97
Diagram: structual analises of the existing building 52 53 54 Diagram: The explosion of the structure of the deck. Diagram: The dimension of the maximum scale for transportation within a starcase.
53
54
55
Diagram:
56
Diagram: The affordability in six chosen broughs in London.
57
Diagram: The growth of population from 2008-2018 in six chosen broughs in London.
58
Diagram: The construction of new homes from 2017-2018 in six chosen broughs in London.
59
Diagram: The rate of growth of jobs in six chosen broughs in London.
60
Diagram: The communicability in six chosen broughs in London.
61
Diagram: The final location in six chosen broughs in London.
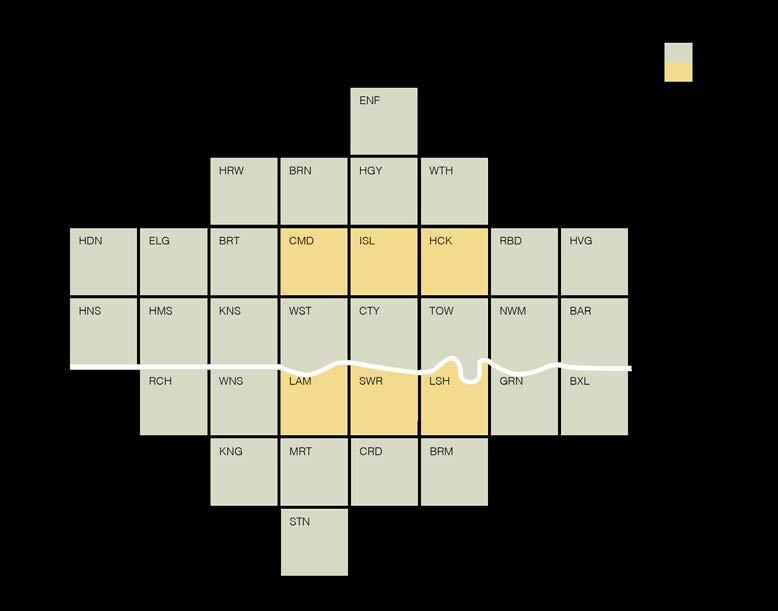
LOCATION SELECTION
The focus of the research led to exploration to find an optimal location of implementation within London for this demographic. The current locations where young professionals are renting and their desired locations to buy were taken into consideration. Most first-time buyers are typically moving out of rental properties in popular neighbourhoods in central London.3 It was concluded that implementing the strategy presented in this thesis in one of these areas in demand, would help mitigate the housing crisis faced by the young professionals of the city. Thus, several boroughs of inner London were studied and analysed for the implementation of this proposal. Six boroughs of inner London were determined to be sought-after by the selected target group: Camden, Islington, Hackney, Lambeth, Southwark, and Lewisham.4 (Figure 55) These locations were then further analysed and ranked according to a list of criteria: population growth (Figure 57), employment growth (Figure 59), commutability score (Figure 60), housing supply growth (Figure 58), and housing affordability. (Figure 56)
First, the population growth of each borough was analysed, with the understanding that population growth correlates to the increase in the need for housing. Camden had the highest growth rate at 25%.5 The rate of employment growth was also considered an indicator of the flow of people in a location and its desirability.6 Hackney had the highest rate of 49%. Islington was the highest ranking regarding the overall commutability with a score of 75 points.7 The densification scheme proposed in this thesis requires sufficient public transport that will not be overwhelmed by the influx of the new population. Islington also took first place with the lowest amount of new home construction with only 674 homes being constructed.8 These statistics demonstrate where the implementation of this proposal will have the greatest effect. Existing housing affordability of each borough was also taken into consideration, for this novel strategy is most needed in the least affordable areas. Lewisham had the lowest percentage of affordability among all 6 boroughs.9 The comparison and ranking of the boroughs according to these statistics led Islington to be chosen as the optimal location for the implementation of this study, given that it would benefit the most from more affordable housing for young professionals. (Figure 61)

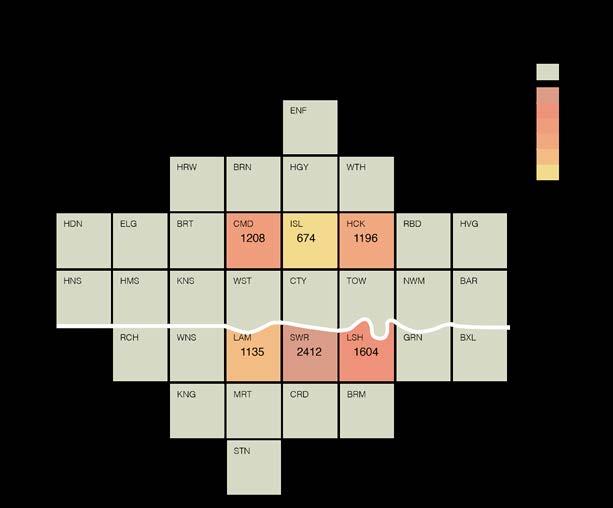
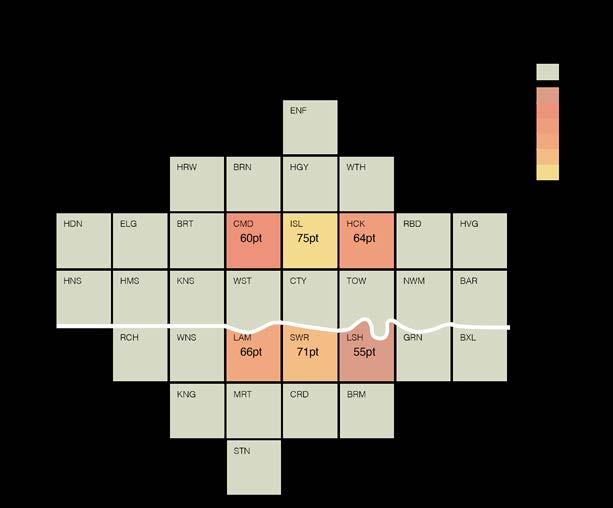
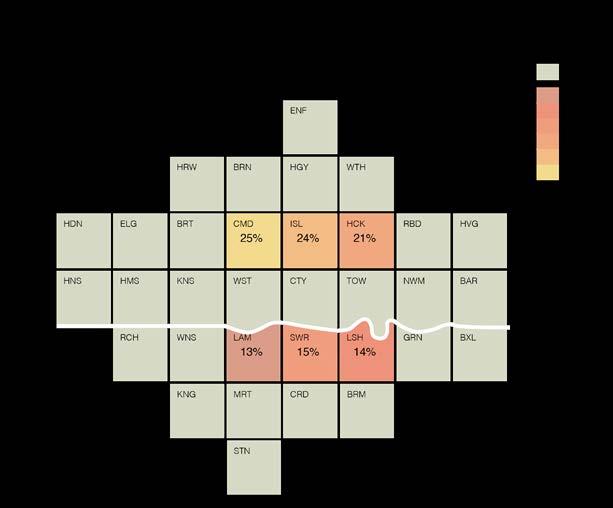
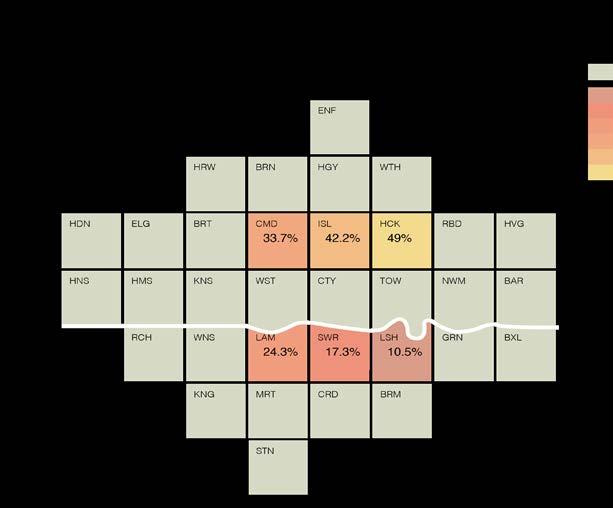
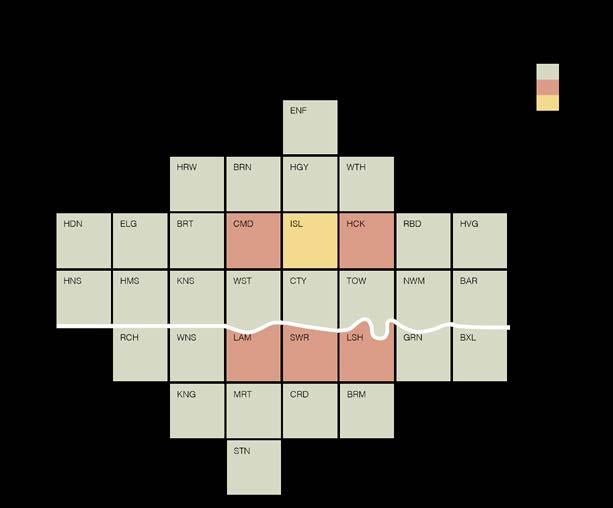
99
The six chosen broughs in London.
56 58 60 57 59 61 55 SITE SELECTION IMPLEMENTATION SITE 04_5
SELECTION ALGORITHM
Upon selecting the borough of Islington as the area of implementation for this proposed strategy, a methodology was needed to study Islington’s built environment and to detect the locations where a vertical expansion was possible.
In the first place, a digital model of Islington was required to run an analysis of the urban fabric and to determine the possible sites of application. To create an accurate digital model all London plans and 3D models that were available online were obtained and examined. In these plans, the building height data of 70% of the buildings in Islington were missing. To acquire this information that is crucial for this study, city plans available on online were studied and cross-checked with photographs taken and satellite imagery. It was ascertained that this data was incorrect and inconsistent. As a last resort, Google Elevation Data was extracted, and the building heights of the site and their surroundings were verified. Finally, after collating the building information in the acquired plans and Google elevation data, an approximate digital model of the site was created.
According to this approximate model, it was determined that there were 58,615 buildings in Islington. Then an algorithm was developed using Grasshopper to analyse the buildings and the possibilities of the area. The height difference between two adjacent buildings was used as the main value that determined if a site was suitable for a vertical expansion. With the algorithm, every building that was at least 3 m shorter than its neighbouring buildings was selected as a possible implementation site, as this height difference is sufficient to insert a new floor. Upon analysing the area, it was determined that there are 10,226 buildings in Islington that allow for a vertical expansion which constitutes 17.5% of the built environment. Furthermore, an analysis was carried out on how many new apartments can be built within this percentage. After calculating the floor area of every building suitable for vertical expansion and subtracting an average area of 15 m2 necessary for a circulation core, the remainder was divided by 45 m2 which was taken as the minimum size of a compact studio apartment. The result of this analysis yielded that 23,497 possible new apartments could be built as vertical expansions in Islington. (figure 1)
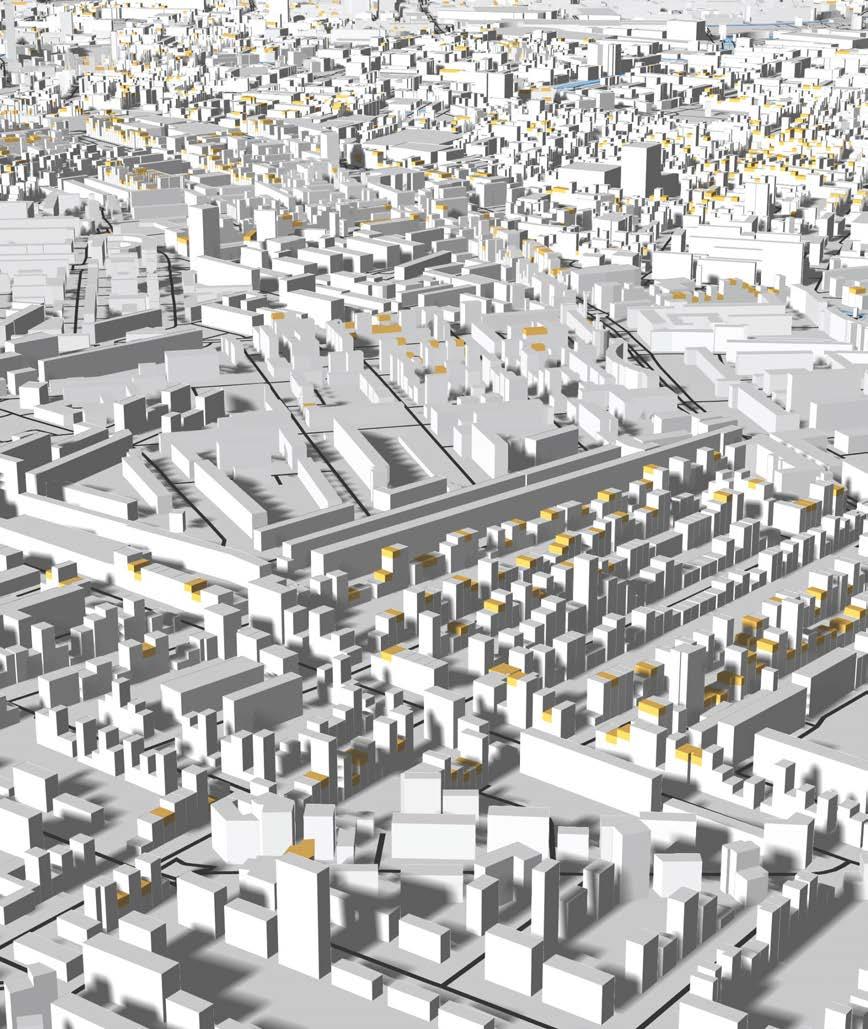
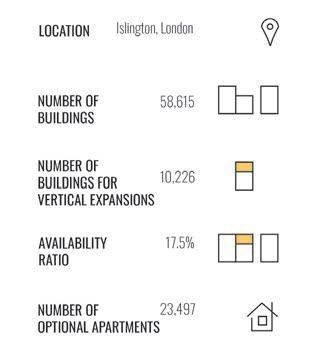
101
62 Diagram: The amount of the existing buildings and new apartments computed by algorisms. 62
INTENTIONS
In order to understand the user’s needs in this research, a survey was conducted addressing young professionals between the ages of 25-35, who aimed to buy an affordable flat in central London. The characteristics of this particular population’s ideal apartment were investigated. 80 young professionals responded to the online survey.
The first question was about what functional space young professionals deemed indispensable in their apartments. In addition, the participants were asked about their preferred combination for a multi-functional space in the apartment, as well as their other general requirements. Finally, questions regarding the facilities necessary for the building’s common spaces were inquired.
RESULTS
For the first question, where multiple selections was possible, 57 participants (73.1%) responded with the option of having a balcony. 31 participants (38.5%) chose to have a study space. (figure 3) As for the multi-functional spaces, 62 respondents (77.6%) preferred to have a kitchen combined with the living room. 10 participants (13.2%) selected the option of having a study space combined with their bedroom. (figure 63)
For the questions regarding common spaces shared amongst different apartments, 79.7% of the respondents chose to have a shared rooftop with the other residents. Only 16.5% wanted to share a common room with sofas and TV while less than 4% preferred sharing a large dining room. (figure 65)
CONCLUSIONS
Several conclusions were inferred from the results of the survey. First, according to the last question regarding common spaces shared amongst different apartments, it was concluded that a co-living type of design was not preferred by the majority of the respondents. Therefore, it was determined that all the housing typologies that will be generated at the end of this study will be separate, self-contained apartments.
Regarding the responses to the second question about multi-functional spaces, it was concluded that the participants preferred having a separate bedroom over having a studio. In addition, they preferred having the study space in the bedroom rather than in the living room.
Based on the results of the first question on must-have spaces, the option of dining room was eliminated as a separate space and merged with the kitchen. In addition, the functions of laundry room and storage room were merged into a single function. (figure 6)
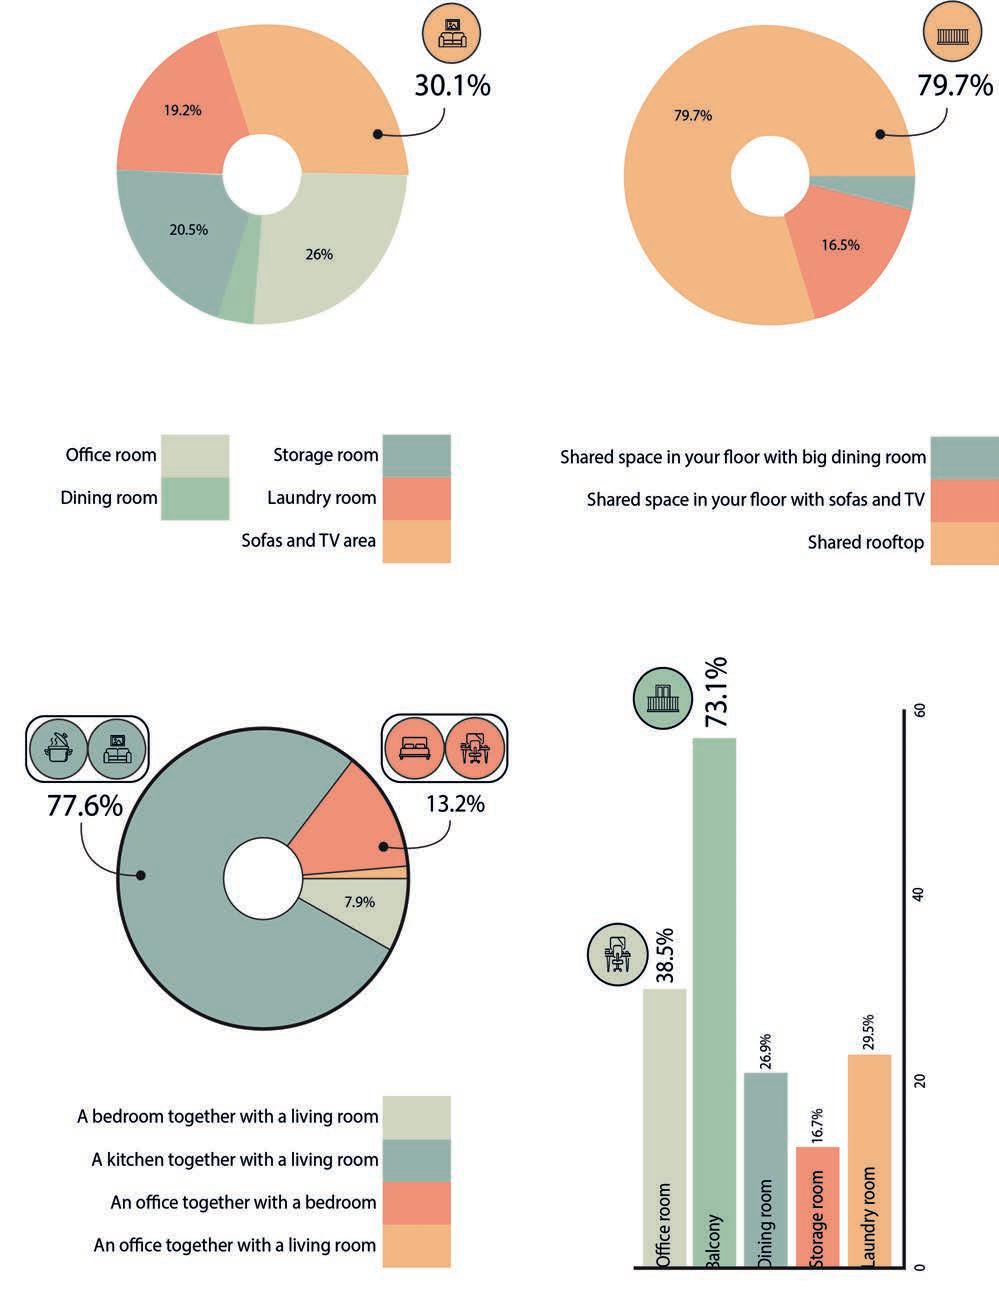
103 SPATIAL CONFIGURATION PLAN DEVELOPMENT 04_6
Graph: The percentage of the shared space with the required facilities in survey. 64 65 66 Graph: The percentage of functional spaces needed in survey Graph: The percentage of the combined functional spaces required in survey. Graph: The percentage of the functional spaces for requirement in survey. 63 63 64 65 66
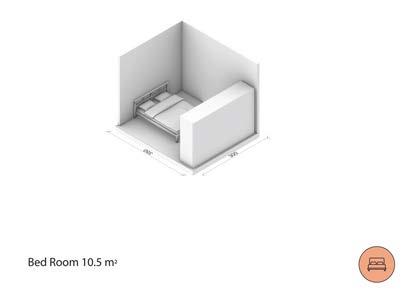
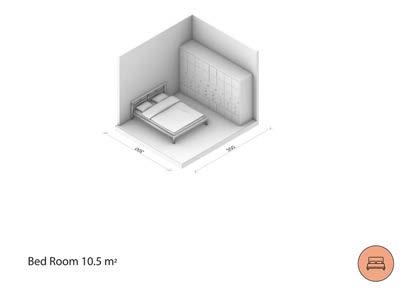
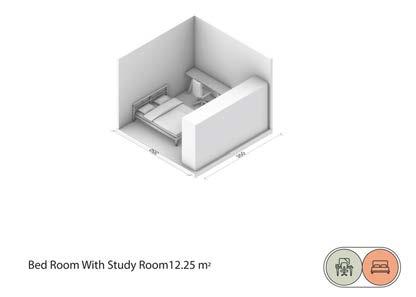
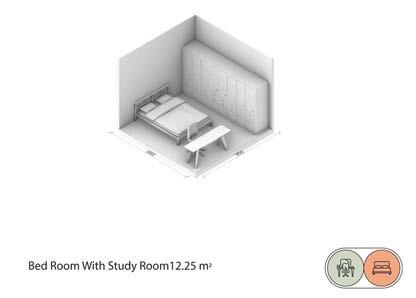
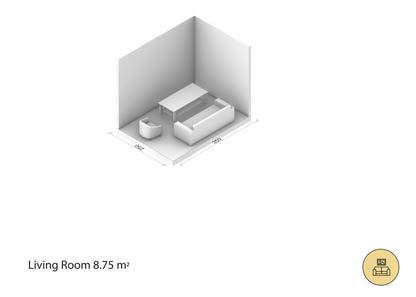
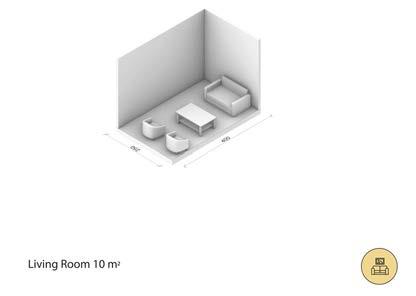
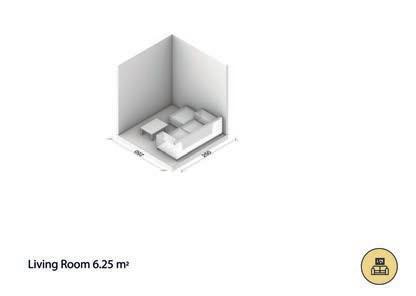
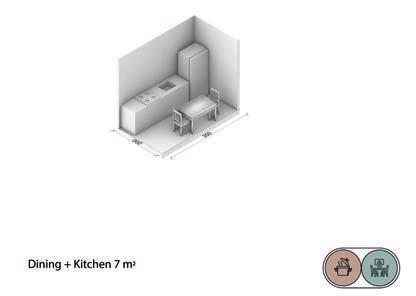
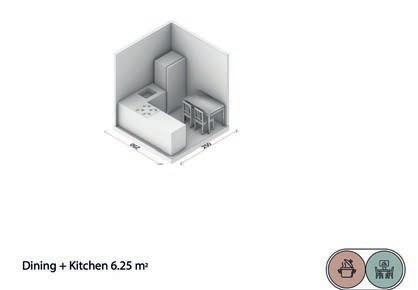
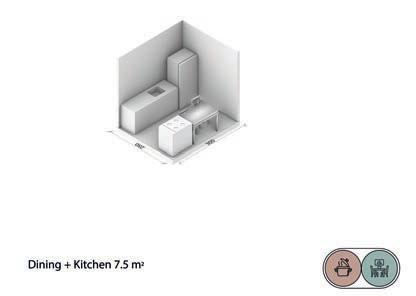
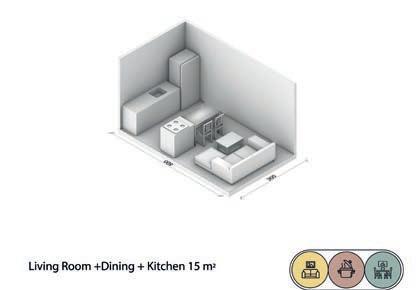
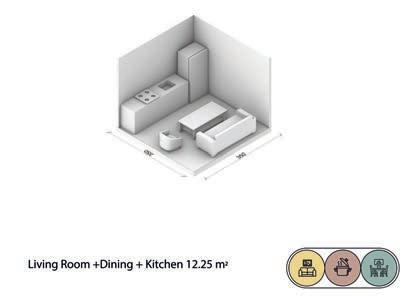
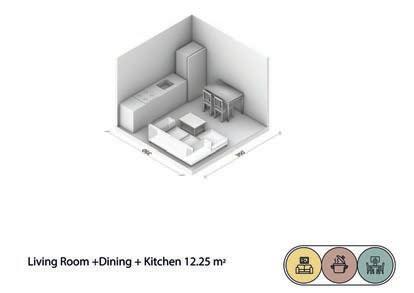
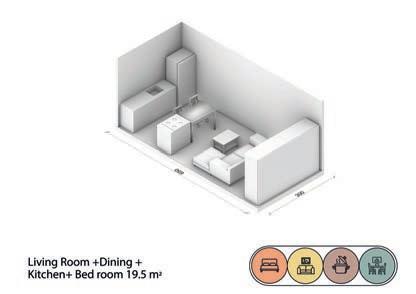
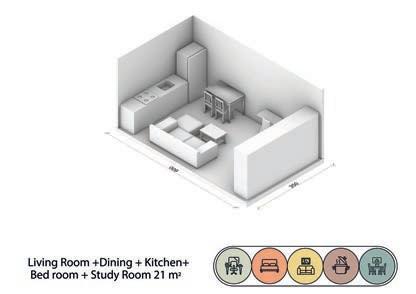
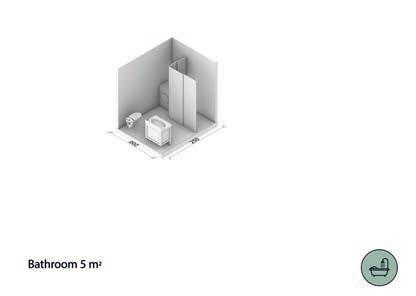
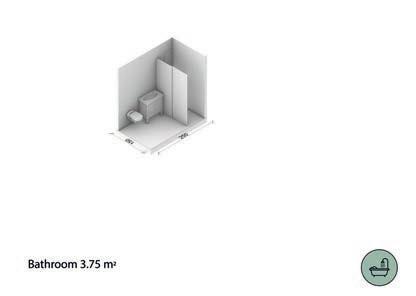
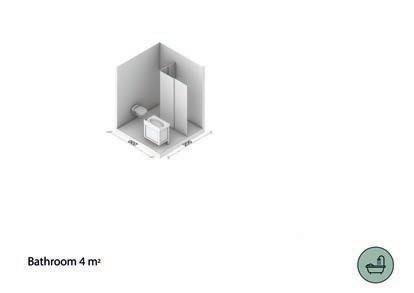
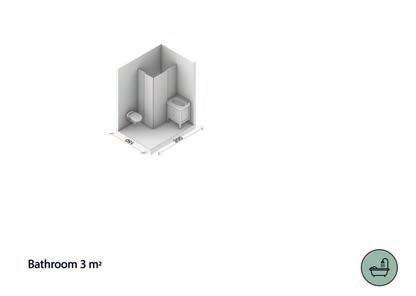
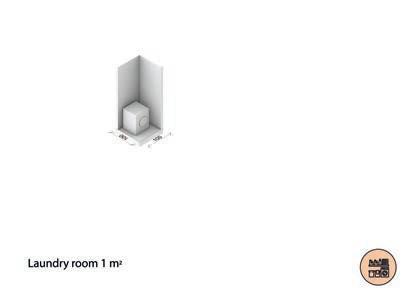
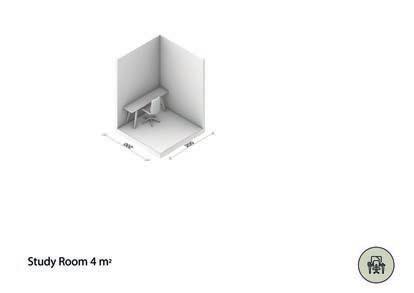
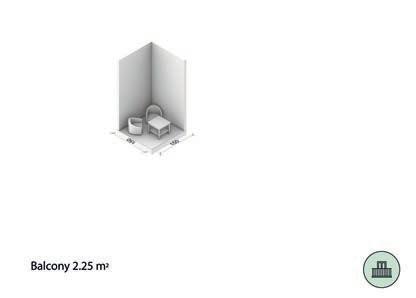
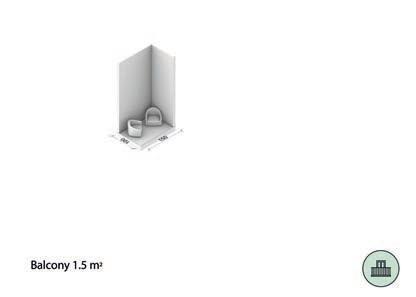
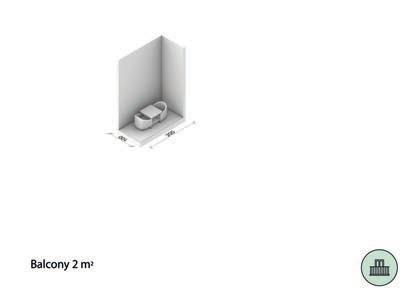
105 67
TOPOLOGICAL NETWORK
After analysing the findings of the survey and inferring spatial and programmatic conclusions, and designing a catalogue of functional spaces, these were in turn used to determine the minimum spatial and functional requirements for the design of a compact apartment. Several computational experiments were carried out regarding the spatial configuration of the new rooftop expansions. The experiments were set up to first generate topological graphs based on Network Theory, and then to translate these graphs into various different apartment plans using the spaces in the catalogue. The goal was to automate the layout phase of the design and to generate criteria-based optimum plans for apartments that would be both compact and fit the requirements set by the results of the survey.
EXPERIMENT 1
In the first experiment, a topological graph was created to represent an apartment and the seven possible programmatic spaces it may include. Each programme is represented by a node in the graph and is located along a large circle that stands for the apartment. Four of the programmatic nodes - i.e. bedroom, living room, kitchen and bathroom - are considered the primary functions, as requisites of a minimal apartment. The latter three functions of balcony, study and laundry/storage are secondary functions as they contribute to the quality of living but are not essential. Finally, five more tertiary functional spaces were established, each of which combines two or more of the primary and secondary programmatic nodes and offers a compact multifunctional space. (figure 26)
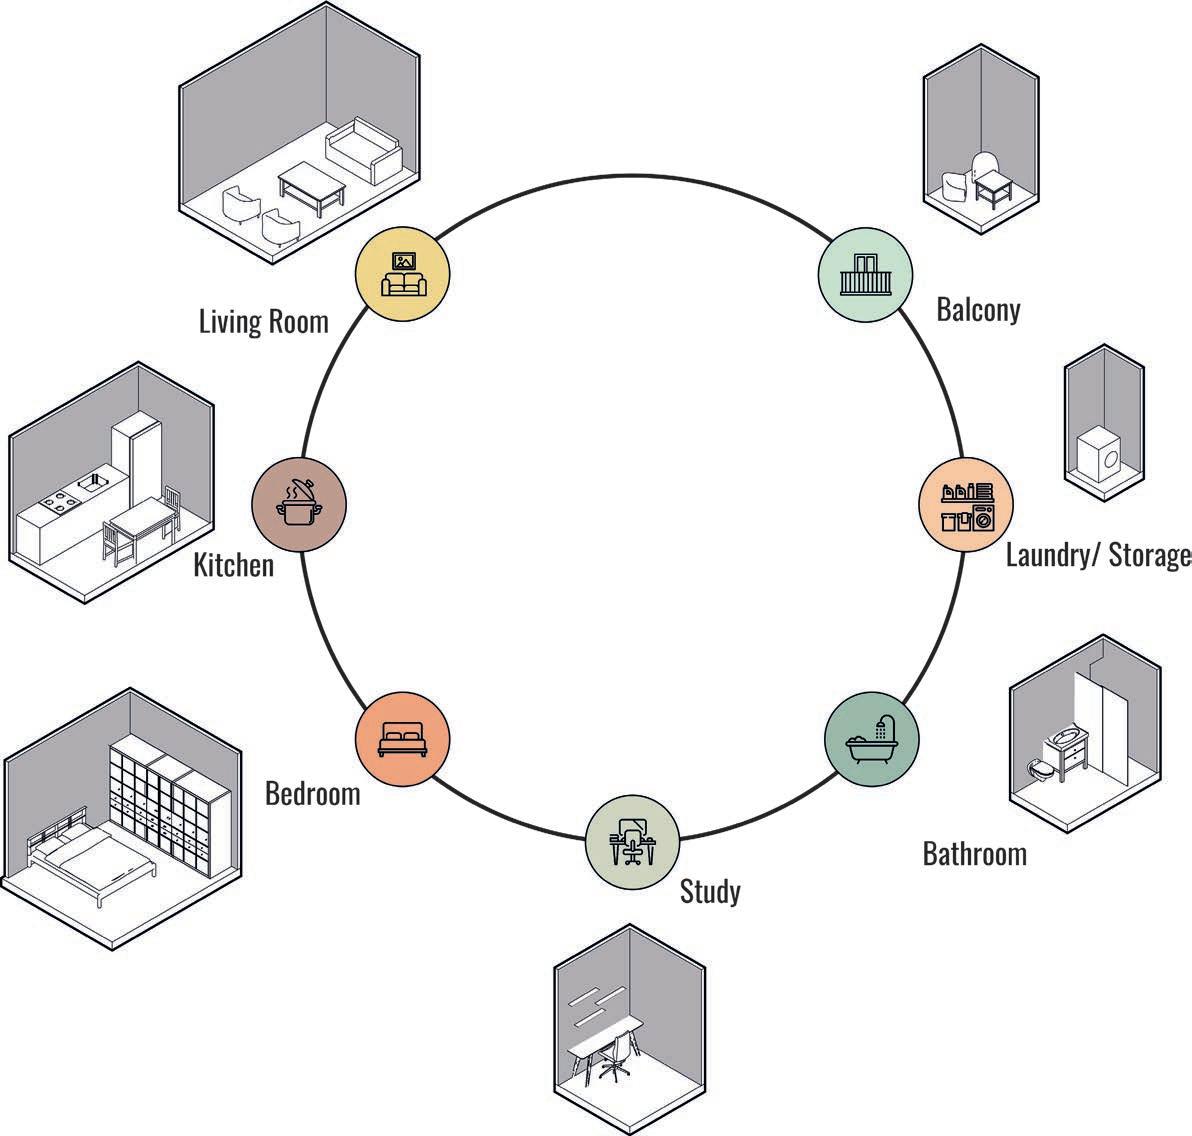
107
67 68 Diagram: a sample of different types of functional space. Diagram: The results of the combination of the functional spaces. 68
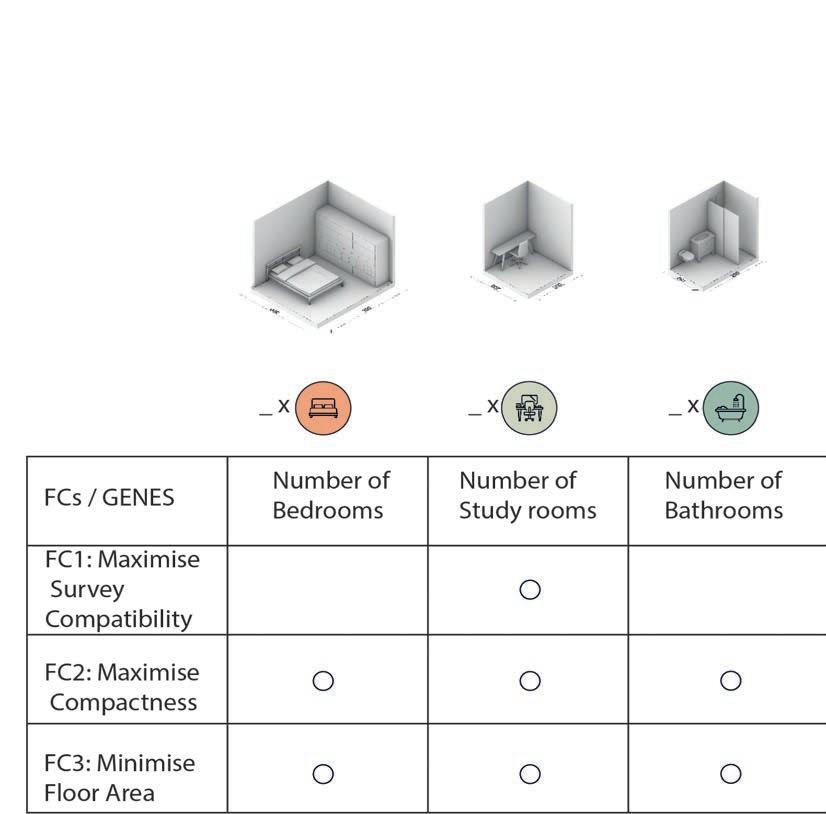
SET-UP
After determining the different possible programmatic nodes, an algorithm was developed in Grasshopper that generated all architecturally relevant possibilities for a minimal apartment for a young professional and that would be joined with a multi-objective optimisation. In this first phase, 62 different combinations of programmatic nodes were generated, 17 of which only included primary nodes and the remaining 45 programmatic possibilities incorporated both primary and secondary or tertiary functions. In other words, 62 different combinations of nodes were generated as templates for a series of topological relationships. (figure 27)
To evaluate the different outputs generated by the algorithm, three fitness criteria were established. The first one FC1 was Maximising Survey Compatibility. This fitness value was calculated by checking the programmatic nodes in the output against the survey results and by assigning a score to the output according to its compatibility. The calculation of this compatibility score was twofold. The first score was regarding the indispensable space in the apartment. Since the survey results yielded that 70% of young professionals prefer having a balcony and 30% prefer a study space in their apartments, an individual that had none of these spaces was assigned a score of 1. An individual with only a study space gained a score of 2, one with only a balcony received a score of 3, and an individual with both study space and a balcony was assigned a score of 4.
The second value was regarding the tertiary or multifunctional spaces. It was determined from the survey results that young professionals preferred having separate functional spaces instead of studios. And if a multifunctional space was inevitable, they preferred having the living room
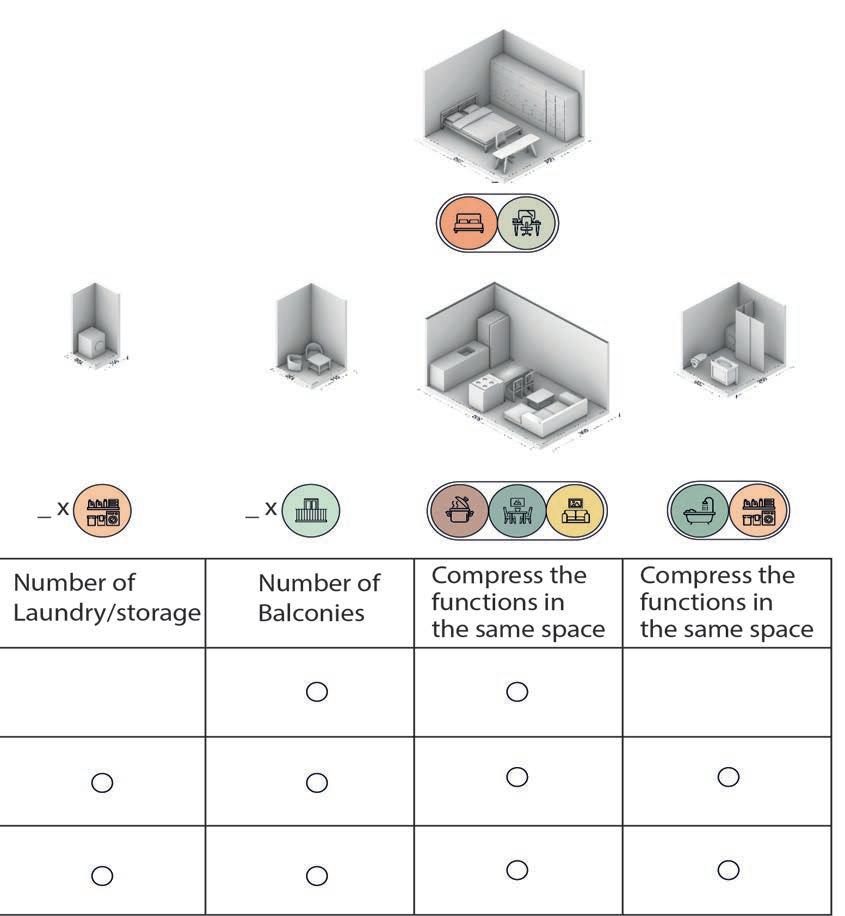
together with the kitchen, not the bedroom. They also preferred having their study space connected to the bedroom rather than the living room. Accordingly, the second compatibility score of an individual was calculated by checking the tertiary functional space types of the individual against these results. If the individual included a studio, it received a score of 1. If the bedroom was a separate space, it received a score of 2. And finally, if both the bedroom was separate and the study space was connected to them, the individual was assigned a score of 3.
After calculating the two scores, these values were added together to obtain the final compatibility score, and this would constitute the fitness value of the individual. The fitness criteria FC1 was established as the higher this compatibility score, the better the performance of the individual. The other two fitness criteria were FC2 Maximising Compactness and FC3 Minimising Floor Area. To calculate the values related to these criteria, the catalogue of functional spaces generated in the previous stage was combined with this topological network. First, the average floor area of each functional space was calculated. Then, the functional spaces in every 62 combinations of nodes were extracted. The average floor areas of the functions in every combination were added together to determine the average size that an apartment with that particular topology would have. This value was used as the fitness value for FC3. This criteria was established as the lower the approximate floor area, the higher the performance of the individual.
Finally, to obtain the fitness value related to FC2 Maximising Compactness, the number of programmatic spaces or nodes in each individual was calculated. This value was then divided by the approximate floor area linked with the individual. Thus, a ratio of compactness could be calculated and used as the individual’s fitness value. FC2 was established as the higher the compactness ratio, the higher the performance of the individual.
109
69 Table: The relationship
in
between seven groups of genes and three fitness criteria
evolution process.
69
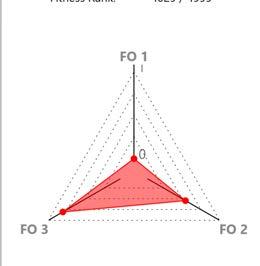
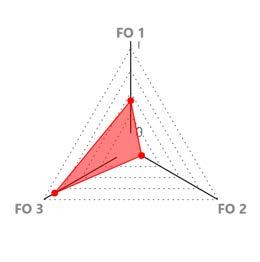
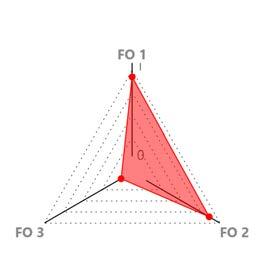

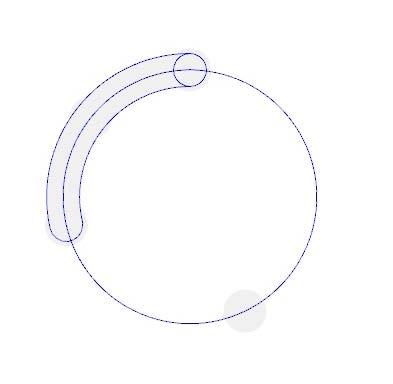
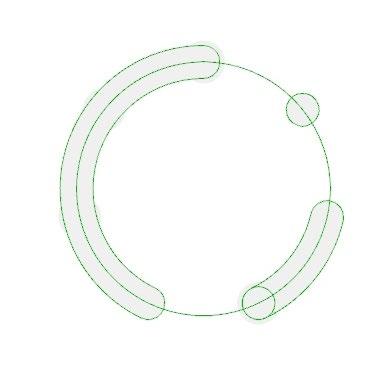
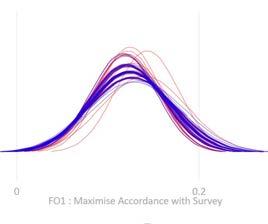
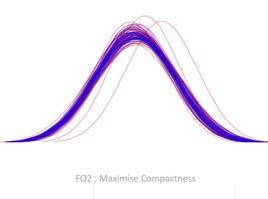
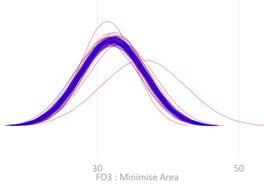
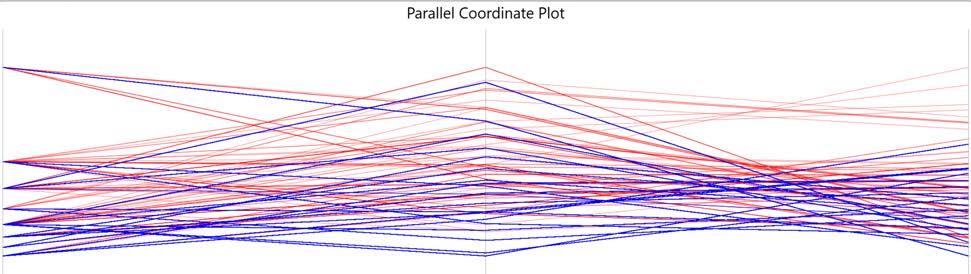
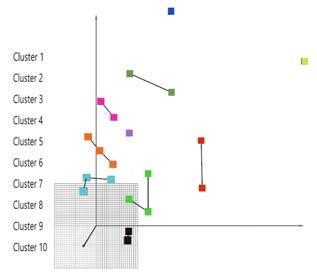
Diagram: The best performance individual in FC2 GEN 10 IND 5 70
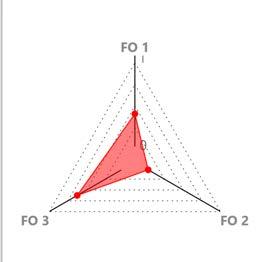
Diagram: The best performance individual in FC1 GEN IND 20
Diagram: The best performance individual in FC3 GEN 4 IND 2 71
73 72
Diagram: average of fitness ranks GEN 1 IND 9
MULTI-OBJECTIVE OPTIMISATION
In this multi-objective optimisation simulation, 100 generations of 50 individuals were generated. It observed that there were 2030 Pareto front individuals throughout the entire population of 5000, and 50 Pareto front individuals in the last generation. The Pareto front individuals of the entire population were grouped into 10 clusters using a K-Means clustering. The first individual of each cluster was exported as an optimally performing Pareto front individual.
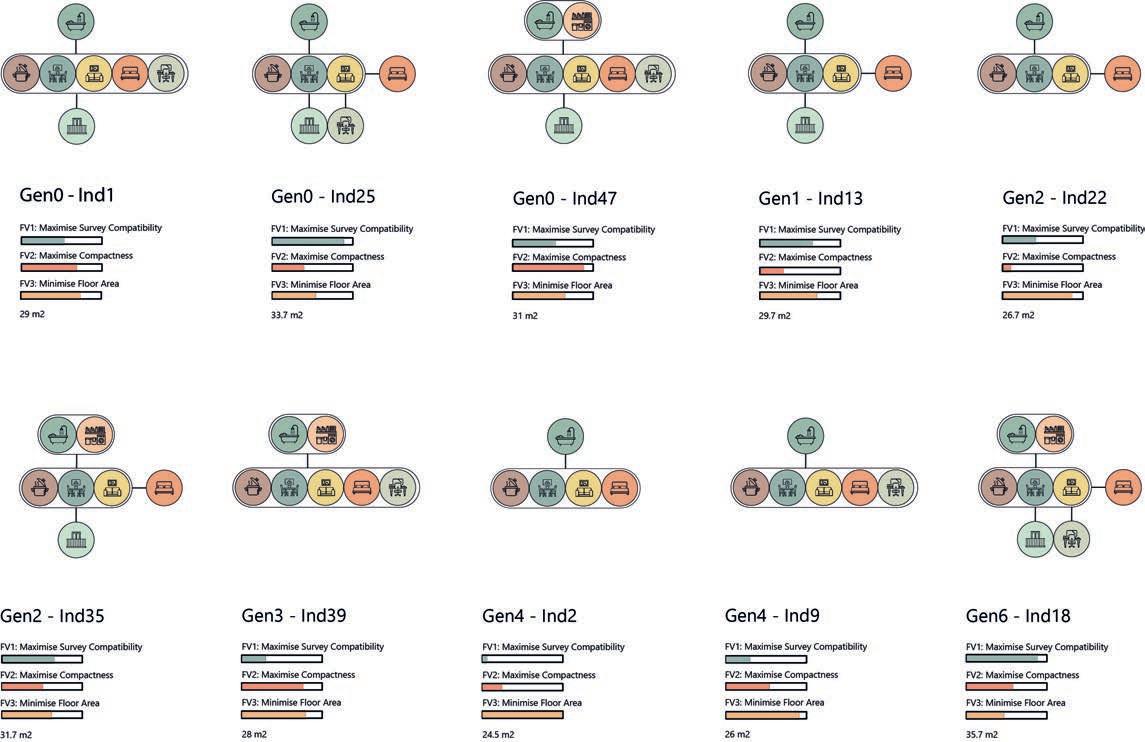
Diagram: The Parallel Coordinate Plot and distribution of pareto front in evolution process.
Diagram: The pareto fronts in evolution process.
74 75 76
Chart: ten chosen idevidual from the pereto front
As can be observed on the Parallel Coordinate Plot graph, FC1 Survey Compatibility and FC3 Minimise Floor Area worked together and contradicted FC2 Maximise Compactness. It was unexpected to observe that FC2 and FC3 were conflicting, given that it was assumed both would force the individuals to converge into small and compact layouts. However, the way that the fitness value for FC2 Maximise Compactness was calculated by dividing the number of nodes by the total floor area. In order to maximise this value, instead of minimising the floor area, the algorithm maximised the number of nodes which in turn increased the ratio and enforced the simulation to yield larger floor plans.
Aside from this unanticipated result due to the method of calculating the fitness value, the PCP graph and the Standard Deviation graphs for the three fitness criteria exhibit an optimised simulation. There is a high degree of variation as observed from the PCP and the fitness values of the individuals converge and move towards the desired value as the simulation progresses. However, the convergence of the individuals is higher than expected. This was since the solution space was only 62 individuals and the simulation generated a population of 5000. This has resulted in repetitions in various extracted individuals. The best-performing individual for FC3 Gen 4 – Ind 2 is the same as the Average of Fitness Ranks Gen 1 – Ind 9, as well as the extracted Pareto front individual Gen 0 – Ind 47. The same goes for the best-performing individual for FC2 Gen 10 – Ind 5 and the Pareto front individual Gen 4 – Ind 2, and the best-performing individual for FC1 Gen 1 – Ind 20 and the Pareto front individual Gen 0 – Ind 25. This repetition demonstrates that the solution space was not large enough for a multi-objective optimisation.
Therefore, this experiment was concluded with the knowledge that the parameters and the solution space of such an experiment should be greater than the population of a genetic simulation, and that the emergence of a series of topological nodes is not enough to evaluate a network. Therefore, a new experiment was developed.
111
70 71 72 73 74 75 76
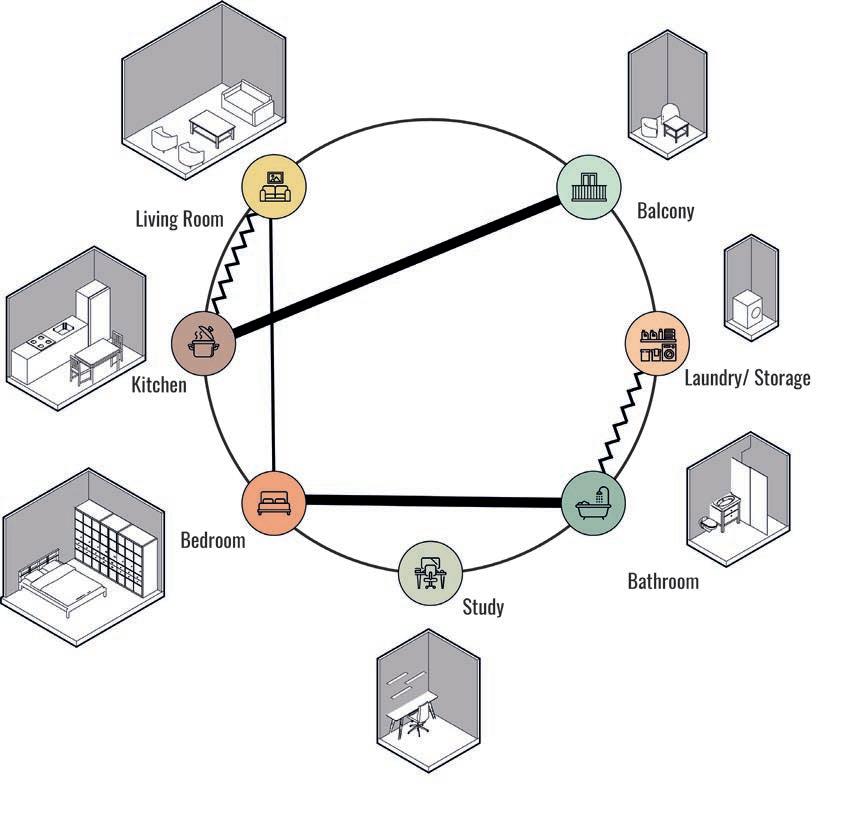
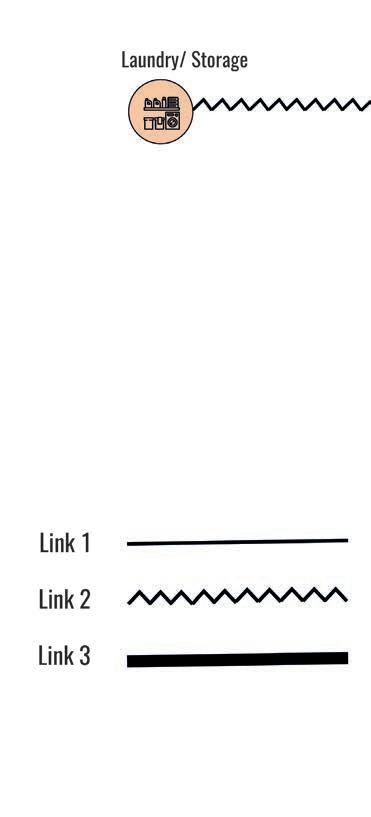
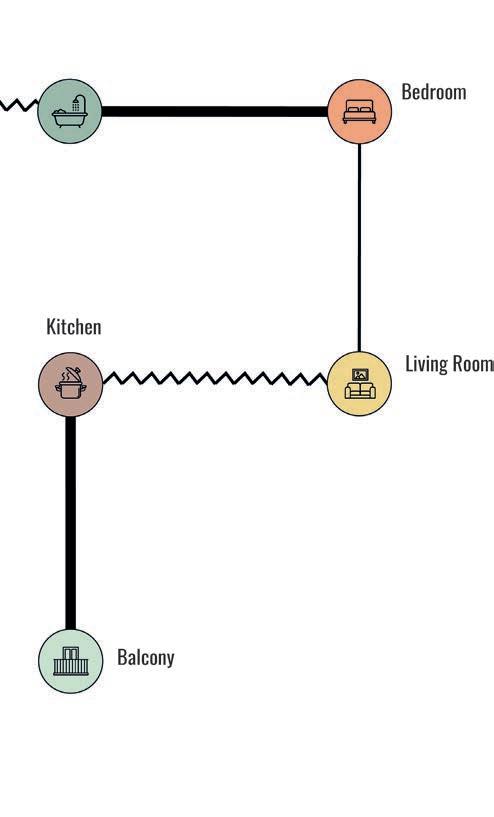
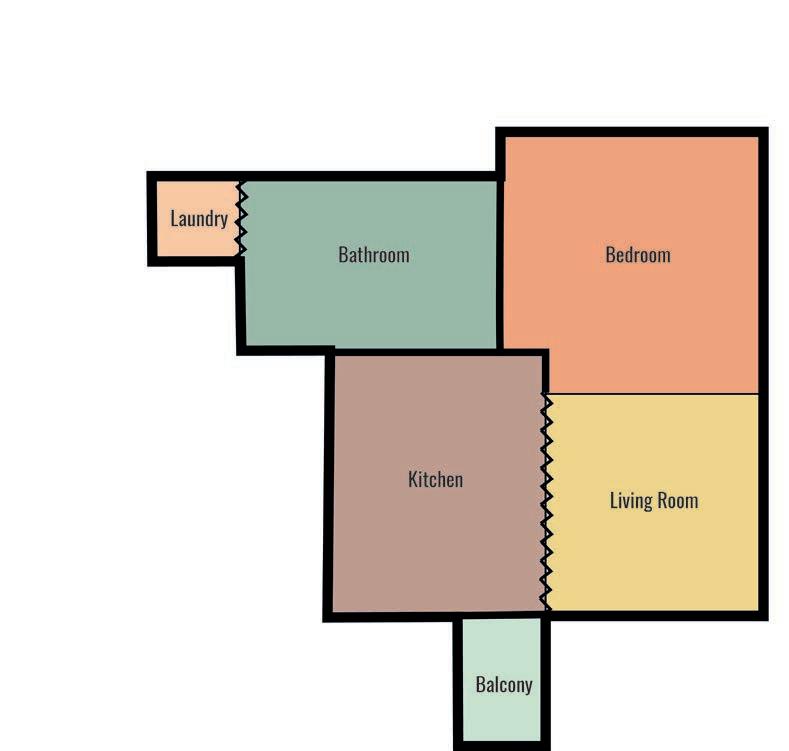
113 77 78 79
77
Diagram: topalogical grapph of difrent spaces
78
Diagram: Nodes and links representation of a plan
79
Diagram: The relationship of the last two diagrams convertan into a floor plan
80
Table: The relations between three fitness criteria and seven groups of genes in evolution process.

EXPERIMENT 2
In the second experiment, the topological graph generated in the previous experiment was further detailed, the nodes were linked together to generate a network and graphs were finally translated into a floor plan. The same graph representation was used for this experiment, with four primary nodes and three secondary nodes. However, the tertiary nodes that represented multi-functional spaces were removed from the algorithm as separate nodes and were generated by introducing different link types.
The development of this genetic algorithm experiment had three levels of hierarchy. On the first level, a circular topological graph was created similarly to the first experiment. The nodes representing the four primary and three secondary functions were placed around the circle. At the second level, this circular was translated into another topological graph with location information. And finally, at the third stage, this graph was translated into a floor plan, using the room plans from the functional spaces catalogue presented previously. (figure 26)
SET-UP
The first set of genes controlled the addition of secondary functions to the topological graph, or in other words if a graph had these secondary nodes or not. Every individual had one of each of the four primary functional spaces of living room, kitchen, bedroom and bathroom. But according to this first set of genes, some individuals had a balcony, a study area and a laundry/ storage room and some did not.
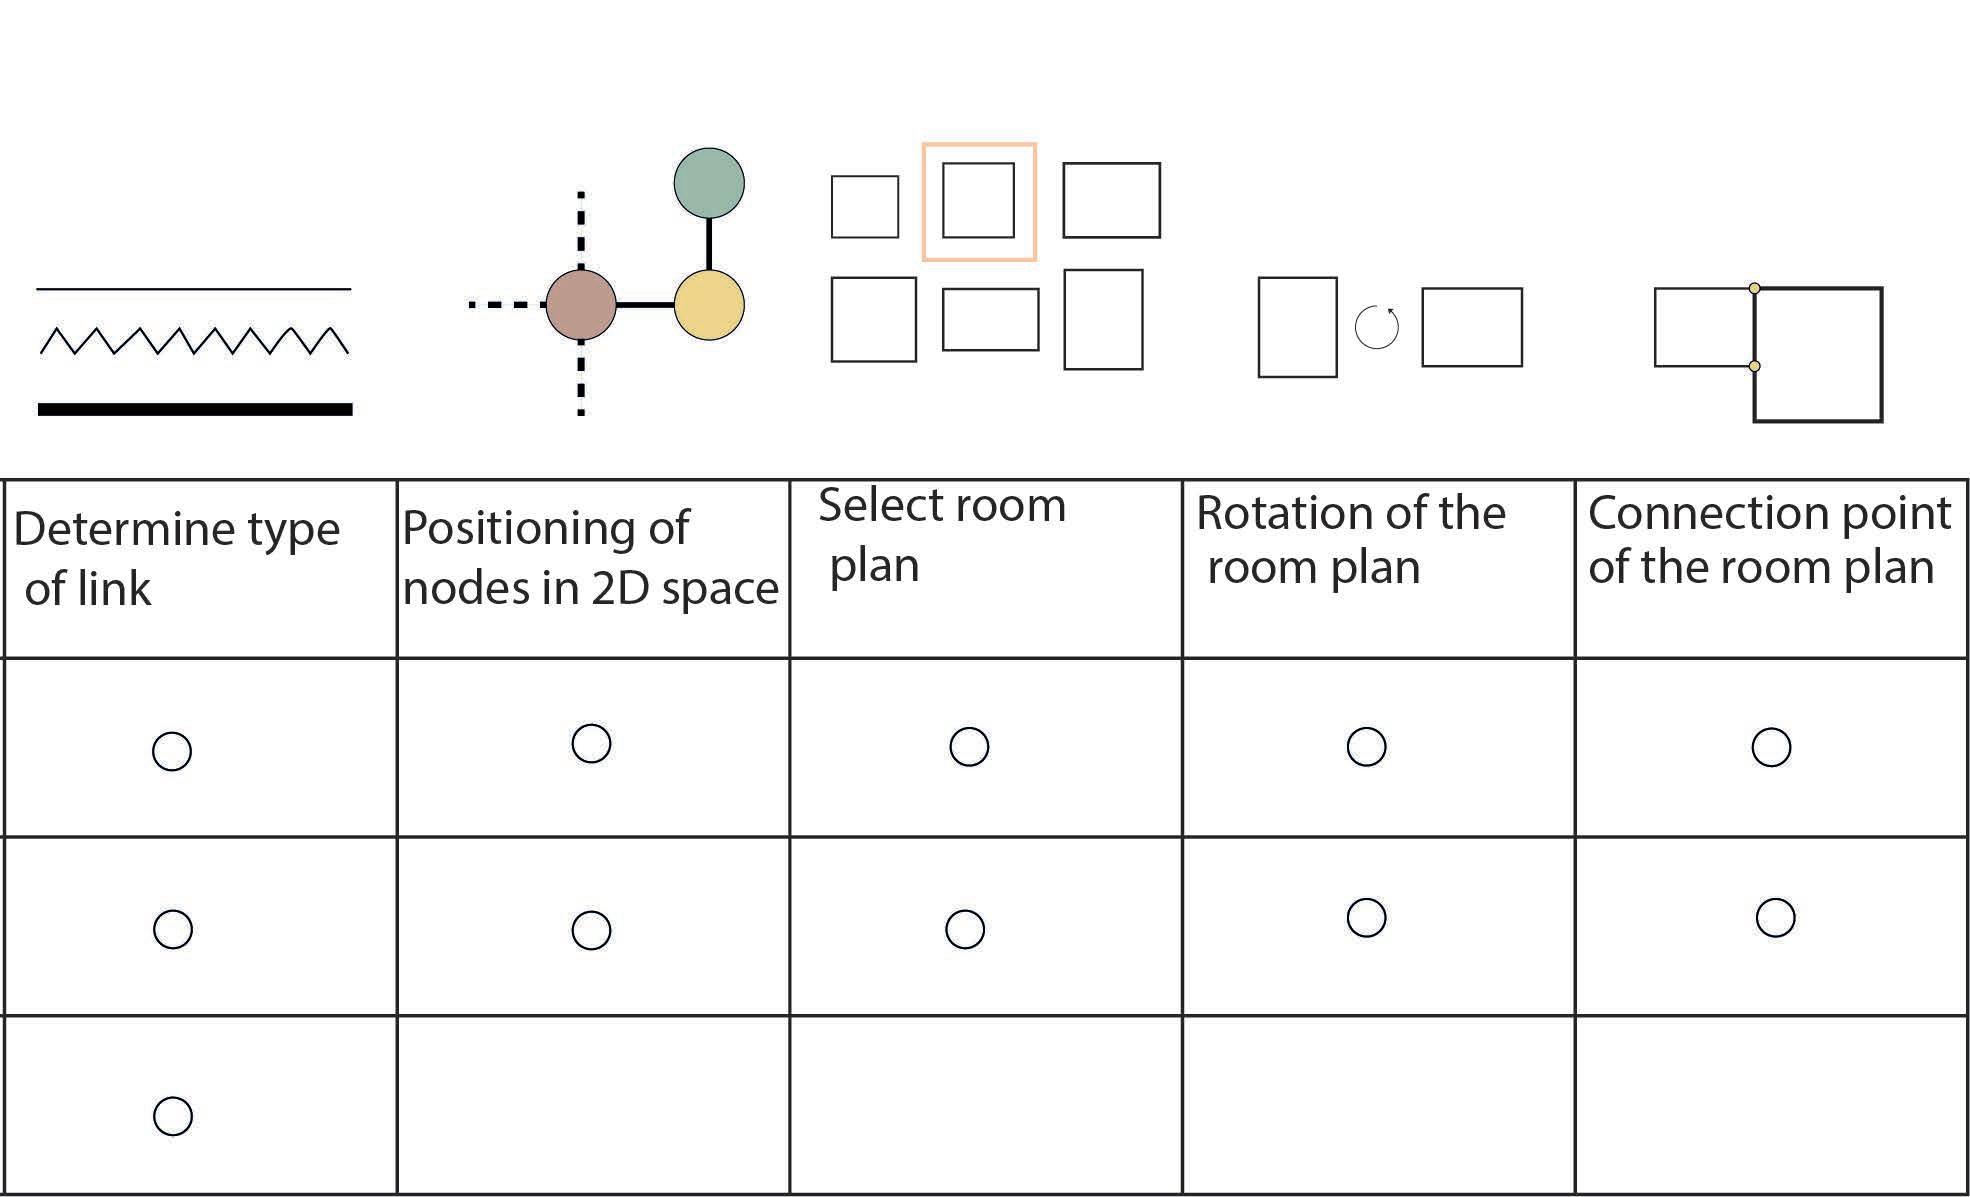
The second set of genes determined to which node each node was linked to. This set of genes was limited through a set of design rules. For instance, the bathroom can only connect to the living room or the bedroom, the balcony can only connect to the living room, the bedroom, or the kitchen, the study space can only connect to the living room or the bedroom etc. Based on these genes, the nodes in the graph were linked together.
The third group of genes assigned the type of link every node had with one another. Three different types of links were established in this experiment. Link Type 1 represented a shared space, meaning that the spaces connected through this kind of link form a multi-functional single space. Link Type 2 represented a connection through a screen door, which could be deployed and compressed. Link Type 3 stood for a connection through a door. With these three sets of genes, the first level of the hierarchy of this experiment was generated and controlled.
The fourth set of genes translated the graph from the first level to the second level. The genes positioned each node and its corresponding links generated in the first level, to a position 2D dimensional space. This positioning followed a sequence, based on the importance of each functional space. To simplify the algorithm, the living room and the kitchen were placed first, always side by side. Next, the bedroom was placed according to the node it was linked to. Then the bathroom, the study space, the laundry/storage space, and the balcony were placed respectively.
The fifth, sixth and seventh groups of genes translated the graph from the second level of hierarchy to the third. The fifth set of genes selected a rectangular plan from the catalogue of spaces for each node in the graph. The sixth group of genes added the possibility of rotating these plans at 0° and 90° angles. These rotated plans were then placed according to the positions of their nodes in the second graph. And finally, the seventh set of genes controlled how each space would be connected to the other one. With these genes, a room can be connected to the other through one vertex or the other, or the middle point. Additionally, in this third stage, the spaces that were connected to each other with Link Type 1 were moved towards each other with a distance of 0,5 m and merged together, thus creating a multi-functional space with less floor area than two separate spaces.
115
80
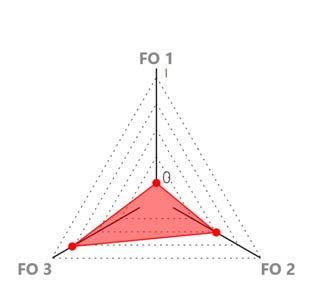
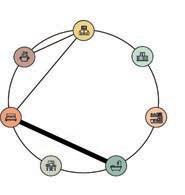
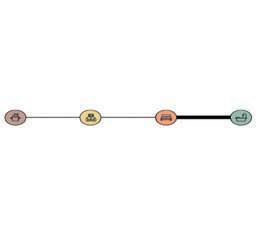
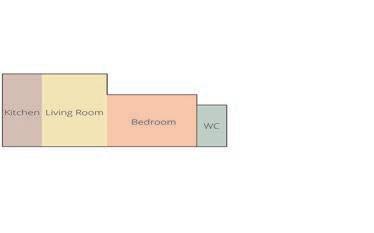
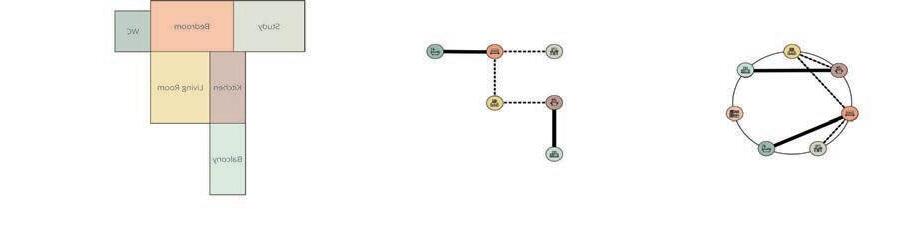
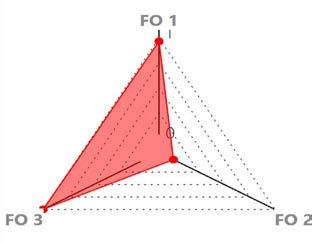
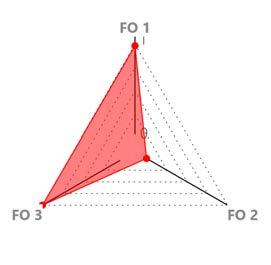
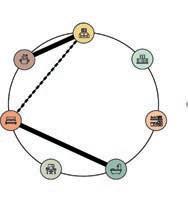
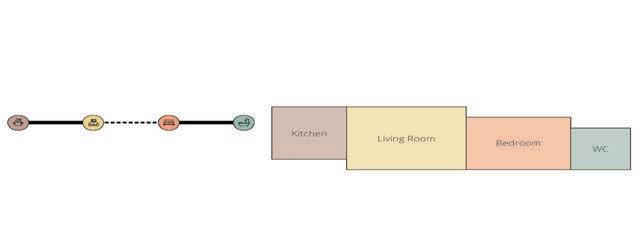
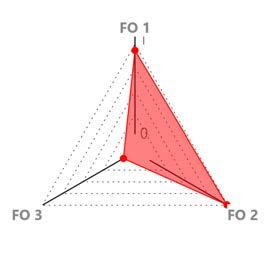
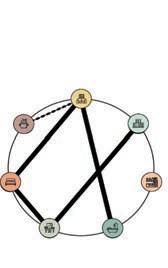
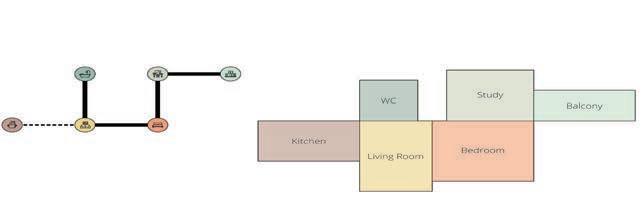
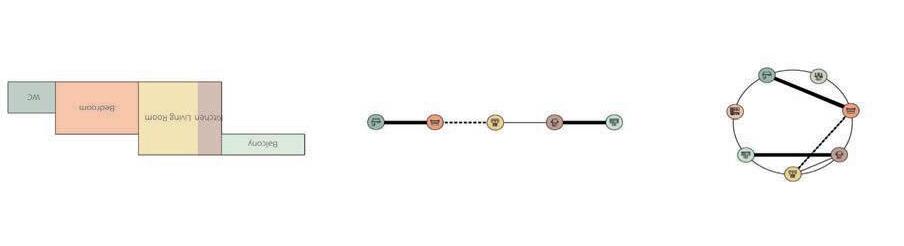
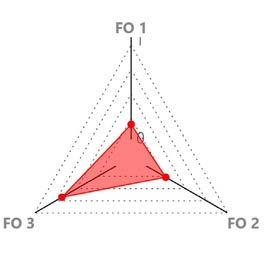
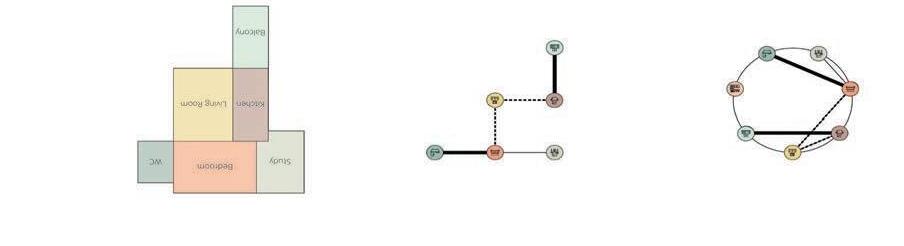
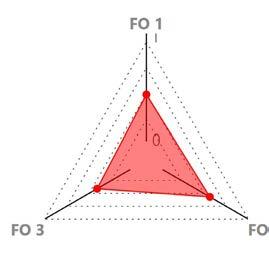
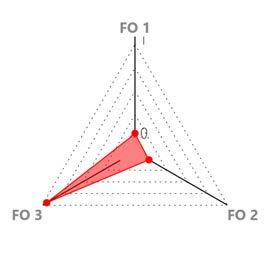
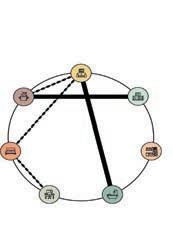
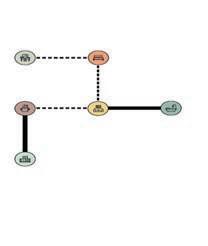
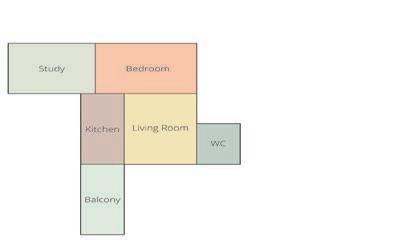
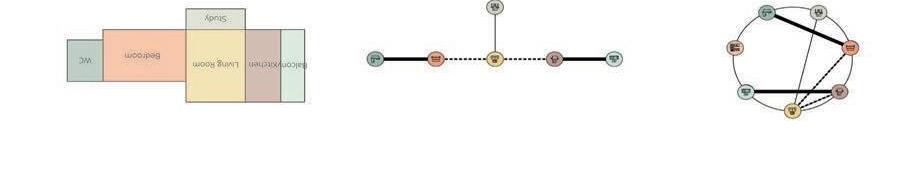
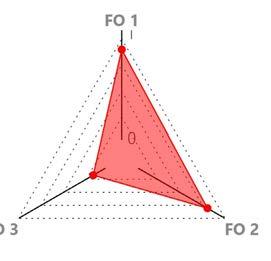
117 81 82 83 84 85 86 87 88
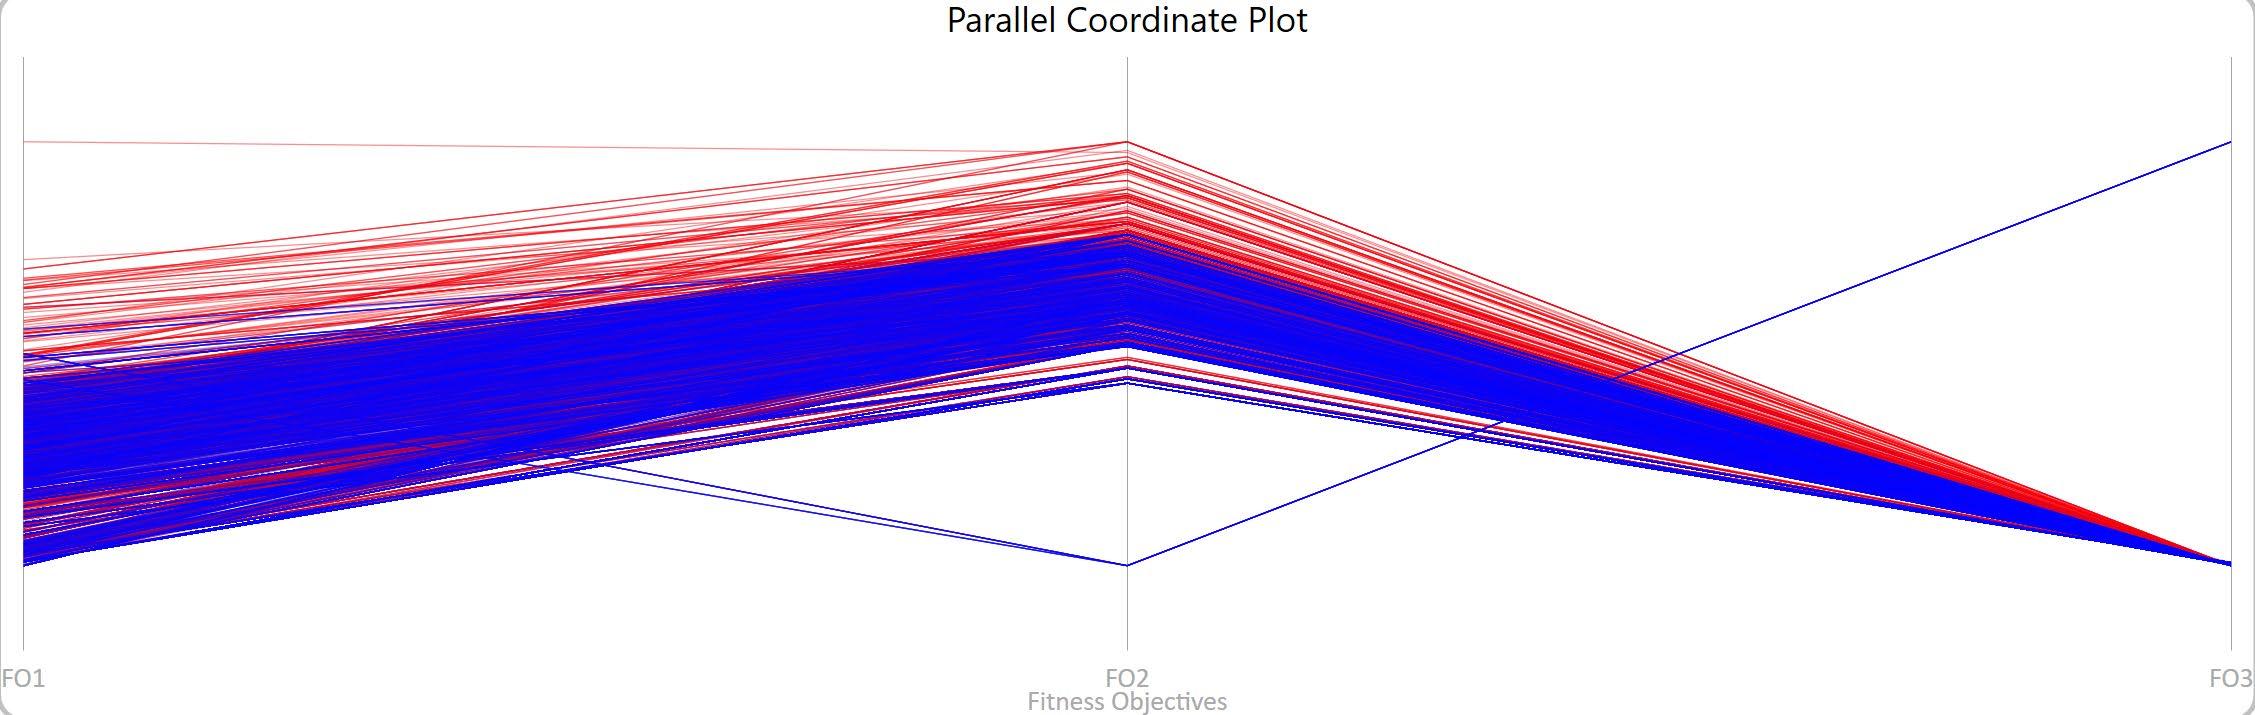
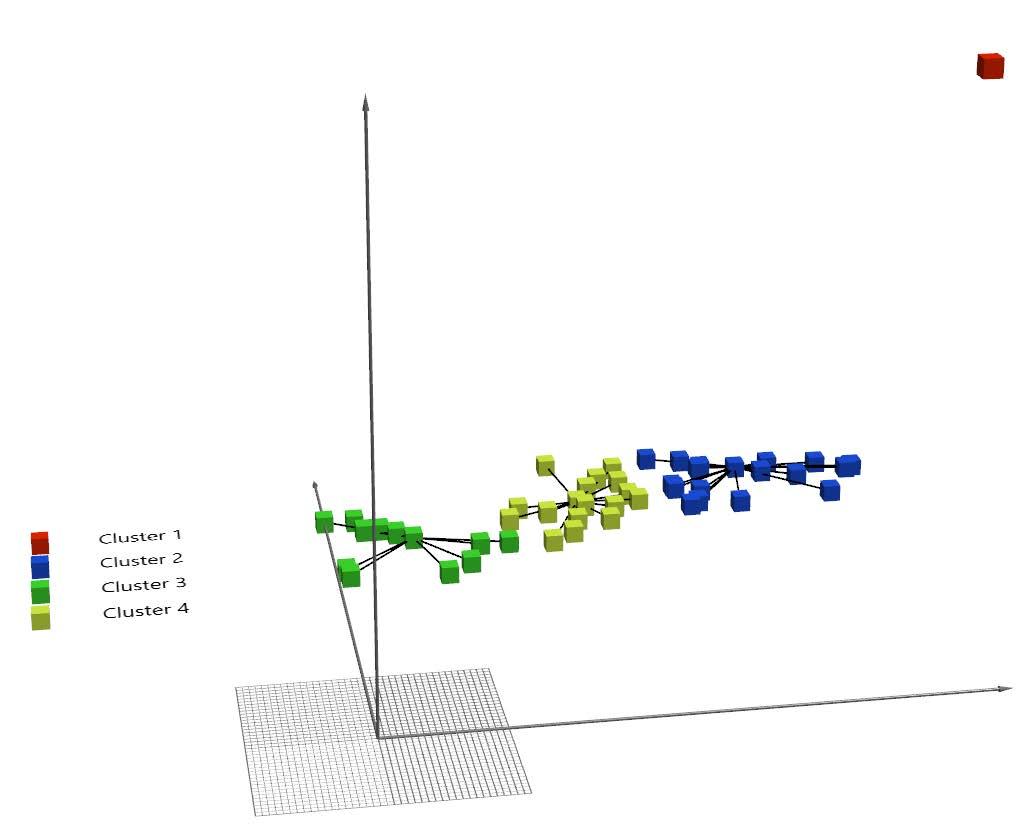
Diagam: The best performance
Diagram:The best performance
Diagram: pareto front cluster GEN 99
86
Diagram: pareto front cluster GEN 99
This set-up was plugged into a multi-objective optimisation engine in order to explore the entire solution space and select optimum floor plans for further development. Three fitness criteria were established for evaluating the performance of the individuals.
FC1 Minimise Floor Area ensured that the final outputs of the optimisation process would be small apartments that can be used for this study and fit in narrow rooftop spaces in London. This was calculated by measuring the area of the entire plan.
FC2 Maximise Compactness was established to generate packed, compact apartments and not branched-out plans with many turns and corners. The fitness value for this criteria was measured by extracting the centre points of all the spaces in the final plan and creating a Convex Hull including these points and calculating the surface area of this polygonal shape. The performance criteria was the smaller this area, the more compact the apartment is.
if both the bedroom was separate and the study space was connected to them, the individual was assigned a score of 3. After calculating the two scores, these values were added together to obtain the final compatibility score, and this would constitute the fitness value of the individual. The fitness criteria FC3 was established as the higher this compatibility score, the better the performance of the individual.
MULTI-OBJECTIVE OPTIMISATION
For this optimisation operation, 100 generations of 50 individuals were generated. After running the simulation, it was observed that there were 459 Pareto front individuals throughout the entire population, and 50 Pareto front individuals in the last generation. These individuals were grouped into four main clusters using a K-Means clustering. The first individual of each cluster was exported as an optimally performing Pareto front individual.
Diagram: pareto front cluster GEN 99
87 88
21
Diagram: pareto front cluster GEN 99
33
Graph: The Parallel Coordinate Plot and distribution of pareto front in evolution process.
Graph: K-Mens clustering revealing
four clusters
FC3 Survey Compatibility was calculated similarly to Experiment 1. It was carried out by checking the output of the algorithm against the survey results and by assigning a score to the output according to its compatibility. The calculation of this compatibility score was twofold. The first score was regarding the indispensable space in the apartment, the balcony and the study space. An individual that had none of these spaces was assigned a score of 1. An individual with only a study space gained a score of 2, one with only a balcony received a score of 3, and an individual with both study space and a balcony was assigned a score of 4. The second value was regarding the multifunctional spaces. It was calculated by checking the multifunctional space types of the individuals against the survey results. If the individual included a studio, it received a score of 1. If the bedroom was a separate space, it received a score of 2. And finally,
As can be observed on the Parallel Coordinate Plot graph, FC1 Minimise Floor Area and FC2 Maximise Compactness worked together and were not contradictory. FC3 Survey Compatibility on the other hand was conflicting with the first two as expected. However, there is a high convergence around a certain low fitness value, which is reducing the variation in the final Pareto front individuals. This phenomenon is also apparent in the Standard Deviation graph for FC3. The reason behind this peculiarity is due to a remapping issue while calculating this fitness value.
However, when comparing the best individual of each fitness criteria with the Pareto front individuals, the simulation appears to have optimised. They all have secondary spaces and are not studios, as determined by FC3, while the layouts appear to be rather small and compact. Nevertheless, individuals performing well for FC3 Survey Compatibility seem to have dominated the gene pool, as proven also by the PCP and SD graphs. The output of the optimisation is still branching-out, non-compact layouts. Furthermore, given that these individuals were designed and generated independently from the rooftop where they would eventually be placed, these plans do not satisfy the expectations of this experiment and could not be transferred as input into the next stage of the research.
119 89 90
IND 15
IND
IND
IND
2 85
individual in FC2
IND
individual
FC3
GEN 91
0 82 83 84 Diagram: average of fitness ranks GEN 43 IND 2 Diagram:The best performance
in
GEN 3 IND 14
individual
89 90
in FC1 GEN 6 IND 20 81
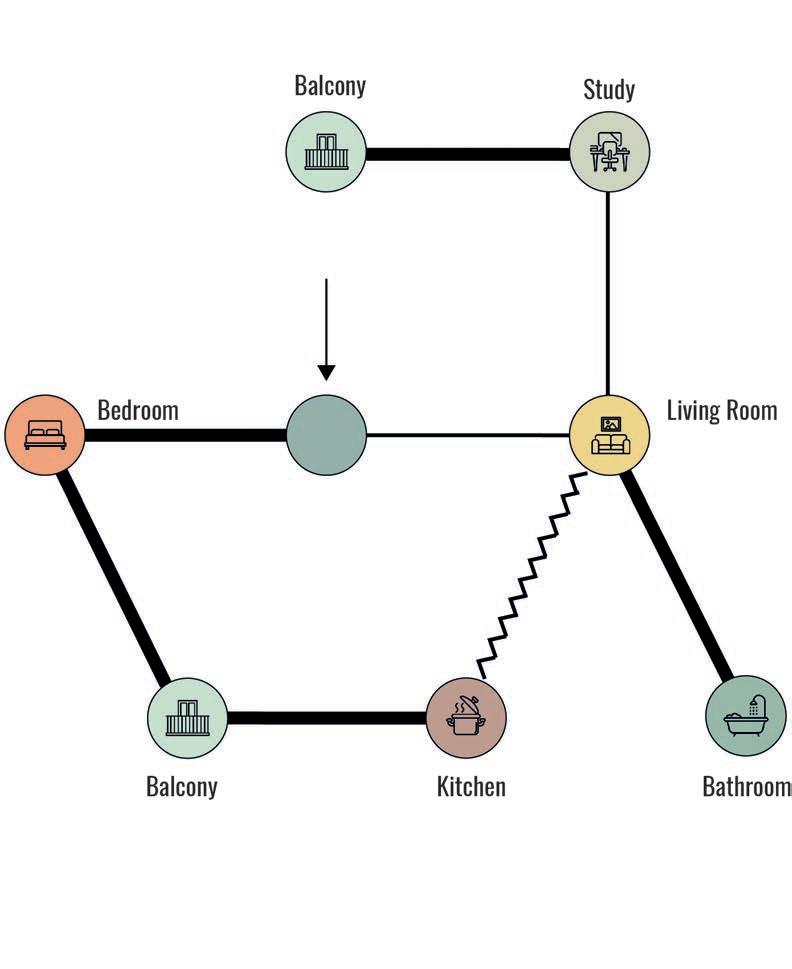
CONCLUSION
Given that the outputs of Experiment 2 did not fulfil the requirements for the rooftop vertical expansion project and needed further investigation, topological experiments were concluded at this stage. For the morphological experiments, a topological network from the first level of hierarchy generated during Experiment 2 was selected for further development. This network graph had all of the primary and secondary spaces, as well as containing all three link types, which made it the most suitable network for morphological explorations. This circular network was translated into the second level of hierarchy by positioning the nodes in 2D locations. The way this network was laid out also would ensure that the morphological explorations would output a great variety of kit-of-parts.
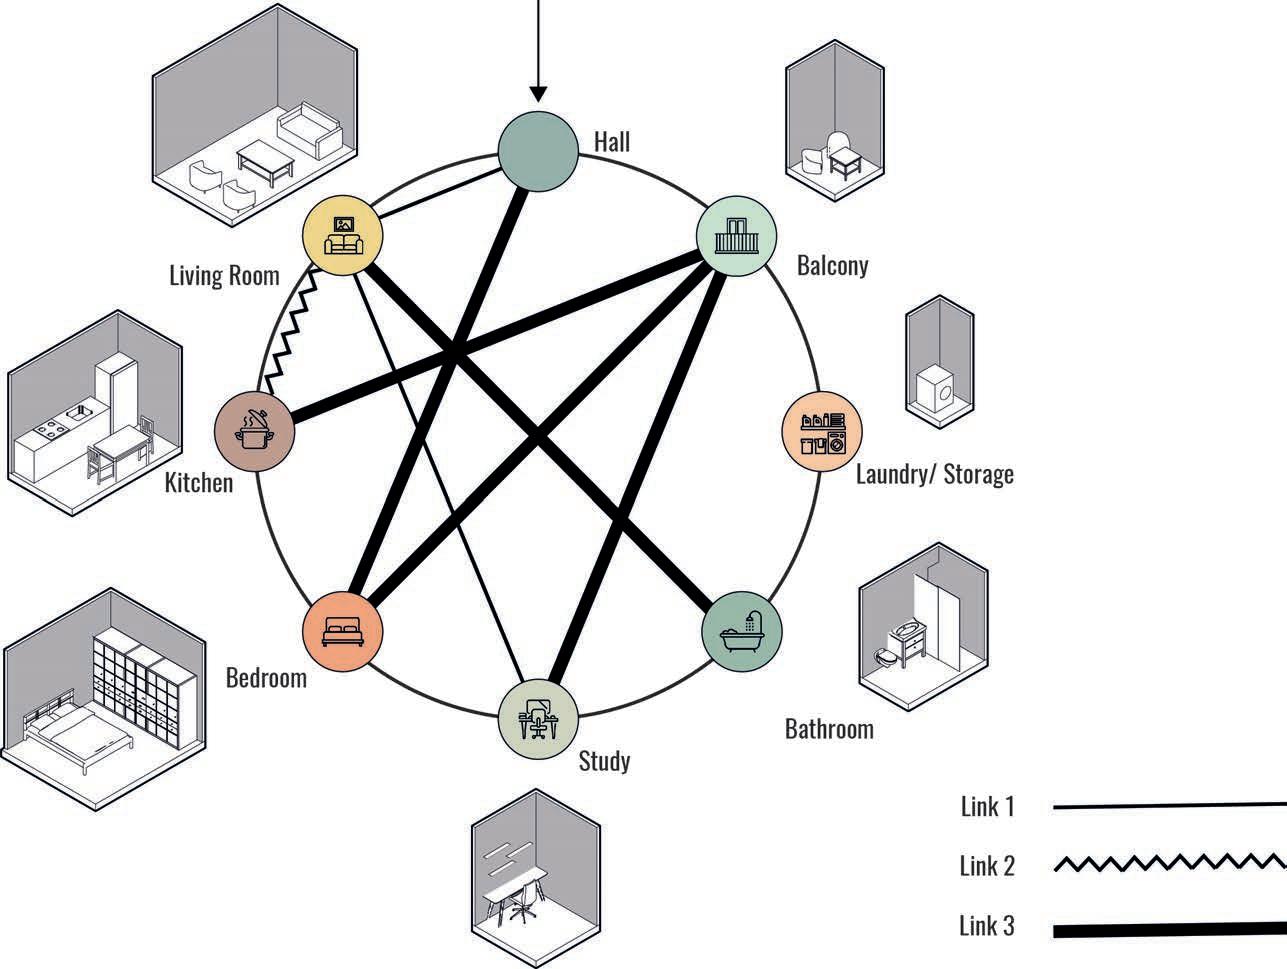
To test the hypothesis of combining a modular design approach with site specificity, this exact same topological network was applied to four different implementation sites, generating four different floor plans by aggregating the functional spaces presented in the catalogue. At this stage, a second floor was added to the layout of two of the rooftop expansions, to introduce more variation to the output of the morphological studies. However, the topological relationships and the dimensions of the spaces were not altered.
121
92
chosen topological relationship in relationship to space requierments Diagram: chosen topological relationship
91
Diagram:
91 92
SITE187A
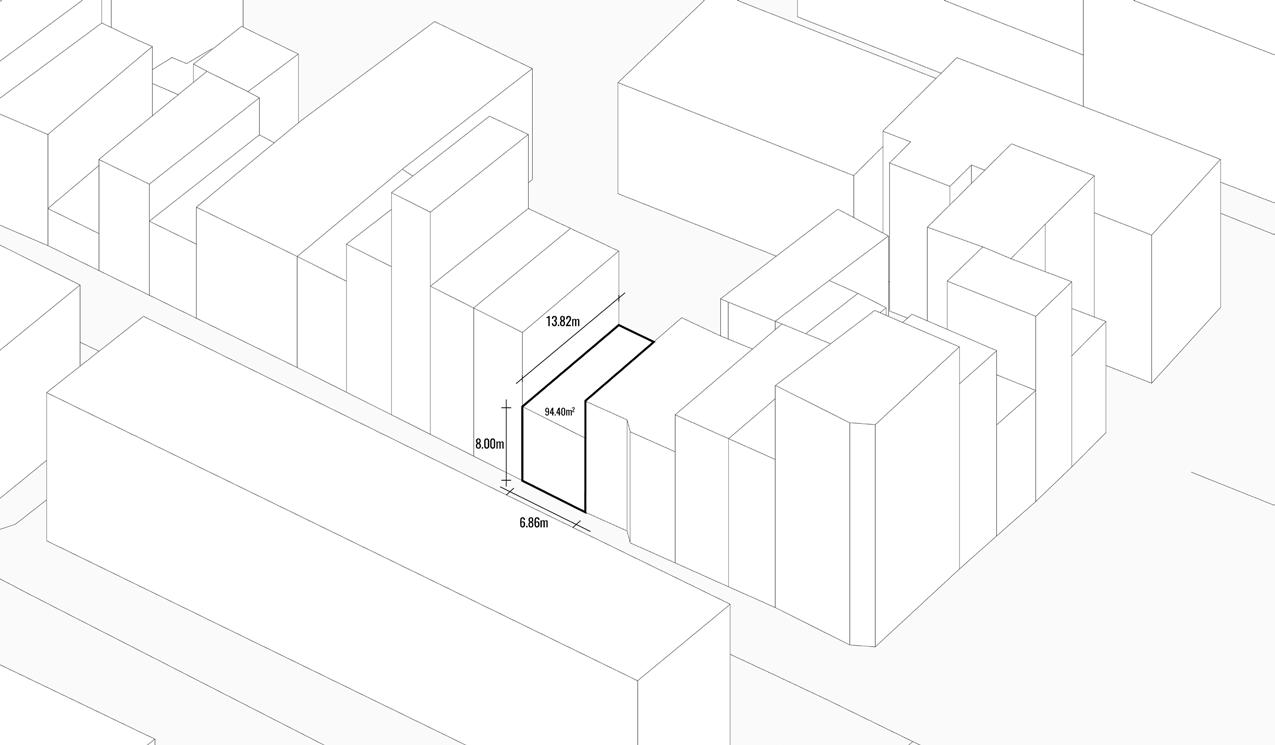
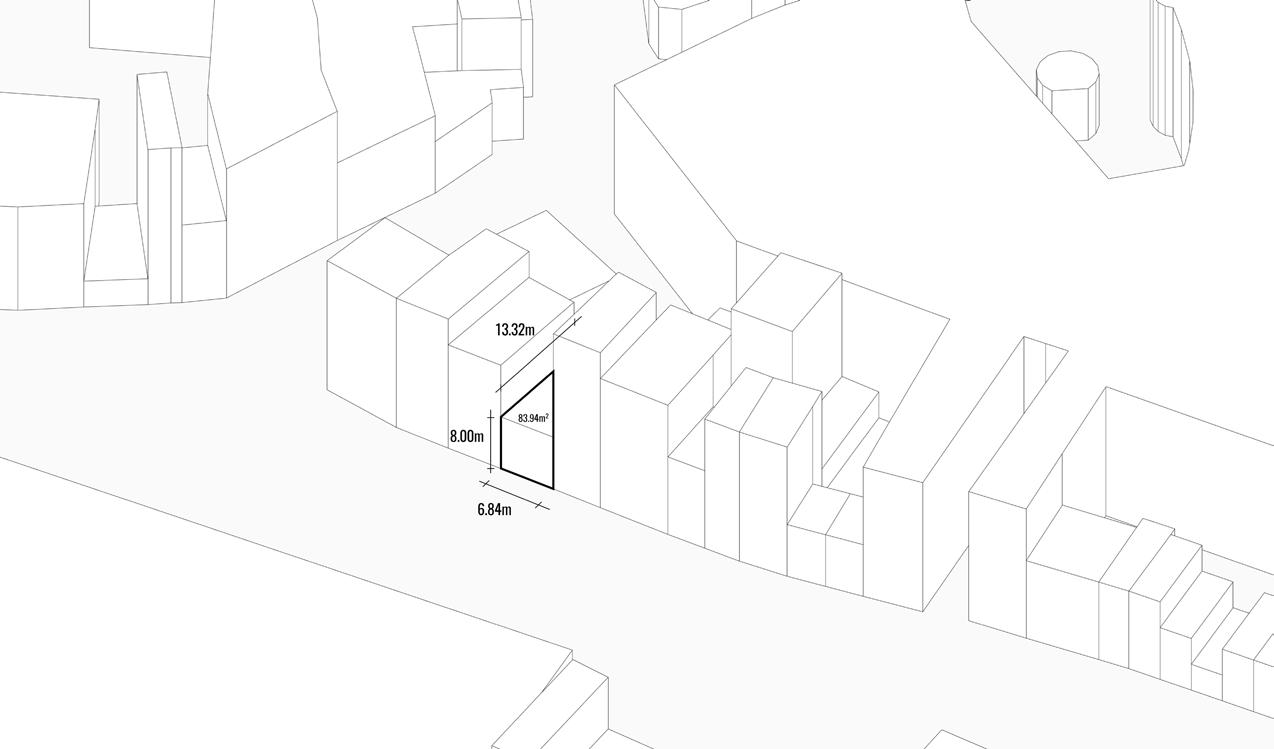
SITE4 Malvern Terrace, London N1 1HR
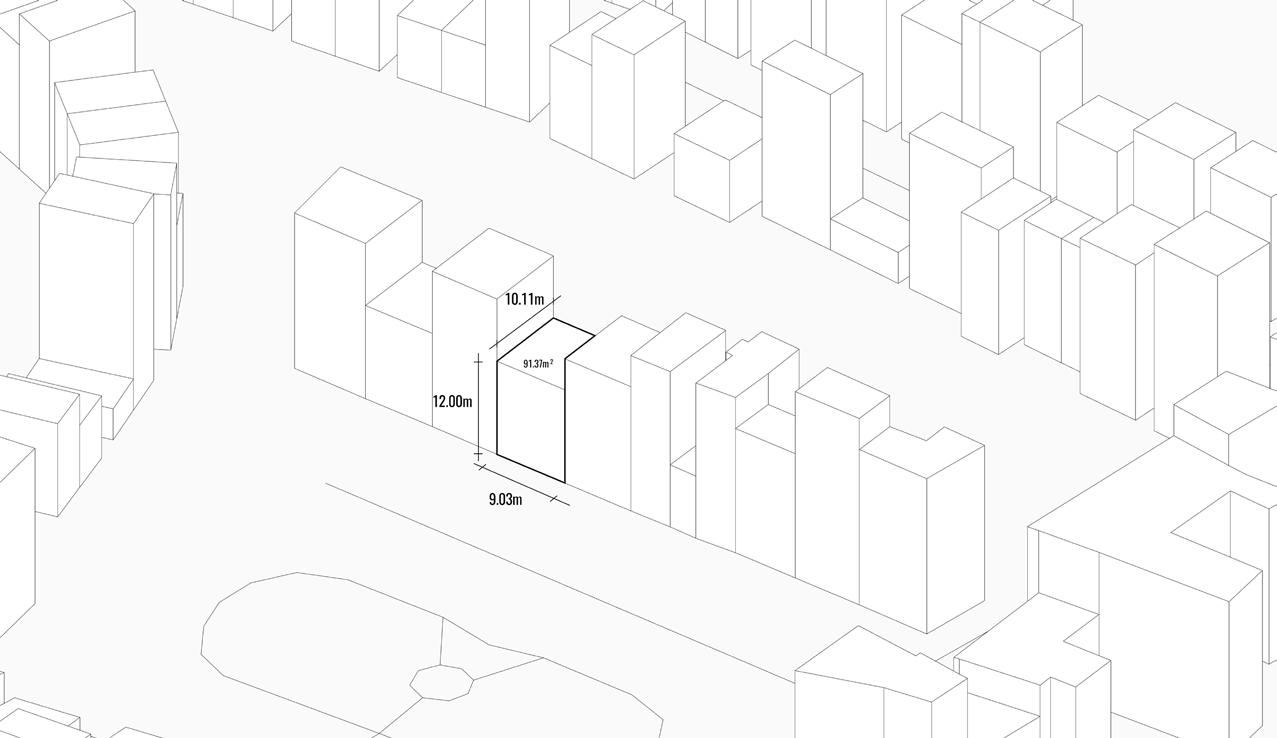
SITE137 Essex Road, N12NR, Islington
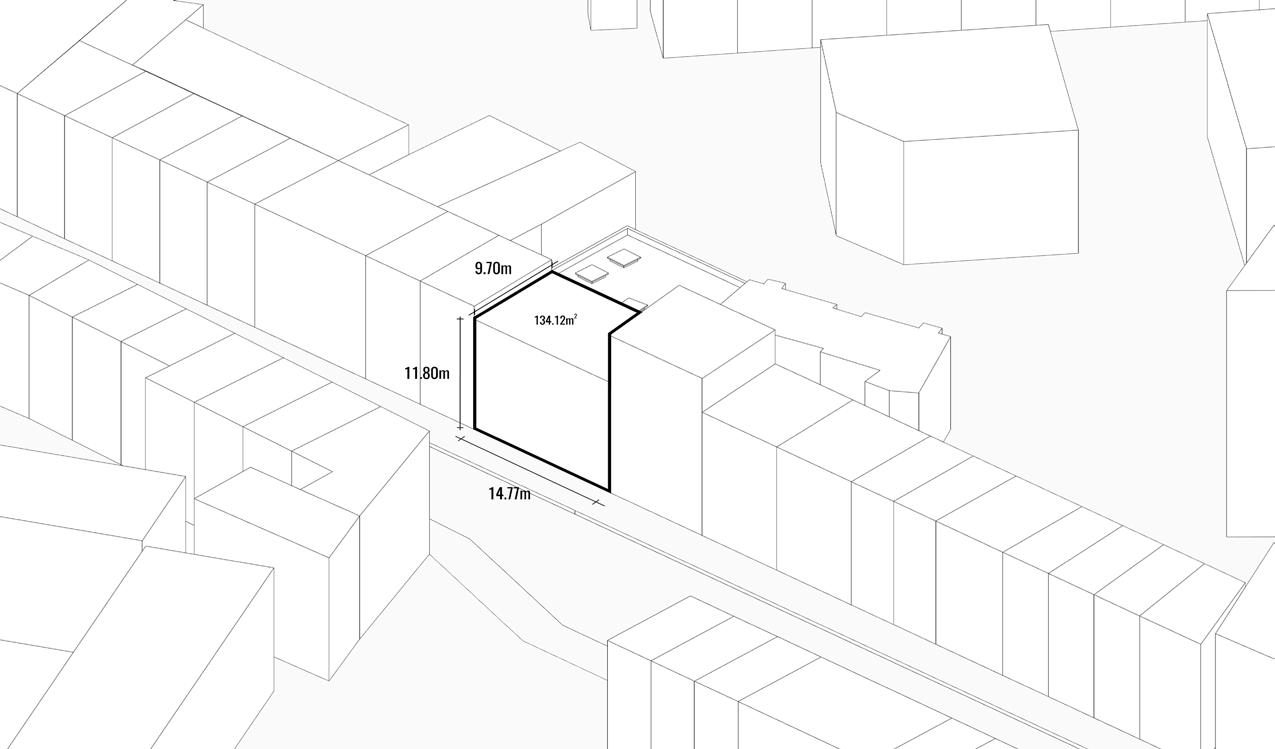
123
Caledonian Rd,
0SL
London N1
Upper St,
SITE12
London N1 0PQ
93 94 95 96
Diagram: site selection 4 Malvern
1HR
Diagram: site selection 137 Essex
Diagram: One of the options for the site A, reflecting on the explosion and the plan.
Diagram: One of the options for the site B, reflecting on the explosion and the plan.
Diagram: One of the options for the site C, reflecting on the explosion and the plan.
Diagram: One of the options for the site D, reflecting on the explosion and the plan.

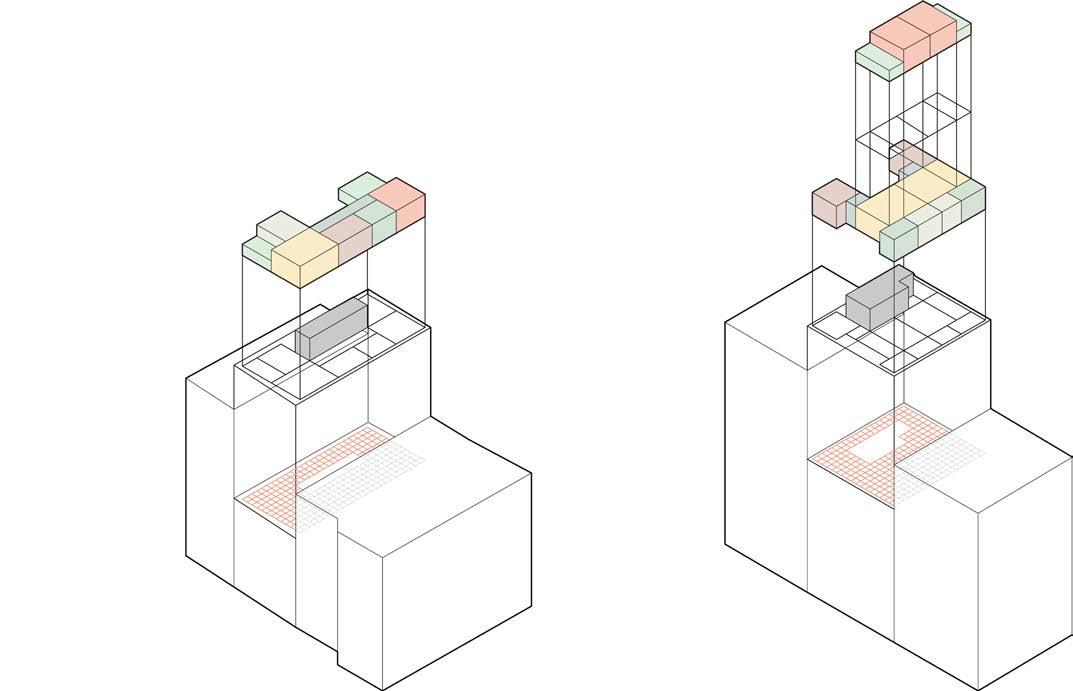
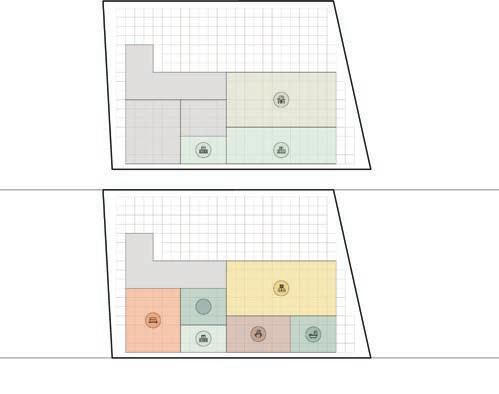
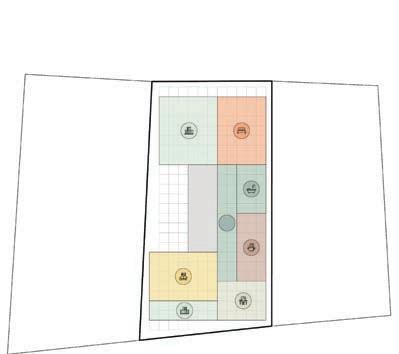

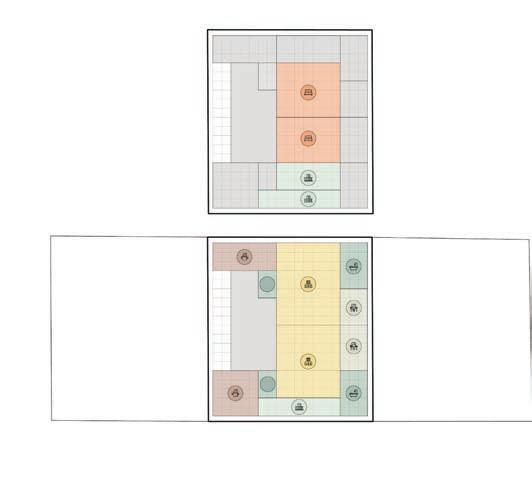
125
98 99 100
97 96
Road, N12NR, Islington 95
Terrace,
London
93
site selection 187A Caledonian Rd, London N1 0SL 97 98 99 100
DEVELOPMENT 04_7
London N1
94 Diagram: site selection 12 Upper St,
N1 0PQ
Diagram:
MORPHOLOGY
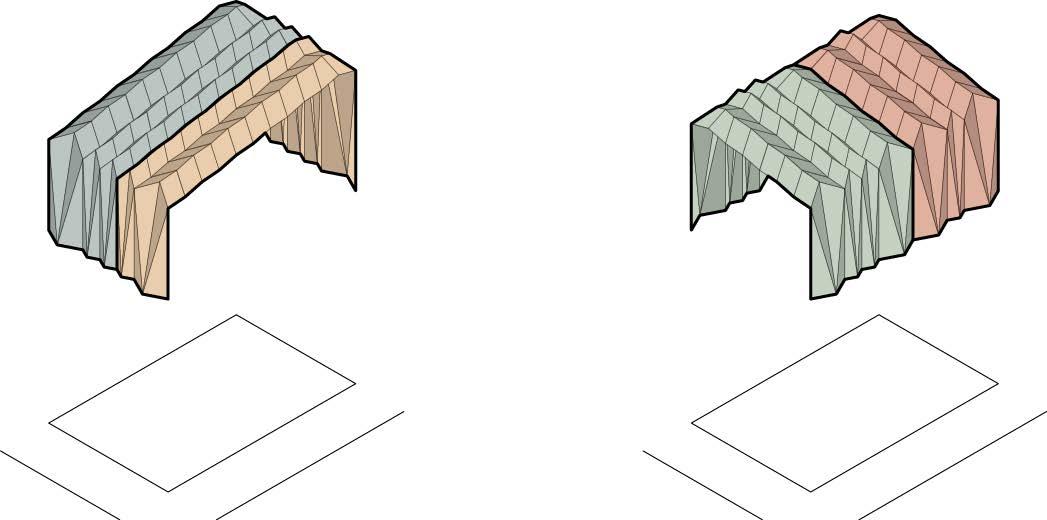
MORPHOLOGICAL EXPERIMENT
For every functional space designed in the previous stage and presented in the catalogue, a series of envelopes are designed. These envelopes have various types. First, the orientation of the envelope is determined. Given that the plans of all functional spaces are rectangles, the envelope could be generated in four different directions. The direction of the envelope also determines which type or combination of types of parts will be used for the front wall, roof, and back wall of this envelope. (Figure 101) Four archetypes of deployable parts were designed, each of which combine folds that span 100 cm and 50 cm, to fit different dimensions. Types A, B, C and D span 1.50 m, 2.00 m, 2.50 m and 3.00 m respectively. Through their combinations, envelopes can be generated for all possible rectangular plans. (Figure 102)
Second, one of three types of envelopes is selected for the particular space. These types are determined according to the topological links that space has with other spaces in the layout. Each of the four edges of the rectangular plan of the functional space in question is indexed with either 0 or 1, depending on if they are connected to another space through that edge or not. For instance, if the plan of a space is connected to two other spaces through its right and left edges, its edges are number 1, 0, 1, 0. If the back edge is also connected to another space, the edge numbers become 1, 1, 1, 0 etc. After selecting the direction of the envelope and placing it on the rectangular plan, the walls are checked against their corresponding edge indices. If the flat side walls correspond to the edges with connections to other spaces, the envelope remains unchanged. If there is a deployable wall that corresponds to an edge with connection, then that deployable wall is replaced with a flat wall and the morphology of the deployable roof is also altered accordingly. As the outcome of this process, three different types of shells are generated: Type 1 with deployable front and back walls, and flat side walls, Type 2 with a deployable front wall and flat side and back walls, and finally Type 3 with four flat walls. All three types have different roof morphologies accompanying the walls. (Figure 103)
In the final stage, the edges of the rectangular plan are once again indexed according to their connections to other spaces and their possibility for openings. A wall that is neither connected nor has the possibility for openings is indexed 0. This is the case for walls that are very close to and face the high side walls of the adjacent buildings for example. Additionally, a side that is not connected to any other space but does have the possibility for openings is indexed 1. This would be a wall facing any other direction and would have openings. Next, an edge that is connected to another space and does not have the possibility for openings is indexed 2. This would be the case if the connecting edges of the two spaces are similar in length, and it would mean that the side walls are replaced with an interior frame. And finally, an edge that is connected to another space and also has the possibility to have openings is indexed 3. In this case, the edge of this space would be longer than the edge it is connected to, and therefore would incorporate both an interior frame at the intersection and an exterior wall at the part that is extending. Thus, the layout of the house and the links between the spaces determine greatly the morphology of the space. (Figure 104)
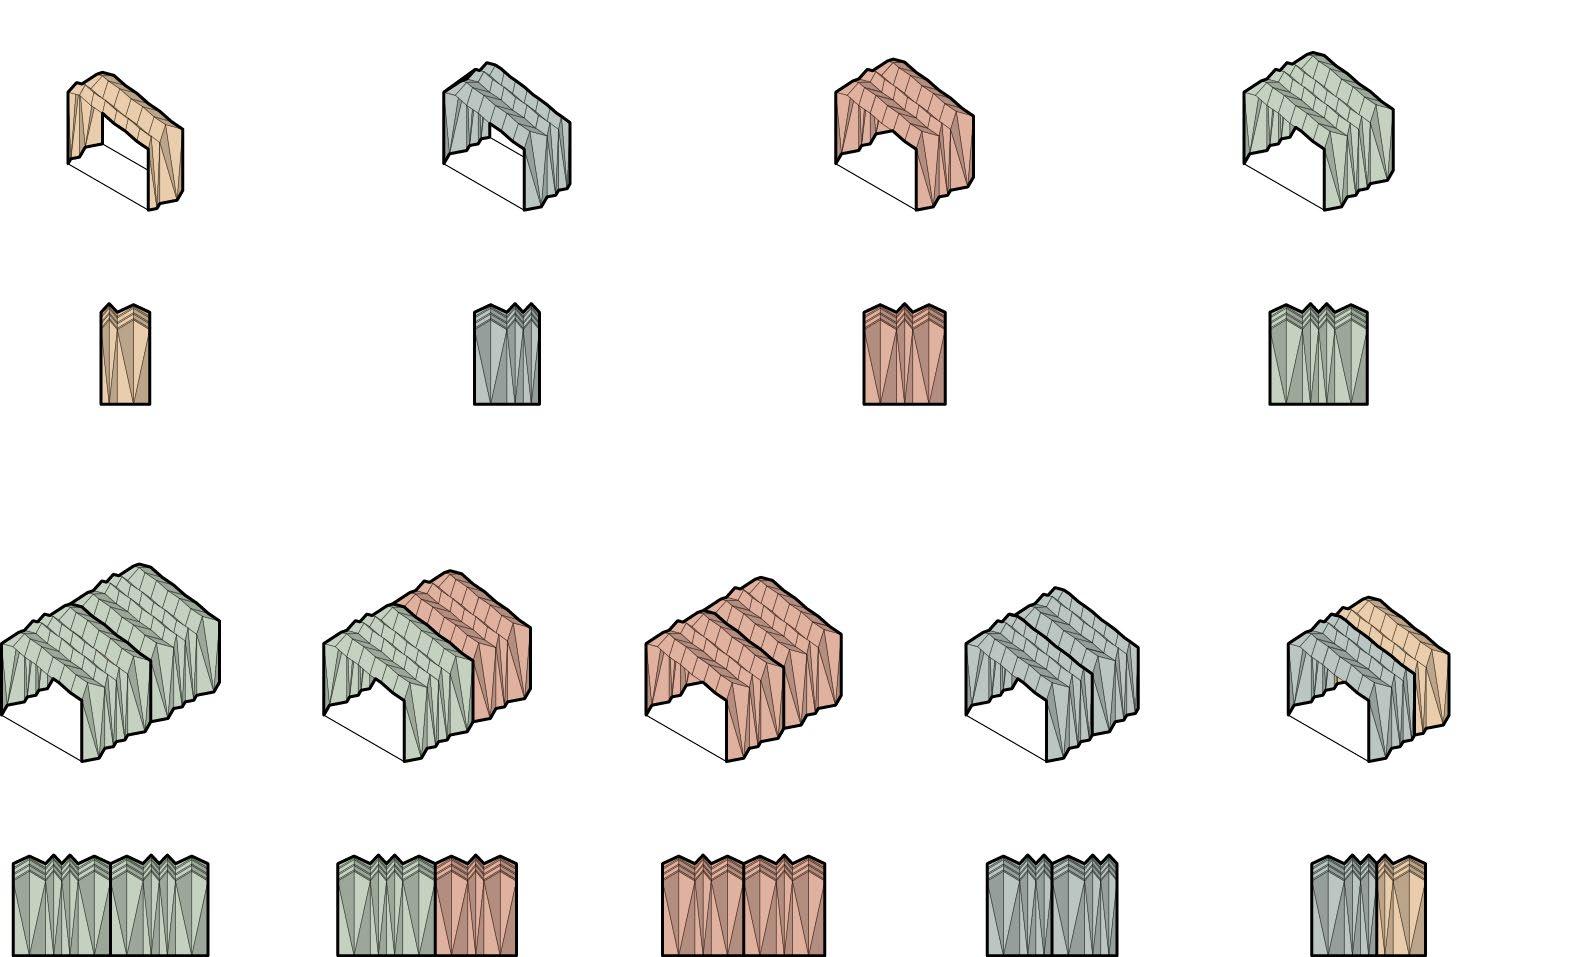
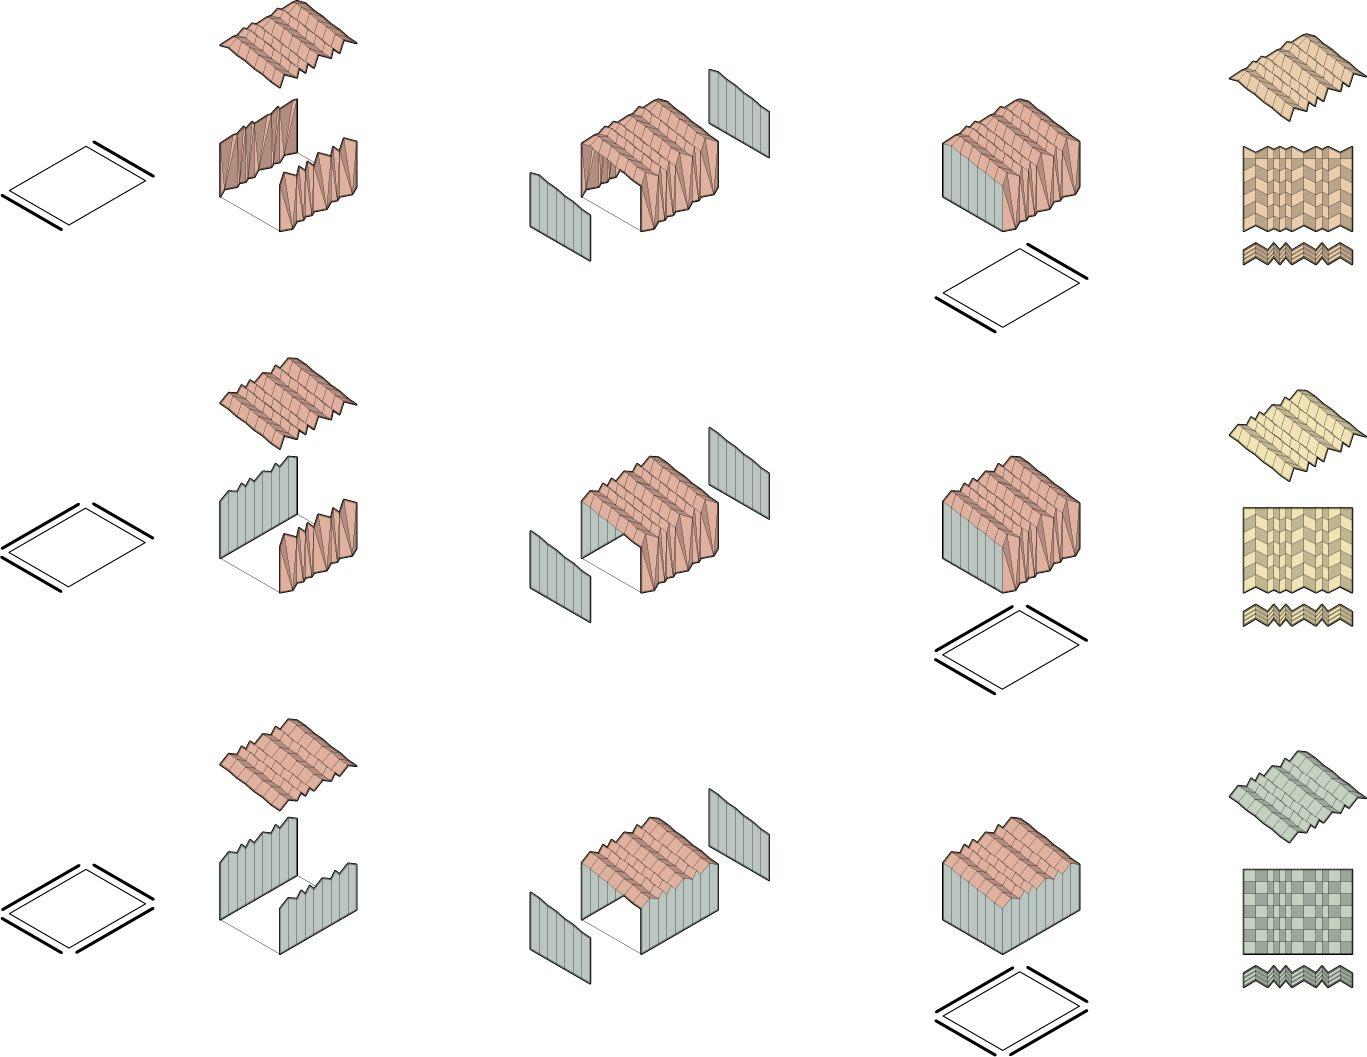
127
The affect of the orientation of the envelope on the morphology
Types 1, 2 and 3 of envelopes and roofs according to the edge conditions
The four types of parts used to generate all 9 envelopes
Diagram:
101 102 103 Diagram:
Diagram:
101 102 103
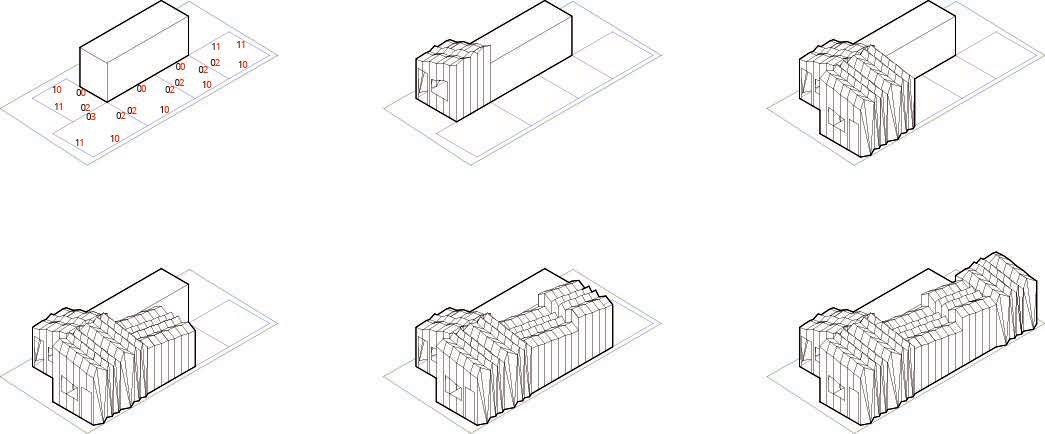
To optimise the morphology of the houses, a multi-objective optimisation was carried out, using the plans generated for the four different implementation sites. Due to limits of time and computational power, the morphologies on the four sites were optimised with the same simulation, and not four simultaneous simulations.
Three gene sets were used to determine the output morphology and its performance. Three fitness criteria were set to measure the performance of an individual. FC1 Minimise Shadow on Context ensured to minimise the shadow cast on the building’s environment. Shadow created on street level is one of the main issues of rooftop expansions and minimising this was determined to be one of the main design ambitions of this study. This was calculated by using the environmental analysis software Ladybug. A grid of points was generated on the street level, and sun vectors derived from Ladybug were projected towards this grid. The morphology was used as a barrier to the sun rays, so the sun vectors could hit the grid unless they were not blocked by the new rooftop expansion. The number of hits these vectors had on the grid of points on the building floor was calculated and added together. The fitness value was calculated as the higher the number of hits, the better the performance of the building.
FC2 Maximise Sunlight Gain intended to maximise the sunlight that would enter the new rooftop expansions. Given that the deployable shell morphologies that were developed in this study are also structural shells, the number of openings that can be made on them is limited. For the deployable roof, the openings are only placed on panels that are larger than 50x50cm and are never placed side by side or at the edges, given that this would compromise the structural performance of the shell. The amount of sunlight entering the house was calculated by using again the environmental analysis software Ladybug, in a similar way to FC1. A grid of points was generated on the floors of the houses, and sun vectors derived from Ladybug were projected towards this grid. The building envelope would act as a barrier to the sun rays, so the sun vectors could only enter the building through the openings on the roof and the walls. The
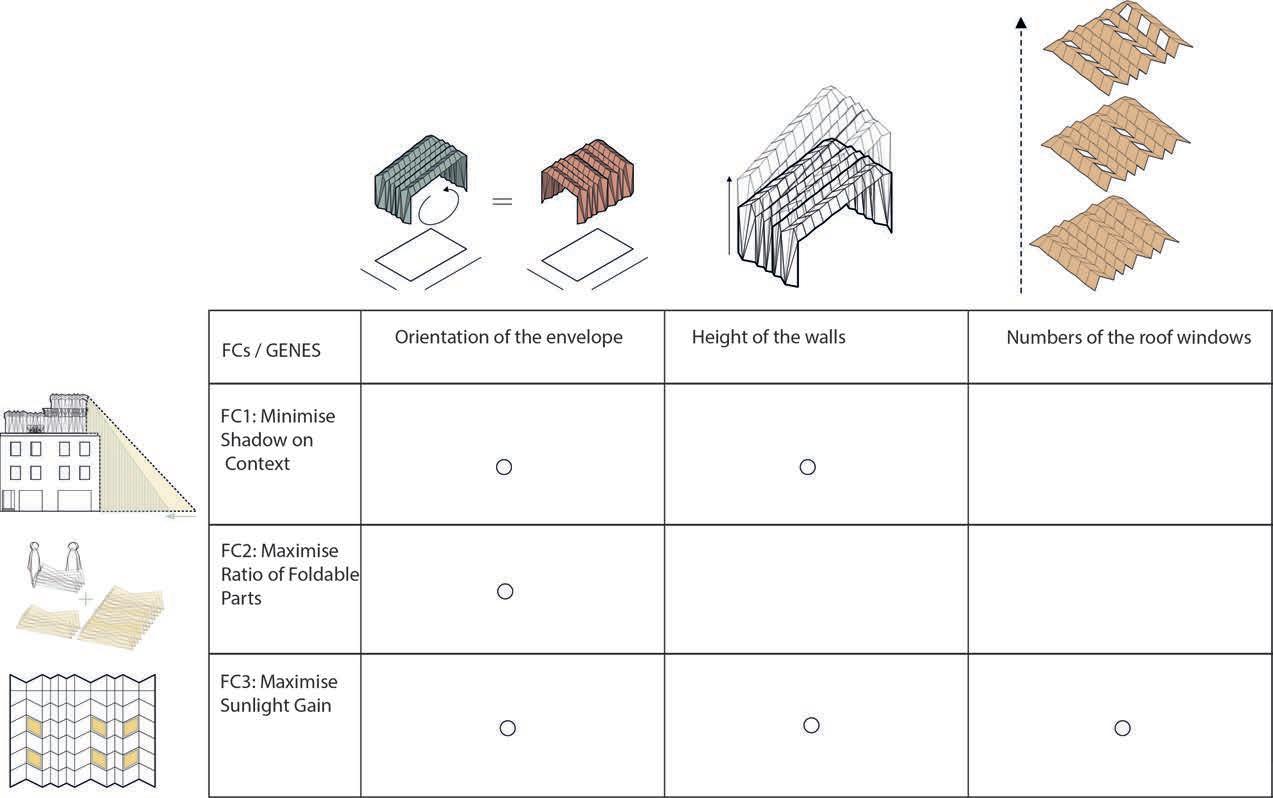
number of hits these vectors had on the grid of points on the building floor was calculated and added together. The fitness value was calculated as the higher the number of hits, the better the performance of the building.
Finally, FC3 Maximise Ratio of Foldable Parts was intended to maximise the ratio of deployable parts in the entire kit-of-parts that make up the morphology. Given that according to the connections between spaces and the edge indices of the plans, deployable walls are sometimes replaced with flat walls. This alters the ratio and affects the kit-of-parts constituting the house, their manufacturing, transportation and assembly. Although it was determined that the kit would be a combination of deployable and flat panels, maximising the ratio of deployable parts was crucial. This fitness value was calculated by counting the number of deployable wall and roof parts and dividing it by the total number of parts. The criteria was established as the higher this value, the better the building’s performance.
The first set of genes controlled the orientation of the envelope for every space. As explained above, the envelope primitive consists of two deployable front and back walls, a deployable roof, and two flat side walls. And the two lists of edge indices determine how this primitive envelope is altered morphologically. Thus, when the envelope is rotated, the types of walls corresponding to each edge change and therefore the morphology is further altered. This gene group affected all three fitness criteria, given that this level of morphological alteration would affect the shadow cast by the morphology, the number of deployable parts, and the sunlight entering the building.
The second set of genes affected the height of each envelope. This gene affected FC1 and FC2, given that the height of an envelope changes the shadow it casts and the amount of light it lets through, but it does not alter the number of foldable or flat parts in an envelope.
The third gene set influenced the number of openings on the roofs of each envelope. This gene only affected FC2, the amount of sunlight that enters the building, since it only altered the number of openings on the deployable roof.
129
The relations between three fitness criteria and three groups of genes in evolution process Diagram: The morphology generation sequence on the site.
104 105 Diagram:
105 104
106
Diagram: The Parallel Coordinate Plot in evolution process.
107
Graph: K-Mens clustering revealing four clusters
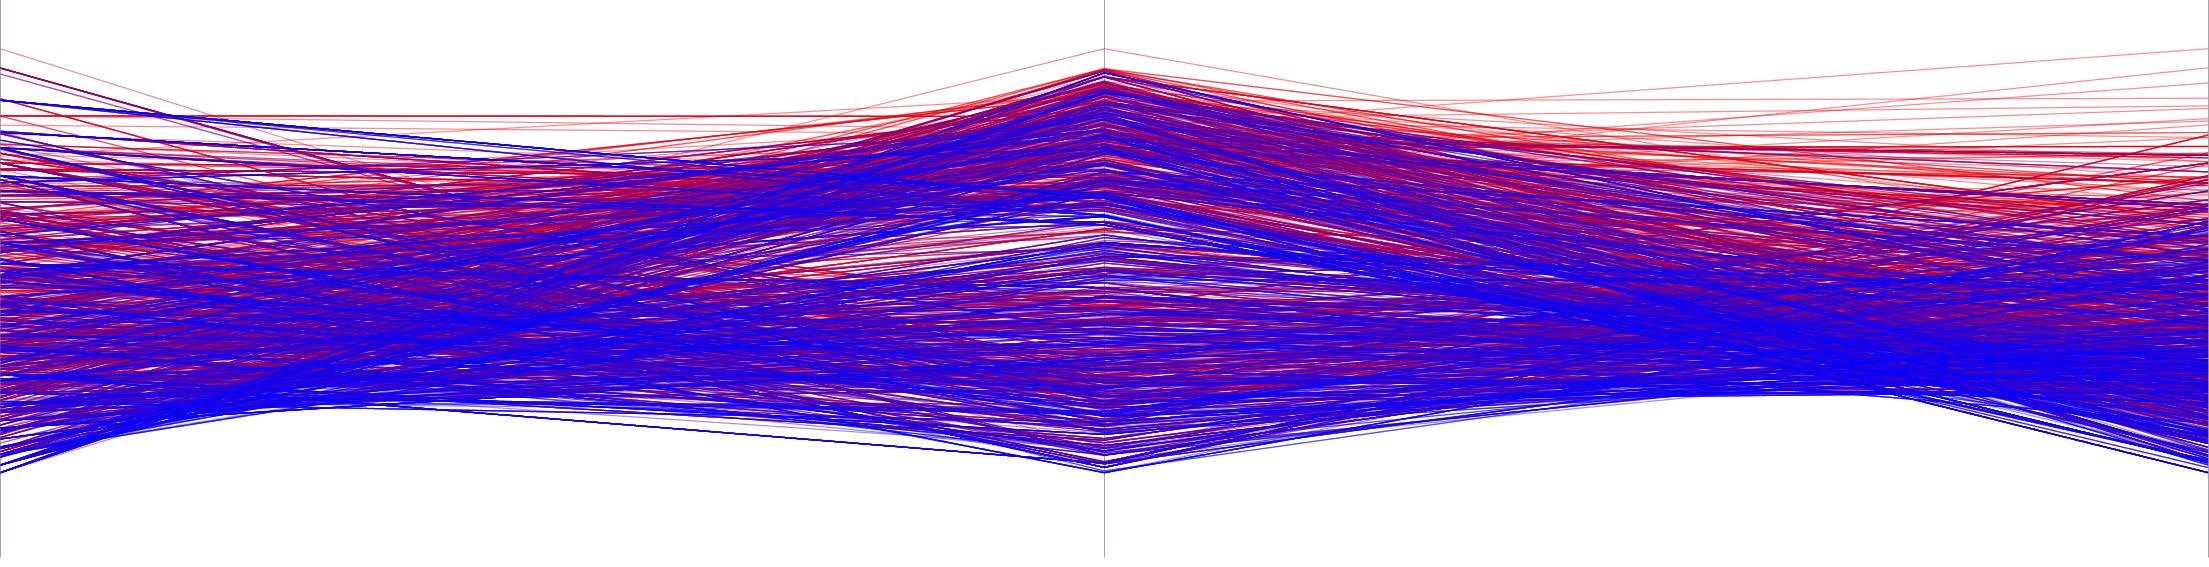
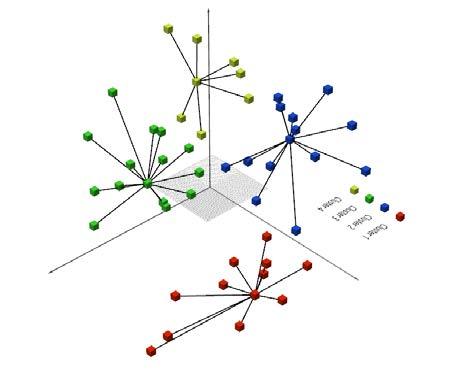
MULTI-OBJECTIVE OPTIMISATION
For this optimisation operation, 50 generations of 50 individuals were generated. After running the simulation, it was observed that there were 159 Pareto front individuals throughout the entire population, and 50 Pareto front individuals in the last generation. These individuals were grouped into four main clusters using a K-Means clustering. The first individual of each cluster was exported as an optimally performing Pareto front individual.
As can be observed on the Parallel Coordinate Plot graph, FC1 Minimise Shadow on Context and FC3 Maximise Ratio of Foldable Parts worked together and were not contradictory. However, FC2 Maximise Sunlight Gain was conflicting with the first two. The reasons behind this phenomenon are twofold. Firstly, the morphologies can gain more sunlight if they are higher but then they would cast more shadow on the context. Furthermore, flat walls offer larger openings than deployable walls, thus the genes rotating the envelopes favour FC2 Maximise Sunlight Gain when they generate an envelope with more flat walls, while favouring FC3 Maximise Ratio of Foldable parts when they output envelopes with more deployable walls. In addition, the Standard Deviation graphs of FC1 and FC2 demonstrate that individuals maintained a certain degree of variation when optimising while they converged more regarding
their performance of FC3. The analysis of the PCP and SD graphs demonstrate that the set-up of this experiment was successful in how the fitness criteria were established and calculated.
When, comparing the best individual of each fitness criteria with the Pareto front individuals, the simulation appears to have optimised. The phenotypes of the four Pareto front clusters all have a high number of openings to let in sunlight as enforced by FC2 Maximise Sunlight Gain. Moreover, a high ratio of deployable parts is observed, enforced by FC3 Maximise Ratio of Foldable Parts. And finally, the roof slope direction and the positioning of the tilted deployable walls of the phenotypes appear to favour a smaller amount of shadow cast on the street level, which was ensured by FC1 Minimise Shadow on Context.
Based on the analysis, it was concluded that this morphological optimisation experiment was successful. However, the optimisation simulation could be improved by running separate simulations for each site, simultaneously. Although optimising four sites at once through a single algorithm does not appear to have affected the phenotypes in a dramatic way, it is possible that the high performance of one morphology affected the outcome and made it possible for other morphologies with lower performances register as optimised individuals. Given that the layout of each primitive was different, optimising each site separately would yield more accurate results and thus fully explore the solution space.
131
106 106
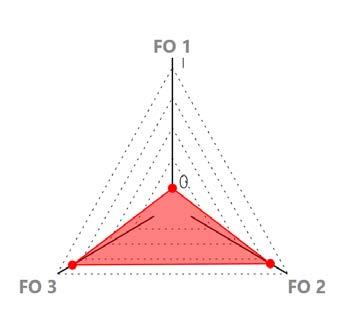
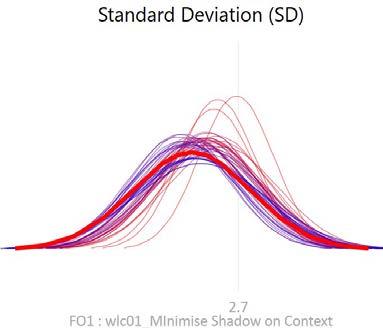
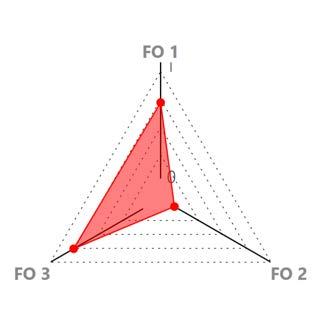
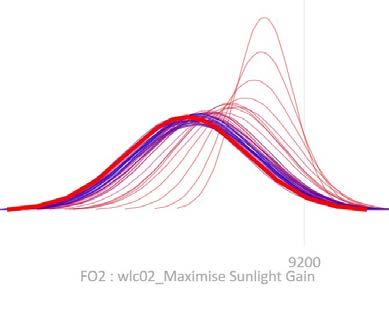
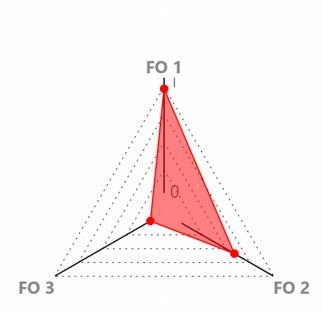
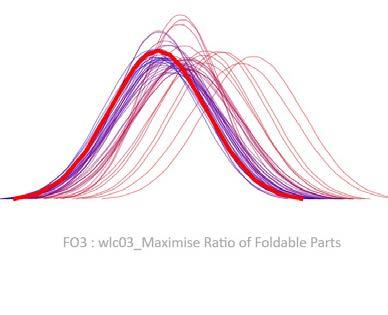
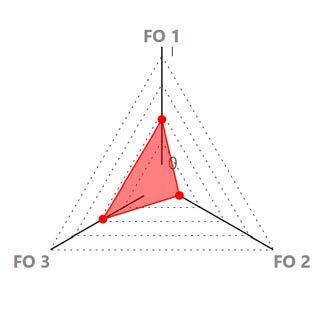
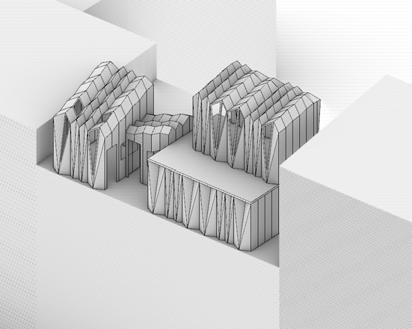
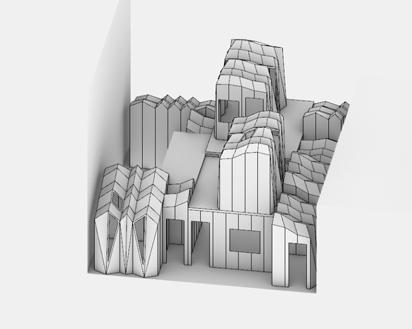
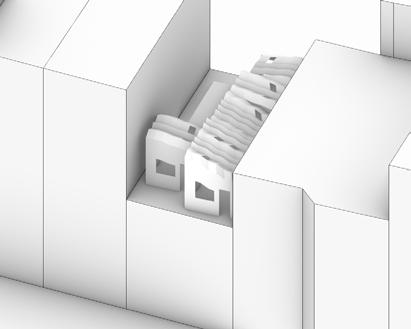
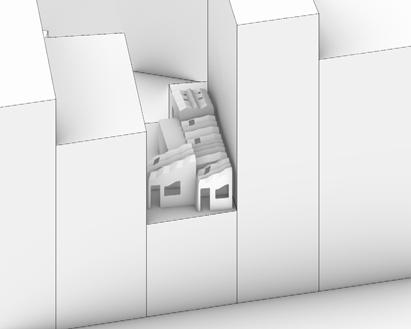
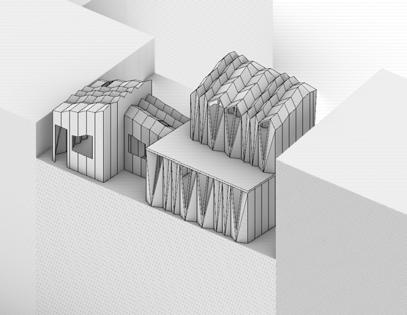
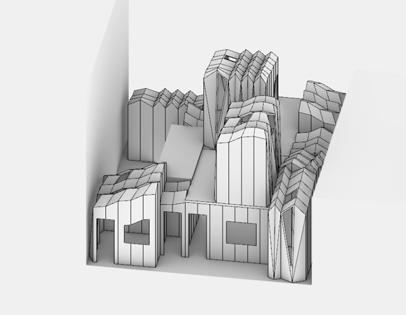
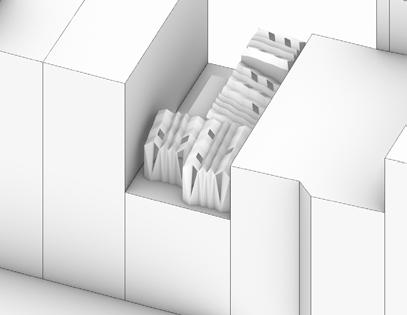
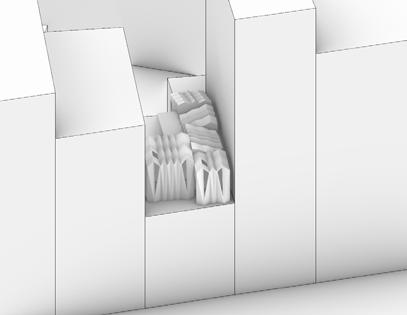
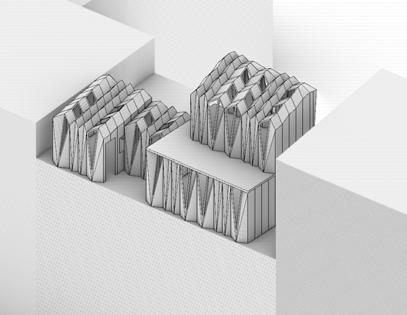
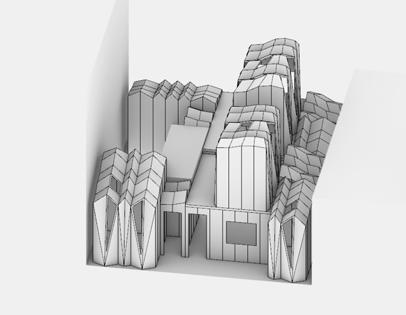
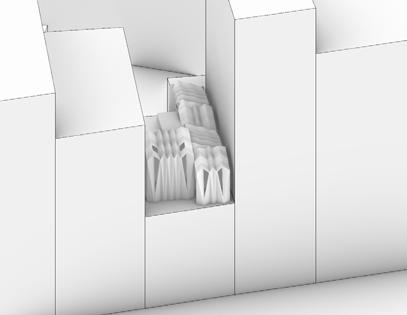
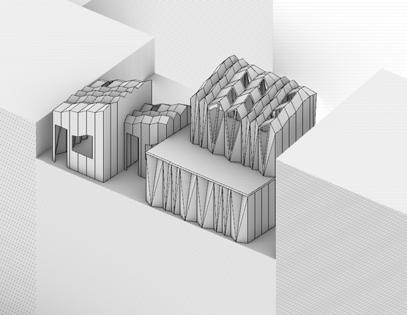
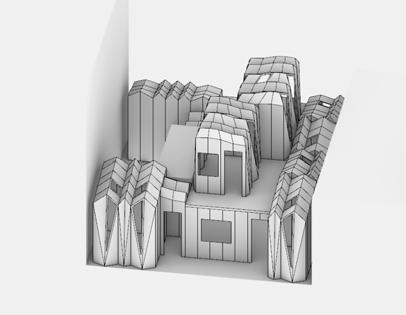
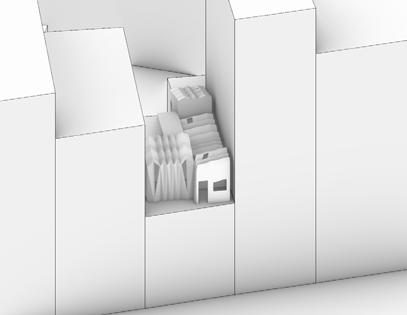
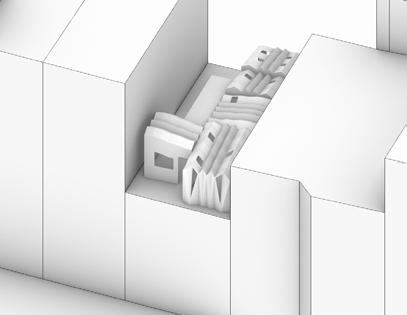
133 Diagram: The best performance individual in FC2 GEN 43 IND 1 109 110 111 Diagram: average of fitness ranks GEN 49 IND 14 Diagram: The best performance individual in FC3 GEN 39 IND 4 Diagram: The best performance individual in FC1 GEN 30 IND 0 108 108 109 110 111
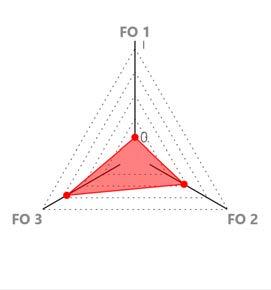
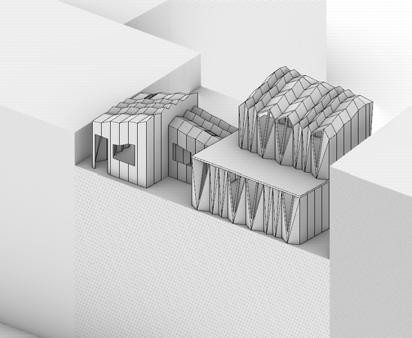
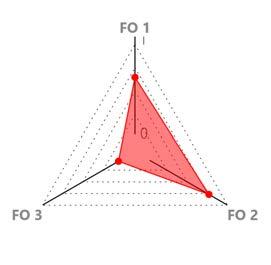
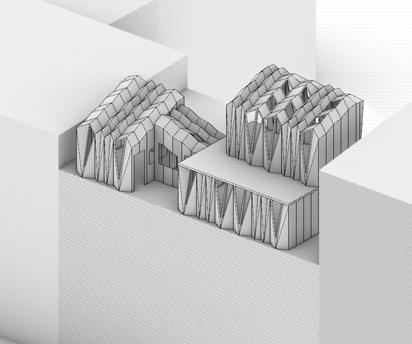
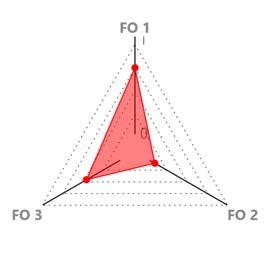
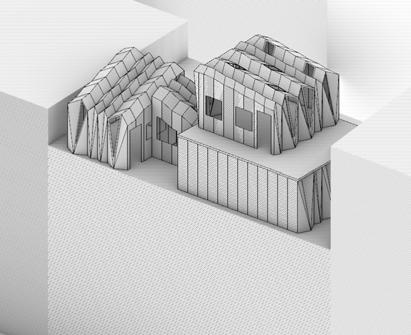
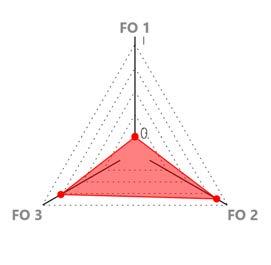
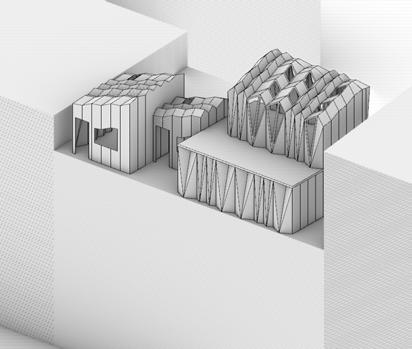
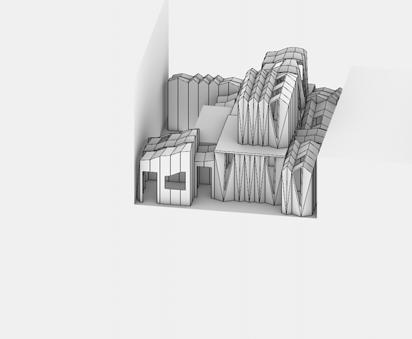
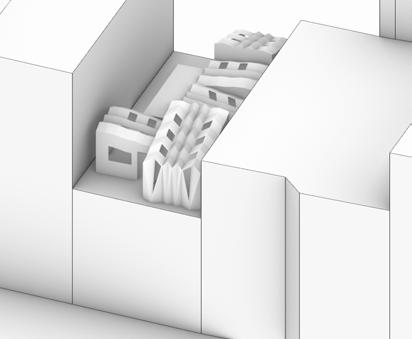
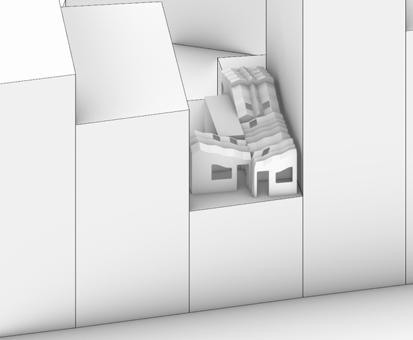
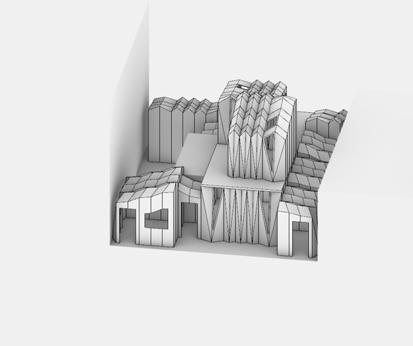
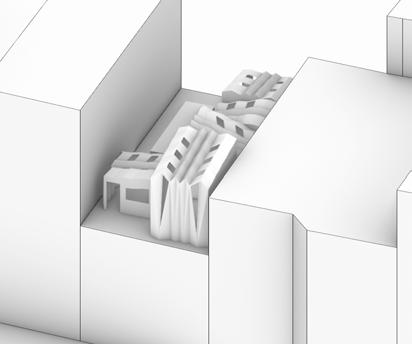
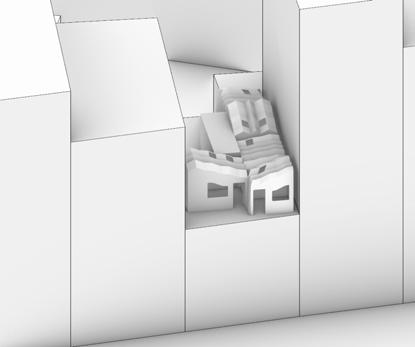
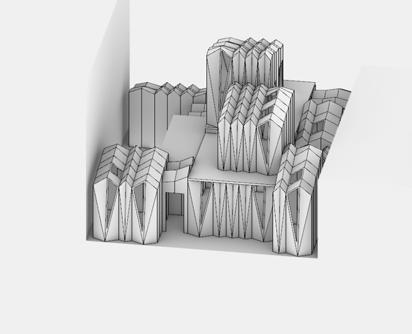
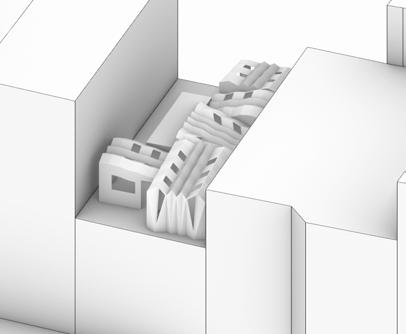
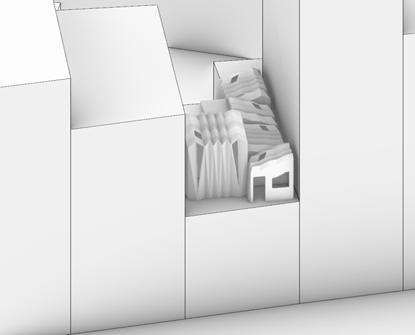
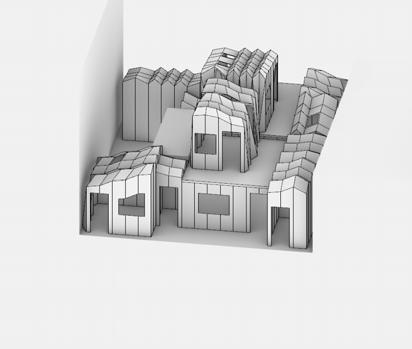
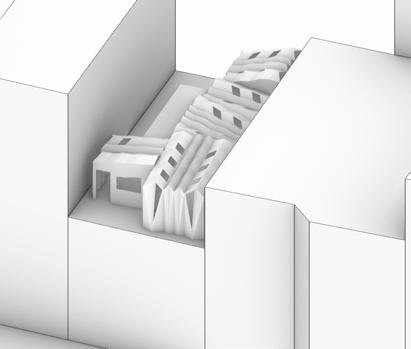
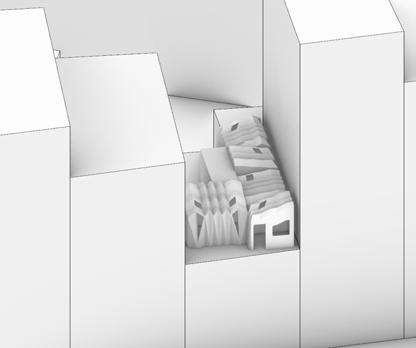
135
Pareto Front Cluster 1 GEN 49 IND 36
Pareto Front Cluster 2 GEN 49 IND 39
Pareto Front Cluster 3 GEN 49 IND 46
Pareto Front Cluster 4 GEN 49 IND 49
GEN
113 114 115
Diagram: Pareto Front Cluster 2
49 IND 39
49
Diagram: Pareto Front Cluster 4 GEN 49 IND
Diagram:Pareto Front Cluster 3
GEN
49 IND 46
GEN 49 IND
112 112 113 114 115
Diagram: Pareto Front Cluster 1
36
Simultaneously with the development of the morphology and the related optimisation experiment, a catalogue of kit-of-parts was developed. These parts were designed according to the 50x50 cm grid that was used in the development of the plans and the morphology. However, they were also developed considering size limitations due to the nature of the project.
The kit-of-parts consists of two groups, external and internal. The external parts are the structural flat and deployable panels with large dimensions that will therefore be hoisted to the rooftops with a crane. The internal parts on the other hand are interior frames and connections, that will be manually carried up through the staircases of the existing buildings. These parts were designed to not exceed 220 cm in size, given that this was calculated as the largest dimension that could be carried through an average staircase. The staircase size limitation was particularly enforced on the designs in order to cut down on the construction cost and reduce transportation time.
The set of external kit-of-parts consists of 200 individual pieces. These parts are grouped into eight main sets: deployable walls, flat wall panels, deployable roofs, wall bases, railings, doors and windows, internal staircase, and loft floor.
The deployable walls and the deployable roofs have four main archetypes, based on their dimension along the X-axis: types A, B, C and D. The roofs with these four main types have 10 different dimensions ranging between 1.5 – 6 m and 3 different opening conditions. The four types of deployable walls have 2 different options, one with a flat upper edge and the other with an elongated upper edge. They have two height options, 2.2 m and 2.4 m.
The side walls in this set of the kit-of-parts were designed as flat and undeployable panels due to three main reasons. First of all, connecting a deployable wall with a Yoshimura pattern with the side edge of the deployable roof with a Miura-Ori pattern presented significant geometrical difficulties and could not be generated with developable flat surfaces. The second reason was to avoid losing space within the apartment due to the high structural depth required for the deployable walls. In this kit-of-parts, the deployable walls have a structural depth of 25 cm, excluding the thickness of the material and insulation layers. However, an approximately 15 cm wall thickness can be achieved with flat wall panels, including all layers. And finally, flat panels facilitate the connection of one envelope with the other and allow for larger openings for interior doors, due to their simple geometry.
The internal kit-of-parts is grouped into six main sets: columns, beams, wall panels, hiding panels, flooring, and connection pieces. The columns and beams form the interior frames in the apartments. These frames both generate the interior partitions of the house by attaching the wall panels and help connect the exterior walls together, forming an integrated structural system that performs as a whole. The columns are all 220 cm high, and the beams’ length varies from 110-220 cm.
Most of the wall panels are 40 cm wide, the remaining ranging from 10-30 cm. They are all 200 cm high and consist of two groups. These groups are based on the types of links explained in the topological network development phase of the research. Group one is the physical implementation of Link Type 2 and the second group is that of Link
Type 3. The first group with hinges at the edges that connect them together to form deployable screen walls, and the second with rigid connections that form the regular stationary partition walls. The hiding panels, on the other hand, are triangular pieces that are used to cover the connection between the internal frames and the external walls. These connection pieces or joineries will be presented in the design development section of this study
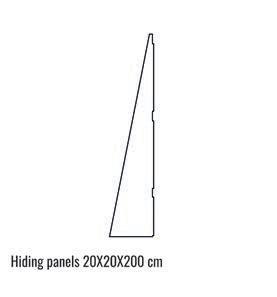
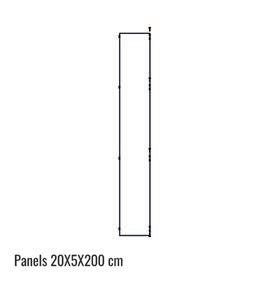
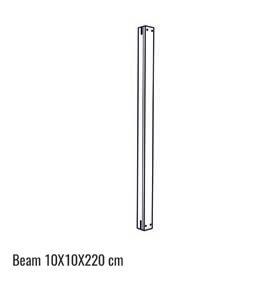
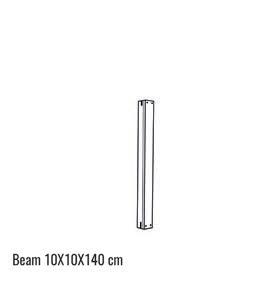
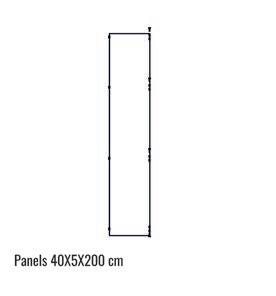
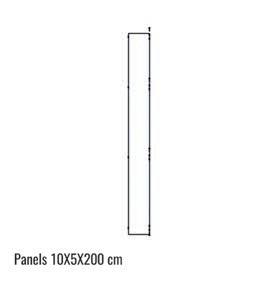
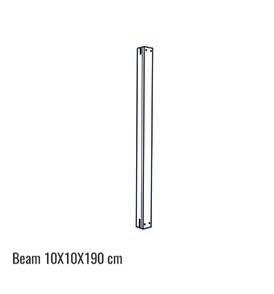
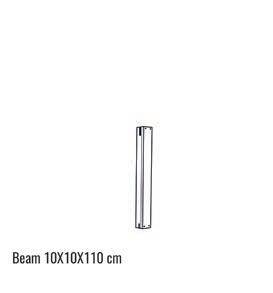
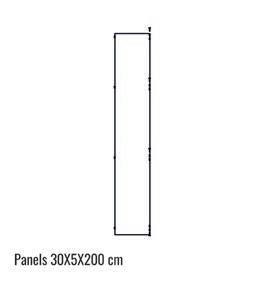
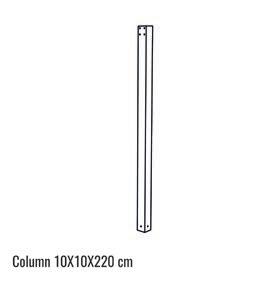
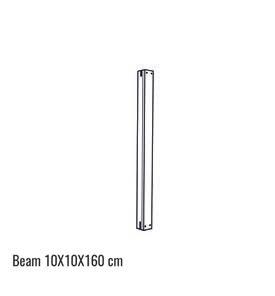
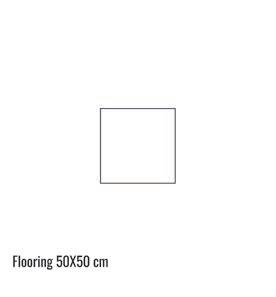
137
CATALOGUE KIT-OF-PARTS 04_8 116 Diagram: catalog of all the kit of parts
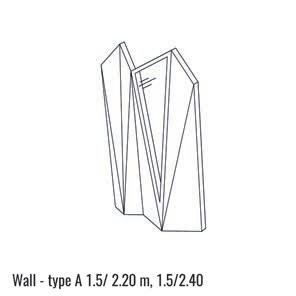
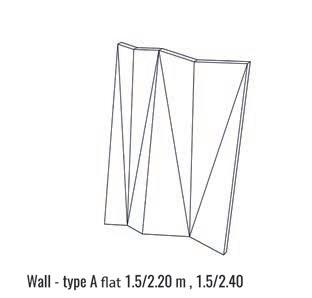
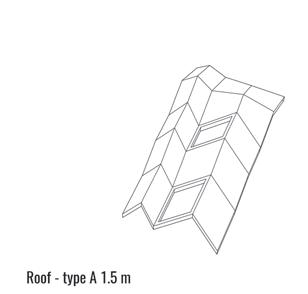
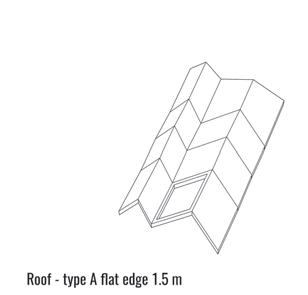
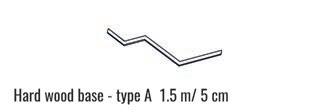
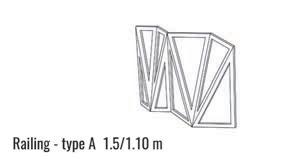
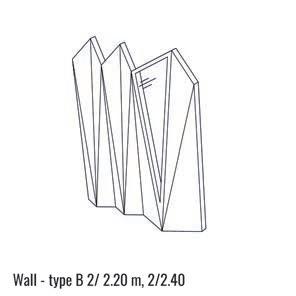
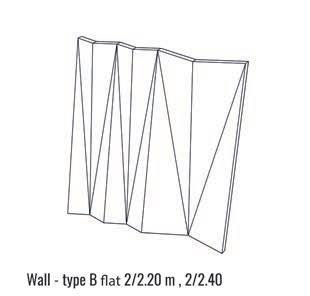
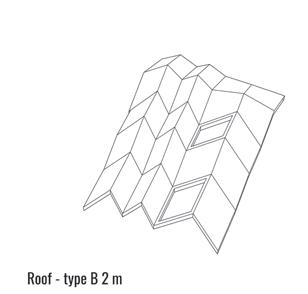
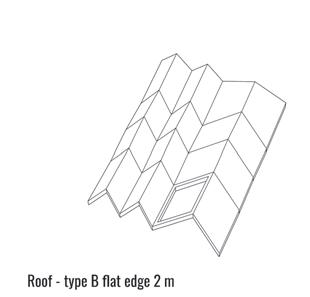
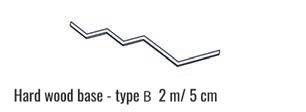
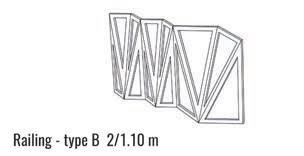
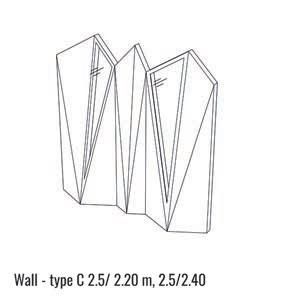
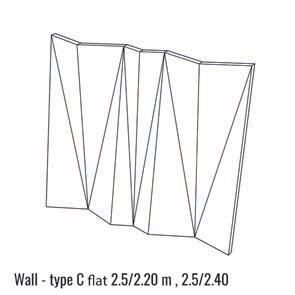
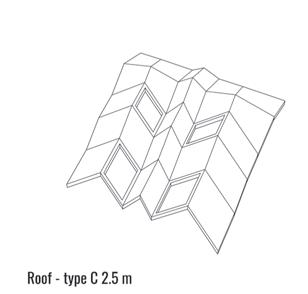
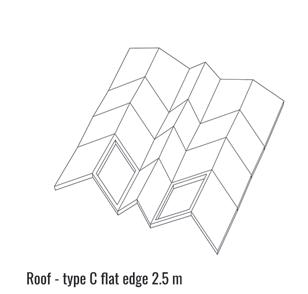
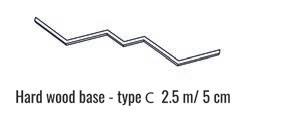
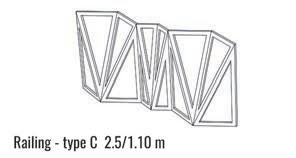
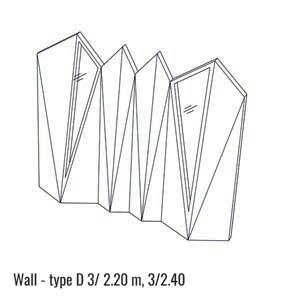
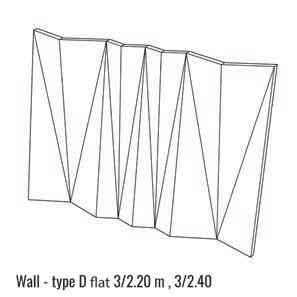
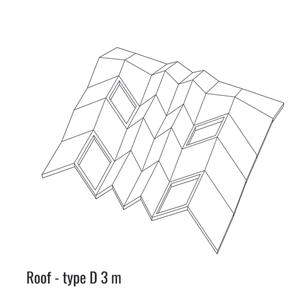
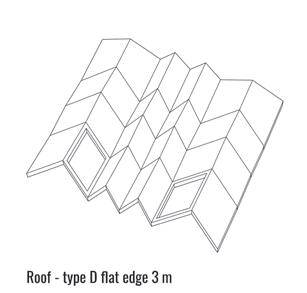
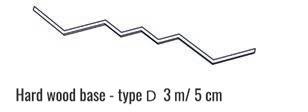
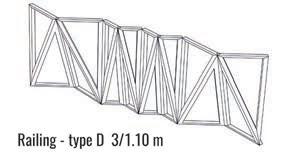
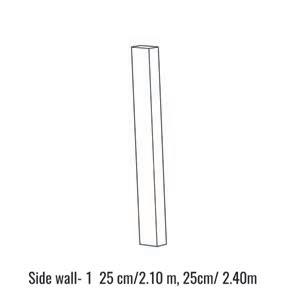
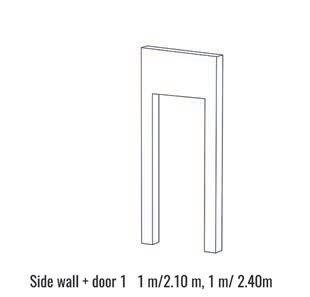
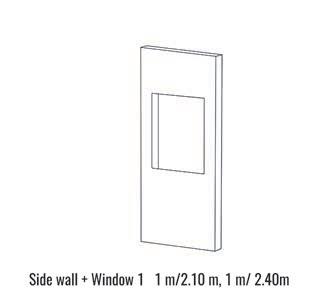
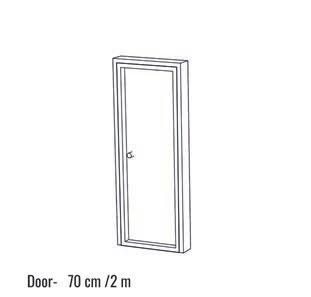
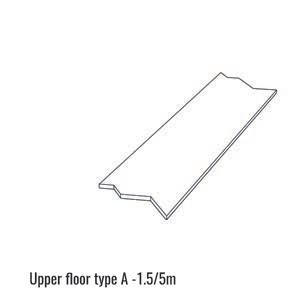
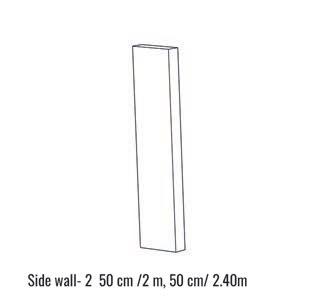
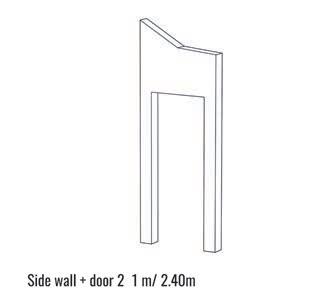
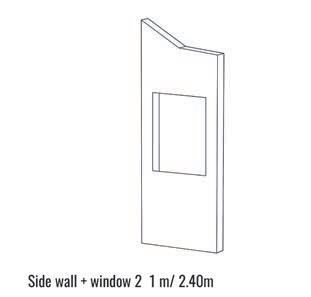
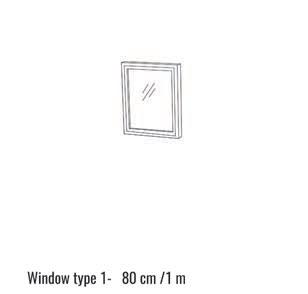
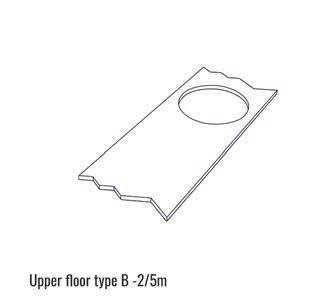
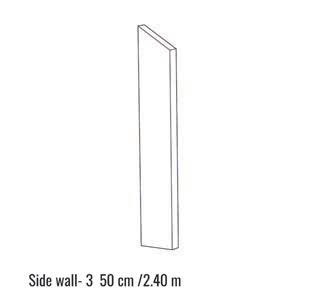
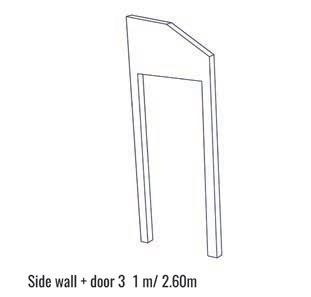
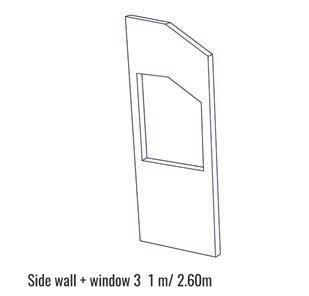
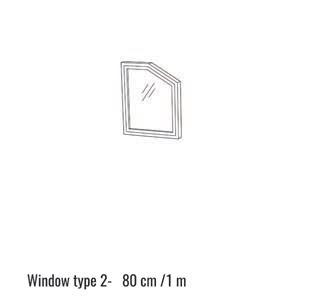
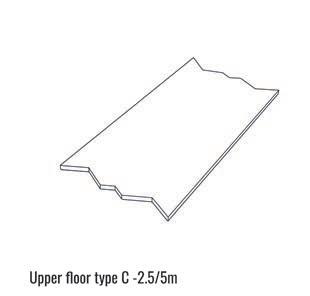
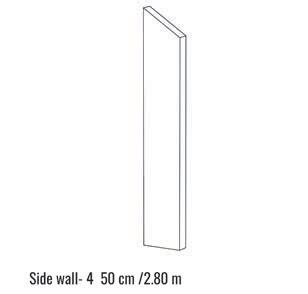
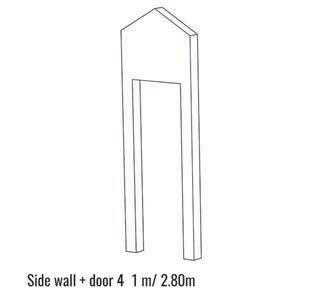
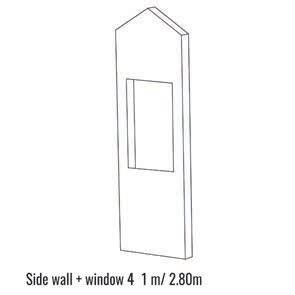
139
SUMMARY 04_9
The learnings and the outcomes of the series of material and computational experiments coalesced into an integrated design and construction framework. The densification strategy proposed at the outset of this strategy is thus substantiated and materialised through a series of outcomes: a material prototype, a spatial and morphological configurator, and a kit-of-parts.
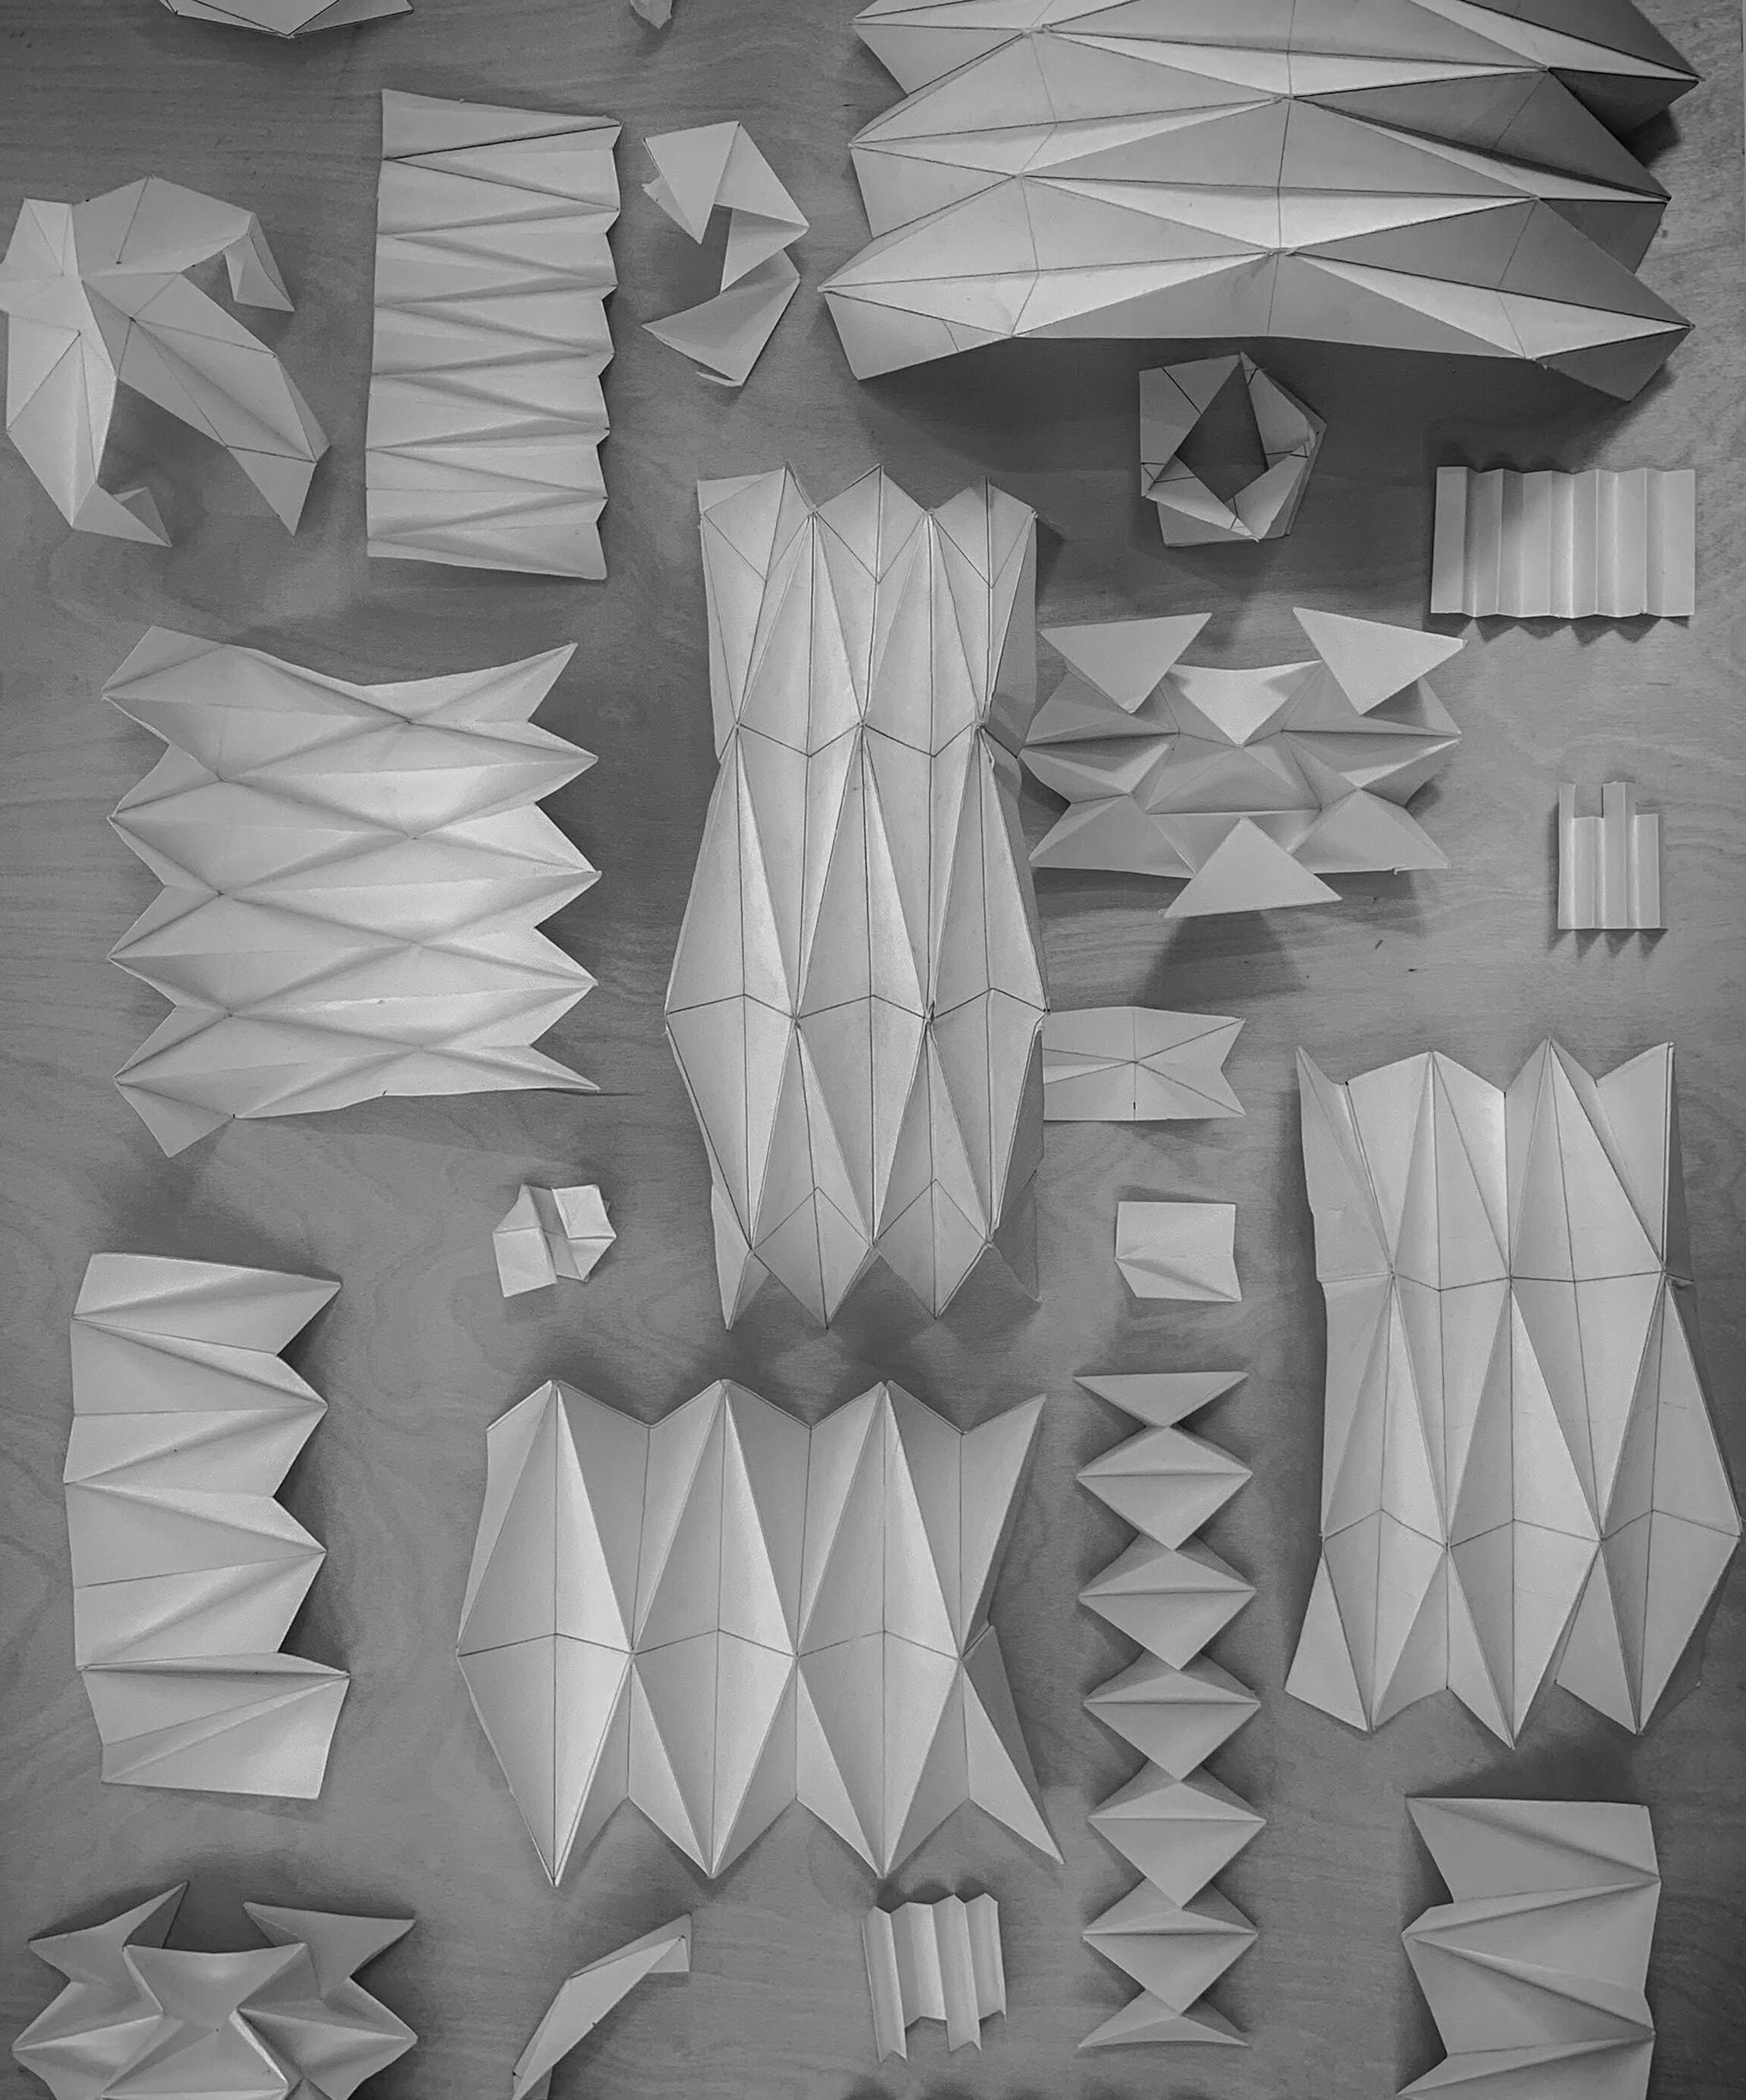
9
7
6
5
4
3
1 2
Sjoerd L van Greevenbroek, ‘FOLDING STRUCTURES: DEVELOPING A NEW METHOD USING THE PRINCIPLES OF ORIGAMI AND CNC MILLING.’, n.d., 14.
Hani Buri and Yves Weinand, ‘ORIGAMI – Folded Plate Structures, Architecture’, n.d., 8.
Andrea Gibbons, ‘Future Brixton and Its Failure to Address the Affordable Housing Crisis’, Brixton Buzz (blog), 28 November 2014, https://www.brixtonbuzz.com/2014/11/future-brixtonand-its-failure-to-address-the-affordable-housing-crisis/.
‘The Best Places to Live in London as a Young Professional’, Simply London relocation, accessed 22 July 2022, https://simplylondonrelocation.com/knowledge-base/best-places-to-livein-london-as-a-young-professional/.
‘GLA Projections Archive – London Datastore’, accessed 22 July 2022, https://data.london.gov. uk/gla-projections-archive/.
‘Jobs and Job Density, Borough - London Datastore’, accessed 22 July 2022, https://data. london.gov.uk/dataset/jobs-and-job-density-borough.
‘Which Is London’s Most Commutable Borough?’, LiFE Residential, accessed 22 July 2022, https://liferesidential.co.uk/news/which-londons-most-commutable-borough/.
8 ‘Ratio of House Prices to Earnings, Borough - London Datastore’, accessed 22 July 2022, https://data.london.gov.uk/dataset/ratio-house-prices-earnings-borough.
Housing in London - The Evidence Base for the Mayor’s Housing Strategy - London Datastore’.
143
4 CHAPTER ENDNOTES
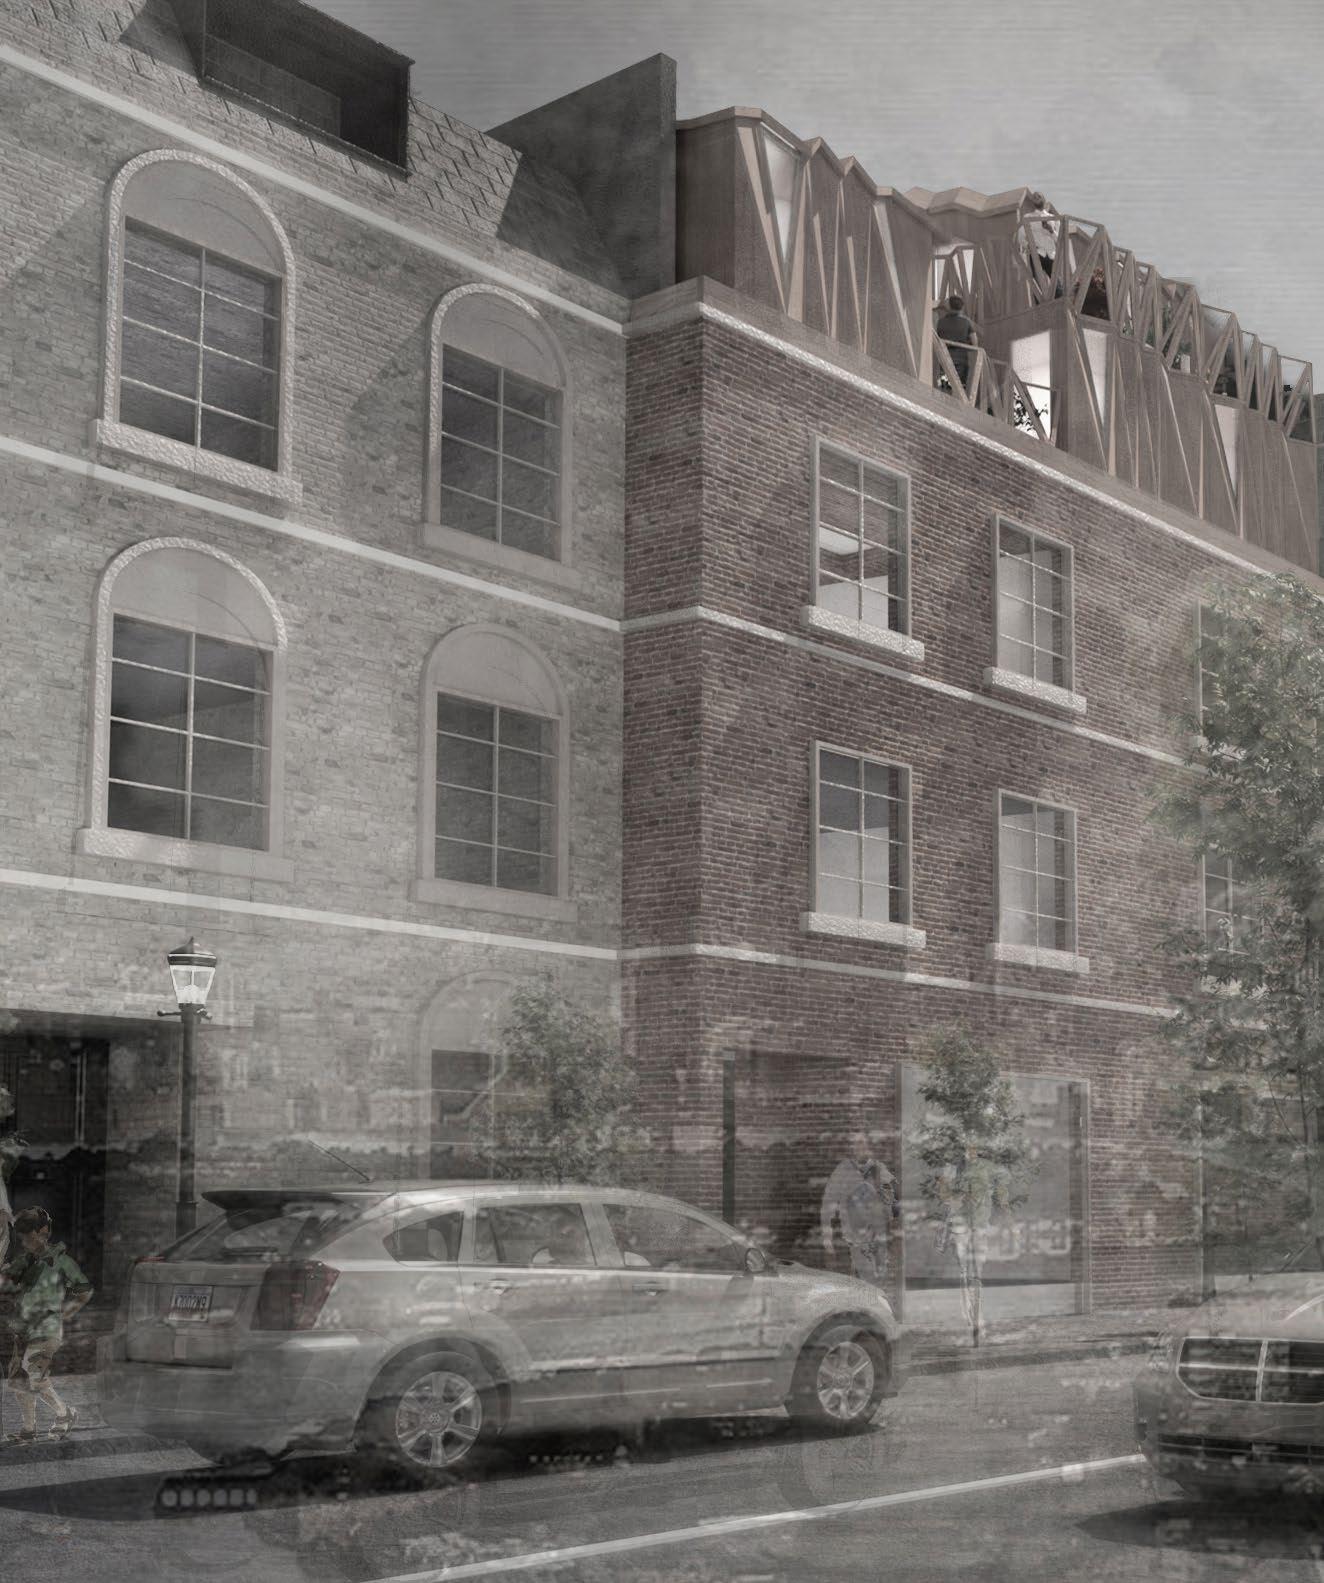
DESIGN DEVELOPMENT
To further develop and present the outputs of the research development, a representative example from the final experiment was selected and detailed. The design development is presented in four main sections. The first part relates the entire process from manufacturing and designing to construction. Then the implementation site is presented. Next, the kit-of-parts and the details of construction and assembly are displayed and explained. Finally, the life cycle of the proposed building framework is described.
145
05
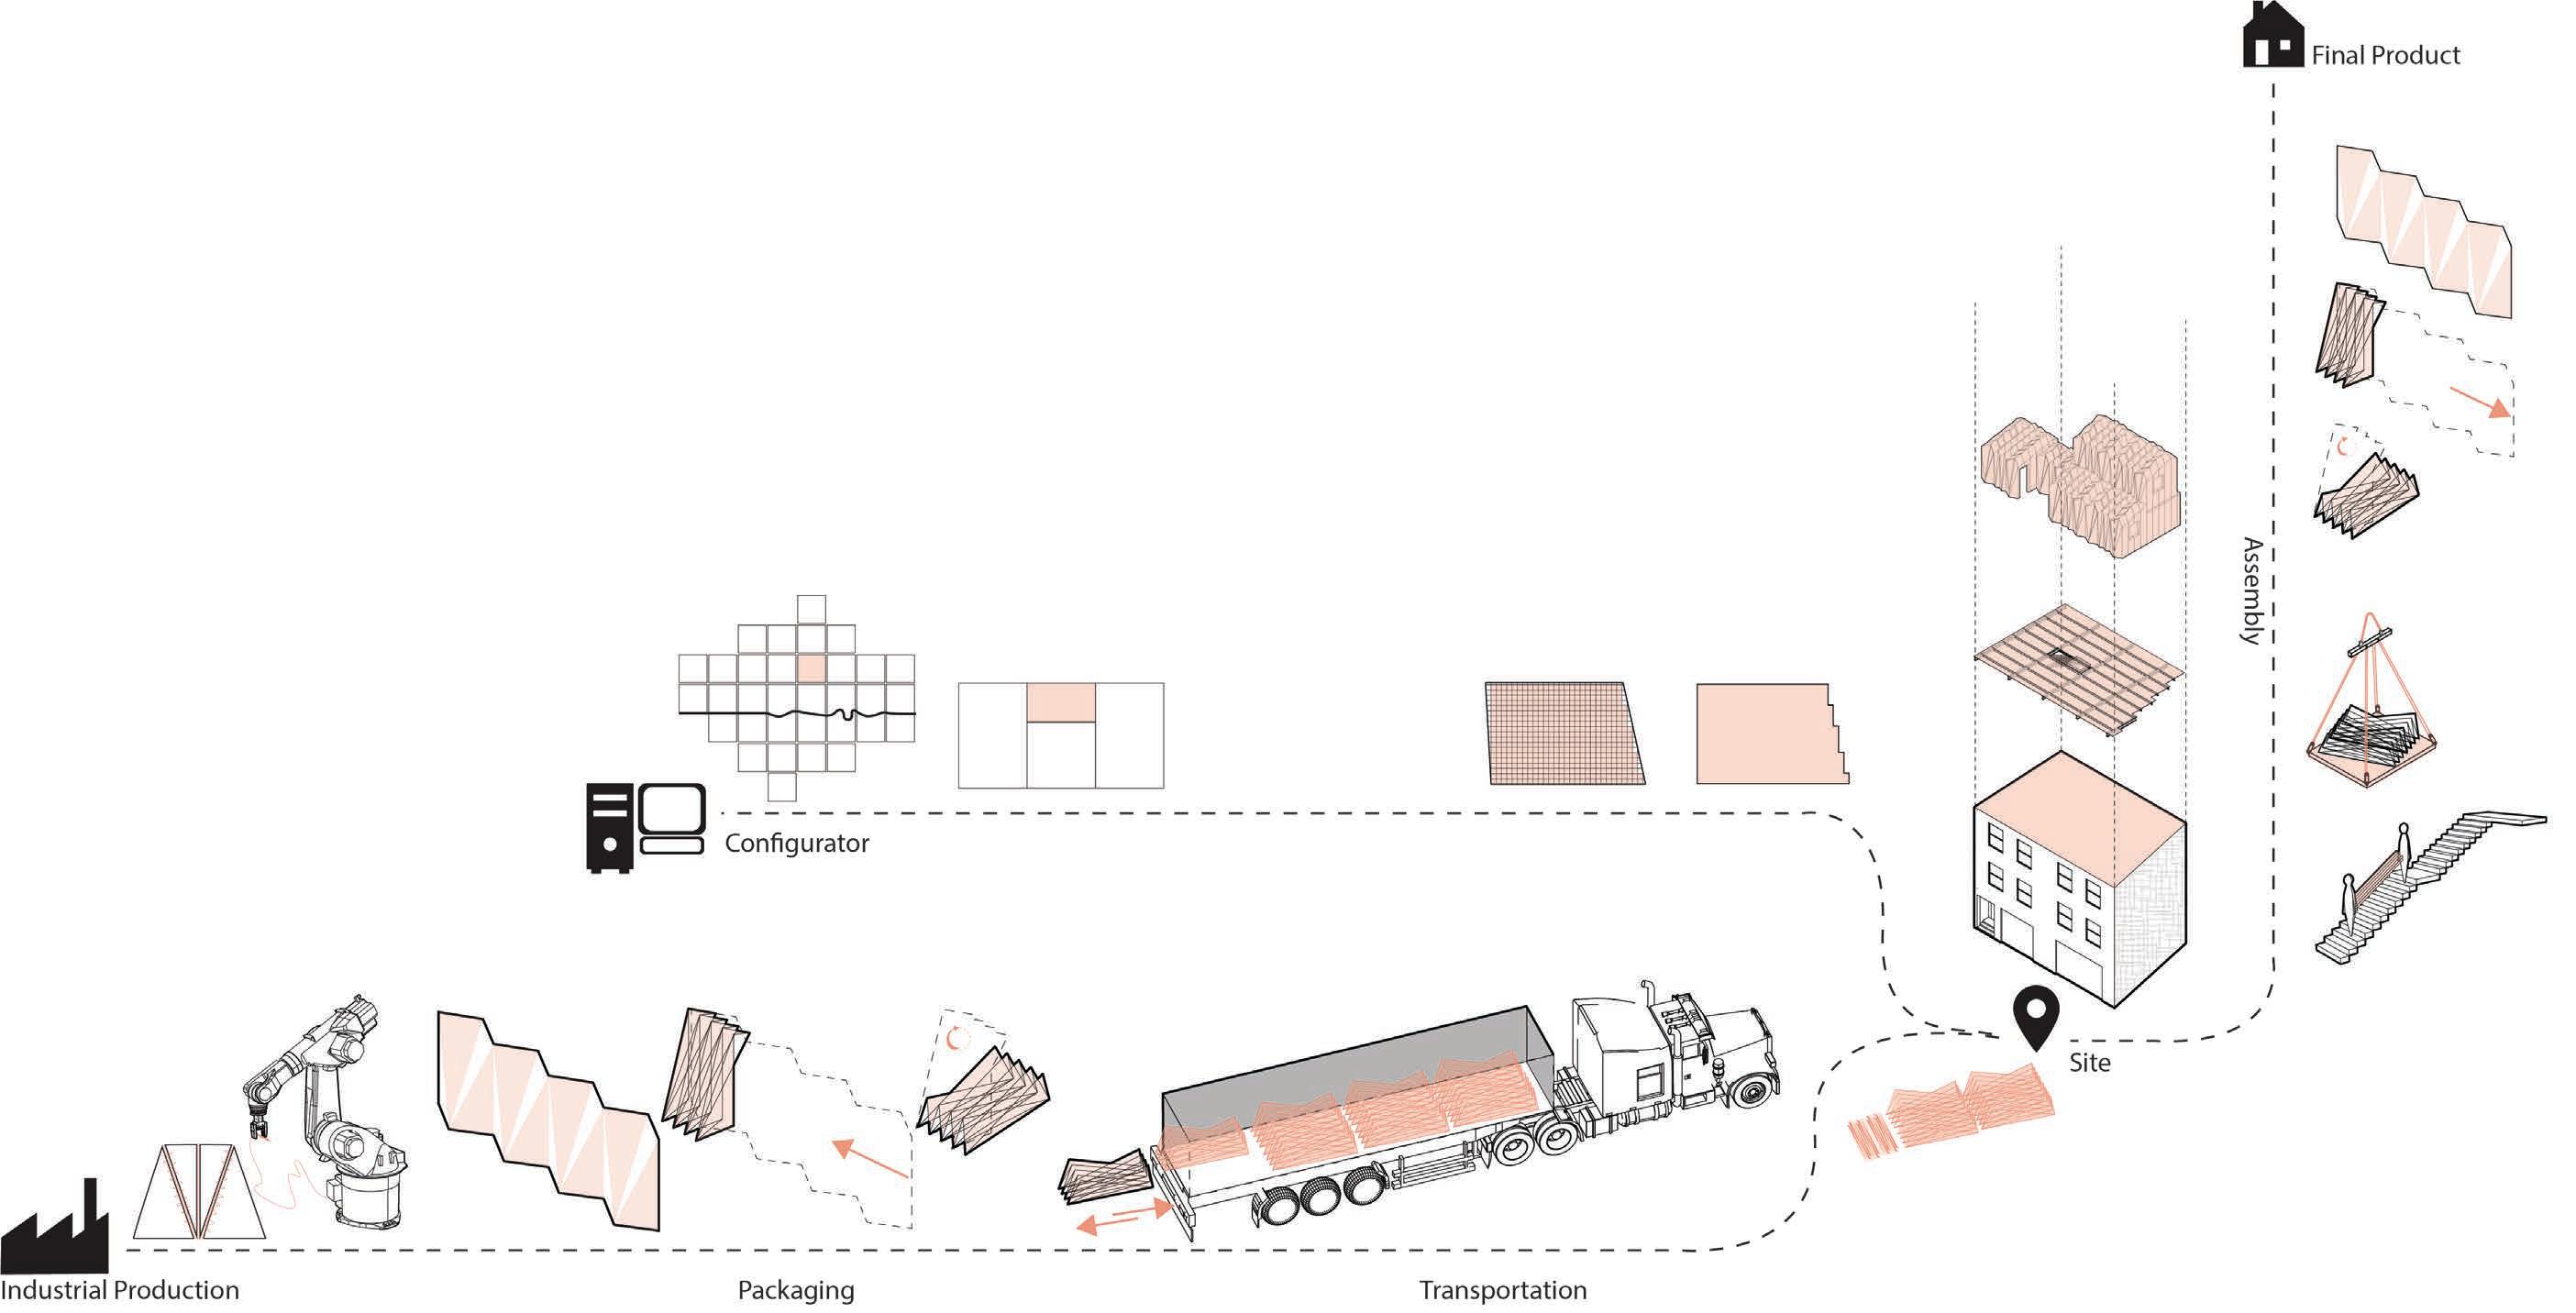
INTENDED WORK FLOW
The envisioned process starts with a mass off-site fabrication of the parts. Upon completion, the parts will be packaged and put into storage awaiting use. When a user wants to order the construction of a rooftop expansion, they would connect to our configurator. They would begin the process by selecting which borough of London they want to live in. This research uses Islington as an example. The configurator then gives the users all the possible locations for development within that borough. Upon selecting a specific site, the spatial requirements are input by the users. The configurator then analyses the chosen site, rationalises it with a 50x50 cm grid, and generates various optimal layouts and morphologies based on site conditions. The options would be displayed for the user to make the final selection. The selected design would then be reported to the storage, and the necessary parts would be shipped to the site. A professional team would then construct the new rooftop expansion apartment for the user.
147
PROCESS OVERALL 05_1 Diagram: overall process 1 1
Diagram : site plan
One site was chosen from the four implementation sites, for implementing the design development of the rooftop expansion’s morphology. The new vertical expansion will be built on a deck that will distribute the load of the new apartment evenly and transfer it to the existing building. However, an accurate calculation of load distribution would need to be performed on each site for further development.
The building at 137 Essex Road, N12 NR, Islington was selected as the implementation site for the design proposal. The building met various criteria of selection as it was close to the tube station, it was on a high street in Islington, it was situated in a residential area, it had a flat roof with a large surface area, it had a height 4 m lower than its adjacent buildings, and it was a multi-storey building meaning that it included a staircase that would allow access to the new vertical expansion. (Figure 6)
Studying the interior and the spatial configuration of the building was essential to developing the design proposal. To this end, the plans of the building were inquired. However, after corresponding with the local authorities of Islington, it was understood that it was not possible to obtain the building plans. Therefore, to collect the necessary information on the site, the building was visited several times. The site was studied as thoroughly as visitor permissions allowed. Measurements, photographs, and videos of the site were taken for further study. Finally, the first-hand collected information was combined with the digitally available data such as Google Street View images and Google elevation data and was used to extract the missing information needed for creating a digital model of the site.
The design on this particular site is derived from the phenotypes extracted from the multiobjective morphology optimisation in the previous section. Therefore, it is based on the exact same topological network used in the previous section. This particular phenotype was selected for design development since it includes all three link
types from the topological network experiments and the morphology provides a diverse range of parts. This design involves two stories and balconies. The entrance hall of the apartment is connected to the core of the building. From the living room, there is access to a separate study room on the upper floor. From the 4 sets of foldable walls and roofs in the kit-of-parts, this design requires 3.
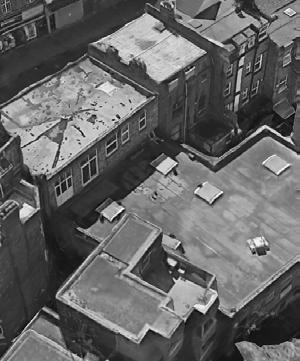
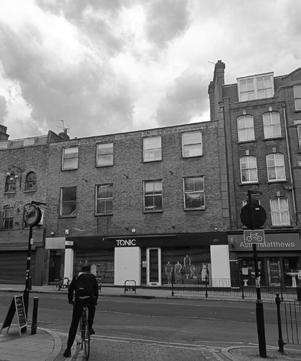
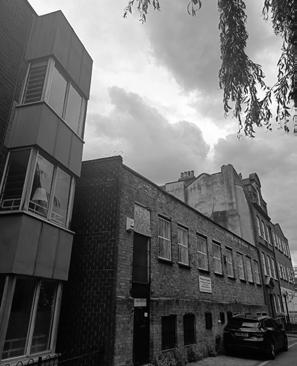
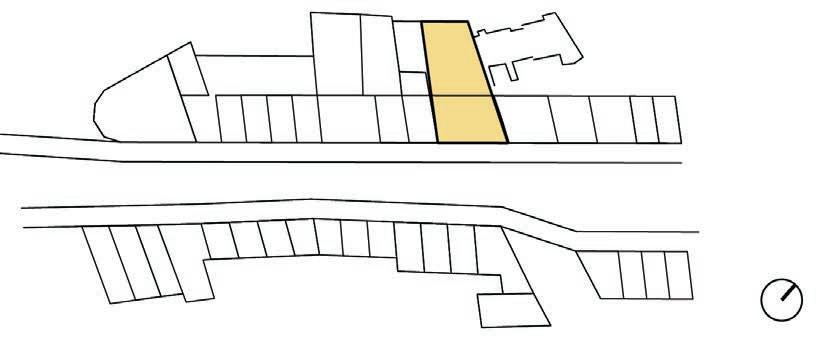
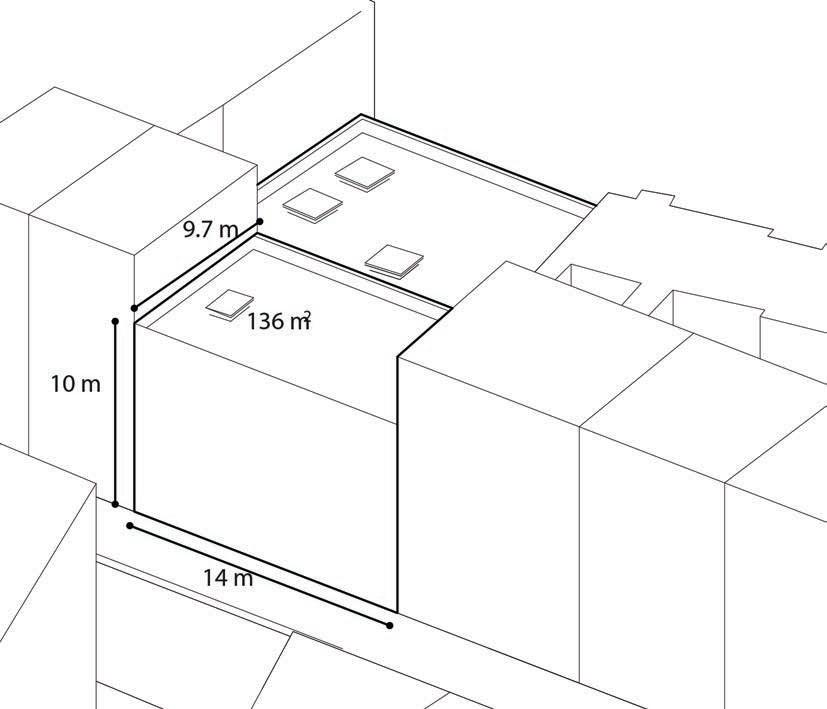
149
6
5
2
Diagram: site 3D axon Image: of the site, back 4 Image: of the site, front 3 Image: of the site, arial
LOCATION 5 6 SITE EXPLANITORY 05_2 2 3 4
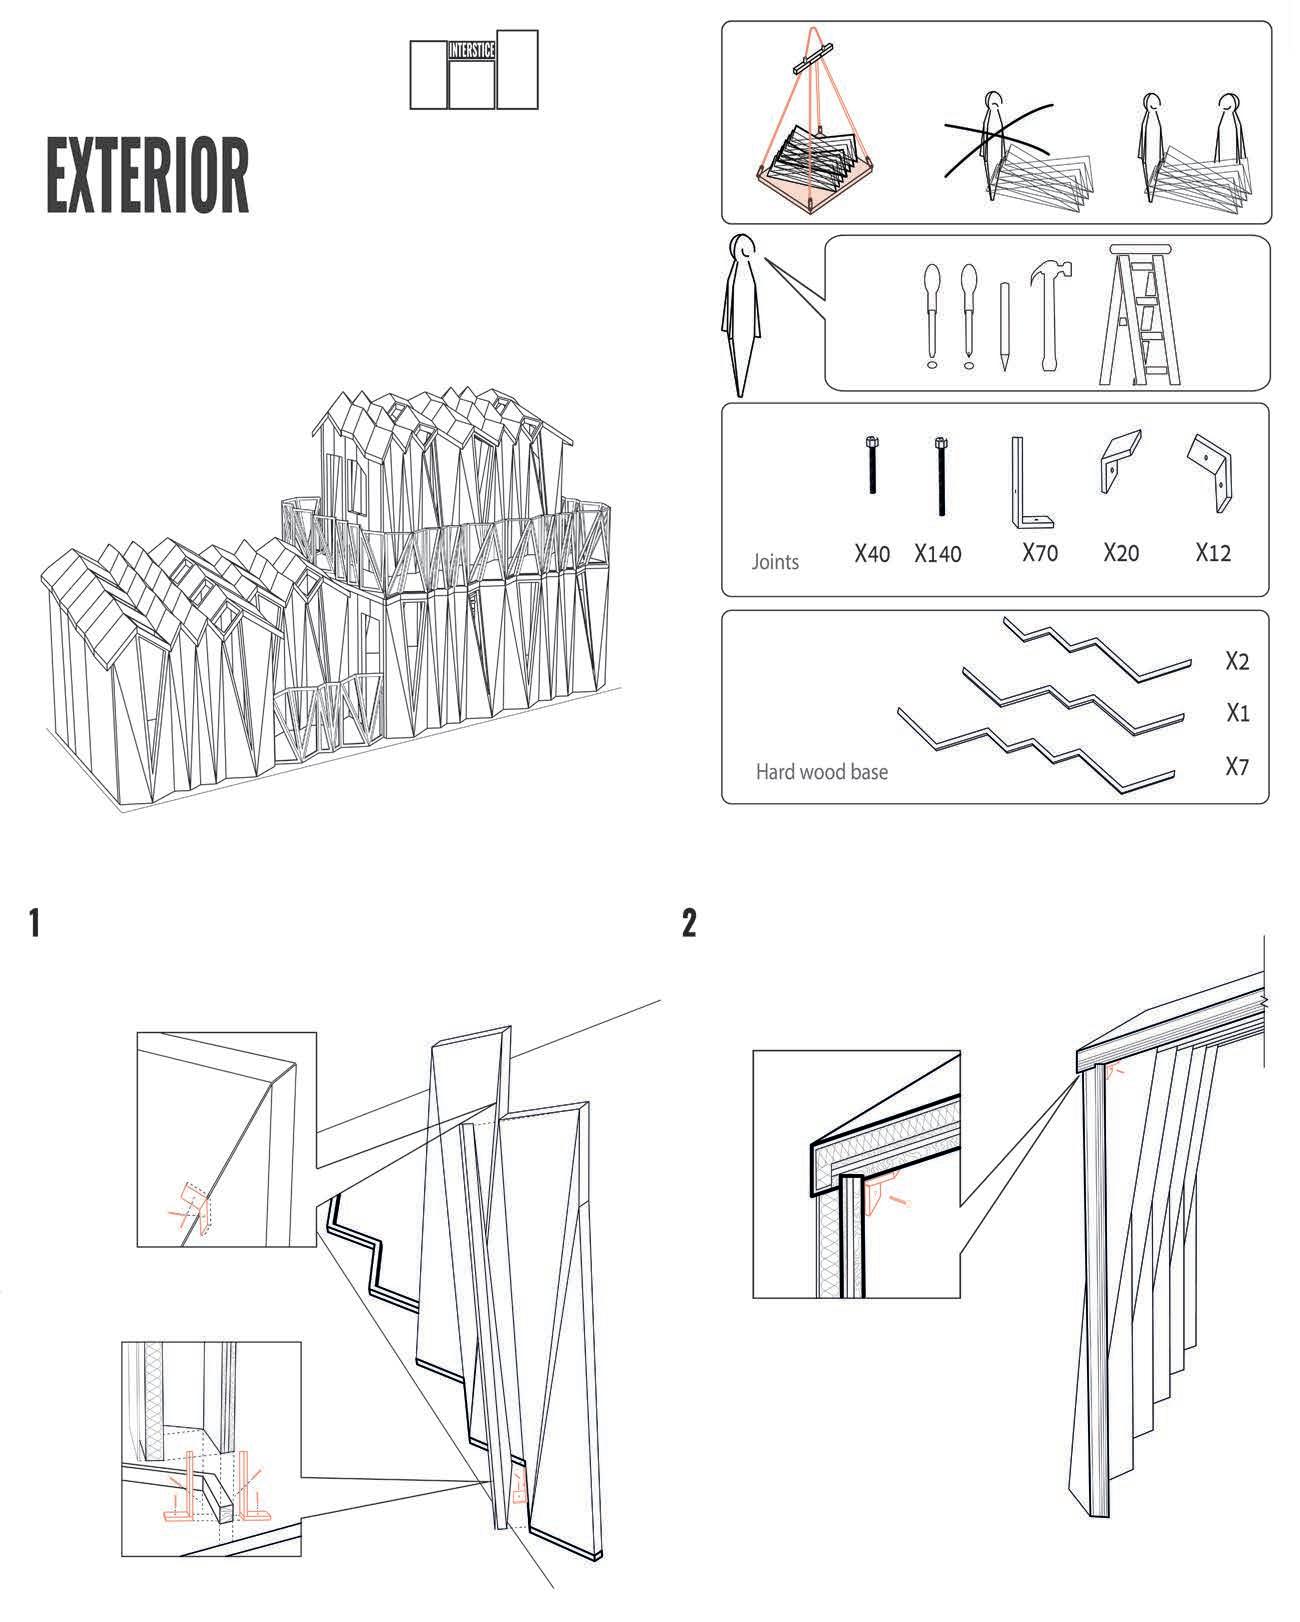
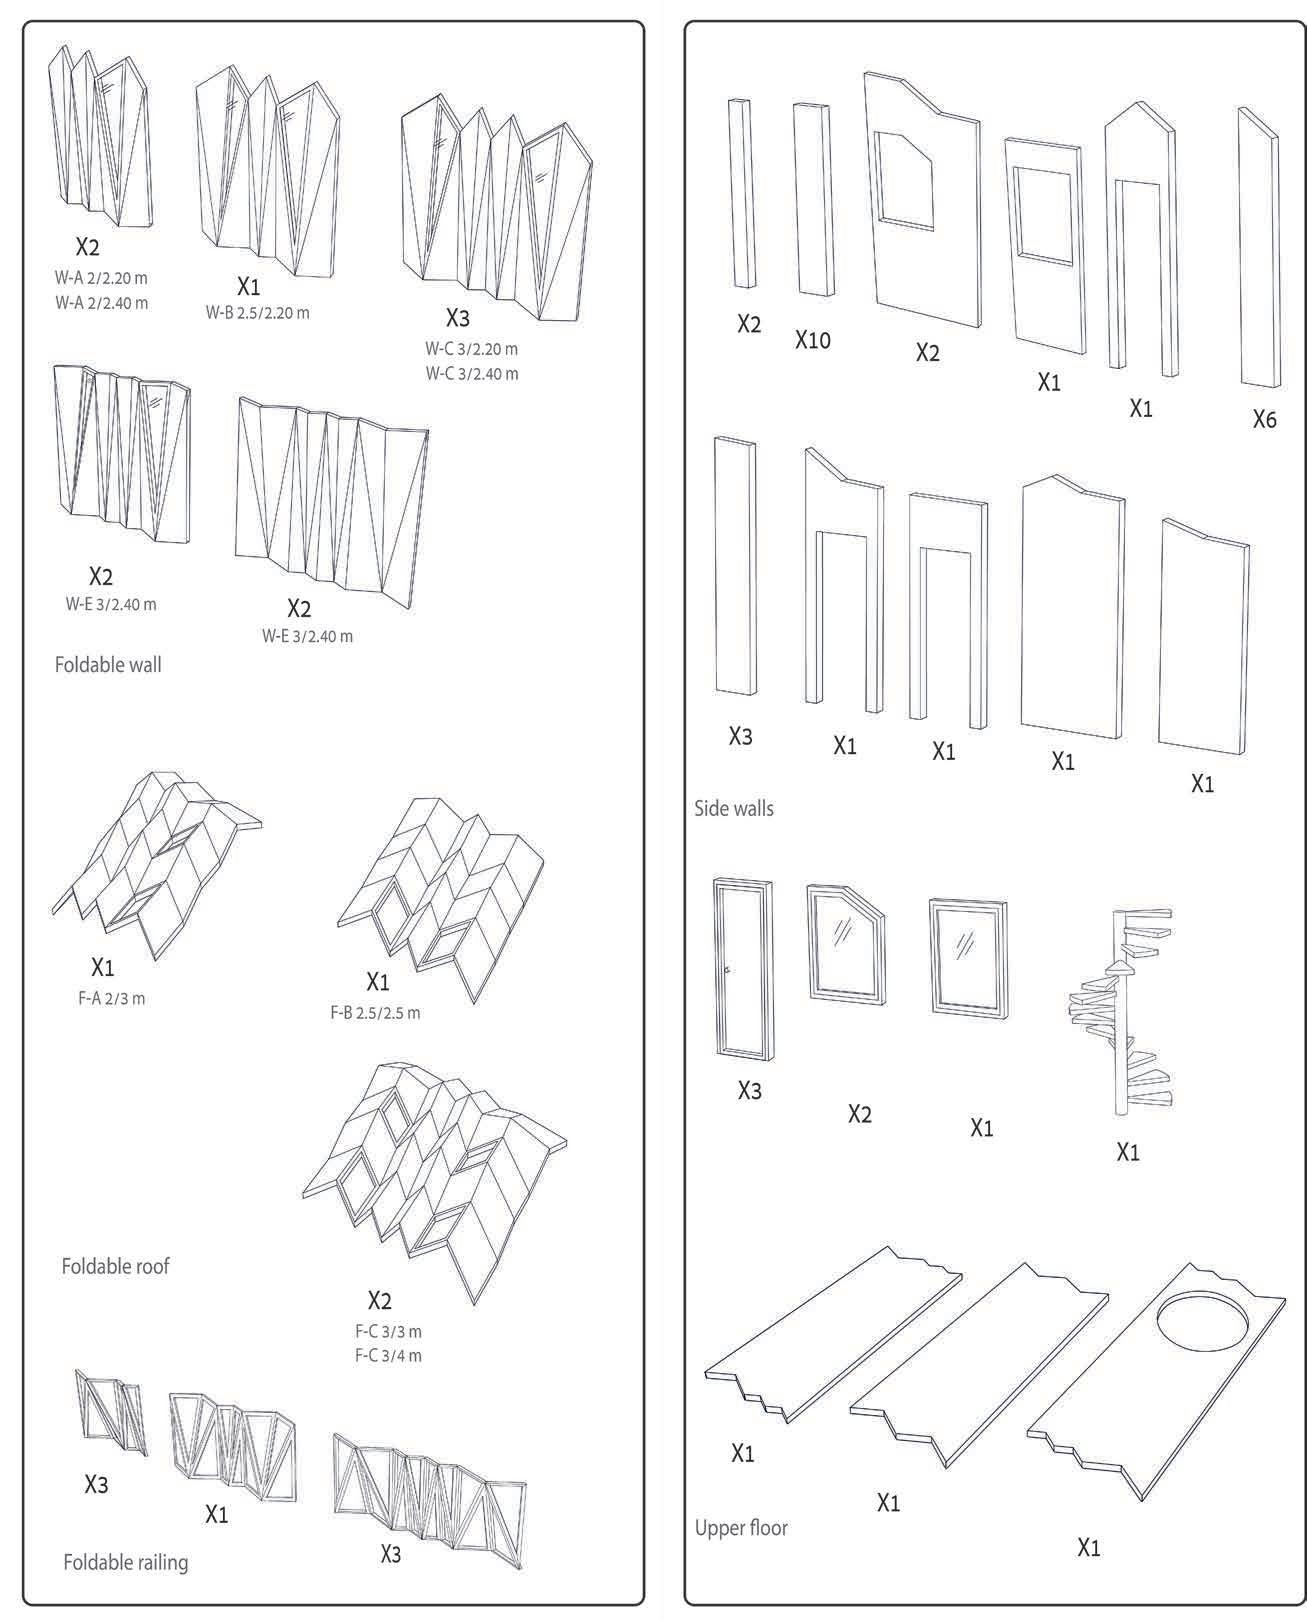
151 6
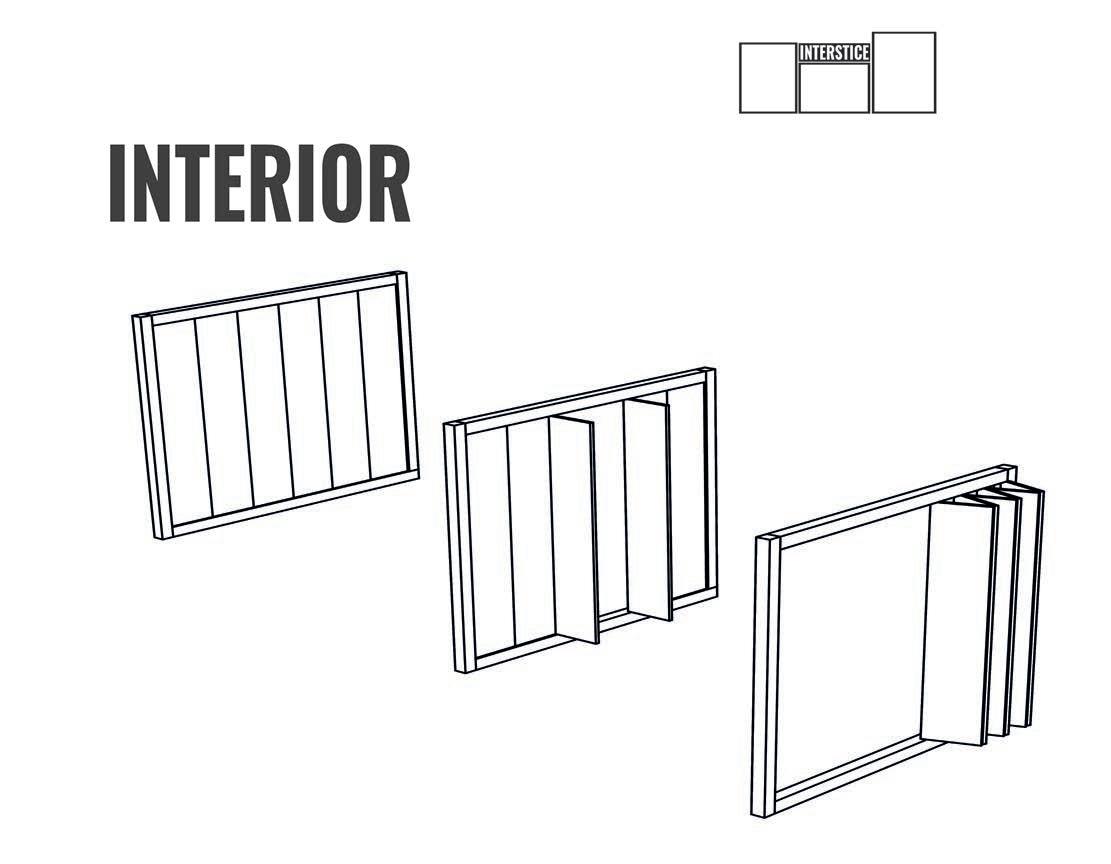
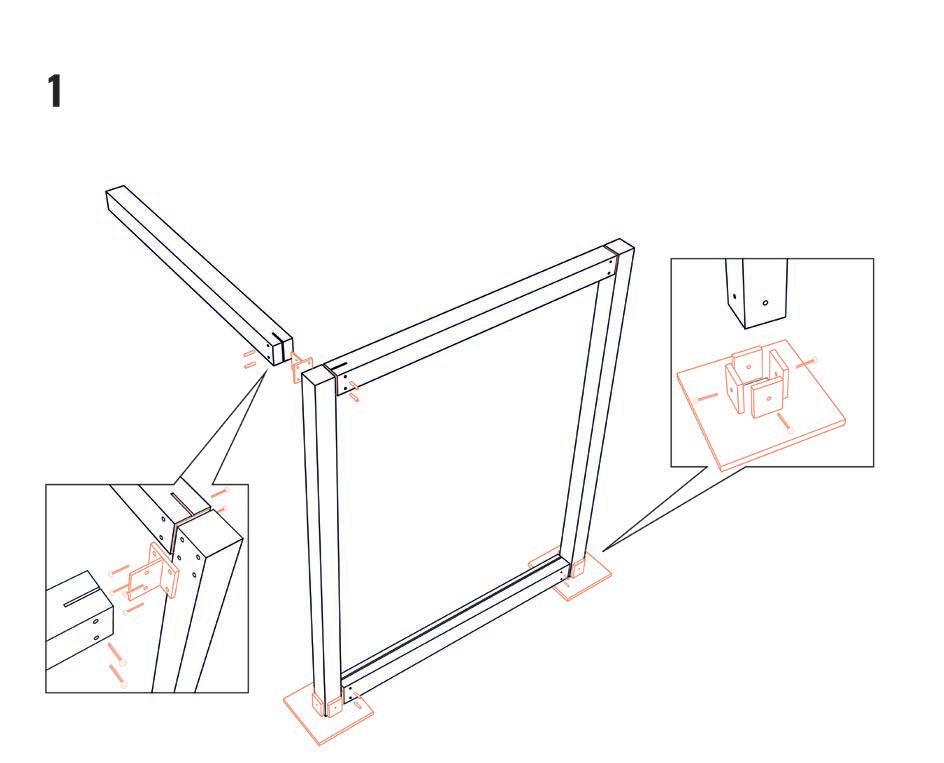
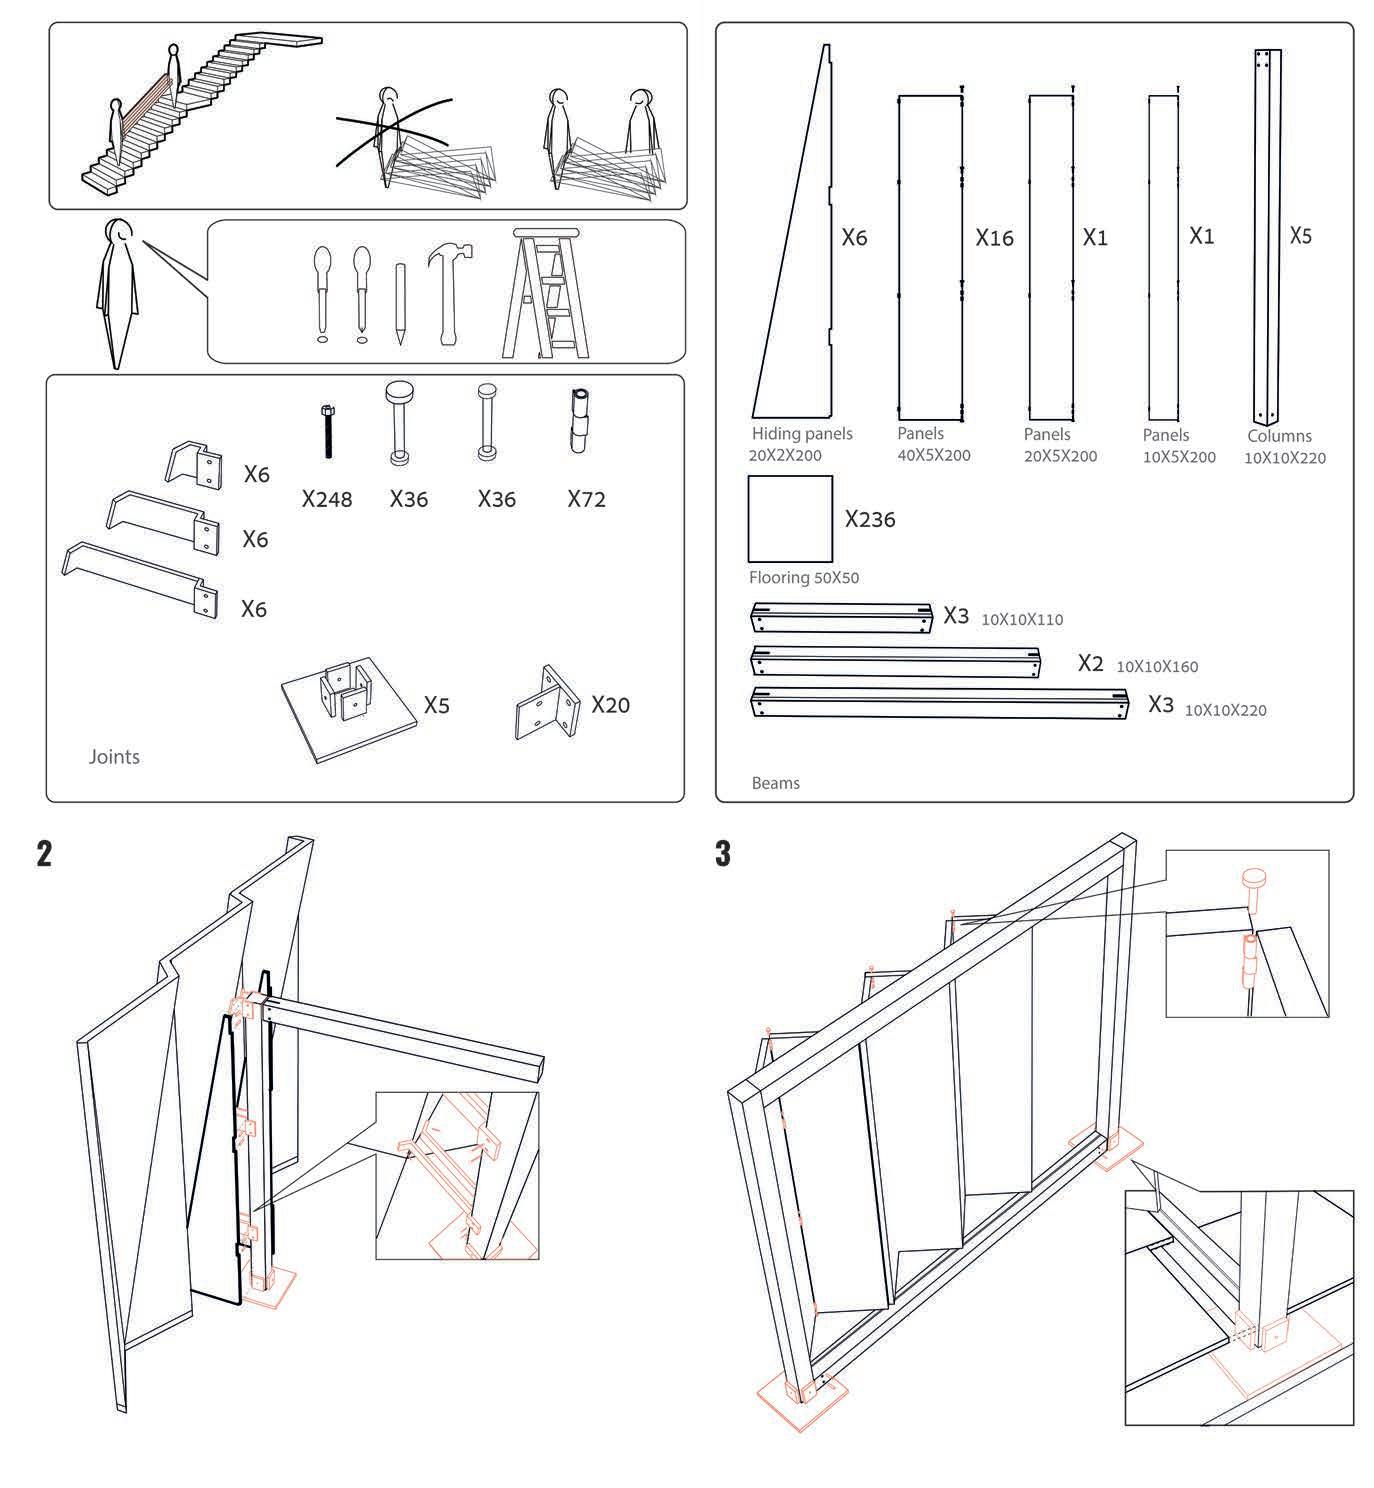
153 7
INSTRUCTION GUIDE
The building crew gets an instruction guide for the construction of the system. The first detail in the guide demonstrates how the deployable walls are attached to the deck with a hardwood base. Separate wall panels are joined together using connection brackets that are inserted into the cavities on two adjacent wall panels. (Figure 8) Another detail shows how the deployable walls are connected to the roof through insertion and brackets, and thus lock the entire shell, forming an integrated structure. (Figure 9) The internal frames were designed according to the 3 different link types that were developed in the topological network section. These interior frames also connect the external walls together and lock their folding. (Figure 10)
This design includes 40 pieces from the developed kit-of-parts. Once the kit is shipped to the site, the external parts are craned up to the rooftop and the internal parts are carried up by the building crew through the staircase. Most of the external parts are deployable panels. The internal parts of the kit were designed to enable the building crew to carry them through the staircase up to the rooftop. The dimensions of these parts were limited by the calculated average staircase dimensions, and the weight allowing manual lifting.
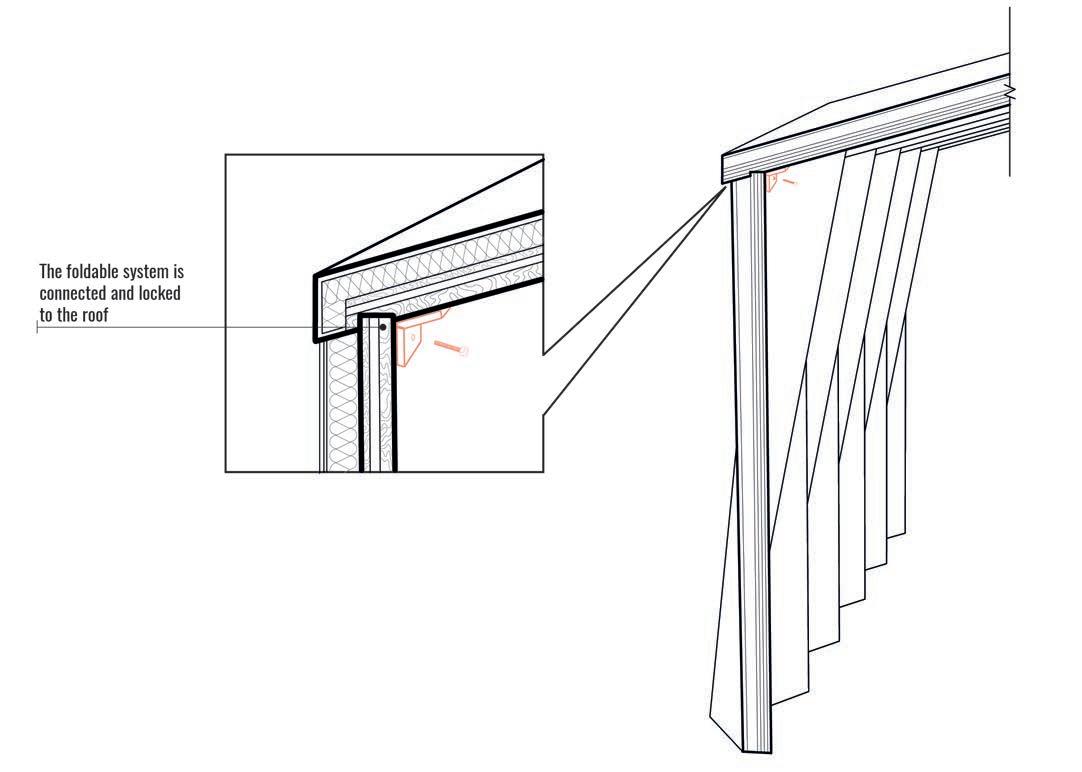
6 7
Diagram: representation of the instruction guide for external walls
Diagram: representation of the instruction guide for internal walls
Diagram: wall to floor detail
Diagram: walls to interior wall detail
8 9 10
Diagram: wall to roof detail
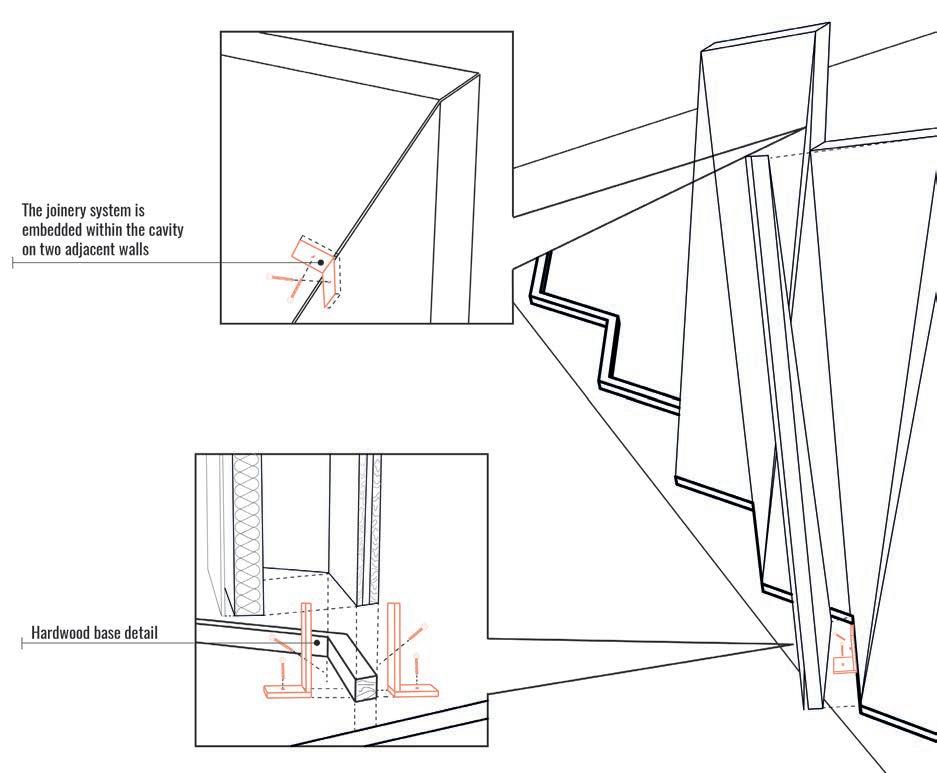
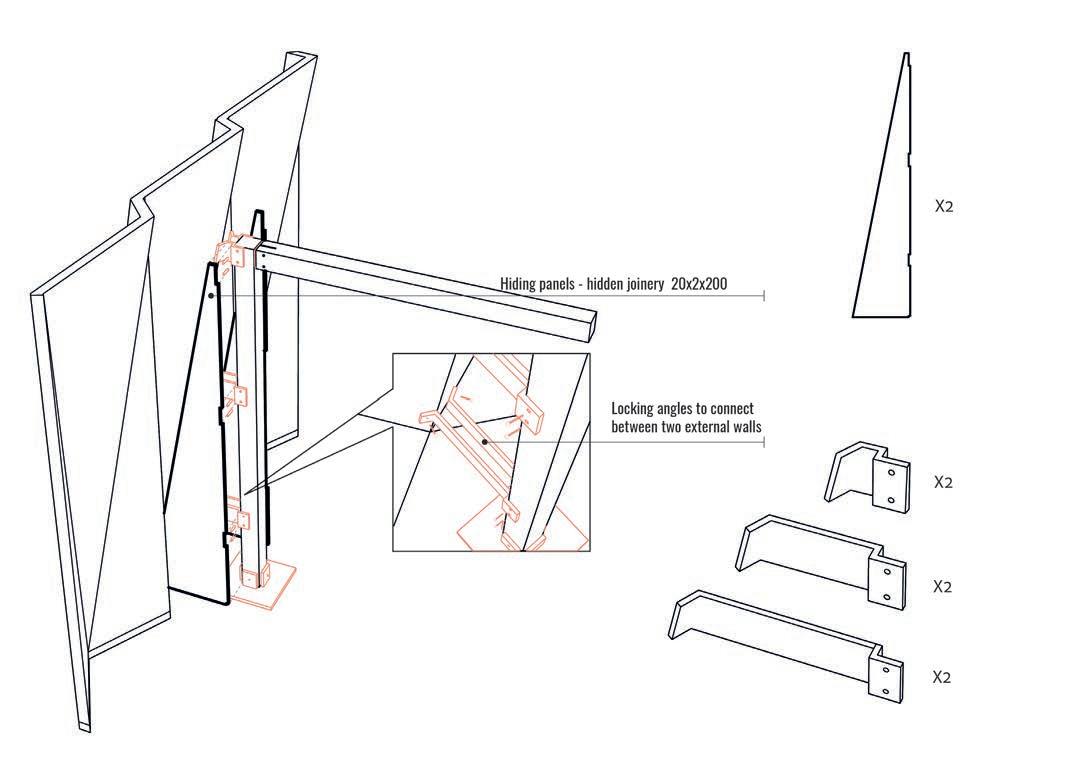
155
8 9 10
PARTS & DETAILS
05_3
BLUEPRINTS FOR IMPLEMENTATION
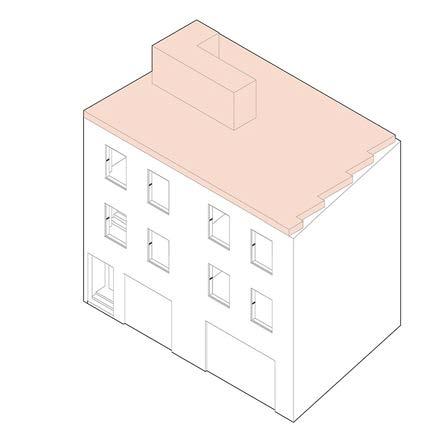
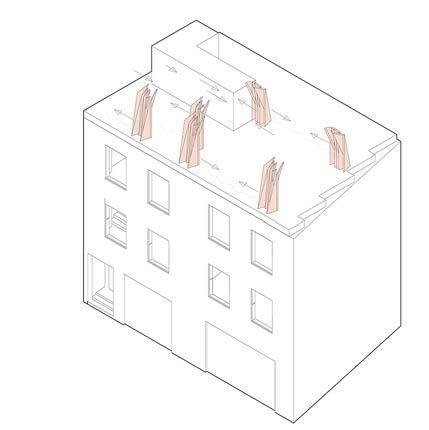
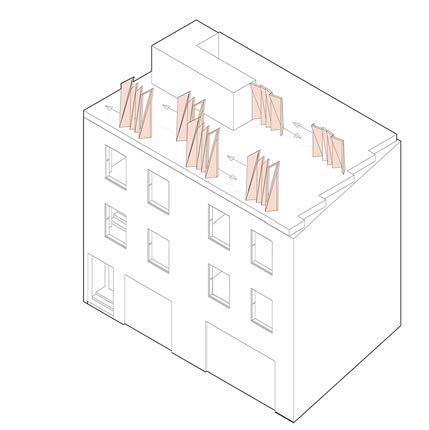
ASSEMBLY PROCESS
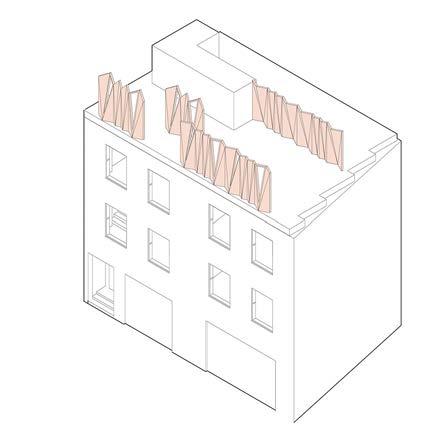
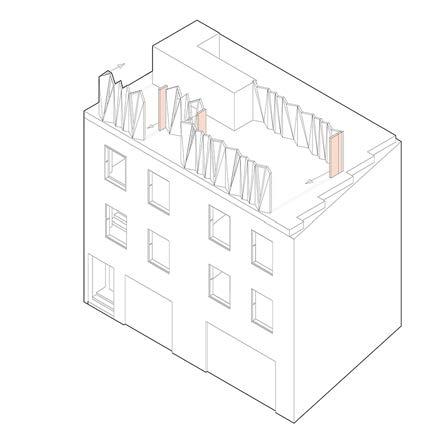
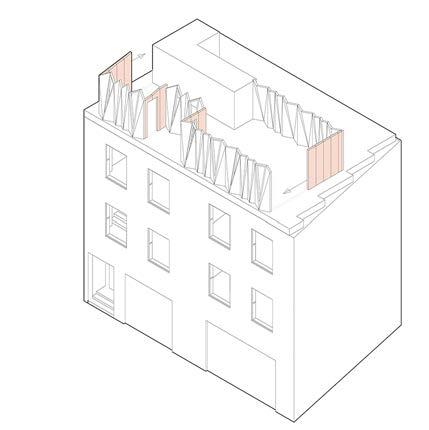
Once all the parts for the apartment are hoisted with a crane or carried up to the roof, a professional team can begin the assembly process. The deployable panels are first deployed starting from the corners of the apartment plan, working inward. The flat
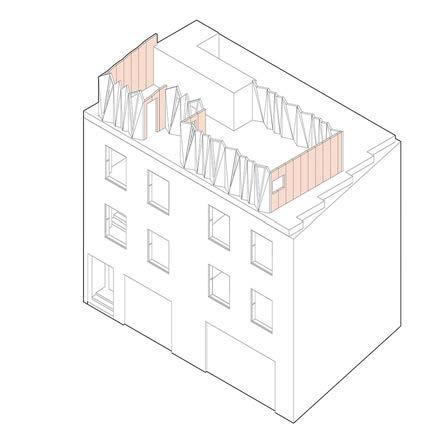
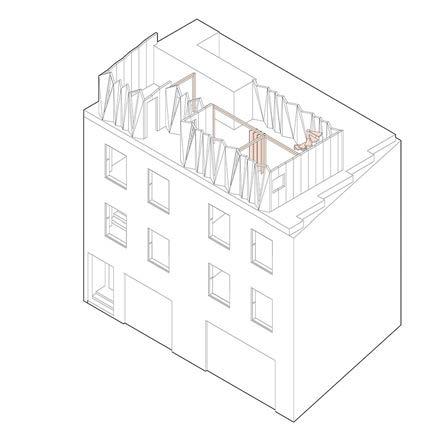
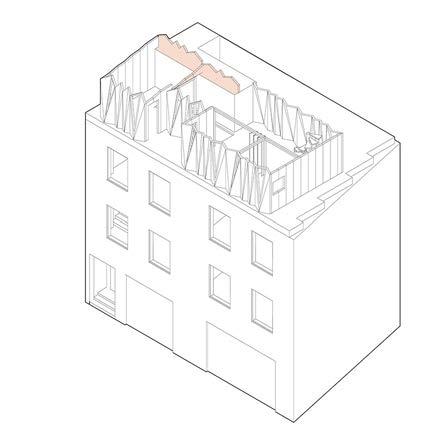
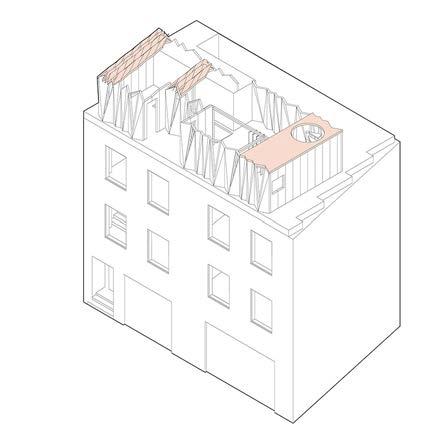
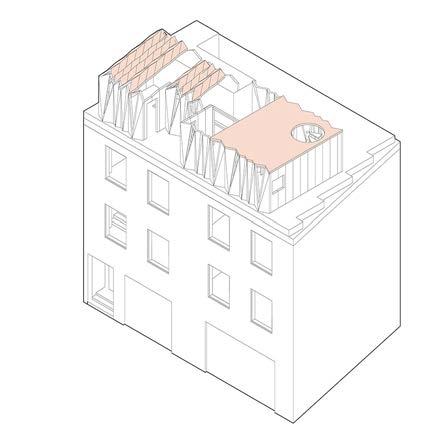
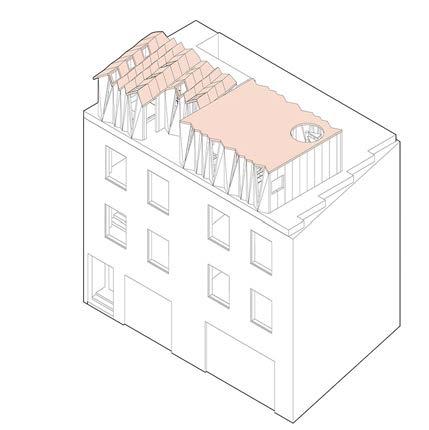
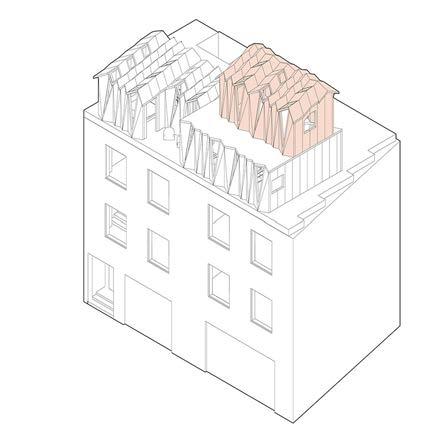
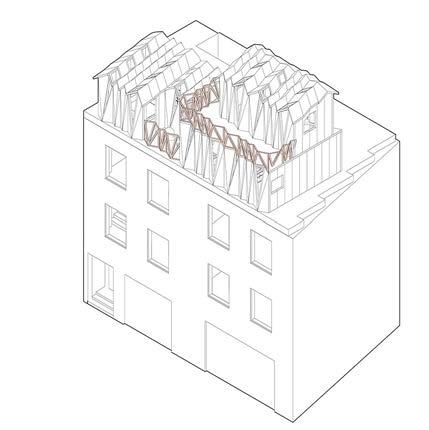
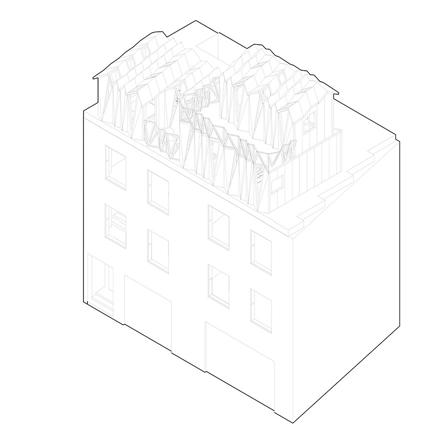
panels are then used to link the deployable panels with the interior walls following. The roof or second floor, depending on the morphology, is then deployed locking the first floor in place, and creating an enclosed system. If the apartment comprises a second floor the same process is repeated until completing the construction sequence of the apartment.
157
11 12
Diagram: section perspective of the appartment
Diagram : assembly process
11
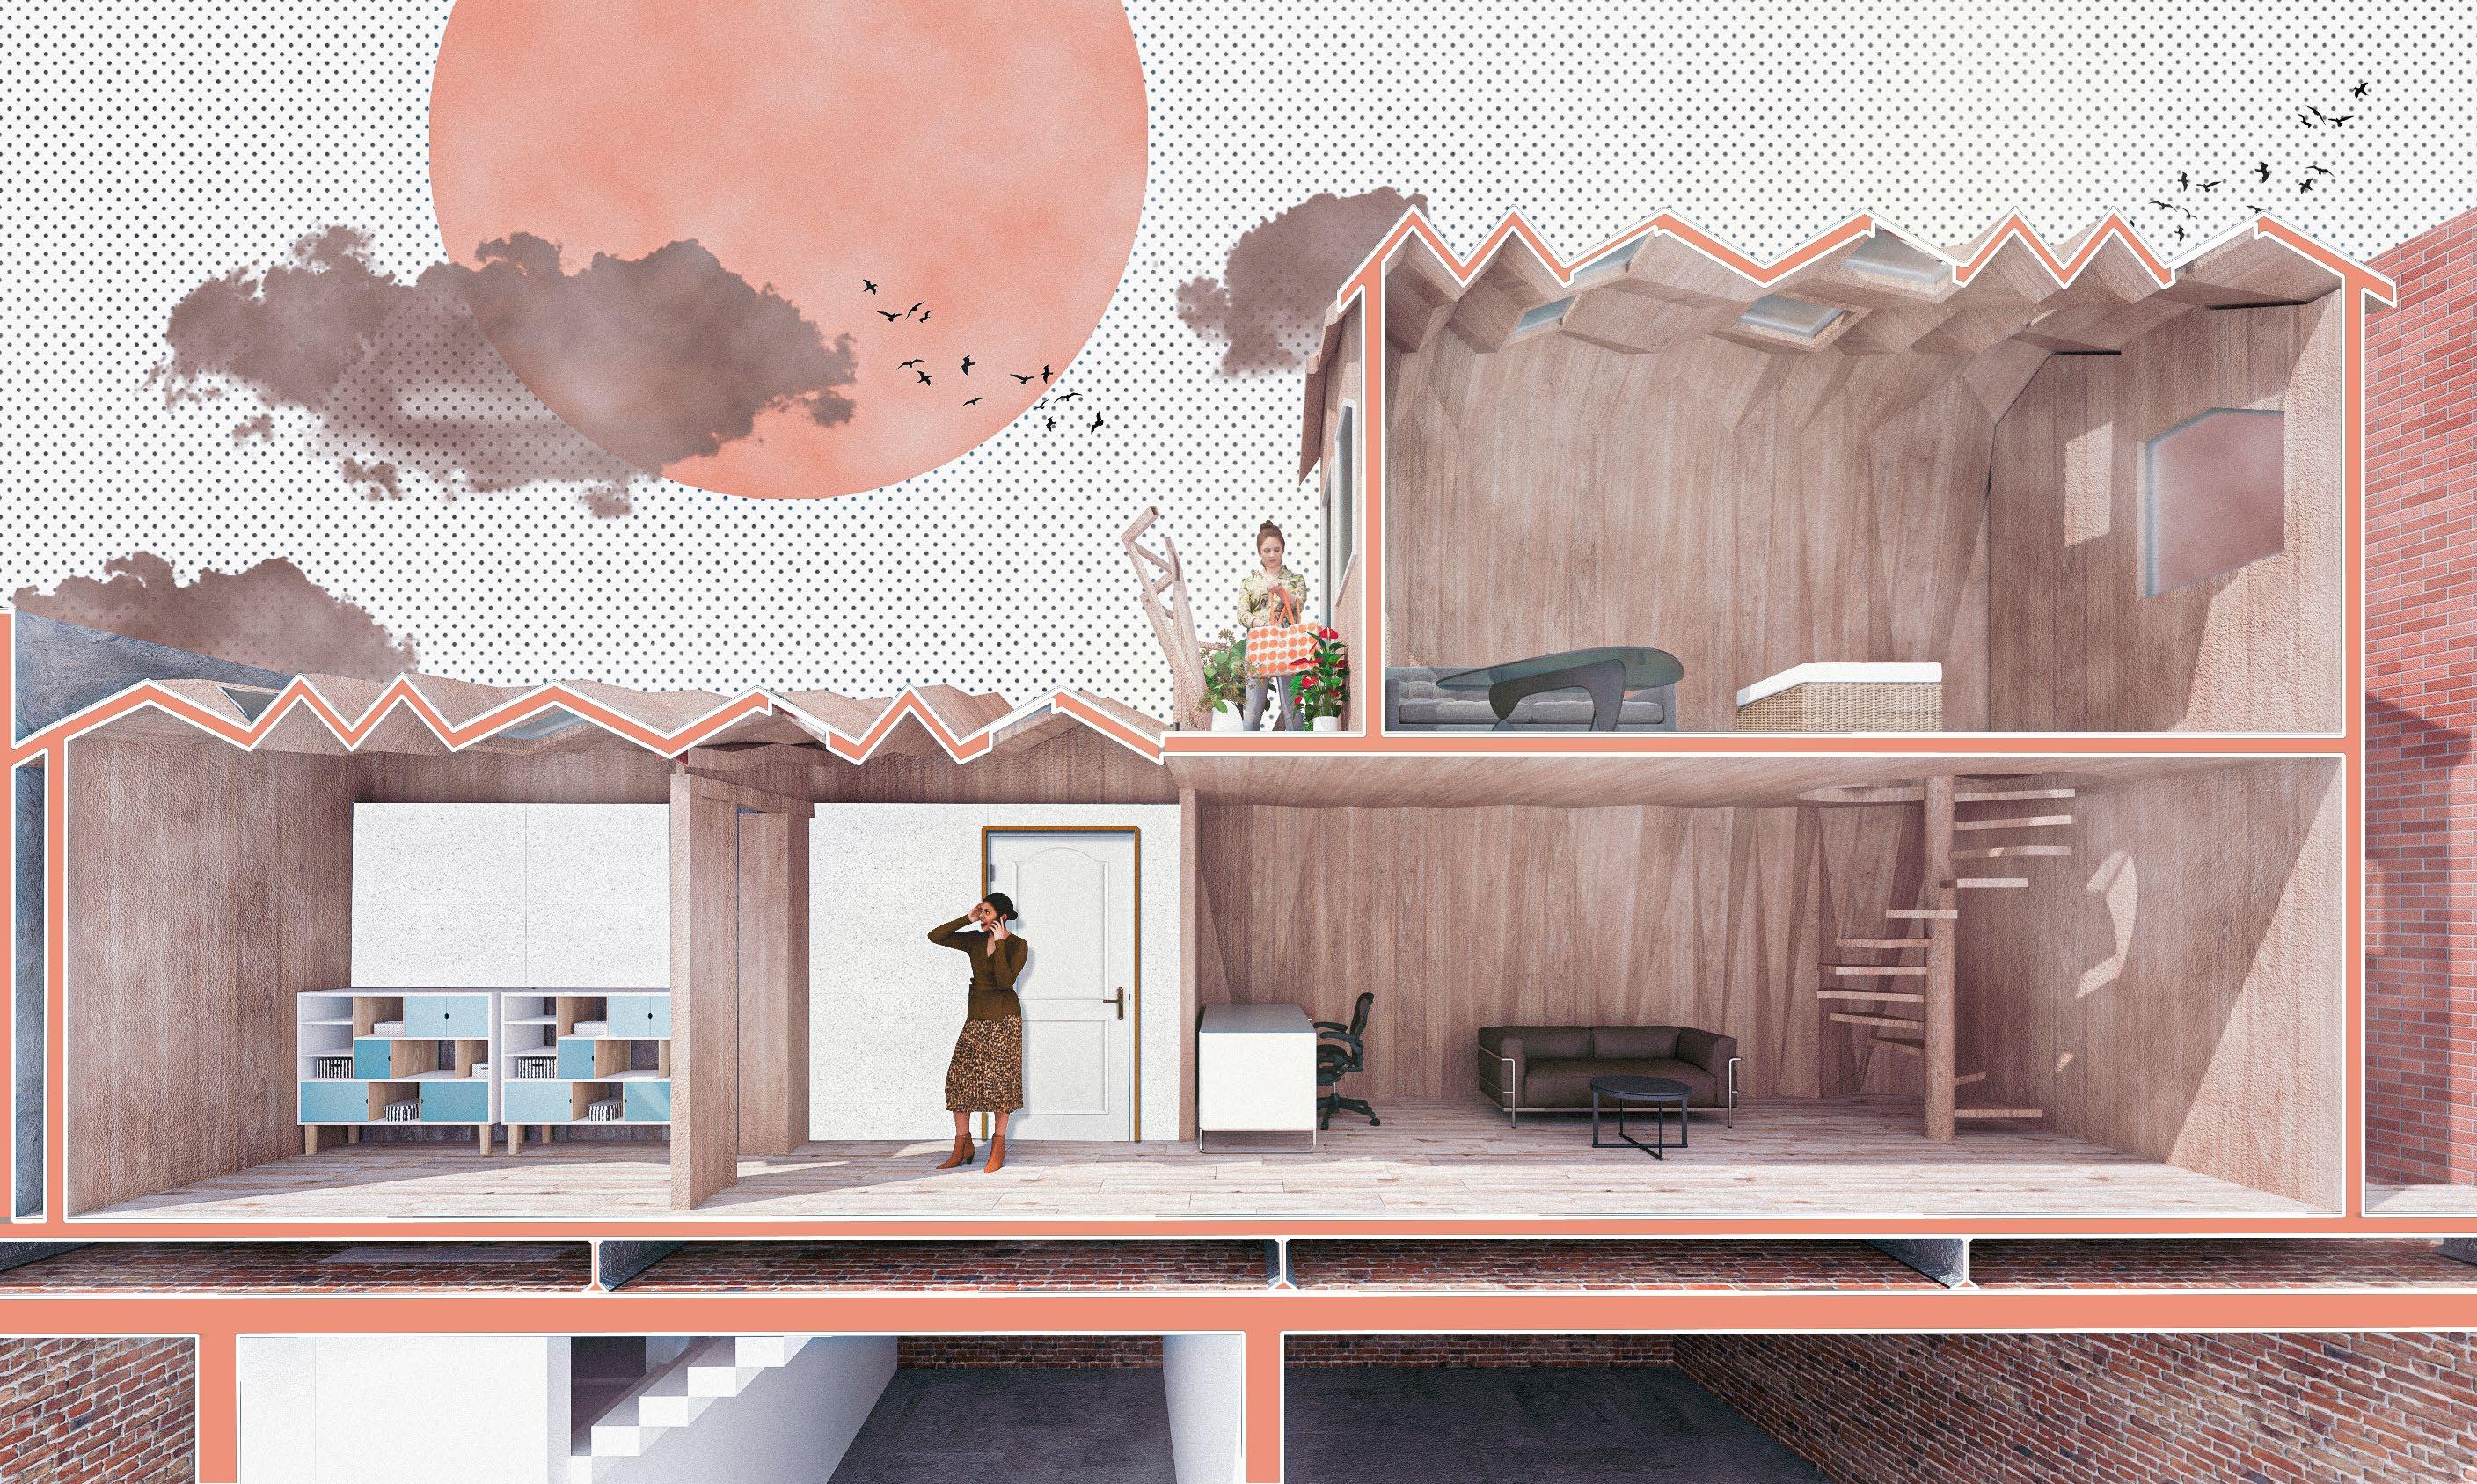
12
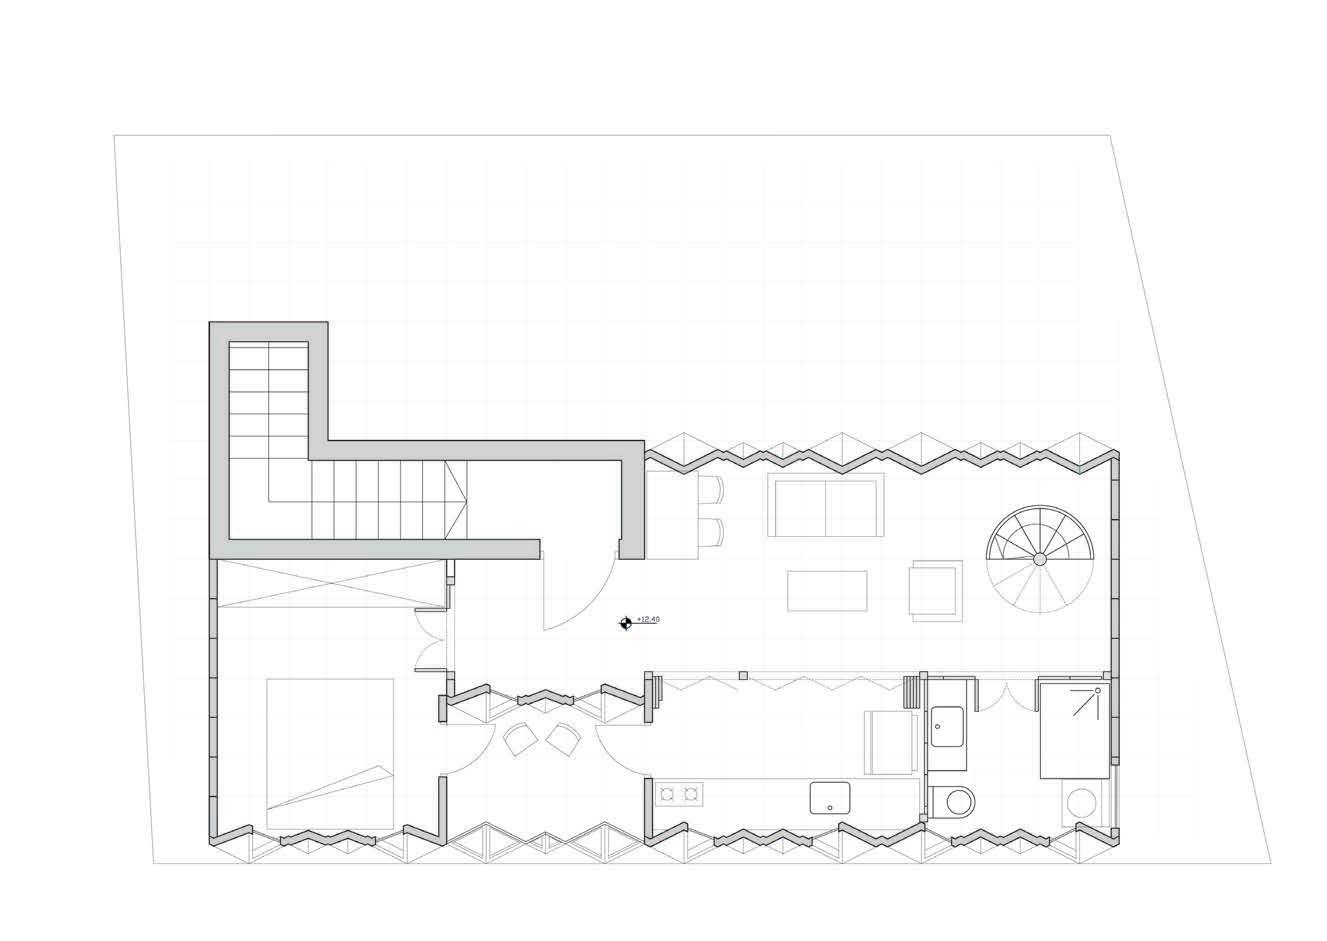
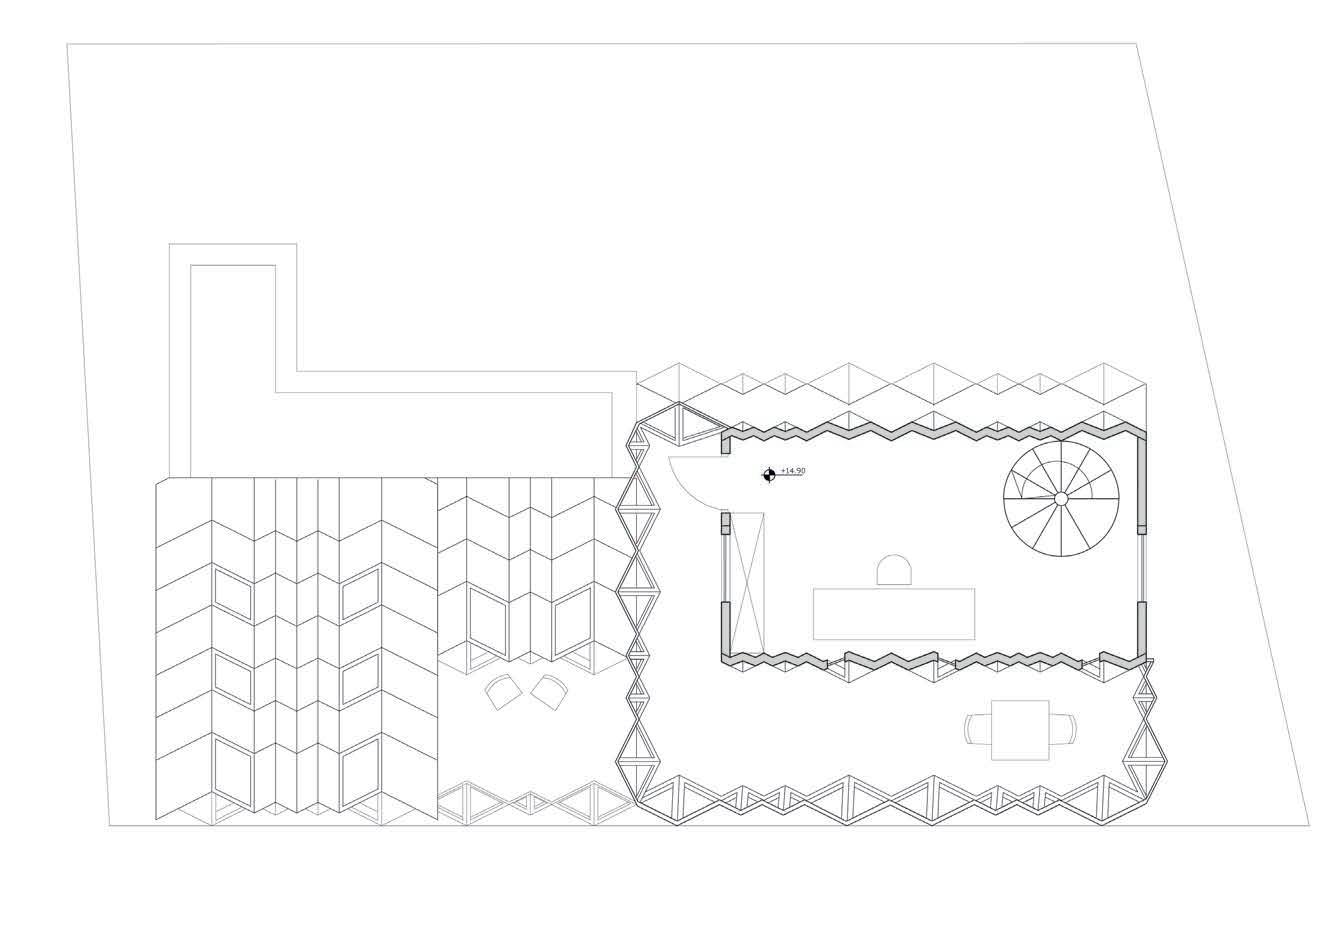
161 13 14 Diagram: seconed floor plan Diagram: first floor plan 13 14
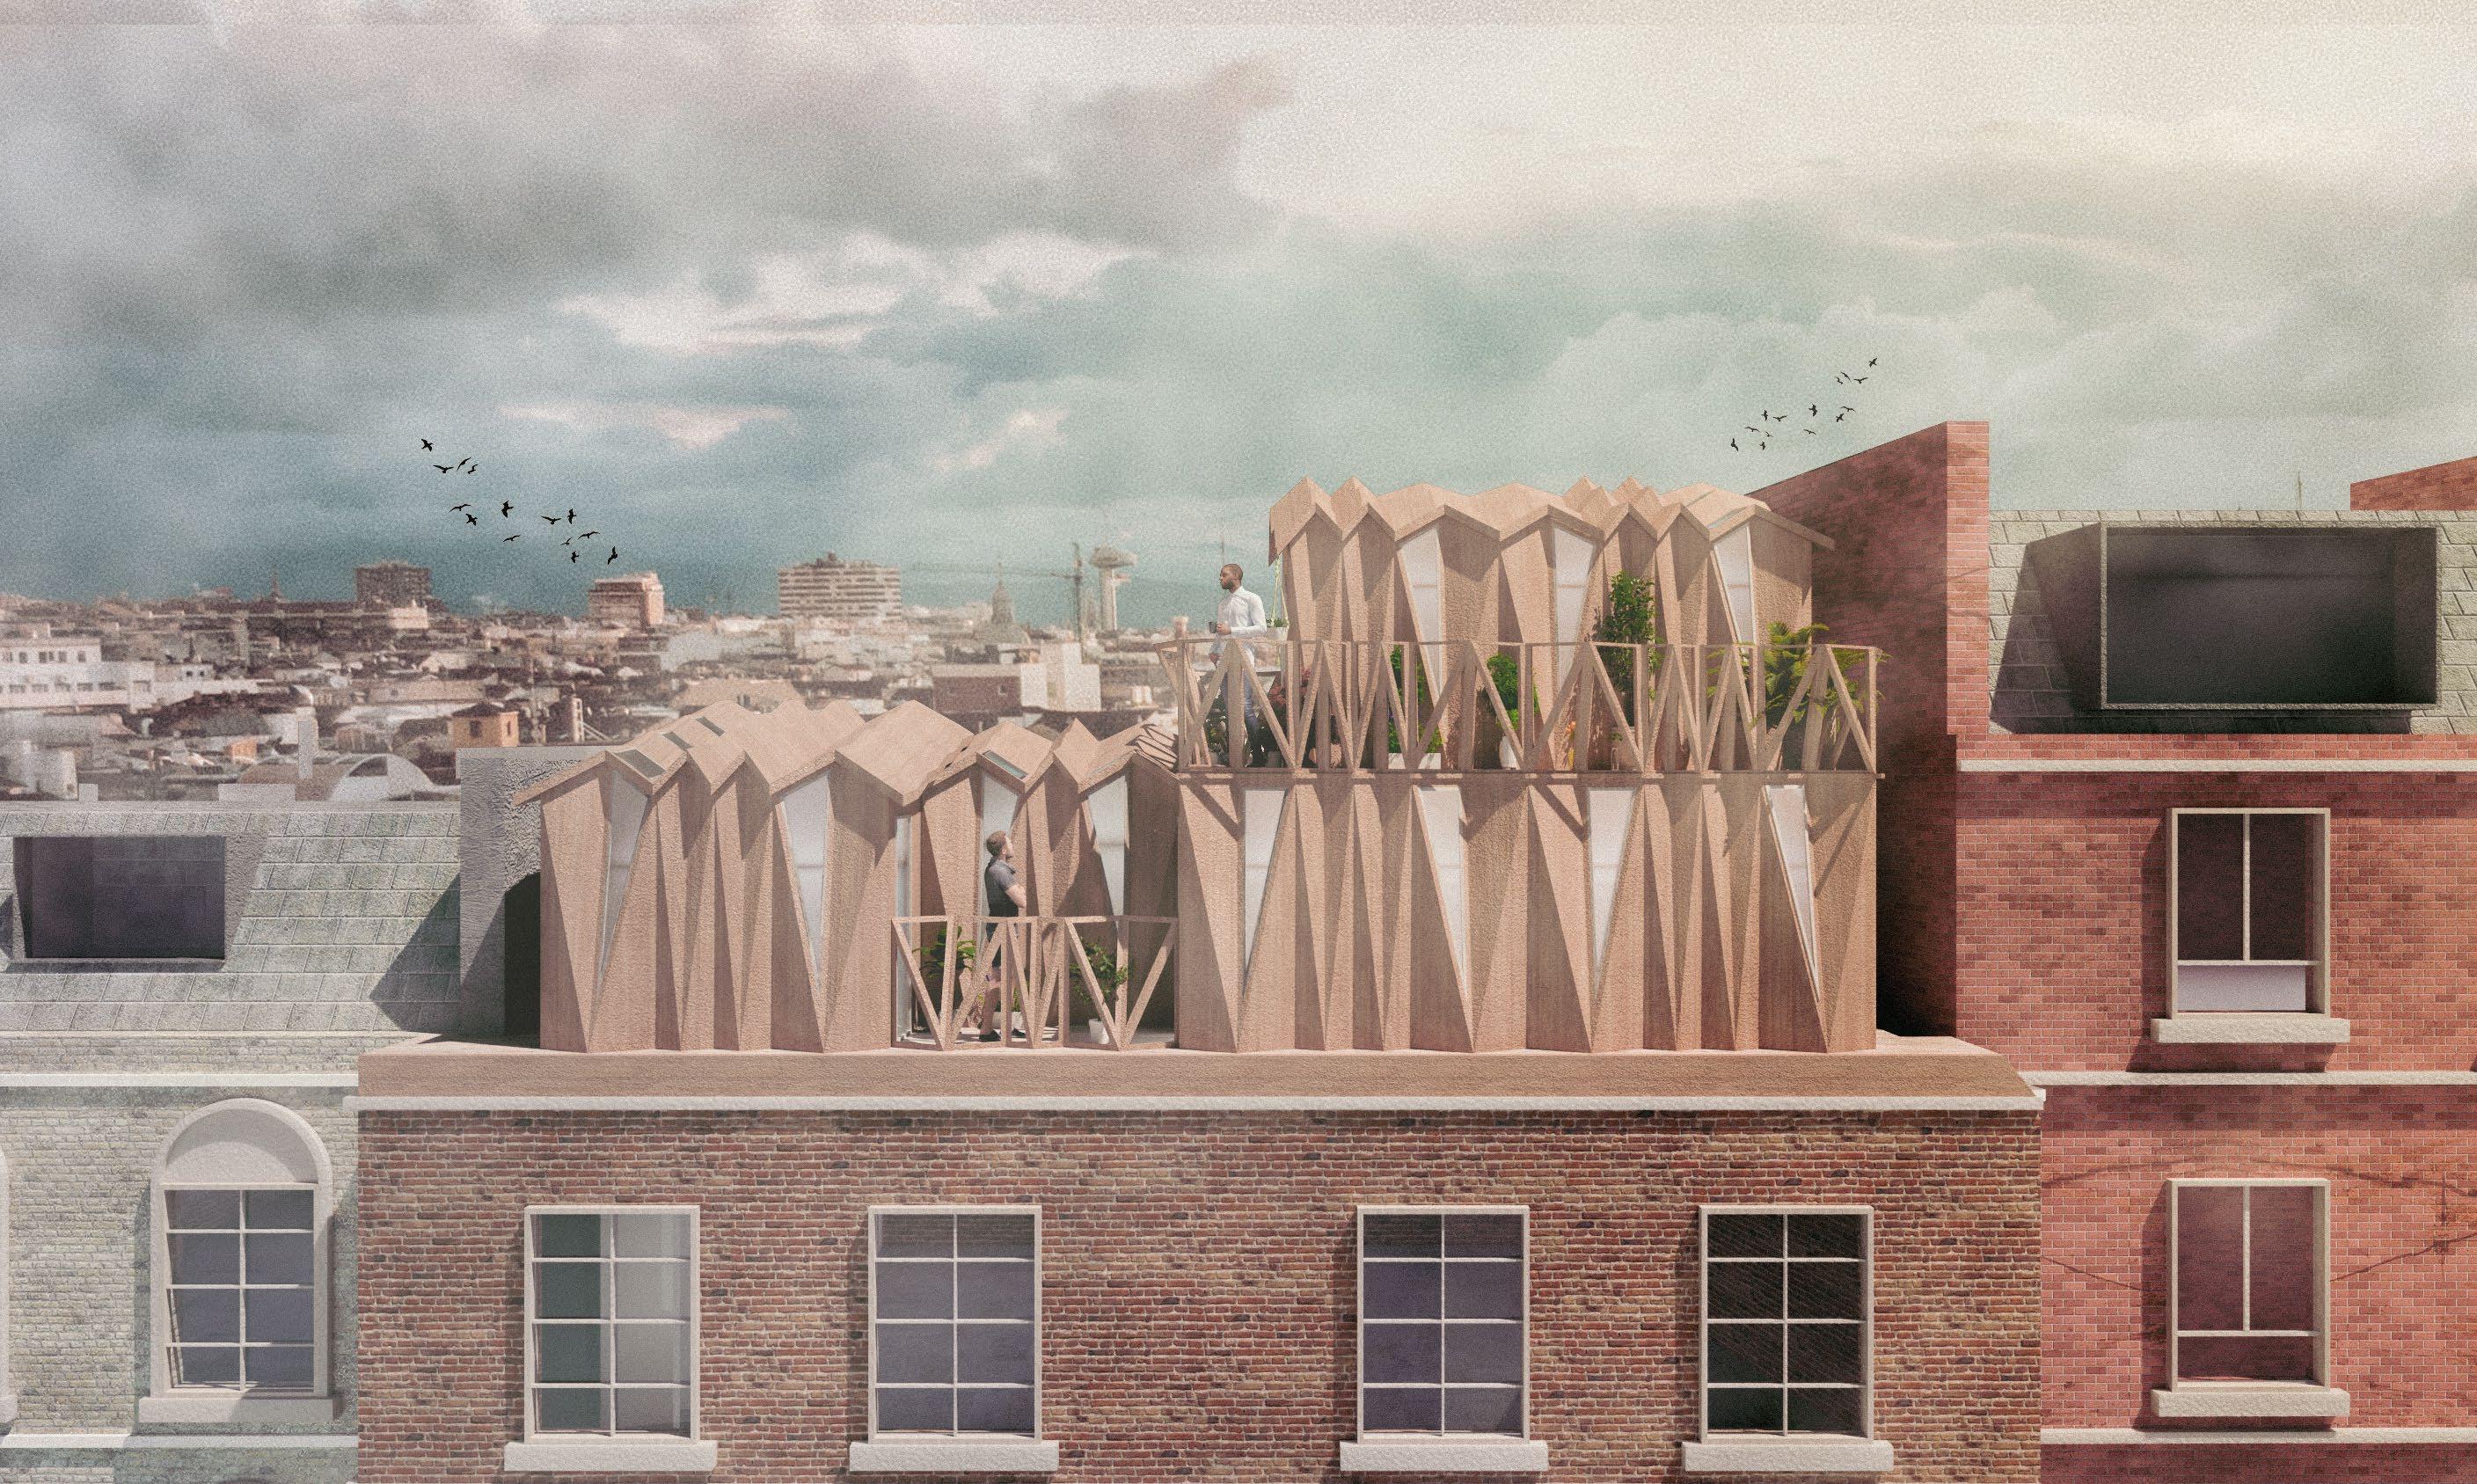
15
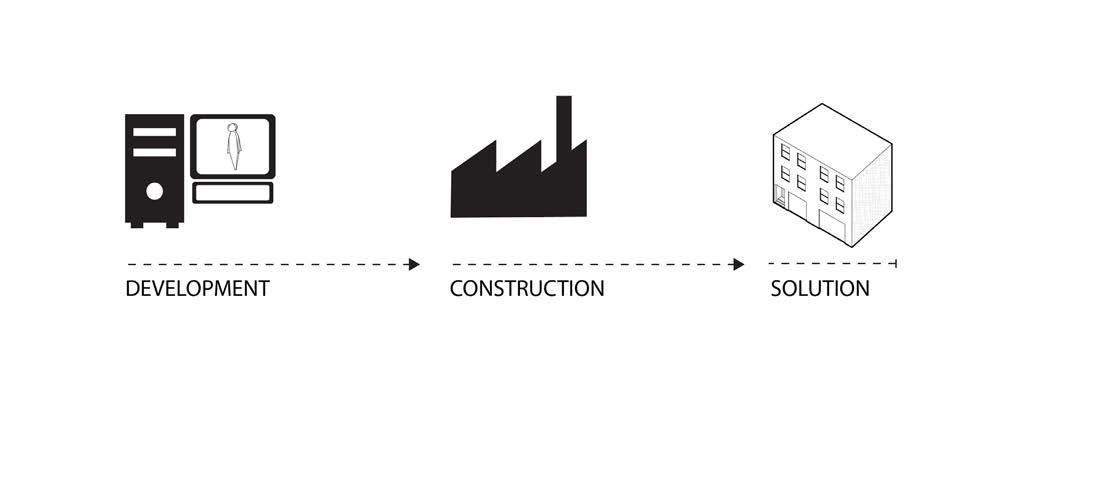
EVOLVING LIFE CYCLE
The conventional approach develops a unique solution for a single problem. However, this process cannot meet the needs of an ever-evolving urban context. For every case, a new solution must be developed, and the accompanying construction methods have a detrimental climatic impact, due to material waste and high carbon emissions.
The research developed in this dissertation proposes a new strategy for distributed mass housing to be built with the ability to change and evolve over time. With the development of a timber kit-of-parts, this study proposes a low-waste, fast-programmable and cost-efficient approach. Furthermore, the proposed system allows for variation and customisation throughout the time of use. For instance, a young couple who bought this system may want to expand their home with the arrival of a child. As their needs change, so do their spatial needs. The developed system allows these users to order more parts and expand their home to meet their new requirements. If the users decide to move, the parts can be returned to the company and stored until they are redeployed in an entirely new site for a new group of users, thus forming a circular construction system.
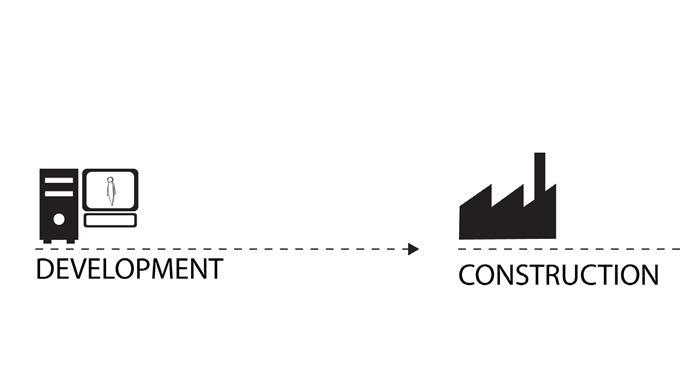
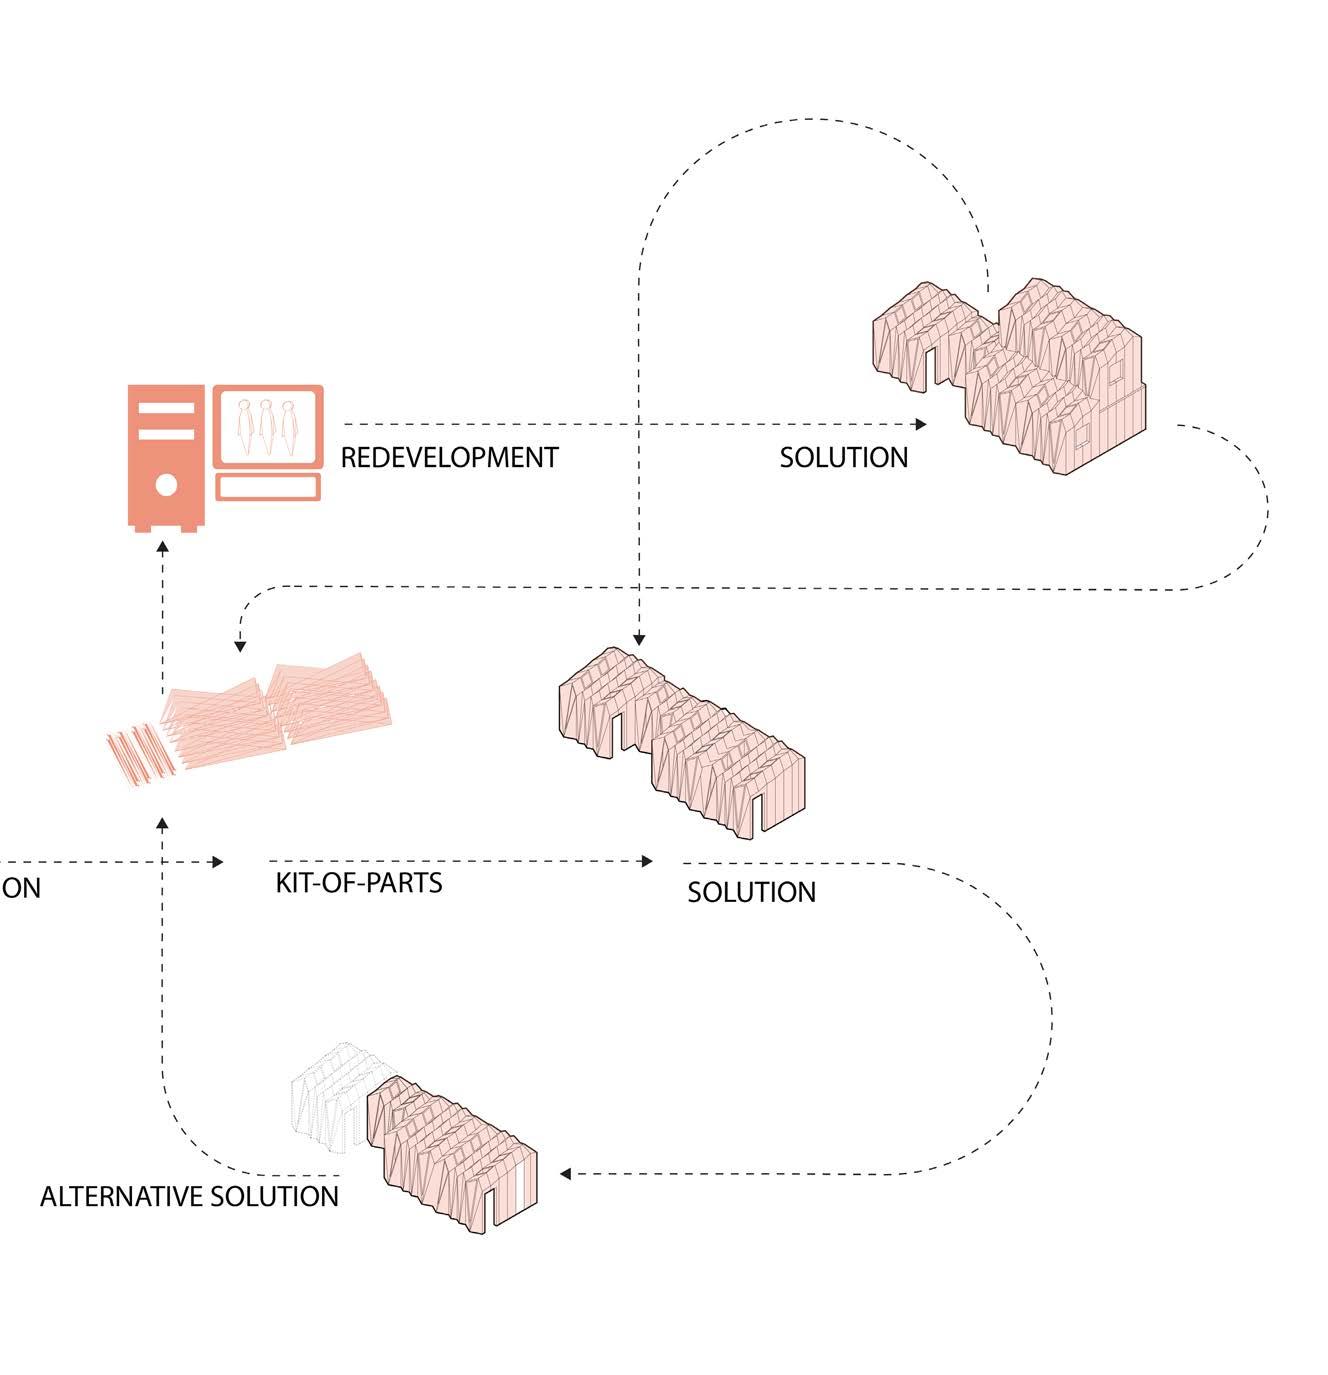
165
LIFE CYCLE NEW DEVELOPMENT 05_4 15 16 Diagram: traditonal life cycle Rendering: front view of a potentail appartment
17 Diagram: intended life cycle 16 17
SUMMARY 05_5
The design and the system presented in this section serve as an example to test the proposed building strategy and to effectuate this novel design and construction strategy. Through the detailing of this rooftop expansion, the execution of the presented building framework and the living experience pertaining to the proposed system were showcased. The architectural design development served to illustrate the finalised outcome of this study
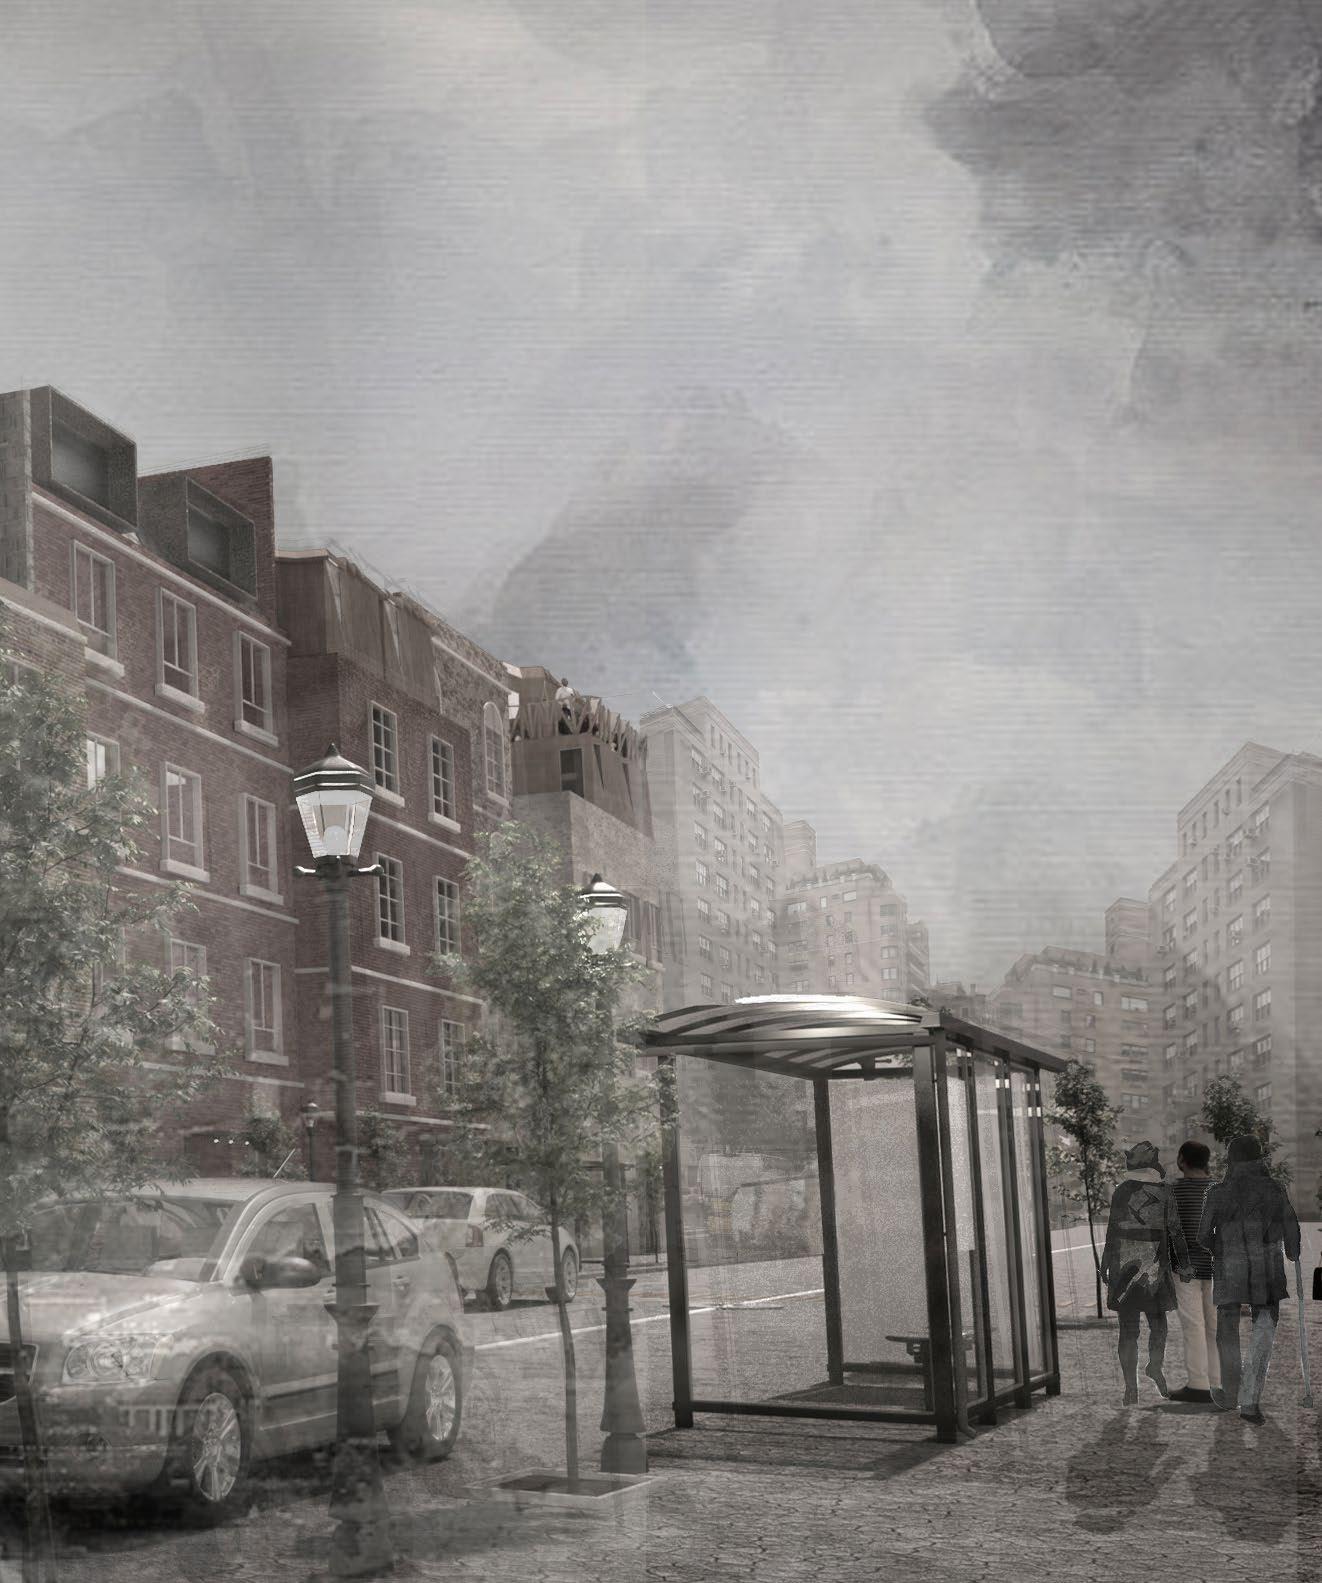
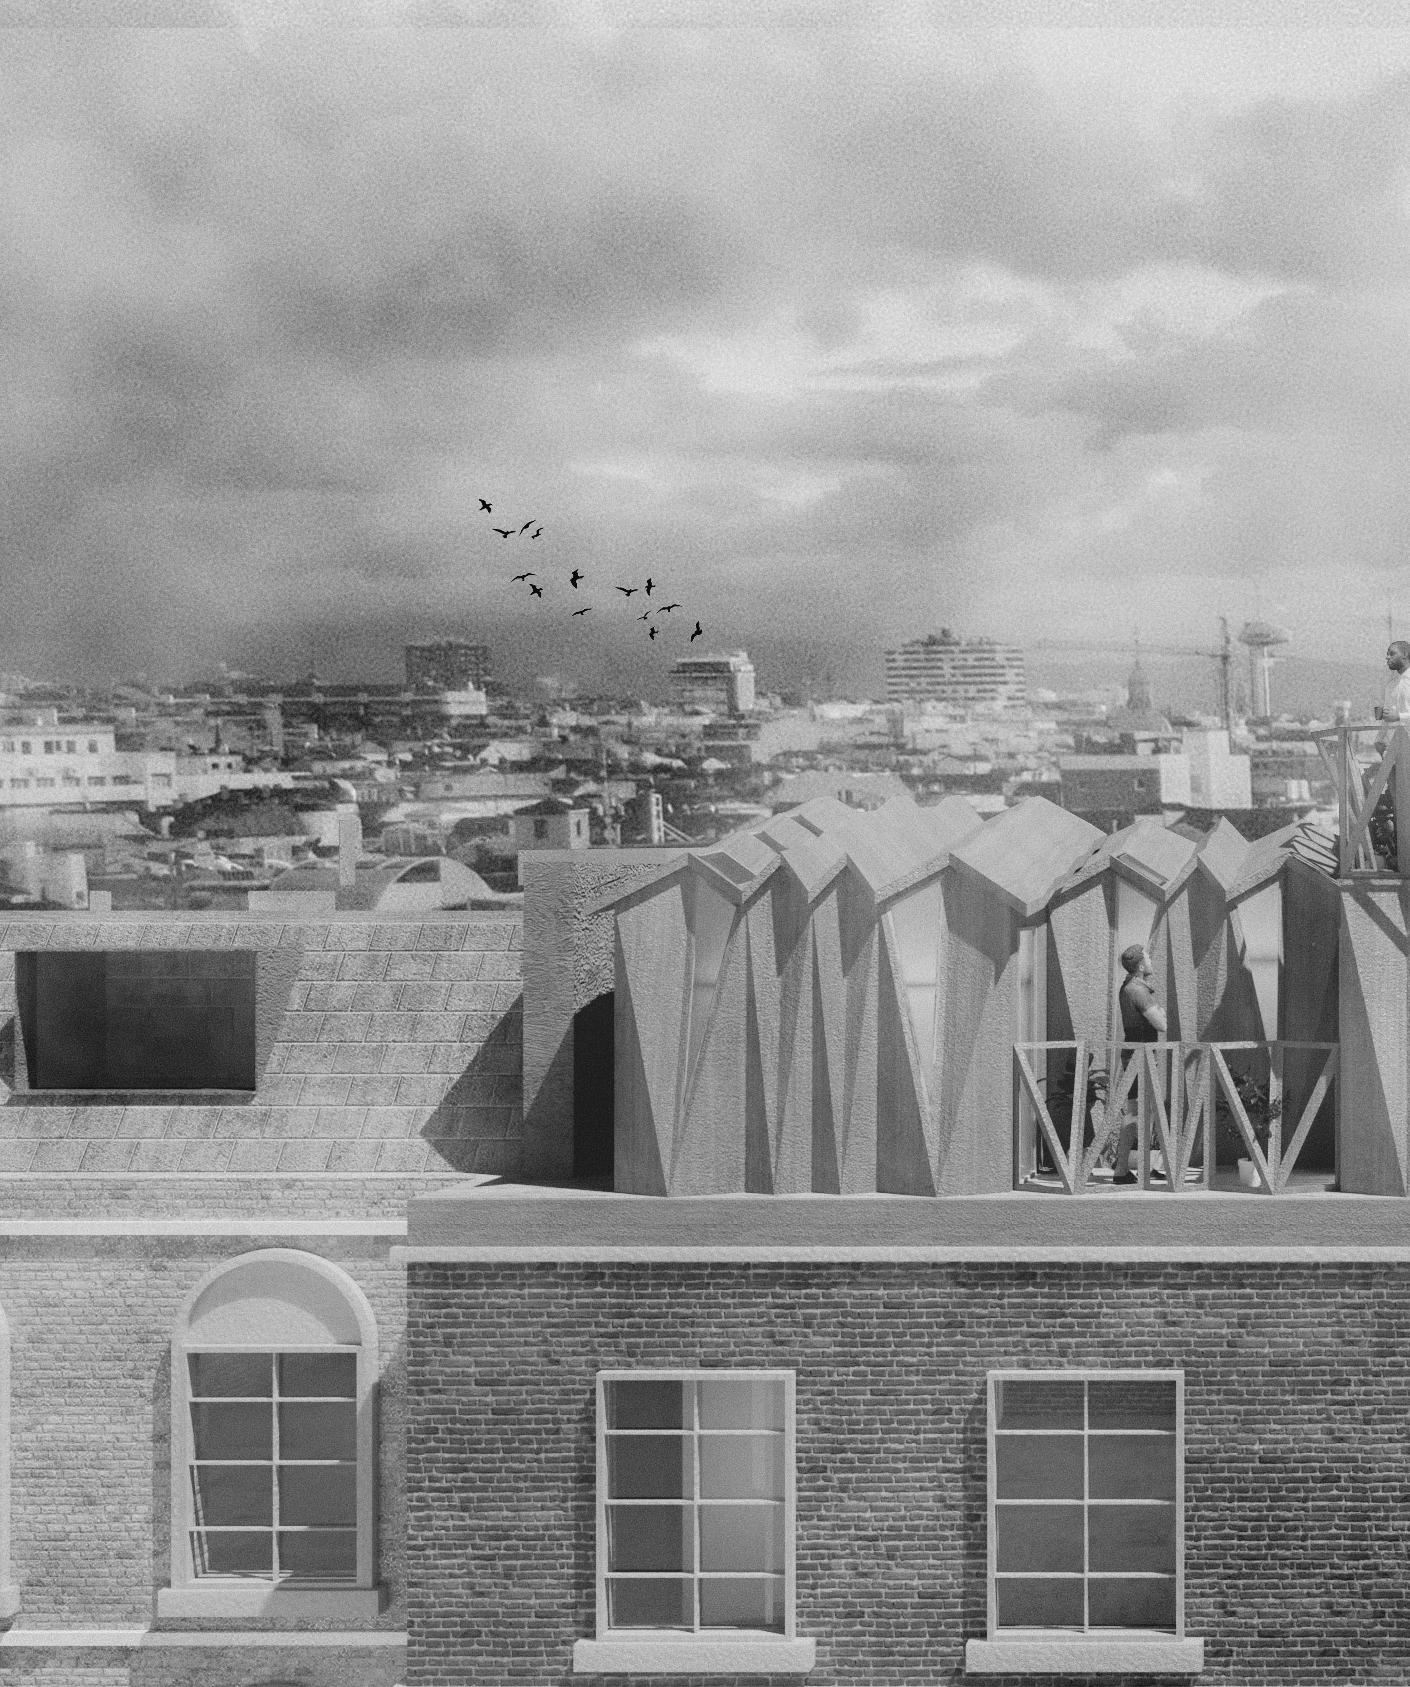
CONCLUSION
Throughout this study, a novel strategy was proposed to convert the underutilised interstitial spaces on rooftops into affordable housing for young professionals to mitigate London’s housing crisis. First, a configurator was developed to analyse all rooftops in the area and generate site-specific plans for each rooftop, based on the needs of the particular users. Along with the configurator, a timber kit-of-parts was designed, allowing for a modular yet customizable building system on a mass scale. This kit-of-parts was designed to be deployable for ease of transportation and assembly, and its design was inspired by origami folding techniques. By creating site-specific strategies, coupled with the efficiency and scalability of the kit-of-parts approach, it was demonstrated that the proposed system can provide mass affordable housing throughout the city’s rooftops without destroying the urban fabric.
169
06
CRITIQUE
The material research conducted for this study consisted of paper folding explorations, computational modelling of origami shell structures, and material prototyping using robotic fabrication.
Various challenges emerged during the material prototyping experiments. Firstly, the thickness of the deployable panels presented several issues. The wall thickness that was necessary to obtain the recommended U value of 0.032 W/m2K in London was 11 cm. However, the prototype could not be folded if this thickness was applied, so it was decided that the deployable section of the wall would only be the 5 cm thick plywood panels and the necessary climatization layers would be applied to the thin shell once it was deployed. To overcome this challenge, the scaling of origami folding should be further studied and experimented with.
Another issue was not having fully explored the potential of the PVC fabric acting as a hinge. Due to time limitations, the robotic fabrication experiments were conducted before the design of the prototype was finalised. In further research, the length of the PVC fabric between the panels and its relationship with the allowed folding angles can be studied and proposed as a detailed angle locking mechanism for deployable structures.
The robotic fabrication experiments also presented many challenges along the way. Firstly, the high tensile strength of the PVC fabric, which was the main reason it was chosen for the prototype, required higher pressure from the needle for the puncture, and would therefore deform the needle. Additionally, the sharp edges of the laser-cut holes on the plywood panels would tear the nylon thread during sewing. In further experimentation, both the needle and the thread must be replaced by stronger ones.
Moreover, the end-effector must be replaced for future studies. Due to the speed of the grip, the alignment of the needle would be altered, and calibration issues would arise. Although rubber shock absorbers and abrasive sheets were applied to the gripper, the needle alignment would continuously deviate from the target and the system had to be recalibrated. These calibration issues also resulted in a very long fabrication time. The challenges that emerged during the robotic fabrication process can be addressed for further development by developing the custom end-effectors and needles with higher precision and performance. The design of these pieces is an area that requires experimentation in itself.
The computational research conducted in this study consisted of plan generation explorations, morphological explorations for origami-inspired shell structures, and the development of a kit-ofparts.
In the plan generation experiments employing topological networks, there were several challenges that need addressing. Although the second experiment functioned well as predicted, the generated plans could not be used in the following stages. The main issue was that these plans were generated independently from the implementation sites, i.e. rooftops, and therefore would not fit into the sites. In further research, this problem can be solved by modifying the algorithm to generate the plans on the sites, using the grid laid on the rooftops for the aggregation of the spaces. Another method for resolving this challenge would be developing an algorithm that generates a myriad of possible options, then analyses the sites’ dimensions and finds the appropriate plan for that site. This type of solution would require a deep learning algorithm to be developed, that recognises plans and sites.
Another set of issues was regarding the kit-of-parts. Although the kit was developed to be easy to build using regular tools and fast to assemble by means of basic connections, it consisted of a very high number of parts, which may render the real-life implementation of the proposed building system complicated. To address this issue, one of the approaches that can be taken is to decrease the amount of variation in the morphologies. Although the use of standard dimensions and a grid of 50x50 cm was adopted from the offset of the morphological explorations, the variation in sizes of spaces and the complex geometries generated by the origami folding patterns engendered many custom parts for the kit. Accordingly, a more bottom-up design approach can help resolve this problem, by designing a limited set of parts that allow for various connections and aggregations. Thus, instead of generating morphologies with high variation and extracting their constituent parts, the connection type of the parts can generate the variation in the output morphologies.
The second challenge was related to the way origami folding techniques were used for the development of the morphologies. The folding patterns were directly translated into architectural forms, which limited the explorations severely. Moreover, the envelopes could only be designed unidirectionally with the studied patterns, further limiting the forms. Due to the particular geometry of the Miura-Ori pattern, the roofs could not be joined to other folding patterns on the sides. This was one of the reasons why flat side walls were used to create closed building envelopes. Another reason was to decrease the loss of space caused by the structural depth of the deployable walls, given that flat wall panels would only reduce the size of the interior space as much as their thickness. However, the folding angles used for the Yoshimura patterns to gain structural rigidity on the front and back walls generated a structural depth of 25 cm. This number would rise to approximately 36 cm when combined with the thickness necessary for the façade layers, decreasing the size of usable space within the envelope. Thus, for further research, different folding patterns and their combinations must be explored for generating better-performing envelopes. Additionally, the leap from small-scale paper folding experiments to computationally modelled large-scale building envelopes caused many of the issues faced in the morphological and prototyping experiments. Therefore, mid-scale prototyping is imperative to develop an understanding of the spaces and morphologies.
Finally, the final morphology developed as a demonstrator of the proposed strategy lacked spatial and visual connection with its context. The proposed system did not consider the qualities of the existing buildings on which the new expansions are built: their design is independent of context. Furthermore, although there is great variation among the proposed design options, they share the same distinct architectural language. And although the designs are site-specific, the main parameters derived from the site are the location and the site dimensions. So, for further development, the spatial, visual, material and spatial qualities of the new designs can be more site-specific and be determined by the architectural environment they are placed in.
171
MATERIAL RESEARCH 06_1 CRITIQUE MORPHOLOGICAL RESEARCH 06_2
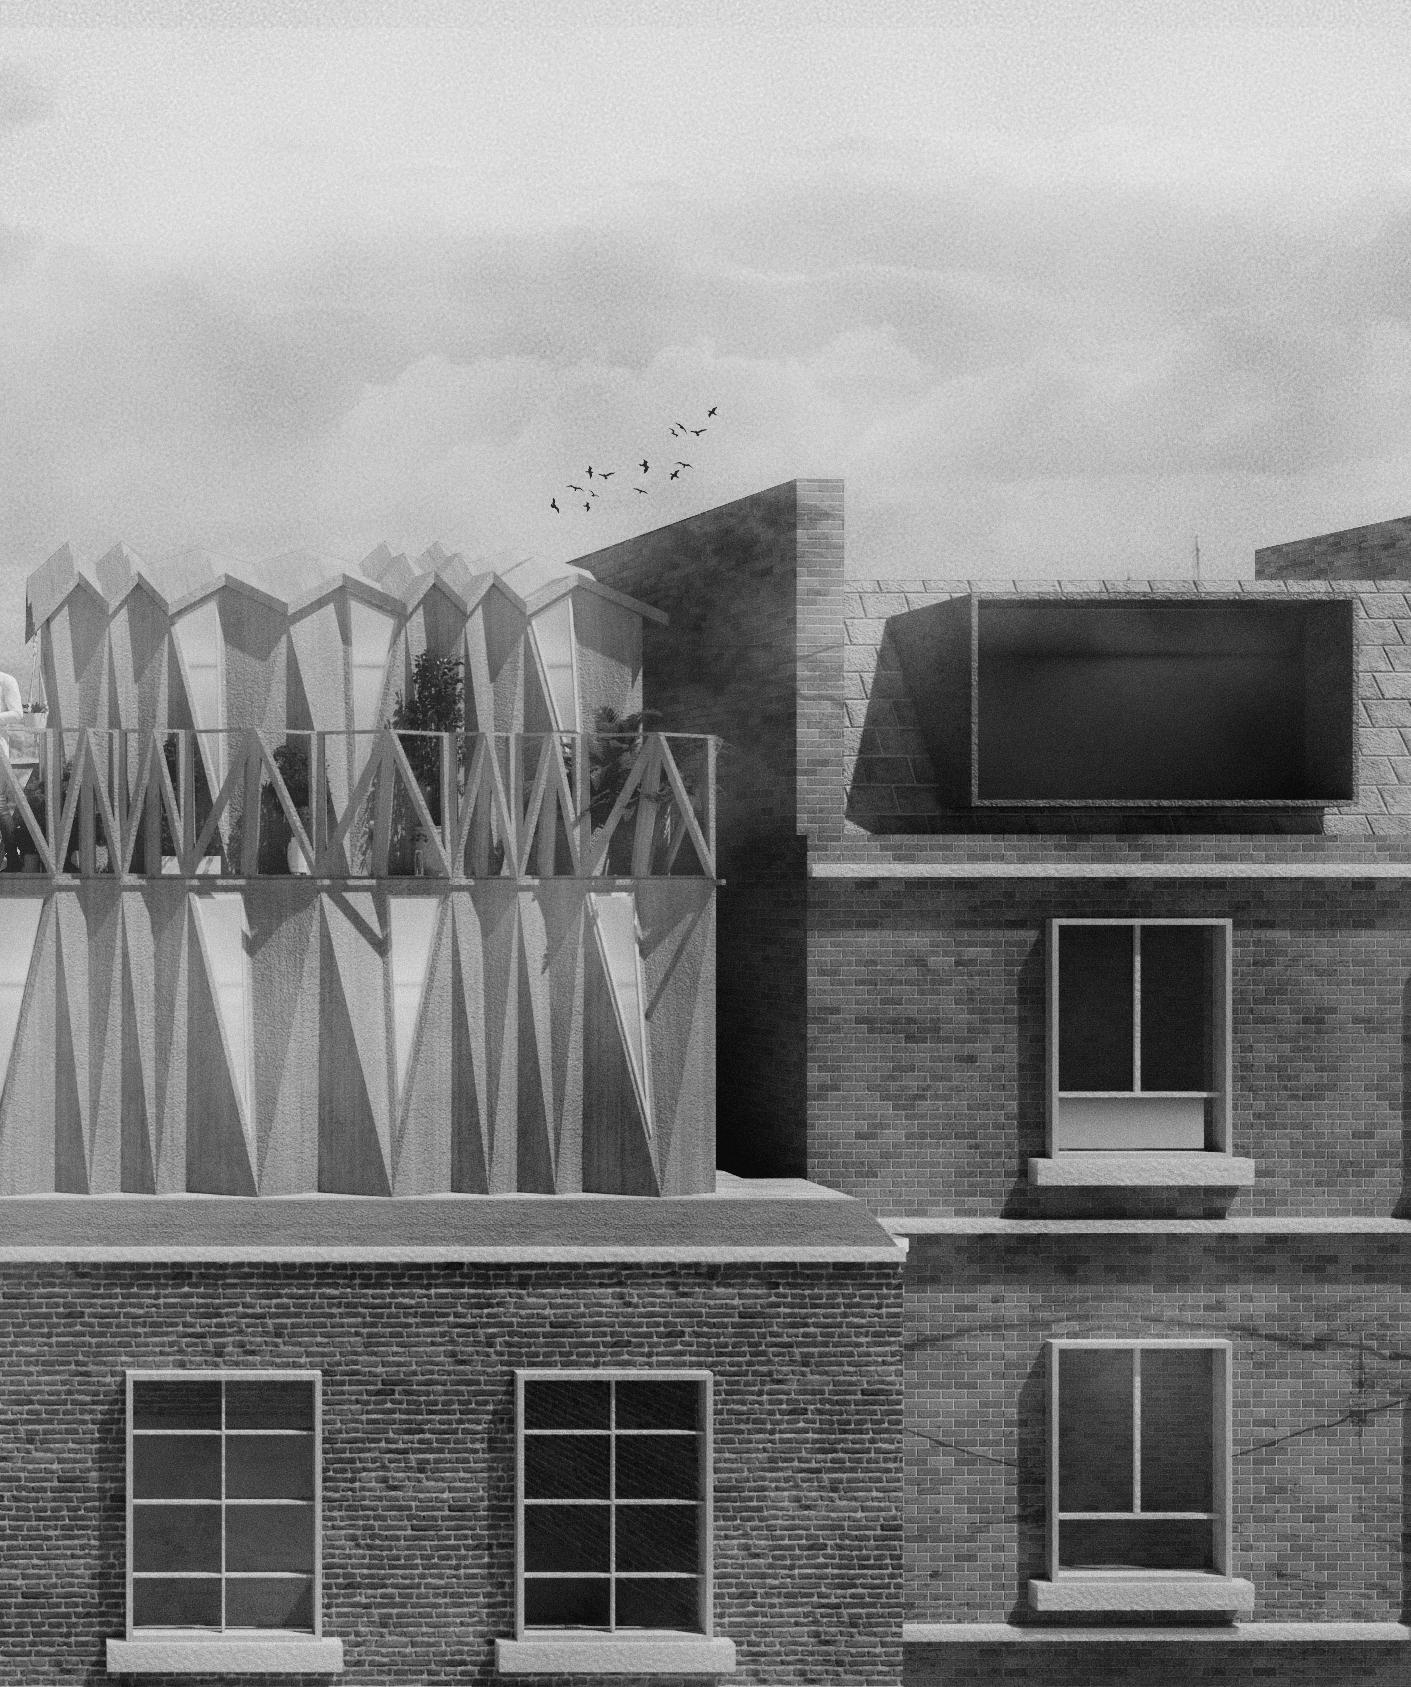
BIBLIOGRAPHY
Bart, István László. ‘Urban Sprawl and Climate Change: A Statistical Exploration of Cause and Effect, with Policy Options for the EU’. Land Use Policy, Forest transitions, 27, no. 2 (1 April 2010): 283–92. https://doi.org/10.1016/j. landusepol.2009.03.003.
Brütting, Jan, Gennaro Senatore, and Corentin Fivet. ‘Design and Fabrication of a Reusable Kit of Parts for Diverse Structures’. Automation in Construction 125 (1 May 2021): 103614. https://doi.org/10.1016/j.autcon.2021.103614.
Buri, Hani, and Yves Weinand. ‘ORIGAMI – Folded Plate Structures, Architecture’, n.d., 8.
‘Chandos Way and Britten Close | RCKa’. Accessed 22 July 2022. https://rcka.co.uk/chandos-way-britten-close/.
‘Choosing between Wood, Concrete and Steel Structures’. Accessed 22 July 2022. https://www.ecohome.net/ guides/1010/how-wood-structures-compare-to-steel-and-concrete/.
Chris Rogers. How To Read London. London: Ivy Press, 2017.
UKGBC - UK Green Building Council. ‘Climate Change’. Accessed 22 July 2022. https://www.ukgbc.org/climatechange-2/.
Colin Marrs. ‘Can Rooftop Extensions Help Solve the Housing Crisis?’ Architects’ Journal, 26 March 2018. https://www. architectsjournal.co.uk/news/can-rooftop-extensions-help-solve-the-housing-crisis.
Lipton Plant Architects. ‘COMMERCIAL Archives’. Accessed 22 July 2022. https://lparchitects.co.uk/project-type/ commercial/.
Edward Denison. 30-Second London. London: Ivy Press, 2017.
‘Families and Households in the UK - Office for National Statistics’. Accessed 22 July 2022. https://www.ons.gov.uk/ peoplepopulationandcommunity/birthsdeathsandmarriages/families/bulletins/familiesandhouseholds/2019.
Frank, Knight. ‘More than 40,000 New Homes Could Be Built on London’s Roofs - Knight Frank’. Accessed 22 July 2022. https://www.knightfrank.co.uk/blog/2017/11/15/more-than-40000-new-homes-could-be-built-on-londons-roofs.
Journal. ‘Free: Download a Construction Kit to Build Your Own “WikiHouse” - Architizer Journal’, 19 February 2019. https://architizer.com/blog/practice/materials/wikihouse-the-open-source-diy-home/.
Future of London 2011 Ltd. ‘Delivering Infill Development: A London 2050 Briefing Paper’. London: Future of London 2011 Ltd, January 2015. https://www.london.gov.uk/sites/default/files/gla_migrate_files_destination/Delivering-InfillDevelopment.pdf.
Gibbons, Andrea. ‘Future Brixton and Its Failure to Address the Affordable Housing Crisis’. Brixton Buzz (blog), 28 November 2014. https://www.brixtonbuzz.com/2014/11/future-brixton-and-its-failure-to-address-the-affordablehousing-crisis/.
‘GLA Projections Archive – London Datastore’. Accessed 22 July 2022. https://data.london.gov.uk/gla-projectionsarchive/.
Greater London Authority. ‘London Housing Strategy: Executive Summary’. Greater London Authority, May 2018. https://www.london.gov.uk/sites/default/files/2018_lhs_exec_summary_fa.pdf.
‘The London Plan’. City Hall, The Queen’s Walk, London: Greater London Authority, March 2021. https://www.london. gov.uk/sites/default/files/the_london_plan_2021.pdf.
‘The London Plan 2016’. London: Greater London Authority, March 2016. https://www.london.gov.uk//what-we-do/ planning/london-plan/past-versions-and-alterations-london-plan/london-plan-2016.
Greevenbroek, Sjoerd L van. ‘FOLDING STRUCTURES: DEVELOPING A NEW METHOD USING THE PRINCIPLES OF ORIGAMI AND CNC MILLING.’, n.d., 14.
Harris, John. ‘The End of Council Housing’. The Guardian, 4 January 2016, sec. Society. https://www.theguardian.com/ society/2016/jan/04/end-of-council-housing-bill-secure-tenancies-pay-to-stay.
Hill, Dave. ‘London Housing Crisis: “reverse Brain Drain” Ahead?’ The Guardian, 26 September 2014, sec. UK news. https://www.theguardian.com/uk-news/davehillblog/2014/sep/26/london-housing-crisis-reverse-brain-drain-ahead.
‘Historical Buildings & Houses in Camden - Knight Frank (UK)’. Accessed 16 September 2022. https://www.knightfrank. co.uk/residential/age-of-housing-stock-in-london/camden.
London City Hall. ‘Homes for Londoners: Affordable Homes Programme 2016-2023’, 22 November 2016. https://www. london.gov.uk//what-we-do/housing-and-land/homes-londoners-affordable-homes-programmes/homes-londonersaffordable-homes-programme-2016-2023.
‘Housing Futures: The Vital Role of Home in Young People’s Futures’. Twickenham: MTVH Metropolitan Thames Valley Housing, 9 February 2022.
‘Housing in London - The Evidence Base for the Mayor’s Housing Strategy - London Datastore’. Accessed 22 July 2022. https://data.london.gov.uk/dataset/housing-london.
Howard, Laura. ‘House Prices – Latest News’. Forbes Advisor UK. Accessed 22 July 2022. https://www.forbes.com/uk/ advisor/personal-finance/2022/07/20/house-prices-updates/.
Jason Clarke, Lyndsey Cheshire Willis. ‘Halifax First-Time Buyer Review 2021’. Press Release. Halifax, 22 January 2022. https://www.lloydsbankinggroup.com/assets/pdfs/media/press-releases/2022-press-releases/halifax/20220122halifax-annual-ftb-review-2021.pdf.
Jessel, Ella. ‘Explainer: What Construction Materials Are in Short Supply, and How Is It Affecting Architects?’ The Architects’ Journal (blog), 31 January 2022. https://www.architectsjournal.co.uk/news/explainer-what-constructionmaterials-will-be-in-short-supply-in-2022-and-are-prices-still-going-up.
‘Jobs and Job Density, Borough - London Datastore’. Accessed 22 July 2022. https://data.london.gov.uk/dataset/jobsand-job-density-borough.
Trust for London. ‘London’s Population Age, London Poverty - Trust For London’. Accessed 22 July 2022. https://www. trustforlondon.org.uk/data/population-age-groups/.
Londontopia. ‘London’s Social History: The History of Public Housing in London’. Accessed 22 July 2022. https:// londontopia.net/culture/architecture/londons-social-history-the-history-of-public-housing-in-london/.
‘LUNARK’. Accessed 22 July 2022. https://saga.dk/projects/lunark.
London City Hall. ‘Mayor Vows to Protect “the Lungs of the Capital”’, 27 November 2017. https://www.london.gov.uk// press-releases/mayoral/london-plan-strengthens-safeguards-for-green-belt.
Michael John Hebbert, Hugh D. Clout, and Blake Ehrlich. ‘London | History, Maps, Population, Area, & Facts | Britannica’. In London. Encyclopedia Britannica, 24 August 2022. https://www.britannica.com/place/London.
Forest Research. ‘Origin of Wood Imports’. Accessed 22 July 2022. https://www.forestresearch.gov.uk/tools-andresources/statistics/forestry-statistics/forestry-statistics-2018/trade-2/origin-of-wood-imports/.
Trust for London. ‘Population Of London, London Population Growth - Trust For London’. Accessed 16 September
175
BIBLIOGRAPHY
2022. https://www.trustforlondon.org.uk/data/population-over-time/.
‘Ratio of House Prices to Earnings, Borough - London Datastore’. Accessed 22 July 2022. https://data.london.gov.uk/ dataset/ratio-house-prices-earnings-borough.
‘Roatán Próspera Residences – Zaha Hadid Architects’. Accessed 22 July 2022. https://www.zaha-hadid.com/ architecture/roatan-prospera-residences/.
Savills. ‘Savills UK | Residential Sites in London at Risk as Industrial Land Values Soar, Says Savills’, 22 June 2022. https://www.savills.co.uk/insight-and-opinion/savills-news/329995-0/residential-sites-in-london-at-risk-as-industrialland-values-soar--says-savills.
Šekularac, Nenad, Jelena Ivanovic-Sekularac, and J. Tovarovic. ‘Folded Structures in Modern Architecture’. Facta Universitatis, Architectura and Civil Engineering 10 (1 January 2012): 1–16. https://doi.org/10.2298/FUACE1201001S.
Sheila Ward. ‘Forestry Statistics 2021, Chapter 3: Trade’. The Research Agency of the Forestry Comission, 30 September 2021. https://cdn.forestresearch.gov.uk/2022/02/ch3_trade_fs2021-1.pdf.
Tachi, Tomohiro. ‘Geometric Considerations for the Design of Rigid Origami Structures’. In Spatial StructuresPermanent and Temporary, 13. Shangai, 2010.
London City Hall. ‘Tackling London’s Housing Crisis’, 30 August 2017. https://www.london.gov.uk//what-we-do/housingand-land/tackling-londons-housing-crisis.
Talora, Joe. ‘London Is “Epicentre” of Housing Crisis as 250,000 Await Council Homes’. Evening Standard, 13 October 2021. https://www.standard.co.uk/news/london/london-housing-crisis-sadiq-khan-council-homes-b960327.html.
Simply London relocation. ‘The Best Places to Live in London as a Young Professional’. Accessed 22 July 2022. https://simplylondonrelocation.com/knowledge-base/best-places-to-live-in-london-as-a-young-professional/.
Shelter England. ‘The Story of Social Housing’. Accessed 22 July 2022. https://england.shelter.org.uk/support_us/ campaigns/story_of_social_housing.
Dezeen. ‘“Timber Prices Going up Daily” in Europe Due to Ukraine War’, 17 June 2022. https://www.dezeen. com/2022/06/17/timber-shortage-ukraine-war-news/.
London City Hall. ‘What Is the Mayor Doing to Increase Council Housing for Londoners?’, 14 October 2019. https:// www.london.gov.uk//what-we-do/housing-and-land/council-and-social-housing/what-mayor-doing-increase-councilhousing-londoners.
LiFE Residential. ‘Which Is London’s Most Commutable Borough?’ Accessed 22 July 2022. https://liferesidential.co.uk/ news/which-londons-most-commutable-borough/.
‘WikiHouse’. Accessed 22 July 2022. https://www.wikihouse.cc/.
Dezeen. ‘Zaha Hadid Architects Unveils Roatán Próspera Housing Complex for Honduras’, 29 July 2020. https://www. dezeen.com/2020/07/29/zaha-hadid-architects-roatan-prospera-housing-complex-honduras/.
177

APPENDIX 07
179
This experiment was focused on the folding system implemented in the construction process. The structure extracted the form of the truss. Based on the triangle cross structure, it was more stable compared to the normal beams and columns. The locking mechanism was to cut the piece into trapezoidal form and touch with other elements edge to edge with rotation. The elements were supposed to be folded into a small size block. And it would be expended if it was going to be built.
But this structure had several limitations. Firstly, it could not hold the entire roof or the wall structure. The support system was based on a single tilted piece in each small region. Therefore, it was easier to be broken. Secondly, there were too many nodes in the system, which was complex for the construction process. Thirdly, the truss could not build any relationship with the spatial configuration. Therefore, the apartment could not be built without the space distribution.
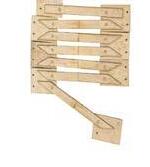
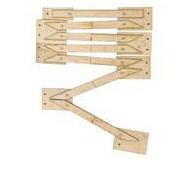
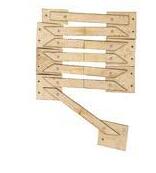
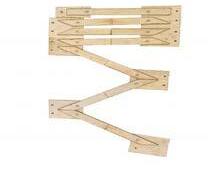
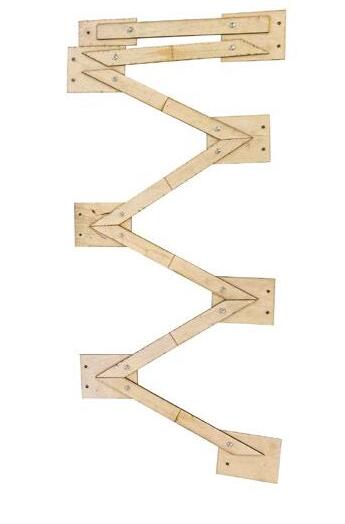
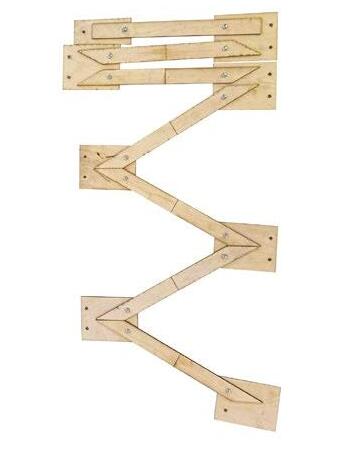
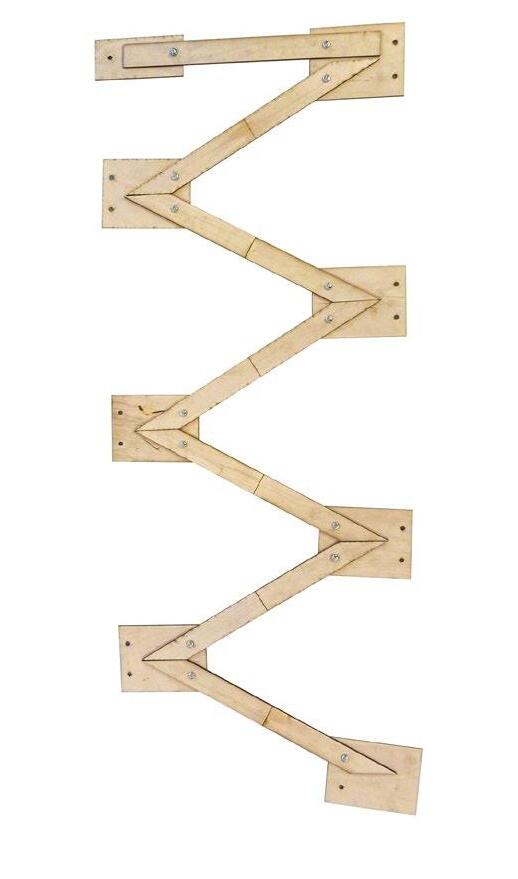
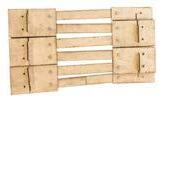
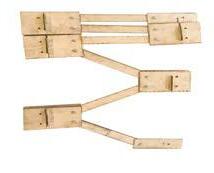
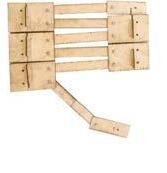
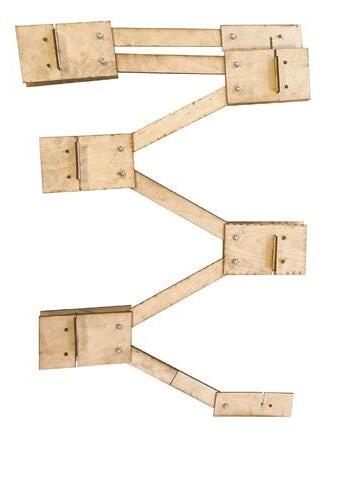
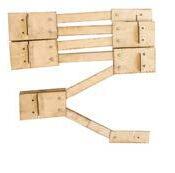
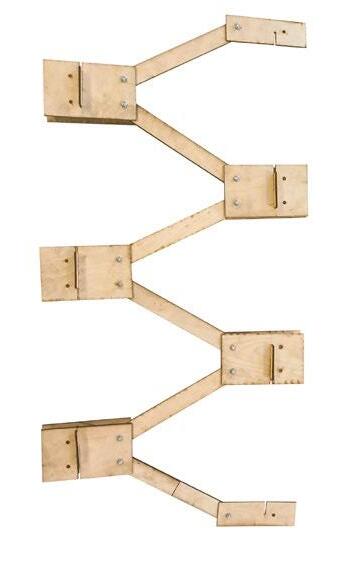
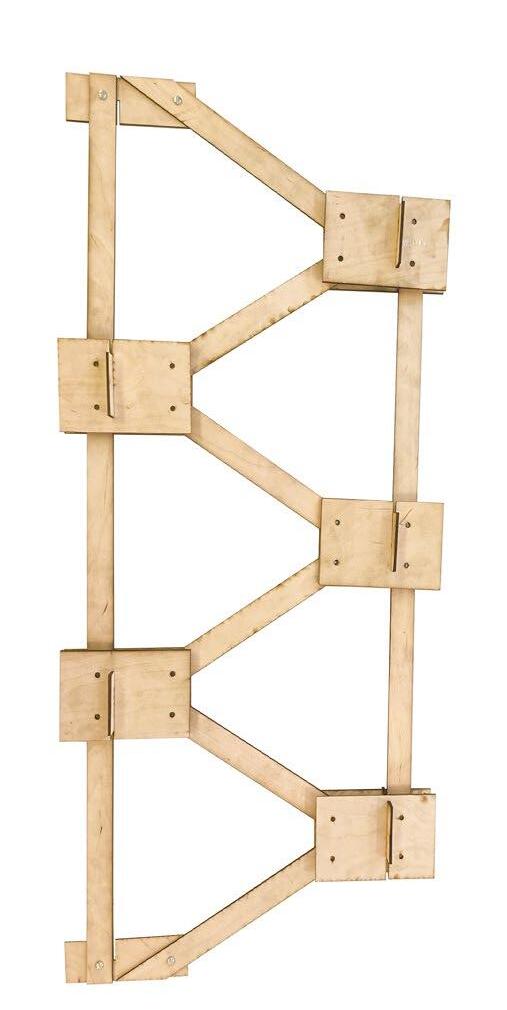
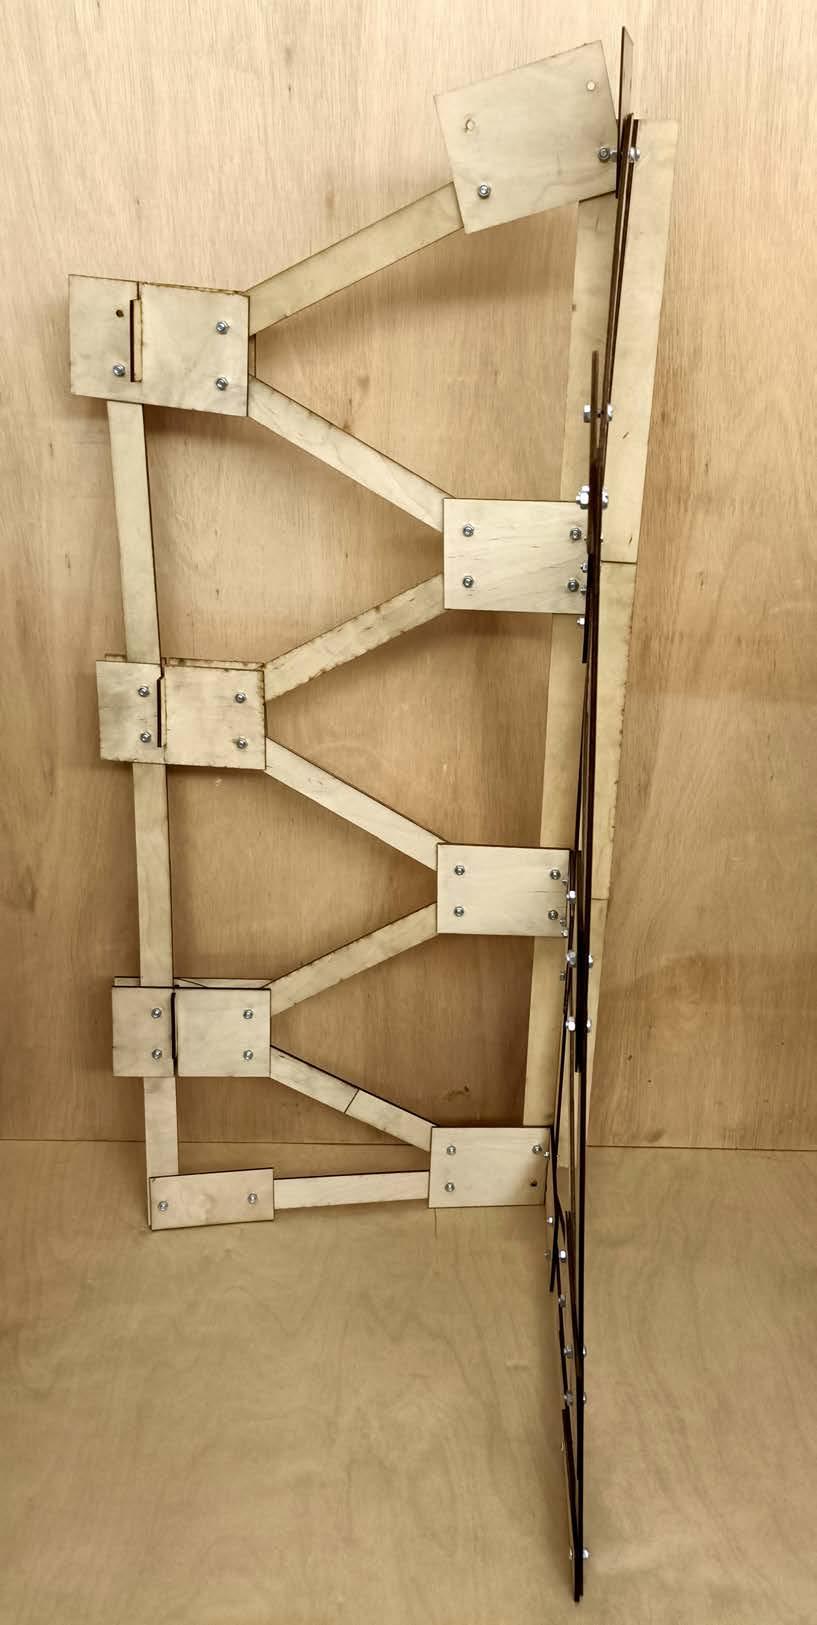
181
1 2 Image: seconed atemp at making a deploabal truss Image: first atemp at making a deploabal truss 3 Image of the seconed truss fully asembaled
OF THE TRUSS 1 2 3
EXPERIMENT
Ambition
To further develop the project, it was necessary to build an algorithm to generate the options for the spatial configuration. Based on the kit of part system, the dimension of the plan was supposed to be the modulus of the unit with 0.5 meters. After the implementation, the roof space was supposed to be divided into several apartments for young professionals. After this stage, the apartment space was going to be further divided for each functional room.
Experiment process
To further distribute the space, there was a method needed to be invoked to divide the roof space. For this experiment, the algorithm was developed by C# language through the iterations. The algorithm split the surface into multiple squares whose dimensions were 0.5 meters by 0.5 meters and get the edge points. Based on these points, there was a polyline generated randomly to split the surface of the roof top into two surfaces. After this process, these surfaces would take the same algorithm until the spaces reached the area in a requirement.
Experiment result
The experiment showed the split result of the rooftop. But there were some limitations except tectonic issues. Firstly, it worked with geometry. Therefore, there was not any relationship between each other apartments. Secondly, the information for the building was not enough as the input of the algorithm. So, the core, the staircase of the building was not considered in the system. For the future step of the project, there would be a structure issue.
Experiment Conclusion
The experiment worked on the spatial configuration and divided the roof space into multiple apartments. The process worked with the C# language through the iteration process to generate the polyline of splitting. However, there were some limitations like the topological relationship and structure issues. For the next experiments, the topological network would be the more important part of the algorithm.
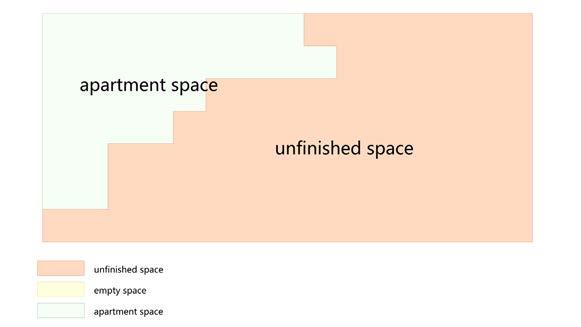
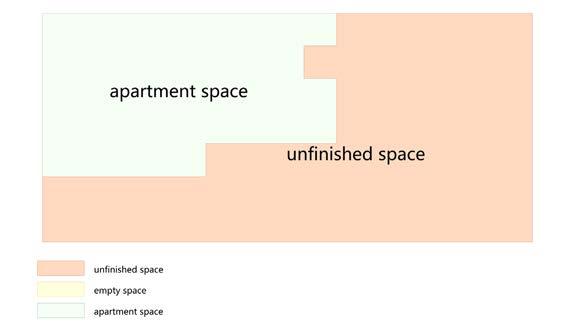
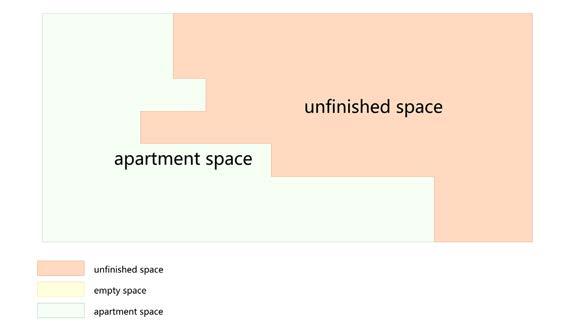
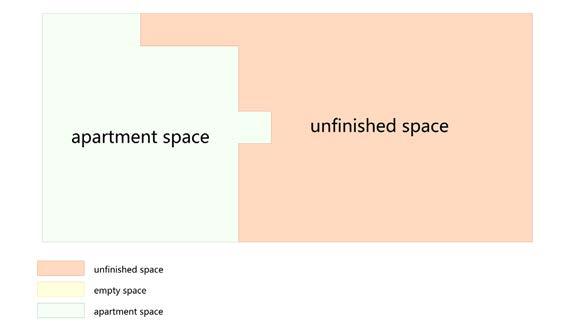
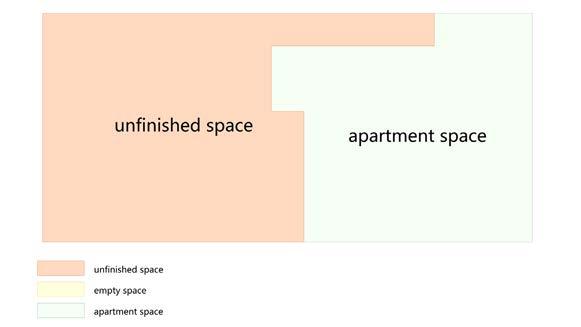
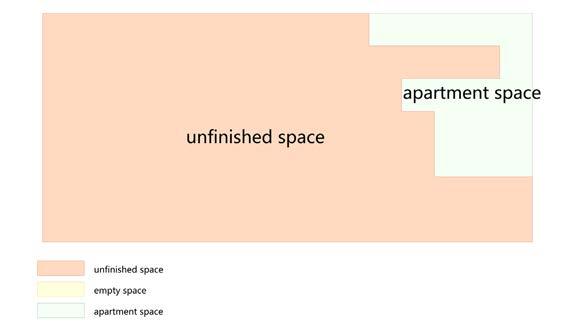
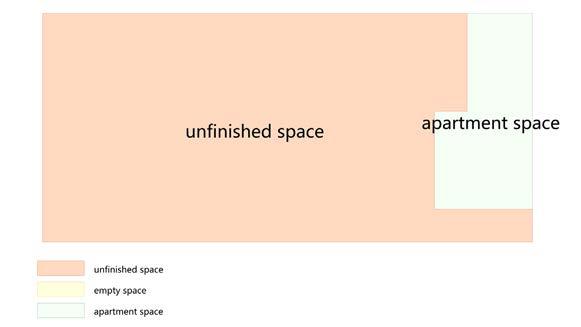
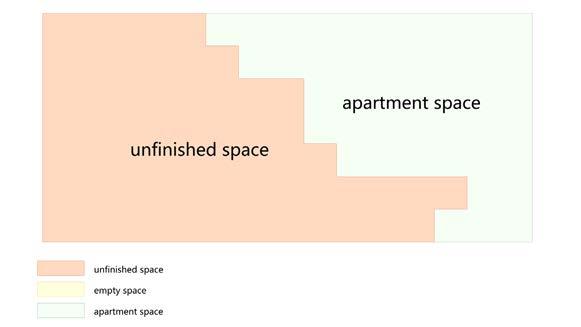
183 4 Diagram: showing how the algorithom subdivides spaces
ALGORITHM DEVELOPMENT 4
using System; using System.Collections; using System.Collections.Generic; using Rhino; using Rhino.Geometry; using Grasshopper; using Grasshopper.Kernel; using Grasshopper.Kernel.Data; using Grasshopper.Kernel.Types; using System.Linq;
public class Script_Instance : GH_ScriptInstance { #Utility functions
#Members
private void RunScript(bool iReset, int iIteration, Polyline iCurve, double iDis, int iOffsetIndex, double iMaxlength, Curve iStaircase, double iMinArea, double iMaxArea, ref object oGrid, ref object oBoundary, ref object oPolylineCurve, ref object oMaxLength, ref object oVecs, ref object oLpts, ref object oFinishedSurface, ref object oSmallSurface, ref object oBigSurface)
List<Point3d> gpts = new List<Point3d>(); Brep brep = new Brep();
List<Point3d> lpts = new List<Point3d>();
List<Vector3d> vecs = new List<Vector3d>();
PolylineCurve pol = new PolylineCurve();
List<Brep> f_srfs = new List<Brep>();
List<Brep> s_srfs = new List<Brep>();
List<Brep> b_srfs = new List<Brep>();
ShapeGrammar shape = new ShapeGrammar(iCurve, iDis);
shape.GridGenerate(ref gpts, ref brep);
shape.ShapeGeneration(ref lpts, ref vecs, iOffsetIndex, iMaxlength, iMinArea, iMaxArea, ref gpts, ref pol, ref brep, ref f_srfs, ref s_srfs, ref b_srfs);
oGrid = gpts; oBoundary = brep; oPolylineCurve = pol; oFinishedSurface = f_srfs; oSmallSurface = s_srfs; oBigSurface = b_srfs; }
// <Custom additional code>
public class ShapeGrammar {
public Polyline crv; public double dis; public int offsetindex; public double maxlength; public Polyline stair; public double minarea; public double maxarea;
public ShapeGrammar(Polyline _crv, double _dis) { crv = _crv; dis = _dis; }
public void GetCounts(Polyline crv, double dis, ref int xcount, ref int ycount)
xcount = (int) (crv.SegmentAt(0).Length / dis); ycount = (int) (crv.SegmentAt(1).Length / dis); }
public void GridGenerate(ref List<Point3d> gpts, ref Brep brep)
int xcount = (int) (crv.SegmentAt(0).Length / dis); int ycount = (int) (crv.SegmentAt(1).Length / dis);
Point3d start = new Point3d(crv.SegmentAt(3).PointAt(0));
//create points double y = start.Y; for(int = 0; i < ycount; i++)
double x = start.X; for(int = 0; j < xcount; j++)
Point3d pt = new Point3d(x, y, 0); gpts.Add(pt);
x += dis; }
y -= dis; }
//move pts all into boundary
Point3d center_pt = new Point3d(0, 0, 0); foreach(Point3d pt in gpts) center_pt += pt; center_pt /= gpts.Count; //moving vector Vector3d totalmove = new Vector3d(crv.CenterPoint() - center_pt); for(int = 0; i < gpts.Count;i++) gpts[i] += totalmove;
//build the Brep boundary brep = Brep.CreateFromCornerPoints(gpts[0], gpts[xcount * (ycount - 1)], gpts[gpts.Count - 1], gpts[xcount - 1], 0); }
185
{
5 Code: C# language code
{
{
{
{
5
public void ShapeGeneration(ref List<Point3d>lpts, ref List<Vector3d> vecs, int offsetindex, double maxlength, double minarea, double maxarea, ref List<Point3d> gpts, ref PolylineCurve pol, ref Brep brep, ref List<Brep> f_srfs, ref List<Brep> s_srfs, ref List<Brep> b_srfs)
{ int xcount = (int) (crv.SegmentAt(0).Length / dis); int ycount = (int) (crv.SegmentAt(1).Length / dis);
//split area
//start point on top edge
Random ran = new Random(); int a;
a = ran.Next(offsetindex, xcount - offsetindex);
Point3d start_point = gpts[a];
Point3d second_point = gpts[a + xcount];
lpts.Add(start_point);
lpts.Add(second_point);
//unit vector
Vector3d start_vec = new Vector3d(0, dis, 0); vecs.Add(start_vec);
for(int i = 1 ; i < 1000; i++)
{
//unit vector
Vector3d unit_vec = new Vector3d(0, dis, 0); //rotate unit vector randomly int r = ran.Next(1, 4); unit_vec.Rotate(r * 0.5 * Math.PI, Vector3d.ZAxis);
//generate rules
//Rule1. dont always stay in certain direction
//find the length of longest segement
Polyline test_pol = new Polyline(lpts);
List<Vector3d> test_vecs = new List<Vector3d>(); Vector3d test_vec = new Vector3d(); for(int j = 1; j < test_pol.SegmentCount; j++) { if(vecs[j] == vecs[j - 1]) test_vec += vecs[j]; else test_vec = vecs[j]; test_vecs.Add(test_vec);
}
//give a max length double max_length = 0; List<double> lens = test_vecs.Select(x => x.Length).ToList(); if(lens.Count > 0) max_length = lens.Max(); if(max_length >= maxlength) unit_vec.Rotate(0.5 * Math.PI, Vector3d.ZAxis); if(unit_vec == -start_vec)
{ unit_vec.Reverse();
}
//Rule.2 dont go back if(unit_vec == -vecs[i - 1]) { unit_vec.Reverse(); }
//create next point
Point3d next_point = lpts[i] + unit_vec; lpts.Add(next_point); vecs.Add(unit_vec);
//stop if over boundary
if(next_point.X <= gpts[0].X || next_point.X >= gpts[xcount - 1].X || next_point.Y >= gpts[0].Y || next_point.Y <= gpts[0].Y - (ycount - 1) * dis ) break;
//end loop }
//split surface
pol = new PolylineCurve(lpts); PolylineCurve pol2 = new PolylineCurve(pol); pol2.Translate(0, 0, 1); NurbsSurface surface = NurbsSurface.CreateRuledSurface(pol, pol2); Brep[] spiltsurfaces = brep.Split(surface.ToBrep(), 0.01); List<Brep> srfs = new List<Brep>(); foreach(Brep srf in spiltsurfaces) srfs.Add(srf);
//dispatch surfaces
f_srfs = new List<Brep>();
s_srfs = new List<Brep>();
b_srfs = new List<Brep>(); for(int i = 0; < srfs.Count; i++)
if(srfs[i].GetArea() >= minarea && srfs[i].GetArea() <= maxarea)
f_srfs.Add(srfs[i]); else if(srfs[i].GetArea() < minarea) s_srfs.Add(srfs[i]); else b_srfs.Add(srfs[i]);
187
//----------------------------------------------------------------------------------------------------------------------------------------------------------------------------------------
{
} } }
Code:
189 6
6
Grashopper script demostrating how two robots can work together abstracting the functions of a sowing macheain
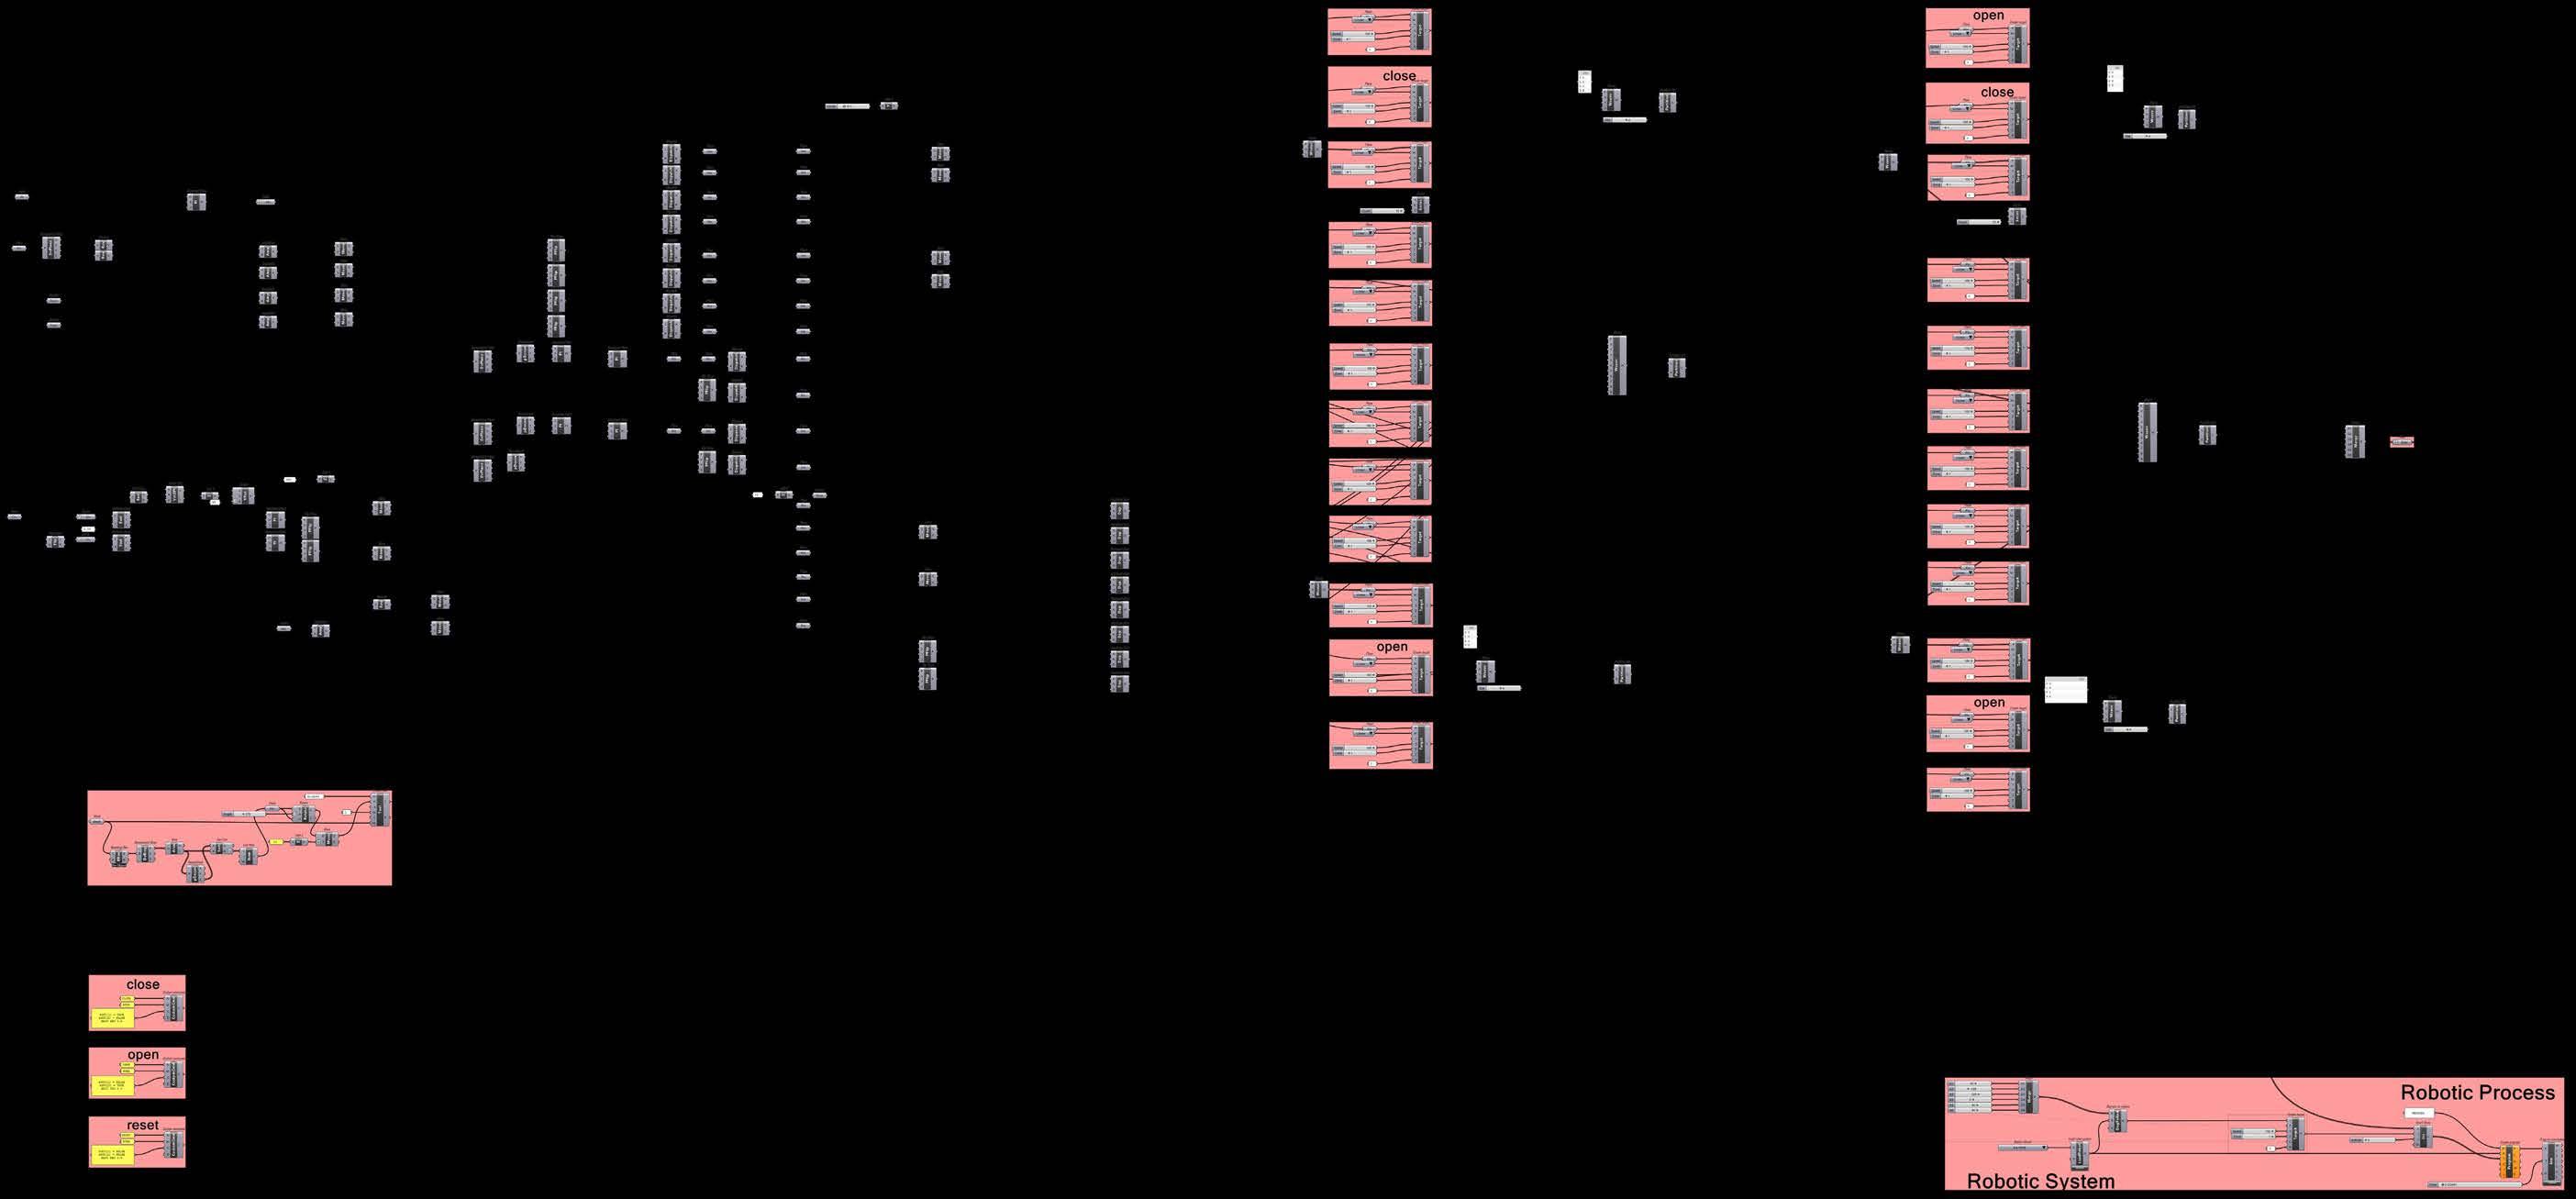
191 7
7
Code:
Grashopper script demostrating how to abstract hand sewing inro a robotic work flow.
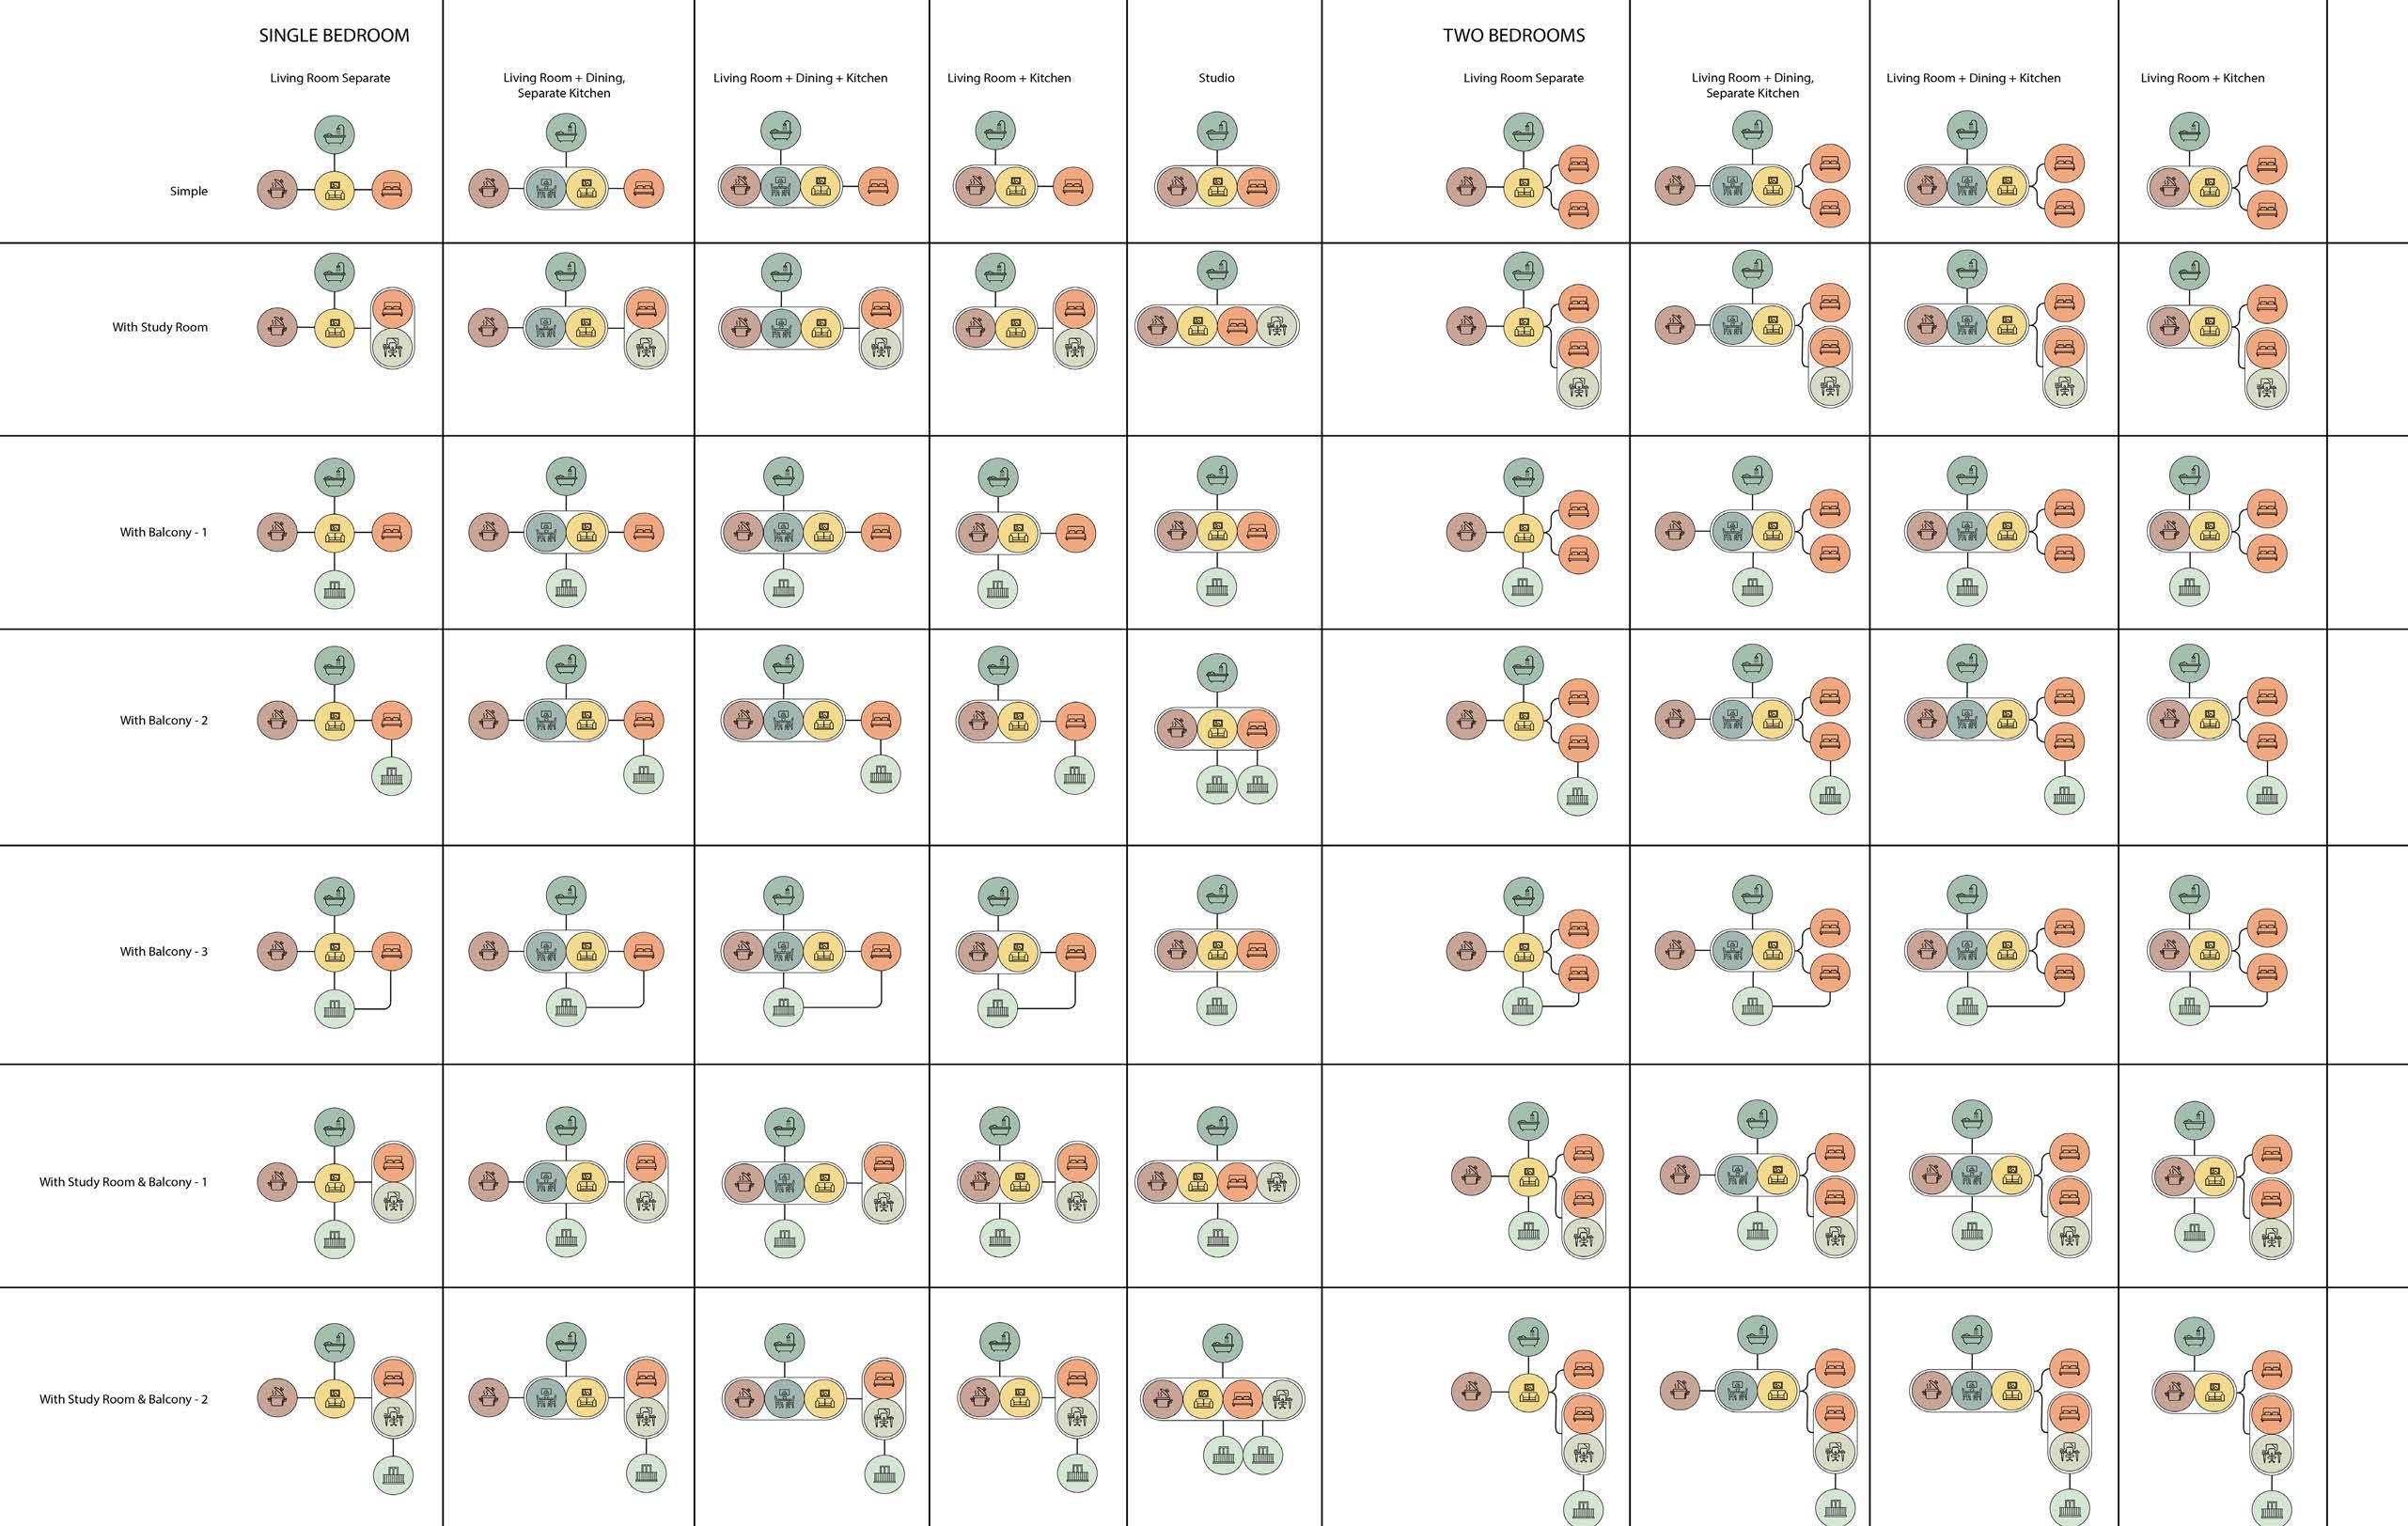
193 8 Diagram: manually developed topological networks 8