AGGREGATIONS
GEOMORPHODYNAMIC
MICROCLIMATES
KAROLADIERICHS EMERGENTTECHNOLOGIESANDDESIGN/MARCH2009 TUTORS:MICHAELWEINSTOCK,MICHAELHENSELANDACHIMMENGES


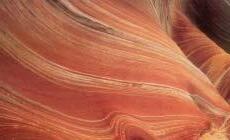
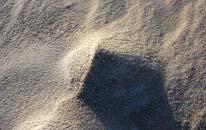
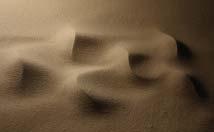


12REFERENCES 12.01 BOOKS 12.02 ARTICLES 12.03 PATENTS 12.04 WEBSITES 11GLOSSAR 10Y APPENDIX 10.01 SOLIDIFICATION METHODS 10.02 SAMPLE FORMATIVE METHOD 10.03 AGGREGATES UNDER VIBRATION 09OUTLOOK 04H 03YPOTHESIS CASES 03.01 INTRODUCTION 03.02 DUNE MORPHOLOGY 03.03 SOFT ENGINEERING 03.04 PHILLIPS PAVILION 03.05 SANDSTONE 03.06 CONCLUSION 02CONTEXT 02.01 INTRODUCTION 02.02 GEOMIMETICS 02.03 GEOMORPHODYNAMICS 02.04 MICROCLIMATES 02.05 GEOMOPHODYNAMIC MICROCLIMATES 02.06 AGGREGATIONS AS EMERGENT SYSTEMS 01ABSTRACT P 09P 17P 27 P 163 P 167P 195P 199 P 05
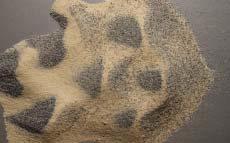


AGGREGATIONS CONTENTS - GEOMORPHODYNAMIC MICROCLIMATES 13DVD14ACKNOWLEDGEMENTS15DISCLAIMER 05METHODS 05.01 INTRODUCTION 05.02 OVERVIEW 05.03 SCALE 05.04 LABORATORY MODELLING 05.05 CONCLUSION 07DESIGNAPPLICATION 07.01 INTRODUCTION 07.02 SITE ANALYSIS 07.03 DESIGN PROPOSAL 07.04 GEOMORPHODYNAMIC MICROCLIMATE 07.05 CONCLUSION 06DESIGNDEVELOPMENT 06.01 INTRODUCTION 06.02 SEDIMENTARY ENVIRONMENTS 06.03 ONSITE MODELS 06.04 LABORATORY MODELS 06.05 SOLIDIFCATION METHODS 06.06 OVERVIEW DESIGN DEVELOPMENT 06.07 CONCLUSION 08EVALUATION P 31 P 47P 115P 159 P 203 P 207P 211
P4
P5
01ABSTRACT
01ABSTRACT
Nature processes large amounts of potential construction material in the form of aggregates and assembles them into dynamic morphologies. The idea is to use these natural formative processes in order to actuate semi-natural dynamic microenvironments. These induce morphological and climatic transformations which are relevant both with regards to their human inhabitation and the original geology. The system can have loose and solid phases, the solid being often embedded in a loose aggregate and thus becoming a particle in itself. The morphologies continuously change over time through cycles of erosion and accretion, entering a cycle of continuous construction. Throughout this process the construction material and energy are in large parts provided by nature itself and the structures are thus formed by minimal energy input. The project investigates several case studies that relate to geomorphodynamic systems as well as natural and architectural methods of aggregate solidification. Coastal beaches are chosen as a sedimentary environment. The hypotheses are then being developed and tested for this specific environment via onsite and laboratory models. A proposal for a design application is made on the island of Sylt/North Germany, where several responses of the system are being investigated. Conclusively further areas of implementation of the thesis are indicated as well as an argument for an emphasis on empirical modeling is being made.
Keywords: Aggregates, Geomorphodynamics, Microclimates, Dune Morphology, Sedimentary Processes, Analogue Modelling
6 AGGREGATIONS 01 ABSTRACT
01
FIGURE
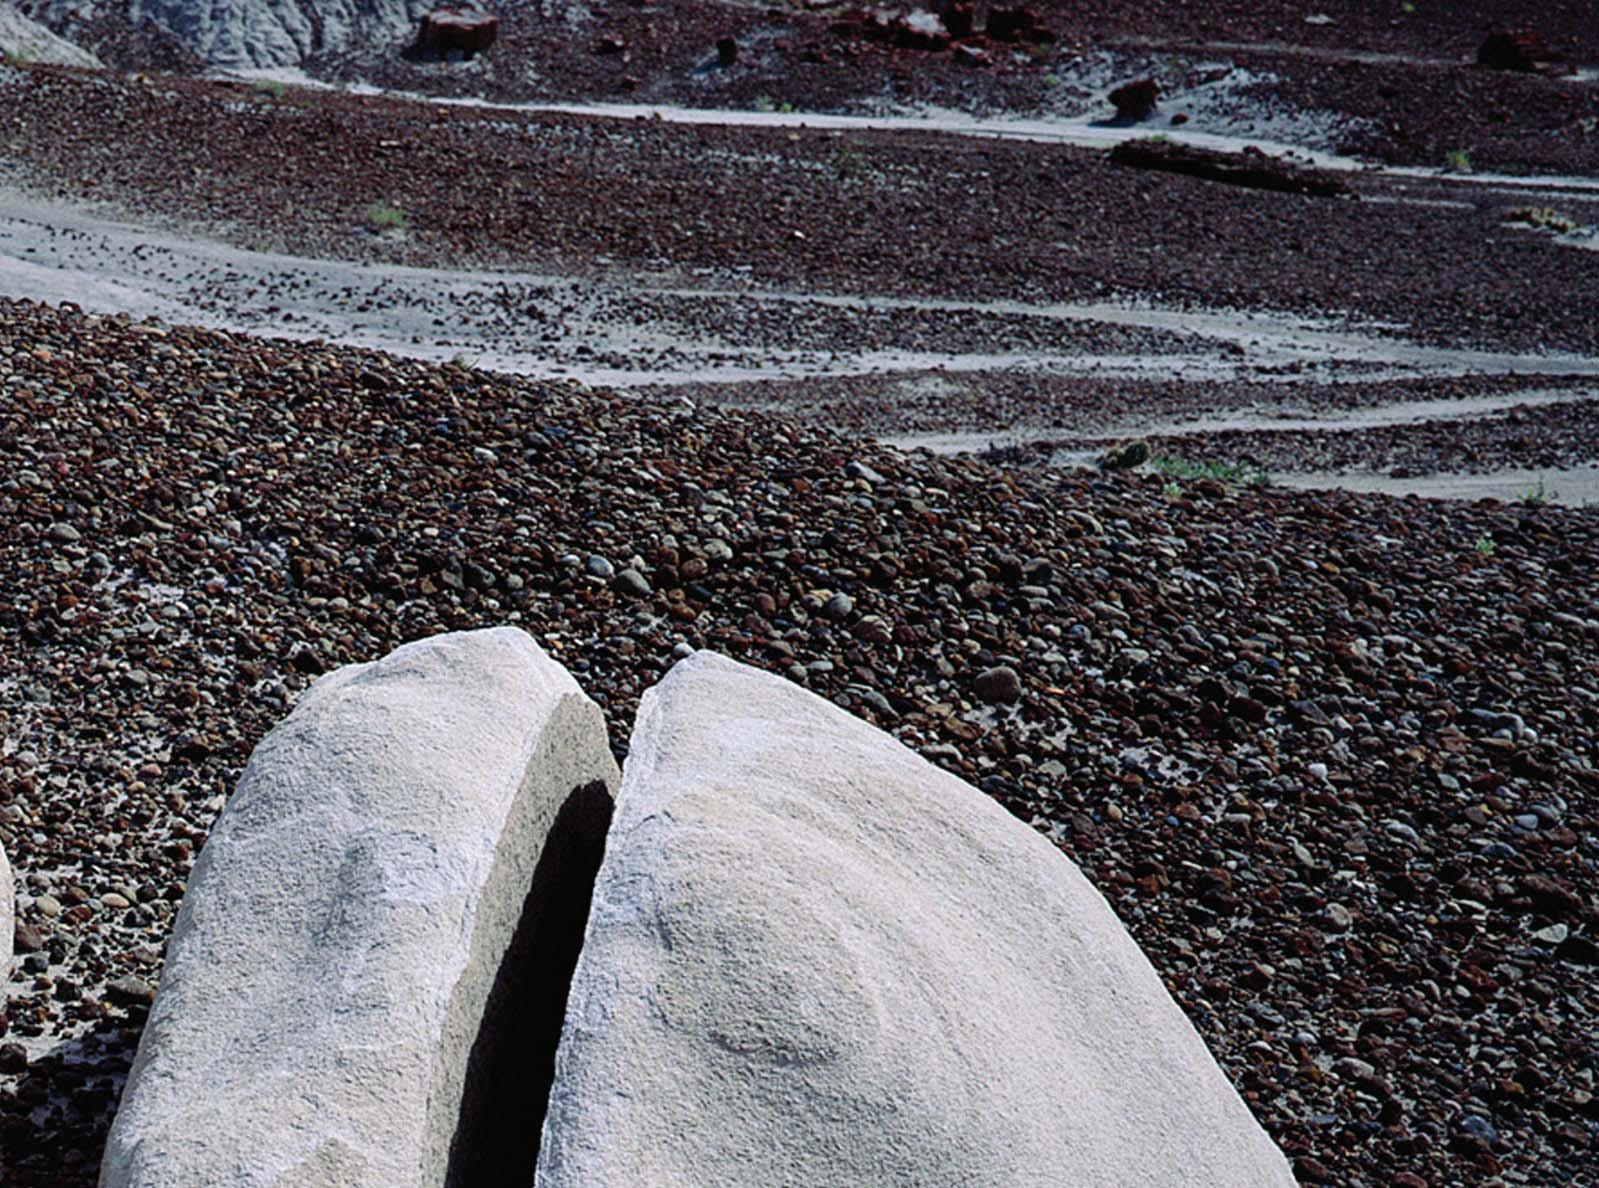
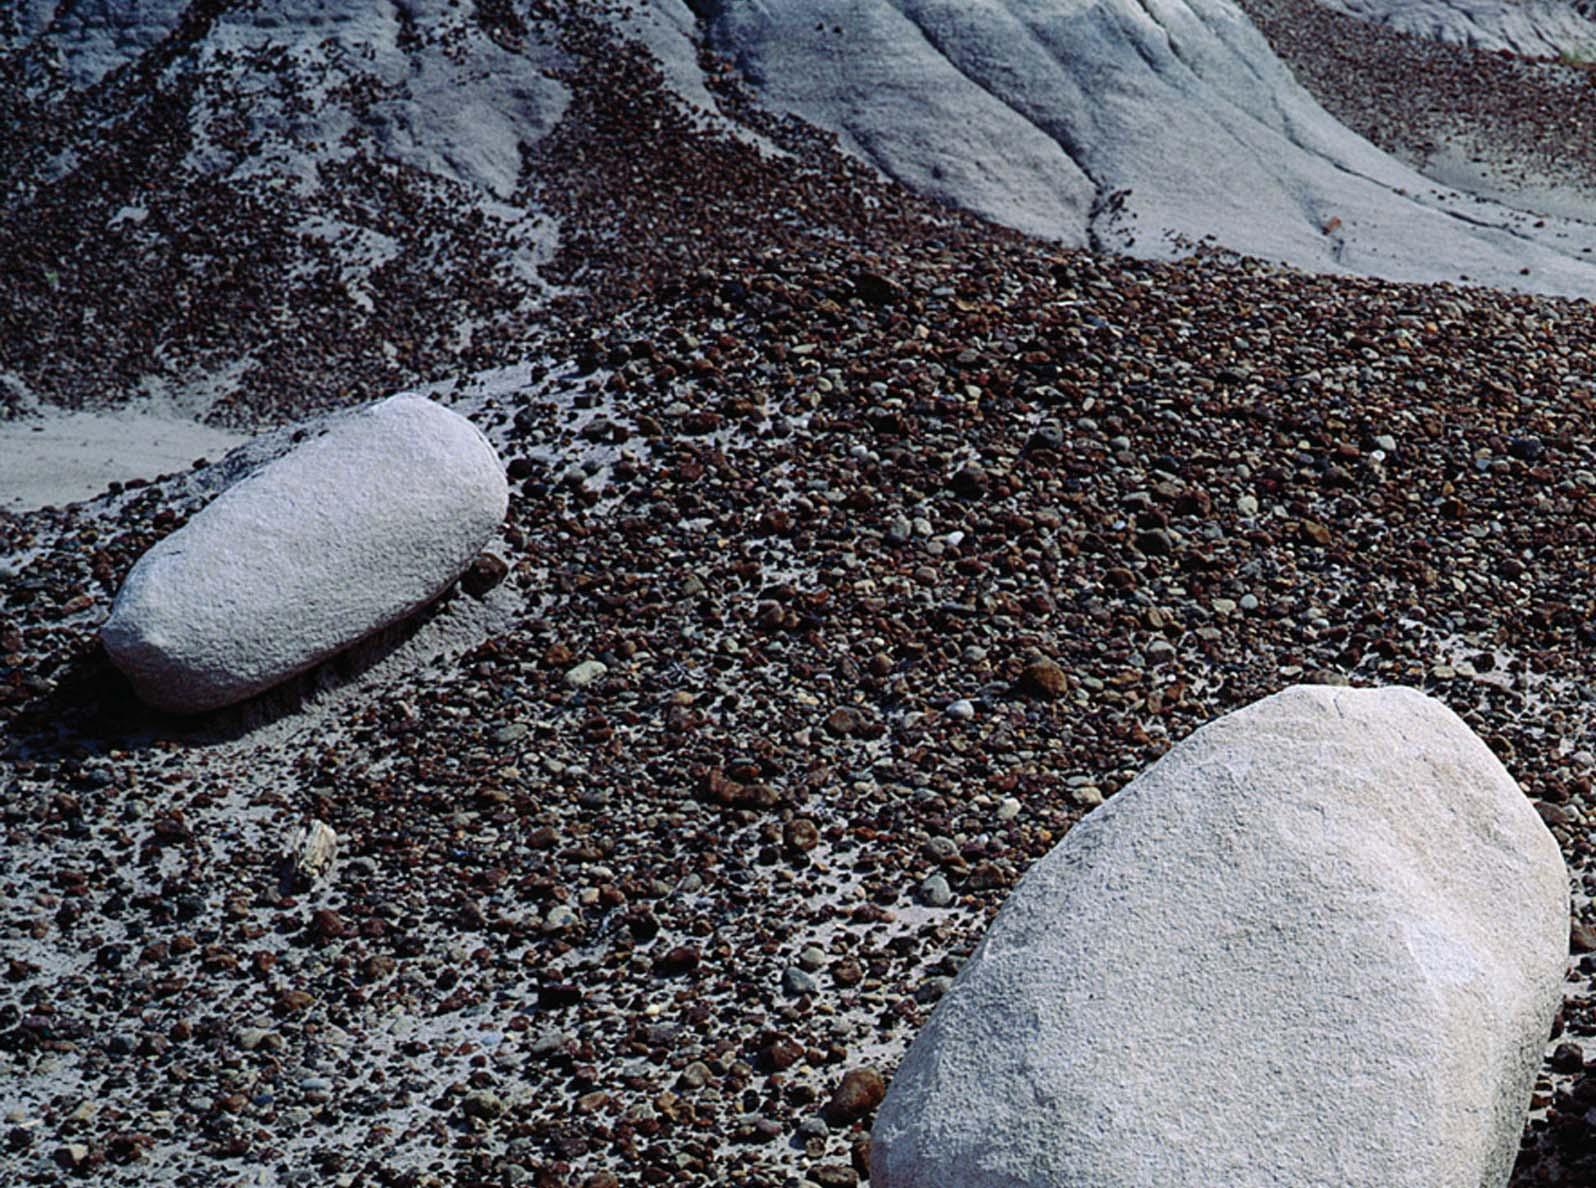
FIGURE01
WEATHERED SANDSTONE BOULDER
This massive lump of sandstone was once attached to the rock outcrop behind it. The processes of weathering caused it to become detached. It has since been smoothed and rounded by wind and water. Gradually it has weathered further and has split into three pieces. Weathering can occur by chemical or mechanical processes. Chemical weathering involves removal of part of the rock in solution by chemical reactions, for example with rainwater. Mechanical weathering causes rock to disintegrate due to physical processes such as extremes of cold or hot temperatures, or freezing and thawing of water. Photographed in Arizona, USA. (Source: George Steinmetz/Science Photo Library)
7 AGGREGATIONS 01 ABSTRACT
P8
02CONTEXT
02.01 INTRODUCTION
02.02 GEOMIMETICS
02.03 GEOMORPHODYNAMICS
02.04 MICROCLIMATES
02.05 GEOMOPHODYNAMIC MICROCLIMATES
02.06 AGGREGATIONS AS EMERGENT SYSTEMS
P9
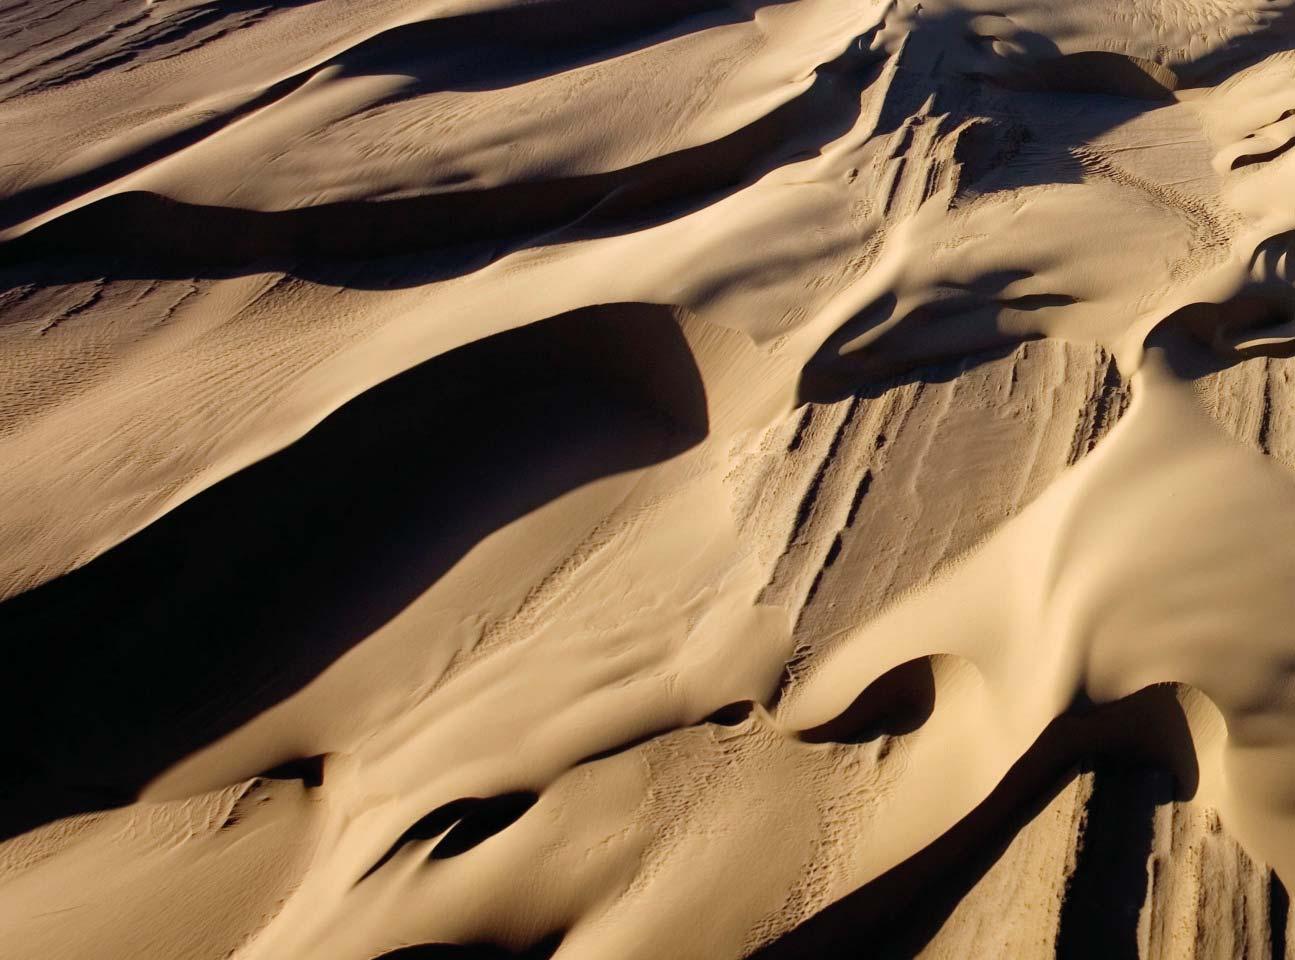
02.01INTRODUCTION
The following introduces the paradigm this research has been conducted in and establishes the basic contextual concepts, i.e. geomorphodynamics and microclimates. A link between these two core aspects is established.
02.02 GEOMIMETICS
Processes mimicking and using geological phenomena for design purposes might be placed within the paradigm of Geomimetics. ‘Geomimetics is the term given to replicating the synthesis of minerals in the laboratory. It is analogous to biomimetics - i.e. chemists developing new organic compounds by copying and enhancing natural ones.’ (Source: IMG). The term is usually applied to the mimicking of minerals coming from geological processes on a very small scale. It would need to be redefined within this context to encompass a wider range of geological solidification and aggregation processes as well as larger scale ranges.
02.03 GEOMORPHODYNAMICS
Geomorphodynamics refers to the dynamic process of landscape formation. The term is used in relation to various landscapes such as dune fields or submarine landscapes. It studies the influences that establish the typical formation of such a landscape and how these as a consequence change over time. The basic processes are those of accretion, sedimentation and erosion, of accumulation, resting and vanishing material assemblies (Source: Siever, 1988). The inherent logic of these material assemblies is thus one of continuous construction, only temporary solidification rather than that of a finite optimized structure. To understand and utilize these processes might entail an architecture, that accepts these core principles of earth formation and rather than opposing utilizes them as an actuator of its designs.
10 FIGURE 02 AGGREGATIONS 02 CONTEXT

11 AGGREGATIONS 02 CONTEXT
FIGURE02
QAIDAM BASIN, CHINA Twisted folds of eroded sedimentary rocks, and sand dunes, in the western part of the Qaidam Basin (also called the Chaidamu Basin), Qinghai, China. This is the western edge of the largest field of yardangs (wind-eroded rocks) in China. (Source: George Steinmetz/Science Photo Library)

02.04MICROCLIMATES
The second contextual concept is that of a microclimate. Climate generally refers to a variety of atmospheric processes, such as wind, rain, heat and solar radiation. Usually these are dealt with on the level of the globe or continents, spanning hundreds to thousands kilometres across. These ranges can be called macroclimates. These macroclimates however will be broken down into a medium range of climatic differentiations, which can be termed mesoclimates. These encompass the range between tens to hundreds of kilometres. Mesoclimates, in turn, can be resolved into numerous microclimates, which relate to scales of less than 0.1 km, as in the climatic differences between forests, crops, and bare soil, at various depths in a plant canopy, at different depths in the soil, on different sides of a building, and so forth (Sources: Oke, 1987, Climatic, 2008 and Microclimates, 2008). Architecture can on one level be understood as a conscious climatic modulation. In this paradigm any change in an environmental climatic condition can thought to be relevant on the level of human inhabitation. Architecture then becomes the modulation of climatic zones and the continuous adaptation of them.
12 FIGURE 03 AGGREGATIONS 02 CONTEXT
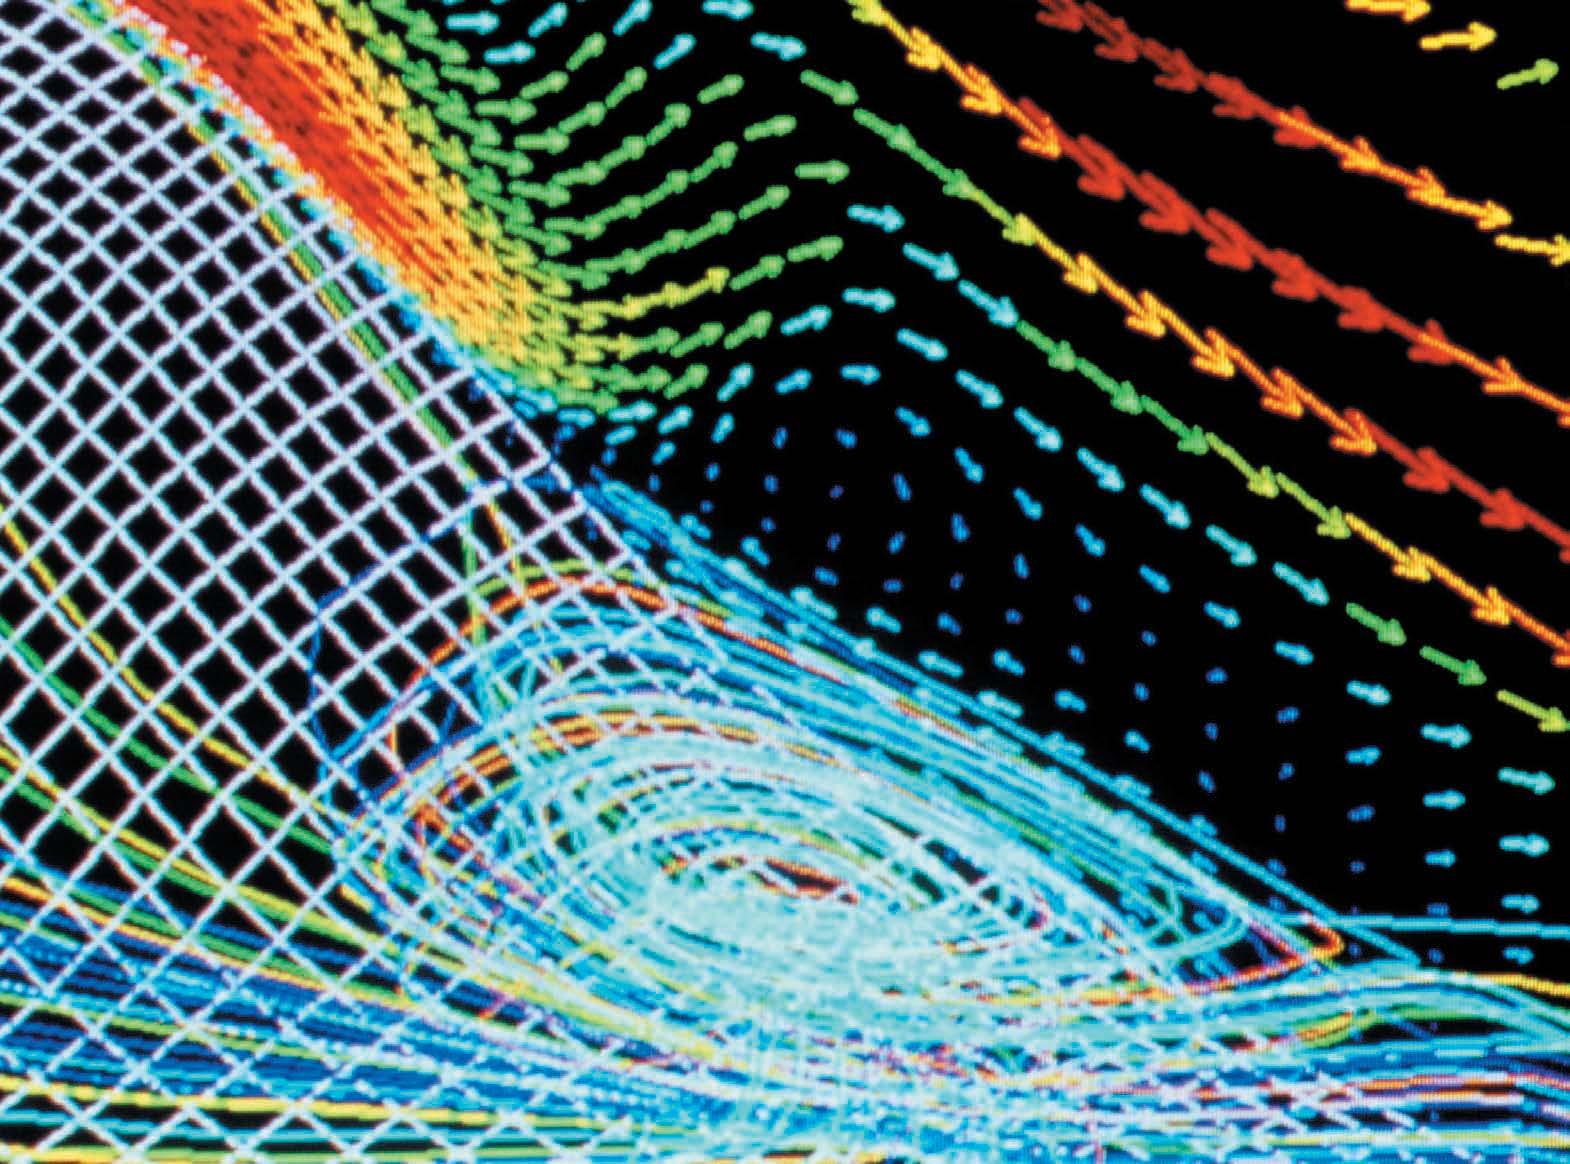
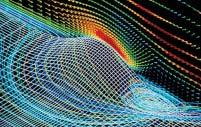
FIGURE03
WIND TUNNEL SIMULATION OF WIND EFFECTS ON A HILL
Computer simulation of the line contours of a hill (at centre) and the path of wind over it. Wind direction is arrowed. Wind speed and force is colour-coded: red is highest, blue is lowest. A circular eddy is seen beneath the hill (lower right). Wind erosion and snowdrift modelling are some applications of this computer study. This research is conducted at the wind tunnel Centre Scientifique et Technique des Batiments (CSTB), Nantes, France. The Centre can also accommodate in its wind tunnel scaled-down models of whole towns, bridges and rockets, to be tested in winds of more than 200 km per hour. Rain, snow, intense sunlight and heat can also be simulated.(Source: Ph. Plailly/Eurelios/Science Photo Library)
13 AGGREGATIONS 02 CONTEXT
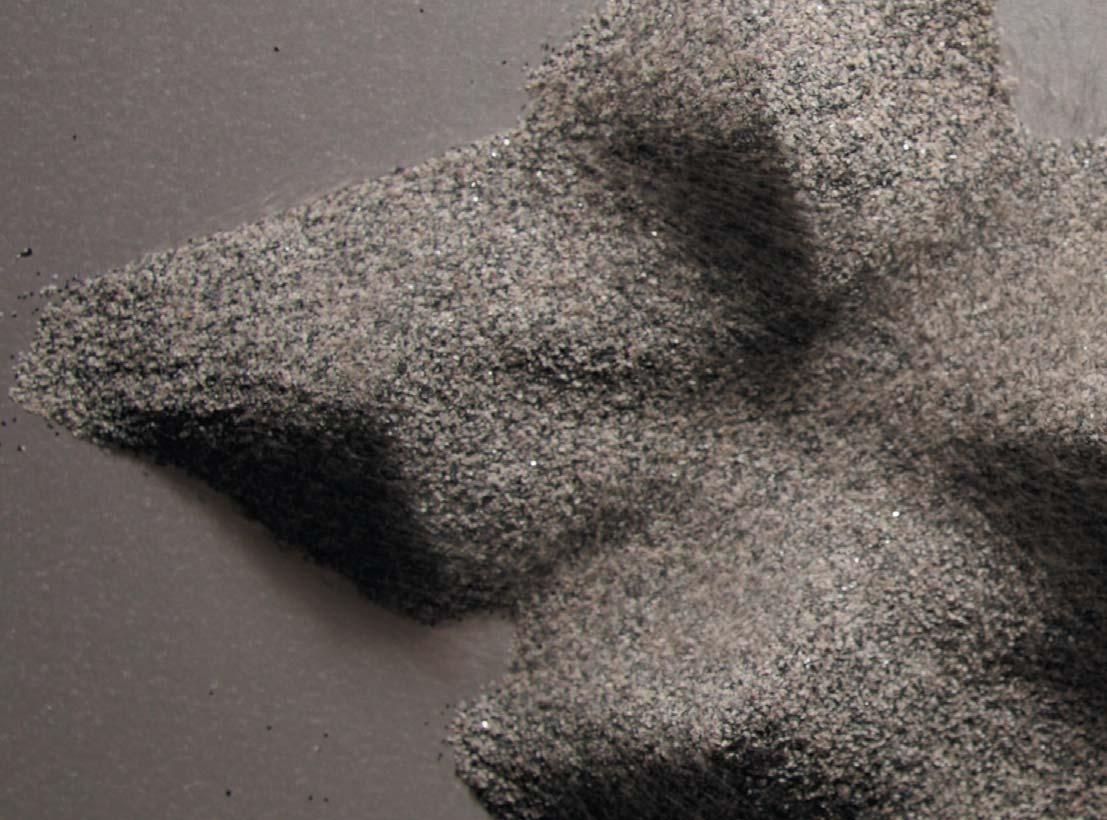
02.05GEOMORPHODYNAMICMICROCLIMATES
The aim of this project is the conscious modulation of geomorphodynamic and microclimatic processes. These modulations result in geomorphodynamic microclimates, conscious modulations of both geology and climatic conditions. This will have an effect on two levels. On the one hand the geomorphology will be altered, inherently linked to this climatic processes will also be affected and this in turn will influence the actuating environment. If on the other hand habitable space is understood as the modulation of climatic processes, such as rain protection, heat provision and ventilation, these geomorphodynamic processes can also have immediate basic architectural effects.
02.06 AGGREGATIONS AS EMERGENT SYSTEMS
Emergent systems can be described as patterns that arise from a multiplicity of simple interactions. Common characteristics of these emergent systems are radical novelty, correlation of the parts, the existence of a global level, dynamic evolution of the system and the clear distinction of the phenomenon (Source: De Wolf/Holvoet, 2005). Aggregate systems are based on the interactions of very basic units, the granules. These form coherent recognizable morphologies, which can be identified as coherent wholes and evolve dynamically over time. They are thus emergent systems. Aggregations can in this far be called emergent as they use these properties of aggregates entirely or in parts.
14 FIGURE 04 AGGREGATIONS 02 CONTEXT
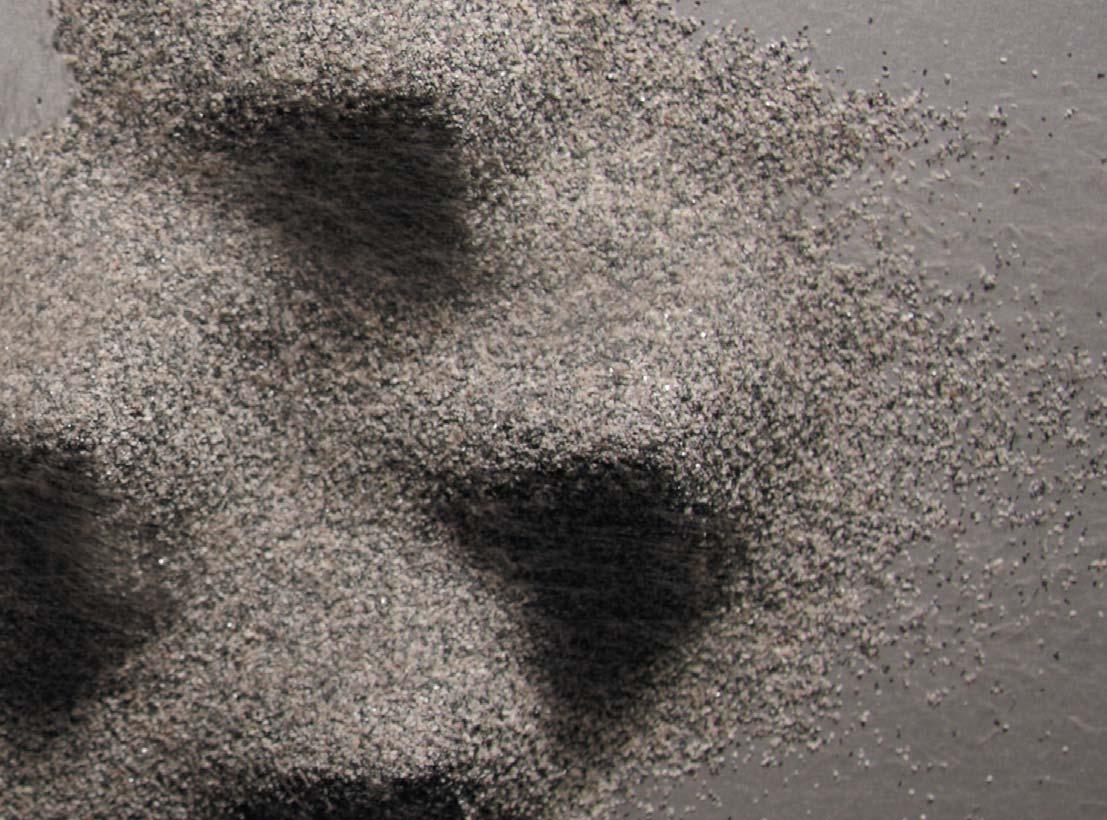
FIGURE04
GEOMORPHODYNAMIC MICROCLIMATE
Seven piles of grey granite ballast, each 4 cm in diameter are exposed to a unidirectional airstream of 21 km/h. The piles deform, showing a low windward slope and a steep slip-face. The lee-faces are areas of wind-shadow, where there is little or no air-movement. The sand thus allows for the formation of a specific climatic modulation due to its ability to react to an impacting force, in this case the airstream. Adaptive modulation processes like this are typical of geomorphodynamic environments.
15 AGGREGATIONS 02 CONTEXT
P16
03CASESTUDIES
03.01 INTRODUCTION 03.02 DUNE MORPHOLOGY 03.03 SOFT ENGINEERING 03.04 PHILLIPS PAVILION 03.05 SANDSTONE 03.06 CONCLUSION
P17
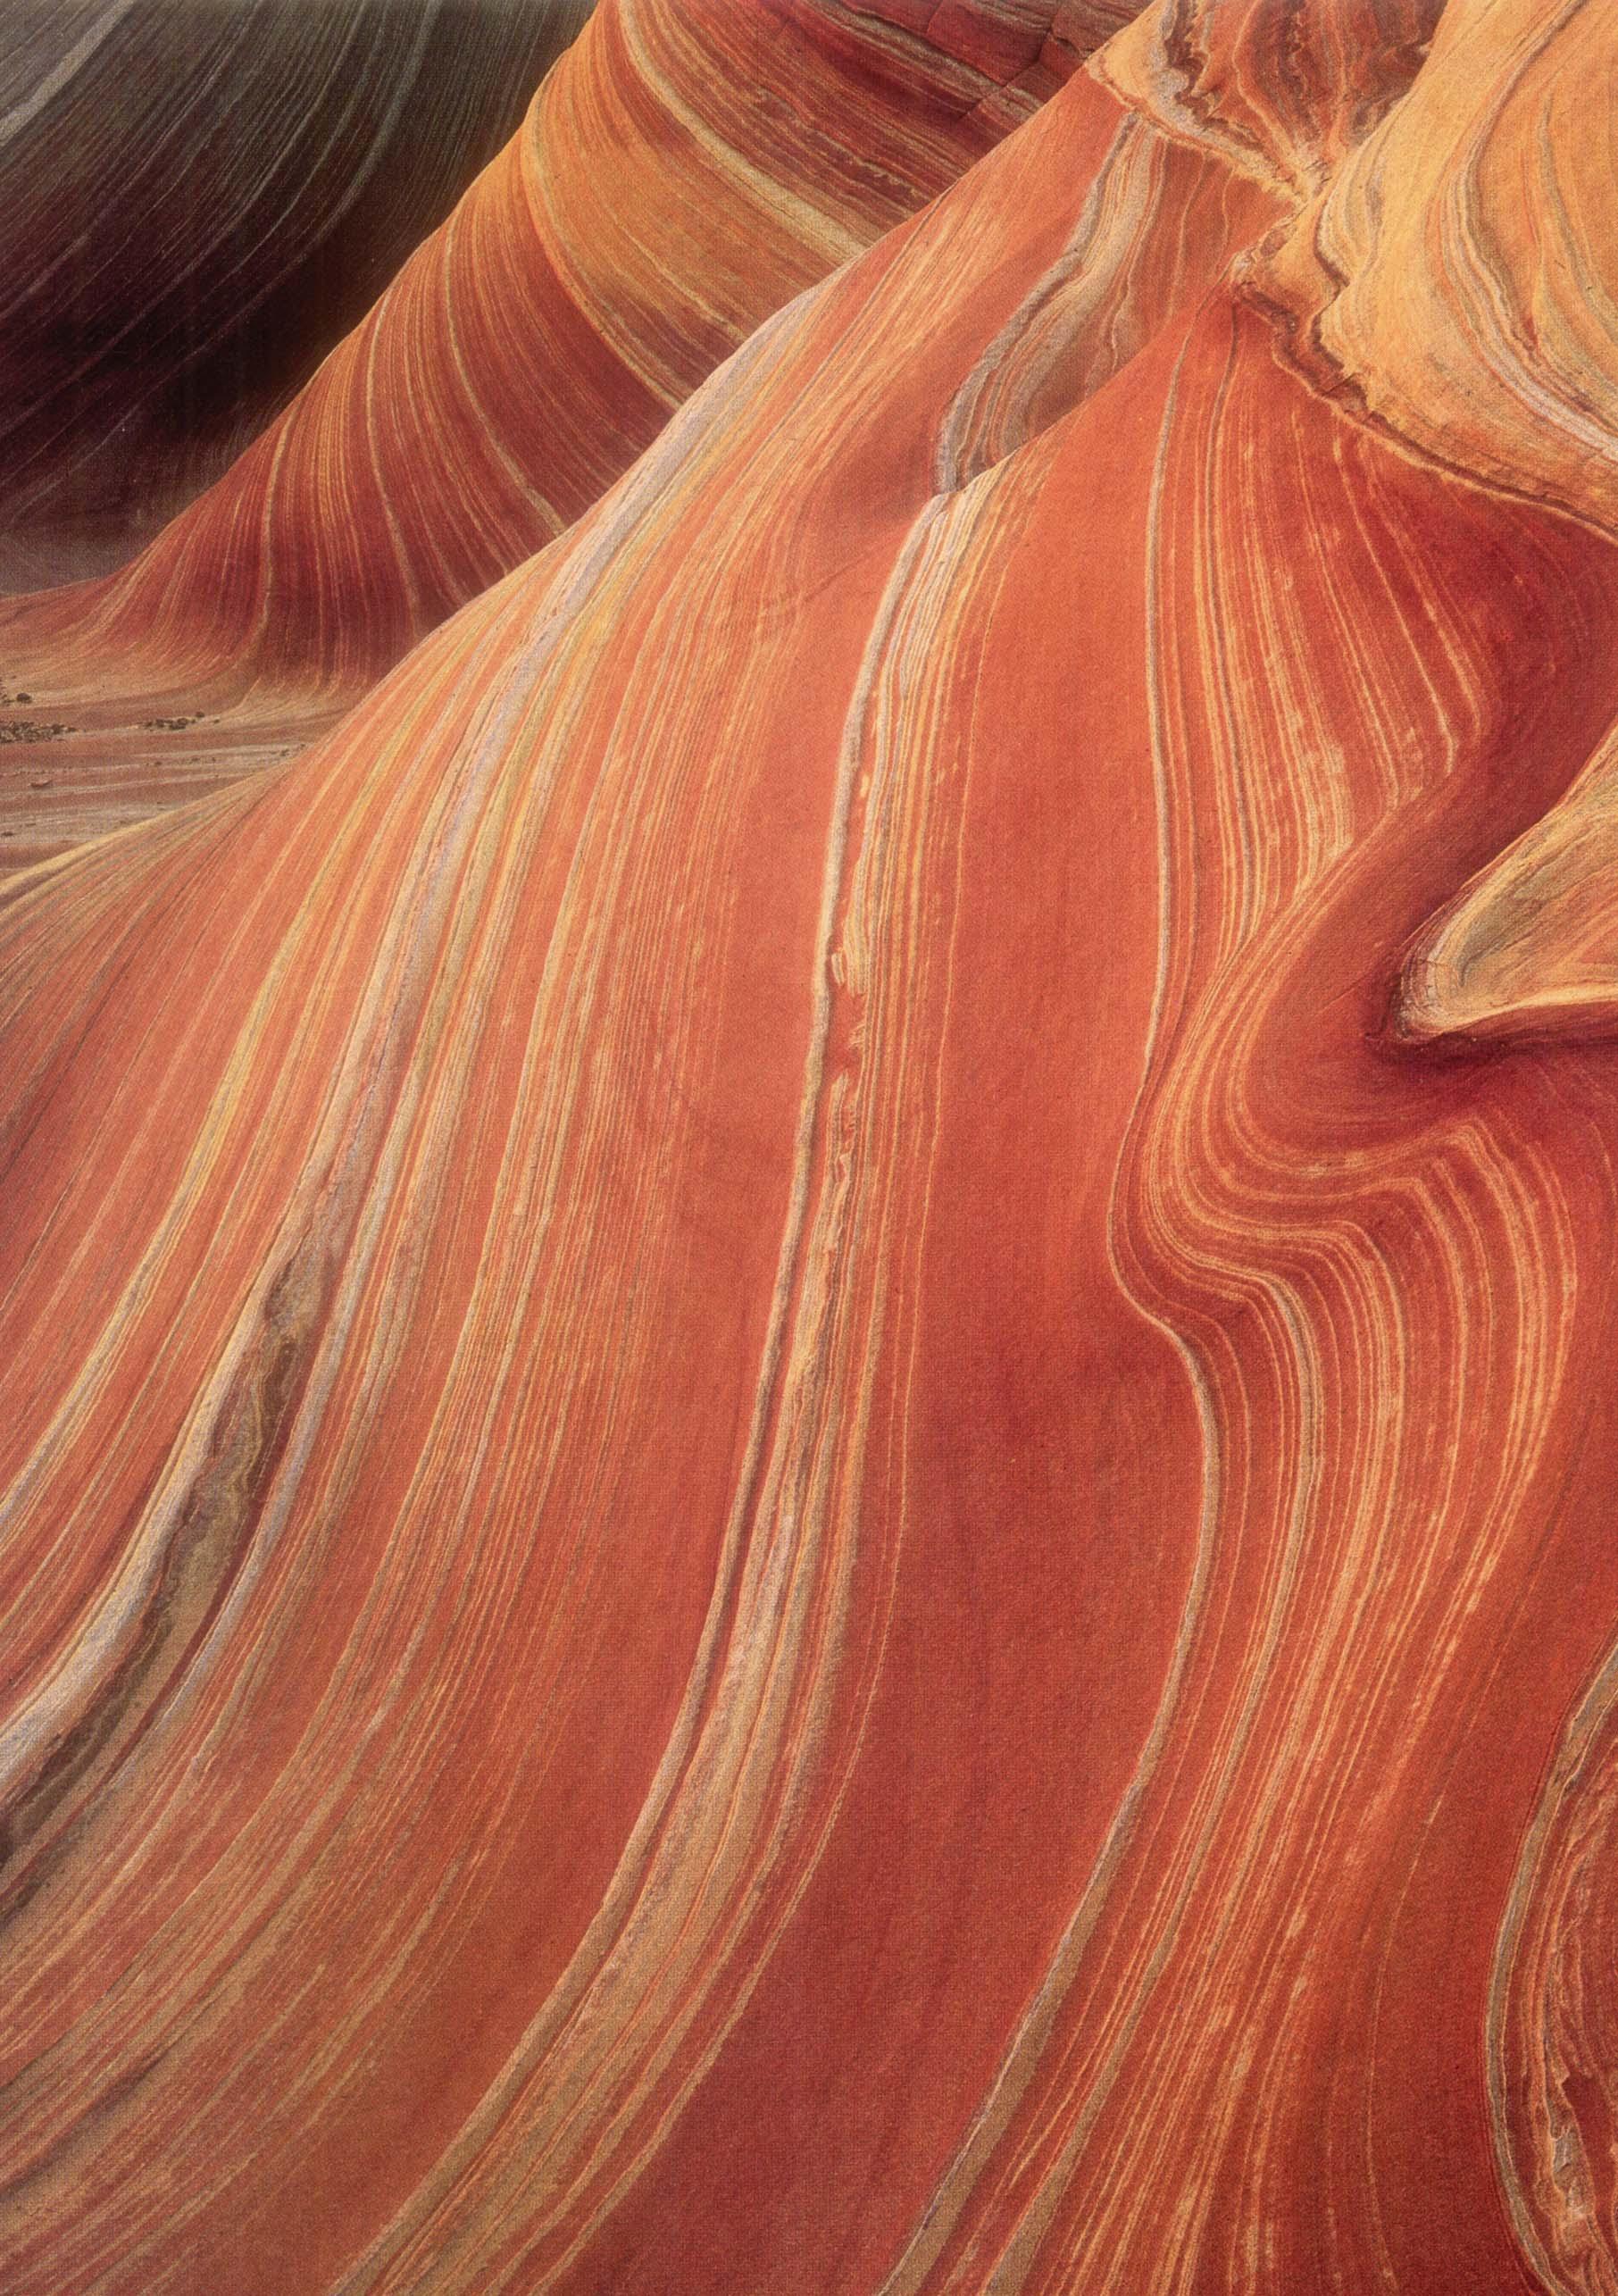
FIGURE 05
NAVAJO SANDSTONE, VERMILION CLIFFS, ARIZONA
This sedimentary rock has formed through the deposition of successive layers of sediment, later compressed into rock. The cross-bedding (narrow lines) was produced by changes in the direction of the depository water over time. (Sources: Science Photo Library and Siever, 1988, p. 01)
03.01INTRODUCTION-CASESTUDIES
Four case studies have been chosen to investigate several aspects relating to the main hypotheses of this research. Two of them, the dune morphology and soft engineering (case 01 and case 02) are being introduced to study the dynamic behaviour of aggregate systems on two scales as well as in the case of soft engineering to investigate already existing construction techniques in that field. The other two cases, the Philips Pavilion and the natural sandstone formations (case 03 and case 04) are being studied with regards to potential solidification methods. Both of them, even though one is an engineering project and the other a natural occurrence, use cementing techniques, where either a top layer or embedded layers of sand are solidified by a binding agent. The following introduces these four cases.
19 AGGREGATIONS 03 CASE STUDIES
FIGURE05
03.02CASE01-DUNEMORPHOLOGY
Dunes are repetitive structures that recur with wavelengths typically of around ten to several hundred metres and 1.00 metre to 100 metres height. Ripples form on them, with wavelengths of 0.5 cm to several metres and a height of 0.5 to 25 cm. Dunes are superimposed on ‘draas’ of 100 metres to several kilometres wavelength. The ‘draas’ are in turn part of the ‘erg’, of up to 500.000 square kilometres (Source: Siever, 1988, pp. 83-86). In order for a dune to form, there needs to be loose sediment, energy mostly in the form of wind, an obstacle to collect the loose sediment or an agglomeration of sand and a predominantly dry climate. Depending on the nature of the wind field, steady or varying in direction, fast or slow, and depending on the amount of sand, different dune morphologies appear. There are five basic types: crescentic, linear, star, dome and parabolic. Reversing dunes are varieties of any of the five basic shapes and appear wherever winds periodically reverse direction. All these dune shapes may appear in three forms: simple, compound, and complex. Simple dunes are basic forms with a minimum number of slip-faces that define the geometric type. Compound dunes are large dunes on which smaller dunes of similar type and slip-face orientation are superimposed, and complex dunes are combinations of two or more dune types. Simple dunes represent a wind regime that has not changed in intensity or direction since the formation of the dune, while compound and complex dunes suggest that the intensity and direction of the wind has changed. (Source: USGS, 1997)
The Barchan or Crescentic Dune can be considered the prototypical dune, as it reduces the mechanisms of dune formation to their essentials. A Barchan Dune forms under constant wind directions in very hot, dry climates, it is thus based on unidirectional wind and dry sand. In plan it has a crescentic shape, with the horns pointing downwind and advancing at a faster rate than the rest of the dune. Its windward side has a slope of ca. 11 degrees and usually shows ripple formation. Beyond the crest, its leeward side, the slip face, gradually forms. More and more sand is deposited on the top, the leeward side thus steepens and finally reaches its angle of repose around 35 degrees. Yet the wind cannot flow smoothly along the steep slip-face and abruptly breaks, thus forming a wind shadow with very little moving air. Only some grains tumble down into that shadow, occasionally setting off an avalanche, if the movement angle around 37 degrees is being reached (Source: Bagnold, 1954).

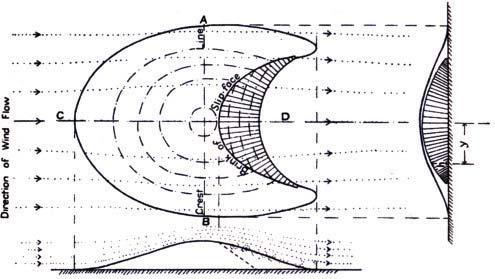
FIGURE06
FORCES ACTING ON A SAND GRAIN IN AN AEOLIAN ENVIRONMENT
The Lift Force (FL) results from an increase in velocity and a decrease in pressure due to airflow compressing above the grain. The drag force (FD) is the resistance to the flow coming from the sand bed. The resulting force is the Fluid Force (FF) that pivots the grain around its neighbour. (Drawn according to Siever, 1988. Illustration for Weinstock, 2009)
FIGURE07
SUSPENSION, SALTATION AND CREEP
Wind impacting on a sand grain can have three different effects. The grain can either be suspended like in a dust storm, it can saltate (Latin: salire, to jump) or it can creep. This depends on the grain size and density as well as the wind speed. Small light particles are most likely to be suspended, but a strong storm can lift even heavy objects from the ground. In saltation, the landing grain can hit other grains which in turn jump off the ground, the effect is thus proliferated across the sand field. (Drawn according to Bagnold, 1954. Illustration for Weinstock, 2009)
FIGURE08
FORMATION OF A SLIP FACE
Wind impacts on a pile of sand and gradually erodes its wind ward slope. This becomes lower in angle. The eroding grains are collected on the leeward side which becomes steeper and steeper, gradually reaching its angle of repose. Occasionally an avalanche is set off if the angle of movement is reached. (Source: Bagnold, 1954, p. 202)
FIGURE09
WIND DISTRIBUTION AROUND A DUNE
Approximate wind distribution and position of a slip face of a Barchan Dune, top view, side view and front view. The windward slope receives the main wind impact whereas the lee side gradually forms a wind shadow. (Source: Bagnold, 1954, p. 209)
DRAG FORCE, FD LIFT FORCE, F L FLUIDFORCE,FF PIVOT AXIS GRAVITY FORCE, F G SUSPENSION SALTATION CREEP 20 AGGREGATIONS 03 CASE STUDIES
FIGURE06 FIGURE07
FIGURE08
FIGURE09
03.03CASE02-SOFTENGINEERING
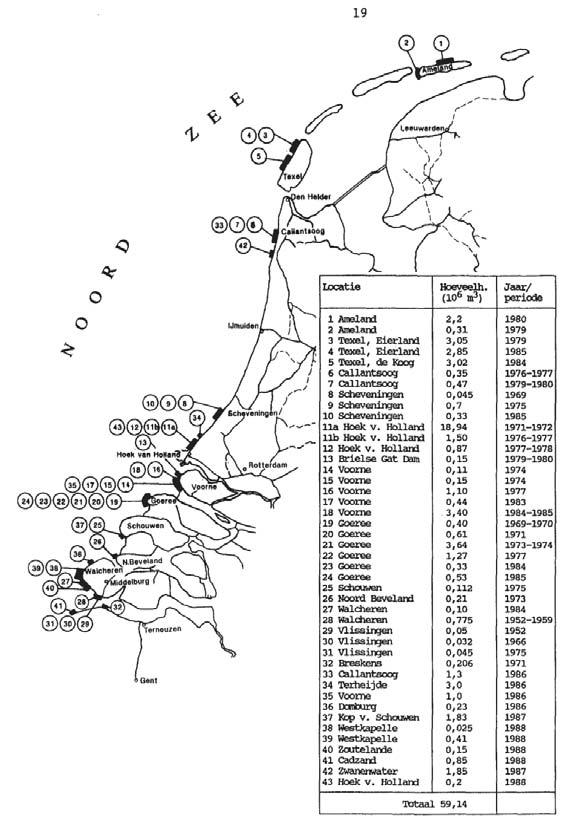
Soft engineering techniques are considered to be the opposite of hard engineering techniques. Whereas hard engineering techniques seek to keep the status quo of a landscape by hardening it, soft engineering techniques use the principles already inherent in a natural system to achieve a specific effect. They deploy methods such as sand nourishment to restore beaches or certain planting strategies. All soft engineering methods have in common that they mimic the natural process and that they are left to perform on their own after and initial induction to the environment. This means that they work dynamically with the landscape morphology and as they are very akin to it only induce subtle modulations. The Dutch Rijkswaterstaat has made a series of such interventions, where sand was added to the coastline at specific locations and quantities. These sand supplements were initially thought to be only protective measures, but have now evolved into new coastal morphologies. These techniques however remain on a landscape engineering level and are not linked to architectural interventions (Sources: Trummer, 2008, MVW, 1989, 01 and MVW, 1989, 02).
FIGURE10
SAND SUPPLEMENTS
Overview map of the sand supplements in front of the Dutch coastline. The map specifies location (Dutch: Locatie), Amount (Dutch: Hoeveelheid) and Year/Period (Dutch: Jaar/Periode) of the sand supplements. Extensive studies have been conducted as to how these sand supplements have affected the makeup of the coast and the wind dynamics along the coastline.
(Source: Rijkwaterstaat, 2008)
21 AGGREGATIONS 03 CASE STUDIES
FIGURE10


03.04CASE03-THEPHILIPSPAVILION
AUTHORS: IANNIS XENAKIS , LE CORBUSIER AND EDGAR VARESE
CLIENT: PHILLIPS / BRUSSELS WORLD FAIR YEAR: 1958
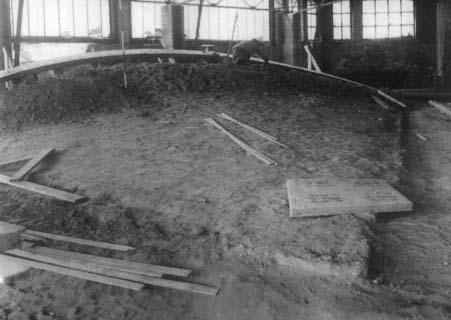
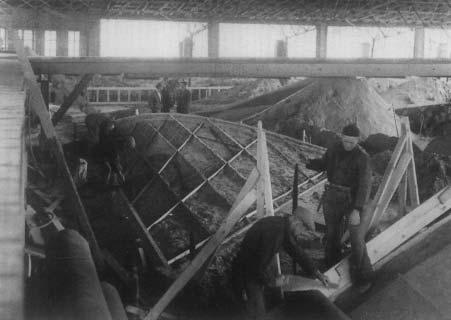
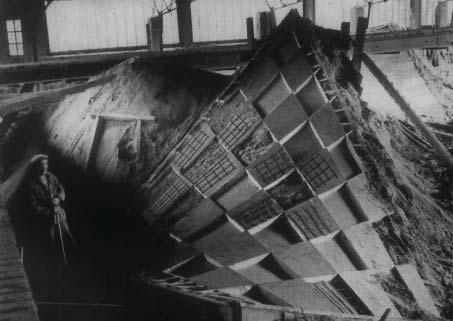
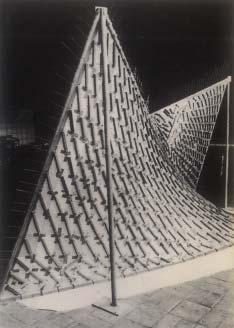
The Phillips Pavilion has been designed by Iannis Xenakis, Edgar Varese and Le Corbusier for the occasion of the Brussels World Fair. It is made from hyperbolic paraboloid shells derived from one of Xenakis scores. The shells are made from pretensioned concrete. In order to construct them, a new manufacturing technique was developed, that uses sand as a mould. This technique is quite primitive and is usually deployed to pour sidewalks. A sand bed is prepared in the form of the eventual shell. Then a wooden framework is placed onto the sand bed and the concrete is poured into alternating compartments for worker mobility. The individual segments are left to cure and then reassembled on site. (Source: Treib, 1996)
FIGURE11.01TO11.03
CASTING PROCESS
The components are being poured onto the sand, using a wooden grid. The sand mould is being laid out. Subsequently its profile is being built up. Should the required angle have been lower, vibration might have been needed to settle it, yet the actual angle of repose match the one required for the wooden mould. The wooden mould is subsequently being placed onto the sand bed and the individual concrete components are being cast using the tile-laying technique. (Source: Treib, 1996)
FIGURE12
CONSTRUCTION PROCESS
The wooden mould is applied onto the sand mould. This will serve as a grid for the casting of the concrete components on the sand bed. This sand-casting method has been specifically developed for the Philips Pavilion. (Source: Treib, 1996)
FIGURE13
HYPERBOLIC SHELL WOOD MODEL
A wooden mock-up model of the entire Phillips Pavilion has been developed and undergone physical load testings. This wood model then has been directly used as a mould for the concrete sand cast. (Source: Treib, 1996)
FIGURE14
TILE LAYING TECHNIQUE
The idea for the sand casting technique was derived from tile-laying. Here, a concrete slurry is applied on a sand bed. The concrete hardens and can be removed from its reusable sand mould. (Source: Treib, 1996)
22 AGGREGATIONS 03 CASE STUDIES
FIGURE 11.01
FIGURE 11.02
FIGURE 11.03
FIGURE 12
FIGURE 13
FIGURE 14

03.05CASE04-SANDSTONE
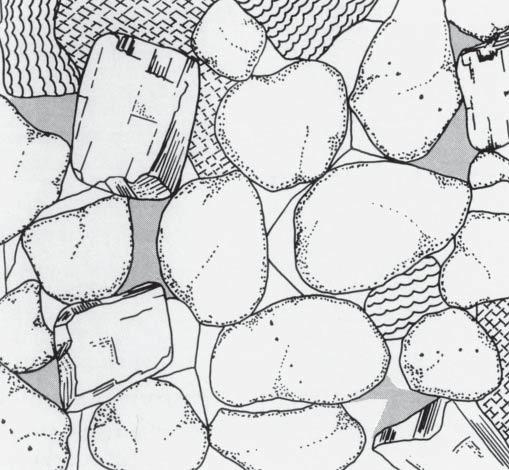
Sand stone originates from a natural sand cementing process. Genesis is the initial process of sedimentation, when a granulate stops moving around, diagenesis are the physical and chemical process which follow and which are responsible for the cementation of the grains into agglomerates of stones. Sand is deposited, i.e. it stops to move around on the ground or the seabed. Subsequently it is compacted by overlying deposits and then cemented mostly through embedding silica or calcium carbonate. Sandstones can be characterized by grain size, sorting and composition as well as rock geometry and sedimentary patterns. Sandstone from marine origins typically shows regular blocks when weathered, whereas deposits from dunes show wavy coloration lines and fluidly shaped patterns. Sandstone is used as a building material either as primary construction material or as a facing stone. As it also can carry other, fluid materials in its pores, such as gases and oils, it is exploited as a natural reservoir. Sandstone is subject to erosion, which can be brought forth by chemical processes, such as reaction with water, and mechanical processes, such as the effect of extreme temperatures or the exposure to windblown sand. It is thus embedded in a continuous cycle of accretion and erosion, which often leads to several sizes of grains and rocks being present together in a given sedimentary environment. Sand grains are often recycled in this process several times, being sedimented, cemented and eroded over and over again (Source: Siever, 1988, pp. 164-191).
FIGURE15
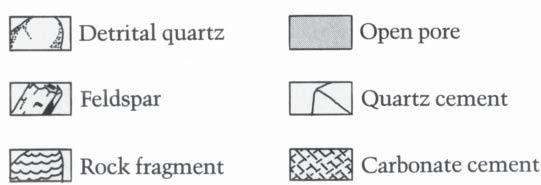
COMPOSITION OF SANDSTONE
A typical sandstone shows, in this magnified image, more or less rounded grains of quartz, feldspar, and rock fragments, cemented by diagenetic, or postdepositional, precipitates of quartz and calcium carbonate. A small amount of open pore space remains. (Source: Siever, 1988, p. 166)
FIGURE16
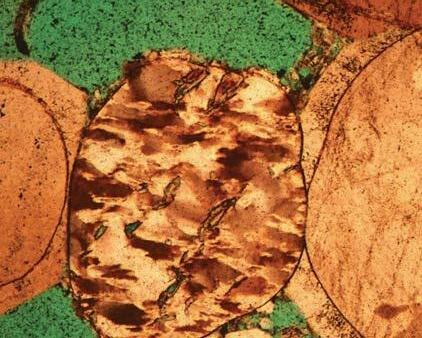
THIN SECTION OF SANDSTONE IN THE PROCESS OF LITHIFICATION
This light micrograph is an example of diagenesis, the process by which rocks are reformed from weathered fragments close to the Earth’s surface at low pressures and temperatures. The sandstone consists of quartz fragments of 3 types, each with a different history, one above the other. The green is epoxy resin, injected into the rock to enable the thin section to be prepared. This picture is one of a pair, showing the same specimen in unpolarised and polarised light. Magnification: x50 at 35mm size, x112 at 6x9cm size. (Source: Mike Mc Namee/Science Photo Library)
FIGURE17
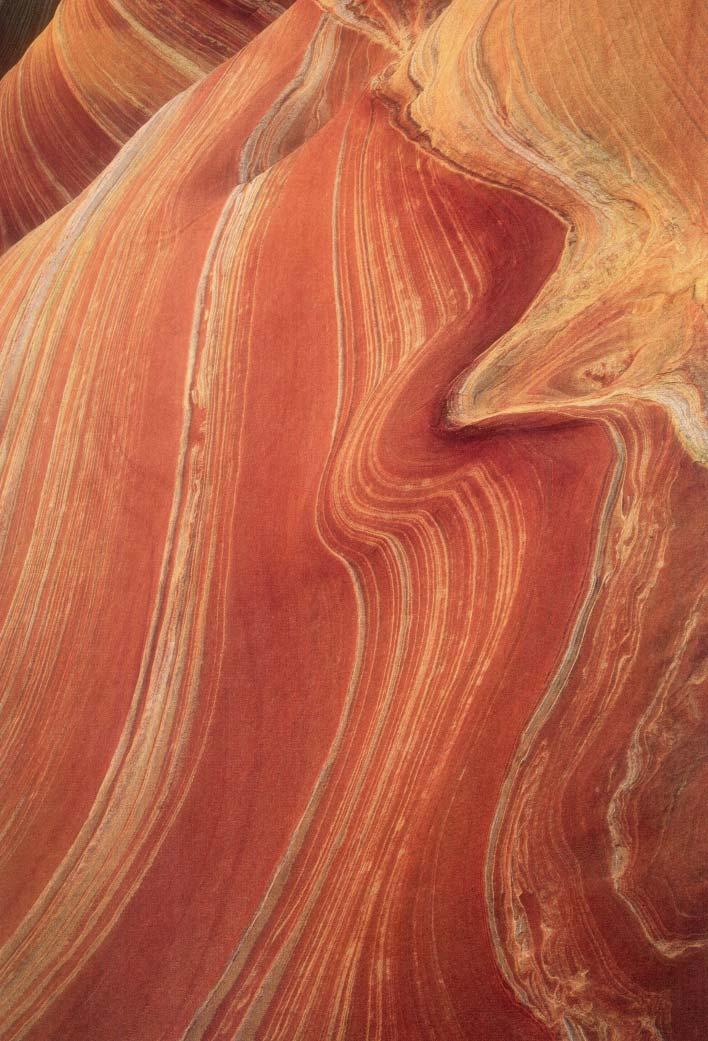
NAVAJO SANDSTONE, VERMILION CLIFFS, ARIZONA
This sedimentary rock has formed through the deposition of successive layers of sediment, later compressed into rock. The cross-bedding (narrow lines) was produced by changes in the direction of the depository water over time. (Sources: Science Photo Library and Siever, 1988, p. 01)
23 AGGREGATIONS 03 CASE STUDIES
FIGURE 17
FIGURE 15
FIGURE 16
03.06CONCLUSION-CASESTUDIES
The four case studies give an initial approach to some of the concepts developed in the hypothesis. Dunes are in a cycle of continuous construction and adaptation. They reconfigure until they fully erode, only to be reconstructed elsewhere. They are also able to modulate climatic conditions through their specific granular makeup which responds to impacting winds. Soft engineering techniques are using the intelligence hidden in natural aggregates systems to develop strategies for coastal protection. These are however not deployed on an architectural level but only as an engineering strategy. With regards to solidification methods, the Philips Pavilion manufacturing process gives a rare example of how sand can be used as a mould, it does apply cementation techniques similar to that of sandstone, but the cement is applied as a wet slurry, so that a careful hardening of individual layers is not possible. Sandstone itself offers a good insight in natural processes of cementation, where binders are filtering into the aggregate as powders or grains and are hardened by water afterwards. This concept will be taken further. Sandstone also gives a good insight into the concept of using onsite material for construction, as it is formed solely of materials that are immediately available in its surroundings. It is like the dunes subject to continuous cycles of construction, being accreted, sedimented, cemented and subsequently eroded.
FIGURE18
DUNES, EMPTY QUARTER, OMAN
These sand dunes, blown by the wind, are moving across drill holes (round, some at centre) made by oil exploration crews in the 1960s. While small dunes (5 or 10 metres high) move from year to year, the larger dunes mostly remain stationary, as shown by the maps made by the oil prospectors some 40 years earlier. The Empty Quarter (Rub’ al Khali) is a vast sand sea in the south of the Arabian Peninsula, and one of the largest deserts in the world, covering an area hundreds of kilometres across. These sand dunes are in Oman’s section of the Empty Quarter. Photographed in 2004. (Source: George Steinmetz / Science Photo Library)
24 AGGREGATIONS 03 CASE STUDIES
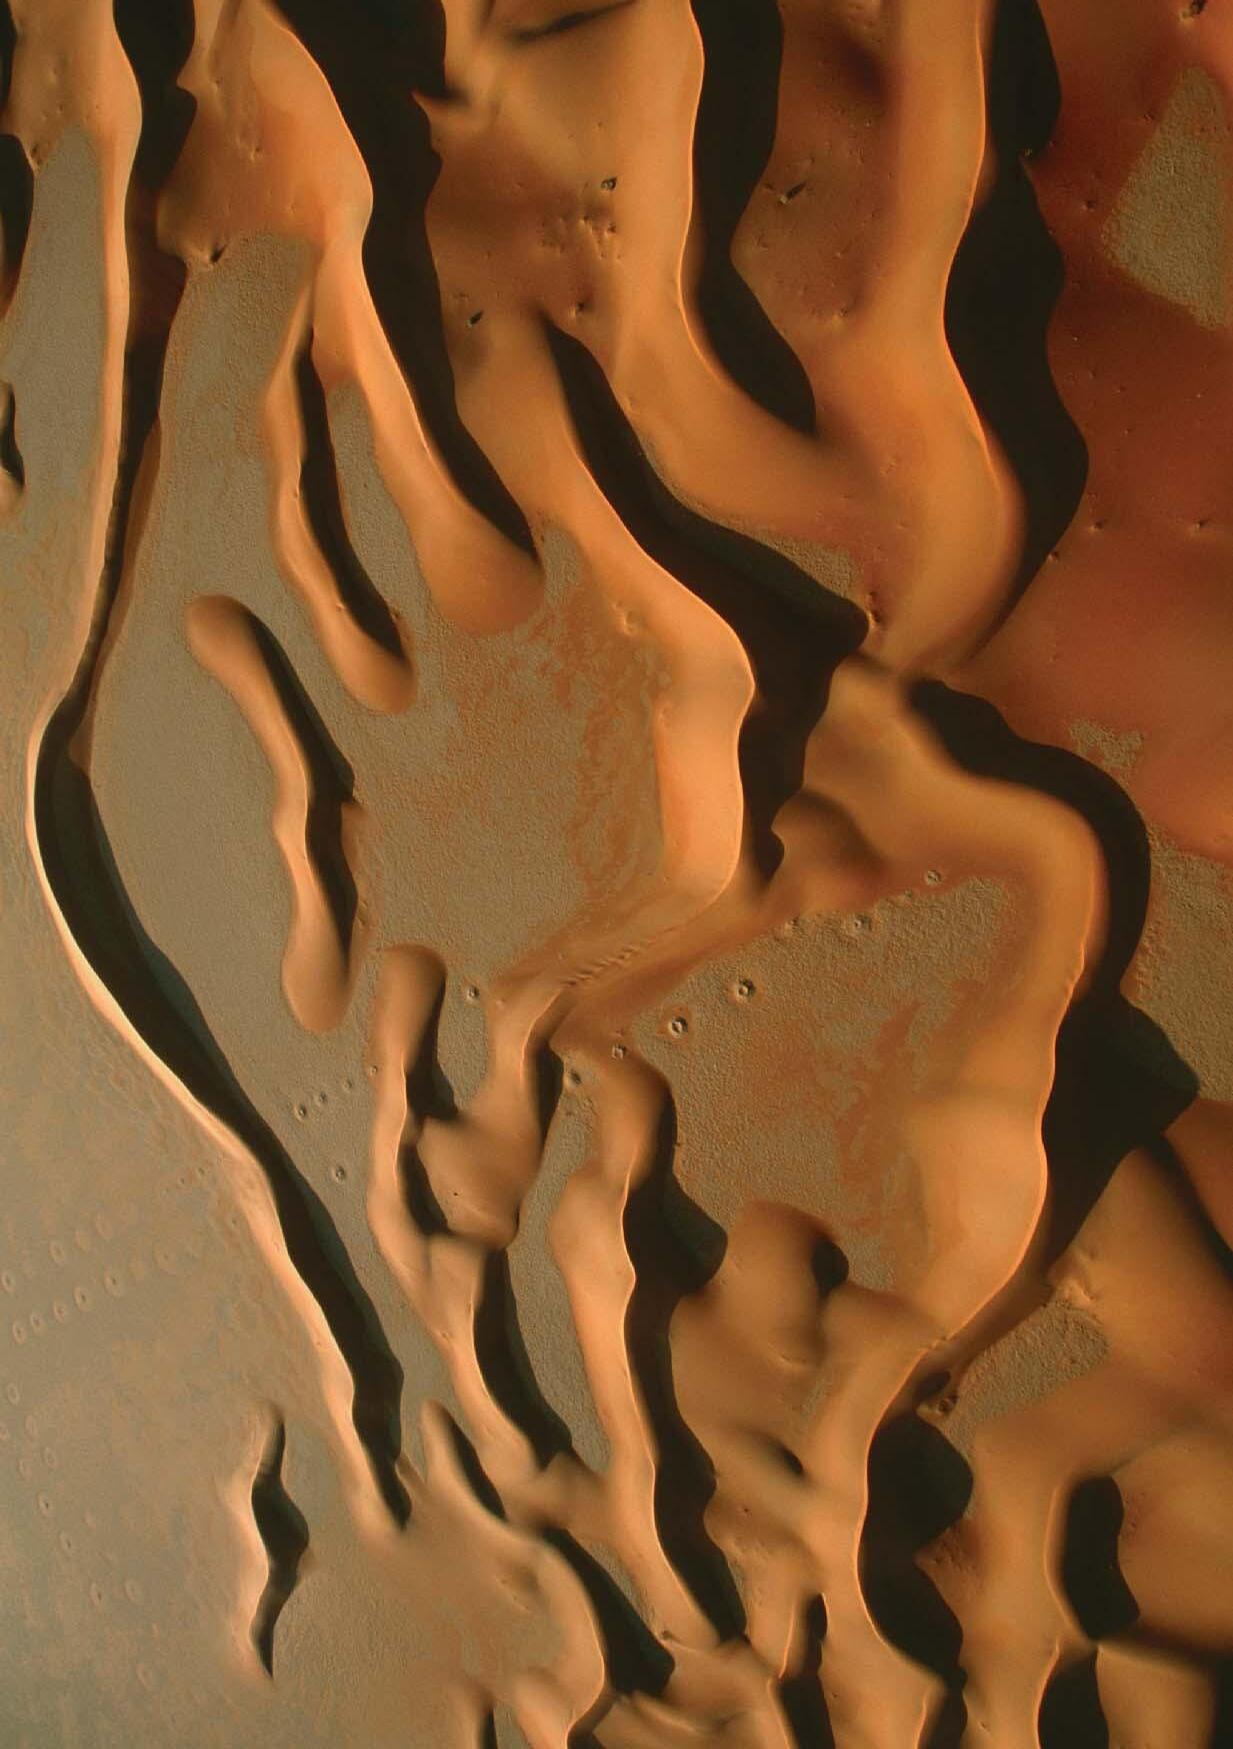
FIGURE 18
P26
04HYPOTHESIS
P27
04HYPOTHESIS
Nature processes large amounts of potential construction material in the form of aggregates and assembles them into dynamic morphologies. The idea is to use these natural formative processes in order to actuate semi-natural dynamic microenvironments. These might induce morphological and climatic transformations which are relevant both with regards to their human inhabitation and the original geology. The main hypothesis is thus to investigate, if natural formative aggregate processes can be deployed to induce new morphologies and then how these new morphologies can perform on an architectural as well as on a geomorphological scale. This main hypothesis might be broken down into the following sub-hypotheses, which will be dealt with throughout the course of the research.
(01) How can these microenvironments induce morphological and climatic transformations which are relevant both with regards to their human inhabitation and the actuating geology.
(02) How can the system have loose and solid phases, the solid being embedded in a loose aggregate and thus becoming loose in itself.
(03) How are these morphologies continuously changing over time through cycles of erosion and accretion, entering a cycle of continuous construction.
(04) How throughout this process can the construction material and energy in large parts be provided by nature itself, the structures thus being formed by minimal energy input.
28 AGGREGATIONS 04 HYPOTHESIS
FIGURE 19
COARSE SAND PILE UNDER STRONG WIND IMPACT
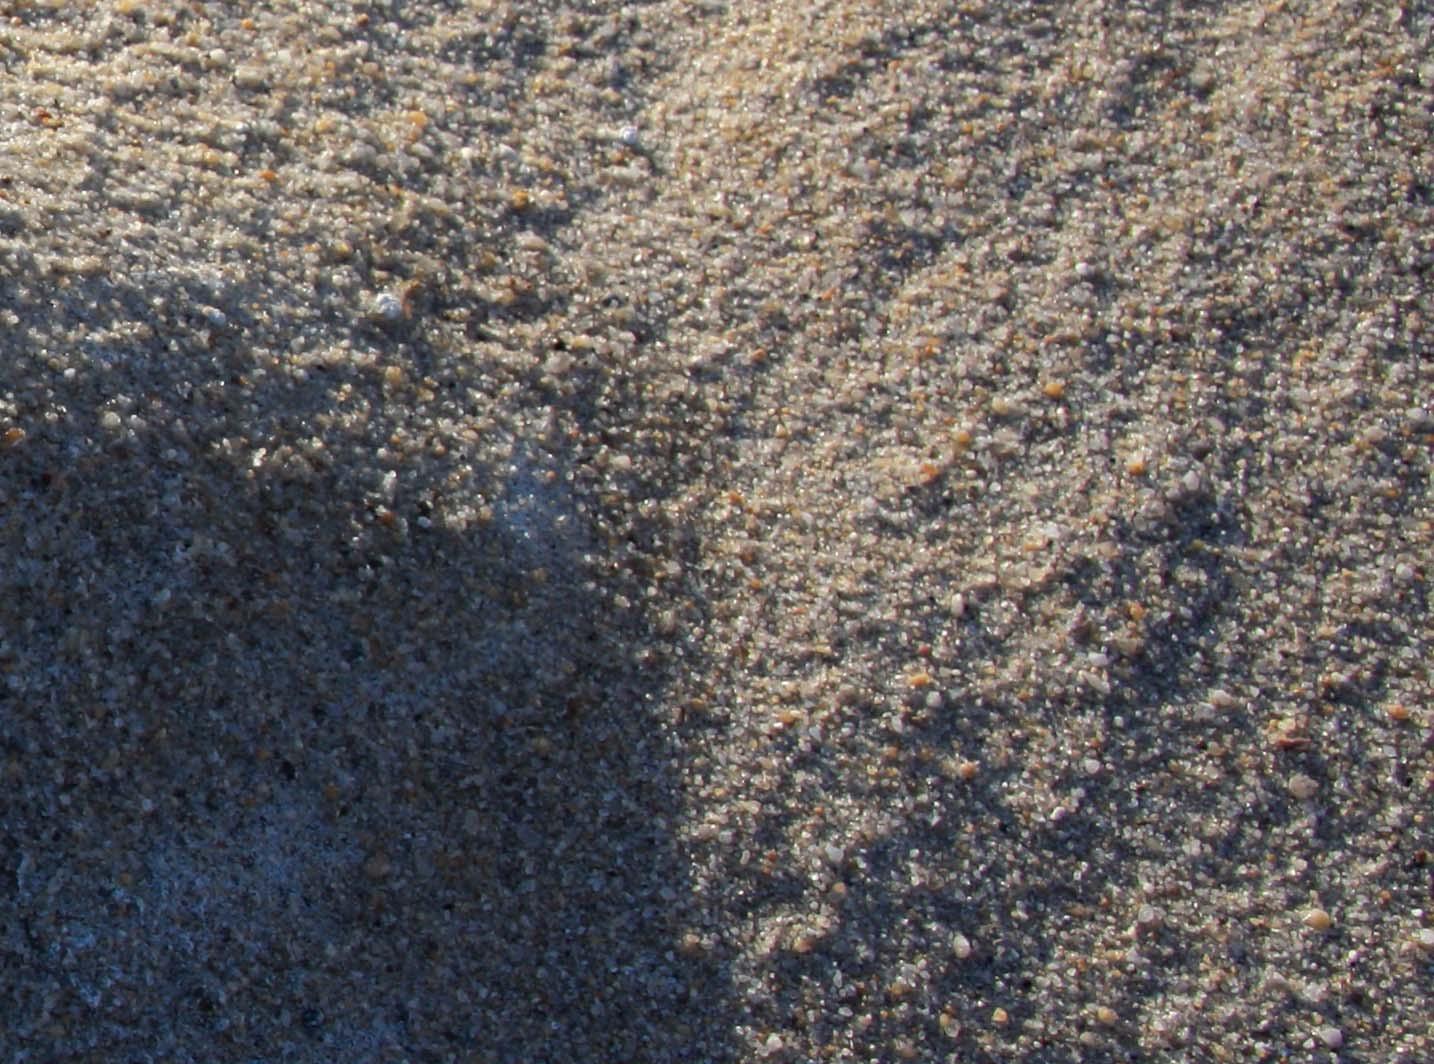
Two piles of coarse sand, 25 cm diameter each, have been built up on the beach in List/Sylt/ Germany. The very strong impacting wind of 45 km/h to 65 km/h almost immediately forms them into a morphology resembling that of a dune, showing a windward low slope and a steep slip face. Smaller and lighter grains are transported across the crest, tumble down in the still air on the leeward side and come to rest in the wind shadow. Coarser grains remain on the windward slope and crest.
29 AGGREGATIONS 04 HYPOTHESIS
FIGURE19
P30
05METHODS
05.01 INTRODUCTION 05.02 OVERVIEW 05.03 SCALE 05.04 LABORATORY MODELLING 05.05 CONCLUSION
P31

FIGURE 20
FIGURE20 LAYERED AGGREGATE MODEL
Two sand types of the same grain size but different colour are built up in layers. The darker one is piled up first, the lighter one is sieved on top. The field is exposed to an airstream. The impact of the air takes off the light-coloured sand, exposing areas in dark, where impact is high and leaving areas in light sand, where there is little or no impact.
05.01INTRODUCTION-METHODS
The following chapter describes the methods that have been chosen to develop the research. Several sources have been consulted on available aggregate modelling methods (Sources: Cambou, 1998, Duran, 2000 and Pöschel/Schwager 2005). There are essentially two main groups, digital and analogue models, which will be introduced in the following. Analogue models are chosen as the main method of research and subsequently the analogue modeling methods applied in this research will be described in terms of their setup and the basic measurements and principles used. Scale issues will be discussed with regards to their qualitative and quantitative accuracy. Conclusively an outlook of required methodological developments will be given.
33 AGGREGATIONS 05 METHODS
ANALOGUE MODELS
ONSITE MODEL
LAB MODEL
FORMATIVE TOOLS
DIGITAL MODELS
DEM - FORMATIVE FEA
05.02OVERVIEWOFMETHODS
The following chapter is an introduction into possible aggregate modelling methods and the description of the models used in the context of this research. The models can be distinguished between formative and analytical ones, as well as between analogue and digital tools. Aggregates are most easily and efficiently modelled by analogue methods and since some of the physics governing aggregates are not yet fully understood, analogue models are also as of yet the most reliable aggregate method. However simulations exist and can be useful in some occasions, even though they have not been used in this context. Analytical tools can equally be devised in an analogue method, and where possible complemented by digital tools.
ANALOGUE MODELLING
Analogue modelling uses physical aggregates like sand or gravel and exposes them to the boundary conditions they would experience in a real situation. The models are very rapid and can yield useful and easily repeatable results. The high number of quick repetitions that are possible makes this method the most accessible one.
ANALOGUE ANALYSIS
In order to complement analogue models, analytical analogue tools can be developed. These are very common in aggregate modelling. Tracer particles that have a different colouring than the main aggregate body are frequently used.
DISCRETE ELEMENT MODELLING (DEM)
Digital simulations of particle systems are based on Discrete Element Methods (DEM). These model the local behaviour between particles using so-called event driven algorithms. As these models tend to be very heavy computationally, cells are grouped into clusters which are repeated periodically. The digital modelling of particle systems is still relatively young. It offers advantages in studying particle motions in great detail and simulations are accurate. However the computational
power needed is very high and simulations are mainly limited to spherical particles (Sources: Duran, 2000 and Pöschel/Schwager, 2005). DEM models are frequently combined with Finite Element Analysis (FEA) to model boundary conditions of the aggregate system.
DISCRETE ELEMENT MODELLING (DEM) ANALYSIS
DEM models can also be used to analyze particle behaviour through the colour coding of digital tracer particles (Source: Pöschel/Schwager, 2005).
34 AGGREGATIONS 05 METHODS FIGURE21
ANALYSIS TOOLS
ONSITE ANALYSIS
LAB ANALYSIS
DEM - ANALYSIS
APPLIED METHOD
FIGURE21
OVERVIEW OF FORMATIVE AND ANALYTICAL ANALOGUE AND DIGITAL TOOLS
This chart gives an overview of the formative and analytical tools available for aggregate modelling. Both digital and analogue modelling methods were investigated. Digital methods rely on Discrete Element Modelling (DEM), which uses event-based algorithms. Yet even the physics of aggregates are not entirely understood, which makes digital models potentially inaccurate. Analogue modelling on the other hand offers a very direct and quick access to aggregate behaviour, which is why it has been chosen as the main methodological basis.
35 AGGREGATIONS 05 METHODS
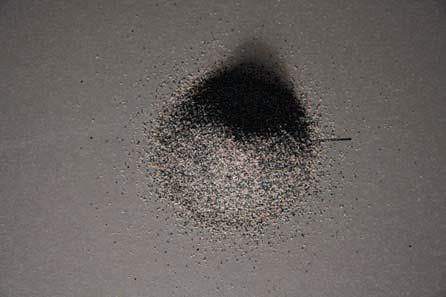

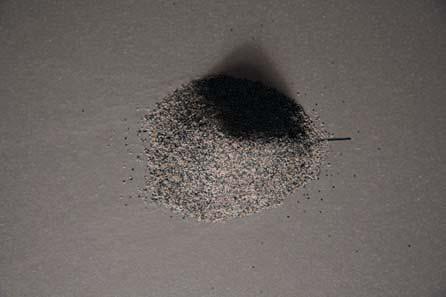
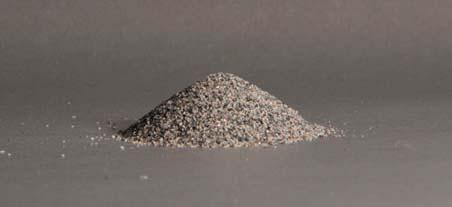
05.03SCALE
‘The physical laws governing the behavior of granular media actually apply to objects whose dimensions cover several orders of magnitude. From grains, a few hundred microns each, to ice floes drifting across the polar seas (over distances of 1000 km), not forgetting Saturn’s rings (made of icy particles about 1 cm wide distributed in a band roughly 1 km thick), the science of granular materials covers at least twelve decades of sizes.’ (Source: Duran, 2000, p.3)
Essentially aggregate models can thus be scaled up or scaled down. Crucial to consider is that all relevant forces need to be scaled accordingly. However, dunes, which are the core morphology of this investigation, have mainly been studied one to one in field conditions. Their morphology has been thought to be scale-dependent, being reduced to the scale order of at least one meter, which does not allow for smaller laboratory experiments. Yet field research is often incomplete and difficult to perform, and experimental laboratory models are increasingly needed to closely understand the dynamics at hand. (Source: GIT, 2005)
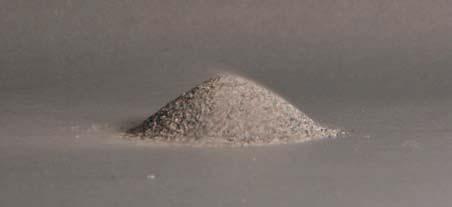
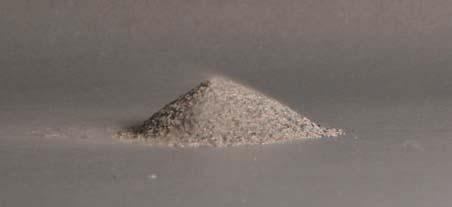
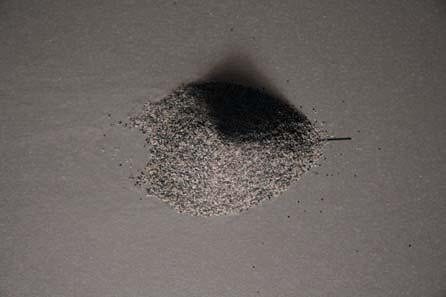
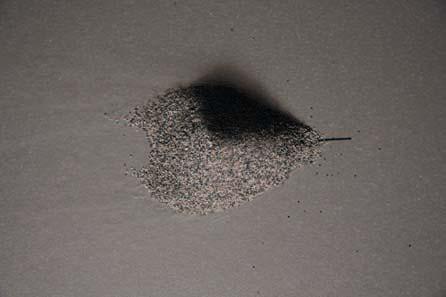
In the course of this dissertation, it has been found that a pile of a diameter as small as 4 cm transforms into the basic morphology of a Barchan Dune under a constant airstream. A Barchan Dune shows a windward slope of ca. 11 degrees, a slip face of ca. 35 degrees and has two horns pointing in the windward direction. The scaled laboratory model developed shows all these features on a much smaller scale. This finding has been consolidated by similar models of other research groups (Sources: ITP, GIT, 2005 and DLGD, 2002). As the development of laboratory models for dunes is extremely recent, it is not yet possible to supply exact quantitative methods for the relative scaling of each factor affecting the model, such as relative wind speeds and grain sizes. This will need a far greater collection of empirical data relating one to one dunes and their laboratory models. It is however possible to give an indicative qualitative assessment of the laboratory and onsite models versus their one to one counterparts. The above study shows the development of a pile under an airstream. Its basic morphology is consistent with that of a Barchan Dune, however the duration of formation is vastly reduced. Natural dunes take years to form, laboratory
ones are made within seconds, which allows to study them in very condensed time spans. This reduction of timescale also allows the observation of the morphological behaviour of dunes in continuous formation one by one, which is very hard to achieve in a natural setting. The main morphological difference between a laboratory and a one to one natural dune is related to the saltation length of the particles. This length remains more or less the same and where in a natural dune, grains are collected on the slip face, in a laboratory dune they are propelled far beyond, leading to a very quick erosion of the formation (Source: DLGD, 2002).
2 CM 2 CM T01: 00 secT02: 02 secT03: 04 sec T01: 00 secT02: 02 secT03: 04 sec T01: 00 SEC T02: 02 SEC T03: 04 SEC 36 AGGREGATIONS 05 METHODS FIGURE22
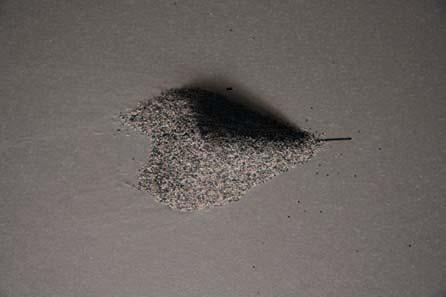
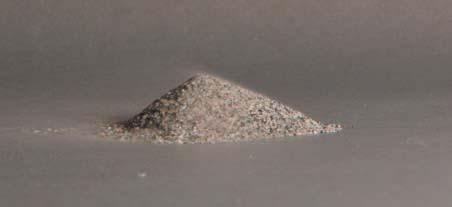
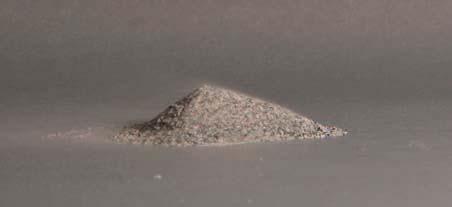
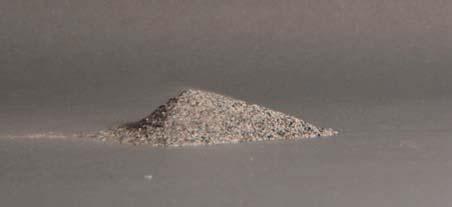
TRANSFORMATION OF A PILE UNDER A MONODIRECTIONAL AIRSTREAM
A sand pile of 4 cm diameter deforms under a mono-directional airstream into a dynamic morphology that is very closely related to that of a typical Barchan (Crescentic) Dune. Under airflow, two horns gradually form, the windward slopes becomes lower through erosion, whereas the leeward side steepens. This process takes about ten seconds. The top row shows a digital model in plan, the second row the same model in perspective view, the third row shows the top view of the physical experiment and the bottom row the same experiment in side view.
T04: 06 secT05: 08 secT06: 10 sec T04: 06 secT05: 08 secT06: 10 sec T04: 06 SEC T05: 08 SEC T06: 10 SEC 37 AGGREGATIONS 05 METHODS
FIGURE22
WINDSPEED 01
WINDSPEED 02
WINDSPEED 03
WINDSPEED 04
WINDSPEED 05
WINDSPEED 06
WINDSPEED 07
WINDSPEED 08
WINDSPEED 09
WINDSPEED 10
05.04LABORATORYMODELLING
A wind-table is constructed in order to model the natural behaviour of the aggregates as closely as possible. The table measures 2.00 m by 0.80 m by 0.34 m and the wind is simulated by two different size ventilators.
WINDTABLE PARTS
01 VENTILATING FANS
Two ventilators of different size have been used for the experiments. The smaller one measures 6.0 cm width and allows to model piles or dunes of up to 4.0 cm width. It allwos to adjust two speed regimes. The larger ventilator of the type Cyclone VAF 250 measures 35 cm width and allows to model a width of 33 cm.
02 HORIZONTAL BOARD
The horizontal board is the base that the dry aggregate is filtered onto and where the dune-field forms under the influence of the ventilating fans.
CAMERA POSITION AND LENS ANGLE
A horizontal camera of the type Canon EOS 40 D can be adjusted to different positions on top of the table using a 17 mm to 85 mm lens and time lapse mechanism (PCLIX TM).
WINDTABLE SPECIFICATIONS
WIDTH OF AIRSTREAM
The width of the airstream defines how big a dune field can be modelled. The airstream needs to be slightly bigger than the modelled field.
DISTANCE FROM SOURCE/AIRSTREAM SPEED
The distance from the airstream defines the speed that can be investigated. The speed decreases with an increasing distance from the airstream.
HORIZONTAL DIRECTION OF AIRSTREAM
The air source can be rotated horizontally to model different wind directions. Increments of ten degrees are marked on the table.
VERTICAL DIRECTION OF AIRSTREAM
The air source can be rotated vertically to model different wind directions. Increments of ten degrees can be achieved by tilting the air source.
REYNOLDS NUMBER OF THE AIRSTREAM
‘Most streams, the surface layers of the ocean stirred by the winds, and the winds close to the ground are turbulent. We can see laminar flows in small rills with thin flows of a few millimetres but rarely elsewhere on the natural surface of this planet. The prevalence of turbulent flows accounts for the sediment-transporting capability of the many different sorts of natural currents found in the environments of the Earth’s surface.’ (Source: Siever, 1988, pp. 40-42). A low Reynolds Number means that there is laminar flow. A high Reynolds Number indicates that there is turbulent flow. In the context of this research only turbulent flow is relevant, as this is the regime that most sedimentary environments are found in. For a more detailed discussion of the Reynolds number see chapter 11.
MAIN AXIS OF AIRSTREAM C01 C02 C03 C04 C05 C06 C07 C08 C09 C10 38 AGGREGATIONS 05 METHODS FIGURE23
FIGURE23
PERSPECTIVE VIEW OF THE WINDTABLE Perspective view of the 2.00 m x 0.80 m wind table. The airstream can be rotated in two axes allowing to simulate varying wind directions. Along the table, the wind speed decreases, so that each zone allows to test a different wind speed, altogether there are ten different zones.
FIGURE24
SIDE VIEW OF THE WINDTABLE
A camera (Canon EOS 40D) is adjusted on top of the wind table at right angle. It is connected to a time lapse device (PCLIX TM), that allows to take digital images at 1 second intervals. The camera can be adjusted along the table in ten different positions and uses a 17mm to 85 mm lens.
WINDSPEED 01 WINDSPEED 02 WINDSPEED 03 WINDSPEED 04 WINDSPEED 05 WINDSPEED 06 WINDSPEED 07 WINDSPEED 08 WINDSPEED 09 WINDSPEED 10 CAMERA 01 CAMERA 02 CAMERA 03 CAMERA 04 CAMERA 05 CAMERA 06 CAMERA 07 CAMERA 08 CAMERA 09 CAMERA 10 MAIN AXIS OF AIRSTREAM 10 20 30 40 50 60 70 80 90 39 AGGREGATIONS 05 METHODS
FIGURE24
MEASUREMENT01 SPEED 01: 40.4 km/h SPEED 02: 26.7 km/h

MEASUREMENT02
01: 33.0 km/h
02: 21.0 km/h
MEASUREMENT03
01: 24.6 km/h
km/h
MEASUREMENT04
01: 20.0 km/h SPEED 02: 14.3 km/h
MEASUREMENT05 SPEED 01: 16.5 km/h SPEED 02: 10.5 km/h
MEASUREMENT01 SPEED 01: 35.0 km/h
MEASUREMENT02
01: 33.1 km/h
MEASUREMENT03
km/h
05.04WINDSPEEDMEASUREMENTS
In order to be able to construct the wind-table as closely to on site conditions as possible, some preparatory measurements are needed, such as the wind speed generated by a regular hairdryer and a large ventilating fan of the type Cyclone 250 VAF, which are used as sources of airflow. Measurements are carried out at 15 cm intervals moving away from the air source. As the hairdryer has two speed levels, two sets of speeds are taken. As a measuring device, a digital hand-held wind speed meter is used.
40 AGGREGATIONS 05 METHODS
MEASUREMENT 010.15 M MEASUREMENT 020.30 M MEASUREMENT 030.45 M MEASUREMENT 040.60 M MEASUREMENT 050.75 M
FIGURE25
SPEED
SPEED
SPEED
SPEED 02: 17.1
SPEED
SPEED
SPEED
FAN01 FAN02
01: 28.6 km/h MEASUREMENT04 SPEED 01: 27.0 km/h MEASUREMENT05 SPEED 01: 25.5

MEASUREMENT06 SPEED 01: 14.0 km/h SPEED 02: 8.9 km/h

MEASUREMENT07 SPEED 01: 11.3 km/h SPEED 02: 7.3 km/h

MEASUREMENT08 SPEED 01: 9.7 km/h SPEED 02: 6.3 km/h
MEASUREMENT09 SPEED 01: 8.8 km/h SPEED 02: 5.2 km/h

MEASUREMENT10 SPEED 01: 7.7 km/h SPEED 02: 4.7 km/h
MEASUREMENT06 SPEED 01: 22.3 km/h
FIGURE25 WINDSPEED MEASUREMENTS ALONG THE WIND TABLE Two fans of different size have been used for the experiments. The top row of wind speed measurements is for a 6 cm wide fan. The bottom row shows speeds for a 36 cm wide fan of the type Cyclone VAF 250. Speeds have been measured using a hand held digital wind speed meter.
41 MEASUREMENT 060.90 M MEASUREMENT 071.05 M MEASUREMENT 081.20 M MEASUREMENT 091.35 M MEASUREMENT 10 -
M
1.50
MEASUREMENT07 SPEED 01: 21.4 km/h
MEASUREMENT08 SPEED 01: 19.0 km/h
METHODS
MEASUREMENT09 SPEED 01: 18.1 km/h MEASUREMENT10 SPEED 01:16.5 km/h AGGREGATIONS 05

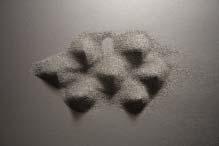
ANALYTICAL METHOD
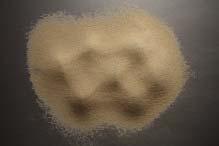


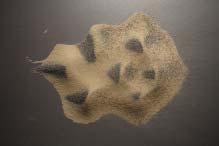
05.04LAYEREDAGGREGATEMODELS
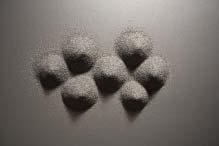
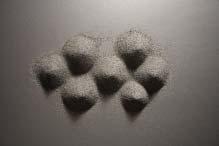
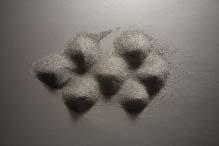
A specific formative and analytical method is being developed in order to study the wind distribution in a modulated aggregate field. Two aggregates of the same grain size yet different colour are layered on top of each other. If an impacting airstream or wind impacts on the modulation, the lighter colour grains are taken off in the areas that are affected by the impact, leaving a clear distribution of areas that are affected by the impacting stream and those that are in a wind shadow. Techniques like these that use so-called marker aggregates are very common in aggregate modelling.
42 AGGREGATIONS 05 METHODS FIGURE26
FORMATIVE METHOD
00sec02sec04sec06sec08sec 00sec02sec04sec06sec08sec
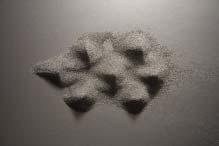
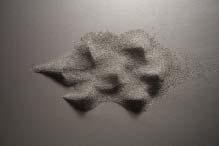
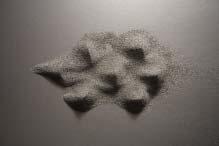
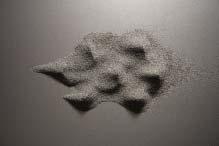
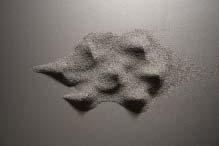
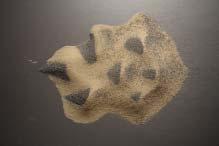
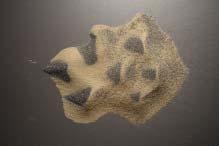
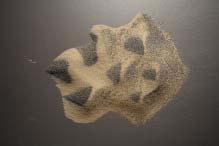
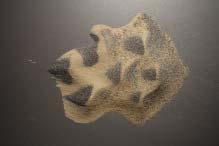
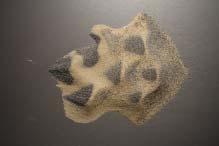
FIGURE26
FORMATIVE AND ANALYTICAL LABORATORY METHOD
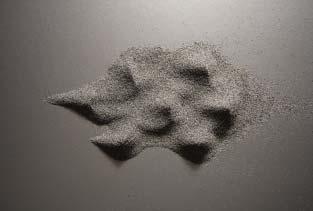
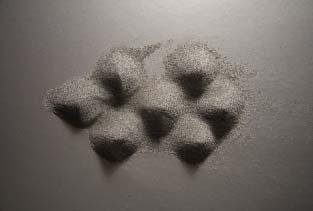
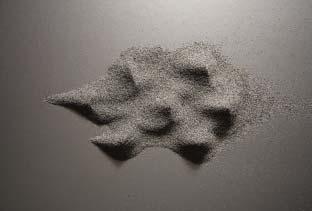
The top row shows the formation of seven sand piles under an airstream of 21 km/h. Windward faces and leeward sides form within seconds. This process can be analyzed by using a lighter coloured sand of the same grade that is taken off at the leeward sides, giving a clear distribution of wind sheltered areas across the entire formation.
43 AGGREGATIONS 05 METHODS 10sec12sec14sec16sec18sec 10sec12sec14sec16sec18sec
05.05CONCLUSION-METHODS
Several approaches to aggregate modelling have been introduced and a detailed description of the analogue setup developed for this research has been given. Deploying these methods has brought up several issues for further development, that will also be described in parts in the overall evaluation, but which will be introduced at this point. Firstly, there is a strong need for accurate aggregate laboratory models, that allow to scale down processes in terms of size or scale. A basic setup has been introduced, but much more empirical tests need to be conducted to arrive at an accurate scaling model. One to one tests preferably on site also become indispensable. It has also become apparent that photographic and image processing methods might be a good way into aggregate research, as they offer to analyze behaviours using time lapse photography (See also: Duran 2000).
Two sand types of the same grain size but different colour are built up in layers. The darker one is piled up first, the lighter one is sieved on top. The field is exposed to an airstream. The impact of the air takes off the light-coloured sand, exposing areas in dark, where impact is high and leaving areas in light sand, where there is little or no impact. Local modulations can be achieved by the impact of a singular airstream.
44 AGGREGATIONS 05 METHODS
FIGURE27
LOCAL BLOWOUTS
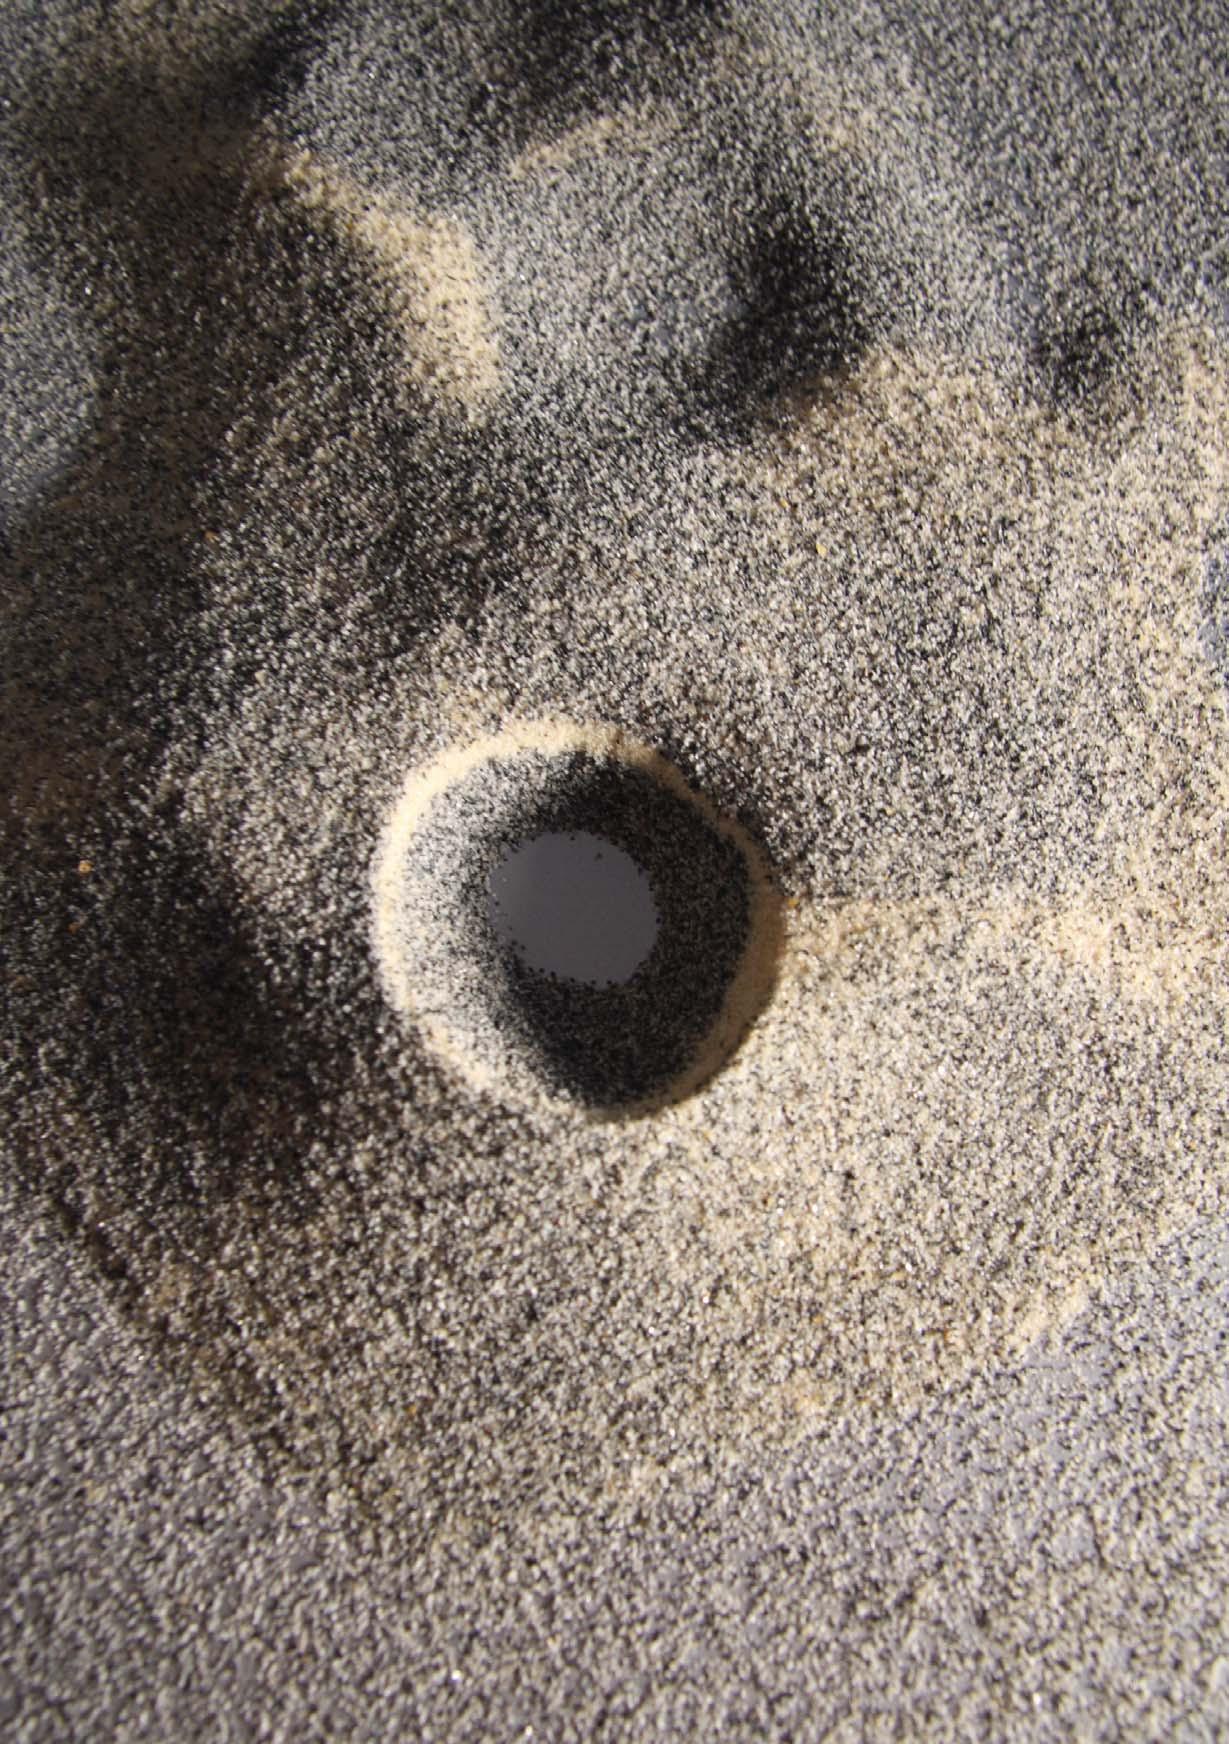
FIGURE 27
P46
06DESIGNDEVELOPMENT
06.01 INTRODUCTION
06.02 SEDIMENTARY ENVIRONMENTS
06.03 ONSITE MODELS
06.04 LABORATORY MODELS
06.05 SOLIDIFCATION METHODS
06.06 OVERVIEW DESIGN DEVELOPMENT
06.07 CONCLUSION
P47

FIGURE 28
FIGURE28
SEVEN PILES UNDER AN AIRSTREAM
Seven piles of kiln dried sand are exposed to an airstream at 21 km/h. They quickly form windward slopes and a lee-face. Time lapse photography allows to see grain movement in motion around the formation and deduce possible airflow patterns.
06.01INTRODUCTION-DESIGNDEVELOPMENT
The aim of this research is to develop a system that uses natural aggregates and their dynamic behaviours in order to actuate semi-natural dynamic morphologies. In order to develop such a system, several phases of design development are being conducted. Initially, all sedimentary environments are being studied in order to get an overview of their specifics and make a clear distinction between them. Common general strategies are being outlined. One specific sedimentary environment, the coastal beaches and dunes, is chosen and analyzed in greater detail. Subsequently, a specific formative material method is developed through onsite and laboratory studies. It is based on the fact that a simple aggregate pile transforms into a morphology resembling that if a dune if exposed to an airstream. This basic setup is developed and expanded. Solidification methods are being introduced. Conclusively an overview of the system is being given.
49 AGGREGATIONS 06 DESIGN DEVELOPMENT
P50
06.02SEDIMENTARYENVIRONMENTS
P51

SEDIMENTARY ENVIRONMENT: Continental. Alluvial fan
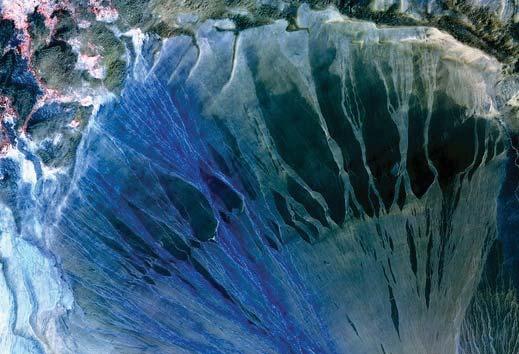
DESCRIPTION: Aprons of river-laid sediment at the edges of valleys bordering mountains
SEDIMENTARY PROCESSES: River transport
SEDIMENT TYPES: Alluvium

SEDIMENTARY ENVIRONMENT: Continental. Glacial
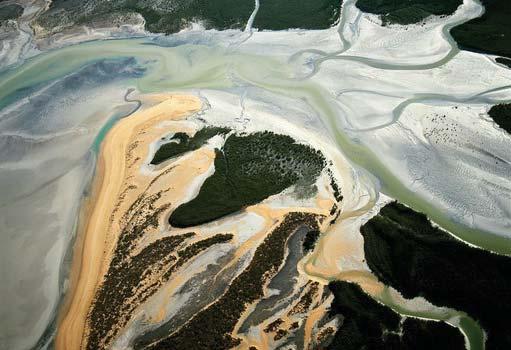
DESCRIPTION: Till and outwash plains of continental and valley glaciers
SEDIMENTARY PROCESSES: Weathering (Mechanical/Chemical)
SEDIMENT TYPES: Intermontane basin fills
06.02SEDIMENTARYENVIRONMENTS
A sedimentary environment shows a consistent sediment facies. It is understood as a group of sediment-forming processes with a corresponding recognizable sediment facies that can be mapped. There are subfacies to the main facies, but the sedimentary environment defines the overall character of the aggregation. Ten different sedimentary environments can be distinguished ranging from glacial moraine fields to abyssal plains under the ocean surface. Within the context of this design investigation only those environments are considered which are above sea level (Source: Siever, 1988, pp. 72 to 77).
SEDIMENTARY ENVIRONMENT: Continental. Alluvial plain
DESCRIPTION: Channel and floodplain deposits of braided- and meandering river-valleys
SEDIMENTARY PROCESSES: River transport
SEDIMENT TYPES: Alluvium (Channel/Floodplain)
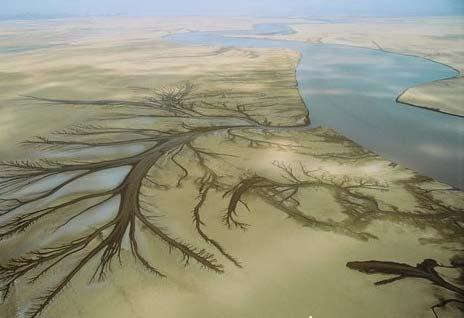
SEDIMENTARY ENVIRONMENT: Coastal. Delta
DESCRIPTION: Shoreline deposits by rivers at their mouths, modified by waves and tides
SEDIMENTARY PROCESSES: Hydraulic sorting and abrasion
SEDIMENT TYPES: Moderate to well-sorted deltaic sediments
52 FIGURE 29 AGGREGATIONS 06 DESIGN DEVELOPMENT
05 06 01 02
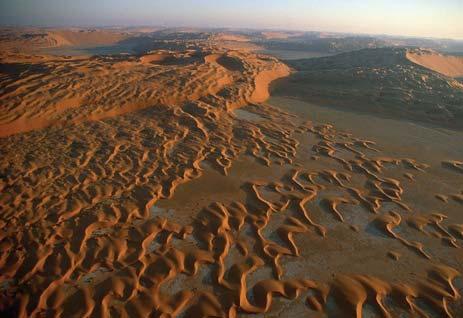
SEDIMENTARY ENVIRONMENT: Continental. Desert or Eolian
DESCRIPTION: Dune fields of deserts; semi-arid, broad, sandy river-valleys; coastal dunes
SEDIMENTARY PROCESSES: Eolian transport
SEDIMENT TYPES: Dunes

SEDIMENTARY ENVIRONMENT: Continental. Lake
DESCRIPTION: Similar to shoreline deposits of deltas, but smaller in scale
SEDIMENTARY PROCESSES: Hydraulic sorting and abrasion
SEDIMENT TYPES: Deltaic sediments
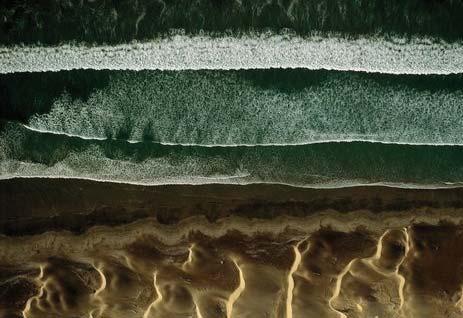
SEDIMENTARY ENVIRONMENT: Coastal. Beach and bar
DESCRIPTION: Sand distributed parallel to the shoreline by waves and tides
SEDIMENTARY PROCESSES: Hydraulic sorting and abrasion
SEDIMENT TYPES: Moderate to well-sorted littoral sediments
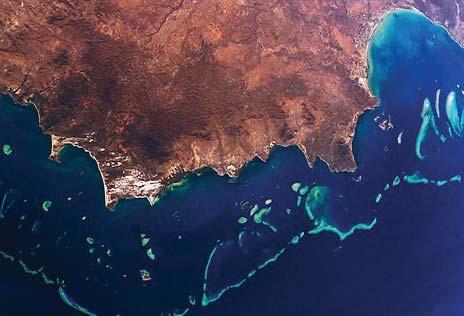
SEDIMENTARY ENVIRONMENT: Continental border. Continental shelf
DESCRIPTION: Sand ribbons, sheets and dunes on shallow, broad continental margins
SEDIMENTARY PROCESSES: Hydraulic sorting and abrasion
SEDIMENT TYPES: Fine-grained and residual shelf-sediments
FIGURE29
OVERVIEW OF SEDIMENTARY ENVIRONMENTS
Eight sedimentary environments are considered relevant with regard to this research. Beyond the Continental Shelf, there are two more submarine sedimentary environments, the continental slope and rise as well as the abyssal plain. These have been left out as they are not relevant as areas of implementation. (Source: Siever, 1988, pp. 74 and 76)
IMAGE CREDITS
01 Alluvial Fan: NASA/Science Photo Library
02 Alluvial Plain: Bernhard Edmaier/Science Photo Library
03 Desert/Aeolian: George Steinmetz/Science Photo Library
04 Lake: Bernhard Edmaier/Science Photo Library
05 Glacial: George Steinmetz/Science Photo Library
06 Delta: George Steinmetz/Science Photo Library
07 Beach/Bar: George Steinmetz/Science Photo Library
08 Continental Shelf: NASA/Science Photo Library
53 AGGREGATIONS 06 DESIGN DEVELOPMENT
07 08 03 04

FORMATIVE PRINCIPLE 01
DYNAMICS: Vibration ENVIRONMENT: Seismic Locations

FORMATIVE PRINCIPLE 02
DYNAMICS: Gravity ENVIRONMENT: Glaciers/Mountains

FORMATIVE PRINCIPLE 03
DYNAMICS: Wind ENVIRONMENT: Desert/Dunes

FORMATIVE PRINCIPLE 04
DYNAMICS: Water ENVIRONMENT: Alluvial
06.02OVERVIEWFORMATIVESTRATEGIES
The intervention in these environments can happen on two scales. On the one scale different formative strategies for the overall aggregate modulation can be devised, depending on the sedimentary environment. They will be determined by the dynamics at hand in a given sedimentary environment, such as branching, wind-driven formation or aggregate piling. Special effects can be used in environments with seismic conditions, where aggregates can form very specific formations under the impact of vibrations. Each of these strategies can also be used in combination, if the environment requires it.
FIGURE30.01
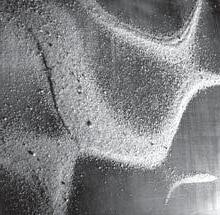
AGGREGATE FORMATIONS UNDER VIBRATION
Sand on a metal plate is collected at the nodal lines under resonant frequencies of the plate. These aggregate effects might be used in seismic environments. (For a more specific experimental setup see the Appendix)
FIGURE30.02
AGGREGATE FORMATION UNDER GRAVITY ONLY
Aggregates under gravity only form piles. Their outline is convex, whereas that of funnels is concave. If the angle of movement is reached, an avalanche occurs until the aggregate again settles at its angle of repose.
FIGURE30.03
AGGREGATE FORMATION UNDER AIRSTREAM IMPACT
A sand pile under the impact of an airstream takes on the morphology of a dune. It develops a low windward slope and a steep slip-face, as well as downwind pointing horns. This strategy might be used in an aeolian environment.
FIGURE30.04
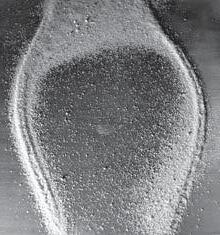
AGGREGATE FORMATION WITH WATER
If an aggregate is built up in a slope and saturated with water, a branching system with inlet, branches and a lake forms. Strategies involving these dynamics might be deployed in alluvial environments.
54 AGGREGATIONS 06 DESIGN DEVELOPMENT
30.01FIGURE 30.02FIGURE 30.03FIGURE 30.04
FIGURE
GRANULAR MODULATION 01
PRINCIPLE: Aggregate Grade EFFECT: Structural/Dynamic Behaviour
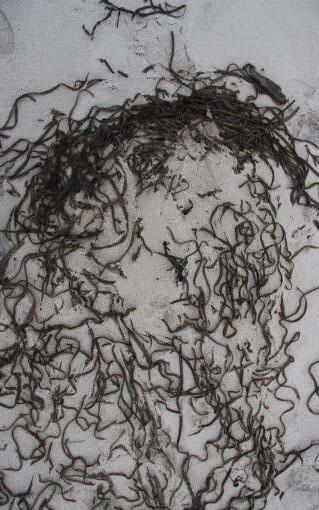
GRANULAR MODULATION 02
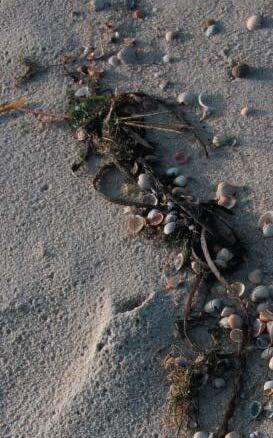
PRINCIPLE: Fibres EFFECT: Structural


GRANULAR MODULATION 03
PRINCIPLE: Climatic Additives EFFECT: Climatic
GRANULAR MODULATION 04
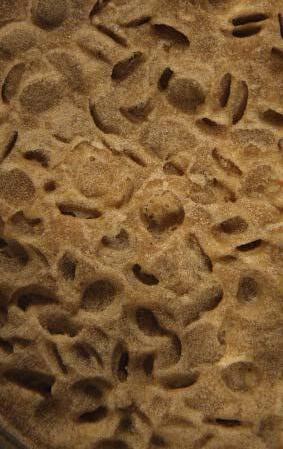
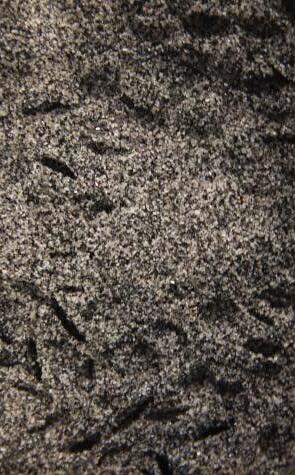
PRINCIPLE: Textural Grains EFFECT: Surface Articulation
06.02OVERVIEWGRANULARMODULATIONS
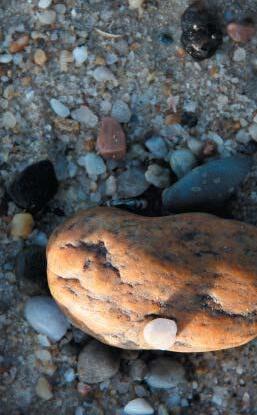
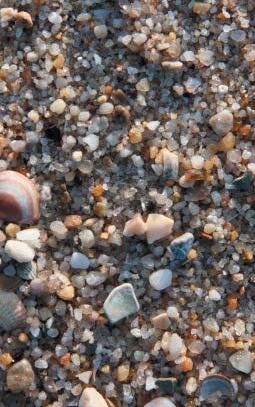
The other scale of intervention can be the granular level itself. Strategies can be the grading of an aggregate assembly by using different grade aggregates available on site. Additives can be used, either available or brought onto site. These might modulate climatic conditions, surface textures or structural performance of the modulations.
FIGURE31.01
AGGREGATE GRADING
Aggregates are frequently appearing in different grade on site. These might be used to achieve several effects, such as additional structural strength or a specific performance under wind and humidity as will be seen in the following chapter.
FIGURE31.02
FIBRE ADDITIVES
Fibres can be included in solidifications to add structural strength. They might be found onsite, as in this case algae, or manufactured and brought onto site.
FIGURE31.03
CLIMATIC ADDITIVES
There are several climatic additives used in materials such as concrete to give specific performative characteristics to the material. Wax pellets for example are used to extract heat from the material and adjacent spaces by melting thus dispersing the heat energy.
FIGURE31.04
TEXTURAL ADDITIVES
Local textural variations such as holes or indentations can be introduced into an aggregation by scattering a coarser aggregate, that spares and thus textures certain areas.
55 AGGREGATIONS 06 DESIGN DEVELOPMENT
31.01FIGURE 31.02FIGURE 31.03FIGURE 31.04
FIGURE
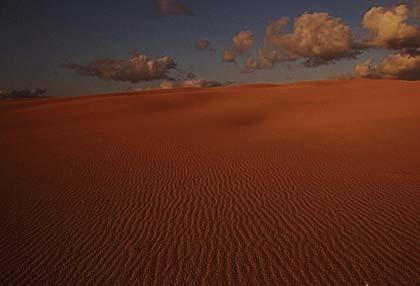
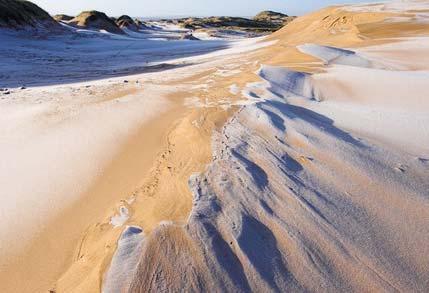
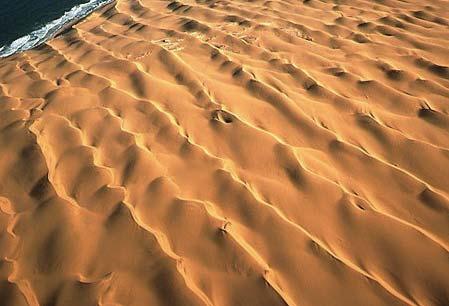

06.02COASTALDUNEBELTS
Coastal dune belts are chosen as a testing bed for the implementation of seminatural dynamic morphologies. They are a sub-group of deserts and eolian sedimentary environments and are related to the sedimentary activity along shorelines. Their morphology is due to typical processes of formation. The basic processes are driven by wind speed and direction as well as the gradation of the sand. A small obstacle, such as a group of pebbles can be the start of sand piling up in the sheltered region behind the pebbles, eventually forming a small dune. Typically the windward slope is relatively hard due to the accretion of saltating sand grains, whereas the lee side is rather soft due to the loose packing caused by cascades of sand forming slip faces. Small ripples form on the windward slope of a dune in transverse direction to the wind. The dune itself can be either transverse or longitudinal to the wind, with a tendency to be transverse under constant wind direction. Dunes can be between 1.00 metre and 100.00 metres high. (Source: Siever, 1988, pp. 84-85)
56 AGGREGATIONS 06 DESIGN DEVELOPMENT
LOCATION: Fraser Island. Australia
DESCRIPTION: Wind-formed ripples on coastal sand dunes IMAGE CREDITS: Bill Bachman/Science Photo Library
LOCATION: Scotland. United Kingdom
DESCRIPTION: Frost covered sand dunes Ythan estuary, Newburgh, Aberdeenshire
IMAGE CREDITS: Duncan Shaw /Science Photo Library
LOCATION: Namibia. Africa
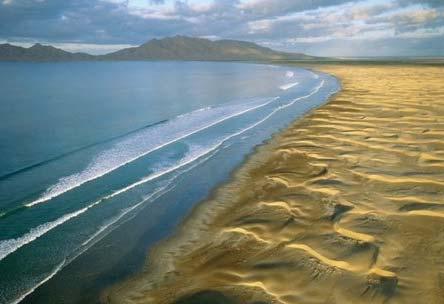
DESCRIPTION: Sand dunes in the Namib Desert, Namibia, as they meet the Atlantic Ocean IMAGE CREDITS: Bernhard Edmaier/Science Photo Library
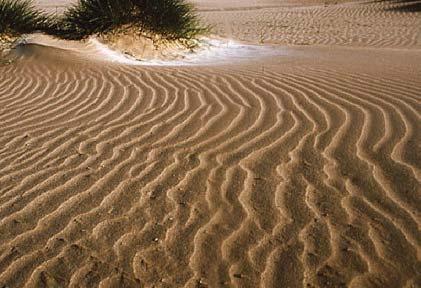
LOCATION: Dyfi Estuary Wales. United Kingdom
DESCRIPTION: Sand dunes patterned with ripples from wind, and vegetated by grasses
05 06 02 01 FIGURE 32
IMAGE CREDITS: Janet Baxter/Science Photo Library
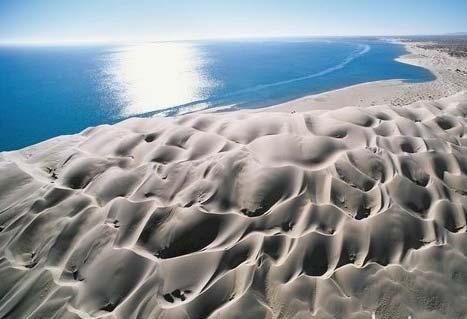
DESCRIPTION: Barchan sand dunes, which are migratory coastal sand dunes
COASTAL DUNEBELTS
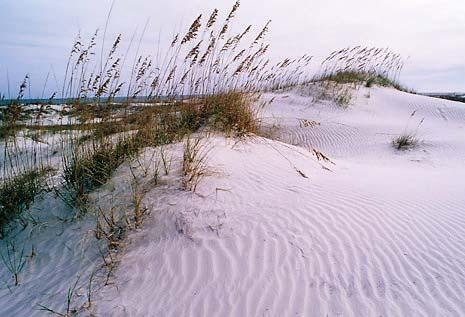
Even though displaying a basic morphology of foreshore, backshore and dunes, coastal dune belts across the world vary widely in their appearance. This is on the one hand due to different sedimentary compositions, on the other hand different aerodynamic and hydraulic conditions result in a wide variety of morphologies, ranging for example from linear to crescentic dune formations.
57 AGGREGATIONS 06 DESIGN DEVELOPMENT
FIGURE32
LOCATION: Baja California Sur. Mexico
IMAGE CREDITS: George Steinmetz/Science Photo Library
LOCATION: Georgia. USA
DESCRIPTION: Sand dunes with sea oats on Cumberland Island National Seashore IMAGE CREDITS: Kenneth Murray/Science Photo Library
LOCATION: Scotland. United Kingdom
DESCRIPTION: Formation of sand dunes along the seashore at Achnahaird
04 03 07 08
IMAGE CREDITS: Simon Fraser/Science Photo Library
LOCATION: Isla Magadalena. Mexico
DESCRIPTION: The dunes are oriented in the direction of the prevailing wind IMAGE CREDITS: George Steinmetz/Science Photo Library
SWELL OR SUMMER PROFILE
NEARSHORE ZONE
06.02STANDARDSHOREPROFILE
The diagram shows the standard profile of a shoreline. A beach has a winter (dotted line) and a summer profile (full line), the winter profile being lower than that during summer months. In the foreshore area, the dynamics are mainly dominated by waves and thus hydraulic accretion and erosion. In the backshore area and dune belt aeolian, wind-driven processes dominate, showing ripple formation and gradually the building up of dunes. The backshore area with ripple formation and little or no dunes is the main area of intervention.
58 FIGURE33 AGGREGATIONS 06 DESIGN DEVELOPMENT
INSHORE
OFFSHORE
BARBAR TROUGH LOW
WATER
SUBAERIAL BEACH (SWELL)
SUBAERIAL BEACH (STORM)
BACKSHORE FORESHORE
BEACH FACE
STORM OR WINTER PROFILE
SEA
CLIFF OR DUNE
FIGURE33
TERMINOLOGY OF A SHORE PROFILE
This diagram shows the terminology for a shore along a shore normal profile. The dotted line shows the storm or winter profile, the full line the summer profile. The backshore beach is the main area of focus. It is frequently considered as a fore dune in itself, but not yet a full dune.
(Source: Schwartz, 2005, p.162)
59 AGGREGATIONS 06 DESIGN DEVELOPMENT
BERM
P60
06.03ONSITEMODELS
P61
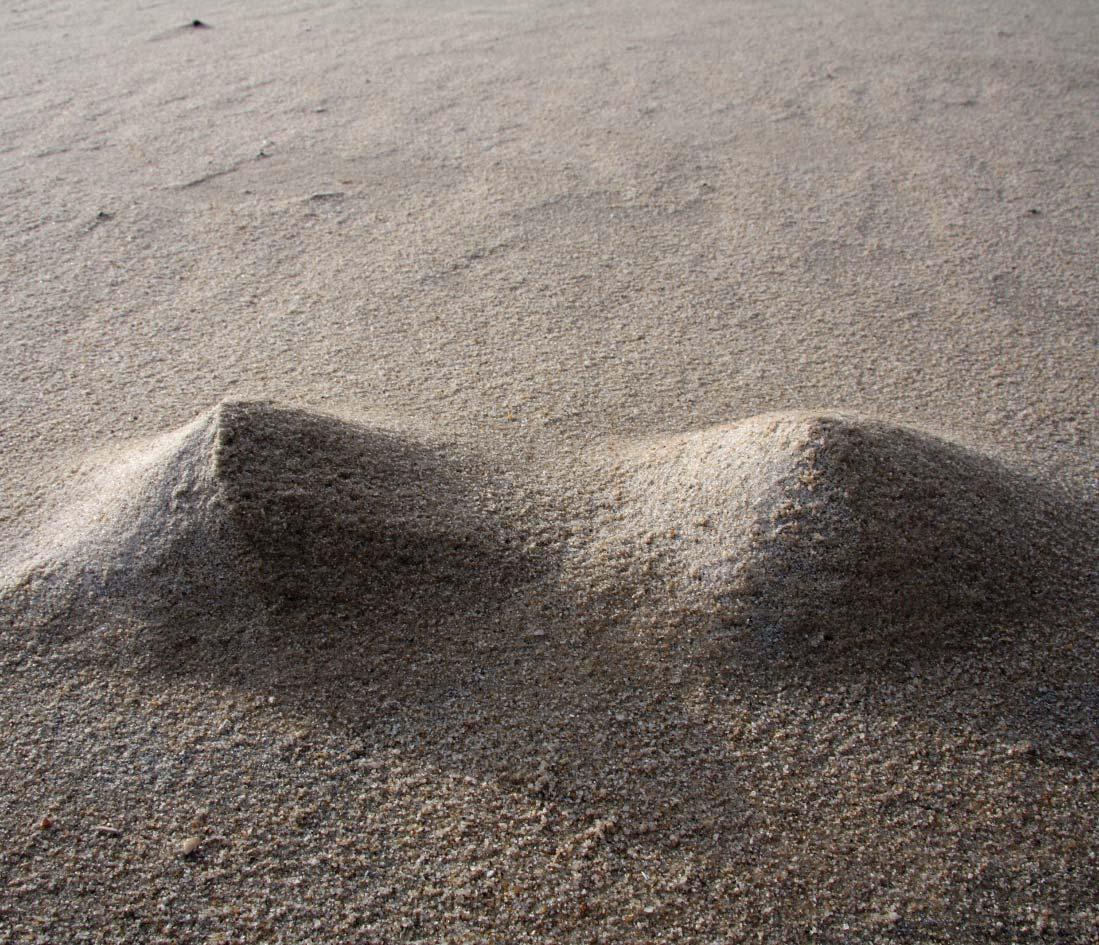
06.03MODULATION01-TWOHUMIDPILES
The onsite models have been conducted in November/December 2008 on the island of Sylt in the German North Sea. After an initial investigation of the beach morphology, which is shown in greater detail in chapter 07, experiments were carried out in the backshore area at the edge of the dune belt. They are all using the same principle, namely that of a pile transforming into a morphology similar to that of a dune under wind impact. All three experiments conducted on site test different aspects of this basic principle. The initial one (modulation 01) is set up to test the behaviour of relatively humid sand and how it affects the formative process.
62 FIGURE 34 AGGREGATIONS 06 DESIGN DEVELOPMENT
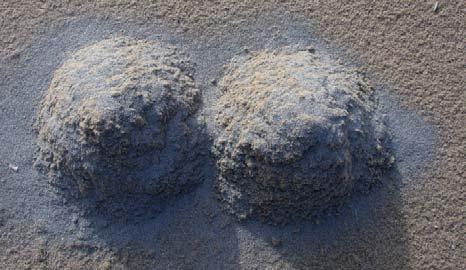
FIGURE34
TWO HUMID SAND PILES AFTER WIND IMPACT
Two piles of humid sand, 35 cm diameter each, have been left to deform on a beach in List/Sylt/ Germany. After three days of impacting winds of around 30 km/h they have formed a windward slope and a slip face.
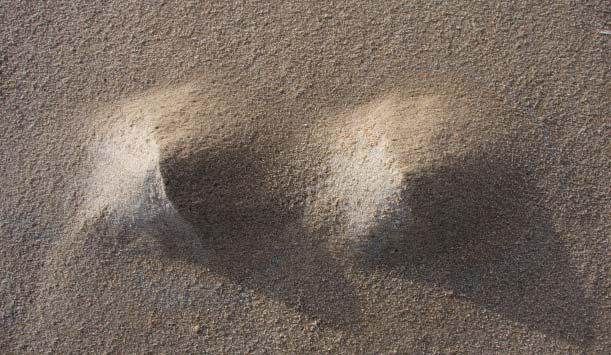
FIGURE35
EDGE CONDITION OF WINDWARD FACE AND LEEWARD SLOPE
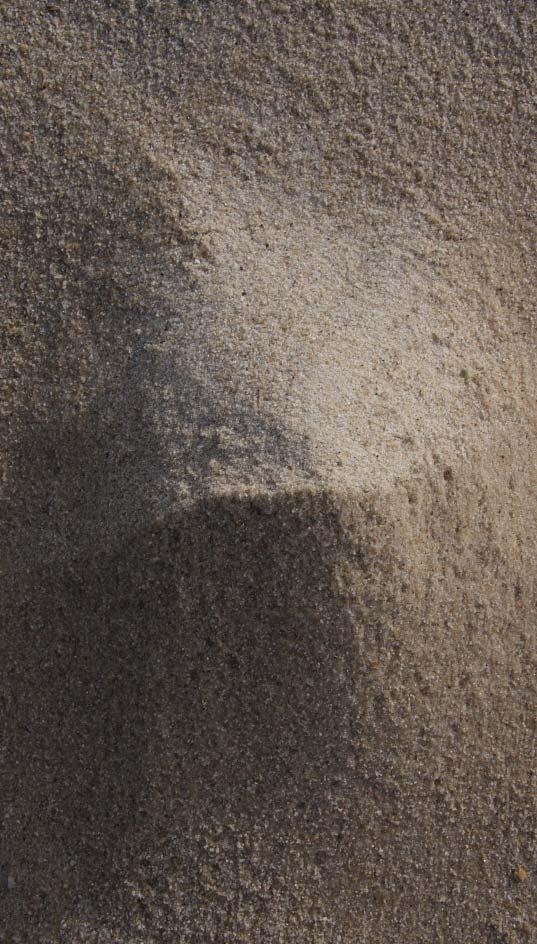
The edge of one of the piles clearly shows two common aspects observed in dune formation. On the one hand only the windward side becomes humid during an impacting rainfall, this clearly shows that the leeward side is wind protected. On the other hand, the windward edge has slightly coarser grains than the leeward one. This is due to the fact that the lighter grains are transported across the ridge and tumble down through the still air at the leeward side, where they remain.
63 AGGREGATIONS 06 DESIGN DEVELOPMENT
FIGURE 35

06.03
MODULATION01-TWOHUMIDSANDPILES
EXPERIMENTAL SPECIFICATIONS
MODEL SIZE: two piles, 35 cm diameter each
CREST CREST DISTANCE: 2 x radius
GRAIN SIZE: 0.1 to 0.2 mm
WIND SPEED: between 25 km/h and 35 km/h
WIND DIRECTION: west/west north to west/west south
RAINFALL: 60%
HUMIDITY: 90%
DURATION: 3 days
PERIOD: 13.11.2008 to 16.11.2008
MODELLING PROCESS
The two piles are being set up at the edge of the dune belt. Relatively humid fine sand is chosen. The piles are covered in darker grain aggregate and left on the beach for three days. Records of their development are taken on a daily basis.
OBSERVATIONS
Humid fine sand was chosen in order to test how humidity which is held mainly in very fine aggregates, affects the process of formation. On day two, windward slopes become discernible, where the marker aggregates is eroding. The lee sides of the piles remain dry under an impacting rainfall. On day three, low windward slopes have formed as well as a steep slip-face. The ridge shows that coarse grains are remaining on the windward side and finer ones are tumbling across the brink and coming to rest in the wind shadow. The windward side is exposed to rain impact, whereas the leeward side remains dry. The wind analysis shows that winds have come mainly from west/west north and west/west south directions.
64
FIGURE 36.01
FIGURE 36.02
FIGURE 36.03
DAY02 DAY03 AGGREGATIONS 06 DESIGN DEVELOPMENT
FIGURE 37 DAY01
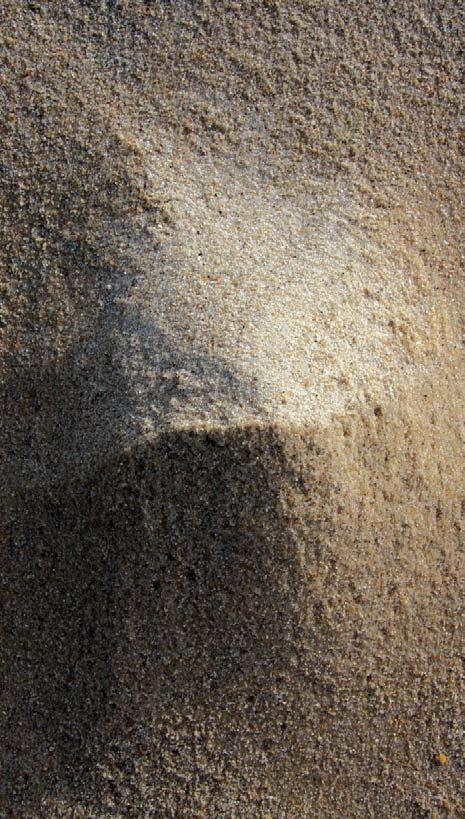

FIGURE36.01TO36.03
MODULATION OF TWO HUMID PILES BY IMPACTING WIND
Two piles of humid sand, 35 cm diameter each, have been left to deform on a beach in List/Sylt/ Germany. On Day 01 they are irregular, on Day 02 they start to show a windward and leeward side, also made visible by marker sand. On Day 03 windward face and slip face are clearly discernible.
FIGURE37 TOPVIEW OF ONE MODULATED PILE
The top view allows for a clear distinction of wind exposed and wind sheltered areas. This especially as an impacting rainfall has marked the zones that are exposed to wind versus those that are left both wind protected and dry.
FIGURE38 CONTRAST ANALYSIS OF TOPVIEW
As light conditions are frequently very shallow on the North Sea image contrasting techniques are used to analyze the image results. The contrast is set to 65%, which allows to more clearly see wind protected areas in lighter tones versus wind exposed areas in darker tones.
FIGURE39 WIND DIRECTION ANALYSIS OF TOPVIEW
The contrast analysis image is used to do a wind direction analysis. A wind rose is placed over the image and the areas that cover the windward side are marked. In this case the wind has come mainly from west/west north to west/west south directions.
E S W N 65 AGGREGATIONS 06 DESIGN DEVELOPMENT
FIGURE 38
FIGURE 39
06.03MODULATION02-TWOCOARSEPILES01
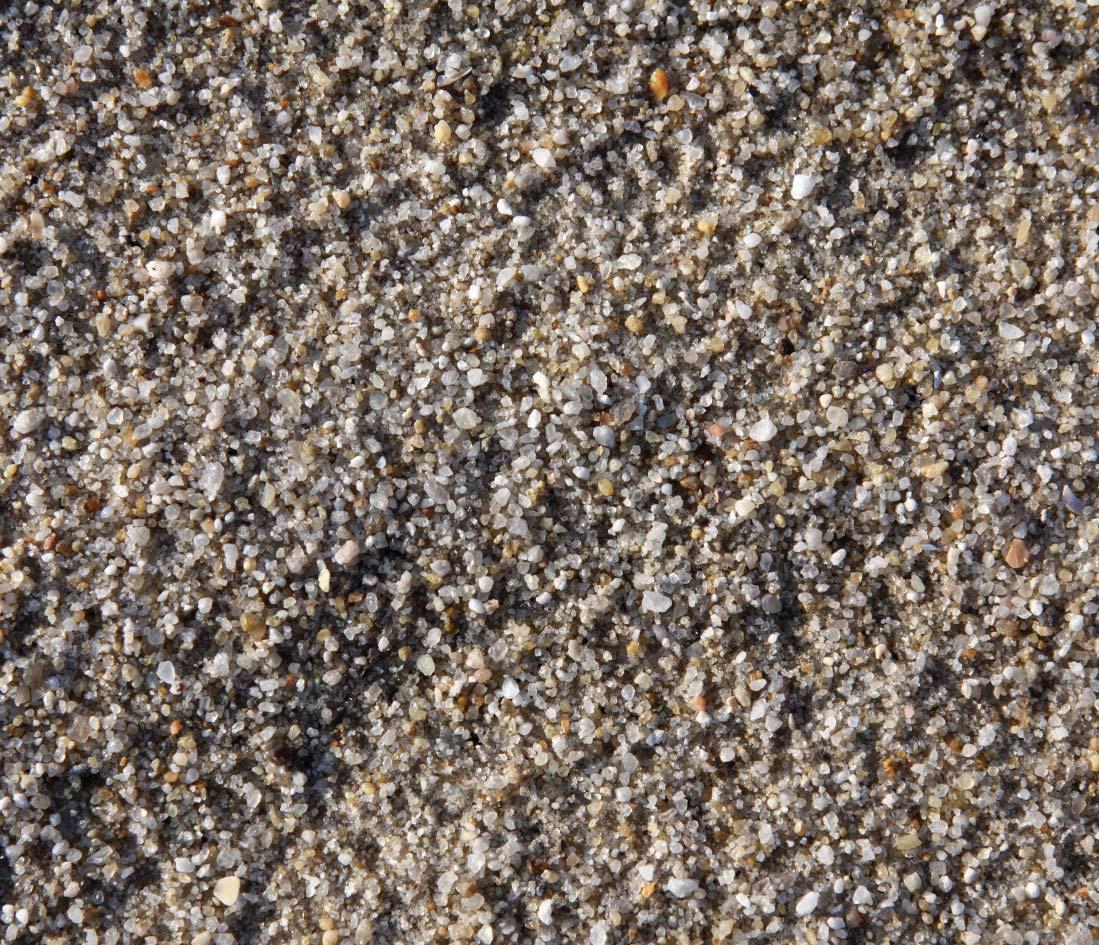
Along the beach the grading of the sand varies. There are coarser stretches as well in the dunes as in the foreshore areas where there is wave impact. This availability of different aggregate composure, which is already sorted by grade through the energies available on site can obviously be used for different applications within the system, such as the temporary solidification of fine sand by a layer of very coarse one on top, which does not saltate as readily. In this case coarse sand has been used as a means to cope with humidity as water drains off more easily than from fine sand. However, heavier grains are not transported by wind as easily. Two tests using this coarse sand (modulation 02 and 03) have been conducted.
66 FIGURE 40 AGGREGATIONS 06 DESIGN DEVELOPMENT

GRAVEL SAND CLOSE UP VIEW
Sand of coarser grain can be found in stretches along the beach. The granules are between 0.80 mm and 1.00 mm. These can be used in extremely wet conditions, as water drains off them more quickly and thus wind modulation can still happen during humid phases.
FIGURE41
MODULATED GRAVEL PILE
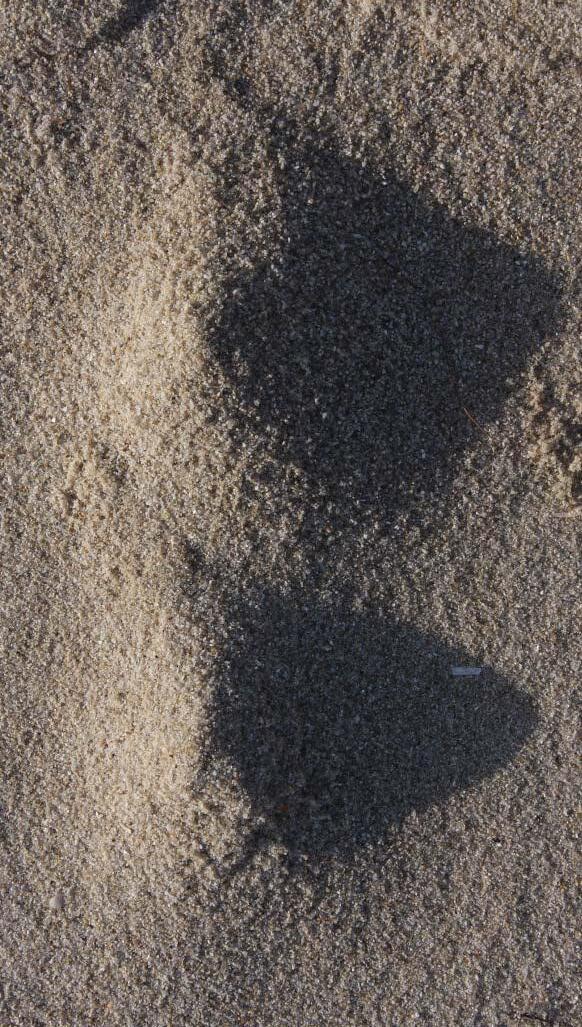
Two piles using gravel sand of 10 cm diameter each are left on the beach. After a period of two days and winds of around 31 km/h, they form a windward face and a lee face. The windward side is more humid due to impacting rain and shows coarser sand, whereas the lee face is dry and collects finer sand in its wind shadow.
67 AGGREGATIONS 06 DESIGN DEVELOPMENT
FIGURE 41
FIGURE40

06.03
MODULATION02-TWOCOARSEPILES01
EXPERIMENTAL SPECIFICATIONS
MODEL SIZE: two piles, 10 cm diameter each
CREST CREST DISTANCE: 2 x radius
GRAIN SIZE: 0.5 to 1.0 mm
WIND SPEED: between 25 km/h and 35 km/h
WIND DIRECTION: south west
RAINFALL: 50%
HUMIDITY: 85%
DURATION: 3 days
PERIOD: 12.11.2008 to 15.11.2008
MODELING PROCESS
Slightly coarser sand is collected from coarse aggregate fields in the foreshore zone. The two piles are being set up at the border between foreshore and backshore. The piles are left on the beach for three days. Records of their development are taken on a daily basis.
OBSERVATIONS
Gravel has been chosen as it drains off water more quickly and can potentially balance effects of humidity has on the formation of sand. It is however heavier than regular dune sand and thus requires slightly higher threshold winds. After a period of three days, a slightly steeper windward side has formed and a wind protected and dry air is discernible. Effects however are not as clear as in Modulation 01-Two Humid Sand Piles, this is probably due to threshold winds, that have been too low for gravel. The wind direction analysis shows that winds have come mainly from south west directions.
68
43 AGGREGATIONS 06 DESIGN DEVELOPMENT
FIGURE
FIGURE 42
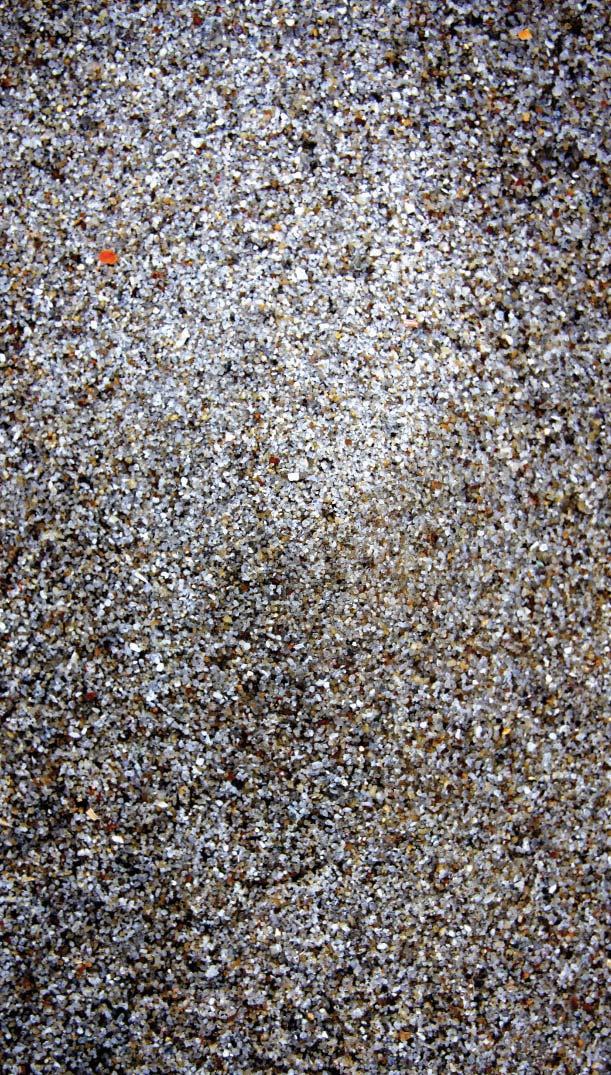
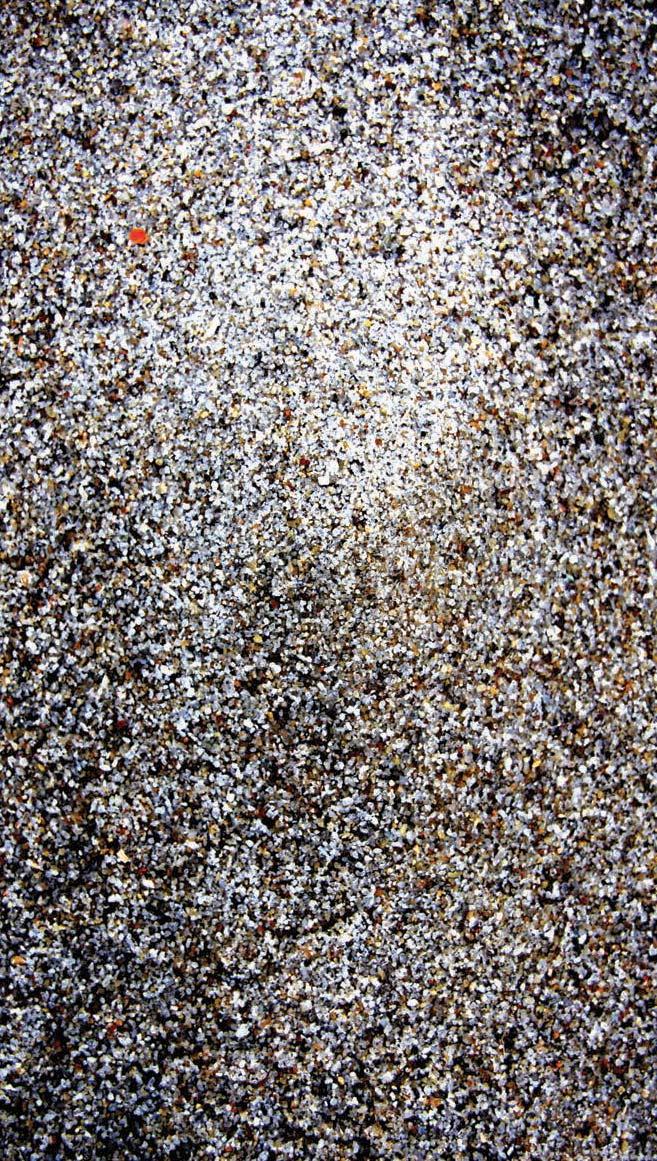
FIGURE42
TOPVIEW OF TWO MODULATED PILES
The top view shows the two piles after three days of impacting winds between 25 km/h and 35 km/h. Even though a windward and leeward side are discernible, their morphology has not changed as significantly as was seen in the two humid piles in modulation 01, which were observed during almost the same period.
FIGURE43
TOPVIEW OF ONE MODULATED PILE
The top view allows for a clear distinction of wind exposed and wind sheltered areas. This especially as an impacting rainfall has marked the zones that are exposed to wind versus those that are left both wind protected and dry.
FIGURE44 CONTRAST ANALYSIS OF TOPVIEW
As light conditions are frequently very shallow on the North Sea, image contrasting techniques are used to analyze the image results. The contrast is set to 70%, which allows to more clearly see wind protected areas in lighter tones versus wind exposed areas in darker tones.
FIGURE45 WIND DIRECTION ANALYSIS OF TOPVIEW
The contrast analysis image is used to do a wind direction analysis. A wind rose is placed over the image and the areas that cover the windward side are marked. In this case the wind has come mainly from southwest directions.
E S W N 69 AGGREGATIONS 06 DESIGN DEVELOPMENT
FIGURE 44
FIGURE 45

06.03MODULATION03-TWOCOARSEPILES02
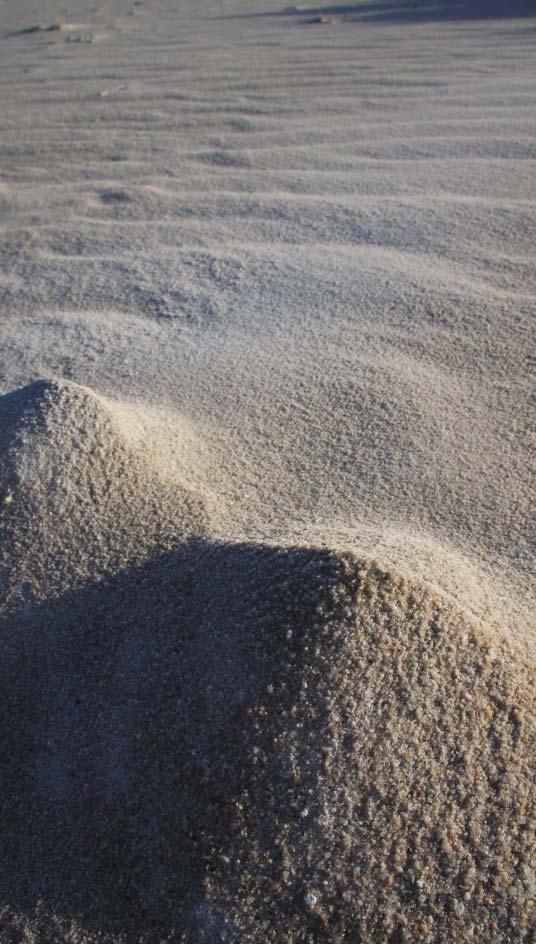
Coarse sand was gain tested, but this time in different boundary conditions of strong winds ranging from 45 km/h to 65 km/h. In this setting, the coarse sand performs extremely well. It does not cluster into larger assemblies as water and humidity drain off and evaporate easily, and the winds are strong enough to transport the grains. They are reaching the so-called threshold strengths. The piles almost immediately settle into a morphology resembling that of a dune with a low windward slope and steep slip-face, where saltating sand grains come to rest.
70 FIGURE 46 AGGREGATIONS 06 DESIGN DEVELOPMENT

VIEW OF TWO MODULATED PILES
Two gravel piles are modulated under a strong wind of 65 km/h. They form a windward side and slip face within one minute, showing a very clear profile similar to that of a dune. The leeward side collects granules of lighter grain that come to rest in the wind protected zone.
FIGURE47
VIEW OF ONE MODULATED PILE
The closer view of one of the two piles again shows the extremely clear geometry that the two piles took during a relatively strong wind. The crest is clearly discernible, the lee face very steep showing the collection of finer sand grains. The wind has been almost unidirectional, which can be seen by the ridge running along the windward slope.
71 AGGREGATIONS 06 DESIGN DEVELOPMENT
FIGURE 47
FIGURE46
06.03
MODULATION03-TWOCOARSEPILES02
EXPERIMENTAL SPECIFICATIONS
MODEL SIZE: two piles, 25 cm diameter each
CREST CREST DISTANCE: 2 x radius
GRAIN SIZE: 0.5 to 1.0 mm
WIND SPEED: between 45 km/h and 65 km/h
WIND DIRECTION: west
RAINFALL: 30%
HUMIDITY: 75%
DURATION: 1 minute
PERIOD: 21.11.2008
MODELING PROCESS
Slightly coarser sand is collected from coarse aggregate fields in the foreshore zone. The two piles are being set up at the border of the dune belt. The piles are left to form under the impact of an extremely string wind. Records of their development are taken minute by minute.
OBSERVATIONS
Gravel has been chosen as it drains off water more quickly and can potentially balance effects of humidity has on the formation of sand. It is however heavier than regular dune sand and thus requires slightly higher threshold winds. As in this experiment wind speeds are very high, the gravel almost immediately takes on a low windward slope and a steep slip face. Lighter grains collect in the wind protected areas on the lee side, whereas coarse grains remain on the crest and windward slope. The minute by minute record shows that the morphology of the formation remains, but gets eroded relatively fast.

72
48 00sec 15sec 40sec
FIGURE
49 AGGREGATIONS 06 DESIGN DEVELOPMENT
FIGURE
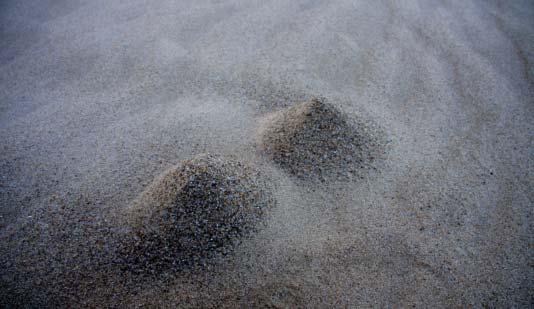
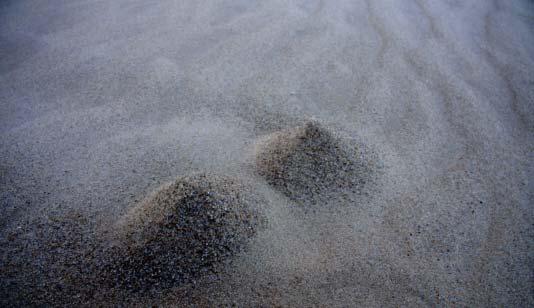

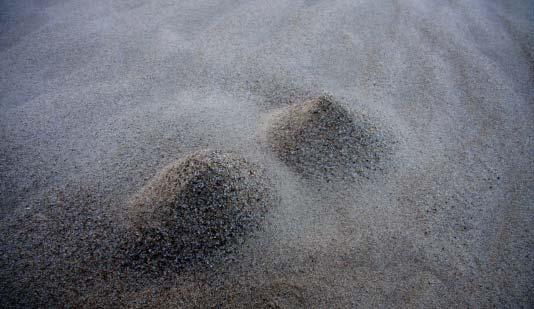
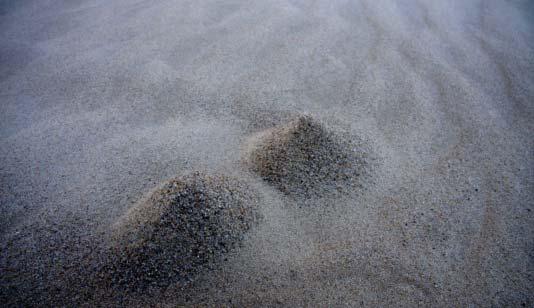
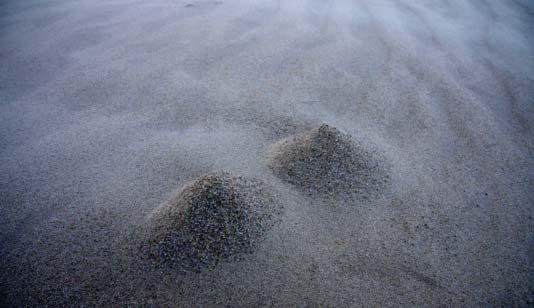
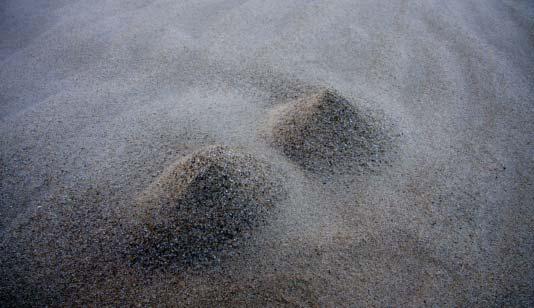
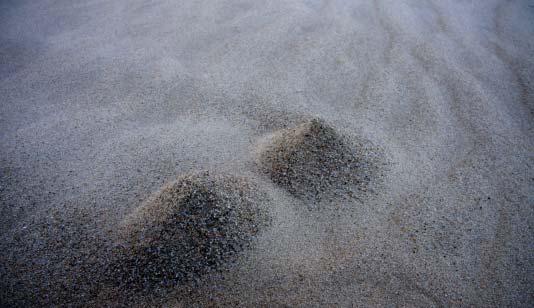
FIGURE48 VIEW OF TWO MODULATED PILES
Two gravel piles are modulated under a strong wind of 65 km/h. They form a windward side and slip face within one minute, showing a very clear profile similar to that of a dune. The crest is clearly discernible, the lee-face very steep showing the collection of finer sand grains. The wind has been almost unidirectional, which can be seen by the ridge running along the windward slope.
FIGURE49 SEQUENCE OF FORMATION OF TWO PILES
As this formation has been forming very quickly, a time lapse observation was possible. The piles almost immediately took on the formation of a windward side and a slip face. This configuration eroded during the time of observation, but its basic configuration remained the same.
73 AGGREGATIONS 06 DESIGN DEVELOPMENT 05sec10sec 30sec35sec 45sec50sec
P74
06.04LABORATORYMODELS
P75
06.04LABORATORYMODELS
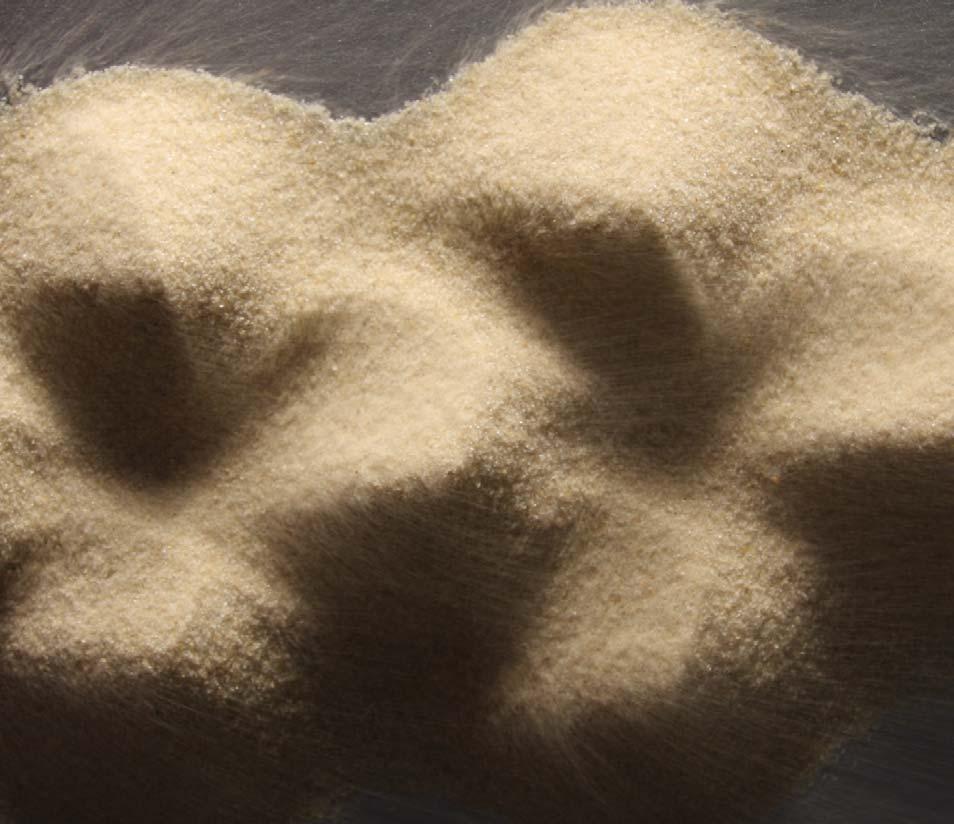
Having observed how a pile transforms into the basic morphology of a dune onsite, this principle is developed in laboratory models using the setup described in chapter 05. The following sequence tests the behaviour of single piles, pile groups, varying crest to crest distances and that of piles on a loose sand bed. All laboratory models show very similar results to the onsite tests, yet they are conducted at a vastly accelerated speed, due to their small scale and continuously high airstream speeds. Onsite models of course will be subject to a change in wind directions, whereas in this series of laboratory models only mono-directional airstreams have been used. This will be further developed in chapter 07, where multi-directional winds are introduced.
76 AGGREGATIONS 06 DESIGN DEVELOPMENT
FIGURE 50
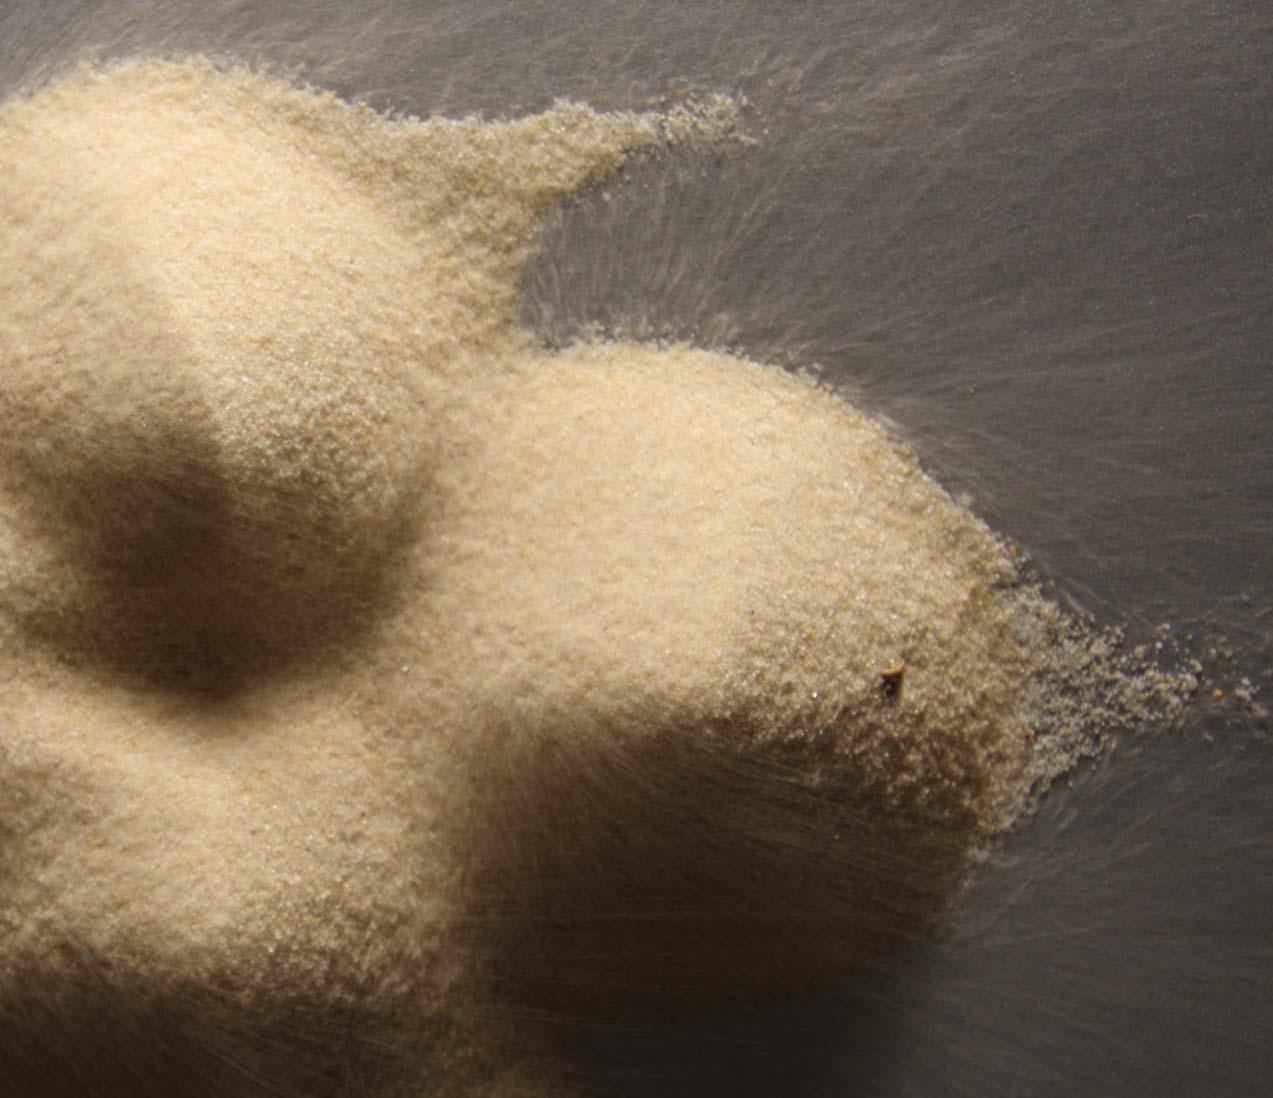
SAND SALTATING AROUND MODULATED PILES 01
Time-lapse photography allows to observe how sand grains are moving around a pile modulation under the impact of an airstream. They flow around the pile at both sides and as crests form are hopping over the edge, leaving the leeward side almost still.
FIGURE51
SAND SALTATING AROUND MODULATED PILES 02
The same process as in the previous figure can be observed, yet this pile configuration is slightly bigger so that features, such as downwind horns, become more distinct.
77 AGGREGATIONS 06 DESIGN DEVELOPMENT
FIGURE50
FIGURE 51
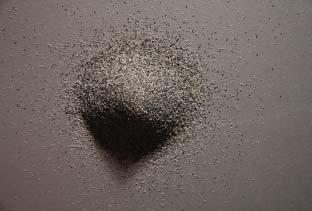
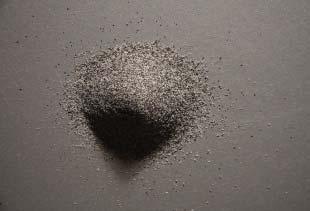
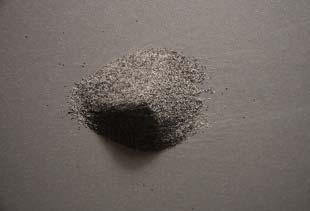


06.04MODULATION01-SINGLEPILE
EXPERIMENTAL SPECIFICATIONS
DIAMETER AIRSTREAM: 5.0 cm
DIAMETER SAND-PILE: 4.0 cm
DISTANCE AIR-SOURCE/SAND-PILE CENTRE: 36.0 cm
AIRSTREAM SPEED: 21 km/h
AIRSTREAM DIRECTION: 0 degrees
GRAIN TYPE: granite ballast
GRAIN SIZE: 0.5 to 1.0 mm
MODELLING PROCESS
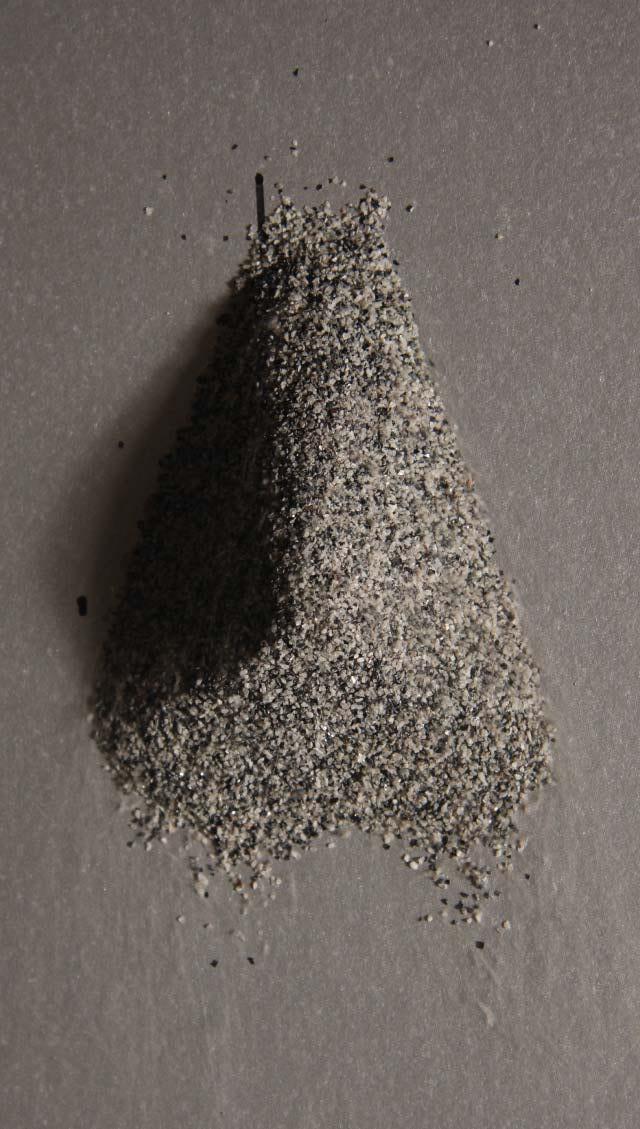
In order to establish the basic ratios of the air source in relationship to the possible scale of the dune, a basic test is carried out. A pile with a diameter a little bit smaller than that of the air source is placed on a flat board. The wind source is placed at a fixed distance from the pile and switched to the lowest possible speed. This test is carried out three times in order to verify the results.
OBSERVATIONS
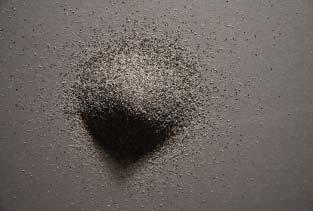
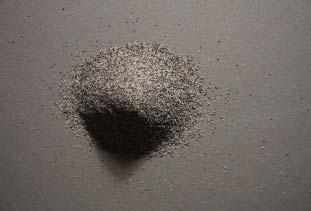
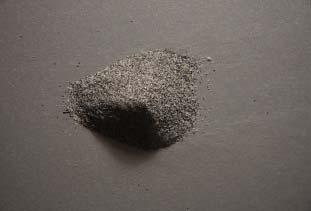
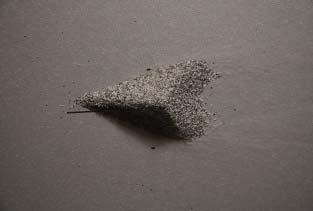
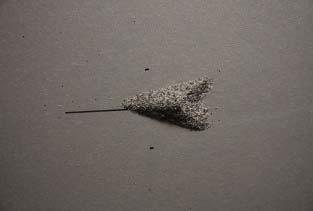
The piles take on the typical dune formation in all three tests. The windward slope has a relatively low angle the slip face remains the angle of repose. A crest forms and the dune takes on a triangular shape with the two horns progressing quicker in the windward direction. At 28 seconds, this morphology is fully discernible afterwards it remains the same, yet erodes very fast. Only in one of the tests does the artificial dune reach a stable state under continuing airflow.
78
52 FIGURE 53 28sec00sec02sec 12sec14sec 24sec26sec 36sec38sec
AGGREGATIONS 06 DESIGN DEVELOPMENT
FIGURE
48sec50sec
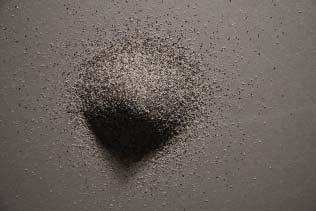
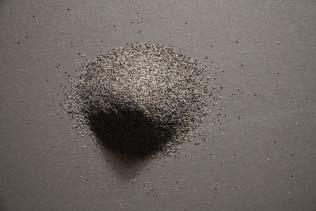

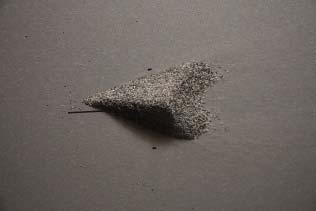
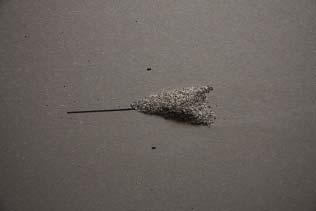
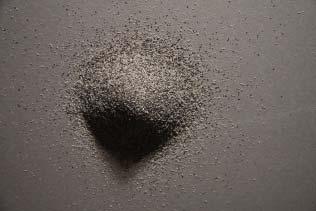
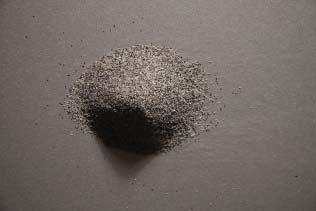
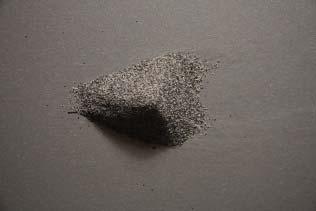


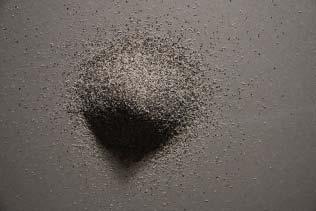
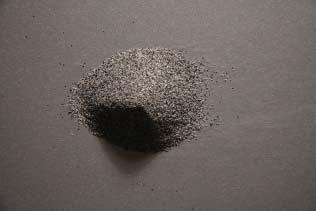
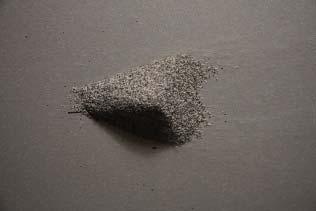


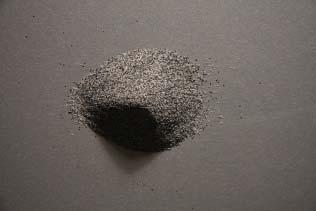
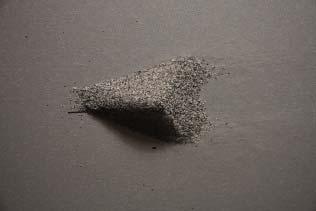
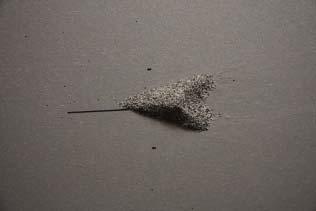
FIGURE52
SINGLE PILE UNDER AN AIRSTREAM
This time lapse image at 28 seconds shows the pile having completely transformed into a morphology resembling a dune. The windward face is low the slip-face is steep, showing two downwind horns. A ridge on the windward face is forming, indicating that the airstream has been unidirectional. The time lapse photo also allows to see the air movement around the formation by tracing the particles in motion.
FIGURE53
SEQUENCE OF FORMATION OF A SINGLE PILE UNDER AN AIRSTREAM
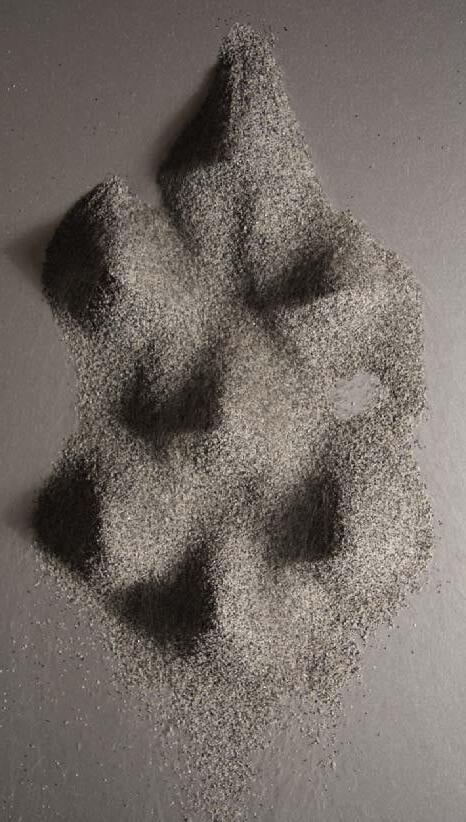
The time lapse photography allows to study the entire development of the pile under an airstream. A clear morphology resembling that of a dune is discernible after 32 seconds. After that point, the formation only erodes, but the basic morphology remains the same.
79 AGGREGATIONS 06 DESIGN DEVELOPMENT 04sec06sec10sec 08sec 16sec18sec22sec 20sec 28sec30sec34sec 32sec 40sec42sec46sec 44sec 52sec54sec58sec 56sec



06.04MODULATION02-SEVENPILES01
EXPERIMENTAL SPECIFICATIONS
DIAMETER AIRSTREAM: 5.0 cm
DIAMETER SAND-PILES: 4.0 cm
AMOUNT SAND PILES: 7
DISTANCE AIR-SOURCE/SAND-PILE CENTRE: 36.0 cm
AIRSTREAM SPEED: 21 km/h
AIRSTREAM DIRECTION: 0 degrees
GRAIN TYPE: granite ballast
GRAIN SIZE: 0.5 to 1.0 mm
MODELLING PROCESS
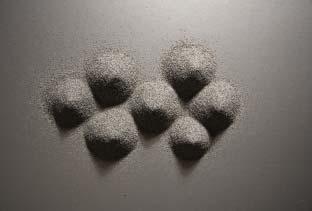
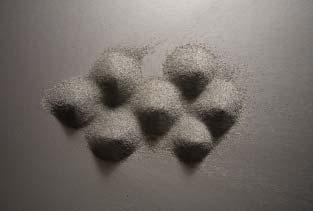
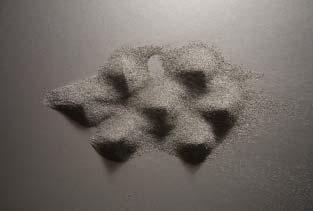
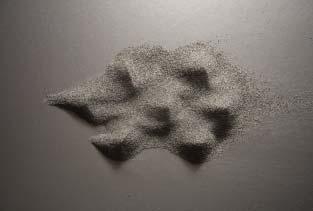
Seven piles, 4.0 cm diameter each are built up in a regular pattern on a flat smooth surface. They are exposed to an airstream of 21 km/h at zero degrees. Records of their development are taken second by second.
OBSERVATIONS
The piles as a group take on the typical dune formation even though they are slightly wider than the impacting airstream. The windward slopes develop relatively low angles and the slip faces remain at the angle of repose. Crests form and the model dunes take on a triangular shape with the two horns becoming transitory ridges between them. At 14 seconds, this morphology is fully discernible afterwards it remains the same, yet erodes very fast.
80 FIGURE 54 FIGURE 55 12sec00sec01sec 06sec07sec 12sec13sec 18sec19sec
AGGREGATIONS 06 DESIGN DEVELOPMENT
24sec25sec
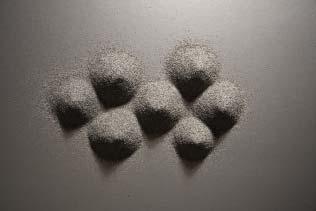
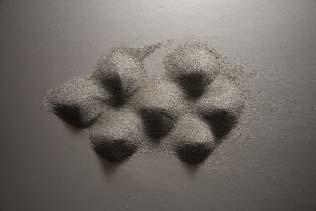
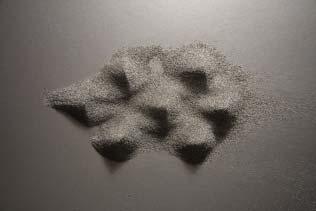
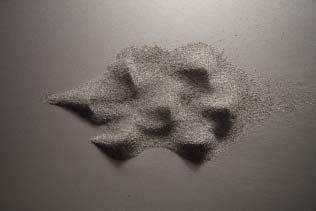
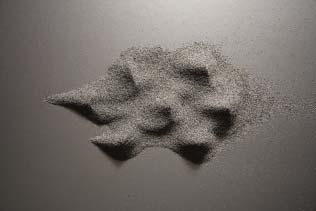
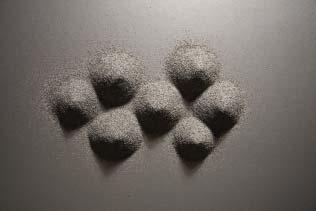
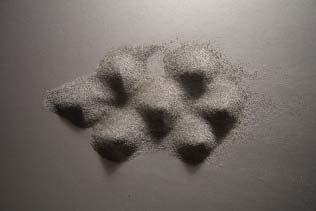
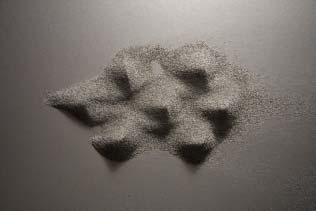
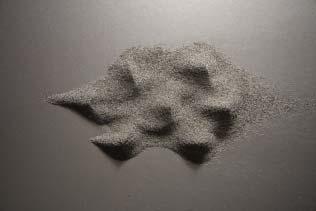


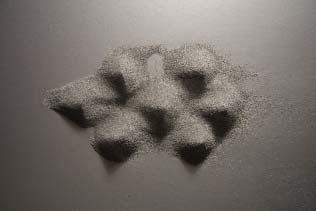

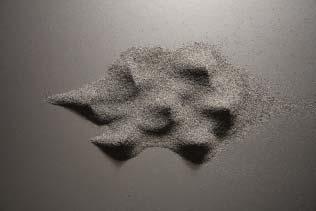

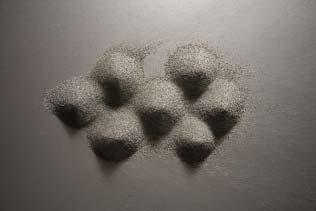


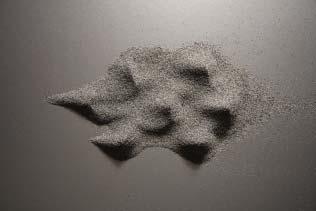

FIGURE54
SEVEN PILES UNDER AN AIRSTREAM
This time lapse image at 12 seconds shows the group of piles having completely transformed into a morphology resembling a dune. The windward faces are low the slip-face is steep. The downwind horns typical of single dunes now become transitional ridges between piles. A ridge on the windward face is forming on each pile, indicating that the airstream has been unidirectional. The time lapse photo also allows to see the air movement around the formation by tracing the particles in motion as they hop over the crests.
FIGURE55
SEQUENCE OF FORMATION OF SEVEN PILES UNDER AN AIRSTREAM
The time lapse photography allows to study the entire development of the piles under an airstream. A clear morphology resembling that of a dune is discernible after 14 seconds. After that point, the formation only erodes, but the basic morphology remains the same.
81 02sec03sec05sec 04sec 08sec09sec11sec 10sec 14sec15sec17sec
20sec21sec23sec
26sec27sec29sec
AGGREGATIONS 06 DESIGN DEVELOPMENT
16sec
22sec
28sec

06.04MODULATION03-SEVENPILES02
EXPERIMENTAL SPECIFICATIONS
DIAMETER AIRSTREAM: 5.0 cm
DIAMETER SAND-PILES: 4.0 cm
AMOUNT SAND PILES: 7
DISTANCE AIR-SOURCE/SAND-PILE CENTRE: 36.0 cm
AIRSTREAM SPEED: 21 km/h
AIRSTREAM DIRECTION: 0 degrees
GRAIN TYPE 01: granite ballast
GRAIN SIZE 01: 0.5 to 1.0 mm
GRAIN TYPE 02: silver sand
GRAIN SIZE 02: 0.3 to 0.8 mm
MODELLING PROCESS
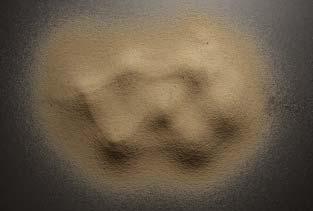
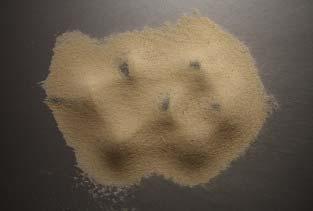
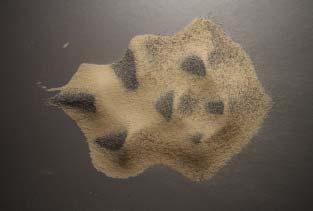
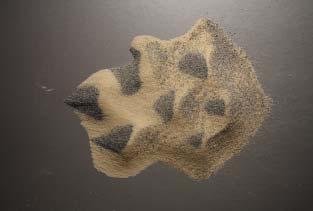
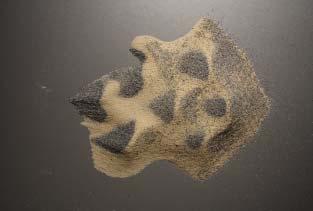
Seven piles, 4.0 cm diameter each are built up in a regular pattern on a flat smooth surface. They are exposed to an airstream of 21 km/h at zero degrees. Records of their development are taken second by second. The field is subsequently covered in a lighter sand for easier distinction. The field is again exposed to an air-flow until the windward sides are exposed.
OBSERVATIONS
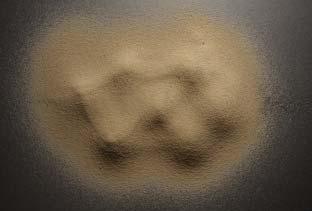
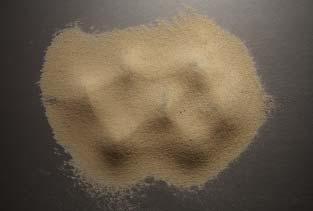
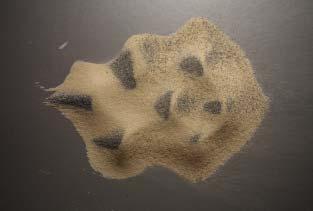
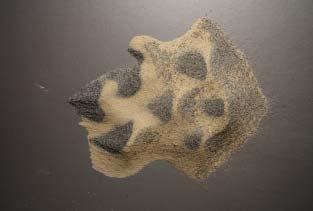
The piles as a group take on the typical dune formation even though they are slightly wider than the impacting airstream. The windward slopes develop relatively low angles and the slip faces remain at the angle of repose. Crests form and the model dunes take on a triangular shape with the two horns becoming transitory ridges between them. At 14 seconds, this morphology is fully discernible afterwards it remains the same, yet erodes very fast. The lighter sand is carried off the wind-ward slopes relatively quickly. It remains stable on the lee-sides and a clear pattern forms. From the one by one study of the time lapse analysis it can be seen, that sand in the back field is eroding from top to bottom as the tips are exposed first and grains gradually are taken off until the foot of the model dune is reached. In the front field, this process is inverted and erosion takes place from bottom to top.

82 AGGREGATIONS 06 DESIGN DEVELOPMENT 29sec00sec01sec 06sec07sec 12sec13sec 18sec19sec 24sec25sec
FIGURE 56
FIGURE 57
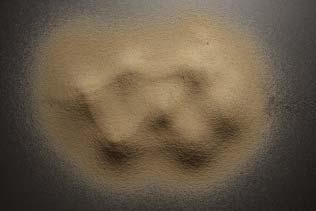

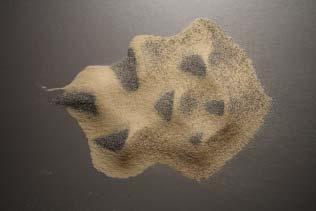
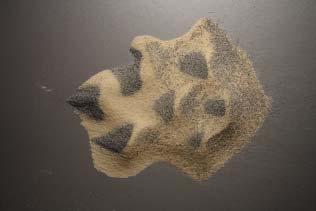
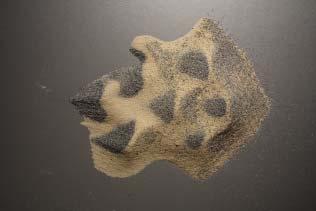
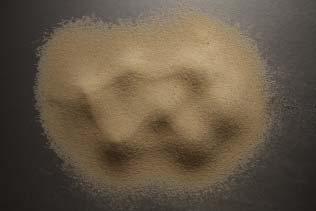
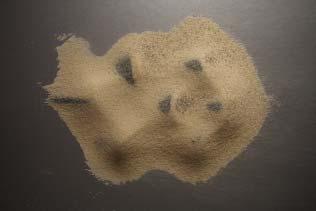
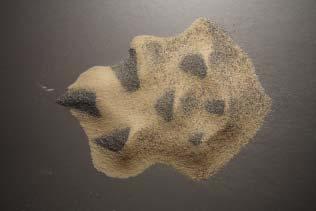
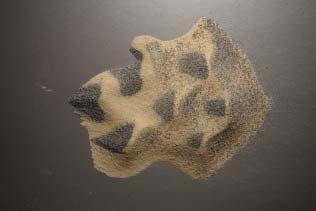

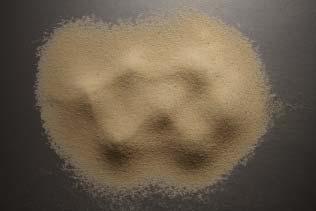

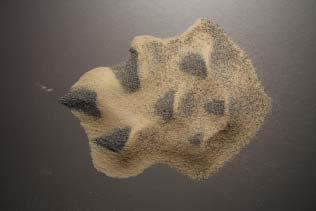

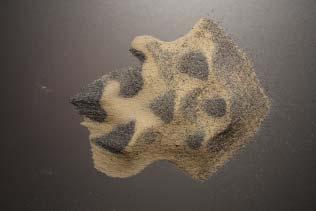
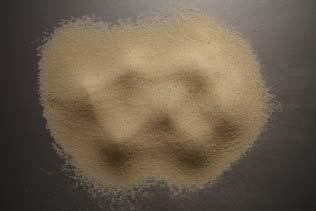
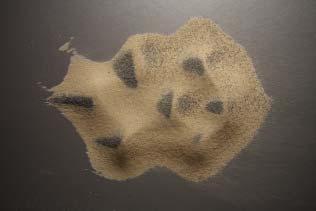
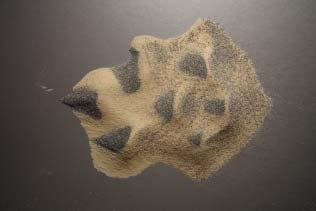
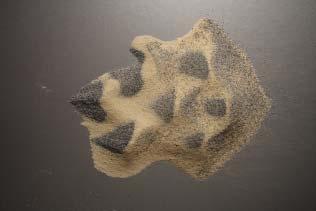
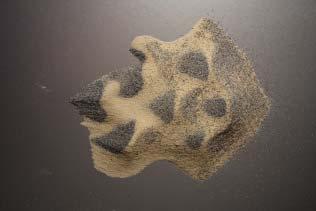
FIGURE56 WIND DISTRIBUTION IN A MODULATED SAND FIELD
This time lapse image at 29 seconds shows the distribution of wind exposed areas in grey and wind sheltered areas in ochre. The modulation of seven piles has been covered in a lighter sand of the same grain, which is eroded on the windward sides, leaving a pattern of wind distribution.
FIGURE57 SEQUENCE OF WIND DISTRIBUTION IN A MODULATED SAND FIELD
The time lapse photography allows to study the entire development of the wind pattern under a mono-directional airstream. The sequence shows that the tips are being more exposed as they are showing dark areas first. The windward sides subsequently get exposed from the top to the bottom.
83 AGGREGATIONS 06 DESIGN DEVELOPMENT 02sec03sec05sec 04sec 08sec09sec11sec 10sec 14sec15sec17sec
20sec21sec23sec
16sec
22sec 26sec27sec29sec 28sec
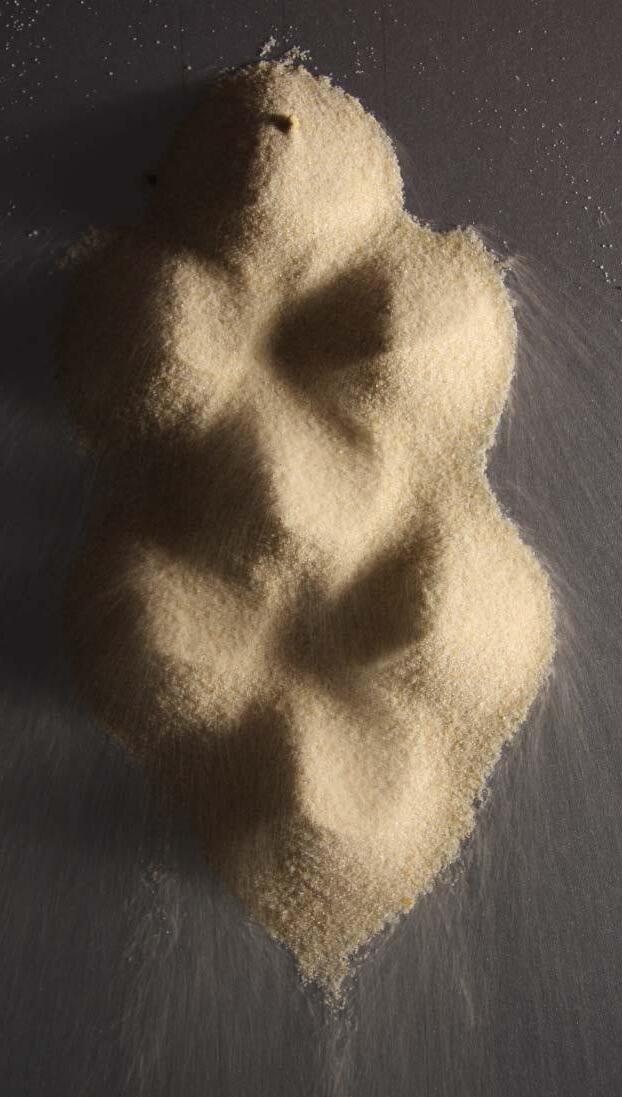
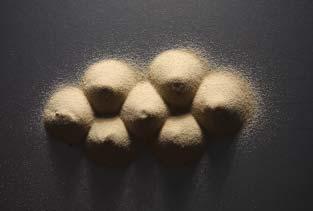
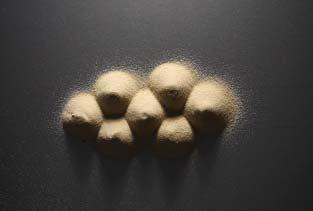
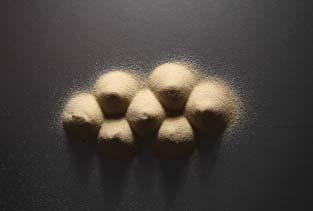
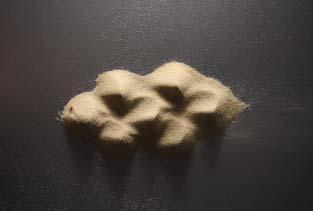

06.04MODULATION04-SEVENPILES03
EXPERIMENTAL SPECIFICATIONS
DIAMETER AIRSTREAM: 5.0 cm
DIAMETER SAND-PILES: 4.0 cm
AMOUNT SAND PILES: 7
CREST CREST DISTANCE: 0.8 x diameter
DISTANCE AIR-SOURCE/SAND-PILE CENTRE: 36.0 cm
AIRSTREAM SPEED: 21 km/h
AIRSTREAM DIRECTION: 0 degrees
GRAIN TYPE: silver sand
GRAIN SIZE: 0.3 to 0.8 mm
MODELLING PROCESS
Seven piles, 4.0 cm diameter each are built up in a regular pattern on a flat smooth surface. The distance between the crests is 0.8 times the diameter of each pile. They are exposed to an airstream of 21 km/h at zero degrees. Records of their development are taken second by second.
OBSERVATIONS
The piles as a group take on the typical dune formation even though they are slightly wider than the impacting airstream. The windward slopes develop relatively low angles and the slip faces remain at the angle of repose. Crests form and the model dunes take on a triangular shape with the two horns becoming transitory ridges between them. At 14 seconds, this morphology is fully discernible afterwards it remains the same. As the crests are slightly moving into one another, the entire formation is more compact than previous tests, but shows the same morphological features. A close up view at 17 seconds allows to see the particles in motion and possible wind paths around the model dune.


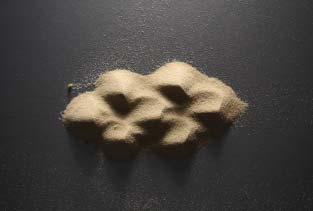
84
FIGURE 59 17sec00sec01sec 06sec07sec 12sec13sec
AGGREGATIONS 06 DESIGN DEVELOPMENT
FIGURE 58
18sec19sec 24sec25sec
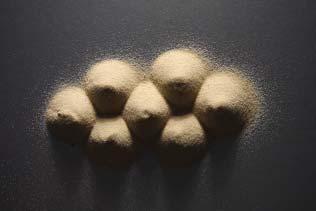
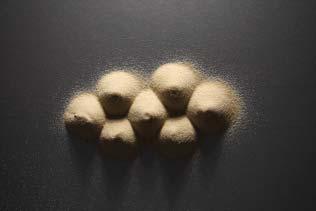
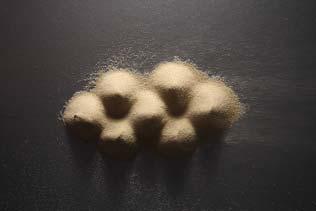
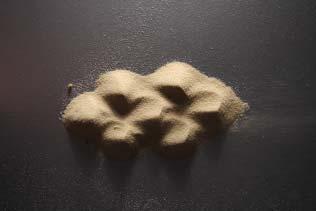
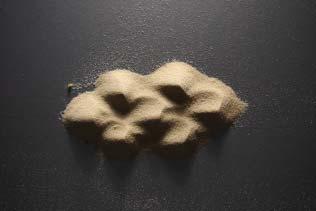
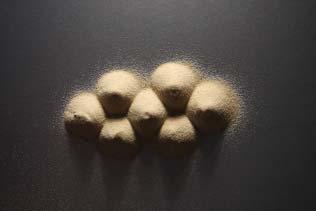
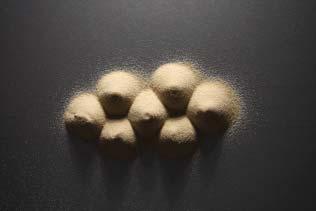
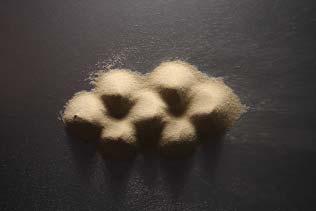
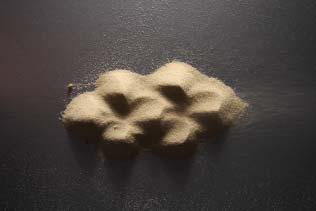
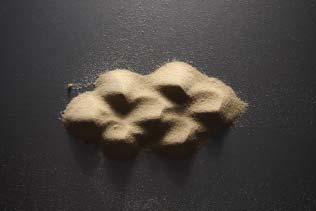
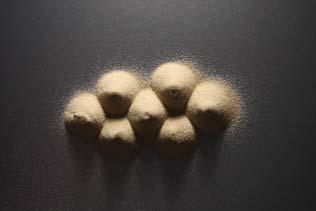
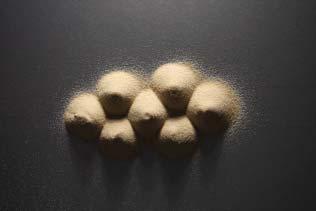
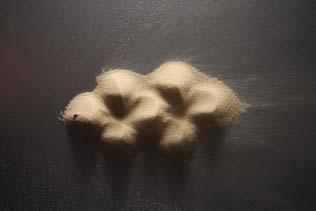
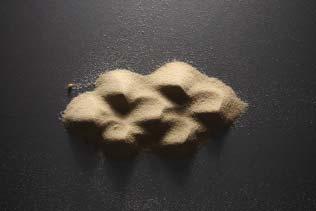
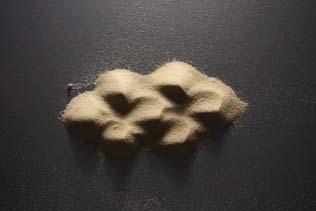
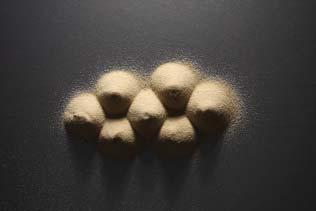
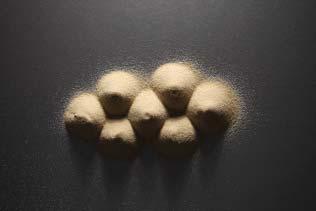
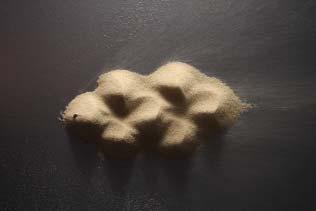
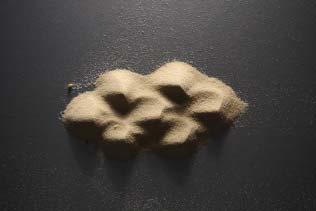
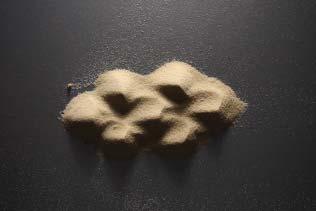
FIGURE58
SEVEN SAND PILES UNDER AN AIRSTREAM
This time lapse image at 17 seconds shows how the piles have almost completely transformed into a dune-like morphology. Windward slopes and lee-sides are clearly discernible and transitory ridges between crests have formed. The time-lapse image allows to see particle paths in motion and trace possible airstream trajectories.
FIGURE59
SEQUENCE OF SEVEN PILES UNDER AN AIRSTREAM
The time lapse photography allows to study the entire development of the seven piles under a mono-directional airstream. At 17 seconds, the morphology has clearly transformed from a pile assembly into one that is related to that of dunes.
85
08sec09sec11sec
14sec15sec17sec
20sec21sec23sec
AGGREGATIONS 06 DESIGN DEVELOPMENT
02sec03sec05sec 04sec
10sec
16sec
22sec 26sec27sec29sec 28sec
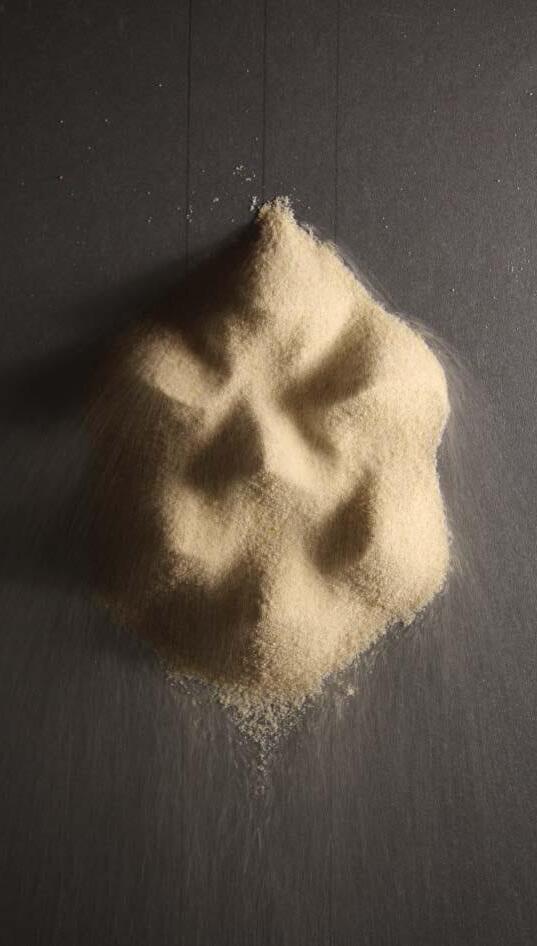
06.04MODULATION05-SEVENPILES04
EXPERIMENTAL SPECIFICATIONS
DIAMETER AIRSTREAM: 5.0 cm
DIAMETER SAND-PILES: 4.0 cm
AMOUNT SAND PILES: 7
CREST CREST DISTANCE: 0.5 x diameter
DISTANCE AIR-SOURCE/SAND-PILE CENTRE: 36.0 cm
AIRSTREAM SPEED: 21 km/h
AIRSTREAM DIRECTION: 0 degrees
GRAIN TYPE: silver sand
GRAIN SIZE: 0.3 to 0.8 mm
MODELLING PROCESS
Seven piles, 4.0 cm diameter each are built up in a regular pattern on a flat smooth surface. The distance between the crests is 0.5 times the diameter of a pile. They are exposed to an airstream of 21 km/h at zero degrees. Records of their development are taken second by second.
OBSERVATIONS
The piles as a group take on the typical dune formation even though they are slightly wider than the impacting airstream. The windward slopes develop relatively low angles and the slip faces remain at the angle of repose. Crests form and the model dunes take on a triangular shape with the two horns becoming transitory ridges between them. At 10 seconds, this morphology is fully discernible afterwards it remains the same. As the crests are now relatively close the entire formation is very compact and the individual dunes merge into each other. Yet the same morphological features of windward and leeward side as well as crests are discernible. The horns become transitory ridges. A close up view at 09 seconds allows to see the particles in motion and possible wind paths around the model dune.
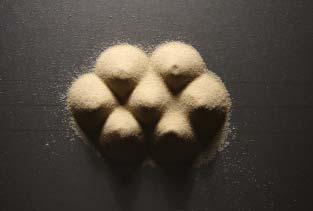
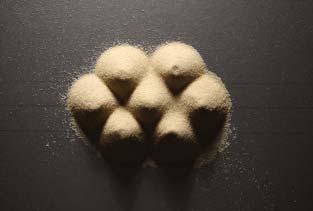
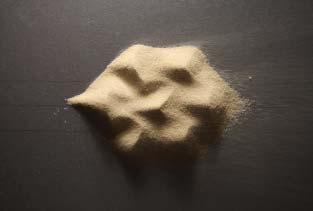
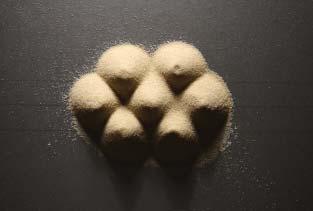
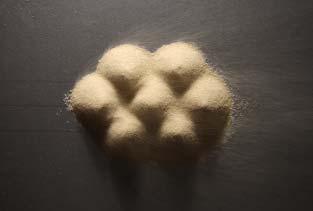
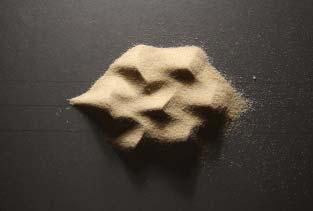
86 FIGURE 60 FIGURE 61 09sec00sec01sec 06sec07sec 12sec13sec AGGREGATIONS 06 DESIGN DEVELOPMENT
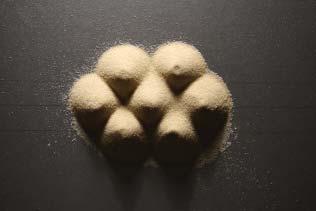
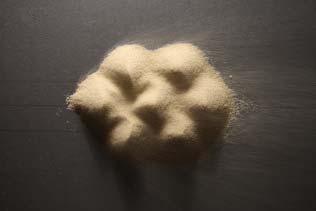
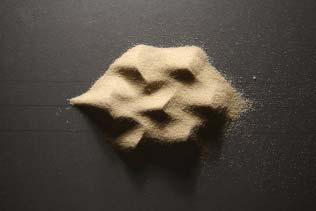
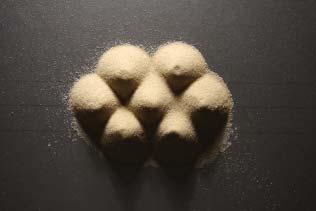


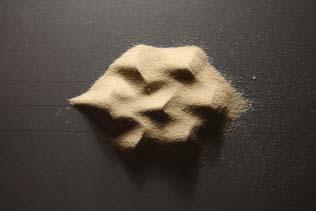
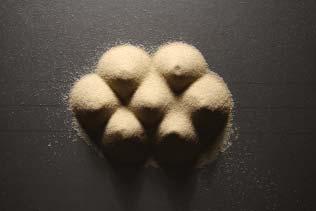
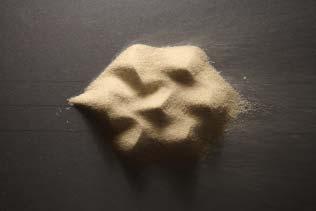
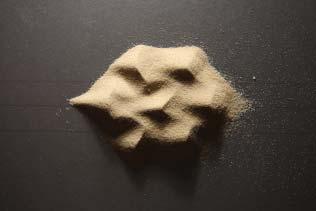
FIGURE60
SEVEN SAND PILES UNDER AN AIRSTREAM
This time lapse image at 09 seconds shows how the piles have almost completely transformed into a dune-like morphology. The pattern is more compact than in the previous setup, yet also here windward slopes and lee-sides are clearly discernible and transitory ridges between crests have formed. The time-lapse image allows to see particle paths in motion and trace possible airstream trajectories.
FIGURE61
SEQUENCE OF SEVEN PILES UNDER AN AIRSTREAM
The time lapse photography allows to study the entire development of the seven piles under a mono-directional airstream. At 09 seconds, the morphology has clearly transformed from a pile assembly into one that is related to that of dunes.
87
04sec 08sec09sec11sec 10sec 14sec15sec17sec
02sec03sec05sec
16sec AGGREGATIONS 06 DESIGN DEVELOPMENT
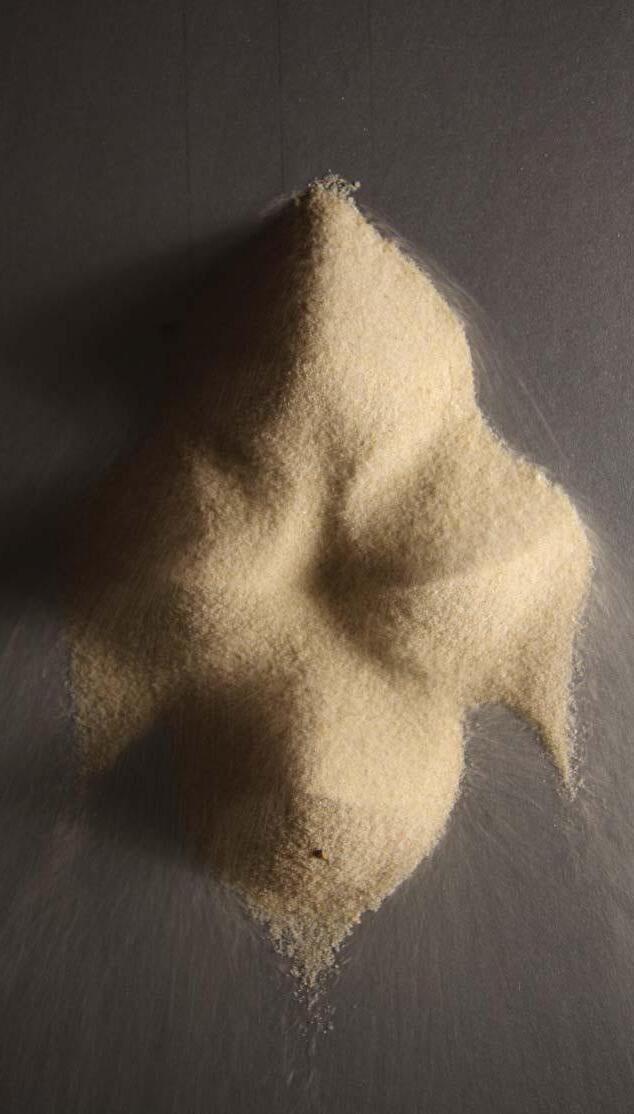
06.04MODULATION06-FOURPILES
EXPERIMENTAL SPECIFICATIONS
DIAMETER AIRSTREAM: 5.0 cm
DIAMETER SAND-PILES: 5.0 cm
AMOUNT SAND PILES: 4
CREST CREST DISTANCE: 0.8 x diameter
DISTANCE AIR-SOURCE/SAND-PILE CENTRE: 36.0 cm
AIRSTREAM SPEED: 21 km/h
AIRSTREAM DIRECTION: 0 degrees
GRAIN TYPE: silver sand
GRAIN SIZE: 0.3 to 0.8 mm
MODELLING PROCESS
Four piles, 5.0 cm diameter each are built up in a regular pattern on a flat smooth surface. The distance between the crests is 0.8 times the diameter of a pile. They are exposed to an airstream of 21 km/h at zero degrees. Records of their development are taken second by second.
OBSERVATIONS
The piles as a group take on the typical dune formation even though they are slightly wider than the impacting airstream. As the configuration is slightly bigger than the previous ones, features are more easily discernible. The windward slopes develop relatively low angles and the slip faces remain at the angle of repose. Crests form and the model dunes take on a triangular shape with the two horns becoming transitory ridges between them. At 05 seconds, this morphology is fully discernible afterwards it remains the same. As the crests are slightly moved in towards each other, the entire formation is compact and the individual dunes merge into each other. Yet the same morphological features of windward and leeward side as well as crests and transitory ridges are discernible. A close up view at 05 seconds allows to see the particles in motion and possible wind paths around the model dune.
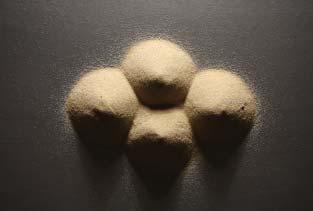
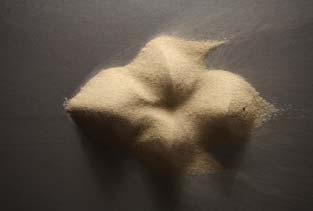
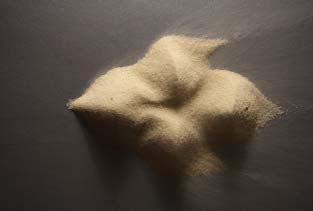
88 FIGURE 62 FIGURE 63 05sec00sec01sec 06sec07sec AGGREGATIONS 06 DESIGN DEVELOPMENT

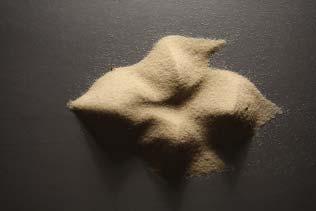
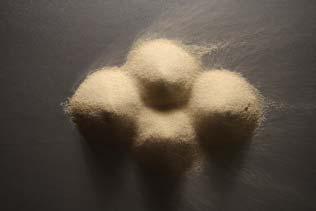
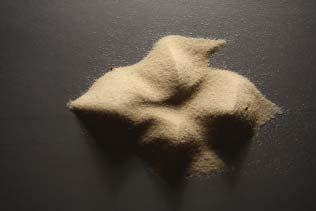
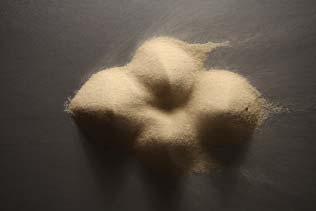
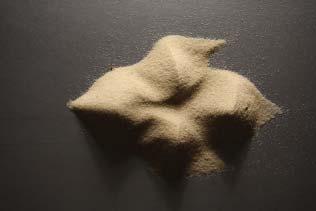

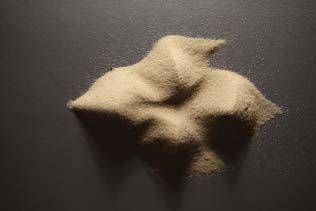
FIGURE62
FOUR SAND PILES UNDER AN AIRSTREAM
This time lapse image at 05 seconds shows how the piles have almost completely transformed into a dune-like morphology. The pattern is more clearly discernible than in the previous setups, as the initial piles are slightly bigger. Especially the transitory ridges between crests are more distinct. The time-lapse image allows to see particle paths in motion and trace possible airstream trajectories.
FIGURE63
SEQUENCE OF FOUR PILES UNDER AN AIRSTREAM
The time lapse photography allows to study the entire development of the four piles under a mono-directional airstream. At 05 seconds, the morphology has clearly transformed from a pile assembly into one that is related to that of dunes. In this slightly bigger setup, the edge piles start to form individual horns where they are not transiting into another crest of a model dune.
89 AGGREGATIONS 06 DESIGN DEVELOPMENT 02sec03sec05sec 04sec 08sec09sec11sec 10sec

06.04MODULATION07-CRESTTOCREST01
EXPERIMENTAL SPECIFICATIONS
DIAMETER AIRSTREAM: 5.0 cm
DIAMETER SAND-PILES: 4.0 cm
AMOUNT SAND PILES: 2
CREST CREST DISTANCE: 0.5 x diameter
DISTANCE AIR-SOURCE/SAND-PILE CENTRE: 36.0 cm
AIRSTREAM SPEED: 21 km/h
AIRSTREAM DIRECTION: 0 degrees
GRAIN TYPE 01: granite ballast
GRAIN SIZE 01: 0.5 to 1.0 mm
GRAIN TYPE 02: silver sand
GRAIN SIZE 02: 0.3 to 0.8 mm
MODELLING PROCESS
Two piles, 4.0 cm diameter each are built up behind each other on a flat smooth surface. The distance between the crests is 0.5 times the diameter of a pile. They are covered in a lighter colour marker sand and exposed to an airstream of 21 km/h at zero degrees. Records of their development are taken second by second.
OBSERVATIONS
This series of experiments (Modulation 07 to 09) has been set up to study the effect, that varying crest to crest distances has on the morphology of the formation. The pile that is closer to the airstream erodes first, as can be seen by the quick exposure of the dark sand under-layer. In this case, erosion happens from bottom to top. The second piles initially seem to receive no wind impact as its top-layer seems relatively undisturbed. The two piles quickly merge, forming a larger model dune that has the typical features of windward slope, slip-face and two horns. This formation collects sand that is eroding from its windward side at the lee face as can be seen by a thin layer of grey ballast on top of the leeward silver sand.
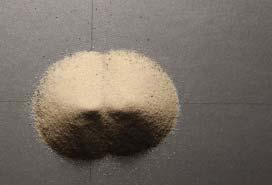
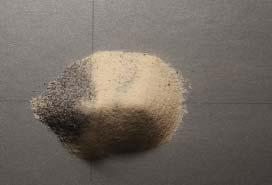
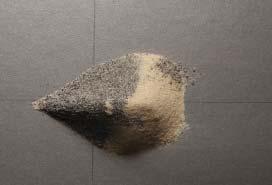
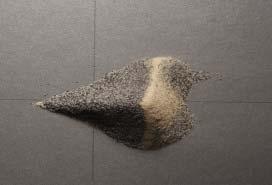
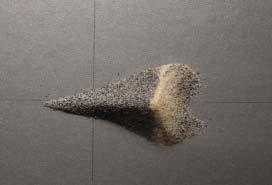
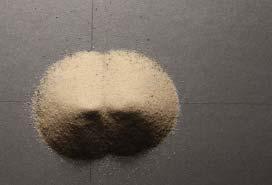
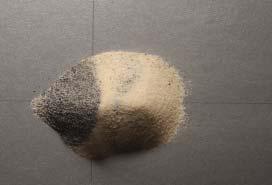
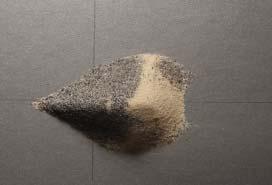
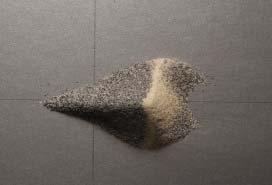
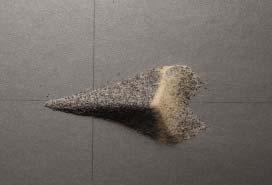
90 AGGREGATIONS 06 DESIGN DEVELOPMENT
FIGURE 64
12sec00sec01sec 06sec07sec 12sec13sec 18sec19sec 24sec25sec
FIGURE 65
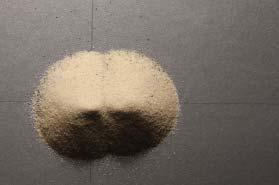
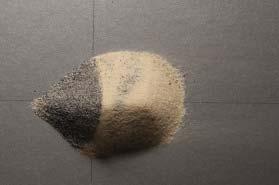
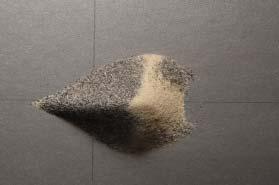
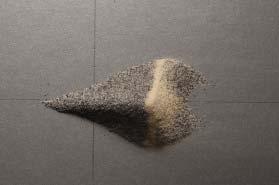
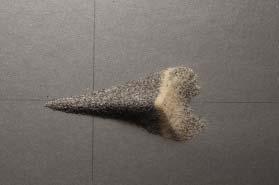
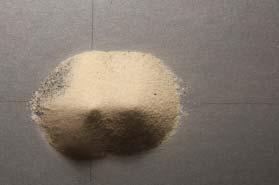
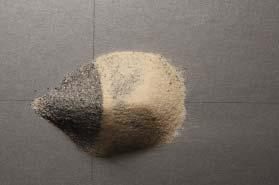
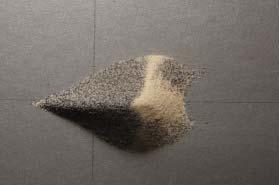
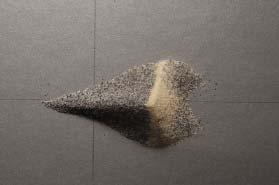
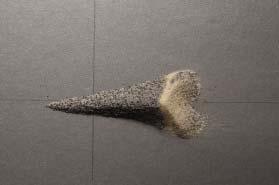

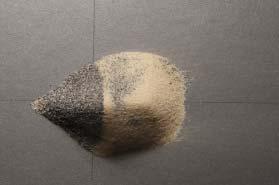

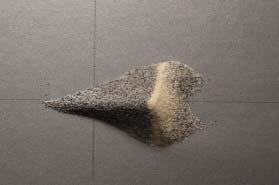
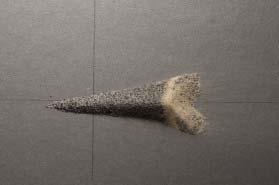
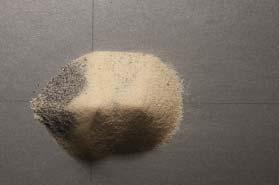
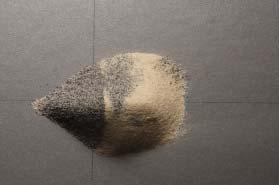
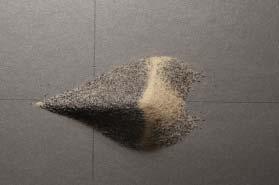
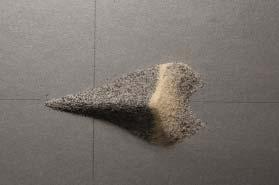
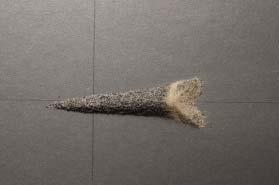
FIGURE64 TWO PILES AT 0.5 DIAMETER APART
Two piles are built up behind each other with regards to an impacting airstream. They are 0.5 their diameter apart from each other. Under and impacting airstream, they quickly merge into one, forming a larger model dune that shows typical features of windward slope and steep lee side as well as horns. At 12 seconds, this modulation becomes clearly discernible.
FIGURE65 SEQUENCE OF TWO PILES AT 0.5 DIAMETER APART
The time lapse photography allows to study the entire development of the two piles. At 12 seconds, they have completely merged into one, after this the morphology remains the same and only erodes rather rapidly.
91 02sec03sec05sec 04sec 08sec09sec11sec 10sec 14sec15sec17sec 16sec 20sec21sec23sec 22sec 26sec27sec29sec 28sec AGGREGATIONS 06 DESIGN DEVELOPMENT
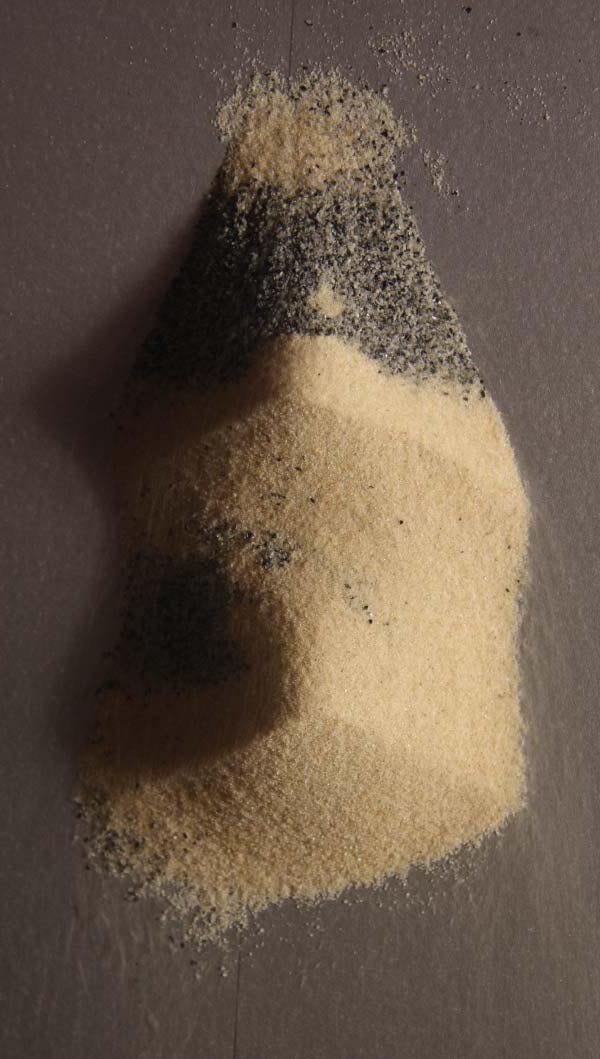
06.04MODULATION08-CRESTTOCREST02
EXPERIMENTAL SPECIFICATIONS
DIAMETER AIRSTREAM: 5.0 cm
DIAMETER SAND-PILES: 4.0 cm
AMOUNT SAND PILES: 2
CREST CREST DISTANCE: 0.7 x diameter
DISTANCE AIR-SOURCE/SAND-PILE CENTRE: 36.0 cm
AIRSTREAM SPEED: 21 km/h
AIRSTREAM DIRECTION: 0 degrees
GRAIN TYPE 01: granite ballast
GRAIN SIZE 01: 0.5 to 1.0 mm
GRAIN TYPE 02: silver sand
GRAIN SIZE 02: 0.3 to 0.8 mm
MODELLING PROCESS
Two piles, 4.0 cm diameter each are built up behind each other on a flat smooth surface. The distance between the crests is 0.7 times the diameter of a pile. They are covered in a lighter colour marker sand and exposed to an airstream of 21 km/h at zero degrees. Records of their development are taken second by second.
OBSERVATIONS
This series of experiments (Modulation 07 to 09) has been set up to study the effect, that varying crest to crest distances has on the morphology of the formation. The pile that is closer to the airstream erodes first, as can be seen by the quick exposure of the dark sand under-layer. In this case erosion happens from bottom to top. The second piles initially seem to receive no wind impact as its top-layer seems relatively undisturbed. At 17 seconds it too starts to erode from bottom to top. The two piles do not merge but form sequential model dunes. The one closer to the airstream shows more distinct horns than the one further away.
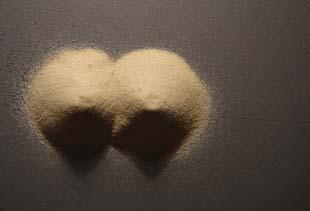
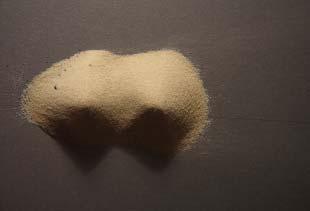
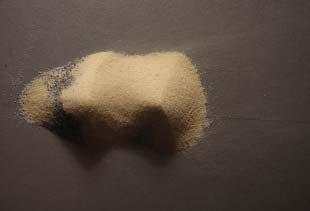
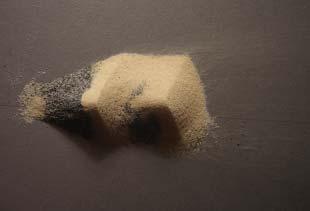
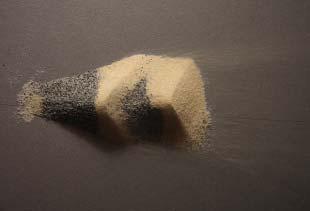
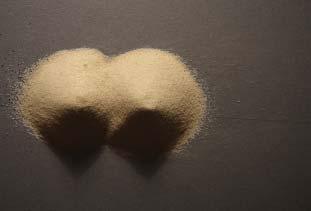
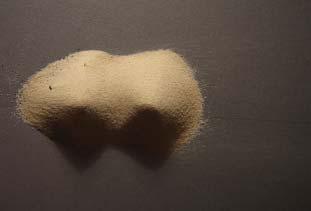
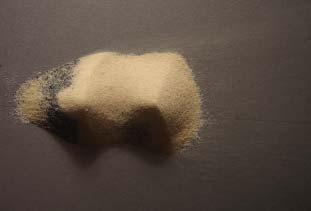
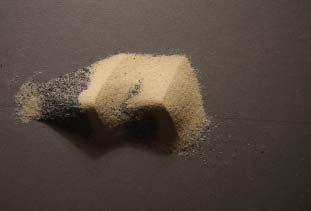
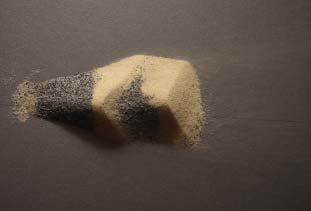
92
66 FIGURE 67 19sec00sec01sec 06sec07sec 12sec13sec 18sec19sec
AGGREGATIONS 06 DESIGN DEVELOPMENT
FIGURE
24sec25sec

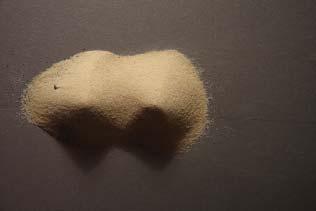
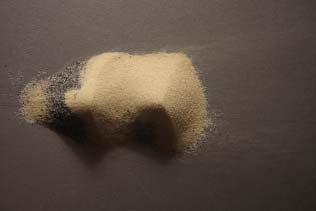
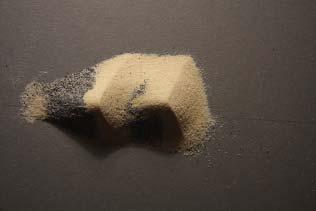
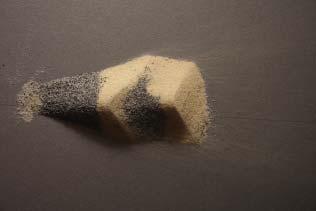
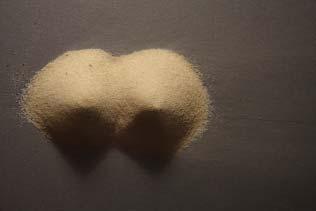
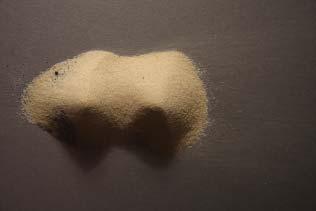
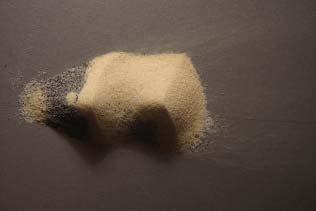
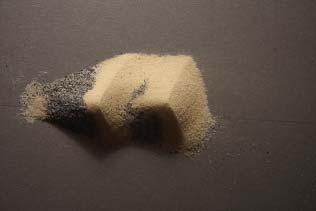
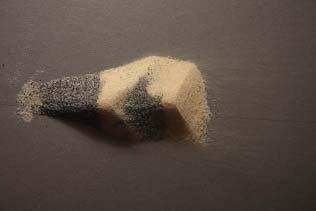
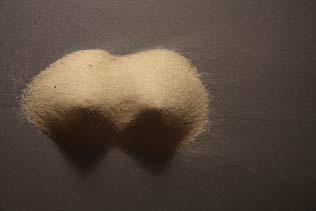

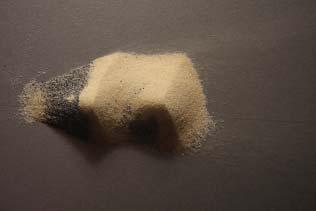
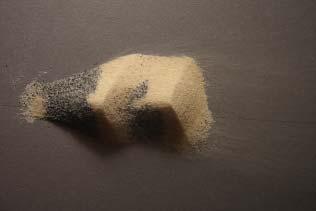

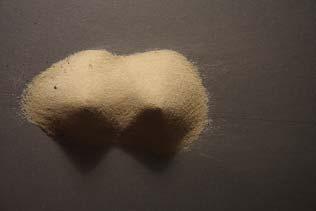

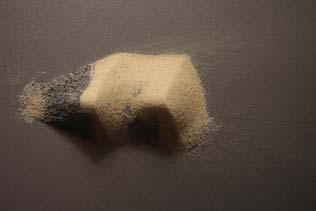
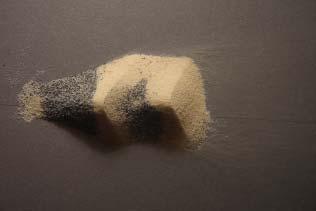
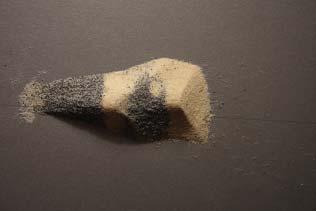
FIGURE66 TWO PILES AT 0.7 DIAMETER APART
Two piles are built up behind each other with regards to an impacting airstream. They are 0.7 their diameter apart from each other. Under and impacting airstream, the pile closer to the fan starts showing a windward slope. Six seconds later, the second one sets in. The two piles do not merge but form sequential model dunes.
FIGURE67 SEQUENCE OF TWO PILES AT 0.7 DIAMETER APART
The time lapse photography allows to study the entire development of the two piles. At 19 seconds, the sequential model dunes have reached their typical morphology, after this the basic formations remains the same and only erodes rather fast.
93 AGGREGATIONS 06 DESIGN DEVELOPMENT 02sec03sec05sec 04sec 08sec09sec11sec 10sec 14sec15sec17sec 16sec 20sec21sec23sec 22sec 26sec27sec29sec 28sec

06.04MODULATION09-CRESTTOCREST03
EXPERIMENTAL SPECIFICATIONS
DIAMETER AIRSTREAM: 5.0 cm
DIAMETER SAND-PILES: 4.0 cm
AMOUNT SAND PILES: 2
CREST CREST DISTANCE: 1.0 x diameter
DISTANCE AIR-SOURCE/SAND-PILE CENTRE: 36.0 cm
AIRSTREAM SPEED: 21 km/h
AIRSTREAM DIRECTION: 0 degrees
GRAIN TYPE 01: granite ballast
GRAIN SIZE 01: 0.5 to 1.0 mm
GRAIN TYPE 02: silver sand
GRAIN SIZE 02: 0.3 to 0.8 mm
MODELLING PROCESS
Two piles, 4.0 cm diameter each are built up behind each other on a flat smooth surface. The distance between the crests is 1.0 times the diameter of a pile. They are covered in a lighter colour marker sand and exposed to an airstream of 21 km/h at zero degrees. Records of their development are taken second by second.
OBSERVATIONS
This series of experiments (Modulation 07 to 09) has been set up to study the effect, that varying crest to crest distances has on the morphology of the formation. The piles in this case start to erode almost at the same time, 10 seconds, the only difference being that the one closer to the airstream erodes more quickly. In this setup erosion happens from the middle both ways to the top and bottom of a windward slope. The two piles do not merge but form sequential model dunes, with almost no distinct horns but discernible slip faces and lee faces. There is some sand collection on the leeward slope, visible by a collection of darker grains on top of the lighter marker sand.
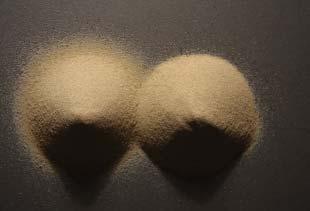
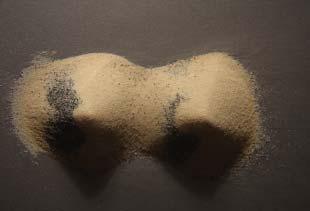

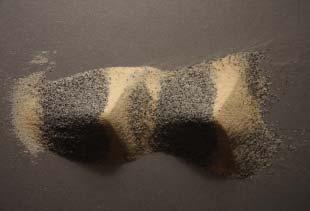
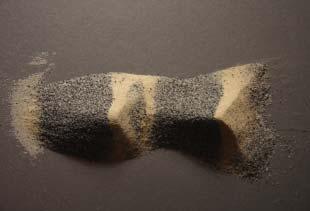
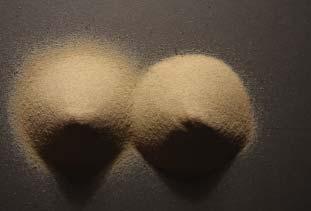
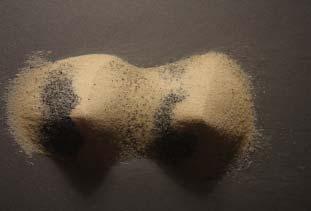


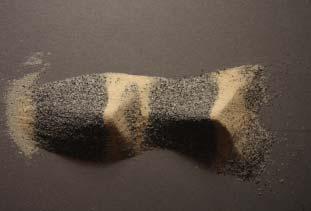
94 AGGREGATIONS 06 DESIGN DEVELOPMENT
68 FIGURE 69 16sec00sec02sec 12sec14sec 24sec26sec 36sec38sec 48sec50sec
FIGURE
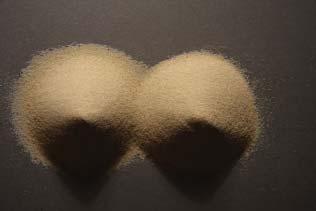
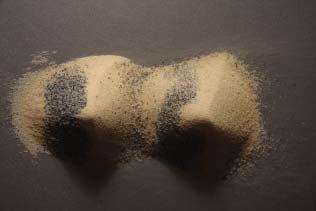

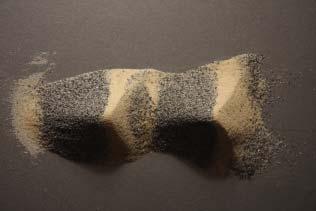
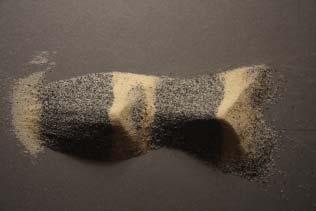
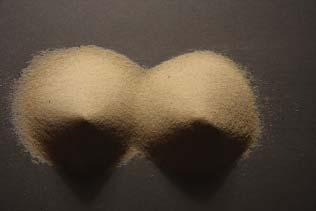
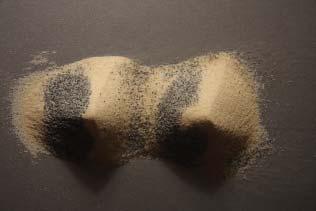
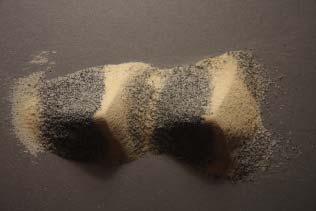
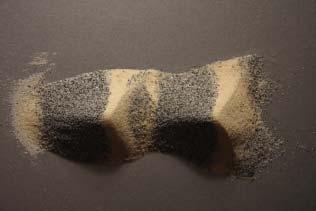
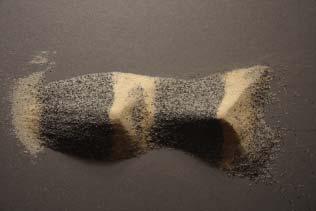

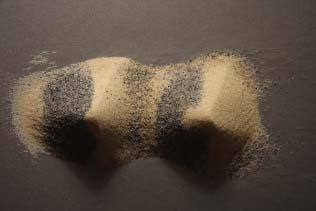
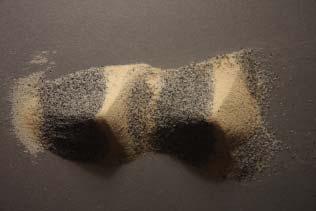


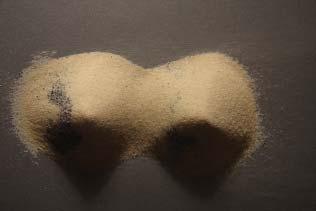
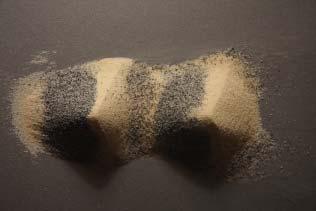
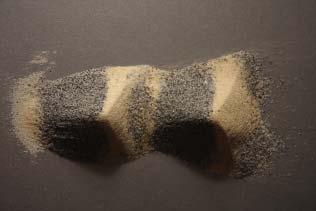
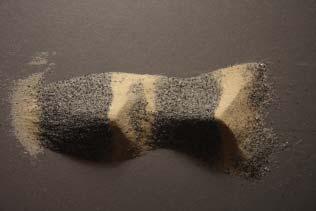
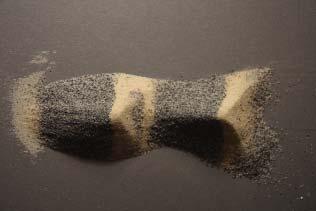
FIGURE68
TWO PILES AT 1.0 DIAMETER APART
Two piles are built up behind each other with regards to an impacting airstream. They are 1.0 their diameter apart from each other. Under and impacting airstream, the pile closer to the fan starts showing a windward slope. Two seconds later, the second one sets in. The two piles do not merge but form sequential model dunes.
FIGURE69
SEQUENCE OF TWO PILES AT 1.0 DIAMETER APART
The time lapse photography allows to study the entire development of the two piles. At 22 seconds, the sequential model dunes have reached their typical morphology, after this the basic formations remains the same and only erodes rather fast. In this case, the formation shows almost no downwind horns, but grains are collected on the lee slopes.
95 04sec06sec10sec 08sec 16sec18sec22sec 20sec 28sec30sec34sec 32sec 40sec42sec46sec 44sec 52sec54sec58sec 56sec AGGREGATIONS 06 DESIGN DEVELOPMENT
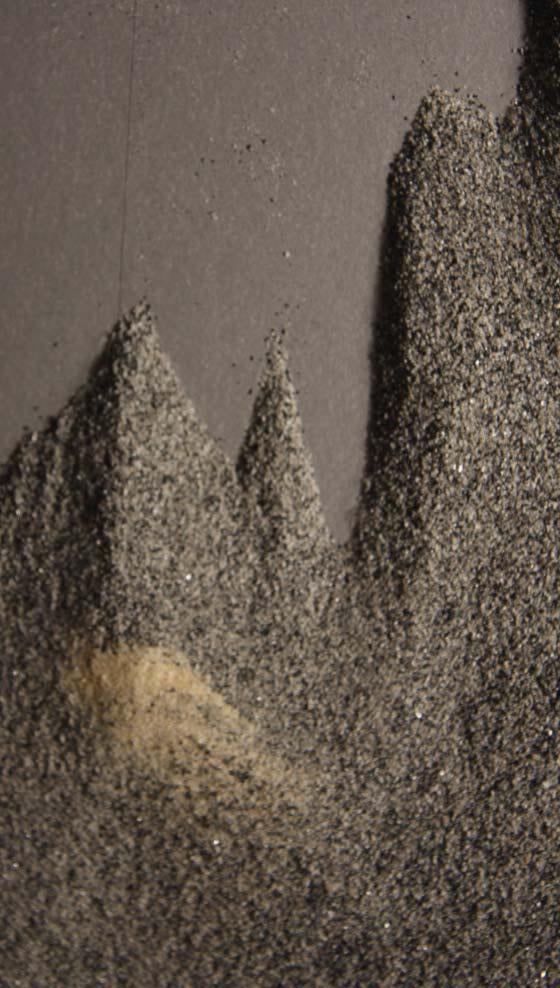
06.04MODULATION10-SANDBED
EXPERIMENTAL SPECIFICATIONS
DIAMETER AIRSTREAM: 5.0 cm
DIAMETER SAND-PILES: 4.0 cm
AMOUNT SAND PILES: 2
CREST CREST DISTANCE: 1.0 x diameter
DISTANCE AIR-SOURCE/SAND-PILE CENTRE: 36.0 cm
AIRSTREAM SPEED: 21 km/h
AIRSTREAM DIRECTION: 0 degrees
GRAIN TYPE 01: granite ballast
GRAIN SIZE 01: 0.5 to 1.0 mm
GRAIN TYPE 02: silver sand
GRAIN SIZE 02: 0.3 to 0.8 mm
MODELLING PROCESS
A sand bed is made on a flat surface. Two piles, 4.0 cm diameter each are built up on top behind each other. The distance between the crests is 1.0 times the diameter of a pile. They are covered in a lighter colour marker sand and exposed to an airstream of 21 km/h at zero degrees. Records of their development are taken second by second.
OBSERVATIONS
This experiment has been set up to study the effect, that a sand bed might have on the formation. The first pile begins to erode from bottom to top. The second one sets in at 12 seconds. It shows a curious erosion pattern starting from the flanks, moving to the middle and then from the middle to equally bottom and top. The two piles stay distinct forming sequential model dunes. The one closer to the airstream erodes before the second one, whereas previously they eroded at the same rate.The sand bed itself scales off, leaving sheets or tongues of sand on the flat surface.
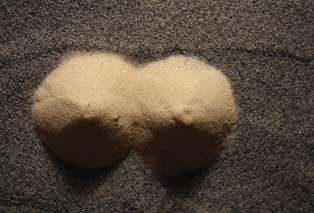

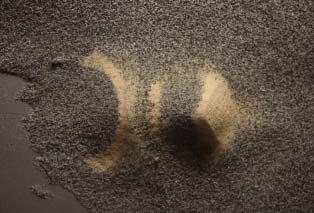
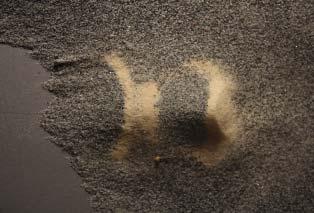
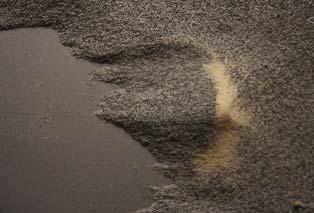

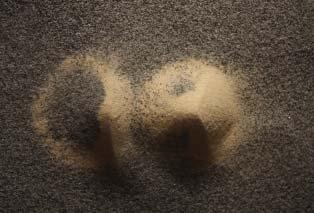


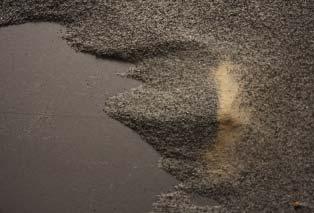
96 AGGREGATIONS 06 DESIGN DEVELOPMENT
71 15sec00sec02sec 12sec14sec 24sec26sec 36sec38sec 48sec50sec
FIGURE
70 FIGURE

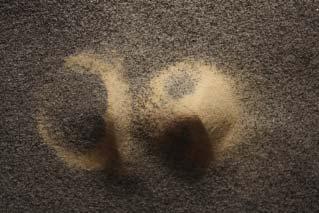
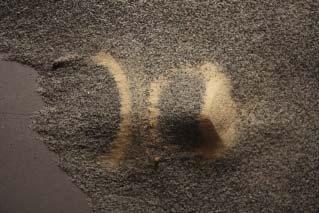
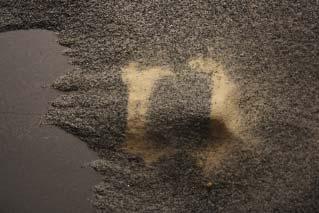

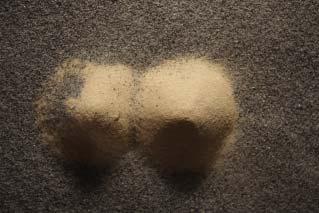
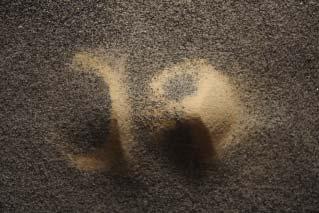
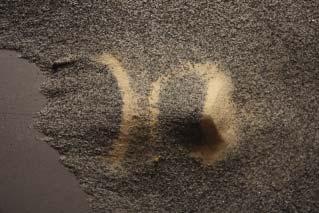

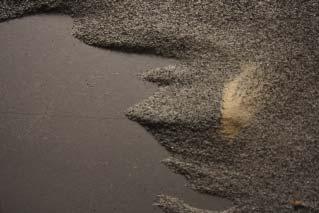


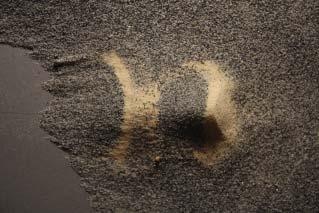
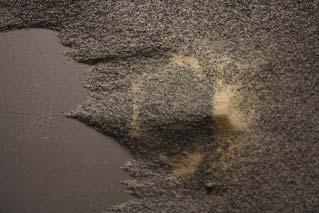

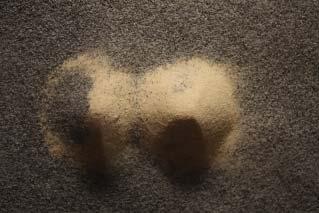
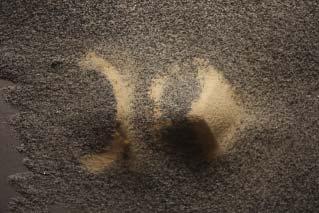
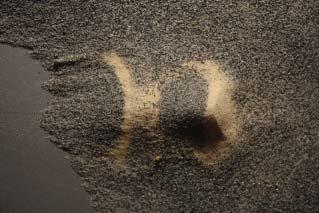


FIGURE70
TWO PILES AT 1.0 DIAMETER APART ON A SAND BED
Two piles are built up on a sand bed. Like in the previous experiments, they start to form windward slopes, yet do not merge and form sequential model dunes. The sand bed itself is not majorly affecting this process, even though the first model dune seem to erode much faster than the second one, whereas previously they eroded at the same rate. The bed itself is equally eroding and starts to show sheet or tongue formations.
FIGURE71
SEQUENCE OF TWO PILES ON A SAND BED
The time lapse photography allows to study the entire development of the modulation. This time, the formation develops sequentially, meaning that the model dune closer to the airstream erodes at a much faster rate than that further away. The closer model dune has reached its morphology at 16 seconds, the other one at 22 seconds, after which both erode without essentially changing their basic morphology.
97 04sec06sec10sec 08sec 16sec18sec22sec 20sec 28sec30sec34sec 32sec 40sec42sec46sec 44sec 52sec54sec58sec 56sec AGGREGATIONS 06 DESIGN DEVELOPMENT
P98
06.05SOLIDIFICATIONMETHODS
P99

06.05SOLIDIFICATIONMETHODS
One aspect that of aggregations that the hypothesis proposes to investigate, is the solidification of an aggregate field and the investigation of how the loose and the solid phase are interacting. A series of tests, investigating different aggregate solidification techniques has been conducted. The results using different materials are shown in detail in the appendix and only the method which has been taken further will be explained at this point.
SAND CEMENT CAST
Case study 04 investigated the formation of sandstone. In this natural system, sand is solidified through the embedding of silica and calcium carbonate, which bind under rain water and air humidity. The solidification method that is proposed uses a very similar process. A loose sand bed is being prepared. Sand and cement are mixed in their dry state and then applied onto the bed using a sieve. The cementsand layer is then sprayed with water for twenty-four hours during which period it fully cures. This method thus uses the basic building materials of concrete, i.e. cement, aggregate and water, only in a different order of application. This has the advantage that the sand bed is left undisturbed by the impacting binder. Binder and bed have the same physical principle, as they both remain granular up to the point of their contact, which allows to quite closely solidify aggregate morphologies and some of their performative qualities.
CEMENT ALTERNATIVES
Cement has been used in experiments as it renders relatively quick results. However its production is potentially environmentally damaging. Alternative binders such as lime mortar or Portland limestone cement might be used. This leads to reduced levels of CO2 emissions and reduced energy consumption compared with the production of the same quantity of Portland CEM I (Source: SustainableConcrete, 2007). Yet tests need to be conducted as to how this binder performs with regards to the casting method proposed.
PATENT
The method has been submitted for patent in Germany. There is one precedent patent dating from 1924, that also proposes the hardening of a dry sand cement mix by a water-spray (Source: PatNo. 398146). Yet this patent does not use the sand as a mould, so the principle developed in the course of this solidification research might be a novelty on the German market.
The following chapter will introduce the basic method and then show application methods related to aeolian environments, i.e. principles that use wind as an agent of application.
100 FIGURE 72 AGGREGATIONS 06 DESIGN DEVELOPMENT
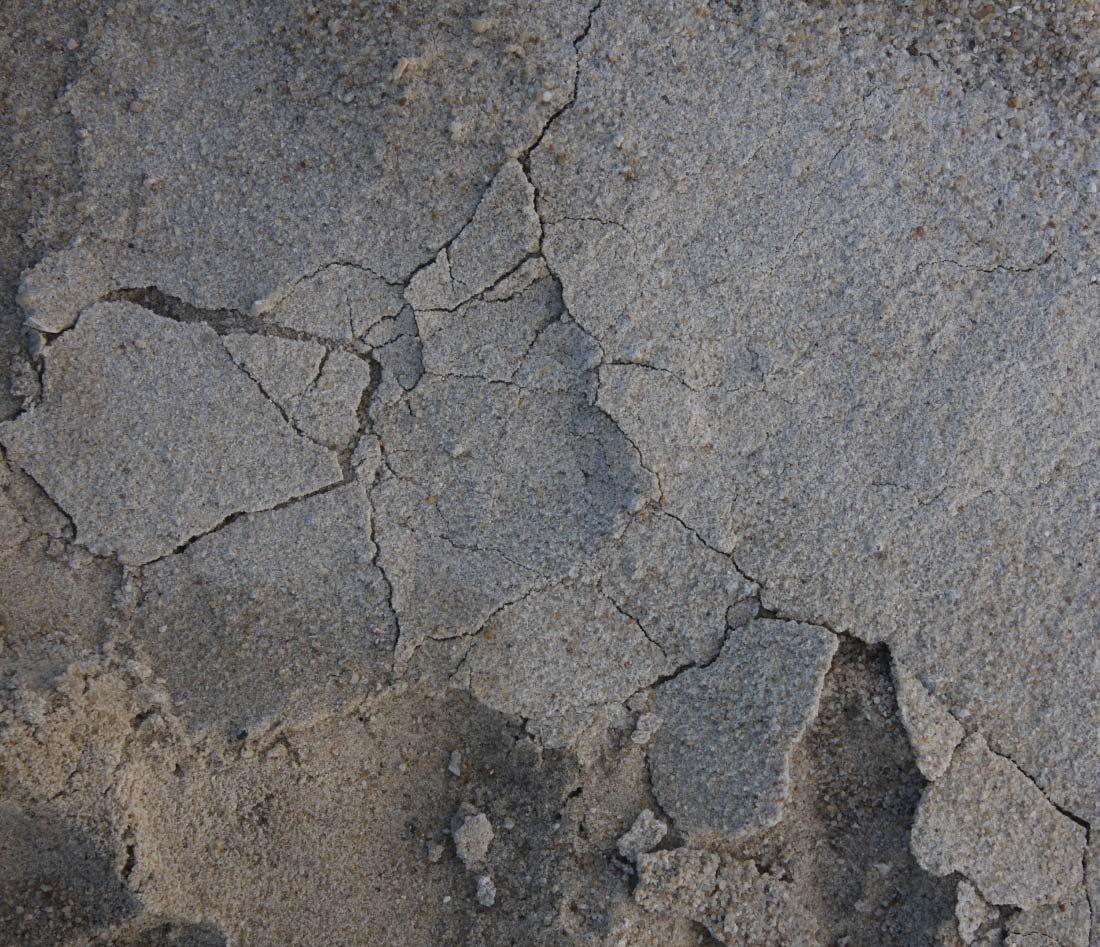
FIGURE72
MATERIAL SAMPLE OF A SAND CEMENT CAST
A flat bed cast using the sand-cement method renders a relatively smooth concrete-like cast. Its bottom tends to ne smoother than the top, where there is impact of water-spray. The section shows a material layering due too the granules filtering down at different speeds under an impacting water-mist.
FIGURE73
RECYCLING OF A SAND CEMENT CAST BY CRUSHING
One of the advantages of the sand cement cast is that layers can be applied at almost any thickness. Thicker layers would need to be applied in steps as the water-spray can only filter through a thickness of ca. 5 mm. Thin layers can be recycled very easily through crushing, which renders the solidifications easily recyclable. Additionally even regular weathering will erode this type of concrete rather easily, as it is not as closely sealed off as the regular construction material.
101 AGGREGATIONS 06 DESIGN DEVELOPMENT
FIGURE 73
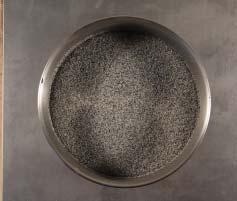
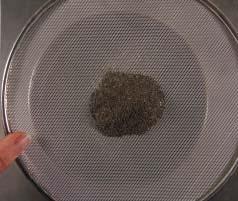

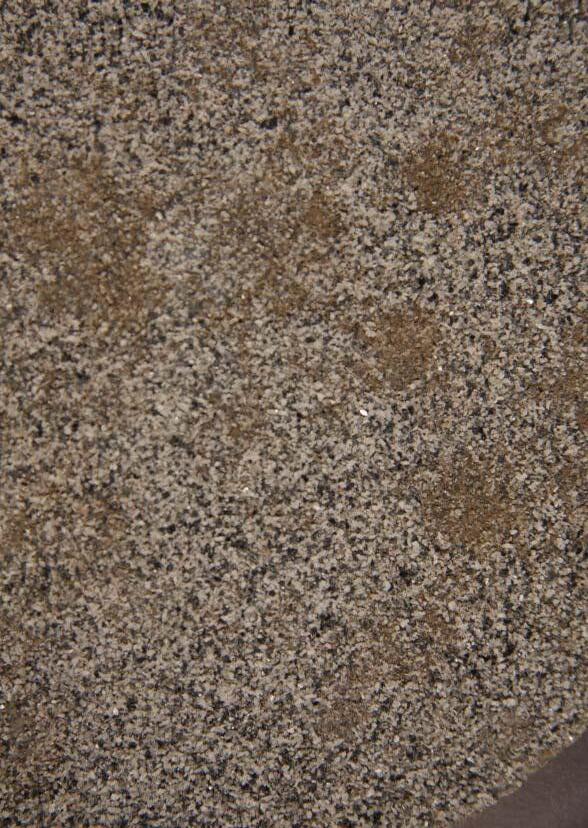

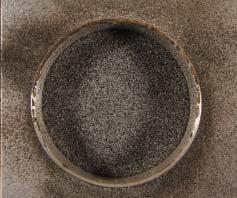

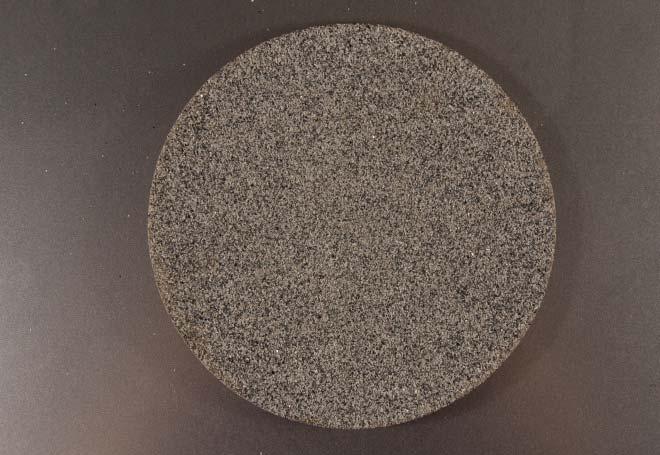
06.05SOLIDIFICATION01-BASICPRINCIPLE01
EXPERIMENTAL SPECIFICATIONS
MOULD AGGREGATE: Grey Ballast
AMOUNT: 500 ml
PHASE CHANGE MATERIAL: Cement Fondu Black-Brown and Granite Ballast
AMOUNT: 90 ml sand: 30 ml cement
CURING AGENT: 15 ml water
CURING TIME: 24 h
MODELLING PROCESS
A metal container is sprayed with mould release agent. The mould aggregate is filled into it. The sand-cement mix is filtered onto the sand bed with a sieve and sprayed with water. It is left to cure for 24 hours.
OBSERVATIONS
The cement sand mix gradually cures under constant hydration of 24 hours and can be removed as a flat piece from the sand mould. The mould sand is entirely reusable. The hardened piece has a similar material composure to concrete, due to being made of cement and sand, yet it is more porous, probably due to the fact that hydration is achieved by spraying with water rather than by mixing. The solidified piece has a rough top layer with bumps and a relatively even sandy bottom layer. Over a longer period of time the cement grows harder.
FIGURE74
MANUFACTURING SEQUENCE OF SAND CEMENT CAST
This sequence illustrates the manufacturing sequence. (01) The sand is placed in a metal container. (02)The dry sand cement mix is sieved onto the bed. (03) The dry sand cement mix comes to rest on the sand bed. (04) The sand cement mix is sprayed with water mist. (05) The cement-sand mix is left to cure under constant hydration for 24 hours.
FIGURE75
DETAIL VIEW OF TOP SURFACE
The top surface of the sand-cement cast shows watermarks from spraying. It keeps its sandy makeup, some grains can still be rubbed off after solidification.
FIGURE76
TOP VIEW OF THE CAST
The top cast has a slightly irregular surface showing watermarks. The shape of the sand mould is modelled relatively accurately.
FIGURE77
BOTTOM VIEW OF THE CAST
The bottom view of the cast shows a very homogeneous sandy under-layer with no watermarks. Again the shape of the mould is modelled very exactly.
102
FIGURE
74
FIGURE 75
FIGURE 76
0102030405 AGGREGATIONS 06 DESIGN DEVELOPMENT
FIGURE 77

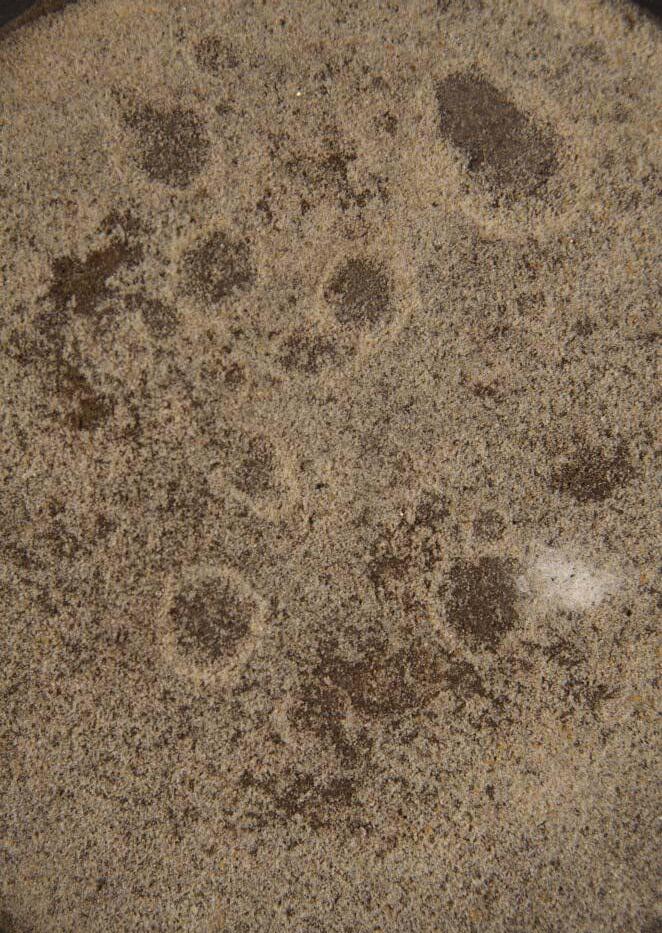

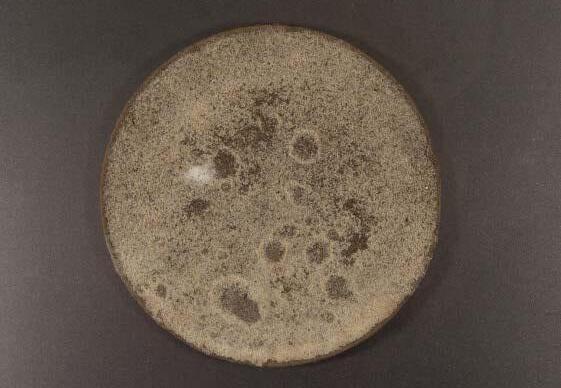
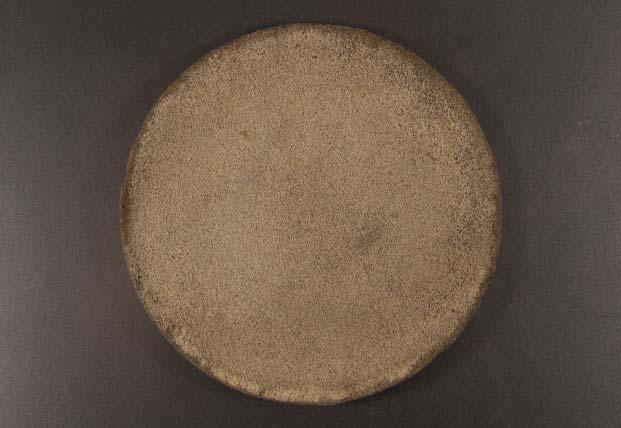
06.05SOLIDIFICATION01-BASICPRINCIPLE02
EXPERIMENTAL SPECIFICATIONS
MOULD AGGREGATE: Silver Sand
AMOUNT: 500 ml
PHASE CHANGE MATERIAL: Cement Fondu Black-Brown and Silver Sand
AMOUNT: 90 ml sand: 30 ml cement
CURING AGENT: 15 ml water
CURING TIME: 24 h
MODELING PROCESS
A metal container is sprayed with mould release agent. The mould aggregate is filled into it. The sand-cement mix is filtered onto the sand bed with a sieve and sprayed with water. It is left to cure for 24 hours.
OBSERVATIONS
The cement sand mix gradually cures under constant hydration of 24 hours and can be removed as a flat piece from the sand mould. The mould sand is entirely reusable. The hardened piece has a similar material composure to concrete, due to being made of cement and sand, yet it is more porous, probably due to the fact that hydration is achieved by spraying with water rather than by mixing. The solidified piece has a rough top layer showing watermarks from spraying and a smooth sandy under layer. If broken apart, the piece shows layers of different material composure due to that fact that some of the granular material sinks more readily under water impact whereas other granules stay on top.
FIGURE78
MANUFACTURING SEQUENCE OF SAND CEMENT CAST
This sequence illustrates the manufacturing sequence. (01) The sand is placed in a metal container. (02)The dry sand cement mix is sieved onto the bed. (03) The dry sand cement mix comes to rest on the sand bed. (04) The sand cement mix is sprayed with water mist. (05) The cement-sand mix is left to cure under constant hydration for 24 hours.
FIGURE79
DETAIL VIEW OF TOP SURFACE
The top surface of the sand-cement cast shows very strong and big watermarks from spraying. It keeps its sandy makeup, yet as the silver sand is finer, it binds a little bit stronger with the cement.
FIGURE80
TOP VIEW OF THE CAST
The top cast has a slightly irregular surface showing the strong watermarks. The shape of the sand mould is modelled relatively accurately.
FIGURE81
BOTTOM VIEW OF THE CAST
The bottom view of the cast shows a very homogeneous sandy under-layer with no watermarks. The shape of the base mould is rendered very exactly.
103 AGGREGATIONS 06 DESIGN DEVELOPMENT
FIGURE 78
FIGURE 79
FIGURE 80
0102030405
FIGURE 81

06.05SOLIDIFICATION-SUBTRACTIVEMETHOD
EXPERIMENTAL SPECIFICATIONS
MOULD AGGREGATE: Kiln Dried Silver Sand
PHASE CHANGE MATERIAL: Cement Fondu Black-Brown and Granite Ballast
AMOUNT: 3 Units Sand: 1 Unit Cement
DISTANCE AIR-SOURCE/SAND-PILE CENTRE: 36.0 cm
AIRSTREAM SPEED: 21 km/h
AIRSTREAM DIRECTION: 0 Degrees
MODELLING PROCESS
Three different pile configurations varying pile size and crest to crest distance are set up and exposed to an airstream of 21 km/h at 36.0 cm distance. After the exposure, a dry sand-cement mix is sieved onto the modulation. After this application, the configurations are each again exposed to the same airstream. Time-lapse records are taken second by second.
OBSERVATIONS
This setup is devised to see if solidification can be modulated by an airstream subtracting phase change material that was previously applied. The initial modulation phase yields the results already observed in the previous section. Under an airstream, windward low slopes and steep slip-face form. They are more modulated, the farther the initial piles are apart and the bigger they are. After the cement-sand mix has applied however, the behaviour of the aggregate has radically changed. As the cement is a powder and probably already starts setting under air humidity, saltation does not happen any more. The configuration remains almost undisturbed, only in the modulations that are more articulated, i.e. larger and further apart, does the impacting air take off some of the cement-sand mix. This however happens in sheets rather than individual grains.
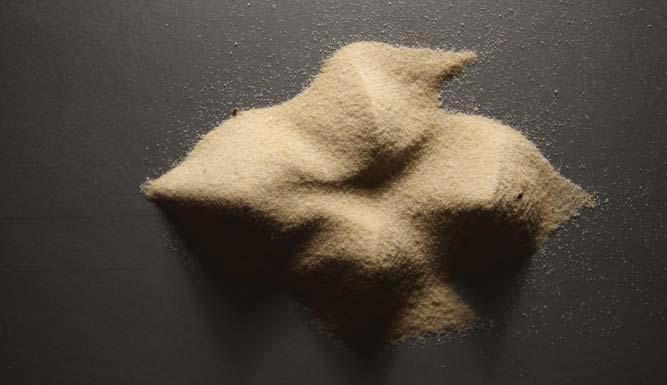
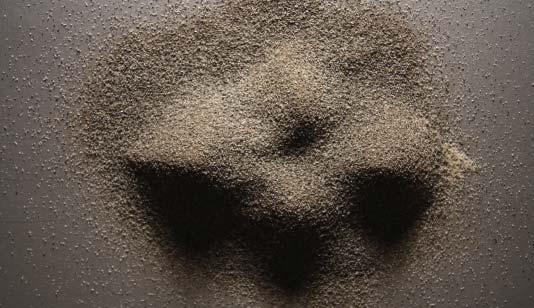
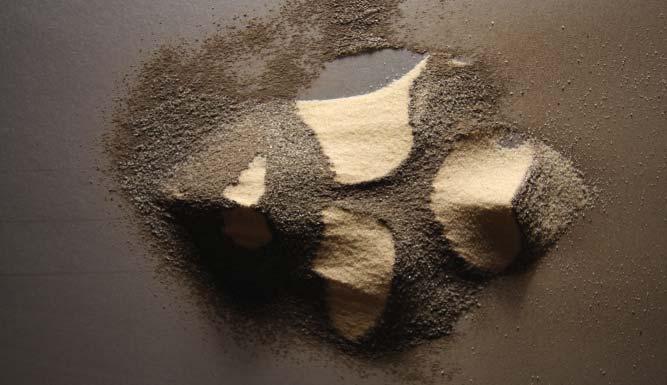
104 FIGURE 82 AGGREGATIONS 06 DESIGN DEVELOPMENT
FIGURE 84.01
FIGURE 85.01
FIGURE 83.01


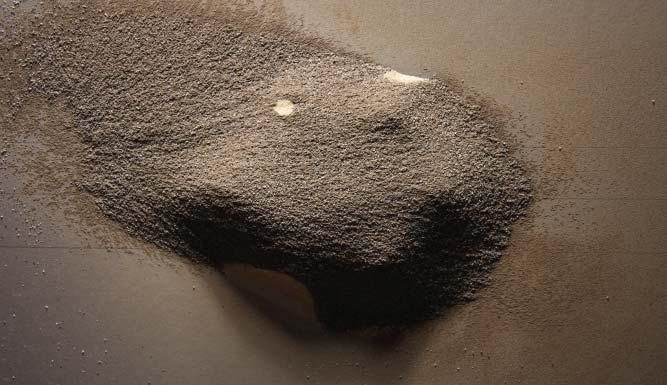
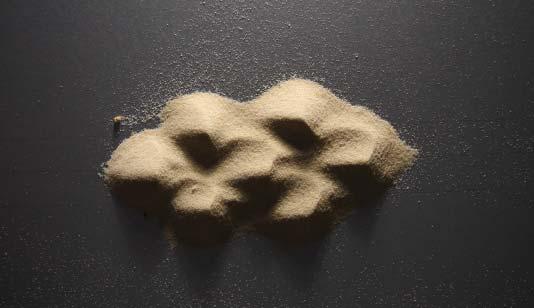


FIGURE82
DETAIL VIEW OF SUBTRACTIVE METHOD
This view shows the most articulated sand modulation after the cement sand mix has been subtracted. Other than in the less articulated configurations, subtraction did happen. Yet the cement sand mix flies off in sheets rather than individual grains saltating.
FIGURE83.01TO83.03
MODULATION OF PILE GROUPS UNDER AN AIRSTREAM
Three pile groups of different articulation are exposed to a mono-directional airstream. They show the typical features of low windward slope and steep slip-face.
FIGURE84.01TO84.03
APPLICATION OF DRY SAND CEMENT ON SAND MODULATIONS
A dry sand cement mix is applied on the sand modulations in order to test if some of the phase change material can be subtract by the impact of an airstream.
FIGURE85.01TO85.03
SUBTRACTION OF SAND CEMENT MIX BY AN AIRSTREAM
The sand cement layer seems to almost immediately set under air humidity. Under the impact of an airstream it hardly moves. Only the more articulated modulations show a sheet-like subtraction of material.
105 AGGREGATIONS 06 DESIGN DEVELOPMENT
FIGURE 84.02
FIGURE 85.02
FIGURE 83.02
FIGURE 84.03
FIGURE 85.03
FIGURE 83.03
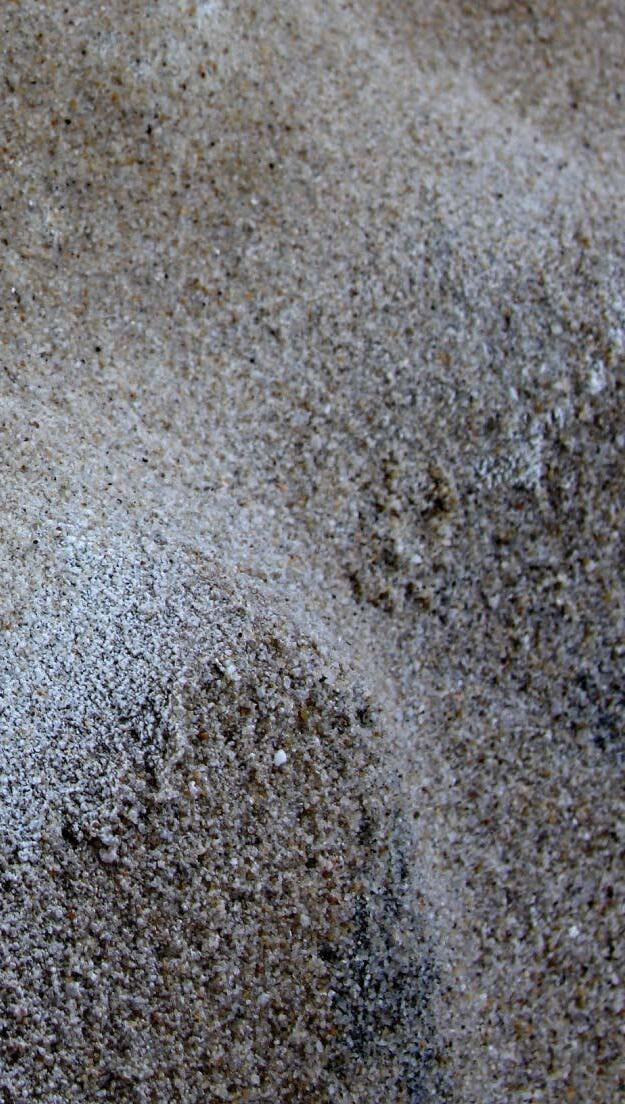
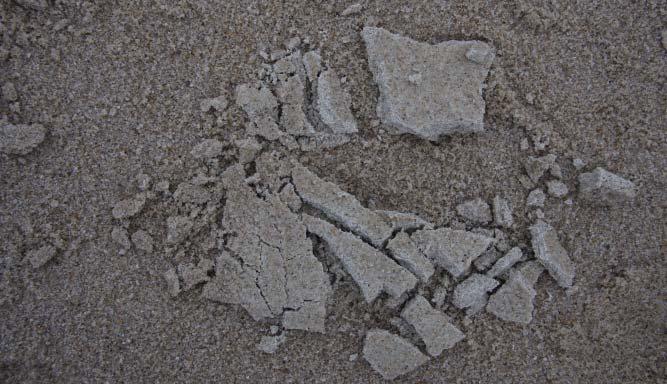

06.05SOLIDIFICATION03-ADDITIVE01
EXPERIMENTAL SPECIFICATIONS
MOULD AGGREGATE: dune sand
PHASE CHANGE MATERIAL: white cement and dune sand
AMOUNT: 90 ml sand: 30 ml cement
APPLICATION METHOD: wind
CURING AGENT: rainwater, air humidity
CURING TIME: 24 h
MODELING PROCESS
A pile of sand is formed on the beach. The sand cement mix is distributed onto it by scattering it into the wind. The cement sand mix is briefly sprayed with regular water and then left to cure under rain water and air humidity for 24 hours.
OBSERVATIONS
Under wind action, the cement sand mix settles onto the windward sides of the piles. It cures under rainwater and air humidity, but not as strongly as under constant spraying in a laboratory setting. This and the fact that the layer is only 2 mm thin, leads to the fact that the layer can be crumbled and decomposed very easily, yet fulfils its purpose of stopping windward erosion as can be seen in the experiments conducted in chapter 07.
FIGURE86
DETAIL VIEW OF ADDITIVE SAND-CEMENT APPLICATION
This contrast image of 65% shows the distribution of cement through wind. The cement sand mix is scattered in the wind and settles on the windward slopes. Cement-covered areas are visible in white, cement-free areas in ochre.
FIGURE87.01to87.03
CRUSHING SEQUENCE OF CEMENT-SAND CAST
Layers are easily decomposable, as on the one hand they are quite thin and on the other they do not set as strongly under air humidity and rain as they do under constant hydration in a laboratory setting. This renders them easy to crush which makes solidifications easy to recycle directly on the beach.
106 FIGURE 86 AGGREGATIONS 06 DESIGN DEVELOPMENT
FIGURE 87.01
FIGURE 87.02
FIGURE 87.03
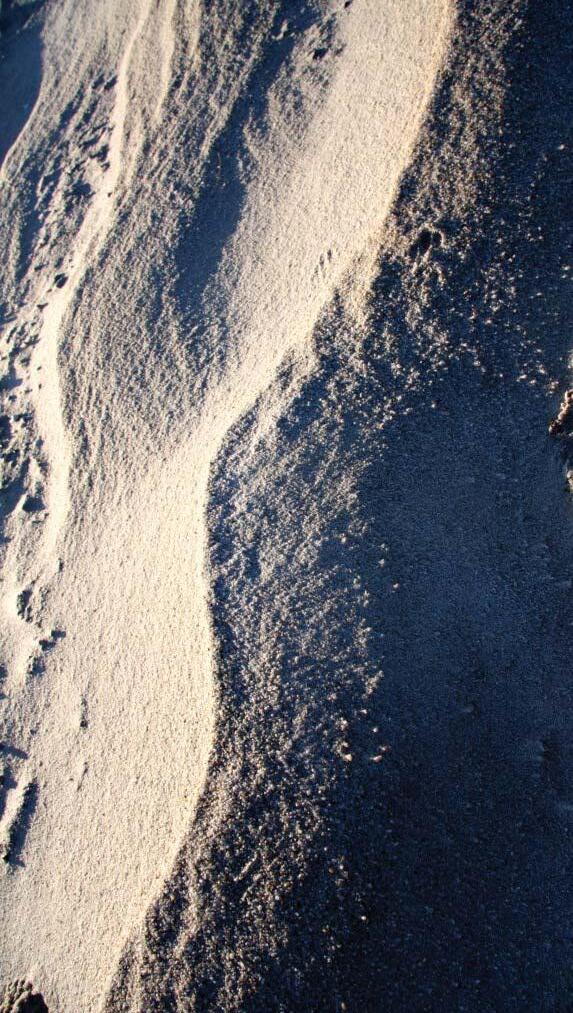
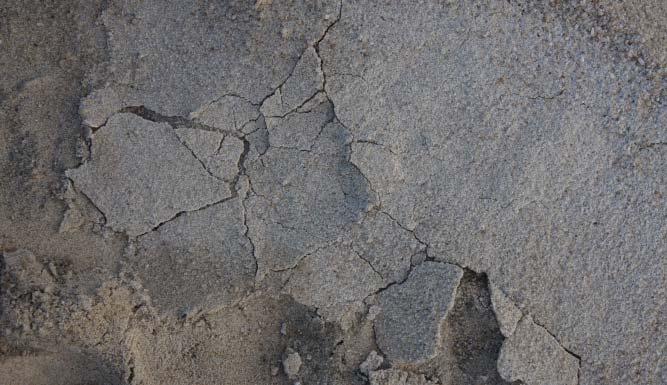

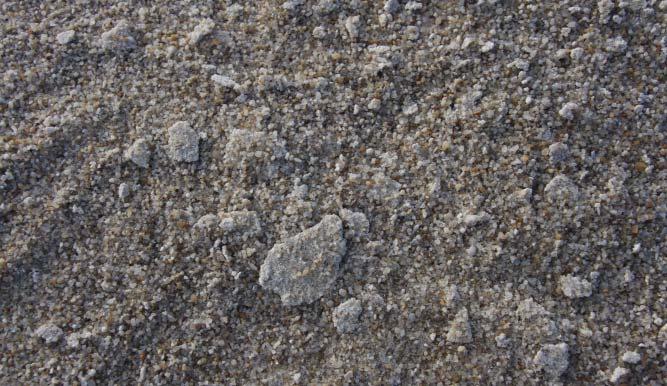
06.05SOLIDIFICATION03-ADDITIVE02
EXPERIMENTAL SPECIFICATIONS
MOULD AGGREGATE: dune sand
PHASE CHANGE MATERIAL: white cement and dune sand
AMOUNT: 90 ml sand: 30 ml cement
APPLICATION METHOD: wind
CURING AGENT: rainwater, air humidity
CURING TIME: 24 h
MODELING PROCESS
A natural sand formation on the beach is chosen for solidification. The sand cement mix is distributed onto it by scattering it into the wind this time using a sieve. The cement sand mix is briefly sprayed with regular water and then left to cure under rain water and air humidity for 24 hours.
OBSERVATIONS
Under wind action, the cement sand mix settles onto the windward sides of the formation. It cures under rainwater and air humidity, but not as strongly as under constant spraying in a laboratory setting. This and the fact that the layer is only 1mm thin, leads to the fact that the layer can be crumbled and decomposed very easily, yet fulfils its purpose of stopping windward erosion as can be seen in the experiments conducted in chapter 07.
VIEW OF ADDITIVE SAND-CEMENT APPLICATION
This view shows the distribution of cement through wind on a natural sand formation. The cement sand mix is sieved in the wind and settles on the windward slope. Cement-covered areas are visible in white.
FIGURE89.01to89.03
CRUSHING SEQUENCE OF CEMENT-SAND CAST
Layers are kept even thinner in this case. This renders them very easy to crush and recycle directly on the beach.
107 AGGREGATIONS 06 DESIGN DEVELOPMENT
FIGURE 88
FIGURE88
FIGURE 89.01
FIGURE 89.02
FIGURE 89.03
P108
P109
06.06OVERVIEWDESIGNDEVELOPMENT

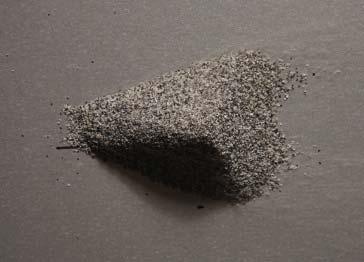

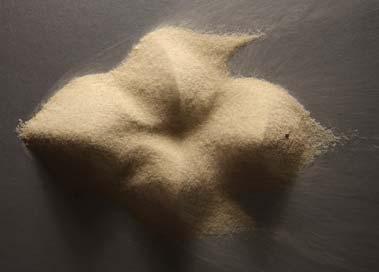
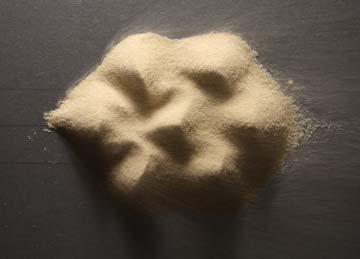

(01) PILE CONFIGURATION ONSITE(02.01) PILE CONFIGURATION LABORATORY (02.02) WIND DISTRIBUTION
06.06OVERVIEWDESIGNDEVELOPMENT
The above chart gives and overview of the experiments conducted onsite and in the laboratory. They are all based on the principle of a simple sand pile transforming into a morphology resembling that of a dune. The following results can be observed.
(01) PILE CONFIGURATION ONSITE
The onsite tests show the sensitivity of the system to varying aggregate and climatic parameters such as humidity and grain size.
(02.01) PILE CONFIGURATION LABORATORY
The laboratory piles show similar results to the onsite models, but they use mainly mono-directional airstreams and are thus more prototypical in morphology.
(02.02) WIND DISTRIBUTION IN A SAND MODULATION
Layered sand pile modulations using sand of the same grade but different colouring allow to see the wind distribution in a modulated sand field.
(03) PILE GROUPS
Pile groups show very similar behaviour to single piles. Yet the downwind horns become transitory ridges between crests.
(04) CREST TO CREST DISTANCE
The crest to crest distance is a crucial factor in modulation a sand pile field. If it is very close, piles merge into a single model dune, if pile crests are apart at at least 0.6 their diameter, they form sequential model dunes.
(05) PILES ON A SAND BED
(03) PILE GROUPS
If placed on sand bed, piles behave in almost the same way as on a flat surface, their morphology becomes smoother and dunes closer to the airstream erode at a much faster rate than those further away.
(06.01) SUBTRACTIVE SOLIDIFICATION
Subtractive modulation of a dry cement-sand layer is hardly possible, as cement binds very quickly under air humidity and does not allow grains to saltate any more for modulation.
(06.02) ADDITIVE SOLIDIFICATION
If a dry sand-cement layer is scattered in an airstream or wind, it sets on the windward slopes of dunes and solidifies their dynamic behaviour.
110 AGGREGATIONS 06 DESIGN DEVELOPMENT
FIGURE
90
01 01 01 02.01 02.02 03 03 03
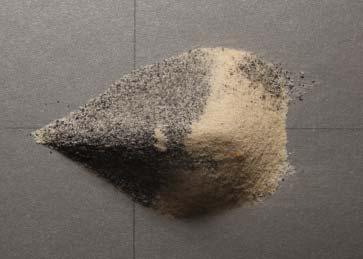
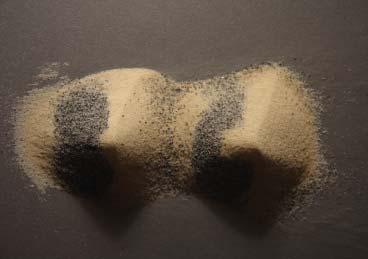

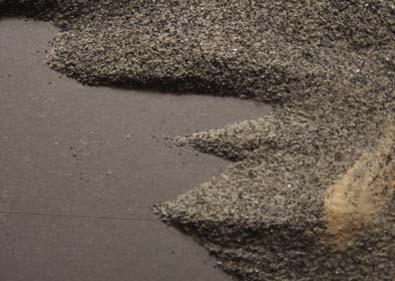
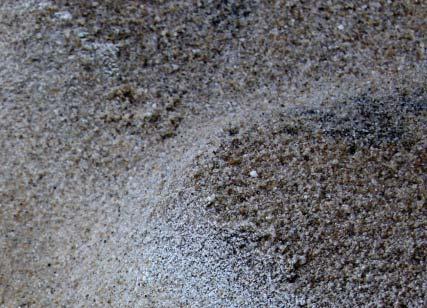

(04) CREST TO CREST DISTANCE(05) PILE CONFIGURATION ON SANDBED(06.01) SUBTRACTIVE SOLIDIFICATION (06.02)
FIGURE90
OVERVIEW OF THE DESIGN DEVELOPMENT
The chart gives an overview of all the experiments conducted in chapter 06.
111 AGGREGATIONS 06 DESIGN DEVELOPMENT
ADDITIVE SOLIDIFICATION 04 04 04 0506.01 06.02
06.07DESIGNDEVELOPMENT-CONCLUSION
The material system has been developed in three main stages. Stage 01 looked at sedimentary environments and potential strategies of aggregate modulations on two scales. Stage 02 focused on aeolian environments and possible modulation principles, specifically that of a transforming into a morphology resembling that of a dune. This was done through onsite and laboratory methods. Stage 03 focused on solidification methods, developing the sand-cement cast and testing it in an aeolian environment as both a subtractive and an additive principle.
The material system developed now bears properties that are laid out in the hypothesis. Firstly it offers a microclimatic modulation, in this case the wind. It also has the potential to embed solid and loose aggregate phase as well as being continuous in its construction cycles. Materials and energies, especially in onsite tests, have mainly been available and intrinsically inherent onsite. The following chapter 07 will test how this basic system can be played out in a specific location.
SAND PILES UNDER AN AIRSTREAM
This time lapse image at 09 seconds shows how seven piles have almost completely transformed into a dune-like morphology under an impacting mono-directional airstream. Windward slopes and lee-sides are clearly discernible and transitory ridges between crests have formed. The time-lapse image allows to see particle paths in motion and trace possible airstream trajectories.
112 AGGREGATIONS 06 DESIGN DEVELOPMENT
FIGURE91
SEVEN
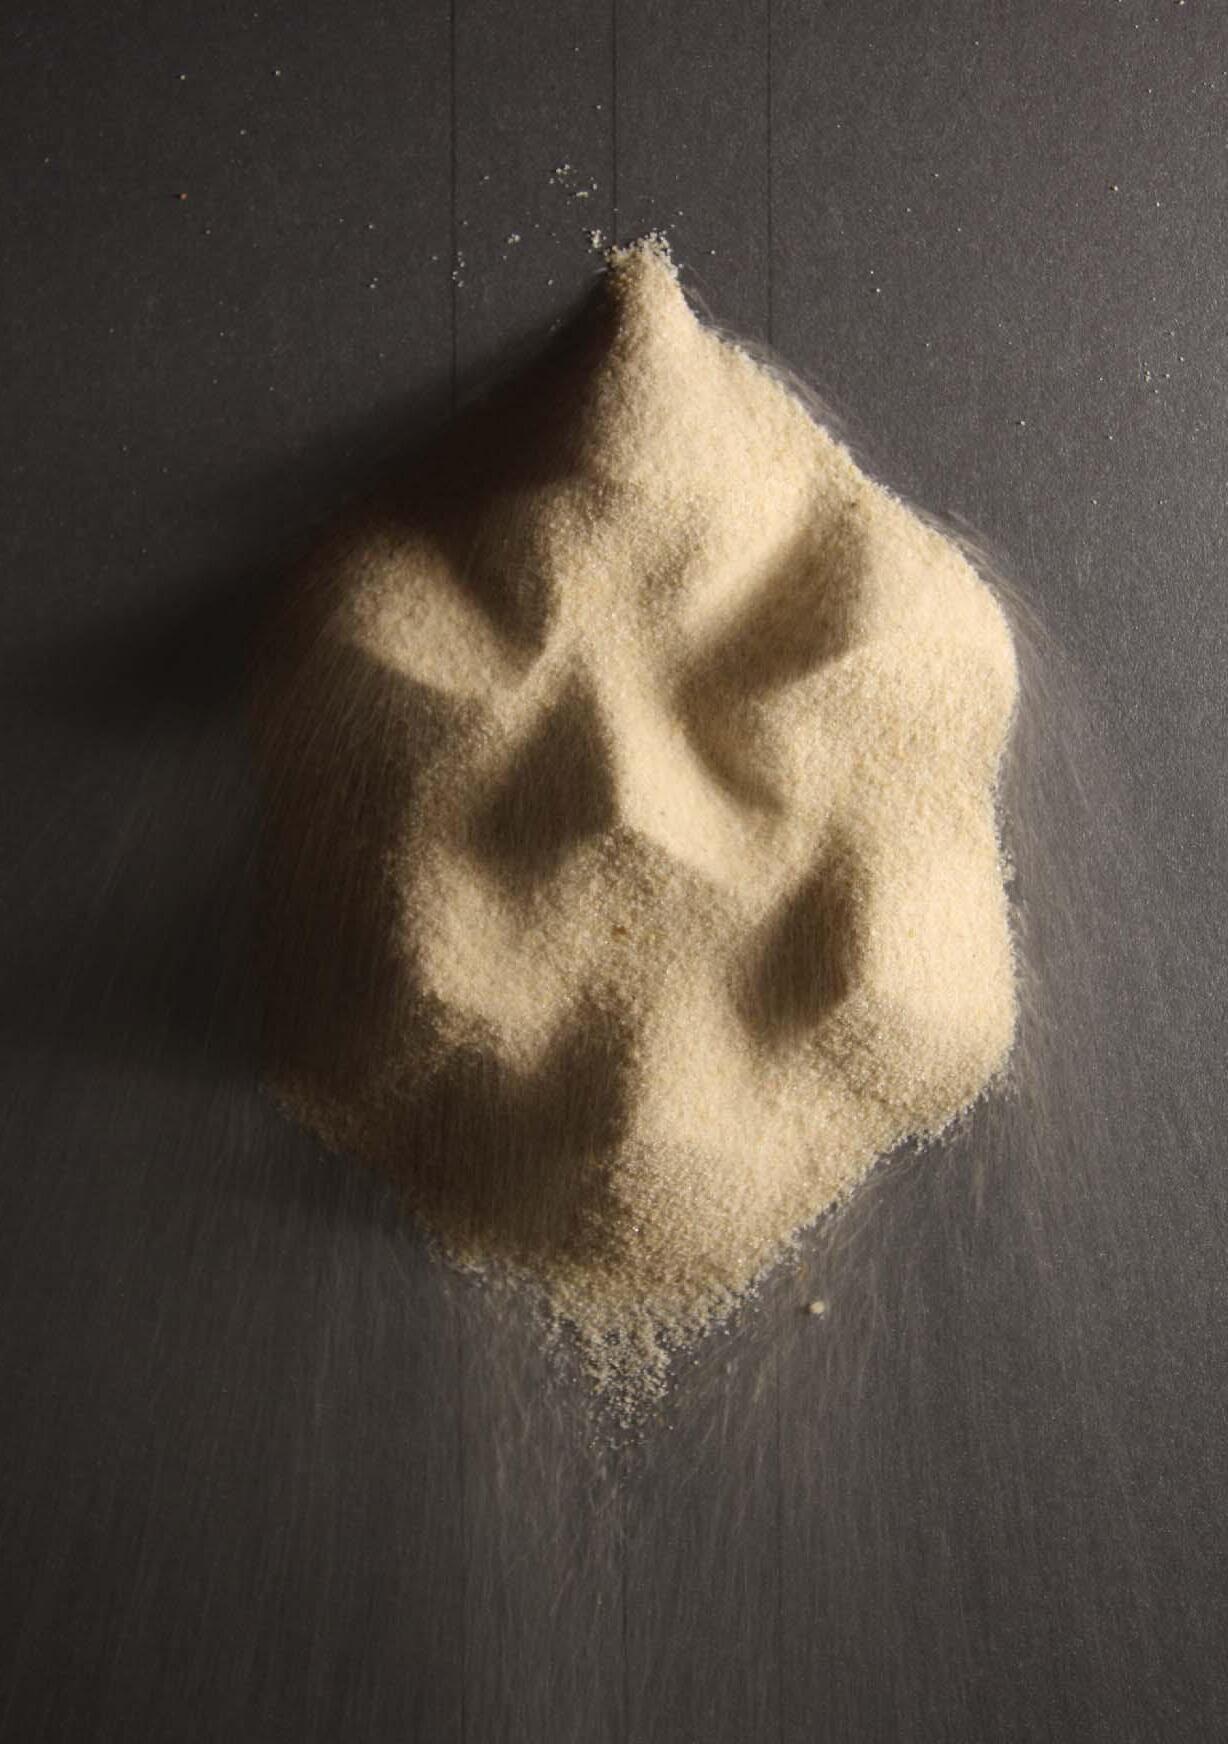
FIGURE 91
P114
07DESIGNAPPLICATION
07.01 INTRODUCTION
07.02 SITE ANALYSIS
07.03 DESIGN PROPOSAL 07.04 GEOMORPHODYNAMIC MICROCLIMATE
07.05 CONCLUSION
P115
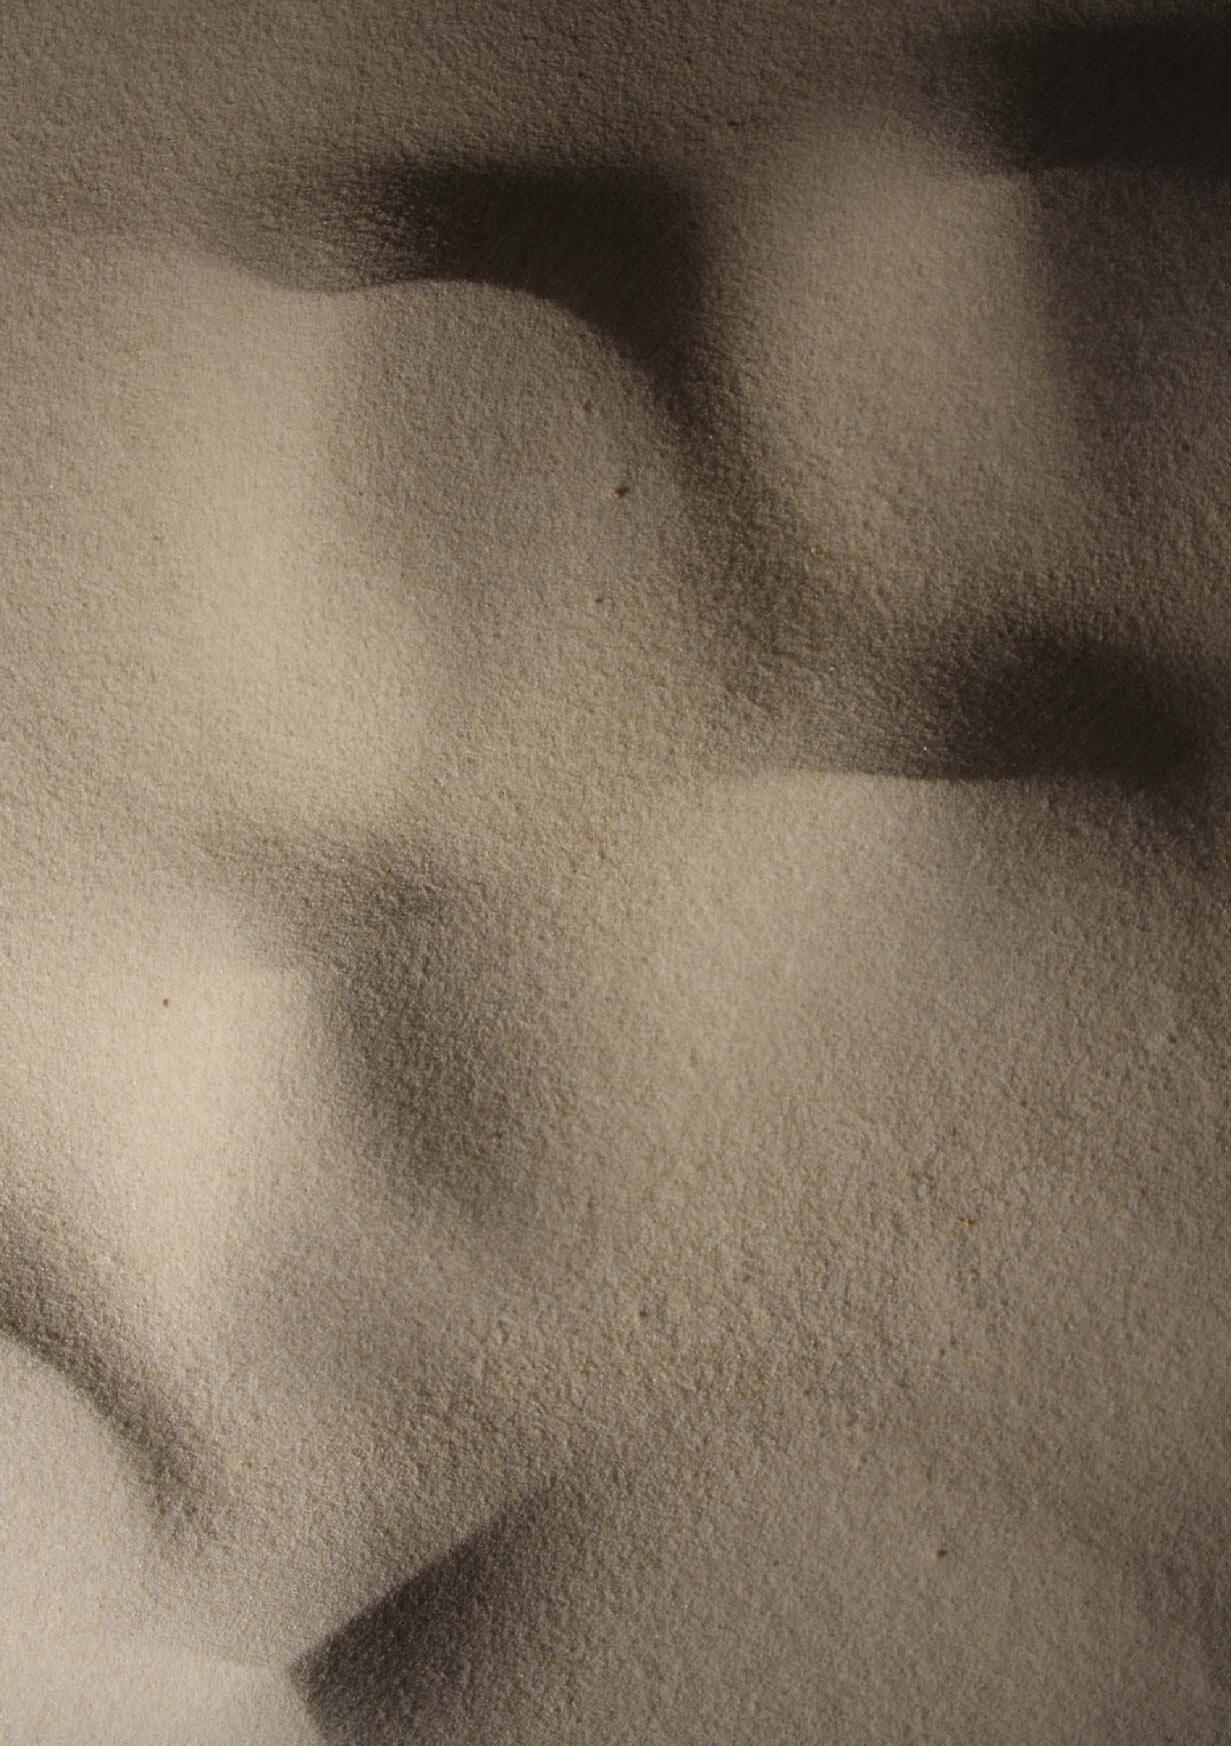
FIGURE 92
FIGURE92
SIX SAND PILES UNDER A TWO DIRECTIONAL AIRSTREAM
Six sand piles are being exposed to an airstream at 35 km/h. The direction of the airstream is varied around 22.5 degrees. Under a mono-directional stream, the piles still remain distinct, whereas under a two-directional one they gradually merge into a linear array.
07.01DESIGNAPPLICATION-INTRODUCTION
As geomorphodynamic microclimates are by nature highly site specific with regards to their material composure and climatic conditions, the island of Sylt/North Germany is chosen as a specific location in order to bind aspects of the system developed so far into a coherent design. After an analysis of the site conditions and the choice of specific location on the island, a proposal for an artificial dune belt is made. This aims to protect newly growing natural dunes from extensive erosion as well as offers wind protection to visiting tourists. A single configuration is being tested with regards to how it performs as a loose phase, how wind-shadowed areas adapt and how a solid and a loose phase can start to perform alongside each other.
117 AGGREGATIONS 07 DESIGN APPLICATION
P118
07.02SITEANALYSIS
P119
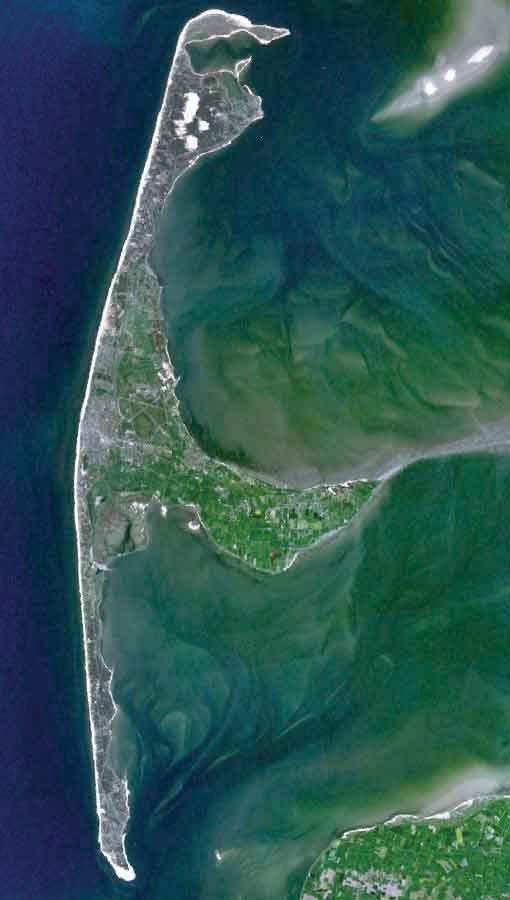

07.02SYLT-SITEDESCRIPTION
SITE
Sylt is the largest island of North Frisia. It spans in north-south direction in front of the North Sea coast of Schleswig-Holstein/Germany. The island is mainly known for its touristically important spa locations, namely Westerland, Kampen and Wenningstedt, as well as for its roughly 40 km long west beach. It is currently being widely discussed in terms of its exposed location in the North Sea and its constant landlosses during spring floods (Source: Sylt).
CLIMATE
Sylt has a sea climate that is influenced by the gulfstream. With 2 °C the winter months are a bit milder than on the neighbouring mainland, whereas the summer months with an average of 17 °C, are a bit cooler despite the island’s longer sun hours. On the average year, Sylt has 4.4 hours of daily sunshine. Due to its low relief, Sylt has more sun hours than the entire German mainland. Clouds cannot build up due to the constant west- or northwest wind. The average year temperature is around 8.7 °C. The wind blows at a year average of 6.7 m/s mainly from westerly directions. The average rainfall per year is around 734 mm (Source: Westerland, 2005, p.6).
GEOLOGY AND FORMATION
The form of the island has been changing continuously over time. This process is still going on today (Source: Thiede/Arendt, 2000, p.1). The northern and southern tips consist almost exclusively of infertile sand-deposits. The middle part however, in the area of Westerland, Wenningstedt and Sylt-East, is based on a geest core. The area of the geest core is closing up on the tidal flats in the area of Sylt East and it is here that it transforms into relatively fertile marshlands (Source: Thiede/Arendt, 2000, pp. 3-4). The island Sylt in its current form exists only since roughly 646 years. It formed like the geest of the mainland from old moraines and thus has the same core, that is still visible today in the middle and the west of the island in the forms of cliff, dunes and sand beach. This geest core eroded due to being exposed to strong sea currents at the island’s plinth during rises in sea levels some 8000 years ago. The west side, originally located 10 km away from the mainland, thus moved more
and more to the east with the northern and southern tips of the island growing longer. Around this geest core, marshland sedimented after the ice ages. Despite having been named an island since 1141, Sylt belonged to a coastal landscape penetrated by rivulets and could be reached by foot at least during low tide. Only during the great Mandraenke or Marcellus Flood in 1362, did it separate from the mainland and the typical hooks at the tips started to form. Still the northern and the southern end are subject to erosion and accretion. From 1870 onwards, yearly records were taken of the receding coastline. According to this, Sylt has lost between 0.5 m and 3.5 m of coastline every year between 1870 and 1955 and between 1870 and 1984, which is when sand was added to the coastline as a protective measure. The tips of the island at List and Hoernum are recording the greatest changes (Source: Thiede/ Arendt, 2000, pp. 17-19).
COASTAL PROTECTION
As a means of protection against the constant erosion of the coast wooden boulders were built already in the 19th century. These were set at a right angle to the coast into the sea. Later on they were replaced by metal and finally reinforced concrete boulders. Yet these structures did not have the desired effect to stop erosion induced by cross currents. The so-called lee erosion at the wind and current downstream side did not allow for remaining sedimentation of sand. In the 1960s socalled ‘tetrapodes’ were placed along the foot of the dunes and into the sea in order to stop the impact of the sea, yet they proved too heavy and have been removed since 2005 (Source: WKRF, [2000], pp. 59-63). Since the beginning of the 1970s sand is being added in front of the coast. This so far is the only effective means of protection, yet it is very costly (Source: Thiede/Arendt, 2000, p. 2 and p.19). Socalled hopper diggers are pumping water-sand slurry to the beach where the mix is distributed by bulldozers. Thus only the added sand is being eroded during spring floods – the actual natural coastline is thus protected and erosion is being slowed down. This process is linked to very high costs. The required yearly 10 million euro are covered by federal, national and European funds. Since 1972, 30 million cubic metres of sand have been added and distributed (Source: Liebermann, p. 162).
120 AGGREGATIONS 07 DESIGN APPLICATION
FIGURE 93
FIGURE 94

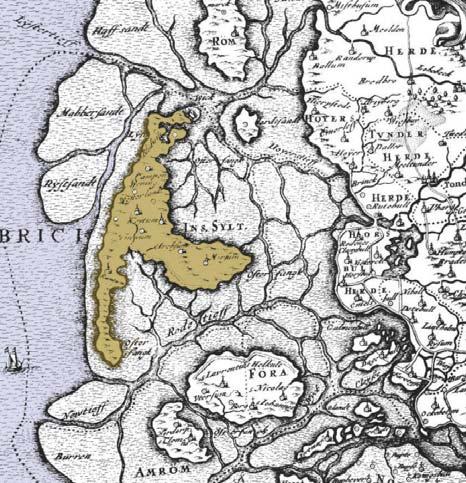
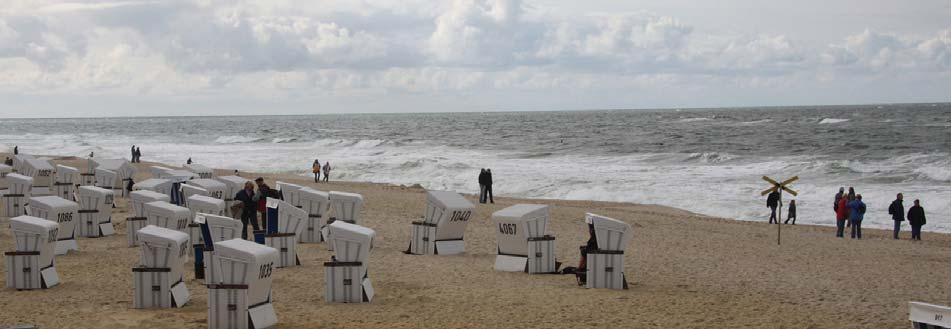
As an alternative, the reinforcement of a natural reef in front of the coast is being discussed. Experiments in this direction have been conducted in 1996 and 2003 (Source: Bleck). Sand drainage, which has been successful on the Danish islands, is not very promising on Sylt due to a steepening of the submarine slope (Source: Newig, p.69). Another alternative is the use of flexible geotextiles as a means to slow down the process of erosion (Source: WKRF, [2000], pp. 62 to 63). In parallel to the sand additions, the aforementioned boulders are being removed at great cost, since they have been proven to be ineffective as a coastal protection. Some experts fear that despite all these measures, Sylt will have to deal with substantial losses of land up to the middle of the 21st century. The progression of global warming will lead to an increasing storm-activity. This in turn will lead to an increase in land losses and its consequences, such as the loss of property. Measurements have shown that the wave energy no longer exhausts itself on the front beach but that their effect is extending over the entire beach stretch. This leads to a loss of sediments of ca. 1.1 million cubic metres per year (Sources: Thiede/Arendt, 2000, and WKRF, [2000]). The dune areas of the island are a natural reserve and can only be accessed on marked pathways. If vegetation is being removed by walking on it, sand comes loose and is prone to erosion. Thus wild walking accelerates erosion and is not permitted throughout the island.
CONCLUSION
Sylt today is characterized by two main tendencies. On the one hand its morphology is under constant change due to its exposed location in the North Sea. Sooner or later it will probably yield to the forces of erosion and accretion despite efforts to maintain its current shape. On the other hand, tourism plays an ever increasing role both as the sole dominating factor on the island itself but also as an economic attractor for the neighbouring mainland. The trend here is towards short stays and large events, which put a further strain on the ecological system. The efforts to maintain the morphological features of the island are mainly due to its crucial economic role that is feeding on tourism only. The challenge is to achieve a change in the approach towards the dynamic geology of the island. Instead of maintaining
a status quo of the island’s features to support its image for tourism, the dynamic morphology itself can become an activator of touristic activity and inhabitations as well as an actuator of new geomorphologic features. Thus tourism and the nature it feeds on no longer strive and struggle for and against each other but start to perform in unison.
FIGURE93
AERIAL VIEW OF SYLT/GERMANY
The island is ca. 41 km long and only 500 m wide in certain parts. The North and South tip show the most extreme geological changes. (Source: NASA, 2006)
FIGURE94
MOVING BODIES OF WATER AROUND THE ISLAND OF SYLT
Coastal erosion is due to both hydraulic and aeolian processes. This aerial view shows the motion of water bodies around the island in October 2007. (Source: DLR, 2009)
FIGURE95.01AND95.02
SYLT BEFORE AND AFTER THE MARCELLUS FLOOD IN 1362
Figure 95.01 shows Sylt before 1362. The island had not yet formed but belonged to the wetlands in front of the coast of Schleswig-Holstein/Germany. Figure 95.02 shows Sylt around 1648. The island has separated from the main land in the ‘Great Mandraenke’ of 1362. This historical flood separated the island from the mainland and the characteristic longitudinal shape was formed. (Source: Thiede/Arendt, 2000 according to Danckwerth 1652)
FIGURE96
BEACH IN WESTERLAND, SYLT
Sylt is one of the most coveted travel destinations within Germany. An average of 784.000 guests are visiting the island per year. Consequently tourism has become the main economic resource on the island. Some of the beaches are infra-structurally developed, whereas others, such as the area in List, are relatively untouched.
121 AGGREGATIONS 07 DESIGN APPLICATION
FIGURE 95.01
FIGURE 95.02
FIGURE 96
07.02IMPLEMENTATIONAREA-LIST/SYLT
The north and south tip of the island are subject to the most geomorphodynamic change. List in the north of Sylt is chosen as area of implementation. It has actually accreted sand which has eroded from the west coast of the island. The Northern tip has thus thickened and even shows new dune formation. The proposal is to build on and encourage this geological process through, on a geological scale, protecting new dunes from extreme wind erosion and on a human scale offering areas of wind shelter to tourists who would otherwise use newly forming dunes and destroy them.
122 AGGREGATIONS 07 DESIGN APPLICATION FIGURE 97
FIGURE97 CHANGING OUTLINE OF LIST/NORTH SYLT Geological studies of the Northern tip of Sylt in List show how the area has accreted and grown in periods when the West of the island experienced strong erosion. This is due to the sediment being transported around the island and accreting at the tips. (Source: AWI)
2004 2002 1989 1936 N 123 AGGREGATIONS 07 DESIGN APPLICATION
ZONE 01
AEOLIAN DUNES

ZONE 02
AEOLIAN RIPPLES

ZONE 03
HYDRAULIC SORTING
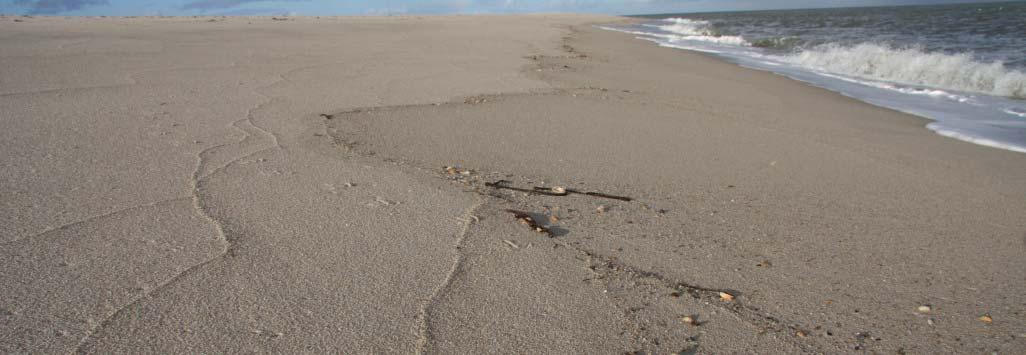
07.02MORPHOLOGICALANALYSIS-LIST/SYLT
In order to establish the sedimentary dynamics working on site as well as the granular makeup of the beach, a strip along the shoreline is analyzed on three scales. Scale 01 looks at the overall morphology and comprises 5.00 m to 10.00 m. Scale 02 observes individual morphological features, such as dunes or wave deposits and looks at a range of 1.00 m to 5.00 m. The smallest scale of ca 0.5 m investigates the granular composition of a specific beach zone. Altogether three zones can be observed, which corresponds to the prototypical shoreline section introduced in chapter 06.02.
FIGURE98 OVERVIEW OF MORPHOLOGICALLY DISTINCT ZONES Along the beach of List/Sylt/Germany three zones can be observed, the aeolian dunes, the aeolian ripples and the wave zone with hydraulic sorting. Each of them shows a distinct morphological and granular makeup.
124 AGGREGATIONS 07 DESIGN APPLICATION
FIGURE 98
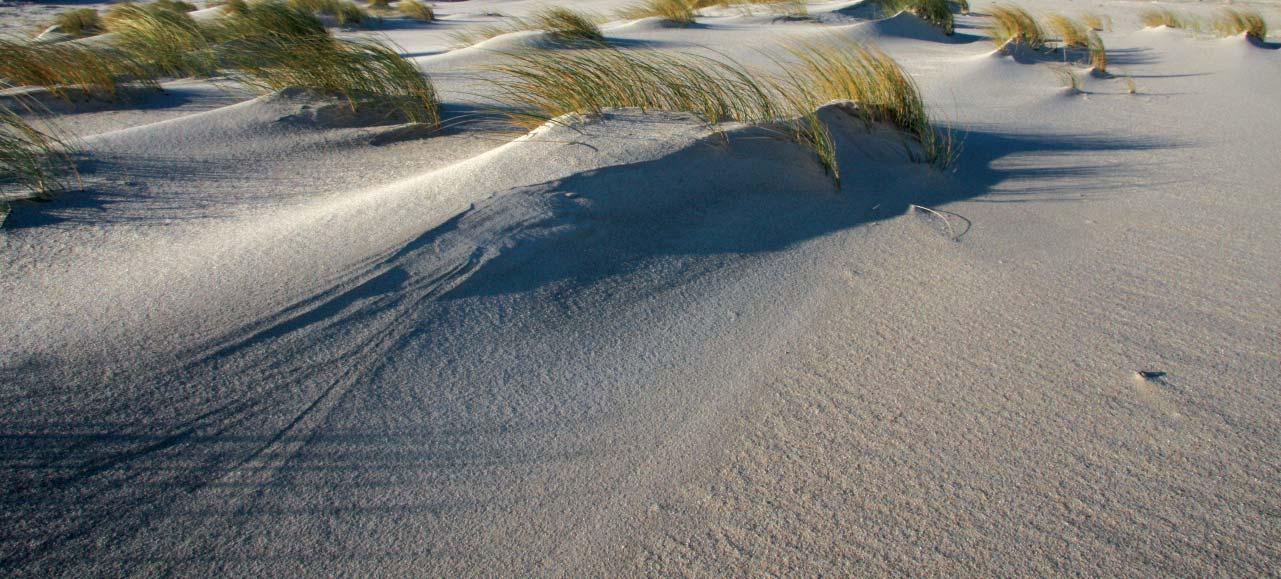
MORPHOLOGICAL PRINCIPLE 01 - AEOLIAN DUNES
NATURAL FORMATION OF NEW DUNES - NATURAL RESERVE ZONE
BEACH ZONE: Foredunes
DESCRIPTION: Area where new dunes form and are solidified by sea oats
SEDIMENTARY PROCESSES: Aeolian transport of sand (suspension, saltation, creep), dune formation
AGGREGATE TYPE: Mainly fine sand (0.01 mm to 0.1 mm) interspersed with coarse fields (0.2 mm to 1mm)
USE: Nature reserve
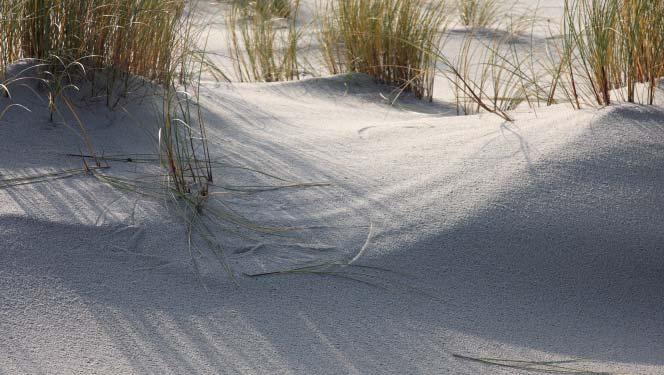
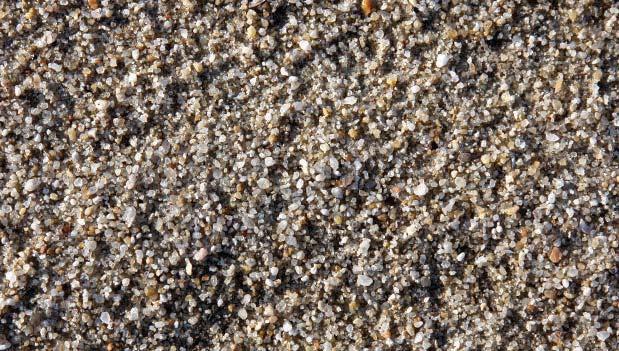
07.02MORPHOLOGICALPRINCIPLE01
In zone 01, dunes form due to aeolian processes of wind driven sand, causing suspension, saltation and creep. Sequential dune fields are interrupted by rippled flats. The profile of the dunes is getting lower the closer they are to the shoreline. On a granular level, fine dune sand is interspersed with coarser fields.
FIGURE99
MORPHOLOGICAL FEATURES ZONE 01
The top row shows the morphological features on a scale of 5.00 m to 10.00 m. The bottom left that of features on a scale of 1.00 m to 5.00 m and the bottom right the granular makeup at 0.5 m size.
125 AGGREGATIONS 07 DESIGN APPLICATION
99 SCALE 01
02 SCALE 03
FIGURE
SCALE
MORPHOLOGICAL PRINCIPLE 02 - AEOLIAN RIPPLES
AEOLIAN TRANSPORT OF SAND - MODULATION ZONE
BEACH ZONE: Backshore/Subaerial beach
DESCRIPTION: Area that stays dry during most floods, except storms
SEDIMENTARY PROCESSES: Aeolian transport of sand (suspension, saltation, creep), ripple formation
AGGREGATE TYPE: Mainly fine sand (0.01 mm to 0.1 mm) interspersed with coarse fields (0.2 mm to 1mm)
USE: Geomorphodynamic/Climatic Modulation
07.02MORPHOLOGICALPRINCIPLE02
In zone 02, ripples form on the flat beach due to aeolian impact, yet there is little or no dune formation. The grains are mainly fine sand, occasionally sheets of coarser sand have been deposited.
FIGURE100
MORPHOLOGICAL FEATURES ZONE 02
The top row shows the morphological features on a scale of 5.00 m to 10.00 m. The bottom left that of features on a scale of 1.00 m to 5.00 m and the bottom right the granular makeup at 0.5 m size.
126 AGGREGATIONS 07 DESIGN APPLICATION
FIGURE 100
01
SCALE
03
SCALE
02 SCALE
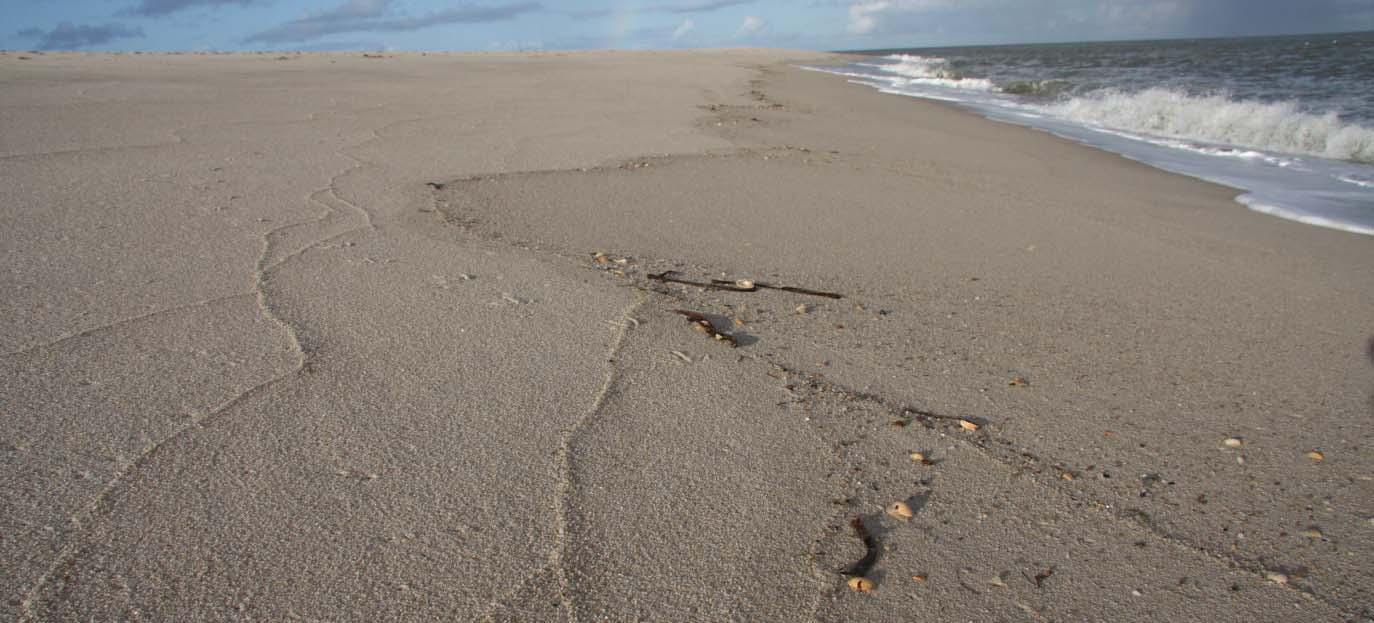
MORPHOLOGICAL PRINCIPLE 03 - HYDRAULIC SORTING
SORTING OF AGGREGATES OF DIFFERENT GRADING - AGGREGATE HARVEST ZONE
BEACH ZONE: Foreshore
DESCRIPTION: Area that falls dry during low tide and is flooded during high tide
SEDIMENTARY PROCESSES: Hydraulic sorting and abrasion
AGGREGATE TYPE: Fine sand (0.01 mm to 0.1 mm) that is patterned by wave deposits containing various aggregate types up tp 5 cm
USE: Aggregate harvesting of different grading
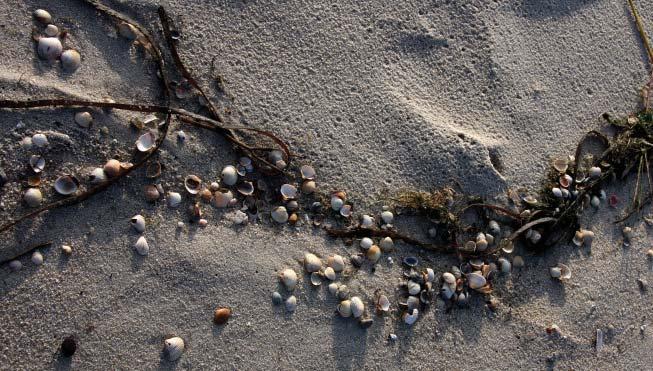

07.02MORPHOLOGICALPRINCIPLE03
Zone 03 is subject to the tidal impact of waves, specified by wave period and wave direction. Aeolian processes play a minor role. The wave impact sorts aggregates by their weight. They are deposited in bands along the tidal zones, each containing grains of similar size and weight.
FIGURE101
MORPHOLOGICAL FEATURES ZONE 01
The top row shows the morphological features on a scale of 5.00 m to 10.00 m. The bottom left that of features on a scale of 1.00 m to 5.00 m and the bottom right the granular makeup at 0.5 m size.
127 AGGREGATIONS 07 DESIGN APPLICATION
FIGURE 101
01
SCALE
SCALE
02
03
SCALE
P128
07.03DESIGNPROPOSAL
P129
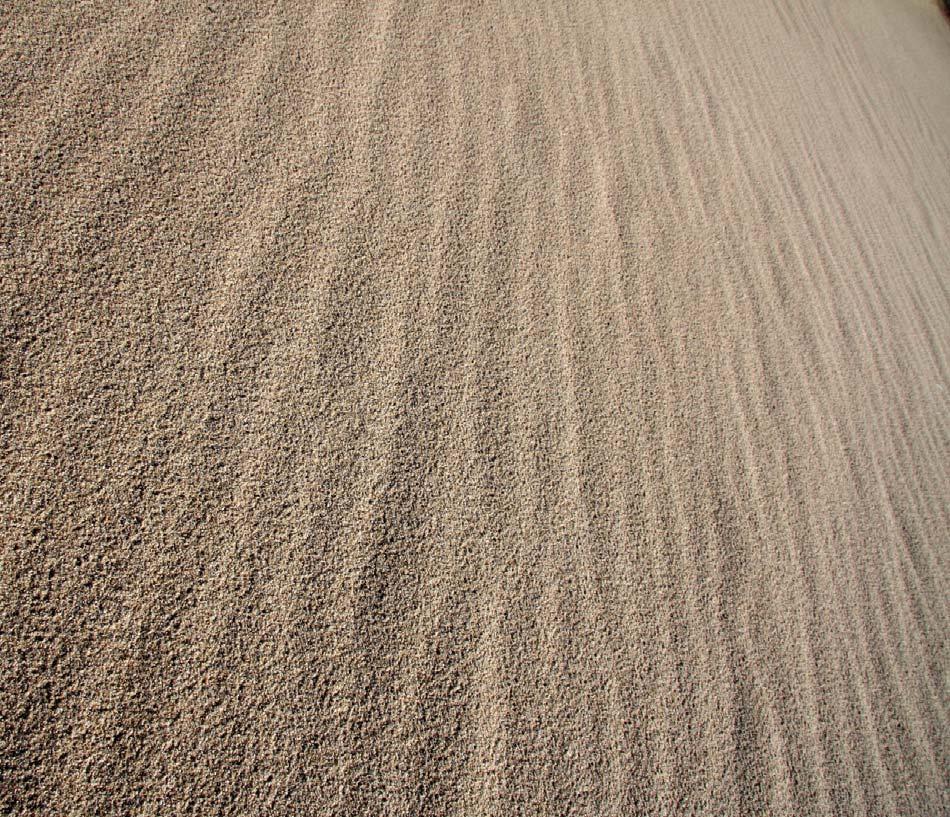
07.03DESIGNPROPOSAL
The proposal is to establish an artificial dune belt in Zone 02, the Rippled Flats. This can have two effects. On the one hand it protects evolving dunes from extreme windfalls and thus promotes their growth. On the other hand, the artificial dunes offer wind-cover for beach visitors. They normally use the natural dunes and in doing so partially destroy them. The artificial dune-belt serves to attract visitors out of the natural reserve. Additionally artificial dunes offer a higher level of control over the spatial arrangement of wind-protected areas, such as varying heights and degrees of density. They are thus a semi-natural landscape using the same materials and principles as the existing one and in doing so they offer protection to the natural and introduce new spatial arrangements on site.
130 AGGREGATIONS 07 DESIGN APPLICATION
FIGURE 102
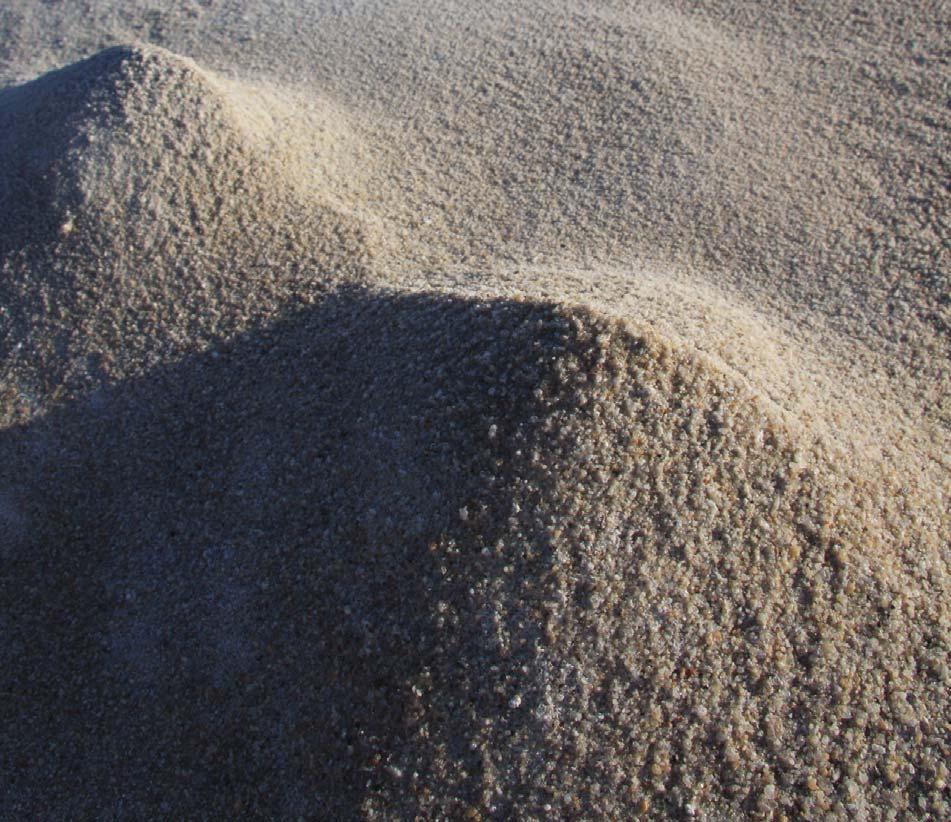
ZONE 02 - RIPPLED FLATS
The rippled flats in front of the dune belt are the area of implementation for geomorphodynamic microclimates. They characterized by wind impact only. In this zone natural dunes are only beginning to form, but the beach is still mainly flat.
FIGURE103
MODULATION IN THE BACKSHORE AREA - ZONE 02
The basic principle of modulation is that of a sand pile developing the morphological features of a dune, namely a windward slope and a steep slip face that offers wind protection to beach visitors.
131 AGGREGATIONS 07 DESIGN APPLICATION
FIGURE 103
FIGURE102
INPUT BOUNDARY
CLIMATE WINDSPEED WINDDIRECTION
VISITORS
MODULATION
PILE HEIGHT
CREST TO CREST DISTANCE
PILE DENSITY
SOLIDIFICATION
LAYER THICKNESS
07.03SYSTEMOVERVIEW
The system developed in chapter 06 can now be specified. Boundary conditions are wind speed and wind direction as well as peak visiting times. The initial piles modulation can be varied with regards to their pile height, crest to crest distance and pile density. These modulation are undergoing a morphological transformation under wind impact. After an initial modulating cycle, additive wind-driven solidifications can be introduced on windward slopes. The system continuously evolves and gradually erodes, never reaching a finite state. It is thought to perform on two scales. Scale 01 is that of human inhabitation, which modulates microclimatic wind conditions. Scale 02 is the geological scale and modulates surface roughness regimes that reduce the wind speed in the boundary layer and thus protect newly forming dunes from strong wind impacts.
SCALE 01 WIND MODULATION 01
SCALE 02 ROUGHNESS 01
01 132 AGGREGATIONS 07 DESIGN APPLICATION
AMOUNT CYCLE
FIGURE104
SCALE 01
WIND MODULATION 02
SCALE 02
ROUGHNESS 02
CYCLE
02
SCALE 01
WIND MODULATION 03
SCALE 02 ROUGHNESS 03
OUTPUT
CYCLE 03
FIGURE104 SYSTEM OVERVIEW
The chart shows an overview of the system and its boundary conditions, as well as input parameters and outcome scales. The system does not reach a finite stage but continuously evolves over time.
133 AGGREGATIONS 07 DESIGN APPLICATION
THRESHOLD
JANUARYFEBRUARYMARCHAPRILMAYJUNE
07.03BOUNDARYCONDITIONS-LIST/SYLT
The main boundary conditions of the system are wind direction, wind speed and the peak visiting times during which the system needs to perform. The above chart shows these data in context with each other. There are two main wind regimes on Sylt, namely Southwestern threshold winds in the winter and Northwestern winds in the summer. The transition happens in May and October respectively. There are seven prevailing wind directions altogether, which is the setup that will be used for simulating a small-scale modulation. Peak visiting times are the summer months.
VISITOR AMOUNT (THSD) WIND DISTRIBUTION 05 10 15 20 2 25 30 35 40 45 50 05 10 15 20 0 25 30 35 40 45 50 05 10 15 20 0 25 30 35 40 45 50 05 10 15 20 0 25 30 35 40 45 50 05 10 15 20 0 25 30 35 40 45 50 05 10 15 20 0 25 30 35 40 45 50
S W E N S W E N S W E N S W E N S W E N S W E N S W E N S W E N S W E N S W E N S W E N S W E N SSWSWWWNNW W 134 AGGREGATIONS 07 DESIGN APPLICATION FIGURE105
WINDS
FIGURE105 OVERVIEW BOUNDARY CONDITIONS
The chart shows the relevant boundary conditions for List/Sylt. The top row charts the numbers of tourists, the middle row threshold winds and prevailing wind directions, the lower shows the wind distribution in a month. The seven main directions appearing in a year are shown at the bottom of the chart. (Sources: Westerland, 2005 and WindFinder, 2002)
JULYAUGUSTSEPTEMBEROCTOBERNOVEMBERDECEMBER 05 10 15 20 0 25 30 35 40 45 50 05 10 15 20 0 25 30 35 40 45 50 05 10 15 1 20 0 25 30 35 40 45 50 05 10 15 1 20 0 25 30 35 40 45 50 05 10 15 1 20 0 25 30 35 40 45 50 05 10 15 1 20 0 25 30 35 40 45 50 S W E N S W E N S W E N S W E N S W E N S W E N S W E N S W E N S W E N S W E N S W E N S W E N W WWNNWSSW 135 AGGREGATIONS 07 DESIGN APPLICATION
INDEX
PileHeight: 2.50 METRES (PH)
CrestCrest: 2/3 DIAMETER (CC)
PileDensity: 2/3 FIELD (PD)
07.03MODULATIONS-BASICINPUT
The initial pile setup can be modulated varying pile height, crest to crest distance and pile density per unit area. Three pile heights are (3.00 m, 2.50 m and 2.00m) are chosen. Crest to crest distance can be one times, 0.6 times or 0.3 times the diameter. Densities vary from full occupancy to 2/3 to 1/3 occupancy per unit area. The above chart shows all possible configurations, altogether 27, that vary the above parameters.
G 10 PH: 3.00 M CC: 1 DIA PD: 1 G 09 PH: 3.00 M CC: 1 DIA PD: 2/3 G 07 PH: 3.00 M CC: 1 DIA PD: 1/3 G 09 PH: 3.00 M CC: 2/3 DIA PD: 1
07 PH:
M CC: 1/3 DIA PD: 1 G 08 PH: 3.00 M CC: 2/3 DIA PD: 2/3 G 05 PH: 3.00 M CC: 2/3 DIA PD: 1/3 G 05 PH:
M CC:
DIA PD:
G
PH:
CC:
PD:
G
3.00
3.00
1/3
2/3
03
3.00 M
1/3 DIA
1/3
136 AGGREGATIONS 07 DESIGN APPLICATION
FIGURE106FIGURE01
FIGURE106 OVERVIEW OF POSSIBLE MODULATIONS The initial pile modulation can vary height, crest to crest distance and pile density. There are altogether 27 different variations combining different values of these three variables.
G 09 PH:
M CC: 1 DIA PD: 1 G 08 PH: 2.50 M CC: 1 DIA PD: 2/3 G 05 PH: 2.50 M CC: 1 DIA PD: 1/3 G08 PH:
M CC:
DIA PD: 1 G06 PH: 2.50 M CC: 2/3 DIA PD: 2/3 G04 PH: 2.50 M CC: 2/3 DIA PD: 1/3 G05 PH:
CC:
DIA PD: 1 G04 PH: 2.50 M CC: 1/3 DIA PD: 2/3 G02 PH: 2.50 M CC: 1/3 DIA PD: 1/3 G 07 PH: 2.00 M CC: 1 DIA PD: 1 G 05 PH: 2.00 M CC: 1 DIA PD: 2/3 G 03 PH: 2.00 M CC: 1 DIA PD: 1/3 G 05 PH: 2.00 M CC: 2/3 DIA PD: 1 G 04 PH: 2.00 M CC: 2/3 DIA PD: 2/3 G 02 PH: 2.00 M CC: 2/3 DIA PD: 1/3 G 03 PH:
M CC: 1/3 DIA PD: 1 G 02 PH:
M CC:
DIA PD: 1 G01 PH: 2.00 M CC: 1/3 DIA PD: 1 137 AGGREGATIONS 07 DESIGN APPLICATION
2.50
2.50
2/3
2.50 M
1/3
2.00
2.00
1/3
ROUGHNESS 04
ROUGHNESS 01
ROUGHNESS 02
INDEX
EXISTING DUNES
ROUGHNESS 03
07.03ROUGHNESSMODULATION
On a geological scale, the system is thought to reduce wind speeds though roughening up the beach’s surface and thus reducing the speed of winds impacting on newly forming dunes. Only an indicative principle can be developed at this stage, as specific empirical onsite and laboratory methods testing the roughness lengths of a specific pile arrangement need to be developed. The principles proposed at this point are based on existing research (Sources: Oke, 1987 and JGR, 2006). Also these sources only make indicative statements and point out the fact, that surface roughness needs to be researched empirically onsite.
ARTIFICIAL DUNEBELT
Aerodynamic surface roughness as it is researched so far is related but not equal to the height, density and articulation of the surface elements. The higher, the denser and the more articulated the elements are, the rougher a surface becomes and the more the wind is reduced (Source: Oke, 1987, p. 57). The existing dune-field in List/Sylt is recorded according to its height and density from a topographical aerial map. The newly proposed dunes are placed in relation to the existing ones using a radial axial growth principle that gives preference to potentially rougher dunes over smoother ones. That way the entire field might be roughened up, but in a gradual manner as airborne sand transport is not entirely stopped where existing dunes are low.
ROUGHNESS 05
R01 = G09 AND G10
R02 = G07 AND G08
R04 = G03 AND G04 R05 = G01 AND G02 R03 = G05 AND G06
08.00 to 10.00 M 06.00 to 08.00 M 02.00 to 04.00 M 00.50 to 02.00 M 04.00 to 06.00 M NEW DUNES CYCLE 01
138 AGGREGATIONS 07 DESIGN APPLICATION FIGURE107
EXISTING DUNES
08.00 to 10.00 M 06.00 to 08.00 M
NEW DUNES CYCLE 01
R01 = G09 AND G10
R02 = G07 AND G08
R03 = G05 AND G06
NEW DUNES CYCLE 02
R01 = G09 AND G10
R02 = G07 AND G08
R03 = G05 AND G06
R04 = G03 AND G04
02.00 to 04.00 M
00.50 to 02.00 M 04.00 to 06.00 M
R04 = G03 AND G04
R05 = G01 AND G02
R05 = G01 AND G02
FIGURE107
METHOD OF INSERTING NEW ARTIFICIAL DUNES
The modulations are inserted using a radial principle that gives preference to rougher dunes. In cycle 01, the roughest dunes are radial proliferated, in cycle 02 the next roughest and so for don to the lowest dunes. This allows for a gradual roughening up of the surface and still gives airborne sand to low dunes.
FIGURE108
MAP OF POSSIBLE NEW DUNE INSERTIONS AFTER TWO CYCLES
The map shows new dunes formations indexed using the basic pile configurations after two growth cycles. INDEX
50 M 0 M 100 M
N 25 M 0 M 0 M
139 AGGREGATIONS 07 DESIGN APPLICATION FIGURE108
07.03CONFIGURATION
A smaller area of the proposed new dune field is modelled in terms of its possible growth in order to identify a possible pile configuration for laboratory testing from it. The chosen area is marked in a grey frame. The actual pile configuration is composed of six piles, 2.50 m high, mainly at a crest to crest distance of 1 diameter, which only at the north western edge transits into crest to crest modulation of 0.6 diameter in order to model a possible transition in surface roughness. This effect will need to be verified experimentally. The overall configuration measures 20.00 by 12.00 metres.
EXISTING DUNES 08.00 to 10 00 M 06.00 to 08.00 M 02.00 to 04.00 M 00.50 to 02.00 M 04.00 to 06.00 M NEW DUNES CYCLE 02 R01 = G09 AND G10 R02 = G07 AND G08 R04 = G03 AND G04 R05 = G01 AND G02 R03 = G05 AND G06 NEW DUNES CYCLE 01 R01 = G09 AND G10 R02 = G07 AND G08 R04 = G03 AND G04 R05 = G01 AND G02 R03 = G05 AND G06 00 M25 M 25 M50 M 50 M100 M 140 FIGURE109 AGGREGATIONS 07 DESIGN APPLICATION
INDEX
INDEX
PileHeight: 2.50 METRES (PH)
CrestCrest 01: 1 DIAMETER (CC 01)
CrestCrest 01: 2/3 DIAMETER (CC 02)
PileDensity: 1 FIELD (PD)
FIGURE109 AREA OF IMPLEMENTATION WITHIN THE NEW DUNEBELT
A specific location within the newly proposed dune belt is modelled and an area of 20.00 m by 12.00 m is marked in grey outline for the definition of a pile configuration.
FIGURE110
PILE CCONFIGURATION
Based on the height of existing dunes the testing pile configuration is defined using the basic index developed on pp. 136-137.
141
AGGREGATIONS 07 DESIGN APPLICATION
FIGURE110
P142
07.04GEOMORPHODYNAMICMICROCLIMATE
P143
07.04LOOSEPHASE
The following pages take the modulation developed in the previous chapter through three experimental phases. Initially the six piles are tested as a loose aggregate. Subsequently the formation of wind-shadows under multi-directional winds is tested. Finally, a solid phase is embedded in the loose one. The initial tests thus investigate the loose behaviour of the proposed modulation. Aggregations are subject to constant cycles of erosion and accretion. If the entire system is left loose, it becomes apparent how the entire configuration might evolve over time. The system then does keep its ability to adapt entirely spontaneously to changing threshold wind conditions, yet it also erodes very rapidly. The following experiments investigate the behaviour of the system in a loose state under the dominant threshold winds in List/Sylt and show a detail study of the transition from individual to linear model dune under changing wind directions.
144 AGGREGATIONS 07 DESIGN APPLICATION
FIGURE 111
FIGURE111 MODULATION OF SIX PILES UNDER A MONO-DIRECTIONAL AIRSTREAM
Six piles of 25 cm diameter each have been exposed to a mono-directional airstream. They quickly form windward and leeward sides, modulating the microclimatic wind field around them.
145 AGGREGATIONS 07 DESIGN APPLICATION



07.04LOOSEPHASE01-THRESHOLDWINDS
EXPERIMENTAL SPECIFICATIONS
AGGREGATE: fine dune sand (0.5 to 1.0 mm)
PILE SIZE: 25 cm
PILE AMOUNT: 6
AIRSTREAM WIDTH: 35 CM
AIRSTREAM DIRECTIONS: dominant wind directions List/Sylt during a year
AIRSTREAM SPEED: 36 km/h
MODELLING PROCESS
A sand bed is prepared and the developed pile configuration is built onto it using a template. The prevailing threshold winds for List on Sylt are adjusted and the configuration is exposed to them. These are: WWN/NW/W/WWN/NW/SSW/SW, starting with the condition in April, which is the beginning of the tourist season. The duration of exposure is adjusted so that a significant morphological response of the configuration to the change in wind direction can be observed and thus varies from step to step. Time lapse records are taken at one second intervals.
OBSERVATIONS
The initial pile configuration responds to the impact of the airstream through forming windward slopes and lee faces. The model dunes stay relatively distinct from each other as long as the air impact comes from similar directions, which is the northwest during summer months. Only as the direction changes more radically do they start to become linear, which corresponds to observations found in Bagnold’s research (Source: Bagnold, 1954), which describes the change from crescentic to linear dunes under changing wind directions. The entire configuration erodes very quickly. One cycle of modelling is enough to wear it off. This might however take longer in a one to one setting as sand gets collected on the slip faces of the dunes, which is hard to model in a laboratory due to saltation lengths not scaling down.
FIGURE112 MODULATION OF SIX PILES UNDER A MULTI-DIRECTIONAL AIRSTREAM
Six piles of 25 cm diameter each are exposed to typical threshold winds happening in List/Sylt/ Germany. Initially they stay distinct, but after several directional changes they form linear arrangements. The images are indexed with the wind direction impacting on them. N is for north, W for west, E for east and S for south or combinations of these basic directions are made.
146 AGGREGATIONS 07 DESIGN APPLICATION
FIGURE 112
WWNWWNNW NWWW WWNWWNNW NWSSWSSW


07.04LOOSEPHASE02-DETAILSTUDY
AGGREGATE: fine dune sand (0.5 to 1.0 mm)
PILE SIZE: 25 cm
PILE AMOUNT: 6
AIRSTREAM WIDTH: 35 CM
AIRSTREAM DIRECTIONS: west (0 degr) changing to west/west north (22.5 degr)
AIRSTREAM SPEED: 36 km/h
MODELING PROCESS
A sand bed is prepared and the developed pile configuration is built onto it using a template. The wind direction is changed from 0 degrees to 22.5 degrees, which is the transition experienced from July to August. The duration of exposure is adjusted so that a significant morphological response of the configuration to the change in wind direction can be observed and thus varies one step to the other. Time lapse records are taken at one second intervals.
OBSERVATIONS
This detail study allows the observation of the gradual formation of linear dunes. Initially the pile configuration responds to the impact of the airstream through forming windward slopes and lee faces. The model dunes stay relatively distinct from each other as long as the air impact comes from one direction. Only as the direction changes do they gradually start to become linear, which corresponds to observations found in Bagnold’s research (Source: Bagnold, 1954), which describes the change from crescentic to linear dunes under changing wind directions. This is still a very subtle change in wind directions, so a more pronounced effect can be expected if the directional change in wind angle is bigger.

FIGURE113
DETAIL OF SIX PILES UNDER A TWO-DIRECTIONAL AIRSTREAM
Six piles of 25 cm diameter each are exposed to a two-directional wind. The study shows the gradual transition from distinct crests to linear model dunes. The images are indexed with the wind direction impacting on them. N is for north, W for west, E for east and S for south or combinations of these basic directions are made.
147 AGGREGATIONS 07 DESIGN APPLICATION
FIGURE 113
WWNNWNW NWNWNW NWNWNW NWNWNW
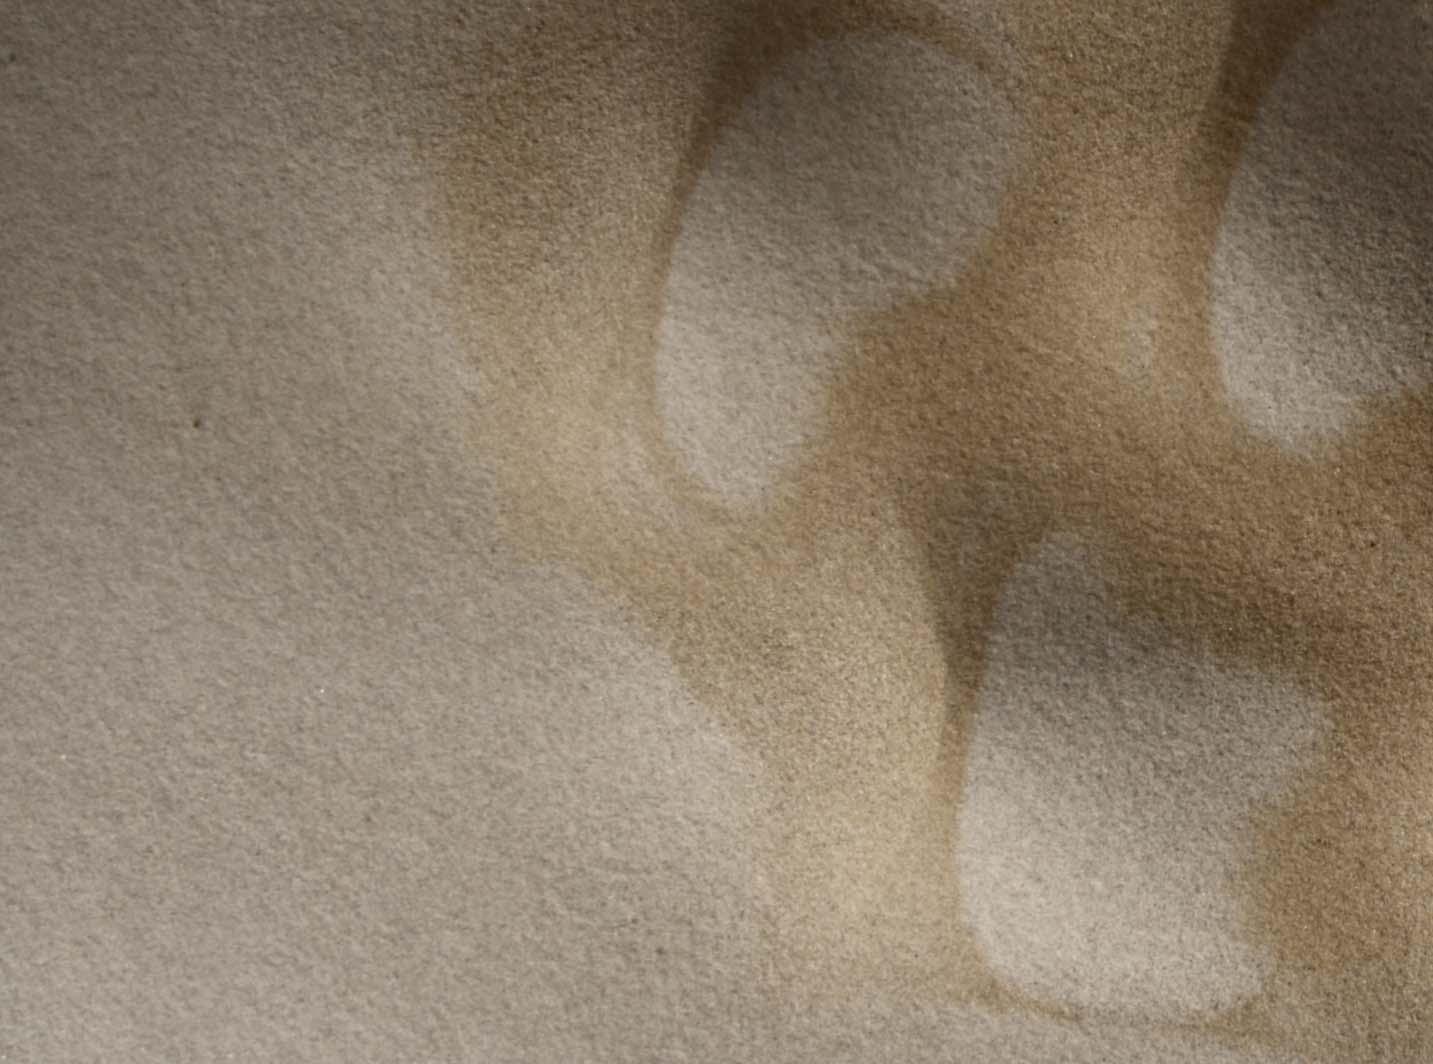
07.04WINDSHADOW
The second set of experiments focuses on the formation of wind-protected areas that can become resting zones for visiting tourists. As has been seen in the development of the design, a simple sand pile if exposed to an airflow takes on the morphology of a dune, showing a windward side and a lee face of wind protected areas. This basic qualitative effect can in principle be transferred across scales however empirical study needs to be done to establish exact quantitative measurements of the parameters involved. The proposed system is based on this effect. The piles are formed and exposed to winds or an airstream and their formation is being observed. Sand of two colours is being used to mark the effect of wind impact and show a clear distribution of the emerging wind-protected areas. The configuration of six piles of varying distances is thus exposed to wind directions typically occurring throughout the year on the island. The marker sand is being applied after each stage to study the distribution of wind-protected areas after a change in threshold winds. The sand dynamically adapts to this change in wind direction and through the marker sand it can be seen that also the wind-protected zones respond to dynamically changing threshold conditions. The system thus responds to changing environmental wind impacts, constantly adapting its performance with regards to potential human inhabitation.
148 AGGREGATIONS 07 DESIGN APPLICATION
FIGURE 114
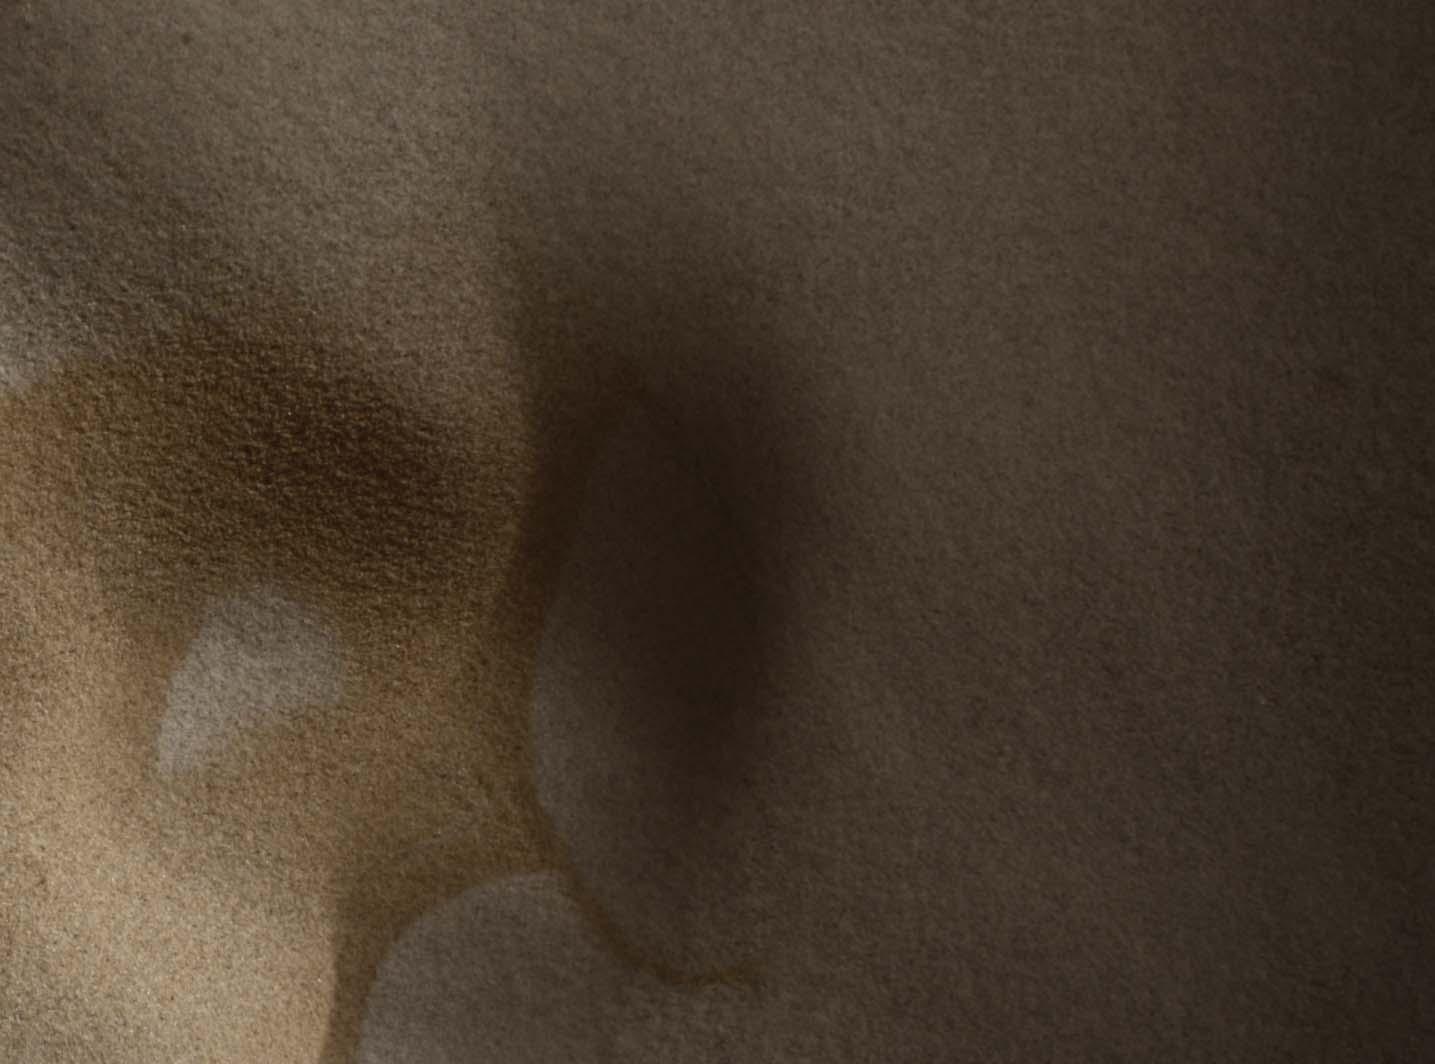
The close-up view shows a blown-out sand pile formation having undergone exposure from four different wind directions. The system has undergone constant re-arrangement always keeping its basic quality of forming a windward slope and a lee-face that offers wind protection.
149 AGGREGATIONS 07 DESIGN APPLICATION
FIGURE114 CLOSEUP VIEW OF SAND MODULATION AND WIND SHADOW AREAS

07.04WINDSHADOW
EXPERIMENTAL SPECIFICATIONS
MAIN AGGREGATE: fine dune sand (0.5 to 1.0 mm)
MARKER AGGREGATE: ochre coloured sand (0.5 to 1.0 mm)
PILE SIZE: 25 cm
PILE AMOUNT: 6
AIRSTREAM WIDTH: 35 CM
AIRSTREAM DIRECTIONS: dominant wind directions List/Sylt during a year
AIRSTREAM SPEED: 36 km/h
MODELLING PROCESS
A sand bed is prepared and the developed pile configuration is built onto it using a template. The prevailing threshold winds for List on Sylt are adjusted and the configuration is exposed to them. These are: WWN/NW/W/WWN/NW/SSW/SW, starting with the condition in April, which is the beginning of the tourist season. The duration of exposure is adjusted so that a significant morphological response of the configuration to the change in wind direction can be observed and thus varies from step to step. Before each change in wind direction the configuration is covered in ochre coloured marker sand. Time lapse records are taken at one second intervals.
OBSERVATIONS
This setup allows to study how wind protected areas, marked by the darker coloured sand adapt to changing threshold winds. The initial pile configuration responds to the impact of the airstream through forming windward slopes and lee faces. The model dunes stay relatively distinct from each other as long as the air impact comes from similar directions, which is the northwest during summer months. Only as the direction changes more radically do they start to become linear. The entire configuration erodes very quickly. Throughout this process, there are always wind protected areas, which respond to a change in wind direction. These become areas of potential inhabitation for beach visitors.

150 AGGREGATIONS 07 DESIGN APPLICATION
115
FIGURE
WWNWWNWWN WWNWWNNW NWNWW WWW



FIGURE115 SEQUENCE OF SAND MODULATION AND WIND SHADOW AREAS
The sequence shows a group of six piles under the typically occurring threshold winds for List/ Germany. Dark marker sand is used to show area of wind-protection. These zones are thought to be areas of human inhabitation. They are adapting to changing threshold conditions. The images are indexed with the wind direction impacting on them. N is for north, W for west, E for east and S for south or combinations of these basic directions are made.
151 AGGREGATIONS 07 DESIGN APPLICATION
WWNWWNWWN NWNWNW SSWSSWSSW SWSWSW

07.04SOLIDIFIEDPHASE
The last set of experiments tests the potential for solidified zones within the loose sand bed. The additive method of applying a dry cement sand mix developed in chapter 06 is being used in order to solidify some of the newly forming dunes. The behaviour of the loose aggregate phase is observed and different solidification methods, cement and plain water, are being tested. These methods can be used to for example prepare a specific wind modulation of the environment during times when the beach is less visited. In this case, the wind modulation for west/west north directions has been modulated and solidified, which is the mainly occurring wind direction during the highly populated month of July. April months show similar wind directions and can be used as a construction period. Under an impacting multi-directional airstream, the loose aggregate phases still adapt dynamically to changing threshold winds, whereas the solidified modulations remain still, only eroding on the edges under extreme changes in wind direction. The system now allows to combine a solid and more permanent, yet less adaptable phase with a loose, adaptable but highly erosive phase.
152 AGGREGATIONS 07 DESIGN APPLICATION
FIGURE 116
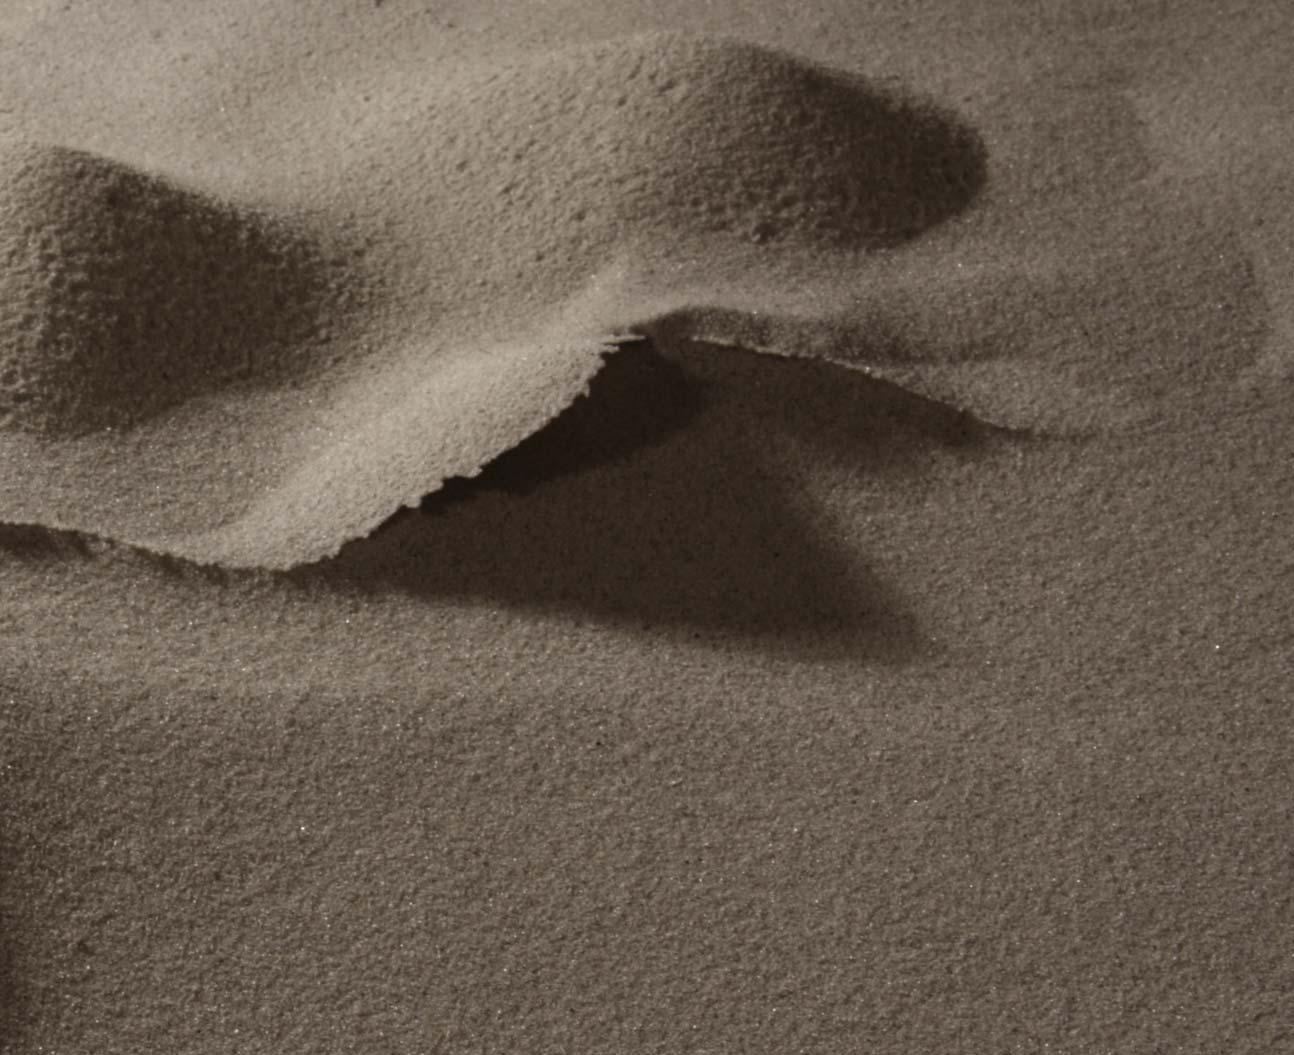
FIGURE116
PERSPECTIVE VIEW OF A SOLIDIFIED PHASE ON A LIQUID SAND BED
The solid phase has been introduced after mono-directional winds from west-west north. The aggregation is subsequently being exposed to typically occurring winds ranging from North West to South-South west. The liquid parts spontaneously adapt to threshold winds and erode over the cycle, whereas the solidified parts remain.
153 AGGREGATIONS 07 DESIGN APPLICATION


07.04SOLIDIFIEDPHASE01-CEMENT
EXPERIMENTAL SPECIFICATIONS
MAIN AGGREGATE: fine dune sand (0.5 to 1.0 mm)
PILE SIZE: 25 cm
PILE AMOUNT: 6
PHASE CHANGE MATERIAL: white cement fondu and fine dune sand
AMOUNT: 1 units cement to 3 units sand
CURING METHOD: water mist
AIRSTREAM WIDTH: 35 CM
AIRSTREAM DIRECTIONS: dominant wind directions List/Sylt during a year
AIRSTREAM SPEED: 36 km/h
MODELLING PROCESS
As in the previous experiments, a sand bed is prepared and the developed pile configuration is built onto it using a template. The prevailing threshold winds for List on Sylt are adjusted and the configuration is exposed to them. These are: WWN/NW/ W/WWN/NW/SSW/SW, starting with the condition in April, which is the beginning of the tourist season. The duration of exposure is adjusted so that a significant morphological response of the configuration to the change in wind direction can be observed and thus varies from step to step. This time however, three piles are covered in a dry sand cement mix and sprayed with water after the initial impacting airstream direction from west/west north. They are left to cure for two days and subsequently the experiment is completed by going through the entire cycle of threshold winds occurring in List/Sylt over year. Time lapse records are taken throughout the experiment at one second intervals.
OBSERVATIONS
This experiment is designed to investigate the behaviour of a solidified phase in the dune field in combination with a loose one. The solidification is consciously chosen after the first impacting airstream from west/west north, as this is also the mainly occurring one during July, which is the month with highest numbers of visitors. Areas
of the modulation can thus be prepared for the mainly occurring threshold winds during busy months, whereas others are left to respond spontaneously to changing threshold winds. In this case however the loose aggregate modulations erode very quickly, leaving almost only the solidified ones remaining.
After an initial impacting air-stream, a dry cement-sand mix is applied using the additive method developed in chapter 06. The cement-sand mix is prayed with water and left to cure under hydration for one day. After two days, the modulation is exposed to the threshold winds typical of List/Sylt throughout a year. The images are indexed with the wind direction impacting on them. N is for north, W for west, E for east and S for south or combinations of these basic directions are made.
154 AGGREGATIONS 07 DESIGN APPLICATION
117
FIGURE
FIGURE117 SEQUENTIAL VIEW OF A COMBINED LOOSE AND SOLID PHASE
NWNWW WWWNWWN NWNWSSW SSWSWSW
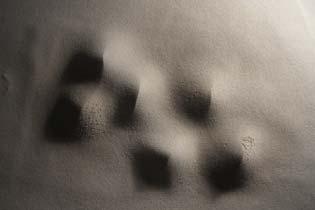
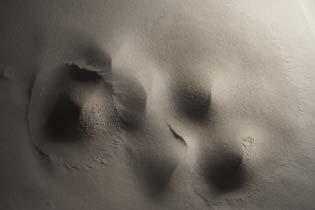
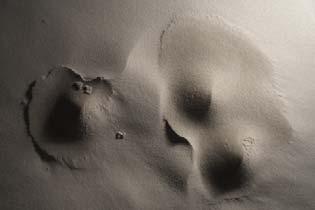
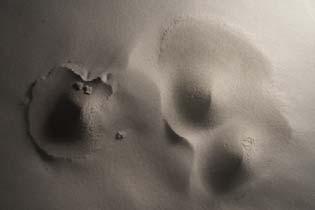


07.04SOLIDIFIEDPHASE02-WATER
EXPERIMENTAL SPECIFICATIONS
MAIN AGGREGATE: fine dune sand (0.5 to 1.0 mm)
PILE SIZE: 25 cm
PILE AMOUNT: 6
AMOUNT: 1 units cement to 3 units sand
BINDING METHOD: water mist
AIRSTREAM WIDTH: 35 CM
AIRSTREAM DIRECTIONS: dominant wind directions List/Sylt during a year
AIRSTREAM SPEED: 36 km/h
MODELLING PROCESS
Again a sand bed is prepared and the developed pile configuration is built onto it using a template. The prevailing threshold winds for List on Sylt are adjusted and the configuration is exposed to them. These are: WWN/NW/W/WWN/NW/SSW/SW, starting with the condition in April, which is the beginning of the tourist season. The duration of exposure is adjusted so that a significant morphological response of the configuration to the change in wind direction can be observed and thus varies from step to step. This time three piles are sprayed with water after the initial impacting airstream direction from west/west north. Subsequently the experiment is completed by going through the entire cycle of threshold winds occurring in List/Sylt over year. Time lapse records are taken throughout the experiment at one second intervals.
OBSERVATIONS
This experiment is designed to more quickly than it is possible with cement investigate the behaviour of a solidified phase in the dune field in combination with a loose one. The solidification is consciously chosen after the first impacting airstream from west/west north, as this is also the mainly occurring one during July, which is the month with highest numbers of visitors. Areas of the modulation can thus be prepared for the main occurring threshold winds during busy months, whereas others are left to respond spontaneously to changing threshold winds. In this case however


the loose aggregate modulations remain and form an adaptive modulation together with the solidified one. The field now combines a stable condition that performs under one specific wind direction and an adaptive eroding one that responds to changes in threshold conditions. After a strong change in direction as it occurs from summer to winter, the solidified phase gets lifted off and is crumbled by the impacting airstream on the edges.
The aggregation is exposed to wind-directions typically occurring throughout the year. These are mainly westerly, in the summer North West directions prevail, in the winter southwest. After an initial impacting air-stream, part of the modulation is solidified with water. Subsequently the modulation is again exposed to multi-directional airflow. The images are indexed with the wind direction impacting on them. N is for north, W for west, E for east and S for south or combinations of these basic directions are made.
155 AGGREGATIONS 07 DESIGN APPLICATION
118
FIGURE
FIGURE118 SEQUENTIAL VIEW OF A COMBINED LOOSE AND SOLID PHASE
WWNNWNW WWWWN WWNNWWNW WSSWSSWSW
07.05DESIGNAPPLICATION-CONCLUSION
In order to test the implication of a specific geomorphodynamic microclimate, a site has been chosen on the island of Sylt in Germany. After an analysis of the morphology and dynamics appearing on site, a proposal has been made for an artificial dune-belt that on the one hand protects new dunes from strong impacting wind and on the other hand offers wind-protection for beach visitors. A basic configuration has been tested in terms of its behaviour in a loose state, its adaptive capacity under changing wind impact and its potential to integrate loose and solid phases. The system developed so far allowed to study material behaviours with regards to these topics, yet considerations on its roughness values remained on a speculative level. Further empirical models thus need to be developed to make reliable statements with regards to the artificial dunes reducing wind speeds.
FIGURE119
TOP VIEW OF A COMBINED LOOSE AND SOLID PHASE
The aggregation is exposed to wind-directions typically occurring throughout the year. These are mainly westerly, in the summer North West directions prevail, in the winter southwest. After an initial impacting wind, part of the modulation is solidified with water. Subsequently the modulation is again exposed to multi-directional airstreams.
156 AGGREGATIONS 07 DESIGN APPLICATION
FIGURE 119
P158
P159
08EVALUATION

08EVALUATION
According to the onsite and laboratory experiments conducted, the use of natural aggregates to actuate semi-natural morphologies seems possible. Further research needs to be conducted with regards to the methods applied, especially empirical roughness studies and experiments investigating the possibility of scaling these models. With regards to the hypotheses stated in Chapter 04, the following evaluation can be made.
(01) GEOLOGICAL AND ARCHITECTURAL EFFECT
As the aggregate processes observed are very closely related to climatic data, these microenvironments do have an effect both on a geological and an architectural scale, given architectural interventions can on one level be defined as climatic modulations, in this case wind shadows. In the context of this research, the architectural relevance has been consciously kept at a modest scale, namely that of a beach modulation for visiting guest mainly during the summer months. As research in this field progresses, one might also raise more complex architectural issues, such as the relationship of urban settlements and their underlying geomorphodynamic processes. The geological effect has in this case been indicated as wind reduction through surface roughness. However, experimental techniques for this investigation still need to be developed. It seems that geological effects especially need to be studied on a one to one scale in order to allow to at least indicate possible effects.
(02) SOLIDIFIED AND LIQUID PHASE AS COMBINED
So far it has been possible to partly solidify the liquid aggregate system and to combine both a very thin solidified and a liquid aggregate phase. The result was that the solidified phase kept its morphology, yet did not adapt to changing threshold conditions, whereas the liquid phase adapted yet eroded very quickly. This effect allows to combine different degrees of permanence and different degrees of adaptability within the system. The interrelated effect between the two phases needs to be studied more closely. Cement as a solidifying agent might be replaced by more environmentally compatible materials such as lime mortar or even water as a temporary binding agent.
(03) CONTINUOUS CYCLE OF CONSTRUCTION
As these microenvironments are modulated within a dynamic climatic environment and as they are loose in large parts, their arrangement changes continuously, adapting to changing climatic conditions, such as wind directions. Sedimentary environments usually show cycles of accretion, sedimentation and erosion. So far only sedimentation and erosion have been modeled. Accretion in a dune happens through sand collection on the leeward side, which was slightly visible in the onsite experiments. In laboratory models saltation lengths are too long to study this effect. Yet on a one to one scale, the artificial dunes might be self-nurturing through the sand that is eroded on the windward side being accreted on the lee-face.
(04) USE OF ONSITE MATERIAL AND CONSTRUCTION ENERGIES
As almost only onsite material is used in the form of sand, which is only being rearranged, the only energy input the structures need is the initial piling up of sand. If parts need to be solidified, cement or another binder needs to be brought to the site, but sets mainly under rainfall or air humidity. This binding process can be replaced by a temporary solidification through water, which again is available on site.
160 FIGURE 120 AGGREGATIONS 08 EVALUATION

FIGURE120 MODULATION OF SAND UNDER TWO-DIRECTIONAL AIR IMPACT
This close-up view shows the transition from singular to linear dunes after the impact of a two-directional airstream. Whereas under a mono-directional one the crests stay distinct, they become linear as a second direction starts to modulate them.
161 AGGREGATIONS 08 EVALUATION
P162
P163 09OUTLOOK
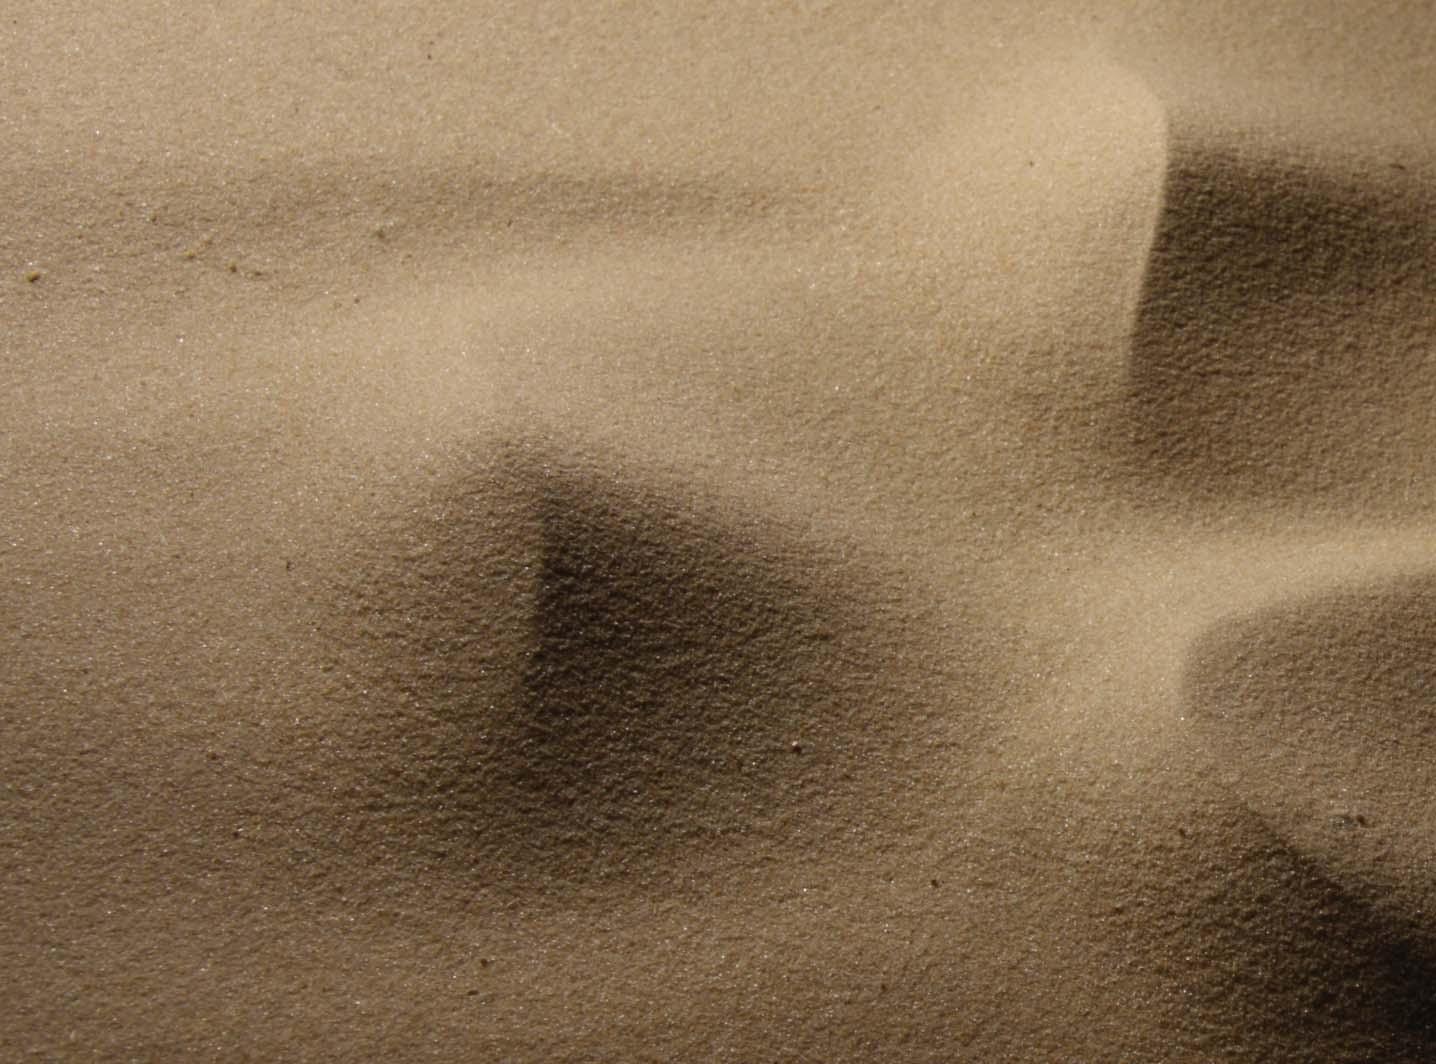
09OUTLOOK
Other sedimentary environments might be thought of that can be equally used to establish designed systems emerging from them. Some possible strategies on a formative and on a granular scale have been introduced in chapter 06.02. Any research investigating this field will need to achieve a close understanding of the dynamics at hand and their potential performative qualities with regards to an architectural application. Performance on the other hand might then be understood not to be only climatic but also structural or spatial. Great potential lies for example in the use of granular systems in seismic environments, as has been indicated and tested in vibration experiments. Even other geological systems might be deployed in the same way. This would entail the study of a different set of material systems, such as ice formation in glaciers. Research in this field would fall into the wider paradigm of geomimetics that deploys geological processes in general for design purposes. However, the research conducted so far has shown that any project undertaken in this field will have to closely redefine what is understood as architectural performance. It will start to question what we perceive as architectural and what as natural and aim at a close relation between the two. Natural geological processes then no longer are seen as a potential threat of architectural structures and systems, but as their actuator. Research in this area will also need to be understanding of the cyclical nature of these natural formative processes and to respond to them accordingly. Cycles, be they climatic or geological, can be researched and predicted only to a certain degree. These predictions can help to indicate possible events, but never to fully foresee them. Empirical study then is the main methodology to be undertaken in this regard, as effects are often yet unknown or unexpected and can have results across varying scale ranges. Systems coming from this research will in this sense be continuously emerging both with respect to their construction and their performative capacities.
164 AGGREGATIONS 09 OUTLOOK
FIGURE 121
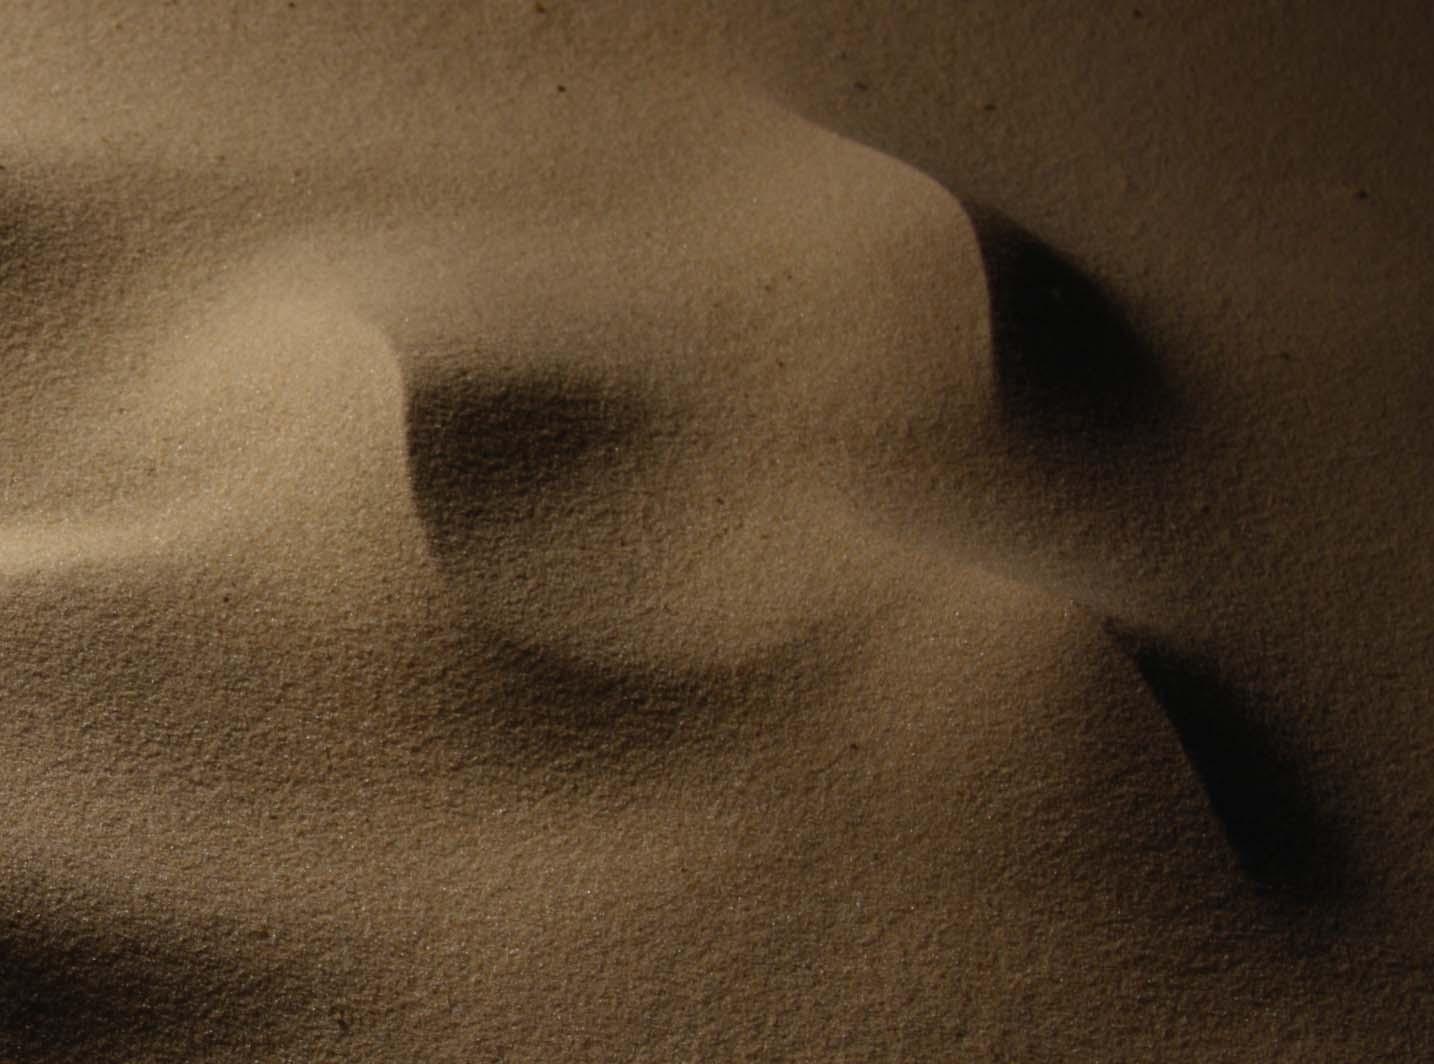
FIGURE121 MODULATION OF SAND UNDER MONO-DIRECTIONAL AIR IMPACT
Close-up view of six sand piles having been exposed to mono-directional winds. After winds from one direction, the windward side and the lee-face are most clearly formed. After the exposure to several directions, piles tend to merge and form linear arrangements.
165 AGGREGATIONS 09 OUTLOOK
P166
10APPENDIX
10.01 SOLIDIFICATION METHODS 10.02 SAMPLE FORMATIVE METHOD 10.03 AGGREGATES UNDER VIBRATION
P167
P168
10.01SOLIDIFICATIONMETHODS
P169


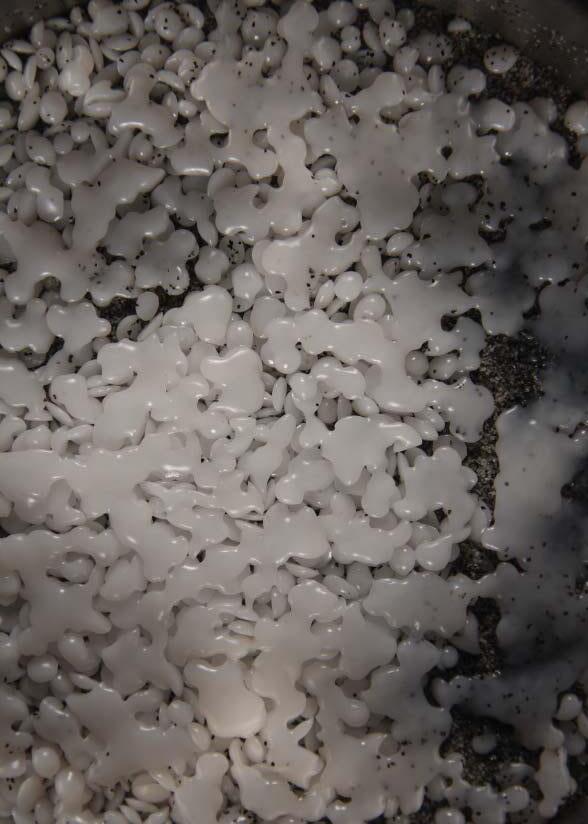

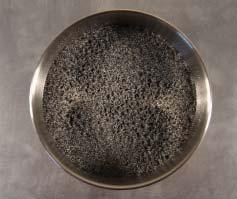
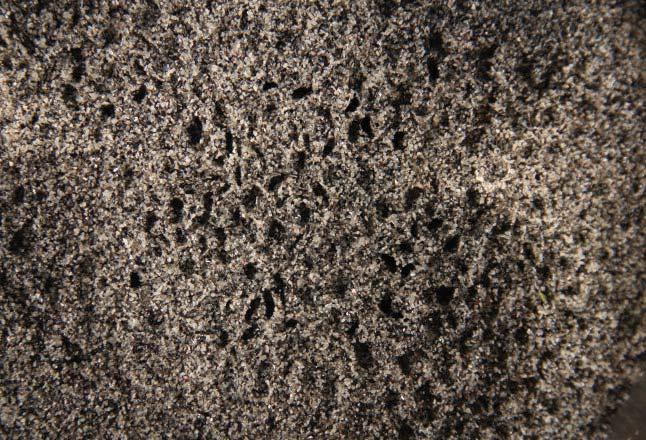
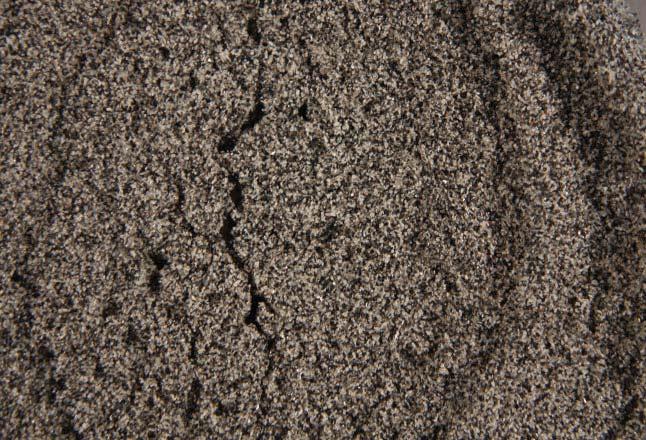
10.01WAXSOLIDIFICATION01
MOULD AGGREGATE: Grey Granite Ballast
AMOUNT: 500 ml
PHASE CHANGE MATERIAL: Microcristalline White Wax Pellets
AMOUNT: 50 ml
CURING METHOD: Heat
CURING TIME: 250 degrees for 10 to 15 minutes then ½ h cooling off
MODELING PROCESS
The metal mould is sprayed with mould release agent. The mould aggregate is filled into the mould and the wax pellets are placed on top. The entire metal mould is placed in the oven and heated up at 250 degrees. Records of the melting process are taken at 2 minute intervals. Subsequently the entire mould is left to cool, the top layer which has solidified is removed and the sand mould is recycled.
OBSERVATIONS
The pellets melt quickly, forming a liquid layer that sinks into the sand. One can stop this process at any time and achieve a semi-molten wax configuration. The resultant cast breaks very easily and shows a very irregular lower surface as well as pellet indentations on the top.
FIGURE122 SEQUENCE OF CAST
The sequence shows the process of casting. (01)The wax pellets are distributed on the mould aggregate. (02) The cast begins to melt after 2 minutes (03) A liquid wax layer has formed on the sand after 6 minutes. (04) The cast is almost completely molten after 8 minutes. (05) The wax has completely molten and bound with the sand.
FIGURE123 DETAIL VIEW OF MELTING WAX ON SAND
The pellets have begun to melt after 2 minutes and form a liquid layer on top of the sand.
FIGURE124 TOP VIEW OF CAST
The top cast is rough showing small indentations from the wax pellets.
FIGURE125 BOTTOM VIEW OF CAST
The bottom cast is irregular with indentations and shows pronounced ridges on the edges. Cracks are visible across the cast.
170 AGGREGATIONS 10 APPENDIX FIGURE 122 0102030405
FIGURE 123
FIGURE 124
FIGURE 125
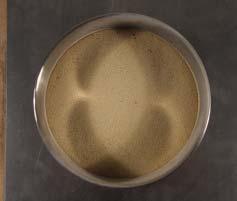


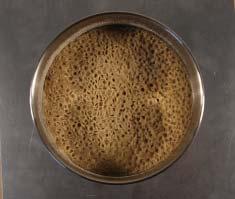

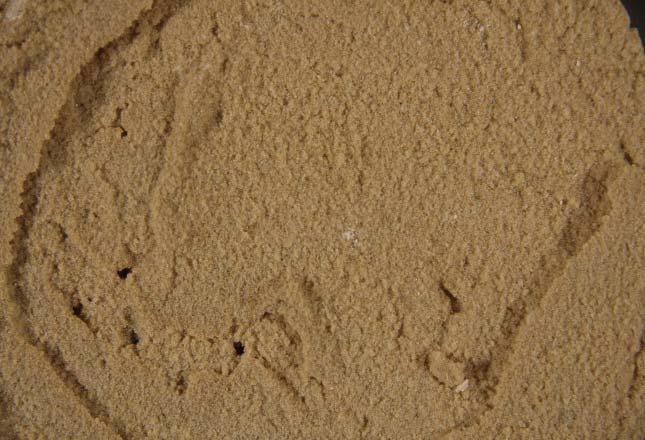
10.01WAXSOLIDIFICATION02
MOULD AGGREGATE: Kiln Dried Silver Sand
AMOUNT: 500 ml
PHASE CHANGE MATERIAL: Microcristalline White Wax Pellets
AMOUNT: 50 ml
CURING METHOD: Heat
CURING TIME: 250 degrees for 10 to 15 minutes then ½ h cooling off
MODELING PROCESS
The metal mould is sprayed with mould release agent. The mould aggregate is filled into the mould and the wax pellets are placed on top. The entire metal mould is placed in the oven and heated up at 250 degrees. Records of the melting process are taken at 2 minute intervals. Subsequently the entire mould is left to cool, the top layer which has solidified is removed and the sand mould is recycled.
OBSERVATIONS
The pellets melt quickly, forming a liquid layer that sinks into the sand. One can stop this process at any time and achieve a semi-molten wax configuration. The resultant cast breaks very easily and shows a very irregular lower surface as well as pellet indentations on the top. Grey Granite Ballast and Silver Sand behave in an almost identical way.
FIGURE126
SEQUENCE OF CAST
The sequence shows the process of casting. (01) The mould aggregate is placed into a metal mould. (02) The wax pellets are distributed on the mould aggregate. (03) The cast begins to melt after 2 minutes (04) The cast is almost completely molten after 8 minutes. (05) The wax has completely molten and bound with the sand.
FIGURE127
DETAIL VIEW OF MELTING WAX ON SAND
The pellets have begun to melt after 2 minutes and form a liquid layer on top of the sand.
FIGURE128
TOP VIEW OF CAST
The top cast is rough showing small indentations from the wax pellets.
FIGURE129
BOTTOM VIEW OF CAST
The bottom cast is irregular with indentations and shows pronounced ridges on the edges.
171 AGGREGATIONS 10 APPENDIX FIGURE 126 0102030405
FIGURE 127
FIGURE 128
FIGURE 129
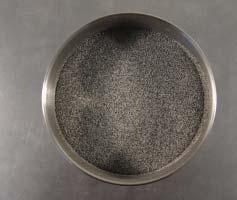
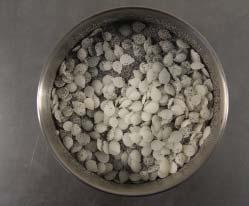
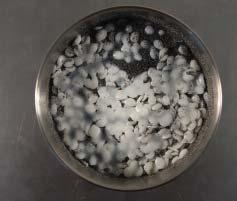
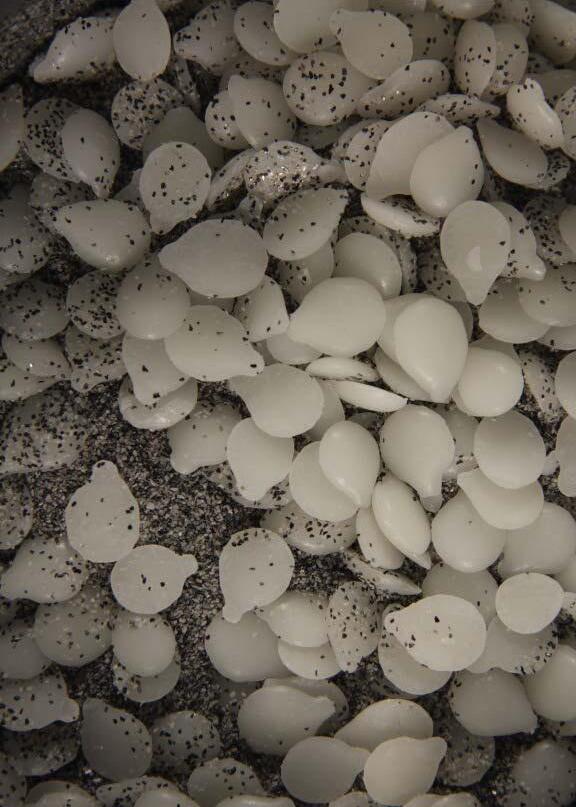
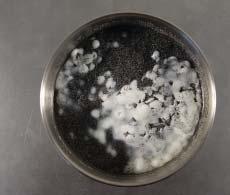
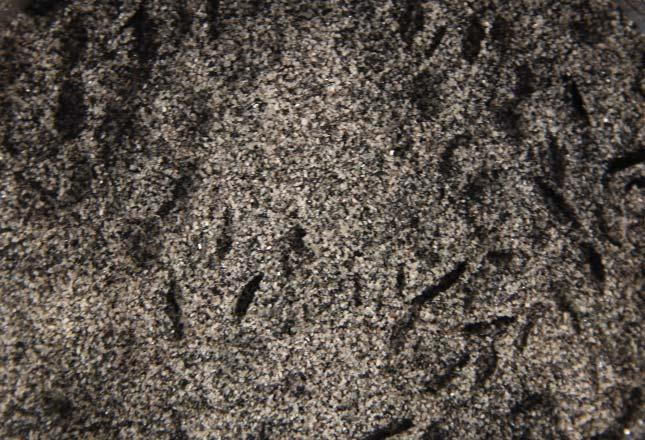
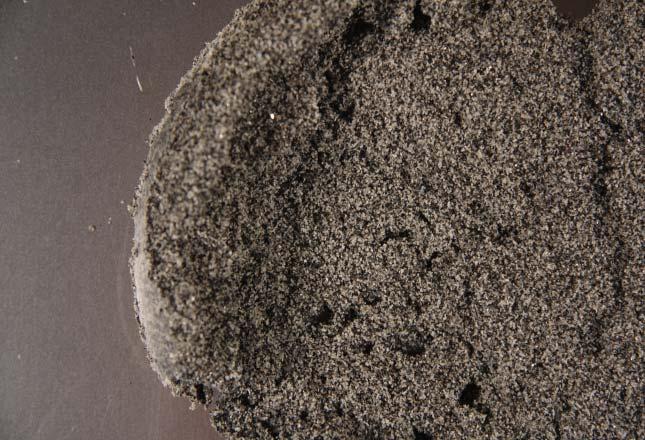
10.01WAXSOLIDIFICATION03
MOULD AGGREGATE: Grey Granite Ballast
AMOUNT: 500 ml
PHASE CHANGE MATERIAL: Beeswax Pellets
AMOUNT: 50 ml
CURING METHOD: Heat
CURING TIME: 250 degrees for 10 to 15 minutes then ½ h cooling off
MODELING PROCESS
The metal mould is sprayed with mould release agent. The mould aggregate is filled into the mould and the wax pellets are placed on top. The entire metal mould is placed in the oven and heated up at 250 degrees. Records of the melting process are taken at 2 minute intervals. Subsequently the entire mould is left to cool, the top layer which has solidified is removed and the sand mould is recycled.
OBSERVATIONS
The pellets melt quickly, forming a liquid layer that sinks into the sand. One can stop this process at any time and achieve a semi-molten wax configuration. The resultant cast breaks even more easily and shows a very irregular lower surface as well as large pellet indentations on the top. Grey Granite Ballast and Silver Sand behave in an almost identical way.
FIGURE130
SEQUENCE OF CAST
The sequence shows the process of casting. (01) The mould aggregate is placed into a metal mould. (02) The wax pellets are distributed on the mould aggregate. (03) The cast begins to melt after 2 minutes (04) The cast is almost completely molten after 8 minutes. (05) The wax has completely molten and bound with the sand.
FIGURE131
DETAIL VIEW OF THE LOOSE WAX PELLETS ON SAND
The pellets are placed on the base aggregate before melting.
FIGURE132
TOP VIEW OF CAST
The top cast is rough showing indentations from the wax pellets.
FIGURE133
BOTTOM VIEW OF CAST
The bottom cast is irregular and shows pronounced ridges on the edges.
172 AGGREGATIONS 10 APPENDIX FIGURE 130 0102030405
FIGURE 131
FIGURE 132
FIGURE 133


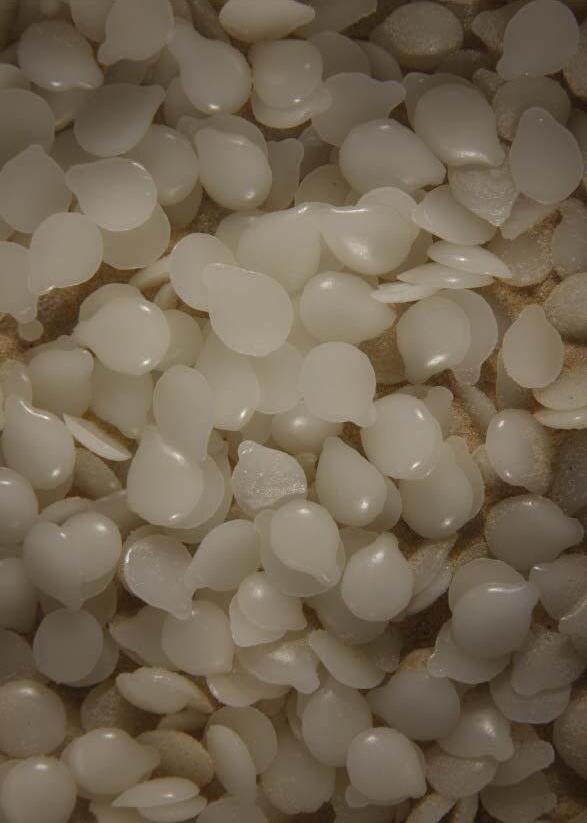
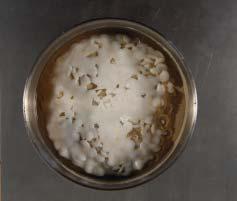
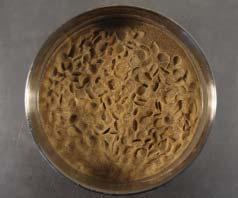
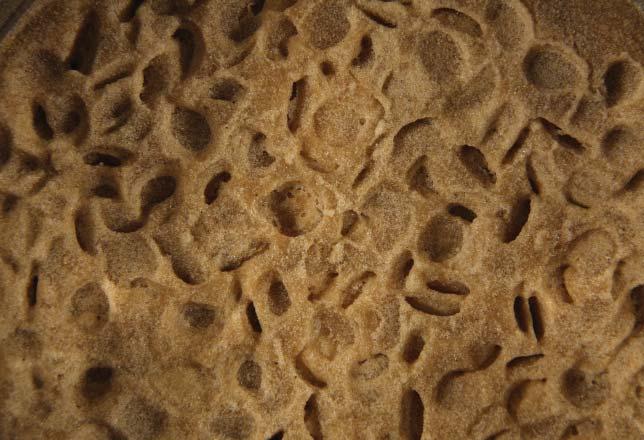
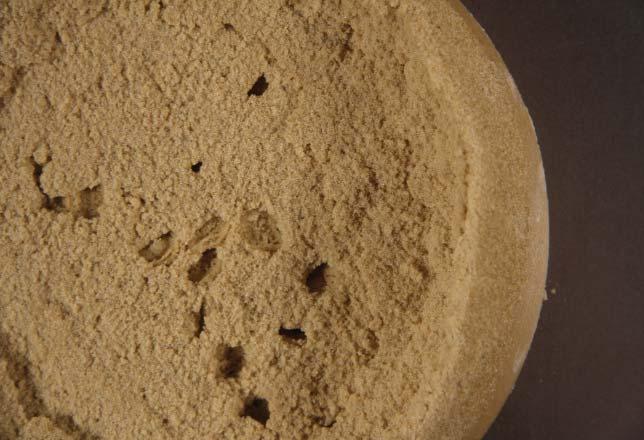
10.01WAXSOLIDIFICATION04
MOULD AGGREGATE: Kiln Dried Silver Sand
AMOUNT: 500 ml
PHASE CHANGE MATERIAL: Beeswax Pellets
AMOUNT: 50 ml
CURING METHOD: Heat
CURING TIME: 250 degrees for 10 to 15 minutes then ½ h cooling off
MODELING PROCESS
The metal mould is sprayed with mould release agent. The mould aggregate is filled into the mould and the wax pellets are placed on top. The entire metal mould is placed in the oven and heated up at 250 degrees. Records of the melting process are taken at 2 minute intervals. Subsequently the entire mould is left to cool, the top layer which has solidified is removed and the sand mould is recycled.
OBSERVATIONS
The pellets melt quickly, forming a liquid layer that sinks into the sand. One can stop this process at any time and achieve a semi-molten wax configuration. The resultant cast breaks even more easily and shows a very irregular lower surface as well as large pellet indentations on the top. Grey Granite Ballast and Silver Sand behave in an almost identical way.
FIGURE134
SEQUENCE OF CAST
The sequence shows the process of casting. (01) The mould aggregate is placed into a metal mould. (02) The wax pellets are distributed on the mould aggregate. (03) The cast begins to melt after 2 minutes (04) The cast is molten after 6 minutes. (05) The wax has completely molten and bound with the sand.
FIGURE135
DETAIL VIEW OF THE LOOSE WAX PELLETS ON SAND
The pellets are placed on the base aggregate before melting.
FIGURE136
TOP VIEW OF CAST
The top cast is rough showing indentations from the wax pellets.
FIGURE137
BOTTOM VIEW OF CAST
The bottom cast is irregular with indentations and shows pronounced ridges on the edges.
173 AGGREGATIONS 10 APPENDIX FIGURE 134 0102030405
FIGURE 135
FIGURE 136
FIGURE 137


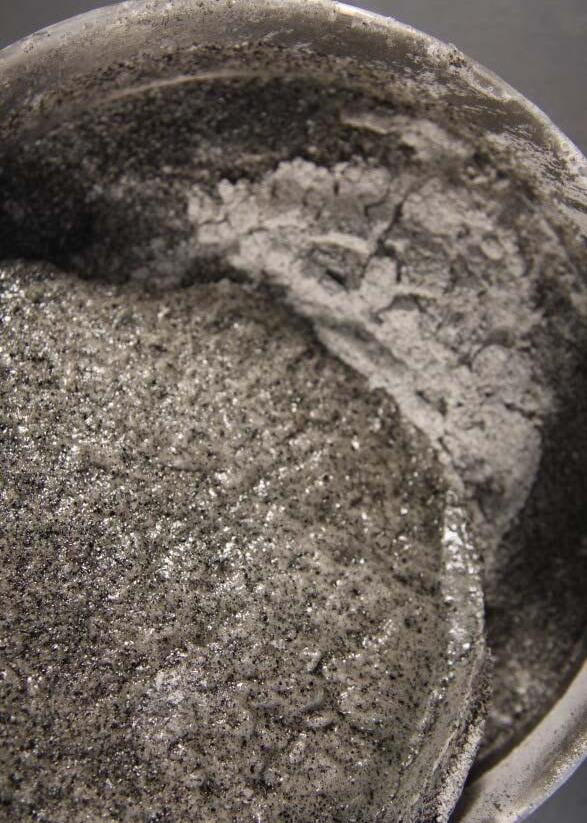

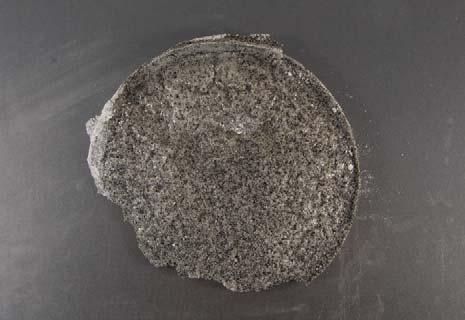
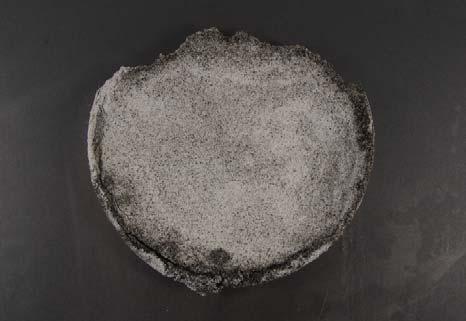
10.01RESINSOLIDIFICATION01
EXPERIMENTAL SPECIFICATIONS
MOULD AGGREGATE: Grey Granite Ballast
AMOUNT: 500 ml
PHASE CHANGE MATERIAL: Jesmonite
AMOUNT: 170 ml powder: 70 ml liquid: 200 ml aggregate
CURING METHOD: Air
CURING TIME: 1 to 2 hours
MODELLING PROCESS
The base aggregate is placed into the metal mould. The powder component of Jesmonite is sieved onto the base layer using a sieve. The liquid component of Jesmonite is sprayed onto the cast. It is left to cure for up to two hours.
OBSERVATIONS
The cast comes off the bed easily. It models the shape of the base aggregate rather accurately. The top surface is smooth in texture, the bottom matte showing remains of the powder Jesmonite component.
FIGURE138 SEQUENCE OF CAST
The sequence shows the process of casting. (01) The powder and the liquid component of Jesmonite are prepared. (02) The mould aggregate is placed into the base mould. (03) The powder phase is filtered onto the base mould. (04) The cast is sprayed with the liquid Jesmonite phase. (05) The cast is left to cure for two hours.
FIGURE139 DETAIL VIEW OF CAST
The cast comes off the sand bed easily.
FIGURE140 TOP VIEW OF CAST
The top cast is smooth and slightly textures by drip marks.
FIGURE141 BOTTOM VIEW OF CAST
The bottom cast is matte, the mould has been modelled quite accurately.
174 AGGREGATIONS 10 APPENDIX FIGURE 138 0102030405
FIGURE 139
FIGURE 140
FIGURE 141


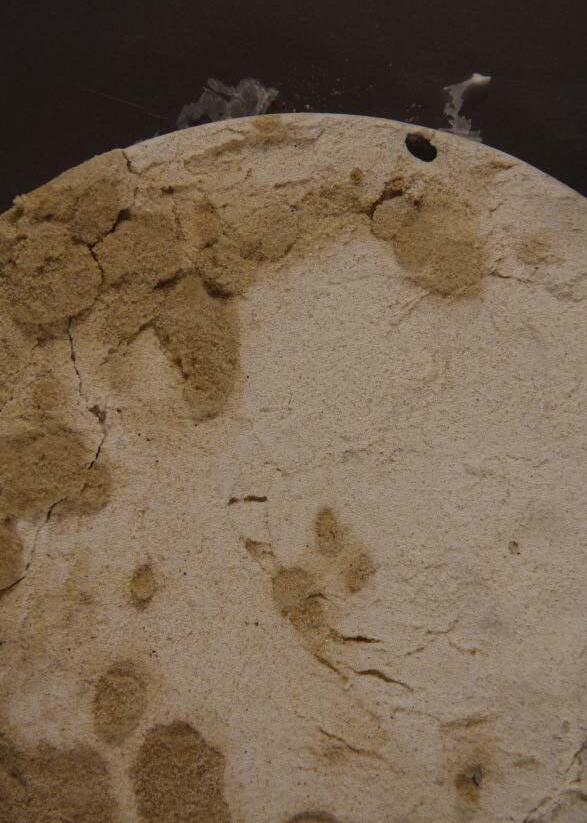

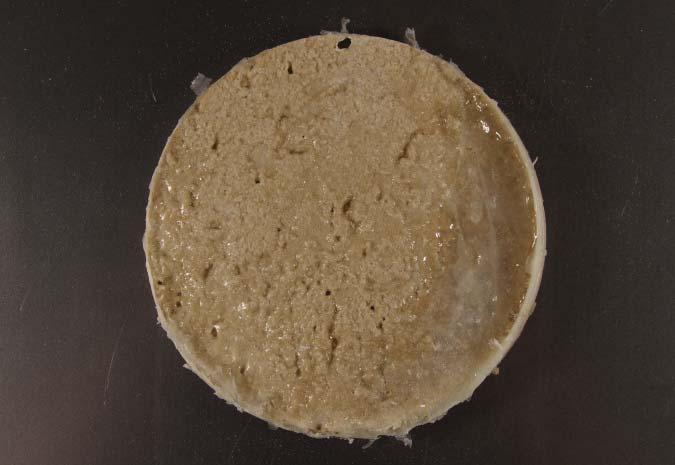

10.01RESINSOLIDIFICATION02
EXPERIMENTAL SPECIFICATIONS
MOULD AGGREGATE: Kiln Dried Silver Sand
AMOUNT: 500 ml
PHASE CHANGE MATERIAL: Jesmonite
AMOUNT: 170 ml powder: 70 ml liquid: 200 ml aggregate
CURING METHOD: Air
CURING TIME: 1 to 2 hours
MODELLING PROCESS
The base aggregate is placed into the metal mould. The powder component of Jesmonite is sieved onto the base layer using a sieve. The liquid component of Jesmonite is sprayed onto the cast. It is left to cure for up to two hours.
OBSERVATIONS
The cast comes off the bed easily. Other than in grey granite ballast sand, the shape of the mould is not modelled very accurately. The top layer is shiny with drip marks the bottom is matte with darker coloured bumps.
FIGURE142 SEQUENCE OF CAST
The sequence shows the process of casting. (01) The powder and the liquid component of Jesmonite are prepared. (02) The mould aggregate is placed into the base mould. (03) The powder phase is filtered onto the base mould. (04) The cast is sprayed with the liquid Jesmonite phase. (05) The cast is left to cure for two hours.
FIGURE143
DETAIL VIEW OF CAST
The bottom cast is very irregular and shows darker coloured bumps.
FIGURE144
TOP VIEW OF CAST
The top cast is shiny and textures by drop marks.
FIGURE145
BOTTOM VIEW OF CAST
The bottom cast is matte, irregular and shows large dark bumps.
175 AGGREGATIONS 10 APPENDIX FIGURE1420102030405
FIGURE 143
FIGURE 144
FIGURE 145

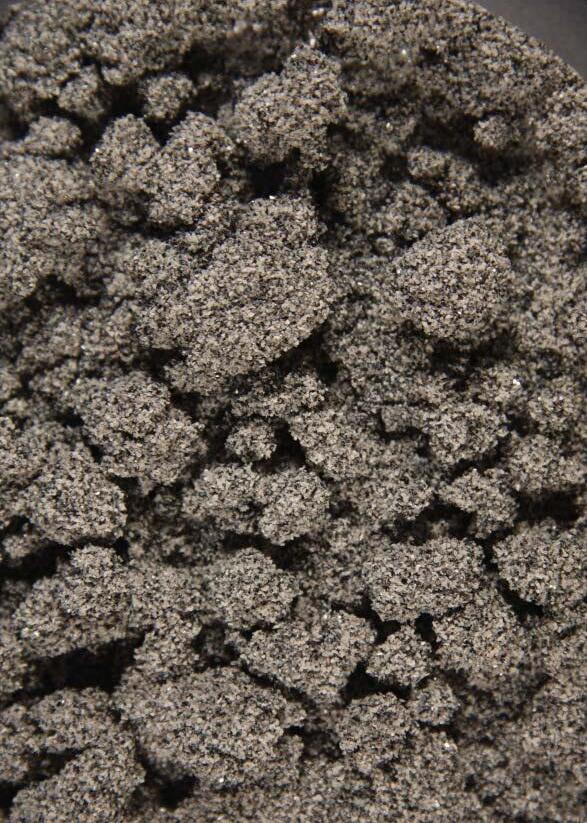

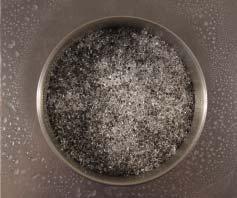


10.01RESINSOLIDIFICATION03
EXPERIMENTAL SPECIFICATION
MOULD AGGREGATE: Grey Granite Ballast
AMOUNT: 500 ml
PHASE CHANGE MATERIAL: Paraloid B72 Pellets
AMOUNT: 50 ml
CURING METHOD: Acetone Spray
CURING TIME: 1 to 2 hours
MODELLING PROCESS
The mould aggregate is placed into a metal base. The pellets are placed on top and sprayed with acetone. The cast is left to set for two hours.
OBSERVATIONS
After curing, the cast comes off the mould easily. It is up to 1cm thick. The top remains the texture and material makeup of the pellets. The bottom shows circular bumps that are up to 0.5 cm wide.
FIGURE146 SEQUENCE OF CAST
The sequence shows the process of casting. (01) The Paraloid B72 Pellets are prepared. (02) The mould aggregate is placed into the base mould. (03) The pellets are placed onto the base mould. (04) The cast is sprayed with acetone. (05) The cast is left to cure for two hours.
FIGURE147 DETAIL VIEW OF CAST
The bottom layer shows large circular bumps of up to 0.5 cm.
FIGURE148 TOP VIEW OF CAST
The top view remains the material makeup of the resin pellets.
FIGURE149 BOTTOM VIEW OF CAST
The cast is up to 1cm thick. The bottom is very inhomogeneous in its texture.
176 AGGREGATIONS 10 APPENDIX
146 0102030405
FIGURE
FIGURE 147
FIGURE148
FIGURE 149

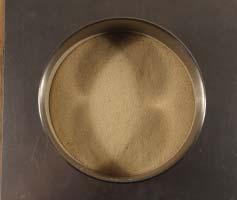
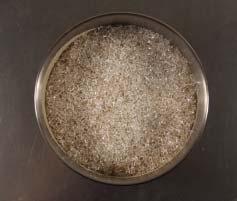
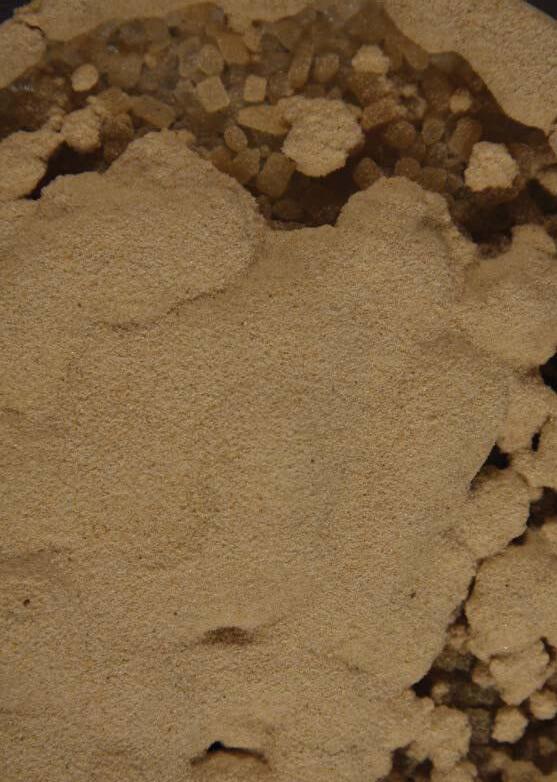
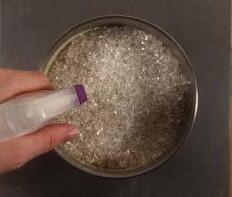
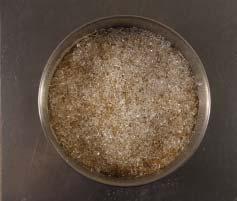
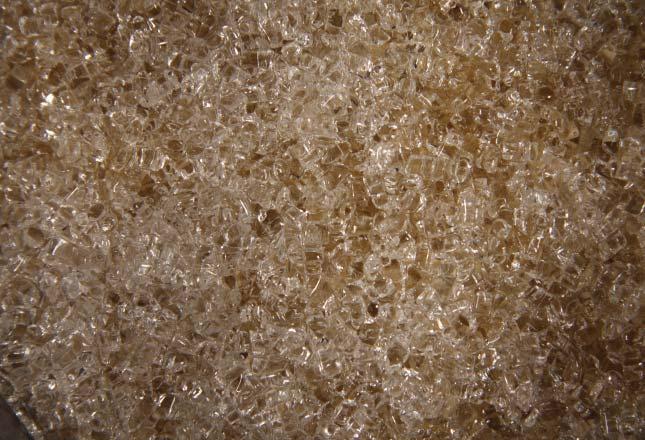
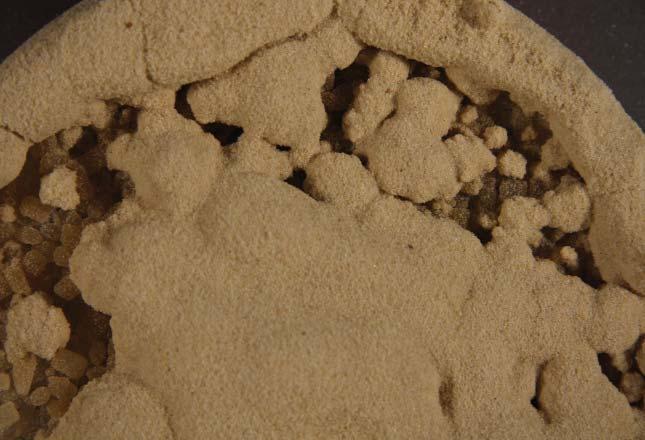
10.01RESINSOLIDIFICATION04
EXPERIMENTAL SPECIFICATIONS
MOULD AGGREGATE: Kiln Dried Silver Sand
AMOUNT: 500 ml
PHASE CHANGE MATERIAL: Paraloid B72 Pellets
AMOUNT: 50 ml
CURING METHOD: Acetone Spray
CURING TIME: 1 to 2 hours
MODELLING PROCESS
The mould aggregate is placed into a metal base. The pellets are placed on top and sprayed with acetone. The cast is left to set for two hours.
OBSERVATIONS
After curing, the cast comes off the mould easily. It is up to 1cm thick. The top remains the texture and material makeup of the pellets. The bottom shows bumpy surface with occasional circular lumps of up to 0.5 cm on the edges.
FIGURE150 SEQUENCE OF CAST
The sequence shows the process of casting. (01) The Paraloid B72 Pellets are prepared. (02)
The mould aggregate is placed into the base mould. (03) The pellets are placed onto the base mould. (04) The cast is sprayed with acetone. (05) The cast is left to cure for two hours.
FIGURE151 DETAIL VIEW OF CAST
The bottom layer is irregular and shows circular bumps of up to 0.5 cm on the edges.
FIGURE152 TOP VIEW OF CAST
The top view remains the material makeup of the resin pellets.
FIGURE153
BOTTOM VIEW OF CAST
The cast is up to 1cm thick. The bottom is very inhomogeneous in its texture.
177 AGGREGATIONS 10 APPENDIX FIGURE 150 0102030405
FIGURE 151
FIGURE 152
FIGURE 153
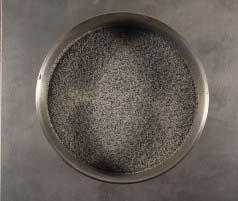
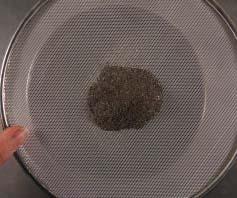

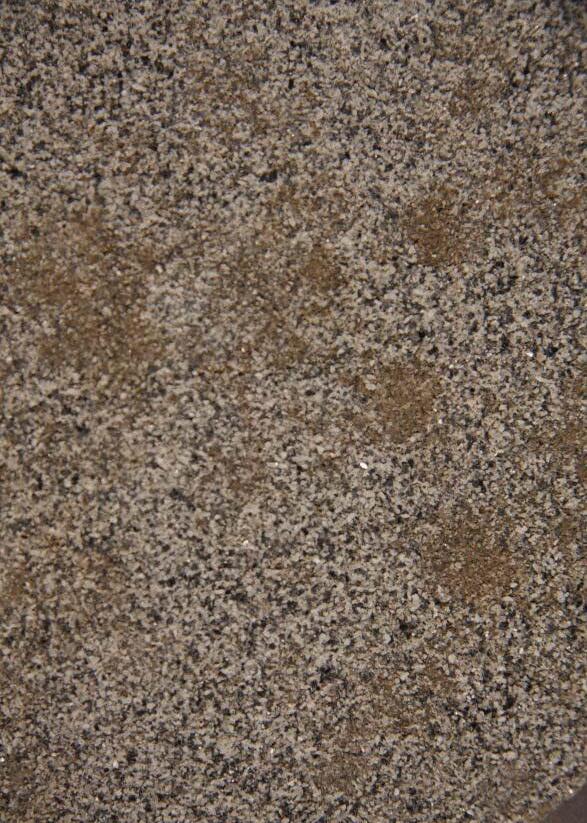



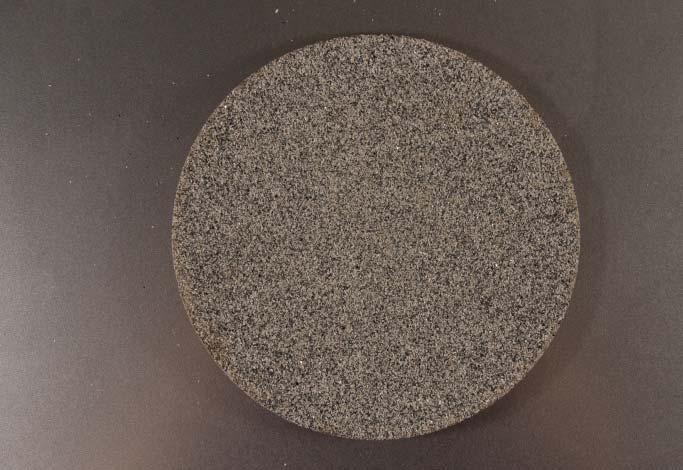
10.01CEMENTSOLIDIFICATION01
EXPERIMENTAL SPECIFICATIONS
MOULD AGGREGATE: Grey Granite Ballast
AMOUNT: 500 ml
PHASE CHANGE MATERIAL: Cement Fondu Black-Brown
AMOUNT: 6 aggregate: 2 cement: 1 water/90 ml sand: 30 ml cement : 15 ml water
CURING TIME: 24 h
MODELLING PROCESS
A metal container is sprayed with mould release agent. The mould aggregate is filled into it. The sand-cement mix is filtered onto the sand bed with a sieve and sprayed with water. It is left to cure for 24 hours.
OBSERVATIONS
The cement sand mix gradually cures under constant hydration of 24 hours and can be removed as a flat piece from the sand mould. The mould sand is entirely reusable. The hardened piece has a similar material composure to concrete, due to being made of cement and sand, yet it is more porous, probably due to the fact that hydration is achieved by spraying with water rather than by mixing. The solidified piece has a rough top layer with bumps and a relatively even sandy bottom layer. Over a longer period of time the cement grows harder.
FIGURE154 SEQUENCE OF CAST
The sequence shows the process of casting. (01) The base aggregate is filled into the mould. (02) The phase change material is sieved onto the base. (03) The phase change material comes to rest. (04) The cast is prayed with water. (05) The cast is left to cure under hydration for 24 hours.
FIGURE155
DETAIL VIEW OF CAST
The top layer is smooth, but shows some watermarks.
FIGURE156 TOP VIEW OF CAST
The cast comes off the bed easily and models the base quite accurately. The top of the cast shows some watermarks but is relatively smooth.
FIGURE157 BOTTOM VIEW OF CAST
The bottom is very homogeneous in its texture showing no marks.
178 AGGREGATIONS 10 APPENDIX FIGURE 154 0102030405
FIGURE 155
FIGURE 156
FIGURE 157
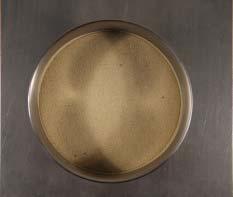


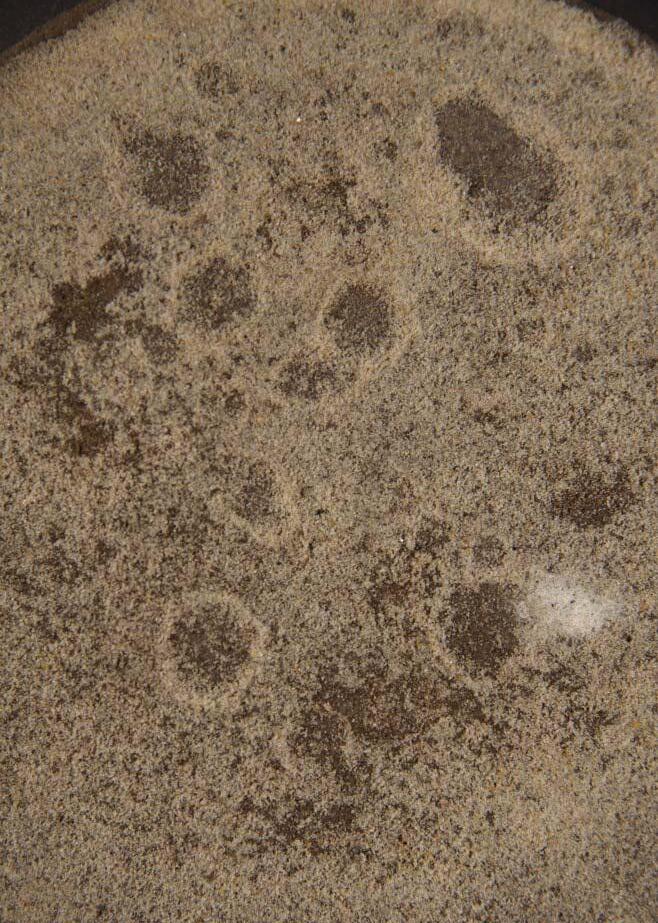

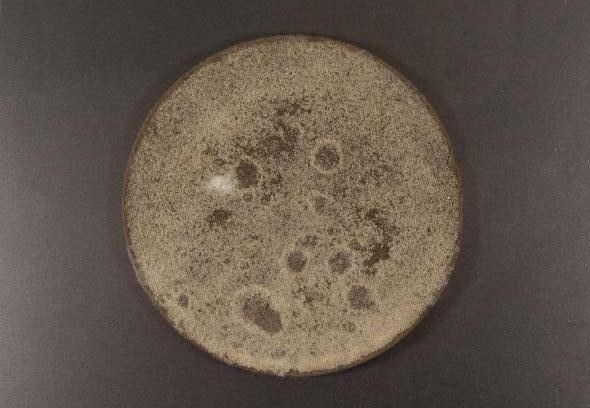
10.01CEMENTSOLIDIFICATION02
MOULD AGGREGATE: Kiln Dried Silver Sand
AMOUNT: 500 ml
PHASE CHANGE MATERIAL: Cement Fondu Black-Brown
AMOUNT: 6 aggregate: 2 cement : 1 water/90 ml sand: 30 ml cement : 15 ml water
CURING TIME: 24 h
MODELING PROCESS
A metal container is sprayed with mould release agent. The mould aggregate is filled into it. The sand-cement mix is filtered onto the sand bed with a sieve and sprayed with water. It is left to cure for 24 hours.
OBSERVATIONS
The cement sand mix gradually cures under constant hydration of 24 hours and can be removed as a flat piece from the sand mould. The mould sand is entirely reusable. The hardened piece has a similar material composure to concrete, due to being made of cement and sand, yet it is more porous, probably due to the fact that hydration is achieved by spraying with water rather than by mixing. The solidified piece has a rough top layer showing watermarks from spraying and a smooth sandy under layer. If broken apart, the piece shows layers of different material composure due to that fact that some of the granular material sinks more readily under water impact whereas other granules stay on top.
FIGURE158
SEQUENCE OF CAST
The sequence shows the process of casting. (01) The base aggregate is filled into the mould. (02) The phase change material is sieved onto the base. (03) The phase change material comes to rest. (04) The cast is prayed with water. (05) The cast is left to cure under hydration for 24 hours.
FIGURE159
DETAIL VIEW OF CAST
The top layer shows strong watermarks.
FIGURE160
TOP VIEW OF CAST
The cast comes off the bed easily and models the base quite accurately. The top of the cast shows strong watermarks but is relatively smooth.
FIGURE161
BOTTOM VIEW OF CAST
The bottom is very homogeneous in its texture showing no marks.
179 AGGREGATIONS 10 APPENDIX
158 0102030405
FIGURE
FIGURE 159
FIGURE 160
FIGURE 161

10.01CEMENTSOLIDIFICATION03
EXPERIMENTAL SPECIFICATIONS
MOULD AGGREGATE: Grey Granite Ballast
AMOUNT: 500 ml
PHASE CHANGE MATERIAL: Cement Fondu White
AMOUNT: 6 aggregate: 2 cement: 1 water/90 ml sand: 30 ml cement : 15 ml water
CURING TIME: 24 h
MODELLING PROCESS
A metal container is sprayed with mould release agent. The mould aggregate is filled into it. The sand-cement mix is filtered onto the sand bed with a sieve and sprayed with water. It is left to cure under hydration for 24 hours.
OBSERVATIONS
The cement sand mix gradually cures under constant hydration of 24 hours and can be removed as a flat piece from the sand mould. The mould sand is entirely reusable. The hardened piece has a similar material composure to concrete, due to being made of cement and sand, yet it is more porous, probably due to the fact that hydration is achieved by spraying with water rather than by mixing. The solidified piece has a rough top layer with bumps and a relatively even sandy bottom layer. Over a longer period of time the cement grows harder.
FIGURE162
SEQUENCE OF CAST
The sequence shows the process of casting. (01) The base aggregate is filled into the mould. (02) The phase change material is sieved onto the base. (03) The phase change material comes to rest. (04) The cast is prayed with water. (05) The cast is left to cure under hydration for 24 hours.
FIGURE163
DETAIL VIEW OF CAST
The bottom layer is very homogeneous showing no marks or colourations.
FIGURE164
TOP VIEW OF CAST
The top of the cast shows some watermarks but is relatively smooth.
FIGURE165
BOTTOM VIEW OF CAST
The bottom is very homogeneous in its texture showing no marks.
180 AGGREGATIONS 10 APPENDIX FIGURE 162 0102030405
FIGURE 163
FIGURE 164
FIGURE 165
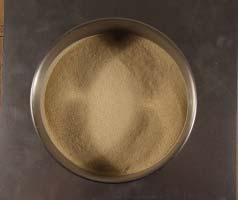
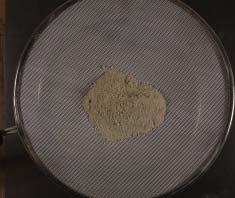

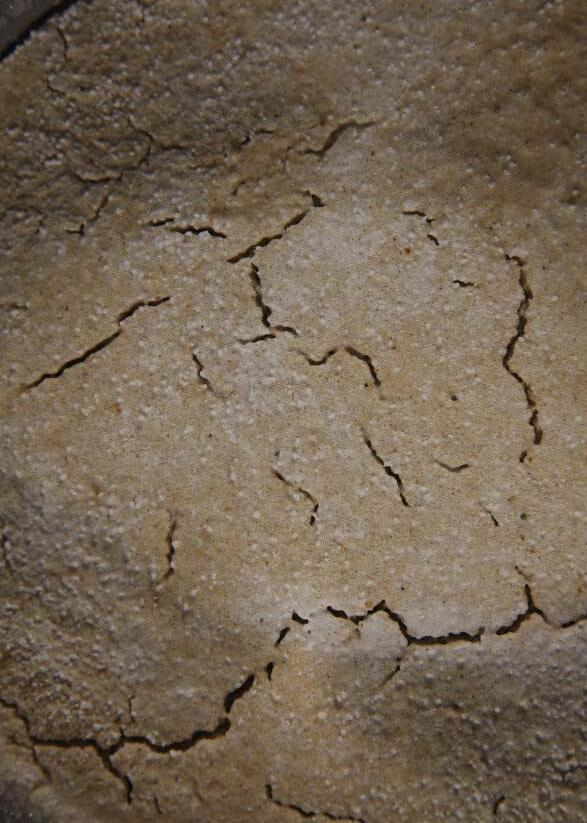

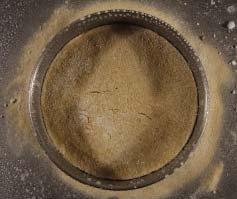


10.01CEMENTSOLIDIFICATION04
EXPERIMENTAL SPECIFICATIONS
MOULD AGGREGATE: Kiln Dried Silver Sand
AMOUNT: 500 ml
PHASE CHANGE MATERIAL: Cement Fondu White
AMOUNT: 6 aggregate: 2 cement: 1 water/90 ml sand: 30 ml cement : 15 ml water
CURING TIME: 24 h
MODELLING PROCESS
A metal container is sprayed with mould release agent. The mould aggregate is filled into it. The sand-cement mix is filtered onto the sand bed with a sieve and sprayed with water. It is left to cure under hydration for 24 hours.
OBSERVATIONS
The cement sand mix gradually cures under constant hydration of 24 hours and can be removed as a flat piece from the sand mould. The mould sand is entirely reusable. The hardened piece has a similar material composure to concrete, due to being made of cement and sand, yet it is more porous, probably due to the fact that hydration is achieved by spraying with water rather than by mixing. The solidified piece has a rough top layer with bumps and a relatively even sandy bottom layer. Over a longer period of time the cement grows harder. Immediately after spraying starts, cracks start to form in the silver sand cast, that do not vanish after curing.
FIGURE166 SEQUENCE OF CAST
The sequence shows the process of casting. (01) The base aggregate is filled into the mould. (02) The phase change material is sieved onto the base. (03) The phase change material comes to rest. (04) The cast is prayed with water. (05) The cast is left to cure under hydration for 24 hours.
FIGURE167
DETAIL VIEW OF CAST
The top layer develops cracks immediately after spraying. They remain and grow bigger after the cement has fully cured.
FIGURE168 TOP VIEW OF CAST
In areas where there are no cracks, the top of the cast shows some watermarks but is relatively smooth.
FIGURE169
BOTTOM VIEW OF CAST
The bottom is very homogeneous and sandy in its texture showing no marks. Sand grains can be rubbed off easily.
181 AGGREGATIONS 10 APPENDIX FIGURE 166 0102030405
FIGURE 167
FIGURE 168
FIGURE 169
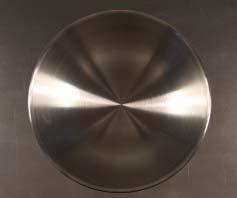
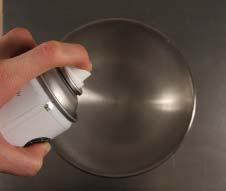

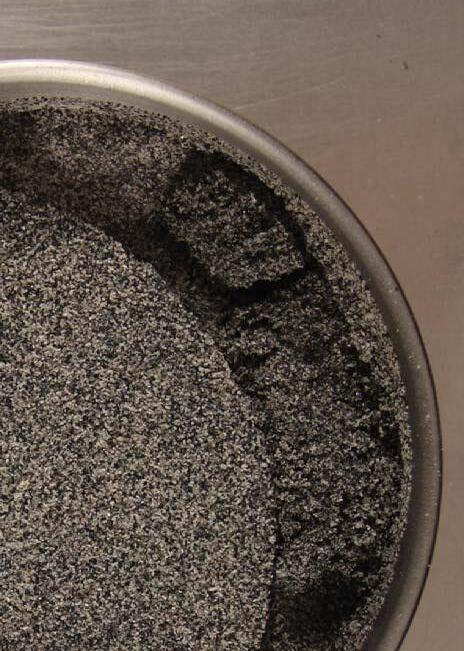
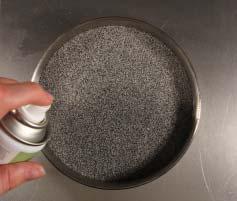
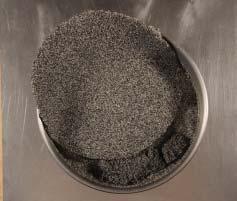
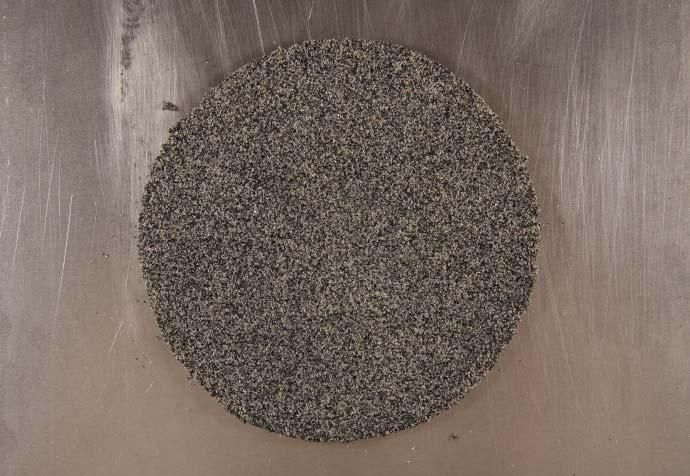
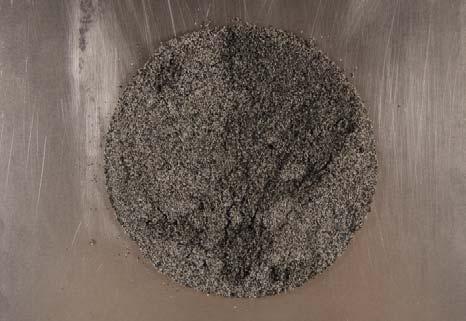
10.01LACQUERSOLIDIFICATION01
EXPERIMENTAL SPECIFICATIONS
MOULD AGGREGATE: Grey Granite Ballast
AMOUNT: 700 ml
PHASE CHANGE MATERIAL: AP Varnish AMOUNT: 100 ml
CURING TIME: 24 h
MODELLING PROCESS
The metal mould is sprayed with mould release agent. The mould aggregate is placed in the mould. Lacquer is sprayed in layers at ten minute intervals, three layers are applied on top of each other. The cast is left to dry for 24 h.
OBSERVATIONS
The lacquer can be sprayed at quite close distance as the air-blast is not very strong. The cast however does not dry. Even after 24 hours the top layer that has been sprayed remains soft and can hardly be taken off the sand mould without tearing.
FIGURE170
SEQUENCE OF CAST
The sequence shows the process of casting. (01) The metal mould is prepared. (02) The mould is sprayed with mould release agent. (03) The base aggregate is filled into the mould. (03) The lacquer is sprayed in individual layers. (04) The lacquer is left to dry for 24 h.
FIGURE171
DETAIL VIEW OF CAST
The sprayed top layer remains soft and can hardly be removed from its sand bed in one piece.
FIGURE172
TOP VIEW OF CAST
The top of the cast is homogeneous, showing no marks.
FIGURE173
BOTTOM VIEW OF CAST
The bottom of the cast shows bumps and tear marks.
182 AGGREGATIONS 10 APPENDIX FIGURE 170 0102030405
FIGURE171
FIGURE 172
FIGURE 173


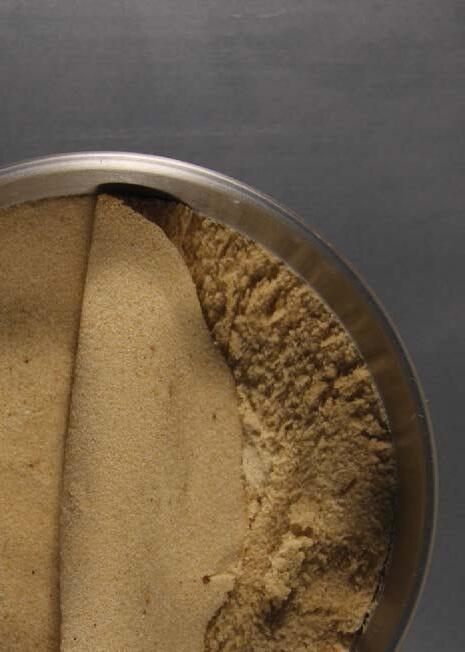

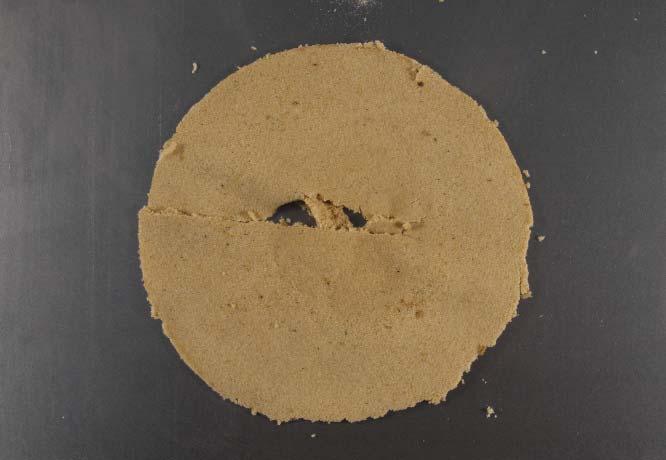
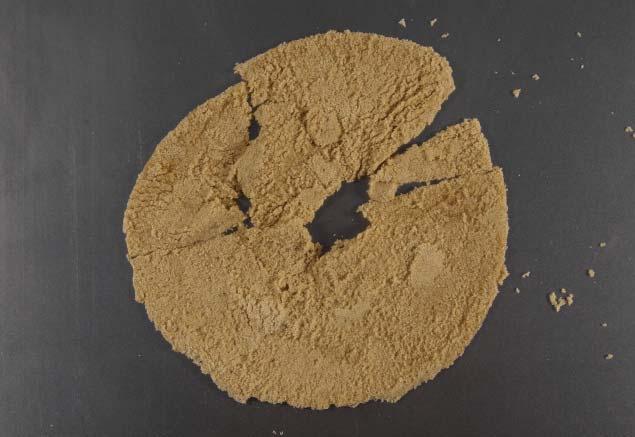
10.01LACQUERSOLIDIFICATION02
EXPERIMENTAL SPECIFICATIONS
MOULD AGGREGATE: Kiln Dried Silver Sand
AMOUNT: 700 ml
PHASE CHANGE MATERIAL: AP Varnish
AMOUNT: 100 ml
CURING TIME: 24 h
MODELLING PROCESS
The metal mould is sprayed with mould release agent. The mould aggregate is placed in the mould. Lacquer is sprayed in layers at ten minute intervals, three layers are applied on top of each other. The cast is left to dry for 24 h.
OBSERVATIONS
The lacquer can be sprayed at quite close distance as the air-blast is not very strong. The cast however does not dry. Even after 24 hours the top layer that has been sprayed remains soft and can hardly be taken off the sand mould without tearing. The silver sand cast is even more prone to falling apart than the one made in granite ballast.
FIGURE174
SEQUENCE OF CAST
The sequence shows the process of casting. (01) The metal mould is prepared. (02) The mould is sprayed with mould release agent. (03) The base aggregate is filled into the mould. (03) The lacquer is sprayed in individual layers. (04) The lacquer is left to dry for 24 h.
FIGURE175
DETAIL VIEW OF CAST
The sprayed top layer remains soft and can hardly be removed from its sand bed in one piece.
FIGURE176
TOP VIEW OF CAST
The top of the cast is homogeneous, showing no marks, but is tearing easily
FIGURE177
BOTTOM VIEW OF CAST
The bottom of the cast shows strong bumps and tear marks.
183 AGGREGATIONS 10 APPENDIX FIGURE 174 0102030405
FIGURE 175
FIGURE 176
FIGURE 177



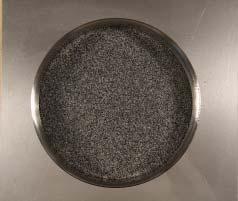
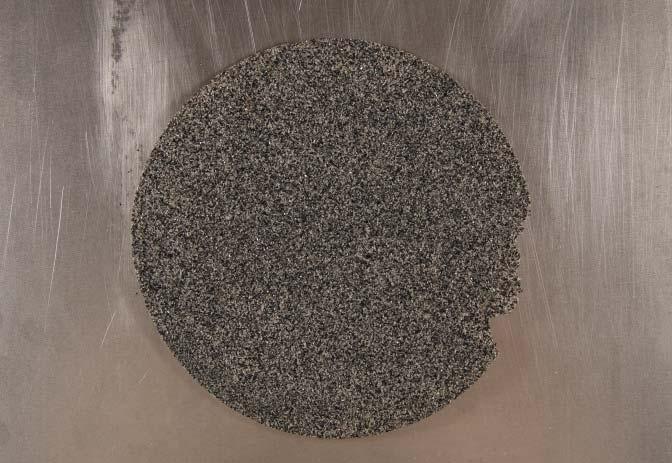
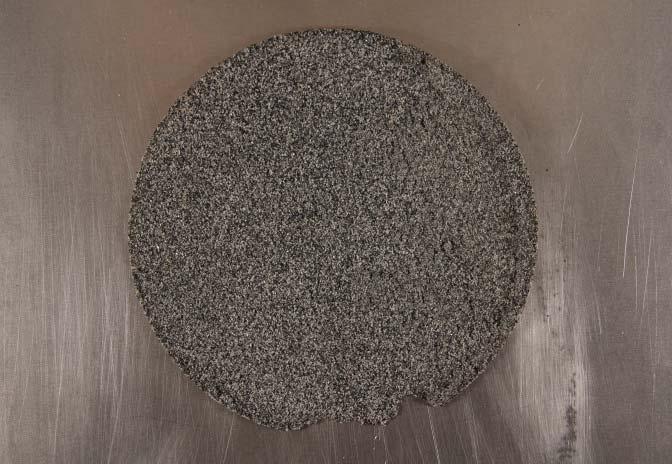
10.01LACQUERSOLIDIFICATION03
EXPERIMENTAL SPECIFICATIONS
MOULD AGGREGATE: Grey Granite Ballast
AMOUNT: 700 ml
PHASE CHANGE MATERIAL: Acrylic Metal Varnish
AMOUNT: 100 ml
CURING TIME: 24 h
MODELLING PROCESS
The metal mould is sprayed with mould release agent. The mould aggregate is placed in the mould. Lacquer is sprayed in layers at ten minute intervals, three layers are applied on top of each other. The cast is left to dry for 24 h.
OBSERVATIONS
The lacquer needs to be sprayed at a distance of at least 25 cm otherwise the airblast disrupts the sand formation. The resultant cast is a thin, translucent layer, that breaks very easily. Top and bottom surface are homogeneous showing no marks.
FIGURE178
SEQUENCE OF CAST
The sequence shows the process of casting. (01) The metal mould is prepared. (02) The mould is sprayed with mould release agent. (03) The base aggregate is filled into the mould. (03) The lacquer is sprayed in individual layers. (04) The lacquer is left to dry for 24 h.
FIGURE179
DETAIL VIEW OF CAST
The hardened cast moves off the sand bed easily and without breaking. Its is translucent and about 0.1 mm thin.
FIGURE180
TOP VIEW OF CAST
The top of the cast is very homogeneous showing no marks.
FIGURE181
BOTTOM VIEW OF CAST
The bottom of the cast is equally homogeneous as the top, showing no marks.
184 AGGREGATIONS 10 APPENDIX FIGURE1780102030405
FIGURE 179
FIGURE 180
FIGURE 181


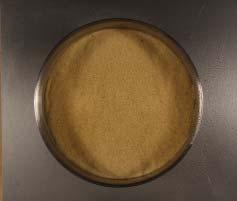
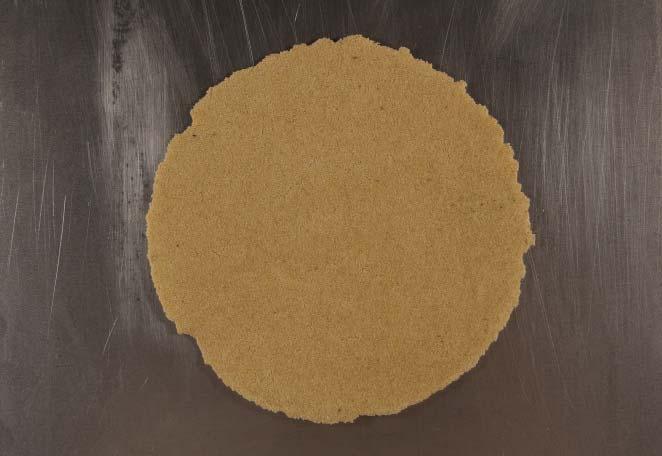

10.01LACQUERSOLIDIFICATION04
EXPERIMENTAL SPECIFICATIONS
MOULD AGGREGATE: Kiln Dried Silver Sand AMOUNT: 700 ml
PHASE CHANGE MATERIAL: Acrylic Metal Varnish AMOUNT: 100 ml
CURING TIME: 24 h
MODELLING PROCESS
The metal mould is sprayed with mould release agent. The mould aggregate is placed in the mould. Lacquer is sprayed in layers at ten minute intervals, three layers are applied on top of each other. The cast is left to dry for 24 h.
OBSERVATIONS
The lacquer needs to be sprayed at a distance of at least 25 cm otherwise the airblast disrupts the sand formation. The resultant cast is a thin, translucent layer, that breaks very easily. Top and bottom surface are homogeneous showing no marks.
FIGURE182 SEQUENCE OF CAST
The sequence shows the process of casting. (01) The metal mould is prepared. (02) The mould is sprayed with mould release agent. (03) The base aggregate is filled into the mould. (03) The lacquer is sprayed in individual layers. (04) The lacquer is left to dry for 24 h.
FIGURE183
DETAIL VIEW OF CAST
The resultant cast is very thin and translucent. The light reveals material irregularities.
FIGURE184
TOP VIEW OF CAST
The top of the cast is, showing no marks. It is slightly smoother than the bottom.
FIGURE185
BOTTOM VIEW OF CAST
The bottom of the cast is very homogeneous showing no marks.
185 AGGREGATIONS 10 APPENDIX FIGURE 182 0102030405
FIGURE 183
FIGURE 184
FIGURE 185
P186
10.02SAMPLEFORMATIVEMETHOD
P187


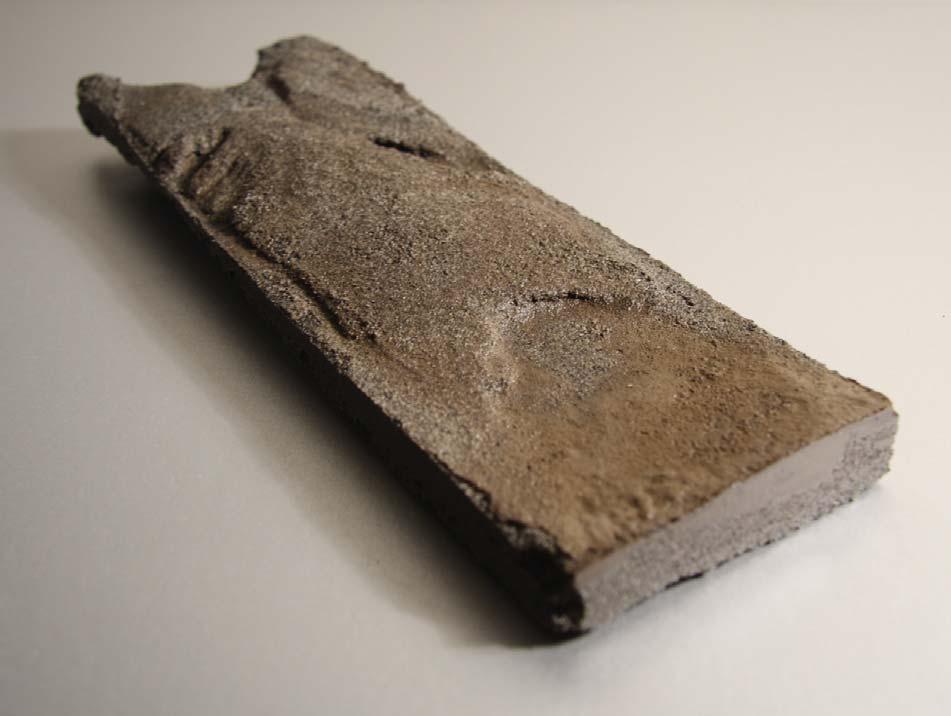
10.02FORMATIVEPRINCIPLE-BRANCHING
Several formative principles have been tested and introduced in chapter 06.02. This sample gives a closer view to a strategy alternative to air-blown configurations. It can be an initial study for methods applicable to alluvial environments.
EXPERIMENTAL SPECIFICATIONS
MOULD AGGREGATE: Granite Ballast
PHASE CHANGE MATERIAL: Cement Fondu Brown and Granite Ballast
CURING METHOD: Water
AMOUNTS: 6 aggregate: 2 cement : 1 water
CURING TIME: 24 h
MODELLING PROCESS
The mould aggregate is filled into a base container at an angle. The phase change material is sieved on top. The slope is saturated with water. After saturation, branching sets in and after a sufficiently clear formation is visible, the cast is left to cure under little or no more hydration.
OBSERVATIONS
After saturation, branching sets in. The formation shows a clear inlet, branching zone and lake. However, the container is rather small for a large branching network to develop. The resultant cast shows all the large scale morphological features as well as a horizontal layering, as the cement being lighter than sand, has been washed downhill easily and collects in the model lake.
188 AGGREGATIONS 10 APPENDIX
186 01020304
FIGURE
187
FIGURE


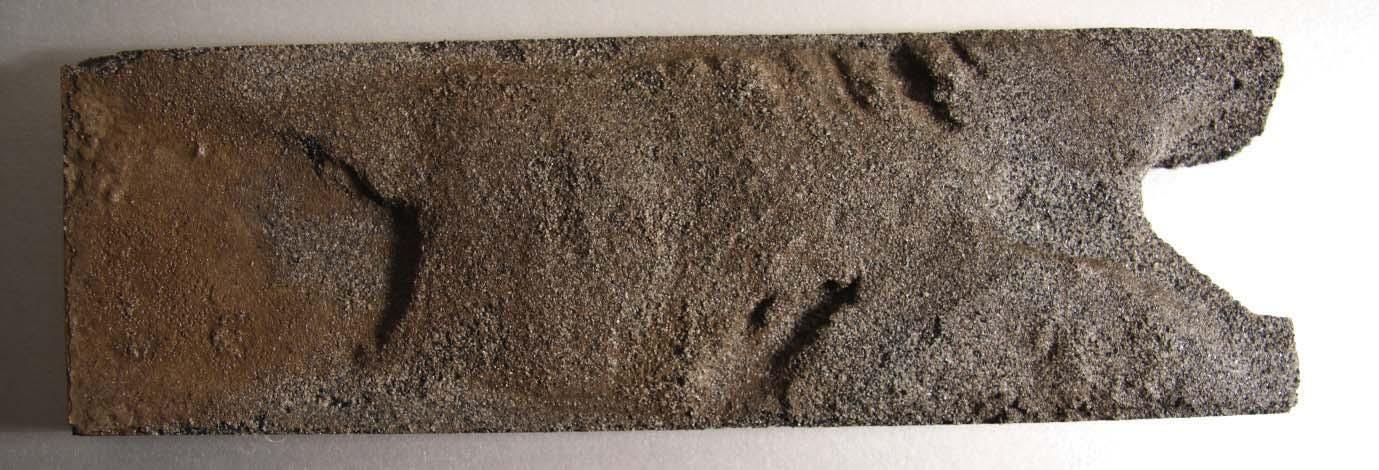
FIGURE186
SEQUENCE OF CAST
The sequence shows the process of casting. (01) The slope is being built up. (02) The phase change material is sieved onto the slope. (03) The phase change material comes to rest on the slope. (04) The cast is saturated with water and left to cure for 24 h.
FIGURE187
PERSPECTIVE VIEW OF CAST
The perspective view shows all the typical morphological features as well as the aggregate filtering, that has transported lighter grains to the bottom more easily.
FIGURE188
DETAIL VIEW OF CAST
The detail view shows the beginning branching pattern. However the mould was rather small, so that the branches could fan out widely enough.
FIGURE189
BOTTOM VIEW OF CAST
The bottom of the cast has a very homogeneous sandy surface, only the inlet point is discernible.
FIGURE190 TOP VIEW OF CAST
The top view has a very heterogeneous surface, showing all the typical morphological zones as well as aggregate sorting due to downstream motion of the water.
189 AGGREGATIONS 10 APPENDIX
188
FIGURE
189
FIGURE
190
FIGURE
P190
10.03AGGREGATESUNDERVIBRATION
P191

10.03AGGREGATESUNDERVIBRATION
If an aggregate like sand is placed on a vibrating metal plate or membrane, it starts to collect at the nodal lines where there is no vibration (Source: Jenny, 2001). In the example shown above, a metal plate of 12.5 cm by 12.5 cm is excited at various resonant frequencies and the aggregate formations are captured in time.
EXPERIMENTAL SPECIFICATIONS
BASE PLATE: Metal, 12.5 cm x 12.5 cm x 0.5 mm
EXCITING FREQUENCIES: 861 Hz, 304 Hz, 265 Hz
EXCITING BODY: Loudspeaker
AGGREGATE: Medium Fine Sand
MODELLING PROCESS
The resonant frequencies of the metal plate are determined by experiment. The sand is placed on top and the frequency is applied until a clear nodal pattern has formed. Time lapse records are taken at intervals of one second.
OBSERVATIONS
The plate has a set of resonant frequencies with one dominant frequency, at which excitation happens very easily. The sand starts to collect on the nodal lines relatively slowly, but clear repeatable configurations are forming. The morphology is specific to each of the different resonant frequencies.
192 AGGREGATIONS 10 APPENDIX FIGURE 191
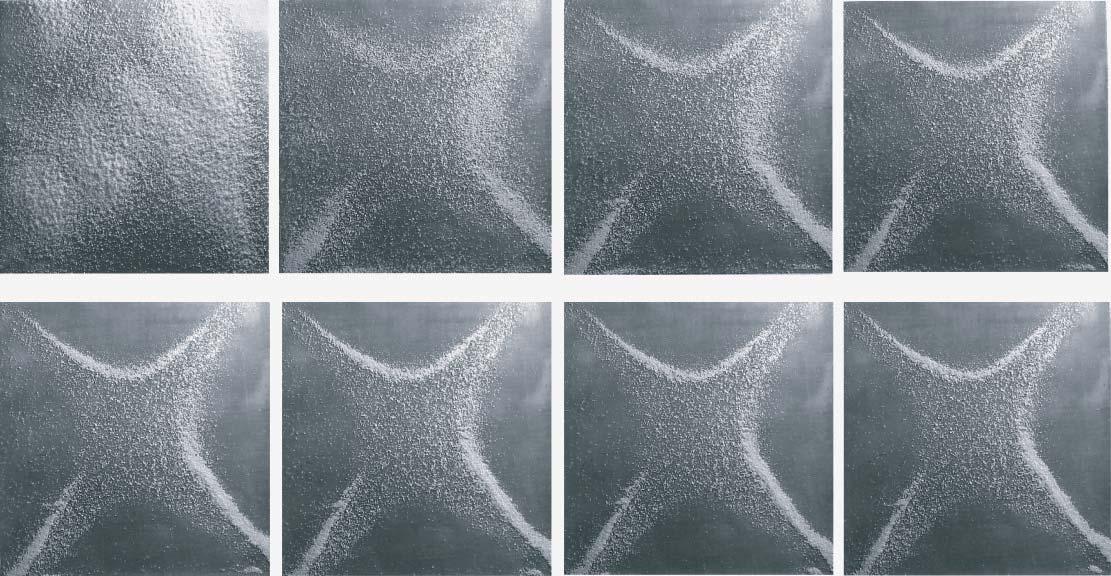

SAND FORMATION AT 861 Hz
The image shows a view of the sand formation at 861 Hz. The higher the frequencies are, the more intricate the patterns become.
FIGURE192
SEQUENCE OF SAND FORMATION AT 265 Hz
Time lapse imaging techniques allow to see how the configuration is forming. At 265 Hz, which is the dominant resonant frequency of the plate, the aggregate is moving in from the edges towards the diagonals of the plate.
FIGURE193
DETAIL OF SAND FORMATION AT 304 Hz
The detail shows a sand formation at 304 Hz. It has the typical ridge formation of a sand configuration produced through vibration.
193 AGGREGATIONS 10 APPENDIX
FIGURE 192
FIGURE 193
FIGURE191
00sec01sec02sec03sec 04sec05sec06sec07sec
P194
11GLOSSARY
P195
196 AGGREGATIONS 11 GLOSSSARY
11GLOSSARY
ACCRETION
Accretion denotes the addition of granules to an assembly. It can happen by mechanical processes, such as wind or wave impact, as well as chemical weathering and transportation. (Source: Siever, 1988, p.168)
AERODYNAMIC SURFACE ROUGHNESS
Z0 (in metres) is the roughness length, which is the measure of aerodynamic roughness of the surface. It is related to, but not equal to, the height of the roughness elements. It is also a function of the shape and density distribution of the elements. (Source: Oke, 1987, p.57)
AGGREGATE
An aggregate is any assembly of a large number of loose elements which are in contact most of the time. The elements can in principle have any size, yet aggregates are specified into different groups according to that. A powder is made up of granules smaller than 100 μm. A granular solid is made of granules ranging from 100 μm to 3000 μm. A broken solid is made up of granules mostly larger than 3 mm, aggregates used for concrete fall into that category. (Source: Duran, 2000, p.26)
AIRBORNE TRANSPORT (SALTATION, SUSPENSION, CREEP)
An aggregate under the influence of wind is subject to airborne transport. The wind impacting on a sand grain can have three different effects. The grain can either be suspended like in a dust storm, it can saltate (Latin: salire, to jump) or it can creep. This depends on the grain size and density as well as the wind speed. Small light particles are most likely to be suspended, but a strong storm can lift even heavy objects from the ground. In saltation, the landing grain can hit other grains which in turn jump off the ground, the effect is thus proliferated across the sand field. (Source: Bagnold, 1954)
ANGLE OF REPOSE
The angle of repose is the angle between the surface of a granular pile and the horizontal surface that it sits on. It is a typical equilibrium state for granular media and varies with the shape of the constituent particles. It typically lies around 35o. There are various differentiations that fall under this general phenomenon. The mound angle forms on an outside pile and is convex, the crater angle forms on an inside pile and is concave. Any such difference is vanishing if radius of curvature is much larger than the mean diameter of the granules. The Embankment Angle consists of the Movement Angle [θm] (angle after which sliding happens), the Angle of Repose [θr] (angle of maximum stability) and the Relaxation Angle δ = [θ m - θr] (movement angle minus angle of repose typically around 2o). In a pile made up of only a few granules, the relaxation angle goes to 0. The defining variable for this is the granule shape or its aspect ratio, e.g. the angle of movement for rice is larger than for sugar. (Source: Duran, 2000, pp. 121 to 122)
BOUNDARY LAYER
The boundary layer denotes that part of the atmosphere in which the wind speed grows logarithmically with height. This is due to the frictional drag caused by the aerodynamic surface roughness of the ground and objects on top of it such as houses and trees. The rougher the surface, the deeper the boundary layer becomes. Above the boundary layer the wind speed is constant across the height profile (Source: Oke, 1987, pp. 54 to 58). The logarithmic decay of the wind speed profile can be described by the formula:
u z = (u*/k) · ln(z/z0)
u z = mean wind speed (m/s)
u* = friction velocity (m/s)
k = von Karman’s constant (≈0.40)
z = height of measurement
z0 = roughness length (m)
CROSSBEDDING
Cross bedding refers to inclined structures in a horizontal layer of rock. It can happen most commonly in dune, tidal and stream environments. The cross-bedding is typical of a sedimentary environment and can give information about the direction of a wind or water flow. (Source: Siever, 1988)
EROSION
Erosion denotes the removal of granules from an assembly. It can happen by mechanical processes, such as wind or wave impact, as well as chemical weathering. (Source: Siever, 1988, p.169)
FACIES
In geology, facies are a body of rock with specified characteristics. Ideally, a facies is a distinctive rock unit that forms under certain conditions of sedimentation, reflecting a particular process or environment. (Source: Siever, 1988, pp. 69 to89)
MORPHOLOGY
Morphology in biology refers to the size, shape and structure of animals, plants and microorganisms. In this research it has been used to describe the shape, size and structure of geological features. (Source: Morphology, 2009)
REYNOLDS NUMBER
Flow can be either laminar or turbulent, which is defined by the Reynolds number. Two scales of flow regimes are to be considered with regards to this investigation. The first one is the large scale flow. Its turbulence depends on the size dimension of the confining walls and in the case of wind in the open or in a wind tunnel/wind table the flow can be taken as fully turbulent. The second one is the small scale flow around individual grains. Here the critical value V∗d / ν > 3.5 determines whether the flow around a sand grain is turbulent or laminar, whether the sand surface is rough or smooth. (Source: Bagnold, 1954, p. 87).
V d / ν > 3.5
V
∗ = threshold velocity
d = mean surface roughness of the order of the grain diameter
ν = kinematic viscosity
SEDIMENTARY ENVIRONMENTS
A sedimentary environment shows a consistent sediment facies. It is understood as a group of sediment-forming processes with a corresponding recognizable sediment facies that can be mapped. There are subfacies to the main facies, but the sedimentary environment defines the overall character of the aggregation. (Source: Siever, 1988).
FLUID THRESHOLD SPEED FOR GRAINS
The fluid threshold for grains denotes the wind velocity at which a grain of a specific size is starting to saltate. It is higher the bigger the grains are and lies at around 0.2 m/s for fine dune sand of 0.025 cm diameter. It is obtained by the following formula (Source: Bagnold, 1954, p. 86).
V ∗t = A √(((σ-ρ) / ρ) gd)
V t = threshold velocity
A =general coefficient, variant with Reynold’s Number
σ = grain density
ρ = fluid density
gd = grain diameter
197 AGGREGATIONS 11 GLOSSSARY
P198
12REFERENCES
12.01 BOOKS 12.02 ARTICLES 12.03 PATENTS 12.04 WEBSITES
P199
12REFERENCES
12.01 BOOKS
QUOTING STYLE:
Author, Initials/first name, Year: Title of book, Edition (only included this if not the first edition), Place, Publisher. (Quoted as: Author, Year)
Bagnold, Ralph Alger, 1941, 1954: The Physics of Blown Sand and Desert Dunes, 2nd edition (2005), Mineola, Dover. (Bagnold, 1954)
Ball, Philip, 1999: The Self-Made Tapestry: Pattern Formation in Nature, 2nd edition (2004), Oxford, Oxford University Press. (Ball, 1999)
Cambou, Bernard (ed.), 1998: Behaviour of Granular Materials, CISM Courses and Lectures No. 385, International Centre for Mechanical Sciences, Udine, Springer. (Cambou, 1998)
Daschkeit, Achim and Schottes, Peter, 2001: Klimafolgen für Mensch und Küste: Am Beispiel der Nordseeinsel Sylt, Heidelberg, Springer. (Daschkeit / Schottes, 2001)
Duran, Jacques, 2000: Sands, Powders, and Grains: An Introduction to the Physics of Granular Materials, Partially Ordered Systems, Translated from French by Axel Reisinger, New York, Springer. (Duran, 2000)
Hensel, Michael and Menges, Achim (eds.), 2006: Morpho-Ecologies, London, AA Publications. (Hensel / Menges, 2006)
Jenny, Hans, 2001: Cymatics, A Study of Wave Phenomena and Vibration, Newmarket NH, Macromedia Publishers. (Jenny, 2001)
Neddermann, R. M., 1992: Statics and Kinematics of Granular Materials, 2nd edition (2005), Cambridge, Cambridge University Press. (Neddermann, 1992)
Oke, T.R., 1978, 1987: Boundary Layer Climates, 2nd edition (1987, 2006), Milton Park / New York, Routledge. (Oke, 1987)
Pöschel, Thorsten and Schwager, Thomas, 2005: Computational Granular Dynamics: Models and Algorithms, Berlin / Heidelberg, Springer. (Pöschel / Schwager, 2005)
Schwartz, Maurice L. (ed.), 2005: Encyclopedia of Coastal Science, Encyclopedia of Earth Sciences, Dordrecht, Springer. (Schwartz, 2005)
Siever, Raymond, 1988: Sand, New York / Oxford, Scientific American Library, Distributed by W.H. Freeman and Company. (Siever, 1988)
Treib, Marc, 1996: Space Calculated in Seconds: The Philips Pavilion, Le Corbusier, Edgar Varese, New Jersey, Princeton University Press. (Treib, 1996)
Weinstock, Michael, 2009: The Architecture of Emergence: The Evolution of Form in Nature and Civilisation, London, Wiley Academy. (Weinstock, 2009)
12.02
ARTICLES
QUOTING STYLE:
Author, Initials/first name, Year: Title of article, Full Title of Journal, Volume number (Issue/Part number), Page numbers. (Quoted as: Authorship, Year)
Arens, S.M., 1999: Evaluatie Dynamisch Zeereepbeheer, Vergelijking Situatie 1988 en 1998, Opdrachtgever Rijkwaterstaat Dienst Weg- en Waterbouwkunde, Arens BSDO, Rapportnummer RAP 99.01, pp. 1-49. (Arens, 1999)
Dauchot, O. , Léchenault, F., Gasquet, C. and Daviaud, F., 2002: ‘Barchan’ Dunes in the Lab / Dunes de type ‘Barchanes’ au laboratoire, Comptes Rendus Mécanique, 330 , (2002), pp. 185-191. (DLGD, 2002)
De Wolf, Tom and Holvoet, Tom, 2005: Emergence Versus Self-Organisation: Different Concepts but Promising When Combined, ESOA, S. Brueckner et al. (Eds.), LNCS 3464, pp. 1-15. (De Wolf / Holvoet, 2005)
Hensel, Michael and Menges, Achim, 2008: Aggregates, Versatility and Vicissitude: Performance in Morpho-Ecological Design, AD, Profile No 192, Vol 78, No 2, pp. 80-87. (Hensel / Menges, 2008, 01)
Hensel, Michael and Menges, Achim, 2008: Aggregate, Form Follows Peformance: Zur Wechselwirkung von Material, Struktur, Umwelt, Arch+, 188, Juli 2008, pp. 76-82. (Hensel / Menges, 2008, 02)
Marticorena, B., Kardous, M., Bergametti, G., Callot, Y., Chazette, P., Khatteli, H., Le Hégarat-Mascle, S., Maillé, M., Rajot, J.-L., Vidal-Madjar, D., Zribi, M., 2006: Surface and aerodynamic roughness in arid and semiarid areas and their relation to radar backscatter coefficient, Journal of Geophysical Research, vol. 111, F03017, pp. 1-23. (JGR, 2006)
Ministerie van Verkeer en Waterstaat, 1989: Strand- en duinsuppleties, Effektiviteit en kosten, Rijkswaterstaat, Technisch Rapport 11, pp. 1-102. (MVW, 1989, 01)
Ministerie van Verkeer en Waterstaat, 1989: Kustverdediging na 1990, Beleidskeuze voor de kustlijnzorg, Rijkswaterstaat, pp. 1-66. (MVW, 1989, 02)
Menges, Achim, 2008: Manufacturing Performance, Versatility and Vicissitude: Performance in Morpho-Ecological Design, AD, Profile No 192, Vol 78, No 2, pp. 42-47. (Menges, 2008)
Sauermann, G., Rognon, P., Poliakov, A. and Herrmann, H. J., 2000: The shape of the barchan dunes of Southern Morocco, Geomorphology, vol. 36, no1-2, pp. 47-62. (SRPH, 2000)
Trummer, Peter, 2008: Engineering Ecologies, Versatility and Vicissitude: Performance in Morpho-Ecological Design, AD, Profile No 192, Vol 78, No 2, pp. 96-101. (Trummer, 2008)
Thiede, J and Arendt, K.: Klimaänderung und Küste – Fallstudie Sylt, Teilprojekt: Fallstudie Klimabedingte Veränderung der Gestalt der Insel Sylt, Abschlußbericht, Förderkennzeichen BMBF 01 LK 9526, Mai 2000, Forschungszentrum für marine Geowissenschaften der Christian-Albrechts Universität zu Kiel, Paläo-Ozeanologie, pp. 1-58. (Thiede/Arendt, 2000)
Witte, J.-O., Koolhaase, S., Radomski, J. and Fröhle, P., [2000]: Klimaänderung und Küste – Fallstudie Sylt, Teilprojekt: Strategien und Optionen der Kuestenschutzplanung fuer die Insel Sylt, Abschlußbericht, BMBF Geschäftszeichen 01 LK 9519/4, Institut für Wasserbau der Universität Rostock, pp. 1-69. (WKRF, [2000])
12.03 PATENTS
QUOTING STYLE: Patenting Body, Date: Title of patent, Patent number, Patent holder: Full name and company, Patented since: date. (Quoted as: Patent number)
Reichspatentamt, 04.07.1924: Herstellung von Modellen, PatNo.:398146, Patent holder: Karl Ritzmann und Zementbaugesellschaft m.b.H. in Rathenow, Patented since: 02.05.1923. (PatNo. 398146)
200 AGGREGATIONS 12 REFERENCES
12.04 WEBSITES
QUOTING STYLE:
Authorship or Source, [Year]: Title of web document or web page, [medium], (last update), available at: web site address, [accessed date]. (Quoted as: Source, [Year]) Note: Square brackets ([]) are inserted, where data are not given on a website.
Alfred Wegener Institut für Polar - und Meeresforschung (AWI), []: Wattenmeerstation Sylt, Forschungsstation in der Stiftung Alfred Wegener Institut für Polar - und Meeresforschung, [online], (last update on []), available at: http://www.awi.de/de/institut/standorte/sylt/, [accessed on 07.11.2008]. (AWI)
Amt für Tourismus, Westerland/Sylt, 2005: Tourismusstatistik 2005, [online], (last update in 2005), available at: http://www.westerland.de/fileroot/service/download/ Tourismusstatistik2005.pdf, [accessed on: 01.02.2009]. (Westerland, 2005)
Bleck, Matthias, []: Funktionale Bemessung künstlicher Riffe für aktiven und sanften Küstenschutz, [online], (last update on []), available at: http://www.stiftung-deutscherkuestenschutz.de/projects/preistraeger/2004/bleck_kuenstliche_riffe.pdf, [accessed on 01.02.2009]. (Bleck)
Centre Scientifique et Technique du Bâtiment (CSTB), 1995/2008: The Jules Verne Climatic Wind Tunnel, [online], (last update in 2008), available at: http://international.cstb.fr/frame.asp?URL=facilities/jules.asp, [accessed on: 05.11.2008]. (CSTB, 2008)
Climatic Classification, 2008: Climatic Classification, General Considerations, [online], (last update in 2008), available at: http://info.britannica.co.uk/, [accessed on: 25.10.2008]. (Climatic, 2008)
Deutscher Wetterdienst (DWD), []: Deutscher Wetterdienst, [online], (last update on 18.12.2008), available at: http://www.dwd.de/, [accessed on: 18.12.2008]. (DWD)
Eklima, []: Der Internationale Klimaindex, [online], (last update on: []), available at: http://www.eklima.de/?d=klimadaten&i=858&s=List%20/%20Sylt&z=Deutschland. [accessed on: 18.12.2008]. (Eklima)
German Aerospace Center (DLR), 2009: Moving bodies of water around the island of Sylt (October 2007), [online], (last update on 24.01.2009), available at: http://www.dlr. de/en/desktopdefault.aspx/tabid-4219/6774_read-11191/gallery-1/gallery_read-Image.1.4632/, [accessed on: 01.02.2009]. (DLR, 2009)
Groupe Instabilités et Turbulences, 2005: Granular Matter, Some applications of our research, [online], (last update on 02.02.2008), available at: http://iramis.cea.fr/spec/ GIT/index.php?ici=983, [accessed on: 07.01.2009]. (GIT, 2005)
Hoogheemraadschap Hollands Noorderkwartier, []: Hoogheemraadschap Hollands Noorderkwartier, [online], (last update on 05.01.2009), available at: http://www.hhnk. nl/, [accessed on: 05.01.2009]. (Quoted as HHNK)
Inorganic Materials Group (IMG), University of Southampton, []: Geomimetics, [online], (last update on []), available at: http://www.soton.ac.uk/~solids/geomimetics.htm, [accessed on 07.11.2008]. (IMG)
Institut für theoretische Physik, Universitaet Leipzig, []: Group Seminar WS 2007/08, [online], (last update on []) available at: http://www.physik.uni-leipzig.de/~kroy/ seminar.html, [accessed on: 07.01.2008]. (ITP)
Liebermann, Nicole von, []: Küstenschutz, Bisherige und zukünftige Maßnahmen, [online], (last update on []), available at: http://www.tu-harburg.de/wb/mitarbeiter/ lieberman/veroeffentlichungen/58.pdf, [accessed on: 01.02.2009]. (Liebermann)
Microclimates, 2008: Microclimates, [online], (last update in 2008), available at: http://info.britannica.co.uk/, [accessed on: 25.10.2008]. (Microclimates, 2008)
Morphology, 2009: Morphology, [online], (last update in 2009), available at: http://www.britannica.com/EBchecked/topic/392797/morphology, [accessed on: 28.01.2009]. (Morphology, 2009)
Nasa, 2006: Worldwind, [online], (last update on 16.10.2006), available at: http://worldwind.arc.nasa.gov/, [accessed on: 01.02.2009]. (Nasa, 2006)
Newig, J., []: Sand auf Sylt, [online], (last update on []), available at: http://www.uni-kiel.de/med-klimatologie/pdftexte/sand.pdf, [accessed on: 01.02.2009]. (Newig)
The Portland Cement Association (PCA), 2008: Portland Cement Association, [online], (last update on 20.10.2008), available at: http://www.cement.org, [accessed on 05.11.2008]. (PCA, 2008)
Rijkswaterstaat, 2008: Rijkswaterstaat, Zandsuppletie, [online], (last update on 25.06.2008), available at: http://www.rijkswaterstaat.nl/help/zoeken.aspx, [accessed on 05.11.2008]. (Rijkswaterstaat, 2008)
Science Photo Library, 1997/2006: Science Photo Library, [online], (last update on: []), available at: http://www.sciencephoto.com/, [accessed on: 01.02.2009]. (Image Author / Science Photo Library)
Specialist Aggregates, 2000: Specialist Aggregates, [online], (last update on 01.10.2008), available at: http://www.specialistaggregates.com/, [accessed on 05.11.2008]. (Specialist Aggregates, 2000)
St. Anthony Falls Laboratory (SAFL), 2005: St. Anthony Falls Laboratory, Facilities at SAFL, [online], (last update on 27.01.2005), available at: http://www.safl.umn.edu/ facilities/facilities.html, [accessed on 07.11.2008]. (SAFL, 2005)
Sustainable Concrete, 2007: Sustainable Concrete, [online], (last update on []), available at: http://194.131.146.31/main.asp?page=0, [accessed on: 31.02.1009]. (SustainableConcrete, 2007)
Sylt, []: Sylt, [online], (last update on []), available at: http://www.sylt.de/, [accessed on: 01.02.2009]. (Sylt)
United States Geological Survey (USGS), 1997: Types of Dunes, [online], (last update on 29.10.1997), available at: http://pubs.usgs.gov/gip/deserts/dunes/, [accessed on: 05.11.2008]. (USGS, 1997)
Windfinder, 2002: Wind and weather statistic, Europe, Germany, List/Sylt, [online], (last update in October 2008), available at: http://www.windfinder.com/windstats/ windstatistic_list_sylt.htm, [accessed on: 14.11.2008]. (Windfinder, 2002)
201 AGGREGATIONS 12 REFERENCES
P202
P203 13DVD
MOVIE 01 - SINGLE PILE


MOVIE 02 - LAYERED PILES


03 - PILE GROUPS


The DVD attached in the back shows a collection of some of the laboratory experiments. All movies are composed using time-lapse photography. This allows to see some of the phenomena of aggregate formation in real time.
204 AGGREGATIONS 13 DVD 06sec07sec 24sec26sec 13DVD
FIGURE 194 12sec13sec 12sec13sec 06sec07sec 06sec07sec
MOVIE


205 AGGREGATIONS 13 DVD 08sec09sec11sec 10sec 28sec30sec34sec 32sec 14sec15sec17sec 16sec 14sec15sec17sec 16sec 08sec09sec11sec 10sec 08sec09sec11sec 10sec
The above chart gives an overview of the movies included in the DVD attached to this document.
FIGURE194 OVERVIEW OF MOVIES
P206
14ACKNOWLEDGEMENTS
P207
208 AGGREGATIONS 14 ACKNOWLEDGEMENTS
I would like to thank Michael Weinstock, Michael Hensel, Achim Menges, George Jeronimidis, Chris Williams and Rainer Dierichs for continuously supporting and encouraging this work.
209 AGGREGATIONS 14 ACKNOWLEDGEMENTS
14THANKS
P210
P211
15DISCLAIMER
212 AGGREGATIONS 15 DISCLAIMER
DISCLAIMER
TERM: Academic Year 2008/09
STUDENT NAME(S): Karola Dierichs
SUBMISSION TITLE: Aggregations - Geomorphodynamic Microclimates
COURSE TUTOR(S): Michael Weinstock, Michael Hensel and Achim Menges
SUBMISSION DATE: 04. 02. 2009
DECLARATION
“I certify that this piece of work is entirely my/our own and that any quotation or paraphrase from the published or unpublished work of others is duly acknowledged.”
SIGNATURE OF STUDENT(S)
213 AGGREGATIONS 15 DISCLAIMER


