Degree / Course
Master of Science, Emergent Technologies and Design
Student : for flood mitigation strategy

Degree / Course
Master of Science, Emergent Technologies and Design
Student : for flood mitigation strategy
Disclaimer & Acknowledgement
Abstract
Chapter III: Experiments
Cover Sheet for course submission Acknowledgement
Dissertation introduction followed by aim and hypothesis of the project Digital and Physical experiments related to the design hyphothesis.
Chapter IV: Design Development
Chapter V: Design Proporsal
Chapter I: Domain
Chapter II: Methods
Thr Project’s investigation, comprises of problems, current situations on both global and local. Relevant knowledge such as physics and the other, which related to the project.
Studies of the current state of the art method that dealing with the similar problem. As well as study a conceptual alternative then evaluate all information to extract the design eventually.
Chapter VI: Conclusion Chapter VII: Appendix Chapter VIII: Bibliography
Pawan Ritipong
Acknowledgement
“Many thanks to...
The twelve month study in the AA has been my remarkable experience. Doing this dissertation was an interesting and also a particular challenge from Emergent Technologies and Design course. This design research could not be finished without all those who helped and supported me throughout my study.
I would like to express my appreciation to those people who have been involved in this project and to all those who gave me the ability to complete this project.
First and foremost, a big thank you to Mike Weinstock, who was abundantly helpful, offered valuable advice, inspiration, great support, pushes and guidance, which influenced me to create effective and useful design research.
I am also very thankful to George Jeronimidis and Toni Kotnik for great and helpful comments during the project. Many thanks to Christina Doumpioti, who is always there to help with cheerfully moments. As well as my sincere gratitude to my partner, best friend, Chao-Yi Chen and fellow classmates for their helps and cheers me up throughout the project. What I have learnt from this course and this dissertation will be of great benefits to my future career.
Abstract
This dissertation aims to investigate new strategies proposed for designing an appropriate system based on topography of areas prone to flash floods.
Forces generated by nature have a destructive effect on buildings, which have been mostly built against the power of nature.
Alternatively, in biology, the morphology of a living system is suitably adapted to extreme environments. Forces are negotiated and balanced by redirection of energy apart from appropriate material organizations.
The solution of them is not only producing more materials to reach a maximum strength resisting the nature but also performing themselves as a part of the force by redirecting, reducing and balancing energy.
Inspired by this, an adaptive structural system, which consists of geometrical transformation and mechanical movement, is developed in order to decrease the stresses induced in hazardous flooding condition, followed by relevant experiments set up to explore the potential capacity of different strategies.
On August 18th, 2010, from the NASA aerial image, grey refers a city of a halfmillion inhabitants, Sukkur, situated in southeastern Pakistan’s Sindh province, which is along the Indus River, Pakistan’s longest, and is the basis for the world’s largest canal-based irrigation system.
Flooding in Sukkur has affected estimated 4,000,000 people in the province. Large agricultural, and the flooding has taken a heavy toll on the region’s crops and fruit trees (NASA,nd. [online]).

Figure 1.1_1: image: earthobservatory/nasa
This pair of images illustrate the affected region, The Indus River, which was collected by Multi-angle Imaging Spectro Radiometre (MISR) which aboard in NASA’s Terra Spacecraft.
The picture on the left was taken on August, 2009. The river width was normally about 1 kilometer width. The other one was at least 23 kilometres in the same month in 2010 when Pakistan largest flood venue was taking place.
Khyber Pakhtunkhwa, Sindh, Punjab and parts of Baluchistan, one-fifth of Pakistan, have affected from the heavy monsoon flooding event in late July, 2010.
Over ten thousands of villages have been submerged in the water, more than 1,500 people have been killed, and uncountable homeless. The floodwaters are not expected to fully recede before late August.
Domain 1.1.1:
Millions of people were displaced causing by flood, approximately 66 million people suffered flood damage from 1973 to 1997 (Unesco,2001,[online]).
7486 was the number of hydro-meteorological disasters occurred during the beginnings of twentieth century until the year 2005. Half of the incidents were floods.
The trend continues to be the most frequent natural disaster, three times more often than a combination of the hazards that arisen from biological and geological causes (UN/ISDR,nd.[online]).
Increasing the world’s population is the first and foremost cause of floods, from an estimated 2.5 to 6.3 billion in only 53 years counted from 1950 according to the U.S. Census Bureau (NASA,nd. [online]).
Prolonged trend has been affecting the cost of natural disasters; more people mean severity of disasters is proportionally amplified, which mainly caused by increasing of the world’s climate.

If global temperatures increase by two degrees Celsius, then approximately five times of large floods, largest occurred about once every 100 years could occur (Allamano et al,2010).
Understanding causes of floods, its typologies and characteristics are essential keys to design a responsive system in order to optimise the maximum durability of small scale architecture, housing, during the venue.
Domain 1.1.2:
This chapter mainly focuses on describing hazardous consequences after climatic alterations, explained by hydro-geography of an example area. Although, extracting flood prediction from meteorology study is the best preventive method. However, not so precisely, the incidents still occurred. As a result, further studies about flooding are compulsory; details of floods, including flow behaviours and structural performances are valuable observations.

Massive flow of flash flood has effected on the Pakistani economy by extensive damage to infrastructure and harvests (dawn, 2010[online]) which are anticipated to exceed 4 billion and over 500 million USD respectively (cber, 2010[online]).
Domain 1.1.3:
The recent flash floods in two different continents occurred in the year 2010; both have been recorded as the most severe flooding ever for their territories.
South-eastern of France costs at least 25 deaths and the largest floods in Pakistan, which is announced to be the greatest humanitarian crisis ever, will be examined as remarkable case studies.
After the Pakistan event, the whole city, Sindh in the south, entirely collapsed. 600,000 people were displaced and in need of help.
Outlining the domain of this research is the aim of this chapter, which comprises some initial arguments for floods’ strategic proposal. Then, concludes and evaluates into several bullet points for further research in the next chapters
“This was an unfortunate evidence that existed-flood protection system was ineffective. Both are valuable for understanding the events information regarding further developing, which is a similar scenario for Bangladesh’s floods that is the research scenario area.”

Globally, although, water seems to be plentiful supply according to the diagrams, however, resources of usable water are not always available in every circumstance. For example, flooding events, which originally influence by global warming, the incidence and amplitude of water-related stresses will rise (Agri-Food,nd[online])
Domain 1.2.1:
Water wraps entire sphere of the earth and covered more than 71% of the whole geographic surface, which consists of a continuous circulation (USGS, nd, [online]).
The living circulation would be broken and might be as an inorganic law that is a linear chain of cause and effect if it is interrupted.
The circulatory processes of water consist of solid, liquid and gaseous. It, firstly, rise up from the oceans, rivers or lakes, and flows with the air in atmospheric currents around the world. Then, when the air passes over the cooler zone such as mountain range, it contracts into clouds and falls down as dew, rain, snow or hail to earth. This called the hydrological cycle.
However, this is only a small part. More than third of rainfall will seek its way to the sea and rivers, and the rest will dissolve into the atmosphere again in order to find other low pressure areas or air currents. Its circulation always repeats approximately thirtyfour times during a year, in which from liquid through vaporization and back to liquid. It’s obvious that every stretch of water, seas and natural rivers has its own circulatory system. Conversely, water always has its way of great or small circulatory systems (Schwenk, 1961).
The heat from the sun is the vital energy to activate this system which mainly has different components: evaporation, transport, condensation, precipitation, groundwater, and run-off. These components process at the same time around the world to maintain the balance of water budget on earth.
However the Greenhouse Effect and climate chage influenced the temperature, resulting in damage of hydrological system, which led to unstable rainfall, breeding about floods, droughts and other disasters (DAS, 1997,[online]).
The mountainous areas in the world are habitat of almost 800 million people, and also are the origin and source of some main world’s rivers. The overflow is powerfully affected by temperature in these areas.
From this information, Allamano et al. (2010) suggested that flooding could be one cause of global warming, however, it still lack of scientific agreement about the influence of temperature variations of floods.
Moreover, from their study on how floods risk varying with temperature, precipitation, and elevation in mountainous regions and the analysis of overflow data recorded by 27 stations in the Swiss Alps.
The research revealed that there have a greater frequently increase of large floods nowadays than previously, and they predict that such floods in the result of global warming will more arise in the future. Interestingly, they also found that the big floods that happened once in the century could be up to five times more often, if global temperatures get higher by two degrees Celsius (ScienceDaily,2010).
Figure 1.3_1: redraw-image: floodobservatory.colorado.edu
Red dots in the map are all locations that flooding have been occurred since 1985-2010 (Darthmouth, 2010,[online]).
As can be seen, almost entire of the world has the flooding problem. In addition, the streamlines in the oceans are the amplitudes of current’s pressures and velocities; brighter (yellow) is higher than darker. The flows provide the predicable ideas of precipitation, then possibly flooding.
Domain 1.3.1: Domain 1.3.2:
Domain 1.3.3:
Floods are part of the natural water cycle, described as an overflow of expansive water that submerges lands.
Floods are hydrological consequences including increased infiltration and contaminants, rising groundwater level, reduced subsurface storage capacity, increased ground water discharge to streams, erosion as well as deposition of soil, loss of vegetation, etc.
There are numerous factors bringing about this phenomenon which can be caused by intense or prolonged rainfall, storm surges during a hurricane, tsunami, melting snow, or by dam collapses.
Another crucial factor is that the increasing population around the world that consumed more lands subject to intensive exploitation,
However, in many parts of the world, floods are not only a threat but an essential component of agricultural and ecological systems owing to rich resources that floodplain provides for the regeneration of crops, plant, aquatic life, and livelihoods.
such as deforestation. Consequent lack of natural vegetation makes soil absorb more moisture so that the run-off increases to form floods.
In addition, man-made construction such as concrete building and pavement also contribute this problem. When floods occurred, artificial facilities such as buildings, bridges, and roadways can be destroyed. Cars and trees are flowed away. People and livestock die due to drowning, and following this is the shortage of water and food supplies with high risk of spreading diseases.

Figure 1.3_2 and 1.3_3: image: mcdaniel.edu &
Understanding typologies of flood will disclose the dissimilarities between the research, flash flood, and the others.
There have many resources attempting to catalogue floods, the sorts are different by their differentiation criteria. To summarize, the classification of floods can be mainly categorised by topographies and characteristics. There have many resources attempting to catalogue floods, the sorts are different by their differentiation criteria.
To summarize, the classification of floods can be mainly categorised by topographies and characteristics.
1. Coastal Floods : The hazard occurs along coastal areas adjacent to the ocean and endured from the change of the water condition driven by a tropical storm, hurricanes and offshore low-pressure system or by seismic effect from fault line of the earth’s skin such as tidal waves, tsunamis, volcanic eruptions and other underwater explosions.
2. Arroyos Floods : The water channels, a river, gully or a water path, that normally dry and be able to fill the water in the rainy season, storms season.

If the precipitation with a high volume of water during a short period takes the venue, this probably initiates flash floods with serious damages.
3. River/Riverine/Fluvial Floods : Heavy rainfall, melting of snow or impulsive release of upstream exceeds the capacity of the water channel. Water-runoff, overflowing alongside the channel area such as river is a consequence.
4. Urban floods : Definition of urban flood is specifically meant to the circumstance when a failure of cities’ drainage systems occurs with a low capability in rainfall absorption of metropolitan roads.
(listphile,nd,[online])
1. Rainfall floods : This is the most common flood occurring when intense rainfall continues over long period of times, especially in the monsoon months. In addition to the consequence of local drainage congestion is impossible because the river’s water level is already over the maximum level.
2. Flash Floods : Preventative action is nearly impracticable for a high velocity flooding, which suddenly runs in a short of time. Harshness of damages is affected from a power of the flow that is able to carry away massive objects. Flash flood is mainly caused by heavy and continuity rainfall or melting water from ice and snow. Flash flood incident area is relatively smaller than the other types of floods, but it is the most deductive flood to habitability of the area.
3. Muddy floods : Muddy flood is generated by runoff on crop land, sediments are then detached by runoff and carried as suspended matter.
(floodsite,nd,[online])

Figure 1.4_1 and 1.4_2: image: militaryphotos.net redraw image: Geological hazards, p.133
(left)
Southern Negev desert, Israel January 18, 2010, Eilat Rescue Unit of an Israeli air force attempted to extract motorists trapped by a flash flood. This event affected entire of the desert, which was caused by heavy rain few days before continuously (military photos, 2010, [online]).
(right)
Diagrams illustrate hydrogeography of flash flood
1. Intensive rain falls on to the ground.
2. Rainfall cannot be absorbed into the ground, and runs down to the river.
3. The river rises dramatically, and floods the valley.
(Kusky, p.133, 2003)
Flash floods, the most dangerous kinds of floods, occur without predictability, reaching their peak only within few minutes and combine the destructive power (nws,1992, [online]).
It is a natural disaster that is a ‘hydrometeorological’ event; it is an event that depends on hydrological and meteorological factors.
Flash flood is a fastest type of flood that different from other types of floods by time scale of occurrence. Normal flood engages an increasing of water and overflowing from its ordinary path, whereas flash floods happen from various reasons such as concentrated rainfall during a slow moving thunderstorm, hurricanes, and tropical storms (Michaud and Sorooshian, 1994). Flash flood happens rapidly and strongly, and be able to damage mitigation even the occur only a few days.
It can be seen that flash floods, particularly dangerous in terms of human casualties. The important feature of flash flood is antecedent precipitation, terrain and surface runoff characteristics (Doswell,1994).
Flash floods are normally originated by excessive rainfall, dam failure, or sudden released water from an ice jam. Therefore, a number of factors will certainly contribute to the severity of flash flooding.
First of all, the intensity and duration of rainfall have vital influences. Furthermore, in terms of topography, the shape and slope of the drainage basin would determine how fast the run-off

converges from one place to another specific area, whereas ground condition such as soil moisture and the amounts of vegetation plays a pronounced role (nws,1992, [online]).
Flash flood is hazardously fast moving floods. It occurs from high to extremely high and heavy rainfall rates in a local. Its torrential floodwater has a power to change the normal area turn to river of death in only short minutes.
Flash floods can leads to hurricanes or melting of rain and snow in the mountain. It has a variety of effects, particularly to people who live in a prone area. Firstly, the visible effect of flash flood is the force of hastily flowing water.
The most distressing flash floods are a dam and levee failures, which suddenly

rising of enormous of water destroy everything in the path. Floodwater’s strength is strongly enough to damage roadways, bridge, and buildings and sometime its foundations.
An increasing of water level then devastates drainage system. Hazardous wastes and substances will be washed out into street and home, which potentially contaminate drinking water that leads to health hazard for human. Furthermore, the rush of floods damages crops and farmland, this resulting in scarcity of foods and starvation (doswell III, 1994).
Moreover, flash floods also affect people’s mentality. It can rapidly evict people away from home, drowning of people, animals and pets. People might lose their beloved, their business or occupation (nws,1992, [online]).

Figure 1.5_1:
image: earthobservatory/nasa
The delta plain, a convergent of the Ganges River, the Brahaputra and Meghna, known as the largest combined delta in the world, It is about 350km wide along the Bay of Bangal. This true-color image from the Moderate-resolution Imaging Spectroradiometer (MODIS) shows both the delta and sediment flowing into the Bay of Bengal. Fed by monsoon rains and Himalayan snowmelt, the rivers often flood. These floods often cause catastrophic damage, but also enrich the soil (NASA, 2001, [online])
Domain 1.5.1:
Geography :
Bangladesh is a small country where covers on 147,570 sq km of the area and the entirety length of the land border is around 4,246 km, which 93.9% and 6.1% shared with India and Myanmar respectively.
The country is bounded by Bay of Bengal in the south and has over 580 km coastline in the country. From the measurement from the base lines
constitutes the economic zone of the country, the territorial waters expand 22.22 km while the area of the high seas extends to 370.4 km. The Bay of Bengal is renowned for the origin of cyclone, which arouse its water and throw them bumping into the coastal plains. It is particularly resulting in floods.
Population :
Bangladesh is ranged of the 8th of the most populous country in the world in terms of the density. It consists of 131.27 million people in the country, meaning 890 persons per squarekilometer.
Bangladesh is one of the least urbanized countries in South Asia; there are only four cities (corporations) in more than one hundred towns.
The capital is Dhaka, the largest metropolis of the country with 9.91 million of population. Chittagong is the port city, having 3.2 million, whereas Khulna is a commercial and industrial area that located in the South West. The fourth largest one is Rajshahi, well-known as an education city.
Physiography :
By reason of a half of the surface is below the 10m contour line makes Bangladesh is set at the lowermost reaches of the three forceful rivers; the Ganges, the Brahmuputra and the Meghna. These three main rivers cover almost three-quarters of the country. It caused heavy monsoon rainfall and leads to floods, which is a major and annual natural phenomenon in Bangladesh.
The land is divided into three major physical regions that are tertiary hills, Pleistocene terraces, and plains
Hydrography
It can be seen that the river network is the pleasure of Bangladesh. The drainage system of Bangladesh is based on the three main rivers; the Ganges, the Brahmaputra, and the Meghna with about 700 streams and distributaries, which is as the artery of the country. There have many feeding channels and small streams for draining water of the hill flow down directly to the Bay of Bangal. The amount of rainwater that be delivered to the Bay of Bengal is approximately 2.4 billion tons annually.
Climate :
Bangladesh is influenced by tropical monsoon climate that consists of three different seasons; summer (pre-monsoon), rainy (monsoon season) and a cool dry water.
In the summer, the temperature is up to 31 Celsius and usually has thunderstorms.
Consequently, after April is a very humid-cluody season that has several wind directions and moistens temperature, which cause the tropical depressions, coming from the Bangal’s Bay
The average of precipitation is 890, 2.030 and the maximum, more than 5,000 mm. in the west, south-east and north-east regions respectively.
Finally, the temperature is ranged from 17-3 Celsius with paltry rainfall in the cool season (Banglapedia, 2006).

1.5.1_4:
(right) The flow chart illustrates all causes of flooding in Bangladesh. The diagram also showing that the hydrohazardius incidents are not occured by internal causes from Bangladesh only but also the external geographical issues, which are Indian flood plains, and the Himalayas.
The causes of floods are various and multifaceted. Each type of flood is frequently resulting from a combination of dissimilar factors. Hughes et al. (1994) point out that there are many reasons for flooding; particularly, the different of each flood is a key feature of flooding in Bangladesh. It can be proven from United Nation’s research about flood in Bangladesh. The specific aspect of floods in 1984, 1987, 1988 and 1991 are compared, and they found that it is difficult to state a standardization of
floods due to there has exact conditions in each flood occurrence.
Flooding in Bangladesh has consequently, occurred every year as. Severity of flooding in Bangladesh also continues damaging without any true explanation. The BBC reviews that part of the answer is, in fact, because of Bangladesh is given massive amounts of water from three major rivers; The Ganges, the Brahmuputra and the Meghna (Logan,2004)
Basically, the hazard is initiated by a heavy and intensive precipitation falls onto the catchment area of the major rivers. As a result, it affects a higher discharge rate of water during summer occurs seasonally. Consequently, the rivers exceeded the ir capacity and
breed overall flooding, accompanied with melting ice from the Himalayas and rising sea-level of Bengal Bay both contributing to a severe problem of drainage congestion.
Moreover, beyond the basics, a pressure by increasing population deteriorates into the situation. Deforestation happening in the Himalayas area markedly increased the run-off and soil erosion which allowed silt washed into the river bed, decreasing its channel capacity. Furthermore, over-extraction of groundwater for irrigation also caused the land subsided to be liable to flooding.
Additionally, this could be verified from literatures. The information was analyzed and summarized into the
(figure: 1.5.1_4) showing the different causes of flooding in three main regions of the basin; the highlands (almost exclusively the Himalayas), the Indian plains of the Ganga and the Brahmapu-tra, and the floodplain of Bangladesh.
It is clear that the flood processes in Bangladesh have affected from the factors outside Bangladesh, indirectly by in one way or be influenced from other factors, such as the hydrological characteristics of the huge river systems that flow through the floodplain of Bangladesh into the Bay of Bangal.
Besides, a reason of flooding in Bangladesh is from Himalayan melting snows. This reason used to bring the flood to Bangladesh in monsoon season. It has been occurring on a 10-year cycle but for the last flooding. It comes three years early.
. For example, deforestation causes soil erosion and deterioration, which leads to a lower capacity to absorb water of land. Irrigation for farming that silt up the river channels, which obstructs drainage water to the sea and decrease ability to hold floods (BBC News,2004[Online]).
There is a number of evidence about the causes of floods resulting from both internal and external factors. It is obvious that Bangladesh cannot avoid flooding. Thus, many researchers have been investigated about the way Bangladesh rehabilitate itself, and they found that Bangladesh has gradual rehabilitation, which might be another one reason of big damaging.
BBC (2004) reviewed that Bangladesh is a poverty country, low level of technology and infrastructure. The combination of these factors absolutely impedes its capability to handle with floods.
1.5.1_2 amd 1.5.1_3: image: www.e-gfl.org www.banglapedia.org
(above) Three major rivers dominate Bangladesh. The Ganges has a large drainage basin across Northern India; the Brahmaputra has its source to the north of the Himalayas; the Meghna has a smaller drainage basin to the East.
(right) Over two-thirds of the total area of the country was flooded in 1998.
Flooded Areas 1998
Ganges Basin


Brahmaputra Basin Meghna Basin
Figure 1.5.1_5 amd 1.5.1_7: images: www.boston.com/bigpicture
People were threatened from Bangladesh floods, which made them homeless due to river erosion. In the rural area, even the flood waters damaged their houses. They still didn’t want to leave their home.
Domain 1.5.1.4:
Bangladesh, one of the most densely populated and poorest countries in the world, suffered the most disastrous flooding in their flooding history between July and September in 1998.
The powerful water inundated approximately two-thirds of areas for 15 to 20 days, causing 30 million people to be made homeless, and more than 1,000 people died from this event, followed by serious problems such as shortage of food and drinking water, along with spread diseases.
In 1998, Bangladesh faced with the big floods that is one of the world’s most compactly populated countries. The floods were resulting from passing through the country of the three main rivers; The Ganges, the Meghna and the Brahmaputra (Sln,2010).
This situation cause many effects to its country. More than 57% of the land was under floodwater, over 1300 people were died, 7 million habitats were devastated that leads to becoming homeless of 25 million people.
Moreover, due to the enormous amounts of water destroyed fields, crops, roads, village and bridge. Consequently, it had the event of food shortage and contaminated of water. Overall, the floods cost the Bangladesh around 1 billion dollars (Ninno et al, 2001; Chowdhury; 2000).


Figure 1.5.2_1 amd 1.5.2_2: images: earthobservatory/nasa msnbcmedia.msn.com
(left) These images show pre and post flooding along the Indus river. 20%of the land area of Pakistan is drawn, particularly, the northwest along the Indus river. As a news report, hence, this is apparently not caused by a rapid rising of the sea level. However, it’s actually an issue of Pakistan being mountainous.
(right) Harshness of Pakistan’s flash flood is the most severity ever for this region, South Asia.
Domain 1.5.2:
Most recent, in August 2010, there has the cruelest disaster that devastated effect in Pakistan. Torrential monsoon caused the heavy rain and generated the serious flash flood in the River Nari, which affected at least 15,000 people in the country (ABC News; UMCOR,2010[Online]).
The flood in Pakistan is mainly come from the unusual climate change,
which leads to the fluctuated temperature. This, consequently, brings the worse monsoon rainfall and produced the greatest volume of water in the northern mountainous part of the country (Guardian,2010[Online]).
Resulting to this situation, it is not only impacted human livelihood, but also damage public infrastructure, homes, roads, bridges and foods. Almost two million people in 15 districts of Balochistan province have affected from storm and floods. More than 1,000 people have died, appeared of 25,000 homeless, and also lack of foods and water (BBC,2010[Online]).
People in the country have influence from this flood; houses have buried


by corrugated iron and woods, tons of mud run into the villages and make dried canals to roaring rivers.
The cost of rebuilding flood-hit areas was estimated up to 15 billion dollars US. (Greenpeace; IDSA,2010[Online]).
It can be spoken that this flash flood in Pakistan is the worst humanitarian crisis in recent time.

Nawabshah and Nausharo Feroze Districts,
Crop Damage Analysis of Dadu, Nawabshah and Nausharo Feroze Districts, Sindh Province, Pakistan
Crop Damage Analysis of Dadu, Nawabshah and Nausharo Feroze Districts, Sindh Province, Pakistan
Figure 1.5.2_3: images: www.geoportal.icimod.org
The analysis illustrates that the cropland had an area of 1050.2 Square Kilometres (White area) of which 821.69 Square Kilometres are flooding inundated (Dark pale blue area). However, these products need field validation and other ground inputs to improve further upon (geoportal, 2010, [online]).


Figure 1.5.2_4 amd 1.5.2_5: images: www.yanabi.com

The largest flash flood in Pakistan made them homeless due to its duration and harshness. In the rural area, people still didn’t want to leave their home even their house was flooded and destroyed. Consequently, thousands of temporary shelters are needed for their living.


1.6.1_1 and 1.6.1_2: redraw images: vogel, 2003, p.118-119, 286
(above) Solid matter performance when stress is applying at the top of a block whose bottom is fixed, two faces of a rectangular solid are distorted in parallelled by the same angle, A
(below) A pair of ideal flat plates with fluid between; the top moves relatively with the bottom, bothe are non-slip condition and the fluid between are the same propeties, and this area a constant velocity gradient is developed.
(far right) Bits of water beneath deepwater waves over a time (a), The actual velocities’ amplitude and vector of bits of wate beneath at an instant in time(b).
Three states of matter in the world comprise of solid, gas and liquid. The differentiation of them can be categorized by several methods. For this research, studying the flow of water, flood in particular, that has the same mechanical properties as liquid, is the main query for further development. Hence, the application of forces, or stresses, on the states of matter considerably to be a relevant way to distinguish them among the way they resist the force.
As a result, compression and tension are resisted in a liquid. It’s almost impossible to tighten or stretch. For instance, squeezing liquid in a container, it will be forced out of any opening.
Therefore, it implies that manipulating the flow locally, flooding in particular, is almost impossible.
Elasticity and stiffness are characteristics of solids, which absent in flowing matters. Fluids and gases share properties and viscosity, which defines the difference between hydro-meteorological disaster and the others. Theoretically, both can be distinguished by their structural performance differences.
For example, solids clearly resist being distorted in shear. In contrast, shear is inconsiderable for fluids, yet, still a matter but in the other way. To explain, greater stress or force is not affect to a more distortion (strain) for fluids and gases. Infinite distortion is a capability of both flowing matters, which can take on any shape of its boundary.
Besides, there is a factor playing in the role, which is the rate of strain of
the fluid cube* and the velocities when the cube is distorted. The shears can be summarized into basic physics equations as:
For Solid, (fig:1.6 above)
Shear stress = shear modulus x shear strain
For Fluids, (fig:1.6 below)
Shear stress = viscosity x shear strain rate
Shear strain rates means rate of change of velocity with distance, how rapidly layers of fluid are sliding with respect to one the other. The result of the flow’s velocity is constantly decreasing its speed. In addition, lack of slip of a fluid at a solid surface implies the presence of such a shearing region with its velocity gradient wherever a fluid flows past a solid. Viscosity is a matter in non slip condition, by rapidity ascents adjoining to surfaces. If the effects of viscosity are slight, then the gradients will be steeper and the distances shorter (Vogel, 2003).
The movement arises within the water through wave movement as a rhythmical ebb and flow on the beach. As Schwenk (1962,p.31)explained that “Flowing movement can also be superimposed upon a rhythmically progressing wave; for instance, a wave bears forward-moving currents on its back when the wind blows so strongly that the water on the surface itself begins to move. Then the water flowing on the top of the wave moves faster than the wave itself overshoots the crest and falls into the trough beyond. This causes the layers to curl over and turn in upon themselves, creating foaming breakers.”
The rhythmically movement of the water was observed by suspension of small particles in the water.
Each wave and movement made the particle moved circling as the chest and trough when the water passed small particle. Furthermore, the tiny circle becomes stretch out and turn into ellipses and more lengthened when the water grows shallower, whereas circular movement becomes increasingly ebb and flow in the deep water as can be seen on a flat beach.
Thus, these moving forms and the formative movements are related with creative principle and living processes used by nature, which influence the creation of organic shapes.
For instance, after an occurrence of the wave and it remains motionless behind a stone in a stream. Its form is being created simply out of movement. Despite exchange of material, this is a creation of organic form, which is a typical principle of all living creations.
There are many interesting aspects about wave, for instance, the process of wave occurrence and the interaction of wind with water. Basically, there have many levels to understanding waves, which most of them required advanced mathematical concepts. However, for this research, studying about the relationship between wavelength and speed for wind driven water waves is more than enough.
Fundamentally, although the surface of the water appears flat when the wind calm down, but in closely inspection, It’s obvious that very small waves moving at different speeds in diverse directions. The size of waves rely on the environment, which usually be bothered by forces, animals, sound, and leaves falling.
There are just a several waves that move in the same direction of the wind. Those waves are gained the energy from the wind, and then they will go in the same size and move as fast as the wind eventually. Thus, the water’s surface will gradually be influenced by these waves as the evaluation and selection processes, as can be seen in the figure 1.6.2_1.
1. Disturbing (horizontal) forces Wind interacts with the water surface, as an input energy to move the flow, In facts, the movement’s velocity of the waves has to be slightly lower than the force, because, if it is faster the energy will instead loose power to the atmosphere.
2. Restoring (vertical) forces: Naturally, when wave is in the motion, it’s obvious that the movement is not only toward the destination only but also vertically, rhythmically, elevates up and down. Therefore, at least one vertical force initiates that recurring actions to original flat position.
Gravity : F = gd
F: force per unit volume
g: gravitational force per unit mass
d: the density of the water or mass per unit volume
As can be seen in the figure1.6.2_2, some sections of wave are above while some are below the level of water (thick red line). Gravity forces the higher water down and raises the lower water up and the green arrows show. This could call ‘standing waves’; the waves do not move, it just go up and down as two red curves in the figure.
Surface tension : F =T curvature
F: force per unit length at surface
T: surface tension of the water
Curvature: the second derivative of the surface; how rapidly the surface bends
Hydrogen bonds are the main factor that makes water molecules attract and bond to each other. However, each water molecule can only bond to water below it at an air-water surface and the effect is a force to reduce the total surface area. In term of mathematic, this is an equal of a force proportional to the second derivative of surface. In other words, if we compare the water surface as a thin-stretched rubber sheet and the right and left boundaries are fixed, surface tension (red arrows) would tend to flatten the surface (green arrow).
It can be called that conservation of mass, which the water neither created nor destroyed; the amount of flowing water in and out a region has to equal. The figure 1.6.2_4 shows an example of balancing of flows.
3. Inertial & mass conservation force
By inertial forces refer Newton’s basic law, it states objects move at a stable speed unless a force is applied. The force necessitates the accelerated change proportionally to the mass. By conservation forces, I mean pressures that maintain balanced flows.
The water as a blue square and there are water flow out on the left at horizontal (H2) and vertical (V2) flow. In the horizontal direction on the right, the flow in of H1 are less than the flow out in H2, as a result, to balance the loss of water, it must increase from vertical flow V1 and V2.
It can be speak that H1-H2 = V1-V2. This is a system of pressures that allow the downward force of gravity on the crest of waves to force the water in the troughs upward, as seen in a previous diagram. The water in the crests is connected to the water in the troughs.
(scienceisart, nd ,[online])
4. Dissipative forces: once the internal currents in water flow pass each other, and even flow over the bottom or sides of the lake, its energy will be lost owing to molecular friction. The energy lost is proportional to the viscosity of the water; the wave will steadily decline its size and clam down again.
From the fact of these four forces, the water velocity in the movement of the wave at a constant speed to the right can be explored. The figure 1.6.2_6 demonstrates the movement of the wave to the right (blue wave moving to the red wave). The research found that there has a little misunderstanding about the movement of waves.
As sitting on the boat when the water moving with the wave, most people feel going up and down with the wave, but actually, the boat is going up and down and also left to right. This resulting from each point of water moves in a circle as can be seen the red narrow that indicate the velocity of the water of each part of the circle of waves.
Himalaya area is homes of almost a half of Earth’s population, comprises of many countries’ resident including Pakistan and especially Bangladesh, ranked as sixth and seventh respectively in the top ten world highest increase in population (internetworldstats, 2010, [online]).
The trends still rapidly increasing, this, also, increasingly demands more natural resource, subsequently conducts deforestation and flooding eventually. By this reason, this area remains as one of the world’s most vulnerable inhabited flooding territory. Bangladesh lost almost a billion US Dollars for the largest flooding venue, in1998.
Even though, the country has developed some flood management
strategies to deal with hydro-meteorological disaster, still, remain the problematic situation.
Pursuant to the relationship between severity of flooding and the budget of mega-project, such as flood embankments which have been built along the main river, now 7500 km since 1947, still under construction and unsuccessful (cgz.e2bn,nd,[online]).
Above arguments lead to a motivating site’s scenario implements the design strategies for any similar climate and geography, which are about monsoon area, by mountains and water channels in a tropical rain forest climate. Moreover, the latter design proposal must be an affordable system regarding regional economics.
In order to achieve the responsive design strategy for the area, understanding floods, especially its behaviors, explaining by physics, is compulsory. Explanations of the water flow have been discussed and extracted the potential ideas already in this chapter, for further synthesizing in the following chapter together with case studies and alternatives.

Figure 2.1: image: regainingparadise.wordpress.com
To bend limbs, branches and twigs have less resistance to natural forces, such as wind and wave. This method also increases a capability of filtration and slowing the force. Solid structures, unbendable, are not designed to mitigate the force but being against it, consequently, reaching the yield point of the rigid structure is much faster than the flexural system (mufc,2005[online]).

Figure 2.2: images: www.whale.to
Dhaka, Bangladesh, the image shows a basic sanitary system during flooding event in 2002. It was very difficult to define that this small bamboo hut was just for temporary or permanent sanitation. Because, actually, they used this as long as the organic-material building can resist the power of the water.
This picture also reveals a creative idea about how they transport during flooding venue. Double of bamboo canes packed together as a bridge connecting building to building. Although, it’s obvious that the footpath seems to be unstable to walk on. However, technically, slimmer shape has less drag force to compare with a full-stable walk way.
This second chapter comprises of three main contents engaging flood management, which are fluid mechanics, case studies and alternatives sequentially.
The aim is not merely to understand all the contents above but also analyse and synthesis to end up with new flood management strategies.
First and foremost, understand a force of the flow applying on the immersed obstacle is the most indispensable studies of this research. Extracting and synthesizing the potential concepts from physics probably conduct to schemes of a new method in the end.
Moreover, effectiveness of recent state of the art’s flood management methods is a valuable acquaintance to understand how the systems work for a particular region and a certain type of flood during the hazardous venue.
Unfortunately, capabilities of all current methods are not a wide-range application for all flood categories. Particularly, there has no successful solution for flash flood, which is a major objective of this research.
Hence, looking for other solutions from different approaches such as biomimetics is a worthwhile researching on the topic of designing appropriate alternative strategies for flash flooding management, particularly for the selected scenario, Bangladesh, Sunamganj.
For a simply example, why coconut trees that facing strong sea shore wind, which is a sort of lateral force as same as flash floods, can reach more than 10 metres high? This kind of inquisitive question is possibly an approach to a new vision of flash flood management strategy.
Adaptive systems in the nature are introduced as a method by changing their local elements, organisms and arrangements in order to survive in flooding as well as other severe situations.
However, globalisation has been conducting not only an increasing of demand in natural resources but in the same time with initiating an establishment of floods problems.
Lessening Levee’s population is one of a good flood cause. Because, it is one of the best natural floods defences using decreasing and mitigating the flow as its strategies. Consequently, man-made, artificial elements are added into the problematic contexts in order to deal with harmful water flow like flash flood. A dam or an embankment is a simply defensive strategy which directly protects people from harshness a massive of water pressure. However, its cost is exceedingly high, for instance, storm surge barrier and floodgate in Netherland, Oosterscheldekering, completed in 1986, and highly priced as 3.75 billion US Dollars, which is now still ranked in the list of top ten the most expensive construction ever (deltawerken,2004[online]).

Figure 2.3: images: www.goodplanet.org
(right)
Flooding incident in Bangladesh in the year 2004, habitants try to find the way to transport by using local material for a temporary intervention.
Methods 2.1.3:
at the end of this chapter along with evaluations of all the studied methods. The assessments aim to extract the efficient ideology of each, which leads to several series of relevant experiments and further application in the upcoming chapters.
To sum up, basic physics is an evaluator to assess all studies, including the existing case studies and conceptual ideas from the biomimetics world. Fluid mechanics will also be the main parameter for all upcoming experiments and design development chapters.
After the alternatives are synthesized, an introduction to the “Responsive Transformation System” is revealed as a new flooding management strategy

Figure 2.2_1: images: msnbcmedia.msn.com zonal manager, faridpur
(above) The image from Pakistan shows the lateral harshness from flash flood situation, which is a major issue to explore in term of design and development.
(below) The image illustrates the typical flooded condition, in Bangladesh, with a certain level of water. In order to survive in this situation, buoyancy element is needed.
Categories of floods are not only distinguished by topographies and their characteristics but also their physics behaviours.
Flash flood is outstanding from the others on account of the horizontal force is considerably to be a main part of the venue’s severity not only the water level Lateral harshness widely harms people and their properties.Moreover, most importantly; there is no particular solution for this catastrophe.
Looking at a more detail of physics of the horizontal flow, flash flood has two main computable parameters, which are velocities and the volume of the flow; both can be calculated with basic Newtonian mechanics. What most often matters is the force divided by the area over which it’s applied.
In addition, fluid statics is also playing a role, especially when the situation is calming down, water remains steady at a specific level. Buoyancy and its stability are the properties that potentially could be developed as one of the flooding management strategies.
In order to survive in flooding situation, elevating the living space is the most essential strategy to do at the beginning. Facing a massive of water could be avoidable by just simply raise the floor area up over the water surface.
In order to do that, understanding the principle of Archimedes is useful. The thousands years old principle states


that the buoyant force on an immersed object is equal to the weight of the displaced fluid by the object (Fairman, 1996,[online]). This is the main principle of vertical force, occurring in any fluids, including flooding, is clearly explained below ( figure 2.2_2).
To explain, if the density of the object is greater than that of the fluid, the object will sink. If the density of the object is equal to that of the fluid, the object will be neither sink nor float. If the density of the object is less than that of the fluid, the object will float.
(BUOYANCY)
= WEIGHT OF WATER, VOLUMN OF WATER
= VOLUMN OF IMMERSED OBJECT
Stability could be a problematic issue while the system is vertically moved up because the upward force on an object must act through the centre of buoyancy, this will avoid the moment of instability when both vertical forces are located in different axis. To explain, the diagram below ( figure 2.2_3) describes the centre of gravity (G) and centre of buoyancy (B) (tutorvista, 2010, [online]).
as shown in (b) (tutorvista, nd, [online]).
The results of both experiments are obviously related to F=P/A formula. When the surface is not perpendicular to the force, means the pressure on the surface is reduced by the vector’s force distribution principle.
Newton’s Principle
Bernoulli’s Principle
The main forces of flood concern are lifting, drag and thrust, which can be described by basic physics theories, such as momentum (Volumn x Mass) from F=MA = MV/t (momentum over time).
Pressure on the surface is the most effective measurement for flooding calculation, which can easily explain by the formula, P=F/A as can be seen from the figures below.
Conservation of energy theory influences Bernoulli’s principle by the extracted statement says,
“The Velocity of fluid will be slower when its Volume is increased.”
(Figure 2.2_6)
It leads to plenty ideas of how to decrease the speed of the flow as well as the force around the immersed obstacle.


In the most cases, a set of fluid forces attempting to distort the object by applying pressure. Pressure distribution provides plenty of information about how the object in the flow deforms its shape according to the force, especially non-rigid object that transforms a lot due to higher property of elasticity.
Secondly, the consequence of the pressure distribution on the object’s surface is drag force.
Another sort of drag contributes a lifting force, if the object orients perpendicular to the direction of the flow. Moreover, different sizes and geometries of the object and different velocities of flow also have an effect on the pressure applying on the obstacle. In the flows, velocity is a main variable that clearly related to Bernoulli’s principle, where drag depends more on pressure than viscosity, drag should vary with the second rather than the first power of velocity (vogel,2003).
The application of the Bernoulli formula gives the range of possible values for the flow velocity in the vicinity of these obstacles, a value that can be compared to the estimated average flow velocity Q/A computed for nearby cross-sections.

y1 = water depth in the area surrounding the obstacle y2 = water depth in front of the obstacle
V1 = velocity in the area surrounding the obstacle
From above formula, V can be known
Moving water exerts pressure on objects:
Pressure = k(constant) x (Velocity) 2
Pressure on an area becomes a force. Force = (Pressure x Area)
Then F=AkV2, k=1.4 for square-cornered
Figure 2.3.1_1: image: morphopedia.com
Float House is a single family inhabited unit organized resembling the shotgun house, a ubiquitous residential type of New Orleans. It was built on a prefabricated chassis, made of polystyrene foam which has a good performance to float on the water.
Methods 2.3.2:
Climate change leads to ever-harsher floods and natural disasters. In the US, over 36 million people presently face the risk of flooding.
Therefore, Float House project was created by the aim to create a sustainable way of living; protect flooding, sustain its own water and power needs and survive in the flood water, which caused by a storm size of Hurricane Katrina.
The Float House was developed as a prototype for prefabrication. It is an affordable house that can be adapted to meet the needs of flood zones worldwide.
The key to this project is its buoyant system, which comprises a modular chassis made of an expanded polystyrene foam block, coated in glass fiber reinforced concrete, with all required electrical, mechanical and plumbing systems pre-installed.
When flood water rises, the system allows for moving 12 feet vertically along two steel guide posts, which are anchored to the concrete pads with six 45-foot deep piles constructed on the site (morphopedia,2010; dezeebm2009).
Location: 1638 Tennessee Street, New Orleans, USA
Client: Make It Right Foundation
Size: 88 gross sq m
Program: This single family residen tial unit
Date: 2007 - 2009
Project Credits : Morphosis TeamIn Collaboration with UCLA Architecture and Urban Design (morphopedia,2010; dezeebm2009).
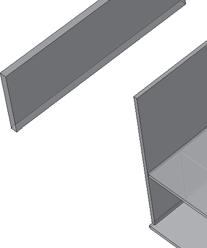
A modular chassis made of an expanded polystyrene foam block is utilized as the main buoyant system which is guided by two steel posts, allowing vertical movement of 12 feet.
However, the system has potential risk to suffer from the moment of force, giving the tendency to twist or rotate the floor, thus retarding the vertical movement.

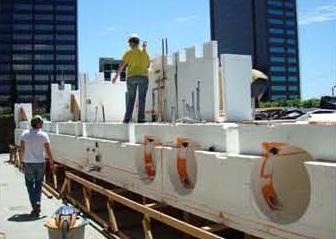
These diagrams illustrate assemblies drawing of the float house. The most significant parts of Float House are the prefabricated chassis and the concrete base constructed on the site.
These two structural elements have buoyancy property. When flooding occurs the chassis will float up in parallel with two main controlling columns, which both will direct the house’s orientation to be steady while floating up stably.

(left to right, upper to lower)
1. Foam block a the main floating system
2. Infill of mechanical, electrical and plumbing lines
3. Glass-Fiber Reinforced Concrete application
4. Chasis Construction
5. Rainwater tanks fitted in the chassis
6. Chassis fitted on the steel masts


(left)
A large water tank with a height of 25.4 m, with a length of 177 m, with a width of 78 m. It can pump up to 200 tons of water into the Edogawa River per second.
Methods 2.3.2:
www.ktr.mlit.go.jp
This project is the biggest flood preventing infrastructure in the world which has successfully controlled flooding every year. Channeling water to the main river of Saitama area is the main objective for the system.
Urbanization formulates environment aspects to have a paramount significant in recent projects due to the surface of the cities have heavily been used, which decreasing natural land in order to renovate their infrastructure systems to manage growth and change.
Japan had faced six major floods since 1979, there has a significantly increase flow of river and floods.
For Japan, it is rather difficult to widen the river or acquire the land for infrastructure improvement, besides, construction of elevated structure is impossible in tightly populated Japan large cities. Hence, underground have to be used to construct much infrastructure and divergence river (Saveur,2003). Appropriate used of underground is the key for refurbishment of degrading environment of urban areas in Japan
The Metropolitan Area Outer Discharge Channel Tunnel or G-Cans project is a gigantic underground infrastructure, waterway and water storage that purposed to collect vast amounts of water for preventing the city from flooding and heavy rain during rainy, typhoon seasons and Tsunami.

The system design consists of four tunnels, standing at 25.4m tall, 78m wide and 177m long. Main tank was built as a huge aqueduct and be operated when the precipitation exceeds the limit.
The rainfall will be pumped up to 200 tons of water and transported to the Edogawa River and several smaller rivers along 6.5 kilometers. Its engineering and excavation are a combination of concretes with innovative structures, technology and materials, which controlled from an operation centre (Atlasobscura; Secret-Japan,2009).
Location: Kasukabe, Saitama, Japan
Client: Japanese Gover nment
Size: 6.4 km of tunnels, 50 m beneath the surface
Purpose: Channeling flood to Edogawa River by pumps
Date: started in 1992
Know as: Underground Temple (Atlasobscura; Secret-Japan,2009)
As the increasing flooding events occurred in tightly populated area around the world, redirecting the water is the key to the problem. G-Can Project has successfully prevented potential floods in Japan, which encourages people to apply the same strategy to different scales.

Figure 2.3.3_1: image: www.hellebeelden.nl
Thames Barrier has 520m spans, 61 m. each, across the river. Six of the main gates lie flat with concrete sills in the riverbed under normal condition, allowing flow and ships to pass through.
Methods 2.3.3:
The Thames Barrier is a flood barrier which comprises 10 independent gates that span 520 meters across the Thames at Woolwich Reach, east of London, preventing surge tide and protecting London from tidal flooding until the year 2030.
Each main gate has a semi-cylindrical shape. Under normal tide conditions, six of the gates lie flat with concrete sills in the riverbed, allowing flow and ships to pass through freely.
The gates are controlled by their own hydraulic power packs, which can raise the gates to flood-defensive position in 15minutes in an emergency, holding back the water loads of up to 9,000 tonnes each. Since 1982 the barrier has been raised over 70 times when tide forecasts have reached critical levels (Richard, 2003).
Location: downstream of central London’s Thames river
Client: Greater London Council
Size: over 1,700 feet in width with four 200 foot openings
Purpose: protect London from being flooded by increasing of water level from the sea, aggravated by a storm surge
Date: Completed in 1982
Designer: Rendel, Palmer and Tritton (mimoa.eu,nd, [online]}
This is a typical solution of building a protective wall to be against natural force which has consumed huge cost and materials, prompting people to rethink its feasibility.

The project built to protect London after disastrous floods in 1953. The Thames Barrier is a series of 10 flood-gates with housing that rise about the water. The gates themselves ate set in the riverbed, so water flow and river traffic are not blocked in normal conditions. By during storms they can be raised to make a steel wall across the river more than 60 feet high (the environment Agency, Britain, nd).
The moveable gate is controlled by hydraulic machinery which can raise the gate against flooding.
Thames Barrier comprise six main gates, allowing navigation. Thames Barrier has 520m spans, 61 m. each, across the river. Six of the main gates lie flat with concrete sills in the riverbed under normal condition, allowing flow and ships to pass through.


Figure 2.3.3_2:
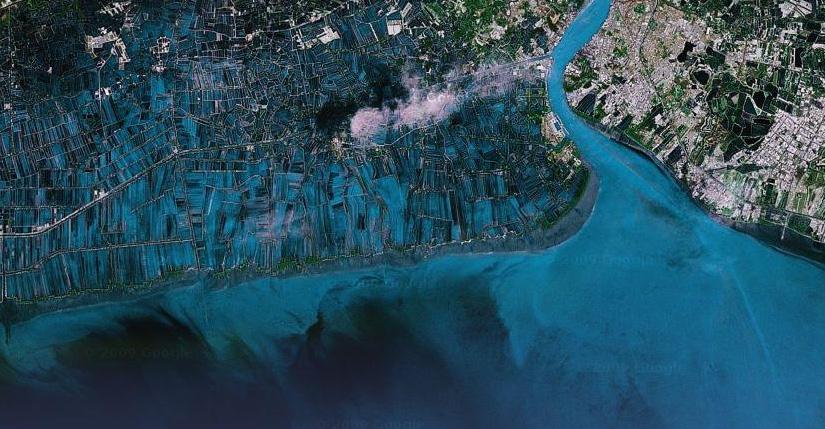
(left) Images: washingtonpost.com (right) Image: googlemap
(Top left)
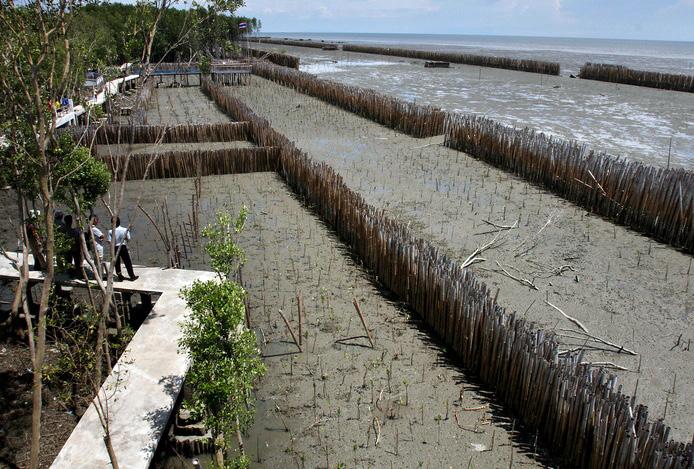
More and more Villagers helped Vorapol Dounglomchan, the developer of bamboo barrier, to construct an ecological defensive infrastructure to protect the land along the seaside in Khun Samutchine, Thailand.
(Bottom left)
Bamboo screens, erected in land densely and laid out in 3 rows, protect the land along the seaside in Khun Samutchine, Thailand. The sediments behind bamboo walls have reached 3 feet hight in the past 2 years which have been used to plant new mangroves, expected to be a whole new natural barrier in the future.
(Right)
Seawater has advanced inland for over 1 kilometer at Khun Samutchine village, south of Thailand in the past 30 years
Methods 2.3.4:
Khun Samutchine, located at southern part of Bangkok in Thailand, is a small village which is the most susceptible to direct impacts of coastal erosion. In the past 30 years, the sea water has swallowed more than one kilometer of land in Khun Samutchine.
At the beginning, villagers established the breakwaters made from concrete poles, crushed rocks or sandbags to reduce the wave intensity.
However, they were unaffordable and didn’t allow for essential exchange of fresh and ocean waters.
Then the villagers came up with a scheme using bamboo poles packed tightly together and laid out in three rows along the coastline as barriers, which not only declined the force of the waves but also trapped sediment from the seawater and prevented silt from being washed away, allowing for a more natural interplay between the marine and fresh water environments at the same time.
The inventor of this method, Vorapol Dounglomchan, pointed out that the benefit of using bamboo is putting a natural material into nature,

which offered an ecological solution to cope with this global problem.
In the past two years, the sediments behind the bamboo rows have accumulated up to three feet high and increased 100 yards of land. A number of mangrove saplings were planted between each bamboo screen, with the hope that the new mangrove forests will act as natural barriers soon.
(Demotic,2009; Sargent,2009; Chomchuen and Cahill,2010)
Location: Khun Samutchine, SAMUT SAKORN Province, Thailand
Client: Samut Sakor n Council
Size: 3-feet high and added up to 100 yards of land
Purpose: affordable coastal erosion management strategy.
Date: Completed
Inventer: Vorapol Dounglomchan (msnbc,nd, [online]}
It is evident that the solution is devised as an ecological way which not only prevents the land from direct impacts of coastal erosion but also traps sediment from the seawater.
It is worth having a more systematic research on the arrangement of bamboos in terms of their density and layouts.

Alternatively, in biology, most of the living organisms facing hazardous forces are able to adapt themselves to the extreme environments. The solution of them is not only producing more materials to reach a maximum strength resisting the natural forces, like building a dam, but also performing themselves as a part of the force, which essentially requires flexibility in order to reduce physical stress occurring on their surface.
The morphological system initiates fundamental properties such as decreasing Young’s modulus of elasticity by changing, adding or reducing its local materials, mainly fibres and cellulose, as well as its orientation with the intention of achieving higher elasticity.
In the plants, photosynthesis process, capturing sunlight is considerably to be the most competed aspect for a tree in a high-density forest. The light-competition forces each of them to expose their leaves vertically to sunlight by manufacturing upright fibres, building up a great column that elevates their photosynthetic elements above.
Consequently, large area of surface above the ground level is an obvious result leading to a tremendous power of drag force, especially in the event of storm.
Height is also a considerable as a problematic issue, it creates leverage which possibly is able to break trunks or wrenching roots out of the ground.
Fig 2.4.1

Regarding building efficient, very high, photosynthetic structures, they might stay parallel to the wind and the latter concomitant with high drag. Rigidity is an obvious option that consumes a lot of material and heaviness.
Alternatively, in fact, “nature does something relatively uncommon in human technology”(Vogel, 2003, p.9). Adjustment of local configuration, such as leaves and their attachments, is the method that the nature does in order to reduce their exposure and flap as the wind enhances.


Methods 2.4.4: Methods 2.4.5:
Postelsia palmaeformis: ‘standing stably on the ground”
Postelsia is its scientific name. It was known as the name of Kakgunuchale by the natives in California and the sea palm or palm seaweed. It is a same species of kelp, which is a kind of seaweed. It can be found in the lower intertidal zones of rocky (wavy area), besides the western coast of North America, where constant waves are. Although it spends most of its life circle in the air but not reaches a metre in height, thus, it is not a big tree. It can survive and remain straight out of water. Sea palm consists of three parts; an attachment (holdfast) is its organism that fixes to the rock it lives on, a column (stripe) that as thick as the tree trunk, and photosynthetic laminae (fronds).
Bangkok
Strutted system
There has two types of this system; both with and without external skins of the strutted system.
Single or branched strut
In this system, all struts join in a common pattern, and no motion is permissible at joints. In other words, it is a simply and statically determined system. It can be seen this system in many forms in daily such as, bicycle frames and support towers for electrical transmission cable. In nature, we can notice trees, branching corals and stiff items. The nature of this system, it usually, the branches of a system diverge without rejoining, whereas struts are sometimes joined into trusses.
Articulated strut
Postelsia is rather brittle and sensitive to scratches; it stipe is relatively soft. This might be as its disadvantage but Postelsia has its high value by its personal tactic; high stretchiness instead of high strength. It has the greater flexibility than another woody tree; it stands against gravity, getting higher in dense stands and has an ability to bend in response to lateral force, particularly waves. Its stipe is greatly suitable for living in a coastal environment due to it can bend with the constant wave action. It has an ability to bend until almost horizontal and then springing back upright, while other inflexible trees could be broken in such an environment.
This system is sharing the common lattice of compression-resisting elements, but their joints permit motion. We can see this system in the joint of many bridges in order to mechanisms can distort safely under the change of wind loads, function loads or thermal size changes. For nature system, the skeleton of human or even insect is good examples for the system of articulated strut (Vogel, 2003).


 Figure 2.4_4 : Postelsia
Flash flood generates very complex and steep force, both below and above the water surface from the beginning of the hazard venue. It causes enormous damages around the world without sufficient time for people to react.
Despite the fact that different kind of researches and practical projects about the flood managements and flood warning system were undertaken. It still cannot effectively solve this global problem, which needs to be managed using integrated strategies, and more flexible measurement based on the experience and historical records of flood events.
Understanding physical behavior of flash floods is the first step to approach the issue.
Studying on existing flood prevention methods in different scale benefits to understand the advantages and limitations of every strategy.
Buoyant design for a single house in the States is a specific solution, which is an effective buoyancy system under pre-fabrication process with a certain risk of suffering the moment of water force. G-cane project in Japan provides a good example of using advanced technologies to create an underground water circulation system which can drain flood water into the river and is also competent to reserve the water resources in case of drought.
However this kind of infrastructure requires specific geographical condition, and cannot be achieved anywhere.
The logic of Thames Barrier is based on protection strategy, which has faced lots of failures, causing dramatic damage around the world. This allows engineers to rethink the concept” living with flood”.
Bamboo Barrier project in Thailand offers an ecological approach to deal with coastal erosion, which has turned to be a positive aspect under this method, giving the supreme concept for this research, also inspired by example of nature organisms that successfully adapt themselves to an extreme environment.
Biological alternatives aims to explore in the experiment chapter by imitating the basic flexure behaviour when the nature adapting itself to the hazard venue.

Fluid mechanics are the key to evaluate these experiment chapters. The power of flood can be simulated by CFD analysis softwares like, Ansys, and indeed also physical experiment aquarium.

According to the synthesized researches and summaries of the previous chapters, buoyancy and mitigation are the main strategies to manage flooding events in regional scale. The strategies are driven by following relevant experiments, including both physical and digital explorations.
Digital simulations are carried out via computational fluid dynamics (CFD) test, ANSYS software, in particular. It is also a main tool to analyze the structural behaviour of the flow and the object in the water. ANSYS is an engineering simulation software which enables various types of digital models with specific material properties, to be tested under simulated environmental parameters.
However, limitations are also there with the software accuracy. All input parameters of flooding are unsteady, even the parameters are collected from trustfully organisation, flooding still unevenly calculable.
As a result, physical experiment might be an alternative to have a higher accuracy for all examinations.
Flooding simulator, the tank, is introduced as a pragmatic tool to examine and integrate the outcome from digital experiment as a consequence of flood water is not a perfect calculable material, which may fluctuate during its locomotion.
The tank mainly consists of one 78 watt jet pump, which can generate approximately 5 m/s2 velocity. The experimental area is about 2025 square centimetres, in 1 to 25 scale and L-shape water container with the capacity of 160,000 cm3. This is enough to circulate the flow in the tank at the water level of 3 meters.
However, limitations are also there with the software accuracy. All input parameters of flooding are unsteady, even the parameters are collected from trustfully organisation, flooding still unevenly calculable.
As a result, physical experiment might be an alternative to have a higher accuracy for all examinations.


Environmental setup:
Inlet: flow speed: 3 m/s
Outlet: relative pressure: 1 atm
Surface: smooth wall
Ground: smooth wall
Boundary: symmetry

The experiment focuses on the optimization of the land surrounding the building which probably be able to somewhat directing the harshness flow in order to reduce the pressure upon the system and also allow the water to go under the buoyant floor, which elevating system will be activated afterward.
Five typologies of landscape accompanied with one object, referred to the living building, at the centre are a combination of the digital, ANSYS, environment setup.
The parameters of this setup are the velocity of three meters per second from the inlet with a corresponding pressure of one Pascal at the outlet. The object in every situation ignored its material property and was thus considered a smooth wall.

The first simulation (01) was made as a basic reference locating at a flat ground, showing the pressure on the object and the variation of flow velocity in the normal condition. The following four simulations were explored in diverse conditions of slope at the position of inlet or outlet.
The pressure on the surface pronouncedly decreased when one downward slope sets at the inlet side which also shrinking the velocity of the flow. Both can be concluded that the fittest surrounding landscape management is the third design.
However, in reality, the land cannot be manipulated by only decreasing the levels without inclining. As a result, the fourth is the most suitable one.

The object’s slippery property will slightly effect to the flow’s velocities, which it’s not considerably to be a part of all parameters in the experiment.
Environmental setup:
Inlet: flow speed: 3 m/s
Outlet: relative pressure: 1 atm
Surface: smooth wall
Ground: smooth wall
Boundary: symmetry


Boundary:


Boundary:


The experiment is aiming to explore an appropriate elevating system regarding buoyancy property in a flash flood condition. Living space requires a protection from the drowning condition. As a result, buoyancy is the most effective strategy to deal with the problem. However, the vertical movement system is still having an immense difficulty with the lateral force applying on the immersed obstacle’s surface, which is the reason of examining this experiment.
In the first part of buoyancy experiment, a 15x15 centimetres floating floor made of foam with two centimetres thickness was a constant element for the three different kinetic systems. Large central core, small corner columns, and twisted supports are the systems that allocated at the centre of the tank’s experimental area then applying similar water force until they floated up and reached the setup height at 12cm (3m).


In the experiments, the central core system consists of one wooden pole of 2.5x2.5x18cm, which is interpenetrated through the centre of the floating platform. Secondly, the corner columns system has one stick of 18cm high with diameter of 0.8cm, which acts like a vertical guidance of the floor. Lastly, twisted support scheme has six rotatable columns floating up with a rotational movement.
Stability is the major issue to evaluate this experiment. As can be seen from the picture, central core system needs a massive column to support the floor and undergoes the strong horizontal force. Corner column system has better performance in terms of stability. However, it would lose its advantage when the higher friction and moment occurred under strong force of flash flood. Twisted system allows more flexibility under strong water force.
The cores systems may perform disappointedly but both of them behave quite fantastic when horizontal force is not applied in contrast with the third system, which is the worse in term of stability.
The accuracy of the experiment may not be sophisticated because the proximity of flooding direction is always from only one steady direction which is not occurred in the real hazardous condition.
The concept of flexural structure is imitated from biology in order to survive in severe conditions. This bending concept is the major investigation also the hypothesis of this research, which aiming to explore the potential of elastic materials geometrically.
Deformation is the main parametre to be evaluated in this experiment.
In digital experiment, three different configurations of elements with the same material comsumption, were individually fixed at top part then given a horizontal force of 30 Newtons at the bottom for a second.
In physical experiment, plastic tubes were utilized as the main elastic materials, which have an excellent performance of bending. The testing elements were placed in front of the outlet of the pump from 35 cm.
1 member
4 mm. x 150 mm.
Environmental setup:
Force: 30 N Time: 1 second

The first member is a single cylinder with the diameter of 4 mm and length of 15 cm, tested as the basic comparative reference. After that, two different kind of subdivisions were also exerted the same force, which caused diverse degrees of deformation relating the areas of its position and cross-section.
Three members made of plastic tubes were again examined physically for the experiment’s accuracy.
Increasing the cross-section area at certain position relatively affects the degree of bending.
To explain, if geometrical requirement is to be rigid, thus just increase the geometries’ section. In contrast, lessening the cross-section area will initiate more degree of flexure, which at some point can adapt to different structural and architectural conditions.
Physical test has bizarre results in the early attempts. The problem was mainly about the force of the jet pump is a sort of point load force.
Hence, if the force hits the experimental elements at the off-centre position, the precision of the result will be deteriorated.
Because, the moment will occurs and influences less bending eventually.


2 members
2 mm. x 150 mm.(x2)
Environmental setup:
Force: 30 N Time: 1 second


5 members
1 mm. x 150 mm.
1 mm. x 120 mm.(x2)
1 mm. x 80 mm.(x2)
Environmental setup:
Force: 30 N Time: 1 second


It is manifest from the outcome given that in flood simulations, the outputs gained from the digital simulations do not represent absolute values and that what they offer is a dimensional relationship between every experimental individual.
In digital bending experiment, more accuracy and variation of simulation objects are necessary for a better reference for actual implementation during design stage.
To achieve this, material properties should be introduced as one crucial parameter in this stage instead of only focusing on the geometrical comparison.
Moreover, different axis of deformation should be considered, reflecting the fluctuation of flood flow. It is recognized that varying cross-section areas would lead to dissimilar output results. Nevertheless, it cannot refer to the result of physical testing precisely owing to diverse environmental and material setup.
In redirection experiment, the tested model is a simple section in a bounding box to generate water flow without considering the whole geometry which may exert a pronounced influence on the result. In order to increase accuracy, changing the way of modeling will be an important step for further development.
As a consequence of series of experiments, the potential strategies were established to be carried to further design development.


These are images that taken when the project still working in the experiments stage Most of them are not the selected system to be develop further.
Development 4.1.1: Development 4.1.2:
After evaluated all the relevant experiments, one geometrical principle and four main strategies have revealed the developable fitness outcomes, then to be developed in this chapter.
The result of the basic geometry for flood mitigation performance is a sphere like. Pursuant to its curve will diminish the damage, pressure, on the geometry’s surface.
The first mitigation strategy that takes the first place in the flooding management procedure is the Redirection.
Channelling and slowing the water flow are the concepts of this method. Secondly, Buoyant system is introduced after the flood was partly diverted.
The floating strategy consists of two main issues, which are the vertical movement configuration and global geometry’s surface reduction in order to evade and lessen the pressure on the building respectively.
The latter strategy is Responsive branching system integrated with the latest strategy, reactive surface. Both use a principle from biology about local
flexibility, which is totally opposite to man-made flood management strategies recently.
This chapter, design development, mainly focuses on detailing the previous experiments’ results. The criteria will be integrated with the preceding outcomes which comprise the design expansion.
The additional are mainly architectural application, which is all about the space requirements, variations of scale and structural aspects, and material optimisation.
Although, the criteria are not covered all issues regarding to create a proper flooding management system for Bangladesh, but the improved design-data, which are about variations of design development results, from this chapter will support the research in the following chapters, which mainly consist of the aspect of architectural applications for a further suitability of the design proposal on the scenario site.

1st Strategy : Filtration
In the venue of flash flooding, runoff water that caused by intensive precipitation in flood risk area, is the main frequent reason that creates floods. When the water flow, its displacement rate is very high, high velocity of flood means high pressure on the obstacles. In addition, sediments that come together with the water will increase more momentum and will cost more damages to the area.
As a result, filtration strategy is needed to separate water and the harmful sediments. This strategy can be done more effective in regional or urban scale.

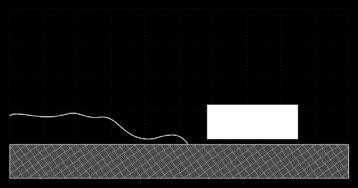


2nd Strategy : Redirection
After the first strategy, the flow will ideally contain only fluid, or with a viscosity property. Although, the flow is running without broken branches of trees or floating cars, the flood remains harmful by its momentum, that consist of mass and velocity.
The best way to diminish this destructive attack is to channel the water to the other direction or just decreasing its speed. The result is possibly not greatly. Because, the water flow is extremely massive and uncontrollable. However, the other important outcome is to give a time for the next strategy to float.


3rd Strategy : Buoyancy / mitigation
After evaluated all the relevant experiments, one geometrical principle and four main strategies have revealed the developable fitness outcomes, then to be developed in this chapter.
The result of the basic geometry for flood mitigation performance is a sphere like. Pursuant to its curve will diminish the damage, pressure, on the geometry’s surface.
This chapter, design development, mainly focuses on detailing the previous experiments’ results. The criteria expansion.
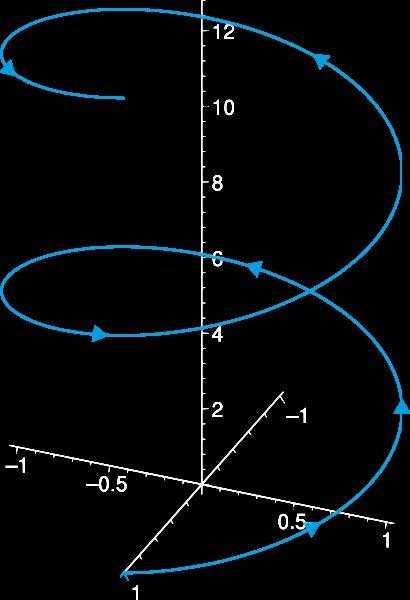


4th Strategy : Responsive Systems
After evaluated all the relevant experiments, one geometrical principle and four main strategies have revealed the developable fitness outcomes, then to be developed in this chapter.
The result of the basic geometry for flood mitigation performance is a sphere like. Pursuant to its curve will diminish the damage, pressure, on the geometry’s surface.
This chapter, design development, mainly focuses on detailing the previous experiments’ results. The criteria expansion.


Development 4.2.1:
After concluded and evaluated the first mitigation strategy, which is the redirection, the fittest design was selected by using Bernoulli’s basic principle, which is about the relationship between speed and the velocity of the flow. The velocity of the fluid is an inverse proportion to the Fluid’s sectional area at the same location. Declining the slope on the facing side will create a larger boundary of the water,
which means more volume and less speed, also less severity. After that, inclining slope directs the flow upward to the original ground level after the water moves through the building. The whole manipulation is physically like a sunken basin (figure 4.3_3).
However, the raw data from the experiment chapter requires the integration with the real world criteria in order to use that outcome as a further applicable design’s resources. The mentioned criteria for the Redirection can be categorized as the two main important parameters. They all relate to each others, which are soil absorption capability and the dimensions of the manipulated land (depth and length).
Development 4.2.2:
Width and length of the sunken-manipulated land around the building system are the objective of this section. The best configuration for a certain context must be one of the outcomes of this experiment.
The diagram (figure 4.2_1), illustrates the process of this experiment resulting from the most fitness of the Redirection experiment. The previous exploration will be developed by integrating
with some important criteria in order to create a set of design resources for a final specific context. The first one is architectural space quality when the land is sunken due to achieving the redirection principle. If the depth is too deep, mentally, it will be inappropriate for a good living condition. Secondly, although, the gap between the slope’s start point and the building is proportionally related to Bernoulli’s equation. Longer distance means the velocity and the pressure at the building is less. However, that is an ideal case; it may not happen in the real site. Lastly, soil’s absorption ability is the other parameter that affects the runoff of the water. Combining all of these main criteria and the result from chapter three initiates the design development of the Redirection eventually.


4.2_4: image: www.ktr.mlit.go.jp
This design development’s experiment setup has several parameters. Bernoulli’s equation is the key of it, which can be explained that the flow surface’s area multiplies by the velocity at exact location of the flow. The result will be equivalent with the other location of the same fluid flow.
Therefore, the sectional of the flow boundaries’ area (A) and the velocity (V) are the main parameters to be explored. The bed length (L) is also a considerable parameter, which mainly focuses on the distance between the declining slope and the building.
The developing experiment aims to explore and comprehend the dimensional factors related to the pressure on the surface and velocity of water flow in order to minimize the pressure and velocity under different conditions of the site.
Two groups of experimental objects were set up under identical ANSYS environments, which are the velocity of 3 meters per second from the inlet with a relative pressure of one standard atmosphere at the outlet.
Three dissimilar heights varied from lowest ground to the bottom of the surface in the first group (A-series). The other three different distances varied from beginning point of the slope to the surface of the object in the second B-series. The object in every situation was ignored its material property and thus considered a smooth wall.
A glance at the outcome of the first group, increasing the height has an efficient and significant effect in terms of reducing pressure and velocity while the parameter of distance from the point of down slope to the surface has no marked influence due to the basic formula of Bernoulli’s Principle:
A1V1 = A2V2.
A large water channel of the G-Cans project in Japan, using redirection strategy. This project has been protected the city for several times.
The idea of this flooding mitigation management is a regional scale, which could be able to develop into a smaller scale like this design development’s experiment.
The result of this experiments cannot be optimised without a specific context because, apparently, the length of the sunken basin can be even infinity and the flood will be vastly reduce its pressure and speed. However, in reality, on the site will have a limit of space to do this strategy on the site.

Inlet:
Outlet:
Surface:
Ground:
Boundary:


Inlet:
Outlet:
Surface:
Ground:
Boundary:


Inlet:
Outlet:
Surface:
Ground:


Inlet:
Outlet:
Surface:
Ground:
Boundary:


Elevating the whole building up in order to avoid the harshness of the lateral force from a flash flood, is the most important and effective strategy. After concluded and evaluated from the Buoyancy experiment, the fittest design was selected by using the friction and flexure as the fitness criteria, which were according to the project’s hypothesis, dealing with flood by imitating the biological methods.
The best result was the twisted vertical movement system. Its flexibility is the most important factor, which the other movement methods were failed due to the flexibility and frictions issues.
Although, the twisting moves along a helix path with calculable parameters and equations, yet, remains inapplicable.
Additional criteria are necessitated in order to have the pertinent results for further and specific development. The foremost parameter is the number of the system’s supports, or columns. This will relatively define the geometry of the supports’ base and the floor plan.
Subsequently, ranges of the angles while the system is twisting will be the other considerable parameter that has to be optimized, minimize the rage of occurring angle regarding the further construction difficulties.
The counts of the twisted supports and their configuration when they perform as a global geometry; is the inputs of this developing experiment.
The objective and the results depend on those parameters. To define the movement of the twisted-vertical movement geometrically, is the first objective if this section.
As a result, every connection between all elements would probably need joints, where the difficulties are.
The angles of the articulation are impossible to define manually because of the twisting movement, when it moves the angle will vary. Thus, it is compulsory for the further processes to minimize the range of angles when the system is elevating.
The flow chart (figure 4.3_1), illustrates the process of this developed experiment resulting from the most fitness of the Buoyancy experiment.
The preceding investigation will be improved by adding some important criteria regarding to create a set of design resources for a final design proposal.
The first one is the variations of architectural scale; in this exploration are sizes of the floor plan and the supports’ radius. These two factors will affect ranges of angles as well.
In order to optimise the geometrical movement by selecting the lowest range of rotational joint’s angle, and the maximum surface area reduction regarding lessening the pressure on the protective surface. Both aspects require a precise tools, which is the parametric design tool, such as Grasshopper

(right)
S.Area = Surface area.
The first row is the elevating system with 1 metres of the twisted supports’ protective extension. The connection of the end of supported members are joined at the floor edges, without protective gap between surface and living space in the second row.
Fix parameters : Base Radius-800 Floor Radius-600
(right)
From left to right, diagrams show the Movements in different levels, start from 0.5, 2.0 and 3.5 metres respectively.
S.Area = Surface area.
The first row is the elevating system with 1 metres of the twisted supports’ protective extension. The connection of the end of supported members are joined at the floor edges, without protective gap between surface and living space in the second row.
Fix parameters : Base Radius-600
Radius-600
From
S.Area = Surface area.
The first row is the elevating system with 1 metres of the twisted supports’ protective extension. The connection of the end of supported members are joined at the floor edges, without protective gap between surface and living space in the second row.
Fix parameters : Base Radius-400 Floor Radius-600
(left)
From left to right, diagrams show the Movements in different levels, start from 0.5, 2.0 and 3.5 metres respectively.
S.Area = Surface area.
The first row is the elevating system with 1 metres of the twisted supports’ protective extension. The connection of the end of supported members are joined at the floor edges, without protective gap between surface and living space in the second row.
(right)
S.Area = Surface area.
The first row is the elevating system with 1 metres of the twisted supports’ protective extension. The connection of the end of supported members are joined at the floor edges, without protective gap between surface and living space in the second row.
Fix parameters : Base Radius-600 Floor Radius-600
(right)
From left to right, diagrams show the Movements in different levels, start from 0.5, 2.0 and 3.5 metres respectively.
S.Area = Surface area.
The first row is the elevating system with 1 metres of the twisted supports’ protective extension. The connection of the end of supported members are joined at the floor edges, without protective gap between surface and living space in the second row.
Fix parameters : Base Radius-400
From left to right, diagrams show the
S.Area = Surface area.
The first row is the elevating system with 1 metres of the twisted supports’ protective extension. The connection of the end of supported members are joined at the floor edges, without protective gap between surface and living space in the second row.
Fix parameters : Base Radius-800 Floor Radius-600
(left)
From left to right, diagrams show the Movements in different levels, start from 0.5, 2.0 and 3.5 metres respectively.
S.Area = Surface area.
The first row is the elevating system with 1 metres of the twisted supports’ protective extension. The connection of the end of supported members are joined at the floor edges, without protective gap between surface and living space in the second row.
Development 4.3.5:
(right)
From left to right, diagrams show the Movements in different levels, start from 0.5, 2.0 and 3.5 metres respectively.
S.Area = Surface area.
The first row is the elevating system with 1 metres of the twisted supports’ protective extension. The connection of the end of supported members are joined at the floor edges, without protective gap between surface and living space in the second row.
Fix parameters :
Base Radius-400
Floor Radius-600
Looking at the range of angles occurring in the system the, results are obvious that, there are no differences of angles’ range when the radius of both planes, the elevating floor and the base, are constant parameters. The ratio of the floor area and the base radius is the key of numbers of angles. To explain, if the ratio is more than one the range of angle will be much wider.
Extending the twisted supports to have a protective gap between branching surface and the living space, is not only a benefit but also controlling the kinky point on the branching, which leads to a geometrical transformation in order to reduce the pressure on the surface ( P = F/A )
Hence, looking at the percentage of surface area reduction, it is obvious that the percentage will not altered when a number of supports is changed . If the planes are measured as the same size, the area reduction percentage is the highest.
For further development, it can be seen that all individuals have different but predictable results. The first thing that could be applied as an optimised design is the middle column, the floor and the base is the same radius, which is the most effective regarding to inflect the geometry for flooding mitigation. However, considering the range of joints those results are not the best, larger base individuals are the most effective one.
Experiment 4.4.3:
The Responsive Transformation is the other mitigation strategy. The concept is arisen up after concluded and evaluated the logic of Biomimetics when living organism dealing with an uncertainty situation, which is more or less a passively response system.
The nature prefers creating flexural elements to mitigate the force rather than building a rigid element to against the force. The design is something like an adaptive system that response to the lateral force of flash flood by the principle of Newtonian.
The basic relevant equation is about; the pressure is equal to the force divides by the area. Hence, it’s obvious that the area is one of the key factors extracting from the formula in order to design an effective system using a reduction of its geometries’ surface area as a strategy.
From the most potential result from bending experiment, branching like elements was selected as the fittest for the further development in this chapter.
(figure 4.4_1).
However, the unprocessed data from the experiments requires the incorporation with the real world criteria in order to use that outcome as a further applicable design’s database. The mentioned criterion for the Responsive is mainly architectural space requirements, like height and living conditions.
The counts of the twisted supports and their configuration when they perform as a global geometry; is the inputs of this developing experiment.
The objective and the results depend on those parameters. To define the movement of the twisted-vertical movement geometrically, is the first objective if this section.
As a result, every connection between all elements would probably need joints, where the difficulties are.
The angles of the articulation are impossible to define manually because of the twisting movement, when it moves the angle will vary. Thus, it is compulsory for the further processes to minimize the range of angles when the system is elevating.
The preceding investigation will be improved by adding some important criteria regarding to create a set of design resources for a final design proposal.
The first one is the variations of architectural scale; in this exploration are sizes of the floor plan and the supports’ radius. These two factors will affect ranges of angles as well.


Different configurations of branches were divided into three groups in which each has one fixed parameter with total height of 12 cm digitally and physically. In ANSYS environment, equal forces of 5,000 Newton were exerted on three bottom points. In the physical simulation tank, bottom parts of every individual branch were attached one smooth surface to catch water force generated from the pump.


In digital experiment, the member that has less deformation when height of the first element minus that of the second element is larger.
The logic can be examined in physical experiment, which has a similar trend except the first member (red line), showing much more deformations, caused by dramatic force of water flow.
Development 4.4.5:
According to the outcome of branching experiment, we can find a manifest difference of deformed degrees by changing bifurcation point, and it revealed that higher hierarchical element has a vital influence on the degree of deformation under the requirement of same height.
The rule can be illustrated that the member would have more deformations if the height of higher hierarchy minus that of lower hierarchy is smaller.
On the contrary, if the result is bigger, the higher hierarchical element will limit bending capacity of the whole member efficiently, leading to fewer deformations.
Considering architectural demands, specific dimension of space is required, which is significant criteria for this project. Therefore, a degree of deformation for bending needs to be limited and decided by manipulating bifurcation points.
Design Development 4.4.6:
According to the branching experiment, one member with decreasing cross-section areas and height has the smallest degree of deformation when applied force at the bottom part. This phenomenon indicates potential application for surface structure as a responsive protection which is not only flexible enough to adapt itself to the external force but also has an appropriate range of limited deformation, preventing internal space from detriment..
The logic of branching interrelates to dimension of branches and proportion of expansion. Therefore the way how one prime branched component grows up to a full surface structure has vital importance. Two way of branching were introduced to organise the geometry of the surface. Compared with the first option below, the second choice has better capacity to maintain the continuity of material by simple bending. Under this logic, different numbers of branches were utilized to embody a full surface structure which can be applied to different scale of space.
Bifurcation point
Bifurcation point
Figure 4.4.6_1:
The drawing shows the logic of organization for branching.
The drawing illustrated the variation of branching surface which can adapt to defferent scale of space.
Bifurcation point
Design Development 4.4.7:
Surface organized by branching system is connected to the twisted supports of the buoyant system, acting as one responsive machine. Height of a space is the fundamental criteria to create the architectural space which tends to increase while flood water lifts the buoyant floor up owing to the geometrical change of the supports.
In the ideal model, surface areas follow the logic of branching which can be comprehended as the sum of different segments with bifurcation points in between. The length of segments starts from the end of the material which is set up as a half height of maximum flood water, known from regional statistics, and the length of following segments is mathematically increased from bottom to top.
(Left)
Two digital models show the geometrical change of the surface when buoyant floor floats up.
(Right)
Significant parameters are shown in he ideal model.


H/2 H/2+ a H/2+ b H/2+ c H/2+ n r r T T’ H/2 H/2+ a H/2+ b H/2+ c H/2+ n h’ H 2m h 2m r r A B C D N N A B C D H/2 H/2+ a H/2+ b H/2+ c H/2+ n r r T
H/2 H/2+ a H/2+ b H/2+ c H/2+ n h’ H 2m h 2m r r A B C D N N A B C D L material length)= H/2+(H/2+a)+(H/2+b)+(H/2+c)+.....+(H/2+n)
> c > b > a r: radius of floor
height of space
maximun deformation of point A
maximum height of flood water
lenghth of single material
bifurcation points
From proposed experiments undertaken in the previous chapter, buoyancy, redirection, and inflection strategies are embodied through different possible variations within dissimilar aspects of the whole system. Further developments aim to establish logics and relationships between all the parameters of strategies, generating more complex and effective topology, which enables the system to be adaptable to various scales and contexts in the dynamic environment.
Parametric models of the buoyant system were built up by Grasshopper software, in order to select an optimized scheme which has the maximum geometrical reduction of surface and minimum range of rotational joints. Based on the same geometry, this system has the potential to be scaled up and down, catering to different design demands.
Flow simulations for the sunken site were made again, altering two parameters in terms of redirection strategy. It is worth noting that increasing the space below the object would significantly reduce the pressure on the surface and also slow down the water velocity. However, varying the distance between the object and the top of the slope has no obvious effect explained by Bernoulli Principle. The result does not mean that this parameter is unimportant; it signifies that more variations are required to understand the limitation of the logic.
The logic of bending one single elastic post was brought further to a branching surface by exerting the force on different configurations of three-generation networks. These were tested digitally and physically. The outcome of digital and physical tests both show the capacity of each member to control the degree of deformation. Nevertheless, digital and physical tests result in slightly different consequences, considered as a deviation during both experiments, which require much more concerns for further progress. The principle of the surface members’ organization was deliberated in this stage. An ideal model is leading to a design principle which integrates the parameters of the system, informing the design proposal in the following chapter where specific contexts of site and materials are introduced.

On the right is a rendered image of Responsive Transformation system for flood mitigation strategy.
This adaptive system comprises of branching structure and component based surfaces, both will be activated by flooding pressure inflecting the geometry in order to reduce the lateral force.

These are images that taken when the project still in the experiments stage Most of them are not the selected one to be develop further.
Development 5.1.1:
The design-relevant database has been collected in the previous chapter, ready to be applied into a specific context. The proposal will be designed and integrated with all preceding synthesises from research & experiments parts. South Asia is the foundation of this project’s studies as well as the example site of the design proposal for this chapter, which is located in the area called Sunamganj, Northern of Bangladesh.
Studying the site is not only providing the idea of its topography due to designing the prone area but also several significant factors to the responsive transformation system, such as the maximum height of flood and the purity of flood. These examples directly influence the system through design parameters in order to create a specific system for that site.
The final proposal for the Bangladesh’s scenario is comprised of all mentioned strategies, which are redirection strategy, twisted buoyancy system and geometries’ inflection system.
All of these flood management methods have a certain advantage and suitability.
The methods perform as an element, part of the whole mitigation system, which cannot functionally work without the others.
Therefore, assembly of all strategies will be illustrated in this chapter explaining how it works by a series of images.
In addition, fabrication and material system is further consequent issues. These following parts will show the concept of the appropriated method to construct complicated architectural intervention systematically. Material system is also considerably to be a significant aspect; as a result of geometries’ inflection strategy, which required elasticity property and density of the material due to buoyancy strategy.
Development 5.1.2:
There are two different tools to evaluate the design proposal, one is digitally by using CFD analysis and the physically by the flooding aquarium. The latter seems to be more effective due to the actual behaviours of the system when the force is applying in the simulation. These evaluative results would probably inform about some aspects that could be optimised, which leads to the project conclusion and further development.

On the right is te flood level map. The darkest spot, meaning the maximum depth of water when flooding occurs, is locater in the area of Sunamganj, inside the red square. The data that important is the level of water , because it will reflect the design directly.
Development 5.2.1:
Site : Sunamganj
In Bangladesh flash floods generally occurs in the north-east, south-east and Chittagong region. Devastating flash floods are a recurrent phenomenon, especially in the north-east region of Bangladesh. The extreme flashy character of the rivers and sudden excessive rainfall in the region causes frequent flash floods in the north-eastern Haor areas.
Sunamganj, located in north-eastern of Bangladesh, is selected as an example site’s scenario because of many reasons. Firstly, according to Banglapedia, official database website of Bangladesh, this area is one of the most frequent flash-flood in the country (Banglapedia,2006,[online])
The city is prone to flash-floods in a regular basis, such as mountainous geography alongside a water channel. The rivers, Surma River and Kushiyara River, runs through Sunamganj, which are dominated by flood plains with seasonally flooded tectonic depressions. The design could be also applicable to another similar topography globally.
Figure2.9Averagedepthofinundation,slightlygeneralized. Sources :Brammer(1994);Pasche(1990).
Development 5.2.2:
Local material : Bamboo
Design proporsal 5.2.3:
The majority of bamboos are in the tropical climate zone. The most suitable temperature is between 28 and 50 Celsius. The sandy loam and loamy clay soils are the most proper soil that bamboo can be grown as they love well drained condition. However, they can also grow in the marsh land (Coolbamboo 2002).
Even they love tropical climate zone, this biggest glass can be found in various climate conditions since in the high land cold mountain to tropical climate zone. They are in the Northeast Asia, since the 50 N latitude in the Pacific islands closed to Russia, in the South Asia up to Himalayas mountain. Moreover, they can even be found in the Sahara desert in Africa and in the southeast of the US to the south of Chile
Bangladesh has a total land area of 14.4 million ha, where more than 33 bamboo species have been found in the forest area. Bamboos have been traditionally used in Bangladesh by the rural people in various household activities, especially housing construction.

(above) Distribution of native bamboo. Thre are more than 10,000 bamboo species in the world, especially in tropical areas, such as South America, Africa, and South-East Asia.
Figure 5.1_4: image: www.powerful-mind.com
Bamboo is a very special plant because of their longitudinal growth, the fastest growing plant in the world. “The canes of bamboo consist of nodes, segments and diaphragms. At the first canes appear as small buds at the nodes of the rootstock. There they grow for several years until they emerge from the soil in the shape of short, thick, conical shoots surrounded by sheath leaves (Coolbamboo 2002, p.3). The sizes of bamboos are very various. Some kinds of them the high can be reach 40 meters and the diameter can be reached 30 centimeters.
Each bamboo will grow to reach its highest within only one years, but bamboos can live between 10-100 years depend on the kinds (DNP, 2007) However, the average cane is about 8-15 meters long, the diameter is about 5-12 centimeters and the wall thickness is about 1 centimeter (Coolbamboo 2002). Interestingly, the size of bamboo cane remains the same since the first year that it already fully grows. The segments of each cane increases from the bottom until the middle, then starting to decrease till the top.
Bamboos have a very high ability to survive in any natural condition. In order to cope with wind and storm, bamboo has a great potential to adapt with these situations because of various reason; the diameter of the cane decrease with the height of the cane which means that the base of bamboo cane is very strong and it carries only the smaller cane till the top. the bamboo root is like a network system which overlay and penetrate between each others, as a result, the whole bushes are stuck together, last but not least, the tissue of bamboo is thick and has a great elasticity (ibid 2002).
Bending property or flexural strength is a special characteristic of bamboo. This property is useful for building the construction that have to deal with the force from outside such as flooding. A bending test by Janssen (2000) found that the usual outcome of bending stress of bamboo is 62N/mm2 where the bamboo fiber is still in the well condition. Another test by Otto (1985), the sampling of bamboos had been chosen. “These material have diameters of 70-100 mm and wall thicknesses of 6-12 mm for free spans of 3.6 m. The values of elastic deflexion were: min. = 1/25.9; max. = 1/16.1; average = 1/20.1 of free span” (Otto 1985, p.88).
(Left top)
Bamboo is recognized as one of a good material for house structure because people can find it easily from the surrounding areas, especially in the countryside. In the economic term bamboo is a low cost material to be use to build a house, in some part of the world, bamboo is even the cheapest material for construction. Moreover, people can extract and modify bamboo by using only simply tools (Mardjono 2002).
(Left bottom)
Maximum force applied on single bamboo is related to its cross-section areas, length, and mass.
(Right)
Mechanical properties of bamboos (Otto, 1985)

Fmax= m /L / BIC * f BIC= Mass / Force * L [ g / N*m] f=1/4.88*d/L*4d12/ (d1+d2)2
Compressive strength in kp / cm 2
Parallel to the fibre Cane Rod Ø 60 Ø 32 636 863 621
Perpendicular to the fibre 525‐930
Tensile strength in kp / cm 2
Outer
Inner
Bamboo Cane
ED=Modulus

Buoyant floor test
Scale : 1/20
Diameter of
Design proporsal 5.2.6:

Due to the imperfect character of bamboo, it is difficult to use Archimedes Principle to precisely calculate the maximum load which one bamboo platform can carry. Therefore testing physical bamboo floor is introduced as an important reference which gives the relationship between areas and weight of the floor, and the maximum load.
Six different sizes and thickness of floors were tested, applied water load on them until shank. Water inside the container is the maximum load each bamboo floor can carry.
The trend of the relationship between floor areas and maximum load can be known from the chart, allowing estimate the load which buoyant system can carry.


: 6mm~10mm
Outer branching structure
Inner branching structure
Buoyant floor system
Kinetic-Global control Supports
Base/Foundation
Development 5.3.1:
After finishing all the design development and having the result as a design database integrating with the contextual requirements, the final design proposal could be proposed.
The design intervention for flooding venue must have strategic elements to deal with the hazard, which in this case is a flexibility of the material performing as a bending property.
On the other hand, a stiffness of the structure is also important in order to maintain the architectural space. Both flexure and rigidity properties in only one structural system seems logic less in the man-mad physics way.
However, after studied from the previous chapters, branching systems is the answer because, it is a hierarchical structural system which provides a more opportunity to apply the logic onto any complicate systems.
The whole branching system is controlled by kinetic support elements. Moreover, this is not only controlling the geometry for remaining architectural quality but also provide a chance to inflect the skin with their supports by lessening the global size of the system.


In addition, the kinetic support is still important in term of controlling the buoyant floor to move up helically.
All of the mentioned elements comprise the responsive transformation system.


Development 5.3.2:
A set of renders below illustrates the movement of the design proposal when flash flooding is taking the area. White small dot refers to the direction of the force and also defining the amplitude of the flood by the distance, when it is close to the building, means higher pressure is now applying.
From the frame number one to eight shows the deformation at the lowest level of the surface’s structure.


The lowest part, slimmest, the most sensitive, of the surface is facing the force of the flood directly, at the water surface level. The geometries’ inflection is required on that location in order to deal with the flood and return to the initial shape when the incident becomes calm.
This proves the application of hierarchical branching into the real responsive system that needs both flexibility (bottom part) and rigidity (to keep the form, top part of the geometry).
After the first attack of a flash flood, all the following pictures show how the building elevates up along the helical path. If there still has a lateral pressure from the water, lower levels of hierarchical surface will be active again.


The six sequential diagrams show the fabrication process of
The process begins with the building’s foundation. After researching from Local building in Bangladesh, most of them use bamboo canes as piles of the footing. The reasomn for this is mainly the cost of the canes., which are affordable for them rather than others expensive materials.
Secondly, the main “kinetics supports” is the most important element in the structural system. Not only controlling the movement of buoyancy of the building but also control the size of the protective surface ( reducing the size for force’s reduction).
Hence, precise calculation is requested for this crucial part that controlled everything when the system starts moving.
Afterthat, building the buoyancy floor by a floating material such as packs of bamboo canes or an artificial foam. This elements will drive the whole system up in order to suvive in the flooding situation.
The next process is the most important for the responsive system that begins with a parametric calculation. This computational tool, grasshopper software, will generate the context-appropriate branching surface, which is geometrically defined by all contextual domain such as flood maximum level, material properties, especially bending.
to be Constructed Material
After designing by all the inputs from the site, construction drawings and building the scaffolding is the most crucial part. To have a precise result all branching interconnections will be supported by pre-calculated scaffolding members, which acts like a control point for the geometry. Then fabricating branching structures and surfaces will be mo


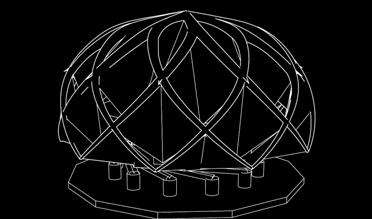
Development 5.5.1:
After combining all the developed strategies, a completing responsive system emerged. One full physical model mainly made of plastic tubes, and sheets was set up in the flood simulation tank, given horizontal forces from the water, generated by the water pump which incessantly exported water into the tank until the water level reached 12 centimeters (3 meter, in reality), then circulating at this level.


As a result, the system elevated in a helical way by buoyant force, and the whole surface successfully became smaller because of the geometrical change of the connection points between main supports and the branching structure, However, were not as flexible as expected owing to the imperfection of the joints at bifurcation points along with the undue stiffness of surface materials. Moreover, insufficient power generated by the pump made the deformation of the surface not easy for observation. Another issue that has significance in this simulation task would be the stability of the whole system which lacked of balance when the centre of mass changed.
ANSYS was also used to examine the global surface, showing the result that part of the surface has more pressure than a fully circular object. This is an important problem which needs further investigation and test.


The image below shows the merging of two images, same experiment but diffent time. It shows how the systems changing its geometry from the beginning of flood venue then when the water reaches 3 meters, which is the maximum recorded level for Bangladesh. Surface area becomes smaller when the height of the building is rising up..

Redirection, inflection, and Buoyancy are proposed as the main strategies to manage the detriment of flash flood, including floating up the floor, redirecting the water flow down in order to prevent direct impact on the outer surface of a house, and inflecting the surface itself by bending surface material which can absorb the energy of horizontal force generated by flood flow. It inspired, by the way, how natural organisms survive. These methods provide with an innovative approach to the aspects of living with floods, differing from conventional flood preventing measurements, tending to retard inherent performance of nature.
As the consequence of the transformation system developed at the typical flood prone region, Sunamganj in Bangladesh, one new spatial typology emerges. In small scale, the prime system applied to urban or rural areas has a capacity to be private housing, which can offer personal safety throughout flood events or to be public space, providing a supplement of food, water, and medical service during a pre-flood and post-flood period.
Similarly, further development of applying the same strategies into a larger scale is of importance but lack of in this research, such as an infrastructure and an urban network, dealing with regional problems of flooding. In addition, further research is necessary to establish a firm connection between digital simulation and physical testing in bending experiment in order to have accurate and effective evaluation, which can be brought to following design process.


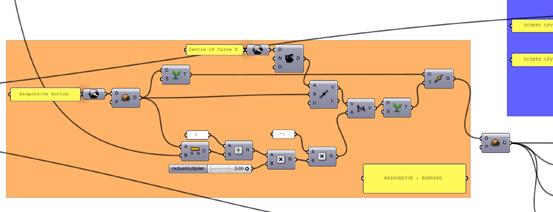


Doswell, C.A. (1994) Flash flood- Producing convective storms: current understanding and research. USA: National Servere STorms laboratory Norman .
Hoferm T. and Messerli, B. (2006) Floods in Bangladesh: History, dynamics and rethinking the role of the Himalayas. NY: United Nations University.
Hughes, R., Adnan, S. and Dalal-Clayton, B. (1994) Floodplains or flood plans? A review of approaches to water management in Bangladesh. London: International Institute for Environment and Development; Dhaka Research and Advisory Services.
Ninno, C.D, et al (2001) The 1998 Floods in Bangladesh: Disaster impacts, Household Coping Strategies, and Response. Washington D.C. : International food policy research institute.
Saveur, J. (2003) (Re)claiming the Underground Space. Netherlands: Swets & Zeitlinger B.V., Lisse.
Otto, F. (2985) Bambus-Bamboo. Stuttgart: Institute for Lightweight Sturctures (IL).
Vogel, S. (2003) Comparative biomechanics: life’s physical world. USA: Princeton University Press.
Barrera, A, Barriendos, M. and Llasat, M.C. (2005) ‘Extreme flash floods in Barcelona country’, European Geosciences Union, 2, pp. 111-116.
Brammer, H. (1990) ‘Flood in Bangladesh: Geographical background to the 1987 and 1988 floods’, The Geographical Journal, 156(1), pp. 12-22.
Chowdhury, M.R. (2000) ‘Natural Hazards: An assessment of flood forecasting in Bangladesh: The experience of the 1988 flood’, Earth and Environment Science, 22(2), pp 139-163.
Hossain, A. (2003) ‘Integrated flood management case study, Bangladesh: Flood management’, The associated programme on flood management.
Llasat, M.C. et al. (2010) ‘High-impact floods and flash floods in Mediterranean countries: the FLASH preliminary database’, European Geosciences Union, 23, pp. 1-9.
Michaud, J.D., Sorooshian, S. (1994) ‘Effect of rainfall-sampling errors on simulations of desert flash floods’, Water Resources Research, 30(10), pp. 2765-2775.
Mirza, M.Q. (2002) ‘Three recent extreme floods in Bangladesh: A Hydro-Meteorological analysis’, Natural Hazards, 28, pp. 35-64.
AllinLondon (2010) Thames Barrier Visiors Centre [Online] Available at:http://www. allinlondon.co.uk/thames-barrier-visitors-centre.php. [Accessed 18th June 2010].
Atlasobscura (2009) G Cans The world’s largest drain. [Online] Available at: http:// atlasobscura.com/place/g-cans-worlds-largest-drain. [Accessed 4th June 2010].
Bamboogrove (2010) Bamboo Architecture. [Online] Available at: http://www.bamboogrove.com/bamboo-architecture.html. [Accessed 8th June 2010].
Banglapedia (2006) National Encyclopedia of Bangladesh. [Online] Available at: http://www.banglapedia.org/httpdocs/HT/B_0184.HTM. [Accessed 25 July 2010].
Barcelonal Field Studies Centre (2010) The Flood Event of 10th June 2000. [Online] Available at: http://geographyfieldwork.com/Flash%20Flood%20Case%20 Study%20June%202000.htm [Accessed 8th June 2010].
Cber (2010) Preliminary Damage Estimates for Pakistani Flood Events, 2010. [Online] Available at: http://cber.iweb.bsu.edu/research/PakistanFlood.pdf. [Accesse d 25th August 2010].
Chomchuen, W. and Cahill, P. (2010) Lonely battle against Thailand’s rising tides [Online] Available at: http://worldblog.msnbc.msn.com/_news/2010/01/09/4376277lonely-battle-against-thailands-rising-tides. [Accessed 2nd August 2010].
Coolbamboo (2002) Bamboo as a Building material. [Online] Available at: http:// www.koolbamboo.com/Bamboo%20as%20a%20building%20material.pdf. [Accessed 9th June 2010].
Dawn (2010) Flood to hit economic growth: Finance Ministry. [Online] Available at: http://www.dawn.com/wps/wcm/connect/dawn-content-library/dawn/news/ business/03-floods-to-hit-economic-growth-finance-ministry-ss-04. [Accessed 24th August 2010].
DAS (1997) Thy Hydrologic Cycle: Online meteorology guide [Online] Available at: http://ww2010.atmos.uiuc.edu/(Gh)/guides/mtr/hyd/home.rxml. [Accessed 26th August 2010].
Deltawerken (2004) [Online] Available at: http://www.deltawerken.com/Deltawerken/16.html. [Accessed 24th August 2010].
Demotix (2009) Thai villagers battle rising sea levels. [Online] Available at: http:// www.demotix.com/news/385201/thai-villagers-battle-rising-sea-levels. [Accessed 2nd August 2010].
Dezeen (2009) Float House by Morphosis for Make it Right. [Online] Available at: http://www.dezeen.com/2009/10/20/float-house-by-morphosis-for-make-it-right/ [Accessed 7th June 2010].
DNP (2007) Bamboo. [Online] Available at: www.dnp.go.th/fca16/ file/3v5lyr1lqz5py4o.doc. [Accessed 19 June 2010].
Edogawa river office (2010) [Online] Available at: http://www.ktr.mlit.go.jp/edogawa/project/g-cans/frame_index.html. [Accessed 5th June 2010].
Fairman, J.G. (1996) Buoyancy: Archimedes Principle. [Online] Available at: http:// www.grc.nasa.gov/WWW/k-12/WindTunnel/Activities/buoy_Archimedes.html.[Accessed 17th August 2010].
Floodsite (2009) [Online] Available at: http://www.floodsite.net/. [Accessed 5th June 2010].
Guardian (2010) Causes of the flooding in Pakistan. [Online] Available at: http:// www.guardian.co.uk/world/2010/aug/12/causes-of-flooding-in-pakistan. [Accessed 26th July 2010].
Internetworldstates (2010) The World population and the top ten countries wih the highest population. [Online] Available at: http://cgz.e2bn.net/e2bn/leas/ c99/schools/cgz/accounts/staff/rchambers/GeoBytes/GCSE/Case%20Studies/ Case%20Study.%20Flooding%20in%20Bangladesh.htm. [Accessed 23rd August 2010].
8.2 References
Janssen, J. (2000) Designing and Building with Bamboo. [Online] Available at: http://www.fundeguadua.org/imagenes/DESARROLLOS%20TECNOLOGICOS/ ARTICULOS%20Y%20PUBLICACIONES/INBAR_Technical_Report_No20.pdf. [Accessed 5th June 2010].
Listphile (2007) Types of floods. [Online] Available at: http://www.listphile.com/ floods_students_role/types_of_floods. [Accessed 16th June 2010].
Logan, T. (2004) Why Bangladesh floods are so bad. [Online] Available at: http:// news.bbc.co.uk/1/hi/world/south_asia/3929217.stm. [Accessed 26th August 2010].
Morphopedia (2010) FLOAT House. [Online] Available at: http://morphopedia.com/ projects/float-house. [Accessed 7th June 2010].
Mufc (2005) Trees and the storm - Katrina 2005. [Online] Available at: http://www. msurbanforest.com/hurricane_trees.html. [Accessed 30th August 2010].
Nasa (2010) ASTER Captures New Image of Pakistan Flooding. [Online] Available at: http://www.nasa.gov/topics/earth/features/pia13343.html. [Accessed 23rd August 2010].
NWS National Weather Service (1992) National Oceanic and Atmospheric Administration National Weather Service. [Online] Available at: http://www.nws.noaa.gov/ om/brochures/ffbro.htm. [Accessed 26th August 2010].
Richards, G.M. (2003) The Development of the Thames Barrier. [Online] Available at: http://www.ewell-probus.org.uk/archive/thames_barrier.htm. [Accessed 5th June 2010].
Riebeek, H. (2005) The Rising Cost of Natural Hazards. [Online] Available at: http:// earthobservatory.nasa.gov/Features/RisingCost/. [Accessed 23rd August 2010].
Sargent, R. (2009) Erosion, climate changes sink villages. [Online] Available at: http://www.bruneitimes.com.bn/science-technology/2009/12/08/erosion-climatechanges-sink-villages. [Accessed 2nd August 2010].
Scienceisart (nd) Water, waves, and ripples. [Online] Available at: http://earthobservatory.nasa.gov/Features/RisingCost/. [Accessed 23rd August 2010].
Sciencedaily (2010) Global warming increases flood risk in Mountain areas. [Online] Available at: http://www.sciencedaily.com/releases/2010/01/100121164054. htm. [Accessed 24th August 2010].
Secret-Japan (2009) G-Cans project (Saitama-ken). [Online] Available at: http:// www.secret-japan.com/forum/g-cans-project-(saitama-ken)-t723.html. [Accessed 4th June 2010].
Sln (2010) BBHS CASE STUDY - Bangladesh - The causes and impact of 1988 flood. [Online] Available at: http://www.sln.org.uk/geography/schools/blythebridge/ GCSEBangladesh.htm. [Accessed 28th July 2010].
TutorVista (2010) Floating and Sinking. [Online] Available at: http://www.tutorvista. com/content/physics/physics-iii/solids-and-fluids/floating-and-sinking.php. [Accessed 18th August 2010].
Vries S. (2002) Bamboo Construction Technology for Housing in Bangladesh: Opportunities and constraints of applying Latin American bamboo construction technologies for housing in selected rural villages of the Chittagong Hill Tracts, Bangladesh: MSc. Thesis in Technological Development Studies Faculty of Technology Management Eindhoven University of Technology the Netherlands. [Online] Available at: http://alexandria.tue.nl/extra2/afstversl/tm/vries2002.pdf. [Accessed 9th June 2010].
Unesco: World water assesstment programme. (2010) Managing Risk. [Online] Available at: http://www.unesco.org/water/wwap/facts_figures/managing_risks. shtml. [Accessed 8th June 2010].
USGS (2010) The water cycle. [Online] Available at: http://ga.water.usgs.gov/edu/ watercycle.html. [Accessed 24th August 2010].
WaterAid International site. (2004) Aftermath of the 2004 Bangladesh flood. [Online] Available at: http://www.wateraid.org/international/what_we_do/where_we_ work/bangladesh/2550.asp. [Accessed 8th June 2010].
WED: World Environment Day. (2004) Bangladesh and Seas: Statistics of Flood [Online] Available: http://www.bdix.net/sdnbd_org/world_env_day/2004/bangladesh/pollutions/flood_statiscs.htm. [Accessed 8th June 2010].