QUAKE | RESPONSE
5 1 - Chapter Name
Chaitanya Chavan Sulaiman Alothman
Lorenzo Franceschini
MArch MArch MSc
4 Quake|Response [EmTech] Emergent Technologies and Design MArch Dissertation 2014-2106 Michael Weinstock George Jeronimidis Evan Greenberg Manja Van de Worp Director Director Studio Master Studio Tutor ARCHITECTURAL ASSOCIATION SCHOOL OF ARCHITECTURE
To the friends, family, and well-wishers, without whom this project would not have been possible.
QUAKE RESPONSE develops a novel seismic resistant construction system with the objective of providing innocuous evacuation of people to a safe zone in an urban scenario, in the event of an earthquake. The design deals with developing a material system of topologically interlocking, mortar-less bricks for the city of Istanbul, which is expected to be struck by an earthquake of 7.2 magnitude in the near future. The aim of this dissertation is to propose and prove the viability of such a solution, within the existing urban fabric of the city.
8 Quake|Response
9 1 - Chapter Name
Contents TABLE OF
1 2 3 4 5 6 7 M. SC RECAP 16 EARTHQUAKE AND CONSEQUENCES 18 1.1 Natural disasters 1.2 Effect on buildings 1.3 Physical behaviour 1.4 Damages 1.5 Conventional strategies URBAN SCENARIOS 28 2.1 Urban issues 2.2 Time-line TOPOLOGICAL INTERLOCKING 34 3.1 Introduction 3.2 History and principles 3.3 Case Studies 3.4 Physical experiments 3.5 Experiment setup 3.6 Evaluations and conclusions 3.7 Complementary non-planar surfaces 3.8 Osteomorphic brick 3.9 Advance in topological interlocking 3.10 Application in urban context 3.11 The wall 3.12 Typologies 3.13 Morphological exploration 3.14 Digital exploration 3.15 Conclusions 3.16 Revisiting the brick 3.17 Assembly 3.18 Conclusions M. SC CRITICAL REFLECTIONS 60 M. ARCH. DISSERTATION 64 METHODS 70 4.1 Methods MATERIAL SYSTEMS 76 CASE STUDIES 78 5.1 Introduction 5.2 Eladio Dieste, Gaussian Vaults (1960s): 5.3 Block Research Group: 5.4 Post-tension Discrete Elements 5.5 Conclusion EXPERIMENTS PHYSICAL | DIGITAL 86 6.1 Aim 6.2 Introduction 6.3 Brick Type-A 6.4 Experiment set-up 6.5 Results 6.6 Brick Type-B. 6.7 Experiment set up 6.8 Results 6.9 Post Tension 6.10 Dynamic Force Analyses 6.11 Observations and conclusion MORPHOLOGY 100 7.1 Introduction 7.2 Experimental Setup 7.3 Evaluation of results 7.4 Morphospace 7.5 Observations 7.6 Additional Supports 7.7 Morphospace : Optimised 7.8 Evaluations and Conclusions
11 12 8 9 10 SHELL | DETAILS 112 8.1 Introduction 8.2 Spectral Response 8.3 Computational Model 8.4 Physical Model 8.5 Evaluations and Conclusions URBAN SYSTEMS 128 ISTANBUL|NETWORK AND SAFE ZONE 132 9.1 Introduction 9.2 Istanbul : Evolution 9.3 Existing Infrastructure of Istanbul 9.4 Syntactical Analyses 9.5 Conclusions 9.6 Safe Zones 9.7 Selection strategy 9.8 Evacuation Network 9.9 Multi Criteria Selection 9.10 Evacuation network : Evaluations 9.11 Safe Zones - Betweenness Centrality 9.12 Evaluations and conclusions FATIH | SAFE ZONE EVALUATION 152 10.1 Introduction 10.2 Safe Zone and Radius of Influence 10.3 Phased Intervention 10.4 Site evaluation Experiment: 10.5 Program distribution 10.6 Site Plan 10.7 Conclusions FATIH | NETWORK EVALUATION 170 11.1 Introduction 11.2 Intersection Priority 11.3 Network Priority 11.4 Identifying crucial junctions 11.5 Vulnerability study 11.6 Safeguarding Intersections 11.7 Wall : Geometry 11.8 Revisiting the Wall 11.9 Additional Supports 11.10 SAFE Plazas 11.11 Support Vaults : Architectural Functions 11.12 Evaluations and Conclusions CONCLUSIONS 184 12.1 Evaluations and Conclusions BIBLIOGRAPHY AND APPENDIX 190
Introduction
Among natural disasters, earthquakes are the most difficult to deal with. The unpredictability of their occurrence and magnitude, and their short onset delay pose arduous challenges for safe evacuation and shelter in an urban setting. Evacuation to safe areas is usually undermined by the collapse of structures that are not built to meet earthquake standards. Seismic retrofitting and reconstruction, therefore, become highpossibility solutions; however, time and cost factors made them unaffordable in some countries. Istanbul, a city expecting a devastating earthquake, is estimated to suffer from the highest amount of damage, both in terms of casualties and economic losses. Its unpreparedness in a highly dense urban fabric occupied with structurally unstable buildings constitutes a great danger to people’s lives.
Moments after an earthquake, people usually seek large, open spaces, including parks, schools, mosques, or open markets. The paths to these spaces are often treacherous and might be blocked due to collapsed buildings or road damage. Not only does this impact
the flow of people to open spaces, but it also affects the distribution network for water, food supplies, and emergency aid. This dissertation will study Istanbul’s existing network through a series of network analyses to propose a safe evacuation plan that ensures clear paths to these open spaces. Within this emerged network, safe areas where people seek shelter (safe zones) will be identified across the city using evaluation criteria, such as population capacity, proximity to emergency facilities, and distance to hazardous points. Similarly, critical junctions within the same network that lead to the safe zones will be defined, while considering building height as a major factor. In order to ensure safe evacuation and shelter for people within the selected safe zones and evacuation network, the study will seek to develop an anti-seismic material system, in the form of built morphologies.
This material system will follow a construction technique using topologically interlocked bricks, which will be inherently earthquake resistant due to their ability to dissipate energy through surface friction. Recent technologies in the field, including the Quake Column by Emergent Objects and the osteomorphic bricks developed by Dyskin, Estrin, and Belov-Kanel, will form the basis of this study, which will lead to introducing complementary non-planar surfaces to the brick This will help minimize the degree of freedom in all of the bricks’ axes. The process will be verified by a series of digital and physical methods along with structural analyses to evaluate the performance of the bricks under different types of loads. The morphology of the bricks promotes intelligent aggregation possibilities for generating curved wall forms, whose purpose will be to safeguard the defined critical junctions. These aspects will be discussed in the first three chapters, which recap the MSc phase of this dissertation.
The study will go forward to investigate the potential of shell structures. Their ability to span long distances in order to create vast, open spaces make them appropriate forms for constructing the safe zone programs, such as at schools, markets, and mosques. Although shell geometries are compression-only structures due to their self-weight, introducing a gridshell of interlocking morphologies on their surfaces can bring new structural capabilities to the system. Case studies of shells from the Gaussian vault by Eladio Dieste and vault structures by the Block Research Group will act as guidance for designing shell forms. A series of computational modeling techniques, along with physical experiments with an oscillating table, will evaluate the performance of the material system in the form of complex shell geometries, under both static and dynamic loads. These will be illustrated in depth in the Research Development section.
The newly developed material system will be implemented in the proposed wall morphology to improve its structural and architectural qualities. In the predefined critical junctions, unstable buildings will be demolished to create safe plazas and the wall morphology will play an important role in protecting these plazas from the falling debris of adjacent buildings during an earthquake. Their new morphology will permit them to house different programs, such as markets and cafes. For a safe-zone scenario, shell morphologies will be implemented to house the functions of schools, mosques, and markets, and these will be reconfigured during an earthquake to function as shelters, storages, or medical centers. The social and cultural implications of such solutions will be evaluated in the area. These approaches will be enforced throughout the predefined safe zones and the critical junctions that lead to them, as an essential preparedness strategy for an earthquake scenario.
16 Quake|Response
17 1 - Chapter Name RECAP OF M. Sc Dissertation
1 DOMAIN
Earthquakes and consequences
Understanding the physics behind an earthquake, this chapter gives a preview of the effect of an earthquake on buildings. It will be investigated if understanding the principles in the state of the art in the field of seismic retrofitting of buildings can be somehow incorporated in the future development of this dissertation.
1.1 NATURAL DISASTERS
According to the Vital Signs by the World-watch institute, 905 catastrophes hit the planet in 2012. Compared to the previous 10 years, this figure exceeds by 105 from the previous average value. 93% of such natural disasters are related to weather behaviour. By subdividing the happenings in four categories, it can be noticed that 45% of them were related to meteorological events (storms), 36% hydrological events (floods), 12% calamities related to climate (extreme temperatures, droughts, fires), and the remaining 7% accounted for the geophysical catastrophes, namely earthquake and volcanic eruptions. The Institute has been monitoring such episodes since 1980, in order to understand their evolution. While the first three above-mentioned categories had a constant increase in number in the past 35 years, geophysical events did not undergo any substantial variation.
The reason for such scenario lays in the fact that, at different degrees, climatological, hydrological and meteorological events are affected by human-relation activities. The corresponding increase in CO2 emission for the same time span which closely matches the escalation of weather-associated natural disasters. On the other hand, geophysical activities are not influenced by human behaviour.
Economical losses is the main criteria generally used to asses the level of damage by catastrophes, and again due to the higher frequency of weather related events they feature as the most threat-full to national and international economies. However, other criteria should also be taken into account in order to define how really menacing disasters are. Adding four more assessment criteria to the economical one, the trend is inversed. Predictability, lethality, affected area and onset delay have been selected by [World Risk Report 2013] in order to broaden the evaluation of natural calamities. It is noticeable from the result in the following graph [ Ref. Fig. 1.1] where, the geophysical category features as the least predictable, most lethal and the one with the shortest onset delay. These three
20 Quake|Response
PRED I CTABILITY LETHALITY AFFECTEDAREA ONSET DELAY LOW GEOPHYSICAL HYDROLOGICAL METEOROLOGICAL CLIMATOLOGICAL HIGH NATURAL DISASTERS CHARACTERISTICS PERCENT CHANGE 1980 Climatological 0 100 200 300 400 500 19841988199219962000200420082012 Hydrological Meteorological Geophysical PRED I CTABILITY LETHALITY AFFECTEDAREA ONSET DELAY LOW GEOPHYSICAL HYDROLOGICAL METEOROLOGICAL CLIMATOLOGICAL 10% 30% 30% 30% HIGH NATURAL DISASTERS CHARACTERISTICS PERCENT CHANGE 1980 Climatological 0 100 200 300 400 500 19841988199219962000200420082012 1990-2012 WORLD SHARE AFFECTED POPULATION AFFECTED LAND 0% 100% HydrologicalMeteorologicalGeophysical Fig.1.1 Percent change in natural disaster, 1980-2014 (The Worldwatch Institute, 2014) Fig.1.2 Natural disaster evaluation
aspects carry eventually a heavy weight in the analysis of danger assessment.
Although the trend of economical losses -from 1980- shows a slight increase in values, thus meaning that the high level of predictability of the most frequent natural disasters is constantly unobserved by governments, this research will focus on the rather more destructive and lethal scenario that people have to face while experiencing an earthquake, together with the long-term damages. Areas in the world threaten by seismic events are not concentrated in a particular location, rather they are more widespread. Only 36% of the inhabited soil has no risk of earthquakes, while 29%, 29% and 6% is the land share that accounts for light, medium and high level of potential happening respectively.
21 1 - Earthquakes and Consequences
Fig.1.3 Earthquake risk zones
1.2 EFFECT ON BUILDINGS
The behaviour of buildings hit by an earthquake has been long studied and analysed especially in those countries within active seismic zones. Having understood its properties and dynamics including ground accelerations, velocities, and waves, it is now possible to move towards the effect that these seismic forces have on buildings. It is to say that the pure physical approach to the matter, seen by an engineering point of view, is excessively complicated to be dealt in few paragraphs, as well as the knowledge required exceeds one year of study. The contents that follows are a brief summary on the wide topic, aimed at understanding essential principles that would help in the formulation of the work. Moreover, the topic of conventional and new retrofitting techniques adopted to structurally reinforce existing buildings are also described.
1.3 PHYSICAL BEHAVIOUR
In order to be able to study the physical response of a building under seismic forces, the common procedure is that of simplifying the analysed system. The building is hence considered as an elastic body (structure) simplified to an oscillator. A note has to be immediately introduced. As previously explained, the ground is subjected to extreme deformation and movement, which implies forces and accelerations
Oscillator
to the building. For the ease of simplifying calculations, the adopted seismic models assume the ground as still while the whole structure is exposed to lateral loads. Therefore, from the motion equation of the oscillator (mut+cu+fs=0), it is possible to retrieve the seismic motion equation (differential equation), given the mass of the system M, its stiffness K and the damping value C: Mü+Cû+Ku=-Mx. Among these values, the mass of the building is easily calculated both for new or existing building, while K and C both for new and existing structures, are still empirically calculated, making the equation not extremely accurate. The values by which these three variables are multiplied, u, û and ü, represent, respectively, displacement, its first derivative velocity and the further derivative acceleration. The resulting –Mx refers to the seismic force, as a vector. The results from this equation must eventually follow specific values set by national or international standards (Eurocode, NTC). The oscillation amplitude and period is then compared (tested with) a graph that carries information on the seismic history of a certain place, namely the response spectra graph. Since every type of soil has its own reference curve, since the forces and accelerations induced by an earthquake are transmitted differently to the building structure depending on the soil. As shown
22 Quake|Response
Fig.1.4 Simple oscillator with mechanical properties
Fig.1.5 Typical response spectra graph with three phases
Bracing
Response spectra
Oscillation graphs Tuned mass NON-SHEAR WALL (bricks + mortar) Normal dampeningIncreased dampening Normal sti nessIncreased sti ness Earthquake property Mu + Cu + Ku = -Mx Mass M g constant acceleration constant velocity constant displacement Δ x Δ x T T T Sti ness K Damping C DEFORMATION Bracing Shear walls
spectra
Oscillation graphs isolation Dampeners Tuned mass SHEAR WALL (reinforced concrete) NON-SHEAR WALL (bricks + mortar) Earthquake property Mu + Cu + Ku = -Mx Mass M g constant acceleration constant velocity constant displacement Δ x T Sti ness K Damping C LATERAL FORCE TENSION COMPRESSION DEFORMATION
Response
Oscillator
in the Fig 1.6, the plotted curve can be divided in three phases; constant acceleration, constant velocity and constant displacement, considering the acceleration (related to g) on the y axis and the earthquake period on the x axis. Ultimately, the system energy balance needs to be verified, where the absolute input energy Ei is compensated by the sum of elastic energy Es (of the structure), absolute kinetic energy Ek, viscous energy Ev (damping energy) and hysteretic energy Eh. This last component is accounted for the energy dissipated from the system when the building starts having a plastic behaviour and not an elastic one, i.e. when strains occur.
1.4 DAMAGES
When it comes to understanding the consequences that seismic loads have on buildings, it is eventually necessary to identify the construction typology. Masonry construction buildings, for instance are considered to be quite unsafe if subjected to lateral forces. The weak point that is usually seen as failure pattern is found in the mortar in between the bricks. Collapse type are all mainly related to such local failure, thus will not be further analysed.
On the other hand, RC structures, feature various and diverse issues that bring the building in a state of serious condition of damage, and in many cases also destruction. Design and construction details that cause structural failure can be found at different scales, from the material one to the aggregation of two or more buildings. The following sub-paragraphs will take into account those effects that also create hazards for people in the surrounding of a weakened building, before and after its collapse.
1.4.1 SOFT STOREY
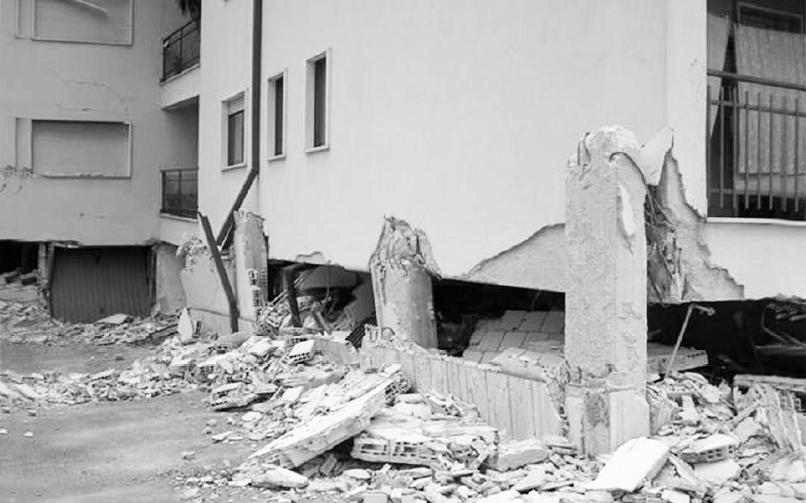
A very common design feature of an RC building is the adoption of an open ground floor. Often required for functional purposes (parking spaces, entrance lobby, porch, shops) this diffused practice increases the risk of collapse in the case of an earthquake.
The so called “soft storey” is indeed considered to be the weakest of all the storeys in a building. It rarely foresees any other structural element rather than columns, thus exposing them to greater shear stresses. The higher the building, the higher these stresses will be; the strains that the elements need to sustain often exceed the elastic deformation, stepping into the plastic deformation, causing the failure of the bearing element. A collapse due to soft storey can also be addressed as “pancake collapse” where the structure above the ground floor sits at the ground level. Although, sometimes the building is accessible, in most serious cases however, the remaining weakened building is not able to undergo such high stresses, resulting in the complete destruction of it.
23 1 - Earthquakes and Consequences
Fig.1.6 Pancake collapse building in Italy, (soft storey), Abruzzo 2009 Earthquake. © www.reluis.it
OVERHANG MAKING STRUCTURE TOP-HEAVY
STUB COLUMNS UNSTABLE BASE CONDITION
NON ALIGNING STRUCTURAL ELEMENTS PRONE TO DAMAGE DUE TO LATERAL MOVEMENT
NO SEISMIC TOLERANCE GAP IN STRUCTURES DAMAGE DUE TO DIFFERENT FREQUENCIES OF MOVEMENT OF STRUCTURES
24 Quake|Response ROAD LEVEL
Fig.1.7 Road section featuring multiple design mistakes, thus constituting hazards
1.4.2 1.8.2 STUB COLUMNS
Stub column’s collapse pattern is very close to the soft story, but the failure concerns the foundations. This structural issue is found in those buildings that are designed to host a basement. Due to the common construction principles, above the wall that plays the role of foundation and retaining wall, before joining the beams that support the mezzanine floor, a stud column is placed in between. [Ref. Fig. 1.7]. This happens when the basement needs to have access to external light, in order to be able to have a suitable setting for windows. Under seismic loads, these short bearing elements are not able to undergo necessary elastic deformation, causing the joints that connect them either to the structure below or above, to fail. The collapse pattern then reflects the soft storey, where depending on the strength of the above structure, it might not entirely collapse.
1.4.3 HAMMERING
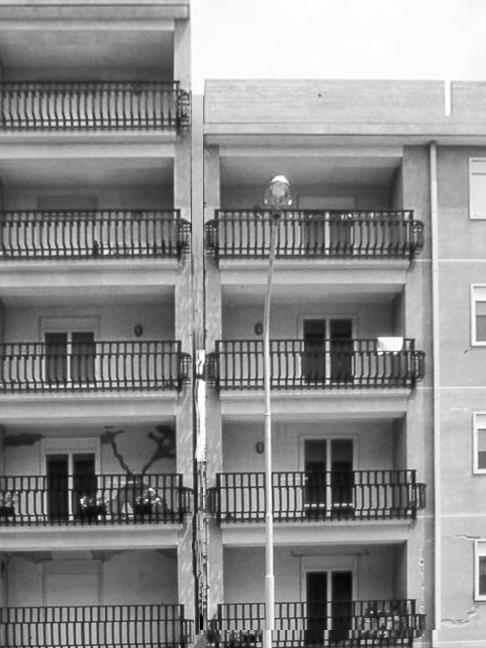
Another point to be addressed in the design mistakes of buildings that will eventually lead to serious situation, is the hammering. Moving from a local scale of the previous two examples to the complete building scale, hammering might cause damages to buildings that per se might be able to resist a quake, by oscillating. As explained in the previous paragraphs, buildings oscillate based on three intrinsic parameters. Two buildings that are built side by side, in different time periods, will surely feature different oscillation frequencies. While moving due to seismic forces, they would bang between each other, increasing the chances of collapse. Measures for this problem have been widely taken into practice, namely a seismic gap between constructions [Ref. Fig. 1.8]. A major issue lays in the fact that if such gap is not properly adopted, the consequences of hammering increase.
1.4.4 STAGGERED FLOORS
Similar to hammering, but causing more damages to the buildings, is when the floors of two neighbouring houses are not aligned. Oscillations will cause the slab of one structure to hit on a vertical bearing element of the near building. Vertical elements are not designed to sustain heavy repeated lateral slams, and the failure of those columns or shear walls is almost inevitable [ Ref. Fig. 1.7]
1.4.5 CLADDING FAILURE
Not related to any structural damage, but still highly dangerous for what concerns people in the surrounding of the building, is the failure and consequent detachment
25 1 - Earthquakes and Consequences
Fig.1.8 Seismic gap between two building © Gianmaria Marchesi
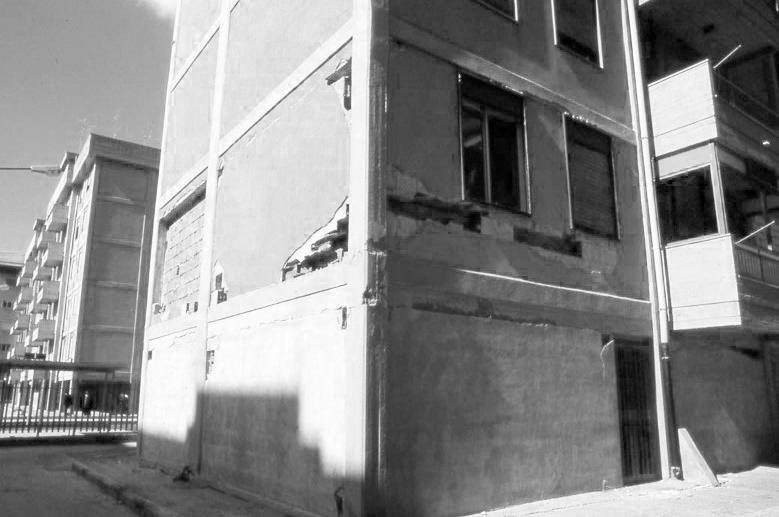
of cladding elements. If a traditional RC residential construction is considered, bricks or hollowed bricks act as cladding in between the structural frame. Having defined the higher level of elasticity of reinforced concrete technology, when strains occur, the cladding will not be able to deform in the same way the rest of the building does. This behaviour would make the wall to fail, usually in the classical “X” pattern (due to the transmission of stresses) and ultimately completely or partially detach from its place, creating great hazard for people leaving the building [Ref. Fig. 1.8]
1.4.6 RC BALCONY PARAPET
The last hazard that is needed to be mentioned is the danger caused by reinforced concrete parapet. Balconies are usually a cantilevering extension of the concrete slab. Heavy railings as the concrete ones, add unnecessary load to the structure, thus increasing the bending moment, that, in case of lateral displacement due to seismic forces, might fail and fall on the street beneath. Parapets built using masonry also constitute an hazard, due to the same failure principle of the cladding.
1.5 CONVENTIONAL STRATEGIES TO REDUCE STRESSES ON BUILDINGS
The first strategy is to protect the building by physically reducing the amount of input energy (Ei). Structures that feature a stiff connection at their foundation don’t have enough elastic properties to bear such lateral forces. It is necessary to disconnect the sub-structure (foundations) with over-structure (rest of the building). By reducing the input energy, being an equation, the energy of all the other members will reduce, managing to bring hysteretic energy to 0.
A second strategy, passive dampening, consists of introducing elements that are able to absorb and dissipate part of the input energy. Another common method to provide the building with the correct features to sustain such jolts consists of increasing the overall stiffness of the structure.
1.5.1 SEISMIC ISOLATION
In case of abutting buildings [Ref. Fig. 1.7], decoupling the two structures implies a diversification with respect to their dynamic behaviour. During a seism, the lower structure would undergo slight deformations (the stiffer the less strain) while the rest of the structure would oscillate with an amplitude which is related to the stiffness of insulator devices (the less the stiffness the wider the amplitude). Such oscillations are to be mainly attributed to the strain below the over-structure, and less to the deformation of the structure itself. For an earthquake scenario, the wider the amplitude of the oscillation, lower the acceleration the structure has to bear, consequently it is likely to have less damages.
The insulating devices are divided into two categories: insulators and auxiliary devices. Those featuring in the first category have the role of bearing vertical loads, with high stiffness in the vertical axis and low stiffness on the horizontal plane, allowing large displacements (relative displacement between structure and ground). Auxiliary devices function as additional energy dissipation, system re-centring, and lateral boundary for
26 Quake|Response
Fig.1.9 Failure and partial collapse of a brick cladding © Gianmaria Marchesi
the movement of the system.
The physical calculation of these devices will not be further discussed, however the consequences resulting from this practice include a lower horizontal displacement of the building, leading to a lower perception of the acceleration (almost no seismic vibrations are transmitted through the bearing elements) as well as a decreased amount of damages of non-structural elements (fittings, furniture, etc.).
1.5.2 INCREASED STIFFNESS
Another strategy used to reduce the possible damages of seismic activity on a building is to increase its stiffness. In the equation introduced in section 1.3 (C: Mü+Cû+Ku=Mx), building mass, damping and stiffness values are used to calculate the oscillatory behaviour of the structure. While isolation increases C value, stiffening the building affects the K component. Steel bracing is the most common method for strengthening tall buildings, while shear walls are widely implemented for low-rise constructions.
The modification of these two parameters in building characteristics (damping and stiffness) affects the oscillations [Ref. Fig. 1.10]
27 1 - Earthquakes and Consequences DAMPINGBase isolation Base isolation Dampeners Dampeners Tuned SHEAR WALL (reinforced concrete) LATERAL FORCE TENSION COMPRESSION Bracing Bracing Shear walls Response spectra Oscillator Oscillation graphs STIFFENING DAMPINGBase isolation Base isolation Dampeners Dampeners Tuned mass Tuned mass SHEAR WALL (reinforced concrete) NON-SHEAR WALL (bricks + mortar) Normal dampeningIncreased Normal sti nessIncreased Earthquake property Mu + Cu + Ku = -Mx Mass M g constant acceleration constant velocity constant displacement Δ x Δ x Sti ness K Damping C LATERAL FORCE TENSION COMPRESSION DEFORMATION
Fig.1.10 Strategies to reduce stresses on buildings
2 DOMAIN Urban Scenarios
The scenario that is experienced by a city soon after an earthquake strikes is closely related its preparedness. Weak buildings and unplanned urbanized area may increase the struggle that the population has to face in the few days when rescuing of people and sustaining a great amount of homeless are the main concern. Road blockages and threats of falling debris from buildings are addressed, as well as the example that Japanese cities provide to deal with such problems. A general timeline of events in various time-steps after an earthquake is analyzed. How can this help in defining requirements and needs for the general aim of the dissertation?
2.1 URBAN ISSUES
Problems at the building level, as seen in the previous chapter, are of course a big threat to people’s life, in the event they get caught inside the structure while it collapses. Psychologically people do not consider their home as a threat, as they rely on the quality and safety it has been built with. On the other hand, weak buildings are not an hazard just to their inhabitants, because their failure might compromise or affect neighbouring buildings or the road they are built on. Such happening is one of the main cause that leads to the explanation of the urban situation that is created in the event of an earthquake. In addition, the behaviour of people, in a panic state, cannot be clearly defined if not by addressing it as unexpected. An unknown and dangerous scenario prevents people to think clearly to make rationalised choices.
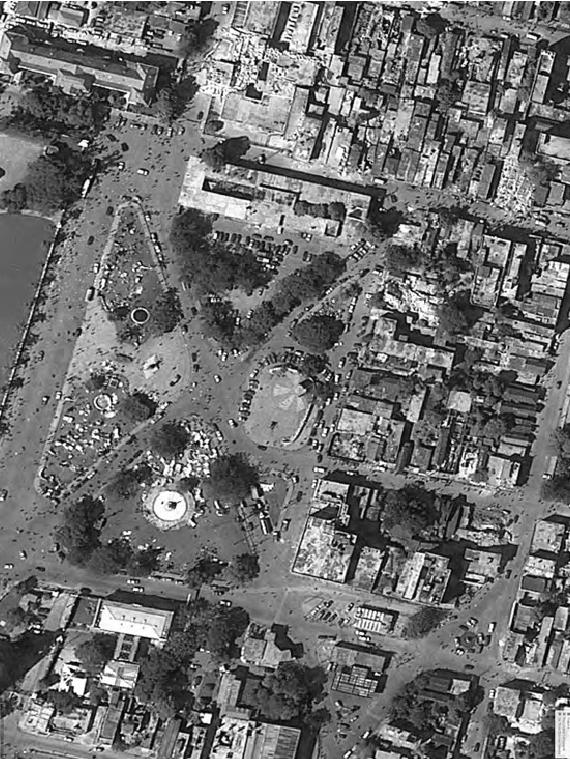
Poor countries, whose buildings do not follow any particular building code and urban planning is the mere result of years of unplanned development, might face harsher consequences. These problems, both at building, and urban scales have been experienced in the earthquake that struck Port-au-Prince in Haiti in 2010, as well as in Nepal in late April 2015. The unpreparedness of the city together with the strength of the seismic activity caused great damages. Many areas of the cities were left isolated due to the impossibility of reaching them because of the amount of debris present on the roads. None of the two countries was able to solely rely on internal logistics and coordination for the rescue operations and temporary relocation of people.
Satellite images provide a very good tool that enable to analyse the aforementioned urban scenario, before the earthquake, on the very day, and for a long period of time during the recovery of the city. Google Earth satellites recorded the images for the Haitian capital for several days in a row after the disaster, allowing to recognize and analyse the resulting patterns of people, building damages, road blockages, temporary shelters camps and so on. Such techniques is eventually a common practice for experts to study and asses damages occurred in cities after earthquakes, and it’s called Multitemporary Satellite Imagery (Adams). Though a very interesting topic, this dissertation will not deal with it.
Haiti as Kathmandu did not have any fully implemented master-plan that could be followed in case of emergency. Pictures show the overcrowding of people in the
30 Quake|Response
Fig.2.1 Image of Port-au-Prince taken from Google Earth. Shot on the 12th January 2010
streets, not only the very day of the earthquake, but many days after as well. Tents and temporary shelter were set up for people to live in and till date, a considerable number of inhabitants still is unable to access their home because considered unsafe. The absence of planning reflects in the situation, where people are forced to resort to squatting on the roads, or in an disorganised building of temporary structures. No routes were defined for people to reach any kind of safe shelter, or construction that would take care of survivors or wounded.
In order to understand how similar scenarios could be avoided, the example that Japanese cities are able to provide is meaningful.
2.1.1 JAPAN COUNTERMEASURES
Past and frequent countless losses that the country suffered over the years pushed authorities at all level of administration to provide the population with clear and precise regulations. Countermeasures are foreseen in every aspect of daily life. Building regulations will not be mentioned, considering the safety of buildings throughout the cities. What is really striking about the methods used to prevent chaotic situation is the coordination among different actors.
At the recording of P waves, not felt by humans, a series of actions are instantaneously performed (Japan Meteorological Agency, 2013) across the city as S waves, those causing actual damages, will be soon expected: warning text messages are sent by mobile companies to all clients, TVs broadcast the news, trains have the power cut off, cranes stop working. As a proof to the effectiveness of this system, the 9.0 jolt that struck Japan in 2011 left no damages whatsoever in the city. Moreover, such system is backed up by an actual network of safe routes and safe shelters arranged around the city pattern. Specific buildings are identified as target in case of emergency, and they are able to provide shelter and provisions for needy people for up to three days. Said buildings, in order to be easily identified from the roads, are clearly marked in frequent road signs, to help people to head in the right direction with no struggle.
2.2 TIMELINE
The following spread illustrates a timeline that marks the events and the behaviour of people in urban scenario. Its aim is not to provide any subjective evaluation to the development of events, but rather the statement of facts that a city would face after an earthquake strikes.
Something that has to be pointed out, due to its strong consequence, is the presence and effects of aftershocks. As it is also visible in the Haitian context, building collapse patterns may eventually vary in the analysed timespan. More buildings, weakened by the first strong shake, will collapse under the loads of smaller upcoming aftershocks. These extra collapses need to be taken into consideration for further research developments, as they are a serious threat to peoples’ lives.
Depending on the city or country on which the timeline is framed, the response of people and events should be altered according to the local studies The one that is presented here takes in consideration facts and consequences as they would happen in an “ideal” world scenario.
31 2 - Urban Scenarios
TAKING COVER
PANIC EVACUATION ON ROADS
PANIC
FIRST AID
HEADING TO OPEN SPACES
EARTHQUAKE
P WAVES TREMOURS
WEAK BUILDING COLLAPSE
S WAVES
STRONG TREMOURS STRUCURE COLLAPSE
DOMESTIC FIRES
DEBRIS ON ROADS
OUTBRAKES OF FIRES
CELLULAR NETWORK COLLAPSE
EMERGENCY VEHICLES ARE DEPLOYED
32 Quake|Response
URBAN
PEOPLE BEHAVIOUR
SCENARIO
T= 0sec T= 5sec - 2min T= 2 - 5min T= 5 - 10min
GATHERING IN TEMPORARY REFUGES
HEADING TO ASSESSED SAFE SHELTERS
HELP IN PROVIDING AID AND SEARCH FOR SURVIVORS
PSYCOLOGICAL SHOCK OF HOUSES BEING DESTROYED
T= 10min - halfday
T= halfday - 3 days
T= 3 days on
AFTERSHOCKS
WEAKENED BUILDINGS COLLAPSE
DIFFICULT MOBILITY DUE TO DEBRIS ON ROADS
GATHER INFORMATION
STRUCTURAL ASSESSMENT OF BUILDINGS
LIFELINES ASSESSMENT
DEBRIS CLEANING
INTERNATIONAL AID
TEMPORARY REFUGES AND MEDICAL FACILITIES ARE SET IN OPEN SPACES
BASIC INFRASTRUCTURE REPAIR
MANAGING TENT CAMPS AND SHELTERS
HIGH POSSIBILITY OF FURTHER COLLAPSE DUE TO AFTERSHOCKS
33 2 - Urban Scenarios
THREATS BY FALLING DEBRIS
3
Topological Interlocking
Components featuring complementary non-planar surfaces, or topological interlocking, allow for planar locking as opposed to axial locking. The contribution that such feature is able to provide to an overall assembly is of general increased stiffness. The variation of morphology of said surfaces is analyzed, taking the Osteomorphic Brick as meaningful case study, compared to its ability to provide locking if subjected to lateral acceleration. Calculation have been carried out with analytical means, manually obtaining friction force through this equation
Stresses concentration on the edges of the surface though, threat the integrity of the brick. What is the correct balance between maximum locking ability and acceptable local stresses?
DOMAIN
Σµ(F k+ W k)+W k-F k k=1 n Σµ(F k+ W k)+W k-F k k=1 n m STATIC ANALYSIS - ACCELERATION INDUCED(a) - SELF PRODUCED FORCE OF m*a
3.1 INTRODUCTION
Monolithic structures often do not represent natural composition of biological individuals: at various scales, configurations, and efficiency, segmentation into constituents is a common feature. A large variety of shapes and morphologies is able to assure higher level of structural stiffness and ability of a faster response to external factors. Compared to engineered monolithic structures, fragmented systems are able to provide a wider range of functions, thus increasing researchers’ interest in the last couple of decades. (Estrin, Dyskin, & Pasternak, 2011)
Extensive but non-complete list of the history and evolution of so called interlocking bricks, mortar-less bricks or topologically interlocked bricks has been compiled by Anand & Ramamurthy, as well as Kintingu.
The principle ruling the concept of adopting such technology to produce surface-like systems stands in the simple assumption that particular shapes can be held in place by a wide-ranging constraints at its boundaries. Kinematic constrains would on the other hand locally lock one component to its neighbours, avoiding any binder or physical connector.
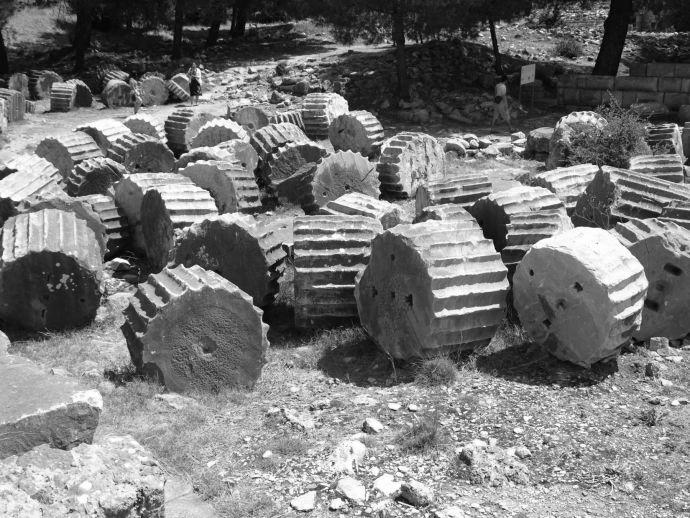
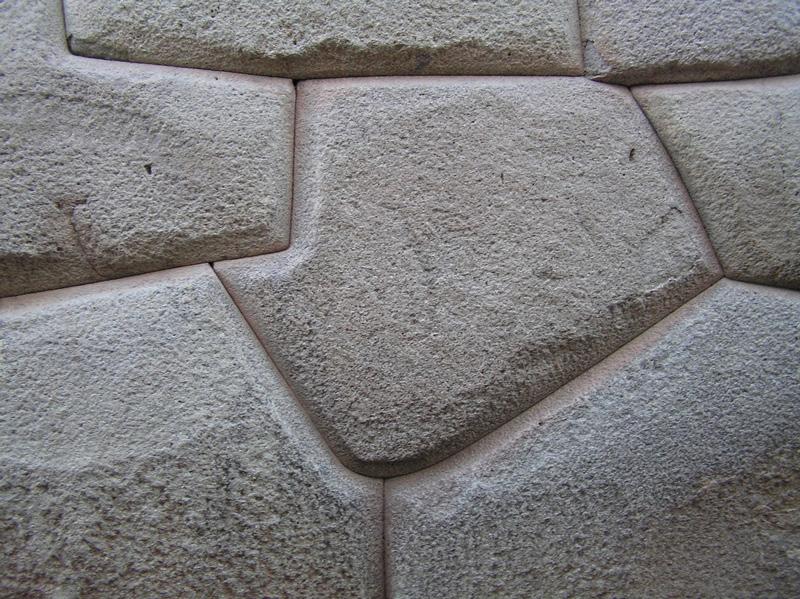
3.2 HISTORY AND PRINCIPLES
Solutions to avoid the issues related to a system based on the dualism between a component and a bonding agent have been first adopted by Greeks, by separating the shaft of a column in equal drums. Those pieces were then connected by mean of wedges, to prevent horizontal sliding. From the apparent design simplicity of columns, interlocking blocks have been used to shape fairly more complex morphologies, as visible in the technique used by the Inca population around the 15th century. Geometrical interlocked bricks constitute walls of simple houses, and the survival up to our times is considered a proof of the effectiveness of such system to be able to sustain earthquake loads.
Other typologies of interlocking bricks have been developed as early as the 1900s,
36 Quake|Response
Fig.3.1 Inca interlocking geometry for stone walls and Greek columns built in interlocking sections (keepandshare.com/photo/388180/priene?ifr=Y, wikipedia.org/wiki/Dry_stone)
with the realization of children’s’ toys (Kintingu, 2009). Creativity, architectural and engineering exploration were the major purposes of leading figures in this sector, whose realizations were mainly made out of tin, metal or wood. After the standardization and success of one of the world’s most famous brand of interlocking bricks ‘Lego’ in 1967, from the 70s, pioneers from Africa, Canada, India and Middle East initiated a variety of experiments on block morphology using sand-cement, compressed, or baked soil.
Locking mechanism of different attempts can be subdivided into three: tongue and groove, protrusion and depression and topological non-planar locking. Such joints are able to restrict specific movements: depending on their geometry, the motion in one or two directions can be avoided. Advantages of using mortar-less technology lay in the increased speed of construction, due to the omission of bedding mortar, which is translated into a reduce construction cost also thanks to the reduced chance of workmanship mistakes. On the other hand, the higher tolerance allowed for bricks size in the presence of bedding mortar, is missing due to the higher accuracy the components need to have in order to have a uniform load transfer among them.
The purpose of such new technological investigation holds according to specific requirements, namely construction easiness linked with cost reduction and a wide use of local materials. For this reason, the evolution of interlocking blocks always aimed at realizing in-complex morphologies, such as houses with planar walls. The effort is then put into cost-effectiveness and production rather than aesthetically pleasing result.
37 3 - Topological Interlocking
Fig.3.2 Evolution of interlocking typologies. From Tongue and groove to topologically interlocked (L to R)
3.3 CASE STUDIES
In order to understand the science behind topological interlocking, two state of the art projects in the field have been studied. By extrapolating the principles and shortcomings from these, a good foundation for the further studies will be established.
3.3.1 POLYBRICK
Polybrick is an Additive Ceramic Component Manufacturing (ACCM) technology informing three dimensional (3D) printing technologies in the architecture discipline (Sabin, Miller, Cassab, & Lucia, 2014)
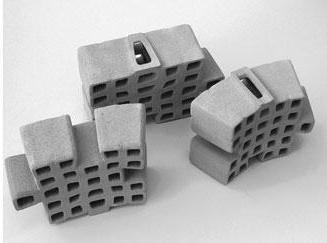
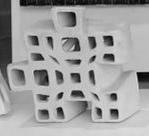
The proposed material system suggests an interlocking of the components where no mortar or adhesive is required for joinery. Rather, the system investigates traditional wood joinery techniques, in specific, the dovetail joint system, where a customized tapering is introduced at the boundary of each unit block depending on its morphology and orientation within its position in the global geometry. The tapering depends on the slope of the generated surface where the narrow end of the tapered dovetail joint is presented at the lower face of the created surface, thus help locking the different components together under gravity force (Sabin, Miller, Cassab, & Lucia, 2014)
In order to utilize material and maintain the strength and stiffness of the system, a structural lattice has been integrated into the brick, to achieve continuity in the surface geometry and reduce the weight of the material system, yet sustaining the overall structural integrity (Sabin, Miller, Cassab, & Lucia, 2014).
3.3.1.A OBSERVATIONS
PolyBrick is a component-based system that explores the possibilities of 3D printing technologies within a digital context using algorithmic design techniques to inform
interlocking strategies and global behaviour. Although the dovetail joint enabled the possibilities of constructing complex geometries, the high stress concentration values caused by it had limited the overall structural performance of the system. Manipulating the morphology of the joint can improve such performance.
38 Quake|Response
Fig.3.3 Bricks with dovetail joint system © Cornell.edu
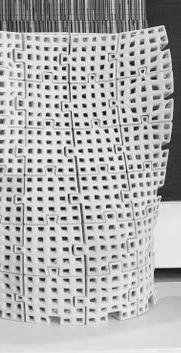
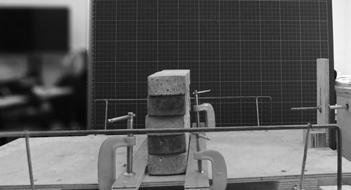
3.3.2 QUAKE COLUMN
An innovative approach to the concept of a column, as developed by the Emergent Objects team Ronald Rael and Virginia San Fratello, ‘Quake column’ disintegrates a traditional column into several interlocking blocks. The principle of Incan building technologies of having mortar-less Cyclopean construction of walls using heavy stone blocks which are shaped perfectly to interlock with all adjacent blocks has been used as an inspiration.
The blocks composing the ‘Quake Column’, are 3D printed using sand composite material. Unlike the Inca Blocks which weigh in tons, the new approach would allow for light weight construction by creating hollow blocks with perfect interlocking with the neighbouring pieces.
Structures have inherent frequencies which they are weak at. The effect of earthquake makes monolithic structures to have resonance, which causes the most structural damage. Moreover, disintegrating a solid structure into interlocking blocks which are not bound by mortar hence having a freedom to move to a certain degree, ensures that the structure does not behave in resonance. This method also means that there are no stress concentration points in the structure. Stress concentration points are areas within a structure where the lines of forces are concentrated, hence not evenly distributed; making these areas susceptible to failure due to stress. Having movable interlocking geometries, solves this problem as it ensures dissipation of energy by friction between the blocks.
3.3.2.A OBSERVATIONS
The Quake column functions as an earthquake resistant structure by application of the principles of interlocking blocks. It should be noted that the interlocking achieved between the blocks is multi directional. This has been done by having slightly inclined edges of the pieces which ensure locking in two directions as opposed to having a straight edge surface which does not lock with its neighbour. However one drawback
observed in this method is that the system is stable only when it is in a closed loop i.e. a circular arrangement of pieces [Ref. Fig. 3.4]. This leads to limitations in applications of the system as a continuous surface. Certain details are yet to be resolved relating to the usability of this column in real world. For example, he addition of other structural elements like beams has not been thought of.
39 3 - Topological Interlocking
Fig.3.4 3D printed prototype of the quake column © Emerging Objects
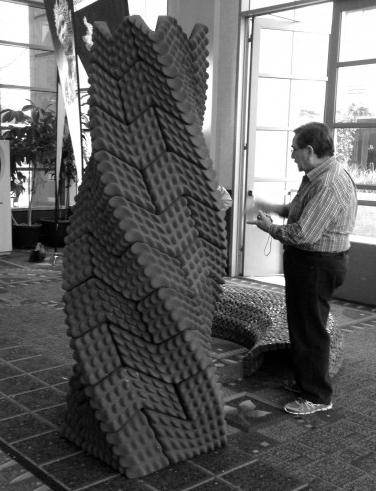
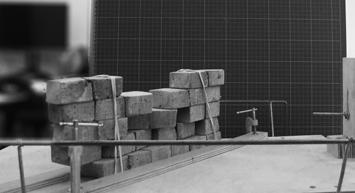
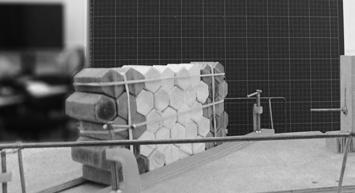
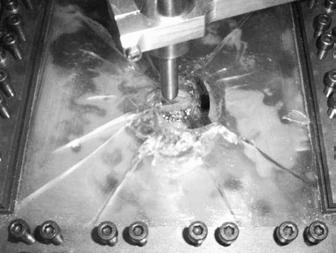
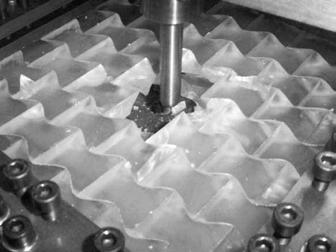
3.4 PHYSICAL EXPERIMENTS
In order to develop a system of interlocking blocks which can resist the lateral movements of an earthquake, a series of experiments which were designed to observe basic behavioural patterns of a stack of blocks have been set. The experiments were carried out on a oscillating table which generated controlled ground accelerations. These values were based on a study of the existing ground acceleration. The range thus applied was bound between 2 and 8m/s2.
Each experiment was divided into 3 force-direction criteria and 4 boundary (tie) conditions; namely parallel, at 45 degree and perpendicular application of acceleration, and Free, horizontal ties, vertical ties and a combination of horizontal and vertical ties, respectively. For each boundary condition and force direction combination, acceleration at failure was recorded. Since the value of acceleration is irrespective of the size of the object, the experiments were conducted on a 1/4th scale of the actual blocks. To compare the data, accelerations were converted to the % of g values i.e. [(ground acceleration/9.8)*100].
V shaped Brick : Locking displacement in x direction and rotation in y and z
3.5 EXPERIMENT SETUP
Acceleration at which failure occurs
Patterns of failure
Block Material
Blocks casted using a mixture of Cement +Sand +PVA glue with proportions
Setup 3 variations of blocks:
V shaped Block (interlocking)
Dimensions: 25x50x40 mm
Curved Edge Block (interlocking)
Dimensions: 25x50x40 mm
Hexagonal extrusion block (interlocking)
Dimensions: 25x50x40 mm
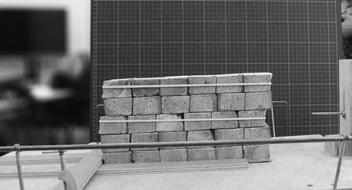
Assembly
Stretcher bond layout for creating a wall using 30 blocks.
Tie conditions
F=Free (no post tensioning ties added)
H=Horizontal ties at alternating layers
V=Vertical ties at the edges of assembly
VH=Both horizontal and vertical ties added
Curved edge Brick : Locking displacement in x direction and rotation in x and z
Hexagonal Brick : No locking inherent to a brick. Locking
40 Quake|Response
z y x y
y y z z x y x y x y z
observed in assembly.
Fig.3.5 Brick shapes and locking properties.
Fig.3.6 Brick assemblies for oscillating table testing
3.5.1 ACCELERATION PARALLEL TO THE ASSEMBLY
The results showed that the hexagonal block assembly was the weakest amongst the three, across all boundary conditions. V profile shows increased resistance when the assembly is tied with horizontal and a combination of horizontal and vertical tie. The V profile blocks were strengthened by adding a horizontal tie. Curved edge blocks showed a decrease in stability in all boundary conditions except the horizontal ties. V profile displayed the most resistance to the failure when it was tied with horizontal and the combination of vertical and horizontal ties.
3.5.2 ACCELERATION 45 DEGREES TO THE ASSEMBLY
The most stable configuration was observed to be that of the hexagonal blocks, which were seen to be the weakest in the previous force direction. If the stability of curved edged blocks were to be seen, in this orientation, there was an overall increase in the resistance to failure through the various boundary conditions. Hexagonal blocks, on the other hand, were observed to be more stable when bound with a horizontal tie.
41 3 - Topological Interlocking
70 60 50 40 30 20 10 00 80 F V PROFILE CURVED EDGESHEXAGONAL BLOCKS ACCELERATION % G H V VH
V PROFILE CURVED EDGESHEXAGONAL BLOCKS 70 60 50 40 30 20 10 00 80 F ACCELERATION % G H V VH
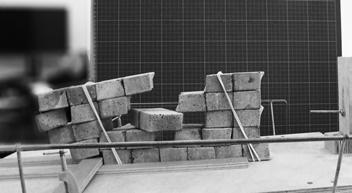
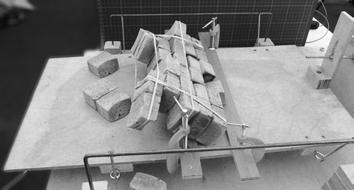
Fig.3.7 Failure pattern,: physical tests.
Fig.3.8 Graph showing failure of assembly against acceleration.
Fig.3.9 Failure pattern,: physical tests.
Fig.3.10 Graph showing failure of assembly against acceleration.
3.5.3 ACCELERATION PERPENDICULAR TO THE ASSEMBLY
The most stable configuration was observed to be the hexagonal blocks, especially when they were tied vertically and horizontally. The behavioural trend of both hexagonal and curved edge blocks showed similarity, although the curved blocks failed at lower acceleration values than hexagonal blocks. V profile blocks were seen to be much resistive when they were either free or with a horizontal tie. It could be observed that vertical ties for the V profile configuration were not of much help in stabilizing the assembly.
3.6 EVALUATIONS AND CONCLUSIONS
The series of experiments were aimed at understanding the behaviour of blocks in an earthquake scenario. Ground accelerations based on generic site conditions, were considered while understanding their effects. It was also observed that the surface area of contact did not play any role when studying the behaviour of scaled down objects; as the ratio of applied and required force for movement of objects nullified the surface area requirement. The experiments were conducted on a much generic component blocks with a primitive assembly pattern. The fact that the experiments were not providing us with any data which was specifically oriented towards a particular design was noted.
The oscillation table was self-designed and developed, and although calculations were made to have a precise way of displacing the table with the respective ground acceleration values, the accuracy of the data was also seen to be of an issue, as manual control of the oscillation table meant that values were not digitally displayed and can thus have some human error in the output.
This data provides for a foundation for the future experiments that will be carried out. The aim of achieving a stable curved surface which is composed of interlocking blocks would be looked at with the basics of blocks’ behaviour, as seen in this set of experiments.
Moreover, it is necessary to mention the ability and the potential offered by the hexagonal brick morphology. While the rest of the samples were only able to achieve simple global geometries, hexagons allowed for the creation of far more complex walls, with curvature in both directions. This characteristic was also backed by the ability of introducing components with dissimilar size, as well as naturally introduce perforations and variations within the bricks.
Due to low availability of physical components, tests have not been performed on such assemblies, but considering the lower amount of contact surface between each brick and the neighbouring ones, failure might have occurred earlier than its simplified version.
42 Quake|Response
V PROFILE CURVED EDGESHEXAGONAL BLOCKS 70 60 50 40 30 20 10 00 80 F ACCELERATION % G H V VH
Fig.3.11 Failure pattern,: physical tests.
Fig.3.12 Graph showing failure of assembly against acceleration.
43 3 - Topological Interlocking H 90 HV H 0 H H 0 F V 90 HV V 90 V V 90 H V 90 F V 45 HV V 45 H V 45 F V 0 V V 0 H V 0 F H 0 HV C 90 HV C 90 V C 90 H C 90 F C 0 V C 0 H C 0 F C 45 F H 45 HV H 0 V C 45 H C 45 V
Fig.3.13 Documentation of different failure patterns with three brick types.
3.7 COMPLEMENTARY NON-PLANAR SURFACES
Results and observations obtained from the physical experiments led to conclusions that enabled a better understanding of the relationship between the behaviour of the brick and its morphology, as well as the with the failure patterns. Axial locking, which was a main characteristic of the bricks that were tested on the oscillating table, was not able to provide enough stiffness to the assembly while acceleration was induced. Depending on the direction of the assembly in relation to the acceleration, not always the axis that was providing locking abilities was at use, leaving the friction contribution alone to work against the lateral force. The diagrams that follow [Ref. Fig. 3.15 and 3.16] point out the difference between axial locking and planar locking. The effectiveness of the second option would allow greater stiffness in the whole assembly.
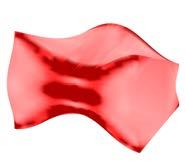
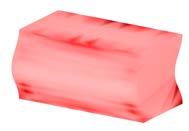
3.8 OSTEOMORPHIC BRICK
The topological interlocking differs from traditional systems, explained in the previous chapter, due to the lack of joining protrusions (keys) which would act as stress attractor for the assembly, increasing the risk of localized failure that would compromise the whole structural stiffness. As firstly introduced, segmentation of a material could provide several structural benefits as well as the
“[…] Possibility to combine elements made from different materials, including dissimilar ones, which is important in creating hybrid materials” - (Dyskin, Estrin, & BelovKanel, 2003)
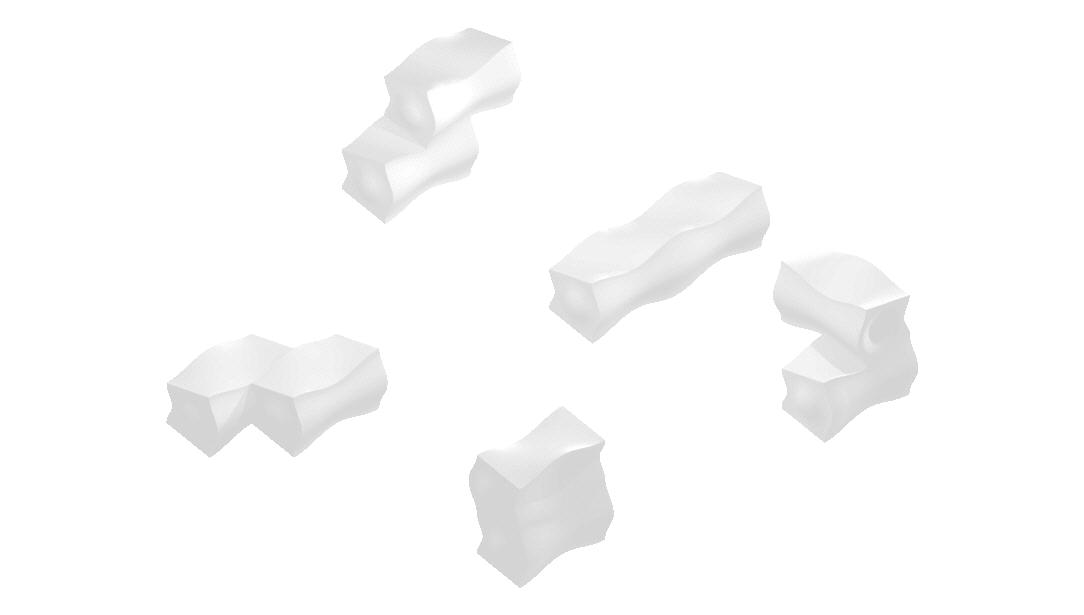
Its system logic is fairly simple, being composed by a single element [Ref. Fig. 3.14]. The ability of creating a complementary surface that allows for the stacking of similar components in a Flemish bond pattern helps increase stiffness and optimises the use of the components when it comes to the overall geometry. In such a system, a single brick is acting as locking element for two other neighbouring bricks beneath it.
44 Quake|Response
Fig.3.14 Osteomorphic block alone and within its resulting assembly
DISPLACEMENT IN XZ PLANE DISPLACEMENT IN XY PLANE 2.6e Stress 2.2e 1 b 0 x y z x y z x y z x y z x y z x y z XY PLANE LOCKING XZ PLANE LOCKING x y z
Fig.3.15 Brick able to provide for axial locking in the x axis, as well as rotations around y and z axis. Fig.3.16 Complementary non-planar surfaces locking in the xy plane as well as rotation around z axis
Extensive tests have been carried out on this particular material system, especially those regarding mechanical properties, with important findings on its behaviour under point loading and bending stiffness. Moreover, a local failure in one of the element does not spread to the rest of the structure, as shown in experiments carried out comparing failure patterns in solid plates and in plates composed of interlocking blocks [Ref. Fig. 3.17] (Dyskin, Estrin, & Belov-Kanel, 2003). The combination of these mechanical properties is believed to have potential for high-resistance protective coating, as space shuttle external layers. (Estrin, Principles and Development of Bio-Inspired Materials, 2010)
Such further development would require a substantial change in the fabrication concept of the osteomorphic block. While the current state of the art conceives that all blocks are equal, so as the result is a planar surface, a shift into protective coatings would require the adaptation to a complex surface thus dealing with all non-similar elements.
Another interesting feature emerged from the evolution and study of topologically interlocked blocks, is the opportunity of developing multi-layer surfaces, by introducing same-type elements able to link one stratum with the following one. Mechanical qualities would be improved, and the high-energy absorption capacity of such assembly may be further investigated for earthquake-safe structures.
3.9 ADVANCE IN TOPOLOGICAL INTERLOCKING
Deviating from the standard morphology of the osteomorphic brick, simultaneously pursuing the same geometrical properties, raises several questions that will seek for answers. The already mentioned issue of the fabrication, where a certain global geometry would be composed of unique pieces, will be addressed, as well as the overall goal of structural stability under lateral loads would be studied. The system itself has been thoroughly tested and proved by the research team led by professor Y. Estrin at Monash University, where constant updates on new findings are published. This dissertation will take into consideration results and observations from the research team, and drive them towards the goals previously mentioned, without though seeking for extremely accurate results (electronic devices will not be used to take measurements). The study and development of the material system will focus on the overall feasibility, structural properties and the architectural quality that could provide, balancing these criteria in different feedback loops.
Due to the complexity of some experiments, especially in the fabrication of unique bricks, all the tests that follow are carried out on a digital base. This method, together with the results, will be analysed, showing not only its potential but also the limitation that might follow.
3.9.1 BRICK DEFINITION
Experiments previously carried out, show how impact load tests for failure patterns have been analysed subjected to a very stiff boundary condition in the form of a steel frame that would provide total locking to the sample layer. For the initial digital experiments, no external additional load was foreseen (i.e. post tensioning or boundary frame). The self load of the brick alone was accounted for. For this reason, solely geometry and friction were the main focus during the set of experiments.
The first of this two parameters alone could provide interesting results where the block morphology is able to provide multiple axis and multiple rotation locking. On
45 3 - Topological Interlocking
Fig.3.17 Failure patterns on interlocking blocks and a solid plate © [Dyskin, Estrin, & Belov-Kanel, 2003]
the other hand, the example of gabions retaining structures rely on their weight and simple friction between the units to increase strength in response to lateral loads. Tetrapods instead, used for breakwater, combine the two properties, providing geometrical interlocking together with high mass.
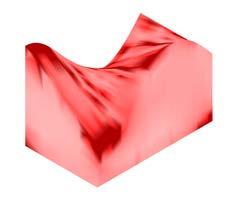
Considering the sinusoidal morphology that characterises the bricks, the first and main experiment will study the implications in terms of lateral load when the amplitude of the wave is changed. Evaluation will be based on the static friction between two sample bricks, considering a lateral uniform applied load and analysing the magnitude of these two forces to understand the resulting displacement.
3.9.2 BLOCK MORPHOLOGY MATRIX
Prior to describing the process, an important foreword has to be mentioned. This dissertation seeks a solution for a material system able to sustain accelerations induced by earthquakes’ waves. The experiments described in section 3.4, were conducted with the aid of an oscillating table. Results were then evaluated based on a dynamic force application, with non constant accelerations and forces applied. This method provided realistic results in terms of failure patterns. On the other hand, the method used to test friction force and geometric implications for the brick-to-brick connection, only took into account a uniform, constant acceleration. Implication of which, shall be further discussed.
A sample value of acceleration is set as 0.6g, corresponding to response spectra prediction for some seismic location in Europe.
Concerning the physical properties of the brick, a lightweight concrete mixture has been considered: 1220 kg/m3 of density. The reason for this choice stands in the fact that, as observed already in Section 3.6, the mass and the contact surface are not included in the mathematical equation that defines the friction force [Ref. Fig. 3.18]. The force F is calculated by the acceleration of the body itself.
If the mass increases, it is true that the friction force is greater as well, but the self produced force induced by the same acceleration will also increase, bringing the ratio to the same result. If external forces are involved to create the acceleration, the increase of mass will only result in more force to produce the set acceleration.
The size of the sample brick has been set to 450x250 mm, where the amplitude (symbol used: A) grows with the height of the block, resulting in different h/A ratios. The the parameters of defining the block are illustrated [ Ref Fig. 3.19]. The method that was followed to understand which h/A ratio would translate in the equilibrium of the brick [ Ref Fig. 3.19]. The target block features in the top position, while the one at the bottom is not subjected to any load or acceleration, it only provides the geometrical boundary for the moving brick.
The same equation for the calculation of the friction has been applied to a certain number (n=20) of divisions along the contact surface. Such surface, being a ruled geometry, always provides straight-line sections. At every analysis point, the mass and the force F have been divided by the total number of divisions and the perpendicular components of the vectors summed and multiplied by the static coefficient, then subtracted by the parallel component of the force induced by the acceleration of the body. The overall equation, explains the process.
The complete matrix of the experiment [Ref. Fig. 3.19], includes all the outcomes in terms of values of the resultant force. Positive if the brick would not move,and negative if the acceleration would displace the body.
46 Quake|Response
R FF FF ≥ F (object is in equilibrium) FF = µR ; F = ma µ(mg) = ma µ = a g m W F
Fig.3.18 Friction force formula
3 - Topological Interlocking

STATIC ANALYSIS - ACCELERATION INDUCED(a) - SELF PRODUCED FORCE OF m*a
UNSTABLE EQUILIBRIUM
EQUILIBRIUM STRESS CONCENTRATION
47
R R R F F F W W W W W F F F F F W W F F Σµ(F k+ W
k-F k k=1 n Σµ(F k+ W k)+W k-F k k=1 n n n n t h A m m m Ratio h/A:Ratio h/A: 2.45 Ratio h/A: 1.50 a a a NON EQUILIBRIUM
Fig.3.19 Friction force calculation of bricks with different height/amplitude ratios: 0, 4, 9
k)+W
3.26 e-6 KN/Cm 6.25 e
3.9.3 EVALUATIONS
The decision of subdividing the object in 20 parts was made by testing the implications of using different values. A test with 10, 20, and 50 analysis points was quickly carried out, using the summation of the resulting vectors, and compared with a traditional equation. The outcome produced different results, in the magnitude of 8%, 2%, 0,03% relatively compared to the traditional method. Considering the large amount of computational data, 20 analysis points and 2% of difference were considered acceptable for the whole process of calculation and evaluation.
As already mentioned, the contribution of the mass of the object was null. However, the position of the centre of mass was believed to be fundamental for the result of the test. Section of a brick [Ref. Fig. 3.20], illustrating the contribution of the geometry and the centre of its mass, to the formation of a rotational movement according to a point along the contact area of the two bricks.
It is visible how a geometry with a lower centre of mass will be able to achieve a higher displacement d1 compared to a geometry with a m2 as centre, thus allowing for more overall stability under lateral forces. The exact behaviour of this effect has been hypothesized, and as well not included in the overall algorithm. Moreover, even though results obtained were correct, the analysis has been carried out on a static and not dynamic basis, as previously mentioned. The oscillatory effect that the brick might take has not been calculated.
48 Quake|Response d1 d2 R FF FF W W F F W F F Σμ(F k+ W k)+W k-F k k=1 n n t l h A A h m m2 2h A β θ FF F β ω
Fig.3.20 Centre of mass of different bricks and its contribute to toppling
3.10 APPLICATION IN URBAN CONTEXT
As explained elaborately in the document the development of interlocking bricks brings a lot of potential with respect to its use in an earthquake resistant mechanism. As these bricks can be a mortar less construction, it becomes a very important characteristic that can be harnessed into the construction sector, which at the moment lacks any such research and development. This thesis looks at exploiting the merits of such interlocking brick construction technique to develop and utilise them to create an urban intervention. This urban intervention would be in the form of a protective mechanism against earthquakes.
Prior to dealing with it, the study calls for understanding the events which unfurl during and after an earthquake in an urban scenario. As the first tremors are felt (P Waves), an immediate response of the people is to evacuate buildings that they are in, and find an area where they could be safe. These safe areas generally constitute of open spaces with sufficient distance from any built form, away from harm’s way of any possible collapse of buildings. Although this act of finding a safe area does put them in another kind of danger.
Immediately after the initial wave, stronger tremors follow (S Waves). These are the waves which cause most of the damages. As a result, people on the road, traveling towards the safe areas are subjected to the danger of falling debris from buildings. Moreover, the routes to these open spaces may get blocked due to the collapse of a structure, thus impeding the flow of people and the ease of movement of rescue operations that follow.
So, the research question that follows,
How can we achieve the safety of people and guarantee that the roads stay clear of debris during and after an earthquake in an urban context?
49 3 - Topological Interlocking
3.11 THE WALL
In this scenario, such dangers could be averted if there were some ways of preventing debris from causing road blockages. This calls for imagining a protective wall, the function of which is to safeguard passage of people from their point of dwellings to the point of safety. These walls can be at critical road junctions, or predetermined danger zones. Considering that this solution can be looked at with a pure engineering point of view, simply designing a bearing wall. However the real challenge would be to look at it also with an architectural motive. Thus, apart from serving a structural purpose, it can also have other subtle functions which can add to the betterment of the urban tissue.
In case of failure of buildings, road blockage is evident [Ref. Fig. 3.21]. The resultant road width would essentially render it useless. With the unsafe nature of such debris, and inaccessibility, the rescue operations would be impacted.
In the presence of a safety wall, the debris is restricted in a confined zone, thus ensuring that the roads stay clear. Also, this wall could function as a protective measure for safety of people evacuating to open areas using the road
3.12 TYPOLOGIES
Considering a city scenario, there could be multiple applications for the protective wall. Different criteria would then have to be considered, which could be derived from the specific site location. Various critical positions can be identified by studying the local conditions such as width of roads, building heights, the overall structural health of buildings; and intervention can be sought at these specific points within the city.
In a generic situation [Ref. Fig. 3.22], it can observed that the wall can be oriented in such a way that to encompass an unstable building, or it is present at an important road junction corner, or it serves the purpose of safeguarding the open spaces, such that they remain viable for the gathering of people in an event of an earthquake.
50 Quake|Response
Fig.3.21 Material system application strategical diagram
SAFETY WALL AROUND THE BUILDING BLOCK IN A U FORMATION
SAFETY WALL AROUND A BUILDING CORVER IN A CURVED FORMATION
SAFETY WALL AROUND OPEN SPACE, ACTING AS A PROTECTIVE LAYER TO THE SAFE ZONE
51 3 - Topological Interlocking
Fig.3.22 Urban application strategical diagram
3.13 MORPHOLOGICAL EXPLORATION
Considering the urban constraints, the possible achievable footprint for the safety wall can be narrowed down to three basic extrusions. A straight profile, which can be located along a linear road, where safety is crucial. A curved profile, which can be implemented on road intersections, where the safety wall prevents the intersection from being blocked by debris, and an open box profile, which can encompass any particular building, that is declared unsafe or prone to damage, thus acting as a preventive measure.
3.14 DIGITAL EXPLORATION
The following experiment will analyse these forms as primitives. Using genetic algorithms, each primitive will be given the freedom to change its morphology, within a given set of domain. The primitive will be divided into points [Re. Fig 3.23], which would then move in XY plane. The top and the bottom edge would be allowed to move independent of each other. The two new curves of top and bottom would be then lofted to attain the resultant geometry. This would be a live process, where each change would be analysed simultaneously. Genetic algorithms strive to achieve fitter individuals over the course of generations, where one generation is the set number of times produces variations (individuals) within the given domain. The next generation is then informed by the previous one, where the flaws are eliminated and thus achieving morphologies, closer to the set goals.
The resultant morphology would be simultaneously analysed for displacement, using structural analysis software, Karamba3D. The geometry will be given a uniform thickness of 300mm and material of Concrete(25/30). All points on the base plane would be anchored. To understand the effects of lateral forces (accounting the weight of the debris) apart from the downward force of gravity, two lateral forces with the magnitude of 6g would be applied in the X and Y directions at the base plane.
Octopus, a genetic algorithm plug-in for Grasshopper3D, will be run, which would strive to achieve the set rules. The fixed goals would be to achieve the least possible
52 Quake|Response
Fig.3.23 Parameters varying on target surfaces
LINEAR
CONFIGURATION CURVED CONFIGURATION
SEMI CLOSED BOX CONFIGURATION
displacement, leading to a more stable geometry. As the top and bottom edges are free to move independently, there is a possibility of some individuals, where the morphology has the two edges in a large offset from each other, thus making the shape inherently unstable. To avoid this situation, each edge would be measured for its length and the second set goal would be to maintain the lower edge to be always longer than the top one. The third goal will be to maximise the surface area. This will be in contrast to the previous aim of getting shorter edge, and will ensure that the morphologies have enough freedom to get a stable configuration.

3.14.1 DIGITAL EXPLORATION
Analysing the displacements amongst the fittest 2 individuals from the final generation, although the morphologies were stable, it was noted that a uniform thickness of 300mm was not practical in a real world application. In order to sustain lateral loads, the thickness would play a major role. A tapering cross section could achieve more structural stability as seen in designs of traditional retaining walls. Again, the same set of software were put to use, with the same experiment, however, this time adding a criteria of thickness. The top and bottom edges, were allowed to be wider. The bottom edge had a domain of 200-800mm and the top between 200-400mm. The diagram compares the same morphologies with uniform thickness and one with tapering cross section. As is evident, the latter solution is much more stable. [Ref. Fig. 3.24]
53 3 - Topological Interlocking a 0.3 M 1.2 M 0.3 0.9 M 0.2 0.3 M a
Fig.3.24 Structural displacement analysis on geometries from the generated library.
3.15 CONCLUSIONS
The pros and cons of having a system which creates stable morphologies of walls should be analysed here. Certain points are to be noted with regards to the effectiveness of such solutions in a real world scenario.
The experiment resulted in walls with bricks which are unique in shape. This is a consequence of starting with a morphology and trying to apply the brick form to achieve the exact same shape. The wall geometry seen in the diagram [Ref. Fig. 3.25], consists of 1,500 unique bricks. This with regards to fabrication, is an undesirable strategy. The most ideal scenario would be to have various achievable morphologies with minimum variations of the components. This would ensure not only efficiency but allow for ease of construction, as this would circumvent the issue of identifying and locating a unique brick in a vast array of different bricks. This aspect will be further investigated to understand the implications and limitations of having minimum variations in blocks, but allowing for flexibility to achieve multiple morphologies within a set domain of possibilities.
Moreover, having curvature in two directions results in localised cantilevered sections. This situation is not desired in an earthquake scenario. Moreover, when the profile deviates from the core of the wall outwards, the centre of mass shifts correspondingly, which, for obvious reasons, is a setback to the structural stability. The observations emphasise the need to understand and rationalise the solutions so that the morphology suits the brick and not the other way around.
54 Quake|Response
LENGTH 30 M
HEIGHT 5 M
BRICKS 1500 (UNIQUE)
55 3 - Topological Interlocking
XY PLANE LOCKING
XZ PLANE LOCKING x y
z
Fig.3.25 Wall assembly with 1500 unique bricks and cantilever section with projection of components outside the footprint
3.16 REVISITING THE BRICK
To understand the nature and behaviour of a component at a local scale and its effect on the global form, each surface of a brick is analysed. As seen in the diagram [ Ref. Fig. 3.26], a simple traditional brick, having planar surfaces on all sides, does not have any interlocking properties whatsoever. Taking reference from the failure patterns observed from the physical experiments, each failure can be attributed to a particular face of a brick.
The resulting brick morphology becomes then a geometrical experiment involving non-planar complementary surfaces, enabling to maximize topological interlocking and brick organization. The first concept has been introduced already, where the larger the amplitude the better the performance to sustain lateral forces. Brick organization deals instead with the issue of the unique element, and the geometrical exercise would enquire the possibility of having the least possible number of unique bricks (ideally up to four morphologies), and being able to match them in more than one way to achieve different global assemblies. At the same time, the goal of achieving a Flemish bond, so as to achieve the structural performances explained in the description of the osteomorphic brick in Section 3.8, is sought.
After having understood the relative task that each primitive brick side has to accomplish, an evolution of such block is proposed. The primitive polyhedron has specific ratios concerning its dimensions, where length: width: height ratio is 2: 1: 1. The top and bottom sides are treated equally, using the resulting ruled surface of two sine waves, whose phase has been shifted. The short faces feature a bump, relatively a concave and convex one on each side, helping in locking rotation in the XY plane.
Moreover, due to results obtained in the structural static analysis of the global geometry, where a thicker/tapering wall section would increase performances, front and back sides of the brick had to be rethought to allow for multi-layering. For this reason, a surface generated between a sine wave on the long side, and two different sinusoids on the short side, resulting in a doubly curved surface.
56 Quake|Response
DISPLACEMENT IN XZ PLANE DISPLACEMENT IN XY PLANE 2.6e+2 kN/Cm Stress Stress Limit Lock 2.2e-1 1 a a b b c c 0 YX Z YX Z DISPLACEMENT IN XZ PLANE DISPLACEMENT IN XY PLANE 2.6e+2 kN/Cm2 Stress Stress Limit Lock 2.2e-1 1 a a b b c c 0 YX Z YX Z
Fig.3.26 Primitive brick and failure patterns attributed to each face
Fig.3.27 Complementary non-planar interlocking surfaces
3 - Topological Interlocking
Stress concentration analysis [Ref. fig.3.28] on bricks showed the non-optimal result achieved on those with height to amplitude ratio bigger than 2.75, even if with higher interlocking performances. The latest evolution of the brick that is described here has a ratio of 3 [Ref. Fig. 3.29], achieved combining friction force tests and stress concentration analysis.
3.17 ASSEMBLY
The resulting brick has the ability of interlocking in several patterns and eventually able to address different structural issues. Unfortunately with no physics engine dynamic simulator, it is not yet possible to assess the effects on the global wall of different locking pattern [Ref. Fig.3.29]
However, these different configurations inform various global wall assemblies. It is possible to increase the overall thickness, thus increasing its structural depth and stiffness. This interlocking side, front-to-back side of the brick, has not been analysed by varying its amplitude, thus the real contribution to resist acceleration/forces along is not known. The concept of it being deeper in order to increase friction force still remains valid. As a Flemish bond is achieved in elevation, in order to have one brick that locks two bricks on the bottom, gets replicated in the plan view as well, where the brick behind ,clamps two in the front. This multi-layering method would allow for a more stable configuration/ Although many topological faces of the geometry do provide stable interlocking concerning the brick-brick connection, if the wall is analysed as a whole, there is still a weak connection among the different layers. For this reason, a possible solution that has
been found is the adoption of ‘double bricks’ [Ref. Fig. 3.29], that would span across two neighbouring layers to insure complete and effective connection. The section shows the positioning of such blocks. It is to note that, being a square-based morphology, and in plan the assembly works with staggered elements, the bond is interrupted if such double block connects two bricks in the front and only one in the back. In order to resume the correct alternating of connections, thus ensuring more stiffness, two half-bricks would need to be introduced on the sides of the double brick. In terms of brick uniqueness, this last half piece that has been introduced is a normal one sliced in half, hence no additional
57
DISPLACEMENT IN XZ PLANE DISPLACEMENT IN XY PLANE 2.6e+2 kN/Cm Stress Stress Limit Lock 2.2e-1 1 a b b c 0 YX Z DISPLACEMENT IN XZ PLANE DISPLACEMENT IN XY PLANE 2.6e+2 kN/Cm Stress Stress Limit Lock 2.2e-1 1 a b b c 0 YX Z DISPLACEMENT IN XZ PLANE DISPLACEMENT IN PLANE 2.6e+2 kN/Cm Stress Stress Limit Lock 2.2e-1 1 a b b c 0 YX Z DISPLACEMENT IN XZ PLANE DISPLACEMENT IN XY PLANE 2.6e+2 kN/Cm Stress Stress Limit Lock 2.2e-1 1 a b b c 0 YX Z
Fig.3.28 Stress concentration at different height/amplitude ratios: 0, 4 and 9
Fig.3.29 Assembly combinations of two evolved bricks
3.18 CONCLUSIONS
The gap between design and fabrication is always considered to be crucial. There has to be a certain achieve-able middle ground when it comes to realising an architect’s design. A successful proposal then, is the one which accounts for fabrication limits. This should not necessarily mean that any architectural proposal should start with these limitations in mind. It means that a certain degree of rationalisation becomes crucial, while implementing any project.
As can be observed, various experiments conducted in this chapter, strive to bridge this very gap. Although not all of them can be claimed to be a success, the aim of rationalising was successfully achieved. Software limitations do come in as hindrances when dealing with complex geometries. This, however, can always be taken as a challenge to develop skills and further ones knowledge towards knowing new (other) software. The dynamic analysis test conducted proved to be one such challenge. It was not clear if the limitation was just related to computational power or was more to do with the script itself. Exploration into the world of structural analyses can substantiate if the logic was correct. However, this at the moment has not been achieved.
Coming back to the point of fabrication, thought can also be given to the balance between the size of a brick, material of the brick, its ease of construction and the effectiveness of overall geometry. This can be an interesting exercise to actually weigh in different scenarios, where change in the brick size results in efficiency, or in some cases,
lack of it.
The brick seen here, although has been calibrated for its material, i.e. concrete, at higher amplitudes of the sine wave in the brick, concrete fails at the stress concentration points. Can there be another material which allows for such high amplitudes, thus in response, a very intense interlocking, and not fail at those stress levels? Finding such material can result in having very stable geometry with minimal failure possible.
With respect to the size of the brick, smaller the size, the smoother the archived curvatures. On the other hand, larger the brick size, heavier the mass, thus providing more stability to the overall assembly. Can a fine balance thus giving more desirable outcomes? Or would it be just a matter of having differentiation in the sizes to achieve variable sections and a much more stable morphology? Actual assembly here then becomes a crucial issue. Can the heavy brick be manageable such that it can be put in place with human hands, or does it become so heavy that mechanical support is needed just to move one brick? This would also affect the construction time and be economically on the costlier side.
The chamfering of bricks would allow for simpler, much cost effective way of constructing a curved profile wall. With variation in angles, different radii of curvature can be achieved. Openings in the wall would provide texture. However, the ambition of achieving an architecture purpose to the wall, apart from being a safety measure, has not yet been addressed, and would be prioritised in further developments to this dissertation.
58 Quake|Response
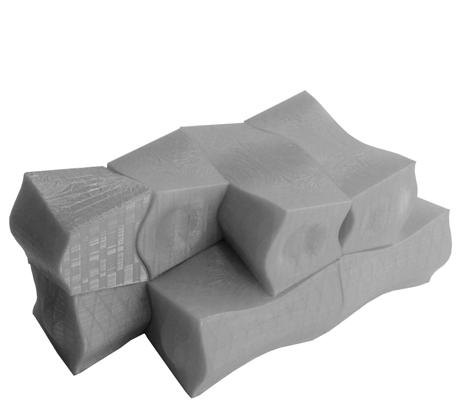
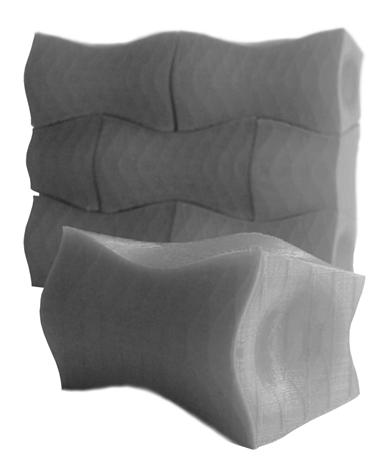
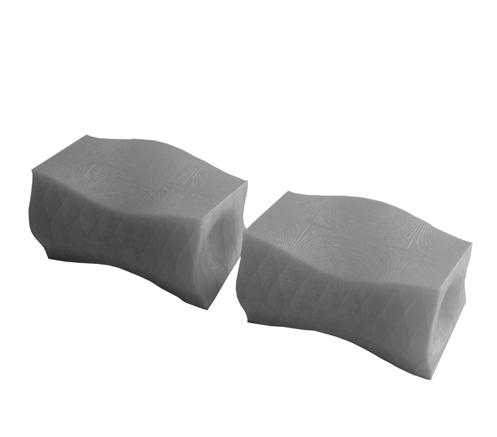
59 3 - Topological Interlocking
M. Sc Critical Reflections
The M.Sc dissertation was had a specific goal: to develop a material system that is easy to construct and provides safety from the effects of earthquakes.
Topological interlocking between blocks has great potential to behave with much resistance to seismic displacements. With precedents like the Quake Column by Emerging Objects, the focus of the thesis was on developing a building block with these interlocking properties and with flexibility in how they interact with each other when assembled at a global scale. Research led to the osteomorphic brick developed by Dyskin, Estrin, and Belov-Kanel, which was studied in much detail in the dissertation. However, a limitation of this system was that it only allowed for interlocking along one plane. Taking note of this, the system was followed up and developed further due to its outstanding mechanical properties as well as its interlocking concept, through nonplanar complementary surfaces. This called for understanding the relationship of the amplitude of the sine wave (accounting for the degree of interlocking) and the size-toheight ratio of the brick.
The bricks were to be used to create structurally stable walls that could withstand an earthquake. The outcome of this experiment can be analyzed for its successes and failures. Using genetic algorithms in conjunction with Karamba3D can be a very good strategy for finding a stable morphology, although it was not used to its full potential. A shortcoming of the process was that the evolution of the form for the wall was done assuming a solid section, but the bricks were not figured into the process yet. The stable “solid” wall was then taken, and the morphology was assembled using the developed brick. Although this process had a defined logic, determining the forms of the walls and the bricks simultaneously could have led to better results. This, however, would require
a lot of digital power, which might have been a problem with the general computers at the disposal. Another difficulty was accounting for the strength of a singular brick under dynamic loads. The experiments carried out were all under static loads using finite element analysis. Moreover, both the generated stable wall morphology and the brick itself were analyzed with the Kangaroo2 physics engine for Grasshopper; however, this led to a failed outcome. In order to implement the physical properties of volumetric geometry as well as actual interaction between all of the geometries, the density of the input mesh has to have high resolution.
Eventually, the wall resulting from the mere application of the generative brick algorithm to the statically analyzed surface did not have optimal results. Under the structural point of view, a wall with curvature in the second direction (yz plane)—and thus allowing for local overhangs—would eventually not be an optimal situation for a mortar-less material system in the event of earthquakes, and optimizing this process would allow for much more stable configurations for the wall.
The M.Sc stage of the project failed to reach any architectural solution to the material system. Although the generation of walls was a result of the interlocking blocks, there was a lack of architectural intent to it. The urban application of such a solution would need to be dealt with in detail. Local demographical inputs would allow for a holistic approach to the problem. As a possible next step, studying the existing infrastructure along with the road network will help to illustrate the extent of intervention required. The purpose of the proposal should not only be safety, but also the architectural functionality, which can feed back to the betterment of the urban quality in addition to making the city safer for earthquakes.
M.Arch. Dissertation
RESEARCH AMBITIONS
The MArch phase ambitions of this dissertation can be separated into three phases, Global, Regional and Local scale. The aim will be to establish a network of safe areas which will be used for temporary shelters for people after an earthquake. Each scale would deal with solving specific problems for the city of Istanbul, to make it seismic resistant and ready for the predicted earthquake.
The Global scale would deal with the city level, where existing road networks and their characteristics will be studied. A syntactical analysis will set a hierarchical importance to the roads thus making available values, from which a suitable network can be selected for acting as a safe evacuation network.
The regional scale will deal with identifying certain areas which can be deemed fit to seek shelter during and after an earthquake. These areas will be called Safe Zones and would be part of the global safety network.
Whereas, on the local scale, the previous research of topologically interlocking, mortar-less construction system will be further developed to be able to create structures with architectural functions. These structures, being earthquake resistant, would be used as shelter spaces after an earthquake.
66
COULD THE CITY OF ISTANBUL BE PREPARED FOR AN UNPREDICTABLE AND CATASTROPHIC EVENT OF EARTHQUAKE UNDER THE EXISTING URBAN CONDITIONS?
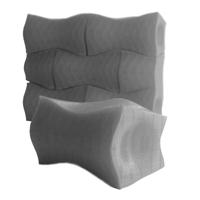
67 Global [City Systems] [Material Systems] Regional Local
1950 Bosporus Bridge First Periphery highway Road and Railway Expansion F S M Bridge Second Periphery highway 1970 1990 2015 Hazardous Facilities Hospital Fire Station Safe Zones Bridge Safe Evacuation Route Secondary Connections Emergency Facilities Safe Zone and Radius of Influence Escape Routes Buildings Hazardous Facilities Hospital Fire Station Safe Zones Bridge Safe Evacuation Route Secondary Connections Emergency Facilities Safe Zone and Radius of Influence Escape Routes Buildings
TIME-LINE
Taking cue from the earlier timeline chalked out in the M.Sc phase, a more detailed study shows the results of earthquakes over the course of the first few minutes to the next few weeks and months. This dissertation will focus on the time frame of the first 48 hours, where the first aid and other emergency facilities become crucial, to the next few weeks, where the need of providing the affected people with a safe shelter and other basic amenities is of utmost importance.
To understand effect of an earthquake from an urban context, it is important to evaluate the major events in chronological order. As the first tremors are felt, within few moments people evacuate their houses and gather in open spaces. The debris cause road blockages which results in failure of vehicular network. The damages to gas and electric lines cause outbreak of fires. Within the first half an hour, aftershocks may cause further damages.
The first few weeks after an earthquake become crucial as people whose houses get damaged, are in the need of shelter, food and water. The already collapsed infrastructure of the city does not allow for easy distribution of such amenities.
68
EVACUATION ON ROADS
FIRST AID PEOPLE HEADING TO OPEN SPACES
THREATS BY FALLING DEBRIS
GATHERING IN TEMPORARY REFUGES
HEADING TO ASSESSED SAFE
SHELTERS
HELP IN PROVIDING AID AND SEARCH FOR SURVIVORS
DISTRIBUTION OF FOOD AND WATER RELOCATION OF PEOPLE TO PERMENANT SHELTER
DOMESTIC FIRES
DEBRIS ON ROADS
OUTBRAKES OF FIRES CELLULAR NETWORK COLLAPSE
EMERGENCY VEHICLES ARE DEPLOYED
AFTERSHOCKS
WEAKENED BUILDINGS
COLLAPSE
DIFFICULT MOBILITY DUE ROADS BLOCKAGE
STRUCTURAL ASSESSMENT OF BUILDINGS
LIFELINES ASSESSMENT
DEBRIS CLEANING
INTERNATIONAL AID
TEMPORARY REFUGES AND MEDICAL FACILITIES ARE SET IN OPEN SPACES
BASIC INFRASTRUCTURE REPAIR
MANAGING TENT CAMPS AND SHELTERS
HIGH POSSIBILITY OF FURTHER COLLAPSE DUE TO AFTERSHOCKS
69 HUMAN ACTIONS URBAN SCENARIO
P WAVES TREMOURS WEAK BUILDING COLLAPSE S WAVES STRONG TREMOURS STRUCURE COLLAPSE T= 0sec T= 5sec - 2minT= 2 - 5min T= 5 - 10min T= 10min - halfday T= halfday - 3 days T= 3 days - 1 month T= 1 month on EARTHQUAKE
INFRASTRUTURE
PROGRESS REPAIR
METHODS
4 WORK FLOW PHYSICAL | DIGITAL APPLICATIONS
Understanding the aims for this dissertation, there can be different means of achieve the same goals. The thought behind the work flow will be explained which makes the process of understanding the bounds of the work easier. Each method will be discussed in detail in their respective chapters. Can these methods, as described here, be achieved by specific softwares, will be the question to be addressed in the respective chapters henceforth.
4.1 METHODS
It is important to sketch out and estimating the required tools and methods for achieving the research ambitions for this dissertation. As stated earlier, the research ambitions are segregated into three stages. A Global scale, regional scale, and a local scale. Each of which, would have their own unique demands for the required tools and software to be used based on the specific aims.
This exercise of outlining the skills and expertise required for certain specific analyses would allow for a pre-emptive learning time where the software can be understood and be able to be comfortable with the interface. As this dissertation deals with seismic design, a lot of engineering oriented analyses would be required. Being able to understand the terminologies and correct methodology for such complicated structural calculations would demand a specific learning experience.
4.1.1 GLOBAL SCALE
Global Scale studies will include the existing road layout of the city of Istanbul along with the available infrastructure and their hierarchy based on the importance each infrastructure has within the urban fabric. Information and details from the state of the art of network studies will influence the tools used for network analysis. Properties of network length, betweenness and hierarchy will be investigated and analysed. Their evaluation through specific software will allow the continuance of the urban argument of the dissertation.
For the syntactical analyses of road network, possible software which could be used are DepthMapperX, which is a stand alone software developed by the space syntax team at UCL. It allows for a detailed graph analysis on smaller as well as very large scale networks. The results from the software can be saved as a .text file which can be used to recreate the result into Rhino using Grasshopper3D. This added step would be required as the platforms of both the software are not compatible to export data. Another possible approach can be to use the Space Syntax plug-in for Grasshopper3D. This will have an added advantage of not needing to change software platforms, as it will perform the analysis within the same Rhino-Grasshopper environment.
For the multi criteria analysis on selecting safe zones across the city of Istanbul, the genetic algorithm plug-in for Grasshopper3D would be ideal. Octopus allows for generating an evolutionary library of solutions using multiple criteria input.
72 Quake|Response
Software Icons (L to R) : 1. DepthMapperX 2. Space Syntax 3. Octopus
4.1.2 REGIONAL SCALE
Regional Scale studies will focus on the individual safe zones which get selected through the multi criteria optimisation exercise carried out on the global scale. The main driver of the exercise in the regional scale will be the proposed development of the selected safe zone. Strategically identifying most vulnerable buildings and proposing to demolish them.
Octopus, again can be used to undertake this multi criteria experiment, where various inputs from the site condition to the structural stability of the building will govern the identification of these vulnerable structures. The existing road layout will then be studied for identifying critical junctions. This can be done using the syntactical tool of Space Syntax within Grasshopper3D. Overlaying of multiple data on to the current geographical map of the city will allow for a holistic view on the problem. ArcGIS can allow for handling of such layered data.
4.1.3 LOCAL SCALE
Local Scale studies will deal specifically with the material system. At this scale, both digital and physical tests will be crucial and the feedback of information from each to other will create a dialogue between the digital world and the physical.
Understanding the behaviour of material on a component scale to a large surface scale, in the digital platform, various options for structural analysis can be investigated. Kangaroo allows for simulating actual physical forces. For an accurate result, it is imperative to have a clean mesh for the geometry to be analysed, which can be achieved various meshing tools like Weaverbird. This could be useful to create stable forms by having a mesh relaxation exercise based on the reverse catenary curve. A form finding exercise can be done using this mesh relaxation in conjunction with the Minimal Surface plug-in for Grasshopper3D.
Strand7 and AnSYS will allow for a dynamic load analysis to simulate the earthquake forces and ground acceleration based on the actual site data. These software however, have a disadvantage of not being able to communicate well with the RhinoGrasshopper3D platform. Thus if a static load analysis has to be performed within the same environment, plug-ins such as Karamba3D and Millipede could be utilised.
Testing out these digital results in the physical world can be done by 3D printing the interlocking blocks to study their behaviour under the dynamic forces, which can be simulated by having an oscillation table which is capable of calibrating to the desired earthquake force.
73 4 - Methods
Software Icons (L to R) : 1. Octopus 2. Space Syntax 3. ArcGIS Esri Software Icons (L to R, Clockwise) : 1.
structural 2.
3.
ANSYS
Strand7 FEA
Weaver-Bird Mesh Edit 4. Karamba3D 5. Ultimaker2 3D Printer 6. Millipede, Structural Analysis 7. Minimal Surface 8. Kangaroo Physics Engine
CASTING
3D PRINT
STABLE FORM FINDING
MODELLING
DOMAIN INPUTS
MATERIAL SYSTEMS
URBANISM
SAFE ZONE SELECTION
SAFE ZONE HIERARCHY SAFE ZONE DEVELOPMENT
SYNTACTICAL ANALYSIS
NETWORK HIERARCHY
NODE HIERARCHY SAFE EVACUATION ROUTES
74 Quake|Response
OSCILLATION TABLE TEST
PHYSICAL
DIGITAL
DYNAMIC STATIC STRESS CONCENTRATION
STABLE FORM WALLS
STABLE FORM SHELLS
SITE EVALUATION
FEASIBILITY
DESIGN PROPOSAL
75 4 - Methods
RESEARCH DEVELOPMENT
Material System Local Scale
The behaviour of topologically interlocking bricks was studied in detail in the MSc stage of the project. This section will take that research forward to develop an architectural intent to the material system.
5
RESEARCH DEVELOPMENT
Case Studies
The state of the art in the field of topological interlocking and shell structures is investigated in this chapter. Understanding the principles of such successful projects would give a solid background to the further studies and explorations in the topic.
5.1 INTRODUCTION
This chapter will highlight the features of interlocking typologies studied in the M.Sc phase of this dissertation, and it will aim to establish a relationship between integrating this system and its emerged structural performance for the construction of shell structures. In this regard, certain precedent-setting studies were selected for guidance and development of a material system.
5.1.1 INTERLOCKING SYSTEMS IN ARCHITECTURE
Interlocking systems are proved to have immense structural capabilities in withstanding different ranges of forces, including gravity, wind loads, earthquakes, etc. In the M.Sc section, the principles of these systems were abstracted for the development of a mortar-less, anti-seismic material system. These principles could be summarized as follows:
1. By considering a component-based system, shear forces are well resisted.
2. Concentration of the stresses in the system is minimized by its fragmentation.
3. The fragmented system ensures the overall structure does not behave in resonance under seismic stress.
4. The morphology of the interlocking surface minimizes the degree of freedom on the three axes (x, y, and z).
5. Energy is dissipated through friction between the surfaces of the interlocking components.
Interlocking systems, therefore, have vast opportunities and potential in architecture to generate intriguing complex spaces that extend beyond simple primitives. Shells, for instance, can be constructed from interlocking components that follow their form, which is referred to as a “gridshell” system. Although shell geometries are compression-only structures due to their self-weight, introducing a gridshell of interlocking morphologies can bring new structural capabilities to the system. Thus, it is important to examine the properties and characteristics of shell structures.
5.1.2 SHELL STRUCTURES
Adriaenssens, Block, Veenendaal, and Routledge (2014) describe shell structures as spatially three-dimensional, curved surfaces that withstand external loads by “membrane stresses” (which refers to axial compression and tension). The curvature enables the shell to act as a membrane, carrying “in-plane forces” and providing great resistance to external loads (Jrr, 2014). Their outstanding structural features can be summed up as follows:
1. The equilibrium state of the shell’s form promotes a high efficiency of load-resistant behavior.
2. The ability to span over long distances makes shells appropriate for vast, open spaces.
3. If shells are well designed, then no bending moment is developed, yet only membrane stresses are acting on the shell and are distributed uniformly over its thickness.
4. The uniformity of force distribution over the shell promotes thinness.
Recent research in developing shell structures that are related to the gridshell type has shown that discrete parts have increased the possibility of such a form to extend beyond compression-only structures. In this regard, this thesis will seek to utilize interlocking systems to improve shell morphologies’ structural performances in a dynamic load scenario. Certain precedents highlighting the aspects of gridshells were studied, including the works of Eladio Dieste, the Block Research Group, and a case study on post-tensioning of discrete concrete elements for free-form shells.
80 Quake|Response
Fig.5.1 Subdivision of shell —Shell grid— into discrete components
[Shell form] [Gridshell] [Discrete elements]
5.2 ELADIO DIESTE, GAUSSIAN VAULTS (1960s):
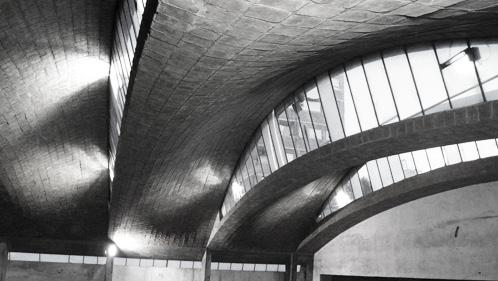
Eladio Dieste’s interest in exploiting the properties of masonry brick under a regional limitation of resources has given rise to the development of novel shell forms, such as the “Gaussian vault.” The principles of Hook’s hanging chain for a catenary curve and its inversion of a stabilized form of a rigid arch served as the primary driver for the development of the Gaussian vault. The vault is constructed from a multiple catenary curves with different heights in the transverse section, subjected to axial compression on the longitudinal section [Ref. Fig. 5.2]. The variation of heights in these curves generates different levels of compression, resulting in shear stresses between them. Dieste introduced reinforcement in the forms of loop tie and steel cables between the bricks to resist such forces (Pedreschi and Larrambebere 2004).
5.2.1 EVALUATION
Dieste’s novel technique for brick construction possibilities mediates between the spatial qualities that emerged from unique vaults and their high structural performance within a specific context. With recent advancements in fabrication techniques and computational modeling, challenges could be drawn and analyzed to improve on these principles for generating highly efficient, stable shells. It can be noticed that Dieste’s use of bricks of the same size with parallel stacking is explained by the limitations of the fabrication technologies of his time. Digital form-finding and material optimization techniques could minimize the amount (thickness) of material used, and with advanced fabrication tools variation of brick sizes could be achieved to provide hierarchy in the structure.
81 5 - Case Studies
Fig.5.2 Gaussian Vault : various height of catenary curves
vertical plane moving along springing points
5.3 BLOCK RESEARCH GROUP
The Block Research Group’s interest in shell structures lies specifically in unreinforced masonry vaults created by means of a computational form-finding technique. The process followed is rigorous and informative, and it involves understanding the structural properties of masonry and how it acts purely in compression. This resulted in an appropriate funicular stable form, in which tessellation patterns were utilized and bricks were formed from these patterns. This digital analysis was verified by means of inverse equilibrium analysis (Block and Lachauer, 2011), taking into consideration principles from Hook’s law. These processes were done with the developed-tool RhinoVault. The last step involved fabricating the bricks and installing them using a specific machine set-up (Rippmann and Block, 2013)
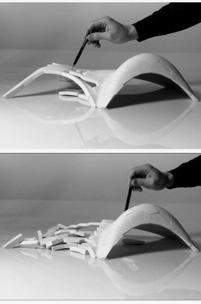
5.3.1 EVALUATION
It was observed that the tessellation follows the force flow pattern imposed on the structure under self-weight, and that the bricks are interlocking in respect to the force flow, which help increase the stability under live loads and prevent buckling (Rippmann and Block, 2013). By experimenting with RhinoVault, it was noticed that tessellation patterns were limited to specific geometrical patterns, and it was difficult to perform parametric operations to control the morphology of bricks, particularly their interlocking surfaces. The resultant bricks or blocks from the tessellation pattern do not take into account locking on all planes, as the aim is to purely create stable vaults from discrete elements under pure compression forces. Consequently, local failure will propagate, causing the whole assembly to collapse.
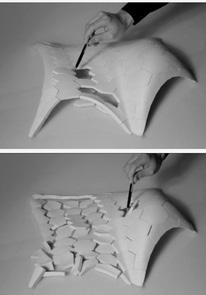
82 Quake|Response
Fig.5.3 Block Research Group : vault’s test
5.4 POST-TENSION DISCRETE ELEMENTS
The research looked into developing new methods of construction for complex shell structures that are composed of unique elements. It involves introducing a discontinuous post-tension element between the connections of the discrete components [Ref. Fig. 5.4] . This approach enables the elimination of form-work toward minimizing construction resources, logistical issues, and simplification of the assembly process. In addition, the post-tension allows the tension imposed on the structure to be taken through the connection between the components, hence, making the shell structure perform beyond its compression-only oriented performance (Block, Knippers, and Mitra, 2014). The research proposes two ways of post tensioning: external and internal. The latter proved its effectiveness in ensuring the tying of the neighboring components with enough tension to allow for the insertion of a new component at a time. The discontinuity of tension elements promoted the assembly process (Block, Knippers, and Mitra, 2014)
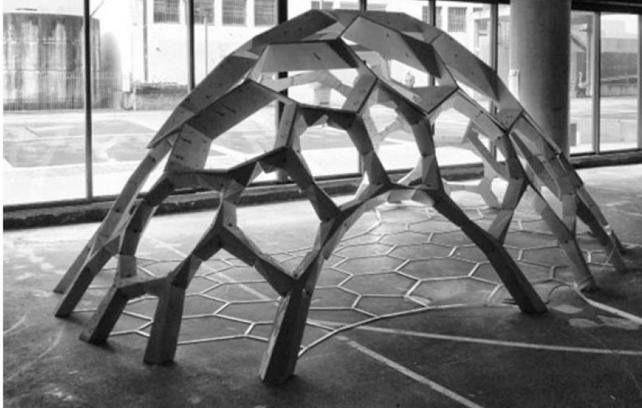
5.4.1 EVALUATIONS
The research was oriented to create a novel technique for form-work elimination during shell construction by means of discontinuous post-tension through the discrete pre-cast concrete elements. Introducing such a system led to the emergence of new structural capabilities in the shell structure, beyond its high performance as purecompression forms under self-weight. However, these capabilities were not expected, as the main aim was to eliminate the use of form-work, hence, it could be of great potential if further Finite Element Analysis (FEA) were conducted to improve the structure under different types of loads. It was noted that the post-tension element is embedded within the components, which made it difficult to deal with after the assembly, as the behavior of the shell will change, and such tensions need to be controlled to accommodate the new structural behavior. In addition, the components have flat surfaces at end conditions and they are only relying on the tension element for locking. Interlocking morphologies could be introduced to further minimize the degree of freedom between the components.
83 5 - Case Studies
Fig.5.4 post-tensioning between the pre-cast concrete discrete components
5.5 CONCLUSION
Shells are an efficient form of structure; their three-dimensional surface curvature allows them to act as membrane stresses in-plane. This promotes high resistance of external loads. Traditional techniques for shell construction with implementation of physics’ principles were evident in the work of Eladio Dieste. His interest in simple, reinforced brick has led to the creation of structural solutions for long-span forms, especially, the Gaussian vault. Recent advancements in computational modelling for form-finding processes and the latest fabrication technologies have made it possible to develop new potentials for shell structures, not only as being compression-only forms. For instance, tessellation patterns following the stress force flow, seen in the Block Research Group case study, increased the structural performance of the system, as forces are perpendicular to the patterns’ plane (bricks), which result in uniform distribution of loads. The limitation in the developed Rhino-vault tool lies in the limited control of the tessellation patterns and the lack of control for manipulating the morphologies of the interlocking surfaces of the blocks. Such challenges will be dealt with in this dissertation, and alternative tools will be investigated to improve the interlocking surfaces in the material system, and the potential for aggregation patterns in the form of stable shell structures. Furthermore, it is seen from the case study “Post-tensioning Discrete Concrete Elements” that post-tension elements within the components helped eliminate the need of form-work, which is predominant in the construction of shell structures. Also, it increased the tension between the components, thus, increasing the locking between them. The thesis will aim to experiment with such system in the development of the material system to improve its behaviour under dynamic loads.
84 Quake|Response
85 5 - Case Studies
RESEARCH DEVELOPMENT
Experiments Physical |
The dialogue between the physical and digital design is an integral part of proposing a material system oriented design. This chapter deals with understanding the possibilities and limitations with the fabrication process in both platforms.
Digital
6
6.1 AIM
-To understand the relationship between the degree of interlocking of the developed brick and the stress-concentration values of the material when used under static-load tests.
-To test the material system in the physical environment on an oscillation table with the post-tension element under different conditions, and to conduct a spectral-response analysis test in the digital platform in order to evaluate the performance of the material system under dynamic motions.
6.2 INTRODUCTION
In order to prove the material system’s resistance to lateral loads, a series of physical experiments have been set to evaluate the new brick morphology in relationship to compression forms—an arch—and to test the effectiveness of the post-tension element. These experiments were tested on an oscillation table with a range of acceleration between 1 and 8 m/s2. The first experiment suggests the first development of the brick morphology brick type-A, testing its aggregation in the form of an arch. The second experiment tested brick type-B improved morphology in different conditions; without ties, with transverse ties, and with longitudinal ties. In each experiment, acceleration at failure was recorded and calculated using the following equation from the principles of Simple Harmonic Motion (SMH):
a = -(2πf)^2 x
f (The frequency of an oscillation) = 1/T; T (The time for one oscillation measured in seconds).
x (The displacement of the object in its oscillation), measured in metres.
The acceleration values for each recorded oscillation were then converted to the percentage value of g values using the following equation:
g = (a/9.8)*100
The conversion reflects the magnitude of earthquakes in respect to the ground acceleration values. This offers an understanding of the actual effect of such acceleration on an object in a real earthquake scenario. In addition, the acceleration values as a result of the object’s motion are independent of the size, shape, and weight of the objects in the absence of air resistance. Hence, by testing a small-scale version of the actual block, real results could be simulated and used. The experiments simulated a 1/10th scale of the actual average block size, which is 400mm x 300mm x 200mm, using 3D printing technology to construct the blocks, in which Poly-lactic acid (PLA) was used as a building material.
6.3 BRICK TYPE-A
The developed brick component is de-constructed into a body plan, where each face of the brick is responsible for a certain degree of interlocking that can be controlled. The degree of interlocking of any face of the brick is promoted by an upper curve (du) with a certain curvature direction and a lower curve (dL) with an opposite curvature direction. A surface is generated between them, thereby ensuring that the element is locked on every plane. A domain for the degree (d) of these two curves was set to be between 0.1 to 0.3 meters [Ref.Fig.6.1]. Considering cement concrete as the material, and an average brick size of 400mm x 300mm x 200mm, a relationship between the degree of interlocking and the stress concentration of the material under static loads was established. The material used for conducting the physical experiments was PLA, and the analysis was specific to concrete for the stress-concentration values. This was done due to the uniqueness of the bricks’ geometry and the ease of constructing them via 3D printing technologies. However, the degree of interlocking will, nevertheless, reflect cement concrete as a material; thus, these experiments are considered for preliminary design purposes, and the results will be comparable to a real-life scenario.
88 Quake|Response
89 6 - Experiments : Physical | Digital
400mm 300mm 200 mm
F1
lower degree
Fig.6.1 Anatomy of brick: deconstructing it into a body plan
du1 dL1 du2 dL2 du3 dL3 du4 dL4
F3 F4
F2 F : Face of the brick du : upper degree of interlocking dL :
of interlocking
6.4 EXPERIMENT SET-UP
Considering the stress analysis values of the brick in relationship to the degree of interlocking [Ref.Fig.6.4], a brick with a domain of between 0.15 and 0.25 metres on the brick faces F1 and F2, and with a domain between 0.15 to 0.2 metres on the brick faces F3 and F4, was set to generate 81 unique bricks. The reason for this choice is that the high-strength concrete tends to fail at 42 Mpa (4.2 Kn/cm2), and the maximum tensile stresses need to not exceed this value. These bricks were then 3D printed for the arch assembly with brick type-A at 1/10th of the actual brick size. The first row of bricks at each end of the arch was bonded to simulate a support base. An egg-crate structure was built as a framework for laying the bricks for the arch assembly.
6.5 RESULTS
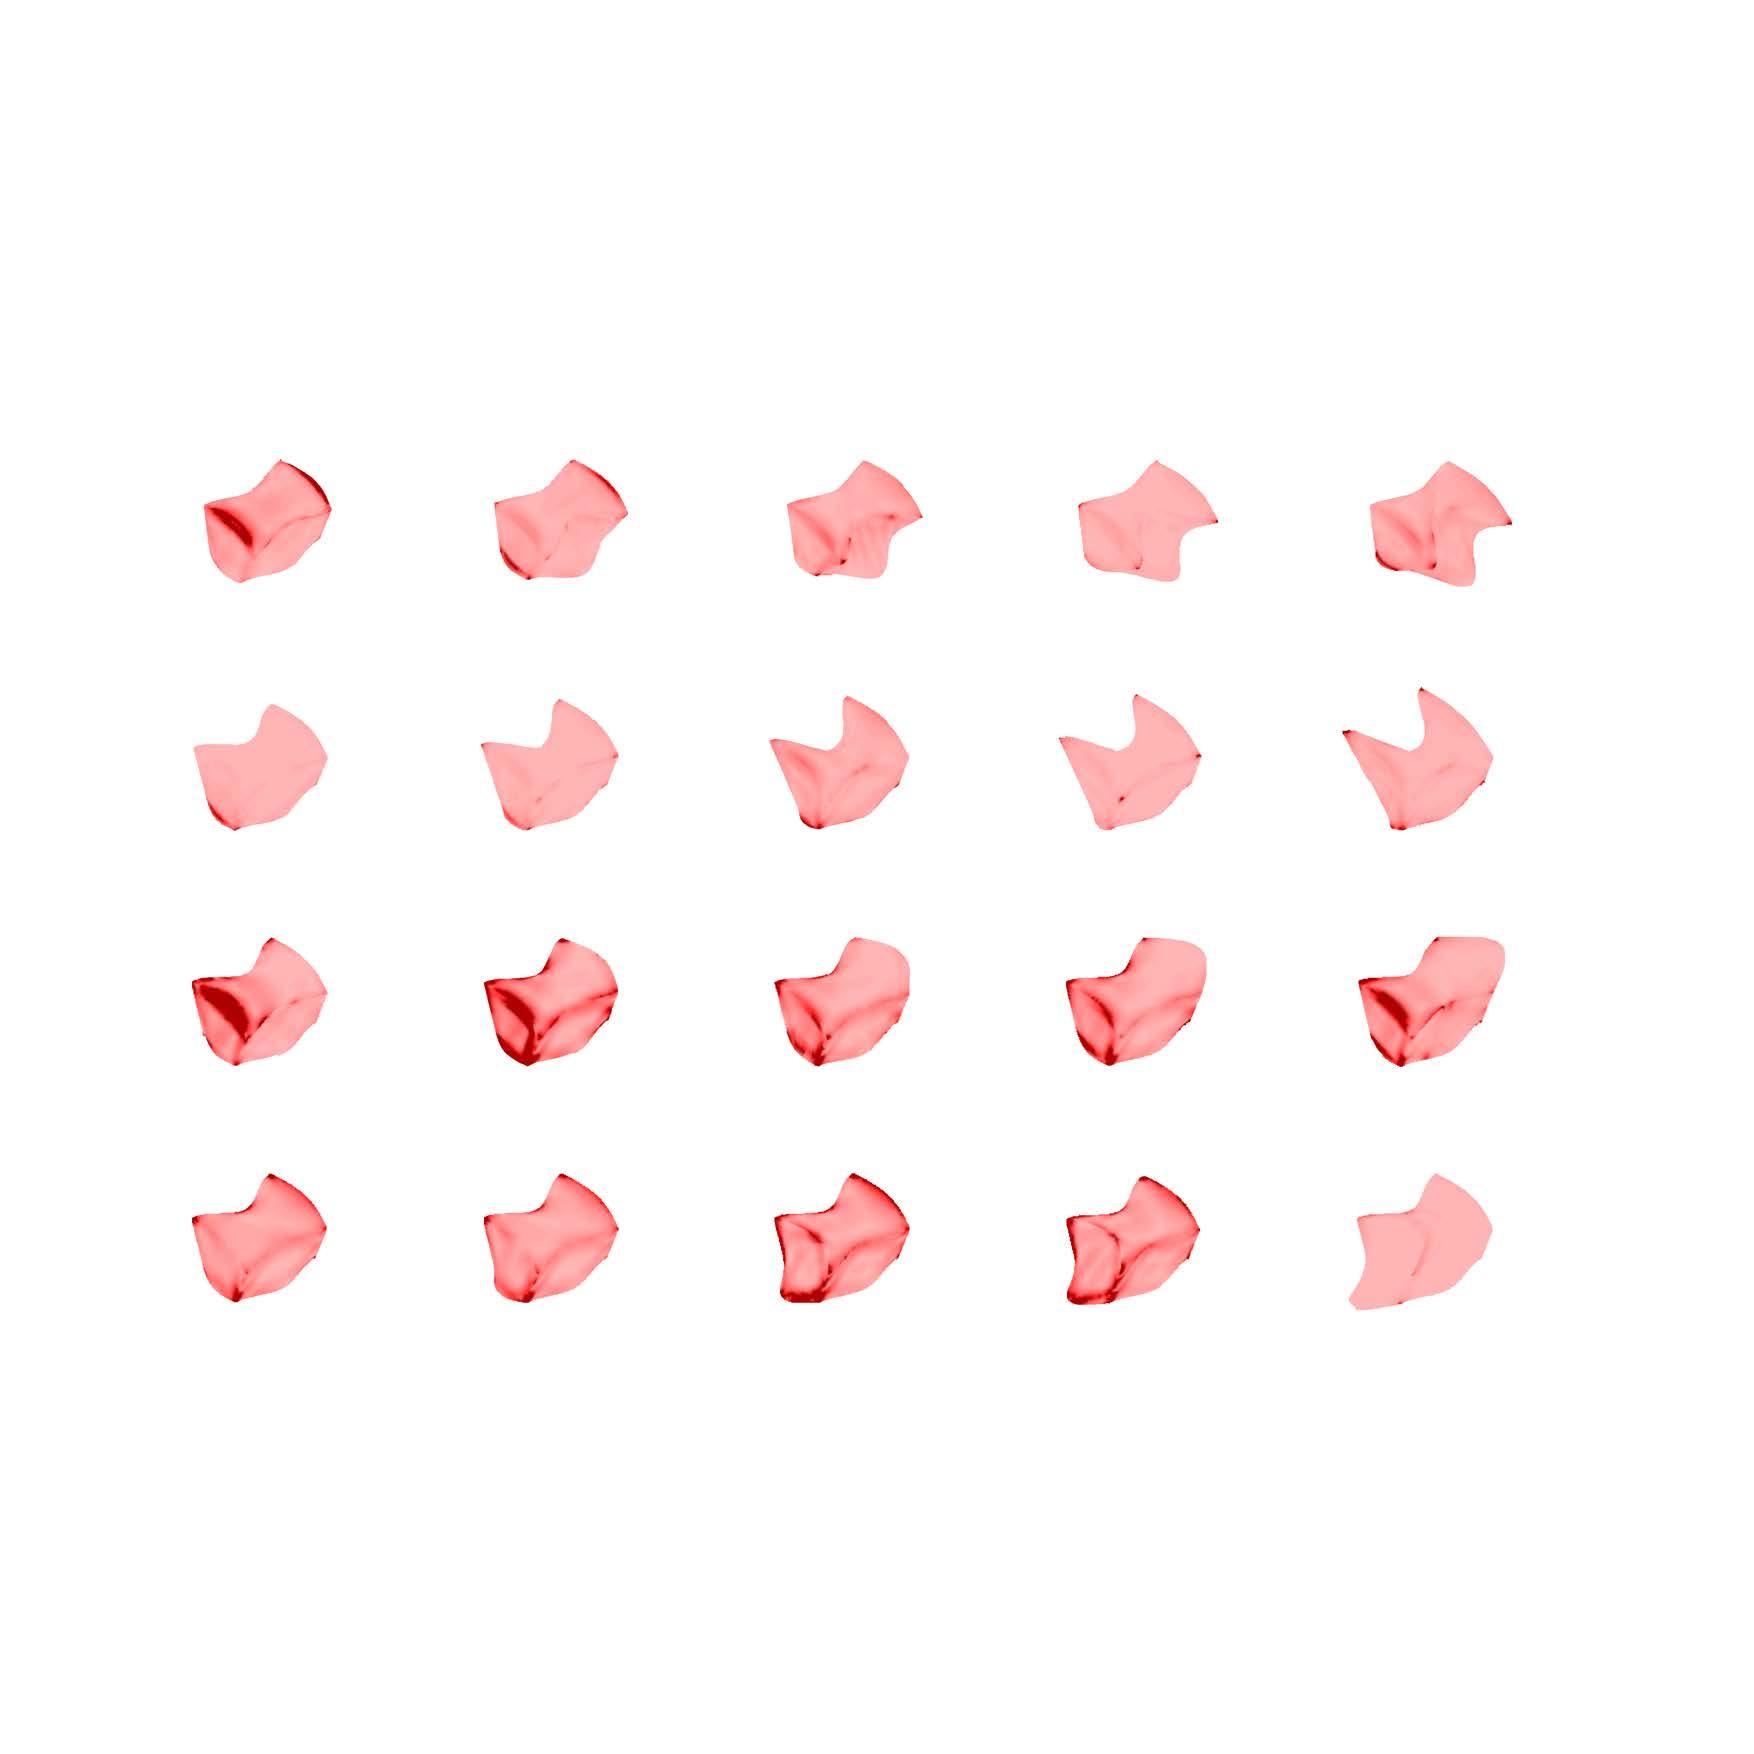
It was seen that the structure collapsed at 7:02 seconds, and the acceleration at failure was reordered as a percentage of g (22.35%) [Ref.Fig.6.3]. It was observed that there was not sufficient interlocking between the components of the horizontal axis (transverse side). This was due to the morphology of the brick faces on that axis, F3 and F4. Although the upper curve (du) had a different direction than the lower curve (dL), the gravity force exceeded the locking strength of the surface generated by the two curves. The morphology of the brick’s face, therefore, promoted the sliding of the neighbouring components on the horizontal axis, resulting in the global failure of the structure [Ref.Fig.6.2]

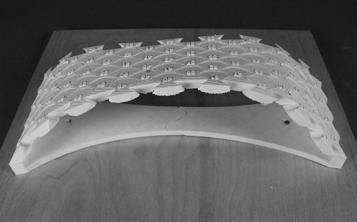
90 Quake|Response
Fig.6.2 Experiment 1: brick type-a - 81 unique bricks for arch assembly - images show the failure pattern
Fig.6.3 Graph shows percentage of g at failure
0 20 40 60 80 100 120 0246 10 8 1214 %g t (s) 35 cm 15 cm
91 6 - Experiments : Physical | Digital
1.04e-2 6.97e-1 9.35e0 2.36e-1 8.55e-1 3.45e-1 1.83e0 13.1e-1 4.47e-1 5.58e-1 2.13e-1 3.41e-1 1.88e-1 2.23e-1 8.04e0 3.26e0 5.8e-1 4.4e-1 9.57e0 1.42e+1 1.54e-1 1.18e-1 1.36e0 1.96e0 1.42e0 1.15e0 5.90e0 9.05e0 1.65e0 3.32e0 1.87e+1 1.54e+1 1.25e+1 1.23e+1 9.22e+1 8.86e+1 2.52e+1 5.66e+1 7.21e+1 1.06e+2 Kn/cm2 Kn/cm2 Kn/cm2 Kn/cm2 Kn/cm2 Kn/cm2 Kn/cm2 Kn/cm2 Kn/cm2 Kn/cm2 Kn/cm2 Kn/cm2 Kn/cm2 Kn/cm2 Kn/cm2 Kn/cm2 Kn/cm2 Kn/cm2 Kn/cm2 Kn/cm2 d1 = 0.1m d2 = 0.1m d3 = 0.1m d4 = 0.1m d1 = 0.15m d2 = 0.15m d3 = 0.15m d4 = 0.15m d1 = 0.2m d2 = 0.2m d3 = 0.2m d4 = 0.2m d1 = 0.25m d2 = 0.25m d3 = 0.23m d4 = 0.23m d1 = 0.3m d2 = 0.3m d3 = 0.27m d4 = 0.27m
Fig.6.4 Relationship between stress concentration values and degree of interlocking for brick type-a
6.6 BRICK TYPE-B.
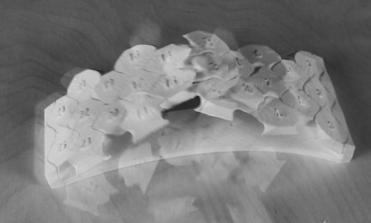
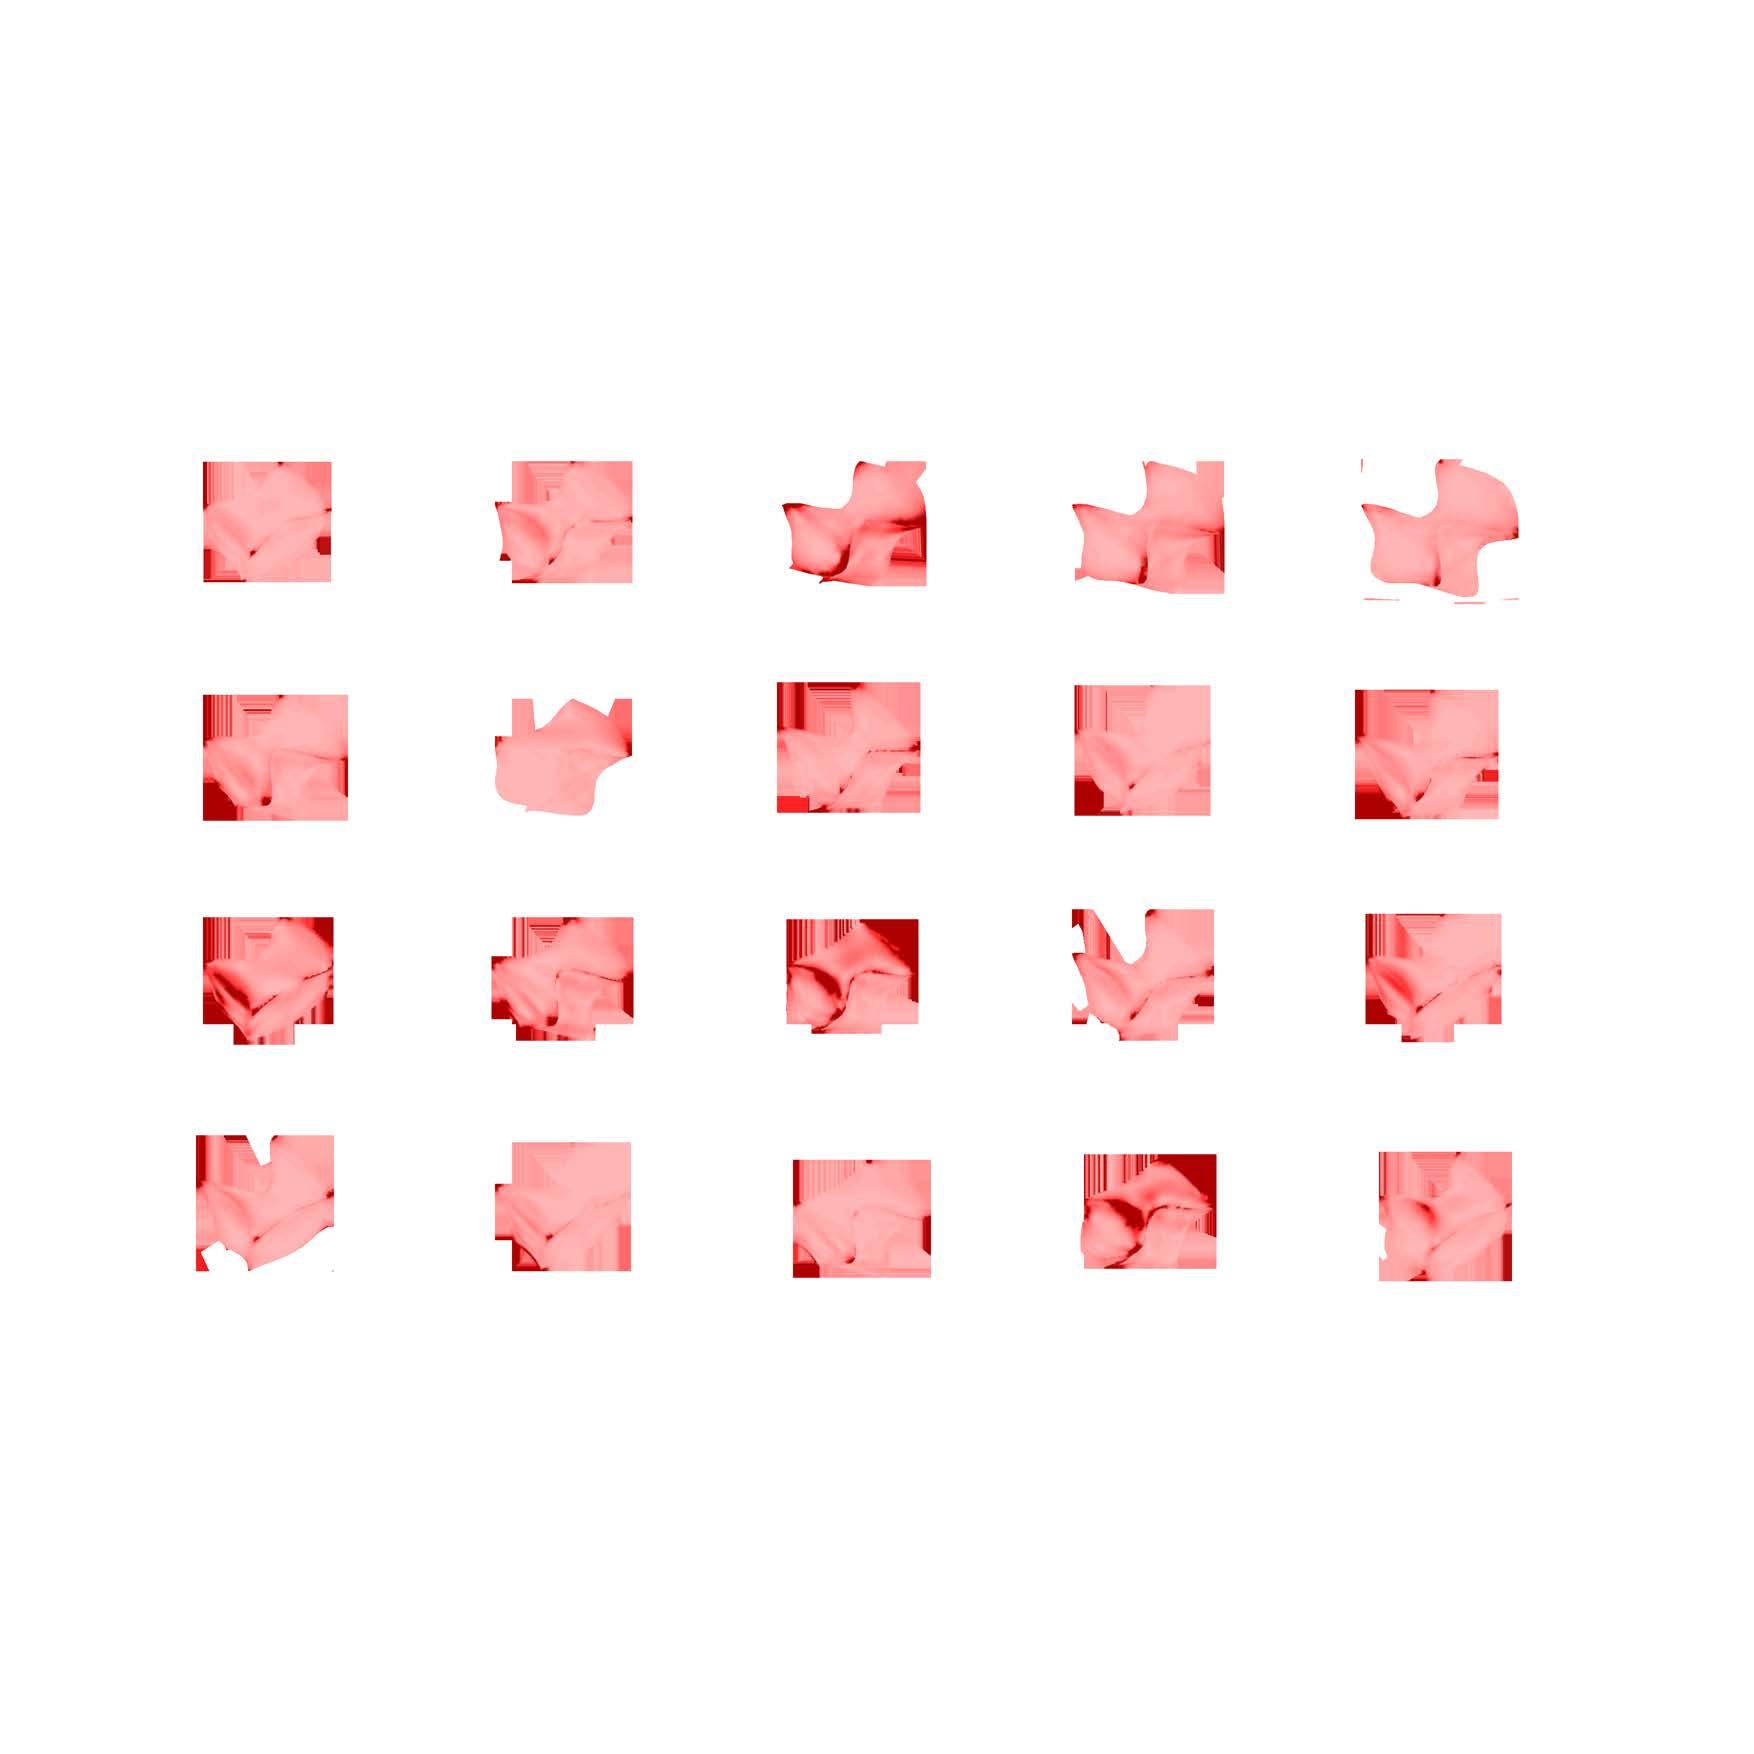
The morphology of the brick faces F3 and F4 were improved to further minimize the degree of freedom. The upper curve and the lower curve of brick faces F3 and F4 were modified to be of the same curvature direction, and in addition, another middle curve was introduced to the opposite curvature. This would increase the degree of interlocking, and thus increase the resistance to gravitational force. Furthermore, the stress concentration analysis was conducted on the evolved brick in relationship to the degree of interlocking (d) of four conditions, all faces with a unified value of (d), all faces with a gradient value of (d), three faces with a gradient value of (d), and two faces with a gradient value of (d). This was implemented to optimize the domain of the optimum degree of interlocking that could be achieved with respect to the stress-concentration values under gravitational and lateral loads, in a static scenario.
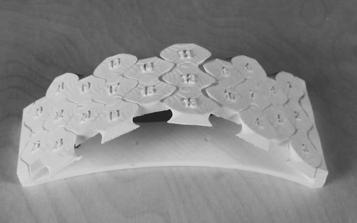
6.7 EXPERIMENT SET UP
Informed from the stress-concentration analysis on the different conditions of the interlocking degree [Ref.Fig.6.7], a brick with a domain of between 0.15 and 0.25 was set for F1 and F2 with an intensifying factor of 1.2 for a gradient effect, and similarly, a domain of between 0.1 and 0.23 was set for F3 and F4 with an intensifying factor of 1.2. These defined domains ensured that the stress-concentration value would not exceed 42 Mpa. 25 unique bricks (brick type-b-) were 3d printed for the assembly of a smaller arch at 1/10th of the scale of the actual brick.
6.8 RESULTS
The acceleration at failure was recorded at 6:19 seconds in a percentage of g (47.69%) [Ref.Fig.6.6]. It is important to note that the failure started at the key of the arch, but not at the free edges, as they were in compression [Ref.Fig.6.5]. The improved brick morphology performed better than brick type-A, and such failure at the key of the arch could be avoided by introducing a post-tension element to the system.
92 Quake|Response
0 20 40 60 80 100 120 0246 10 8 1214 %g t (s) 25 cm 15 cm
Fig.6.5 Experiment 2: brick type-b - 35 unique bricks for arch assembly - images show the failure pattern Fig.6.6 Graph shows percentage of g at failure
93 6 - Experiments : Physical | Digital
4.66e-2 3.63e-2 5.12e-3 2.85e-3 5.98e-2 5.22e-2 3.82e-3 6.95e-3 7.74e-1 6.47e-1 1.70e-2 4.87e-3 2.86e0 1.86e0 1.90e-2 3.78e-2 4.75e0 2.46e0 2.0e-2 7.11e-2 3.45e-1 1.63e-1 3.35e-2 8.32e-2 6.73e-1 5.86e-1 3.45e-1 7.68e-2 6.26e0 3.43e0 4.14e-1 9.31e-2 1.42e+1 7.31e0 6.33e-1 4.19e-1 2.68e+1 3.62e+1 5.66e-1 8.01e-1 Kn/cm2 Kn/cm2 Kn/cm2 Kn/cm2 Kn/cm2 Kn/cm2 Kn/cm2 Kn/cm2 Kn/cm2 Kn/cm2 Kn/cm2 Kn/cm2 Kn/cm2 Kn/cm2 Kn/cm2 Kn/cm2 Kn/cm2 Kn/cm2 Kn/cm2 Kn/cm2 d1,2,3,4 = 0.1m d1,2,3,4 = 0.15m d1,2,3,4 = 0.2m d1,2,3,4 = 0.25m d1,2,3,4 = 0.3m d4 = 0.1m, d2 = 0.14m d3 = 0.17m, d1 = 0.2m d2 = 0.15m, d3 = 0.18m d1 = 0.21m, d4 = 0.25m d2 = 0.15m, d3 = 0.18m, d4 = 0.21m d2 = 0.15m, d3 = 0.18m d3 = 0.2m, d1 = 0.24m d4 = 0.28m, d2 = 0.34m d3 = 0.2m, d1 = 0.24m, d4 = 0.28m d3 = 0.2m, d1 = 0.24m d1 = 0.25m, d4 = 0.3m d2 = 0.36m, d3 = 0.43m d1 = 0.25m, d4 = 0.3m, d2 = 0.36m d1 = 0.25m, d4 = 0.3m d4 = 0.3m, d1 = 0.36m d3 = 0.43m, d2 = 0.51m d4 = 0.3m, d2 = 0.36m, d3 = 0.43m d4 = 0.3m, d2 = 0.36m d4 = 0.1m, d2 = 0.14m, d3 = 0.17m d4 = 0.1m, d2 = 0.14m
Fig.6.7 Relationship between stress concentration values and degree of interlocking for brick type-b
6.9 POST TENSION
To increase the pressure between the bricks, thereby further minimizing the degree of freedom, experiments with transverse and longitudinal ties were conducted on the previous arch structure to evaluate the performance of such a system under dynamic motion.
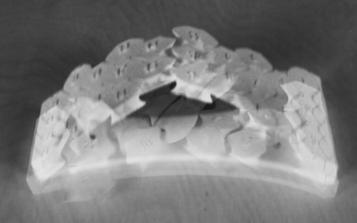
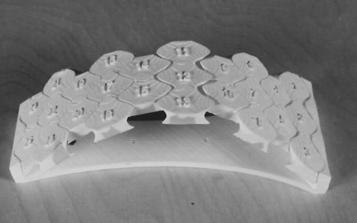
6.9.1 TRANSVERSE POST TENSION
The acceleration at failure was recorded as a percentage of g (79.49%) at 10:05 seconds [Ref.Fig.6.9]. It was shown that the system resistance to lateral forces with transverse ties improved in comparison to a state without any ties. The transverse tie acted on a row of bricks, making them behave as one brick, resulting in a substantial increase in the surface area of interlocking. Nevertheless, the compression between each row was not sufficient enough, and out-of-plane motion resulted at the key of the arch, which led to the collapse of the structure [Ref.Fig.6.8].
94 Quake|Response
0 20 40 60 80 100 120 0246 10 8 1214 %g t (s) 25 cm 15 cm
Fig.6.8 Experiment 2a: brick type-b, transverse ties. - 35 unique bricks for arch assembly - images show the failure pattern
Fig.6.9 Graph shows percentage of g at failure
6.9.2 LONGITUDINAL POST TENSION
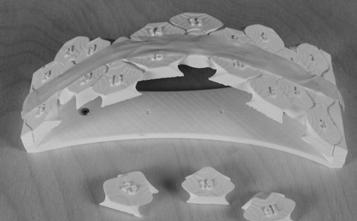
It was observed that the most promising result was achieved with ties on the longitudinal axis. The structure did not comply until failure [Ref.Fig.6.10], and the maximum recorded acceleration as a percentage of g was 109.3% [Ref.Fig.6.11]. The longitudinal tie acted as a beam element spanning from one end of the arch to the other, increasing the pressure between the interlocking components in the middle. The bricks on the sides were kept in compression as well, because the ties played a role in minimizing the movements on both sides. Furthermore, it was noticed that when one brick or more, which was not passing through the tie element, was removed, there was no sign of global failure [Ref.Fig.6.10]. This proves the effectiveness of such a system in a dynamic-load scenario.
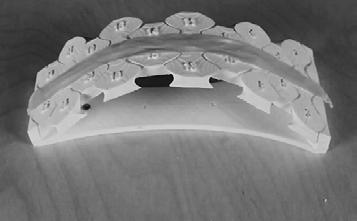
95 6 - Experiments : Physical | Digital
Fig.6.10 Experiment 2b: brick type-b, longitudinal ties. - 35 unique bricks for arch assembly -left image show no sign the failure pattern - right image show no global failure when removing some bricks Fig.6.11 Graph shows percentage of g at failure
0 20 40 60 80 100 120 0246 10 8 1214 %g t (s) 25 cm 15 cm
6.10 DYNAMIC FORCE ANALYSES
To understand the impact of changing the degree of interlocking of a brick on the stability of an assembly, it is important to corroborate the physical experiment data with digital analysis. Using Strand7 FEA software, an experiment to observe the behaviour of a simple brick wall under earthquake forces was carried out.
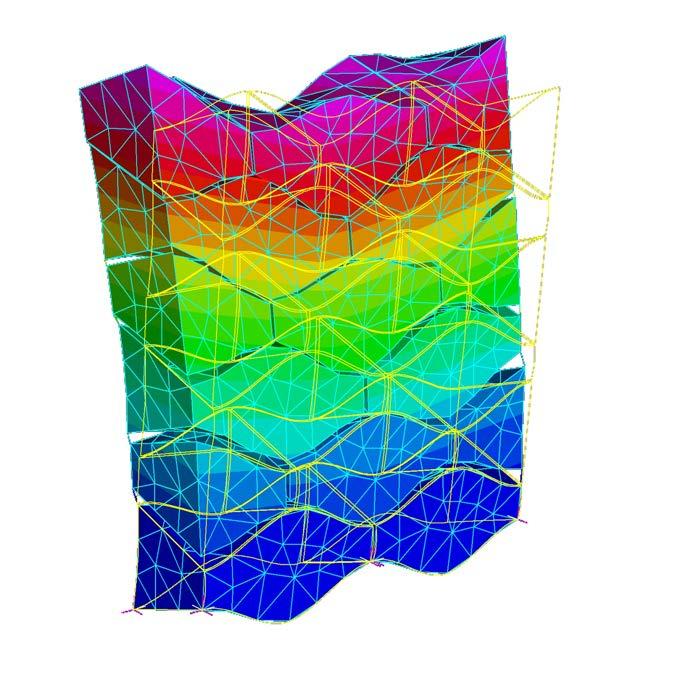
The experiment was set up in three stages. The first stage involved analysing an assembly that included a brick with a moderate degree of interlocking. The spectral analysis engine of Strand7 was used, where the earthquake table for Factor vs Frequency was input based on the Izmir earthquake. Based on concrete material, the natural frequencies of the brick assembly were calculated, which analyses various modes of failure. These data together were used to analyse the spectral response of the assemblies in Strand7. The second stage was to increase the degree of interlocking and to analyse the displacements. The third step was to introduce post tensioning along the longer side of the wall (vertical) and to understand the effects. The post tensioning used was a stainless steel cord with a c/s of 50mm. It should be noted that the natural frequency analysis had to be done individually for all the three setup, as the mass and the materials change.
The first test was to evaluate vertical displacements, which were not significant in themselves but were still more significant than those in the second stage, in which considerable improvement was observed in the displacement values. This substantiates the importance of the degree of interlocking to the overall stability of a system. The introduction of post tensioning in the third stage further improved the results, although they were not drastically different from the second stage.
2.01 x 10⁻³ m -2.01 x 10⁻³
d = 0.16 m
Size 0.3 x 0.45 x 0.25 m
96 Quake|Response
Fig.6.12 Moderate Degree of Interlocking
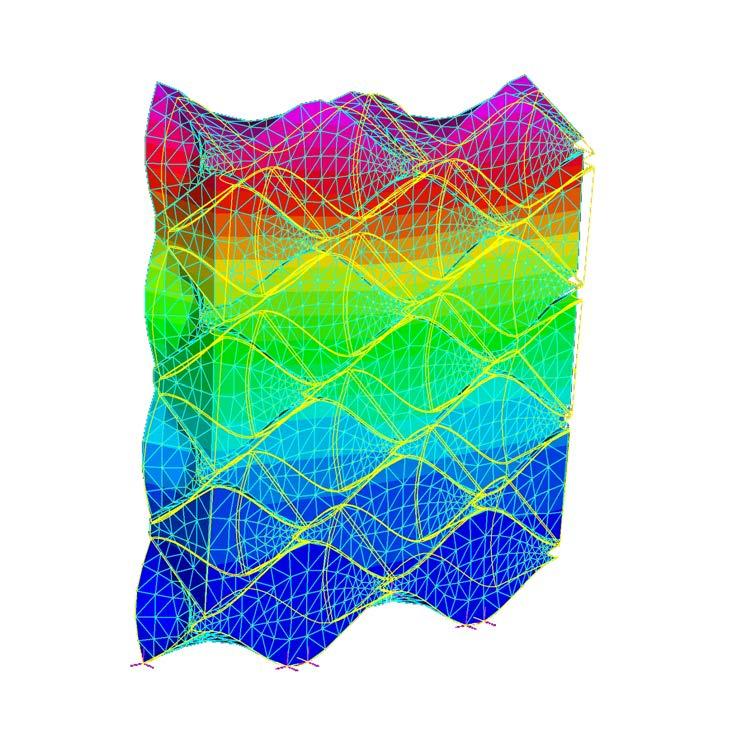

97 6 - Experiments : Physical | Digital 1.32
-1.32x
1.08x
m -1.08
x 10-3 m
10-3
10-3
x
10-3
d =
0.27
m Size 0.3 x 0.45 x 0.25 m
d = 0.27 m Size 0.3 x 0.45 x 0.25 m
Fig.6.13 High Degree of Interlocking
Fig.6.14 High Degree of Interlocking with Post Tensioning
the brick’s faces F3 and F4 increased the pressure between the interlocking components of the horizontal axis of the arch. Further morphological modification could be implemented in further experiments to strengthen the locking between the interlocking components. It should be noted that the calculations for the displacement values of the objects at each recorded oscillation were manually measured, due to the limitation of the self-designed oscillation table. The accuracy of the data could be influential, especially when slight changes in the interlocking degree value were present.
The post-tension element in the form of ties was introduced in the second experiment to increase the pressure between the interlocking components, which could further limit the movements between them. It was observed that the longitudinal tie was more
6.11 OBSERVATIONS AND CONCLUSION
The series of experiments aimed to evaluate the effectiveness of morphological changes in the interlocking surfaces of a material system and to understand the effect of different post-tension elements on the behaviour of interlocking bricks in an earthquake scenario. Stress-concentration analysis was carried out on bricks with concert material in order to establish a relationship with the optimum degree of interlocking. The material choice showed that it could not handle a high amount of stress. This could be achieved with a more ductile material that could resist localized stresses.
Once the relationship between the stress concentration values and the degree of interlocking of the brick’s faces was established, the bricks could be printed using a different material. Due to the uniqueness and complexity of their geometry, bricks were 3D printed using PLA material. However, the results would have been more realistic if the bricks were made of the actual material. Considering the density of concrete, which is higher than PLA, the friction force would be greater under the same ground acceleration, thereby increasing the overall stiffness and also the texture of the concrete, which is rougher than PLA. Hence, the data from the experiments would be more practical for evaluation purposes in a real-life scenario.
The first experiment implemented brick type-A, which showed a lower resistance to dynamic motion and a failure at ground acceleration of 2.1 m/s2. Brick type-B, on the other hand, failed at a ground acceleration of 4.6 m/s2, at which a change in the morphology of
Brick type-B - longitudinal ties
Brick type-B - transverse ties
Brick type-B - no ties
Brick type-A - no ties
98 Quake|Response
0 20 40 60 80 100 120 0246 10 8 1214 %g t (s)
Fig.6.15 Graph indicates the improvement of the interlocking systems throughout the different iterations
effective than the transverse one, as it behaved as a beam element, thereby securing the adjacent components in compression [Ref. Fig.6.15]. In addition, it should be mentioned that the post-tension element was not properly fixed; rather, the bricks were bonded together at their bottom or top surface using masking tape as a way to simulate the effect of post tension. The post tension should be a cable that can pass through the centre of each desired brick, allowing the tension to be adjusted to control the freedom of the movement. For preliminary design purposes, the experiments gave good results to evaluate the concepts; hence, taking into account testing with actual material and proper post-tension techniques would be a prerequisite for advanced experiments. Moreover, it was shown that when one brick or more was removed from the arch assembly under longitudinal ties, the material system resisted lateral loads and no failure was recorded. This proved that local failure does not propagate and cause a global failure. This gives flexibility to the system, for example, by introducing openings at certain less-critical locations.
On the digital analysis side, the behavioural trend of the interlocking blocks was observed to be similar to the physical tests conducted. However, some limitations were faced while dealing with the software Strand7. As it is not compatible with the Grasshopper-Rhino environment—unlike Karamba3D—there was no live feedback loop. The evaluations were carried out on two different platforms and any feedback had to be done manually. Secondly, the calibration of the seismic analysis tool in Strand7 was difficult. Not having in-depth structural know-how, the structural jargon was a slight hurdle. Although most of the analysis was conducted by referring to the user manual and other structural references online, taking utmost care to input the right values for the analyses, the user interface of the software was not as intuitive as, for example, Karamba3D. This, however, is a user-specific problem and cannot be attributed to the software itself.
99 6 - Experiments : Physical | Digital
RESEARCH DEVELOPMENT
Morphology
Form finding for a stable shell would allow for creating earthquake resistant shell structures which can then be used in the earthquake prone zone of Istanbul. Morphology deals with study of such forms based on certain predefined criteria.
7
7.1 INTRODUCTION
Physical and digital experimentation with various scenarios of the material system can be conducted to improve the system performance in compression. Additional methods of structural reinforcement in the form of post tensioning help in achieving a doubly curved surface that can withstand the dynamic external forces of an earthquake. This chapter deals with a morphology exercise that will result in a library of forms, the aim of which is to understand the possible ways of creating stable shell structures. A genetic algorithm will be set, with a live feedback loop of structural analysis for displacement due to self-weight and lateral loads.
7.2 EXPERIMENTAL SETUP
Three types of “footprints” will be investigated, each based on the number of support points for the form: three, four and five. For the purposes of this exercise, all these points will be plotted on circles of the same radius. This ensures that the forms generated from the three options can be comparable. The selection of the number of points on this circle decides the footprint type. For example, a triangular footprint [Ref. Fig. 7.1] is generated by the following method: the circle is divided into three parts so the location of the splitting can be controlled. Each arc becomes a domain for one point, which can move
anywhere along its parent arc. These three points then become the support locations for the shell, thus creating a triangular footprint. Using Kangaroo, a physics engine for Grasshopper3D, mesh relaxation is performed based on the reverse catenary principle. The relaxed mesh is then analysed using Karamba3D, which calculates the displacement of the shell against the self-weight and lateral loads. This is plugged into the multicriteria optimization plug-in Octopus, which tries to minimize the displacement on the shell by adjusting the footprint. Another objective is the height factor. Thus, the aim is to achieve a stable shell form with a desired hight.
7.3 EVALUATION OF RESULTS
The resultant forms of each of these three footprints were documented as a form library. This library allows for an overall view of the performance of the shells as well as the ability to compare them with others. A good area to height ratio is desirable. Individual G50.32 [Ref. Fig. 7.2] has an area of 320 sqm with a total height of 5m. Though it is not the highest amongst the lot, the area for others is not as great. G50.12, for example, has a height of 7m but an area of only 200 sqm. For the comparison, the fittest 50 individuals from each support type were selected. The comparison shows the behavioural trends of the shells against three criteria: Area, Height and Displacement. The results can be visualized by plotting these values on a 3 axis graph.
102 Quake|Response


103 7 - Morphology
Fig.7.1 Three footprint options for the Morphology.
7.4 MORPHOSPACE
An individual with a triangular footprint [Ref. Fig. 7.3] achieved the highest value for displacement, though with the lowest area value and a very high displacement. In contrast, a 4-support individual recorded the lowest values in all three factors. It is therefore important to visualize the location of these individuals in a three-dimensional graph. This allows for identifying irrational forms that cannot be built in the real world and those that are feasible. Among the analysed individuals, the forms lying on the higher side of the displacement value are generally irrational in the case of the triangular base. A general trend of stability was noted among the five support shells, with areas and heights on the higher side. Moreover, there is a distinct separation seen among all three types when it comes to height, as the range is more or less constant.
7.5 OBSERVATIONS
The results of the experiment look promising. However, there are some issues that need to be addressed here. The criteria of height and area were given higher importance, which led to some shells being highly displaced. There is no even distribution of solutions observed in the graph. The Pareto-front of the graph was observed to be more toward the higher displacement. One possible way to counter such situations could be to introduce more supports as inputs in the feedback loop. Thus, after analyzing the displacement values, supports would be introduced in the area with high displacement values on the shell. The next part of this experiment will investigate this as a possible solution to achieve stable forms.
104 Quake|Response Footprint Area(msq) 250 6 Height (m) G50.25 Footprint Area(msq) 320 5 Height (m) G50.32 Footprint Area(msq) 200 7 Height (m) G50.12 Footprint Area(msq) 235 4 Height (m) G50.19
Fig.7.2 Sample shells from the generated library.
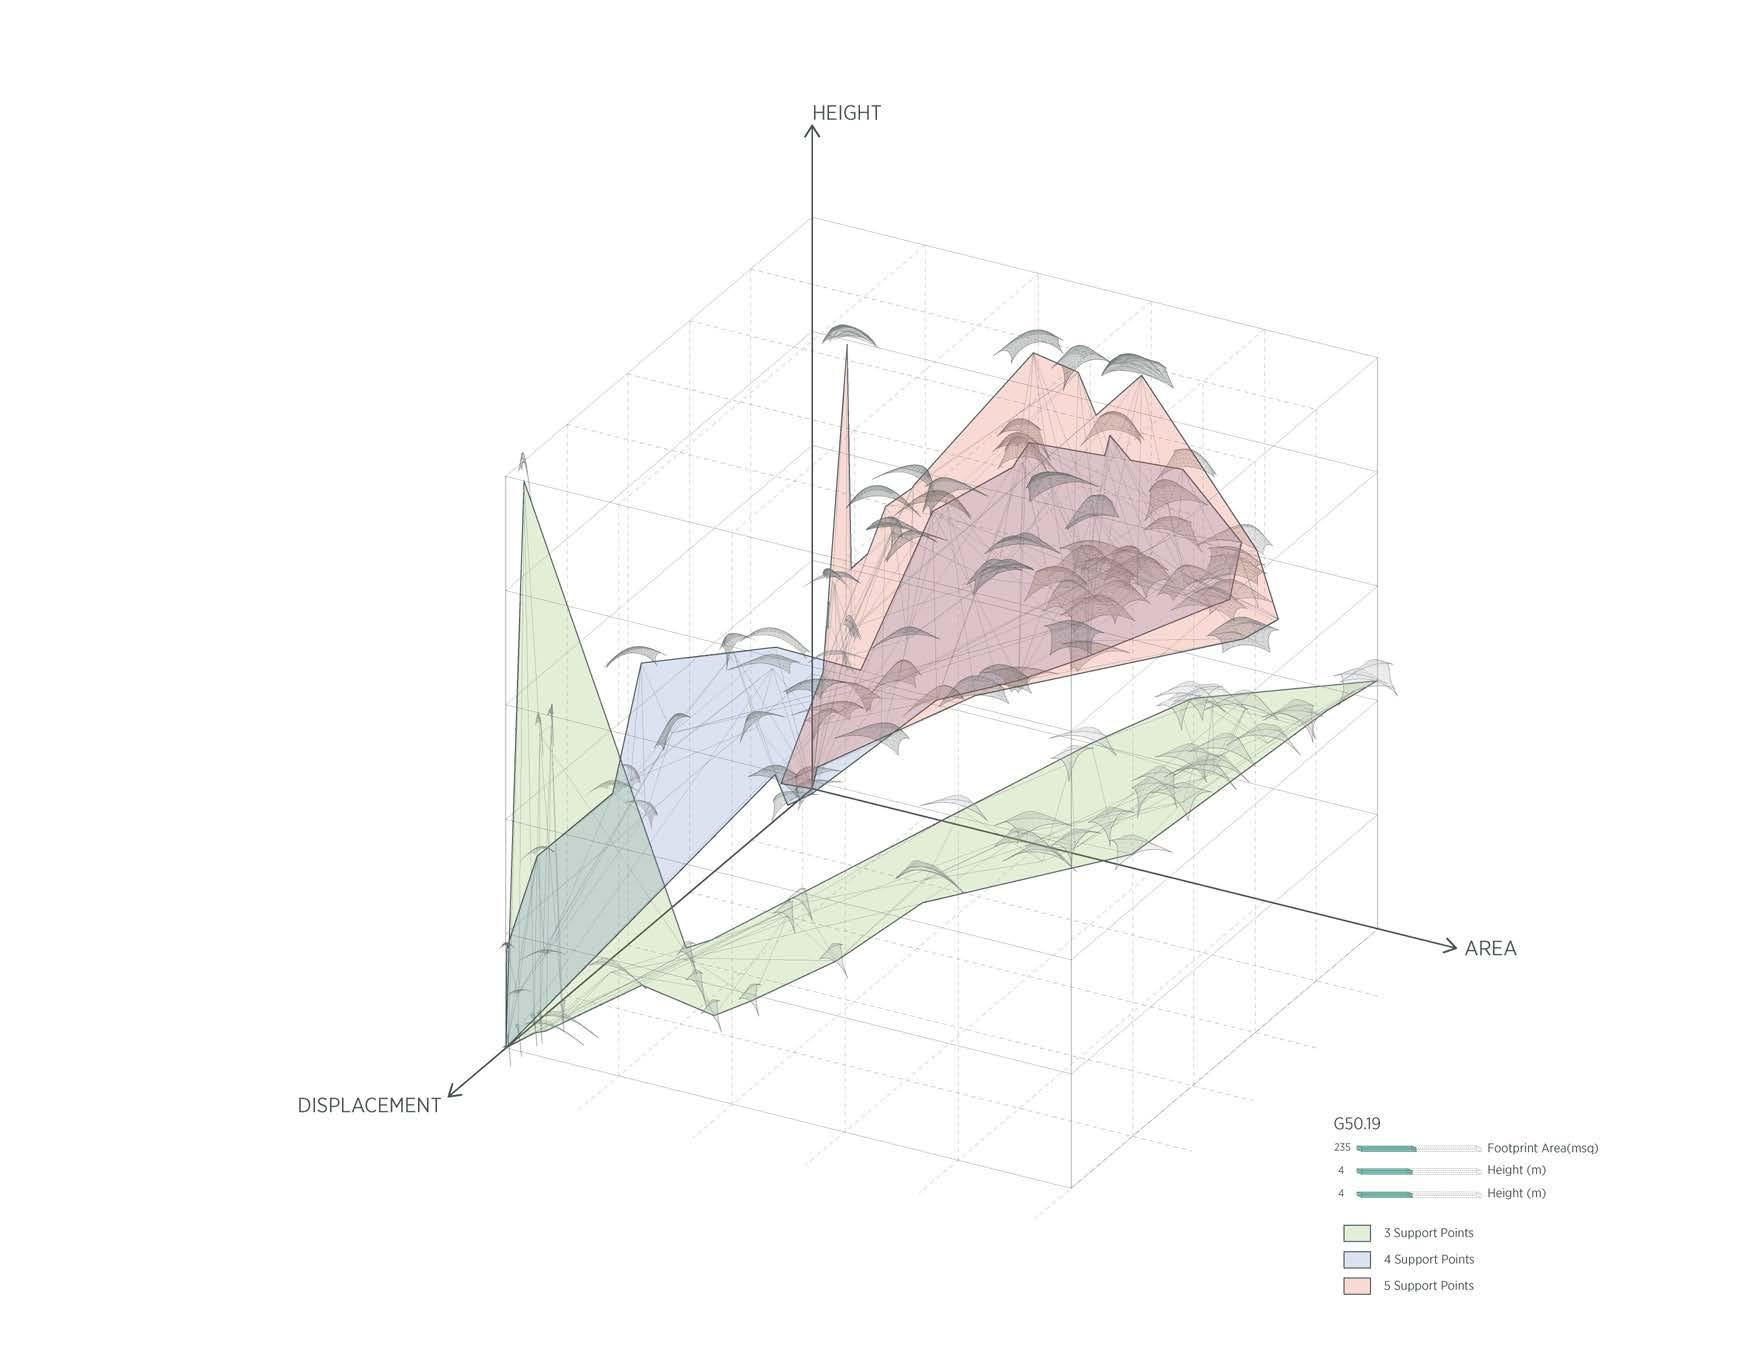
105 7 - Morphology
Fig.7.3 All generated shells plotted on a 3 axes graph.
7.6 ADDITIONAL SUPPORTS
Using Karamba3D, the points with high displacement can be found. These points get projected on the base plane and a circle is drawn, the radius of which is dependent on the displacement value of the point. Thus, points with higher displacement have bigger circles. These circles then become the support where the initial mesh of the shell is altered. The same mesh relaxation sequence, as before, is run on the new mesh and the resultant mesh is studied for displacement values. As seen in the example, there is considerable reduction of displacement by adding these support points.
7.7 MORPHOSPACE : OPTIMISED
To establish the possible achievable forms with this system and establish a library of stable forms which can be further modified based on the local site inputs, an experiment will be carried out wherein a live feedback loop of mesh relaxation, shell formation and structural analysis for displacement will be performed. Using Karamba3D, the points with high displacement can be found. These points get projected on the base plane and a circle is drawn, the radius of which is dependent on the displacement value of the point. Thus points with higher displacement have bigger circles. These circles then become the support where the initial mesh of the shell is altered. As before, the same mesh relaxation sequence is run on the new mesh, and the resultant mesh is studied for displacement values. As seen in the example, adding these support points considerably reduces displacement.

106 Quake|Response Footprint Area(msq) 250 6 Height (m) G50.25 Footprint Area(msq) 250 6 Height (m) G50.25
Fig.7.4 Process of addition of supports.
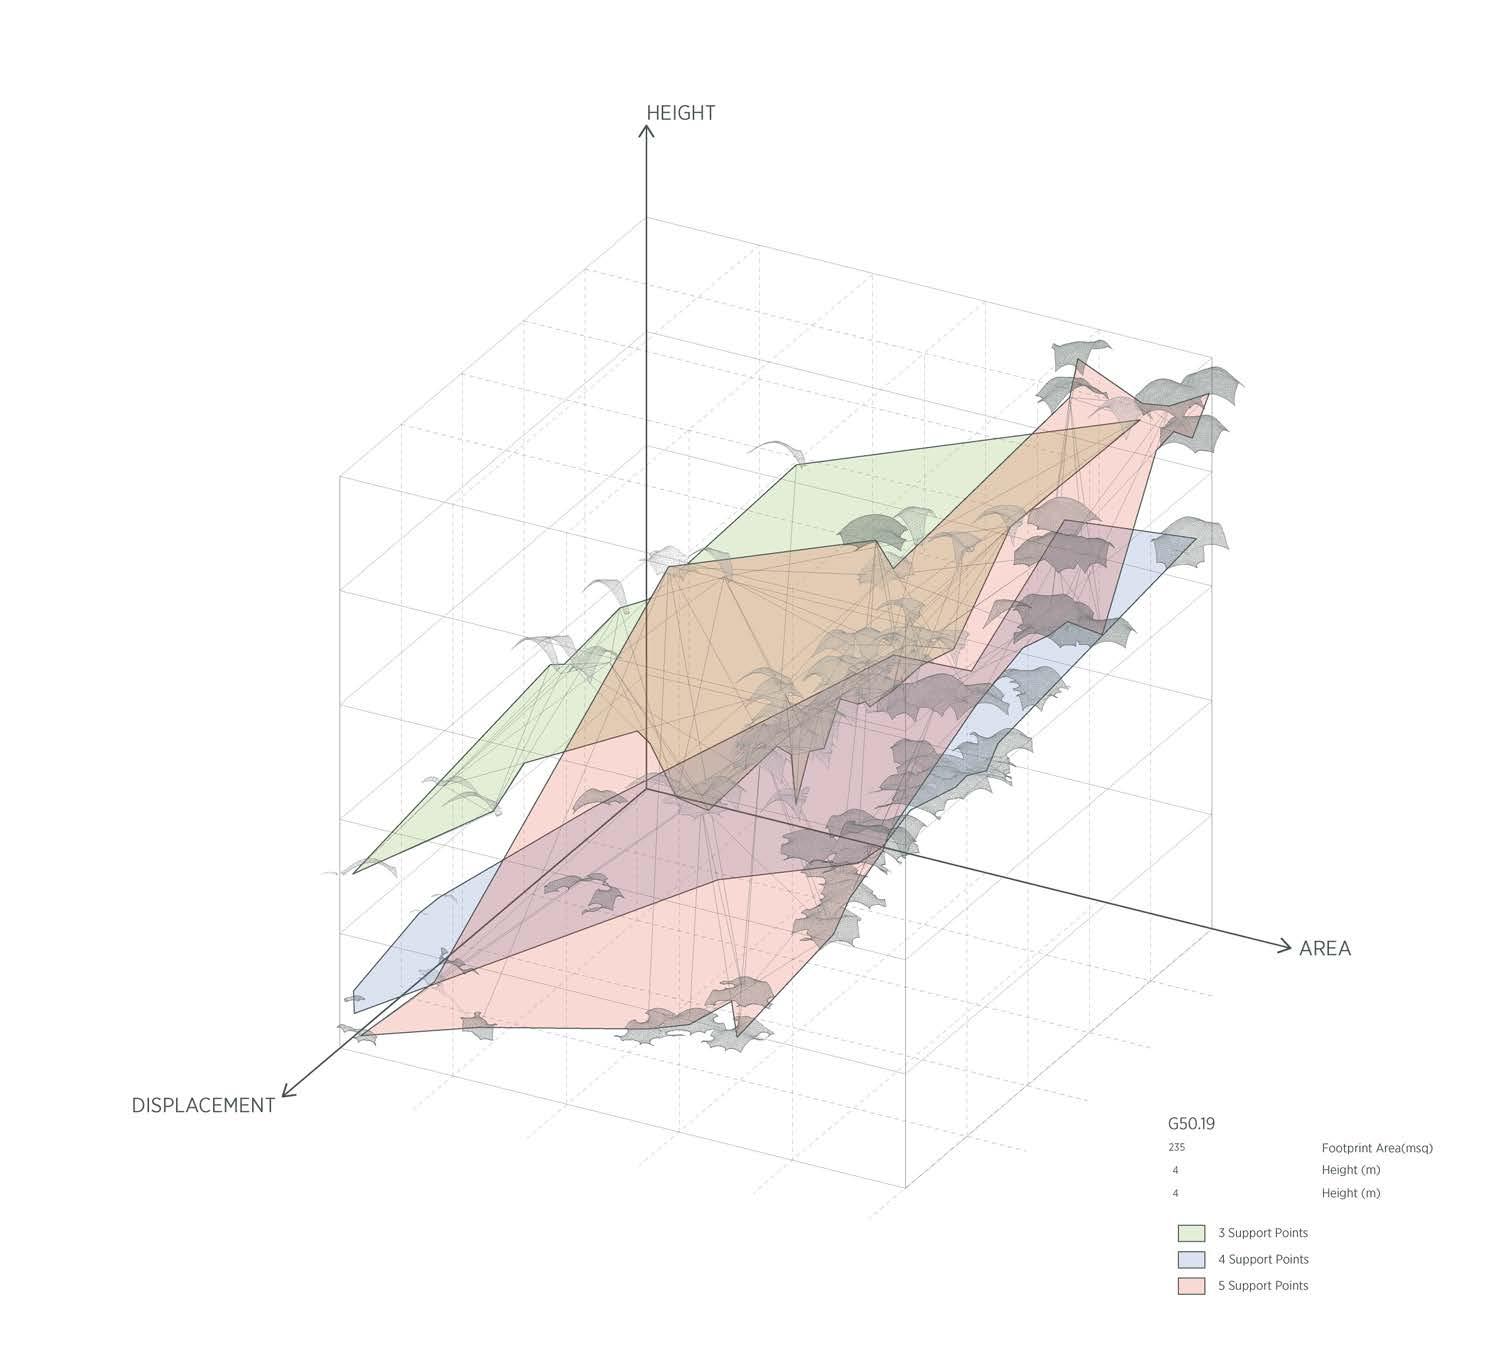
107 7 - Morphology
Fig.7.5 All generated shells with additional support, plotted on a 3 axes graph.
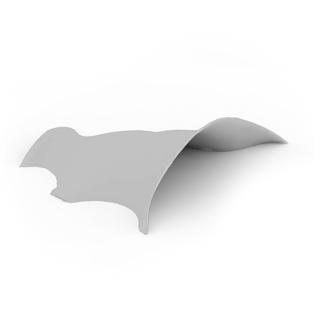
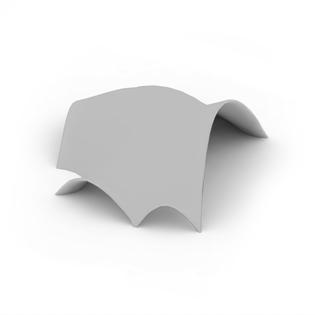
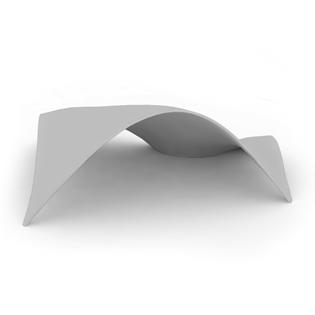
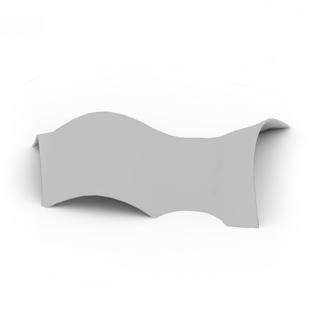


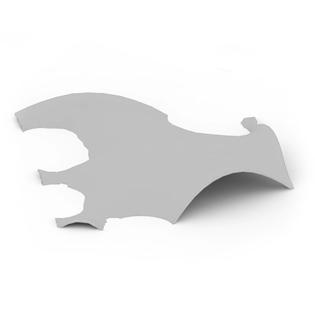
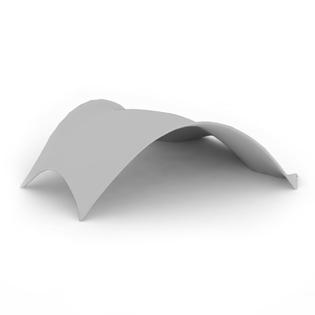
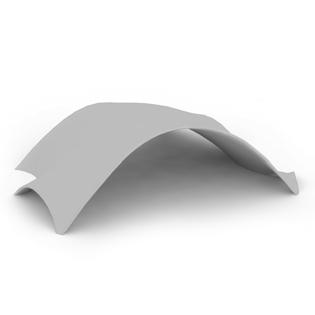
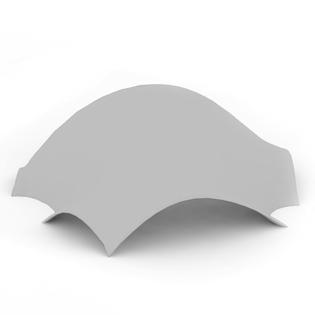
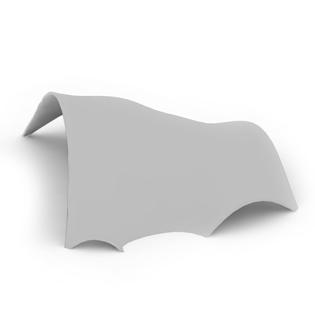
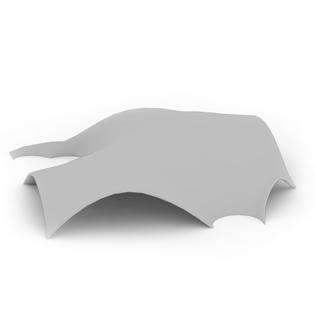
108 Quake|Response G50.5 Height: 7 m Usable Area: 343 sqm Max. Span: 20 m G50.3 Height: 8m Usable Area: 340 sqm Max. Span: 14.8 m G50.18 Height: 6m Usable Area: 358 sqm Max. Span: 18 m G50.32 Height: 4m Usable Area: 366 sqm Max. Span: 20.9 m G50.11 Height: 5m Usable Area: 368 sqm Max. Span: 17.1 m G51.5 Height: 11m Usable Area: 394 sqm Max. Span: 15.12 m G51.22 Height: 6m Usable Area: 397 sqm Max. Span: 19.3 m G50.32 Height: 5m Usable Area: 400 sqm Max. Span: 18.6 m G52.8 Height: 9m Usable Area: 405 sqm Max. Span: 21.8 m G50.9 Height: 6m Usable Area: 410 sqm Max. Span: 19.2 m G50.9 Height: 9m Usable Area: 499 sqm Max. Span: 18 m G50.15 Height: 8m Usable Area: 502 sqm Max. Span: 20.5 m G50.32 Height: 9m Usable Area: 439 sqm Max. Span: 17.4 m G52.7 Height: 6m Usable Area: 448 sqm Max. Span: 17.1 m G51.5 Height: 8m Usable Area: 454 sqm Max. Span: 16.7 m

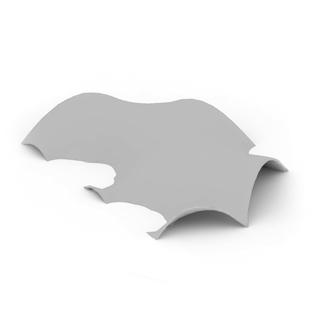
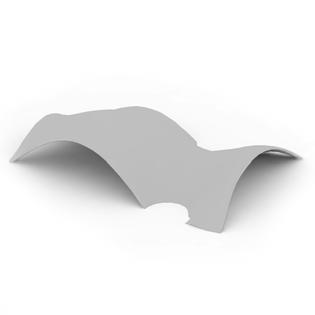


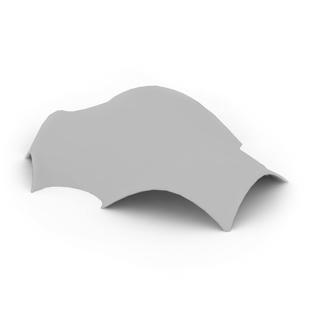
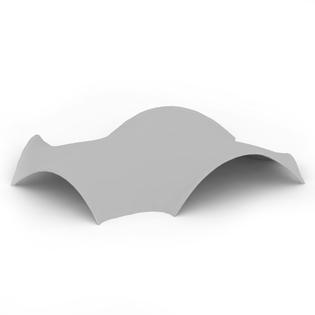
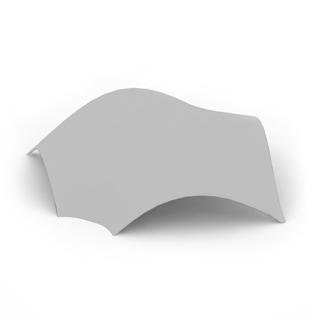
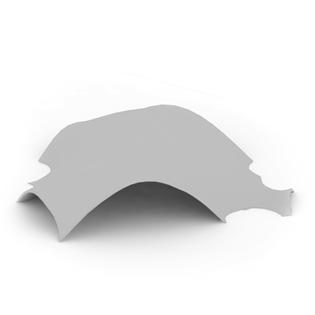
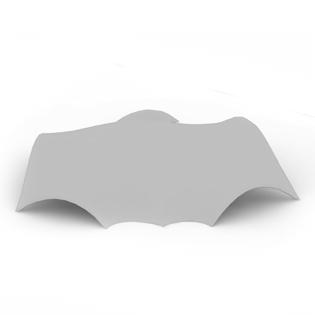
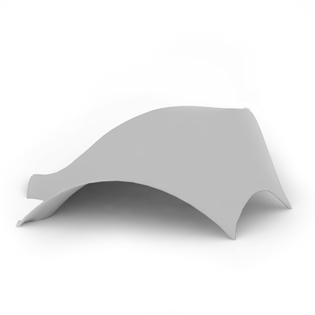
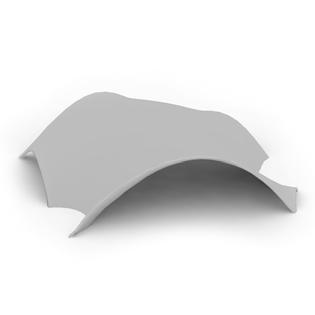
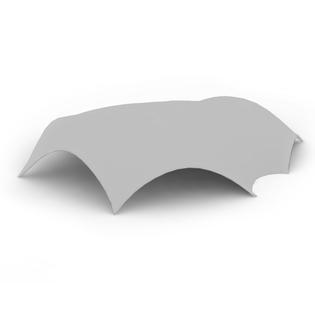
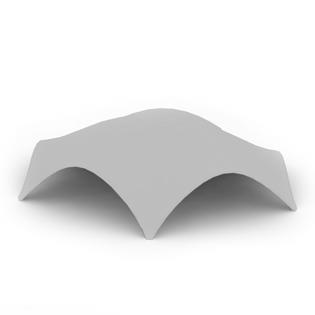
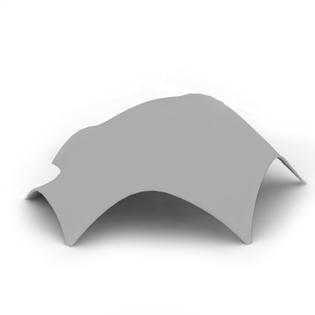
109 7 - Morphology 4m Area: 366 sqm Span: 20.9 m G50.11 Height: 5m Usable Area: 368 sqm Max. Span: 17.1 m G51.4 Height: 8m Usable Area: 376 sqm Max. Span: 17.4 m G50.22 Height: 10m Usable Area: 377 sqm Max. Span: 17.4 m G53.6 Height: 10m Usable Area: 392 sqm Max. Span: 17.1 m G51.3 Height: 5m Usable Area: 393 sqm Max. Span: 17.36 m 9m Area: 405 sqm Span: 21.8 m G50.9 Height: 6m Usable Area: 410 sqm Max. Span: 19.2 m G50.16 Height: 5m Usable Area: 431 sqm Max. Span: 16.9 m G52.17 Height: 7m Usable Area: 482 sqm Max. Span: 18.6 m G52.19 Height: 6m Usable Area: 439 sqm Max. Span: 21.8 m G50.13 Height: 5m Usable Area: 440 sqm Max. Span: 18 m 6m Area: 448 sqm Span: 17.1 m G51.5 Height: 8m Usable Area: 454 sqm Max. Span: 16.7 m G51.21 Height: 7m Usable Area: 465 sqm Max. Span: 18.6 m G51.4 Height: 6m Usable Area: 466 sqm Max. Span: 22.8 m G52.16 Height: 8m Usable Area: 481 sqm Max. Span: 24.4 m G53.13 Height: 7m Usable Area: 487 sqm Max. Span: 23 m
Fig.7.6 Shells with the most satisfactory results.
7.8
EVALUATIONS AND CONCLUSIONS
This exercise deals with possible ways to achieve stable configurations for creating shell structures. A logical way of approaching the process was undertaken where, based on the number of support points input, a feedback loop between mesh relaxation and surface analysis resulted in achieving surfaces with the least vertical displacements under linear static loads. There were some issues faced while creating the mesh in Kangaroo, a physics engine for Grasshopper3D. The demand for computation power was very high because the genetic algorithm created a live output of meshes. This was solved by increasing the edge length of the mesh faces. However, this meant that the resolution of the shape was not as fine, which was taken as a compromise.
Further experiments in having additional support points proved successful, as they resulted in a very stable geometry with significantly fewer displacements. One point to be noted here is that there needs to be a wider support at the original support points, as at the moment, the shell is supported on a single point in these locations, which would not be the case in real life scenarios. We believe this would further reduce the displacements in the geometry. One other major drawback of this experiment was the lack of any dynamic spectral analysis on the forms. As they need to be stable underground acceleration forces, this analysis would help in understanding real world behaviour. However, due to lack of availability of any structural software that is compatible with Grasshopper3D for doing live seismic analyses, a possible substitute solution for having
static lateral loads in more than one direction, along with the force of gravity, was used. The next developments for this exercise will be to test these geometries in the dynamic loading analysis.
110 Quake|Response
111 7 - Morphology
RESEARCH DEVELOPMENT
8 Shell : Detail
Further optimisation, structurally and materially, on a stable form from the previous exercise would establish the process of creating earthquake resistant shell structures using topologically interlocking bricks. This chapter deals with several experiments testing these shells both under static and dynamic loads.
8.1 INTRODUCTION
This chapter will focus on selecting one of the stable shell structures generated from the previous multi-criteria optimization experiments. The selected shell will undergo a series of stress and displacement analyses under the effect of dynamic and static loads. The first exercise was done to implement differentiation in the thickness of the selected shell toward material optimization. An experiment was set up to evaluate the stress values of the shell with a consistent thickness of 0.2 meters made of concrete material under linear static analysis. Using Karamba3D, both lateral load—specific to the acceleration value recorded for the nearest Istanbul earthquake—and gravity force were applied as vectors of magnitude of (0,0.2,0) and (0,0,-0.98), respectively, on the shell mesh vertices. It was found that the high stresses were mostly concentrated at the base of the shell, and stresses became low at areas further away from the base [Ref. Fig. 8.1]. It is therefore necessary to increase the thickness at the base and also at certain critical areas. A domain for the shell thickness was determined to be between 0.2 and 0.8 meters. The mesh vertices as a result of stress analysis had certain stress values that corresponded to their location on the whole mesh. These values were remapped between 0.20 and 0.80, and then the mesh vertices were translated along their normal vector with their new remapped value. A surface was generated between these translated vertices above the original shell surface, signifying the emergence of the new thickened shell.
8.1.1 THICKENED SHELL
It is important to evaluate the new thickened shell for stress analysis to understand the improvement of the implemented concept. The analysis revealed that high stress values at the base were substantially reduced, and the maximum stress value was lessened from 9.1 Mpa to 4.1 Mpa [Ref. Fig. 8.1]. Moreover, the results from the analysis showed that the lowest stress values were presented at the high points of the arches defined at the shell boundary, which suggested efficient utilization of the material. Also, it can be pointed out that when the arch span was increased, stress values were slightly higher at the peak of the arch, which is evident in the north part of the shell [Ref. Fig. 8.1]
114 Quake|Response
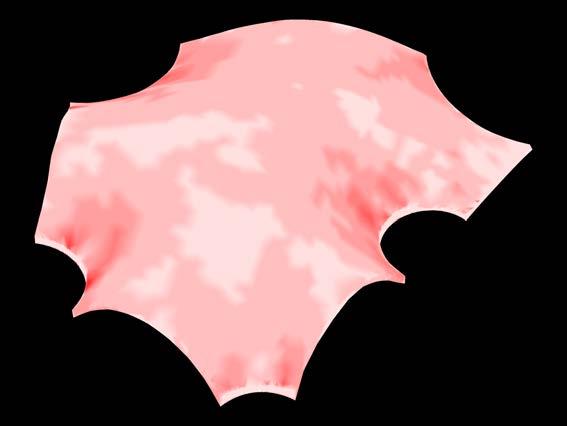

115 8 - Shell: Detail 0.2-0.24m (min) 0.2-0.78m (max) (Mpa) Stress Concentration 9.4 3.7 (Mpa) Stress Concentration 4.1 2.4
Support location
Fig.8.1 Comparison of stress concentration analysis between a shell of consistent thickness and a shell of varied thickness.
8.2 SPECTRAL RESPONSE
The previous chapter dealt with the study and possibilities of creating stable shell structures. The process of multi-criteria optimization for usable area, height and displacement under linear static loads allowed for separating the fitter solutions from the non-optimized ones. What the process lacked was seismic analysis of the solutions. Due to the lack of any spectral response analysis tools within the Grasshopper-Rhino environment, it was not feasible to have a live feedback loop between the large libraries of forms generated using genetic algorithms. As a viable substitution, Karamba3D was used to apply static forces, self-mass (gravity) and linear forces in the XX and YY directions. This method nonetheless created stable and optimized forms within the given domain of criteria.
Furthermore, this section deals with the procedure of analysing the forms for dynamic forces and the possible solution for making them earthquake resistant. The analysis was conducted on a surface rather than the constituent brick assembly, as this surface analysis would inform the global behaviour of the shell.
8.2.1 SETUP
As seen in the previous spectral analysis on a small brick assembly, the spectral response analysis is based on the Izmir Factor vs Frequency earthquake graph. The first step of the analysis is to set up the model for Strand7. As stated earlier, the compatibility issues require exporting the 3D model into IGES format. This can then be imported into Strand7 as a geometry. It is crucial to use the clean geometry tool in Strand7 to further remodel the input in the software. To create a mesh that the analysis can be run on, the auto mesh tool allows for generating a triangulated/quadrangulated mesh that approximates the input geometry. As for any FEA analysis, the smaller the mesh edges, the higher the resolution of the result. However, it also demands relatively more computational power. Therefore, a suitable edge length needs to be decided by trying out a couple of values. Furthermore, the load conditions need to be set up. In this case, the vertical force of gravity (self-weight) is the only loading case, as the rest will be external forces of ground acceleration acting on the model. The nodes that fall at the support conditions need to be selected and assigned a no freedom value, thus effectively anchoring them to the ground and creating the desired support conditions.
116 Quake|Response
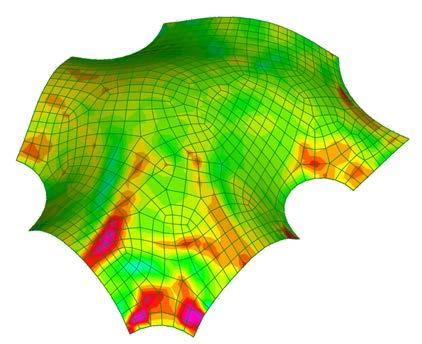
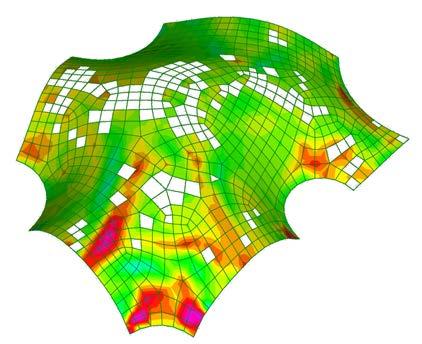
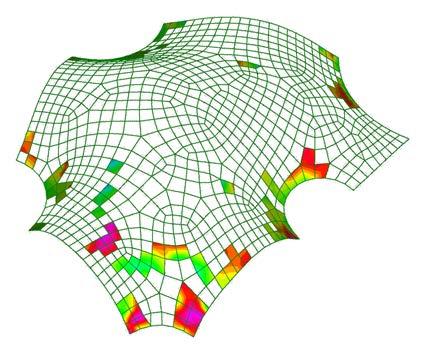
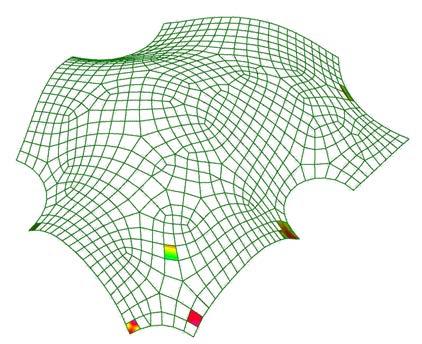
117 8 - Shell: Detail
Plate Stress XX MPa 0.3 0.06 >0.05
>0.15
≥0.3
>0.25
Fig.8.2 Plate Stress concentration study.
MPa
MPa
MPa
MPa
8.2.2 ANALYSES
The natural frequency analysis gives the modes of behaviour for a structure. This is crucial to understanding the frequencies at which failure may occur. The natural frequencies are specific to the materials used. Hence defining the material for the generated mesh is important. In this case, concrete material was used. The thickness of the plate also needs to be defined, thus allowing for a calculating the structural mass. This information is required for the spectral response study because the failure pattern results are calculated based on the natural frequencies. Strand7 allows for visualizing the results in various ways. Stress concentration in plates and Displacements can be visualized either in a colour spectrum, by contour lines, or by vector directions. Each view can be displayed against a principal axis.
8.2.3 RESULTS
Two results were taken into consideration for further optimization. Plate stress analysis [Ref. Fig. 8.2] visualizes the key parts of the model, in which there is a high concentration of stress due to the ground acceleration motion. The stress limit of the material used for building along with the values of stress concentration allow for understanding the failure locations. Filtering the stresses based on certain thresholds, it can be seen that less than
1% of the shell structure is subjected to very high stresses. Displacement results along the Z axis for the shell under the same ground acceleration inform which parts of the structure are prone to deformation. About 2% of the total surface area was subjected to displacements on the higher end of the domain. However, the overall structure seemed to be more or less stable.
8.2.4 POST TENSIONING
To further improve the structural stability of the structure, taking a cue from the earlier physical experiments, post tensioning along the form was introduced. The location of the post tensioning was governed by the localized displacements seen in the surface along with the high stress concentration values. As the further steps for this exercise would be to divide the surface into its constituent topologically interlocking bricks, the post tensioning would have a major role in keeping certain key bricks in place while still allowing for localized movement in the other bricks. Furthermore, all openings in the shell, acting as arches, were tied together by having the post-tensioning in them regardless of the stress concentration/displacement values in these areas. This was done because the boundary condition of the openings needed to be strengthened. The displacement in the shell was reduced drastically [Ref. Fig. 8.3] when the spectral response analysis was rerun considering the addition of the tying members.
118 Quake|Response

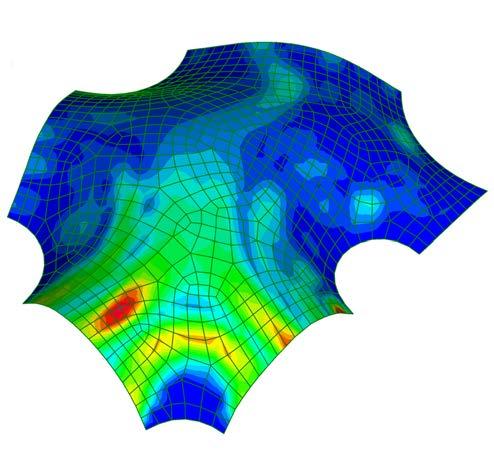
119 8 - Shell: Detail 25 mm Displacement Z axis Displacement Z axis mm 0.24 0.91 0.09 25 mm Displacement Z axis Displacement Z axis mm 0.24 0.91 0.09
Fig.8.3 Displacement in shell on Z axis under seismic force - Before and after introducing Post-Tensioning.
8.3 COMPUTATIONAL MODEL
The computational modeling of implementation of the material system on the emerged shell began by defining the stress flow forces on the shell under a linear static analysis test on Karamba3D. This process enabled the shell to be divided into a number of parts for ease of fabrication and assembly purposes [Ref. Fig. 8.4]. One division was then selected to begin the computation process in Grasshopper3D. A parameter was defined to control the number of divisions on both the lower and upper surfaces. An interpolate curve component defined these divisions, in which every other control point within these curves was moved along the referenced surfaces to define a wave-like curve responsible for the degree of interlocking on the transverse side of the assembly/ brick. This method was followed for the longitudinal side of the referenced surfaces to define the degree of interlocking on the other side. Once all the curves were defined with their degree of interlocking, a network surface was assigned to generate surfaces on all planes, and each brick was defined by joining them. These unique generated bricks were hierarchically ordered for fabrication and assembly purposes [Ref. Fig. 8.5]. Moreover, differentiation within the degree of interlocking was implemented in the computation process by defining a certain domain that could be controlled, which enabled the lower part of the selected division—the base—to have a higher degree of interlocking, since it was subjected to the highest amount of stresses.
120 Quake|Response
a b c d e f g h i j k l m n
Fig.8.4 Panels’ division in reference to the stress force flow analysis in Karamba3D
121 8 - Shell: Detail
Fig.8.5 Axon view of the emerged bricks from the developed algorithm, forming the shell structure.
Post tension
858 Unique Bricks
8.4 PHYSICAL MODEL
In order to evaluate the algorithm developed for implementing the material system— interlocking bricks—on the selected shell form, it was necessary to translate the digital model into the physical platform by means of digital fabrication. Moreover, this exercise aimed to test the structural performance of the material system under dynamic motions.
The process began by incorporating the shell within a chosen site in Istanbul with a dimension of 30x30 meters, which was characterized by its deep slope, measured to be 3.5 meters from the lowest to the highest point. The digital model was scaled to 1/35 scale. This scale was necessary to accommodate the limitation of the CNC machine because its pit only goes to a certain depth. Also, material limitation was a factor, since plywood was available only in the standard sheet size of 2.4 x 1.2 m, and also to reduce any material waste. In response to these factors, a block of plywood made of several 18mm thick ply was prepared for the CNC machine. The locations of the shell foundations were also defined according to the digital model, and they were to be cut at a specific required depth. The foundations were 3D printed with the Ultimaker2 and placed on the site model [Ref. Fig. 8.6].
Since the material system is mortar-less, it was necessary to design a scaffolding system for laying the bricks toward the assembly of each panel. This was promoted by constructing a scaffold made of an egg-crate structure for each panel. The placement of these scaffolding structures was identified easily by the irregular topography of the site [Ref. Fig. 8.7].
From the exercise of the panel division, Section 8.3, the developed algorithm was implemented on all the panels to generate the interlocking bricks for the shell assembly. Hollow channels in certain bricks were modeled to accommodate the insertion of a post-tension element in specific locations. The bricks in each panel were organized in a sequence to aid in the assembly process and were 3D printed on the Ultimaker2 [Ref. Fig. 8.8]
The assembly process of the bricks on site began with laying brick Panel A on its corresponding scaffolding, and the sequence was intended to be followed chronologically ending with panel-n.
122 Quake|Response
Fig.8.6 Step 01: Placement of the 3D printed foundation pieces on the CNC cut site
123 8 - Shell: Detail
Fig.8.7 Step02: Placement of the assembled scaffolding on the site
Fig.8.8 Step03: Assembly of the bricks for each panel on their corresponding scaffolding.
8.5 EVALUATIONS AND CONCLUSIONS
The implementation of differentiation in the shell thickness proved to be vital in regard to material optimization and stress reduction in the overall shell. However, certain limitations during both the analysis process and the experiment setup on the digital platform have to be noted. The stress analysis was specific to static loads, as Karamba3D is not compatible with dynamic load analysis. Alternatively, Strand7 would have been an option; however, the mesh vertices’ values cannot be stored in these vertices and exported back to the Grasshopper environment while maintaining both their values and exact location in respect to the shell mesh for the construction of the shell with varying thickness. Thus, the mesh generated by Strand7 would not be compatible with the mesh from Grasshopper, and this process for varying the shell thickness could not be performed.
The lack of compatibility of the software platforms of Strand and Grasshopper-Rhino led to a manual exporting and importing of the digital model into each software. It was observed that there was a loss of resolution of the model as it was exported, converted and reconverted to and from Rhino. The mesh machine in Strand7 recreated the mesh divisions, thus effectively changing the number of vertices of the total geometry, as stated earlier. On the other hand, the software does not allow for inserting post tensioning as independent components. Thus a work-around to this was used. By having a global thermal loading case—that is, while analysing—an external temperature rise is induced, and by using post-tensioning chords with a negative thermal expansion value, we can simulate a possible post-tensioning behaviour. This, although not the best practice, was seen to be effective.
The computational process developed an algorithm that was extensively utilized to generate bricks on doubly curved surfaces that were parts of the shell structure. With regard to the computation environment, certain drawbacks were noted for further improvement and implementation in future iterations. The algorithm was designed to receive only surfaces defined by four boundary curves, but surfaces with more than four curves could still be valid inputs depending on the complexity of the surface. Although this was rare, the results produced were desirable. Moreover, the interlocking surface generated by the upper and lower defined wave-like curves on the transverse side of the brick had a slight overlap with its adjacent interlocking surface. This was due to the
resolution of the Tween Curves component, which created a number of curves between two defined curves that were lofted to build the interlocking surface. The number of curves in the algorithm was set to 10, and a further increase in the number would have overcome this overlapping issue. Another drawback arose from the Network Surface component, where curves with a deep degree of interlocking were not able to generate proper surfaces; rather, their surfaces tended to twist at areas with an extreme degree of interlocking, which led to overlapping between geometries. Thus, the range of domain responsible for controlling the degree of interlocking had to be reduced, which in turn would reduce the amount of pressure between the interlocking components, leading to a possible failure of the system under dynamic loads. Furthermore, all divided panels were to have a similar number of divisions in order to match the sides of adjacent panels. This created large bricks in the large panels and small bricks in the smaller panels. Dividing the selected shell into equal panel sizes would resolve the problem in future iterations.
The translation of the design from the digital to the physical was an important step in understanding the behaviour of the material system. It also informed the logical construction sequence that could be followed in the real-world scenario. Although the proposed material for the bricks was cement, a scaled model was constructed using 3D-printed PLA bricks. The physical model experienced some failures, from which certain key points can be noted. The panel divisions were done based on the positioning of the post-tensioning cables derived from the structural analyses. However, for this reason, the assembly was not precise. Due to the post-tensioning passing through the middle of the two bricks, and the bricks being separate, it was difficult to keep the bricks in place till the whole panel was assembled. Secondly, the vertical divisions of the bricks—that is, the surface of contact between two bricks laterally—were not normal to the force direction, but were determined based on the boundary of the panel division. Because they were not normal, there was a lot of tangential force acting, thus effectively “opening up” the system instead of keeping it in the desired shape. Thirdly, the tolerance, which was calculated digitally, was not enough. There was a lot of overlapping of materials on the interlocking surfaces of the brick because of the material resolution of the PLA. The 3D-printed layers for the bricks measured 0.6mm each, and because of the smaller size of the brick, the material did not correspond to the smoothness of the surface. If the same brick is scaled up, it should be tested to determine whether the material resolution still creates the same tolerance issues. As the desired model could not be completed, the initial goal of conducting an oscillation table test for the model could not be conducted.
124 Quake|Response
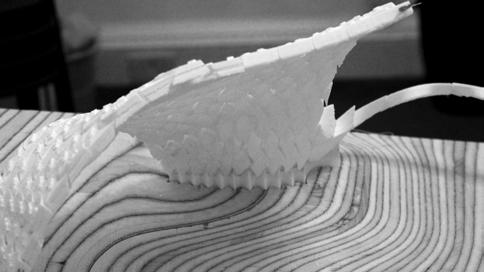
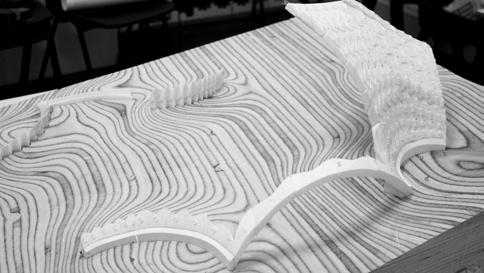
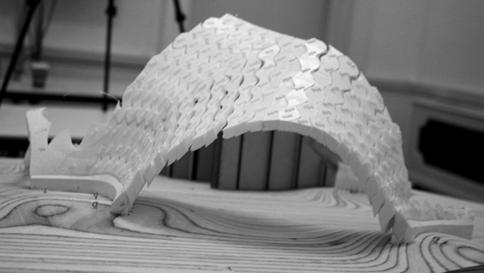
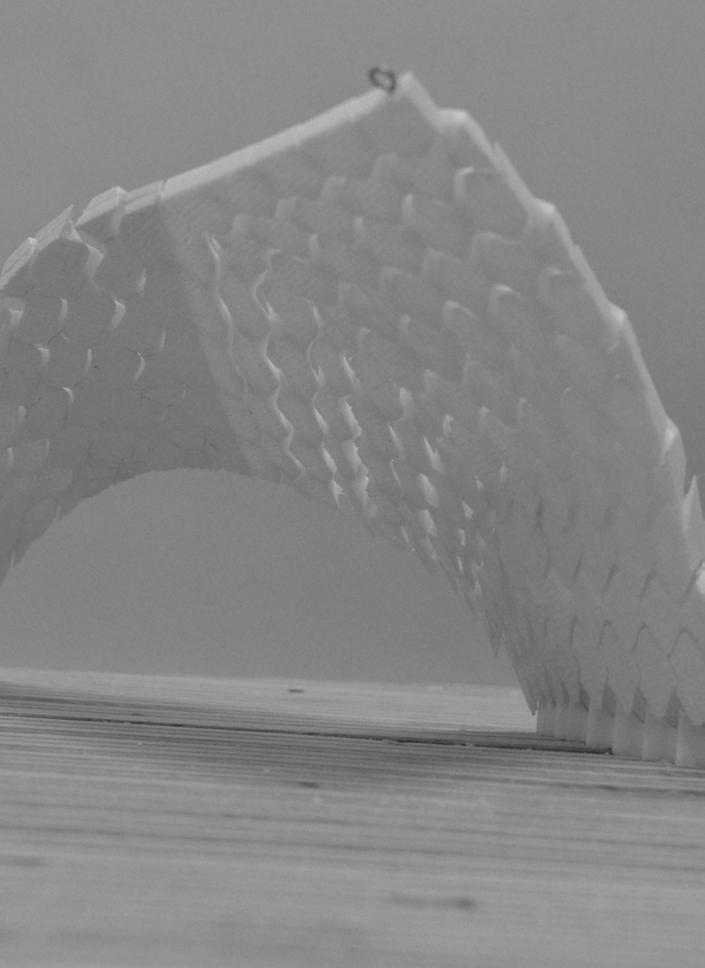
125 8 - Shell: Detail
Fig.8.9 Physical Model Photographs
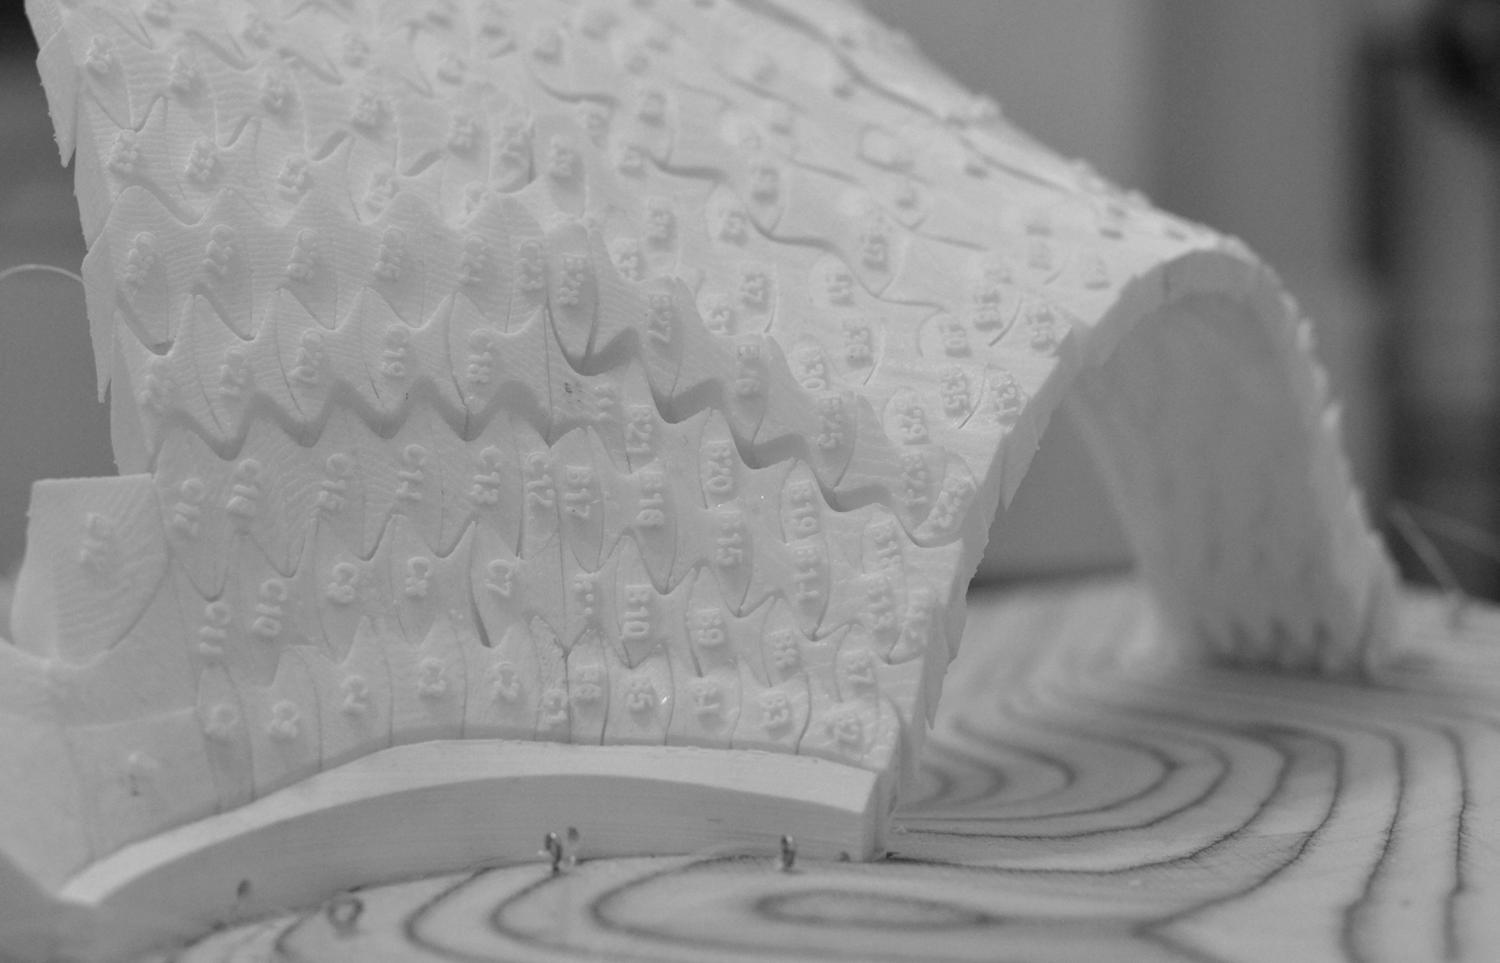
126 Quake|Response
Fig.8.10 Nomenclature system and panel assembly.
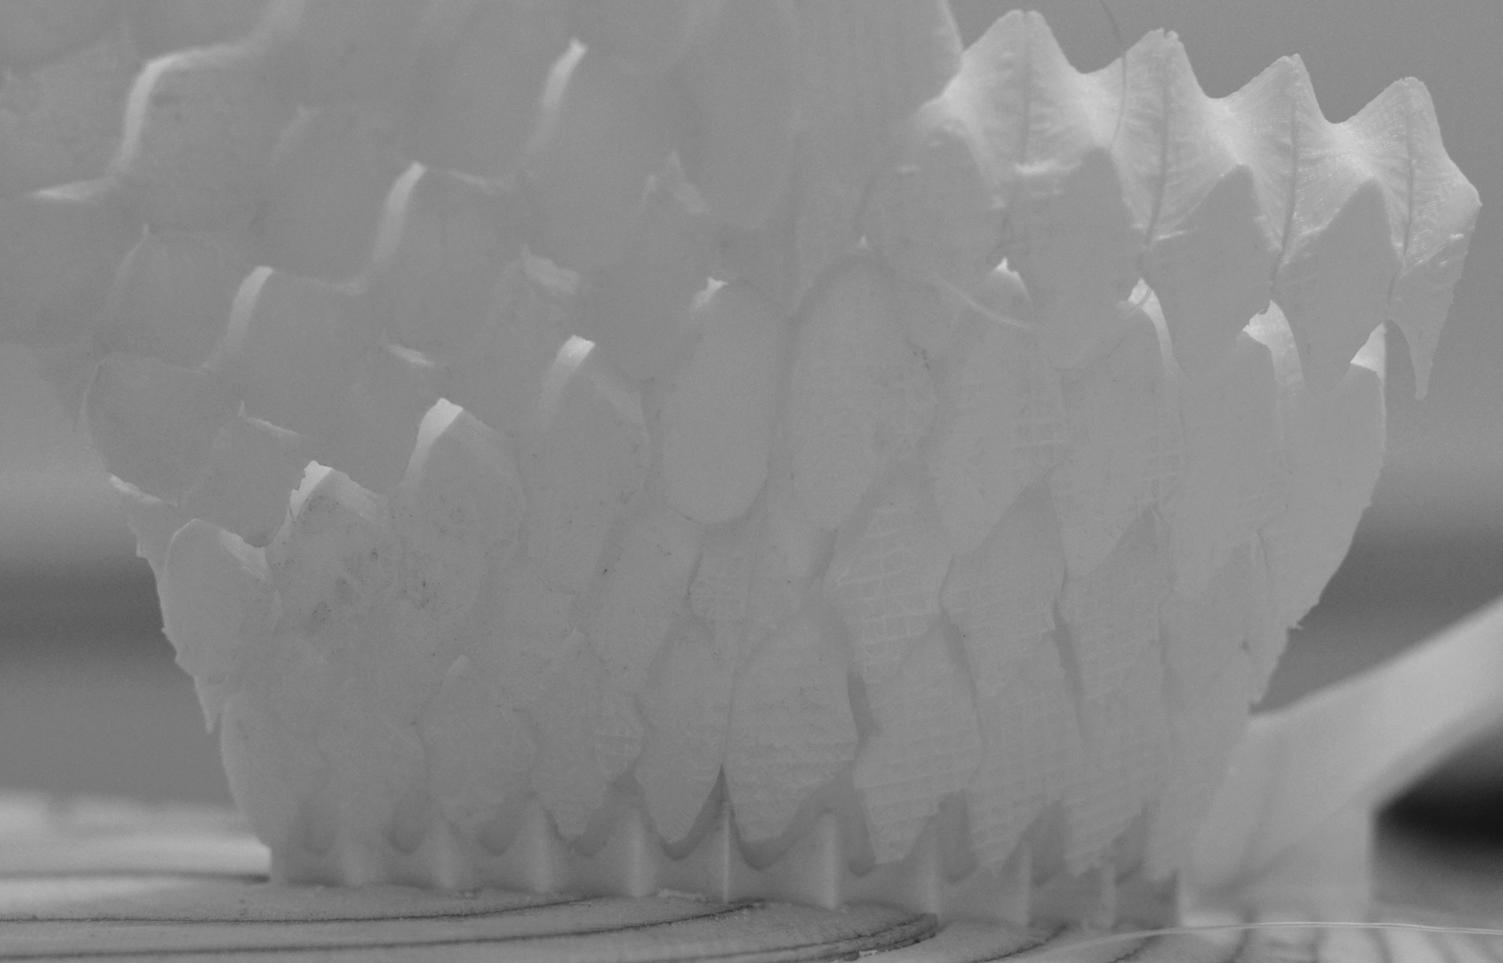
127 8 - Shell: Detail
Fig.8.11 The apparent gap between the two rows of bricks, due to the material tolerance issue.
RESEARCH DEVELOPMENT
Urban System Global | Regional Scale
The three stages mentioned in the Research ambition were ranging from a city level to a more smaller scale, on the material system. This section of the dissertation deals with the urban aspect of the project. Studying the infrastructure along with the existing urban fabric of the city of Istanbul will be the main focus.
INTERVENTION STRATEGY
The Dissertation proposes a five step intervention strategy for the city of Istanbul, to prepare it for the predicted earthquake.
The first step would be on the city level scale, where potential safe zones would be identified. Safe zones would be areas which can be deemed safe during and after an earthquake where people can seek shelter. This step will also introduce a safe evacuation network, this will be a selected road network, from the existing road layouts, which would be activated after an earthquake to act as a primary conduit for first aid and emergency services and for movement of people to and from safe areas. This network will be connecting all the safe zones to each other and to other key infrastructure points throughout the city.
Steps Two-Five will deal on a regional scale, where each safe zone and its radius of influence will be studied in detail. Step three will be to device a strategic solution to demolish certain vulnerable buildings within this safe zone. The next step will be to identify and provide the required areas and functions within this zone. This would be the functions which would be allotted for the earthquake resistant shell structures to be built in the safe zones. The Fifth and the last step will be to identify crucial road junctions, which are vulnerable to blockage due to collapsing of buildings, thus affecting the entire network. Here, steps would be taken to safeguard this junction.
130
STEP 01
SAFE ZONE SELECTION AND NETWORK IDENTIFICATION
STEP 02
RADIUS OF INFLUENCE CONTEXTUAL ANALYSIS
STEP 03
STRATEGIC DEMOLITION OF VULNERABLE STRUCTURES
STEP 04
DISTRIBUTION OF PROGRAMME ON SITE
STEP 05
SAFEGUARDING LINK
BETWEEN SAFE ZONES
131
RESEARCH DEVELOPMENT
ISTANBUL NETWORKS AND SAFE ZONES
This chapter deals with Istanbul and its existing infrastructure. A detailed study of the road networks and their integration in the urban context will form the major focus. The process of finding a Safe Evacuation network and the identification of Safe Zones will be explained here.
9
134 Quake|Response 1950 Bosporus Bridge First Periphery highway Road and Railway Expansion F S M Bridge Second Periphery highway 1970 1990 2015
Fig.9.1 Evolution of the City of Istanbul since 1950 (Diagram reconstructed from : Yenikapi Transfer Center and Archeopark)
9.1 INTRODUCTION
Istanbul has seen expansion of its borders over centuries and under various empires. Each era saw buildings being built over the existing ones, as is often the case with most of the ancient cities. The road network, however, saw little or no change. The main avenues of the Byzantine Empire, which were used for the royal ceremonial processions and connected major landmarks, were retained under the Ottoman Empire. The Mese of Constantinople can be still seen in the present-day Istanbul in the form of Divanyolu Avenue. These main thoroughfares were by default taken as the most important connections and have been superseded by modern-day roads in the same locations.
Present-day Istanbul is faced with a major traffic congestion issue. As cost of living in the city centre escalates, people are forced to move away from the city, thus forming new suburbs. These fast-growing suburbs of Istanbul, mostly on the Asian side, were built at a rapid pace, with little or no future planning of infrastructure. Most of the working population stays in these suburbs to travel back into the city every day. This results in a major traffic issue and it may take up to three hours to reach the working place from the place of residence.
9.2 ISTANBUL : EVOLUTION
Studying the evolution and expansion of Istanbul, a key factor to be noted is population explosion. As more and more people started migrating to the city from all over the country, the existing infrastructure of Istanbul was not prepared for this influx. From a population of just over 900,000 in the 1950s, within two decades it grew to 2.7 million, almost three times the previous number. The first major bridge across the Bosporus was built during this time, further linking the European and the Asian sides of Istanbul. This also acted as a catalyst for growth across the Asian side. Following this, other major infrastructure projects were built, further expanding the road and rail network across the city. The present-day population of 14 million, in addition to the impending earthquake predicted by seismologists, would pose a serious issue if no preemptive measures are
taken. In an emergency situation, such as the aftermath of an earthquake, these issues can pose a serious threat to the movement of primary care and emergency personnel through the city. Considering the vast spread of Istanbul, identifying certain routes which can act as the safety and evacuation conduits in such a case becomes important. This can act as a redundancy plan for the network, where various failures are taken into account and the best possible route is selected for connecting various emergency facilities like hospitals, fire stations, and other important points.
135 9 - Istanbul | Networks and Safe Zones
Fig.9.2 Integration of ancient roads into the modern network. The historical district of Fatih, Istanbul.
9.3 EXISTING INFRASTRUCTURE OF ISTANBUL
Lifelines for a city are not only limited to food and water but also include other basic necessities such as electricity, gas, and communications. It becomes impossible to live in a house that may have survived the onslaught of an earthquake but has no access to the basic infrastructure mentioned above. Understanding the vulnerability of these supplies to damage due to an earthquake would allow for foreseeing the possible locations within Istanbul where an earthquake would lead to collapse of such infrastructure. A study of the locations of the main existing supply and distribution infrastructure, and a ranking of them based on their susceptibility to damage, would allow for a hierarchical approach to creating an infrastructure network.
Roads play an important role, as they are not only a means of allowing people to flow across the city, but also act as a conduit for these lifelines since, in most cases, pipelines carrying water and gas and electric and communication cables underlie the major highways. The damage to the highways, then, results also in damage to these pipes. Bridges over these major roads also become important, as they often are the weak link. Identification of these areas where the major network may suffer possible disconnection due to collapse of a bridge can lead to establishing other secondary backup links which can be activated in such a situation.
This makes it important to understand and evaluate the conditions of the existing road networks across the city. This study can establish the hierarchies within the road layouts and help understand the effectiveness of the same. The comparison of such analyses with the existing urban conditions can be an important input in establishing a post-earthquake safety and evacuation network for Istanbul.
Thus to identify an effective network from the present roads that could act as an evacuation and aid network for the city of Istanbul, the existing network has to be studied. A syntactic analysis would identify the road values with respect to betweenness centrality, the total integration and the connection values of each network branch, the analysis of which can be further made use of in deciding the safety network for the city. The analysis will be topographically mapped onto the extensive road network of Istanbul.
9.4 SYNTACTICAL ANALYSES
The existing road network of Istanbul was mapped using Depth-mapper [(c) 20112014, Tasos Varoudis] for carrying out syntactical analyses. The values obtained from Depth-mapper were then reassigned using Grasshopper to obtain a visual representation of the road network. The following observations show the betweenness centrality, connectivity, and integration of Istanbul. The observations allow for a holistic view of road values and are important for understanding the city patterns of Istanbul.
9.4.1 BETWEENNESS CENTRALITY
The betweenness centrality of a network can be defined as the centrality of any segment of the network with respect to the overall network connections. If a person were to travel from all possible locations to every other location in the network, the betweenness centrality of a road is the number of times that road is being used while traveling if only the shortest path is followed.
When analysing the Istanbul network for betweenness values, it can be observed that although the road layouts are spread across the city in an organic fashion, many major roads do not have high values. About 4.5% of all roads have high or very high betweenness centrality values, 8% have medium-range values, and the rest have low or very low values, meaning these roads are less used. Out of the two connections across the Bosporus, only one has a very high centrality value. This fact corresponds to the actual situation in Istanbul. The two major highways form the central connection as the rest of the network permeates through the outskirts of the city centre.
136 Quake|Response
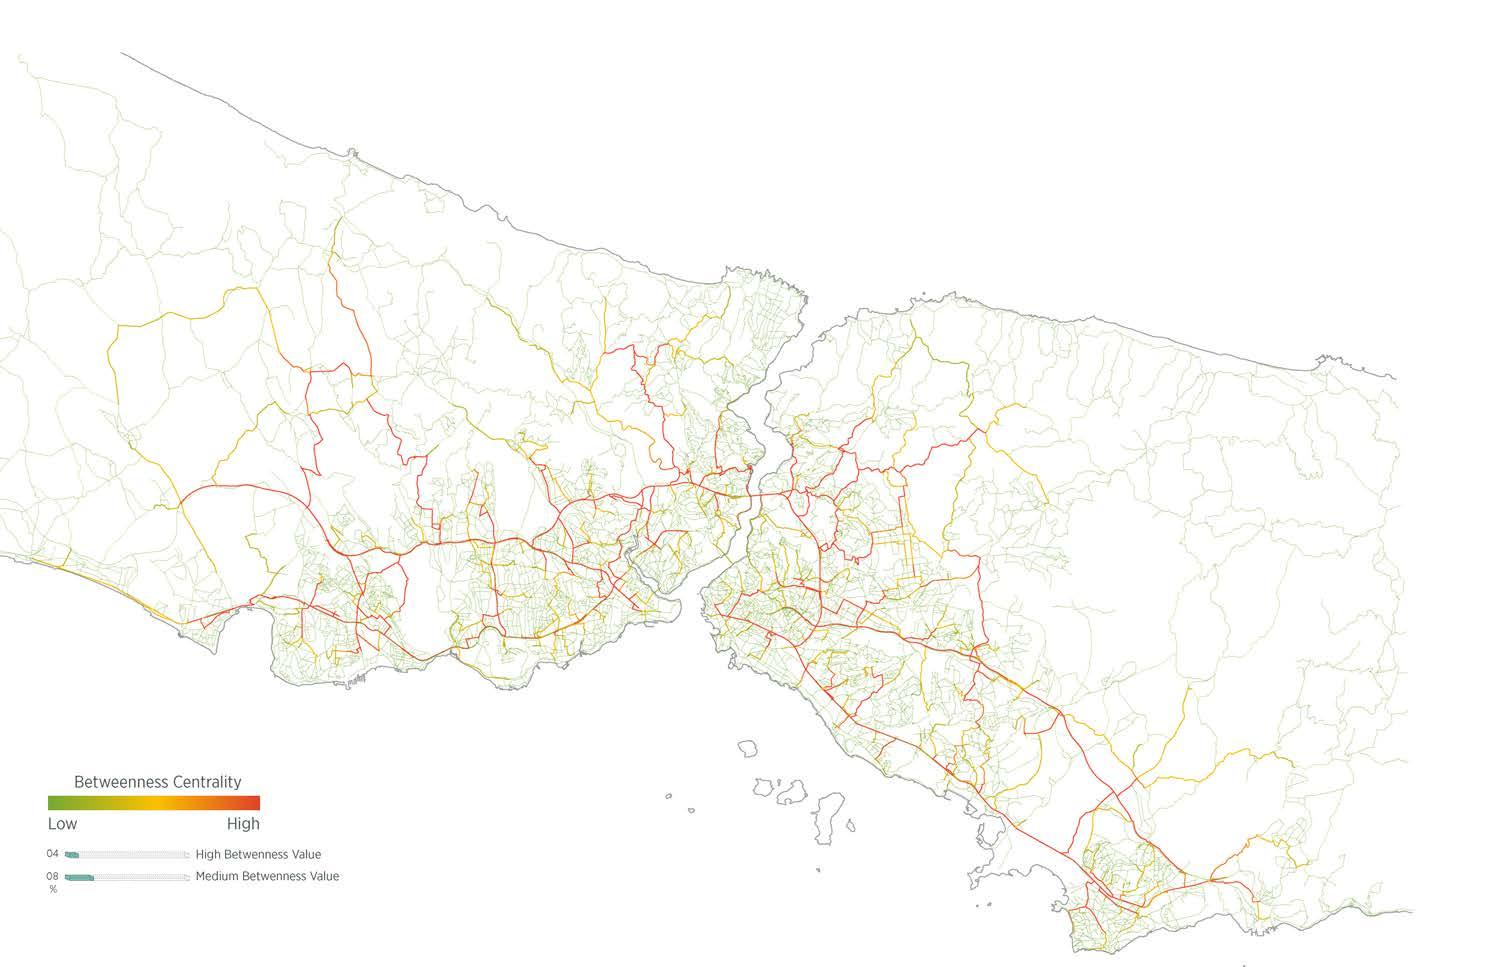
137 9 - Istanbul | Networks and Safe Zones
Fig.9.3 Betweenness Centrality analysis of road network of Istanbul..
9.4.2 AXIAL GLOBAL INTEGRATION
Integration is a relative measure of the connection of a particular section of a network to every other part of the network. This study examines the relative depth of the network, and through a city-level analysis gives insight into the areas that are most integrated in the overall city. The higher its integration value, the more central the space is in the network, as it has more possible connections to all other points. These form what is known as the integration core, the most integrated area in the network.
Analysing the road networks of Istanbul in terms of integration, it can be seen [Ref. Fig. 9.4] that the more integrated areas fall within the historic Fatih district, where most of the ancient road layouts have been superseded by new ones, although with the same network qualities, and on the Asian side, with newly developed districts like Kadikoy, where most of the young population of the city resides. One more observation to be noted here is that a majority of the people working on the European side of the city travel to work across almost the entire city from these newly developed districts, which would also justify the integration values in those areas.
138 Quake|Response
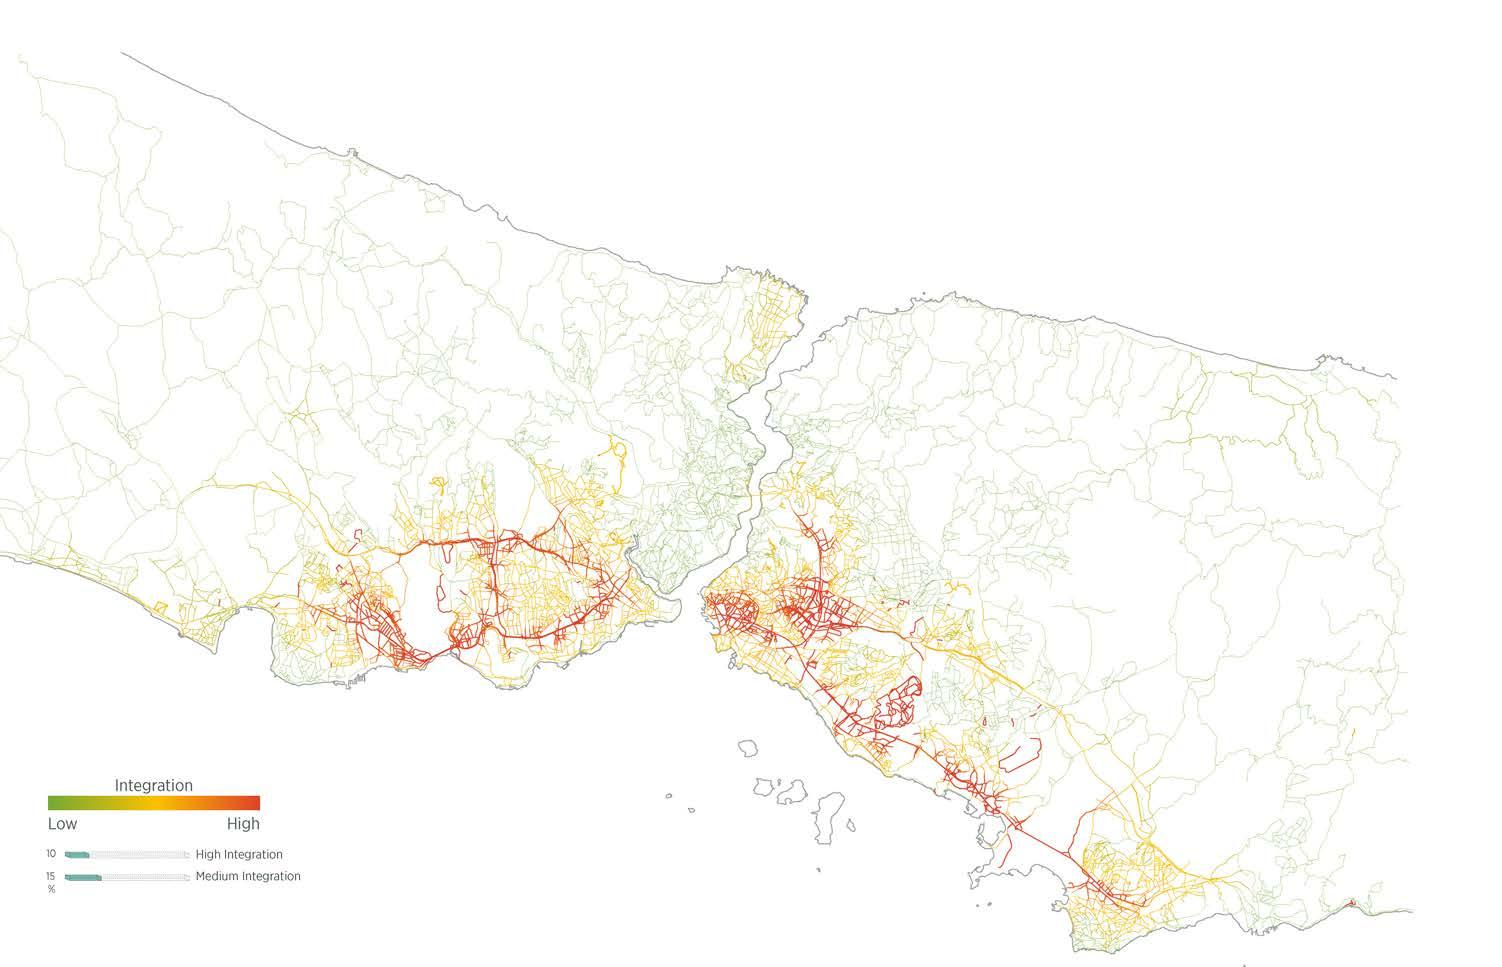
139 9 - Istanbul | Networks and Safe Zones
Fig.9.4 Global Integration of Istanbul’s Road layout.
9.4.3 GLOBAL CONNECTIVITY
The connectivity of a network is defined as the number of connections any particular section of the network has. Higher value in a global connection analysis would indicate the importance of that link in terms of its ability connect to every other point in the network.
Observing the analysis of Istanbul [Ref. Fig. 9.5], as seen in the betweenness values, the link across the Bosporus is highly connected along with the areas around it. One interesting fact emerges: the most touristy and historic area, Fatih, does not have very high connectivity values. This could be for two possible reasons. First, as there is no link across the Bosporus in this area and it happens to be more or less a peninsula, the connectivity would be lower compared to the more geographically central areas of the city. Second, as the analysis was conducted globally, the value threshold increased drastically, meaning local areas with high connectivity may not be as visible as the domain of the values increases.
9.5 CONCLUSIONS
Evaluations from the syntactic analysis give an in-depth view of the importance of the network. Assigning values to roads allows for further experiments, where these values become integral to calculating other qualities such as road vulnerability and potential evacuation network. However, it should be noted here that all analyses were done on a global level, which resulted in increasing the bounds for the values considerably. This meant that local conditions of areas could not be understood in detail; for example, integration of a particular district gets remapped because it falls far below the average, even though locally the integration might be excellent. Also, a possible way of analysing this was to disconnect the Asian and European sides to understand values independent of either side. This was not achieved and could be looked at as a possible future study.
140 Quake|Response
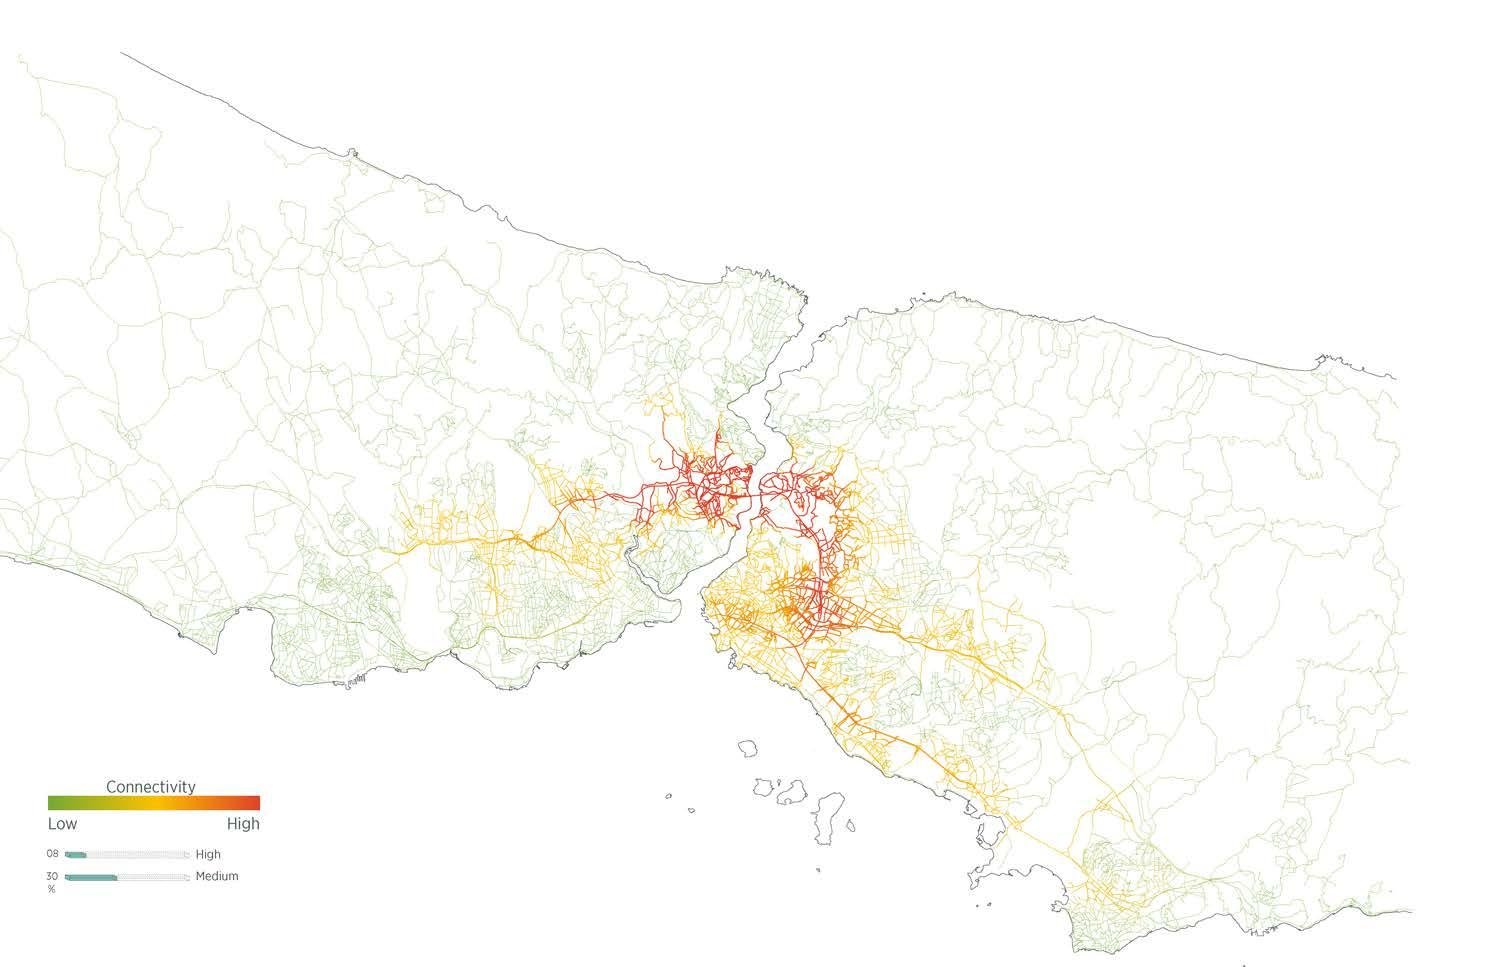
141 9 - Istanbul | Networks and Safe Zones
Fig.9.5 Global level Connectivity of Istanbul’s Road layout.
9.6 SAFE ZONES
The possibility of providing a safe area where people can seek shelter during and after an earthquake is investigated. Such an area is called a safe zone. Each safe zone will have a radius of influence based on its capacity. The population within this radius would be able to reach the safe zone in relative safety and be able to seek shelter. Such a solution can be implemented for the whole of Istanbul, whereby safe zones are identified and this identification is informed by certain predefined factors. Thus each safe zone, instead of being an isolated area, is more integrated in an overall city-level scheme.
9.7 SELECTION STRATEGY
Istanbul’s unpreparedness for an expected earthquake raises concern for peoples’ safety, in particular, concern for ensuring a safe evacuation passage after the expected damages to the vulnerable roads in the network and for safeguarding the people in safe points where necessary commodities are provided following a quake event. The research deals with adapting both the present Istanbul network and existing buildings as means for seismic preparedness strategies. The latter is considered an immediate solution to the problem, and after the selection process is finalized the safe zones will be evaluated in depth in regards to their urban and structural conditions.
9.7.1 MAPPING POTENTIAL SAFE ZONES
The safe zones will highlight existing buildings, including schools, mosques, and parks. These types of buildings are occupied on an everyday basis by the community. Most of them are characterized by their open spaces and ease of accessibility, which in turn recommends them as potential safe points in an earthquake event. The selection process for the safe points will be informed by a genetic algorithm experiment where
certain criteria are proposed to find and select the most crucial zones in respect to the existing network and urban conditions. Prior to setting up the experiment, it is essential to geographically plot the location of existing safe points. The process of mapping safe points takes into consideration the following criteria:
- Each safe zone should cover a minimum of 3% of the total population of the district it belongs to.
- Assigned safe area value of 2 m2/person.
In reference to these proposed criteria, for instance, the population of the district of Bagcilar is 750,000 people. Each selected safe point should house 22,500 people (750,000*0.03). This means the area of each safe zone should not be less than 11,250 m2 (22,500/2). In Bagcilar, there are 88 mosques and Islamic centres; only three of them are selected based on the resulting threshold. Similarly, this process is also applied to schools and parks within each district [Ref. Fig 9.6]
9.7.2 EMERGENCY FACILITY POINTS
Safe points are means of ensuring the safety of people, and they are carefully selected such that they are effectively connected with the safe evacuation network. It is important to locate emergency facility points within this evacuation network to fulfil the immediate needs for health care in case of injuries or clearing roads that lead to safe points as a result of debris blockage or fire. Furthermore, these facilities, which include hospitals, police stations, and fire stations, will act as distribution points for relief items after an earthquake. Their geographic location is plotted prior to initiating the experiment for selecting safe points [Ref. Fig 9.6]
142 Quake|Response
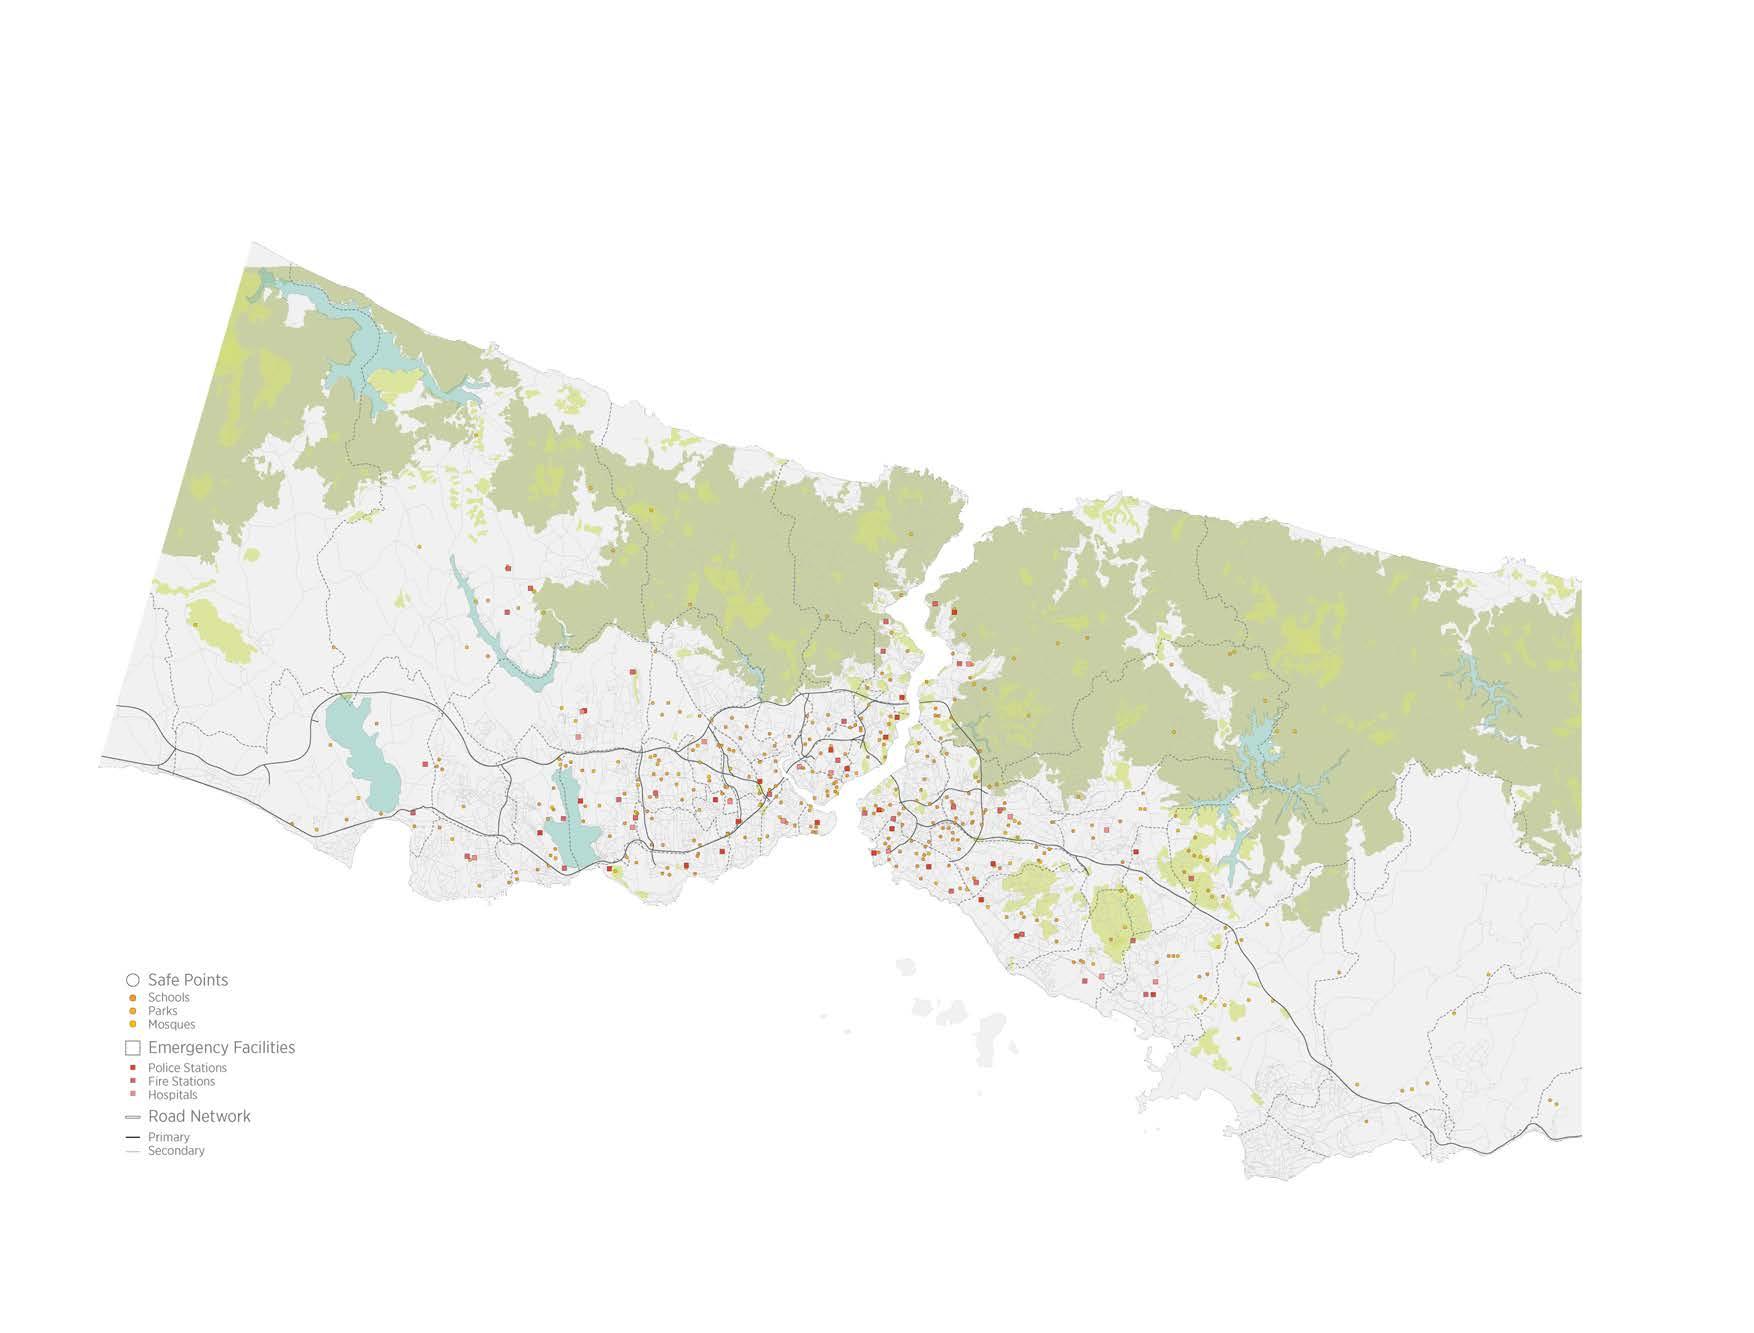
143 9 - Istanbul | Networks and Safe Zones
Fig.9.6 Mapping of all possible safe zones over the city of Istanbul.
9.7.3 SAFE ZONES SELECTION CRITERIA
In order for safe points to function effectively within the evacuation network, it is important to establish certain criteria for selection, in which a multi-criteria objective model will help identify specific safe points from all possible ones. The algorithm towards the first criteria deals with maximizing the sum of the safe points’ radius of influence specific to a district, in which it is set between 50 and 1,200 m. Further, the algorithm takes into account the district’s density in the process of determining the number of safe points and their radius of influence. For instance, Fatih has a population density of 864 people per hectare; it is more effective there to have more safe points with a lower radius of influence. By contrast, Kartal has a low population density of 211 people per hectare; having fewer safe points with a larger radius of influence might be the ideal scenario here.
The second criteria introduces the population-coverage percentage. It is proposed that the safe points collectively in each district should try to cover at 100% of its population. The algorithm will maximize the ratio between the total covered population and the radius of influence of the selected safe points within each district based on the assigned safe area of 2 m2/person to that of the district population.
It is important to have the emergency facilities in close proximity to safe points, away from the vulnerable roads and buildings that are prone to damages. The third criteria aims to minimize the distance between the emergency facilities and the safe points within each district.
The fourth criteria is intended to maximize the distance between the hazardous facilities and the safe points, as those facilities are the locations most vulnerable to catching fire and thus deactivating roads that lead in and out of the safe points.
9.7.4 EXPERIMENT SET-UP
After defining the criteria for the experiment, the genetic algorithm model was set so that it evaluated each of the 33 districts in Istanbul taking into consideration only
their neighboring districts. Each district has its own gene pool that consists of a series of controlling parameters responsible for determining the number of safe zones, their location, and their radius of influence. The genetic experiment was run for a population size of 100 individuals through 30 generations.
9.7.5 RESULTS AND EVALUATIONS
The outcome of the genetic algorithm experiment produced great variations in all aspects of the specified criteria. It provided a solution [Indv.29:Gen.30] with a high population-coverage figure of 130%. This means the safe zones would cater to 32.5% of Istanbul’s population, more than the objective target of 25%. In addition, the safe zones had an average distance of 267 m to the emergency facilities; however, their distance from the hazardous facilities is not sufficient and might undermine the evacuation process due to fire. This solution is vital for districts with high population density and with fewer links to lethal points such as gas stations and chemical factories. Another solution [Indv.78:Gen.30], which had the lowest average distance between the safe zones and the emergency facilities, fulfilled the required coverage of Istanbul population, yet it provided safe zones with a low radius of influence, meaning it did not adequately cover the entire district’s area. This solution would be important for large districts with concentrated population in certain neighborhoods or (mahalle). Furthermore, a solution [Indv.14:Gen.30] with a high average distance of almost 1 km between the safe zones and hazardous points was achieved. It had an accumulative radius of influence for safe zones of 8.7%. This solution would fit the scenario of an industrial district where factories and production are dominant and more safe areas are required. Nevertheless, the solution covered only 65% of the targeted covered population. A different solution [Indv.45:Gen.30] attained from the experiment highlighted the maximum safe zones’ accumulative radius of influence of 10%. This means that 10% of Istanbul’s area is safely accessible and can be habitable during and after an earthquake shock. This solution also had a reasonable average distance of 833 m to hazardous points, and a good average distance of 512 m to emergency facilities. This solution would fit districts with large area and medium population density, given the fact that it had a covered population of 70% of the targeted one. [Ref. Fig. 9.7]
144 Quake|Response
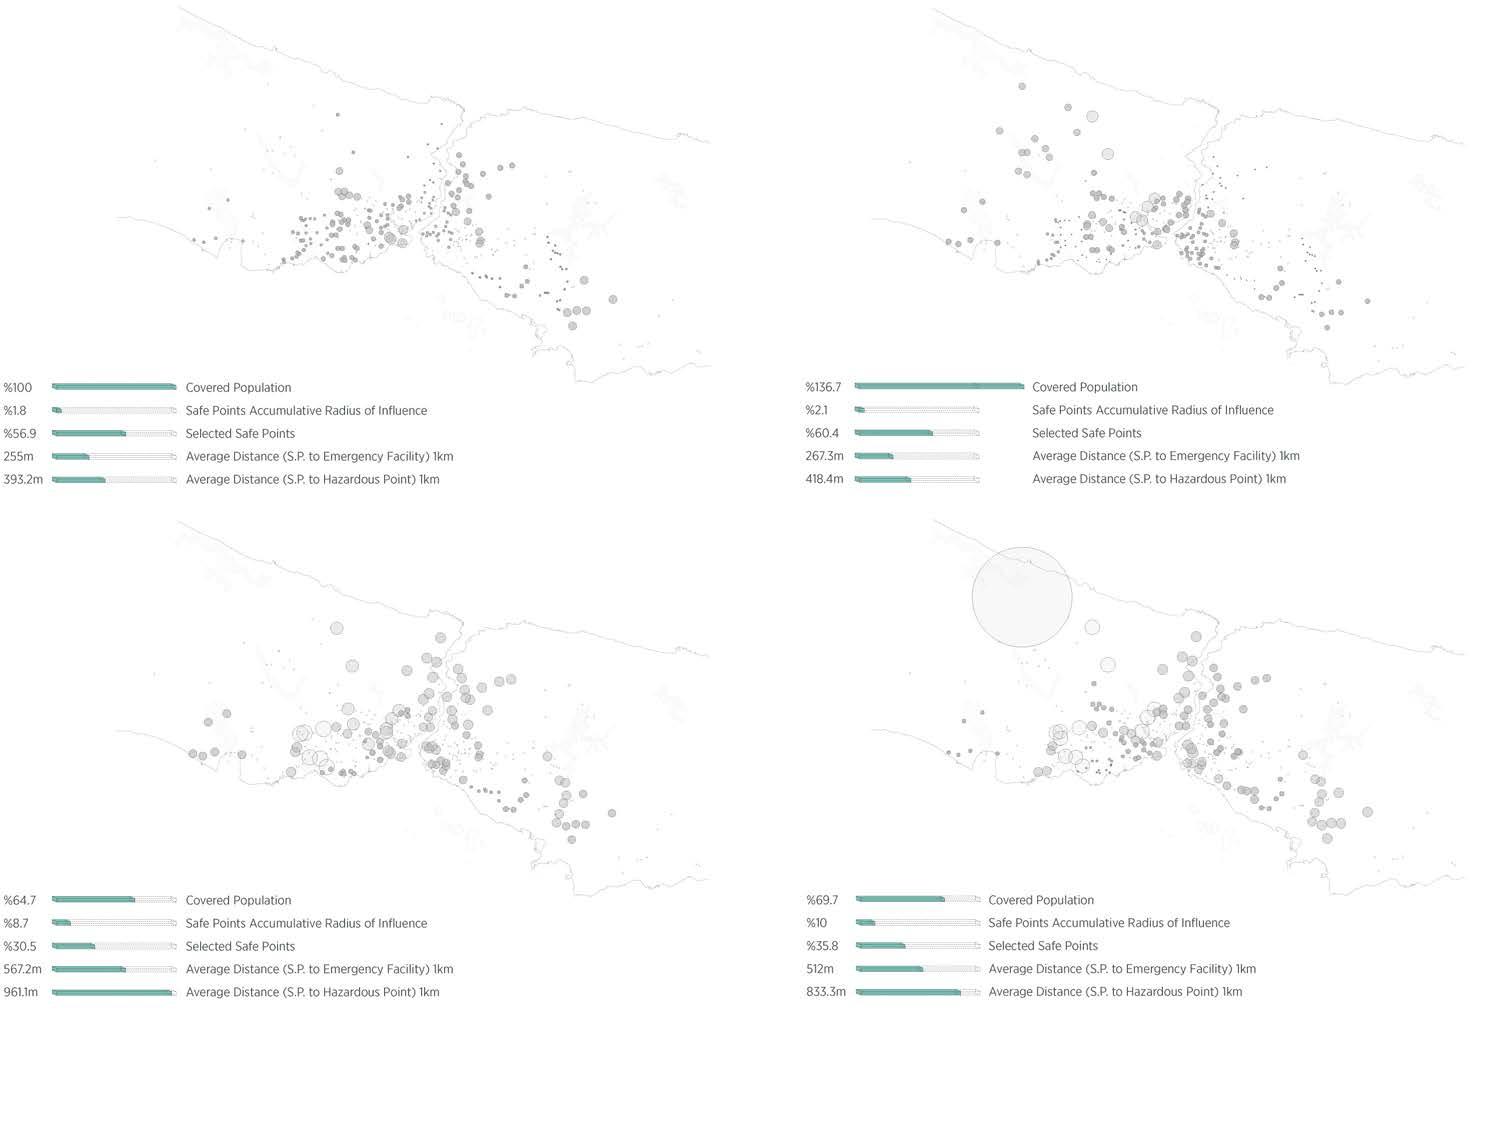
145 9 - Istanbul | Networks and Safe Zones
Fig.9.7 Some of the outcomes of the experiment, highlighting the achieved values.
[Indv.29:Gen.30]
[Indv.45:Gen.30]
[Indv.78:Gen.30]
[Indv.14:Gen.30]
9.7.6 CONCLUSION
The selection experiment for the safe zones was applied to Istanbul’s network explicitly in reference to its population density and its distance to the emergency facilities and hazardous points. The experiment was successful in providing solutions with adequate results, and a process of evaluating certain ones took place to highlight the most satisfying one. The selected individual [Ref. Fig.9.8] achieved a population coverage of around 75-80% of the population of Istanbul (14 million). These safe zones would cover 4% of the total area of Istanbul. They had an average distance of 360 m to the emergency facilities, which is approximately a four-minute walk or one-minute drive, making it very efficient in case of a calamity. The experiment was run for all the districts together with all the criteria having analogous importance, and the four results highlighted in [Ref. Fig. 9.7] would work in different scenarios depending on the district characteristics. The experiment could be run for each district solely depending on its condition and what criteria need to be maximized the most. Therefore, the solutions would be more effective, specific, and related to each district’s conditions. Another aspect that could be revisited is to take the Mahalle of each district, rather than the districts themselves, and rerun the experiment. In this case, there would be a very precise outcome related to the existing conditions, thus promoting the effectiveness and performance of the safe zones within the evacuation network.
146 Quake|Response
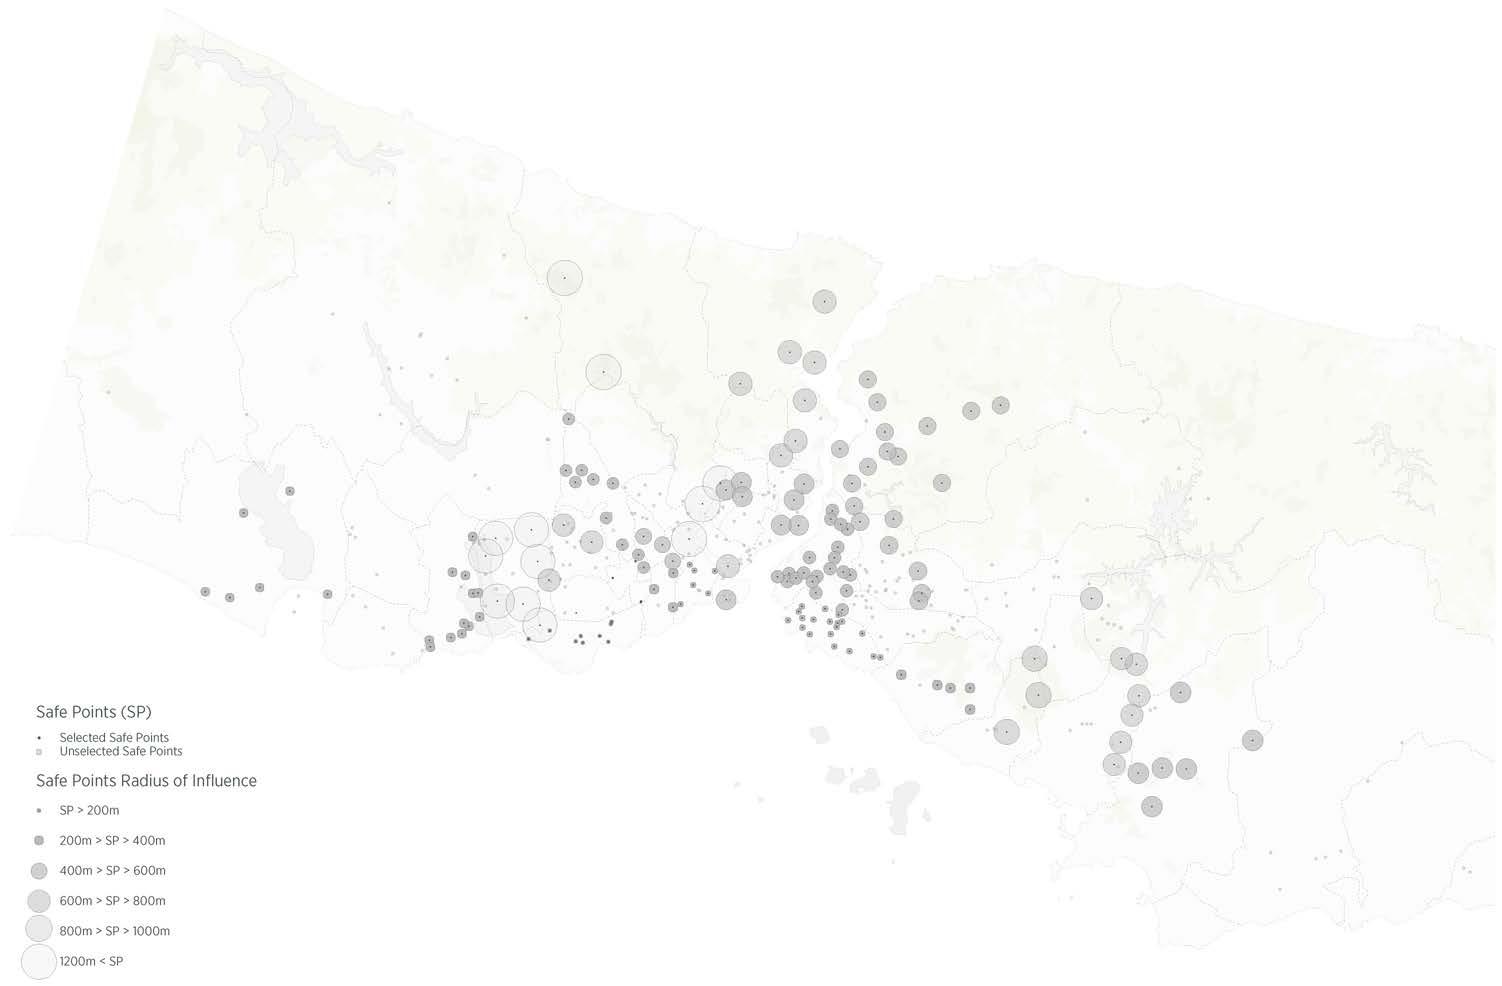
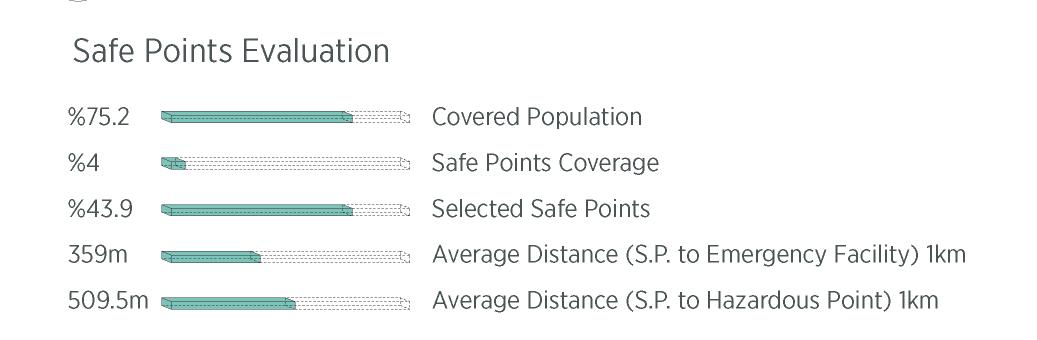
147 9 - Istanbul | Networks and Safe Zones
Fig.9.8 Optimum solution amongst the achieved options from experiments. The final location of the Selected Safe Zones with their radius of influence.
9.8 EVACUATION NETWORK
After identification of the location of safe zones based on multiple criteria, there is a need to identify an efficient road network which would connect all the emergency facilities and important infrastructure points like water sources as well as all the safe zones, thus creating a unified safe evacuation network. The following experiment tries to achieve a balance between certain set criteria and select the best possible option for connecting these infrastructure points.
9.9 MULTI CRITERIA SELECTION
The selection of evacuation routes was based on the following criteria:
9.9.1 HAZARDOUS FACILITIES
These include petrol pumps, chemical plants, and gas stations that could be vulnerable in an earthquake scenario and where a mishap could result in the nearby roads becoming dysfunctional. The selection process allowed for these inputs and avoided selecting roads which were within a certain radius of influence of these hazardous facilities.
9.9.2 EMERGENCY FACILITIES
These include hospitals, fire stations, and other key infrastructure points constituted as emergency facilities. The network always took these into consideration and formed key links within the network. All such points were compulsorily connected. Each such facility was equally weighed for selection.
9.9.3 BETWEENNESS VALUE
As seen earlier [Ref. Fig. 9.3], the betweenness values of all the roads were established. The selection of a network would try to have the highest values of betweenness. This was achieved by summing all the values, and the goal was to maximize this value.
9.9.4 BRIDGE
The failure of bridges usually makes an entire link of a network defunct. Bridges in Istanbul are especially vulnerable to damages as most of them are not built to resist earthquakes. Therefore any such bridges were avoided in finding the path.
9.9.5 SHORTEST PATH
This criteria allowed for selection of the shortest possible route within two points. [Ref. Fig. 9.6]. In contrast to the previous two criteria, which by joining all the desired points could lead to a very long network, selecting the shortest path within these points would mean that the travel time would be the shortest within the network.
Fig.9.9 Topological representation of Selection Criteria.
148 Quake|Response
A B Hazardous Facilities Hospital Fire Station Safe Zones Bridge Safe Evacuation Route Secondary Connections Emergency Facilities
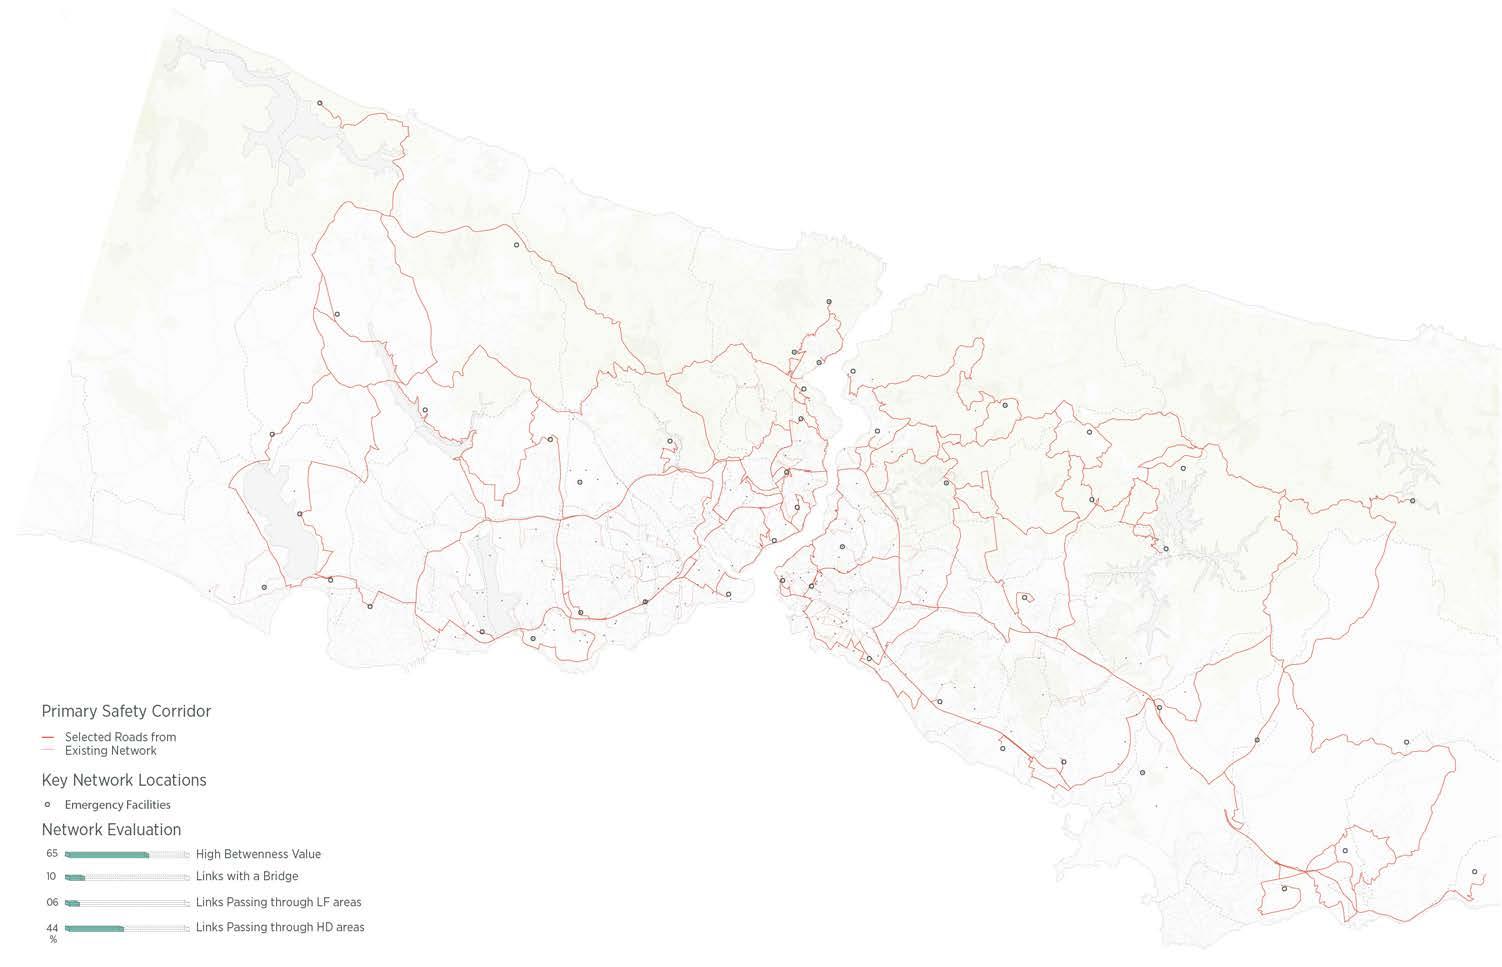
149 9 - Istanbul | Networks and Safe Zones
Fig.9.10 Selected Safety Evacuation Network based on the most optimum selection values.
9.10 EVACUATION NETWORK : EVALUATIONS
A genetic algorithm was run to determine the fittest solution. Various outcomes were analyzed for their criteria values and the best possible combination of values which served all criteria favorably was selected. [Ref. Fig. 9.7]. This network would be the safety evacuation network which will act as the primary conduit between all the key infrastructure points after an earthquake in Istanbul. The result shows a fairly spread out network with almost 90% coverage of the city. One major flaw which has to be noted here is that there is only one link across the Bosporus in this network, which is the major bridge connecting the European and the Asian sides of Istanbul. This is possibly because the betweenness centrality and connectivity values were taken into consideration [Ref. Fig. 9.3 and 9.5]. Also, in some areas, redundant links get created, because of the unavailability of an existing road. This aspect is noted; however, as this dissertation does not deal with proposing new roads, the shortcoming was accepted as the solution to it falls beyond the design aspirations.
9.11 SAFE ZONES - BETWEENNESS CENTRALITY
To understand the relative importance of each safe zone in the overall global scheme, the betweenness centrality was calculated based on the newly identified safety evacuation network. This study would establish hierarchies within the safe zones and serve as a guide to implement solutions to safeguard these areas and make them ready for a post-earthquake scenario. The radius of each circle reflects the betweenness value [Ref. Fig. 9.8] of the safe zone. The radius of influence of the safe zone should not be confused here with the radius assigned in this representation, as those two are not related. Safe zones along the connection across the Bosporus rank high in the list, whereas the ones which lie on the outskirts rank low. Failure of network links at these highly central safe zones would lead to de-linking of various other safe zones from the network. Most of the safe zones have redundant networks which could be activated in such a case; however, not all safe zones have such secondary connections to rely
upon. This shortcoming should be noted here. As in the case of the observations for the network, the same limitations apply here; as proposing new links or roads falls out of the purview of this dissertation, such a solution is not applied.
9.12 EVALUATIONS AND CONCLUSIONS
This chapter deals with identification of the safety network and safe zones (Stages 1 and 2 as stated in the five-stage intervention strategy). The existing network structure in Istanbul becomes very important. Various syntactical analyses bring forth many interesting facts about the way these networks function and how they affect the human settlements and vice versa. Furthermore, the studies conducted here are purely within the frames of the requirement for this thesis. The city networks and their influences would be a very fascinating area to study further in depth. This is noted and should be addressed in any further explorations in this area.
The safe zone selection exercise investigated various possible locations for creating safe zones. This multi-criteria approach was considered to be very successful, as the resultant safe zones were part of a city-level scheme and not isolated places, thus creating an inherent virtual network between them. This correlation helped in achieving maximum coverage of the radii of influence. Considering the very high density and population of Istanbul (14.3 million people), it should be noted here that any such solution will have its own innate problems. Although the exercise strives to cover as much area as possible under the radius of influence, a 100% coverage seemed Utopian and difficult to achieve. Establishing a hierarchy amongst these safe zones will be of great importance where a phased plan can be drafted that would establish the sequence with which the safe zones will be constructed, which will be seen in further chapters.
The evacuation network experiment was also based on multiple-criteria analysis. This method allowed for generation of multiple viable options from which the most suitable option could be selected. By joining key infrastructure points with all the safe zones, this network would allow for transport of first aid, water, food, and other supplies within the city after an earthquake. The fact that this network is selected from the existing roads emphasizes the least invasive means of safety, that is, by not introducing new or additional road layouts.
150 Quake|Response
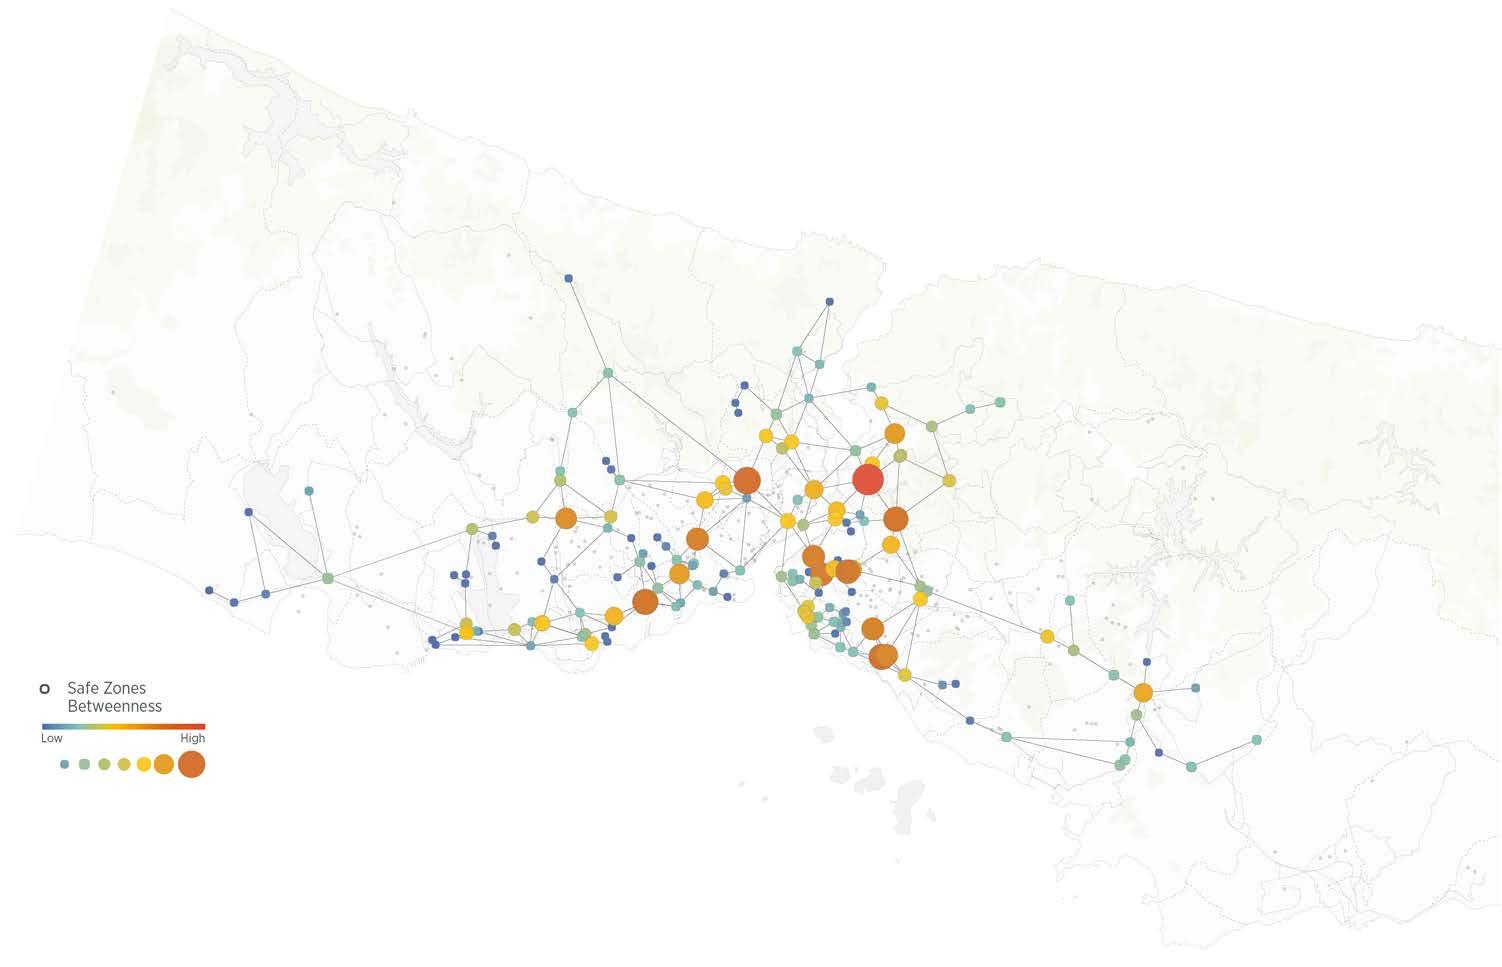
151 9 - Istanbul | Networks and Safe Zones
Fig.9.11 Betweenness centrality of safe zones for hierarchical classification.
DESIGN DEVELOPMENT
10 Fatih SAFE ZONE EVALUATION
Establishing a safe evacuation network over the city, and allocating areas for safe zones, this chapter delves into the method of how these selected areas are transformed into a safe urban oasis where people can seek shelter during and after an earthquake.
154 Quake|Response
Safe Zone 02 Radius of Influence Safe Zone 01 Radius of Influence Residential Safe Zone and Radius of Influence Safe Evacuation Route Commercial Religious Medical Educational
Fig.10.1 Safe Zone and Radius of
Influence. Land-use and Area studies.
10.1 INTRODUCTION
As seen in the previous chapter, safe zones were selected across the city of Istanbul. The selection criteria were based on finding evenly spread, safer areas which were well connected to the existing infrastructure. By selecting a safe evacuation network, which created an interconnected network of safe zones across the city, a possible solution is sought out to make Istanbul ready for earthquakes. The hierarchical classification of safe zones, based on betweenness analysis, informs the order of intervention to be followed; the more central safe zones are to be made ready first. The process of redeveloping these selected areas is illustrated in this chapter. For the purposes of explaining the process, two safe zones from the historical district of Fatih have been selected. In the 5-step proposal for the city, this step becomes an integral part of the scheme whereby the demographics and urban fabric of the local area define the way the safe zone is developed. This ensures a tailored answer to the problem rather than a blanket solution to be applied equally to all safe zones. The existing infrastructure and other amenities within the radius of influence of each safe zone will be studied, and based on the study, an informed decision will be made to introduce functions within the safe zone.
The existing buildings within the selected area will be demolished to make way for the proposed new structures, which would be either schools, mosques, markets or hospitals. These structures will be built before the earthquake, each having its own architectural functions. These will then be reconfigured either to temporarily be used as
refuge shelters, medical facilities, storage spaces or to aid distribution centres after an earthquake. Each safe zone will also have a central open space, which will be used as a gathering place, and the locations will be selected based on the current population within the radius of influence.
10.2 SAFE ZONE AND RADIUS OF INFLUENCE
Each safe zone is assigned a specific radius of influence which it will serve. This radius is based on the existing population density, the available size of the safe zone and the relative betweenness of it, within the network. Assigning 2 square meters of safe space per person within this radius of influence, the safe zone will cater to the entire population within the radius. This will also govern the actual footprint of the safe zone. Selecting two safe zones, as stated before, from the district of Fatih, will be a microcosm for the overall scheme of safe zones. Safe Zone 01 [Ref. Fig. 10.1] for example, has a total population of 40,800 people within its radius of influence, thus requiring a total safe area of 80k square meters. There are 10 schools within the area and 25 mosques. The total area for these schools is about 50 thousand square meters, with the mosques totalling around 35 thousand square meters. The total residential area, however, is 162 thousand square meters, giving 4 square meters of habitable space per person, which makes it an extremely densely populated area. The total area for mixed-use buildings, which include markets, commercial centres and other places of
155 10 - Fatih : Safe Zone Evaluation
business, is 300 thousand: almost double the total residential area. Considering the Turkish standards for area allocation, there should be a total of 1.5 square meters of area per person, including schools. Thus, the area requirement of the radius of influence for the schools is 60,000 square meters. With an existing school area of 50,000 sqm, to meet the needs of the safe zone, we need 10,000 square meters for schools. Similar calculations for other functions yield the requirement of 1,000 sqm for mosques and a further 1,200 sqm for markets. Thus, Safe Zone 01 will propose a school, mosque and market. The market can either be under one structure or be bifurcated into smaller areas amounting to the required number.
Similar calculations for Safe Zone 02 give area requirements of 40,000 square meters, as the total population within its radius of influence is 20k people. This zone, however, has an excess of school area, amounting to 50k sqm, significantly above the required 30k. Thus the safe zone will not include a school.
10.3 PHASED INTERVENTION
The next steps involve taking Safe Zone 01 as a case study for further implementing the design proposal; analysing the area requirements for the safe zones and using a function allocation to provide the context of the safe zone. Furthermore, a systematic plan for the redevelopment of the actual area has to be thought of. Factoring in the local conditions becomes crucial in this step. Considering the logistical issues involved in developing such a large area, a more step-by-step approach would be advisable. Instead of demolishing all the buildings within the assigned area at once, a more phased demolition will create safe areas in steps. This approach has another benefit: If the entire area were to be redeveloped at once, and the earthquake were to strike, there would be no safe spaces; however, if a phased development were to be carried out, even if the earthquake strikes during phase 02, there would be the safe areas developed in phase 01.
Analysing Safe Zone 01 [Ref. Fig. 10.1 and 10.2], there are total of 407 buildings in the area. Out of which about half of those, that is 200 are vulnerable to moderate or heavy damages due to an earthquake. With a population if 40k, the zone is critical to be safeguarded.
An exercise to find the most concentration of unsafe buildings was carried out. Based on this, the area was divided into 3 phases. The first phase has the highest number of vulnerable buildings, amounting to 80. This area will therefore be developed as a priority. The first phase will have a footprint of 32,000 square meters, allowing the sheltering of 16,000 people. This will be followed by phase 02, with a similar footprint of 30,000 square meters. This phase will have the capacity to shelter 15,000 people. The last phase, phase 03, will prepare the remaining space, which is 20,000 square meters and has a capacity of 10,000 people.
156 Quake|Response
Building vulnerability High Low Medium 01 03 02 Phase
Fig.10.2 Topological diagram explaining selection of phases.
157 10 - Fatih : Safe Zone Evaluation Footprint (msq) Vulnerable Buildings | Total Population 82,000 200 | 407 4370 Shelter capacity Footprint (msq) Vulnerable Buildings | Total Population Shelter capacity Footprint (msq) Vulnerable Buildings | Total Population Shelter capacity 40,000 Safe Zone 01 32,000 80 | 153 1600 16,000 30,000 70 | 165 1800 15,000 Footprint (msq) Vulnerable Buildings | Total Population Shelter capacity 20,000 37 | 89 987 10,000 Phase 01 Phase 02 Phase 03
Fig.10.3 Phases of implementing safe zones.
10.4 SITE EVALUATION EXPERIMENT:
Prior to allocating the required architectural program on the selected patch (Phase 01: Safe Zone 01), it was essential to evaluate the site based on certain criteria to understand which spaces could be opened or constructed. These criteria, including distance to vulnerable buildings, site visibility and solar exposure on site, are primarily affected by the surrounding context, specifically by building height factor. Thus, by establishing a relationship between the defined criteria and building height factor, a site evaluation plan could be proposed for a more appropriate program allocation.
10.4.1 EVALUATION CRITERIA
In phase 01 site, a square grid is constructed of 3 x 3 metre cells. The center of each cell is evaluated with respect to each criterion. Similarly, this process will be adopted to evaluate the other phases.
10.4.1.A DISTANCE TO VULNERABLE BUILDING
The distance between the buildings on the periphery of the site to every cell’s center is calculated. Once a distance is calculated, it is multiplied by the building’s number of stories, whereas the building vulnerability to damages is generally determined by its height, as mentioned in the previous chapters. The calculated distances to all buildings for each cell’s center are then summed, and stored. It is established that the smaller the value is, the better the cell location is in respect to others ( Diagrammatically, bigger the radius of circle, the better the location of the cell) [Ref. Fig. 10.4a]. Thus, these locations, since they are the least vulnerable to building damages, could be the main congregation areas during a seismic event
10.4.1.B SOLAR EXPOSURE
Istanbul is characterized by its temperate, oceanic climate, so solar exposure is considered a crucial factor for program allocation. High solar exposure would be desirable for open areas under Istanbul’s climatic conditions . Hence, solar exposure analysis was conducted with Ladybug to evaluate the given grid on the phase 01 site between the months of October and April. The solar exposure value for each evaluated cell’s center is stored [Ref. Fig. 10.4b].
158 Quake|Response High Building heightDistance to vulnerable building Low High Site visibility Low High Site solar exposure Low [B] [A] [C]
Fig.10.4 Topological diagrams illustrating the different evaluation criteria for the site evaluation experiment
10.4.1.C SITE VISIBILITY
The overall visibility of the site is crucial in the evacuation strategy during an earthquake. Therefore, a clear sight of the safe zone is necessary for easy way-finding. An Isovist analysis with the Decoding Space plug-in in the Grasshopper3D environment was performed on the generated grid, in which each input cell’s centre is evaluated in respect to what is seen from it, given the existing building context [Ref. Fig. 10.4c]. The visibility is calculated for each cell’s centre, and the resulting value is stored. Cells with high visibility value are appropriate for open areas, as people tend to first seek open spaces in a disaster scenario.
10.4.2 EXPERIMENT SET-UP
Since each criterion has its own measurement unit and their values were widely spread, it was necessary to remap them on a comparable scale. Also, these values were remapped according to their importance; for instance, site visibility and distance to vulnerable buildings were given more weight, since the foremost concern is the safety of people. They were assigned a domain from 0 to 20, and solar exposure with the least weight was given a domain from 0 to 5. It is important to note that the domain for the criterion of distance to vulnerable building was reversed — 20 to 0 —given that the less value the cell has, the better its location. Each cell has three values, which are added together to establish a site-ranking hierarchy. A geometric circle defined by a radius that represents the cell value was chosen as a means of visually representing the vulnerability values on site. For instance, cells with high values had the highest radii, suggesting they were less vulnerable locations with high visibility and high solar exposure.
10.4.3 RESULTS:
A hierarchy of the defined criteria was established on site, where high-scoring locations were evident mostly in the central part and on the southwest corner of the site [Ref. Fig. 10.5]. It could be inferred that since distances to vulnerable buildings were weighted the most and these buildings were on the periphery of the site, the central part would be the most favourable location, and open spaces would be desirable there.
159 10 - Fatih : Safe Zone Evaluation
High Low Site ranking
Fig.10.5 The site evaluation plan with ranked grid cell.
10.5 PROGRAM DISTRIBUTION
The study of the requirements of architectural functions within the radius of influence for Safe Zone 01 in section 10.4, along with the site evaluation exercise in section 10.4, were implemented as drivers for allocating the different programs on site by means of multi-criteria optimization. This approach will provide a variety of solutions considering the contextual data and the desired hierarchy of the programs within the safe zone site. Proposed solutions will be carefully assessed, and the most appropriate one will be carried out to construction of shell structures on site. This experiment is conducted during Phase 01 of Safe Zone 01 on the same grid generated in the site evaluation experiment, which will be employed for other phases, and similarly for the safe zones identified throughout Istanbul.
10.5.1 EVALUATION CRITERIA
People tend to seek open spaces during an earthquake to avoid falling debris from damaged buildings. It is important to allocate adequate area for these open spaces. The first criterion ensures meeting the demand of open spaces, which is proposed to be no less than 25% of the whole site, which equals 8000 sqm for phase 01 in Safe Zone 01. The open spaces will have priority to occupy the highest-scoring cell from the site evaluation experiment, as they are the least vulnerable to damage and have good solar exposure values.
The second criterion intends to maximize the program areas to meet its requirements. In regards to section 10.2, it is found that mosques, schools and markets need to be 10,000 sqm, 1,000 sqm, and 1,200 sqm, respectively. These are not set as numbers to exceed; rather the algorithm will only seek to maximize these values in respect to other criteria. It has to be noted that these values cover the whole safe zone, and each phase of the safe zone will aim to fulfil a third of the requirements, given the fact that each safe zone is divided into three phases.
The third criterion aims to maximize the distance between the architectural programs
and simultaneously minimize their occupying the lowest-scored cells from the site evaluation experiment. This will avoid creating small circulation spaces, which could be unsafe to pass through to reach the main open space for congregation during a disaster. Yet, in conflict, the program will avoid the cells most vulnerable to damages, in which the algorithm will try to cluster the program as close as possible.
10.5.2 EXPERIMENT SET-UP
Considering the defined criteria for the multi-criteria optimization experiment, a genetic algorithm (GA) model was set to evaluate the distribution of the given architectural programs on Phase 01 of Safe Zone 01. Each architectural program has its own gene pool consisting of the series of parameters that control the number and size of clusters; for instance, the number of markets could be anywhere between 1 and 6, considering a total area of more than 1,000 sqm. The genetic experiment was run for a population size of 50 individuals for 20 generations.
10.5.3 RESULTS
The GA experiment provided a great variation of solutions with respect to the defined criteria for Phase 01 of Safe Zone 01. It provided a solution, (Indv32:Gen20), with the highest area for central open space, constituting over 50 percent of the site area. This would be vital in safe zones where less building space is required. On the other hand, certain safe zones that lack public and commercial programs and contain large open spaces, (Indv.19:Gen.20), would be an optimal choice. Another selected solution provided maximum usage of sites for both open spaces and architectural programs, which will be appropriate for safe zones that lack both functions. Finally, (Ind.11:Gen20) more or less fulfilled the requirements of the architectural program, providing almost 25% of the site for central open space, 4,100 sqm of school area, 2,700 sqm of mosque area, and 4,100 sqm in six markets. This solution is believed to be vital for phase 01, as it has a balanced hierarchical distribution of the required functions.
160 Quake|Response
161 10 - Fatih : Safe Zone Evaluation Schools Mosques Markets Central Open Space Others %15 %10 %15 %23 %47 Schools Mosques Markets Central Open Space Others Schools Mosques Markets Central Open Space Others Schools Mosques Markets Central Open Space Others %25 %15 %26 %9 %25 %13 %12 %5 %53 %17 %13 %14 %39 %25 %9 [Indv.11:Gen.20] [Indv.19:Gen.20] [Indv.32:Gen.20] [Indv.4:Gen.20]
Fig.10.6 Selected solutions from the multi-criteria optimisation experiment in Octopus —evolutionary computation engine—
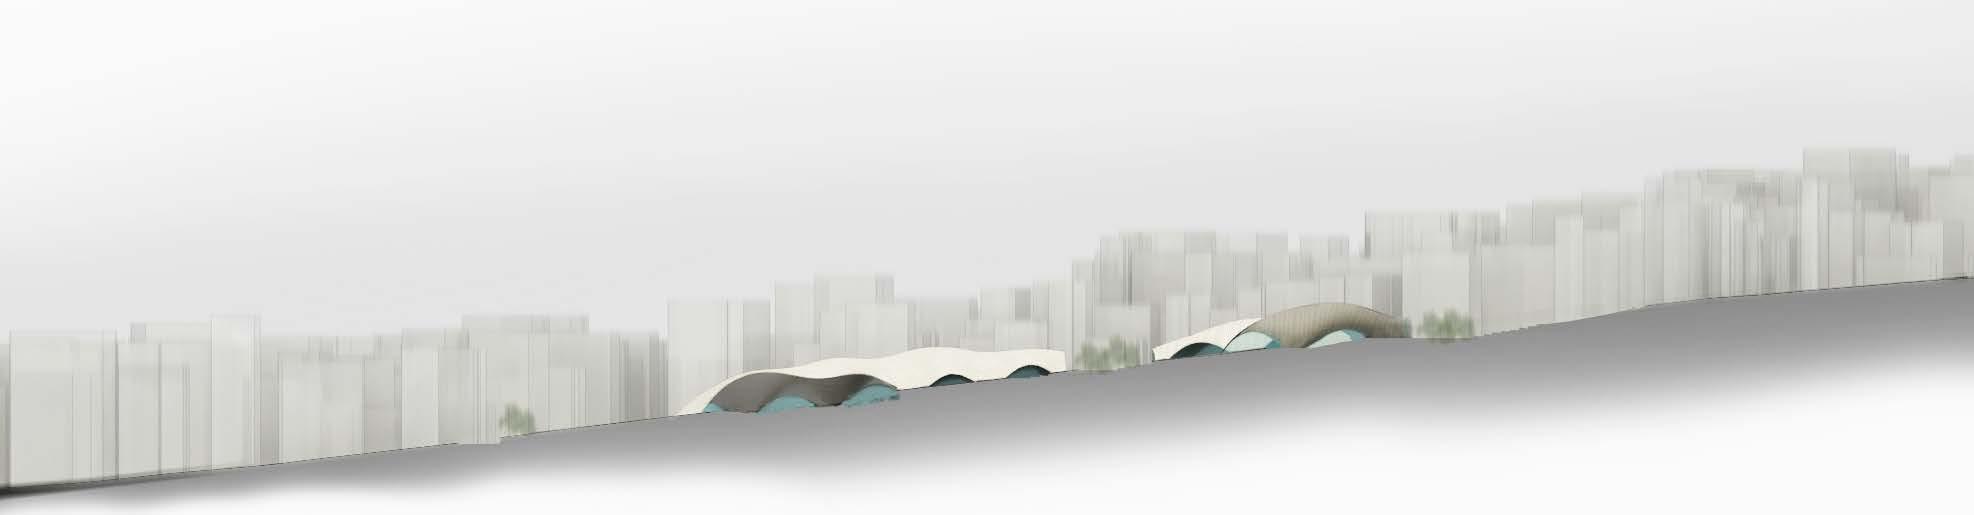
162 Quake|Response +25 m +14 m +10 m Ref. ± 0.0 m
Fig.10.7 Section AA’
Existing Buildings
Shells : Market
Shell : Mosque
Shell : School
Landscape
10.6 SITE PLAN
Based on the area requirements, site analysis, and area distribution, the overall site layout can be imagined. Going back to the morphology experiment, the desired footprints allowed the creation of stable shell forms. Each form was analysed for its suitability to the preferred function based on the available area, the length of spans achieved and the number of openings. This helped in developing function-specific architectural spaces. The mosque, for example was not to have any openings on the shorter sides, and the school needed as many openings as possible to make it more open and lit. The markets were split into 5 areas, rather than kept as one big space. This would help diversify the spaces, which after an earthquake can each be used separately for various functions like storage, medical facilities, food distribution centres and such. A large, central open space would be an urban plaza for activities in day-to-day life, and this large open area will host temporary facilities after an earthquake. Schools and mosques have their own open areas, which become semi-private areas.
Section AA’ shows the interior spaces created within the mosque and a school. Considering the topography of Istanbul, the layout will consider having steps throughout the site. This is also a typical characteristic of the existing fabric of the city. Thus, by emulating the condition, the design would aim to blend with the urban ethos.
163 10 - Fatih : Safe Zone Evaluation 0.0 m
A
A’ B B’
Fig.10.8 Site Plan for Phase 01
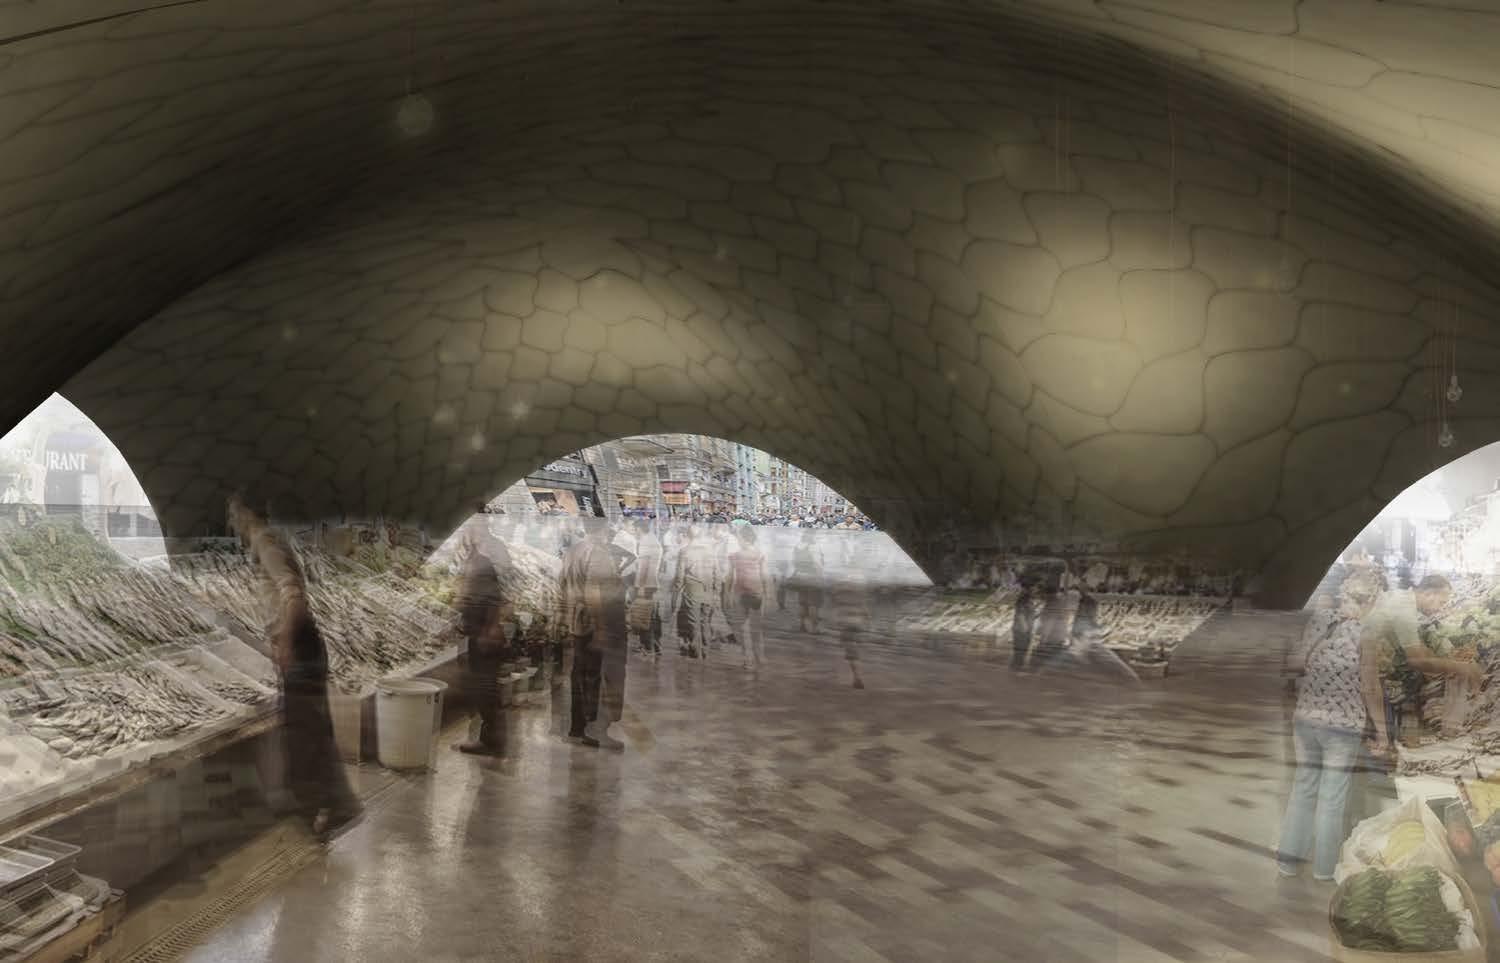
164 Quake|Response
Fig.10.9 Interior of the market shell before an earthquake event
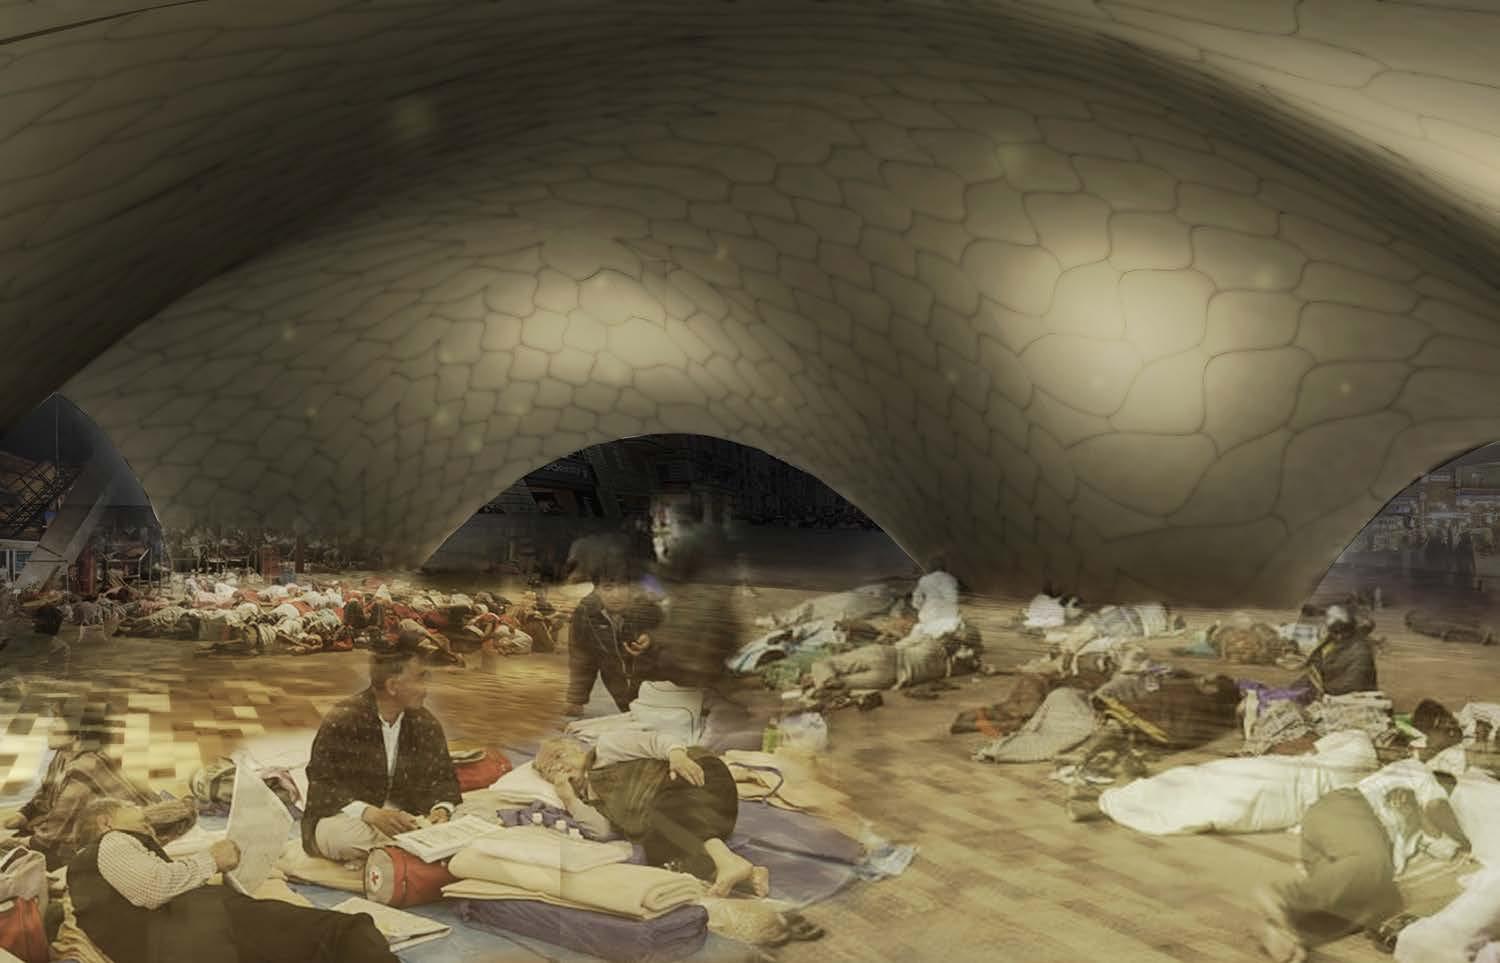
165 10 - Fatih : Safe Zone Evaluation
Fig.10.10 Interior of the market shell after an earthquake event
10.7 CONCLUSIONS
The process of incorporating the existing urban conditions and area requirements into the redevelopment of a safe zone ensures the viability of such a solution, as the safe zone specifically caters to the area it serves. Taking two sample safe zones in the district of Fatih, this experiment dealt with understanding the area allocations and forming findings on the site. A phased approach was proposed for redevelopment, which is seen as the logical option. However, it is acknowledged that such a radical solution for the city will result in the displacement of many people currently living in the safe zone area. However, such a solution may be required to make the city earthquake ready. Relocation of the affected people is a project in itself, and if handled in conjunction with this proposed thesis, will help provide a holistic view in this process. However, for the purposes of this dissertation, only the safe zone was focused on.
The exercise for evaluating phase 01 of Safe Zone 01 was integral to the program allocation experiment. In this exercise, the evaluation was specific to criteria that mostly address safety during a disaster scenario, such as distance to vulnerable buildings and site visibility, yet secondarily relate to environmental issues. Hence, additional criteria can be implemented to address social, cultural and environmental facets in other safe zones. Moreover, it has to be noted that topography was clearly not taken into consideration during the analyses of Isovist and solar exposure. This was due to the limitation of the plug-in used, which only operates in a 2D environment. In regards to this limitation,
alternative analysis tools could be explored and evaluated for future experiments.
The multi-criteria optimization experiment, which highlights the program distribution in the different phases of the safe zone, proved to be successful. It exploited the data from the site evaluation experiment and produced a wide variety of desirable solutions, which can be tailored specifically to each safe zone. Yet, certain limitations need to be considered and implemented to improve such an experiment. The experiment aimed to maximize the required programs’ area. In certain solutions, like (Indv.4:Gen.20), markets with 7,000 sqm of floor area were selected although only 1,000 sqm is required in Safe Zone 01. This can be avoided by introducing an constraint into the experiment to limit spaces to a certain size. Moreover, priority was given to the main open space to occupy the high-scoring cells from the site evaluation experiment for safety purposes. Other architectural functions will occupy the second set of high-score cells, but second priority for schools and mosques should be given and implemented in the experiment, as these spaces will be reconfigured to shelter people during a seismic event.
In regards to the site plan, an important aspect involving the treatment of the edge condition of the safe zone can be improved in the proposal. The existing roads can be reoriented to allow for much smoother flow of people and traffic. However, as the aim of this thesis was not to propose new roads, this solution was not put forward.
166 Quake|Response
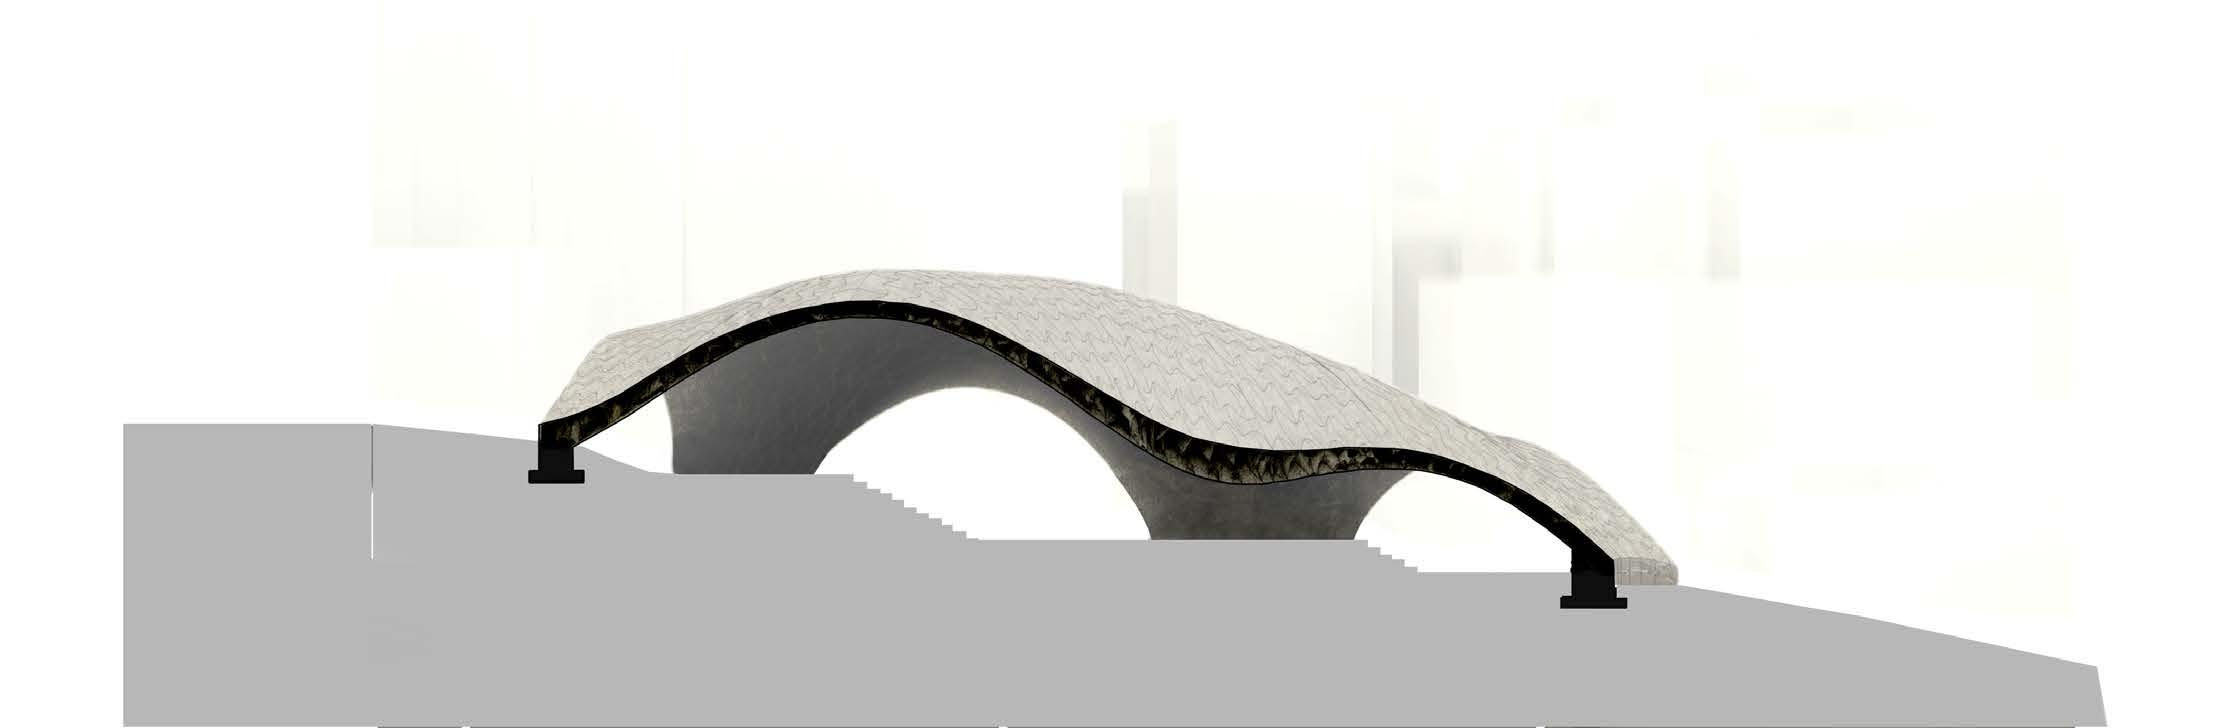
167 10 - Fatih : Safe Zone Evaluation +7.5 m 0.75 m 2.25 m Ref. ± 0.0 m
Fig.10.11 Section BB’ showing the interior space of a market.
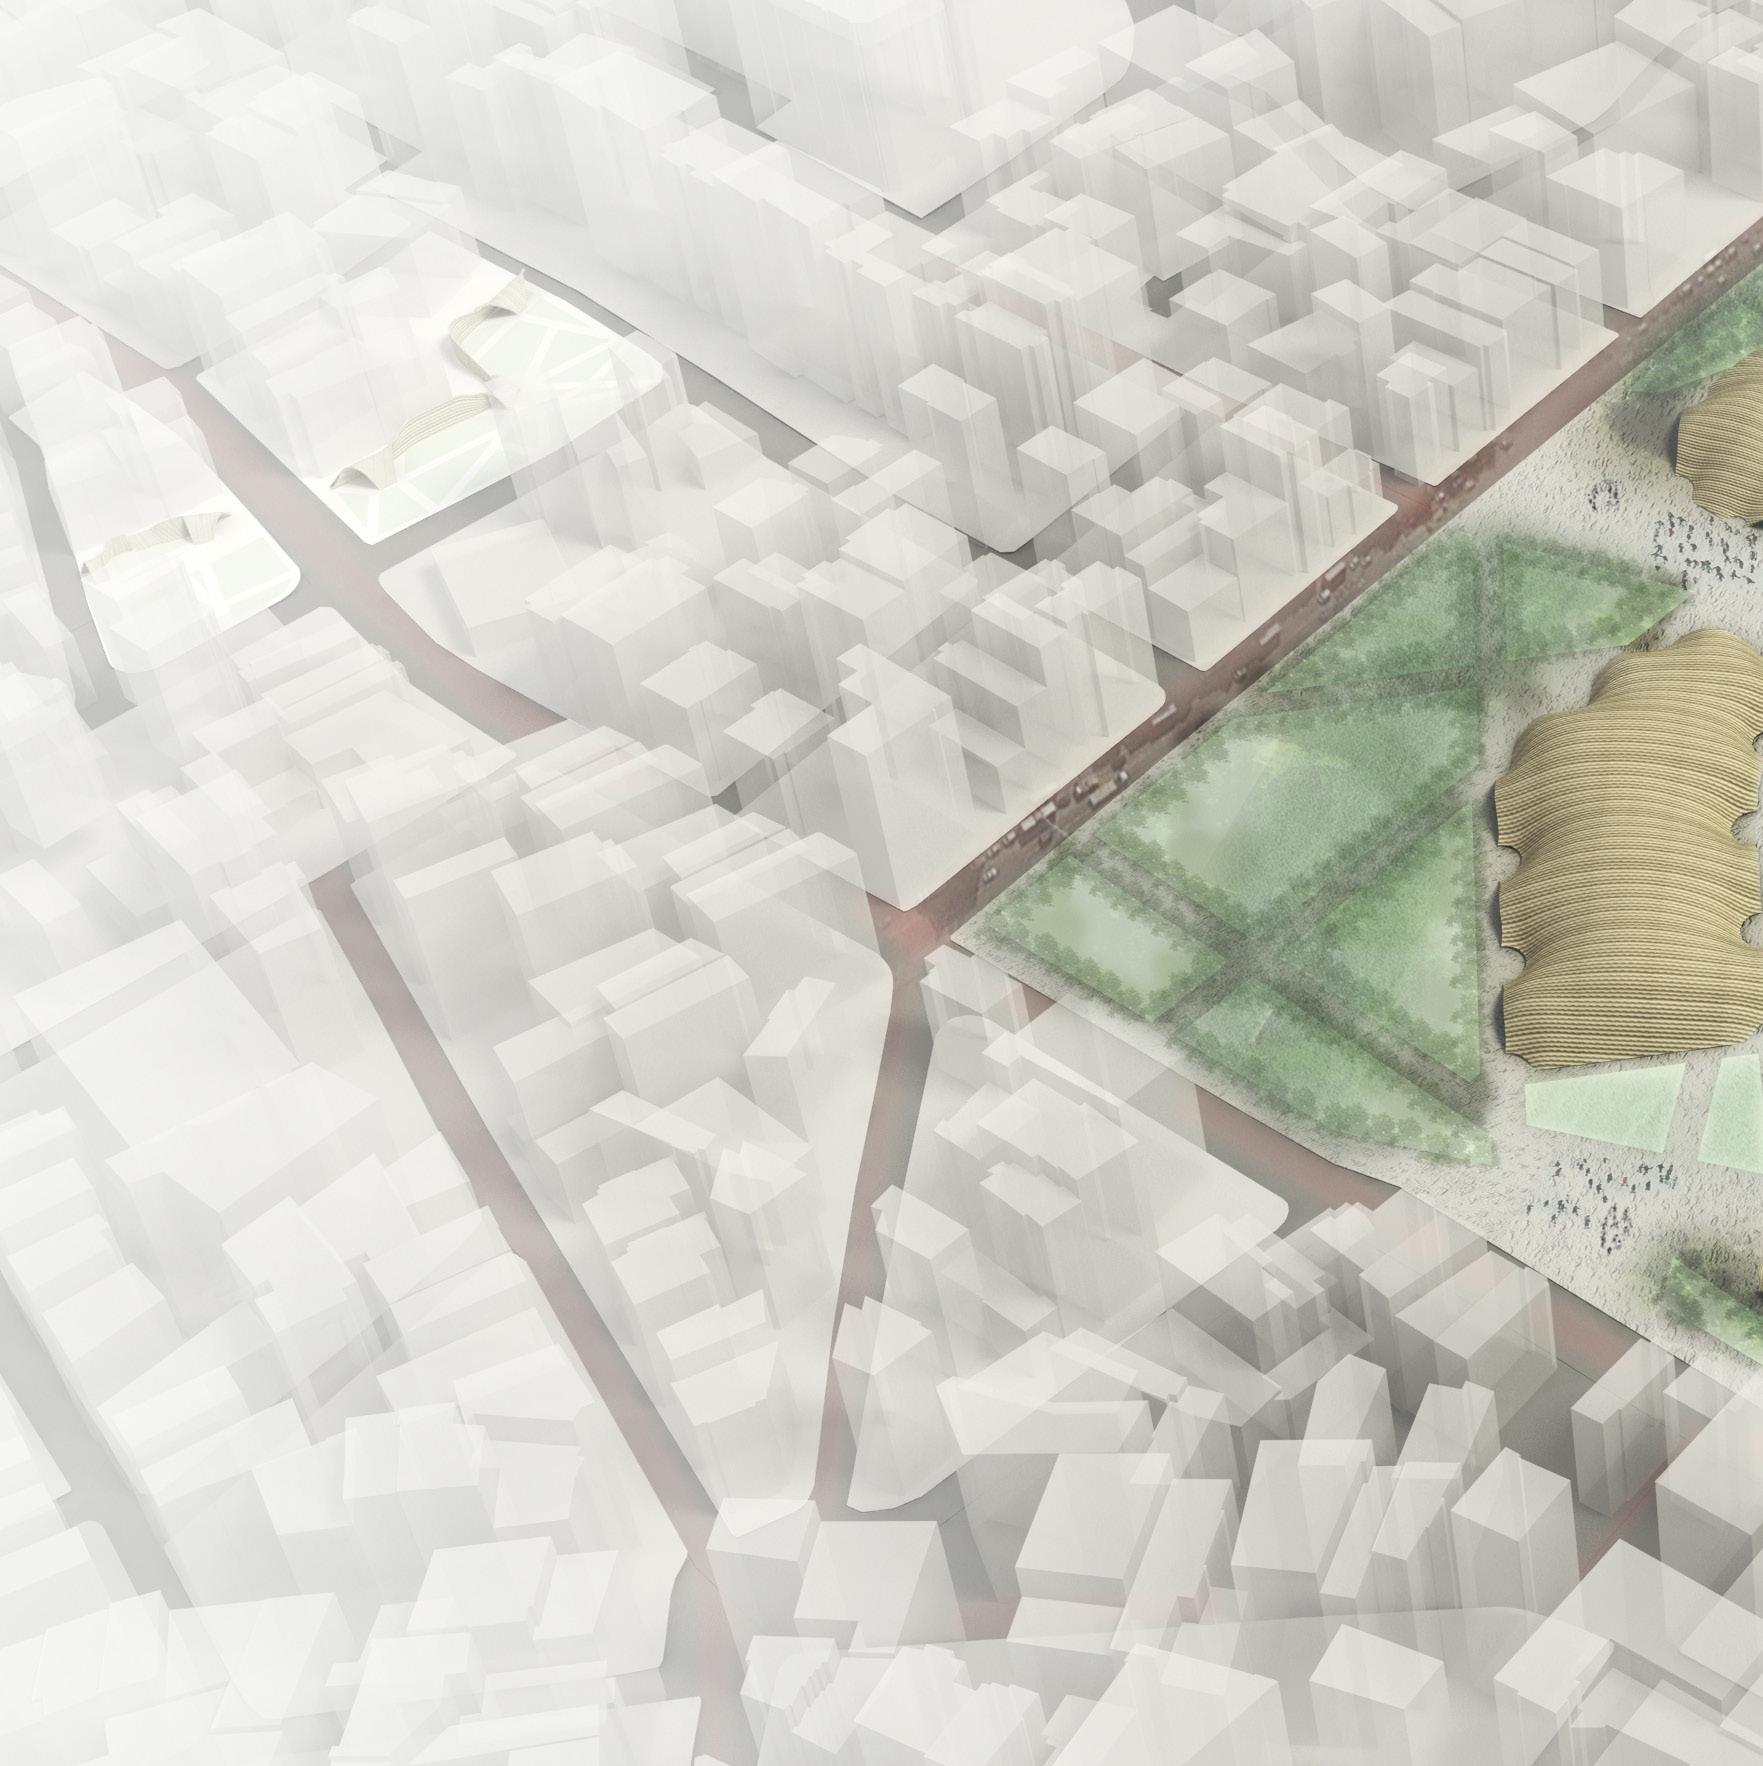
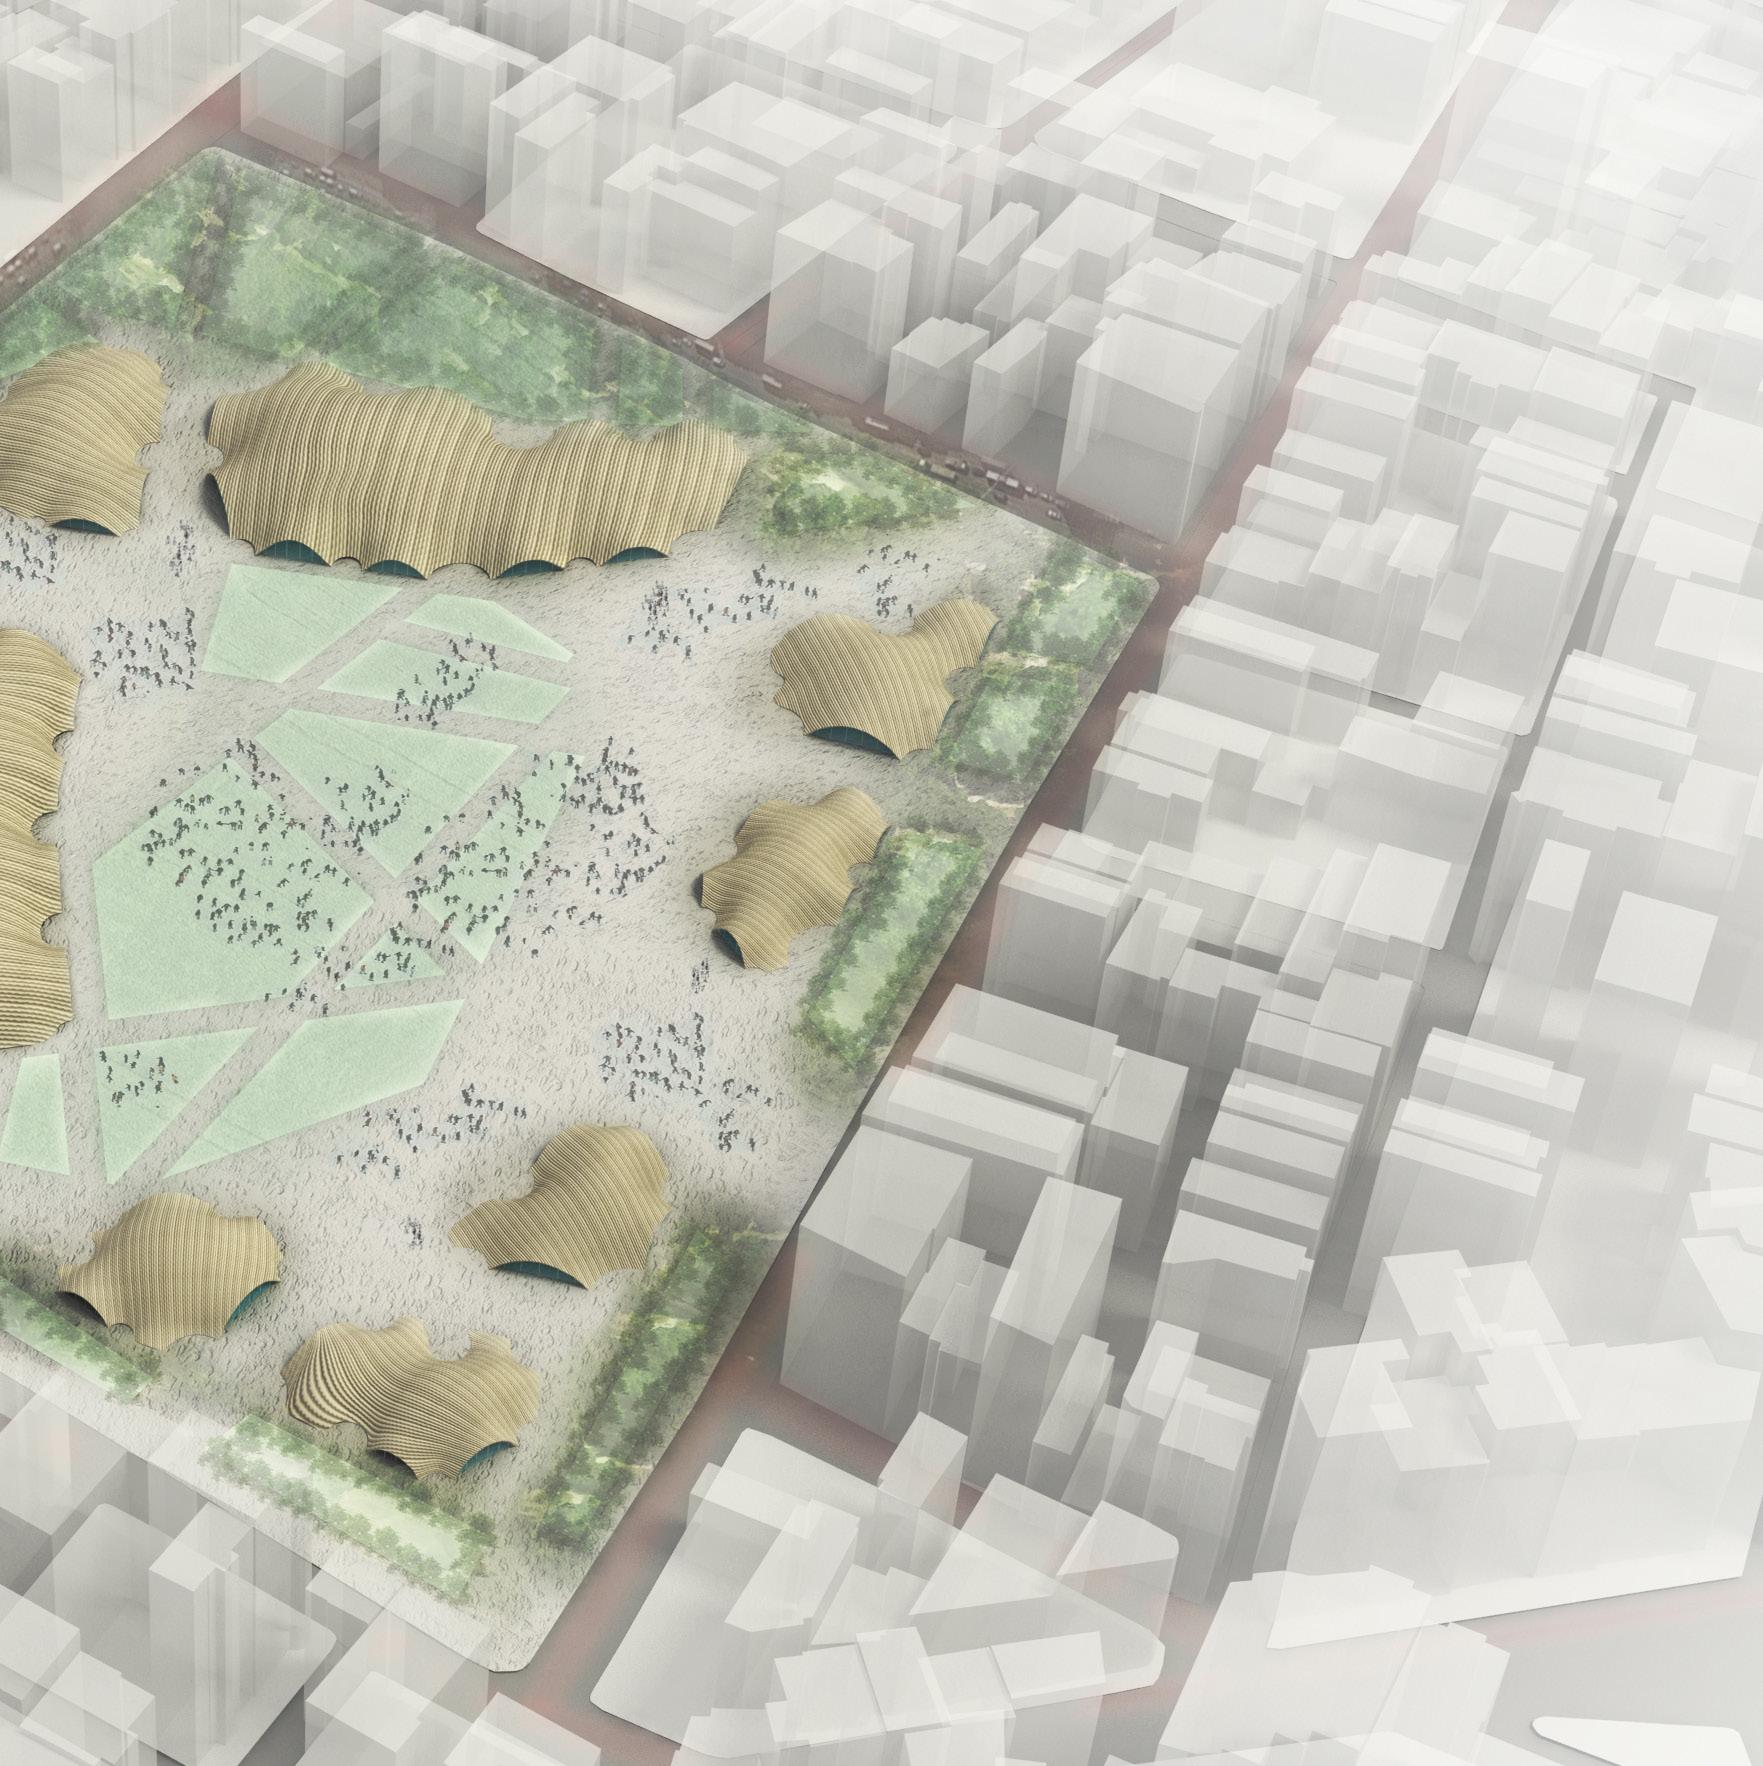
11
DESIGN DEVELOPMENT
Fatih NETWORKS EVALUATION
Possibility of creating smaller spaces within the city, which can act as safe plazas during an earthquake is investigated in this chapter. Revisiting the materials system to create safety walls, which can act as a deterrent factor to the spread of debris over the roads blocking them in turn, which will be placed around these safe plazas.
11.1 INTRODUCTION
Network functionality plays an important role in the post-earthquake scenario. Understanding the relation between various aspects of such a scenario is important to establishing a post-disaster plan.
11.2 INTERSECTION PRIORITY
The exercise [Ref. Fig. 11.1], composed of a simple grid, aims at understanding the importance of a network features (nodes and connections) in relation to the ability to travel from point A to point B. Three cases are analysed: (1) one in which all the routes are assumed to be safe, (2) one in which 6 randomly selected connections are considered to be unusable, and (3) one in which randomly selected nodes are considered to be unavailable.
The analysis of the first case results in 74 path possibilities. Only the shortest routes have been taken into account, and, since the grid is regular, there are multiple solutions (the number of turns has been intentionally not accounted for). Regarding the two other options, ONLY 3 routes to the safety area (point B) would be available to citizens if the ways to nodes were impeded. On the other hand, if each intersection is made safe but some buildings obstruct the roads, the number of potential routes increases to 24. This simple but effective example shows how, as a priority, nodes appear to be more important than connections. Local conditions on site might eventually slightly alter this consideration.
172 Quake|Response
A B A B A B
Fig.11.1 Topological network study for establishing node, link hierarchy.
11.3 NETWORK PRIORITY
As seen in the experiment in the previous chapter, safe zones are identified from potential safe points, consisting of major mosques, schools and open spaces (public parks), resulting in a network of such zones catering to the whole of Istanbul. Safety corridors linking the safe zones in the network are also evaluated and identified. Additionally, a hierarchy is established ranking the importance of the safe zones. Two of the safe zones are selected for further experiments to establish the rules for built and open spaces—the architectural program for each safe zone is based on the amenities within the radius of the zone’s influence.
To make a safe zone successful, it is crucial to have safe networks, thereby facilitating much safer transfer of people from their houses to safe zones. As established, nodes are more crucial in a network than links. In this case, for the proper functioning of the whole network, a road intersection is much more important to safeguard. It is thus important to pinpoint these crucial junctions in the existing layout.
11.4 IDENTIFYING CRUCIAL JUNCTIONS
By knowing the building typology in Istanbul and having a detailed structural assessment, it is possible to determine which buildings are prone to damage from earthquakes. However, for the purpose of this thesis, a different approach is adopted as the structural data is not accessible. By knowing the building heights and road widths, each road is given a vulnerability value. The narrower the road, and the higher the buildings along the road, the more susceptible the road/junction is to blockage due to fallen debris from the buildings, as higher buildings are more likely to fail [Ref. Fig.11.2].
Building Heights
Hight to Low
Road Vulnerability
Hight to Low
Critical Junctions
173 11 - Fatih : Network Evaluation
A B A B A B
Fig.11.2 Topological network study for establishing intersection priority.
Road Vulnerability
Hight to Low
Critical Junctions
174 Quake|Response
Fig.11.3 Road vulnerability analysis on selected safe zone radius of influence.
11.5 VULNERABILITY STUDY
The results of applying the analysis on the selected patch gives an idea of how many junctions are vulnerable to severe damage. About 20% of the total road network has medium or low possibility of damage. 70% of the roads are deemed safe in their existing condition. However, 10% have very high vulnerability values [Ref. Fig. 11.3]. The focus will be on these junctions and how to make them safe and thus not impede access to a safe zone. Later in the chapter, one of these critical junctions is selected to further establish the procedure of intervention.
11.6 SAFEGUARDING INTERSECTIONS
The falling debris from buildings spreads over a considerable distance away from the building itself [Ref. Fig. 11.4]. This condition is observed in a pancake failure of a building. As established earlier, the majority of structures in Istanbul have a short column at the ground level; thus, failure would be in a pancake fashion. To limit the spread of debris, a wall made using the interlocking material system, proposed in the M. Sc level of this thesis, would prove beneficial. By limiting the debris’ influence, we effectively reduce the possibility of a blockade [Ref. Fig. 11.5].
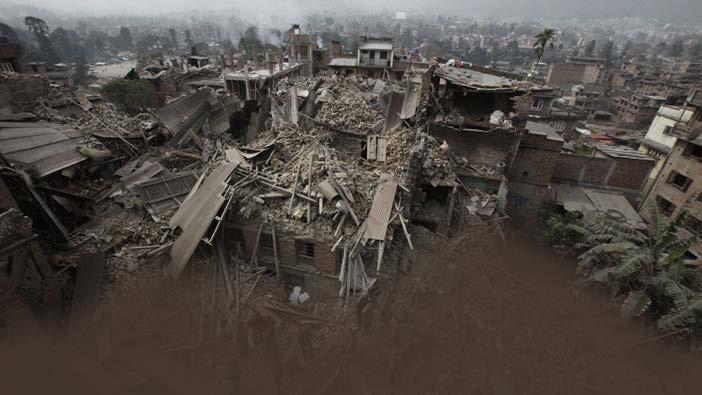
Revisiting the M. Sc proposal, the solution of a wall as a protective measure is further investigated. The focus of the investigation is the possibility of the wall serving an urban function in addition to being a wall. Limitations and shortcomings from the before-done study are noted and dealt with, with suitable approaches.
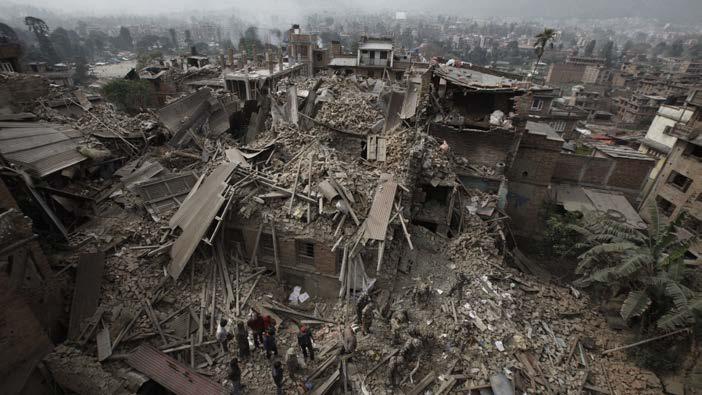
175 11 - Fatih : Network Evaluation
Fig.11.4 Spread of building debris after an earthquake (Top)
Fig.11.5 Possible retainment of debris by addition of a wall (Bottom)
Image courtesy : AP Images. Nepal Earthquake, 2015
(Recap from M.Sc)
A form-finding exercise for the wall morphology was conducted. A live feedback loop from Karamba3D analysis tried to achieve less displacement of the resultant form. The height and base shape of the wall were changeable. This allowed more freedom in achieving a stable geometry. In addition to the form-finding exercise, the thickness of the wall was also tested. It was found that a tapering cross section fared much better than a single thickness cross section.
176 Quake|Response a 0.3 M 1.2 M 0.3 0.9 M 0.2 0.3 M a 2 2 0 0 m m DISPLACEMENT DISPLACEMENT
11.7 WALL : GEOMETRY
Fig.11.6 Displacement against static lateral load conditions.
11.8 REVISITING THE WALL
It is also possible to re imagine the developed material system as a multi-layered protective wall. As the system was proposed to be used along crucial escape routes in the M. Sc phase, the further development of this project led to re-imagining the system. The problems faced earlier were related to instability of the boundary conditions for the walls in the system. The ends, which are subjected to the most displacements, were the unstable parts. A tapered cross section—with a bulkier section at the bottom and a thinner one on the top—much improved the stability of the wall.
As is explained earlier in the thesis, the material system performs very well in a compression-only structure. A possible solution for stabilizing the wall-end conditions is to introduce additional supports that deal with the free-end condition problem.
11.9 ADDITIONAL SUPPORTS
An experiment was carried out to understand the optimum support conditions for the ends of the walls. Taking cue from the shell structures proposed earlier, a vault-like support was tested. It was understood that the locations for these supports were best suited where there was a change of linearity of the wall and also at the end conditions. Thus, if the wall was turning at an angle, the support was added there. The displacement values were studied. This was done using Karamba 3D and it has to be noted that the load conditions were under multiple static loads as with the other tests. This result can be applied to the actual wall positions based on the critical junction analysis done earlier in the chapter.

177 11 - Fatih : Network Evaluation
ADDITIONAL SUPPORT DISPLACEMENT
0.5 0 M
Fig.11.7 Displacement on a wall against static lateral load conditions.
Fig.11.8 Reduction of displacements by addition of supports.
11.10 SAFE PLAZAS
The risk of blockage of critical junctions in the network is mainly due to fallen debris from high buildings. If such vulnerable buildings were removed, it would ensure that junctions remained functional. Such buildings could be identified and proposals to remove them from specific locations could be made [Ref. Fig. 11.9]. Smaller open plazas could be created. These smaller public spaces could be used in addition to the main safe zones for congregations of people during and after an earthquake. The wall could be introduced as a protective layer to make the plazas safe from adjacent buildings. As seen before, with its supports, the wall would form a unique urban condition.
The vault-like supports would create unique architectural spaces. The purpose would not only be to make the wall structural but also to make it blend in with the existing urban fabric through specific architectural intent. The walls could be green and could have public seating. The open plazas could be used in day-to-day life as pop-up market spaces or for other public events.
11.11 SUPPORT VAULTS : ARCHITECTURAL FUNCTIONS
Depending on local conditions, each vault could be assigned an architectural function. They could have glazing on either side to create an enclosed space that could be used as a café.
Other spaces could be utilized as markets with small stalls. Considering the existing open markets of Istanbul, this would be an apt addition to the urban scene. Depending on size, a safe plaza could potentially accommodate up to 500-700 people during an earthquake. It must be noted here that these plazas would only be used as congregation spaces and not for shelter. The open market/café spaces could be reconfigured as food/ water distribution points after an earthquake.
178 Quake|Response PLAZA WALL LOCATION HIGH BUILDINGS 1 1 2 2 2 3 3 PLAZA WALL LOCATION HIGH BUILDINGS 1 1 2 2 2 3 3
Fig.11.9
Critical Junction and Safe Plazas
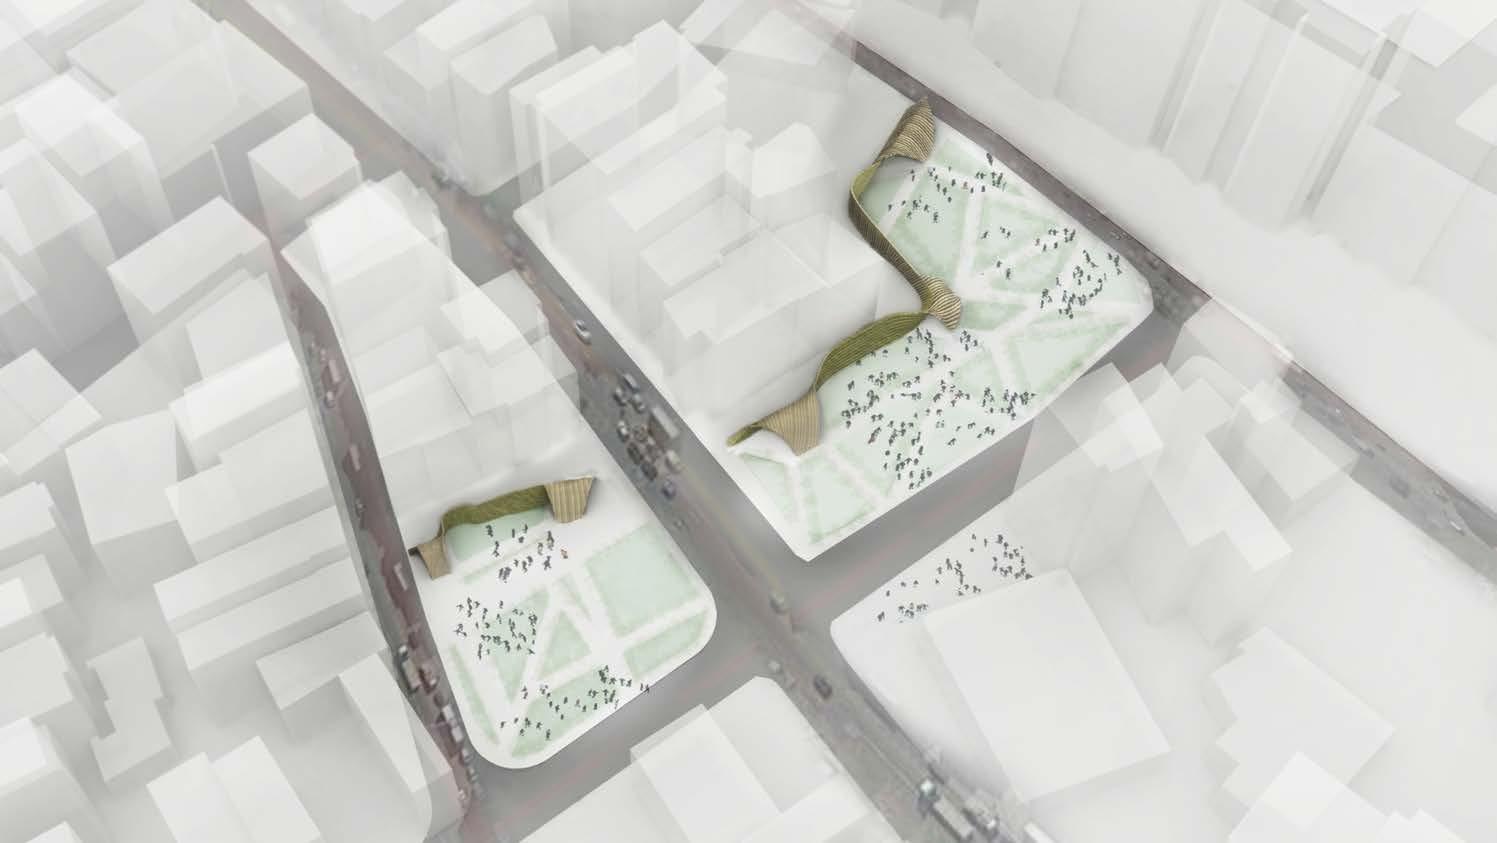
179 11 - Fatih : Network Evaluation 1
2 3
1 Cafe 2 Market 3 Plaza
Fig.11.10 Critical Junction and Safe Plazas Public Spaces within the existing network.
11.12 OBSERVATIONS AND CONCLUSIONS
Functionality of networks becomes crucial in the post-earthquake scenario. Identifying the crucial junctions was done based on building heights and road widths. This was because the actual structural assessment of buildings was unavailable—when such assessment becomes available, the outcome of this experiment could be more easily applied to a real-world scenario. Additionally, the analysis using building heights could also provide somewhat more realistic results as higher buildings are more vulnerable to damage.
The idea of re-imagining the material system as a protective wall seems to be a viable solution from the material system point of view. The displacement analyses done on these walls were based on static lateral forces. However, it should be noted that the actual debris force was not taken into account. The structural viability of the wall to retain the debris is yet to be tested and is something that could be dealt with as a way forward.
The usage of this wall in an urban context will also be important. The assignment of architectural function to an otherwise structural solution was seen as a success. The interesting spaces created by the support vaults for the walls are definitely a value addition to the urban quality.
It is imperative to note that the said wall is not supposed to reinforce the buildings, or be able to take the force from the falling debris directly, the intended purpose is to
have a layer of protection around the safe plaza, which will ensure that the debris from the fallen building is restricted to a certain area and does not block the road or the plaza. Thus the wall can be understood as a retaining structure, able to withstand lateral loads, and also having an architectural programme within the urban fabric.
180 Quake|Response
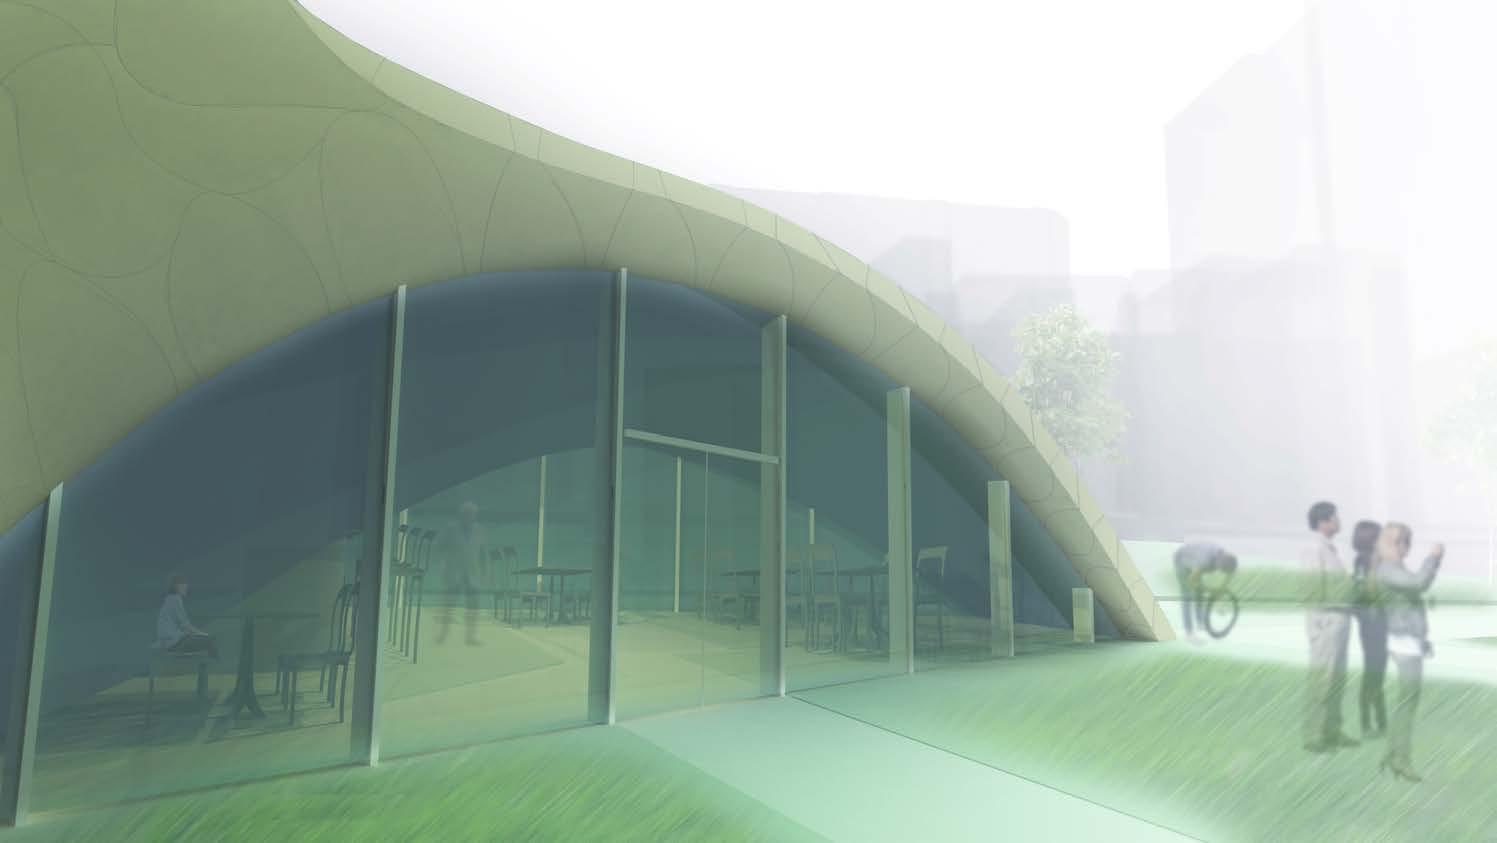
181 11 - Fatih : Network Evaluation
Fig.11.11 View of the wall support as Cafe.
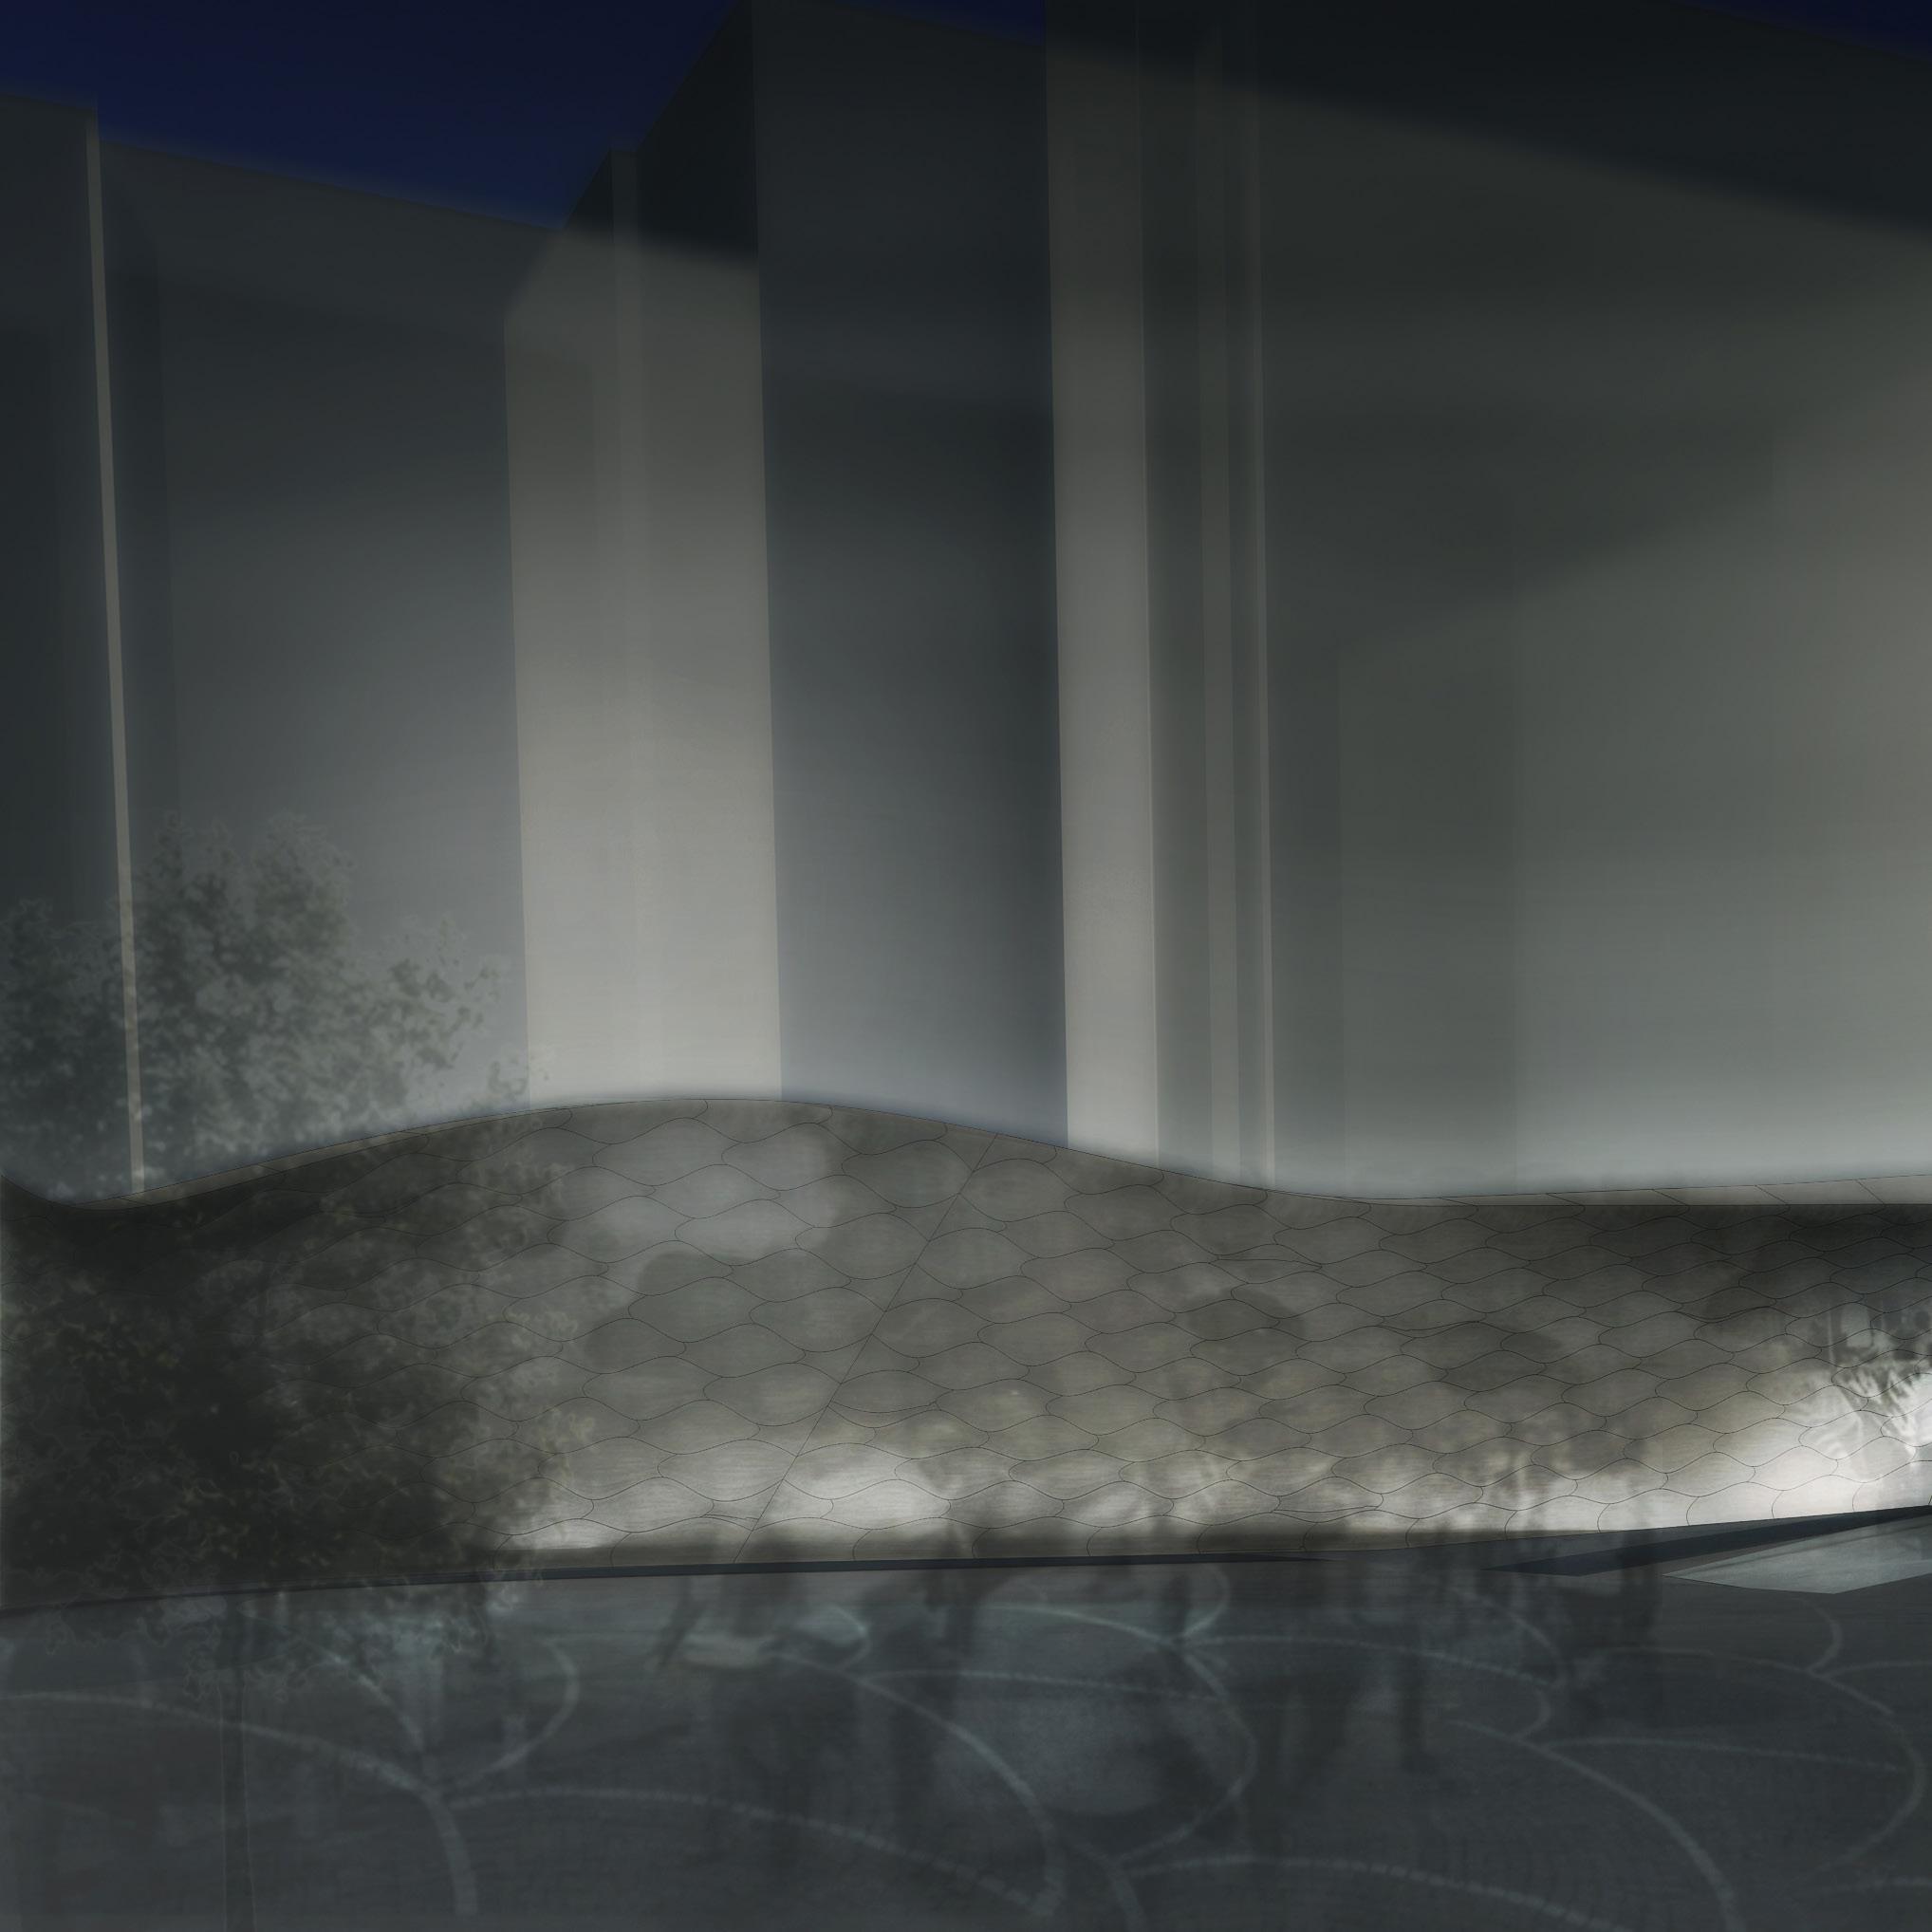
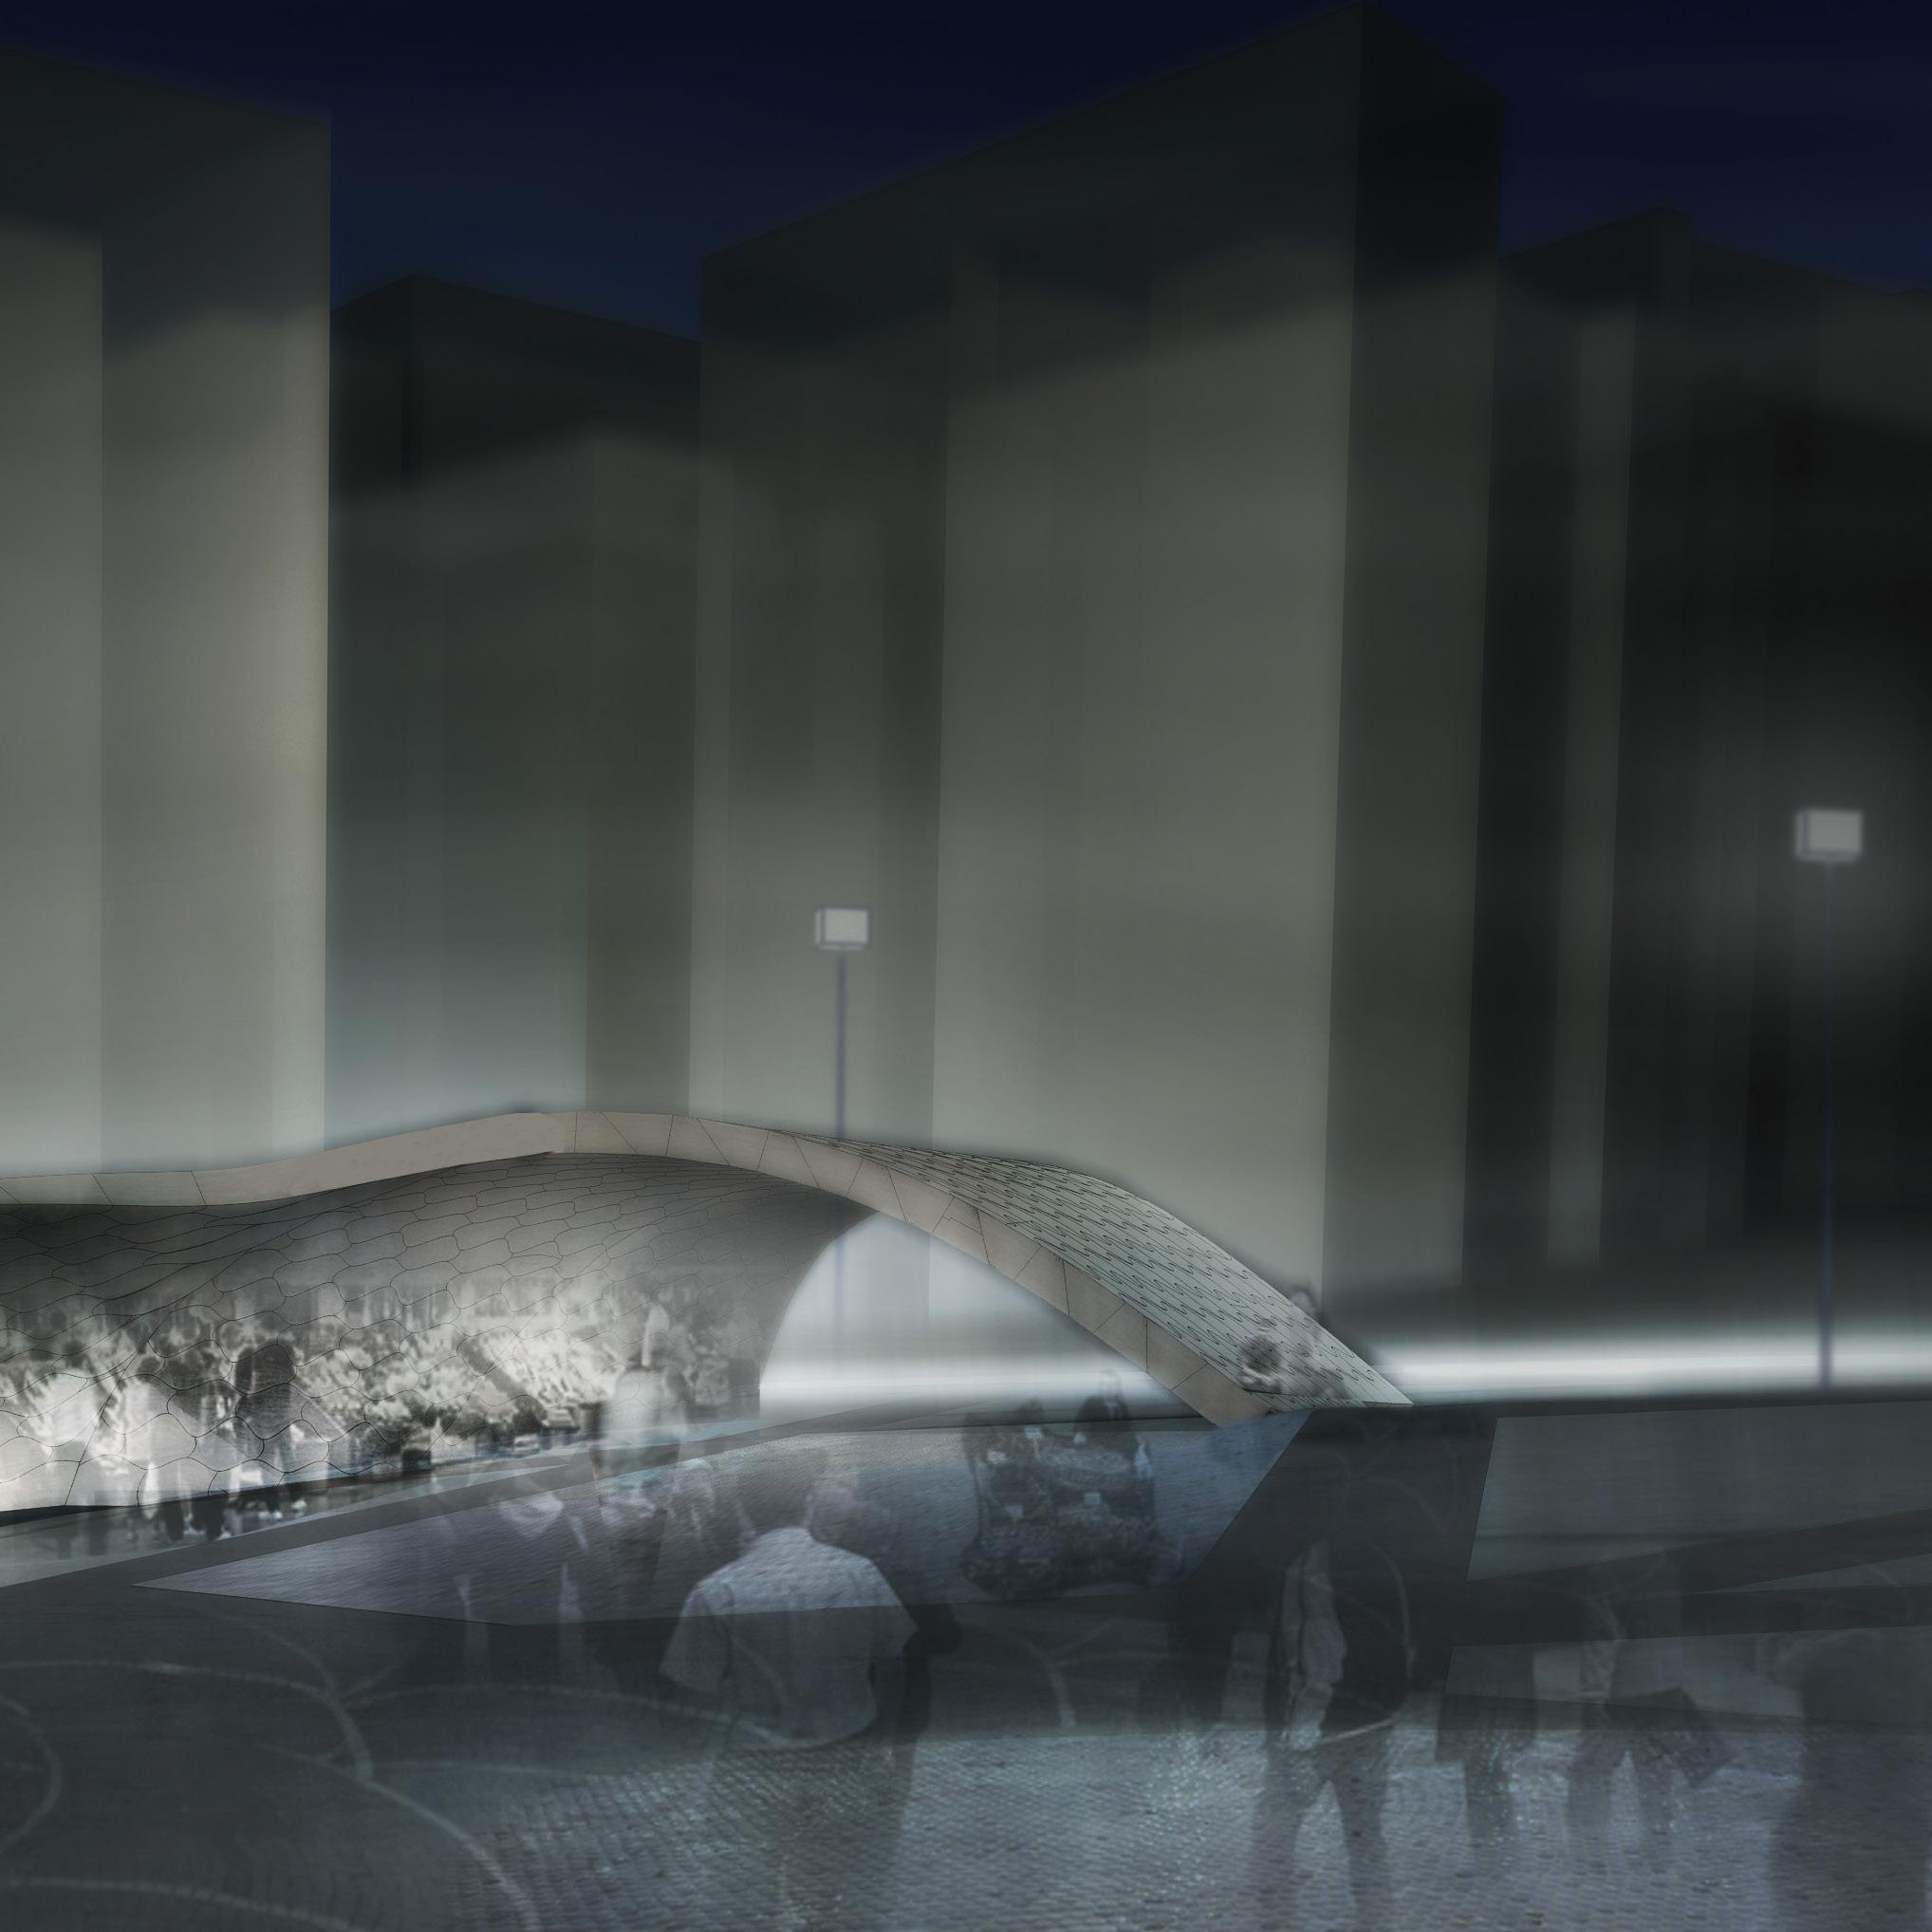
12 Dissertation Evaluations | Conclusions DESIGN PROPOSAL
12.1 EVALUATIONS AND CONCLUSIONS
Researchers are still trying to investigate ways to accurately predict the occurrence of earthquakes. Doing so successfully would save millions of lives worldwide. However, until such a time, offence is the best defence against quakes for humanity. In countries lying within the seismically active zones of the earth, damages can be prevented by constructing seismically resistant buildings. This remains a challenge for developing countries, as adherence to such construction codes is often too expensive. Another problem is having enough skilled workmen, who are often in short supply, adding to the overall costs. This scenario calls for a solution that can circumvent such deterrent factors. This dissertation set out with a similar goal: to develop a material system that is easy to construct and provides safety from the effects of earthquakes.
With its population of 14 million, Istanbul would face dire consequences if an earthquake were to hit within its present situation. Experts predict that an earthquake with a magnitude of 7.2 on the Richter scale is expected to strike the city, and as with all other earthquakes, the “when” is unknown. The fact that most of the city’s construction was done with minimal seismic resistive methods is considered, along with the imminent threat of a quake, which necessitates an intervention. Understanding the time-line of public behaviour against infrastructure failure provided a framework in which to work and allowed the stages of an earthquake scenario to be identified that need more attention.
The MSc stage of this dissertation dealt with thoroughly understanding the
science and workings of topologically interlocking blocks. A brick was developed with sinusoidal surfaces on all four sides, which correspond to other bricks’ surfaces, thus creating a complementary, non-planar interlocking. This approach was studied in depth, both physically and digitally, to conclude that such a solution is indeed viable as an earthquake-resistant construction technique. Taking this as a domain for further research in this field, this MArch dissertation focusses more on creating an architectural solution using this system, taking in mind the urban aspect of the proposal.
The material system was revisited to investigate the possibility of creating habitable structures. A simple arch was built physically using the interlocking bricks and was subjected to an oscillation table test, which established that the boundary condition of any structure created by these bricks needed to be restrained for limited movement, thus allowing the whole assembly to keep to its desired geometry. The preliminary idea of having post-tensioning was established at this stage. However, it should be noted that the physical tests carried out utilized masking tape across the model [Ref. Fig. 6.10], which cannot be necessarily be termed as post-tensioning. That approach created, in effect, a beam element across the arch, which was not factored in while proceeding from the results of the experiment. Although utmost care and focus were given to understand and implement the engineering principles, the limited scope of knowledge in the field was definitely a concern, if not a hurdle. Consultations with tutors with engineering backgrounds helped to keep the project on the right path when having to deal with structural analyses.
Digital explorations with regards to form finding were seen as a successful exercise. I decided to pursue an experiment to find stable shell forms, as the material system of interlocking blocks performed well in compression-only structures. Another reason for choosing shell structures as a design approach was because of the end use of these forms. The outcome was to be implemented in the earthquake zone of the city of Istanbul. These forms were to have regular architectural functions as a school or a hospital but be easily reconfigurable into a safe shelter for affected people. Having large spans of open spaces within the shell would help in this aspect, rather than having any other conventional building type. The column-free, large ‘roofed’ area can be very versatile to reconfigure.
The live feedback loop between surface analysis (displacement) and mesh relaxation created libraries of such shell structures. The individual solutions from these libraries
could then be categorized based on the desired use. A major limitation in this approach, however, was the lack of any dynamic structural analysis within the live feedback loop. This was because of the software limitation of not having a compatible tool within Grasshopper3D that was capable of achieving such seismic analyses. Nonetheless, it was a very interesting exercise to understand various ways in which forces act (static forces, in this case) and how the structural analysis data can be used to inform the design process, in effect creating a holistic approach to design. The knowledge gained in this process, can definitely not only within this dissertation, but also in other projects in the future.
Going back to the component scale, the results of the proposal include unique interlocking bricks that form the required geometry. This can be a major drawback of the whole proposal, depending on how it is looked at. If we were to factor in the cost of having unique bricks against the merits of the system, the positive side of the solution would outweigh the cost implications. By having the shape and location of each brick predefined, the requirement of skilled labour is done away with. This also ensures that the construction will be extremely rapid, as such shells can be built in a fraction of the time it would take to build any conventional earthquake-resistant structure. Considering that the exact time of earthquake is impossible to predict, building structures that require less construction time becomes very important, as opposed to those that take years to build and are labour intensive. Another possible limitation is that of the site context in which these shells are proposed. In Istanbul, whose major building workforce is trained to construct conventional reinforced concrete buildings, it would be difficult to establish such an unorthodox system into the existing construction industry present there.
The way to manufacture these unique bricks is, in itself, another project to be studied. At the moment, this dissertation does not completely address the manufacturing and storage of such building blocks. One possible solution is a reconfigurable mould, which could deal with each surface of the brick separately and thus achieve any desired form. Another approach could be that of rationalizing the bricks, such as by having only five or six families of bricks, the permutations and combinations of which would produce a desired form (This approach was investigated in the MSc stage, in which a single brick was able to achieve different interlocking possibilities; however, this limited the morphology to a simple extrusion and no complex forms were achieved). The logistical implications of storing these bricks should also be looked into. Since the bricks are not strictly a
simple box geometry, enormous amounts of space will be required to store them (The detailed structure seen in the Shell chapter had 850 unique bricks, for example).
The physical model built of one of the shells informed much about the system’s behaviour and the limitations that can arise while constructing such a structure. As the bricks were 3D printed using PLA, the material tolerance was a major issue during fabrication. Also, the way the bricks were constructed digitally required more resolution to the output mesh than it was giving at that moment. The tweened surfaces that were created caused intersecting geometries, thus affecting the physical model. A detailed approach into the actual division of the surface needs to be carried out, in order to understand the optimum size and shape of the bricks. Moreover, this approach is highly top–down and possibly can be countered by studying a bottom–up approach, in which the end geometries are governed by the bricks’ limitations.
Moving onto the urban aspect of this dissertation, the proposed five-step intervention can be an effective way to tackle the urban issue of creating a safer city, with regards to its earthquake preparedness. After studying the existing urban fabric of the city of Istanbul, a large quantity of data was collected, which can be used to understand the city’s growth patterns. A syntactical analysis on the existing road networks was carried out to locate areas that are more central within the network. Interestingly, these findings corresponded to the existing conditions within the city. The historic neighbourhood of Faith, for example, was far more integrated into the network than other parts, as is the case in the real world. These graph studies of the network can be further studied in detail for means other than that of this dissertation.
Identifying certain areas that can be developed into safe zones is a solution that can have far-reaching effects. By creating areas for people to seek shelter, the city can be made earthquake ready within the existing infrastructure. However, the approach would mean that many people would be displaced from the area, as it would needs to be cleared in order to build the safe shell structures. This may not be a populist approach, as it would result in a bureaucratic logjam, which would be motivated by the current political situation. However, as this dissertation is an academic exercise, this aspect of the displacement and relocation of people to other areas was not focused on. Furthermore, it should be definitely argued that the creation of such zones would not only help to secure the city but would also create unique urban spaces that could be used as social areas during other times. The unique style of architecture of the shells within these areas
themselves would become a visual indicator of the area’s safety. This visual cue can thus easily inform people of areas in which they can seek shelter.
The creation of smaller urban plazas, in addition to the safe zones, would help in further creating usable urban spaces that are safe during earthquakes. The possibility of re-imagining the material system in the form of protective walls can solve the problem of debris blocking roads. However, this solution’s ability to retain the debris has not been tested successfully. The purpose of the wall is to restrict the spread of debris and not to reinforce the buildings or to actually take the force of the falling building. The wall is placed by keeping in mind the ways in which the buildings are projected to fail, i.e., a pancake failure, where buildings do not topple but crumble under their own weight, vertically. This fact governs the purpose of the walls.
The challenge of making a city earthquake ready can be tackled in many ways. However, a successful solution would not only factor in the economic implications but would also deal with the solution’s social impact. In the process of creating safer cities, one must focus on the human implications. Instead of creating a blanket solution for the entire city, a solution that is much more focused and has a parametric approach, which would mould itself to the specific requirements at a local scale, would be successful in creating a safer Istanbul.
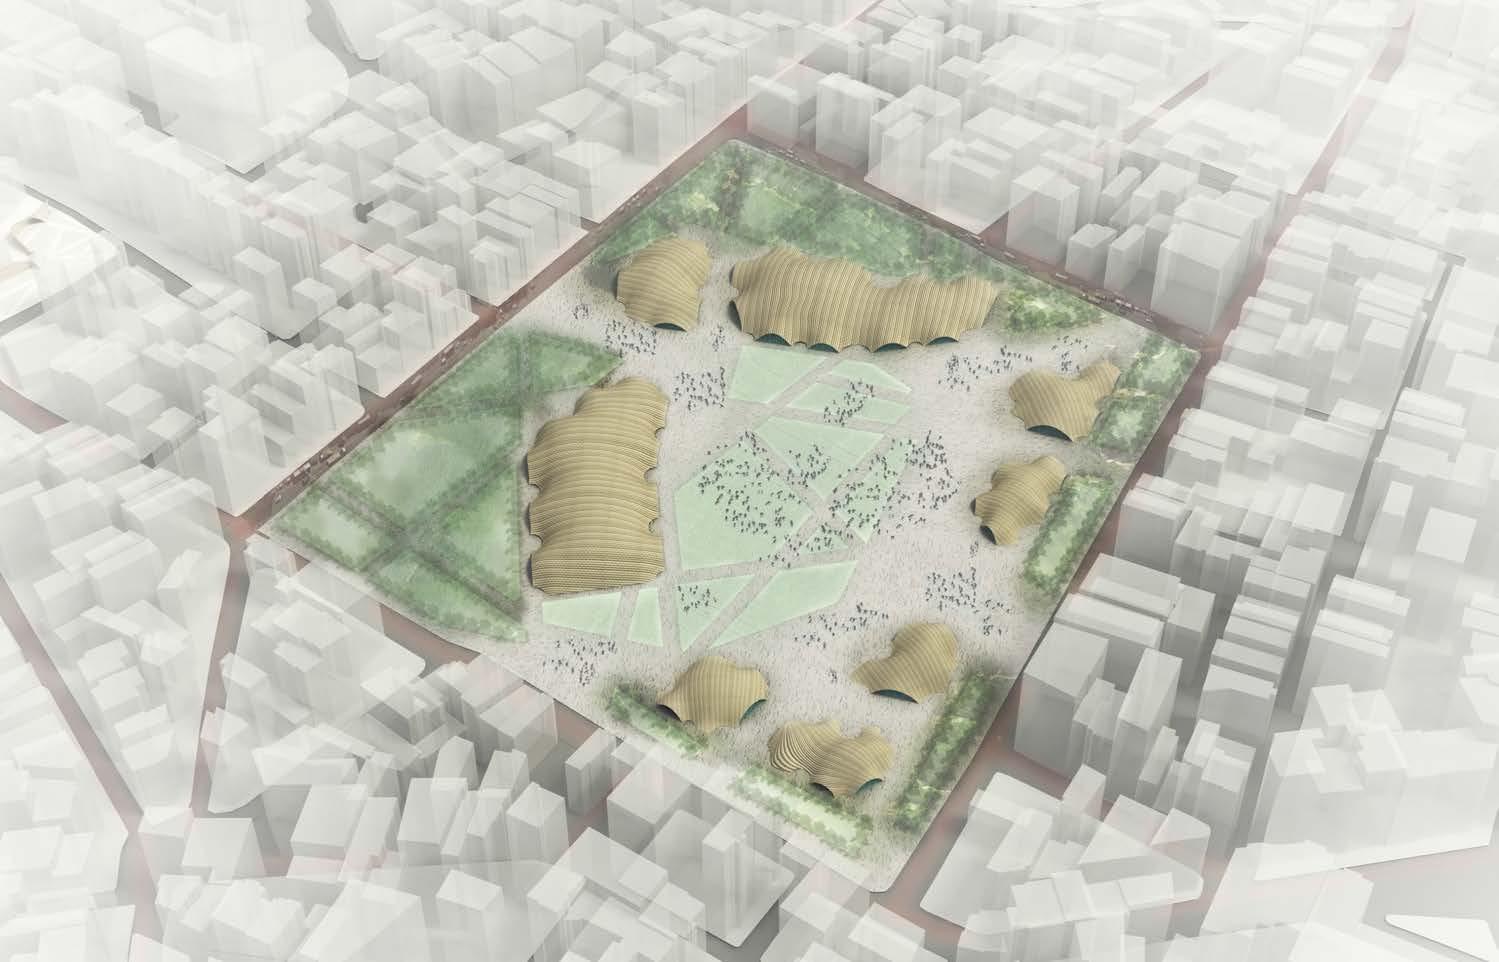
Bibliography and Appendix
13.1 BIBLIOGRAPHY AND REFERENCES
Adams, B. J. Improved disaster management through post-earthquake building damage assessment using multitemporal satellite imagery.
Adriaenssens, Sigrid. Shell Structure for Architecture: Form Finding and Optimization. Abingdon: Routledge - Imprint of Taylor & Francis Group, 2014. Print.
Anderson, Stanford, and Eladio Dieste. Eladio Dieste: Innovation in Structural Art. New York: Princeton Architectural, 2004. Print.
Alden, A. (s.d.). Seismic Hazard Maps of the World. Accessed on Sept 10, 2015 on About Education: http://geology.about.com/od/seishazardmaps/ss/ World-Seismic-Hazard-Maps.htm#step1
Ali, M., & Chouw, N. (2013, May). Dynamic response of mortar-free interlocking structures. Construction And Building Materials , 168-189.
Alliance Development Works. (2013). WorldRiskReport 2013. Bündnis Entwicklung Hilft.
Anand, K., & Ramamurthy, K. (2000). Development and performance evaluation of interlocking-block masonry. In American Society of Civil Engineers (Vol. 6, p. 45-51).
Andrew, R. (2012). Earthquake - Nature and Culture. Reaktion Books.
Block Philippe, Knippers Jan, Mitra Niloy, and Wang Wenping. Advances in Architectural Geometry 2014. SpringerLink : Bücher. Springer International Publishing.
Chu, J. (2014, Sept. 11). Seismic gap may be filled by an earthquake near Istanbul. Accessed on 05 23, 2015 on MIT News: http://newsoffice.mit.edu/2014/ seismic-gap-earthquake-istanbul-0911
Doganiero, N. (2011, Febbraio 25). Problemi specifici nel progetto di strutture isolate alla base. Spoleto, Italia.
Dyskin, A. V., Estrin, Y., & Belov-Kanel, A. Y. (2003, January). Fracture Resistant Structures Based on Topological Interlocking with Non-planar Contacts. ADVANCED ENGINEERING MATERIALS , 116-119.
Estrin, Y. (2010, April 14). Principles and Development of Bio-Inspired Materials. Topological Interlocking as a Materials Design Concept . Vienna.
Estrin, Y., Dyskin, A., & Pasternak, E. (2011). Topological interlocking as a material design concept. In Material science & engineering (Vol. 31, p. 1189-1194). Amsterdam: Elsevier Science B. V.
Greg Lynn FORM - Exhibition. (n.d.). Retrieved September 7, 2015, from http://www.sciarc.edu/exhibition.php?id=1222
Japan International Cooperation Agency (JICA. (2002). A study on a disaster prevention/ MItigation basic plan in Istanbul including seismic microzonation in the Republic of Turkey. Istanbul.
Japan Meteorological Agency. (2013, January). Smart City Resilience, Learning from Emergency Response and Coordination in Japan. From GSMA: www.gsma.com/connectedliving/smart-cities
192 Quake|Response
Kintingu, S. H. (2009). Design Of Interlocking Bricks For Enhanced Wall Construction Flexibility, Alignment Accuracy And Load Bearing.
Lynn, G. (2009). Blobwall - Greg Lynn FORM. Architectural Design, 79(2), 96–99.
Metropolitan Municipality of Istanbul. (2003). Earthquake Masterplan for Istanbul. Planning and Construction Directorate, Geotechnical and Earthquake Investigation Department, Istanbul.
NADAAA BLOG » Catenary Compression: the Tensile Vault, reconsidered. (n.d.). Retrieved from http://nadaaa.com/blog/?p=7202
Rippmann, M., & Block, P. (2013). Rethinking Structural Masonry: Unreinforced, Stone-cut Shells, 166(6), 378–389. http://doi.org/10.1680/coma.12.00033
Sabin, J. E., Miller, M., Cassab, N., & Lucia, A. (2014). PolyBrick: Variegated Additive Ceramic Component Manufacturing (ACCM) . 3D printing, 78-84.
Şenyapili, T. (1982). On Physical Aspects Of Souatters In Turkey. O.d.t.ü. Mimarlık Fakültesi Dergisi, 143-170.
The Worldwatch Institute. (2014). Vital Signs (Vol. 21).
Vona, M. (2010-2011). Strutture in muratura soggette ad azioni sismicheComportamento degli edifici. Potenza, Italia.
193 13 - Bibliography and Appendix
13.2 APPENDIX
194 Quake|Response
Electrical motor
Gears to scale force up or down
Rotating gear providing lateral displacement Ball socket joint (3D printed)
Oscillating table Suspension springs
Fig.AP.1 Diagram of the oscillating table built to test dynamic forces. [CHAPTER 07]
195 13 - Bibliography and Appendix
Fig.AP.2 Assembly process of interlocking bricks with post tension element
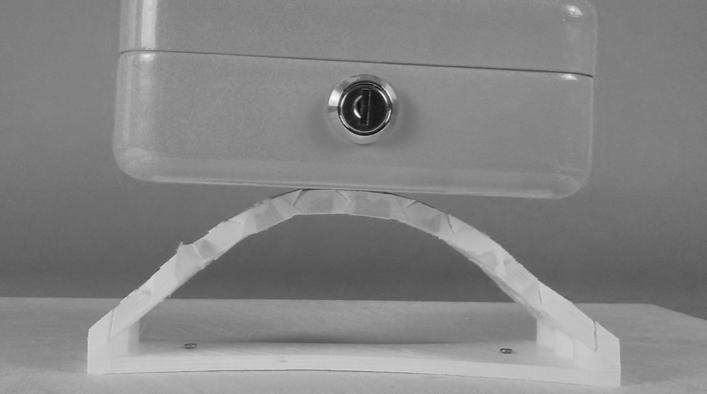
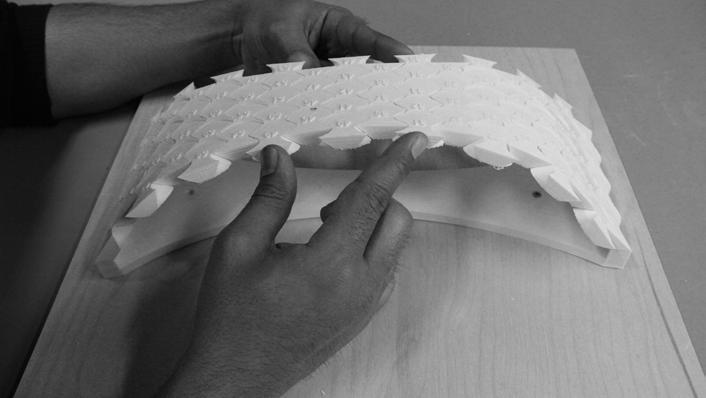
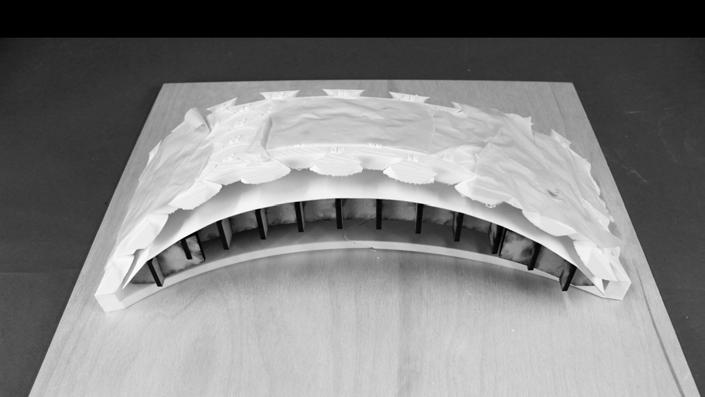
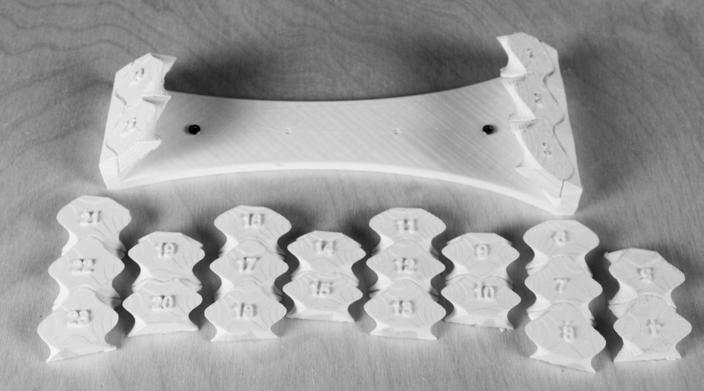
196 Quake|Response
Fig.AP.3 Assembly process of Arch
Fig.AP.4 Stability of the Arch.
Fig.AP.5 Scaffold of Arch
Fig.AP.6 Individual Bricks..
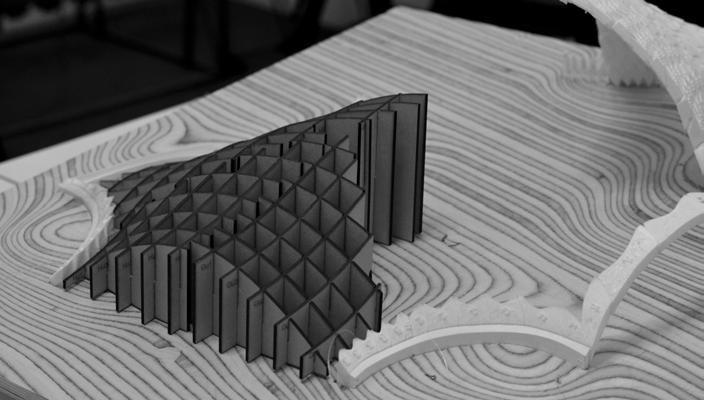
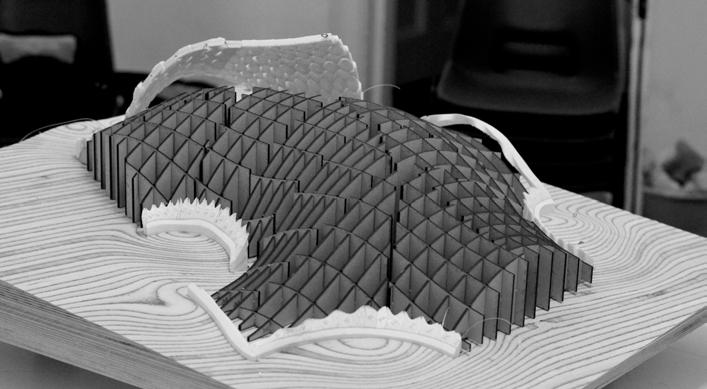
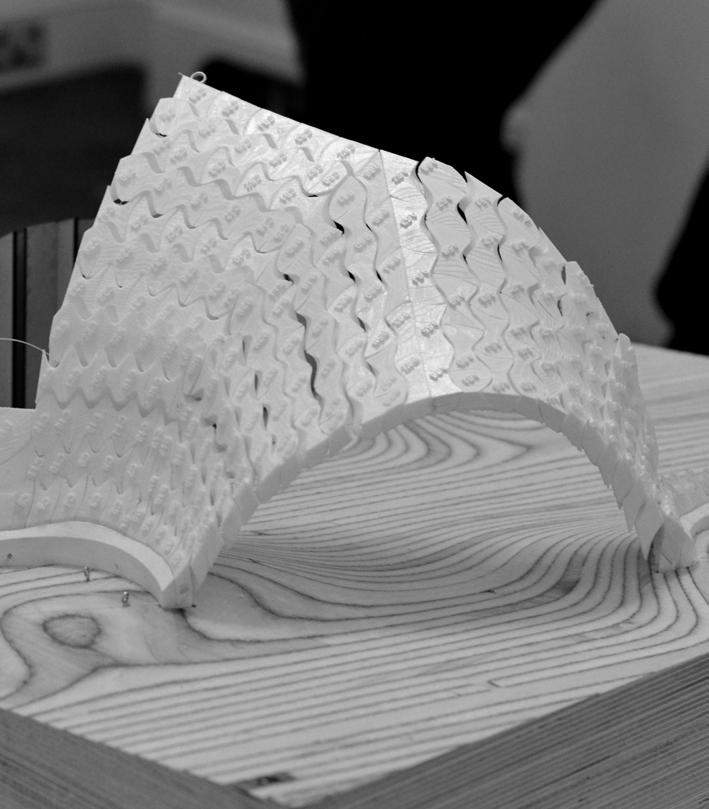
197 13 - Bibliography and Appendix
Fig.AP.7 Scaffoldings for Physical Model of the Shell.
Fig.AP.8 Post tensioned - assembled panel.
198 Quake|Response Land Liquefaction Possibility High Medium Low
Fig.AP.9 Possible land liquefaction areas
199 13 - Bibliography and Appendix
Fig.AP.10 Visibility Analysis with step by step removal of buildings
Existing Buildings Demolished Buildings Existing Buildings Demolished Buildings Existing Buildings Demolished Buildings
Fig.AP.11 Solar Exposure Analysis of Safe Zone 01
200 Quake|Response CODEDISTRICT POPULATIONPOPULATION DENSITY PPL/HA BUILDING DISTRIBUTION BUILDING DENSITY BUILDINGS/HA BUIILDNG HEIGHT 1-3 BUILDING HEIGHT 4-7 BUILDING HEIGHT 8+ NUMBER OF BEDS PER 100.000 PEOPLE NUMBER OF HOSPITALS FLOOR AREA PER SCHOOL SQM/PERSON NUMBER OF SCHOOLS ROAD DENSITY M/HA HAZARDOUS FACILITIES 1ADALAR 17738 16 6517 681.318.700.00 0 2 0.37 8111 0 2AVCILAR 231799 6014030 435.0062.502.50139 11 0.08 32111 17 3BAHÇELIEVLER 469844 28319690 1218.2071.7010.10 240 12 0.04 73224 36 4BAKIRKÖY 206459 7010067 331.5065.103.402048 20 0.05 58118 19 5BAGCILAR 557588 25436059 1636.7061.701.50 32 27 0.02 78256 61 6BEYKOZ 182864 4428280 789.909.800.20164 9 0.04 59133 13 7BEYOGLU 234964 26426468 3045.3052.302.30366 23 0.03 63271 22 8BESIKTAS 182658 10114399 841.9053.504.60 95 4 0.04 66180 18 9BÜYÜKÇEKMECE 34737 243347 237.4062.000.60386 4 2.57 769010BAYRAMPASA 237874 24820195 2135.6063.800.60109 18 0.04 32245 21 12EMINÖNÜ 54518 10714149 2856.0040.603.50770 10 0.95 24231 7 13EYÜP 232104 4625716 575.8024.100.20 32 14 0.08 5696 29 14FAITH 394042 37731946 3137.1062.001.00 274 32 0.03 86256 29 15GÜNGÖREN 271874 37810655 1513.1080.006.90 76 7 0.07 38258 18 16GAZIOSMANPASA 667809 11856483 1053.7045.700.60 74 11 0.06102151 59 17KADIKÖY 660619 16038615 942.1044.5013.40 171 62 0.04137177 46 18KARTAL 332090 10624295 857.7037.205.10 276 15 0.08 81195 46 19KAGITHANE 342477 23728737 2049.3048.402.40 83 3 0.05 59238 44 20KÜÇÜKÇEKMECE 589139 4845816 456.0041.302.80 57 27 0.18 90103 43 21MALTEPE 345662 6323311 556.8040.003.10 25 7 0.11 69133 26 22PENDIK 372553 7939877 869.5029.101.40 65 16 0.15 71156 67 23SARIYER 212996 7730781 1179.0020.600.30239 18 0.03 74179 20 26SISLI 271003 7622576 639.5051.009.50589 21 0.03 69133 33 28TUZLA 100609 2014726 374.4025.300.30 0 0 0.13 36111 6 29ÜMRANIYE 443358 9743473 1070.4028.800.80 20 28 0.14 99215 54 30ÜSKÜDAR 496402 13143021 1156.4042.800.90410 33 0.09126200 33 32ZEYTINBURNU 239927 20915573 1428.9067.403.70552 16 0.1 37204 35 902ESENLER 388003 10022700 633.1065.101.80 38 14 0.05 30132 12 903ÇATALCA 15624 32573 082.1017.800.10 320 1 1.19 52-904SILVIRI 44432 12 8534 274.7024.301.00 331 3 0.4 50---
Fig.AP.12 District population data
201 13 - Bibliography and Appendix CODEDISTRICTFIRE FIGHTING FACILITIES OPEN SPACE AVAILABILITY 10 SQM/PERSON LESS THAN 25% GAS PIPELINE DAMAGES SEWAGE PIPELINE DAMAGES WATER PIPELINE DAMAGES CASUALITIESBUILDING DAMAGE HAZARDOUS FACILITIES ROAD DENSITY M/HA BUILDING DENSITY BUILDINGS/HA SLOPE GRADIENT 0-10% (ACCESSIBILITY) 1ADALAR 4 0 34 8.463.3 0111 6 11 2AVCILAR 1 44 29 37 35 1.855.5 17111 4 71 3BAHÇELIEVLER 1 45 22 36 33 1.257.3 36224 12 86 4BAKIRKÖY 1 7 28 5047 1.863.9 19118 3 96 5BAGCILAR 1 77 14 25 22 0.839.8 61256 16 76 6BEYKOZ 2 37 - 6 8 0.214.9 13133 7 19 7BEYOGLU 0 69 12 17 20 1.338.5 22271 30 40 8BESIKTAS 1 22 6 9 10 0.526 18180 8 40 9BÜYÜKÇEKMECE 1 0 - - - - 2.250.2 90 2 59 10BAYRAMPASA 2 9 17 - 23 1.5 47 21245 21 77 12EMINÖNÜ 0 39 18 - 29 4.648.8 7231 28 72 13EYÜP 2 25 14 - 23 0.734.9 2996 5 42 14FAITH 1 62 24 - 34 1.655.4 29256 31 83 15GÜNGÖREN 1 73 19 - 38 1.154.6 18258 15 75 16GAZIOSMANPASA 1 76 7 - 6 0.325 59151 10 37 17KADIKÖY 2 64 9 14 13 0.531.6 46177 9 83 18KARTAL 1 60 14 17 16 0.739 46195 8 70 19KAGITHANE 2 58 6 20 8 0.425.6 44238 20 37 20KÜÇÜKÇEKMECE 2 83 22 29 25 142.1 43103 4 51 21MALTEPE 1 67 12 15 14 0.634.7 26133 5 48 22PENDIK 1 55 16 18 14 0.736 67156 8 67 23SARIYER 2 39 2 4 5 0.113.3 20179 11 24 26SISLI 2 75 6 6 6 0.423.9 33133 6 38 28TUZLA 2 18 18 30 21 1.340.9 6111 3 68 29ÜMRANIYE 1 64 4 6 5 0.219.9 54215 10 69 30ÜSKÜDAR 2 35 5 7 7 0.321.7 33200 11 42 32ZEYTINBURNU 1 54 29 - 37 1.961.2 35204 14 94 902ESENLER 0 78 14 - 15 0.736.2 12132 6 67 903ÇATALCA 1 100 - - - 0.220.6 - - 0 75 904SILVIRI 1 100 - - - 1.127.4 - - 2 91
Fig.AP.13 Data relevant to vulnerabilityof Districts of Istanbul
ARCHITECTURAL ASSOCIATION SCHOOL OF ARCHITECTURE GRADUATE SCHOOL PROGRAMMES
Emergent Technologies and Design
MArch Dissertation
05th February, 2016
“We hereby certify that this piece of work is entirely our own and that any quotation or paraphrase from the published or unpublished work of others is duly acknowledged.”
202 Quake|Response
Chaitanya Chavan Sulaiman Alothman
203 13 - Bibliography and Appendix [EmTech] 2014-2016
