RESPONSIVE GROWTH SYSTEM
RESPONSIVE GROWTH SYSTEM
Emergent Technologies and Design

RESPONSIVE GROWTH SYSTEM
M. Arch. Dissertation
Radhika Amin
Samidha Kowli
Rachelle Spiteri
EMERGENT TECHNOLOGIES AND DESIGN
Michael Weinstock Director
George Jeronimidis Director
Evan Greenberg Studio Master
Mehran Gharleghi Studio Tutor
Wolf Mangelsdorf Visiting Professor
ARCHITECTURAL ASSOCIATION, SCHOOL OF ARCHITECTURE
GRADUATE SCHOOL PROGRAMME
COVERSHEET FOR SUBMISSION 2013-14
PROGRAMME:
Emergent Technologies and Desgn
TERM:
2015 Term 4
COURSE TITLE:
M.Arch. Dissertation
COURSE TUTORS:
Evan Greenberg, Mehran Gharleghi
SUBMISSION DATE:
February 6, 2015
DECLARATION:
SUBMISSION TITLE:
STUDENT NAMES:
Michael Weinstock, George Jeronimidis, “We certify that this piece work is entirely our own and that any quotation or paraphrase from the published or unpublished work of others is duly acknowledged.”
Responsive Growth System
Radhika Amin, Samidha Kowli, Rachelle Spiteri
SIGNATURE OF STUDENTS:
Radhika Amin
DATE:
February 6, 2015
Rachelle Spiteri Samidha Kowli
We would like to thank our families, tutors and friends for their support and encouragement throughout the project.
A special thanks to:
Em.Tech. staff: Michael Weinstock
George Jeronimidis
Evan Greenberg
Mehran Gharleghi
Fellow colleague: Antiopi Koronaki
CONCLUSION 8.1 Overview 8.2 System refinements 8.3 System Potentials APPENDIX Finite element analysis Surface Variation
Logic Growth Simulation SYSTEM DEVELOPMENT 6.1 Overview 6.2 Residual Sites 6.3 Urban Growth Negotiators 6.4 Site Strategy SYSTEM IMPLEMENTATION 7.1 Overview 7.2 Strategy Implementation on site 7.3 Sequential Occupation 7.4 System Evaluation
INTRODUCTION THE DOMAIN 2.1 Overview 2.2 Informal urban settlements 2.3 Dharavi: Existing Urban Fabric 2.4 Precedents 2.5 Ambition METHODS 3.1 Overview 3.2 Techniques 3.3 Tools MATERIAL SYSTEM 4.1 Overview 4.2 Material techtonics 4.3 Geometry Exploration 4.4 Material System Development 4.5 Material System Potentials 4.6 Conclusion URBAN GROWTH STUDIES 5.1 Overview 5.2 Urban Character Analysis 5.3 Urban Growth Simulation 5.4 Conclusion 1. 4. 8 10 20 28 38 1 3 126 128 134 146 56 58 60 66 72 74 80 82 98 120 156 158 160 176 190 194 198 202 44 46 48 180 182 184 6. 8. 2. 5. 7. 3. CONTENTS
Combinatorial
ABSTRACT
Abstract
Located in the metropolitan city of Mumbai in India, the informal settlement of Dharavi with its dense population and scarce resources highlights a condition commonly encountered in developing countries, of rapid urbanisation. The potential of Dharavi lies in its numerous household industries which shape the existing urban fabric through social clustering of dwellings. Their contribution to the economy of the city makes them integral to the city’s development, however a lack of infrastructure provision results in an unhealthy, polluted living environment with high cases of waterborne diseases. The existing rehabilitation efforts of relocation into high-rise apartments disregard their social organisation and income generating means, resulting into failure of the typology.
Characterised by rapid growth and fluctuating population, a lowtech, fast assembly material system supplemented with social and sanitation infrastructures, is developed for urban growth deployment in Dharavi. Sensitive precedent approaches incorporate incremental growth of a unit, however there is no consideration of the temporality of land occupation and flexibility of clustering demanded by a variable user group which is very important in the context of high density informal settlements.
The focus of the research is on developing a strategy for urban growth moderation driven by sociocultural context and environmental comfort. The interventions both at the material scale and urban scale are non-prescriptive such that they are adaptive to different aggregation scenarios and enable a permanency and consolidation of the fabric with time.
1 ABSTRACT
1. INTRODUCTION
The social and economic success, and the resilience of informal settlements can be traced back to their self-built character, which allows them to accommodate increasingly high populations. In the case of Dharavi, this character has encouraged the formation of work-based communities which have become major contributors to Mumbai’s economy. So while these communities are successful for their social organisation, the issue of overcrowding has brought about problems of poor health and sanitation.
By understanding self-building as an enabler of community values and adaptive urban growth (in terms of spatial extension and structural temporality), but also identifying the limitations it has beyond a certain scale of self-organisation, the challenge for any intervention in this context, to address the issue of health and sanitation, is to negotiate with the self-built character across different scales of the built fabric.
The research will concentrate on addressing this issue at three scales: developing a material system for self-building, distributing community open space backed-up with structural elements and infrastructure plug-ins for growth initiation as well as mediation and providing a skeleton of underground infrastructure.
The material system will need to deal with the issue of unsafe, non-ventilated dwellings resulting from poor quality and knowledge of construction techniques. In order to accommodate the variation inherent in the social structure of Dharavi, the material system will be developed as a ‘kit’ of component surfaces informed by structural and environmental performance. Materiality of the components will be developed such that it enables an increased permanency with time.
At the urban scale, a strategy for implementation of open spaces and access to infrastructure will be developed. The open space
insertions will be informed by and inform the potential for selfbuilt agglomerations, to provide an adequate open-to-built space ratio and porosity for environmental comfort and households’ access to infrastructure. An underground infrastructure network enables individual plug-in connections relative to an emergent cluster formation and will have the potential to be reconfigured with incremental growth of the fabric.
A site specific strategy through the study of existing context conditions will be devised in order to integrate the different scales of urban interventions. This will be informed by a detailed analysis of the existing urban fabric to understand the physical organisation and existent diversity; critical evaluation of the developed material system through simulation of growth for its ability to enable the existing variant aggregation characteristics and potentials for improved habitability in terms of environmental comfort for the outdoor space.
The research is carried out through the following stages.
The Domain sets out the current scenario of informal settlements focussing on specific values and issues in Dharavi, taking into account its potential as a craft-based settlement. A detailed investigation of the built and open spaces in Dharavi and related precedent approaches are studied to outline the ambition of the research
This Methods establishes the various stages of the development of the strategy to moderate urban growth in the context of informal settlements. It also discusses the various tools used in the process of the system development.
The development of research is conducted through two chapters.
The Material system chapter focuses on developing a structurally sound, fast assembly material system informed by the social and environmental parameters. The adaptation of the material system for a low-tech fabrication and permanency of the dwelling unit with respect to its lifespan will also be discussed.
In Urban growth studies, an in-depth analysis of the different existing urban spatial characters is carried out. Following these studies, an algorithm for urban growth simulation will be set up, with existing spatial logic informed with inputs from the material system. Through climatic analysis, conclusions will be drawn which will inform the spatial characters required for community open spaces.
The System development will establish the program with respect to the existing community structure. The urban growth moderators will be detailed out in terms of their geometry variation for environmental comfort. The site strategy for urban deployment will be developed relative to the existing context conditions and detailed out for three different scenarios.
In System implementation, the strategy developed will be tested on a site by simulating a pseudo scenario for urban growth. The emergent cluster formation will be studied to contrast with the existing fabric. The urban growth will be studied across a time scale by recording specific instances in terms of the permanency of the fabric. The underground infrastructure as well as materiality of the architecture will be detailed out.
The Conclusions chapter critically analyses the developed system in context of Dharavi and discusses the future potentials of the system in terms of future scope for the material system as well as the value of the project in other relevant scenarios.
4 5 INTRODUCTION RESPONSIVE GROWTH SYSTEM
2. THE DOMAIN
The chapter begins with a discussion on informal settlements, recognising the positive aspects of a self-organised social structure and its potentials. Many of the fastest growing informal settlements are in South Asian countries, such as India. The informal settlement of Dharavi, in Mumbai, is taken into consideration, particularly for the relationship between its social structure and built urban character, and the positive effect this has on the community. There are however, also problems which arise from the informality of the settlement, these are outlined followed by discussion of precedent examples of interventions on informal settlement, which address infrastructure and sanitation on the one hand and incremental growth on the other. The ambition is outlined for the need to address the problem of an unsafe and unhealthy environment at two scales: the introduction of a material system for a low-cost selfbuilt housing typology that works in a context such as Dharavi’s, together with a strategy for an urban intervention which provides open spaces and infrastructure in derelict or vacant sites within Dharavi for their integration into the urban fabric so that these may contribute to the generation of safer and healthier urban growth.
8 9 THE DOMAIN RESPONSIVE GROWTH SYSTEM 2.1 OVERVIEW a b
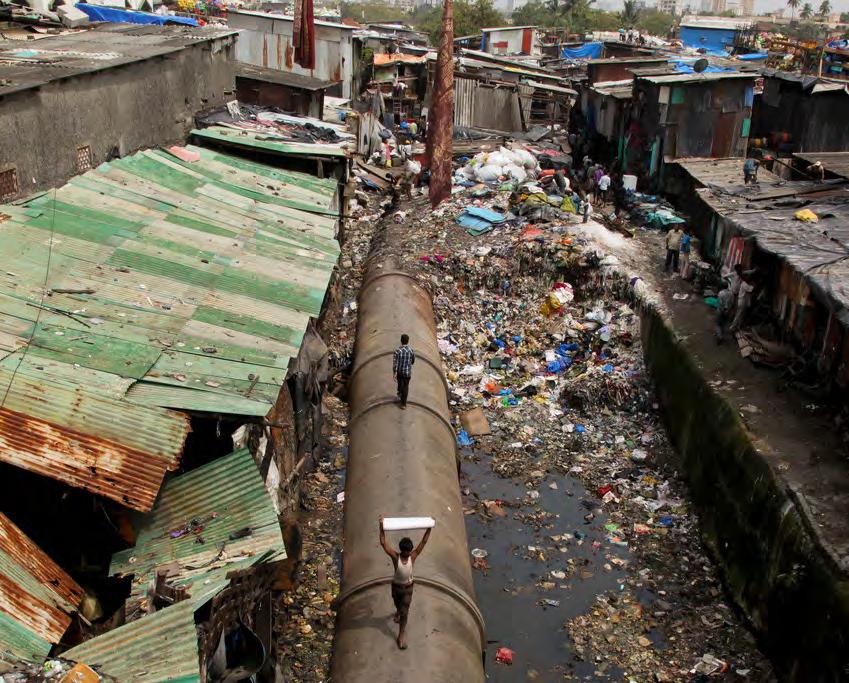
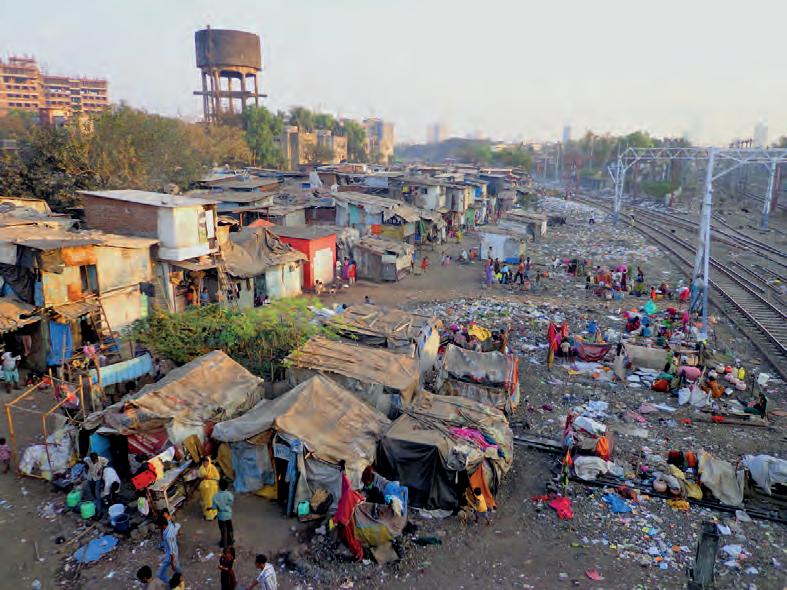
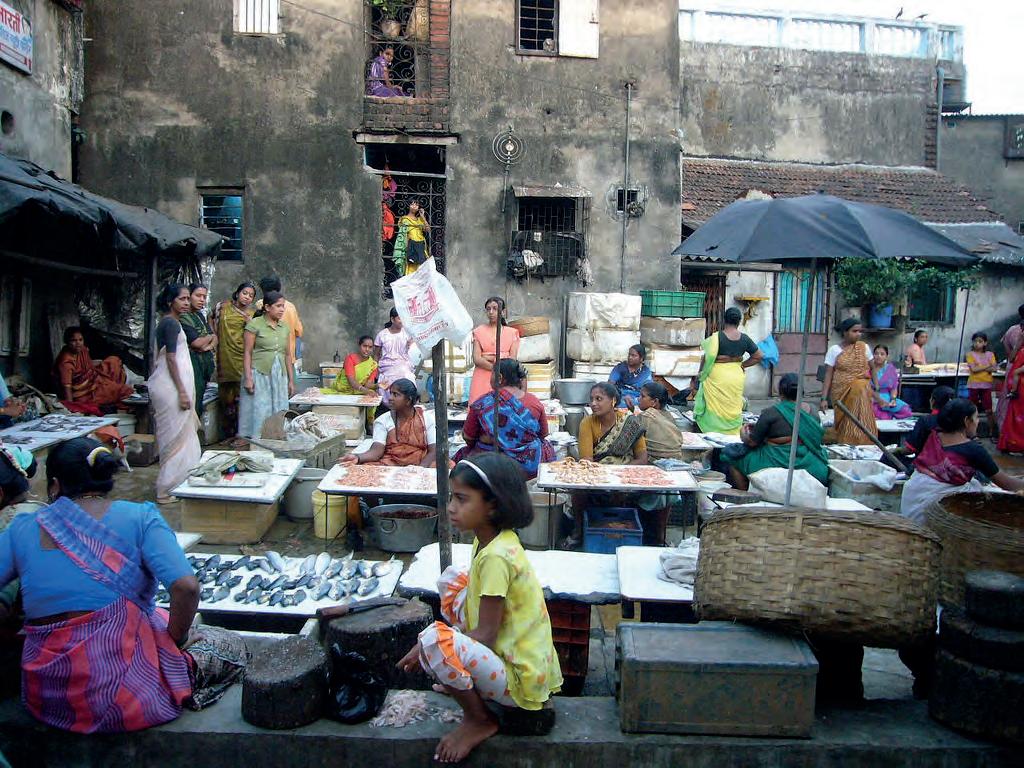
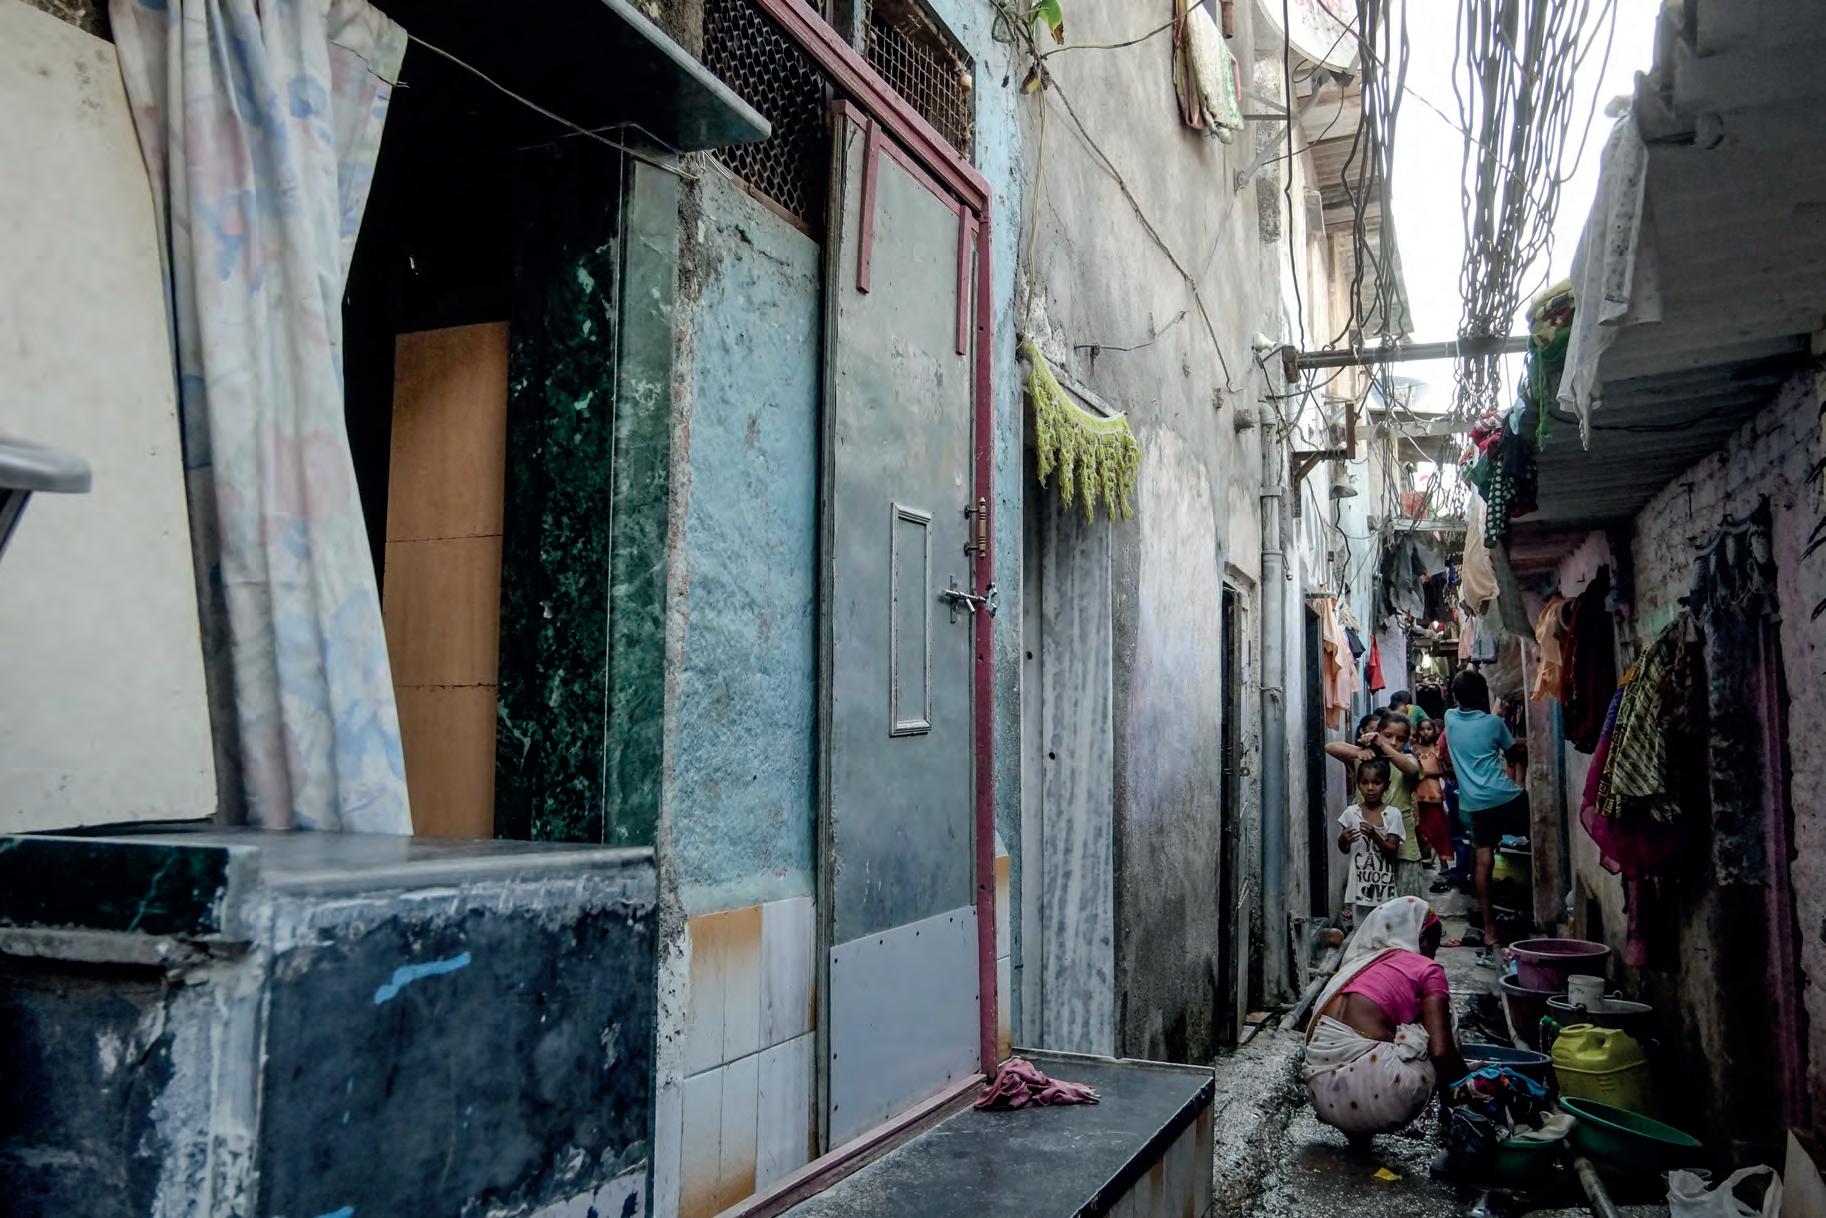
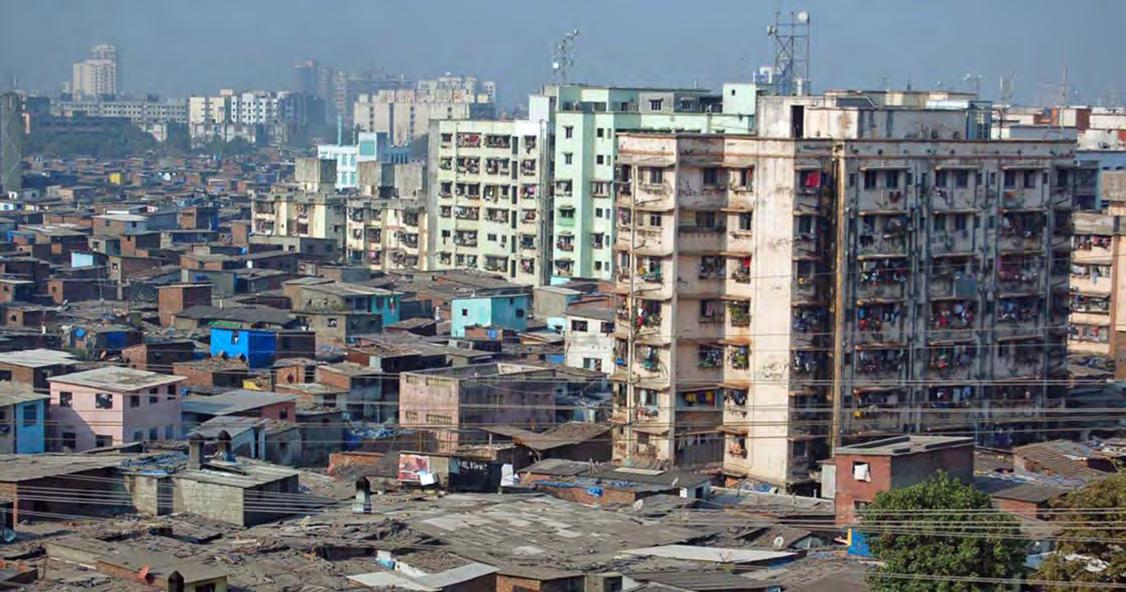
2.01
a. & b.
Scenes from Dharavi, one of Mumbai’s largest informal settlements.
Sources:
a. flickr.com/photos/_ spoutnik, b. commons. wikimedia.org
2.02
Total population growth in Asian regions 1950-2010, and projections for 2010-2050. Asia is the fastest growing continent and is predicted to more than double its population by 2050.
Source: UN-DESA, 2009
The majority of the global population growth at present and in the predicted near future is concentrated in urban areas of developing countries, predominantly due to rural-to-urban migration. Rapid urbanisation positively affects the economy of the country, but at the same time gives rise to an equally high demand for shelter, employment and urban infrastructure. In developing countries, cities are unable to support this growth. The divide between high demand and low supply of housing and infrastructure results in the formation of informal settlements.
As per the United Nations, 30 percent of total world population was urban in 1950, which has grown to 54 percent in 2014 and is predicted to reach 66 percent by 2050. Fastest growing urban agglomerations are medium sized cities located in Africa and Asia. The developing countries of India and China are projected to receive an additional 404 million and 292 million urban dwellers respectively between 2014 and 2050. Presently, at least one in three people (33 percent) of Asia’s urban population does not have access to basic shelter and services1 and with urbanisation, the condition will worsen adding to the population of urban poor.
Informal settlements are high density, self-built environments, usually formed on derelict vacant land. They are heterogeneous agglomerations, housing a low-income population ranging from skilled artisans and labourers to unskilled workers. The attitude or necessity of self-building allows for the flexibility required to accommodate this high influx of varied population.
The informal workforce of self-employed and wage-based workers residing and working from informal settlements, supports the formal sector and in turn positively affects the economy of a country. Anthropologist and economist Keith Hart coined the term ‘informal economy’ to refer to the same. In a lot of cases, the residence doubles up as a work place, wherein there exists a production or
retail space, sometimes overlapping with the living space. In this sense, the ‘house’ or ‘dwelling’ is an economic resource, since it is used as a production space giving them an income-earning opportunity. However, the overall income earned is low, which affects the living standards.
These settlements are unauthorised, due to which people live in fear of eviction. This is reflected in the construction quality of their self-built structures. The majority of them are temporary in nature, poorly constructed out of cheap, scavenged materials, rendering them structurally unsafe. Incremental extensions encroach on the open spaces as and when required, resulting in overcrowding and compromising on natural light and ventilation. The segregation from urban infrastructure, and lack of access to drinking water and sewage system, create an unhealthy and unhygienic environment. In many cases such settlements have a high crime rate, hence considered unsafe.
Efforts for improving these areas range from relocating the residents to housing developments (often far away from the city centre), to in-situ up-grading by retrofitting existing settlements with better infrastructure. However, the former destroys the existing economic and social networks, while the latter improves social interaction but is usually more expensive. Current interventions that involve residents in the rehabilitation process have proven to be beneficial in improving their overall living conditions.
Interventions on these settlements should therefore cater for the existing social structure and sociocultural requirements of their heterogeneous population. There is a knowledge of self-building which accommodates high population influxes however the issue of availability of resources in terms of construction materials and infrastructure provision causes problems.
2.03
Regional informal settlement population estimate 2010 for Asia. India with 109 million inhabitants is the country with the second largest informal population.
Source: UN-DESA, 2009
1950 3,000,000 2,500,000 2,000,000 1,500,000 1,000,000 500,000 South Asia East Asia South East Asia Western Asia 0 1955 1960 1965 1970 1975 1980 1985 1990 1995 2000 2005 2010 2015 2020 2025 2030 2035 2040 2045 2050 Urban population (1,000s) Year 1950 3,000,000
2,500,000
1,000,000 500,000 South Asia East Asia South East Asia Western Asia 0 1955 1960 1965 1970 1975 1980 1985 1990 1995 2000 2005 2010 2015 2020 2025 2030 2035 2040 2045 2050 Urban population (1,000s) Year 250,000 200,000 150,000 100,000 50,000 Rest of South Asia India South Asia East Asia East Asia South East Asia South East Asia Western Asia Western Asia 0 Urban Informal settlement population (1,000s) Region 10 11 THE DOMAIN RESPONSIVE GROWTH SYSTEM 2.2 INFORMAL SETTLEMENTS: VALUES AND ISSUES
2,000,000 1,500,000
RURAL-TO-URBAN MIGRATION
Supporting home-based income generating activities is one of the approaches promoted by the World Bank for the upgrading of the informal settlements. Traditional live-work communities are successful models of self-organised communities centred around work and economy generation, which makes them suitable to study in the context of informal settlements. They both successfully foster means for providing their own income, enabling them to be self-sufficient.
The idea of combining the work place with the dwelling has been prevalent historically, particularly before the industrial revolution. The vernacular architecture of many different cultures usually incorporated work with spaces for living, wherein a part of the residential space was used for retail or manufacturing.
In many cultures, craft-specific communities were formed with houses organised in close proximity to one another. During the medieval period, such an organisation was taken one step further wherein guilds were formed amongst similar craftsmen and traders, to regulate the quality and cost of their goods. The workshops were a part of the house, usually with all the adults of the family working. People under a guild formed a neighbourhood, sharing knowledge and resources, which brought a strong sense of community.
In this scenario, each family or a live-work household shared ties with the other households in terms of occupation, social and cultural values as well as environmental conditions. The physical spatial organisation was a resultant of these mutual relationships. Members of the community shared the same goals,
hence cooperate to reach them faster. This enabled them to take decisions collectively, with each member involved in the decision making process. Coaction was an inherently productive process, this productivity was not confined to economy, but also involved political, cultural, technological and ecological aspects.2
Like other self-organised systems, social self-organisation displays synergistic properties and emergent characteristics. Self-organisation in physical and chemical systems means the spontaneous self-structuring of matter and is temporary in nature; whereas living systems are self-structuring as well as selfmaintaining, and social systems are additionally self-creative.3
In line with this, vernacular architecture, which is self-built and organised following the social self-organised character, is proven to be efficient in responding to the sociocultural and environmental context. It is also adaptive to change and flexible in accommodating a varied population.
Similarities can be drawn between current informal urban settlements and the traditional models of craft-based communities and their physical arrangements. In informal urban settlements land is a precious commodity, due to the high-density. The overlap in functional usage of space results into the space being used throughout the day. This enables the accommodation of higher mixed-use densities and avoids the segregation that results from planned land-use zoning prevalent today. Additionally, in cultures where women predominantly take care of housework, It allows them to simultaneously mind the family and generate income.
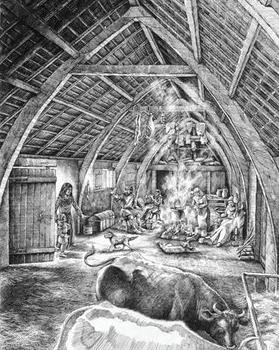
of spinning/ weaving/ dressmaking workshop, butchery, tannery and byre in addition to kitchen, dining and bedroom
Source: © English Heritage
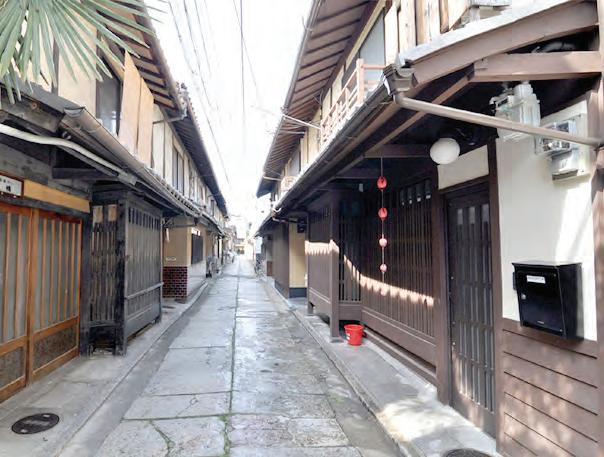
b & c. ‘Machiya’traditional Japanese merchants’ workhome. It provides a sequence of flexible spaces inclusive of the work space and private living.
Sources: b. www. maeniiya.com
c. www. theworkhome.com/
Formal entrance & shop Private entrance & garden Rear garden & services Storage Living area 12 13 THE DOMAIN RESPONSIVE GROWTH SYSTEM 2.2 INFORMAL SETTLEMENTS: VALUES AND ISSUES
a c
CRAFT-BASED AGGLOMERATIONS
2.04 a. Single storied, rectangular building inhabited by medieval peasants. The animals lived at one end and the people at the other. This single open-plan space was a combination
India: scenario
In India, 1 in 10 people lack durable housing, which creates a national housing deficit of 40 million units. Mumbai is a harbour city located on the western coast of India, and is the country’s financial capital. With a current population of 21 million it is forecast to become world’s second-largest urban agglomeration after Tokyo.4 55 percent of its current population lives in slums or slum-like conditions without access to basic necessities like clean water and decent sanitation. Hence, the challenge is not just to eliminate the existing deficit but also absorb the fast-paced growth.
Dharavi is one of Mumbai’s oldest informal settlements and spreads over an area of 2.4 km2. During the 18th century, migrants from neighbouring states began to occupy the low-lying mudflats surrounding the Mahim creek, forming small work-communities. Over a period of time with the city sprawling northwards, Dharavi which was initially located on Mumbai’s outskirts became central.
Dharavi has a total population of 700,000 people with a striking population density of 300,000 people/km2. People now migrate from villages all over India to Dharavi in search of work. There is a high ratio of migrants from rural areas of Maharashtra as well as those of many other Indian states. According to Human Development Report, almost 66 to 75 percent of migrants in Mumbai are of rural origin.5
Dharavi comprises of five smaller sectors each with 10 to 15 neighbourhoods. The communities are formed based on similarities of work or religion; the oldest communities of potters and leather tanners being up to three generations old.
INDIA 0 2001000km Mumbai N
Mudflats Forest Mangroves Railway Rivers & Waterbodies
Bandra Sion-Bandra road link Mahim bay Bandra-Kurla complex Western railway Central railway Sion Kurla Airport Mithi River Arabian Sea Khargo Creek Navi Mumbai Mumbai Harbour Powai Lake Cshiwara River Western Railway Vihar Lake Tulsi Lake Vasai Creek Dahisar River Poisar River Mira Uttan 14 15 THE DOMAIN RESPONSIVE GROWTH SYSTEM 2.2 INFORMAL SETTLEMENTS: VALUES AND ISSUES DHARAVI
MUMBAI
Dharavi
2.05
Location of Dharavi on landfilled mudflats off the Mahim creek in Mumbai. Centrally located, it benefits from the main railway lines flanking its southern and eastern boundary.
Source: Fact Finding Committee on Mumbai Floods
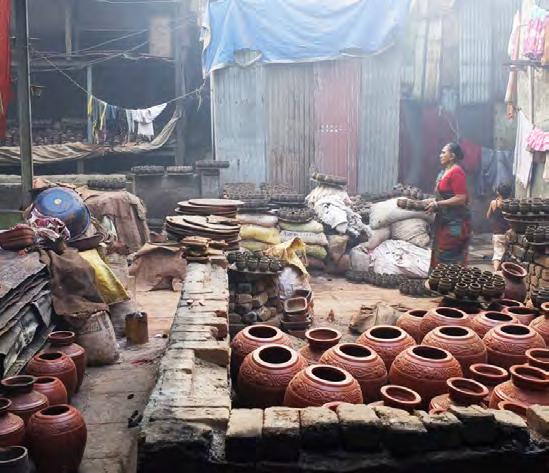
2.06
Dharavi consists of smaller neighbourhoods of live-work communities sharing common household or small scale industries.
Live-work paradigm
“Dharavi embodies an efficient preindustrial live-work paradigm that is now being reinterpreted in post-industrial societies as a sustainable lifestyle option.”6
Dharavi houses a total of 4,900 production units of different scales. It is one of the most important sites of manufacturing in the city. Its central location in Mumbai makes it well connected locally as well as globally, giving it an economic impetus. In a city where rail is the most important mode of transport, Dharavi is flanked on its two sides by the central and western railway lines. Additionally, the creation of the Sion-Bandra link to the international airport makes it viable for location of export outlets.
There exists a symbiotic relationship between Mumbai and Dharavi: the city benefits from Dharavi’s small scale industries, manufacturing units and available workforce, while the informal settlement benefits from availability of resources and raw materials, connectivity and a user market spread locally as well as globally.
A number of household industries like pottery, broom-making and food packaging are mostly community based with families and in some cases women, working from home. This live-work environment is composed of workshops or work-spaces on the ground floor with extensions into open yards and private spaces on the upper floors.
Mumbai has a tropical climate with a distinct dry and wet season, therefore shaded open space is often used as a work space which provides comfort in high humidity. Open work spaces become important many times due to the nature of the activity, also because they are unbuilt so infrastructure cost is minimised. They are usually shared, which gives rise to work based community clustering.
Another very important industry in Dharavi is recycling, from products like plastics, rubber, cardboard and paper, to steel and electronic components. This activity is a major economy generator as it comprises around 80 percent of Mumbai’s recycling activity. In addition to this there are small manufacturing units of textile and tailoring, and leather, which mass produce garments and leather products; service industries like laundry, masonry as well as small and large retail units. Migrant workers live as tenants and work in semi-skilled labour intensive jobs.
Thus, there exist different forms of economy generation ranging from women working at home, manufacturing units (rooms for embroidery or making leather products) hiring wage-based labourers, shared open work yards between families manufacturing processed food or broom-making as well as trades involving the whole family, like potters, with a dedicated production space.
N Self-built Mangroves Railway Social amenities Government structure Major road 0100 500m Potter’s Village Muslim Nagar Dhobi Ghat (Laundry Services) BMC - Services Quarters Scrap Dealers Leather/ Zari-craft/ Textile Industry Leather/ Zari-craft/ Textile Industry Koliwada (Fishermen Colony) Recycling Industry Food - making Industry 16 17 THE DOMAIN RESPONSIVE GROWTH SYSTEM 2.2 INFORMAL SETTLEMENTS: VALUES AND ISSUES
DHARAVI
INFORMAL SETTLEMENTS
unplanned, unauthorised housing
- South-Asian developing countries
RAPID POPULATION GROWTH
housing deficit
SELF - BUILT accommodating rapid growth
CRAFT-BASED AGGLOMERATIONS
self-built, social clustering - vernacular settlements - medieval guilds
LIVE-WORK ENVIRONMENTS
flexible spacial use informal economy generation
Dharavi’s self-organised social character enables the production of a thriving informal economy of household and small-scale industries, which makes a significant contribution to Mumbai and national markets. In addition to generating their own employment through their live-work setup, the multifunctional use of space is able to accommodate a high-density population which is still rapidly growing.
This social structure is made possible by the self-built character of it’s urban fabric, which shares similarities with vernacular craftbased settlements in that the physical space is user-generated according to specific needs; in this case the need for flexibility and adaptability of space due to limited land.
However, as with other informal settlements, there are problems which arise as a result of the self-built character due to lack of resources and government support.
high density urban fabric household industries 18 19 THE DOMAIN RESPONSIVE GROWTH SYSTEM 2.2 INFORMAL SETTLEMENTS: VALUES AND ISSUES CONCLUSION
DHARAVI
2.07
Dharavi’s residential and live-work communities are very close-knit, structured around family ties and work types. Their social values are manifested in the settlement’s physical urban characters. Migrant families generally build their first shack from scavenged sheet materials. The choice of location for where they settle is crucial for establishing themselves into the existing network of work communities, which consists of numerous household and smallscale industries.
When a suitable location is found, it becomes permanently occupied, although the dwelling will incrementally grow and its construction will become more durable over time as the family grows in number and becomes more economically stable. Once it is financially feasible, a family will resort to a permanent construction of brick and concrete, which is safer and also allows for vertical extensions to accommodate an extended family which can consist of over twenty people living under one roof.
This transition of individual dwellings in size and structure is most notable when comparing settlements of different ages. Recently formed communities, such as the Rajiv Gandhi Nagar, which have developed over the past 30 years and continue to receive newcomers, have temporary or semi-permanent dwellings which generally consist of ground floor rooms, but never exceed two floors due to their poor construction.
The fishermen’s community (Koliwada) and the potters’ quarter (Kumbharwada) are amongst the oldest in Dharavi. Their urban tissue has been consolidated over time with the result of two- to four-storey pukka (made of brick and concrete or stone) and semi-pukka (brick walls with a light-weight roof, usually corrugated metal or asbestos) dwellings and well-defined open spaces that host numerous events depending on the specific requirements at a given time: from providing space for work activities, a market, or for recreational activities and social gatherings during festivals. However, neighbourhoods like these, which are amongst the better parts of Dharavi, have reached this level of consolidation after generations of development and gradual improvement of their homes.
Therefore, although the problem of poor living conditions is true for all of Dharavi, it is most acute in the residual spaces around Dharavi’s periphery which get occupied by newcomers, and in the newer neighbourhoods, due to the poor quality of building materials and construction techniques used.
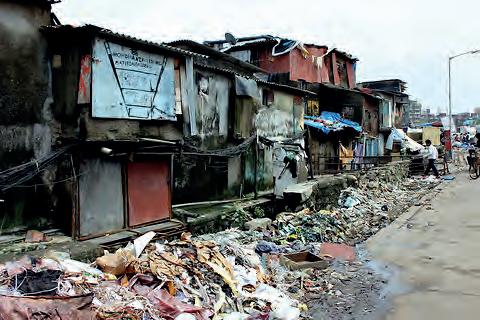
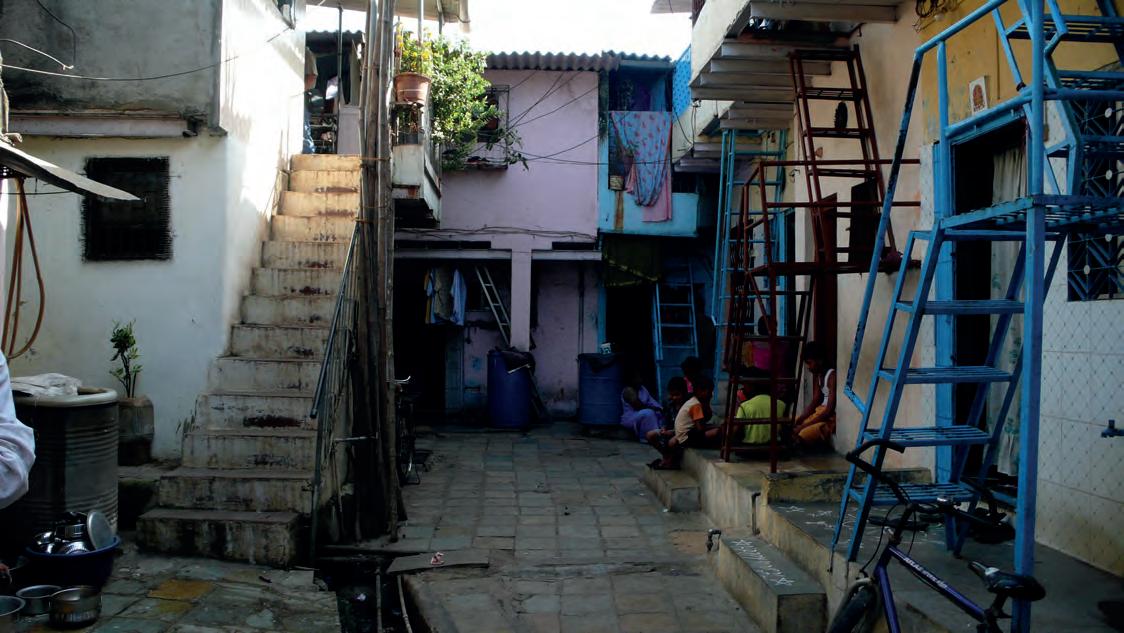
2.08
2.3 DHARAVI: EXISTING URBAN FABRIC 20 21 THE DOMAIN RESPONSIVE GROWTH SYSTEM
Dharavi’s settlements: a. Recent migrants build temporary shacks along existing settlements.
Source: Anna Phipps
b. Semi-permanent dwellings in Rajiv Gandhi Nagar, which is still undergoing population growth.
Source: Raksha Kumar
c. Pukka houses in Koliwada, Dharavi‘s oldest settlement.
a c b
Source: Camillo Boano
Incremental growth and permanency of an individual dwelling. a. Temporary stage: scavenged sheet materials for individual room construction. b. Semi-permanent stage: horizontal room additions; construction consists of brick walls and sheet material for the roof. c. Permanent stage: vertical room additions in brick and concrete a b c
INCREMENTAL GROWTH
Given the limitations of indoor space due to scarcity of land availability and building resources, communal activities in Dharavi usually take place outdoors. As with indoor spaces, which transform from bedroom to work place to kitchen according to the family’s requirements for space at different times of day, outdoor space is rarely dedicated to one single activity and its users control and transform it according to their needs.
While the development of the built fabric is characterised by incremental extensions and gradual consolidation of individual dwellings, open spaces have an emergent character which is affected by the existing surrounding buildings, and thus the type of activities that spill out onto the open spaces as a result. In this respect, open space is never privately owned, belonging to a single family, but is always shared and its character is moderated by the households and work communities which surround it.
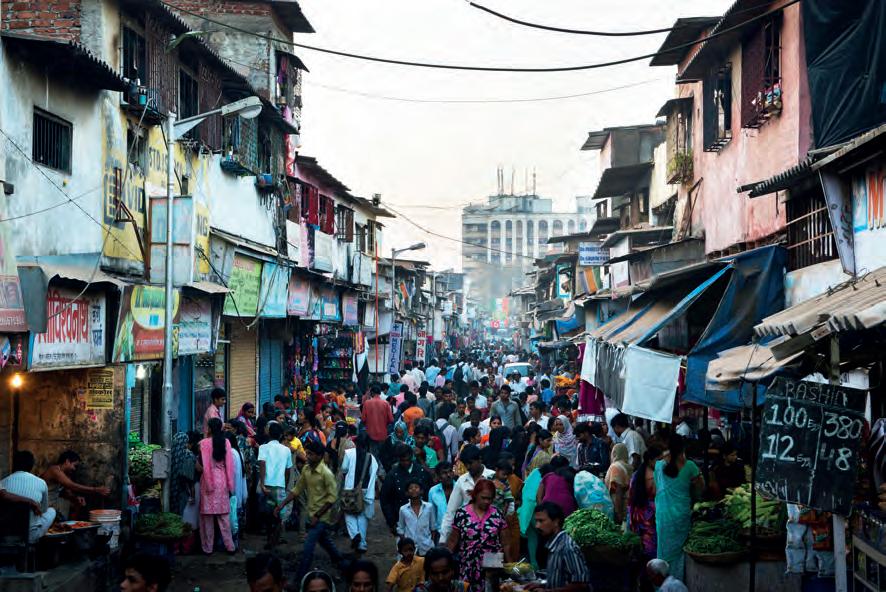
Three principal types of emergent open spaces can be identified: main streets which usually form along commercial activities and attract high traffic; community yards which are predominantly used by a work communities as work-yards, but which can also double up as recreational space, particularly during festivities; and
residential streets which have a semi-private character because they are shared by smaller numbers of families, they are used as extensions of indoor space due to shared water taps provided by the government, but they are also spaces for social interaction and for young children to play.
The surrounding buildings also affect the open space in terms of its size and accessibility. A dwelling’s first extension will be a horizontal encroachment onto open space; however when an open space accommodates commercial activities, such as shops or markets which attract high traffic and large crowds, or is used for production, such as potter’s yards, the built encroachment is limited because these outdoor spaces are essential for people to earn their livelihood and are therefore safeguarded by their users, acting as moderators for growth.
Conversely, residential streets can become extremely narrow, due to a compromise with a need for more indoor private space. However, when open spaces become susceptible to encroachment, to the extent that they become narrow alleys or culde-sac, dwellings get poor access to adequate ventilation and light, and problems of flooding arise due to heavy monsoon rains.
2.3 DHARAVI: EXISTING URBAN FABRIC 22 23 THE DOMAIN RESPONSIVE GROWTH SYSTEM 2.09 Adams a b c
EMERGENT OPEN SPACES

The incremental growth and consolidation of individual dwellings, promoted by their self-built character, allows families the flexibility of adapting their homes according to their needs and means, however problems also emerge which lead to an unhealthy environment.
Across Dharavi, dwellings suffer from poor ventilation due to overbuilding, with little consideration for providing windows to all interior spaces. This also affects the light quality indoors. The inferior quality of scavenged materials used and inadequate construction of shacks and some semi-pukka dwellings make them prone to collapse in adverse weather.
Due to poor drainage systems and narrow streets, often littered with garbage, many areas flood. This is accentuated during the monsoon season due to proximity of the Mithi River, which is highly contaminated with heavy chemicals and oils from industries upstream, and which regularly floods Dharavi during the wet season. The stagnant and contaminated water is a source of waterborne diseases, such as cholera, which affect an estimated 4,000 people a day.
Being an unplanned informal settlement, the government provides scarce infrastructure in terms of water and electricity supply, and sanitation. Water is supplied for two hours a day through outdoor water taps usually shared by four to five households, so water is collected and stored in vessels and plastic drums, which increases the risk of water contamination. The government also provides communal toilets; however each of these is shared by 1,500 people, making them impractical for many but also particularly unsafe for women.
Incremental growth of individual households can in some cases also have a negative effect on the urban scale when community open space is put in jeopardy. Unless an open space is crucial to the community’s livelihood, it will be encroached upon to the extent that the only remaining open spaces in many areas of Dharavi are long narrow alleys. Besides their inadequacy for providing natural light and ventilation indoors, and the problems associated with flooding, there is a lack of community yards which can act as places for social interaction but which can also provide pockets of light and enhance air circulation to surrounding dwellings and alleys.
2.3 DHARAVI: EXISTING URBAN FABRIC 24 25 THE DOMAIN RESPONSIVE GROWTH SYSTEM 2.10 a b c SANITATION PROBLEM
BUILT SPACE
- temporary stage
- semi-permanent stage
- permanent stage
INCREMENTAL GROWTH AND PERMANENCY accommodates high population influx, varied population
BUILT QUALITY
- scavenged construction material - poor light, ventilation & structure
SELF-BUILDING live-work communities
customisation based on user requirements
ENCROACHMENT OF COMMUNITY OPEN SPACE
Dharavi’s pressing sanitation problem needs to be addressed in terms of safer and healthier building construction, and infrastructure providing clean water and electricity, and effective sewerage and rain water drainage systems. However the positive opportunities of a self-built settlement must also be taken into consideration, and any interventions should allow for the degree of flexibility and adaptability necessary for the self-built fabric to continue to accommodate a poor but industrious population.
There are a number of vacant lots in Dharavi that are currently disused; they lie on the outskirts collecting garbage or were previously occupied and have been cleared out for the construction of SRA apartment buildings. These sites offer an opportunity for generating an improved self-built urban fabric, which, if successful, can also contribute to the betterment of surrounding existing neighbourhoods.
The development of an urban strategy that provides basic community amenities of infrastructure, and that complements the self-built organisation, could help with the reintegration of these vacant lots into the existing urban fabric, thus acting as generators for positive growth. There are also the available resources of cheap labour and the self-building attitude which can be banked upon to develop a strategy for the upgrading of living conditions with community involvement in order to improve the living conditions and enhance the social character.
HABITABLE URBAN ENVIRONMENT
provision
2.3 DHARAVI: EXISTING URBAN FABRIC 26 27 THE DOMAIN RESPONSIVE GROWTH SYSTEM AMBITION
durable
infrastructure
dwelling
LACK
OF SANITATION
OPEN SPACE commercial streets residential streets community open space open work space
urban fabric NEGATIVES POSITIVE
DHARAVI
OPPORTUNITIES
The construction of informal settlements should not be perceived as a problem but a solution to the housing shortage7 in the city, since they accommodate the rapid rural-urban migration and contribute to its growing urban economy. However, owing to their poor living conditions, which concern in particular health and sanitation issues, the first reaction was to clear them out of the cities. This resulted in the passing of the slum clearance policy in 1950, however, it has proved to be futile since their occurrence and growth cannot be curbed.
Since then attempts have been made by the government authorities in most developing countries to experiment appropriate strategies and policies for the improvement and upgrading of slums.
Two distinct development strategies have been explored so far – one includes rehabilitation through public housing schemes while other is an in-situ upgrading strategy through investment in infrastructure development and provision of relevant services and amenities. Each approach has its own benefits and drawbacks,
however, these schemes are generally formulated in association with the dearth of economic and limited professional resources that the authorities can allocate.
Perceived as a financial burden on the city and a depreciating public investment, the informal sector, thus, has been left with very limited options of funds, land and resources. Hence, most of the traditional schemes couple with TDR (Transferable Developmental Rights) as incentive to promote developers to invest which, in many instances like in Dharavi’s redevelopment, encourage vested commercial interests further compromising on the development of these settlements.
Nonetheless there are some models which have managed to effectively operate within the conventional framework of these legal and economic constraints. The current traditional public housing scheme of Dharavi’s Redevelopment plan is further discussed in the light of the successful incremental housing models of Aranya Housing Project in Indore, India and Social Housing in Quinta Monroy, Iquique Chile to arrive to some suitable conclusions.
2.4 PRECEDENTS: STRATEGIES FOR INTERVENTIONS IN INFORMAL SETTLEMENTS 28 29 THE DOMAIN RESPONSIVE GROWTH SYSTEM
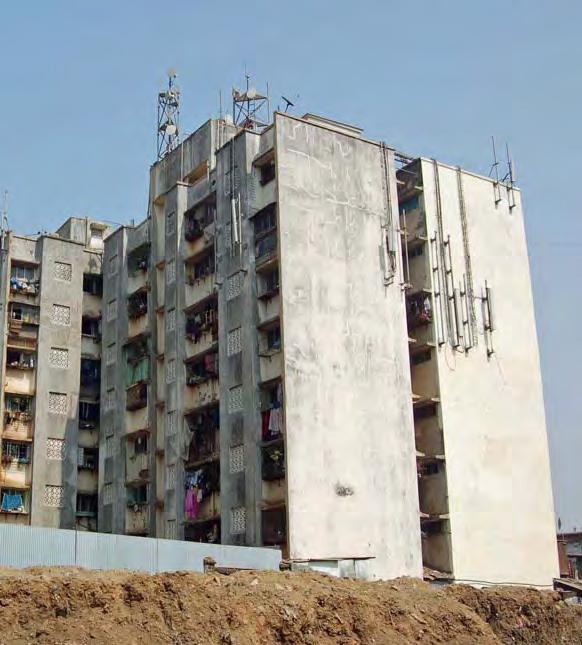
2.11
Conventional public housing scheme wedged in between informal housing settlements - Slum Rehabilitation Authority (SRA) development in Dharavi, Mumbai.
Source: Sytse de Maat
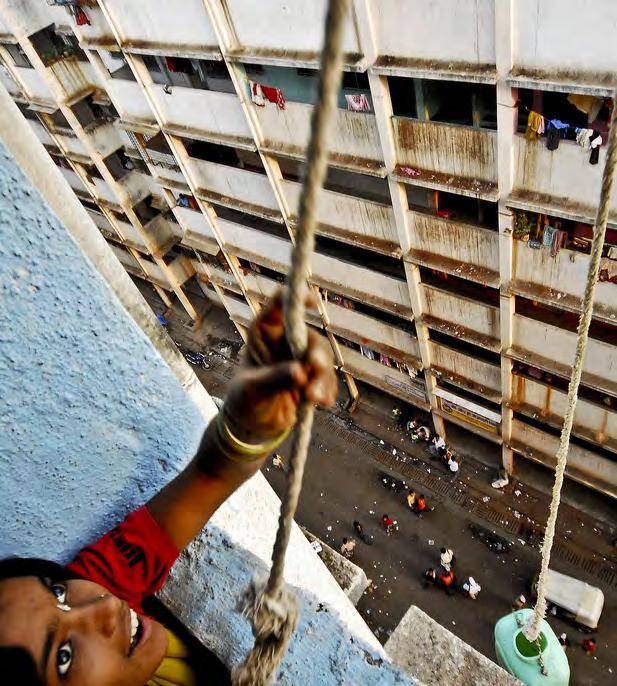
b. Residents of SRA development in
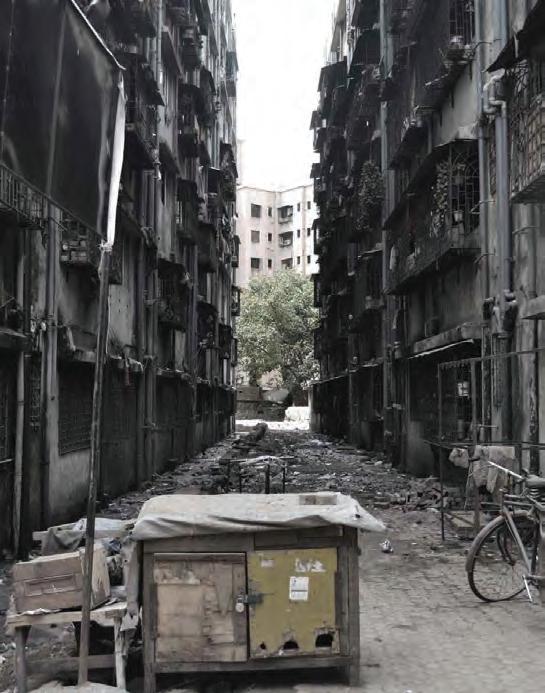
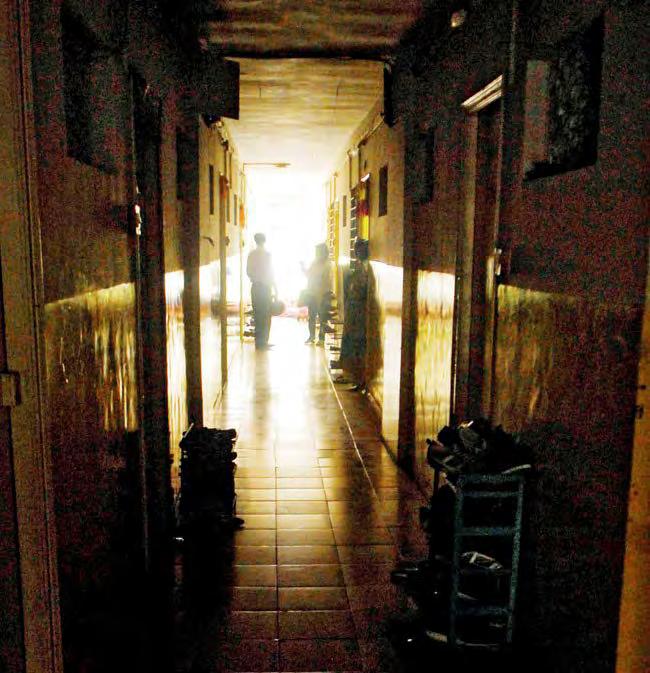
2.13
a. Lack of maintenance and the narrow space between two 7-10 storeys SRA apartment blocks create dark and unpleasant gaps that collect garbage, and attract rats and breeding of mosquitoes, rather than human activity
Source: In_situMArch Dissertation of
b. SRA housing in Pune where common lobbies and corridors are ill-lit and poorly ventilated
Source: Midday News website.
The Slum Rehabilitation Authority (SRA), set up in 1995, is the planning authority responsible for designing and implementing schemes for the upgrading of the cities’ slums in India. The present scheme for redevelopment of Dharavi involves the demolition of the existing informal neighbourhoods and construction of highrise apartment blocks in their place with formalisation of major enterprises.
The Municipal Corporation for Greater Mumbai is in charge of the distribution of services and infrastructure across Mumbai and its slums. Since the prime concern is safety and upgrading of the living standards, the high-rise typology has been opted for to ensure structurally sound constructions and ease of access to safe water and sewage for healthier environment. However, this typology highly restricts the relationships households share with the community and the informal sector, leading to failure of this scheme at number of levels.
The lack of provision of live-work spaces and their segregation in the high-rise apartment blocks leads to the loss of community and social interactions that would have otherwise benefitted community well-being and proliferation of the informal enterprises within a dense horizontal fabric. It also increases the challenge for the residents to manage the house and family while they work. With only 225 sq ft apartments being provided, and no room for expansion, the problem of overcrowding is amplified. The
fundamental deficiency in the scheme is the standardization of procedures and its ‘one-size fits all’ approach in order to operate economically. By necessity this conflicts with the local variety and housing priority in such settlements8 with no allowance for their current structure of social, religious, cultural, and professional divisions.
Lack of adaption to such a drastic change in the way of living coupled with high maintenance costs for the building’s up-keeping result in neglect and inability of the residents to continue to uphold such livelihood. Narrow alleys between the apartment blocks built to maximise on the commercially developable land, turn into dump yards and lead to poorly lit and ventilated spaces. The consequence is “the creation of vertical slums which occupy a smaller ground footprint than the original informal neighbourhood”9 further worsening the quality of life.
Moreover, in the proposed master plan, only 25 percent of the current residential population is being relocated in the apartments leaving 75 percent homeless and forced to move to other slums in the city adding further to the city’s growing housing deficit rather than resolving it. The formalization and segregation of the enterprises curbs small businesses by offering fewer opportunities for their sustenance leading also to certain repercussions on the city’s economy.
2.14
Typical section and plan of the SRA apartment block typology proposed in Dharavi. Some of such blocks have already been built on the periphery of the settlement. The highlighted areas indicate an individual dwelling the typology.
Source: Study conducted by students of Sir JJ college of Architecture, Mumbai
2.4 PRECEDENTS: STRATEGIES FOR INTERVENTIONS IN INFORMAL SETTLEMENTS 30 31 THE DOMAIN RESPONSIVE GROWTH SYSTEM a b a b
Johanna Bratela and Stina Hellqvist
2.12
a. SRA apartment blocks in Dharavi
Source: Sytse de Maat
Lallubhai Compound, Mankhurd, Mumbai
have no running water access in their poorly maintained 7 storey buildings due to broken elevators and inactive water pumping system.
Sources: Akshay Mahajan
DHARAVI REDEVELOPMENT SCHEME
2.15 a.
2.16
Unlike Dharavi Redevelopment Plan, incremental housing proposals search for a middle ground between non-participatory public housing schemes that supply ready-built dwellings and slum upgrading schemes or serviced sites for new constructions which have an increased initial site investment and no cost recovery.
Aranya Township in Indore, India responds to the demands of a growing economy and harnesses the latent construction knowledge and self-building skills within the community to generate an active settlement with the capacity and means to grow. It was developed in 1983 with an initial population estimate of 40,000 people which could grow up to 60,000 people. Comprising of 6,500 housing units on plots varying between 35 to 457 m2 in size, the township proposed to accommodate a variety of income groups but predominantly EWS (economically weaker sectors), on
the 220 acres site, where basic infrastructure, including electricity, water and drainage were provided with all necessary social, welfare, economic and cultural amenities. The number of housing typologies facilitating traditional construction and modes of living were designed such that they could be added on to or adapted by inhabitants over the course of time.
While the inhabitants could buy a whole house built on a plot, there was the flexibility of purchasing only a plot with plinth to build on and a built ‘service core’ of kitchen, washroom and an additional room. This catered to different financial means and enabled the inhabitants to add to given infrastructure subsequently with gradual built accretions according to their preferences and growing needs. Though the project was located outside the city, its strength lies in its culturally appropriate design and the flexibility of space it offered that stimulated the ‘self-help’ factor to further reinforce the community way of living.
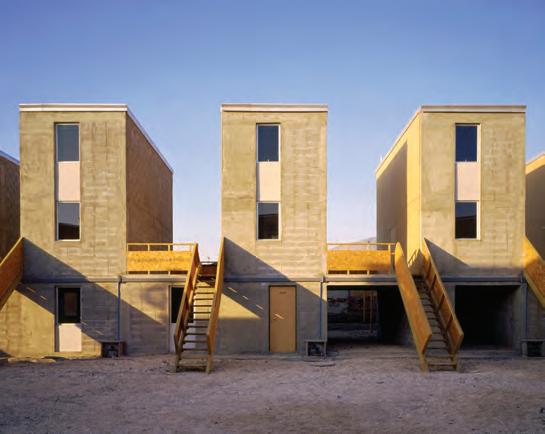
2.18
The prefabricated half house consisting of overall structure, kitchen, bathroom and stairs and its extended version by the residents.
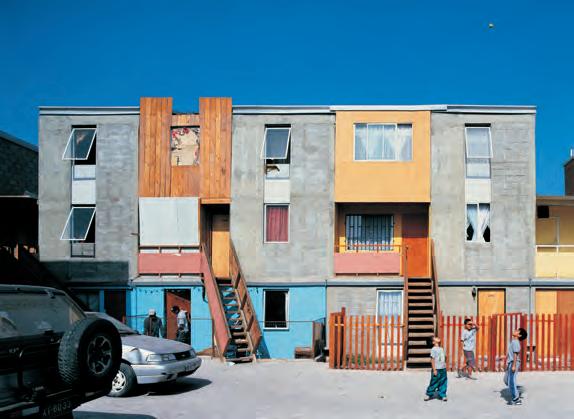
Much like Aranya Township, the in-situ resettlement project of 100 families in Quinta Monroy, Iquique Chile developed by Elemental, also concentrates on providing the basic house nucleus including overall structure, kitchen, bathroom and stairs within the provisional 30 m2 and a standard government subsidiary of US$700 per family. The challenge was the limited land which was intended to accommodate only 30 families (one family house per plot) and the limited money left over from buying the land being enough to build only half a house for 100 families. Hence, the strategy was to build only the essentials in that half house which was otherwise a 72 m2 home, to which the residents could add or extend as per their convenience and circumstances. This incremental nature allows for customisation through occupation and financial appreciation is achieved through gradual investment.
Both Aranya Housing and Quinta Monroy Resettlement avail of legal government support and financial subsidiaries to effectively
transform informal solutions into spatial agents that generate a suitable scenario for built growth. The participative design process and the enabling of self-build facilitate an adaptive growth and also empower of sense of ownership to the inhabitants.
This, exemplifies how a social housing project can become a potential social investment by creating a framework within design where incremental physical development can take place within legal, economical and organisational needs. It is however necessary to note that both cases are in a way prescriptive to a certain limit since they are devised for predefined limited community size and variation. This is possible only if the end user is known and the growth scenarios can be precomputed. Also, although there is a level of flexibility at the individual dwelling scale, both projects introduce elements at neighbourhood and master plan scale which leave little room for adaptability and change in social character and organisation.
2.4 PRECEDENTS: STRATEGIES FOR INTERVENTIONS IN INFORMAL SETTLEMENTS 32 33 THE DOMAIN RESPONSIVE GROWTH SYSTEM Plot with plinth and built service core Initial built blocks of the house Gradual extensions over time Prefabricated structural and service core water tank structure Cores in an array of row houses Customisation and extensions on occupation a b a b
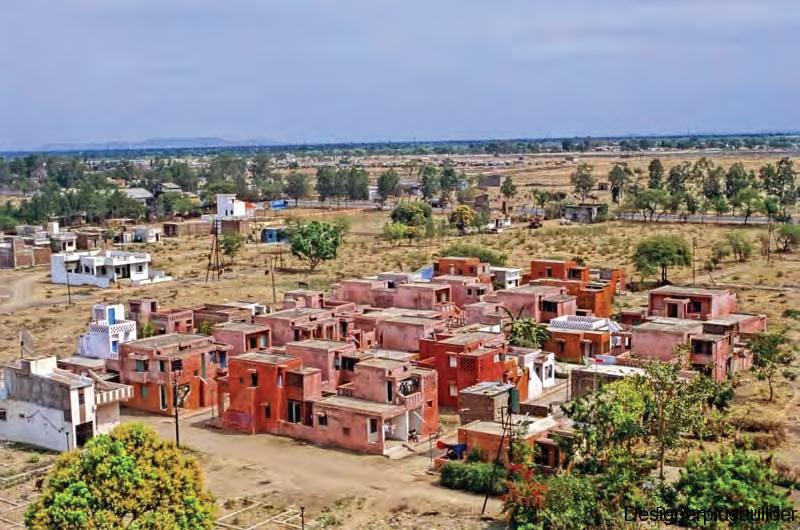
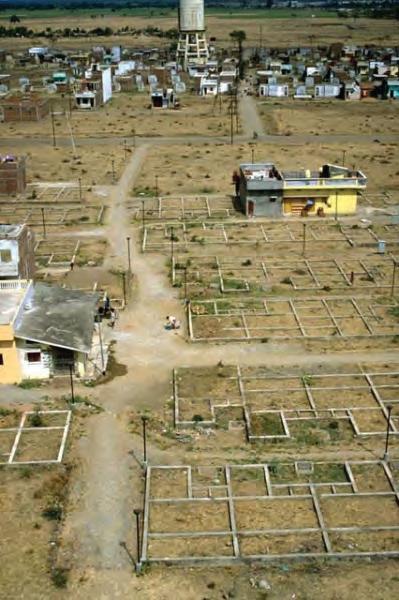
a.
2.17
& b.
Scenes from
Quinta Monroy
Social Housing of what was provided under the government scheme and what was realised on its occupation and customisation. Sources: Archdaily, csanchezreyes. wordpress.com
Source: Alejandro Aravena of Elemental in Architectural Design Vol.81 No.3
& b.
low-cost housing
prior to
occupied
built by
residents. Sources: architexturez.net, AID - Architecture in Development
Scenes from Aranya
project,
occupation and after being
and gradually
the
housing
to
adapt over time
Architect
Foundation
Model of incremental construction of traditional
typologies that inhabitants can add
or
Source:
- Vastu Shilpa
Aranya Township and Quinta Monroy Social Housing
INCREMENTAL HOUSING
2.19
Examples of PUI interventions
a. Parque Biblioteca España in the Northeast of Medellin, b. outdoor escalators in Comuna 13, c. the metro cable running on 3 lines across the city.
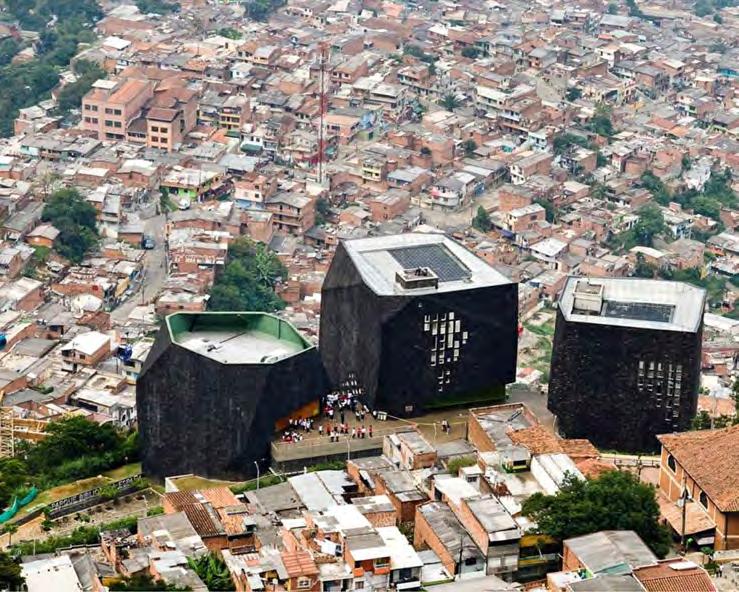
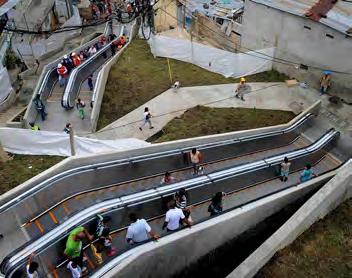

Sources: Municipality of Medellin 2.20
Integral Urban Project, Medellin, Colombia
Another approach for the upgrading of informal settlements is the insertion of infrastructure and relevant services and amenities into the existing fabric, so as to “improve the spatial and social quality of area while respecting the existing spatial organisation.”10 While in cases like Integral Urban Project in Medellin, Colombia, the focus is mainly on social development by improving community access, social and cultural amenities and community activities, other projects like Slum Networking in Indore, and the Potty project in Savda Ghevra, both in India, (discussed next) capitalise on bettering infrastructure and use water and environmental sanitation as a catalyst to radically improve the settlement. This approach unlike public social housing schemes does not include large amounts of demolition and displacement but does involve a higher initial investment.
Medellin is one of Colombia’s largest cities. By the 1990s it was reputed to be the most violent city in the world, largely due to the illegal activities that flourished in its slums. In an attempt to decrease its crime rate, PRIMED was set up in 1993 for “integrated slum upgrading” in Medellin. The programme succeeded at improving public services and infrastructure and providing public parks, schools and communal facilities. However, these physical
improvements to the city’s informal settlements were not enough to improve the quality of life of their residents, who remained segregated from the rest of the city.11
Therefore, following the partial success of PRIMED, Integral Urban Project (PUI) was developed as part of the Development Plan for Medellin 2004-2007, with greater emphasis on improving slum communities’ living conditions. Rather than trying to upgrade an entire slum at once, the project focuses on implementing individual projects in specific areas of the informal urban settlements, creating a network of state-of-the-art schools, libraries, public parks and transport systems. The insertion of these services within the poorest areas of the city has helped integrate the slums with the formal city, improving the residents’ access to employment, health services and education, but also encouraging visitors into these impoverished areas creating a platform for cultural and economic exchange.
The crucial element of the programme implemented at Medellin is identification of the need of community activities and amenities specific to the social context and their strategic insertions and improved accessibility which contributes to the betterment and positive growth within the settlement. However, in some cases, a large number of insertions may be required to fully realise the
benefits of this approach which may not always be plausible.
Slum Networking and Potty Project
Slum Networking project in Indore, India was developed by engineer Himanshu Parekh in 1987, identifying lack of water and environmental sanitation as the primary concerns of informal settlements. Since most of the slums are usually located in low-lying areas, the project focused on developing an effective infrastructure network of water and sewage that takes advantage of the natural water course and connects the slums within the city. This not only helped to arrest the pollution of the underwater resources but also enabled individual houses to access the infrastructure network, improved streets by laying storm water drains and developed a buffer of green public areas in the otherwise residual parts connecting two slums. The provision of a basic framework of infrastructure at such a larger scale became a great incentive for inhabitants to invest in building private and public toilets and upgrade their living significantly.
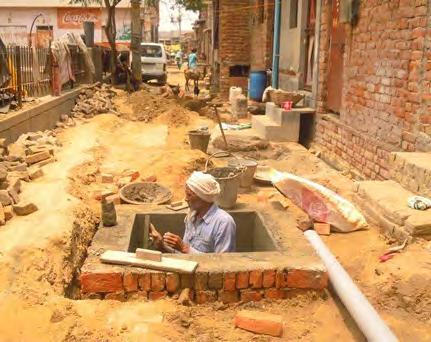
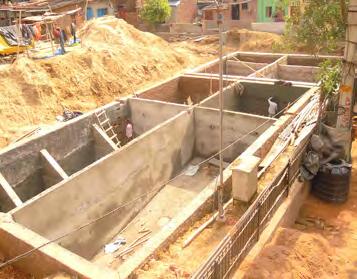
The Potty Project developed by Julia King in Savda Ghevra, India goes a step further from a general urban master plan, and guides individual house upgrades to accommodate a new toilet and connection to the sewer system. This equitable sanitation
system enables 322 different households to add toilets to their present homes whether of pukka (permanent), semi-pukka (semipermanent) or kaccha (temporary) construction. Having private home toilets is a “safer, healthier, dignified and preferred sanitation option to public toilets, especially for women and young girls.”12
The toilets are connected through common shallow sewers running through the existing street network of the settlement to a septic tank linked to a simplified decentralised treatment system. The project succeeded in engaging the inhabitants themselves in the delivery of infrastructure with little technical guidance from the authorities.
Both the projects of Slum Networking and Potty Project, though operating at different scales succeed in improving the overall health and sanitation standards of the settlements they were implemented in without largely altering the built fabric amount of demolition or displacing residents. However, this approach does not support capacity building and enhancing the community since the solutions pertain only to the issues at hand and are not amenable to change. It involves huge monetary investment but does not support cost recovery. Also, given a high density built fabric in context, this retrofitting approach will be a slow and tedious process marking its limitations.
2.4 PRECEDENTS: STRATEGIES FOR INTERVENTIONS IN INFORMAL SETTLEMENTS 34 35 THE DOMAIN RESPONSIVE GROWTH SYSTEM a b c a b c
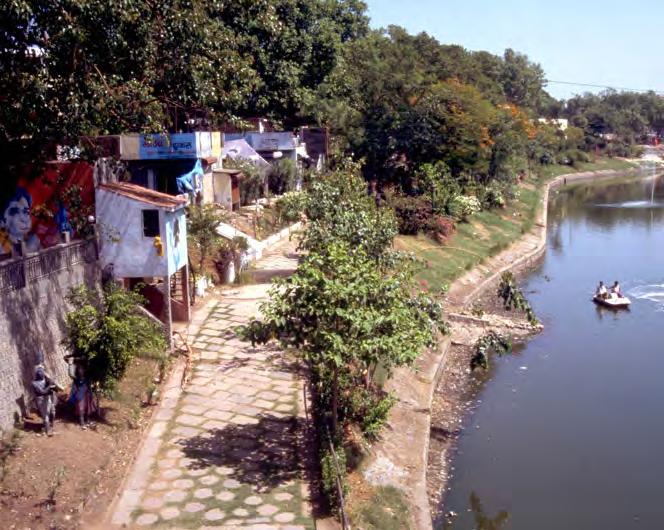
Examples of slum upgrading projects
a.
Buffer green public areas developed as result of Slum Networking in Indore, India.
Source: Aga Khan Awards Website b. & c. Laying of chambers and common sewers and building of the decentralised treatment system as part of the equitable sanitation system developed by Julia King in Savda Ghevra.
Sources: Archdaily and Holcim Foundation
UPGRADED INFRASTRUCTURE
GOVERNMENT REHABILITATION
high rise apartments ‘one size fits all’ structurally safe, but poor maintenance
LOSS OF GROUND CONNECTION loss of ‘informal economy’, live-work environment
INCREMENTAL GROWTH predefined plots with services expansion over time
INFRASTRUCTURE PROVISION upgrading in existing settlement with sewage and water supply provision
PHYSICAL INFRASTRUCTURE
ENABLING GROWTH
POSITIVE NEGATIVE
SYSTEM ENABLING SELF-BUILDING low-tech construction system with community involvement
GROWTH MODERATORS
Though Dharavi’s principle drawback is the problem of sanitation and unhealthy living conditions, the provision of a well-designed habitat and access to clean water and sewage does not necessarily ensure that the successful and active community character will be maintained. The network of social connections, informal work activities and amenability to change are the basic instruments inherent within the community which are essential for its survival.
Thus, in order to improve Dharavi and similar settlements, it is imperative not only to resolve housing and sanitation conditions but also ensure social empowerment, capacity building and adaptability through the process. An incremental housing approach enables this to a point but there is a necessity to allow a certain degree of freedom to respect the social organization of various economic, cultural and professional divisions prevalent in Dharavi and to accommodate the population fluctuation.
Provisions of infrastructure networks and amenity services are equally essential for better functioning of the settlement. These are also important determinants of the settlement’s urban form and influence its growth patterns. Thus, a system needs to be developed where the main infrastructure network not only facilitates individual dwelling connections to ensure minimum health and sanitation in the settlement but also mediates the settlement growth.
A strategy needs to be developed, which is informed by both the approaches of incremental housing and provisions of suitable amenities and upgraded infrastructure in conjunction, so that these two approaches negotiate with each other at different scales ensuring either of the two isn’t too prescriptive or too flexible and potentially address the problems of Dharavi.
2.4 PRECEDENTS: STRATEGIES FOR INTERVENTIONS IN INFORMAL SETTLEMENTS 36 37 THE DOMAIN RESPONSIVE GROWTH SYSTEM
CONCLUSION
Informal urban settlements provide viable models for the integration of live-work spaces and rapid urban growth. However, they also suffer from problems of low living standards and the high rise of population, due to rapid urbanization.
Dharavi’s greatest problem is the poor sanitation and infrastructure provision which affects the daily lives and safety of the community. This is brought about primarily by two factors: first an intrusive incremental growth of self-built structures which eat into open spaces that could otherwise serve the community as multifunctional social space, and which are of poor construction to the detriment of their dwellers’ health and safety; second, the insufficient provision of infrastructure delivering clean water and electricity and which addresses sanitation directly.
At the same time, the self-built character of Dharavi’s urban fabric is fundamental for the adaptive and rapid accommodation of migrant communities, and the formation of household industries which contribute to the economy. By understanding this relationship between social and physical character of Dharavi, this project aims to address the sanitation problem at three scales:
The first is the introduction of a material and construction system of cheap, temporary and semi-permanent housing, which is self-built and enables incremental growth and consolidation over time. This will provide safer structures with better ventilation and access to natural light, addressing the problems of poor habitable environment of individual dwellings and neighbourhoods.
The second is at the cluster scale with provision of community open yards. The distribution of open space respects user generated cluster formation with emergent yards where as deters over building to maintain habitability for the neighbourhood. At the neighbourhood scale, social amenities and an underground infrastructure network for drainage and water supply are provided.
The three scales of insertions will be developed as a strategy for the urban integration of residual sites in which open community yards are laid out, backed up with a skeleton of infrastructure lines of water, electricity and sewerage mains, to which households can plug-in into. The community open space will be informed by the material system in terms of its geometry as well as peripheral placement of structural elements which can initiate growth. These sites will have the potential for accommodating different scenarios of growth over time and allow for the emergence of spaces that are driven by communities’ live-work requirements.
The aim is that through a provision of demarcated open spaces, there can be a negotiation between incremental self-organised growth, informed by the proposed material system, and a pre-established provision of infrastructure and open space requirements. This will improve the urban environmental quality within and around the areas of intervention, while respecting the indeterminate character and community requirements of a fast growing, transient population whose success has been in creating a highly flexible urban fabric that is tailored to their needs.
MODERATORS
Physical infrastructure ensuring habitability Flexibility to accommodate transience & expansion
2.5 AMBITION 38 39 THE DOMAIN RESPONSIVE GROWTH SYSTEM
CRAFT BASED SETTLEMENTS
live-work spaces Flexible spatial usage
growth POOR LIVING CONDITIONS Poor construction Open space encroachment Lack of basic infrastructure SAFER DWELLING PROVISION FOR OPEN SPACE MATERIAL SYSTEM Modular, component based construction system COMMUNITY OPEN SPACE ensuring minimum built-open ratio INFRASTRUCTURE sewage, water supply, electricity PROVISION OF SANITATION DHARAVI
Integrated
Self-building accommodating rapid
1 The current urban population of the world is 3.9 million; United Nations, Department of Economic and Social Affairs, Population Division (2014). World Urbanization Prospects: The 2014 Revision, Highlights (ST/ESA/SER.A/352), p.1
Out of this over 750 million are urban poor; Casanova, M. (2009). Mumbai Dharavi - Scenarios for Development. 1st ed. New York: Graduate School of Architecture, Planning and Preservation of Columbia University, p.13.
2 Fuchs, C. (2003). Co-Operation and Self-Organization. [pdf] Vienna University of Technology, p.13. Available at: http://www.triple-c.at [Accessed 24 Dec. 2014].
3 I.b.i.d., p.2.
4 Majale, M., Tipple, G. and French, M. (2011). Affordable land and housing in Asia. Nairobi: United Nations, p.viii.
5 Mumbai human development report. (2009). [online] Oxford university press. p. 55. Available at: http://mhupa.gov.in/W_new/Mumbai.pdf [Accessed 24 Dec. 2014].
6 Casanova, M. (2009). Mumbai Dharavi - Scenarios for Development. 1st ed. New York: Graduate School of Architecture, Planning and
Preservation of Columbia University, p.13.
7 Turner, J. (1977). Housing by People: Towards Autonomy in Building Environments. New York: Pantheon Books,
8 I.b.i.d., p.51.
9 Casanova, M. (2009). Mumbai Dharavi - Scenarios for Development. 1st ed. New York: Graduate School of Architecture, Planning and Preservation of Columbia University, p.9.
10 Andres, C. and Arcila, C. (2008). Learning from Slum Upgrading and Participation Degree Project SoM EX 2008-18. Kungliga Tekniska Högskolan, p.25-26.
11 I.b.i.d.,p.57.
12 http://worlddesignimpact.org/projects/project2013/29/
REFERENCES 40 41 THE DOMAIN RESPONSIVE GROWTH SYSTEM
3.
METHODS
PHYSICAL EXPERIMENTS / DIGITAL SIMULATION
ANALYSIS / DIGITAL SIMULATION DIGITAL SIMULATION
ANALYSIS / DIGITAL SIMULATION
- geometrical explorations
- material properties
- fabrication process
- material surface treatment
CLUSTER COMMUNITY NEIGHBOURHOOD URBAN GROWTH AMBITION MATERIAL ‘KIT’ OPEN SPACE URBAN INFRASTRUCTURE
- aggregation logic - urban character analysis - urban growth simulation - community open space insertion - urban deployment strategy - time scale of site implementation
The potential of Dharavi lies in its social organisation which is expressed through the self-built character of the fabric. The positive aspect of self-building is absorption of a fast paced growth, negative is the resultant urban fabric which is of poor structural quality and is over built which compromises the habitability standards.
The growth is moderated at different scales of spatial organisation through specific inferences drawn from the urban fabric. The system can be categorised into inter-related parts of a material kit for unit formation, open space allocation and infrastructure access. The method for the research aims to integrate the various parts of the system through a loop of information flow where each level informs the next.
This chapter establishes the various stages of the development of the strategy to moderate urban growth in the context of informal settlements. It also discusses the various tools used in the process of the system development.
44 45 METHODS RESPONSIVE GROWTH SYSTEM 3.1 OVERVIEW UNIT
DATA
DATA
MATERIAL SYSTEM DEVELOPMENT PHYSICAL EXPERIMENTS / DIGITAL SIMULATION
Mechanical properties of cardboard as a construction material will be extracted.
Parameters related to the material behaviour for structural and climatic efficiency will be established.
Fabrication techniques for a low-tech assembly will be detailed.
Techniques will be charted for adaptation of the material system with regards to the incremental growth of the unit.
Existing urban fabric samples will be analysed to extract positive urban qualities and negative characters.
Existing urban fabric, open space hierarchy and street network will be quantified in order to extract the aggregation logic of the settlement.
The samples will be evaluated in terms of network efficiency and climatic performance.
Urban growth simulation techniques like Cellular Automation (CA) and decision trees will be studied as precedent methods for growth simulation.
An algorithm for urban growth simulation combining the existing aggregation logic with material system constraints and habitability standards will be developed.
Experiments with growth simulation will be carried out to check the adaptability of the material system to the existing spatial organisation. These experiments will be evaluated in terms of environmental performance and will inform growth negotiation.
By analysing the social logic and open space hierarchy generated through the growth simulation, the scales for spatial organisation and programmatic drivers will be established.
Community open spaces incorporated with connections for underground infrastructure will be inserted as growth moderators.
A genetic algorithm will be used to create variation of geometries for the open space informed by material and climatic constraints. The developed geometries will be measured by the fitness criteria and categorized into variations based on the social character they can generate.
Cataloguing of residual patches in terms of peripheral context condition quantification will inform the initiation of urban growth.
A multi-phase strategy informed by the programme, spatial organisation and community structure will be developed for distribution of growth moderators. Context specific attractor-based and grid-based rules for distribution of open spaces will be developed to test the strategy on different site scenarios.
The strategy will be detailed at the patch scale (site preparation for an instance) in terms of specificity of community open space variation.
A hierarchical infrastructure network of primary, secondary and tertiary branches will be delineated.
The established strategy will be tested on site by simulating a scenario of urban growth. The potential of the parts of the system in terms of their flexibility and adaptability will be critically analysed.
Additionally, the design will be evaluated with the existing urban fabric and the rehabilitation typology of highrise, in order to compare and contrast the positives and negatives.
47 METHODS
UNIT
DATA COLLECTION DIGITAL
DIGITAL SIMULATION DIGITAL SIMULATION DATA COLLECTION / DIGITAL SIMULATION DIGITAL SIMULATION
DATA ANALYSIS
GROWTH
URBAN
URBAN
SYSTEM IMPLEMENTATION & EVALUATION
RESEARCH DEVELOPMENT SYSTEM DEVELOPMENT COMMUNITY NEIGHBOURHOOD 46 RESPONSIVE GROWTH SYSTEM 3.2 TECHNIQUES
SIMULATION
/
URBAN CHARACTER ANALYSIS
SIMULATION
GROWTH NEGOTIATORS
GROWTH DEPLOYMENT
CLUSTER
MATERIAL TECTONICS STRUCTURAL PERFORMANCE
ENVIRONMENTAL PERFORMANCE
DIGITAL SIMULATION / PHYSICAL EXPERIMENTS
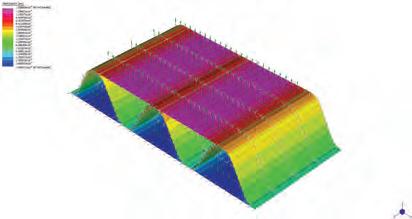
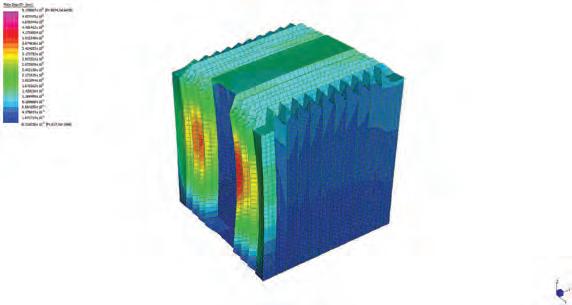
The material’s geometry will be modelled digitally using finite element analysis (FEA) to extract the structural properties of cardboard. This will facilitate the finite element analysis of folded cardboard geometries, by using plane surfaces with attributed thickness and assigned material properties. Digital tools such as Strand 7 shall be used to conduct structural analysis.
Physical models of corrugated cardboard will help evaluate the ease and time efficiency in folding. At the same time, this shall provide information on the actual effect that the values attributed to the geometrical parameters have.
DIGITAL SIMULATION
In order to perform structurally, the cardboard needs to withstand both the live load, as well as the lateral pressure applied on its vertical surfaces by the wind. These loads will be applied digitally with the finite elements method on folded geometry to which cardboard properties have been assigned.
The results will allow for the comparison of the deformation with an allowable range of values. It will help establish the final folding patterns and the range of allowable variations. The differentiated stress of the material in the local parts of the structure is analysed to delineate the parts that require further treatment and support.
DIGITAL SIMULATION
After ensuring a surface’s structural performance, its response to environmental inputs is studied. The manipulation of the pattern’s geometrical parameters and its effect on comfort levels is studied in terms of the levels of natural lighting in the interior, the effect of self-shading on its surface and its response to wind.
The tools that will be used are computational fluid dynamics analysis (CFD) for the response to wind, a daylight analysis to calculate the daylight factor for an overcast sky and the environmental plug-in LadyBug for Grasshopper which runs in Rhino to study self-shading.
ENVIRONMENTAL PERFORMANCE
FABRICATION FOR LOW-TECH ASSEMBLY MATERIAL SYSTEM POTENTIAL

DIGITAL SIMULATION PHYSICAL EXPERIMENTS PRECEDENT EXAMPLES
At this stage the surfaces will be studied in combinations within a range of habitable room dimensions. The environmental performance of these will be evaluated in terms of their response to wind, the daylight factor and the self-shading effect to establish a combinatorial logic. The surface combinations will be correlated with the spatial effects produced.
A unit will be developed with inputs from the social structure of Dharavi and structural and environmental limits set. An evaluation for environmental factors for a unit will reveal the extent to which it’s behaviour corresponds to the target values set and provide inputs for revisions.
A kit of modular components consisting of specialised surfaces like structural and ventilation faces with a range of variations for spatial effects, with a system of standardised connections will be established which will allow for an efficient assembly of a unit.
The production line for the fabrication of the material system components will be established clearly defining the industrial and manual processes involved.
Variations of cardboard treatment for different lifespans of material system will be established through a review of the precedent techniques for construction using corrugated cardboard. This will enable an incremental growth and expansion of the unit with respect to the user needs.
3.3 TOOLS 48 RESPONSIVE GROWTH SYSTEM UNIT
49 METHODS
CLUSTER
URBAN CHARACTER ANALYSIS
PHYSICAL ORGANISATION NETWORK ANALYSIS

DATA ANALYSIS
DIGITAL SIMULATION
Three distinct fabrics will be analysed to extract the principles of spatial organisation at three scales: unit, cluster and neighbourhood. At each scale, the urban fabric is quantified in terms of built-open relationship and open space hierarchy. The dimensions, ratios and physical characters are documented in order to understand the existing diversity in the fabric.
These studies along with the existing network hierarchy for the neighbourhood and an environmental analysis of the open spaces will help identify the characters that need to be retained to inform the urban growth simulation and those which need to be changed or avoided or added to.
Analysis using graph theory will help understand the network hierarchy and its integration in the fabric, establish relatively important nodes and their relationship to the existing use of space. This analysis will be done in order to understand the efficiency of the user generated networks.
The measured quantities are closeness and betweenness centrality. Spatial analysis plug-in Decoding spaces for Grasshopper which runs in Rhino is used for network analysis.
URBAN GROWTH SIMULATION
By understanding the existing aggregation rules, the urban growth will be simulated. An algorithm will be defined which will incorporate inputs from the material system and habitability constraints into the existing community’s aggregation logic. The logic is mapped out in a decision tree, with adjacency rules. Python scripting language in Rhino - Grasshopper environment will be used to write the algorithm.
This will help analyse the material system’s adaptability to generate emergent positive characters existing in the fabric. This tool will also inform the level of interventions necessary to ensure a habitability standard through the designed material system.

The urban growth generated will be analysed for the climatic performance of the open space agglomerations (yards).
This will include outdoor wind flow analysis through computational fluid dynamics using Simulation CFD and the study of selfshading with an environmental plug-in for Grasshopper.
The physical characters of yards in terms of their proportions and geometry along with the inlet and outlet and access points in terms of their widths and distribution will be analysed for their influence on the overall ventilation and the thermal comfort of the outdoor environment.
These analyses will help establish parameters for community open space in terms of their size, access points and extents for cluster formations around them.
3.3 TOOLS 50 51 METHODS RESPONSIVE GROWTH SYSTEM
COMMUNITY
URBAN GROWTH NEGOTIATORS
OPEN SPACE + INFRASTRUCTURE
RESIDUAL SITE STUDY
NEIGHBOURHOOD
DIGITAL SIMULATION
From the parameters established for achieving environmental comfort for open space, a variation of geometries for the community yards will be established.
A genetic algorithm will be used to create this variation within parameters defining the material system and climatic inputs. The produced geometries will be analysed in order to categorise them into variations based on the form generated and their social performance. This will inform their placement relative to the existing context.
A strategy will be developed for an infrastructure network to mediate municipal main line and individual dwellings.
DATA MAPPING
Distinct context conditions will be measured for the existing residual sites in Dharavi to identify their potential of engaging with the existing growth. This will inform new growth initiation in terms of adjacency rules.
The site periphery will be measured in terms of adjacent residential communities and pedestrian routes, amenities and open spaces, accessibility to major roads in order to inform the strategy for distribution of open space and infrastructure.
URBAN GROWTH DEPLOYMENT
STRATEGY FOR DISTRIBUTION
DIGITAL SIMULATION
A multi-level strategy for urban deployment of growth moderators will be defined. This will include preparation of the ground with distribution of the community yards and laying of infrastructure lines and.
The program drivers will be identified with respect to the scales of spatial organisation which will inform the sequential growth logic for large sites.
3.3 TOOLS 52 53 METHODS RESPONSIVE GROWTH SYSTEM
MATERIAL SYSTEM
4.
SOCIOCULTURAL CONTEXT PRECEDENTS CARDBOARD BUILDINGS
MATERIAL PROPERTIES OF CARDBOARD
ADVANTAGES OF FOLDING
CORRUGATED CARDBOARD SHEETS
-Potential building material
-Cheap, low skill and locally available
- Structural durability
- Environmental performance
Sociocultural Context
MATERIAL SYSTEM
EVALUATION
- Habitability
- Spatial variation
SELF-SHADING DAY-LIGHTINGCROSS VENTILATION
DEVELOPMENT OF KIT
-Local production
-Self building
ASSEMBLY LOGICFABRICATIONSURFACE TREATMENT
The material system is intended for a user group consisting predominantly of people who have just migrated to Dharavi in search of work. These migrants arrive with little-to-no money and few belongings; and due to their precarious situation, they prefer to set up their own shelter from cheap scavenged materials. The temporary nature of their dwellings reflects their transient lifestyle, and only if and once they find a foothold in Dharavi do they begin to make more permanent and durable dwellings. It is important to understand this social context in order to develop the material system so that it can be integrated into this scenario and appropriately improve these people’s standard of living. Therefore the material system is developed as a temporary system, but with the potential of an extended lifespan.
For the context of Dharavi, the material system needs to satisfy different requirements. Climatically, it must withstand the heavy monsoon rains. Its fabrication, including any treatments to the cardboard must be cheap and low-tech. For the given social context, the components should be fast to assemble and easy to replace or modify according to the needs of the rapid growing and changing population.
Dharavi’s population is a huge labour force, a majority of whom are skilled or semi-skilled in various crafts and trades. This craftbased culture offers an opportunity for incorporating processes of fabrication of the material system on site with workshops set up for its production and distribution. Such a set-up would provide several benefits: establishing profitable community participation, reducing transportation costs, facilitating distribution and promoting the use of the material system.
KIT OF FOLDED CARDBOARD COMPONENTS
-Modular
-Extended Life spans
-Incremental
56 57 MATERIAL SYSTEM RESPONSIVE GROWTH SYSTEM 4.1 OVERVIEW
4.01
Corrugated
properties.
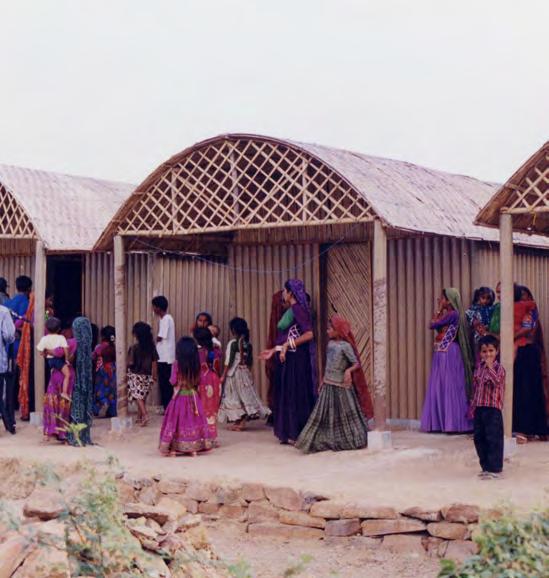
Cardboard as a Building Material
India has an established paper and cardboard production, as well as a corrugated cardboard box manufacturing industry. At Tera Compound in Dharavi, scrap dealers deposit collections of paper and cardboard daily. These are sorted and reworked into smaller cardboard boxes, and are often used as provisional indoor furniture due to abundant availability. Therefore, in terms of material availability, corrugated cardboard sheets, both brand new and for re-use, are easily procured in Dharavi.
Corrugated cardboard is not generally thought of as a construction material owing to its perceived limitations, particularly its vulnerability to moisture and fire; however, it is beginning to gain increasing popularity for its cheap cost, ease of manufacturing, and low environmental impact. Corrugated cardboard is structurally strong and stiff, and is a very good thermal and acoustic insulator. It has a high strength-to-weight ratio, is easy to transport and reuse or recycle, thus providing potential for its application to low-cost and light-weight constructions.
Despite its high strength, applied point loads and mechanical joints can lead to plastic deformation. Exposure to moisture tends to soften the fibres, loosening their bonds and weakening the corrugations, making the cardboard susceptible to tearing. Therefore, its use as a construction material requires certain considerations, such as adding chemicals in pulp production and external impregnation or coating for moisture protection, and
treatment for fire resistance and against biological attacks.
Two prime examples of the use of cardboard as a main building material are Shigeru Ban’s Paper Log Houses1 and Cottrell & Vermeulen Architecture Cardboard Building2. Shigeru Ban’s Paper Log Houses in Bhuj, India, built in 2001, are part of a disaster relief housing project. Based on the earlier prototypes, these units consist of paper tubes lined up together to form walls, with the corner tubes secured by steel rods and plaster of Paris for increased structural stiffness. For protection against rain, the paper tubes are coated with paraffin wax. They stand on rubble foundations, finished with traditional mud floor, and are roofed over with a vault of locally woven cane and a clear plastic tarpaulin (for protection against rain) supported on by bamboo ribs.
The Paper Log Houses are state-of-the-art solutions for cheap lowtech structures. Since paper tubes are inexpensive to manufacture, using small and simple machinery, they are produced on-site, reducing transportation costs. Construction is very quick: one house takes 8 people 2 days to build with no machines. The units are easy to replace or dismantle, and the materials are readily recycled. However, the application of this construction system has so far only been used for temporary relief housing.
The Cardboard Building for Westborough Primary School in West Cliff, by Cottrell & Vermeulen Architecture, also built in 2001, has a projected 20-year life-span. Household cardboard waste was collected and converted into the main building components, which
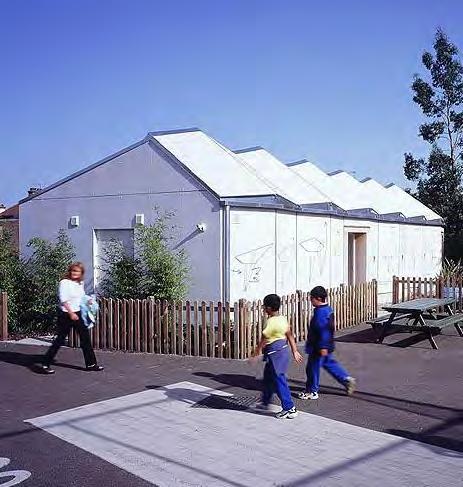
consist of wall panels and tubular support pillars. Cardboard tubes form an internal wall, supporting the timber roof truss; while cardboard tri-wall panels form an external load bearing wall. These 1.5 m by 2 m panels framed in 50 mm timber, consist of 3 layers of 50 mm honeycomb cardboard; each layer separated by a 2 mm layer of solid card and enclosed between two stiff pieces of 6 mm thick cardboard. The multilayered cardboard core provides adequate thermal and acoustic insulation and helps to control moisture levels.
The cardboard is made water resistant by adding a vapour retarder to the pulp while still retaining its recyclable nature; an outer plastic coating with an inner breathing membrane forms a protective layer. The 6 mm outer solid card increases the fire-resistance and minimizes the surface spread of the flame since it chars like timber rather than burning. The panels and tubes are also treated with proprietary flame retardant paint. The structure has been standing for over a decade without any major issues of moisture or fire, in spite of its extensive use of cardboard as a structural element.
Both Shigeru Ban’s Paper Log House and the Cardboard Building in Westborough, explore the potential of cardboard as a building material, tackling its vulnerabilities to enhance its performance. They demonstrate two alternatives to treating cardboard: Ban takes a very low-tech approach which is suitable for temporary use of cardboard, while Cottrell and Vermeulen resolve to a more complex treatment of cardboard to achieve a significantly extended life-span.
Structural Properties of Cardboard
Corrugated cardboard is a composite material constructed from three layers: two flat sheets of Kraft paper with a corrugated flute core in the middle. It is mainly composed of recycled paper pulp, forming disordered networks of cellulose fibres; the bonds between these fibres and their properties determine the overall mechanical behaviour of cardboard which can be altered and adjusted by the amount and type of additives in the pulp as well as the type of fibres.
Cardboard is commonly classified in terms of its flute type, determined by the flutes’ length, radius and thickness. There are four commercially available flute types: A, B, C and E. The geometry of cardboard presents a high level of complexity, owing to the corrugated layer which controls cardboard’s anisotropic behaviour. In order to verify its structural potential as folded modular system, an extraction of its properties is necessary, so that this data can be applied on a simplified digital representation of cardboard.
The material’s geometry is modelled digitally and, using finite element analysis (FEA) to test different load cases, the structural properties of cardboard are extracted. (Consult Appendix for further reference.) This facilitates a finite element analysis of folded cardboard geometries, by using plane surfaces with attributed thickness and assigned material properties.
b corner paper tube column plaster of Paris infill paraffin wax coating steel rod for support plywood cap c tri-wall section 2mm solid card 150 mm 6mm cardboard honeycomb cardboard corrugation to strengthen fibre orientation CD - cross machine direction MD - machine direction a 58 59 MATERIAL SYSTEM RESPONSIVE GROWTH SYSTEM 4.2 MATERIAL TECTONICS CARDBOARD 4.02 Examples of cardboard used as a primary building material. a. Shigeru Ban’s Paper log houses in India Source: Shigeru Ban Architects b. Cardboard building in England by Cottrell & Vermeulen Architecture Source: Buro Happold c. The corner paper tube column used by Ban is reinforced with plaster of Paris infill and steel rods, and coated in wax. The tri-wall section used by Cottrell and Vermeulen consists of multi-layers of different cardboard types.
cardboard sheets are composite materials with anisotropic
4.03
The two folding patterns and their geometrical parameters for structural and environmental variation.
a. Concertina pattern
b. Herringbone pattern
The Advantages of Folding
In architecture, folding is often employed to increase structural strength and produce spatial variations, establishing a relationship between material, geometry and structure. It provides a high strength-to-weight ratio, making it suitable for light-weight structural systems. Folding also has the potential of significantly increasing a surface’s environmental performance, as observed in some organisms such as ribbed cacti3
Existing studies of the microclimate effect of folding inspired by cacti have identified three parameters which influence a folded surface’s environmental performance in terms of self-shading and micro turbulence which enhance surface cooling. These are the fold depth and angle, the phyllotaxis angle (or the angle of torsion), and the complexity of a fold pattern which disrupts the continuity of the ribs.
Therefore for the development of the folded cardboard construction system, two fold patterns are identified which can improve cardboard’s structural and environmental performance: the concertina and herringbone folds. Although the range of folding parameters established for both patterns work within acceptable structural and environmental limits, the concertina folds are optimised for structural performance while the herringbone pattern has a degree of variations for different environmental effects.
Physical Explorations
Physical experiments for foldability inform on the relation between material performance and geometrical folding parameters. They also help to establish some initial inputs for the manual process of the fabrication of folded cardboard components.
A 1:1 scale model of the herringbone pattern is folded, using a twoply (flute types B and C) cardboard sheet of size 0.6 m by 0.755 m.
The folding pattern is comprised of edge lengths of 0.2 m along the flute direction, and edge lengths of 0.4 m at an inclination of 60o to the direction of the flutes, as shown in Figure 4.04.
Manual scoring and creasing of the two-ply cardboard are sufficient for it to be folded with relative ease by two people. Difficulties are faced when folding the edges around the internal vertices, due to a large area of resisting material. Therefore, the minimum edge length of the pattern is restricted to 0.4 m, instead of 0.2 m, to increase the ease of foldability by cutting down on the density of folds at the centre of sheet; this also helps decrease folding time.
Conclusions are also drawn in terms of the angle of the pattern. The 60o angle applied is easily foldable, but some unpredicted creasing occurs around the vertex. Given their small size and number, it is estimated that mechanical creasing can help to avoid the imperfections of the manual creasing. However a minimum angle of 60o is set for the folding pattern.


Digital Testing
Habitability standards for rooms with lengths within the range of 2 m to 8 m set the context in which the material system needs to perform structurally and environmentally. Digital representations of folded cardboard geometries are analysed using finite elements method. (Consult Appendix for further reference.)
To analyse folded cardboard’s structural behaviour, a number of closed room geometries are tested, using both the concertina and herringbone patterns, and applying the cardboard properties extracted from the FEA described in the previous section.
The parameters explored for the concertina pattern are the horizontal folding angle and edge length, and the number of cardboard plies needed to achieve displacements under 5 mm for live loads of 5 kN/m2, and under 15 mm for lateral loads of 1.37e-04 N/mm2. For the herringbone fold, additional parameters considered are the vertical angle and the number and position of horizontal openings.
The range of values explored for these parameters are: 60o to 150o for horizontal folding angles, 200 mm to 700 mm for horizontal edge length, with a maximum structural depth of 250 mm, with 2 to 4 ply corrugated laminations. These values are informed by commercially available cardboard sizes, and are within the range of cardboard’s foldability, as established through the physical experiments.
Conclusions
From FEA, the maximum edge length for different fold angles is established. The laminated folded cardboard performs well structurally in a variety of fold parameters on different room sizes, however, through a multi-objective optimisation with fitness criteria for increased self-shading, deceased number of folds (for material efficiency and ease of fabrication), and increased area of openings (for herringbone folds), the results converge to a preferred horizontal fold angle of 90o and an edge length of 230 mm, for three-ply cardboard (flute types C-B-C). (Consult Appendix for further reference.)
Following this observation, and in order to develop a modular system, these parameters (90o fold angle, 230 mm edge length and three-ply cardboard) are selected to further develop the material system, with an additional option for the herringbone pattern to have a horizontal fold angle of 127o with an edge length of 360 mm. These two sets of parameters are compatible with one another for both concertina and herringbone folds, ensuring the modularity of the system is maintained.
Owing to live loads on the floor, flooring components need a five-ply thickness, due to the use of simple concertina folding. For reasons of habitability, further developments of the material system are carried out with room lengths in the range of approximately 3 m to 4 m.
4.04
1:1 model of cardboard component folded in the herringbone pattern in two positions: a. and b.
From this physical model the degree of foldability and the maximum density of folds is established for two-ply cardboard.
4.3 GEOMETRY EXPLORATION 60 61 MATERIAL SYSTEM RESPONSIVE GROWTH SYSTEM a b = horizontal angle = edge length = vertical angle = position and number of openings a a o a a v o b a = horizontal angle = edge length ah a STRUCTURAL FOLDING
4.05
The variables explored in the herringbone pattern allow for the manipulation of the internal microclimate, while also relating the pattern to human proportions.
A variety of spatial qualities are needed for different household activities. A live-work space in which most of the day-time activities take place, requires high indirect natural lighting (i.e. a daylight factor, DF, between 2.5% and 8%), as opposed to private space, used for evening family gatherings and sleeping (0.5% to 2.5% DF). Cross-ventilation is needed to maintain thermal comfort. Social spaces and work yards need higher ventilation (an air flow of around 2 m/s) due to higher occupancy while private spaces need a minimum of 0.5 m/s. This distinction between different spaces in a residential unit helps to establish a gradient of environmental requirements based on associated room activities.
Interior environmental variations can be achieved by manipulating the folding parameters to control microclimate. After establishing the range of folding parameters which work structurally for herringbone folded surfaces, these are analysed for self-shading cross ventilation and natural lighting, to determine the percentage of openings and vertical angle limits in order to achieve minimum indoor comfort levels.
The advantage of the herringbone pattern over the concertina fold is its ability to incorporate openings for natural cross ventilation and sunlight access in the faces which receive least direct solar radiation, enhancing the climatic and environmental performance of the material system.
A variation in interior environments, informed by the type of activities held within a space, is a necessary requirement to improve the habitable quality of self-built spaces in Dharavi. It is also an advantage of the folded material system produced: that small geometrical variations at the surface scale can have significant effects on the interior space they enclose, particularly in terms of enhancing cross-ventilation and indirect natural lighting, as well as in terms of exploiting self-shading to decrease the amount of heat transferred to the interior from outside.
The proportions of the folding parameters explored are related to the human scale and the social context. By modifying the distribution of openings across a surface, visual connections can be enabled (or prevented for reasons of privacy) between different eye-levels on opposite sides of a surface, while maintaining good levels of thermal comfort.
Also, the geometry of the herringbone pattern facilitates rainwater runoff from its surface, protecting openings. The pattern enables to the incorporation of larger folds at the top of the surface to act as overhangs - thereby not only protecting the remainder of the surface from harsh sun and rain, but also offering shelter for passersby, contributing to the outdoor microclimate, particularly in the case of streets and smaller open spaces.
4.3 GEOMETRY EXPLORATION 62 63 MATERIAL SYSTEM RESPONSIVE GROWTH SYSTEM ah w n a v f Depth of space / Enclosed volume 600 900 1800 = horizontal folding angle = width of fold = number of vertical folds = vertical folding angle = edge length = open faces ah w n a v ENVIRONMENTAL AND SOCIAL ADVANTAGES OF FOLDING
4.06
Changing variables in herringbone folded surfaces enables the micro-climatic control of interior spaces, particularly in terms of natural lighting, ventilation and solar heat gain. This is an analysis gird for a DF simulation for an arrangement of rooms with different folded surfaces, around an open space; it shows the gradient of lighting levels that can be achieved for different activities.

Self-shading Analysis
Self-shading is important for the reduction of thermal gain due to solar exposure. In Mumbai, East- and West-facing surfaces receive higher radiation than South-facing surfaces, while the North orientation receives the least amount of direct sunlight.
By analysing the radiation exposure for herringbone folded surfaces with an East-facing orientation for the month of April, the hottest month of the year, it is concluded that faces receiving less than 20 kwh/m2 of radiation can be converted into openings. (Consult Appendix for further reference.) For structural stability, two consecutive faces cannot be opened; this means that a maximum of 20% of the total faces can be made into openings for a surface.
The radiation analysis also informs on the most suitable orientation for a given surface, in order to cut down on heat gains. Steeper vertical angles of 30o and surfaces with a higher number of vertical divisions receive less direct solar radiation. It is concluded that they are therefore suitable for West or East-facing orientations. Surfaces with less vertical folds or with less steep vertical fold angles are more suited for North or South-facing orientations, which are less exposed to direct sunlight during the dry season.
Combinatorial Logic
As mentioned earlier, a multi-objective optimisation is performed on the possible folding pattern variations with fitness criteria for increased self-shading, deceased number of folds, and increased area of openings. Five generations of ten individuals each are produced. Although the later iterations of the optimisation give convergent results, which are used to standardise certain parameters of the folding patterns, the experiment produced a large degree of variation of surfaces with the herringbone pattern, in terms of vertical divisions, self-shading, location and area of openings, and fold width and horizontal angle.
To facilitate the analyses, the surfaces are categorised into five variations based on the absolute area of openings and their distribution on the surface, since this affects the natural light levels and cross ventilation in the space. The area of opening is classified into low (less than 1.5 m2), medium (1.5 m2 to 2.7 m2) and high (above 2.7 m2). The location of openings considers if they are placed entirely below or entirely above 2.1 m, or scattered across the whole surface. In order to move from the surface scale to the room scale, seven test cases are analysed with pairs of surface variations assigned to opposite walls of a 3.4 m by 3.4 m room; their environmental performance is evaluated based on the degree of environmental requirements for a given room and the activities it could house. This leads to a combinatorial logic for application of different folding variations in a single room for a desired spatial use.
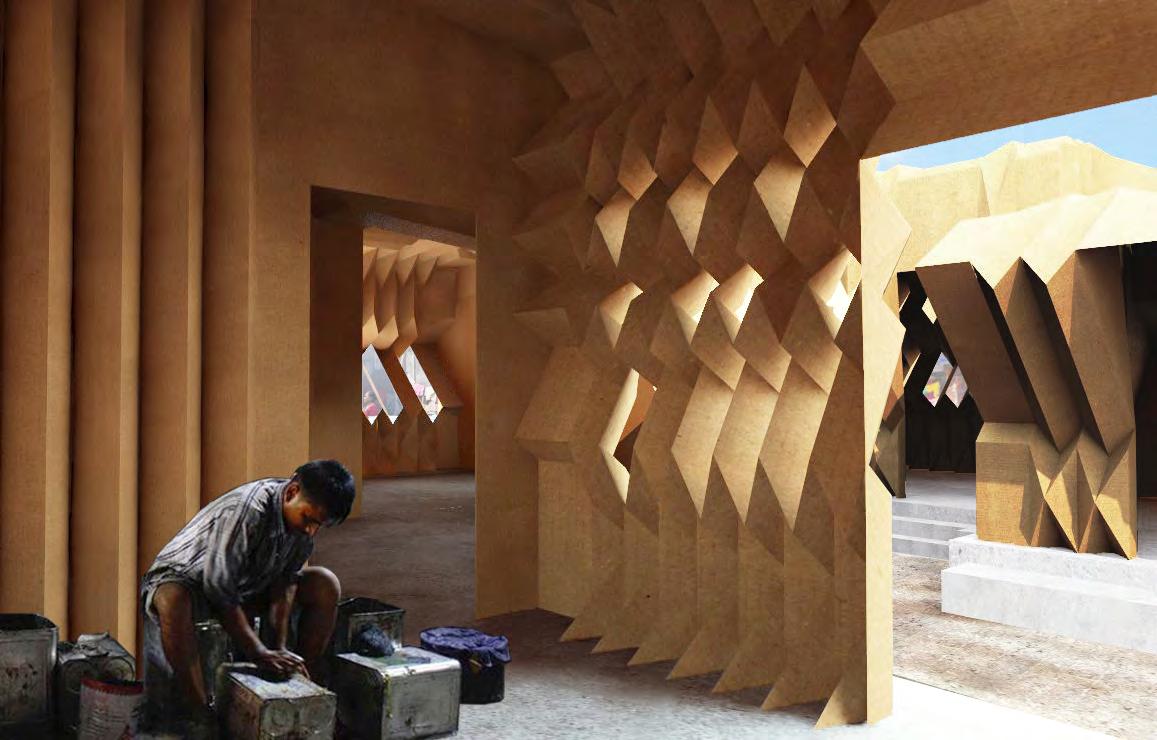
Cross Ventilation
Wind speeds in Dharavi can reach a velocity of 15 m/s during the monsoon season. For each test case, two opposite wind directions are applied, perpendicular to the surfaces with openings at wind speeds of 5 m/s and 15 m/s. (Consult Appendix for further reference.) The distribution of openings across the input and output surfaces affects air flow, while the area of openings affects air velocity.
From the CFD analysis it is concluded that a distribution of medium openings in the lower part of the surface coupled with a scattered distribution of large openings, produces a smooth airflow across the interior, suitable for live-work spaces. The smaller inlet area with a larger output area has a dampening effect on wind speeds; this should be taken into consideration for orientations towards strong wind speeds.
Combining surfaces with a small area of openings in the upper and middle sections tends to produce turbulent airflow, although the airflow is drastically reduced. The high dampening effect and the fact that the turbulence produced is at wind speeds of under 2 m/s, makes this surface combination suitable for private spaces, which are used during the night-time when the air temperature is cooler.
Inlet and outlet surfaces with scattered openings produce adequate interior wind speeds for thermal comfort. This combination is appropriate for both live-work spaces and private spaces, especially those facing strong winds, since the dampening effect is sufficient to avoid the creation of gusty interiors.
Daylight factor analysis
For each case, the distribution of daylight is calculated for work planes at 400 mm and at 800 mm from the interior floor level, for tasks performed when sitting on the floor and at tabletop height. (Consult Appendix for further reference.) The models are set up within a 4 m wide street context.
The results are categorised on the basis of daylight distribution. Although the established target range of day lighting values is between 0.5% and 8% DF, a good distribution is one in which most of the analysis grid receives a day light factor above 48%; test cases with a good distribution at both 400 mm and 800 mm from the floor level are suitable for live-work spaces. These lighting levels are achieved by combining surfaces with a high area of openings, distributed in the lower section of the surfaces or scattered across the surfaces.
A fair lighting distribution is one in which most of the analysis grid receives a daylight factor above 16%. This is the case of surface combinations with medium to low area of surface openings, which produce either a good distribution at 800 mm and a fair distribution at 400 mm, or vice versa. Such rooms are suitable for living spaces, but are insufficiently lit to perform manual work. Poor distributions receive light below 16% DF, making them suitable for private rooms in which not a lot of light is needed, or to maintain visual privacy, if the room overlooks a large yard or street. Following these studies, the surfaces are tested on an aggregation of rooms around an open yard, providing a more realistic context for analysis.
4.3 GEOMETRY EXPLORATION 64 65 MATERIAL SYSTEM RESPONSIVE GROWTH SYSTEM 0.00 80.00 Daylight factor % Level: 0.40 m 1 2 3 Opening distribution No. of divisions Opening area 1 3 2 CLIMATE CONTROL 4.07 Visual representation of the light levels in one of the live-work spaces, and surface self-shading, from the room aggregation shown in figure 4.06.
4.08
The kit of parts if composed of five elements with standardised connections for efficiency of assembly.
Modular Components
Following the studies investigating the structural and environmental performance of folded cardboard elements, the material system is further refined as a complex kit of parts, with each element modified to enhance its structural or environmental performance. The final set of components is composed of five elements: a floor, structural columns, structural walls, ventilation walls and a roof.
The floor, consisting of a concertina folded surface, infilled with sand and covered with a five-ply cardboard sheet, is supported by a 200 mm brick plinth. Once the structure is in place, the plinth is finished with a layer of cement screed. This construction of the plinth in brick facilitates the option to make modifications to the plinth over time to accommodate room extensions or additions. The plinth can also be extended to serve as a semi-public space for display of goods in the case of a shop, or as a space for neighbours to socialise and children to play.
Corners with a folded cavity are supported on brick foundations, within the plinth. The corners support the walls through the implementation of a friction joint, thereby avoiding mechanical joints, which could tear the cardboard, or adhesive, which would restrict the ease of surface replacement in the event of surface damage or change in user requirements. The corners are the principal structural element of the material system; they can be constructed from either cardboard or plywood, for increased durability. To improve structural performance, the cavity can be infilled with clay (a readily available material in Dharavi).
Structural walls consist of two concertina folded surfaces attached back-to-back to create a series of cavities. The cavities are infilled with clay, similarly to the cavity in the corners, to increase the structural strength and thermal mass of the structure.
The ventilation walls are folded cardboard surfaces with the herringbone pattern, accommodating openings for ventilation
and day-lighting. Unlike the other elements in the kit, the ventilation faces consist of surfaces with a range of variations of the herringbone pattern in order to produce different indoor environmental effects according to the user’s requirements, as discussed earlier. These geometrical variations in the ventilation walls create complexity in the kit; however, through the standardisation of certain parameters, which ensures compatibility of all variations with the remainder of the material system components, and the development of a low-tech fabrication process (which will be discussed next), the implementation of this material system in Dharavi is deemed feasible.
The roofing element consists of a concertina folded surface, similar to the floor element. It is attached to the walls for watertightness, at an inclination of 5o for fast rainwater runoff during the monsoon season.
Assembly logic
The order of assembly for a unit would be as follows: first the columns are set up on brick foundations; the brick plinth is then constructed and the flooring is laid; the walls are then slotted into the corners with an overlap with the floor to prevent water entry. The walls of a room will consist of two to one ventilation walls, with the remainder being structural walls; two ventilation walls are preferred to enhance cross-ventilation, but given the small size of the rooms (between 9 m2 to 16 m2 and their interconnectivity, adequate ventilation should be achieved with a combination of two or one ventilation faces per room. Finally the roof is placed and the plinth is finished in screed.
Each cardboard surface is composed of cardboard sheets assembled together using adhesive, prior to the assembly of a room. The fabrication process for producing folded surfaces from these standard sheet sizes is discussed next.
4.4 MATERIAL SYSTEM DEVELOPMENT 66 67 MATERIAL SYSTEM RESPONSIVE GROWTH SYSTEM 1 Plinth with cardboard floor Brick Sand filling 2 Corner joint Timber/ cardboard Brick foundation 4 Ventilation surfaces Variation based on spatial usage 5 Roof 5 inclination for water runoff Clay-infilled cardboard 3 Structural surfaces 3 4 5 2 1 COMPLEX KIT OF PARTS
4.09
The production line for the fabrication of the material system components.
1 Lamination
Industrial process
- Production of 3-ply cardboard
2 Creasing and Cutting
Manual process
- Folding pattern is creased onto sheet using metal profiles
- Excess material and opening are is cut out
3 Folding
Manual process
- Folding time for two people per sheet circa 2 minutes
- Timber moulds can be used to facilitate the folding of herringbone pattern
The fabrication process for the production of the cardboard components is broken down into 5 steps. With the exception of the first step, the process can be performed manually with few tools and little expertise. This enables a possible scenario of on-site fabrication, where small workshops can be set up in Dharavi for the production and distribution of the material system.
The first process is the lamination of cardboard; as discussed earlier in this chapter, the components need to be made from threeply cardboard. This can be procured from a mainstream industry as it is a commercially available material.
Cardboard sheets come in standard sizes of 1.2 m by 1.5 m, or 1.6 m by 1.6 m. These sheets need to be assembled into the component surfaces. However, owing to the size of the final components, to facilitate fabrication, the individual sheets are treated as surface sub-components and are only assembled into
4 Surface Treatment for waterproofing
Manual process
- Wax dipping for temporary lifespan
- Clay application for semi-permanent lifespan
5 Assembly Manual process
- Gluing sub-components along overlapping areas
the final components at the end of the production line.
The folding patterns are creased onto the individual sheets using metal edges shaped in the different profiles of the folding patterns. An area for overlap with adjacent sub-components is left along the edges of the sheet, of around 200 mm from the edge. Any excess material or openings (in the case of the herringbone pattern) are cut out. To reduce material waste, the proportions of the folding patterns are also informed by the available cardboard sheet sizes.
The individual sub-component sheets are then manually folded. From the physical folding test described earlier in this chapter, it takes around two minutes for two people to fold a full sheet in the herringbone pattern. Although manual folding of creased cardboard is relatively easy, tools, such as timber moulds could aid in the folding process particularly for the more intricate herringbone folds.
Before assembling the sub-components into the different
components, they are treated to be made waterproof and fireresistant. Two variations of the treatment are devised for cardboard to create different lifespans of the material system: a temporary lifespan using polymer waterproofing and fire retardant; and a semipermanent treatment using clay. In this way, the material system is made adaptable, to respond to the social context. Both processes are discussed in detail later; however they both employ low-tech manual processes using locally sourced materials.
The cardboard sub-components are assembled into their respective components using an adhesive, such as PVA or wood glue, which provides a weather-resistant connection. The adhesive is applied on the area of overlap between sub-components. Joints are devised for horizontal and vertical sub-component connections, to prevent water entry (refer to next page joint details); the double layer of overlapping material at intervals across a component’s surface will also serve as ribs which add structural stiffness to the components.
4.4 MATERIAL SYSTEM DEVELOPMENT 68 69 MATERIAL SYSTEM RESPONSIVE GROWTH SYSTEM
mountain folds valley folds area of overlap / gluing above area of overlap / gluing below
LOW-TECH FABRICATION

70 71 MATERIAL SYSTEM RESPONSIVE GROWTH SYSTEM 3.00m Scale 1:50 4.00m 0.20m 3.50m a b c d 5-ply cardboard flooring 3-ply folded cardboard sand infill waterproof membrane gravel infill cement screed brick plinth adhesive single-ply surface joint detail corner tongue-and-groove friction joint wall surface tongue-and-groove profile clay infilled cavity 1 2 3 4 5 6 7 8 9 10 11 12 DETAILS
Section through a two-room unit and details of assembly. Detail a.1: Vertical connection between cardboard sheets on a folded surface. Detail a.2: Horizontal connection between cardboard sheets on a folded surface. Detail b: Tongue-andgroove friction joint between wall surface and corner. Detail c: Infilled floor. Detail d: Plinth.
4.10
As part of the manual fabrication process, prior to the assembly of the folded cardboard sheets into the material system components, the cardboard needs to be waterproofed and treated with a fire retardant.
Two surface treatments for the cardboard sheets are developed: a temporary treatment and a semi-permanent treatment, which enable rapid and adaptable urban growth while maintaining some standards of safety. These treatment processes are informed by Shigeru Ban’s Paper Log Houses and the Cardboard Building by Cottrell and Vermeulen, discussed earlier in this chapter. These two precedent examples offer insight on possible cardboard treatments and their projected lifespan. Inferences from these are adapted to Dharavi’s context in terms of available materials and technologies.
The temporary surface treatment for cardboard involves applying an undercoat of fire retardant paint, after which the cardboard is waterproofed with a thick coat of locally sourced rice bran wax, which has a high melting point (77oC). The wax is applied by dipping the cardboard in it; the immersion process is repeated until a thick coat of wax is obtained. The exact required thickness of the wax layer needs to be verified through empirical testing, however, it should be of a thickness that can withstand two consecutive monsoon seasons. The wax coating will also protect the cardboard from biological attack. The two-year lifespan covers the projected time it should take a newcomer to Dharavi to find employment and earn enough income to afford a more durable housing solution, either in the same location or elsewhere.
The second type of cardboard treatment creates a more durable coating using clay, a material which is readily available in Dharavi. This surface treatment has the potential of offering a longer projected lifespan of the structure of five to ten years (although
this should be verified with empirical testing, it is a precautious estimate, since Cottrell and Vermeulen’s Cardboard Building has been standing for over a decade because of an effective weatherproofing of cardboard). A fibrous material, such as jute fibres, is applied on the cardboard surface with adhesive, onto which clay is applied and left to sun-dry in a process similar to the production of sun-dried bricks. The fibrous layer creates a rough surface finish for the clay to adhere to, but it will also contribute to strengthening the cardboard, particularly against tearing. This procedure slightly alters the fabrication process, where the surface treatment is performed after the component assembly, rather than before it, as in the case of the temporary treatment.
Different clay consistencies can be used for the different cardboard elements, depending on the degree of structural strength desired: for corner elements, which are subject to compression when an additional floor is added, a stronger clay mix might be preferred than that for ventilation faces, which are not load bearing. The sundried clay coating will provide protection from the rain and increase fire resistance. It has the potential of improving the structural performance of the material system, and its semi-permanent lifespan promotes vertical extensions of units due to a longer occupancy period during which a family can grow.
This semi-permanent variation of the material system would be used by families who are beginning to settle in Dharavi, possibly forming new small work communities. It is intended for people who are in transition between newly arriving to Dharavi and setting up a permanent dwelling and occupation. It offers the same flexibility and adaptability for expansion as the temporary version, however the increased durability and extended lifespan gives the occupant sufficient time to become financially stable enough to be able to invest in a more permanent construction.
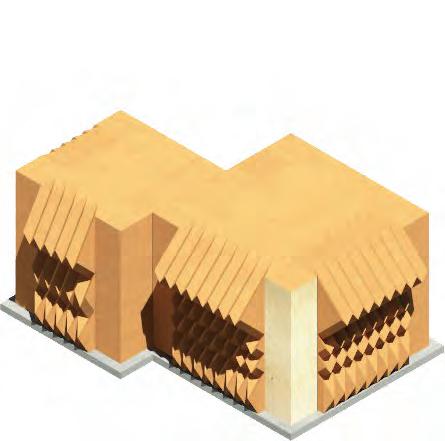
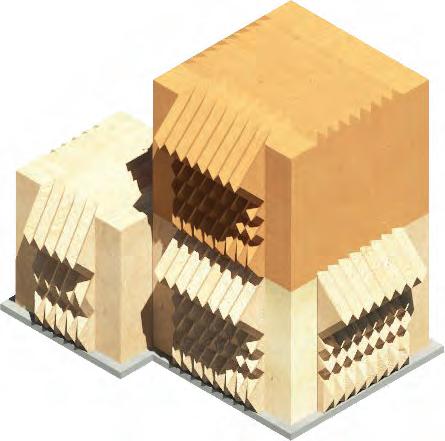
4.5 MATERIAL SCIENCE POTENTIALS 72 73 MATERIAL SYSTEM RESPONSIVE GROWTH SYSTEM Temporary Cardboard Construction 2 year lifespan 3-ply cardboard Flame-retardant paint Waterproofing thick coat: rice bran wax (melting point 77°C a Semi-permanent Cardboard Construction 5 to 10 year lifespan 3-ply cardboard Layer of jute fibres (as sub-layer to clay) Clay rendering for improved structural behaviour, waterproofing and flame retardant b SURFACE TREATMENT 4.11 Variations of cardboard treatment for different lifespans of material system, enabling incremental growth and expansion. a. Temporary cardboard construction around a plywood corner. With this treatment, the cardboard has an estimated lifespan of two years. b. Semi-permanent cardboard construction with a vertical extension in the temporary variation. The semipermanent treatment extends the material system’s life span to 5 to 10 years.
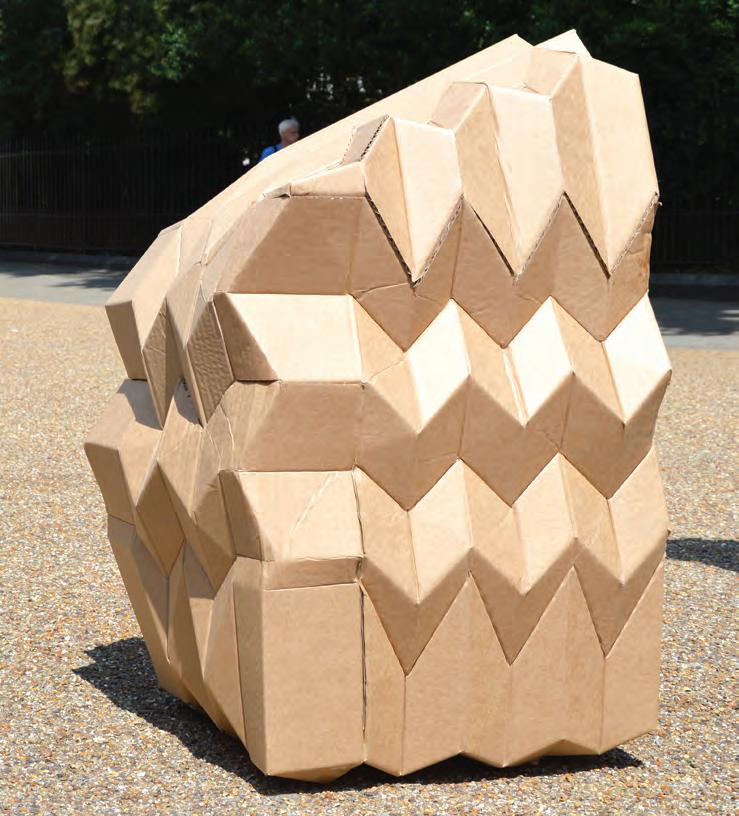
The material system targets the problem of sanitation at the unit scale: providing safer materials and construction methods, and improving the microclimate. However, for its integration into the existing urban context of Dharavi, it must also address the sociocultural character of its intended users. It does this in two ways.
The simple, modular assembly together with the temporary and semi-permanent treatment give the material system a temporal nature which can be adapted for transient migrants or for incremental unit growth, to accommodate family expansion in a similar way as observed in the existing fabric.
The fabrication process is low-tech, relying on manual operations with very few tools; and cheap, using locally sourced materials and labour. This aspect can aid in the actual implementation of the material system through the setting up of workshops inside Dharavi, in which the components are fabricated.
However, for a holistic effort for urban improvement, the potential for implementation of the material system must be integrated in the urban-scale strategy for the deployment of community open spaces and infrastructure, which will be discussed in detail in the following two chapters.
4.6 CONCLUSION 74 75 MATERIAL SYSTEM RESPONSIVE GROWTH SYSTEM
4.12
Physical model of an early cardboard prototype in the herringbone pattern
(Scale 1:5)
1 Ban, Shigeru et al. (2009). Shigeru Ban. New York: Rizzoli International Publications.
2 Ayan, Ö. (2009). Cardboard in Architectural Technology and Structural Engineering: A Conceptual Approach to Cardboard Buildings in Architecture Doctor of Sciences, ETH, p.16.
3 Goff,D. , Jirathiyut, T. Koerner J. , Yu S. (2011). Saguaro cactus, Biomimetics Studio, Emergent Technologies and Design, Architectural Association, p.2.1-3.4.
REFERENCES 76 77 MATERIAL SYSTEM RESPONSIVE GROWTH SYSTEM
5. URBAN GROWTH STUDIES
URBAN SPATIAL CHARACTER ANALYSIS
URBAN CHARACTER ANALYSIS
-Urban fabric quantification
-Built-open relationship
-Open space hierarchy
-Street network (geographical)
-Network analysis
-Climatic analysis
URBAN GROWTH SIMULATION
-Urban growth prediction techniques
-Growth algorithm
-Simulation experiments
-Environmental parameters
RULES FOR COMMUNITY OPEN SPACES INSERTION
URBAN DEPLOYMENT STRATEGY
As part of the ambition to develop an urban deployment strategy that can generate an improvement in the urban fabric of Dharavi, an in-depth analysis of the different existing urban spatial characters must be carried out. From such an analysis, more accurate conclusions can be drawn on the positive urban qualities, which should be facilitated by the strategy, and the negative characters, which need to be moderated.
Following these studies, an algorithm for urban growth simulation can be set up, informed by the existing spatial logic and with inputs from the material system, described in the previous chapter. The simulations generated can be studied and compared to the existing counterpart to verify similarity in the relationships of built and open spaces. These experiments also inform on the contribution of the material system to the urban character.
As part of the urban deployment strategy, community open spaces will be inserted in residual sites to act as growth generators and moderators. From an analysis of the simulations, conclusions can be drawn which will inform on the spatial characters required for these new community open spaces, in order for them to be successful both socially and climatically.
80 81 URBAN GROWTH STUDIES RESPONSIVE GROWTH SYSTEM 5.1 OVERVIEW
Open space used as a work-place
a. Drying of food - food processing industry
b. Broom-making from palm tree leaves

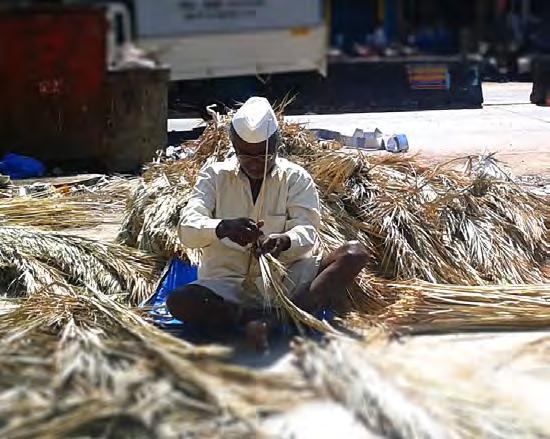
Dharavi’s self-built urban fabric is a result of the social interaction among people. As with other craft-based settlements, people dealing in a similar trade or those with similar beliefs tend to cluster together. Analysing the urban fabric gives an understanding of the influence of social organisation on the physical urban character.
Open space is most essential in Dharavi, economically as well as culturally and climatically. A lot of production based activities are carried out in open space: the hot-humid climate with distinct wet and dry seasons, makes shaded outdoor space comfortable to work in. The dwellings’ semi-open plinth extensions onto yards and streets is a place for socialising for the community.
Despite their importance, open spaces are most susceptible to encroachment which is one of the major contributors to the problem of sanitation in Dharavi. Narrow streets coupled with open drains cause flooding due to water clogging; and lack of light and ventilation affect indoor habitability.
Studying the organisation of these open spaces, their relationship with the built, the spatial porosity of their edges and their
relationship to the network demonstrates the privacy hierarchies, accessibility and network character.
Three distinct fabrics are analysed and the principles of spatial organisation are extracted at three scales: unit, cluster and neighbourhood. Sample A is an example of a work-based community of potters. The community has expanded over time since 1932, when it was set-up. The open yards, used as work spaces, are important economically and the community has managed to preserve them. Sample B is an example of a predominantly residential community. It is considered to be a safe community and has strong social networks. Sample C is an example of a highly dense fabric, over-encroached with poor spatial qualities.
The dimensions, ratios and physical characters of open spaces are documented in order to understand the existing diversity in the fabric. These studies along with an environmental analysis of the open spaces help identify the characters that need to be retained, to inform the urban growth simulation, and those which need to be changed or avoided or added to the urban deployment strategy.
82 83 URBAN GROWTH STUDIES RESPONSIVE GROWTH SYSTEM 5.2 URBAN CHARACTER ANALYSIS CRAFT-BASED AGGLOMERATIONS
5.01
b a
Sources: Melanie Belore, Revan Sidhu
5.02
Map of Dharavi with location of the samples studied
5.03 opposite page
Land-use map of samples studied.
Sample C, AGK nagar
Sample B, Muslimnagar
Sample A, Potter’s quarters
Measuring the built form in terms of the land-use distribution helps understand the prevalent aggregation relationships. The built-toopen ratio helps in identifying the prevailing open space variation relative to each fabric.
The residential units are differentiated into three categories: units with people involved in informal work, units with a manufacturing set-up and units owning shops and selling this produce. All three fabrics have a heterogeneous mix of residential units, with varying ratios. However, it is noted that units with similar kind of activity cluster together into micro-communities.
Analysis
The built fabric adjacent to major streets houses commercial activity. In the potters’ community (sample A), open spaces are used for making and drying of pots with yards shared between four adjacent units. This results in an emergent pattern of continuous open work corridors. Sample B is mostly residential; here too there is a prevalent pattern of units clustering around open spaces. However the open spaces are smaller with a higher degree of privacy than those of the potters.
The overall built-to-open ratio is similar in all three cases; however if the area of the school playground is deducted from sample C, the shared open space drops from 36 percent to 20 percent, and there is a complete absence of clustering around open space. One of the reasons for this could be the nature of work carried out in this sample: textile units of sewing and embroidery, which prominently occupy indoor spaces. The open space consists mostly of streets flanked by residential units on both sides. Due to horizontal extensions of these units, the streets have been transformed into long narrow alleys.
Conclusion
As a community grows, the fabric organises itself around on the requirements related to the specific demographic profile. However, there is a need for moderators which can support and regulate this growth. Since open space is a useful sociocultural asset, a system can be devised which enables user generated yards to emerge while deterring over-building and open space encroachment. It is important to note that any open space which serves as a useful resource to the community will avoid being encroached upon. The relationship between built and open is studied in further detail at the cluster scale by zooming into different tissue sub-samples.
84 85 URBAN GROWTH STUDIES RESPONSIVE GROWTH SYSTEM 5.2 URBAN CHARACTER ANALYSIS 020 100m N Type of community Area of patch Built Open Open area / dwelling No. of storeys (min) No. of storeys (max) Live-informal work Live-manufacture Live-retail Built up / dwelling Population Density (estimated) 44,232 28,955 (65%) 15,277 (35%) 10.9 1 2 376 (27.1%) 837 (60.2%) 177 (12.7%) 19.1 10,000 226,080 18,994 13,003 (68%) 5,991 (32%) 5.2 1 2 974 (84.7%) 59 (5.1%) 117 (10.2%) 12 5,000 263,241 17,183 11,074 (64%) 6,109 (36%)* 4.1+ 1 2 312 (36.4%) 452 (52.7%) 93 (10.9%) 10.1 3,200 248,988# m m m m floor floors no. no. no. m people ppl/km2 SAMPLE A SAMPLE B SAMPLE C UNITS VALUE Potters’ colony Predominantly work-based: pottery, whole family is involved Predominantly residential with informal work Clusters of live-huts and live-manufacture units Muslim nagar AGK nagar *6,109 m [3546 (network and common open space) + 2563 (open playground outside school)] + open playground is excluded # area of school and playground excluded from density calculation; A1=12,852 Source of data: Ohlsson, Helena. 'Gendered Spaces'. Masters. Blekinge Institute of Technology, 2013. p. 82-108
live-huts (informal work) amenities brick kiln industrial units SAMPLE A SAMPLE B SAMPLE C URBAN FABRIC QUANTIFICATION
live-retail huts live-manufacture huts
5.04
Two prominent yard characters in two of the oldest quarters in Dharavi.
a. Work-yards in the potters’ community (Kumbharwada)
b. Social yards in the fishermen’s community (Koliwada). These yards host a multitude of activities: drying of laundry, drying of processed food & socialising.
5.05
opposite page, from top to bottom
Key plan with location of clusters,
Spatial use, Built and porous edges of the open space
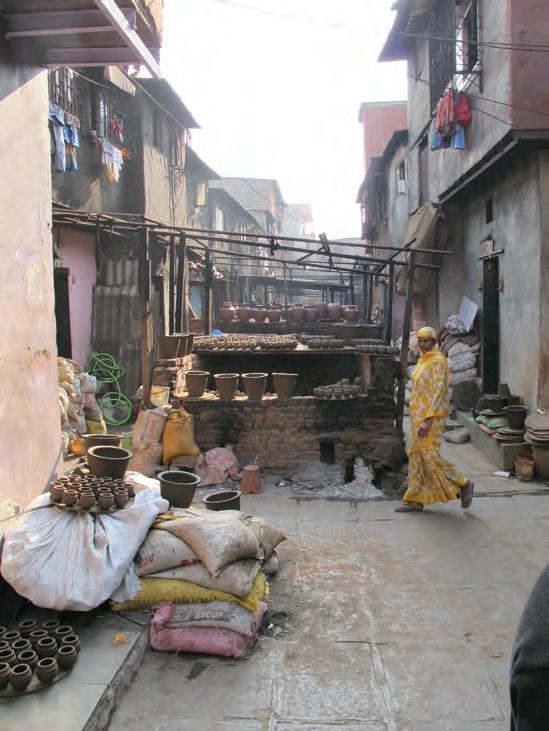
Sources: Ronni Hendel-Giller, Luke W Perry a b
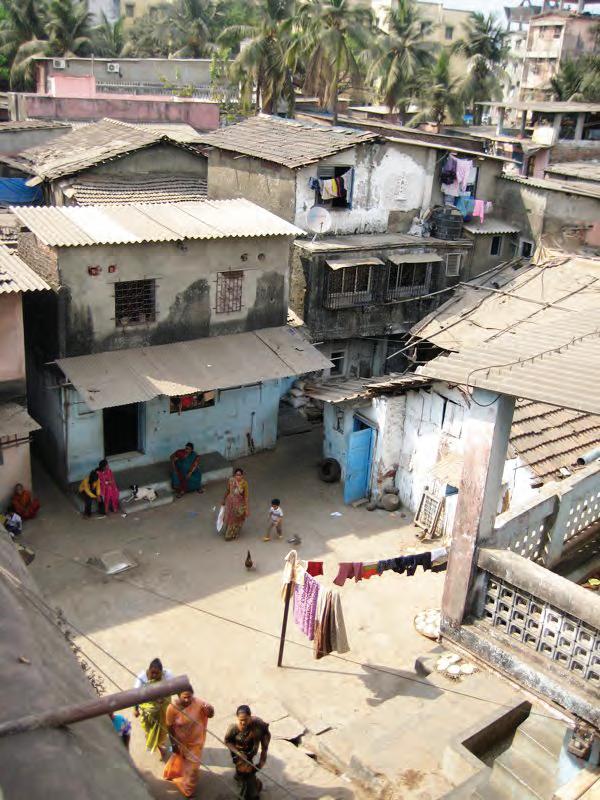
Clusters of 20 to 40 units along with their surrounding open space from the three samples are analysed. Distinct examples are chosen to study the variation existing in terms of clustering. The samples include a live-work cluster of families involved in pottery making, a residential cluster with social yards and a mix of manufacturing and residential units. The primary intention of this analysis is to identify the existing variations and quantify the open spaces in terms of their size, privacy hierarchy, relationship to the built and access points.
The open spaces in manufacturing clusters are categorised as work yards, since these house production activities. Those with residents involved in informal work have a functional overlap of activities where-in women use it as a work space, children as a play area and elders as a social space, these are categorised as social yards.
Analysis
Work yards are bigger than social yards. In case of work yards, a continuous corridor of shared open space is formed, with built units on either side. In case of social yards, the yard is shared between four to six dwellings, thus enclosed by built structures on three or four of its edges.
All yards are well connected to the surrounding fabric, each of them having at least two to four different access points. However in certain cases, predominantly for the social yards, a low percentage open perimeter results in narrow access points.
Conclusion
Socially, in addition to the built unit, a family also owns the surrounding open space, depending on its requirements. Work yards would typically have a minimum area of 15 m2 per unit and social yards close to 9 m2 per unit. The spatial hierarchy is a transition from a public to private realm: open ‘social’ or ‘work’ spaces are the most public, built space with a functional overlap of activities like working, eating and meeting guests acts as a semiprivate transition, and a more private zone is used for sleeping.
Built units incrementally expand, and in the current scenario extremely narrow lanes are an emergent phenomenon attributed to building extensions. This results into the narrow access points for the shared open space. So, one of the methods of deterring formation of narrow lanes could be by maintaining a minimum width of these access points to shared open yards.
86 87 URBAN GROWTH STUDIES RESPONSIVE GROWTH SYSTEM 5.2 URBAN CHARACTER ANALYSIS live-huts (informal work) social yard work yard live-manufacture huts N Type of cluster No. of dwellings Live-informal work Live-work Dwellings / social yard Dwellings / work yard Yard area / dwelling Access / yard Porosity* 20204 to 5 15.5 to 20.6 4 0.27 20 20--0.1 20 203 to 53.3 to 4.1 2 - 4 0.06 40 29 11 3 to 5 5 to 6 6.3 to 9.3 2 - 4 0.14 20202.5 to 3.50.1 m2 (min - max) no. % SAMPLE B2 SAMPLE A1 SAMPLE B3 SAMPLE C1 UNITS VALUE Potter’s colony Cluster with informal home-based work Cluster adjacent to the primary traffic flow in the site Live-work cluster with pottery making as a family occupation Mixed use of both informal and formal work-spaces Cluster of work-based households of textile units Muslim nagar Muslim nagar SAMPLE B1 Muslim nagar AGK nagar * Considers cumulative open space (yards+streets), Porosity = open perimeter/total perimeter SAMPLE B2 SAMPLE A1 SAMPLE B3 SAMPLE C1 SAMPLE B1 BUILT - OPEN RELATIONSHIP
Open space is a continuous network of streets, public open spaces and yards. All open space is shared space, with different hierarchies of privacy. The open space adjacent to amenities like religious buildings and schools is used for public gathering and is used by the whole community; whereas yards which are used for production or social interaction are shared between the immediate neighbours. A prominent feature in the built forms is the semicovered plinth, this becomes an interface between the built and open space.
Analysis
The overall built-to-open ratio approximates 30 percent in all the three samples (refer to the previous section 5.2 Urban Fabric Quantification) However when further classified into streets and shared open space, the distribution ratios are very varied across the samples.
In the live-work area of the potters’ community, most of the open space is used as production space, physically organised into an emergent pattern of alternate built and open corridors. In the absence of a dedicated street network, the work spaces double up as transport corridors. But this region with production units is completely devoid of any community gathering space; the majority
of public open spaces are located around the residential clusters.
Sample B has a dense street network comprising close to 70 percent of the total open space. This is supplemented by small shared social yards scattered across the fabric creating porosity to natural light and ventilation.
In sample C, 50 percent of the total open space is streets, this is less than sample B. The open playground around the school has deterred encroachment, but otherwise there is a dearth of any shared open space.
Conclusion
The size of public open space ranges from 30 m2 to 350 m2 Prominent sizes are in the range of 150 to 250 m2. These are community gathering spaces and there is additional opportunity to look at these for housing an infrastructure support for the community. The strategy of distribution of these open spaces across the fabric should be a negotiation between ensuring habitability through the size of the open space and its frequency of occurrence and the freedom of enabling user-generated cluster formation.
88 89 URBAN GROWTH STUDIES RESPONSIVE GROWTH SYSTEM 5.2 URBAN CHARACTER ANALYSIS 020 100m N Streets Public open space: adjacent to amenities Public open space: Playground Work yards / Social yards 5,703 (41.5) 1,559 (11.4)6,465 (47.1) 4,333 (69.7) 1200 (19.3)680 (11) 3,023 (48.5) 431 (6.9) 2,563 (41.2) 209 (3.4) m2 (%) m2 (%) m2 (%) m2 (%) SAMPLE A SAMPLE B SAMPLE C UNITS VALUE Potter’s colony Muslim nagar AGK nagar public open space (adj to amenity) streets open space (with streets) public open space (playground) work yards / social yards OPEN SPACE HIERARCHY SAMPLE A SAMPLE B SAMPLE C semi-covered plinth work yard / social yard street 5.06 Interface between the built and immediate open space and the relationship with street network 5.07 opposite page, from top to bottom open space network hierarchy of open spaces - streets, public open space, yards
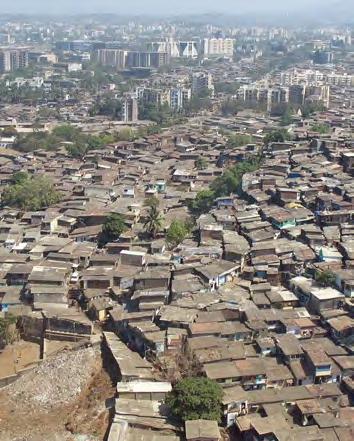
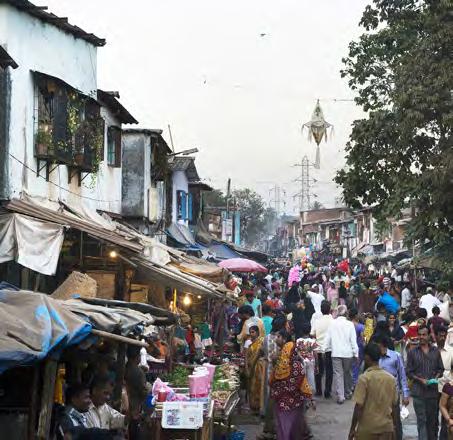
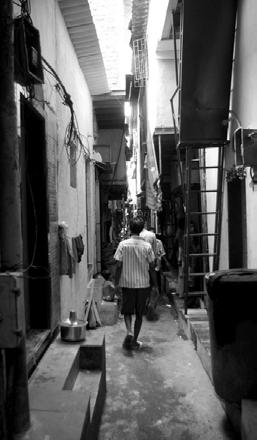
The potters’ community has a distributed network of primary streets cutting across the fabric. A secondary network of perpendicular streets connects these primary streets. The tertiary network is minuscule since most of the houses are production based and well connected to the secondary network.
In sample B the foreground network consists of a centrally located primary street. The background network consists of secondary streets branching out of the primary network at regular intervals throughout the settlement. The tertiary streets make 61 percent of the total network and are relatively small and interconnected. These are private zones and not directly accessible from the primary streets.
In the high-density sample, there is an irregular network distribution of long narrow streets and with very few cross connections. The
length of primary network is very low. Some of the streets which originate from the adjacent vehicular roads end in dead ends. Additionally, due to an absence of social open space, the streets double up as extensions of the dwelling with housing activities like cooking and laundry. This sort of encroachment on narrow streets causes clogging of the open drains.
Conclusion
A three-level hierarchy of network is observed in all three patches studied, however the size/length of these levels, as well as the relationship between them varies significantly. An important observation is the frequency of primary streets in sample A and B. The distance (x, refer to figure 5.09) between two consecutive primary street inlets is close to 40 m. Thus there is a similarity in the foreground network however the background network of secondary and tertiary streets is very different in the two samples. This is an emergent phenomenon dependent on the nature of the community.
90 91 URBAN GROWTH STUDIES RESPONSIVE GROWTH SYSTEM 5.2 URBAN CHARACTER ANALYSIS x x x 020 100m N tertiary roads secondary roads primary roads vehicular adjacent roads Primary roads Secondary roads Tertiary roads No. of streets No of intersections* No of streets with dead-ends Parallel primary street distance (x) Max Length of street Max street width# Min street width 1258 (33) 1624 (43) 890 (24) 105 54 45 41 258 14.7 0.8 572 (16) 806 (23) 2114 (61) 132 21 72 47 232 5.1 0.9 404 (17) 969 (41) 993 (42) 63 17 23 75 188 2.9 0.45 m, (%) m, (%) m, (%) nodes m m m m SAMPLE A SAMPLE B SAMPLE C UNITS VALUE Potter’s colony Muslim nagar AGK nagar * No. of intersections between primary and secondary streets # Width = circulation corridor which is inclusive of a yard if any STREET NETWORK (GEOGRAPHICAL) SAMPLE A SAMPLE B SAMPLE C 5.08 a. Aerial view of Dharavi showing the emergent street network b. A commercial street in Dharavi c. Residential street with the dwellings encroaching onto the street Sources: http://blogs.
Lambert 5.09 opposite page Hierarchy of the street network a b c
yahoo.co.jp/yuikkkbj, Julien Gregorio, Léopold
Analysis
5.10
Closeness centrality analysis
Betweenness centrality analysis
Dharavi has a dense street network which has emerged over a period of time. Analysis using graph theory helps to understand the network hierarchy and its integration in the fabric. Moreover, it can be used to identify the relatively important nodes and their relationship to the existing use of space. This analysis is carried out to evaluate the efficiency of the user generated networks. The measured quantities are closeness and betweenness centrality; these are measures of a node within a graph. Closeness centrality is the reciprocal value of the addition of all the distances of one node to all other nodes. Betweenness centrality is a measure of the number of times a node is crossed when the shortest path between two other nodes is crossed.
Analysis
The streets in the potters’ community have high closeness values, many of which pass through the work yards. This reflects the character of the user-generated network which is a production network where the work areas need to be well connected with each other for efficiency. It also shows the highly integrated fabric of work spaces, which makes this sample successful. Conversely, towards the southern end of the fabric, which is a predominantly residential area with social yards, the streets are less integrated confirming the private character of the social yards.
As for betweenness centrality, the shortest paths lie along the periphery of the sample, with appropriately located commercial and retail activity, these tend to become busy zones with high built density. Internally, some of the secondary interconnections perpendicular to the primary streets have a higher probability of being used frequently. However, an alternate route which helps separate the common circulation path from the work-spaces needs to be addressed. The approach should be to provide opportunity
for movement redirection rather than a prescriptive solution.
The primary and secondary street network in sample B has a high closeness value, hence is well connected. Also, the shortest path is centrally located and highly integrated. If we examine the land-use along this street, there is a pattern of commercial activity along the busy primary street.
Many of the social yards are observed on tertiary streets with a low integration value. These streets also have a low betweenness value implying that they do not get crossed frequently. Considering the residential character of the fabric, with clusters having a social character, such network is beneficial in providing privacy to the social spaces.
In sample C, there is a loss of continuity of the network as a result of overbuilding. Due to this a lot of streets have dead ends and there is no continuous short path which crosses through the fabric.
Conclusion
The networks generated vary considerably depending on the surrounding land use, this shows that users are capable of producing networks which suit their needs. The emergent characters discussed are beneficial economically as well as socially. However there are problems of loss of connectivity in scenarios of very high density. By understanding possible movement directions, the problem of overbuilding can be addressed through open space provision, using as attractors infrastructure and amenities, such that these new open spaces become probable routes of circulation for the inhabitants, without directly controlling the development of a user-generated network.
92 93 URBAN GROWTH STUDIES RESPONSIVE GROWTH SYSTEM 5.2 URBAN CHARACTER ANALYSIS closeness low high work yards / social yards betweenness low high commercial and live-retail 020 100m N NETWORK ANALYSIS SAMPLE A SAMPLE B SAMPLE C
top to bottom
opposite page, from
Climatic analysis is carried out at the cluster scale to understand how existing spaces work climatically. Though the fabric is selfbuilt, the organisation is a response to social ties. Hence, climatic efficiency is not a priority as would be with other indigenous settlements. Hence it needs to be critically analysed.
The aim is to test the most critical conditions. Hence solar radiation analysis is carried out for the hottest month of the year, April. The height of the surrounding dwelling units is considered single storey. For wind analysis, the ventilation of the open yards is analysed. In high density, prominently ground sprawling built environments, the incident wind speed slows down due to the presence of built forms and hence is lesser than the recorded wind speeds. For the simulation, incident wind speed is considered 5 m/s. For an outdoor shaded space a wind speed of 1.6 m/s is necessary for human comfort.
Analysis
A comfortable outdoor environment is a result of the physical character of the yards and the wind inlets and outlets.
Large rectangular yards (A1) are vulnerable to solar radiation, as opposed to these, staggered rectilinear yards are better suited for shelter from solar radiation. Sunlight from south and west is harsh
and it is essential to protect an open space in these two directions. Staggers provide shaded zones along with sunlit areas.
Streets less than a metre in width (C1) cause wind tunnel effect, increasing the incident wind speed. Whereas streets as wide as 5 m result into yards with wind speeds higher than the desirable range (A1) (although this is also an exceptional case owing the presence of kilns which produce a lot of smoke, so for this context high wind speeds aid in maintaining a higher air change rate). 1.5 to 2.5 m wide inlets and outlets for wind help in maintaining the comfortable wind speed in the yard (B2).
Conclusion
In terms of ventilation, the inlets and outlets for wind, i.e. the physical access points need to be addressed. Access points, if of a suitable width and staggered across the opposite edges of the open space, help break down the speed of incident wind and achieve better cross-ventilation.
These are observations from the existing fabric which will inform the simulation of clusters using the designed material system. However, the clusters thus generated would have to be analysed again climatically.
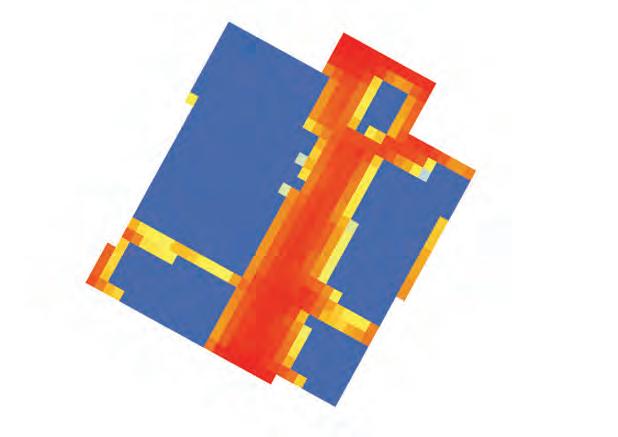
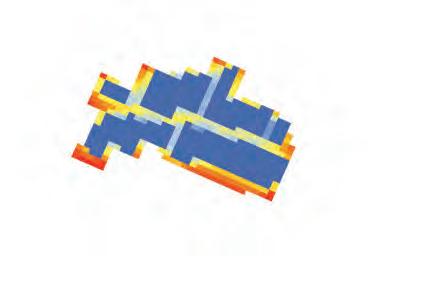
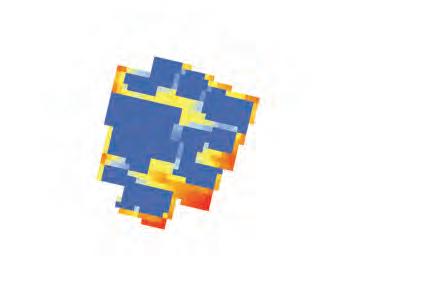
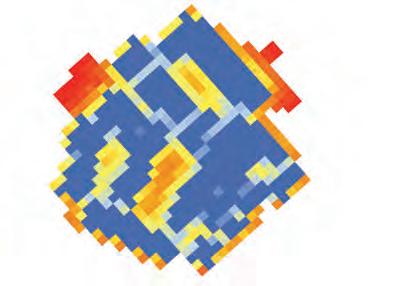
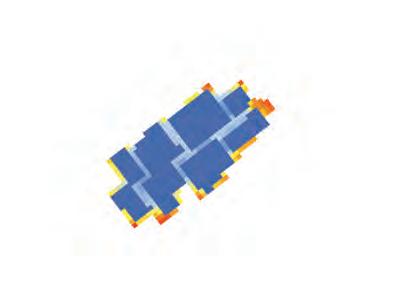
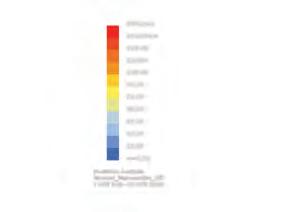
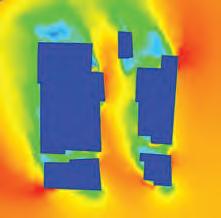
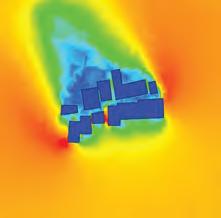
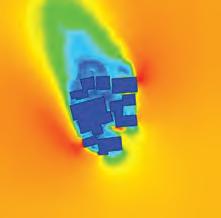
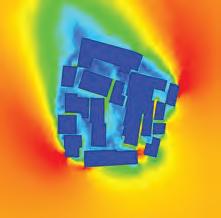
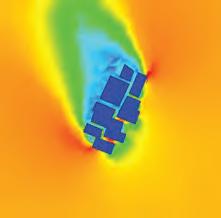
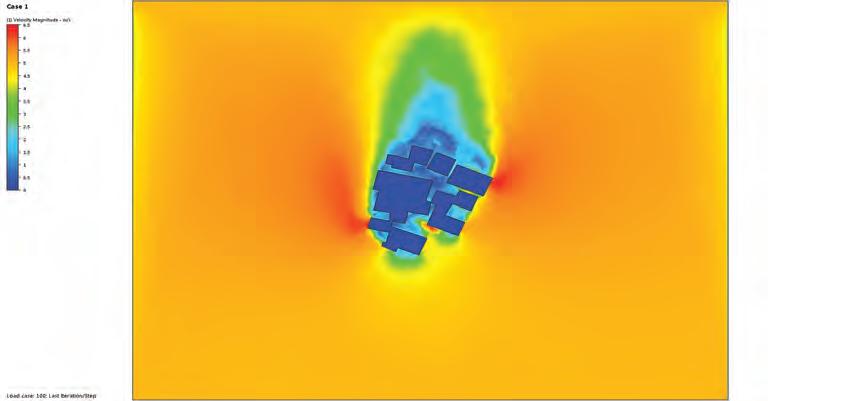
94 95 URBAN GROWTH STUDIES RESPONSIVE GROWTH SYSTEM 5.2 URBAN CHARACTER ANALYSIS CLIMATIC ANALYSIS SAMPLE B2 SAMPLE A1 SAMPLE B3 SAMPLE C1 SAMPLE B1 SAMPLE B2 SAMPLE A1 SAMPLE B3 SAMPLE C1 SAMPLE B1 N live-informal work huts yard live-work huts N live-informal work huts yard live-work huts 8:00 to 20:00 150kw/hr 0kw/hr Month April 8:00 to 20:00 High High Medium Low shading High Narrow Corridors Medium yards Small yards Large yards Narrow Corridors Shading Type of space High High Medium Low shading High Narrow Corridors Medium yards Small yards Large yards Narrow Corridors Shading Type of space 0m/s Inlet: South Outlet: North Incident wind speed: 5m/s 6.5m/s 0m/s Inlet: South Outlet: North Incident wind speed: 5m/s 6.5m/s Wind circulation Wind tunnel Wind circulation High wind velocity Wind tunnel Narrow Corridors Medium yards, indirect inlet Small yards, Larger inlets Large inlet and outlet Narrow Corridors Ventilation Type of space Wind circulation Wind tunnel Wind circulation High wind velocity Wind tunnel Narrow Corridors Medium yards, indirect inlet Small yards, Larger inlets Large inlet and outlet Narrow Corridors Ventilation Type of space 5.11 opposite page, from top to bottom Key plan with location of clusters, Spatial use, Solar radiation
analysis, CFD for wind analysis
Religious
URBAN FABRIC
The analysis of existing urban characters informs the Inputs for urban growth simulation. The urban fabric is a result of sequential aggregation of individual units with each successive unit relating to the existing units. Principles are extracted from the studies relative to the different patterns of urban growth observed.
From the three samples studied, similarities and variations are observed. Similarities are at the unit scale in terms of a logic of spatial organisation. The open spaces are growth initiators and the built spaces are room aggregations depending on the demographic profile. The variation is in terms of the user’s family size and type which influences the area occupied and the choice of placement of the unit with respect to those existing. Built densities across the three samples are similar, however within each sample there is a density gradient, with the areas along the primary network hosting commercial activity and hence a higher built density.
Units with similar demographic profiles cluster together. The size of a social cluster ranges from three to six dwellings. The enclosure or built periphery for the shared open space is a variable. As observed from the study, work yards have two built edges, where as social yards have three or four built edges.
Relating climatic studies to habitability standards, in order to achieve efficient ventilation of open spaces and to avoid wind tunnel effect, the accesses for yards should be in the range of 1.5 m to 2.5 m to achieve adequate thermal comfort.
96 97 URBAN GROWTH STUDIES RESPONSIVE GROWTH SYSTEM 5.2 URBAN CHARACTER ANALYSIS CONCLUSION
Single space Living area Private spaces Elevated plinth Semi-open Enclosed Open Enclosed Elevated plinth Living area Production area Shop/ retail space Private spaces Elevated plinth Work Yard BUILT FORM (UNIT)
Live-Work Live-Informal work Tenant
purpose Markets
Ceremonies and marriages
Socialisation Play area Schools Public health centres Neighbourhood Cluster COMMUNITY OPEN SPACE Wide, vehicular access Character Activity Narrow, mostly pedestrian
Shared-work Pottery,broom making, drying of processed food
Character Activity
room shared
Character Activity Women working from home Manufacturing based, one
members of
family involved Secondary lanes Main streets NETWORK Commercial activity Manufacturing units Small scale enterprises Social interaction Small shops Shared between 4-6 units Tertiary lanes Narrow, segregated
Open space for work, usually is not affected by encroachment
Encroached on with increase in population density Single
between a single family or one or more bachelors
or more
the
SELF-ORGANISING COMMUNITY
INTERVENTION
Material system + Community yards + Infrastructure
INDIVIDUAL DECISION MAKING
USER-GENERATED URBAN FABRIC
What makes social systems complex is that their components are self-conscious, decision-making individuals, whose choices directly influence (marginally or largely) the structure of their system. In this way, social systems are self-structured and self-maintained, with the potential of being reconfigured or re-created through the behaviour of their individuals.2
Dharavi’s community is self-organised, and as such is also emergent and unpredictable, consisting of decentralised connected parts. These “parts” are micro-communities which share similar values or occupation, forming part of a dense heterogeneous community.3 This complex social structure is manifested in the physical character of the urban fabric discussed earlier; it is a usergenerated environment, where the making of decisions shapes the fabric over time, with the ability to reconfigure based on changes in this process.
Within such a context, the design intention is the improvement of the community’s habitability and access to infrastructure. Interventions aim to be integrated into the community’s lifestyle, in order to enable the continuation of an adaptive user-generated growth. The interventions become more of a system, with the design being the result of the community’s emergent behaviour within this system, and therefore not entirely prescribed. The research focuses on identifying the level of implementation of these interventions necessary to ensure a habitability standard through the employment of a material system for construction of dwellings and the provision of community open space with infrastructure plug-in points.
5.3 URBAN GROWTH SIMULATION 98 99 URBAN GROWTH STUDIES RESPONSIVE GROWTH SYSTEM
STRATEGY FOR URBAN INTERVENTION
PROPOSED EXISTING
AGGREGATION LOGIC
MATERIAL SYSTEM + HABITABILITY CONSTRAINTS
URBAN GROWTH SIMULATION
if-then-else conditions + variable inputs
SPATIAL CHARACTER VARIATION
To design such a system so that its level of interference is enough to positively affect the urban fabric that is generated around it, it is necessary to produce simulations of the urban model which reproduce the emergent characters, and from this take spatial and environmental inferences with which to design and gauge the system. Attention must be paid to the design of such a system, so that its level of interference is enough to positively affect the urban fabric generated around it, yet at the same time allow for selforganisation to be achieved.
In Dharavi’s scenario, the growth of individual units and their aggregation into clusters is an incremental and time-dependent process. At both these scales of growth, the existing agglomeration will influence the next increment in terms of its functional character and its spatial relationship to the existing context. It is a settlement whose generative and emergent characters stem from adjacent trends. For this reason, simulations of the existing urban model are being produced, which reproduce the emergent characters. Spatial and environmental inferences are taken from their results, according to which the system is designed and gauged.
Urban growth prediction models are used to simulate the spatial heterogeneity of the urban fabric and the correlations between its different parts.4 Spatial heterogeneity and autocorrelation are mathematically complex, so an efficient way of achieving these patterns is through simple algorithms that are able to generate complexity.
One prevalent computational modelling technique used to simulate urban growth is cellular automation. Cellular automata (CA) are dynamic systems, in which neighbourhood rules are used to simulate rapid urban sprawl across a grid over discrete time intervals. They are based on an algorithm which forms agglomerations of individual cells. Each cell has two potential states, 0 or 1, respectively defining whether it will be active or inactive in the agglomeration produced. Whether a cell is attributed
with the value of 0 or 1 depends on the value prescribed to its neighbouring cells, according to the algorithm and the rules applied. The non-linearity of cellular automata and the bottom-up approach of exhibiting global character through locally dependent changes are relevant to the context of Dharavi.
The complexity of the simulation generated by a CA can be increased by the varying the number of seeds, i.e. the cells which are made active prior to the running the algorithm, and their initial configuration across the grid. Heterogeneity can be introduced by weighing the probably that a rule is applied or not.5
For the purpose of this research, the level of detail of information needed is spatial, more precisely in terms of the configuration of individual units and their aggregation into clusters. These are evaluated in terms of the material system’s influence on the growth and the potential variations produced are compared to the samples of the existing urban tissue. Although, a CA can be used to simulate the interconnectivity within and among units to form clusters, such a simulation would lack detail at the resolution of the material system in terms of physical spatial relations.
An algorithm is therefore defined that incorporates inputs from the material system and habitability constraints into the existing community’s aggregation logic. The logic is mapped out in a decision tree - a graph which traces the different choices and their consequent outcomes - with similar “if-then-else” conditions as would be used in CA. The potential for indeterminate outcomes is created through the use of variables which can be controlled or chosen randomly to reflect the character of chance. The limitation of the algorithm in comparison with a CA is the linearity of the generation process, which is opted for over the increased complexity of writing a non-linear algorithm. However, the employment of random variables and the generation of a large sample of simulations give satisfactory results in terms of variation of spatial characters.
5.3 URBAN GROWTH SIMULATION 100 101 URBAN GROWTH STUDIES RESPONSIVE GROWTH SYSTEM
URBAN GROWTH PREDICTION TECHNIQUES
For the purpose of simulating Dharavi’s user-generated physical built aggregation, its social organisation which is its primary driver is abstracted at two scales: within a unit and in between units. Though different communities have different requirements for built and yard areas, depending on their nature of work and family structures, the spatial relationships within a unit and in between neighbouring units principally operate on the same social logic.
Since an open yard space per unit is central to every family, the room aggregation logic within a unit works on achieving the spatial hierarchy defined by the degree of privacy of every space and its placement in relation to this yard space which is communal in nature. The clustering logic in between units aggregates these individual open yard spaces together into cumulative shared yards for either work or social purposes.
The main aim of the growth simulation is to determine the kind of spatial configurations which are enabled by this inherent social logic, but also informed by the material system components (discussed in Chapter 4) for improved habitability. Therefore, some inherent logics of the material system and habitability requirements are incorporated as rules in the algorithm. Possible room dimensions and their connections to each other through the material system’s modular proportions and possible configurations are embedded within the material system’s employment logic.
Taking into consideration the minimum habitable built area, a required number of such built rooms are defined for each of live, work and private purposes, to cater for different family structures. The smallest family, of three people, has one live or multifunctional live-work space and a separate private space. As the family size grows, the number of private spaces increases. The area requirement for the adjacent yard space per unit for a family type is established from the urban character analysis discussed earlier (a minimum area of 15 m2 per unit for work yards, and 9 m2 per unit
for social yards).
The number of built edges of a yard reflects its social or work character. Each unit’s yard space has either one or two edges built by its own unit to enable open-built interaction within the unit as well as connections to other yard spaces. Since the western and southern edges of the open spaces are climatically vulnerable, two preferred orders, W-E-S-N and W-S-E-N are defined for building around the open yard spaces and choosing ventilation sides for a built room. Also, the material kit is supplemented with either one or two ventilation surfaces per room to ensure light and ventilation standards.
Therefore, while some of the growth aggregation ‘decisions’ are derived from habitability standards and material system parameters along with the social logic, other decisions, like the number of built yard edges and their climatically preferred orientation, and the number of ventilation surfaces per room are taken as variable inputs to achieve different scenarios of growth.
The algorithm takes as an input a community structure of different units and the variable inputs mentioned above; growth aggregation is simulated through unit-by-unit accretion. The variable inputs can change with every iteration, however, in order to draw some inferences on the effect of each variable they are fixed in all iterations of a single growth experiment.
In every iteration of the experiment, the input of a family structure contains information on the type of yard and the number of live, work and private spaces required for the iteration. Configurations for both built and open spaces are chosen from the predefined material system input and habitable sizes. Each unit configuration in itself is formed following a hierarchical spatial logic and the placement of every unit is determined by the ‘in-between units’ relationships and data from previous iterations.
5.3 URBAN GROWTH SIMULATION 102 103 URBAN GROWTH STUDIES RESPONSIVE GROWTH SYSTEM GROWTH ALGORITHM LOGIC 5.12 a. Flowchart of the growth aggregation logic
The three variable inputs within the growth logic Yard to yard placement Open space relationship in between the units Room to yard/other room placement Spatial hierarchy of built spaces w.r.t. yard within a unit Repeat for all rooms Repeat for all units Data for successive iterations UNIT GROWTH AGGREGATION OPEN BUILT Community Structure Unit Family Structure Preferred Climate Order No. of Yard built edges No. of Ventilation edges W 1 E S N 3 4 2 W 1 E S N 2 4 3
b.
The algorithm starts by placing a unit’s open yard space; this is placed at the seed point in the first iteration and its built and open edges are assigned based on predefined inputs. The live/ work spaces are placed on a yard’s built edges first, followed by the private spaces which are placed in the most compact configurations to reduce the extent of the unit’s footprint. This helps achieve maximum interaction and connectivity between the live-work spaces and the yard, and higher levels of privacy for the private spaces. The location of the prescribed number ventilation sides for each room is determined first by the adjacency to a yard or any ventilation corridor (i.e. a 2 m-wide space placed in front of a room’s ventilation face to ensure light and ventilation) and then by order following climatic considerations. The remaining room edges are assigned as structural walls to which the succeeding rooms of the unit latch onto in case of the unavailability of buildable yard edges.
Once a unit is formed, the open edges of its yard space and the ventilation edges of its built rooms are taken as inputs for the successive iterations. The yard of the next unit is placed such that it shares one of its edges with one of the previous yard’s open edges,
in the most compact configuration possible. The remainder of the new yard’s edges are then assigned as buildable and open. The room aggregation of the unit around the new yard follows the same logic of the previous one making sure that none of its built spaces overlay on the ventilation corridors. In the iterations that follow, more units are formed in a similar logic with their yards attaching to the prior yards’ open edges and with the data updated with each iteration. Once all the yards’ open edges are occupied, the next unit’s yard is placed on a ventilation edge of one of the built spaces of an already placed unit, to enable the growth aggregation to continue.
17 experiments with various combinations of different community structures with the variable inputs are run to aggregate clusters of 20 units; 5 variations of each growth scenario are generated. 10 of such variations from different experiments are analysed to determine whether the existing social characters are retained with the introduction of material and habitability rules. (Consult Appendix for all the experiments). In the following pages, a comparative analysis between these selected variations is discussed.
5.3 URBAN GROWTH SIMULATION 104 105 URBAN GROWTH STUDIES RESPONSIVE GROWTH SYSTEM
GROWTH SIMULATION PSEUDOCODE Formation of a single unit through spatial logic and assignment of ventilation sides Placement successive unit’s yard space on the open yard egde and the formation of the unit Successive unit formations through placement of yard open edges Placement unit’s yard space on a ventilation edge of built space 1 1 1 1 2 1 2 1 2 3 4 5 7 8 6 1 2 3 4 5 7 8 6 9 10 11 12 5.13 Pseudocode explaining the logic of the growth simulation 5.14 opposite page A diagram of a potential output from the urban growth simulation. Choice Revised Inputs Decisions Output Data for successive Iterations Variable Inputs Fixed Input for every iteration(n) Place at seed point Place at compact most configuration without intersection Place at compact most configuration without intersection Assign Edge type based on BE value and preferred order Is n=0? 1 1 Other yards’ open edges? No Yes Yes Yes Unoccupied No. of yard built edges (BE) 2 2 2 3 Preferred Climate Order 3 No. of Ventilation edges (VE) Occupied No Other ventilation edge? No Which unoccupied edges? Unoccupied Occupied No No Update Yes Yes Which unoccupied edges? Is it adjacent to yard? Are all rooms placed? Own Yard built edge? Rooms’ Structural edges? No Yes Yes Place on first floor No Occupied Edges Yard Built Edges Yard Open Edges Ventilation Edges Structural Edges Assign Edge type based on VE value and preferred order B n All rooms’ ventilation edges A n Bn-1 An-1 Data from previous steps of unit formation DATA from all previous iterations (n-1) Chosen built Configuration Chosen yard Configuration 3.2 X 3.2M 3.2 X 4.2M 4.2 X 4.2M 3.2 X 3.2M 4.2 X 4.2M 3.2 X 5.2M Built rooms (Type and no. of spaces) Open Yard (Type and Area) Unit Family Structure


One
Aggregation experiments 1.3 and 4.1 are run with similar inputs of family structure, number of yard built edges and number ventilation surfaces per room, however, the preferred order of building orientations are different in each case. This drastically affects the direction of the simulated growth. In experiment 1.3 (experiment 1, variation 3), the individual yard spaces form a continuous corridor of large shared open spaces with built units on either side. There is an indication of the formation of possible streets running across the axis of the yards which can be connected only through the shared open spaces to produce a continuous network character. The
In experiment 4.1, there is a prominent main network spine that connects the different open shared yards, which are shared among 4 to 6 units but can be independent of each other. Some smaller emergent shared open spaces are also identified; these are accessible through built units, but not directly through the main network, creating a private social character. However, the larger yards have a range of porosities.
5.3 URBAN GROWTH SIMULATION 106 107 URBAN GROWTH STUDIES RESPONSIVE GROWTH SYSTEM SIMULATION EXPERIMENTS
yards are highly porous with wide and multiple access points. A yard area per unit between 11.3 m2 and 24.8 m2 is noted.
11.324.8 m2 30 46 0 10 2245 % 5.118.7 m2 30 46 0 10 1151 % 45% yards 51% streets 38% yards 52% streets Open Space DistributionNetwork Character Continuous Yard Area per dwellingNo. of dwellings per yardPorosity of yard Open Space DistributionNetwork Character Connector Yard Area per dwellingNo. of dwellings per yardPorosity of yard 0.17 0.5 0.17 0.5 43% built 45% built Experiment 1.3
Type Livework (S,M)
of Yard built edges
No. of Ventilation Faces Two for all spaces Preferred Built order W-E-S-N Built to Open Distribution Compactness (perimeter to area) Built to Open Distribution Compactness (perimeter to area) Experiment 4.1
Type Livework (S,M)
Yard built edges
Family
No.
One
Family
No. of
No.
Ventilation Faces
for all spaces Preferred Built order W-S-E-N Live Live-work Private Dedicated Yards Emergent yards Built Open yards Streets Built edge
of
Two


No. of Yard built edges
Similar to experiment 1.3, the aggregation for experiment 6.3 is generated, but with a different community structure of residential family units which have small yard area requirement as compared to the live-work families. Though the physical configuration shows similarities to experiment 1.3, the network generated is highly inefficient with the corridors interlaced with each other. This leads to large open space being lacking a social character, used for circulation, and only a few number yard spaces are observed. This is probably why in existing communities a heterogeneous mix of residential and live-work families is observed, as it enables moderation of growth and development of an efficient network.
In experiment 9.4, live-work families are aggregated with rooms along two yard edges of each unit’s yard space. The variables of ventilation surfaces and preferred order are kept the same as in experiments 1.3 and 6.3. An equal number of both dedicated yard spaces and emergent open spaces are observed. A main network connects the larger yards and the smaller emergent yards are shared among 4 to 6 units. All the open spaces show good range of porosity and adequate access points.
5.3 URBAN GROWTH SIMULATION 108 109 URBAN GROWTH STUDIES RESPONSIVE GROWTH SYSTEM
10.34.3 m2 30 23 0 10 2731 % 4.320 m2 30 46 0 10 1131 % 10% yards 83% streets 34.7% yards 24.3% streets Open Space DistributionNetwork Character Interlaced Yard Area per dwellingNo. of dwellings per yardPorosity of yard Open Space DistributionNetwork Character Connected Yard Area per dwellingNo. of dwellings per yardPorosity of yard SIMULATION EXPERIMENTS 0.14 0.5 0.17 0.5 45% built 44.7% built
Type Live (S,M)
of Yard built edges
No.
Ventilation Faces Two for all spaces
W-E-S-N
Experiment 6.3 Family
No.
One
of
Preferred Built order
Experiment 9.4 Family Type Livework (S,M)
Built to Open Distribution Compactness (perimeter to area) Built to Open Distribution Compactness (perimeter to area) Live Live-work Private Dedicated Yards Emergent yards Built Open yards Streets Built edge
Two No. of Ventilation Faces Two for all spaces Preferred Built order W-E-S-N

Experiment 12.4
Preferred

Experiment 13.2
No.
Experiment 12.4 is another aggregation of live-work families generated with rooms along two yard edges but with the other preferred built order of W-S-E-N. This generated a range of yard sizes distributed across the aggregation, but with very low porosity, accessible only through their adjacent units, making them disconnected from each other and from the network. Low porosity aids in shading of the yards but results in poor ventilation. In addition, very few street connections are formed, which are fragmented and along the perimeter of the aggregation. Experiment 13.2 is a similar scenario, but with residential families, and shows similar results.
5.3 URBAN GROWTH SIMULATION 110 111 URBAN GROWTH STUDIES RESPONSIVE GROWTH SYSTEM
4.717.8 m2 30 46 0 10 235 % 2.518.8 m2 30 46 0 10 827 % 66.5% yards 21.3% streets 56.3% yards 22.8% streets Open Space DistributionNetwork Character Fragmented Yard Area per dwellingNo. of dwellings per yardPorosity of yard Open Space DistributionNetwork Character Fragmented Yard Area per dwellingNo. of dwellings per yardPorosity of yard SIMULATION EXPERIMENTS 0.17 0.5 0.19 0.5 47% built 47% built
Family Type Livework (S,M)
No. of Yard built edges Two
No. of Ventilation Faces Two for all spaces
Built order W-S-E-N
Family Type Live (S,M)
of Yard built edges
of Ventilation Faces
for all spaces Preferred Built order W-S-E-N Built to Open Distribution Compactness (perimeter to area) Built to Open Distribution Compactness (perimeter to area) Live Live-work Private Dedicated Yards Emergent yards Built Open yards Streets Built edge
Two No.
Two


Experiment 14.2 is similar to experiment 9.4, with the exception of the unit types. Residential family units are aggregated with rooms along two yard edges of each unit’s yard space, keeping the variables of ventilation surfaces as two per room and preferred order of W-E-S-N. The formation of a network spine is observed, however, with 53% of open space being dedicated to circulation, most of the network is interlaced across the aggregation. Few shared yard are formed; these are connected to the network. The emergent open spaces are independent of the network with very low porosities and are shared between 2 to 4 units.
In experiment 15.5 large residential and live-work family units (with more private rooms) are aggregated with two yard built edges. Yards obtained vary in sizes and configurations but are shared among 4 to 6 units and have similar porosities. A network of streets connects these yards together and some small emergent open spaces are generated enabling the different yards and these open spaces to facilitate work and social open space characters. Because extended family units are aggregated, the overall built density (48%) is slightly higher than that compared to the other experiments analysed above. However, with two built yard edges per unit, the compactness of the aggregation is low.
5.3 URBAN GROWTH SIMULATION 112 113 URBAN GROWTH STUDIES RESPONSIVE GROWTH SYSTEM
3.313.7 m2 30 42 0 10 27.41.3 % 6.724.5 m2 30 46 0 10 1626 % 22.7% yards 52.7% streets 29.1% yards 31.6% streets Open Space DistributionNetwork Character Interlaced Yard Area per dwellingNo. of dwellings per yardPorosity of yard Open Space DistributionNetwork Character Connector Yard Area per dwellingNo. of dwellings per yardPorosity of yard SIMULATION EXPERIMENTS 0.15 0 0.5 0.15 0 0.5 46.3% built 48% built Experiment 14.2 Family Type Live (S,M) No. of Yard built edges Two No. of Ventilation Faces Two for all spaces Preferred Built order W-E-S-N Experiment 15.5 Family Type Mixed (L) No. of Yard built edges Two No. of Ventilation Faces Two for all spaces Preferred Built order W-E-S-N Built to Open Distribution Compactness (perimeter to area) Built to Open Distribution Compactness (perimeter to area) Live Live-work Private Dedicated Yards Emergent yards Built Open yards Streets Built edge


Experiments 16.1 and 17.1 are run to further analyse the role of the variable input of number of ventilation surfaces in the aggregation logic. The setup of these experiments is similar to experiment 1.3. The only variable that is altered is that of ventilation surfaces with two surfaces for live/live-work rooms and one for private rooms in experiment 16.1, and one ventilation surface per room in experiment 17.1. This considerably increases the built distribution to 51% and 54% respectively, but since the overall habitability considerations are incorporated within the aggregation logic it does not compromise on the total open space. However, the
compactness values of the aggregations are significantly higher; and even the open space distribution shows a higher percentage of yards than of streets, resulting in much more consolidated built and open configurations.
Apart from the built densities, open space distributions and compactness values, similarities to experiment 1.3 are observed in terms of large yards and a continuous network. More units (4 to
with
Yard
5.3 URBAN GROWTH SIMULATION 114 115 URBAN GROWTH STUDIES RESPONSIVE GROWTH SYSTEM
yard,
high yard areas per unit
up
31 m2
porosities
relatively high
2030 m2 30 48 0 10 26 16 % 5.5 24 m2 30 48 0 10 2637 % 52% yards 36% streets 55% yards 38% streets Open Space DistributionNetwork Character Continuous Yard Area per dwellingNo. of dwellings per yardPorosity of yard Open Space DistributionNetwork Character Continuous Yard Area per dwelling No. of dwellings per yardPorosity of yard SIMULATION EXPERIMENTS 0.27 0.5 0.31 0.5 51.4% built 54% built Experiment 16.1 Family Type Livework (S,M) No. of Yard built edges One No. of Ventilation Faces Two for live & One for private Preferred Built order W-E-S-N Experiment 17.1 Family Type Livework (S,M) No. of Yard built edges One No. of Ventilation Faces One for all spaces Preferred Built order W-E-S-N Built to Open Distribution Compactness (perimeter to area) Built to Open Distribution Compactness (perimeter to area) Live Live-work Private Dedicated Yards Emergent yards Built Open yards Streets Built edge
8) share a
ranging
to
are
as well.
From the simulations of urban growth, a large variation is observed in terms of the cluster formations and yard configurations which exhibit similarities to Dharavi’s existing urban characters discussed earlier in this chapter; namely the formation of emergent yards with a potential for enhancing the social and environmental character, and the formation of a dense, well connected network of different hierarchical levels. By altering the input parameters it is possible to manipulate the experiment results, to some extent, so that they replicate these positive aspects of Dharavi’s urban fabric.
Most of the experiments have similar built-to-open distributions and overall compactness owing to the habitability rules. However, the open space distribution into yards and streets varies, leading to different yard characters and their relationship to emergent network and adjacent units.
A wide range of yard areas per unit (2.5 m2 to 31 m2) is achieved, which lend themselves to different work or social activities. Larger yard areas like those in experiments 1.3, 4.1, 16.1 and 17.1 form corridor-like cumulative shared yards enabling a continuous production network through them similar to that observed in the manufacturing clusters in the urban character analysis. While some experiments do show inefficient network development with fragmented or interlaced corridors, the shared yards, like experiments 9.4 and 14.2, are well connected enabling ease of access to the independent clusters and further network connections to other aggregations.
A predominant emergent character of clusters of 4 to 6 units is observed in most of the experiments which enables smaller yard spaces to emerge. These can be potential social spaces for informal work for women or for recreation for children and elders. The larger yards, ranging from 70 m2 to 210 m2 in area, aid the formation of such clusters and emergent yards around them in varying numbers and configurations. These sizes are identified for the design of community open spaces which will be inserted as generators and moderators of growth. However, they exhibit a range of porosities and configurations and are thus further evaluated in terms of their environmental performance to inform their design parameters.
W-S-E-N
W-E-S-N
W-E-S-N
W-E-S-N
W-E-S-N
5.3 URBAN GROWTH SIMULATION 116 117 URBAN GROWTH STUDIES RESPONSIVE GROWTH SYSTEM Experiment Number *L=live live-work spaces, P-Private spaces +open space - yard + streets + uncategorised open spaces Family & community structure No. of Yard Built Edges Preferred Built Order Open Space Distribution+ YardsStreets Compactness (Perimeter/ area) Network Character Yard area per unit No. of units per yard Yard Porosity No. of ventilation surfaces 1.3 4.1 6.3 9.4 12.4 13.2 14.2 15.5 16.1 17.1 Live-work Live-work Live Live-work Live-work Live Live Mixed Live-work Live-work 0.17 0.17 0.14 0.17 0.17 0.19 0.15 0.15 0.27 0.31 Built Area 43.0% 45.0% 45.0% 44.7% 47.0% 47.0% 46.3% 48.0% 51.4% 54.0% 45.0% 38.0% 10.0% 34.7% 66.5% 56.3% 22.7% 29.1% 52.0% 55.0% 51.0% 52.0% 83.0% 24.3% 21.3% 22.8% 52.7% 31.6% 36.0% 38.0% Continuous Connector Interlaced Connector Fragmented Fragmented Interlaced Connector Continuous Continuous 11.3 - 23.8 m2 5.1 - 18.7 m2 4.3 - 10.3 m2 4.5 - 20.0 m2 4.7 - 17.8 m2 2.5 - 18.8 m2 3.3 - 13.7 m2 6.7 - 24.5 m2 20.0 - 31.0 m2 5.5 - 24.0 m2 4-6 units 4-6 units 2-3 units 4-6 units 4-6 units 4-6 units 2-4 units 4-6 units 4-8 units 4-8 units 22 - 45% 11 - 51% 27 - 31% 11 - 31% 5 - 23% 8 - 27% 1.3 - 27% 16 - 26% 20 - 43% 25 - 37% 1 1 1 2 2 2 2 2 1 1 2 2 2 2 2 2 2 2 2-L, 1-P * 1
W-E-S-N W-S-E-N W-E-S-N W-E-S-N W-S-E-N
INPUTS RESULTANT CHARACTERISTICS Climate Social LogicMaterial System Existing characters Emergent Characters 5.15 Table
SIMULATION EXPERIMENTS
of the 10 experiments analysed earlier, summarising the different variables involved as inputs, and the resultant characters simulated, both existing and emergent.
5.16
Comparison of solar radiation and wind (CFD) analyses results of 5 yard samples chosen from different growth simulations.
Because of the hot humid climate, the open yards generated in the simulation experiments are analysed for self-shading and ventilation. For an outdoor environment, an increased intensity of solar exposure results in the need of a higher wind speeds to achieve thermal comfort. However, high wind speeds are considerably disturbing due to the effect of wind force and thus, wind speeds ranging between 1.5 to 2.5 m/s are considered ideal for such a climate and high built densities.6 The yards are evaluated for the most critical climatic conditions. The solar radiation analysis is carried out for the hottest month of the year, April, and the wind analysis is conducted considering the incident wind speed of 5 m/s. The different physical configurations of these yards are analysed to determine if their physical attributes can offer a comfortable outdoor environment.
Analysis
Five distinct yard samples from the 17 simulated experiments are compared together to derive the parameters that can improve shelter from solar radiation through self-shading as well as ensure adequate cross ventilation in the yards. (Consult Appendix for climatic analysis of whole experiments)
Long narrow configurations coupled with low porosity as in experiment 17.2, provide adequate self-shading however, they lack ventilation. The yards with widths (w) of less than 6.5 m and lengths (l) being proportionately more than 4 times the width, causes a wind tunnel effect. Similar proportions but with higher porosity, as in experiment 9.4 ensure cross ventilation in one incident wind direction but in the other direction the symmetrically opposite inlets and outlets fail to evenly ventilate the yard area.
Likewise, in experiment 16.1, the 3 m wide inlet and outlet facing each other increase the incident wind speed considerably only in part of the open yard rather than across the whole area. However, staggering and unequally distributing these yard inlets and outlets, as in experiment 17.1 and 2.4, help to reduce the wind speed to the desired comfort range of 1.5 to 2.5 m/s and enable better cross ventilation. These accesses are 2.2 m in width and the yard porosities are in the medium range (0.15 to 0.27). The staggered geometrical configurations of the yard boundaries reduces their vulnerability to solar radiation.
Conclusion
The physical characters of yards in terms of their proportions and geometry along with the inlet and outlet access points (their widths and distribution), influence the overall ventilation and the thermal comfort of their outdoor environment.
Staggered boundaries help moderate the intensity of solar exposure and the wind speeds. At the same time, their higher perimeters allow more built areas to avail of access to light and ventilation from the open yards. The width-to-length proportions of these geometries if limited to 1 by 4 with no dimension being less than 6.5 m helps avoid wind tunnel effect. The staggering of inlets and outlets on opposite edges of the yards with circa 2 m widths ensures cross ventilation of the yards. The number of such access points depends on the area and size of the open yard. A minimum of 3 access points which are unequally distributed on the peripheries is necessary for adequate ventilation and self-shading of the yard provided their cumulative width is within the medium porosity range (0.15 to 0.27) of the yards.
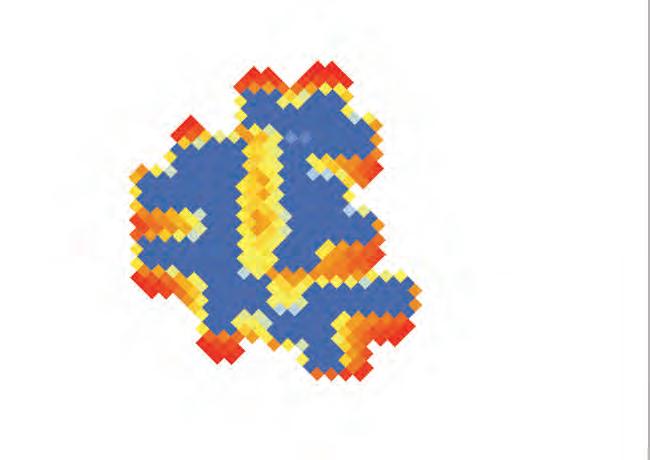

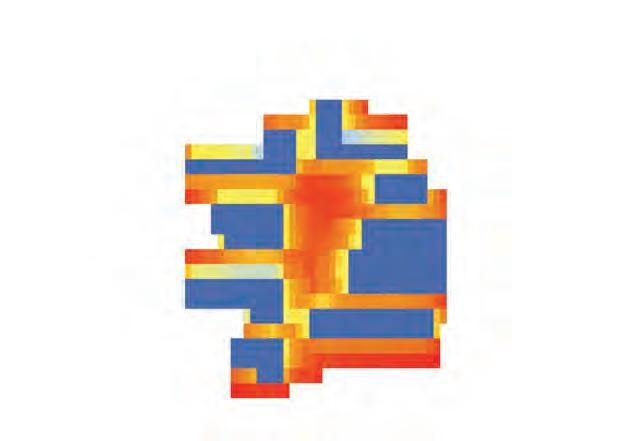
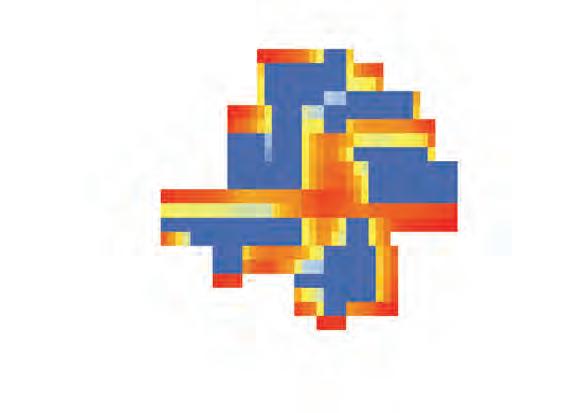
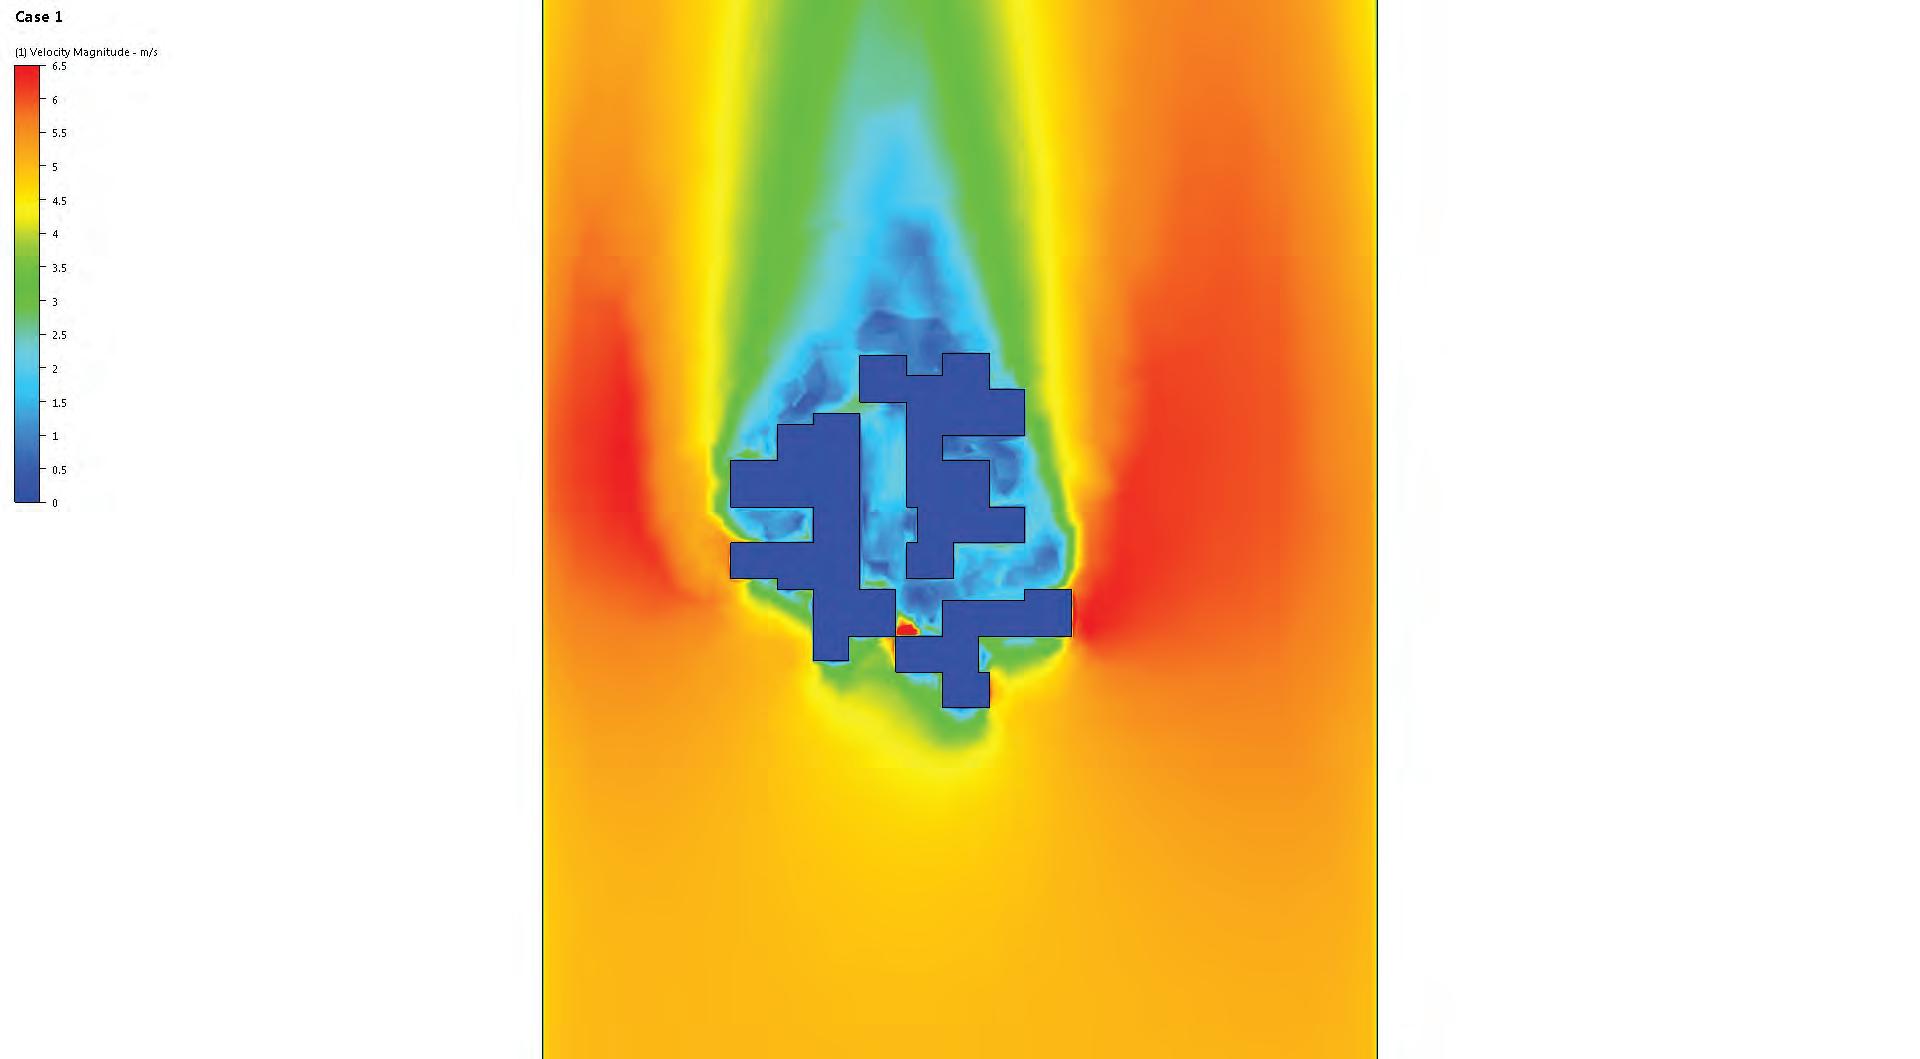

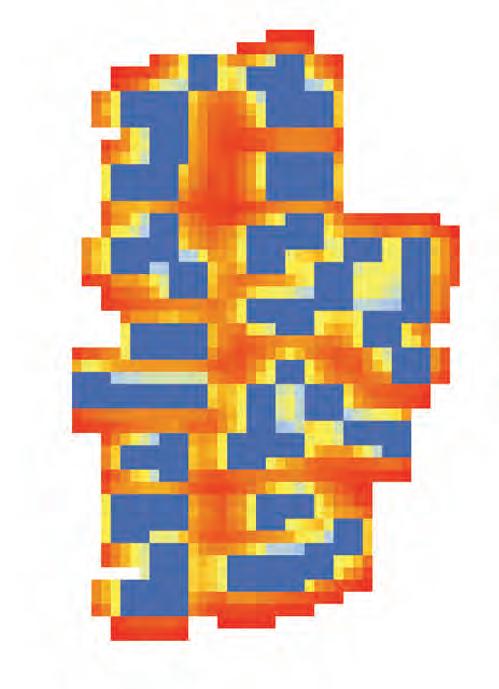
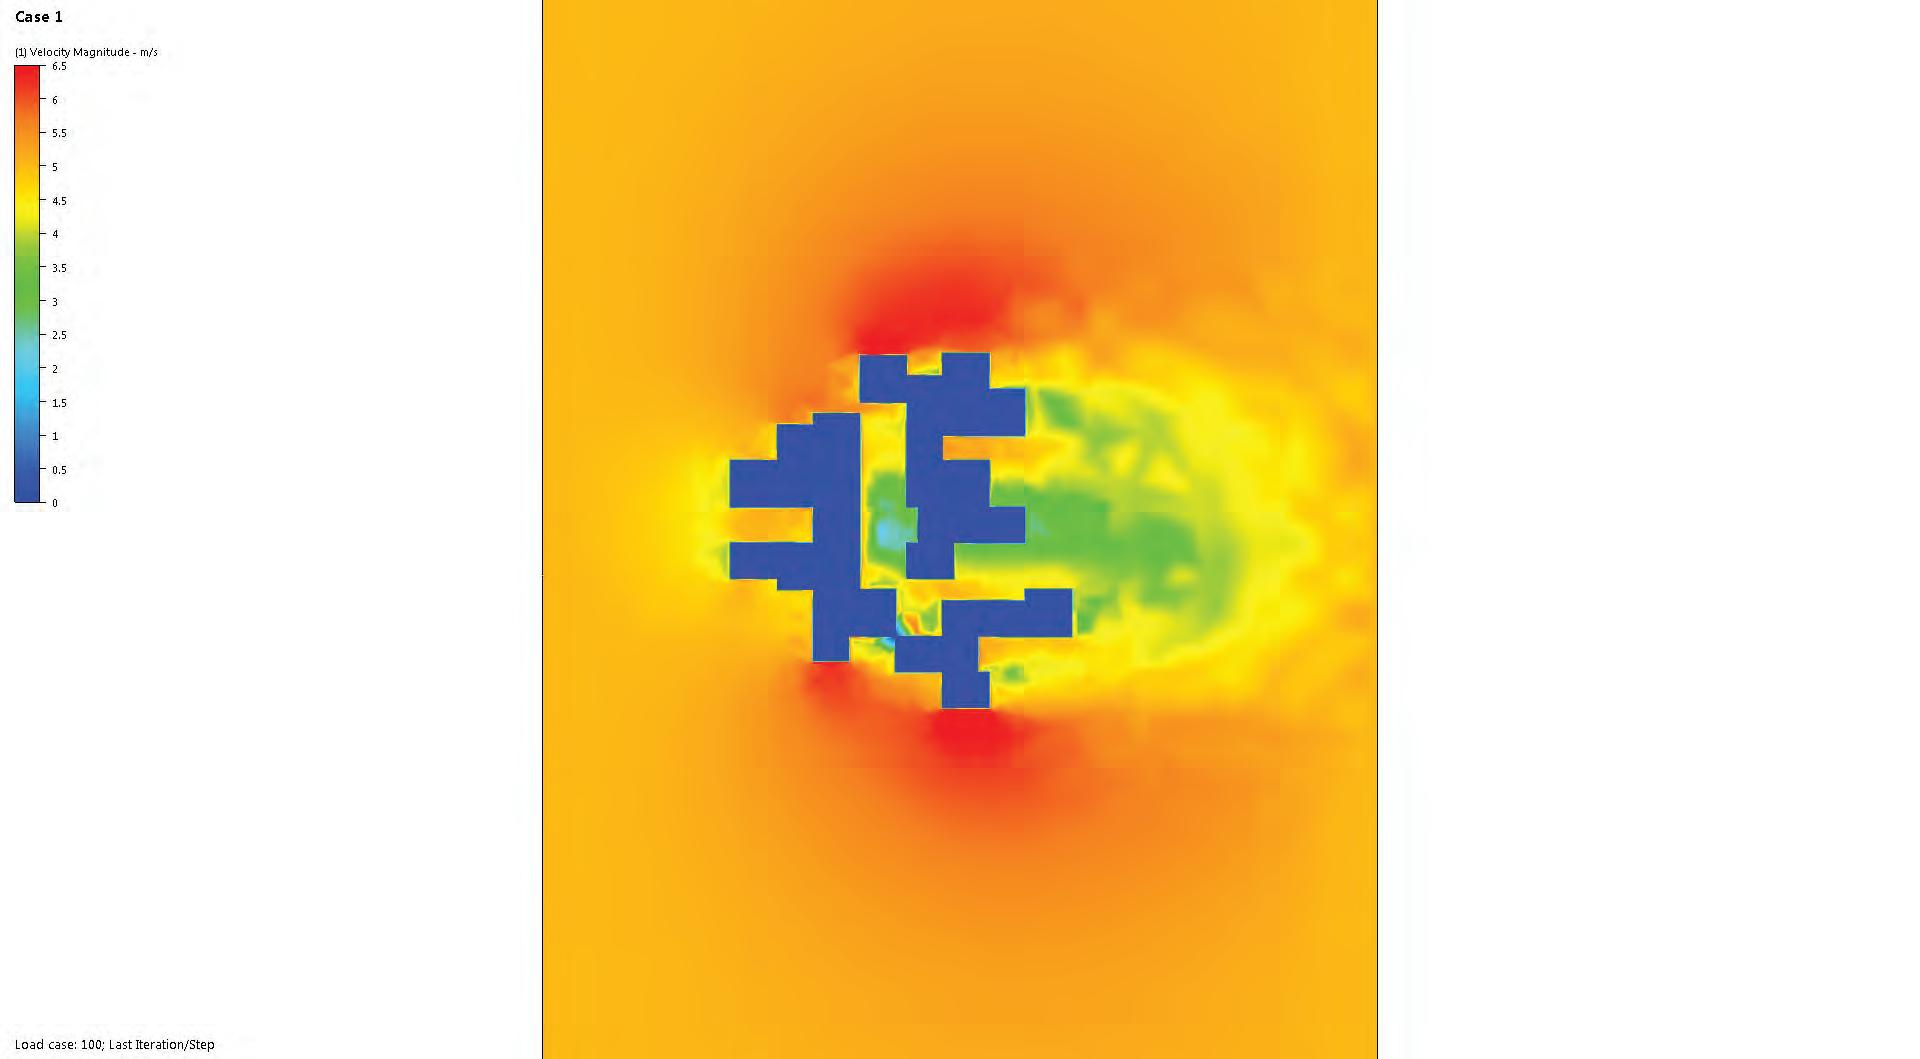
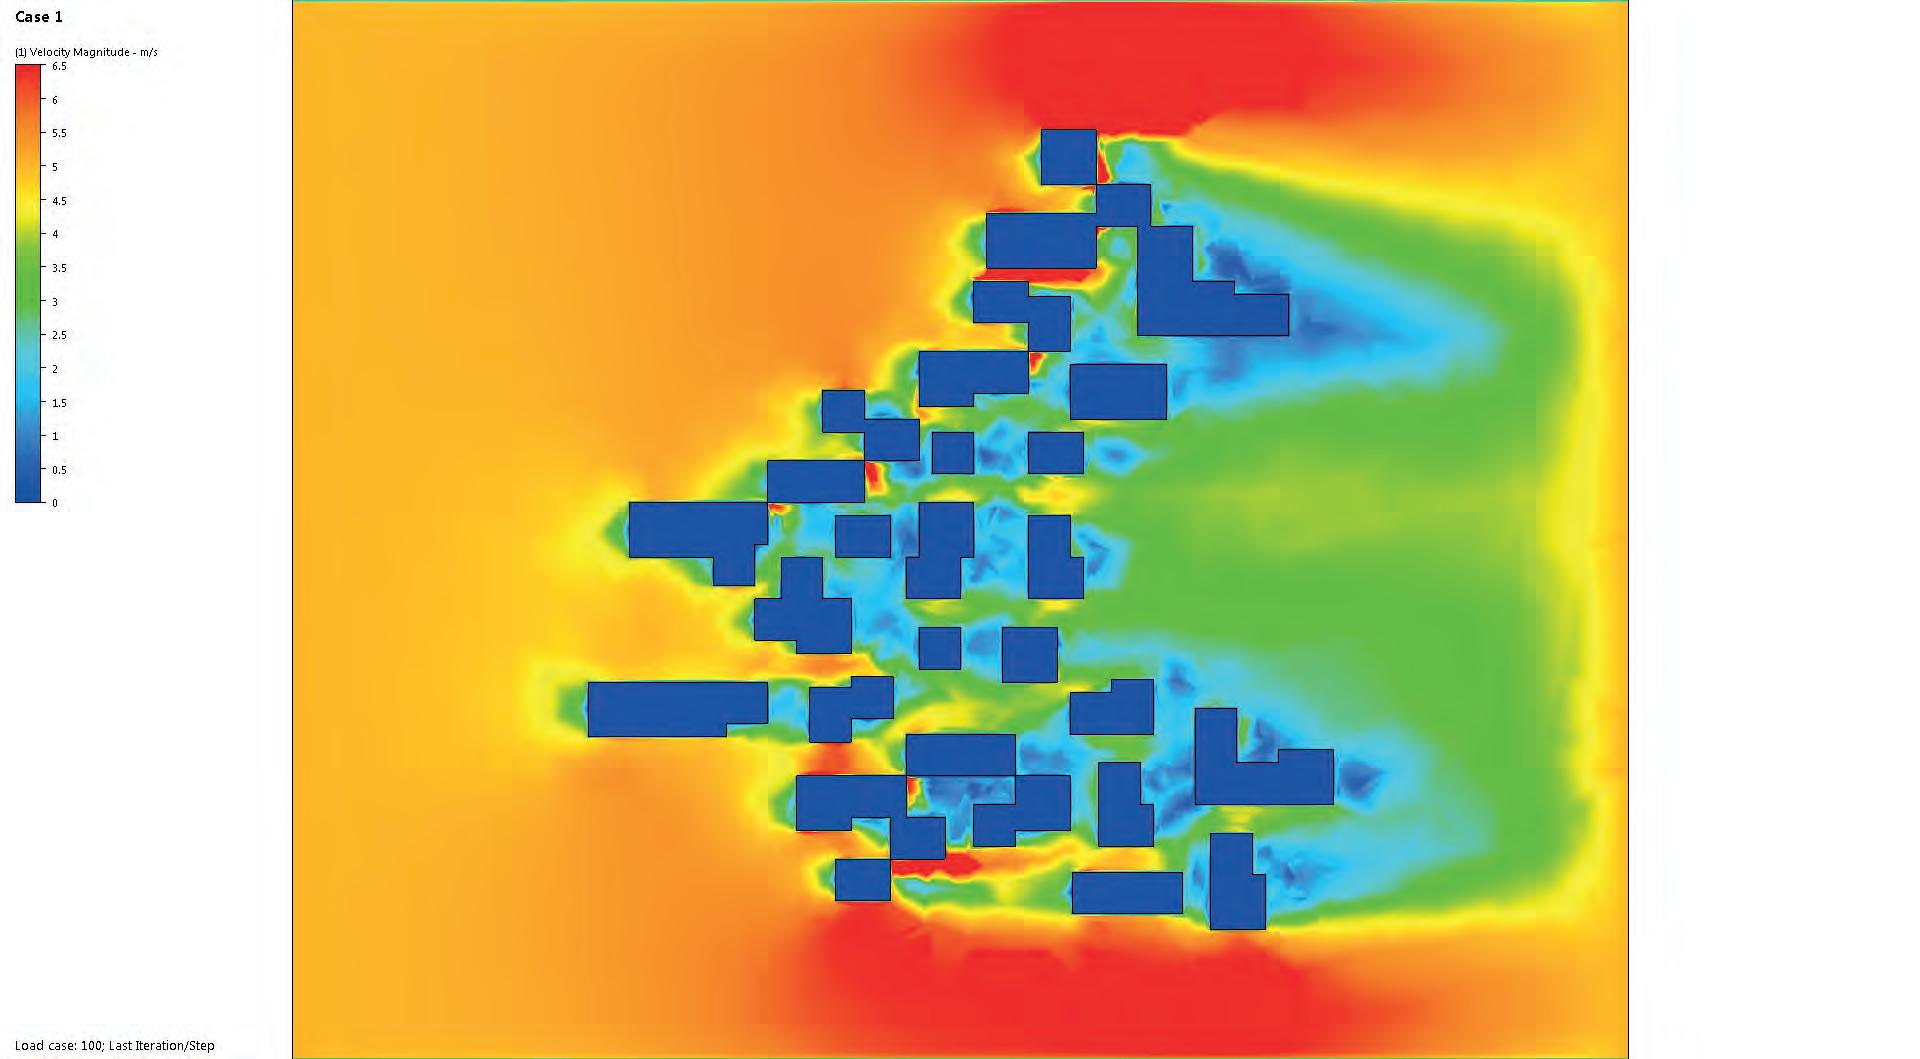
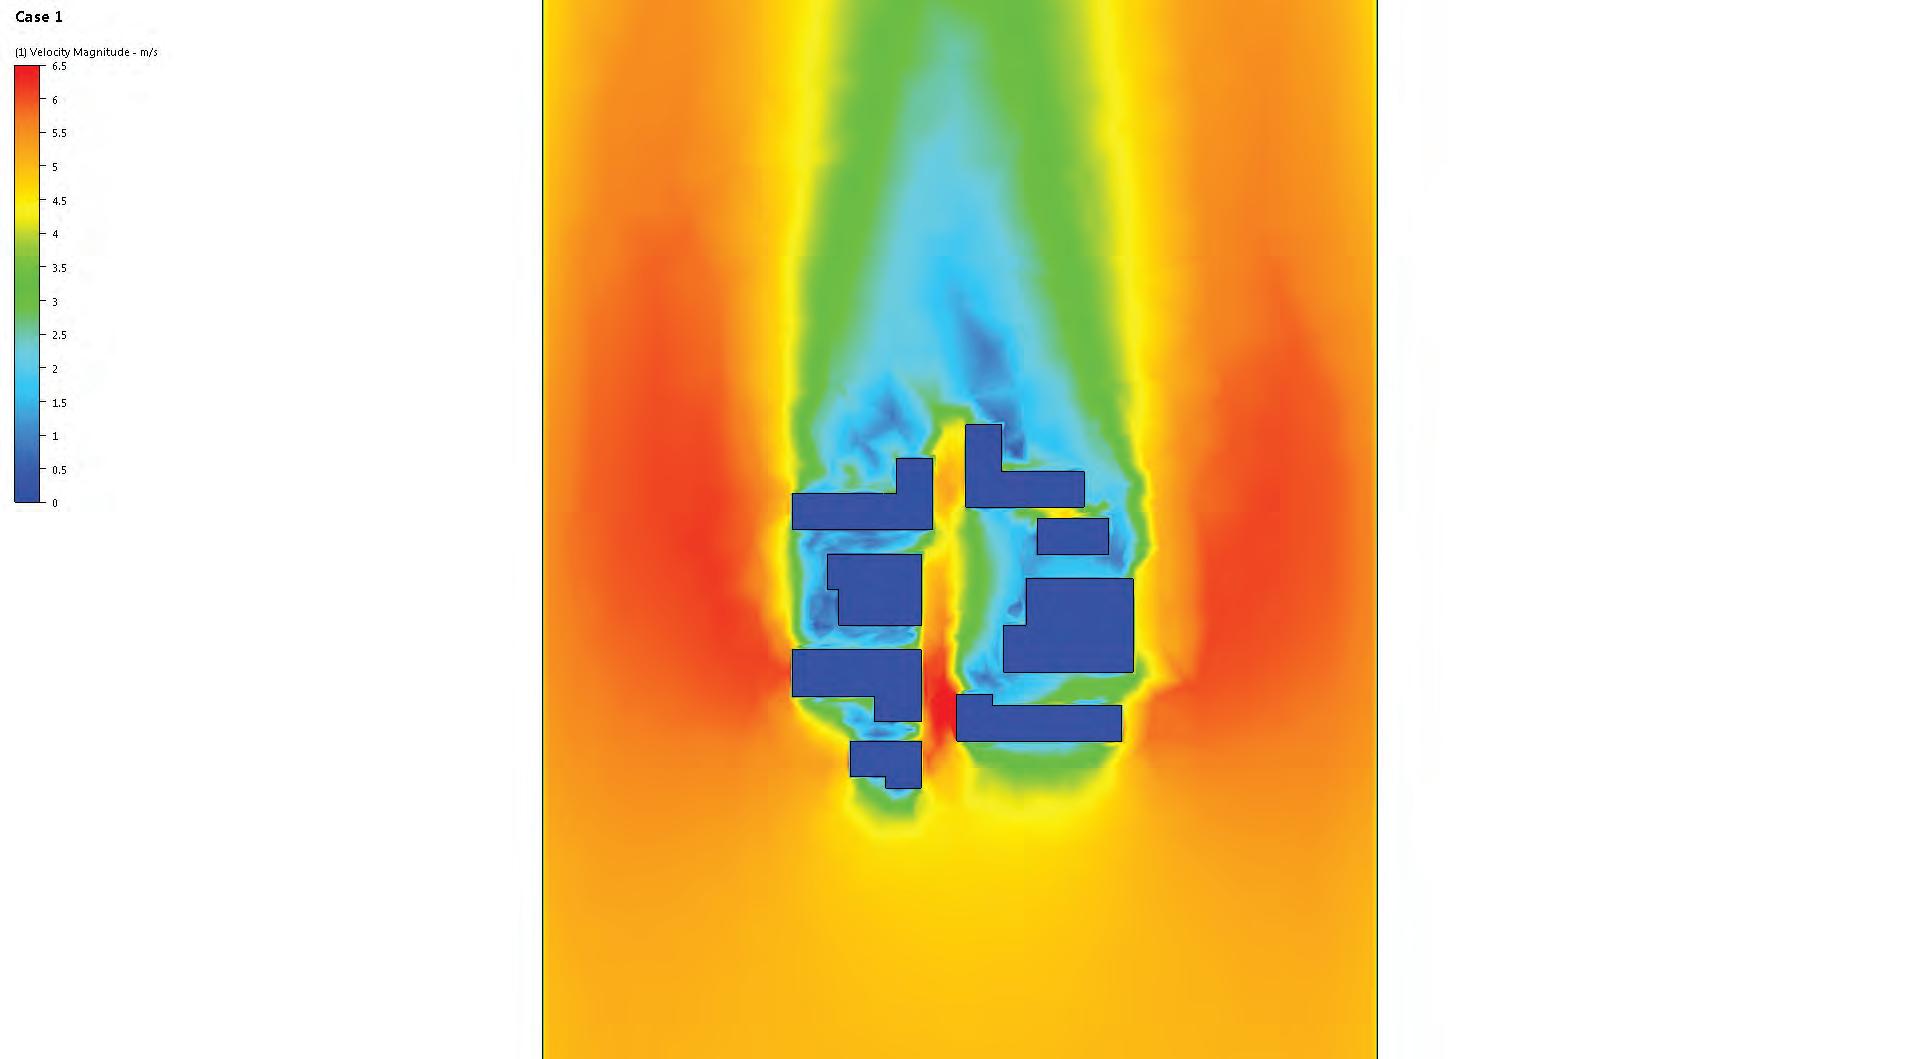
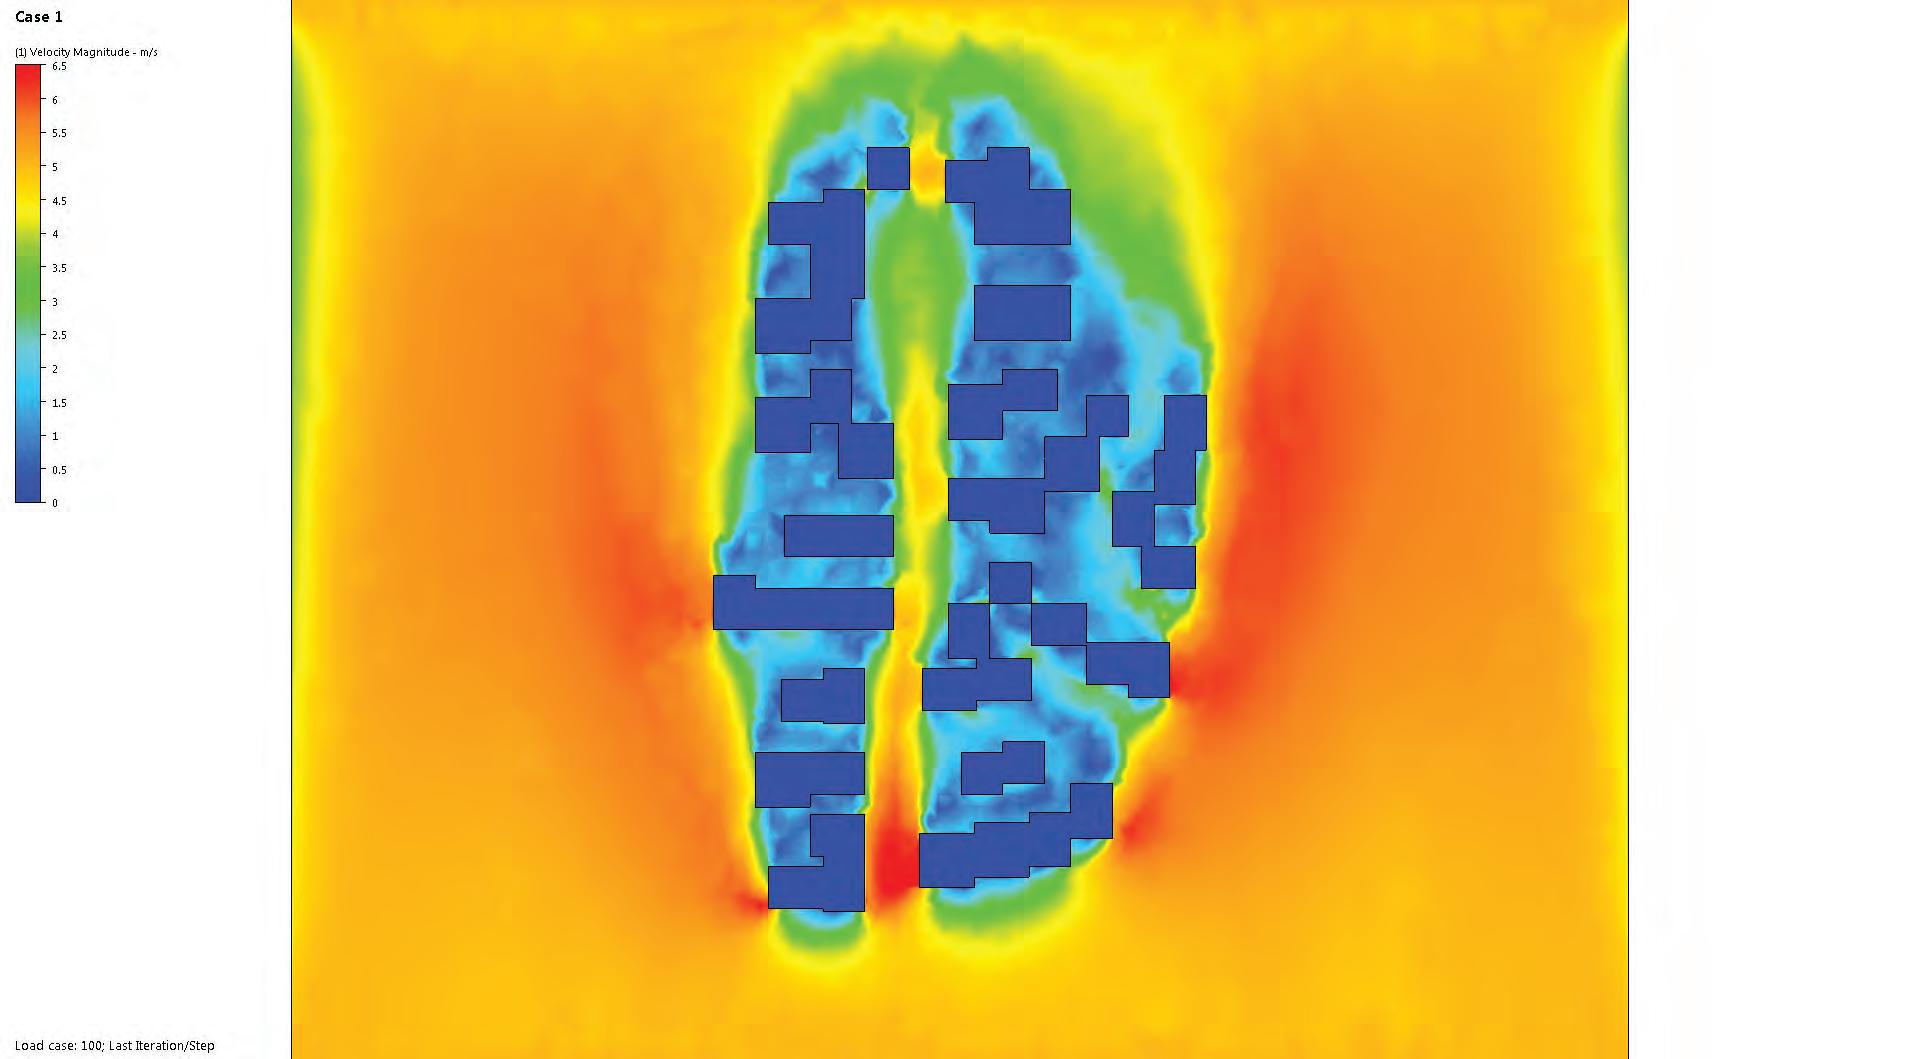
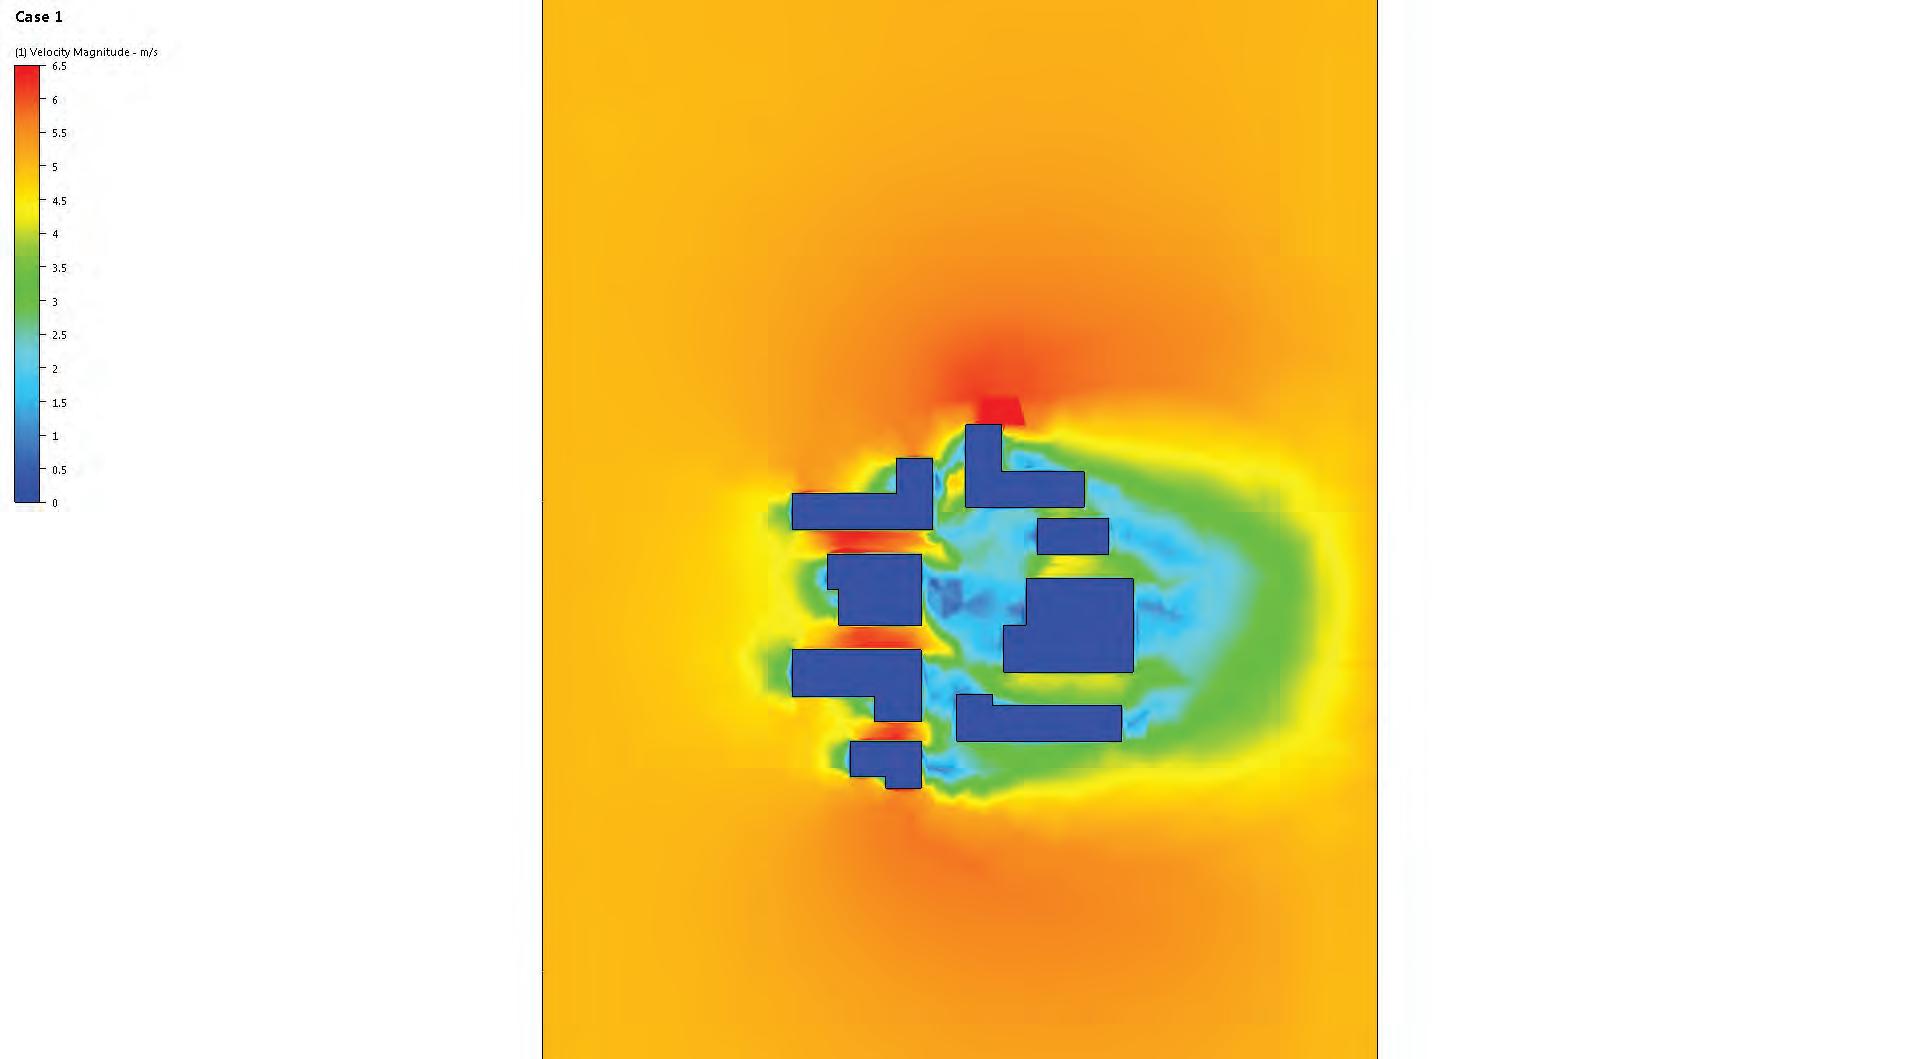
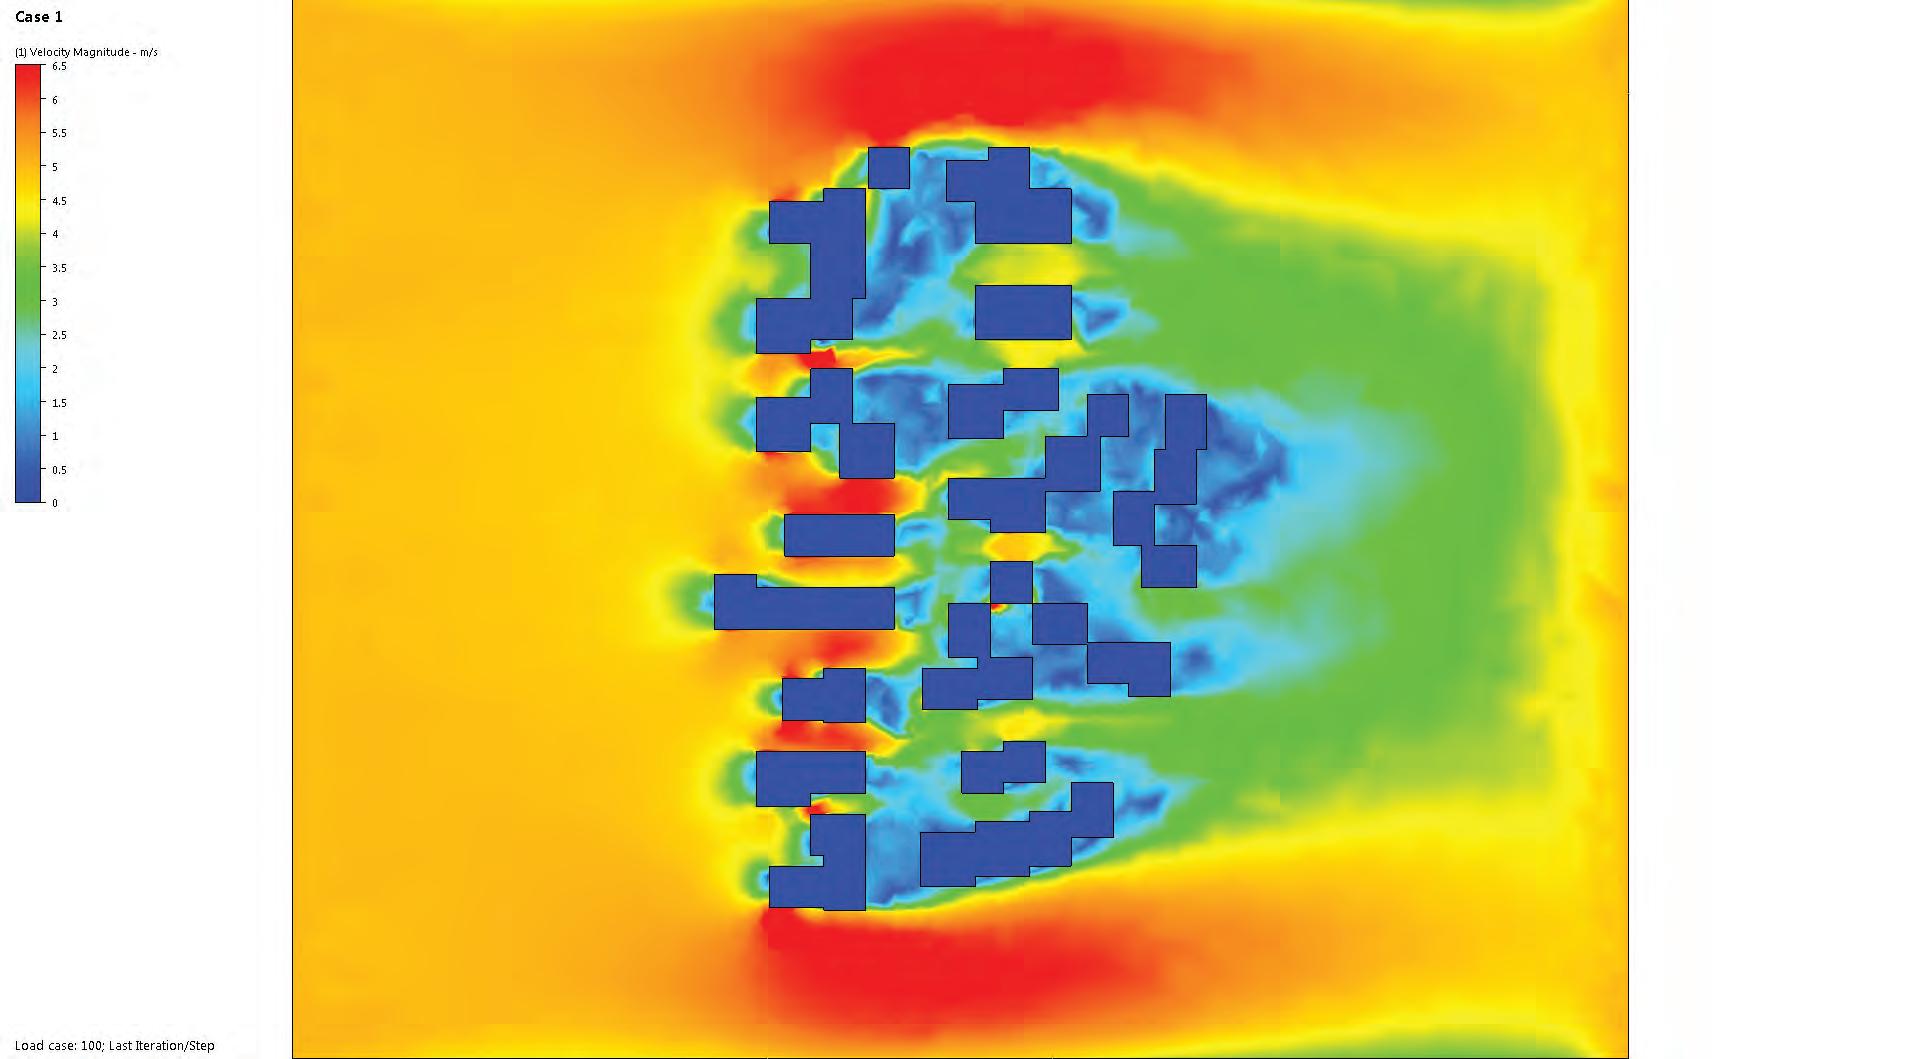
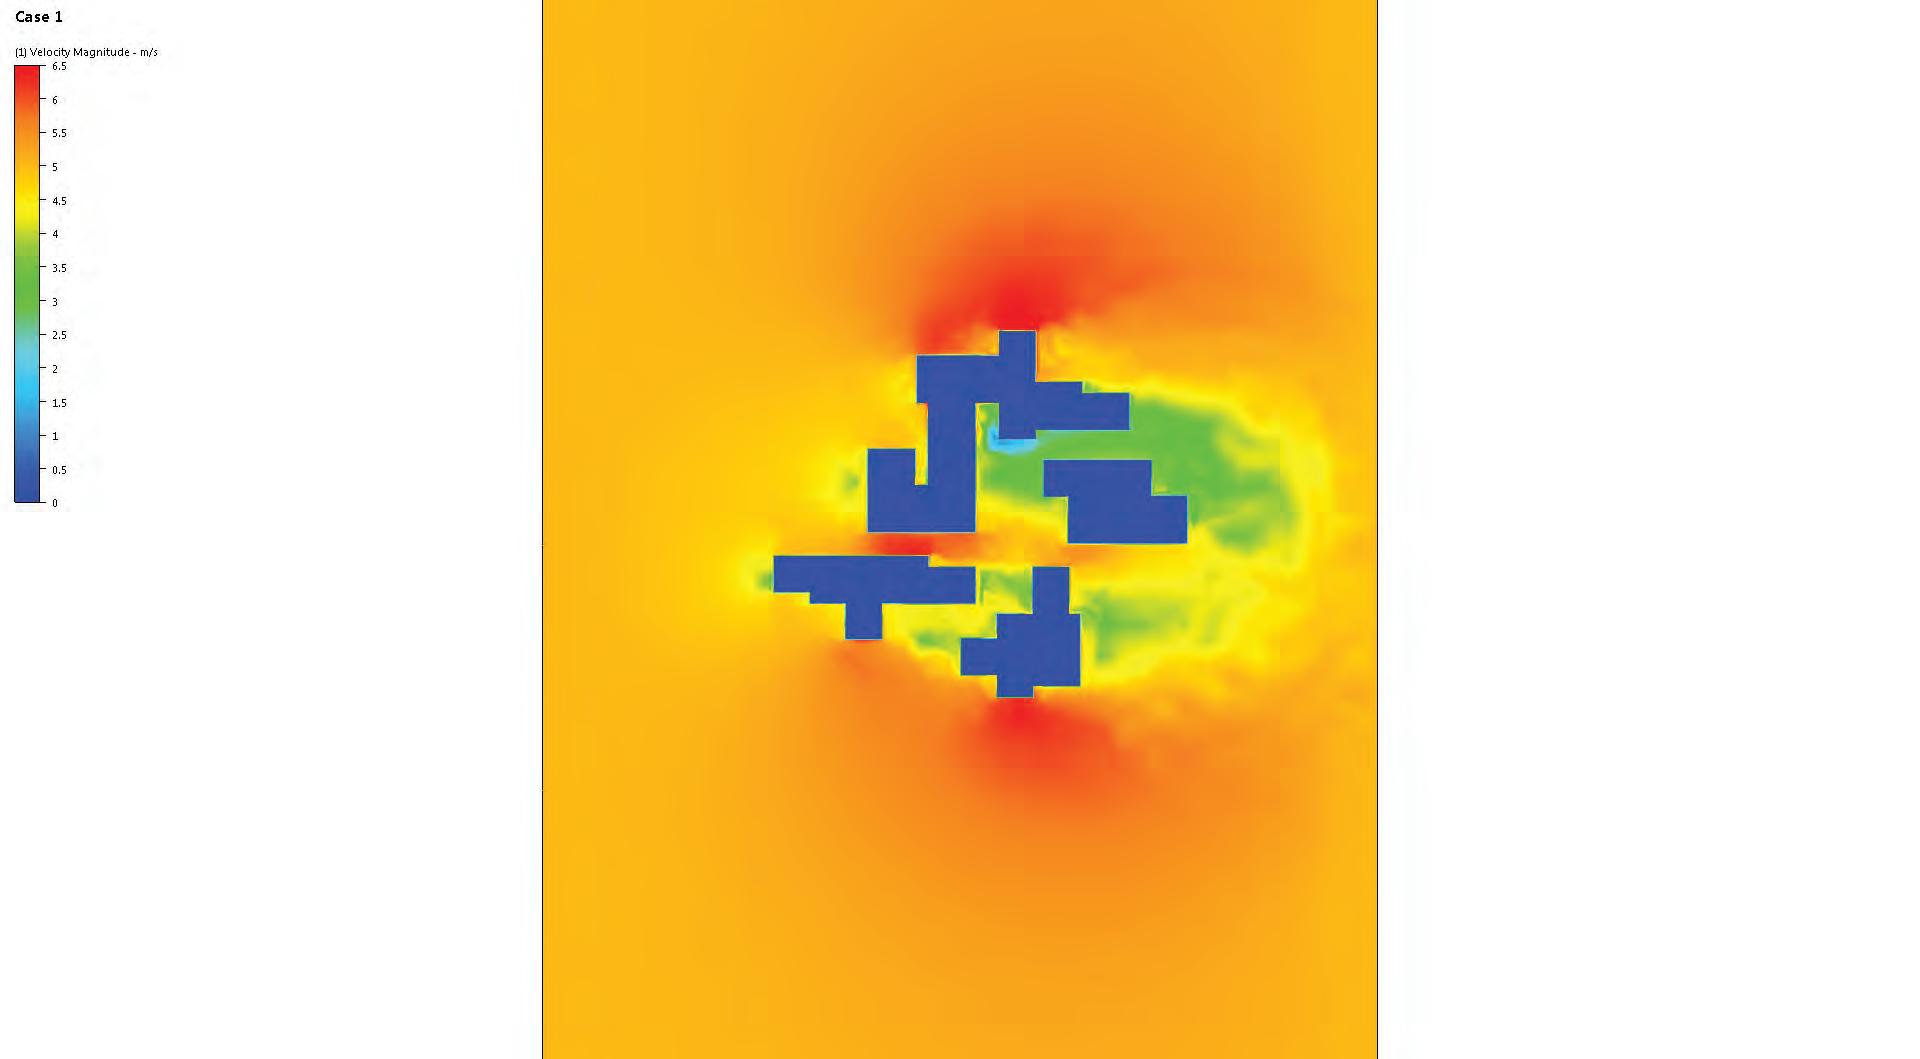
5.3 URBAN GROWTH SIMULATION 118 RESPONSIVE GROWTH SYSTEM private yard live/live-work 150kw/hr Sample Area (m2 Perimeter (m) Porosity 17.2 96.6 60 0.05 9.4 81 46.4 0.39 16.1 150 54 0.31 17.1 146 78.4 0.13 2.4 100 60.8 0.15 Shading Physical Attributes High Narrow proportions High Narrow proportions Low High Porosity Medium Staggered Geometry Medium Staggered Geometry Ventilation Physical Attributes Wind tunnel effect Poor Proportions Increased wind speeds High porosity Uneven Distribution Wide opposite inlet/outlets Desired wind speed Minimum width of 6.5m Cross Ventilation Staggered access points ENVIRONMENTAL PARAMETERS
5.17
The three sizes chosen for the community open spaces and their population and cluster capacities, with growth extents.
Taking inputs from the studies on Dharavi’s urban character analysis, various growth scenarios are simulated through the proposed material system’s employment. These are able to reproduce the positive physical urban characters which are vital for Dharavi’s heterogeneity. Increasing the open-to-built ratios for habitability standards provides open spaces with better outdoor environment than those prevalent in the existing yards studied, allowing cross ventilation and preventing wind tunnel effect. Thus, the proposed material system, with the embedded habitability rules of possible room sizes and ventilation walls, validates its adaptability to accommodate different communities; and with the communities’ inherent social logic, it enables a healthy and an adaptive user-generated growth.
For designing community open spaces so that their insertion can positively influence urban growth, the larger variations of yards from the simulated growth experiments are studied to provided inferences for growth facilitators. From the climatic inferences the parameters for the physical attributes of these community yards are extracted in terms of their optimum proportions, built porosities and the design of their access points. Cluster sizes of 4 to 6 units are also defined from these simulations, and used to estimate the population capacity for a given yard.
Depending on their size and configuration, these yards need to enable multiple 4-to-6-unit clusters to develop around their periphery, enabling various user-generated shared open spaces to emerge within and between these clusters.
Three yard sizes are defined with their areas, estimated population and the number of clusters they can accommodate. The number of clusters and their sizes determine the extents of growth for these open spaces. These growth extents will further influence the distribution of these yards in the urban deployment strategy.
5.4 CONCLUSION 120 121 URBAN GROWTH STUDIES RESPONSIVE GROWTH SYSTEM
TYPE Size (m2 No. of clusters Capacity (ppl) Extents (m) TYPE Size (m2 No. of clusters Capacity (ppl) Extents (m) SMALL 64 - 90 4 140 12 MEDIUM 100 - 135 5 180 16 TYPE Size (m2 No. of clusters Capacity (ppl) Extents (m) LARGE 145 - 210 6 210 20 13.2m 12.3m 18.3m 17.4m 16.1m 20.0m
1 Kamla Raheja Vidyanidhi Insitute of Architecture and Environmental Studies, Mumbai (KRVIA)
2 Fuchs, Christian. Concepts Of Social Self-Organisation. SSRN Journal 2-3. Web.
3 Fuchs, C. (2003). Co-Operation and Self-Organization. [pdf] Vienna University of Technology, p.3. Available at: http://www.triple-c.at [Accessed 24 Dec. 2014].
4 Triantakonstantis, Dimitrios. Urban Growth Prediction: A Review Of Computational Models And Human Perceptions. JGIS 04.06 (2012): 556. Web.
5 Batty, Michael. Cellular Automata And Urban Form: A Primer. Journal of the American Planning Association 63.2 (1997): 267- 271. Web.
6 Cheng, V. and Ng, E. (2008). 304: Wind for Comfort in High Density Cities [pdf] Department of Architecture at the University of Cambridge and the Chinese University of Hong Kong, p.5. Available at: http://plea-arch.org/ARCHIVE/2008/content/papers/oral/PLEA_FinalPaper_ ref_304.pdf [Accessed 28 Jan. 2015].
REFERENCES 122 123 URBAN GROWTH STUDIES RESPONSIVE GROWTH SYSTEM
6. SYSTEM DEVELOPMENT
URBAN GROWTH STUDIES
-Design parameters
-Rules of insertion
COMMUNITY STRUCTURE
-Programme for community and neighbourhood
DISTRIBUTION STRATEGY
-Attractor based and grid based differentiation
COMMUNITY OPEN SPACES
-Urban growth negotiators with structural elements (material) and plug-in connections (infrastructure)
RESIDUAL SITES
-Site programme
-Context Quantification
-Degree of dependency
SEQUENTIAL PATCHES
-Subdivsion into patches
-Ground preparation in increments
URBAN DEPLOYMENT STRATEGY
INFRASTRUCTURE NETWORK
-Basic framework of network connecting mains
To enable the formation of a habitable self-built urban fabric, a strategy is devised for the implementation and deployment of growth moderators in residual sites in Dharavi. The strategy aims at moderating the existing negative characters of overbuilding and lack of infrastructure, and banks on employing the existing resources of skill and man power.
The strategy follows a logic of incremental occupation of a vacant site, which initiates from the existing communities around the site’s periphery, making the whole process inclusive rather than exclusive, as is seen in the current rehabilitation efforts of high rise buildings.
Also, besides engaging with the existing community, one major advantage of the incremental occupation strategy is that the constraints established though the distribution of the growth moderators are context specific, which enhances its implementation on any residual site. Therefore, the potential for user and context-specific variation is catered for at different scales. The existing variation in terms of size and character of residual sites allows the strategy to be tested on various scenarios to inform and later verify its adaptability.
The design and categorisation of a variation community yard types, gives a range of ground conditions which can be tested with urban growth. Certain conditions might be more advantageous for the growth while some might prove to have detrimental effects. This helps analyse the validity of the strategy.
126 127 SYSTEM DEVELOPMENT RESPONSIVE GROWTH SYSTEM 6.1 OVERVIEW
These
2.01
Semi-dependent
Dependent ( < 2500m2)
Semi-dependent
(4500 to 9000 m2
Independent
(33,000 to 35,000 m2

Although Dharavi has a dense urban fabric, there are a number of vacant unused lots. These are either located in the peripheral region or are previously occupied sites cleared up for rehabilitation by the government. These areas fall into neglect either because of their unattractive location for finding employment, or due to stalled construction work; they become dumping grounds for garbage and simultaneously the first sites of occupation for new migrants.
have an existing underground infrastructure of drainage and water supply from which connections can be drawn into the site.
Industrial sheds, government rehabilitation and formal apartments are compounded buildings and have no engagement with existing or new development.
2.02
A residual site adjacent to the existing community currently accumulating waste
Source: www.264days. wordpress.com
Railway
Social amenities
Government structure
Residual sites
The primary objective is to enable these sites to develop an improved self-built urban fabric. If successful, they have a potential to contribute positively to the surrounding fabric. From the urban character analysis (Chapter 5, section 5.2) it is observed that the aggregation logic is based on adjacency rules. For example similar live-work dwellings cluster together, or areas closer to major streets develop as commercial zones with high density. Thus it is essential to enable an urban growth that can continue to respond to the adjacent site conditions.
Distinct context conditions are identified based on their potential for attracting the new growth. The site boundaries adjacent to residential communities, pedestrian routes, amenities and open spaces could be the potentially attractive zones for community interaction. Adjacent vehicular roads determine the accessibility of the site and are attractive for commercial activities. These streets
Depending on the size of the sites, projections can made for the community character they could house. Small sites with an area below 2,500 m2 would probably host residential communities which are dependent on their surroundings for institutional support like schools and health services. The sites in the range of 4,500 m2 to 9,000 m2 could accommodate semi-dependent communities, which have some social infrastructure like neighbourhood nursery schools and community halls. The new amenities would be shared by the new and existing communities, complement the existing amenities in the surrounding fabric. The largest sites have an area close to 35,000 m2 and can potentially house an independent community, with a full provision of amenities. However even in this case there would still be an engagement with the adjacent fabric.
The enabling of these three different characters to develop, with different relations to the existing adjacent communities, shall be addressed through the development of a strategy for the urban deployment of growth moderators.
N Self-built Mangroves
Independent
128 129 SYSTEM DEVELOPMENT RESPONSIVE GROWTH SYSTEM 6.2 RESIDUAL SITES
POTENTIAL CHARACTERS
Map of Dharavi showing the location of residual sites.
are vacant plots located on the periphery of Dharavi, or have been cleared for redevelopment.
SITE
2.03
2.04
8958 m2 197 896 SEMI-DEPENDENT Area Dwellings (estimated) Population (estimated) Pedestrian connection Access to vehicular road Existing community edges Walled edges Site 2 9 2% 79% 19% Site 3 4496 m2 99 450 SEMI-DEPENDENT Area Dwellings (estimated) Population (estimated) Pedestrian connection Access to vehicular road Existing community edges Walled edges 3 71% 9% 20% 5 31% 46% 23% Site 4 5570 m2 122 557 SEMI-DEPENDENT Area Dwellings (estimated) Population (estimated) Pedestrian connection Access to vehicular road Existing community edges Walled edges Ratio Family type Area/dwellingComposition*Occupancy *The composition percentage is based on the first growth which would be predominantly migrants. It is however indicative and will vary in the actual scenario.
AREA NO OF FLOORS: 2 for maximum saturation Built 55% Open 45% DWELLINGS Dwelling variation 1 Living area +1 private space Dwelling variation 2 Living area + 2 private spaces 23 m2 34 m2 75% 25% 3 to 5 people 7 people Site 1.1 Site 1.2 Site 1.3 Site 1.3 Site 1.1 Area Dwellings (estimated) Population (estimated) for ground occupancy Pedestrian connection Access to vehicular road Existing community edges Walled edges 1271 m2 28 127 6395 m2 141 640 Site 1.2 DEPENDENT DEPENDENT SEMI-DEPENDENT Area Dwellings (estimated) Population (estimated) Pedestrian connection Access to vehicular road Existing community edges Walled edges 2420 m2 53 242 Area Dwellings (estimated) Population (estimated) Pedestrian connection Access to vehicular road Existing community edges Walled edges 8 24% 52% 24% 482% 18% 4 6.5% 93.5%130 131 SYSTEM DEVELOPMENT RESPONSIVE GROWTH SYSTEM 6.2 RESIDUAL SITES BOUNDARY CONDITIONS
Estimated number of dwellings and projected population calculation for residual sites.
Existing residual sites with their context conditions.
3 8% 17% 74% Site 6 35,453 m 779 3547 INDEPENDENT Area Dwellings (estimated) Population (estimated)
connection Access to vehicular road
community edges Walled edges 1357% 43% Site 5 33,075 m2 727 3309 INDEPENDENT Area Dwellings (estimated) Population (estimated)
connection Access to vehicular road
community edges
edges 132 133 SYSTEM DEVELOPMENT RESPONSIVE GROWTH SYSTEM 6.2 RESIDUAL SITES BOUNDARY CONDITIONS
Pedestrian
Existing
Pedestrian
Existing
Walled
Dwelling in relation to adjacent open space
2.05
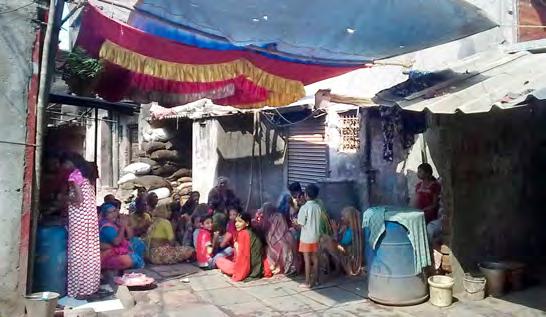
Dharavi is composed of small close-knit communities, with the family as the smallest unit. Bachelor migrants usually live together until they become economically stable, after which they invest in a separate dwelling and are joined by their family. It is a patrilineal society: men live with their family even after marriage and the dwelling expands to accommodate the extended family.
Families organise their dwellings around an open space to form a cluster. Established as a community of rural immigrants, people from similar regions or with similar beliefs settle in vicinity of each other. Therefore neighbours share a strong social bond, especially the women of the households. They have an important role within the family: most women engage in income generating activities along with housekeeping and child-minding. The common open space between dwellings is thus used for a multitude of activities like work, social interaction and children’s recreation.
A number of such clusters form a neighbourhood. The families in a neighbourhood share community amenities like nursery schools, public health centres, social gathering spaces like religious buildings, and community halls, which usually house a library and educational activities for children and adults.
These amenities usually have a larger open space around them, which doubles up as a public open space for informal markets, ceremonies and marriages. In the present scenario, the only amenities present in Dharavi are religious institutions and few schools for formal education.
Spatial relationships
From the social logic, the community structure is broken down to define four scales of spatial organisation which the proposed growth moderators will engage with. The first and the smallest of these is the dwelling unit.
A unit consists of the built space along with a semi-open interface with the adjacent open space. In the proposed strategy, the will have units assembled using the proposed material system ,with connections to the infrastructure supply.
The next scale of spatial organisation is the cluster. The size of the cluster is inferred from the existing urban fabric analysis and the urban growth simulation with inputs from the proposed material system. It is defined by four to six units organised around a shared open space. The open space is an emergent character shaped by its users and their types of activity. As observed from the urban fabric analysis, social yards are small and intimate as compared to relatively large, well connected work yards.
Through the implementation of urban growth moderations, the formation of clusters will continue to be user-dependent, but enabled through self-building using the material system components. As an input for the next scale of spatial hierarchy, a range of extents is defined for cluster size, informed by the urban growth simulations.
The next level of spatial hierarchy is an open space shared between a number of small clusters forming a community. This has a character similar to existing public open space with activities like informal markets, ceremonies, social gatherings. An important observation in Dharavi is the problem of sanitation and overbuilding resulting in low levels of habitability. To address this problem, these community open spaces combined with infrastructure have the potential to support the community.
For a neighbourhood intervention, public amenities are introduced alongside such yards. These community yards become urban growth negotiators where they enable unit formation and clustering, and provide infrastructure access, and ensuring habitability of the neighbourhood.
Organisation of dwellings around open space
CLUSTER COMMUNITY
Clusters of live-huts and live-manufacture huts around a public open space (community yard)
NEIGHBOURHOOD
Agglomeration of clusters with shared amenities
6.3 URBAN GROWTH NEGOTIATORS 134 RESPONSIVE GROWTH SYSTEM
UNIT
Family type Built (m2 Population range Nuclear Extended TenantLive-informalLive-work 2323 - 3423-34 3-55-7 5-7 10-1410-14 Large 180 6 20 ORGANISATION DATA
Cluster No. of units Extents (x) Population* Social Work 3-5 4-6 12-20 35 35 * estimates for ground occupancy, with maximum saturation the population can reach upto double 12-20 Community yard Area (yard) No. of clusters Extents (y) Population* SmallMedium 70 120 4 5 12 16 210 140 180 Size of patch Population* Amenity Nursery school Health centre & Community hall 600 - 800 5500m2 - 6000m CapacitySize 75 (2-9 age)120m (2 floors) 1/ patch 1/ patch 60m2 (2 floors) extents (x) yard extents (y) 135 SYSTEM DEVELOPMENT COMMUNITY STRUCTURE 2.06 The levels of spatial organisation inferred from the social organisation of the community
Source: www.flickr. com
Use of open space for social interaction between immediate neighbours
2.07
The positive aspect of the settlement is its ability to self-build thereby absorbing a fast-paced customised growth with a high density. On the other hand, the biggest challenge faced by its community is lack of resources, primarily land, resulting into overbuilding, and underground infrastructure, leading to sanitation issues.
In order to mediate between these two problems, the sites need to be prepared with certain basic infrastructure which can supplement urban growth. However, since the freedom to self-build and organise according to social requirements is a necessity, the infrastructure provision cannot be too deterministic. For this reason, open public space or community yards are considered suitable for as growth negotiators. As observed from the earlier studies, an open space will not be encroached upon if it is a useful resource for the community. The yards thus have two-fold support infrastructure: underground infrastructure and overground infrastructure.
These community yards are designed as an open space defined by a sunken depth of 0.45 m. This depth is specified so that the edges of the yards can double up as seating space benefitting social interaction; while the during the monsoon,they help in absorbing the rainfall to mitigate flooding, with a porous gravel finish allows for fast percolation of water. Minimum access points for the open spaces, inferred from the climatic analysis experiments, are defined to maintain a minimum of cross ventilation in the open space, in the case that buildings occupy the entire yard boundary.
Along the periphery of the open space, a few corner components from the material system are installed as infrastructure support, to encourage first growth. These are made from plywood to increase their durability while remaining compatible with the cardboard kit.
An underground network of water supply, sewage, storm water drainage and electricity is drawn from the infrastructure mainlines along adjacent vehicular streets to the community yards. Possible connections are provided close to the yard boundary, with at least
one connection point per cluster. Users have the freedom to plug-in to these connections and lay domestic pipelines to their dwellings. The site implementation strategy, discussed later in this chapter, addresses this in detail.
Thus unit growth and resultant urban organisation around these yards is affected through two scales: the material scale by providing a modular kit of components, influencing dwelling size and microclimate; and the urban scale through the provision for specific support infrastructure. Both the scales complement each other and this allows for freedom of organisation based on the user’s choice without being prescriptive.
The factors which influence the design of the community yards are their size variation relative to the potential clustering around them, the climatic study for cross ventilation and solar radiation, the material system proportions and spatial organisation.
The estimated number of clusters an open space can accommodate depends on its boundary conditions. As inferred from the wind analysis, an absolute minimum width of 6.4 m is defined for the yards, with a length that doesn’t exceed four times the width. Staggered boundaries are better for creating increased shading from adjacent building, additionally they increase the edge perimeter which accommodates a higher built periphery. This is directly related to the ventilation surfaces that can be placed along the yard. Thus a higher buildable perimeter, provides better ventilation to the built units. The perimeter of the yard corresponds to the material kit in terms of the edge lengths of the potential room sizes, which are used to proportion the lengths of staggered boundary edges.
Thus, a variation of yards is created using a multi-objective genetic algorithm, which is then categorised based similarities of the forms generated. The yards are analysed for solar shading assuming a built periphery of one floor in height, for solar shading.
6.3 URBAN GROWTH NEGOTIATORS 136 137 SYSTEM DEVELOPMENT RESPONSIVE GROWTH SYSTEM Structural
accommodating
Access
Brick
Potential
To
elements
initial growth
points Depth of the yard: 450 mm Finish: Gravel
paved surface
initial growth
infrastructure mainline Plug-in infrastructure points
COMMUNITY YARDS
Community open spaces with supporting infrastructure which enable urban growth


SMALL YARDS

6.3 URBAN GROWTH NEGOTIATORS 138 139 SYSTEM DEVELOPMENT RESPONSIVE GROWTH SYSTEM Area Built perimeter Shaded surface 73m2 G1.4 42m 31m2 Porosity 0.24% Area Built perimeter Shaded surface 83m2 37.7m 40m2 Porosity 0.25% G5.7 Area Built perimeter Shaded surface 71.5m 41.4m 52m2 Porosity 0.16% G4.1 Area Built perimeter Shaded surface 78.5m 33.2m 45m2 Porosity 0.30% G5.6
AREA OF PRIMITIVE 70 m2 Wide and linear
and segmented Bottle-neck
S,M,L
width : length <=1:4 ROTATION
SPLIT EDGE 3.2,4.2,2.2 STAGGER SUB-EDGE [-2,2] Large yards: split to maintain 1:4 proportion and have a freedom of rotation Small and medium yards: rectangular primitive with 1:4 proportion Edges are split respecting the dimensions of the material kit Climatic response in terms of yard porosity and solar shading to maintain outdoor comfort
AREA CLOSE TO PRIMITIVE MAXIMISE BUILT PERIMETER MAXIMISE SHADING POROSITY RANGE [0.15,0.27] YARD VARIATION - SMALL
Examples from the catalogue of the yards generated classified into variations
Parameters for generating variation for three different yard sizes
Narrow
PRIMITIVE
PROPORTION
[-90,90]
FITNESS CRITERIA
2.09
2.08
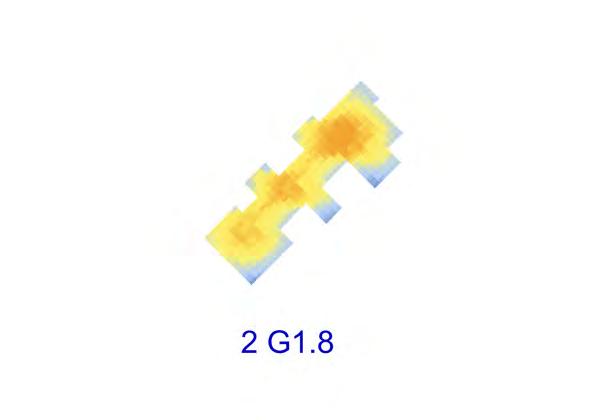
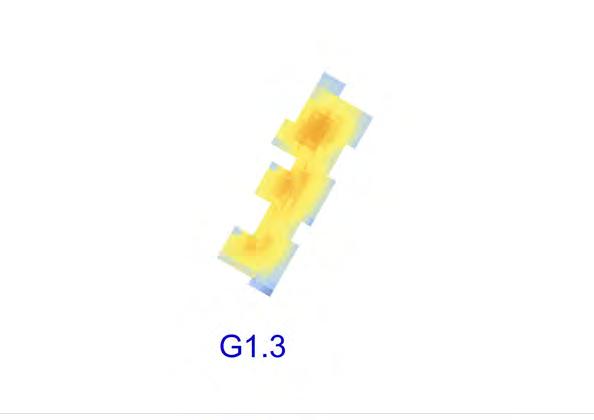
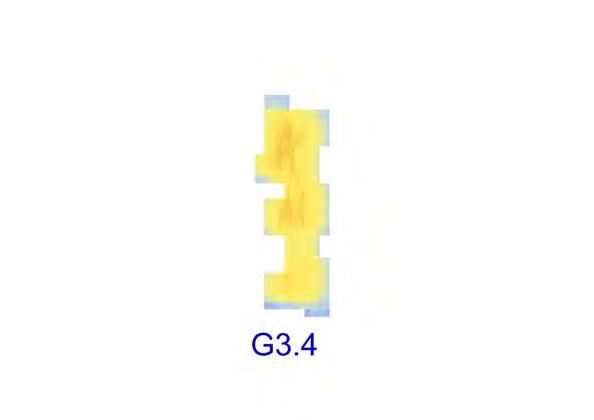
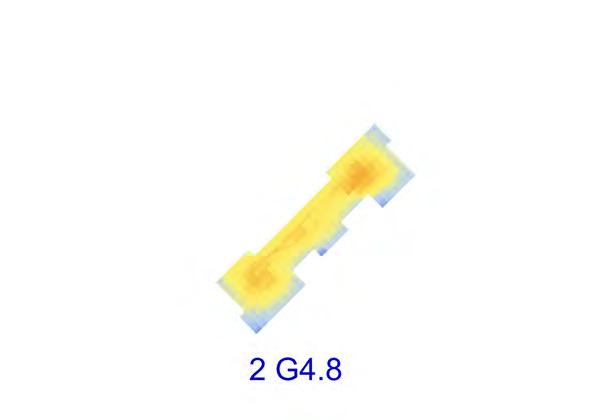
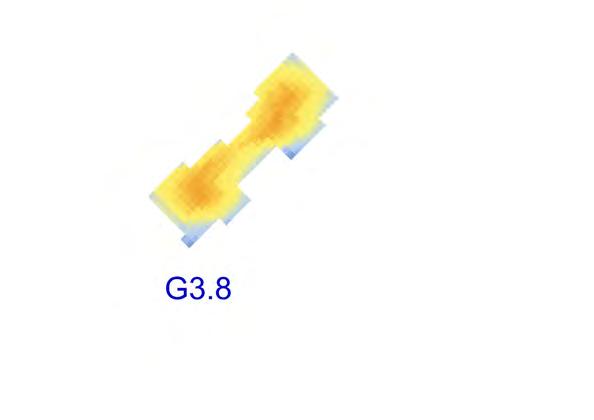

6.3 URBAN GROWTH NEGOTIATORS 140 141 SYSTEM DEVELOPMENT RESPONSIVE GROWTH SYSTEM Area Built perimeter Shaded surface 122.7m 55.7m 62.7m Porosity 0.22% G3.4 Area Built perimeter Shaded surface 118.6m 52m 55.1m Porosity 0.23% G4.8 Area Built perimeter Shaded surface 124m2 49.8m 57.5m Porosity 0.24% G3.8 Area Built perimeter Shaded surface 145m2 61.7m 54.7m Porosity 0.18% G6.6
Area Built perimeter Shaded surface 161.8m2 49m 53m Porosity 0.29% G1.6 Area Built perimeter Shaded surface 154.8m2 53.2m 57.5m2 Porosity 0.23% G1.5 Area Built perimeter Shaded surface 140.8m2 62m 62.7m2 Porosity 0.21% G1.8 Area Built perimeter Shaded surface 122.7m2 55.7m 61.1m2 Porosity 0.22% G1.3
AREA OF PRIMITIVE 120 m2
Bottle-neck
MEDIUM YARDS
Wide and linear
YARD VARIATION - MEDIUM
Narrow and segmented
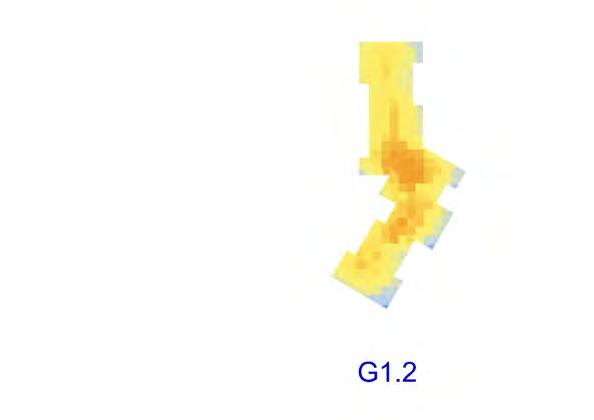
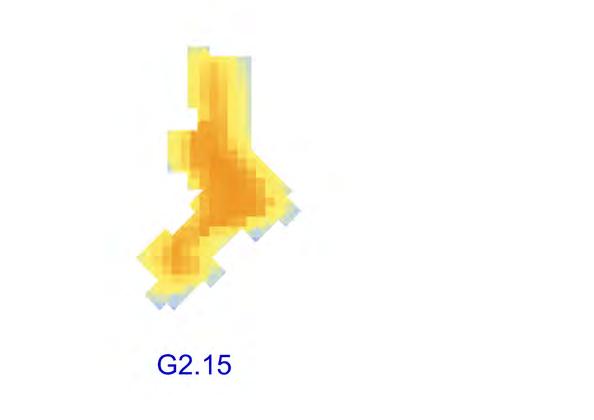

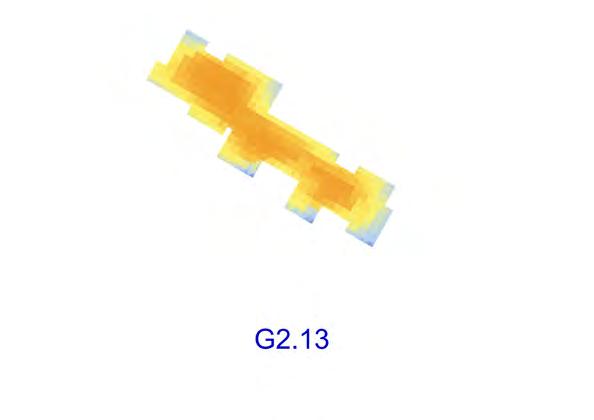
6.3 URBAN GROWTH NEGOTIATORS 142 143 SYSTEM DEVELOPMENT RESPONSIVE GROWTH SYSTEM Area Built perimeter Shaded surface 181.6m 56.85m 84.5m Porosity 0.41% G3.12 Area Built perimeter Shaded surface 208m2 73.63m 84.5m Porosity 0.23% G2.4 Area Built perimeter Shaded surface 190m2 78m 85.7m Porosity 0.23% G3.14 Area Built perimeter Shaded surface 158m2 75.4m 90.8m Porosity 0.19% G2.19
Area Built perimeter Shaded surface 155m 66.9m 86.6m2 Porosity 0.22% G1.2 Area Built perimeter Shaded surface 191.4m2 62m 85.2m2 Porosity 0.31% G2.15 Area Built perimeter Shaded surface 150.7m2 66.5m 75.8m2 Porosity 0.15% G2.2 Area Built perimeter Shaded surface 169.7m2 69.52m 69.1m2 Porosity 0.22% G2.13 LARGE YARDS AREA OF PRIMITIVE 180 m2
Bottle-neck
Angled
YARD VARIATION - LARGE
Narrow and segmented
2.10
Potential placement for yards relative to existing context conditions
Social Character
Wide & Linear Angled
Large Crowd gatherings around amenities
Adjacent site context
Extension of existing open space
Angled yards are relatively wide and have a high area, thus can accommodate large crowds for neighbourhood activities. Another prominent feature is their rectilinear configuration with which they act as a bridge between an existing residential community and new growth, by being placed partly within an existing open space on the boundary of the residual site. These yards can be coupled with an amenity, mostly a nursery school or a community hall, encouraging an overlap of activities between the yard and the amenity.
The probable location for these yards would be an existing amenity or an open space in the adjacent urban fabric. The yards are expected to generate a symbiotic relationship between the two fabrics with the amenity supporting the existing community until the new growth initiates and the existing fabric providing a social link for the new growth.
Long-stay Activities
High built-density area
Wide and linear yards are similar to the angled variation,but smaller in size. These are potential spaces for transient informal activities like temporary markets.
Their wide configuration enables them to accommodate small crowd gatherings. Therefore, they can be located near an existing residential or work community, acting a community yard that can be shared between an existing community and a new one.
Narrow & Segmented Edges
Short-stay Activities
Proximity to high traffic or low-attraction areas
Narrow yards have a high buildable perimeter and are well shaded due to the staggers in the profile. They can potentially house more units along the periphery as compared to the other variations with the same area of open space. A high buildable periphery provides for a higher number of adjacent units to benefit from direct ventilation of the yard.
They can be located in zones where a rapid growth is expected, mostly along major vehicular streets; since these are zones with a high commercial activity with residences selling the produce. The small shaded zones in the yard also allow for informal work.
Bottle-neck
Allows for smaller scales of activity
Undefined context
The prominent character of bottle-neck yards is that a central area of circulation, sub-divides into the yard into two distinct sub-yards. The width of the central region is narrow in some cases hence creating a bottleneck entry for the sub-yards.
They are placed in zones which have an undetermined context, hence regions away from the site periphery. Cluster formation can initiate around one of the sub-yards and depending on the speed of development proliferation around the rest of the yard.
6.3 URBAN GROWTH NEGOTIATORS 144 145 SYSTEM DEVELOPMENT RESPONSIVE GROWTH SYSTEM
YARD CHARACTERS
2.11
Incremental Occupation
The strategy addresses the distribution of the proposed growth moderators. It involves a preparation of the site with basic infrastructure to receive the migrant population. The strategy is broken down into three parts: ground preparation, distribution of community yards and laying of infrastructure lines.
The existing residual sites vary broadly in size. They have similar context conditions, however they vary in percentage distributions. The challenge for the strategy is to make it site specific yet develop rules which can be applied across various sites. The strategy is discussed on a large site, and general observations are drawn for application of the strategy on the different site scenarios.
The strategy developed is context specific, and considers incremental site occupation from the peripheries, primarily around growth attractors. Based on the type of site and the existing context, specific programs are identified which can attract new migrants to settle around them. Adjacent site conditions like an existing community, particularly with existing open spaces or amenity, or the site’s vicinity to a vehicular road become the growth initiators. A peripheral amenity offers social resources which benefit both existing and new communities; this makes them also spaces for interaction between the existing settlement and new growth.
Ground preparation involves the laying out underground infrastructure, installing the community yards and finishing the surface with brick paving. Brick is locally made and is a predominantly used construction material, making it cheap. The advantage of finishing the surface in brick over concrete is that it is relatively easy to manipulate the material to lay the plug-in network for individual dwellings as and when they are constructed.
Due to the unpredictability of the population, the procedure developed is to prepare large sites in multiple increments over time, as their population increase and grows towards their centre. For a given instant, the ground shall be prepared to receive 600 to 800 people. This breaking down of large site areas into smaller patches helps negotiate the scale. The patch size can be considered as a unit of incremental development, and patches can be sequentially developed gauging the demand for them. In this way, there can be new migrants can occupy a prepared patch while a successive
patch is simultaneously being prepared.
Following this logic, the patches on the periphery, close to existing growth attractors are prepared first. Depending on the speed of growth and occupation, the remaining patches are sequentially prepared. In the example illustrated here, the two patches A1 and A2 are prepared in the first instance because of their adjacency to existing residential communities. Depending on the pattern of occupancy of A1 and A2, either B1 or B2 or both shall be prepared next.
Community yards
Prior to the overground preparation, the distribution of yards across the patch is laid out.
Built-to-open ratios established from the urban growth simulations, with the developed material system, become the basis for determining the percentage of minimum open space required within a patch. The total area for open space includes community yards, user dependent emergent open space and street network. An area of circa 10 percent of the total area of the patch is dedicated to community open space. This area is subdivided to determine the number and size yards; a mix of small, medium and large yards, with different characters and informed by the existing context, is distributed across the patch.
The placement of yards along the periphery of the site is influenced by the context, since they become a social space for an active community where as a compounded context of industrial units or busy vehicular roads have no interaction with the open space. A large and dense existing population will need the provision of larger yards as well as more amenities. The yards placed adjacent to a live-work community are either medium or large in size and of angled or wide variation, with one yard edge shared with the existing built fabric.
Internally, the distribution of yard is uniform and based on a grid. The size of the grid is defined by the yard extents (defined by a range of cluster sizes that can populate around a yard). Differentiation of grid size is a function of the size of patch and the size of the yard.
6.4 SITE STRATEGY 146 147 SYSTEM DEVELOPMENT RESPONSIVE GROWTH SYSTEM Open space distribution Size of site Open area (45%) Community yards (10%) Emergent yards & streets (35%) Built:open 55:45 14,883m2 3,300m2 33,075m2 11,576m2 A1 A2 B1 C1 C2 C3 Attractor-based Grid-based Attractor-based Grid-based Attractor-based Grid-based Attractor-based Grid-based Attractor-based Grid-based Attractor-based Grid-based S M L 2 1 2 1 4 1 1 1 1 4 2 1 1 4 1 6 1 5 1 8 Size Type of distribution Community yards Yards adjacent to existing fabric Yard size Large Medium Small Potential extents of clusters Yard size Large Medium Small Grid based distribution Programme Allocation INDEPENDENT SITE Size of site Population* Amenity Nursery school Health centre & Community hall 3309 33,075m2 4 4 (1/800ppl) Adjacent live-work community Existing open space Community yard with amenity Potential placement of periphery community yards Walled edges Sequential ground preparation A1 A2 B1 C1 C2 C3 Ground preparation at a time Area - 5500-6000 m2 Capacity - 600-800 people t 3 234m 68m 180m 84m
GROUND PREPARATION 2.12 Urban implementation strategy: Distribution
of community yards.
Urban
implementation strategy: Ground preparation
2.13
Infrastructure mainlines
Sewage pipe
150mm ø depth: 1.5m
Water supply pipe
90mm ø depth: 0.75m
Secondary branches frequency: 50-70m
Sewage pipe
100mm ø depth: 1m
Water supply pipe
63mm ø depth: 0.75m
Underground Infrastructure
A skeleton network of underground infrastructure is prepared such that it allows for individual plug-in connections for the residents. These are distinct supply and collection points, with at least one connection point estimated per cluster (of 4 to 6 dwellings). The system includes water supply, sewage, storm water drainage and electricity connections. The connection chambers are located underground with a removable cover such that they can be accessed for laying connections to adjacent individual dwellings.
The major roads in Dharavi have an existing underground sewage and water supply network laid out by the municipality.
An infrastructure mainline is drawn from these and laid along the periphery of the residual site. Secondary lines branch from this mainline, one line per patch for system efficiency. A tertiary network from these branches is laid out reaching each plug-in connection point around the community yard.
Following the laying of the infrastructure lines and connection points, the yards and the brick ground finishes are laid.
Urban Deployment
The developed strategy is applied on three sites in order to compare and contrast the results. In this way the adaptability of the strategy to produce site specific variation using the same rules can be validated.
The first example is residual site 4 (refer to Section 6.2), a medium sized site with an existing residential live-work fabric on two opposite edges, a busy vehicular road along one edge and a highrise SRA apartment along the fourth edge. The other two sites are residual site 5 and site 6 (refer to Section 6.2). They are the two largest residual sites in Dharavi, but with very different context conditions.
57 percent of the site periphery of site 5 is live-work community with a total of 13 pedestrian connections. Although it is not flanked by vehicular roads, two major roads lie parallel to the site edges providing indirect infrastructure access points and a high probability of connectivity. As opposed to this, site 6 is located adjacent to a railway track. It is a narrow linear site with a bottle-neck vehicular
connection. Almost three-fourths of the site boundary is walled. Although it is seemingly poorly connected, a foot over bridge provides access to the railway station connecting it very well to the rest of the city. Thus all three sites are attractive for residential-work community clusters to develop, at varying degrees.
Site 4 is of medium size hence the ground will be prepared in a single instance. Whereas on sites 5 and 6 the ground is prepared in increments. From the incremental occupation strategy established, there is a potential for occupancy on sites 4 and 5 from two edges due to their adjacency to the existing urban fabric. As opposed to this, site 6 has only link for growth initiation, along the upper edge in proximity to an existing religious amenity and residential community.
The three scenarios developed help visualise the variation resulting from site specific implementation of the strategy. This overall strategy helps establish the sequence of patch development and context specific peripheral yards. The specific yard placement as well as a detail of infrastructure connection points is further detailed at the patch scale.
Tertiary network
Sewage pipe
100mm ø depth: 1m
Water supply pipe
63mm ø depth: 0.75m
Existing municipal infrastructure
Main underground infrastructure line
Secondary branches
Tertiary network to each community yard
6.4 SITE STRATEGY 148 149 SYSTEM DEVELOPMENT RESPONSIVE GROWTH SYSTEM
GROUND PREPARATION
Urban
Underground infrastructure
implementation strategy:
2.14
Urban deployment of growth moderators, overall strategy layout
Sequential ground preparation
Medium sized sites have one large yard with an amenity which is placed depending on the ones existing in the context and multiple small sized yards.
Surrounded by a high density urban fabric, the first patches prepared are on two opposite ends, growth successively filters in.
With 75% of the periphery walled, the growth is linear initiating from one edge of the site. Each patch is successively developed, with at least on large yard with an amenity.
6.4 SITE STRATEGY 150 151 SYSTEM DEVELOPMENT RESPONSIVE GROWTH SYSTEM 71m 410m 77m 64m 62m 64m 72m 75m 100m 54m 60m 234m 50m 68m 64m 68m 180m 72m 84m 0 t3
infrastructure Connections from mains Yards (S,M,L) Growth extents
Existing municipal
GROUND PREPARATION
The initiator patches are detailed out for all the three sites discussed earlier. A variation of yards with infrastructure connection points are deployed relative the context conditions as discussed in urban growth moderators (Section 6.3). The amount of open space distributed as community yards and their frequency is a compromise between enabling user-generated cluster formation and deterring over-building.
A method for evaluation for the patches would be empirical testing,
by generating multiple scenarios of occupancy using the urban growth algorithm discussed in Chapter 5; although due to the indeterminacy involved, the best method for testing the strategy would be through pilot experimentation. However, a scenario of incremental occupancy within a patch is simulated in order to verify whether the intended outcomes of emergent open space and network, and potential for densification are made possible through the system and its implementation strategy. This is discussed in the next chapter.
6.4 SITE STRATEGY 152 153 SYSTEM DEVELOPMENT RESPONSIVE GROWTH SYSTEM B B B B C D D D B C C D A Infrastructure plug-ins Underground drainage and water supply network A B B C C D B B B C C D D A B C D A Yard variation Angled Wide and linear Narrow and segmented Bottle-neck Context Adjacent residential and work community Walled edges Vehicular road OPEN SPACE DISTRIBUTION
2.15
Urban deployment of growth moderators, patch prepared in a single timescale above underground infrastructure, below placement of community yards with structural elements on the periphery
7. SYSTEM IMPLEMENTATION
CARDBOARD MATERIAL KIT
COMMUNITY YARDS
URBAN INFRASTRUCTURE
SYSTEM OF GROWTH MODERATORS
SYSTEM IMPLEMENTATION
SEQUENTIAL OCCUPATION
-Pseudo growth simulation across a timescale
MATERIAL TEMPORALITY
URBAN CHARACTERS
The modular component-based cardboard material system, the provision of community yards, and the laying of infrastructure network framework together constitute a system of growth moderators which is to be implemented on the residual sites in Dharavi through the strategy discussed earlier. However, since the socially organised communities of Dharavi are emergent as well as unpredictable, the challenge lies in evaluation of such a system strategy prior to actual site implementation.
Since through the experiments from the growth algorithm discussed in chapter 5, some urban characters comparable to Dharavi’s existing social fabric have been successfully reproduced, a pseudo scenario is generated with the same algorithm on a residual site to gauge the influence of the moderators on a new growth over a timescale. It is true that many scenarios are possible, but one scenario of growth on residual site 4 is discussed here to see the extent to which the growth can reconfigure itself to respond to the community behaviour and the urban characters and material temporalities that result out of this. It is further compared to an existing settlement in Dharavi and the government proposal for similar population.
RESPONSIVE GROWTH
-User generated urban development
-Flexibility and adaptability
-Improved habitability and access to sanitation
SYSTEM EVALUATION
-Data Comparison
156 157 SYSTEM IMPLEMENTATION RESPONSIVE GROWTH SYSTEM 7.1 OVERVIEW
2.01
a. The table indicates the different community yard spaces placed on site with the overground infrastructure provision and projected capacity
b. Layout of underground infrastructure network connecting to the main line.
c. A plan showing the distribution of the community yards on site 4 along with the overground infrastructure.
For the purpose of testing the strategy, an urban growth simulation is carried out on residual site 4, using the growth algorithm discussed in Chapter 4. As discussed in Chapter 6, this is a semi-independent site with an area of 5570 m2 which can support 122 units and an initial population of 557 for ground occupancy. As per the strategy discussed in the previous chapter, a residual site is prepared in patch increments with a ground preparation to accommodate 600 to 800 people; this is approximately the total capacity of site 4, so the entire site is prepared in one increment.
The site boundary is adjacent to three distinct contexts. Two opposite edges are adjacent to existing communities, and are assumed to be the main growth attractors, providing pedestrian connections and a potential for community interaction. The initial growth is predicted to start from here and progressively fill in towards the centre of the patch. The edge along a vehicular road along provides access to an existing underground infrastructure mainline of drainage and water supply. The walled edge flanking the SRA apartment block offers no engagement for the new growth.
10 percent of the site area is allocated for community yards, and this is distributed on the patch as yards of different variations and sizes. The main objective of the strategy is the integration of the residual sites within the existing settlement. The distribution of the yards facilitates this by taking into account the adjacent context conditions.
Since the existing adjacent communities are very dense, three of the community yards are placed along their edges. These yards will be the first to attract new growth. A large yard of variation type A (Y1), is placed to serve as extension of an existing open space and its angled configuration encourages interaction between the old and new growth. It is also supplemented with a nursery school which can cater for the surrounding settlement as well as the new growth. Two small yards (Y4, Y5) of B variation (wide and linear
configuration) are placed on the opposite community edge to promote long stay activities. These three yards are predicted to be occupied first owing to their proximity to the existing community.
Two other small yards (Y2, Y3) with a narrow and segmented configuration (variation C) are strategically located near the vehicular road, which is an attractor of commercial activity, to supplement potentially dense, fast growth. Small yards of variations B and D (Y6, Y7) provide community open space in the remaining area. The distribution and placement of all the yards in relation to each other is governed by their extents of growth according to their respective sizes as established in the strategy (Chapter 6, 6.4).
As described in Chapter 6, each yard is 0.45 m depth and finished with porous gravel for fast rainwater percolation. Its two-fold support infrastructure includes the underground infrastructure supplying a number of plug-in connection points, and yard access points designed as per the climatic inferences from the urban growth studies (Chapter 5). A few timber corner components from the material kit are installed to guide and direct the initial growth.
Below the yards, a basic network of infrastructure is laid with primary lines (diameters:150 mm for sewage, 90 mm for water supply) branching into secondary and tertiary lines that connect the plug-in points to the infrastructure mainline below the vehicular road. Both secondary and tertiary lines have a 100 mm diameter for sewage outflow and a 63 mm diameter for water supply. The entire site is paved and finished in brick.
To provide for the production and distribution of the cardboard building components, a small workshop is set up near yard Y7. Cardboard sheets will be brought here, and prepared into the different component parts, as discussed in chapter 4. The new migrants can procure the ready-to-assemble cardboard kit from here configure their units, according to their needs.
158 159 RESPONSIVE GROWTH SYSTEM 7.2 STRATEGY IMPLEMENTATION ON SITE SYSTEM IMPLEMENTATION SITE 4 Y1 Y2 Y7 Y6 Y5 Y3 Y4 Infrastructure plug-ins Underground drainage and water supply network N 05 20m b c
For
growth capacity, half of its established capacity is considered if the yard is to serve the existing population on the site as well Yard SizeYard Variation* No. of plug-in connections No. of columns Individuals Y1 Y2 Y3 Y4 Y5 Y6 Y7 Large Small Small Small Small Small Small 3 3 3 2 2 3 2 No. of access points New growth capacity 3 2 2 3 3 3 3 100 140 140 70 70 140 140 Serving Population Existing and new New New Existing and new Existing and new New New A C C B B D C G2.2 G4.1 G5.2 G2.4 G1.4 G1.2 G5.3 7 4 4 4 3 4 4 a
*A - Angled, B - Wide and linear, C - Narrow and segmented, D - Bottle-neck as discussed in chapter 6.
new
A pseudo growth scenario is simulated and postulated to demonstrate how the site is occupied. It is important to note that this is just one possible pattern of occupation generated using the growth algorithm discussed in Chapter 5. However, in a real-life scenario, owing to several indeterminate factors, many different and unpredictable developments are possible due to a socially-driven organized growth through self-building. The simulation is run in sequential iterations, changing the input variables and placing a new seed point for each iteration. The input variables are modified within the ranges which, in the experiment setups (Chapter 5), reproduce existing urban characters prevalent in Dharavi.
The growth is simulated on the entire site and the corresponding material system implementation overtime is illustrated through sequential occupation. From the migrant families’ transition periods observed in Dharavi as well as that of the material kit (discussed in Chapter 4) three intervals are highlighted following the initial ground preparation. Within the first two-year period, new migrants begin to appear; five-years later, some families begin to grow a community character is established; then three years later sees the a further densification and some urban consolidation.
So to begin with, at t 0, the site is prepared with distributed yards (with plug-in connection points and timber corner components), brick paving and underlying infrastructure network. A nursery school is provided to act as an additional incentive for growth, and a small workshop for the production and distribution of the material system components is set up.
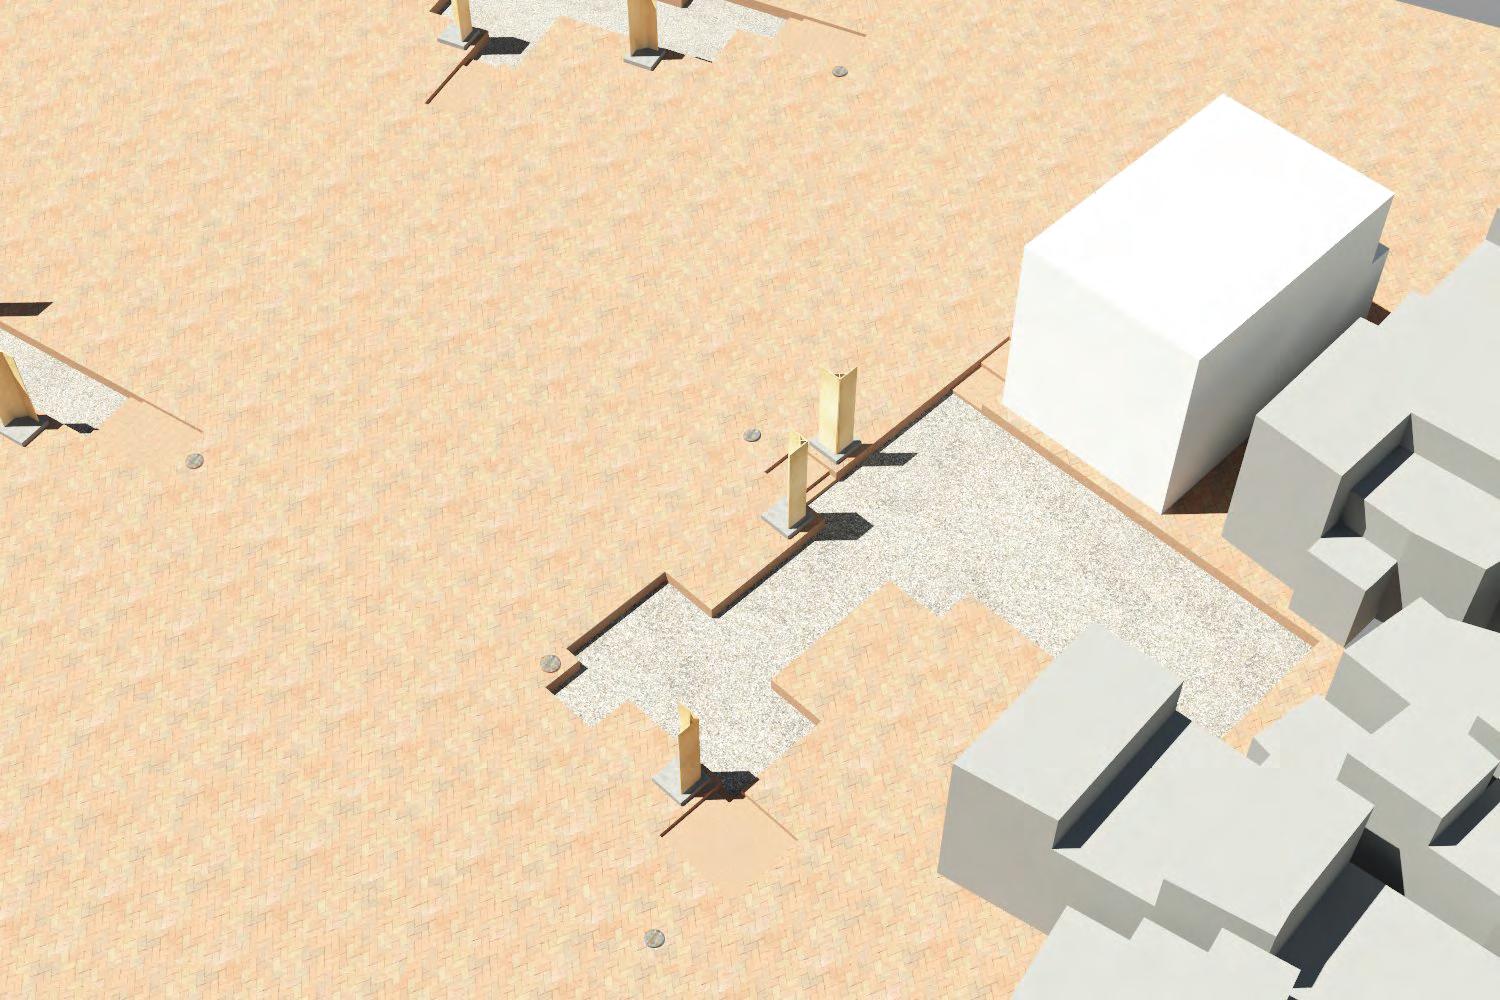
7.3 SEQUENTIAL OCCUPATION 160 161 RESPONSIVE GROWTH SYSTEM SYSTEM IMPLEMENTATION GROUND PREPARATION b
Brick paved ground
Adjacent settlement
Social Amenity (nursery school)
Access points Timber corner components Infrastructure
connection points
Gravel
yard surface (sunk to 0.45m depth)
plug-in
Ground preparation prior to occupation. a. Plan of the site b. opposite page, View of the community yard (Y1) adjacent
the existing
and
a
a t - Ground preparation 7 10 years 0 2 Timescale 010 50m N
2.02
to
settlement
supplemented with
nursery school.
The growth is predicted to start along the edges adjacent to the existing communities and over time move into the site, progressively activating the inner yards.
So, the first migrants would aggregate around the community yards closest to adjacent communities. Since many of them are either transient or economically weak, they are more ‘dependent’ at this stage, and setting up close to the existing community helps to integrate themselves within the settlement, socially and economically.
The nursery school would already be in used by the adjacent settlement (making it an active amenity), drawing more migrants to settle around the community yard adjacent to it as it also offers an opportunity for interaction with the adjacent settlement.
This is the projected scenario for the initial occupation of the site, t 1, in which time any constructions will be in temporary-treated cardboard, which has a maximum lifespan of two-years. 2.03
The migrants can procure the temporary cardboard material kit from the local workshop on site to set up their unit. The plywood corner components around the yards being durable support elements serve as building attractors and units are configured around these components accordingly. The plinth supported on the brick paved surface is built first and connections are drawn from the yard’s plug-in points to the plinth. The material kit is easy and quick to assemble on site since it is component-based.

7.3 SEQUENTIAL OCCUPATION 162 163 RESPONSIVE GROWTH SYSTEM SYSTEM IMPLEMENTATION PHASE 1 b Temporary cardboard construction polymer waterproofing & fire retardant
with connection to infrastructure
Amenity (nursery school) Timber corner components
Plinth
Social
Time frame 1 showing the temporary cardboard construction phase of 2 years. a. Plan showing edge infiltration b. opposite page, Temporary cardboard constructions around the edges of the yard a 7 10 years 0 2 Timescale t - Phase of temporary constructions N 010 50m
2.04 Time frame 2 showing the temporary and semipermanent cardboard constructions at the end of 7 years.
a. Plan showing community growth and occupancy of all yards with circulation b. opposite page, Semi-permanent cardboard constructions with clay replacing temporary constructions on the edges of the yard
As some of the first migrants begin to settle, they are joined by their families, and the community continues to expand. Some families being to seek a more durable dwelling, thereby semi-permanent cardboard constructions begin to appear in t 2
The units built in t 1 around the yards grow incrementally as the families grow in number and become economically more stable. Some of the temporary cardboard constructions are replaced by sun-dried clay-covered cardboard constructions which are more durable and have longer life-span. Their cavity walls are infilled with clay to support additional floors on top. In other cases, some families continue to construct using the temporary construction for financial reasons of because they are in transit.
Some of the transient migrants from t 1 leave, while more new migrants start aggregating with temporary constructions around the semi-permanent units of the already settled families and the other community yards on the site. Thus, the community gradually grows with some semi-permanent extended units around yards and the temporary constructions built on newer plinths around these with the infrastructure extensions serving every unit.
User generated open spaces develop as more units form clusters. Both yards and these open spaces lend themselves for either work or social activities. The access points of the community yards enable the development of circulation routes resulting in the emergence of an open space network, connecting the community yards with the user generated open spaces through these circulation routes.
Therefore, within this time frame, dwellings and the open spaces they define continue to be reconfigured based on patterns of occupancy and enabled by the temporality of the material system and the flexible infrastructure provision. It will be noted that temporary cardboard buildings are reconfigured more frequently than their semi-permanent counterpart, owing to the difference in material lifespan.
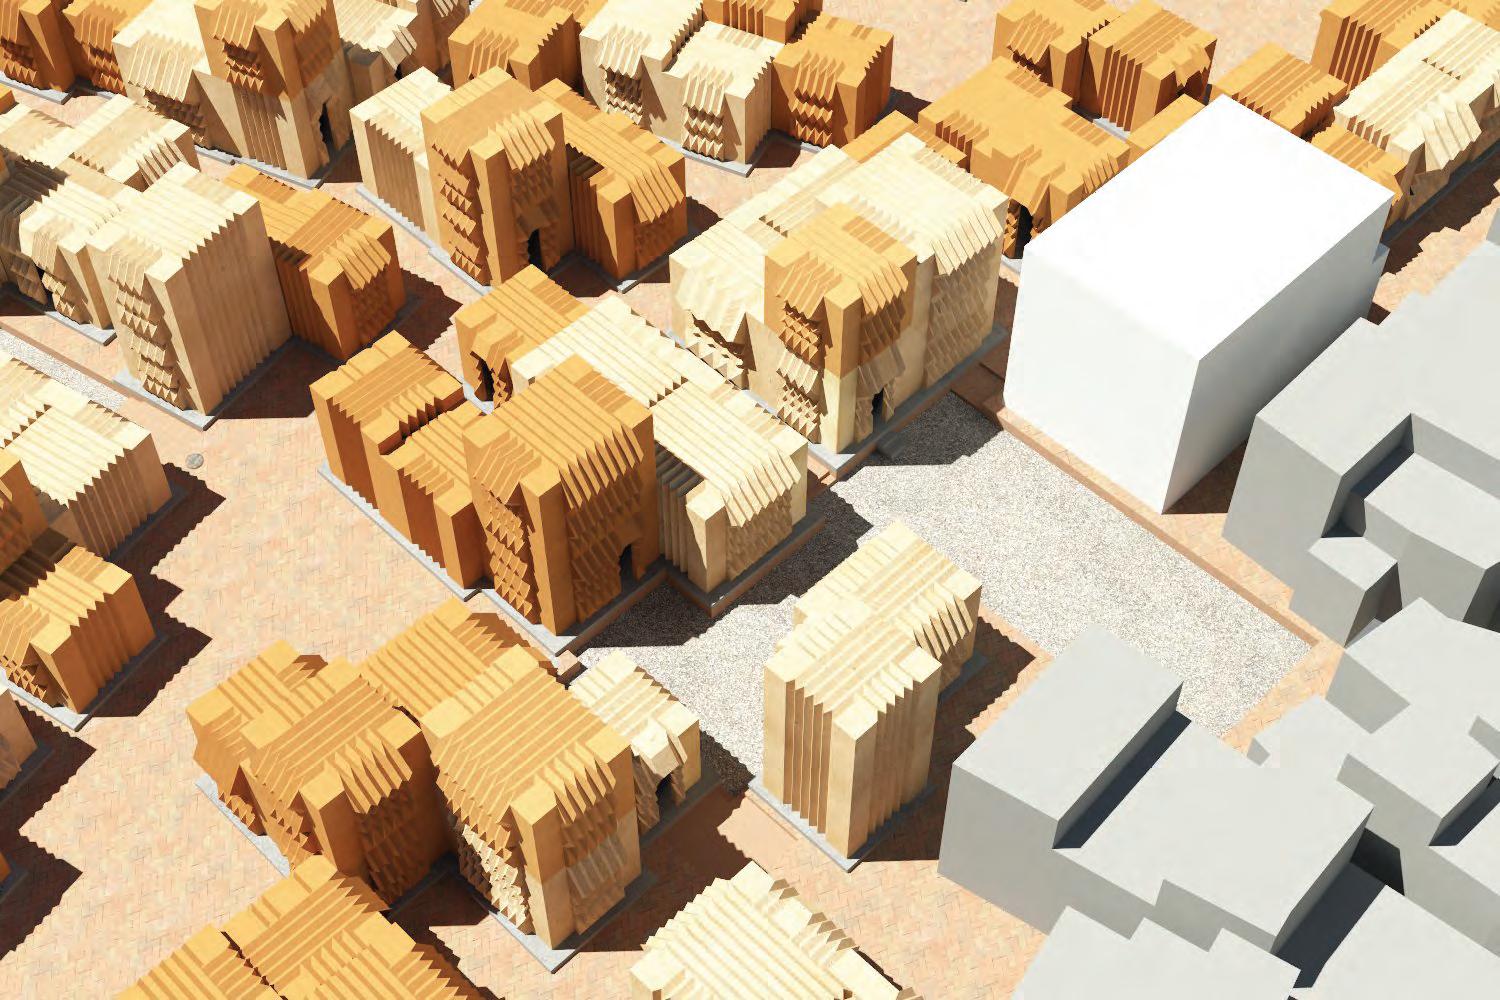
7.3 SEQUENTIAL OCCUPATION 164 165 RESPONSIVE GROWTH SYSTEM SYSTEM IMPLEMENTATION PHASE 2 b Semi-permanent cardboard construction sun-dried clay surface cover & clay-infilled cavity walls Temporary cardboard construction polymer waterproofing & fire retardant Social Amenity (nursery school) Temporary cardboard extensions on upper floors
a 7 10 years 0 2 Timescale t - Phase of semi-permament and temporary constructions 010 50m N
Over a period of ten years t 3), there is a potential for densification across the site, still enabled by the temporality of the material: more new units might appear, and existing ones might extend both horizontally and vertically with either temporary or semi-permanent constructions. Depending on the nature of the community, there might be a stronger presence of semi-permanent dwellings as more families choose to settle.
With the ageing of the community, the settlement could also start to consolidate in some areas, particularly around open spaces (both provided by the strategy or emergent) which develop distinct uses defined by the community itself. The user-generated circulation routes become established streets for regular commuting. As a result, the dependency on the adjacent settlement gradually reduces as the new community starts becoming more self-reliant.
The initial migrant families of t 1 would have settled economically by now and thus, some permanent constructions in brick or timber could emerge especially in place of the oldest units around the yards. Thus, it is projected that within a decade from the implementation of the strategy, the fabric could be composed of three distinct materialities with different lifespans, catering for different needs of its population. However, despite potential for urban consolidation, the temporality of the cardboard material system will continue to be a feasible option for the continuous influx of transient migrants, who particularly seek temporary shelter. Therefore enabling the fabric to continue to rapidly change and adapt for its transient users.
In the following pages, some more details of the growth at 2 are shown to further illustrate the potential for emergence of different urban characters and community patterns, and the reconfiguration of built fabric facilitated by the two materiality scales of the cardboard material system through self-building and infrastructure extensions.
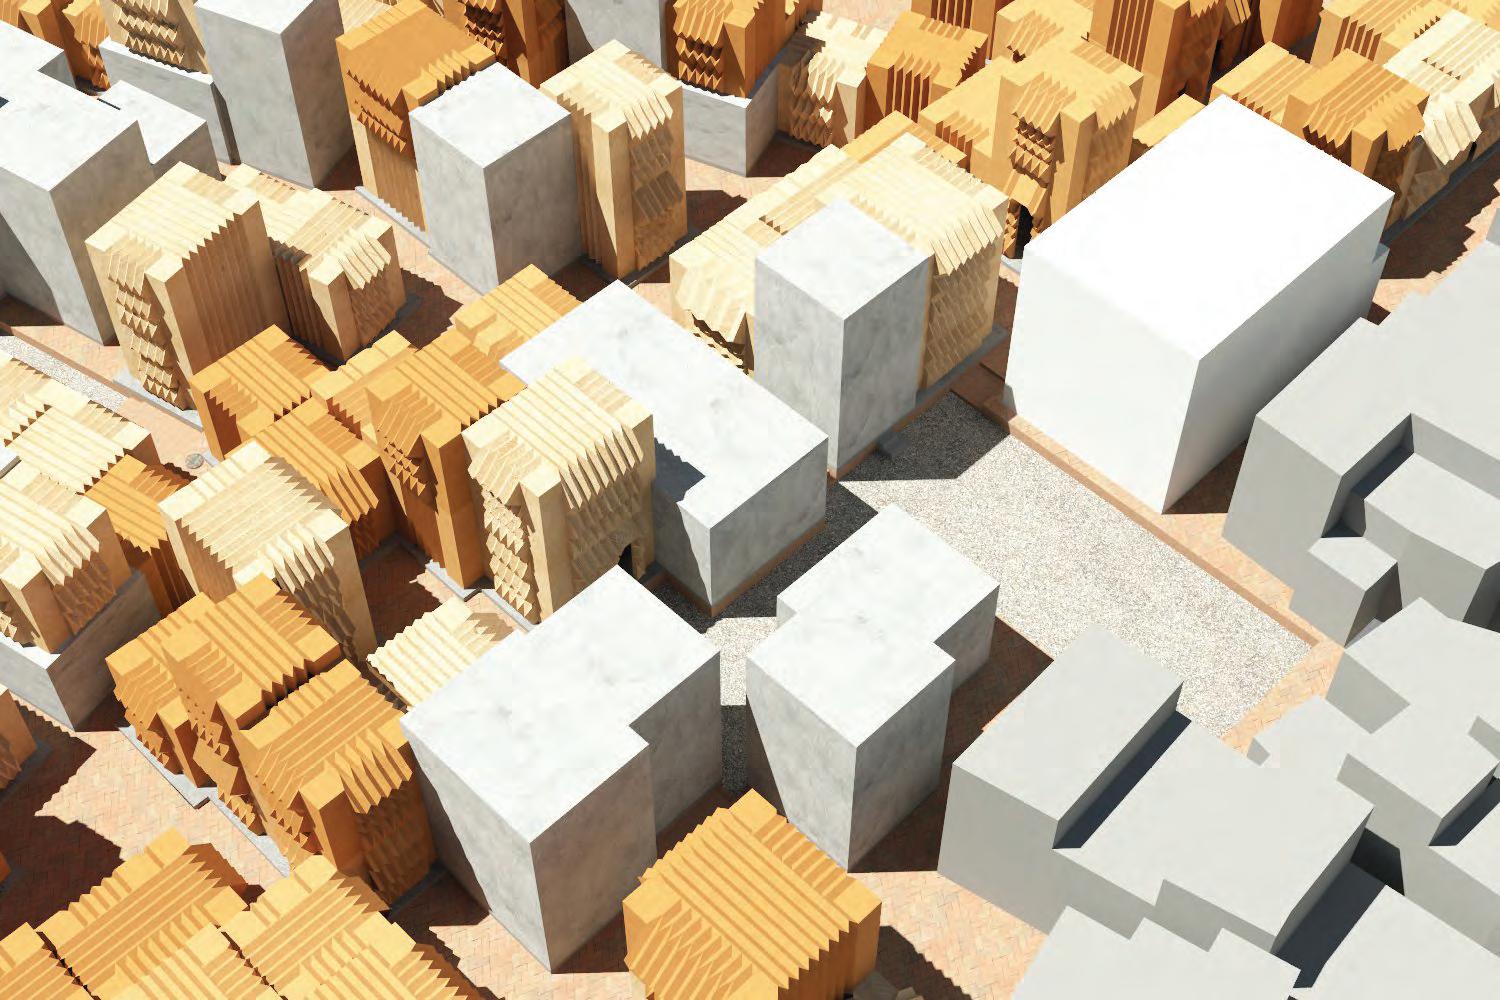
7.3 SEQUENTIAL OCCUPATION 166 167 RESPONSIVE GROWTH SYSTEM SYSTEM IMPLEMENTATION PHASE 3 b Permanent construction consolidation with brick or timber Semi-permanent cardboard construction sun-dried clay surface cover & clay-infilled cavity walls Social Amenity (nursery school) Temporary cardboard construction polymer waterproofing & fire retardant
Time frame 3 showing all three material scales at the end of 10 years. a. Plan showing development of street network and user generated open spaces b. opposite page, Consolidation of older units around the yards into more permanent constructions. a 7 10 years 0 2 Timescale t - Phase of all three material scales 010 50m N
2.05


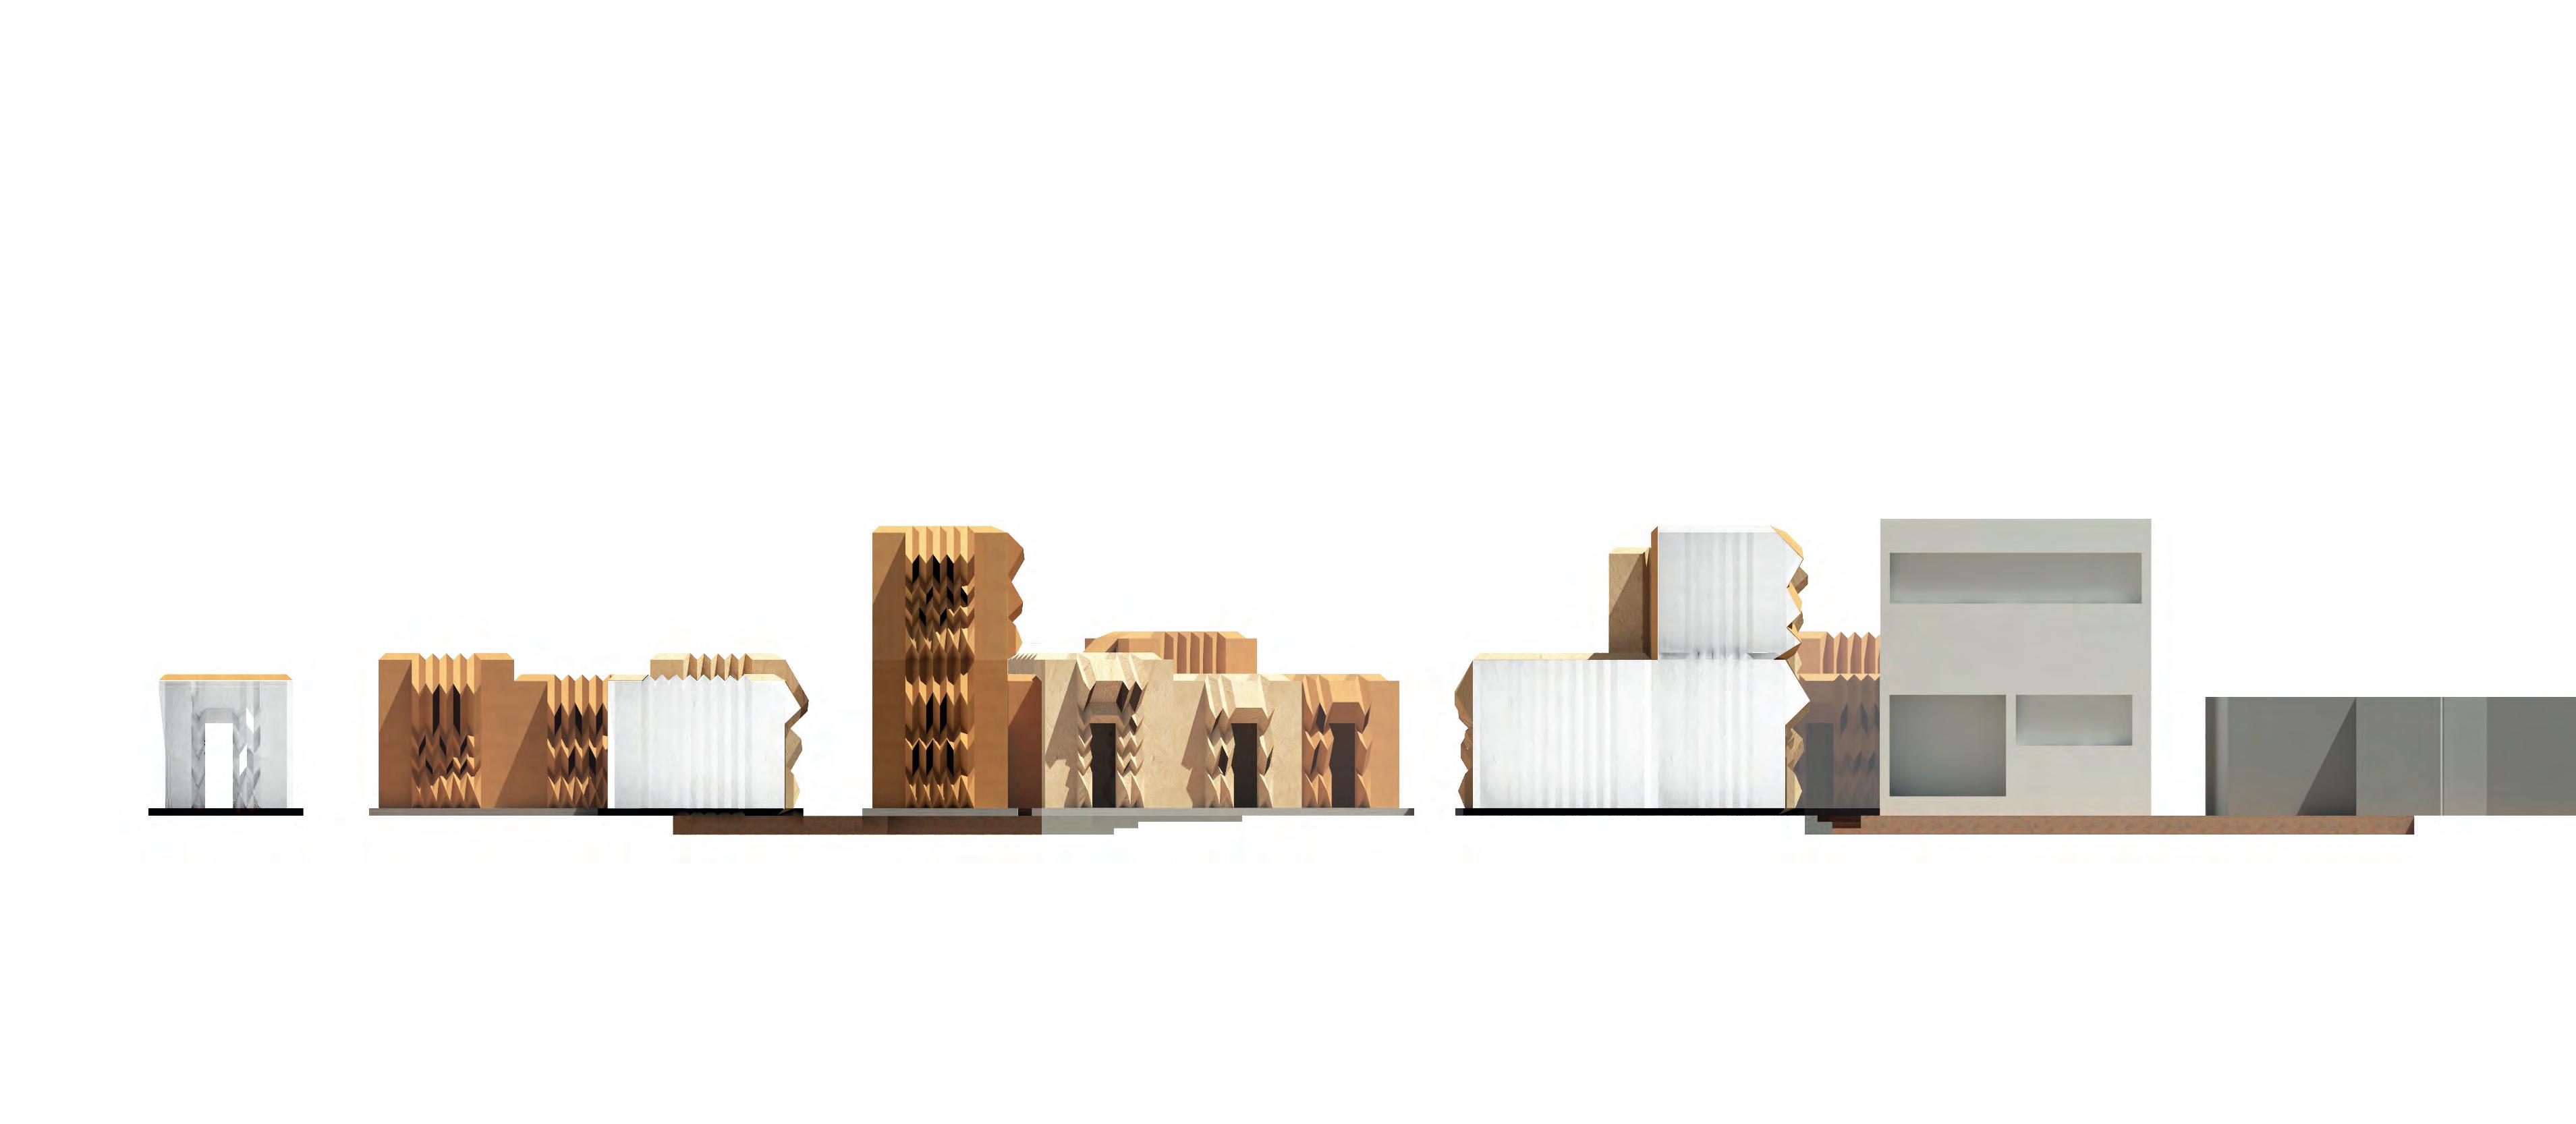
7.3 SEQUENTIAL OCCUPATION 169 0.45 0.20 1.00 3.00 3.50 PHASE 2 SECTION 0.45 0.20 1.00 3.00 3.50 1.40 10.50 14.00 0.45 0.20 0.75 1.00 3.00 3.50 Nursery School Community Yard Porous Gravel finish Site context Existing Settlement Storm water drain 100mm ø Tertiary branches Sewage (100mm ø) Water suppy (63mm ø) Plug-in Chambers Sewage & water suppy Circulation CorridorPipelines to dwellings Secondary branch Sewage (100mm ø) Water suppy (63mm ø) Emergent Open Space work or social activities 2.06 At timescale 2 1. Site key plan 2. Schematic section through site 3. Section (1:100) showing the two material scales of the cardboard material system. The nursery school along the yard caters for both existing and new settlement

7.3 SEQUENTIAL OCCUPATION PHASE 2 SECTION 7.00 7.60 1.40 3.50 3.00 0.45 0.20 0.75 1.00 Community Yard Porous Gravel finish Storm water drain 100mm ø Tertiary branches Sewage (100mm ø) Water suppy (63mm ø) Plug-in Chambers Sewage & water suppy Circulation Corridor Pipelines to dwellings Secondary branch Sewage (100mm ø) Water suppy (63mm ø) Emergent Open Space work or social activities Emergent Open Space work or social activities a 2.07 At timescale 2 1. Site key plan 2. Schematic section through site 3. Section (1:100) showing the emergent open spaces and community yards with the infrastructure Detail ‘a‘ is illustrated further

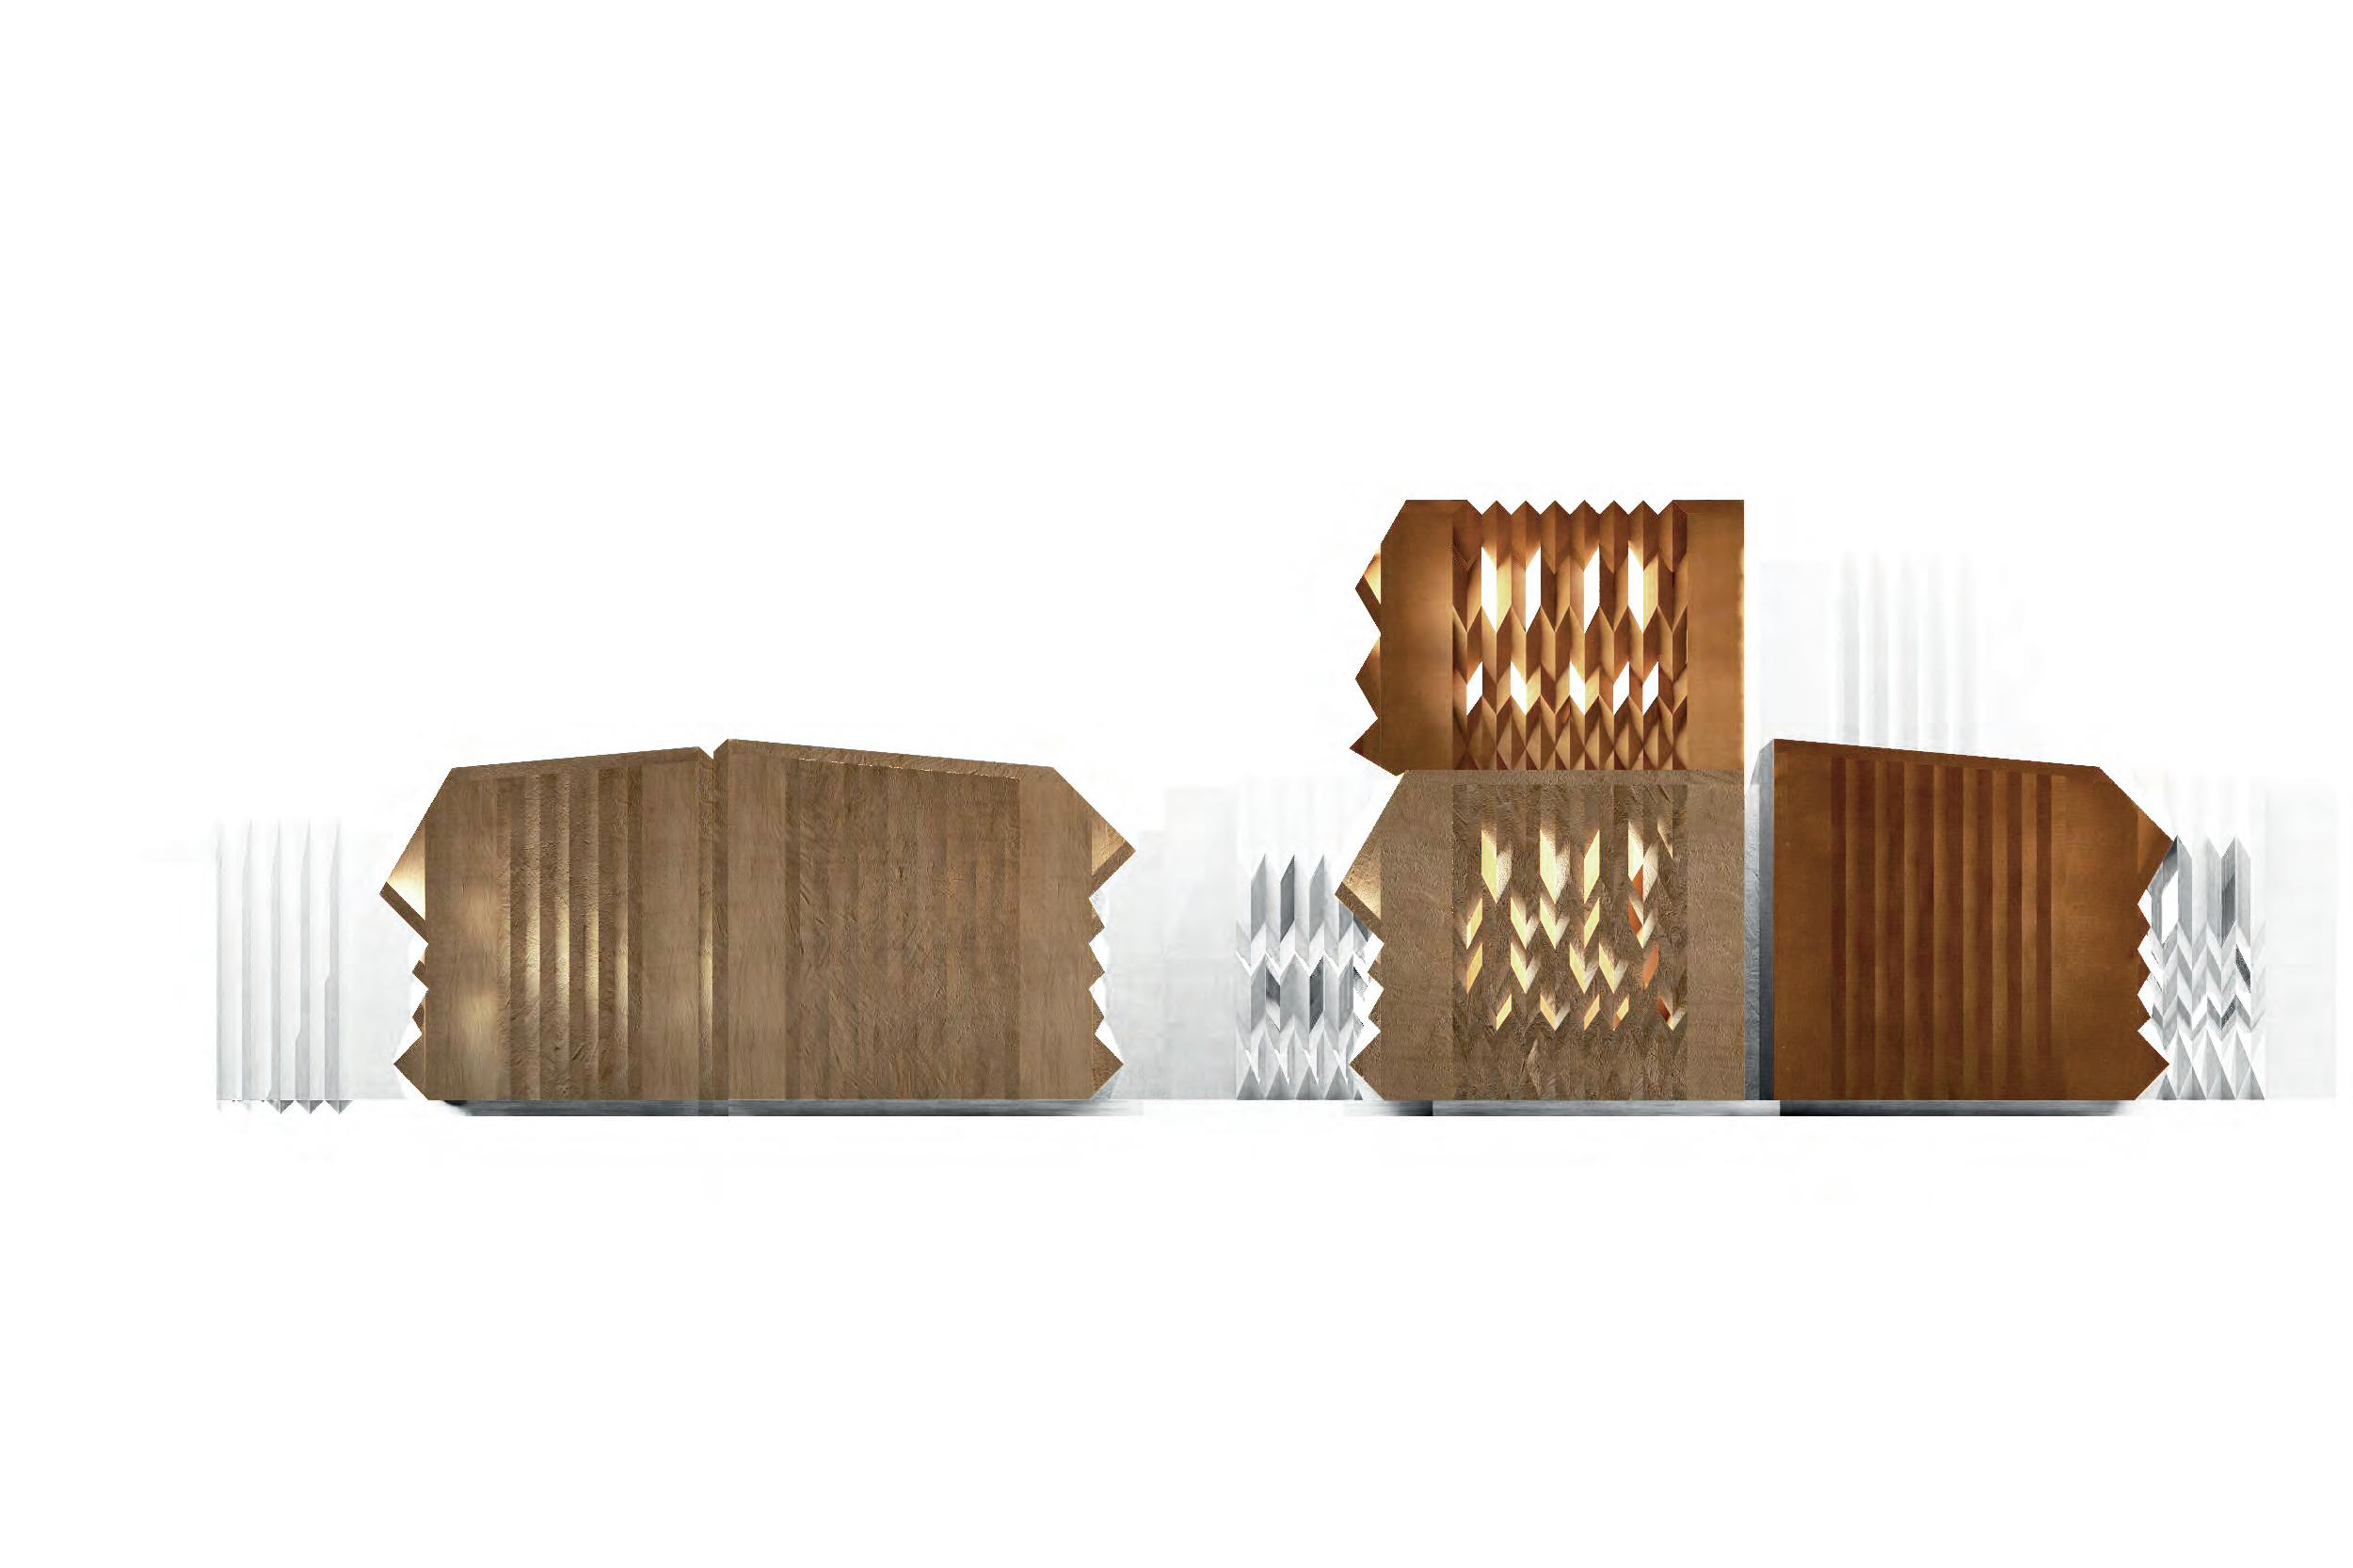
173 PHASE 2 SECTION 3.00 0.90 0.20 3.50 3.00 0.90 0.20 3.50 3.00 4.00 2.40 4.00 4.00 b Private area Temporary Cardboard Vertical Extension Pipeline to the unit Sewage outlet 100mm ø Private area Temporary Cardboard Construction Structural wall Clay Infilled Plug-in Chambers Sewage (100mm ø) Water suppy (63mm ø) Pipeline to the unit Water supply 35mm ø Live-work Semi-permanent Cardboard Construction Wet Area 2.08 Section (1:50)through two units showing connections drawn from the plug-in chambers to the units’ individual wet areas through their plinth. Detail of the plugin chamber (b) is illustrated further
As shown in the site sections, it is speculated that within a 7-year the urban fabric will be composed of semi-permanent and temporary material constructions across the site, following the new growth inception. The in the space between the distributed community yards, different will units cluster together, shaping the surrounding open space. A network of circulation routes will begin to develop connecting the yards to emergent open spaces. This user-generated urban character is enabled through an informed distribution of the community yards and the self-build character offered by the cardboard material system. There is still potential for further densification, but since most of the spaces are defined by now, further developments will be moderated by the users themselves.
The brick paved surface provides a durable foundation base to support the units. Moreover, being a commonly used material and modular in nature, modifying the brick surface is easy for the users to lay their infrastructure extensions. The sunken yards with their
0.45 m depth and porous gravel surface, serve as storm water collection points and help to avoid flooding during monsoons.
The yard connection points are inspection chambers of sewage disposal and water supply lines, from which individual units draw their connection pipes to their plinth. The frequency of the basic infrastructure network lines and the distribution of adequate plug-in points along the yards ensure that all units have sufficient access to proper sanitation, and at the same time allow the infrastructure support to be reconfigured and altered as per the user’s need without being too prescriptive.
Thus, the entire system with the temporary and semi-permanent cardboard material system and the community yards consisting of their two-fold infrastructure support and their distribution strategy, enables sufficient freedom for a socially organised built fabric to develop through self-building but at the same time moderates its growth to avoid overbuilding and ensure habitability through access to adequate sanitation.
7.3 SEQUENTIAL OCCUPATION 174 175 RESPONSIVE GROWTH SYSTEM SYSTEM IMPLEMENTATION 300mm a. Scale 1:20 b. Scale 1:20 slope 1:100 450mm 450mm 1. Brick 2. Sand Setting bed 3. Gravel bed 4. Compacted Subbase 5. Plain Cement Base 6. Compacted gravel 7. 63mm ø Water supply pipe 8. 100mm ø Sewage pipe 9. 35mm ø G.I. supply pipe 10. 75mm thk RCC cover 11. 50mm thk RCC cover 12. 100mm ø perforated storm water pipe 150mm 18mm 100mm 230mm 18mm 100mm 100mm 1 18mm 32mm 2 3 6 2 3 4 4 8 9 4 2 3 8 5 10 1 11 7 5 12 900mm
DETAILS 2.09 Details a. Section of the ground preparation showing the brick paved surface and the sunk yard b. Section through the plug-in connection chamber of a yard
2.10
Comparative study between estimated data for a maximum built capacity on site 4, enabled by the proposed system of urban growth moderators, statistical data for an 8-storey SRA apartment building proposed for site 4, and data from the potters’ community previously discussed in Chapter 5.
Refer to Section 5.2 for projected data calculation.
Source: Reinventingdharavi.org, 2014 and Study conducted by students of Sir JJ College of Architecture, Mumbai.
Source: Ohlsson, Helena. 'Gendered Spaces'. Masters. Blekinge Institute of Technology, 2013. p. 82-108.
Note: Site diagrams are representative and not to scale.
The material system and the strategy for the provision of community yards with access to infrastructure, are developed together and integrated into a system of urban growth moderators. The implementation of this system addresses the problem of sanitation in Dharavi at two levels: though the materiality and construction technology of individual dwellings, and through the urban-scale deployment of community open spaces and infrastructure connections. The value of the proposed system lies in its adaptability to rapidly change and re-configure to accommodate user-generated urban development, while maintaining an improved standard of habitability.
The system engages in the feedback loop between user-decisions and their manifestation in the urban character, by directly affecting the user’s lifestyle through individual access to sanitation, improved microclimate, and through the introduction of local production lines which could become sources of employment. However, these influences on the already indeterministic nature of the urban growth are impossible to realistically predict in order evaluate them. The value of the simulation on site 4, discussed in this chapter, lies in observing whether the predicted characters of emergent network and user-generated yards are in fact facilitated by the yard deployment and material system. Although the algorithm for urban growth produces satisfactory outputs for gauging the degree of flexibility produced for user-generated urban organisation, it can also be used to draw estimates on the potential capacity that can be accommodated on site 4, using the proposed system of growth moderators, for a more concrete evaluation of this system.
To draw some conclusions on the potentials of this system, estimated data for a maximum-density scenario enabled by the proposed system for site 4, is compared to statistical data for an 8-storey SRA apartment building planned for the same site, and also to data from the potters’ community discussed in Chapter 5. In this way the proposed system can be compared to two existing scenarios in Dharavi. As discussed in Chapter 2, the proposed SRA apartment blocks for the relocation of Dharavi’s residents is the prevalent intervention strategy for urban upgrading in Dharavi; however the provided apartments are too small and completely disconnected from ground activities, making them undesirable for their intended users. The potters’ community is reputed to be one of the better areas in Dharavi in terms of built-to-open space;
however the interior habitable quality of its dwellings is poor.
The statistical data for the proposed system of growth moderators is estimated from simulations for urban growth using the proposed material system. A maximum built density scenario is assumed, with structures having two floors. It is assumed that there are independent units per floor as this gives the maximum number of dwellings the site can accommodate with the proposed system and existing social logic. These maximum estimates are taken so as to gauge the potential capacity that can be generated through the implementation of the proposed system.
Comparing the number for the planned apartment building to the estimated data of proposed system, the number of dwellings in the planned apartment building is marginally more than those that can be generated by the proposed system. However, while the SRA provides “one-size-fits-all” apartments irrespective of family size, the proposed system enables the construction of units of different sizes and configurations adapted to different family structures. Therefore, estimating an average of three people per private space, the proposed system can accommodate a much higher population density than a standard apartment building typology, making it a more suitable alternative to urban upgrading than the traditional approach.
The area sampled for the potters’ community is over eight times the size of site 4, therefore only proportional data can be compared. Although there is a higher built-to-open ratio in the potters’ community as compared to the data for the proposed system, the open area per unit is more in the potters’ community. This owes to the assumption made for the proposed system where the assumed scenario is one in which all the spaces on the first floors are assumed to be units independent from their ground floor counterparts; while in the potters’ community it is assumed that a single unit spans two floors. Therefore, a comparison of these two cases based on open area per unit is misleading. What can be noted by comparing estimates for the proposed system to the existing potters’ community is that although the potter’s community accommodates a higher estimated population density, the proposed system comes reasonably close to achieving this high density, while maintaining a higher standard of indoor conditions, through the provision of cross-ventilation surfaces.
7.4 EVALUATION 176 177 SYSTEM IMPLEMENTATION RESPONSIVE GROWTH SYSTEM
Type of community Area of patch Built ground Open No. of dwellings Built area / unit No. of storeys (max) Open area / unit Population (estimated) Density (estimated) m2 m2 m2 m2 floors m2 people ppl/km2 UNITS VALUE 44,232 28,955 (65%) 15,277 (35%) 1390 20.8 2 10.9 10,000 (up to 5ppl/pr. sp.) 226,080 Potters’ colony2 Predominantly work-based: pottery, whole family is involved 5,155 1,669 (32%) 3486 (68%) 256 21 8768 (@ 3ppl/pr. sp.) 148,981 Proposed Rehabilitation 8-storey apartment block Government2 5,155 2,835 (55%) 2,320 (45%) 246 23 - 34 2 9.43 1,122 217,652 Generated scenario
max. saturation Simulation
proposed
at
with
systema
DATA COMPARISON
8. CONCLUSION

Dharavi presents an extremely complex urban scenario. It receives a high number of migrants from different rural parts of India daily, which contribute to its high density and rapid growth. These migrants live in very vulnerable conditions owing to their poverty and their fear of impending eviction. There is also a poor environmental quality across the settlement which is due to several factors: insufficient provision of government infrastructure, garbage in the streets which clogs up the open drains resulting in flooding particularly during the monsoon season, inadequate building materials and construction, and several polluting small-scale industrial activities which have no provision for the management of fumes, waste and other by-products.
The resilience of the society relies on the establishment of informal craft-based communities, which not only serve for the generation income, but have enabled the integration of a live-work scenario, around which the community is built. This character enables the multi-functional and adaptive use of space, maximising this limited resource; the strong community ties that are developed as a result of this setup, help shape the urban fabric as a user-generated environment.
This thesis draws from this strong social character, and focuses its scope on an improved dwelling construction and the provision of basic infrastructure. These two factors are deemed to influence most directly the day-to-day life of the community, thereby potentially initiating a change for urban improvement from the grassroots, in addition to the far reaching effects that an adequate access of sanitation can have on the community.
The system developed brings these two interventions together through a strategy for urban deployment of community open spaces. The strategy is designed for implementation in residual sites which are scattered across Dharavi. These sites are vulnerable to becoming dump yards if neglected, while they are also the mostly likely areas to accommodate new migrants who move to Dharavi to find work. The strategy is for the integration of these areas into the surrounding fabric, by enabling an improved urban development through the implementation of the system of growth moderators. The material system with the ingrained degrees of permanency enables a flexible and adaptive urban growth that can be quickly and easily reconfigured according to changes to the user requirements, thereby reflecting the nature of the a transient migrant community.
180 181 CONCLUSION RESPONSIVE GROWTH SYSTEM 8.1 OVERVIEW
8.01
Dharavi
Source: Rajanish Kakade
The proposed system of moderators is constituted of a modular component-based material system, the provision of community yards, and the laying out a skeleton infrastructure network.
The material system is a set of easy-to-assemble modular folded cardboard components, which can be produced within Dharavi though a cheap and low-tech process. The components are designed to perform structurally and improve indoor thermal comfort. Another advantage of this material system is it can accommodate two different timescales of a dwelling unit’s growth – a two-year temporary lifespan, and a semi-permanent life-span of five to ten years – by applying different surface treatments to the cardboard surfaces. This is suitable for the transient migrant population who cannot immediately afford to invest in a permanent shelter. This aspect also enables the development of a fabric that can continue to keep changing even after maximum occupancy is reached.
The community yards are intended to attract community activities within their bounds and moderate the formation of buildings around their edges. They are designed to enhance environmental comfort, provide access to infrastructure connections and aid with the fast drainage of rainwater during the monsoon season through an underlying storm water drainage network. They are intended to moderate the process of overbuilding which is eating up community opening spaces in Dharavi.
The provision of infrastructure of sewerage, water and electricity is designed so that users can create their own connections to the infrastructure network, thereby enabling the flexibility of usegenerated growth. This is done by laying out an adequate number of connection points around the community yards.
Local Production of Cardboard
Further refinements to the proposed system of growth moderators address the implementation of the system in Dharavi.
The fabrication of the material components relies on manual operations for easily implementing a strategy for local production. Setting up workshops in the vicinity of the sites prepared to accommodate the growth moderators, will encourage community involvement, provide a source of employment, and facilitate the availability of the material system.
In the proposed scenario, cardboard is procured from mainstream industries. However, the abundant availability of recyclable materials including paper and textile fabric, and the presence of existing small-scale industries that employ machinery for the production of various goods, including WHO certified surgical thread, makes the scenario feasible for the setup of other such industries to improve the proposed fabrication process.
Therefore, the production of cardboard could be looked into and introduced to Dharavi. This would enable a more customised production of cardboard, such as, for example introducing textile fibres in the pulp to increase strength and stability; or similarly to the Cardboard Building by Cottrell and Vermeulen Architecture, additives could be added to the pulp to improve water resistance. There is also the potential of using small machinery for the other process of the production line (creasing and cutting, folding, and surface waterproofing); this could decrease production time and increase quality control.
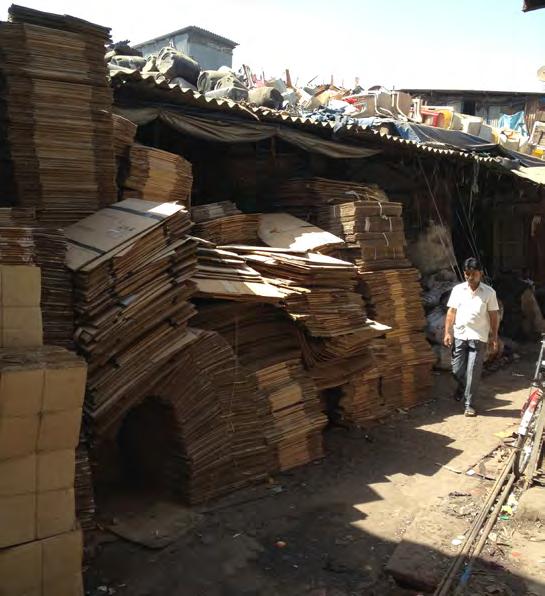
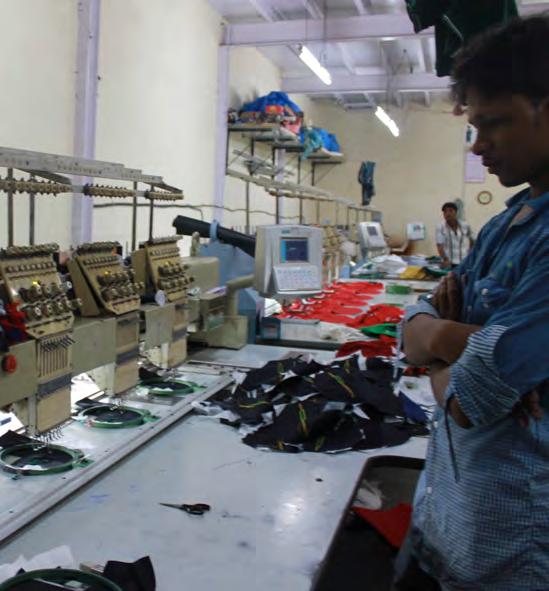
a b 182 183 CONCLUSION RESPONSIVE GROWTH SYSTEM 8.2 SYSTEM REFINEMENTS
8.02
a. Piles of used cardboard boxes which will be recycled.
Source: Neville Mars
b. Embroidery factory in Dharavi.
Source: Chelsea Rudman
8.03
The system is designed to engage with the existing social scenario, so that the resulting urban growth can respond to the growth moderators generating an improved urban fabric in terms of improved indoor habitability, increased community open space, and safer and wider access to sanitation infrastructure. However, the effect that the strategy for urban implementation of the growth moderators will have on the social character would need to be realistically verified through a pilot experiment within Dharavi, in order to really gauge the success of the system.
The system holds potentials for the emergence of a permanent material system, as a development of the proposed temporary and semi-permanent material components, so that any urban consolidation can continue to maintain a habitable environment and engage with the surrounding
Further research could investigate the potential of the system applied to different contexts with a similar need for fast and adaptive urban growth. One such scenario are work camps for construction workers, which is another emerging phenomenon in Indian cities due to the booming construction industry, and who share similarities with Dharavi in terms of being a transient live-work community, albeit with different social structures and issues. There are also other similarly fast growing informal settlements across the developing world, due to similar rural-to-urban migration trends. Other forms of migration happen due to conflict, which for example see migrants from a mix of social and educational backgrounds travel from Africa to Europe in search of refuge. They can currently spend months living in overcrowded detention centres awaiting refugee status, which are not capable of accommodating the high influx of people. Finally the system could also be adapted for disaster relief housing; this is another instant in which a fast and temporary solution to providing housing on an urban scale, with all the related needs for urban infrastructure of sanitation and community spaces, is required.
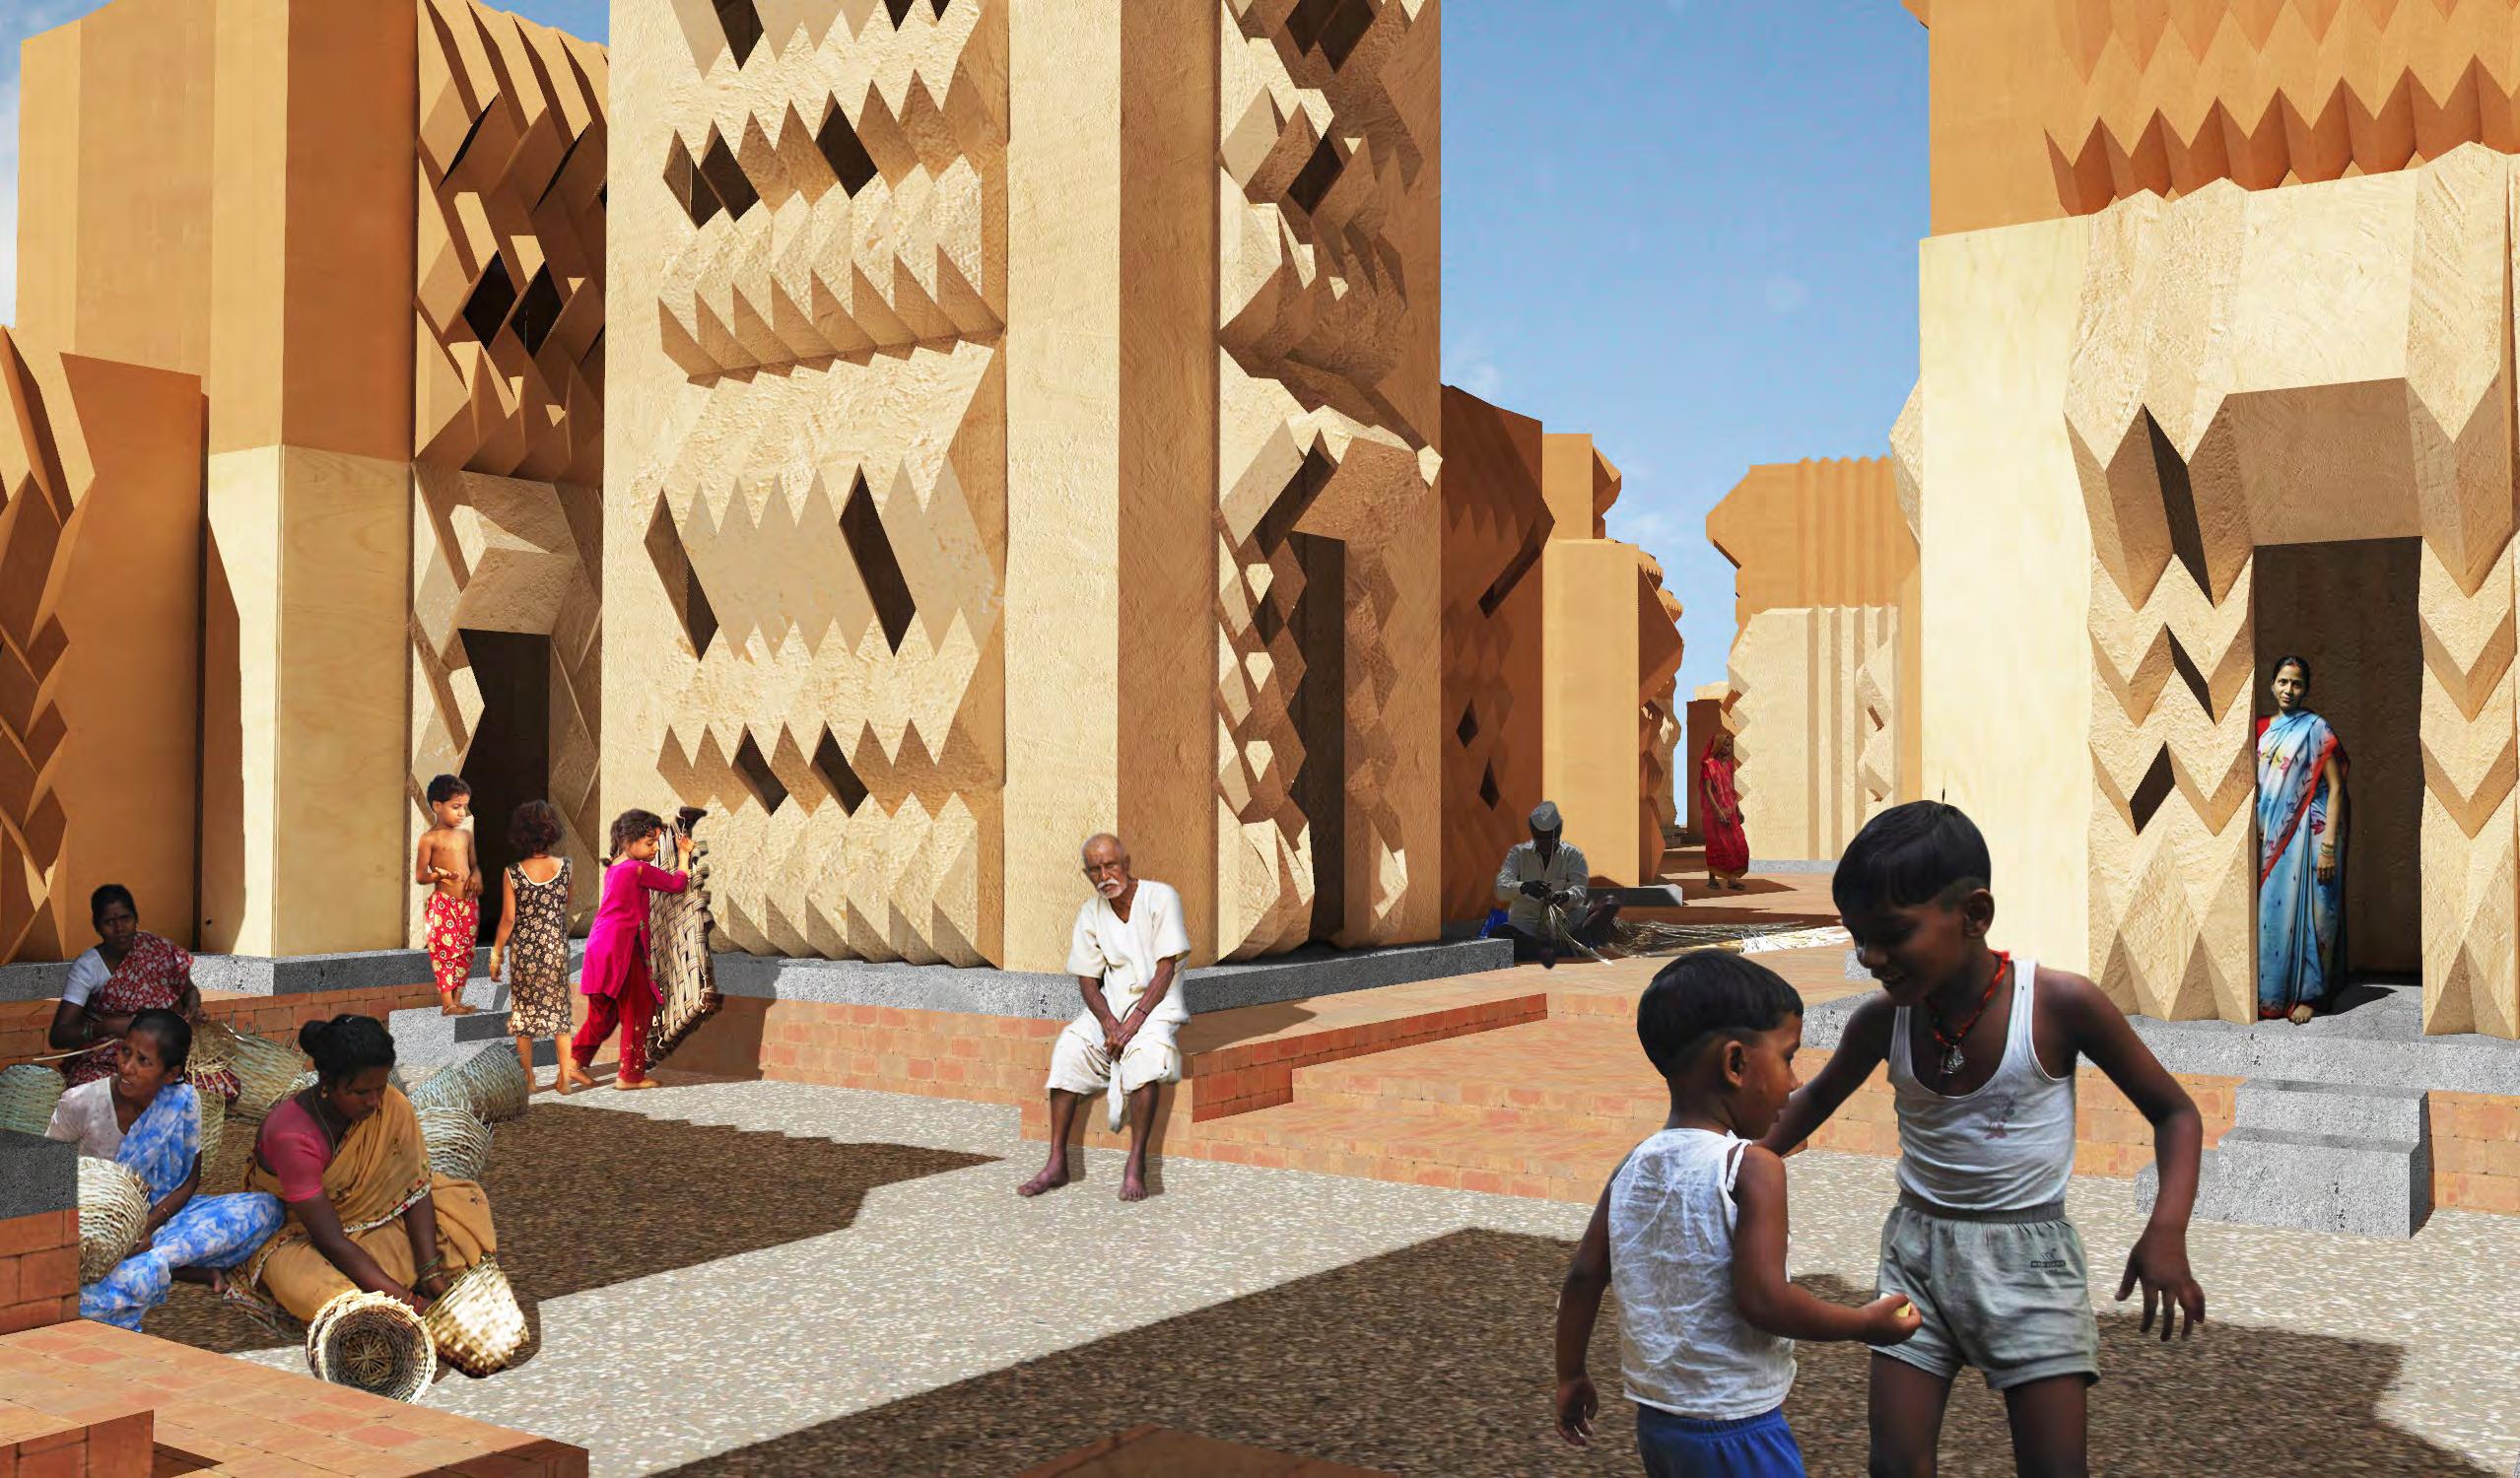
8.3 SYSTEM POTENTIALS 184 185 CONCLUSION RESPONSIVE GROWTH SYSTEM
A visualisation of the proposed social environment, enabled through the insertion of community yards around which new migrants can set up temporary or semipermanent residence while they find foothold in Dharavi.
APPENDIX
Diagrams showing the forces and restraints applied in the FEA analysis to extract the material properties.
a,b,c. Elastic modulus, d,e,f. Shear modulus, g,h. Poisson ratio, i. Local buckling.
Elastic modulus / Pseudo “Ex” b. Elastic modulus / Pseudo “Ez” c. Elastic modulus / Pseudo “Ey”
d. Shear modulus / Gzx e. Shear modulus / Gxy f. Shear modulus / Gzy : Force applied : Boundary of restrained area : Area where force is applied : Restraint in translation/rotation in x,y,z axes
Local
188 189 APPENDIX RESPONSIVE GROWTH SYSTEM FINITE ELEMENT ANALYSIS MATERIAL PROPERTIES EXTRACTION 0 2.00 4.00 6.00 8.00 10.00 (E+02) Poisson ratii YX XZ Ey Ez Ex 0 1.00 2.00 3.00 4.00 5.00 (E+02) Elastic moduli Gzy Gxy Gzx Shear moduli (E+02) 0 1.00 2.00 3.00 4.00 5.00 0 40.7 81.4 122.2 162.9 203.7 C B A Flute type σ comp.max (N/ mm²)
g.
h.
YX i.
Comparative
results of the different flute types’ performance in the four behaviours evaluated. a.
Poisson ratio XZ
Poisson ratio
buckling
Structural tests are conducted on different geometries with two load cases to evaluate the deformations and stress areas
Both concertina and herringbone patterns are tested. Extracted corrugated cardboard properties (on previous page) are used for testing
Test 1: Evaluating the side with the opening
and
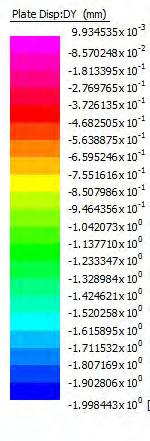
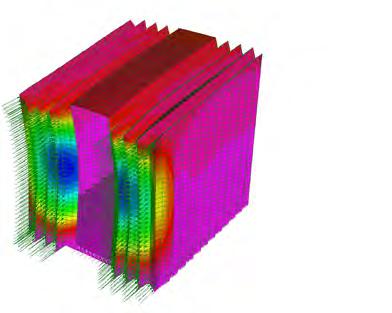
Wind pressure applied: 1.37E-04 N/mm2 maximum displacement (mm):
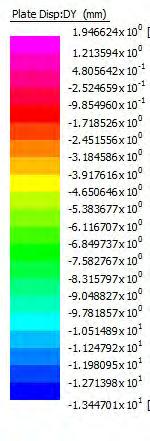
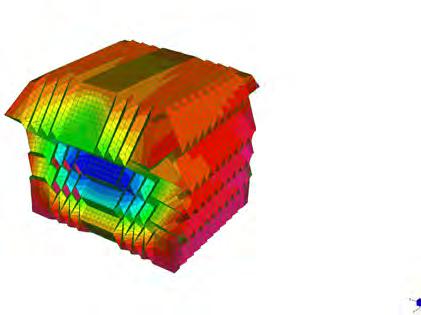
Wind pressure applied: 1.37E-04 N/mm2 maximum displacement (mm): 13.45mm
Test 2: Evaluating the sloping side
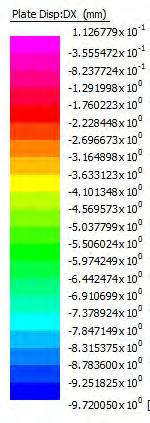
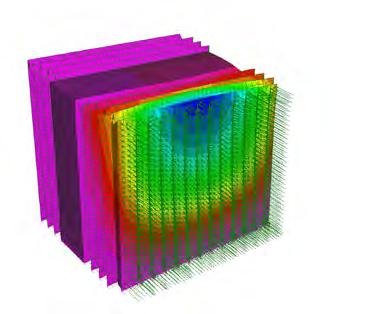
Wind pressure applied: 1.37E-04 N/mm2 maximum displacement (mm):
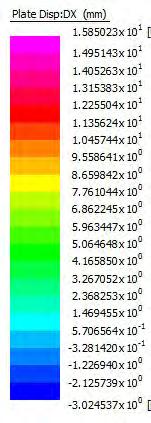
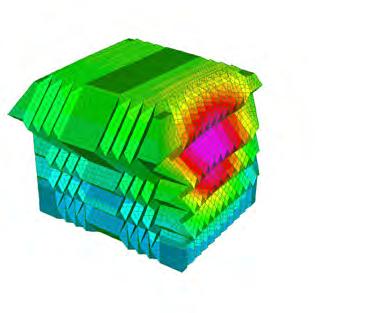
Wind pressure applied: 1.37E-04 N/mm2 maximum displacement (mm): 15.85mm
to
190 191 APPENDIX RESPONSIVE GROWTH SYSTEM FINITE ELEMENT ANALYSIS Angle (°) Edge length (mm) Structural depth (mm) 60 90 120 150 173 141 100 52 199 163 115 60 242 198 140 72 303 247 175 91 390 318 225 116 606 495 350 181 200 230 280 350 450 700
STRUCTURAL ANALYSIS
Diagram showing the potential structural depths for the different values of angles and edge lengths
evaluating them according
the allowable range of depths set. These range of depths are tested for structural durability and on the following pages the combinations that work are illustrated.
Graph below demonstrating these rooms with the combination of their geometrical parameters amongst the other experiments that are carried out
192 193 APPENDIX RESPONSIVE GROWTH SYSTEM FINITE ELEMENT ANALYSIS STRUCTURAL ANALYSIS
Edge length (cm): Angle (°): Laminates number: 0 20 23 28 35 45 0 30 60 90 120 4 3 2 1 Edge length (cm): Angle (°): Laminates number: 0 20 23 28 35 45 0 30 60 90 120 4 3 2 1 Edge length (cm): Angle (°): Laminates number: 0 20 23 28 35 45 0 30 60 90 120 4 3 2 1 Edge length (cm): Angle (°): Laminates number: 0 20 23 28 35 45 0 30 60 90 120 4 3 2 1 Edge length (cm): Angle (°): Laminates number: 0 20 23 28 35 45 0 30 60 90 120 4 3 2 1 Edge length (cm): Angle (°): Laminates number: 0 20 23 28 35 45 0 30 60 90 120 4 3 2 1 Edge Length (mm) Number of Ply Angle(°) 4 3 2 200 230 280 350 450 120° 90° 60° a n k m b h e g d c o structurally performing well not performing structurally Room type: Medium Dimensions: 3.4 * 3.4 m Room type: Medium Dimensions: 3.0 * 4.0 m Room type: Medium Dimensions: 3.0 * 4.0 m Room type: Medium Dimensions: 6.0 * 6.0 m Room type: Medium Dimensions: 3.0 * 4.0 m Room type: Medium Dimensions: 6.0 * 6.0 m m k n o Individual room sizes and their geometrical parameters with comparative data of the result that works structurally Edge length (cm): Angle (°): Laminates number: Room type: Small Dimensions: 2.4 * 2.4 m 0 20 23 28 35 45 0 30 60 90 120 4 3 2 1 Edge length (cm): Angle (°): Laminates number: Room type: Small Dimensions: 2.0 * 3.0 m 0 20 23 28 35 45 0 30 60 90 120 4 3 2 1 Edge length (cm): Angle (°): Laminates number: Room type: Medium Dimensions: 3.4 * 3.4 m 0 20 23 28 35 45 0 30 60 90 120 4 3 2 1 Edge length (cm): Angle (°): Laminates number: 0 20 23 28 35 45 0 30 60 90 120 4 3 2 1 Edge length (cm): Angle (°): Laminates number: 0 20 23 28 35 45 0 30 60 90 120 4 3 2 1 Edge length (cm): Angle (°): Laminates number: 0 20 23 28 35 45 0 30 60 90 120 4 3 2 1 Edge length (cm): Angle (°): Laminates number: 0 20 23 28 35 45 0 30 60 90 120 4 3 2 1 Edge length (cm): Angle (°): Laminates number: 0 20 23 28 35 45 0 30 60 90 120 4 3 2 1 Edge length (cm): Angle (°): Laminates number: 0 20 23 28 35 45 0 30 60 90 120 4 3 2 1 Room type: Medium Dimensions: 3.4 * 3.4 m Room type: Medium Dimensions: 3.4 * 3.4 m Room type: Medium Dimensions: 3.4 * 3.4 m Room type: Medium Dimensions: 3.4 * 3.4 m Room type: Medium Dimensions: 3.4 * 3.4 m Room type: Medium Dimensions: 3.4 * 3.4 m a d g b e h c f
Geometrical rules In a reverse fold -The main crease alternates between a mountain and a valley. -A constant angle is required along the length of the fold. -The sum of angles at a vertex = 360
With these rules the two patterns, concertina and herringbone , are modelled and their parameters are varied to achieve variation


a. & b. The logic behind digital modelling of the reverse fold, using a reflection plane.
c. Depending on the angle of the reflection plane the reflected fold can vary in respect to the incident fold.
Surface types and their corresponding ranges for location of openings, area of openings and number of
folds, as well as a sample specimen for each, taken from the 29 surfaces produced using the multiobjective optimization genetic algorithm.
194 195 APPENDIX RESPONSIVE GROWTH SYSTEM SURFACE VARIATIONS Type
Type
Type
Area of openings: 2.1 m Vertical folds: 2 Openings: 0.9-1.8 m from FFL Area of openings: 1.0 m Vertical folds: 3 Openings: 2.4-3.2 m from FFL Area of openings: 1.5 m2 Vertical folds: 2 Openings: 0.9-3.2 m from FFL Area of openings: 2.4 m Vertical folds: 4 Openings: 0.9-3.1 m from FFL Area of openings: 3.0 m2 Vertical folds: 3 Openings: 0.9-2.9 m from FFL Location of openings 0.77m < 1.9m >1.9m < 0.77m < 0.77m < 0.77m Area of openings medium low medium - high low high high Number of vertical folds 2 5 1 - 5 3 - 5 2 - 5 2 Generation 4 Individual 4 Generation 1 Individual 10 Specimens Generation 5 Individual 5 Generation 2 Individual 8 Generation 2 Individual 4
REVERSE FOLD AND MULTI-OBJECTIVE OPTIMISATION γ d1 w1 d2 w2 θ +θ +θ +θ = 360° for constant α if w1 > w2, d1 > d2 θ θ θ α1 = α α1 α 2 α MM+ w β γ d M+ = Mountain crease M- = Valley crease α = Angle between folds β = Angle between main crease M+ and Mγ = Angle between secondary mountain crease w = width of flap d = depth of fold Constants γ varies depending on α and β Splitting plane Reflection plane
A
BType CType D
E
vertical
a b c
196 197 APPENDIX RESPONSIVE GROWTH SYSTEM SURFACE VARIATIONS SURFACE CLASSIFICATION Generation 1 Individual 2 Generation 1 Individual 5 Generation 2 Individual 3 Generation 2 Individual 4 Generation 5 Individual 2 Generation 3 Individual 10 Generation 3 Individual 9 Generation 3 Individual 2 Generation 2 Individual 8 Generation 2 Individual 7 Generation 1 Individual 6 Generation 1 Individual 10 Generation 2 Individual 9 Generation 2 Individual 10 Generation 1 Individual 7 Generation 1 Individual 3 Generation 3 Individual 6 Generation 4 Individual 2 Generation 4 Individual 4 Generation 4 Individual 9 Generation 5 Individual 8 Type A Type B Type C Type D Type E Generation 3 Individual 8 Generation 4 Individual 7 Generation 5 Individual 3 Generation 5 Individual 4 Generation 5 Individual 5 Generation 5 Individual 6 Generation 5 Individual 9 Generation 1 Individual 4 The 29 surface generated from the multi-objective optimization genetic algorithm organised by surface type.


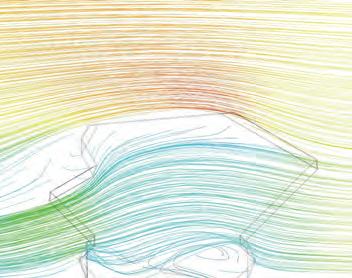
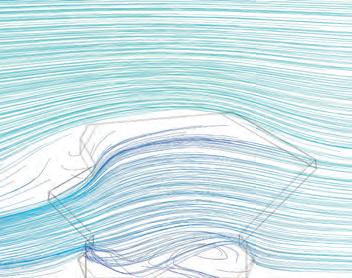


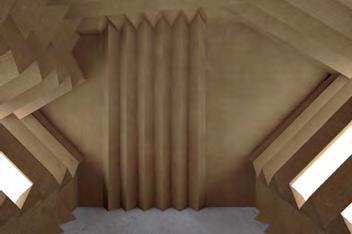
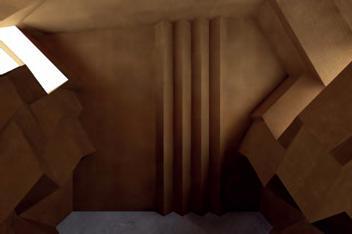
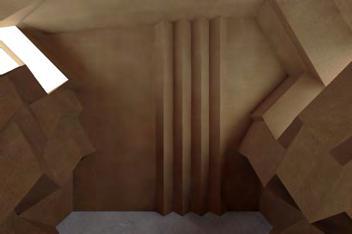

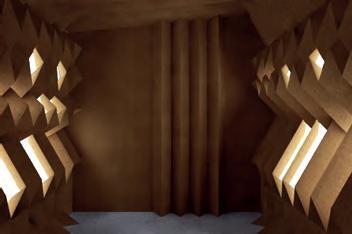
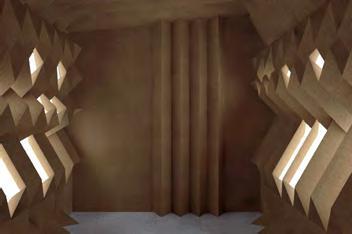
COMBINATORIAL LOGIC 198 199 APPENDIX RESPONSIVE GROWTH SYSTEM A - E B - C D - D 0 1 5m % 80.0+ 72.0 64.0 56.0 48.0 40.0 32.0 24.0 16.0 8.0 0.0 daylight factor overcast sky A E B C D D A E B C D D 3.7m2 area of openings scattered openings 2.1m2 area of openings low openings 0.9m2 area of openings scattered openings 1.6m2 area of openings high openings 2.3m2 area of openings scattered openings 1.7m2 area of openings scattered openings Results from the daylight analyses run on three different rooms. a.-c. Show the lighting distribution at 400 mm from the interior floor level. d.-f. Show the lighting distribution at 800 mm from the interior floor level. g.-i. Are rendered views of the 3 different room cases, showing how the geometry of the folded walls and the distribution of openings across them allow for the creation of different interior lighting scenarios. A - E B - C D - D A E B C D D inlet 3.7m area of openings scattered openings outlet 2.1m2 area of openings low openings inlet 0.9m area of openings scattered openings outlet 1.6m area of openings high openings inlet 2.3m area of openings scattered openings outlet 1.7m2 area of openings scattered openings outlet inlet outlet inlet outlet inlet A E B C D D A E B C outlet inlet outlet inlet velocity 0 5 10 15 20 m/s 0 1 6m a d g b e h c Results from the CFD analyses run on three different rooms. a.-c. Air flows from right to left at an input velocity of 15 m/s d.-f. Air flows from left to right at an input velocity of 15 m/s g.-h. Air flows from left to right at an initial velocity of 5 m/s CROSS VENTILATION AND DAY-LIGHTING
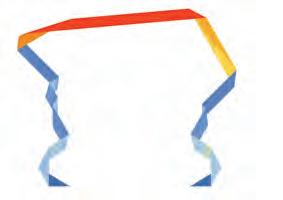

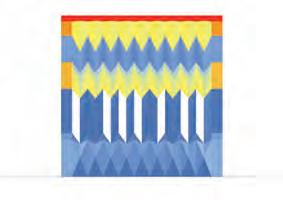

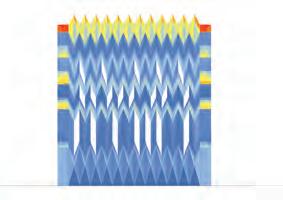


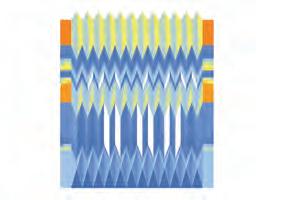
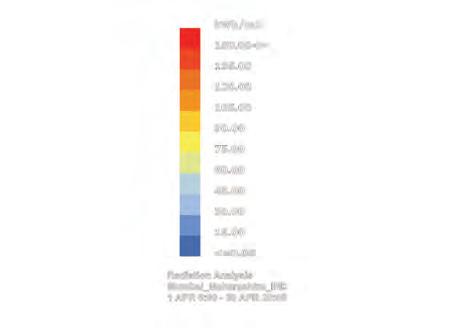
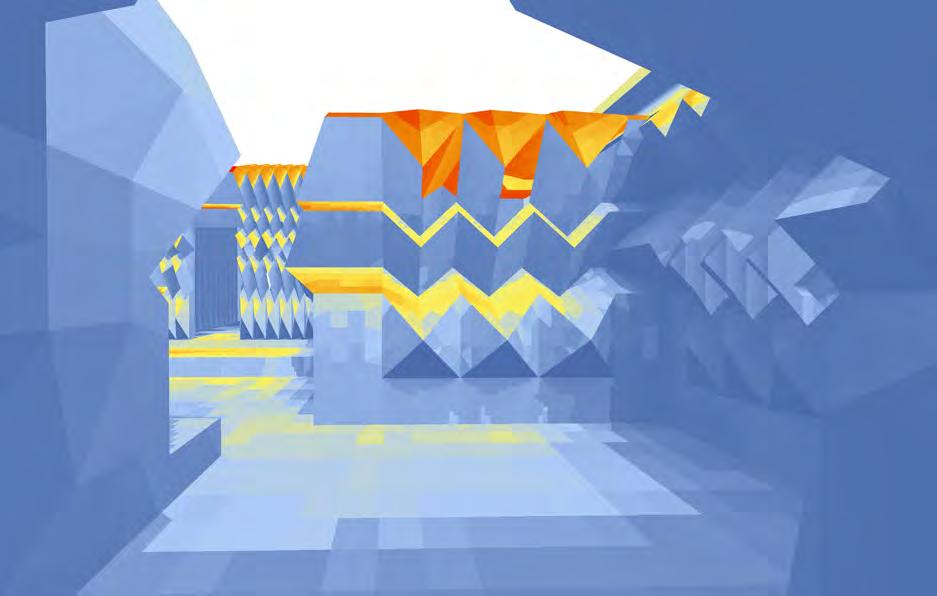
COMBINATORIAL LOGIC 200 201 APPENDIX RESPONSIVE GROWTH SYSTEM Results from the solar exposure analyses run on a unit configuration with different rooms, with a West-East orientation and exposure time for the month of April. The configurations and the surface folding allows most of the faces to be shaded with reduced exposure to solar radiation. SELF-SHADING A - E B - C D - D A E B C D D 2 vertical folds 90o horizontal fold angle 230mm horizontal fold length A 3 vertical folds 120 horizontal fold angle 450mm horizontal fold length B 3 vertical folds 60o horizontal fold angle 230mm horizontal fold length D 4 vertical folds 60o horizontal fold angle 230mm horizontal fold length D 1 vertical folds 90o horizontal fold angle 230mm horizontal fold length E 2 vertical folds 120 horizontal fold angle 450mm horizontal fold length C 0 1 6m <= 0 60 105 150 <= kWh/sq.m April 1, 6am to April 30, 8pm radiation Results from the solar exposure analyses run on three different rooms, with a West-East orientation. Exposure time is throughout the month of April which is the hottest month Dharavi’s dry season. During April, West and Eastfacing surfacing are the second most exposed surfaces to solar radiation, are the roof.

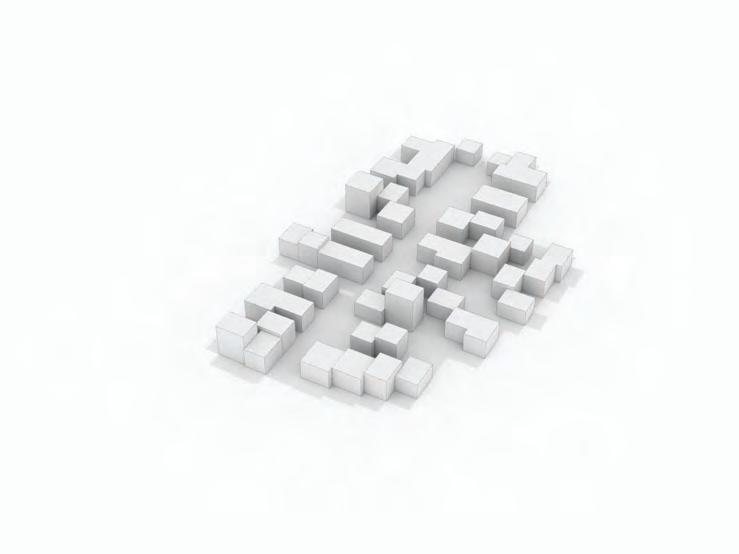


GROWTH SIMULATION 202 203 APPENDIX RESPONSIVE GROWTH SYSTEM Experiment 5.3 Family type Yard Built Edges Ventilation Edges Preferred Built Order Input Variables Resultant Characters Live 1 2 W-E-S-N Built Area Open Space (Yards) Open Space (Streets) Yard Porosity Range 44.7% 13.3% 72.6% 1.3-23% Experiment 9.4 Family type Yard Built Edges Ventilation Edges Preferred Built Order Input Variables Resultant Characters Live-work 2 2 W-E-S-N Built Area Open Space (Yards) Open Space (Streets) Yard Porosity Range 44.7% 34.7% 24.3% 11-31% Experiment 6.3 Family type Yard Built Edges Ventilation Edges Preferred Built Order Input Variables Resultant Characters Live 1 2 W-E-S-N Built Area Open Space (Yards) Open Space (Streets) Yard Porosity Range 45.0% 10.0% 83.0% 27-31% Experiment 10.5 Family type Yard Built Edges Ventilation Edges Preferred Built Order Input Variables Resultant Characters Live-work 2 2 W-E-S-N Built Area Open Space (Yards) Open Space (Streets) Yard Porosity Range 46.5% 51.7% 20.9% 7-23% Experiment 1.3 Family type Yard Built Edges Ventilation Edges Preferred Built Order Input Variables Resultant Characters Live-work 1 2 W-E-S-N Built Area Open Space (Yards) Open Space (Streets) Yard Porosity Range 43.0% 45.0% 51.0% 22-45% Experiment 3.5 Family type Yard Built Edges Ventilation Edges Preferred Built Order Input Variables Resultant Characters Live-work 1 2 W-S-E-N Built Area Open Space (Yards) Open Space (Streets) Yard Porosity Range 42.9% 47.8% 51.0% 18-29% Experiment 2.4 Family type Yard Built Edges Ventilation Edges Preferred Built Order Input Variables Resultant Characters Live-work 1 2 W-E-S-N Built Area Open Space (Yards) Open Space (Streets) Yard Porosity Range 40.0% 49.2% 35.7% 15-31% Experiment 4.1 Family type Yard Built Edges Ventilation Edges Preferred Built Order Input Variables Resultant Characters Live-work 1 2 W-S-E-N Built Area Open Space (Yards) Open Space (Streets) Yard Porosity Range 45.0% 38.0% 52.0% 11-51% EXPERIMENT DATA SHEET

GROWTH SIMULATION 204 205 APPENDIX RESPONSIVE GROWTH SYSTEM Experiment 15.5 Family type Yard Built Edges Ventilation Edges Preferred Built Order Input Variables Resultant Characters Mixed 1 2 W-E-S-N Built Area Open Space (Yards) Open Space (Streets) Yard Porosity Range 48.0% 29.1% 31.6% 16-26% Experiment 16.1 Family type Yard Built Edges Ventilation Edges Preferred Built Order Input Variables Resultant Characters Live-work 1 1Li , 2 Pr W-E-S-N Built Area Open Space (Yards) Open Space (Streets) Yard Porosity Range 51.4% 52.0% 36.0% 20-43% Experiment 17.1 Family type Yard Built Edges Ventilation Edges Preferred Built Order Input Variables Resultant Characters Live-work 1 1 W-E-S-N Built Area Open Space (Yards) Open Space (Streets) Yard Porosity Range 54.0% 55.0% 38.0% 25-37% Experiment 11.4 Family type Yard Built Edges Ventilation Edges Preferred Built Order Input Variables Resultant Characters Live-work 2 2 W-E-S-N Built Area Open Space (Yards) Open Space (Streets) Yard Porosity Range 44.1% 42.3% 30.9% 16-35% Experiment 13.2 Family type Yard Built Edges Ventilation Edges Preferred Built Order Input Variables Resultant Characters Live 2 2 W-S-E-N Built Area Open Space (Yards) Open Space (Streets) Yard Porosity Range 47.0% 56.3% 22.8% 8-27% Experiment 12.4 Family type Yard Built Edges Ventilation Edges Preferred Built Order Input Variables Resultant Characters Live-work 2 2 W-S-E-N Built Area Open Space (Yards) Open Space (Streets) Yard Porosity Range 47.0% 66.5% 21.3% 5-23% Experiment 14.2 Family type Yard Built Edges Ventilation Edges Preferred Built Order Input Variables Resultant Characters Live 2 2 W-E-S-N Built Area Open Space (Yards) Open Space (Streets) Yard Porosity Range 46.3% 22.7% 52.7% 1.3-27% EXPERIMENT DATA SHEET
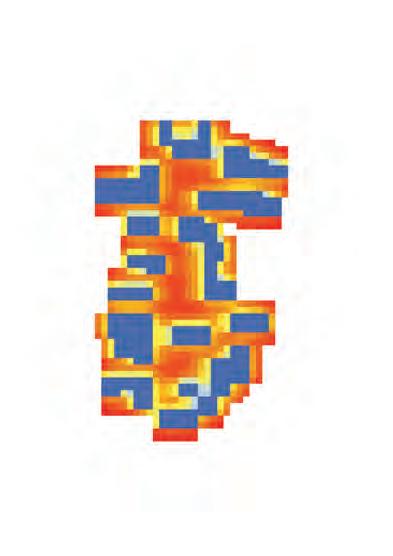
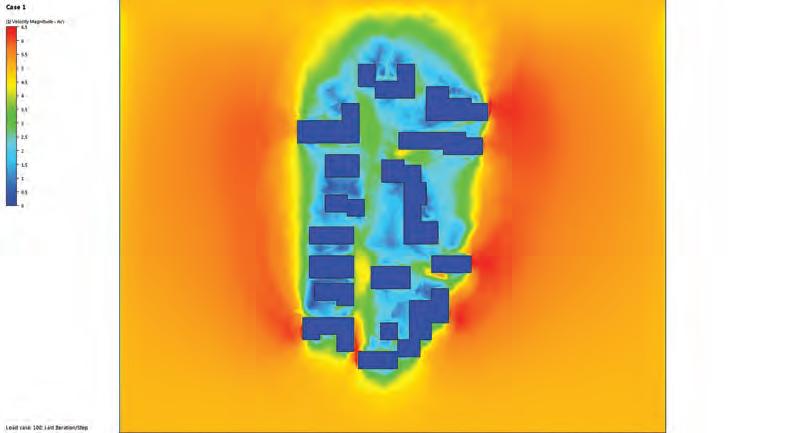
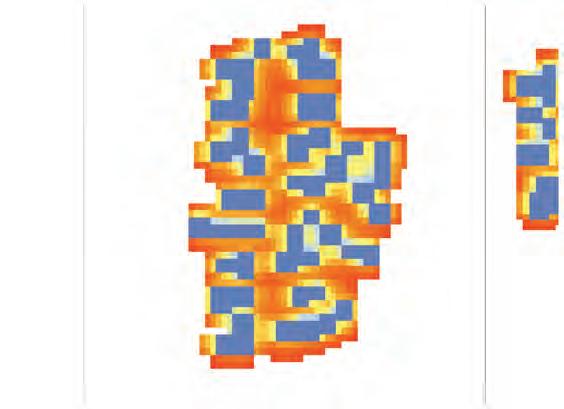
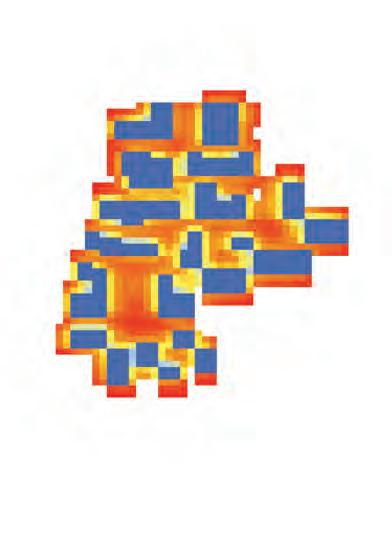
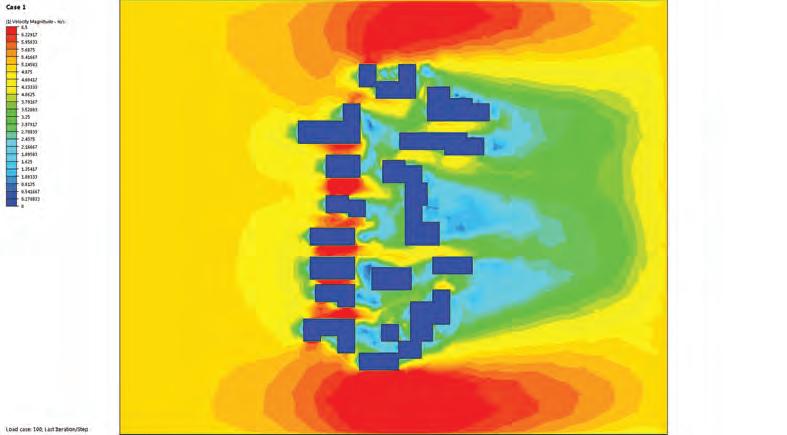
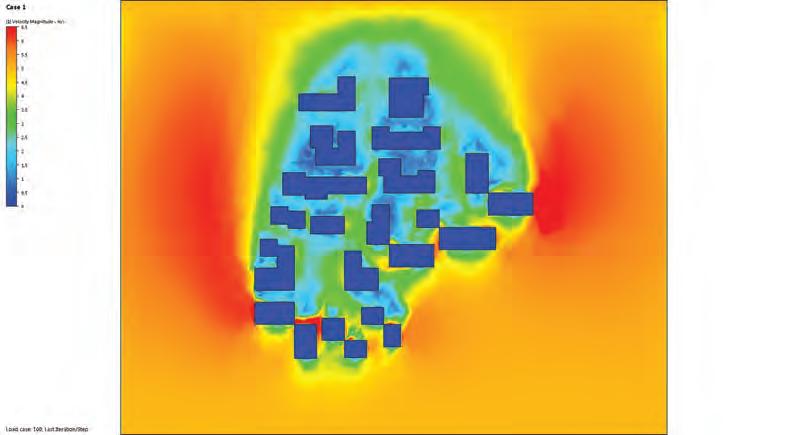
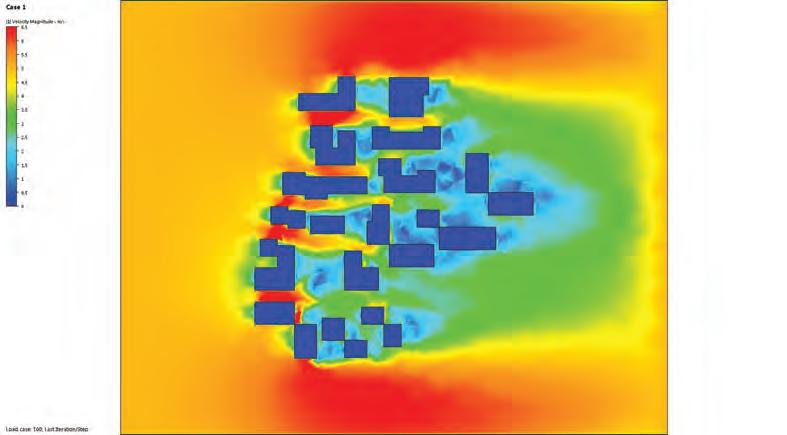
GROWTH SIMULATION 206 207 APPENDIX RESPONSIVE GROWTH SYSTEM 150kw/hr 0 Month April 8:00 to 20:00 N Experiment 1.3 Family Type Livework (S,M) No. of Yard built edges One No. of Ventilation Faces Two for all spaces Preferred Built order W-E-S-N Experiment 2.4 Family Type Livework (S,M) No. of Yard built edges One No. of Ventilation Faces Two for all spaces Preferred Built order W-E-S-N Experiment 3.5 Family Type Livework (S,M) No. of Yard built edges One No. of Ventilation Faces Two for all spaces Preferred Built order W-S-E-N Live Live-work Private Dedicated Yards Emergent yards CLIMATIC ANALYSIS
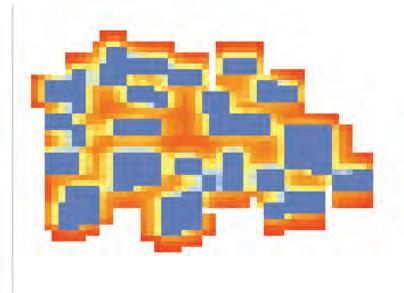
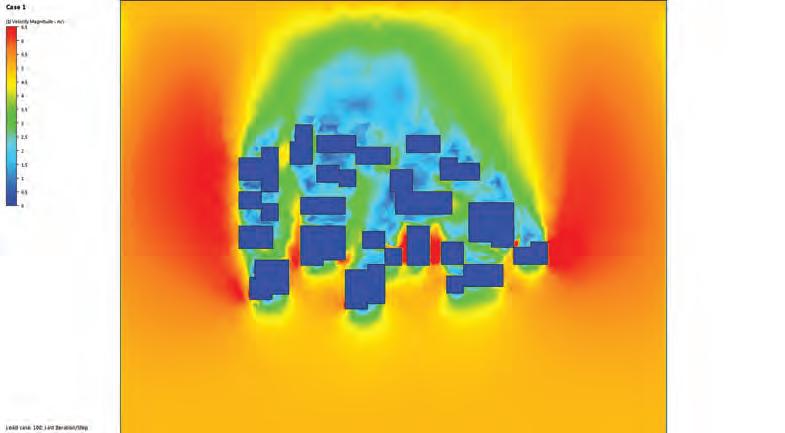
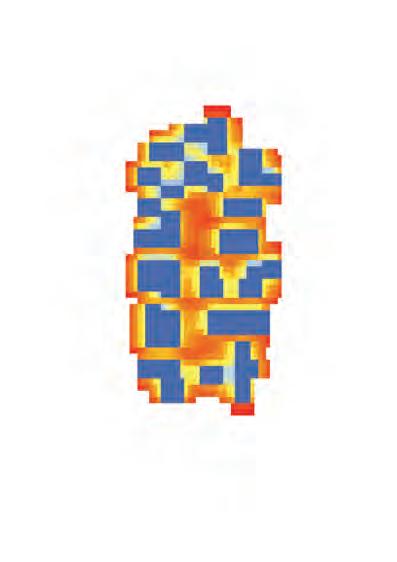
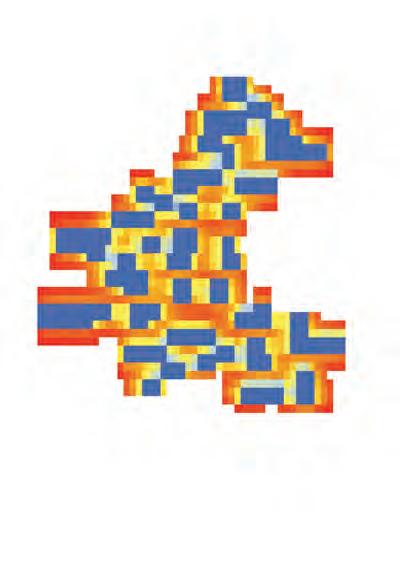
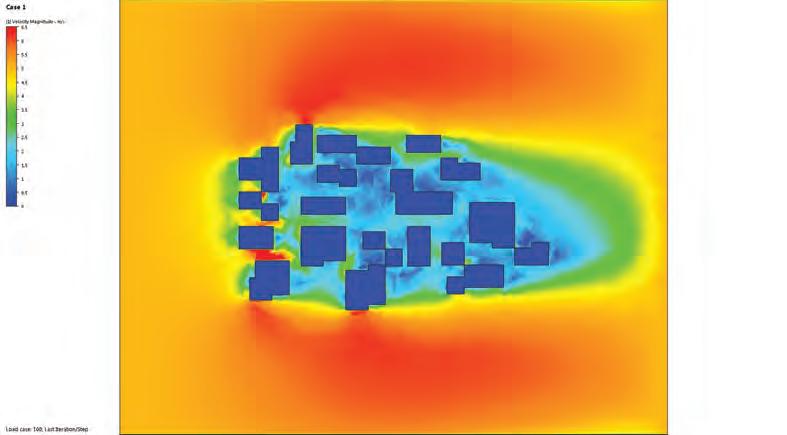
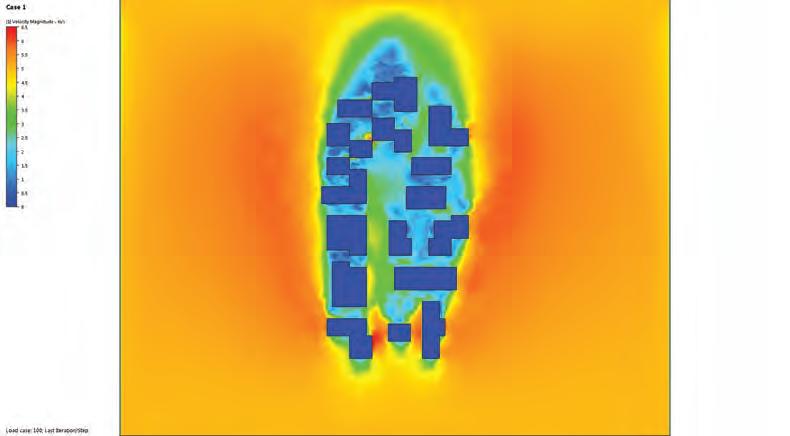
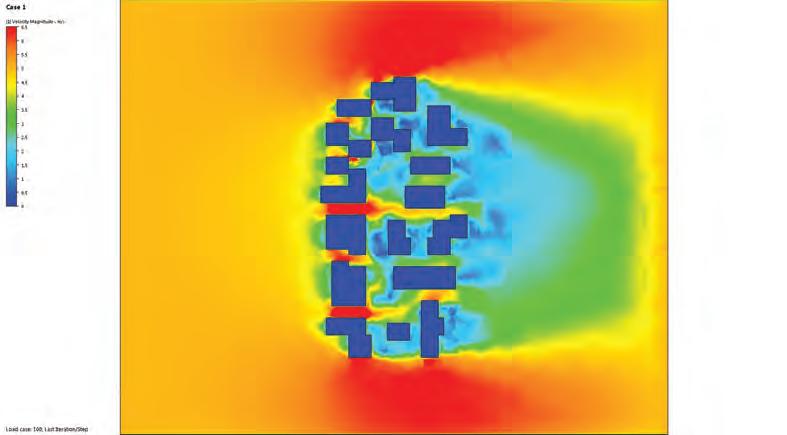
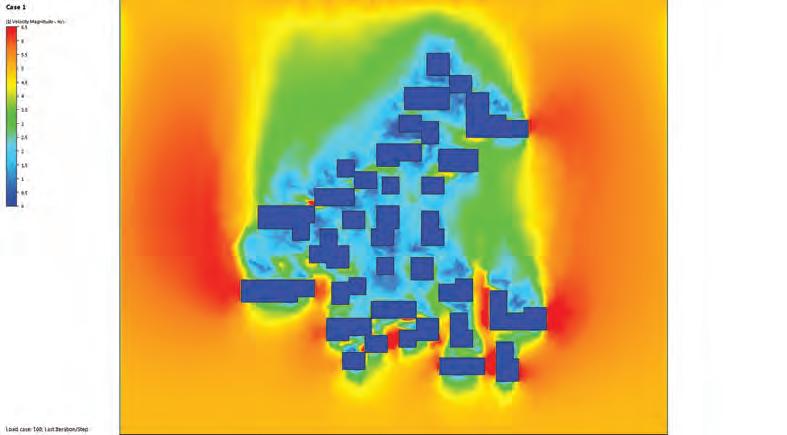
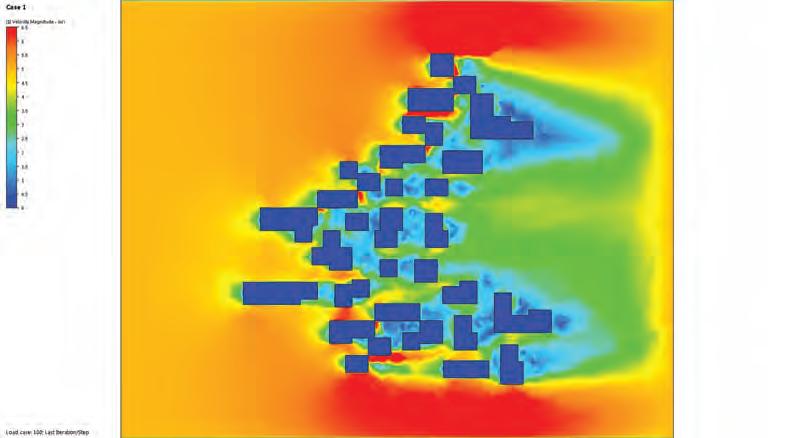
GROWTH SIMULATION 208 209 APPENDIX RESPONSIVE GROWTH SYSTEM 150kw/hr 0 Month April 8:00 to 20:00 N Experiment 5.3 Family Type Live (S,M) No. of Yard built edges One No. of Ventilation Faces Two for all spaces Preferred Built order W-E-S-N Experiment 4.1 Family Type Livework (S,M) No. of Yard built edges One No. of Ventilation Faces Two for all spaces Preferred Built order W-S-E-N Experiment 9.4 Family Type Livework (S,M) No. of Yard built edges Two No. of Ventilation Faces Two for all spaces Preferred Built order W-E-S-N Live Live-work Private Dedicated Yards Emergent yards CLIMATIC ANALYSIS
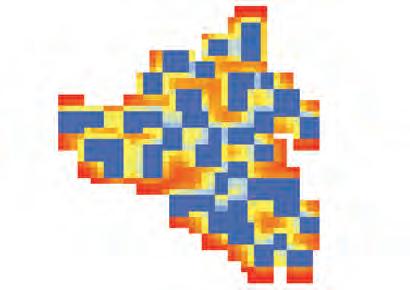
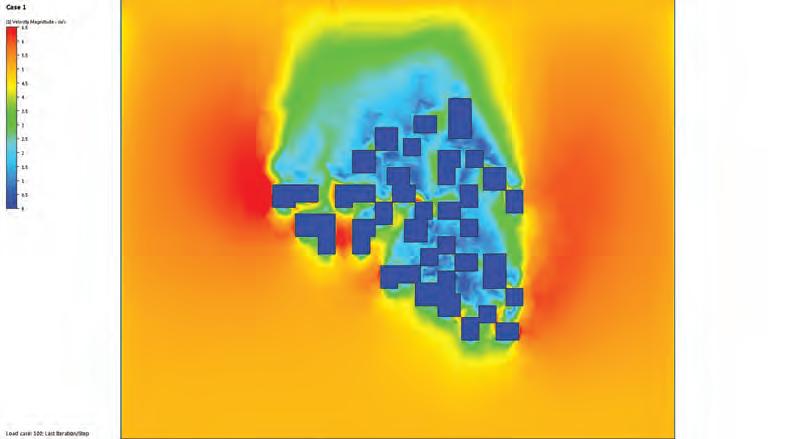
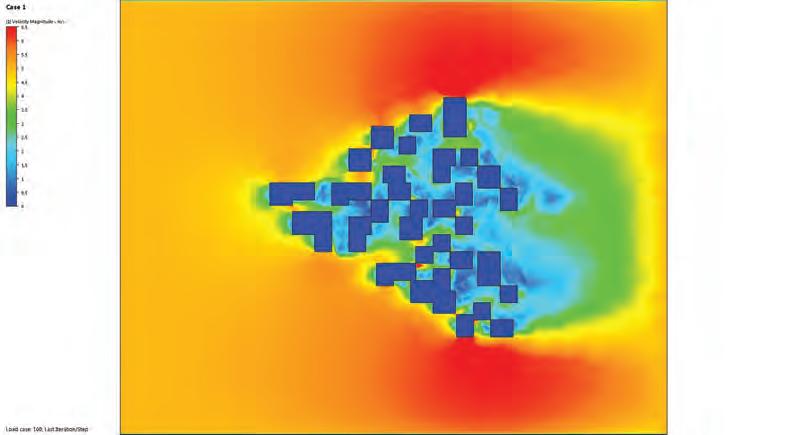
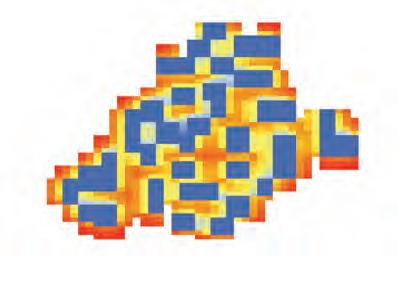

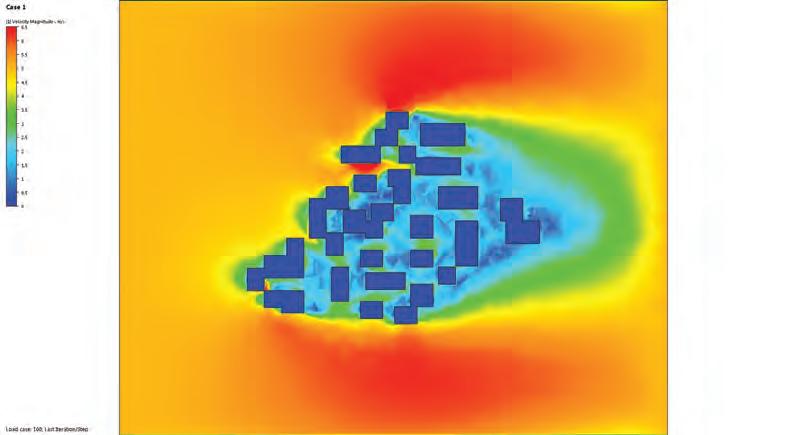
GROWTH SIMULATION 210 211 APPENDIX RESPONSIVE GROWTH SYSTEM 150kw/hr 0 Month April 8:00 to 20:00 N Experiment 13.2 Family Type Live (S,M) No. of Yard built edges Two No. of Ventilation Faces Two for all spaces Preferred Built order W-S-E-N Experiment 14.2 Family Type Live (S,M) No. of Yard built edges Two No. of Ventilation Faces Two for all spaces Preferred Built order W-E-S-N Live Live-work Private Dedicated Yards Emergent yards CLIMATIC ANALYSIS
